UNITED STATES
SECURITIES AND EXCHANGE COMMISSION
Washington, D.C. 20549
FORM N-CSR
CERTIFIED SHAREHOLDER REPORT OF REGISTERED
MANAGEMENT INVESTMENT COMPANIES
Investment Company Act file number 811-05349
Goldman Sachs Trust
(Exact name of registrant as specified in charter)
71 South Wacker Drive, Chicago, Illinois 60606
(Address of principal executive offices) (Zip code)
| | |
| Caroline Kraus, Esq. | | Copies to: |
| Goldman Sachs & Co. LLC | | Geoffrey R.T. Kenyon, Esq. |
| 200 West Street | | Dechert LLP |
| New York, New York 10282 | | 100 Oliver Street |
| | 40th Floor |
| | Boston, MA 02110-2605 |
(Name and address of agents for service)
Registrant’s telephone number, including area code: (312) 655-4400
Date of fiscal year end: August 31
Date of reporting period: February 28, 2021
| ITEM 1. | REPORTS TO STOCKHOLDERS. |
| | The Semi-Annual Report to Shareholders is filed herewith. |
Goldman Sachs Funds

| | | | |
| | |
| Semi-Annual Report | | | | February 28, 2021 |
| | |
| | | | Fundamental Equity Growth Funds |
| | | | Capital Growth |
| | | | Concentrated Growth |
| | | | Flexible Cap |
| | | | Growth Opportunities |
| | | | Small Cap Growth |
| | | | Small/Mid Cap Growth |
| | | | Strategic Growth |
| | | | Technology Opportunities |
| | | | U.S. Equity ESG |

Goldman Sachs Fundamental Equity Growth Funds
| ∎ | | TECHNOLOGY OPPORTUNITIES |
| | | | |
| | | |
| NOT FDIC-INSURED | | May Lose Value | | No Bank Guarantee |
FUND BASICS
Capital Growth Fund
as of February 28, 2021
| | | | | | | | | | |
| | PERFORMANCE REVIEW | |
| | | |
| | | September 1, 2020–February 28, 2021 | | Fund Total Return
(based on NAV)1 | | | Russell 1000®
Index2 | |
| | Class A | | | 11.22 | % | | | 11.78 | % |
| | Class C | | | 10.84 | | |
| 11.78
|
|
| | Institutional | | | 11.41 | | |
| 11.78
|
|
| | Service | | | 11.16 | | | | 11.78 | |
| | Investor | | | 11.36 | | | | 11.78 | |
| | Class R6 | | | 11.43 | | | | 11.78 | |
| | Class R | | | 11.12 | | | | 11.78 | |
| | | Class P | | | 11.44 | | | | 11.78 | |
| 1 | | The net asset value (“NAV”) represents the net assets of the class of the Fund (ex-dividend) divided by the total number of shares of the class outstanding. The Fund’s performance reflects the reinvestment of dividends and other distributions. The Fund’s performance does not reflect the deduction of any applicable sales charges. |
| 2 | | The Russell 1000 Index measures the performance of the large-cap segment of the U.S. equity universe. It includes those Russell 1000 Index companies with lower price-to-book ratios and lower expected growth values. The Russell 1000 Index is constructed to provide a comprehensive and unbiased barometer for the large-cap value segment. The Russell 1000 Index is completely reconstituted annually to ensure new and growing equities are included and that the represented companies continue to reflect value characteristics. It is not possible to invest directly in an index. |
The returns set forth in the table above represent past performance. Past performance does not guarantee future results. The Fund’s investment return and principal value will fluctuate so that an investor’s shares, when redeemed, may be worth more or less than their original cost. Current performance may be lower or higher than the performance quoted above. Please visit our web site at www.GSAMFUNDS.com to obtain the most recent month-end returns. Performance reflects applicable fee waivers and/or expense limitations in effect during the periods shown. In their absence, performance would be reduced. Returns do not reflect the deduction of taxes that a shareholder would pay on Fund distributions or the redemption of Fund shares.
| | | | | | | | |
| | TOP TEN HOLDINGS AS OF 2/28/20213 |
| | | |
| | | Holding | | % of Net Assets | | | Line of Business |
| | | |
| | Microsoft Corp. | | | 5.1 | % | | Software |
| | | |
| | Apple, Inc. | | | 4.9 | | | Technology Hardware, Storage & Peripherals |
| | | |
| | Amazon.com, Inc. | | | 4.3 | | | Internet & Direct Marketing Retail |
| | | |
| | Alphabet, Inc., Class A | | | 2.2 | | | Interactive Media & Services |
| | | |
| | Facebook, Inc., Class A | | | 1.9 | | | Interactive Media & Services |
| | | |
| | Alphabet, Inc., Class C | | | 1.8 | | | Interactive Media & Services |
| | | |
| | Visa, Inc., Class A | | | 1.7 | | | IT Services |
| | | |
| | American Express Co. | | | 1.6 | | | Consumer Finance |
| | | |
| | PayPal Holdings, Inc. | | | 1.5 | | | IT Services |
| | | Eli Lilly and Co. | | | 1.4 | | | Pharmaceuticals |
| 3 | | The top 10 holdings may not be representative of the Fund’s future investments. |
1
FUND BASICS
|
| FUND VS. BENCHMARK SECTOR ALLOCATION4 |
|
| As of February 28, 2021 |
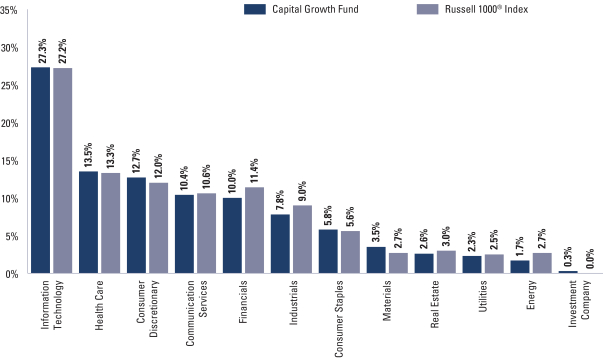
| 4 | | The Fund is actively managed and, as such, its composition may differ over time. Consequently, the Fund’s overall sector allocations may differ from the percentages contained in the graph above. The graph categorizes investments using the Global Industry Classification Standard (“GICS”), however, the sector classifications used by the portfolio management team may differ from GICS. The percentage shown for each investment category reflects the value of investments in that category as a percentage of market value. The graph depicts the Fund’s investments but may not represent the Fund’s market exposure due to the exclusion of certain derivatives, if any, as listed in the Additional Investment Information section of the Schedule of Investments. |
For more information about the Fund, please refer to www.GSAMFUNDS.com. There, you can learn more about the Fund’s investment strategies, holdings, and performance.
2
FUND BASICS
Concentrated Growth Fund
as of February 28, 2021
| | | | | | | | | | |
| | PERFORMANCE REVIEW | |
| | | |
| | | September 1, 2020–February 28, 2021 | | Fund Total Return
(based on NAV)1 | | | Russell 1000®
Growth Index2 | |
| | Class A | | | 5.93 | % | | | 5.34 | % |
| | Class C | | | 5.56 | | | | 5.34 | |
| | Institutional | | | 6.10 | | | | 5.34 | |
| | Investor | | | 6.10 | | | | 5.34 | |
| | Class R6 | | | 6.11 | | | | 5.34 | |
| | Class R | | | 5.81 | | | | 5.34 | |
| | | Class P | | | 6.12 | | | | 5.34 | |
| 1 | | The net asset value (“NAV”) represents the net assets of the class of the Fund (ex-dividend) divided by the total number of shares of the class outstanding. The Fund’s performance reflects the reinvestment of dividends and other distributions. The Fund’s performance does not reflect the deduction of any applicable sales charges. |
| 2 | | The Russell 1000® Growth Index is an unmanaged index that measures the performance of those Russell 1000® companies with higher price-to-book ratios and higher forecasted growth values. The Russell 1000® Growth Index figures do not reflect any deduction for fees, expenses or taxes. It is not possible to invest directly in an index. |
The returns set forth in the table above represent past performance. Past performance does not guarantee future results. The Fund’s investment return and principal value will fluctuate so that an investor’s shares, when redeemed, may be worth more or less than their original cost. Current performance may be lower or higher than the performance quoted above. Please visit our web site at www.GSAMFUNDS.com to obtain the most recent month-end returns. Performance reflects applicable fee waivers and/or expense limitations in effect during the periods shown. In their absence, performance would be reduced. Returns do not reflect the deduction of taxes that a shareholder would pay on Fund distributions or the redemption of Fund shares.
| | | | | | | | |
| | TOP TEN HOLDINGS AS OF 2/28/20213 |
| | | |
| | | Holding | | % of Net Assets | | | Line of Business |
| | | |
| | Microsoft Corp. | | | 8.2 | % | | Software |
| | | |
| | Apple, Inc. | | | 7.5 | | | Technology Hardware, Storage & Peripherals |
| | | |
| | Alphabet, Inc., Class A | | | 6.4 | | | Interactive Media & Services |
| | | |
| | Visa, Inc., Class A | | | 4.8 | | | IT Services |
| | | |
| | Amazon.com, Inc. | | | 4.7 | | | Internet & Direct Marketing Retail |
| | | |
| | PayPal Holdings, Inc. | | | 3.8 | | | IT Services |
| | | |
| | Eli Lilly and Co. | | | 3.2 | | | Pharmaceuticals |
| | | |
| | NVIDIA Corp. | | | 3.1 | | | Semiconductors & Semiconductor Equipment |
| | | |
| | Marvell Technology Group Ltd. | | | 3.1 | | | Semiconductors & Semiconductor Equipment |
| | | NXP Semiconductors NV | | | 3.0 | | | Semiconductors & Semiconductor Equipment |
| 3 | | The top 10 holdings may not be representative of the Fund’s future investments. |
3
FUND BASICS
|
| FUND VS. BENCHMARK SECTOR ALLOCATION4 |
|
| As of February 28, 2021 |
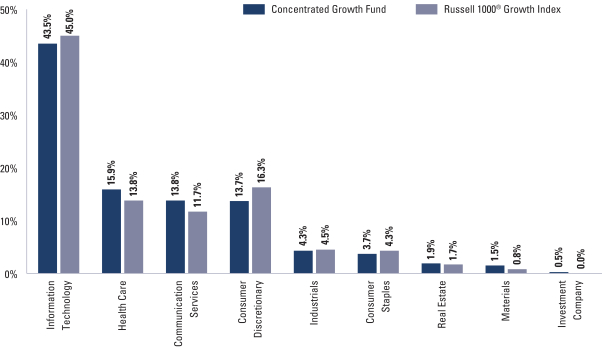
| 4 | | The Fund is actively managed and, as such, its composition may differ over time. Consequently, the Fund’s overall sector allocations may differ from the percentages contained in the graph above. The graph categorizes investments using the Global Industry Classification Standard (“GICS”); however, the sector classifications used by the portfolio management team may differ from GICS. The percentage shown for each investment category reflects the value of investments in that category as a percentage of market value. The graph depicts the Fund’s investments but may not represent the Fund’s market exposure due to the exclusion of certain derivatives, if any, as listed in the Additional Investment Information section of the Schedule of Investments. |
For more information about the Fund, please refer to www.GSAMFUNDS.com. There, you can learn more about the Fund’s investment strategies, holdings, and performance.
4
FUND BASICS
Flexible Cap Fund
as of February 28, 2021
| | | | | | | | | | |
| | PERFORMANCE REVIEW | |
| | | |
| | | September 1, 2020–February 28, 2021 | | Fund Total Return
(based on NAV)1 | | | S&P 500®
Index2 | |
| | Class A | | | 9.61 | % | | | 9.74 | % |
| | Class C | | | 9.31 | | | | 9.74 | |
| | Institutional | | | 9.86 | | | | 9.74 | |
| | Investor | | | 9.77 | | | | 9.74 | |
| | Class R6 | | | 9.90 | | | | 9.74 | |
| | Class R | | | 9.52 | | | | 9.74 | |
| | | Class P | | | 9.83 | | | | 9.74 | |
| 1 | | The net asset value (“NAV”) represents the net assets of the class of the Fund (ex-dividend) divided by the total number of shares of the class outstanding. The Fund’s performance reflects the reinvestment of dividends and other distributions. The Fund’s performance does not reflect the deduction of any applicable sales charges. |
| 2 | | The S&P 500® Index is the Standard & Poor’s 500 Composite Index of 500 stocks, an unmanaged index of common stock prices. The S&P 500® Index figures do not reflect any deduction for fees, expenses or taxes. It is not possible to invest directly in an index. |
The returns set forth in the table above represent past performance. Past performance does not guarantee future results. The Fund’s investment return and principal value will fluctuate so that an investor’s shares, when redeemed, may be worth more or less than their original cost. Current performance may be lower or higher than the performance quoted above. Please visit our web site at www.GSAMFUNDS.com to obtain the most recent month-end returns. Performance reflects applicable fee waivers and/or expense limitations in effect during the periods shown. In their absence, performance would be reduced. Returns do not reflect the deduction of taxes that a shareholder would pay on Fund distributions or the redemption of Fund shares.
| | | | | | | | |
| | TOP TEN HOLDINGS AS OF 2/28/20213 |
| | | |
| | | Holding | | % of Net Assets | | | Line of Business |
| | | |
| | Microsoft Corp. | | | 5.9 | % | | Software |
| | | |
| | Apple, Inc. | | | 5.9 | | | Technology Hardware, Storage & Peripherals |
| | | |
| | Amazon.com, Inc. | | | 4.6 | | | Internet & Direct Marketing Retail |
| | | |
| | Alphabet, Inc., Class A | | | 2.3 | | | Interactive Media & Services |
| | | |
| | Facebook, Inc., Class A | | | 2.2 | | | Interactive Media & Services |
| | | |
| | JPMorgan Chase & Co. | | | 2.0 | | | Banks |
| | | |
| | Alphabet, Inc., Class C | | | 1.9 | | | Interactive Media & Services |
| | | |
| | Visa, Inc., Class A | | | 1.6 | | | IT Services |
| | | |
| | UnitedHealth Group, Inc. | | | 1.4 | | | Health Care Providers & Services |
| | | Walt Disney Co. (The) | | | 1.4 | | | Entertainment |
| 3 | | The top 10 holdings may not be representative of the Fund’s future investments. |
5
FUND BASICS
|
| FUND VS. BENCHMARK SECTOR ALLOCATION4 |
|
| As of February 28, 2021 |
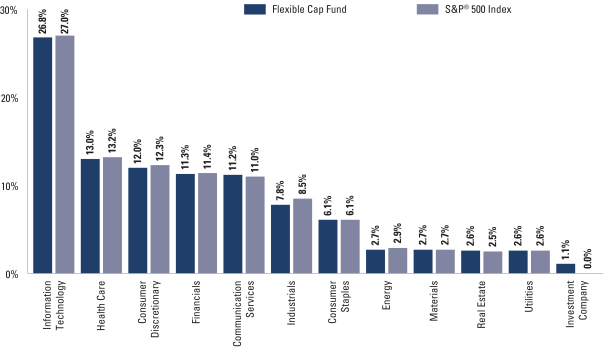
| 4 | | The Fund is actively managed and, as such, its composition may differ over time. Consequently, the Fund’s overall sector allocations may differ from the percentages contained in the graph above. The graph categorizes investments using the Global Industry Classification Standard (“GICS”), however, the sector classifications used by the portfolio management team may differ from GICS. The percentage shown for each investment category reflects the value of investments in that category as a percentage of market value. The graph depicts the Fund’s investments but may not represent the Fund’s market exposure due to the exclusion of certain derivatives, if any, as listed in the Additional Investment Information section of the Schedule of Investments. |
For more information about the Fund, please refer to www.GSAMFUNDS.com. There, you can learn more about the Fund’s investment strategies, holdings, and performance.
6
FUND BASICS
Growth Opportunities Fund
as of February 28, 2021
| | | | | | | | | | |
| | PERFORMANCE REVIEW | |
| | | |
| | | September 1, 2020–February 28, 2021 | | Fund Total Return
(based on NAV)1 | | | Russell Midcap®
Growth Index2 | |
| | Class A | | | 20.54 | % | | | 18.96 | % |
| | Class C | | | 20.19 | | | | 18.96 | |
| | Institutional | | | 20.73 | | | | 18.96 | |
| | Service | | | 20.46 | | | | 18.96 | |
| | Investor | | | 20.71 | | | | 18.96 | |
| | Class R6 | | | 20.75 | | | | 18.96 | |
| | Class R | | | 20.34 | | | | 18.96 | |
| | | Class P | | | 20.75 | | | | 18.96 | |
| 1 | | The net asset value (“NAV”) represents the net assets of the class of the Fund (ex-dividend) divided by the total number of shares of the class outstanding. The Fund’s performance reflects the reinvestment of dividends and other distributions. The Fund’s performance does not reflect the deduction of any applicable sales charges. |
| 2 | | The Russell Midcap® Growth Index is an unmanaged market capitalization weighted index that measures the performance of those Russell Midcap companies with higher price-to-book ratios and higher forecasted growth values. The Russell Midcap® Growth Index figures do not reflect any deduction for fees, expenses or taxes. It is not possible to invest directly in an index. |
The returns set forth in the table above represent past performance. Past performance does not guarantee future results. The Fund’s investment return and principal value will fluctuate so that an investor’s shares, when redeemed, may be worth more or less than their original cost. Current performance may be lower or higher than the performance quoted above. Please visit our web site at www.GSAMFUNDS.com to obtain the most recent month-end returns. Performance reflects applicable fee waivers and/or expense limitations in effect during the periods shown. In their absence, performance would be reduced. Returns do not reflect the deduction of taxes that a shareholder would pay on Fund distributions or the redemption of Fund shares.
| | | | | | | | |
| | TOP TEN HOLDINGS AS OF 2/28/20213 |
| | | |
| | | Holding | | % of Net Assets | | | Line of Business |
| | Veeva Systems, Inc., Class A | | | 2.6 | % | | Health Care Technology |
| | Cadence Design Systems, Inc. | | | 2.3 | | | Software |
| | RingCentral, Inc., Class A | | | 2.3 | | | Software |
| | Palo Alto Networks, Inc. | | | 2.3 | | | Software |
| | HubSpot, Inc. | | | 2.0 | | | Software |
| | DocuSign, Inc. | | | 2.0 | | | Software |
| | Amphenol Corp., Class A | | | 1.9 | | | Electronic Equipment, Instruments & Components |
| | Rockwell Automation, Inc. | | | 1.9 | | | Electrical Equipment |
| | Match Group, Inc. | | | 1.9 | | | Interactive Media & Services |
| | | Etsy, Inc. | | | 1.8 | | | Internet & Direct Marketing Retail |
| 3 | | The top 10 holdings may not be representative of the Fund’s future investments. |
7
FUND BASICS
|
| FUND VS. BENCHMARK SECTOR ALLOCATION4 |
|
| As of February 28, 2021 |
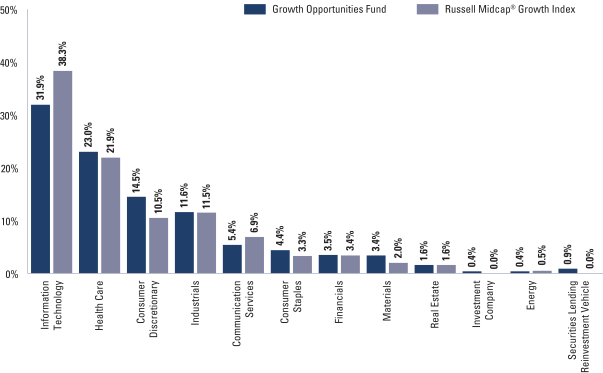
| 4 | | The Fund is actively managed and, as such, its composition may differ over time. Consequently, the Fund’s overall sector allocations may differ from the percentages contained in the graph above. The graph categorizes investments using the Global Industry Classification Standard (“GICS”); however, the sector classifications used by the portfolio management team may differ from GICS. The percentage shown for each investment category reflects the value of investments in that category as a percentage of market value. The graph depicts the Fund’s investments but may not represent the Fund’s market exposure due to the exclusion of certain derivatives, if any, as listed in the Additional Investment Information section of the Schedule of Investments. |
For more information about the Fund, please refer to www.GSAMFUNDS.com. There, you can learn more about the Fund’s investment strategies, holdings, and performance.
8
FUND BASICS
Small Cap Growth Fund
as of February 28, 2021
| | | | | | | | | | |
| | PERFORMANCE REVIEW | |
| | | |
| | | September 1, 2020–February 28, 2021 | | Fund Total Return
(based on NAV)1 | | | Russell 2000®
Growth Index2 | |
| | Class A | | | 36.75 | % | | | 37.33 | % |
| | Class C | | | 36.22 | | | | 37.33 | |
| | Institutional | | | 37.00 | | | | 37.33 | |
| | Investor | | | 36.93 | | | | 37.33 | |
| | Class R6 | | | 36.99 | | | | 37.33 | |
| | Class R | | | 36.56 | | | | 37.33 | |
| | | Class P | | | 36.92 | | | | 37.33 | |
| 1 | | The net asset value (“NAV”) represents the net assets of the class of the Fund (ex-dividend) divided by the total number of shares of the class outstanding. The Fund’s performance reflects the reinvestment of dividends and other distributions. The Fund’s performance does not reflect the deduction of any applicable sales charges. |
| 2 | | The Russell 2000® Growth Index (with dividends reinvested) is an unmanaged index of common stock prices that measures the performance of those Russell 2000 companies with higher price-to-book ratios and higher forecasted growth values. The Russell 2000® Growth Index figures do not reflect any deduction for fees, expenses or taxes. It is not possible to invest directly in an index. |
The returns set forth in the table above represent past performance. Past performance does not guarantee future results. The Fund’s investment return and principal value will fluctuate so that an investor’s shares, when redeemed, may be worth more or less than their original cost. Current performance may be lower or higher than the performance quoted above. Please visit our web site at www.GSAMFUNDS.com to obtain the most recent month-end returns. Performance reflects applicable fee waivers and/or expense limitations in effect during the periods shown. In their absence, performance would be reduced. Returns do not reflect the deduction of taxes that a shareholder would pay on Fund distributions or the redemption of Fund shares.
| | | | | | | | |
| | TOP TEN HOLDINGS AS OF 2/28/20213 |
| | | |
| | | Holding | | % of Net Assets | | | Line of Business |
| | Halozyme Therapeutics, Inc. | | | 1.8 | % | | Biotechnology |
| | Quanterix Corp. | | | 1.7 | | | Life Sciences Tools & Services |
| | Brooks Automation, Inc. | | | 1.6 | | | Semiconductors & Semiconductor Equipment |
| | Crocs, Inc. | | | 1.6 | | | Textiles, Apparel & Luxury Goods |
| | Colfax Corp. | | | 1.5 | | | Machinery |
| | RBC Bearings, Inc. | | | 1.5 | | | Machinery |
| | Workiva, Inc. | | | 1.5 | | | Software |
| | Omnicell, Inc. | | | 1.4 | | | Health Care Technology |
| | YETI Holdings, Inc. | | | 1.4 | | | Leisure Products |
| | | Kratos Defense & Security Solutions, Inc. | | | 1.4 | | | Aerospace & Defense |
| 3 | | The top 10 holdings may not be representative of the Fund’s future investments. |
9
FUND BASICS
|
| FUND VS. BENCHMARK SECTOR ALLOCATION4 |
|
| As of February 28, 2021 |
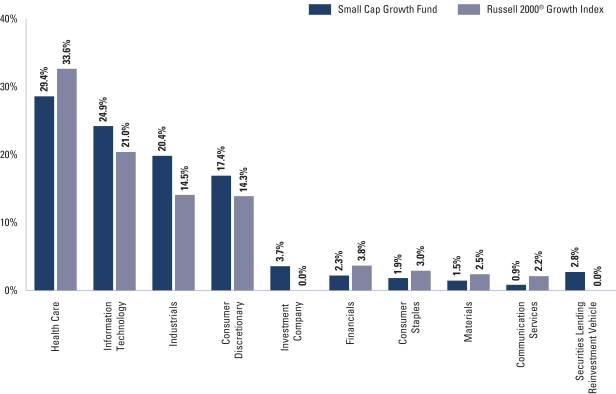
| 4 | | The Fund is actively managed and, as such, its composition may differ over time. Consequently, the Fund’s overall sector allocations may differ from the percentages contained in the graph above. The graph categorizes investments using the Global Industry Classification Standard (“GICS”); however, the sector classifications used by the portfolio management team may differ from GICS. The percentage shown for each investment category reflects the value of investments in that category as a percentage of market value. The graph depicts the Fund’s investments but may not represent the Fund’s market exposure due to the exclusion of certain derivatives, if any, as listed in the Additional Investment Information section of the Schedule of Investments. |
For more information about the Fund, please refer to www.GSAMFUNDS.com. There, you can learn more about the Fund’s investment strategies, holdings, and performance.
10
FUND BASICS
Small/Mid Cap Growth Fund
as of February 28, 2021
| | | | | | | | | | |
| | PERFORMANCE REVIEW | |
| | | |
| | | September 1, 2020–February 28, 2021 | | Fund Total Return
(based on NAV)1 | | | Russell 2500®
Growth Index2 | |
| | Class A | | | 29.47 | % | | | 32.45 | % |
| | Class C | | | 28.97 | | | | 32.45 | |
| | Institutional | | | 29.68 | | | | 32.45 | |
| | Service | | | 29.34 | | | | 32.45 | |
| | Investor | | | 29.63 | | | | 32.45 | |
| | Class R6 | | | 29.65 | | | | 32.45 | |
| | Class R | | | 29.32 | | | | 32.45 | |
| | | Class P | | | 29.69 | | | | 32.45 | |
| 1 | | The net asset value (“NAV”) represents the net assets of the class of the Fund (ex-dividend) divided by the total number of shares of the class outstanding. The Fund’s performance reflects the reinvestment of dividends and other distributions. The Fund’s performance does not reflect the deduction of any applicable sales charges. |
| 2 | | The Russell 2500® Growth Index is an unmanaged index that measures the performance of the small to mid-cap growth segment of the US equity universe. The Russell 2500® Growth Index is constructed to provide a comprehensive and unbiased barometer of the small- to mid-cap growth market. Based on ongoing empirical research of investment manager behavior, the methodology used to determine growth probability approximates the aggregate small- to mid-cap growth manager’s opportunity set. The Russell 2500® Growth Index figures do not reflect any deduction for fees, expenses or taxes. It is not possible to invest directly in an index. |
The returns set forth in the table above represent past performance. Past performance does not guarantee future results. The Fund’s investment return and principal value will fluctuate so that an investor’s shares, when redeemed, may be worth more or less than their original cost. Current performance may be lower or higher than the performance quoted above. Please visit our web site at www.GSAMFUNDS.com to obtain the most recent month-end returns. Performance reflects applicable fee waivers and/or expense limitations in effect during the periods shown. In their absence, performance would be reduced. Returns do not reflect the deduction of taxes that a shareholder would pay on Fund distributions or the redemption of Fund shares.
| | | | | | | | |
| | TOP TEN HOLDINGS AS OF 2/28/20213 |
| | | |
| | | Holding | | % of Net Assets | | | Line of Business |
| | Generac Holdings, Inc. | | | 2.4 | % | | Electrical Equipment |
| | HubSpot, Inc. | | | 2.2 | | | Software |
| | Guardant Health, Inc. | | | 2.1 | | | Health Care Providers & Services |
| | Zendesk, Inc. | | | 1.8 | | | Software |
| | PerkinElmer, Inc. | | | 1.8 | | | Life Sciences Tools & Services |
| | Bio-Techne Corp. | | | 1.8 | | | Life Sciences Tools & Services |
| | Entegris, Inc. | | | 1.7 | | | Semiconductors & Semiconductor Equipment |
| | Colfax Corp. | | | 1.7 | | | Machinery |
| | Molina Healthcare, Inc. | | | 1.6 | | | Health Care Providers & Services |
| | | Dynatrace, Inc. | | | 1.6 | | | Software |
| 3 | | The top 10 holdings may not be representative of the Fund’s future investments. |
11
FUND BASICS
| | |
| | FUND VS. BENCHMARK SECTOR ALLOCATION4 |
| |
| | | As of February 28, 2021 |
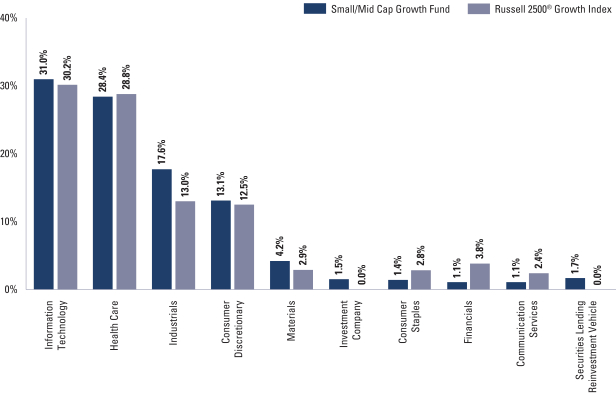
| 4 | | The Fund is actively managed and, as such, its composition may differ over time. Consequently, the Fund’s overall sector allocations may differ from the percentages contained in the graph above. The graph categorizes investments using the Global Industry Classification Standard (“GICS”), however, the sector classifications used by the portfolio management team may differ from GICS. The percentage shown for each investment category reflects the value of investments in that category as a percentage of market value. The graph depicts the Fund’s investments but may not represent the Fund’s market exposure due to the exclusion of certain derivatives, if any, as listed in the Additional Investment Information section of the Schedule of Investments. |
For more information about the Fund, please refer to www.GSAMFUNDS.com. There, you can learn more about the Fund’s investment strategies, holdings, and performance.
12
FUND BASICS
Strategic Growth Fund
as of February 28, 2021
| | | | | | | | | | |
| | PERFORMANCE REVIEW | |
| | | |
| | | September 1, 2020–February 28, 2021 | | Fund Total Return
(based on NAV)1 | | | Russell 1000®
Growth Index2 | |
| | Class A | | | 8.26 | % | | | 5.34 | % |
| | Class C | | | 7.93 | | | | 5.34 | |
| | Institutional | | | 8.46 | | | | 5.34 | |
| | Service | | | 8.17 | | | | 5.34 | |
| | Investor | | | 8.31 | | | | 5.34 | |
| | Class R6 | | | 8.42 | | | | 5.34 | |
| | Class R | | | 8.12 | | | | 5.34 | |
| | | Class P | | | 8.42 | | | | 5.34 | |
| 1 | | The net asset value (“NAV”) represents the net assets of the class of the Fund (ex-dividend) divided by the total number of shares of the class outstanding. The Fund’s performance reflects the reinvestment of dividends and other distributions. The Fund’s performance does not reflect the deduction of any applicable sales charges. |
| 2 | | The Russell 1000® Growth Index is an unmanaged index that measures the performance of those Russell 1000® companies with higher price-to-book ratios and higher forecasted growth values. The Russell 1000® Growth Index figures do not reflect any deduction for fees, expenses or taxes. It is not possible to invest directly in an index. |
The returns set forth in the table above represent past performance. Past performance does not guarantee future results. The Fund’s investment return and principal value will fluctuate so that an investor’s shares, when redeemed, may be worth more or less than their original cost. Current performance may be lower or higher than the performance quoted above. Please visit our web site at www.GSAMFUNDS.com to obtain the most recent month-end returns. Performance reflects applicable fee waivers and/or expense limitations in effect during the periods shown. In their absence, performance would be reduced. Returns do not reflect the deduction of taxes that a shareholder would pay on Fund distributions or the redemption of Fund shares.
| | | | | | | | |
| | TOP TEN HOLDINGS AS OF 2/28/20213 |
| | | |
| | | Holding | | % of Net Assets | | | Line of Business |
| | Apple, Inc. | | | 8.4 | % | | Technology Hardware, Storage & Peripherals |
| | Microsoft Corp. | | | 7.3 | | | Software |
| | Amazon.com, Inc. | | | 5.4 | | | Internet & Direct Marketing Retail |
| | Alphabet, Inc., Class A | | | 4.5 | | | Interactive Media & Services |
| | Visa, Inc., Class A | | | 3.5 | | | IT Services |
| | Facebook, Inc., Class A | | | 3.4 | | | Interactive Media & Services |
| | NVIDIA Corp. | | | 3.1 | | | Semiconductors & Semiconductor Equipment |
| | Alphabet, Inc., Class C | | | 2.7 | | | Interactive Media & Services |
| | Tesla, Inc. | | | 2.6 | | | Automobiles |
| | | PayPal Holdings, Inc. | | | 2.6 | | | IT Services |
| 3 | | The top 10 holdings may not be representative of the Fund’s future investments. |
13
FUND BASICS
|
| FUND VS. BENCHMARK SECTOR ALLOCATION4 |
|
| As of February 28, 2021 |
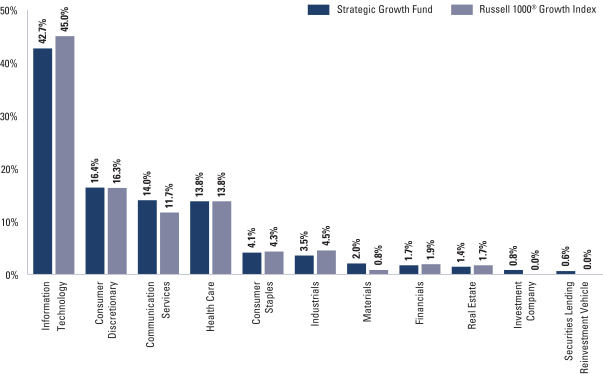
| 4 | | The Fund is actively managed and, as such, its composition may differ over time. Consequently, the Fund’s overall sector allocations may differ from the percentages contained in the graph above. The graph categorizes investments using the Global Industry Classification Standard (“GICS”), however, the sector classifications used by the portfolio management team may differ from GICS. The percentage shown for each investment category reflects the value of investments in that category as a percentage of market value. The graph depicts the Fund’s investments but may not represent the Fund’s market exposure due to the exclusion of certain derivatives, if any, as listed in the Additional Investment Information section of the Schedule of Investments. |
For more information about the Fund, please refer to www.GSAMFUNDS.com. There, you can learn more about the Fund’s investment strategies, holdings, and performance.
14
FUND BASICS
Technology Opportunities Fund
as of February 28, 2021
| | | | | | | | | | |
| | PERFORMANCE REVIEW | |
| | | |
| | | September 1, 2020–February 28, 2021 | | Fund Total Return
(based on NAV)1 | | | NASDAQ Composite
Total Return Index2 | |
| | Class A | | | 8.00 | % | | | 12.43 | % |
| | Class C | | | 7.59 | | | | 12.43 | |
| | Institutional | | | 8.14 | | | | 12.43 | |
| | Service | | | 7.85 | | | | 12.43 | |
| | Investor | | | 8.15 | | | | 12.43 | |
| | Class R6 | | | 8.13 | | | | 12.43 | |
| | | |
| | | Class P | | | 8.13 | | | | 12.43 | |
| 1 | | The net asset value (“NAV”) represents the net assets of the class of the Fund (ex-dividend) divided by the total number of shares of the class outstanding. The Fund’s performance reflects the reinvestment of dividends and other distributions. The Fund’s performance does not reflect the deduction of any applicable sales charges. |
| 2 | | The NASDAQ Composite Index includes all domestic and international based common type stocks listed on The NASDAQ Stock Market. The NASDAQ Composite Index is a broad based Index. It is not possible to invest directly in an index. |
The returns set forth in the table above represent past performance. Past performance does not guarantee future results. The Fund’s investment return and principal value will fluctuate so that an investor’s shares, when redeemed, may be worth more or less than their original cost. Current performance may be lower or higher than the performance quoted above. Please visit our web site at www.GSAMFUNDS.com to obtain the most recent month-end returns. Performance reflects applicable fee waivers and/or expense limitations in effect during the periods shown. In their absence, performance would be reduced. Returns do not reflect the deduction of taxes that a shareholder would pay on Fund distributions or the redemption of Fund shares.
| | | | | | | | |
| | TOP TEN HOLDINGS AS OF 2/28/20213 |
| | | |
| | | Holding | | % of Net Assets | | | Line of Business |
| | Microsoft Corp. | | | 8.4 | % | | Software |
| | Alphabet, Inc., Class C | | | 6.1 | | | Interactive Media & Services |
| | Facebook, Inc., Class A | | | 5.3 | | | Interactive Media & Services |
| | Amazon.com, Inc. | | | 4.6 | | | Internet & Direct Marketing Retail |
| | PayPal Holdings, Inc. | | | 4.4 | | | IT Services |
| | Visa, Inc., Class A | | | 4.2 | | | IT Services |
| | Alphabet, Inc., Class A | | | 4.0 | | | Interactive Media & Services |
| | Marvell Technology Group Ltd. | | | 3.0 | | | Semiconductors & Semiconductor Equipment |
| | Apple, Inc. | | | 3.0 | | | Technology Hardware, Storage & Peripherals |
| | | Walt Disney Co. (The) | | | 2.8 | | | Entertainment |
| 3 | | The top 10 holdings may not be representative of the Fund’s future investments. |
15
FUND BASICS
| | |
| | FUND VS. BENCHMARK SECTOR ALLOCATION4 |
| |
| | | As of February 28, 2021 |
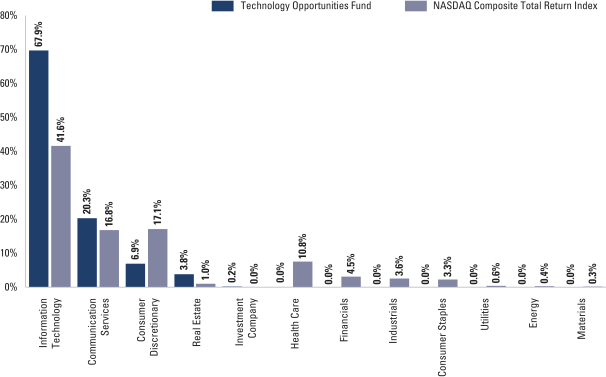
| 4 | | The Fund is actively managed and, as such, its composition may differ over time. Consequently, the Fund’s overall sector allocations may differ from the percentages contained in the graph above. The graph categorizes investments using the Global Industry Classification Standard (“GICS”), however, the sector classifications used by the portfolio management team may differ from GICS. The percentage shown for each investment category reflects the value of investments in that category as a percentage of market value. The graph depicts the Fund’s investments but may not represent the Fund’s market exposure due to the exclusion of certain derivatives, if any, as listed in the Additional Investment Information section of the Schedule of Investments. |
For more information about the Fund, please refer to www.GSAMFUNDS.com. There, you can learn more about the Fund’s investment strategies, holdings, and performance.
16
FUND BASICS
U.S. Equity ESG Fund
as of February 28, 2021
| | | | | | | | | | |
| | PERFORMANCE REVIEW | |
| | | |
| | | September 1, 2020–February 28, 2021 | | Fund Total Return
(based on NAV)1 | | | S&P 500®
Index2 | |
| | Class A | | | 12.49 | % | | | 9.74 | % |
| | Class C | | | 12.07 | | | | 9.74 | |
| | Institutional | | | 12.65 | | | | 9.74 | |
| | Investor | | | 12.63 | | | | 9.74 | |
| | Class R6 | | | 12.64 | | | | 9.74 | |
| | Class R | | | 12.37 | | | | 9.74 | |
| | | Class P | | | 12.65 | | | | 9.74 | |
| 1 | | The net asset value (“NAV”) represents the net assets of the class of the Fund (ex-dividend) divided by the total number of shares of the class outstanding. The Fund’s performance reflects the reinvestment of dividends and other distributions. The Fund’s performance does not reflect the deduction of any applicable sales charges. |
| 2 | | The S&P 500® Index is the Standard & Poor’s 500 Composite Index of 500 stocks, an unmanaged index of common stock prices. The S&P 500® Index figures do not reflect any deduction for fees, expenses or taxes. It is not possible to invest directly in an index. |
The returns set forth in the table above represent past performance. Past performance does not guarantee future results. The Fund’s investment return and principal value will fluctuate so that an investor’s shares, when redeemed, may be worth more or less than their original cost. Current performance may be lower or higher than the performance quoted above. Please visit our web site at www.GSAMFUNDS.com to obtain the most recent month-end returns. Performance reflects applicable fee waivers and/or expense limitations in effect during the periods shown. In their absence, performance would be reduced. Returns do not reflect the deduction of taxes that a shareholder would pay on Fund distributions or the redemption of Fund shares.
| | | | | | | | |
| | TOP TEN HOLDINGS AS OF 2/28/20213 |
| | | |
| | | Holding | | % of Net Assets | | | Line of Business |
| | Microsoft Corp. | | | 6.4 | % | | Software |
| | Apple, Inc. | | | 5.4 | | | Technology Hardware, Storage & Peripherals |
| | Alphabet, Inc., Class A | | | 5.3 | | | Interactive Media & Services |
| | JPMorgan Chase & Co. | | | 3.7 | | | Banks |
| | Visa, Inc., Class A | | | 3.3 | | | IT Services |
| | Walt Disney Co. (The) | | | 3.3 | | | Entertainment |
| | Eli Lilly and Co. | | | 3.1 | | | Pharmaceuticals |
| | American Express Co. | | | 2.7 | | | Consumer Finance |
| | Union Pacific Corp. | | | 2.7 | | | Road & Rail |
| | | NextEra Energy, Inc. | | | 2.6 | | | Electric Utilities |
| 3 | | The top 10 holdings may not be representative of the Fund’s future investments. |
17
FUND BASICS
|
| FUND VS. BENCHMARK SECTOR ALLOCATION4 |
|
| As of February 28, 2021 |
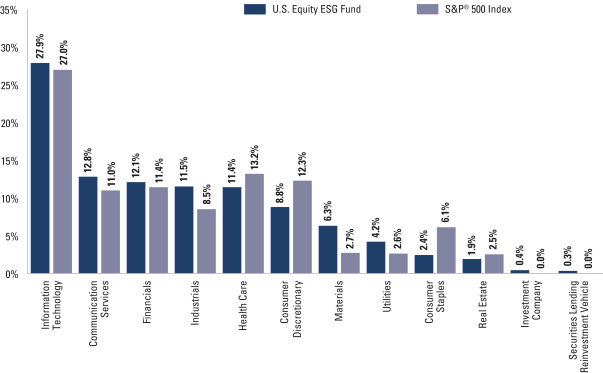
| 4 | | The Fund is actively managed and, as such, its composition may differ over time. Consequently, the Fund’s overall sector allocations may differ from the percentages contained in the graph above. The graph categorizes investments using the Global Industry Classification Standard (“GICS”), however, the sector classifications used by the portfolio management team may differ from GICS. The percentage shown for each investment category reflects the value of investments in that category as a percentage of market value. The graph depicts the Fund’s investments but may not represent the Fund’s market exposure due to the exclusion of certain derivatives, if any, as listed in the Additional Investment Information section of the Schedule of Investments. |
For more information about the Fund, please refer to www.GSAMFUNDS.com. There, you can learn more about the Fund’s investment strategies, holdings, and performance.
18
GOLDMAN SACHS CAPITAL GROWTH FUND
Schedule of Investments
February 28, 2021 (Unaudited)
| | | | | | | | |
| Shares | | |
Description | | Value | |
|
| Common Stocks – 97.5% | |
| Aerospace & Defense – 1.4% | |
| | 26,233 | | | Boeing Co. (The)* | | $ | 5,561,658 | |
| | 15,006 | | | HEICO Corp. | | | 1,887,455 | |
| | 26,621 | | | L3Harris Technologies, Inc. | | | 4,842,626 | |
| | 8,576 | | | Northrop Grumman Corp. | | | 2,501,276 | |
| | | | | | | | |
| | | | | | | 14,793,015 | |
| | |
| Airlines – 0.2% | |
| | 45,214 | | | United Airlines Holdings, Inc.* | | | 2,381,874 | |
| | |
| Auto Components – 0.6% | |
| | 42,960 | | | Aptiv PLC* | | | 6,437,126 | |
| | |
| Automobiles – 0.8% | |
| | 11,811 | | | Tesla, Inc.* | | | 7,978,331 | |
| | |
| Banks – 2.4% | |
| | 70,349 | | | JPMorgan Chase & Co. | | | 10,353,262 | |
| | 14,988 | | | M&T Bank Corp. | | | 2,262,289 | |
| | 26,424 | | | Pinnacle Financial Partners, Inc. | | | 2,144,836 | |
| | 9,927 | | | SVB Financial Group* | | | 5,016,709 | |
| | 98,686 | | | Truist Financial Corp. | | | 5,621,154 | |
| | | | | | | | |
| | | | | | | 25,398,250 | |
| | |
| Beverages – 1.8% | |
| | 125,565 | | | Coca-Cola Co. (The) | | | 6,151,429 | |
| | 102,803 | | | Coca-Cola European Partners PLC (United Kingdom) | | | 5,237,813 | |
| | 27,707 | | | Constellation Brands, Inc., Class A | | | 5,933,177 | |
| | 22,387 | | | Monster Beverage Corp.* | | | 1,964,236 | |
| | | | | | | | |
| | | | | | | 19,286,655 | |
| | |
| Biotechnology – 1.6% | |
| | 38,595 | | | ACADIA Pharmaceuticals, Inc.* | | | 1,889,997 | |
| | 17,143 | | | Agios Pharmaceuticals, Inc.* | | | 813,264 | |
| | 8,208 | | | Biogen, Inc.* | | | 2,239,799 | |
| | 21,888 | | | BioMarin Pharmaceutical, Inc.* | | | 1,694,788 | |
| | 105,611 | | | Genmab A/S ADR (Denmark)* | | | 3,577,044 | |
| | 24,567 | | | Ionis Pharmaceuticals, Inc.* | | | 1,287,311 | |
| | 18,636 | | | Neurocrine Biosciences, Inc.* | | | 2,040,828 | |
| | 18,146 | | | Sarepta Therapeutics, Inc.* | | | 1,579,791 | |
| | 10,353 | | | Seagen, Inc.* | | | 1,564,442 | |
| | | | | | | | |
| | | | | | | 16,687,264 | |
| | |
| Building Products – 0.2% | |
| | 16,554 | | | Trane Technologies PLC | | | 2,536,735 | |
| | |
| Capital Markets – 2.5% | |
| | 22,389 | | | Bank of New York Mellon Corp. (The) | | | 943,920 | |
| | 5,193 | | | BlackRock, Inc. | | | 3,606,539 | |
| | 35,181 | | | Charles Schwab Corp. (The) | | | 2,171,371 | |
| | 6,807 | | | CME Group, Inc. | | | 1,359,358 | |
| | 21,277 | | | Intercontinental Exchange, Inc. | | | 2,347,066 | |
| | 140,363 | | | Morgan Stanley | | | 10,789,704 | |
| | 7,279 | | | Northern Trust Corp. | | | 692,451 | |
| | 11,639 | | | Raymond James Financial, Inc. | | | 1,358,737 | |
| | 9,078 | | | S&P Global, Inc. | | | 2,989,930 | |
| | | | | | | | |
| | | | | | | 26,259,076 | |
| | |
|
| Common Stocks – (continued) | |
| Chemicals – 1.9% | |
| | 33,934 | | | Ecolab, Inc. | | | 7,104,422 | |
| | 35,396 | | | Linde PLC (United Kingdom) | | | 8,646,181 | |
| | 7,135 | | | Sherwin-Williams Co. (The) | | | 4,854,226 | |
| | | | | | | | |
| | | | | | | 20,604,829 | |
| | |
| Commercial Services & Supplies – 0.1% | |
| | 5,686 | | | Waste Connections, Inc. | | | 555,465 | |
| | |
| Communications Equipment – 0.9% | |
| | 201,288 | | | Cisco Systems, Inc. | | | 9,031,792 | |
| | |
| Construction Materials – 0.9% | |
| | 26,855 | | | Martin Marietta Materials, Inc. | | | 9,046,644 | |
| | |
| Consumer Finance – 2.2% | |
| | 128,195 | | | American Express Co. | | | 17,339,656 | |
| | 63,904 | | | Discover Financial Services | | | 6,011,449 | |
| | | | | | | | |
| | | | | | | 23,351,105 | |
| | |
| Containers & Packaging – 0.5% | |
| | 63,708 | | | Ball Corp. | | | 5,440,026 | |
| | |
| Diversified Consumer Services – 0.1% | |
| | 7,245 | | | Bright Horizons Family Solutions, Inc.* | | | 1,156,737 | |
| | |
| Diversified Financial Services – 1.4% | |
| | 62,253 | | | Berkshire Hathaway, Inc., Class B* | | | 14,972,469 | |
| | |
| Diversified Telecommunication Services – 0.2% | |
| | 42,696 | | | Verizon Communications, Inc. | | | 2,361,089 | |
| | |
| Electric Utilities – 0.9% | |
| | 118,333 | | | NextEra Energy, Inc. | | | 8,695,109 | |
| | 20,943 | | | Xcel Energy, Inc. | | | 1,227,050 | |
| | | | | | | | |
| | | | | | | 9,922,159 | |
| | |
| Electrical Equipment – 0.3% | |
| | 24,984 | | | Eaton Corp. PLC | | | 3,252,667 | |
| | |
| Electronic Equipment, Instruments & Components – 0.6% | |
| | 49,248 | | | Amphenol Corp., Class A | | | 6,189,489 | |
| | |
| Entertainment – 2.9% | |
| | 21,746 | | | Activision Blizzard, Inc. | | | 2,079,135 | |
| | 24,105 | | | Electronic Arts, Inc. | | | 3,229,347 | |
| | 18,130 | | | Live Nation Entertainment, Inc.* | | | 1,611,032 | |
| | 18,763 | | | Netflix, Inc.* | | | 10,110,442 | |
| | 75,624 | | | Walt Disney Co. (The)* | | | 14,295,961 | |
| | | | | | | | |
| | | | | | | 31,325,917 | |
| | |
| Equity Real Estate Investment Trusts (REITs) – 2.6% | |
| | 23,187 | | | Alexandria Real Estate Equities, Inc. REIT | | | 3,702,732 | |
| | 16,424 | | | American Tower Corp. REIT | | | 3,549,719 | |
| | 29,579 | | | CyrusOne, Inc. REIT | | | 1,941,270 | |
| | 2,124 | | | Equinix, Inc. REIT | | | 1,377,074 | |
| | 21,937 | | | Equity LifeStyle Properties, Inc. REIT | | | 1,352,416 | |
| | 40,139 | | | Healthpeak Properties, Inc. REIT | | | 1,167,644 | |
| | 88,429 | | | Host Hotels & Resorts, Inc. REIT | | | 1,467,037 | |
| | |
| | |
| The accompanying notes are an integral part of these financial statements. | | 19 |
GOLDMAN SACHS CAPITAL GROWTH FUND
Schedule of Investments (continued)
February 28, 2021 (Unaudited)
| | | | | | | | |
| Shares | | |
Description | | Value | |
|
| Common Stocks – (continued) | |
| Equity Real Estate Investment Trusts (REITs) – (continued) | |
| | 84,773 | | | Invitation Homes, Inc. REIT | | $ | 2,470,285 | |
| | 34,506 | | | Life Storage, Inc. REIT | | | 2,895,053 | |
| | 57,854 | | | Prologis, Inc. REIT | | | 5,731,596 | |
| | 23,394 | | | Welltower, Inc. REIT | | | 1,588,453 | |
| | | | | | | | |
| | | | | | | 27,243,279 | |
| | |
| Food & Staples Retailing – 0.8% | |
| | 66,369 | | | Walmart, Inc. | | | 8,622,661 | |
| | |
| Food Products – 1.2% | |
| | 74,920 | | | McCormick & Co., Inc. | | | 6,314,258 | |
| | 126,020 | | | Mondelez International, Inc., Class A | | | 6,699,223 | |
| | | | | | | | |
| | | | | | | 13,013,481 | |
| | |
| Gas Utilities – 0.2% | |
| | 22,527 | | | Atmos Energy Corp. | | | 1,906,009 | |
| | |
| Health Care Equipment & Supplies – 4.4% | |
| | 245,316 | | | Boston Scientific Corp.* | | | 9,513,355 | |
| | 31,996 | | | Danaher Corp. | | | 7,028,561 | |
| | 37,293 | | | Hologic, Inc.* | | | 2,688,452 | |
| | 22,087 | | | Insulet Corp.* | | | 5,722,742 | |
| | 10,235 | | | Intuitive Surgical, Inc.* | | | 7,541,148 | |
| | 18,816 | | | West Pharmaceutical Services, Inc. | | | 5,280,710 | |
| | 55,203 | | | Zimmer Biomet Holdings, Inc. | | | 9,001,401 | |
| | | | | | | | |
| | | | | | | 46,776,369 | |
| | |
| Health Care Providers & Services – 2.7% | |
| | 128,218 | | | CVS Health Corp. | | | 8,735,492 | |
| | 30,781 | | | Guardant Health, Inc.* | | | 4,530,348 | |
| | 12,501 | | | Humana, Inc. | | | 4,746,005 | |
| | 32,856 | | | UnitedHealth Group, Inc. | | | 10,915,420 | |
| | | | | | | | |
| | | | | | | 28,927,265 | |
| | |
| Health Care Technology – 0.8% | |
| | 118,986 | | | American Well Corp., Class A* | | | 2,911,587 | |
| | 21,036 | | | Veeva Systems, Inc., Class A* | | | 5,892,394 | |
| | | | | | | | |
| | | | | | | 8,803,981 | |
| | |
| Hotels, Restaurants & Leisure – 2.0% | |
| | 33,493 | | | Las Vegas Sands Corp. | | | 2,096,662 | |
| | 41,390 | | | McDonald’s Corp. | | | 8,532,135 | |
| | 19,326 | | | Wyndham Hotels & Resorts, Inc. | | | 1,261,601 | |
| | 32,564 | | | Wynn Resorts Ltd.* | | | 4,289,656 | |
| | 45,897 | | | Yum! Brands, Inc. | | | 4,751,716 | |
| | | | | | | | |
| | | | | | | 20,931,770 | |
| | |
| Household Durables – 0.1% | |
| | 8,907 | | | Lennar Corp., Class A | | | 739,014 | |
| | |
| Household Products – 1.2% | |
| | 105,552 | | | Procter & Gamble Co. (The) | | | 13,038,839 | |
| | |
| Industrial Conglomerates – 1.6% | |
| | 591,899 | | | General Electric Co. | | | 7,422,413 | |
| | 48,200 | | | Honeywell International, Inc. | | | 9,753,270 | |
| | | | | | | | |
| | | | | | | 17,175,683 | |
| | |
|
| Common Stocks – (continued) | |
| Insurance – 1.5% | |
| | 12,818 | | | Allstate Corp. (The) | | | 1,366,399 | |
| | 15,375 | | | American International Group, Inc. | | | 675,731 | |
| | 32,647 | | | Chubb Ltd. | | | 5,307,749 | |
| | 25,209 | | | Globe Life, Inc. | | | 2,354,521 | |
| | 2,412 | | | Markel Corp.* | | | 2,626,186 | |
| | 24,458 | | | Marsh & McLennan Cos., Inc. | | | 2,818,051 | |
| | 3,476 | | | Progressive Corp. (The) | | | 298,762 | |
| | 7,332 | | | Reinsurance Group of America, Inc. | | | 896,190 | |
| | | | | | | | |
| | | | | | | 16,343,589 | |
| | |
| Interactive Media & Services – 6.1% | |
| | 11,288 | | | Alphabet, Inc., Class A* | | | 22,823,320 | |
| | 9,122 | | | Alphabet, Inc., Class C* | | | 18,580,237 | |
| | 77,239 | | | Facebook, Inc., Class A* | | | 19,898,311 | |
| | 45,513 | | | Snap, Inc., Class A* | | | 2,988,384 | |
| | | | | | | | |
| | | | | | | 64,290,252 | |
| | |
| Internet & Direct Marketing Retail – 4.7% | |
| | 14,643 | | | Amazon.com, Inc.* | | | 45,289,774 | |
| | 14,180 | | | Etsy, Inc.* | | | 3,123,429 | |
| | 20,076 | | | Farfetch Ltd., Class A (United Kingdom)* | | | 1,322,607 | |
| | | | | | | | |
| | | | | | | 49,735,810 | |
| | |
| IT Services – 6.5% | |
| | 7,278 | | | Accenture PLC, Class A | | | 1,826,050 | |
| | 15,156 | | | Booz Allen Hamilton Holding Corp. | | | 1,169,134 | |
| | 42,930 | | | Cognizant Technology Solutions Corp., Class A | | | 3,154,496 | |
| | 7,506 | | | EPAM Systems, Inc.* | | | 2,804,317 | |
| | 79,107 | | | Fidelity National Information Services, Inc. | | | 10,916,766 | |
| | 18,477 | | | Fiserv, Inc.* | | | 2,131,692 | |
| | 45,289 | | | International Business Machines Corp. | | | 5,386,221 | |
| | 21,619 | | | Mastercard, Inc., Class A | | | 7,649,883 | |
| | 60,472 | | | PayPal Holdings, Inc.* | | | 15,713,649 | |
| | 3,036 | | | Snowflake, Inc., Class A* | | | 787,963 | |
| | 84,694 | | | Visa, Inc., Class A | | | 17,988,159 | |
| | | | | | | | |
| | | | | | | 69,528,330 | |
| | |
| Leisure Products – 0.2% | |
| | 24,912 | | | Brunswick Corp. | | | 2,201,473 | |
| | |
| Life Sciences Tools & Services – 0.9% | |
| | 12,603 | | | Adaptive Biotechnologies Corp.* | | | 712,952 | |
| | 7,705 | | | Illumina, Inc.* | | | 3,385,654 | |
| | 29,404 | | | PerkinElmer, Inc. | | | 3,707,550 | |
| | 3,318 | | | Thermo Fisher Scientific, Inc. | | | 1,493,366 | |
| | | | | | | | |
| | | | | | | 9,299,522 | |
| | |
| Machinery – 1.5% | |
| | 23,900 | | | Deere & Co. | | | 8,343,968 | |
| | 39,735 | | | Illinois Tool Works, Inc. | | | 8,033,622 | |
| | | | | | | | |
| | | | | | | 16,377,590 | |
| | |
| Media – 0.9% | |
| | 191,271 | | | Comcast Corp., Class A | | | 10,083,807 | |
| | |
| | |
| 20 | | The accompanying notes are an integral part of these financial statements. |
GOLDMAN SACHS CAPITAL GROWTH FUND
| | | | | | | | |
| Shares | | |
Description | | Value | |
|
| Common Stocks – (continued) | |
| Metals & Mining – 0.2% | |
| | 61,702 | | | Freeport-McMoRan, Inc.* | | $ | 2,092,315 | |
| | |
| Multiline Retail – 0.7% | |
| | 11,766 | | | Dollar General Corp. | | | 2,223,656 | |
| | 47,985 | | | Dollar Tree, Inc.* | | | 4,712,127 | |
| | | | | | | | |
| | | | | | | 6,935,783 | |
| | |
| Multi-Utilities – 0.8% | |
| | 58,493 | | | Ameren Corp. | | | 4,110,303 | |
| | 84,200 | | | CMS Energy Corp. | | | 4,556,062 | |
| | | | | | | | |
| | | | | | | 8,666,365 | |
| | |
| Oil, Gas & Consumable Fuels – 1.7% | |
| | 106,984 | | | Cheniere Energy, Inc.* | | | 7,209,652 | |
| | 78,014 | | | Chevron Corp. | | | 7,801,400 | |
| | 49,477 | | | ConocoPhillips | | | 2,573,299 | |
| | | | | | | | |
| | | | | | | 17,584,351 | |
| | |
| Personal Products – 0.7% | |
| | 27,760 | | | Estee Lauder Cos., Inc. (The), Class A | | | 7,935,474 | |
| | |
| Pharmaceuticals – 3.1% | |
| | 49,000 | | | AstraZeneca PLC ADR (United Kingdom)(a) | | | 2,370,620 | |
| | 181,882 | | | Bristol-Myers Squibb Co. | | | 11,154,823 | |
| | 40,048 | | | Catalent, Inc.* | | | 4,553,858 | |
| | 73,655 | | | Eli Lilly and Co. | | | 15,091,173 | |
| | | | | | | | |
| | | | | | | 33,170,474 | |
| | |
| Professional Services – 0.4% | |
| | 41,242 | | | TransUnion | | | 3,472,989 | |
| | 3,826 | | | Verisk Analytics, Inc. | | | 626,890 | |
| | | | | | | | |
| | | | | | | 4,099,879 | |
| | |
| Road & Rail – 2.0% | |
| | 25,040 | | | Norfolk Southern Corp. | | | 6,311,582 | |
| | 22,404 | | | Old Dominion Freight Line, Inc. | | | 4,811,707 | |
| | 50,878 | | | Union Pacific Corp. | | | 10,478,833 | |
| | | | | | | | |
| | | | | | | 21,602,122 | |
| | |
| Semiconductors & Semiconductor Equipment – 4.5% | |
| | 48,006 | | | Advanced Micro Devices, Inc.* | | | 4,056,987 | |
| | 17,953 | | | KLA Corp. | | | 5,587,512 | |
| | 160,257 | | | Marvell Technology Group Ltd. | | | 7,737,208 | |
| | 24,210 | | | Micron Technology, Inc.* | | | 2,215,941 | |
| | 13,386 | | | NVIDIA Corp. | | | 7,343,292 | |
| | 43,161 | | | NXP Semiconductors NV (Netherlands) | | | 7,879,041 | |
| | 19,137 | | | Taiwan Semiconductor Manufacturing Co. Ltd. ADR (Taiwan) | | | 2,410,114 | |
| | 61,086 | | | Texas Instruments, Inc. | | | 10,523,285 | |
| | | | | | | | |
| | | | | | | 47,753,380 | |
| | |
| Software – 10.0% | |
| | 22,582 | | | Adobe, Inc.* | | | 10,380,268 | |
| | 14,823 | | | Atlassian Corp. PLC, Class A* | | | 3,523,427 | |
| | 18,926 | | | Bill.com Holdings, Inc.* | | | 3,122,979 | |
| | |
|
| Common Stocks – (continued) | |
| Software – (continued) | |
| | 13,185 | | | HubSpot, Inc.* | | | 6,790,275 | |
| | 12,556 | | | Intuit, Inc. | | | 4,898,598 | |
| | 234,260 | | | Microsoft Corp. | | | 54,437,339 | |
| | 14,063 | | | Palo Alto Networks, Inc.* | | | 5,038,913 | |
| | 4,771 | | | Paycom Software, Inc.* | | | 1,785,499 | |
| | 39,255 | | | Qualtrics International, Inc., Class A* | | | 1,491,690 | |
| | 10,017 | | | ServiceNow, Inc.* | | | 5,343,669 | |
| | 23,106 | | | Splunk, Inc.* | | | 3,304,389 | |
| | 23,428 | | | Workday, Inc., Class A* | | | 5,744,077 | |
| | | | | | | | |
| | | | | | | 105,861,123 | |
| | |
| Specialty Retail – 2.1% | |
| | 17,751 | | | Advance Auto Parts, Inc. | | | 2,846,373 | |
| | 4,539 | | | Burlington Stores, Inc.* | | | 1,174,784 | |
| | 29,706 | | | Lowe’s Cos., Inc. | | | 4,745,533 | |
| | 5,563 | | | O’Reilly Automotive, Inc.* | | | 2,488,497 | |
| | 3,759 | | | RH* | | | 1,843,301 | |
| | 40,746 | | | Ross Stores, Inc. | | | 4,752,613 | |
| | 13,751 | | | Ulta Beauty, Inc.* | | | 4,432,360 | |
| | | | | | | | |
| | | | | | | 22,283,461 | |
| | |
| Technology Hardware, Storage & Peripherals – 4.9% | |
| | 428,155 | | | Apple, Inc. | | | 51,918,075 | |
| | |
| Textiles, Apparel & Luxury Goods – 1.5% | |
| | 11,883 | | | Lululemon Athletica, Inc.* | | | 3,703,693 | |
| | 66,706 | | | NIKE, Inc., Class B | | | 8,990,635 | |
| | 34,153 | | | PVH Corp. | | | 3,413,934 | |
| | | | | | | | |
| | | | | | | 16,108,262 | |
| | |
| Water Utilities – 0.4% | |
| | 28,947 | | | American Water Works Co., Inc. | | | 4,107,000 | |
| | |
| Wireless Telecommunication Services – 0.2% | |
| | 21,190 | | | T-Mobile US, Inc.* | | | 2,542,164 | |
| | |
| | TOTAL COMMON STOCKS | |
| | (Cost $605,458,385) | | $ | 1,036,667,666 | |
| | |
| | | | | | | | |
| Shares | | | Dividend
Rate | | Value | |
|
| Investment Company – 0.3%(b) | |
| Goldman Sachs Financial Square Government Fund –
Institutional Shares |
|
| | 3,237,339 | | | 0.036% | | $ | 3,237,339 | |
| | (Cost $3,237,339) | |
| | |
| TOTAL INVESTMENTS BEFORE SECURITIES LENDING
REINVESTMENT VEHICLE |
|
| | (Cost $608,695,724) | | $ | 1,039,905,005 | |
| | |
| | |
| The accompanying notes are an integral part of these financial statements. | | 21 |
GOLDMAN SACHS CAPITAL GROWTH FUND
Schedule of Investments (continued)
February 28, 2021 (Unaudited)
| | | | | | | | |
| Shares | | | Dividend
Rate | | Value | |
|
| Securities Lending Reinvestment Vehicle – 0.0%(b) | |
| Goldman Sachs Financial Square Government Fund –
Institutional Shares |
|
| | 5,000 | | | 0.036% | | $ | 5,000 | |
| | (Cost $5,000) | |
| | |
| | TOTAL INVESTMENTS – 97.8% | |
| | (Cost $608,700,724) | | $ | 1,039,910,005 | |
| | |
| OTHER ASSETS IN EXCESS OF
LIABILITIES – 2.2% | | | 22,897,634 | |
| | |
| | NET ASSETS – 100.0% | | $ | 1,062,807,639 | |
| | |
| | |
|
| The percentage shown for each investment category reflects the value of investments in that category as a percentage of net assets. |
| |
* | | Non-income producing security. |
| |
(a) | | All or a portion of security is on loan. |
| |
(b) | | Represents an affiliated issuer. |
| | | | |
|
Investment Abbreviations: |
ADR | | —American Depositary Receipt |
PLC | | —Public Limited Company |
REIT | | —Real Estate Investment Trust |
|
| | |
| 22 | | The accompanying notes are an integral part of these financial statements. |
GOLDMAN SACHS CONCENTRATED GROWTH FUND
Schedule of Investments
February 28, 2021 (Unaudited)
| | | | | | | | |
| Shares | | | Description | |
Value | |
|
| Common Stocks – 98.2% | |
| Aerospace & Defense – 1.3% | |
| | 11,477 | | | Boeing Co. (The)* | | $ | 2,433,239 | |
| | |
| Auto Components – 1.9% | |
| | 23,318 | | | Aptiv PLC* | | | 3,493,969 | |
| | |
| Beverages – 1.4% | |
| | 31,010 | | | Monster Beverage Corp.* | | | 2,720,817 | |
| | |
| Biotechnology – 3.2% | |
| | 24,851 | | | BioMarin Pharmaceutical, Inc.* | | | 1,924,213 | |
| | 61,539 | | | Genmab A/S ADR (Denmark)* | | | 2,084,326 | |
| | 24,315 | | | Sarepta Therapeutics, Inc.* | | | 2,116,864 | |
| | | | | | | | |
| | | | | | | 6,125,403 | |
| | |
| Chemicals – 1.5% | |
| | 13,922 | | | Ecolab, Inc. | | | 2,914,710 | |
| | |
| Entertainment – 4.2% | |
| | 31,484 | | | Live Nation Entertainment, Inc.* | | | 2,797,668 | |
| | 9,696 | | | Netflix, Inc.* | | | 5,224,690 | |
| | | | | | | | |
| | | | | | | 8,022,358 | |
| | |
| Equity Real Estate Investment Trusts (REITs) – 1.9% | |
| | 16,957 | | | American Tower Corp. REIT | | | 3,664,916 | |
| | |
| Food & Staples Retailing – 1.1% | |
| | 16,613 | | | Walmart, Inc. | | | 2,158,361 | |
| | |
| Food Products – 1.1% | |
| | 25,582 | | | McCormick & Co., Inc. | | | 2,156,051 | |
| | |
| Health Care Equipment & Supplies – 5.5% | |
| | 132,291 | | | Boston Scientific Corp.* | | | 5,130,245 | |
| | 12,205 | | | Danaher Corp. | | | 2,681,072 | |
| | 10,120 | | | Insulet Corp.* | | | 2,622,092 | |
| | | | | | | | |
| | | | | | | 10,433,409 | |
| | |
| Health Care Providers & Services – 1.3% | |
| | 6,363 | | | Humana, Inc. | | | 2,415,713 | |
| | |
| Health Care Technology – 1.2% | |
| | 8,114 | | | Veeva Systems, Inc., Class A* | | | 2,272,813 | |
| | |
| Hotels, Restaurants & Leisure – 1.5% | |
| | 13,561 | | | McDonald’s Corp. | | | 2,795,465 | |
| | |
| Interactive Media & Services – 9.5% | |
| | 5,976 | | | Alphabet, Inc., Class A* | | | 12,082,934 | |
| | 2,021 | | | Alphabet, Inc., Class C* | | | 4,116,494 | |
| | 28,098 | | | Snap, Inc., Class A* | | | 1,844,915 | |
| | | | | | | | |
| | | | | | | 18,044,343 | |
| | |
| Internet & Direct Marketing Retail – 4.7% | |
| | 2,850 | | | Amazon.com, Inc.* | | | 8,814,851 | |
| | |
| IT Services – 11.9% | |
| | 31,427 | | | Fidelity National Information Services, Inc. | | | 4,336,926 | |
| | 27,962 | | | PayPal Holdings, Inc.* | | | 7,265,925 | |
| | 7,531 | | | Snowflake, Inc., Class A* | | | 1,954,596 | |
| | |
|
| Common Stocks – (continued) | |
| IT Services – (continued) | |
| | 42,720 | | | Visa, Inc., Class A | | | 9,073,301 | |
| | | | | | | | |
| | | | | | | 22,630,748 | |
| | |
| Life Sciences Tools & Services – 1.5% | |
| | 6,470 | | | Illumina, Inc.* | | | 2,842,983 | |
| | |
| Pharmaceuticals – 3.2% | |
| | 29,170 | | | Eli Lilly and Co. | | | 5,976,641 | |
| | |
| Professional Services – 1.3% | |
| | 14,564 | | | Verisk Analytics, Inc. | | | 2,386,311 | |
| | |
| Road & Rail – 1.7% | |
| | 36,078 | | | CSX Corp. | | | 3,302,941 | |
| | |
| Semiconductors & Semiconductor Equipment – 9.2% | |
| | 122,130 | | | Marvell Technology Group Ltd. | | | 5,896,436 | |
| | 10,806 | | | NVIDIA Corp. | | | 5,927,955 | |
| | 31,061 | | | NXP Semiconductors NV (Netherlands) | | | 5,670,186 | |
| | | | | | | | |
| | | | | | | 17,494,577 | |
| | |
| Software – 14.9% | |
| | 12,061 | | | Adobe, Inc.* | | | 5,544,080 | |
| | 67,260 | | | Microsoft Corp. | | | 15,629,879 | |
| | 17,449 | | | Splunk, Inc.* | | | 2,495,382 | |
| | 18,691 | | | Workday, Inc., Class A* | | | 4,582,659 | |
| | | | | | | | |
| | | | | | | 28,252,000 | |
| | |
| Specialty Retail – 1.5% | |
| | 24,823 | | | Ross Stores, Inc. | | | 2,895,355 | |
| | |
| Technology Hardware, Storage & Peripherals – 7.5% | |
| | 116,698 | | | Apple, Inc. | | | 14,150,799 | |
| | |
| Textiles, Apparel & Luxury Goods – 4.2% | |
| | 7,935 | | | Lululemon Athletica, Inc.* | | | 2,473,181 | |
| | 40,377 | | | NIKE, Inc., Class B | | | 5,442,012 | |
| | | | | | | | |
| | | | | | | 7,915,193 | |
| | |
| | TOTAL COMMON STOCKS | |
| | (Cost $98,335,657) | | $ | 186,313,966 | |
| | |
| | |
| Shares | | | Dividend
Rate | | Value | |
|
| Investment Company – 0.4%(a) | |
| Goldman Sachs Financial Square Government Fund –
Institutional Shares |
|
| | 850,967 | | | 0.036% | | $ | 850,967 | |
| | (Cost $850,967) | |
| | |
| | TOTAL INVESTMENTS – 98.6% | |
| | (Cost $99,186,624) | | $ | 187,164,933 | |
| | |
| OTHER ASSETS IN EXCESS OF
LIABILITIES – 1.4% | | | 2,497,757 | |
| | |
| | NET ASSETS – 100.0% | | $ | 189,662,690 | |
| | |
| | |
| The accompanying notes are an integral part of these financial statements. | | 23 |
GOLDMAN SACHS CONCENTRATED GROWTH FUND
Schedule of Investments (continued)
February 28, 2021 (Unaudited)
| | |
|
The percentage shown for each investment category reflects the value of investments in that category as a percentage of net assets. |
| |
* | | Non-income producing security. |
| |
(a) | | Represents an affiliated issuer. |
| | |
|
Investment Abbreviations: |
ADR | | —American Depositary Receipt |
PLC | | —Public Limited Company |
REIT | | —Real Estate Investment Trust |
|
| | |
| 24 | | The accompanying notes are an integral part of these financial statements. |
GOLDMAN SACHS FLEXIBLE CAP FUND
Schedule of Investments
February 28, 2021 (Unaudited)
| | | | | | | | |
| Shares | | | Description | |
Value | |
|
| Common Stocks – 98.8% | |
| Automobiles – 1.2% | |
| | 469 | | | Tesla, Inc.* | | $ | 316,810 | |
| | |
| Banks – 5.0% | |
| | 1,595 | | | Bank of America Corp. | | | 55,363 | |
| | 2,779 | | | East West Bancorp, Inc. | | | 200,533 | |
| | 3,579 | | | JPMorgan Chase & Co. | | | 526,721 | |
| | 1,145 | | | M&T Bank Corp. | | | 172,826 | |
| | 389 | | | SVB Financial Group* | | | 196,585 | |
| | 3,520 | | | Truist Financial Corp. | | | 200,499 | |
| | | | | | | | |
| | | | | | | 1,352,527 | |
| | |
| Beverages – 1.8% | |
| | 3,236 | | | Coca-Cola Co. (The) | | | 158,532 | |
| | 2,062 | | | Coca-Cola European Partners PLC (United Kingdom) | | | 105,059 | |
| | 568 | | | Constellation Brands, Inc., Class A | | | 121,631 | |
| | 1,245 | | | Monster Beverage Corp.* | | | 109,236 | |
| | | | | | | | |
| | | | | | | 494,458 | |
| | |
| Biotechnology – 1.6% | |
| | 1,445 | | | BioMarin Pharmaceutical, Inc.* | | | 111,886 | |
| | 3,181 | | | Genmab A/S ADR (Denmark)* | | | 107,741 | |
| | 1,239 | | | Neurocrine Biosciences, Inc.* | | | 135,683 | |
| | 833 | | | Sarepta Therapeutics, Inc.* | | | 72,521 | |
| | | | | | | | |
| | | | | | | 427,831 | |
| | |
| Building Products – 0.6% | |
| | 1,045 | | | Trane Technologies PLC | | | 160,136 | |
| | |
| Capital Markets – 1.7% | |
| | 1,398 | | | Cboe Global Markets, Inc. | | | 138,346 | |
| | 1,462 | | | Raymond James Financial, Inc. | | | 170,674 | |
| | 491 | | | S&P Global, Inc. | | | 161,716 | |
| | | | | | | | |
| | | | | | | 470,736 | |
| | |
| Chemicals – 0.5% | |
| | 693 | | | Ecolab, Inc. | | | 145,086 | |
| | |
| Communications Equipment – 0.9% | |
| | 4,965 | | | Juniper Networks, Inc. | | | 115,585 | |
| | 789 | | | Motorola Solutions, Inc. | | | 138,454 | |
| | | | | | | | |
| | | | | | | 254,039 | |
| | |
| Construction Materials – 0.6% | |
| | 497 | | | Martin Marietta Materials, Inc. | | | 167,424 | |
| | |
| Consumer Finance – 1.5% | |
| | 1,590 | | | American Express Co. | | | 215,063 | |
| | 2,092 | | | Discover Financial Services | | | 196,795 | |
| | | | | | | | |
| | | | | | | 411,858 | |
| | |
| Containers & Packaging – 0.9% | |
| | 1,430 | | | Ball Corp. | | | 122,108 | |
| | 973 | | | Packaging Corp. of America | | | 128,455 | |
| | | | | | | | |
| | | | | | | 250,563 | |
| | |
| Diversified Financial Services – 1.0% | |
| | 1,061 | | | Berkshire Hathaway, Inc., Class B* | | | 255,181 | |
| | |
|
| Common Stocks – (continued) | |
| Diversified Telecommunication Services – 0.9% | |
| | 1,518 | | | AT&T, Inc. | | | 42,337 | |
| | 3,565 | | | Verizon Communications, Inc. | | | 197,145 | |
| | | | | | | | |
| | | | | | | 239,482 | |
| | |
| Electrical Equipment – 1.1% | |
| | 1,351 | | | Eaton Corp. PLC | | | 175,886 | |
| | 542 | | | Rockwell Automation, Inc. | | | 131,858 | |
| | | | | | | | |
| | | | | | | 307,744 | |
| | |
| Electronic Equipment, Instruments & Components – 0.4% | |
| | 3,705 | | | Vontier Corp.* | | | 116,337 | |
| | |
| Energy Equipment & Services – 0.5% | |
| | 5,991 | | | Baker Hughes Co. | | | 146,660 | |
| | |
| Entertainment – 2.1% | |
| | 775 | | | Electronic Arts, Inc. | | | 103,827 | |
| | 151 | | | Netflix, Inc.* | | | 81,366 | |
| | 2,001 | | | Walt Disney Co. (The)* | | | 378,269 | |
| | | | | | | | |
| | | | | | | 563,462 | |
| | |
| Equity Real Estate Investment Trusts (REITs) – 2.6% | |
| | 750 | | | AvalonBay Communities, Inc. REIT | | | 131,812 | |
| | 496 | | | Essex Property Trust, Inc. REIT | | | 126,376 | |
| | 3,303 | | | Invitation Homes, Inc. REIT | | | 96,249 | |
| | 3,030 | | | MGM Growth Properties LLC, Class A REIT | | | 100,051 | |
| | 412 | | | SBA Communications Corp. REIT | | | 105,114 | |
| | 1,311 | | | Simon Property Group, Inc. REIT | | | 148,038 | |
| | | | | | | | |
| | | | | | | 707,640 | |
| | |
| Food & Staples Retailing – 0.9% | |
| | 1,774 | | | Walmart, Inc. | | | 230,478 | |
| | |
| Food Products – 1.3% | |
| | 1,379 | | | Lamb Weston Holdings, Inc. | | | 110,003 | |
| | 1,064 | | | McCormick & Co., Inc. | | | 89,674 | |
| | 2,657 | | | Mondelez International, Inc., Class A | | | 141,246 | |
| | | | | | | | |
| | | | | | | 340,923 | |
| | |
| Health Care Equipment & Supplies – 3.0% | |
| | 4,543 | | | Boston Scientific Corp.* | | | 176,178 | |
| | 1,072 | | | Danaher Corp. | | | 235,486 | |
| | 1,783 | | | Hologic, Inc.* | | | 128,536 | |
| | 461 | | | West Pharmaceutical Services, Inc. | | | 129,380 | |
| | 937 | | | Zimmer Biomet Holdings, Inc. | | | 152,787 | |
| | | | | | | | |
| | | | | | | 822,367 | |
| | |
| Health Care Providers & Services – 3.5% | |
| | 2,208 | | | Centene Corp.* | | | 129,256 | |
| | 2,724 | | | CVS Health Corp. | | | 185,586 | |
| | 378 | | | Humana, Inc. | | | 143,508 | |
| | 992 | | | Quest Diagnostics, Inc. | | | 114,665 | |
| | 1,148 | | | UnitedHealth Group, Inc. | | | 381,389 | |
| | | | | | | | |
| | | | | | | 954,404 | |
| | |
| | |
| The accompanying notes are an integral part of these financial statements. | | 25 |
GOLDMAN SACHS FLEXIBLE CAP FUND
Schedule of Investments (continued)
February 28, 2021 (Unaudited)
| | | | | | | | |
| Shares | | | Description | |
Value | |
|
| Common Stocks – (continued) | |
| Health Care Technology – 0.5% | |
| | 463 | | | Veeva Systems, Inc., Class A* | | $ | 129,691 | |
| | |
| Hotels, Restaurants & Leisure – 2.1% | |
| | 2,384 | | | Las Vegas Sands Corp. | | | 149,239 | |
| | 1,245 | | | McDonald’s Corp. | | | 256,644 | |
| | 1,451 | | | Yum! Brands, Inc. | | | 150,222 | |
| | | | | | | | |
| | | | | | | 556,105 | |
| | |
| Household Durables – 0.6% | |
| | 1,900 | | | Lennar Corp., Class A | | | 157,643 | |
| | |
| Household Products – 1.6% | |
| | 1,258 | | | Church & Dwight Co., Inc. | | | 99,067 | |
| | 2,662 | | | Procter & Gamble Co. (The) | | | 328,837 | |
| | | | | | | | |
| | | | | | | 427,904 | |
| | |
| Independent Power and Renewable Electricity Producers – 0.6% | |
| | 5,698 | | | AES Corp. (The) | | | 151,339 | |
| | |
| Industrial Conglomerates – 0.8% | |
| | 1,106 | | | Honeywell International, Inc. | | | 223,799 | |
| | |
| Insurance – 2.1% | |
| | 1,320 | | | Allstate Corp. (The) | | | 140,712 | |
| | 1,564 | | | American Financial Group, Inc. | | | 166,879 | |
| | 1,323 | | | Globe Life, Inc. | | | 123,568 | |
| | 2,872 | | | Hartford Financial Services Group, Inc. (The) | | | 145,582 | |
| | | | | | | | |
| | | | | | | 576,741 | |
| | |
| Interactive Media & Services – 6.7% | |
| | 310 | | | Alphabet, Inc., Class A* | | | 626,792 | |
| | 249 | | | Alphabet, Inc., Class C* | | | 507,178 | |
| | 2,261 | | | Facebook, Inc., Class A* | | | 582,479 | |
| | 670 | | | Match Group, Inc.* | | | 102,410 | |
| | | | | | | | |
| | | | | | | 1,818,859 | |
| | |
| Internet & Direct Marketing Retail – 4.6% | |
| | 398 | | | Amazon.com, Inc.* | | | 1,230,986 | |
| | |
| IT Services – 5.3% | |
| | 529 | | | Accenture PLC, Class A | | | 132,726 | |
| | 1,293 | | | Booz Allen Hamilton Holding Corp. | | | 99,742 | |
| | 2,084 | | | Cognizant Technology Solutions Corp., Class A | | | 153,132 | |
| | 1,274 | | | Fidelity National Information Services, Inc. | | | 175,812 | |
| | 1,902 | | | International Business Machines Corp. | | | 226,205 | |
| | 370 | | | Mastercard, Inc., Class A | | | 130,925 | |
| | 400 | | | PayPal Holdings, Inc.* | | | 103,940 | |
| | 1,975 | | | Visa, Inc., Class A | | | 419,470 | |
| | | | | | | | |
| | | | | | | 1,441,952 | |
| | |
| Leisure Products – 0.5% | |
| | 1,443 | | | Brunswick Corp. | | | 127,518 | |
| | |
| Life Sciences Tools & Services – 1.5% | |
| | 125 | | | Mettler-Toledo International, Inc.* | | | 139,506 | |
| | 938 | | | PerkinElmer, Inc. | | | 118,272 | |
| | |
|
| Common Stocks – (continued) | |
| Life Sciences Tools & Services – (continued) | |
| | 1,060 | | | PRA Health Sciences, Inc.* | | | 156,255 | |
| | | | | | | | |
| | | | | | | 414,033 | |
| | |
| Machinery – 3.1% | |
| | 607 | | | Cummins, Inc. | | | 153,692 | |
| | 2,091 | | | Fortive Corp. | | | 137,630 | |
| | 1,833 | | | Graco, Inc. | | | 127,119 | |
| | 656 | | | IDEX Corp. | | | 128,031 | |
| | 766 | | | Illinois Tool Works, Inc. | | | 154,870 | |
| | 1,667 | | | ITT, Inc. | | | 138,328 | |
| | | | | | | | |
| | | | | | | 839,670 | |
| | |
| Media – 1.5% | |
| | 5,805 | | | Comcast Corp., Class A | | | 306,040 | |
| | 2,174 | | | Liberty Media Corp.-Liberty SiriusXM, Class A* | | | 96,547 | |
| | | | | | | | |
| | | | | | | 402,587 | |
| | |
| Metals & Mining – 0.6% | |
| | 4,733 | | | Freeport-McMoRan, Inc.* | | | 160,496 | |
| | |
| Multiline Retail – 0.5% | |
| | 739 | | | Dollar General Corp. | | | 139,664 | |
| | |
| Multi-Utilities – 1.6% | |
| | 1,399 | | | Ameren Corp. | | | 98,308 | |
| | 1,836 | | | CMS Energy Corp. | | | 99,346 | |
| | 2,229 | | | Public Service Enterprise Group, Inc. | | | 119,987 | |
| | 985 | | | Sempra Energy | | | 114,240 | |
| | | | | | | | |
| | | | | | | 431,881 | |
| | |
| Oil, Gas & Consumable Fuels – 2.2% | |
| | 1,852 | | | Cheniere Energy, Inc.* | | | 124,806 | |
| | 2,825 | | | Chevron Corp. | | | 282,500 | |
| | 2,152 | | | Phillips 66 | | | 178,724 | |
| | | | | | | | |
| | | | | | | 586,030 | |
| | |
| Personal Products – 0.6% | |
| | 577 | | | Estee Lauder Cos., Inc. (The), Class A | | | 164,941 | |
| | |
| Pharmaceuticals – 2.8% | |
| | 4,293 | | | Bristol-Myers Squibb Co. | | | 263,290 | |
| | 1,325 | | | Eli Lilly and Co. | | | 271,479 | |
| | 1,403 | | | Johnson & Johnson | | | 222,319 | |
| | | | | | | | |
| | | | | | | 757,088 | |
| | |
| Professional Services – 0.5% | |
| | 797 | | | Verisk Analytics, Inc. | | | 130,588 | |
| | |
| Road & Rail – 1.2% | |
| | 1,998 | | | CSX Corp. | | | 182,917 | |
| | 607 | | | Old Dominion Freight Line, Inc. | | | 130,365 | |
| | | | | | | | |
| | | | | | | 313,282 | |
| | |
| Semiconductors & Semiconductor Equipment – 3.5% | |
| | 1,275 | | | Intel Corp. | | | 77,495 | |
| | 1,082 | | | Microchip Technology, Inc. | | | 165,146 | |
| | 868 | | | MKS Instruments, Inc. | | | 143,133 | |
| | |
| | |
| 26 | | The accompanying notes are an integral part of these financial statements. |
GOLDMAN SACHS FLEXIBLE CAP FUND
| | | | | | | | |
| Shares | | | Description | |
Value | |
|
| Common Stocks – (continued) | |
| Semiconductors & Semiconductor Equipment – (continued) | |
| | 271 | | | NVIDIA Corp. | | $ | 148,665 | |
| | 899 | | | NXP Semiconductors NV (Netherlands) | | | 164,112 | |
| | 1,492 | | | Texas Instruments, Inc. | | | 257,027 | |
| | | | | | | | |
| | | | | | | 955,578 | |
| | |
| Software – 10.0% | |
| | 613 | | | Adobe, Inc.* | | | 281,778 | |
| | 1,230 | | | Cadence Design Systems, Inc.* | | | 173,541 | |
| | 571 | | | Intuit, Inc. | | | 222,770 | |
| | 6,909 | | | Microsoft Corp. | | | 1,605,513 | |
| | 416 | | | Palo Alto Networks, Inc.* | | | 149,057 | |
| | 989 | | | Proofpoint, Inc.* | | | 119,590 | |
| | 182 | | | salesforce.com, Inc.* | | | 39,403 | |
| | 464 | | | Workday, Inc., Class A* | | | 113,763 | |
| | | | | | | | |
| | | | | | | 2,705,415 | |
| | |
| Specialty Retail – 2.7% | |
| | 713 | | | Advance Auto Parts, Inc. | | | 114,330 | |
| | 424 | | | Home Depot, Inc. (The) | | | 109,536 | |
| | 1,303 | | | Lowe’s Cos., Inc. | | | 208,154 | |
| | 343 | | | O’Reilly Automotive, Inc.* | | | 153,434 | |
| | 408 | | | Ulta Beauty, Inc.* | | | 131,511 | |
| | | | | | | | |
| | | | | | | 716,965 | |
| | |
| Technology Hardware, Storage & Peripherals – 6.6% | |
| | 13,216 | | | Apple, Inc. | | | 1,602,572 | |
| | 2,727 | | | NetApp, Inc. | | | 170,710 | |
| | | | | | | | |
| | | | | | | 1,773,282 | |
| | |
| Trading Companies & Distributors – 0.5% | |
| | 2,956 | | | Fastenal Co. | | | 137,070 | |
| | |
| Water Utilities – 0.4% | |
| | 825 | | | American Water Works Co., Inc. | | | 117,051 | |
| | |
| | TOTAL COMMON STOCKS | |
| | (Cost $18,027,218) | | $ | 26,724,304 | |
| | |
| | | | | | | | |
| Shares | | | Dividend
Rate | | Value | |
|
| Investment Company – 1.1%(a) | |
| Goldman Sachs Financial Square Government Fund –
Institutional Shares |
|
| | 298,315 | | | 0.036% | | $ | 298,315 | |
| | (Cost $298,315) | | | | |
| | |
| | TOTAL INVESTMENTS – 99.9% | |
| | (Cost $18,325,533) | | $ | 27,022,619 | |
| | |
| OTHER ASSETS IN EXCESS OF
LIABILITIES – 0.1% | | | 24,988 | |
| | |
| | NET ASSETS – 100.0% | | $ | 27,047,607 | |
| | |
| | |
|
| The percentage shown for each investment category reflects the value of investments in that category as a percentage of net assets. |
| |
* | | Non-income producing security. |
| |
(a) | | Represents an affiliated issuer. |
| | |
|
Investment Abbreviations: |
ADR | | —American Depositary Receipt |
PLC | | —Public Limited Company |
REIT | | —Real Estate Investment Trust |
|
| | |
| The accompanying notes are an integral part of these financial statements. | | 27 |
GOLDMAN SACHS GROWTH OPPORTUNITIES FUND
Schedule of Investments
February 28, 2021 (Unaudited)
| | | | | | | | |
| Shares | | |
Description | | Value | |
|
| Common Stocks – 99.7% | |
| Aerospace & Defense – 0.5% | |
| | 57,177 | | | HEICO Corp. | | $ | 7,191,723 | |
| | |
| Beverages – 1.0% | |
| | 277,083 | | | Coca-Cola European Partners PLC (United Kingdom) | | | 14,117,379 | |
| | |
| Biotechnology – 3.8% | |
| | 168,098 | | | Agios Pharmaceuticals, Inc.* | | | 7,974,569 | |
| | 118,695 | | | BioMarin Pharmaceutical, Inc.* | | | 9,190,554 | |
| | 54,407 | | | Exact Sciences Corp.* | | | 7,405,881 | |
| | 142,003 | | | Genmab A/S ADR (Denmark)* | | | 4,809,642 | |
| | 127,422 | | | Neurocrine Biosciences, Inc.* | | | 13,953,983 | |
| | 71,702 | | | Seagen, Inc.* | | | 10,834,889 | |
| | | | | | | | |
| | | | | | | 54,169,518 | |
| | |
| Building Products – 2.0% | |
| | 376,173 | | | AZEK Co., Inc. (The)* | | | 16,592,991 | |
| | 77,409 | | | Trane Technologies PLC | | | 11,862,155 | |
| | | | | | | | |
| | | | | | | 28,455,146 | |
| | |
| Capital Markets – 2.1% | |
| | 38,507 | | | MarketAxess Holdings, Inc. | | | 21,407,582 | |
| | 21,114 | | | MSCI, Inc. | | | 8,752,175 | |
| | | | | | | | |
| | | | | | | 30,159,757 | |
| | |
| Chemicals – 0.4% | |
| | 156,002 | | | Danimer Scientific, Inc.*(a) | | | 5,948,356 | |
| | |
| Construction Materials – 1.2% | |
| | 50,240 | | | Martin Marietta Materials, Inc. | | | 16,924,349 | |
| | |
| Consumer Finance – 1.4% | |
| | 207,380 | | | Discover Financial Services | | | 19,508,237 | |
| | |
| Containers & Packaging – 1.8% | |
| | 301,995 | | | Ball Corp. | | | 25,787,353 | |
| | |
| Diversified Consumer Services – 0.9% | |
| | 133,018 | | | Chegg, Inc.* | | | 12,840,228 | |
| | |
| Electrical Equipment – 2.9% | |
| | 111,694 | | | AMETEK, Inc. | | | 13,176,541 | |
| | 113,047 | | | Rockwell Automation, Inc. | | | 27,502,074 | |
| | | | | | | | |
| | | | | | | 40,678,615 | |
| | |
| Electronic Equipment, Instruments & Components – 2.2% | |
| | 219,406 | | | Amphenol Corp., Class A | | | 27,574,946 | |
| | 29,954 | | | Keysight Technologies, Inc.* | | | 4,239,090 | |
| | | | | | | | |
| | | | | | | 31,814,036 | |
| | |
| Entertainment – 1.7% | |
| | 153,882 | | | Live Nation Entertainment, Inc.* | | | 13,673,954 | |
| | 33,683 | | | Spotify Technology SA* | | | 10,353,481 | |
| | | | | | | | |
| | | | | | | 24,027,435 | |
| | |
| Equity Real Estate Investment Trusts (REITs) – 1.5% | |
| | 139,442 | | | Equity LifeStyle Properties, Inc. REIT | | | 8,596,599 | |
| | 118,432 | | | Simon Property Group, Inc. REIT | | | 13,373,342 | |
| | | | | | | | |
| | | | | | | 21,969,941 | |
| | |
|
| Common Stocks – (continued) | |
| Food Products – 2.3% | |
| | 241,756 | | | McCormick & Co., Inc. | | | 20,375,196 | |
| | 475,121 | | | Utz Brands, Inc. | | | 12,006,307 | |
| | | | | | | | |
| | | | | | | 32,381,503 | |
| | |
| Health Care Equipment & Supplies – 10.0% | |
| | 33,712 | | | Align Technology, Inc.* | | | 19,118,412 | |
| | 399,299 | | | Boston Scientific Corp.* | | | 15,484,815 | |
| | 272,006 | | | Hologic, Inc.* | | | 19,608,913 | |
| | 42,497 | | | IDEXX Laboratories, Inc.* | | | 22,105,665 | |
| | 81,650 | | | Insulet Corp.* | | | 21,155,515 | |
| | 360,304 | | | OraSure Technologies, Inc.* | | | 3,819,222 | |
| | 84,102 | | | West Pharmaceutical Services, Inc. | | | 23,603,226 | |
| | 108,815 | | | Zimmer Biomet Holdings, Inc. | | | 17,743,374 | |
| | | | | | | | |
| | | | | | | 142,639,142 | |
| | |
| Health Care Providers & Services – 2.3% | |
| | 102,186 | | | Centene Corp.* | | | 5,981,968 | |
| | 162,809 | | | Guardant Health, Inc.* | | | 23,962,229 | |
| | 100,404 | | | Signify Health, Inc., Class A* | | | 3,315,340 | |
| | | | | | | | |
| | | | | | | 33,259,537 | |
| | |
| Health Care Technology – 3.3% | |
| | 209,345 | | | American Well Corp., Class A* | | | 5,122,672 | |
| | 113,983 | | | Certara, Inc.* | | | 3,949,511 | |
| | 132,634 | | | Veeva Systems, Inc., Class A* | | | 37,152,110 | |
| | | | | | | | |
| | | | | | | 46,224,293 | |
| | |
| Hotels, Restaurants & Leisure – 2.5% | |
| | 47,825 | | | Wingstop, Inc. | | | 6,511,374 | |
| | 137,909 | | | Wynn Resorts Ltd.* | | | 18,166,752 | |
| | 106,637 | | | Yum! Brands, Inc. | | | 11,040,129 | |
| | | | | | | | |
| | | | | | | 35,718,255 | |
| | |
| Household Products – 1.1% | |
| | 206,837 | | | Church & Dwight Co., Inc. | | | 16,288,414 | |
| | |
| Interactive Media & Services – 3.7% | |
| | 72,331 | | | Bumble, Inc., Class A* | | | 4,868,600 | |
| | 172,921 | | | Match Group, Inc.* | | | 26,430,975 | |
| | 258,128 | | | Pinterest, Inc., Class A* | | | 20,799,954 | |
| | | | | | | | |
| | | | | | | 52,099,529 | |
| | |
| Internet & Direct Marketing Retail – 3.5% | |
| | 117,477 | | | Etsy, Inc.* | | | 25,876,659 | |
| | 104,440 | | | Expedia Group, Inc. | | | 16,814,840 | |
| | 4,122 | | | MercadoLibre, Inc. (Argentina)* | | | 6,752,289 | |
| | | | | | | | |
| | | | | | | 49,443,788 | |
| | |
| IT Services – 3.0% | |
| | 58,345 | | | Akamai Technologies, Inc.* | | | 5,513,603 | |
| | 48,172 | | | Okta, Inc.* | | | 12,594,569 | |
| | 60,734 | | | Twilio, Inc., Class A* | | | 23,861,174 | |
| | | | | | | | |
| | | | | | | 41,969,346 | |
| | |
| Life Sciences Tools & Services – 2.1% | |
| | 48,169 | | | 10X Genomics, Inc., Class A* | | | 8,573,600 | |
| | 8,987 | | | Mettler-Toledo International, Inc.* | | | 10,029,941 | |
| | |
| | |
| 28 | | The accompanying notes are an integral part of these financial statements. |
GOLDMAN SACHS GROWTH OPPORTUNITIES FUND
| | | | | | | | |
| Shares | | |
Description | | Value | |
|
| Common Stocks – (continued) | |
| Life Sciences Tools & Services – (continued) | |
| | 85,030 | | | PerkinElmer, Inc. | | $ | 10,721,433 | |
| | | | | | | | |
| | | | | | | 29,324,974 | |
| | |
| Machinery – 1.7% | |
| | 28,222 | | | Cummins, Inc. | | | 7,145,810 | |
| | 95,353 | | | Graco, Inc. | | | 6,612,731 | |
| | 133,590 | | | ITT, Inc. | | | 11,085,298 | |
| | | | | | | | |
| | | | | | | 24,843,839 | |
| | |
| Multiline Retail – 1.3% | |
| | 188,139 | | | Dollar Tree, Inc.* | | | 18,475,250 | |
| | |
| Oil, Gas & Consumable Fuels – 0.4% | |
| | 91,656 | | | Cheniere Energy, Inc.* | | | 6,176,698 | |
| | |
| Pharmaceuticals – 1.5% | |
| | 181,247 | | | Catalent, Inc.* | | | 20,609,596 | |
| | |
| Professional Services – 4.1% | |
| | 141,605 | | | Booz Allen Hamilton Holding Corp. | | | 10,923,410 | |
| | 26,762 | | | CoStar Group, Inc.* | | | 22,045,465 | |
| | 149,780 | | | Verisk Analytics, Inc. | | | 24,541,453 | |
| | | | | | | | |
| | | | | | | 57,510,328 | |
| | |
| Road & Rail – 1.2% | |
| | 80,137 | | | Old Dominion Freight Line, Inc. | | | 17,211,024 | |
| | |
| Semiconductors & Semiconductor Equipment – 7.3% | |
| | 63,312 | | | Cree, Inc.* | | | 7,183,379 | |
| | 124,282 | | | Entegris, Inc. | | | 13,075,709 | |
| | 42,833 | | | KLA Corp. | | | 13,330,915 | |
| | 231,403 | | | Marvell Technology Group Ltd. | | | 11,172,137 | |
| | 107,797 | | | Microchip Technology, Inc. | | | 16,453,056 | |
| | 90,302 | | | MKS Instruments, Inc. | | | 14,890,800 | |
| | 115,452 | | | ON Semiconductor Corp.* | | | 4,649,252 | |
| | 73,413 | | | Teradyne, Inc. | | | 9,441,646 | |
| | 103,410 | | | Xilinx, Inc. | | | 13,474,323 | |
| | | | | | | | |
| | | | | | | 103,671,217 | |
| | |
| Software – 18.6% | |
| | 177,761 | | | Anaplan, Inc.* | | | 11,552,687 | |
| | 55,903 | | | ANSYS, Inc.* | | | 19,062,364 | |
| | 61,620 | | | Avalara, Inc.* | | | 9,670,643 | |
| | 32,235 | | | Bill.com Holdings, Inc.* | | | 5,319,097 | |
| | 57,538 | | | C3.ai, Inc., Class A*(a) | | | 6,470,724 | |
| | 230,019 | | | Cadence Design Systems, Inc.* | | | 32,453,381 | |
| | 48,317 | | | Coupa Software, Inc.* | | | 16,730,244 | |
| | 123,078 | | | DocuSign, Inc.* | | | 27,896,860 | |
| | 267,961 | | | Dynatrace, Inc.* | | | 13,333,739 | |
| | 55,088 | | | HubSpot, Inc.* | | | 28,370,320 | |
| | 89,215 | | | Palo Alto Networks, Inc.* | | | 31,966,627 | |
| | 24,856 | | | Paycom Software, Inc.* | | | 9,302,109 | |
| | 84,622 | | | RingCentral, Inc., Class A* | | | 32,000,656 | |
| | 139,447 | | | Splunk, Inc.* | | | 19,942,315 | |
| | | | | | | | |
| | | | | | | 264,071,766 | |
| | |
|
| Common Stocks – (continued) | |
| Specialty Retail – 4.6% | |
| | 83,727 | | | Burlington Stores, Inc.* | | | 21,670,222 | |
| | 52,331 | | | O’Reilly Automotive, Inc.* | | | 23,409,226 | |
| | 60,921 | | | Ulta Beauty, Inc.* | | | 19,636,666 | |
| | | | | | | | |
| | | | | | | 64,716,114 | |
| | |
| Textiles, Apparel & Luxury Goods – 1.8% | |
| | 80,196 | | | Lululemon Athletica, Inc.* | | | 24,995,489 | |
| | |
| | TOTAL COMMON STOCKS | |
| | (Cost $951,070,791) | | $ | 1,415,222,175 | |
| | |
| | | | | | | | |
| Shares | | | Dividend
Rate | | Value | |
|
| Investment Company – 0.4%(b) | |
| Goldman Sachs Financial Square Government Fund –
Institutional Shares |
|
| | 6,219,751 | | | 0.036% | | $ | 6,219,751 | |
| | (Cost $6,219,751) | |
| | |
| TOTAL INVESTMENTS BEFORE SECURITIES LENDING
REINVESTMENT VEHICLE |
|
| | (Cost $957,290,542) | | $ | 1,421,441,926 | |
| | |
| | | | | | | | |
|
| Securities Lending Reinvestment Vehicle – 0.9%(b) | |
| Goldman Sachs Financial Square Government Fund –
Institutional Shares |
|
| | 12,260,776 | | | 0.036% | | $ | 12,260,776 | |
| | (Cost $12,260,776) | |
| | |
| | TOTAL INVESTMENTS – 101.0% | |
| | (Cost $969,551,318) | | $ | 1,433,702,702 | |
| | |
| LIABILITIES IN EXCESS OF OTHER
ASSETS – (1.0)% | | | (14,102,745 | ) |
| | |
| | NET ASSETS – 100.0% | | $ | 1,419,599,957 | |
| | |
| | |
|
| The percentage shown for each investment category reflects the value of investments in that category as a percentage of net assets. |
| |
* | | Non-income producing security. |
| |
(a) | | All or a portion of security is on loan. |
| |
(b) | | Represents an affiliated issuer. |
| | |
|
Investment Abbreviations: |
ADR | | —American Depositary Receipt |
PLC | | —Public Limited Company |
REIT | | —Real Estate Investment Trust |
|
| | |
| The accompanying notes are an integral part of these financial statements. | | 29 |
GOLDMAN SACHS SMALL CAP GROWTH FUND
Schedule of Investments
February 28, 2021 (Unaudited)
| | | | | | | | |
| Shares | | | Description | |
Value | |
|
| Common Stocks – 98.7% | |
| Aerospace & Defense – 3.4% | |
| | 1,745 | | | AeroVironment, Inc.* | | $ | 192,090 | |
| | 11,810 | | | Kratos Defense & Security Solutions, Inc.* | | | 324,775 | |
| | 2,680 | | | Maxar Technologies, Inc. | | | 128,238 | |
| | 2,165 | | | Moog, Inc., Class A | | | 168,134 | |
| | | | | | | | |
| | | | | | | 813,237 | |
| | |
| Auto Components – 1.3% | |
| | 2,362 | | | Fox Factory Holding Corp.* | | | 300,328 | |
| | |
| Automobiles – 0.8% | |
| | 2,772 | | | Winnebago Industries, Inc. | | | 192,931 | |
| | |
| Beverages – 1.0% | |
| | 3,860 | | | Celsius Holdings, Inc.* | | | 229,786 | |
| | |
| Biotechnology – 14.7% | |
| | 4,015 | | | 4D Molecular Therapeutics, Inc.* | | | 168,550 | |
| | 1,539 | | | Acceleron Pharma, Inc.* | | | 209,550 | |
| | 5,495 | | | Agios Pharmaceuticals, Inc.* | | | 260,683 | |
| | 4,832 | | | Akouos, Inc.* | | | 98,428 | |
| | 2,791 | | | Allogene Therapeutics, Inc.* | | | 96,876 | |
| | 2,467 | | | Applied Molecular Transport, Inc.*(a) | | | 120,562 | |
| | 3,804 | | | ARYA Sciences Acquisition Corp III, Class A* | | | 59,723 | |
| | 5,939 | | | Avidity Biosciences, Inc.* | | | 143,308 | |
| | 3,015 | | | Beam Therapeutics, Inc.* | | | 268,727 | |
| | 2,819 | | | Coherus Biosciences, Inc.* | | | 45,780 | |
| | 5,001 | | | Concert Pharmaceuticals, Inc.* | | | 33,457 | |
| | 3,558 | | | Constellation Pharmaceuticals, Inc.* | | | 89,662 | |
| | 5,090 | | | Cytokinetics, Inc.* | | | 95,336 | |
| | 4,503 | | | Dyne Therapeutics, Inc.* | | | 83,170 | |
| | 3,428 | | | FibroGen, Inc.* | | | 171,503 | |
| | 2,453 | | | Generation Bio Co.* | | | 85,659 | |
| | 9,583 | | | Halozyme Therapeutics, Inc.* | | | 433,631 | |
| | 651 | | | IGM Biosciences, Inc.* | | | 56,917 | |
| | 6,755 | | | Inozyme Pharma, Inc.*(a) | | | 135,100 | |
| | 2,167 | | | Kiniksa Pharmaceuticals Ltd., Class A* | | | 44,575 | |
| | 2,657 | | | Kronos Bio, Inc.*(a) | | | 77,239 | |
| | 1,857 | | | ORIC Pharmaceuticals, Inc.* | | | 60,167 | |
| | 619 | | | Pharvaris BV (Netherlands)* | | | 23,516 | |
| | 2,260 | | | PMV Pharmaceuticals, Inc.* | | | 85,044 | |
| | 1,034 | | | PTC Therapeutics, Inc.* | | | 59,041 | |
| | 2,213 | | | Relay Therapeutics, Inc.* | | | 91,330 | |
| | 2,111 | | | Repare Therapeutics, Inc. (Canada)* | | | 69,452 | |
| | 1,374 | | | REVOLUTION Medicines, Inc.* | | | 62,764 | |
| | 3,900 | | | Sutro Biopharma, Inc.* | | | 86,580 | |
| | 2,762 | | | Y-mAbs Therapeutics, Inc.* | | | 97,139 | |
| | 1,464 | | | Zentalis Pharmaceuticals, Inc.* | | | 61,546 | |
| | | | | | | | |
| | | | | | | 3,475,015 | |
| | |
| Building Products – 2.5% | |
| | 4,734 | | | AZEK Co., Inc. (The)* | | | 208,817 | |
| | 2,492 | | | Gibraltar Industries, Inc.* | | | 217,676 | |
| | 1,466 | | | Masonite International Corp.* | | | 160,850 | |
| | | | | | | | |
| | | | | | | 587,343 | |
| | |
|
| Common Stocks – (continued) | |
| Capital Markets – 1.4% | |
| | 1,468 | | | Houlihan Lokey, Inc. | | | 93,306 | |
| | 3,882 | | | Open Lending Corp., Class A* | | | 148,448 | |
| | 3,023 | | | Virtu Financial, Inc., Class A | | | 82,437 | |
| | | | | | | | |
| | | | | | | 324,191 | |
| | |
| Chemicals – 1.5% | |
| | 2,034 | | | Ashland Global Holdings, Inc. | | | 171,100 | |
| | 1,551 | | | Balchem Corp. | | | 185,127 | |
| | | | | | | | |
| | | | | | | 356,227 | |
| | |
| Commercial Services & Supplies – 0.6% | |
| | 963 | | | Tetra Tech, Inc. | | | 133,250 | |
| | |
| Construction & Engineering – 1.2% | |
| | 2,399 | | | Ameresco, Inc., Class A* | | | 137,031 | |
| | 1,997 | | | Dycom Industries, Inc.* | | | 152,930 | |
| | | | | | | | |
| | | | | | | 289,961 | |
| | |
| Diversified Telecommunication Services – 0.9% | |
| | 1,273 | | | Bandwidth, Inc., Class A* | | | 201,592 | |
| | |
| Electrical Equipment – 1.3% | |
| | 2,913 | | | Allied Motion Technologies, Inc. | | | 141,397 | |
| | 3,308 | | | Plug Power, Inc.* | | | 160,041 | |
| | | | | | | | |
| | | | | | | 301,438 | |
| | |
| Electronic Equipment, Instruments & Components – 2.5% | |
| | 1,240 | | | 908 Devices, Inc.* | | | 65,956 | |
| | 2,536 | | | Badger Meter, Inc. | | | 275,384 | |
| | 1,857 | | | Novanta, Inc.* | | | 245,737 | |
| | | | | | | | |
| | | | | | | 587,077 | |
| | |
| Food Products – 1.0% | |
| | 1,467 | | | Freshpet, Inc.* | | | 228,676 | |
| | |
| Health Care Equipment & Supplies – 5.9% | |
| | 5,580 | | | Axonics Modulation Technologies, Inc.* | | | 280,730 | |
| | 1,476 | | | Hill-Rom Holdings, Inc. | | | 157,445 | |
| | 2,138 | | | Neogen Corp.* | | | 175,145 | |
| | 1,120 | | | Nevro Corp.* | | | 185,002 | |
| | 12,689 | | | OraSure Technologies, Inc.* | | | 134,503 | |
| | 1,572 | | | Outset Medical, Inc.* | | | 78,270 | |
| | 2,285 | | | Shockwave Medical, Inc.* | | | 266,797 | |
| | 1,146 | | | Tandem Diabetes Care, Inc.* | | | 110,004 | |
| | | | | | | | |
| | | | | | | 1,387,896 | |
| | |
| Health Care Providers & Services – 1.5% | |
| | 3,844 | | | Castle Biosciences, Inc.* | | | 292,452 | |
| | 1,387 | | | National Research Corp. | | | 71,666 | |
| | | | | | | | |
| | | | | | | 364,118 | |
| | |
| Health Care Technology – 2.1% | |
| | 2,675 | | | Omnicell, Inc.* | | | 339,458 | |
| | 2,027 | | | Simulations Plus, Inc. | | | 145,376 | |
| | | | | | | | |
| | | | | | | 484,834 | |
| | |
| | |
| 30 | | The accompanying notes are an integral part of these financial statements. |
GOLDMAN SACHS SMALL CAP GROWTH FUND
| | | | | | | | |
| Shares | | | Description | |
Value | |
|
| Common Stocks – (continued) | |
| Hotels, Restaurants & Leisure – 4.6% | |
| | 1,077 | | | Churchill Downs, Inc. | | $ | 248,388 | |
| | 1,659 | | | Shake Shack, Inc., Class A* | | | 196,558 | |
| | 3,351 | | | Texas Roadhouse, Inc. | | | 304,539 | |
| | 1,245 | | | Wingstop, Inc. | | | 169,507 | |
| | 2,707 | | | Wyndham Hotels & Resorts, Inc. | | | 176,713 | |
| | | | | | | | |
| | | | | | | 1,095,705 | |
| | |
| Household Durables – 1.7% | |
| | 5,978 | | | Purple Innovation, Inc.* | | | 219,931 | |
| | 968 | | | TopBuild Corp.* | | | 184,317 | |
| | | | | | | | |
| | | | | | | 404,248 | |
| | |
| Insurance – 0.9% | |
| | 1,609 | | | Goosehead Insurance, Inc., Class A | | | 208,430 | |
| | |
| Internet & Direct Marketing Retail – 2.6% | |
| | 900 | | | Poshmark, Inc., Class A*(a) | | | 52,254 | |
| | 4,046 | | | PubMatic, Inc., Class A*(a) | | | 262,221 | |
| | 6,700 | | | Revolve Group, Inc.* | | | 308,870 | |
| | | | | | | | |
| | | | | | | 623,345 | |
| | |
| IT Services – 0.7% | |
| | 2,987 | | | BigCommerce Holdings, Inc. Series 1* | | | 176,562 | |
| | |
| Leisure Products – 2.4% | |
| | 3,210 | | | Malibu Boats, Inc., Class A* | | | 239,273 | |
| | 4,765 | | | YETI Holdings, Inc.* | | | 327,689 | |
| | | | | | | | |
| | | | | | | 566,962 | |
| | |
| Life Sciences Tools & Services – 3.6% | |
| | 3,432 | | | NeoGenomics, Inc.* | | | 174,929 | |
| | 8,954 | | | Pacific Biosciences of California, Inc.* | | | 273,724 | |
| | 5,378 | | | Quanterix Corp.* | | | 407,383 | |
| | | | | | | | |
| | | | | | | 856,036 | |
| | |
| Machinery – 8.8% | |
| | 2,104 | | | Chart Industries, Inc.* | | | 301,061 | |
| | 7,864 | | | Colfax Corp.* | | | 348,768 | |
| | 7,878 | | | Evoqua Water Technologies Corp.* | | | 193,405 | |
| | 4,932 | | | Federal Signal Corp. | | | 179,574 | |
| | 2,425 | | | Franklin Electric Co., Inc. | | | 182,021 | |
| | 1,253 | | | John Bean Technologies Corp. | | | 184,905 | |
| | 708 | | | Proto Labs, Inc.* | | | 103,141 | |
| | 1,748 | | | RBC Bearings, Inc.* | | | 347,957 | |
| | 3,977 | | | Shyft Group, Inc. (The) | | | 130,804 | |
| | 930 | | | Watts Water Technologies, Inc., Class A | | | 106,104 | |
| | | | | | | | |
| | | | | | | 2,077,740 | |
| | |
| Pharmaceuticals – 1.6% | |
| | 1,650 | | | Atea Pharmaceuticals, Inc.*(a) | | | 124,344 | |
| | 4,714 | | | Omeros Corp.*(a) | | | 93,997 | |
| | 5,265 | | | Provention Bio, Inc.* | | | 66,971 | |
| | 5,260 | | | Theravance Biopharma, Inc.* | | | 87,158 | |
| | | | | | | | |
| | | | | | | 372,470 | |
| | |
| Professional Services – 1.7% | |
| | 3,135 | | | ManTech International Corp., Class A | | | 245,032 | |
| | |
|
| Common Stocks – (continued) | |
| Professional Services – (continued) | |
| | 1,711 | | | Science Applications International Corp. | | | 147,368 | |
| | | | | | | | |
| | | | | | | 392,400 | |
| | |
| Road & Rail – 0.9% | |
| | 1,089 | | | Saia, Inc.* | | | 218,377 | |
| | |
| Semiconductors & Semiconductor Equipment – 9.1% | |
| | 2,552 | | | Ambarella, Inc.* | | | 287,075 | |
| | 4,601 | | | Brooks Automation, Inc. | | | 382,619 | |
| | 6,689 | | | Cohu, Inc.* | | | 290,637 | |
| | 6,639 | | | FormFactor, Inc.* | | | 301,211 | |
| | 4,653 | | | MACOM Technology Solutions Holdings, Inc.* | | | 299,421 | |
| | 3,489 | | | Power Integrations, Inc. | | | 308,323 | |
| | 3,707 | | | Semtech Corp.* | | | 271,760 | |
| | | | | | | | |
| | | | | | | 2,141,046 | |
| | |
| Software – 12.6% | |
| | 8,604 | | | 8x8, Inc.* | | | 294,343 | |
| | 10,052 | | | BTRS Holdings, Inc.*(a) | | | 169,879 | |
| | 4,568 | | | Domo, Inc., Class B* | | | 291,119 | |
| | 6,572 | | | Medallia, Inc.* | | | 265,312 | |
| | 6,518 | | | PagerDuty, Inc.* | | | 291,615 | |
| | 9,551 | | | Ping Identity Holding Corp.* | | | 223,780 | |
| | 3,286 | | | Rapid7, Inc.* | | | 250,525 | |
| | 4,696 | | | Sailpoint Technologies Holdings, Inc.* | | | 264,760 | |
| | 6,162 | | | Sumo Logic, Inc.*(a) | | | 187,202 | |
| | 5,195 | | | Tenable Holdings, Inc.* | | | 212,527 | |
| | 5,832 | | | Vertex, Inc., Class A* | | | 179,334 | |
| | 3,388 | | | Workiva, Inc.* | | | 342,696 | |
| | | | | | | | |
| | | | | | | 2,973,092 | |
| | |
| Specialty Retail – 1.7% | |
| | 8,963 | | | Leslie’s, Inc.* | | | 217,621 | |
| | 383 | | | RH* | | | 187,812 | |
| | | | | | | | |
| | | | | | | 405,433 | |
| | |
| Textiles, Apparel & Luxury Goods – 2.2% | |
| | 4,784 | | | Crocs, Inc.* | | | 367,029 | |
| | 474 | | | Deckers Outdoor Corp.* | | | 154,576 | |
| | | | | | | | |
| | | | | | | 521,605 | |
| | |
| | TOTAL COMMON STOCKS | |
| | (Cost $17,236,637) | | $ | 23,291,351 | |
| | |
| | | | | | | | |
| Shares | | | Dividend
Rate | | Value | |
|
| Investment Company – 3.7%(b) | |
| Goldman Sachs Financial Square Government Fund –
Institutional Shares |
|
| | 881,172 | | | 0.036% | | $ | 881,172 | |
| | (Cost $881,172) | |
| | |
| TOTAL INVESTMENTS BEFORE SECURITIES LENDING
REINVESTMENT VEHICLE |
|
| | (Cost $18,117,809) | | $ | 24,172,523 | |
| | |
| | |
| The accompanying notes are an integral part of these financial statements. | | 31 |
GOLDMAN SACHS SMALL CAP GROWTH FUND
Schedule of Investments (continued)
February 28, 2021 (Unaudited)
| | | | | | | | |
| Shares | | | Dividend
Rate | | Value | |
|
| Securities Lending Reinvestment Vehicle – 2.8%(b) | |
| Goldman Sachs Financial Square Government Fund –
Institutional Shares |
|
| | 649,259 | | | 0.036% | | $ | 649,259 | |
| | (Cost $649,259) | |
| | |
| | TOTAL INVESTMENTS – 105.2% | |
| | (Cost $18,767,068) | | $ | 24,821,782 | |
| | |
| LIABILITIES IN EXCESS OF
OTHER ASSETS – (5.2)% | | | (1,235,433 | ) |
| | |
| | NET ASSETS – 100.0% | | $ | 23,586,349 | |
| | |
| | |
|
| The percentage shown for each investment category reflects the value of investments in that category as a percentage of net assets. |
| |
* | | Non-income producing security. |
| |
(a) | | All or a portion of security is on loan. |
| |
(b) | | Represents an affiliated issuer. |
| | |
| 32 | | The accompanying notes are an integral part of these financial statements. |
GOLDMAN SACHS SMALL/MID CAP GROWTH FUND
Schedule of Investments
February 28, 2021 (Unaudited)
| | | | | | | | |
| Shares | | | Description | |
Value | |
|
| Common Stocks – 98.0% | |
| Aerospace & Defense – 2.5% | |
| | 175,833 | | | HEICO Corp., Class A | | $ | 20,354,428 | |
| | 766,839 | | | Kratos Defense & Security Solutions, Inc.* | | | 21,088,073 | |
| | 95,881 | | | Teledyne Technologies, Inc.* | | | 35,571,851 | |
| | | | | | | | |
| | | | | | | 77,014,352 | |
| | |
| Air Freight & Logistics – 0.6% | |
| | 173,012 | | | XPO Logistics, Inc.* | | | 20,173,199 | |
| | |
| Auto Components – 0.8% | |
| | 196,614 | | | Fox Factory Holding Corp.* | | | 24,999,470 | |
| | |
| Biotechnology – 11.7% | |
| | 676,523 | | | Agios Pharmaceuticals, Inc.* | | | 32,094,251 | |
| | 314,358 | | | Allogene Therapeutics, Inc.* | | | 10,911,366 | |
| | 180,760 | | | Alnylam Pharmaceuticals, Inc.* | | | 26,770,556 | |
| | 201,601 | | | Arena Pharmaceuticals, Inc.* | | | 16,198,640 | |
| | 99,474 | | | Argenx SE ADR (Netherlands)* | | | 32,894,062 | |
| | 408,149 | | | Beam Therapeutics, Inc.*(a) | | | 36,378,320 | |
| | 1,079,389 | | | Exelixis, Inc.* | | | 23,379,566 | |
| | 193,741 | | | Galapagos NV ADR (Belgium)* | | | 16,003,007 | |
| | 839,209 | | | Halozyme Therapeutics, Inc.* | | | 37,974,207 | |
| | 389,451 | | | Neurocrine Biosciences, Inc.* | | | 42,648,779 | |
| | 50,953 | | | Novavax, Inc.* | | | 11,781,862 | |
| | 202,536 | | | Relay Therapeutics, Inc.* | | | 8,358,661 | |
| | 174,791 | | | REVOLUTION Medicines, Inc.* | | | 7,984,453 | |
| | 113,445 | | | Turning Point Therapeutics, Inc.* | | | 13,376,300 | |
| | 56,835 | | | Twist Bioscience Corp.* | | | 7,822,770 | |
| | 194,813 | | | Ultragenyx Pharmaceutical, Inc.* | | | 27,573,832 | |
| | 331,989 | | | Y-mAbs Therapeutics, Inc.* | | | 11,676,053 | |
| | | | | | | | |
| | | | | | | 363,826,685 | |
| | |
| Building Products – 2.6% | |
| | 265,772 | | | Allegion PLC | | | 28,910,678 | |
| | 798,441 | | | AZEK Co., Inc. (The)* | | | 35,219,232 | |
| | 59,058 | | | Lennox International, Inc. | | | 16,522,657 | |
| | | | | | | | |
| | | | | | | 80,652,567 | |
| | |
| Capital Markets – 1.1% | |
| | 141,753 | | | Evercore, Inc., Class A | | | 16,977,757 | |
| | 296,918 | | | Stifel Financial Corp. | | | 18,135,751 | |
| | | | | | | | |
| | | | | | | 35,113,508 | |
| | |
| Chemicals – 3.2% | |
| | 329,664 | | | Ashland Global Holdings, Inc. | | | 27,731,336 | |
| | 521,539 | | | RPM International, Inc. | | | 41,535,366 | |
| | 136,320 | | | Scotts Miracle-Gro Co. (The) | | | 29,056,608 | |
| | | | | | | | |
| | | | | | | 98,323,310 | |
| | |
| Commercial Services & Supplies – 0.8% | |
| | 169,696 | | | Tetra Tech, Inc. | | | 23,480,836 | |
| | |
| Containers & Packaging – 1.1% | |
| | 187,945 | | | Avery Dennison Corp. | | | 32,929,843 | |
| | |
| Distributors – 0.9% | |
| | 87,010 | | | Pool Corp. | | | 29,128,338 | |
| | |
|
| Common Stocks – (continued) | |
| Diversified Telecommunication Services – 0.6% | |
| | 127,673 | | | Bandwidth, Inc., Class A* | | | 20,218,296 | |
| | |
| Electrical Equipment – 2.9% | |
| | 228,031 | | | Generac Holdings, Inc.* | | | 75,149,896 | |
| | 179,065 | | | Plug Power, Inc.* | | | 8,663,165 | |
| | 212,327 | | | Shoals Technologies Group, Inc., Class A* | | | 6,926,107 | |
| | | | | | | | |
| | | | | | | 90,739,168 | |
| | |
| Electronic Equipment, Instruments & Components – 2.6% | |
| | 361,553 | | | Badger Meter, Inc. | | | 39,261,040 | |
| | 305,918 | | | Novanta, Inc.* | | | 40,482,129 | |
| | | | | | | | |
| | | | | | | 79,743,169 | |
| | |
| Food Products – 1.4% | |
| | 276,994 | | | Freshpet, Inc.* | | | 43,177,825 | |
| | |
| Health Care Equipment & Supplies – 4.3% | |
| | 71,398 | | | iRhythm Technologies, Inc.* | | | 11,487,938 | |
| | 184,918 | | | Neogen Corp.* | | | 15,148,483 | |
| | 154,251 | | | Nevro Corp.* | | | 25,479,180 | |
| | 265,327 | | | Tandem Diabetes Care, Inc.* | | | 25,468,739 | |
| | 78,640 | | | Teleflex, Inc. | | | 31,308,157 | |
| | 89,567 | | | West Pharmaceutical Services, Inc. | | | 25,136,978 | |
| | | | | | | | |
| | | | | | | 134,029,475 | |
| | |
| Health Care Providers & Services – 4.3% | |
| | 243,258 | | | Castle Biosciences, Inc.* | | | 18,507,068 | |
| | 443,804 | | | Guardant Health, Inc.* | | | 65,319,073 | |
| | 226,771 | | | Molina Healthcare, Inc.* | | | 49,154,882 | |
| | | | | | | | |
| | | | | | | 132,981,023 | |
| | |
| Health Care Technology – 0.6% | |
| | 437,490 | | | American Well Corp., Class A* | | | 10,705,380 | |
| | 225,218 | | | Certara, Inc.* | | | 7,803,804 | |
| | | | | | | | |
| | | | | | | 18,509,184 | |
| | |
| Hotels, Restaurants & Leisure – 2.7% | |
| | 237,384 | | | Choice Hotels International, Inc. | | | 24,894,460 | |
| | 74,828 | | | Churchill Downs, Inc. | | | 17,257,582 | |
| | 329,024 | | | Texas Roadhouse, Inc. | | | 29,901,701 | |
| | 92,955 | | | Wingstop, Inc. | | | 12,655,823 | |
| | | | | | | | |
| | | | | | | 84,709,566 | |
| | |
| Interactive Media & Services – 0.4% | |
| | 189,250 | | | Bumble, Inc., Class A*(a) | | | 12,738,417 | |
| | |
| Internet & Direct Marketing Retail – 1.8% | |
| | 158,161 | | | Etsy, Inc.* | | | 34,838,123 | |
| | 273,477 | | | Stitch Fix, Inc., Class A* | | | 20,869,030 | |
| | | | | | | | |
| | | | | | | 55,707,153 | |
| | |
| IT Services – 2.2% | |
| | 100,334 | | | MongoDB, Inc.* | | | 38,721,901 | |
| | 406,032 | | | Shift4 Payments, Inc., Class A* | | | 31,061,448 | |
| | | | | | | | |
| | | | | | | 69,783,349 | |
| | |
| | |
| The accompanying notes are an integral part of these financial statements. | | 33 |
GOLDMAN SACHS SMALL/MID CAP GROWTH FUND
Schedule of Investments (continued)
February 28, 2021 (Unaudited)
| | | | | | | | |
| Shares | | | Description | |
Value | |
|
| Common Stocks – (continued) | |
| Leisure Products – 1.5% | |
| | 322,724 | | | Brunswick Corp. | | $ | 28,519,120 | |
| | 281,229 | | | YETI Holdings, Inc.* | | | 19,340,118 | |
| | | | | | | | |
| | | | | | | 47,859,238 | |
| | |
| Life Sciences Tools & Services – 6.2% | |
| | 169,292 | | | 10X Genomics, Inc., Class A* | | | 30,132,283 | |
| | 130,415 | | | Berkeley Lights, Inc.* | | | 8,081,818 | |
| | 150,465 | | | Bio-Techne Corp. | | | 54,421,686 | |
| | 444,224 | | | PerkinElmer, Inc. | | | 56,012,204 | |
| | 284,500 | | | Quanterix Corp.* | | | 21,550,875 | |
| | 107,390 | | | Repligen Corp.* | | | 22,808,562 | |
| | | | | | | | |
| | | | | | | 193,007,428 | |
| | |
| Machinery – 6.3% | |
| | 237,611 | | | Chart Industries, Inc.* | | | 33,999,758 | |
| | 1,209,295 | | | Colfax Corp.* | | | 53,632,233 | |
| | 172,408 | | | IDEX Corp. | | | 33,648,869 | |
| | 86,526 | | | Proto Labs, Inc.* | | | 12,605,108 | |
| | 197,191 | | | RBC Bearings, Inc.* | | | 39,252,841 | |
| | 236,805 | | | Xylem, Inc. | | | 23,576,306 | |
| | | | | | | | |
| | | | | | | 196,715,115 | |
| | |
| Pharmaceuticals – 1.4% | |
| | 220,867 | | | Atea Pharmaceuticals, Inc.*(a) | | | 16,644,537 | |
| | 784,234 | | | Elanco Animal Health, Inc.* | | | 25,769,929 | |
| | | | | | | | |
| | | | | | | 42,414,466 | |
| | |
| Professional Services – 2.1% | |
| | 430,066 | | | Booz Allen Hamilton Holding Corp. | | | 33,175,291 | |
| | 267,002 | | | Jacobs Engineering Group, Inc. | | | 30,726,590 | |
| | | | | | | | |
| | | | | | | 63,901,881 | |
| | |
| Semiconductors & Semiconductor Equipment – 8.8% | |
| | 1,040,743 | | | Allegro MicroSystems, Inc. (Japan)* | | | 27,205,022 | |
| | 183,247 | | | Brooks Automation, Inc. | | | 15,238,821 | |
| | 151,545 | | | Enphase Energy, Inc.* | | | 26,681,013 | |
| | 511,488 | | | Entegris, Inc. | | | 53,813,652 | |
| | 503,027 | | | Lattice Semiconductor Corp.* | | | 24,205,659 | |
| | 259,828 | | | MKS Instruments, Inc. | | | 42,845,637 | |
| | 118,987 | | | Monolithic Power Systems, Inc. | | | 44,563,011 | |
| | 305,483 | | | Teradyne, Inc. | | | 39,288,169 | |
| | | | | | | | |
| | | | | | | 273,840,984 | |
| | |
| Software – 16.4% | |
| | 200,799 | | | Anaplan, Inc.* | | | 13,049,927 | |
| | 113,375 | | | Asana, Inc., Class A* | | | 3,926,176 | |
| | 303,585 | | | Avalara, Inc.* | | | 47,644,630 | |
| | 172,412 | | | Bill.com Holdings, Inc.* | | | 28,449,704 | |
| | 278,683 | | | Blackline, Inc.* | | | 34,562,266 | |
| | 627,004 | | | Duck Creek Technologies, Inc.* | | | 29,657,289 | |
| | 978,006 | | | Dynatrace, Inc.* | | | 48,665,579 | |
| | 315,953 | | | Elastic NV* | | | 42,460,924 | |
| | 132,190 | | | HubSpot, Inc.* | | | 68,077,850 | |
| | 319,197 | | | JFrog Ltd. (Israel)*(a) | | | 17,073,847 | |
| | 154,212 | | | nCino, Inc.* | | | 10,545,017 | |
| | |
|
| Common Stocks – (continued) | |
| Software – (continued) | |
| | 440,992 | | | Rapid7, Inc.* | | | 33,621,230 | |
| | 556,536 | | | Sumo Logic, Inc.*(a) | | | 16,907,564 | |
| | 184,588 | | | Varonis Systems, Inc.* | | | 33,879,281 | |
| | 763,471 | | | Vertex, Inc., Class A* | | | 23,476,733 | |
| | 389,976 | | | Zendesk, Inc.* | | | 56,991,093 | |
| | | | | | | | |
| | | | | | | 508,989,110 | |
| | |
| Specialty Retail – 4.0% | |
| | 216,004 | | | Five Below, Inc.* | | | 40,202,665 | |
| | 387,906 | | | Floor & Decor Holdings, Inc., Class A* | | | 36,885,982 | |
| | 74,917 | | | RH* | | | 36,737,049 | |
| | 214,033 | | | Vroom, Inc.* | | | 9,470,960 | |
| | | | | | | | |
| | | | | | | 123,296,656 | |
| | |
| Textiles, Apparel & Luxury Goods – 1.3% | |
| | 127,316 | | | Deckers Outdoor Corp.* | | | 41,519,021 | |
| | |
| Trading Companies & Distributors – 0.9% | |
| | 182,633 | | | SiteOne Landscape Supply, Inc.* | | | 28,949,157 | |
| | |
| | TOTAL COMMON STOCKS | |
| | (Cost $2,035,240,094) | | $ | 3,048,471,789 | |
| | |
| | | | | | | | |
| Shares | | | Dividend
Rate | | Value | |
|
| Investment Company – 1.5%(b) | |
| Goldman Sachs Financial Square Government Fund –
Institutional Shares |
|
| | 46,766,661 | | | 0.036% | | $ | 46,766,661 | |
| | (Cost $46,766,661) | |
| | |
| TOTAL INVESTMENTS BEFORE SECURITIES LENDING
REINVESTMENT VEHICLE |
|
| | (Cost $2,082,006,755) | | $ | 3,095,238,450 | |
| | |
| | | | | | | | |
|
| Securities Lending Reinvestment Vehicle – 1.7%(b) | |
| Goldman Sachs Financial Square Government Fund –
Institutional Shares |
|
| | 51,347,800 | | | 0.036% | | $ | 51,347,800 | |
| | (Cost $51,347,800) | |
| | |
| | TOTAL INVESTMENTS – 101.2% | |
| | (Cost $2,133,354,555) | | $ | 3,146,586,250 | |
| | |
| LIABILITIES IN EXCESS OF
OTHER ASSETS – (1.2)% | | | (34,624,860 | ) |
| | |
| | NET ASSETS – 100.0% | | $ | 3,111,961,390 | |
| | |
| | |
| 34 | | The accompanying notes are an integral part of these financial statements. |
GOLDMAN SACHS SMALL/MID CAP GROWTH FUND
| | |
|
The percentage shown for each investment category reflects the value of investments in that category as a percentage of net assets. |
| |
* | | Non-income producing security. |
| |
(a) | | All or a portion of security is on loan. |
| |
(b) | | Represents an affiliated issuer. |
| | |
|
Investment Abbreviations: |
ADR | | —American Depositary Receipt |
PLC | | —Public Limited Company |
|
| | |
| The accompanying notes are an integral part of these financial statements. | | 35 |
GOLDMAN SACHS STRATEGIC GROWTH FUND
Schedule of Investments
February 28, 2021 (Unaudited)
| | | | | | | | |
| Shares | | | Description | |
Value | |
|
| Common Stocks – 99.4% | |
| Aerospace & Defense – 0.6% | |
| | 4,915 | | | Boeing Co. (The)* | | $ | 1,042,029 | |
| | |
| Auto Components – 0.8% | |
| | 9,476 | | | Aptiv PLC* | | | 1,419,884 | |
| | |
| Automobiles – 2.6% | |
| | 7,182 | | | Tesla, Inc.* | | | 4,851,441 | |
| | |
| Beverages – 1.5% | |
| | 34,458 | | | Coca-Cola Co. (The) | | | 1,688,097 | |
| | 13,467 | | | Monster Beverage Corp.* | | | 1,181,595 | |
| | | | | | | | |
| | | | | | | 2,869,692 | |
| | |
| Biotechnology – 2.0% | |
| | 8,994 | | | BioMarin Pharmaceutical, Inc.* | | | 696,405 | |
| | 33,686 | | | Genmab A/S ADR (Denmark)* | | | 1,140,945 | |
| | 8,844 | | | Sarepta Therapeutics, Inc.* | | | 769,959 | |
| | 7,855 | | | Seagen, Inc.* | | | 1,186,969 | |
| | | | | | | | |
| | | | | | | 3,794,278 | |
| | |
| Capital Markets – 1.7% | |
| | 30,923 | | | Charles Schwab Corp. (The) | | | 1,908,568 | |
| | 10,558 | | | Intercontinental Exchange, Inc. | | | 1,164,653 | |
| | | | | | | | |
| | | | | | | 3,073,221 | |
| | |
| Chemicals – 1.6% | |
| | 4,710 | | | Ecolab, Inc. | | | 986,086 | |
| | 3,757 | | | Linde PLC (United Kingdom) | | | 917,722 | |
| | 1,493 | | | Sherwin-Williams Co. (The) | | | 1,015,748 | |
| | | | | | | | |
| | | | | | | 2,919,556 | |
| | |
| Construction Materials – 0.4% | |
| | 2,337 | | | Martin Marietta Materials, Inc. | | | 787,265 | |
| | |
| Diversified Consumer Services – 0.5% | |
| | 10,589 | | | Chegg, Inc.* | | | 1,022,156 | |
| | |
| Electronic Equipment, Instruments & Components – 0.9% | |
| | 13,014 | | | Amphenol Corp., Class A | | | 1,635,600 | |
| | |
| Entertainment – 2.9% | |
| | 14,854 | | | Live Nation Entertainment, Inc.* | | | 1,319,927 | |
| | 7,538 | | | Netflix, Inc.* | | | 4,061,851 | |
| | | | | | | | |
| | | | | | | 5,381,778 | |
| | |
| Equity Real Estate Investment Trusts (REITs) – 1.4% | |
| | 6,517 | | | American Tower Corp. REIT | | | 1,408,519 | |
| | 1,826 | | | Equinix, Inc. REIT | | | 1,183,869 | |
| | | | | | | | |
| | | | | | | 2,592,388 | |
| | |
| Food & Staples Retailing – 0.6% | |
| | 9,289 | | | Walmart, Inc. | | | 1,206,827 | |
| | |
| Food Products – 0.9% | |
| | 8,933 | | | McCormick & Co., Inc. | | | 752,873 | |
| | 16,021 | | | Mondelez International, Inc., Class A | | | 851,677 | |
| | | | | | | | |
| | | | | | | 1,604,550 | |
| | |
|
| Common Stocks – (continued) | |
| Health Care Equipment & Supplies – 4.1% | |
| | 51,247 | | | Boston Scientific Corp.* | | | 1,987,359 | |
| | 6,916 | | | Danaher Corp. | | | 1,519,238 | |
| | 4,302 | | | Insulet Corp.* | | | 1,114,648 | |
| | 2,060 | | | Intuitive Surgical, Inc.* | | | 1,517,808 | |
| | 5,079 | | | West Pharmaceutical Services, Inc. | | | 1,425,421 | |
| | | | | | | | |
| | | | | | | 7,564,474 | |
| | |
| Health Care Providers & Services – 1.6% | |
| | 9,796 | | | Guardant Health, Inc.* | | | 1,441,775 | |
| | 3,907 | | | Humana, Inc. | | | 1,483,293 | |
| | | | | | | | |
| | | | | | | 2,925,068 | |
| | |
| Health Care Technology – 0.9% | |
| | 22,789 | | | American Well Corp., Class A* | | | 557,647 | |
| | 3,796 | | | Veeva Systems, Inc., Class A* | | | 1,063,297 | |
| | | | | | | | |
| | | | | | | 1,620,944 | |
| | |
| Hotels, Restaurants & Leisure – 1.4% | |
| | 13,042 | | | Las Vegas Sands Corp. | | | 816,429 | |
| | 8,609 | | | McDonald’s Corp. | | | 1,774,659 | |
| | | | | | | | |
| | | | | | | 2,591,088 | |
| | |
| Interactive Media & Services – 11.1% | |
| | 4,067 | | | Alphabet, Inc., Class A* | | | 8,223,108 | |
| | 2,490 | | | Alphabet, Inc., Class C* | | | 5,071,781 | |
| | 24,163 | | | Facebook, Inc., Class A* | | | 6,224,872 | |
| | 14,934 | | | Snap, Inc., Class A* | | | 980,567 | |
| | | | | | | | |
| | | | | | | 20,500,328 | |
| | |
| Internet & Direct Marketing Retail – 6.2% | |
| | 3,214 | | | Amazon.com, Inc.* | | | 9,940,677 | |
| | 6,807 | | | Etsy, Inc.* | | | 1,499,378 | |
| | | | | | | | |
| | | | | | | 11,440,055 | |
| | |
| IT Services – 10.5% | |
| | 15,862 | | | Fidelity National Information Services, Inc. | | | 2,188,956 | |
| | 12,182 | | | Mastercard, Inc., Class A | | | 4,310,601 | |
| | 3,473 | | | Okta, Inc.* | | | 908,016 | |
| | 18,320 | | | PayPal Holdings, Inc.* | | | 4,760,452 | |
| | 3,179 | | | Snowflake, Inc., Class A* | | | 825,077 | |
| | 30,111 | | | Visa, Inc., Class A | | | 6,395,275 | |
| | | | | | | | |
| | | | | | | 19,388,377 | |
| | |
| Life Sciences Tools & Services – 2.3% | |
| | 6,799 | | | 10X Genomics, Inc., Class A* | | | 1,210,154 | |
| | 20,170 | | | Adaptive Biotechnologies Corp.* | | | 1,141,017 | |
| | 4,403 | | | Illumina, Inc.* | | | 1,934,722 | |
| | | | | | | | |
| | | | | | | 4,285,893 | |
| | |
| Machinery – 0.7% | |
| | 3,880 | | | Deere & Co. | | | 1,354,586 | |
| | |
| Personal Products – 1.0% | |
| | 6,691 | | | Estee Lauder Cos., Inc. (The), Class A | | | 1,912,689 | |
| | |
| | |
| 36 | | The accompanying notes are an integral part of these financial statements. |
GOLDMAN SACHS STRATEGIC GROWTH FUND
| | | | | | | | |
| Shares | | | Description | |
Value | |
|
| Common Stocks – (continued) | |
| Pharmaceuticals – 2.9% | |
| | 38,888 | | | Bristol-Myers Squibb Co. | | $ | 2,385,001 | |
| | 14,128 | | | Eli Lilly and Co. | | | 2,894,686 | |
| | | | | | | | |
| | | | | | | 5,279,687 | |
| | |
| Professional Services – 0.8% | |
| | 8,575 | | | Verisk Analytics, Inc. | | | 1,405,014 | |
| | |
| Road & Rail – 1.4% | |
| | 12,909 | | | Union Pacific Corp. | | | 2,658,738 | |
| | |
| Semiconductors & Semiconductor Equipment – 6.4% | |
| | 44,096 | | | Marvell Technology Group Ltd. | | | 2,128,955 | |
| | 10,587 | | | NVIDIA Corp. | | | 5,807,816 | |
| | 11,546 | | | NXP Semiconductors NV (Netherlands) | | | 2,107,722 | |
| | 13,309 | | | QUALCOMM, Inc. | | | 1,812,553 | |
| | | | | | | | |
| | | | | | | 11,857,046 | |
| | |
| Software – 16.5% | |
| | 8,426 | | | Adobe, Inc.* | | | 3,873,179 | |
| | 4,757 | | | Atlassian Corp. PLC, Class A* | | | 1,130,739 | |
| | 5,596 | | | Bill.com Holdings, Inc.* | | | 923,396 | |
| | 9,515 | | | C3.ai, Inc., Class A*(a) | | | 1,070,057 | |
| | 3,557 | | | HubSpot, Inc.* | | | 1,831,855 | |
| | 57,779 | | | Microsoft Corp. | | | 13,426,684 | |
| | 23,945 | | | Qualtrics International, Inc., Class A* | | | 909,910 | |
| | 3,603 | | | ServiceNow, Inc.* | | | 1,922,056 | |
| | 12,662 | | | Splunk, Inc.* | | | 1,810,793 | |
| | 15,073 | | | Workday, Inc., Class A* | | | 3,695,598 | |
| | | | | | | | |
| | | | | | | 30,594,267 | |
| | |
| Specialty Retail – 2.1% | |
| | 19,412 | | | Ross Stores, Inc. | | | 2,264,216 | |
| | 5,334 | | | Ulta Beauty, Inc.* | | | 1,719,308 | |
| | | | | | | | |
| | | | | | | 3,983,524 | |
| | |
| Technology Hardware, Storage & Peripherals – 8.4% | |
| | 127,496 | | | Apple, Inc. | | | 15,460,165 | |
| | |
| Textiles, Apparel & Luxury Goods – 2.7% | |
| | 3,233 | | | Lululemon Athletica, Inc.* | | | 1,007,661 | |
| | 23,170 | | | NIKE, Inc., Class B | | | 3,122,853 | |
| | 8,266 | | | PVH Corp. | | | 826,269 | |
| | | | | | | | |
| | | | | | | 4,956,783 | |
| | |
| | TOTAL COMMON STOCKS | |
| | (Cost $78,966,290) | | $ | 183,979,391 | |
| | |
| | | | | | | | |
| Shares | | | Dividend
Rate | | Value | |
|
| Investment Company – 0.8%(b) | |
| Goldman Sachs Financial Square Government Fund –
Institutional Shares |
|
| | 1,420,481 | | | 0.036% | | $ | 1,420,481 | |
| | (Cost $1,420,481) | |
| | |
| TOTAL INVESTMENTS BEFORE SECURITIES LENDING
REINVESTMENT VEHICLE |
|
| | (Cost $80,386,771) | | $ | 185,399,872 | |
| | |
| | |
|
| Securities Lending Reinvestment Vehicle – 0.6%(b) | |
| Goldman Sachs Financial Square Government Fund –
Institutional Shares |
|
| | 1,055,303 | | | 0.036% | | $ | 1,055,303 | |
| | (Cost $1,055,303) | |
| | |
| | TOTAL INVESTMENTS – 100.8% | |
| | (Cost $81,442,074) | | $ | 186,455,175 | |
| | |
| LIABILITIES IN EXCESS OF
OTHER ASSETS – (0.8)% | | | (1,456,107 | ) |
| | |
| | NET ASSETS – 100.0% | | $ | 184,999,068 | |
| | |
| | |
|
| The percentage shown for each investment category reflects the value of investments in that category as a percentage of net assets. |
| |
* | | Non-income producing security. |
| |
(a) | | All or a portion of security is on loan. |
| |
(b) | | Represents an affiliated issuer. |
| | |
|
Investment Abbreviations: |
ADR | | —American Depositary Receipt |
PLC | | —Public Limited Company |
REIT | | —Real Estate Investment Trust |
|
| | |
| The accompanying notes are an integral part of these financial statements. | | 37 |
GOLDMAN SACHS TECHNOLOGY OPPORTUNITIES FUND
Schedule of Investments
February 28, 2021 (Unaudited)
| | | | | | | | |
| Shares | | | Description | |
Value | |
|
| Common Stocks – 98.9% | |
| Communications Equipment – 2.0% | |
| | 367,140 | | | Cisco Systems, Inc. | | $ | 16,473,572 | |
| | |
| Entertainment – 4.9% | |
| | 176,549 | | | Activision Blizzard, Inc. | | | 16,879,850 | |
| | 122,892 | | | Walt Disney Co. (The)* | | | 23,231,504 | |
| | | | | | | | |
| | | | | | | 40,111,354 | |
| | |
| Equity Real Estate Investment Trusts (REITs) – 3.8% | |
| | 67,318 | | | American Tower Corp. REIT | | | 14,549,439 | |
| | 25,618 | | | Equinix, Inc. REIT | | | 16,609,174 | |
| | | | | | | | |
| | | | | | | 31,158,613 | |
| | |
| Interactive Media & Services – 15.4% | |
| | 16,174 | | | Alphabet, Inc., Class A* | | | 32,702,372 | |
| | 24,409 | | | Alphabet, Inc., Class C* | | | 49,717,716 | |
| | 168,495 | | | Facebook, Inc., Class A* | | | 43,407,682 | |
| | | | | | | | |
| | | | | | | 125,827,770 | |
| | |
| Internet & Direct Marketing Retail – 6.9% | |
| | 12,132 | | | Amazon.com, Inc.* | | | 37,523,427 | |
| | 261,900 | | | Meituan, Class B (China)*(a) | | | 11,763,097 | |
| | 4,476 | | | MercadoLibre, Inc. (Argentina)* | | | 7,332,180 | |
| | | | | | | | |
| | | | | | | 56,618,704 | |
| | |
| IT Services – 17.2% | |
| | 58,874 | | | Accenture PLC, Class A | | | 14,771,487 | |
| | 66,773 | | | Akamai Technologies, Inc.* | | | 6,310,048 | |
| | 158,171 | | | Fidelity National Information Services, Inc. | | | 21,827,598 | |
| | 98,136 | | | Fiserv, Inc.* | | | 11,321,950 | |
| | 48,353 | | | Mastercard, Inc., Class A | | | 17,109,709 | |
| | 137,063 | | | PayPal Holdings, Inc.* | | | 35,615,821 | |
| | 160,821 | | | Visa, Inc., Class A | | | 34,156,772 | |
| | | | | | | | |
| | | | | | | 141,113,385 | |
| | |
| Semiconductors & Semiconductor Equipment – 18.8% | |
| | 157,296 | | | Advanced Micro Devices, Inc.* | | | 13,293,085 | |
| | 41,385 | | | KLA Corp. | | | 12,880,254 | |
| | 22,558 | | | Lam Research Corp. | | | 12,794,672 | |
| | 509,172 | | | Marvell Technology Group Ltd. | | | 24,582,824 | |
| | 83,843 | | | Microchip Technology, Inc. | | | 12,796,957 | |
| | 31,548 | | | NVIDIA Corp. | | | 17,306,602 | |
| | 107,348 | | | NXP Semiconductors NV (Netherlands) | | | 19,596,377 | |
| | 168,561 | | | Taiwan Semiconductor Manufacturing Co. Ltd. ADR (Taiwan) | | | 21,228,572 | |
| | 111,107 | | | Texas Instruments, Inc. | | | 19,140,403 | |
| | | | | | | | |
| | | | | | | 153,619,746 | |
| | |
| Software – 26.9% | |
| | 36,641 | | | Adobe, Inc.* | | | 16,842,768 | |
| | 52,288 | | | Atlassian Corp. PLC, Class A* | | | 12,428,858 | |
| | 42,281 | | | HubSpot, Inc.* | | | 21,774,715 | |
| | 58,998 | | | Intuit, Inc. | | | 23,017,480 | |
| | 296,807 | | | Microsoft Corp. | | | 68,972,011 | |
| | 39,880 | | | Palo Alto Networks, Inc.* | | | 14,289,403 | |
| | 41,472 | | | Paycom Software, Inc.* | | | 15,520,481 | |
| | |
|
| Common Stocks – (continued) | |
| Software – (continued) | |
| | 103,349 | | | Qualtrics International, Inc., Class A* | | | 3,927,262 | |
| | 20,920 | | | ServiceNow, Inc.* | | | 11,159,983 | |
| | 72,283 | | | Splunk, Inc.* | | | 10,337,192 | |
| | 87,750 | | | Workday, Inc., Class A* | | | 21,514,545 | |
| | | | | | | | |
| | | | | | | 219,784,698 | |
| | |
| Technology Hardware, Storage & Peripherals – 3.0% | |
| | 201,693 | | | Apple, Inc. | | | 24,457,293 | |
| | |
| | TOTAL COMMON STOCKS | |
| | (Cost $400,830,851) | | $ | 809,165,135 | |
| | |
| | | | | | | | |
| Shares | | | Dividend Rate | | Value | |
|
| Investment Company – 0.2%(b) | |
| Goldman Sachs Financial Square Government Fund –
Institutional Shares |
|
| | 1,303,664 | | | 0.036% | | $ | 1,303,664 | |
| | (Cost $1,303,664) | |
| | |
| | TOTAL INVESTMENTS – 99.1% | |
| | (Cost $402,134,515) | | $ | 810,468,799 | |
| | |
| OTHER ASSETS IN EXCESS OF
LIABILITIES – 0.9% | | | 7,784,498 | |
| | |
| | NET ASSETS – 100.0% | | $ | 818,253,297 | |
| | |
| | |
|
| The percentage shown for each investment category reflects the value of investments in that category as a percentage of net assets. |
| |
* | | Non-income producing security. |
| |
(a) | | Exempt from registration under Rule 144A of the Securities Act of 1933. |
| |
(b) | | Represents an affiliated issuer. |
| | |
|
Investment Abbreviations: |
ADR | | —American Depositary Receipt |
PLC | | —Public Limited Company |
REIT | | —Real Estate Investment Trust |
|
| | |
| 38 | | The accompanying notes are an integral part of these financial statements. |
GOLDMAN SACHS U.S. EQUITY ESG FUND
Schedule of Investments
February 28, 2021 (Unaudited)
| | | | | | | | |
| Shares | | | Description | |
Value | |
|
| Common Stocks – 99.2% | |
| Auto Components – 2.6% | |
| | 2,058 | | | Aptiv PLC* | | $ | 308,371 | |
| | |
| Banks – 3.7% | |
| | 3,077 | | | JPMorgan Chase & Co. | | | 452,842 | |
| | |
| Biotechnology – 0.5% | |
| | 825 | | | BioMarin Pharmaceutical, Inc.* | | | 63,880 | |
| | |
| Building Products – 0.7% | |
| | 1,806 | | | AZEK Co., Inc. (The)* | | | 79,663 | |
| | |
| Capital Markets – 5.6% | |
| | 350 | | | BlackRock, Inc. | | | 243,075 | |
| | 845 | | | CME Group, Inc. | | | 168,747 | |
| | 3,522 | | | Morgan Stanley | | | 270,736 | |
| | | | | | | | |
| | | | | | | 682,558 | |
| | |
| Chemicals – 4.3% | |
| | 1,012 | | | Danimer Scientific, Inc.*(a) | | | 38,588 | |
| | 1,196 | | | Ecolab, Inc. | | | 250,395 | |
| | 946 | | | Linde PLC (United Kingdom) | | | 231,079 | |
| | | | | | | | |
| | | | | | | 520,062 | |
| | |
| Communications Equipment – 2.4% | |
| | 6,474 | | | Cisco Systems, Inc. | | | 290,488 | |
| | |
| Consumer Finance – 2.7% | |
| | 2,435 | | | American Express Co. | | | 329,358 | |
| | |
| Containers & Packaging – 1.9% | |
| | 2,760 | | | Ball Corp. | | | 235,676 | |
| | |
| Diversified Telecommunication Services – 2.0% | |
| | 4,290 | | | Verizon Communications, Inc. | | | 237,237 | |
| | |
| Electric Utilities – 2.6% | |
| | 4,305 | | | NextEra Energy, Inc. | | | 316,331 | |
| | |
| Electrical Equipment – 3.9% | |
| | 2,042 | | | Eaton Corp. PLC | | | 265,848 | |
| | 839 | | | Rockwell Automation, Inc. | | | 204,112 | |
| | | | | | | | |
| | | | | | | 469,960 | |
| | |
| Entertainment – 3.3% | |
| | 2,088 | | | Walt Disney Co. (The)* | | | 394,716 | |
| | |
| Equity Real Estate Investment Trusts (REITs) – 1.9% | |
| | 543 | | | American Tower Corp. REIT | | | 117,359 | |
| | 178 | | | Equinix, Inc. REIT | | | 115,404 | |
| | | | | | | | |
| | | | | | | 232,763 | |
| | |
| Health Care Equipment & Supplies – 2.2% | |
| | 1,202 | | | Danaher Corp. | | | 264,043 | |
| | |
| Health Care Providers & Services – 3.6% | |
| | 3,605 | | | CVS Health Corp. | | | 245,609 | |
| | 504 | | | Humana, Inc. | | | 191,343 | |
| | | | | | | | |
| | | | | | | 436,952 | |
| | |
|
| Common Stocks – (continued) | |
| Hotels, Restaurants & Leisure – 2.0% | |
| | 1,175 | | | McDonald’s Corp. | | | 242,214 | |
| | |
| Household Products – 2.4% | |
| | 2,340 | | | Procter & Gamble Co. (The) | | | 289,060 | |
| | |
| Industrial Conglomerates – 2.0% | |
| | 19,604 | | | General Electric Co. | | | 245,834 | |
| | |
| Interactive Media & Services – 5.3% | |
| | 316 | | | Alphabet, Inc., Class A* | | | 638,924 | |
| | |
| IT Services – 3.3% | |
| | 1,891 | | | Visa, Inc., Class A | | | 401,629 | |
| | |
| Machinery – 2.3% | |
| | 782 | | | Deere & Co. | | | 273,012 | |
| | |
| Media – 2.3% | |
| | 5,217 | | | Comcast Corp., Class A | | | 275,040 | |
| | |
| Pharmaceuticals – 5.0% | |
| | 3,745 | | | Bristol-Myers Squibb Co. | | | 229,681 | |
| | 1,845 | | | Eli Lilly and Co. | | | 378,022 | |
| | | | | | | | |
| | | | | | | 607,703 | |
| | |
| Road & Rail – 2.7% | |
| | 1,577 | | | Union Pacific Corp. | | | 324,799 | |
| | |
| Semiconductors & Semiconductor Equipment – 7.3% | |
| | 1,745 | | | Cree, Inc.* | | | 197,988 | |
| | 4,517 | | | Marvell Technology Group Ltd. | | | 218,081 | |
| | 399 | | | NVIDIA Corp. | | | 218,883 | |
| | 1,455 | | | Texas Instruments, Inc. | | | 250,653 | |
| | | | | | | | |
| | | | | | | 885,605 | |
| | |
| Software – 9.5% | |
| | 458 | | | Adobe, Inc.* | | | 210,529 | |
| | 3,350 | | | Microsoft Corp. | | | 778,473 | |
| | 656 | | | Workday, Inc., Class A* | | | 160,838 | |
| | | | | | | | |
| | | | | | | 1,149,840 | |
| | |
| Specialty Retail – 2.0% | |
| | 2,046 | | | Ross Stores, Inc. | | | 238,645 | |
| | |
| Technology Hardware, Storage & Peripherals – 5.4% | |
| | 5,372 | | | Apple, Inc. | | | 651,409 | |
| | |
| Textiles, Apparel & Luxury Goods – 2.2% | |
| | 2,006 | | | NIKE, Inc., Class B | | | 270,369 | |
| | |
| Water Utilities – 1.6% | |
| | 1,348 | | | American Water Works Co., Inc. | | | 191,254 | |
| | |
| | TOTAL COMMON STOCKS | |
| | (Cost $8,712,965) | | $ | 12,000,237 | |
| | |
| | |
| The accompanying notes are an integral part of these financial statements. | | 39 |
GOLDMAN SACHS U.S. EQUITY ESG FUND
Schedule of Investments (continued)
February 28, 2021 (Unaudited)
| | | | | | | | |
| Shares | | | Dividend
Rate | | Value | |
|
| Investment Company – 0.4%(b) | |
| Goldman Sachs Financial Square Government Fund –
Institutional Shares |
|
| | 50,998 | | | 0.036% | | $ | 50,998 | |
| | (Cost $50,998) | |
| | |
| TOTAL INVESTMENTS BEFORE SECURITIES LENDING
REINVESTMENT VEHICLE |
|
| | (Cost $8,763,963) | | $ | 12,051,235 | |
| | |
| | | | | | | | |
|
| Securities Lending Reinvestment Vehicle – 0.3%(b) | |
| Goldman Sachs Financial Square Government Fund –
Institutional Shares |
|
| | 38,200 | | | 0.036% | | $ | 38,200 | |
| | (Cost $38,200) | |
| | |
| | TOTAL INVESTMENTS – 99.9% | |
| | (Cost $8,802,163) | | $ | 12,089,435 | |
| | |
| OTHER ASSETS IN EXCESS OF
LIABILITIES – 0.1% | | | 7,546 | |
| | |
| | NET ASSETS – 100.0% | | $ | 12,096,981 | |
| | |
| | |
|
| The percentage shown for each investment category reflects the value of investments in that category as a percentage of net assets. |
| |
* | | Non-income producing security. |
| |
(a) | | All or a portion of security is on loan. |
| |
(b) | | Represents an affiliated issuer. |
| | |
|
Investment Abbreviations: |
PLC—Public Limited Company |
REIT—Real Estate Investment Trust |
|
| | |
| 40 | | The accompanying notes are an integral part of these financial statements. |
GOLDMAN SACHS FUNDAMENTAL EQUITY GROWTH FUNDS
Statements of Assets and Liabilities
February 28, 2021 (Unaudited)
| | | | | | | | | | | | | | |
| | | | |
Capital
Growth Fund | | | Concentrated
Growth Fund | | | Flexible Cap
Fund | |
| Assets: | | | | | | | | | | | | | | |
| | Investments in unaffiliated issuers, at value (cost $605,458,385, $98,335,657 and $18,027,218, respectively)(a) | | $ | 1,036,667,666 | | | $ | 186,313,966 | | | $ | 26,724,304 | |
| | Investments in affiliated issuers, at value (cost $3,237,339, $850,967 and $298,315, respectively) | | | 3,237,339 | | | | 850,967 | | | | 298,315 | |
| | Investments in securities lending reinvestment vehicle, at value which equals cost | | | 5,000 | | | | — | | | | — | |
| | Cash | | | 21,252,615 | | | | 46,945 | | | | 97,811 | |
| | Receivables: | | | | | | | | | | | | |
| | Investments sold | | | 3,933,189 | | | | 7,530,868 | | | | — | |
| | Dividends | | | 983,440 | | | | 114,830 | | | | 28,973 | |
| | Fund shares sold | | | 175,267 | | | | 3,738 | | | | 3,123 | |
| | Reimbursement from investment adviser | | | 44,674 | | | | 22,034 | | | | 25,036 | |
| | Foreign tax reclaims | | | 2,054 | | | | — | | | | — | |
| | Other assets | | | 68,300 | | | | 45,039 | | | | 61,882 | |
| | Total assets | | | 1,066,369,544 | | | | 194,928,387 | | | | 27,239,444 | |
| | | | | | | | | | | | | | |
| | Liabilities: | | | | | | | | | | | | |
| | Payables: | | | | | | | | | | | | |
| | Investments purchased | | | 1,688,786 | | | | 4,981,248 | | | | 46,005 | |
| | Fund shares redeemed | | | 604,391 | | | | 1,779 | | | | 314 | |
| | Management fees | | | 583,107 | | | | 114,614 | | | | 11,444 | |
| | Distribution and Service fees and Transfer Agency fees | | | 294,564 | | | | 8,647 | | | | 3,738 | |
| | Upon return of securities loaned | | | 5,000 | | | | — | | | | — | |
| | Accrued expenses | | | 386,057 | | | | 159,409 | | | | 130,336 | |
| | Total liabilities | | | 3,561,905 | | | | 5,265,697 | | | | 191,837 | |
| | | | | | | | | | | | | | |
| | Net Assets: | | | | | | | | | | | | |
| | Paid-in capital | | | 604,019,522 | | | | 84,516,622 | | | | 17,915,536 | |
| | Total distributable earnings | | | 458,788,117 | | | | 105,146,068 | | | | 9,132,071 | |
| | | NET ASSETS | | $ | 1,062,807,639 | | | $ | 189,662,690 | | | $ | 27,047,607 | |
| | | Net Assets: | | | | | | | | | | | | |
| | | Class A | | $ | 828,917,785 | | | $ | 9,601,886 | | | $ | 6,459,232 | |
| | | Class C | | | 17,308,572 | | | | 1,056,198 | | | | 1,264,115 | |
| | | Institutional | | | 79,921,531 | | | | 14,434,704 | | | | 1,162,136 | |
| | | Service | | | 1,647,554 | | | | — | | | | — | |
| | | Investor | | | 11,833,240 | | | | 216,386 | | | | 41,318 | |
| | | Class R6 | | | 4,206,134 | | | | 857,969 | | | | 249,612 | |
| | | Class R | | | 10,519,739 | | | | 34,703 | | | | 55,146 | |
| | | Class P | | | 108,453,084 | | | | 163,460,844 | | | | 17,816,048 | |
| | | Total Net Assets | | $ | 1,062,807,639 | | | $ | 189,662,690 | | | $ | 27,047,607 | |
| | | Shares Outstanding $0.001 par value (unlimited number of shares authorized): | | | | | | | | | | | | |
| | | Class A | | | 28,720,810 | | | | 421,645 | | | | 452,514 | |
| | | Class C | | | 1,033,652 | | | | 61,979 | | | | 105,437 | |
| | | Institutional | | | 2,381,888 | | | | 578,691 | | | | 74,448 | |
| | | Service | | | 60,461 | | | | — | | | | — | |
| | | Investor | | | 400,840 | | | | 9,252 | | | | 2,713 | |
| | | Class R6 | | | 125,540 | | | | 34,483 | | | | 16,026 | |
| | | Class R | | | 388,489 | | | | 1,606 | | | | 4,064 | |
| | | Class P | | | 3,237,899 | | | | 6,572,033 | | | | 1,143,264 | |
| | | Net asset value, offering and redemption price per share:(b) | | | | | | | | | | | | |
| | | Class A | | | $28.86 | | | | $22.77 | | | | $14.27 | |
| | | Class C | | | 16.75 | | | | 17.04 | | | | 11.99 | |
| | | Institutional | | | 33.55 | | | | 24.94 | | | | 15.61 | |
| | | Service | | | 27.25 | | | | — | | | | — | |
| | | Investor | | | 29.52 | | | | 23.39 | | | | 15.23 | |
| | | Class R6 | | | 33.50 | | | | 24.88 | | | | 15.58 | |
| | | Class R | | | 27.08 | | | | 21.61 | | | | 13.57 | |
| | | Class P | | | 33.49 | | | | 24.87 | | | | 15.58 | |
| | (a) | | Includes loaned securities having a market value of $4,838 for Capital Growth Fund. |
| | (b) | | Maximum public offering price per share for Class A Shares of the Capital Growth, Concentrated Growth and Flexible Cap Funds is $30.54, $24.10 and $15.10, respectively. At redemption, Class C Shares may be subject to a contingent deferred sales charge, assessed on the amount equal to the lesser of the current net asset value (“NAV”) or the original purchase price of the shares. |
| | |
| The accompanying notes are an integral part of these financial statements. | | 41 |
GOLDMAN SACHS FUNDAMENTAL EQUITY GROWTH FUNDS
Statements of Assets and Liabilities (continued)
February 28, 2021 (Unaudited)
| | | | | | | | | | | | | | |
| | | | | Growth
Opportunities
Fund | | | Small Cap
Growth Fund | | | Small/Mid Cap
Growth Fund | |
| | Assets: | | | | | | | | | | | | |
| | Investments in unaffiliated issuers, at value (cost $951,070,791, $17,236,637 and $2,035,240,094, respectively)(a) | | $ | 1,415,222,175 | | | $ | 23,291,351 | | | $ | 3,048,471,789 | |
| | Investments in affiliated issuers, at value (cost $6,219,751, $881,172 and $46,766,661, respectively) | | | 6,219,751 | | | | 881,172 | | | | 46,766,661 | |
| | Investments in securities lending reinvestment vehicle, at value which equals cost | | | 12,260,776 | | | | 649,259 | | | | 51,347,800 | |
| | Cash | | | — | | | | 510,362 | | | | 394,197 | |
| | Receivables: | | | | | | | | | | | | |
| | Investments sold | | | 2,685,135 | | | | 111,944 | | | | 18,379,364 | |
| | Fund shares sold | | | 1,348,878 | | | | 3,208 | | | | 6,699,558 | |
| | Dividends | | | 581,758 | | | | 2,940 | | | | 822,412 | |
| | Reimbursement from investment adviser | | | 134,431 | | | | 26,399 | | | | 87,612 | |
| | Securities lending income | | | 49,586 | | | | 353 | | | | 17,279 | |
| | Other assets | | | 88,138 | | | | 53,401 | | | | 147,614 | |
| | Total assets | | | 1,438,590,628 | | | | 25,530,389 | | | | 3,173,134,286 | |
| | | | | | | | | | | | | | |
| | Liabilities: | | | | | | | | | | | | |
| | Payables: | | | | | | | | | | | | |
| | Upon return of securities loaned | | | 12,260,776 | | | | 649,259 | | | | 51,347,800 | |
| | Fund shares redeemed | | | 4,368,214 | | | | — | | | | 622,894 | |
| | Management fees | | | 1,040,097 | | | | 15,693 | | | | 2,012,932 | |
| | Due to custodian | | | 664,836 | | | | — | | | | — | |
| | Distribution and Service fees and Transfer Agency fees | | | 232,613 | | | | 1,026 | | | | 447,566 | |
| | Investments purchased | | | — | | | | 1,138,122 | | | | 6,109,297 | |
| | Accrued expenses | | | 424,135 | | | | 139,940 | | | | 632,407 | |
| | Total liabilities | | | 18,990,671 | | | | 1,944,040 | | | | 61,172,896 | |
| | | | | | | | | | | | | | |
| | Net Assets: | | | | | | | | | | | | |
| | Paid-in capital | | | 875,772,918 | | | | 15,895,788 | | | | 1,913,312,921 | |
| | Total distributable earnings | | | 543,827,039 | | | | 7,690,561 | | | | 1,198,648,469 | |
| | | NET ASSETS | | $ | 1,419,599,957 | | | $ | 23,586,349 | | | $ | 3,111,961,390 | |
| | | Net Assets: | | | | | | | | | | | | |
| | | Class A | | $ | 383,264,009 | | | $ | 534,711 | | | $ | 401,402,628 | |
| | | Class C | | | 28,017,533 | | | | 152,770 | | | | 167,627,534 | |
| | | Institutional | | | 481,300,543 | | | | 17,269,929 | | | | 1,200,731,483 | |
| | | Service | | | 31,889,820 | | | | — | | | | 23,506,051 | |
| | | Investor | | | 100,498,954 | | | | 87,969 | | | | 698,262,828 | |
| | | Class R6 | | | 246,736,750 | | | | 88,128 | | | | 113,985,835 | |
| | | Class R | | | 55,822,006 | | | | 87,387 | | | | 16,371,066 | |
| | | Class P | | | 92,070,342 | | | | 5,365,455 | | | | 490,073,965 | |
| | | Total Net Assets | | $ | 1,419,599,957 | | | $ | 23,586,349 | | | $ | 3,111,961,390 | |
| | | Shares Outstanding $0.001 par value (unlimited number of shares authorized): | | | | | | | | | | | | |
| | | Class A | | | 23,379,597 | | | | 32,858 | | | | 15,228,229 | |
| | | Class C | | | 7,225,807 | | | | 9,466 | | | | 8,449,347 | |
| | | Institutional | | | 20,060,743 | | | | 1,057,143 | | | | 40,441,158 | |
| | | Service | | | 2,214,589 | | | | — | | | | 936,938 | |
| | | Investor | | | 5,421,230 | | | | 5,389 | | | | 24,756,747 | |
| | | Class R6 | | | 10,269,126 | | | | 5,394 | | | | 3,834,778 | |
| | | Class R | | | 3,870,046 | | | | 5,380 | | | | 664,995 | |
| | | Class P | | | 3,829,959 | | | | 328,579 | | | | 16,485,430 | |
| | | Net asset value, offering and redemption price per share:(b) | | | | | | | | | | | | |
| | | Class A | | | $16.39 | | | | $16.27 | | | | $26.36 | |
| | | Class C | | | 3.88 | | | | 16.14 | | | | 19.84 | |
| | | Institutional | | | 23.99 | | | | 16.34 | | | | 29.69 | |
| | | Service | | | 14.40 | | | | — | | | | 25.09 | |
| | | Investor | | | 18.54 | | | | 16.32 | | | | 28.20 | |
| | | Class R6 | | | 24.03 | | | | 16.34 | | | | 29.72 | |
| | | Class R | | | 14.42 | | | | 16.24 | | | | 24.62 | |
| | | Class P | | | 24.04 | | | | 16.33 | | | | 29.73 | |
| | (a) | | Includes loaned securities having a market value of $11,786,679, $624,495 and $48,754,938 for Growth Opportunities, Small Cap Growth and Small/Mid Cap Growth Funds, respectively. |
| | (b) | | Maximum public offering price per share for Class A Shares of the Growth Opportunities, Small Cap Growth and Small/Mid Cap Growth Funds is $17.34, $17.22 and $27.89, respectively. At redemption, Class C Shares may be subject to a contingent deferred sales charge, assessed on the amount equal to the lesser of the current net asset value (“NAV”) or the original purchase price of the shares. |
| | |
| 42 | | The accompanying notes are an integral part of these financial statements. |
GOLDMAN SACHS FUNDAMENTAL EQUITY GROWTH FUNDS
Statements of Assets and Liabilities (continued)
February 28, 2021 (Unaudited)
| | | | | | | | | | | | | | |
| | | | | Strategic
Growth Fund | | | Technology
Opportunities
Fund | | | U.S. Equity
ESG Fund | |
| | Assets: | | | | | | | | | | | | |
| | Investments in unaffiliated issuers, at value (cost $78,966,290, $400,830,851 and $8,712,965, respectively)(a) | | $ | 183,979,391 | | | $ | 809,165,135 | | | $ | 12,000,237 | |
| | Investments in affiliated issuers, at value (cost $1,420,481, $1,303,664 and $50,998, respectively) | | | 1,420,481 | | | | 1,303,664 | | | | 50,998 | |
| | Investments in securities lending reinvestment vehicle, at value which equals cost | | | 1,055,303 | | | | — | | | | 38,200 | |
| | Cash | | | 467,235 | | | | — | | | | 67,430 | |
| | Receivables: | | | | | | | | | | | | |
| | Investments sold | | | 432,122 | | | | 5,478,183 | | | | — | |
| | Dividends | | | 97,469 | | | | 361,144 | | | | 11,868 | |
| | Fund shares sold | | | 87,312 | | | | 4,113,652 | | | | 2,043 | |
| | Reimbursement from investment adviser | | | 23,299 | | | | 55,939 | | | | 17,319 | |
| | Securities lending income | | | 925 | | | | — | | | | 396 | |
| | Other assets | | | 56,656 | | | | 101,507 | | | | 55,100 | |
| | Total assets | | | 187,620,193 | | | | 820,579,224 | | | | 12,243,591 | |
| | | | | | | | | | | | | | |
| | Liabilities: | | | | | | | | | | | | |
| | Payables: | | | | | | | | | | | | |
| | Upon return of securities loaned | | | 1,055,303 | | | | — | | | | 38,200 | |
| | Fund shares redeemed | | | 896,281 | | | | 798,030 | | | | 1,688 | |
| | Investments purchased | | | 371,084 | | | | — | | | | — | |
| | Management fees | | | 105,837 | | | | 612,293 | | | | 5,216 | |
| | Distribution and Service fees and Transfer Agency fees | | | 21,563 | | | | 200,839 | | | | 4,060 | |
| | Due to custodian | | | — | | | | 529,093 | | | | — | |
| | Accrued expenses | | | 171,057 | | | | 185,672 | | | | 97,446 | |
| | Total liabilities | | | 2,621,125 | | | | 2,325,927 | | | | 146,610 | |
| | | | | | | | | | | | | | |
| | Net Assets: | | | | | | | | | | | | |
| | Paid-in capital | | | 68,929,245 | | | | 378,222,522 | | | | 8,568,460 | |
| | Total distributable earnings | | | 116,069,823 | | | | 440,030,775 | | | | 3,528,521 | |
| | | NET ASSETS | | $ | 184,999,068 | | | $ | 818,253,297 | | | $ | 12,096,981 | |
| | | Net Assets: | | | | | | | | | | | | |
| | | Class A | | $ | 38,560,421 | | | $ | 443,185,707 | | | $ | 6,062,923 | |
| | | Class C | | | 4,658,752 | | | | 28,423,782 | | | | 2,157,248 | |
| | | Institutional | | | 56,912,575 | | | | 163,782,764 | | | | 1,535,089 | |
| | | Service | | | 485,868 | | | | 36,705,881 | | | | — | |
| | | Investor | | | 2,694,214 | | | | 42,737,686 | | | | 379,515 | |
| | | Class R6 | | | 697,212 | | | | 1,744,841 | | | | 1,087,248 | |
| | | Class R | | | 44,840 | | | | — | | | | 25,779 | |
| | | Class P | | | 80,945,186 | | | | 101,672,636 | | | | 849,179 | |
| | | Total Net Assets | | $ | 184,999,068 | | | $ | 818,253,297 | | | $ | 12,096,981 | |
| | | Shares Outstanding $0.001 par value (unlimited number of shares authorized): | | | | | | | | | | | | |
| | | Class A | | | 3,734,636 | | | | 15,101,947 | | | | 384,237 | |
| | | Class C | | | 876,011 | | | | 1,383,536 | | | | 145,254 | |
| | | Institutional | | | 4,691,810 | | | | 4,734,861 | | | | 96,231 | |
| | | Service | | | 48,421 | | | | 1,299,663 | | | | — | |
| | | Investor | | | 223,330 | | | | 1,266,332 | | | | 23,770 | |
| | | Class R6 | | | 57,631 | | | | 50,408 | | | | 68,126 | |
| | | Class R | | | 4,625 | | | | — | | | | 1,622 | |
| | | Class P | | | 6,702,324 | | | | 2,937,457 | | | | 53,238 | |
| | | Net asset value, offering and redemption price per share:(b) | | | | | | | | | | | | |
| | | Class A | | | $10.33 | | | | $29.35 | | | | $15.78 | |
| | | Class C | | | 5.32 | | | | 20.54 | | | | 14.85 | |
| | | Institutional | | | 12.13 | | | | 34.59 | | | | 15.95 | |
| | | Service | | | 10.03 | | | | 28.24 | | | | — | |
| | | Investor | | | 12.06 | | | | 33.75 | | | | 15.97 | |
| | | Class R6 | | | 12.10 | | | | 34.61 | | | | 15.96 | |
| | | Class R | | | 9.69 | | | | — | | | | 15.90 | |
| | | Class P | | | 12.08 | | | | 34.61 | | | | 15.95 | |
| | (a) | | Includes loaned securities having a market value of $1,016,526 and $36,643 for Strategic Growth and U.S. Equity ESG Funds, respectively. |
| | (b) | | Maximum public offering price per share for Class A Shares of the Strategic Growth, Technology Opportunities and U.S. Equity ESG Funds is $10.93, $31.06 and $16.70, respectively. At redemption, Class C Shares may be subject to a contingent deferred sales charge, assessed on the amount equal to the lesser of the current net asset value (“NAV”) or the original purchase price of the shares. |
| | |
| The accompanying notes are an integral part of these financial statements. | | 43 |
GOLDMAN SACHS FUNDAMENTAL EQUITY GROWTH FUNDS
Statements of Operations
For the Six Months Ended February 28, 2021 (Unaudited)
| | | | | | | | | | | | | | |
| | | | |
Capital Growth Fund | | | Concentrated
Growth Fund | | | Flexible Cap
Fund | |
| | Investment income: | | | | | | | | | | | | |
| | | | |
| | Dividends — unaffiliated issuer (net of foreign withholding taxes of $10,259, $3,545 and $96, respectively) | | $ | 4,937,785 | | | $ | 464,689 | | | $ | 154,498 | |
| | | | |
| | Securities lending income — unaffiliated issuer | | | 13,763 | | | | 6,066 | | | | — | |
| | | | |
| | Dividends — affiliated issuers | | | 392 | | | | 170 | | | | 21 | |
| | | | |
| | Total investment income | | | 4,951,940 | | | | 470,925 | | | | 154,519 | |
| | | | | | | | | | | | | | |
| | Expenses: | | | | | | | | | | | | |
| | | | |
| | Management fees | | | 3,524,198 | | | | 702,904 | | | | 66,573 | |
| | | | |
| | Distribution and Service (12b-1) fees(a) | | | 1,072,996 | | | | 15,904 | | | | 12,480 | |
| | | | |
| | Transfer Agency fees(a) | | | 688,754 | | | | 35,397 | | | | 8,510 | |
| | | | |
| | Custody, accounting and administrative services | | | 103,711 | | | | 18,333 | | | | 12,093 | |
| | | | |
| | Registration fees | | | 66,073 | | | | 53,058 | | | | 74,365 | |
| | | | |
| | Printing and mailing costs | | | 62,448 | | | | 8,294 | | | | 6,871 | |
| | | | |
| | Professional fees | | | 46,709 | | | | 55,821 | | | | 47,093 | |
| | | | |
| | Service fees — Class C | | | 19,853 | | | | 1,369 | | | | 1,571 | |
| | | | |
| | Trustee fees | | | 10,663 | | | | 10,097 | | | | 9,983 | |
| | | | |
| | Shareholder administration fees — Service Shares | | | 2,016 | | | | — | | | | — | |
| | | | |
| | Other | | | 10,806 | | | | 6,508 | | | | 3,714 | |
| | | | |
| | Total expenses | | | 5,608,227 | | | | 907,685 | | | | 243,253 | |
| | | | |
| | Less — expense reductions | | | (282,984 | ) | | | (152,014 | ) | | | (153,771 | ) |
| | | | |
| | Net expenses | | | 5,325,243 | | | | 755,671 | | | | 89,482 | |
| | | | |
| | NET INVESTMENT INCOME (LOSS) | | | (373,303 | ) | | | (284,746 | ) | | | 65,037 | |
| | | | | | | | | | | | | | |
| | Realized and unrealized gain (loss): | | | | | | | | | | | | |
| | | | |
| | Net realized gain (loss) from: | | | | | | | | | | | | |
| | | | |
| | Investments — unaffiliated issuers | | | 46,640,359 | | | | 18,691,162 | | | | 521,527 | |
| | | | |
| | Net change in unrealized gain (loss) on: | | | | | | | | | | | | |
| | | | |
| | Investments — unaffiliated issuers | | | 60,782,461 | | | | (7,232,271 | ) | | | 1,655,711 | |
| | | | |
| | Net realized and unrealized gain | | | 107,422,820 | | | | 11,458,891 | | | | 2,177,238 | |
| | | | |
| | NET INCREASE IN NET ASSETS RESULTING FROM OPERATIONS | | $ | 107,049,517 | | | $ | 11,174,145 | | | $ | 2,242,275 | |
| | (a) | | Class specific Distribution and/or Service and Transfer Agency fees were as follows: |
| | | | | | | | | | | | | | | | | | | | | | | | | | | | | | | | | | | | | | | | | | | | | | | | |
| | | Distribution and/or Service (12b-1) Fees | | | Transfer Agency Fees | |
Fund | | Class A | | | Class C | | | Service | | | Class R | | | Class A | | | Class C | | | Institutional | | | Service | | | Investor | | | Class R6 | | | Class R | | | Class P | |
Capital Growth | | $ | 986,560 | | | $ | 59,558 | | | $ | 2,016 | | | $ | 24,862 | | | $ | 631,403 | | | $ | 12,706 | | | $ | 13,307 | | | $ | 323 | | | $ | 7,696 | | | $ | 412 | | | $ | 7,956 | | | $ | 14,951 | |
Concentrated Growth | | | 11,714 | | | | 4,108 | | | | — | | | | 82 | | | | 7,497 | | | | 876 | | | | 2,786 | | | | — | | | | 159 | | | | 119 | | | | 26 | | | | 23,934 | |
Flexible Cap | | | 7,638 | | | | 4,713 | | | | — | | | | 129 | | | | 4,889 | | | | 1,005 | | | | 125 | | | | — | | | | 31 | | | | 35 | | | | 41 | | | | 2,384 | |
| | |
| 44 | | The accompanying notes are an integral part of these financial statements. |
GOLDMAN SACHS FUNDAMENTAL EQUITY GROWTH FUNDS
Statements of Operations (continued)
For the Six Months Ended February 28, 2021 (Unaudited)
| | | | | | | | | | | | | | |
| | | | | Growth
Opportunities
Fund | | | Small Cap
Growth Fund | | | Small/Mid Cap
Growth Fund | |
| | Investment income: | | | | | | | | | | | | |
| | | | |
| | Dividends — unaffiliated issuer (net of foreign withholding taxes of $5,711, $— and $—, respectively) | | $ | 2,515,092 | | | $ | 12,821 | | | $ | 3,036,487 | |
| | | | |
| | Securities lending income — unaffiliated issuer | | | 108,366 | | | | 930 | | | | 187,774 | |
| | | | |
| | Dividends — affiliated issuers | | | 1,132 | | | | 38 | | | | 5,451 | |
| | | | |
| | Total investment income | | | 2,624,590 | | | | 13,789 | | | | 3,229,712 | |
| | | | | | | | | | | | | | |
| | Expenses: | | | | | | | | | | | | |
| | | | |
| | Management fees | | | 6,198,615 | | | | 73,768 | | | | 11,129,258 | |
| | | | |
| | Distribution and Service (12b-1) fees(a) | | | 735,323 | | | | 985 | | | | 1,148,748 | |
| | | | |
| | Transfer Agency fees(a) | | | 578,777 | | | | 3,630 | | | | 1,180,770 | |
| | | | |
| | Custody, accounting and administrative services | | | 83,940 | | | | 23,415 | | | | 157,687 | |
| | | | |
| | Registration fees | | | 75,508 | | | | 28,750 | | | | 96,648 | |
| | | | |
| | Printing and mailing costs | | | 66,816 | | | | 19,352 | | | | 82,892 | |
| | | | |
| | Professional fees | | | 48,433 | | | | 48,051 | | | | 46,496 | |
| | | | |
| | Shareholder administration fees — Service Shares | | | 37,664 | | | | — | | | | 53,795 | |
| | | | |
| | Service fees — Class C | | | 34,993 | | | | 140 | | | | 204,970 | |
| | | | |
| | Trustee fees | | | 10,880 | | | | 9,976 | | | | 11,650 | |
| | | | |
| | Amortization of offering costs | | | — | | | | 10,861 | | | | — | |
| | | | |
| | Other | | | 8,162 | | | | 9,832 | | | | 16,932 | |
| | | | |
| | Total expenses | | | 7,879,111 | | | | 228,760 | | | | 14,129,846 | |
| | | | |
| | Less — expense reductions | | | (767,623 | ) | | | (148,376 | ) | | | (326,295 | ) |
| | | | |
| | Net expenses | | | 7,111,488 | | | | 80,384 | | | | 13,803,551 | |
| | | | |
| | NET INVESTMENT LOSS | | | (4,486,898 | ) | | | (66,595 | ) | | | (10,573,839 | ) |
| | | | | | | | | | | | | | |
| | Realized and unrealized gain (loss): | | | | | | | | | | | | |
| | | | |
| | Net realized gain (loss) from: | | | | | | | | | | | | |
| | | | |
| | Investments — unaffiliated issuers | | | 141,686,194 | | | | 2,319,097 | | | | 312,219,954 | |
| | | | |
| | Net change in unrealized gain (loss) on: | | | | | | | | | | | | |
| | | | |
| | Investments — unaffiliated issuers | | | 116,499,216 | | | | 2,758,502 | | | | 384,370,594 | |
| | | | |
| | Net realized and unrealized gain | | | 258,185,410 | | | | 5,077,599 | | | | 696,590,548 | |
| | | | |
| | NET INCREASE IN NET ASSETS RESULTING FROM OPERATIONS | | $ | 253,698,512 | | | $ | 5,011,004 | | | $ | 686,016,709 | |
| | (a) | | Class specific Distribution and/or Service and Transfer Agency fees were as follows: |
| | | | | | | | | | | | | | | | | | | | | | | | | | | | | | | | | | | | | | | | | | | | | | | | |
| | | Distribution and/or Service (12b-1) Fees | | | Transfer Agency Fees | |
Fund | | Class A | | | Class C | | | Service | | | Class R | | | Class A | | | Class C | | | Institutional | | | Service | | | Investor | | | Class R6 | | | Class R | | | Class P | |
Growth Opportunities | | $ | 461,135 | | | $ | 104,979 | | | $ | 37,664 | | | $ | 131,545 | | | $ | 295,128 | | | $ | 22,396 | | | $ | 92,326 | | | $ | 6,026 | | | $ | 73,684 | | | $ | 34,487 | | | $ | 42,095 | | | $ | 12,635 | |
Small Cap Growth | | | 376 | | | | 420 | | | | — | | | | 189 | | | | 240 | | | | 90 | | | | 2,638 | | | | — | | | | 61 | | | | 11 | | | | 61 | | | | 529 | |
Small/Mid Cap Growth | | | 442,021 | | | | 614,908 | | | | 53,795 | | | | 38,024 | | | | 282,895 | | | | 131,181 | | | | 212,996 | | | | 8,607 | | | | 463,128 | | | | 14,144 | | | | 12,168 | | | | 55,651 | |
| | |
| The accompanying notes are an integral part of these financial statements. | | 45 |
GOLDMAN SACHS FUNDAMENTAL EQUITY GROWTH FUNDS
Statements of Operations (continued)
For the Six Months Ended February 28, 2021 (Unaudited)
| | | | | | | | | | | | | | |
| | | | | Strategic
Growth Fund | | | Technology
Opportunities
Fund | | | U.S. Equity
ESG Fund | |
| | Investment income: | | | | | | | | | | | | |
| | | | |
| | Dividends — unaffiliated issuer (net of foreign withholding taxes of $1,375, $37,226 and $—, respectively) | | $ | 491,328 | | | $ | 2,000,209 | | | $ | 70,422 | |
| | | | |
| | Securities lending income — unaffiliated issuer | | | 10,696 | | | | — | | | | 591 | |
| | | | |
| | Dividends — affiliated issuers | | | 84 | | | | 1,880 | | | | 10 | |
| | | | |
| | Total investment income | | | 502,108 | | | | 2,002,089 | | | | 71,023 | |
| | | | | | | | | | | | | | |
| | Expenses: | | | | | | | | | | | | |
| | | | |
| | Management fees | | | 644,834 | | | | 3,618,166 | | | | 31,277 | |
| | | | |
| | Registration fees | | | 66,735 | | | | 59,337 | | | | 53,861 | |
| | | | |
| | Distribution and Service (12b-1) fees(a) | | | 64,363 | | | | 679,645 | | | | 14,804 | |
| | | | |
| | Transfer Agency fees(a) | | | 59,039 | | | | 450,815 | | | | 7,051 | |
| | | | |
| | Professional fees | | | 46,699 | | | | 46,627 | | | | 48,664 | |
| | | | |
| | Custody, accounting and administrative services | | | 19,368 | | | | 49,972 | | | | 10,006 | |
| | | | |
| | Printing and mailing costs | | | 13,948 | | | | 50,568 | | | | 6,594 | |
| | | | |
| | Trustee fees | | | 10,095 | | | | 10,497 | | | | 9,975 | |
| | | | |
| | Service fees — Class C | | | 5,776 | | | | 34,718 | | | | 2,530 | |
| | | | |
| | Shareholder administration fees — Service Shares | | | 604 | | | | 46,414 | | | | — | |
| | | | |
| | Other | | | 8,099 | | | | 5,262 | | | | 3,673 | |
| | | | |
| | Total expenses | | | 939,560 | | | | 5,052,021 | | | | 188,435 | |
| | | | |
| | Less — expense reductions | | | (161,956 | ) | | | (475,413 | ) | | | (129,413 | ) |
| | | | |
| | Net expenses | | | 777,604 | | | | 4,576,608 | | | | 59,022 | |
| | | | |
| | NET INVESTMENT INCOME (LOSS) | | | (275,496 | ) | | | (2,574,519 | ) | | | 12,001 | |
| | | | | | | | | | | | | | |
| | Realized and unrealized gain (loss): | | | | | | | | | | | | |
| | | | |
| | Net realized gain (loss) from: | | | | | | | | | | | | |
| | | | |
| | Investments — unaffiliated issuers | | | 15,922,992 | | | | 52,929,520 | | | | 353,061 | |
| | | | |
| | Foreign currency transactions | | | — | | | | (523 | ) | | | — | |
| | | | |
| | Net change in unrealized gain (loss) on: | | | | | | | | | | | | |
| | | | |
| | Investments — unaffiliated issuers | | | (968,229 | ) | | | 10,411,818 | | | | 984,581 | |
| | | | |
| | Net realized and unrealized gain | | | 14,954,763 | | | | 63,340,815 | | | | 1,337,642 | |
| | | | |
| | NET INCREASE IN NET ASSETS RESULTING FROM OPERATIONS | | $ | 14,679,267 | | | $ | 60,766,296 | | | $ | 1,349,643 | |
| | (a) | | Class specific Distribution and/or Service and Transfer Agency fees were as follows: |
| | | | | | | | | | | | | | | | | | | | | | | | | | | | | | | | | | | | | | | | | | | | | | | | |
| | | Distribution and/or Service (12b-1) Fees | | | Transfer Agency Fees | |
Fund | | Class A | | | Class C | | | Service | | | Class R | | | Class A | | | Class C | | | Institutional | | | Service | | | Investor | | | Class R6 | | | Class R | | | Class P | |
Strategic Growth | | $ | 46,291 | | | $ | 17,328 | | | $ | 604 | | | $ | 140 | | | $ | 29,627 | | | $ | 3,697 | | | $ | 11,412 | | | $ | 96 | | | $ | 2,220 | | | $ | 93 | | | $ | 44 | | | $ | 11,850 | |
Technology Opportunities | | | 529,078 | | | | 104,153 | | | | 46,414 | | | | — | | | | 338,612 | | | | 22,220 | | | | 30,995 | | | | 7,426 | | | | 40,074 | | | | 220 | | | | — | | | | 11,268 | |
U.S. Equity ESG | | | 7,155 | | | | 7,589 | | | | — | | | | 60 | | | | 4,579 | | | | 1,619 | | | | 238 | | | | — | | | | 288 | | | | 183 | | | | 19 | | | | 125 | |
| | |
| 46 | | The accompanying notes are an integral part of these financial statements. |
GOLDMAN SACHS FUNDAMENTAL EQUITY GROWTH FUNDS
Statements of Changes in Net Assets
| | | | | | | | | | | | | | | | | | | | | | |
| | | | | Capital Growth Fund | | | | | | Concentrated Growth Fund | |
| | | | | For the
Six Months Ended
February 28, 2021
(Unaudited) | | | For the Fiscal
Year Ended
August 31, 2020 | | | | | | For the
Six Months Ended
February 28, 2021
(Unaudited) | | | For the Fiscal
Year Ended
August 31, 2020 | |
| | From operations: | | | | | | | | | | | | | |
| | | | | | |
| | Net investment income (loss) | | $ | (373,303 | ) | | $ | 2,641,405 | | | | | | | $ | (284,746 | ) | | $ | (131,790 | ) |
| | | | | | |
| | Net realized gain | | | 46,640,359 | | | | 35,198,989 | | | | | | | | 18,691,162 | | | | 13,618,666 | |
| | | | | | |
| | Net change in unrealized gain (loss) | | | 60,782,461 | | | | 143,218,010 | | | | | | | | (7,232,271 | ) | | | 42,115,306 | |
| | | | | | |
| �� | Net increase in net assets resulting from operations | | | 107,049,517 | | | | 181,058,404 | | | | | | | | 11,174,145 | | | | 55,602,182 | |
| | | | | | | | | | | | | | | | | | | | | | |
| | Distributions to shareholders: | | | | | | | | | | | | | |
| | | | | | |
| | From distributable earnings: | | | | | | | | | | | | | | | | | | | | |
| | | | | | |
| | Class A Shares | | | (29,785,751 | ) | | | (29,383,082 | ) | | | | | | | (589,089 | ) | | | (570,407 | ) |
| | | | | | |
| | Class C Shares | | | (947,434 | ) | | | (1,094,018 | ) | | | | | | | (92,741 | ) | | | (82,505 | ) |
| | | | | | |
| | Institutional Shares | | | (2,366,718 | ) | | | (2,359,339 | ) | | | | | | | (802,544 | ) | | | (939,102 | ) |
| | | | | | |
| | Service Shares | | | (56,146 | ) | | | (70,266 | ) | | | | | | | — | | | | — | |
| | | | | | |
| | Investor Shares | | | (371,777 | ) | | | (310,127 | ) | | | | | | | (12,344 | ) | | | (11,029 | ) |
| | | | | | |
| | Class R6 Shares | | | (92,242 | ) | | | (78,605 | ) | | | | | | | (45,645 | ) | | | (40,913 | ) |
| | | | | | |
| | Class R Shares | | | (385,347 | ) | | | (366,639 | ) | | | | | | | (2,170 | ) | | | (3,148 | ) |
| | | | | | |
| | Class P Shares | | | (3,547,586 | ) | | | (3,401,935 | ) | | | | | | | (9,334,560 | ) | | | (10,103,292 | ) |
| | | | | | |
| | Total distributions to shareholders | | | (37,553,001 | ) | | | (37,064,011 | ) | | | | | | | (10,879,093 | ) | | | (11,750,396 | ) |
| | | | | | | | | | | | | | | | | | | | | | |
| | From share transactions: | | | | | | | | | | | | | |
| | | | | | |
| | Proceeds from sales of shares | | | 38,189,201 | | | | 32,027,024 | | | | | | | | 6,561,731 | | | | 6,673,794 | |
| | | | | | |
| | Reinvestment of distributions | | | 35,802,172 | | | | 35,117,504 | | | | | | | | 10,783,130 | | | | 11,629,845 | |
| | | | | | |
| | Cost of shares redeemed | | | (57,153,198 | ) | | | (126,823,345 | ) | | | | | | | (13,795,115 | ) | | | (25,388,297 | ) |
| | | | | | |
| | Net increase (decrease) in net assets resulting from share transactions | | | 16,838,175 | | | | (59,678,817 | ) | | | | | | | 3,549,746 | | | | (7,084,658 | ) |
| | | | | | |
| | TOTAL INCREASE | | | 86,334,691 | | | | 84,315,576 | | | | | | | | 3,844,798 | | | | 36,767,128 | |
| | | | | | | | | | | | | | | | | | | | | | |
| | Net assets: | | | | | | | | | | | | | |
| | | | | | |
| | Beginning of period | | | 976,472,948 | | | | 892,157,372 | | | | | | | | 185,817,892 | | | | 149,050,764 | |
| | | | | | |
| | End of period | | $ | 1,062,807,639 | | | $ | 976,472,948 | | | | | | | $ | 189,662,690 | | | $ | 185,817,892 | |
| | |
| The accompanying notes are an integral part of these financial statements. | | 47 |
GOLDMAN SACHS FUNDAMENTAL EQUITY GROWTH FUNDS
Statements of Changes in Net Assets (continued)
| | | | | | | | | | | | | | | | | | | | | | |
| | | | | Flexible Cap Fund | | | | | | Growth Opportunities Fund | |
| | | | | For the
Six Months Ended
February 28, 2021
(Unaudited) | | | For the Fiscal
Year Ended
August 31, 2020 | | | | | | For the
Six Months Ended
February 28, 2021
(Unaudited) | | | For the Fiscal
Year Ended
August 31, 2020 | |
| | From operations: | | | | | | | | | | | | | |
| | | | | | |
| | Net investment income (loss) | | $ | 65,037 | | | $ | 158,714 | | | | | | | $ | (4,486,898 | ) | | $ | (5,206,960 | ) |
| | | | | | |
| | Net realized gain | | | 521,527 | | | | 1,298,428 | | | | | | | | 141,686,194 | | | | 255,049,975 | |
| | | | | | |
| | Net change in unrealized gain | | | 1,655,711 | | | | 2,881,593 | | | | | | | | 116,499,216 | | | | 47,781,792 | |
| | | | | | |
| | Net increase in net assets resulting from operations | | | 2,242,275 | | | | 4,338,735 | | | | | | | | 253,698,512 | | | | 297,624,807 | |
| | | | | | | | | | | | | | | | | | | | | | |
| | Distributions to shareholders: | | | | | | | | | | | | | |
| | | | | | |
| | From distributable earnings: | | | | | | | | | | | | | | | | | | | | |
| | | | | | |
| | Class A Shares | | | (348,337 | ) | | | (329,577 | ) | | | | | | | (80,419,726 | ) | | | (84,857,623 | ) |
| | | | | | |
| | Class C Shares | | | (76,792 | ) | | | (83,942 | ) | | | | | | | (15,392,994 | ) | | | (17,520,548 | ) |
| | | | | | |
| | Institutional Shares | | | (30,388 | ) | | | (35,557 | ) | | | | | | | (73,299,105 | ) | | | (101,191,952 | ) |
| | | | | | |
| | Service Shares | | | — | | | | — | | | | | | | | (7,330,638 | ) | | | (7,618,287 | ) |
| | | | | | |
| | Investor Shares | | | (2,137 | ) | | | (4,078 | ) | | | | | | | (17,952,306 | ) | | | (18,957,577 | ) |
| | | | | | |
| | Class R6 Shares | | | (13,001 | ) | | | (12,478 | ) | | | | | | | (36,107,697 | ) | | | (39,106,235 | ) |
| | | | | | |
| | Class R Shares | | | (2,962 | ) | | | (2,314 | ) | | | | | | | (12,453,846 | ) | | | (12,585,464 | ) |
| | | | | | |
| | Class P Shares | | | (868,917 | ) | | | (648,520 | ) | | | | | | | (13,547,235 | ) | | | (13,993,377 | ) |
| | | | | | |
| | Total distributions to shareholders | | | (1,342,534 | ) | | | (1,116,466 | ) | | | | | | | (256,503,547 | ) | | | (295,831,063 | ) |
| | | | | | | | | | | | | | | | | | | | | | |
| | From share transactions: | | | | | | | | | | | | | |
| | | | | | |
| | Proceeds from sales of shares | | | 2,423,563 | | | | 2,838,561 | | | | | | | | 144,183,055 | | | | 246,951,218 | |
| | | | | | |
| | Reinvestment of distributions | | | 1,342,533 | | | | 1,116,467 | | | | | | | | 239,672,958 | | | | 272,525,182 | |
| | | | | | |
| | Cost of shares redeemed | | | (1,147,087 | ) | | | (2,328,449 | ) | | | | | | | (220,582,010 | ) | | | (526,294,400 | ) |
| | | | | | |
| | Net increase (decrease) in net assets resulting from share transactions | | | 2,619,009 | | | | 1,626,579 | | | | | | | | 163,274,003 | | | | (6,818,000 | ) |
| | | | | | |
| | TOTAL INCREASE (DECREASE) | | | 3,518,750 | | | | 4,848,848 | | | | | | | | 160,468,968 | | | | (5,024,256 | ) |
| | | | | | | | | | | | | | | | | | | | | | |
| | Net assets: | | | | | | | | | | | | | | | | | | | | |
| | | | | | |
| | Beginning of period | | | 23,528,857 | | | | 18,680,009 | | | | | | | | 1,259,130,989 | | | | 1,264,155,245 | |
| | | | | | |
| | End of period | | $ | 27,047,607 | | | $ | 23,528,857 | | | | | | | $ | 1,419,599,957 | | | $ | 1,259,130,989 | |
| | |
| 48 | | The accompanying notes are an integral part of these financial statements. |
GOLDMAN SACHS FUNDAMENTAL EQUITY GROWTH FUNDS
Statements of Changes in Net Assets (continued)
| | | | | | | | | | | | | | | | | | | | | | |
| | | | | Small Cap Growth Fund | | | | | | Small/Mid Cap Growth Fund | |
| | | | | For the
Six Months Ended
February 28, 2021
(Unaudited) | | | For the period
October 31, 2019*
to
August 31, 2020 | | | | | | For the
Six Months Ended
February 28, 2021
(Unaudited) | | | For the Fiscal
Year Ended
August 31, 2020 | |
| | From operations: | | | | | | | | | | | | | |
| | | | | | |
| | Net investment loss | | $ | (66,595 | ) | | $ | (38,007 | ) | | | | | | $ | (10,573,839 | ) | | $ | (10,626,178 | ) |
| | | | | | |
| | Net realized gain | | | 2,319,097 | | | | 681,031 | | | | | | | | 312,219,954 | | | | 333,727,471 | |
| | | | | | |
| | Net change in unrealized gain | | | 2,758,502 | | | | 3,296,117 | | | | | | | | 384,370,594 | | | | 235,696,580 | |
| | | | | | |
| | Net increase in net assets resulting from operations | | | 5,011,004 | | | | 3,939,141 | | | | | | | | 686,016,709 | | | | 558,797,873 | |
| | | | | | | | | | | | | | | | | | | | | | |
| | Distributions to shareholders: | | | | | | | | | | | | | |
| | | | | | |
| | From distributable earnings: | | | | | | | | | | | | | | | | | | | | |
| | | | | | |
| | Class A Shares | | | (22,970 | ) | | | (82 | ) | | | | | | | (49,888,744 | ) | | | (39,805,523 | ) |
| | | | | | |
| | Class C Shares | | | (8,216 | ) | | | (18 | ) | | | | | | | (30,046,612 | ) | | | (27,720,082 | ) |
| | | | | | |
| | Institutional Shares | | | (953,009 | ) | | | (8,547 | ) | | | | | | | (138,905,563 | ) | | | (106,605,505 | ) |
| | | | | | |
| | Service Shares | | | — | | | | — | | | | | | | | (6,207,186 | ) | | | (2,626,257 | ) |
| | | | | | |
| | Investor Shares | | | (5,612 | ) | | | (104 | ) | | | | | | | (77,471,106 | ) | | | (52,201,231 | ) |
| | | | | | |
| | Class R6 Shares | | | (5,676 | ) | | | (117 | ) | | | | | | | (12,136,651 | ) | | | (7,519,351 | ) |
| | | | | | |
| | Class R Shares | | | (5,508 | ) | | | (61 | ) | | | | | | | (2,365,428 | ) | | | (2,127,370 | ) |
| | | | | | |
| | Class P Shares | | | (250,100 | ) | | | (117 | ) | | | | | | | (46,974,296 | ) | | | (24,025,405 | ) |
| | | | | | |
| | Total distributions to shareholders | | | (1,251,091 | ) | | | (9,046 | ) | | | | | | | (363,995,586 | ) | | | (262,630,724 | ) |
| | | | | | | | | | | | | | | | | | | | | | |
| | From share transactions: | | | | | | | | | | | | | |
| | | | | | |
| | Proceeds from sales of shares | | | 5,313,022 | | | | 10,431,165 | | | | | | | | 611,179,710 | | | | 584,729,950 | |
| | | | | | |
| | Reinvestment of distributions | | | 1,251,091 | | | | 9,047 | | | | | | | | 339,495,791 | | | | 237,385,247 | |
| | | | | | |
| | Cost of shares redeemed | | | (544,656 | ) | | | (563,328 | ) | | | | | | | (445,918,864 | ) | | | (834,560,777 | ) |
| | | | | | |
| | Net increase (decrease) in net assets resulting from share transactions | | | 6,019,457 | | | | 9,876,884 | | | | | | | | 504,756,637 | | | | (12,445,580 | ) |
| | | | | | |
| | TOTAL INCREASE | | | 9,779,370 | | | | 13,806,979 | | | | | | | | 826,777,760 | | | | 283,721,569 | |
| | | | | | | | | | | | | | | | | | | | | | |
| | Net assets: | | | | | | | | | | | | | | | | | | | | |
| | | | | | |
| | Beginning of period | | | 13,806,979 | | | | — | | | | | | | | 2,285,183,630 | | | | 2,001,462,061 | |
| | | | | | |
| | End of period | | $ | 23,586,349 | | | $ | 13,806,979 | | | | | | | $ | 3,111,961,390 | | | $ | 2,285,183,630 | |
| | * | | Commencement of operations. |
| | |
| The accompanying notes are an integral part of these financial statements. | | 49 |
GOLDMAN SACHS FUNDAMENTAL EQUITY GROWTH FUNDS
Statements of Changes in Net Assets (continued)
| | | | | | | | | | | | | | | | | | | | | | |
| | | | | Strategic Growth Fund | | | | | | Technology Opportunities Fund | |
| | | | | For the
Six Months Ended
February 28, 2021
(Unaudited) | | | For the Fiscal
Year Ended
August 31, 2020 | | | | | | For the
Six Months Ended
February 28, 2021
(Unaudited) | | | For the Fiscal
Year Ended
August 31, 2020 | |
| | From operations: | | | | | | | | | | | | | |
| | | | | | |
| | Net investment loss | | $ | (275,496 | ) | | $ | (17,349 | ) | | | | | | $ | (2,574,519 | ) | | $ | (2,837,247 | ) |
| | | | | | |
| | Net realized gain | | | 15,922,992 | | | | 24,739,132 | | | | | | | | 52,928,997 | | | | 64,543,294 | |
| | | | | | |
| | Net change in unrealized gain (loss) | | | (968,229 | ) | | | 34,445,849 | | | | | | | | 10,411,818 | | | | 186,929,345 | |
| | | | | | |
| | Net increase in net assets resulting from operations | | | 14,679,267 | | | | 59,167,632 | | | | | | | | 60,766,296 | | | | 248,635,392 | |
| | | | | | | | | | | | | | | | | | | | | | |
| | Distributions to shareholders: | | | | | | | | | | | | | |
| | | | | | |
| | From distributable earnings: | | | | | | | | | | | | | | | | | | | | |
| | | | | | |
| | Class A Shares | | | (5,753,616 | ) | | | (4,611,552 | ) | | | | | | | (37,649,057 | ) | | | (46,818,272 | ) |
| | | | | | |
| | Class C Shares | | | (1,246,700 | ) | | | (998,734 | ) | | | | | | | (3,403,030 | ) | | | (4,769,848 | ) |
| | | | | | |
| | Institutional Shares | | | (7,620,404 | ) | | | (7,359,404 | ) | | | | | | | (11,618,167 | ) | | | (10,990,995 | ) |
| | | | | | |
| | Service Shares | | | (79,067 | ) | | | (100,316 | ) | | | | | | | (3,325,261 | ) | | | (4,475,409 | ) |
| | | | | | |
| | Investor Shares | | | (382,725 | ) | | | (235,813 | ) | | | | | | | (3,999,623 | ) | | | (2,550,857 | ) |
| | | | | | |
| | Class R6 Shares | | | (84,348 | ) | | | (54,771 | ) | | | | | | | (113,026 | ) | | | (32,559 | ) |
| | | | | | |
| | Class R Shares | | | (6,717 | ) | | | (41,983 | ) | | | | | | | — | | | | — | |
| | | | | | |
| | Class P Shares | | | (10,678,493 | ) | | | (10,817,531 | ) | | | | | | | (5,859,003 | ) | | | (3,525,530 | ) |
| | | | | | |
| | Total distributions to shareholders | | | (25,852,070 | ) | | | (24,220,104 | ) | | | | | | | (65,967,167 | ) | | | (73,163,470 | ) |
| | | | | | | | | | | | | | | | | | | | | | |
| | From share transactions: | | | | | | | | | | | | | |
| | | | | | |
| | Proceeds from sales of shares | | | 11,600,377 | | | | 27,015,766 | | | | | | | | 101,180,570 | | | | 203,785,120 | |
| | | | | | |
| | Reinvestment of distributions | | | 25,398,921 | | | | 23,784,787 | | | | | | | | 62,828,022 | | | | 68,777,718 | |
| | | | | | |
| | Cost of shares redeemed | | | (24,888,826 | ) | | | (62,657,586 | ) | | | | | | | (111,395,437 | ) | | | (155,360,052 | ) |
| | | | | | |
| | Net increase (decrease) in net assets resulting from share transactions | | | 12,110,472 | | | | (11,857,033 | ) | | | | | | | 52,613,155 | | | | 117,202,786 | |
| | | | | | |
| | TOTAL INCREASE | | | 937,669 | | | | 23,090,495 | | | | | | | | 47,412,284 | | | | 292,674,708 | |
| | | | | | | | | | | | | | | | | | | | | | |
| | Net assets: | | | | | | | | | | | | | | | | | | | | |
| | | | | | |
| | Beginning of period | | | 184,061,399 | | | | 160,970,904 | | | | | | | | 770,841,013 | | | | 478,166,305 | |
| | | | | | |
| | End of period | | $ | 184,999,068 | | | $ | 184,061,399 | | | | | | | $ | 818,253,297 | | | $ | 770,841,013 | |
| | |
| 50 | | The accompanying notes are an integral part of these financial statements. |
GOLDMAN SACHS FUNDAMENTAL EQUITY GROWTH FUNDS
Statements of Changes in Net Assets (continued)
| | | | | | | | | | |
| | | | | U.S. Equity ESG Fund | |
| | | | | For the
Six Months Ended
February 28, 2021
(Unaudited) | | | For the Fiscal
Year Ended
August 31, 2020 | |
| | From operations: | |
| | | |
| | Net investment income | | $ | 12,001 | | | $ | 72,576 | |
| | | |
| | Net realized gain | | | 353,061 | | | | 1,207,438 | |
| | | |
| | Net change in unrealized gain | | | 984,581 | | | | 419,704 | |
| | | |
| | Net increase in net assets resulting from operations | | | 1,349,643 | | | | 1,699,718 | |
| | | | | | | | | | |
| | Distributions to shareholders: | |
| | | |
| | From distributable earnings: | | | | | | | | |
| | | |
| | Class A Shares | | | (600,873 | ) | | | (177,225 | ) |
| | | |
| | Class C Shares | | | (212,062 | ) | | | (59,804 | ) |
| | | |
| | Institutional Shares | | | (138,080 | ) | | | (39,352 | ) |
| | | |
| | Investor Shares | | | (38,039 | ) | | | (11,386 | ) |
| | | |
| | Class R6 Shares | | | (127,443 | ) | | | (123,480 | ) |
| | | |
| | Class R Shares | | | (2,431 | ) | | | (824 | ) |
| | | |
| | Class P Shares | | | (91,452 | ) | | | (100,044 | ) |
| | | |
| | Total distributions to shareholders | | | (1,210,380 | ) | | | (512,115 | ) |
| | | | | | | | | | |
| | From share transactions: | |
| | | |
| | Proceeds from sales of shares | | | 825,295 | | | | 2,753,884 | |
| | | |
| | Reinvestment of distributions | | | 1,123,800 | | | | 486,610 | |
| | | |
| | Cost of shares redeemed | | | (954,933 | ) | | | (6,067,463 | ) |
| | | |
| | Net increase (decrease) in net assets resulting from share transactions | | | 994,162 | | | | (2,826,969 | ) |
| | | |
| | TOTAL INCREASE (DECREASE) | | | 1,133,425 | | | | (1,639,366 | ) |
| | | | | | | | | | |
| | Net assets: | | | | | | | | |
| | | |
| | Beginning of period | | | 10,963,556 | | | | 12,602,922 | |
| | | |
| | End of period | | $ | 12,096,981 | | | $ | 10,963,556 | |
| | |
| The accompanying notes are an integral part of these financial statements. | | 51 |
GOLDMAN SACHS CAPITAL GROWTH FUND
Financial Highlights
Selected Share Data for a Share Outstanding Throughout Each Period
| | | | | | | | | | | | | | | | | | | | | | | | | | |
| | | | | Goldman Sachs Capital Growth Fund | |
| | | | | Class A Shares | |
| | | | | Six Months Ended
February 28, 2021
(Unaudited) | | | Year Ended August 31, | |
| | | | | 2020 | | | 2019 | | | 2018 | | | 2017 | | | 2016 | |
| | Per Share Data | | | | | | | | | | | | | | | | | | | | | | | | |
| | | | | | | |
| | Net asset value, beginning of period | | $ | 26.94 | | | $ | 22.93 | | | $ | 32.46 | | | $ | 28.92 | | | $ | 24.15 | | | $ | 24.80 | |
| | | | | | | |
| | Net investment income (loss)(a) | | | (0.02 | ) | | | 0.05 | | | | 0.08 | | | | 0.02 | | | | 0.04 | | | | 0.03 | |
| | | | | | | |
| | Net realized and unrealized gain (loss) | | | 3.00 | | | | 4.93 | | | | (0.28 | ) | | | 6.01 | | | | 5.07 | | | | 1.37 | |
| | | | | | | |
| | Total from investment operations | | | 2.98 | | | | 4.98 | | | | (0.20 | ) | | | 6.03 | | | | 5.11 | | | | 1.40 | |
| | | | | | | |
| | Distributions to shareholders from net investment income | | | (0.06 | ) | | | (0.08 | ) | | | — | (b) | | | (0.02 | ) | | | (0.01 | ) | | | — | |
| | | | | | | |
| | Distributions to shareholders from net realized gains | | | (1.00 | ) | | | (0.89 | ) | | | (9.33 | ) | | | (2.47 | ) | | | (0.33 | ) | | | (2.05 | ) |
| | | | | | | |
| | Total distributions | | | (1.06 | ) | | | (0.97 | ) | | | (9.33 | ) | | | (2.49 | ) | | | (0.34 | ) | | | (2.05 | ) |
| | | | | | | |
| | Net asset value, end of period | | $ | 28.86 | | | $ | 26.94 | | | $ | 22.93 | | | $ | 32.46 | | | $ | 28.92 | | | $ | 24.15 | |
| | | | | | | |
| | Total Return(c) | | | 11.22 | % | | | 22.26 | % | | | 3.72 | % | | | 22.01 | % | | | 21.47 | % | | | 5.79 | % |
| | | | | | | |
| | Net assets, end of period (in 000’s) | | $ | 828,918 | | | $ | 776,919 | | | $ | 708,827 | | | $ | 745,362 | | | $ | 671,371 | | | $ | 630,091 | |
| | | | | | | |
| | Ratio of net expenses to average net assets | | | 1.12 | %(d) | | | 1.14 | % | | | 1.14 | % | | | 1.14 | % | | | 1.15 | % | | | 1.15 | % |
| | | | | | | |
| | Ratio of total expenses to average net assets | | | 1.18 | %(d) | | | 1.22 | % | | | 1.22 | % | | | 1.31 | % | | | 1.51 | % | | | 1.51 | % |
| | | | | | | |
| | Ratio of net investment income (loss) to average net assets | | | (0.13 | )%(d) | | | 0.23 | % | | | 0.36 | % | | | 0.06 | % | | | 0.14 | % | | | 0.11 | % |
| | | | | | | |
| | Portfolio turnover rate(e) | | | 19 | % | | | 47 | % | | | 55 | % | | | 93 | % | | | 48 | % | | | 45 | % |
| | (a) | | Calculated based on the average shares outstanding methodology. |
| | (b) | | Amount is less than $0.005 per share. |
| | (c) | | Assumes investment at the NAV at the beginning of the period, reinvestment of all dividends and distributions, a complete redemption of the investment at the NAV at the end of the period and no sales or redemption charges (if any). Total returns would be reduced if a sales or redemption charge was taken into account. Returns do not reflect the impact of taxes to shareholders relating to Fund distributions or the redemption of Fund shares. Total returns for periods less than one full year are not annualized. |
| | (e) | | The Fund’s portfolio turnover rate is calculated in accordance with regulatory requirements, without regard to transactions involving short term investments. If such transactions were included, the Fund’s portfolio turnover rate may be higher. |
| | |
| 52 | | The accompanying notes are an integral part of these financial statements. |
GOLDMAN SACHS CAPITAL GROWTH FUND
Financial Highlights (continued)
Selected Share Data for a Share Outstanding Throughout Each Period
| | | | | | | | | | | | | | | | | | | | | | | | | | |
| | | | | Goldman Sachs Capital Growth Fund | |
| | | | | Class C Shares | |
| | | | | Six Months Ended
February 28, 2021
(Unaudited) | | | Year Ended August 31, | |
| | | | | 2020 | | | 2019 | | | 2018 | | | 2017 | | | 2016 | |
| | Per Share Data | | | | | | | | | | | | | | | | | | | | | | | | |
| | | | | | | |
| | Net asset value, beginning of period | | $ | 16.05 | | | $ | 14.05 | | | $ | 24.01 | | | $ | 22.13 | | | $ | 18.68 | | | $ | 19.77 | |
| | | | | | | |
| | Net investment loss(a) | | | (0.07 | ) | | | (0.06 | ) | | | (0.07 | ) | | | (0.16 | ) | | | (0.12 | ) | | | (0.12 | ) |
| | | | | | | |
| | Net realized and unrealized gain (loss) | | | 1.77 | | | | 2.95 | | | | (0.56 | ) | | | 4.51 | | | | 3.90 | | | | 1.08 | |
| | | | | | | |
| | Total from investment operations | | | 1.70 | | | | 2.89 | | | | (0.63 | ) | | | 4.35 | | | | 3.78 | | | | 0.96 | |
| | | | | | | |
| | Distributions to shareholders from net realized gains | | | (1.00 | ) | | | (0.89 | ) | | | (9.33 | ) | | | (2.47 | ) | | | (0.33 | ) | | | (2.05 | ) |
| | | | | | | |
| | Net asset value, end of period | | $ | 16.75 | | | $ | 16.05 | | | $ | 14.05 | | | $ | 24.01 | | | $ | 22.13 | | | $ | 18.68 | |
| | | | | | | |
| | Total Return(b) | | | 10.84 | % | | | 21.37 | % | | | 3.01 | % | | | 21.11 | % | | | 20.59 | % | | | 4.98 | % |
| | | | | | | |
| | Net assets, end of period (in 000’s) | | $ | 17,309 | | | $ | 16,596 | | | $ | 18,674 | | | $ | 65,983 | | | $ | 62,701 | | | $ | 68,960 | |
| | | | | | | |
| | Ratio of net expenses to average net assets | | | 1.87 | %(c) | | | 1.89 | % | | | 1.89 | % | | | 1.89 | % | | | 1.90 | % | | | 1.90 | % |
| | | | | | | |
| | Ratio of total expenses to average net assets | | | 1.92 | %(c) | | | 1.97 | % | | | 1.97 | % | | | 2.06 | % | | | 2.26 | % | | | 2.26 | % |
| | | | | | | |
| | Ratio of net investment loss to average net assets | | | (0.87 | )%(c) | | | (0.45 | )% | | | (0.41 | )% | | | (0.70 | )% | | | (0.61 | )% | | | (0.64 | )% |
| | | | | | | |
| | Portfolio turnover rate(d) | | | 19 | % | | | 47 | % | | | 55 | % | | | 93 | % | | | 48 | % | | | 45 | % |
| | (a) | | Calculated based on the average shares outstanding methodology. |
| | (b) | | Assumes investment at the NAV at the beginning of the period, reinvestment of all dividends and distributions, a complete redemption of the investment at the NAV at the end of the period and no sales or redemption charges (if any). Total returns would be reduced if a sales or redemption charge was taken into account. Returns do not reflect the impact of taxes to shareholders relating to Fund distributions or the redemption of Fund shares. Total returns for periods less than one full year are not annualized. |
| | (d) | | The Fund’s portfolio turnover rate is calculated in accordance with regulatory requirements, without regard to transactions involving short term investments. If such transactions were included, the Fund’s portfolio turnover rate may be higher. |
| | |
| The accompanying notes are an integral part of these financial statements. | | 53 |
GOLDMAN SACHS CAPITAL GROWTH FUND
Financial Highlights (continued)
Selected Share Data for a Share Outstanding Throughout Each Period
| | | | | | | | | | | | | | | | | | | | | | | | | | |
| | | | | Goldman Sachs Capital Growth Fund | |
| | | | | Institutional Shares | |
| | | | | Six Months Ended
February 28, 2021
(Unaudited) | | | Year Ended August 31, | |
| | | | | 2020 | | | 2019 | | | 2018 | | | 2017 | | | 2016 | |
| | Per Share Data | | | | | | | | | | | | | | | | | | | | | | | | |
| | | | | | | |
| | Net asset value, beginning of period | | $ | 31.19 | | | $ | 26.39 | | | $ | 35.76 | | | $ | 31.60 | | | $ | 26.35 | | | $ | 26.82 | |
| | | | | | | |
| | Net investment income(a) | | | 0.04 | | | | 0.16 | | | | 0.20 | | | | 0.13 | | | | 0.15 | | | | 0.13 | |
| | | | | | | |
| | Net realized and unrealized gain (loss) | | | 3.47 | | | | 5.70 | | | | (0.17 | ) | | | 6.62 | | | | 5.54 | | | | 1.49 | |
| | | | | | | |
| | Total from investment operations | | | 3.51 | | | | 5.86 | | | | 0.03 | | | | 6.75 | | | | 5.69 | | | | 1.62 | |
| | | | | | | |
| | Distributions to shareholders from net investment income | | | (0.15 | ) | | | (0.17 | ) | | | (0.07 | ) | | | (0.12 | ) | | | (0.11 | ) | | | (0.04 | ) |
| | | | | | | |
| | Distributions to shareholders from net realized gains | | | (1.00 | ) | | | (0.89 | ) | | | (9.33 | ) | | | (2.47 | ) | | | (0.33 | ) | | | (2.05 | ) |
| | | | | | | |
| | Total distributions | | | (1.15 | ) | | | (1.06 | ) | | | (9.40 | ) | | | (2.59 | ) | | | (0.44 | ) | | | (2.09 | ) |
| | | | | | | |
| | Net asset value, end of period | | $ | 33.55 | | | $ | 31.19 | | | $ | 26.39 | | | $ | 35.76 | | | $ | 31.60 | | | $ | 26.35 | |
| | | | | | | |
| | Total Return(b) | | | 11.41 | % | | | 22.71 | % | | | 4.14 | % | | | 22.50 | % | | | 21.96 | % | | | 6.19 | % |
| | | | | | | |
| | Net assets, end of period (in 000’s) | | $ | 79,922 | | | $ | 64,708 | | | $ | 60,169 | | | $ | 77,293 | | | $ | 165,948 | | | $ | 141,442 | |
| | | | | | | |
| | Ratio of net expenses to average net assets | | | 0.75 | %(c) | | | 0.76 | % | | | 0.75 | % | | | 0.75 | % | | | 0.75 | % | | | 0.75 | % |
| | | | | | | |
| | Ratio of total expenses to average net assets | | | 0.81 | %(c) | | | 0.84 | % | | | 0.83 | % | | | 0.93 | % | | | 1.11 | % | | | 1.11 | % |
| | | | | | | |
| | Ratio of net investment income to average net assets | | | 0.25 | %(c) | | | 0.58 | % | | | 0.74 | % | | | 0.40 | % | | | 0.54 | % | | | 0.50 | % |
| | | | | | | |
| | Portfolio turnover rate(d) | | | 19 | % | | | 47 | % | | | 55 | % | | | 93 | % | | | 48 | % | | | 45 | % |
| | (a) | | Calculated based on the average shares outstanding methodology. |
| | (b) | | Assumes investment at the NAV at the beginning of the period, reinvestment of all dividends and distributions, a complete redemption of the investment at the NAV at the end of the period and no sales or redemption charges (if any). Total returns would be reduced if a sales or redemption charge was taken into account. Returns do not reflect the impact of taxes to shareholders relating to Fund distributions or the redemption of Fund shares. Total returns for periods less than one full year are not annualized. |
| | (d) | | The Fund’s portfolio turnover rate is calculated in accordance with regulatory requirements, without regard to transactions involving short term investments. If such transactions were included, the Fund’s portfolio turnover rate may be higher. |
| | |
| 54 | | The accompanying notes are an integral part of these financial statements. |
GOLDMAN SACHS CAPITAL GROWTH FUND
Financial Highlights (continued)
Selected Share Data for a Share Outstanding Throughout Each Period
| | | | | | | | | | | | | | | | | | | | | | | | | | |
| | | | | Goldman Sachs Capital Growth Fund | |
| | | | | Service Shares | |
| | | | | Six Months Ended
February 28, 2021
(Unaudited) | | | Year Ended August 31, | |
| | | | | 2020 | | | 2019 | | | 2018 | | | 2017 | | | 2016 | |
| | Per Share Data | | | | | | | | | | | | | | | | | | | | | | | | |
| | | | | | | |
| | Net asset value, beginning of period | | $ | 25.46 | | | $ | 21.73 | | | $ | 31.33 | | | $ | 28.00 | | | $ | 23.40 | | | $ | 24.12 | |
| | | | | | | |
| | Net investment income (loss)(a) | | | (0.04 | ) | | | 0.03 | | | | 0.06 | | | | (0.01 | ) | | | — | | | | — | (b) |
| | | | | | | |
| | Net realized and unrealized gain (loss) | | | 2.84 | | | | 4.66 | | | | (0.33 | ) | | | 5.81 | | | | 4.93 | | | | 1.33 | |
| | | | | | | |
| | Total from investment operations | | | 2.80 | | | | 4.69 | | | | (0.27 | ) | | | 5.80 | | | | 4.93 | | | | 1.33 | |
| | | | | | | |
| | Distributions to shareholders from net investment income | | | (0.01 | ) | | | (0.07 | ) | | | — | | | | — | | | | — | | | | — | |
| | | | | | | |
| | Distributions to shareholders from net realized gains | | | (1.00 | ) | | | (0.89 | ) | | | (9.33 | ) | | | (2.47 | ) | | | (0.33 | ) | | | (2.05 | ) |
| | | | | | | |
| | Total distributions | | | (1.01 | ) | | | (0.96 | ) | | | (9.33 | ) | | | (2.47 | ) | | | (0.33 | ) | | | (2.05 | ) |
| | | | | | | |
| | Net asset value, end of period | | $ | 27.25 | | | $ | 25.46 | | | $ | 21.73 | | | $ | 31.33 | | | $ | 28.00 | | | $ | 23.40 | |
| | | | | | | |
| | Total Return(c) | | | 11.16 | % | | | 22.12 | % | | | 3.57 | % | | | 21.91 | % | | | 21.36 | % | | | 5.66 | % |
| | | | | | | |
| | Net assets, end of period (in 000’s) | | $ | 1,648 | | | $ | 1,814 | | | $ | 1,546 | | | $ | 1,802 | | | $ | 1,437 | | | $ | 1,561 | |
| | | | | | | |
| | Ratio of net expenses to average net assets | | | 1.25 | %(d) | | | 1.26 | % | | | 1.25 | % | | | 1.25 | % | | | 1.25 | % | | | 1.25 | % |
| | | | | | | |
| | Ratio of total expenses to average net assets | | | 1.31 | %(d) | | | 1.34 | % | | | 1.33 | % | | | 1.41 | % | | | 1.61 | % | | | 1.61 | % |
| | | | | | | |
| | Ratio of net investment income (loss) to average net assets | | | (0.27 | )%(d) | | | 0.13 | % | | | 0.25 | % | | | (0.04 | )% | | | 0.02 | % | | | 0.01 | % |
| | | | | | | |
| | Portfolio turnover rate(e) | | | 19 | % | | | 47 | % | | | 55 | % | | | 93 | % | | | 48 | % | | | 45 | % |
| | (a) | | Calculated based on the average shares outstanding methodology. |
| | (b) | | Amount is less than $0.005 per share. |
| | (c) | | Assumes investment at the NAV at the beginning of the period, reinvestment of all dividends and distributions, a complete redemption of the investment at the NAV at the end of the period and no sales or redemption charges (if any). Total returns would be reduced if a sales or redemption charge was taken into account. Returns do not reflect the impact of taxes to shareholders relating to Fund distributions or the redemption of Fund shares. Total returns for periods less than one full year are not annualized. |
| | (e) | | The Fund’s portfolio turnover rate is calculated in accordance with regulatory requirements, without regard to transactions involving short term investments. If such transactions were included, the Fund’s portfolio turnover rate may be higher. |
| | |
| The accompanying notes are an integral part of these financial statements. | | 55 |
GOLDMAN SACHS CAPITAL GROWTH FUND
Financial Highlights (continued)
Selected Share Data for a Share Outstanding Throughout Each Period
| | | | | | | | | | | | | | | | | | | | | | | | | | |
| | | | | Goldman Sachs Capital Growth Fund | |
| | | | | Investor Shares | |
| | | | | Six Months Ended
February 28, 2021
(Unaudited) | | | Year Ended August 31, | |
| | | | | 2020 | | | 2019 | | | 2018 | | | 2017 | | | 2016 | |
| | Per Share Data | | | | | | | | | | | | | | | | | | | | | | | | |
| | | | | | | |
| | Net asset value, beginning of period | | $ | 27.56 | | | $ | 23.43 | | | $ | 32.94 | | | $ | 29.31 | | | $ | 24.48 | | | $ | 25.07 | |
| | | | | | | |
| | Net investment income(a) | | | 0.02 | | | | 0.11 | | | | 0.15 | | | | 0.09 | | | | 0.11 | | | | 0.08 | |
| | | | | | | |
| | Net realized and unrealized gain (loss) | | | 3.07 | | | | 5.05 | | | | (0.28 | ) | | | 6.11 | | | | 5.13 | | | | 1.40 | |
| | | | | | | |
| | Total from investment operations | | | 3.09 | | | | 5.16 | | | | (0.13 | ) | | | 6.20 | | | | 5.24 | | | | 1.48 | |
| | | | | | | |
| | Distributions to shareholders from net investment income | | | (0.13 | ) | | | (0.14 | ) | | | (0.05 | ) | | | (0.10 | ) | | | (0.08 | ) | | | (0.02 | ) |
| | | | | | | |
| | Distributions to shareholders from net realized gains | | | (1.00 | ) | | | (0.89 | ) | | | (9.33 | ) | | | (2.47 | ) | | | (0.33 | ) | | | (2.05 | ) |
| | | | | | | |
| | Total distributions | | | (1.13 | ) | | | (1.03 | ) | | | (9.38 | ) | | | (2.57 | ) | | | (0.41 | ) | | | (2.07 | ) |
| | | | | | | |
| | Net asset value, end of period | | $ | 29.52 | | | $ | 27.56 | | | $ | 23.43 | | | $ | 32.94 | | | $ | 29.31 | | | $ | 24.48 | |
| | | | | | | |
| | Total Return(b) | | | 11.36 | % | | | 22.56 | % | | | 3.96 | % | | | 22.35 | % | | | 21.77 | % | | | 6.05 | % |
| | | | | | | |
| | Net assets, end of period (in 000’s) | | $ | 11,833 | | | $ | 8,703 | | | $ | 6,649 | | | $ | 9,259 | | | $ | 8,496 | | | $ | 4,297 | |
| | | | | | | |
| | Ratio of net expenses to average net assets | | | 0.87 | %(c) | | | 0.89 | % | | | 0.89 | % | | | 0.89 | % | | | 0.90 | % | | | 0.90 | % |
| | | | | | | |
| | Ratio of total expenses to average net assets | | | 0.93 | %(c) | | | 0.96 | % | | | 0.97 | % | | | 1.06 | % | | | 1.26 | % | | | 1.26 | % |
| | | | | | | |
| | Ratio of net investment income to average net assets | | | 0.13 | %(c) | | | 0.46 | % | | | 0.60 | % | | | 0.31 | % | | | 0.43 | % | | | 0.35 | % |
| | | | | | | |
| | Portfolio turnover rate(d) | | | 19 | % | | | 47 | % | | | 55 | % | | | 93 | % | | | 48 | % | | | 45 | % |
| | (a) | | Calculated based on the average shares outstanding methodology. |
| | (b) | | Assumes investment at the NAV at the beginning of the period, reinvestment of all dividends and distributions, a complete redemption of the investment at the NAV at the end of the period and no sales or redemption charges (if any). Total returns would be reduced if a sales or redemption charge was taken into account. Returns do not reflect the impact of taxes to shareholders relating to Fund distributions or the redemption of Fund shares. Total returns for periods less than one full year are not annualized. |
| | (d) | | The Fund’s portfolio turnover rate is calculated in accordance with regulatory requirements, without regard to transactions involving short term investments. If such transactions were included, the Fund’s portfolio turnover rate may be higher. |
| | |
| 56 | | The accompanying notes are an integral part of these financial statements. |
GOLDMAN SACHS CAPITAL GROWTH FUND
Financial Highlights (continued)
Selected Share Data for a Share Outstanding Throughout Each Period
| | | | | | | | | | | | | | | | | | | | | | | | | | |
| | | | | Goldman Sachs Capital Growth Fund | |
| | | | | Class R6 Shares | |
| | | | | Six Months Ended
February 28, 2021
(Unaudited) | | | Year Ended August 31, | |
| | | | | 2020 | | | 2019 | | | 2018 | | | 2017 | | | 2016 | |
| | Per Share Data | | | | | | | | | | | | | | | | | | | | | | | | |
| | | | | | | |
| | Net asset value, beginning of period | | $ | 31.14 | | | $ | 26.35 | | | $ | 35.75 | | | $ | 31.60 | | | $ | 26.34 | | | $ | 26.82 | |
| | | | | | | |
| | Net investment income(a) | | | 0.04 | | | | 0.16 | | | | 0.19 | | | | 0.20 | | | | 0.16 | | | | 0.13 | |
| | | | | | | |
| | Net realized and unrealized gain (loss) | | | 3.47 | | | | 5.69 | | | | (0.17 | ) | | | 6.55 | | | | 5.55 | | | | 1.49 | |
| | | | | | | |
| | Total from investment operations | | | 3.51 | | | | 5.85 | | | | 0.02 | | | | 6.75 | | | | 5.71 | | | | 1.62 | |
| | | | | | | |
| | Distributions to shareholders from net investment income | | | (0.15 | ) | | | (0.17 | ) | | | (0.09 | ) | | | (0.13 | ) | | | (0.12 | ) | | | (0.05 | ) |
| | | | | | | |
| | Distributions to shareholders from net realized gains | | | (1.00 | ) | | | (0.89 | ) | | | (9.33 | ) | | | (2.47 | ) | | | (0.33 | ) | | | (2.05 | ) |
| | | | | | | |
| | Total distributions | | | (1.15 | ) | | | (1.06 | ) | | | (9.42 | ) | | | (2.60 | ) | | | (0.45 | ) | | | (2.10 | ) |
| | | | | | | |
| | Net asset value, end of period | | $ | 33.50 | | | $ | 31.14 | | | $ | 26.35 | | | $ | 35.75 | | | $ | 31.60 | | | $ | 26.34 | |
| | | | | | | |
| | Total Return(b) | | | 11.43 | % | | | 22.71 | % | | | 4.12 | % | | | 22.53 | % | | | 21.99 | % | | | 6.19 | % |
| | | | | | | |
| | Net assets, end of period (in 000’s) | | $ | 4,206 | | | $ | 2,454 | | | $ | 2,313 | | | $ | 60 | | | $ | 16 | | | $ | 10 | |
| | | | | | | |
| | Ratio of net expenses to average net assets | | | 0.74 | %(c) | | | 0.75 | % | | | 0.74 | % | | | 0.74 | % | | | 0.75 | % | | | 0.74 | % |
| | | | | | | |
| | Ratio of total expenses to average net assets | | | 0.80 | %(c) | | | 0.83 | % | | | 0.83 | % | | | 0.90 | % | | | 1.10 | % | | | 1.09 | % |
| | | | | | | |
| | Ratio of net investment income to average net assets | | | 0.28 | %(c) | | | 0.59 | % | | | 0.75 | % | | | 0.60 | % | | | 0.56 | % | | | 0.52 | % |
| | | | | | | |
| | Portfolio turnover rate(d) | | | 19 | % | | | 47 | % | | | 55 | % | | | 93 | % | | | 48 | % | | | 45 | % |
| | (a) | | Calculated based on the average shares outstanding methodology. |
| | (b) | | Assumes investment at the NAV at the beginning of the period, reinvestment of all dividends and distributions, a complete redemption of the investment at the NAV at the end of the period and no sales or redemption charges (if any). Total returns would be reduced if a sales or redemption charge was taken into account. Returns do not reflect the impact of taxes to shareholders relating to Fund distributions or the redemption of Fund shares. Total returns for periods less than one full year are not annualized. |
| | (d) | | The Fund’s portfolio turnover rate is calculated in accordance with regulatory requirements, without regard to transactions involving short term investments. If such transactions were included, the Fund’s portfolio turnover rate may be higher. |
| | |
| The accompanying notes are an integral part of these financial statements. | | 57 |
GOLDMAN SACHS CAPITAL GROWTH FUND
Financial Highlights (continued)
Selected Share Data for a Share Outstanding Throughout Each Period
| | | | | | | | | | | | | | | | | | | | | | | | | | |
| | | | | Goldman Sachs Capital Growth Fund | |
| | | | | Class R Shares | |
| | | | | Six Months Ended
February 28, 2021
(Unaudited) | | | Year Ended August 31, | |
| | | | | 2020 | | | 2019 | | | 2018 | | | 2017 | | | 2016 | |
| | Per Share Data | | | | | | | | | | | | | | | | | | | | | | | | |
| | | | | | | |
| | Net asset value, beginning of period | | $ | 25.32 | | | $ | 21.63 | | | $ | 31.26 | | | $ | 28.01 | | | $ | 23.44 | | | $ | 24.19 | |
| | | | | | | |
| | Net investment income (loss)(a) | | | (0.05 | ) | | | — | (b) | | | 0.02 | | | | (0.06 | ) | | | (0.03 | ) | | | (0.03 | ) |
| | | | | | | |
| | Net realized and unrealized gain (loss) | | | 2.83 | | | | 4.62 | | | | (0.32 | ) | | | 5.81 | | | | 4.93 | | | | 1.33 | |
| | | | | | | |
| | Total from investment operations | | | 2.78 | | | | 4.62 | | | | (0.30 | ) | | | 5.75 | | | | 4.90 | | | | 1.30 | |
| | | | | | | |
| | Distributions to shareholders from net investment income | | | (0.02 | ) | | | (0.04 | ) | | | — | | | | (0.03 | ) | | | — | | | | — | |
| | | | | | | |
| | Distributions to shareholders from net realized gains | | | (1.00 | ) | | | (0.89 | ) | | | (9.33 | ) | | | (2.47 | ) | | | (0.33 | ) | | | (2.05 | ) |
| | | | | | | |
| | Total distributions | | | (1.02 | ) | | | (0.93 | ) | | | (9.33 | ) | | | (2.50 | ) | | | (0.33 | ) | | | (2.05 | ) |
| | | | | | | |
| | Net asset value, end of period | | $ | 27.08 | | | $ | 25.32 | | | $ | 21.63 | | | $ | 31.26 | | | $ | 28.01 | | | $ | 23.44 | |
| | | | | | | |
| | Total Return(c) | | | 11.12 | % | | | 21.90 | % | | | 3.47 | % | | | 21.73 | % | | | 21.19 | % | | | 5.51 | % |
| | | | | | | |
| | Net assets, end of period (in 000’s) | | $ | 10,520 | | | $ | 10,097 | | | $ | 8,559 | | | $ | 8,887 | | | $ | 8,093 | | | $ | 3,450 | |
| | | | | | | |
| | Ratio of net expenses to average net assets | | | 1.37 | %(d) | | | 1.39 | % | | | 1.39 | % | | | 1.39 | % | | | 1.40 | % | | | 1.40 | % |
| | | | | | | |
| | Ratio of total expenses to average net assets | | | 1.43 | %(d) | | | 1.47 | % | | | 1.47 | % | | | 1.56 | % | | | 1.77 | % | | | 1.76 | % |
| | | | | | | |
| | Ratio of net investment income (loss) to average net assets | | | (0.38 | )%(d) | | | 0.01 | % | | | 0.11 | % | | | (0.20 | )% | | | (0.10 | )% | | | (0.15 | )% |
| | | | | | | |
| | Portfolio turnover rate(e) | | | 19 | % | | | 47 | % | | | 55 | % | | | 93 | % | | | 48 | % | | | 45 | % |
| | (a) | | Calculated based on the average shares outstanding methodology. |
| | (b) | | Amount is less than $0.005 per share. |
| | (c) | | Assumes investment at the NAV at the beginning of the period, reinvestment of all dividends and distributions, a complete redemption of the investment at the NAV at the end of the period and no sales or redemption charges (if any). Total returns would be reduced if a sales or redemption charge was taken into account. Returns do not reflect the impact of taxes to shareholders relating to Fund distributions or the redemption of Fund shares. Total returns for periods less than one full year are not annualized. |
| | (e) | | The Fund’s portfolio turnover rate is calculated in accordance with regulatory requirements, without regard to transactions involving short term investments. If such transactions were included, the Fund’s portfolio turnover rate may be higher. |
| | |
| 58 | | The accompanying notes are an integral part of these financial statements. |
GOLDMAN SACHS CAPITAL GROWTH FUND
Financial Highlights (continued)
Selected Share Data for a Share Outstanding Throughout Each Period
| | | | | | | | | | | | | | | | | | |
| | | | | Goldman Sachs Capital Growth Fund | |
| | | | | Class P Shares | |
| | | | | Six Months Ended
February 28, 2021
(Unaudited) | | | Year Ended August 31, | | | Period Ended
August 31, 2018(a) | |
| | | | | 2020 | | | 2019 | |
| | Per Share Data | | | | | | | | | | | | | | | | |
| | | | | |
| | Net asset value, beginning of period | | $ | 31.13 | | | $ | 26.34 | | | $ | 35.74 | | | $ | 33.39 | |
| | | | | |
| | Net investment income(b) | | | 0.04 | | | | 0.16 | | | | 0.20 | | | | 0.09 | |
| | | | | |
| | Net realized and unrealized gain (loss) | | | 3.47 | | | | 5.69 | | | | (0.18 | ) | | | 2.26 | |
| | | | | |
| | Total from investment operations | | | 3.51 | | | | 5.85 | | | | 0.02 | | | | 2.35 | |
| | | | | |
| | Distributions to shareholders from net investment income | | | (0.15 | ) | | | (0.17 | ) | | | (0.09 | ) | | | — | |
| | | | | |
| | Distributions to shareholders from net realized gains | | | (1.00 | ) | | | (0.89 | ) | | | (9.33 | ) | | | — | |
| | | | | |
| | Total distributions | | | (1.15 | ) | | | (1.06 | ) | | | (9.42 | ) | | | — | |
| | | | | |
| | Net asset value, end of period | | $ | 33.49 | | | $ | 31.13 | | | $ | 26.34 | | | $ | 35.74 | |
| | | | | |
| | Total Return(c) | | | 11.44 | % | | | 22.73 | % | | | 4.13 | % | | | 7.04 | % |
| | | | | |
| | Net assets, end of period (in 000’s) | | $ | 108,453 | | | $ | 95,182 | | | $ | 85,422 | | | $ | 104,131 | |
| | | | | |
| | Ratio of net expenses to average net assets | | | 0.74 | %(d) | | | 0.75 | % | | | 0.74 | % | | | 0.74 | %(d) |
| | | | | |
| | Ratio of total expenses to average net assets | | | 0.80 | %(d) | | | 0.83 | % | | | 0.82 | % | | | 0.85 | %(d) |
| | | | | |
| | Ratio of net investment income to average net assets | | | 0.25 | %(d) | | | 0.59 | % | | | 0.75 | % | | | 0.72 | %(d) |
| | | | | |
| | Portfolio turnover rate(e) | | | 19 | % | | | 47 | % | | | 55 | % | | | 93 | % |
| | (a) | | Commenced operations on April 17, 2018. |
| | (b) | | Calculated based on the average shares outstanding methodology. |
| | (c) | | Assumes investment at the NAV at the beginning of the period, reinvestment of all dividends and distributions, a complete redemption of the investment at the NAV at the end of the period and no sales or redemption charges (if any). Total returns would be reduced if a sales or redemption charge was taken into account. Returns do not reflect the impact of taxes to shareholders relating to Fund distributions or the redemption of Fund shares. Total returns for periods less than one full year are not annualized. |
| | (e) | | The Fund’s portfolio turnover rate is calculated in accordance with regulatory requirements, without regard to transactions involving short term investments. If such transactions were included, the Fund’s portfolio turnover rate may be higher. |
| | |
| The accompanying notes are an integral part of these financial statements. | | 59 |
GOLDMAN SACHS CONCENTRATED GROWTH FUND
Financial Highlights (continued)
Selected Share Data for a Share Outstanding Throughout Each Period
| | | | | | | | | | | | | | | | | | | | | | | | | | |
| | | | | Goldman Sachs Concentrated Growth Fund | |
| | | | | Class A Shares | |
| | | | | Six Months Ended
February 28, 2021
(Unaudited) | | | Year Ended August 31, | |
| | | | | 2020 | | | 2019 | | | 2018 | | | 2017 | | | 2016 | |
| | Per Share Data | | | | | | | | | | | | | | | | | | | | | | | | |
| | | | | | | |
| | Net asset value, beginning of period | | $ | 22.91 | | | $ | 17.55 | | | $ | 19.33 | | | $ | 17.62 | | | $ | 15.06 | | | $ | 16.06 | |
| | | | | | | |
| | Net investment income (loss)(a) | | | (0.07 | ) | | | (0.08 | ) | | | (0.03 | ) | | | (0.01 | ) | | | 0.02 | | | | — | (b) |
| | | | | | | |
| | Net realized and unrealized gain | | | 1.38 | | | | 6.92 | | | | 0.35 | | | | 3.82 | | | | 2.64 | | | | 0.81 | |
| | | | | | | |
| | Total from investment operations | | | 1.31 | | | | 6.84 | | | | 0.32 | | | | 3.81 | | | | 2.66 | | | | 0.81 | |
| | | | | | | |
| | Distributions to shareholders from net investment income | | | — | | | | — | | | | — | | | | — | (c) | | | (0.03 | ) | | | — | |
| | | | | | | |
| | Distributions to shareholders from net realized gains | | | (1.45 | ) | | | (1.48 | ) | | | (2.10 | ) | | | (2.10 | ) | | | (0.07 | ) | | | (1.81 | ) |
| | | | | | | |
| | Total distributions | | | (1.45 | ) | | | (1.48 | ) | | | (2.10 | ) | | | (2.10 | ) | | | (0.10 | ) | | | (1.81 | ) |
| | | | | | | |
| | Net asset value, end of period | | $ | 22.77 | | | $ | 22.91 | | | $ | 17.55 | | | $ | 19.33 | | | $ | 17.62 | | | $ | 15.06 | |
| | | | | | | |
| | Total Return(d) | | | 5.93 | % | | | 41.52 | % | | | 3.58 | % | | | 23.68 | % | | | 17.75 | % | | | 5.10 | % |
| | | | | | | |
| | Net assets, end of period (in 000’s) | | $ | 9,602 | | | $ | 9,302 | | | $ | 6,735 | | | $ | 5,633 | | | $ | 5,462 | | | $ | 6,573 | |
| | | | | | | |
| | Ratio of net expenses to average net assets | | | 1.12 | %(e) | | | 1.16 | % | | | 1.16 | % | | | 1.17 | % | | | 1.20 | % | | | 1.22 | % |
| | | | | | | |
| | Ratio of total expenses to average net assets | | | 1.33 | %(e) | | | 1.37 | % | | | 1.45 | % | | | 1.51 | % | | | 1.65 | % | | | 1.63 | % |
| | | | | | | |
| | Ratio of net investment income (loss) to average net assets | | | (0.62 | )%(e) | | | (0.44 | )% | | | (0.18 | )% | | | (0.05 | )% | | | 0.11 | % | | | 0.03 | %(b) |
| | | | | | | |
| | Portfolio turnover rate(f) | | | 21 | % | | | 36 | % | | | 40 | % | | | 44 | % | | | 54 | %(g) | | | 55 | % |
| | (a) | | Calculated based on the average shares outstanding methodology. |
| | (b) | | Reflects income recognized from a special dividend which amounted to $0.03 per share and 0.19% of average net assets. |
| | (c) | | Amount is less than $0.005 per share. |
| | (d) | | Assumes investment at the NAV at the beginning of the period, reinvestment of all dividends and distributions, a complete redemption of the investment at the NAV at the end of the period and no sales or redemption charges (if any). Total returns would be reduced if a sales or redemption charge was taken into account. Returns do not reflect the impact of taxes to shareholders relating to Fund distributions or the redemption of Fund shares. Total returns for periods less than one full year are not annualized. |
| | (f) | | The Fund’s portfolio turnover rate is calculated in accordance with regulatory requirements, without regard to transactions involving short term investments. If such transactions were included, the Fund’s portfolio turnover rate may be higher. |
| | (g) | | On July 28, 2017, Goldman Sachs Concentrated Growth Fund acquired all of the net assets of Goldman Sachs Focused Growth Fund pursuant to an Agreement and Plan of Reorganization. Portfolio turnover excludes purchases and sales of securities by Goldman Sachs Focused Growth Fund (acquired fund) prior to the merger date. |
| | |
| 60 | | The accompanying notes are an integral part of these financial statements. |
GOLDMAN SACHS CONCENTRATED GROWTH FUND
Financial Highlights (continued)
Selected Share Data for a Share Outstanding Throughout Each Period
| | | | | | | | | | | | | | | | | | | | | | | | | | |
| | | | | Goldman Sachs Concentrated Growth Fund | |
| | | | | Class C Shares | |
| | | | | Six Months Ended
February 28, 2021
(Unaudited) | | | Year Ended August 31, | |
| | | | | 2020 | | | 2019 | | | 2018 | | | 2017 | | | 2016 | |
| | Per Share Data | | | | | | | | | | | | | | | | | | | | | | | | |
| | | | | | | |
| | Net asset value, beginning of period | | $ | 17.56 | | | $ | 13.87 | | | $ | 15.88 | | | $ | 14.93 | | | $ | 12.84 | | | $ | 14.05 | |
| | | | | | | |
| | Net investment loss(a) | | | (0.12 | ) | | | (0.17 | ) | | | (0.13 | ) | | | (0.12 | ) | | | (0.08 | ) | | | (0.09 | )(b) |
| | | | | | | |
| | Net realized and unrealized gain | | | 1.05 | | | | 5.34 | | | | 0.22 | | | | 3.17 | | | | 2.24 | | | | 0.69 | |
| | | | | | | |
| | Total from investment operations | | | 0.93 | | | | 5.17 | | | | 0.09 | | | | 3.05 | | | | 2.16 | | | | 0.60 | |
| | | | | | | |
| | Distributions to shareholders from net realized gains | | | (1.45 | ) | | | (1.48 | ) | | | (2.10 | ) | | | (2.10 | ) | | | (0.07 | ) | | | (1.81 | ) |
| | | | | | | |
| | Net asset value, end of period | | $ | 17.04 | | | $ | 17.56 | | | $ | 13.87 | | | $ | 15.88 | | | $ | 14.93 | | | $ | 12.84 | |
| | | | | | | |
| | Total Return(c) | | | 5.56 | % | | | 40.47 | % | | | 2.81 | % | | | 22.74 | % | | | 16.88 | % | | | 4.27 | % |
| | | | | | | |
| | Net assets, end of period (in 000’s) | | $ | 1,056 | | | $ | 1,162 | | | $ | 823 | | | $ | 2,137 | | | $ | 2,210 | | | $ | 2,192 | |
| | | | | | | |
| | Ratio of net expenses to average net assets | | | 1.87 | %(d) | | | 1.91 | % | | | 1.91 | % | | | 1.92 | % | | | 1.95 | % | | | 1.98 | % |
| | | | | | | |
| | Ratio of total expenses to average net assets | | | 2.08 | %(d) | | | 2.10 | % | | | 2.21 | % | | | 2.26 | % | | | 2.40 | % | | | 2.38 | % |
| | | | | | | |
| | Ratio of net investment loss to average net assets | | | (1.36 | )%(d) | | | (1.23 | )% | | | (0.98 | )% | | | (0.80 | )% | | | (0.61 | )% | | | (0.71 | )%(b) |
| | | | | | | |
| | Portfolio turnover rate(e) | | | 21 | % | | | 36 | % | | | 40 | % | | | 44 | % | | | 54 | %(f) | | | 55 | % |
| | (a) | | Calculated based on the average shares outstanding methodology. |
| | (b) | | Reflects income recognized from a special dividend which amounted to $0.03 per share and 0.19% of average net assets. |
| | (c) | | Assumes investment at the NAV at the beginning of the period, reinvestment of all dividends and distributions, a complete redemption of the investment at the NAV at the end of the period and no sales or redemption charges (if any). Total returns would be reduced if a sales or redemption charge was taken into account. Returns do not reflect the impact of taxes to shareholders relating to Fund distributions or the redemption of Fund shares. Total returns for periods less than one full year are not annualized. |
| | (e) | | The Fund’s portfolio turnover rate is calculated in accordance with regulatory requirements, without regard to transactions involving short term investments. If such transactions were included, the Fund’s portfolio turnover rate may be higher. |
| | (f) | | On July 28, 2017, Goldman Sachs Concentrated Growth Fund acquired all of the net assets of Goldman Sachs Focused Growth Fund pursuant to an Agreement and Plan of Reorganization. Portfolio turnover excludes purchases and sales of securities by Goldman Sachs Focused Growth Fund (acquired fund) prior to the merger date. |
| | |
| The accompanying notes are an integral part of these financial statements. | | 61 |
GOLDMAN SACHS CONCENTRATED GROWTH FUND
Financial Highlights (continued)
Selected Share Data for a Share Outstanding Throughout Each Period
| | | | | | | | | | | | | | | | | | | | | | | | | | |
| | | | | Goldman Sachs Concentrated Growth Fund | |
| | | | | Institutional Shares | |
| | | | | Six Months Ended
February 28, 2021
(Unaudited) | | | Year Ended August 31, | |
| | | | | 2020 | | | 2019 | | | 2018 | | | 2017 | | | 2016 | |
| | Per Share Data | | | | | | | | | | | | | | | | | | | | | | | | |
| | | | | | | |
| | Net asset value, beginning of period | | $ | 24.92 | | | $ | 18.93 | | | $ | 20.61 | | | $ | 18.65 | | | $ | 15.94 | | | $ | 16.88 | |
| | | | | | | |
| | Net investment income (loss)(a) | | | (0.04 | ) | | | (0.01 | ) | | | 0.03 | | | | 0.06 | | | | 0.09 | | | | 0.07 | (b) |
| | | | | | | |
| | Net realized and unrealized gain | | | 1.51 | | | | 7.50 | | | | 0.41 | | | | 4.07 | | | | 2.78 | | | | 0.84 | |
| | | | | | | |
| | Total from investment operations | | | 1.47 | | | | 7.49 | | | | 0.44 | | | | 4.13 | | | | 2.87 | | | | 0.91 | |
| | | | | | | |
| | Distributions to shareholders from net investment income | | | — | | | | (0.02 | ) | | | (0.02 | ) | | | (0.07 | ) | | | (0.09 | ) | | | (0.04 | ) |
| | | | | | | |
| | Distributions to shareholders from net realized gains | | | (1.45 | ) | | | (1.48 | ) | | | (2.10 | ) | | | (2.10 | ) | | | (0.07 | ) | | | (1.81 | ) |
| | | | | | | |
| | Total distributions | | | (1.45 | ) | | | (1.50 | ) | | | (2.12 | ) | | | (2.17 | ) | | | (0.16 | ) | | | (1.85 | ) |
| | | | | | | |
| | Net asset value, end of period | | $ | 24.94 | | | $ | 24.92 | | | $ | 18.93 | | | $ | 20.61 | | | $ | 18.65 | | | $ | 15.94 | |
| | | | | | | |
| | Total Return(c) | | | 6.10 | % | | | 41.98 | % | | | 3.98 | % | | | 24.13 | % | | | 18.22 | % | | | 5.47 | % |
| | | | | | | |
| | Net assets, end of period (in 000’s) | | $ | 14,435 | | | $ | 13,744 | | | $ | 12,497 | | | $ | 15,286 | | | $ | 142,623 | | | $ | 134,818 | |
| | | | | | | |
| | Ratio of net expenses to average net assets | | | 0.80 | %(d) | | | 0.81 | % | | | 0.80 | % | | | 0.81 | % | | | 0.82 | % | | | 0.82 | % |
| | | | | | | |
| | Ratio of total expenses to average net assets | | | 0.96 | %(d) | | | 1.01 | % | | | 1.07 | % | | | 1.20 | % | | | 1.26 | % | | | 1.23 | % |
| | | | | | | |
| | Ratio of net investment income (loss) to average net assets | | | (0.29 | )%(d) | | | (0.07 | )% | | | 0.17 | % | | | 0.31 | % | | | 0.51 | % | | | 0.43 | %(b) |
| | | | | | | |
| | Portfolio turnover rate(e) | | | 21 | % | | | 36 | % | | | 40 | % | | | 44 | % | | | 54 | %(f) | | | 55 | % |
| | (a) | | Calculated based on the average shares outstanding methodology. |
| | (b) | | Reflects income recognized from a special dividend which amounted to $0.03 per share and 0.19% of average net assets. |
| | (c) | | Assumes investment at the NAV at the beginning of the period, reinvestment of all dividends and distributions, a complete redemption of the investment at the NAV at the end of the period and no sales or redemption charges (if any). Total returns would be reduced if a sales or redemption charge was taken into account. Returns do not reflect the impact of taxes to shareholders relating to Fund distributions or the redemption of Fund shares. Total returns for periods less than one full year are not annualized. |
| | (e) | | The Fund’s portfolio turnover rate is calculated in accordance with regulatory requirements, without regard to transactions involving short term investments. If such transactions were included, the Fund’s portfolio turnover rate may be higher. |
| | (f) | | On July 28, 2017, Goldman Sachs Concentrated Growth Fund acquired all of the net assets of Goldman Sachs Focused Growth Fund pursuant to an Agreement and Plan of Reorganization. Portfolio turnover excludes purchases and sales of securities by Goldman Sachs Focused Growth Fund (acquired fund) prior to the merger date. |
| | |
| 62 | | The accompanying notes are an integral part of these financial statements. |
GOLDMAN SACHS CONCENTRATED GROWTH FUND
Financial Highlights (continued)
Selected Share Data for a Share Outstanding Throughout Each Period
| | | | | | | | | | | | | | | | | | | | | | | | | | |
| | | | | Goldman Sachs Concentrated Growth Fund | |
| | | | | Investor Shares | |
| | | | | Six Months Ended
February 28, 2021
(Unaudited) | | | Year Ended August 31, | |
| | | | | 2020 | | | 2019 | | | 2018 | | | 2017 | | | 2016 | |
| | Per Share Data | | | | | | | | | | | | | | | | | | | | | | | | |
| | | | | | | |
| | Net asset value, beginning of period | | $ | 23.46 | | | $ | 17.90 | | | $ | 19.66 | | | $ | 17.88 | | | $ | 15.28 | | | $ | 16.26 | |
| | | | | | | |
| | Net investment income (loss)(a) | | | (0.04 | ) | | | (0.03 | ) | | | 0.01 | | | | 0.03 | | | | 0.07 | | | | 0.04 | (b) |
| | | | | | | |
| | Net realized and unrealized gain | | | 1.42 | | | | 7.07 | | | | 0.36 | | | | 3.88 | | | | 2.67 | | | | 0.81 | |
| | | | | | | |
| | Total from investment operations | | | 1.38 | | | | 7.04 | | | | 0.37 | | | | 3.91 | | | | 2.74 | | | | 0.85 | |
| | | | | | | |
| | Distributions to shareholders from net investment income | | | — | | | | — | (c) | | | (0.03 | ) | | | (0.03 | ) | | | (0.07 | ) | | | (0.02 | ) |
| | | | | | | |
| | Distributions to shareholders from net realized gains | | | (1.45 | ) | | | (1.48 | ) | | | (2.10 | ) | | | (2.10 | ) | | | (0.07 | ) | | | (1.81 | ) |
| | | | | | | |
| | Total distributions | | | (1.45 | ) | | | (1.48 | ) | | | (2.13 | ) | | | (2.13 | ) | | | (0.14 | ) | | | (1.83 | ) |
| | | | | | | |
| | Net asset value, end of period | | $ | 23.39 | | | $ | 23.46 | | | $ | 17.90 | | | $ | 19.66 | | | $ | 17.88 | | | $ | 15.28 | |
| | | | | | | |
| | Total Return(d) | | | 6.10 | % | | | 41.87 | % | | | 3.83 | % | | | 23.94 | % | | | 18.14 | % | | | 5.31 | % |
| | | | | | | |
| | Net assets, end of period (in 000’s) | | $ | 216 | | | $ | 189 | | | $ | 133 | | | $ | 463 | | | $ | 780 | | | $ | 452 | |
| | | | | | | |
| | Ratio of net expenses to average net assets | | | 0.87 | %(e) | | | 0.91 | % | | | 0.91 | % | | | 0.92 | % | | | 0.95 | % | | | 0.97 | % |
| | | | | | | |
| | Ratio of total expenses to average net assets | | | 1.08 | %(e) | | | 1.11 | % | | | 1.22 | % | | | 1.26 | % | | | 1.41 | % | | | 1.38 | % |
| | | | | | | |
| | Ratio of net investment income (loss) to average net assets | | | (0.36 | )%(e) | | | (0.18 | )% | | | 0.03 | % | | | 0.17 | % | | | 0.45 | % | | | 0.27 | %(b) |
| | | | | | | |
| | Portfolio turnover rate(f) | | | 21 | % | | | 36 | % | | | 40 | % | | | 44 | % | | | 54 | %(g) | | | 55 | % |
| | (a) | | Calculated based on the average shares outstanding methodology. |
| | (b) | | Reflects income recognized from a special dividend which amounted to $0.03 per share and 0.19% of average net assets. |
| | (c) | | Amount is less than $0.005 per share. |
| | (d) | | Assumes investment at the NAV at the beginning of the period, reinvestment of all dividends and distributions, a complete redemption of the investment at the NAV at the end of the period and no sales or redemption charges (if any). Total returns would be reduced if a sales or redemption charge was taken into account. Returns do not reflect the impact of taxes to shareholders relating to Fund distributions or the redemption of Fund shares. Total returns for periods less than one full year are not annualized. |
| | (f) | | The Fund’s portfolio turnover rate is calculated in accordance with regulatory requirements, without regard to transactions involving short term investments. If such transactions were included, the Fund’s portfolio turnover rate may be higher. |
| | (g) | | On July 28, 2017, Goldman Sachs Concentrated Growth Fund acquired all of the net assets of Goldman Sachs Focused Growth Fund pursuant to an Agreement and Plan of Reorganization. Portfolio turnover excludes purchases and sales of securities by Goldman Sachs Focused Growth Fund (acquired fund) prior to the merger date. |
| | |
| The accompanying notes are an integral part of these financial statements. | | 63 |
GOLDMAN SACHS CONCENTRATED GROWTH FUND
Financial Highlights (continued)
Selected Share Data for a Share Outstanding Throughout Each Period
| | | | | | | | | | | | | | | | | | | | | | | | | | |
| | | | | Goldman Sachs Concentrated Growth Fund | |
| | | | | Class R6 Shares | |
| | | | | Six Months Ended
February 28, 2021
(Unaudited) | | | Year Ended August 31, | |
| | | | | 2020 | | | 2019 | | | 2018 | | | 2017 | | | 2016 | |
| | Per Share Data | | | | | | | | | | | | | | | | | | | | | | | | |
| | | | | | | |
| | Net asset value, beginning of period | | $ | 24.86 | | | $ | 18.88 | | | $ | 20.60 | | | $ | 18.65 | | | $ | 15.95 | | | $ | 16.88 | |
| | | | | | | |
| | Net investment income (loss)(a) | | | (0.03 | ) | | | (0.01 | ) | | | 0.04 | | | | 0.06 | | | | 0.13 | | | | 0.07 | (b) |
| | | | | | | |
| | Net realized and unrealized gain | | | 1.50 | | | | 7.49 | | | | 0.39 | | | | 4.06 | | | | 2.74 | | | | 0.85 | |
| | | | | | | |
| | Total from investment operations | | | 1.47 | | | | 7.48 | | | | 0.43 | | | | 4.12 | | | | 2.87 | | | | 0.92 | |
| | | | | | | |
| | Distributions to shareholders from net investment income | | | — | | | | (0.02 | ) | | | (0.05 | ) | | | (0.07 | ) | | | (0.10 | ) | | | (0.04 | ) |
| | | | | | | |
| | Distributions to shareholders from net realized gains | | | (1.45 | ) | | | (1.48 | ) | | | (2.10 | ) | | | (2.10 | ) | | | (0.07 | ) | | | (1.81 | ) |
| | | | | | | |
| | Total distributions | | | (1.45 | ) | | | (1.50 | ) | | | (2.15 | ) | | | (2.17 | ) | | | (0.17 | ) | | | (1.85 | ) |
| | | | | | | |
| | Net asset value, end of period | | $ | 24.88 | | | $ | 24.86 | | | $ | 18.88 | | | $ | 20.60 | | | $ | 18.65 | | | $ | 15.95 | |
| | | | | | | |
| | Total Return(c) | | | 6.11 | % | | | 42.05 | % | | | 4.00 | % | | | 24.09 | % | | | 18.17 | % | | | 5.56 | % |
| | | | | | | |
| | Net assets, end of period (in 000’s) | | $ | 858 | | | $ | 806 | | | $ | 538 | | | $ | 99 | | | $ | 68 | | | $ | 10 | |
| | | | | | | |
| | Ratio of net expenses to average net assets | | | 0.79 | %(d) | | | 0.80 | % | | | 0.79 | % | | | 0.80 | % | | | 0.82 | % | | | 0.81 | % |
| | | | | | | |
| | Ratio of total expenses to average net assets | | | 0.95 | %(d) | | | 0.98 | % | | | 1.04 | % | | | 1.09 | % | | | 1.32 | % | | | 1.21 | % |
| | | | | | | |
| | Ratio of net investment income (loss) to average net assets | | | (0.28 | )%(d) | | | (0.07 | )% | | | 0.22 | % | | | 0.34 | % | | | 0.74 | % | | | 0.44 | %(b) |
| | | | | | | |
| | Portfolio turnover rate(e) | | | 21 | % | | | 36 | % | | | 40 | % | | | 44 | % | | | 54 | %(f) | | | 55 | % |
| | (a) | | Calculated based on the average shares outstanding methodology. |
| | (b) | | Reflects income recognized from a special dividend which amounted to $0.03 per share and 0.19% of average net assets. |
| | (c) | | Assumes investment at the NAV at the beginning of the period, reinvestment of all dividends and distributions, a complete redemption of the investment at the NAV at the end of the period and no sales or redemption charges (if any). Total returns would be reduced if a sales or redemption charge was taken into account. Returns do not reflect the impact of taxes to shareholders relating to Fund distributions or the redemption of Fund shares. Total returns for periods less than one full year are not annualized. |
| | (e) | | The Fund’s portfolio turnover rate is calculated in accordance with regulatory requirements, without regard to transactions involving short term investments. If such transactions were included, the Fund’s portfolio turnover rate may be higher. |
| | (f) | | On July 28, 2017, Goldman Sachs Concentrated Growth Fund acquired all of the net assets of Goldman Sachs Focused Growth Fund pursuant to an Agreement and Plan of Reorganization. Portfolio turnover excludes purchases and sales of securities by Goldman Sachs Focused Growth Fund (acquired fund) prior to the merger date. |
| | |
| 64 | | The accompanying notes are an integral part of these financial statements. |
GOLDMAN SACHS CONCENTRATED GROWTH FUND
Financial Highlights (continued)
Selected Share Data for a Share Outstanding Throughout Each Period
| | | | | | | | | | | | | | | | | | | | | | | | | | |
| | | | | Goldman Sachs Concentrated Growth Fund | |
| | | | | Class R Shares | |
| | | | | Six Months Ended
February 28, 2021
(Unaudited) | | | Year Ended August 31, | |
| | | | | 2020 | | | 2019 | | | 2018 | | | 2017 | | | 2016 | |
| | Per Share Data | | | | | | | | | | | | | | | | | | | | | | | | |
| | | | | | | |
| | Net asset value, beginning of period | | $ | 21.84 | | | $ | 16.84 | | | $ | 18.68 | | | $ | 17.13 | | | $ | 14.65 | | | $ | 15.71 | |
| | | | | | | |
| | Net investment loss(a) | | | (0.09 | ) | | | (0.12 | ) | | | (0.07 | ) | | | (0.05 | ) | | | (0.02 | ) | | | (0.04 | )(b) |
| | | | | | | |
| | Net realized and unrealized gain | | | 1.31 | | | | 6.60 | | | | 0.33 | | | | 3.70 | | | | 2.57 | | | | 0.79 | |
| | | | | | | |
| | Total from investment operations | | | 1.22 | | | | 6.48 | | | | 0.26 | | | | 3.65 | | | | 2.55 | | | | 0.75 | |
| | | | | | | |
| | Distributions to shareholders from net realized gains | | | (1.45 | ) | | | (1.48 | ) | | | (2.10 | ) | | | (2.10 | ) | | | (0.07 | ) | | | (1.81 | ) |
| | | | | | | |
| | Net asset value, end of period | | $ | 21.61 | | | $ | 21.84 | | | $ | 16.84 | | | $ | 18.68 | | | $ | 17.13 | | | $ | 14.65 | |
| | | | | | | |
| | Total Return(c) | | | 5.81 | % | | | 41.12 | % | | | 3.36 | % | | | 23.37 | % | | | 17.46 | % | | | 4.81 | % |
| | | | | | | |
| | Net assets, end of period (in 000’s) | | $ | 35 | | | $ | 33 | | | $ | 36 | | | $ | 34 | | | $ | 25 | | | $ | 22 | |
| | | | | | | |
| | Ratio of net expenses to average net assets | | | 1.37 | %(d) | | | 1.41 | % | | | 1.41 | % | | | 1.42 | % | | | 1.45 | % | | | 1.48 | % |
| | | | | | | |
| | Ratio of total expenses to average net assets | | | 1.58 | %(d) | | | 1.66 | % | | | 1.70 | % | | | 1.75 | % | | | 1.91 | % | | | 1.89 | % |
| | | | | | | |
| | Ratio of net investment loss to average net assets | | | (0.86 | )%(d) | | | (0.69 | )% | | | (0.43 | )% | | | (0.29 | )% | | | (0.14 | )% | | | (0.25 | )%(b) |
| | | | | | | |
| | Portfolio turnover rate(e) | | | 21 | % | | | 36 | % | | | 40 | % | | | 44 | % | | | 54 | %(f) | | | 55 | % |
| | (a) | | Calculated based on the average shares outstanding methodology. |
| | (b) | | Reflects income recognized from a special dividend which amounted to $0.03 per share and 0.19% of average net assets. |
| | (c) | | Assumes investment at the NAV at the beginning of the period, reinvestment of all dividends and distributions, a complete redemption of the investment at the NAV at the end of the period and no sales or redemption charges (if any). Total returns would be reduced if a sales or redemption charge was taken into account. Returns do not reflect the impact of taxes to shareholders relating to Fund distributions or the redemption of Fund shares. Total returns for periods less than one full year are not annualized. |
| | (e) | | The Fund’s portfolio turnover rate is calculated in accordance with regulatory requirements, without regard to transactions involving short term investments. If such transactions were included, the Fund’s portfolio turnover rate may be higher. |
| | (f) | | On July 28, 2017, Goldman Sachs Concentrated Growth Fund acquired all of the net assets of Goldman Sachs Focused Growth Fund pursuant to an Agreement and Plan of Reorganization. Portfolio turnover excludes purchases and sales of securities by Goldman Sachs Focused Growth Fund (acquired fund) prior to the merger date. |
| | |
| The accompanying notes are an integral part of these financial statements. | | 65 |
GOLDMAN SACHS CONCENTRATED GROWTH FUND
Financial Highlights (continued)
Selected Share Data for a Share Outstanding Throughout Each Period
| | | | | | | | | | | | | | | | | | |
| | | | | Goldman Sachs Concentrated Growth Fund | |
| | | | | Class P Shares | |
| | | | | Six Months Ended
February 28, 2021
(Unaudited) | | | Year Ended August 31, | | | Period Ended
August 31, 2018(a) | |
| | | | | 2020 | | | 2019 | |
| | Per Share Data | | | | | | | | | | | | | | | | |
| | | | | |
| | Net asset value, beginning of period | | $ | 24.85 | | | $ | 18.88 | | | $ | 20.60 | | | $ | 18.54 | |
| | | | | |
| | Net investment income (loss)(b) | | | (0.03 | ) | | | (0.01 | ) | | | 0.03 | | | | 0.02 | |
| | | | | |
| | Net realized and unrealized gain | | | 1.50 | | | | 7.48 | | | | 0.40 | | | | 2.04 | |
| | | | | |
| | Total from investment operations | | | 1.47 | | | | 7.47 | | | | 0.43 | | | | 2.06 | |
| | | | | |
| | Distributions to shareholders from net investment income | | | — | | | | (0.02 | ) | | | (0.05 | ) | | | — | |
| | | | | |
| | Distributions to shareholders from net realized gains | | | (1.45 | ) | | | (1.48 | ) | | | (2.10 | ) | | | — | |
| | | | | |
| | Total distributions | | | (1.45 | ) | | | (1.50 | ) | | | (2.15 | ) | | | — | |
| | | | | |
| | Net asset value, end of period | | $ | 24.87 | | | $ | 24.85 | | | $ | 18.88 | | | $ | 20.60 | |
| | | | | |
| | Total Return(c) | | | 6.12 | % | | | 42.00 | % | | | 4.01 | % | | | 11.11 | % |
| | | | | |
| | Net assets, end of period (in 000’s) | | $ | 163,461 | | | $ | 160,582 | | | $ | 128,289 | | | $ | 143,078 | |
| | | | | |
| | Ratio of net expenses to average net assets | | | 0.79 | %(d) | | | 0.80 | % | | | 0.79 | % | | | 0.79 | %(d) |
| | | | | |
| | Ratio of total expenses to average net assets | | | 0.95 | %(d) | | | 0.99 | % | | | 1.06 | % | | | 0.72 | %(d) |
| | | | | |
| | Ratio of net investment income (loss) to average net assets | | | (0.28 | )%(d) | | | (0.06 | )% | | | 0.18 | % | | | 0.32 | %(d) |
| | | | | |
| | Portfolio turnover rate(e) | | | 21 | % | | | 36 | % | | | 40 | % | | | 44 | % |
| | (a) | | Commenced operations on April 17, 2018. |
| | (b) | | Calculated based on the average shares outstanding methodology. |
| | (c) | | Assumes investment at the NAV at the beginning of the period, reinvestment of all dividends and distributions, a complete redemption of the investment at the NAV at the end of the period and no sales or redemption charges (if any). Total returns would be reduced if a sales or redemption charge was taken into account. Returns do not reflect the impact of taxes to shareholders relating to Fund distributions or the redemption of Fund shares. Total returns for periods less than one full year are not annualized. |
| | (e) | | The Fund’s portfolio turnover rate is calculated in accordance with regulatory requirements, without regard to transactions involving short term investments. If such transactions were included, the Fund’s portfolio turnover rate may be higher. |
| | |
| 66 | | The accompanying notes are an integral part of these financial statements. |
GOLDMAN SACHS FLEXIBLE CAP FUND
Financial Highlights (continued)
Selected Share Data for a Share Outstanding Throughout Each Period
| | | | | | | | | | | | | | | | | | | | | | | | | | |
| | | | | Goldman Sachs Flexible Cap Fund | |
| | | | | Class A Shares | |
| | | | | Six Months Ended
February 28, 2021
(Unaudited) | | | Year Ended August 31, | |
| | | | | 2020 | | | 2019 | | | 2018 | | | 2017 | | | 2016 | |
| | Per Share Data | | | | | | | | | | | | | | | | | | | | | | | | |
| | | | | | | |
| | Net asset value, beginning of period | | $ | 13.78 | | | $ | 11.93 | | | $ | 12.66 | | | $ | 14.09 | | | $ | 11.74 | | | $ | 11.90 | |
| | | | | | | |
| | Net investment income (loss)(a) | | | 0.02 | | | | 0.07 | | | | 0.09 | | | | 0.09 | | | | — | (b) | | | (0.02 | ) |
| | | | | | | |
| | Net realized and unrealized gain | | | 1.27 | | | | 2.48 | | | | 0.15 | | | | 2.17 | | | | 2.36 | | | | 0.59 | |
| | | | | | | |
| | Total from investment operations | | | 1.29 | | | | 2.55 | | | | 0.24 | | | | 2.26 | | | | 2.36 | | | | 0.57 | |
| | | | | | | |
| | Distributions to shareholders from net investment income | | | (0.06 | ) | | | (0.08 | ) | | | (0.10 | ) | | | (0.01 | ) | | | — | | | | — | |
| | | | | | | |
| | Distributions to shareholders from net realized gains | | | (0.74 | ) | | | (0.62 | ) | | | (0.87 | ) | | | (3.68 | ) | | | (0.01 | ) | | | (0.73 | ) |
| | | | | | | |
| | Total distributions | | | (0.80 | ) | | | (0.70 | ) | | | (0.97 | ) | | | (3.69 | ) | | | (0.01 | ) | | | (0.73 | ) |
| | | | | | | |
| | Net asset value, end of period | | $ | 14.27 | | | $ | 13.78 | | | $ | 11.93 | | | $ | 12.66 | | | $ | 14.09 | | | $ | 11.74 | |
| | | | | | | |
| | Total Return(c) | | | 9.61 | % | | | 22.18 | % | | | 3.07 | % | | | 18.82 | % | | | 20.14 | % | | | 4.93 | % |
| | | | | | | |
| | Net assets, end of period (in 000’s) | | $ | 6,459 | | | $ | 5,843 | | | $ | 5,383 | | | $ | 5,490 | | | $ | 5,627 | | | $ | 5,927 | |
| | | | | | | |
| | Ratio of net expenses to average net assets | | | 0.96 | %(d) | | | 1.00 | % | | | 0.97 | % | | | 0.95 | % | | | 1.20 | % | | | 1.22 | % |
| | | | | | | |
| | Ratio of total expenses to average net assets | | | 2.23 | %(d) | | | 2.47 | % | | | 2.88 | % | | | 2.47 | % | | | 3.01 | % | | | 3.07 | % |
| | | | | | | |
| | Ratio of net investment income (loss) to average net assets | | | 0.31 | %(d) | | | 0.58 | % | | | 0.74 | % | | | 0.73 | % | | | (0.01 | )% | | | (0.21 | )% |
| | | | | | | |
| | Portfolio turnover rate(e) | | | 19 | % | | | 69 | % | | | 50 | % | | | 157 | % | | | 47 | % | | | 46 | % |
| | (a) | | Calculated based on the average shares outstanding methodology. |
| | (b) | | Amount is less than $0.005 per share. |
| | (c) | | Assumes investment at the NAV at the beginning of the period, reinvestment of all dividends and distributions, a complete redemption of the investment at the NAV at the end of the period and no sales or redemption charges (if any). Total returns would be reduced if a sales or redemption charge was taken into account. Returns do not reflect the impact of taxes to shareholders relating to Fund distributions or the redemption of Fund shares. Total returns for periods less than one full year are not annualized. |
| | (e) | | The Fund’s portfolio turnover rate is calculated in accordance with regulatory requirements, without regard to transactions involving short term investments. If such transactions were included, the Fund’s portfolio turnover rate may be higher. |
| | |
| The accompanying notes are an integral part of these financial statements. | | 67 |
GOLDMAN SACHS FLEXIBLE CAP FUND
Financial Highlights (continued)
Selected Share Data for a Share Outstanding Throughout Each Period
| | | | | | | | | | | | | | | | | | | | | | | | | | |
| | | | | Goldman Sachs Flexible Cap Fund | |
| | | | | Class C Shares | |
| | | | | Six Months Ended
February 28, 2021
(Unaudited) | | | Year Ended August 31, | |
| | | | | 2020 | | | 2019 | | | 2018 | | | 2017 | | | 2016 | |
| | Per Share Data | | | | | | | | | | | | | | | | | | | | | | | | |
| | | | | | | |
| | Net asset value, beginning of period | | $ | 11.67 | | | $ | 10.23 | | | $ | 11.00 | | | $ | 12.75 | | | $ | 10.71 | | | $ | 11.00 | |
| | | | | | | |
| | Net investment loss(a) | | | (0.03 | ) | | | (0.02 | ) | | | — | (b) | | | — | (b) | | | (0.09 | ) | | | (0.10 | ) |
| | | | | | | |
| | Net realized and unrealized gain | | | 1.09 | | | | 2.10 | | | | 0.13 | | | | 1.93 | | | | 2.14 | | | | 0.54 | |
| | | | | | | |
| | Total from investment operations | | | 1.06 | | | | 2.08 | | | | 0.13 | | | | 1.93 | | | | 2.05 | | | | 0.44 | |
| | | | | | | |
| | Distributions to shareholders from net investment income | | | — | | | | (0.02 | ) | | | (0.03 | ) | | | — | | | | — | | | | — | |
| | | | | | | |
| | Distributions to shareholders from net realized gains | | | (0.74 | ) | | | (0.62 | ) | | | (0.87 | ) | | | (3.68 | ) | | | (0.01 | ) | | | (0.73 | ) |
| | | | | | | |
| | Total distributions | | | (0.74 | ) | | | (0.64 | ) | | | (0.90 | ) | | | (3.68 | ) | | | (0.01 | ) | | | (0.73 | ) |
| | | | | | | |
| | Net asset value, end of period | | $ | 11.99 | | | $ | 11.67 | | | $ | 10.23 | | | $ | 11.00 | | | $ | 12.75 | | | $ | 10.71 | |
| | | | | | | |
| | Total Return(c) | | | 9.31 | % | | | 21.16 | % | | | 2.30 | % | | | 18.00 | % | | | 19.18 | % | | | 4.12 | % |
| | | | | | | |
| | Net assets, end of period (in 000’s) | | $ | 1,264 | | | $ | 1,516 | | | $ | 1,288 | | | $ | 1,304 | | | $ | 1,512 | | | $ | 1,474 | |
| | | | | | | |
| | Ratio of net expenses to average net assets | | | 1.71 | %(d) | | | 1.75 | % | | | 1.72 | % | | | 1.70 | % | | | 1.95 | % | | | 1.97 | % |
| | | | | | | |
| | Ratio of total expenses to average net assets | | | 2.98 | %(d) | | | 3.19 | % | | | 3.63 | % | | | 3.20 | % | | | 3.76 | % | | | 3.82 | % |
| | | | | | | |
| | Ratio of net investment loss to average net assets | | | (0.45 | )%(d) | | | (0.16 | )% | | | — | %(e) | | | (0.02 | )% | | | (0.75 | )% | | | (0.96 | )% |
| | | | | | | |
| | Portfolio turnover rate(f) | | | 19 | % | | | 69 | % | | | 50 | % | | | 157 | % | | | 47 | % | | | 46 | % |
| | (a) | | Calculated based on the average shares outstanding methodology. |
| | (b) | | Amount is less than $0.005 per share. |
| | (c) | | Assumes investment at the NAV at the beginning of the period, reinvestment of all dividends and distributions, a complete redemption of the investment at the NAV at the end of the period and no sales or redemption charges (if any). Total returns would be reduced if a sales or redemption charge was taken into account. Returns do not reflect the impact of taxes to shareholders relating to Fund distributions or the redemption of Fund shares. Total returns for periods less than one full year are not annualized. |
| | (e) | | Amount is less than 0.005% per share. |
| | (f) | | The Fund’s portfolio turnover rate is calculated in accordance with regulatory requirements, without regard to transactions involving short term investments. If such transactions were included, the Fund’s portfolio turnover rate may be higher. |
| | |
| 68 | | The accompanying notes are an integral part of these financial statements. |
GOLDMAN SACHS FLEXIBLE CAP FUND
Financial Highlights (continued)
Selected Share Data for a Share Outstanding Throughout Each Period
| | | | | | | | | | | | | | | | | | | | | | | | | | |
| | | | | Goldman Sachs Flexible Cap Fund | |
| | | | | Institutional Shares | |
| | | | | Six Months Ended
February 28, 2021
(Unaudited) | | | Year Ended August 31, | |
| | | | | 2020 | | | 2019 | | | 2018 | | | 2017 | | | 2016 | |
| | Per Share Data | | | | | | | | | | | | | | | | | | | | | | | | |
| | | | | | | |
| | Net asset value, beginning of period | | $ | 15.01 | | | $ | 12.94 | | | $ | 13.61 | | | $ | 14.88 | | | $ | 12.35 | | | $ | 12.44 | |
| | | | | | | |
| | Net investment income(a) | | | 0.05 | | | | 0.12 | | | | 0.13 | | | | 0.14 | | | | 0.05 | | | | 0.02 | |
| | | | | | | |
| | Net realized and unrealized gain | | | 1.40 | | | | 2.70 | | | | 0.19 | | | | 2.33 | | | | 2.49 | | | | 0.62 | |
| | | | | | | |
| | Total from investment operations | | | 1.45 | | | | 2.82 | | | | 0.32 | | | | 2.47 | | | | 2.54 | | | | 0.64 | |
| | | | | | | |
| | Distributions to shareholders from net investment income | | | (0.11 | ) | | | (0.13 | ) | | | (0.12 | ) | | | (0.06 | ) | | | — | | | | — | |
| | | | | | | |
| | Distributions to shareholders from net realized gains | | | (0.74 | ) | | | (0.62 | ) | | | (0.87 | ) | | | (3.68 | ) | | | (0.01 | ) | | | (0.73 | ) |
| | | | | | | |
| | Total distributions | | | (0.85 | ) | | | (0.75 | ) | | | (0.99 | ) | | | (3.74 | ) | | | (0.01 | ) | | | (0.73 | ) |
| | | | | | | |
| | Net asset value, end of period | | $ | 15.61 | | | $ | 15.01 | | | $ | 12.94 | | | $ | 13.61 | | | $ | 14.88 | | | $ | 12.35 | |
| | | | | | | |
| | Total Return(b) | | | 9.86 | % | | | 22.53 | % | | | 3.47 | % | | | 19.29 | % | | | 20.61 | % | | | 5.29 | % |
| | | | | | | |
| | Net assets, end of period (in 000’s) | | $ | 1,162 | | | $ | 594 | | | $ | 587 | | | $ | 1,633 | | | $ | 11,111 | | | $ | 9,330 | |
| | | | | | | |
| | Ratio of net expenses to average net assets | | | 0.59 | %(c) | | | 0.62 | % | | | 0.59 | % | | | 0.59 | % | | | 0.82 | % | | | 0.82 | % |
| | | | | | | |
| | Ratio of total expenses to average net assets | | | 1.85 | %(c) | | | 2.11 | % | | | 2.41 | % | | | 2.01 | % | | | 2.62 | % | | | 2.68 | % |
| | | | | | | |
| | Ratio of net investment income to average net assets | | | 0.72 | %(c) | | | 0.95 | % | | | 1.08 | % | | | 1.04 | % | | | 0.38 | % | | | 0.20 | % |
| | | | | | | |
| | Portfolio turnover rate(d) | | | 19 | % | | | 69 | % | | | 50 | % | | | 157 | % | | | 47 | % | | | 46 | % |
| | (a) | | Calculated based on the average shares outstanding methodology. |
| | (b) | | Assumes investment at the NAV at the beginning of the period, reinvestment of all dividends and distributions, a complete redemption of the investment at the NAV at the end of the period and no sales or redemption charges (if any). Total returns would be reduced if a sales or redemption charge was taken into account. Returns do not reflect the impact of taxes to shareholders relating to Fund distributions or the redemption of Fund shares. Total returns for periods less than one full year are not annualized. |
| | (d) | | The Fund’s portfolio turnover rate is calculated in accordance with regulatory requirements, without regard to transactions involving short term investments. If such transactions were included, the Fund’s portfolio turnover rate may be higher. |
| | |
| The accompanying notes are an integral part of these financial statements. | | 69 |
GOLDMAN SACHS FLEXIBLE CAP FUND
Financial Highlights (continued)
Selected Share Data for a Share Outstanding Throughout Each Period
| | | | | | | | | | | | | | | | | | | | | | | | | | |
| | | | | Goldman Sachs Flexible Cap Fund | |
| | | | | Investor Shares | |
| | | | | Six Months Ended
February 28, 2021
(Unaudited) | | | Year Ended August 31, | |
| | | | | 2020 | | | 2019 | | | 2018 | | | 2017 | | | 2016 | |
| | Per Share Data | | | | | | | | | | | | | | | | | | | | | | | | |
| | | | | | | |
| | Net asset value, beginning of period | | $ | 14.66 | | | $ | 12.65 | | | $ | 13.35 | | | $ | 14.63 | | | $ | 12.16 | | | $ | 12.27 | |
| | | | | | | |
| | Net investment income(a) | | | 0.04 | | | | 0.10 | | | | 0.12 | | | | 0.12 | | | | 0.05 | | | | — | (b) |
| | | | | | | |
| | Net realized and unrealized gain | | | 1.36 | | | | 2.64 | | | | 0.18 | | | | 2.28 | | | | 2.43 | | | | 0.62 | |
| | | | | | | |
| | Total from investment operations | | | 1.40 | | | | 2.74 | | | | 0.30 | | | | 2.40 | | | | 2.48 | | | | 0.62 | |
| | | | | | | |
| | Distributions to shareholders from net investment income | | | (0.09 | ) | | | (0.11 | ) | | | (0.13 | ) | | | — | | | | — | | | | — | |
| | | | | | | |
| | Distributions to shareholders from net realized gains | | | (0.74 | ) | | | (0.62 | ) | | | (0.87 | ) | | | (3.68 | ) | | | (0.01 | ) | | | (0.73 | ) |
| | | | | | | |
| | Total distributions | | | (0.83 | ) | | | (0.73 | ) | | | (1.00 | ) | | | (3.68 | ) | | | (0.01 | ) | | | (0.73 | ) |
| | | | | | | |
| | Net asset value, end of period | | $ | 15.23 | | | $ | 14.66 | | | $ | 12.65 | | | $ | 13.35 | | | $ | 14.63 | | | $ | 12.16 | |
| | | | | | | |
| | Total Return(c) | | | 9.77 | % | | | 22.43 | % | | | 3.40 | % | | | 19.08 | % | | | 20.43 | % | | | 5.20 | % |
| | | | | | | |
| | Net assets, end of period (in 000’s) | | $ | 41 | | | $ | 38 | | | $ | 70 | | | $ | 68 | | | $ | 379 | | | $ | 197 | |
| | | | | | | |
| | Ratio of net expenses to average net assets | | | 0.71 | %(d) | | | 0.76 | % | | | 0.72 | % | | | 0.70 | % | | | 0.95 | % | | | 0.97 | % |
| | | | | | | |
| | Ratio of total expenses to average net assets | | | 1.98 | %(d) | | | 2.66 | % | | | 2.63 | % | | | 2.08 | % | | | 2.83 | % | | | 2.76 | % |
| | | | | | | |
| | Ratio of net investment income to average net assets | | | 0.56 | %(d) | | | 0.78 | % | | | 0.99 | % | | | 0.88 | % | | | 0.35 | % | | | 0.03 | % |
| | | | | | | |
| | Portfolio turnover rate(e) | | | 19 | % | | | 69 | % | | | 50 | % | | | 157 | % | | | 47 | % | | | 46 | % |
| | (a) | | Calculated based on the average shares outstanding methodology. |
| | (b) | | Amount is less than $0.005 per share. |
| | (c) | | Assumes investment at the NAV at the beginning of the period, reinvestment of all dividends and distributions, a complete redemption of the investment at the NAV at the end of the period and no sales or redemption charges (if any). Total returns would be reduced if a sales or redemption charge was taken into account. Returns do not reflect the impact of taxes to shareholders relating to Fund distributions or the redemption of Fund shares. Total returns for periods less than one full year are not annualized. |
| | (e) | | The Fund’s portfolio turnover rate is calculated in accordance with regulatory requirements, without regard to transactions involving short term investments. If such transactions were included, the Fund’s portfolio turnover rate may be higher. |
| | |
| 70 | | The accompanying notes are an integral part of these financial statements. |
GOLDMAN SACHS FLEXIBLE CAP FUND
Financial Highlights (continued)
Selected Share Data for a Share Outstanding Throughout Each Period
| | | | | | | | | | | | | | | | | | | | | | | | | | |
| | | | | Goldman Sachs Flexible Cap Fund | |
| | | | | Class R6 Shares | |
| | | | | Six Months Ended
February 28, 2021
(Unaudited) | | | Year Ended August 31, | |
| | | | | 2020 | | | 2019 | | | 2018 | | | 2017 | | | 2016 | |
| | Per Share Data | | | | | | | | | | | | | | | | | | | | | | | | |
| | | | | | | |
| | Net asset value, beginning of period | | $ | 14.98 | | | $ | 12.91 | | | $ | 13.61 | | | $ | 14.88 | | | $ | 12.35 | | | $ | 12.44 | |
| | | | | | | |
| | Net investment income(a) | | | 0.05 | | | | 0.13 | | | | 0.14 | | | | 0.15 | | | | 0.05 | | | | 0.03 | |
| | | | | | | |
| | Net realized and unrealized gain | | | 1.40 | | | | 2.69 | | | | 0.18 | | | | 2.32 | | | | 2.49 | | | | 0.61 | |
| | | | | | | |
| | Total from investment operations | | | 1.45 | | | | 2.82 | | | | 0.32 | | | | 2.47 | | | | 2.54 | | | | 0.64 | |
| | | | | | | |
| | Distributions to shareholders from net investment income | | | (0.11 | ) | | | (0.13 | ) | | | (0.15 | ) | | | (0.06 | ) | | | — | | | | — | |
| | | | | | | |
| | Distributions to shareholders from net realized gains | | | (0.74 | ) | | | (0.62 | ) | | | (0.87 | ) | | | (3.68 | ) | | | (0.01 | ) | | | (0.73 | ) |
| | | | | | | |
| | Total distributions | | | (0.85 | ) | | | (0.75 | ) | | | (1.02 | ) | | | (3.74 | ) | | | (0.01 | ) | | | (0.73 | ) |
| | | | | | | |
| | Net asset value, end of period | | $ | 15.58 | | | $ | 14.98 | | | $ | 12.91 | | | $ | 13.61 | | | $ | 14.88 | | | $ | 12.35 | |
| | | | | | | |
| | Total Return(b) | | | 9.90 | % | | | 22.60 | % | | | 3.47 | % | | | 19.27 | % | | | 20.61 | % | | | 5.29 | % |
| | | | | | | |
| | Net assets, end of period (in 000’s) | | $ | 250 | | | $ | 226 | | | $ | 202 | | | $ | 14 | | | $ | 12 | | | $ | 10 | |
| | | | | | | |
| | Ratio of net expenses to average net assets | | | 0.58 | %(c) | | | 0.61 | % | | | 0.59 | % | | | 0.58 | % | | | 0.82 | % | | | 0.81 | % |
| | | | | | | |
| | Ratio of total expenses to average net assets | | | 1.85 | %(c) | | | 2.10 | % | | | 2.59 | % | | | 2.09 | % | | | 2.61 | % | | | 2.66 | % |
| | | | | | | |
| | Ratio of net investment income to average net assets | | | 0.69 | %(c) | | | 0.96 | % | | | 1.17 | % | | | 1.11 | % | | | 0.39 | % | | | 0.22 | % |
| | | | | | | |
| | Portfolio turnover rate(d) | | | 19 | % | | | 69 | % | | | 50 | % | | | 157 | % | | | 47 | % | | | 46 | % |
| | (a) | | Calculated based on the average shares outstanding methodology. |
| | (b) | | Assumes investment at the NAV at the beginning of the period, reinvestment of all dividends and distributions, a complete redemption of the investment at the NAV at the end of the period and no sales or redemption charges (if any). Total returns would be reduced if a sales or redemption charge was taken into account. Returns do not reflect the impact of taxes to shareholders relating to Fund distributions or the redemption of Fund shares. Total returns for periods less than one full year are not annualized. |
| | (d) | | The Fund’s portfolio turnover rate is calculated in accordance with regulatory requirements, without regard to transactions involving short term investments. If such transactions were included, the Fund’s portfolio turnover rate may be higher. |
| | |
| The accompanying notes are an integral part of these financial statements. | | 71 |
GOLDMAN SACHS FLEXIBLE CAP FUND
Financial Highlights (continued)
Selected Share Data for a Share Outstanding Throughout Each Period
| | | | | | | | | | | | | | | | | | | | | | | | | | |
| | | | | Goldman Sachs Flexible Cap Fund | |
| | | | | Class R Shares | |
| | | | | Six Months Ended
February 28, 2021
(Unaudited) | | | Year Ended August 31, | |
| | | | | 2020 | | | 2019 | | | 2018 | | | 2017 | | | 2016 | |
| | Per Share Data | | | | | | | | | | | | | | | | | | | | | | | | |
| | | | | | | |
| | Net asset value, beginning of period | | $ | 13.13 | | | $ | 11.40 | | | $ | 12.14 | | | $ | 13.67 | | | $ | 11.42 | | | $ | 11.63 | |
| | | | | | | |
| | Net investment income (loss)(a) | | | — | (b) | | | 0.04 | | | | 0.05 | | | | 0.06 | | | | (0.03 | ) | | | (0.05 | ) |
| | | | | | | |
| | Net realized and unrealized gain | | | 1.22 | | | | 2.36 | | | | 0.16 | | | | 2.09 | | | | 2.29 | | | | 0.57 | |
| | | | | | | |
| | Total from investment operations | | | 1.22 | | | | 2.40 | | | | 0.21 | | | | 2.15 | | | | 2.26 | | | | 0.52 | |
| | | | | | | |
| | Distributions to shareholders from net investment income | | | (0.04 | ) | | | (0.05 | ) | | | (0.08 | ) | | | — | | | | — | | | | — | |
| | | | | | | |
| | Distributions to shareholders from net realized gains | | | (0.74 | ) | | | (0.62 | ) | | | (0.87 | ) | | | (3.68 | ) | | | (0.01 | ) | | | (0.73 | ) |
| | | | | | | |
| | Total distributions | | | (0.78 | ) | | | (0.67 | ) | | | (0.95 | ) | | | (3.68 | ) | | | (0.01 | ) | | | (0.73 | ) |
| | | | | | | |
| | Net asset value, end of period | | $ | 13.57 | | | $ | 13.13 | | | $ | 11.40 | | | $ | 12.14 | | | $ | 13.67 | | | $ | 11.42 | |
| | | | | | | |
| | Total Return(c) | | | 9.52 | % | | | 21.78 | % | | | 2.89 | % | | | 18.50 | % | | | 19.83 | % | | | 4.61 | % |
| | | | | | | |
| | Net assets, end of period (in 000’s) | | $ | 55 | | | $ | 49 | | | $ | 39 | | | $ | 49 | | | $ | 39 | | | $ | 37 | |
| | | | | | | |
| | Ratio of net expenses to average net assets | | | 1.21 | %(d) | | | 1.25 | % | | | 1.22 | % | | | 1.20 | % | | | 1.45 | % | | | 1.47 | % |
| | | | | | | |
| | Ratio of total expenses to average net assets | | | 2.48 | %(d) | | | 2.63 | % | | | 3.13 | % | | | 2.74 | % | | | 3.28 | % | | | 3.33 | % |
| | | | | | | |
| | Ratio of net investment income (loss) to average net assets | | | 0.06 | %(d) | | | 0.33 | % | | | 0.49 | % | | | 0.48 | % | | | (0.23 | )% | | | (0.45 | )% |
| | | | | | | |
| | Portfolio turnover rate(e) | | | 19 | % | | | 69 | % | | | 50 | % | | | 157 | % | | | 47 | % | | | 46 | % |
| | (a) | | Calculated based on the average shares outstanding methodology. |
| | (b) | | Amount is less than $0.005 per share. |
| | (c) | | Assumes investment at the NAV at the beginning of the period, reinvestment of all dividends and distributions, a complete redemption of the investment at the NAV at the end of the period and no sales or redemption charges (if any). Total returns would be reduced if a sales or redemption charge was taken into account. Returns do not reflect the impact of taxes to shareholders relating to Fund distributions or the redemption of Fund shares. Total returns for periods less than one full year are not annualized. |
| | (e) | | The Fund’s portfolio turnover rate is calculated in accordance with regulatory requirements, without regard to transactions involving short term investments. If such transactions were included, the Fund’s portfolio turnover rate may be higher. |
| | |
| 72 | | The accompanying notes are an integral part of these financial statements. |
GOLDMAN SACHS FLEXIBLE CAP FUND
Financial Highlights (continued)
Selected Share Data for a Share Outstanding Throughout Each Period
| | | | | | | | | | | | | | | | | | |
| | | | | Goldman Sachs Flexible Cap Fund | |
| | | | | Class P Shares | |
| | | | | Six Months Ended
February 28, 2021
(Unaudited) | | | Year Ended August 31, | | | Period Ended
August 31, 2018(a) | |
| | | | | 2020 | | | 2019 | |
| | Per Share Data | | | | | | | | | | | | | | | | |
| | | | | |
| | Net asset value, beginning of period | | $ | 14.99 | | | $ | 12.92 | | | $ | 13.61 | | | $ | 12.75 | |
| | | | | |
| | Net investment income(b) | | | 0.05 | | | | 0.13 | | | | 0.14 | | | | 0.09 | |
| | | | | |
| | Net realized and unrealized gain | | | 1.39 | | | | 2.69 | | | | 0.19 | | | | 0.77 | |
| | | | | |
| | Total from investment operations | | | 1.44 | | | | 2.82 | | | | 0.33 | | | | 0.86 | |
| | | | | |
| | Distributions to shareholders from net investment income | | | (0.11 | ) | | | (0.13 | ) | | | (0.15 | ) | | | — | |
| | | | | |
| | Distributions to shareholders from net realized gains | | | (0.74 | ) | | | (0.62 | ) | | | (0.87 | ) | | | — | |
| | | | | |
| | Total distributions | | | (0.85 | ) | | | (0.75 | ) | | | (1.02 | ) | | | — | |
| | | | | |
| | Net asset value, end of period | | $ | 15.58 | | | $ | 14.99 | | | $ | 12.92 | | | $ | 13.61 | |
| | | | | |
| | Total Return(c) | | | 9.83 | % | | | 22.58 | % | | | 3.56 | % | | | 6.75 | % |
| | | | | |
| | Net assets, end of period (in 000’s) | | $ | 17,816 | | | $ | 15,263 | | | $ | 11,110 | | | $ | 12,616 | |
| | | | | |
| | Ratio of net expenses to average net assets | | | 0.58 | %(d) | | | 0.61 | % | | | 0.58 | % | | | 0.58 | %(d) |
| | | | | |
| | Ratio of total expenses to average net assets | | | 1.85 | %(d) | | | 1.94 | % | | | 2.47 | % | | | 3.14 | %(d) |
| | | | | |
| | Ratio of net investment income to average net assets | | | 0.69 | %(d) | | | 0.96 | % | | | 1.13 | % | | | 1.79 | %(d) |
| | | | | |
| | Portfolio turnover rate(e) | | | 19 | % | | | 69 | % | | | 50 | % | | | 157 | % |
| | (a) | | Commenced operations on April 17, 2018. |
| | (b) | | Calculated based on the average shares outstanding methodology. |
| | (c) | | Assumes investment at the NAV at the beginning of the period, reinvestment of all dividends and distributions, a complete redemption of the investment at the NAV at the end of the period and no sales or redemption charges (if any). Total returns would be reduced if a sales or redemption charge was taken into account. Returns do not reflect the impact of taxes to shareholders relating to Fund distributions or the redemption of Fund shares. Total returns for periods less than one full year are not annualized. |
| | (e) | | The Fund’s portfolio turnover rate is calculated in accordance with regulatory requirements, without regard to transactions involving short term investments. If such transactions were included, the Fund’s portfolio turnover rate may be higher. |
| | |
| The accompanying notes are an integral part of these financial statements. | | 73 |
GOLDMAN SACHS GROWTH OPPORTUNITIES FUND
Financial Highlights (continued)
Selected Share Data for a Share Outstanding Throughout Each Period
| | | | | | | | | | | | | | | | | | | | | | | | | | |
| | | | | Goldman Sachs Growth Opportunities Fund | |
| | | | | Class A Shares | |
| | | | | Six Months Ended
February 28, 2021
(Unaudited) | | | Year Ended August 31, | |
| | | | | 2020 | | | 2019 | | | 2018 | | | 2017 | | | 2016 | |
| | Per Share Data | | | | | | | | | | | | | | | | | | | | | | | | |
| | | | | | | |
| | Net asset value, beginning of period | | $ | 17.14 | | | $ | 18.14 | | | $ | 23.42 | | | $ | 23.97 | | | $ | 21.70 | | | $ | 23.84 | |
| | | | | | | |
| | Net investment loss(a) | | | (0.07 | ) | | | (0.10 | ) | | | (0.09 | ) | | | (0.14 | ) | | | (0.12 | ) | | | (0.10 | )(b) |
| | | | | | | |
| | Net realized and unrealized gain | | | 3.37 | | | | 4.13 | | | | 0.69 | | | | 4.20 | | | | 2.94 | | | | 0.77 | |
| | | | | | | |
| | Total from investment operations | | | 3.30 | | | | 4.03 | | | | 0.60 | | | | 4.06 | | | | 2.82 | | | | 0.67 | |
| | | | | | | |
| | Distributions to shareholders from net realized gains | | | (4.05 | ) | | | (5.03 | ) | | | (5.88 | ) | | | (4.61 | ) | | | (0.55 | ) | | | (2.81 | ) |
| | | | | | | |
| | Net asset value, end of period | | $ | 16.39 | | | $ | 17.14 | | | $ | 18.14 | | | $ | 23.42 | | | $ | 23.97 | | | $ | 21.70 | |
| | | | | | | |
| | Total Return(c) | | | 20.54 | % | | | 28.84 | % | | | 8.00 | % | | | 19.37 | % | | | 13.40 | % | | | 3.39 | % |
| | | | | | | |
| | Net assets, end of period (in 000’s) | | $ | 383,264 | | | $ | 347,644 | | | $ | 331,433 | | | $ | 421,605 | | | $ | 486,115 | | | $ | 631,053 | |
| | | | | | | |
| | Ratio of net expenses to average net assets | | | 1.24 | %(d) | | | 1.25 | % | | | 1.27 | % | | | 1.30 | % | | | 1.30 | % | | | 1.32 | % |
| | | | | | | |
| | Ratio of total expenses to average net assets | | | 1.37 | %(d) | | | 1.41 | % | | | 1.39 | % | | | 1.40 | % | | | 1.43 | % | | | 1.42 | % |
| | | | | | | |
| | Ratio of net investment loss to average net assets | | | (0.85 | )%(d) | | | (0.64 | )% | | | (0.51 | )% | | | (0.60 | )% | | | (0.56 | )% | | | (0.47 | )%(b) |
| | | | | | | |
| | Portfolio turnover rate(e) | | | 27 | % | | | 65 | % | | | 69 | % | | | 60 | % | | | 61 | % | | | 55 | % |
| | (a) | | Calculated based on the average shares outstanding methodology. |
| | (b) | | Reflects income recognized from special dividends which amounted to $0.04 per share and 0.16% of average net assets. |
| | (c) | | Assumes investment at the NAV at the beginning of the period, reinvestment of all dividends and distributions, a complete redemption of the investment at the NAV at the end of the period and no sales or redemption charges (if any). Total returns would be reduced if a sales or redemption charge was taken into account. Returns do not reflect the impact of taxes to shareholders relating to Fund distributions or the redemption of Fund shares. Total returns for periods less than one full year are not annualized. |
| | (e) | | The Fund’s portfolio turnover rate is calculated in accordance with regulatory requirements, without regard to transactions involving short term investments. If such transactions were included, the Fund’s portfolio turnover rate may be higher. |
| | |
| 74 | | The accompanying notes are an integral part of these financial statements. |
GOLDMAN SACHS GROWTH OPPORTUNITIES FUND
Financial Highlights (continued)
Selected Share Data for a Share Outstanding Throughout Each Period
| | | | | | | | | | | | | | | | | | | | | | | | | | |
| | | | | Goldman Sachs Growth Opportunities Fund | |
| | | | | Class C Shares | |
| | | | | Six Months Ended
February 28, 2021
(Unaudited) | | | Year Ended August 31, | |
| | | | | 2020 | | | 2019 | | | 2018 | | | 2017 | | | 2016 | |
| | Per Share Data | | | | | | | | | | | | | | | | | | | | | | | | |
| | | | | | | |
| | Net asset value, beginning of period | | $ | 6.78 | | | $ | 10.16 | | | $ | 16.11 | | | $ | 17.95 | | | $ | 16.52 | | | $ | 18.95 | |
| | | | | | | |
| | Net investment loss(a) | | | (0.04 | ) | | | (0.09 | ) | | | (0.13 | ) | | | (0.22 | ) | | | (0.22 | ) | | | (0.20 | )(b) |
| | | | | | | |
| | Net realized and unrealized gain | | | 1.19 | | | | 1.74 | | | | 0.06 | | | | 2.99 | | | | 2.20 | | | | 0.58 | |
| | | | | | | |
| | Total from investment operations | | | 1.15 | | | | 1.65 | | | | (0.07 | ) | | | 2.77 | | | | 1.98 | | | | 0.38 | |
| | | | | | | |
| | Distributions to shareholders from net realized gains | | | (4.05 | ) | | | (5.03 | ) | | | (5.88 | ) | | | (4.61 | ) | | | (0.55 | ) | | | (2.81 | ) |
| | | | | | | |
| | Net asset value, end of period | | $ | 3.88 | | | $ | 6.78 | | | $ | 10.16 | | | $ | 16.11 | | | $ | 17.95 | | | $ | 16.52 | |
| | | | | | | |
| | Total Return(c) | | | 20.19 | % | | | 27.86 | % | | | 7.24 | % | | | 18.52 | % | | | 12.49 | % | | | 2.66 | % |
| | | | | | | |
| | Net assets, end of period (in 000’s) | | $ | 28,018 | | | $ | 28,894 | | | $ | 40,072 | | | $ | 77,990 | | | $ | 91,086 | | | $ | 128,788 | |
| | | | | | | |
| | Ratio of net expenses to average net assets | | | 1.99 | %(d) | | | 2.00 | % | | | 2.02 | % | | | 2.05 | % | | | 2.05 | % | | | 2.07 | % |
| | | | | | | |
| | Ratio of total expenses to average net assets | | | 2.12 | %(d) | | | 2.16 | % | | | 2.14 | % | | | 2.15 | % | | | 2.18 | % | | | 2.17 | % |
| | | | | | | |
| | Ratio of net investment loss to average net assets | | | (1.60 | )%(d) | | | (1.38 | )% | | | (1.25 | )% | | | (1.35 | )% | | | (1.32 | )% | | | (1.23 | )%(b) |
| | | | | | | |
| | Portfolio turnover rate(e) | | | 27 | % | | | 65 | % | | | 69 | % | | | 60 | % | | | 61 | % | | | 55 | % |
| | (a) | | Calculated based on the average shares outstanding methodology. |
| | (b) | | Reflects income recognized from special dividends which amounted to $0.04 per share and 0.16% of average net assets. |
| | (c) | | Assumes investment at the NAV at the beginning of the period, reinvestment of all dividends and distributions, a complete redemption of the investment at the NAV at the end of the period and no sales or redemption charges (if any). Total returns would be reduced if a sales or redemption charge was taken into account. Returns do not reflect the impact of taxes to shareholders relating to Fund distributions or the redemption of Fund shares. Total returns for periods less than one full year are not annualized. |
| | (e) | | The Fund’s portfolio turnover rate is calculated in accordance with regulatory requirements, without regard to transactions involving short term investments. If such transactions were included, the Fund’s portfolio turnover rate may be higher. |
| | |
| The accompanying notes are an integral part of these financial statements. | | 75 |
GOLDMAN SACHS GROWTH OPPORTUNITIES FUND
Financial Highlights (continued)
Selected Share Data for a Share Outstanding Throughout Each Period
| | | | | | | | | | | | | | | | | | | | | | | | | | |
| | | | | Goldman Sachs Growth Opportunities Fund | |
| | | | | Institutional Shares | |
| | | | | Six Months Ended
February 28, 2021
(Unaudited) | | | Year Ended August 31, | |
| | | | | 2020 | | | 2019 | | | 2018 | | | 2017 | | | 2016 | |
| | Per Share Data | | | | | | | | | | | | | | | | | | | | | | | | |
| | | | | | | |
| | Net asset value, beginning of period | | $ | 23.41 | | | $ | 22.93 | | | $ | 27.78 | | | $ | 27.54 | | | $ | 24.76 | | | $ | 26.71 | |
| | | | | | | |
| | Net investment loss(a) | | | (0.06 | ) | | | (0.06 | ) | | | (0.04 | ) | | | (0.07 | ) | | | (0.05 | ) | | | (0.03 | )(b) |
| | | | | | | |
| | Net realized and unrealized gain | | | 4.69 | | | | 5.57 | | | | 1.07 | | | | 4.92 | | | | 3.38 | | | | 0.89 | |
| | | | | | | |
| | Total from investment operations | | | 4.63 | | | | 5.51 | | | | 1.03 | | | | 4.85 | | | | 3.33 | | | | 0.86 | |
| | | | | | | |
| | Distributions to shareholders from net realized gains | | | (4.05 | ) | | | (5.03 | ) | | | (5.88 | ) | | | (4.61 | ) | | | (0.55 | ) | | | (2.81 | ) |
| | | | | | | |
| | Net asset value, end of period | | $ | 23.99 | | | $ | 23.41 | | | $ | 22.93 | | | $ | 27.78 | | | $ | 27.54 | | | $ | 24.76 | |
| | | | | | | |
| | Total Return(c) | | | 20.73 | % | | | 29.33 | % | | | 8.34 | % | | | 19.78 | % | | | 13.81 | % | | | 3.76 | % |
| | | | | | | |
| | Net assets, end of period (in 000’s) | | $ | 481,301 | | | $ | 442,693 | | | $ | 491,659 | | | $ | 1,178,239 | | | $ | 1,670,808 | | | $ | 2,160,714 | |
| | | | | | | |
| | Ratio of net expenses to average net assets | | | 0.90 | %(d) | | | 0.91 | % | | | 0.93 | % | | | 0.96 | % | | | 0.95 | % | | | 0.95 | % |
| | | | | | | |
| | Ratio of total expenses to average net assets | | | 1.00 | %(d) | | | 1.03 | % | | | 1.00 | % | | | 1.01 | % | | | 1.03 | % | | | 1.02 | % |
| | | | | | | |
| | Ratio of net investment loss to average net assets | | | (0.51 | )%(d) | | | (0.29 | )% | | | (0.17 | )% | | | (0.26 | )% | | | (0.21 | )% | | | (0.11 | )%(b) |
| | | | | | | |
| | Portfolio turnover rate(e) | | | 27 | % | | | 65 | % | | | 69 | % | | | 60 | % | | | 61 | % | | | 55 | % |
| | (a) | | Calculated based on the average shares outstanding methodology. |
| | (b) | | Reflects income recognized from special dividends which amounted to $0.04 per share and 0.16% of average net assets. |
| | (c) | | Assumes investment at the NAV at the beginning of the period, reinvestment of all dividends and distributions, a complete redemption of the investment at the NAV at the end of the period and no sales or redemption charges (if any). Total returns would be reduced if a sales or redemption charge was taken into account. Returns do not reflect the impact of taxes to shareholders relating to Fund distributions or the redemption of Fund shares. Total returns for periods less than one full year are not annualized. |
| | (e) | | The Fund’s portfolio turnover rate is calculated in accordance with regulatory requirements, without regard to transactions involving short term investments. If such transactions were included, the Fund’s portfolio turnover rate may be higher. |
| | |
| 76 | | The accompanying notes are an integral part of these financial statements. |
GOLDMAN SACHS GROWTH OPPORTUNITIES FUND
Financial Highlights (continued)
Selected Share Data for a Share Outstanding Throughout Each Period
| | | | | | | | | | | | | | | | | | | | | | | | | | |
| | | | | Goldman Sachs Growth Opportunities Fund | |
| | | | | Service Shares | |
| | | | | Six Months Ended
February 28, 2021
(Unaudited) | | | Year Ended August 31, | |
| | | | | 2020 | | | 2019 | | | 2018 | | | 2017 | | | 2016 | |
| | Per Share Data | | | | | | | | | | | | | | | | | | | | | | | | |
| | | | | | | |
| | Net asset value, beginning of period | | $ | 15.50 | | | $ | 16.89 | | | $ | 22.29 | | | $ | 23.05 | | | $ | 20.92 | | | $ | 23.11 | |
| | | | | | | |
| | Net investment loss(a) | | | (0.08 | ) | | | (0.11 | ) | | | (0.11 | ) | | | (0.17 | ) | | | (0.15 | ) | | | (0.13 | )(b) |
| | | | | | | |
| | Net realized and unrealized gain | | | 3.03 | | | | 3.75 | | | | 0.59 | | | | 4.02 | | | | 2.83 | | | | 0.75 | |
| | | | | | | |
| | Total from investment operations | | | 2.95 | | | | 3.64 | | | | 0.48 | | | | 3.85 | | | | 2.68 | | | | 0.62 | |
| | | | | | | |
| | Distributions to shareholders from net realized gains | | | (4.05 | ) | | | (5.03 | ) | | | (5.88 | ) | | | (4.61 | ) | | | (0.55 | ) | | | (2.81 | ) |
| | | | | | | |
| | Net asset value, end of period | | $ | 14.40 | | | $ | 15.50 | | | $ | 16.89 | | | $ | 22.29 | | | $ | 23.05 | | | $ | 20.92 | |
| | | | | | | |
| | Total Return(c) | | | 20.46 | % | | | 28.64 | % | | | 7.82 | % | | | 19.21 | % | | | 13.22 | % | | | 3.27 | % |
| | | | | | | |
| | Net assets, end of period (in 000’s) | | $ | 31,890 | | | $ | 27,723 | | | $ | 27,094 | | | $ | 34,211 | | | $ | 33,159 | | | $ | 37,432 | |
| | | | | | | |
| | Ratio of net expenses to average net assets | | | 1.40 | %(d) | | | 1.41 | % | | | 1.43 | % | | | 1.46 | % | | | 1.45 | % | | | 1.45 | % |
| | | | | | | |
| | Ratio of total expenses to average net assets | | | 1.50 | %(d) | | | 1.53 | % | | | 1.51 | % | | | 1.51 | % | | | 1.53 | % | | | 1.52 | % |
| | | | | | | |
| | Ratio of net investment loss to average net assets | | | (1.01 | )%(d) | | | (0.79 | )% | | | (0.67 | )% | | | (0.76 | )% | | | (0.71 | )% | | | (0.61 | )%(b) |
| | | | | | | |
| | Portfolio turnover rate(e) | | | 27 | % | | | 65 | % | | | 69 | % | | | 60 | % | | | 61 | % | | | 55 | % |
| | (a) | | Calculated based on the average shares outstanding methodology. |
| | (b) | | Reflects income recognized from special dividends which amounted to $0.04 per share and 0.16% of average net assets. |
| | (c) | | Assumes investment at the NAV at the beginning of the period, reinvestment of all dividends and distributions, a complete redemption of the investment at the NAV at the end of the period and no sales or redemption charges (if any). Total returns would be reduced if a sales or redemption charge was taken into account. Returns do not reflect the impact of taxes to shareholders relating to Fund distributions or the redemption of Fund shares. Total returns for periods less than one full year are not annualized. |
| | (e) | | The Fund’s portfolio turnover rate is calculated in accordance with regulatory requirements, without regard to transactions involving short term investments. If such transactions were included, the Fund’s portfolio turnover rate may be higher. |
| | |
| The accompanying notes are an integral part of these financial statements. | | 77 |
GOLDMAN SACHS GROWTH OPPORTUNITIES FUND
Financial Highlights (continued)
Selected Share Data for a Share Outstanding Throughout Each Period
| | | | | | | | | | | | | | | | | | | | | | | | | | |
| | | | | Goldman Sachs Growth Opportunities Fund | |
| | | | | Investor Shares | |
| | | | | Six Months Ended
February 28, 2021
(Unaudited) | | | Year Ended August 31, | |
| | | | | 2020 | | | 2019 | | | 2018 | | | 2017 | | | 2016 | |
| | Per Share Data | | | | | | | | | | | | | | | | | | | | | | | | |
| | | | | | | |
| | Net asset value, beginning of period | | $ | 18.90 | | | $ | 19.47 | | | $ | 24.59 | | | $ | 24.90 | | | $ | 22.46 | | | $ | 24.52 | |
| | | | | | | |
| | Net investment loss(a) | | | (0.06 | ) | | | (0.07 | ) | | | (0.05 | ) | | | (0.08 | ) | | | (0.07 | ) | | | (0.05 | )(b) |
| | | | | | | |
| | Net realized and unrealized gain | | | 3.75 | | | | 4.53 | | | | 0.81 | | | | 4.38 | | | | 3.06 | | | | 0.80 | |
| | | | | | | |
| | Total from investment operations | | | 3.69 | | | | 4.46 | | | | 0.76 | | | | 4.30 | | | | 2.99 | | | | 0.75 | |
| | | | | | | |
| | Distributions to shareholders from net realized gains | | | (4.05 | ) | | | (5.03 | ) | | | (5.88 | ) | | | (4.61 | ) | | | (0.55 | ) | | | (2.81 | ) |
| | | | | | | |
| | Net asset value, end of period | | $ | 18.54 | | | $ | 18.90 | | | $ | 19.47 | | | $ | 24.59 | | | $ | 24.90 | | | $ | 22.46 | |
| | | | | | | |
| | Total Return(c) | | | 20.71 | % | | | 29.15 | % | | | 8.33 | % | | | 19.64 | % | | | 13.71 | % | | | 3.64 | % |
| | | | | | | |
| | Net assets, end of period (in 000’s) | | $ | 100,499 | | | $ | 81,928 | | | $ | 77,012 | | | $ | 93,889 | | | $ | 132,003 | | | $ | 135,930 | |
| | | | | | | |
| | Ratio of net expenses to average net assets | | | 0.99 | %(d) | | | 1.00 | % | | | 1.01 | % | | | 1.05 | % | | | 1.05 | % | | | 1.07 | % |
| | | | | | | |
| | Ratio of total expenses to average net assets | | | 1.12 | %(d) | | | 1.16 | % | | | 1.15 | % | | | 1.15 | % | | | 1.18 | % | | | 1.17 | % |
| | | | | | | |
| | Ratio of net investment loss to average net assets | | | (0.60 | )%(d) | | | (0.39 | )% | | | (0.25 | )% | | | (0.35 | )% | | | (0.31 | )% | | | (0.23 | )%(b) |
| | | | | | | |
| | Portfolio turnover rate(e) | | | 27 | % | | | 65 | % | | | 69 | % | | | 60 | % | | | 61 | % | | | 55 | % |
| | (a) | | Calculated based on the average shares outstanding methodology. |
| | (b) | | Reflects income recognized from special dividends which amounted to $0.04 per share and 0.16% of average net assets. |
| | (c) | | Assumes investment at the NAV at the beginning of the period, reinvestment of all dividends and distributions, a complete redemption of the investment at the NAV at the end of the period and no sales or redemption charges (if any). Total returns would be reduced if a sales or redemption charge was taken into account. Returns do not reflect the impact of taxes to shareholders relating to Fund distributions or the redemption of Fund shares. Total returns for periods less than one full year are not annualized. |
| | (e) | | The Fund’s portfolio turnover rate is calculated in accordance with regulatory requirements, without regard to transactions involving short term investments. If such transactions were included, the Fund’s portfolio turnover rate may be higher. |
| | |
| 78 | | The accompanying notes are an integral part of these financial statements. |
GOLDMAN SACHS GROWTH OPPORTUNITIES FUND
Financial Highlights (continued)
Selected Share Data for a Share Outstanding Throughout Each Period
| | | | | | | | | | | | | | | | | | | | | | | | | | |
| | | | | Goldman Sachs Growth Opportunities Fund | |
| | | | | Class R6 Shares | |
| | | | | Six Months Ended
February 28, 2021
(Unaudited) | | | Year Ended August 31, | |
| | | | | 2020 | | | 2019 | | | 2018 | | | 2017 | | | 2016 | |
| | Per Share Data | | | | | | | | | | | | | | | | | | | | | | | | |
| | | | | | | |
| | Net asset value, beginning of period | | $ | 23.44 | | | $ | 22.95 | | | $ | 27.80 | | | $ | 27.55 | | | $ | 24.77 | | | $ | 26.71 | |
| | | | | | | |
| | Net investment loss(a) | | | (0.06 | ) | | | (0.06 | ) | | | (0.04 | ) | | | (0.07 | ) | | | (0.04 | ) | | | (0.04 | )(b) |
| | | | | | | |
| | Net realized and unrealized gain | | | 4.70 | | | | 5.58 | | | | 1.07 | | | | 4.93 | | | | 3.37 | | | | 0.91 | |
| | | | | | | |
| | Total from investment operations | | | 4.64 | | | | 5.52 | | | | 1.03 | | | | 4.86 | | | | 3.33 | | | | 0.87 | |
| | | | | | | |
| | Distributions to shareholders from net realized gains | | | (4.05 | ) | | | (5.03 | ) | | | (5.88 | ) | | | (4.61 | ) | | | (0.55 | ) | | | (2.81 | ) |
| | | | | | | |
| | Net asset value, end of period | | $ | 24.03 | | | $ | 23.44 | | | $ | 22.95 | | | $ | 27.80 | | | $ | 27.55 | | | $ | 24.77 | |
| | | | | | | |
| | Total Return(c) | | | 20.75 | % | | | 29.35 | % | | | 8.35 | % | | | 19.80 | % | | | 13.80 | % | | | 3.81 | % |
| | | | | | | |
| | Net assets, end of period (in 000’s) | | $ | 246,737 | | | $ | 211,480 | | | $ | 181,988 | | | $ | 231,077 | | | $ | 118,634 | | | $ | 44,865 | |
| | | | | | | |
| | Ratio of net expenses to average net assets | | | 0.89 | %(d) | | | 0.90 | % | | | 0.92 | % | | | 0.95 | % | | | 0.93 | % | | | 0.93 | % |
| | | | | | | |
| | Ratio of total expenses to average net assets | | | 0.99 | %(d) | | | 1.02 | % | | | 1.00 | % | | | 0.99 | % | | | 1.01 | % | | | 1.01 | % |
| | | | | | | |
| | Ratio of net investment loss to average net assets | | | (0.50 | )%(d) | | | (0.28 | )% | | | (0.16 | )% | | | (0.25 | )% | | | (0.18 | )% | | | (0.19 | )%(b) |
| | | | | | | |
| | Portfolio turnover rate(e) | | | 27 | % | | | 65 | % | | | 69 | % | | | 60 | % | | | 61 | % | | | 55 | % |
| | (a) | | Calculated based on the average shares outstanding methodology. |
| | (b) | | Reflects income recognized from special dividends which amounted to $0.04 per share and 0.16% of average net assets. |
| | (c) | | Assumes investment at the NAV at the beginning of the period, reinvestment of all dividends and distributions, a complete redemption of the investment at the NAV at the end of the period and no sales or redemption charges (if any). Total returns would be reduced if a sales or redemption charge was taken into account. Returns do not reflect the impact of taxes to shareholders relating to Fund distributions or the redemption of Fund shares. Total returns for periods less than one full year are not annualized. |
| | (e) | | The Fund’s portfolio turnover rate is calculated in accordance with regulatory requirements, without regard to transactions involving short term investments. If such transactions were included, the Fund’s portfolio turnover rate may be higher. |
| | |
| The accompanying notes are an integral part of these financial statements. | | 79 |
GOLDMAN SACHS GROWTH OPPORTUNITIES FUND
Financial Highlights (continued)
Selected Share Data for a Share Outstanding Throughout Each Period
| | | | | | | | | | | | | | | | | | | | | | | | | | |
| | | | | Goldman Sachs Growth Opportunities Fund | |
| | | | | Class R Shares | |
| | | | | Six Months Ended
February 28, 2021
(Unaudited) | | | Year Ended August 31, | |
| | | | | 2020 | | | 2019 | | | 2018 | | | 2017 | | | 2016 | |
| | Per Share Data | | | | | | | | | | | | | | | | | | | | | | | | |
| | | | | | | |
| | Net asset value, beginning of period | | $ | 15.53 | | | $ | 16.92 | | | $ | 22.33 | | | $ | 23.11 | | | $ | 20.99 | | | $ | 23.21 | |
| | | | | | | |
| | Net investment loss(a) | | | (0.08 | ) | | | (0.12 | ) | | | (0.13 | ) | | | (0.19 | ) | | | (0.17 | ) | | | (0.15 | )(b) |
| | | | | | | |
| | Net realized and unrealized gain | | | 3.02 | | | | 3.76 | | | | 0.60 | | | | 4.02 | | | | 2.84 | | | | 0.74 | |
| | | | | | | |
| | Total from investment operations | | | 2.94 | | | | 3.64 | | | | 0.47 | | | | 3.83 | | | | 2.67 | | | | 0.59 | |
| | | | | | | |
| | Distributions to shareholders from net realized gains | | | (4.05 | ) | | | (5.03 | ) | | | (5.88 | ) | | | (4.61 | ) | | | (0.55 | ) | | | (2.81 | ) |
| | | | | | | |
| | Net asset value, end of period | | $ | 14.42 | | | $ | 15.53 | | | $ | 16.92 | | | $ | 22.33 | | | $ | 23.11 | | | $ | 20.99 | |
| | | | | | | |
| | Total Return(c) | | | 20.34 | % | | | 28.58 | % | | | 7.75 | % | | | 19.06 | % | | | 13.13 | % | | | 3.12 | % |
| | | | | | | |
| | Net assets, end of period (in 000’s) | | $ | 55,822 | | | $ | 48,780 | | | $ | 45,005 | | | $ | 54,359 | | | $ | 59,225 | | | $ | 63,105 | |
| | | | | | | |
| | Ratio of net expenses to average net assets | | | 1.49 | %(d) | | | 1.50 | % | | | 1.51 | % | | | 1.55 | % | | | 1.55 | % | | | 1.57 | % |
| | | | | | | |
| | Ratio of total expenses to average net assets | | | 1.62 | %(d) | | | 1.66 | % | | | 1.64 | % | | | 1.65 | % | | | 1.68 | % | | | 1.67 | % |
| | | | | | | |
| | Ratio of net investment loss to average net assets | | | (1.10 | )%(d) | | | (0.89 | )% | | | (0.76 | )% | | | (0.85 | )% | | | (0.81 | )% | | | (0.73 | )%(b) |
| | | | | | | |
| | Portfolio turnover rate(e) | | | 27 | % | | | 65 | % | | | 69 | % | | | 60 | % | | | 61 | % | | | 55 | % |
| | (a) | | Calculated based on the average shares outstanding methodology. |
| | (b) | | Reflects income recognized from special dividends which amounted to $0.04 per share and 0.16% of average net assets. |
| | (c) | | Assumes investment at the NAV at the beginning of the period, reinvestment of all dividends and distributions, a complete redemption of the investment at the NAV at the end of the period and no sales or redemption charges (if any). Total returns would be reduced if a sales or redemption charge was taken into account. Returns do not reflect the impact of taxes to shareholders relating to Fund distributions or the redemption of Fund shares. Total returns for periods less than one full year are not annualized. |
| | (e) | | The Fund’s portfolio turnover rate is calculated in accordance with regulatory requirements, without regard to transactions involving short term investments. If such transactions were included, the Fund’s portfolio turnover rate may be higher. |
| | |
| 80 | | The accompanying notes are an integral part of these financial statements. |
GOLDMAN SACHS GROWTH OPPORTUNITIES FUND
Financial Highlights (continued)
Selected Share Data for a Share Outstanding Throughout Each Period
| | | | | | | | | | | | | | | | | | |
| | | | | Goldman Sachs Growth Opportunities Fund | |
| | | | | Class P Shares | |
| | | | | Six Months Ended
February 28, 2021
(Unaudited) | | | Year Ended August 31, | | | Period Ended
August 31, 2018(a) | |
| | 2020 | | | 2019 | |
| | Per Share Data | | | | | | | | | | | | | | | | |
| | | | | |
| | Net asset value, beginning of period | | $ | 23.45 | | | $ | 22.96 | | | $ | 27.80 | | | $ | 26.35 | |
| | | | | |
| | Net investment loss(b) | | | (0.06 | ) | | | (0.06 | ) | | | (0.04 | ) | | | (0.04 | ) |
| | | | | |
| | Net realized and unrealized gain | | | 4.70 | | | | 5.58 | | | | 1.08 | | | | 1.49 | |
| | | | | |
| | Total from investment operations | | | 4.64 | | | | 5.52 | | | | 1.04 | | | | 1.45 | |
| | | | | |
| | Distributions to shareholders from net realized gains | | | (4.05 | ) | | | (5.03 | ) | | | (5.88 | ) | | | — | |
| | | | | |
| | Net asset value, end of period | | $ | 24.04 | | | $ | 23.45 | | | $ | 22.96 | | | $ | 27.80 | |
| | | | | |
| | Total Return(c) | | | 20.75 | % | | | 29.34 | % | | | 8.38 | % | | | 5.50 | % |
| | | | | |
| | Net assets, end of period (in 000’s) | | $ | 92,070 | | | $ | 69,989 | | | $ | 69,893 | | | $ | 94,794 | |
| | | | | |
| | Ratio of net expenses to average net assets | | | 0.89 | %(d) | | | 0.90 | % | | | 0.92 | % | | | 0.95 | %(d) |
| | | | | |
| | Ratio of total expenses to average net assets | | | 0.99 | %(d) | | | 1.02 | % | | | 1.00 | % | | | 1.00 | %(d) |
| | | | | |
| | Ratio of net investment loss to average net assets | | | (0.50 | )%(d) | | | (0.28 | )% | | | (0.16 | )% | | | (0.36 | )%(d) |
| | | | | |
| | Portfolio turnover rate(e) | | | 27 | % | | | 65 | % | | | 69 | % | | | 60 | % |
| | (a) | | Commenced operations on April 17, 2018. |
| | (b) | | Calculated based on the average shares outstanding methodology. |
| | (c) | | Assumes investment at the NAV at the beginning of the period, reinvestment of all dividends and distributions, a complete redemption of the investment at the NAV at the end of the period and no sales or redemption charges (if any). Total returns would be reduced if a sales or redemption charge was taken into account. Returns do not reflect the impact of taxes to shareholders relating to Fund distributions or the redemption of Fund shares. Total returns for periods less than one full year are not annualized. |
| | (e) | | The Fund’s portfolio turnover rate is calculated in accordance with regulatory requirements, without regard to transactions involving short term investments. If such transactions were included, the Fund’s portfolio turnover rate may be higher. |
| | |
| The accompanying notes are an integral part of these financial statements. | | 81 |
GOLDMAN SACHS SMALL CAP GROWTH FUND
Financial Highlights (continued)
Selected Share Data for a Share Outstanding Throughout Each Period
| | | | | | | | | | |
| | | | | Goldman Sachs Small Cap Growth Fund | |
| | | | | Class A Shares | |
| | | | | Six Months Ended
February 28, 2021
(Unaudited) | | | Period Ended
August 31, 2020(a) | |
| | Per Share Data | | | | | | | | |
| | | |
| | Net asset value, beginning of period | | $ | 12.81 | | | $ | 10.00 | |
| | | |
| | Net investment loss(b) | | | (0.09 | ) | | | (0.09 | ) |
| | | |
| | Net realized and unrealized gain | | | 4.67 | | | | 2.92 | |
| | | |
| | Total from investment operations | | | 4.58 | | | | 2.83 | |
| | | |
| | Distributions to shareholders from net investment income | | | (0.02 | ) | | | (0.02 | ) |
| | | |
| | Distributions to shareholders from net realized gains | | | (1.10 | ) | | | — | |
| | | |
| | Total distributions | | | (1.12 | ) | | | (0.02 | ) |
| | | |
| | Net asset value, end of period | | $ | 16.27 | | | $ | 12.81 | |
| | | |
| | Total Return(c) | | | 36.75 | % | | | 28.30 | % |
| | | |
| | Net assets, end of period (in 000’s) | | $ | 535 | | | $ | 175 | |
| | | |
| | Ratio of net expenses to average net assets | | | 1.28 | %(d) | | | 1.30 | %(d) |
| | | |
| | Ratio of total expenses to average net assets | | | 2.92 | %(d) | | | 8.30 | %(d) |
| | | |
| | Ratio of net investment loss to average net assets | | | (1.13 | )%(d) | | | (0.94 | )%(d) |
| | | |
| | Portfolio turnover rate(e) | | | 44 | % | | | 70 | % |
| | (a) | | Commenced operations on October 31, 2019. |
| | (b) | | Calculated based on the average shares outstanding methodology. |
| | (c) | | Assumes investment at the NAV at the beginning of the period, reinvestment of all dividends and distributions, a complete redemption of the investment at the NAV at the end of the period and no sales or redemption charges (if any). Total returns would be reduced if a sales or redemption charge was taken into account. Returns do not reflect the impact of taxes to shareholders relating to Fund distributions or the redemption of Fund shares. Total returns for periods less than one full year are not annualized. |
| | (e) | | The Fund’s portfolio turnover rate is calculated in accordance with regulatory requirements, without regard to transactions involving short term investments. If such transactions were included, the Fund’s portfolio turnover rate may be higher. |
| | |
| 82 | | The accompanying notes are an integral part of these financial statements. |
GOLDMAN SACHS SMALL CAP GROWTH FUND
Financial Highlights (continued)
Selected Share Data for a Share Outstanding Throughout Each Period
| | | | | | | | | | |
| | | | | Goldman Sachs Small Cap Growth Fund | |
| | | | | Class C Shares | |
| | | | | Six Months Ended
February 28, 2021
(Unaudited) | | | Period Ended
August 31, 2020(a) | |
| | Per Share Data | | | | | | | | |
| | | |
| | Net asset value, beginning of period | | $ | 12.74 | | | $ | 10.00 | |
| | | |
| | Net investment loss(b) | | | (0.14 | ) | | | (0.15 | ) |
| | | |
| | Net realized and unrealized gain | | | 4.64 | | | | 2.89 | |
| | | |
| | Total from investment operations | | | 4.50 | | | | 2.74 | |
| | | |
| | Distributions to shareholders from net investment income | | | — | | | | — | (c) |
| | | |
| | Distributions to shareholders from net realized gains | | | (1.10 | ) | | | — | |
| | | |
| | Total distributions | | | (1.10 | ) | | | — | (c) |
| | | |
| | Net asset value, end of period | | $ | 16.14 | | | $ | 12.74 | |
| | | |
| | Total Return(d) | | | 36.22 | % | | | 27.44 | % |
| | | |
| | Net assets, end of period (in 000’s) | | $ | 153 | | | $ | 91 | |
| | | |
| | Ratio of net expenses to average net assets | | | 2.03 | %(e) | | | 2.06 | %(e) |
| | | |
| | Ratio of total expenses to average net assets | | | 3.68 | %(e) | | | 9.80 | %(e) |
| | | |
| | Ratio of net investment loss to average net assets | | | (1.87 | )%(e) | | | (1.70 | )%(e) |
| | | |
| | Portfolio turnover rate(f) | | | 44 | % | | | 70 | % |
| | (a) | | Commenced operations on October 31, 2019. |
| | (b) | | Calculated based on the average shares outstanding methodology. |
| | (c) | | Amount is less than $0.005 per share. |
| | (d) | | Assumes investment at the NAV at the beginning of the period, reinvestment of all dividends and distributions, a complete redemption of the investment at the NAV at the end of the period and no sales or redemption charges (if any). Total returns would be reduced if a sales or redemption charge was taken into account. Returns do not reflect the impact of taxes to shareholders relating to Fund distributions or the redemption of Fund shares. Total returns for periods less than one full year are not annualized. |
| | (f) | | The Fund’s portfolio turnover rate is calculated in accordance with regulatory requirements, without regard to transactions involving short term investments. If such transactions were included, the Fund’s portfolio turnover rate may be higher. |
| | |
| The accompanying notes are an integral part of these financial statements. | | 83 |
GOLDMAN SACHS SMALL CAP GROWTH FUND
Financial Highlights (continued)
Selected Share Data for a Share Outstanding Throughout Each Period
| | | | | | | | | | |
| | | | | Goldman Sachs Small Cap Growth Fund | |
| | | | | Institutional Shares | |
| | | | | Six Months Ended
February 28, 2021
(Unaudited) | | | Period Ended
August 31, 2020(a) | |
| | Per Share Data | | | | | | | | |
| | | |
| | Net asset value, beginning of period | | $ | 12.84 | | | $ | 10.00 | |
| | | |
| | Net investment loss(b) | | | (0.06 | ) | | | (0.05 | ) |
| | | |
| | Net realized and unrealized gain | | | 4.69 | | | | 2.91 | |
| | | |
| | Total from investment operations | | | 4.63 | | | | 2.86 | |
| | | |
| | Distributions to shareholders from net investment income | | | (0.03 | ) | | | (0.02 | ) |
| | | |
| | Distributions to shareholders from net realized gains | | | (1.10 | ) | | | — | |
| | | |
| | Total distributions | | | (1.13 | ) | | | (0.02 | ) |
| | | |
| | Net asset value, end of period | | $ | 16.34 | | | $ | 12.84 | |
| | | |
| | Total Return(c) | | | 37.00 | % | | | 28.68 | % |
| | | |
| | Net assets, end of period (in 000’s) | | $ | 17,270 | | | $ | 10,516 | |
| | | |
| | Ratio of net expenses to average net assets | | | 0.91 | %(d) | | | 0.93 | %(d) |
| | | |
| | Ratio of total expenses to average net assets | | | 2.55 | %(d) | | | 8.24 | %(d) |
| | | |
| | Ratio of net investment loss to average net assets | | | (0.75 | )%(d) | | | (0.58 | )%(d) |
| | | |
| | Portfolio turnover rate(e) | | | 44 | % | | | 70 | % |
| | (a) | | Commenced operations on October 31, 2019. |
| | (b) | | Calculated based on the average shares outstanding methodology. |
| | (c) | | Assumes investment at the NAV at the beginning of the period, reinvestment of all dividends and distributions, a complete redemption of the investment at the NAV at the end of the period and no sales or redemption charges (if any). Total returns would be reduced if a sales or redemption charge was taken into account. Returns do not reflect the impact of taxes to shareholders relating to Fund distributions or the redemption of Fund shares. Total returns for periods less than one full year are not annualized. |
| | (e) | | The Fund’s portfolio turnover rate is calculated in accordance with regulatory requirements, without regard to transactions involving short term investments. If such transactions were included, the Fund’s portfolio turnover rate may be higher. |
| | |
| 84 | | The accompanying notes are an integral part of these financial statements. |
GOLDMAN SACHS SMALL CAP GROWTH FUND
Financial Highlights (continued)
Selected Share Data for a Share Outstanding Throughout Each Period
| | | | | | | | | | |
| | | | | Goldman Sachs Small Cap Growth Fund | |
| | | | | Investor Shares | |
| | | | | Six Months Ended
February 28, 2021
(Unaudited) | | | Period Ended
August 31, 2020(a) | |
| | Per Share Data | | | | | | | | |
| | | |
| | Net asset value, beginning of period | | $ | 12.83 | | | $ | 10.00 | |
| | | |
| | Net investment loss(b) | | | (0.06 | ) | | | (0.06 | ) |
| | | |
| | Net realized and unrealized gain | | | 4.67 | | | | 2.91 | |
| | | |
| | Total from investment operations | | | 4.61 | | | | 2.85 | |
| | | |
| | Distributions to shareholders from net investment income | | | (0.02 | ) | | | (0.02 | ) |
| | | |
| | Distributions to shareholders from net realized gains | | | (1.10 | ) | | | — | |
| | | |
| | Total distributions | | | (1.12 | ) | | | (0.02 | ) |
| | | |
| | Net asset value, end of period | | $ | 16.32 | | | $ | 12.83 | |
| | | |
| | Total Return(c) | | | 36.93 | % | | | 28.55 | % |
| | | |
| | Net assets, end of period (in 000’s) | | $ | 88 | | | $ | 64 | |
| | | |
| | Ratio of net expenses to average net assets | | | 1.03 | %(d) | | | 1.06 | %(d) |
| | | |
| | Ratio of total expenses to average net assets | | | 2.68 | %(d) | | | 9.22 | %(d) |
| | | |
| | Ratio of net investment loss to average net assets | | | (0.87 | )%(d) | | | (0.69 | )%(d) |
| | | |
| | Portfolio turnover rate(e) | | | 44 | % | | | 70 | % |
| | (a) | | Commenced operations on October 31, 2019. |
| | (b) | | Calculated based on the average shares outstanding methodology. |
| | (c) | | Assumes investment at the NAV at the beginning of the period, reinvestment of all dividends and distributions, a complete redemption of the investment at the NAV at the end of the period and no sales or redemption charges (if any). Total returns would be reduced if a sales or redemption charge was taken into account. Returns do not reflect the impact of taxes to shareholders relating to Fund distributions or the redemption of Fund shares. Total returns for periods less than one full year are not annualized. |
| | (e) | | The Fund’s portfolio turnover rate is calculated in accordance with regulatory requirements, without regard to transactions involving short term investments. If such transactions were included, the Fund’s portfolio turnover rate may be higher. |
| | |
| The accompanying notes are an integral part of these financial statements. | | 85 |
GOLDMAN SACHS SMALL CAP GROWTH FUND
Financial Highlights (continued)
Selected Share Data for a Share Outstanding Throughout Each Period
| | | | | | | | | | |
| | | | | Goldman Sachs Small Cap Growth Fund | |
| | | | | Class R6 Shares | |
| | | | | Six Months Ended
February 28, 2021
(Unaudited) | | | Period Ended
August 31, 2020(a) | |
| | Per Share Data | | | | | | | | |
| | | |
| | Net asset value, beginning of period | | $ | 12.84 | | | $ | 10.00 | |
| | | |
| | Net investment loss(b) | | | (0.05 | ) | | | (0.05 | ) |
| | | |
| | Net realized and unrealized gain | | | 4.68 | | | | 2.91 | |
| | | |
| | Total from investment operations | | | 4.63 | | | | 2.86 | |
| | | |
| | Distributions to shareholders from net investment income | | | (0.03 | ) | | | (0.02 | ) |
| | | |
| | Distributions to shareholders from net realized gains | | | (1.10 | ) | | | — | |
| | | |
| | Total distributions | | | (1.13 | ) | | | (0.02 | ) |
| | | |
| | Net asset value, end of period | | $ | 16.34 | | | $ | 12.84 | |
| | | |
| | Total Return(c) | | | 36.99 | % | | | 28.68 | % |
| | | |
| | Net assets, end of period (in 000’s) | | $ | 88 | | | $ | 64 | |
| | | |
| | Ratio of net expenses to average net assets | | | 0.90 | %(d) | | | 0.93 | %(d) |
| | | |
| | Ratio of total expenses to average net assets | | | 2.55 | %(d) | | | 9.08 | %(d) |
| | | |
| | Ratio of net investment loss to average net assets | | | (0.74 | )%(d) | | | (0.55 | )%(d) |
| | | |
| | Portfolio turnover rate(e) | | | 44 | % | | | 70 | % |
| | (a) | | Commenced operations on October 31, 2019. |
| | (b) | | Calculated based on the average shares outstanding methodology. |
| | (c) | | Assumes investment at the NAV at the beginning of the period, reinvestment of all dividends and distributions, a complete redemption of the investment at the NAV at the end of the period and no sales or redemption charges (if any). Total returns would be reduced if a sales or redemption charge was taken into account. Returns do not reflect the impact of taxes to shareholders relating to Fund distributions or the redemption of Fund shares. Total returns for periods less than one full year are not annualized. |
| | (e) | | The Fund’s portfolio turnover rate is calculated in accordance with regulatory requirements, without regard to transactions involving short term investments. If such transactions were included, the Fund’s portfolio turnover rate may be higher. |
| | |
| 86 | | The accompanying notes are an integral part of these financial statements. |
GOLDMAN SACHS SMALL CAP GROWTH FUND
Financial Highlights (continued)
Selected Share Data for a Share Outstanding Throughout Each Period
| | | | | | | | | | |
| | | | | Goldman Sachs Small Cap Growth Fund | |
| | | | | Class R Shares | |
| | | | | Six Months Ended
February 28, 2021
(Unaudited) | | | Period Ended
August 31, 2020(a) | |
| | Per Share Data | | | | | | | | |
| | | |
| | Net asset value, beginning of period | | $ | 12.79 | | | $ | 10.00 | |
| | | |
| | Net investment loss(b) | | | (0.10 | ) | | | (0.11 | ) |
| | | |
| | Net realized and unrealized gain | | | 4.65 | | | | 2.91 | |
| | | |
| | Total from investment operations | | | 4.55 | | | | 2.80 | |
| | | |
| | Distributions to shareholders from net investment income | | | — | | | | (0.01 | ) |
| | | |
| | Distributions to shareholders from net realized gains | | | (1.10 | ) | | | — | |
| | | |
| | Total distributions | | | (1.10 | ) | | | (0.01 | ) |
| | | |
| | Net asset value, end of period | | $ | 16.24 | | | $ | 12.79 | |
| | | |
| | Total Return(c) | | | 36.56 | % | | | 28.05 | % |
| | | |
| | Net assets, end of period (in 000’s) | | $ | 87 | | | $ | 64 | |
| | | |
| | Ratio of net expenses to average net assets | | | 1.53 | %(d) | | | 1.56 | %(d) |
| | | |
| | Ratio of total expenses to average net assets | | | 3.18 | %(d) | | | 9.73 | %(d) |
| | | |
| | Ratio of net investment loss to average net assets | | | (1.37 | )%(d) | | | (1.19 | )%(d) |
| | | |
| | Portfolio turnover rate(e) | | | 44 | % | | | 70 | % |
| | (a) | | Commenced operations on October 31, 2019. |
| | (b) | | Calculated based on the average shares outstanding methodology. |
| | (c) | | Assumes investment at the NAV at the beginning of the period, reinvestment of all dividends and distributions, a complete redemption of the investment at the NAV at the end of the period and no sales or redemption charges (if any). Total returns would be reduced if a sales or redemption charge was taken into account. Returns do not reflect the impact of taxes to shareholders relating to Fund distributions or the redemption of Fund shares. Total returns for periods less than one full year are not annualized. |
| | (e) | | The Fund’s portfolio turnover rate is calculated in accordance with regulatory requirements, without regard to transactions involving short term investments. If such transactions were included, the Fund’s portfolio turnover rate may be higher. |
| | |
| The accompanying notes are an integral part of these financial statements. | | 87 |
GOLDMAN SACHS SMALL CAP GROWTH FUND
Financial Highlights (continued)
Selected Share Data for a Share Outstanding Throughout Each Period
| | | | | | | | | | |
| | | | | Goldman Sachs Small Cap Growth Fund | |
| | | | | Class P Shares | |
| | | | | Six Months Ended
February 28, 2021
(Unaudited) | | | Period Ended
August 31, 2020(a) | |
| | Per Share Data | | | | | | | | |
| | | |
| | Net asset value, beginning of period | | $ | 12.84 | | | $ | 10.00 | |
| | | |
| | Net investment loss(b) | | | (0.05 | ) | | | (0.05 | ) |
| | | |
| | Net realized and unrealized gain | | | 4.67 | | | | 2.91 | |
| | | |
| | Total from investment operations | | | 4.62 | | | | 2.86 | |
| | | |
| | Distributions to shareholders from net investment income | | | (0.03 | ) | | | (0.02 | ) |
| | | |
| | Distributions to shareholders from net realized gains | | | (1.10 | ) | | | — | |
| | | |
| | Total distributions | | | (1.13 | ) | | | (0.02 | ) |
| | | |
| | Net asset value, end of period | | $ | 16.33 | | | $ | 12.84 | |
| | | |
| | Total Return(c) | | | 36.92 | % | | | 28.68 | % |
| | | |
| | Net assets, end of period (in 000’s) | | $ | 5,365 | | | $ | 2,831 | |
| | | |
| | Ratio of net expenses to average net assets | | | 0.90 | %(d) | | | 0.90 | %(d) |
| | | |
| | Ratio of total expenses to average net assets | | | 2.54 | %(d) | | | 6.73 | %(d) |
| | | |
| | Ratio of net investment loss to average net assets | | | (0.74 | )%(d) | | | (0.55 | )%(d) |
| | | |
| | Portfolio turnover rate(e) | | | 44 | % | | | 70 | % |
| | (a) | | Commenced operations on October 31, 2019. |
| | (b) | | Calculated based on the average shares outstanding methodology. |
| | (c) | | Assumes investment at the NAV at the beginning of the period, reinvestment of all dividends and distributions, a complete redemption of the investment at the NAV at the end of the period and no sales or redemption charges (if any). Total returns would be reduced if a sales or redemption charge was taken into account. Returns do not reflect the impact of taxes to shareholders relating to Fund distributions or the redemption of Fund shares. Total returns for periods less than one full year are not annualized. |
| | (e) | | The Fund’s portfolio turnover rate is calculated in accordance with regulatory requirements, without regard to transactions involving short term investments. If such transactions were included, the Fund’s portfolio turnover rate may be higher. |
| | |
| 88 | | The accompanying notes are an integral part of these financial statements. |
GOLDMAN SACHS SMALL/MID CAP GROWTH FUND
Financial Highlights (continued)
Selected Share Data for a Share Outstanding Throughout Each Period
| | | | | | | | | | | | | | | | | | | | | | | | | | |
| | | | | Goldman Sachs Small/Mid Cap Growth Fund | |
| | | | | Class A Shares | |
| | | | | Six Months Ended
February 28, 2021
(Unaudited) | | | Year Ended August 31, | |
| | | | | 2020 | | | 2019 | | | 2018 | | | 2017 | | | 2016 | |
| | Per Share Data | | | | | | | | | | | | | | | | | | | | | | | | |
| | | | | | | |
| | Net asset value, beginning of period | | $ | 23.56 | | | $ | 20.53 | | | $ | 23.94 | | | $ | 21.81 | | | $ | 19.85 | | | $ | 20.72 | |
| | | | | | | |
| | Net investment loss(a) | | | (0.12 | ) | | | (0.15 | ) | | | (0.12 | )(b) | | | (0.14 | )(c) | | | (0.12 | )(d) | | | (0.14 | )(e) |
| | | | | | | |
| | Net realized and unrealized gain | | | 6.76 | | | | 6.20 | | | | 0.36 | | | | 5.15 | | | | 2.77 | | | | — | |
| | | | | | | |
| | Total from investment operations | | | 6.64 | | | | 6.05 | | | | 0.24 | | | | 5.01 | | | | 2.65 | | | | (0.14 | ) |
| | | | | | | |
| | Distributions to shareholders from net realized gains | | | (3.84 | ) | | | (3.02 | ) | | | (3.65 | ) | | | (2.88 | ) | | | (0.69 | ) | | | (0.73 | ) |
| | | | | | | |
| | Net asset value, end of period | | $ | 26.36 | | | $ | 23.56 | | | $ | 20.53 | | | $ | 23.94 | | | $ | 21.81 | | | $ | 19.85 | |
| | | | | | | |
| | Total Return(f) | | | 29.47 | % | | | 33.09 | % | | | 4.33 | % | | | 25.22 | % | | | 13.78 | % | | | (0.56 | )% |
| | | | | | | |
| | Net assets, end of period (in 000’s) | | $ | 401,403 | | | $ | 309,715 | | | $ | 295,072 | | | $ | 346,289 | | | $ | 351,253 | | | $ | 736,221 | |
| | | | | | | |
| | Ratio of net expenses to average net assets | | | 1.21 | %(g) | | | 1.27 | % | | | 1.26 | % | | | 1.28 | % | | | 1.29 | % | | | 1.31 | % |
| | | | | | | |
| | Ratio of total expenses to average net assets | | | 1.27 | %(g) | | | 1.32 | % | | | 1.32 | % | | | 1.35 | % | | | 1.46 | % | | | 1.45 | % |
| | | | | | | |
| | Ratio of net investment loss to average net assets | | | (0.97 | )%(g) | | | (0.74 | )% | | | (0.59 | )%(b) | | | (0.64 | )%(c) | | | (0.62 | )%(d) | | | (0.73 | )%(e) |
| | | | | | | |
| | Portfolio turnover rate(h) | | | 37 | % | | | 76 | % | | | 76 | % | | | 59 | % | | | 60 | % | | | 67 | % |
| | (a) | | Calculated based on the average shares outstanding methodology. |
| | (b) | | Reflects income recognized from special dividends which amounted to $0.02 per share and 0.08% of average net assets. |
| | (c) | | Reflects income recognized from special dividends which amounted to $0.03 per share and 0.11% of average net assets. |
| | (d) | | Reflects income recognized from special dividends which amounted to $0.03 per share and 0.14% of average net assets. |
| | (e) | | Reflects income recognized from special dividends which amounted to $0.03 per share and 0.15% of average net assets. |
| | (f) | | Assumes investment at the NAV at the beginning of the period, reinvestment of all dividends and distributions, a complete redemption of the investment at the NAV at the end of the period and no sales or redemption charges (if any). Total returns would be reduced if a sales or redemption charge was taken into account. Returns do not reflect the impact of taxes to shareholders relating to Fund distributions or the redemption of Fund shares. Total returns for periods less than one full year are not annualized. |
| | (h) | | The Fund’s portfolio turnover rate is calculated in accordance with regulatory requirements, without regard to transactions involving short term investments. If such transactions were included, the Fund’s portfolio turnover rate may be higher. |
| | |
| The accompanying notes are an integral part of these financial statements. | | 89 |
GOLDMAN SACHS SMALL/MID CAP GROWTH FUND
Financial Highlights (continued)
Selected Share Data for a Share Outstanding Throughout Each Period
| | | | | | | | | | | | | | | | | | | | | | | | | | |
| | | | | Goldman Sachs Small/Mid Cap Growth Fund | |
| | | | | Class C Shares | |
| | | | | Six Months Ended
February 28, 2021
(Unaudited) | | | Year Ended August 31, | |
| | | | | 2020 | | | 2019 | | | 2018 | | | 2017 | | | 2016 | |
| | Per Share Data | | | | | | | | | | | | | | | | | | | | | | | | |
| | | | | | | |
| | Net asset value, beginning of period | | $ | 18.59 | | | $ | 16.90 | | | $ | 20.60 | | | $ | 19.27 | | | $ | 17.75 | | | $ | 18.74 | |
| | | | | | | |
| | Net investment loss(a) | | | (0.17 | ) | | | (0.25 | ) | | | (0.22 | )(b) | | | (0.27 | )(c) | | | (0.24 | )(d) | | | (0.25 | )(e) |
| | | | | | | |
| | Net realized and unrealized gain (loss) | | | 5.26 | | | | 4.96 | | | | 0.17 | | | | 4.48 | | | | 2.45 | | | | (0.01 | ) |
| | | | | | | |
| | Total from investment operations | | | 5.09 | | | | 4.71 | | | | (0.05 | ) | | | 4.21 | | | | 2.21 | | | | (0.26 | ) |
| | | | | | | |
| | Distributions to shareholders from net realized gains | | | (3.84 | ) | | | (3.02 | ) | | | (3.65 | ) | | | (2.88 | ) | | | (0.69 | ) | | | (0.73 | ) |
| | | | | | | |
| | Net asset value, end of period | | $ | 19.84 | | | $ | 18.59 | | | $ | 16.90 | | | $ | 20.60 | | | $ | 19.27 | | | $ | 17.75 | |
| | | | | | | |
| | Total Return(f) | | | 28.97 | % | | | 32.18 | % | | | 3.50 | % | | | 24.30 | % | | | 12.98 | % | | | (1.34 | )% |
| | | | | | | |
| | Net assets, end of period (in 000’s) | | $ | 167,628 | | | $ | 153,835 | | | $ | 166,172 | | | $ | 232,881 | | | $ | 217,385 | | | $ | 265,282 | |
| | | | | | | |
| | Ratio of net expenses to average net assets | | | 1.96 | %(g) | | | 2.02 | % | | | 2.01 | % | | | 2.03 | % | | | 2.04 | % | | | 2.06 | % |
| | | | | | | |
| | Ratio of total expenses to average net assets | | | 2.02 | %(g) | | | 2.08 | % | | | 2.07 | % | | | 2.10 | % | | | 2.21 | % | | | 2.20 | % |
| | | | | | | |
| | Ratio of net investment loss to average net assets | | | (1.72 | )%(g) | | | (1.55 | )% | | | (1.35 | )%(b) | | | (1.38 | )%(c) | | | (1.36 | )%(d) | | | (1.48 | )%(e) |
| | | | | | | |
| | Portfolio turnover rate(h) | | | 37 | % | | | 76 | % | | | 76 | % | | | 59 | % | | | 60 | % | | | 67 | % |
| | (a) | | Calculated based on the average shares outstanding methodology. |
| | (b) | | Reflects income recognized from special dividends which amounted to $0.02 per share and 0.08% of average net assets. |
| | (c) | | Reflects income recognized from special dividends which amounted to $0.03 per share and 0.11% of average net assets. |
| | (d) | | Reflects income recognized from special dividends which amounted to $0.03 per share and 0.14% of average net assets. |
| | (e) | | Reflects income recognized from special dividends which amounted to $0.03 per share and 0.15% of average net assets. |
| | (f) | | Assumes investment at the NAV at the beginning of the period, reinvestment of all dividends and distributions, a complete redemption of the investment at the NAV at the end of the period and no sales or redemption charges (if any). Total returns would be reduced if a sales or redemption charge was taken into account. Returns do not reflect the impact of taxes to shareholders relating to Fund distributions or the redemption of Fund shares. Total returns for periods less than one full year are not annualized. |
| | (h) | | The Fund’s portfolio turnover rate is calculated in accordance with regulatory requirements, without regard to transactions involving short term investments. If such transactions were included, the Fund’s portfolio turnover rate may be higher. |
| | |
| 90 | | The accompanying notes are an integral part of these financial statements. |
GOLDMAN SACHS SMALL/MID CAP GROWTH FUND
Financial Highlights (continued)
Selected Share Data for a Share Outstanding Throughout Each Period
| | | | | | | | | | | | | | | | | | | | | | | | | | |
| | | | | Goldman Sachs Small/Mid Cap Growth Fund | |
| | | | | Institutional Shares | |
| | | | | Six Months Ended
February 28, 2021
(Unaudited) | | | Year Ended August 31, | |
| | | | | 2020 | | | 2019 | | | 2018 | | | 2017 | | | 2016 | |
| | Per Share Data | | | | | | | | | | | | | | | | | | | | | | | | |
| | | | | | | |
| | Net asset value, beginning of period | | $ | 26.09 | | | $ | 22.36 | | | $ | 25.63 | | | $ | 23.08 | | | $ | 20.89 | | | $ | 21.69 | |
| | | | | | | |
| | Net investment loss(a) | | | (0.09 | ) | | | (0.09 | ) | | | (0.06 | )(b) | | | (0.07 | )(c) | | | (0.05 | )(d) | | | (0.07 | )(e) |
| | | | | | | |
| | Net realized and unrealized gain | | | 7.53 | | | | 6.84 | | | | 0.44 | | | | 5.50 | | | | 2.93 | | | | — | |
| | | | | | | |
| | Total from investment operations | | | 7.44 | | | | 6.75 | | | | 0.38 | | | | 5.43 | | | | 2.88 | | | | (0.07 | ) |
| | | | | | | |
| | Distributions to shareholders from net realized gains | | | (3.84 | ) | | | (3.02 | ) | | | (3.65 | ) | | | (2.88 | ) | | | (0.69 | ) | | | (0.73 | ) |
| | | | | | | |
| | Net asset value, end of period | | $ | 29.69 | | | $ | 26.09 | | | $ | 22.36 | | | $ | 25.63 | | | $ | 23.08 | | | $ | 20.89 | |
| | | | | | | |
| | Total Return(f) | | | 29.68 | % | | | 33.55 | % | | | 4.62 | % | | | 25.69 | % | | | 14.21 | % | | | (0.21 | )% |
| | | | | | | |
| | Net assets, end of period (in 000’s) | | $ | 1,200,731 | | | $ | 921,412 | | | $ | 853,375 | | | $ | 1,067,540 | | | $ | 1,149,459 | | | $ | 1,235,282 | |
| | | | | | | |
| | Ratio of net expenses to average net assets | | | 0.90 | %(g) | | | 0.94 | % | | | 0.93 | % | | | 0.92 | % | | | 0.92 | % | | | 0.93 | % |
| | | | | | | |
| | Ratio of total expenses to average net assets | | | 0.90 | %(g) | | | 0.95 | % | | | 0.93 | % | | | 0.96 | % | | | 1.06 | % | | | 1.05 | % |
| | | | | | | |
| | Ratio of net investment loss to average net assets | | | (0.66 | )%(g) | | | (0.39 | )% | | | (0.26 | )%(b) | | | (0.27 | )%(c) | | | (0.24 | )%(d) | | | (0.35 | )%(e) |
| | | | | | | |
| | Portfolio turnover rate(h) | | | 37 | % | | | 76 | % | | | 76 | % | | | 59 | % | | | 60 | % | | | 67 | % |
| | (a) | | Calculated based on the average shares outstanding methodology. |
| | (b) | | Reflects income recognized from special dividends which amounted to $0.02 per share and 0.08% of average net assets. |
| | (c) | | Reflects income recognized from special dividends which amounted to $0.03 per share and 0.11% of average net assets. |
| | (d) | | Reflects income recognized from special dividends which amounted to $0.03 per share and 0.14% of average net assets. |
| | (e) | | Reflects income recognized from special dividends which amounted to $0.03 per share and 0.15% of average net assets. |
| | (f) | | Assumes investment at the NAV at the beginning of the period, reinvestment of all dividends and distributions, a complete redemption of the investment at the NAV at the end of the period and no sales or redemption charges (if any). Total returns would be reduced if a sales or redemption charge was taken into account. Returns do not reflect the impact of taxes to shareholders relating to Fund distributions or the redemption of Fund shares. Total returns for periods less than one full year are not annualized. |
| | (h) | | The Fund’s portfolio turnover rate is calculated in accordance with regulatory requirements, without regard to transactions involving short term investments. If such transactions were included, the Fund’s portfolio turnover rate may be higher. |
| | |
| The accompanying notes are an integral part of these financial statements. | | 91 |
GOLDMAN SACHS SMALL/MID CAP GROWTH FUND
Financial Highlights (continued)
Selected Share Data for a Share Outstanding Throughout Each Period
| | | | | | | | | | | | | | | | | | | | | | | | | | |
| | | | | Goldman Sachs Small/Mid Cap Growth Fund | |
| | | | | Service Shares | |
| | | | | Six Months Ended
February 28, 2021
(Unaudited) | | | Year Ended August 31, | |
| | | | | 2020 | | | 2019 | | | 2018 | | | 2017 | | | 2016 | |
| | Per Share Data | | | | | | | | | | | | | | | | | | | | | | | | |
| | | | | | | |
| | Net asset value, beginning of period | | $ | 22.60 | | | $ | 19.84 | | | $ | 23.32 | | | $ | 21.33 | | | $ | 19.46 | | | $ | 20.35 | |
| | | | | | | |
| | Net investment loss(a) | | | (0.14 | ) | | | (0.18 | ) | | | (0.15 | )(b) | | | (0.17 | )(c) | | | (0.14 | )(d) | | | (0.16 | )(e) |
| | | | | | | |
| | Net realized and unrealized gain | | | 6.47 | | | | 5.96 | | | | 0.32 | | | | 5.04 | | | | 2.70 | | | | — | |
| | | | | | | |
| | Total from investment operations | | | 6.33 | | | | 5.78 | | | | 0.17 | | | | 4.87 | | | | 2.56 | | | | (0.16 | ) |
| | | | | | | |
| | Distributions to shareholders from net realized gains | | | (3.84 | ) | | | (3.02 | ) | | | (3.65 | ) | | | (2.88 | ) | | | (0.69 | ) | | | (0.73 | ) |
| | | | | | | |
| | Net asset value, end of period | | $ | 25.09 | | | $ | 22.60 | | | $ | 19.84 | | | $ | 23.32 | | | $ | 21.33 | | | $ | 19.46 | |
| | | | | | | |
| | Total Return(f) | | | 29.34 | % | | | 32.87 | % | | | 4.13 | % | | | 25.12 | % | | | 13.59 | % | | | (0.67 | )% |
| | | | | | | |
| | Net assets, end of period (in 000’s) | | $ | 23,506 | | | $ | 32,215 | | | $ | 18,395 | | | $ | 18,210 | | | $ | 16,520 | | | $ | 13,956 | |
| | | | | | | |
| | Ratio of net expenses to average net assets | | | 1.40 | %(g) | | | 1.44 | % | | | 1.43 | % | | | 1.42 | % | | | 1.42 | % | | | 1.43 | % |
| | | | | | | |
| | Ratio of total expenses to average net assets | | | 1.40 | %(g) | | | 1.45 | % | | | 1.44 | % | | | 1.46 | % | | | 1.56 | % | | | 1.55 | % |
| | | | | | | |
| | Ratio of net investment loss to average net assets | | | (1.14 | )%(g) | | | (0.92 | )% | | | (0.75 | )%(b) | | | (0.77 | )%(c) | | | (0.73 | )%(d) | | | (0.85 | )%(e) |
| | | | | | | |
| | Portfolio turnover rate(h) | | | 37 | % | | | 76 | % | | | 76 | % | | | 59 | % | | | 60 | % | | | 67 | % |
| | (a) | | Calculated based on the average shares outstanding methodology. |
| | (b) | | Reflects income recognized from special dividends which amounted to $0.02 per share and 0.08% of average net assets. |
| | (c) | | Reflects income recognized from special dividends which amounted to $0.03 per share and 0.11% of average net assets. |
| | (d) | | Reflects income recognized from special dividends which amounted to $0.03 per share and 0.14% of average net assets. |
| | (e) | | Reflects income recognized from special dividends which amounted to $0.03 per share and 0.15% of average net assets. |
| | (f) | | Assumes investment at the NAV at the beginning of the period, reinvestment of all dividends and distributions, a complete redemption of the investment at the NAV at the end of the period and no sales or redemption charges (if any). Total returns would be reduced if a sales or redemption charge was taken into account. Returns do not reflect the impact of taxes to shareholders relating to Fund distributions or the redemption of Fund shares. Total returns for periods less than one full year are not annualized. |
| | (h) | | The Fund’s portfolio turnover rate is calculated in accordance with regulatory requirements, without regard to transactions involving short term investments. If such transactions were included, the Fund’s portfolio turnover rate may be higher. |
| | |
| 92 | | The accompanying notes are an integral part of these financial statements. |
GOLDMAN SACHS SMALL/MID CAP GROWTH FUND
Financial Highlights (continued)
Selected Share Data for a Share Outstanding Throughout Each Period
| | | | | | | | | | | | | | | | | | | | | | | | | | |
| | | | | Goldman Sachs Small/Mid Cap Growth Fund | |
| | | | | Investor Shares | |
| | | | | Six Months Ended
February 28, 2021
(Unaudited) | | | Year Ended August 31, | |
| | | | | 2020 | | | 2019 | | | 2018 | | | 2017 | | | 2016 | |
| | Per Share Data | | | | | | | | | | | | | | | | | | | | | | | | |
| | | | | | | |
| | Net asset value, beginning of period | | $ | 24.96 | | | $ | 21.53 | | | $ | 24.85 | | | $ | 22.48 | | | $ | 20.39 | | | $ | 21.21 | |
| | | | | | | |
| | Net investment loss(a) | | | (0.10 | ) | | | (0.10 | ) | | | (0.07 | )(b) | | | (0.09 | )(c) | | | (0.08 | )(d) | | | (0.09 | )(e) |
| | | | | | | |
| | Net realized and unrealized gain | | | 7.18 | | | | 6.55 | | | | 0.40 | | | | 5.34 | | | | 2.86 | | | | — | |
| | | | | | | |
| | Total from investment operations | | | 7.08 | | | | 6.45 | | | | 0.33 | | | | 5.25 | | | | 2.78 | | | | (0.09 | ) |
| | | | | | | |
| | Distributions to shareholders from net realized gains | | | (3.84 | ) | | | (3.02 | ) | | | (3.65 | ) | | | (2.88 | ) | | | (0.69 | ) | | | (0.73 | ) |
| | | | | | | |
| | Net asset value, end of period | | $ | 28.20 | | | $ | 24.96 | | | $ | 21.53 | | | $ | 24.85 | | | $ | 22.48 | | | $ | 20.39 | |
| | | | | | | |
| | Total Return(f) | | | 29.63 | % | | | 33.44 | % | | | 4.57 | % | | | 25.57 | % | | | 14.06 | % | | | (0.31 | )% |
| | | | | | | |
| | Net assets, end of period (in 000’s) | | $ | 698,263 | | | $ | 495,629 | | | $ | 409,019 | | | $ | 529,670 | | | $ | 437,309 | | | $ | 313,812 | |
| | | | | | | |
| | Ratio of net expenses to average net assets | | | 0.96 | %(g) | | | 1.02 | % | | | 1.01 | % | | | 1.03 | % | | | 1.04 | % | | | 1.06 | % |
| | | | | | | |
| | Ratio of total expenses to average net assets | | | 1.02 | %(g) | | | 1.07 | % | | | 1.07 | % | | | 1.10 | % | | | 1.21 | % | | | 1.20 | % |
| | | | | | | |
| | Ratio of net investment loss to average net assets | | | (0.72 | )%(g) | | | (0.47 | )% | | | (0.34 | )%(b) | | | (0.38 | )%(c) | | | (0.36 | )%(d) | | | (0.48 | )%(e) |
| | | | | | | |
| | Portfolio turnover rate(h) | | | 37 | % | | | 76 | % | | | 76 | % | | | 59 | % | | | 60 | % | | | 67 | % |
| | (a) | | Calculated based on the average shares outstanding methodology. |
| | (b) | | Reflects income recognized from special dividends which amounted to $0.02 per share and 0.08% of average net assets. |
| | (c) | | Reflects income recognized from special dividends which amounted to $0.03 per share and 0.11% of average net assets. |
| | (d) | | Reflects income recognized from special dividends which amounted to $0.03 per share and 0.14% of average net assets. |
| | (e) | | Reflects income recognized from special dividends which amounted to $0.03 per share and 0.15% of average net assets. |
| | (f) | | Assumes investment at the NAV at the beginning of the period, reinvestment of all dividends and distributions, a complete redemption of the investment at the NAV at the end of the period and no sales or redemption charges (if any). Total returns would be reduced if a sales or redemption charge was taken into account. Returns do not reflect the impact of taxes to shareholders relating to Fund distributions or the redemption of Fund shares. Total returns for periods less than one full year are not annualized. |
| | (h) | | The Fund’s portfolio turnover rate is calculated in accordance with regulatory requirements, without regard to transactions involving short term investments. If such transactions were included, the Fund’s portfolio turnover rate may be higher. |
| | |
| The accompanying notes are an integral part of these financial statements. | | 93 |
GOLDMAN SACHS SMALL/MID CAP GROWTH FUND
Financial Highlights (continued)
Selected Share Data for a Share Outstanding Throughout Each Period
| | | | | | | | | | | | | | | | | | | | | | | | | | |
| | | | | Goldman Sachs Small/Mid Cap Growth Fund | |
| | | | | Class R6 Shares | |
| | | | | Six Months Ended
February 28, 2021
(Unaudited) | | | Year Ended August 31, | |
| | | | | 2020 | | | 2019 | | | 2018 | | | 2017 | | | 2016 | |
| | Per Share Data | | | | | | | | | | | | | | | | | | | | | | | | |
| | | | | | | |
| | Net asset value, beginning of period | | $ | 26.12 | | | $ | 22.38 | | | $ | 25.64 | | | $ | 23.09 | | | $ | 20.89 | | | $ | 21.69 | |
| | | | | | | |
| | Net investment loss(a) | | | (0.09 | ) | | | (0.08 | ) | | | (0.05 | )(b) | | | (0.06 | )(c) | | | (0.04 | )(d) | | | (0.06 | )(e) |
| | | | | | | |
| | Net realized and unrealized gain (loss) | | | 7.53 | | | | 6.84 | | | | 0.44 | | | | 5.49 | | | | 2.93 | | | | (0.01 | ) |
| | | | | | | |
| | Total from investment operations | | | 7.44 | | | | 6.76 | | | | 0.39 | | | | 5.43 | | | | 2.89 | | | | (0.07 | ) |
| | | | | | | |
| | Distributions to shareholders from net realized gains | | | (3.84 | ) | | | (3.02 | ) | | | (3.65 | ) | | | (2.88 | ) | | | (0.69 | ) | | | (0.73 | ) |
| | | | | | | |
| | Net asset value, end of period | | $ | 29.72 | | | $ | 26.12 | | | $ | 22.38 | | | $ | 25.64 | | | $ | 23.09 | | | $ | 20.89 | |
| | | | | | | |
| | Total Return(f) | | | 29.65 | % | | | 33.56 | % | | | 4.67 | % | | | 25.68 | % | | | 14.26 | % | | | (0.21 | )% |
| | | | | | | |
| | Net assets, end of period (in 000’s) | | $ | 113,986 | | | $ | 73,863 | | | $ | 54,916 | | | $ | 39,263 | | | $ | 22,660 | | | $ | 9,785 | |
| | | | | | | |
| | Ratio of net expenses to average net assets | | | 0.89 | %(g) | | | 0.93 | % | | | 0.92 | % | | | 0.91 | % | | | 0.90 | % | | | 0.92 | % |
| | | | | | | |
| | Ratio of total expenses to average net assets | | | 0.89 | %(g) | | | 0.94 | % | | | 0.93 | % | | | 0.95 | % | | | 1.04 | % | | | 1.04 | % |
| | | | | | | |
| | Ratio of net investment loss to average net assets | | | (0.64 | )%(g) | | | (0.38 | )% | | | (0.23 | )%(b) | | | (0.25 | )%(c) | | | (0.18 | )%(d) | | | (0.28 | )%(e) |
| | | | | | | |
| | Portfolio turnover rate(h) | | | 37 | % | | | 76 | % | | | 76 | % | | | 59 | % | | | 60 | % | | | 67 | % |
| | (a) | | Calculated based on the average shares outstanding methodology. |
| | (b) | | Reflects income recognized from special dividends which amounted to $0.02 per share and 0.08% of average net assets. |
| | (c) | | Reflects income recognized from special dividends which amounted to $0.03 per share and 0.11% of average net assets. |
| | (d) | | Reflects income recognized from special dividends which amounted to $0.03 per share and 0.14% of average net assets. |
| | (e) | | Reflects income recognized from special dividends which amounted to $0.03 per share and 0.15% of average net assets. |
| | (f) | | Assumes investment at the NAV at the beginning of the period, reinvestment of all dividends and distributions, a complete redemption of the investment at the NAV at the end of the period and no sales or redemption charges (if any). Total returns would be reduced if a sales or redemption charge was taken into account. Returns do not reflect the impact of taxes to shareholders relating to Fund distributions or the redemption of Fund shares. Total returns for periods less than one full year are not annualized. |
| | (h) | | The Fund’s portfolio turnover rate is calculated in accordance with regulatory requirements, without regard to transactions involving short term investments. If such transactions were included, the Fund’s portfolio turnover rate may be higher. |
| | |
| 94 | | The accompanying notes are an integral part of these financial statements. |
GOLDMAN SACHS SMALL/MID CAP GROWTH FUND
Financial Highlights (continued)
Selected Share Data for a Share Outstanding Throughout Each Period
| | | | | | | | | | | | | | | | | | | | | | | | | | |
| | | | | Goldman Sachs Small/Mid Cap Growth Fund | |
| | | | | Class R Shares | |
| | | | | Six Months Ended
February 28, 2021
(Unaudited) | | | Year Ended August 31, | |
| | | | | 2020 | | | 2019 | | | 2018 | | | 2017 | | | 2016 | |
| | Per Share Data | | | | | | | | | | | | | | | | | | | | | | | | |
| | | | | | | |
| | Net asset value, beginning of period | | $ | 22.24 | | | $ | 19.58 | | | $ | 23.08 | | | $ | 21.17 | | | $ | 19.34 | | | $ | 20.26 | |
| | | | | | | |
| | Net investment loss(a) | | | (0.15 | ) | | | (0.19 | ) | | | (0.16 | )(b) | | | (0.19 | )(c) | | | (0.17 | )(d) | | | (0.18 | )(e) |
| | | | | | | |
| | Net realized and unrealized gain (loss) | | | 6.37 | | | | 5.87 | | | | 0.31 | | | | 4.98 | | | | 2.69 | | | | (0.01 | ) |
| | | | | | | |
| | Total from investment operations | | | 6.22 | | | | 5.68 | | | | 0.15 | | | | 4.79 | | | | 2.52 | | | | (0.19 | ) |
| | | | | | | |
| | Distributions to shareholders from net realized gains | | | (3.84 | ) | | | (3.02 | ) | | | (3.65 | ) | | | (2.88 | ) | | | (0.69 | ) | | | (0.73 | ) |
| | | | | | | |
| | Net asset value, end of period | | $ | 24.62 | | | $ | 22.24 | | | $ | 19.58 | | | $ | 23.08 | | | $ | 21.17 | | | $ | 19.34 | |
| | | | | | | |
| | Total Return(f) | | | 29.32 | % | | | 32.78 | % | | | 4.07 | % | | | 24.92 | % | | | 13.47 | % | | | (0.83 | )% |
| | | | | | | |
| | Net assets, end of period (in 000’s) | | $ | 16,371 | | | $ | 13,209 | | | $ | 15,856 | | | $ | 24,215 | | | $ | 26,918 | | | $ | 34,493 | |
| | | | | | | |
| | Ratio of net expenses to average net assets | | | 1.46 | %(g) | | | 1.52 | % | | | 1.51 | % | | | 1.53 | % | | | 1.54 | % | | | 1.56 | % |
| | | | | | | |
| | Ratio of total expenses to average net assets | | | 1.52 | %(g) | | | 1.57 | % | | | 1.57 | % | | | 1.61 | % | | | 1.71 | % | | | 1.70 | % |
| | | | | | | |
| | Ratio of net investment loss to average net assets | | | (1.22 | )%(g) | | | (1.00 | )% | | | (0.85 | )%(b) | | | (0.90 | )%(c) | | | (0.86 | )%(d) | | | (0.98 | )%(e) |
| | | | | | | |
| | Portfolio turnover rate(h) | | | 37 | % | | | 76 | % | | | 76 | % | | | 59 | % | | | 60 | % | | | 67 | % |
| | (a) | | Calculated based on the average shares outstanding methodology. |
| | (b) | | Reflects income recognized from special dividends which amounted to $0.02 per share and 0.08% of average net assets. |
| | (c) | | Reflects income recognized from special dividends which amounted to $0.03 per share and 0.11% of average net assets. |
| | (d) | | Reflects income recognized from special dividends which amounted to $0.03 per share and 0.14% of average net assets. |
| | (e) | | Reflects income recognized from special dividends which amounted to $0.03 per share and 0.15% of average net assets. |
| | (f) | | Assumes investment at the NAV at the beginning of the period, reinvestment of all dividends and distributions, a complete redemption of the investment at the NAV at the end of the period and no sales or redemption charges (if any). Total returns would be reduced if a sales or redemption charge was taken into account. Returns do not reflect the impact of taxes to shareholders relating to Fund distributions or the redemption of Fund shares. Total returns for periods less than one full year are not annualized. |
| | (h) | | The Fund’s portfolio turnover rate is calculated in accordance with regulatory requirements, without regard to transactions involving short term investments. If such transactions were included, the Fund’s portfolio turnover rate may be higher. |
| | |
| The accompanying notes are an integral part of these financial statements. | | 95 |
GOLDMAN SACHS SMALL/MID CAP GROWTH FUND
Financial Highlights (continued)
Selected Share Data for a Share Outstanding Throughout Each Period
| | | | | | | | | | | | | | | | | | |
| | | | | Goldman Sachs Small/Mid Cap Growth Fund | |
| | | | | Class P Shares | |
| | | | | Six Months Ended
February 28, 2021
(Unaudited) | | | Year Ended August 31, | | | Period Ended
August 31, 2018(a) | |
| | | | | 2020 | | | 2019 | |
| | Per Share Data | | | | | | | | | | | | | | | | |
| | | | | |
| | Net asset value, beginning of period | | $ | 26.12 | | | $ | 22.38 | | | $ | 25.64 | | | $ | 23.61 | |
| | | | | |
| | Net investment loss(b) | | | (0.09 | ) | | | (0.08 | ) | | | (0.05 | )(c) | | | (0.03 | )(d) |
| | | | | |
| | Net realized and unrealized gain | | | 7.54 | | | | 6.84 | | | | 0.44 | | | | 2.06 | |
| | | | | |
| | Total from investment operations | | | 7.45 | | | | 6.76 | | | | 0.39 | | | | 2.03 | |
| | | | | |
| | Distributions to shareholders from net realized gains | | | (3.84 | ) | | | (3.02 | ) | | | (3.65 | ) | | | — | |
| | | | | |
| | Net asset value, end of period | | $ | 29.73 | | | $ | 26.12 | | | $ | 22.38 | | | $ | 25.64 | |
| | | | | |
| | Total Return(e) | | | 29.69 | % | | | 33.56 | % | | | 4.67 | % | | | 8.60 | % |
| | | | | |
| | Net assets, end of period (in 000’s) | | $ | 490,074 | | | $ | 285,307 | | | $ | 188,657 | | | $ | 245,612 | |
| | | | | |
| | Ratio of net expenses to average net assets | | | 0.88 | %(f) | | | 0.93 | % | | | 0.92 | % | | | 0.90 | %(f) |
| | | | | |
| | Ratio of total expenses to average net assets | | | 0.89 | %(f) | | | 0.94 | % | | | 0.92 | % | | | 0.91 | %(f) |
| | | | | |
| | Ratio of net investment loss to average net assets | | | (0.64 | )%(f) | | | (0.38 | )% | | | (0.25 | )%(c) | | | (0.36 | )%(d)(f) |
| | | | | |
| | Portfolio turnover rate(g) | | | 37 | % | | | 76 | % | | | 76 | % | | | 59 | % |
| | (a) | | Commenced operations on April 17, 2018. |
| | (b) | | Calculated based on the average shares outstanding methodology. |
| | (c) | | Reflects income recognized from special dividends which amounted to $0.02 per share and 0.08% of average net assets. |
| | (d) | | Reflects income recognized from special dividends which amounted to $0.03 per share and 0.11% of average net assets. |
| | (e) | | Assumes investment at the NAV at the beginning of the period, reinvestment of all dividends and distributions, a complete redemption of the investment at the NAV at the end of the period and no sales or redemption charges (if any). Total returns would be reduced if a sales or redemption charge was taken into account. Returns do not reflect the impact of taxes to shareholders relating to Fund distributions or the redemption of Fund shares. Total returns for periods less than one full year are not annualized. |
| | (g) | | The Fund’s portfolio turnover rate is calculated in accordance with regulatory requirements, without regard to transactions involving short term investments. If such transactions were included, the Fund’s portfolio turnover rate may be higher. |
| | |
| 96 | | The accompanying notes are an integral part of these financial statements. |
GOLDMAN SACHS STRATEGIC GROWTH FUND
Financial Highlights (continued)
Selected Share Data for a Share Outstanding Throughout Each Period
| | | | | | | | | | | | | | | | | | | | | | | | | | |
| | | | | Goldman Sachs Strategic Growth Fund | |
| | | | | Class A Shares | |
| | | | | Six Months Ended
February 28, 2021
(Unaudited) | | | Year Ended August 31, | |
| | | | | 2020 | | | 2019 | | | 2018 | | | 2017 | | | 2016 | |
| | Per Share Data | | | | | | | | | | | | | | | | | | | | | | | | |
| | | | | | | |
| | Net asset value, beginning of period | | $ | 11.24 | | | $ | 9.25 | | | $ | 13.83 | | | $ | 13.79 | | | $ | 11.91 | | | $ | 11.86 | |
| | | | | | | |
| | Net investment income (loss)(a) | | | (0.03 | ) | | | (0.03 | ) | | | (0.01 | ) | | | (0.02 | ) | | | 0.02 | | | | 0.02 | |
| | | | | | | |
| | Net realized and unrealized gain (loss) | | | 0.89 | | | | 3.58 | | | | (0.30 | ) | | | 3.03 | | | | 2.26 | | | | 0.74 | |
| | | | | | | |
| | Total from investment operations | | | 0.86 | | | | 3.55 | | | | (0.31 | ) | | | 3.01 | | | | 2.28 | | | | 0.76 | |
| | | | | | | |
| | Distributions to shareholders from net investment income | | | — | | | | — | | | | — | | | | — | | | | (0.04 | ) | | | (0.02 | ) |
| | | | | | | |
| | Distributions to shareholders from net realized gains | | | (1.77 | ) | | | (1.56 | ) | | | (4.27 | ) | | | (2.97 | ) | | | (0.36 | ) | | | (0.69 | ) |
| | | | | | | |
| | Total distributions | | | (1.77 | ) | | | (1.56 | ) | | | (4.27 | ) | | | (2.97 | ) | | | (0.40 | ) | | | (0.71 | ) |
| | | | | | | |
| | Net asset value, end of period | | $ | 10.33 | | | $ | 11.24 | | | $ | 9.25 | | | $ | 13.83 | | | $ | 13.79 | | | $ | 11.91 | |
| | | | | | | |
| | Total Return(b) | | | 8.26 | % | | | 43.98 | % | | | 2.86 | % | | | 25.59 | % | | | 19.79 | % | | | 6.48 | % |
| | | | | | | |
| | Net assets, end of period (in 000’s) | | $ | 38,560 | | | $ | 36,688 | | | $ | 28,311 | | | $ | 30,174 | | | $ | 46,114 | | | $ | 46,093 | |
| | | | | | | |
| | Ratio of net expenses to average net assets | | | 1.12 | %(c) | | | 1.14 | % | | | 1.14 | % | | | 1.14 | % | | | 1.15 | % | | | 1.15 | % |
| | | | | | | |
| | Ratio of total expenses to average net assets | | | 1.30 | %(c) | | | 1.35 | % | | | 1.40 | % | | | 1.39 | % | | | 1.55 | % | | | 1.54 | % |
| | | | | | | |
| | Ratio of net investment income (loss) to average net assets | | | (0.57 | )%(c) | | | (0.35 | )% | | | (0.07 | )% | | | (0.15 | )% | | | 0.15 | % | | | 0.19 | % |
| | | | | | | |
| | Portfolio turnover rate(d) | | | 12 | % | | | 39 | % | | | 28 | % | | | 40 | % | | | 54 | % | | | 56 | % |
| | (a) | | Calculated based on the average shares outstanding methodology. |
| | (b) | | Assumes investment at the NAV at the beginning of the period, reinvestment of all dividends and distributions, a complete redemption of the investment at the NAV at the end of the period and no sales or redemption charges (if any). Total returns would be reduced if a sales or redemption charge was taken into account. Returns do not reflect the impact of taxes to shareholders relating to Fund distributions or the redemption of Fund shares. Total returns for periods less than one full year are not annualized. |
| | (d) | | The Fund’s portfolio turnover rate is calculated in accordance with regulatory requirements, without regard to transactions involving short term investments. If such transactions were included, the Fund’s portfolio turnover rate may be higher. |
| | |
| The accompanying notes are an integral part of these financial statements. | | 97 |
GOLDMAN SACHS STRATEGIC GROWTH FUND
Financial Highlights (continued)
Selected Share Data for a Share Outstanding Throughout Each Period
| | | | | | | | | | | | | | | | | | | | | | | | | | |
| | | | | Goldman Sachs Strategic Growth Fund | |
| | | | | Class C Shares | |
| | | | | Six Months Ended
February 28, 2021
(Unaudited) | | | Year Ended August 31, | |
| | 2020 | | | 2019 | | | 2018 | | | 2017 | | | 2016 | |
| | Per Share Data | | | | | | | | | | | | | | | | | | | | | | | | |
| | | | | | | |
| | Net asset value, beginning of period | | $ | 6.63 | | | $ | 6.09 | | | $ | 10.81 | | | $ | 11.46 | | | $ | 10.00 | | | $ | 10.12 | |
| | | | | | | |
| | Net investment loss(a) | | | (0.04 | ) | | | (0.07 | ) | | | (0.06 | ) | | | (0.09 | ) | | | (0.06 | ) | | | (0.05 | ) |
| | | | | | | |
| | Net realized and unrealized gain (loss) | | | 0.50 | | | | 2.17 | | | | (0.39 | ) | | | 2.41 | | | | 1.88 | | | | 0.62 | |
| | | | | | | |
| | Total from investment operations | | | 0.46 | | | | 2.10 | | | | (0.45 | ) | | | 2.32 | | | | 1.82 | | | | 0.57 | |
| | | | | | | |
| | Distributions to shareholders from net realized gains | | | (1.77 | ) | | | (1.56 | ) | | | (4.27 | ) | | | (2.97 | ) | | | (0.36 | ) | | | (0.69 | ) |
| | | | | | | |
| | Net asset value, end of period | | $ | 5.32 | | | $ | 6.63 | | | $ | 6.09 | | | $ | 10.81 | | | $ | 11.46 | | | $ | 10.00 | |
| | | | | | | |
| | Total Return(b) | | | 7.93 | % | | | 42.88 | % | | | 2.07 | % | | | 24.61 | % | | | 18.89 | % | | | 5.70 | % |
| | | | | | | |
| | Net assets, end of period (in 000’s) | | $ | 4,659 | | | $ | 4,522 | | | $ | 4,142 | | | $ | 9,081 | | | $ | 9,326 | | | $ | 11,103 | |
| | | | | | | |
| | Ratio of net expenses to average net assets | | | 1.87 | %(c) | | | 1.89 | % | | | 1.89 | % | | | 1.89 | % | | | 1.90 | % | | | 1.90 | % |
| | | | | | | |
| | Ratio of total expenses to average net assets | | | 2.05 | %(c) | | | 2.11 | % | | | 2.14 | % | | | 2.13 | % | | | 2.30 | % | | | 2.29 | % |
| | | | | | | |
| | Ratio of net investment loss to average net assets | | | (1.32 | )%(c) | | | (1.25 | )% | | | (0.83 | )% | | | (0.85 | )% | | | (0.60 | )% | | | (0.56 | )% |
| | | | | | | |
| | Portfolio turnover rate(d) | | | 12 | % | | | 39 | % | | | 28 | % | | | 40 | % | | | 54 | % | | | 56 | % |
| | (a) | | Calculated based on the average shares outstanding methodology. |
| | (b) | | Assumes investment at the NAV at the beginning of the period, reinvestment of all dividends and distributions, a complete redemption of the investment at the NAV at the end of the period and no sales or redemption charges (if any). Total returns would be reduced if a sales or redemption charge was taken into account. Returns do not reflect the impact of taxes to shareholders relating to Fund distributions or the redemption of Fund shares. Total returns for periods less than one full year are not annualized. |
| | (d) | | The Fund’s portfolio turnover rate is calculated in accordance with regulatory requirements, without regard to transactions involving short term investments. If such transactions were included, the Fund’s portfolio turnover rate may be higher. |
| | |
| 98 | | The accompanying notes are an integral part of these financial statements. |
GOLDMAN SACHS STRATEGIC GROWTH FUND
Financial Highlights (continued)
Selected Share Data for a Share Outstanding Throughout Each Period
| | | | | | | | | | | | | | | | | | | | | | | | | | |
| | | | | Goldman Sachs Strategic Growth Fund | |
| | | | | Institutional Shares | |
| | | | | Six Months Ended
February 28, 2021
(Unaudited) | | | Year Ended August 31, | |
| | | | | 2020 | | | 2019 | | | 2018 | | | 2017 | | | 2016 | |
| | Per Share Data | | | | | | | | | | | | | | | | | | | | | | | | |
| | | | | | | |
| | Net asset value, beginning of period | | $ | 12.88 | | | $ | 10.39 | | | $ | 14.92 | | | $ | 14.67 | | | $ | 12.64 | | | $ | 12.53 | |
| | | | | | | |
| | Net investment income (loss)(a) | | | (0.01 | ) | | | 0.01 | | | | 0.03 | | | | 0.04 | | | | 0.07 | | | | 0.07 | |
| | | | | | | |
| | Net realized and unrealized gain (loss) | | | 1.03 | | | | 4.07 | | | | (0.26 | ) | | | 3.25 | | | | 2.40 | | | | 0.78 | |
| | | | | | | |
| | Total from investment operations | | | 1.02 | | | | 4.08 | | | | (0.23 | ) | | | 3.29 | | | | 2.47 | | | | 0.85 | |
| | | | | | | |
| | Distributions to shareholders from net investment income | | | — | (b) | | | (0.03 | ) | | | (0.03 | ) | | | (0.07 | ) | | | (0.08 | ) | | | (0.05 | ) |
| | | | | | | |
| | Distributions to shareholders from net realized gains | | | (1.77 | ) | | | (1.56 | ) | | | (4.27 | ) | | | (2.97 | ) | | | (0.36 | ) | | | (0.69 | ) |
| | | | | | | |
| | Total distributions | | | (1.77 | ) | | | (1.59 | ) | | | (4.30 | ) | | | (3.04 | ) | | | (0.44 | ) | | | (0.74 | ) |
| | | | | | | |
| | Net asset value, end of period | | $ | 12.13 | | | $ | 12.88 | | | $ | 10.39 | | | $ | 14.92 | | | $ | 14.67 | | | $ | 12.64 | |
| | | | | | | |
| | Total Return(c) | | | 8.46 | % | | | 44.36 | % | | | 3.31 | % | | | 26.11 | % | | | 20.29 | % | | | 6.89 | % |
| | | | | | | |
| | Net assets, end of period (in 000’s) | | $ | 56,913 | | | $ | 60,474 | | | $ | 52,461 | | | $ | 75,470 | | | $ | 211,311 | | | $ | 294,952 | |
| | | | | | | |
| | Ratio of net expenses to average net assets | | | 0.75 | %(d) | | | 0.76 | % | | | 0.75 | % | | | 0.75 | % | | | 0.75 | % | | | 0.75 | % |
| | | | | | | |
| | Ratio of total expenses to average net assets | | | 0.93 | %(d) | | | 0.98 | % | | | 1.00 | % | | | 0.99 | % | | | 1.14 | % | | | 1.14 | % |
| | | | | | | |
| | Ratio of net investment income (loss) to average net assets | | | (0.20 | )%(d) | | | 0.10 | % | | | 0.32 | % | | | 0.31 | % | | | 0.51 | % | | | 0.59 | % |
| | | | | | | |
| | Portfolio turnover rate(e) | | | 12 | % | | | 39 | % | | | 28 | % | | | 40 | % | | | 54 | % | | | 56 | % |
| | (a) | | Calculated based on the average shares outstanding methodology. |
| | (b) | | Amount is less than $0.005 per share. |
| | (c) | | Assumes investment at the NAV at the beginning of the period, reinvestment of all dividends and distributions, a complete redemption of the investment at the NAV at the end of the period and no sales or redemption charges (if any). Total returns would be reduced if a sales or redemption charge was taken into account. Returns do not reflect the impact of taxes to shareholders relating to Fund distributions or the redemption of Fund shares. Total returns for periods less than one full year are not annualized. |
| | (e) | | The Fund’s portfolio turnover rate is calculated in accordance with regulatory requirements, without regard to transactions involving short term investments. If such transactions were included, the Fund’s portfolio turnover rate may be higher. |
| | |
| The accompanying notes are an integral part of these financial statements. | | 99 |
GOLDMAN SACHS STRATEGIC GROWTH FUND
Financial Highlights (continued)
Selected Share Data for a Share Outstanding Throughout Each Period
| | | | | | | | | | | | | | | | | | | | | | | | | | |
| | | | | Goldman Sachs Strategic Growth Fund | |
| | | | | Service Shares | |
| | | | | Six Months Ended
February 28, 2021
(Unaudited) | | | Year Ended August 31, | |
| | | | | 2020 | | | 2019 | | | 2018 | | | 2017 | | | 2016 | |
| | Per Share Data | | | | | | | | | | | | | | | | | | | | | | | | |
| | | | | | | |
| | Net asset value, beginning of period | | $ | 10.97 | | | $ | 9.08 | | | $ | 13.67 | | | $ | 13.70 | | | $ | 11.85 | | | $ | 11.81 | |
| | | | | | | |
| | Net investment income (loss)(a) | | | (0.04 | ) | | | (0.04 | ) | | | (0.01 | ) | | | (0.03 | ) | | | 0.01 | | | | 0.01 | |
| | | | | | | |
| | Net realized and unrealized gain (loss) | | | 0.87 | | | | 3.49 | | | | (0.31 | ) | | | 3.00 | | | | 2.24 | | | | 0.73 | |
| | | | | | | |
| | Total from investment operations | | | 0.83 | | | | 3.45 | | | | (0.32 | ) | | | 2.97 | | | | 2.25 | | | | 0.74 | |
| | | | | | | |
| | Distributions to shareholders from net investment income | | | — | | | | — | | | | — | | | | (0.03 | ) | | | (0.04 | ) | | | (0.01 | ) |
| | | | | | | |
| | Distributions to shareholders from net realized gains | | | (1.77 | ) | | | (1.56 | ) | | | (4.27 | ) | | | (2.97 | ) | | | (0.36 | ) | | | (0.69 | ) |
| | | | | | | |
| | Total distributions | | | (1.77 | ) | | | (1.56 | ) | | | (4.27 | ) | | | (3.00 | ) | | | (0.40 | ) | | | (0.70 | ) |
| | | | | | | |
| | Net asset value, end of period | | $ | 10.03 | | | $ | 10.97 | | | $ | 9.08 | | | $ | 13.67 | | | $ | 13.70 | | | $ | 11.85 | |
| | | | | | | |
| | Total Return(b) | | | 8.17 | % | | | 43.67 | % | | | 2.79 | % | | | 25.48 | % | | | 19.66 | % | | | 6.40 | % |
| | | | | | | |
| | Net assets, end of period (in 000’s) | | $ | 486 | | | $ | 505 | | | $ | 622 | | | $ | 597 | | | $ | 478 | | | $ | 272 | |
| | | | | | | |
| | Ratio of net expenses to average net assets | | | 1.25 | %(c) | | | 1.26 | % | | | 1.25 | % | | | 1.25 | % | | | 1.25 | % | | | 1.25 | % |
| | | | | | | |
| | Ratio of total expenses to average net assets | | | 1.43 | %(c) | | | 1.53 | % | | | 1.53 | % | | | 1.48 | % | | | 1.65 | % | | | 1.64 | % |
| | | | | | | |
| | Ratio of net investment income (loss) to average net assets | | | (0.69 | )%(c) | | | (0.47 | )% | | | (0.14 | )% | | | (0.21 | )% | | | 0.09 | % | | | 0.11 | % |
| | | | | | | |
| | Portfolio turnover rate(d) | | | 12 | % | | | 39 | % | | | 28 | % | | | 40 | % | | | 54 | % | | | 56 | % |
| | (a) | | Calculated based on the average shares outstanding methodology. |
| | (b) | | Assumes investment at the NAV at the beginning of the period, reinvestment of all dividends and distributions, a complete redemption of the investment at the NAV at the end of the period and no sales or redemption charges (if any). Total returns would be reduced if a sales or redemption charge was taken into account. Returns do not reflect the impact of taxes to shareholders relating to Fund distributions or the redemption of Fund shares. Total returns for periods less than one full year are not annualized. |
| | (d) | | The Fund’s portfolio turnover rate is calculated in accordance with regulatory requirements, without regard to transactions involving short term investments. If such transactions were included, the Fund’s portfolio turnover rate may be higher. |
| | |
| 100 | | The accompanying notes are an integral part of these financial statements. |
GOLDMAN SACHS STRATEGIC GROWTH FUND
Financial Highlights (continued)
Selected Share Data for a Share Outstanding Throughout Each Period
| | | | | | | | | | | | | | | | | | | | | | | | | | |
| | | | | Goldman Sachs Strategic Growth Fund | |
| | | | | Investor Shares | |
| | | | | Six Months Ended
February 28, 2021
(Unaudited) | | �� | Year Ended August 31, | |
| | | | | 2020 | | | 2019 | | | 2018 | | | 2017 | | | 2016 | |
| | Per Share Data | | | | | | | | | | | | | | | | | | | | | | | | |
| | | | | | | |
| | Net asset value, beginning of period | | $ | 12.83 | | | $ | 10.34 | | | $ | 14.89 | | | $ | 14.66 | | | $ | 12.63 | | | $ | 12.53 | |
| | | | | | | |
| | Net investment income (loss)(a) | | | (0.02 | ) | | | (0.01 | ) | | | 0.02 | | | | 0.02 | | | | 0.06 | | | | 0.05 | |
| | | | | | | |
| | Net realized and unrealized gain (loss) | | | 1.02 | | | | 4.07 | | | | (0.27 | ) | | | 3.24 | | | | 2.40 | | | | 0.78 | |
| | | | | | | |
| | Total from investment operations | | | 1.00 | | | | 4.06 | | | | (0.25 | ) | | | 3.26 | | | | 2.46 | | | | 0.83 | |
| | | | | | | |
| | Distributions to shareholders from net investment income | | | — | | | | (0.01 | ) | | | (0.03 | ) | | | (0.06 | ) | | | (0.07 | ) | | | (0.04 | ) |
| | | | | | | |
| | Distributions to shareholders from net realized gains | | | (1.77 | ) | | | (1.56 | ) | | | (4.27 | ) | | | (2.97 | ) | | | (0.36 | ) | | | (0.69 | ) |
| | | | | | | |
| | Total distributions | | | (1.77 | ) | | | (1.57 | ) | | | (4.30 | ) | | | (3.03 | ) | | | (0.43 | ) | | | (0.73 | ) |
| | | | | | | |
| | Net asset value, end of period | | $ | 12.06 | | | $ | 12.83 | | | $ | 10.34 | | | $ | 14.89 | | | $ | 14.66 | | | $ | 12.63 | |
| | | | | | | |
| | Total Return(b) | | | 8.31 | % | | | 44.28 | % | | | 3.14 | % | | | 25.90 | % | | | 20.15 | % | | | 6.69 | % |
| | | | | | | |
| | Net assets, end of period (in 000’s) | | $ | 2,694 | | | $ | 2,758 | | | $ | 1,533 | | | $ | 2,578 | | | $ | 2,264 | | | $ | 829 | |
| | | | | | | |
| | Ratio of net expenses to average net assets | | | 0.87 | %(c) | | | 0.89 | % | | | 0.89 | % | | | 0.89 | % | | | 0.90 | % | | | 0.90 | % |
| | | | | | | |
| | Ratio of total expenses to average net assets | | | 1.05 | %(c) | | | 1.06 | % | | | 1.14 | % | | | 1.12 | % | | | 1.30 | % | | | 1.29 | % |
| | | | | | | |
| | Ratio of net investment income (loss) to average net assets | | | (0.33 | )%(c) | | | (0.09 | )% | | | 0.16 | % | | | 0.15 | % | | | 0.48 | % | | | 0.44 | % |
| | | | | | | |
| | Portfolio turnover rate(d) | | | 12 | % | | | 39 | % | | | 28 | % | | | 40 | % | | | 54 | % | | | 56 | % |
| | (a) | | Calculated based on the average shares outstanding methodology. |
| | (b) | | Assumes investment at the NAV at the beginning of the period, reinvestment of all dividends and distributions, a complete redemption of the investment at the NAV at the end of the period and no sales or redemption charges (if any). Total returns would be reduced if a sales or redemption charge was taken into account. Returns do not reflect the impact of taxes to shareholders relating to Fund distributions or the redemption of Fund shares. Total returns for periods less than one full year are not annualized. |
| | (d) | | The Fund’s portfolio turnover rate is calculated in accordance with regulatory requirements, without regard to transactions involving short term investments. If such transactions were included, the Fund’s portfolio turnover rate may be higher. |
| | |
| The accompanying notes are an integral part of these financial statements. | | 101 |
GOLDMAN SACHS STRATEGIC GROWTH FUND
Financial Highlights (continued)
Selected Share Data for a Share Outstanding Throughout Each Period
| | | | | | | | | | | | | | | | | | | | | | | | | | |
| | | | | Goldman Sachs Strategic Growth Fund | |
| | | | | Class R6 Shares | |
| | | | | Six Months Ended
February 28, 2021
(Unaudited) | | | Year Ended August 31, | |
| | | | | 2020 | | | 2019 | | | 2018 | | | 2017 | | | 2016 | |
| | Per Share Data | | | | | | | | | | | | | | | | | | | | | | | | |
| | | | | | | |
| | Net asset value, beginning of period | | $ | 12.86 | | | $ | 10.37 | | | $ | 14.91 | | | $ | 14.66 | | | $ | 12.63 | | | $ | 12.53 | |
| | | | | | | |
| | Net investment income (loss)(a) | | | (0.01 | ) | | | 0.01 | | | | 0.04 | | | | 0.04 | | | | 0.08 | | | | 0.07 | |
| | | | | | | |
| | Net realized and unrealized gain (loss) | | | 1.02 | | | | 4.07 | | | | (0.27 | ) | | | 3.25 | | | | 2.40 | | | | 0.77 | |
| | | | | | | |
| | Total from investment operations | | | 1.01 | | | | 4.08 | | | | (0.23 | ) | | | 3.29 | | | | 2.48 | | | | 0.84 | |
| | | | | | | |
| | Distributions to shareholders from net investment income | | | — | (b) | | | (0.03 | ) | | | (0.04 | ) | | | (0.07 | ) | | | (0.09 | ) | | | (0.05 | ) |
| | | | | | | |
| | Distributions to shareholders from net realized gains | | | (1.77 | ) | | | (1.56 | ) | | | (4.27 | ) | | | (2.97 | ) | | | (0.36 | ) | | | (0.69 | ) |
| | | | | | | |
| | Total distributions | | | (1.77 | ) | | | (1.59 | ) | | | (4.31 | ) | | | (3.04 | ) | | | (0.45 | ) | | | (0.74 | ) |
| | | | | | | |
| | Net asset value, end of period | | $ | 12.10 | | | $ | 12.86 | | | $ | 10.37 | | | $ | 14.91 | | | $ | 14.66 | | | $ | 12.63 | |
| | | | | | | |
| | Total Return(c) | | | 8.42 | % | | | 44.49 | % | | | 3.33 | % | | | 26.15 | % | | | 20.33 | % | | | 6.83 | % |
| | | | | | | |
| | Net assets, end of period (in 000’s) | | $ | 697 | | | $ | 509 | | | $ | 477 | | | $ | 15 | | | $ | 12 | | | $ | 10 | |
| | | | | | | |
| | Ratio of net expenses to average net assets | | | 0.74 | %(d) | | | 0.75 | % | | | 0.74 | % | | | 0.74 | % | | | 0.75 | % | | | 0.76 | % |
| | | | | | | |
| | Ratio of total expenses to average net assets | | | 0.92 | %(d) | | | 0.99 | % | | | 1.03 | % | | | 0.97 | % | | | 1.14 | % | | | 1.15 | % |
| | | | | | | |
| | Ratio of net investment income (loss) to average net assets | | | (0.19 | )%(d) | | | 0.10 | % | | | 0.40 | % | | | 0.30 | % | | | 0.57 | % | | | 0.59 | % |
| | | | | | | |
| | Portfolio turnover rate(e) | | | 12 | % | | | 39 | % | | | 28 | % | | | 40 | % | | | 54 | % | | | 56 | % |
| | (a) | | Calculated based on the average shares outstanding methodology. |
| | (b) | | Amount is less than $0.005 per share. |
| | (c) | | Assumes investment at the NAV at the beginning of the period, reinvestment of all dividends and distributions, a complete redemption of the investment at the NAV at the end of the period and no sales or redemption charges (if any). Total returns would be reduced if a sales or redemption charge was taken into account. Returns do not reflect the impact of taxes to shareholders relating to Fund distributions or the redemption of Fund shares. Total returns for periods less than one full year are not annualized. |
| | (e) | | The Fund’s portfolio turnover rate is calculated in accordance with regulatory requirements, without regard to transactions involving short term investments. If such transactions were included, the Fund’s portfolio turnover rate may be higher. |
| | |
| 102 | | The accompanying notes are an integral part of these financial statements. |
GOLDMAN SACHS STRATEGIC GROWTH FUND
Financial Highlights (continued)
Selected Share Data for a Share Outstanding Throughout Each Period
| | | | | | | | | | | | | | | | | | | | | | | | | | |
| | | | | Goldman Sachs Strategic Growth Fund | |
| | | | | Class R Shares | |
| | | | | Six Months Ended
February 28, 2021
(Unaudited) | | | Year Ended August 31, | |
| | | | | 2020 | | | 2019 | | | 2018 | | | 2017 | | | 2016 | |
| | Per Share Data | | | | | | | | | | | | | | | | | | | | | | | | |
| | | | | | | |
| | Net asset value, beginning of period | | $ | 10.67 | | | $ | 8.88 | | | $ | 13.49 | | | $ | 13.56 | | | $ | 11.75 | | | $ | 11.74 | |
| | | | | | | |
| | Net investment loss(a) | | | (0.04 | ) | | | (0.06 | ) | | | (0.03 | ) | | | (0.04 | ) | | | (0.01 | ) | | | (0.01 | ) |
| | | | | | | |
| | Net realized and unrealized gain (loss) | | | 0.83 | | | | 3.41 | | | | (0.31 | ) | | | 2.96 | | | | 2.23 | | | | 0.73 | |
| | | | | | | |
| | Total from investment operations | | | 0.79 | | | | 3.35 | | | | (0.34 | ) | | | 2.92 | | | | 2.22 | | | | 0.72 | |
| | | | | | | |
| | Distributions to shareholders from net investment income | | | — | | | | — | | | | — | | | | (0.02 | ) | | | (0.05 | ) | | | (0.02 | ) |
| | | | | | | |
| | Distributions to shareholders from net realized gains | | | (1.77 | ) | | | (1.56 | ) | | | (4.27 | ) | | | (2.97 | ) | | | (0.36 | ) | | | (0.69 | ) |
| | | | | | | |
| | Total distributions | | | (1.77 | ) | | | (1.56 | ) | | | (4.27 | ) | | | (2.99 | ) | | | (0.41 | ) | | | (0.71 | ) |
| | | | | | | |
| | Net asset value, end of period | | $ | 9.69 | | | $ | 10.67 | | | $ | 8.88 | | | $ | 13.49 | | | $ | 13.56 | | | $ | 11.75 | |
| | | | | | | |
| | Total Return(b) | | | 8.12 | % | | | 43.52 | % | | | 2.67 | % | | | 25.29 | % | | | 19.56 | % | | | 6.18 | % |
| | | | | | | |
| | Net assets, end of period (in 000’s) | | $ | 45 | | | $ | 66 | | | $ | 292 | | | $ | 255 | | | $ | 169 | | | $ | 81 | |
| | | | | | | |
| | Ratio of net expenses to average net assets | | | 1.37 | %(c) | | | 1.40 | % | | | 1.39 | % | | | 1.39 | % | | | 1.40 | % | | | 1.40 | % |
| | | | | | | |
| | Ratio of total expenses to average net assets | | | 1.56 | %(c) | | | 1.75 | % | | | 1.65 | % | | | 1.62 | % | | | 1.80 | % | | | 1.79 | % |
| | | | | | | |
| | Ratio of net investment loss to average net assets | | | (0.80 | )%(c) | | | (0.66 | )% | | | (0.31 | )% | | | (0.34 | )% | | | (0.07 | )% | | | (0.05 | )% |
| | | | | | | |
| | Portfolio turnover rate(d) | | | 12 | % | | | 39 | % | | | 28 | % | | | 40 | % | | | 54 | % | | | 56 | % |
| | (a) | | Calculated based on the average shares outstanding methodology. |
| | (b) | | Assumes investment at the NAV at the beginning of the period, reinvestment of all dividends and distributions, a complete redemption of the investment at the NAV at the end of the period and no sales or redemption charges (if any). Total returns would be reduced if a sales or redemption charge was taken into account. Returns do not reflect the impact of taxes to shareholders relating to Fund distributions or the redemption of Fund shares. Total returns for periods less than one full year are not annualized. |
| | (d) | | The Fund’s portfolio turnover rate is calculated in accordance with regulatory requirements, without regard to transactions involving short term investments. If such transactions were included, the Fund’s portfolio turnover rate may be higher. |
| | |
| The accompanying notes are an integral part of these financial statements. | | 103 |
GOLDMAN SACHS STRATEGIC GROWTH FUND
Financial Highlights (continued)
Selected Share Data for a Share Outstanding Throughout Each Period
| | | | | | | | | | | | | | | | | | |
| | | | | Goldman Sachs Strategic Growth Fund | |
| | | | | Class P Shares | |
| | | | | Six Months Ended
February 28, 2021
(Unaudited) | | | Year Ended August 31, | | | Period Ended
August 31, 2018(a) | |
| | | | | 2020 | | | 2019 | |
| | Per Share Data | | | | | | | | | | | | | | | | |
| | | | | |
| | Net asset value, beginning of period | | $ | 12.84 | | | $ | 10.35 | | | $ | 14.90 | | | $ | 13.53 | |
| | | | | |
| | Net investment income (loss)(b) | | | (0.01 | ) | | | 0.01 | | | | 0.04 | | | | 0.01 | |
| | | | | |
| | Net realized and unrealized gain (loss) | | | 1.02 | | | | 4.07 | | | | (0.28 | ) | | | 1.36 | |
| | | | | |
| | Total from investment operations | | | 1.01 | | | | 4.08 | | | | (0.24 | ) | | | 1.37 | |
| | | | | |
| | Distributions to shareholders from net investment income | | | — | (c) | | | (0.03 | ) | | | (0.04 | ) | | | — | |
| | | | | |
| | Distributions to shareholders from net realized gains | | | (1.77 | ) | | | (1.56 | ) | | | (4.27 | ) | | | — | |
| | | | | |
| | Total distributions | | | (1.77 | ) | | | (1.59 | ) | | | (4.31 | ) | | | — | |
| | | | | |
| | Net asset value, end of period | | $ | 12.08 | | | $ | 12.84 | | | $ | 10.35 | | | $ | 14.90 | |
| | | | | |
| | Total Return(d) | | | 8.42 | % | | | 44.56 | % | | | 3.26 | % | | | 10.13 | % |
| | | | | |
| | Net assets, end of period (in 000’s) | | $ | 80,945 | | | $ | 78,539 | | | $ | 73,132 | | | $ | 104,590 | |
| | | | | |
| | Ratio of net expenses to average net assets | | | 0.74 | %(e) | | | 0.75 | % | | | 0.74 | % | | | 0.74 | %(e) |
| | | | | |
| | Ratio of total expenses to average net assets | | | 0.92 | %(e) | | | 0.98 | % | | | 0.99 | % | | | 0.96 | %(e) |
| | | | | |
| | Ratio of net investment income (loss) to average net assets | | | (0.19 | )%(e) | | | 0.12 | % | | | 0.32 | % | | | 0.22 | %(e) |
| | | | | |
| | Portfolio turnover rate(f) | | | 12 | % | | | 39 | % | | | 28 | % | | | 40 | % |
| | (a) | | Commenced operations on April 17, 2018. |
| | (b) | | Calculated based on the average shares outstanding methodology. |
| | (c) | | Amount is less than $0.005 per share. |
| | (d) | | Assumes investment at the NAV at the beginning of the period, reinvestment of all dividends and distributions, a complete redemption of the investment at the NAV at the end of the period and no sales or redemption charges (if any). Total returns would be reduced if a sales or redemption charge was taken into account. Returns do not reflect the impact of taxes to shareholders relating to Fund distributions or the redemption of Fund shares. Total returns for periods less than one full year are not annualized. |
| | (f) | | The Fund’s portfolio turnover rate is calculated in accordance with regulatory requirements, without regard to transactions involving short term investments. If such transactions were included, the Fund’s portfolio turnover rate may be higher. |
| | |
| 104 | | The accompanying notes are an integral part of these financial statements. |
GOLDMAN SACHS TECHNOLOGY OPPORTUNITIES FUND
Financial Highlights (continued)
Selected Share Data for a Share Outstanding Throughout Each Period
| | | | | | | | | | | | | | | | | | | | | | | | | | |
| | | | | Goldman Sachs Technology Opportunities Fund | |
| | | | | Class A Shares | |
| | | | | Six Months Ended
February 28, 2021
(Unaudited) | | | Year Ended August 31, | |
| | 2020 | | | 2019 | | | 2018 | | | 2017 | | | 2016 | |
| | Per Share Data | | | | | | | | | | | | | | | | | | | | | | | | |
| | | | | | | |
| | Net asset value, beginning of period | | $ | 29.76 | | | $ | 23.17 | | | $ | 27.91 | | | $ | 23.04 | | | $ | 18.73 | | | $ | 17.93 | |
| | | | | | | |
| | Net investment loss(a) | | | (0.11 | ) | | | (0.13 | ) | | | (0.12 | ) | | | (0.16 | ) | | | (0.15 | ) | | | (0.12 | )(b) |
| | | | | | | |
| | Net realized and unrealized gain | | | 2.35 | | | | 10.43 | | | | 0.44 | | | | 6.79 | | | | 5.37 | | | | 2.50 | |
| | | | | | | |
| | Total from investment operations | | | 2.24 | | | | 10.30 | | | | 0.32 | | | | 6.63 | | | | 5.22 | | | | 2.38 | |
| | | | | | | |
| | Distributions to shareholders from net realized gains | | | (2.65 | ) | | | (3.71 | ) | | | (5.06 | ) | | | (1.76 | ) | | | (0.91 | ) | | | (1.58 | ) |
| | | | | | | |
| | Net asset value, end of period | | $ | 29.35 | | | $ | 29.76 | | | $ | 23.17 | | | $ | 27.91 | | | $ | 23.04 | | | $ | 18.73 | |
| | | | | | | |
| | Total Return(c) | | | 8.00 | % | | | 51.05 | % | | | 4.73 | % | | | 30.46 | % | | | 29.17 | % | | | 13.71 | % |
| | | | | | | |
| | Net assets, end of period (in 000’s) | | $ | 443,186 | | | $ | 429,267 | | | $ | 305,666 | | | $ | 312,289 | | | $ | 268,746 | | | $ | 233,097 | |
| | | | | | | |
| | Ratio of net expenses to average net assets | | | 1.25 | %(d) | | | 1.28 | % | | | 1.34 | % | | | 1.38 | % | | | 1.42 | % | | | 1.47 | % |
| | | | | | | |
| | Ratio of total expenses to average net assets | | | 1.41 | %(d) | | | 1.46 | % | | | 1.48 | % | | | 1.48 | % | | | 1.53 | % | | | 1.55 | % |
| | | | | | | |
| | Ratio of net investment loss to average net assets | | | (0.73 | )%(d) | | | (0.55 | )% | | | (0.53 | )% | | | (0.65 | )% | | | (0.74 | )% | | | (0.68 | )%(b) |
| | | | | | | |
| | Portfolio turnover rate(e) | | | 20 | % | | | 41 | % | | | 27 | % | | | 46 | % | | | 19 | % | | | 22 | % |
| | (a) | | Calculated based on the average shares outstanding methodology. |
| | (b) | | Reflects income recognized from special dividends which amounted to $0.02 per share and 0.13% of average net assets. |
| | (c) | | Assumes investment at the NAV at the beginning of the period, reinvestment of all dividends and distributions, a complete redemption of the investment at the NAV at the end of the period and no sales or redemption charges (if any). Total returns would be reduced if a sales or redemption charge was taken into account. Returns do not reflect the impact of taxes to shareholders relating to Fund distributions or the redemption of Fund shares. Total returns for periods less than one full year are not annualized. |
| | (e) | | The Fund’s portfolio turnover rate is calculated in accordance with regulatory requirements, without regard to transactions involving short term investments. If such transactions were included, the Fund’s portfolio turnover rate may be higher. |
| | |
| The accompanying notes are an integral part of these financial statements. | | 105 |
GOLDMAN SACHS TECHNOLOGY OPPORTUNITIES FUND
Financial Highlights (continued)
Selected Share Data for a Share Outstanding Throughout Each Period
| | | | | | | | | | | | | | | | | | | | | | | | | | |
| | | | | Goldman Sachs Technology Opportunities Fund | |
| | | | | Class C Shares | |
| | | | | Six Months Ended
February 28, 2021
(Unaudited) | | | Year Ended August 31, | |
| | 2020 | | | 2019 | | | 2018 | | | 2017 | | | 2016 | |
| | Per Share Data | | | | | | | | | | | | | | | | | | | | | | | | |
| | | | | | | |
| | Net asset value, beginning of period | | $ | 21.68 | | | $ | 17.94 | | | $ | 23.05 | | | $ | 19.45 | | | $ | 16.07 | | | $ | 15.70 | |
| | | | | | | |
| | Net investment loss(a) | | | (0.15 | ) | | | (0.23 | ) | | | (0.24 | ) | | | (0.29 | ) | | | (0.25 | ) | | | (0.22 | )(b) |
| | | | | | | |
| | Net realized and unrealized gain | | | 1.66 | | | | 7.68 | | | | 0.19 | | | | 5.65 | | | | 4.54 | | | | 2.17 | |
| | | | | | | |
| | Total from investment operations | | | 1.51 | | | | 7.45 | | | | (0.05 | ) | | | 5.36 | | | | 4.29 | | | | 1.95 | |
| | | | | | | |
| | Distributions to shareholders from net realized gains | | | (2.65 | ) | | | (3.71 | ) | | | (5.06 | ) | | | (1.76 | ) | | | (0.91 | ) | | | (1.58 | ) |
| | | | | | | |
| | Net asset value, end of period | | $ | 20.54 | | | $ | 21.68 | | | $ | 17.94 | | | $ | 23.05 | | | $ | 19.45 | | | $ | 16.07 | |
| | | | | | | |
| | Total Return(c) | | | 7.59 | % | | | 49.93 | % | | | 3.97 | % | | | 29.49 | % | | | 28.18 | % | | | 12.87 | % |
| | | | | | | |
| | Net assets, end of period (in 000’s) | | $ | 28,424 | | | $ | 30,011 | | | $ | 24,948 | | | $ | 57,207 | | | $ | 50,779 | | | $ | 52,843 | |
| | | | | | | |
| | Ratio of net expenses to average net assets | | | 1.99 | %(d) | | | 2.03 | % | | | 2.10 | % | | | 2.13 | % | | | 2.17 | % | | | 2.22 | % |
| | | | | | | |
| | Ratio of total expenses to average net assets | | | 2.15 | %(d) | | | 2.21 | % | | | 2.23 | % | | | 2.23 | % | | | 2.28 | % | | | 2.30 | % |
| | | | | | | |
| | Ratio of net investment loss to average net assets | | | (1.48 | )%(d) | | | (1.31 | )% | | | (1.31 | )% | | | (1.40 | )% | | | (1.49 | )% | | | (1.43 | )%(b) |
| | | | | | | |
| | Portfolio turnover rate(e) | | | 20 | % | | | 41 | % | | | 27 | % | | | 46 | % | | | 19 | % | | | 22 | % |
| | (a) | | Calculated based on the average shares outstanding methodology. |
| | (b) | | Reflects income recognized from special dividends which amounted to $0.02 per share and 0.13% of average net assets. |
| | (c) | | Assumes investment at the NAV at the beginning of the period, reinvestment of all dividends and distributions, a complete redemption of the investment at the NAV at the end of the period and no sales or redemption charges (if any). Total returns would be reduced if a sales or redemption charge was taken into account. Returns do not reflect the impact of taxes to shareholders relating to Fund distributions or the redemption of Fund shares. Total returns for periods less than one full year are not annualized. |
| | (e) | | The Fund’s portfolio turnover rate is calculated in accordance with regulatory requirements, without regard to transactions involving short term investments. If such transactions were included, the Fund’s portfolio turnover rate may be higher. |
| | |
| 106 | | The accompanying notes are an integral part of these financial statements. |
GOLDMAN SACHS TECHNOLOGY OPPORTUNITIES FUND
Financial Highlights (continued)
Selected Share Data for a Share Outstanding Throughout Each Period
| | | | | | | | | | | | | | | | | | | | | | | | | | |
| | | | | Goldman Sachs Technology Opportunities Fund | |
| | | | | Institutional Shares | |
| | | | | Six Months Ended
February 28, 2021
(Unaudited) | | | Year Ended August 31, | |
| | 2020 | | | 2019 | | | 2018 | | | 2017 | | | 2016 | |
| | Per Share Data | | | | | | | | | | | | | | | | | | | | | | | | |
| | | | | | | |
| | Net asset value, beginning of period | | $ | 34.57 | | | $ | 26.28 | | | $ | 30.78 | | | $ | 25.15 | | | $ | 20.29 | | | $ | 19.22 | |
| | | | | | | |
| | Net investment loss(a) | | | (0.08 | ) | | | (0.07 | ) | | | (0.04 | ) | | | (0.07 | ) | | | (0.07 | ) | | | (0.05 | )(b) |
| | | | | | | |
| | Net realized and unrealized gain | | | 2.75 | | | | 12.07 | | | | 0.60 | | | | 7.46 | | | | 5.84 | | | | 2.70 | |
| | | | | | | |
| | Total from investment operations | | | 2.67 | | | | 12.00 | | | | 0.56 | | | | 7.39 | | | | 5.77 | | | | 2.65 | |
| | | | | | | |
| | Distributions to shareholders from net realized gains | | | (2.65 | ) | | | (3.71 | ) | | | (5.06 | ) | | | (1.76 | ) | | | (0.91 | ) | | | (1.58 | ) |
| | | | | | | |
| | Net asset value, end of period | | $ | 34.59 | | | $ | 34.57 | | | $ | 26.28 | | | $ | 30.78 | | | $ | 25.15 | | | $ | 20.29 | |
| | | | | | | |
| | Total Return(c) | | | 8.14 | % | | | 51.49 | % | | | 5.12 | % | | | 30.95 | % | | | 29.66 | % | | | 14.22 | % |
| | | | | | | |
| | Net assets, end of period (in 000’s) | | $ | 163,783 | | | $ | 157,267 | | | $ | 74,728 | | | $ | 87,522 | | | $ | 85,095 | | | $ | 83,746 | |
| | | | | | | |
| | Ratio of net expenses to average net assets | | | 0.98 | %(d) | | | 0.99 | % | | | 0.98 | % | | | 0.99 | % | | | 1.02 | % | | | 1.07 | % |
| | | | | | | |
| | Ratio of total expenses to average net assets | | | 1.04 | %(d) | | | 1.08 | % | | | 1.09 | % | | | 1.09 | % | | | 1.13 | % | | | 1.15 | % |
| | | | | | | |
| | Ratio of net investment loss to average net assets | | | (0.46 | )%(d) | | | (0.27 | )% | | | (0.17 | )% | | | (0.26 | )% | | | (0.34 | )% | | | (0.27 | )%(b) |
| | | | | | | |
| | Portfolio turnover rate(e) | | | 20 | % | | | 41 | % | | | 27 | % | | | 46 | % | | | 19 | % | | | 22 | % |
| | (a) | | Calculated based on the average shares outstanding methodology. |
| | (b) | | Reflects income recognized from special dividends which amounted to $0.02 per share and 0.13% of average net assets. |
| | (c) | | Assumes investment at the NAV at the beginning of the period, reinvestment of all dividends and distributions, a complete redemption of the investment at the NAV at the end of the period and no sales or redemption charges (if any). Total returns would be reduced if a sales or redemption charge was taken into account. Returns do not reflect the impact of taxes to shareholders relating to Fund distributions or the redemption of Fund shares. Total returns for periods less than one full year are not annualized. |
| | (e) | | The Fund’s portfolio turnover rate is calculated in accordance with regulatory requirements, without regard to transactions involving short term investments. If such transactions were included, the Fund’s portfolio turnover rate may be higher. |
| | |
| The accompanying notes are an integral part of these financial statements. | | 107 |
GOLDMAN SACHS TECHNOLOGY OPPORTUNITIES FUND
Financial Highlights (continued)
Selected Share Data for a Share Outstanding Throughout Each Period
| | | | | | | | | | | | | | | | | | | | | | | | | | |
| | | | | Goldman Sachs Technology Opportunities Fund | |
| | | | | Service Shares | |
| | | | | Six Months Ended
February 28, 2021
(Unaudited) | | | Year Ended August 31, | |
| | 2020 | | | 2019 | | | 2018 | | | 2017 | | | 2016 | |
| | Per Share Data | | | | | | | | | | | | | | | | | | | | | | | | |
| | | | | | | |
| | Net asset value, beginning of period | | $ | 28.77 | | | $ | 22.56 | | | $ | 27.35 | | | $ | 22.64 | | | $ | 18.44 | | | $ | 17.69 | |
| | | | | | | |
| | Net investment loss(a) | | | (0.13 | ) | | | (0.17 | ) | | | (0.15 | ) | | | (0.18 | ) | | | (0.16 | ) | | | (0.14 | )(b) |
| | | | | | | |
| | Net realized and unrealized gain | | | 2.25 | | | | 10.09 | | | | 0.42 | | | | 6.65 | | | | 5.27 | | | | 2.47 | |
| | | | | | | |
| | Total from investment operations | | | 2.12 | | | | 9.92 | | | | 0.27 | | | | 6.47 | | | | 5.11 | | | | 2.33 | |
| | | | | | | |
| | Distributions to shareholders from net realized gains | | | (2.65 | ) | | | (3.71 | ) | | | (5.06 | ) | | | (1.76 | ) | | | (0.91 | ) | | | (1.58 | ) |
| | | | | | | |
| | Net asset value, end of period | | $ | 28.24 | | | $ | 28.77 | | | $ | 22.56 | | | $ | 27.35 | | | $ | 22.64 | | | $ | 18.44 | |
| | | | | | | |
| | Total Return(c) | | | 7.85 | % | | | 50.71 | % | | | 4.62 | % | | | 30.28 | % | | | 29.03 | % | | | 13.61 | % |
| | | | | | | |
| | Net assets, end of period (in 000’s) | | $ | 36,706 | | | $ | 41,024 | | | $ | 29,084 | | | $ | 33,109 | | | $ | 18,919 | | | $ | 11,186 | |
| | | | | | | |
| | Ratio of net expenses to average net assets | | | 1.48 | %(d) | | | 1.49 | % | | | 1.48 | % | | | 1.49 | % | | | 1.51 | % | | | 1.57 | % |
| | | | | | | |
| | Ratio of total expenses to average net assets | | | 1.54 | %(d) | | | 1.58 | % | | | 1.59 | % | | | 1.59 | % | | | 1.63 | % | | | 1.65 | % |
| | | | | | | |
| | Ratio of net investment loss to average net assets | | | (0.96 | )%(d) | | | (0.77 | )% | | | (0.67 | )% | | | (0.75 | )% | | | (0.83 | )% | | | (0.79 | )%(b) |
| | | | | | | |
| | Portfolio turnover rate(e) | | | 20 | % | | | 41 | % | | | 27 | % | | | 46 | % | | | 19 | % | | | 22 | % |
| | (a) | | Calculated based on the average shares outstanding methodology. |
| | (b) | | Reflects income recognized from special dividends which amounted to $0.02 per share and 0.13% of average net assets. |
| | (c) | | Assumes investment at the NAV at the beginning of the period, reinvestment of all dividends and distributions, a complete redemption of the investment at the NAV at the end of the period and no sales or redemption charges (if any). Total returns would be reduced if a sales or redemption charge was taken into account. Returns do not reflect the impact of taxes to shareholders relating to Fund distributions or the redemption of Fund shares. Total returns for periods less than one full year are not annualized. |
| | (e) | | The Fund’s portfolio turnover rate is calculated in accordance with regulatory requirements, without regard to transactions involving short term investments. If such transactions were included, the Fund’s portfolio turnover rate may be higher. |
| | |
| 108 | | The accompanying notes are an integral part of these financial statements. |
GOLDMAN SACHS TECHNOLOGY OPPORTUNITIES FUND
Financial Highlights (continued)
Selected Share Data for a Share Outstanding Throughout Each Period
| | | | | | | | | | | | | | | | | | | | | | | | | | |
| | | | | Goldman Sachs Technology Opportunities Fund | |
| | | | | Investor Shares | |
| | | | | Six Months Ended
February 28, 2021
(Unaudited) | | | Year Ended August 31, | |
| | 2020 | | | 2019 | | | 2018 | | | 2017 | | | 2016 | |
| | Per Share Data | | | | | | | | | | | | | | | | | | | | | | | | |
| | | | | | | |
| | Net asset value, beginning of period | | $ | 33.79 | | | $ | 25.78 | | | $ | 30.33 | | | $ | 24.84 | | | $ | 20.08 | | | $ | 19.07 | |
| | | | | | | |
| | Net investment loss(a) | | | (0.08 | ) | | | (0.08 | ) | | | (0.07 | ) | | | (0.11 | ) | | | (0.10 | ) | | | (0.08 | )(b) |
| | | | | | | |
| | Net realized and unrealized gain | | | 2.69 | | | | 11.80 | | | | 0.58 | | | | 7.36 | | | | 5.77 | | | | 2.67 | |
| | | | | | | |
| | Total from investment operations | | | 2.61 | | | | 11.72 | | | | 0.51 | | | | 7.25 | | | | 5.67 | | | | 2.59 | |
| | | | | | | |
| | Distributions to shareholders from net realized gains | | | (2.65 | ) | | | (3.71 | ) | | | (5.06 | ) | | | (1.76 | ) | | | (0.91 | ) | | | (1.58 | ) |
| | | | | | | |
| | Net asset value, end of period | | $ | 33.75 | | | $ | 33.79 | | | $ | 25.78 | | | $ | 30.33 | | | $ | 24.84 | | | $ | 20.08 | |
| | | | | | | |
| | Total Return(c) | | | 8.15 | % | | | 51.40 | % | | | 5.01 | % | | | 30.76 | % | | | 29.46 | % | | | 14.00 | % |
| | | | | | | |
| | Net assets, end of period (in 000’s) | | $ | 42,738 | | | $ | 48,387 | | | $ | 19,207 | | | $ | 22,520 | | | $ | 23,317 | | | $ | 6,741 | |
| | | | | | | |
| | Ratio of net expenses to average net assets | | | 1.00 | %(d) | | | 1.02 | % | | | 1.09 | % | | | 1.13 | % | | | 1.16 | % | | | 1.22 | % |
| | | | | | | |
| | Ratio of total expenses to average net assets | | | 1.16 | %(d) | | | 1.21 | % | | | 1.23 | % | | | 1.23 | % | | | 1.28 | % | | | 1.30 | % |
| | | | | | | |
| | Ratio of net investment loss to average net assets | | | (0.48 | )%(d) | | | (0.31 | )% | | | (0.29 | )% | | | (0.40 | )% | | | (0.46 | )% | | | (0.43 | )%(b) |
| | | | | | | |
| | Portfolio turnover rate(e) | | | 20 | % | | | 41 | % | | | 27 | % | | | 46 | % | | | 19 | % | | | 22 | % |
| | (a) | | Calculated based on the average shares outstanding methodology. |
| | (b) | | Reflects income recognized from special dividends which amounted to $0.02 per share and 0.13% of average net assets. |
| | (c) | | Assumes investment at the NAV at the beginning of the period, reinvestment of all dividends and distributions, a complete redemption of the investment at the NAV at the end of the period and no sales or redemption charges (if any). Total returns would be reduced if a sales or redemption charge was taken into account. Returns do not reflect the impact of taxes to shareholders relating to Fund distributions or the redemption of Fund shares. Total returns for periods less than one full year are not annualized. |
| | (e) | | The Fund’s portfolio turnover rate is calculated in accordance with regulatory requirements, without regard to transactions involving short term investments. If such transactions were included, the Fund’s portfolio turnover rate may be higher. |
| | |
| The accompanying notes are an integral part of these financial statements. | | 109 |
GOLDMAN SACHS TECHNOLOGY OPPORTUNITIES FUND
Financial Highlights (continued)
Selected Share Data for a Share Outstanding Throughout Each Period
| | | | | | | | | | | | | | | | | | |
| | | | | Goldman Sachs Technology Opportunities Fund | |
| | | | | Class R6 Shares | |
| | | | | Six Months Ended
February 28, 2021
(Unaudited) | | | Year Ended August 31, | | | Period Ended
August 31, 2018(a) | |
| | 2020 | | | 2019 | |
| | Per Share Data | | | | | | | | | | | | | | | | |
| | | | | |
| | Net asset value, beginning of period | | $ | 34.59 | | | $ | 26.29 | | | $ | 30.78 | | | $ | 25.08 | |
| | | | | |
| | Net investment loss(b) | | | (0.08 | ) | | | (0.08 | ) | | | (0.02 | ) | | | (0.04 | ) |
| | | | | |
| | Net realized and unrealized gain | | | 2.75 | | | | 12.09 | | | | 0.59 | | | | 5.74 | |
| | | | | |
| | Total from investment operations | | | 2.67 | | | | 12.01 | | | | 0.57 | | | | 5.70 | |
| | | | | |
| | Distributions to shareholders from net realized gains | | | (2.65 | ) | | | (3.71 | ) | | | (5.06 | ) | | | — | |
| | | | | |
| | Net asset value, end of period | | $ | 34.61 | | | $ | 34.59 | | | $ | 26.29 | | | $ | 30.78 | |
| | | | | |
| | Total Return(c) | | | 8.13 | % | | | 51.51 | % | | | 5.15 | % | | | 22.73 | % |
| | | | | |
| | Net assets, end of period (in 000’s) | | $ | 1,745 | | | $ | 1,330 | | | $ | 138 | | | $ | 12 | |
| | | | | |
| | Ratio of net expenses to average net assets | | | 0.97 | %(d) | | | 0.97 | % | | | 0.97 | % | | | 0.98 | %(d) |
| | | | | |
| | Ratio of total expenses to average net assets | | | 1.03 | %(d) | | | 1.06 | % | | | 1.09 | % | | | 1.08 | %(d) |
| | | | | |
| | Ratio of net investment loss to average net assets | | | (0.45 | )%(d) | | | (0.28 | )% | | | (0.07 | )% | | | (0.20 | )%(d) |
| | | | | |
| | Portfolio turnover rate(e) | | | 20 | % | | | 41 | % | | | 27 | % | | | 46 | % |
| | (a) | | Commenced operations on December 29, 2017. |
| | (b) | | Calculated based on the average shares outstanding methodology. |
| | (c) | | Assumes investment at the NAV at the beginning of the period, reinvestment of all dividends and distributions, a complete redemption of the investment at the NAV at the end of the period and no sales or redemption charges (if any). Total returns would be reduced if a sales or redemption charge was taken into account. Returns do not reflect the impact of taxes to shareholders relating to Fund distributions or the redemption of Fund shares. Total returns for periods less than one full year are not annualized. |
| | (e) | | The Fund’s portfolio turnover rate is calculated in accordance with regulatory requirements, without regard to transactions involving short term investments. If such transactions were included, the Fund’s portfolio turnover rate may be higher. |
| | |
| 110 | | The accompanying notes are an integral part of these financial statements. |
GOLDMAN SACHS TECHNOLOGY OPPORTUNITIES FUND
Financial Highlights (continued)
Selected Share Data for a Share Outstanding Throughout Each Period
| | | | | | | | | | | | | | | | | | |
| | | | | Goldman Sachs Technology Opportunities Fund | |
| | | | | Class P Shares | |
| | | | | Six Months Ended
February 28, 2021
(Unaudited) | | | Year Ended August 31, | | | Period Ended
August 31, 2018(a) | |
| | 2020 | | | 2019 | |
| | Per Share Data | | | | | | | | | | | | | | | | |
| | | | | |
| | Net asset value, beginning of period | | $ | 34.59 | | | $ | 26.29 | | | $ | 30.79 | | | $ | 27.83 | |
| | | | | |
| | Net investment income (loss)(b) | | | (0.07 | ) | | | (0.07 | ) | | | (0.04 | ) | | | 0.01 | |
| | | | | |
| | Net realized and unrealized gain | | | 2.74 | | | | 12.08 | | | | 0.60 | | | | 2.95 | |
| | | | | |
| | Total from investment operations | | | 2.67 | | | | 12.01 | | | | 0.56 | | | | 2.96 | |
| | | | | |
| | Distributions to shareholders from net realized gains | | | (2.65 | ) | | | (3.71 | ) | | | (5.06 | ) | | | — | |
| | | | | |
| | Net asset value, end of period | | $ | 34.61 | | | $ | 34.59 | | | $ | 26.29 | | | $ | 30.79 | |
| | | | | |
| | Total Return(c) | | | 8.13 | % | | | 51.51 | % | | | 5.11 | % | | | 10.64 | % |
| | | | | |
| | Net assets, end of period (in 000’s) | | $ | 101,673 | | | $ | 63,555 | | | $ | 24,396 | | | $ | 24,951 | |
| | | | | |
| | Ratio of net expenses to average net assets | | | 0.97 | %(d) | | | 0.98 | % | | | 0.97 | % | | | 0.97 | %(d) |
| | | | | |
| | Ratio of total expenses to average net assets | | | 1.02 | %(d) | | | 1.07 | % | | | 1.08 | % | | | 1.14 | %(d) |
| | | | | |
| | Ratio of net investment income (loss) to average net assets | | | (0.44 | )%(d) | | | (0.25 | )% | | | (0.16 | )% | | | 0.08 | %(d) |
| | | | | |
| | Portfolio turnover rate(e) | | | 20 | % | | | 41 | % | | | 27 | % | | | 46 | % |
| | (a) | | Commenced operations on April 17, 2018. |
| | (b) | | Calculated based on the average shares outstanding methodology. |
| | (c) | | Assumes investment at the NAV at the beginning of the period, reinvestment of all dividends and distributions, a complete redemption of the investment at the NAV at the end of the period and no sales or redemption charges (if any). Total returns would be reduced if a sales or redemption charge was taken into account. Returns do not reflect the impact of taxes to shareholders relating to Fund distributions or the redemption of Fund shares. Total returns for periods less than one full year are not annualized. |
| | (e) | | The Fund’s portfolio turnover rate is calculated in accordance with regulatory requirements, without regard to transactions involving short term investments. If such transactions were included, the Fund’s portfolio turnover rate may be higher. |
| | |
| The accompanying notes are an integral part of these financial statements. | | 111 |
GOLDMAN SACHS U.S EQUITY ESG FUND
Financial Highlights (continued)
Selected Share Data for a Share Outstanding Throughout Each Period
| | | | | | | | | | | | | | | | | | | | | | | | | | |
| | | | | Goldman Sachs U.S. Equity ESG Fund | |
| | | | | Class A Shares | |
| | | | | Six Months Ended
February 28, 2021
(Unaudited) | | | Year Ended August 31, | |
| | | | | 2020 | | | 2019 | | | 2018 | | | 2017 | | | 2016 | |
| | Per Share Data | | | | | | | | | | | | | | | | | | | | | | | | |
| | | | | | | |
| | Net asset value, beginning of period | | $ | 15.63 | | | $ | 13.59 | | | $ | 14.00 | | | $ | 14.84 | | | $ | 13.08 | | | $ | 13.92 | |
| | | | | | | |
| | Net investment income(a) | | | 0.02 | | | | 0.09 | | | | 0.12 | | | | 0.11 | | | | 0.07 | | | | 0.09 | |
| | | | | | | |
| | Net realized and unrealized gain | | | 1.82 | | | | 2.56 | | | | 0.64 | | | | 2.15 | | | | 1.76 | | | | 0.50 | |
| | | | | | | |
| | Total from investment operations | | | 1.84 | | | | 2.65 | | | | 0.76 | | | | 2.26 | | | | 1.83 | | | | 0.59 | |
| | | | | | | |
| | Distributions to shareholders from net investment income | | | (0.07 | ) | | | (0.15 | ) | | | (0.08 | ) | | | (0.09 | ) | | | (0.07 | ) | | | (0.07 | ) |
| | | | | | | |
| | Distributions to shareholders from net realized gains | | | (1.62 | ) | | | (0.46 | ) | | | (1.09 | ) | | | (3.01 | ) | | | — | (b) | | | (1.36 | ) |
| | | | | | | |
| | Total distributions | | | (1.69 | ) | | | (0.61 | ) | | | (1.17 | ) | | | (3.10 | ) | | | (0.07 | ) | | | (1.43 | ) |
| | | | | | | |
| | Net asset value, end of period | | $ | 15.78 | | | $ | 15.63 | | | $ | 13.59 | | | $ | 14.00 | | | $ | 14.84 | | | $ | 13.08 | |
| | | | | | | |
| | Total Return(c) | | | 12.49 | % | | | 19.93 | % | | | 6.80 | % | | | 17.50 | % | | | 14.06 | % | | | 4.39 | % |
| | | | | | | |
| | Net assets, end of period (in 000’s) | | $ | 6,063 | | | $ | 5,448 | | | $ | 3,878 | | | $ | 2,533 | | | $ | 1,880 | | | $ | 2,124 | |
| | | | | | | |
| | Ratio of net expenses to average net assets | | | 1.01 | %(d) | | | 1.05 | % | | | 1.03 | % | | | 1.04 | % | | | 1.17 | % | | | 1.22 | % |
| | | | | | | |
| | Ratio of total expenses to average net assets | | | 3.29 | %(d) | | | 3.30 | % | | | 4.26 | % | | | 5.12 | % | | | 4.64 | % | | | 3.60 | % |
| | | | | | | |
| | Ratio of net investment income to average net assets | | | 0.24 | %(d) | | | 0.64 | % | | | 0.90 | % | | | 0.81 | % | | | 0.53 | % | | | 0.67 | % |
| | | | | | | |
| | Portfolio turnover rate(e) | | | 20 | % | | | 65 | % | | | 47 | % | | | 71 | % | | | 77 | % | | | 49 | % |
| | (a) | | Calculated based on the average shares outstanding methodology. |
| | (b) | | Amount is less than $0.005 per share. |
| | (c) | | Assumes investment at the NAV at the beginning of the period, reinvestment of all dividends and distributions, a complete redemption of the investment at the NAV at the end of the period and no sales or redemption charges (if any). Total returns would be reduced if a sales or redemption charge was taken into account. Returns do not reflect the impact of taxes to shareholders relating to Fund distributions or the redemption of Fund shares. Total returns for periods less than one full year are not annualized. |
| | (e) | | The Fund’s portfolio turnover rate is calculated in accordance with regulatory requirements, without regard to transactions involving short term investments. If such transactions were included, the Fund’s portfolio turnover rate may be higher. |
| | |
| 112 | | The accompanying notes are an integral part of these financial statements. |
GOLDMAN SACHS U.S EQUITY ESG FUND
Financial Highlights (continued)
Selected Share Data for a Share Outstanding Throughout Each Period
| | | | | | | | | | | | | | | | | | | | | | | | | | |
| | | | | Goldman Sachs U.S. Equity ESG Fund | |
| | | | | Class C Shares | |
| | | | | Six Months Ended
February 28, 2021
(Unaudited) | | | Year Ended August 31, | |
| | | | | 2020 | | | 2019 | | | 2018 | | | 2017 | | | 2016 | |
| | Per Share Data | | | | | | | | | | | | | | | | | | | | | | | | |
| | | | | | | |
| | Net asset value, beginning of period | | $ | 14.79 | | | $ | 12.91 | | | $ | 13.40 | | | $ | 14.36 | | | $ | 12.69 | | | $ | 13.56 | |
| | | | | | | |
| | Net investment income (loss)(a) | | | (0.04 | ) | | | (0.01 | ) | | | 0.02 | | | | 0.01 | | | | (0.02 | ) | | | (0.01 | ) |
| | | | | | | |
| | Net realized and unrealized gain | | | 1.72 | | | | 2.41 | | | | 0.62 | | | | 2.07 | | | | 1.69 | | | | 0.50 | |
| | | | | | | |
| | Total from investment operations | | | 1.68 | | | | 2.40 | | | | 0.64 | | | | 2.08 | | | | 1.67 | | | | 0.49 | |
| | | | | | | |
| | Distributions to shareholders from net investment income | | | — | | | | (0.06 | ) | | | (0.04 | ) | | | (0.03 | ) | | | — | | | | — | |
| | | | | | | |
| | Distributions to shareholders from net realized gains | | | (1.62 | ) | | | (0.46 | ) | | | (1.09 | ) | | | (3.01 | ) | | | — | (b) | | | (1.36 | ) |
| | | | | | | |
| | Total distributions | | | (1.62 | ) | | | (0.52 | ) | | | (1.13 | ) | | | (3.04 | ) | | | — | (b) | | | (1.36 | ) |
| | | | | | | |
| | Net asset value, end of period | | $ | 14.85 | | | $ | 14.79 | | | $ | 12.91 | | | $ | 13.40 | | | $ | 14.36 | | | $ | 12.69 | |
| | | | | | | |
| | Total Return(c) | | | 12.07 | % | | | 18.97 | % | | | 6.04 | % | | | 16.66 | % | | | 13.18 | % | | | 3.66 | % |
| | | | | | | |
| | Net assets, end of period (in 000’s) | | $ | 2,157 | | | $ | 1,985 | | | $ | 1,487 | | | $ | 172 | | | $ | 178 | | | $ | 195 | |
| | | | | | | |
| | Ratio of net expenses to average net assets | | | 1.76 | %(d) | | | 1.80 | % | | | 1.78 | % | | | 1.80 | % | | | 1.92 | % | | | 1.97 | % |
| | | | | | | |
| | Ratio of total expenses to average net assets | | | 4.04 | %(d) | | | 4.07 | % | | | 4.97 | % | | | 5.86 | % | | | 5.38 | % | | | 4.33 | % |
| | | | | | | |
| | Ratio of net investment income (loss) to average net assets | | | (0.51 | )%(d) | | | (0.11 | )% | | | 0.18 | % | | | 0.05 | % | | | (0.18 | )% | | | (0.10 | )% |
| | | | | | | |
| | Portfolio turnover rate(e) | | | 20 | % | | | 65 | % | | | 47 | % | | | 71 | % | | | 77 | % | | | 49 | % |
| | (a) | | Calculated based on the average shares outstanding methodology. |
| | (b) | | Amount is less than $0.005 per share. |
| | (c) | | Assumes investment at the NAV at the beginning of the period, reinvestment of all dividends and distributions, a complete redemption of the investment at the NAV at the end of the period and no sales or redemption charges (if any). Total returns would be reduced if a sales or redemption charge was taken into account. Returns do not reflect the impact of taxes to shareholders relating to Fund distributions or the redemption of Fund shares. Total returns for periods less than one full year are not annualized. |
| | (e) | | The Fund’s portfolio turnover rate is calculated in accordance with regulatory requirements, without regard to transactions involving short term investments. If such transactions were included, the Fund’s portfolio turnover rate may be higher. |
| | |
| The accompanying notes are an integral part of these financial statements. | | 113 |
GOLDMAN SACHS U.S EQUITY ESG FUND
Financial Highlights (continued)
Selected Share Data for a Share Outstanding Throughout Each Period
| | | | | | | | | | | | | | | | | | | | | | | | | | |
| | | | | Goldman Sachs U.S. Equity ESG Fund | |
| | | | | Institutional Shares | |
| | | | | Six Months Ended
February 28, 2021
(Unaudited) | | | Year Ended August 31, | |
| | | | | 2020 | | | 2019 | | | 2018 | | | 2017 | | | 2016 | |
| | Per Share Data | | | | | | | | | | | | | | | | | | | | | | | | |
| | | | | | | |
| | Net asset value, beginning of period | | $ | 15.80 | | | $ | 13.73 | | | $ | 14.10 | | | $ | 14.92 | | | $ | 13.17 | | | $ | 14.01 | |
| | | | | | | |
| | Net investment income(a) | | | 0.05 | | | | 0.14 | | | | 0.16 | | | | 0.16 | | | | 0.12 | | | | 0.14 | |
| | | | | | | |
| | Net realized and unrealized gain | | | 1.84 | | | | 2.58 | | | | 0.67 | | | | 2.17 | | | | 1.77 | | | | 0.51 | |
| | | | | | | |
| | Total from investment operations | | | 1.89 | | | | 2.72 | | | | 0.83 | | | | 2.33 | | | | 1.89 | | | | 0.65 | |
| | | | | | | |
| | Distributions to shareholders from net investment income | | | (0.12 | ) | | | (0.19 | ) | | | (0.11 | ) | | | (0.14 | ) | | | (0.14 | ) | | | (0.13 | ) |
| | | | | | | |
| | Distributions to shareholders from net realized gains | | | (1.62 | ) | | | (0.46 | ) | | | (1.09 | ) | | | (3.01 | ) | | | — | (b) | | | (1.36 | ) |
| | | | | | | |
| | Total distributions | | | (1.74 | ) | | | (0.65 | ) | | | (1.20 | ) | | | (3.15 | ) | | | (0.14 | ) | | | (1.49 | ) |
| | | | | | | |
| | Net asset value, end of period | | $ | 15.95 | | | $ | 15.80 | | | $ | 13.73 | | | $ | 14.10 | | | $ | 14.92 | | | $ | 13.17 | |
| | | | | | | |
| | Total Return(c) | | | 12.65 | % | | | 20.29 | % | | | 7.27 | % | | | 17.92 | % | | | 14.43 | % | | | 4.84 | % |
| | | | | | | |
| | Net assets, end of period (in 000’s) | | $ | 1,535 | | | $ | 1,009 | | | $ | 791 | | | $ | 4,969 | | | $ | 3,499 | | | $ | 4,754 | |
| | | | | | | |
| | Ratio of net expenses to average net assets | | | 0.67 | %(d) | | | 0.70 | % | | | 0.67 | % | | | 0.68 | % | | | 0.79 | % | | | 0.82 | % |
| | | | | | | |
| | Ratio of total expenses to average net assets | | | 2.87 | %(d) | | | 2.99 | % | | | 3.97 | % | | | 4.65 | % | | | 4.28 | % | | | 3.16 | % |
| | | | | | | |
| | Ratio of net investment income to average net assets | | | 0.59 | %(d) | | | 0.99 | % | | | 1.22 | % | | | 1.20 | % | | | 0.88 | % | | | 1.10 | % |
| | | | | | | |
| | Portfolio turnover rate(e) | | | 20 | % | | | 65 | % | | | 47 | % | | | 71 | % | | | 77 | % | | | 49 | % |
| | (a) | | Calculated based on the average shares outstanding methodology. |
| | (b) | | Amount is less than $0.005 per share. |
| | (c) | | Assumes investment at the NAV at the beginning of the period, reinvestment of all dividends and distributions, a complete redemption of the investment at the NAV at the end of the period and no sales or redemption charges (if any). Total returns would be reduced if a sales or redemption charge was taken into account. Returns do not reflect the impact of taxes to shareholders relating to Fund distributions or the redemption of Fund shares. Total returns for periods less than one full year are not annualized. |
| | (e) | | The Fund’s portfolio turnover rate is calculated in accordance with regulatory requirements, without regard to transactions involving short term investments. If such transactions were included, the Fund’s portfolio turnover rate may be higher. |
| | |
| 114 | | The accompanying notes are an integral part of these financial statements. |
GOLDMAN SACHS U.S EQUITY ESG FUND
Financial Highlights (continued)
Selected Share Data for a Share Outstanding Throughout Each Period
| | | | | | | | | | | | | | | | | | | | | | | | | | |
| | | | | Goldman Sachs U.S. Equity ESG Fund | |
| | | | | Investor Shares | |
| | | | | Six Months Ended
February 28, 2021
(Unaudited) | | | Year Ended August 31, | |
| | | | | 2020 | | | 2019 | | | 2018 | | | 2017 | | | 2016 | |
| | Per Share Data | | | | | | | | | | | | | | | | | | | | | | | | |
| | | | | | | |
| | Net asset value, beginning of period | | $ | 15.81 | | | $ | 13.72 | | | $ | 14.11 | | | $ | 14.92 | | | $ | 13.16 | | | $ | 13.98 | |
| | | | | | | |
| | Net investment income(a) | | | 0.04 | | | | 0.11 | | | | 0.15 | | | | 0.14 | | | | 0.11 | | | | 0.13 | |
| | | | | | | |
| | Net realized and unrealized gain | | | 1.84 | | | | 2.60 | | | | 0.65 | | | | 2.18 | | | | 1.76 | | | | 0.50 | |
| | | | | | | |
| | Total from investment operations | | | 1.88 | | | | 2.71 | | | | 0.80 | | | | 2.32 | | | | 1.87 | | | | 0.63 | |
| | | | | | | |
| | Distributions to shareholders from net investment income | | | (0.10 | ) | | | (0.16 | ) | | | (0.10 | ) | | | (0.12 | ) | | | (0.11 | ) | | | (0.09 | ) |
| | | | | | | |
| | Distributions to shareholders from net realized gains | | | (1.62 | ) | | | (0.46 | ) | | | (1.09 | ) | | | (3.01 | ) | | | — | (b) | | | (1.36 | ) |
| | | | | | | |
| | Total distributions | | | (1.72 | ) | | | (0.62 | ) | | | (1.19 | ) | | | (3.13 | ) | | | (0.11 | ) | | | (1.45 | ) |
| | | | | | | |
| | Net asset value, end of period | | $ | 15.97 | | | $ | 15.81 | | | $ | 13.72 | | | $ | 14.11 | | | $ | 14.92 | | | $ | 13.16 | |
| | | | | | | |
| | Total Return(c) | | | 12.63 | % | | | 20.23 | % | | | 7.05 | % | | | 17.86 | % | | | 14.27 | % | | | 4.67 | % |
| | | | | | | |
| | Net assets, end of period (in 000’s) | | $ | 380 | | | $ | 344 | | | $ | 1,064 | | | $ | 235 | | | $ | 188 | | | $ | 156 | |
| | | | | | | |
| | Ratio of net expenses to average net assets | | | 0.76 | %(d) | | | 0.85 | % | | | 0.78 | % | | | 0.79 | % | | | 0.92 | % | | | 0.97 | % |
| | | | | | | |
| | Ratio of total expenses to average net assets | | | 3.04 | %(d) | | | 3.75 | % | | | 4.06 | % | | | 4.87 | % | | | 4.47 | % | | | 3.54 | % |
| | | | | | | |
| | Ratio of net investment income to average net assets | | | 0.49 | %(d) | | | 0.76 | % | | | 1.16 | % | | | 1.06 | % | | | 0.78 | % | | | 0.97 | % |
| | | | | | | |
| | Portfolio turnover rate(e) | | | 20 | % | | | 65 | % | | | 47 | % | | | 71 | % | | | 77 | % | | | 49 | % |
| | (a) | | Calculated based on the average shares outstanding methodology. |
| | (b) | | Amount is less than $0.005 per share. |
| | (c) | | Assumes investment at the NAV at the beginning of the period, reinvestment of all dividends and distributions, a complete redemption of the investment at the NAV at the end of the period and no sales or redemption charges (if any). Total returns would be reduced if a sales or redemption charge was taken into account. Returns do not reflect the impact of taxes to shareholders relating to Fund distributions or the redemption of Fund shares. Total returns for periods less than one full year are not annualized. |
| | (e) | | The Fund’s portfolio turnover rate is calculated in accordance with regulatory requirements, without regard to transactions involving short term investments. If such transactions were included, the Fund’s portfolio turnover rate may be higher. |
| | |
| The accompanying notes are an integral part of these financial statements. | | 115 |
GOLDMAN SACHS U.S EQUITY ESG FUND
Financial Highlights (continued)
Selected Share Data for a Share Outstanding Throughout Each Period
| | | | | | | | | | | | | | | | | | | | | | | | | | |
| | | | | Goldman Sachs U.S. Equity ESG Fund | |
| | | | | Class R6 Shares | |
| | | | | Six Months Ended
February 28, 2021
(Unaudited) | | | Year Ended August 31, | |
| | | | | 2020 | | | 2019 | | | 2018 | | | 2017 | | | 2016 | |
| | Per Share Data | | | | | | | | | | | | | | | | | | | | | | | | |
| | | | | | | |
| | Net asset value, beginning of period | | $ | 15.81 | | | $ | 13.73 | | | $ | 14.11 | | | $ | 14.93 | | | $ | 13.17 | | | $ | 14.01 | |
| | | | | | | |
| | Net investment income(a) | | | 0.05 | | | | 0.13 | | | | 0.17 | | | | 0.16 | | | | 0.13 | | | | 0.14 | |
| | | | | | | |
| | Net realized and unrealized gain | | | 1.83 | | | | 2.60 | | | | 0.65 | | | | 2.17 | | | | 1.77 | | | | 0.51 | |
| | | | | | | |
| | Total from investment operations | | | 1.88 | | | | 2.73 | | | | 0.82 | | | | 2.33 | | | | 1.90 | | | | 0.65 | |
| | | | | | | |
| | Distributions to shareholders from net investment income | | | (0.11 | ) | | | (0.19 | ) | | | (0.11 | ) | | | (0.14 | ) | | | (0.14 | ) | | | (0.13 | ) |
| | | | | | | |
| | Distributions to shareholders from net realized gains | | | (1.62 | ) | | | (0.46 | ) | | | (1.09 | ) | | | (3.01 | ) | | | — | (b) | | | (1.36 | ) |
| | | | | | | |
| | Total distributions | | | (1.73 | ) | | | (0.65 | ) | | | (1.20 | ) | | | (3.15 | ) | | | (0.14 | ) | | | (1.49 | ) |
| | | | | | | |
| | Net asset value, end of period | | $ | 15.96 | | | $ | 15.81 | | | $ | 13.73 | | | $ | 14.11 | | | $ | 14.93 | | | $ | 13.17 | |
| | | | | | | |
| | Total Return(c) | | | 12.64 | % | | | 20.37 | % | | | 7.20 | % | | | 17.94 | % | | | 14.52 | % | | | 4.86 | % |
| | | | | | | |
| | Net assets, end of period (in 000’s) | | $ | 1,087 | | | $ | 1,325 | | | $ | 3,229 | | | $ | 11 | | | $ | 11 | | | $ | 10 | |
| | | | | | | |
| | Ratio of net expenses to average net assets | | | 0.66 | %(d) | | | 0.71 | % | | | 0.66 | % | | | 0.68 | % | | | 0.77 | % | | | 0.81 | % |
| | | | | | | |
| | Ratio of total expenses to average net assets | | | 2.94 | %(d) | | | 3.84 | % | | | 3.76 | % | | | 4.73 | % | | | 4.20 | % | | | 3.14 | % |
| | | | | | | |
| | Ratio of net investment income to average net assets | | | 0.57 | %(d) | | | 0.96 | % | | | 1.31 | % | | | 1.16 | % | | | 0.95 | % | | | 1.09 | % |
| | | | | | | |
| | Portfolio turnover rate(e) | | | 20 | % | | | 65 | % | | | 47 | % | | | 71 | % | | | 77 | % | | | 49 | % |
| | (a) | | Calculated based on the average shares outstanding methodology. |
| | (b) | | Amount is less than $0.005 per share. |
| | (c) | | Assumes investment at the NAV at the beginning of the period, reinvestment of all dividends and distributions, a complete redemption of the investment at the NAV at the end of the period and no sales or redemption charges (if any). Total returns would be reduced if a sales or redemption charge was taken into account. Returns do not reflect the impact of taxes to shareholders relating to Fund distributions or the redemption of Fund shares. Total returns for periods less than one full year are not annualized. |
| | (e) | | The Fund’s portfolio turnover rate is calculated in accordance with regulatory requirements, without regard to transactions involving short term investments. If such transactions were included, the Fund’s portfolio turnover rate may be higher. |
| | |
| 116 | | The accompanying notes are an integral part of these financial statements. |
GOLDMAN SACHS U.S EQUITY ESG FUND
Financial Highlights (continued)
Selected Share Data for a Share Outstanding Throughout Each Period
| | | | | | | | | | | | | | | | | | | | | | | | | | |
| | | | | Goldman Sachs U.S. Equity ESG Fund | |
| | | | | Class R Shares | |
| | | | | Six Months Ended
February 28, 2021
(Unaudited) | | | Year Ended August 31, | |
| | | | | 2020 | | | 2019 | | | 2018 | | | 2017 | | | 2016 | |
| | Per Share Data | | | | | | | | | | | | | | | | | | | | | | | | |
| | | | | | | |
| | Net asset value, beginning of period | | $ | 15.72 | | | $ | 13.67 | | | $ | 14.07 | | | $ | 14.89 | | | $ | 13.09 | | | $ | 13.88 | |
| | | | | | | |
| | Net investment income(a) | | | — | (b) | | | 0.05 | | | | 0.08 | | | | 0.08 | | | | 0.04 | | | | 0.07 | |
| | | | | | | |
| | Net realized and unrealized gain | | | 1.84 | | | | 2.57 | | | | 0.67 | | | | 2.16 | | | | 1.76 | | | | 0.50 | |
| | | | | | | |
| | Total from investment operations | | | 1.84 | | | | 2.62 | | | | 0.75 | | | | 2.24 | | | | 1.80 | | | | 0.57 | |
| | | | | | | |
| | Distributions to shareholders from net investment income | | | (0.04 | ) | | | (0.11 | ) | | | (0.06 | ) | | | (0.05 | ) | | | — | | | | — | |
| | | | | | | |
| | Distributions to shareholders from net realized gains | | | (1.62 | ) | | | (0.46 | ) | | | (1.09 | ) | | | (3.01 | ) | | | — | (b) | | | (1.36 | ) |
| | | | | | | |
| | Total distributions | | | (1.66 | ) | | | (0.57 | ) | | | (1.15 | ) | | | (3.06 | ) | | | — | (b) | | | (1.36 | ) |
| | | | | | | |
| | Net asset value, end of period | | $ | 15.90 | | | $ | 15.72 | | | $ | 13.67 | | | $ | 14.07 | | | $ | 14.89 | | | $ | 13.09 | |
| | | | | | | |
| | Total Return(c) | | | 12.37 | % | | | 19.56 | % | | | 6.58 | % | | | 17.21 | % | | | 13.77 | % | | | 4.18 | % |
| | | | | | | |
| | Net assets, end of period (in 000’s) | | $ | 26 | | | $ | 23 | | | $ | 20 | | | $ | 20 | | | $ | 22 | | | $ | 19 | |
| | | | | | | |
| | Ratio of net expenses to average net assets | | | 1.26 | %(d) | | | 1.30 | % | | | 1.27 | % | | | 1.29 | % | | | 1.41 | % | | | 1.47 | % |
| | | | | | | |
| | Ratio of total expenses to average net assets | | | 3.54 | %(d) | | | 3.68 | % | | | 4.53 | % | | | 5.36 | % | | | 4.88 | % | | | 3.70 | % |
| | | | | | | |
| | Ratio of net investment income (loss) to average net assets | | | (0.01 | )%(d) | | | 0.39 | % | | | 0.64 | % | | | 0.55 | % | | | 0.30 | % | | | 0.49 | % |
| | | | | | | |
| | Portfolio turnover rate(e) | | | 20 | % | | | 65 | % | | | 47 | % | | | 71 | % | | | 77 | % | | | 49 | % |
| | (a) | | Calculated based on the average shares outstanding methodology. |
| | (b) | | Amount is less than $0.005 per share. |
| | (c) | | Assumes investment at the NAV at the beginning of the period, reinvestment of all dividends and distributions, a complete redemption of the investment at the NAV at the end of the period and no sales or redemption charges (if any). Total returns would be reduced if a sales or redemption charge was taken into account. Returns do not reflect the impact of taxes to shareholders relating to Fund distributions or the redemption of Fund shares. Total returns for periods less than one full year are not annualized. |
| | (e) | | The Fund’s portfolio turnover rate is calculated in accordance with regulatory requirements, without regard to transactions involving short term investments. If such transactions were included, the Fund’s portfolio turnover rate may be higher. |
| | |
| The accompanying notes are an integral part of these financial statements. | | 117 |
GOLDMAN SACHS U.S EQUITY ESG FUND
Financial Highlights (continued)
Selected Share Data for a Share Outstanding Throughout Each Period
| | | | | | | | | | | | | | | | | | |
| | | | | Goldman Sachs U.S. Equity ESG Fund | |
| | | | | Class P Shares | |
| | | | | Six Months Ended
February 28, 2021
(Unaudited) | | | Year Ended August 31, | | | Period Ended
August 31, 2018(a) | |
| | | | | 2020 | | | 2019 | |
| | Per Share Data | | | | | | | | | | | | | | | | |
| | | | | |
| | Net asset value, beginning of period | | $ | 15.80 | | | $ | 13.73 | | | $ | 14.11 | | | $ | 13.06 | |
| | | | | |
| | Net investment income(b) | | | 0.05 | | | | 0.14 | | | | 0.17 | | | | 0.06 | |
| | | | | |
| | Net realized and unrealized gain | | | 1.83 | | | | 2.58 | | | | 0.65 | | | | 0.99 | |
| | | | | |
| | Total from investment operations | | | 1.88 | | | | 2.72 | | | | 0.82 | | | | 1.05 | |
| | | | | |
| | Distributions to shareholders from net investment income | | | (0.11 | ) | | | (0.19 | ) | | | (0.11 | ) | | | — | |
| | | | | |
| | Distributions to shareholders from net realized gains | | | (1.62 | ) | | | (0.46 | ) | | | (1.09 | ) | | | — | |
| | | | | |
| | Total distributions | | | (1.73 | ) | | | (0.65 | ) | | | (1.20 | ) | | | — | |
| | | | | |
| | Net asset value, end of period | | $ | 15.95 | | | $ | 15.80 | | | $ | 13.73 | | | $ | 14.11 | |
| | | | | |
| | Total Return(c) | | | 12.65 | % | | | 20.30 | % | | | 7.22 | % | | | 8.04 | % |
| | | | | |
| | Net assets, end of period (in 000’s) | | $ | 849 | | | $ | 830 | | | $ | 2,135 | | | $ | 2,026 | |
| | | | | |
| | Ratio of net expenses to average net assets | | | 0.66 | %(d) | | | 0.71 | % | | | 0.66 | % | | | 0.66 | %(d) |
| | | | | |
| | Ratio of total expenses to average net assets | | | 2.93 | %(d) | | | 3.98 | % | | | 3.88 | % | | | 5.72 | %(d) |
| | | | | |
| | Ratio of net investment income to average net assets | | | 0.58 | %(d) | | | 0.98 | % | | | 1.26 | % | | | 1.23 | %(d) |
| | | | | |
| | Portfolio turnover rate(e) | | | 20 | % | | | 65 | % | | | 47 | % | | | 71 | % |
| | (a) | | Commenced operations on April 17, 2018. |
| | (b) | | Calculated based on the average shares outstanding methodology. |
| | (c) | | Assumes investment at the NAV at the beginning of the period, reinvestment of all dividends and distributions, a complete redemption of the investment at the NAV at the end of the period and no sales or redemption charges (if any). Total returns would be reduced if a sales or redemption charge was taken into account. Returns do not reflect the impact of taxes to shareholders relating to Fund distributions or the redemption of Fund shares. Total returns for periods less than one full year are not annualized. |
| | (e) | | The Fund’s portfolio turnover rate is calculated in accordance with regulatory requirements, without regard to transactions involving short term investments. If such transactions were included, the Fund’s portfolio turnover rate may be higher. |
| | |
| 118 | | The accompanying notes are an integral part of these financial statements. |
GOLDMAN SACHS FUNDAMENTAL EQUITY GROWTH FUNDS
Notes to Financial Statements
February 28, 2021 (Unaudited)
Goldman Sachs Trust (the “Trust”) is a Delaware statutory trust registered under the Investment Company Act of 1940, as amended (the “Act”), as an open-end management investment company. The following table lists those series of the Trust that are included in this report (collectively, the “Funds” or individually a “Fund”), along with their corresponding share classes and respective diversification status under the Act:
| | | | |
| Fund | | Share Classes Offered | | Diversified/
Non-diversified |
Capital Growth, Growth Opportunities, Small/Mid Cap Growth and Strategic Growth | | A, C, Institutional, Service, Investor, R6, R and P | | Diversified |
Concentrated Growth, Flexible Cap, Small Cap Growth and U.S. Equity ESG Fund | | A, C, Institutional, Investor, R6, R and P | | Diversified |
Technology Opportunities | | A, C, Institutional, Service, Investor, R6 and P | | Diversified |
Class A Shares are sold with a front-end sales charge of up to 5.50%. Class C Shares are sold with a contingent deferred sales charge (“CDSC”) of 1.00%, which is imposed on redemptions made within 12 months of purchase. Institutional, Service, Investor, Class R6, Class R and Class P Shares are not subject to a sales charge.
Goldman Sachs Asset Management, L.P. (“GSAM”), an affiliate of Goldman Sachs & Co. LLC (“Goldman Sachs”), serves as investment adviser to the Funds pursuant to a management agreement (the “Agreement”) with the Trust.
|
| 2. SIGNIFICANT ACCOUNTING POLICIES |
The financial statements have been prepared in accordance with accounting principles generally accepted in the United States of America (“GAAP”) and require management to make estimates and assumptions that may affect the reported amounts and disclosures. Actual results may differ from those estimates and assumptions. Each Fund is an investment company under GAAP and follows the accounting and reporting guidance applicable to investment companies.
A. Investment Valuation — The Funds’ valuation policy is to value investments at fair value.
B. Investment Income and Investments — Investment income includes interest income, dividend income and securities lending income, if any. Interest income is accrued daily and adjusted for amortization of premiums and accretion of discounts. Dividend income is recognized on ex-dividend date or, for certain foreign securities, as soon as such information is obtained subsequent to the ex-dividend date. Non-cash dividends, if any, are recorded at the fair market value of the securities received. Investment transactions are reflected on trade date. Realized gains and losses are calculated using identified cost. Investment transactions are recorded on the following business day for daily net asset value (“NAV”) calculations. Investment income is recorded net of any foreign withholding taxes, less any amounts reclaimable. The Funds may file withholding tax reclaims in certain jurisdictions to recover a portion of amounts previously withheld. Any foreign capital gains tax is accrued daily based upon net unrealized gains, and is payable upon sale of such investments. Distributions received from the Funds’ investments in U.S. real estate investment trusts (“REITs”) may be characterized as ordinary income, net capital gain and/or a return of capital. A return of capital is recorded by the Funds as a reduction to the cost basis of the REIT.
C. Class Allocations and Expenses — Investment income, realized and unrealized gain (loss), if any, and non-class specific expenses of each Fund are allocated daily based upon the proportion of net assets of each class. Non-class specific expenses directly incurred by a Fund are charged to that Fund, while such expenses incurred by the Trust are allocated across the applicable Funds on a straight-line and/or pro-rata basis depending upon the nature of the expenses. Class specific expenses, where applicable, are borne by the respective share classes and include Distribution and Service, Transfer Agency and Service and Shareholder Administration fees.
119
GOLDMAN SACHS FUNDAMENTAL EQUITY GROWTH FUNDS
Notes to Financial Statements (continued)
February 28, 2021 (Unaudited)
|
| 2. SIGNIFICANT ACCOUNTING POLICIES (continued) |
D. Federal Taxes and Distributions to Shareholders — It is each Fund’s policy to comply with the requirements of the Internal Revenue Code of 1986, as amended (the “Code”), applicable to regulated investment companies and to distribute each year substantially all of its investment company taxable income and capital gains to its shareholders. Accordingly, each Fund is not required to make any provisions for the payment of federal income tax. Distributions to shareholders are recorded on the
ex-dividend date. Income and capital gains distributions, if any, are declared and paid at least annually.
Net capital losses, if any, are carried forward to future fiscal years and may be used to the extent allowed by the Code to offset any future capital gains. Losses that are carried forward will retain their character as either short-term or long-term capital losses. Utilization of capital loss carryforwards will reduce the requirement of future capital gains distributions.
The characterization of distributions to shareholders for financial reporting purposes is determined in accordance with federal income tax rules, which may differ from GAAP. The source of each Fund’s distributions may be shown in the accompanying financial statements as either from distributable earnings or capital. Certain components of the Funds’ net assets on the Statements of Assets and Liabilities reflect permanent GAAP/tax differences based on the appropriate tax character.
E. Foreign Currency Translation — The accounting records and reporting currency of the Funds are maintained in U.S. dollars. Assets and liabilities denominated in foreign currencies are translated into U.S. dollars using the current exchange rates at the close of each business day. The effect of changes in foreign currency exchange rates on investments is included within net realized and unrealized gain (loss) on investments. Changes in the value of other assets and liabilities as a result of fluctuations in foreign exchange rates are included in the Statements of Operations within net change in unrealized gain (loss) on foreign currency translation. Transactions denominated in foreign currencies are translated into U.S. dollars on the date the transaction occurred, the effects of which are included within net realized gain (loss) on foreign currency transactions.
F. Offering Costs — Offering costs paid in connection with the initial offering of shares of Small Cap Growth Fund were amortized on a straight-line basis over 12 months from the date of commencement of operations.
|
| 3. INVESTMENTS AND FAIR VALUE MEASUREMENTS |
U.S. GAAP defines the fair value of a financial instrument as the amount that would be received to sell an asset or paid to transfer a liability in an orderly transaction between market participants at the measurement date (i.e., the exit price); the Funds’ policy is to use the market approach. GAAP establishes a fair value hierarchy that prioritizes the inputs to valuation techniques used to measure fair value. The hierarchy gives the highest priority to unadjusted quoted prices in active markets for identical assets or liabilities (Level 1 measurements) and the lowest priority to unobservable inputs (Level 3 measurements). The level in the fair value hierarchy within which the fair value measurement in its entirety falls shall be determined based on the lowest level input that is significant to the fair value measurement in its entirety. The levels used for classifying investments are not necessarily an indication of the risk associated with investing in these investments. The three levels of the fair value hierarchy are described below:
Level 1 — Unadjusted quoted prices in active markets that are accessible at the measurement date for identical, unrestricted assets or liabilities;
Level 2 — Quoted prices in markets that are not active or financial instruments for which significant inputs are observable (including, but not limited to, quoted prices for similar investments, interest rates, foreign exchange rates, volatility and credit spreads), either directly or indirectly;
Level 3 — Prices or valuations that require significant unobservable inputs (including GSAM’s assumptions in determining fair value measurement).
The Board of Trustees (“Trustees”) has approved Valuation Procedures that govern the valuation of the portfolio investments held by the Funds, including investments for which market quotations are not readily available. The Trustees have delegated to GSAM day-to-day responsibility for implementing and maintaining internal controls and procedures related to the valuation of the Funds’ investments. To assess the continuing appropriateness of pricing sources and methodologies, GSAM regularly performs price
120
GOLDMAN SACHS FUNDAMENTAL EQUITY GROWTH FUNDS
|
| 3. INVESTMENTS AND FAIR VALUE MEASUREMENTS (continued) |
verification procedures and issues challenges as necessary to third party pricing vendors or brokers, and any differences are reviewed in accordance with the Valuation Procedures.
A. Level 1 and Level 2 Fair Value Investments — The valuation techniques and significant inputs used in determining the fair values for investments classified as Level 1 and Level 2 are as follows:
Equity Securities — Equity securities traded on a United States (“U.S.”) securities exchange or the NASDAQ system, or those located on certain foreign exchanges, including but not limited to the Americas, are valued daily at their last sale price or official closing price on the principal exchange or system on which they are traded. If there is no sale or official closing price or such price is believed by GSAM to not represent fair value, equity securities will be valued at the valid closing bid price for long positions and at the valid closing ask price for short positions (i.e. where there is sufficient volume, during normal exchange trading hours). If no valid bid/ask price is available, the equity security will be valued pursuant to the Valuation Procedures approved by the Trustees and consistent with applicable regulatory guidance. To the extent these investments are actively traded, they are classified as Level 1 of the fair value hierarchy, otherwise they are generally classified as Level 2. Certain equity securities containing unique attributes may be classified as Level 2.
Unlisted equity securities for which market quotations are available are valued at the last sale price on the valuation date, or if no sale occurs, at the last bid price for long positions or the last ask price for short positions, and are generally classified as Level 2. Securities traded on certain foreign securities exchanges are valued daily at fair value determined by an independent fair value service (if available) under Fair Valuation Procedures approved by the Trustees and consistent with applicable regulatory guidance. The independent fair value service takes into account multiple factors including, but not limited to, movements in the securities markets, certain depositary receipts, futures contracts and foreign currency exchange rates that have occurred subsequent to the close of the foreign securities exchange. These investments are generally classified as Level 2 of the fair value hierarchy.
Money Market Funds — Investments in the Goldman Sachs Financial Square Government Fund (“Underlying Fund”) are valued at the NAV per share of the Institutional Share class on the day of valuation. These investments are generally classified as Level 1 of the fair value hierarchy. For information regarding the Underlying Fund’s accounting policies and investment holdings, please see the Underlying Fund’s shareholder report.
B. Level 3 Fair Value Investments — To the extent that significant inputs to valuation models and other alternative pricing sources are unobservable, or if quotations are not readily available, or if GSAM believes that such quotations do not accurately reflect fair value, the fair value of a Fund’s investments may be determined under Valuation Procedures approved by the Trustees. GSAM, consistent with its procedures and applicable regulatory guidance, may make an adjustment to the most recent valuation prices of either domestic or foreign securities in light of significant events to reflect what it believes to be the fair value of the securities at the time of determining a Fund’s NAV. To the extent investments are valued using single source broker quotations obtained directly from the broker or passed through from third party pricing vendors, such investments are classified as Level 3 investments.
121
GOLDMAN SACHS FUNDAMENTAL EQUITY GROWTH FUNDS
Notes to Financial Statements (continued)
February 28, 2021 (Unaudited)
|
| 3. INVESTMENTS AND FAIR VALUE MEASUREMENTS (continued) |
C. Fair Value Hierarchy — The following is a summary of the Funds’ investments classified in the fair value hierarchy as of February 28, 2021:
| | | | | | | | | | | | |
|
| CAPITAL GROWTH FUND | |
| | | |
| Investment Type | | Level 1 | | | Level 2 | | | Level 3 | |
| | | |
| Assets | | | | | | | | | | | | |
|
Common Stock and/or Other Equity Investments(a) | |
| | | |
Asia | | $ | 2,410,114 | | | $ | — | | | $ | — | |
| | | |
Europe | | | 29,033,306 | | | | — | | | | — | |
| | | |
North America | | | 1,005,224,246 | | | | — | | | | — | |
| | | |
Investment Company | | | 3,237,339 | | | | — | | | | — | |
| | | |
Securities Lending Reinvestment Vehicle | | | 5,000 | | | | — | | | | — | |
| | | |
| Total | | $ | 1,039,910,005 | | | $ | — | | | $ | — | |
|
| CONCENTRATED GROWTH FUND | |
| | | |
| Investment Type | | Level 1 | | | Level 2 | | | Level 3 | |
| | | |
| Assets | | | | | | | | | | | | |
|
Common Stock and/or Other Equity Investments(a) | |
| | | |
Europe | | $ | 7,754,512 | | | $ | — | | | $ | — | |
| | | |
North America | | | 178,559,454 | | | | — | | | | — | |
| | | |
Investment Company | | | 850,967 | | | | — | | | | — | |
| | | |
| Total | | $ | 187,164,933 | | | $ | — | | | $ | — | |
|
| FLEXIBLE CAP FUND | |
| | | |
| Investment Type | | Level 1 | | | Level 2 | | | Level 3 | |
| | | |
| Assets | | | | | | | | | | | | |
|
Common Stock and/or Other Equity Investments(a) | |
| | | |
Europe | | $ | 376,912 | | | $ | — | | | $ | — | |
| | | |
North America | | | 26,347,392 | | | | — | | | | — | |
| | | |
Investment Company | | | 298,315 | | | | — | | | | — | |
| | | |
| Total | | $ | 27,022,619 | | | $ | — | | | $ | — | |
|
| GROWTH OPPORTUNITIES FUND | |
| | | |
| Investment Type | | Level 1 | | | Level 2 | | | Level 3 | |
| | | |
| Assets | | | | | | | | | | | | |
|
Common Stock and/or Other Equity Investments(a) | |
| | | |
Europe | | $ | 18,927,021 | | | $ | — | | | $ | — | |
| | | |
North America | | | 1,389,542,865 | | | | — | | | | — | |
| | | |
South America | | | 6,752,289 | | | | — | | | | — | |
| | | |
Investment Company | | | 6,219,751 | | | | — | | | | — | |
| | | |
Securities Lending Reinvestment Vehicle | | | 12,260,776 | | | | — | | | | — | |
| | | |
| Total | | $ | 1,433,702,702 | | | $ | — | | | $ | — | |
| (a) | | Amounts are disclosed by continent to highlight the impact of time zone differences between local market close and the calculation of NAV. Security valuations are based on the principal exchange or system on which they are traded, which may differ from country of domicile noted in table. |
122
GOLDMAN SACHS FUNDAMENTAL EQUITY GROWTH FUNDS
|
| 3. INVESTMENTS AND FAIR VALUE MEASUREMENTS (continued) |
| | | | | | | | | | | | |
|
| SMALL CAP GROWTH FUND | |
| | | |
| Investment Type | | Level 1 | | | Level 2 | | | Level 3 | |
| | | |
| Assets | | | | | | | | | | | | |
|
Common Stock and/or Other Equity Investments(a) | |
| | | |
Europe | | $ | 23,516 | | | $ | — | | | $ | — | |
| | | |
North America | | | 23,267,835 | | | | — | | | | — | |
| | | |
Investment Company | | | 881,172 | | | | — | | | | — | |
| | | |
Securities Lending Reinvestment Vehicle | | | 649,259 | | | | — | | | | — | |
| | | |
| Total | | $ | 24,821,782 | | | $ | — | | | $ | — | |
|
| SMALL/MID CAP GROWTH FUND | |
| | | |
| Investment Type | | Level 1 | | | Level 2 | | | Level 3 | |
| | | |
| Assets | | | | | | | | | | | | |
|
Common Stock and/or Other Equity Investments(a) | |
| | | |
Asia | | $ | 44,278,869 | | | $ | — | | | $ | — | |
| | | |
Europe | | | 48,897,069 | | | | — | | | | — | |
| | | |
North America | | | 2,955,295,851 | | | | — | | | | — | |
| | | |
Investment Company | | | 46,766,661 | | | | — | | | | — | |
| | | |
Securities Lending Reinvestment Vehicle | | | 51,347,800 | | | | — | | | | — | |
| | | |
| Total | | $ | 3,146,586,250 | | | $ | — | | | $ | — | |
|
| STRATEGIC GROWTH FUND | |
| | | |
| Investment Type | | Level 1 | | | Level 2 | | | Level 3 | |
| | | |
| Assets | | | | | | | | | | | | |
|
Common Stock and/or Other Equity Investments(a) | |
| | | |
Europe | | $ | 4,166,389 | | | $ | — | | | $ | — | |
| | | |
North America | | | 179,813,002 | | | | — | | | | — | |
| | | |
Investment Company | | | 1,420,481 | | | | — | | | | — | |
| | | |
Securities Lending Reinvestment Vehicle | | | 1,055,303 | | | | — | | | | — | |
| | | |
| Total | | $ | 186,455,175 | | | $ | — | | | $ | — | |
|
| TECHNOLOGY OPPORTUNITIES FUND | |
| | | |
| Investment Type | | Level 1 | | | Level 2 | | | Level 3 | |
| | | |
| Assets | | | | | | | | | | | | |
|
Common Stock and/or Other Equity Investments(a) | |
| | | |
Asia | | $ | 21,228,572 | | | $ | 11,763,097 | | | $ | — | |
| | | |
Europe | | | 19,596,377 | | | | — | | | | — | |
| | | |
North America | | | 749,244,909 | | | | — | | | | — | |
| | | |
South America | | | 7,332,180 | | | | — | | | | — | |
| | | |
Investment Company | | | 1,303,664 | | | | — | | | | — | |
| | | |
| Total | | $ | 798,705,702 | | | $ | 11,763,097 | | | $ | — | |
| (a) | | Amounts are disclosed by continent to highlight the impact of time zone differences between local market close and the calculation of NAV. Security valuations are based on the principal exchange or system on which they are traded, which may differ from country of domicile noted in table. The Fund utilizes fair value model prices by an independent third-party (fair value) service for certain international equity securities resulting in a Level 2 classification. |
123
GOLDMAN SACHS FUNDAMENTAL EQUITY GROWTH FUNDS
Notes to Financial Statements (continued)
February 28, 2021 (Unaudited)
|
| 3. INVESTMENTS AND FAIR VALUE MEASUREMENTS (continued) |
| | | | | | | | | | | | |
|
| U.S. EQUITY ESG FUND | |
| | | |
| Investment Type | | Level 1 | | | Level 2 | | | Level 3 | |
| | | |
| Assets | | | | | | | | | | | | |
|
Common Stock and/or Other Equity Investments(a) | |
| | | |
Europe | | $ | 231,079 | | | $ | — | | | $ | — | |
| | | |
North America | | | 11,769,158 | | | | — | | | | — | |
| | | |
Investment Company | | | 50,998 | | | | — | | | | — | |
| | | |
Securities Lending Reinvestment Vehicle | | | 38,200 | | | | — | | | | — | |
| | | |
| Total | | $ | 12,089,435 | | | $ | — | | | $ | — | |
| (a) | | Amounts are disclosed by continent to highlight the impact of time zone differences between local market close and the calculation of NAV. Security valuations are based on the principal exchange or system on which they are traded, which may differ from country of domicile noted in table. |
For further information regarding security characteristics, see the Schedules of Investments.
|
| 4. AGREEMENTS AND AFFILIATED TRANSACTIONS |
A. Management Agreement — Under the Agreement, GSAM manages the Funds, subject to the general supervision of the Trustees.
As compensation for the services rendered pursuant to the Agreement, the assumption of the expenses related thereto and administration of the Funds’ business affairs, including providing facilities, GSAM is entitled to a management fee, accrued daily and paid monthly, equal to an annual percentage rate of each Fund’s average daily net assets.
As of February 28, 2021, contractual management fees with GSAM were as stated below. The effective contractual management rates and effective net management rates represent the rates for the six month period ended February 28, 2021.
| | | | | | | | | | | | | | | | | | | | | | | | | | | | | | | | |
| | | | | | Contractual Management Rate | | | Effective
Contractual
Management
Rate | | | Effective Net
Management
Rate# | |
Fund | | | | | First $1 billion | | | Next $1 billion | | | Next $3 billion | | | Next $3 billion | | | Over $8 billion | |
Capital Growth | | | | | | | 0.71 | % | | | 0.64 | % | | | 0.61 | % | | | 0.61 | % | | | 0.61 | % | | | 0.71 | % | | | 0.71 | % |
Concentrated Growth | | | | | | | 0.76 | | | | 0.68 | | | | 0.65 | | | | 0.64 | | | | 0.62 | | | | 0.76 | | | | 0.76 | |
Flexible Cap | | | | | | | 0.55 | | | | 0.50 | | | | 0.47 | | | | 0.46 | | | | 0.45 | | | | 0.55 | | | | 0.55 | |
Growth Opportunities | | | | | | | 0.92 | | | | 0.92 | | | | 0.83 | | | | 0.79 | | | | 0.77 | | | | 0.92 | | | | 0.86 | * |
Small Cap Growth | | | | | | | 0.85 | | | | 0.85 | | | | 0.77 | | | | 0.73 | | | | 0.71 | | | | 0.85 | | | | 0.85 | |
Small/Mid Cap Growth | | | | | | | 0.85 | | | | 0.85 | | | | 0.77 | | | | 0.73 | | | | 0.71 | | | | 0.83 | | | | 0.83 | |
Strategic Growth | | | | | | | 0.71 | | | | 0.64 | | | | 0.61 | | | | 0.59 | | | | 0.58 | | | | 0.71 | | | | 0.71 | |
Technology Opportunities | | | | | | | 0.94 | | | | 0.85 | | | | 0.80 | | | | 0.79 | | | | 0.77 | | | | 0.94 | | | | 0.94 | |
U.S. Equity ESG Fund | | | | | | | 0.55 | | | | 0.50 | | | | 0.47 | | | | 0.46 | | | | 0.45 | | | | 0.55 | | | | 0.55 | |
| # | | The Effective Net Management Rate includes the impact of management fee waivers of affiliated underlying funds, if any. The Effective Net Management Rate may not correlate to the Contractual Management Rate as a result of management fee waivers that may be in effect from time to time. |
| *The | | Investment Adviser agreed to waive a portion of its management fee in order to achieve an effective net management fee rate of 0.86% as an annual percentage rate of the Growth Opportunities Fund’s average daily net assets. This arrangement will remain in effect through at least December 29, 2021. |
124
GOLDMAN SACHS FUNDAMENTAL EQUITY GROWTH FUNDS
|
| 4. AGREEMENTS AND AFFILIATED TRANSACTIONS (continued) |
The Funds invest in Institutional Shares of the Goldman Sachs Financial Square Government Fund (“Government Money Market Fund”), which is an affiliated Underlying Fund. GSAM has agreed to waive a portion of its management fee payable by the Funds in an amount equal to the management fee it earns as an investment adviser to the affiliated Underlying Fund in which the Funds invest, except those management fees it earns from the Funds’ investments of cash collateral received in connection with securities lending transactions in the Government Money Market Fund. For the six months ended February 28, 2021, the management fee waived by GSAM for each Fund was as follows:
| | | | | | |
| Fund | | | | Management
Fee Waived | |
Capital Growth | | | | $ | 2,484 | |
Concentrated Growth | | | | | 1,061 | |
Flexible Cap | | | | | 137 | |
Growth Opportunities | | | | | 7,014 | |
Small Cap Growth | | | | | 223 | |
Small/Mid Cap Growth | | | | | 32,793 | |
Strategic Growth | | | | | 645 | |
Technology Opportunities | | | | | 12,032 | |
U.S. Equity ESG Fund | | | | | 75 | |
B. Distribution and/or Service (12b-1) Plans — The Trust, on behalf of Class A and Class R Shares of each applicable Fund, has adopted Distribution and Service Plans subject to Rule 12b-1 under the Act. Under the Distribution and Service Plans, Goldman Sachs, which serves as distributor (the “Distributor”), is entitled to a fee accrued daily and paid monthly for distribution
services and personal and account maintenance services, which may then be paid by Goldman Sachs to authorized dealers. These fees are equal to an annual percentage rate of the average daily net assets attributable to Class A or Class R Shares of the Funds, as applicable, as set forth below.
The Trust, on behalf of Class C Shares of each applicable Fund, has adopted a Distribution Plan subject to Rule 12b-1 under the Act. Under the Distribution Plan, Goldman Sachs as Distributor is entitled to a fee accrued daily and paid monthly for distribution services, which may then be paid by Goldman Sachs to authorized dealers. These fees are equal to an annual percentage rate of the average daily net assets attributable to Class C Shares of the Funds, as set forth below.
The Trust, on behalf of Service Shares of each applicable Fund, has adopted a Service Plan subject to Rule 12b-1 under the Act to allow Service Shares to compensate service organizations (including Goldman Sachs) for providing personal and account maintenance services to their customers who are beneficial owners of such shares. The Service Plan provides for compensation to the service organizations equal to an annual percentage rate of the average daily net assets attributable to Service Shares of the Funds, as set forth below.
| | | | | | | | | | | | | | | | |
| | | Distribution and/or Service Plan Rates | |
| | | Class A* | | | Class C | | | Class R* | | | Service | |
Distribution and/or Service Plan | | | 0.25 | % | | | 0.75 | % | | | 0.50 | % | | | 0.25 | % |
| * | | With respect to Class A and Class R Shares, the Distributor at its discretion may use compensation for distribution services paid under the Distribution and/or Service Plans to compensate service organizations for personal and account maintenance services and expenses as long as such total compensation does not exceed the maximum cap on “service fees” imposed by the Financial Industry Regulatory Authority. |
125
GOLDMAN SACHS FUNDAMENTAL EQUITY GROWTH FUNDS
Notes to Financial Statements (continued)
February 28, 2021 (Unaudited)
|
| 4. AGREEMENTS AND AFFILIATED TRANSACTIONS (continued) |
C. Distribution Agreement — Goldman Sachs, as Distributor of the shares of the Funds pursuant to a Distribution Agreement, may retain a portion of the Class A Shares’ front end sales charge and Class C Shares’ CDSC. During the six months ended February 28, 2021, Goldman Sachs retained the following amounts:
| | | | | | | | | | |
| | | | | Front End
Sales Charge | | | Contingent Deferred
Sales Charge | |
| Fund | | | | Class A | | | Class C | |
Capital Growth | | | | $ | 7,955 | | | $ | 390 | |
Concentrated Growth | | | | | 1,647 | | | | — | |
Flexible Cap | | | | | 219 | | | | — | |
Growth Opportunities | | | | | 12,463 | | | | 701 | |
Small/Mid Cap Growth | | | | | 24,568 | | | | — | |
Strategic Growth | | | | | 1,512 | | | | — | |
Technology Opportunities | | | | | 7,800 | | | | 445 | |
U.S. Equity ESG Fund | | | | | 211 | | | | — | |
D. Service and Shareholder Administration Plans — The Trust, on behalf of each applicable Fund, has adopted Service Plans to allow Class C Shares and Shareholder Administration Plans to allow Service Shares, respectively, to compensate service organizations (including Goldman Sachs) for providing varying levels of personal and account maintenance or shareholder administration services to their customers who are beneficial owners of such shares. The Service and Shareholder Administration Plans each provide for compensation to the service organizations equal to an annual percentage rate of 0.25% of the average daily net assets attributable to Class C and Service Shares of the Funds, respectively.
E. Transfer Agency Agreement — Goldman Sachs also serves as the transfer agent of the Funds for a fee pursuant to the Transfer Agency Agreement. The fees charged for such transfer agency services are accrued daily and paid monthly at annual rates
as follows: 0.16% of the average daily net assets of Class A, Class C, Investor and Class R Shares; 0.03% of the average daily net assets of Class R6 and Class P Shares; and 0.04% of the average daily net assets of Institutional and Service Shares.
For the six months ended February 28, 2021, the transfer agency fee waivers were as follows:
| | | | | | | | |
| Transfer Agency Waivers (Class A, Class C, Investor, and Class R Shares) | |
| Fund | | Before December 29, 2020 | | | As of December 29, 2020* | |
Concentrated Growth | | | 0.03 | % | | | 0.07 | % |
Growth Opportunities | | | 0.03 | % | | | 0.02 | % |
Small/Mid Cap Growth | | | 0.05 | % | | | 0.04 | % |
Technology Opportunities | | | 0.11 | % | | | 0.08 | % |
U.S. Equity ESG Fund | | | 0.03 | % | | | 0.02 | % |
| * | | These arrangements will remain in effect through at least December 29, 2021, and prior to such date, Goldman Sachs may not terminate the arrangement without the approval of the Board of Trustees. |
126
GOLDMAN SACHS FUNDAMENTAL EQUITY GROWTH FUNDS
|
| 4. AGREEMENTS AND AFFILIATED TRANSACTIONS (continued) |
F. Other Expense Agreements and Affiliated Transactions — GSAM has agreed to reduce or limit certain “Other Expenses” of the Funds (excluding acquired fund fees and expenses, transfer agency fees and expenses, service fees and shareholder administration fees (as applicable), taxes, interest, brokerage fees, expenses of shareholder meetings, litigation and indemnification, and extraordinary expenses) to the extent such expenses exceed, on an annual basis, a percentage rate of the average daily net assets of each Fund. Such Other Expense reimbursements, if any, are accrued daily and paid monthly. In addition, the Funds are not obligated to reimburse GSAM for prior fiscal year expense reimbursements, if any. The Other Expense limitations as an annual percentage rate of average daily net assets for Capital Growth, Concentrated Growth, Flexible Cap, Growth Opportunities, Small Cap Growth, Small/Mid Cap Growth, Strategic Growth, Technology Opportunities, and U.S. Equity ESG Funds are 0.004%, 0.004%, 0.004%, 0.004%, 0.024%, 0.044%, 0.004%, 0.004%, and 0.084%, respectively. Prior to December 29, 2020, the Other Expense limitation for Small/Mid Cap Growth was 0.064%. These Other Expense limitations will remain in place through at least December 29, 2021, and prior to such date GSAM may not terminate the arrangements without the approval of the Trustees. In addition, the Funds have entered into certain offset arrangements with the transfer agent, which may result in a reduction of the Funds’ expenses and are received irrespective of the application of the “Other Expense” limitations described above.
For the six months ended February 28, 2021, these expense reductions, including any fee waivers and Other Expense reimbursements, were as follows:
| | | | | | | | | | | | | | | | | | |
| Fund | | | | Management
Fee Waiver | | | Transfer Agency
Fee Waiver/Credits | | | Other Expense Reimbursements | | | Total Expense Reductions | |
Capital Growth | | | | $ | 2,484 | | | $ | — | | | $ | 280,500 | | | $ | 282,984 | |
Concentrated Growth | | | | | 1,061 | | | | 2,543 | | | | 148,410 | | | | 152,014 | |
Flexible Cap | | | | | 137 | | | | — | | | | 153,634 | | | | 153,771 | |
Growth Opportunities | | | | | 411,272 | | | | 89,562 | | | | 266,789 | | | | 767,623 | |
Small Cap Growth | | | | | 223 | | | | — | | | | 148,153 | | | | 148,376 | |
Small/Mid Cap Growth | | | | | 32,793 | | | | 293,502 | | | | — | | | | 326,295 | |
Strategic Growth | | | | | 645 | | | | — | | | | 161,311 | | | | 161,956 | |
Technology Opportunities | | | | | 12,032 | | | | 256,516 | | | | 206,865 | | | | 475,413 | |
U.S. Equity ESG Fund | | | | | 75 | | | | 1,342 | | | | 127,996 | | | | 129,413 | |
G. Line of Credit Facility — As of February 28, 2021, the Funds participated in a $700,000,000 committed, unsecured revolving line of credit facility (the “facility”) together with other funds of the Trust and certain registered investment companies having management agreements with GSAM or its affiliates. This facility is to be used for temporary emergency purposes, or to allow for an orderly liquidation of securities to meet redemption requests. The interest rate on borrowings is based on the federal funds rate. The facility also requires a fee to be paid by the Funds based on the amount of the commitment that has not been utilized. For the six months ended February 28, 2021, the Funds did not have any borrowings under the facility.
I. Other Transactions with Affiliates — For the six months ended February 28, 2021, Goldman Sachs earned $1,959, $20, $5,632, $392, $11,354, $504 and $2,673 in brokerage commissions from portfolio transactions, on behalf of the Capital Growth, Flexible Cap, Growth Opportunities, Small Cap Growth, Small/Mid Cap Growth, Strategic Growth, and Technology Opportunities Funds, respectively.
127
GOLDMAN SACHS FUNDAMENTAL EQUITY GROWTH FUNDS
Notes to Financial Statements (continued)
February 28, 2021 (Unaudited)
|
| 4. AGREEMENTS AND AFFILIATED TRANSACTIONS (continued) |
The table below shows the transactions in and earnings from investments in the Government Money Market Fund — Institutional Shares for the six months ended February 28, 2021:
| | | | | | | | | | | | | | | | | | | | | | | | |
| Fund | | Beginning
Value as of
August 31,
2020 | | | Purchases
at Cost | | | Proceeds
from Sales | | | Market Value
as of
February 28,
2021 | | | Shares as of
February 28,
2021 | | | Dividend
Income | |
Capital Growth | | $ | 1,589,879 | | | $ | 20,823,092 | | | $ | (19,175,632 | ) | | $ | 3,237,339 | | | | 3,237,339 | | | $ | 392 | |
Concentrated Growth | | | 950,092 | | | | 9,618,665 | | | | (9,717,790 | ) | | | 850,967 | | | | 850,967 | | | | 170 | |
Flexible Cap | | | 100,184 | | | | 1,941,106 | | | | (1,742,975 | ) | | | 298,315 | | | | 298,315 | | | | 21 | |
Growth Opportunities | | | 1,701,230 | | | | 139,498,312 | | | | (134,979,791 | ) | | | 6,219,751 | | | | 6,219,751 | | | | 1,132 | |
Small Cap Growth | | | 76,393 | | | | 5,321,681 | | | | (4,516,902 | ) | | | 881,172 | | | | 881,172 | | | | 38 | |
Small/Mid Cap Growth | | | 25,252,010 | | | | 453,237,334 | | | | (431,722,683 | ) | | | 46,766,661 | | | | 46,766,661 | | | | 5,451 | |
Strategic Growth | | | 91,121 | | | | 14,692,210 | | | | (13,362,850 | ) | | | 1,420,481 | | | | 1,420,481 | | | | 84 | |
Technology Opportunities | | | 21,043,925 | | | | 67,778,356 | | | | (87,518,617 | ) | | | 1,303,664 | | | | 1,303,664 | | | | 1,880 | |
U.S. Equity ESG Fund | | | 118,383 | | | | 761,758 | | | | (829,143 | ) | | | 50,998 | | | | 50,998 | | | | 10 | |
As of February 28, 2021, The Goldman Sachs Group, Inc. was the beneficial owner of 5% or more of outstanding shares of the following Funds:
| | | | | | | | | | | | | | | | | | | | | | | | | | | | |
| Fund | | Class A | | | Class C | | | Institutional | | | Investor | | | Class P | | | Class R | | | Class R6 | |
Concentrated Growth | |
| —
| %
| |
| —
| %
| |
| —
| %
| | | 17 | % | |
| —
| %
| | | 100 | % | |
| —
| %
|
Flexible Cap | | | — | | | | — | | | | — | | | | 100 | | | | — | | | | 70 | | | | 8 | |
Small Cap Growth | | | 16 | | | | 57 | | | | 38 | | | | 100 | | | | — | | | | 100 | | | | 100 | |
Stategic Growth | | | — | | | | — | | | | — | | | | — | | | | — | | | | 36 | | | | — | |
U.S. Equity ESG | | | — | | | | — | | | | 35 | | | | 7 | | | | — | | | | 100 | | | | — | |
128
GOLDMAN SACHS FUNDAMENTAL EQUITY GROWTH FUNDS
|
| 5. PORTFOLIO SECURITIES TRANSACTIONS |
The cost of purchases and proceeds from sales and maturities of long-term securities for the six months ended February 28, 2021, were as follows:
| | | | | | | | | | |
| Fund | | | | Purchases | | | Sales | |
Capital Growth | | | | $ | 188,772,341 | | | $ | 224,179,126 | |
Concentrated Growth | | | | | 38,826,333 | | | | 48,329,387 | |
Flexible Cap | | | | | 5,770,700 | | | | 4,649,270 | |
Growth Opportunities | | | | | 364,791,524 | | | | 464,017,338 | |
Small Cap Growth | | | | | 11,973,368 | | | | 7,446,354 | |
Small/Mid Cap Growth | | | | | 1,087,451,687 | | | | 981,900,026 | |
Strategic Growth | | | | | 21,482,312 | | | | 36,220,727 | |
Technology Opportunities | | | | | 153,243,214 | | | | 156,285,658 | |
U.S. Equity ESG Fund | | | | | 2,209,394 | | | | 2,418,890 | |
The Funds may lend their securities through a securities lending agent, the Bank of New York Mellon (“BNYM”), to certain qualified borrowers. In accordance with the Funds’ securities lending procedures, the Funds receive cash collateral at least equal to the market value of the securities on loan. The market value of the loaned securities is determined at the close of business of the Funds, at their last sale price or official closing price on the principal exchange or system on which they are traded, and any additional required collateral is delivered to the Funds on the next business day. As with other extensions of credit, the Funds may experience delay in the recovery of their securities or incur a loss should the borrower of the securities breach its agreement with the Funds or become insolvent at a time when the collateral is insufficient to cover the cost of repurchasing securities on loan.
Dividend income received from securities on loan may not be subject to withholding taxes and therefore withholding taxes paid may differ from the amounts listed in the Statements of Operations. Loans of securities are terminable at any time and as such 1) the remaining contractual maturities of the outstanding securities lending transactions are considered to be overnight and continuous and 2) the borrower, after notice, is required to return borrowed securities within the standard time period for settlement of securities transactions.
The Capital Growth, Concentrated Growth, Growth Opportunities, Small Cap Growth, Small/Mid Cap Growth, Strategic Growth and U.S. Equity ESG Funds invest the cash collateral received in connection with securities lending transactions in the Government Money Market Fund, an affiliated series of the Goldman Sachs Trust. The Government Money Market Fund is registered under the Act as an open end investment company, is subject to Rule 2a-7 under the Act, and is managed by GSAM, for which GSAM may receive a management fee of up to 0.16% on an annualized basis of the average daily net assets of the Government Money Market Fund.
In the event of a default by a borrower with respect to any loan, BNYM may exercise any and all remedies provided under the applicable borrower agreement to make the Funds whole. These remedies include purchasing replacement securities by applying the collateral held from the defaulting broker against the purchase cost of the replacement securities. If BNYM is unable to purchase replacement securities, BNYM will indemnify the Funds by paying the Funds an amount equal to the market value of the securities loaned minus the value of cash collateral received from the borrower for the loan, subject to an exclusion for any shortfalls resulting from a loss of value in such cash collateral due to reinvestment risk. The Funds’ master netting agreements with certain borrowers provide the right, in the event of a default (including bankruptcy or insolvency), for the non-defaulting party to liquidate the collateral and calculate net exposure to the defaulting party or request additional collateral. However, in the event of a
129
GOLDMAN SACHS FUNDAMENTAL EQUITY GROWTH FUNDS
Notes to Financial Statements (continued)
February 28, 2021 (Unaudited)
|
| 6. SECURITIES LENDING (continued) |
default by a borrower, a resolution authority could determine that such rights are not enforceable due to the restrictions or prohibitions against the right of set-off that may be imposed in accordance with a particular jurisdiction’s bankruptcy or insolvency laws. The Funds’ loaned securities were all subject to enforceable Securities Lending Agreements and the value of the collateral was at least equal to the value of the cash received. The amounts of the Funds’ overnight and continuous agreements, which represent the gross amounts of recognized liabilities for securities lending transactions outstanding as of February 28, 2021, are disclosed as “Payable upon return of securities loaned” on the Statements of Assets and Liabilities, where applicable.
Each of the Funds and BNYM received compensation relating to the lending of the Funds’ securities. The amounts earned, if any, by the Funds for the six months ended February 28, 2021, are reported under Investment Income on the Statements of Operations.
The following table provides information about the Funds’ investments in the Government Money Market Fund for the six months ended February 28, 2021:
| | | | | | | | | | | | | | | | | | |
| Fund | | | | Beginning
Value as of
August 31, 2020 | | | Purchases
at Cost | | | Proceeds
from Sales | | | Ending Value as of
February 28, 2021 | |
Capital Growth | | | | $ | — | | | $ | 27,102,127 | | | $ | (27,097,127) | | �� | $ | 5,000 | |
Concentrated Growth | | | | | — | | | | 12,396,078 | | | | (12,396,078 | ) | | | — | |
Flexible Cap | | | | | — | | | | — | | | | — | | | | — | |
Growth Opportunities | | | | | — | | | | 100,296,754 | | | | (88,035,978 | ) | | | 12,260,776 | |
Small Cap Growth | | | | | | | | | 1,514,506 | | | | (865,247 | ) | | | 649,259 | |
Small/Mid Cap Growth | | | | | 13,387,318 | | | | 278,523,844 | | | | (240,563,362 | ) | | | 51,347,800 | |
Strategic Growth | | | | | — | | | | 14,859,351 | | | | (13,804,048 | ) | | | 1,055,303 | |
Technology Opportunities | | | | | — | | | | — | | | | — | | | | — | |
U.S. Equity ESG | | | | | — | | | | 568,566 | | | | (530,366 | ) | | | 38,200 | |
As of the Funds’ most recent fiscal year end, August 31, 2020, the Funds’ certain timing differences on a tax basis were as follows:
| | | | | | | | | | | | | | | | | | | | | | | | | | | | | | | | | | | | |
| | | Capital
Growth | | | Concentrated
Growth | | | Flexible
Cap
Growth | | | Growth
Opportunitites | | | Small Cap
Growth | | | Small/
Mid Cap
Growth | | | Strategic
Growth | | | Technology
Opportunities | | | U.S. Equity
ESG Fund | |
Qualified Late Year Loss Deferral and Post October Losses | | $ | (5,794,504 | ) | | $ | — | | | $ | — | | | $ | — | | | $ | (34,211 | ) | | $ | (7,413,820 | ) | | $ | (41,547 | ) | | $ | (1,830,687 | ) | | $ | (9,848 | ) |
130
GOLDMAN SACHS FUNDAMENTAL EQUITY GROWTH FUNDS
|
| 7. TAX INFORMATION (continued) |
As of February 28, 2021, the Funds’ aggregate security unrealized gains and losses based on cost for U.S. federal income tax purposes were as follows:
| | | | | | | | | | | | | | | | | | | | | | | | | | | | | | | | | | | | |
| | | Capital Growth | | | Concentrated
Growth | | | Flexible Cap
Growth | | | Growth
Opportunities | | | Small Cap
Growth | | | Small/Mid Cap
Growth | | | Strategic
Growth | | | Technology
Opportunities | | | U.S. Equity
ESG Fund | |
Tax Cost | | $ | 615,890,832 | | | $ | 99,506,992 | | | $ | 18,436,960 | | | $ | 975,554,820 | | | $ | 18,819,325 | | | $ | 2,136,498,248 | | | $ | 81,692,652 | | | $ | 403,008,486 | | | $ | 8,826,101 | |
Gross unrealized gain | | | 437,615,642 | | | | 89,238,830 | | | | 9,014,430 | | | | 472,649,445 | | | | 6,396,095 | | | | 1,039,627,581 | | | | 105,646,374 | | | | 410,644,957 | | | | 3,372,981 | |
Gross unrealized loss | | | (13,596,469 | ) | | | (1,580,889 | ) | | | (428,771 | ) | | | (14,501,563 | ) | | | (393,638 | ) | | | (29,539,579 | ) | | | (883,851 | ) | | | (3,184,644 | ) | | | (109,647 | ) |
Net unrealized gains (losses) | | $ | 424,019,173 | | | $ | 87,657,941 | | | $ | 8,585,659 | | | $ | 458,147,882 | | | $ | 6,002,457 | | | $ | 1,010,088,002 | | | $ | 104,762,523 | | | $ | 407,460,313 | | | $ | 3,263,334 | |
The difference between GAAP-basis and tax basis unrealized gains (losses) is attributable primarily to wash sales, differences to the tax treatment of underlying fund investments, and passive foreign investment company investments.
GSAM has reviewed the Funds’ tax positions for all open tax years (the current and prior three years, as applicable) and has concluded that no provision for income tax is required in the Funds’ financial statements. Such open tax years remain subject to examination and adjustment by tax authorities.
The Funds’ risks include, but are not limited to, the following:
Foreign and Emerging Countries Risk — Investing in foreign markets may involve special risks and considerations not typically associated with investing in the United States. Foreign securities may be subject to risk of loss because of more or less foreign government regulation, less public information and less economic, political and social stability in the countries in which a Fund invest. The imposition of exchange controls (including repatriation restrictions), confiscation of assets and property, trade restrictions (including tariffs) and other government restrictions by the United States or other governments, or problems with registration, settlement or custody, may also result in losses. Foreign risk also involves the risk of negative foreign currency rate fluctuations, which may cause the value of securities denominated in such foreign currency (or other instruments through which a Fund has exposure to foreign currencies) to decline in value. Currency exchange rates may fluctuate significantly over short periods of time.
Foreign Custody Risk — If a Fund invests in foreign securities, the Fund may hold such securities and cash with foreign banks, agents, and securities depositories appointed by the Fund’s custodian (each a “Foreign Custodian”). Some foreign custodians may be recently organized or new to the foreign custody business. In some countries, Foreign Custodians may be subject to little or no regulatory oversight over, or independent evaluation of, their operations. Further, the laws of certain countries may place limitations on a Fund’s ability to recover its assets if a Foreign Custodian enters bankruptcy. Investments in emerging markets may be subject to even greater custody risks than investments in more developed markets. Custody services in emerging market countries are very often undeveloped and may be considerably less well regulated than in more developed countries, and thus may not afford the same level of investor protection as would apply in developed countries.
Industry Concentration Risk — The Technology Opportunities Fund invests primarily in equity investments in high-quality technology, media, or service companies that adopt or use technology to improve their cost structure, revenue opportunities or competitive advantage. Because of its focus on technology, media and service companies, the Technology Opportunities Fund is subject to greater risk of loss as a result of adverse economic, business or other developments than if its investments were diversified across different industry sectors. The Technology Opportunities Fund may also invest in a relatively few number of issuers. Thus, the Technology Opportunities Fund may be more susceptible to adverse developments affecting any single issuer held in its portfolio and may be more susceptible to greater losses because of these developments.
131
GOLDMAN SACHS FUNDAMENTAL EQUITY GROWTH FUNDS
Notes to Financial Statements (continued)
February 28, 2021 (Unaudited)
|
| 8. OTHER RISKS (continued) |
Under normal circumstances, the Concentrated Growth Fund and the U.S. Equity ESG Fund intend to invest in up to approximately 40 and 50 companies, respectively. As a result of the relatively small number of issuers in which a Fund generally invests, it may be subject to greater risks than a fund that invests in a greater number of issuers. A change in the value of any single investment held by a Fund may affect the overall value of the Fund more than it would affect a mutual fund that holds more investments. In particular, a Fund may be more susceptible to adverse developments affecting any single issuer in the Fund and may be susceptible to greater losses because of these developments.
Investments in Other Investment Companies Risk — As a shareholder of another investment company, a Fund will indirectly bear its proportionate share of any net management fees and other expenses paid by such other investment companies, in addition to the fees and expenses regularly borne by the Fund.
Large Shareholder Transactions Risk — A Fund may experience adverse effects when certain large shareholders, such as other funds, institutional investors (including those trading by use of non-discretionary mathematical formulas), financial intermediaries (who may make investment decisions on behalf of underlying clients and/or include a Fund in their investment model), individuals, accounts and Goldman Sachs affiliates, purchase or redeem large amounts of shares of a Fund. Such large shareholder redemptions, which may occur rapidly or unexpectedly, may cause a Fund to sell portfolio securities at times when it would not otherwise do so, which may negatively impact a Fund’s NAV and liquidity. These transactions may also accelerate the realization of taxable income to shareholders if such sales of investments resulted in gains, and may also increase transaction costs. In addition, a large redemption could result in a Fund’s current expenses being allocated over a smaller asset base, leading to an increase in the Fund’s expense ratio. Similarly, large Fund share purchases may adversely affect a Fund’s performance to the extent that the Fund is delayed in investing new cash or otherwise maintains a larger cash position than it ordinarily would.
Liquidity Risk — A Fund may make investments that are illiquid or that may become less liquid in response to market developments or adverse investor perceptions. Illiquid investments may be more difficult to value. Liquidity risk may also refer to the risk that a Fund will not be able to pay redemption proceeds within the allowable time period or without significant dilution to remaining investors’ interests because of unusual market conditions, an unusually high volume of redemption requests, or other reasons. To meet redemption requests, a Fund may be forced to sell investments at an unfavorable time and/or under unfavorable conditions. If a Fund is forced to sell securities at an unfavorable time and/or under unfavorable conditions, such sales may adversely affect the Fund’s NAV and dilute remaining investors’ interests. These risks may be more pronounced in connection with the Funds’ investments in securities of issuers located in emerging market countries. Redemptions by large shareholders may have a negative impact on the Fund’s liquidity.
Market and Credit Risks — In the normal course of business, a Fund trades financial instruments and enters into financial transactions where risk of potential loss exists due to changes in the market (market risk). The value of the securities in which a Fund invests may go up or down in response to the prospects of individual companies, particular sectors or governments and/or general economic conditions throughout the world due to increasingly interconnected global economies and financial markets. Events such as war, acts of terrorism, social unrest, natural disasters, the spread of infectious illness or other public health threats could also significantly impact a Fund and its investments.
Additionally, a Fund may also be exposed to credit risk in the event that an issuer or guarantor fails to perform or that an institution or entity with which the Fund has unsettled or open transactions defaults.
Under the Trust’s organizational documents, its Trustees, officers, employees and agents are indemnified, to the extent permitted by the Act and state law, against certain liabilities that may arise out of performance of their duties to the Funds. Additionally, in the course of business, the Funds enter into contracts that contain a variety of indemnification clauses. The Funds’ maximum exposure under these arrangements is unknown, as this would involve future claims that may be made against the Funds that have not yet occurred. However, GSAM believes the risk of loss under these arrangements to be remote.
132
GOLDMAN SACHS FUNDAMENTAL EQUITY GROWTH FUNDS
On October 22, 2020, Goldman Sachs announced a settlement of matters involving 1Malaysia Development Bhd. (1MDB), a Malaysian sovereign wealth fund, with the United States Department of Justice as well as criminal and civil authorities in the UK, Singapore and Hong Kong. Further information regarding the 1MDB settlement can be found at https://www.goldmansachs.com/media-relations/press-releases/current/goldman-sachs-2020-10-22.html. The 1MDB settlement will not materially adversely affect GSAM’s ability to serve as investment manager.
At a special meeting of the shareholders of the Goldman Sachs Trust held on April 16, 2021, the Strategic Growth Fund’s shareholders approved a proposal to change the Fund’s sub-classification under the Act, from “diversified” to “non-diversified” and eliminated the related fundamental investment restriction. Accordingly, effective April 16, 2021, the Strategic Growth Fund is “non-diversified” and may invest a greater portion of its assets in one or more issuers or in fewer issuers than “diversified” mutual funds.
Other than noted above, subsequent events after the Statements of Assets and Liabilities date have been evaluated, and GSAM has concluded that there is no impact requiring adjustment or disclosure in the financial statements.
133
GOLDMAN SACHS FUNDAMENTAL EQUITY GROWTH FUNDS
Notes to Financial Statements (continued)
February 28, 2021 (Unaudited)
|
| 12. SUMMARY OF SHARE TRANSACTIONS |
| | | | | | | | | | | | | | | | |
| | | Capital Growth Fund | |
| | | | |
| | | For the Six Months Ended
February 28, 2021
(Unaudited) | | | For the Fiscal Year Ended
August 31, 2020 | |
| | | | |
| | | Shares | | | Dollars | | | Shares | | | Dollars | |
| | | | |
| Class A Shares | | | | | | | | | | | | | | | | |
Shares sold | | | 310,076 | | | $ | 8,760,490 | | | | 509,128 | | | $ | 11,684,562 | |
Reinvestment of distributions | | | 1,027,779 | | | | 28,450,840 | | | | 1,181,420 | | | | 27,979,749 | |
Shares redeemed | | | (1,457,068 | ) | | | (40,411,798 | ) | | | (3,761,845 | ) | | | (85,901,304 | ) |
| | | | (119,213 | ) | | | (3,200,468 | ) | | | (2,071,297 | ) | | | (46,236,993 | ) |
| Class C Shares | | | | | | | | | | | | | | | | |
Shares sold | | | 206,242 | | | | 3,415,502 | | | | 170,312 | | | | 2,318,595 | |
Reinvestment of distributions | | | 58,241 | | | | 934,178 | | | | 71,152 | | | | 1,004,660 | |
Shares redeemed | | | (265,039 | ) | | | (4,315,749 | ) | | | (536,412 | ) | | | (7,409,929 | ) |
| | | | (556 | ) | | | 33,931 | | | | (294,948 | ) | | | (4,086,674 | ) |
| Institutional Shares | | | | | | | | | | | | | | | | |
Shares sold | | | 440,468 | | | | 14,868,789 | | | | 165,989 | | | | 4,497,004 | |
Reinvestment of distributions | | | 61,338 | | | | 1,978,574 | | | | 70,107 | | | | 1,922,071 | |
Shares redeemed | | | (194,808 | ) | | | (6,304,503 | ) | | | (441,460 | ) | | | (11,580,510 | ) |
| | | | 306,998 | | | | 10,542,860 | | | | (205,364 | ) | | | (5,161,435 | ) |
| Service Shares | | | | | | | | | | | | | | | | |
Shares sold | | | 2,955 | | | | 82,364 | | | | 16,235 | | | | 372,217 | |
Reinvestment of distributions | | | 2,075 | | | | 54,101 | | | | 3,047 | | | | 68,220 | |
Shares redeemed | | | (15,837 | ) | | | (385,690 | ) | | | (19,150 | ) | | | (388,887 | ) |
| | | | (10,807 | ) | | | (249,225 | ) | | | 132 | | | | 51,550 | |
| Investor Shares | | | | | | | | | | | | | | | | |
Shares sold | | | 96,411 | | | | 2,817,645 | | | | 136,874 | | | | 3,218,458 | |
Reinvestment of distributions | | | 13,102 | | | | 371,777 | | | | 12,797 | | | | 310,127 | |
Shares redeemed | | | (24,472 | ) | | | (706,245 | ) | | | (117,666 | ) | | | (2,785,148 | ) |
| | | | 85,041 | | | | 2,483,177 | | | | 32,005 | | | | 743,437 | |
| Class R6 Shares | | | | | | | | | | | | | | | | |
Shares sold | | | 52,273 | | | | 1,759,001 | | | | 23,451 | | | | 624,213 | |
Reinvestment of distributions | | | 2,625 | | | | 84,554 | | | | 2,870 | | | | 78,575 | |
Shares redeemed | | | (8,162 | ) | | | (261,878 | ) | | | (35,280 | ) | | | (950,712 | ) |
| | | | 46,736 | | | | 1,581,677 | | | | (8,959 | ) | | | (247,924 | ) |
| Class R Shares | | | | | | | | | | | | | | | | |
Shares sold | | | 24,653 | | | | 642,577 | | | | 94,899 | | | | 2,152,097 | |
Reinvestment of distributions | | | 14,679 | | | | 380,562 | | | | 15,822 | | | | 352,167 | |
Shares redeemed | | | (49,566 | ) | | | (1,253,552 | ) | | | (107,748 | ) | | | (2,347,836 | ) |
| | | | (10,234 | ) | | | (230,413 | ) | | | 2,973 | | | | 156,428 | |
| Class P Shares | | | | | | | | | | | | | | | | |
Shares sold | | | 177,214 | | | | 5,842,833 | | | | 269,239 | | | | 7,159,878 | |
Reinvestment of distributions | | | 110,152 | | | | 3,547,586 | | | | 124,310 | | | | 3,401,935 | |
Shares redeemed | | | (106,716 | ) | | | (3,513,783 | ) | | | (578,888 | ) | | | (15,459,019 | ) |
| | | | 180,650 | | | | 5,876,636 | | | | (185,339 | ) | | | (4,897,206 | ) |
| | | | |
NET INCREASE (DECREASE) | | | 478,615 | | | $ | 16,838,175 | | | | (2,730,797 | ) | | $ | (59,678,817 | ) |
134
GOLDMAN SACHS FUNDAMENTAL EQUITY GROWTH FUNDS
|
| 12. SUMMARY OF SHARE TRANSACTIONS (continued) |
| | | | | | | | | | | | | | | | |
| | | Concentrated Growth Fund | |
| | | | |
| | | For the Six Months Ended
February 28, 2021
(Unaudited) | | | For the Fiscal Year Ended
August 31, 2020 | |
| | | | |
| | | Shares | | | Dollars | | | Shares | | | Dollars | |
| | | | |
| Class A Shares | | | | | | | | | | | | | | | | |
Shares sold | | | 41,008 | | | $ | 918,627 | | | | 53,997 | | | $ | 994,775 | |
Reinvestment of distributions | | | 23,289 | | | | 511,420 | | | | 28,021 | | | | 488,414 | |
Shares redeemed | | | (48,649 | ) | | | (1,114,367 | ) | | | (59,729 | ) | | | (1,101,894 | ) |
| | | | 15,648 | | | | 315,680 | | | | 22,289 | | | | 381,295 | |
| Class C Shares | | | | | | | | | | | | | | | | |
Shares sold | | | 14,078 | | | | 245,784 | | | | 39,614 | | | | 508,211 | |
Reinvestment of distributions | | | 5,634 | | | | 92,741 | | | | 4,844 | | | | 65,059 | |
Shares redeemed | | | (23,873 | ) | | | (406,099 | ) | | | (37,662 | ) | | | (536,353 | ) |
| | | | (4,161 | ) | | | (67,574 | ) | | | 6,796 | | | | 36,917 | |
| Institutional Shares | | | | | | | | | | | | | | | | |
Shares sold | | | 41,208 | | | | 991,814 | | | | 24,191 | | | | 478,401 | |
Reinvestment of distributions | | | 32,623 | | | | 784,250 | | | | 48,540 | | | | 919,091 | |
Shares redeemed | | | (46,586 | ) | | | (1,157,703 | ) | | | (181,552 | ) | | | (3,448,442 | ) |
| | | | 27,245 | | | | 618,361 | | | | (108,821 | ) | | | (2,050,950 | ) |
| Investor Shares | | | | | | | | | | | | | | | | |
Shares sold | | | 632 | | | | 14,767 | | | | 755 | | | | 11,837 | |
Reinvestment of distributions | | | 548 | | | | 12,344 | | | | 619 | | | | 11,029 | |
Shares redeemed | | | — | | | | — | | | | (730 | ) | | | (13,288 | ) |
| | | | 1,180 | | | | 27,111 | | | | 644 | | | | 9,578 | |
| Class R6 Shares | | | | | | | | | | | | | | | | |
Shares sold | | | 2,647 | | | | 68,101 | | | | 12,509 | | | | 258,679 | |
Reinvestment of distributions | | | 1,903 | | | | 45,645 | | | | 2,165 | | | | 40,913 | |
Shares redeemed | | | (2,474 | ) | | | (60,995 | ) | | | (10,757 | ) | | | (218,738 | ) |
| | | | 2,076 | | | | 52,751 | | | | 3,917 | | | | 80,854 | |
| Class R Shares | | | | | | | | | | | | | | | | |
Shares sold | | | — | | | | — | | | | 176 | | | | 2,986 | |
Reinvestment of distributions | | | 104 | | | | 2,170 | | | | 123 | | | | 2,047 | |
Shares redeemed | | | — | | | | — | | | | (918 | ) | | | (15,755 | ) |
| | | | 104 | | | | 2,170 | | | | (619 | ) | | | (10,722 | ) |
| Class P Shares | | | | | | | | | | | | | | | | |
Shares sold | | | 173,621 | | | | 4,322,638 | | | | 219,615 | | | | 4,418,905 | |
Reinvestment of distributions | | | 389,427 | | | | 9,334,560 | | | | 534,993 | | | | 10,103,292 | |
Shares redeemed | | | (451,758 | ) | | | (11,055,951 | ) | | | (1,089,383 | ) | | | (20,053,827 | ) |
| | | | 111,290 | | | | 2,601,247 | | | | (334,775 | ) | | | (5,531,630 | ) |
| | | | |
NET INCREASE (DECREASE) | | | 153,382 | | | $ | 3,549,746 | | | | (410,569 | ) | | $ | (7,084,658 | ) |
135
GOLDMAN SACHS FUNDAMENTAL EQUITY GROWTH FUNDS
Notes to Financial Statements (continued)
February 28, 2021 (Unaudited)
|
| 12. SUMMARY OF SHARE TRANSACTIONS (continued) |
| | | | | | | | | | | | | | | | |
| | | Flexible Cap Fund | |
| | | | |
| | | For the Six Months Ended
February 28, 2021
(Unaudited) | | | For the Fiscal Year Ended
August 31, 2020 | |
| | | | |
| | | Shares | | | Dollars | | | Shares | | | Dollars | |
| | | | |
| Class A Shares | | | | | | | | | | | | | | | | |
Shares sold | | | 34,745 | | | $ | 477,650 | | | | 31,470 | | | $ | 379,391 | |
Reinvestment of distributions | | | 25,327 | | | | 348,337 | | | | 27,095 | | | | 329,577 | |
Shares redeemed | | | (31,644 | ) | | | (441,588 | ) | | | (85,587 | ) | | | (1,011,671 | ) |
| | | | 28,428 | | | | 384,399 | | | | (27,022 | ) | | | (302,703 | ) |
| Class C Shares | | | | | | | | | | | | | | | | |
Shares sold | | | 3,772 | | | | 44,524 | | | | 22,339 | | | | 220,974 | |
Reinvestment of distributions | | | 6,672 | | | | 76,792 | | | | 8,140 | | | | 83,942 | |
Shares redeemed | | | (34,854 | ) | | | (399,905 | ) | | | (26,577 | ) | | | (259,968 | ) |
| | | | (24,410 | ) | | | (278,589 | ) | | | 3,902 | | | | 44,948 | |
| Institutional Shares | | | | | | | | | | | | | | | | |
Shares sold | | | 38,255 | | | | 612,251 | | | | 17,400 | | | | 221,848 | |
Reinvestment of distributions | | | 2,015 | | | | 30,388 | | | | 2,684 | | | | 35,557 | |
Shares redeemed | | | (5,398 | ) | | | (81,075 | ) | | | (25,854 | ) | | | (328,449 | ) |
| | | | 34,872 | | | | 561,564 | | | | (5,770 | ) | | | (71,044 | ) |
| Investor Shares | | | | | | | | | | | | | | | | |
Shares sold | | | — | | | | — | | | | 506 | | | | 6,675 | |
Reinvestment of distributions | | | 146 | | | | 2,137 | | | | 315 | | | | 4,078 | |
Shares redeemed | | | — | | | | — | | | | (3,781 | ) | | | (50,058 | ) |
| | | | 146 | | | | 2,137 | | | | (2,960 | ) | | | (39,305 | ) |
| Class R6 Shares | | | | | | | | | | | | | | | | |
Shares sold | | | 844 | | | | 13,159 | | | | 3,902 | | | | 52,182 | |
Reinvestment of distributions | | | 864 | | | | 13,001 | | | | 944 | | | | 12,478 | |
Shares redeemed | | | (776 | ) | | | (11,883 | ) | | | (5,409 | ) | | | (71,382 | ) |
| | | | 932 | | | | 14,277 | | | | (563 | ) | | | (6,722 | ) |
| Class R Shares | | | | | | | | | | | | | | | | |
Shares sold | | | 77 | | | | 1,029 | | | | 137 | | | | 1,550 | |
Reinvestment of distributions | | | 227 | | | | 2,962 | | | | 200 | | | | 2,314 | |
Shares redeemed | | | (1 | ) | | | (16 | ) | | | (4 | ) | | | (45 | ) |
| | | | 303 | | | | 3,975 | | | | 333 | | | | 3,819 | |
| Class P Shares | | | | | | | | | | | | | | | | |
Shares sold | | | 81,211 | | | | 1,274,950 | | | | 160,203 | | | | 1,955,941 | |
Reinvestment of distributions | | | 57,745 | | | | 868,916 | | | | 49,025 | | | | 648,521 | |
Shares redeemed | | | (14,115 | ) | | | (212,620 | ) | | | (50,921 | ) | | | (606,876 | ) |
| | | | 124,841 | | | | 1,931,246 | | | | 158,307 | | | | 1,997,586 | |
| | | | |
NET INCREASE | | | 165,112 | | | $ | 2,619,009 | | | | 126,227 | | | $ | 1,626,579 | |
136
GOLDMAN SACHS FUNDAMENTAL EQUITY GROWTH FUNDS
|
| 12. SUMMARY OF SHARE TRANSACTIONS (continued) |
| | | | | | | | | | | | | | | | |
| | | Growth Opportunities Fund | |
| | | | |
| | | For the Six Months Ended
February 28, 2021
(Unaudited) | | | For the Fiscal Year Ended
August 31, 2020 | |
| | | | |
| | | Shares | | | Dollars | | | Shares | | | Dollars | |
| | | | |
| Class A Shares | | | | | | | | | | | | | | | | |
Shares sold | | | 2,377,418 | | | $ | 40,283,097 | | | | 3,557,918 | | | $ | 52,567,974 | |
Reinvestment of distributions | | | 4,768,671 | | | | 74,105,140 | | | | 5,640,613 | | | | 77,784,047 | |
Shares redeemed | | | (4,044,304 | ) | | | (67,691,994 | ) | | | (7,191,542 | ) | | | (109,881,675 | ) |
| | | | 3,101,785 | | | | 46,696,243 | | | | 2,006,989 | | | | 20,470,346 | |
| Class C Shares | | | | | | | | | | | | | | | | |
Shares sold | | | 429,949 | | | | 1,914,131 | | | | 919,073 | | | | 5,231,584 | |
Reinvestment of distributions | | | 4,148,159 | | | | 15,265,226 | | | | 2,761,788 | | | | 15,134,597 | |
Shares redeemed | | | (1,613,395 | ) | | | (7,811,117 | ) | | | (3,364,985 | ) | | | (21,480,985 | ) |
| | | | 2,964,713 | | | | 9,368,240 | | | | 315,876 | | | | (1,114,804 | ) |
| Institutional Shares | | | | | | | | | | | | | | | | |
Shares sold | | | 1,891,015 | | | | 45,552,560 | | | | 6,074,577 | | | | 121,027,748 | |
Reinvestment of distributions | | | 2,934,286 | | | | 66,696,305 | | | | 4,948,888 | | | | 92,940,121 | |
Shares redeemed | | | (3,673,203 | ) | | | (87,347,141 | ) | | | (13,552,375 | ) | | | (269,388,899 | ) |
| | | | 1,152,098 | | | | 24,901,724 | | | | (2,528,910 | ) | | | (55,421,030 | ) |
| Service Shares | | | | | | | | | | | | | | | | |
Shares sold | | | 218,311 | | | | 3,347,310 | | | | 424,825 | | | | 5,812,784 | |
Reinvestment of distributions | | | 523,212 | | | | 7,141,844 | | | | 561,939 | | | | 7,013,003 | |
Shares redeemed | | | (315,123 | ) | | | (4,612,748 | ) | | | (802,783 | ) | | | (10,436,556 | ) |
| | | | 426,400 | | | | 5,876,406 | | | | 183,981 | | | | 2,389,231 | |
| Investor Shares | | | | | | | | | | | | | | | | |
Shares sold | | | 603,476 | | | | 11,708,916 | | | | 925,508 | | | | 15,193,353 | |
Reinvestment of distributions | | | 1,022,341 | | | | 17,952,306 | | | | 1,249,675 | | | | 18,957,577 | |
Shares redeemed | | | (538,723 | ) | | | (10,345,621 | ) | | | (1,797,301 | ) | | | (26,657,889 | ) |
| | | | 1,087,094 | | | | 19,315,601 | | | | 377,882 | | | | 4,493,041 | |
| Class R6 Shares | | | | | | | | | | | | | | | | |
Shares sold | | | 1,010,877 | | | | 24,219,311 | | | | 1,723,177 | | | | 34,918,433 | |
Reinvestment of distributions | | | 1,443,405 | | | | 32,851,908 | | | | 1,839,234 | | | | 34,577,597 | |
Shares redeemed | | | (1,207,055 | ) | | | (29,064,514 | ) | | | (2,468,722 | ) | | | (49,771,961 | ) |
| | | | 1,247,227 | | | | 28,006,705 | | | | 1,093,689 | | | | 19,724,069 | |
| Class R Shares | | | | | | | | | | | | | | | | |
Shares sold | | | 335,901 | | | | 5,114,889 | | | | 629,794 | | | | 8,750,163 | |
Reinvestment of distributions | | | 885,453 | | | | 12,112,994 | | | | 969,214 | | | | 12,124,863 | |
Shares redeemed | | | (492,541 | ) | | | (7,445,891 | ) | | | (1,117,506 | ) | | | (15,506,141 | ) |
| | | | 728,813 | | | | 9,781,992 | | | | 481,502 | | | | 5,368,885 | |
| Class P Shares | | | | | | | | | | | | | | | | |
Shares sold | | | 516,280 | | | | 12,042,841 | | | | 164,784 | | | | 3,449,179 | |
Reinvestment of distributions | | | 594,960 | | | | 13,547,235 | | | | 743,933 | | | | 13,993,377 | |
Shares redeemed | | | (265,744 | ) | | | (6,262,984 | ) | | | (967,912 | ) | | | (20,170,294 | ) |
| | | | 845,496 | | | | 19,327,092 | | | | (59,195 | ) | | | (2,727,738 | ) |
| | | | |
NET INCREASE (DECREASE) | | | 11,553,626 | | | $ | 163,274,003 | | | | 1,871,814 | | | $ | (6,818,000 | ) |
137
GOLDMAN SACHS FUNDAMENTAL EQUITY GROWTH FUNDS
Notes to Financial Statements (continued)
February 28, 2021 (Unaudited)
|
| 12. SUMMARY OF SHARE TRANSACTIONS (continued) |
| | | | | | | | | | | | | | | | |
| | | Small Cap Growth Fund | |
| | | | |
| | | For the Six Months Ended
February 28, 2021
(Unaudited) | | | For the period
October 31, 2019* to
August 31, 2020 | |
| | | | |
| | | Shares | | | Dollars | | | Shares | | | Dollars | |
| | | | |
| Class A Shares | | | | | | | | | | | | | | | | |
Shares sold | | | 23,145 | | | $ | 368,750 | | | | 24,816 | | | $ | 260,087 | |
Reinvestment of distributions | | | 1,558 | | | | 22,970 | | | | 8 | | | | 83 | |
Shares redeemed | | | (5,543 | ) | | | (92,079 | ) | | | (11,126 | ) | | | (117,360 | ) |
| | | | 19,160 | | | | 299,641 | | | | 13,698 | | | | 142,810 | �� |
| Class C Shares | | | | | | | | | | | | | | | | |
Shares sold | | | 1,735 | | | | 28,826 | | | | 7,167 | | | | 67,619 | |
Reinvestment of distributions | | | 562 | | | | 8,216 | | | | 2 | | | | 18 | |
| | | | 2,297 | | | | 37,042 | | | | 7,169 | | | | 67,637 | |
| Institutional Shares | | | | | | | | | | | | | | | | |
Shares sold | | | 188,265 | | | | 3,136,296 | | | | 829,480 | | | | 7,210,281 | |
Reinvestment of distributions | | | 64,374 | | | | 953,009 | | | | 806 | | | | 8,547 | |
Shares redeemed | | | (14,283 | ) | | | (238,038 | ) | | | (11,499 | ) | | | (108,704 | ) |
| | | | 238,356 | | | | 3,851,267 | | | | 818,787 | | | | 7,110,124 | |
| Investor Shares | | | | | | | | | | | | | | | | |
Shares sold | | | — | | | | — | | | | 5,000 | | | | 50,000 | |
Reinvestment of distributions | | | 379 | | | | 5,612 | | | | 10 | | | | 104 | |
| | | | 379 | | | | 5,612 | | | | 5,010 | | | | 50,104 | |
| Class R6 Shares | | | | | | | | | | | | | | | | |
Shares sold | | | — | | | | — | | | | 5,000 | | | | 50,000 | |
Reinvestment of distributions | | | 383 | | | | 5,676 | | | | 11 | | | | 117 | |
| | | | 383 | | | | 5,676 | | | | 5,011 | | | | 50,117 | |
| Class R Shares | | | | | | | | | | | | | | | | |
Shares sold | | | — | | | | — | | | | 5,000 | | | | 50,000 | |
Reinvestment of distributions | | | 374 | | | | 5,508 | | | | 6 | | | | 61 | |
| | | | 374 | | | | 5,508 | | | | 5,006 | | | | 50,061 | |
| Class P Shares | | | | | | | | | | | | | | | | |
Shares sold | | | 105,665 | | | | 1,779,150 | | | | 251,440 | | | | 2,743,178 | |
Reinvestment of distributions | | | 16,894 | | | | 250,100 | | | | 11 | | | | 117 | |
Shares redeemed | | | (14,493 | ) | | | (214,539 | ) | | | (30,938 | ) | | | (337,264 | ) |
| | | | 108,066 | | | | 1,814,711 | | | | 220,513 | | | | 2,406,031 | |
| | | | |
NET INCREASE | | | 369,015 | | | $ | 6,019,457 | | | | 1,075,194 | | | $ | 9,876,884 | |
| * | | Commencement of Operations |
138
GOLDMAN SACHS FUNDAMENTAL EQUITY GROWTH FUNDS
|
| 12. SUMMARY OF SHARE TRANSACTIONS (continued) |
| | | | | | | | | | | | | | | | |
| | | Small/Mid Cap Growth Fund | |
| | | | |
| | | For the Six Months Ended
February 28, 2021
(Unaudited) | | | For the Fiscal Year Ended
August 31, 2020 | |
| | | | |
| | | Shares | | | Dollars | | | Shares | | | Dollars | |
| | | | |
| Class A Shares | | | | | | | | | | | | | | | | |
Shares sold | | | 1,808,910 | | | $ | 46,765,469 | | | | 3,787,265 | | | $ | 73,547,275 | |
Reinvestment of distributions | | | 1,836,091 | | | | 44,874,070 | | | | 1,906,384 | | | | 35,840,022 | |
Shares redeemed | | | (1,562,662 | ) | | | (40,018,998 | ) | | | (6,922,792 | ) | | | (131,322,470 | ) |
| | | | 2,082,339 | | | | 51,620,541 | | | | (1,229,143 | ) | | | (21,935,173 | ) |
| Class C Shares | | | | | | | | | | | | | | | | |
Shares sold | | | 412,285 | | | | 8,211,902 | | | | 606,585 | | | | 9,332,945 | |
Reinvestment of distributions | | | 1,601,630 | | | | 29,518,042 | | | | 1,697,652 | | | | 25,311,985 | |
Shares redeemed | | | (1,841,326 | ) | | | (36,507,294 | ) | | | (3,857,818 | ) | | | (59,971,098 | ) |
| | | | 172,589 | | | | 1,222,650 | | | | (1,553,581 | ) | | | (25,326,168 | ) |
| Institutional Shares | | | | | | | | | | | | | | | | |
Shares sold | | | 6,921,990 | | | | 199,752,638 | | | | 10,993,756 | | | | 239,838,233 | |
Reinvestment of distributions | | | 4,377,026 | | | | 120,455,750 | | | | 4,259,079 | | | | 88,461,069 | |
Shares redeemed | | | (6,169,703 | ) | | | (178,025,837 | ) | | | (18,101,436 | ) | | | (383,808,691 | ) |
| | | | 5,129,313 | | | | 142,182,551 | | | | (2,848,601 | ) | | | (55,509,389 | ) |
| Service Shares | | | | | | | | | | | | | | | | |
Shares sold | | | 1,533,582 | | | | 33,870,850 | | | | 994,719 | | | | 20,782,076 | |
Reinvestment of distributions | | | 260,883 | | | | 6,070,740 | | | | 130,447 | | | | 2,354,561 | |
Shares redeemed | | | (2,282,925 | ) | | | (56,628,466 | ) | | | (627,094 | ) | | | (11,735,697 | ) |
| | | | (488,460 | ) | | | (16,686,876 | ) | | | 498,072 | | | | 11,400,940 | |
| Investor Shares | | | | | | | | | | | | | | | | |
Shares sold | | | 5,240,745 | | | | 147,090,245 | | | | 5,938,295 | | | | 127,370,352 | |
Reinvestment of distributions | | | 2,963,694 | | | | 77,470,953 | | | | 2,624,916 | | | | 52,183,322 | |
Shares redeemed | | | (3,307,722 | ) | | | (88,929,060 | ) | | | (7,704,411 | ) | | | (158,699,905 | ) |
| | | | 4,896,717 | | | | 135,632,138 | | | | 858,800 | | | | 20,853,769 | |
| Class R6 Shares | | | | | | | | | | | | | | | | |
Shares sold | | | 1,100,661 | | | | 31,782,116 | | | | 981,189 | | | | 21,371,966 | |
Reinvestment of distributions | | | 431,371 | | | | 11,884,258 | | | | 354,195 | | | | 7,363,714 | |
Shares redeemed | | | (525,329 | ) | | | (15,192,502 | ) | | | (961,271 | ) | | | (20,831,469 | ) |
| | | | 1,006,703 | | | | 28,473,872 | | | | 374,113 | | | | 7,904,211 | |
| Class R Shares | | | | | | | | | | | | | | | | |
Shares sold | | | 135,801 | | | | 3,305,468 | | | | 187,440 | | | | 3,412,058 | |
Reinvestment of distributions | | | 98,410 | | | | 2,247,682 | | | | 103,778 | | | | 1,845,169 | |
Shares redeemed | | | (163,111 | ) | | | (3,925,350 | ) | | | (507,184 | ) | | | (9,368,570 | ) |
| | | | 71,100 | | | | 1,627,800 | | | | (215,966 | ) | | | (4,111,343 | ) |
| Class P Shares | | | | | | | | | | | | | | | | |
Shares sold | | | 4,802,003 | | | | 140,401,022 | | | | 4,245,963 | | | | 89,075,046 | |
Reinvestment of distributions | | | 1,705,056 | | | | 46,974,296 | | | | 1,155,623 | | | | 24,025,405 | |
Shares redeemed | | | (944,008 | ) | | | (26,691,357 | ) | | | (2,908,213 | ) | | | (58,822,878 | ) |
| | | | 5,563,051 | | | | 160,683,961 | | | | 2,493,373 | | | | 54,277,573 | |
| | | | |
NET INCREASE (DECREASE) | | | 18,433,352 | | | $ | 504,756,637 | | | | (1,622,933 | ) | | $ | (12,445,580 | ) |
139
GOLDMAN SACHS FUNDAMENTAL EQUITY GROWTH FUNDS
Notes to Financial Statements (continued)
February 28, 2021 (Unaudited)
|
| 12. SUMMARY OF SHARE TRANSACTIONS (continued) |
| | | | | | | | | | | | | | | | |
| | | Strategic Growth Fund | |
| | | | |
| | | For the Six Months Ended
February 28, 2021
(Unaudited) | | | For the Fiscal Year Ended
August 31, 2020 | |
| | | | |
| | | Shares | | | Dollars | | | Shares | | | Dollars | |
| | | | |
| Class A Shares | | | | | | | | | | | | | | | | |
Shares sold | | | 338,009 | | | $ | 3,644,190 | | | | 553,235 | | | $ | 4,903,579 | |
Reinvestment of distributions | | | 539,120 | | | | 5,353,462 | | | | 513,629 | | | | 4,304,210 | |
Shares redeemed | | | (407,409 | ) | | | (4,353,141 | ) | | | (862,216 | ) | | | (7,517,379 | ) |
| | | | 469,720 | | | | 4,644,511 | | | | 204,648 | | | | 1,690,410 | |
| Class C Shares | | | | | | | | | | | | | | | | |
Shares sold | | | 124,587 | | | | 770,900 | | | | 141,767 | | | | 736,027 | |
Reinvestment of distributions | | | 242,301 | | | | 1,240,583 | | | | 188,776 | | | | 938,217 | |
Shares redeemed | | | (172,615 | ) | | | (985,371 | ) | | | (328,543 | ) | | | (1,733,964 | ) |
| | | | 194,273 | | | | 1,026,112 | | | | 2,000 | | | | (59,720 | ) |
| Institutional Shares | | | | | | | | | | | | | | | | |
Shares sold | | | 271,542 | | | | 3,362,224 | | | | 829,394 | | | | 7,933,508 | |
Reinvestment of distributions | | | 651,729 | | | | 7,599,286 | | | | 762,714 | | | | 7,331,386 | |
Shares redeemed | | | (925,420 | ) | | | (11,476,474 | ) | | | (1,949,649 | ) | | | (19,965,455 | ) |
| | | | (2,149 | ) | | | (514,964 | ) | | | (357,541 | ) | | | (4,700,561 | ) |
| Service Shares | | | | | | | | | | | | | | | | |
Shares sold | | | 6,181 | | | | 62,910 | | | | 9,552 | | | | 90,934 | |
Reinvestment of distributions | | | 8,193 | | | | 79,067 | | | | 12,249 | | | | 100,316 | |
Shares redeemed | | | (11,942 | ) | | | (119,328 | ) | | | (44,300 | ) | | | (322,197 | ) |
| | | | 2,432 | | | | 22,649 | | | | (22,499 | ) | | | (130,947 | ) |
| Investor Shares | | | | | | | | | | | | | | | | |
Shares sold | | | 27,831 | | | | 348,626 | | | | 699,635 | | | | 6,739,272 | |
Reinvestment of distributions | | | 32,993 | | | | 382,724 | | | | 24,665 | | | | 235,813 | |
Shares redeemed | | | (52,492 | ) | | | (651,304 | ) | | | (657,615 | ) | | | (5,547,277 | ) |
| | | | 8,332 | | | | 80,046 | | | | 66,685 | | | | 1,427,808 | |
| Class R6 Shares | | | | | | | | | | | | | | | | |
Shares sold | | | 18,008 | | | | 220,868 | | | | 22,653 | | | | 245,561 | |
Reinvestment of distributions | | | 5,037 | | | | 58,588 | | | | 5,708 | | | | 54,757 | |
Shares redeemed | | | (5,032 | ) | | | (63,545 | ) | | | (34,804 | ) | | | (358,218 | ) |
| | | | 18,013 | | | | 215,911 | | | | (6,443 | ) | | | (57,900 | ) |
| Class R Shares | | | | | | | | | | | | | | | | |
Shares sold | | | 161 | | | | 1,617 | | | | 14,367 | | | | 116,717 | |
Reinvestment of distributions | | | 720 | | | | 6,717 | | | | 321 | | | | 2,557 | |
Shares redeemed | | | (2,418 | ) | | | (26,787 | ) | | | (41,401 | ) | | | (357,139 | ) |
| | | | (1,537 | ) | | | (18,453 | ) | | | (26,713 | ) | | | (237,865 | ) |
| Class P Shares | | | | | | | | | | | | | | | | |
Shares sold | | | 255,789 | | | | 3,189,042 | | | | 623,912 | | | | 6,250,168 | |
Reinvestment of distributions | | | 919,738 | | | | 10,678,494 | | | | 1,128,927 | | | | 10,817,531 | |
Shares redeemed | | | (592,168 | ) | | | (7,212,876 | ) | | | (2,698,348 | ) | | | (26,855,957 | ) |
| | | | 583,359 | | | | 6,654,660 | | | | (945,509 | ) | | | (9,788,258 | ) |
| | | | |
NET INCREASE (DECREASE) | | | 1,272,443 | | | $ | 12,110,472 | | | | (1,085,372 | ) | | $ | (11,857,033 | ) |
140
GOLDMAN SACHS FUNDAMENTAL EQUITY GROWTH FUNDS
|
| 12. SUMMARY OF SHARE TRANSACTIONS (continued) |
| | | | | | | | | | | | | | | | |
| | | Technology Opportunities Fund | |
| | | | |
| | | For the Six Months Ended
February 28, 2021
(Unaudited) | | | For the Fiscal Year Ended
August 31, 2020 | |
| | | | |
| | | Shares | | | Dollars | | | Shares | | | Dollars | |
| | | | |
| Class A Shares | | | | | | | | | | | | | | | | |
Shares sold | | | 756,519 | | | $ | 21,981,750 | | | | 2,497,794 | | | $ | 57,989,772 | |
Reinvestment of distributions | | | 1,253,567 | | | | 34,974,532 | | | | 2,085,573 | | | | 43,609,325 | |
Shares redeemed | | | (1,333,750 | ) | | | (38,423,450 | ) | | | (3,350,577 | ) | | | (77,184,340 | ) |
| | | | 676,336 | | | | 18,532,832 | | | | 1,232,790 | | | | 24,414,757 | |
| Class C Shares | | | | | | | | | | | | | | | | |
Shares sold | | | 123,785 | | | | 2,581,601 | | | | 411,605 | | | | 7,006,981 | |
Reinvestment of distributions | | | 172,234 | | | | 3,368,893 | | | | 269,706 | | | | 4,131,894 | |
Shares redeemed | | | (296,535 | ) | | | (6,136,366 | ) | | | (687,548 | ) | | | (11,865,762 | ) |
| | | | (516 | ) | | | (185,872 | ) | | | (6,237 | ) | | | (726,887 | ) |
| Institutional Shares | | | | | | | | | | | | | | | | |
Shares sold | | | 825,680 | | | | 28,035,747 | | | | 2,457,174 | | | | 67,343,687 | |
Reinvestment of distributions | | | 340,510 | | | | 11,192,560 | | | | 433,094 | | | | 10,502,518 | |
Shares redeemed | | | (980,703 | ) | | | (33,450,308 | ) | | | (1,184,364 | ) | | | (30,880,214 | ) |
| | | | 185,487 | | | | 5,777,999 | | | | 1,705,904 | | | | 46,965,991 | |
| Service Shares | | | | | | | | | | | | | | | | |
Shares sold | | | 168,852 | | | | 4,668,841 | | | | 740,768 | | | | 16,455,724 | |
Reinvestment of distributions | | | 123,618 | | | | 3,320,385 | | | | 218,520 | | | | 4,425,035 | |
Shares redeemed | | | (418,871 | ) | | | (11,616,517 | ) | | | (822,663 | ) | | | (18,106,252 | ) |
| | | | (126,401 | ) | | | (3,627,291 | ) | | | 136,625 | | | | 2,774,507 | |
| Investor Shares | | | | | | | | | | | | | | | | |
Shares sold | | | 261,449 | | | | 8,717,158 | | | | 875,798 | | | | 22,475,983 | |
Reinvestment of distributions | | | 124,715 | | | | 3,999,623 | | | | 107,586 | | | | 2,550,857 | |
Shares redeemed | | | (551,644 | ) | | | (18,843,842 | ) | | | (296,616 | ) | | | (7,844,763 | ) |
| | | | (165,480 | ) | | | (6,127,061 | ) | | | 686,768 | | | | 17,182,077 | |
| Class R6 Shares | | | | | | | | | | | | | | | | |
Shares sold | | | 9,461 | | | | 330,829 | | | | 40,331 | | | | 1,174,805 | |
Reinvestment of distributions | | | 3,436 | | | | 113,026 | | | | 1,342 | | | | 32,559 | |
Shares redeemed | | | (933 | ) | | | (31,126 | ) | | | (8,472 | ) | | | (199,381 | ) |
| | | | 11,964 | | | | 412,729 | | | | 33,201 | | | | 1,007,983 | |
| Class P Shares | | | | | | | | | | | | | | | | |
Shares sold | | | 1,007,906 | | | | 34,864,644 | | | | 1,140,621 | | | | 31,338,168 | |
Reinvestment of distributions | | | 178,139 | | | | 5,859,003 | | | | 145,323 | | | | 3,525,530 | |
Shares redeemed | | | (86,097 | ) | | | (2,893,828 | ) | | | (376,367 | ) | | | (9,279,340 | ) |
| | | | 1,099,948 | | | | 37,829,819 | | | | 909,577 | | | | 25,584,358 | |
| | | | |
NET INCREASE | | | 1,681,338 | | | $ | 52,613,155 | | | | 4,698,628 | | | $ | 117,202,786 | |
141
GOLDMAN SACHS FUNDAMENTAL EQUITY GROWTH FUNDS
Notes to Financial Statements (continued)
February 28, 2021 (Unaudited)
|
| 12. SUMMARY OF SHARE TRANSACTIONS (continued) |
| | | | | | | | | | | | | | | | |
| | | U.S. Equity ESG Fund | |
| | | | |
| | | For the Six Months Ended
February 28, 2021
(Unaudited) | | | For the Fiscal Year Ended
August 31, 2020 | |
| | | | |
| | | Shares | | | Dollars | | | Shares | | | Dollars | |
| | | | |
| Class A Shares | | | | | | | | | | | | | | | | |
Shares sold | | | 16,224 | | | $ | 255,451 | | | | 128,411 | | | $ | 1,726,402 | |
Reinvestment of distributions | | | 40,273 | | | | 600,840 | | | | 12,565 | | | | 176,323 | |
Shares redeemed | | | (20,776 | ) | | | (326,679 | ) | | | (77,681 | ) | | | (1,056,288 | ) |
| | | | 35,721 | | | | 529,612 | | | | 63,295 | | | | 846,437 | |
| Class C Shares | | | | | | | | | | | | | | | | |
Shares sold | | | 1,789 | | | | 26,115 | | | | 19,484 | | | | 254,410 | |
Reinvestment of distributions | | | 15,158 | | | | 212,062 | | | | 4,445 | | | | 59,055 | |
Shares redeemed | | | (5,886 | ) | | | (86,667 | ) | | | (4,920 | ) | | | (60,492 | ) |
| | | | 11,061 | | | | 151,510 | | | | 19,009 | | | | 252,973 | |
| Institutional Shares | | | | | | | | | | | | | | | | |
Shares sold | | | 29,112 | | | | 480,624 | | | | 8,620 | | | | 115,908 | |
Reinvestment of distributions | | | 3,494 | | | | 52,836 | | | | 1,252 | | | | 17,743 | |
Shares redeemed | | | (188 | ) | | | (3,047 | ) | | | (3,698 | ) | | | (48,507 | ) |
| | | | 32,418 | | | | 530,413 | | | | 6,174 | | | | 85,144 | |
| Investor Shares | | | | | | | | | | | | | | | | |
Shares sold | | | 249 | | | | 3,940 | | | | 5,965 | | | | 82,388 | |
Reinvestment of distributions | | | 2,516 | | | | 38,039 | | | | 737 | | | | 10,448 | |
Shares redeemed | | | (748 | ) | | | (12,061 | ) | | | (62,468 | ) | | | (875,883 | ) |
| | | | 2,017 | | | | 29,918 | | | | (55,766 | ) | | | (783,047 | ) |
| Class R6 Shares | | | | | | | | | | | | | | | | |
Shares sold | | | 3,687 | | | | 59,165 | | | | 41,308 | | | | 574,818 | |
Reinvestment of distributions | | | 8,342 | | | | 126,140 | | | | 8,674 | | | | 122,997 | |
Shares redeemed | | | (27,693 | ) | | | (445,327 | ) | | | (201,316 | ) | | | (2,732,496 | ) |
| | | | (15,664 | ) | | | (260,022 | ) | | | (151,334 | ) | | | (2,034,681 | ) |
| Class R Shares | | | | | | | | | | | | | | | | |
Reinvestment of distributions | | | 162 | | | | 2,431 | | | | — | | | | — | |
| | | | 162 | | | | 2,431 | | | | — | | | | — | |
| Class P Shares | | | | | | | | | | | | | | | | |
Reinvestment of distributions | | | 6,053 | | | | 91,452 | | | | 7,056 | | | | 100,044 | |
Shares redeemed | | | (5,371 | ) | | | (81,152 | ) | | | (110,018 | ) | | | (1,293,839 | ) |
| | | | 682 | | | | 10,300 | | | | (102,962 | ) | | | (1,193,795 | ) |
| | | | |
NET INCREASE (DECREASE) | | | 66,397 | | | $ | 994,162 | | | | (221,584 | ) | | $ | (2,826,969 | ) |
142
GOLDMAN SACHS FUNDAMENTAL EQUITY GROWTH FUNDS
Liquidity Risk Management Program
Each Fund has adopted and implemented a liquidity risk management program (the “Program”) in accordance with Rule 22e-4 under the 1940 Act. The Program seeks to assess and manage each Fund’s liquidity risk, i.e., the risk that a Fund is unable to satisfy redemption requests without significantly diluting remaining investors’ interests in the Fund. The Board of Trustees of the Trust has designated GSAM, each Fund’s investment adviser, to administer the Program. Certain aspects of the Program rely on third parties to perform certain functions, including the provision of market data and application of models.
The Program is comprised of various components designed to support the assessment and/or management of liquidity risk, including: (1) the periodic assessment (no less frequently than annually) of certain factors that influence a Fund’s liquidity risk; (2) the periodic classification (no less frequently than monthly) of a Fund’s investments into one of four liquidity categories that reflect an estimate of their liquidity under current market conditions; (3) a 15% limit on the acquisition of “illiquid investments” (as defined under Rule 22e-4); (4) for a Fund that does not invest primarily in “highly liquid investments” (as defined under Rule 22e-4), the determination of a minimum percentage of the Fund’s assets that will generally be invested in highly liquid investments (a “Highly Liquid Investment Minimum”); and (5) periodic reporting to the Board of Trustees.
At a meeting of the Board of Trustees on February 9-10, 2021, GSAM provided a written report to the Board addressing the operation, and the adequacy and effectiveness of the implementation, of the Program, including, as applicable, the operation of any Highly Liquid Investment Minimum and any material changes to the Program, for the period from January 1, 2020 through December 31, 2020 (the “Reporting Period”). Among other things, the annual report and related materials discussed: (1) the results of stress tests designed to assess liquidity under a hypothetical stressed scenario involving elevated redemptions; (2) an assessment of the methodologies used to classify investments into one of four liquidity categories; and (3) the impact of the COVID-19 pandemic on liquidity and management of liquidity risk during the Reporting Period, including during stressed market conditions caused by the COVID-19 pandemic. The report concluded that the Program continues to be reasonably designed to assess and manage liquidity risk and was adequately and effectively implemented during the Reporting Period.
There can be no assurance that the Program will achieve its objectives under all circumstances in the future. Please refer to your Fund’s prospectus for more information regarding the Fund’s exposure to liquidity risk and other risks to which it may be subject.
143
GOLDMAN SACHS FUNDAMENTAL EQUITY GROWTH FUNDS
Fund Expenses — Six Month Period Ended February 28, 2021 (Unaudited)
As a shareholder of Class A, Class C, Institutional, Service, Investor, Class R6, Class R or Class P Shares of a Fund, you incur two types of costs: (1) transaction costs, including sales charges on purchase payments (with respect to Class A Shares), contingent deferred sales charges on redemptions (with respect to Class C Shares), and (2) ongoing costs, including management fees; distribution and/or service (12b-1) fees (with respect to Class A, Class C, Service and Class R Shares); and other Fund expenses. The example is intended to help you understand your ongoing costs (in dollars) of investing in Class A, Class C, Institutional, Service, Investor, Class R6, Class R and Class P Shares of the Funds and to compare these costs with the ongoing costs of investing in other mutual funds.
The example is based on an investment of $1,000 invested at the beginning of the period and held for the entire period from September 1, 2020 through February 28, 2021, which represents a period of 181 days of a 365 day year.
Actual Expenses — The first line under each share class in the table below provides information about actual account values and actual expenses. You may use the information in this line, together with the amount you invested, to estimate the expenses that you paid over the period. Simply divide your account value by $1,000 (for example, an $8,600 account value divided by $1,000=8.6), then multiply the result by the number in the first line under the heading entitled “Expenses Paid” to estimate the expenses you paid on your account during this period.
Hypothetical Example for Comparison Purposes — The second line under each share class in the table below provides information about hypothetical account values and hypothetical expenses based on the Funds’ actual net expense ratios and an assumed rate of return of 5% per year before expenses, which is not the Funds’ actual return. The hypothetical account values and expenses may not be used to estimate the actual ending account balance or expenses you paid for the period. You may use this information to compare the ongoing costs of investing in the Funds and other funds. To do so, compare this 5% hypothetical example with the 5% hypothetical examples that appear in the shareholder reports of the other funds.
Please note that the expenses shown in the table are meant to highlight your ongoing costs only and do not reflect any transactional costs, such as sales charges, redemption fees, or exchange fees. Therefore, the second line of the table is useful in comparing ongoing costs only, and will not help you determine the relative total costs of owning different funds. In addition, if these transactional costs were included, your costs would have been higher.
| | | | | | | | | | | | | | | | | | | | | | | | | | | | | | | | | | | | | | | | | | | | | | | | | | | | | | | | | | | | |
| | | Capital Growth Fund | | | Concentrated Growth Fund | | | Flexible Cap Fund | | | Growth Opportunities Fund | | | Small Cap Growth Fund | |
| Share Class | | Beginning
Account
Value
9/1/20 | | | Ending
Account
Value
2/28/21 | | | Expenses
Paid for the
6 months ended
2/28/2021* | | | Beginning
Account
Value
9/1/20 | | | Ending
Account
Value
2/28/21 | | | Expenses
Paid for the
6 months ended
2/28/2021* | | | Beginning
Account
Value
9/1/20 | | | Ending
Account
Value
2/28/21 | | | Expenses
Paid for the
6 months ended
2/28/2021* | | | Beginning
Account
Value
9/1/20 | | | Ending
Account
Value
2/28/21 | | | Expenses
Paid for the
6 months ended
2/28/2021* | | | Beginning
Account
Value
9/1/20 | | | Ending
Account
Value
2/28/21 | | | Expenses Paid for the
6 months ended
2/28/2021* | |
| Class A | | | | | | | | | | | | | | | | | | | | | | | | | | | | | | | | | | | | | | | | | | | | | | | | | | | | | | | | | | | | |
Actual | | $ | 1,000.00 | | | $ | 1,112.24 | | | $ | 5.87 | | | $ | 1,000.00 | | | $ | 1,059.31 | | | $ | 5.72 | | | $ | 1,000.00 | | | $ | 1,096.08 | | | $ | 4.99 | | | $ | 1,000.00 | | | $ | 1,205.40 | | | $ | 6.78 | | | $ | 1,000.00 | | | $ | 1,367.50 | | | $ | 7.51 | |
Hypothetical 5% return | | | 1,000.00 | | | | 1,019.24 | + | | | 5.61 | | | | 1,000.00 | | | | 1,019.24 | + | | | 5.61 | | | | 1,000.00 | | | | 1,020.03 | + | | | 4.81 | | | | 1,000.00 | | | | 1,018.65 | + | | | 6.21 | | | | 1,000.00 | | | | 1,018.45 | + | | | 6.41 | |
| Class C | | | | | | | | | | | | | | | | | | | | | | | | | | | | | | | | | | | | | | | | | | | | | | | | | | | | | | | | | | | | |
Actual | | | 1,000.00 | | | | 1,108.35 | | | | 9.78 | | | | 1,000.00 | | | | 1,055.60 | | | | 9.53 | | | | 1,000.00 | | | | 1,093.13 | | | | 8.87 | | | | 1,000.00 | | | | 1,201.93 | | | | 10.86 | | | | 1,000.00 | | | | 1,362.16 | | | | 11.89 | |
Hypothetical 5% return | | | 1,000.00 | | | | 1,015.52 | + | | | 9.35 | | | | 1,000.00 | | | | 1,015.52 | + | | | 9.35 | | | | 1,000.00 | | | | 1,016.31 | + | | | 8.55 | | | | 1,000.00 | | | | 1,014.93 | + | | | 9.94 | | | | 1,000.00 | | | | 1,014.73 | + | | | 10.14 | |
| Institutional | | | | | | | | | | | | | | | | | | | | | | | | | | | | | | | | | | | | | | | | | | | | | | | | | | | | | | | | | | | | |
Actual | | | 1,000.00 | | | | 1,114.05 | | | | 3.93 | | | | 1,000.00 | | | | 1,060.98 | | | | 4.09 | | | | 1,000.00 | | | | 1,098.63 | | | | 3.07 | | | | 1,000.00 | | | | 1,207.32 | | | | 4.93 | | | | 1,000.00 | | | | 1,369.96 | | | | 5.35 | |
Hypothetical 5% return | | | 1,000.00 | | | | 1,021.08 | + | | | 3.76 | | | | 1,000.00 | | | | 1,020.83 | + | | | 4.01 | | | | 1,000.00 | | | | 1,021.87 | + | | | 2.96 | | | | 1,000.00 | | | | 1,020.33 | + | | | 4.51 | | | | 1,000.00 | | | | 1,020.28 | + | | | 4.56 | |
| Service | | | | | | | | | | | | | | | | | | | | | | | | | | | | | | | | | | | | | | | | | | | | | | | | | | | | | | | | | | | | |
Actual | | | 1,000.00 | | | | 1,111.57 | | | | 6.54 | | | | 1,000.00 | | | | N/A | | | | N/A | | | | 1,000.00 | | | | N/A | | | | N/A | | | | 1,000.00 | | | | 1,204.61 | | | | 7.65 | | | | 1,000.00 | | | | N/A | | | | N/A | |
Hypothetical 5% return | | | 1,000.00 | | | | 1,018.60 | + | | | 6.26 | | | | 1,000.00 | | | | N/A | | | | N/A | | | | 1,000.00 | | | | N/A | | | | N/A | | | | 1,000.00 | | | | 1,017.85 | + | | | 7.00 | | | | 1,000.00 | | | | N/A | | | | N/A | |
| Investor | | | | | | | | | | | | | | | | | | | | | | | | | | | | | | | | | | | | | | | | | | | | | | | | | | | | | | | | | | | | |
Actual | | | 1,000.00 | | | | 1,113.58 | | | | 4.56 | | | | 1,000.00 | | | | 1,060.95 | | | | 4.45 | | | | 1,000.00 | | | | 1,097.73 | | | | 3.69 | | | | 1,000.00 | | | | 1,207.14 | | | | 5.42 | | | | 1,000.00 | | | | 1,369.25 | | | | 6.05 | |
Hypothetical 5% return | | | 1,000.00 | | | | 1,020.48 | + | | | 4.36 | | | | 1,000.00 | | | | 1,020.48 | + | | | 4.36 | | | | 1,000.00 | | | | 1,021.27 | + | | | 3.56 | | | | 1,000.00 | | | | 1,019.89 | + | | | 4.96 | | | | 1,000.00 | | | | 1,019.69 | + | | | 5.16 | |
| Class R6 | | | | | | | | | | | | | | | | | | | | | | | | | | | | | | | | | | | | | | | | | | | | | | | | | | | | | | | | | | | | |
Actual | | | 1,000.00 | | | | 1,114.35 | | | | 3.88 | | | | 1,000.00 | | | | 1,061.13 | | | | 4.04 | | | | 1,000.00 | | | | 1,099.01 | | | | 3.02 | | | | 1,000.00 | | | | 1,207.55 | | | | 4.87 | | | | 1,000.00 | | | | 1,369.95 | | | | 5.29 | |
Hypothetical 5% return | | | 1,000.00 | | | | 1,021.12 | + | | | 3.71 | | | | 1,000.00 | | | | 1,020.88 | + | | | 3.96 | | | | 1,000.00 | | | | 1,021.92 | + | | | 2.91 | | | | 1,000.00 | | | | 1,020.38 | + | | | 4.46 | | | | 1,000.00 | | | | 1,020.33 | + | | | 4.51 | |
| Class R | | | | | | | | | | | | | | | | | | | | | | | | | | | | | | | | | | | | | | | | | | | | | | | | | | | | | | | | | | | | |
Actual | | | 1,000.00 | | | | 1,111.21 | | | | 7.17 | | | | 1,000.00 | | | | 1,058.06 | | | | 6.99 | | | | 1,000.00 | | | | 1,095.20 | | | | 6.29 | | | | 1,000.00 | | | | 1,203.35 | | | | 8.14 | | | | 1,000.00 | | | | 1,365.57 | | | | 8.97 | |
Hypothetical 5% return | | | 1,000.00 | | | | 1,018.00 | + | | | 6.85 | | | | 1,000.00 | | | | 1,018.00 | + | | | 6.85 | | | | 1,000.00 | | | | 1,018.79 | + | | | 6.06 | | | | 1,000.00 | | | | 1,017.41 | + | | | 7.45 | | | | 1,000.00 | | | | 1,017.21 | + | | | 7.65 | |
| Class P | | | | | | | | | | | | | | | | | | | | | | | | | | | | | | | | | | | | | | | | | | | | | | | | | | | | | | | | | | | | |
Actual | | | 1,000.00 | | | | 1,114.37 | | | | 3.88 | | | | 1,000.00 | | | | 1,061.15 | | | | 4.04 | | | | 1,000.00 | | | | 1,098.28 | | | | 3.02 | | | | 1,000.00 | | | | 1,207.46 | | | | 4.87 | | | | 1,000.00 | | | | 1,369.25 | | | | 5.29 | |
Hypothetical 5% return | | | 1,000.00 | | | | 1,021.12 | + | | | 3.71 | | | | 1,000.00 | | | | 1,020.88 | + | | | 3.96 | | | | 1,000.00 | | | | 1,021.92 | + | | | 2.91 | | | | 1,000.00 | | | | 1,020.38 | + | | | 4.46 | | | | 1,000.00 | | | | 1,020.33 | + | | | 4.51 | |
| + | | Hypothetical expenses are based on each Fund’s actual annualized net expense ratios and an assumed rate of return of 5% per year before expenses. |
| * | | Expenses for each share class are calculated using each Fund’s annualized net expense ratio for each class, which represents the ongoing expenses as a percentage of net assets for the six months ended February 28, 2021. Expenses are calculated by multiplying the annualized net expense ratio by the average account value for the period; then multiplying the result by the number of days in the most recent fiscal half year; and then dividing that result by the number of days in the fiscal year. The annualized net expense ratios for the period were as follows: |
| | | | | | | | | | | | | | | | | | | | | | | | | | | | | | | | |
| Fund | | Class A
Shares | | | Class C
Shares | | | Institutional
Shares | | | Service
Shares | | | Investor
Shares | | | Class R6
Shares | | | Class R
Shares | | | Class P
Shares | |
Capital Growth Fund | | | 1.12 | % | | | 1.87 | % | | | 0.75 | % | | | 1.25 | % | | | 0.87 | % | | | 0.74 | % | | | 1.37 | % | | | 0.74 | % |
Concentrated Growth Fund | | | 1.12 | | | | 1.87 | | | | 0.80 | | | | N/A | | | | 0.87 | | | | 0.79 | | | | 1.37 | | | | 0.79 | |
Flexible Cap Fund | | | 0.96 | | | | 1.71 | | | | 0.59 | | | | N/A | | | | 0.71 | | | | 0.58 | | | | 1.21 | | | | 0.58 | |
Growth Opportunities Fund | | | 1.24 | | | | 1.99 | | | | 0.90 | | | | 1.40 | | | | 0.99 | | | | 0.89 | | | | 1.49 | | | | 0.89 | |
Small Cap Growth Fund | | | 1.28 | | | | 2.03 | | | | 0.91 | | | | N/A | | | | 1.03 | | | | 0.90 | | | | 1.53 | | | | 0.90 | |
144
GOLDMAN SACHS FUNDAMENTAL EQUITY GROWTH FUNDS
Fund Expenses — Six Month Period Ended February 28, 2021 (Unaudited) (continued)
| | | | | | | | | | | | | | | | | | | | | | | | | | | | | | | | | | | | | | | | | | | | | | | | |
| | | Small/Mid Cap Growth Fund | | | Strategic Growth Fund | | | Technology Opportunities Fund | | | U.S. Equity ESG Fund | |
| Share Class | | Beginning
Account
Value 9/1/20 | | | Ending
Account
Value
2/28/21 | | | Expenses
Paid for the
6 months ended
2/28/2021* | | | Beginning
Account
Value 9/1/20 | | | Ending
Account
Value
2/28/21 | | | Expenses
Paid for the
6 months ended
2/28/2021* | | | Beginning
Account
Value 9/1/20 | | | Ending
Account
Value
2/28/21 | | | Expenses
Paid for the 6
months ended
2/28/2021* | | | Beginning
Account
Value 9/1/20 | | | Ending
Account
Value
2/28/21 | | | Expenses
Paid for the
6 months ended
2/28/2021* | |
| Class A | | | | | | | | | | | | | | | | | | | | | | | | | | | | | | | | | | | | | | | | | | | | | | | | |
Actual | | $ | 1,000.00 | | | $ | 1,294.69 | | | $ | 6.88 | | | $ | 1,000.00 | | | $ | 1,082.55 | | | $ | 5.78 | | | $ | 1,000.00 | | | $ | 1,080.02 | | | $ | 6.45 | | | $ | 1,000.00 | | | $ | 1,124.93 | | | $ | 5.32 | |
Hypothetical 5% return | | | 1,000.00 | | | | 1,018.79 | + | | | 6.06 | | | | 1,000.00 | | | | 1,019.24 | + | | | 5.61 | | | | 1,000.00 | | | | 1,018.60 | + | | | 6.26 | | | | 1,000.00 | | | | 1,019.79 | + | | | 5.06 | |
| Class C | | | | | | | | | | | | | | | | | | | | | | | | | | | | | | | | | | | | | | | | | | | | | | | | |
Actual | | | 1,000.00 | | | | 1,289.67 | | | | 11.13 | | | | 1,000.00 | | | | 1,079.29 | | | | 9.64 | | | | 1,000.00 | | | | 1,075.94 | | | | 10.24 | | | | 1,000.00 | | | | 1,120.66 | | | | 9.25 | |
Hypothetical 5% return | | | 1,000.00 | | | | 1,015.08 | + | | | 9.79 | | | | 1,000.00 | | | | 1,015.52 | + | | | 9.35 | | | | 1,000.00 | | | | 1,014.93 | + | | | 9.94 | | | | 1,000.00 | | | | 1,016.07 | + | | | 8.80 | |
| Institutional | | | | | | | | | | | | | | | | | | | | | | | | | | | | | | | | | | | | | | | | | | | | | | | | |
Actual | | | 1,000.00 | | | | 1,296.82 | | | | 5.13 | | | | 1,000.00 | | | | 1,084.61 | | | | 3.88 | | | | 1,000.00 | | | | 1,081.35 | | | | 5.06 | | | | 1,000.00 | | | | 1,126.51 | | | | 3.53 | |
Hypothetical 5% return | | | 1,000.00 | | | | 1,020.33 | + | | | 4.51 | | | | 1,000.00 | | | | 1,021.08 | + | | | 3.76 | | | | 1,000.00 | | | | 1,019.93 | + | | | 4.91 | | | | 1,000.00 | | | | 1,021.47 | + | | | 3.36 | |
| Service | | | | | | | | | | | | | | | | | | | | | | | | | | | | | | | | | | | | | | | | | | | | | | | | |
Actual | | | 1,000.00 | | | | 1,293.43 | | | | 7.96 | | | | 1,000.00 | | | | 1,081.70 | | | | 6.45 | | | | 1,000.00 | | | | 1,078.55 | | | | 7.63 | | | | 1,000.00 | | | | N/A | | | | N/A | |
Hypothetical 5% return | | | 1,000.00 | | | | 1,017.85 | + | | | 7.00 | | | | 1,000.00 | | | | 1,018.60 | + | | | 6.26 | | | | 1,000.00 | | | | 1,017.46 | + | | | 7.40 | | | | 1,000.00 | | | | N/A | | | | N/A | |
| Investor | | | | | | | | | | | | | | | | | | | | | | | | | | | | | | | | | | | | | | | | | | | | | | | | |
Actual | | | 1,000.00 | | | | 1,296.29 | | | | 5.47 | | | | 1,000.00 | | | | 1,083.15 | | | | 4.49 | | | | 1,000.00 | | | | 1,081.46 | | | | 5.16 | | | | 1,000.00 | | | | 1,126.30 | | | | 4.01 | |
Hypothetical 5% return | | | 1,000.00 | | | | 1,020.03 | + | | | 4.81 | | | | 1,000.00 | | | | 1,020.48 | + | | | 4.36 | | | | 1,000.00 | | | | 1,019.84 | + | | | 5.01 | | | | 1,000.00 | | | | 1,021.03 | + | | | 3.81 | |
| Class R6 | | | | | | | | | | | | | | | | | | | | | | | | | | | | | | | | | | | | | | | | | | | | | | | | |
Actual | | | 1,000.00 | | | | 1,296.46 | | | | 5.07 | | | | 1,000.00 | | | | 1,084.20 | | | | 3.82 | | | | 1,000.00 | | | | 1,081.30 | | | | 5.01 | | | | 1,000.00 | | | | 1,126.42 | | | | 3.48 | |
Hypothetical 5% return | | | 1,000.00 | | | | 1,020.38 | + | | | 4.46 | | | | 1,000.00 | | | | 1,021.12 | + | | | 3.71 | | | | 1,000.00 | | | | 1,019.98 | + | | | 4.86 | | | | 1,000.00 | | | | 1,021.52 | + | | | 3.31 | |
| Class R | | | | | | | | | | | | | | | | | | | | | | | | | | | | | | | | | | | | | | | | | | | | | | | | |
Actual | | | 1,000.00 | | | | 1,293.19 | | | | 8.30 | | | | 1,000.00 | | | | 1,081.23 | | | | 7.07 | | | | 1,000.00 | | | | N/A | | | | N/A | | | | 1,000.00 | | | | 1,123.71 | | | | 6.63 | |
Hypothetical 5% return | | | 1,000.00 | | | | 1,017.55 | + | | | 7.30 | | | | 1,000.00 | | | | 1,018.00 | + | | | 6.85 | | | | 1,000.00 | | | | N/A | | | | N/A | | | | 1,000.00 | | | | 1,018.55 | + | | | 6.31 | |
| Class P | | | | | | | | | | | | | | | | | | | | | | | | | | | | | | | | | | | | | | | | | | | | | | | | |
Actual | | | 1,000.00 | | | | 1,296.90 | | | | 5.01 | | | | 1,000.00 | | | | 1,084.24 | | | | 3.82 | | | | 1,000.00 | | | | 1,081.30 | | | | 5.01 | | | | 1,000.00 | | | | 1,126.46 | | | | 3.48 | |
Hypothetical 5% return | | | 1,000.00 | | | | 1,020.43 | + | | | 4.41 | | | | 1,000.00 | | | | 1,021.12 | + | | | 3.71 | | | | 1,000.00 | | | | 1,019.98 | + | | | 4.86 | | | | 1,000.00 | | | | 1,021.52 | + | | | 3.31 | |
| + | | Hypothetical expenses are based on each Fund’s actual annualized net expense ratios and an assumed rate of return of 5% per year before expenses. |
| * | | Expenses for each share class are calculated using each Fund’s annualized net expense ratio for each class, which represents the ongoing expenses as a percentage of net assets for the six months ended February 28, 2021. Expenses are calculated by multiplying the annualized net expense ratio by the average account value for the period; then multiplying the result by the number of days in the most recent fiscal half year; and then dividing that result by the number of days in the fiscal year. The annualized net expense ratios for the period were as follows: |
| | | | | | | | | | | | | | | | | | | | | | | | | | | | | | | | |
| Fund | | Class A
Shares | | | Class C
Shares | | | Institutional
Shares | | | Service
Shares | | | Investor
Shares | | | Class R6
Shares | | | Class R
Shares | | | Class P
Shares | |
Small/Mid Cap Growth Fund | | | 1.21 | % | | | 1.96 | % | | | 0.90 | % | | | 1.40 | % | | | 0.96 | % | | | 0.89 | % | | | 1.46 | % | | | 0.88 | % |
Strategic Growth Fund | | | 1.12 | | | | 1.87 | | | | 0.75 | | | | 1.25 | | | | 0.87 | | | | 0.74 | | | | 1.37 | | | | 0.74 | |
Technology Opportunities Fund | | | 1.25 | | | | 1.99 | | | | 0.98 | | | | 1.48 | | | | 1.00 | | | | 0.97 | | | | N/A | | | | 0.97 | |
U.S. Equity ESG Fund | | | 1.01 | | | | 1.76 | | | | 0.67 | | | | N/A | | | | 0.76 | | | | 0.66 | | | | 1.26 | | | | 0.66 | |
145
FUNDS PROFILE
Goldman Sachs Funds
Goldman Sachs is a premier financial services firm, known since 1869 for creating thoughtful and customized investment solutions in complex global markets.
Today, the Asset Management Division of Goldman Sachs serves a diverse set of clients worldwide, including private institutions, public entities and individuals. With approximately $1.95 trillion in assets under supervision as of December 31, 2020, Goldman Sachs Asset Management (“GSAM”) has portfolio management teams located around the world and our investment professionals bring firsthand knowledge of local markets to every investment decision. Assets under supervision includes assets under management and other client assets for which Goldman Sachs does not have full discretion. GSAM leverages the resources of Goldman Sachs & Co. LLC subject to legal, internal and regulatory restrictions.
Money Market
Financial Square FundsSM
| ∎ | | Financial Square Treasury Solutions Fund1 |
| ∎ | | Financial Square Government Fund1 |
| ∎ | | Financial Square Money Market Fund2 |
| ∎ | | Financial Square Prime Obligations Fund2 |
| ∎ | | Financial Square Treasury Instruments Fund1 |
| ∎ | | Financial Square Treasury Obligations Fund1 |
| ∎ | | Financial Square Federal Instruments Fund1 |
Investor FundsSM
| ∎ | | Investor Money Market Fund3 |
| ∎ | | Investor Tax-Exempt Money Market Fund3 |
Fixed Income
Short Duration and Government
| ∎ | | High Quality Floating Rate Fund |
| ∎ | | Short-Term Conservative Income Fund |
| ∎ | | Short Duration Government Fund |
| ∎ | | Short Duration Income Fund |
| ∎ | | Inflation Protected Securities Fund |
Multi-Sector
| ∎ | | Global Core Fixed Income Fund4 |
Municipal and Tax-Free
| ∎ | | High Yield Municipal Fund |
| ∎ | | Dynamic Municipal Income Fund |
| ∎ | | Short Duration Tax-Free Fund |
| ∎ | | Municipal Income Completion Fund |
Single Sector
| ∎ | | Investment Grade Credit Fund |
| ∎ | | High Yield Floating Rate Fund |
| ∎ | | Emerging Markets Debt Fund |
| ∎ | | Local Emerging Markets Debt Fund |
Fixed Income Alternatives
| ∎ | | Long Short Credit Strategies Fund |
Fundamental Equity
| ∎ | | Small/Mid Cap Value Fund |
| ∎ | | Small/Mid Cap Growth Fund |
| ∎ | | Concentrated Growth Fund |
| ∎ | | Technology Opportunities Fund |
| ∎ | | Growth Opportunities Fund |
| ∎ | | Rising Dividend Growth Fund |
Tax-Advantaged Equity
| ∎ | | U.S. Tax-Managed Equity Fund |
| ∎ | | International Tax-Managed Equity Fund |
| ∎ | | U.S. Equity Dividend and Premium Fund |
| ∎ | | International Equity Dividend and Premium Fund |
Equity Insights
| ∎ | | Small Cap Equity Insights Fund |
| ∎ | | U.S. Equity Insights Fund |
| ∎ | | Small Cap Growth Insights Fund |
| ∎ | | Large Cap Growth Insights Fund |
| ∎ | | Large Cap Value Insights Fund |
| ∎ | | Small Cap Value Insights Fund |
| ∎ | | International Small Cap Insights Fund |
| ∎ | | International Equity Insights Fund |
| ∎ | | Emerging Markets Equity Insights Fund |
Fundamental Equity International
| ∎ | | International Equity Income Fund |
| ∎ | | International Equity ESG Fund |
| ∎ | | Emerging Markets Equity Fund |
| ∎ | | ESG Emerging Markets Equity Fund |
Alternative
| ∎ | | Clean Energy Income Fund |
| ∎ | | Real Estate Securities Fund |
| ∎ | | International Real Estate Securities Fund |
| ∎ | | Commodity Strategy Fund |
| ∎ | | Global Real Estate Securities Fund |
| ∎ | | Alternative Premia Fund |
| ∎ | | Absolute Return Tracker Fund |
| ∎ | | Managed Futures Strategy Fund |
| ∎ | | MLP Energy Infrastructure Fund |
| ∎ | | Energy Infrastructure Fund6 |
| ∎ | | Multi-Manager Alternatives Fund |
| ∎ | | Global Infrastructure Fund |
Total Portfolio Solutions
| ∎ | | Global Managed Beta Fund |
| ∎ | | Multi-Manager Non-Core Fixed Income Fund |
| ∎ | | Multi-Manager Global Equity Fund |
| ∎ | | Multi-Manager International Equity Fund |
| ∎ | | Tactical Tilt Overlay Fund |
| ∎ | | Balanced Strategy Portfolio |
| ∎ | | Multi-Manager U.S. Small Cap Equity Fund |
| ∎ | | Multi-Manager Real Assets Strategy Fund |
| ∎ | | Growth and Income Strategy Portfolio |
| ∎ | | Growth Strategy Portfolio |
| ∎ | | Dynamic Global Equity Fund |
| ∎ | | Satellite Strategies Portfolio |
| ∎ | | Enhanced Dividend Global Equity Portfolio |
| ∎ | | Tax-Advantaged Global Equity Portfolio |
| ∎ | | Strategic Factor Allocation Fund |
| ∎ | | Strategic Volatility Premium Fund |
| ∎ | | Target Date Retirement Portfolio |
| ∎ | | Target Date 2025 Portfolio |
| ∎ | | Target Date 2030 Portfolio |
| ∎ | | Target Date 2035 Portfolio |
| ∎ | | Target Date 2040 Portfolio |
| ∎ | | Target Date 2045 Portfolio |
| ∎ | | Target Date 2050 Portfolio |
| ∎ | | Target Date 2055 Portfolio |
| ∎ | | Target Date 2060 Portfolio |
| ∎ | | GQG Partners International Opportunities Fund |
| 1 | | You could lose money by investing in the Fund. Although the Fund seeks to preserve the value of your investment at $1.00 per share, it cannot guarantee it will do so. An investment in the Fund is not a deposit of a bank and is not insured or guaranteed by the Federal Deposit Insurance Corporation or any other government agency. The Fund’s sponsor has no legal obligation to provide financial support to the Fund, and you should not expect that the sponsor will provide financial support to the Fund at any time. |
| 2 | | You could lose money by investing in the Fund. Because the share price of the Fund will fluctuate, when you sell your shares they may be worth more or less than what you originally paid for them. The Fund may impose a fee upon sale of your shares or may temporarily suspend your ability to sell shares if the Fund’s liquidity falls below required minimums because of market conditions or other factors. An investment in the Fund is not a deposit of a bank and is not insured or guaranteed by the Federal Deposit Insurance Corporation or any other government agency. The Fund’s sponsor has no legal obligation to provide financial support to the Fund, and you should not expect that the sponsor will provide financial support to the Fund at any time. |
| 3 | | You could lose money by investing in the Fund. Although the Fund seeks to preserve the value of your investment at $1.00 per share, it cannot guarantee it will do so. The Fund may impose a fee upon sale of your shares or may temporarily suspend your ability to sell shares if the Fund’s liquidity falls below required minimums because of market conditions or other factors. An investment in the Fund is not a deposit of a bank and is not insured or guaranteed by the Federal Deposit Insurance Corporation or any other government agency. The Fund’s sponsor has no legal obligation to provide financial support to the Fund, and you should not expect that the sponsor will provide financial support to the Fund at any time. |
| 4 | | Effective after the close of business on April 30, 2020, the Goldman Sachs Global Income Fund was renamed the Goldman Sachs Global Core Fixed Income Fund. |
| 5 | | Effective after the close on business of August 30, 2020, the Goldman Sachs Blue Chip Fund was renamed the Goldman Sachs U.S. Equity ESG Fund. |
| 6 | | Effective after the close of business on June 26, 2020, the Goldman Sachs MLP & Energy Fund was renamed the Goldman Sachs Energy Infrastructure Fund. |
| | | Financial Square FundsSM and Investor FundsSM are registered service marks of Goldman Sachs & Co. LLC. |
| * | | This list covers open-end funds only. Please visit our website at www.GSAMFUNDS.com to learn about our closed-end funds and exchange-traded funds. |
| | |
TRUSTEES Jessica Palmer, Chair Dwight L. Bush Kathryn A. Cassidy Diana M. Daniels Joaquin Delgado James A. McNamara Roy W. Templin Gregory G. Weaver | | OFFICERS James A. McNamara, President Joseph F. DiMaria, Principal Financial Officer, Principal Accounting Officer and Treasurer Caroline L. Kraus, Secretary |
| |
GOLDMAN SACHS & CO. LLC Distributor and Transfer Agent | | GOLDMAN SACHS ASSET MANAGEMENT, L.P. Investment Adviser |
Visit our web site at www.GSAMFUNDS.com to obtain the most recent month-end returns.
Goldman Sachs Asset Management, L.P. 200 West Street, New York, New York 10282
The reports concerning the Funds included in this shareholder report may contain certain forward-looking statements about the factors that may affect the performance of the Funds in the future. These statements are based on Fund management’s predictions and expectations concerning certain future events and their expected impact on the Funds, such as performance of the economy as a whole and of specific industry sectors, changes in the levels of interest rates, the impact of developing world events, and other factors that may influence the future performance of the Funds. Management believes these forward-looking statements to be reasonable, although they are inherently uncertain and difficult to predict. Actual events may cause adjustments in portfolio management strategies from those currently expected to be employed.
A description of the policies and procedures that the Funds use to determine how to vote proxies relating to portfolio securities and information regarding how a Fund voted proxies relating to portfolio securities during the most recent 12-month period ended June 30 is available (i) without charge, upon request by calling 1-800-526-7384 (for Retail Shareholders) or 1-800-621-2550 (for Institutional Shareholders); and (ii) on the Securities and Exchange Commission (“SEC”) web site at http://www.sec.gov.
The Funds will file portfolio holdings information for each month in a fiscal quarter within 60 days after the end of the relevant fiscal quarter on Form N-PORT. Portfolio holdings information for the third month of each fiscal quarter will be made available on the SEC’s web site at http://www.sec.gov. Portfolio holdings information may be obtained upon request and without charge by calling 1-800-526-7384 (for Retail Shareholders) or 1-800-621-2550 (for Institutional Shareholders).
Goldman Sachs & Co. LLC (‘‘Goldman Sachs’’) does not provide legal, tax or accounting advice. Any statement contained in this communication (including any attachments) concerning U.S. tax matters was not intended or written to be used, and cannot be used, for the purpose of avoiding penalties under the Internal Revenue Code, and was written to support the promotion or marketing of the transaction(s) or matter(s) addressed. Clients of Goldman Sachs should obtain their own independent tax advice based on their particular circumstances.
Fund holdings and allocations shown are as of February 28, 2021 and may not be representative of future investments. Fund holdings should not be relied on in making investment decisions and should not be construed as research or investment advice regarding particular securities. Current and future holdings are subject to risk.
The Global Industry Classification Standard (GICS) was developed by and is the exclusive property and a service mark of Morgan Stanley Capital International Inc. (MSCI) and Standard & Poor’s, a division of The McGraw-Hill Companies, Inc. (S&P) and is licensed for use by Goldman Sachs. Neither MSCI, S&P nor any other party involved in making or compiling the GICS or any GICS classifications makes any express or implied warranties or representations with respect to such standard or classification (or the results to be obtained by the use thereof), and all such parties hereby expressly disclaim all warranties of originality, accuracy, completeness, merchantability or fitness for a particular purpose with respect to any of such standard or classification. Without limiting any of the foregoing, in no event shall MSCI, S&P, any of their affiliates or any third party involved in making or compiling the GICS or any GICS classifications have any liability for any direct, indirect, special, punitive, consequential or any other damages (including lost profits) even if notified of the possibility of such damages.
The portfolio risk management process includes an effort to monitor and manage risk, but does not imply low risk.
This material is not authorized for distribution to prospective investors unless preceded or accompanied by a current Prospectus or summary prospectus, if applicable. Investors should consider a Fund’s objective, risks, and charges and expenses, and read the summary prospectus, if available, and/or the Prospectus carefully before investing or sending money. The summary prospectus, if available, and the Prospectus contain this and other information about a Fund and may be obtained from your authorized dealer or from Goldman Sachs & Co. LLC by calling (retail – 1-800-526-7384) (institutional – 1-800-621-2550).
© 2021 Goldman Sachs. All rights reserved. 236970-OTU-1390647 EQGRWSAR-21
Goldman Sachs Funds

| | | | |
| | |
| Semi-Annual Report | | | | February 28, 2021 |
| | |
| | | | Fundamental Equity Value Funds |
| | | | Equity Income |
| | | | Focused Value |
| | | | Large Cap Value |
| | | | Mid Cap Value |
| | | | Small Cap Value |
| | | | Small/Mid Cap Value |

Goldman Sachs Fundamental Equity Value Funds
| | | | |
| | | |
| NOT FDIC-INSURED | | May Lose Value | | No Bank Guarantee |
FUND BASICS
Equity Income Fund
as of February 28, 2021
| | | | | | | | | | |
| | PERFORMANCE REVIEW | |
| | | |
| | | September 1, 2020–February 28, 2021 | | Fund Total Return
(based on NAV)1 | | | Russell 1000®
Value Index2 | |
| | Class A | | | 10.55 | % | | | 19.15 | % |
| | Class C | | | 10.12 | | | | 19.15 | |
| | Institutional | | | 10.72 | | | | 19.15 | |
| | Service | | | 10.47 | | | | 19.15 | |
| | Investor | | | 10.67 | | | | 19.15 | |
| | Class R6 | | | 10.73 | | | | 19.15 | |
| | Class R | | | 10.42 | | | | 19.15 | |
| | | Class P | | | 10.73 | | | | 19.15 | |
| 1 | | The net asset value (“NAV”) represents the net assets of the class of the Fund (ex-dividend) divided by the total number of shares of the class outstanding. The Fund’s performance reflects the reinvestment of dividends and other distributions. The Fund’s performance does not reflect the deduction of any applicable sales charges. |
| 2 | | The unmanaged Russell 1000 Value Index is a market capitalization weighted index of the 1,000 largest U.S. companies with lower price-to-book ratios and lower forecasted growth values. The Russell 1000 Value Index figures do not reflect any deduction of fees, expenses or taxes. It is not possible to invest directly in an unmanaged index. |
The returns set forth in the table above represent past performance. Past performance does not guarantee future results. The Fund’s investment return and principal value will fluctuate so that an investor’s shares, when redeemed, may be worth more or less than their original cost. Current performance may be lower or higher than the performance quoted above. Please visit our web site at www.GSAMFUNDS.com to obtain the most recent month-end returns. Performance reflects applicable fee waivers and/or expense limitations in effect during the periods shown. In their absence, performance would be reduced. Returns do not reflect the deduction of taxes that a shareholder would pay on Fund distributions or the redemption of Fund shares.
| | | | | | | | |
| | TOP 10 HOLDINGS AS OF 2/28/213 |
| | | |
| | | Holding | | % of Net Assets | | | Line of Business |
| | | |
| | JPMorgan Chase & Co. | | | 4.3 | % | | Banks |
| | Johnson & Johnson | | | 2.9 | | | Pharmaceuticals |
| | Verizon Communications, Inc. | | | 2.8 | | | Diversified Telecommunication Services |
| | Chevron Corp. | | | 2.7 | | | Oil, Gas & Consumable Fuels |
| | Medtronic PLC | | | 2.6 | | | Health Care Equipment & Supplies |
| | Comcast Corp., Class A | | | 2.5 | | | Media |
| | Eli Lilly and Co. | | | 2.4 | | | Pharmaceuticals |
| | Linde PLC | | | 2.2 | | | Chemicals |
| | Walmart, Inc. | | | 2.1 | | | Food & Staples Retailing |
| | | Bristol-Myers Squibb Co. | | | 2.1 | | | Pharmaceuticals |
| 3 | | The top 10 holdings may not be representative of the Fund’s future investments. |
1
FUND BASICS
|
| FUND VS. BENCHMARK SECTOR ALLOCATIONS4 |
|
| As of February 28, 2021 |
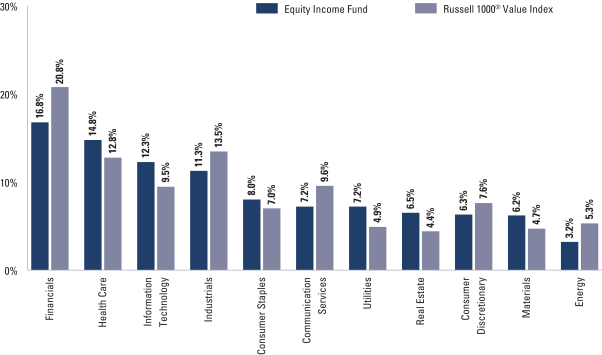
| 4 | | The Fund is actively managed and, as such, its composition may differ over time. Consequently, the Fund’s overall sector allocations may differ from the percentages contained in the graph above. Figures in the above graph may not sum to 100% due to the exclusion of other assets and liabilities. The graph categorizes investments using the Global Industry Classification Standard (“GICS”); however, the sector classifications used by the portfolio management team may differ from GICS. The percentage shown for each investment category reflects the value of investments in that category as a percentage of market value. The graph depicts the Fund’s investments but may not represent the Fund’s market exposure due to the exclusion of certain derivatives, if any, as listed in the Additional Investment Information section of the Schedule of Investments. |
For more information about the Fund, please refer to www.GSAMFUNDS.com. There, you can learn more about the Fund’s investment strategies, holdings, and performance.
2
FUND BASICS
Focused Value Fund
as of February 28, 2021
| | | | | | | | | | |
| | PERFORMANCE REVIEW | |
| | | |
| | | September 1, 2020–February 28, 2021 | | Fund Total Return
(based on NAV)1 | | | Russell 1000®
Value Index2 | |
| | Class A | | | 18.05 | % | | | 19.15 | % |
| | Class C | | | 17.59 | | | | 19.15 | |
| | Institutional | | | 18.27 | | | | 19.15 | |
| | Investor | | | 18.24 | | | | 19.15 | |
| | Class R6 | | | 18.31 | | | | 19.15 | |
| | Class R | | | 17.97 | | | | 19.15 | |
| | | Class P | | | 18.21 | | | | 19.15 | |
| 1 | | The net asset value (“NAV”) represents the net assets of the class of the Fund (ex-dividend) divided by the total number of shares of the class outstanding. The Fund’s performance reflects the reinvestment of dividends and other distributions. The Fund’s performance does not reflect the deduction of any applicable sales charges. |
| 2 | | The unmanaged Russell 1000 Value Index is a market capitalization weighted index of the 1,000 largest U.S. companies with lower price-to-book ratios and lower forecasted growth values. The Russell 1000 Value Index figures do not reflect any deduction of fees, expenses or taxes. It is not possible to invest directly in an unmanaged index. |
The returns set forth in the table above represent past performance. Past performance does not guarantee future results. The Fund’s investment return and principal value will fluctuate so that an investor’s shares, when redeemed, may be worth more or less than their original cost. Current performance may be lower or higher than the performance quoted above. Please visit our web site at www.GSAMFUNDS.com to obtain the most recent month-end returns. Performance reflects applicable fee waivers and/or expense limitations in effect during the periods shown. In their absence, performance would be reduced. Returns do not reflect the deduction of taxes that a shareholder would pay on Fund distributions or the redemption of Fund shares.
| | | | | | | | |
| | TOP TEN HOLDINGS AS OF 2/28/213 |
| | | |
| | | Holding | | % of Net Assets | | | Line of Business |
| | | |
| | JPMorgan Chase & Co. | | | 4.5 | % | | Banks |
| | Walt Disney Co. (The) | | | 4.3 | | | Entertainment |
| | Alphabet, Inc., Class A | | | 4.0 | | | Interactive Media & Services |
| | NXP Semiconductors NV | | | 3.7 | | | Semiconductors & Semiconductor Equipment |
| | Honeywell International, Inc. | | | 3.7 | | | Industrial Conglomerates |
| | Zimmer Biomet Holdings, Inc. | | | 3.4 | | | Health Care Equipment & Supplies |
| | Comcast Corp., Class A | | | 3.3 | | | Media |
| | American Express Co. | | | 3.3 | | | Consumer Finance |
| | Truist Financial Corp. | | | 3.1 | | | Banks |
| | | General Electric Co. | | | 3.1 | | | Industrial Conglomerates |
| 3 | | The top 10 holdings may not be representative of the Fund’s future investments. |
3
FUND BASICS
|
| FUND VS. BENCHMARK SECTOR ALLOCATIONS4 |
|
| As of February 28, 2021 |
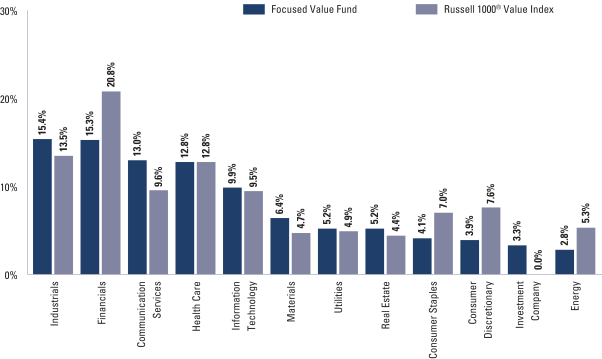
| 4 | | The Fund is actively managed and, as such, its composition may differ over time. Consequently, the Fund’s overall sector allocations may differ from the percentages contained in the graph above. Figures in the above graph may not sum to 100% due to the exclusion of other assets and liabilities. The graph categorizes investments using the Global Industry Classification Standard (“GICS”); however, the sector classifications used by the portfolio management team may differ from GICS. The percentage shown for each investment category reflects the value of investments in that category as a percentage of market value. The graph depicts the Fund’s investments but may not represent the Fund’s market exposure due to the exclusion of certain derivatives, if any, as listed in the Additional Investment Information section of the Schedule of Investments. |
For more information about the Fund, please refer to www.GSAMFUNDS.com. There, you can learn more about the Fund’s investment strategies, holdings, and performance.
4
FUND BASICS
Large Cap Value Fund
as of February 28, 2021
| | | | | | | | | | |
| | PERFORMANCE REVIEW | |
| | | |
| | | September 1, 2020–February 28, 2021 | | Fund Total Return
(based on NAV)1 | | | Russell 1000®
Value Index2 | |
| | Class A | | | 16.52 | % | | | 19.15 | % |
| | Class C | | | 16.01 | | | | 19.15 | |
| | Institutional | | | 16.74 | | | | 19.15 | |
| | Service | | | 16.36 | | | | 19.15 | |
| | Investor | | | 16.63 | | | | 19.15 | |
| | Class R6 | | | 16.69 | | | | 19.15 | |
| | Class R | | | 16.38 | | | | 19.15 | |
| | | Class P | | | 16.68 | | | | 19.15 | |
| 1 | | The net asset value (“NAV”) represents the net assets of the class of the Fund (ex-dividend) divided by the total number of shares of the class outstanding. The Fund’s performance reflects the reinvestment of dividends and other distributions. The Fund’s performance does not reflect the deduction of any applicable sales charges. |
| 2 | | The unmanaged Russell 1000 Value Index is a market capitalization weighted index of the 1,000 largest U.S. companies with lower price-to-book ratios and lower forecasted growth values. The Russell 1000 Value Index figures do not reflect any deduction of fees, expenses or taxes. It is not possible to invest directly in an unmanaged index. |
The returns set forth in the table above represent past performance. Past performance does not guarantee future results. The Fund’s investment return and principal value will fluctuate so that an investor’s shares, when redeemed, may be worth more or less than their original cost. Current performance may be lower or higher than the performance quoted above. Please visit our web site at www.GSAMFUNDS.com to obtain the most recent month-end returns. Performance reflects applicable fee waivers and/or expense limitations in effect during the periods shown. In their absence, performance would be reduced. Returns do not reflect the deduction of taxes that a shareholder would pay on Fund distributions or the redemption of Fund shares.
| | | | | | | | |
| | TOP TEN HOLDINGS AS OF 2/28/213 |
| | | |
| | | Holding | | % of Net Assets | | | Line of Business |
| | | |
| | JPMorgan Chase & Co. | | | 4.1 | % | | Banks |
| | Walt Disney Co. (The) | | | 2.8 | | | Entertainment |
| | Verizon Communications, Inc. | | | 2.2 | | | Diversified Telecommunication Services |
| | Chevron Corp. | | | 2.2 | | | Oil, Gas & Consumable Fuels |
| | NextEra Energy, Inc. | | | 2.1 | | | Electric Utilities |
| | Alphabet, Inc., Class A | | | 2.0 | | | Interactive Media & Services |
| | Honeywell International, Inc. | | | 2.0 | | | Industrial Conglomerates |
| | Truist Financial Corp. | | | 2.0 | | | Banks |
| | Comcast Corp., Class A | | | 2.0 | | | Media |
| | | American Express Co. | | | 1.9 | | | Consumer Finance |
| 3 | | The top 10 holdings may not be representative of the Fund’s future investments. |
5
FUND BASICS
|
| FUND VS. BENCHMARK SECTOR ALLOCATIONS4 |
|
| As of February 28, 2021 |
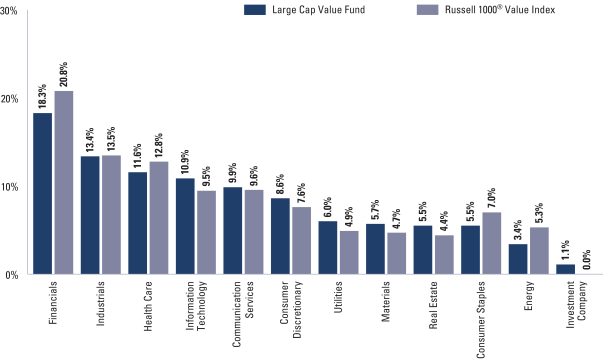
| 4 | | The Fund is actively managed and, as such, its composition may differ over time. Consequently, the Fund’s overall sector allocations may differ from the percentages contained in the graph above. Figures in the above graph may not sum to 100% due to the exclusion of other assets and liabilities. The graph categorizes investments using the Global Industry Classification Standard (“GICS”); however, the sector classifications used by the portfolio management team may differ from GICS. The percentage shown for each investment category reflects the value of investments in that category as a percentage of market value. The graph depicts the Fund’s investments but may not represent the Fund’s market exposure due to the exclusion of certain derivatives, if any, as listed in the Additional Investment Information section of the Schedule of Investments. |
For more information about the Fund, please refer to www.GSAMFUNDS.com. There, you can learn more about the Fund’s investment strategies, holdings, and performance.
6
FUND BASICS
Mid Cap Value Fund
as of February 28, 2021
| | | | | | | | | | |
| | PERFORMANCE REVIEW | |
| | | |
| | | September 1, 2020–February 28, 2021 | | Fund Total Return
(based on NAV)1 | | | Russell Midcap®
Value Index2 | |
| | | |
| | Class A | | | 26.09 | % | | | 26.53 | % |
| | Class C | | | 25.63 | | | | 26.53 | |
| | Institutional | | | 26.32 | | | | 26.53 | |
| | Service | | | 26.02 | | | | 26.53 | |
| | Investor | | | 26.26 | | | | 26.53 | |
| | Class R6 | | | 26.36 | | | | 26.53 | |
| | Class R | | | 25.97 | | | | 26.53 | |
| | | Class P | | | 26.33 | | | | 26.53 | |
| 1 | | The net asset value (“NAV”) represents the net assets of the class of the Fund (ex-dividend) divided by the total number of shares of the class outstanding. The Fund’s performance reflects the reinvestment of dividends and other distributions. The Fund’s performance does not reflect the deduction of any applicable sales charges. |
| 2 | | The Russell Midcap Value® Index is an unmanaged index of common stock prices that measures the performance of those Russell Midcap companies with lower price-to-book ratios and lower forecasted growth values. The Russell Midcap Value Index figures do not reflect any deduction for fees, expenses or taxes. It is not possible to invest directly in an unmanaged index. |
The returns set forth in the table above represent past performance. Past performance does not guarantee future results. The Fund’s investment return and principal value will fluctuate so that an investor’s shares, when redeemed, may be worth more or less than their original cost. Current performance may be lower or higher than the performance quoted above. Please visit our web site at www.GSAMFUNDS.com to obtain the most recent month-end returns. Performance reflects applicable fee waivers and/or expense limitations in effect during the periods shown. In their absence, performance would be reduced. Returns do not reflect the deduction of taxes that a shareholder would pay on Fund distributions or the redemption of Fund shares.
| | | | | | | | |
| | TOP TEN HOLDINGS AS OF 2/28/213 |
| | | |
| | | Holding | | % of Net Assets | | | Line of Business |
| | | |
| | Zimmer Biomet Holdings, Inc. | | | 2.0 | % | | Health Care Equipment & Supplies |
| | Corteva, Inc. | | | 1.8 | | | Chemicals |
| | AMETEK, Inc. | | | 1.8 | | | Electrical Equipment |
| | M&T Bank Corp. | | | 1.8 | | | Banks |
| | Marvell Technology Group Ltd. | | | 1.8 | | | Semiconductors & Semiconductor Equipment |
| | SVB Financial Group | | | 1.7 | | | Banks |
| | ITT, Inc. | | | 1.7 | | | Machinery |
| | Freeport-McMoRan, Inc. | | | 1.7 | | | Metals & Mining |
| | United Airlines Holdings, Inc. | | | 1.7 | | | Airlines |
| | | Pinnacle Financial Partners, Inc. | | | 1.6 | | | Banks |
| 3 | | The top 10 holdings may not be representative of the Fund’s future investments. |
7
FUND BASICS
|
| FUND VS. BENCHMARK SECTOR ALLOCATIONS4 |
|
| As of February 28, 2021 |

| 4 | | The Fund is actively managed and, as such, its composition may differ over time. Consequently, the Fund’s overall sector allocations may differ from the percentages contained in the graph above. Figures in the above graph may not sum to 100% due to the exclusion of other assets and liabilities. The graph categorizes investments using the Global Industry Classification Standard (“GICS”); however, the sector classifications used by the portfolio management team may differ from GICS. The percentage shown for each investment category reflects the value of investments in that category as a percentage of market value. The graph depicts the Fund’s investments but may not represent the Fund’s market exposure due to the exclusion of certain derivatives, if any, as listed in the Additional Investment Information section of the Schedule of Investments. |
For more information about the Fund, please refer to www.GSAMFUNDS.com. There, you can learn more about the Fund’s investment strategies, holdings, and performance.
8
FUND BASICS
Small Cap Value Fund
as of February 28, 2021
| | | | | | | | | | |
| | PERFORMANCE REVIEW | |
| | | |
| | | September 1, 2020–February 28, 2021 | | Fund Total Return (based on NAV)1 | | | Russell 2000® Value Index2 | |
| | Class A | | | 39.70 | % | | | 46.42 | % |
| | Class C | | | 39.20 | | | | 46.42 | |
| | Institutional | | | 39.95 | | | | 46.42 | |
| | Service | | | 39.60 | | | | 46.42 | |
| | Investor | | | 39.89 | | | | 46.42 | |
| | Class R6 | | | 39.96 | | | | 46.42 | |
| | Class R | | | 39.51 | | | | 46.42 | |
| | | Class P | | | 39.93 | | | | 46.42 | |
| 1 | | The net asset value (“NAV”) represents the net assets of the class of the Fund (ex-dividend) divided by the total number of shares of the class outstanding. The Fund’s performance reflects the reinvestment of dividends and other distributions. The Fund’s performance does not reflect the deduction of any applicable sales charges. |
| 2 | | The Russell 2000 Value Index is an unmanaged index of common stock prices that measures the performance of those Russell 2000 companies with lower price-to-book ratios and lower forecasted growth values. The Russell 2000 Value Index figures do not reflect any deduction for fees, expenses or taxes. It is not possible to invest directly in an unmanaged index. |
The returns set forth in the table above represent past performance. Past performance does not guarantee future results. The Fund’s investment return and principal value will fluctuate so that an investor’s shares, when redeemed, may be worth more or less than their original cost. Current performance may be lower or higher than the performance quoted above. Please visit our web site at www.GSAMFUNDS.com to obtain the most recent month-end returns. Performance reflects applicable fee waivers and/or expense limitations in effect during the periods shown. In their absence, performance would be reduced. Returns do not reflect the deduction of taxes that a shareholder would pay on Fund distributions or the redemption of Fund shares.
| | | | | | | | |
| | TOP TEN HOLDINGS AS OF 2/28/213 |
| | | |
| | | Holding | | % of Net Assets | | | Line of Business |
| | | |
| | Darling Ingredients, Inc. | | | 1.2 | % | | Food Products |
| | Avient Corp. | | | 1.1 | | | Chemicals |
| | Boyd Gaming Corp. | | | 1.1 | | | Hotels, Restaurants & Leisure |
| | ChampionX Corp. | | | 1.1 | | | Energy Equipment & Services |
| | MasTec, Inc. | | | 1.1 | | | Construction & Engineering |
| | KBR, Inc. | | | 1.0 | | | IT Services |
| | Performance Food Group Co. | | | 1.0 | | | Food & Staples Retailing |
| | Rexnord Corp. | | | 1.0 | | | Machinery |
| | Glacier Bancorp, Inc. | | | 0.9 | | | Banks |
| | | Chart Industries, Inc. | | | 0.9 | | | Machinery |
| 3 | | The top 10 holdings may not be representative of the Fund’s future investments. |
9
FUND BASICS
|
| FUND VS. BENCHMARK SECTOR ALLOCATIONS4 |
|
| As of February 28, 2021 |
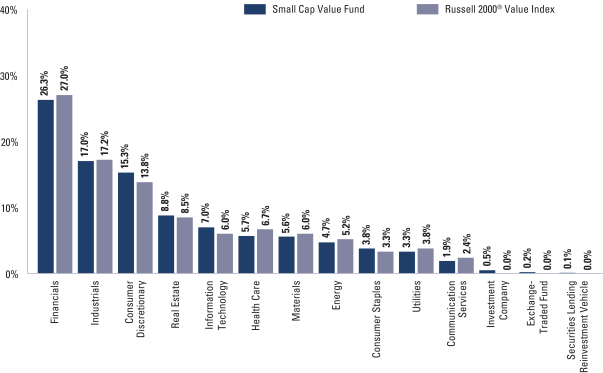
| 4 | | The Fund is actively managed and, as such, its composition may differ over time. Consequently, the Fund’s overall sector allocations may differ from the percentages contained in the graph above. Figures in the above graph may not sum to 100% due to the exclusion of other assets and liabilities. The graph categorizes investments using the Global Industry Classification Standard (“GICS”); however, the sector classifications used by the portfolio management team may differ from GICS. Underlying sector allocations of Exchange Traded Funds held by the Fund are not reflected in the graph above. The percentage shown for each investment category reflects the value of investments in that category as a percentage of market value. The graph depicts the Fund’s investments but may not represent the Fund’s market exposure due to the exclusion of certain derivatives, if any, as listed in the Additional Investment Information section of the Schedule of Investments. |
For more information about the Fund, please refer to www.GSAMFUNDS.com. There, you can learn more about the Fund’s investment strategies, holdings, and performance.
10
FUND BASICS
Small/Mid Cap Value Fund
as of February 28, 2021
| | | | | | | | | | |
| | PERFORMANCE REVIEW | |
| | | |
| | | September 1, 2020–February 28, 2021 | | Fund Total Return
(based on NAV)1 | | | Russell 2500®
Value Index2 | |
| | Class A | | | 34.39 | % | | | 37.53 | % |
| | Class C | | | 33.96 | | | | 37.53 | |
| | Institutional | | | 34.59 | | | | 37.53 | |
| | Investor | | | 34.50 | | | | 37.53 | |
| | Class R6 | | | 34.63 | | | | 37.53 | |
| | Class R | | | 34.21 | | | | 37.53 | |
| | | Class P | | | 34.54 | | | | 37.53 | |
| 1 | | The net asset value (“NAV”) represents the net assets of the class of the Fund (ex-dividend) divided by the total number of shares of the class outstanding. The Fund’s performance reflects the reinvestment of dividends and other distributions. The Fund’s performance does not reflect the deduction of any applicable sales charges. |
| 2 | | The Russell 2500 Value Index is composed of the smallest 2,500 of the 3,000 largest U.S. companies based on total market capitalization with lower price-to-book ratios and lower forecast growth values. It is calculated by Frank Russell Company, and reflects reinvestment of all dividends and capital gains. The Russell 2500 Value Index figures do not reflect any deduction for fees, expenses or taxes. It is not possible to invest directly in an unmanaged index. |
The returns set forth in the table above represent past performance. Past performance does not guarantee future results. The Fund’s investment return and principal value will fluctuate so that an investor’s shares, when redeemed, may be worth more or less than their original cost. Current performance may be lower or higher than the performance quoted above. Please visit our web site at www.GSAMFUNDS.com to obtain the most recent month-end returns. Performance reflects applicable fee waivers and/or expense limitations in effect during the periods shown. In their absence, performance would be reduced. Returns do not reflect the deduction of taxes that a shareholder would pay on Fund distributions or the redemption of Fund shares.
| | | | | | | | |
| | TOP TEN HOLDINGS AS OF 2/28/213 |
| | | |
| | | Holding | | % of Net Assets | | | Line of Business |
| | | |
| | L Brands, Inc. | | | 1.4 | % | | Specialty Retail |
| | Catalent, Inc. | | | 1.1 | | | Pharmaceuticals |
| | Crown Holdings, Inc. | | | 1.0 | | | Containers & Packaging |
| | XPO Logistics, Inc. | | | 1.0 | | | Air Freight & Logistics |
| | AECOM | | | 1.0 | | | Construction & Engineering |
| | Avient Corp. | | | 1.0 | | | Chemicals |
| | Signature Bank | | | 0.9 | | | Banks |
| | East West Bancorp, Inc. | | | 0.9 | | | Banks |
| | Timken Co. (The) | | | 0.9 | | | Machinery |
| | | Performance Food Group Co. | | | 0.9 | | | Food & Staples Retailing |
| 3 | | The top 10 holdings may not be representative of the Fund’s future investments. |
11
FUND BASICS
|
| FUND VS. BENCHMARK SECTOR ALLOCATIONS4 |
|
| As of February 28, 2021 |
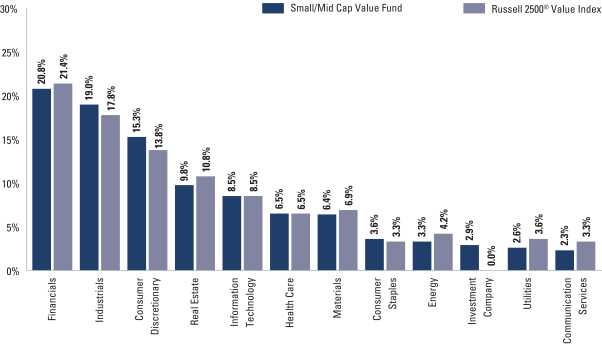
| 4 | | The Fund is actively managed and, as such, its composition may differ over time. Consequently, the Fund’s overall sector allocations may differ from the percentages contained in the graph above. Figures in the above graph may not sum to 100% due to the exclusion of other assets and liabilities. The graph categorizes investments using the Global Industry Classification Standard (“GICS”); however, the sector classifications used by the portfolio management team may differ from GICS. The percentage shown for each investment category reflects the value of investments in that category as a percentage of market value. The graph depicts the Fund’s investments but may not represent the Fund’s market exposure due to the exclusion of certain derivatives, if any, as listed in the Additional Investment Information section of the Schedule of Investments. |
For more information about the Fund, please refer to www.GSAMFUNDS.com. There, you can learn more about the Fund’s investment strategies, holdings, and performance.
12
GOLDMAN SACHS EQUITY INCOME FUND
Schedule of Investments
February 28, 2021 (Unaudited)
| | | | | | | | |
| Shares | | | Description | | Value | |
|
| Common Stocks – 99.9% | |
| Aerospace & Defense – 1.4% | |
| | 17,483 | | | Northrop Grumman Corp. | | $ | 5,099,092 | |
| | |
| Banks – 7.9% | |
| | 110,668 | | | JPMorgan Chase & Co. | | | 16,287,010 | |
| | 44,800 | | | M&T Bank Corp. | | | 6,762,112 | |
| | 115,039 | | | Truist Financial Corp. | | | 6,552,621 | |
| | | | | | | | |
| | | | | | | 29,601,743 | |
| | |
| Beverages – 1.6% | |
| | 121,664 | | | Coca-Cola Co. (The) | | | 5,960,319 | |
| | |
| Biotechnology – 0.9% | |
| | 15,694 | | | Amgen, Inc. | | | 3,529,895 | |
| | |
| Capital Markets – 4.7% | |
| | 6,897 | | | BlackRock, Inc. | | | 4,789,966 | |
| | 23,534 | | | CME Group, Inc. | | | 4,699,740 | |
| | 50,980 | | | Morgan Stanley | | | 3,918,833 | |
| | 39,420 | | | Singapore Exchange Ltd. ADR (Singapore) | | | 4,412,675 | |
| | | | | | | | |
| | | | | | | 17,821,214 | |
| | |
| Chemicals – 3.2% | |
| | 16,880 | | | Ecolab, Inc. | | | 3,533,997 | |
| | 34,138 | | | Linde PLC (United Kingdom) | | | 8,338,889 | |
| | | | | | | | |
| | | | | | | 11,872,886 | |
| | |
| Commercial Services & Supplies – 1.3% | |
| | 54,008 | | | Republic Services, Inc. | | | 4,811,573 | |
| | |
| Communications Equipment – 2.5% | |
| | 168,199 | | | Cisco Systems, Inc. | | | 7,547,089 | |
| | 72,985 | | | Juniper Networks, Inc. | | | 1,699,091 | |
| | | | | | | | |
| | | | | | | 9,246,180 | |
| | |
| Construction & Engineering – 0.6% | |
| | 91,943 | | | Vinci SA ADR (France) | | | 2,391,437 | |
| | |
| Consumer Finance – 1.9% | |
| | 53,705 | | | American Express Co. | | | 7,264,138 | |
| | |
| Containers & Packaging – 1.2% | |
| | 88,665 | | | International Paper Co. | | | 4,402,217 | |
| | |
| Diversified Telecommunication Services – 2.7% | |
| | 187,058 | | | Verizon Communications, Inc. | | | 10,344,307 | |
| | |
| Electric Utilities – 1.7% | |
| | 45,730 | | | NextEra Energy, Inc. | | | 3,360,241 | |
| | 50,148 | | | Xcel Energy, Inc. | | | 2,938,171 | |
| | | | | | | | |
| | | | | | | 6,298,412 | |
| | |
| Electrical Equipment – 1.9% | |
| | 54,996 | | | Eaton Corp. PLC | | | 7,159,929 | |
| | |
| Electronic Equipment, Instruments & Components – 1.0% | |
| | 30,425 | | | TE Connectivity Ltd. | | | 3,956,163 | |
| | |
| Entertainment – 2.0% | |
| | 40,238 | | | Walt Disney Co. (The)* | | | 7,606,592 | |
| | |
|
| Common Stocks – (continued) | |
| Equity Real Estate Investment Trusts (REITs) – 6.5% | |
| | 23,107 | | | Alexandria Real Estate Equities, Inc. REIT | | | 3,689,957 | |
| | 10,359 | | | American Tower Corp. REIT | | | 2,238,891 | |
| | 26,718 | | | AvalonBay Communities, Inc. REIT | | | 4,695,688 | |
| | 70,879 | | | Duke Realty Corp. REIT | | | 2,782,001 | |
| | 105,431 | | | Hudson Pacific Properties, Inc. REIT | | | 2,697,979 | |
| | 42,205 | | | Prologis, Inc. REIT | | | 4,181,249 | |
| | 80,232 | | | Ventas, Inc. REIT | | | 4,244,273 | |
| | | | | | | | |
| | | | | | | 24,530,038 | |
| | |
| Food & Staples Retailing – 2.1% | |
| | 61,683 | | | Walmart, Inc. | | | 8,013,855 | |
| | |
| Food Products – 1.3% | |
| | 35,905 | | | Archer-Daniels-Midland Co. | | | 2,031,505 | |
| | 56,580 | | | Mondelez International, Inc., Class A | | | 3,007,793 | |
| | | | | | | | |
| | | | | | | 5,039,298 | |
| | |
| Health Care Equipment & Supplies – 3.9% | |
| | 84,619 | | | Medtronic PLC | | | 9,897,885 | |
| | 30,304 | | | Zimmer Biomet Holdings, Inc. | | | 4,941,370 | |
| | | | | | | | |
| | | | | | | 14,839,255 | |
| | |
| Health Care Providers & Services – 2.5% | |
| | 82,400 | | | CVS Health Corp. | | | 5,613,912 | |
| | 9,808 | | | Humana, Inc. | | | 3,723,607 | |
| | | | | | | | |
| | | | | | | 9,337,519 | |
| | |
| Hotels, Restaurants & Leisure – 4.2% | |
| | 178,419 | | | Aramark | | | 6,622,913 | |
| | 32,224 | | | McDonald’s Corp. | | | 6,642,655 | |
| | 23,759 | | | Starbucks Corp. | | | 2,566,685 | |
| | | | | | | | |
| | | | | | | 15,832,253 | |
| | |
| Household Products – 3.0% | |
| | 33,903 | | | Kimberly-Clark Corp. | | | 4,350,772 | |
| | 54,857 | | | Procter & Gamble Co. (The) | | | 6,776,485 | |
| | | | | | | | |
| | | | | | | 11,127,257 | |
| | |
| Industrial Conglomerates – 1.7% | |
| | 30,783 | | | Honeywell International, Inc. | | | 6,228,940 | |
| | |
| Insurance – 2.3% | |
| | 23,729 | | | Chubb Ltd. | | | 3,857,861 | |
| | 32,582 | | | Travelers Cos., Inc. (The) | | | 4,740,681 | |
| | | | | | | | |
| | | | | | | 8,598,542 | |
| | |
| IT Services – 4.4% | |
| | 20,565 | | | Accenture PLC, Class A | | | 5,159,759 | |
| | 49,278 | | | Cognizant Technology Solutions Corp., Class A | | | 3,620,947 | |
| | 33,262 | | | Fidelity National Information Services, Inc. | | | 4,590,156 | |
| | 26,071 | | | International Business Machines Corp. | | | 3,100,624 | |
| | | | | | | | |
| | | | | | | 16,471,486 | |
| | |
| | |
| The accompanying notes are an integral part of these financial statements. | | 13 |
GOLDMAN SACHS EQUITY INCOME FUND
Schedule of Investments (continued)
February 28, 2021 (Unaudited)
| | | | | | | | |
| Shares | | | Description | | Value | |
|
| Common Stocks – (continued) | |
| Machinery – 3.5% | |
| | 21,185 | | | Deere & Co. | | $ | 7,396,107 | |
| | 28,302 | | | Illinois Tool Works, Inc. | | | 5,722,099 | |
| | | | | | | | |
| | | | | | | 13,118,206 | |
| | |
| Media – 2.5% | |
| | 176,390 | | | Comcast Corp., Class A | | | 9,299,281 | |
| | |
| Metals & Mining – 1.9% | |
| | 81,864 | | | Rio Tinto PLC ADR (Australia) | | | 7,154,914 | |
| | |
| Multi-Utilities – 3.8% | |
| | 59,373 | | | Ameren Corp. | | | 4,172,141 | |
| | 35,975 | | | CMS Energy Corp. | | | 1,946,607 | |
| | 56,580 | | | National Grid PLC ADR (United Kingdom) | | | 3,162,256 | |
| | 42,664 | | | Sempra Energy | | | 4,948,171 | |
| | | | | | | | |
| | | | | | | 14,229,175 | |
| | |
| Oil, Gas & Consumable Fuels – 3.2% | |
| | 101,976 | | | Chevron Corp. | | | 10,197,600 | |
| | 49,063 | | | Royal Dutch Shell PLC, Class B ADR (Netherlands) | | | 1,907,569 | |
| | | | | | | | |
| | | | | | | 12,105,169 | |
| | |
| Pharmaceuticals – 7.4% | |
| | 129,083 | | | Bristol-Myers Squibb Co. | | | 7,916,660 | |
| | 44,357 | | | Eli Lilly and Co. | | | 9,088,306 | |
| | 68,424 | | | Johnson & Johnson | | | 10,842,467 | |
| | | | | | | | |
| | | | | | | 27,847,433 | |
| | |
| Road & Rail – 1.0% | |
| | 18,794 | | | Union Pacific Corp. | | | 3,870,812 | |
| | |
| Semiconductors & Semiconductor Equipment – 3.8% | |
| | 12,089 | | | KLA Corp. | | | 3,762,460 | |
| | 73,940 | | | Marvell Technology Group Ltd. | | | 3,569,823 | |
| | 23,706 | | | QUALCOMM, Inc. | | | 3,228,520 | |
| | 22,689 | | | Texas Instruments, Inc. | | | 3,908,634 | |
| | | | | | | | |
| | | | | | | 14,469,437 | |
| | |
| Software – 0.5% | |
| | 8,706 | | | Microsoft Corp. | | | 2,023,100 | |
| | |
| Specialty Retail – 2.1% | |
| | 30,270 | | | Home Depot, Inc. (The) | | | 7,819,952 | |
| | |
| Water Utilities – 1.8% | |
| | 47,247 | | | American Water Works Co., Inc. | | | 6,703,404 | |
| | |
| | TOTAL INVESTMENTS – 99.9% | |
| | (Cost $299,192,101) | | $ | 376,025,423 | |
| | |
| OTHER ASSETS IN EXCESS OF
LIABILITIES – 0.1% | | | 517,471 | |
| | |
| | NET ASSETS – 100.0% | | $ | 376,542,894 | |
| | |
| | |
|
| The percentage shown for each investment category reflects the value of investments in that category as a percentage of net assets. |
| |
* | | Non-income producing security. |
| | | | |
|
Investment Abbreviations: |
ADR | | —American Depositary Receipt |
PLC | | —Public Limited Company |
REIT | | —Real Estate Investment Trust |
|
| | |
| 14 | | The accompanying notes are an integral part of these financial statements. |
GOLDMAN SACHS FOCUSED VALUE FUND
Schedule of Investments
February 28, 2021 (Unaudited)
| | | | | | | | |
| Shares | | | Description | | Value | |
|
| Common Stocks – 93.8% | |
| Aerospace & Defense – 1.9% | |
| | 2,773 | | | L3Harris Technologies, Inc. | | $ | 504,436 | |
| | |
| Automobiles – 2.3% | |
| | 11,656 | | | General Motors Co. | | | 598,303 | |
| | |
| Banks – 9.3% | |
| | 8,110 | | | JPMorgan Chase & Co. | | | 1,193,549 | |
| | 2,972 | | | M&T Bank Corp. | | | 448,594 | |
| | 14,490 | | | Truist Financial Corp. | | | 825,350 | |
| | | | | | | | |
| | | | | | | 2,467,493 | |
| | |
| Beverages – 2.3% | |
| | 12,161 | | | Coca-Cola Co. (The) | | | 595,767 | |
| | |
| Capital Markets – 2.7% | |
| | 1,013 | | | BlackRock, Inc. | | | 703,529 | |
| | |
| Chemicals – 4.5% | |
| | 3,210 | | | Ecolab, Inc. | | | 672,046 | |
| | 2,126 | | | Linde PLC (United Kingdom) | | | 519,318 | |
| | | | | | | | |
| | | | | | | 1,191,364 | |
| | |
| Commercial Services & Supplies – 1.7% | |
| | 4,509 | | | Waste Connections, Inc. | | | 440,484 | |
| | |
| Construction Materials – 1.9% | |
| | 1,475 | | | Martin Marietta Materials, Inc. | | | 496,883 | |
| | |
| Consumer Finance – 3.3% | |
| | 6,377 | | | American Express Co. | | | 862,553 | |
| | |
| Electric Utilities – 2.6% | |
| | 9,216 | | | NextEra Energy, Inc. | | | 677,192 | |
| | |
| Entertainment – 5.6% | |
| | 2,651 | | | Electronic Arts, Inc. | | | 355,154 | |
| | 5,940 | | | Walt Disney Co. (The)* | | | 1,122,898 | |
| | | | | | | | |
| | | | | | | 1,478,052 | |
| | |
| Equity Real Estate Investment Trusts (REITs) – 5.1% | |
| | 4,001 | | | Alexandria Real Estate Equities, Inc. REIT | | | 638,919 | |
| | 4,101 | | | AvalonBay Communities, Inc. REIT | | | 720,751 | |
| | | | | | | | |
| | | | | | | 1,359,670 | |
| | |
| Food Products – 1.9% | |
| | 9,366 | | | Mondelez International, Inc., Class A | | | 497,896 | |
| | |
| Health Care Equipment & Supplies – 5.6% | |
| | 15,271 | | | Boston Scientific Corp.* | | | 592,210 | |
| | 5,506 | | | Zimmer Biomet Holdings, Inc. | | | 897,808 | |
| | | | | | | | |
| | | | | | | 1,490,018 | |
| | |
| Health Care Providers & Services – 2.0% | |
| | 1,426 | | | Humana, Inc. | | | 541,381 | |
| | |
| Hotels, Restaurants & Leisure – 1.6% | |
| | 6,750 | | | Las Vegas Sands Corp. | | | 422,550 | |
| | |
| Industrial Conglomerates – 6.8% | |
| | 64,987 | | | General Electric Co. | | | 814,937 | |
| | 4,785 | | | Honeywell International, Inc. | | | 968,245 | |
| | | | | | | | |
| | | | | | | 1,783,182 | |
| | |
|
| Common Stocks – (continued) | |
| Interactive Media & Services – 4.0% | |
| | 525 | | | Alphabet, Inc., Class A* | | | 1,061,503 | |
| | |
| IT Services – 3.8% | |
| | 7,448 | | | Cognizant Technology Solutions Corp., Class A | | | 547,279 | |
| | 3,398 | | | Fidelity National Information Services, Inc. | | | 468,924 | |
| | | | | | | | |
| | | | | | | 1,016,203 | |
| | |
| Machinery – 2.0% | |
| | 2,599 | | | Illinois Tool Works, Inc. | | | 525,466 | |
| | |
| Media – 3.3% | |
| | 16,660 | | | Comcast Corp., Class A | | | 878,315 | |
| | |
| Multi-Utilities – 2.6% | |
| | 9,866 | | | Ameren Corp. | | | 693,284 | |
| | |
| Oil, Gas & Consumable Fuels – 2.8% | |
| | 7,379 | | | Chevron Corp. | | | 737,900 | |
| | |
| Pharmaceuticals – 5.1% | |
| | 10,890 | | | Bristol-Myers Squibb Co. | | | 667,884 | |
| | 3,267 | | | Eli Lilly and Co. | | | 669,375 | |
| | | | | | | | |
| | | | | | | 1,337,259 | |
| | |
| Road & Rail – 3.1% | |
| | 3,939 | | | Union Pacific Corp. | | | 811,276 | |
| | |
| Semiconductors & Semiconductor Equipment – 3.7% | |
| | 5,391 | | | NXP Semiconductors NV (Netherlands) | | | 984,127 | |
| | |
| Software – 2.3% | |
| | 2,630 | | | Microsoft Corp. | | | 611,159 | |
| | |
| | TOTAL COMMON STOCKS | |
| | (Cost $22,325,996) | | $ | 24,767,245 | |
| | |
| | | | | | | | |
| Shares | | Dividend
Rate | | | Value | |
|
| Investment Company – 3.3%(a) | |
Goldman Sachs Financial Square Government Fund – Institutional Shares | |
| 874,527 | | | 0.036 | % | | $ | 874,527 | |
| (Cost $874,527) | |
| |
| TOTAL INVESTMENTS – 97.1% | |
| (Cost $23,200,523) | | | $ | 25,641,772 | |
| |
OTHER ASSETS IN EXCESS OF
LIABILITIES – 2.9% | | | | 752,812 | |
| |
| NET ASSETS – 100.0% | | | $ | 26,394,584 | |
| |
| | |
|
| The percentage shown for each investment category reflects the value of investments in that category as a percentage of net assets. |
| |
* | | Non-income producing security. |
| |
(a) | | Represents an affiliated issuer. |
| | | | |
|
Investment Abbreviations: |
PLC | | —Public Limited Company |
REIT | | —Real Estate Investment Trust |
|
| | |
| The accompanying notes are an integral part of these financial statements. | | 15 |
GOLDMAN SACHS LARGE CAP VALUE FUND
Schedule of Investments
February 28, 2021 (Unaudited)
| | | | | | | | |
| Shares | | |
Description | | Value | |
|
| Common Stocks – 98.7% | |
| Aerospace & Defense – 1.4% | |
| | 34,200 | | | L3Harris Technologies, Inc. | | $ | 6,221,322 | |
| | |
| Airlines – 1.2% | |
| | 100,584 | | | United Airlines Holdings, Inc.* | | | 5,298,765 | |
| | |
| Automobiles – 1.1% | |
| | 98,861 | | | General Motors Co. | | | 5,074,535 | |
| | |
| Banks – 9.2% | |
| | 124,167 | | | JPMorgan Chase & Co. | | | 18,273,657 | |
| | 47,400 | | | M&T Bank Corp. | | | 7,154,556 | |
| | 156,526 | | | Truist Financial Corp. | | | 8,915,721 | |
| | 191,093 | | | Wells Fargo & Co. | | | 6,911,834 | |
| | | | | | | | |
| | | | | | | 41,255,768 | |
| | |
| Beverages – 2.5% | |
| | 127,314 | | | Coca-Cola Co. (The) | | | 6,237,113 | |
| | 22,780 | | | Constellation Brands, Inc., Class A | | | 4,878,109 | |
| | | | | | | | |
| | | | | | | 11,115,222 | |
| | |
| Biotechnology – 0.8% | |
| | 2,761 | | | Biogen, Inc.* | | | 753,422 | |
| | 10,065 | | | BioMarin Pharmaceutical, Inc.* | | | 779,333 | |
| | 23,190 | | | Genmab A/S ADR (Denmark)* | | | 785,445 | |
| | 9,572 | | | Neurocrine Biosciences, Inc.* | | | 1,048,230 | |
| | | | | | | | |
| | | | | | | 3,366,430 | |
| | |
| Capital Markets – 3.5% | |
| | 10,658 | | | BlackRock, Inc. | | | 7,401,981 | |
| | 110,230 | | | Morgan Stanley | | | 8,473,380 | |
| | | | | | | | |
| | | | | | | 15,875,361 | |
| | |
| Chemicals – 2.7% | |
| | 25,049 | | | Ecolab, Inc. | | | 5,244,259 | |
| | 27,919 | | | Linde PLC (United Kingdom) | | | 6,819,774 | |
| | | | | | | | |
| | | | | | | 12,064,033 | |
| | |
| Commercial Services & Supplies – 0.7% | |
| | 30,426 | | | Waste Connections, Inc. | | | 2,972,316 | |
| | |
| Communications Equipment – 1.9% | |
| | 143,631 | | | Cisco Systems Inc/Delaware | | | 6,444,723 | |
| | 91,278 | | | Juniper Networks, Inc. | | | 2,124,952 | |
| | | | | | | | |
| | | | | | | 8,569,675 | |
| | |
| Construction Materials – 1.1% | |
| | 14,276 | | | Martin Marietta Materials, Inc. | | | 4,809,156 | |
| | |
| Consumer Finance – 1.9% | |
| | 64,437 | | | American Express Co. | | | 8,715,749 | |
| | |
| Containers & Packaging – 1.0% | |
| | 33,781 | | | Packaging Corp. of America | | | 4,459,768 | |
| | |
| Diversified Financial Services – 1.0% | |
| | 19,031 | | | Berkshire Hathaway, Inc., Class B* | | | 4,577,146 | |
| | |
| Diversified Telecommunication Services – 2.2% | |
| | 177,560 | | | Verizon Communications, Inc. | | | 9,819,068 | |
| | |
|
| Common Stocks – (continued) | |
| Electric Utilities – 3.1% | |
| | 126,693 | | | NextEra Energy, Inc. | | | 9,309,402 | |
| | 74,816 | | | Xcel Energy, Inc. | | | 4,383,469 | |
| | | | | | | | |
| | | | | | | 13,692,871 | |
| | |
| Electrical Equipment – 1.0% | |
| | 33,663 | | | Eaton Corp. PLC | | | 4,382,586 | |
| | |
| Entertainment – 3.7% | |
| | 29,002 | | | Electronic Arts, Inc. | | | 3,885,398 | |
| | 66,463 | | | Walt Disney Co. (The)* | | | 12,564,165 | |
| | | | | | | | |
| | | | | | | 16,449,563 | |
| | |
| Equity Real Estate Investment Trusts (REITs) – 5.5% | |
| | 23,012 | | | Alexandria Real Estate Equities, Inc. REIT | | | 3,674,786 | |
| | 25,277 | | | AvalonBay Communities, Inc. REIT | | | 4,442,433 | |
| | 49,813 | | | Equity Residential REIT | | | 3,258,268 | |
| | 39,788 | | | Extra Space Storage, Inc. REIT | | | 5,001,351 | |
| | 39,009 | | | Prologis, Inc. REIT | | | 3,864,622 | |
| | 64,481 | | | Welltower, Inc. REIT | | | 4,378,260 | |
| | | | | | | | |
| | | | | | | 24,619,720 | |
| | |
| Food & Staples Retailing – 1.6% | |
| | 53,753 | | | Walmart, Inc. | | | 6,983,590 | |
| | |
| Food Products – 0.9% | |
| | 77,157 | | | Mondelez International, Inc., Class A | | | 4,101,666 | |
| | |
| Gas Utilities – 0.5% | |
| | 26,447 | | | Atmos Energy Corp. | | | 2,237,681 | |
| | |
| Health Care Equipment & Supplies – 4.5% | |
| | 163,157 | | | Boston Scientific Corp.* | | | 6,327,229 | |
| | 62,462 | | | Medtronic PLC | | | 7,306,180 | |
| | 41,504 | | | Zimmer Biomet Holdings, Inc. | | | 6,767,642 | |
| | | | | | | | |
| | | | | | | 20,401,051 | |
| | |
| Health Care Providers & Services – 1.1% | |
| | 12,459 | | | Humana, Inc. | | | 4,730,059 | |
| | |
| Hotels, Restaurants & Leisure – 3.7% | |
| | 49,149 | | | Hilton Worldwide Holdings, Inc.* | | | 6,078,748 | |
| | 48,058 | | | Las Vegas Sands Corp. | | | 3,008,431 | |
| | 35,730 | | | McDonald’s Corp. | | | 7,365,382 | |
| | | | | | | | |
| | | | | | | 16,452,561 | |
| | |
| Household Products – 0.5% | |
| | 19,519 | | | Procter & Gamble Co. (The) | | | 2,411,182 | |
| | |
| Industrial Conglomerates – 3.7% | |
| | 618,416 | | | General Electric Co. | | | 7,754,937 | |
| | 44,295 | | | Honeywell International, Inc. | | | 8,963,093 | |
| | | | | | | | |
| | | | | | | 16,718,030 | |
| | |
| Insurance – 2.6% | |
| | 21,113 | | | Allstate Corp. (The) | | | 2,250,646 | |
| | 35,778 | | | American Financial Group, Inc. | | | 3,817,512 | |
| | 34,484 | | | Chubb Ltd. | | | 5,606,409 | |
| | | | | | | | |
| | | | | | | 11,674,567 | |
| | |
| | |
| 16 | | The accompanying notes are an integral part of these financial statements. |
GOLDMAN SACHS LARGE CAP VALUE FUND
| | | | | | | | |
| Shares | | |
Description | | Value | |
|
| Common Stocks – (continued) | |
| Interactive Media & Services – 2.0% | |
| | 4,533 | | | Alphabet, Inc., Class A* | | $ | 9,165,318 | |
| | |
| IT Services – 4.5% | |
| | 69,048 | | | Cognizant Technology Solutions Corp., Class A | | | 5,073,647 | |
| | 53,296 | | | Fidelity National Information Services, Inc. | | | 7,354,848 | |
| | 36,497 | | | International Business Machines Corp. | | | 4,340,588 | |
| | 16,324 | | | Visa, Inc., Class A | | | 3,467,055 | |
| | | | | | | | |
| | | | | | | 20,236,138 | |
| | |
| Leisure Products – 0.9% | |
| | 47,297 | | | Brunswick Corp. | | | 4,179,636 | |
| | |
| Life Sciences Tools & Services – 1.0% | |
| | 9,495 | | | Thermo Fisher Scientific, Inc. | | | 4,273,510 | |
| | |
| Machinery – 2.5% | |
| | 20,030 | | | Deere & Co. | | | 6,992,874 | |
| | 21,389 | | | Illinois Tool Works, Inc. | | | 4,324,428 | |
| | | | | | | | |
| | | | | | | 11,317,302 | |
| | |
| Media – 2.0% | |
| | 168,278 | | | Comcast Corp., Class A | | | 8,871,616 | |
| | |
| Metals & Mining – 0.9% | |
| | 123,366 | | | Freeport-McMoRan, Inc.* | | | 4,183,341 | |
| | |
| Multi-Utilities – 1.5% | |
| | 51,802 | | | Ameren Corp. | | | 3,640,127 | |
| | 60,384 | | | CMS Energy Corp. | | | 3,267,378 | |
| | | | | | | | |
| | | | | | | 6,907,505 | |
| | |
| Oil, Gas & Consumable Fuels – 3.4% | |
| | 96,584 | | | Chevron Corp. | | | 9,658,400 | |
| | 106,660 | | | ConocoPhillips | | | 5,547,387 | |
| | | | | | | | |
| | | | | | | 15,205,787 | |
| | |
| Pharmaceuticals – 4.3% | |
| | 122,913 | | | Bristol-Myers Squibb Co. | | | 7,538,254 | |
| | 17,758 | | | Eli Lilly and Co. | | | 3,638,437 | |
| | 52,175 | | | Johnson & Johnson | | | 8,267,650 | |
| | | | | | | | |
| | | | | | | 19,444,341 | |
| | |
| Road & Rail – 2.9% | |
| | 21,921 | | | Norfolk Southern Corp. | | | 5,525,407 | |
| | 36,257 | | | Union Pacific Corp. | | | 7,467,492 | |
| | | | | | | | |
| | | | | | | 12,992,899 | |
| | |
| Semiconductors & Semiconductor Equipment – 3.5% | |
| | 19,280 | | | Cree, Inc.* | | | 2,187,509 | |
| | 6,918 | | | KLA Corp. | | | 2,153,089 | |
| | 63,490 | | | Marvell Technology Group Ltd. | | | 3,065,297 | |
| | 18,880 | | | NXP Semiconductors NV (Netherlands) | | | 3,446,544 | |
| | 28,587 | | | Texas Instruments, Inc. | | | 4,924,683 | |
| | | | | | | | |
| | | | | | | 15,777,122 | |
| | |
|
| Common Stocks – (continued) | |
| Software – 0.9% | |
| | 9,935 | | | Microsoft Corp. | | | 2,308,695 | |
| | 13,421 | | | Splunk, Inc.* | | | 1,919,337 | |
| | | | | | | | |
| | | | | | | 4,228,032 | |
| | |
| Specialty Retail – 2.9% | |
| | 90,402 | | | L Brands, Inc.* | | | 4,941,373 | |
| | 12,379 | | | O’Reilly Automotive, Inc.* | | | 5,537,498 | |
| | 20,830 | | | Ross Stores, Inc. | | | 2,429,611 | |
| | | | | | | | |
| | | | | | | 12,908,482 | |
| | |
| Water Utilities – 0.9% | |
| | 28,398 | | | American Water Works Co., Inc. | | | 4,029,108 | |
| | |
| | TOTAL COMMON STOCKS | |
| | (Cost $345,874,444) | | $ | 442,769,578 | |
| | |
| | | | | | | | |
| Shares | | Dividend
Rate | | | Value | |
|
| Investment Company – 1.1%(a) | |
Goldman Sachs Financial Square Government Fund – Institutional Shares | |
| 4,759,736 | | | 0.036 | % | | $ | 4,759,736 | |
| (Cost $4,759,736) | |
| |
| TOTAL INVESTMENTS – 99.8% | |
| (Cost $350,634,180) | | | $ | 447,529,314 | |
| |
OTHER ASSETS IN EXCESS OF
LIABILITIES – 0.2% | | | | 883,723 | |
| |
| NET ASSETS – 100.0% | | | $ | 448,413,037 | |
| |
| | |
|
| The percentage shown for each investment category reflects the value of investments in that category as a percentage of net assets. |
| |
* | | Non-income producing security. |
| |
(a) | | Represents an affiliated issuer. |
| | | | |
|
Investment Abbreviations: |
ADR | | —American Depositary Receipt |
PLC | | —Public Limited Company |
REIT | | —Real Estate Investment Trust |
|
| | |
| The accompanying notes are an integral part of these financial statements. | | 17 |
GOLDMAN SACHS MID CAP VALUE FUND
Schedule of Investments
February 28, 2021 (Unaudited)
| | | | | | | | |
| Shares | | | Description | | Value | |
|
| Common Stocks – 99.1% | |
| Aerospace & Defense – 1.1% | |
| | 30,609 | | | L3Harris Technologies, Inc. | | $ | 5,568,083 | |
| | 12,382 | | | TransDigm Group, Inc.* | | | 7,140,328 | |
| | | | | | | | |
| | | | | | | 12,708,411 | |
| | |
| Airlines – 2.3% | |
| | 395,367 | | | JetBlue Airways Corp.* | | | 7,286,614 | |
| | 359,160 | | | United Airlines Holdings, Inc.* | | | 18,920,549 | |
| | | | | | | | |
| | | | | | | 26,207,163 | |
| | |
| Auto Components – 1.4% | |
| | 109,687 | | | Aptiv PLC* | | | 16,435,500 | |
| | |
| Banks – 7.7% | |
| | 245,389 | | | East West Bancorp, Inc. | | | 17,707,270 | |
| | 132,343 | | | M&T Bank Corp. | | | 19,975,852 | |
| | 223,986 | | | Pinnacle Financial Partners, Inc. | | | 18,180,944 | |
| | 53,494 | | | Signature Bank | | | 11,679,880 | |
| | 39,044 | | | SVB Financial Group* | | | 19,731,276 | |
| | | | | | | | |
| | | | | | | 87,275,222 | |
| | |
| Beverages – 2.1% | |
| | 247,686 | | | Coca-Cola European Partners PLC (United Kingdom) | | | 12,619,602 | |
| | 49,655 | | | Constellation Brands, Inc., Class A | | | 10,633,121 | |
| | | | | | | | |
| | | | | | | 23,252,723 | |
| | |
| Biotechnology – 0.7% | |
| | 52,953 | | | Ionis Pharmaceuticals, Inc.* | | | 2,774,737 | |
| | 42,763 | | | Neurocrine Biosciences, Inc.* | | | 4,682,976 | |
| | | | | | | | |
| | | | | | | 7,457,713 | |
| | |
| Building Products – 0.8% | |
| | 56,280 | | | Trane Technologies PLC | | | 8,624,347 | |
| | |
| Capital Markets – 2.1% | |
| | 193,574 | | | Bank of New York Mellon Corp. (The) | | | 8,161,080 | |
| | 54,437 | | | Evercore, Inc., Class A | | | 6,519,919 | |
| | 81,748 | | | Raymond James Financial, Inc. | | | 9,543,262 | |
| | | | | | | | |
| | | | | | | 24,224,261 | |
| | |
| Chemicals – 2.6% | |
| | 109,724 | | | Ashland Global Holdings, Inc. | | | 9,229,983 | |
| | 449,227 | | | Corteva, Inc. | | | 20,282,599 | |
| | | | | | | | |
| | | | | | | 29,512,582 | |
| | |
| Communications Equipment – 2.2% | |
| | 272,124 | | | Juniper Networks, Inc. | | | 6,335,047 | |
| | 48,235 | | | Motorola Solutions, Inc. | | | 8,464,278 | |
| | 638,384 | | | Viavi Solutions, Inc.* | | | 10,332,245 | |
| | | | | | | | |
| | | | | | | 25,131,570 | |
| | |
| Construction Materials – 1.0% | |
| | 34,085 | | | Martin Marietta Materials, Inc. | | | 11,482,214 | |
| | |
|
| Common Stocks – (continued) | |
| Consumer Finance – 1.7% | |
| | 199,069 | | | Ally Financial, Inc. | | | 8,261,364 | |
| | 114,621 | | | Discover Financial Services | | | 10,782,397 | |
| | | | | | | | |
| | | | | | | 19,043,761 | |
| | |
| Containers & Packaging – 2.3% | |
| | 156,859 | | | Ball Corp. | | | 13,394,190 | |
| | 95,931 | | | Packaging Corp. of America | | | 12,664,811 | |
| | | | | | | | |
| | | | | | | 26,059,001 | |
| | |
| Diversified Financial Services – 0.5% | |
| | 92,639 | | | Voya Financial, Inc. | | | 5,584,279 | |
| | |
| Electric Utilities – 1.4% | |
| | 184,613 | | | Alliant Energy Corp. | | | 8,521,736 | |
| | 131,517 | | | Xcel Energy, Inc. | | | 7,705,581 | |
| | | | | | | | |
| | | | | | | 16,227,317 | |
| | |
| Electrical Equipment – 3.0% | |
| | 170,041 | | | AMETEK, Inc. | | | 20,059,737 | |
| | 59,617 | | | Rockwell Automation, Inc. | | | 14,503,624 | |
| | | | | | | | |
| | | | | | | 34,563,361 | |
| | |
| Electronic Equipment, Instruments & Components – 1.2% | |
| | 144,926 | | | National Instruments Corp. | | | 6,434,714 | |
| | 216,009 | | | Vontier Corp.* | | | 6,782,683 | |
| | | | | | | | |
| | | | | | | 13,217,397 | |
| | |
| Entertainment – 0.8% | |
| | 108,001 | | | Live Nation Entertainment, Inc.* | | | 9,596,969 | |
| | |
| Equity Real Estate Investment Trusts (REITs) – 10.9% | |
| | 56,381 | | | Alexandria Real Estate Equities, Inc. REIT | | | 9,003,482 | |
| | 55,018 | | | AvalonBay Communities, Inc. REIT | | | 9,669,414 | |
| | 94,276 | | | Boston Properties, Inc. REIT | | | 9,345,580 | |
| | 69,039 | | | Camden Property Trust REIT | | | 7,190,412 | |
| | 85,888 | | | CyrusOne, Inc. REIT | | | 5,636,829 | |
| | 369,780 | | | Duke Realty Corp. REIT | | | 14,513,865 | |
| | 121,299 | | | Equity LifeStyle Properties, Inc. REIT | | | 7,478,083 | |
| | 27,534 | | | Essex Property Trust, Inc. REIT | | | 7,015,388 | |
| | 315,751 | | | Healthpeak Properties, Inc. REIT | | | 9,185,197 | |
| | 190,511 | | | Highwoods Properties, Inc. REIT | | | 7,612,820 | |
| | 236,982 | | | Invitation Homes, Inc. REIT | | | 6,905,655 | |
| | 102,256 | | | Life Storage, Inc. REIT | | | 8,579,278 | |
| | 226,343 | | | MGM Growth Properties LLC, Class A REIT | | | 7,473,846 | |
| | 197,150 | | | Welltower, Inc. REIT | | | 13,386,485 | |
| | | | | | | | |
| | | | | | | 122,996,334 | |
| | |
| Food & Staples Retailing – 0.6% | |
| | 132,567 | | | Performance Food Group Co.* | | | 7,190,434 | |
| | |
| Food Products – 1.7% | |
| | 76,241 | | | McCormick & Co., Inc. | | | 6,425,591 | |
| | 405,758 | | | Nomad Foods Ltd. (United Kingdom)* | | | 9,584,004 | |
| | 107,570 | | | Utz Brands, Inc. | | | 2,718,294 | |
| | | | | | | | |
| | | | | | | 18,727,889 | |
| | |
| | |
| 18 | | The accompanying notes are an integral part of these financial statements. |
GOLDMAN SACHS MID CAP VALUE FUND
| | | | | | | | |
| Shares | | | Description | | Value | |
|
| Common Stocks – (continued) | |
| Gas Utilities – 0.7% | |
| | 91,200 | | | Atmos Energy Corp. | | $ | 7,716,432 | |
| | |
| Health Care Equipment & Supplies – 3.6% | |
| | 28,433 | | | Cooper Cos., Inc. (The) | | | 10,978,835 | |
| | 94,280 | | | Hologic, Inc.* | | | 6,796,645 | |
| | 140,452 | | | Zimmer Biomet Holdings, Inc. | | | 22,902,103 | |
| | | | | | | | |
| | | | | | | 40,677,583 | |
| | |
| Health Care Providers & Services – 1.2% | |
| | 80,701 | | | Centene Corp.* | | | 4,724,237 | |
| | 59,938 | | | Quest Diagnostics, Inc. | | | 6,928,233 | |
| | 76,072 | | | Signify Health, Inc., Class A* | | | 2,511,897 | |
| | | | | | | | |
| | | | | | | 14,164,367 | |
| | |
| Health Care Technology – 0.3% | |
| | 83,483 | | | Certara, Inc.* | | | 2,892,686 | |
| | |
| Hotels, Restaurants & Leisure – 2.9% | |
| | 154,097 | | | Wyndham Hotels & Resorts, Inc. | | | 10,059,452 | |
| | 106,716 | | | Wynn Resorts Ltd.* | | | 14,057,699 | |
| | 86,065 | | | Yum! Brands, Inc. | | | 8,910,310 | |
| | | | | | | | |
| | | | | | | 33,027,461 | |
| | |
| Independent Power and Renewable Electricity Producers – 1.0% | |
| | 180,160 | | | AES Corp. (The) | | | 4,785,050 | |
| | 93,886 | | | NextEra Energy Partners LP | | | 6,819,879 | |
| | | | | | | | |
| | | | | | | 11,604,929 | |
| | |
| Insurance – 4.9% | |
| | 9,215 | | | Alleghany Corp. | | | 5,956,852 | |
| | 84,999 | | | American Financial Group, Inc. | | | 9,069,393 | |
| | 69,217 | | | Arthur J Gallagher & Co. | | | 8,292,197 | |
| | 135,468 | | | Brown & Brown, Inc. | | | 6,217,981 | |
| | 70,923 | | | Globe Life, Inc. | | | 6,624,208 | |
| | 11,586 | | | Markel Corp.* | | | 12,614,837 | |
| | 56,078 | | | Reinsurance Group of America, Inc. | | | 6,854,414 | |
| | | | | | | | |
| | | | | | | 55,629,882 | |
| | |
| Interactive Media & Services – 1.0% | |
| | 34,993 | | | Bumble, Inc., Class A* | | | 2,355,379 | |
| | 112,904 | | | Twitter, Inc.* | | | 8,700,382 | |
| | | | | | | | |
| | | | | | | 11,055,761 | |
| | |
| Internet & Direct Marketing Retail – 1.4% | |
| | 97,407 | | | Expedia Group, Inc. | | | 15,682,527 | |
| | |
| IT Services – 1.3% | |
| | 102,703 | | | Booz Allen Hamilton Holding Corp. | | | 7,922,510 | |
| | 32,764 | | | WEX, Inc.* | | | 6,826,379 | |
| | | | | | | | |
| | | | | | | 14,748,889 | |
| | |
| Leisure Products – 0.9% | |
| | 115,511 | | | Brunswick Corp. | | | 10,207,707 | |
| | |
| Life Sciences Tools & Services – 0.7% | |
| | 66,467 | | | PerkinElmer, Inc. | | | 8,380,824 | |
| | |
|
| Common Stocks – (continued) | |
| Machinery – 5.8% | |
| | 59,431 | | | Cummins, Inc. | | | 15,047,929 | |
| | 200,089 | | | Fortive Corp. | | | 13,169,858 | |
| | 136,660 | | | Graco, Inc. | | | 9,477,371 | |
| | 41,634 | | | IDEX Corp. | | | 8,125,708 | |
| | 232,959 | | | ITT, Inc. | | | 19,330,938 | |
| | | | | | | | |
| | | | | | | 65,151,804 | |
| | |
| Media – 1.6% | |
| | 53,445 | | | Liberty Broadband Corp., Class C* | | | 7,990,562 | |
| | 217,966 | | | Liberty Media Corp.-Liberty SiriusXM, Class A* | | | 9,679,870 | |
| | | | | | | | |
| | | | | | | 17,670,432 | |
| | |
| Metals & Mining – 2.1% | |
| | 243,337 | | | Allegheny Technologies, Inc.* | | | 4,784,005 | |
| | 558,558 | | | Freeport-McMoRan, Inc.* | | | 18,940,702 | |
| | | | | | | | |
| | | | | | | 23,724,707 | |
| | |
| Multiline Retail – 0.7% | |
| | 83,493 | | | Dollar Tree, Inc.* | | | 8,199,013 | |
| | |
| Multi-Utilities – 2.5% | |
| | 154,126 | | | Ameren Corp. | | | 10,830,434 | |
| | 170,570 | | | CMS Energy Corp. | | | 9,229,543 | |
| | 149,751 | | | Public Service Enterprise Group, Inc. | | | 8,061,096 | |
| | | | | | | | |
| | | | | | | 28,121,073 | |
| | |
| Oil, Gas & Consumable Fuels – 3.4% | |
| | 173,289 | | | Cheniere Energy, Inc.* | | | 11,677,946 | |
| | 192,113 | | | Hess Corp. | | | 12,589,165 | |
| | 98,290 | | | Pioneer Natural Resources Co. | | | 14,602,945 | |
| | | | | | | | |
| | | | | | | 38,870,056 | |
| | |
| Pharmaceuticals – 1.4% | |
| | 135,637 | | | Catalent, Inc.* | | | 15,423,283 | |
| | |
| Road & Rail – 1.3% | |
| | 69,703 | | | Old Dominion Freight Line, Inc. | | | 14,970,113 | |
| | |
| Semiconductors & Semiconductor Equipment – 5.5% | |
| | 64,556 | | | Cree, Inc.* | | | 7,324,524 | |
| | 76,702 | | | Entegris, Inc. | | | 8,069,817 | |
| | 410,176 | | | Marvell Technology Group Ltd. | | | 19,803,297 | |
| | 63,842 | | | Microchip Technology, Inc. | | | 9,744,205 | |
| | 40,247 | | | MKS Instruments, Inc. | | | 6,636,730 | |
| | 277,217 | | | ON Semiconductor Corp.* | | | 11,163,529 | |
| | | | | | | | |
| | | | | | | 62,742,102 | |
| | |
| Software – 0.5% | |
| | 40,547 | | | Splunk, Inc.* | | | 5,798,626 | |
| | |
| Specialty Retail – 3.8% | |
| | 78,939 | | | Advance Auto Parts, Inc. | | | 12,657,869 | |
| | 37,881 | | | Burlington Stores, Inc.* | | | 9,804,360 | |
| | 230,217 | | | L Brands, Inc.* | | | 12,583,661 | |
| | 15,419 | | | RH* | | | 7,561,015 | |
| | | | | | | | |
| | | | | | | 42,606,905 | |
| | |
| | |
| The accompanying notes are an integral part of these financial statements. | | 19 |
GOLDMAN SACHS MID CAP VALUE FUND
Schedule of Investments (continued)
February 28, 2021 (Unaudited)
| | | | | | | | |
| Shares | | | Description | | Value | |
|
| Common Stocks – (continued) | |
| Textiles, Apparel & Luxury Goods – 0.8% | |
| | 194,101 | | | Capri Holdings Ltd.* | | $ | 9,058,694 | |
| | |
| Trading Companies & Distributors – 0.8% | |
| | 189,728 | | | Fastenal Co. | | | 8,797,687 | |
| | |
| Water Utilities – 0.9% | |
| | 70,791 | | | American Water Works Co., Inc. | | | 10,043,827 | |
| | |
| | TOTAL COMMON STOCKS | |
| | (Cost $833,874,510) | | $ | 1,122,485,818 | |
| | |
| | | | | | | | |
| Shares | | Dividend
Rate | | | Value | |
|
| Investment Company – 0.5%(a) | |
Goldman Sachs Financial Square Government Fund – Institutional Shares | |
| 6,015,624 | | | 0.036 | % | | $ | 6,015,624 | |
| (Cost $6,015,624) | |
| |
| TOTAL INVESTMENTS – 99.6% | |
| (Cost $839,890,134) | | | $ | 1,128,501,442 | |
| |
OTHER ASSETS IN EXCESS OF
LIABILITIES – 0.4% | | | | 3,852,421 | |
| |
| NET ASSETS – 100.0% | | | $ | 1,132,353,863 | |
| |
| | |
|
| The percentage shown for each investment category reflects the value of investments in that category as a percentage of net assets. |
| |
* | | Non-income producing security. |
| |
(a) | | Represents an affiliated issuer. |
| | | | |
|
Investment Abbreviations: |
LP | | —Limited Partnership |
PLC | | —Public Limited Company |
REIT | | —Real Estate Investment Trust |
|
| | |
| 20 | | The accompanying notes are an integral part of these financial statements. |
GOLDMAN SACHS SMALL CAP VALUE FUND
Schedule of Investments
February 28, 2021 (Unaudited)
| | | | | | | | |
| Shares | | | Description | | Value | |
|
| Common Stocks – 99.7% | |
| Aerospace & Defense – 1.3% | |
| | 722,953 | | | AAR Corp. | | $ | 28,759,071 | |
| | 38,040 | | | Cubic Corp. | | | 2,641,878 | |
| | 257,228 | | | Ducommun, Inc.* | | | 13,993,203 | |
| | 474,400 | | | Kaman Corp. | | | 23,084,304 | |
| | | | | | | | |
| | | | | | | 68,478,456 | |
| | |
| Air Freight & Logistics – 0.2% | |
| | 478,521 | | | Air Transport Services Group, Inc.* | | | 12,699,947 | |
| | |
| Airlines – 0.8% | |
| | 75,686 | | | Allegiant Travel Co.* | | | 19,087,252 | |
| | 394,397 | | | SkyWest, Inc. | | | 22,232,159 | |
| | | | | | | | |
| | | | | | | 41,319,411 | |
| | |
| Auto Components – 1.5% | |
| | 1,235,271 | | | Adient PLC* | | | 45,803,849 | |
| | 95,764 | | | Cooper Tire & Rubber Co. | | | 5,481,531 | |
| | 555,590 | | | Goodyear Tire & Rubber Co. (The)* | | | 9,339,468 | |
| | 108,261 | | | Visteon Corp.* | | | 13,767,552 | |
| | 268,861 | | | Workhorse Group, Inc.*(a) | | | 4,347,482 | |
| | | | | | | | |
| | | | | | | 78,739,882 | |
| | |
| Banks – 16.4% | |
| | 333,164 | | | Amalgamated Bank, Class A | | | 5,850,360 | |
| | 889,352 | | | Ameris Bancorp | | | 42,368,729 | |
| | 825,789 | | | Atlantic Union Bankshares Corp. | | | 30,331,230 | |
| | 1,142,572 | | | BancorpSouth Bank | | | 34,345,714 | |
| | 94,220 | | | Bank of Hawaii Corp. | | | 8,244,250 | |
| | 619,056 | | | Banner Corp. | | | 32,054,720 | |
| | 1,314,245 | | | Brookline Bancorp, Inc. | | | 18,701,706 | |
| | 442,106 | | | Cadence BanCorp | | | 9,072,015 | |
| | 927,949 | | | Columbia Banking System, Inc. | | | 41,098,861 | |
| | 529,629 | | | Community Bank System, Inc. | | | 37,704,289 | |
| | 833,262 | | | ConnectOne Bancorp, Inc. | | | 19,356,676 | |
| | 1,497,655 | | | CVB Financial Corp. | | | 32,064,794 | |
| | 686,618 | | | FB Financial Corp. | | | 29,119,469 | |
| | 624,080 | | | First Financial Bankshares, Inc. | | | 27,871,413 | |
| | 828,845 | | | First Merchants Corp. | | | 34,852,932 | |
| | 460,896 | | | First Midwest Bancorp, Inc. | | | 9,116,523 | |
| | 184,733 | | | First of Long Island Corp. (The) | | | 3,432,339 | |
| | 397,418 | | | German American Bancorp, Inc. | | | 15,658,269 | |
| | 889,319 | | | Glacier Bancorp, Inc. | | | 48,201,090 | |
| | 567,203 | | | Great Western Bancorp, Inc. | | | 15,218,056 | |
| | 603,268 | | | Heritage Financial Corp. | | | 15,618,609 | |
| | 1,135,322 | | | Home BancShares, Inc. | | | 27,747,270 | |
| | 438,153 | | | Independent Bank Corp. | | | 37,466,463 | |
| | 566,606 | | | Lakeland Financial Corp. | | | 39,067,484 | |
| | 1,054,176 | | | OceanFirst Financial Corp. | | | 22,907,244 | |
| | 820,261 | | | Pacific Premier Bancorp, Inc. | | | 33,056,518 | |
| | 442,961 | | | PacWest Bancorp | | | 16,052,907 | |
| | 350,390 | | | Pinnacle Financial Partners, Inc. | | | 28,441,156 | |
| | 950,864 | | | Renasant Corp. | | | 37,349,938 | |
| | 502,069 | | | South State Corp. | | | 39,593,161 | |
| | 576,948 | | | Towne Bank | | | 16,639,180 | |
| | 518,493 | | | TriCo Bancshares | | | 22,331,494 | |
| | 1,246,810 | | | United Community Banks, Inc. | | | 41,219,539 | |
| | | | | | | | |
| | | | | | | 872,154,398 | |
| | |
|
| Common Stocks – (continued) | |
| Beverages – 0.5% | |
| | 1,829,878 | | | Primo Water Corp. | | | 26,148,957 | |
| | |
| Biotechnology – 0.8% | |
| | 234,723 | | | Arena Pharmaceuticals, Inc.* | | | 18,859,993 | |
| | 82,445 | | | Emergent BioSolutions, Inc.* | | | 7,914,720 | |
| | 63,234 | | | Novavax, Inc.* | | | 14,621,598 | |
| | | | | | | | |
| | | | | | | 41,396,311 | |
| | |
| Building Products – 1.5% | |
| | 95,579 | | | AZEK Co., Inc. (The)* | | | 4,215,990 | |
| | 88,376 | | | Builders FirstSource, Inc.* | | | 3,823,587 | |
| | 273,345 | | | Gibraltar Industries, Inc.* | | | 23,876,686 | |
| | 238,472 | | | Griffon Corp. | | | 5,866,411 | |
| | 1,776,134 | | | Resideo Technologies, Inc.* | | | 42,662,739 | |
| | | | | | | | |
| | | | | | | 80,445,413 | |
| | |
| Capital Markets – 2.0% | |
| | 245,625 | | | Hamilton Lane, Inc., Class A | | | 21,958,875 | |
| | 233,829 | | | Houlihan Lokey, Inc. | | | 14,862,171 | |
| | 234,779 | | | PJT Partners, Inc., Class A | | | 16,368,792 | |
| | 742,424 | | | Stifel Financial Corp. | | | 45,347,258 | |
| | 174,787 | | | Virtu Financial, Inc., Class A | | | 4,766,442 | |
| | | | | | | | |
| | | | | | | 103,303,538 | |
| | |
| Chemicals – 2.5% | |
| | 1,397,917 | | | Avient Corp. | | | 60,417,973 | |
| | 340,311 | | | HB Fuller Co. | | | 19,081,238 | |
| | 342,607 | | | Kraton Corp.* | | | 12,741,554 | |
| | 293,758 | | | Livent Corp.* | | | 5,469,774 | |
| | 32,315 | | | Quaker Chemical Corp. | | | 9,125,110 | |
| | 1,487,683 | | | Tronox Holdings PLC, Class A | | | 27,284,106 | |
| | | | | | | | |
| | | | | | | 134,119,755 | |
| | |
| Commercial Services & Supplies – 1.0% | |
| | 547,134 | | | ABM Industries, Inc. | | | 23,625,246 | |
| | 273,829 | | | Brady Corp., Class A | | | 14,351,378 | |
| | 245,186 | | | Casella Waste Systems, Inc., Class A* | | | 14,201,173 | |
| | | | | | | | |
| | | | | | | 52,177,797 | |
| | |
| Communications Equipment – 0.7% | |
| | 481,678 | | | NetScout Systems, Inc.* | | | 13,592,953 | |
| | 1,587,773 | | | Viavi Solutions, Inc.* | | | 25,698,106 | |
| | | | | | | | |
| | | | | | | 39,291,059 | |
| | |
| Construction & Engineering – 2.5% | |
| | 431,246 | | | Arcosa, Inc. | | | 24,464,586 | |
| | 242,595 | | | EMCOR Group, Inc. | | | 23,621,475 | |
| | 640,330 | | | MasTec, Inc.* | | | 55,548,627 | |
| | 1,045,698 | | | WillScot Mobile Mini Holdings Corp.* | | | 28,997,206 | |
| | | | | | | | |
| | | | | | | 132,631,894 | |
| | |
| Construction Materials – 0.4% | |
| | 730,064 | | | Summit Materials, Inc., Class A* | | | 20,230,073 | |
| | |
| | |
| The accompanying notes are an integral part of these financial statements. | | 21 |
GOLDMAN SACHS SMALL CAP VALUE FUND
Schedule of Investments (continued)
February 28, 2021 (Unaudited)
| | | | | | | | |
| Shares | | | Description | | Value | |
|
| Common Stocks – (continued) | |
| Consumer Finance – 0.7% | |
| | 178,442 | | | FirstCash, Inc. | | $ | 11,298,947 | |
| | 318,443 | | | Green Dot Corp., Class A* | | | 15,049,616 | |
| | 251,340 | | | Oportun Financial Corp.* | | | 4,101,869 | |
| | 123,953 | | | PROG Holdings, Inc. | | | 6,197,650 | |
| | | | | | | | |
| | | | | | | 36,648,082 | |
| | |
| Diversified Financial Services – 0.1% | |
| | 167,562 | | | Alerus Financial Corp. | | | 4,609,631 | |
| | |
| Diversified Telecommunication Services – 0.5% | |
| | 2,124,172 | | | Vonage Holdings Corp.* | | | 28,081,554 | |
| | |
| Electric Utilities – 1.9% | |
| | 398,457 | | | ALLETE, Inc. | | | 24,756,133 | |
| | 277,271 | | | IDACORP, Inc. | | | 23,911,851 | |
| | 336,127 | | | MGE Energy, Inc. | | | 21,411,290 | |
| | 770,868 | | | Portland General Electric Co. | | | 32,499,795 | |
| | | | | | | | |
| | | | | | | 102,579,069 | |
| | |
| Electronic Equipment, Instruments & Components – 2.0% | |
| | 589,374 | | | CTS Corp. | | | 18,960,162 | |
| | 234,692 | | | FARO Technologies, Inc.* | | | 21,934,314 | |
| | 632,322 | | | Knowles Corp.* | | | 13,145,974 | |
| | 189,037 | | | Rogers Corp.* | | | 34,306,435 | |
| | 1,397,595 | | | TTM Technologies, Inc.* | | | 19,734,041 | |
| | | | | | | | |
| | | | | | | 108,080,926 | |
| | |
| Energy Equipment & Services – 1.5% | |
| | 686,831 | | | Cactus, Inc., Class A | | | 21,889,304 | |
| | 2,684,439 | | | ChampionX Corp.* | | | 57,098,018 | |
| | | | | | | | |
| | | | | | | 78,987,322 | |
| | |
| Entertainment – 0.5% | |
| | 727,190 | | | Cinemark Holdings, Inc. | | | 16,325,415 | |
| | 270,228 | | | IMAX Corp.* | | | 5,585,613 | |
| | 37,302 | | | Live Nation Entertainment, Inc.* | | | 3,314,656 | |
| | | | | | | | |
| | | | | | | 25,225,684 | |
| | |
| Equity Real Estate Investment Trusts (REITs) – 8.5% | |
| | 1,852,435 | | | Acadia Realty Trust REIT | | | 35,029,546 | |
| | 3,605,651 | | | Colony Capital, Inc. REIT | | | 21,345,454 | |
| | 163,607 | | | CyrusOne, Inc. REIT | | | 10,737,527 | |
| | 146,472 | | | EastGroup Properties, Inc. REIT | | | 19,936,304 | |
| | 1,126,959 | | | Healthcare Realty Trust, Inc. REIT | | | 32,524,037 | |
| | 489,384 | | | Highwoods Properties, Inc. REIT | | | 19,555,785 | |
| | 688,956 | | | Hudson Pacific Properties, Inc. REIT | | | 17,630,384 | |
| | 384,358 | | | Life Storage, Inc. REIT | | | 32,247,636 | |
| | 510,561 | | | National Health Investors, Inc. REIT | | | 34,855,999 | |
| | 1,261,290 | | | Park Hotels & Resorts, Inc. REIT | | | 27,433,057 | |
| | 2,004,545 | | | Pebblebrook Hotel Trust REIT | | | 45,422,990 | |
| | 1,560,293 | | | Physicians Realty Trust REIT | | | 26,524,981 | |
| | 749,933 | | | Preferred Apartment Communities, Inc., Class A REIT | | | 6,171,949 | |
| | 124,893 | | | PS Business Parks, Inc. REIT | | | 18,092,000 | |
| | 2,262,551 | | | RLJ Lodging Trust REIT | | | 35,522,051 | |
| | 177,880 | | | Safehold, Inc. REIT | | | 13,563,350 | |
| | 960,809 | | | STAG Industrial, Inc. REIT | | | 30,313,524 | |
| | |
|
| Common Stocks – (continued) | |
| Equity Real Estate Investment Trusts (REITs) – (continued) | |
| | 471,439 | | | Terreno Realty Corp. REIT | | | 26,419,441 | |
| | | | | | | | |
| | | | | | | 453,326,015 | |
| | |
| Food & Staples Retailing – 1.0% | |
| | 993,995 | | | Performance Food Group Co.* | | | 53,914,289 | |
| | |
| Food Products – 2.3% | |
| | 1,000,244 | | | Darling Ingredients, Inc.* | | | 63,055,382 | |
| | 665,328 | | | Hostess Brands, Inc.* | | | 9,574,070 | |
| | 49,830 | | | Sanderson Farms, Inc. | | | 7,599,075 | |
| | 521,926 | | | Simply Good Foods Co. (The)* | | | 15,224,581 | |
| | 969,134 | | | Utz Brands, Inc. | | | 24,490,016 | |
| | | | | | | | |
| | | | | | | 119,943,124 | |
| | |
| Gas Utilities – 0.8% | |
| | 131,799 | | | Chesapeake Utilities Corp. | | | 13,935,108 | |
| | 438,768 | | | ONE Gas, Inc. | | | 29,384,293 | |
| | | | | | | | |
| | | | | | | 43,319,401 | |
| | |
| Health Care Equipment & Supplies – 1.8% | |
| | 646,612 | | | Avanos Medical, Inc.* | | | 29,731,220 | |
| | 234,370 | | | CONMED Corp. | | | 28,841,572 | |
| | 220,489 | | | LivaNova PLC* | | | 17,096,717 | |
| | 177,095 | | | Merit Medical Systems, Inc.* | | | 9,867,734 | |
| | 155,240 | | | NuVasive, Inc.* | | | 9,365,629 | |
| | | | | | | | |
| | | | | | | 94,902,872 | |
| | |
| Health Care Providers & Services – 1.8% | |
| | 435,520 | | | Acadia Healthcare Co., Inc.* | | | 24,058,125 | |
| | 233,805 | | | AMN Healthcare Services, Inc.* | | | 17,037,370 | |
| | 538,713 | | | Owens & Minor, Inc. | | | 18,321,629 | |
| | 721,345 | | | Tenet Healthcare Corp.* | | | 36,803,022 | |
| | | | | | | | |
| | | | | | | 96,220,146 | |
| | |
| Health Care Technology – 0.3% | |
| | 1,127,510 | | | Allscripts Healthcare Solutions, Inc.* | | | 17,397,479 | |
| | |
| Hotels, Restaurants & Leisure – 5.2% | |
| | 1,009,850 | | | Boyd Gaming Corp.* | | | 59,278,195 | |
| | 451,766 | | | Brinker International, Inc. | | | 30,986,630 | |
| | 376,119 | | | Caesars Entertainment, Inc.* | | | 35,144,559 | |
| | 169,839 | | | Jack in the Box, Inc. | | | 17,383,022 | |
| | 255,930 | | | Marriott Vacations Worldwide Corp.* | | | 43,433,880 | |
| | 292,840 | | | Penn National Gaming, Inc.* | | | 33,905,015 | |
| | 641,293 | | | SeaWorld Entertainment, Inc.* | | | 31,846,611 | |
| | 426,651 | | | Travel + Leisure Co. | | | 25,782,520 | |
| | | | | | | | |
| | | | | | | 277,760,432 | |
| | |
| Household Durables – 1.9% | |
| | 11,450 | | | Helen of Troy Ltd.* | | | 2,482,360 | |
| | 144,489 | | | Installed Building Products, Inc.* | | | 15,801,317 | |
| | 334,465 | | | Meritage Homes Corp.* | | | 28,198,744 | |
| | 207,374 | | | Purple Innovation, Inc.* | | | 7,629,290 | |
| | 965,127 | | | Taylor Morrison Home Corp.* | | | 26,550,644 | |
| | 571,476 | | | Tupperware Brands Corp.* | | | 17,470,021 | |
| | | | | | | | |
| | | | | | | 98,132,376 | |
| | |
| | |
| 22 | | The accompanying notes are an integral part of these financial statements. |
GOLDMAN SACHS SMALL CAP VALUE FUND
| | | | | | | | |
| Shares | | | Description | | Value | |
|
| Common Stocks – (continued) | |
| Independent Power and Renewable Electricity Producers – 0.3% | |
| | 605,948 | | | Clearway Energy, Inc., Class A | | $ | 15,845,540 | |
| | |
| Insurance – 3.4% | |
| | 210,008 | | | AMERISAFE, Inc. | | | 12,289,668 | |
| | 665,564 | | | BRP Group, Inc., Class A* | | | 17,657,413 | |
| | 367,528 | | | CNO Financial Group, Inc. | | | 8,842,724 | |
| | 119,297 | | | Enstar Group Ltd.* | | | 25,361,349 | |
| | 136,167 | | | Kemper Corp. | | | 10,296,949 | |
| | 75,405 | | | Kinsale Capital Group, Inc. | | | 13,275,804 | |
| | 157,378 | | | Palomar Holdings, Inc.* | | | 13,397,589 | |
| | 183,045 | | | Primerica, Inc. | | | 25,851,445 | |
| | 207,226 | | | RLI Corp. | | | 21,621,961 | |
| | 477,722 | | | Selective Insurance Group, Inc. | | | 32,403,883 | |
| | | | | | | | |
| | | | | | | 180,998,785 | |
| | |
| Internet & Direct Marketing Retail – 0.1% | |
| | 113,815 | | | Magnite, Inc.* | | | 5,562,139 | |
| | |
| IT Services – 1.3% | |
| | 1,746,831 | | | KBR, Inc. | | | 54,151,761 | |
| | 182,125 | | | ManTech International Corp., Class A | | | 14,234,890 | |
| | | | | | | | |
| | | | | | | 68,386,651 | |
| | |
| Leisure Products – 0.6% | |
| | 705,411 | | | Callaway Golf Co. | | | 19,716,238 | |
| | 145,752 | | | Malibu Boats, Inc., Class A* | | | 10,864,354 | |
| | | | | | | | |
| | | | | | | 30,580,592 | |
| | |
| Life Sciences Tools & Services – 0.9% | |
| | 451,247 | | | Luminex Corp. | | | 14,674,553 | |
| | 105,840 | | | PRA Health Sciences, Inc.* | | | 15,601,874 | |
| | 239,448 | | | Syneos Health, Inc.* | | | 18,521,303 | |
| | | | | | | | |
| | | | | | | 48,797,730 | |
| | |
| Machinery – 6.4% | |
| | 410,977 | | | Astec Industries, Inc. | | | 27,913,558 | |
| | 326,048 | | | Chart Industries, Inc.* | | | 46,654,208 | |
| | 323,063 | | | CIRCOR International, Inc.* | | | 11,504,274 | |
| | 776,301 | | | Colfax Corp.* | | | 34,428,949 | |
| | 428,559 | | | Columbus McKinnon Corp. | | | 21,573,660 | |
| | 831,507 | | | Federal Signal Corp. | | | 30,275,170 | |
| | 833,499 | | | Kennametal, Inc. | | | 31,139,523 | |
| | 1,149,752 | | | Rexnord Corp. | | | 51,681,353 | |
| | 465,711 | | | SPX FLOW, Inc.* | | | 28,669,169 | |
| | 196,584 | | | Timken Co. (The) | | | 15,402,356 | |
| | 733,185 | | | TriMas Corp.* | | | 24,627,684 | |
| | 133,801 | | | Watts Water Technologies, Inc., Class A | | | 15,265,356 | |
| | | | | | | | |
| | | | | | | 339,135,260 | |
| | |
| Media – 0.9% | |
| | 211,891 | | | Nexstar Media Group, Inc., Class A | | | 29,145,607 | |
| | 1,109,201 | | | TEGNA, Inc. | | | 20,220,734 | |
| | | | | | | | |
| | | | | | | 49,366,341 | |
| | |
|
| Common Stocks – (continued) | |
| Metals & Mining – 2.7% | |
| | 456,434 | | | Alcoa Corp.* | | | 11,205,455 | |
| | 961,661 | | | Allegheny Technologies, Inc.* | | | 18,906,255 | |
| | 1,092,789 | | | Arconic Corp.* | | | 23,953,935 | |
| | 2,749,882 | | | Cleveland-Cliffs, Inc. | | | 36,683,426 | |
| | 2,250,908 | | | Coeur Mining, Inc.* | | | 20,280,681 | |
| | 586,845 | | | Commercial Metals Co. | | | 14,759,152 | |
| | 871,576 | | | Constellium SE* | | | 11,539,666 | |
| | 206,018 | | | Warrior Met Coal, Inc. | | | 3,949,365 | |
| | | | | | | | |
| | | | | | | 141,277,935 | |
| | |
| Mortgage Real Estate Investment Trusts (REITs) – 1.6% | |
| | 1,249,370 | | | KKR Real Estate Finance Trust, Inc. REIT | | | 23,025,889 | |
| | 1,340,940 | | | PennyMac Mortgage Investment Trust REIT | | | 25,437,632 | |
| | 4,623,948 | | | Two Harbors Investment Corp. REIT | | | 33,384,905 | |
| | | | | | | | |
| | | | | | | 81,848,426 | |
| | |
| Multiline Retail – 0.1% | |
| | 55,697 | | | Big Lots, Inc. | | | 3,538,987 | |
| | |
| Oil, Gas & Consumable Fuels – 3.2% | |
| | 867,924 | | | Brigham Minerals, Inc., Class A | | | 12,419,992 | |
| | 1,086,892 | | | CNX Resources Corp.* | | | 13,705,708 | |
| | 1,649,851 | | | Devon Energy Corp. | | | 35,537,791 | |
| | 1,517,996 | | | EQT Corp.* | | | 27,005,149 | |
| | 949,408 | | | Golar LNG Ltd. (Cameroon)* | | | 10,718,816 | |
| | 428,921 | | | Matador Resources Co.* | | | 8,960,160 | |
| | 287,216 | | | PDC Energy, Inc.* | | | 10,038,199 | |
| | 823,336 | | | Rattler Midstream LP | | | 9,056,696 | |
| | 182,465 | | | Renewable Energy Group, Inc.* | | | 14,190,303 | |
| | 1,901,754 | | | Viper Energy Partners LP | | | 29,819,503 | |
| | | | | | | | |
| | | | | | | 171,452,317 | |
| | |
| Paper & Forest Products – 0.1% | |
| | 114,569 | | | Domtar Corp. | | | 4,244,781 | |
| | |
| Pharmaceuticals – 0.1% | |
| | 164,937 | | | Intra-Cellular Therapies, Inc.* | | | 5,843,718 | |
| | |
| Professional Services – 1.0% | |
| | 424,099 | | | ASGN, Inc.* | | | 39,428,484 | |
| | 159,799 | | | ICF International, Inc. | | | 13,335,227 | |
| | | | | | | | |
| | | | | | | 52,763,711 | |
| | |
| Real Estate Management & Development – 0.3% | |
| | 861,758 | | | Kennedy-Wilson Holdings, Inc. | | | 16,166,580 | |
| | |
| Road & Rail – 1.0% | |
| | 396,181 | | | ArcBest Corp. | | | 23,370,717 | |
| | 148,353 | | | Saia, Inc.* | | | 29,749,227 | |
| | | | | | | | |
| | | | | | | 53,119,944 | |
| | |
| Semiconductors & Semiconductor Equipment – 2.2% | |
| | 381,589 | | | Allegro MicroSystems, Inc. (Japan)* | | | 9,974,736 | |
| | 746,937 | | | Cohu, Inc.* | | | 32,454,413 | |
| | 152,113 | | | MACOM Technology Solutions Holdings, Inc.* | | | 9,788,471 | |
| | |
| | |
| The accompanying notes are an integral part of these financial statements. | | 23 |
GOLDMAN SACHS SMALL CAP VALUE FUND
Schedule of Investments (continued)
February 28, 2021 (Unaudited)
| | | | | | | | |
| Shares | | | Description | | Value | |
|
| Common Stocks – (continued) | |
| Semiconductors & Semiconductor Equipment – (continued) | |
| | 537,084 | | | Onto Innovation, Inc.* | | $ | 33,546,267 | |
| | 132,399 | | | Semtech Corp.* | | | 9,706,171 | |
| | 117,650 | | | Silicon Laboratories, Inc.* | | | 18,322,811 | |
| | | | | | | | |
| | | | | | | 113,792,869 | |
| | |
| Software – 0.8% | |
| | 283,212 | | | Bottomline Technologies DE, Inc.* | | | 12,710,555 | |
| | 1,067,268 | | | Cloudera, Inc.* | | | 17,225,705 | |
| | 227,314 | | | InterDigital, Inc. | | | 14,404,888 | |
| | | | | | | | |
| | | | | | | 44,341,148 | |
| | |
| Specialty Retail – 4.2% | |
| | 644,408 | | | Abercrombie & Fitch Co., Class A | | | 17,637,447 | |
| | 1,567,518 | | | American Eagle Outfitters, Inc. | | | 40,285,213 | |
| | 149,585 | | | At Home Group, Inc.* | | | 3,768,046 | |
| | 902,479 | | | Bed Bath & Beyond, Inc. | | | 24,240,586 | |
| | 10,434 | | | Burlington Stores, Inc.* | | | 2,700,528 | |
| | 30,908 | | | Five Below, Inc.* | | | 5,752,597 | |
| | 112,117 | | | Group 1 Automotive, Inc. | | | 17,091,116 | |
| | 96,780 | | | Lithia Motors, Inc., Class A | | | 36,190,881 | |
| | 474,782 | | | Rent-A-Center, Inc. | | | 27,423,408 | |
| | 32,868 | | | RH* | | | 16,117,481 | |
| | 258,506 | | | Signet Jewelers Ltd.* | | | 12,868,429 | |
| | 21,795 | | | Sleep Number Corp.* | | | 2,988,748 | |
| | 56,886 | | | Sonic Automotive, Inc., Class A | | | 2,623,013 | |
| | 313,076 | | | Zumiez, Inc.* | | | 14,113,466 | |
| | | | | | | | |
| | | | | | | 223,800,959 | |
| | |
| Textiles, Apparel & Luxury Goods – 1.8% | |
| | 530,840 | | | Capri Holdings Ltd.* | | | 24,774,303 | |
| | 344,628 | | | Crocs, Inc.* | | | 26,439,860 | |
| | 8,137 | | | Deckers Outdoor Corp.* | | | 2,653,557 | |
| | 597,307 | | | Tapestry, Inc. | | | 25,170,517 | |
| | 464,319 | | | Wolverine World Wide, Inc. | | | 16,227,949 | |
| | | | | | | | |
| | | | | | | 95,266,186 | |
| | |
| Thrifts & Mortgage Finance – 2.2% | |
| | 2,453,649 | | | MGIC Investment Corp. | | | 29,885,445 | |
| | 912,176 | | | NMI Holdings, Inc., Class A* | | | 20,852,343 | |
| | 136,473 | | | Provident Financial Services, Inc. | | | 2,760,849 | |
| | 357,678 | | | Walker & Dunlop, Inc. | | | 35,646,189 | |
| | 973,907 | | | Washington Federal, Inc. | | | 29,431,470 | |
| | | | | | | | |
| | | | | | | 118,576,296 | |
| | |
| Trading Companies & Distributors – 1.3% | |
| | 640,310 | | | Beacon Roofing Supply, Inc.* | | | 30,626,027 | |
| | 451,531 | | | Herc Holdings, Inc.* | | | 39,626,361 | |
| | | | | | | | |
| | | | | | | 70,252,388 | |
| | |
| Water Utilities – 0.3% | |
| | 248,027 | | | SJW Group | | | 15,546,332 | |
| | |
| | TOTAL COMMON STOCKS | |
| | (Cost $3,531,592,198) | | $ | 5,292,770,908 | |
| | |
|
| Exchange-Traded Fund – 0.2% | |
| | 81,010 | | | iShares Russell 2000 Value ETF | | | | |
| | (Cost $12,315,051) | | $ | 12,281,116 | |
| | |
| | | | | | |
| Shares | | Dividend
Rate | | Value | |
|
| Investment Company – 0.4%(b) | |
Goldman Sachs Financial Square Government Fund – Institutional Shares | |
| 23,686,984 | | 0.036% | | $ | 23,686,984 | |
| (Cost $23,686,984) | |
| |
| TOTAL INVESTMENTS BEFORE SECURITIES LENDING REINVESTMENT VEHICLE | |
| (Cost $3,567,594,233) | | $ | 5,328,739,008 | |
| |
| | | | | | | | |
|
| Securities Lending Reinvestment Vehicle – 0.1%(b) | |
Goldman Sachs Financial Square Government Fund – Institutional Shares | |
| 5,933,827 | | | 0.036 | % | | $ | 5,933,827 | |
| (Cost $5,933,827) | |
| |
| TOTAL INVESTMENTS – 100.4% | |
| (Cost $3,573,528,060) | | | $ | 5,334,672,835 | |
| |
| LIABILITIES IN EXCESS OF OTHER ASSETS – (0.4)% | | | | (22,347,281 | ) |
| |
| NET ASSETS – 100.0% | | | $ | 5,312,325,554 | |
| |
| | |
|
| The percentage shown for each investment category reflects the value of investments in that category as a percentage of net assets. |
| |
* | | Non-income producing security. |
| |
(a) | | All or a portion of security is on loan. |
| |
(b) | | Represents an affiliated issuer. |
| | | | |
|
Investment Abbreviations: |
LP | | —Limited Partnership |
PLC | | —Public Limited Company |
REIT | | —Real Estate Investment Trust |
|
| | |
| 24 | | The accompanying notes are an integral part of these financial statements. |
GOLDMAN SACHS SMALL/MID CAP VALUE FUND
Schedule of Investments
February 28, 2021 (Unaudited)
| | | | | | | | |
| Shares | | | Description | |
Value | |
|
| Common Stocks – 97.8% | |
| Aerospace & Defense – 1.1% | |
| | 16,812 | | | AAR Corp. | | $ | 668,781 | |
| | 2,679 | | | Curtiss-Wright Corp. | | | 296,003 | |
| | 12,984 | | | Hexcel Corp.* | | | 698,020 | |
| | | | | | | | |
| | | | | | | 1,662,804 | |
| | |
| Air Freight & Logistics – 1.0% | |
| | 12,838 | | | XPO Logistics, Inc.* | | | 1,496,911 | |
| | |
| Airlines – 1.1% | |
| | 3,716 | | | Allegiant Travel Co.* | | | 937,138 | |
| | 13,790 | | | SkyWest, Inc. | | | 777,342 | |
| | | | | | | | |
| | | | | | | 1,714,480 | |
| | |
| Auto Components – 1.2% | |
| | 33,868 | | | Adient PLC* | | | 1,255,826 | |
| | 3,079 | | | Lear Corp. | | | 511,391 | |
| | | | | | | | |
| | | | | | | 1,767,217 | |
| | |
| Banks – 10.4% | |
| | 8,827 | | | Bank of Hawaii Corp. | | | 772,363 | |
| | 7,284 | | | Cadence BanCorp | | | 149,468 | |
| | 18,968 | | | Columbia Banking System, Inc. | | | 840,093 | |
| | 13,404 | | | Commerce Bancshares, Inc. | | | 992,298 | |
| | 10,133 | | | Community Bank System, Inc. | | | 721,368 | |
| | 8,013 | | | Cullen/Frost Bankers, Inc. | | | 836,557 | |
| | 18,596 | | | East West Bancorp, Inc. | | | 1,341,887 | |
| | 18,628 | | | First Financial Bankshares, Inc. | | | 831,926 | |
| | 17,851 | | | Glacier Bancorp, Inc. | | | 967,524 | |
| | 8,311 | | | Independent Bank Corp. | | | 710,674 | |
| | 26,896 | | | PacWest Bancorp | | | 974,711 | |
| | 15,450 | | | Pinnacle Financial Partners, Inc. | | | 1,254,077 | |
| | 11,117 | | | Prosperity Bancshares, Inc. | | | 816,766 | |
| | 6,332 | | | Signature Bank | | | 1,382,529 | |
| | 12,796 | | | South State Corp. | | | 1,009,093 | |
| | 27,156 | | | Synovus Financial Corp. | | | 1,148,970 | |
| | 12,152 | | | Wintrust Financial Corp. | | | 895,116 | |
| | | | | | | | |
| | | | | | | 15,645,420 | |
| | |
| Beverages – 0.7% | |
| | 356 | | | Boston Beer Co., Inc. (The), Class A* | | | 366,221 | |
| | 43,466 | | | Primo Water Corp. | | | 621,129 | |
| | | | | | | | |
| | | | | | | 987,350 | |
| | |
| Biotechnology – 0.2% | |
| | 3,495 | | | Emergent BioSolutions, Inc.* | | | 335,520 | |
| | |
| Building Products – 1.7% | |
| | 21,551 | | | AZEK Co., Inc. (The)* | | | 950,614 | |
| | 5,545 | | | Gibraltar Industries, Inc.* | | | 484,356 | |
| | 48,493 | | | Resideo Technologies, Inc.* | | | 1,164,802 | |
| | | | | | | | |
| | | | | | | 2,599,772 | |
| | |
| Capital Markets – 2.0% | |
| | 6,124 | | | Hamilton Lane, Inc., Class A | | | 547,486 | |
| | 6,462 | | | Houlihan Lokey, Inc. | | | 410,725 | |
| | 7,847 | | | LPL Financial Holdings, Inc. | | | 1,032,194 | |
| | 14,577 | | | Stifel Financial Corp. | | | 890,363 | |
| | |
|
| Common Stocks – (continued) | |
| Capital Markets – (continued) | |
| | 4,838 | | | Virtu Financial, Inc., Class A | | | 131,932 | |
| | | | | | | | |
| | | | | | | 3,012,700 | |
| | |
| Chemicals – 2.9% | |
| | 12,735 | | | Ashland Global Holdings, Inc. | | | 1,071,268 | |
| | 33,264 | | | Avient Corp. | | | 1,437,670 | |
| | 12,444 | | | Axalta Coating Systems Ltd.* | | | 340,219 | |
| | 13,349 | | | Huntsman Corp. | | | 364,428 | |
| | 39,284 | | | Tronox Holdings PLC, Class A | | | 720,468 | |
| | 5,469 | | | Westlake Chemical Corp. | | | 468,092 | |
| | | | | | | | |
| | | | | | | 4,402,145 | |
| | |
| Communications Equipment – 1.0% | |
| | 13,889 | | | Ciena Corp.* | | | 724,589 | |
| | 46,906 | | | Viavi Solutions, Inc.* | | | 759,174 | |
| | | | | | | | |
| | | | | | | 1,483,763 | |
| | |
| Construction & Engineering – 3.1% | |
| | 25,388 | | | AECOM* | | | 1,469,711 | |
| | 6,773 | | | Jacobs Engineering Group, Inc. | | | 779,437 | |
| | 13,700 | | | MasTec, Inc.* | | | 1,188,475 | |
| | 14,819 | | | Quanta Services, Inc. | | | 1,242,573 | |
| | | | | | | | |
| | | | | | | 4,680,196 | |
| | |
| Construction Materials – 0.2% | |
| | 1,760 | | | Vulcan Materials Co. | | | 293,902 | |
| | |
| Consumer Finance – 1.4% | |
| | 24,300 | | | Ally Financial, Inc. | | | 1,008,450 | |
| | 4,917 | | | FirstCash, Inc. | | | 311,344 | |
| | 5,099 | | | Green Dot Corp., Class A* | | | 240,979 | |
| | 10,604 | | | OneMain Holdings, Inc. | | | 497,434 | |
| | | | | | | | |
| | | | | | | 2,058,207 | |
| | |
| Containers & Packaging – 1.8% | |
| | 4,499 | | | Avery Dennison Corp. | | | 788,270 | |
| | 16,011 | | | Crown Holdings, Inc.* | | | 1,530,011 | |
| | 2,518 | | | Packaging Corp. of America | | | 332,426 | |
| | | | | | | | |
| | | | | | | 2,650,707 | |
| | |
| Diversified Consumer Services – 0.5% | |
| | 3,826 | | | Chegg, Inc.* | | | 369,324 | |
| | 7,257 | | | frontdoor, Inc.* | | | 380,049 | |
| | | | | | | | |
| | | | | | | 749,373 | |
| | |
| Diversified Financial Services – 0.5% | |
| | 13,112 | | | Voya Financial, Inc. | | | 790,391 | |
| | |
| Diversified Telecommunication Services – 0.4% | |
| | 49,276 | | | Vonage Holdings Corp.* | | | 651,429 | |
| | |
| Electric Utilities – 1.6% | |
| | 6,467 | | | ALLETE, Inc. | | | 401,795 | |
| | 14,124 | | | Alliant Energy Corp. | | | 651,964 | |
| | 8,738 | | | IDACORP, Inc. | | | 753,565 | |
| | 13,933 | | | Portland General Electric Co. | | | 587,415 | |
| | | | | | | | |
| | | | | | | 2,394,739 | |
| | |
| | |
| The accompanying notes are an integral part of these financial statements. | | 25 |
GOLDMAN SACHS SMALL/MID CAP VALUE FUND
Schedule of Investments (continued)
February 28, 2021 (Unaudited)
| | | | | | | | |
| Shares | | | Description | |
Value | |
|
| Common Stocks – (continued) | |
| Electrical Equipment – 1.1% | |
| | 5,110 | | | Hubbell, Inc. | | $ | 907,076 | |
| | 5,873 | | | Regal Beloit Corp. | | | 802,663 | |
| | | | | | | | |
| | | | | | | 1,709,739 | |
| | |
| Electronic Equipment, Instruments & Components – 2.6% | |
| | 43,550 | | | Flex Ltd.* | | | 792,175 | |
| | 2,675 | | | Littelfuse, Inc. | | | 696,088 | |
| | 20,079 | | | National Instruments Corp. | | | 891,508 | |
| | 13,500 | | | Trimble, Inc.* | | | 1,000,890 | |
| | 17,476 | | | Vontier Corp.* | | | 548,746 | |
| | | | | | | | |
| | | | | | | 3,929,407 | |
| | |
| Energy Equipment & Services – 0.7% | |
| | 50,518 | | | ChampionX Corp.* | | | 1,074,518 | |
| | |
| Entertainment – 1.4% | |
| | 20,813 | | | Cinemark Holdings, Inc. | | | 467,252 | |
| | 22,730 | | | Liberty Media Corp.-Liberty Formula One, Class C* | | | 997,847 | |
| | 7,308 | | | Live Nation Entertainment, Inc.* | | | 649,389 | |
| | | | | | | | |
| | | | | | | 2,114,488 | |
| | |
| Equity Real Estate Investment Trusts (REITs) – 9.2% | |
| | 19,711 | | | Americold Realty Trust REIT | | | 690,674 | |
| | 9,456 | | | Camden Property Trust REIT | | | 984,842 | |
| | 15,579 | | | Cousins Properties, Inc. REIT | | | 522,520 | |
| | 21,685 | | | CubeSmart REIT | | | 801,478 | |
| | 11,676 | | | CyrusOne, Inc. REIT | | | 766,296 | |
| | 19,195 | | | Duke Realty Corp. REIT | | | 753,404 | |
| | 6,793 | | | EastGroup Properties, Inc. REIT | | | 924,595 | |
| | 16,131 | | | Equity LifeStyle Properties, Inc. REIT | | | 994,476 | |
| | 23,545 | | | Healthcare Realty Trust, Inc. REIT | | | 679,509 | |
| | 25,953 | | | Highwoods Properties, Inc. REIT | | | 1,037,082 | |
| | 21,627 | | | Hudson Pacific Properties, Inc. REIT | | | 553,435 | |
| | 8,416 | | | Life Storage, Inc. REIT | | | 706,102 | |
| | 4,447 | | | Mid-America Apartment Communities, Inc. REIT | | | 599,144 | |
| | 9,223 | | | National Health Investors, Inc. REIT | | | 629,654 | |
| | 38,446 | | | Pebblebrook Hotel Trust REIT | | | 871,186 | |
| | 2,445 | | | PS Business Parks, Inc. REIT | | | 354,183 | |
| | 54,500 | | | RLJ Lodging Trust REIT | | | 855,650 | |
| | 3,720 | | | Sun Communities, Inc. REIT | | | 565,254 | |
| | 9,408 | | | Terreno Realty Corp. REIT | | | 527,224 | |
| | | | | | | | |
| | | | | | | 13,816,708 | |
| | |
| Food & Staples Retailing – 0.9% | |
| | 23,845 | | | Performance Food Group Co.* | | | 1,293,353 | |
| | |
| Food Products – 2.1% | |
| | 16,664 | | | Darling Ingredients, Inc.* | | | 1,050,499 | |
| | 11,371 | | | Hostess Brands, Inc.* | | | 163,629 | |
| | 10,655 | | | Lamb Weston Holdings, Inc. | | | 849,949 | |
| | 4,875 | | | Post Holdings, Inc.* | | | 468,292 | |
| | 24,646 | | | Utz Brands, Inc. | | | 622,804 | |
| | | | | | | | |
| | | | | | | 3,155,173 | |
| | |
|
| Common Stocks – (continued) | |
| Gas Utilities – 0.7% | |
| | 5,466 | | | Atmos Energy Corp. | | | 462,478 | |
| | 9,523 | | | ONE Gas, Inc. | | | 637,756 | |
| | | | | | | | |
| | | | | | | 1,100,234 | |
| | |
| Health Care Equipment & Supplies – 2.0% | |
| | 7,118 | | | Avanos Medical, Inc.* | | | 327,286 | |
| | 6,559 | | | DENTSPLY SIRONA, Inc. | | | 348,086 | |
| | 10,115 | | | Globus Medical, Inc., Class A* | | | 632,188 | |
| | 8,399 | | | Hill-Rom Holdings, Inc. | | | 895,921 | |
| | 11,342 | | | Integra LifeSciences Holdings Corp.* | | | 775,112 | |
| | | | | | | | |
| | | | | | | 2,978,593 | |
| | |
| Health Care Providers & Services – 1.0% | |
| | 14,758 | | | Acadia Healthcare Co., Inc.* | | | 815,232 | |
| | 13,733 | | | Tenet Healthcare Corp.* | | | 700,658 | |
| | | | | | | | |
| | | | | | | 1,515,890 | |
| | |
| Hotels, Restaurants & Leisure – 3.8% | |
| | 18,950 | | | Boyd Gaming Corp.* | | | 1,112,365 | |
| | 11,171 | | | Brinker International, Inc. | | | 766,219 | |
| | 11,355 | | | Caesars Entertainment, Inc.* | | | 1,061,011 | |
| | 4,391 | | | Marriott Vacations Worldwide Corp.* | | | 745,197 | |
| | 3,145 | | | Penn National Gaming, Inc.* | | | 364,128 | |
| | 17,429 | | | SeaWorld Entertainment, Inc.* | | | 865,524 | |
| | 14,346 | | | Travel + Leisure Co. | | | 866,929 | |
| | | | | | | | |
| | | | | | | 5,781,373 | |
| | |
| Household Durables – 1.3% | |
| | 901 | | | Helen of Troy Ltd.* | | | 195,337 | |
| | 5,371 | | | Installed Building Products, Inc.* | | | 587,373 | |
| | 6,873 | | | Meritage Homes Corp.* | | | 579,463 | |
| | 22,303 | | | Taylor Morrison Home Corp.* | | | 613,555 | |
| | | | | | | | |
| | | | | | | 1,975,728 | |
| | |
| Independent Power and Renewable Electricity Producers – 0.3% | |
| | 14,533 | | | Clearway Energy, Inc., Class A | | | 380,038 | |
| | |
| Industrial Conglomerates – 0.7% | |
| | 7,781 | | | Carlisle Cos., Inc. | | | 1,130,190 | |
| | |
| Insurance – 4.2% | |
| | 8,320 | | | American Financial Group, Inc. | | | 887,744 | |
| | 17,389 | | | Brown & Brown, Inc. | | | 798,155 | |
| | 11,452 | | | Globe Life, Inc. | | | 1,069,617 | |
| | 3,278 | | | Hanover Insurance Group, Inc. (The) | | | 378,117 | |
| | 7,883 | | | Kemper Corp. | | | 596,113 | |
| | 1,621 | | | Kinsale Capital Group, Inc. | | | 285,393 | |
| | 5,174 | | | Primerica, Inc. | | | 730,724 | |
| | 2,348 | | | RenaissanceRe Holdings Ltd. (Bermuda) | | | 392,069 | |
| | 7,511 | | | Selective Insurance Group, Inc. | | | 509,471 | |
| | 10,952 | | | W R Berkley Corp. | | | 759,302 | |
| | | | | | | | |
| | | | | | | 6,406,705 | |
| | |
| IT Services – 1.3% | |
| | 3,433 | | | CACI International, Inc., Class A* | | | 759,860 | |
| | 16,939 | | | Genpact Ltd. | | | 685,013 | |
| | 2,828 | | | WEX, Inc.* | | | 589,214 | |
| | | | | | | | |
| | | | | | | 2,034,087 | |
| | |
| | |
| 26 | | The accompanying notes are an integral part of these financial statements. |
GOLDMAN SACHS SMALL/MID CAP VALUE FUND
| | | | | | | | |
| Shares | | | Description | |
Value | |
|
| Common Stocks – (continued) | |
| Leisure Products – 0.9% | |
| | 10,760 | | | Brunswick Corp. | | $ | 950,861 | |
| | 14,814 | | | Callaway Golf Co. | | | 414,051 | |
| | | | | | | | |
| | | | | | | 1,364,912 | |
| | |
| Life Sciences Tools & Services – 2.2% | |
| | 9,077 | | | PerkinElmer, Inc. | | | 1,144,519 | |
| | 6,557 | | | PRA Health Sciences, Inc.* | | | 966,567 | |
| | 15,496 | | | Syneos Health, Inc.* | | | 1,198,616 | |
| | | | | | | | |
| | | | | | | 3,309,702 | |
| | |
| Machinery – 5.3% | |
| | 4,751 | | | Chart Industries, Inc.* | | | 679,821 | |
| | 26,441 | | | Colfax Corp.* | | | 1,172,658 | |
| | 12,554 | | | Donaldson Co., Inc. | | | 739,556 | |
| | 44,240 | | | Gates Industrial Corp. PLC* | | | 663,600 | |
| | 12,984 | | | Graco, Inc. | | | 900,441 | |
| | 14,535 | | | ITT, Inc. | | | 1,206,114 | |
| | 27,940 | | | Rexnord Corp. | | | 1,255,903 | |
| | 16,644 | | | Timken Co. (The) | | | 1,304,057 | |
| | | | | | | | |
| | | | | | | 7,922,150 | |
| | |
| Media – 0.5% | |
| | 4,942 | | | Nexstar Media Group, Inc., Class A | | | 679,772 | |
| | |
| Metals & Mining – 1.5% | |
| | 20,504 | | | Allegheny Technologies, Inc.* | | | 403,108 | |
| | 14,538 | | | Arconic Corp.* | | | 318,673 | |
| | 31,425 | | | Coeur Mining, Inc.* | | | 283,139 | |
| | 23,232 | | | Commercial Metals Co. | | | 584,285 | |
| | 24,267 | | | Constellium SE* | | | 321,295 | |
| | 9,808 | | | Steel Dynamics, Inc. | | | 407,817 | |
| | | | | | | | |
| | | | | | | 2,318,317 | |
| | |
| Mortgage Real Estate Investment Trusts (REITs) – 1.1% | |
| | 24,147 | | | KKR Real Estate Finance Trust, Inc. REIT | | | 445,029 | |
| | 25,995 | | | PennyMac Mortgage Investment Trust REIT | | | 493,125 | |
| | 95,358 | | | Two Harbors Investment Corp. REIT | | | 688,485 | |
| | | | | | | | |
| | | | | | | 1,626,639 | |
| | |
| Oil, Gas & Consumable Fuels – 2.6% | |
| | 15,904 | | | Cheniere Energy, Inc.* | | | 1,071,770 | |
| | 48,261 | | | Devon Energy Corp. | | | 1,039,542 | |
| | 29,868 | | | EQT Corp.* | | | 531,352 | |
| | 5,160 | | | Pioneer Natural Resources Co. | | | 766,621 | |
| | 28,251 | | | Viper Energy Partners LP | | | 442,976 | |
| | | | | | | | |
| | | | | | | 3,852,261 | |
| | |
| Pharmaceuticals – 1.1% | |
| | 14,582 | | | Catalent, Inc.* | | | 1,658,119 | |
| | |
| Professional Services – 1.9% | |
| | 13,066 | | | ASGN, Inc.* | | | 1,214,746 | |
| | 11,501 | | | Robert Half International, Inc. | | | 894,663 | |
| | 8,693 | | | Science Applications International Corp. | | | 748,728 | |
| | | | | | | | |
| | | | | | | 2,858,137 | |
| | |
|
| Common Stocks – (continued) | |
| Real Estate Management & Development – 0.6% | |
| | 38,307 | | | Cushman & Wakefield PLC* | | | 592,993 | |
| | 15,849 | | | Kennedy-Wilson Holdings, Inc. | | | 297,327 | |
| | | | | | | | |
| | | | | | | 890,320 | |
| | |
| Road & Rail – 1.1% | |
| | 10,759 | | | ArcBest Corp. | | | 634,673 | |
| | 3,936 | | | Old Dominion Freight Line, Inc. | | | 845,335 | |
| | 1,225 | | | Saia, Inc.* | | | 245,649 | |
| | | | | | | | |
| | | | | | | 1,725,657 | |
| | |
| Semiconductors & Semiconductor Equipment – 2.9% | |
| | 22,769 | | | Allegro MicroSystems, Inc. (Japan)* | | | 595,182 | |
| | 7,665 | | | Cree, Inc.* | | | 869,671 | |
| | 6,089 | | | Entegris, Inc. | | | 640,624 | |
| | 3,528 | | | First Solar, Inc.* | | | 285,838 | |
| | 4,646 | | | MKS Instruments, Inc. | | | 766,125 | |
| | 30,549 | | | ON Semiconductor Corp.* | | | 1,230,208 | |
| | | | | | | | |
| | | | | | | 4,387,648 | |
| | |
| Software – 0.6% | |
| | 20,301 | | | Nuance Communications, Inc.* | | | 905,425 | |
| | |
| Specialty Retail – 5.3% | |
| | 12,921 | | | Abercrombie & Fitch Co., Class A | | | 353,648 | |
| | 41,555 | | | American Eagle Outfitters, Inc. | | | 1,067,963 | |
| | 15,731 | | | Bed Bath & Beyond, Inc. | | | 422,535 | |
| | 2,206 | | | Burlington Stores, Inc.* | | | 570,957 | |
| | 2,243 | | | Dick’s Sporting Goods, Inc. | | | 160,083 | |
| | 3,223 | | | Five Below, Inc.* | | | 599,865 | |
| | 25,343 | | | Gap, Inc. (The)* | | | 632,308 | |
| | 39,397 | | | L Brands, Inc.* | | | 2,153,440 | |
| | 1,766 | | | Lithia Motors, Inc., Class A | | | 660,396 | |
| | 10,457 | | | Rent-A-Center, Inc. | | | 603,996 | |
| | 1,446 | | | RH* | | | 709,075 | |
| | 1,685 | | | Signet Jewelers Ltd.* | | | 83,879 | |
| | | | | | | | |
| | | | | | | 8,018,145 | |
| | |
| Textiles, Apparel & Luxury Goods – 2.2% | |
| | 20,434 | | | Capri Holdings Ltd.* | | | 953,655 | |
| | 10,025 | | | Crocs, Inc.* | | | 769,118 | |
| | 640 | | | Deckers Outdoor Corp.* | | | 208,710 | |
| | 27,677 | | | Tapestry, Inc. | | | 1,166,309 | |
| | 6,428 | | | Wolverine World Wide, Inc. | | | 224,659 | |
| | | | | | | | |
| | | | | | | 3,322,451 | |
| | |
| Thrifts & Mortgage Finance – 1.2% | |
| | 63,656 | | | MGIC Investment Corp. | | | 775,330 | |
| | 14,966 | | | NMI Holdings, Inc., Class A* | | | 342,123 | |
| | 20,947 | | | Washington Federal, Inc. | | | 633,018 | |
| | | | | | | | |
| | | | | | | 1,750,471 | |
| | |
| Trading Companies & Distributors – 0.7% | |
| | 11,962 | | | Beacon Roofing Supply, Inc.* | | | 572,143 | |
| | 1,993 | | | Watsco, Inc. | | | 484,498 | |
| | | | | | | | |
| | | | | | | 1,056,641 | |
| | |
| | TOTAL COMMON STOCKS | |
| | (Cost $109,662,892) | | $ | 147,420,017 | |
| | |
| | |
| The accompanying notes are an integral part of these financial statements. | | 27 |
GOLDMAN SACHS SMALL/MID CAP VALUE FUND
Schedule of Investments (continued)
February 28, 2021 (Unaudited)
| | | | | | | | |
| Shares | | Dividend
Rate | | | Value | |
|
| Investment Company – 2.9%(a) | |
Goldman Sachs Financial Square Government Fund – Institutional Shares | |
| 4,416,463 | | | 0.036 | % | | $ | 4,416,463 | |
| (Cost $4,416,463) | |
| |
| TOTAL INVESTMENTS – 100.7% | |
| (Cost $114,079,355) | | | $ | 151,836,480 | |
| |
| LIABILITIES IN EXCESS OF OTHER ASSETS – (0.7)% | | | | (1,116,208 | ) |
| |
| NET ASSETS – 100.0% | | | $ | 150,720,272 | |
| |
| | |
|
| The percentage shown for each investment category reflects the value of investments in that category as a percentage of net assets. |
| |
* | | Non-income producing security. |
| |
(a) | | Represents an affiliated issuer. |
| | | | |
|
Investment Abbreviations: |
LP | | —Limited Partnership |
PLC | | —Public Limited Company |
REIT | | —Real Estate Investment Trust |
|
| | |
| 28 | | The accompanying notes are an integral part of these financial statements. |
GOLDMAN SACHS FUNDAMENTAL EQUITY VALUE FUNDS
Statements of Assets and Liabilities
February 28, 2021 (Unaudited)
| | | | | | | | | | | | | | |
| | | | | Equity Income
Fund | | | Focused
Value Fund | | | Large Cap
Value Fund | |
| | Assets: | | | | | | | | | | | | |
| | Investments in unaffiliated issuers, at value (cost $299,192,101, $22,325,996, and $345,874,444, respectively) | | $ | 376,025,423 | | | $ | 24,767,245 | | | $ | 442,769,578 | |
| | Investments in affiliated issuers, at value (cost $0, $874,527 and $4,759,736, respectively) | | | — | | | | 874,527 | | | | 4,759,736 | |
| | Cash | | | — | | | | 257,827 | | | | 951,689 | |
| | Receivables: | | | | | | | | | | | | |
| | Dividends | | | 712,143 | | | | 36,247 | | | | 735,447 | |
| | Investments sold | | | 400,721 | | | | — | | | | — | |
| | Fund shares sold | | | 109,396 | | | | 1,025,917 | | | | 235,289 | |
| | Foreign tax reclaims | | | 36,636 | | | | 242 | | | | 54,936 | |
| | Reimbursement from investment adviser | | | 28,288 | | | | 16,995 | | | | 59,775 | |
| | Other assets | | | 79,145 | | | | 38,014 | | | | 65,996 | |
| | Total assets | | | 377,391,752 | | | | 27,017,014 | | | | 449,632,446 | |
| | | | | | | | | | | | | | |
| | Liabilities: | | | | | | | | | | | | |
| | Payables: | | | | | | | | | | | | |
| | Management fees | | | 200,885 | | | | 12,389 | | | | 257,614 | |
| | Due to custodian | | | 152,401 | | | | — | | | | — | |
| | Fund shares redeemed | | | 149,559 | | | | — | | | | 318,763 | |
| | Distribution and Service fees and Transfer Agency fees | | | 104,664 | | | | 715 | | | | 55,612 | |
| | Investments purchased | | | — | | | | 476,686 | | | | 365,821 | |
| | Accrued expenses | | | 241,349 | | | | 132,640 | | | | 221,599 | |
| | Total liabilities | | | 848,858 | | | | 622,430 | | | | 1,219,409 | |
| | | | | | | | | | | | | | |
| | Net Assets: | | | | | | | | | | | | |
| | Paid-in capital | | | 301,295,810 | | | | 23,554,363 | | | | 347,598,718 | |
| | Total distributable earnings | | | 75,247,084 | | | | 2,840,221 | | | | 100,814,319 | |
| | NET ASSETS | | $ | 376,542,894 | | | $ | 26,394,584 | | | $ | 448,413,037 | |
| | | Net Assets: | | | | | | | | | | | | |
| | | Class A | | $ | 305,229,495 | | | $ | 235,490 | | | $ | 81,036,631 | |
| | | Class C | | | 5,632,612 | | | | 68,181 | | | | 16,427,051 | |
| | | Institutional | | | 28,232,993 | | | | 5,332,794 | | | | 163,573,857 | |
| | | Service | | | 91,207 | | | | — | | | | 827,845 | |
| | | Investor | | | 2,600,834 | | | | 11,657 | | | | 3,403,666 | |
| | | Class R6 | | | 5,593,000 | | | | 11,657 | | | | 1,653,750 | |
| | | Class R | | | 1,237,357 | | | | 38,194 | | | | 2,996,388 | |
| | | Class P | | | 27,925,396 | | | | 20,696,611 | | | | 178,493,849 | |
| | | Total Net Assets | | $ | 376,542,894 | | | $ | 26,394,584 | | | $ | 448,413,037 | |
| | | Shares Outstanding $0.001 par value (unlimited number of shares authorized): | | | | | | | | | | | | |
| | | Class A | | | 7,327,910 | | | | 18,040 | | | | 5,164,998 | |
| | | Class C | | | 142,265 | | | | 5,277 | | | | 1,108,834 | |
| | | Institutional | | | 665,400 | | | | 407,489 | | | | 10,316,015 | |
| | | Service | | | 2,182 | | | | — | | | | 52,954 | |
| | | Investor | | | 62,548 | | | | 893 | | | | 217,059 | |
| | | Class R6 | | | 131,805 | | | | 892 | | | | 101,697 | |
| | | Class R | | | 29,876 | | | | 2,940 | | | | 197,284 | |
| | | Class P | | | 658,257 | | | | 1,583,660 | | | | 10,977,856 | |
| | | Net asset value, offering and redemption price per share:(a) | | | | | | | | | | | | |
| | | Class A | | | $41.65 | | | | $13.05 | | | | $15.69 | |
| | | Class C | | | 39.59 | | | | 12.92 | | | | 14.81 | |
| | | Institutional | | | 42.43 | | | | 13.09 | | | | 15.86 | |
| | | Service | | | 41.81 | | | | — | | | | 15.63 | |
| | | Investor | | | 41.58 | | | | 13.06 | | | | 15.68 | |
| | | Class R6 | | | 42.43 | | | | 13.07 | | | | 16.26 | |
| | | Class R | | | 41.42 | | | | 12.99 | | | | 15.19 | |
| | | Class P | | | 42.42 | | | | 13.07 | | | | 16.26 | |
| | (a) | | Maximum public offering price per share for Class A Shares of the Equity Income, Focused Value and Large Cap Value Funds is $44.07, $13.81 and $16.60, respectively. At redemption, Class C Shares may be subject to a contingent deferred sales charge, assessed on the amount equal to the lesser of the current net asset value (“NAV”) or the original purchase price of the shares. |
| | |
| The accompanying notes are an integral part of these financial statements. | | 29 |
GOLDMAN SACHS FUNDAMENTAL EQUITY VALUE FUNDS
Statements of Assets and Liabilities (continued)
February 28, 2021 (Unaudited)
| | | | | | | | | | | | | | |
| | | | | Mid Cap
Value Fund | | | Small Cap
Value Fund | | | Small/Mid Cap
Value Fund | |
| | Assets: | | | | | | | | | | | | |
| | Investments in unaffiliated issuers, at value (cost $833,874,510, $3,543,907,249, and $109,662,892, respectively)(a) | | $ | 1,122,485,818 | | | $ | 5,305,052,024 | | | $ | 147,420,017 | |
| | Investments in affiliated issuers, at value (cost $6,015,624, $23,686,984 and $4,416,463, respectively) | | | 6,015,624 | | | | 23,686,984 | | | | 4,416,463 | |
| | Investments in securities lending reinvestment vehicle, at value which equals cost | | | — | | | | 5,933,827 | | | | — | |
| | Cash | | | 7,682,598 | | | | — | | | | 178,325 | |
| | Receivables: | | | | | | | | | | | | |
| | Investments sold | | | 2,108,182 | | | | 27,895,164 | | | | 806,775 | |
| | Fund shares sold | | | 1,796,247 | | | | 8,171,799 | | | | 253,995 | |
| | Dividends | | | 1,153,100 | | | | 3,294,080 | | | | 116,450 | |
| | Reimbursement from investment adviser | | | 18,433 | | | | 200,750 | | | | 28,969 | |
| | Foreign tax reclaims | | | 6,591 | | | | 208,183 | | | | 4,469 | |
| | Securities lending income | | | 1,629 | | | | 4,953 | | | | 16 | |
| | Other assets | | | 68,084 | | | | 136,508 | | | | 63,082 | |
| | Total assets | | | 1,141,336,306 | | | | 5,374,584,272 | | | | 153,288,561 | |
| | | | | | | | | | | | | | |
| | Liabilities: | | | | | | | | | | | | |
| | Payables: | | | | | | | | | | | | |
| | Investments purchased | | | 6,755,626 | | | | 14,175,817 | | | | 2,322,659 | |
| | Fund shares redeemed | | | 966,668 | | | | 24,626,854 | | | | 8,435 | |
| | Management fees | | | 650,547 | | | | 3,698,122 | | | | 89,798 | |
| | Distribution and Service fees and Transfer Agency fees | | | 212,975 | | | | 347,751 | | | | 5,313 | |
| | Upon return of securities loaned | | | — | | | | 5,933,827 | | | | — | |
| | Due to custodian | | | — | | | | 12,655,561 | | | | — | |
| | Accrued expenses | | | 396,627 | | | | 820,786 | | | | 142,084 | |
| | Total liabilities | | | 8,982,443 | | | | 62,258,718 | | | | 2,568,289 | |
| | | | | | | | | | | | | | |
| | Net Assets: | | | | | | | | | | | | |
| | Paid-in capital | | | 803,604,377 | | | | 3,556,634,160 | | | | 118,815,276 | |
| | Total distributable earnings | | | 328,749,486 | | | | 1,755,691,394 | | | | 31,904,996 | |
| | | NET ASSETS | | $ | 1,132,353,863 | | | $ | 5,312,325,554 | | | $ | 150,720,272 | |
| | | Net Assets: | | | | | | | | | | | | |
| | | Class A | | $ | 489,829,567 | | | $ | 485,806,262 | | | $ | 1,385,869 | |
| | | Class C | | | 16,108,779 | | | | 2,942,564 | | | | 1,326,750 | |
| | | Institutional | | | 302,268,908 | | | | 2,817,151,164 | | | | 14,030,084 | |
| | | Service | | | 32,174,002 | | | | 35,646,625 | | | | — | |
| | | Investor | | | 37,929,762 | | | | 161,857,386 | | | | 3,422,273 | |
| | | Class R6 | | | 69,628,529 | | | | 1,443,782,176 | | | | 72,859,423 | |
| | | Class R | | | 19,342,419 | | | | 65,369,032 | | | | 74,003 | |
| | | Class P | | | 165,071,897 | | | | 299,770,345 | | | | 57,621,870 | |
| | | Total Net Assets | | $ | 1,132,353,863 | | | $ | 5,312,325,554 | | | $ | 150,720,272 | |
| | | Shares Outstanding $0.001 par value (unlimited number of shares authorized): | | | | | | | | | | | | |
| | | Class A | | | 12,488,474 | | | | 8,581,982 | | | | 89,984 | |
| | | Class C | | | 474,843 | | | | 73,723 | | | | 88,771 | |
| | | Institutional | | | 7,614,177 | | | | 45,436,036 | | | | 899,249 | |
| | | Service | | | 839,036 | | | | 653,336 | | | | — | |
| | | Investor | | | 992,957 | | | | 2,886,894 | | | | 220,601 | |
| | | Class R6 | | | 1,755,261 | | | | 23,298,114 | | | | 4,674,863 | |
| | | Class R | | | 511,068 | | | | 1,186,715 | | | | 4,811 | |
| | | Class P | | | 4,161,960 | | | | 4,837,121 | | | | 3,697,726 | |
| | | Net asset value, offering and redemption price per share:(b) | | | | | | | | | | | | |
| | | Class A | | | $39.22 | | | | $56.61 | | | | $15.40 | |
| | | Class C | | | 33.92 | | | | 39.91 | | | | 14.95 | |
| | | Institutional | | | 39.70 | | | | 62.00 | | | | 15.60 | |
| | | Service | | | 38.35 | | | | 54.56 | | | | — | |
| | | Investor | | | 38.20 | | | | 56.07 | | | | 15.51 | |
| | | Class R6 | | | 39.67 | | | | 61.97 | | | | 15.59 | |
| | | Class R | | | 37.85 | | | | 55.08 | | | | 15.38 | |
| | | Class P | | | 39.66 | | | | 61.97 | | | | 15.58 | |
| | (a) | | Includes loaned securities having a market value of $–, $5,115,803 and $— for Mid Cap Value, Small Cap Value and Small/Mid Cap Value Funds, respectively. |
| | (b) | | Maximum public offering price per share for Class A Shares of the Mid Cap Value, Small Cap Value and Small/Mid Cap Value Funds is $41.50, $59.90 and $16.30, respectively. At redemption, Class C Shares may be subject to a contingent deferred sales charge, assessed on the amount equal to the lesser of the current net asset value (“NAV”) or the original purchase price of the shares. |
| | |
| 30 | | The accompanying notes are an integral part of these financial statements. |
GOLDMAN SACHS FUNDAMENTAL EQUITY VALUE FUNDS
Statements of Operations
For the Six Months Ended February 28, 2021 (Unaudited)
| | | | | | | | | | | | | | |
| | | | | Equity Income
Fund | | | Focused Value
Fund | | | Large Cap
Value Fund | |
| | Investment income: | | | | | | | | | | | | |
| | | | |
| | Dividends — unaffiliated issuer (net of foreign withholding taxes of $–, $311 and $4,641, respectively) | | $ | 4,036,126 | | | $ | 106,739 | | | $ | 3,827,011 | |
| | | | |
| | Dividends — affiliated issuers | | | 104 | | | | 54 | | | | 502 | |
| | | | |
| | Securities lending income — unaffiliated issuer | | | 1,459 | | | | — | | | | — | |
| | | | |
| | Total investment income | | | 4,037,689 | | | | 106,793 | | | | 3,827,513 | |
| | | | | | | | | | | | | | |
| | Expenses: | |
| | | | |
| | Management fees | | | 1,232,358 | | | | 48,468 | | | | 1,554,501 | |
| | | | |
| | Distribution and Service fees(a) | | | 390,427 | | | | 472 | | | | 167,145 | |
| | | | |
| | Transfer Agency fees(a) | | | 252,140 | | | | 2,376 | | | | 134,477 | |
| | | | |
| | Registration fees | | | 65,198 | | | | 49,446 | | | | 61,118 | |
| | | | |
| | Professional fees | | | 47,813 | | | | 46,593 | | | | 46,587 | |
| | | | |
| | Printing and mailing costs | | | 40,567 | | | | 8,974 | | | | 23,367 | |
| | | | |
| | Custody, accounting and administrative services | | | 26,816 | | | | 10,183 | | | | 31,301 | |
| | | | |
| | Trustee fees | | | 10,221 | | | | 9,974 | | | | 10,255 | |
| | | | |
| | Service fees — Class C | | | 6,625 | | | | 54 | | | | 20,967 | |
| | | | |
| | Shareholder Administration fees — Service Shares | | | 188 | | | | — | | | | 1,026 | |
| | | | |
| | Other | | | 9,159 | | | | 4,124 | | | | 9,257 | |
| | | | |
| | Total expenses | | | 2,081,512 | | | | 180,664 | | | | 2,060,001 | |
| | | | |
| | Less — expense reductions | | | (269,749 | ) | | | (129,441 | ) | | | (336,151 | ) |
| | | | |
| | Net expenses | | | 1,811,763 | | | | 51,223 | | | | 1,723,850 | |
| | | | |
| | NET INVESTMENT INCOME | | | 2,225,926 | | | | 55,570 | | | | 2,103,663 | |
| | | | |
| | | | | | | | | | | | | | |
| | Realized and unrealized gain (loss): | |
| | | | |
| | Net realized gain (loss) from: | | | | | | | | | | | | |
| | | | |
| | Investments — unaffiliated issuers | | | 11,531,222 | | | | 796,464 | | | | 10,897,308 | |
| | | | |
| | Net change in unrealized gain (loss) on: | | | | | | | | | | | | |
| | | | |
| | Investments — unaffiliated issuers | | | 22,725,678 | | | | 1,445,862 | | | | 51,710,333 | |
| | | | |
| | Net realized and unrealized gain | | | 34,256,900 | | | | 2,242,326 | | | | 62,607,641 | |
| | | | |
| | NET INCREASE IN NET ASSETS RESULTING FROM OPERATIONS | | $ | 36,482,826 | | | $ | 2,297,896 | | | $ | 64,711,304 | |
| | (a) | | Class specific Distribution and/or Service and Transfer Agency fees were as follows: |
| | | | | | | | | | | | | | | | | | | | | | | | | | | | | | | | | | | | | | | | | | | | | | | | |
| | | Distribution and/or Service Fees | | | Transfer Agency Fees | |
Fund | | Class A | | | Class C | | | Service | | | Class R | | | Class A | | | Class C | | | Institutional | | | Service | | | Investor | | | Class R6 | | | Class R | | | Class P | |
Equity Income | | $ | 367,419 | | | $ | 19,875 | | | $ | 188 | | | $ | 2,945 | | | $ | 235,149 | | | $ | 4,240 | | | $ | 5,120 | | | $ | 30 | | | $ | 2,463 | | | $ | 801 | | | $ | 943 | | | $ | 3,394 | |
Focused Value | | | 202 | | | | 161 | | | | — | | | | 109 | | | | 129 | | | | 34 | | | | 349 | | | | — | | | | 25 | | | | 5 | | | | 35 | | | | 1,799 | |
Large Cap Value | | | 95,706 | | | | 62,904 | | | | 1,026 | | | | 7,509 | | | | 61,253 | | | | 13,420 | | | | 29,891 | | | | 164 | | | | 2,657 | | | | 273 | | | | 2,403 | | | | 24,416 | |
| | |
| The accompanying notes are an integral part of these financial statements. | | 31 |
GOLDMAN SACHS FUNDAMENTAL EQUITY VALUE FUNDS
Statements of Operations (continued)
For the Six Months Ended February 28, 2021 (Unaudited)
| | | | | | | | | | | | | | |
| | | | | Mid Cap
Value Fund | | | Small Cap
Value Fund | | | Small/Mid Cap
Value Fund | |
| | Investment income: | | | | | | | | | | | | |
| | | | |
| | Dividends — unaffiliated issuer (net of foreign withholding taxes of $3,607, $– and $–, respectively) | | $ | 6,196,691 | | | $ | 27,441,010 | | | $ | 702,924 | |
| | | | |
| | Dividends — affiliated issuers | | | 489 | | | | 1,846 | | | | 162 | |
| | | | |
| | Securities lending income — unaffiliated issuer | | | 4,954 | | | | 126,588 | | | | 422 | |
| | | | |
| | Total investment income | | | 6,202,134 | | | | 27,569,444 | | | | 703,508 | |
| | | | | | | | | | | | | | |
| | Expenses: | |
| | | | |
| | Management fees | | | 3,854,611 | | | | 22,209,812 | | | | 471,833 | |
| | | | |
| | Distribution and Service fees(a) | | | 704,726 | | | | 751,945 | | | | 5,607 | |
| | | | |
| | Transfer Agency fees(a) | | | 506,285 | | | | 1,263,989 | | | | 20,635 | |
| | | | |
| | Registration fees | | | 75,439 | | | | 85,738 | | | | 75,358 | |
| | | | |
| | Printing and mailing costs | | | 69,011 | | | | 213,940 | | | | 9,913 | |
| | | | |
| | Custody, accounting and administrative services | | | 68,875 | | | | 293,873 | | | | 17,283 | |
| | | | |
| | Service fees — Class C | | | 19,874 | | | | 3,311 | | | | 1,344 | |
| | | | |
| | Professional fees | | | 46,778 | | | | 47,372 | | | | 46,808 | |
| | | | |
| | Shareholder Administration fees — Service Shares | | | 38,186 | | | | 47,528 | | | | — | |
| | | | |
| | Trustee fees | | | 10,673 | | | | 12,461 | | | | 10,040 | |
| | | | |
| | Other | | | 8,337 | | | | 24,947 | | | | 4,459 | |
| | | | |
| | Total expenses | | | 5,402,795 | | | | 24,954,916 | | | | 663,280 | |
| | | | |
| | Less — expense reductions | | | (3,063 | ) | | | (651,981 | ) | | | (162,484 | ) |
| | | | |
| | Net expenses | | | 5,399,732 | | | | 24,302,935 | | | | 500,796 | |
| | | | |
| | NET INVESTMENT INCOME | | | 802,402 | | | | 3,266,509 | | | | 202,712 | |
| | | | |
| | | | | | | | | | | | | | |
| | Realized and unrealized gain (loss): | |
| | | | |
| | Net realized gain (loss) from: | | | | | | | | | | | | |
| | | | |
| | Investments — unaffiliated issuers | | | 89,046,865 | | | | 366,059,326 | | | | 5,821,215 | |
| | | | |
| | Net change in unrealized gain (loss) on: | | | | | | | | | | | | |
| | | | |
| | Investments — unaffiliated issuers | | | 150,707,458 | | | | 1,287,431,661 | | | | 29,606,050 | |
| | | | |
| | Net realized and unrealized gain | | | 239,754,323 | | | | 1,653,490,987 | | | | 35,427,265 | |
| | | | |
| | NET INCREASE IN NET ASSETS RESULTING FROM OPERATIONS | | $ | 240,556,725 | | | $ | 1,656,757,496 | | | $ | 35,629,977 | |
| | (a) | | Class specific Distribution and/or Service and Transfer Agency fees were as follows: |
| | | | | | | | | | | | | | | | | | | | | | | | | | | | | | | | | | | | | | | | | | | | | | | | |
| | | Distribution and/or Service Fees | | | Transfer Agency Fees | |
Fund | | Class A | | | Class C | | | Service | | | Class R | | | Class A | | | Class C | | | Institutional | | | Service | | | Investor | | | Class R6 | | | Class R | | | Class P | |
Mid Cap Value | | $ | 562,559 | | | $ | 59,619 | | | $ | 38,186 | | | $ | 44,361 | | | $ | 360,040 | | | $ | 12,719 | | | $ | 55,100 | | | $ | 6,110 | | | $ | 27,564 | | | $ | 9,185 | | | $ | 14,196 | | | $ | 21,371 | |
Small Cap Value | | | 546,454 | | | | 9,935 | | | | 47,528 | | | | 148,028 | | | | 349,733 | | | | 2,119 | | | | 517,559 | | | | 7,605 | | | | 103,722 | | | | 199,353 | | | | 47,369 | | | | 36,529 | |
Small/Mid Cap Value | | | 1,368 | | | | 4,032 | | | | — | | | | 207 | | | | 875 | | | | 860 | | | | 1,771 | | | | — | | | | 1,273 | | | | 8,967 | | | | 66 | | | | 6,823 | |
| | |
| 32 | | The accompanying notes are an integral part of these financial statements. |
GOLDMAN SACHS FUNDAMENTAL EQUITY VALUE FUNDS
Statements of Changes in Net Assets
| | | | | | | | | | | | | | | | | | | | | | |
| | | | | Equity Income Fund | | | | | | Focused Value Fund | |
| | | | | For the
Six Months Ended
February 28, 2021
(Unaudited) | | | For the Fiscal
Year Ended
August 31, 2020 | | | | | | For the
Six Months Ended
February 28, 2021
(Unaudited) | | | For the Fiscal
Year Ended
August 31, 2020 | |
| | From operations: | | | | | | | | | | | | | |
| | Net investment income | | $
| 2,225,926
|
| | $ | 5,876,288 | | | | | | | $
| 55,570
|
| | $ | 97,729 | |
| | Net realized gain (loss) | | | 11,531,222 | | | | (13,778,505 | ) | | | | | | | 796,464 | | | | (263,076 | ) |
| | Net change in unrealized gain | | | 22,725,678 | | | | 17,898,586 | | | | | | | | 1,445,862 | | | | 749,647 | |
| | Net increase in net assets resulting from operations | | | 36,482,826 | | | | 9,996,369 | | | | | | | | 2,297,896 | | | | 584,300 | |
| | | | | | | | | | | | | | | | | | | | | | |
| | Distributions to shareholders: | | | | | | | | | | | | | | | | | | | | |
| | From distributable earnings: | | | | | | | | | | | | | | | | | | | | |
| | Class A Shares | | | (2,028,211 | ) | | | (17,532,636 | ) | | | | | | | (2,864 | ) | | | (896 | ) |
| | Class C Shares | | | (16,714 | ) | | | (409,370 | ) | | | | | | | (390 | ) | | | (328 | ) |
| | Institutional Shares | | | (214,636 | ) | | | (1,216,336 | ) | | | | | | | (19,225 | ) | | | (13,526 | ) |
| | Service Shares | | | (963 | ) | | | (9,520 | ) | | | | | | | — | | | | — | |
| | Investor Shares | | | (25,762 | ) | | | (148,693 | ) | | | | | | | (715 | ) | | | (521 | ) |
| | Class R6 Shares | | | (44,857 | ) | | | (352,619 | ) | | | | | | | (749 | ) | | | (557 | ) |
| | Class R Shares | | | (6,688 | ) | | | (83,278 | ) | | | | | | | (1,033 | ) | | | (358 | ) |
| | Class P Shares | | | (182,619 | ) | | | (751,373 | ) | | | | | | | (221,552 | ) | | | (141,442 | ) |
| | From return of capital: | | | | | | | | | | | | | | | | | | | | |
| | Total distributions to shareholders | | | (2,520,450 | ) | | | (20,503,825 | ) | | | | | | | (246,528 | ) | | | (157,628 | ) |
| | | | | | | | | | | | | | | | | | | | | | |
| | From share transactions: | | | | | | | | | | | | | | | | | | | | |
| | Proceeds from sales of shares | | | 19,723,778 | | | | 27,017,610 | | | | | | | | 16,320,230 | | | | 5,277,622 | |
| | Reinvestment of distributions | | | 2,468,708 | | | | 20,013,288 | | | | | | | | 246,527 | | | | 157,628 | |
| | Cost of shares redeemed | | | (29,235,739 | ) | | | (48,563,613 | ) | | | | | | | (2,032,775 | ) | | | (1,754,963 | ) |
| | Net increase (decrease) in net assets resulting from share transactions | | | (7,043,253 | ) | | | (1,532,715 | ) | | | | | | | 14,533,982 | | | | 3,680,287 | |
| | TOTAL INCREASE (DECREASE) | | | 26,919,123 | | | | (12,040,171 | ) | | | | | | | 16,585,350 | | | | 4,106,959 | |
| | | | | | | | | | | | | | | | | | | | | | |
| | Net assets: | | | | | | | | | | | | | | | | | | | | |
| | Beginning of period | | | 349,623,771 | | | | 361,663,942 | | | | | | | | 9,809,234 | | | | 5,702,275 | |
| | End of period | | $ | 376,542,894 | | | $ | 349,623,771 | | | | | | | $ | 26,394,584 | | | $ | 9,809,234 | |
| | |
| The accompanying notes are an integral part of these financial statements. | | 33 |
GOLDMAN SACHS FUNDAMENTAL EQUITY VALUE FUNDS
Statements of Changes in Net Assets (continued)
| | | | | | | | | | | | | | | | | | | | | | |
| | | | | Large Cap Value Fund | | | | | | Mid Cap Value Fund | |
| | | | | For the
Six Months Ended
February 28, 2021
(Unaudited) | | | For the Fiscal
Year Ended
August 31, 2020 | | | | | | For the
Six Months Ended
February 28, 2021
(Unaudited) | | | For the Fiscal
Year Ended
August 31, 2020 | |
| | From operations: | | | | | | | | | | | | | | | | | | | | |
| | Net investment income | | $
| 2,103,663
|
| | $ | 5,602,606 | | | | | | | $
| 802,402
|
| | $ | 6,756,368 | |
| | Net realized gain (loss) | | | 10,897,308 | | | | 11,871,508 | | | | | | | | 89,046,865 | | | | (18,287,118 | ) |
| | Net change in unrealized gain (loss) | | | 51,710,333 | | | | (8,987,506 | ) | | | | | | | 150,707,458 | | | | 6,802,943 | |
| | Net increase (decrease) in net assets resulting from operations | | | 64,711,304 | | | | 8,486,608 | | | | | | | | 240,556,725 | | | | (4,727,807 | ) |
| | | | | | | | | | | | | | | | | | | | | | |
| | Distributions to shareholders: | | | | | | | | | | | | | | | | | | | | |
| | From distributable earnings: | | | | | | | | | | | | | | | | | | | | |
| | Class A Shares | | | (2,596,115 | ) | | | (4,777,394 | ) | | | | | | | (1,732,461 | ) | | | (15,695,026 | ) |
| | Class C Shares | | | (463,197 | ) | | | (1,128,907 | ) | | | | | | | — | | | | (730,806 | ) |
| | Institutional Shares | | | (5,488,119 | ) | | | (8,924,042 | ) | | | | | | | (1,983,199 | ) | | | (11,197,871 | ) |
| | Service Shares | | | (26,170 | ) | | | (55,313 | ) | | | | | | | (69,711 | ) | | | (1,246,153 | ) |
| | Investor Shares | | | (118,038 | ) | | | (239,744 | ) | | | | | | | (214,960 | ) | | | (1,409,539 | ) |
| | Class R6 Shares | | | (68,223 | ) | | | (112,182 | ) | | | | | | | (461,696 | ) | | | (1,788,686 | ) |
| | Class R Shares | | | (95,537 | ) | | | (208,225 | ) | | | | | | | (26,075 | ) | | | (644,977 | ) |
| | Class P Shares | | | (5,747,841 | ) | | | (10,614,391 | ) | | | | | | | (1,049,073 | ) | | | (4,380,812 | ) |
| | From return of capital: | | | | | | | | | | | | | | | | | | | | |
| | Class A Shares | | | — | | | | — | | | | | | | | — | | | | (496,723 | ) |
| | Class C Shares | | | — | | | | — | | | | | | | | — | | | | (23,129 | ) |
| | Institutional Shares | | | — | | | | — | | | | | | | | — | | | | (354,394 | ) |
| | Service Shares | | | — | | | | — | | | | | | | | — | | | | (39,439 | ) |
| | Investor Shares | | | — | | | | — | | | | | | | | — | | | | (44,610 | ) |
| | Class R6 Shares | | | — | | | | — | | | | | | | | — | | | | (56,609 | ) |
| | Class R Shares | | | — | | | | — | | | | | | | | — | | | | (20,412 | ) |
| | Class P Shares | | | — | | | | — | | | | | | | | — | | | | (138,646 | ) |
| | Total distributions to shareholders | | | (14,603,240 | ) | | | (26,060,198 | ) | | | | | | | (5,537,175 | ) | | | (38,267,832 | ) |
| | | | | | | | | | | | | | | | | | | | | | |
| | From share transactions: | | | | | | | | | | | | | | | | | | | | |
| | Proceeds from sales of shares | | | 21,448,935 | | | | 39,333,770 | | | | | | | | 64,890,768 | | | | 168,041,377 | |
| | Reinvestment of distributions | | | 14,548,855 | | | | 25,541,835 | | | | | | | | 5,131,888 | | | | 35,333,367 | |
| | Cost of shares redeemed | | | (33,871,431 | ) | | | (126,591,157 | ) | | | | | | | (150,082,111 | ) | | | (387,348,378 | ) |
| | Net increase (decrease) in net assets resulting from share transactions | | | 1,926,359 | | | | (61,715,552 | ) | | | | | | | (80,059,455 | ) | | | (183,973,634 | ) |
| | TOTAL INCREASE (DECREASE) | | | 52,034,423 | | | | (79,289,142 | ) | | | | | | | 154,960,095 | | | | (226,969,273 | ) |
| | | | | | | | | | | | | | | | | | | | | | |
| | Net assets: | | | | | | | | | | | | | | | | | | | | |
| | Beginning of period | | | 396,378,614 | | | | 475,667,756 | | | | | | | | 977,393,768 | | | | 1,204,363,041 | |
| | End of period | | $ | 448,413,037 | | | $ | 396,378,614 | | | | | | | $ | 1,132,353,863 | | | $ | 977,393,768 | |
| | |
| 34 | | The accompanying notes are an integral part of these financial statements. |
GOLDMAN SACHS FUNDAMENTAL EQUITY VALUE FUNDS
Statements of Changes in Net Assets (continued)
| | | | | | | | | | | | | | | | | | |
| | | | | Small Cap Value Fund | | | Small/Mid Cap Value Fund | |
| | | | | For the
Six Months Ended
February 28, 2021
(Unaudited) | | | For the Fiscal
Year Ended
August 31, 2020 | | | For the
Six Months Ended
February 28, 2021
(Unaudited) | | | For the Fiscal
Year Ended
August 31, 2020 | |
| | From operations: | | | | | | | | | | | | | | | | |
| | | | | |
| | Net investment income | | $
| 3,266,509
|
| | $ | 34,972,897 | | | $
| 202,712
|
| | $ | 854,786 | |
| | | | | |
| | Net realized gain (loss) | | | 366,059,326 | | | | (193,640,071 | ) | | | 5,821,215 | | | | (8,209,215 | ) |
| | | | | |
| | Net change in unrealized gain (loss) | | | 1,287,431,661 | | | | (309,976,878 | ) | | | 29,606,050 | | | | 1,696,171 | |
| | | | | |
| | Net increase (decrease) in net assets resulting from operations | | | 1,656,757,496 | | | | (468,644,052 | ) | | | 35,629,977 | | | | (5,658,258 | ) |
| | | | | | | | | | | | | | | | | | |
| | Distributions to shareholders: | | | | | | | | | | | | | | | | |
| | | | | |
| | From distributable earnings: | | | | | | | | | | | | | | | | |
| | | | | |
| | Class A Shares | | | (884,665 | ) | | | (27,617,788 | ) | | | (4,199 | ) | | | (7,146 | ) |
| | | | | |
| | Class C Shares | | | — | | | | (455,913 | ) | | | — | | | | — | |
| | | | | |
| | Institutional Shares | | | (13,501,670 | ) | | | (150,441,897 | ) | | | (60,427 | ) | | | (64,934 | ) |
| | | | | |
| | Service Shares | | | (18,081 | ) | | | (2,760,504 | ) | | | — | | | | — | |
| | | | | |
| | Investor Shares | | | (585,487 | ) | | | (7,064,182 | ) | | | (7,543 | ) | | | (29,922 | ) |
| | | | | |
| | Class R6 Shares | | | (7,311,413 | ) | | | (65,209,388 | ) | | | (439,348 | ) | | | (605,200 | ) |
| | | | | |
| | Class R Shares | | | — | | | | (3,705,297 | ) | | | — | | | | (584 | ) |
| | | | | |
| | Class P Shares | | | (1,337,472 | ) | | | (10,863,518 | ) | | | (332,143 | ) | | | (508,457 | ) |
| | | | | |
| | From return of capital: | | | | | | | | | | | | | | | | |
| | | | | |
| | Total distributions to shareholders | | | (23,638,788 | ) | | | (268,118,487 | ) | | | (843,660 | ) | | | (1,216,243 | ) |
| | | | | | | | | | | | | | | | | | |
| | From share transactions: | | | | | | | | | | | | | | | | |
| | | | | |
| | Proceeds from sales of shares | | | 517,325,174 | | | | 1,187,909,742 | | | | 26,262,249 | | | | 19,961,483 | |
| | | | | |
| | Reinvestment of distributions | | | 23,006,156 | | | | 258,783,478 | | | | 842,799 | | | | 1,215,128 | |
| | | | | |
| | Cost of shares redeemed | | | (1,380,267,048 | ) | | | (1,736,309,339 | ) | | | (12,328,255 | ) | | | (31,021,453 | ) |
| | | | | |
| | Net increase (decrease) in net assets resulting from share transactions | | | (839,935,718 | ) | | | (289,616,119 | ) | | | 14,776,793 | | | | (9,844,842 | ) |
| | | | | |
| | TOTAL INCREASE (DECREASE) | | | 793,182,990 | | | | (1,026,378,658 | ) | | | 49,563,110 | | | | (16,719,343 | ) |
| | | | | | | | | | | | | | | | | | |
| | Net assets: | | | | | | | | | | | | | | | | |
| | | | | |
| | Beginning of period | | | 4,519,142,564 | | | | 5,545,521,222 | | | | 101,157,162 | | | | 117,876,505 | |
| | End of period | | $ | 5,312,325,554 | | | $ | 4,519,142,564 | | | $ | 150,720,272 | | | $ | 101,157,162 | |
| | |
| The accompanying notes are an integral part of these financial statements. | | 35 |
GOLDMAN SACHS EQUITY INCOME FUND
Financial Highlights
Selected Share Data for a Share Outstanding Throughout Each Period
| | | | | | | | | | | | | | | | | | | | | | | | | | |
| | | | | Goldman Sachs Equity Income Fund | |
| | | | | Class A Shares | |
| | | | | Six Months Ended
February 28, 2021
(Unaudited) | | | Year Ended August 31, | |
| | | | | 2020 | | | 2019 | | | 2018 | | | 2017 | | | 2016 | |
| | Per Share Data | | | | | | | | | | | | | | | | | | | | | | | | |
| | | | | | | |
| | Net asset value, beginning of period | | $ | 37.94 | | | $ | 38.96 | | | $ | 38.26 | | | $ | 35.17 | | | $ | 32.53 | | | $ | 30.47 | |
| | | | | | | |
| | Net investment income(a) | | | 0.24 | | | | 0.62 | | | | 0.67 | | | | 0.67 | | | | 0.61 | | | | 0.68 | |
| | | | | | | |
| | Net realized and unrealized gain | | | 3.74 | | | | 0.58 | | | | 0.99 | | | | 3.12 | | | | 2.60 | | | | 2.02 | |
| | | | | | | |
| | Total from investment operations | | | 3.98 | | | | 1.20 | | | | 1.66 | | | | 3.79 | | | | 3.21 | | | | 2.70 | |
| | | | | | | |
| | Distributions to shareholders from net investment income | | | (0.27 | ) | | | (0.65 | ) | | | (0.66 | ) | | | (0.70 | ) | | | (0.57 | ) | | | (0.64 | ) |
| | | | | | | |
| | Distributions to shareholders from net realized gains | | | — | | | | (1.57 | ) | | | (0.30 | ) | | | — | | | | — | | | | — | |
| | | | | | | |
| | Total distributions | | | (0.27 | ) | | | (2.22 | ) | | | (0.96 | ) | | | (0.70 | ) | | | (0.57 | ) | | | (0.64 | ) |
| | | | | | | |
| | Net asset value, end of period | | $ | 41.65 | | | $ | 37.94 | | | $ | 38.96 | | | $ | 38.26 | | | $ | 35.17 | | | $ | 32.53 | |
| | | | | | | |
| | Total Return(b) | | | 10.55 | % | | | 3.08 | % | | | 4.53 | % | | | 10.88 | % | | | 9.93 | % | | | 9.01 | % |
| | | | | | | |
| | Net assets, end of period (in 000’s) | | $ | 305,229 | | | $ | 292,009 | | | $ | 312,148 | | | $ | 318,960 | | | $ | 327,650 | | | $ | 359,003 | |
| | | | | | | |
| | Ratio of net expenses to average net assets | | | 1.05 | %(c) | | | 1.08 | % | | | 1.09 | % | | | 1.12 | % | | | 1.13 | % | | | 1.13 | % |
| | | | | | | |
| | Ratio of total expenses to average net assets | | | 1.21 | %(c) | | | 1.25 | % | | | 1.25 | % | | | 1.27 | % | | | 1.24 | % | | | 1.26 | % |
| | | | | | | |
| | Ratio of net investment income to average net assets | | | 1.21 | %(c) | | | 1.67 | % | | | 1.79 | % | | | 1.81 | % | | | 1.77 | % | | | 2.22 | % |
| | | | | | | |
| | Portfolio turnover rate(d) | | | 17 | % | | | 42 | % | | | 42 | % | | | 69 | % | | | 43 | % | | | 61 | % |
| | (a) | | Calculated based on the average shares outstanding methodology. |
| | (b) | | Assumes investment at the NAV at the beginning of the period, reinvestment of all dividends and distributions, a complete redemption of the investment at the NAV at the end of the period and no sales or redemption charges (if any). Total returns would be reduced if a sales or redemption charge was taken into account. Returns do not reflect the impact of taxes to shareholders relating to Fund distributions or the redemption of Fund shares. Total returns for periods less than one full year are not annualized. |
| | (d) | | The Fund’s portfolio turnover rate is calculated in accordance with regulatory requirements, without regard to transactions involving short term investments. If such transactions were included, the Fund’s portfolio turnover rate may be higher. |
| | |
| 36 | | The accompanying notes are an integral part of these financial statements. |
GOLDMAN SACHS EQUITY INCOME FUND
Financial Highlights (continued)
Selected Share Data for a Share Outstanding Throughout Each Period
| | | | | | | | | | | | | | | | | | | | | | | | | | |
| | | | | Goldman Sachs Equity Income Fund | |
| | | | | Class C Shares | |
| | | | | Six Months Ended
February 28, 2021
(Unaudited) | | | Year Ended August 31, | |
| | | | | 2020 | | | 2019 | | | 2018 | | | 2017 | | | 2016 | |
| | Per Share Data | | | | | | | | | | | | | | | | | | | | | | | | |
| | | | | | | |
| | Net asset value, beginning of period | | $ | 36.06 | | | $ | 37.12 | | | $ | 36.41 | | | $ | 33.50 | | | $ | 31.01 | | | $ | 29.08 | |
| | | | | | | |
| | Net investment income(a) | | | 0.08 | | | | 0.34 | | | | 0.38 | | | | 0.37 | | | | 0.33 | | | | 0.43 | |
| | | | | | | |
| | Net realized and unrealized gain | | | 3.57 | | | | 0.54 | | | | 0.96 | | | | 2.98 | | | | 2.48 | | | | 1.93 | |
| | | | | | | |
| | Total from investment operations | | | 3.65 | | | | 0.88 | | | | 1.34 | | | | 3.35 | | | | 2.81 | | | | 2.36 | |
| | | | | | | |
| | Distributions to shareholders from net investment income | | | (0.12 | ) | | | (0.37 | ) | | | (0.33 | ) | | | (0.44 | ) | | | (0.32 | ) | | | (0.43 | ) |
| | | | | | | |
| | Distributions to shareholders from net realized gains | | | — | | | | (1.57 | ) | | | (0.30 | ) | | | — | | | | — | | | | — | |
| | | | | | | |
| | Total distributions | | | (0.12 | ) | | | (1.94 | ) | | | (0.63 | ) | | | (0.44 | ) | | | (0.32 | ) | | | (0.43 | ) |
| | | | | | | |
| | Net asset value, end of period | | $ | 39.59 | | | $ | 36.06 | | | $ | 37.12 | | | $ | 36.41 | | | $ | 33.50 | | | $ | 31.01 | |
| | | | | | | |
| | Total Return(b) | | | 10.12 | % | | | 2.33 | % | | | 3.82 | % | | | 10.06 | % | | | 9.10 | % | | | 8.21 | % |
| | | | | | | |
| | Net assets, end of period (in 000’s) | | $ | 5,633 | | | $ | 5,477 | | | $ | 8,116 | | | $ | 16,982 | | | $ | 18,460 | | | $ | 22,371 | |
| | | | | | | |
| | Ratio of net expenses to average net assets | | | 1.80 | %(c) | | | 1.83 | % | | | 1.85 | % | | | 1.87 | % | | | 1.88 | % | | | 1.88 | % |
| | | | | | | |
| | Ratio of total expenses to average net assets | | | 1.96 | %(c) | | | 2.00 | % | | | 2.00 | % | | | 2.02 | % | | | 1.99 | % | | | 2.01 | % |
| | | | | | | |
| | Ratio of net investment income to average net assets | | | 0.45 | %(c) | | | 0.94 | % | | | 1.05 | % | | | 1.06 | % | | | 1.02 | % | | | 1.47 | % |
| | | | | | | |
| | Portfolio turnover rate(d) | | | 17 | % | | | 42 | % | | | 42 | % | | | 69 | % | | | 43 | % | | | 61 | % |
| | (a) | | Calculated based on the average shares outstanding methodology. |
| | (b) | | Assumes investment at the NAV at the beginning of the period, reinvestment of all dividends and distributions, a complete redemption of the investment at the NAV at the end of the period and no sales or redemption charges (if any). Total returns would be reduced if a sales or redemption charge was taken into account. Returns do not reflect the impact of taxes to shareholders relating to Fund distributions or the redemption of Fund shares. Total returns for periods less than one full year are not annualized. |
| | (d) | | The Fund’s portfolio turnover rate is calculated in accordance with regulatory requirements, without regard to transactions involving short term investments. If such transactions were included, the Fund’s portfolio turnover rate may be higher. |
| | |
| The accompanying notes are an integral part of these financial statements. | | 37 |
GOLDMAN SACHS EQUITY INCOME FUND
Financial Highlights (continued)
Selected Share Data for a Share Outstanding Throughout Each Period
| | | | | | | | | | | | | | | | | | | | | | | | | | |
| | | | | Goldman Sachs Equity Income Fund | |
| | | | | Institutional Shares | |
| | | | | Six Months Ended
February 28, 2021
(Unaudited) | | | Year Ended August 31, | |
| | | | | 2020 | | | 2019 | | | 2018 | | | 2017 | | | 2016 | |
| | Per Share Data | | | | | | | | | | | | | | | | | | | | | | | | |
| | | | | | | |
| | Net asset value, beginning of period | | $ | 38.65 | | | $ | 39.66 | | | $ | 38.92 | | | $ | 35.77 | | | $ | 33.07 | | | $ | 30.96 | |
| | | | | | | |
| | Net investment income(a) | | | 0.31 | | | | 0.76 | | | | 0.83 | | | | 0.81 | | | | 0.77 | | | | 0.82 | |
| | | | | | | |
| | Net realized and unrealized gain | | | 3.80 | | | | 0.58 | | | | 1.01 | | | | 3.18 | | | | 2.64 | | | | 2.06 | |
| | | | | | | |
| | Total from investment operations | | | 4.11 | | | | 1.34 | | | | 1.84 | | | | 3.99 | | | | 3.41 | | | | 2.88 | |
| | | | | | | |
| | Distributions to shareholders from net investment income | | | (0.33 | ) | | | (0.78 | ) | | | (0.80 | ) | | | (0.84 | ) | | | (0.71 | ) | | | (0.77 | ) |
| | | | | | | |
| | Distributions to shareholders from net realized gains | | | — | | | | (1.57 | ) | | | (0.30 | ) | | | — | | | | — | | | | — | |
| | | | | | | |
| | Total distributions | | | (0.33 | ) | | | (2.35 | ) | | | (1.10 | ) | | | (0.84 | ) | | | (0.71 | ) | | | (0.77 | ) |
| | | | | | | |
| | Net asset value, end of period | | $ | 42.43 | | | $ | 38.65 | | | $ | 39.66 | | | $ | 38.92 | | | $ | 35.77 | | | $ | 33.07 | |
| | | | | | | |
| | Total Return(b) | | | 10.72 | % | | | 3.41 | % | | | 4.94 | % | | | 11.30 | % | | | 10.38 | % | | | 9.46 | % |
| | | | | | | |
| | Net assets, end of period (in 000’s) | | $ | 28,233 | | | $ | 22,592 | | | $ | 19,906 | | | $ | 24,658 | | | $ | 37,415 | | | $ | 31,409 | |
| | | | | | | |
| | Ratio of net expenses to average net assets | | | 0.73 | %(c) | | | 0.74 | % | | | 0.73 | % | | | 0.73 | % | | | 0.73 | % | | | 0.73 | % |
| | | | | | | |
| | Ratio of total expenses to average net assets | | | 0.84 | %(c) | | | 0.86 | % | | | 0.86 | % | | | 0.87 | % | | | 0.84 | % | | | 0.86 | % |
| | | | | | | |
| | Ratio of net investment income to average net assets | | | 1.53 | %(c) | | | 2.00 | % | | | 2.17 | % | | | 2.17 | % | | | 2.19 | % | | | 2.61 | % |
| | | | | | | |
| | Portfolio turnover rate(d) | | | 17 | % | | | 42 | % | | | 42 | % | | | 69 | % | | | 43 | % | | | 61 | % |
| | (a) | | Calculated based on the average shares outstanding methodology. |
| | (b) | | Assumes investment at the NAV at the beginning of the period, reinvestment of all dividends and distributions, a complete redemption of the investment at the NAV at the end of the period and no sales or redemption charges (if any). Total returns would be reduced if a sales or redemption charge was taken into account. Returns do not reflect the impact of taxes to shareholders relating to Fund distributions or the redemption of Fund shares. Total returns for periods less than one full year are not annualized. |
| | (d) | | The Fund’s portfolio turnover rate is calculated in accordance with regulatory requirements, without regard to transactions involving short term investments. If such transactions were included, the Fund’s portfolio turnover rate may be higher. |
| | |
| 38 | | The accompanying notes are an integral part of these financial statements. |
GOLDMAN SACHS EQUITY INCOME FUND
Financial Highlights (continued)
Selected Share Data for a Share Outstanding Throughout Each Period
| | | | | | | | | | | | | | | | | | | | | | | | | | |
| | | | | Goldman Sachs Equity Income Fund | |
| | | | | Service Shares | |
| | | | | Six Months Ended
February 28, 2021
(Unaudited) | | | Year Ended August 31, | |
| | | | | 2020 | | | 2019 | | | 2018 | | | 2017 | | | 2016 | |
| | Per Share Data | | | | | | | | | | | | | | | | | | | | | | | | |
| | | | | | | |
| | Net asset value, beginning of period | | $ | 38.08 | | | $ | 39.10 | | | $ | 38.39 | | | $ | 35.28 | | | $ | 32.53 | | | $ | 30.46 | |
| | | | | | | |
| | Net investment income(a) | | | 0.19 | | | | 0.57 | | | | 0.61 | | | | 0.63 | | | | 0.57 | | | | 0.65 | |
| | | | | | | |
| | Net realized and unrealized gain | | | 3.77 | | | | 0.57 | | | | 1.01 | | | | 3.13 | | | | 2.61 | | | | 2.02 | |
| | | | | | | |
| | Total from investment operations | | | 3.96 | | | | 1.14 | | | | 1.62 | | | | 3.76 | | | | 3.18 | | | | 2.67 | |
| | | | | | | |
| | Distributions to shareholders from net investment income | | | (0.23 | ) | | | (0.59 | ) | | | (0.61 | ) | | | (0.65 | ) | | | (0.43 | ) | | | (0.60 | ) |
| | | | | | | |
| | Distributions to shareholders from net realized gains | | | — | | | | (1.57 | ) | | | (0.30 | ) | | | — | | | | — | | | | — | |
| | | | | | | |
| | Total distributions | | | (0.23 | ) | | | (2.16 | ) | | | (0.91 | ) | | | (0.65 | ) | | | (0.43 | ) | | | (0.60 | ) |
| | | | | | | |
| | Net asset value, end of period | | $ | 41.81 | | | $ | 38.08 | | | $ | 39.10 | | | $ | 38.39 | | | $ | 35.28 | | | $ | 32.53 | |
| | | | | | | |
| | Total Return(b) | | | 10.47 | % | | | 2.89 | % | | | 4.40 | % | | | 10.77 | % | | | 9.84 | % | | | 8.88 | % |
| | | | | | | |
| | Net assets, end of period (in 000’s) | | $ | 91 | | | $ | 161 | | | $ | 175 | | | $ | 84 | | | $ | 86 | | | $ | 324 | |
| | | | | | | |
| | Ratio of net expenses to average net assets | | | 1.23 | %(c) | | | 1.24 | % | | | 1.23 | % | | | 1.23 | % | | | 1.23 | % | | | 1.23 | % |
| | | | | | | |
| | Ratio of total expenses to average net assets | | | 1.34 | %(c) | | | 1.37 | % | | | 1.36 | % | | | 1.38 | % | | | 1.33 | % | | | 1.36 | % |
| | | | | | | |
| | Ratio of net investment income to average net assets | | | 0.99 | %(c) | | | 1.52 | % | | | 1.60 | % | | | 1.70 | % | | | 1.66 | % | | | 2.11 | % |
| | | | | | | |
| | Portfolio turnover rate(d) | | | 17 | % | | | 42 | % | | | 42 | % | | | 69 | % | | | 43 | % | | | 61 | % |
| | (a) | | Calculated based on the average shares outstanding methodology. |
| | (b) | | Assumes investment at the NAV at the beginning of the period, reinvestment of all dividends and distributions, a complete redemption of the investment at the NAV at the end of the period and no sales or redemption charges (if any). Total returns would be reduced if a sales or redemption charge was taken into account. Returns do not reflect the impact of taxes to shareholders relating to Fund distributions or the redemption of Fund shares. Total returns for periods less than one full year are not annualized. |
| | (d) | | The Fund’s portfolio turnover rate is calculated in accordance with regulatory requirements, without regard to transactions involving short term investments. If such transactions were included, the Fund’s portfolio turnover rate may be higher. |
| | |
| The accompanying notes are an integral part of these financial statements. | | 39 |
GOLDMAN SACHS EQUITY INCOME FUND
Financial Highlights (continued)
Selected Share Data for a Share Outstanding Throughout Each Period
| | | | | | | | | | | | | | | | | | | | | | | | | | |
| | | | | Goldman Sachs Equity Income Fund | |
| | | | | Investor Shares | |
| | | | | Six Months Ended
February 28, 2021
(Unaudited) | | | Year Ended August 31, | |
| | | | | 2020 | | | 2019 | | | 2018 | | | 2017 | | | 2016 | |
| | Per Share Data | | | | | | | | | | | | | | | | | | | | | | | | |
| | | | | | | |
| | Net asset value, beginning of period | | $ | 37.88 | | | $ | 38.91 | | | $ | 38.20 | | | $ | 35.12 | | | $ | 32.49 | | | $ | 30.41 | |
| | | | | | | |
| | Net investment income(a) | | | 0.29 | | | | 0.71 | | | | 0.76 | | | | 0.76 | | | | 0.75 | | | | 0.76 | |
| | | | | | | |
| | Net realized and unrealized gain | | | 3.72 | | | | 0.58 | | | | 1.00 | | | | 3.11 | | | | 2.55 | | | | 2.02 | |
| | | | | | | |
| | Total from investment operations | | | 4.01 | | | | 1.29 | | | | 1.76 | | | | 3.87 | | | | 3.30 | | | | 2.78 | |
| | | | | | | |
| | Distributions to shareholders from net investment income | | | (0.31 | ) | | | (0.75 | ) | | | (0.75 | ) | | | (0.79 | ) | | | (0.67 | ) | | | (0.70 | ) |
| | | | | | | |
| | Distributions to shareholders from net realized gains | | | — | | | | (1.57 | ) | | | (0.30 | ) | | | — | | | | — | | | | — | |
| | | | | | | |
| | Total distributions | | | (0.31 | ) | | | (2.32 | ) | | | (1.05 | ) | | | (0.79 | ) | | | (0.67 | ) | | | (0.70 | ) |
| | | | | | | |
| | Net asset value, end of period | | $ | 41.58 | | | $ | 37.88 | | | $ | 38.91 | | | $ | 38.20 | | | $ | 35.12 | | | $ | 32.49 | |
| | | | | | | |
| | Total Return(b) | | | 10.67 | % | | | 3.33 | % | | | 4.82 | % | | | 11.15 | % | | | 10.21 | % | | | 9.27 | % |
| | | | | | | |
| | Net assets, end of period (in 000’s) | | $ | 2,601 | | | $ | 2,384 | | | $ | 2,321 | | | $ | 2,851 | | | $ | 2,623 | | | $ | 743 | |
| | | | | | | |
| | Ratio of net expenses to average net assets | | | 0.80 | %(c) | | | 0.83 | % | | | 0.85 | % | | | 0.87 | % | | | 0.88 | % | | | 0.88 | % |
| | | | | | | |
| | Ratio of total expenses to average net assets | | | 0.96 | %(c) | | | 0.99 | % | | | 1.00 | % | | | 1.02 | % | | | 1.00 | % | | | 1.01 | % |
| | | | | | | |
| | Ratio of net investment income to average net assets | | | 1.49 | %(c) | | | 1.92 | % | | | 2.04 | % | | | 2.07 | % | | | 2.17 | % | | | 2.47 | % |
| | | | | | | |
| | Portfolio turnover rate(d) | | | 17 | % | | | 42 | % | | | 42 | % | | | 69 | % | | | 43 | % | | | 61 | % |
| | (a) | | Calculated based on the average shares outstanding methodology. |
| | (b) | | Assumes investment at the NAV at the beginning of the period, reinvestment of all dividends and distributions, a complete redemption of the investment at the NAV at the end of the period and no sales or redemption charges (if any). Total returns would be reduced if a sales or redemption charge was taken into account. Returns do not reflect the impact of taxes to shareholders relating to Fund distributions or the redemption of Fund shares. Total returns for periods less than one full year are not annualized. |
| | (d) | | The Fund’s portfolio turnover rate is calculated in accordance with regulatory requirements, without regard to transactions involving short term investments. If such transactions were included, the Fund’s portfolio turnover rate may be higher. |
| | |
| 40 | | The accompanying notes are an integral part of these financial statements. |
GOLDMAN SACHS EQUITY INCOME FUND
Financial Highlights (continued)
Selected Share Data for a Share Outstanding Throughout Each Period
| | | | | | | | | | | | | | | | | | | | | | | | | | |
| | | | | Goldman Sachs Equity Income Fund | |
| | | | | Class R6 Shares | |
| | | | | Six Months Ended
February 28, 2021
(Unaudited) | | | Year Ended August 31, | |
| | | | | 2020 | | | 2019 | | | 2018 | | | 2017 | | | 2016 | |
| | Per Share Data | | | | | | | | | | | | | | | | | | | | | | | | |
| | | | | | | |
| | Net asset value, beginning of period | | $ | 38.65 | | | $ | 39.66 | | | $ | 38.92 | | | $ | 35.76 | | | $ | 33.06 | | | $ | 30.97 | |
| | | | | | | |
| | Net investment income(a) | | | 0.31 | | | | 0.76 | | | | 0.80 | | | | 0.83 | | | | 0.77 | | | | 0.82 | |
| | | | | | | |
| | Net realized and unrealized gain | | | 3.81 | | | | 0.58 | | | | 1.04 | | | | 3.17 | | | | 2.64 | | | | 2.04 | |
| | | | | | | |
| | Total from investment operations | | | 4.12 | | | | 1.34 | | | | 1.84 | | | | 4.00 | | | | 3.41 | | | | 2.86 | |
| | | | | | | |
| | Distributions to shareholders from net investment income | | | (0.34 | ) | | | (0.78 | ) | | | (0.80 | ) | | | (0.84 | ) | | | (0.71 | ) | | | (0.77 | ) |
| | | | | | | |
| | Distributions to shareholders from net realized gains | | | — | | | | (1.57 | ) | | | (0.30 | ) | | | — | | | | — | | | | — | |
| | | | | | | |
| | Total distributions | | | (0.34 | ) | | | (2.35 | ) | | | (1.10 | ) | | | (0.84 | ) | | | (0.71 | ) | | | (0.77 | ) |
| | | | | | | |
| | Net asset value, end of period | | $ | 42.43 | | | $ | 38.65 | | | $ | 39.66 | | | $ | 38.92 | | | $ | 35.76 | | | $ | 33.06 | |
| | | | | | | |
| | Total Return(b) | | | 10.73 | % | | | 3.42 | % | | | 4.95 | % | | | 11.34 | % | | | 10.39 | % | | | 9.40 | % |
| | | | | | | |
| | Net assets, end of period (in 000’s) | | $ | 5,593 | | | $ | 5,378 | | | $ | 5,973 | | | $ | 13 | | | $ | 11 | | | $ | 10 | |
| | | | | | | |
| | Ratio of net expenses to average net assets | | | 0.72 | %(c) | | | 0.73 | % | | | 0.72 | % | | | 0.72 | % | | | 0.73 | % | | | 0.73 | % |
| | | | | | | |
| | Ratio of total expenses to average net assets | | | 0.83 | %(c) | | | 0.86 | % | | | 0.85 | % | | | 0.86 | % | | | 0.84 | % | | | 0.86 | % |
| | | | | | | |
| | Ratio of net investment income to average net assets | | | 1.53 | %(c) | | | 2.00 | % | | | 2.08 | % | | | 2.22 | % | | | 2.20 | % | | | 2.62 | % |
| | | | | | | |
| | Portfolio turnover rate(d) | | | 17 | % | | | 42 | % | | | 42 | % | | | 69 | % | | | 43 | % | | | 61 | % |
| | (a) | | Calculated based on the average shares outstanding methodology. |
| | (b) | | Assumes investment at the NAV at the beginning of the period, reinvestment of all dividends and distributions, a complete redemption of the investment at the NAV at the end of the period and no sales or redemption charges (if any). Total returns would be reduced if a sales or redemption charge was taken into account. Returns do not reflect the impact of taxes to shareholders relating to Fund distributions or the redemption of Fund shares. Total returns for periods less than one full year are not annualized. |
| | (d) | | The Fund’s portfolio turnover rate is calculated in accordance with regulatory requirements, without regard to transactions involving short term investments. If such transactions were included, the Fund’s portfolio turnover rate may be higher. |
| | |
| The accompanying notes are an integral part of these financial statements. | | 41 |
GOLDMAN SACHS EQUITY INCOME FUND
Financial Highlights (continued)
Selected Share Data for a Share Outstanding Throughout Each Period
| | | | | | | | | | | | | | | | | | | | | | | | | | |
| | | | | Goldman Sachs Equity Income Fund | |
| | | | | Class R Shares | |
| | | | | Six Months Ended
February 28, 2021
(Unaudited) | | | Year Ended August 31, | |
| | | | | 2020 | | | 2019 | | | 2018 | | | 2017 | | | 2016 | |
| | Per Share Data | | | | | | | | | | | | | | | | | | | | | | | | |
| | | | | | | |
| | Net asset value, beginning of period | | $ | 37.73 | | | $ | 38.75 | | | $ | 38.05 | | | $ | 34.98 | | | $ | 32.35 | | | $ | 30.32 | |
| | | | | | | |
| | Net investment income(a) | | | 0.19 | | | | 0.53 | | | | 0.57 | | | | 0.57 | | | | 0.53 | | | | 0.60 | |
| | | | | | | |
| | Net realized and unrealized gain | | | 3.72 | | | | 0.57 | | | | 1.00 | | | | 3.10 | | | | 2.59 | | | | 2.00 | |
| | | | | | | |
| | Total from investment operations | | | 3.91 | | | | 1.10 | | | | 1.57 | | | | 3.67 | | | | 3.12 | | | | 2.60 | |
| | | | | | | |
| | Distributions to shareholders from net investment income | | | (0.22 | ) | | | (0.55 | ) | | | (0.57 | ) | | | (0.60 | ) | | | (0.49 | ) | | | (0.57 | ) |
| | | | | | | |
| | Distributions to shareholders from net realized gains | | | — | | | | (1.57 | ) | | | (0.30 | ) | | | — | | | | — | | | | — | |
| | | | | | | |
| | Total distributions | | | (0.22 | ) | | | (2.12 | ) | | | (0.87 | ) | | | (0.60 | ) | | | (0.49 | ) | | | (0.57 | ) |
| | | | | | | |
| | Net asset value, end of period | | $ | 41.42 | | | $ | 37.73 | | | $ | 38.75 | | | $ | 38.05 | | | $ | 34.98 | | | $ | 32.35 | |
| | | | | | | |
| | Total Return(b) | | | 10.42 | % | | | 2.82 | % | | | 4.29 | % | | | 10.59 | % | | | 9.68 | % | | | 8.71 | % |
| | | | | | | |
| | Net assets, end of period (in 000’s) | | $ | 1,237 | | | $ | 1,131 | | | $ | 1,525 | | | $ | 1,492 | | | $ | 1,571 | | | $ | 1,477 | |
| | | | | | | |
| | Ratio of net expenses to average net assets | | | 1.30 | %(c) | | | 1.33 | % | | | 1.34 | % | | | 1.37 | % | | | 1.38 | % | | | 1.38 | % |
| | | | | | | |
| | Ratio of total expenses to average net assets | | | 1.46 | %(c) | | | 1.50 | % | | | 1.50 | % | | | 1.52 | % | | | 1.49 | % | | | 1.51 | % |
| | | | | | | |
| | Ratio of net investment income to average net assets | | | 0.96 | %(c) | | | 1.42 | % | | | 1.54 | % | | | 1.55 | % | | | 1.54 | % | | | 1.96 | % |
| | | | | | | |
| | Portfolio turnover rate(d) | | | 17 | % | | | 42 | % | | | 42 | % | | | 69 | % | | | 43 | % | | | 61 | % |
| | (a) | | Calculated based on the average shares outstanding methodology. |
| | (b) | | Assumes investment at the NAV at the beginning of the period, reinvestment of all dividends and distributions, a complete redemption of the investment at the NAV at the end of the period and no sales or redemption charges (if any). Total returns would be reduced if a sales or redemption charge was taken into account. Returns do not reflect the impact of taxes to shareholders relating to Fund distributions or the redemption of Fund shares. Total returns for periods less than one full year are not annualized. |
| | (d) | | The Fund’s portfolio turnover rate is calculated in accordance with regulatory requirements, without regard to transactions involving short term investments. If such transactions were included, the Fund’s portfolio turnover rate may be higher. |
| | |
| 42 | | The accompanying notes are an integral part of these financial statements. |
GOLDMAN SACHS EQUITY INCOME FUND
Financial Highlights (continued)
Selected Share Data for a Share Outstanding Throughout Each Period
| | | | | | | | | | | | | | | | | | |
| | | | | Goldman Sachs Equity Income Fund | |
| | | | | Class P Shares | |
| | | | | Six Months Ended
February 28, 2021
(Unaudited) | | | Year Ended August 31, | | | Period Ended
August 31, 2018(a) | |
| | | | 2020 | | | 2019 | |
| | Per Share Data | | | | | | | | | | | | | | | | |
| | | | | |
| | Net asset value, beginning of period | | $ | 38.64 | | | $ | 39.65 | | | $ | 38.92 | | | $ | 37.37 | |
| | | | | |
| | Net investment income(b) | | | 0.31 | | | | 0.76 | | | | 0.82 | | | | 0.31 | |
| | | | | |
| | Net realized and unrealized gain | | | 3.81 | | | | 0.59 | | | | 1.01 | | | | 1.48 | |
| | | | | |
| | Total from investment operations | | | 4.12 | | | | 1.35 | | | | 1.83 | | | | 1.79 | |
| | | | | |
| | Distributions to shareholders from net investment income | | | (0.34 | ) | | | (0.79 | ) | | | (0.80 | ) | | | (0.24 | ) |
| | | | | |
| | Distributions to shareholders from net realized gains | | | — | | | | (1.57 | ) | | | (0.30 | ) | | | — | |
| | | | | |
| | Total distributions | | | (0.34 | ) | | | (2.36 | ) | | | (1.10 | ) | | | (0.24 | ) |
| | | | | |
| | Net asset value, end of period | | $ | 42.42 | | | $ | 38.64 | | | $ | 39.65 | | | $ | 38.92 | |
| | | | | |
| | Total Return(c) | | | 10.73 | % | | | 3.43 | % | | | 4.92 | % | | | 4.84 | % |
| | | | | |
| | Net assets, end of period (in 000’s) | | $ | 27,925 | | | $ | 20,492 | | | $ | 11,500 | | | $ | 10,835 | |
| | | | | |
| | Ratio of net expenses to average net assets | | | 0.72 | %(d) | | | 0.73 | % | | | 0.72 | % | | | 0.72 | %(d) |
| | | | | |
| | Ratio of total expenses to average net assets | | | 0.83 | %(d) | | | 0.85 | % | | | 0.85 | % | | | 0.95 | %(d) |
| | | | | |
| | Ratio of net investment income to average net assets | | | 1.53 | %(d) | | | 2.04 | % | | | 2.16 | % | | | 2.20 | %(d) |
| | | | | |
| | Portfolio turnover rate(e) | | | 17 | % | | | 42 | % | | | 42 | % | | | 69 | % |
| | (a) | | Commenced operations on April 17, 2018. |
| | (b) | | Calculated based on the average shares outstanding methodology. |
| | (c) | | Assumes investment at the NAV at the beginning of the period, reinvestment of all dividends and distributions, a complete redemption of the investment at the NAV at the end of the period and no sales or redemption charges (if any). Total returns would be reduced if a sales or redemption charge was taken into account. Returns do not reflect the impact of taxes to shareholders relating to Fund distributions or the redemption of Fund shares. Total returns for periods less than one full year are not annualized. |
| | (e) | | The Fund’s portfolio turnover rate is calculated in accordance with regulatory requirements, without regard to transactions involving short term investments. If such transactions were included, the Fund’s portfolio turnover rate may be higher. |
| | |
| The accompanying notes are an integral part of these financial statements. | | 43 |
GOLDMAN SACHS FOCUSED VALUE FUND
Financial Highlights (continued)
Selected Share Data for a Share Outstanding Throughout Each Period
| | | | | | | | | | | | | | | | | | | | | | | | | | |
| | | | | Goldman Sachs Focused Value Fund | |
| | | | | Class A Shares | |
| | | | | Six Months Ended
February 28, 2021
(Unaudited) | | | Year Ended August 31, | |
| | | | | 2020 | | | 2019 | | | 2018 | | | 2017 | | | 2016 | |
| | Per Share Data | | | | | | | | | | | | | | | | | | | | | | | | |
| | | | | | | |
| | Net asset value, beginning of period | | $ | 11.25 | | | $ | 10.69 | | | $ | 11.08 | | | $ | 11.10 | | | $ | 9.89 | | | $ | 9.28 | |
| | | | | | | |
| | Net investment income(a) | | | 0.03 | | | | 0.09 | | | | 0.08 | | | | 0.05 | | | | 0.10 | | | | 0.12 | |
| | | | | | | |
| | Net realized and unrealized gain | | | 1.99 | | | | 0.62 | | | | 0.09 | | | | 0.87 | | | | 1.22 | | | | 0.52 | |
| | | | | | | |
| | Total from investment operations | | | 2.02 | | | | 0.71 | | | | 0.17 | | | | 0.92 | | | | 1.32 | | | | 0.64 | |
| | | | | | | |
| | Distributions to shareholders from net investment income | | | (0.08 | ) | | | (0.04 | ) | | | (0.05 | ) | | | (0.08 | ) | | | (0.11 | ) | | | (0.03 | ) |
| | | | | | | |
| | Distributions to shareholders from net realized gains | | | (0.14 | ) | | | (0.11 | ) | | | (0.51 | ) | | | (0.86 | ) | | | — | | | | — | |
| | | | | | | |
| | Total distributions | | | (0.22 | ) | | | (0.15 | ) | | | (0.56 | ) | | | (0.94 | ) | | | (0.11 | ) | | | (0.03 | ) |
| | | | | | | |
| | Net asset value, end of period | | $ | 13.05 | | | $ | 11.25 | | | $ | 10.69 | | | $ | 11.08 | | | $ | 11.10 | | | $ | 9.89 | |
| | | | | | | |
| | Total Return(b) | | | 18.05 | % | | | 6.60 | % | | | 2.10 | % | | | 8.64 | % | | | 13.42 | % | | | 6.93 | % |
| | | | | | | |
| | Net assets, end of period (in 000’s) | | $ | 235 | | | $ | 148 | | | $ | 63 | | | $ | 52 | | | $ | 50 | | | $ | 25 | |
| | | | | | | |
| | Ratio of net expenses to average net assets | | | 1.05 | %(c) | | | 1.09 | % | | | 1.09 | % | | | 1.12 | % | | | 1.13 | % | | | 1.13 | % |
| | | | | | | |
| | Ratio of total expenses to average net assets | | | 3.09 | %(c) | | | 4.71 | % | | | 8.11 | % | | | 4.84 | % | | | 7.96 | % | | | 14.54 | % |
| | | | | | | |
| | Ratio of net investment income to average net assets | | | 0.50 | %(c) | | | 0.83 | % | | | 0.78 | % | | | 0.50 | % | | | 0.95 | % | | | 1.33 | % |
| | | | | | | |
| | Portfolio turnover rate(d) | | | 52 | % | | | 102 | % | | | 122 | % | | | 204 | % | | | 126 | % | | | 161 | % |
| | (a) | | Calculated based on the average shares outstanding methodology. |
| | (b) | | Assumes investment at the NAV at the beginning of the period, reinvestment of all dividends and distributions, a complete redemption of the investment at the NAV at the end of the period and no sales or redemption charges (if any). Total returns would be reduced if a sales or redemption charge was taken into account. Returns do not reflect the impact of taxes to shareholders relating to Fund distributions or the redemption of Fund shares. Total returns for periods less than one full year are not annualized. |
| | (d) | | The Fund’s portfolio turnover rate is calculated in accordance with regulatory requirements, without regard to transactions involving short term investments. If such transactions were included, the Fund’s portfolio turnover rate may be higher. |
| | |
| 44 | | The accompanying notes are an integral part of these financial statements. |
GOLDMAN SACHS FOCUSED VALUE FUND
Financial Highlights (continued)
Selected Share Data for a Share Outstanding Throughout Each Period
| | | | | | | | | | | | | | | | | | | | | | | | | | |
| | | | | Goldman Sachs Focused Value Fund | |
| | | | | Class C Shares | |
| | | | | Six Months Ended
February 28, 2021
(Unaudited) | | | Year Ended August 31, | |
| | | | | 2020 | | | 2019 | | | 2018 | | | 2017 | | | 2016 | |
| | Per Share Data | | | | | | | | | | | | | | | | | | | | | | | | |
| | | | | | | |
| | Net asset value, beginning of period | | $ | 11.11 | | | $ | 10.60 | | | $ | 11.03 | | | $ | 11.05 | | | $ | 9.84 | | | $ | 9.28 | |
| | | | | | | |
| | Net investment income (loss)(a) | | | (0.02 | ) | | | 0.01 | | | | — | | | | (0.03 | ) | | | 0.03 | | | | 0.05 | |
| | | | | | | |
| | Net realized and unrealized gain | | | 1.97 | | | | 0.61 | | | | 0.09 | | | | 0.87 | | | | 1.21 | | | | 0.51 | |
| | | | | | | |
| | Total from investment operations | | | 1.95 | | | | 0.62 | | | | 0.09 | | | | 0.84 | | | | 1.24 | | | | 0.56 | |
| | | | | | | |
| | Distributions to shareholders from net investment income | | | — | | | | — | | | | (0.01 | ) | | | — | | | | (0.03 | ) | | | — | (b) |
| | | | | | | |
| | Distributions to shareholders from net realized gains | | | (0.14 | ) | | | (0.11 | ) | | | (0.51 | ) | | | (0.86 | ) | | | — | | | | — | |
| | | | | | | |
| | Total distributions | | | (0.14 | ) | | | (0.11 | ) | | | (0.52 | ) | | | (0.86 | ) | | | (0.03 | ) | | | — | (b) |
| | | | | | | |
| | Net asset value, end of period | | $ | 12.92 | | | $ | 11.11 | | | $ | 10.60 | | | $ | 11.03 | | | $ | 11.05 | | | $ | 9.84 | |
| | | | | | | |
| | Total Return(c) | | | 17.59 | % | | | 5.85 | % | | | 1.27 | % | | | 7.87 | % | | | 12.64 | % | | | 6.06 | % |
| | | | | | | |
| | Net assets, end of period (in 000’s) | | $ | 68 | | | $ | 32 | | | $ | 30 | | | $ | 30 | | | $ | 48 | | | $ | 25 | |
| | | | | | | |
| | Ratio of net expenses to average net assets | | | 1.79 | %(d) | | | 1.85 | % | | | 1.85 | % | | | 1.87 | % | | | 1.88 | % | | | 1.88 | % |
| | | | | | | |
| | Ratio of total expenses to average net assets | | | 3.67 | %(d) | | | 5.81 | % | | | 8.79 | % | | | 5.77 | % | | | 8.66 | % | | | 15.30 | % |
| | | | | | | |
| | Ratio of net investment income (loss) to average net assets | | | (0.38 | )%(d) | | | 0.06 | % | | | 0.05 | % | | | (0.24 | )% | | | 0.25 | % | | | 0.58 | % |
| | | | | | | |
| | Portfolio turnover rate(e) | | | 52 | % | | | 102 | % | | | 122 | % | | | 204 | % | | | 126 | % | | | 161 | % |
| | (a) | | Calculated based on the average shares outstanding methodology. |
| | (b) | | Amount is less than $0.005 per share. |
| | (c) | | Assumes investment at the NAV at the beginning of the period, reinvestment of all dividends and distributions, a complete redemption of the investment at the NAV at the end of the period and no sales or redemption charges (if any). Total returns would be reduced if a sales or redemption charge was taken into account. Returns do not reflect the impact of taxes to shareholders relating to Fund distributions or the redemption of Fund shares. Total returns for periods less than one full year are not annualized. |
| | (e) | | The Fund’s portfolio turnover rate is calculated in accordance with regulatory requirements, without regard to transactions involving short term investments. If such transactions were included, the Fund’s portfolio turnover rate may be higher. |
| | |
| The accompanying notes are an integral part of these financial statements. | | 45 |
GOLDMAN SACHS FOCUSED VALUE FUND
Financial Highlights (continued)
Selected Share Data for a Share Outstanding Throughout Each Period
| | | | | | | | | | | | | | | | | | | | | | | | | | |
| | | | | Goldman Sachs Focused Value Fund | |
| | | | | Institutional Shares | |
| | | | | Six Months Ended
February 28, 2021
(Unaudited) | | | Year Ended August 31, | |
| | | | | 2020 | | | 2019 | | | 2018 | | | 2017 | | | 2016 | |
| | Per Share Data | | | | | | | | | | | | | | | | | | | | | | | | |
| | | | | | | |
| | Net asset value, beginning of period | | $ | 11.29 | | | $ | 10.72 | | | $ | 11.13 | | | $ | 11.14 | | | $ | 9.92 | | | $ | 9.29 | |
| | | | | | | |
| | Net investment income(a) | | | 0.05 | | | | 0.12 | | | | 0.12 | | | | 0.09 | | | | 0.15 | | | | 0.16 | |
| | | | | | | |
| | Net realized and unrealized gain | | | 2.00 | | | | 0.63 | | | | 0.08 | | | | 0.88 | | | | 1.21 | | | | 0.52 | |
| | | | | | | |
| | Total from investment operations | | | 2.05 | | | | 0.75 | | | | 0.20 | | | | 0.97 | | | | 1.36 | | | | 0.68 | |
| | | | | | | |
| | Distributions to shareholders from net investment income | | | (0.11 | ) | | | (0.07 | ) | | | (0.10 | ) | | | (0.12 | ) | | | (0.14 | ) | | | (0.05 | ) |
| | | | | | | |
| | Distributions to shareholders from net realized gains | | | (0.14 | ) | | | (0.11 | ) | | | (0.51 | ) | | | (0.86 | ) | | | — | | | | — | |
| | | | | | | |
| | Total distributions | | | (0.25 | ) | | | (0.18 | ) | | | (0.61 | ) | | | (0.98 | ) | | | (0.14 | ) | | | (0.05 | ) |
| | | | | | | |
| | Net asset value, end of period | | $ | 13.09 | | | $ | 11.29 | | | $ | 10.72 | | | $ | 11.13 | | | $ | 11.14 | | | $ | 9.92 | |
| | | | | | | |
| | Total Return(b) | | | 18.27 | % | | | 7.00 | % | | | 2.47 | % | | | 9.06 | % | | | 13.79 | % | | | 7.33 | % |
| | | | | | | |
| | Net assets, end of period (in 000’s) | | $ | 5,333 | | | $ | 871 | | | $ | 776 | | | $ | 1,007 | | | $ | 4,802 | | | $ | 3,206 | |
| | | | | | | |
| | Ratio of net expenses to average net assets | | | 0.73 | %(c) | | | 0.76 | % | | | 0.73 | % | | | 0.73 | % | | | 0.73 | % | | | 0.73 | % |
| | | | | | | |
| | Ratio of total expenses to average net assets | | | 2.25 | %(c) | | | 4.65 | % | | | 7.57 | % | | | 4.40 | % | | | 7.40 | % | | | 13.52 | % |
| | | | | | | |
| | Ratio of net investment income to average net assets | | | 0.83 | %(c) | | | 1.13 | % | | | 1.16 | % | | | 0.86 | % | | | 1.39 | % | | | 1.73 | % |
| | | | | | | |
| | Portfolio turnover rate(d) | | | 52 | % | | | 102 | % | | | 122 | % | | | 204 | % | | | 126 | % | | | 161 | % |
| | (a) | | Calculated based on the average shares outstanding methodology. |
| | (b) | | Assumes investment at the NAV at the beginning of the period, reinvestment of all dividends and distributions, a complete redemption of the investment at the NAV at the end of the period and no sales or redemption charges (if any). Total returns would be reduced if a sales or redemption charge was taken into account. Returns do not reflect the impact of taxes to shareholders relating to Fund distributions or the redemption of Fund shares. Total returns for periods less than one full year are not annualized. |
| | (d) | | The Fund’s portfolio turnover rate is calculated in accordance with regulatory requirements, without regard to transactions involving short term investments. If such transactions were included, the Fund’s portfolio turnover rate may be higher. |
| | |
| 46 | | The accompanying notes are an integral part of these financial statements. |
GOLDMAN SACHS FOCUSED VALUE FUND
Financial Highlights (continued)
Selected Share Data for a Share Outstanding Throughout Each Period
| | | | | | | | | | | | | | | | | | | | | | | | | | |
| | | | | Goldman Sachs Focused Value Fund | |
| | | | | Investor Shares | |
| | | | | Six Months Ended
February 28, 2021
(Unaudited) | | | Year Ended August 31, | |
| | | | | 2020 | | | 2019 | | | 2018 | | | 2017 | | | 2016 | |
| | Per Share Data | | | | | | | | | | | | | | | | | | | | | | | | |
| | | | | | | |
| | Net asset value, beginning of period | | $ | 11.26 | | | $ | 10.69 | | | $ | 11.13 | | | $ | 11.13 | | | $ | 9.91 | | | $ | 9.29 | |
| | | | | | | |
| | Net investment income(a) | | | 0.04 | | | | 0.11 | | | | 0.11 | | | | 0.08 | | | | 0.13 | | | | 0.15 | |
| | | | | | | |
| | Net realized and unrealized gain | | | 2.00 | | | | 0.63 | | | | 0.07 | | | | 0.88 | | | | 1.22 | | | | 0.51 | |
| | | | | | | |
| | Total from investment operations | | | 2.04 | | | | 0.74 | | | | 0.18 | | | | 0.96 | | | | 1.35 | | | | 0.66 | |
| | | | | | | |
| | Distributions to shareholders from net investment income | | | (0.10 | ) | | | (0.06 | ) | | | (0.11 | ) | | | (0.10 | ) | | | (0.13 | ) | | | (0.04 | ) |
| | | | | | | |
| | Distributions to shareholders from net realized gains | | | (0.14 | ) | | | (0.11 | ) | | | (0.51 | ) | | | (0.86 | ) | | | — | | | | — | |
| | | | | | | |
| | Total distributions | | | (0.24 | ) | | | (0.17 | ) | | | (0.62 | ) | | | (0.96 | ) | | | (0.13 | ) | | | (0.04 | ) |
| | | | | | | |
| | Net asset value, end of period | | $ | 13.06 | | | $ | 11.26 | | | $ | 10.69 | | | $ | 11.13 | | | $ | 11.13 | | | $ | 9.91 | |
| | | | | | | |
| | Total Return(b) | | | 18.24 | % | | | 6.92 | % | | | 2.26 | % | | | 9.01 | % | | | 13.65 | % | | | 7.26 | % |
| | | | | | | |
| | Net assets, end of period (in 000’s) | | $ | 12 | | | $ | 34 | | | $ | 32 | | | $ | 31 | | | $ | 28 | | | $ | 25 | |
| | | | | | | |
| | Ratio of net expenses to average net assets | | | 0.80 | %(c) | | | 0.85 | % | | | 0.85 | % | | | 0.87 | % | | | 0.88 | % | | | 0.88 | % |
| | | | | | | |
| | Ratio of total expenses to average net assets | | | 3.03 | %(c) | | | 4.81 | % | | | 7.79 | % | | | 4.77 | % | | | 7.61 | % | | | 14.28 | % |
| | | | | | | |
| | Ratio of net investment income to average net assets | | | 0.66 | %(c) | | | 1.04 | % | | | 1.05 | % | | | 0.72 | % | | | 1.20 | % | | | 1.58 | % |
| | | | | | | |
| | Portfolio turnover rate(d) | | | 52 | % | | | 102 | % | | | 122 | % | | | 204 | % | | | 126 | % | | | 161 | % |
| | (a) | | Calculated based on the average shares outstanding methodology. |
| | (b) | | Assumes investment at the NAV at the beginning of the period, reinvestment of all dividends and distributions, a complete redemption of the investment at the NAV at the end of the period and no sales or redemption charges (if any). Total returns would be reduced if a sales or redemption charge was taken into account. Returns do not reflect the impact of taxes to shareholders relating to Fund distributions or the redemption of Fund shares. Total returns for periods less than one full year are not annualized. |
| | (d) | | The Fund’s portfolio turnover rate is calculated in accordance with regulatory requirements, without regard to transactions involving short term investments. If such transactions were included, the Fund’s portfolio turnover rate may be higher. |
| | |
| The accompanying notes are an integral part of these financial statements. | | 47 |
GOLDMAN SACHS FOCUSED VALUE FUND
Financial Highlights (continued)
Selected Share Data for a Share Outstanding Throughout Each Period
| | | | | | | | | | | | | | | | | | | | | | | | | | |
| | | | | Goldman Sachs Focused Value Fund | |
| | | | | Class R6 Shares | |
| | | | | Six Months Ended
February 28, 2021
(Unaudited) | | | Year Ended August 31, | |
| | | | | 2020 | | | 2019 | | | 2018 | | | 2017 | | | 2016 | |
| | Per Share Data | | | | | | | | | | | | | | | | | | | | | | | | |
| | | | | | | |
| | Net asset value, beginning of period | | $ | 11.27 | | | $ | 10.71 | | | $ | 11.14 | | | $ | 11.15 | | | $ | 9.92 | | | $ | 9.29 | |
| | | | | | | |
| | Net investment income(a) | | | 0.04 | | | | 0.12 | | | | 0.12 | | | | 0.10 | | | | 0.15 | | | | 0.16 | |
| | | | | | | |
| | Net realized and unrealized gain | | | 2.01 | | | | 0.62 | | | | 0.09 | | | | 0.87 | | | | 1.22 | | | | 0.52 | |
| | | | | | | |
| | Total from investment operations | | | 2.05 | | | | 0.74 | | | | 0.21 | | | | 0.97 | | | | 1.37 | | | | 0.68 | |
| | | | | | | |
| | Distributions to shareholders from net investment income | | | (0.11 | ) | | | (0.07 | ) | | | (0.13 | ) | | | (0.12 | ) | | | (0.14 | ) | | | (0.05 | ) |
| | | | | | | |
| | Distributions to shareholders from net realized gains | | | (0.14 | ) | | | (0.11 | ) | | | (0.51 | ) | | | (0.86 | ) | | | — | | | | — | |
| | | | | | | |
| | Total distributions | | | (0.25 | ) | | | (0.18 | ) | | | (0.64 | ) | | | (0.98 | ) | | | (0.14 | ) | | | (0.05 | ) |
| | | | | | | |
| | Net asset value, end of period | | $ | 13.07 | | | $ | 11.27 | | | $ | 10.71 | | | $ | 11.14 | | | $ | 11.15 | | | $ | 9.92 | |
| | | | | | | |
| | Total Return(b) | | | 18.31 | % | | | 6.92 | % | | | 2.52 | % | | | 9.06 | % | | | 13.91 | % | | | 7.34 | % |
| | | | | | | |
| | Net assets, end of period (in 000’s) | | $ | 12 | | | $ | 34 | | | $ | 32 | | | $ | 31 | | | $ | 28 | | | $ | 25 | |
| | | | | | | |
| | Ratio of net expenses to average net assets | | | 0.72 | %(c) | | | 0.75 | % | | | 0.72 | % | | | 0.72 | % | | | 0.71 | % | | | 0.71 | % |
| | | | | | | |
| | Ratio of total expenses to average net assets | | | 2.90 | %(c) | | | 4.67 | % | | | 7.64 | % | | | 4.64 | % | | | 7.46 | % | | | 14.11 | % |
| | | | | | | |
| | Ratio of net investment income to average net assets | | | 0.74 | %(c) | | | 1.13 | % | | | 1.16 | % | | | 0.87 | % | | | 1.37 | % | | | 1.75 | % |
| | | | | | | |
| | Portfolio turnover rate(d) | | | 52 | % | | | 102 | % | | | 122 | % | | | 204 | % | | | 126 | % | | | 161 | % |
| | (a) | | Calculated based on the average shares outstanding methodology. |
| | (b) | | Assumes investment at the NAV at the beginning of the period, reinvestment of all dividends and distributions, a complete redemption of the investment at the NAV at the end of the period and no sales or redemption charges (if any). Total returns would be reduced if a sales or redemption charge was taken into account. Returns do not reflect the impact of taxes to shareholders relating to Fund distributions or the redemption of Fund shares. Total returns for periods less than one full year are not annualized. |
| | (d) | | The Fund’s portfolio turnover rate is calculated in accordance with regulatory requirements, without regard to transactions involving short term investments. If such transactions were included, the Fund’s portfolio turnover rate may be higher. |
| | |
| 48 | | The accompanying notes are an integral part of these financial statements. |
GOLDMAN SACHS FOCUSED VALUE FUND
Financial Highlights (continued)
Selected Share Data for a Share Outstanding Throughout Each Period
| | | | | | | | | | | | | | | | | | | | | | | | | | |
| | | | | Goldman Sachs Focused Value Fund | |
| | | | | Class R Shares | |
| | | | | Six Months Ended
February 28, 2021
(Unaudited) | | | Year Ended August 31, | |
| | | | | 2020 | | | 2019 | | | 2018 | | | 2017 | | | 2016 | |
| | Per Share Data | | | | | | | | | | | | | | | | | | | | | | | | |
| | | | | | | |
| | Net asset value, beginning of period | | $ | 11.20 | | | $ | 10.65 | | | $ | 11.07 | | | $ | 11.09 | | | $ | 9.88 | | | $ | 9.28 | |
| | | | | | | |
| | Net investment income(a) | | | 0.01 | | | | 0.06 | | | | 0.06 | | | | 0.02 | | | | 0.07 | | | | 0.10 | |
| | | | | | | |
| | Net realized and unrealized gain | | | 1.99 | | | | 0.61 | | | | 0.09 | | | | 0.87 | | | | 1.22 | | | | 0.52 | |
| | | | | | | |
| | Total from investment operations | | | 2.00 | | | | 0.67 | | | | 0.15 | | | | 0.89 | | | | 1.29 | | | | 0.62 | |
| | | | | | | |
| | Distributions to shareholders from net investment income | | | (0.07 | ) | | | (0.01 | ) | | | (0.06 | ) | | | (0.05 | ) | | | (0.08 | ) | | | (0.02 | ) |
| | | | | | | |
| | Distributions to shareholders from net realized gains | | | (0.14 | ) | | | (0.11 | ) | | | (0.51 | ) | | | (0.86 | ) | | | — | | | | — | |
| | | | | | | |
| | Total distributions | | | (0.21 | ) | | | (0.12 | ) | | | (0.57 | ) | | | (0.91 | ) | | | (0.08 | ) | | | (0.02 | ) |
| | | | | | | |
| | Net asset value, end of period | | $ | 12.99 | | | $ | 11.20 | | | $ | 10.65 | | | $ | 11.07 | | | $ | 11.09 | | | $ | 9.88 | |
| | | | | | | |
| | Total Return(b) | | | 17.97 | % | | | 6.27 | % | | | 1.91 | % | | | 8.35 | % | | | 13.08 | % | | | 6.60 | % |
| | | | | | | |
| | Net assets, end of period (in 000’s) | | $ | 38 | | | $ | 33 | | | $ | 31 | | | $ | 30 | | | $ | 28 | | | $ | 25 | |
| | | | | | | |
| | Ratio of net expenses to average net assets | | | 1.29 | %(c) | | | 1.35 | % | | | 1.35 | % | | | 1.37 | % | | | 1.38 | % | | | 1.38 | % |
| | | | | | | |
| | Ratio of total expenses to average net assets | | | 3.26 | %(c) | | | 5.31 | % | | | 8.29 | % | | | 5.27 | % | | | 8.12 | % | | | 14.79 | % |
| | | | | | | |
| | Ratio of net investment income to average net assets | | | 0.20 | %(c) | | | 0.55 | % | | | 0.54 | % | | | 0.22 | % | | | 0.70 | % | | | 1.08 | % |
| | | | | | | |
| | Portfolio turnover rate(d) | | | 52 | % | | | 102 | % | | | 122 | % | | | 204 | % | | | 126 | % | | | 161 | % |
| | (a) | | Calculated based on the average shares outstanding methodology. |
| | (b) | | Assumes investment at the NAV at the beginning of the period, reinvestment of all dividends and distributions, a complete redemption of the investment at the NAV at the end of the period and no sales or redemption charges (if any). Total returns would be reduced if a sales or redemption charge was taken into account. Returns do not reflect the impact of taxes to shareholders relating to Fund distributions or the redemption of Fund shares. Total returns for periods less than one full year are not annualized. |
| | (d) | | The Fund’s portfolio turnover rate is calculated in accordance with regulatory requirements, without regard to transactions involving short term investments. If such transactions were included, the Fund’s portfolio turnover rate may be higher. |
| | |
| The accompanying notes are an integral part of these financial statements. | | 49 |
GOLDMAN SACHS FOCUSED VALUE FUND
Financial Highlights (continued)
Selected Share Data for a Share Outstanding Throughout Each Period
| | | | | | | | | | | | | | | | | | |
| | | | | Goldman Sachs Focused Value Fund | |
| | | | | Class P Shares | |
| | | | | Six Months Ended
February 28, 2021
(Unaudited) | | | Year Ended August 31, | | | Period Ended
August 31, 2018(a) | |
| | | | 2020 | | | 2019 | |
| | Per Share Data | | | | | | | | | | | | | | | | |
| | | | | |
| | Net asset value, beginning of period | | $ | 11.28 | | | $ | 10.71 | | | $ | 11.15 | | | $ | 10.54 | |
| | | | | |
| | Net investment income(b) | | | 0.05 | | | | 0.12 | | | | 0.12 | | | | 0.04 | |
| | | | | |
| | Net realized and unrealized gain | | | 1.99 | | | | 0.63 | | | | 0.08 | | | | 0.57 | |
| | | | | |
| | Total from investment operations | | | 2.04 | | | | 0.75 | | | | 0.20 | | | | 0.61 | |
| | | | | |
| | Distributions to shareholders from net investment income | | | (0.11 | ) | | | (0.07 | ) | | | (0.13 | ) | | | — | |
| | | | | |
| | Distributions to shareholders from net realized gains | | | (0.14 | ) | | | (0.11 | ) | | | (0.51 | ) | | | — | |
| | | | | |
| | Total distributions | | | (0.25 | ) | | | (0.18 | ) | | | (0.64 | ) | | | — | |
| | | | | |
| | Net asset value, end of period | | $ | 13.07 | | | $ | 11.28 | | | $ | 10.71 | | | $ | 11.15 | |
| | | | | |
| | Total Return(c) | | | 18.21 | % | | | 7.03 | % | | | 2.44 | % | | | 5.79 | % |
| | | | | |
| | Net assets, end of period (in 000’s) | | $ | 20,697 | | | $ | 8,657 | | | $ | 4,739 | | | $ | 5,652 | |
| | | | | |
| | Ratio of net expenses to average net assets | | | 0.72 | %(d) | | | 0.74 | % | | | 0.72 | % | | | 0.72 | %(d) |
| | | | | |
| | Ratio of total expenses to average net assets | | | 2.60 | %(d) | | | 4.45 | % | | | 7.47 | % | | | 5.91 | %(d) |
| | | | | |
| | Ratio of net investment income to average net assets | | | 0.79 | %(d) | | | 1.16 | % | | | 1.16 | % | | | 0.89 | %(d) |
| | | | | |
| | Portfolio turnover rate(e) | | | 52 | % | | | 102 | % | | | 122 | % | | | 204 | % |
| | (a) | | Commenced operations on April 17, 2018. |
| | (b) | | Calculated based on the average shares outstanding methodology. |
| | (c) | | Assumes investment at the NAV at the beginning of the period, reinvestment of all dividends and distributions, a complete redemption of the investment at the NAV at the end of the period and no sales or redemption charges (if any). Total returns would be reduced if a sales or redemption charge was taken into account. Returns do not reflect the impact of taxes to shareholders relating to Fund distributions or the redemption of Fund shares. Total returns for periods less than one full year are not annualized. |
| | (e) | | The Fund’s portfolio turnover rate is calculated in accordance with regulatory requirements, without regard to transactions involving short term investments. If such transactions were included, the Fund’s portfolio turnover rate may be higher. |
| | |
| 50 | | The accompanying notes are an integral part of these financial statements. |
GOLDMAN SACHS LARGE CAP VALUE FUND
Financial Highlights (continued)
Selected Share Data for a Share Outstanding Throughout Each Period
| | | | | | | | | | | | | | | | | | | | | | | | | | |
| | | | | Goldman Sachs Large Cap Value Fund | |
| | | | | Class A Shares | |
| | | | | Six Months Ended
February 28, 2021
(Unaudited) | | | Year Ended August 31, | |
| | | | | 2020 | | | 2019 | | | 2018 | | | 2017 | | | 2016 | |
| | Per Share Data | | | | | | | | | | | | | | | | | | | | | | | | |
| | | | | | | |
| | Net asset value, beginning of period | | $ | 13.92 | | | $ | 14.42 | | | $ | 16.16 | | | $ | 17.25 | | | $ | 16.08 | | | $ | 16.45 | |
| | | | | | | |
| | Net investment income(a) | | | 0.06 | | | | 0.16 | | | | 0.16 | | | | 0.13 | | | | 0.19 | | | | 0.24 | |
| | | | | | | |
| | Net realized and unrealized gain (loss) | | | 2.20 | | | | 0.18 | | | | (0.25 | ) | | | 1.35 | | | | 1.26 | | | | 0.95 | |
| | | | | | | |
| | Total from investment operations | | | 2.26 | | | | 0.34 | | | | (0.09 | ) | | | 1.48 | | | | 1.45 | | | | 1.19 | |
| | | | | | | |
| | Distributions to shareholders from net investment income | | | (0.16 | ) | | | (0.17 | ) | | | (0.14 | ) | | | (0.21 | ) | | | (0.28 | ) | | | (0.12 | ) |
| | | | | | | |
| | Distributions to shareholders from net realized gains | | | (0.33 | ) | | | (0.67 | ) | | | (1.51 | ) | | | (2.36 | ) | | | — | | | | (1.44 | ) |
| | | | | | | |
| | Total distributions | | | (0.49 | ) | | | (0.84 | ) | | | (1.65 | ) | | | (2.57 | ) | | | (0.28 | ) | | | (1.56 | ) |
| | | | | | | |
| | Net asset value, end of period | | $ | 15.69 | | | $ | 13.92 | | | $ | 14.42 | | | $ | 16.16 | | | $ | 17.25 | | | $ | 16.08 | |
| | | | | | | |
| | Total Return(b) | | | 16.52 | % | | | 1.97 | % | | | 0.38 | % | | | 9.29 | % | | | 9.04 | % | | | 7.73 | % |
| | | | | | | |
| | Net assets, end of period (in 000’s) | | $ | 81,037 | | | $ | 74,559 | | | $ | 84,723 | | | $ | 92,226 | | | $ | 153,608 | | | $ | 197,754 | |
| | | | | | | |
| | Ratio of net expenses to average net assets | | | 1.03 | %(c) | | | 1.07 | % | | | 1.11 | % | | | 1.11 | % | | | 1.14 | % | | | 1.18 | % |
| | | | | | | |
| | Ratio of total expenses to average net assets | | | 1.25 | %(c) | | | 1.28 | % | | | 1.28 | % | | | 1.24 | % | | | 1.22 | % | | | 1.22 | % |
| | | | | | | |
| | Ratio of net investment income to average net assets | | | 0.81 | %(c) | | | 1.13 | % | | | 1.10 | % | | | 0.81 | % | | | 1.14 | % | | | 1.54 | % |
| | | | | | | |
| | Portfolio turnover rate(d) | | | 24 | % | | | 64 | % | | | 62 | % | | | 171 | % | | | 124 | % | | | 116 | % |
| | (a) | | Calculated based on the average shares outstanding methodology. |
| | (b) | | Assumes investment at the NAV at the beginning of the period, reinvestment of all dividends and distributions, a complete redemption of the investment at the NAV at the end of the period and no sales or redemption charges (if any). Total returns would be reduced if a sales or redemption charge was taken into account. Returns do not reflect the impact of taxes to shareholders relating to Fund distributions or the redemption of Fund shares. Total returns for periods less than one full year are not annualized. |
| | (d) | | The Fund’s portfolio turnover rate is calculated in accordance with regulatory requirements, without regard to transactions involving short term investments. If such transactions were included, the Fund’s portfolio turnover rate may be higher. |
| | |
| The accompanying notes are an integral part of these financial statements. | | 51 |
GOLDMAN SACHS LARGE CAP VALUE FUND
Financial Highlights (continued)
Selected Share Data for a Share Outstanding Throughout Each Period
| | | | | | | | | | | | | | | | | | | | | | | | | | |
| | | | | Goldman Sachs Large Cap Value Fund | |
| | | | | Class C Shares | |
| | | | | Six Months Ended
February 28, 2021
(Unaudited) | | | Year Ended August 31, | |
| | | | | 2020 | | | 2019 | | | 2018 | | | 2017 | | | 2016 | |
| | Per Share Data | | | | | | | | | | | | | | | | | | | | | | | | |
| | | | | | | |
| | Net asset value, beginning of period | | $ | 13.12 | | | $ | 13.64 | | | $ | 15.32 | | | $ | 16.51 | | | $ | 15.43 | | | $ | 15.83 | |
| | | | | | | |
| | Net investment income(a) | | | — | | | | 0.05 | | | | 0.05 | | | | 0.01 | | | | 0.07 | | | | 0.12 | |
| | | | | | | |
| | Net realized and unrealized gain (loss) | | | 2.07 | | | | 0.17 | | | | (0.22 | ) | | | 1.29 | | | | 1.19 | | | | 0.93 | |
| | | | | | | |
| | Total from investment operations | | | 2.07 | | | | 0.22 | | | | (0.17 | ) | | | 1.30 | | | | 1.26 | | | | 1.05 | |
| | | | | | | |
| | Distributions to shareholders from net investment income | | | (0.05 | ) | | | (0.07 | ) | | | — | | | | (0.13 | ) | | | (0.18 | ) | | | (0.01 | ) |
| | | | | | | |
| | Distributions to shareholders from net realized gains | | | (0.33 | ) | | | (0.67 | ) | | | (1.51 | ) | | | (2.36 | ) | | | — | | | | (1.44 | ) |
| | | | | | | |
| | Total distributions | | | (0.38 | ) | | | (0.74 | ) | | | (1.51 | ) | | | (2.49 | ) | | | (0.18 | ) | | | (1.45 | ) |
| | | | | | | |
| | Net asset value, end of period | | $ | 14.81 | | | $ | 13.12 | | | $ | 13.64 | | | $ | 15.32 | | | $ | 16.51 | | | $ | 15.43 | |
| | | | | | | |
| | Total Return(b) | | | 16.01 | % | | | 1.21 | % | | | (0.28 | )% | | | 8.46 | % | | | 8.18 | % | | | 7.01 | % |
| | | | | | | |
| | Net assets, end of period (in 000’s) | | $ | 16,427 | | | $ | 17,422 | | | $ | 21,481 | | | $ | 36,819 | | | $ | 39,403 | | | $ | 41,587 | |
| | | | | | | |
| | Ratio of net expenses to average net assets | | | 1.78 | %(c) | | | 1.82 | % | | | 1.86 | % | | | 1.86 | % | | | 1.89 | % | | | 1.93 | % |
| | | | | | | |
| | Ratio of total expenses to average net assets | | | 1.99 | %(c) | | | 2.03 | % | | | 2.03 | % | | | 1.99 | % | | | 1.97 | % | | | 1.97 | % |
| | | | | | | |
| | Ratio of net investment income to average net assets | | | 0.06 | %(c) | | | 0.39 | % | | | 0.35 | % | | | 0.06 | % | | | 0.41 | % | | | 0.79 | % |
| | | | | | | |
| | Portfolio turnover rate(d) | | | 24 | % | | | 64 | % | | | 62 | % | | | 171 | % | | | 124 | % | | | 116 | % |
| | (a) | | Calculated based on the average shares outstanding methodology. |
| | (b) | | Assumes investment at the NAV at the beginning of the period, reinvestment of all dividends and distributions, a complete redemption of the investment at the NAV at the end of the period and no sales or redemption charges (if any). Total returns would be reduced if a sales or redemption charge was taken into account. Returns do not reflect the impact of taxes to shareholders relating to Fund distributions or the redemption of Fund shares. Total returns for periods less than one full year are not annualized. |
| | (d) | | The Fund’s portfolio turnover rate is calculated in accordance with regulatory requirements, without regard to transactions involving short term investments. If such transactions were included, the Fund’s portfolio turnover rate may be higher. |
| | |
| 52 | | The accompanying notes are an integral part of these financial statements. |
GOLDMAN SACHS LARGE CAP VALUE FUND
Financial Highlights (continued)
Selected Share Data for a Share Outstanding Throughout Each Period
| | | | | | | | | | | | | | | | | | | | | | | | | | |
| | | | | Goldman Sachs Large Cap Value Fund | |
| | | | | Institutional Shares | |
| | | | | Six Months Ended
February 28, 2021
(Unaudited) | | | Year Ended August 31, | |
| | | | | 2020 | | | 2019 | | | 2018 | | | 2017 | | | 2016 | |
| | Per Share Data | | | | | | | | | | | | | | | | | | | | | | | | |
| | | | | | | |
| | Net asset value, beginning of period | | $ | 14.08 | | | $ | 14.58 | | | $ | 16.32 | | | $ | 17.42 | | | $ | 16.25 | | | $ | 16.61 | |
| | | | | | | |
| | Net investment income(a) | | | 0.08 | | | | 0.20 | | | | 0.21 | | | | 0.19 | | | | 0.25 | | | | 0.30 | |
| | | | | | | |
| | Net realized and unrealized gain (loss) | | | 2.24 | | | | 0.19 | | | | (0.26 | ) | | | 1.36 | | | | 1.27 | | | | 0.97 | |
| | | | | | | |
| | Total from investment operations | | | 2.32 | | | | 0.39 | | | | (0.05 | ) | | | 1.55 | | | | 1.52 | | | | 1.27 | |
| | | | | | | |
| | Distributions to shareholders from net investment income | | | (0.21 | ) | | | (0.22 | ) | | | (0.18 | ) | | | (0.28 | ) | | | (0.35 | ) | | | (0.19 | ) |
| | | | | | | |
| | Distributions to shareholders from net realized gains | | | (0.33 | ) | | | (0.67 | ) | | | (1.51 | ) | | | (2.37 | ) | | | — | | | | (1.44 | ) |
| | | | | | | |
| | Total distributions | | | (0.54 | ) | | | (0.89 | ) | | | (1.69 | ) | | | (2.65 | ) | | | (0.35 | ) | | | (1.63 | ) |
| | | | | | | |
| | Net asset value, end of period | | $ | 15.86 | | | $ | 14.08 | | | $ | 14.58 | | | $ | 16.32 | | | $ | 17.42 | | | $ | 16.25 | |
| | | | | | | |
| | Total Return(b) | | | 16.74 | % | | | 2.26 | % | | | 0.69 | % | | | 9.65 | % | | | 9.41 | % | | | 8.17 | % |
| | | | | | | |
| | Net assets, end of period (in 000’s) | | $ | 163,574 | | | $ | 140,814 | | | $ | 177,613 | | | $ | 174,803 | | | $ | 645,552 | | | $ | 905,400 | |
| | | | | | | |
| | Ratio of net expenses to average net assets | | | 0.73 | %(c) | | | 0.76 | % | | | 0.79 | % | | | 0.79 | % | | | 0.78 | % | | | 0.78 | % |
| | | | | | | |
| | Ratio of total expenses to average net assets | | | 0.88 | %(c) | | | 0.90 | % | | | 0.89 | % | | | 0.85 | % | | | 0.82 | % | | | 0.82 | % |
| | | | | | | |
| | Ratio of net investment income to average net assets | | | 1.11 | %(c) | | | 1.43 | % | | | 1.42 | % | | | 1.13 | % | | | 1.46 | % | | | 1.93 | % |
| | | | | | | |
| | Portfolio turnover rate(d) | | | 24 | % | | | 64 | % | | | 62 | % | | | 171 | % | | | 124 | % | | | 116 | % |
| | (a) | | Calculated based on the average shares outstanding methodology. |
| | (b) | | Assumes investment at the NAV at the beginning of the period, reinvestment of all dividends and distributions, a complete redemption of the investment at the NAV at the end of the period and no sales or redemption charges (if any). Total returns would be reduced if a sales or redemption charge was taken into account. Returns do not reflect the impact of taxes to shareholders relating to Fund distributions or the redemption of Fund shares. Total returns for periods less than one full year are not annualized. |
| | (d) | | The Fund’s portfolio turnover rate is calculated in accordance with regulatory requirements, without regard to transactions involving short term investments. If such transactions were included, the Fund’s portfolio turnover rate may be higher. |
| | |
| The accompanying notes are an integral part of these financial statements. | | 53 |
GOLDMAN SACHS LARGE CAP VALUE FUND
Financial Highlights (continued)
Selected Share Data for a Share Outstanding Throughout Each Period
| | | | | | | | | | | | | | | | | | | | | | | | | | |
| | | | | Goldman Sachs Large Cap Value Fund | |
| | | | | Service Shares | |
| | | | | Six Months Ended
February 28, 2021
(Unaudited) | | | Year Ended August 31, | |
| | | | | 2020 | | | 2019 | | | 2018 | | | 2017 | | | 2016 | |
| | Per Share Data | | | | | | | | | | | | | | | | | | | | | | | | |
| | | | | | | |
| | Net asset value, beginning of period | | $ | 13.86 | | | $ | 14.36 | | | $ | 16.03 | | | $ | 17.14 | | | $ | 15.99 | | | $ | 16.36 | |
| | | | | | | |
| | Net investment income(a) | | | 0.04 | | | | 0.13 | | | | 0.13 | | | | 0.10 | | | | 0.17 | | | | 0.22 | |
| | | | | | | |
| | Net realized and unrealized gain (loss) | | | 2.19 | | | | 0.19 | | | | (0.24 | ) | | | 1.35 | | | | 1.23 | | | | 0.96 | |
| | | | | | | |
| | Total from investment operations | | | 2.23 | | | | 0.32 | | | | (0.11 | ) | | | 1.45 | | | | 1.40 | | | | 1.18 | |
| | | | | | | |
| | Distributions to shareholders from net investment income | | | (0.13 | ) | | | (0.15 | ) | | | (0.05 | ) | | | (0.20 | ) | | | (0.25 | ) | | | (0.11 | ) |
| | | | | | | |
| | Distributions to shareholders from net realized gains | | | (0.33 | ) | | | (0.67 | ) | | | (1.51 | ) | | | (2.36 | ) | | | — | | | | (1.44 | ) |
| | | | | | | |
| | Total distributions | | | (0.46 | ) | | | (0.82 | ) | | | (1.56 | ) | | | (2.56 | ) | | | (0.25 | ) | | | (1.55 | ) |
| | | | | | | |
| | Net asset value, end of period | | $ | 15.63 | | | $ | 13.86 | | | $ | 14.36 | | | $ | 16.03 | | | $ | 17.14 | | | $ | 15.99 | |
| | | | | | | |
| | Total Return(b) | | | 16.36 | % | | | 1.80 | % | | | 0.20 | % | | | 9.15 | % | | | 8.80 | % | | | 7.67 | % |
| | | | | | | |
| | Net assets, end of period (in 000’s) | | $ | 828 | | | $ | 836 | | | $ | 1,004 | | | $ | 1,201 | | | $ | 2,914 | | | $ | 3,549 | |
| | | | | | | |
| | Ratio of net expenses to average net assets | | | 1.23 | %(c) | | | 1.26 | % | | | 1.29 | % | | | 1.29 | % | | | 1.28 | % | | | 1.28 | % |
| | | | | | | |
| | Ratio of total expenses to average net assets | | | 1.38 | %(c) | | | 1.40 | % | | | 1.39 | % | | | 1.35 | % | | | 1.32 | % | | | 1.32 | % |
| | | | | | | |
| | Ratio of net investment income to average net assets | | | 0.61 | %(c) | | | 0.94 | % | | | 0.91 | % | | | 0.64 | % | | | 1.01 | % | | | 1.45 | % |
| | | | | | | |
| | Portfolio turnover rate(d) | | | 24 | % | | | 64 | % | | | 62 | % | | | 171 | % | | | 124 | % | | | 116 | % |
| | (a) | | Calculated based on the average shares outstanding methodology. |
| | (b) | | Assumes investment at the NAV at the beginning of the period, reinvestment of all dividends and distributions, a complete redemption of the investment at the NAV at the end of the period and no sales or redemption charges (if any). Total returns would be reduced if a sales or redemption charge was taken into account. Returns do not reflect the impact of taxes to shareholders relating to Fund distributions or the redemption of Fund shares. Total returns for periods less than one full year are not annualized. |
| | (d) | | The Fund’s portfolio turnover rate is calculated in accordance with regulatory requirements, without regard to transactions involving short term investments. If such transactions were included, the Fund’s portfolio turnover rate may be higher. |
| | |
| 54 | | The accompanying notes are an integral part of these financial statements. |
GOLDMAN SACHS LARGE CAP VALUE FUND
Financial Highlights (continued)
Selected Share Data for a Share Outstanding Throughout Each Period
| | | | | | | | | | | | | | | | | | | | | | | | | | |
| | | | | Goldman Sachs Large Cap Value Fund | |
| | | | | Investor Shares | |
| | | | | Six Months Ended
February 28, 2021
(Unaudited) | | | Year Ended August 31, | |
| | | | | 2020 | | | 2019 | | | 2018 | | | 2017 | | | 2016 | |
| | Per Share Data | | | | | | | | | | | | | | | | | | | | | | | | |
| | | | | | | |
| | Net asset value, beginning of period | | $ | 13.93 | | | $ | 14.43 | | | $ | 16.17 | | | $ | 17.28 | | | $ | 16.11 | | | $ | 16.47 | |
| | | | | | | |
| | Net investment income(a) | | | 0.08 | | | | 0.19 | | | | 0.20 | | | | 0.17 | | | | 0.25 | | | | 0.27 | |
| | | | | | | |
| | Net realized and unrealized gain (loss) | | | 2.20 | | | | 0.19 | | | | (0.26 | ) | | | 1.36 | | | | 1.23 | | | | 0.97 | |
| | | | | | | |
| | Total from investment operations | | | 2.28 | | | | 0.38 | | | | (0.06 | ) | | | 1.53 | | | | 1.48 | | | | 1.24 | |
| | | | | | | |
| | Distributions to shareholders from net investment income | | | (0.20 | ) | | | (0.21 | ) | | | (0.17 | ) | | | (0.27 | ) | | | (0.31 | ) | | | (0.16 | ) |
| | | | | | | |
| | Distributions to shareholders from net realized gains | | | (0.33 | ) | | | (0.67 | ) | | | (1.51 | ) | | | (2.37 | ) | | | — | | | | (1.44 | ) |
| | | | | | | |
| | Total distributions | | | (0.53 | ) | | | (0.88 | ) | | | (1.68 | ) | | | (2.64 | ) | | | (0.31 | ) | | | (1.60 | ) |
| | | | | | | |
| | Net asset value, end of period | | $ | 15.68 | | | $ | 13.93 | | | $ | 14.43 | | | $ | 16.17 | | | $ | 17.28 | | | $ | 16.11 | |
| | | | | | | |
| | Total Return(b) | | | 16.63 | % | | | 2.22 | % | | | 0.64 | % | | | 9.61 | % | | | 9.26 | % | | | 8.05 | % |
| | | | | | | |
| | Net assets, end of period (in 000’s) | | $ | 3,404 | | | $ | 3,460 | | | $ | 4,191 | | | $ | 7,447 | | | $ | 6,516 | | | $ | 3,654 | |
| | | | | | | |
| | Ratio of net expenses to average net assets | | | 0.78 | %(c) | | | 0.82 | % | | | 0.86 | % | | | 0.86 | % | | | 0.88 | % | | | 0.93 | % |
| | | | | | | |
| | Ratio of total expenses to average net assets | | | 1.00 | %(c) | | | 1.03 | % | | | 1.03 | % | | | 0.99 | % | | | 0.97 | % | | | 0.97 | % |
| | | | | | | |
| | Ratio of net investment income to average net assets | | | 1.06 | %(c) | | | 1.37 | % | | | 1.35 | % | | | 1.06 | % | | | 1.47 | % | | | 1.77 | % |
| | | | | | | |
| | Portfolio turnover rate(d) | | | 24 | % | | | 64 | % | | | 62 | % | | | 171 | % | | | 124 | % | | | 116 | % |
| | (a) | | Calculated based on the average shares outstanding methodology. |
| | (b) | | Assumes investment at the NAV at the beginning of the period, reinvestment of all dividends and distributions, a complete redemption of the investment at the NAV at the end of the period and no sales or redemption charges (if any). Total returns would be reduced if a sales or redemption charge was taken into account. Returns do not reflect the impact of taxes to shareholders relating to Fund distributions or the redemption of Fund shares. Total returns for periods less than one full year are not annualized. |
| | (d) | | The Fund’s portfolio turnover rate is calculated in accordance with regulatory requirements, without regard to transactions involving short term investments. If such transactions were included, the Fund’s portfolio turnover rate may be higher. |
| | |
| The accompanying notes are an integral part of these financial statements. | | 55 |
GOLDMAN SACHS LARGE CAP VALUE FUND
Financial Highlights (continued)
Selected Share Data for a Share Outstanding Throughout Each Period
| | | | | | | | | | | | | | | | | | | | | | | | | | |
| | | | | Goldman Sachs Large Cap Value Fund | |
| | | | | Class R6 Shares | |
| | | | | Six Months Ended
February 28, 2021
(Unaudited) | | | Year Ended August 31, | |
| | | | | 2020 | | | 2019 | | | 2018 | | | 2017 | | | 2016 | |
| | Per Share Data | | | | | | | | | | | | | | | | | | | | | | | | |
| | | | | | | |
| | Net asset value, beginning of period | | $ | 14.43 | | | $ | 14.92 | | | $ | 16.66 | | | $ | 17.45 | | | $ | 16.25 | | | $ | 16.61 | |
| | | | | | | |
| | Net investment income(a) | | | 0.08 | | | | 0.21 | | | | 0.22 | | | | 0.18 | | | | 0.21 | | | | 0.31 | |
| | | | | | | |
| | Net realized and unrealized gain (loss) | | | 2.29 | | | | 0.19 | | | | (0.26 | ) | | | 1.39 | | | | 1.34 | | | | 0.96 | |
| | | | | | | |
| | Total from investment operations | | | 2.37 | | | | 0.40 | | | | (0.04 | ) | | | 1.57 | | | | 1.55 | | | | 1.27 | |
| | | | | | | |
| | Distributions to shareholders from net investment income | | | (0.21 | ) | | | (0.22 | ) | | | (0.19 | ) | | | — | | | | (0.35 | ) | | | (0.19 | ) |
| | | | | | | |
| | Distributions to shareholders from net realized gains | | | (0.33 | ) | | | (0.67 | ) | | | (1.51 | ) | | | (2.36 | ) | | | — | | | | (1.44 | ) |
| | | | | | | |
| | Total distributions | | | (0.54 | ) | | | (0.89 | ) | | | (1.70 | ) | | | (2.36 | ) | | | (0.35 | ) | | | (1.63 | ) |
| | | | | | | |
| | Net asset value, end of period | | $ | 16.26 | | | $ | 14.43 | | | $ | 14.92 | | | $ | 16.66 | | | $ | 17.45 | | | $ | 16.25 | |
| | | | | | | |
| | Total Return(b) | | | 16.69 | % | | | 2.29 | % | | | 0.73 | % | | | 9.67 | % | | | 9.63 | % | | | 8.21 | % |
| | | | | | | |
| | Net assets, end of period (in 000’s) | | $ | 1,654 | | | $ | 1,636 | | | $ | 2,172 | | | $ | 1,106 | | | $ | 11 | | | $ | 121,773 | |
| | | | | | | |
| | Ratio of net expenses to average net assets | | | 0.72 | %(c) | | | 0.75 | % | | | 0.78 | % | | | 0.78 | % | | | 0.76 | % | | | 0.76 | % |
| | | | | | | |
| | Ratio of total expenses to average net assets | | | 0.87 | %(c) | | | 0.89 | % | | | 0.89 | % | | | 0.85 | % | | | 0.79 | % | | | 0.80 | % |
| | | | | | | |
| | Ratio of net investment income to average net assets | | | 1.11 | %(c) | | | 1.43 | % | | | 1.44 | % | | | 1.12 | % | | | 1.27 | % | | | 2.05 | % |
| | | | | | | |
| | Portfolio turnover rate(d) | | | 24 | % | | | 64 | % | | | 62 | % | | | 171 | % | | | 124 | % | | | 116 | % |
| | (a) | | Calculated based on the average shares outstanding methodology. |
| | (b) | | Assumes investment at the NAV at the beginning of the period, reinvestment of all dividends and distributions, a complete redemption of the investment at the NAV at the end of the period and no sales or redemption charges (if any). Total returns would be reduced if a sales or redemption charge was taken into account. Returns do not reflect the impact of taxes to shareholders relating to Fund distributions or the redemption of Fund shares. Total returns for periods less than one full year are not annualized. |
| | (d) | | The Fund’s portfolio turnover rate is calculated in accordance with regulatory requirements, without regard to transactions involving short term investments. If such transactions were included, the Fund’s portfolio turnover rate may be higher. |
| | |
| 56 | | The accompanying notes are an integral part of these financial statements. |
GOLDMAN SACHS LARGE CAP VALUE FUND
Financial Highlights (continued)
Selected Share Data for a Share Outstanding Throughout Each Period
| | | | | | | | | | | | | | | | | | | | | | | | | | |
| | | | | Goldman Sachs Large Cap Value Fund | |
| | | | | Class R Shares | |
| | | | | Six Months Ended
February 28, 2021
(Unaudited) | | | Year Ended August 31, | |
| | | | | 2020 | | | 2019 | | | 2018 | | | 2017 | | | 2016 | |
| | Per Share Data | | | | | | | | | | | | | | | | | | | | | | | | |
| | | | | | | |
| | Net asset value, beginning of period | | $ | 13.47 | | | $ | 13.97 | | | $ | 15.71 | | | $ | 16.86 | | | $ | 15.73 | | | $ | 16.12 | |
| | | | | | | |
| | Net investment income(a) | | | 0.04 | | | | 0.12 | | | | 0.12 | | | | 0.09 | | | | 0.15 | | | | 0.20 | |
| | | | | | | |
| | Net realized and unrealized gain (loss) | | | 2.13 | | | | 0.17 | | | | (0.25 | ) | | | 1.32 | | | | 1.22 | | | | 0.94 | |
| | | | | | | |
| | Total from investment operations | | | 2.17 | | | | 0.29 | | | | (0.13 | ) | | | 1.41 | | | | 1.37 | | | | 1.14 | |
| | | | | | | |
| | Distributions to shareholders from net investment income | | | (0.12 | ) | | | (0.12 | ) | | | (0.10 | ) | | | (0.20 | ) | | | (0.24 | ) | | | (0.09 | ) |
| | | | | | | |
| | Distributions to shareholders from net realized gains | | | (0.33 | ) | | | (0.67 | ) | | | (1.51 | ) | | | (2.36 | ) | | | — | | | | (1.44 | ) |
| | | | | | | |
| | Total distributions | | | (0.45 | ) | | | (0.79 | ) | | | (1.61 | ) | | | (2.56 | ) | | | (0.24 | ) | | | (1.53 | ) |
| | | | | | | |
| | Net asset value, end of period | | $ | 15.19 | | | $ | 13.47 | | | $ | 13.97 | | | $ | 15.71 | | | $ | 16.86 | | | $ | 15.73 | |
| | | | | | | |
| | Total Return(b) | | | 16.38 | % | | | 1.70 | % | | | 0.12 | % | | | 9.05 | % | | | 8.73 | % | | | 7.51 | % |
| | | | | | | |
| | Net assets, end of period (in 000’s) | | $ | 2,996 | | | $ | 2,932 | | | $ | 4,008 | | | $ | 5,252 | | | $ | 6,204 | | | $ | 7,130 | |
| | | | | | | |
| | Ratio of net expenses to average net assets | | | 1.28 | %(c) | | | 1.32 | % | | | 1.36 | % | | | 1.36 | % | | | 1.39 | % | | | 1.43 | % |
| | | | | | | |
| | Ratio of total expenses to average net assets | | | 1.50 | %(c) | | | 1.53 | % | | | 1.53 | % | | | 1.49 | % | | | 1.47 | % | | | 1.47 | % |
| | | | | | | |
| | Ratio of net investment income to average net assets | | | 0.56 | %(c) | | | 0.89 | % | | | 0.85 | % | | | 0.56 | % | | | 0.90 | % | | | 1.30 | % |
| | | | | | | |
| | Portfolio turnover rate(d) | | | 24 | % | | | 64 | % | | | 62 | % | | | 171 | % | | | 124 | % | | | 116 | % |
| | (a) | | Calculated based on the average shares outstanding methodology. |
| | (b) | | Assumes investment at the NAV at the beginning of the period, reinvestment of all dividends and distributions, a complete redemption of the investment at the NAV at the end of the period and no sales or redemption charges (if any). Total returns would be reduced if a sales or redemption charge was taken into account. Returns do not reflect the impact of taxes to shareholders relating to Fund distributions or the redemption of Fund shares. Total returns for periods less than one full year are not annualized. |
| | (d) | | The Fund’s portfolio turnover rate is calculated in accordance with regulatory requirements, without regard to transactions involving short term investments. If such transactions were included, the Fund’s portfolio turnover rate may be higher. |
| | |
| The accompanying notes are an integral part of these financial statements. | | 57 |
GOLDMAN SACHS LARGE CAP VALUE FUND
Financial Highlights (continued)
Selected Share Data for a Share Outstanding Throughout Each Period
| | | | | | | | | | | | | | | | | | |
| | | | | Goldman Sachs Large Cap Value Fund | |
| | | | | Class P Shares | |
| | | | | Six Months Ended
February 28, 2021
(Unaudited) | | | Year Ended August 31, | | | Period Ended
August 31, 2018(a) | |
| | | | 2020 | | | 2019 | |
| | Per Share Data | | | | | | | | | | | | | | | | |
| | | | | |
| | Net asset value, beginning of period | | $ | 14.43 | | | $ | 14.92 | | | $ | 16.66 | | | $ | 15.81 | |
| | | | | |
| | Net investment income(b) | | | 0.08 | | | | 0.21 | | | | 0.21 | | | | 0.08 | |
| | | | | |
| | Net realized and unrealized gain (loss) | | | 2.29 | | | | 0.19 | | | | (0.25 | ) | | | 0.77 | |
| | | | | |
| | Total from investment operations | | | 2.37 | | | | 0.40 | | | | (0.04 | ) | | | 0.85 | |
| | | | | |
| | Distributions to shareholders from net investment income | | | (0.21 | ) | | | (0.22 | ) | | | (0.19 | ) | | | — | |
| | | | | |
| | Distributions to shareholders from net realized gains | | | (0.33 | ) | | | (0.67 | ) | | | (1.51 | ) | | | — | |
| | | | | |
| | Total distributions | | | (0.54 | ) | | | (0.89 | ) | | | (1.70 | ) | | | — | |
| | | | | |
| | Net asset value, end of period | | $ | 16.26 | | | $ | 14.43 | | | $ | 14.92 | | | $ | 16.66 | |
| | | | | |
| | Total Return(c) | | | 16.68 | % | | | 2.29 | % | | | 0.74 | % | | | 5.38 | % |
| | | | | |
| | Net assets, end of period (in 000’s) | | $ | 178,494 | | | $ | 154,720 | | | $ | 180,475 | | | $ | 248,012 | |
| | | | | |
| | Ratio of net expenses to average net assets | | | 0.72 | %(d) | | | 0.75 | % | | | 0.78 | % | | | 0.78 | %(d) |
| | | | | |
| | Ratio of total expenses to average net assets | | | 0.87 | %(d) | | | 0.89 | % | | | 0.88 | % | | | 0.85 | %(d) |
| | | | | |
| | Ratio of net investment income to average net assets | | | 1.12 | %(d) | | | 1.45 | % | | | 1.43 | % | | | 1.26 | %(d) |
| | | | | |
| | Portfolio turnover rate(e) | | | 24 | % | | | 64 | % | | | 62 | % | | | 171 | % |
| | (a) | | Commenced operations on April 17, 2018. |
| | (b) | | Calculated based on the average shares outstanding methodology. |
| | (c) | | Assumes investment at the NAV at the beginning of the period, reinvestment of all dividends and distributions, a complete redemption of the investment at the NAV at the end of the period and no sales or redemption charges (if any). Total returns would be reduced if a sales or redemption charge was taken into account. Returns do not reflect the impact of taxes to shareholders relating to Fund distributions or the redemption of Fund shares. Total returns for periods less than one full year are not annualized. |
| | (e) | | The Fund’s portfolio turnover rate is calculated in accordance with regulatory requirements, without regard to transactions involving short term investments. If such transactions were included, the Fund’s portfolio turnover rate may be higher. |
| | |
| 58 | | The accompanying notes are an integral part of these financial statements. |
GOLDMAN SACHS MID CAP VALUE FUND
Financial Highlights (continued)
Selected Share Data for a Share Outstanding Throughout Each Period
| | | | | | | | | | | | | | | | | | | | | | | | | | |
| | | | | Goldman Sachs Mid Cap Value Fund | |
| | | | | Class A Shares | |
| | | | | Six Months Ended
February 28, 2021
(Unaudited) | | | Year Ended August 31, | |
| | | | | 2020 | | | 2019 | | | 2018 | | | 2017 | | | 2016 | |
| | Per Share Data | | | | | | | | | | | | | | | | | | | | | | | | |
| | | | | | | |
| | Net asset value, beginning of period | | $ | 31.22 | | | $ | 32.33 | | | $ | 36.62 | | | $ | 38.27 | | | $ | 35.25 | | | $ | 38.81 | |
| | | | | | | |
| | Net investment income(a) | | | — | | | | 0.16 | | | | 0.16 | | | | 0.08 | | | | 0.19 | | | | 0.32 | |
| | | | | | | |
| | Net realized and unrealized gain (loss) | | | 8.13 | | | | (0.22 | ) | | | 0.40 | | | | 3.71 | | | | 3.20 | | | | 0.56 | |
| | | | | | | |
| | Total from investment operations | | | 8.13 | | | | (0.06 | ) | | | 0.56 | | | | 3.79 | | | | 3.39 | | | | 0.88 | |
| | | | | | | |
| | Distributions to shareholders from net investment income | | | (0.13 | ) | | | (0.18 | ) | | | (0.14 | ) | | | (0.15 | ) | | | (0.37 | ) | | | (0.10 | ) |
| | | | | | | |
| | Distributions to shareholders from net realized gains | | | — | | | | (0.84 | ) | | | (4.71 | ) | | | (5.29 | ) | | | — | | | | (4.34 | ) |
| | | | | | | |
| | Distributions to shareholders from return of capital | | | — | | | | (0.03 | ) | | | — | | | | — | | | | — | | | | — | |
| | | | | | | |
| | Total distributions | | | (0.13 | ) | | | (1.05 | ) | | | (4.85 | ) | | | (5.44 | ) | | | (0.37 | ) | | | (4.44 | ) |
| | | | | | | |
| | Net asset value, end of period | | $ | 39.22 | | | $ | 31.22 | | | $ | 32.33 | | | $ | 36.62 | | | $ | 38.27 | | | $ | 35.25 | |
| | | | | | | |
| | Total Return(b) | | | 26.09 | % | | | (0.41 | )% | | | 3.39 | % | | | 10.68 | % | | | 9.66 | % | | | 3.00 | % |
| | | | | | | |
| | Net assets, end of period (in 000’s) | | $ | 489,830 | | | $ | 424,878 | | | $ | 526,864 | | | $ | 630,820 | | | $ | 851,681 | | | $ | 1,363,093 | |
| | | | | | | |
| | Ratio of net expenses to average net assets | | | 1.21 | %(c) | | | 1.24 | % | | | 1.22 | % | | | 1.22 | % | | | 1.17 | % | | | 1.15 | % |
| | | | | | | |
| | Ratio of total expenses to average net assets | | | 1.21 | %(c) | | | 1.24 | % | | | 1.23 | % | | | 1.22 | % | | | 1.17 | % | | | 1.15 | % |
| | | | | | | |
| | Ratio of net investment income to average net assets | | | (0.01 | )%(c) | | | 0.52 | % | | | 0.49 | % | | | 0.22 | % | | | 0.51 | % | | | 0.92 | % |
| | | | | | | |
| | Portfolio turnover rate(d) | | | 30 | % | | | 87 | % | | | 82 | % | | | 137 | % | | | 124 | % | | | 111 | % |
| | (a) | | Calculated based on the average shares outstanding methodology. |
| | (b) | | Assumes investment at the NAV at the beginning of the period, reinvestment of all dividends and distributions, a complete redemption of the investment at the NAV at the end of the period and no sales or redemption charges (if any). Total returns would be reduced if a sales or redemption charge was taken into account. Returns do not reflect the impact of taxes to shareholders relating to Fund distributions or the redemption of Fund shares. Total returns for periods less than one full year are not annualized. |
| | (d) | | The Fund’s portfolio turnover rate is calculated in accordance with regulatory requirements, without regard to transactions involving short term investments. If such transactions were included, the Fund’s portfolio turnover rate may be higher. |
| | |
| The accompanying notes are an integral part of these financial statements. | | 59 |
GOLDMAN SACHS MID CAP VALUE FUND
Financial Highlights (continued)
Selected Share Data for a Share Outstanding Throughout Each Period
| | | | | | | | | | | | | | | | | | | | | | | | | | |
| | | | | Goldman Sachs Mid Cap Value Fund | |
| | | | | Class C Shares | |
| | | | | Six Months Ended
February 28, 2021
(Unaudited) | | | Year Ended August 31, | |
| | | | | 2020 | | | 2019 | | | 2018 | | | 2017 | | | 2016 | |
| | Per Share Data | | | | | | | | | | | | | | | | | | | | | | | | |
| | | | | | | |
| | Net asset value, beginning of period | | $ | 27.00 | | | $ | 28.10 | | | $ | 32.59 | | | $ | 34.68 | | | $ | 32.00 | | | $ | 35.80 | |
| | | | | | | |
| | Net investment income (loss)(a) | | | (0.11 | ) | | | (0.02 | ) | | | (0.07 | ) | | | (0.17 | ) | | | (0.09 | ) | | | 0.05 | |
| | | | | | | |
| | Net realized and unrealized gain (loss) | | | 7.03 | | | | (0.24 | ) | | | 0.29 | | | | 3.33 | | | | 2.92 | | | | 0.49 | |
| | | | | | | |
| | Total from investment operations | | | 6.92 | | | | (0.26 | ) | | | 0.22 | | | | 3.16 | | | | 2.83 | | | | 0.54 | |
| | | | | | | |
| | Distributions to shareholders from net investment income | | | — | | | | — | | | | — | | | | — | | | | (0.15 | ) | | | — | |
| | | | | | | |
| | Distributions to shareholders from net realized gains | | | — | | | | (0.81 | ) | | | (4.71 | ) | | | (5.25 | ) | | | — | | | | (4.34 | ) |
| | | | | | | |
| | Distributions to shareholders from return of capital | | | — | | | | (0.03 | ) | | | — | | | | — | | | | — | | | | — | |
| | | | | | | |
| | Total distributions | | | — | | | | (0.84 | ) | | | (4.71 | ) | | | (5.25 | ) | | | (0.15 | ) | | | (4.34 | ) |
| | | | | | | |
| | Net asset value, end of period | | $ | 33.92 | | | $ | 27.00 | | | $ | 28.10 | | | $ | 32.59 | | | $ | 34.68 | | | $ | 32.00 | |
| | | | | | | |
| | Total Return(b) | | | 25.63 | % | | | (1.14 | )% | | | 2.58 | % | | | 9.86 | % | | | 8.86 | % | | | 2.20 | % |
| | | | | | | |
| | Net assets, end of period (in 000’s) | | $ | 16,109 | | | $ | 16,230 | | | $ | 28,175 | | | $ | 78,897 | | | $ | 102,928 | | | $ | 141,081 | |
| | | | | | | |
| | Ratio of net expenses to average net assets | | | 1.96 | %(c) | | | 1.99 | % | | | 1.98 | % | | | 1.97 | % | | | 1.92 | % | | | 1.90 | % |
| | | | | | | |
| | Ratio of total expenses to average net assets | | | 1.96 | %(c) | | | 1.99 | % | | | 1.98 | % | | | 1.97 | % | | | 1.92 | % | | | 1.90 | % |
| | | | | | | |
| | Ratio of net investment income (loss) to average net assets | | | (0.76 | )%(c) | | | (0.07 | )% | | | (0.24 | )% | | | (0.53 | )% | | | (0.25 | )% | | | 0.16 | % |
| | | | | | | |
| | Portfolio turnover rate(d) | | | 30 | % | | | 87 | % | | | 82 | % | | | 137 | % | | | 124 | % | | | 111 | % |
| | (a) | | Calculated based on the average shares outstanding methodology. |
| | (b) | | Assumes investment at the NAV at the beginning of the period, reinvestment of all dividends and distributions, a complete redemption of the investment at the NAV at the end of the period and no sales or redemption charges (if any). Total returns would be reduced if a sales or redemption charge was taken into account. Returns do not reflect the impact of taxes to shareholders relating to Fund distributions or the redemption of Fund shares. Total returns for periods less than one full year are not annualized. |
| | (d) | | The Fund’s portfolio turnover rate is calculated in accordance with regulatory requirements, without regard to transactions involving short term investments. If such transactions were included, the Fund’s portfolio turnover rate may be higher. |
| | |
| 60 | | The accompanying notes are an integral part of these financial statements. |
GOLDMAN SACHS MID CAP VALUE FUND
Financial Highlights (continued)
Selected Share Data for a Share Outstanding Throughout Each Period
| | | | | | | | | | | | | | | | | | | | | | | | | | |
| | | | | Goldman Sachs Mid Cap Value Fund | |
| | | | | Institutional Shares | |
| | | | | Six Months Ended
February 28, 2021
(Unaudited) | | | Year Ended August 31, | |
| | | | | 2020 | | | 2019 | | | 2018 | | | 2017 | | | 2016 | |
| | Per Share Data | | | | | | | | | | | | | | | | | | | | | | | | |
| | | | | | | |
| | Net asset value, beginning of period | | $ | 31.65 | | | $ | 32.76 | | | $ | 37.06 | | | $ | 38.68 | | | $ | 35.64 | | | $ | 39.22 | |
| | | | | | | |
| | Net investment income(a) | | | 0.06 | | | | 0.26 | | | | 0.29 | | | | 0.21 | | | | 0.34 | | | | 0.46 | |
| | | | | | | |
| | Net realized and unrealized gain (loss) | | | 8.25 | | | | (0.19 | ) | | | 0.39 | | | | 3.77 | | | | 3.25 | | | | 0.56 | |
| | | | | | | |
| | Total from investment operations | | | 8.31 | | | | 0.07 | | | | 0.68 | | | | 3.98 | | | | 3.59 | | | | 1.02 | |
| | | | | | | |
| | Distributions to shareholders from net investment income | | | (0.26 | ) | | | (0.30 | ) | | | (0.27 | ) | | | (0.26 | ) | | | (0.55 | ) | | | (0.26 | ) |
| | | | | | | |
| | Distributions to shareholders from net realized gains | | | — | | | | (0.84 | ) | | | (4.71 | ) | | | (5.34 | ) | | | — | | | | (4.34 | ) |
| | | | | | | |
| | Distributions to shareholders from return of capital | | | — | | | | (0.04 | ) | | | — | | | | — | | | | — | | | | — | |
| | | | | | | |
| | Total distributions | | | (0.26 | ) | | | (1.18 | ) | | | (4.98 | ) | | | (5.60 | ) | | | (0.55 | ) | | | (4.60 | ) |
| | | | | | | |
| | Net asset value, end of period | | $ | 39.70 | | | $ | 31.65 | | | $ | 32.76 | | | $ | 37.06 | | | $ | 38.68 | | | $ | 35.64 | |
| | | | | | | |
| | Total Return(b) | | | 26.32 | % | | | (0.03 | )% | | | 3.78 | % | | | 11.13 | % | | | 10.12 | % | | | 3.39 | % |
| | | | | | | |
| | Net assets, end of period (in 000’s) | | $ | 302,269 | | | $ | 271,283 | | | $ | 346,004 | | | $ | 555,930 | | | $ | 1,424,886 | | | $ | 3,687,681 | |
| | | | | | | |
| | Ratio of net expenses to average net assets | | | 0.84 | %(c) | | | 0.86 | % | | | 0.84 | % | | | 0.83 | % | | | 0.77 | % | | | 0.75 | % |
| | | | | | | |
| | Ratio of total expenses to average net assets | | | 0.84 | %(c) | | | 0.86 | % | | | 0.84 | % | | | 0.83 | % | | | 0.77 | % | | | 0.75 | % |
| | | | | | | |
| | Ratio of net investment income to average net assets | | | 0.36 | %(c) | | | 0.82 | % | | | 0.89 | % | | | 0.58 | % | | | 0.91 | % | | | 1.31 | % |
| | | | | | | |
| | Portfolio turnover rate(d) | | | 30 | % | | | 87 | % | | | 82 | % | | | 137 | % | | | 124 | % | | | 111 | % |
| | (a) | | Calculated based on the average shares outstanding methodology. |
| | (b) | | Assumes investment at the NAV at the beginning of the period, reinvestment of all dividends and distributions, a complete redemption of the investment at the NAV at the end of the period and no sales or redemption charges (if any). Total returns would be reduced if a sales or redemption charge was taken into account. Returns do not reflect the impact of taxes to shareholders relating to Fund distributions or the redemption of Fund shares. Total returns for periods less than one full year are not annualized. |
| | (d) | | The Fund’s portfolio turnover rate is calculated in accordance with regulatory requirements, without regard to transactions involving short term investments. If such transactions were included, the Fund’s portfolio turnover rate may be higher. |
| | |
| The accompanying notes are an integral part of these financial statements. | | 61 |
GOLDMAN SACHS MID CAP VALUE FUND
Financial Highlights (continued)
Selected Share Data for a Share Outstanding Throughout Each Period
| | | | | | | | | | | | | | | | | | | | | | | | | | |
| | | | | Goldman Sachs Mid Cap Value Fund | |
| | | | | Service Shares | |
| | | | | Six Months Ended
February 28, 2021
(Unaudited) | | | Year Ended August 31, | |
| | | | | 2020 | | | 2019 | | | 2018 | | | 2017 | | | 2016 | |
| | Per Share Data | | | | | | | | | | | | | | | | | | | | | | | | |
| | | | | | | |
| | Net asset value, beginning of period | | $ | 30.50 | | | $ | 31.58 | | | $ | 35.89 | | | $ | 37.61 | | | $ | 34.63 | | | $ | 38.21 | |
| | | | | | | |
| | Net investment income(a) | | | (0.02 | ) | | | 0.13 | | | | 0.12 | | | | 0.04 | | | | 0.15 | | | | 0.28 | |
| | | | | | | |
| | Net realized and unrealized gain (loss) | | | 7.95 | | | | (0.24 | ) | | | 0.38 | | | | 3.65 | | | | 3.15 | | | | 0.54 | |
| | | | | | | |
| | Total from investment operations | | | 7.93 | | | | (0.10 | ) | | | 0.50 | | | | 3.69 | | | | 3.30 | | | | 0.82 | |
| | | | | | | |
| | Distributions to shareholders from net investment income | | | (0.08 | ) | | | (0.11 | ) | | | (0.10 | ) | | | (0.12 | ) | | | (0.32 | ) | | | (0.06 | ) |
| | | | | | | |
| | Distributions to shareholders from net realized gains | | | — | | | | (0.84 | ) | | | (4.71 | ) | | | (5.29 | ) | | | — | | | | (4.34 | ) |
| | | | | | | |
| | Distributions to shareholders from return of capital | | | — | | | | (0.03 | ) | | | — | | | | — | | | | — | | | | — | |
| | | | | | | |
| | Total distributions | | | (0.08 | ) | | | (0.98 | ) | | | (4.81 | ) | | | (5.41 | ) | | | (0.32 | ) | | | (4.40 | ) |
| | | | | | | |
| | Net asset value, end of period | | $ | 38.35 | | | $ | 30.50 | | | $ | 31.58 | | | $ | 35.89 | | | $ | 37.61 | | | $ | 34.63 | |
| | | | | | | |
| | Total Return(b) | | | 26.02 | % | | | (0.52 | )% | | | 3.25 | % | | | 10.58 | % | | | 9.56 | % | | | 2.87 | % |
| | | | | | | |
| | Net assets, end of period (in 000’s) | | $ | 32,174 | | | $ | 30,424 | | | $ | 47,597 | | | $ | 65,727 | | | $ | 87,438 | | | $ | 139,677 | |
| | | | | | | |
| | Ratio of net expenses to average net assets | | | 1.34 | %(c) | | | 1.36 | % | | | 1.34 | % | | | 1.33 | % | | | 1.27 | % | | | 1.25 | % |
| | | | | | | |
| | Ratio of total expenses to average net assets | | | 1.34 | %(c) | | | 1.36 | % | | | 1.34 | % | | | 1.33 | % | | | 1.28 | % | | | 1.25 | % |
| | | | | | | |
| | Ratio of net investment income to average net assets | | | (0.14 | )%(c) | | | 0.43 | % | | | 0.38 | % | | | 0.11 | % | | | 0.40 | % | | | 0.84 | % |
| | | | | | | |
| | Portfolio turnover rate(d) | | | 30 | % | | | 87 | % | | | 82 | % | | | 137 | % | | | 124 | % | | | 111 | % |
| | (a) | | Calculated based on the average shares outstanding methodology. |
| | (b) | | Assumes investment at the NAV at the beginning of the period, reinvestment of all dividends and distributions, a complete redemption of the investment at the NAV at the end of the period and no sales or redemption charges (if any). Total returns would be reduced if a sales or redemption charge was taken into account. Returns do not reflect the impact of taxes to shareholders relating to Fund distributions or the redemption of Fund shares. Total returns for periods less than one full year are not annualized. |
| | (d) | | The Fund’s portfolio turnover rate is calculated in accordance with regulatory requirements, without regard to transactions involving short term investments. If such transactions were included, the Fund’s portfolio turnover rate may be higher. |
| | |
| 62 | | The accompanying notes are an integral part of these financial statements. |
GOLDMAN SACHS MID CAP VALUE FUND
Financial Highlights (continued)
Selected Share Data for a Share Outstanding Throughout Each Period
| | | | | | | | | | | | | | | | | | | | | | | | | | |
| | | | | Goldman Sachs Mid Cap Value Fund | |
| | | | | Investor Shares | |
| | | | | Six Months Ended
February 28, 2021
(Unaudited) | | | Year Ended August 31, | |
| | | | | 2020 | | | 2019 | | | 2018 | | | 2017 | | | 2016 | |
| | Per Share Data | | | | | | | | | | | | | | | | | | | | | | | | |
| | | | | | | |
| | Net asset value, beginning of period | | $ | 30.44 | | | $ | 31.55 | | | $ | 35.89 | | | $ | 37.57 | | | $ | 34.63 | | | $ | 38.23 | |
| | | | | | | |
| | Net investment income(a) | | | 0.04 | | | | 0.22 | | | | 0.23 | | | | 0.17 | | | | 0.27 | | | | 0.39 | |
| | | | | | | |
| | Net realized and unrealized gain (loss) | | | 7.94 | | | | (0.19 | ) | | | 0.37 | | | | 3.63 | | | | 3.17 | | | | 0.55 | |
| | | | | | | |
| | Total from investment operations | | | 7.98 | | | | 0.03 | | | | 0.60 | | | | 3.80 | | | | 3.44 | | | | 0.94 | |
| | | | | | | |
| | Distributions to shareholders from net investment income | | | (0.22 | ) | | | (0.26 | ) | | | (0.23 | ) | | | (0.18 | ) | | | (0.50 | ) | | | (0.20 | ) |
| | | | | | | |
| | Distributions to shareholders from net realized gains | | | — | | | | (0.84 | ) | | | (4.71 | ) | | | (5.30 | ) | | | — | | | | (4.34 | ) |
| | | | | | | |
| | Distributions to shareholders from return of capital | | | — | | | | (0.04 | ) | | | — | | | | — | | | | — | | | | — | |
| | | | | | | |
| | Total distributions | | | (0.22 | ) | | | (1.14 | ) | | | (4.94 | ) | | | (5.48 | ) | | | (0.50 | ) | | | (4.54 | ) |
| | | | | | | |
| | Net asset value, end of period | | $ | 38.20 | | | $ | 30.44 | | | $ | 31.55 | | | $ | 35.89 | | | $ | 37.57 | | | $ | 34.63 | |
| | | | | | | |
| | Total Return(b) | | | 26.26 | % | | | (0.16 | )% | | | 3.63 | % | | | 10.98 | % | | | 9.94 | % | | | 3.24 | % |
| | | | | | | |
| | Net assets, end of period (in 000’s) | | $ | 37,930 | | | $ | 33,249 | | | $ | 41,809 | | | $ | 51,375 | | | $ | 77,446 | | | $ | 220,429 | |
| | | | | | | |
| | Ratio of net expenses to average net assets | | | 0.96 | %(c) | | | 0.99 | % | | | 0.97 | % | | | 0.97 | % | | | 0.92 | % | | | 0.90 | % |
| | | | | | | |
| | Ratio of total expenses to average net assets | | | 0.96 | %(c) | | | 0.99 | % | | | 0.98 | % | | | 0.97 | % | | | 0.92 | % | | | 0.90 | % |
| | | | | | | |
| | Ratio of net investment income to average net assets | | | 0.24 | %(c) | | | 0.72 | % | | | 0.74 | % | | | 0.47 | % | | | 0.73 | % | | | 1.16 | % |
| | | | | | | |
| | Portfolio turnover rate(d) | | | 30 | % | | | 87 | % | | | 82 | % | | | 137 | % | | | 124 | % | | | 111 | % |
| | (a) | | Calculated based on the average shares outstanding methodology. |
| | (b) | | Assumes investment at the NAV at the beginning of the period, reinvestment of all dividends and distributions, a complete redemption of the investment at the NAV at the end of the period and no sales or redemption charges (if any). Total returns would be reduced if a sales or redemption charge was taken into account. Returns do not reflect the impact of taxes to shareholders relating to Fund distributions or the redemption of Fund shares. Total returns for periods less than one full year are not annualized. |
| | (d) | | The Fund’s portfolio turnover rate is calculated in accordance with regulatory requirements, without regard to transactions involving short term investments. If such transactions were included, the Fund’s portfolio turnover rate may be higher. |
| | |
| The accompanying notes are an integral part of these financial statements. | | 63 |
GOLDMAN SACHS MID CAP VALUE FUND
Financial Highlights (continued)
Selected Share Data for a Share Outstanding Throughout Each Period
| | | | | | | | | | | | | | | | | | | | | | | | | | |
| | | | | Goldman Sachs Mid Cap Value Fund | |
| | | | | Class R6 Shares | |
| | | | | Six Months Ended
February 28, 2021
(Unaudited) | | | Year Ended August 31, | |
| | | | | 2020 | | | 2019 | | | 2018 | | | 2017 | | | 2016 | |
| | Per Share Data | | | | | | | | | | | | | | | | | | | | | | | | |
| | | | | | | |
| | Net asset value, beginning of period | | $ | 31.62 | | | $ | 32.74 | | | $ | 37.04 | | | $ | 38.66 | | | $ | 35.64 | | | $ | 39.23 | |
| | | | | | | |
| | Net investment income(a) | | | 0.07 | | | | 0.25 | | | | 0.27 | | | | 0.22 | | | | 0.36 | | | | 0.47 | |
| | | | | | | |
| | Net realized and unrealized gain (loss) | | | 8.24 | | | | (0.18 | ) | | | 0.41 | | | | 3.76 | | | | 3.22 | | | | 0.56 | |
| | | | | | | |
| | Total from investment operations | | | 8.31 | | | | 0.07 | | | | 0.68 | | | | 3.98 | | | | 3.58 | | | | 1.03 | |
| | | | | | | |
| | Distributions to shareholders from net investment income | | | (0.26 | ) | | | (0.27 | ) | | | (0.27 | ) | | | (0.27 | ) | | | (0.56 | ) | | | (0.28 | ) |
| | | | | | | |
| | Distributions to shareholders from net realized gains | | | — | | | | (0.84 | ) | | | (4.71 | ) | | | (5.33 | ) | | | — | | | | (4.34 | ) |
| | | | | | | |
| | Distributions to shareholders from return of capital | | | — | | | | (0.08 | ) | | | — | | | | — | | | | — | | | | — | |
| | | | | | | |
| | Total distributions | | | (0.26 | ) | | | (1.19 | ) | | | (4.98 | ) | | | (5.60 | ) | | | (0.56 | ) | | | (4.62 | ) |
| | | | | | | |
| | Net asset value, end of period | | $ | 39.67 | | | $ | 31.62 | | | $ | 32.74 | | | $ | 37.04 | | | $ | 38.66 | | | $ | 35.64 | |
| | | | | | | |
| | Total Return(b) | | | 26.36 | % | | | (0.05 | )% | | | 3.79 | % | | | 11.10 | % | | | 10.13 | % | | | 3.41 | % |
| | | | | | | |
| | Net assets, end of period (in 000’s) | | $ | 69,629 | | | $ | 54,633 | | | $ | 50,538 | | | $ | 39,520 | | | $ | 73,505 | | | $ | 372,313 | |
| | | | | | | |
| | Ratio of net expenses to average net assets | | | 0.83 | %(c) | | | 0.85 | % | | | 0.82 | % | | | 0.82 | % | | | 0.75 | % | | | 0.73 | % |
| | | | | | | |
| | Ratio of total expenses to average net assets | | | 0.83 | %(c) | | | 0.85 | % | | | 0.83 | % | | | 0.82 | % | | | 0.75 | % | | | 0.73 | % |
| | | | | | | |
| | Ratio of net investment income to average net assets | | | 0.37 | %(c) | | | 0.82 | % | | | 0.85 | % | | | 0.60 | % | | | 0.97 | % | | | 1.39 | % |
| | | | | | | |
| | Portfolio turnover rate(d) | | | 30 | % | | | 87 | % | | | 82 | % | | | 137 | % | | | 124 | % | | | 111 | % |
| | (a) | | Calculated based on the average shares outstanding methodology. |
| | (b) | | Assumes investment at the NAV at the beginning of the period, reinvestment of all dividends and distributions, a complete redemption of the investment at the NAV at the end of the period and no sales or redemption charges (if any). Total returns would be reduced if a sales or redemption charge was taken into account. Returns do not reflect the impact of taxes to shareholders relating to Fund distributions or the redemption of Fund shares. Total returns for periods less than one full year are not annualized. |
| | (d) | | The Fund’s portfolio turnover rate is calculated in accordance with regulatory requirements, without regard to transactions involving short term investments. If such transactions were included, the Fund’s portfolio turnover rate may be higher. |
| | |
| 64 | | The accompanying notes are an integral part of these financial statements. |
GOLDMAN SACHS MID CAP VALUE FUND
Financial Highlights (continued)
Selected Share Data for a Share Outstanding Throughout Each Period
| | | | | | | | | | | | | | | | | | | | | | | | | | |
| | | | | Goldman Sachs Mid Cap Value Fund | |
| | | | | Class R Shares | |
| | | | | Six Months Ended
February 28, 2021
(Unaudited) | | | Year Ended August 31, | |
| | | | | 2020 | | | 2019 | | | 2018 | | | 2017 | | | 2016 | |
| | Per Share Data | | | | | | | | | | | | | | | | | | | | | | | | |
| | | | | | | |
| | Net asset value, beginning of period | | $ | 30.09 | | | $ | 31.20 | | | $ | 35.52 | | | $ | 37.28 | | | $ | 34.38 | | | $ | 38.00 | |
| | | | | | | |
| | Net investment income (loss)(a) | | | (0.04 | ) | | | 0.10 | | | | 0.08 | | | | (0.01 | ) | | | 0.09 | | | | 0.22 | |
| | | | | | | |
| | Net realized and unrealized gain (loss) | | | 7.85 | | | | (0.24 | ) | | | 0.37 | | | | 3.61 | | | | 3.13 | | | | 0.55 | |
| | | | | | | |
| | Total from investment operations | | | 7.81 | | | | (0.14 | ) | | | 0.45 | | | | 3.60 | | | | 3.22 | | | | 0.77 | |
| | | | | | | |
| | Distributions to shareholders from net investment income | | | (0.05 | ) | | | (0.10 | ) | | | (0.06 | ) | | | (0.09 | ) | | | (0.32 | ) | | | (0.05 | ) |
| | | | | | | |
| | Distributions to shareholders from net realized gains | | | — | | | | (0.84 | ) | | | (4.71 | ) | | | (5.27 | ) | | | — | | | | (4.34 | ) |
| | | | | | | |
| | Distributions to shareholders from return of capital | | | — | | | | (0.03 | ) | | | — | | | | — | | | | — | | | | — | |
| | | | | | | |
| | Total distributions | | | (0.05 | ) | | | (0.97 | ) | | | (4.77 | ) | | | (5.36 | ) | | | (0.32 | ) | | | (4.39 | ) |
| | | | | | | |
| | Net asset value, end of period | | $ | 37.85 | | | $ | 30.09 | | | $ | 31.20 | | | $ | 35.52 | | | $ | 37.28 | | | $ | 34.38 | |
| | | | | | | |
| | Total Return(c) | | | 25.97 | % | | | (0.65 | )% | | | 3.10 | % | | | 10.43 | % | | | 9.40 | % | | | 2.72 | % |
| | | | | | | |
| | Net assets, end of period (in 000’s) | | $ | 19,342 | | | $ | 17,015 | | | $ | 21,916 | | | $ | 28,103 | | | $ | 34,193 | | | $ | 40,111 | |
| | | | | | | |
| | Ratio of net expenses to average net assets | | | 1.46 | %(d) | | | 1.49 | % | | | 1.47 | % | | | 1.47 | % | | | 1.42 | % | | | 1.40 | % |
| | | | | | | |
| | Ratio of total expenses to average net assets | | | 1.46 | %(d) | | | 1.49 | % | | | 1.48 | % | | | 1.47 | % | | | 1.43 | % | | | 1.40 | % |
| | | | | | | |
| | Ratio of net investment income (loss) to average net assets | | | (0.26 | )%(d) | | | 0.32 | % | | | 0.25 | % | | | (0.03 | )% | | | 0.25 | % | | | 0.66 | % |
| | | | | | | |
| | Portfolio turnover rate(e) | | | 30 | % | | | 87 | % | | | 82 | % | | | 137 | % | | | 124 | % | | | 111 | % |
| | (a) | | Calculated based on the average shares outstanding methodology. |
| | (b) | | Amount is less than $0.005 per share. |
| | (c) | | Assumes investment at the NAV at the beginning of the period, reinvestment of all dividends and distributions, a complete redemption of the investment at the NAV at the end of the period and no sales or redemption charges (if any). Total returns would be reduced if a sales or redemption charge was taken into account. Returns do not reflect the impact of taxes to shareholders relating to Fund distributions or the redemption of Fund shares. Total returns for periods less than one full year are not annualized. |
| | (e) | | The Fund’s portfolio turnover rate is calculated in accordance with regulatory requirements, without regard to transactions involving short term investments. If such transactions were included, the Fund’s portfolio turnover rate may be higher. |
| | |
| The accompanying notes are an integral part of these financial statements. | | 65 |
GOLDMAN SACHS MID CAP VALUE FUND
Financial Highlights (continued)
Selected Share Data for a Share Outstanding Throughout Each Period
| | | | | | | | | | | | | | | | | | |
| | | | | Goldman Sachs Mid Cap Value Fund | |
| | | | | Class P Shares | |
| | | | | Six Months Ended
February 28, 2021
(Unaudited) | | | Year Ended August 31, | | | Period Ended
August 31, 2018(a) | |
| | | | 2020 | | | 2019 | |
| | Per Share Data | | | | | | | | | | | | | | | | |
| | | | | |
| | Net asset value, beginning of period | | $ | 31.62 | | | $ | 32.73 | | | $ | 37.04 | | | $ | 35.64 | |
| | | | | |
| | Net investment income(b) | | | 0.07 | | | | 0.26 | | | | 0.29 | | | | 0.13 | |
| | | | | |
| | Net realized and unrealized gain (loss) | | | 8.23 | | | | (0.19 | ) | | | 0.39 | | | | 1.27 | |
| | | | | |
| | Total from investment operations | | | 8.30 | | | | 0.07 | | | | 0.68 | | | | 1.40 | |
| | | | | |
| | Distributions to shareholders from net investment income | | | (0.26 | ) | | | (0.33 | ) | | | (0.28 | ) | | | — | |
| | | | | |
| | Distributions to shareholders from net realized gains | | | — | | | | (0.84 | ) | | | (4.71 | ) | | | — | |
| | | | | |
| | Distributions to shareholders from return of capital | | | — | | | | (0.01 | ) | | | — | | | | — | |
| | | | | |
| | Total distributions | | | (0.26 | ) | | | (1.18 | ) | | | (4.99 | ) | | | — | |
| | | | | |
| | Net asset value, end of period | | $ | 39.66 | | | $ | 31.62 | | | $ | 32.73 | | | $ | 37.04 | |
| | | | | |
| | Total Return(c) | | | 26.33 | % | | | (0.02 | )% | | | 3.80 | % | | | 3.93 | % |
| | | | | |
| | Net assets, end of period (in 000’s) | | $ | 165,072 | | | $ | 129,680 | | | $ | 141,460 | | | $ | 172,003 | |
| | | | | |
| | Ratio of net expenses to average net assets | | | 0.83 | %(d) | | | 0.85 | % | | | 0.83 | % | | | 0.86 | %(d) |
| | | | | |
| | Ratio of total expenses to average net assets | | | 0.83 | %(d) | | | 0.85 | % | | | 0.83 | % | | | 0.86 | %(d) |
| | | | | |
| | Ratio of net investment income to average net assets | | | 0.37 | %(d) | | | 0.82 | % | | | 0.89 | % | | | 0.94 | %(d) |
| | | | | |
| | Portfolio turnover rate(e) | | | 30 | % | | | 87 | % | | | 82 | % | | | 137 | % |
| | (a) | | Commenced operations on April 17, 2018. |
| | (b) | | Calculated based on the average shares outstanding methodology. |
| | (c) | | Assumes investment at the NAV at the beginning of the period, reinvestment of all dividends and distributions, a complete redemption of the investment at the NAV at the end of the period and no sales or redemption charges (if any). Total returns would be reduced if a sales or redemption charge was taken into account. Returns do not reflect the impact of taxes to shareholders relating to Fund distributions or the redemption of Fund shares. Total returns for periods less than one full year are not annualized. |
| | (e) | | The Fund’s portfolio turnover rate is calculated in accordance with regulatory requirements, without regard to transactions involving short term investments. If such transactions were included, the Fund’s portfolio turnover rate may be higher. |
| | |
| 66 | | The accompanying notes are an integral part of these financial statements. |
GOLDMAN SACHS SMALL CAP VALUE FUND
Financial Highlights (continued)
Selected Share Data for a Share Outstanding Throughout Each Period
| | | | | | | | | | | | | | | | | | | | | | | | | | |
| | | | | Goldman Sachs Small Cap Value Fund | |
| | | | | Class A Shares | |
| | | | | Six Months Ended
February 28, 2021
(Unaudited) | | | Year Ended August 31, | |
| | | | | 2020 | | | 2019 | | | 2018 | | | 2017 | | | 2016 | |
| | Per Share Data | | | | | | | | | | | | | | | | | | | | | | | | |
| | | | | | | |
| | Net asset value, beginning of period | | $ | 40.60 | | | $ | 47.20 | | | $ | 59.98 | | | $ | 56.63 | | | $ | 52.52 | | | $ | 49.78 | |
| | | | | | | |
| | Net investment income(a) | | | (0.04 | ) | | | 0.20 | | | | 0.20 | | | | 0.04 | | | | 0.16 | | | | 0.20 | |
| | | | | | | |
| | Net realized and unrealized gain (loss) | | | 16.15 | | | | (4.48 | ) | | | (7.12 | ) | | | 9.70 | | | | 5.92 | | | | 5.11 | |
| | | | | | | |
| | Total from investment operations | | | 16.11 | | | | (4.28 | ) | | | (6.92 | ) | | | 9.74 | | | | 6.08 | | | | 5.31 | |
| | | | | | | |
| | Distributions to shareholders from net investment income | | | (0.10 | ) | | | (0.26 | ) | | | (0.02 | ) | | | (0.08 | ) | | | (0.22 | ) | | | (0.16 | ) |
| | | | | | | |
| | Distributions to shareholders from net realized gains | | | — | | | | (2.06 | ) | | | (5.84 | ) | | | (6.31 | ) | | | (1.75 | ) | | | (2.41 | ) |
| | | | | | | |
| | Total distributions | | | (0.10 | ) | | | (2.32 | ) | | | (5.86 | ) | | | (6.39 | ) | | | (1.97 | ) | | | (2.57 | ) |
| | | | | | | |
| | Net asset value, end of period | | $ | 56.61 | | | $ | 40.60 | | | $ | 47.20 | | | $ | 59.98 | | | $ | 56.63 | | | $ | 52.52 | |
| | | | | | | |
| | Total Return(b) | | | 39.70 | % | | | (9.92 | )% | | | (11.16 | )% | | | 18.15 | % | | | 11.56 | % | | | 11.22 | % |
| | | | | | | |
| | Net assets, end of period (in 000’s) | | $ | 485,806 | | | $ | 413,666 | | | $ | 594,825 | | | $ | 803,918 | | | $ | 851,497 | | | $ | 928,091 | |
| | | | | | | |
| | Ratio of net expenses to average net assets | | | 1.31 | %(c) | | | 1.34 | % | | | 1.34 | % | | | 1.33 | % | | | 1.34 | % | | | 1.35 | % |
| | | | | | | |
| | Ratio of total expenses to average net assets | | | 1.36 | %(c) | | | 1.37 | % | | | 1.36 | % | | | 1.36 | % | | | 1.38 | % | | | 1.39 | % |
| | | | | | | |
| | Ratio of net investment income to average net assets | | | (0.18 | )%(c) | | | 0.47 | % | | | 0.39 | % | | | 0.07 | % | | | 0.29 | % | | | 0.42 | % |
| | | | | | | |
| | Portfolio turnover rate(d) | | | 26 | % | | | 75 | % | | | 47 | % | | | 55 | % | | | 68 | % | | | 46 | % |
| | (a) | | Calculated based on the average shares outstanding methodology. |
| | (b) | | Assumes investment at the NAV at the beginning of the period, reinvestment of all dividends and distributions, a complete redemption of the investment at the NAV at the end of the period and no sales or redemption charges (if any). Total returns would be reduced if a sales or redemption charge was taken into account. Returns do not reflect the impact of taxes to shareholders relating to Fund distributions or the redemption of Fund shares. Total returns for periods less than one full year are not annualized. |
| | (d) | | The Fund’s portfolio turnover rate is calculated in accordance with regulatory requirements, without regard to transactions involving short term investments. If such transactions were included, the Fund’s portfolio turnover rate may be higher. |
| | |
| The accompanying notes are an integral part of these financial statements. | | 67 |
GOLDMAN SACHS SMALL CAP VALUE FUND
Financial Highlights (continued)
Selected Share Data for a Share Outstanding Throughout Each Period
| | | | | | | | | | | | | | | | | | | | | | | | | | |
| | | | | Goldman Sachs Small Cap Value Fund | |
| | | | | Class C Shares | |
| | | | | Six Months Ended
February 28, 2021
(Unaudited) | | | Year Ended August 31, | |
| | | | | 2020 | | | 2019 | | | 2018 | | | 2017 | | | 2016 | |
| | Per Share Data | | | | | | | | | | | | | | | | | | | | | | | | |
| | | | | | | |
| | Net asset value, beginning of period | | $ | 28.68 | | | $ | 33.97 | | | $ | 45.37 | | | $ | 44.50 | | | $ | 41.75 | | | $ | 40.23 | |
| | | | | | | |
| | Net investment loss(a) | | | (0.15 | ) | | | (0.02 | ) | | | (0.13 | ) | | | (0.31 | ) | | | (0.20 | ) | | | (0.13 | ) |
| | | | | | | |
| | Net realized and unrealized gain (loss) | | | 11.38 | | | | (3.21 | ) | | | (5.43 | ) | | | 7.49 | | | | 4.70 | | | | 4.06 | |
| | | | | | | |
| | Total from investment operations | | | 11.23 | | | | (3.23 | ) | | | (5.56 | ) | | | 7.18 | | | | 4.50 | | | | 3.93 | |
| | | | | | | |
| | Distributions to shareholders from net investment income | | | — | | | | — | | | | — | | | | — | | | | — | | | | — | (b) |
| | | | | | | |
| | Distributions to shareholders from net realized gains | | | — | | | | (2.06 | ) | | | (5.84 | ) | | | (6.31 | ) | | | (1.75 | ) | | | (2.41 | ) |
| | | | | | | |
| | Total distributions | | | — | | | | (2.06 | ) | | | (5.84 | ) | | | (6.31 | ) | | | (1.75 | ) | | | (2.41 | ) |
| | | | | | | |
| | Net asset value, end of period | | $ | 39.91 | | | $ | 28.68 | | | $ | 33.97 | | | $ | 45.37 | | | $ | 44.50 | | | $ | 41.75 | |
| | | | | | | |
| | Total Return(c) | | | 39.20 | % | | | (10.61 | )% | | | (11.83 | )% | | | 17.26 | % | | | 10.72 | % | | | 10.40 | % |
| | | | | | | |
| | Net assets, end of period (in 000’s) | | $ | 2,943 | | | $ | 3,220 | | | $ | 8,867 | | | $ | 37,157 | | | $ | 37,357 | | | $ | 47,925 | |
| | | | | | | |
| | Ratio of net expenses to average net assets | | | 2.06 | %(d) | | | 2.09 | % | | | 2.09 | % | | | 2.08 | % | | | 2.09 | % | | | 2.10 | % |
| | | | | | | |
| | Ratio of total expenses to average net assets | | | 2.10 | %(d) | | | 2.12 | % | | | 2.11 | % | | | 2.11 | % | | | 2.13 | % | | | 2.14 | % |
| | | | | | | |
| | Ratio of net investment loss to average net assets | | | (0.92 | )%(d) | | | (0.05 | )% | | | (0.36 | )% | | | (0.69 | )% | | | (0.45 | )% | | | (0.33 | )% |
| | | | | | | |
| | Portfolio turnover rate(e) | | | 26 | % | | | 75 | % | | | 47 | % | | | 55 | % | | | 68 | % | | | 46 | % |
| | (a) | | Calculated based on the average shares outstanding methodology. |
| | (b) | | Amount is less than $0.005 per share. |
| | (c) | | Assumes investment at the NAV at the beginning of the period, reinvestment of all dividends and distributions, a complete redemption of the investment at the NAV at the end of the period and no sales or redemption charges (if any). Total returns would be reduced if a sales or redemption charge was taken into account. Returns do not reflect the impact of taxes to shareholders relating to Fund distributions or the redemption of Fund shares. Total returns for periods less than one full year are not annualized. |
| | (e) | | The Fund’s portfolio turnover rate is calculated in accordance with regulatory requirements, without regard to transactions involving short term investments. If such transactions were included, the Fund’s portfolio turnover rate may be higher. |
| | |
| 68 | | The accompanying notes are an integral part of these financial statements. |
GOLDMAN SACHS SMALL CAP VALUE FUND
Financial Highlights (continued)
Selected Share Data for a Share Outstanding Throughout Each Period
| | | | | | | | | | | | | | | | | | | | | | | | | | |
| | | | | Goldman Sachs Small Cap Value Fund | |
| | | | | Institutional Shares | |
| | | | | Six Months Ended
February 28, 2021
(Unaudited) | | | Year Ended August 31, | |
| | | | | 2020 | | | 2019 | | | 2018 | | | 2017 | | | 2016 | |
| | Per Share Data | | | | | | | | | | | | | | | | | | | | | | | | |
| | | | | | | |
| | Net asset value, beginning of period | | $ | 44.52 | | | $ | 51.56 | | | $ | 64.90 | | | $ | 60.78 | | | $ | 56.20 | | | $ | 53.10 | |
| | | | | | | |
| | Net investment income(a) | | | 0.05 | | | | 0.35 | | | | 0.43 | | | | 0.28 | | | | 0.41 | | | | 0.42 | |
| | | | | | | |
| | Net realized and unrealized gain (loss) | | | 17.70 | | | | (4.87 | ) | | | (7.71 | ) | | | 10.46 | | | | 6.34 | | | | 5.45 | |
| | | | | | | |
| | Total from investment operations | | | 17.75 | | | | (4.52 | ) | | | (7.28 | ) | | | 10.74 | | | | 6.75 | | | | 5.87 | |
| | | | | | | |
| | Distributions to shareholders from net investment income | | | (0.27 | ) | | | (0.46 | ) | | | (0.22 | ) | | | (0.31 | ) | | | (0.42 | ) | | | (0.36 | ) |
| | | | | | | |
| | Distributions to shareholders from net realized gains | | | — | | | | (2.06 | ) | | | (5.84 | ) | | | (6.31 | ) | | | (1.75 | ) | | | (2.41 | ) |
| | | | | | | |
| | Total distributions | | | (0.27 | ) | | | (2.52 | ) | | | (6.06 | ) | | | (6.62 | ) | | | (2.17 | ) | | | (2.77 | ) |
| | | | | | | |
| | Net asset value, end of period | | $ | 62.00 | | | $ | 44.52 | | | $ | 51.56 | | | $ | 64.90 | | | $ | 60.78 | | | $ | 56.20 | |
| | | | | | | |
| | Total Return(b) | | | 39.95 | % | | | (9.60 | )% | | | (10.81 | )% | | | 18.62 | % | | | 12.00 | % | | | 11.66 | % |
| | | | | | | |
| | Net assets, end of period (in 000’s) | | $ | 2,817,151 | | | $ | 2,454,781 | | | $ | 3,114,853 | | | $ | 4,304,041 | | | $ | 4,393,986 | | | $ | 4,476,848 | |
| | | | | | | |
| | Ratio of net expenses to average net assets | | | 0.96 | %(c) | | | 0.96 | % | | | 0.95 | % | | | 0.94 | % | | | 0.94 | % | | | 0.95 | % |
| | | | | | | |
| | Ratio of total expenses to average net assets | | | 0.99 | %(c) | | | 0.99 | % | | | 0.97 | % | | | 0.97 | % | | | 0.98 | % | | | 0.99 | % |
| | | | | | | |
| | Ratio of net investment income to average net assets | | | 0.18 | %(c) | | | 0.74 | % | | | 0.78 | % | | | 0.45 | % | | | 0.69 | % | | | 0.82 | % |
| | | | | | | |
| | Portfolio turnover rate(d) | | | 26 | % | | | 75 | % | | | 47 | % | | | 55 | % | | | 68 | % | | | 46 | % |
| | (a) | | Calculated based on the average shares outstanding methodology. |
| | (b) | | Assumes investment at the NAV at the beginning of the period, reinvestment of all dividends and distributions, a complete redemption of the investment at the NAV at the end of the period and no sales or redemption charges (if any). Total returns would be reduced if a sales or redemption charge was taken into account. Returns do not reflect the impact of taxes to shareholders relating to Fund distributions or the redemption of Fund shares. Total returns for periods less than one full year are not annualized. |
| | (d) | | The Fund’s portfolio turnover rate is calculated in accordance with regulatory requirements, without regard to transactions involving short term investments. If such transactions were included, the Fund’s portfolio turnover rate may be higher. |
| | |
| The accompanying notes are an integral part of these financial statements. | | 69 |
GOLDMAN SACHS SMALL CAP VALUE FUND
Financial Highlights (continued)
Selected Share Data for a Share Outstanding Throughout Each Period
| | | | | | | | | | | | | | | | | | | | | | | | | | |
| | | | | Goldman Sachs Small Cap Value Fund | |
| | | | | Service Shares | |
| | | | | Six Months Ended
February 28, 2021
(Unaudited) | | | Year Ended August 31, | |
| | | | | 2020 | | | 2019 | | | 2018 | | | 2017 | | | 2016 | |
| | Per Share Data | | | | | | | | | | | | | | | | | | | | | | | | |
| | | | | | | |
| | Net asset value, beginning of period | | $ | 39.10 | | | $ | 45.50 | | | $ | 58.10 | | | $ | 55.04 | | | $ | 51.10 | | | $ | 48.50 | |
| | | | | | | |
| | Net investment income (loss)(a) | | | (0.07 | ) | | | 0.16 | | | | 0.14 | | | | (0.03 | ) | | | 0.09 | | | | 0.15 | |
| | | | | | | |
| | Net realized and unrealized gain (loss) | | | 15.55 | | | | (4.35 | ) | | | (6.90 | ) | | | 9.42 | | | | 5.77 | | | | 4.96 | |
| | | | | | | |
| | Total from investment operations | | | 15.48 | | | | (4.19 | ) | | | (6.76 | ) | | | 9.39 | | | | 5.86 | | | | 5.11 | |
| | | | | | | |
| | Distributions to shareholders from net investment income | | | (0.02 | ) | | | (0.15 | ) | | | — | | | | (0.02 | ) | | | (0.17 | ) | | | (0.10 | ) |
| | | | | | | |
| | Distributions to shareholders from net realized gains | | | — | | | | (2.06 | ) | | | (5.84 | ) | | | (6.31 | ) | | | (1.75 | ) | | | (2.41 | ) |
| | | | | | | |
| | Total distributions | | | (0.02 | ) | | | (2.21 | ) | | | (5.84 | ) | | | (6.33 | ) | | | (1.92 | ) | | | (2.51 | ) |
| | | | | | | |
| | Net asset value, end of period | | $ | 54.56 | | | $ | 39.10 | | | $ | 45.50 | | | $ | 58.10 | | | $ | 55.04 | | | $ | 51.10 | |
| | | | | | | |
| | Total Return(b) | | | 39.60 | % | | | (10.04 | )% | | | (11.26 | )% | | | 18.02 | % | | | 11.44 | % | | | 11.11 | % |
| | | | | | | |
| | Net assets, end of period (in 000’s) | | $ | 35,647 | | | $ | 39,295 | | | $ | 75,860 | | | $ | 110,636 | | | $ | 145,996 | | | $ | 119,315 | |
| | | | | | | |
| | Ratio of net expenses to average net assets | | | 1.46 | %(c) | | | 1.46 | % | | | 1.45 | % | | | 1.44 | % | | | 1.44 | % | | | 1.45 | % |
| | | | | | | |
| | Ratio of total expenses to average net assets | | | 1.49 | %(c) | | | 1.49 | % | | | 1.47 | % | | | 1.47 | % | | | 1.48 | % | | | 1.49 | % |
| | | | | | | |
| | Ratio of net investment income (loss) to average net assets | | | (0.32 | )%(c) | | | 0.39 | % | | | 0.29 | % | | | (0.06 | )% | | | 0.17 | % | | | 0.32 | % |
| | | | | | | |
| | Portfolio turnover rate(d) | | | 26 | % | | | 75 | % | | | 47 | % | | | 55 | % | | | 68 | % | | | 46 | % |
| | (a) | | Calculated based on the average shares outstanding methodology. |
| | (b) | | Assumes investment at the NAV at the beginning of the period, reinvestment of all dividends and distributions, a complete redemption of the investment at the NAV at the end of the period and no sales or redemption charges (if any). Total returns would be reduced if a sales or redemption charge was taken into account. Returns do not reflect the impact of taxes to shareholders relating to Fund distributions or the redemption of Fund shares. Total returns for periods less than one full year are not annualized. |
| | (d) | | The Fund’s portfolio turnover rate is calculated in accordance with regulatory requirements, without regard to transactions involving short term investments. If such transactions were included, the Fund’s portfolio turnover rate may be higher. |
| | |
| 70 | | The accompanying notes are an integral part of these financial statements. |
GOLDMAN SACHS SMALL CAP VALUE FUND
Financial Highlights (continued)
Selected Share Data for a Share Outstanding Throughout Each Period
| | | | | | | | | | | | | | | | | | | | | | | | | | |
| | | | | Goldman Sachs Small Cap Value Fund | |
| | | | | Investor Shares | |
| | | | | Six Months Ended
February 28, 2021
(Unaudited) | | | Year Ended August 31, | |
| | | | | 2020 | | | 2019 | | | 2018 | | | 2017 | | | 2016 | |
| | Per Share Data | | | | | | | | | | | | | | | | | | | | | | | | |
| | | | | | | |
| | Net asset value, beginning of period | | $ | 40.26 | | | $ | 46.84 | | | $ | 59.60 | | | $ | 56.32 | | | $ | 52.23 | | | $ | 49.55 | |
| | | | | | | |
| | Net investment income(a) | | | 0.01 | | | | 0.27 | | | | 0.32 | | | | 0.18 | | | | 0.29 | | | | 0.32 | |
| | | | | | | |
| | Net realized and unrealized gain (loss) | | | 16.02 | | | | (4.39 | ) | | | (7.09 | ) | | | 9.64 | | | | 5.90 | | | | 5.07 | |
| | | | | | | |
| | Total from investment operations | | | 16.03 | | | | (4.12 | ) | | | (6.77 | ) | | | 9.82 | | | | 6.19 | | | | 5.39 | |
| | | | | | | |
| | Distributions to shareholders from net investment income | | | (0.22 | ) | | | (0.40 | ) | | | (0.15 | ) | | | (0.23 | ) | | | (0.35 | ) | | | (0.30 | ) |
| | | | | | | |
| | Distributions to shareholders from net realized gains | | | — | | | | (2.06 | ) | | | (5.84 | ) | | | (6.31 | ) | | | (1.75 | ) | | | (2.41 | ) |
| | | | | | | |
| | Total distributions | | | (0.22 | ) | | | (2.46 | ) | | | (5.99 | ) | | | (6.54 | ) | | | (2.10 | ) | | | (2.71 | ) |
| | | | | | | |
| | Net asset value, end of period | | $ | 56.07 | | | $ | 40.26 | | | $ | 46.84 | | | $ | 59.60 | | | $ | 56.32 | | | $ | 52.23 | |
| | | | | | | |
| | Total Return(b) | | | 39.89 | % | | | (9.70 | )% | | | (10.94 | )% | | | 18.44 | % | | | 11.84 | % | | | 11.50 | % |
| | | | | | | |
| | Net assets, end of period (in 000’s) | | $ | 161,857 | | | $ | 115,491 | | | $ | 132,434 | | | $ | 173,176 | | | $ | 168,986 | | | $ | 162,661 | |
| | | | | | | |
| | Ratio of net expenses to average net assets | | | 1.06 | %(c) | | | 1.09 | % | | | 1.09 | % | | | 1.08 | % | | | 1.09 | % | | | 1.10 | % |
| | | | | | | |
| | Ratio of total expenses to average net assets | | | 1.11 | %(c) | | | 1.12 | % | | | 1.11 | % | | | 1.11 | % | | | 1.13 | % | | | 1.14 | % |
| | | | | | | |
| | Ratio of net investment income to average net assets | | | 0.06 | %(c) | | | 0.64 | % | | | 0.64 | % | | | 0.31 | % | | | 0.53 | % | | | 0.67 | % |
| | | | | | | |
| | Portfolio turnover rate(d) | | | 26 | % | | | 75 | % | | | 47 | % | | | 55 | % | | | 68 | % | | | 46 | % |
| | (a) | | Calculated based on the average shares outstanding methodology. |
| | (b) | | Assumes investment at the NAV at the beginning of the period, reinvestment of all dividends and distributions, a complete redemption of the investment at the NAV at the end of the period and no sales or redemption charges (if any). Total returns would be reduced if a sales or redemption charge was taken into account. Returns do not reflect the impact of taxes to shareholders relating to Fund distributions or the redemption of Fund shares. Total returns for periods less than one full year are not annualized. |
| | (d) | | The Fund’s portfolio turnover rate is calculated in accordance with regulatory requirements, without regard to transactions involving short term investments. If such transactions were included, the Fund’s portfolio turnover rate may be higher. |
| | |
| The accompanying notes are an integral part of these financial statements. | | 71 |
GOLDMAN SACHS SMALL CAP VALUE FUND
Financial Highlights (continued)
Selected Share Data for a Share Outstanding Throughout Each Period
| | | | | | | | | | | | | | | | | | | | | | | | | | |
| | | | | Goldman Sachs Small Cap Value Fund | |
| | | | | Class R6 Shares | |
| | | | | Six Months Ended
February 28, 2021
(Unaudited) | | | Year Ended August 31, | |
| | | | | 2020 | | | 2019 | | | 2018 | | | 2017 | | | 2016 | |
| | Per Share Data | | | | | | | | | | | | | | | | | | | | | | | | |
| | | | | | | |
| | Net asset value, beginning of period | | $ | 44.50 | | | $ | 51.53 | | | $ | 64.88 | | | $ | 60.77 | | | $ | 56.19 | | | $ | 53.10 | |
| | | | | | | |
| | Net investment income(a) | | | 0.05 | | | | 0.35 | | | | 0.42 | | | | 0.27 | | | | 0.38 | | | | 0.37 | |
| | | | | | | |
| | Net realized and unrealized gain (loss) | | | 17.70 | | | | (4.85 | ) | | | (7.70 | ) | | | 10.47 | | | | 6.39 | | | | 5.51 | |
| | | | | | | |
| | Total from investment operations | | | 17.75 | | | | (4.50 | ) | | | (7.28 | ) | | | 10.74 | | | | 6.77 | | | | 5.88 | |
| | | | | | | |
| | Distributions to shareholders from net investment income | | | (0.28 | ) | | | (0.47 | ) | | | (0.23 | ) | | | (0.32 | ) | | | (0.44 | ) | | | (0.38 | ) |
| | | | | | | |
| | Distributions to shareholders from net realized gains | | | — | | | | (2.06 | ) | | | (5.84 | ) | | | (6.31 | ) | | | (1.75 | ) | | | (2.41 | ) |
| | | | | | | |
| | Total distributions | | | (0.28 | ) | | | (2.53 | ) | | | (6.07 | ) | | | (6.63 | ) | | | (2.19 | ) | | | (2.79 | ) |
| | | | | | | |
| | Net asset value, end of period | | $ | 61.97 | | | $ | 44.50 | | | $ | 51.53 | | | $ | 64.88 | | | $ | 60.77 | | | $ | 56.19 | |
| | | | | | | |
| | Total Return(b) | | | 39.96 | % | | | (9.58 | )% | | | (10.81 | )% | | | 18.63 | % | | | 12.03 | % | | | 11.68 | % |
| | | | | | | |
| | Net assets, end of period (in 000’s) | | $ | 1,443,782 | | | $ | 1,229,047 | | | $ | 1,302,069 | | | $ | 1,146,132 | | | $ | 759,095 | | | $ | 317,289 | |
| | | | | | | |
| | Ratio of net expenses to average net assets | | | 0.95 | %(c) | | | 0.95 | % | | | 0.94 | % | | | 0.93 | % | | | 0.92 | % | | | 0.93 | % |
| | | | | | | |
| | Ratio of total expenses to average net assets | | | 0.98 | %(c) | | | 0.98 | % | | | 0.96 | % | | | 0.96 | % | | | 0.96 | % | | | 0.98 | % |
| | | | | | | |
| | Ratio of net investment income to average net assets | | | 0.19 | %(c) | | | 0.74 | % | | | 0.77 | % | | | 0.44 | % | | | 0.63 | % | | | 0.71 | % |
| | | | | | | |
| | Portfolio turnover rate(d) | | | 26 | % | | | 75 | % | | | 47 | % | | | 55 | % | | | 68 | % | | | 46 | % |
| | (a) | | Calculated based on the average shares outstanding methodology. |
| | (b) | | Assumes investment at the NAV at the beginning of the period, reinvestment of all dividends and distributions, a complete redemption of the investment at the NAV at the end of the period and no sales or redemption charges (if any). Total returns would be reduced if a sales or redemption charge was taken into account. Returns do not reflect the impact of taxes to shareholders relating to Fund distributions or the redemption of Fund shares. Total returns for periods less than one full year are not annualized. |
| | (d) | | The Fund’s portfolio turnover rate is calculated in accordance with regulatory requirements, without regard to transactions involving short term investments. If such transactions were included, the Fund’s portfolio turnover rate may be higher. |
| | |
| 72 | | The accompanying notes are an integral part of these financial statements. |
GOLDMAN SACHS SMALL CAP VALUE FUND
Financial Highlights (continued)
Selected Share Data for a Share Outstanding Throughout Each Period
| | | | | | | | | | | | | | | | | | | | | | | | | | |
| | | | | Goldman Sachs Small Cap Value Fund | |
| | | | | Class R Shares | |
| | | | | Six Months Ended
February 28, 2021
(Unaudited) | | | Year Ended August 31, | |
| | | | | 2020 | | | 2019 | | | 2018 | | | 2017 | | | 2016 | |
| | Per Share Data | | | | | | | | | | | | | | | | | | | | | | | | |
| | | | | | | |
| | Net asset value, beginning of period | | $ | 39.48 | | | $ | 45.96 | | | $ | 58.69 | | | $ | 55.60 | | | $ | 51.62 | | | $ | 48.95 | |
| | | | | | | |
| | Net investment income (loss)(a) | | | (0.09 | ) | | | 0.13 | | | | 0.07 | | | | (0.11 | ) | | | 0.02 | | | | 0.08 | |
| | | | | | | |
| | Net realized and unrealized gain (loss) | | | 15.69 | | | | (4.42 | ) | | | (6.96 | ) | | | 9.51 | | | | 5.82 | | | | 5.03 | |
| | | | | | | |
| | Total from investment operations | | | 15.60 | | | | (4.29 | ) | | | (6.89 | ) | | | 9.40 | | | | 5.84 | | | | 5.11 | |
| | | | | | | |
| | Distributions to shareholders from net investment income | | | — | | | | (0.13 | ) | | | — | | | | — | | | | (0.11 | ) | | | (0.03 | ) |
| | | | | | | |
| | Distributions to shareholders from net realized gains | | | — | | | | (2.06 | ) | | | (5.84 | ) | | | (6.31 | ) | | | (1.75 | ) | | | (2.41 | ) |
| | | | | | | |
| | Total distributions | | | — | | | | (2.19 | ) | | | (5.84 | ) | | | (6.31 | ) | | | (1.86 | ) | | | (2.44 | ) |
| | | | | | | |
| | Net asset value, end of period | | $ | 55.08 | | | $ | 39.48 | | | $ | 45.96 | | | $ | 58.69 | | | $ | 55.60 | | | $ | 51.62 | |
| | | | | | | |
| | Total Return(b) | | | 39.51 | % | | | (10.16 | )% | | | 11.37 | % | | | 17.85 | % | | | 11.28 | % | | | 10.96 | % |
| | | | | | | |
| | Net assets, end of period (in 000’s) | | $ | 65,369 | | | $ | 57,272 | | | $ | 84,684 | | | $ | 123,288 | | | $ | 124,039 | | | $ | 122,526 | |
| | | | | | | |
| | Ratio of net expenses to average net assets | | | 1.56 | %(c) | | | 1.59 | % | | | 1.59 | % | | | 1.58 | % | | | 1.59 | % | | | 1.60 | % |
| | | | | | | |
| | Ratio of total expenses to average net assets | | | 1.60 | %(c) | | | 1.62 | % | | | 1.61 | % | | | 1.61 | % | | | 1.63 | % | | | 1.64 | % |
| | | | | | | |
| | Ratio of net investment income (loss) to average net assets | | | (0.42 | )%(c) | | | 0.30 | % | | | 0.15 | % | | | (0.19 | )% | | | 0.04 | % | | | 0.18 | % |
| | | | | | | |
| | Portfolio turnover rate(d) | | | 26 | % | | | 75 | % | | | 47 | % | | | 55 | % | | | 68 | % | | | 46 | % |
| | (a) | | Calculated based on the average shares outstanding methodology. |
| | (b) | | Assumes investment at the NAV at the beginning of the period, reinvestment of all dividends and distributions, a complete redemption of the investment at the NAV at the end of the period and no sales or redemption charges (if any). Total returns would be reduced if a sales or redemption charge was taken into account. Returns do not reflect the impact of taxes to shareholders relating to Fund distributions or the redemption of Fund shares. Total returns for periods less than one full year are not annualized. |
| | (d) | | The Fund’s portfolio turnover rate is calculated in accordance with regulatory requirements, without regard to transactions involving short term investments. If such transactions were included, the Fund’s portfolio turnover rate may be higher. |
| | |
| The accompanying notes are an integral part of these financial statements. | | 73 |
GOLDMAN SACHS SMALL CAP VALUE FUND
Financial Highlights (continued)
Selected Share Data for a Share Outstanding Throughout Each Period
| | | | | | | | | | | | | | | | | | |
| | | | | Goldman Sachs Small Cap Value Fund | |
| | | | | Class P Shares | |
| | | | | Six Months Ended
February 28, 2021
(Unaudited) | | | Year Ended August 31, | | | Period Ended
August 31, 2018(a) | |
| | | | 2020 | | | 2019 | |
| | Per Share Data | | | | | | | | | | | | | | | | |
| | | | | |
| | Net asset value, beginning of period | | $ | 44.50 | | | $ | 51.53 | | | $ | 64.88 | | | $ | 60.80 | |
| | | | | |
| | Net investment income(b) | | | 0.04 | | | | 0.34 | | | | 0.43 | | | | 0.11 | |
| | | | | |
| | Net realized and unrealized gain (loss) | | | 17.71 | | | | (4.85 | ) | | | (7.71 | ) | | | 3.97 | |
| | | | | |
| | Total from investment operations | | | 17.75 | | | | (4.51 | ) | | | (7.28 | ) | | | 4.08 | |
| | | | | |
| | Distributions to shareholders from net investment income | | | (0.28 | ) | | | (0.46 | ) | | | (0.23 | ) | | | — | |
| | | | | |
| | Distributions to shareholders from net realized gains | | | — | | | | (2.06 | ) | | | (5.84 | ) | | | — | |
| | | | | |
| | Total distributions | | | (0.28 | ) | | | (2.52 | ) | | | (6.07 | ) | | | — | |
| | | | | |
| | Net asset value, end of period | | $ | 61.97 | | | $ | 44.50 | | | $ | 51.53 | | | $ | 64.88 | |
| | | | | |
| | Total Return(c) | | | 39.93 | % | | | (9.56 | )% | | | (10.80 | )% | | | 6.71 | % |
| | | | | |
| | Net assets, end of period (in 000’s) | | $ | 299,770 | | | $ | 206,370 | | | $ | 231,930 | | | $ | 317,224 | |
| | | | | |
| | Ratio of net expenses to average net assets | | | 0.95 | %(d) | | | 0.95 | % | | | 0.94 | % | | | 0.93 | %(d) |
| | | | | |
| | Ratio of total expenses to average net assets | | | 0.98 | %(d) | | | 0.98 | % | | | 0.96 | % | | | 0.97 | %(d) |
| | | | | |
| | Ratio of net investment income to average net assets | | | 0.17 | %(d) | | | 0.74 | % | | | 0.79 | % | | | 0.46 | %(d) |
| | | | | |
| | Portfolio turnover rate(e) | | | 26 | % | | | 75 | % | | | 47 | % | | | 55 | % |
| | (a) | | Commenced operations on April 17, 2018. |
| | (b) | | Calculated based on the average shares outstanding methodology. |
| | (c) | | Assumes investment at the NAV at the beginning of the period, reinvestment of all dividends and distributions, a complete redemption of the investment at the NAV at the end of the period and no sales or redemption charges (if any). Total returns would be reduced if a sales or redemption charge was taken into account. Returns do not reflect the impact of taxes to shareholders relating to Fund distributions or the redemption of Fund shares. Total returns for periods less than one full year are not annualized. |
| | (e) | | The Fund’s portfolio turnover rate is calculated in accordance with regulatory requirements, without regard to transactions involving short term investments. If such transactions were included, the Fund’s portfolio turnover rate may be higher. |
| | |
| 74 | | The accompanying notes are an integral part of these financial statements. |
GOLDMAN SACHS SMALL/MID CAP VALUE FUND
Financial Highlights (continued)
Selected Share Data for a Share Outstanding Throughout Each Period
| | | | | | | | | | | | | | | | | | | | | | | | | | |
| | | | | Goldman Sachs Small/Mid Cap Value Fund | |
| | | | | Class A Shares | |
| | | | | Six Months Ended
February 28, 2021
(Unaudited) | | | Year Ended August 31, | |
| | | | | 2020 | | | 2019 | | | 2018 | | | 2017 | | | 2016 | |
| | Per Share Data | | | | | | | | | | | | | | | | | | | | | | | | |
| | | | | | | |
| | Net asset value, beginning of period | | $ | 11.50 | | | $ | 11.99 | | | $ | 13.58 | | | $ | 12.37 | | | $ | 11.18 | | | $ | 10.46 | |
| | | | | | | |
| | Net investment income(a) | | | — | | | | 0.06 | | | | 0.07 | | | | 0.04 | | | | 0.07 | | | | 0.08 | (b) |
| | | | | | | |
| | Net realized and unrealized gain (loss) | | | 3.95 | | | | (0.48 | ) | | | (0.88 | ) | | | 1.72 | | | | 1.19 | | | | 0.70 | |
| | | | | | | |
| | Total from investment operations | | | 3.95 | | | | (0.42 | ) | | | (0.81 | ) | | | 1.76 | | | | 1.26 | | | | 0.78 | |
| | | | | | | |
| | Distributions to shareholders from net investment income | | | (0.05 | ) | | | (0.07 | ) | | | (0.02 | ) | | | (0.08 | ) | | | (0.07 | ) | | | (0.01 | ) |
| | | | | | | |
| | Distributions to shareholders from net realized gains | | | — | | | | — | | | | (0.76 | ) | | | (0.47 | ) | | | — | | | | (0.05 | ) |
| | | | | | | |
| | Total distributions | | | (0.05 | ) | | | (0.07 | ) | | | (0.78 | ) | | | (0.55 | ) | | | (0.07 | ) | | | (0.06 | ) |
| | | | | | | |
| | Net asset value, end of period | | $ | 15.40 | | | $ | 11.50 | | | $ | 11.99 | | | $ | 13.58 | | | $ | 12.37 | | | $ | 11.18 | |
| | | | | | | |
| | Total Return(c) | | | 34.39 | % | | | (3.56 | )% | | | (5.42 | )% | | | 14.47 | % | | | 11.30 | % | | | 7.49 | % |
| | | | | | | |
| | Net assets, end of period (in 000’s) | | $ | 1,386 | | | $ | 988 | | | $ | 1,467 | | | $ | 1,699 | | | $ | 1,497 | | | $ | 1,128 | |
| | | | | | | |
| | Ratio of net expenses to average net assets | | | 1.21 | %(d) | | | 1.23 | % | | | 1.23 | % | | | 1.23 | % | | | 1.24 | % | | | 1.26 | % |
| | | | | | | |
| | Ratio of total expenses to average net assets | | | 1.48 | %(d) | | | 1.50 | % | | | 1.56 | % | | | 1.47 | % | | | 1.73 | % | | | 2.25 | % |
| | | | | | | |
| | Ratio of net investment income to average net assets | | | (0.02 | )%(d) | | | 0.49 | % | | | 0.61 | % | | | 0.34 | % | | | 0.58 | % | | | 0.78 | %(b) |
| | | | | | | |
| | Portfolio turnover rate(e) | | | 29 | % | | | 76 | % | | | 73 | % | | | 105 | % | | | 108 | % | | | 109 | % |
| | (a) | | Calculated based on the average shares outstanding methodology. |
| | (b) | | Reflects income recognized from special dividends which amounted to $0.03 per share and 0.29% of average net assets. |
| | (c) | | Assumes investment at the NAV at the beginning of the period, reinvestment of all dividends and distributions, a complete redemption of the investment at the NAV at the end of the period and no sales or redemption charges (if any). Total returns would be reduced if a sales or redemption charge was taken into account. Returns do not reflect the impact of taxes to shareholders relating to Fund distributions or the redemption of Fund shares. Total returns for periods less than one full year are not annualized. |
| | (e) | | The Fund’s portfolio turnover rate is calculated in accordance with regulatory requirements, without regard to transactions involving short term investments. If such transactions were included, the Fund’s portfolio turnover rate may be higher. |
| | |
| The accompanying notes are an integral part of these financial statements. | | 75 |
GOLDMAN SACHS SMALL/MID CAP VALUE FUND
Financial Highlights (continued)
Selected Share Data for a Share Outstanding Throughout Each Period
| | | | | | | | | | | | | | | | | | | | | | | | | | |
| | | | | Goldman Sachs Small/Mid Cap Value Fund | |
| | | | | Class C Shares | |
| | | | | Six Months Ended
February 28, 2021
(Unaudited) | | | Year Ended August 31, | |
| | | | | 2020 | | | 2019 | | | 2018 | | | 2017 | | | 2016 | |
| | Per Share Data | | | | | | | | | | | | | | | | | | | | | | | | |
| | | | | | | |
| | Net asset value, beginning of period | | $ | 11.17 | | | $ | 11.67 | | | $ | 13.30 | | | $ | 12.14 | | | $ | 11.01 | | | $ | 10.37 | |
| | | | | | | |
| | Net investment loss(a) | | | (0.05 | ) | | | (0.01 | ) | | | (0.02 | ) | | | (0.06 | ) | | | (0.02 | ) | | | — | (b)(c) |
| | | | | | | |
| | Net realized and unrealized gain (loss) | | | 3.83 | | | | (0.49 | ) | | | (0.85 | ) | | | 1.69 | | | | 1.17 | | | | 0.69 | |
| | | | | | | |
| | Total from investment operations | | | 3.78 | | | | (0.50 | ) | | | (0.87 | ) | | | 1.63 | | | | 1.15 | | | | 0.69 | |
| | | | | | | |
| | Distributions to shareholders from net investment income | | | — | | | | — | | | | — | | | | — | | | | (0.02 | ) | | | — | |
| | | | | | | |
| | Distributions to shareholders from net realized gains | | | — | | | | — | | | | (0.76 | ) | | | (0.47 | ) | | | — | | | | (0.05 | ) |
| | | | | | | |
| | Total distributions | | | — | | | | — | | | | (0.76 | ) | | | (0.47 | ) | | | (0.02 | ) | | | (0.05 | ) |
| | | | | | | |
| | Net asset value, end of period | | $ | 14.95 | | | $ | 11.17 | | | $ | 11.67 | | | $ | 13.30 | | | $ | 12.14 | | | $ | 11.01 | |
| | | | | | | |
| | Total Return(d) | | | 33.96 | % | | | (4.36 | )% | | | (6.07 | )% | | | 13.63 | % | | | 10.48 | % | | | 6.71 | % |
| | | | | | | |
| | Net assets, end of period (in 000’s) | | $ | 1,327 | | | $ | 948 | | | $ | 994 | | | $ | 1,140 | | | $ | 1,126 | | | $ | 618 | |
| | | | | | | |
| | Ratio of net expenses to average net assets | | | 1.96 | %(e) | | | 1.98 | % | | | 1.98 | % | | | 1.98 | % | | | 1.99 | % | | | 2.01 | % |
| | | | | | | |
| | Ratio of total expenses to average net assets | | | 2.23 | %(e) | | | 2.24 | % | | | 2.31 | % | | | 2.22 | % | | | 2.47 | % | | | 2.99 | % |
| | | | | | | |
| | Ratio of net investment income (loss) to average net assets | | | (0.77 | )%(e) | | | (0.07 | )% | | | (0.15 | )% | | | (0.44 | )% | | | (0.17 | )% | | | 0.04 | %(c) |
| | | | | | | |
| | Portfolio turnover rate(f) | | | 29 | % | | | 76 | % | | | 73 | % | | | 105 | % | | | 108 | % | | | 109 | % |
| | (a) | | Calculated based on the average shares outstanding methodology. |
| | (b) | | Amount is less than $0.005 per share. |
| | (c) | | Reflects income recognized from special dividends which amounted to $0.03 per share and 0.29% of average net assets. |
| | (d) | | Assumes investment at the NAV at the beginning of the period, reinvestment of all dividends and distributions, a complete redemption of the investment at the NAV at the end of the period and no sales or redemption charges (if any). Total returns would be reduced if a sales or redemption charge was taken into account. Returns do not reflect the impact of taxes to shareholders relating to Fund distributions or the redemption of Fund shares. Total returns for periods less than one full year are not annualized. |
| | (f) | | The Fund’s portfolio turnover rate is calculated in accordance with regulatory requirements, without regard to transactions involving short term investments. If such transactions were included, the Fund’s portfolio turnover rate may be higher. |
| | |
| 76 | | The accompanying notes are an integral part of these financial statements. |
GOLDMAN SACHS SMALL/MID CAP VALUE FUND
Financial Highlights (continued)
Selected Share Data for a Share Outstanding Throughout Each Period
| | | | | | | | | | | | | | | | | | | | | | | | | | |
| | | | | Goldman Sachs Small/Mid Cap Value Fund | |
| | | | | Institutional Shares | |
| | | | | Six Months Ended
February 28, 2021
(Unaudited) | | | Year Ended August 31, | |
| | | | | 2020 | | | 2019 | | | 2018 | | | 2017 | | | 2016 | |
| | Per Share Data | | | | | | | | | | | | | | | | | | | | | | | | |
| | | | | | | |
| | Net asset value, beginning of period | | $ | 11.67 | | | $ | 12.18 | | | $ | 13.74 | | | $ | 12.50 | | | $ | 11.29 | | | $ | 10.53 | |
| | | | | | | |
| | Net investment income(a) | | | 0.02 | | | | 0.09 | | | | 0.12 | | | | 0.08 | | | | 0.12 | | | | 0.12 | (b) |
| | | | | | | |
| | Net realized and unrealized gain (loss) | | | 4.01 | | | | (0.47 | ) | | | (0.88 | ) | | | 1.75 | | | | 1.20 | | | | 0.71 | |
| | | | | | | |
| | Total from investment operations | | | 4.03 | | | | (0.38 | ) | | | (0.76 | ) | | | 1.83 | | | | 1.32 | | | | 0.83 | |
| | | | | | | |
| | Distributions to shareholders from net investment income | | | (0.10 | ) | | | (0.13 | ) | | | (0.04 | ) | | | (0.12 | ) | | | (0.11 | ) | | | (0.02 | ) |
| | | | | | | |
| | Distributions to shareholders from net realized gains | | | — | | | | — | | | | (0.76 | ) | | | (0.47 | ) | | | — | | | | (0.05 | ) |
| | | | | | | |
| | Total distributions | | | (0.10 | ) | | | (0.13 | ) | | | (0.80 | ) | | | (0.59 | ) | | | (0.11 | ) | | | (0.07 | ) |
| | | | | | | |
| | Net asset value, end of period | | $ | 15.60 | | | $ | 11.67 | | | $ | 12.18 | | | $ | 13.74 | | | $ | 12.50 | | | $ | 11.29 | |
| | | | | | | |
| | Total Return(c) | | | 34.59 | % | | | (3.26 | )% | | | (5.00 | )% | | | 14.93 | % | | | 11.71 | % | | | 7.96 | % |
| | | | | | | |
| | Net assets, end of period (in 000’s) | | $ | 14,030 | | | $ | 7,054 | | | $ | 6,223 | | | $ | 5,666 | | | $ | 42,085 | | | $ | 39,176 | |
| | | | | | | |
| | Ratio of net expenses to average net assets | | | 0.84 | %(d) | | | 0.85 | % | | | 0.84 | % | | | 0.84 | % | | | 0.84 | % | | | 0.87 | % |
| | | | | | | |
| | Ratio of total expenses to average net assets | | | 1.11 | %(d) | | | 1.12 | % | | | 1.17 | % | | | 1.08 | % | | | 1.35 | % | | | 1.84 | % |
| | | | | | | |
| | Ratio of net investment income to average net assets | | | 0.37 | %(d) | | | 0.78 | % | | | 0.99 | % | | | 0.58 | % | | | 0.97 | % | | | 1.18 | %(b) |
| | | | | | | |
| | Portfolio turnover rate(e) | | | 29 | % | | | 76 | % | | | 73 | % | | | 105 | % | | | 108 | % | | | 109 | % |
| | (a) | | Calculated based on the average shares outstanding methodology. |
| | (b) | | Reflects income recognized from special dividends which amounted to $0.03 per share and 0.29% of average net assets. |
| | (c) | | Assumes investment at the NAV at the beginning of the period, reinvestment of all dividends and distributions, a complete redemption of the investment at the NAV at the end of the period and no sales or redemption charges (if any). Total returns would be reduced if a sales or redemption charge was taken into account. Returns do not reflect the impact of taxes to shareholders relating to Fund distributions or the redemption of Fund shares. Total returns for periods less than one full year are not annualized. |
| | (e) | | The Fund’s portfolio turnover rate is calculated in accordance with regulatory requirements, without regard to transactions involving short term investments. If such transactions were included, the Fund’s portfolio turnover rate may be higher. |
| | |
| The accompanying notes are an integral part of these financial statements. | | 77 |
GOLDMAN SACHS SMALL/MID CAP VALUE FUND
Financial Highlights (continued)
Selected Share Data for a Share Outstanding Throughout Each Period
| | | | | | | | | | | | | | | | | | | | | | | | | | |
| | | | | Goldman Sachs Small/Mid Cap Value Fund | |
| | | | | Investor Shares | |
| | | | | Six Months Ended
February 28, 2021
(Unaudited) | | | Year Ended August 31, | |
| | | | | 2020 | | | 2019 | | | 2018 | | | 2017 | | | 2016 | |
| | Per Share Data | | | | | | | | | | | | | | | | | | | | | | | | |
| | | | | | | |
| | Net asset value, beginning of period | | $ | 11.59 | | | $ | 12.09 | | | $ | 13.67 | | | $ | 12.44 | | | $ | 11.23 | | | $ | 10.49 | |
| | | | | | | |
| | Net investment income(a) | | | 0.02 | | | | 0.08 | | | | 0.10 | | | | 0.08 | | | | 0.10 | | | | 0.11 | (b) |
| | | | | | | |
| | Net realized and unrealized gain (loss) | | | 3.97 | | | | (0.47 | ) | | | (0.88 | ) | | | 1.73 | | | | 1.19 | | | | 0.71 | |
| | | | | | | |
| | Total from investment operations | | | 3.99 | | | | (0.39 | ) | | | (0.78 | ) | | | 1.81 | | | | 1.29 | | | | 0.82 | |
| | | | | | | |
| | Distributions to shareholders from net investment income | | | (0.07 | ) | | | (0.11 | ) | | | (0.04 | ) | | | (0.11 | ) | | | (0.08 | ) | | | (0.03 | ) |
| | | | | | | |
| | Distributions to shareholders from net realized gains | | | — | | | | — | | | | (0.76 | ) | | | (0.47 | ) | | | — | | | | (0.05 | ) |
| | | | | | | |
| | Total distributions | | | (0.07 | ) | | | (0.11 | ) | | | (0.80 | ) | | | (0.58 | ) | | | (0.08 | ) | | | (0.08 | ) |
| | | | | | | |
| | Net asset value, end of period | | $ | 15.51 | | | $ | 11.59 | | | $ | 12.09 | | | $ | 13.67 | | | $ | 12.44 | | | $ | 11.23 | |
| | | | | | | |
| | Total Return(c) | | | 34.50 | % | | | (3.32 | )% | | | (5.19 | )% | | | 14.82 | % | | | 11.52 | % | | | 7.81 | % |
| | | | | | | |
| | Net assets, end of period (in 000’s) | | $ | 3,422 | | | $ | 1,435 | | | $ | 3,253 | | | $ | 5,541 | | | $ | 3,250 | | | $ | 2,846 | |
| | | | | | | |
| | Ratio of net expenses to average net assets | | | 0.96 | %(d) | | | 0.98 | % | | | 0.98 | % | | | 0.98 | % | | | 0.99 | % | | | 1.01 | % |
| | | | | | | |
| | Ratio of total expenses to average net assets | | | 1.23 | %(d) | | | 1.26 | % | | | 1.30 | % | | | 1.22 | % | | | 1.48 | % | | | 2.03 | % |
| | | | | | | |
| | Ratio of net investment income to average net assets | | | 0.30 | %(d) | | | 0.74 | % | | | 0.85 | % | | | 0.61 | % | | | 0.82 | % | | | 1.08 | %(b) |
| | | | | | | |
| | Portfolio turnover rate(e) | | | 29 | % | | | 76 | % | | | 73 | % | | | 105 | % | | | 108 | % | | | 109 | % |
| | (a) | | Calculated based on the average shares outstanding methodology. |
| | (b) | | Reflects income recognized from special dividends which amounted to $0.03 per share and 0.29% of average net assets. |
| | (c) | | Assumes investment at the NAV at the beginning of the period, reinvestment of all dividends and distributions, a complete redemption of the investment at the NAV at the end of the period and no sales or redemption charges (if any). Total returns would be reduced if a sales or redemption charge was taken into account. Returns do not reflect the impact of taxes to shareholders relating to Fund distributions or the redemption of Fund shares. Total returns for periods less than one full year are not annualized. |
| | (e) | | The Fund’s portfolio turnover rate is calculated in accordance with regulatory requirements, without regard to transactions involving short term investments. If such transactions were included, the Fund’s portfolio turnover rate may be higher. |
| | |
| 78 | | The accompanying notes are an integral part of these financial statements. |
GOLDMAN SACHS SMALL/MID CAP VALUE FUND
Financial Highlights (continued)
Selected Share Data for a Share Outstanding Throughout Each Period
| | | | | | | | | | | | | | | | | | | | | | | | | | |
| | | | | Goldman Sachs Small/Mid Cap Value Fund | |
| | | | | Class R6 Shares | |
| | | | | Six Months Ended
February 28, 2021
(Unaudited) | | | Year Ended August 31, | |
| | | | | 2020 | | | 2019 | | | 2018 | | | 2017 | | | 2016 | |
| | Per Share Data | | | | | | | | | | | | | | | | | | | | | | | | |
| | | | | | | |
| | Net asset value, beginning of period | | $ | 11.66 | | | $ | 12.16 | | | $ | 13.75 | | | $ | 12.51 | | | $ | 11.29 | | | $ | 10.53 | |
| | | | | | | |
| | Net investment income(a) | | | 0.02 | | | | 0.09 | | | | 0.12 | | | | 0.10 | | | | 0.12 | | | | 0.12 | (b) |
| | | | | | | |
| | Net realized and unrealized gain (loss) | | | 4.01 | | | | (0.46 | ) | | | (0.89 | ) | | | 1.73 | | | | 1.21 | | | | 0.72 | |
| | | | | | | |
| | Total from investment operations | | | 4.03 | | | | (0.37 | ) | | | (0.77 | ) | | | 1.83 | | | | 1.33 | | | | 0.84 | |
| | | | | | | |
| | Distributions to shareholders from net investment income | | | (0.10 | ) | | | (0.13 | ) | | | (0.06 | ) | | | (0.12 | ) | | | (0.11 | ) | | | (0.03 | ) |
| | | | | | | |
| | Distributions to shareholders from net realized gains | | | — | | | | — | | | | (0.76 | ) | | | (0.47 | ) | | | — | | | | (0.05 | ) |
| | | | | | | |
| | Total distributions | | | (0.10 | ) | | | (0.13 | ) | | | (0.82 | ) | | | (0.59 | ) | | | (0.11 | ) | | | (0.08 | ) |
| | | | | | | |
| | Net asset value, end of period | | $ | 15.59 | | | $ | 11.66 | | | $ | 12.16 | | | $ | 13.75 | | | $ | 12.51 | | | $ | 11.29 | |
| | | | | | | |
| | Total Return(c) | | | 34.63 | % | | | (3.17 | )% | | | (5.06 | )% | | | 14.94 | % | | | 11.80 | % | | | 7.98 | % |
| | | | | | | |
| | Net assets, end of period (in 000’s) | | $ | 72,859 | | | $ | 52,507 | | | $ | 57,055 | | | $ | 60,931 | | | $ | 61,251 | | | $ | 10 | |
| | | | | | | |
| | Ratio of net expenses to average net assets | | | 0.83 | %(d) | | | 0.84 | % | | | 0.83 | % | | | 0.83 | % | | | 0.83 | % | | | 0.88 | % |
| | | | | | | |
| | Ratio of total expenses to average net assets | | | 1.11 | %(d) | | | 1.11 | % | | | 1.16 | % | | | 1.07 | % | | | 1.08 | % | | | 1.90 | % |
| | | | | | | |
| | Ratio of net investment income to average net assets | | | 0.36 | %(d) | | | 0.79 | % | | | 1.00 | % | | | 0.75 | % | | | 0.97 | % | | | 1.14 | %(b) |
| | | | | | | |
| | Portfolio turnover rate(e) | | | 29 | % | | | 76 | % | | | 73 | % | | | 105 | % | | | 108 | % | | | 109 | % |
| | (a) | | Calculated based on the average shares outstanding methodology. |
| | (b) | | Reflects income recognized from special dividends which amounted to $0.03 per share and 0.29% of average net assets. |
| | (c) | | Assumes investment at the NAV at the beginning of the period, reinvestment of all dividends and distributions, a complete redemption of the investment at the NAV at the end of the period and no sales or redemption charges (if any). Total returns would be reduced if a sales or redemption charge was taken into account. Returns do not reflect the impact of taxes to shareholders relating to Fund distributions or the redemption of Fund shares. Total returns for periods less than one full year are not annualized. |
| | (e) | | The Fund’s portfolio turnover rate is calculated in accordance with regulatory requirements, without regard to transactions involving short term investments. If such transactions were included, the Fund’s portfolio turnover rate may be higher. |
| | |
| The accompanying notes are an integral part of these financial statements. | | 79 |
GOLDMAN SACHS SMALL/MID CAP VALUE FUND
Financial Highlights (continued)
Selected Share Data for a Share Outstanding Throughout Each Period
| | | | | | | | | | | | | | | | | | | | | | | | | | |
| | | | | Goldman Sachs Small/Mid Cap Value Fund | |
| | | | | Class R Shares | |
| | | | | Six Months Ended
February 28, 2021
(Unaudited) | | | Year Ended August 31, | |
| | | | | 2020 | | | 2019 | | | 2018 | | | 2017 | | | 2016 | |
| | Per Share Data | | | | | | | | | | | | | | | | | | | | | | | | |
| | | | | | | |
| | Net asset value, beginning of period | | $ | 11.46 | | | $ | 11.96 | | | $ | 13.56 | | | $ | 12.35 | | | $ | 11.15 | | | $ | 10.45 | |
| | | | | | | |
| | Net investment income(a) | | | (0.02 | ) | | | 0.03 | | | | 0.04 | | | | 0.01 | | | | 0.04 | | | | 0.05 | (c) |
| | | | | | | |
| | Net realized and unrealized gain (loss) | | | 3.94 | | | | (0.49 | ) | | | (0.87 | ) | | | 1.72 | | | | 1.19 | | | | 0.70 | |
| | | | | | | |
| | Total from investment operations | | | 3.92 | | | | (0.46 | ) | | | (0.83 | ) | | | 1.73 | | | | 1.23 | | | | 0.75 | |
| | | | | | | |
| | Distributions to shareholders from net investment income | | | — | | | | (0.04 | ) | | | (0.01 | ) | | | (0.05 | ) | | | (0.03 | ) | | | — | |
| | | | | | | |
| | Distributions to shareholders from net realized gains | | | — | | | | — | | | | (0.76 | ) | | | (0.47 | ) | | | — | | | | (0.05 | ) |
| | | | | | | |
| | Total distributions | | | — | | | | (0.04 | ) | | | (0.77 | ) | | | (0.52 | ) | | | (0.03 | ) | | | (0.05 | ) |
| | | | | | | |
| | Net asset value, end of period | | $ | 15.38 | | | $ | 11.46 | | | $ | 11.96 | | | $ | 13.56 | | | $ | 12.35 | | | $ | 11.15 | |
| | | | | | | |
| | Total Return(d) | | | 34.21 | % | | | (3.85 | )% | | | (5.65 | )% | | | 14.20 | % | | | 11.06 | % | | | 7.24 | % |
| | | | | | | |
| | Net assets, end of period (in 000’s) | | $ | 74 | | | $ | 74 | | | $ | 160 | | | $ | 207 | | | $ | 131 | | | $ | 132 | |
| | | | | | | |
| | Ratio of net expenses to average net assets | | | 1.46 | %(e) | | | 1.48 | % | | | 1.48 | % | | | 1.48 | % | | | 1.49 | % | | | 1.52 | % |
| | | | | | | |
| | Ratio of total expenses to average net assets | | | 1.74 | %(e) | | | 1.76 | % | | | 1.81 | % | | | 1.72 | % | | | 2.00 | % | | | 2.50 | % |
| | | | | | | |
| | Ratio of net investment income (loss) to average net assets | | | (0.27 | )%(e) | | | 0.29 | % | | | 0.36 | % | | | 0.09 | % | | | 0.32 | % | | | 0.49 | %(c) |
| | | | | | | |
| | Portfolio turnover rate(f) | | | 29 | % | | | 76 | % | | | 73 | % | | | 105 | % | | | 108 | % | | | 109 | % |
| | (a) | | Calculated based on the average shares outstanding methodology. |
| | (b) | | Amount is less than $0.005 per share. |
| | (c) | | Reflects income recognized from special dividends which amounted to $0.03 per share and 0.29% of average net assets. |
| | (d) | | Assumes investment at the NAV at the beginning of the period, reinvestment of all dividends and distributions, a complete redemption of the investment at the NAV at the end of the period and no sales or redemption charges (if any). Total returns would be reduced if a sales or redemption charge was taken into account. Returns do not reflect the impact of taxes to shareholders relating to Fund distributions or the redemption of Fund shares. Total returns for periods less than one full year are not annualized. |
| | (f) | | The Fund’s portfolio turnover rate is calculated in accordance with regulatory requirements, without regard to transactions involving short term investments. If such transactions were included, the Fund’s portfolio turnover rate may be higher. |
| | |
| 80 | | The accompanying notes are an integral part of these financial statements. |
GOLDMAN SACHS SMALL/MID CAP VALUE FUND
Financial Highlights (continued)
Selected Share Data for a Share Outstanding Throughout Each Period
| | | | | | | | | | | | | | | | | | |
| | | | | Goldman Sachs Small/Mid Cap Value Fund | |
| | | | | Class P Shares | |
| | | | | Six Months Ended
February 28, 2021
(Unaudited) | | | Year Ended August 31, | | | Period Ended
August 31, 2018(a) | |
| | | | 2020 | | | 2019 | |
| | Per Share Data | | | | | | | | | | | | | | | | |
| | | | | |
| | Net asset value, beginning of period | | $ | 11.66 | | | $ | 12.16 | | | $ | 13.75 | | | $ | 13.26 | |
| | | | | |
| | Net investment income(b) | | | 0.02 | | | | 0.09 | | | | 0.12 | | | | 0.05 | |
| | | | | |
| | Net realized and unrealized gain (loss) | | | 4.00 | | | | (0.46 | ) | | | (0.89 | ) | | | 0.44 | |
| | | | | |
| | Total from investment operations | | | 4.02 | | | | (0.37 | ) | | | (0.77 | ) | | | 0.49 | |
| | | | | |
| | Distributions to shareholders from net investment income | | | (0.10 | ) | | | (0.13 | ) | | | (0.06 | ) | | | — | |
| | | | | |
| | Distributions to shareholders from net realized gains | | | — | | | | — | | | | (0.76 | ) | | | — | |
| | | | | |
| | Total distributions | | | (0.10 | ) | | | (0.13 | ) | | | (0.82 | ) | | | — | |
| | | | | |
| | Net asset value, end of period | | $ | 15.58 | | | $ | 11.66 | | | $ | 12.16 | | | $ | 13.75 | |
| | | | | |
| | Total Return(c) | | | 34.54 | % | | | (3.17 | )% | | | (5.05 | )% | | | 3.70 | % |
| | | | | |
| | Net assets, end of period (in 000’s) | | $ | 57,622 | | | $ | 38,153 | | | $ | 48,725 | | | $ | 54,660 | |
| | | | | |
| | Ratio of net expenses to average net assets | | | 0.83 | %(d) | | | 0.84 | % | | | 0.83 | % | | | 0.83 | %(d) |
| | | | | |
| | Ratio of total expenses to average net assets | | | 1.11 | %(d) | | | 1.11 | % | | | 1.16 | % | | | 1.09 | %(d) |
| | | | | |
| | Ratio of net investment income to average net assets | | | 0.36 | %(d) | | | 0.79 | % | | | 1.00 | % | | | 0.99 | %(d) |
| | | | | |
| | Portfolio turnover rate(e) | | | 29 | % | | | 76 | % | | | 73 | % | | | 105 | % |
| | (a) | | Commenced operations on April 17, 2018. |
| | (b) | | Calculated based on the average shares outstanding methodology. |
| | (c) | | Assumes investment at the NAV at the beginning of the period, reinvestment of all dividends and distributions, a complete redemption of the investment at the NAV at the end of the period and no sales or redemption charges (if any). Total returns would be reduced if a sales or redemption charge was taken into account. Returns do not reflect the impact of taxes to shareholders relating to Fund distributions or the redemption of Fund shares. Total returns for periods less than one full year are not annualized. |
| | (e) | | The Fund’s portfolio turnover rate is calculated in accordance with regulatory requirements, without regard to transactions involving short term investments. If such transactions were included, the Fund’s portfolio turnover rate may be higher. |
| | |
| The accompanying notes are an integral part of these financial statements. | | 81 |
GOLDMAN SACHS FUNDAMENTAL EQUITY VALUE FUNDS
Notes to Financial Statements
February 28, 2021 (Unaudited)
Goldman Sachs Trust (the “Trust”) is a Delaware statutory trust registered under the Investment Company Act of 1940, as amended (the “Act”), as an open-end management investment company. The following table lists those series of the Trust that are included in this report (collectively, the “Funds” or individually a “Fund”), along with their corresponding share classes and respective diversification status under the Act:
| | | | |
| Fund | | Share Classes Offered | | Diversified/ Non-diversified |
Focused Value | | A, C, Institutional, Investor, P, R and R6 | | Non-diversified |
Equity Income, Large Cap Value, Mid Cap Value, Small Cap Value | | A, C, Institutional, Service, Investor, P, R and R6 | | Diversified |
Small/Mid Cap Value | | A, C, Institutional, Investor, P, R and R6 | | Diversified |
Class A Shares are sold with a front-end sales charge of up to 5.50%. Class C Shares are sold with a contingent deferred sales charge (“CDSC”) of 1.00%, which is imposed on redemptions made within 12 months of purchase. Institutional, Service, Investor, Class R6, Class R and Class P Shares are not subject to a sales charge.
Goldman Sachs Asset Management, L.P. (“GSAM”), an affiliate of Goldman Sachs & Co. LLC (“Goldman Sachs”), serves as investment adviser to the Funds pursuant to a management agreement (the “Agreement”) with the Trust.
|
| 2. SIGNIFICANT ACCOUNTING POLICIES |
The financial statements have been prepared in accordance with accounting principles generally accepted in the United States of America (“GAAP”) and require management to make estimates and assumptions that may affect the reported amounts and disclosures. Actual results may differ from those estimates and assumptions. Each Fund is an investment company under GAAP and follows the accounting and reporting guidance applicable to investment companies.
A. Investment Valuation — The Funds’ valuation policy is to value investments at fair value.
B. Investment Income and Investments — Investment income includes interest income, dividend income, and securities lending income, if any. Interest income is accrued daily and adjusted for amortization of premiums and accretion of discounts. Dividend income is recognized on ex-dividend date or, for certain foreign securities, as soon as such information is obtained subsequent to the ex-dividend date. Non-cash dividends, if any, are recorded at the fair market value of the securities received. Investment transactions are reflected on trade date. Realized gains and losses are calculated using identified cost. Investment transactions are recorded on the following business day for daily net asset value (“NAV”) calculations. Investment income is recorded net of any foreign withholding taxes, less any amounts reclaimable. The Funds may file withholding tax reclaims in certain jurisdictions to recover a portion of amounts previously withheld. Any foreign capital gains tax is accrued daily based upon net unrealized gains, and is payable upon sale of such investments. Distributions received from the Funds’ investments in U.S. real estate investment trusts (“REITs”) may be characterized as ordinary income, net capital gain and/or a return of capital. A return of capital is recorded by the Funds as a reduction to the cost basis of the REIT.
C. Class Allocations and Expenses — Investment income, realized and unrealized gain (loss), if any, and non-class specific expenses of each Fund are allocated daily based upon the proportion of net assets of each class. Non-class specific expenses directly incurred by a Fund are charged to that Fund, while such expenses incurred by the Trust are allocated across the applicable Funds on a straight-line and/or pro-rata basis depending upon the nature of the expenses. Class specific expenses, where applicable, are borne by the respective share classes and include Distribution and Service, Transfer Agency and Service and Shareholder Administration fees.
D. Federal Taxes and Distributions to Shareholders — It is each Fund’s policy to comply with the requirements of the Internal Revenue Code of 1986, as amended (the “Code”), applicable to regulated investment companies and to distribute each
82
GOLDMAN SACHS FUNDAMENTAL EQUITY VALUE FUNDS
|
| 2. SIGNIFICANT ACCOUNTING POLICIES (continued) |
year substantially all of its investment company taxable income and capital gains to its shareholders. Accordingly, each Fund is not required to make any provisions for the payment of federal income tax. Distributions to shareholders are recorded on the ex-dividend date. Income and capital gains distributions, if any, are declared and paid according to the following schedule:
| | | | | | |
| Fund | | | | Income Distributions
Declared/Paid | | Capital Gains Distributions
Declared/Paid |
Equity Income | | | | Quarterly | | Annually |
Focused Value, Large Cap Value, Mid Cap Value, Small Cap Value and Small/Mid Cap Value | | | | Annually | | Annually |
Net capital losses, if any, are carried forward to future fiscal years and may be used to the extent allowed by the Code to offset any future capital gains. Losses that are carried forward will retain their character as either short-term or long-term capital losses. Utilization of capital loss carryforwards will reduce the requirement of future capital gains distributions.
The characterization of distributions to shareholders for financial reporting purposes is determined in accordance with federal income tax rules, which may differ from GAAP. The source of each Fund’s distributions may be shown in the accompanying financial statements as either from distributable earnings or capital. Certain components of the Funds’ net assets on the Statements of Assets and Liabilities reflect permanent GAAP/tax differences based on the appropriate tax character.
E. Foreign Currency Translation — The accounting records and reporting currency of the Funds are maintained in U.S. dollars. Assets and liabilities denominated in foreign currencies are translated into U.S. dollars using the current exchange rates at the close of each business day. The effect of changes in foreign currency exchange rates on investments is included within net realized and unrealized gain (loss) on investments. Changes in the value of other assets and liabilities as a result of fluctuations in foreign exchange rates are included in the Statements of Operations within net change in unrealized gain (loss) on foreign currency translation. Transactions denominated in foreign currencies are translated into U.S. dollars on the date the transaction occurred, the effects of which are included within net realized gain (loss) on foreign currency transactions.
|
| 3. INVESTMENTS AND FAIR VALUE MEASUREMENTS |
U.S. GAAP defines the fair value of a financial instrument as the amount that would be received to sell an asset or paid to transfer a liability in an orderly transaction between market participants at the measurement date (i.e., the exit price); the Funds’ policy is to use the market approach. GAAP establishes a fair value hierarchy that prioritizes the inputs to valuation techniques used to measure fair value. The hierarchy gives the highest priority to unadjusted quoted prices in active markets for identical assets or liabilities (Level 1 measurements) and the lowest priority to unobservable inputs (Level 3 measurements). The level in the fair value hierarchy within which the fair value measurement in its entirety falls shall be determined based on the lowest level input that is significant to the fair value measurement in its entirety. The levels used for classifying investments are not necessarily an indication of the risk associated with investing in these investments. The three levels of the fair value hierarchy are described below:
Level 1 — Unadjusted quoted prices in active markets that are accessible at the measurement date for identical, unrestricted assets or liabilities;
Level 2 — Quoted prices in markets that are not active or financial instruments for which significant inputs are observable
(including, but not limited to, quoted prices for similar investments, interest rates, foreign exchange rates, volatility and credit spreads), either directly or indirectly;
Level 3 — Prices or valuations that require significant unobservable inputs (including GSAM’s assumptions in determining fair value measurement).
The Board of Trustees (“Trustees”) has approved Valuation Procedures that govern the valuation of the portfolio investments held by the Funds, including investments for which market quotations are not readily available. The Trustees have delegated to GSAM day-to-day responsibility for implementing and maintaining internal controls and procedures related to the valuation of the Funds’
83
GOLDMAN SACHS FUNDAMENTAL EQUITY VALUE FUNDS
Notes to Financial Statements (continued)
February 28, 2021 (Unaudited)
|
| 3. INVESTMENTS AND FAIR VALUE MEASUREMENTS (continued) |
investments. To assess the continuing appropriateness of pricing sources and methodologies, GSAM regularly performs price verification procedures and issues challenges as necessary to third party pricing vendors or brokers, and any differences are reviewed in accordance with the Valuation Procedures.
A. Level 1 and Level 2 Fair Value Investments — The valuation techniques and significant inputs used in determining the fair values for investments classified as Level 1 and Level 2 are as follows:
Equity Securities — Equity securities traded on a United States (“U.S.”) securities exchange or the NASDAQ system, or those located on certain foreign exchanges, including but not limited to the Americas, are valued daily at their last sale price or official closing price on the principal exchange or system on which they are traded. If there is no sale or official closing price or such price is believed by GSAM to not represent fair value, equity securities will be valued at the valid closing bid price for long positions and at the valid closing ask price for short positions (i.e. where there is sufficient volume, during normal exchange trading hours). If no valid bid/ask price is available, the equity security will be valued pursuant to the Valuation Procedures approved by the Trustees and consistent with applicable regulatory guidance. To the extent these investments are actively traded, they are classified as Level 1 of the fair value hierarchy, otherwise they are generally classified as Level 2. Certain equity securities containing unique attributes may be classified as Level 2.
Unlisted equity securities for which market quotations are available are valued at the last sale price on the valuation date, or if no sale occurs, at the last bid price for long positions or the last ask price for short positions, and are generally classified as Level 2. Securities traded on certain foreign securities exchanges are valued daily at fair value determined by an independent fair value service (if available) under Valuation Procedures approved by the Trustees and consistent with applicable regulatory guidance. The independent fair value service takes into account multiple factors including, but not limited to, movements in the securities markets, certain depositary receipts, futures contracts and foreign currency exchange rates that have occurred subsequent to the close of the foreign securities exchange. These investments are generally classified as Level 2 of the fair value hierarchy.
Underlying Funds (including Money Market Funds) — Underlying funds (“Underlying Funds”) include other investment companies and exchange-traded funds (“ETFs”). Investments in the Underlying Funds (except ETFs) are valued at the NAV per share on the day of valuation. ETFs are valued daily at the last sale price or official closing price on the principal exchange or system on which the investment is traded. Because the Funds invest in Underlying Funds that fluctuate in value, the Funds’ shares will correspondingly fluctuate in value. To the extent these investments are actively traded, they are classified as Level 1 of the fair value hierarchy, otherwise they are generally classified as Level 2. For information regarding an Underlying Fund’s accounting policies and investment holdings, please see the Underlying Fund’s shareholder report.
B. Level 3 Fair Value Investments — To the extent that significant inputs to valuation models and other alternative pricing sources are unobservable, or if quotations are not readily available, or if GSAM believes that such quotations do not accurately reflect fair value, the fair value of a Fund’s investments may be determined under Valuation Procedures approved by the Trustees. GSAM, consistent with its procedures and applicable regulatory guidance, may make an adjustment to the most recent valuation prices of either domestic or foreign securities in light of significant events to reflect what it believes to be the fair value of the securities at the time of determining a Fund’s NAV. To the extent investments are valued using single source broker quotations obtained directly from the broker or passed through from third party pricing vendors, such investments are classified as Level 3 investments.
84
GOLDMAN SACHS FUNDAMENTAL EQUITY VALUE FUNDS
|
| 3. INVESTMENTS AND FAIR VALUE MEASUREMENTS (continued) |
C. Fair Value Hierarchy — The following is a summary of the Funds’ investments and derivatives classified in the fair value hierarchy as of February 28, 2021:
| | | | | | | | | | | | |
|
| EQUITY INCOME FUND | |
| | | |
| Investment Type | | Level 1 | | | Level 2 | | | Level 3 | |
| | | |
| Assets | | | | | | | | | | | | |
| | | |
Common Stock and/or Other Equity Investments(a) | | | | | | | | | | | | |
| | | |
Asia | | $ | 4,412,675 | | | $ | — | | | $ | — | |
| | | |
Europe | | | 15,800,151 | | | | — | | | | — | |
| | | |
North America | | | 348,657,683 | | | | — | | | | — | |
| | | |
Oceania | | | 7,154,914 | | | | — | | | | — | |
| | | |
| Total | | $ | 376,025,423 | | | $ | — | | | $ | — | |
|
| FOCUSED VALUE FUND | |
| | | |
| Investment Type | | Level 1 | | | Level 2 | | | Level 3 | |
| | | |
| Assets | | | | | | | | | | | | |
| | | |
Common Stock and/or Other Equity Investments(a) | | | | | | | | | | | | |
| | | |
Europe | | $ | 1,503,445 | | | $ | — | | | $ | — | |
| | | |
North America | | | 23,263,800 | | | | — | | | | — | |
| | | |
Investment Company | | | 874,527 | | | | — | | | | — | |
| | | |
| Total | | $ | 25,641,772 | | | $ | — | | | $ | — | |
|
| LARGE CAP VALUE FUND | |
| | | |
| Investment Type | | Level 1 | | | Level 2 | | | Level 3 | |
| | | |
| Assets | | | | | | | | | | | | |
| | | |
Common Stock and/or Other Equity Investments(a) | | | | | | | | | | | | |
| | | |
Europe | | $ | 11,051,763 | | | $ | — | | | $ | — | |
| | | |
North America | | | 431,717,815 | | | | — | | | | — | |
| | | |
Investment Company | | | 4,759,736 | | | | — | | | | — | |
| | | |
| Total | | $ | 447,529,314 | | | $ | — | | | $ | — | |
|
| MID CAP VALUE FUND | |
| | | |
| Investment Type | | Level 1 | | | Level 2 | | | Level 3 | |
| | | |
| Assets | | | | | | | | | | | | |
| | | |
Common Stock and/or Other Equity Investments(a) | | | | | | | | | | | | |
| | | |
Europe | | $ | 22,203,606 | | | $ | — | | | $ | — | |
| | | |
North America | | | 1,100,282,212 | | | | — | | | | — | |
| | | |
Investment Company | | | 6,015,624 | | | | — | | | | — | |
| | | |
| Total | | $ | 1,128,501,442 | | | $ | — | | | $ | — | |
| (a) | | Amounts are disclosed by continent to highlight the impact of time zone differences between local market close and the calculation of NAV. Security valuations are based on the principal exchange or system on which they are traded, which may differ from country of domicile noted in table. |
85
GOLDMAN SACHS FUNDAMENTAL EQUITY VALUE FUNDS
Notes to Financial Statements (continued)
February 28, 2021 (Unaudited)
|
| 3. INVESTMENTS AND FAIR VALUE MEASUREMENTS (continued) |
| | | | | | | | | | | | |
|
| SMALL CAP VALUE FUND | |
| | | |
| Investment Type | | Level 1 | | | Level 2 | | | Level 3 | |
| | | |
| Assets | | | | | | | | | | | | |
| | | |
Common Stock and/or Other Equity Investments(a) | | | | | | | | | | | | |
| | | |
Africa | | $ | 10,718,816 | | | $ | — | | | $ | — | |
| | | |
Asia | | | 9,974,736 | | | | — | | | | — | |
| | | |
North America | | | 5,284,358,472 | | | | — | | | | — | |
| | | |
Investment Company | | | 23,686,984 | | | | — | | | | — | |
| | | |
Securities Lending Reinvestment Vehicle | | | 5,933,827 | | | | — | | | | — | |
| | | |
| Total | | $ | 5,334,672,835 | | | $ | — | | | $ | — | |
|
| SMALL/MID CAP VALUE FUND | |
| | | |
| Investment Type | | Level 1 | | | Level 2 | | | Level 3 | |
| | | |
| Assets | | | | | | | | | | | | |
| | | |
Common Stock and/or Other Equity Investments(a) | | | | | | | | | | | | |
| | | |
Asia | | $ | 595,182 | | | $ | — | | | $ | — | |
| | | |
North America | | | 146,824,835 | | | | — | | | | — | |
| | | |
Investment Company | | | 4,416,463 | | | | — | | | | — | |
| | | |
| Total | | $ | 151,836,480 | | | $ | — | | | $ | — | |
| (a) | | Amounts are disclosed by continent to highlight the impact of time zone differences between local market close and the calculation of NAV. Security valuations are based on the principal exchange or system on which they are traded, which may differ from country of domicile noted in table. |
For further information regarding security characteristics, see the Schedules of Investments.
|
| 4. AGREEMENTS AND AFFILIATED TRANSACTIONS |
A. Management Agreement — Under the Agreement, GSAM manages the Funds, subject to the general supervision of the Trustees.
As compensation for the services rendered pursuant to the Agreement, the assumption of the expenses related thereto and administration of the Funds’ business affairs, including providing facilities, GSAM is entitled to a management fee, accrued daily and paid monthly, equal to an annual percentage rate of each Fund’s average daily net assets.
For the six months ended February 28, 2021, contractual and effective net management fees with GSAM were at the following rates:
| | | | | | | | | | | | | | | | | | | | | | | | | | | | | | | | |
| | | | | | Contractual Management Rate | | | Effective Net
Management
Rate# | |
| Fund | | | | | First
$1 Billion | | | Next
$1 Billion | | | Next
$3 Billion | | | Next
$3 Billion | | | Over
$8 Billion | | | Effective
Rate | |
Equity Income | | | | | | | 0.69 | % | | | 0.62 | % | | | 0.59 | % | | | 0.58 | % | | | 0.57 | % | | | 0.69 | % | | | 0.69 | % |
Focused Value | | | | | | | 0.69 | | | | 0.62 | | | | 0.59 | | | | 0.58 | | | | 0.57 | | | | 0.69 | | | | 0.69 | |
Large Cap Value | | | | | | | 0.75 | | | | 0.68 | | | | 0.65 | | | | 0.64 | | | | 0.63 | | | | 0.75 | | | | 0.69 | * |
Mid Cap Value | | | | | | | 0.75 | | | | 0.75 | | | | 0.68 | | | | 0.65 | | | | 0.64 | | | | 0.75 | | | | 0.75 | |
Small Cap Value | | | | | | | 0.98 | | | | 0.98 | | | | 0.88 | | | | 0.84 | | | | 0.82 | | | | 0.92 | | | | 0.92 | |
Small/Mid Cap Value | | | | | | | 0.80 | | | | 0.80 | | | | 0.72 | | | | 0.68 | | | | 0.67 | | | | 0.80 | | | | 0.80 | |
86
GOLDMAN SACHS FUNDAMENTAL EQUITY VALUE FUNDS
|
| 4. AGREEMENTS AND AFFILIATED TRANSACTIONS (continued) |
| # | | The Effective Net Management Rate includes the impact of management fee waivers of affiliated underlying funds, if any. The Effective Net Management Rate may not correlate to the Contractual Management Rate as a result of management fee waivers that may be in effect from time to time. |
| * | | Effective December 29, 2020, GSAM agreed to waive a portion of its management fee with respect to the Large Cap Value Fund in order to achieve an effective net management fee rate of 0.69% as an annual percentage of the Fund’s average daily net assets. This arrangement will remain in effect through at least December 29, 2021, and prior to such date, GSAM may not terminate the arrangement without the approval of the Board of Trustees. |
The Funds invest in Institutional Shares of Goldman Sachs Financial Square Government Fund (“Government Money Market Fund”) which is an affiliated Underlying Fund. GSAM has agreed to waive a portion of its management fee payable by the Funds in an amount equal to the management fee it earns as an investment adviser to the affiliated Underlying Fund in which the Funds invest, except those management fees it earns from the Funds’ investments of cash collateral received in connection with securities lending transactions in the Government Money Market Fund. For the six months ended February 28, 2021, the management fee waived by GSAM for each Fund was as follows:
| | | | |
| |
| Fund | | Management Fee Waived | |
Equity Income | | $ | 702 | |
Focused Value | | | 356 | |
Large Cap Value | | | 127,815 | |
Mid Cap Value | | | 3,063 | |
Small Cap Value | | | 10,934 | |
Small/Mid Cap Value | | | 983 | |
B. Distribution and/or Service (12b-1) Plans — The Trust, on behalf of Class A and Class R Shares of each applicable Fund, has adopted Distribution and Service Plans subject to Rule 12b-1 under the Act. Under the Distribution and Service Plans, Goldman Sachs, which serves as distributor (the “Distributor”), is entitled to a fee accrued daily and paid monthly for distribution services and personal and account maintenance services, which may then be paid by Goldman Sachs to authorized dealers. These fees are equal to an annual percentage rate of the average daily net assets attributable to Class A or Class R Shares of the Funds, as set forth below.
The Trust, on behalf of Class C Shares of each applicable Fund, has adopted a Distribution Plan subject to Rule 12b-1 under the Act. Under the Distribution Plan, Goldman Sachs as Distributor is entitled to a fee accrued daily and paid monthly for distribution services, which may then be paid by Goldman Sachs to authorized dealers. These fees are equal to an annual percentage rate of the average daily net assets attributable to Class C Shares of the Funds, as set forth below.
The Trust, on behalf of Service Shares of each applicable Fund, has adopted a Service Plan subject to Rule 12b-1 under the Act to allow Service Shares to compensate service organizations (including Goldman Sachs) for providing personal and account maintenance services to their customers who are beneficial owners of such shares. The Service Plan provides for compensation to the service organizations equal to an annual percentage rate of the average daily net assets attributable to Service Shares of the Funds, as set forth below.
| | | | | | | | | | | | | | | | |
| | | Distribution and/or Service Plan Rates | |
| | | Class A* | | | Class C | | | Service | | | Class R* | |
Distribution and/or Service Plan | | | 0.25 | % | | | 0.75 | % | | | 0.25 | % | | | 0.50 | % |
| * | | With respect to Class A and Class R Shares, the Distributor at its discretion may use compensation for distribution services paid under the Distribution and Service Plans to compensate service organizations for personal and account maintenance services and expenses as long as such total compensation does not exceed the maximum cap on “service fees” imposed by the Financial Industry Regulatory Authority. |
87
GOLDMAN SACHS FUNDAMENTAL EQUITY VALUE FUNDS
Notes to Financial Statements (continued)
February 28, 2021 (Unaudited)
|
| 4. AGREEMENTS AND AFFILIATED TRANSACTIONS (continued) |
C. Distribution Agreement — Goldman Sachs, as Distributor of the shares of the Funds pursuant to a Distribution Agreement, may retain a portion of the Class A Shares’ front end sales charge and Class C Shares’ CDSC. During the six months ended February 28, 2021, Goldman Sachs retained the following amounts:
| | | | | | | | | | |
| | | | | Front End
Sales Charge | | | Contingent Deferred
Sales Charge | |
| Fund | | | | Class A | | | Class C | |
Equity Income | | | | $ | 4,349 | | | $ | — | |
Focused Value | | | | | 101 | | | | — | |
Large Cap Value | | | | | 1,988 | | | | — | |
Mid Cap Value | | | | | 4,999 | | | | — | |
Small Cap Value | | | | | 2,358 | | | | — | |
Small/Mid Cap Value | | | | | 57 | | | | — | |
D. Service and Shareholder Administration Plans — The Trust, on behalf of each applicable Fund, has adopted Service Plans to allow Class C Shares and Shareholder Administration Plans to allow Service Shares, respectively, to compensate service organizations (including Goldman Sachs) for providing varying levels of personal and account maintenance or shareholder administration services to their customers who are beneficial owners of such shares. The Service and Shareholder Administration Plans each provide for compensation to the service organizations equal to an annual percentage rate of 0.25% of the average daily net assets attributable to Class C and Service Shares of the Funds, respectively.
E. Transfer Agency Agreement — Goldman Sachs also serves as the transfer agent of the Funds for a fee pursuant to the Transfer Agency Agreement. The fees charged for such transfer agency services are accrued daily and paid monthly at annual rates as follows: 0.16% of the average daily net assets of Class A, Class C, Investor and Class R Shares; 0.03% of the average daily net assets of Class R6 and Class P Shares; and 0.04% of the average daily net assets of Institutional and Service Shares.
For the six months ended February 28, 2021, the transfer agency fee waivers were as follows:
| | | | | | | | | | | | |
| Transfer Agency Waivers (Class A, Class C, Investor, and Class R Shares) | |
| Fund | | | | | Before December 29, 2020 | | | As of December 29, 2020* | |
Large Cap Value Fund | | | | | | | 0.07 | % | | | 0.06 | % |
Equity Income Fund | | | | | | | 0.04 | % | | | 0.06 | % |
Focused Value Fund | | | | | | | 0.04 | % | | | 0.06 | % |
Small Cap Value Fund | | | | | | | — | | | | 0.05 | % |
| * | | These arrangements will remain in effect through at least December 29, 2021, and prior to such date, Goldman Sachs may not terminate the arrangement without the approval of the Board of Trustees. |
F. Other Expense Agreements and Affiliated Transactions — GSAM has agreed to reduce or limit certain “Other Expenses” of the Funds (excluding acquired fund fees and expenses, transfer agency fees and expenses, service fees and shareholder administration fees (as applicable), taxes, interest, brokerage fees, expenses of shareholder meetings, litigation and indemnification, and extraordinary expenses) to the extent such expenses exceed, on an annual basis, a percentage rate of the average daily net assets of each Fund. Such Other Expense reimbursements, if any, are accrued daily and paid monthly. In addition, the Funds are not obligated to reimburse GSAM for prior fiscal year expense reimbursements, if any. The Other Expense limitations as an annual
88
GOLDMAN SACHS FUNDAMENTAL EQUITY VALUE FUNDS
|
| 4. AGREEMENTS AND AFFILIATED TRANSACTIONS (continued) |
percentage rate of average daily net assets for Equity Income, Focused Value, Large Cap Value, Small Cap Value and Small/Mid Cap Value Funds is 0.004% and for Mid Cap Value Fund is 0.104%. These Other Expense limitations will remain in place through at least December 29, 2021, and prior to such date GSAM may not terminate the arrangements without the approval of the Trustees. In addition, the Funds have entered into certain offset arrangements with the transfer agent, which may result in a reduction of the Funds’ expenses and are received irrespective of the application of the “Other Expense” limitations described above.
Goldman Sachs may voluntarily waive a portion of any payments under a Fund’s Distribution and Service Plan, Service Plan and Shareholder Administration Plan, and Transfer Agency Agreement, and these waivers are in addition to what is stipulated in any contractual fee waiver arrangements (as applicable). These temporary waivers may be modified or terminated at any time at the option of Goldman Sachs without shareholder approval.
For the six months ended February 28, 2021, these expense reductions, including any fee waivers and Other Expense reimbursements, were as follows:
| | | | | | | | | | | | | | | | | | |
| Fund | | | | Management
Fee Waiver | | | Transfer Agency
Fee Waiver/
Credits | | | Other Expense
Reimbursements | | | Total
Expense
Reductions | |
Equity Income | | | | $ | 702 | | | $ | 76,418 | | | $ | 192,629 | | | $ | 269,749 | |
Focused Value | | | | | 356 | | | | 72 | | | | 129,013 | | | | 129,441 | |
Large Cap Value | | | | | 127,815 | | | | 34,743 | | | | 173,593 | | | | 336,151 | |
Mid Cap Value | | | |
| 3,063
|
| | | — | | | | — | | | | 3,063 | |
Small Cap Value | | | | | 10,934 | | | | 59,288 | | | | 581,759 | | | | 651,981 | |
Small/Mid Cap Value | | | | | 983 | | | | — | | | | 161,501 | | | | 162,484 | |
G. Line of Credit Facility — As of February 28, 2021, the Funds participated in a $700,000,000 committed, unsecured revolving line of credit facility (the “facility”) together with other funds of the Trust and certain registered investment companies having management agreements with GSAM or its affiliates. This facility is to be used for temporary emergency purposes, or to allow for an orderly liquidation of securities to meet redemption requests. The interest rate on borrowings is based on the federal funds rate. The facility also requires a fee to be paid by the Funds based on the amount of the commitment that has not been utilized. For the six months ended February 28, 2021, the Funds did not have any borrowings under the facility.
H. Other Transactions with Affiliates — The table below shows the transactions in and earnings from the investments by the Funds in the Government Money Market Fund for the six months ended February 28, 2021:
| | | | | | | | | | | | | | | | | | | | | | | | | | |
| Fund | | | | Beginning
value as of
August 31, 2020 | | | Purchases at
Cost | | | Proceeds from
Sales | | | Ending value as
of
February 28, 2021 | | | Shares as of
February 28, 2021 | | | Dividend
Income | |
Equity Income | | | | $ | 1,485,827 | | | $ | 12,409,069 | | | $ | (13,894,896 | ) | | $ | — | | | $ | — | | | $ | 104 | |
Focused Value | | | | | 116,661 | | | | 9,948,840 | | | | (9,190,974 | ) | | | 874,527 | | | | 874,527 | | | | 54 | |
Large Cap Value | | | | | 3,050,807 | | | | 26,738,697 | | | | (25,029,768 | ) | | | 4,759,736 | | | | 4,759,736 | | | | 502 | |
Mid Cap Value | | | | | — | | | | 99,106,101 | | | | (93,090,477 | ) | | | 6,015,624 | | | | 6,015,624 | | | | 489 | |
Small Cap Value | | | | | 4,535,074 | | | | 477,445,402 | | | | (458,293,492 | ) | | | 23,686,984 | | | | 23,686,984 | | | | 1,846 | |
Small/Mid Cap Value | | | | | — | | | | 20,095,916 | | | | (15,679,453 | ) | | | 4,416,463 | | | | 4,416,463 | | | | 162 | |
89
GOLDMAN SACHS FUNDAMENTAL EQUITY VALUE FUNDS
Notes to Financial Statements (continued)
February 28, 2021 (Unaudited)
|
| 4. AGREEMENTS AND AFFILIATED TRANSACTIONS (continued) |
As of February 28, 2021, the Goldman Sachs Group, Inc. was the beneficial owner of 5% or more of total outstanding shares of the following funds:
| | | | | | | | | | | | | | | | | | | | | | | | | | | | | | |
| Fund | | | | Class A | | | Class C | | | Institutional | | | Investor | | | Class R6 | | | Class R | | | Class P | |
Focused Value | | | | | — | % | | | 17 | % | | | — | % | | | 100 | % | | | 100 | % | | | 31 | % | | | — | % |
Small/Mid Cap Value | | | | | — | | | | — | | | | — | | | | — | | | | — | | | | 20 | | | | — | |
|
| 5. PORTFOLIO SECURITIES TRANSACTIONS |
The cost of purchases and proceeds from sales and maturities of long-term securities for the six months ended February 28, 2021, were as follows:
| | | | | | | | | | |
| Fund | | | | Purchases | | | Sales and Maturities | |
Equity Income | | | | $ | 61,725,540 | | | $ | 67,033,181 | |
Focused Value | | | | | 20,254,410 | | | | 7,428,581 | |
Large Cap Value | | | | | 99,672,005 | | | | 112,048,007 | |
Mid Cap Value | | | | | 308,416,266 | | | | 393,645,866 | |
Small Cap Value | �� | | | | 1,224,889,617 | | | | 2,087,210,353 | |
Small/Mid Cap Value | | | | | 45,214,810 | | | | 34,182,895 | |
The Funds may lend their securities through a securities lending agent, the Bank of New York Mellon (“BNYM”), to certain qualified borrowers. In accordance with the Funds’ securities lending procedures, the Funds receive cash collateral at least equal to the market value of the securities on loan. The market value of the loaned securities is determined at the close of business of the Funds at their last sale price or official closing price on the principal exchange or system on which they are traded, and any additional required collateral is delivered to the Funds on the next business day. As with other extensions of credit, the Funds may experience delay in the recovery of their securities or incur a loss should the borrower of the securities breach its agreement with the Funds or become insolvent at a time when the collateral is insufficient to cover the cost of repurchasing securities on loan. Dividend income received from securities on loan may not be subject to withholding taxes and therefore withholding taxes paid may differ from the amounts listed in the Statements of Operations. Loans of securities are terminable at any time and as such 1) the remaining contractual maturities of the outstanding securities lending transactions are considered to be overnight and continuous and 2) the borrower, after notice, is required to return borrowed securities within the standard time period for settlement of securities transactions.
The Funds invest the cash collateral received in connection with securities lending transactions in the Government Money Market Fund, an affiliated series of the Goldman Sachs Trust. The Government Money Market Fund is registered under the Act as an open end investment company, is subject to Rule 2a-7 under the Act, and is managed by GSAM, for which GSAM may receive a management fee of up to 0.16% on an annualized basis of the average daily net assets of the Government Money Market Fund.
In the event of a default by a borrower with respect to any loan, BNYM may exercise any and all remedies provided under the applicable borrower agreement to make the Funds whole. These remedies include purchasing replacement securities by applying the collateral held from the defaulting broker against the purchase cost of the replacement securities. If BNYM is unable to purchase replacement securities, BNYM will indemnify the Funds by paying the Funds an amount equal to the market value of the
90
GOLDMAN SACHS FUNDAMENTAL EQUITY VALUE FUNDS
|
| 6. SECURITIES LENDING (continued) |
securities loaned minus the value of cash collateral received from the borrower for the loan, subject to an exclusion for any shortfalls resulting from a loss of value in such cash collateral due to reinvestment risk. The Funds’ master netting agreements with certain borrowers provide the right, in the event of a default (including bankruptcy or insolvency), for the non-defaulting party to liquidate the collateral and calculate net exposure to the defaulting party or request additional collateral. However, in the event of a default by a borrower, a resolution authority could determine that such rights are not enforceable due to the restrictions or prohibitions against the right of set-off that may be imposed in accordance with a particular jurisdiction’s bankruptcy or insolvency laws. The Funds’ loaned securities were all subject to enforceable Securities Lending Agreements and the value of the collateral was at least equal to the value of the cash received. The amounts of the Funds’ overnight and continuous agreements, which represent the gross amounts of recognized liabilities for securities lending transactions outstanding as of February 28, 2021, are disclosed as “Payable upon return of securities loaned” on the Statements of Assets and Liabilities, where applicable.
Each of the Funds and BNYM received compensation relating to the lending of the Funds’ securities. The amounts earned, if any, by the Funds for the six months ended February 28, 2021, are reported under Investment Income on the Statements of Operations.
The following table provides information about the Funds’ investments in the Government Money Market Fund for the six months ended February 28, 2021:
| | | | | | | | | | | | | | | | | | |
| Fund | | | | Beginning
value as of
August 31, 2020 | | | Purchase
at Cost | | | Proceeds
from Sales | | | Ending
value as of
February 28, 2021 | |
Equity Income | | | | $ | 600,080 | | | $ | 3,872,542 | | | $ | (4,472,622 | ) | | $ | — | |
Mid Cap Value | | | | | 6,163,823 | | | | 15,584,009 | | | | (21,747,832 | ) | | | — | |
Small Cap Value | | | | | 25,114,389 | | | | 133,273,654 | | | | (152,454,216 | ) | | | 5,933,827 | |
Small/Mid Cap Value | | | | | 219,900 | | | | 2,515,040 | | | | (2,734,940 | ) | | | — | |
As of the Funds’ most recent fiscal year end, August 31, 2020, the Funds’ capital loss carryforward and certain timing differences on a tax basis were as follows:
| | | | | | | | | | | | | | | | | | | | | | | | |
| | | Equity
Income | | | Focused
Value | | | Large
Cap Value | | | Mid
Cap Value | | | Small
Cap Value | | | Small/
Mid Cap
Value | |
Capital loss carryforwards: | | | | | | | | | | | | | | | | | | | | | | | | |
Perpetual Short-Term | | $ | — | | | $ | — | | | $ | — | | | $ | — | | | $ | (46,420,689 | ) | | $ | (1,546,844 | ) |
Perpetual Long-Term | | $ | (2,090,486 | ) | | $ | — | | | $ | — | | | $ | — | | | $ | — | | | $ | — | |
Total capital loss carryovers | | $ | (2,090,486 | ) | | $ | — | | | $ | — | | | $ | — | | | $ | (46,420,689 | ) | | $ | (1,546,844 | ) |
Timing differences (Qualified Late Year Loss Deferral | | $ | (11,646,699 | ) | | $ | (61,632 | ) | | $ | (5,147,631 | ) | | $ | (30,560,776 | ) | | $ | (275,123,563 | ) | | $ | (8,394,491 | ) |
91
GOLDMAN SACHS FUNDAMENTAL EQUITY VALUE FUNDS
Notes to Financial Statements (continued)
February 28, 2021 (Unaudited)
|
| 7. TAX INFORMATION (continued) |
As of February 28, 2021, the Fund’s aggregate security unrealized gains and losses based on cost for U.S federal income tax purposes were as follows:
| | | | | | | | | | | | | | | | | | | | | | | | |
| | | Equity Income
Fund | | | Focused
Value
Fund | | | Large
Cap Value
Fund | | | Mid
Cap Value
Fund | | | Small
Cap Value
Fund | | | Small/Mid
Cap Value
Fund | |
Tax Cost | | $ | 299,241,385 | | | $ | 23,556,350 | | | $ | 354,005,952 | | | $ | 853,503,272 | | | $ | 3,614,672,749 | | | $ | 115,779,837 | |
Gross unrealized gain | | | 82,930,740 | | | | 2,627,002 | | | | 102,947,468 | | | | 297,617,923 | | | | 1,865,814,873 | | | | 40,053,378 | |
Gross unrealized loss | | | (6,146,701 | ) | | | (541,580 | ) | | | (9,424,106 | ) | | | (22,619,753 | ) | | | (145,814,787 | ) | | | (3,996,736 | ) |
Net unrealized gain | | $ | 76,784,039 | | | $ | 2,085,422 | | | $ | 93,523,362 | | | $ | 274,998,170 | | | $ | 1,720,000,086 | | | $ | 36,056,642 | |
The difference between GAAP-basis and tax-basis unrealized gains (losses) is attributable primarily to wash sales, and differences related to the tax treatment of underlying fund investments.
GSAM has reviewed the Funds’ tax positions for all open tax years (the current and prior three years, as applicable) and has concluded that no provision for income tax is required in the Funds’ financial statements. Such open tax years remain subject to examination and adjustment by tax authorities.
The Funds’ risks include, but are not limited to, the following:
Dividend-Paying Investments Risk — A Fund’s investments in dividend-paying securities could cause a Fund to underperform other funds. Securities that pay dividends, as a group, can fall out of favor with the market, causing such securities to underperform securities that do not pay dividends. Depending upon market conditions and political and legislative responses to such conditions, dividend-paying securities that meet a Fund’s investment criteria may not be widely available and/or may be highly concentrated in only a few market sectors. In addition, issuers that have paid regular dividends or distributions to shareholders may not continue to do so at the same level or at all in the future. This may limit the ability of a Fund to produce current income.
Foreign and Emerging Countries Risk — Investing in foreign markets may involve special risks and considerations not typically associated with investing in the United States. Foreign securities may be subject to risk of loss because of more or less foreign government regulation, less public information and less economic, political and social stability in the countries in which a Fund invests. The imposition of exchange controls (including repatriation restrictions), confiscation of assets and property, trade restrictions (including tariffs) and other government restrictions by the United States or other governments, or problems with registration, settlement or custody, may result in losses. Foreign risk also involves the risk of negative foreign currency rate fluctuations, which may cause the value of securities denominated in such foreign currency (or other instruments through which a Fund has exposure to foreign currencies) to decline in value. Currency exchange rates may fluctuate significantly over short periods of time.
Foreign Custody Risk — If a Fund invests in foreign securities, the Fund may hold such securities and cash with foreign banks, agents, and securities depositories appointed by the Fund’s custodian (each a “Foreign Custodian”). Some foreign custodians may be recently organized or new to the foreign custody business. In some countries, Foreign Custodians may be subject to little or no regulatory oversight over, or independent evaluation of, their operations. Further, the laws of certain countries may place limitations on a Fund’s ability to recover its assets if a Foreign Custodian enters bankruptcy. Investments in emerging markets may be subject to even greater custody risks than investments in more developed markets. Custody services in emerging market countries are very often undeveloped and may be considerably less well regulated than in more developed countries, and thus may not afford the same level of investor protection as would apply in developed countries.
92
GOLDMAN SACHS FUNDAMENTAL EQUITY VALUE FUNDS
|
| 8. OTHER RISKS (continued) |
Investments in Other Investment Companies Risk — As a shareholder of another investment company, including an ETF, a Fund will indirectly bear its proportionate share of any net management fees and other expenses paid by such other investment companies, in addition to the fees and expenses regularly borne by the Fund. ETFs are subject to risks that do not apply to conventional mutual funds, including but not limited to the following: (i) the market price of the ETF’s shares may trade at a premium or a discount to their NAV; and (ii) an active trading market for an ETF’s shares may not develop or be maintained.
Large Shareholder Transactions Risk — A Fund may experience adverse effects when certain large shareholders, such as other funds, institutional investors (including those trading by use of non-discretionary mathematical formulas), financial intermediaries (who may make investment decisions on behalf of underlying clients and/or include a Fund in their investment model), individuals, accounts and Goldman Sachs affiliates, purchase or redeem large amounts of shares of a Fund. Such large shareholder redemptions, which may occur rapidly or unexpectedly, may cause a Fund to sell portfolio securities at times when it would not otherwise do so, which may negatively impact a Fund’s NAV and liquidity. These transactions may also accelerate the realization of taxable income to shareholders if such sales of investments resulted in gains, and may also increase transaction costs. In addition, a large redemption could result in a Fund’s current expenses being allocated over a smaller asset base, leading to an increase in the Fund’s expense ratio. Similarly, large Fund share purchases may adversely affect a Fund’s performance to the extent that the Fund is delayed in investing new cash or otherwise maintains a larger cash position than it ordinarily would.
Liquidity Risk — A Fund may make investments that are illiquid or that may become less liquid in response to market developments or adverse investor perceptions. Illiquid investments may be more difficult to value. Liquidity risk may also refer to the risk that a Fund will not be able to pay redemption proceeds within the allowable time period or without significant dilution to remaining investors’ interests because of unusual market conditions, an unusually high volume of redemption requests, or other reasons. To meet redemption requests, a Fund may be forced to sell investments at an unfavorable time and/or under unfavorable conditions. If a Fund is forced to sell securities at an unfavorable time and/or under unfavorable conditions, such sales may adversely affect the Fund’s NAV and dilute remaining investors’ interests. These risks may be more pronounced in connection with a Fund’s investments in securities of issuers located in emerging market countries. Redemptions by large shareholders may have a negative impact on a Fund’s liquidity.
Market and Credit Risks — In the normal course of business, a Fund trades financial instruments and enters into financial transactions where risk of potential loss exists due to changes in the market (market risk). The value of the securities in which a Fund invests may go up or down in response to the prospects of individual companies, particular sectors or governments and/or general economic conditions throughout the world due to increasingly interconnected global economies and financial markets. Events such as war, acts of terrorism, social unrest, natural disasters, the spread of infectious illness or other public health threats could also significantly impact a Fund and its investments. Additionally, a Fund may also be exposed to credit risk in the event that an issuer or guarantor fails to perform or that an institution or entity with which the Fund has unsettled or open transactions defaults.
Non-Diversification Risk — The Focused Value Fund is non-diversified, meaning that it is permitted to invest a larger percentage of its assets in fewer issuers than diversified mutual funds. Thus, the Fund may be more susceptible to adverse developments affecting any single issuer held in its portfolio, and may be more susceptible to greater losses because of these developments.
Under the Trust’s organizational documents, its Trustees, officers, employees and agents are indemnified, to the extent permitted by the Act and state law, against certain liabilities that may arise out of performance of their duties to the Funds. Additionally, in the course of business, the Funds enter into contracts that contain a variety of indemnification clauses. The Funds’ maximum exposure under these arrangements is unknown, as this would involve future claims that may be made against the Funds that have not yet occurred. However, GSAM believes the risk of loss under these arrangements to be remote.
93
GOLDMAN SACHS FUNDAMENTAL EQUITY VALUE FUNDS
Notes to Financial Statements (continued)
February 28, 2021 (Unaudited)
On October 22, 2020, Goldman Sachs announced a settlement of matters involving 1Malaysia Development Bhd. (1MDB), a Malaysian sovereign wealth fund, with the United States Department of Justice as well as criminal and civil authorities in the UK, Singapore and Hong Kong. Further information regarding the 1MDB settlement can be found at https://www.goldmansachs.com/media-relations/press-releases/current/goldman-sachs-2020-10-22.html. The 1MDB settlement will not materially adversely affect GSAM’s ability to serve as investment manager.
Subsequent events after the Statements of Assets and Liabilities date have been evaluated, and GSAM has concluded that there is no impact requiring adjustment or disclosure in the financial statements.
94
GOLDMAN SACHS FUNDAMENTAL EQUITY VALUE FUNDS
|
| 12. SUMMARY OF SHARE TRANSACTIONS |
Share activity is as follows:
| | | | | | | | | | | | | | | | |
| | | Equity Income Fund | |
| | | | |
| | | For the Six Months Ended
February 28, 2021
(Unaudited) | | | For the Fiscal Year Ended
August 31, 2020 | |
| | | | |
| | | Shares | | | Dollars | | | Shares | | | Dollars | |
| | | | |
| Class A Shares | | | | | | | | | | | | | | | | |
Shares sold | | | 71,877 | | | $ | 2,831,416 | | | | 229,198 | | | $ | 8,334,088 | |
Reinvestment | | | 51,760 | | | | 1,982,215 | | | | 447,033 | | | | 17,177,416 | |
Shares redeemed | | | (491,587 | ) | | | (19,431,332 | ) | | | (991,362 | ) | | | (36,324,580 | ) |
| | | | (367,950 | ) | | | (14,617,701 | ) | | | (315,131 | ) | | | (10,813,076 | ) |
| Class C Shares | | | | | | | | | | | | | | | | |
Shares sold | | | 16,231 | | | | 635,247 | | | | 19,753 | | | | 694,804 | |
Reinvestment | | | 457 | | | | 16,625 | | | | 9,369 | | | | 345,797 | |
Shares redeemed | | | (26,286 | ) | | | (978,269 | ) | | | (95,896 | ) | | | (3,260,186 | ) |
| | | | (9,598 | ) | | | (326,397 | ) | | | (66,774 | ) | | | (2,219,585 | ) |
| Institutional Shares | | | | | | | | | | | | | | | | |
Shares sold | | | 200,904 | | | | 7,731,240 | | | | 152,713 | | | | 5,725,739 | |
Reinvestment | | | 5,354 | | | | 209,041 | | | | 29,967 | | | | 1,167,826 | |
Shares redeemed | | | (125,380 | ) | | | (4,845,723 | ) | | | (100,115 | ) | | | (3,717,733 | ) |
| | | | 80,878 | | | | 3,094,558 | | | | 82,565 | | | | 3,175,832 | |
| Service Shares | | | | | | | | | | | | | | | | |
Shares sold | | | — | | | | — | | | | 3 | | | | 100 | |
Reinvestment | | | 23 | | | | 901 | | | | 216 | | | | 8,319 | |
Shares redeemed | | | (2,069 | ) | | | (84,917 | ) | | | (455 | ) | | | (18,051 | ) |
| | | | (2,046 | ) | | | (84,016 | ) | | | (236 | ) | | | (9,632 | ) |
| Investor Shares | | | | | | | | | | | | | | | | |
Shares sold | | | 49,944 | | | | 1,847,259 | | | | 27,234 | | | | 981,695 | |
Reinvestment | | | 681 | | | | 25,762 | | | | 3,885 | | | | 148,693 | |
Shares redeemed | | | (51,001 | ) | | | (2,028,575 | ) | | | (27,845 | ) | | | (980,116 | ) |
| | | | (376 | ) | | | (155,554 | ) | | | 3,274 | | | | 150,272 | |
| Class R6 Shares | | | | | | | | | | | | | | | | |
Shares sold | | | 13,961 | | | | 559,892 | | | | 22,265 | | | | 831,682 | |
Reinvestment | | | 1,149 | | | | 44,857 | | | | 9,024 | | | | 352,619 | |
Shares redeemed | | | (22,445 | ) | | | (890,569 | ) | | | (42,762 | ) | | | (1,547,746 | ) |
| | | | (7,335 | ) | | | (285,820 | ) | | | (11,473 | ) | | | (363,445 | ) |
| Class R Shares | | | | | | | | | | | | | | | | |
Shares sold | | | 867 | | | | 34,005 | | | | 3,070 | | | | 115,279 | |
Reinvestment | | | 176 | | | | 6,688 | | | | 1,600 | | | | 61,245 | |
Shares redeemed | | | (1,150 | ) | | | (47,516 | ) | | | (14,039 | ) | | | (475,013 | ) |
| | | | (107 | ) | | | (6,823 | ) | | | (9,369 | ) | | | (298,489 | ) |
| Class P Shares | | | | | | | | | | | | | | | | |
Shares sold | | | 146,010 | | | | 6,084,719 | | | | 285,806 | | | | 10,334,223 | |
Reinvestment | | | 4,672 | | | | 182,619 | | | | 19,541 | | | | 751,373 | |
Shares redeemed | | | (22,682 | ) | | | (928,838 | ) | | | (65,131 | ) | | | (2,240,188 | ) |
| | | | 128,000 | | | | 5,338,500 | | | | 240,216 | | | | 8,845,408 | |
| | | | |
NET INCREASE/(DECREASE) | | | (178,534 | ) | | $ | (7,043,253 | ) | | | (76,928 | ) | | $ | (1,532,715 | ) |
95
GOLDMAN SACHS FUNDAMENTAL EQUITY VALUE FUNDS
Notes to Financial Statements (continued)
February 28, 2021 (Unaudited)
|
| 12. SUMMARY OF SHARE TRANSACTIONS (continued) |
| | | | | | | | | | | | | | | | |
| | | Focused Value Fund | |
| | | | |
| | | For the Six Months Ended
February 28, 2021
(Unaudited) | | | For the Fiscal Year Ended
August 31, 2020 | |
| | | | |
| | | Shares | | | Dollars | | | Shares | | | Dollars | |
| | | | |
| Class A Shares | | | | | | | | | | | | | | | | |
Shares sold | | | 6,859 | | | $ | 89,561 | | | | 10,516 | | | $ | 103,695 | |
Reinvestment | | | 233 | | | | 2,864 | | | | 78 | | | | 896 | |
Shares redeemed | | | (2,240 | ) | | | (28,076 | ) | | | (3,328 | ) | | | (35,000 | ) |
| | | | 4,852 | | | | 64,349 | | | | 7,266 | | | | 69,591 | |
| Class C Shares | | | | | | | | | | | | | | | | |
Shares sold | | | 4,376 | | | | 55,724 | | | | — | | | | — | |
Reinvestment | | | 32 | | | | 390 | | | | 28 | | | | 328 | |
Shares redeemed | | | (2,016 | ) | | | (25,058 | ) | | | — | | | | — | |
| | | | 2,392 | | | | 31,056 | | | | 28 | | | | 328 | |
| Institutional Shares | | | | | | | | | | | | | | | | |
Shares sold | | | 403,085 | | | | 5,137,335 | | | | 3,678 | | | | 36,000 | |
Reinvestment | | | 1,558 | | | | 19,225 | | | | 1,167 | | | | 13,526 | |
Shares redeemed | | | (74,330 | ) | | | (932,872 | ) | | | — | | | | — | |
| | | | 330,313 | | | | 4,223,688 | | | | 4,845 | | | | 49,526 | |
| Investor Shares | | | | | | | | | | | | | | | | |
Reinvestment | | | 58 | | | | 715 | | | | 45 | | | | 521 | |
Shares redeemed | | | (2,160 | ) | | | (27,117 | ) | | | — | | | | — | |
| | | | (2,102 | ) | | | (26,402 | ) | | | 45 | | | | 521 | |
| Class R6 Shares | | | | | | | | | | | | | | | | |
Reinvestment | | | 61 | | | | 749 | | | | 48 | | | | 557 | |
Shares redeemed | | | (2,182 | ) | | | (27,410 | ) | | | — | | | | — | |
| | | | (2,121 | ) | | | (26,661 | ) | | | 48 | | | | 557 | |
| Class R Shares | | | | | | | | | | | | | | | | |
Shares sold | | | 2,009 | | | | 25,005 | | | | — | | | | — | |
Reinvestment | | | 85 | | | | 1,033 | | | | 31 | | | | 358 | |
Shares redeemed | | | (2,088 | ) | | | (26,067 | ) | | | — | | | | — | |
| | | | 6 | | | | (29 | ) | | | 31 | | | | 358 | |
| Class P Shares | | | | | | | | | | | | | | | | |
Shares sold | | | 883,012 | | | | 11,012,613 | | | | 493,259 | | | | 5,137,927 | |
Reinvestment | | | 17,987 | | | | 221,552 | | | | 12,220 | | | | 141,442 | |
Shares redeemed | | | (85,090 | ) | | | (966,184 | ) | | | (180,182 | ) | | | (1,719,963 | ) |
| | | | 815,909 | | | | 10,267,981 | | | | 325,297 | | | | 3,559,406 | |
| | | | |
NET INCREASE/(DECREASE) | | | 1,149,249 | | | $ | 14,533,982 | | | | 337,560 | | | $ | 3,680,287 | |
96
GOLDMAN SACHS FUNDAMENTAL EQUITY VALUE FUNDS
|
| 12. SUMMARY OF SHARE TRANSACTIONS (continued) |
| | | | | | | | | | | | | | | | |
| | | Large Cap Value Fund | |
| | | | |
| | | For the Six Months Ended
February 28, 2021
(Unaudited) | | | For the Fiscal Year Ended
August 31, 2020 | |
| | | | |
| | | Shares | | | Dollars | | | Shares | | | Dollars | |
| | | | |
| Class A Shares | | | | | | | | | | | | | | | | |
Shares sold | | | 168,135 | | | $ | 2,502,833 | | | | 386,613 | | | $ | 5,266,125 | |
Reinvestment | | | 162,305 | | | | 2,413,491 | | | | 298,925 | | | | 4,482,803 | |
Shares redeemed | | | (521,357 | ) | | | (7,691,518 | ) | | | (1,203,250 | ) | | | (16,167,723 | ) |
| | | | (190,917 | ) | | | (2,775,194 | ) | | | (517,712 | ) | | | (6,418,795 | ) |
| Class C Shares | | | | | | | | | | | | | | | | |
Shares sold | | | 19,681 | | | | 277,015 | | | | 33,194 | | | | 431,506 | |
Reinvestment | | | 33,099 | | | | 462,331 | | | | 76,995 | | | | 1,087,870 | |
Shares redeemed | | | (272,336 | ) | | | (3,784,039 | ) | | | (356,987 | ) | | | (4,573,900 | ) |
| | | | (219,556 | ) | | | (3,044,693 | ) | | | (246,798 | ) | | | (3,054,524 | ) |
| Institutional Shares | | | | | | | | | | | | | | | | |
Shares sold | | | 714,420 | | | | 10,739,971 | | | | 1,320,839 | | | | 17,273,248 | |
Reinvestment | | | 361,313 | | | | 5,436,359 | | | | 579,508 | | | | 8,786,383 | |
Shares redeemed | | | (758,825 | ) | | | (11,401,083 | ) | | | (4,081,453 | ) | | | (57,927,064 | ) |
| | | | 316,908 | | | | 4,775,247 | | | | (2,181,106 | ) | | | (31,867,433 | ) |
| Service Shares | | | | | | | | | | | | | | | | |
Shares sold | | | 2,388 | | | | 35,874 | | | | 6,329 | | | | 87,929 | |
Reinvestment | | | 692 | | | | 10,246 | | | | 1,053 | | | | 15,722 | |
Shares redeemed | | | (10,431 | ) | | | (155,486 | ) | | | (17,011 | ) | | | (233,542 | ) |
| | | | (7,351 | ) | | | (109,366 | ) | | | (9,629 | ) | | | (129,891 | ) |
| Investor Shares | | | | | | | | | | | | | | | | |
Shares sold | | | 12,931 | | | | 188,694 | | | | 50,524 | | | | 714,528 | |
Reinvestment | | | 7,936 | | | | 118,038 | | | | 15,988 | | | | 239,744 | |
Shares redeemed | | | (52,264 | ) | | | (752,673 | ) | | | (108,501 | ) | | | (1,478,132 | ) |
| | | | (31,397 | ) | | | (445,941 | ) | | | (41,989 | ) | | | (523,860 | ) |
| Class R6 Shares | | | | | | | | | | | | | | | | |
Shares sold | | | 21,441 | | | | 313,721 | | | | 20,426 | | | | 282,346 | |
Reinvestment | | | 4,213 | | | | 65,011 | | | | 7,116 | | | | 110,527 | |
Shares redeemed | | | (37,287 | ) | | | (572,540 | ) | | | (59,729 | ) | | | (841,724 | ) |
| | | | (11,633 | ) | | | (193,808 | ) | | | (32,187 | ) | | | (448,851 | ) |
| Class R Shares | | | | | | | | | | | | | | | | |
Shares sold | | | 12,488 | | | | 174,346 | | | | 48,042 | | | | 601,189 | |
Reinvestment | | | 6,648 | | | | 95,537 | | | | 14,096 | | | | 204,395 | |
Shares redeemed | | | (39,534 | ) | | | (579,402 | ) | | | (131,311 | ) | | | (1,708,958 | ) |
| | | | (20,398 | ) | | | (309,519 | ) | | | (69,173 | ) | | | (903,374 | ) |
| Class P Shares | | | | | | | | | | | | | | | | |
Shares sold | | | 461,452 | | | | 7,216,481 | | | | 1,252,345 | | | | 14,676,899 | |
Reinvestment | | | 372,659 | | | | 5,747,842 | | | | 683,416 | | | | 10,614,391 | |
Shares redeemed | | | (579,606 | ) | | | (8,934,690 | ) | | | (3,307,653 | ) | | | (43,660,114 | ) |
| | | | 254,505 | | | | 4,029,633 | | | | (1,371,892 | ) | | | (18,368,824 | ) |
| | | | |
NET INCREASE/(DECREASE) | | | 90,161 | | | $ | 1,926,359 | | | | (4,470,486 | ) | | $ | (61,715,552 | ) |
97
GOLDMAN SACHS FUNDAMENTAL EQUITY VALUE FUNDS
Notes to Financial Statements (continued)
February 28, 2021 (Unaudited)
|
| 12. SUMMARY OF SHARE TRANSACTIONS (continued) |
| | | | | | | | | | | | | | | | |
| | | Mid Cap Value Fund | |
| | | | |
| | | For the Six Months Ended
February 28, 2021
(Unaudited) | | | For the Fiscal Year Ended
August 31, 2020 | |
| | | | |
| | | Shares | | | Dollars | | | Shares | | | Dollars | |
| | | | |
| Class A Shares | | | | | | | | | | | | | | | | |
Shares sold | | | 474,472 | | | $ | 16,808,862 | | | | 1,462,153 | | | $ | 44,185,577 | |
Reinvestment | | | 44,871 | | | | 1,625,681 | | | | 448,655 | | | | 15,125,065 | |
Shares redeemed | | | (1,640,284 | ) | | | (57,184,064 | ) | | | (4,599,003 | ) | | | (140,817,910 | ) |
| | | | (1,120,941 | ) | | | (38,749,521 | ) | | | (2,688,195 | ) | | | (81,507,268 | ) |
| Class C Shares | | | | | | | | | | | | | | | | |
Shares sold | | | 22,677 | | | | 714,260 | | | | 59,183 | | | | 1,562,938 | |
Reinvestment | | | — | | | | — | | | | 21,940 | | | | 639,105 | |
Shares redeemed | | | (148,926 | ) | | | (4,491,000 | ) | | | (482,559 | ) | | | (12,808,402 | ) |
| | | | (126,249 | ) | | | (3,776,740 | ) | | | (401,436 | ) | | | (10,606,359 | ) |
| Institutional Shares | | | | | | | | | | | | | | | | |
Shares sold | | | 517,603 | | | | 18,659,822 | | | | 1,799,443 | | | | 52,742,609 | |
Reinvestment | | | 47,467 | | | | 1,739,185 | | | | 297,359 | | | | 10,160,261 | |
Shares redeemed | | | (1,523,315 | ) | | | (51,630,405 | ) | | | (4,087,541 | ) | | | (127,141,314 | ) |
| | | | (958,245 | ) | | | (31,231,398 | ) | | | (1,990,739 | ) | | | (64,238,444 | ) |
| Service Shares | | | | | | | | | | | | | | | | |
Shares sold | | | 36,788 | | | | 1,258,585 | | | | 125,414 | | | | 3,600,498 | |
Reinvestment | | | 1,886 | | | | 66,820 | | | | 35,593 | | | | 1,171,369 | |
Shares redeemed | | | (197,283 | ) | | | (6,606,969 | ) | | | (670,629 | ) | | | (20,177,249 | ) |
| | | | (158,609 | ) | | | (5,281,564 | ) | | | (509,622 | ) | | | (15,405,382 | ) |
| Investor Shares | | | | | | | | | | | | | | | | |
Shares sold | | | 86,842 | | | | 3,064,912 | | | | 184,165 | | | | 5,476,121 | |
Reinvestment | | | 6,094 | | | | 214,953 | | | | 44,223 | | | | 1,454,013 | |
Shares redeemed | | | (192,230 | ) | | | (6,434,631 | ) | | | (461,350 | ) | | | (13,655,472 | ) |
| | | | (99,294 | ) | | | (3,154,766 | ) | | | (232,962 | ) | | | (6,725,338 | ) |
| Class R6 Shares | | | | | | | | | | | | | | | | |
Shares sold | | | 252,834 | | | | 8,923,865 | | | | 625,333 | | | | 18,941,033 | |
Reinvestment | | | 11,214 | | | | 410,672 | | | | 48,892 | | | | 1,669,401 | |
Shares redeemed | | | (236,383 | ) | | | (8,365,963 | ) | | | (490,436 | ) | | | (15,224,407 | ) |
| | | | 27,665 | | | | 968,574 | | | | 183,789 | | | | 5,386,027 | |
| Class R Shares | | | | | | | | | | | | | | | | |
Shares sold | | | 89,743 | | | | 3,024,549 | | | | 195,531 | | | | 5,217,356 | |
Reinvestment | | | 729 | | | | 25,504 | | | | 18,303 | | | | 594,695 | |
Shares redeemed | | | (144,823 | ) | | | (4,810,938 | ) | | | (350,810 | ) | | | (10,017,755 | ) |
| | | | (54,351 | ) | | | (1,760,885 | ) | | | (136,976 | ) | | | (4,205,704 | ) |
| Class P Shares | | | | | | | | | | | | | | | | |
Shares sold | | | 333,011 | | | | 12,435,913 | | | | 1,148,507 | | | | 36,315,245 | |
Reinvestment | | | 28,655 | | | | 1,049,073 | | | | 132,360 | | | | 4,519,458 | |
Shares redeemed | | | (300,927 | ) | | | (10,558,142 | ) | | | (1,501,890 | ) | | | (47,505,869 | ) |
| | | | 60,739 | | | | 2,926,844 | | | | (221,023 | ) | | | (6,671,166 | ) |
| | | | |
NET INCREASE/(DECREASE) | | | (2,429,285 | ) | | $ | (80,059,456 | ) | | | (5,997,164 | ) | | $ | (183,973,634 | ) |
98
GOLDMAN SACHS FUNDAMENTAL EQUITY VALUE FUNDS
|
| 12. SUMMARY OF SHARE TRANSACTIONS (continued) |
| | | | | | | | | | | | | | | | |
| | | Small Cap Value Fund | |
| | | | |
| | | For the Six Months Ended
February 28, 2021
(Unaudited) | | | For the Fiscal Year Ended
August 31, 2020 | |
| | | | |
| | | Shares | | | Dollars | | | Shares | | | Dollars | |
| | | | |
| Class A Shares | | | | | | | | | | | | | | | | |
Shares sold | | | 546,400 | | | $ | 25,967,138 | | | | 1,596,036 | | | $ | 64,703,525 | |
Reinvestment | | | 15,527 | | | | 780,234 | | | | 489,214 | | | | 24,251,852 | |
Shares redeemed | | | (2,168,721 | ) | | | (102,514,104 | ) | | | (4,497,850 | ) | | | (191,651,785 | ) |
| | | | (1,606,794 | ) | | | (75,766,732 | ) | | | (2,412,600 | ) | | | (102,696,408 | ) |
| Class C Shares | | | | | | | | | | | | | | | | |
Shares sold | | | 17,124 | | | | 596,236 | | | | 17,457 | | | | 551,502 | |
Reinvestment | | | — | | | | — | | | | 9,946 | | | | 348,108 | |
Shares redeemed | | | (55,698 | ) | | | (1,704,877 | ) | | | (176,111 | ) | | | (5,227,096 | ) |
| | | | (38,574 | ) | | | (1,108,641 | ) | | | (148,708 | ) | | | (4,327,486 | ) |
| Institutional Shares | | | | | | | | | | | | | | | | |
Shares sold | | | 4,618,333 | | | | 241,216,803 | | | | 12,946,460 | | | | 564,333,088 | |
Reinvestment | | | 238,033 | | | | 13,094,190 | | | | 2,681,940 | | | | 145,860,418 | |
Shares redeemed | | | (14,555,819 | ) | | | (766,493,312 | ) | | | (20,910,025 | ) | | | (975,609,347 | ) |
| | | | (9,699,453 | ) | | | (512,182,319 | ) | | | (5,281,625 | ) | | | (265,415,841 | ) |
| Service Shares | | | | | | | | | | | | | | | | |
Shares sold | | | 130,570 | | | | 5,523,242 | | | | 273,152 | | | | 10,478,056 | |
Reinvestment | | | 362 | | | | 17,550 | | | | 55,828 | | | | 2,662,203 | |
Shares redeemed | | | (482,593 | ) | | | (21,809,524 | ) | | | (991,281 | ) | | | (43,692,687 | ) |
| | | | (351,661 | ) | | | (16,268,732 | ) | | | (662,301 | ) | | | (30,552,428 | ) |
| Investor Shares | | | | | | | | | | | | | | | | |
Shares sold | | | 789,419 | | | | 39,651,106 | | | | 1,164,040 | | | | 47,831,966 | |
Reinvestment | | | 11,766 | | | | 585,347 | | | | 143,535 | | | | 7,062,623 | |
Shares redeemed | | | (782,851 | ) | | | (37,864,883 | ) | | | (1,266,322 | ) | | | (53,884,434 | ) |
| | | | 18,334 | | | | 2,371,570 | | | | 41,253 | | | | 1,010,155 | |
| Class R6 Shares | | | | | | | | | | | | | | | | |
Shares sold | | | 3,299,762 | | | | 169,361,294 | | | | 9,345,715 | | | | 430,038,206 | |
Reinvestment | | | 130,800 | | | | 7,191,362 | | | | 1,180,724 | | | | 64,189,653 | |
Shares redeemed | | | (7,750,232 | ) | | | (412,459,812 | ) | | | (8,174,988 | ) | | | (369,771,737 | ) |
| | | | (4,319,670 | ) | | | (235,907,156 | ) | | | 2,351,451 | | | | 124,456,122 | |
| Class R Shares | | | | | | | | | | | | | | | | |
Shares sold | | | 99,551 | | | | 4,693,579 | | | | 337,273 | | | | 12,358,142 | |
Reinvestment | | | — | | | | — | | | | 73,604 | | | | 3,545,103 | |
Shares redeemed | | | (363,384 | ) | | | (16,615,841 | ) | | | (803,072 | ) | | | (33,210,279 | ) |
| | | | (263,833 | ) | | | (11,922,262 | ) | | | (392,195 | ) | | | (17,307,034 | ) |
| Class P Shares | | | | | | | | | | | | | | | | |
Shares sold | | | 568,001 | | | | 30,315,776 | | | | 1,361,647 | | | | 57,615,257 | |
Reinvestment | | | 24,327 | | | | 1,337,472 | | | | 199,821 | | | | 10,863,518 | |
Shares redeemed | | | (392,303 | ) | | | (20,804,694 | ) | | | (1,425,012 | ) | | | (63,261,974 | ) |
| | | | 200,025 | | | | 10,848,554 | | | | 136,456 | | | | 5,216,801 | |
| | | | |
NET INCREASE/(DECREASE) | | | (16,061,626 | ) | | $ | (839,935,718 | ) | | | (6,368,269 | ) | | $ | (289,616,119 | ) |
99
GOLDMAN SACHS FUNDAMENTAL EQUITY VALUE FUNDS
Notes to Financial Statements (continued)
February 28, 2021 (Unaudited)
|
| 12. SUMMARY OF SHARE TRANSACTIONS (continued) |
| | | | | | | | | | | | | | | | |
| | | Small/Mid Cap Value Fund | |
| | | | |
| | | For the Six Months Ended
February 28, 2021
(Unaudited) | | | For the Fiscal Year Ended
August 31, 2020 | |
| | | | |
| | | Shares | | | Dollars | | | Shares | | | Dollars | |
| | | | |
| Class A Shares | | | | | | | | | | | | | | | | |
Shares sold | | | 19,381 | | | $ | 263,717 | | | | 29,384 | | | $ | 354,871 | |
Reinvestment | | | 302 | | | | 4,187 | | | | 550 | | | | 7,146 | |
Shares redeemed | | | (15,558 | ) | | | (192,486 | ) | | | (66,412 | ) | | | (738,596 | ) |
| | | | 4,125 | | | | 75,418 | | | | (36,478 | ) | | | (376,579 | ) |
| Class C Shares | | | | | | | | | | | | | | | | |
Shares sold | | | 10,880 | | | | 147,750 | | | | 17,292 | | | | 194,135 | |
Reinvestment | | | — | | | | — | | | | — | | | | — | |
Shares redeemed | | | (6,982 | ) | | | (86,958 | ) | | | (17,578 | ) | | | (190,853 | ) |
| | | | 3,898 | | | | 60,792 | | | | (286 | ) | | | 3,282 | |
| Institutional Shares | | | | | | | | | | | | | | | | |
Shares sold | | | 361,999 | | | | 5,278,317 | | | | 203,391 | | | | 2,221,517 | |
Reinvestment | | | 4,243 | | | | 59,578 | | | | 4,849 | | | | 63,819 | |
Shares redeemed | | | (71,393 | ) | | | (981,639 | ) | | | (114,906 | ) | | | (1,293,991 | ) |
| | | | 294,849 | | | | 4,356,256 | | | | 93,334 | | | | 991,345 | |
| Investor Shares | | | | | | | | | | | | | | | | |
Shares sold | | | 125,174 | | | | 1,895,960 | | | | 25,034 | | | | 288,631 | |
Reinvestment | | | 540 | | | | 7,543 | | | | 2,288 | | | | 29,922 | |
Shares redeemed | | | (28,901 | ) | | | (344,152 | ) | | | (172,493 | ) | | | (1,873,035 | ) |
| | | | 96,813 | | | | 1,559,351 | | | | (145,171 | ) | | | (1,554,482 | ) |
| Class R6 Shares | | | | | | | | | | | | | | | | |
Shares sold | | | 763,141 | | | | 10,739,852 | | | | 1,153,473 | | | | 12,846,150 | |
Reinvestment | | | 31,315 | | | | 439,348 | | | | 46,058 | | | | 605,200 | |
Shares redeemed | | | (623,590 | ) | | | (8,500,776 | ) | | | (1,386,202 | ) | | | (15,813,637 | ) |
| | | | 170,866 | | | | 2,678,424 | | | | (186,671 | ) | | | (2,362,287 | ) |
| Class R Shares | | | | | | | | | | | | | | | | |
Shares sold | | | 97 | | | | 1,236 | | | | 938 | | | | 9,766 | |
Reinvestment | | | — | | | | — | | | | 45 | | | | 584 | |
Shares redeemed | | | (1,705 | ) | | | (25,879 | ) | | | (7,957 | ) | | | (76,904 | ) |
| | | | (1,608 | ) | | | (24,643 | ) | | | (6,974 | ) | | | (66,554 | ) |
| Class P Shares | | | | | | | | | | | | | | | | |
Shares sold | | | 559,025 | | | | 7,935,417 | | | | 347,145 | | | | 4,046,413 | |
Reinvestment | | | 23,674 | | | | 332,143 | | | | 38,695 | | | | 508,457 | |
Shares redeemed | | | (158,179 | ) | | | (2,196,365 | ) | | | (1,119,273 | ) | | | (11,034,437 | ) |
| | | | 424,520 | | | | 6,071,195 | | | | (733,433 | ) | | | (6,479,567 | ) |
| | | | |
NET INCREASE/(DECREASE) | | | 993,463 | | | $ | 14,776,793 | | | | (1,015,679 | ) | | $ | (9,844,842 | ) |
100
GOLDMAN SACHS FUNDAMENTAL EQUITY VALUE FUNDS
Liquidity Risk Management Program
Each Fund has adopted and implemented a liquidity risk management program (the “Program”) in accordance with Rule 22e-4 under the 1940 Act. The Program seeks to assess and manage each Fund’s liquidity risk, i.e., the risk that a Fund is unable to satisfy redemption requests without significantly diluting remaining investors’ interests in the Fund. The Board of Trustees of the Trust has designated GSAM, each Fund’s investment adviser, to administer the Program. Certain aspects of the Program rely on third parties to perform certain functions, including the provision of market data and application of models.
The Program is comprised of various components designed to support the assessment and/or management of liquidity risk, including: (1) the periodic assessment (no less frequently than annually) of certain factors that influence a Fund’s liquidity risk; (2) the periodic classification (no less frequently than monthly) of a Fund’s investments into one of four liquidity categories that reflect an estimate of their liquidity under current market conditions; (3) a 15% limit on the acquisition of “illiquid investments” (as defined under Rule 22e-4); (4) for a Fund that does not invest primarily in “highly liquid investments” (as defined under Rule 22e-4), the determination of a minimum percentage of the Fund’s assets that will generally be invested in highly liquid investments (a “Highly Liquid Investment Minimum”); and (5) periodic reporting to the Board of Trustees.
At a meeting of the Board of Trustees on February 9-10, 2021, GSAM provided a written report to the Board addressing the operation, and the adequacy and effectiveness of the implementation, of the Program, including, as applicable, the operation of any Highly Liquid Investment Minimum and any material changes to the Program, for the period from January 1, 2020 through December 31, 2020 (the “Reporting Period”). Among other things, the annual report and related materials discussed: (1) the results of stress tests designed to assess liquidity under a hypothetical stressed scenario involving elevated redemptions; (2) an assessment of the methodologies used to classify investments into one of four liquidity categories; and (3) the impact of the COVID-19 pandemic on liquidity and management of liquidity risk during the Reporting Period, including during stressed market conditions caused by the COVID-19 pandemic. The report concluded that the Program continues to be reasonably designed to assess and manage liquidity risk and was adequately and effectively implemented during the Reporting Period.
There can be no assurance that the Program will achieve its objectives under all circumstances in the future. Please refer to your Fund’s prospectus for more information regarding the Fund’s exposure to liquidity risk and other risks to which it may be subject.
101
GOLDMAN SACHS FUNDAMENTAL EQUITY VALUE FUNDS
Fund Expenses — Six Month Period Ended February 28, 2021 (Unaudited)
As a shareholder of Class A, Class C, Institutional, Service, Investor, Class R6, Class R and Class P Shares of a Fund, you incur two types of costs: (1) transaction costs, including sales charges on purchase payments (with respect to Class A Shares), contingent deferred sales charges on redemptions (with respect to Class C Shares), and (2) ongoing costs, including management fees; distribution and/or service (12b-1) fees (with respect to Class A, Class C, Service and Class R Shares); and other Fund expenses. This example is intended to help you understand your ongoing costs (in dollars) of investing in Class A, Class C, Institutional, Service, Investor, Class R6, Class R and Class P Shares of the Funds and to compare these costs with the ongoing costs of investing in other mutual funds.
The example is based on an investment of $1,000 invested at the beginning of the period and held for the entire period from September 1, 2020 through February 28, 2021, which represents a period of 181 days of a 365 day year.
Actual Expenses — The first line under each share class in the table below provides information about actual account values and actual expenses. You may use the information in this line, together with the amount you invested, to estimate the expenses that you paid over the period. Simply divide your account value by $1,000 (for example, an $8,600 account value divided by $1,000=8.6), then multiply the result by the number in the first line under the heading entitled “Expenses Paid” to estimate the expenses you paid on your account during this period.
Hypothetical Example for Comparison Purposes — The second line under each share class in the table below provides information about hypothetical account values and hypothetical expenses based on the Funds’ actual net expense ratios and an assumed rate of return of 5% per year before expenses, which is not the Funds’ actual return. The hypothetical account values and expenses may not be used to estimate the actual ending account balance or expenses you paid for the period. You may use this information to compare the ongoing costs of investing in the Funds and other funds. To do so, compare this 5% hypothetical example with the 5% hypothetical examples that appear in the shareholder reports of the other funds.
Please note that the expenses shown in the table are meant to highlight your ongoing costs only and do not reflect any transactional costs, such as sales charges, redemption fees, or exchange fees. Therefore, the second line of the table is useful in comparing ongoing costs only, and will not help you determine the relative total costs of owning different funds. In addition, if these transactional costs were included, your costs would have been higher:
| | | | | | | | | | | | | | | | | | | | | | | | | | | | | | | | | | | | |
| | | Equity Income Fund | | | Focused Value Fund | | | Large Cap Value Fund | |
| Share Class | | Beginning
Account
Value
9/1/20 | | | Ending
Account
Value
2/28/21 | | | Expenses
Paid for the
6 months ended
2/28/2021* | | | Beginning
Account
Value
9/1/20 | | | Ending
Account
Value
2/28/21 | | | Expenses
Paid for the
6 months ended
2/28/2021* | | | Beginning
Account
Value
9/1/20 | | | Ending
Account
Value
2/28/21 | | | Expenses
Paid for the
6 months ended
2/28/2021* | |
| Class A | | | | | | | | | | | | | | | | | | | | | | | | | | | | | | | | | | | | |
Actual | | $ | 1,000.00 | | | $ | 1,105.49 | | | | 5.48 | | | $ | 1,000.00 | | | $ | 1,180.55 | | | $ | 5.68 | | | $ | 1,000.00 | | | $ | 1,165.24 | | | $ | 5.53 | |
Hypothetical 5% return | | | 1,000.00 | | | | 1,019.59 | + | | | 5.26 | | | | 1,000.00 | | | | 1,019.59 | + | | | 5.26 | | | | 1,000.00 | | | | 1,019.69 | + | | | 5.16 | |
| Class C | | | | | | | | | | | | | | | | | | | | | | | | | | | | | | | | | | | | |
Actual | | | 1,000.00 | | | $ | 1,101.16 | | | | 9.38 | | | | 1,000.00 | | | | 1,175.92 | | | | 9.66 | | | | 1,000.00 | | | | 1,160.05 | | | | 9.53 | |
Hypothetical 5% return | | | 1,000.00 | | | | 1,015.87 | + | | | 9.00 | | | | 1,000.00 | | | | 1,015.92 | + | | | 8.95 | | | | 1,000.00 | | | | 1,015.97 | + | | | 8.90 | |
| Institutional | | | | | | | | | | | | | | | | | | | | | | | | | | | | | | | | | | | | |
Actual | | | 1,000.00 | | | $ | 1,107.24 | | | | 3.81 | | | | 1,000.00 | | | | 1,182.70 | | | | 3.95 | | | | 1,000.00 | | | | 1,167.37 | | | | 3.92 | |
Hypothetical 5% return | | | 1,000.00 | | | | 1,021.17 | + | | | 3.66 | | | | 1,000.00 | | | | 1,021.17 | + | | | 3.66 | | | | 1,000.00 | | | | 1,021.17 | + | | | 3.66 | |
| Service | | | | | | | | | | | | | | | | | | | | | | | | | | | | | | | | | | | | |
Actual | | | 1,000.00 | | | $ | 1,104.67 | | | | 6.42 | | | | 1,000.00 | | | | N/A | | | | N/A | | | | 1,000.00 | | | | 1,163.56 | | | | 6.60 | |
Hypothetical 5% return | | | 1,000.00 | | | | 1,018.70 | + | | | 6.16 | | | | 1,000.00 | | | | N/A | | | | N/A | | | | 1,000.00 | | | | 1,018.70 | + | | | 6.16 | |
| Investor | | | | | | | | | | | | | | | | | | | | | | | | | | | | | | | | | | | | |
Actual | | | 1,000.00 | | | $ | 1,106.70 | | | | 4.18 | | | | 1,000.00 | | | | 1,182.36 | | | | 4.33 | | | | 1,000.00 | | | | 1,166.28 | | | | 4.19 | |
Hypothetical 5% return | | | 1,000.00 | | | | 1,020.83 | + | | | 4.01 | | | | 1,000.00 | | | | 1,020.83 | + | | | 4.01 | | | | 1,000.00 | | | | 1,020.93 | + | | | 3.91 | |
| Class R6 | | | | | | | | | | | | | | | | | | | | | | | | | | | | | | | | | | | | |
Actual | | | 1,000.00 | | | $ | 1,107.28 | | | | 3.76 | | | | 1,000.00 | | | | 1,183.12 | | | | 3.90 | | | | 1,000.00 | | | | 1,166.86 | | | | 3.87 | |
Hypothetical 5% return | | | 1,000.00 | | | | 1,021.22 | + | | | 3.61 | | | | 1,000.00 | | | | 1,021.22 | + | | | 3.61 | | | | 1,000.00 | | | | 1,021.22 | + | | | 3.61 | |
| Class R | | | | | | | | | | | | | | | | | | | | | | | | | | | | | | | | | | | | |
Actual | | | 1,000.00 | | | $ | 1,104.17 | | | | 6.78 | | | | 1,000.00 | | | | 1,179.65 | | | | 6.97 | | | | 1,000.00 | | | | 1,163.81 | | | | 6.87 | |
Hypothetical 5% return | | | 1,000.00 | | | | 1,018.35 | + | | | 6.51 | | | | 1,000.00 | | | | 1,018.40 | + | | | 6.46 | | | | 1,000.00 | | | | 1,018.45 | + | | | 6.41 | |
| Class P | | | | | | | | | | | | | | | | | | | | | | | | | | | | | | | | | | | | |
Actual | | | 1,000.00 | | | $ | 1,107.32 | | | | 3.76 | | | | 1,000.00 | | | | 1,182.12 | | | | 3.90 | | | | 1,000.00 | | | | 1,166.84 | | | | 3.87 | |
Hypothetical 5% return | | | 1,000.00 | | | | 1,021.22 | + | | | 3.61 | | | | 1,000.00 | | | | 1,021.22 | + | | | 3.61 | | | | 1,000.00 | | | | 1,021.22 | + | | | 3.61 | |
| + | | Hypothetical expenses are based on each Fund’s actual annualized net expense ratios and an assumed rate of return of 5% per year before expenses. |
| * | | Expenses for each share class are calculated using each Fund’s annualized net expense ratio for each class, which represents the ongoing expenses as a percentage of net assets for the six months ended February 28, 2021. Expenses are calculated by multiplying the annualized net expense ratio by the average account value for the period; then multiplying the result by the number of days in the most recent fiscal half year; and then dividing that result by the number of days in the fiscal year. The annualized net expense ratios for the period were as follows: |
| | | | | | | | | | | | | | | | | | | | | | | | | | | | | | | | |
| Fund | | Class A
Shares | | | Class C
Shares | | | Institutional
Shares | | | Service
Shares | | | Investor
Shares | | | Class R6
Shares | | | Class R
Shares | | | Class P
Shares | |
Equity Income Fund | | | 1.05 | % | | | 1.80 | % | | | 0.73 | % | | | 1.23 | % | | | 0.80 | % | | | 0.72 | % | | | 1.30 | % | | | 0.72 | % |
Focused Value Fund | | | 1.05 | | | | 1.79 | | | | 0.73 | | | | N/A | | | | 0.80 | | | | 0.72 | | | | 1.29 | | | | 0.72 | |
Large Cap Value Fund | | | 1.03 | | | | 1.78 | | | | 0.73 | | | | 1.23 | | | | 0.78 | | | | 0.72 | | | | 1.28 | | | | 0.72 | |
102
GOLDMAN SACHS FUNDAMENTAL EQUITY VALUE FUNDS
Fund Expenses — Six Month Period Ended February 28, 2021 (Unaudited) (continued)
| | | | | | | | | | | | | | | | | | | | | | | | | | | | | | | | | | | | |
| | | Mid Cap Value Fund | | | Small Cap Value Fund | | | Small/Mid Cap Value Fund | |
| Share Class | | Beginning
Account
Value 9/1/20 | | | Ending
Account
Value
2/28/21 | | | Expenses
Paid for the
6 months ended
2/28/2021* | | | Beginning
Account
Value 9/1/20 | | | Ending
Account
Value
2/28/21 | | | Expenses
Paid for the
6 months ended
2/28/2021* | | | Beginning
Account
Value 9/1/20 | | | Ending
Account
Value
2/28/21 | | | Expenses
Paid for the
6 months ended
2/28/2021* | |
| Class A | | | | | | | | | | | | | | | | | | | | | | | | | | | | | | | | | | | | |
Actual | | $ | 1,000.00 | | | $ | 1,260.91 | | | $ | 6.78 | | | $ | 1,000.00 | | | $ | 1,397.01 | | | $ | 7.79 | | | $ | 1,000.00 | | | $ | 1,343.86 | | | $ | 7.03 | |
Hypothetical 5% return | | | 1,000.00 | | | | 1,018.79 | + | | | 6.06 | | | | 1,000.00 | | | | 1,018.30 | + | | | 6.56 | | | | 1,000.00 | | | | 1,018.79 | + | | | 6.06 | |
| Class C | | | | | | | | | | | | | | | | | | | | | | | | | | | | | | | | | | | | |
Actual | | | 1,000.00 | | | | 1,256.30 | | | | 10.96 | | | | 1,000.00 | | | | 1,392.05 | | | | 12.22 | | | | 1,000.00 | | | | 1,339.61 | | | | 11.37 | |
Hypothetical 5% return | | | 1,000.00 | | | | 1,015.08 | + | | | 9.79 | | | | 1,000.00 | | | | 1,014.58 | + | | | 10.29 | | | | 1,000.00 | | | | 1,015.08 | + | | | 9.79 | |
| Institutional | | | | | | | | | | | | | | | | | | | | | | | | | | | | | | | | | | | | |
Actual | | | 1,000.00 | | | | 1,263.22 | | | | 4.71 | | | | 1,000.00 | | | | 1,399.52 | | | | 5.71 | | | | 1,000.00 | | | | 1,345.92 | | | | 4.89 | |
Hypothetical 5% return | | | 1,000.00 | | | | 1,020.63 | + | | | 4.21 | | | | 1,000.00 | | | | 1,020.03 | + | | | 4.81 | | | | 1,000.00 | | | | 1,020.63 | + | | | 4.21 | |
| Service | | | | | | | | | | | | | | | | | | | | | | | | | | | | | | | | | | | | |
Actual | | | 1,000.00 | | | | 1,260.21 | | | | 7.51 | | | | 1,000.00 | | | | 1,396.04 | | | | 8.67 | | | | 1,000.00 | | | | — | | | | — | |
Hypothetical 5% return | | | 1,000.00 | | | | 1,018.15 | + | | | 6.71 | | | | 1,000.00 | | | | 1,017.55 | + | | | 7.30 | | | | 1,000.00 | | | | — | | | | — | |
| Investor | | | | | | | | | | | | | | | | | | | | | | | | | | | | | | | | | | | | |
Actual | | | 1,000.00 | | | | 1,262.62 | | | | 5.39 | | | | 1,000.00 | | | | 1,398.88 | | | | 6.30 | | | | 1,000.00 | | | | 1,345.01 | | | | 5.58 | |
Hypothetical 5% return | | | 1,000.00 | | | | 1,020.03 | + | | | 4.81 | | | | 1,000.00 | | | | 1,019.54 | + | | | 5.31 | | | | 1,000.00 | | | | 1,020.03 | + | | | 4.81 | |
| Class R6 | | | | | | | | | | | | | | | | | | | | | | | | | | | | | | | | | | | | |
Actual | | | 1,000.00 | | | | 1,263.64 | | | | 4.66 | | | | 1,000.00 | | | | 1,399.63 | | | | 5.65 | | | | 1,000.00 | | | | 1,346.30 | | | | 4.83 | |
Hypothetical 5% return | | | 1,000.00 | | | | 1,020.68 | + | | | 4.16 | | | | 1,000.00 | | | | 1,020.08 | + | | | 4.76 | | | | 1,000.00 | | | | 1,020.68 | + | | | 4.16 | |
| Class R | | | | | | | | | | | | | | | | | | | | | | | | | | | | | | | | | | | | |
Actual | | | 1,000.00 | | | | 1,259.68 | | | | 8.18 | | | | 1,000.00 | | | | 1,395.14 | | | | 9.26 | | | | 1,000.00 | | | | 1,342.06 | | | | 8.48 | |
Hypothetical 5% return | | | 1,000.00 | | | | 1,017.55 | + | | | 7.30 | | | | 1,000.00 | | | | 1,017.06 | + | | | 7.80 | | | | 1,000.00 | | | | 1,017.55 | + | | | 7.30 | |
| Class P | | | | | | | | | | | | | | | | | | | | | | | | | | | | | | | | | | | | |
Actual | | | 1,000.00 | | | | 1,263.31 | | | | 4.66 | | | | 1,000.00 | | | | 1,399.34 | | | | 5.65 | | | | 1,000.00 | | | | 1,345.43 | | | | 4.83 | |
Hypothetical 5% return | | | 1,000.00 | | | | 1,020.68 | + | | | 4.16 | | | | 1,000.00 | | | | 1,020.08 | + | | | 4.76 | | | | 1,000.00 | | | | 1,020.68 | + | | | 4.16 | |
| + | | Hypothetical expenses are based on each Fund’s actual annualized net expense ratios and an assumed rate of return of 5% per year before expenses. |
| * | | Expenses for each share class are calculated using each Fund’s annualized net expense ratio for each class, which represents the ongoing expenses as a percentage of net assets for the six months ended February 28, 2021. Expenses are calculated by multiplying the annualized net expense ratio by the average account value for the period; then multiplying the result by the number of days in the most recent fiscal half year; and then dividing that result by the number of days in the fiscal year. The annualized net expense ratios for the period were as follows: |
| | | | | | | | | | | | | | | | | | | | | | | | | | | | | | | | |
| Fund | | Class A
Shares | | | Class C
Shares | | | Institutional
Shares | | | Service
Shares | | | Investor
Shares | | | Class R6
Shares | | | Class R
Shares | | | Class P
Shares | |
Mid Cap Value Fund | | | 1.21 | % | | | 1.96 | % | | | 0.84 | % | | | 1.34 | % | | | 0.96 | % | | | 0.83 | % | | | 1.46 | % | | | 0.83 | % |
Small Cap Value Fund | | | 1.31 | | | | 2.06 | | | | 0.96 | | | | 1.46 | | | | 1.06 | | | | 0.95 | | | | 1.56 | | | | 0.95 | |
Small/Mid Cap Value Fund | | | 1.21 | | | | 1.96 | | | | 0.84 | | | | N/A | | | | 0.96 | | | | 0.83 | | | | 1.46 | | | | 0.83 | |
103
FUNDS PROFILE
Goldman Sachs Funds
Goldman Sachs is a premier financial services firm, known since 1869 for creating thoughtful and customized investment solutions in complex global markets.
Today, the Asset Management Division of Goldman Sachs serves a diverse set of clients worldwide, including private institutions, public entities and individuals. With approximately $1.95 trillion in assets under supervision as of December 31, 2020, Goldman Sachs Asset Management (“GSAM”) has portfolio management teams located around the world and our investment professionals bring firsthand knowledge of local markets to every investment decision. Assets under supervision includes assets under management and other client assets for which Goldman Sachs does not have full discretion. GSAM leverages the resources of Goldman Sachs & Co. LLC subject to legal, internal and regulatory restrictions.
Money Market
Financial Square FundsSM
| ∎ | | Financial Square Treasury Solutions Fund1 |
| ∎ | | Financial Square Government Fund1 |
| ∎ | | Financial Square Money Market Fund2 |
| ∎ | | Financial Square Prime Obligations Fund2 |
| ∎ | | Financial Square Treasury Instruments Fund1 |
| ∎ | | Financial Square Treasury Obligations Fund1 |
| ∎ | | Financial Square Federal Instruments Fund1 |
Investor FundsSM
| ∎ | | Investor Money Market Fund3 |
| ∎ | | Investor Tax-Exempt Money Market Fund3 |
Fixed Income
Short Duration and Government
| ∎ | | High Quality Floating Rate Fund |
| ∎ | | Short-Term Conservative Income Fund |
| ∎ | | Short Duration Government Fund |
| ∎ | | Short Duration Income Fund |
| ∎ | | Inflation Protected Securities Fund |
Multi-Sector
| ∎ | | Global Core Fixed Income Fund4 |
Municipal and Tax-Free
| ∎ | | High Yield Municipal Fund |
| ∎ | | Dynamic Municipal Income Fund |
| ∎ | | Short Duration Tax-Free Fund |
| ∎ | | Municipal Income Completion Fund |
Single Sector
| ∎ | | Investment Grade Credit Fund |
| ∎ | | High Yield Floating Rate Fund |
| ∎ | | Emerging Markets Debt Fund |
| ∎ | | Local Emerging Markets Debt Fund |
Fixed Income Alternatives
| ∎ | | Long Short Credit Strategies Fund |
Fundamental Equity
| ∎ | | Small/Mid Cap Value Fund |
| ∎ | | Small/Mid Cap Growth Fund |
| ∎ | | Concentrated Growth Fund |
| ∎ | | Technology Opportunities Fund |
| ∎ | | Growth Opportunities Fund |
| ∎ | | Rising Dividend Growth Fund |
Tax-Advantaged Equity
| ∎ | | U.S. Tax-Managed Equity Fund |
| ∎ | | International Tax-Managed Equity Fund |
| ∎ | | U.S. Equity Dividend and Premium Fund |
| ∎ | | International Equity Dividend and Premium Fund |
Equity Insights
| ∎ | | Small Cap Equity Insights Fund |
| ∎ | | U.S. Equity Insights Fund |
| ∎ | | Small Cap Growth Insights Fund |
| ∎ | | Large Cap Growth Insights Fund |
| ∎ | | Large Cap Value Insights Fund |
| ∎ | | Small Cap Value Insights Fund |
| ∎ | | International Small Cap Insights Fund |
| ∎ | | International Equity Insights Fund |
| ∎ | | Emerging Markets Equity Insights Fund |
Fundamental Equity International
| ∎ | | International Equity Income Fund |
| ∎ | | International Equity ESG Fund |
| ∎ | | Emerging Markets Equity Fund |
| ∎ | | ESG Emerging Markets Equity Fund |
Alternative
| ∎ | | Clean Energy Income Fund |
| ∎ | | Real Estate Securities Fund |
| ∎ | | International Real Estate Securities Fund |
| ∎ | | Commodity Strategy Fund |
| ∎ | | Global Real Estate Securities Fund |
| ∎ | | Alternative Premia Fund |
| ∎ | | Absolute Return Tracker Fund |
| ∎ | | Managed Futures Strategy Fund |
| ∎ | | MLP Energy Infrastructure Fund |
| ∎ | | Energy Infrastructure Fund6 |
| ∎ | | Multi-Manager Alternatives Fund |
| ∎ | | Global Infrastructure Fund |
Total Portfolio Solutions
| ∎ | | Global Managed Beta Fund |
| ∎ | | Multi-Manager Non-Core Fixed Income Fund |
| ∎ | | Multi-Manager Global Equity Fund |
| ∎ | | Multi-Manager International Equity Fund |
| ∎ | | Tactical Tilt Overlay Fund |
| ∎ | | Balanced Strategy Portfolio |
| ∎ | | Multi-Manager U.S. Small Cap Equity Fund |
| ∎ | | Multi-Manager Real Assets Strategy Fund |
| ∎ | | Growth and Income Strategy Portfolio |
| ∎ | | Growth Strategy Portfolio |
| ∎ | | Dynamic Global Equity Fund |
| ∎ | | Satellite Strategies Portfolio |
| ∎ | | Enhanced Dividend Global Equity Portfolio |
| ∎ | | Tax-Advantaged Global Equity Portfolio |
| ∎ | | Strategic Factor Allocation Fund |
| ∎ | | Strategic Volatility Premium Fund |
| ∎ | | Target Date Retirement Portfolio |
| ∎ | | Target Date 2025 Portfolio |
| ∎ | | Target Date 2030 Portfolio |
| ∎ | | Target Date 2035 Portfolio |
| ∎ | | Target Date 2040 Portfolio |
| ∎ | | Target Date 2045 Portfolio |
| ∎ | | Target Date 2050 Portfolio |
| ∎ | | Target Date 2055 Portfolio |
| ∎ | | Target Date 2060 Portfolio |
| ∎ | | GQG Partners International Opportunities Fund |
| 1 | | You could lose money by investing in the Fund. Although the Fund seeks to preserve the value of your investment at $1.00 per share, it cannot guarantee it will do so. An investment in the Fund is not a deposit of a bank and is not insured or guaranteed by the Federal Deposit Insurance Corporation or any other government agency. The Fund’s sponsor has no legal obligation to provide financial support to the Fund, and you should not expect that the sponsor will provide financial support to the Fund at any time. |
| 2 | | You could lose money by investing in the Fund. Because the share price of the Fund will fluctuate, when you sell your shares they may be worth more or less than what you originally paid for them. The Fund may impose a fee upon sale of your shares or may temporarily suspend your ability to sell shares if the Fund’s liquidity falls below required minimums because of market conditions or other factors. An investment in the Fund is not a deposit of a bank and is not insured or guaranteed by the Federal Deposit Insurance Corporation or any other government agency. The Fund’s sponsor has no legal obligation to provide financial support to the Fund, and you should not expect that the sponsor will provide financial support to the Fund at any time. |
| 3 | | You could lose money by investing in the Fund. Although the Fund seeks to preserve the value of your investment at $1.00 per share, it cannot guarantee it will do so. The Fund may impose a fee upon sale of your shares or may temporarily suspend your ability to sell shares if the Fund’s liquidity falls below required minimums because of market conditions or other factors. An investment in the Fund is not a deposit of a bank and is not insured or guaranteed by the Federal Deposit Insurance Corporation or any other government agency. The Fund’s sponsor has no legal obligation to provide financial support to the Fund, and you should not expect that the sponsor will provide financial support to the Fund at any time. |
| 4 | | Effective after the close of business on April 30, 2020, the Goldman Sachs Global Income Fund was renamed the Goldman Sachs Global Core Fixed Income Fund. |
| 5 | | Effective after the close on business of August 30, 2020, the Goldman Sachs Blue Chip Fund was renamed the Goldman Sachs U.S. Equity ESG Fund. |
| 6 | | Effective after the close of business on June 26, 2020, the Goldman Sachs MLP & Energy Fund was renamed the Goldman Sachs Energy Infrastructure Fund. |
| | | Financial Square FundsSM and Investor FundsSM are registered service marks of Goldman Sachs & Co. LLC. |
| * | | This list covers open-end funds only. Please visit our website at www.GSAMFUNDS.com to learn about our closed-end funds and exchange-traded funds. |
| | |
TRUSTEES Jessica Palmer, Chair Dwight L. Bush Kathryn A. Cassidy Diana M. Daniels Joaquin Delgado James A. McNamara Roy W. Templin Gregory G. Weaver | | OFFICERS James A. McNamara, President Joseph F. DiMaria, Principal Financial Officer, Principal Accounting Officer and Treasurer Caroline L. Kraus, Secretary |
| |
GOLDMAN SACHS & CO. LLC Distributor and Transfer Agent | | GOLDMAN SACHS ASSET MANAGEMENT, L.P. Investment Adviser |
Visit our web site at www.GSAMFUNDS.com to obtain the most recent month-end returns.
Goldman Sachs Asset Management, L .P. 200 West Street, New York, New York 10282
The reports concerning the Funds included in this shareholder report may contain certain forward-looking statements about the factors that may affect the performance of the Funds in the future. These statements are based on Fund management’s predictions and expectations concerning certain future events and their expected impact on the Funds, such as performance of the economy as a whole and of specific industry sectors, changes in the levels of interest rates, the impact of developing world events, and other factors that may influence the future performance of the Funds. Management believes these forward-looking statements to be reasonable, although they are inherently uncertain and difficult to predict. Actual events may cause adjustments in portfolio management strategies from those currently expected to be employed.
A description of the policies and procedures that the Funds use to determine how to vote proxies relating to portfolio securities and information regarding how a Fund voted proxies relating to portfolio securities during the most recent 12-month period ended June 30 is available (i) without charge, upon request by calling 1-800-526-7384 (for Retail Shareholders) or 1-800-621-2550 (for Institutional Shareholders); and (ii) on the Securities and Exchange Commission (“SEC”) web site at http://www.sec.gov.
The Funds will file portfolio holdings information for each month in a fiscal quarter within 60 days after the end of the relevant fiscal quarter on Form N-PORT. Portfolio holdings information for the third month of each fiscal quarter will be made available on the SEC’s web site at http://www.sec.gov. Portfolio holdings information may be obtained upon request and without charge by calling 1-800-526-7384 (for Retail Shareholders) or 1-800-621-2550 (for Institutional Shareholders).
Goldman Sachs & Co. LLC (‘‘Goldman Sachs’’) does not provide legal, tax or accounting advice. Any statement contained in this communication (including any attachments) concerning U.S. tax matters was not intended or written to be used, and cannot be used, for the purpose of avoiding penalties under the Internal Revenue Code, and was written to support the promotion or marketing of the transaction(s) or matter(s) addressed. Clients of Goldman Sachs should obtain their own independent tax advice based on their particular circumstances.
Fund holdings and allocations shown are as of February 28, 2021 and may not be representative of future investments. Fund holdings should not be relied on in making investment decisions and should not be construed as research or investment advice regarding particular securities. Current and future holdings are subject to risk.
The Global Industry Classification Standard (GICS) was developed by and is the exclusive property and a service mark of Morgan Stanley Capital International Inc. (MSCI) and Standard & Poor’s, a division of The McGraw-Hill Companies, Inc. (S&P) and is licensed for use by Goldman Sachs. Neither MSCI, S&P nor any other party involved in making or compiling the GICS or any GICS classifications makes any express or implied warranties or representations with respect to such standard or classification (or the results to be obtained by the use thereof), and all such parties hereby expressly disclaim all warranties of originality, accuracy, completeness, merchantability or fitness for a particular purpose with respect to any of such standard or classification. Without limiting any of the foregoing, in no event shall MSCI, S&P, any of their affiliates or any third party involved in making or compiling the GICS or any GICS classifications have any liability for any direct, indirect, special, punitive, consequential or any other damages (including lost profits) even if notified of the possibility of such damages.
The portfolio risk management process includes an effort to monitor and manage risk, but does not imply low risk.
This material is not authorized for distribution to prospective investors unless preceded or accompanied by a current Prospectus or summary prospectus, if applicable. Investors should consider a Fund’s objective, risks, and charges and expenses, and read the summary prospectus, if available, and/or the Prospectus carefully before investing or sending money. The summary prospectus, if available, and the Prospectus contain this and other information about a Fund and may be obtained from your Authorized Institution or from Goldman Sachs & Co. LLC by calling (retail – 1-800-526-7384) (institutional – 1-800-621-2550).
© 2021 Goldman Sachs. All rights reserved. 236969-OTU-1390648 EQVALSAR-21
Goldman Sachs Funds

| | | | |
| | |
| Semi-Annual Report | | | | February 28, 2021 |
| | |
| | | | Global Tax-Aware Equity Portfolios |
| | | | Enhanced Dividend Global Equity Portfolio |
| | | | Tax-Advantaged Global Equity Portfolio |

Goldman Sachs Global Tax-Aware Equity Portfolios
| ∎ | | ENHANCED DIVIDEND GLOBAL EQUITY PORTFOLIO |
| ∎ | | TAX-ADVANTAGED GLOBAL EQUITY PORTFOLIO |
| | | | |
| | | |
| NOT FDIC-INSURED | | May Lose Value | | No Bank Guarantee |
FUND BASICS
Enhanced Dividend Global Equity Portfolio
as of February 28, 2021
| | | | | | | | | | | | | | | | | | |
| | PERFORMANCE REVIEW | |
| | | | | |
| | | September 1, 2020–February 28, 2021 | | Portfolio
Total Return
(based on NAV)1 | | | EDGE
Composite
Index2 | | | Bloomberg
Barclays U.S.
Aggregate Bond
Index3 | | | Morgan Stanley Capital
International (MSCI) All
Country World Index
(ACWI) Investable
Market Index (IMI)
(“MSCI ACWI IMI”)
(Net, USD, Unhedged)4 | |
| | Class A | | | 12.50 | % | | | 13.21 | % | | | -1.55 | % | | | 17.45 | % |
| | Institutional | | | 12.65 | | | | 13.21 | | | | -1.55 | | | | 17.45 | |
| | Class R6 | | | 12.60 | | | | 13.21 | | | | -1.55 | | | | 17.45 | |
| | | Class P | | | 12.61 | | | | 13.21 | | | | -1.55 | | | | 17.45 | |
| 1 | | The net asset value (“NAV”) represents the net assets of the class of the Portfolio (ex-dividend) divided by the total number of shares of the class outstanding. The Portfolio’s performance reflects the reinvestment of dividends and other distributions. The Portfolio’s performance does not reflect the deduction of any applicable sales charges. |
| 2 | | The EDGE Composite Index (“EDGE Composite”) is a composite representation prepared by the investment adviser of the performance of the Portfolio’s asset classes weighted according to their respective weightings in the Portfolio’s target range. |
| | | The EDGE Composite is comprised of MSCI ACWI IMI (90%) and the Bloomberg Barclays U.S. Aggregate Bond Index (10%). The EDGE Composite figures do not reflect any deduction for fees, expenses or taxes. |
| 3 | | The Bloomberg Barclays U.S. Aggregate Bond Index represents an unmanaged diversified portfolio of fixed income securities, including U.S. Treasuries, investment grade corporate bonds and mortgage backed and asset-backed securities. |
| 4 | | The MSCI ACWI IMI captures large, mid and small cap representation across 23 developed markets and 27 emerging markets. With 8,939 constituents, the MSCI ACWI IMI is comprehensive, covering approximately 99% of the global equity investment opportunity set. As of February 28, 2021, the 23 developed markets in the MSCI ACWI IMI include Australia, Austria, Belgium, Canada, Denmark, Finland, France, Germany, Hong Kong, Ireland, Israel, Italy, Japan, Netherlands, New Zealand, Norway, Portugal, Singapore, Spain, Sweden, Switzerland, the U.K. and the U.S. The 27 emerging markets include Argentina, Brazil, Chile, China, Colombia, Czech Republic, Egypt, Greece, Hungary, India, Indonesia, South Korea, Kuwait, Malaysia, Mexico, Pakistan, Peru, Philippines, Poland, Russia, Qatar, Saudi Arabia, South Africa, Taiwan, Thailand, Turkey and United Arab Emirates. |
The returns set forth in the table above represent past performance. Past performance does not guarantee future results. The Portfolio’s investment return and principal value will fluctuate so that an investor’s shares, when redeemed, may be worth more or less than their original cost. Current performance may be lower or higher than the performance quoted above. Please visit our web site at www.GSAMFUNDS.com to obtain the most recent month-end returns. Performance reflects applicable fee waivers and/or expense limitations in effect during the periods shown. In their absence, performance would be reduced. Returns do not reflect the deduction of taxes that a shareholder would pay on Portfolio distributions or the redemption of Portfolio shares.
1
FUND BASICS
|
| OVERALL UNDERLYING FUND WEIGHTINGS1,2 |
|
| Percentage of Net Assets |
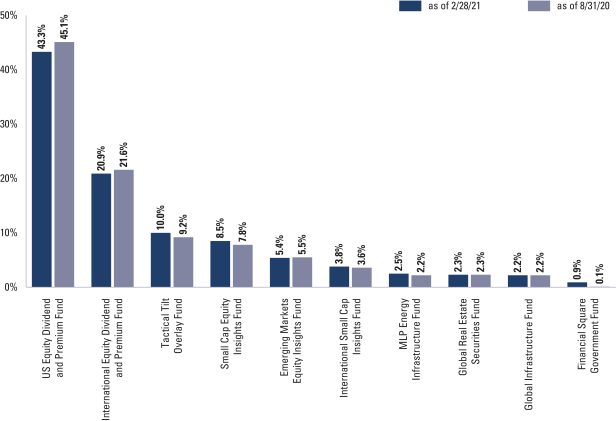
| 1 | | The Portfolio is actively managed and, as such, its composition may differ over time. The percentage shown for each Underlying Fund reflects the value of that Underlying Fund as a percentage of net assets of the Portfolio. Figures in the graph above may not sum to 100% due to rounding and/or exclusion of other assets and liabilities. The above graph depicts the Portfolio’s investments but may not represent the Portfolio’s market exposure due to the exclusion of certain derivatives, if any, as listed in the Additional Investment Information section of the Schedule of Investments. |
| 2 | | Represents affiliated funds. |
For more information about the Portfolio, please refer to www.GSAMFUNDS.com. There, you can learn more about the Portfolio’s investment strategies, holdings, and performance.
2
FUND BASICS
Tax-Advantaged Global Equity Portfolio
as of February 28, 2021
| | | | | | | | | | | | | | | | | | |
| | PERFORMANCE REVIEW | |
| | | | | |
| | | September 1, 2020–February 28, 2021 | | Portfolio
Total Return
(based on NAV)1 | | | TAG
Composite
Index2 | | | Bloomberg
Barclays U.S.
Aggregate
Bond Index3 | | | Morgan Stanley Capital
International (MSCI) All
Country World Index
(ACWI) Investable
Market Index (IMI)
(“MSCI ACWI IMI”)
(Net, USD, Unhedged)4 | |
| | Class A | | | 11.01 | % | | | 13.21 | % | | | -1.55 | % | | | 17.45 | % |
| | Institutional | | | 11.21 | | | | 13.21 | | | | -1.55 | | | | 17.45 | |
| | Class R6 | | | 11.29 | | | | 13.21 | | | | -1.55 | | | | 17.45 | |
| | | Class P | | | 11.27 | | | | 13.21 | | | | -1.55 | | | | 17.45 | |
| 1 | | The net asset value (“NAV”) represents the net assets of the class of the Portfolio (ex-dividend) divided by the total number of shares of the class outstanding. The Portfolio’s performance reflects the reinvestment of dividends and other distributions. The Portfolio’s performance does not reflect the deduction of any applicable sales charges. |
| 2 | | The TAG Composite Index (“TAG Composite”) is a composite representation prepared by the investment adviser of the performance of the Portfolio’s asset classes weighted according to their respective weightings in the Portfolio’s target range. |
| | | The TAG Composite is comprised of the MSCI ACWI IMI (90%) and the Bloomberg Barclays U.S. Aggregate Bond Index (10%). The TAG Composite figures do not reflect any deduction for fees, expenses or taxes. |
| 3 | | The Bloomberg Barclays U.S. Aggregate Bond Index represents an unmanaged diversified portfolio of fixed income securities, including U.S. Treasuries, investment grade corporate bonds and mortgage-backed and asset-backed securities. |
| 4 | | The MSCI ACWI IMI captures large, mid and small cap representation across 23 developed markets and 27 emerging markets. With 8,939 constituents, the MSCI ACWI IMI is comprehensive, covering approximately 99% of the global equity investment opportunity set. As of February 28, 2021, the 23 developed markets in the MSCI ACWI IMI include Australia, Austria, Belgium, Canada, Denmark, Finland, France, Germany, Hong Kong, Ireland, Israel, Italy, Japan, Netherlands, New Zealand, Norway, Portugal, Singapore, Spain, Sweden, Switzerland, the U.K. and the U.S. The 27 emerging markets include Argentina, Brazil, Chile, China, Colombia, Czech Republic, Egypt, Greece, Hungary, India, Indonesia, South Korea, Kuwait, Malaysia, Mexico, Pakistan, Peru, Philippines, Poland, Russia, Qatar, Saudi Arabia, South Africa, Taiwan, Thailand, Turkey and United Arab Emirates. |
The returns set forth in the table above represent past performance. Past performance does not guarantee future results. The Portfolio’s investment return and principal value will fluctuate so that an investor’s shares, when redeemed, may be worth more or less than their original cost. Current performance may be lower or higher than the performance quoted above. Please visit our web site at www.GSAMFUNDS.com to obtain the most recent month-end returns. Performance reflects applicable fee waivers and/or expense limitations in effect during the periods shown. In their absence, performance would be reduced. Returns do not reflect the deduction of taxes that a shareholder would pay on Portfolio distributions or the redemption of Portfolio shares.
3
FUND BASICS
|
| OVERALL UNDERLYING FUND WEIGHTINGS1,2 |
|
| Percentage of Net Assets |

| 1 | | The Portfolio is actively managed and, as such, its composition may differ over time. The percentage shown for each Underlying Fund reflects the value of that Underlying Fund as a percentage of net assets of the Portfolio. Figures in the graph above may not sum to 100% due to rounding and/or exclusion of other assets and liabilities. The above graph depicts the Portfolio’s investments but may not represent the Portfolio’s market exposure due to the exclusion of certain derivatives, if any, as listed in the Additional Investment Information section of the Schedule of Investments. |
| 2 | | Represents affiliated funds. |
For more information about the Portfolio, please refer to www.GSAMFUNDS.com. There, you can learn more about the Portfolio’s investment strategies, holdings, and performance.
4
GOLDMAN SACHS ENHANCED DIVIDEND GLOBAL EQUITY PORTFOLIO
Schedule of Investments
February 28, 2021 (Unaudited)
| | | | | | | | |
| Shares | | | Description | |
Value | |
|
| Underlying Funds (Class R6 Shares)(a) – 98.9% | |
| Equity – 98.9% | |
| | 13,465,719 | | | Goldman Sachs US Equity Dividend and Premium Fund | | $ | 194,175,667 | |
| | 13,281,460 | | | Goldman Sachs International Equity Dividend and Premium Fund | | | 93,899,924 | |
| | 4,494,303 | | | Goldman Sachs Tactical Tilt Overlay Fund | | | 44,853,145 | |
| | 1,158,685 | | | Goldman Sachs Small Cap Equity Insights Fund | | | 38,109,148 | |
| | 1,969,191 | | | Goldman Sachs Emerging Markets Equity Insights Fund | | | 24,417,966 | |
| | 1,308,073 | | | Goldman Sachs International Small Cap Insights Fund | | | 17,044,196 | |
| | 562,796 | | | Goldman Sachs MLP Energy Infrastructure Fund | | | 11,362,852 | |
| | 994,223 | | | Goldman Sachs Global Real Estate Securities Fund | | | 10,389,633 | |
| | 865,371 | | | Goldman Sachs Global Infrastructure Fund | | | 9,917,147 | |
| | |
| | TOTAL UNDERLYING FUNDS (CLASS R6 SHARES) | |
| | (Cost $311,223,636) | | $ | 444,169,678 | |
| | |
| Shares | | | Dividend
Rate | | Value | |
|
| Investment Company(a) – 0.9% | |
| Goldman Sachs Financial Square Government Fund –
Institutional Shares |
|
| | 4,023,421 | | | 0.036% | | $ | 4,023,421 | |
| | (Cost $4,023,421) | |
| | |
| | TOTAL INVESTMENTS – 99.8% | |
| | (Cost $315,247,057) | | $ | 448,193,099 | |
| | |
| OTHER ASSETS IN EXCESS OF
LIABILITIES – 0.2% | | | 1,013,360 | |
| | |
| | NET ASSETS – 100.0% | | $ | 449,206,459 | |
| | |
| | |
|
| The percentage shown for each investment and investment category reflects the value of the respective investment or category as a percentage of net assets. |
| |
(a) | | Represents an Affiliated Issuer. |
| | |
|
Currency Abbreviations: |
AUD | | —Australian Dollar |
CHF | | —Swiss Franc |
EUR | | —Euro |
GBP | | —British Pound |
JPY | | —Japanese Yen |
USD | | —United States Dollar |
|
|
| ADDITIONAL INVESTMENT INFORMATION |
FORWARD FOREIGN CURRENCY EXCHANGE CONTRACTS — At February 28, 2021, the Portfolio had the following forward foreign currency exchange contracts:
FORWARD FOREIGN CURRENCY EXCHANGE CONTRACTS WITH UNREALIZED GAIN
| | | | | | | | | | | | | | | | | | | | | | | | |
| Counterparty | | Currency
Purchased | | | Currency
Sold | | | Settlement
Date | | | Unrealized
Gain | |
Morgan Stanley Co., Inc. | | | USD | | | | 6,133,072 | | | | CHF | | | | 5,480,844 | | | | 03/17/2021 | | | $ | 105,039 | |
| | | USD | | | | 19,226,280 | | | | EUR | | | | 15,864,225 | | | | 03/17/2021 | | | | 77,919 | |
| | | | USD | | | | 15,006,876 | | | | JPY | | | | 1,566,272,100 | | | | 03/17/2021 | | | | 310,732 | |
| | | | | | |
| TOTAL | | | | | | | | | | | | | | | | | | | | | | $ | 493,690 | |
FORWARD FOREIGN CURRENCY EXCHANGE CONTRACTS WITH UNREALIZED LOSS
| | | | | | | | | | | | | | | | | | | | | | | | |
| Counterparty | | Currency
Purchased | | | Currency
Sold | | | Settlement
Date | | | Unrealized
Loss | |
Morgan Stanley Co., Inc. | | | CHF | | | | 370,000 | | | | USD | | | | 418,896 | | | | 03/17/2021 | | | $ | (11,956 | ) |
| | | USD | | | | 3,997,242 | | | | AUD | | | | 5,409,962 | | | | 03/17/2021 | | | | (165,730 | ) |
| | | | USD | | | | 8,370,109 | | | | GBP | | | | 6,259,415 | | | | 03/17/2021 | | | | (351,347 | ) |
| | | | | | |
| TOTAL | | | | | | | | | | | | | | | | | | | | | | $ | (529,033 | ) |
| | |
| The accompanying notes are an integral part of these financial statements. | | 5 |
GOLDMAN SACHS ENHANCED DIVIDEND GLOBAL EQUITY PORTFOLIO
Schedule of Investments (continued)
February 28, 2021 (Unaudited)
|
| ADDITIONAL INVESTMENT INFORMATION (continued) |
FUTURES CONTRACTS — At February 28, 2021, the Portfolio had the following futures contracts:
| | | | | | | | | | | | | | | | |
| Description | | Number of
Contracts | | | Expiration Date | | | Notional
Amount | | | Unrealized
Appreciation/
(Depreciation) | |
Long position contracts: | | | | | | | | | | | | | | | | |
S&P 500 E-Mini Index | | | 26 | | | | 03/19/2021 | | | $ | 4,951,960 | | | $ | 219,717 | |
| | |
| 6 | | The accompanying notes are an integral part of these financial statements. |
GOLDMAN SACHS TAX-ADVANTAGED GLOBAL EQUITY PORTFOLIO
Schedule of Investments
February 28, 2021 (Unaudited)
| | | | | | | | |
| Shares | | | Description | |
Value | |
|
| Underlying Funds (Class R6 Shares)(a) – 98.7% | |
| Equity – 98.7% | |
| | 51,651,031 | | | Goldman Sachs US Tax-Managed Equity Fund | | $ | 1,603,764,521 | |
| | 57,859,843 | | | Goldman Sachs International Tax-Managed Equity Fund | | | 652,080,431 | |
| | 31,265,724 | | | Goldman Sachs Tactical Tilt Overlay Fund | | | 312,031,929 | |
| | 13,588,131 | | | Goldman Sachs Emerging Markets Equity Insights Fund | | | 168,492,823 | |
| | 9,057,009 | | | Goldman Sachs International Small Cap Insights Fund | | | 118,012,824 | |
| | 3,883,058 | | | Goldman Sachs MLP Energy Infrastructure Fund | | | 78,398,932 | |
| | 6,828,086 | | | Goldman Sachs Global Real Estate Securities Fund | | | 71,353,503 | |
| | 6,019,553 | | | Goldman Sachs Global Infrastructure Fund | | | 68,984,072 | |
| | |
| | TOTAL UNDERLYING FUNDS (CLASS R6 SHARES) | |
| | (Cost $1,851,639,099) | | $ | 3,073,119,035 | |
| | |
| Shares | | | Dividend
Rate | | Value | |
|
| Investment Company(a) – 1.0% | |
| Goldman Sachs Financial Square Government Fund –
Institutional Shares |
|
| | 31,930,365 | | | 0.036% | | $ | 31,930,365 | |
| | (Cost $31,930,365) | |
| | |
| | TOTAL INVESTMENTS – 99.7% | |
| | (Cost $1,883,569,464) | | $ | 3,105,049,400 | |
| | |
| OTHER ASSETS IN EXCESS OF
LIABILITIES – 0.3% | | | 8,007,092 | |
| | |
| | NET ASSETS – 100.0% | | $ | 3,113,056,492 | |
| | |
| | |
|
| The percentage shown for each investment and investment category reflects the value of the respective investment or category as a percentage of net assets. |
| |
(a) | | Represents an Affiliated Issuer. |
| | |
|
Currency Abbreviations: |
AUD | | —Australian Dollar |
CHF | | —Swiss Franc |
EUR | | —Euro |
GBP | | —British Pound |
JPY | | —Japanese Yen |
USD | | —United States Dollar |
|
|
| ADDITIONAL INVESTMENT INFORMATION |
FORWARD FOREIGN CURRENCY EXCHANGE CONTRACTS — At February 28, 2021, the Portfolio had the following forward foreign currency exchange contracts:
FORWARD FOREIGN CURRENCY EXCHANGE CONTRACTS WITH UNREALIZED GAIN
| | | | | | | | | | | | | | | | | | | | | | | | |
| Counterparty | | Currency
Purchased | | | Currency
Sold | | | Settlement
Date | | | Unrealized
Gain | |
Morgan Stanley Co., Inc. | | | USD | | | | 2,930,569 | | | | AUD | | | | 3,800,000 | | | | 03/17/2021 | | | $ | 6,464 | |
| | | USD | | | | 35,061,650 | | | | CHF | | | | 31,332,984 | | | | 03/17/2021 | | | | 600,487 | |
| | | USD | | | | 119,951,770 | | | | EUR | | | | 98,923,958 | | | | 03/17/2021 | | | | 549,047 | |
| | | | USD | | | | 93,988,790 | | | | JPY | | | | 9,803,154,282 | | | | 03/17/2021 | | | | 2,006,970 | |
| | | | | | |
| TOTAL | | | | | | | | | | | | | | | | | | | | | | $ | 3,162,968 | |
FORWARD FOREIGN CURRENCY EXCHANGE CONTRACTS WITH UNREALIZED LOSS
| | | | | | | | | | | | | | | | | | | | | | | | |
| Counterparty | | Currency
Purchased | | | Currency
Sold | | | Settlement
Date | | | Unrealized
Loss | |
Morgan Stanley Co., Inc. | | | USD | | | | 22,886,238 | | | | AUD | | | | 30,974,774 | | | | 03/17/2021 | | | $ | (948,891 | ) |
| | | | USD | | | | 52,285,751 | | | | GBP | | | | 39,051,169 | | | | 03/17/2021 | | | | (2,125,567 | ) |
| | | | | | |
| TOTAL | | | | | | | | | | | | | | | | | | | | | | $ | (3,074,458 | ) |
| | |
| The accompanying notes are an integral part of these financial statements. | | 7 |
GOLDMAN SACHS TAX-ADVANTAGED GLOBAL EQUITY PORTFOLIO
Schedule of Investments (continued)
February 28, 2021 (Unaudited)
|
| ADDITIONAL INVESTMENT INFORMATION (continued) |
FUTURES CONTRACTS — At February 28, 2021, the Portfolio had the following futures contracts:
| | | | | | | | | | | | | | | | |
| Description | | Number of
Contracts | | | Expiration Date | | | Notional
Amount | | | Unrealized
Appreciation/
(Depreciation) | |
Long position contracts: | | | | | | | | | | | | | | | | |
S&P 500 E-Mini Index | | | 166 | | | | 03/19/2021 | | | $ | 31,616,360 | | | $ | 1,402,808 | |
| | |
| 8 | | The accompanying notes are an integral part of these financial statements. |
GOLDMAN SACHS GLOBAL TAX-AWARE EQUITY PORTFOLIOS
Statements of Assets and Liabilities
February 28, 2021 (Unaudited)
| | | | | | | | | | |
| | | | | Enhanced Dividend
Global Equity
Portfolio | | | Tax-Advantaged
Global Equity
Portfolio | |
| | Assets: | |
| | Investments in affiliated Underlying Funds, at value (cost $315,247,057 and $1,883,569,464) | | $ | 448,193,099 | | | $ | 3,105,049,400 | |
| | Cash | | | 558,008 | | | | 3,209,356 | |
| | Foreign currencies, at value (cost $0 and $128,355) | | | — | | | | 136,425 | |
| | Receivables: | | | | | | | | |
| | Collateral on certain derivative contracts(a) | | | 824,600 | | | | 5,008,600 | |
| | Portfolio shares sold | | | 228,554 | | | | 3,910,731 | |
| | Reimbursement from investment adviser | | | 20,945 | | | | 15,705 | |
| | Dividends | | | 62 | | | | 643 | |
| | Unrealized gain on forward foreign currency exchange contracts | | | 493,690 | | | | 3,162,968 | |
| | Other assets | | | 25,782 | | | | 51,985 | |
| | Total assets | | | 450,344,740 | | | | 3,120,545,813 | |
| | | | | | | | | | |
| | Liabilities: | | | | | | | | |
| | Unrealized loss on forward foreign currency exchange contracts | | | 529,033 | | | | 3,074,458 | |
| | Variation margin on futures | | | 24,436 | | | | 156,037 | |
| | Payables: | | | | | | | | |
| | Portfolio shares redeemed | | | 367,425 | | | | 964,206 | |
| | Management fees | | | 28,234 | | | | 193,506 | |
| | Investments purchased | | | 21,258 | | | | 2,779,602 | |
| | Distribution and Service fees and Transfer Agency fees | | | 11,850 | | | | 72,952 | |
| | Accrued expenses | | | 156,045 | | | | 248,560 | |
| | Total liabilities | | | 1,138,281 | | | | 7,489,321 | |
| | | | | | | | | | |
| | Net Assets: | | | | | | | | |
| | Paid-in capital | | | 324,845,668 | | | | 1,987,683,905 | |
| | Total distributable earnings (loss) | | | 124,360,791 | | | | 1,125,372,587 | |
| | | NET ASSETS | | $ | 449,206,459 | | | $ | 3,113,056,492 | |
| | | Net Assets: | | | | | | | | |
| | | Class A | | $ | 3,900,468 | | | $ | 522,211 | |
| | | Institutional | | | 12,849,076 | | | | 29,847,201 | |
| | | Class R6 | | | 12,303 | | | | 8,913,986 | |
| | | Class P | | | 432,444,612 | | | | 3,073,773,094 | |
| | | Total Net Assets | | $ | 449,206,459 | | | $ | 3,113,056,492 | |
| | | Shares outstanding $0.001 par value (unlimited shares authorized): | | | | | | | | |
| | | Class A | | | 298,233 | | | | 27,647 | |
| | | Institutional | | | 971,291 | | | | 1,569,033 | |
| | | Class R6 | | | 932 | | | | 474,989 | |
| | | Class P | | | 32,774,841 | | | | 163,758,751 | |
| | | Net asset value, offering and redemption price per share:(b) | | | | | | | | |
| | | Class A | | | $13.08 | | | | $18.89 | |
| | | Institutional | | | 13.23 | | | | 19.02 | |
| | | Class R6 | | | 13.20 | | | | 18.77 | |
| | | Class P | | | 13.19 | | | | 18.77 | |
| | (a) | | Segregated for initial margin and/or collateral on transactions as follows: |
| | | | | | | | |
| Portfolio | | Forwards | | | Futures | |
Enhanced Dividend Global Equity | | $ | 500,000 | | | $ | 324,600 | |
| | |
Tax-Advantaged Global Equity | | | 2,990,000 | | | | 2,018,600 | |
| | (b) | | Maximum public offering price per share for Class A Shares of the Enhanced Dividend Global Equity and Tax-Advantaged Global Equity Portfolios is $13.84 and $19.99, respectively. |
| | |
| The accompanying notes are an integral part of these financial statements. | | 9 |
GOLDMAN SACHS GLOBAL TAX-AWARE EQUITY PORTFOLIOS
Statements of Operations
For the Six Months Ended February 28, 2021 (Unaudited)
| | | | | | | | | | |
| | | | | Enhanced Dividend
Global Equity
Portfolio | | | Tax-Advantaged
Global Equity
Portfolio | |
| | Investment income: | |
| | | |
| | Dividends from affiliated Underlying Funds | | $ | 6,465,863 | | | $ | 38,079,060 | |
| | | | | | | | | | |
| | Expenses: | | | | | | | | |
| | | |
| | Management fees | | | 345,626 | | | | 2,136,562 | |
| | | |
| | Transfer Agency fees(a) | | | 72,593 | | | | 429,135 | |
| | | |
| | Professional fees | | | 54,852 | | | | 54,852 | |
| | | |
| | Custody, accounting and administrative services | | | 46,745 | | | | 154,611 | |
| | | |
| | Registration fees | | | 30,349 | | | | 40,224 | |
| | | |
| | Printing and mailing costs | | | 18,279 | | | | 30,953 | |
| | | |
| | Trustee fees | | | 9,809 | | | | 11,541 | |
| | | |
| | Distribution and Service (12b-1) fees | | | 5,162 | | | | 609 | |
| | | |
| | Other | | | 10,537 | | | | 26,329 | |
| | | |
| | Total expenses | | | 593,952 | | | | 2,884,816 | |
| | | |
| | Less — expense reductions | | | (298,904 | ) | | | (1,111,874 | ) |
| | | |
| | Net expenses | | | 295,048 | | | | 1,772,942 | |
| | | |
| | NET INVESTMENT INCOME | | | 6,170,815 | | | | 36,306,118 | |
| | | | | | | | | | |
| | Realized and unrealized gain (loss): | | | | | | | | |
| | | |
| | Net realized gain (loss) from: | | | | | | | | |
| | | |
| | Investments in affiliated Underlying Funds | | | 10,613,927 | | | | 12,215,826 | |
| | | |
| | Investments — unaffiliated issuers | | | — | | | | (58,624 | ) |
| | | |
| | Futures contracts | | | 892,980 | | | | 5,251,842 | |
| | | |
| | Forward foreign currency exchange contracts | | | (2,888,131 | ) | | | (16,656,278 | ) |
| | | |
| | Foreign currency transactions | | | — | | | | 593 | |
| | | |
| | Capital gain distributions from affiliated Underlying Funds | | | 10,816,766 | | | | 149,649 | |
| | | |
| | Net change in unrealized gain (loss) on: | | | | | | | | |
| | | |
| | Investments in affiliated Underlying Funds | | | 28,558,224 | | | | 258,095,349 | |
| | | |
| | Futures contracts | | | (469,124 | ) | | | (2,540,215 | ) |
| | | |
| | Forward foreign currency exchange contracts | | | 2,506,736 | | | | 14,613,626 | |
| | | |
| | Foreign currency translation | | | — | | | | (1,238 | ) |
| | | |
| | Net realized and unrealized gain | | | 50,031,378 | | | | 271,070,530 | |
| | | |
| | NET INCREASE IN NET ASSETS RESULTING FROM OPERATIONS | | $ | 56,202,193 | | | $ | 307,376,648 | |
| | (a) | | Class specific Transfer Agency fees were as follows: |
| | | | | | | | | | | | | | | | |
| | | Transfer Agency Fees | |
Portfolio | | Class A | | | Institutional | | | Class R6 | | | Class P | |
Enhanced Dividend Global Equity | | $ | 3,303 | | | $ | 3,134 | | | $ | 2 | | | $ | 66,154 | |
Tax-Advantaged Global Equity | | | 390 | | | | 6,013 | | | | 985 | | | | 421,747 | |
| | |
| 10 | | The accompanying notes are an integral part of these financial statements. |
GOLDMAN SACHS GLOBAL TAX-AWARE EQUITY PORTFOLIOS
Statements of Changes in Net Assets
| | | | | | | | | | | | | | | | | | | | | | |
| | | | | Enhanced Dividend Global Equity Portfolio | | | | | | Tax-Advantaged Global Equity Portfolio | |
| | | | | For the
Six Months Ended
February 28, 2021
(Unaudited) | | | For the Fiscal
Year Ended
August 31, 2020 | | | | | | For the
Six Months Ended
February 28, 2021
(Unaudited) | | | For the Fiscal
Year Ended
August 31, 2020 | |
| | From operations: | | | | | | | | | | | | | |
| | | | | | |
| | Net investment income | | $ | 6,170,815 | | | $ | 10,251,549 | | | | | | | $ | 36,306,118 | | | $ | 35,565,081 | |
| | | | | | |
| | Net realized gain (loss) | | | 19,435,542 | | | | 1,167,191 | | | | | | | | 903,008 | | | | (26,849,863 | ) |
| | | | | | |
| | Net change in unrealized gain | | | 30,595,836 | | | | 5,865,666 | | | | | | | | 270,167,522 | | | | 278,676,219 | |
| | | | | | |
| | Net increase in net assets resulting from operations | | | 56,202,193 | | | | 17,284,406 | | | | | | | | 307,376,648 | | | | 287,391,437 | |
| | | | | | | | | | | | | | | | | | | | | | |
| | Distributions to shareholders: | | | | | | | | | | | | | |
| | | | | | |
| | From distributable earnings: | | | | | | | | | | | | | | | | | | | | |
| | | | | | |
| | Class A Shares | | | (45,537 | ) | | | (311,665 | ) | | | | | | | (4,264 | ) | | | (4,637 | ) |
| | | | | | |
| | Institutional Shares | | | (192,865 | ) | | | (1,087,162 | ) | | | | | | | (336,299 | ) | | | (648,419 | ) |
| | | | | | |
| | Class R6 Shares | | | (152 | ) | | | (476 | ) | | | | | | | (103,968 | ) | | | (158 | ) |
| | | | | | |
| | Class P Shares | | | (5,958,071 | ) | | | (25,246,149 | ) | | | | | | | (34,570,994 | ) | | | (42,914,283 | ) |
| | | | | | |
| | Return of capital | | | | | | | | | | | | | | | | | | | | |
| | | | | | |
| | Class A Shares | | | — | | | | (8,162 | ) | | | | | | | — | | | | — | |
| | | | | | |
| | Institutional Shares | | | — | | | | (26,731 | ) | | | | | | | — | | | | — | |
| | | | | | |
| | Class R6 Shares | | | — | | | | (12 | ) | | | | | | | — | | | | — | |
| | | | | | |
| | Class P Shares | | | — | | | | (613,732 | ) | | | | | | | — | | | | — | |
| | | | | | |
| | Total distributions to shareholders | | | (6,196,625 | ) | | | (27,294,089 | ) | | | | | | | (35,015,525 | ) | | | (43,567,497 | ) |
| | | | | | | | | | | | | | | | | | | | | | |
| | From share transactions: | | | | | | | | | | | | | |
| | | | | | |
| | Proceeds from sales of shares | | | 21,284,438 | | | | 26,713,852 | | | | | | | | 209,743,024 | | | | 307,373,807 | |
| | | | | | |
| | Reinvestment of distributions | | | 6,180,892 | | | | 26,879,858 | | | | | | | | 34,861,505 | | | | 43,449,706 | |
| | | | | | |
| | Cost of shares redeemed | | | (92,430,777 | ) | | | (187,103,975 | ) | | | | | | | (149,094,156 | ) | | | (636,876,111 | ) |
| | | | | | |
| | Net increase (decrease) in net assets resulting from share transactions | | | (64,965,447 | ) | | | (133,510,265 | ) | | | | | | | 95,510,373 | | | | (286,052,598 | ) |
| | | | | | |
| | TOTAL INCREASE (DECREASE) | | | (14,959,879 | ) | | | (143,519,948 | ) | | | | | | | 367,871,496 | | | | (42,228,658 | ) |
| | | | | | | | | | | | | | | | | | | | | | |
| | Net Assets: | | | | | | | | | | | | | |
| | | | | | |
| | Beginning of period | | | 464,166,338 | | | | 607,686,286 | | | | | | | | 2,745,184,996 | | | | 2,787,413,654 | |
| | | | | | |
| | End of period | | $ | 449,206,459 | | | $ | 464,166,338 | | | | | | | $ | 3,113,056,492 | | | $ | 2,745,184,996 | |
| | |
| The accompanying notes are an integral part of these financial statements. | | 11 |
GOLDMAN SACHS ENHANCED DIVIDEND GLOBAL EQUITY PORTFOLIO
Financial Highlights
Selected Data for a Share Outstanding Throughout Each Period
| | | | | | | | | | | | | | | | | | | | | | | | | | |
| | | | | Goldman Sachs Enhanced Dividend Global Equity Portfolio | |
| | | | | Class A Shares | |
| | | | | Six Months Ended
February 28, 2021
(Unaudited) | | | Year Ended August 31, | |
| | | | | 2020 | | | 2019 | | | 2018 | | | 2017 | | | 2016 | |
| | Per Share Data | | | | | | | | | | | | | | | | | | | | | | | | |
| | | | | | | |
| | Net asset value, beginning of period | | $ | 11.76 | | | $ | 11.50 | | | $ | 12.34 | | | $ | 11.70 | | | $ | 10.68 | | | $ | 10.69 | |
| | | | | | | |
| | Net investment income(a)(b) | | | 0.13 | | | | 0.17 | | | | 0.19 | | | | 0.15 | | | | 0.17 | | | | 0.11 | |
| | | | | | | |
| | Net realized and unrealized gain (loss) | | | 1.33 | | | | 0.59 | | | | (0.44 | ) | | | 0.88 | | | | 1.12 | | | | 0.52 | |
| | | | | | | |
| | Total from investment operations | | | 1.46 | | | | 0.76 | | | | (0.25 | ) | | | 1.03 | | | | 1.29 | | | | 0.63 | |
| | | | | | | |
| | Distributions to shareholders from net investment income | | | (0.14 | ) | | | (0.22 | ) | | | (0.27 | ) | | | (0.25 | ) | | | (0.20 | ) | | | (0.31 | ) |
| | | | | | | |
| | Distributions to shareholders from net realized gains | | | — | | | | (0.27 | ) | | | (0.32 | ) | | | (0.14 | ) | | | (0.07 | ) | | | (0.33 | ) |
| | | | | | | |
| | Distributions to shareholders from return of capital | | | — | | | | (0.01 | ) | | | — | | | | — | | | | — | | | | — | |
| | | | | | | |
| | Total distributions | | | (0.14 | ) | | | (0.50 | ) | | | (0.59 | ) | | | (0.39 | ) | | | (0.27 | ) | | | (0.64 | ) |
| | | | | | | |
| | Net asset value, end of period | | $ | 13.08 | | | $ | 11.76 | | | $ | 11.50 | | | $ | 12.34 | | | $ | 11.70 | | | $ | 10.68 | |
| | | | | | | |
| | Total return(c) | | | 12.50 | % | | | 6.71 | % | | | (1.78 | )% | | | 8.94 | % | | | 12.25 | % | | | 6.32 | % |
| | | | | | | |
| | Net assets, end of period (in 000s) | | $ | 3,900 | | | $ | 5,501 | | | $ | 8,661 | | | $ | 10,418 | | | $ | 9,289 | | | $ | 4,993 | |
| | | | | | | |
| | Ratio of net expenses to average net assets(d) | | | 0.50 | %(e) | | | 0.51 | % | | | 0.52 | % | | | 0.52 | % | | | 0.53 | % | | | 0.53 | % |
| | | | | | | |
| | Ratio of total expenses to average net assets(d) | | | 0.63 | %(e) | | | 0.64 | % | | | 0.65 | % | | | 0.62 | % | | | 0.63 | % | | | 0.64 | % |
| | | | | | | |
| | Ratio of net investment income to average net assets(b) | | | 2.16 | %(e) | | | 1.54 | % | | | 1.62 | % | | | 1.21 | % | | | 1.54 | % | | | 1.09 | % |
| | | | | | | |
| | Portfolio turnover rate(f) | | | 8 | % | | | 13 | % | | | 15 | % | | | 20 | % | | | 8 | % | | | 19 | % |
| | (a) | | Calculated based on the average shares outstanding methodology. |
| | (b) | | Recognition of net investment income by the Portfolio is affected by the timing of declaration of dividends by the Underlying Funds in which the Portfolio invests. |
| | (c) | | Assumes investment at the net asset value at the beginning of the period, reinvestment of all distributions, a complete redemption of the investment at the net asset value at the end of the period and no sales or redemption charges (if any). Total returns would be reduced if a sales or redemption charge was taken into account. Returns do not reflect the impact of taxes to shareholders relating to Portfolio distributions or the redemption of Portfolio shares. Total returns for periods less than one full year are not annualized. |
| | (d) | | Expense ratios exclude the expenses of the Underlying Funds in which the Portfolio invests. |
| | (f) | | The portfolio turnover rate is calculated in accordance with regulatory requirements, without regard to transactions involving short term investments and certain derivatives. If such transactions were included, the portfolio turnover rate may be higher. |
| | |
| 12 | | The accompanying notes are an integral part of these financial statements. |
GOLDMAN SACHS ENHANCED DIVIDEND GLOBAL EQUITY PORTFOLIO
Financial Highlights (continued)
Selected Data for a Share Outstanding Throughout Each Period
| | | | | | | | | | | | | | | | | | | | | | | | | | |
| | | | | Goldman Sachs Enhanced Dividend Global Equity Portfolio | |
| | | | | Institutional Shares | |
| | | | | Six Months Ended
February 28, 2021
(Unaudited) | | | Year Ended August 31, | |
| | | | | 2020 | | | 2019 | | | 2018 | | | 2017 | | | 2016 | |
| | Per Share Data | | | | | | | | | | | | | | | | | | | | | | | | |
| | | | | | | |
| | Net asset value, beginning of period | | $ | 11.90 | | | $ | 11.63 | | | $ | 12.48 | | | $ | 11.80 | | | $ | 10.76 | | | $ | 10.76 | |
| | | | | | | |
| | Net investment income(a)(b) | | | 0.15 | | | | 0.22 | | | | 0.23 | | | | 0.17 | | | | 0.22 | | | | 0.16 | |
| | | | | | | |
| | Net realized and unrealized gain (loss) | | | 1.34 | | | | 0.59 | | | | (0.44 | ) | | | 0.93 | | | | 1.12 | | | | 0.51 | |
| | | | | | | |
| | Total from investment operations | | | 1.49 | | | | 0.81 | | | | (0.21 | ) | | | 1.10 | | | | 1.34 | | | | 0.67 | |
| | | | | | | |
| | Distributions to shareholders from net investment income | | | (0.16 | ) | | | (0.26 | ) | | | (0.32 | ) | | | (0.28 | ) | | | (0.23 | ) | | | (0.34 | ) |
| | | | | | | |
| | Distributions to shareholders from net realized gains | | | — | | | | (0.27 | ) | | | (0.32 | ) | | | (0.14 | ) | | | (0.07 | ) | | | (0.33 | ) |
| | | | | | | |
| | Distributions to shareholders from return of capital | | | — | | | | (0.01 | ) | | | — | | | | — | | | | — | | | | — | |
| | | | | | | |
| | Total distributions | | | (0.16 | ) | | | (0.54 | ) | | | (0.64 | ) | | | (0.42 | ) | | | (0.30 | ) | | | (0.67 | ) |
| | | | | | | |
| | Net asset value, end of period | | $ | 13.23 | | | $ | 11.90 | | | $ | 11.63 | | | $ | 12.48 | | | $ | 11.80 | | | $ | 10.76 | |
| | | | | | | |
| | Total return(c) | | | 12.65 | % | | | 7.17 | % | | | (1.46 | )% | | | 9.45 | % | | | 12.66 | % | | | 6.67 | % |
| | | | | | | |
| | Net assets, end of period (in 000s) | | $ | 12,849 | | | $ | 19,695 | | | $ | 25,244 | | | $ | 33,490 | | | $ | 637,000 | | | $ | 507,845 | |
| | | | | | | |
| | Ratio of net expenses to average net assets(d) | | | 0.13 | %(e) | | | 0.13 | % | | | 0.13 | % | | | 0.13 | % | | | 0.13 | % | | | 0.13 | % |
| | | | | | | |
| | Ratio of total expenses to average net assets(d) | | | 0.26 | %(e) | | | 0.26 | % | | | 0.26 | % | | | 0.23 | % | | | 0.24 | % | | | 0.24 | % |
| | | | | | | |
| | Ratio of net investment income to average net assets(b) | | | 2.46 | %(e) | | | 1.90 | % | | | 2.00 | % | | | 1.43 | % | | | 1.93 | % | | | 1.58 | % |
| | | | | | | |
| | Portfolio turnover rate(f) | | | 8 | % | | | 13 | % | | | 15 | % | | | 20 | % | | | 8 | % | | | 19 | % |
| | (a) | | Calculated based on the average shares outstanding methodology. |
| | (b) | | Recognition of net investment income by the Portfolio is affected by the timing of declaration of dividends by the Underlying Funds in which the Portfolio invests. |
| | (c) | | Assumes investment at the net asset value at the beginning of the period, reinvestment of all distributions, a complete redemption of the investment at the net asset value at the end of the period and no sales or redemption charges (if any). Total returns would be reduced if a sales or redemption charge was taken into account. Returns do not reflect the impact of taxes to shareholders relating to Portfolio distributions or the redemption of Portfolio shares. Total returns for periods less than one full year are not annualized. |
| | (d) | | Expense ratios exclude the expenses of the Underlying Funds in which the Portfolio invests. |
| | (f) | | The portfolio turnover rate is calculated in accordance with regulatory requirements, without regard to transactions involving short term investments and certain derivatives. If such transactions were included, the portfolio turnover rate may be higher. |
| | |
| The accompanying notes are an integral part of these financial statements. | | 13 |
GOLDMAN SACHS ENHANCED DIVIDEND GLOBAL EQUITY PORTFOLIO
Financial Highlights (continued)
Selected Data for a Share Outstanding Throughout Each Period
| | | | | | | | | | | | | | | | | | |
| | | | | Goldman Sachs Enhanced Dividend Global Equity Portfolio | |
| | | | | Class R6 Shares | |
| | | | | Six Months Ended
February 28, 2021
(Unaudited) | | | Year Ended August 31, | | | December 29, 2017*
to
August 31, 2018 | |
| | | | | 2020 | | | 2019 | |
| | Per Share Data | | | | | | | | | | | | | | | | |
| | | | | |
| | Net asset value, beginning of period | | $ | 11.88 | | | $ | 11.60 | | | $ | 12.46 | | | $ | 12.17 | |
| | | | | |
| | Net investment income(a)(b) | | | 0.16 | | | | 0.21 | | | | 0.23 | | | | 0.10 | |
| | | | | |
| | Net realized and unrealized gain (loss) | | | 1.33 | | | | 0.61 | | | | (0.45 | ) | | | 0.31 | |
| | | | | |
| | Total from investment operations | | | 1.49 | | | | 0.82 | | | | (0.22 | ) | | | 0.41 | |
| | | | | |
| | Distributions to shareholders from net investment income | | | (0.17 | ) | | | (0.26 | ) | | | (0.32 | ) | | | (0.12 | ) |
| | | | | |
| | Distributions to shareholders from net realized gains | | | — | | | | (0.27 | ) | | | (0.32 | ) | | | — | |
| | | | | |
| | Distributions to shareholders from return of capital | | | — | | | | (0.01 | ) | | | — | | | | — | |
| | | | | |
| | Total distributions | | | (0.17 | ) | | | (0.54 | ) | | | (0.64 | ) | | | (0.12 | ) |
| | | | | |
| | Net asset value, end of period | | $ | 13.20 | | | $ | 11.88 | | | $ | 11.60 | | | $ | 12.46 | |
| | | | | |
| | Total return(c) | | | 12.60 | % | | | 7.28 | % | | | (1.54 | )% | | | 3.39 | % |
| | | | | |
| | Net assets, end of period (in 000s) | | $ | 12 | | | $ | 11 | | | $ | 10 | | | $ | 10 | |
| | | | | |
| | Ratio of net expenses to average net assets(d) | | | 0.13 | %(e) | | | 0.12 | % | | | 0.12 | % | | | 0.12 | %(e) |
| | | | | |
| | Ratio of total expenses to average net assets(d) | | | 0.21 | %(e) | | | 0.22 | % | | | 0.23 | % | | | 0.18 | %(e) |
| | | | | |
| | Ratio of net investment income to average net assets(b) | | | 2.66 | %(e) | | | 1.87 | % | | | 2.01 | % | | | 1.27 | %(e) |
| | | | | |
| | Portfolio turnover rate(f) | | | 8 | % | | | 13 | % | | | 15 | % | | | 20 | % |
| | * | | Commencement of operations. |
| | (a) | | Calculated based on the average shares outstanding methodology. |
| | (b) | | Recognition of net investment income by the Portfolio is affected by the timing of declaration of dividends by the Underlying Funds in which the Portfolio invests. |
| | (c) | | Assumes investment at the net asset value at the beginning of the period, reinvestment of all distributions, a complete redemption of the investment at the net asset value at the end of the period and no sales or redemption charges (if any). Total returns would be reduced if a sales or redemption charge was taken into account. Returns do not reflect the impact of taxes to shareholders relating to Portfolio distributions or the redemption of Portfolio shares. Total returns for periods less than one full year are not annualized. |
| | (d) | | Expense ratios exclude the expenses of the Underlying Funds in which the Portfolio invests. |
| | (f) | | The portfolio turnover rate is calculated in accordance with regulatory requirements, without regard to transactions involving short term investments and certain derivatives. If such transactions were included, the portfolio turnover rate may be higher. |
| | |
| 14 | | The accompanying notes are an integral part of these financial statements. |
GOLDMAN SACHS ENHANCED DIVIDEND GLOBAL EQUITY PORTFOLIO
Financial Highlights (continued)
Selected Data for a Share Outstanding Throughout Each Period
| | | | | | | | | | | | | | | | | | |
| | | | | Goldman Sachs Enhanced Dividend Global Equity Portfolio | |
| | | | | Class P Shares | |
| | | | | Six Months Ended
February 28, 2021
(Unaudited) | | | Year Ended August 31, | | | April 17, 2018*
to
August 31, 2018 | |
| | | | | 2020 | | | 2019 | |
| | Per Share Data | | | | | | | | | | | | | | | | |
| | | | | |
| | Net asset value, beginning of period | | $ | 11.87 | | | $ | 11.60 | | | $ | 12.45 | | | $ | 12.18 | |
| | | | | |
| | Net investment income(a)(b) | | | 0.17 | | | | 0.22 | | | | 0.23 | | | | 0.11 | |
| | | | | |
| | Net realized and unrealized gain (loss) | | | 1.32 | | | | 0.59 | | | | (0.44 | ) | | | 0.23 | |
| | | | | |
| | Total from investment operations | | | 1.49 | | | | 0.81 | | | | (0.21 | ) | | | 0.34 | |
| | | | | |
| | Distributions to shareholders from net investment income | | | (0.17 | ) | | | (0.26 | ) | | | (0.32 | ) | | | (0.07 | ) |
| | | | | |
| | Distributions to shareholders from net realized gains | | | — | | | | (0.27 | ) | | | (0.32 | ) | | | — | |
| | | | | |
| | Distributions to shareholders from return of capital | | | — | | | | (0.01 | ) | | | — | | | | — | |
| | | | | |
| | Total distributions | | | (0.17 | ) | | | (0.54 | ) | | | (0.64 | ) | | | (0.07 | ) |
| | | | | |
| | Net asset value, end of period | | $ | 13.19 | | | $ | 11.87 | | | $ | 11.60 | | | $ | 12.45 | |
| | | | | |
| | Total return(c) | | | 12.61 | % | | | 7.20 | % | | | (1.45 | )% | | | 2.80 | % |
| | | | | |
| | Net assets, end of period (in 000s) | | $ | 432,445 | | | $ | 438,960 | | | $ | 573,771 | | | $ | 636,733 | |
| | | | | |
| | Ratio of net expenses to average net assets(d) | | | 0.12 | %(e) | | | 0.12 | % | | | 0.12 | % | | | 0.13 | %(e) |
| | | | | |
| | Ratio of total expenses to average net assets(d) | | | 0.25 | %(e) | | | 0.25 | % | | | 0.25 | % | | | 0.25 | %(e) |
| | | | | |
| | Ratio of net investment income to average net assets(b) | | | 2.68 | %(e) | | | 1.92 | % | | | 2.02 | % | | | 2.48 | %(e) |
| | | | | |
| | Portfolio turnover rate(f) | | | 8 | % | | | 13 | % | | | 15 | % | | | 20 | % |
| | * | | Commencement of operations. |
| | (a) | | Calculated based on the average shares outstanding methodology. |
| | (b) | | Recognition of net investment income by the Portfolio is affected by the timing of declaration of dividends by the Underlying Funds in which the Portfolio invests. |
| | (c) | | Assumes investment at the net asset value at the beginning of the period, reinvestment of all distributions, a complete redemption of the investment at the net asset value at the end of the period and no sales or redemption charges (if any). Total returns would be reduced if a sales or redemption charge was taken into account. Returns do not reflect the impact of taxes to shareholders relating to Portfolio distributions or the redemption of Portfolio shares. Total returns for periods less than one full year are not annualized. |
| | (d) | | Expense ratios exclude the expenses of the Underlying Funds in which the Portfolio invests. |
| | (f) | | The portfolio turnover rate is calculated in accordance with regulatory requirements, without regard to transactions involving short term investments and certain derivatives. If such transactions were included, the portfolio turnover rate may be higher. |
| | |
| The accompanying notes are an integral part of these financial statements. | | 15 |
GOLDMAN SACHS TAX-ADVANTAGED GLOBAL EQUITY PORTFOLIO
Financial Highlights (continued)
Selected Data for a Share Outstanding Throughout Each Period
| | | | | | | | | | | | | | | | | | | | | | | | | | |
| | | | | Goldman Sachs Tax-Advantaged Global Equity Portfolio | |
| | | | | Class A Shares | |
| | | | | Six Months Ended
February 28, 2021
(Unaudited) | | | Year Ended August 31, | |
| | | | | 2020 | | | 2019 | | | 2018 | | | 2017 | | | 2016 | |
| | Per Share Data | | | | | | | | | | | | | | | | | | | | | | | | |
| | | | | | | |
| | Net asset value, beginning of period | | $ | 17.16 | | | $ | 15.44 | | | $ | 16.51 | | | $ | 14.78 | | | $ | 12.91 | | | $ | 12.58 | |
| | | | | | | |
| | Net investment income(a)(b) | | | 0.19 | | | | 0.13 | | | | 0.13 | | | | 0.12 | | | | 0.11 | | | | 0.08 | |
| | | | | | | |
| | Net realized and unrealized gain (loss) | | | 1.70 | | | | 1.76 | | | | (0.97 | ) | | | 1.77 | | | | 1.85 | | | | 0.52 | |
| | | | | | | |
| | Total from investment operations | | | 1.89 | | | | 1.89 | | | | (0.84 | ) | | | 1.89 | | | | 1.96 | | | | 0.60 | |
| | | | | | | |
| | Distributions to shareholders from net investment income | | | (0.16 | ) | | | (0.13 | ) | | | (0.13 | ) | | | (0.16 | ) | | | (0.09 | ) | | | (0.18 | ) |
| | | | | | | |
| | Distributions to shareholders from net realized gains | | | — | | | | (0.04 | ) | | | (0.10 | ) | | | — | | | | — | | | | (0.09 | ) |
| | | | | | | |
| | Total distributions | | | (0.16 | ) | | | (0.17 | ) | | | (0.23 | ) | | | (0.16 | ) | | | (0.09 | ) | | | (0.27 | ) |
| | | | | | | |
| | Net asset value, end of period | | $ | 18.89 | | | $ | 17.16 | | | $ | 15.44 | | | $ | 16.51 | | | $ | 14.78 | | | $ | 12.91 | |
| | | | | | | |
| | Total return(c) | | | 11.01 | % | | | 12.24 | % | | | (4.96 | )% | | | 12.81 | % | | | 15.23 | % | | | 4.88 | % |
| | | | | | | |
| | Net assets, end of period (in 000s) | | $ | 522 | | | $ | 470 | | | $ | 447 | | | $ | 658 | | | $ | 615 | | | $ | 591 | |
| | | | | | | |
| | Ratio of net expenses to average net assets(d) | | | 0.50 | %(e) | | | 0.51 | % | | | 0.52 | % | | | 0.52 | % | | | 0.53 | % | | | 0.53 | % |
| | | | | | | |
| | Ratio of total expenses to average net assets(d) | | | 0.58 | %(e) | | | 0.59 | % | | | 0.61 | % | | | 0.60 | % | | | 0.61 | % | | | 0.61 | % |
| | | | | | | |
| | Ratio of net investment income to average net assets(b) | | | 2.16 | %(e) | | | 0.86 | % | | | 0.81 | % | | | 0.77 | % | | | 0.80 | % | | | 0.64 | % |
| | | | | | | |
| | Portfolio turnover rate(f) | | | 6 | % | | | 12 | % | | | 14 | % | | | 17 | % | | | 8 | % | | | 19 | % |
| | (a) | | Calculated based on the average shares outstanding methodology. |
| | (b) | | Recognition of net investment income by the Portfolio is affected by the timing of declaration of dividends by the Underlying Funds in which the Portfolio invests. |
| | (c) | | Assumes investment at the net asset value at the beginning of the period, reinvestment of all distributions, a complete redemption of the investment at the net asset value at the end of the period and no sales or redemption charges (if any). Total returns would be reduced if a sales or redemption charge was taken into account. Returns do not reflect the impact of taxes to shareholders relating to Portfolio distributions or the redemption of Portfolio shares. Total returns for periods less than one full year are not annualized. |
| | (d) | | Expense ratios exclude the expenses of the Underlying Funds in which the Portfolio invests. |
| | (f) | | The portfolio turnover rate is calculated in accordance with regulatory requirements, without regard to transactions involving short term investments and certain derivatives. If such transactions were included, the portfolio turnover rate may be higher. |
| | |
| 16 | | The accompanying notes are an integral part of these financial statements. |
GOLDMAN SACHS TAX-ADVANTAGED GLOBAL EQUITY PORTFOLIO
Financial Highlights (continued)
Selected Data for a Share Outstanding Throughout Each Period
| | | | | | | | | | | | | | | | | | | | | | | | | | |
| | | | | Goldman Sachs Tax-Advantaged Global Equity Portfolio | |
| | | | | Institutional Shares | |
| | | | | Six Months Ended
February 28, 2021
(Unaudited) | | | Year Ended August 31, | |
| | | | | 2020 | | | 2019 | | | 2018 | | | 2017 | | | 2016 | |
| | Per Share Data | | | | | | | | | | | | | | | | | | | | | | | | |
| | | | | | | |
| | Net asset value, beginning of period | | $ | 17.30 | | | $ | 15.58 | | | $ | 16.46 | | | $ | 14.72 | | | $ | 12.86 | | | $ | 12.53 | |
| | | | | | | |
| | Net investment income(a)(b) | | | 0.21 | | | | 0.22 | | | | 0.20 | | | | 0.17 | | | | 0.17 | | | | 0.11 | |
| | | | | | | |
| | Net realized and unrealized gain (loss) | | | 1.72 | | | | 1.74 | | | | (0.96 | ) | | | 1.78 | | | | 1.84 | | | | 0.53 | |
| | | | | | | |
| | Total from investment operations | | | 1.93 | | | | 1.96 | | | | (0.76 | ) | | | 1.95 | | | | 2.01 | | | | 0.64 | |
| | | | | | | |
| | Distributions to shareholders from net investment income | | | (0.21 | ) | | | (0.20 | ) | | | (0.02 | ) | | | (0.21 | ) | | | (0.15 | ) | | | (0.22 | ) |
| | | | | | | |
| | Distributions to shareholders from net realized gains | | | — | | | | (0.04 | ) | | | (0.10 | ) | | | — | | | | — | | | | (0.09 | ) |
| | | | | | | |
| | Total distributions | | | (0.21 | ) | | | (0.24 | ) | | | (0.12 | ) | | | (0.21 | ) | | | (0.15 | ) | | | (0.31 | ) |
| | | | | | | |
| | Net asset value, end of period | | $ | 19.02 | | | $ | 17.30 | | | $ | 15.58 | | | $ | 16.46 | | | $ | 14.72 | | | $ | 12.86 | |
| | | | | | | |
| | Total return(c) | | | 11.21 | % | | | 12.60 | % | | | (4.61 | )% | | | 13.32 | % | | | 15.74 | % | | | 5.22 | % |
| | | | | | | |
| | Net assets, end of period (in 000s) | | $ | 29,847 | | | $ | 33,800 | | | $ | 43,565 | | | $ | 62,718 | | | $ | 2,207,827 | | | $ | 1,816,911 | |
| | | | | | | |
| | Ratio of net expenses to average net assets(d) | | | 0.13 | %(e) | | | 0.13 | % | | | 0.13 | % | | | 0.13 | % | | | 0.13 | % | | | 0.13 | % |
| | | | | | | |
| | Ratio of total expenses to average net assets(d) | | | 0.21 | %(e) | | | 0.21 | % | | | 0.22 | % | | | 0.21 | % | | | 0.21 | % | | | 0.21 | % |
| | | | | | | |
| | Ratio of net investment income to average net assets(b) | | | 2.36 | %(e) | | | 1.41 | % | | | 1.28 | % | | | 1.06 | % | | | 1.26 | % | | | 0.92 | % |
| | | | | | | |
| | Portfolio turnover rate(f) | | | 6 | % | | | 12 | % | | | 14 | % | | | 17 | % | | | 8 | % | | | 19 | % |
| | (a) | | Calculated based on the average shares outstanding methodology. |
| | (b) | | Recognition of net investment income by the Portfolio is affected by the timing of declaration of dividends by the Underlying Funds in which the Portfolio invests. |
| | (c) | | Assumes investment at the net asset value at the beginning of the period, reinvestment of all distributions, a complete redemption of the investment at the net asset value at the end of the period and no sales or redemption charges (if any). Total returns would be reduced if a sales or redemption charge was taken into account. Returns do not reflect the impact of taxes to shareholders relating to Portfolio distributions or the redemption of Portfolio shares. Total returns for periods less than one full year are not annualized. |
| | (d) | | Expense ratios exclude the expenses of the Underlying Funds in which the Portfolio invests. |
| | (f) | | The portfolio turnover rate is calculated in accordance with regulatory requirements, without regard to transactions involving short term investments and certain derivatives. If such transactions were included, the portfolio turnover rate may be higher. |
| | |
| The accompanying notes are an integral part of these financial statements. | | 17 |
GOLDMAN SACHS TAX-ADVANTAGED GLOBAL EQUITY PORTFOLIO
Financial Highlights (continued)
Selected Data for a Share Outstanding Throughout Each Period
| | | | | | | | | | | | | | | | | | |
| | | | | Goldman Sachs Tax-Advantaged Global Equity Portfolio | |
| | | | | Class R6 Shares | |
| | | | | Six Months Ended
February 28, 2021
(Unaudited) | | | Year Ended August 31, | | | December 29, 2017*
to
August 31, 2018 | |
| | | | | 2020 | | | 2019 | |
| | Per Share Data | | | | | | | | | | | | | | | | |
| | | | | |
| | Net asset value, beginning of period | | $ | 17.07 | | | $ | 15.38 | | | $ | 16.46 | | | $ | 15.59 | |
| | | | | |
| | Net investment income (loss)(a)(b) | | | 0.29 | | | | 0.20 | | | | 0.19 | | | | (0.01 | ) |
| | | | | |
| | Net realized and unrealized gain (loss) | | | 1.63 | | | | 1.73 | | | | (0.97 | ) | | | 0.88 | |
| | | | | |
| | Total from investment operations | | | 1.92 | | | | 1.93 | | | | (0.78 | ) | | | 0.87 | |
| | | | | |
| | Distributions to shareholders from net investment income | | | (0.22 | ) | | | (0.20 | ) | | | (0.20 | ) | | | — | |
| | | | | |
| | Distributions to shareholders from net realized gains | | | — | | | | (0.04 | ) | | | (0.10 | ) | | | — | |
| | | | | |
| | Total distributions | | | (0.22 | ) | | | (0.24 | ) | | | (0.30 | ) | | | — | |
| | | | | |
| | Net asset value, end of period | | $ | 18.77 | | | $ | 17.07 | | | $ | 15.38 | | | $ | 16.46 | |
| | | | | |
| | Total return(c) | | | 11.29 | % | | | 12.58 | % | | | (4.57 | )% | | | 5.58 | % |
| | | | | |
| | Net assets, end of period (in 000s) | | $ | 8,914 | | | $ | 11 | | | $ | 10 | | | $ | 11 | |
| | | | | |
| | Ratio of net expenses to average net assets(d) | | | 0.12 | %(e) | | | 0.12 | % | | | 0.12 | % | | | 0.12 | %(e) |
| | | | | |
| | Ratio of total expenses to average net assets(d) | | | 0.20 | %(e) | | | 0.18 | % | | | 0.19 | % | | | 0.18 | %(e) |
| | | | | |
| | Ratio of net investment income (loss) to average net assets(b) | | | 3.25 | %(e) | | | 1.25 | % | | | 1.22 | % | | | (0.05 | )%(e) |
| | | | | |
| | Portfolio turnover rate(f) | | | 6 | % | | | 12 | % | | | 14 | % | | | 17 | % |
| | * | | Commencement of operations. |
| | (a) | | Calculated based on the average shares outstanding methodology. |
| | (b) | | Recognition of net investment income by the Portfolio is affected by the timing of declaration of dividends by the Underlying Funds in which the Portfolio invests. |
| | (c) | | Assumes investment at the net asset value at the beginning of the period, reinvestment of all distributions, a complete redemption of the investment at the net asset value at the end of the period and no sales or redemption charges (if any). Total returns would be reduced if a sales or redemption charge was taken into account. Returns do not reflect the impact of taxes to shareholders relating to Portfolio distributions or the redemption of Portfolio shares. Total returns for periods less than one full year are not annualized. |
| | (d) | | Expense ratios exclude the expenses of the Underlying Funds in which the Portfolio invests. |
| | (f) | | The portfolio turnover rate is calculated in accordance with regulatory requirements, without regard to transactions involving short term investments and certain derivatives. If such transactions were included, the portfolio turnover rate may be higher. |
| | |
| 18 | | The accompanying notes are an integral part of these financial statements. |
GOLDMAN SACHS TAX-ADVANTAGED GLOBAL EQUITY PORTFOLIO
Financial Highlights (continued)
Selected Data for a Share Outstanding Throughout Each Period
| | | | | | | | | | | | | | | | | | |
| | | | | Goldman Sachs Tax-Advantaged Global Equity Portfolio | |
| | | | | Class P Shares | |
| | | | | Six Months Ended
February 28, 2021
(Unaudited) | | | Year Ended August 31, | | | April 17, 2018*
to
August 31, 2018 | |
| | | | | 2020 | | | 2019 | |
| | Per Share Data | | | | | | | | | | | | | | | | |
| | | | | |
| | Net asset value, beginning of period | | $ | 17.07 | | | $ | 15.38 | | | $ | 16.47 | | | $ | 15.84 | |
| | | | | |
| | Net investment income(a)(b) | | | 0.22 | | | | 0.20 | | | | 0.19 | | | | 0.01 | |
| | | | | |
| | Net realized and unrealized gain (loss) | | | 1.70 | | | | 1.74 | | | | (0.98 | ) | | | 0.62 | |
| | | | | |
| | Total from investment operations | | | 1.92 | | | | 1.94 | | | | (0.79 | ) | | | 0.63 | |
| | | | | |
| | Distributions to shareholders from net investment income | | | (0.22 | ) | | | (0.21 | ) | | | (0.20 | ) | | | — | |
| | | | | |
| | Distributions to shareholders from net realized gains | | | — | | | | (0.04 | ) | | | (0.10 | ) | | | — | |
| | | | | |
| | Total distributions | | | (0.22 | ) | | | (0.25 | ) | | | (0.30 | ) | | | — | |
| | | | | |
| | Net asset value, end of period | | $ | 18.77 | | | $ | 17.07 | | | $ | 15.38 | | | $ | 16.47 | |
| | | | | |
| | Total return(c) | | | 11.27 | % | | | 12.59 | % | | | (4.60 | )% | | | 3.98 | % |
| | | | | |
| | Net assets, end of period (in 000s) | | $ | 3,073,773 | | | $ | 2,710,904 | | | $ | 2,743,392 | | | $ | 2,797,271 | |
| | | | | |
| | Ratio of net expenses to average net assets(d) | | | 0.12 | %(e) | | | 0.12 | % | | | 0.12 | % | | | 0.12 | %(e) |
| | | | | |
| | Ratio of total expenses to average net assets(d) | | | 0.20 | %(e) | | | 0.20 | % | | | 0.21 | % | | | 0.20 | %(e) |
| | | | | |
| | Ratio of net investment income to average net assets(b) | | | 2.54 | %(e) | | | 1.30 | % | | | 1.21 | % | | | 0.15 | %(e) |
| | | | | |
| | Portfolio turnover rate(f) | | | 6 | % | | | 12 | % | | | 14 | % | | | 17 | % |
| | * | | Commencement of operations. |
| | (a) | | Calculated based on the average shares outstanding methodology. |
| | (b) | | Recognition of net investment income by the Portfolio is affected by the timing of declaration of dividends by the Underlying Funds in which the Portfolio invests. |
| | (c) | | Assumes investment at the net asset value at the beginning of the period, reinvestment of all distributions, a complete redemption of the investment at the net asset value at the end of the period and no sales or redemption charges (if any). Total returns would be reduced if a sales or redemption charge was taken into account. Returns do not reflect the impact of taxes to shareholders relating to Portfolio distributions or the redemption of Portfolio shares. Total returns for periods less than one full year are not annualized. |
| | (d) | | Expense ratios exclude the expenses of the Underlying Funds in which the Portfolio invests. |
| | (f) | | The portfolio turnover rate is calculated in accordance with regulatory requirements, without regard to transactions involving short term investments and certain derivatives. If such transactions were included, the portfolio turnover rate may be higher. |
| | |
| The accompanying notes are an integral part of these financial statements. | | 19 |
GOLDMAN SACHS GLOBAL TAX-AWARE EQUITY PORTFOLIOS
Notes to Financial Statements
February 28, 2021 (Unaudited)
Goldman Sachs Trust (the “Trust”) is a Delaware statutory trust registered under the Investment Company Act of 1940, as amended (the “Act”), as an open-end management investment company. The following table lists those series of the Trust that are included in this report (collectively, the “Portfolios” or individually a “Portfolio”), along with their corresponding share classes and respective diversification status under the Act:
| | | | |
| Portfolio | | Share Classes Offered | | Diversified/
Non-diversified |
Enhanced Dividend Global Equity and Tax-Advantaged Global Equity | | A, Institutional, R6 and P | | Diversified |
Class A Shares are sold with a front-end sales charge of up to 5.50%. Institutional, Class R6 and Class P Shares are not subject to a sales charge.
Goldman Sachs Asset Management, L.P. (“GSAM”), an affiliate of Goldman Sachs & Co. LLC (“Goldman Sachs”), serves as investment adviser to the Portfolios pursuant to a management agreement (the “Agreement”) with the Trust.
The Portfolios are expected to invest primarily in a combination of domestic and international equity and fixed income underlying funds (“Underlying Funds”) which are registered under the Act, for which GSAM acts as the investment adviser. Additionally, these Portfolios may invest a portion of their assets directly in other securities and instruments, including unaffiliated exchange traded funds.
|
| 2. SIGNIFICANT ACCOUNTING POLICIES |
The financial statements have been prepared in accordance with accounting principles generally accepted in the United States of America (“GAAP”) and require management to make estimates and assumptions that may affect the reported amounts and disclosures. Actual results may differ from those estimates and assumptions. Each Portfolio is an investment company under GAAP and follows the accounting and reporting guidance applicable to investment companies.
A. Investment Valuation — The valuation policy of the Portfolios and Underlying Funds is to value investments at fair value.
B. Investment Income and Investments — Investment income includes interest income, dividend income, and securities lending income, if any. Interest income is accrued daily and adjusted for amortization of premiums and accretion of discounts. Dividend income is recognized on ex-dividend date or, for certain foreign securities, as soon as such information is obtained subsequent to the ex-dividend date. Non-cash dividends, if any, are recorded at the fair market value of the securities received. Investment transactions are reflected on trade date. Realized gains and losses are calculated using identified cost. Investment transactions are recorded on the following business day for daily net asset value (“NAV”) calculations. Distributions from master limited partnerships (“MLPs”) are generally recorded based on the characterization reported on the MLP’s tax return. The Goldman Sachs MLP Energy Infrastructure Fund (the “Underlying MLP Fund”) records its pro-rata share of the income/loss and capital gains/losses, allocated from the underlying partnerships and adjusts the cost basis of the underlying partnerships accordingly. Income distributions are recognized as capital gains or income in the financial statements in accordance with the character that is distributed.
For derivative contracts, realized gains and losses are recorded upon settlement of the contract.
C. Class Allocations and Expenses — Investment income, realized and unrealized gain (loss), if any, and non-class specific expenses of each Portfolio are allocated daily based upon the proportion of net assets of each class. Non-class specific expenses directly incurred by a Portfolio are charged to that Portfolio, while such expenses incurred by the Trust are allocated across the applicable Portfolios on a straight-line and/or pro-rata basis depending upon the nature of the expenses. Class specific expenses, where applicable, are borne by the respective share classes and include Distribution and Service and Transfer Agency fees. Expenses included in the accompanying financial statements reflect the expenses of each Portfolio and do not include any expenses associated with the Underlying Funds. Because the Underlying Funds have varied expense and fee levels and the Portfolios may
20
GOLDMAN SACHS GLOBAL TAX-AWARE EQUITY PORTFOLIOS
|
| 2. SIGNIFICANT ACCOUNTING POLICIES (continued) |
own different proportions of the Underlying Funds at different times, the amount of fees and expenses incurred indirectly by each Portfolio will vary.
D. Federal Taxes and Distributions to Shareholders — It is each Portfolio’s policy to comply with the requirements of the Internal Revenue Code of 1986, as amended (the “Code”), applicable to regulated investment companies and to distribute each year substantially all of its investment company taxable income and capital gains to its shareholders. Accordingly, each Portfolio is not required to make any provisions for the payment of federal income tax. Distributions to shareholders are recorded on the ex-dividend date. Income and capital gains distributions, if any, are declared and paid according to the following schedule:
| | | | | | |
| Portfolio | | | | Income Distributions
Declared/Paid | | Capital Gains Distributions
Declared/Paid |
Enhanced Dividend Global Equity | | | | Quarterly | | Annually |
Tax-Advantaged Global Equity | | | | Annually | | Annually |
Net capital losses, if any, are carried forward to future fiscal years and may be used to the extent allowed by the Code to offset any future capital gains. Losses that are carried forward will retain their character as either short-term or long-term capital losses. Utilization of capital loss carryforwards will reduce the requirement of future capital gains distributions.
The characterization of distributions to shareholders for financial reporting purposes is determined in accordance with federal income tax rules, which may differ from GAAP. The source of each Portfolio’s distributions may be shown in the accompanying financial statements as either from distributable earnings or capital. Certain components of the Portfolios’ net assets on the Statements of Assets and Liabilities reflect permanent GAAP/tax differences based on the appropriate tax character.
E. Foreign Currency Translation — The accounting records and reporting currency of a Portfolio are maintained in United States (“U.S.”) dollars. Assets and liabilities denominated in foreign currencies are translated into U.S. dollars using the current exchange rates at the close of each business day. The effect of changes in foreign currency exchange rates on investments is included within net realized and unrealized gain (loss) on investments. Changes in the value of other assets and liabilities as a result of fluctuations in foreign exchange rates are included in the Statements of Operations within net change in unrealized gain (loss) on foreign currency translation. Transactions denominated in foreign currencies are translated into U.S. dollars on the date the transaction occurred, the effects of which are included within net realized gain (loss) on foreign currency transactions.
|
| 3. INVESTMENTS AND FAIR VALUE MEASUREMENTS |
U.S. GAAP defines the fair value of a financial instrument as the amount that would be received to sell an asset or paid to transfer a liability in an orderly transaction between market participants at the measurement date (i.e., the exit price); the Portfolios’ policy is to use the market approach. GAAP establishes a fair value hierarchy that prioritizes the inputs to valuation techniques used to measure fair value. The hierarchy gives the highest priority to unadjusted quoted prices in active markets for identical assets or liabilities (Level 1 measurements) and the lowest priority to unobservable inputs (Level 3 measurements). The level in the fair value hierarchy within which the fair value measurement in its entirety falls shall be determined based on the lowest level input that is significant to the fair value measurement in its entirety. The levels used for classifying investments are not necessarily an indication of the risk associated with investing in these investments. The three levels of the fair value hierarchy are described below:
Level 1 — Unadjusted quoted prices in active markets that are accessible at the measurement date for identical, unrestricted assets or liabilities;
Level 2 — Quoted prices in markets that are not active or financial instruments for which significant inputs are observable (including, but not limited to, quoted prices for similar investments, interest rates, foreign exchange rates, volatility and credit spreads), either directly or indirectly;
Level 3 — Prices or valuations that require significant unobservable inputs (including GSAM’s assumptions in determining fair value measurement).
21
GOLDMAN SACHS GLOBAL TAX-AWARE EQUITY PORTFOLIOS
Notes to Financial Statements (continued)
February 28, 2021 (Unaudited)
|
| 3. INVESTMENTS AND FAIR VALUE MEASUREMENTS (continued) |
The Board of Trustees (“Trustees”) has approved Valuation Procedures that govern the valuation of the portfolio investments held by the Portfolios, including investments for which market quotations are not readily available. The Trustees have delegated to GSAM day-to-day responsibility for implementing and maintaining internal controls and procedures related to the valuation of the Portfolios’ investments. To assess the continuing appropriateness of pricing sources and methodologies, GSAM regularly performs price verification procedures and issues challenges as necessary to third party pricing vendors or brokers, and any differences are reviewed in accordance with the Valuation Procedures.
A. Level 1 and Level 2 Fair Value Investments — The valuation techniques and significant inputs used in determining the fair values for investments classified as Level 1 and Level 2 are as follows:
Equity Securities — Equity securities traded on a U.S. securities exchange or the NASDAQ system, or those located on certain foreign exchanges, including but not limited to the Americas, are valued daily at their last sale price or official closing price on the principal exchange or system on which they are traded. If there is no sale or official closing price or such price is believed by GSAM to not represent fair value, equity securities will be valued at the valid closing bid price for long positions and at the valid closing ask price for short positions (i.e. where there is sufficient volume, during normal exchange trading hours). If no valid bid/ask price is available, the equity security will be valued pursuant to the Valuation Procedures approved by the Trustees and consistent with applicable regulatory guidance. To the extent these investments are actively traded, they are classified as Level 1 of the fair value hierarchy, otherwise they are generally classified as Level 2. Certain equity securities containing unique attributes may be classified as Level 2.
Unlisted equity securities for which market quotations are available are valued at the last sale price on the valuation date, or if no sale occurs, at the last bid price for long positions or the last ask price for short positions, and are generally classified as Level 2.
Underlying Funds (including Money Market Funds) — Investments in the Underlying Funds are valued at the NAV per share on the day of valuation. Because the Portfolios invest primarily in other mutual funds that fluctuate in value, the Portfolios’ shares will correspondingly fluctuate in value. These investments are generally classified as Level 1 of the fair value hierarchy. For information regarding an Underlying Fund’s accounting policies and investment holdings, please see the Underlying Fund’s shareholder report.
Derivative Contracts — A derivative is an instrument whose value is derived from underlying assets, indices, reference rates or a combination of these factors. A Portfolio enters into derivative transactions to hedge against changes in interest rates, securities prices, and/or currency exchange rates, to increase total return, or to gain access to certain markets or attain exposure to other underliers. For financial reporting purposes, cash collateral that has been pledged to cover obligations of a Portfolio and cash collateral received, if any, is reported separately on the Statements of Assets and Liabilities as receivables/payables for collateral on certain derivatives contracts. Non-cash collateral pledged by a Portfolio, if any, is noted in the Schedules of Investments.
Exchange-traded derivatives, including futures and options contracts, are generally valued at the last sale or settlement price on the exchange where they are principally traded. Exchange-traded options without settlement prices are generally valued at the midpoint of the bid and ask prices on the exchange where they are principally traded (or, in the absence of two-way trading, at the last bid price for long positions and the last ask price for short positions). Exchange-traded derivatives typically fall within Level 1 of the fair value hierarchy. Over-the-counter (“OTC”) and centrally cleared derivatives are valued using market transactions and other market evidence, including market-based inputs to models, calibration to market-clearing transactions, broker or dealer quotations, or other alternative pricing sources. Where models are used, the selection of a particular model to value OTC and centrally cleared derivatives depends upon the contractual terms of, and specific risks inherent in, the instrument, as well as the availability of pricing information in the market. Valuation models require a variety of inputs, including contractual terms, market prices, yield curves, credit curves, measures of volatility, voluntary and involuntary prepayment rates, loss severity rates and correlations of such inputs. For OTC and centrally cleared derivatives that trade in liquid markets, model inputs can generally be verified and model selection does not involve significant management judgment. OTC and centrally cleared derivatives are classified within Level 2 of the fair value hierarchy when significant inputs are corroborated by market evidence.
22
GOLDMAN SACHS GLOBAL TAX-AWARE EQUITY PORTFOLIOS
|
| 3. INVESTMENTS AND FAIR VALUE MEASUREMENTS (continued) |
i. Forward Contracts — A forward contract is a contract between two parties to buy or sell an asset at a specified price on a future date. A forward contract settlement can occur on a cash or delivery basis. Forward contracts are marked-to-market daily using independent vendor prices, and the change in value, if any, is recorded as an unrealized gain or loss. Cash and certain investments may be used to collateralize forward contracts.
A forward foreign currency exchange contract is a forward contract in which a Portfolio agrees to receive or deliver a fixed quantity of one currency for another, at a pre-determined price at a future date. All forward foreign currency exchange contracts are marked to market daily by using the outright forward rates or interpolating based upon maturity dates, where available. Non-deliverable forward foreign currency exchange contracts are settled with the counterparty in cash without the delivery of foreign currency.
ii. Futures Contracts — Futures contracts are contracts to buy or sell a standardized quantity of a specified commodity or security. Upon entering into a futures contract, a Portfolio deposits cash or securities in an account on behalf of the broker in an amount sufficient to meet the initial margin requirement. Subsequent payments are made or received by a Portfolio equal to the daily change in the contract value and are recorded as variation margin receivable or payable with a corresponding offset to unrealized gains or losses.
B. Level 3 Fair Value Investments — To the extent that significant inputs to valuation models and other alternative pricing sources are unobservable, or if quotations are not readily available, or if GSAM believes that such quotations do not accurately reflect fair value, the fair value of a Portfolio’s investments may be determined under Valuation Procedures approved by the Trustees. GSAM, consistent with its procedures and applicable regulatory guidance, may make an adjustment to the most recent valuation prices of either domestic or foreign securities in light of significant events to reflect what it believes to be the fair value of the securities at the time of determining a Portfolio’s NAV. To the extent investments are valued using single source broker quotations obtained directly from the broker or passed through from third party pricing vendors, such investments are classified as Level 3 investments.
C. Fair Value Hierarchy — The following is a summary of the Portfolios’ investments and derivatives classified in the fair value hierarchy as of February 28, 2021:
| | | | | | | | | | | | |
|
| ENHANCED DIVIDEND GLOBAL EQUITY | |
| | | |
| Investment Type | | Level 1 | | | Level 2 | | | Level 3 | |
| | | |
| Assets | | | | | | | | | | | | |
| | | |
Underlying Equity Funds | | $ | 444,169,678 | | | $ | — | | | $ | — | |
| | | |
Investment Company | | | 4,023,421 | | | | — | | | | — | |
| | | |
| Total | | $ | 448,193,099 | | | $ | — | | | $ | — | |
| Derivative Type | | | | | | | | | | | | |
| | | |
| Assets(a) | | | | | | | | | | | | |
| | | |
Forward Foreign Currency Exchange Contracts | | $ | — | | | $ | 493,690 | | | $ | — | |
| | | |
Futures Contracts | | | 219,717 | | | | — | | | | — | |
| | | |
| Total | | $ | 219,717 | | | $ | 493,690 | | | $ | — | |
| | | |
| Liabilities(a) | | | | | | | | | | | | |
| | | |
Forward Foreign Currency Exchange Contracts | | $ | — | | | $ | (529,033 | ) | | $ | — | |
| (a) | | Amount shown represents unrealized gain (loss) at period end. |
23
GOLDMAN SACHS GLOBAL TAX-AWARE EQUITY PORTFOLIOS
Notes to Financial Statements (continued)
February 28, 2021 (Unaudited)
|
| 3. INVESTMENTS AND FAIR VALUE MEASUREMENTS (continued) |
| | | | | | | | | | | | |
| | | |
| TAX-ADVANTAGED GLOBAL EQUITY | | | | | | | | | | | | |
| | | |
| Investment Type | | Level 1 | | | Level 2 | | | Level 3 | |
| | | |
| Assets | | | | | | | | | | | | |
| | | |
Underlying Equity Funds | | $ | 3,073,119,035 | | | $ | — | | | $ | — | |
| | | |
Investment Company | | | 31,930,365 | | | | — | | | | — | |
| | | |
| Total | | $ | 3,105,049,400 | | | $ | — | | | $ | — | |
| | | |
| Derivative Type | | | | | | | | | |
| | | |
| Assets(a) | | | | | | | | | | | | |
| | | |
Forward Foreign Currency Exchange Contracts | | $ | — | | | $ | 3,162,968 | | | $ | — | |
| | | |
Futures Contracts | | | 1,402,808 | | | | — | | | | — | |
| | | |
| Total | | $ | 1,402,808 | | | $ | 3,162,968 | | | $ | — | |
| | | |
| Liabilities(a) | | | | | | | | | | | | |
| | | |
Forward Foreign Currency Exchange Contracts | | $ | — | | | $ | (3,074,458 | ) | | $ | — | |
| (a) | | Amount shown represents unrealized gain (loss) at period end. |
For further information regarding security characteristics, see the Schedules of Investments.
|
| 4. INVESTMENTS IN DERIVATIVES |
The following tables set forth, by certain risk types, the gross value of derivative contracts (not considered to be hedging instruments for accounting disclosure purposes) as of February 28, 2021. These instruments were used as part of the Portfolios’ investment strategies and to obtain and/or manage exposure related to the risks below. The values in the tables below exclude the effects of cash collateral received or posted pursuant to these derivative contracts, and therefore are not representative of the Portfolios’ net exposure:
| | | | | | | | | | | | |
| | | |
| Enhanced Dividend Global Equity | | | | | | | | | | |
| | | | |
| Risk | | Statements of Assets
and Liabilities | | Assets | | | Statements of Assets
and Liabilities | | Liabilities | |
Currency | | Receivable for unrealized gain on forward foreign currency exchange contracts | | $ | 493,690 | | | Payable for unrealized loss on forward foreign currency exchange contracts | | $ | (529,033) | |
Equity | | Variation margin on futures contracts | | | 219,717 | (a) | | — | | | — | |
| Total | | | | $ | 713,407 | | | | | $ | (529,033) | |
| | | |
| Tax-Advantaged Global Equity | | | | | | | | | | |
| | | | |
| Risk | | Statements of Assets
and Liabilities | | Assets | | | Statements of Assets
and Liabilities | | Liabilities | |
Currency | | Receivable for unrealized gain on forward foreign currency exchange contracts | | $ | 3,162,968 | | | Payable for unrealized loss on forward foreign currency exchange contracts | | $ | (3,074,458) | |
Equity | | Variation margin on futures contracts | | | 1,402,808 | (a) | | — | | | — | |
| Total | | | | $ | 4,565,776 | | | | | $ | (3,074,458) | |
| (a) | | Includes unrealized gain (loss) on futures contracts described in the Additional Investment Information sections of the Schedules of Investments. Only the variation margin as of February 28, 2021 is reported within the Statements of Assets and Liabilities. |
24
GOLDMAN SACHS GLOBAL TAX-AWARE EQUITY PORTFOLIOS
|
| 4. INVESTMENTS IN DERIVATIVES (continued) |
The following tables set forth, by certain risk types, the Portfolios’ gains (losses) related to these derivatives and their indicative volumes for the six months ended February 28, 2021. These gains (losses) should be considered in the context that these derivative contracts may have been executed to create investment opportunities and/or economically hedge certain investments, and accordingly, certain gains (losses) on such derivative contracts may offset certain (losses) gains attributable to investments. These gains (losses) are included in “Net realized gain (loss)” or “Net change in unrealized gain (loss)” on the Statements of Operations:
| | | | | | | | | | | | | | |
| | | |
| Enhanced Dividend Global Equity | | | | | | | | | | | | |
| Risk | | Statements of Operations | | Net Realized
Gain (Loss) | | | Net Change in
Unrealized
Gain (Loss) | | | Average
Number of
Contracts(a) | |
| Currency | | Net realized gain (loss) from forward foreign currency exchange contracts/Net change in unrealized gain (loss) on forward foreign currency exchange contracts | | $ | (2,888,131 | ) | | $ | 2,506,736 | | | | 8 | |
| Equity | | Net realized gain (loss) from futures contracts/Net change in unrealized gain (loss) on futures contracts | | | 892,980 | | | | (469,124 | ) | | | 27 | |
| Total | | | | $ | (1,995,151 | ) | | $ | 2,037,612 | | | | 35 | |
| | | |
| Tax-Advantaged Global Equity | | | | | | | | | | | | |
| Risk | | Statements of Operations | | Net Realized
Gain (Loss) | | | Net Change in
Unrealized
Gain (Loss) | | | Average
Number of
Contracts(a) | |
| Currency | | Net realized gain (loss) from forward foreign currency exchange contracts/Net change in unrealized gain (loss) on forward foreign currency exchange contracts | | $ | (16,656,278 | ) | | $ | 14,613,626 | | | | 8 | |
| Equity | | Net realized gain (loss) from futures contracts/Net change in unrealized gain (loss) on futures contracts | | | 5,251,842 | | | | (2,540,215 | ) | | | 166 | |
| Total | | | | $ | (11,404,436 | ) | | $ | 12,073,411 | | | | 174 | |
| (a) | | Average number of contracts is based on the average of month end balances for the six months ended February 28, 2021. |
|
| 5. AGREEMENTS AND AFFILIATED TRANSACTIONS |
A. Management Agreement — Under the Agreement, GSAM manages the Portfolios, subject to the general supervision of the Trustees.
As compensation for the services rendered pursuant to the Agreement, the assumption of the expenses related thereto and administration of the Portfolios’ business affairs, including providing facilities, GSAM is entitled to a management fee, accrued daily and paid monthly, equal to an annual percentage rate of 0.15% of each Portfolio’s average daily net assets. GSAM has agreed to waive a portion of its management fee in order to achieve an effective net rate of 0.08% as an annual percentage rate of average daily net assets of each Portfolio through at least December 29, 2021, and prior to such date, GSAM may not terminate the arrangements without the approval of the Trustees.
B. Distribution and/or Service (12b-1) Plan — The Trust, on behalf of Class A Shares of each applicable Portfolio, has adopted a Distribution and Service Plan subject to Rule 12b-1 under the Act. Under the Distribution and Service Plan, Goldman Sachs, which serves as distributor (the “Distributor”), is entitled to a fee accrued daily and paid monthly for distribution services and personal and account maintenance services, which may then be paid by Goldman Sachs to authorized dealers. These fees are equal to an annual percentage rate of 0.25% of the average daily net assets attributable to Class A Shares of the Portfolios.
C. Distribution Agreement — Goldman Sachs, as Distributor of the shares of the Portfolios pursuant to a Distribution Agreement, may retain a portion of the Class A Shares’ front end sales charge. During the six months ended February 28, 2021, Goldman Sachs retained front-end sales charges of $26 for the Enhanced Dividend Global Equity Portfolio.
25
GOLDMAN SACHS GLOBAL TAX-AWARE EQUITY PORTFOLIOS
Notes to Financial Statements (continued)
February 28, 2021 (Unaudited)
|
| 5. AGREEMENTS AND AFFILIATED TRANSACTIONS (continued) |
D. Transfer Agency Agreement — Goldman Sachs also serves as the transfer agent of the Portfolios for a fee pursuant to the Transfer Agency Agreement. The fees charged for such transfer agency services are accrued daily and paid monthly at annual rates as follows: 0.16% of the average daily net assets of Class A Shares; 0.03% of the average daily net assets of Class R6 and Class P Shares; and 0.04% of the average daily net assets of Institutional Shares.
E. Other Expense Agreements and Affiliated Transactions — GSAM has agreed to reduce or limit certain “Other Expenses” of the Portfolios (excluding acquired fund fees and expenses, transfer agency fees and expenses, service fees and shareholder administration fees (as applicable), taxes, interest, brokerage fees, expenses of shareholder meetings, litigation and indemnification, and extraordinary expenses) to the extent such expenses exceed, on an annual basis, a percentage rate of the average daily net assets of each Portfolio. Such Other Expense reimbursements, if any, are accrued daily and paid monthly. In addition, the Portfolios are not obligated to reimburse GSAM for prior fiscal year expense reimbursements, if any. The Other Expense limitations as an annual percentage rate of average daily net assets for the Portfolios is 0.014%. These Other Expense limitations will remain in place through at least December 29, 2021, and prior to such date GSAM may not terminate the arrangements without the approval of the Trustees. In addition, the Portfolios have entered into certain offset arrangements with the custodian and the transfer agent, which may result in a reduction of the Portfolios’ expenses and are received irrespective of the application of the “Other Expense” limitations described above.
For the six months ended February 28, 2021, these expense reductions, including any fee waivers and Other Expense reimbursements, were as follows:
| | | | | | | | | | | | | | |
| Portfolio | | | | Management
Fee Waiver | | | Other Expense
Reimbursement | | | Total Expense
Reductions | |
Enhanced Dividend Global Equity | | | | $ | 161,292 | | | $ | 137,612 | | | $ | 298,904 | |
Tax-Advantaged Global Equity | | | | | 997,064 | | | | 114,810 | | | | 1,111,874 | |
F. Line of Credit Facility — As of February 28, 2021, the Portfolios participated in a $700,000,000 committed, unsecured revolving line of credit facility (the “facility”) together with other funds of the Trust and certain registered investment companies having management agreements with GSAM or its affiliates. This facility is to be used for temporary emergency purposes, or to allow for an orderly liquidation of securities to meet redemption requests. The interest rate on borrowings is based on the federal funds rate. The facility also requires a fee to be paid by the Portfolios based on the amount of the commitment that has not been utilized. For the six months ended February 28, 2021, the Portfolios did not have any borrowings under the facility.
26
GOLDMAN SACHS GLOBAL TAX-AWARE EQUITY PORTFOLIOS
|
| 5. AGREEMENTS AND AFFILIATED TRANSACTIONS (continued) |
G. Other Transactions with Affiliates — The Portfolios invest primarily in Class R6 Shares of the Underlying Funds. These Underlying Funds are considered to be affiliated with the Portfolios. The tables below show the transactions in and earnings from investments in these Underlying Funds for the six months ended February 28, 2021:
| | | | | | | | | | | | | | | | | | | | | | | | | | | | | | | | | | | | | | | | |
|
| Enhanced Dividend Global Equity | |
| Underlying Funds | | Beginning Value as
of August 31,
2020 | | | Purchases
at Cost | | | Proceeds
from Sales | | | Return of
Capital on
Dividends | | | Net Realized
Gain/(Loss)
from Affiliated
Investment
Companies | | | Change in
Unrealized
Appreciation/
(Depreciation) | | | Ending Value as
of February 28,
2021 | | | Shares as of
February 28,
2021 | | | Dividend
Income from
Affiliated
Investment
Companies | | | Capital Gain
Distributions
from
Affiliated
Investment
Companies | |
Goldman Sachs Emerging Markets Equity Insights Fund | | $ | 25,446,938 | | | $ | 652,338 | | | $ | (7,072,708 | ) | | $ | — | | | $ | 1,994,256 | | | $ | 3,397,142 | | | $ | 24,417,966 | | | | 1,969,191 | | | $ | 308,683 | | | $ | — | |
Goldman Sachs Financial Square Government Fund (Institutional Shares) | | | 514,765 | | | | 80,428,595 | | | | (76,919,939 | ) | | | — | | | | — | | | | — | | | | 4,023,421 | | | | 4,023,421 | | | | 167 | | | | — | |
Goldman Sachs Global Infrastructure Fund | | | 10,278,772 | | | | 1,466,374 | | | | (1,815,403 | ) | | | (37,647 | ) | | | 52,908 | | | | (27,857 | ) | | | 9,917,147 | | | | 865,371 | | | | 85,919 | | | | — | |
Goldman Sachs Global Real Estate Securities Fund | | | 10,759,811 | | | | 552,939 | | | | (1,815,400 | ) | | | (5,015 | ) | | | (51,095 | ) | | | 948,393 | | | | 10,389,633 | | | | 994,223 | | | | 61,404 | | | | 23,712 | |
Goldman Sachs International Equity Dividend and Premium Fund | | | 100,181,603 | | | | 3,033,348 | | | | (18,653,615 | ) | | | (50,504 | ) | | | 631,442 | | | | 8,757,650 | | | | 93,899,924 | | | | 13,281,460 | | | | 1,562,250 | | | | — | |
Goldman Sachs International Small Cap Insights Fund | | | 16,732,048 | | | | 933,800 | | | | (2,859,862 | ) | | | — | | | | 372,942 | | | | 1,865,268 | | | | 17,044,196 | | | | 1,308,073 | | | | 322,519 | | | | — | |
Goldman Sachs MLP Energy Infrastructure Fund | | | 10,116,597 | | | | 1,901,840 | | | | (3,205,403 | ) | | | (233,555 | ) | | | (1,314,374 | ) | | | 4,097,747 | | | | 11,362,852 | | | | 562,796 | | | | 205,475 | (a) | | | — | |
Goldman Sachs Small Cap Equity Insights Fund | | | 36,379,358 | | | | 1,185,669 | | | | (10,734,063 | ) | | | — | | | | 4,169,910 | | | | 7,108,274 | | | | 38,109,148 | | | | 1,158,685 | | | | 220,186 | | | | — | |
Goldman Sachs Tactical Tilt Overlay Fund | | | 42,708,276 | | | | 9,423,309 | | | | (7,791,427 | ) | | | — | | | | 57,559 | | | | 455,428 | | | | 44,853,145 | | | | 4,494,303 | | | | 2,117,479 | | | | — | |
Goldman Sachs US Equity Dividend and Premium Fund | | | 209,334,068 | | | | 17,446,655 | | | | (39,247,248 | ) | | | (14,366 | ) | | | 4,700,379 | | | | 1,956,179 | | | | 194,175,667 | | | | 13,465,719 | | | | 1,581,781 | | | | 10,793,054 | |
| | | | | | | | | | |
Total | | $ | 462,452,236 | | | $ | 117,024,867 | | | $ | (170,115,068 | ) | | $ | (341,087 | ) | | $ | 10,613,927 | | | $ | 28,558,224 | | | $ | 448,193,099 | | | | | | | $ | 6,465,863 | | | $ | 10,816,766 | |
| (a) | | Amount includes return of capital distributions of $233,555, a portion of which represents the difference between the estimated amount related to the fiscal year ended August 31, 2020 and the final amount recorded during the period ended February 28, 2021. |
27
GOLDMAN SACHS GLOBAL TAX-AWARE EQUITY PORTFOLIOS
Notes to Financial Statements (continued)
February 28, 2021 (Unaudited)
|
| 5. AGREEMENTS AND AFFILIATED TRANSACTIONS (continued) |
| | | | | | | | | | | | | | | | | | | | | | | | | | | | | | | | | | | | | | | | |
|
| Tax-Advantaged Global Equity | |
| Underlying Funds | | Beginning
Value as
of August 31,
2020 | | | Purchases
at Cost | | | Proceeds
from Sales | | | Return of
Capital on
Dividends | | | Net Realized
Gain/(Loss)
from
Affiliated
Investment
Companies | | |
Change in
Unrealized
Appreciation/
(Depreciation) | | | Ending Value as
of February 28,
2021 | | |
Shares as of
February 28,
2021 | | | Dividend
Income from
Affiliated
Investment
Companies | | | Capital Gain
Distributions
from
Affiliated
Investment
Companies | |
Goldman Sachs Emerging Markets Equity Insights Fund | | $ | 148,158,919 | | | $ | 7,886,380 | | | $ | (20,013,207 | ) | | $ | — | | | $ | 2,607,663 | | | $ | 29,853,068 | | | $ | 168,492,823 | | | | 13,588,131 | | | $ | 1,924,809 | | | $ | — | |
Goldman Sachs Financial Square Government Fund (Institutional Shares) | | | 4,042,158 | | | | 544,815,430 | | | | (516,927,223 | ) | | | — | | | | — | | | | — | | | | 31,930,365 | | | | 31,930,365 | | | | 1,576 | | | | — | |
Goldman Sachs Global Infrastructure Fund | | | 59,940,656 | | | | 11,145,936 | | | | (1,682,228 | ) | | | (219,292 | ) | | | 1,541 | | | | (202,541 | ) | | | 68,984,072 | | | | 6,019,553 | | | | 525,791 | | | | — | |
Goldman Sachs Global Real Estate Securities Fund | | | 62,684,039 | | | | 4,735,858 | | | | (1,682,228 | ) | | | (28,256 | ) | | | (110,133 | ) | | | 5,754,223 | | | | 71,353,503 | | | | 6,828,086 | | | | 357,102 | | | | 149,649 | |
Goldman Sachs International Small Cap Insights Fund | | | 97,321,206 | | | | 9,786,431 | | | | (2,614,517 | ) | | | — | | | | (64,021 | ) | | | 13,583,725 | | | | 118,012,824 | | | | 9,057,009 | | | | 1,985,646 | | | | — | |
Goldman Sachs International Tax-Managed Equity Fund | | | 593,013,649 | | | | 34,109,275 | | | | (37,990,611 | ) | | | — | | | | 771,897 | | | | 62,176,221 | | | | 652,080,431 | | | | 57,859,843 | | | | 9,460,627 | | | | — | |
Goldman Sachs MLP Energy Infrastructure Fund | | | 58,886,596 | | | | 14,072,518 | | | | (10,132,228 | ) | | | (1,444,161 | ) | | | (5,347,405 | ) | | | 22,363,612 | | | | 78,398,932 | | | | 3,883,058 | | | | 1,417,505 | (a) | | | — | |
Goldman Sachs Tactical Tilt Overlay Fund | | | 248,920,435 | | | | 67,004,072 | | | | (7,219,860 | ) | | | — | | | | (119,786 | ) | | | 3,447,068 | | | | 312,031,929 | | | | 31,265,724 | | | | 13,287,029 | | | | — | |
Goldman Sachs US Tax-Managed Equity Fund | | | 1,475,649,105 | | | | 69,470,153 | | | | (75,111,744 | ) | | | (1,839,036 | ) | | | 14,476,070 | | | | 121,119,973 | | | | 1,603,764,521 | | | | 51,651,031 | | | | 9,118,975 | | | | — | |
| | | | | | | | | | |
Total | | $ | 2,748,616,763 | | | $ | 763,026,053 | | | $ | (673,373,846 | ) | | $ | (3,530,745 | ) | | $ | 12,215,826 | | | $ | 258,095,349 | | | $ | 3,105,049,400 | | | | | | | $ | 38,079,060 | | | $ | 149,649 | |
| (a) | | Amount includes return of capital distributions of $1,444,161, a portion of which represents the difference between the estimated amount related to the fiscal year ended August 31, 2020 and the final amount recorded during the period ended February 28, 2021. |
28
GOLDMAN SACHS GLOBAL TAX-AWARE EQUITY PORTFOLIOS
|
| 5. AGREEMENTS AND AFFILIATED TRANSACTIONS (continued) |
As of February 28, 2021, the Portfolios were beneficial owners of 5% or more of total outstanding shares of the following Funds:
| | | | | | | | | | |
| Underlying Funds | | | | Enhanced Dividend
Global Equity | | | Tax-Advantaged
Global Equity | |
Goldman Sachs Emerging Markets Equity Insights Fund | | | | | — | % | | | 9 | % |
Goldman Sachs Global Infrastructure Fund | | | | | 5 | | | | 38 | |
Goldman Sachs Global Real Estate Securities Fund | | | | | 6 | | | | 40 | |
Goldman Sachs International Equity Dividend and Premium Fund | | | | | 50 | | | | — | |
Goldman Sachs International Tax-Managed Equity Fund | | | | | — | | | | 87 | |
Goldman Sachs MLP Energy Infrastructure Fund | | | | | — | | | | 7 | |
Goldman Sachs Small Cap Equity Insights Fund | | | | | 7 | | | | — | |
Goldman Sachs Tactical Tilt Overlay Fund | | | | | — | | | | 9 | |
Goldman Sachs U.S. Equity Dividend and Premium Fund | | | | | 7 | | | | — | |
Goldman Sachs U.S. Tax-Managed Equity Fund | | | | | — | | | | 83 | |
As of February 28, 2021, The Goldman Sachs Group, Inc. was the beneficial owner of the following share class of the Portfolios:
| | | | |
| Portfolio | | Class R6 | |
Enhanced Dividend Global Equity | | | 100 | % |
|
| 6. PORTFOLIO SECURITIES TRANSACTIONS |
The cost of purchases and proceeds from sales and maturities of long-term securities for the six months ended February 28, 2021 were as follows:
| | | | | | | | | | |
| Portfolio | | | | Purchases | | | Sales | |
Enhanced Dividend Global Equity | | | | $ | 36,596,271 | | | $ | 93,195,129 | |
Tax-Advantaged Global Equity | | | | | 218,210,622 | | | | 180,447,423 | |
As of the Portfolios’ most recent fiscal year end, August 31, 2020, the Portfolios’ capital loss carryforwards and certain timing differences, on a tax-basis were as follows:
| | | | | | | | |
| | | Enhanced Dividend
Global Equity | | | Tax-Advantaged Global Equity | |
Capital Loss carryforwards | | | | | | | | |
Perpetual Short-term | | $ | — | | | $ | (771,723 | ) |
Perpetual Long-Term | | | — | | | | (1,074,750 | ) |
Total capital loss carryforwards | | $ | — | | | $ | (1,846,473 | ) |
Timing differences (Post October Loss Deferral, Late Year Ordinary Loss Deferral) | | $ | (2,949,263 | ) | | $ | (28,873,902 | ) |
29
GOLDMAN SACHS GLOBAL TAX-AWARE EQUITY PORTFOLIOS
Notes to Financial Statements (continued)
February 28, 2021 (Unaudited)
|
| 7. TAX INFORMATION (continued) |
As of February 28, 2021, the Portfolios’ aggregate security unrealized gains and losses based on cost for U.S. federal income tax purposes were as follows:
| | | | | | | | |
| | | Enhanced Dividend
Global Equity | | | Tax-Advantaged
Global Equity | |
Tax cost | | $ | 340,477,151 | | | $ | 1,952,674,060 | |
Gross unrealized gain | | | 134,441,304 | | | | 1,156,540,108 | |
Gross unrealized loss | | | (26,725,356 | ) | | | (4,164,769 | ) |
Net unrealized gain | | $ | 107,715,948 | | | $ | 1,152,375,339 | |
The difference between GAAP-basis and tax-basis unrealized gains (losses) is attributable primarily to wash sales, net mark to market gains (losses) on regulated futures and net mark to market gains (loss) on foreign currency contracts.
GSAM has reviewed the Portfolios’ tax positions for all open tax years (the current and prior three years, as applicable) and has concluded that no provision for income tax is required in the Portfolios’ financial statements. Such open tax years remain subject to examination and adjustment by tax authorities.
The Portfolios’ and Underlying Funds’ risks include, but are not limited to, the following:
Derivatives Risk — The Portfolios’ use of derivatives may result in loss. Derivative instruments, which may pose risks in addition to and greater than those associated with investing directly in securities, currencies or other instruments, may be illiquid or less liquid, volatile, difficult to price and leveraged so that small changes in the value of the underlying instruments may produce disproportionate losses to the Portfolios. Derivatives are also subject to counterparty risk, which is the risk that the other party in the transaction will not fulfill its contractual obligation. The use of derivatives is a highly specialized activity that involves investment techniques and risks different from those associated with investments in more traditional securities and instruments. Losses from derivatives can also result from a lack of correlation between changes in the value of derivative instruments and the portfolio assets (if any) being hedged.
Dividend-Paying Investments Risk — A Portfolio’s investments in dividend-paying securities could cause a Portfolio to underperform other funds. Securities that pay dividends, as a group, can fall out of favor with the market, causing such securities to underperform securities that do not pay dividends. Depending upon market conditions and political and legislative responses to such conditions, dividend-paying securities that meet a Portfolio’s investment criteria may not be widely available and/or may be highly concentrated in only a few market sectors. In addition, issuers that have paid regular dividends or distributions to shareholders may not continue to do so at the same level or at all in the future. This may limit the ability of a Portfolio to produce current income.
Energy Sector Risk — The Underlying MLP Fund concentrates its investments in the energy sector, and will therefore be susceptible to adverse economic, environmental, business, regulatory or other occurrences affecting that sector. The energy sector has historically experienced substantial price volatility. MLPs and other companies operating in the energy sector are subject to specific risks, including, among others: fluctuations in commodity prices; reduced consumer demand for commodities such as oil, natural gas or petroleum products; reduced availability of natural gas or other commodities for transporting, processing, storing or delivering; slowdowns in new construction; extreme weather or other natural disasters; and threats of attack by terrorists on energy assets. Additionally, changes in the regulatory environment for energy companies may adversely impact their profitability. Over time, depletion of natural gas reserves and other energy reserves may also affect the profitability of energy companies.
Foreign and Emerging Countries Risk — Investing in foreign markets may involve special risks and considerations not typically associated with investing in the U.S. Foreign securities may be subject to risk of loss because of more or less foreign
30
GOLDMAN SACHS GLOBAL TAX-AWARE EQUITY PORTFOLIOS
|
| 8. OTHER RISKS (continued) |
government regulation, less public information and less economic, political and social stability in the countries in which a Portfolio or an Underlying Fund invests. The imposition of exchange controls (including repatriation restrictions), confiscations of assets and property, trade restrictions (including tariffs) and other government restrictions by the U.S. or other governments, or problems with registration, settlement or custody, may also result in losses. Foreign risk also involves the risk of negative foreign currency rate fluctuations, which may cause the value of securities denominated in such foreign currency (or other instruments through which a Portfolio or an Underlying Fund has exposure to foreign currencies) to decline in value. Currency exchange rates may fluctuate significantly over short periods of time. To the extent that a Portfolio or an Underlying Fund also invests in securities of issuers located in emerging markets, these risks may be more pronounced.
Investments in Other Investment Companies Risk — As a shareholder of another investment company, a Portfolio will indirectly bear its proportionate share of any net management fees and other expenses paid by such other investment companies, in addition to the fees and expenses regularly borne by the Portfolio.
Investments in the Underlying Funds — The Portfolios invest primarily in a combination of Underlying Funds, and are subject to the risk factors associated with the investments of those Underlying Funds in direct proportion to the amount of assets allocated to each. As of February 28, 2021, the Enhanced Dividend Global Equity Portfolio invested 43.3% and 20.9% of its net assets in the Goldman Sachs U.S. Equity Dividend and Premium Fund (the “U.S. Equity Dividend and Premium Fund”) and the Goldman Sachs International Equity Dividend and Premium Fund (the “International Equity Dividend and Premium Fund”), respectively. Because of the high concentration of its assets in these Underlying Funds, the Enhanced Dividend Global Equity Portfolio has greater exposure to the risks associated with these Underlying Funds than it does to the risks associated with the other Underlying Funds in which it invests. The U.S. Equity Dividend and Premium Fund invests primarily in dividend paying equity investments in large-capitalization U.S. issuers, with public stock market capitalizations within the range of the market capitalization of the S&P 500® Index at the time of investment. This Underlying Fund expects that, under normal circumstances, it will write (sell) call options on the S&P 500® Index or related exchange-traded funds in an amount that is between 20% and 75% of the value of its portfolio. The International Equity Dividend and Premium Fund invests primarily in dividend-paying equity investments in non-U.S. issuers with public stock market capitalizations within the range of capitalization of the Morgan Stanley Capital International (“MSCI”) Europe, Australasia, Far East (“EAFE”) Index (“MSCI EAFE Index”) at the time of investment. This Underlying Fund expects that, under normal circumstances, it will write (sell) call options on the MSCI EAFE Index, other national or regional stock market indices or related exchange-traded funds in an amount that is between 20% and 75% of the value of its portfolio.
As of February 28, 2021, the Tax-Advantaged Global Equity Portfolio invested 51.6% and 20.9% of its net assets in the Goldman Sachs U.S. Tax-Managed Equity Fund (the “U.S. Tax-Managed Equity Fund”) and the Goldman Sachs International Tax-Managed Equity Fund (the “International Tax-Managed Equity Fund”), respectively. Because of the high concentration of its assets in these Underlying Funds, the Tax-Advantaged Global Equity Portfolio has greater exposure to the risks associated with these Underlying Funds than it does to the risks associated with the other Underlying Funds in which it invests. The U.S. Tax-Managed Equity Fund invests primarily in equity investments in U.S. issuers. This Underlying Fund will seek to maintain risk, style, capitalization and industry characteristics similar to the Russell 3000 Index. The International Tax-Managed Equity Fund invests primarily in equity investments in non-U.S. issuers. This Underlying Fund will seek to maintain risk, style, capitalization and industry characteristics similar to the MSCI EAFE Index. The investment adviser may seek tax-efficiency by offsetting gains and losses, limiting portfolio turnover or selling high tax basis securities for both Underlying Funds.
The Portfolios do not invest in the Underlying Funds for the purpose of exercising management or control; however, investments by the Portfolios within their principal investment strategies may represent a significant portion of an Underlying Fund’s net assets.
Large Shareholder Transactions Risk — A Portfolio or an Underlying Fund may experience adverse effects when certain large shareholders, such as other funds, institutional investors (including those trading by use of non-discretionary mathematical formulas), financial intermediaries (who may make investment decisions on behalf of underlying clients and/or include a Portfolio or an Underlying Fund in their investment model), individuals, accounts and Goldman Sachs affiliates, purchase or redeem large amounts of shares of a Portfolio or an Underlying Fund. Such large shareholder redemptions, which may occur rapidly or
31
GOLDMAN SACHS GLOBAL TAX-AWARE EQUITY PORTFOLIOS
Notes to Financial Statements (continued)
February 28, 2021 (Unaudited)
|
| 8. OTHER RISKS (continued) |
unexpectedly, may cause a Portfolio or an Underlying Fund to sell portfolio securities at times when it would not otherwise do so, which may negatively impact a Portfolio’s or an Underlying Fund’s NAV and liquidity. These transactions may also accelerate the realization of taxable income to shareholders if such sales of investments resulted in gains, and may also increase transaction costs. In addition, a large redemption could result in a Portfolio’s or an Underlying Fund’s current expenses being allocated over a smaller asset base, leading to an increase in the Portfolio’s or the Underlying Fund’s expense ratio. Similarly, large Portfolio or Underlying Fund share purchases may adversely affect a Portfolio’s or an Underlying Fund’s performance to the extent that the Portfolio or the Underlying Fund is delayed in investing new cash or otherwise maintains a larger cash position than it ordinarily would.
Liquidity Risk — A Portfolio or an Underlying Fund may make investments that are illiquid or that may become less liquid in response to market developments or adverse investor perceptions. Illiquid investments may be more difficult to value. Liquidity risk may also refer to the risk that a Portfolio or Underlying Fund will not be able to pay redemption proceeds within the allowable time period or without significant dilution to remaining investors’ interests because of unusual market conditions, an unusually high volume of redemption requests, or other reasons. To meet redemption requests, a Portfolio or Underlying Fund may be forced to sell investments at an unfavorable time and/or under unfavorable conditions. If a Portfolio or Underlying Fund is forced to sell securities at an unfavorable time and/or under unfavorable conditions, such sales may adversely affect the Portfolio’s or Underlying Fund’s NAV and dilute remaining investors’ interests. Liquidity risk may be the result of, among other things, the reduced number and capacity of traditional market participants to make a market in fixed income securities or the lack of an active market. The potential for liquidity risk may be magnified by a rising interest rate environment or other circumstances where investor redemptions from fixed income mutual funds may be higher than normal, potentially causing increased supply in the market due to selling activity. These risks may be more pronounced in connection with a Portfolio’s investments in securities of issuers located in emerging market countries. Redemptions by large shareholders may have a negative impact on a Portfolio’s or Underlying Fund’s liquidity.
Market and Credit Risks — In the normal course of business, a Portfolio and an Underlying Fund trade financial instruments and enter into financial transactions where risk of potential loss exists due to changes in the market (market risk). The value of the securities in which a Portfolio and/or an Underlying Fund invests may go up or down in response to the prospects of individual companies, particular sectors or governments and/or general economic conditions throughout the world due to increasingly interconnected global economies and financial markets. Events such as war, acts of terrorism, social unrest, natural disasters, the spread of infectious illness or other public health threats could also significantly impact a Portfolio and/or an Underlying Fund and their investments. Additionally, a Portfolio and/or an Underlying Fund may also be exposed to credit risk in the event that an issuer or guarantor fails to perform or that an institution or entity with which the Portfolio and the Underlying Fund have unsettled or open transactions defaults.
Under the Trust’s organizational documents, its Trustees, officers, employees and agents are indemnified, to the extent permitted by the Act and state law, against certain liabilities that may arise out of performance of their duties to the Portfolios. Additionally, in the course of business, the Portfolios enter into contracts that contain a variety of indemnification clauses. The Portfolios’ maximum exposure under these arrangements is unknown, as this would involve future claims that may be made against the Portfolios that have not yet occurred. However, GSAM believes the risk of loss under these arrangements to be remote.
On October 22, 2020, Goldman Sachs announced a settlement of matters involving 1Malaysia Development Bhd. (1MDB), a Malaysian sovereign wealth fund, with the United States Department of Justice as well as criminal and civil authorities in the UK, Singapore and Hong Kong. Further information regarding the 1MDB settlement can be found at https://www.goldmansachs.com/media-relations/press-releases/current/goldman-sachs-2020-10-22.html. The 1MDB settlement will not materially adversely affect GSAM’s ability to serve as investment manager.
32
GOLDMAN SACHS GLOBAL TAX-AWARE EQUITY PORTFOLIOS
Subsequent events after the Statements of Assets and Liabilities date have been evaluated, and GSAM has concluded that there is no impact requiring adjustment or disclosure in the financial statements.
|
| 12. SUMMARY OF SHARE TRANSACTIONS |
Share activity is as follows:
| | | | | | | | | | | | | | | | |
| | | Enhanced Dividend Global Equity Portfolio | |
| | | For the Six Months Ended
February 28, 2021
(Unaudited) | | | For the Fiscal Year Ended
August 31, 2020 | |
| | | Shares | | | Dollars | | | Shares | | | Dollars | |
| | | | |
| Class A Shares | | | | | | | | | | | | | | | | |
Shares sold | | | 13,502 | | | $ | 170,305 | | | | 37,935 | | | $ | 429,619 | |
Reinvestment of distributions | | | 3,427 | | | | 42,142 | | | | 26,127 | | | | 304,108 | |
Shares redeemed | | | (186,242 | ) | | | (2,191,143 | ) | | | (349,960 | ) | | | (3,934,449 | ) |
| | | | (169,313 | ) | | | (1,978,696 | ) | | | (285,898 | ) | | | (3,200,722 | ) |
| Institutional Shares | | | | | | | | | | | | | | | | |
Shares sold | | | 87,167 | | | | 1,047,488 | | | | 100,714 | | | | 1,172,359 | |
Reinvestment of distributions | | | 14,751 | | | | 180,527 | | | | 61,169 | | | | 715,382 | |
Shares redeemed | | | (785,761 | ) | | | (9,717,141 | ) | | | (678,244 | ) | | | (7,424,170 | ) |
| | | | (683,843 | ) | | | (8,489,126 | ) | | | (516,361 | ) | | | (5,536,429 | ) |
| Class R6 Shares | | | | | | | | | | | | | | | | |
Reinvestment of distributions | | | 13 | | | | 152 | | | | 42 | | | | 487 | |
| | | | 13 | | | | 152 | | | | 42 | | | | 487 | |
| Class P Shares | | | | | | | | | | | | | | | | |
Shares sold | | | 1,606,465 | | | | 20,066,645 | | | | 2,177,793 | | | | 25,111,874 | |
Reinvestment of distributions | | | 481,474 | | | | 5,958,071 | | | | 2,213,900 | | | | 25,859,881 | |
Shares redeemed | | | (6,295,427 | ) | | | (80,522,493 | ) | | | (16,881,525 | ) | | | (175,745,356 | ) |
| | | | (4,207,488 | ) | | | (54,497,777 | ) | | | (12,489,832 | ) | | | (124,773,601 | ) |
| | | | |
NET DECREASE | | | (5,060,631 | ) | | $ | (64,965,447 | ) | | | (13,292,049 | ) | | $ | (133,510,265 | ) |
33
GOLDMAN SACHS GLOBAL TAX-AWARE EQUITY PORTFOLIOS
Notes to Financial Statements (continued)
February 28, 2021 (Unaudited)
|
| 12. SUMMARY OF SHARE TRANSACTIONS (continued) |
| | | | | | | | | | | | | | | | |
| | | Tax-Advantaged Global Equity Portfolio | |
| | | | |
| | | For the Six Months Ended
February 28, 2021
(Unaudited) | | | For the Fiscal Year Ended
August 31, 2020 | |
| | | | |
| | | Shares | | | Dollars | | | Shares | | | Dollars | |
| | | | |
| Class A Shares | | | | | | | | | | | | | | | | |
Shares sold | | | 131 | | | $ | 2,313 | | | | 94 | | | $ | 1,367 | |
Reinvestment of distributions | | | 232 | | | | 4,264 | | | | 280 | | | | 4,636 | |
Shares redeemed | | | (105 | ) | | | (1,961 | ) | | | (1,951 | ) | | | (29,834 | ) |
| | | | 258 | | | | 4,616 | | | | (1,577 | ) | | | (23,831 | ) |
| Institutional Shares | | | | | | | | | | | | | | | | |
Shares sold | | | 125,486 | | | | 2,117,787 | | | | 25,375 | | | | 373,510 | |
Reinvestment of distributions | | | 18,178 | | | | 336,299 | | | | 37,605 | | | | 626,183 | |
Shares redeemed | | | (528,356 | ) | | | (9,243,722 | ) | | | (905,538 | ) | | | (12,132,909 | ) |
| | | | (384,692 | ) | | | (6,789,636 | ) | | | (842,558 | ) | | | (11,133,216 | ) |
| Class R6 Shares | | | | | | | | | | | | | | | | |
Shares sold | | | 470,969 | | | | 8,072,405 | | | | — | | | | — | |
Reinvestment of distributions | | | 5,697 | | | | 103,968 | | | | 10 | | | | 158 | |
Shares redeemed | | | (2,342 | ) | | | (41,832 | ) | | | — | | | | — | |
| | | | 474,324 | | | | 8,134,541 | | | | 10 | | | | 158 | |
| Class P Shares | | | | | | | | | | | | | | | | |
Shares sold | | | 10,953,675 | | | | 199,550,519 | | | | 20,348,001 | | | | 306,998,930 | |
Reinvestment of distributions | | | 1,885,862 | | | | 34,416,974 | | | | 2,605,468 | | | | 42,818,729 | |
Shares redeemed | | | (7,849,934 | ) | | | (139,806,641 | ) | | | (42,560,000 | ) | | | (624,713,368 | ) |
| | | | 4,989,603 | | | | 94,160,852 | | | | (19,606,531 | ) | | | (274,895,709 | ) |
| | | | |
NET INCREASE (DECREASE) | | | 5,079,493 | | | $ | 95,510,373 | | | | (20,450,656 | ) | | $ | (286,052,598 | ) |
34
GOLDMAN SACHS GLOBAL TAX-AWARE EQUITY PORTFOLIOS
Liquidity Risk Management Program
Each Portfolio has adopted and implemented a liquidity risk management program (the “Program”) in accordance with Rule 22e-4 under the 1940 Act. The Program seeks to assess and manage each Portfolio’s liquidity risk, i.e., the risk that a Portfolio is unable to satisfy redemption requests without significantly diluting remaining investors’ interests in the Portfolio. The Board of Trustees of the Trust has designated GSAM, each Portfolio’s investment adviser, to administer the Program. Certain aspects of the Program rely on third parties to perform certain functions, including the provision of market data and application of models.
The Program is comprised of various components designed to support the assessment and/or management of liquidity risk, including: (1) the periodic assessment (no less frequently than annually) of certain factors that influence a Portfolio’s liquidity risk; (2) the periodic classification (no less frequently than monthly) of a Portfolio’s investments into one of four liquidity categories that reflect an estimate of their liquidity under current market conditions; (3) a 15% limit on the acquisition of “illiquid investments” (as defined under Rule 22e-4); (4) for a Portfolio that does not invest primarily in “highly liquid investments” (as defined under Rule 22e-4), the determination of a minimum percentage of the Portfolio’s assets that will generally be invested in highly liquid investments (a “Highly Liquid Investment Minimum”); and (5) periodic reporting to the Board of Trustees.
At a meeting of the Board of Trustees on February 2-3, 2021, GSAM provided a written report to the Board addressing the operation, and the adequacy and effectiveness of the implementation, of the Program, including, as applicable, the operation of any Highly Liquid Investment Minimum and any material changes to the Program, for the period from January 1, 2020 through December 31, 2020 (the “Reporting Period”). Among other things, the annual report and related materials discussed: (1) the results of stress tests designed to assess liquidity under a hypothetical stressed scenario involving elevated redemptions; (2) an assessment of the methodologies used to classify investments into one of four liquidity categories; and (3) the impact of the COVID-19 pandemic on liquidity and management of liquidity risk during the Reporting Period, including during stressed market conditions caused by the COVID-19 pandemic. The report concluded that the Program continues to be reasonably designed to assess and manage liquidity risk and was adequately and effectively implemented during the Reporting Period.
There can be no assurance that the Program will achieve its objectives under all circumstances in the future. Please refer to your Portfolio’s prospectus for more information regarding the Portfolio’s exposure to liquidity risk and other risks to which it may be subject.
35
GOLDMAN SACHS GLOBAL TAX-AWARE EQUITY PORTFOLIOS
| | |
| | |
Portfolio Expenses — Six Month Period Ended February 28, 2021 (Unaudited) | | |
As a shareholder of Class A, Institutional, Class R6 or Class P Shares of a Portfolio, you incur two types of costs: (1) transaction costs, including sales charges on purchase payments (with respect to Class A Shares), and (2) ongoing costs, including management fees; distribution and/or service (12b-1) fees (with respect to Class A Shares); and other Portfolio expenses. This example is intended to help you understand your ongoing costs (in dollars) of investing in Class A, Institutional, Class R6 and Class P Shares of the Portfolios and to compare these costs with the ongoing costs of investing in other mutual funds.
The example is based on an investment of $1,000 invested at the beginning of the period and held for the entire period from September 1, 2020 through February 28, 2021, which represents a period of 181 days of a 365 day year.
Actual Expenses — The first line under each share class in the table below provides information about actual account values and actual expenses. You may use the information in this line, together with the amount you invested, to estimate the expenses that you paid over the period. Simply divide your account value by $1,000 (for example, an $8,600 account value divided by $1,000=8.6), then multiply the result by the number in the first line under the heading entitled “Expenses Paid” to estimate the expenses you paid on your account during this period.
Hypothetical Example for Comparison Purposes — The second line under each share class in the table below provides information about hypothetical account values and hypothetical expenses based on the Portfolios’ actual net expense ratios and an assumed rate of return of 5% per year before expenses, which is not the Portfolios’ actual return. The hypothetical account values and expenses may not be used to estimate the actual ending account balance or expenses you paid for the period. You may use this information to compare the ongoing costs of investing in the Portfolios and other funds. To do so, compare this 5% hypothetical example with the 5% hypothetical examples that appear in the shareholder reports of the other funds.
Please note that the expenses shown in the table are meant to highlight your ongoing costs only and do not reflect any transactional costs, such as sales charges, redemption fees, or exchange fees and do not include expenses of Underlying Funds in which the Portfolios invest. Therefore, the second line of the table is useful in comparing ongoing costs only and will not help you determine the relative total costs of owning different funds. In addition, if these transactional costs were included, your costs would have been higher.
| | | | | | | | | | | | | | | | | | | | | | | | |
| | | Enhanced Dividend Global Equity Portfolio | | | Tax-Advantaged Global Equity Portfolio | |
| Share Class | | Beginning
Account Value
9/01/20 | | | Ending
Account Value
2/28/21 | | | Expenses
Paid for the
6 Months
Ended
2/28/21* | | | Beginning
Account Value
9/01/20 | | | Ending
Account Value
2/28/21 | | | Expenses
Paid for the
6 Months
Ended
2/28/21* | |
| Class A | | | | | | | | | | | | | | | | | | | | | | | | |
Actual | | $ | 1,000 | | | $ | 1,125.00 | | | $ | 2.63 | | | $ | 1,000 | | | $ | 1,110.10 | | | $ | 2.62 | |
Hypothetical 5% return | | | 1,000 | | | | 1,022.32 | + | | | 2.51 | | | | 1,000 | | | | 1,022.32 | + | | | 2.51 | |
| Institutional | | | | | | | | | | | | | | | | | | | | | | | | |
Actual | | | 1,000 | | | | 1,126.50 | | | | 0.69 | | | | 1,000 | | | | 1,112.10 | | | | 0.68 | |
Hypothetical 5% return | | | 1,000 | | | | 1,024.15 | + | | | 0.65 | | | | 1,000 | | | | 1,024.15 | + | | | 0.65 | |
| Class R6 | | | | | | | | | | | | | | | | | | | | | | | | |
Actual | | | 1,000 | | | | 1,126.00 | | | | 0.69 | | | | 1,000 | | | | 1,112.90 | | | | 0.63 | |
Hypothetical 5% return | | | 1,000 | | | | 1,024.15 | + | | | 0.65 | | | | 1,000 | | | | 1,024.20 | + | | | 0.60 | |
| Class P | | | | | | | | | | | | | | | | | | | | | | | | |
Actual | | | 1,000 | | | | 1,126.10 | | | | 0.63 | | | | 1,000 | | | | 1,112.70 | | | | 0.63 | |
Hypothetical 5% return | | | 1,000 | | | | 1,024.20 | + | | | 0.60 | | | | 1,000 | | | | 1,024.20 | + | | | 0.60 | |
| | + | | Hypothetical expenses are based on each Portfolio’s actual annualized net expense ratios and an assumed rate of return of 5% per year before expenses. | |
| | * | | Expenses are calculated using each Portfolio’s annualized net expense ratio for each class, which represents the ongoing expenses as a percentage of net assets for the six months ended February 28, 2021. Expenses are calculated by multiplying the annualized net expense ratio by the average account value for the period; then multiplying the result by the number of days in the most recent fiscal half year; and then dividing that result by the number of days in the fiscal year. The annualized net expense ratios for the period were as follows: | |
| | | | | | | | | | | | | | | | |
| Portfolio | | Class A | | | Institutional | | | Class R6 | | | Class P | |
Enhanced Dividend Global Equity | | | 0.50 | % | | | 0.13 | % | | | 0.13 | % | | | 0.12 | % |
| | | | |
Tax-Advantaged Global Equity | | | 0.50 | | | | 0.13 | | | | 0.12 | | | | 0.12 | |
36
FUNDS PROFILE
Goldman Sachs Funds
Goldman Sachs is a premier financial services firm, known since 1869 for creating thoughtful and customized investment solutions in complex global markets.
Today, the Asset Management Division of Goldman Sachs serves a diverse set of clients worldwide, including private institutions, public entities and individuals. With approximately $1.95 trillion in assets under supervision as of December 31, 2020, Goldman Sachs Asset Management (“GSAM”) has portfolio management teams located around the world and our investment professionals bring firsthand knowledge of local markets to every investment decision. Assets under supervision includes assets under management and other client assets for which Goldman Sachs does not have full discretion. GSAM leverages the resources of Goldman Sachs & Co. LLC subject to legal, internal and regulatory restrictions.
Money Market
Financial Square FundsSM
| ∎ | | Financial Square Treasury Solutions Fund1 |
| ∎ | | Financial Square Government Fund1 |
| ∎ | | Financial Square Money Market Fund2 |
| ∎ | | Financial Square Prime Obligations Fund2 |
| ∎ | | Financial Square Treasury Instruments Fund1 |
| ∎ | | Financial Square Treasury Obligations Fund1 |
| ∎ | | Financial Square Federal Instruments Fund1 |
Investor FundsSM
| ∎ | | Investor Money Market Fund3 |
| ∎ | | Investor Tax-Exempt Money Market Fund3 |
Fixed Income
Short Duration and Government
| ∎ | | High Quality Floating Rate Fund |
| ∎ | | Short-Term Conservative Income Fund |
| ∎ | | Short Duration Government Fund |
| ∎ | | Short Duration Income Fund |
| ∎ | | Inflation Protected Securities Fund |
Multi-Sector
| ∎ | | Global Core Fixed Income Fund4 |
Municipal and Tax-Free
| ∎ | | High Yield Municipal Fund |
| ∎ | | Dynamic Municipal Income Fund |
| ∎ | | Short Duration Tax-Free Fund |
| ∎ | | Municipal Income Completion Fund |
Single Sector
| ∎ | | Investment Grade Credit Fund |
| ∎ | | High Yield Floating Rate Fund |
| ∎ | | Emerging Markets Debt Fund |
| ∎ | | Local Emerging Markets Debt Fund |
Fixed Income Alternatives
| ∎ | | Long Short Credit Strategies Fund |
Fundamental Equity
| ∎ | | Small/Mid Cap Value Fund |
| ∎ | | Small/Mid Cap Growth Fund |
| ∎ | | Concentrated Growth Fund |
| ∎ | | Technology Opportunities Fund |
| ∎ | | Growth Opportunities Fund |
| ∎ | | Rising Dividend Growth Fund |
Tax-Advantaged Equity
| ∎ | | U.S. Tax-Managed Equity Fund |
| ∎ | | International Tax-Managed Equity Fund |
| ∎ | | U.S. Equity Dividend and Premium Fund |
| ∎ | | International Equity Dividend and Premium Fund |
Equity Insights
| ∎ | | Small Cap Equity Insights Fund |
| ∎ | | U.S. Equity Insights Fund |
| ∎ | | Small Cap Growth Insights Fund |
| ∎ | | Large Cap Growth Insights Fund |
| ∎ | | Large Cap Value Insights Fund |
| ∎ | | Small Cap Value Insights Fund |
| ∎ | | International Small Cap Insights Fund |
| ∎ | | International Equity Insights Fund |
| ∎ | | Emerging Markets Equity Insights Fund |
Fundamental Equity International
| ∎ | | International Equity Income Fund |
| ∎ | | International Equity ESG Fund |
| ∎ | | Emerging Markets Equity Fund |
| ∎ | | ESG Emerging Markets Equity Fund |
Alternative
| ∎ | | Clean Energy Income Fund |
| ∎ | | Real Estate Securities Fund |
| ∎ | | International Real Estate Securities Fund |
| ∎ | | Commodity Strategy Fund |
| ∎ | | Global Real Estate Securities Fund |
| ∎ | | Alternative Premia Fund |
| ∎ | | Absolute Return Tracker Fund |
| ∎ | | Managed Futures Strategy Fund |
| ∎ | | MLP Energy Infrastructure Fund |
| ∎ | | Energy Infrastructure Fund6 |
| ∎ | | Multi-Manager Alternatives Fund |
| ∎ | | Global Infrastructure Fund |
Total Portfolio Solutions
| ∎ | | Global Managed Beta Fund |
| ∎ | | Multi-Manager Non-Core Fixed Income Fund |
| ∎ | | Multi-Manager Global Equity Fund |
| ∎ | | Multi-Manager International Equity Fund |
| ∎ | | Tactical Tilt Overlay Fund |
| ∎ | | Balanced Strategy Portfolio |
| ∎ | | Multi-Manager U.S. Small Cap Equity Fund |
| ∎ | | Multi-Manager Real Assets Strategy Fund |
| ∎ | | Growth and Income Strategy Portfolio |
| ∎ | | Growth Strategy Portfolio |
| ∎ | | Dynamic Global Equity Fund |
| ∎ | | Satellite Strategies Portfolio |
| ∎ | | Enhanced Dividend Global Equity Portfolio |
| ∎ | | Tax-Advantaged Global Equity Portfolio |
| ∎ | | Strategic Factor Allocation Fund |
| ∎ | | Strategic Volatility Premium Fund |
| ∎ | | Target Date Retirement Portfolio |
| ∎ | | Target Date 2025 Portfolio |
| ∎ | | Target Date 2030 Portfolio |
| ∎ | | Target Date 2035 Portfolio |
| ∎ | | Target Date 2040 Portfolio |
| ∎ | | Target Date 2045 Portfolio |
| ∎ | | Target Date 2050 Portfolio |
| ∎ | | Target Date 2055 Portfolio |
| ∎ | | Target Date 2060 Portfolio |
| ∎ | | GQG Partners International Opportunities Fund |
| 1 | | You could lose money by investing in the Fund. Although the Fund seeks to preserve the value of your investment at $1.00 per share, it cannot guarantee it will do so. An investment in the Fund is not a deposit of a bank and is not insured or guaranteed by the Federal Deposit Insurance Corporation or any other government agency. The Fund’s sponsor has no legal obligation to provide financial support to the Fund, and you should not expect that the sponsor will provide financial support to the Fund at any time. |
| 2 | | You could lose money by investing in the Fund. Because the share price of the Fund will fluctuate, when you sell your shares they may be worth more or less than what you originally paid for them. The Fund may impose a fee upon sale of your shares or may temporarily suspend your ability to sell shares if the Fund’s liquidity falls below required minimums because of market conditions or other factors. An investment in the Fund is not a deposit of a bank and is not insured or guaranteed by the Federal Deposit Insurance Corporation or any other government agency. The Fund’s sponsor has no legal obligation to provide financial support to the Fund, and you should not expect that the sponsor will provide financial support to the Fund at any time. |
| 3 | | You could lose money by investing in the Fund. Although the Fund seeks to preserve the value of your investment at $1.00 per share, it cannot guarantee it will do so. The Fund may impose a fee upon sale of your shares or may temporarily suspend your ability to sell shares if the Fund’s liquidity falls below required minimums because of market conditions or other factors. An investment in the Fund is not a deposit of a bank and is not insured or guaranteed by the Federal Deposit Insurance Corporation or any other government agency. The Fund’s sponsor has no legal obligation to provide financial support to the Fund, and you should not expect that the sponsor will provide financial support to the Fund at any time. |
| 4 | | Effective after the close of business on April 30, 2020, the Goldman Sachs Global Income Fund was renamed the Goldman Sachs Global Core Fixed Income Fund. |
| 5 | | Effective after the close on business of August 30, 2020, the Goldman Sachs Blue Chip Fund was renamed the Goldman Sachs U.S. Equity ESG Fund. |
| 6 | | Effective after the close of business on June 26, 2020, the Goldman Sachs MLP & Energy Fund was renamed the Goldman Sachs Energy Infrastructure Fund. |
| | | Financial Square FundsSM and Investor FundsSM are registered service marks of Goldman Sachs & Co. LLC. |
| * | | This list covers open-end funds only. Please visit our website at www.GSAMFUNDS.com to learn about our closed-end funds and exchange-traded funds. |
| | |
TRUSTEES Jessica Palmer, Chair Dwight L. Bush Kathryn A. Cassidy Diana M. Daniels Joaquin Delgado James A. McNamara Roy W. Templin Gregory G. Weaver | | OFFICERS James A. McNamara, President Joseph F. DiMaria, Principal Financial Officer,
Principal Accounting Officer and Treasurer Caroline L. Kraus, Secretary |
| |
GOLDMAN SACHS & CO. LLC Distributor and Transfer Agent | | GOLDMAN SACHS ASSET MANAGEMENT, L.P. Investment Adviser |
Visit our web site at www.GSAMFUNDS.com to obtain the most recent month-end returns.
Goldman Sachs Asset Management, L.P., 200 West Street, New York, New York 10282
The reports concerning the Portfolios included in this shareholder report may contain certain forward-looking statements about the factors that may affect the performance of the Portfolios in the future. These statements are based on Portfolio management’s predictions and expectations concerning certain future events and their expected impact on the Portfolios, such as performance of the economy as a whole and of specific industry sectors, changes in the levels of interest rates, the impact of developing world events, and other factors that may influence the future performance of the Portfolios. Management believes these forward-looking statements to be reasonable, although they are inherently uncertain and difficult to predict. Actual events may cause adjustments in portfolio management strategies from those currently expected to be employed.
A description of the policies and procedures that the Portfolios use to determine how to vote proxies relating to portfolio securities and information regarding how a Portfolio voted proxies relating to portfolio securities during the most recent 12-month period ended June 30 is available (i) without charge, upon request by calling 1-800-526-7384 (for Retail Shareholders) or 1-800-621-2550 (for Institutional Shareholders); and (ii) on the Securities and Exchange Commission (“SEC”) web site at http://www.sec.gov.
The Portfolios will file portfolio holdings information for each month in a fiscal quarter within 60 days after the end of the relevant fiscal quarter on Form N-PORT. Portfolio holdings information for the third month of each fiscal quarter will be made available on the SEC’s web site at http://www.sec.gov. Portfolio holdings information may be obtained upon request and without charge by calling 1-800-526-7384 (for Retail Shareholders) or 1-800-621-2550 (for Institutional Shareholders).
Economic and market forecasts presented herein reflect our judgment as of the date of this report and are subject to change without notice. These forecasts do not take into account the specific investment objectives, restrictions, tax and financial situation or other needs of any specific client. Actual data will vary and may not be reflected here. These forecasts are subject to high levels of uncertainty that may affect actual performance. Accordingly, these forecasts should be viewed as merely representative of a broad range of possible outcomes. These forecasts are estimated, based on assumptions, and are subject to significant revision and may change materially as economic and market conditions change. Goldman Sachs has no obligation to provide updates or changes to these forecasts. Case studies and examples are for illustrative purposes only.
Goldman Sachs & Co. LLC (“Goldman Sachs”) does not provide legal, tax or accounting advice. Any statement contained in this communication (including any attachments) concerning U.S. tax matters was not intended or written to be used, and cannot be used, for the purpose of avoiding penalties under the Internal Revenue Code, and was written to support the promotion or marketing of the transaction(s) or matter(s) addressed. Clients of Goldman Sachs should obtain their own independent tax advice based on their particular circumstances.
Fund holdings and allocations shown are as of February 28, 2021 and may not be representative of future investments. Portfolio holdings should not be relied on in making investment decisions and should not be construed as research or investment advice regarding particular securities. Current and future holdings are subject to risk. Diversification does not protect an investor from market risk and does not ensure a profit.
This material is not authorized for distribution to prospective investors unless preceded or accompanied by a current Prospectus or summary prospectus, if applicable. Investors should consider a Portfolio’s objective, risks, and charges and expenses, and read the summary prospectus, if available, and/or the Prospectus carefully before investing or sending money. The summary prospectus, if available, and the Prospectus contain this and other information about a Portfolio and may be obtained from your authorized dealer or from Goldman Sachs & Co. LLC by calling (retail – 1-800-526-7384) (institutional – 1-800-621-2550).
Goldman Sachs & Co. LLC is the distributor of the Goldman Sachs Funds.
© 2021 Goldman Sachs. All rights reserved. 236968-OTU-1394673 TAGEDSAR-21
Goldman Sachs Funds

| | | | |
| | |
| Semi-Annual Report | | | | February 28, 2021 |
| | |
| | | | Allocation Funds |
| | | | Global Managed Beta Fund |
| | | | Strategic Factor Allocation Fund |
| | | | Tactical Tilt Overlay Fund |

Goldman Sachs Allocation Funds
| ∎ | | GLOBAL MANAGED BETA FUND |
| ∎ | | STRATEGIC FACTOR ALLOCATION FUND |
| ∎ | | TACTICAL TILT OVERLAY FUND |
| | | | |
| | | |
| NOT FDIC-INSURED | | May Lose Value | | No Bank Guarantee |
FUND BASICS
Global Managed Beta Fund
as of February 28, 2021
| | | | | | | | | | |
| | PERFORMANCE REVIEW | |
| | | |
| | | September 1, 2020–February 28, 2021 | | Fund Total Return
(based on NAV)1 | | | MSCI All Country World Index
Investable Market Index2 | |
| | | Institutional Shares | | | 15.61 | % | | | 14.72 | % |
| 1 | | The net asset value (“NAV”) represents the net assets of the class of the Fund (ex-dividend) divided by the total number of shares of the class outstanding. The Fund’s performance assumes the reinvestment of dividends and other distributions. The Fund’s performance does not reflect the deduction of any applicable sales charges. |
| 2 | | The MSCI All Country World Index Investable Market Index (Net, USD, 50% Non-US Developed Hedged to USD) captures large, mid and small cap representation across 23 developed markets and 27 emerging markets. With 8,939 constituents, the MSCI ACWI IMI is comprehensive, covering approximately 99% of the global equity investment opportunity set. As of February 28, 2021, the 23 developed markets in the MSCI ACWI IMI include Australia, Austria, Belgium, Canada, Denmark, Finland, France, Germany, Hong Kong, Ireland, Israel, Italy, Japan, Netherlands, New Zealand, Norway, Portugal, Singapore, Spain, Sweden, Switzerland, the U.K. and the U.S. The 26 emerging markets include Argentina, Brazil, Chile, China, Colombia, Czech Republic, Egypt, Greece, Hungary, India, Indonesia, Korea, Kuwait, Malaysia, Mexico, Pakistan, Peru, Philippines, Poland, Russia, Qatar, Saudi Arabia, South Africa, Taiwan, Thailand, Turkey and United Arab Emirates. It is not possible to invest directly in an index. |
The returns set forth in the table above represent past performance. Past performance does not guarantee future results. The Fund’s investment return and principal value will fluctuate so that an investor’s shares, when redeemed, may be worth more or less than their original cost. Current performance may be lower or higher than the performance quoted above. Please visit our web site at www.GSAMFUNDS.com to obtain the most recent month-end returns. Performance reflects applicable fee waivers and/or expense limitations in effect during the periods shown. In their absence, performance would be reduced. Returns do not reflect the deduction of taxes that a shareholder would pay on Fund distributions or the redemption of Fund shares.
1
FUND BASICS
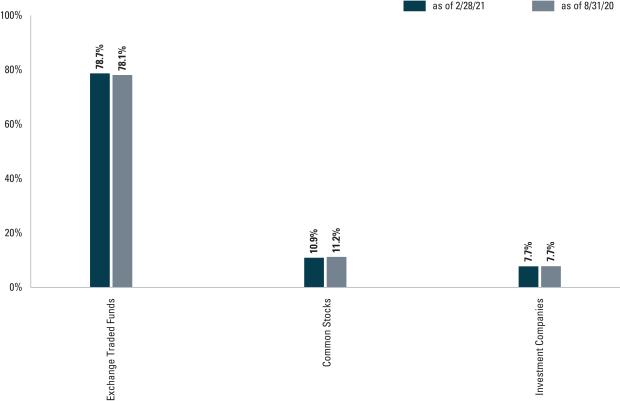
| 3 | | Underlying sector allocations of exchange traded funds and investment companies held by the Fund are not reflected in the graph above. The percentage shown for each investment category reflects the value of investments in that category as a percentage of net assets. Figures in the graph may not sum to 100% due to the exclusion of other assets and liabilities. The graph depicts the Fund’s investments but may not represent the Fund’s market exposure due to the exclusion of certain derivatives, if any, as listed in the Additional Investment Information section of the Consolidated Schedule of Investments. |
For more information about your Fund, please refer to www.GSAMFUNDS.com. There, you can learn more about your Fund’s investment strategies, holdings, and performance.
2
FUND BASICS
Strategic Factor Allocation Fund
as of February 28, 2021
| | | | | | | | | | | | | | | | | | |
| | PERFORMANCE REVIEW | |
| | | | | |
| | | September 1, 2020–February 28, 2021 | | Fund Total
Return
(based on NAV)1 | | | Strategic Factor
Allocation
Composite
Index2 | | | S&P 500®
Index3 | | | Bloomberg
Barclays U.S.
Aggregate Bond
Index4 | |
| | Institutional | | | 3.12 | % | | | 4.12 | % | | | 9.74 | % | | | -1.55 | % |
| | Class R6 | | | 3.14 | | | | 4.12 | | | | 9.74 | | | | -1.55 | |
| | | Class P | | | 3.14 | | | | 4.12 | | | | 9.74 | | | | -1.55 | |
| 1 | | The net asset value (“NAV”) represents the net assets of the class of the Fund (ex-dividend) divided by the total number of shares of the class outstanding. The Fund’s performance assumes the reinvestment of dividends and other distributions. The Fund’s performance does not reflect the deduction of any applicable sales charges. |
| 2 | | The Strategic Factor Allocation Composite Index is a blend of 50% the S&P 500® Index and 50% the Bloomberg Barclays U.S. Aggregate Bond Index. It is not possible to invest in an unmanaged index. |
| 3 | | The S&P 500® Index is the Standard & Poor’s Composite Index of 500 stocks, an unmanaged index of common stock prices. The index figure does not reflect any deduction for fees, expenses or taxes. It is not possible to invest directly in an index. |
| 4 | | The Bloomberg Barclays U.S. Aggregate Bond Index represents an unmanaged diversified portfolio of fixed income securities, including U.S. Treasuries, investment-grade corporate bonds and mortgage-backed and asset-backed securities. The index figure does not reflect any deduction for fees, expenses or taxes. It is not possible to invest directly in an index. |
The returns set forth in the table above represent past performance. Past performance does not guarantee future results. The Fund’s investment return and principal value will fluctuate so that an investor’s shares, when redeemed, may be worth more or less than their original cost. Current performance may be lower or higher than the performance quoted above. Please visit our web site at www.GSAMFUNDS.com to obtain the most recent month-end returns. Performance reflects applicable fee waivers and/or expense limitations in effect during the periods shown. In their absence, performance would be reduced. Returns do not reflect the deduction of taxes that a shareholder would pay on Fund distributions or the redemption of Fund shares.
| | | | | | | | | | |
| | HOLDINGS AS OF 2/28/21‡ | | | | | | | | |
| | | |
| | | Holding | | % of Net Assets | | | Line of Business | |
| | | Goldman Sachs Financial Square Government Fund — Institutional Shares | | | 77.1 | % | | | Investment Companies | |
| ‡ | | The holdings may not be representative of the Fund’s future investments. Figures in the table above may not sum to 100% due to the exclusion of other assets and liabilities. The holdings may not represent the Fund’s market exposure due to the exclusion of certain derivatives, if any, as listed in the Additional Investment Information section of the Schedule of Investments. |
For more information about your Fund, please refer to www.GSAMFUNDS.com. There, you can learn more about your Fund’s investment strategies, holdings, and performance.
3
FUND BASICS
Tactical Tilt Overlay Fund
as of February 28, 2021
| | | | | | | | | | |
| | PERFORMANCE REVIEW | |
| | | |
| | | September 1, 2020–February 28, 2021 | | Fund Total Return (based on NAV)1 | | | ICE® BofAML® U.S. Dollar Three- Month LIBOR Constant Maturity Index2 | |
| | | |
| | Institutional | | | 5.84 | % | | | 0.12 | % |
| | Class R6 | | | 5.77 | | | | 0.12 | |
| | | Class P | | | 5.76 | | | | 0.12 | |
| | 1 | | The net asset value (“NAV”) represents the net assets of the class of the Fund (ex-dividend) divided by the total number of shares of the class outstanding. The Fund’s performance assumes the reinvestment of dividends and other distributions. The Fund’s performance does not reflect the deduction of any applicable sales charges. |
| | 2 | | The ICE® BofAML® U.S. Dollar Three-Month LIBOR Constant Maturity Index (the “Index”) tracks the performance of a synthetic asset paying LIBOR to a stated maturity. The Index is based on the assumed purchase at par of a synthetic instrument having exactly its stated maturity and with a coupon equal to that day’s fixing rate. That issue is assumed to be sold the following day (priced at a yield equal to the current day fixing rate) and rolled into a new instrument. The Index figure does not reflect any deductions for fees, expenses or taxes. It is not possible to invest directly in an index. |
The returns set forth in the table above represent past performance. Past performance does not guarantee future results. The Fund’s investment return and principal value will fluctuate so that an investor’s shares, when redeemed, may be worth more or less than their original cost. Current performance may be lower or higher than the performance quoted above. Please visit our web site at www.GSAMFUNDS.com to obtain the most recent month-end returns. Performance reflects applicable fee waivers and/or expense limitations in effect during the periods shown. In their absence, performance would be reduced. Returns do not reflect the deductions of taxes that a shareholder would pay on Fund distributions or the redemption of Fund shares.
4
FUND BASICS
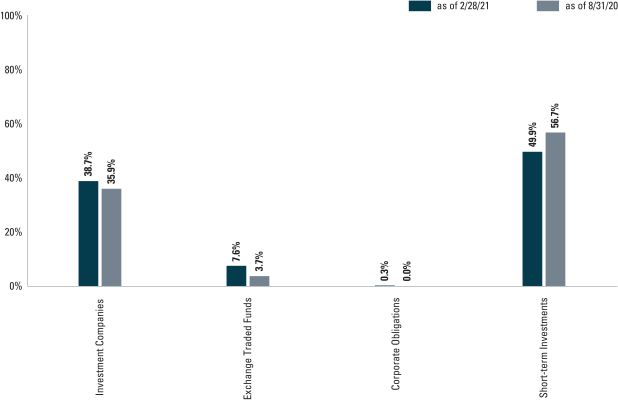
| 3 | | Underlying sector allocations of exchange traded funds and investment companies held by the Fund are not reflected in the graph above. The percentage shown for each investment category reflects the value of investments in that category as a percentage of net assets. Short-term investments represent certificates of deposit and commercial paper. Figures in the graph may not sum to 100% due to the exclusion of other assets and liabilities. Investments in the securities lending vehicle represented 0.5% of the Fund’s net assets as of February 28, 2021. The graph depicts the Fund’s investments but may not represent the Fund’s market exposure due to the exclusion of certain derivatives, if any, as listed in the Additional Investment Information section of the Consolidated Schedule of Investments. |
For more information about your Fund, please refer to www.GSAMFUNDS.com. There, you can learn more about your Fund’s investment strategies, holdings, and performance.
5
GOLDMAN SACHS GLOBAL MANAGED BETA FUND
Schedule of Investments
February 28, 2021 (Unaudited)
| | | | | | | | |
Shares | | | Description | | Value | |
|
| Common Stocks – 10.9% | |
| Aerospace & Defense – 0.1% | |
| | 5,896 | | | BAE Systems PLC | | $ | 39,910 | |
| | 222 | | | Elbit Systems Ltd. | | | 28,734 | |
| | 318 | | | General Dynamics Corp. | | | 51,984 | |
| | 171 | | | HEICO Corp. Class A | | | 19,795 | |
| | 814 | | | Huntington Ingalls Industries, Inc. | | | 143,191 | |
| | 643 | | | L3Harris Technologies, Inc. | | | 116,968 | |
| | 505 | | | Lockheed Martin Corp. | | | 166,776 | |
| | 782 | | | Northrop Grumman Corp. | | | 228,078 | |
| | 1,270 | | | Raytheon Technologies Corp. | | | 91,427 | |
| | 213 | | | Safran SA* | | | 29,035 | |
| | 224 | | | Teledyne Technologies, Inc.* | | | 83,104 | |
| | 3,850 | | | Textron, Inc. | | | 193,809 | |
| | 297 | | | Thales SA | | | 28,129 | |
| | 234 | | | The Boeing Co. | | | 49,610 | |
| | | | | | | | |
| | | | 1,270,550 | |
| | |
| Air Freight & Logistics – 0.1% | |
| | 2,891 | | | C.H. Robinson Worldwide, Inc. | | | 262,647 | |
| | 10,499 | | | Deutsche Post AG | | | 521,460 | |
| | 506 | | | DSV PANALPINA A/S | | | 92,548 | |
| | 1,049 | | | Expeditors International of Washington, Inc. | | | 96,340 | |
| | 841 | | | FedEx Corp. | | | 214,034 | |
| | 1,570 | | | SG Holdings Co. Ltd. | | | 36,049 | |
| | 1,555 | | | United Parcel Service, Inc. Class B | | | 245,426 | |
| | 2,164 | | | XPO Logistics, Inc.* | | | 252,322 | |
| | 2,846 | | | Yamato Holdings Co. Ltd. | | | 75,103 | |
| | | | | | | | |
| | | | 1,795,929 | |
| | |
| Auto Components – 0.0% | |
| | 605 | | | Aptiv PLC | | | 90,653 | |
| | 3,965 | | | BorgWarner, Inc. | | | 178,425 | |
| | 1,222 | | | Bridgestone Corp. | | | 48,274 | |
| | 235 | | | Cie Generale des Etablissements Michelin SCA | | | 33,979 | |
| | 636 | | | Denso Corp. | | | 38,424 | |
| | 299 | | | Koito Manufacturing Co. Ltd. | | | 20,089 | |
| | 311 | | | Lear Corp. | | | 51,654 | |
| | 1,244 | | | Magna International, Inc. | | | 104,781 | |
| | 735 | | | Stanley Electric Co. Ltd. | | | 21,928 | |
| | 1,887 | | | Sumitomo Electric Industries Ltd. | | | 27,648 | |
| | 1,259 | | | Toyoda Gosei Co. Ltd. | | | 32,923 | |
| | 373 | | | Toyota Industries Corp. | | | 32,047 | |
| | | | | | | | |
| | | | 680,825 | |
| | |
| Automobiles – 0.1% | |
| | 533 | | | Bayerische Motoren Werke AG | | | 46,056 | |
| | 1,448 | | | Daimler AG | | | 116,079 | |
| | 300 | | | Ferrari NV | | | 58,382 | |
| | 29,715 | | | Ford Motor Co. | | | 347,666 | |
| | 2,527 | | | General Motors Co. | | | 129,711 | |
| | 4,700 | | | Honda Motor Co. Ltd. | | | 129,914 | |
| | 2,501 | | | Stellantis NV | | | 40,538 | |
| | 1,277 | | | Tesla, Inc.* | | | 862,613 | |
| | 1,977 | | | Toyota Motor Corp. | | | 146,088 | |
| | | | | | | | |
| | | | 1,877,047 | |
| | |
|
| Common Stocks – (continued) | |
| Banks – 0.4% | |
| | 6,596 | | | Australia & New Zealand Banking Group Ltd. | | $ | 132,459 | |
| | 4,450 | | | Bank Hapoalim BM* | | | 31,352 | |
| | 15,743 | | | Bank Leumi Le-Israel BM | | | 95,484 | |
| | 19,788 | | | Bank of America Corp. | | | 686,841 | |
| | 1,831 | | | Bank of Montreal | | | 149,605 | |
| | 391 | | | Banque Cantonale Vaudoise | | | 40,978 | |
| | 35,149 | | | Barclays PLC | | | 78,443 | |
| | 2,077 | | | BNP Paribas SA* | | | 123,472 | |
| | 20,086 | | | BOC Hong Kong Holdings Ltd. | | | 66,736 | |
| | 1,018 | | | Canadian Imperial Bank of Commerce | | | 93,857 | |
| | 5,315 | | | Citigroup, Inc. | | | 350,152 | |
| | 1,649 | | | Citizens Financial Group, Inc. | | | 71,633 | |
| | 2,969 | | | Commonwealth Bank of Australia | | | 186,360 | |
| | 3,311 | | | Credit Agricole SA* | | | 46,392 | |
| | 1,725 | | | Danske Bank A/S* | | | 31,711 | |
| | 2,869 | | | DBS Group Holdings Ltd. | | | 56,848 | |
| | 2,734 | | | DNB ASA | | | 53,114 | |
| | 2,099 | | | Fifth Third Bancorp | | | 72,814 | |
| | 2,283 | | | FinecoBank Banca Fineco SpA* | | | 40,042 | |
| | 398 | | | First Republic Bank | | | 65,571 | |
| | 1,949 | | | Hang Seng Bank Ltd. | | | 37,642 | |
| | 15,412 | | | HSBC Holdings PLC* | | | 92,324 | |
| | 2,966 | | | Huntington Bancshares, Inc. | | | 45,498 | |
| | 4,891 | | | ING Groep NV | | | 53,570 | |
| | 17,150 | | | Intesa Sanpaolo SpA* | | | 44,093 | |
| | 10,673 | | | Israel Discount Bank Ltd. Class A | | | 39,357 | |
| | 4,046 | | | Japan Post Bank Co. Ltd. | | | 38,670 | |
| | 9,358 | | | JPMorgan Chase & Co. | | | 1,377,217 | |
| | 381 | | | KBC Group NV* | | | 27,344 | |
| | 2,230 | | | KeyCorp. | | | 44,912 | |
| | 439 | | | M&T Bank Corp. | | | 66,263 | |
| | 3,912 | | | Mediobanca Banca di Credito Finanziario SpA* | | | 40,622 | |
| | 21,923 | | | Mitsubishi UFJ Financial Group, Inc. | | | 115,308 | |
| | 2,319 | | | Mizrahi Tefahot Bank Ltd. | | | 55,175 | |
| | 3,878 | | | Mizuho Financial Group, Inc. | | | 57,078 | |
| | 4,993 | | | National Australia Bank Ltd. | | | 94,803 | |
| | 3,794 | | | National Bank of Canada | | | 238,981 | |
| | 4,118 | | | Nordea Bank Abp | | | 37,296 | |
| | 20,940 | | | Oversea-Chinese Banking Corp. Ltd. | | | 171,307 | |
| | 1,006 | | | Raiffeisen Bank International AG* | | | 20,337 | |
| | 2,610 | | | Regions Financial Corp. | | | 53,844 | |
| | 7,526 | | | Resona Holdings, Inc. | | | 30,411 | |
| | 5,754 | | | Royal Bank of Canada | | | 489,945 | |
| | 2,594 | | | Shinsei Bank Ltd. | | | 37,112 | |
| | 5,390 | | | Skandinaviska Enskilda Banken AB Class A* | | | 61,922 | |
| | 4,380 | | | Standard Chartered PLC* | | | 28,346 | |
| | 6,873 | | | Sumitomo Mitsui Financial Group, Inc. | | | 242,654 | |
| | 1,315 | | | Sumitomo Mitsui Trust Holdings, Inc. | | | 43,418 | |
| | 164 | | | SVB Financial Group* | | | 82,879 | |
| | |
| | |
| 6 | | The accompanying notes are an integral part of these financial statements. |
GOLDMAN SACHS GLOBAL MANAGED BETA FUND
| | | | | | | | |
Shares | | | Description | | Value | |
|
| Common Stocks – (continued) | |
| Banks – (continued) | |
| | 4,564 | | | Svenska Handelsbanken AB Class A* | | $ | 48,117 | |
| | 29,440 | | | The Bank of East Asia Ltd. | | | 69,433 | |
| | 331 | | | The Bank of Kyoto Ltd. | | | 19,945 | |
| | 2,108 | | | The Bank of Nova Scotia | | | 123,240 | |
| | 694 | | | The PNC Financial Services Group, Inc. | | | 116,842 | |
| | 6,279 | | | The Toronto-Dominion Bank | | | 380,608 | |
| | 1,413 | | | Truist Financial Corp. | | | 80,484 | |
| | 2,824 | | | U.S. Bancorp | | | 141,200 | |
| | 3,675 | | | United Overseas Bank Ltd. | | | 67,488 | |
| | 6,332 | | | Wells Fargo & Co. | | | 229,028 | |
| | 4,557 | | | Westpac Banking Corp. | | | 83,540 | |
| | | | | | | | |
| | | | 7,602,117 | |
| | |
| Beverages – 0.1% | |
| | 960 | | | Asahi Group Holdings Ltd. | | | 41,911 | |
| | 1,475 | | | Brown-Forman Corp. Class B | | | 105,581 | |
| | 433 | | | Carlsberg AS Class B | | | 67,993 | |
| | 4,983 | | | Coca-Cola Amatil Ltd. | | | 51,448 | |
| | 1,458 | | | Coca-Cola Bottlers Japan Holdings, Inc. | | | 25,204 | |
| | 2,126 | | | Coca-Cola European Partners PLC | | | 108,320 | |
| | 1,097 | | | Coca-Cola HBC AG | | | 34,400 | |
| | 253 | | | Constellation Brands, Inc. Class A | | | 54,178 | |
| | 3,438 | | | Davide Campari-Milano NV | | | 38,856 | |
| | 2,323 | | | Diageo PLC | | | 91,384 | |
| | 509 | | | Heineken Holding NV | | | 43,726 | |
| | 543 | | | Heineken NV | | | 53,526 | |
| | 2,683 | | | Ito En Ltd. | | | 148,421 | |
| | 2,041 | | | Keurig Dr Pepper, Inc. | | | 62,291 | |
| | 6,953 | | | Molson Coors Beverage Co. Class B | | | 309,061 | |
| | 3,384 | | | Monster Beverage Corp.* | | | 296,912 | |
| | 4,518 | | | PepsiCo, Inc. | | | 583,681 | |
| | 376 | | | Pernod Ricard SA | | | 71,377 | |
| | 191 | | | Remy Cointreau SA | | | 36,391 | |
| | 1,619 | | | Suntory Beverage & Food Ltd. | | | 55,577 | |
| | 6,581 | | | The Coca-Cola Co. | | | 322,403 | |
| | | | | | | | |
| | | | 2,602,641 | |
| | |
| Biotechnology – 0.2% | |
| | 5,675 | | | AbbVie, Inc. | | | 611,424 | |
| | 1,997 | | | Alexion Pharmaceuticals, Inc.* | | | 305,042 | |
| | 567 | | | Alnylam Pharmaceuticals, Inc.* | | | 83,973 | |
| | 1,515 | | | Amgen, Inc. | | | 340,754 | |
| | 156 | | | Argenx SE* | | | 51,887 | |
| | 1,496 | | | Biogen, Inc.* | | | 408,228 | |
| | 474 | | | BioMarin Pharmaceutical, Inc.* | | | 36,702 | |
| | 862 | | | CSL Ltd. | | | 175,675 | |
| | 164 | | | Exact Sciences Corp.* | | | 22,324 | |
| | 186 | | | Genmab A/S* | | | 62,382 | |
| | 4,868 | | | Gilead Sciences, Inc. | | | 298,895 | |
| | 2,486 | | | Grifols SA | | | 62,284 | |
| | 3,263 | | | Incyte Corp.* | | | 256,668 | |
| | 863 | | | Ionis Pharmaceuticals, Inc.* | | | 45,221 | |
| | 604 | | | Moderna, Inc.* | | | 93,505 | |
| | |
|
| Common Stocks – (continued) | |
| Biotechnology – (continued) | |
| | 461 | | | Neurocrine Biosciences, Inc.* | | | 50,484 | |
| | 298 | | | Regeneron Pharmaceuticals, Inc.* | | | 134,270 | |
| | 612 | | | Sarepta Therapeutics, Inc.* | | | 53,281 | |
| | 1,719 | | | Seagen, Inc.* | | | 259,758 | |
| | 1,269 | | | Vertex Pharmaceuticals, Inc.* | | | 269,726 | |
| | | | | | | | |
| | | | 3,622,483 | |
| | |
| Building Products – 0.1% | |
| | 1,336 | | | A.O. Smith Corp. | | | 79,318 | |
| | 1,749 | | | Allegion PLC | | | 190,256 | |
| | 2,187 | | | Assa Abloy AB Class B | | | 54,860 | |
| | 1,968 | | | Carrier Global Corp. | | | 71,891 | |
| | 3,123 | | | Cie de Saint-Gobain* | | | 167,944 | |
| | 555 | | | Daikin Industries Ltd. | | | 108,163 | |
| | 1,121 | | | Fortune Brands Home & Security, Inc. | | | 93,200 | |
| | 107 | | | Geberit AG | | | 63,085 | |
| | 2,127 | | | Johnson Controls International PLC | | | 118,665 | |
| | 529 | | | Kingspan Group PLC* | | | 38,456 | |
| | 699 | | | Lennox International, Inc. | | | 195,559 | |
| | 779 | | | Lixil Corp. | | | 21,966 | |
| | 5,980 | | | Masco Corp. | | | 318,256 | |
| | 1,502 | | | Nibe Industrier AB Class B | | | 47,204 | |
| | 2,425 | | | Owens Corning | | | 196,474 | |
| | 100 | | | Rockwool International A/S Class B | | | 36,154 | |
| | 326 | | | TOTO Ltd. | | | 19,771 | |
| | 730 | | | Trane Technologies PLC | | | 111,865 | |
| | 25,678 | | | Xinyi Glass Holdings Ltd. | | | 71,848 | |
| | | | | | | | |
| | | | 2,004,935 | |
| | |
| Capital Markets – 0.3% | |
| | 1,144 | | | Ameriprise Financial, Inc. | | | 253,099 | |
| | 1,185 | | | ASX Ltd. | | | 61,708 | |
| | 272 | | | BlackRock, Inc. | | | 188,904 | |
| | 804 | | | Brookfield Asset Management, Inc. Class A | | | 32,473 | |
| | 671 | | | Cboe Global Markets, Inc. | | | 66,402 | |
| | 318 | | | CME Group, Inc. | | | 63,505 | |
| | 3,696 | | | Credit Suisse Group AG | | | 53,468 | |
| | 5,673 | | | Daiwa Securities Group, Inc. | | | 27,763 | |
| | 554 | | | Deutsche Boerse AG | | | 90,772 | |
| | 2,099 | | | EQT AB | | | 58,186 | |
| | 850 | | | FactSet Research Systems, Inc. | | | 258,323 | |
| | 1,041 | | | Franklin Resources, Inc. | | | 27,243 | |
| | 8,717 | | | Hargreaves Lansdown PLC | | | 184,292 | |
| | 4,131 | | | Hong Kong Exchanges & Clearing Ltd. | | | 253,986 | |
| | 1,471 | | | IGM Financial, Inc. | | | 40,133 | |
| | 1,382 | | | Intercontinental Exchange, Inc. | | | 152,448 | |
| | 9,859 | | | Invesco Ltd. | | | 221,039 | |
| | 2,430 | | | Japan Exchange Group, Inc. | | | 52,480 | |
| | 1,016 | | | KKR & Co., Inc. Class A | | | 46,289 | |
| | 1,063 | | | London Stock Exchange Group PLC | | | 142,845 | |
| | 590 | | | Macquarie Group Ltd. | | | 64,583 | |
| | 2,863 | | | Magellan Financial Group Ltd. | | | 95,660 | |
| | 428 | | | MarketAxess Holdings, Inc. | | | 237,942 | |
| | |
| | |
| The accompanying notes are an integral part of these financial statements. | | 7 |
GOLDMAN SACHS GLOBAL MANAGED BETA FUND
Schedule of Investments (continued)
February 28, 2021 (Unaudited)
| | | | | | | | |
Shares | | | Description | | Value | |
|
| Common Stocks – (continued) | |
| Capital Markets – (continued) | |
| | 1,598 | | | Moody’s Corp. | | $ | 439,274 | |
| | 5,831 | | | Morgan Stanley | | | 448,229 | |
| | 236 | | | MSCI, Inc. | | | 97,827 | |
| | 530 | | | Nasdaq, Inc. | | | 73,294 | |
| | 594 | | | Northern Trust Corp. | | | 56,507 | |
| | 160 | | | Partners Group Holding AG | | | 191,563 | |
| | 484 | | | Raymond James Financial, Inc. | | | 56,502 | |
| | 1,082 | | | S&P Global, Inc. | | | 356,367 | |
| | 645 | | | Schroders PLC | | | 31,567 | |
| | 1,766 | | | SEI Investments Co. | | | 98,896 | |
| | 33,802 | | | Singapore Exchange Ltd. | | | 251,664 | |
| | 1,810 | | | St. James’s Place PLC | | | 29,854 | |
| | 1,818 | | | State Street Corp. | | | 132,296 | |
| | 1,300 | | | T. Rowe Price Group, Inc. | | | 210,782 | |
| | 2,889 | | | The Bank of New York Mellon Corp. | | | 121,800 | |
| | 2,531 | | | The Blackstone Group, Inc. Class A | | | 175,221 | |
| | 1,705 | | | The Charles Schwab Corp. | | | 105,233 | |
| | 640 | | | TMX Group Ltd. | | | 61,098 | |
| | 681 | | | Tradeweb Markets, Inc. Class A | | | 49,570 | |
| | 6,478 | | | UBS Group AG | | | 100,787 | |
| | | | | | | | |
| | | | 5,761,874 | |
| | |
| Chemicals – 0.2% | |
| | 1,010 | | | Air Liquide SA | | | 152,101 | |
| | 382 | | | Air Products & Chemicals, Inc. | | | 97,647 | |
| | 1,103 | | | Akzo Nobel NV | | | 114,061 | |
| | 461 | | | Albemarle Corp. | | | 72,474 | |
| | 1,411 | | | Arkema SA | | | 155,545 | |
| | 773 | | | BASF SE | | | 63,240 | |
| | 292 | | | Celanese Corp. | | | 40,562 | |
| | 453 | | | Chr Hansen Holding A/S* | | | 38,844 | |
| | 1,673 | | | Corteva, Inc. | | | 75,536 | |
| | 690 | | | Covestro AG(a) | | | 49,960 | |
| | 937 | | | Croda International PLC | | | 80,897 | |
| | 1,346 | | | Dow, Inc. | | | 79,831 | |
| | 2,117 | | | DuPont de Nemours, Inc. | | | 148,867 | |
| | 1,290 | | | Eastman Chemical Co. | | | 140,945 | |
| | 958 | | | Ecolab, Inc. | | | 200,567 | |
| | 77 | | | EMS-Chemie Holding AG | | | 68,232 | |
| | 268 | | | FMC Corp. | | | 27,253 | |
| | 34 | | | Givaudan SA | | | 128,053 | |
| | 274 | | | International Flavors & Fragrances, Inc. | | | 37,130 | |
| | 914 | | | Johnson Matthey PLC | | | 39,056 | |
| | 1,243 | | | JSR Corp. | | | 37,257 | |
| | 431 | | | Koninklijke DSM NV | | | 71,066 | |
| | 798 | | | Linde PLC | | | 194,927 | |
| | 232 | | | LyondellBasell Industries NV Class A | | | 23,917 | |
| | 5,794 | | | Mitsubishi Chemical Holdings Corp. | | | 40,517 | |
| | 1,010 | | | Mitsubishi Gas Chemical Co., Inc. | | | 23,657 | |
| | 2,131 | | | Mitsui Chemicals, Inc. | | | 66,014 | |
| | 881 | | | Nippon Paint Holdings Co. Ltd. | | | 65,620 | |
| | 2,221 | | | Nippon Sanso Holdings Corp. | | | 41,975 | |
| | 771 | | | Nitto Denko Corp. | | | 66,180 | |
| | |
|
| Common Stocks – (continued) | |
| Chemicals – (continued) | |
| | 898 | | | Novozymes A/S Class B | | | 55,283 | |
| | 2,160 | | | Nutrien Ltd. | | | 116,588 | |
| | 2,141 | | | Orica Ltd. | | | 20,762 | |
| | 440 | | | PPG Industries, Inc. | | | 59,321 | |
| | 831 | | | RPM International, Inc. | | | 66,181 | |
| | 541 | | | Shin-Etsu Chemical Co. Ltd. | | | 88,667 | |
| | 342 | | | Sika AG | | | 90,438 | |
| | 312 | | | Solvay SA | | | 37,977 | |
| | 576 | | | Symrise AG | | | 67,289 | |
| | 2,378 | | | Teijin Ltd. | | | 41,026 | |
| | 4,908 | | | The Mosaic Co. | | | 144,295 | |
| | 300 | | | The Sherwin-Williams Co. | | | 204,102 | |
| | 3,799 | | | Toray Industries, Inc. | | | 25,062 | |
| | 349 | | | Umicore SA | | | 20,503 | |
| | 693 | | | Yara International ASA | | | 33,294 | |
| | | | | | | | |
| | | | 3,512,719 | |
| | |
| Commercial Services & Supplies – 0.1% | |
| | 5,689 | | | Brambles Ltd. | | | 43,460 | |
| | 797 | | | Cintas Corp. | | | 258,499 | |
| | 1,032 | | | Copart, Inc.* | | | 112,653 | |
| | 1,156 | | | Dai Nippon Printing Co. Ltd. | | | 20,898 | |
| | 1,369 | | | GFL Environmental, Inc. | | | 42,492 | |
| | 5,644 | | | Rentokil Initial PLC* | | | 36,774 | |
| | 861 | | | Republic Services, Inc. | | | 76,706 | |
| | 1,058 | | | Ritchie Bros Auctioneers, Inc. | | | 57,739 | |
| | 9,657 | | | Rollins, Inc. | | | 320,323 | |
| | 460 | | | Secom Co. Ltd. | | | 40,055 | |
| | 4,454 | | | Securitas AB Class B | | | 68,284 | |
| | 796 | | | Waste Connections, Inc. | | | 77,761 | |
| | 728 | | | Waste Management, Inc. | | | 80,728 | |
| | | | | | | | |
| | | | 1,236,372 | |
| | |
| Communications Equipment – 0.1% | |
| | 238 | | | Arista Networks, Inc.* | | | 66,602 | |
| | 11,477 | | | Cisco Systems, Inc. | | | 514,973 | |
| | 1,409 | | | F5 Networks, Inc.* | | | 267,681 | |
| | 3,543 | | | Juniper Networks, Inc. | | | 82,481 | |
| | 508 | | | Motorola Solutions, Inc. | | | 89,144 | |
| | 5,168 | | | Nokia Oyj* | | | 20,590 | |
| | 6,541 | | | Telefonaktiebolaget LM Ericsson Class B | | | 81,736 | |
| | | | | | | | |
| | | | 1,123,207 | |
| | |
| Construction & Engineering – 0.1% | |
| | 9,883 | | | ACS Actividades de Construccion y Servicios SA | | | 301,969 | |
| | 1,919 | | | Bouygues SA | | | 77,689 | |
| | 1,424 | | | Eiffage SA* | | | 146,366 | |
| | 1,874 | | | Ferrovial SA | | | 46,509 | |
| | 728 | | | HOCHTIEF AG | | | 65,059 | |
| | 2,597 | | | Obayashi Corp. | | | 22,419 | |
| | 6,199 | | | Skanska AB Class B | | | 150,000 | |
| | 1,724 | | | Vinci SA | | | 179,296 | |
| | 4,824 | | | WSP Global, Inc. | | | 417,807 | |
| | | | | | | | |
| | | | 1,407,114 | |
| | |
| | |
| 8 | | The accompanying notes are an integral part of these financial statements. |
GOLDMAN SACHS GLOBAL MANAGED BETA FUND
| | | | | | | | |
Shares | | | Description | | Value | |
|
| Common Stocks – (continued) | |
| Construction Materials – 0.0% | |
| | 1,432 | | | CRH PLC* | | $ | 62,165 | |
| | 1,006 | | | HeidelbergCement AG | | | 79,568 | |
| | 1,280 | | | James Hardie Industries PLC | | | 35,900 | |
| | 1,594 | | | LafargeHolcim Ltd. | | | 87,936 | |
| | 177 | | | Martin Marietta Materials, Inc. | | | 59,626 | |
| | 244 | | | Vulcan Materials Co. | | | 40,745 | |
| | | | | | | | |
| | | | 365,940 | |
| | |
| Consumer Finance – 0.0% | |
| | 4,672 | | | Ally Financial, Inc. | | | 193,888 | |
| | 1,466 | | | American Express Co. | | | 198,291 | |
| | 165 | | | Capital One Financial Corp. | | | 19,831 | |
| | 1,855 | | | Discover Financial Services | | | 174,500 | |
| | 1 | | | Isracard Ltd. | | | 3 | |
| | 5,706 | | | Synchrony Financial | | | 220,708 | |
| | | | | | | | |
| | | | 807,221 | |
| | |
| Containers & Packaging – 0.1% | |
| | 2,459 | | | Amcor PLC | | | 26,902 | |
| | 402 | | | Avery Dennison Corp. | | | 70,434 | |
| | 768 | | | Ball Corp. | | | 65,580 | |
| | 792 | | | CCL Industries, Inc. Class B | | | 41,716 | |
| | 919 | | | Crown Holdings, Inc.* | | | 87,820 | |
| | 2,189 | | | International Paper Co. | | | 108,684 | |
| | 222 | | | Packaging Corp. of America | | | 29,308 | |
| | 476 | | | Sealed Air Corp. | | | 19,944 | |
| | 4,627 | | | Smurfit Kappa Group PLC | | | 218,619 | |
| | 3,410 | | | Westrock Co. | | | 148,642 | |
| | | | | | | | |
| | | | 817,649 | |
| | |
| Distributors – 0.0% | |
| | 1,869 | | | Genuine Parts Co. | | | 196,899 | |
| | 6,659 | | | LKQ Corp.* | | | 262,298 | |
| | 686 | | | Pool Corp. | | | 229,652 | |
| | | | | | | | |
| | | | 688,849 | |
| | |
| Diversified Financial Services – 0.1% | |
| | 2,417 | | | Berkshire Hathaway, Inc. Class B* | | | 581,313 | |
| | 342 | | | Groupe Bruxelles Lambert SA | | | 33,829 | |
| | 589 | | | Industrivarden AB Class A* | | | 20,929 | |
| | 2,453 | | | Industrivarden AB Class C* | | | 80,962 | |
| | 1,702 | | | Investor AB Class B | | | 125,741 | |
| | 2,216 | | | Kinnevik AB Class B | | | 102,830 | |
| | 1,234 | | | L E Lundbergforetagen AB Class B* | | | 61,374 | |
| | 13,335 | | | M&G PLC | | | 34,346 | |
| | 4,094 | | | ORIX Corp. | | | 69,855 | |
| | 186 | | | Sofina SA | | | 61,478 | |
| | 1,033 | | | Tokyo Century Corp. | | | 67,953 | |
| | 1,647 | | | Voya Financial, Inc. | | | 99,281 | |
| | 189 | | | Wendel SE | | | 21,562 | |
| | | | | | | | |
| | | | 1,361,453 | |
| | |
| Diversified Telecommunication Services – 0.2% | |
| | 20,535 | | | AT&T, Inc. | | | 572,721 | |
| | 1,043 | | | BCE, Inc. | | | 44,610 | |
| | 1,059 | | | Cellnex Telecom SA(a) | | | 57,620 | |
| | |
|
| Common Stocks – (continued) | |
| Diversified Telecommunication Services – (continued) | |
| | 10,347 | | | Deutsche Telekom AG | | | 188,216 | |
| | 848 | | | Elisa Oyj | | | 50,705 | |
| | 37,703 | | | HKT Trust and HKT Ltd. | | | 51,246 | |
| | 308 | | | Iliad SA | | | 54,663 | |
| | 4,721 | | | Infrastrutture Wireless Italiane SpA(a) | | | 49,148 | |
| | 11,358 | | | Koninklijke KPN NV | | | 37,226 | |
| | 7,153 | | | Liberty Global PLC Class A* | | | 176,143 | |
| | 8,081 | | | Liberty Global PLC Class C* | | | 196,368 | |
| | 17,204 | | | Lumen Technologies, Inc. | | | 211,437 | |
| | 10,490 | | | Nippon Telegraph & Telephone Corp. | | | 271,744 | |
| | 3,682 | | | Orange SA | | | 42,423 | |
| | 64,218 | | | PCCW Ltd. | | | 36,830 | |
| | 15,280 | | | Singapore Telecommunications Ltd. | | | 26,905 | |
| | 14,275 | | | Spark New Zealand Ltd. | | | 47,341 | |
| | 153 | | | Swisscom AG | | | 76,856 | |
| | 86,846 | | | Telecom Italia SpA | | | 41,236 | |
| | 78,061 | | | Telecom Italia SpA RSP | | | 41,849 | |
| | 8,726 | | | Telefonica SA | | | 37,253 | |
| | 3,393 | | | Telenor ASA | | | 54,844 | |
| | 8,289 | | | Telia Co. AB | | | 33,577 | |
| | 16,665 | | | Telstra Corp. Ltd. | | | 39,653 | |
| | 2,320 | | | TELUS Corp. | | | 46,488 | |
| | 14,582 | | | TPG Telecom Ltd.* | | | 77,144 | |
| | 960 | | | United Internet AG | | | 42,290 | |
| | 10,412 | | | Verizon Communications, Inc. | | | 575,784 | |
| | | | | | | | |
| | | | 3,182,320 | |
| | |
| Electric Utilities – 0.2% | |
| | 986 | | | Alliant Energy Corp. | | | 45,514 | |
| | 926 | | | American Electric Power Co., Inc. | | | 69,311 | |
| | 38,024 | | | AusNet Services | | | 48,549 | |
| | 3,420 | | | CLP Holdings Ltd. | | | 33,389 | |
| | 959 | | | Duke Energy Corp. | | | 82,081 | |
| | 438 | | | Edison International | | | 23,648 | |
| | 24,944 | | | EDP – Energias de Portugal SA | | | 142,972 | |
| | 285 | | | Elia Group SA | | | 30,729 | |
| | 930 | | | Emera, Inc. | | | 36,642 | |
| | 2,652 | | | Endesa SA | | | 65,532 | |
| | 21,218 | | | Enel SpA | | | 200,062 | |
| | 357 | | | Entergy Corp. | | | 30,991 | |
| | 743 | | | Evergy, Inc. | | | 39,847 | |
| | 578 | | | Eversource Energy | | | 45,939 | |
| | 2,468 | | | Exelon Corp. | | | 95,265 | |
| | 1,038 | | | Fortis, Inc. | | | 39,967 | |
| | 1,136 | | | Fortum Oyj | | | 28,303 | |
| | 32,706 | | | HK Electric Investments & HK Electric Investments Ltd. | | | 32,033 | |
| | 2,473 | | | Hydro One Ltd.(a) | | | 52,507 | |
| | 13,369 | | | Iberdrola SA | | | 167,539 | |
| | 3,280 | | | Kyushu Electric Power Co., Inc. | | | 28,183 | |
| | 11,187 | | | Mercury NZ Ltd. | | | 48,842 | |
| | 4,096 | | | NextEra Energy, Inc. | | | 300,974 | |
| | 8,570 | | | NRG Energy, Inc. | | | 312,891 | |
| | 1,220 | | | OGE Energy Corp. | | | 35,709 | |
| | |
| | |
| The accompanying notes are an integral part of these financial statements. | | 9 |
GOLDMAN SACHS GLOBAL MANAGED BETA FUND
Schedule of Investments (continued)
February 28, 2021 (Unaudited)
| | | | | | | | |
Shares | | | Description | | Value | |
|
| Common Stocks – (continued) | |
| Electric Utilities – (continued) | |
| | 911 | | | Orsted A/S(a) | | $ | 146,832 | |
| | 1,948 | | | PG&E Corp.* | | | 20,473 | |
| | 478 | | | Pinnacle West Capital Corp. | | | 33,427 | |
| | 3,998 | | | Power Assets Holdings Ltd. | | | 22,185 | |
| | 1,331 | | | PPL Corp. | | | 34,859 | |
| | 2,047 | | | Red Electrica Corp. SA | | | 34,198 | |
| | 1,906 | | | SSE PLC | | | 35,326 | |
| | 8,823 | | | Terna Rete Elettrica Nazionale SpA | | | 61,206 | |
| | 2,899 | | | The Chugoku Electric Power Co., Inc. | | | 34,575 | |
| | 2,027 | | | The Kansai Electric Power Co., Inc. | | | 20,257 | |
| | 995 | | | The Southern Co. | | | 56,436 | |
| | 2,586 | | | Tohoku Electric Power Co., Inc. | | | 22,779 | |
| | 619 | | | Verbund AG | | | 47,055 | |
| | 1,097 | | | Xcel Energy, Inc. | | | 64,273 | |
| | | | | | | | |
| | | | 2,671,300 | |
| | |
| Electrical Equipment – 0.1% | |
| | 3,348 | | | ABB Ltd. | | | 96,387 | |
| | 823 | | | AMETEK, Inc. | | | 97,089 | |
| | 2,070 | | | Ballard Power Systems, Inc.* | | | 57,906 | |
| | 1,115 | | | Eaton Corp. PLC | | | 145,162 | |
| | 899 | | | Emerson Electric Co. | | | 77,224 | |
| | 312 | | | Generac Holdings, Inc.* | | | 102,823 | |
| | 726 | | | Legrand SA | | | 63,118 | |
| | 2,971 | | | Mitsubishi Electric Corp. | | | 43,997 | |
| | 837 | | | Nidec Corp. | | | 106,730 | |
| | 1,957 | | | Plug Power, Inc.* | | | 94,680 | |
| | 1,101 | | | Prysmian SpA | | | 35,365 | |
| | 642 | | | Rockwell Automation, Inc. | | | 156,186 | |
| | 1,076 | | | Schneider Electric SE | | | 159,113 | |
| | 1,259 | | | Sensata Technologies Holding PLC* | | | 72,128 | |
| | 713 | | | Siemens Energy AG* | | | 26,883 | |
| | 1,624 | | | Siemens Gamesa Renewable Energy SA | | | 60,240 | |
| | 1,334 | | | Sunrun, Inc.* | | | 83,482 | |
| | 541 | | | Vestas Wind Systems A/S | | | 101,451 | |
| | | | | | | | |
| | | | 1,579,964 | |
| | |
| Electronic Equipment, Instruments & Components – 0.2% | |
| | 1,117 | | | Amphenol Corp. Class A | | | 140,385 | |
| | 3,244 | | | Arrow Electronics, Inc.* | | | 325,243 | |
| | 1,258 | | | Azbil Corp. | | | 53,524 | |
| | 2,651 | | | CDW Corp. | | | 415,915 | |
| | 923 | | | Cognex Corp. | | | 76,231 | |
| | 2,408 | | | Corning, Inc. | | | 92,082 | |
| | 3,419 | | | Halma PLC | | | 108,236 | |
| | 569 | | | Hamamatsu Photonics KK | | | 33,600 | |
| | 615 | | | Hexagon AB Class B | | | 51,153 | |
| | 200 | | | Hirose Electric Co. Ltd. | | | 29,318 | |
| | 3,116 | | | Hitachi Ltd. | | | 143,718 | |
| | 807 | | | Ibiden Co. Ltd. | | | 32,967 | |
| | 292 | | | IPG Photonics Corp.* | | | 66,386 | |
| | 342 | | | Keyence Corp. | | | 163,086 | |
| | 1,580 | | | Keysight Technologies, Inc.* | | | 223,602 | |
| | 634 | | | Kyocera Corp. | | | 41,037 | |
| | |
|
| Common Stocks – (continued) | |
| Electronic Equipment, Instruments & Components – (continued) | |
| | 1,314 | | | Murata Manufacturing Co. Ltd. | | | 112,642 | |
| | 994 | | | Omron Corp. | | | 80,648 | |
| | 539 | | | Shimadzu Corp. | | | 19,558 | |
| | 253 | | | TDK Corp. | | | 36,436 | |
| | 970 | | | TE Connectivity Ltd. | | | 126,129 | |
| | 967 | | | Trimble, Inc.* | | | 71,693 | |
| | 2,472 | | | Venture Corp. Ltd. | | | 35,275 | |
| | 481 | | | Zebra Technologies Corp. Class A* | | | 240,226 | |
| | | | | | | | |
| | | | 2,719,090 | |
| | |
| Energy Equipment & Services – 0.0% | |
| | 6,825 | | | Baker Hughes Co. | | | 167,076 | |
| | 5,726 | | | Halliburton Co. | | | 124,999 | |
| | 2,574 | | | Schlumberger N.V | | | 71,840 | |
| | 8,048 | | | Tenaris SA | | | 84,043 | |
| | | | | | | | |
| | | | 447,958 | |
| | |
| Entertainment – 0.1% | |
| | 2,276 | | | Activision Blizzard, Inc. | | | 217,608 | |
| | 32,886 | | | Bollore SA | | | 157,637 | |
| | 1,535 | | | Capcom Co. Ltd. | | | 93,163 | |
| | 1,247 | | | Electronic Arts, Inc. | | | 167,061 | |
| | 717 | | | Koei Tecmo Holdings Co. Ltd. | | | 40,280 | |
| | 307 | | | Konami Holdings Corp. | | | 19,822 | |
| | 970 | | | Liberty Media Corp.-Liberty Formula One Class C* | | | 42,583 | |
| | 461 | | | Live Nation Entertainment, Inc.* | | | 40,965 | |
| | 797 | | | Netflix, Inc.* | | | 429,464 | |
| | 1,675 | | | Nexon Co. Ltd. | | | 52,740 | |
| | 214 | | | Nintendo Co. Ltd. | | | 130,877 | |
| | 828 | | | Roku, Inc.* | | | 327,457 | |
| | 1,122 | | | Square Enix Holdings Co. Ltd. | | | 63,695 | |
| | 758 | | | Take-Two Interactive Software, Inc.* | | | 139,821 | |
| | 2,535 | | | The Walt Disney Co.* | | | 479,216 | |
| | 834 | | | Toho Co. Ltd. | | | 31,482 | |
| | 1,312 | | | Ubisoft Entertainment SA* | | | 106,969 | |
| | 2,042 | | | Vivendi SA | | | 70,678 | |
| | | | | | | | |
| | | | 2,611,518 | |
| | |
| Equity Real Estate Investment Trusts (REITs) – 0.1% | |
| | 694 | | | Alexandria Real Estate Equities, Inc. | | | 110,825 | |
| | 382 | | | American Tower Corp. | | | 82,562 | |
| | 10,532 | | | Ascendas Real Estate Investment Trust | | | 23,036 | |
| | 194 | | | AvalonBay Communities, Inc. | | | 34,096 | |
| | 629 | | | Boston Properties, Inc. | | | 62,353 | |
| | 1,496 | | | Camden Property Trust | | | 155,808 | |
| | 814 | | | Canadian Apartment Properties REIT | | | 32,647 | |
| | 466 | | | Crown Castle International Corp. | | | 72,579 | |
| | 4,704 | | | Dexus | | | 32,269 | |
| | 1,606 | | | Digital Realty Trust, Inc. | | | 216,376 | |
| | 882 | | | Duke Realty Corp. | | | 34,618 | |
| | 199 | | | Equinix, Inc. | | | 129,020 | |
| | 487 | | | Equity LifeStyle Properties, Inc. | | | 30,024 | |
| | |
| | |
| 10 | | The accompanying notes are an integral part of these financial statements. |
GOLDMAN SACHS GLOBAL MANAGED BETA FUND
| | | | | | | | |
Shares | | | Description | | Value | |
|
| Common Stocks – (continued) | |
| Equity Real Estate Investment Trusts (REITs) – (continued) | |
| | 484 | | | Equity Residential | | $ | 31,658 | |
| | 99 | | | Essex Property Trust, Inc. | | | 25,224 | |
| | 525 | | | Extra Space Storage, Inc. | | | 65,992 | |
| | 6,503 | | | Goodman Group | | | 83,108 | |
| | 1,001 | | | Invitation Homes, Inc. | | | 29,169 | |
| | 736 | | | Iron Mountain, Inc. | | | 25,605 | |
| | 3,020 | | | Link REIT | | | 28,507 | |
| | 23,558 | | | Mapletree Logistics Trust | | | 32,503 | |
| | 773 | | | Mid-America Apartment Communities, Inc. | | | 104,146 | |
| | 21 | | | Nippon Prologis REIT, Inc. | | | 64,050 | |
| | 1,532 | | | Prologis, Inc. | | | 151,775 | |
| | 309 | | | Public Storage | | | 72,287 | |
| | 955 | | | Regency Centers Corp. | | | 52,315 | |
| | 222 | | | SBA Communications Corp. | | | 56,639 | |
| | 5,894 | | | Segro PLC | | | 74,821 | |
| | 10,224 | | | Stockland | | | 32,668 | |
| | 764 | | | Sun Communities, Inc. | | | 116,090 | |
| | 528 | | | UDR, Inc. | | | 21,738 | |
| | 1,171 | | | Ventas, Inc. | | | 61,946 | |
| | 4,756 | | | VICI Properties, Inc. | | | 135,546 | |
| | 901 | | | Weyerhaeuser Co. | | | 30,517 | |
| | | | | | | | |
| | | | 2,312,517 | |
| | |
| Food & Staples Retailing – 0.3% | |
| | 2,009 | | | Aeon Co. Ltd. | | | 60,665 | |
| | 3,664 | | | Alimentation Couche-Tard, Inc. Class B | | | 110,127 | |
| | 7,061 | | | Carrefour SA | | | 123,203 | |
| | 16,643 | | | Coles Group Ltd. | | | 197,040 | |
| | 392 | | | Cosmos Pharmaceutical Corp. | | | 56,104 | |
| | 1,523 | | | Costco Wholesale Corp. | | | 504,113 | |
| | 11,664 | | | Empire Co. Ltd. Class A | | | 324,183 | |
| | 892 | | | Etablissements Franz Colruyt NV | | | 53,435 | |
| | 1,837 | | | George Weston Ltd. | | | 134,924 | |
| | 1,271 | | | ICA Gruppen AB | | | 60,314 | |
| | 58,395 | | | J Sainsbury PLC | | | 184,820 | |
| | 12,025 | | | Jeronimo Martins SGPS SA | | | 186,117 | |
| | 2,127 | | | Kesko Oyj Class B | | | 54,120 | |
| | 1,322 | | | Kobe Bussan Co. Ltd. | | | 33,970 | |
| | 15,057 | | | Koninklijke Ahold Delhaize NV | | | 397,576 | |
| | 1,322 | | | Lawson, Inc. | | | 61,911 | |
| | 3,630 | | | Loblaw Cos. Ltd. | | | 174,939 | |
| | 1,273 | | | Metro, Inc. | | | 52,917 | |
| | 2,493 | | | Seven & i Holdings Co. Ltd. | | | 95,019 | |
| | 3,456 | | | Sundrug Co. Ltd. | | | 129,957 | |
| | 3,575 | | | Sysco Corp. | | | 284,677 | |
| | 28,346 | | | Tesco PLC | | | 89,095 | |
| | 13,425 | | | The Kroger Co. | | | 432,419 | |
| | 1,474 | | | Tsuruha Holdings, Inc. | | | 189,783 | |
| | 4,897 | | | Walgreens Boots Alliance, Inc. | | | 234,713 | |
| | 6,579 | | | Walmart, Inc. | | | 854,744 | |
| | 5,988 | | | Welcia Holdings Co. Ltd. | | | 190,814 | |
| | 19,974 | | | Wm Morrison Supermarkets PLC | | | 47,700 | |
| | 9,350 | | | Woolworths Group Ltd. | | | 285,147 | |
| | | | | | | | |
| | | | 5,604,546 | |
| | |
|
| Common Stocks – (continued) | |
| Food Products – 0.2% | |
| | 4,941 | | | Ajinomoto Co., Inc. | | | 98,450 | |
| | 1,549 | | | Archer-Daniels-Midland Co. | | | 87,642 | |
| | 4,535 | | | Associated British Foods PLC* | | | 150,392 | |
| | 16 | | | Barry Callebaut AG | | | 34,612 | |
| | 793 | | | Bunge Ltd. | | | 60,728 | |
| | 2,487 | | | Calbee, Inc. | | | 65,490 | |
| | 1,425 | | | Campbell Soup Co. | | | 64,809 | |
| | 6 | | | Chocoladefabriken Lindt & Spruengli AG | | | 130,339 | |
| | 5,477 | | | Conagra Brands, Inc. | | | 185,835 | |
| | 3,958 | | | Danone SA | | | 269,148 | |
| | 4,015 | | | General Mills, Inc. | | | 220,865 | |
| | 1,685 | | | Hormel Foods Corp. | | | 78,133 | |
| | 518 | | | JDE Peet’s NV* | | | 20,972 | |
| | 1,263 | | | Kellogg Co. | | | 72,888 | |
| | 334 | | | Kerry Group PLC Class A | | | 40,187 | |
| | 531 | | | Kikkoman Corp. | | | 35,225 | |
| | 361 | | | Lamb Weston Holdings, Inc. | | | 28,797 | |
| | 1,304 | | | McCormick & Co., Inc. | | | 109,901 | |
| | 646 | | | MEIJI Holdings Co. Ltd. | | | 41,096 | |
| | 2,812 | | | Mondelez International, Inc. Class A | | | 149,486 | |
| | 1,277 | | | Mowi ASA | | | 30,840 | |
| | 7,464 | | | Nestle SA | | | 779,007 | |
| | 396 | | | Nissin Foods Holdings Co. Ltd. | | | 29,925 | |
| | 4,833 | | | Orkla ASA | | | 44,514 | |
| | 1,585 | | | Saputo, Inc. | | | 44,638 | |
| | 3,611 | | | The a2 Milk Co. Ltd.* | | | 25,397 | |
| | 1,467 | | | The Hershey Co. | | | 213,669 | |
| | 1,505 | | | The J.M. Smucker Co. | | | 168,560 | |
| | 5,809 | | | The Kraft Heinz Co. | | | 211,331 | |
| | 628 | | | Toyo Suisan Kaisha Ltd. | | | 26,735 | |
| | 2,956 | | | Tyson Foods, Inc. Class A | | | 200,033 | |
| | 71,609 | | | WH Group Ltd.(a) | | | 64,227 | |
| | 28,291 | | | Wilmar International Ltd. | | | 111,385 | |
| | 7,214 | | | Yamazaki Baking Co. Ltd. | | | 121,649 | |
| | | | | | | | |
| | | | 4,016,905 | |
| | |
| Gas Utilities – 0.0% | |
| | 2,083 | | | AltaGas Ltd. | | | 31,574 | |
| | 5,526 | | | APA Group | | | 39,666 | |
| | 423 | | | Atmos Energy Corp. | | | 35,790 | |
| | 1,419 | | | Enagas SA | | | 29,722 | |
| | 21,641 | | | Hong Kong & China Gas Co. Ltd. | | | 32,660 | |
| | 1,616 | | | Naturgy Energy Group SA | | | 40,247 | |
| | 1,345 | | | Osaka Gas Co. Ltd. | | | 24,089 | |
| | 17,060 | | | Snam SpA | | | 88,312 | |
| | 535 | | | Toho Gas Co. Ltd. | | | 31,384 | |
| | 1,079 | | | Tokyo Gas Co. Ltd. | | | 22,296 | |
| | 5,044 | | | UGI Corp. | | | 193,236 | |
| | | | | | | | |
| | | | 568,976 | |
| | |
| Health Care Equipment & Supplies – 0.4% | |
| | 3,321 | | | Abbott Laboratories | | | 397,789 | |
| | 945 | | | ABIOMED, Inc.* | | | 306,700 | |
| | 637 | | | Alcon, Inc.* | | | 43,871 | |
| | 689 | | | Align Technology, Inc.* | | | 390,739 | |
| | |
| | |
| The accompanying notes are an integral part of these financial statements. | | 11 |
GOLDMAN SACHS GLOBAL MANAGED BETA FUND
Schedule of Investments (continued)
February 28, 2021 (Unaudited)
| | | | | | | | |
Shares | | | Description | | Value | |
|
| Common Stocks – (continued) | |
| Health Care Equipment & Supplies – (continued) | |
| | 1,058 | | | Ambu A/S Class B | | $ | 48,757 | |
| | 1,170 | | | Asahi Intecc Co. Ltd. | | | 33,600 | |
| | 1,581 | | | Baxter International, Inc. | | | 122,828 | |
| | 562 | | | Becton Dickinson & Co. | | | 135,526 | |
| | 1,057 | | | BioMerieux | | | 134,164 | |
| | 2,004 | | | Boston Scientific Corp.* | | | 77,715 | |
| | 311 | | | Carl Zeiss Meditec AG | | | 46,720 | |
| | 1,085 | | | Cochlear Ltd. | | | 177,026 | |
| | 904 | | | Coloplast A/S Class B | | | 137,700 | |
| | 1,470 | | | Danaher Corp. | | | 322,915 | |
| | 884 | | | DENTSPLY SIRONA, Inc. | | | 46,914 | |
| | 362 | | | DexCom, Inc.* | | | 143,996 | |
| | 934 | | | DiaSorin SpA | | | 183,107 | |
| | 3,378 | | | Edwards Lifesciences Corp.* | | | 280,712 | |
| | 2,547 | | | Fisher & Paykel Healthcare Corp. Ltd. | | | 54,161 | |
| | 440 | | | GN Store Nord A/S | | | 36,874 | |
| | 1,754 | | | Hologic, Inc.* | | | 126,446 | |
| | 2,216 | | | Hoya Corp. | | | 252,019 | |
| | 1,031 | | | IDEXX Laboratories, Inc.* | | | 536,295 | |
| | 674 | | | Insulet Corp.* | | | 174,633 | |
| | 232 | | | Intuitive Surgical, Inc.* | | | 170,938 | |
| | 2,907 | | | Koninklijke Philips NV* | | | 158,714 | |
| | 683 | | | Masimo Corp.* | | | 171,249 | |
| | 1,250 | | | Medtronic PLC | | | 146,212 | |
| | 1,735 | | | Novocure Ltd.* | | | 258,688 | |
| | 10,304 | | | Olympus Corp. | | | 217,102 | |
| | 1,448 | | | ResMed, Inc. | | | 279,145 | |
| | 803 | | | Siemens Healthineers AG(a) | | | 44,499 | |
| | 6,236 | | | Smith & Nephew PLC | | | 121,110 | |
| | 321 | | | Sonova Holding AG* | | | 82,149 | |
| | 433 | | | STERIS PLC | | | 75,688 | |
| | 125 | | | Straumann Holding AG | | | 150,958 | |
| | 679 | | | Stryker Corp. | | | 164,787 | |
| | 775 | | | Sysmex Corp. | | | 80,691 | |
| | 144 | | | Teleflex, Inc. | | | 57,329 | |
| | 1,202 | | | Terumo Corp. | | | 44,715 | |
| | 238 | | | The Cooper Cos., Inc. | | | 91,899 | |
| | 951 | | | Varian Medical Systems, Inc.* | | | 166,682 | |
| | 492 | | | West Pharmaceutical Services, Inc. | | | 138,080 | |
| | 332 | | | Zimmer Biomet Holdings, Inc. | | | 54,136 | |
| | | | | | | | |
| | | | 6,885,978 | |
| | |
| Health Care Providers & Services – 0.3% | |
| | 1,678 | | | AmerisourceBergen Corp. | | | 169,847 | |
| | 733 | | | Amplifon SpA* | | | 29,157 | |
| | 723 | | | Anthem, Inc. | | | 219,206 | |
| | 3,515 | | | Cardinal Health, Inc. | | | 181,093 | |
| | 2,915 | | | Centene Corp.* | | | 170,644 | |
| | 1,735 | | | Cigna Corp. | | | 364,177 | |
| | 6,115 | | | CVS Health Corp. | | | 416,615 | |
| | 2,262 | | | DaVita, Inc.* | | | 231,018 | |
| | 1,392 | | | Fresenius Medical Care AG & Co. KGaA | | | 96,372 | |
| | 2,336 | | | Fresenius SE & Co. KGaA | | | 100,081 | |
| | 1,310 | | | HCA Healthcare, Inc. | | | 225,359 | |
| | |
|
| Common Stocks – (continued) | |
| Health Care Providers & Services – (continued) | |
| | 3,162 | | | Henry Schein, Inc.* | | | 195,570 | |
| | 570 | | | Humana, Inc. | | | 216,401 | |
| | 1,455 | | | Laboratory Corp. of America Holdings* | | | 349,069 | |
| | 1,470 | | | McKesson Corp. | | | 249,194 | |
| | 3,205 | | | Medipal Holdings Corp. | | | 63,672 | |
| | 358 | | | Molina Healthcare, Inc.* | | | 77,600 | |
| | 1,559 | | | Quest Diagnostics, Inc. | | | 180,205 | |
| | 2,188 | | | Sonic Healthcare Ltd. | | | 53,644 | |
| | 2,952 | | | UnitedHealth Group, Inc. | | | 980,714 | |
| | 1,164 | | | Universal Health Services, Inc. Class B | | | 145,884 | |
| | | | | | | | |
| | | | 4,715,522 | |
| | |
| Health Care Technology – 0.0% | |
| | 3,888 | | | Cerner Corp. | | | 268,816 | |
| | 1,242 | | | M3, Inc. | | | 98,711 | |
| | 417 | | | Teladoc Health, Inc.* | | | 92,195 | |
| | 969 | | | Veeva Systems, Inc. Class A* | | | 271,427 | |
| | | | | | | | |
| | | | 731,149 | |
| | |
| Hotels, Restaurants & Leisure – 0.1% | |
| | 823 | | | Accor SA* | | | 34,346 | |
| | 5,147 | | | Aramark | | | 191,057 | |
| | 1,836 | | | Aristocrat Leisure Ltd. | | | 42,950 | |
| | 80 | | | Chipotle Mexican Grill, Inc.* | | | 115,360 | |
| | 297 | | | Darden Restaurants, Inc. | | | 40,787 | |
| | 902 | | | Domino’s Pizza, Inc. | | | 312,552 | |
| | 7,042 | | | Entain PLC* | | | 139,313 | |
| | 1,040 | | | Evolution Gaming Group AB(a) | | | 129,682 | �� |
| | 382 | | | Flutter Entertainment PLC* | | | 73,173 | |
| | 919 | | | Hilton Worldwide Holdings, Inc. | | | 113,662 | |
| | 6,142 | | | La Francaise des Jeux SAEM(a) | | | 277,248 | |
| | 337 | | | Las Vegas Sands Corp. | | | 21,096 | |
| | 740 | | | Marriott International, Inc. Class A | | | 109,572 | |
| | 1,278 | | | McDonald’s Corp. | | | 263,447 | |
| | 779 | | | McDonald’s Holdings Co. Japan Ltd. | | | 38,707 | |
| | 1,751 | | | MGM Resorts International | | | 66,170 | |
| | 303 | | | Oriental Land Co. Ltd. | | | 51,020 | |
| | 1,499 | | | Starbucks Corp. | | | 161,937 | |
| | 85 | | | Vail Resorts, Inc. | | | 26,280 | |
| | 2,750 | | | Yum! Brands, Inc. | | | 284,708 | |
| | | | | | | | |
| | | | 2,493,067 | |
| | |
| Household Durables – 0.1% | |
| | 8,407 | | | Barratt Developments PLC* | | | 78,129 | |
| | 582 | | | Berkeley Group Holdings PLC | | | 32,974 | |
| | 1,106 | | | D.R. Horton, Inc. | | | 85,018 | |
| | 3,672 | | | Electrolux AB Class B | | | 86,691 | |
| | 715 | | | Garmin Ltd. | | | 88,674 | |
| | 8,590 | | | Husqvarna AB Class B | | | 105,055 | |
| | 1,993 | | | Iida Group Holdings Co. Ltd. | | | 45,341 | |
| | 1,969 | | | Lennar Corp. Class A | | | 163,368 | |
| | 1,402 | | | Mohawk Industries, Inc.* | | | 245,336 | |
| | 5,046 | | | Newell Brands, Inc. | | | 116,916 | |
| | |
| | |
| 12 | | The accompanying notes are an integral part of these financial statements. |
GOLDMAN SACHS GLOBAL MANAGED BETA FUND
| | | | | | | | |
Shares | | | Description | | Value | |
|
| Common Stocks – (continued) | |
| Household Durables – (continued) | |
| | 25 | | | NVR, Inc.* | | $ | 112,521 | |
| | 2,890 | | | Panasonic Corp. | | | 37,362 | |
| | 1,944 | | | PulteGroup, Inc. | | | 87,694 | |
| | 247 | | | Rinnai Corp. | | | 25,049 | |
| | 1,867 | | | SEB SA | | | 335,380 | |
| | 3,934 | | | Sekisui House Ltd. | | | 74,229 | |
| | 1,095 | | | Sharp Corp. | | | 20,813 | |
| | 2,749 | | | Sony Corp. | | | 290,298 | |
| | 255 | | | Whirlpool Corp. | | | 48,471 | |
| | | | | | | | |
| | | | 2,079,319 | |
| | |
| Household Products – 0.1% | |
| | 1,266 | | | Church & Dwight Co., Inc. | | | 99,697 | |
| | 5,593 | | | Colgate-Palmolive Co. | | | 420,594 | |
| | 1,664 | | | Essity AB Class B | | | 49,998 | |
| | 1,180 | | | Henkel AG & Co. KGaA | | | 110,609 | |
| | 1,819 | | | Kimberly-Clark Corp. | | | 233,432 | |
| | 2,631 | | | Lion Corp. | | | 50,500 | |
| | 2,511 | | | Pigeon Corp. | | | 90,930 | |
| | 1,594 | | | Reckitt Benckiser Group PLC | | | 133,706 | |
| | 1,775 | | | The Clorox Co. | | | 321,364 | |
| | 5,715 | | | The Procter & Gamble Co. | | | 705,974 | |
| | 1,362 | | | Unicharm Corp. | | | 53,960 | |
| | | | | | | | |
| | | | 2,270,764 | |
| | |
| Independent Power and Renewable Electricity Producers – 0.0% | |
| | 15,841 | | | Meridian Energy Ltd. | | | 65,213 | |
| | 1,643 | | | Northland Power, Inc. | | | 54,547 | |
| | 3,473 | | | The AES Corp. | | | 92,243 | |
| | 3,652 | | | Uniper SE | | | 127,647 | |
| | 17,160 | | | Vistra Corp. | | | 296,010 | |
| | | | | | | | |
| | | | 635,660 | |
| | |
| Industrial Conglomerates – 0.1% | |
| | 1,237 | | | 3M Co. | | | 216,549 | |
| | 21,501 | | | CK Hutchison Holdings Ltd. | | | 162,255 | |
| | 253 | | | DCC PLC | | | 20,437 | |
| | 6,795 | | | General Electric Co. | | | 85,209 | |
| | 670 | | | Honeywell International, Inc. | | | 135,575 | |
| | 2,127 | | | Investment AB Latour Class B | | | 48,339 | |
| | 1,385 | | | Jardine Matheson Holdings Ltd. | | | 72,201 | |
| | 550 | | | Keihan Holdings Co. Ltd. | | | 24,796 | |
| | 226 | | | Roper Technologies, Inc. | | | 85,342 | |
| | 1,427 | | | Siemens AG | | | 220,844 | |
| | | | | | | | |
| | | | 1,071,547 | |
| | |
| Insurance – 0.4% | |
| | 8,122 | | | Admiral Group PLC | | | 351,474 | |
| | 4,284 | | | Aegon NV | | | 20,532 | |
| | 2,561 | | | Aflac, Inc. | | | 122,646 | |
| | 1,306 | | | Ageas SA | | | 73,204 | |
| | 19,958 | | | AIA Group Ltd. | | | 251,699 | |
| | 43 | | | Alleghany Corp. | | | 27,797 | |
| | 1,201 | | | Allianz SE | | | 289,873 | |
| | 1,395 | | | Aon PLC Class A | | | 317,655 | |
| | 3,046 | | | Arch Capital Group Ltd.* | | | 109,108 | |
| | |
|
| Common Stocks – (continued) | |
| Insurance – (continued) | |
| | 1,384 | | | Arthur J. Gallagher & Co. | | | 165,803 | |
| | 7,809 | | | Assicurazioni Generali SpA* | | | 146,441 | |
| | 525 | | | Assurant, Inc. | | | 64,691 | |
| | 2,337 | | | Athene Holding Ltd. Class A* | | | 106,544 | |
| | 20,657 | | | Aviva PLC | | | 104,657 | |
| | 4,282 | | | AXA SA | | | 107,685 | |
| | 475 | | | Baloise Holding AG | | | 83,079 | |
| | 1,980 | | | Brown & Brown, Inc. | | | 90,882 | |
| | 930 | | | Chubb Ltd. | | | 151,199 | |
| | 290 | | | Cincinnati Financial Corp. | | | 28,382 | |
| | 3,785 | | | CNP Assurances* | | | 68,112 | |
| | 2,060 | | | Dai-ichi Life Holdings, Inc. | | | 36,613 | |
| | 22,196 | | | Direct Line Insurance Group PLC | | | 99,229 | |
| | 653 | | | Erie Indemnity Co. Class A | | | 158,091 | |
| | 237 | | | Everest Re Group Ltd. | | | 57,309 | |
| | 103 | | | Fairfax Financial Holdings Ltd. | | | 41,958 | |
| | 1,837 | | | Fidelity National Financial, Inc. | | | 70,320 | |
| | 4,939 | | | Gjensidige Forsikring ASA | | | 113,281 | |
| | 828 | | | Globe Life, Inc. | | | 77,335 | |
| | 4,402 | | | Great-West Lifeco, Inc. | | | 112,662 | |
| | 548 | | | Hannover Rueck SE | | | 92,785 | |
| | 4,252 | | | iA Financial Corp., Inc. | | | 218,481 | |
| | 7,993 | | | Insurance Australia Group Ltd. | | | 30,683 | |
| | 739 | | | Intact Financial Corp. | | | 82,599 | |
| | 7,225 | | | Japan Post Holdings Co. Ltd. | | | 62,100 | |
| | 23,802 | | | Legal & General Group PLC | | | 86,549 | |
| | 2,384 | | | Lincoln National Corp. | | | 135,578 | |
| | 5,208 | | | Manulife Financial Corp. | | | 103,824 | |
| | 28 | | | Markel Corp.* | | | 30,486 | |
| | 1,679 | | | Marsh & McLennan Cos., Inc. | | | 193,454 | |
| | 12,505 | | | Medibank Pvt. Ltd. | | | 26,689 | |
| | 3,727 | | | MetLife, Inc. | | | 214,675 | |
| | 1,397 | | | MS&AD Insurance Group Holdings, Inc. | | | 39,653 | |
| | 371 | | | Muenchener Rueckversicherungs-Gesellschaft AG in Muenchen | | | 109,132 | |
| | 2,321 | | | NN Group NV | | | 107,169 | |
| | 6,961 | | | Poste Italiane SpA(a) | | | 78,864 | |
| | 8,464 | | | Power Corp. of Canada | | | 204,051 | |
| | 1,436 | | | Principal Financial Group, Inc. | | | 81,249 | |
| | 643 | | | Reinsurance Group of America, Inc. | | | 78,594 | |
| | 252 | | | RenaissanceRe Holdings Ltd. | | | 42,079 | |
| | 5,437 | | | RSA Insurance Group PLC | | | 51,330 | |
| | 970 | | | SCOR SE* | | | 32,181 | |
| | 878 | | | Sompo Holdings, Inc. | | | 33,791 | |
| | 1,730 | | | Sun Life Financial, Inc. | | | 83,251 | |
| | 11,150 | | | Suncorp Group Ltd. | | | 85,424 | |
| | 352 | | | Swiss Life Holding AG | | | 174,957 | |
| | 267 | | | Swiss Re AG | | | 25,084 | |
| | 2,559 | | | The Allstate Corp. | | | 272,789 | |
| | 1,442 | | | The Hartford Financial Services Group, Inc. | | | 73,095 | |
| | 2,562 | | | The Progressive Corp. | | | 220,204 | |
| | 878 | | | The Travelers Cos., Inc. | | | 127,749 | |
| | 1,160 | | | Tokio Marine Holdings, Inc. | | | 57,627 | |
| | 1,146 | | | Tryg A/S | | | 35,988 | |
| | |
| | |
| The accompanying notes are an integral part of these financial statements. | | 13 |
GOLDMAN SACHS GLOBAL MANAGED BETA FUND
Schedule of Investments (continued)
February 28, 2021 (Unaudited)
| | | | | | | | |
Shares | | | Description | | Value | |
|
| Common Stocks – (continued) | |
| Insurance – (continued) | |
| | 494 | | | W.R. Berkley Corp. | | $ | 34,249 | |
| | 592 | | | Willis Towers Watson PLC | | | 130,619 | |
| | 380 | | | Zurich Insurance Group AG | | | 155,120 | |
| | | | | | | | |
| | | | 7,060,413 | |
| | |
| Interactive Media & Services – 0.4% | |
| | 2,697 | | | Adevinta ASA* | | | 37,534 | |
| | 808 | | | Alphabet, Inc. Class A* | | | 1,633,703 | |
| | 877 | | | Alphabet, Inc. Class C* | | | 1,786,326 | |
| | 34,991 | | | Auto Trader Group PLC(a) | | | 269,031 | |
| | 7,528 | | | Facebook, Inc. Class A* | | | 1,939,363 | |
| | 353 | | | InterActiveCorp.* | | | 86,425 | |
| | 6,309 | | | Kakaku.com, Inc. | | | 200,996 | |
| | 2,317 | | | Match Group, Inc.* | | | 354,153 | |
| | 2,339 | | | Pinterest, Inc. Class A* | | | 188,477 | |
| | 1,110 | | | REA Group Ltd. | | | 117,301 | |
| | 849 | | | Scout24 AG(a) | | | 64,040 | |
| | 1,680 | | | SEEK Ltd. | | | 33,233 | |
| | 2,631 | | | Snap, Inc. Class A* | | | 172,751 | |
| | 2,144 | | | Twitter, Inc.* | | | 165,217 | |
| | 9,699 | | | Z Holdings Corp. | | | 59,215 | |
| | 408 | | | Zillow Group, Inc. Class A* | | | 69,287 | |
| | 656 | | | Zillow Group, Inc. Class C* | | | 105,832 | |
| | | | | | | | |
| | | | 7,282,884 | |
| | |
| Internet & Direct Marketing Retail – 0.4% | |
| | 1,389 | | | Amazon.com, Inc.* | | | 4,296,080 | |
| | 106 | | | Booking Holdings, Inc.* | | | 246,822 | |
| | 842 | | | Chewy, Inc. Class A* | | | 85,513 | |
| | 460 | | | Delivery Hero SE*(a) | | | 58,779 | |
| | 5,246 | | | eBay, Inc. | | | 295,979 | |
| | 459 | | | Etsy, Inc.* | | | 101,104 | |
| | 456 | | | Expedia Group, Inc. | | | 73,416 | |
| | 2,786 | | | HelloFresh SE* | | | 216,459 | |
| | 231 | | | Just Eat Takeaway.com NV*(a) | | | 22,228 | |
| | 105 | | | MercadoLibre, Inc.* | | | 172,002 | |
| | 796 | | | Mercari, Inc.* | | | 38,298 | |
| | 3,637 | | | Ocado Group PLC* | | | 111,741 | |
| | 1,039 | | | Prosus NV | | | 123,866 | |
| | 9,073 | | | Rakuten, Inc. | | | 101,979 | |
| | 1,794 | | | Wayfair, Inc. Class A* | | | 518,430 | |
| | 3,533 | | | Zalando SE*(a) | | | 363,218 | |
| | 7,864 | | | ZOZO, Inc. | | | 246,782 | |
| | | | | | | | |
| | | | 7,072,696 | |
| | |
| IT Services – 0.5% | |
| | 2,719 | | | Accenture PLC Class A | | | 682,197 | |
| | 50 | | | Adyen NV*(a) | | | 116,669 | |
| | 669 | | | Afterpay Ltd.* | | | 61,109 | |
| | 897 | | | Akamai Technologies, Inc.* | | | 84,766 | |
| | 3,368 | | | Atos SE* | | | 263,241 | |
| | 810 | | | Automatic Data Processing, Inc. | | | 140,956 | |
| | 169 | | | Bechtle AG | | | 31,823 | |
| | 1,650 | | | Black Knight, Inc.* | | | 126,538 | |
| | 619 | | | Broadridge Financial Solutions, Inc. | | | 88,201 | |
| | 976 | | | Capgemini SE | | | 156,746 | |
| | |
|
| Common Stocks – (continued) | |
| IT Services – (continued) | |
| | 2,194 | | | CGI, Inc.* | | | 163,783 | |
| | 4,893 | | | Cognizant Technology Solutions Corp. Class A | | | 359,538 | |
| | 654 | | | Edenred | | | 36,246 | |
| | 373 | | | EPAM Systems, Inc.* | | | 139,357 | |
| | 2,163 | | | Fidelity National Information Services, Inc. | | | 298,494 | |
| | 2,392 | | | Fiserv, Inc.* | | | 275,965 | |
| | 563 | | | FleetCor Technologies, Inc.* | | | 156,126 | |
| | 745 | | | Fujitsu Ltd. | | | 108,083 | |
| | 1,166 | | | Gartner, Inc.* | | | 208,761 | |
| | 1,030 | | | Global Payments, Inc. | | | 203,930 | |
| | 323 | | | GMO Payment Gateway, Inc. | | | 42,751 | |
| | 859 | | | GoDaddy, Inc. Class A* | | | 69,682 | |
| | 4,016 | | | International Business Machines Corp. | | | 477,623 | |
| | 1,107 | | | Itochu Techno-Solutions Corp. | | | 34,025 | |
| | 493 | | | Jack Henry & Associates, Inc. | | | 73,181 | |
| | 2,170 | | | Mastercard, Inc. Class A | | | 767,854 | |
| | 277 | | | MongoDB, Inc.* | | | 106,903 | |
| | 1,731 | | | NEC Corp. | | | 94,684 | |
| | 1,492 | | | Nomura Research Institute Ltd. | | | 46,291 | |
| | 2,940 | | | NTT Data Corp. | | | 45,134 | |
| | 376 | | | Obic Co. Ltd. | | | 63,340 | |
| | 496 | | | Okta, Inc.* | | | 129,679 | |
| | 522 | | | Otsuka Corp. | | | 24,249 | |
| | 1,624 | | | Paychex, Inc. | | | 147,898 | |
| | 2,155 | | | PayPal Holdings, Inc.* | | | 559,977 | |
| | 235 | | | Shopify, Inc. Class A* | | | 304,457 | |
| | 445 | | | Snowflake, Inc. Class A* | | | 115,495 | |
| | 846 | | | Square, Inc. Class A* | | | 194,605 | |
| | 8,664 | | | The Western Union Co. | | | 201,178 | |
| | 356 | | | Twilio, Inc. Class A* | | | 139,865 | |
| | 1,099 | | | VeriSign, Inc.* | | | 213,239 | |
| | 3,198 | | | Visa, Inc. Class A | | | 679,223 | |
| | 994 | | | Wix.com Ltd.* | | | 346,479 | |
| | | | | | | | |
| | | | 8,580,341 | |
| | |
| Leisure Products – 0.0% | |
| | 712 | | | Bandai Namco Holdings, Inc. | | | 54,462 | |
| | 294 | | | Hasbro, Inc. | | | 27,551 | |
| | 639 | | | Peloton Interactive, Inc. Class A* | | | 76,980 | |
| | 1,326 | | | Sega Sammy Holdings, Inc. | | | 22,359 | |
| | 170 | | | Shimano, Inc. | | | 37,965 | |
| | | | | | | | |
| | | | 219,317 | |
| | |
| Life Sciences Tools & Services – 0.1% | |
| | 442 | | | 10X Genomics, Inc. Class A* | | | 78,672 | |
| | 1,359 | | | Agilent Technologies, Inc. | | | 165,893 | |
| | 191 | | | Bio-Rad Laboratories, Inc. Class A* | | | 111,640 | |
| | 623 | | | Eurofins Scientific SE* | | | 55,301 | |
| | 376 | | | Illumina, Inc.* | | | 165,218 | |
| | 512 | | | IQVIA Holdings, Inc.* | | | 98,708 | |
| | 248 | | | Lonza Group AG | | | 156,425 | |
| | 367 | | | Mettler-Toledo International, Inc.* | | | 409,590 | |
| | 865 | | | PerkinElmer, Inc. | | | 109,068 | |
| | |
| | |
| 14 | | The accompanying notes are an integral part of these financial statements. |
GOLDMAN SACHS GLOBAL MANAGED BETA FUND
| | | | | | | | |
Shares | | | Description | | Value | |
|
| Common Stocks – (continued) | |
| Life Sciences Tools & Services – (continued) | |
| | 914 | | | PPD, Inc.* | | $ | 32,045 | |
| | 1,504 | | | QIAGEN NV* | | | 74,401 | |
| | 488 | | | Sartorius Stedim Biotech | | | 213,144 | |
| | 909 | | | Thermo Fisher Scientific, Inc. | | | 409,123 | |
| | 844 | | | Waters Corp.* | | | 231,155 | |
| | | | | | | | |
| | | | 2,310,383 | |
| | |
| Machinery – 0.2% | |
| | 836 | | | Alstom SA* | | | 41,670 | |
| | 1,301 | | | Atlas Copco AB Class A | | | 74,249 | |
| | 1,042 | | | Atlas Copco AB Class B | | | 50,490 | |
| | 984 | | | Caterpillar, Inc. | | | 212,426 | |
| | 2,703 | | | CNH Industrial NV* | | | 39,898 | |
| | 1,232 | | | Cummins, Inc. | | | 311,942 | |
| | 502 | | | Daifuku Co. Ltd. | | | 48,212 | |
| | 716 | | | Deere & Co. | | | 249,970 | |
| | 779 | | | Dover Corp. | | | 96,020 | |
| | 1,450 | | | Epiroc AB Class A | | | 30,731 | |
| | 1,494 | | | Epiroc AB Class B | | | 29,364 | |
| | 231 | | | FANUC Corp. | | | 57,729 | |
| | 640 | | | Fortive Corp. | | | 42,125 | |
| | 987 | | | GEA Group AG | | | 34,173 | |
| | 474 | | | Harmonic Drive Systems, Inc. | | | 36,540 | |
| | 289 | | | IDEX Corp. | | | 56,404 | |
| | 874 | | | Illinois Tool Works, Inc. | | | 176,705 | |
| | 644 | | | Ingersoll Rand, Inc.* | | | 29,843 | |
| | 866 | | | KION Group AG | | | 73,174 | |
| | 741 | | | Knorr-Bremse AG | | | 94,358 | |
| | 1,111 | | | Komatsu Ltd. | | | 33,353 | |
| | 1,042 | | | Kone Oyj Class B | | | 83,166 | |
| | 2,478 | | | Kubota Corp. | | | 56,215 | |
| | 502 | | | Kurita Water Industries Ltd. | | | 20,394 | |
| | 2,964 | | | MISUMI Group, Inc. | | | 90,875 | |
| | 787 | | | Miura Co. Ltd. | | | 40,944 | |
| | 706 | | | Nabtesco Corp. | | | 30,126 | |
| | 224 | | | Nordson Corp. | | | 43,100 | |
| | 984 | | | Otis Worldwide Corp. | | | 62,691 | |
| | 959 | | | PACCAR, Inc. | | | 87,259 | |
| | 1,060 | | | Parker-Hannifin Corp. | | | 304,178 | |
| | 597 | | | Pentair PLC | | | 33,390 | |
| | 37 | | | Rational AG | | | 31,651 | |
| | 1,093 | | | Sandvik AB* | | | 29,353 | |
| | 407 | | | Schindler Holding AG | | | 109,810 | |
| | 2,492 | | | SKF AB Class B | | | 67,898 | |
| | 110 | | | SMC Corp. | | | 65,236 | |
| | 1,517 | | | Snap-on, Inc. | | | 308,118 | |
| | 439 | | | Spirax-Sarco Engineering PLC | | | 65,792 | |
| | 433 | | | Stanley Black & Decker, Inc. | | | 75,706 | |
| | 11,959 | | | Techtronic Industries Co. Ltd. | | | 182,015 | |
| | 1,571 | | | Volvo AB Class B* | | | 40,218 | |
| | 1,164 | | | Westinghouse Air Brake Technologies Corp. | | | 84,309 | |
| | 397 | | | Xylem, Inc. | | | 39,525 | |
| | 800 | | | Yaskawa Electric Corp. | | | 40,250 | |
| | | | | | | | |
| | | | 3,811,595 | |
| | |
|
| Common Stocks – (continued) | |
| Marine – 0.0% | |
| | 129 | | | AP Moller – Maersk A/S Class A | | | 257,750 | |
| | 122 | | | AP Moller – Maersk A/S Class B | | | 260,922 | |
| | 1,108 | | | Kuehne & Nagel International AG | | | 262,918 | |
| | 710 | | | Nippon Yusen KK | | | 20,537 | |
| | | | | | | | |
| | | | 802,127 | |
| | |
| Media – 0.3% | |
| | 45 | | | Cable One, Inc. | | | 86,168 | |
| | 421 | | | Charter Communications, Inc. Class A* | | | 258,250 | |
| | 13,055 | | | Comcast Corp. Class A | | | 688,259 | |
| | 5,070 | | | CyberAgent, Inc. | | | 306,186 | |
| | 2,749 | | | Dentsu Group, Inc. | | | 95,992 | |
| | 7,658 | | | Discovery, Inc. Class A* | | | 406,104 | |
| | 9,343 | | | Discovery, Inc. Class C* | | | 420,435 | |
| | 6,246 | | | Fox Corp. Class A | | | 208,054 | |
| | 6,058 | | | Fox Corp. Class B | | | 193,432 | |
| | 2,474 | | | Hakuhodo DY Holdings, Inc. | | | 41,087 | |
| | 744 | | | Liberty Broadband Corp. Class A* | | | 108,148 | |
| | 857 | | | Liberty Broadband Corp. Class C* | | | 128,130 | |
| | 4,541 | | | Liberty Media Corp.-Liberty SiriusXM Class A* | | | 201,666 | |
| | 4,473 | | | Liberty Media Corp.-Liberty SiriusXM Class C* | | | 197,349 | |
| | 11,532 | | | News Corp. Class A | | | 270,425 | |
| | 2,338 | | | Omnicom Group, Inc. | | | 160,691 | |
| | 1,940 | | | Pearson PLC | | | 20,439 | |
| | 1,763 | | | Publicis Groupe SA | | | 103,667 | |
| | 1,596 | | | Quebecor, Inc. Class B | | | 41,261 | |
| | 871 | | | Schibsted ASA Class A* | | | 35,102 | |
| | 2,073 | | | Schibsted ASA Class B* | | | 71,086 | |
| | 5,071 | | | SES SA | | | 40,526 | |
| | 1,717 | | | Shaw Communications, Inc. Class B | | | 29,885 | |
| | 11,214 | | | Sirius XM Holdings, Inc. | | | 65,602 | |
| | 6,456 | | | The Interpublic Group of Cos., Inc. | | | 168,631 | |
| | 4,879 | | | ViacomCBS, Inc. Class B | | | 314,647 | |
| | 8,405 | | | WPP PLC | | | 100,519 | |
| | | | | | | | |
| | | | 4,761,741 | |
| | |
| Metals & Mining – 0.2% | |
| | 749 | | | Agnico Eagle Mines Ltd. | | | 41,811 | |
| | 1,452 | | | Anglo American PLC | | | 56,339 | |
| | 1,597 | | | Antofagasta PLC | | | 39,858 | |
| | 11,926 | | | ArcelorMittal SA* | | | 278,488 | |
| | 11,499 | | | B2Gold Corp. | | | 50,059 | |
| | 4,303 | | | Barrick Gold Corp. | | | 80,305 | |
| | 4,800 | | | BHP Group Ltd. | | | 181,442 | |
| | 3,782 | | | BHP Group PLC | | | 120,118 | |
| | 14,188 | | | BlueScope Steel Ltd. | | | 181,197 | |
| | 603 | | | Boliden AB | | | 23,881 | |
| | 8,534 | | | Evolution Mining Ltd. | | | 27,305 | |
| | 18,176 | | | Evraz PLC | | | 145,917 | |
| | 1,666 | | | First Quantum Minerals Ltd. | | | 35,909 | |
| | 8,573 | | | Fortescue Metals Group Ltd. | | | 158,327 | |
| | 637 | | | Franco-Nevada Corp. | | | 68,205 | |
| | 3,127 | | | Freeport-McMoRan, Inc. | | | 106,037 | |
| | |
| | |
| The accompanying notes are an integral part of these financial statements. | | 15 |
GOLDMAN SACHS GLOBAL MANAGED BETA FUND
Schedule of Investments (continued)
February 28, 2021 (Unaudited)
| | | | | | | | |
Shares | | | Description | | Value | |
|
| Common Stocks – (continued) | |
| Metals & Mining – (continued) | |
| | 2,624 | | | Fresnillo PLC | | $ | 33,139 | |
| | 25,606 | | | Glencore PLC* | | | 104,206 | |
| | 8,985 | | | Kinross Gold Corp. | | | 55,847 | |
| | 1,656 | | | Kirkland Lake Gold Ltd. | | | 54,159 | |
| | 1,713 | | | Lundin Mining Corp. | | | 19,612 | |
| | 1,903 | | | Newcrest Mining Ltd. | | | 35,761 | |
| | 2,181 | | | Newmont Corp. | | | 118,603 | |
| | 16,842 | | | Norsk Hydro ASA | | | 93,242 | |
| | 3,676 | | | Northern Star Resources Ltd. | | | 28,473 | |
| | 2,217 | | | Nucor Corp. | | | 132,621 | |
| | 1,210 | | | Pan American Silver Corp. | | | 39,982 | |
| | 1,072 | | | Rio Tinto Ltd. | | | 105,185 | |
| | 1,918 | | | Rio Tinto PLC | | | 166,227 | |
| | 87,313 | | | South32 Ltd. | | | 185,534 | |
| | 818 | | | Sumitomo Metal Mining Co. Ltd. | | | 39,675 | |
| | 1,740 | | | Teck Resources Ltd. Class B | | | 36,233 | |
| | 3,384 | | | voestalpine AG | | | 133,649 | |
| | 1,070 | | | Wheaton Precious Metals Corp. | | | 38,273 | |
| | 8,134 | | | Yamana Gold, Inc. | | | 32,342 | |
| | | | | | | | |
| | | | 3,047,961 | |
| | |
| Mortgage Real Estate Investment Trusts (REITs) – 0.0% | |
| | 3,860 | | | AGNC Investment Corp. | | | 61,876 | |
| | |
| Multi-Utilities – 0.1% | |
| | 10,144 | | | AGL Energy Ltd. | | | 72,943 | |
| | 1,530 | | | Algonquin Power & Utilities Corp. | | | 23,697 | |
| | 674 | | | Ameren Corp. | | | 47,362 | |
| | 954 | | | Canadian Utilities Ltd. Class A | | | 22,579 | |
| | 890 | | | CMS Energy Corp. | | | 48,158 | |
| | 731 | | | Consolidated Edison, Inc. | | | 47,990 | |
| | 891 | | | Dominion Energy, Inc. | | | 60,873 | |
| | 290 | | | DTE Energy Co. | | | 34,139 | |
| | 5,759 | | | E.ON SE | | | 58,721 | |
| | 5,313 | | | Engie SA* | | | 77,353 | |
| | 6,219 | | | National Grid PLC | | | 69,929 | |
| | 1,593 | | | NiSource, Inc. | | | 34,409 | |
| | 1,180 | | | Public Service Enterprise Group, Inc. | | | 63,519 | |
| | 3,727 | | | RWE AG | | | 140,768 | |
| | 354 | | | Sempra Energy | | | 41,057 | |
| | 7,265 | | | Suez SA | | | 151,012 | |
| | 2,984 | | | Veolia Environnement SA | | | 80,020 | |
| | 648 | | | WEC Energy Group, Inc. | | | 52,255 | |
| | | | | | | | |
| | | | 1,126,784 | |
| | |
| Multiline Retail – 0.1% | |
| | 789 | | | Canadian Tire Corp. Ltd. Class A | | | 101,951 | |
| | 1,470 | | | Dollar General Corp. | | | 277,815 | |
| | 2,091 | | | Dollar Tree, Inc.* | | | 205,336 | |
| | 2,821 | | | Dollarama, Inc. | | | 107,356 | |
| | 2,234 | | | Next PLC* | | | 236,636 | |
| | 1,184 | | | Pan Pacific International Holdings Corp. | | | 27,767 | |
| | 7,530 | | | Ryohin Keikaku Co. Ltd. | | | 170,611 | |
| | 3,622 | | | Target Corp. | | | 664,420 | |
| | 8,260 | | | Wesfarmers Ltd. | | | 314,171 | |
| | | | | | | | |
| | | | 2,106,063 | |
| | |
|
| Common Stocks – (continued) | |
| Oil, Gas & Consumable Fuels – 0.1% | |
| | 1,156 | | | Ampol Ltd. | | | 21,974 | |
| | 7,896 | | | BP PLC | | | 32,338 | |
| | 1,320 | | | Cabot Oil & Gas Corp. | | | 24,433 | |
| | 2,494 | | | Cameco Corp. | | | 39,137 | |
| | 2,403 | | | Canadian Natural Resources Ltd. | | | 65,542 | |
| | 936 | | | Cheniere Energy, Inc.* | | | 63,077 | |
| | 1,581 | | | Chevron Corp. | | | 158,100 | |
| | 924 | | | Devon Energy Corp. | | | 19,903 | |
| | 1,122 | | | Enbridge, Inc. | | | 37,894 | |
| | 15,230 | | | ENEOS Holdings, Inc. | | | 67,347 | |
| | 594 | | | EOG Resources, Inc. | | | 38,349 | |
| | 4,059 | | | Exxon Mobil Corp. | | | 220,688 | |
| | 884 | | | Idemitsu Kosan Co. Ltd. | | | 23,252 | |
| | 4,802 | | | Kinder Morgan, Inc. | | | 70,589 | |
| | 922 | | | Koninklijke Vopak NV | | | 43,993 | |
| | 1,020 | | | Marathon Petroleum Corp. | | | 55,712 | |
| | 1,026 | | | Neste Oyj | | | 67,767 | |
| | 2,436 | | | OMV AG | | | 117,364 | |
| | 1,908 | | | Parkland Corp. | | | 60,631 | |
| | 9,614 | | | Royal Dutch Shell PLC Class A | | | 196,649 | |
| | 8,927 | | | Royal Dutch Shell PLC Class B | | | 174,999 | |
| | 1,722 | | | The Williams Cos., Inc. | | | 39,330 | |
| | 1,269 | | | TOTAL SE | | | 59,174 | |
| | 1,670 | | | Valero Energy Corp. | | | 128,557 | |
| | 886 | | | Washington H Soul Pattinson & Co. Ltd. | | | 20,390 | |
| | | | | | | | |
| | | | 1,847,189 | |
| | |
| Paper & Forest Products – 0.0% | |
| | 1,106 | | | Mondi PLC | | | 26,690 | |
| | 4,380 | | | Oji Holdings Corp. | | | 27,718 | |
| | 2,047 | | | Stora Enso Oyj Class R | | | 40,318 | |
| | 2,653 | | | Svenska Cellulosa AB SCA Class B* | | | 45,630 | |
| | 1,282 | | | UPM-Kymmene Oyj | | | 48,978 | |
| | | | | | | | |
| | | | 189,334 | |
| | |
| Personal Products – 0.1% | |
| | 1,124 | | | Beiersdorf AG | | | 111,059 | |
| | 472 | | | Kao Corp. | | | 31,756 | |
| | 323 | | | Kobayashi Pharmaceutical Co. Ltd. | | | 30,580 | |
| | 902 | | | Kose Corp. | | | 144,988 | |
| | 1,303 | | | L’Oreal SA | | | 475,529 | |
| | 5,298 | | | Pola Orbis Holdings, Inc. | | | 121,408 | |
| | 2,341 | | | Shiseido Co. Ltd. | | | 174,994 | |
| | 1,777 | | | The Estee Lauder Cos., Inc. Class A | | | 507,973 | |
| | 3,793 | | | Unilever PLC | | | 197,719 | |
| | | | | | | | |
| | | | 1,796,006 | |
| | |
| Pharmaceuticals – 0.5% | |
| | 11,771 | | | Astellas Pharma, Inc. | | | 186,113 | |
| | 2,903 | | | AstraZeneca PLC | | | 281,980 | |
| | 1,418 | | | Bausch Health Cos., Inc.* | | | 44,626 | |
| | 4,264 | | | Bayer AG | | | 259,000 | |
| | 8,431 | | | Bristol-Myers Squibb Co. | | | 517,073 | |
| | 1,000 | | | Canopy Growth Corp.* | | | 32,925 | |
| | 808 | | | Catalent, Inc.* | | | 91,878 | |
| | |
| | |
| 16 | | The accompanying notes are an integral part of these financial statements. |
GOLDMAN SACHS GLOBAL MANAGED BETA FUND
| | | | | | | | |
Shares | | | Description | | Value | |
|
| Common Stocks – (continued) | |
| Pharmaceuticals – (continued) | |
| | 2,739 | | | Chugai Pharmaceutical Co. Ltd. | | $ | 122,968 | |
| | 3,015 | | | Daiichi Sankyo Co. Ltd. | | | 85,615 | |
| | 1,057 | | | Eisai Co. Ltd. | | | 72,892 | |
| | 894 | | | Elanco Animal Health, Inc.* | | | 29,377 | |
| | 3,531 | | | Eli Lilly & Co. | | | 723,467 | |
| | 12,934 | | | GlaxoSmithKline PLC | | | 215,814 | |
| | 1,645 | | | H. Lundbeck A/S | | | 62,470 | |
| | 2,520 | | | Hikma Pharmaceuticals PLC | | | 78,831 | |
| | 1,060 | | | Horizon Therapeutics PLC* | | | 96,365 | |
| | 4,668 | | | Ipsen SA | | | 397,460 | |
| | 1,839 | | | Jazz Pharmaceuticals PLC* | | | 309,025 | |
| | 7,896 | | | Johnson & Johnson | | | 1,251,200 | |
| | 1,196 | | | Kyowa Kirin Co. Ltd. | | | 33,456 | |
| | 7,166 | | | Merck & Co., Inc. | | | 520,395 | |
| | 1,592 | | | Merck KGaA | | | 258,808 | |
| | 4,550 | | | Novartis AG | | | 391,875 | |
| | 5,249 | | | Novo Nordisk A/S Class B | | | 374,448 | |
| | 2,118 | | | Ono Pharmaceutical Co. Ltd. | | | 57,130 | |
| | 3,855 | | | Orion Oyj Class B | | | 158,145 | |
| | 881 | | | Otsuka Holdings Co. Ltd. | | | 35,140 | |
| | 11,978 | | | Pfizer, Inc. | | | 401,143 | |
| | 2,657 | | | Recordati Industria Chimica e Farmaceutica SpA | | | 135,061 | |
| | 2,472 | | | Roche Holding AG | | | 811,451 | |
| | 758 | | | Royalty Pharma PLC Class A | | | 35,300 | |
| | 2,942 | | | Sanofi | | | 269,989 | |
| | 517 | | | Shionogi & Co. Ltd. | | | 26,417 | |
| | 7,289 | | | Sumitomo Dainippon Pharma Co. Ltd. | | | 115,860 | |
| | 1,029 | | | Taisho Pharmaceutical Holdings Co. Ltd. | | | 63,399 | |
| | 2,848 | | | Takeda Pharmaceutical Co. Ltd. | | | 95,974 | |
| | 29,039 | | | Teva Pharmaceutical Industries Ltd. ADR* | | | 312,460 | |
| | 1,539 | | | UCB SA | | | 152,602 | |
| | 17,127 | | | Viatris, Inc.* | | | 254,336 | |
| | 1,414 | | | Zoetis, Inc. | | | 219,509 | |
| | | | | | | | |
| | | | 9,581,977 | |
| | |
| Professional Services – 0.2% | |
| | 1,291 | | | Adecco Group AG | | | 81,251 | |
| | 2,358 | | | Booz Allen Hamilton Holding Corp. | | | 181,896 | |
| | 1,137 | | | Bureau Veritas SA* | | | 30,758 | |
| | 90 | | | CoStar Group, Inc.* | | | 74,138 | |
| | 340 | | | Equifax, Inc. | | | 55,039 | |
| | 1,370 | | | Experian PLC | | | 43,489 | |
| | 563 | | | IHS Markit Ltd. | | | 50,760 | |
| | 483 | | | Intertek Group PLC | | | 36,205 | |
| | 1,040 | | | Jacobs Engineering Group, Inc. | | | 119,683 | |
| | 3,445 | | | Leidos Holdings, Inc. | | | 304,710 | |
| | 738 | | | Nihon M&A Center, Inc. | | | 40,277 | |
| | 5,442 | | | Persol Holdings Co. Ltd. | | | 108,713 | |
| | 2,621 | | | Randstad NV* | | | 175,288 | |
| | 5,854 | | | Recruit Holdings Co. Ltd. | | | 292,521 | |
| | 6,032 | | | RELX PLC | | | 142,730 | |
| | 7,578 | | | Robert Half International, Inc. | | | 589,493 | |
| | |
|
| Common Stocks – (continued) | |
| Professional Services – (continued) | |
| | 130 | | | SGS SA | | | 371,510 | |
| | 154 | | | Teleperformance | | | 54,555 | |
| | 618 | | | Thomson Reuters Corp. | | | 53,758 | |
| | 450 | | | TransUnion | | | 37,895 | |
| | 398 | | | Verisk Analytics, Inc. | | | 65,212 | |
| | 1,605 | | | Wolters Kluwer NV | | | 127,227 | |
| | | | | | | | |
| | | | 3,037,108 | |
| | |
| Real Estate Management & Development – 0.1% | |
| | 4,949 | | | Aroundtown SA | | | 35,987 | |
| | 390 | | | Azrieli Group Ltd. | | | 23,571 | |
| | 9,284 | | | CapitaLand Ltd. | | | 21,980 | |
| | 5,031 | | | CBRE Group, Inc. Class A* | | | 381,199 | |
| | 11,922 | | | CK Asset Holdings Ltd. | | | 70,072 | |
| | 972 | | | Daito Trust Construction Co. Ltd. | | | 108,466 | |
| | 1,604 | | | Deutsche Wohnen SE | | | 75,393 | |
| | 9,159 | | | ESR Cayman Ltd.*(a) | | | 28,952 | |
| | 285 | | | FirstService Corp. | | | 43,243 | |
| | 11,134 | | | Hang Lung Properties Ltd. | | | 28,844 | |
| | 6,848 | | | Henderson Land Development Co. Ltd. | | | 29,830 | |
| | 378 | | | LEG Immobilien AG | | | 51,573 | |
| | 1,430 | | | Sun Hung Kai Properties Ltd. | | | 23,211 | |
| | 10,882 | | | Swire Pacific Ltd. Class A | | | 79,756 | |
| | 474 | | | Swiss Prime Site AG | | | 44,366 | |
| | 1,665 | | | Vonovia SE | | | 106,042 | |
| | | | | | | | |
| | | | 1,152,485 | |
| | |
| Road & Rail – 0.1% | |
| | 74 | | | AMERCO | | | 42,529 | |
| | 8,352 | | | Aurizon Holdings Ltd. | | | 24,594 | |
| | 1,272 | | | Canadian National Railway Co. | | | 138,845 | |
| | 318 | | | Canadian Pacific Railway Ltd. | | | 113,327 | |
| | 1,119 | | | CSX Corp. | | | 102,444 | |
| | 324 | | | East Japan Railway Co. | | | 24,148 | |
| | 679 | | | Hankyu Hanshin Holdings, Inc. | | | 22,703 | |
| | 374 | | | J.B. Hunt Transport Services, Inc. | | | 54,929 | |
| | 386 | | | Kansas City Southern | | | 81,963 | |
| | 262 | | | Keio Corp. | | | 19,657 | |
| | 3,624 | | | Knight-Swift Transportation Holdings, Inc. | | | 156,557 | |
| | 968 | | | Kyushu Railway Co. | | | 25,307 | |
| | 3,927 | | | MTR Corp. Ltd. | | | 23,548 | |
| | 1,110 | | | Nagoya Railroad Co. Ltd. | | | 28,338 | |
| | 276 | | | Nippon Express Co. Ltd. | | | 20,642 | |
| | 333 | | | Norfolk Southern Corp. | | | 83,936 | |
| | 939 | | | Odakyu Electric Railway Co. Ltd. | | | 27,598 | |
| | 413 | | | Old Dominion Freight Line, Inc. | | | 88,700 | |
| | 1,830 | | | Tokyu Corp. | | | 25,259 | |
| | 948 | | | Uber Technologies, Inc.* | | | 49,059 | |
| | 1,090 | | | Union Pacific Corp. | | | 224,496 | |
| | | | | | | | |
| | | | 1,378,579 | |
| | |
| Semiconductors & Semiconductor Equipment – 0.5% | |
| | 6,306 | | | Advanced Micro Devices, Inc.* | | | 532,920 | |
| | 1,298 | | | Advantest Corp. | | | 107,224 | |
| | |
| | |
| The accompanying notes are an integral part of these financial statements. | | 17 |
GOLDMAN SACHS GLOBAL MANAGED BETA FUND
Schedule of Investments (continued)
February 28, 2021 (Unaudited)
| | | | | | | | |
Shares | | | Description | | Value | |
|
| Common Stocks – (continued) | |
| Semiconductors & Semiconductor Equipment – (continued) | |
| | 621 | | | Analog Devices, Inc. | | $ | 96,764 | |
| | 3,847 | | | Applied Materials, Inc. | | | 454,677 | |
| | 227 | | | ASM International NV | | | 61,228 | |
| | 1,454 | | | ASM Pacific Technology Ltd. | | | 20,184 | |
| | 724 | | | ASML Holding NV | | | 410,596 | |
| | 1,123 | | | Broadcom, Inc. | | | 527,664 | |
| | 82 | | | Disco Corp. | | | 25,854 | |
| | 499 | | | Enphase Energy, Inc.* | | | 87,854 | |
| | 1,962 | | | Infineon Technologies AG | | | 85,370 | |
| | 16,309 | | | Intel Corp. | | | 991,261 | |
| | 549 | | | KLA Corp. | | | 170,865 | |
| | 447 | | | Lam Research Corp. | | | 253,534 | |
| | 506 | | | Lasertec Corp. | | | 61,954 | |
| | 2,921 | | | Marvell Technology Group Ltd. | | | 141,026 | |
| | 2,095 | | | Maxim Integrated Products, Inc. | | | 195,191 | |
| | 1,086 | | | Microchip Technology, Inc. | | | 165,756 | |
| | 4,696 | | | Micron Technology, Inc.* | | | 429,825 | |
| | 243 | | | Monolithic Power Systems, Inc. | | | 91,009 | |
| | 1,480 | | | NVIDIA Corp. | | | 811,899 | |
| | 1,715 | | | NXP Semiconductors NV | | | 313,073 | |
| | 7,534 | | | ON Semiconductor Corp.* | | | 303,394 | |
| | 1,955 | | | Qorvo, Inc.* | | | 341,597 | |
| | 3,698 | | | QUALCOMM, Inc. | | | 503,631 | |
| | 7,939 | | | Renesas Electronics Corp.* | | | 87,334 | |
| | 202 | | | Rohm Co. Ltd. | | | 20,002 | |
| | 815 | | | Skyworks Solutions, Inc. | | | 144,923 | |
| | 235 | | | SolarEdge Technologies, Inc.* | | | 70,103 | |
| | 1,881 | | | STMicroelectronics NV | | | 73,053 | |
| | 2,813 | | | Teradyne, Inc. | | | 361,780 | |
| | 3,644 | | | Texas Instruments, Inc. | | | 627,752 | |
| | 239 | | | Tokyo Electron Ltd. | | | 99,667 | |
| | 1,257 | | | Xilinx, Inc. | | | 163,787 | |
| | | | | | | | |
| | | | 8,832,751 | |
| | |
| Software – 0.8% | |
| | 1,518 | | | Adobe, Inc.* | | | 697,779 | |
| | 242 | | | ANSYS, Inc.* | | | 82,520 | |
| | 1,433 | | | Autodesk, Inc.* | | | 395,508 | |
| | 539 | | | Avalara, Inc.* | | | 84,591 | |
| | 588 | | | AVEVA Group PLC | | | 27,931 | |
| | 5,587 | | | BlackBerry Ltd.* | | | 56,502 | |
| | 4,191 | | | Cadence Design Systems, Inc.* | | | 591,308 | |
| | 607 | | | Ceridian HCM Holding, Inc.* | | | 54,424 | |
| | 504 | | | Check Point Software Technologies Ltd.* | | | 55,561 | |
| | 2,790 | | | Citrix Systems, Inc. | | | 372,688 | |
| | 910 | | | Cloudflare, Inc. Class A* | | | 67,313 | |
| | 316 | | | Constellation Software, Inc. | | | 409,146 | |
| | 236 | | | Coupa Software, Inc.* | | | 81,717 | |
| | 584 | | | Crowdstrike Holdings, Inc. Class A* | | | 126,144 | |
| | 135 | | | CyberArk Software Ltd.* | | | 19,822 | |
| | 346 | | | Dassault Systemes SE | | | 71,863 | |
| | 1,041 | | | Datadog, Inc. Class A* | | | 99,322 | |
| | 893 | | | DocuSign, Inc.* | | | 202,407 | |
| | 9,355 | | | Dropbox, Inc. Class A* | | | 210,909 | |
| | 1,333 | | | Dynatrace, Inc.* | | | 66,330 | |
| | |
|
| Common Stocks – (continued) | |
| Software – (continued) | |
| | 426 | | | Fair Isaac Corp.* | | | 194,916 | |
| | 1,758 | | | Fortinet, Inc.* | | | 296,838 | |
| | 609 | | | Guidewire Software, Inc.* | | | 67,593 | |
| | 225 | | | HubSpot, Inc.* | | | 115,875 | |
| | 1,364 | | | Intuit, Inc. | | | 532,151 | |
| | 23,176 | | | Microsoft Corp. | | | 5,385,639 | |
| | 1,724 | | | Nemetschek SE | | | 108,621 | |
| | 492 | | | Nice Ltd.* | | | 113,643 | |
| | 13,370 | | | NortonLifeLock, Inc. | | | 260,849 | |
| | 797 | | | Open Text Corp. | | | 35,497 | |
| | 7,205 | | | Oracle Corp. | | | 472,967 | |
| | 465 | | | Palo Alto Networks, Inc.* | | | 166,614 | |
| | 253 | | | Paycom Software, Inc.* | | | 94,683 | |
| | 710 | | | PTC, Inc.* | | | 97,227 | |
| | 947 | | | RingCentral, Inc. Class A* | | | 358,118 | |
| | 2,430 | | | salesforce.com, Inc.* | | | 526,095 | |
| | 2,681 | | | SAP SE | | | 331,604 | |
| | 847 | | | ServiceNow, Inc.* | | | 451,841 | |
| | 1,616 | | | Slack Technologies, Inc. Class A* | | | 66,143 | |
| | 496 | | | Splunk, Inc.* | | | 70,933 | |
| | 4,599 | | | SS&C Technologies Holdings, Inc. | | | 304,822 | |
| | 1,020 | | | Synopsys, Inc.* | | | 250,114 | |
| | 818 | | | TeamViewer AG*(a) | | | 43,862 | |
| | 170 | | | Temenos AG | | | 22,955 | |
| | 19,516 | | | The Sage Group PLC | | | 152,497 | |
| | 139 | | | The Trade Desk, Inc. Class A* | | | 111,949 | |
| | 342 | | | Tyler Technologies, Inc.* | | | 158,490 | |
| | 1,189 | | | VMware, Inc. Class A* | | | 164,332 | |
| | 1,742 | | | WiseTech Global, Ltd. | | | 36,425 | |
| | 502 | | | Workday, Inc. Class A* | | | 123,080 | |
| | 722 | | | Xero Ltd.* | | | 66,077 | |
| | 739 | | | Zendesk, Inc.* | | | 107,997 | |
| | 618 | | | Zoom Video Communications, Inc. Class A* | | | 230,891 | |
| | 435 | | | Zscaler, Inc.* | | | 89,188 | |
| | | | | | | | |
| | | | 15,384,311 | |
| | |
| Specialty Retail – 0.3% | |
| | 1,043 | | | Advance Auto Parts, Inc. | | | 167,245 | |
| | 291 | | | AutoZone, Inc.* | | | 337,537 | |
| | 4,909 | | | Best Buy Co., Inc. | | | 492,618 | |
| | 868 | | | Burlington Stores, Inc.* | | | 224,656 | |
| | 548 | | | CarMax, Inc.* | | | 65,491 | |
| | 196 | | | Carvana Co.* | | | 55,566 | |
| | 240 | | | Fast Retailing Co. Ltd. | | | 237,955 | |
| | 11,989 | | | Hennes & Mauritz AB Class B* | | | 282,007 | |
| | 8,855 | | | Industria de Diseno Textil SA | | | 291,978 | |
| | 17,173 | | | JD Sports Fashion PLC* | | | 199,602 | |
| | 18,754 | | | Kingfisher PLC* | | | 69,511 | |
| | 3,747 | | | Lowe’s Cos., Inc. | | | 598,583 | |
| | 1,181 | | | Nitori Holdings Co. Ltd. | | | 220,504 | |
| | 686 | | | O’Reilly Automotive, Inc.* | | | 306,868 | |
| | 1,243 | | | Ross Stores, Inc. | | | 144,984 | |
| | 364 | | | Shimamura Co. Ltd. | | | 36,373 | |
| | 3,803 | | | The Home Depot, Inc. | | | 982,467 | |
| | 5,077 | | | The TJX Cos., Inc. | | | 335,031 | |
| | |
| | |
| 18 | | The accompanying notes are an integral part of these financial statements. |
GOLDMAN SACHS GLOBAL MANAGED BETA FUND
| | | | | | | | |
Shares | | | Description | | Value | |
|
| Common Stocks – (continued) | |
| Specialty Retail – (continued) | |
| | 2,043 | | | Tractor Supply Co. | | $ | 324,755 | |
| | 855 | | | Ulta Beauty, Inc.* | | | 275,592 | |
| | 17,757 | | | Yamada Holdings Co. Ltd. | | | 85,207 | |
| | | | | | | | |
| | | | 5,734,530 | |
| | |
| Technology Hardware, Storage & Peripherals – 0.5% | |
| | 57,032 | | | Apple, Inc. | | | 6,915,700 | |
| | 3,222 | | | Brother Industries Ltd. | | | 63,843 | |
| | 1,951 | | | Canon, Inc. | | | 42,314 | |
| | 2,693 | | | Dell Technologies, Inc. Class C* | | | 218,322 | |
| | 3,575 | | | FUJIFILM Holdings Corp. | | | 204,419 | |
| | 2,305 | | | Hewlett Packard Enterprise Co. | | | 33,561 | |
| | 6,832 | | | HP, Inc. | | | 197,923 | |
| | 1,340 | | | Logitech International SA | | | 142,462 | |
| | 2,773 | | | NetApp, Inc. | | | 173,590 | |
| | 3,283 | | | Seagate Technology PLC | | | 240,414 | |
| | 2,067 | | | Seiko Epson Corp. | | | 34,255 | |
| | 514 | | | Western Digital Corp. | | | 35,224 | |
| | | | | | | | |
| | | | 8,302,027 | |
| | |
| Textiles, Apparel & Luxury Goods – 0.2% | |
| | 1,087 | | | adidas AG* | | | 378,912 | |
| | 9,718 | | | Burberry Group PLC* | | | 247,395 | |
| | 677 | | | Cie Financiere Richemont SA | | | 65,237 | |
| | 626 | | | EssilorLuxottica SA | | | 102,121 | |
| | 397 | | | Hermes International | | | 442,273 | |
| | 231 | | | Kering SA | | | 146,096 | |
| | 1,485 | | | Lululemon Athletica, Inc.* | | | 462,845 | |
| | 885 | | | LVMH Moet Hennessy Louis Vuitton SE | | | 560,753 | |
| | 4,924 | | | Moncler SpA* | | | 304,487 | |
| | 5,352 | | | NIKE, Inc. Class B | | | 721,343 | |
| | 2,701 | | | Pandora A/S | | | 262,228 | |
| | 2,198 | | | Puma SE* | | | 234,051 | |
| | 947 | | | The Swatch Group AG | | | 88,632 | |
| | 2,803 | | | VF Corp. | | | 221,801 | |
| | | | | | | | |
| | | | 4,238,174 | |
| | |
| Tobacco – 0.1% | |
| | 2,225 | | | Altria Group, Inc. | | | 97,010 | |
| | 7,972 | | | British American Tobacco PLC | | | 276,829 | |
| | 8,138 | | | Imperial Brands PLC | | | 151,632 | |
| | 2,193 | | | Japan Tobacco, Inc. | | | 39,708 | |
| | 5,759 | | | Philip Morris International, Inc. | | | 483,871 | |
| | 2,528 | | | Swedish Match AB | | | 181,444 | |
| | | | | | | | |
| | | | 1,230,494 | |
| | |
| Trading Companies & Distributors – 0.1% | |
| | 758 | | | Ashtead Group PLC | | | 41,183 | |
| | 2,195 | | | Brenntag SE | | | 170,084 | |
| | 1,401 | | | Bunzl PLC | | | 43,740 | |
| | 7,976 | | | Fastenal Co. | | | 369,847 | |
| | 2,572 | | | Ferguson PLC | | | 304,296 | |
| | 4,427 | | | ITOCHU Corp. | | | 132,226 | |
| | 24,929 | | | Marubeni Corp. | | | 186,766 | |
| | 2,883 | | | Mitsubishi Corp. | | | 81,728 | |
| | |
|
| Common Stocks – (continued) | |
| Trading Companies & Distributors – (continued) | |
| | 1,782 | | | Mitsui & Co. Ltd. | | | 38,160 | |
| | 4,984 | | | MonotaRO Co. Ltd. | | | 286,540 | |
| | 3,884 | | | Sumitomo Corp. | | | 56,600 | |
| | 865 | | | Toromont Industries Ltd. | | | 63,009 | |
| | 3,740 | | | Toyota Tsusho Corp. | | | 157,759 | |
| | 775 | | | United Rentals, Inc.* | | | 230,470 | |
| | 885 | | | W.W. Grainger, Inc. | | | 329,848 | |
| | | | | | | | |
| | | | 2,492,256 | |
| | |
| Transportation Infrastructure – 0.0% | |
| | 3,378 | | | Atlantia SpA* | | | 63,242 | |
| | 1,352 | | | Getlink SE* | | | 22,156 | |
| | 3,655 | | | Transurban Group | | | 36,222 | |
| | | | | | | | |
| | | | | | | 121,620 | |
| | |
| Water Utilities – 0.0% | |
| | 648 | | | American Water Works Co., Inc. | | | 91,938 | |
| | 585 | | | Essential Utilities, Inc. | | | 24,605 | |
| | 2,038 | | | Severn Trent PLC | | | 62,416 | |
| | 3,555 | | | United Utilities Group PLC | | | 42,553 | |
| | | | | | | | |
| | | | | | | 221,512 | |
| | |
| Wireless Telecommunication Services – 0.0% | |
| | 6,240 | | | KDDI Corp. | | | 194,522 | |
| | 635 | | | Rogers Communications, Inc. Class B | | | 27,509 | |
| | 4,105 | | | SoftBank Corp. | | | 55,509 | |
| | 1,854 | | | SoftBank Group Corp. | | | 173,033 | |
| | 1,660 | | | T-Mobile US, Inc.* | | | 199,150 | |
| | 2,727 | | | Tele2 AB Class B | | | 34,468 | |
| | 59,757 | | | Vodafone Group PLC | | | 102,294 | |
| | | | | | | | |
| | | | | | | 786,485 | |
| | |
| | TOTAL COMMON STOCKS | |
| | (Cost $136,186,623) | | $ | 199,708,044 | |
| | |
| | | | | | | | |
| Shares | | | Dividend
Rate | | Value | |
|
| Preferred Stocks – 0.0% | |
| Automobiles – 0.0% | |
| | Volkswagen AG | | | | |
| | EUR211 | | | 2.470% | | $ | 44,145 | |
| | |
| Chemicals – 0.0% | | | |
| | FUCHS PETROLUB SE | | | | |
| | 3,146 | | | 1.880 | | | 172,560 | |
| | |
| Health Care Equipment & Supplies – 0.0% | | | |
| | Sartorius AG | | | | |
| | 288 | | | 0.080 | | | 147,924 | |
| | |
| | TOTAL PREFERRED STOCKS | |
| | (Cost $248,188) | | $ | 364,629 | |
| | |
| | |
| The accompanying notes are an integral part of these financial statements. | | 19 |
GOLDMAN SACHS GLOBAL MANAGED BETA FUND
Schedule of Investments (continued)
February 28, 2021 (Unaudited)
| | | | | | | | |
| Shares | | | Description | |
Value | |
| |
| Exchange Traded Funds – 78.7% | | | |
| | 574,773 | | | Goldman Sachs ActiveBeta Emerging Markets Equity ETF(b) | | $ | 22,605,822 | |
| | 5,164,778 | | | Goldman Sachs MarketBeta International Equity ETF(b) | | | 275,131,339 | |
| | 5,162,182 | | | Goldman Sachs MarketBeta U.S. Equity ETF(b) | | | 275,310,523 | |
| | 3,415,017 | | | iShares Core MSCI Emerging Markets ETF | | | 221,054,050 | |
| | 1,888,846 | | | iShares MSCI EAFE ETF | | | 139,793,493 | |
| | 1,174,293 | | | iShares MSCI EAFE Small-Cap ETF | | | 82,435,369 | |
| | 1,209,592 | | | Vanguard S&P 500 ETF | | | 422,861,267 | |
| | |
| | TOTAL EXCHANGE TRADED FUNDS | |
| | (Cost $1,113,409,775) | | $ | 1,439,191,863 | |
| | |
| | | | | | | | |
| Shares | | | Dividend
Rate | | Value | |
| |
| Investment Company(b) – 7.7% | | | |
| Goldman Sachs Financial Square Government Fund –
Institutional Shares |
|
| | 139,760,285 | | | 0.036% | | $ | 139,760,285 | |
| | (Cost $139,760,285) | | | | |
| | |
| | TOTAL INVESTMENTS – 97.3% | |
| | (Cost $1,389,604,871) | | $ | 1,779,024,821 | |
| | |
| OTHER ASSETS IN EXCESS OF
LIABILITIES – 2.7% | | | 48,995,140 | |
| | |
| | NET ASSETS – 100.0% | | $ | 1,828,019,961 | |
| | |
| | |
|
| The percentage shown for each investment category reflects the value of investments in that category as a percentage of net assets. |
| |
* | | Non-income producing security. |
| |
(a) | | Exempt from registration under Rule 144A of the Securities Act of 1933. |
| |
(b) | | Represents an affiliated fund. |
| | |
|
Currency Abbreviations: |
AUD | | —Australian Dollar |
CAD | | —Canadian Dollar |
CHF | | —Swiss Franc |
DKK | | —Danish Krone |
EUR | | —Euro |
GBP | | —British Pound |
HKD | | —Hong Kong Dollar |
ILS | | —Israeli Shekel |
JPY | | —Japanese Yen |
NOK | | —Norwegian Krone |
NZD | | —New Zealand Dollar |
SEK | | —Swedish Krona |
SGD | | —Singapore Dollar |
USD | | —U.S. Dollar |
| | |
Investment Abbreviations: |
ADR | | —American Depositary Receipt |
ETF | | —Exchange Traded Fund |
PLC | | —Public Limited Company |
REIT | | —Real Estate Investment Trust |
|
|
| ADDITIONAL INVESTMENT INFORMATION |
FORWARD FOREIGN CURRENCY EXCHANGE CONTRACTS — At February 28, 2021, the Fund had the following forward foreign currency exchange contracts:
FORWARD FOREIGN CURRENCY EXCHANGE CONTRACTS WITH UNREALIZED GAIN
| | | | | | | | | | | | | | | | | | | | |
| Counterparty | | Currency
Purchased | | | Currency
Sold | | | Settlement
Date | | | Unrealized
Gain | |
MS & Co. Int. PLC | | AUD | | | 1,970,000 | | | USD | | | 1,505,982 | | | | 03/17/21 | | | $ | 9,950 | |
| | CAD | | | 32,370,000 | | | USD | | | 25,142,614 | | | | 03/17/21 | | | | 294,795 | |
| | CHF | | | 320,000 | | | USD | | | 351,914 | | | | 03/17/21 | | | | 58 | |
| | DKK | | | 240,000 | | | USD | | | 38,949 | | | | 03/17/21 | | | | 3 | |
| | GBP | | | 3,310,000 | | | USD | | | 4,536,276 | | | | 03/17/21 | | | | 75,738 | |
| | NZD | | | 90,000 | | | USD | | | 64,582 | | | | 03/17/21 | | | | 448 | |
| | USD | | | 32,255,431 | | | CHF | | | 28,820,000 | | | | 03/17/21 | | | | 555,931 | |
| | USD | | | 8,416,360 | | | DKK | | | 51,720,000 | | | | 03/17/21 | | | | 22,265 | |
| | USD | | | 109,645,156 | | | EUR | | | 90,460,000 | | | | 03/17/21 | | | | 452,067 | |
| | USD | | | 10,698,754 | | | HKD | | | 82,930,000 | | | | 03/17/21 | | | | 6,590 | |
| | USD | | | 1,110,351 | | | ILS | | | 3,640,000 | | | | 03/17/21 | | | | 10,419 | |
| | USD | | | 87,268,180 | | | JPY | | | 9,104,000,000 | | | | 03/17/21 | | | | 1,844,159 | |
| | USD | | | 58,327 | | | NOK | | | 500,000 | | | | 03/17/21 | | | | 661 | |
| | USD | | | 1,157,494 | | | SEK | | | 9,750,000 | | | | 03/17/21 | | | | 2,562 | |
| | | USD | | | 195,428 | | | SGD | | | 260,000 | | | | 03/17/21 | | | | 451 | |
| |
| TOTAL | | | $ | 3,276,097 | |
| | |
| 20 | | The accompanying notes are an integral part of these financial statements. |
GOLDMAN SACHS GLOBAL MANAGED BETA FUND
|
| ADDITIONAL INVESTMENT INFORMATION (continued) |
FORWARD FOREIGN CURRENCY EXCHANGE CONTRACTS WITH UNREALIZED LOSS
| | | | | | | | | | | | | | | | | | | | |
| Counterparty | | Currency
Purchased | | | Currency
Sold | | | Settlement
Date | | | Unrealized
Loss | |
MS & Co. Int. PLC | | AUD | | | 60,000 | | | USD | | | 46,262 | | | | 03/17/21 | | | $ | (92 | ) |
| | CHF | | | 1,520,000 | | | USD | | | 1,708,587 | | | | 03/17/21 | | | | (36,719 | ) |
| | DKK | | | 3,580,000 | | | USD | | | 584,643 | | | | 03/17/21 | | | | (3,614 | ) |
| | EUR | | | 6,930,000 | | | USD | | | 8,417,933 | | | | 03/17/21 | | | | (52,821 | ) |
| | HKD | | | 5,040,000 | | | USD | | | 650,144 | | | | 03/17/21 | | | | (337 | ) |
| | ILS | | | 360,000 | | | USD | | | 109,526 | | | | 03/17/21 | | | | (742 | ) |
| | JPY | | | 647,000,000 | | | USD | | | 6,179,504 | | | | 03/17/21 | | | | (108,619 | ) |
| | NOK | | | 1,250,000 | | | USD | | | 145,932 | | | | 03/17/21 | | | | (1,767 | ) |
| | NZD | | | 150,000 | | | USD | | | 108,389 | | | | 03/17/21 | | | | (6 | ) |
| | SEK | | | 5,475,000 | | | USD | | | 655,526 | | | | 03/17/21 | | | | (6,987 | ) |
| | SGD | | | 420,000 | | | USD | | | 316,189 | | | | 03/17/21 | | | | (1,226 | ) |
| | USD | | | 24,147,691 | | | AUD | | | 32,550,000 | | | | 03/17/21 | | | | (899,824 | ) |
| | USD | | | 3,584,481 | | | EUR | | | 2,970,000 | | | | 03/17/21 | | | | (567 | ) |
| | USD | | | 49,435,616 | | | GBP | | | 37,000,000 | | | | 03/17/21 | | | | (2,118,608 | ) |
| | USD | | | 831,531 | | | HKD | | | 6,450,000 | | | | 03/17/21 | | | | (68 | ) |
| | USD | | | 4,540,981 | | | JPY | | | 484,000,000 | | | | 03/17/21 | | | | (454 | ) |
| | USD | | | 2,023,450 | | | NOK | | | 17,850,000 | | | | 03/17/21 | | | | (35,229 | ) |
| | USD | | | 1,001,248 | | | NZD | | | 1,420,000 | | | | 03/17/21 | | | | (24,782 | ) |
| | USD | | | 10,743,076 | | | SEK | | | 91,275,000 | | | | 03/17/21 | | | | (68,865 | ) |
| | | USD | | | 3,576,006 | | | SGD | | | 4,790,000 | | | | 03/17/21 | | | | (16,074 | ) |
| |
| TOTAL | | | $ | (3,377,401 | ) |
FUTURES CONTRACTS — At February 28, 2021, the Fund had the following futures contracts:
| | | | | | | | | | | | | | | | |
| Description | | Number of
Contracts | | | Expiration
Date | | | Notional
Amount | | | Unrealized
Appreciation/
(Depreciation) | |
Long position contracts: | | | | | | | | | | | | | | | | |
S&P 500 E-Mini Index | | | 459 | | | | 03/19/21 | | | $ | 87,421,140 | | | $ | 3,563,432 | |
E-Mini Russell 2000 Index | | | 1,137 | | | | 03/19/21 | | | | 125,024,520 | | | | 15,155,430 | |
S&P Toronto Stock Exchange 60 Index | | | 256 | | | | 03/18/21 | | | | 43,121,295 | | | | 1,764,873 | |
| |
| TOTAL FUTURES CONTRACTS | | | $ | 20,483,735 | |
OVER THE COUNTER TOTAL RETURN SWAP CONTRACTS ON COMMODITY INDICES
| | | | | | | | | | | | | | | | | | |
| Reference Obligation/ Index | | Financing Rate
Paid
by the Fund(a) | | Counterparty | | Termination
Date(b) | | Notional
Amount
(000s) | | | Value | | | Unrealized
Appreciation/
(Depreciation)* | |
| | | | | | |
MSGSHBC Index | | 0.500% | | MS & Co. Int. PLC | | 08/26/21 | | $ | 221 | | | $ | (576,724 | ) | | $ | (576,724 | ) |
| | * | | There are no upfront payments on the swap contracts, therefore the unrealized gain (loss) on the swap contracts is equal to their market value. |
| | (a) | | Payments made quarterly. |
| | (b) | | The Fund pays/receives annual coupon payments in accordance with the swap contract. On the termination date of the swap contract, the Fund will either receive from or pay to the counterparty an amount equal to the net of the accrued financing fees and the value of the reference security subtracted from the original notional cost (notional multiplied by the price change of the reference security, converted to U.S. Dollars). |
| | |
| The accompanying notes are an integral part of these financial statements. | | 21 |
GOLDMAN SACHS GLOBAL MANAGED BETA FUND
Schedule of Investments (continued)
February 28, 2021 (Unaudited)
|
| ADDITIONAL INVESTMENT INFORMATION (continued) |
PURCHASED AND WRITTEN OPTIONS CONTRACTS — At February 28, 2021, the Fund had the following purchased and written options:
EXCHANGE TRADED OPTIONS ON FUTURES
| | | | | | | | | | | | | | | | | | | | | | | | | | |
| Description | | Exercise
Price | | Expiration
Date | | | Number of
Contracts | | | Notional
Amount | | | Market
Value | | | Premiums
Paid (Received)
by Fund | | | Unrealized
Appreciation/
(Depreciation) | |
Purchased option contracts | | | | | | | | | | | | | | | | | | | | | | | | | | |
Calls | | | | | | | | | | | | | | | | | | | | | | | | | | |
Eurodollar Futures | | $98.250 | | | 03/15/2021 | | | | 1,219 | | | $ | 3,047,500 | | | $ | 4,784,575 | | | $ | 1,362,691 | | | $ | 3,421,884 | |
Eurodollar Futures | | 98.250 | | | 06/14/2021 | | | | 1,066 | | | | 2,665,000 | | | | 4,210,700 | | | | 1,202,273 | | | | 3,008,427 | |
Eurodollar Futures | | 98.250 | | | 09/13/2021 | | | | 1,041 | | | | 2,602,500 | | | | 4,059,900 | | | | 1,225,865 | | | | 2,834,035 | |
| | | | | | |
| TOTAL | | | | | | 3,326 | | | $ | 8,315,000 | | | $ | 13,055,175 | | | $ | 3,790,829 | | | $ | 9,264,346 | |
EXCHANGE TRADED OPTIONS ON EQUITIES CONTRACTS
| | | | | | | | | | | | | | | | | | | | | | | | | | |
| Description | | Exercise
Price | | Expiration
Date | | | Number of
Contracts | | | Notional
Amount | | | Market
Value | | | Premiums
Paid (Received)
by Fund | | | Unrealized
Appreciation/
(Depreciation) | |
Written option contracts | | | | | | | | | | | | | | | | | | | | | | | | | | |
Calls | | | | | | | | | | | | | | | | | | | | | | | | | | |
Euro Stoxx 50 Index | | $ 3,675.000 | | | 03/19/2021 | | | | (3 | ) | | $ | (30 | ) | | $ | (1,726 | ) | | $ | (2,285 | ) | | $ | 559 | |
Euro Stoxx 50 Index | | 3,700.000 | | | 03/19/2021 | | | | (17 | ) | | | (170 | ) | | | (7,384 | ) | | | (5,755 | ) | | | (1,629 | ) |
Euro Stoxx 50 Index | | 3,750.000 | | | 03/19/2021 | | | | (43 | ) | | | (430 | ) | | | (9,546 | ) | | | (16,834 | ) | | | 7,288 | |
Euro Stoxx 50 Index | | 3,775.000 | | | 03/19/2021 | | | | (40 | ) | | | (400 | ) | | | (5,985 | ) | | | (16,662 | ) | | | 10,677 | |
Euro Stoxx 50 Index | | 3,725.000 | | | 04/16/2021 | | | | (9 | ) | | | (90 | ) | | | (5,668 | ) | | | (4,494 | ) | | | (1,174 | ) |
Euro Stoxx 50 Index | | 3,775.000 | | | 04/16/2021 | | | | (1 | ) | | | (10 | ) | | | (404 | ) | | | (478 | ) | | | 74 | |
Euro Stoxx 50 Index | | 3,800.000 | | | 04/16/2021 | | | | (34 | ) | | | (340 | ) | | | (10,706 | ) | | | (13,133 | ) | | | 2,427 | |
Euro Stoxx 50 Index | | 3,825.000 | | | 04/16/2021 | | | | (44 | ) | | | (440 | ) | | | (10,564 | ) | | | (19,396 | ) | | | 8,832 | |
Euro Stoxx 50 Index | | 3,825.000 | | | 05/21/2021 | | | | (7 | ) | | | (70 | ) | | | (2,778 | ) | | | (3,172 | ) | | | 394 | |
FTSE 100 Index | | 6,650.000 | | | 03/19/2021 | | | | (4 | ) | | | (40 | ) | | | (2,173 | ) | | | (3,053 | ) | | | 880 | |
FTSE 100 Index | | 6,750.000 | | | 03/19/2021 | | | | (4 | ) | | | (40 | ) | | | (1,004 | ) | | | (2,515 | ) | | | 1,511 | |
FTSE 100 Index | | 6,800.000 | | | 03/19/2021 | | | | (1 | ) | | | (10 | ) | | | (167 | ) | | | (1,706 | ) | | | 1,539 | |
FTSE 100 Index | | 6,850.000 | | | 03/19/2021 | | | | (1 | ) | | | (10 | ) | | | (111 | ) | | | (1,321 | ) | | | 1,210 | |
FTSE 100 Index | | 6,925.000 | | | 03/19/2021 | | | | (5 | ) | | | (50 | ) | | | (314 | ) | | | (4,165 | ) | | | 3,851 | |
FTSE 100 Index | | 7,050.000 | | | 03/19/2021 | | | | (4 | ) | | | (40 | ) | | | (111 | ) | | | (2,891 | ) | | | 2,780 | |
FTSE 100 Index | | 7,150.000 | | | 03/19/2021 | | | | (3 | ) | | | (30 | ) | | | (42 | ) | | | (2,792 | ) | | | 2,750 | |
FTSE 100 Index | | 6,700.000 | | | 04/16/2021 | | | | (8 | ) | | | (80 | ) | | | (6,855 | ) | | | (8,167 | ) | | | 1,312 | |
FTSE 100 Index | | 6,800.000 | | | 04/16/2021 | | | | (2 | ) | | | (20 | ) | | | (1,031 | ) | | | (1,764 | ) | | | 733 | |
FTSE 100 Index | | 6,825.000 | | | 04/16/2021 | | | | (5 | ) | | | (50 | ) | | | (2,264 | ) | | | (4,460 | ) | | | 2,196 | |
FTSE 100 Index | | 6,850.000 | | | 04/16/2021 | | | | (4 | ) | | | (40 | ) | | | (1,589 | ) | | | (1,903 | ) | | | 314 | |
FTSE 100 Index | | 6,900.000 | | | 05/21/2021 | | | | (1 | ) | | | (10 | ) | | | (703 | ) | | | (813 | ) | | | 110 | |
Nikkei 225 Index | | 27,875.000 | | | 03/12/2021 | | | | (1 | ) | | | (1,000 | ) | | | (15,104 | ) | | | (3,570 | ) | | | (11,534 | ) |
Nikkei 225 Index | | 28,125.000 | | | 03/12/2021 | | | | (2 | ) | | | (2,000 | ) | | | (26,081 | ) | | | (8,374 | ) | | | (17,707 | ) |
Nikkei 225 Index | | 28,375.000 | | | 03/12/2021 | | | | (3 | ) | | | (3,000 | ) | | | (33,210 | ) | | | (22,114 | ) | | | (11,096 | ) |
Nikkei 225 Index | | 29,625.000 | | | 03/12/2021 | | | | (1 | ) | | | (1,000 | ) | | | (3,518 | ) | | | (2,896 | ) | | | (622 | ) |
Nikkei 225 Index | | 29,750.000 | | | 03/12/2021 | | | | (4 | ) | | | (4,000 | ) | | | (12,008 | ) | | | (11,638 | ) | | | (370 | ) |
Nikkei 225 Index | | 29,875.000 | | | 03/12/2021 | | | | (2 | ) | | | (2,000 | ) | | | (4,785 | ) | | | (5,198 | ) | | | 413 | |
Nikkei 225 Index | | 29,875.000 | | | 04/09/2021 | | | | (3 | ) | | | (3,000 | ) | | | (14,775 | ) | | | (11,253 | ) | | | (3,522 | ) |
Nikkei 225 Index | | 30,000.000 | | | 04/09/2021 | | | | (3 | ) | | | (3,000 | ) | | | (13,650 | ) | | | (8,511 | ) | | | (5,139 | ) |
Nikkei 225 Index | | 30,750.000 | | | 04/09/2021 | | | | (3 | ) | | | (3,000 | ) | | | (6,895 | ) | | | (9,413 | ) | | | 2,518 | |
Nikkei 225 Index | | 31,500.000 | | | 04/09/2021 | | | | (2 | ) | | | (2,000 | ) | | | (2,533 | ) | | | (5,989 | ) | | | 3,456 | |
Nikkei 225 Index | | 32,125.000 | | | 05/14/2021 | | | | (1 | ) | | | (1,000 | ) | | | (1,923 | ) | | | (3,803 | ) | | | 1,880 | |
S&P 500 Index | | 3,925.000 | | | 03/03/2021 | | | | (16 | ) | | | (1,600 | ) | | | (6,800 | ) | | | (46,297 | ) | | | 39,497 | |
| | |
| 22 | | The accompanying notes are an integral part of these financial statements. |
GOLDMAN SACHS GLOBAL MANAGED BETA FUND
|
| ADDITIONAL INVESTMENT INFORMATION (continued) |
EXCHANGE TRADED OPTIONS ON EQUITIES CONTRACTS (continued)
| | | | | | | | | | | | | | | | | | | | | | | | | | |
| Description | | Exercise
Price | | Expiration
Date | | | Number of
Contracts | | | Notional
Amount | | | Market
Value | | | Premiums
Paid (Received)
by Fund | | | Unrealized
Appreciation/
(Depreciation) | |
S&P 500 Index | | $ 4,010.000 | | | 03/10/2021 | | | | (16 | ) | | $ | (1,600 | ) | | $ | (3,280 | ) | | $ | (36,659 | ) | | $ | 33,379 | |
S&P 500 Index | | 4,025.000 | | | 03/17/2021 | | | | (16 | ) | | | (1,600 | ) | | | (6,400 | ) | | | (35,236 | ) | | | 28,836 | |
S&P 500 Index | | 3,980.000 | | | 03/24/2021 | | | | (16 | ) | | | (1,600 | ) | | | (21,760 | ) | | | (55,299 | ) | | | 33,539 | |
S&P 500 Index | | 3,915.000 | | | 03/31/2021 | | | | (1 | ) | | | (100 | ) | | | (4,010 | ) | | | (5,927 | ) | | | 1,917 | |
S&P 500 Index | | 3,950.000 | | | 03/31/2021 | | | | (13 | ) | | | (1,300 | ) | | | (35,750 | ) | | | (42,405 | ) | | | 6,655 | |
S&P 500 Index | | 3,955.000 | | | 03/31/2021 | | | | (13 | ) | | | (1,300 | ) | | | (33,670 | ) | | | (40,192 | ) | | | 6,522 | |
S&P 500 Index | | 3,960.000 | | | 03/31/2021 | | | | (13 | ) | | | (1,300 | ) | | | (31,720 | ) | | | (37,588 | ) | | | 5,868 | |
S&P 500 Index | | 3,965.000 | | | 03/31/2021 | | | | (16 | ) | | | (1,600 | ) | | | (36,800 | ) | | | (52,252 | ) | | | 15,452 | |
S&P 500 Index | | 3,970.000 | | | 03/31/2021 | | | | (13 | ) | | | (1,300 | ) | | | (28,145 | ) | | | (33,501 | ) | | | 5,356 | |
S&P 500 Index | | 3,980.000 | | | 03/31/2021 | | | | (2 | ) | | | (200 | ) | | | (3,821 | ) | | | (8,547 | ) | | | 4,726 | |
S&P 500 Index | | 3,990.000 | | | 03/31/2021 | | | | (4 | ) | | | (400 | ) | | | (6,720 | ) | | | (15,761 | ) | | | 9,041 | |
S&P 500 Index | | 3,995.000 | | | 03/31/2021 | | | | (1 | ) | | | (100 | ) | | | (1,580 | ) | | | (3,699 | ) | | | 2,119 | |
S&P 500 Index | | 4,015.000 | | | 03/31/2021 | | | | (4 | ) | | | (400 | ) | | | (4,900 | ) | | | (13,306 | ) | | | 8,406 | |
S&P 500 Index | | 4,050.000 | | | 03/31/2021 | | | | (3 | ) | | | (300 | ) | | | (2,310 | ) | | | (10,492 | ) | | | 8,182 | |
S&P 500 Index | | 4,055.000 | | | 03/31/2021 | | | | (2 | ) | | | (200 | ) | | | (1,450 | ) | | | (5,897 | ) | | | 4,447 | |
S&P 500 Index | | 4,050.000 | | | 04/30/2021 | | | | (4 | ) | | | (400 | ) | | | (11,420 | ) | | | (20,304 | ) | | | 8,884 | |
S&P 500 Index | | 4,105.000 | | | 04/30/2021 | | | | (2 | ) | | | (200 | ) | | | (3,661 | ) | | | (9,613 | ) | | | 5,952 | |
S&P 500 Index | | 4,115.000 | | | 04/30/2021 | | | | (3 | ) | | | (300 | ) | | | (5,055 | ) | | | (12,918 | ) | | | 7,863 | |
| | | | | | | |
| | | | | | | | | | (423 | ) | | $ | (43,200 | ) | | $ | (454,859 | ) | | $ | (696,411 | ) | | $ | 241,552 | |
Puts | | | | | | | | | | | | | | | | | | | | | | | | | | |
Euro Stoxx 50 Index | | 3,325.000 | | | 03/19/2021 | | | | (3 | ) | | | (30 | ) | | | (702 | ) | | | (2,852 | ) | | | 2,150 | |
Euro Stoxx 50 Index | | 3,425.000 | | | 03/19/2021 | | | | (24 | ) | | | (240 | ) | | | (8,426 | ) | | | (25,089 | ) | | | 16,663 | |
Euro Stoxx 50 Index | | 3,500.000 | | | 03/19/2021 | | | | (39 | ) | | | (390 | ) | | | (19,010 | ) | | | (33,973 | ) | | | 14,963 | |
Euro Stoxx 50 Index | | 3,525.000 | | | 03/19/2021 | | | | (32 | ) | | | (320 | ) | | | (17,528 | ) | | | (28,743 | ) | | | 11,215 | |
Euro Stoxx 50 Index | | 3,575.000 | | | 03/19/2021 | | | | (6 | ) | | | (60 | ) | | | (4,177 | ) | | | (3,663 | ) | | | (514 | ) |
Euro Stoxx 50 Index | | 3,375.000 | | | 04/16/2021 | | | | (9 | ) | | | (90 | ) | | | (5,342 | ) | | | (10,944 | ) | | | 5,602 | |
Euro Stoxx 50 Index | | 3,475.000 | | | 04/16/2021 | | | | (1 | ) | | | (10 | ) | | | (806 | ) | | | (1,129 | ) | | | 323 | |
Euro Stoxx 50 Index | | 3,500.000 | | | 04/16/2021 | | | | (14 | ) | | | (140 | ) | | | (12,213 | ) | | | (12,656 | ) | | | 443 | |
Euro Stoxx 50 Index | | 3,525.000 | | | 04/16/2021 | | | | (20 | ) | | | (200 | ) | | | (18,919 | ) | | | (16,957 | ) | | | (1,962 | ) |
Euro Stoxx 50 Index | | 3,550.000 | | | 04/16/2021 | | | | (24 | ) | | | (240 | ) | | | (24,672 | ) | | | (17,348 | ) | | | (7,324 | ) |
Euro Stoxx 50 Index | | 3,575.000 | | | 04/16/2021 | | | | (19 | ) | | | (190 | ) | | | (21,274 | ) | | | (21,553 | ) | | | 279 | |
Euro Stoxx 50 Index | | 3,475.000 | | | 05/21/2021 | | | | (1 | ) | | | (10 | ) | | | (1,322 | ) | | | (1,021 | ) | | | (301 | ) |
Euro Stoxx 50 Index | | 3,500.000 | | | 05/21/2021 | | | | (6 | ) | | | (60 | ) | | | (8,455 | ) | | | (8,605 | ) | | | 150 | |
FTSE 100 Index | | 6,175.000 | | | 03/19/2021 | | | | (1 | ) | | | (10 | ) | | | (878 | ) | | | (1,477 | ) | | | 599 | |
FTSE 100 Index | | 6,250.000 | | | 03/19/2021 | | | | (5 | ) | | | (50 | ) | | | (5,364 | ) | | | (9,717 | ) | | | 4,353 | |
FTSE 100 Index | | 6,275.000 | | | 03/19/2021 | | | | (3 | ) | | | (30 | ) | | | (3,428 | ) | | | (3,677 | ) | | | 249 | |
FTSE 100 Index | | 6,325.000 | | | 03/19/2021 | | | | (1 | ) | | | (10 | ) | | | (1,317 | ) | | | (982 | ) | | | (335 | ) |
FTSE 100 Index | | 6,475.000 | | | 03/19/2021 | | | | (5 | ) | | | (50 | ) | | | (10,240 | ) | | | (8,687 | ) | | | (1,553 | ) |
FTSE 100 Index | | 6,550.000 | | | 03/19/2021 | | | | (4 | ) | | | (40 | ) | | | (10,310 | ) | | | (8,295 | ) | | | (2,015 | ) |
FTSE 100 Index | | 6,575.000 | | | 03/19/2021 | | | | (3 | ) | | | (30 | ) | | | (8,339 | ) | | | (5,251 | ) | | | (3,088 | ) |
FTSE 100 Index | | 6,200.000 | | | 04/16/2021 | | | | (5 | ) | | | (50 | ) | | | (8,463 | ) | | | (10,330 | ) | | | 1,867 | |
FTSE 100 Index | | 6,225.000 | | | 04/16/2021 | | | | (4 | ) | | | (40 | ) | | | (7,105 | ) | | | (5,638 | ) | | | (1,467 | ) |
FTSE 100 Index | | 6,350.000 | | | 04/16/2021 | | | | (5 | ) | | | (50 | ) | | | (11,459 | ) | | | (7,658 | ) | | | (3,801 | ) |
FTSE 100 Index | | 6,400.000 | | | 04/16/2021 | | | | (4 | ) | | | (40 | ) | | | (10,171 | ) | | | (9,601 | ) | | | (570 | ) |
FTSE 100 Index | | 6,325.000 | | | 05/21/2021 | | | | (1 | ) | | | (10 | ) | | | (3,114 | ) | | | (3,001 | ) | | | (113 | ) |
Nikkei 225 Index | | 25,500.000 | | | 03/12/2021 | | | | (1 | ) | | | (1,000 | ) | | | (366 | ) | | | (4,005 | ) | | | 3,639 | |
Nikkei 225 Index | | 25,750.000 | | | 03/12/2021 | | | | (1 | ) | | | (1,000 | ) | | | (440 | ) | | | (5,029 | ) | | | 4,589 | |
Nikkei 225 Index | | 25,875.000 | | | 03/12/2021 | | | | (2 | ) | | | (2,000 | ) | | | (994 | ) | | | (7,554 | ) | | | 6,560 | |
Nikkei 225 Index | | 26,125.000 | | | 03/12/2021 | | | | (3 | ) | | | (3,000 | ) | | | (1,830 | ) | | | (9,245 | ) | | | 7,415 | |
Nikkei 225 Index | | 27,500.000 | | | 03/12/2021 | | | | (3 | ) | | | (3,000 | ) | | | (4,362 | ) | | | (16,050 | ) | | | 11,688 | |
| | |
| The accompanying notes are an integral part of these financial statements. | | 23 |
GOLDMAN SACHS GLOBAL MANAGED BETA FUND
Schedule of Investments (continued)
February 28, 2021 (Unaudited)
|
| ADDITIONAL INVESTMENT INFORMATION (continued) |
EXCHANGE TRADED OPTIONS ON EQUITIES CONTRACTS (continued)
| | | | | | | | | | | | | | | | | | | | | | | | | | |
| Description | | Exercise
Price | | Expiration
Date | | | Number of
Contracts | | | Notional
Amount | | | Market
Value | | | Premiums
Paid (Received)
by Fund | | | Unrealized
Appreciation/
(Depreciation) | |
Nikkei 225 Index | | $27,625.000 | | | 03/12/2021 | | | | (2 | ) | | $ | (2,000 | ) | | $ | (4,409 | ) | | $ | (9,631 | ) | | $ | 5,222 | |
Nikkei 225 Index | | 27,750.000 | | | 03/12/2021 | | | | (1 | ) | | | (1,000 | ) | | | (1,736 | ) | | | (7,286 | ) | | | 5,550 | |
Nikkei 225 Index | | 27,875.000 | | | 03/12/2021 | | | | (1 | ) | | | (1,000 | ) | | | (2,205 | ) | | | (3,086 | ) | | | 881 | |
Nikkei 225 Index | | 27,250.000 | | | 04/09/2021 | | | | (1 | ) | | | (1,000 | ) | | | (4,737 | ) | | | (6,357 | ) | | | 1,620 | |
Nikkei 225 Index | | 27,375.000 | | | 04/09/2021 | | | | (2 | ) | | | (2,000 | ) | | | (8,443 | ) | | | (18,001 | ) | | | 9,558 | |
Nikkei 225 Index | | 27,500.000 | | | 04/09/2021 | | | | (3 | ) | | | (3,000 | ) | | | (13,650 | ) | | | (14,960 | ) | | | 1,310 | |
Nikkei 225 Index | | 28,375.000 | | | 04/09/2021 | | | | (3 | ) | | | (3,000 | ) | | | (19,419 | ) | | | (16,937 | ) | | | (2,482 | ) |
Nikkei 225 Index | | 29,125.000 | | | 04/09/2021 | | | | (2 | ) | | | (2,000 | ) | | | (18,200 | ) | | | (10,938 | ) | | | (7,262 | ) |
Nikkei 225 Index | | 28,750.000 | | | 05/14/2021 | | | | (1 | ) | | | (1,000 | ) | | | (10,601 | ) | | | (7,182 | ) | | | (3,419 | ) |
S&P 500 Index | | 3,720.000 | | | 03/03/2021 | | | | (16 | ) | | | (1,600 | ) | | | (36,480 | ) | | | (78,540 | ) | | | 42,060 | |
S&P 500 Index | | 3,820.000 | | | 03/10/2021 | | | | (16 | ) | | | (1,600 | ) | | | (118,480 | ) | | | (81,563 | ) | | | (36,917 | ) |
S&P 500 Index | | 3,840.000 | | | 03/17/2021 | | | | (16 | ) | | | (1,600 | ) | | | (154,240 | ) | | | (86,010 | ) | | | (68,230 | ) |
S&P 500 Index | | 3,780.000 | | | 03/24/2021 | | | | (16 | ) | | | (1,600 | ) | | | (135,760 | ) | | | (68,698 | ) | | | (67,062 | ) |
S&P 500 Index | | 3,555.000 | | | 03/31/2021 | | | | (1 | ) | | | (100 | ) | | | (4,410 | ) | | | (7,976 | ) | | | 3,566 | |
S&P 500 Index | | 3,640.000 | | | 03/31/2021 | | | | (6 | ) | | | (600 | ) | | | (35,220 | ) | | | (49,362 | ) | | | 14,142 | |
S&P 500 Index | | 3,670.000 | | | 03/31/2021 | | | | (4 | ) | | | (400 | ) | | | (25,960 | ) | | | (32,413 | ) | | | 6,453 | |
S&P 500 Index | | 3,685.000 | | | 03/31/2021 | | | | (13 | ) | | | (1,300 | ) | | | (88,790 | ) | | | (81,735 | ) | | | (7,055 | ) |
S&P 500 Index | | 3,690.000 | | | 03/31/2021 | | | | (13 | ) | | | (1,300 | ) | | | (90,285 | ) | | | (82,964 | ) | | | (7,321 | ) |
S&P 500 Index | | 3,695.000 | | | 03/31/2021 | | | | (18 | ) | | | (1,800 | ) | | | (127,080 | ) | | | (137,335 | ) | | | 10,255 | |
S&P 500 Index | | 3,700.000 | | | 03/31/2021 | | | | (13 | ) | | | (1,300 | ) | | | (93,340 | ) | | | (85,928 | ) | | | (7,412 | ) |
S&P 500 Index | | 3,705.000 | | | 03/31/2021 | | | | (13 | ) | | | (1,300 | ) | | | (94,900 | ) | | | (87,264 | ) | | | (7,636 | ) |
S&P 500 Index | | 3,770.000 | | | 03/31/2021 | | | | (1 | ) | | | (100 | ) | | | (9,115 | ) | | | (5,089 | ) | | | (4,026 | ) |
S&P 500 Index | | 3,780.000 | | | 03/31/2021 | | | | (3 | ) | | | (300 | ) | | | (28,305 | ) | | | (21,844 | ) | | | (6,461 | ) |
S&P 500 Index | | 3,815.000 | | | 03/31/2021 | | | | (2 | ) | | | (200 | ) | | | (21,320 | ) | | | (13,084 | ) | | | (8,236 | ) |
S&P 500 Index | | 3,725.000 | | | 04/30/2021 | | | | (4 | ) | | | (400 | ) | | | (46,580 | ) | | | (30,154 | ) | | | (16,426 | ) |
S&P 500 Index | | 3,745.000 | | | 04/30/2021 | | | | (2 | ) | | | (200 | ) | | | (24,430 | ) | | | (20,345 | ) | | | (4,085 | ) |
S&P 500 Index | | 3,775.000 | | | 04/30/2021 | | | | (3 | ) | | | (300 | ) | | | (39,615 | ) | | | (28,894 | ) | | | (10,721 | ) |
| | | | | | | |
| | | | | | | | | | (425 | ) | | $ | (44,390 | ) | | $ | (1,488,736 | ) | | $ | (1,394,306 | ) | | $ | (94,430 | ) |
| | | | | | | |
| TOTAL | | | | | | | | | (848 | ) | | $ | (87,590 | ) | | $ | (1,943,595 | ) | | $ | (2,090,717 | ) | | $ | 147,122 | |
| | |
|
Abbreviations: |
MS & Co. Int. PLC—Morgan Stanley & Co. International PLC |
|
| | |
| 24 | | The accompanying notes are an integral part of these financial statements. |
GOLDMAN SACHS STRATEGIC FACTOR ALLOCATION FUND
Schedule of Investments
February 28, 2021 (Unaudited)
| | | | | | | | | | |
| Shares | | | Dividend
Rate | | | Value | |
| | | | | | | | | | |
|
| Investment Company(a) – 77.1% | |
| Goldman Sachs Financial Square Government
Fund – Institutional Shares |
|
| | 1,469,722,865 | | | | 0.036 | % | | $ | 1,469,722,865 | |
| | (Cost $1,469,722,865) | | | | | |
| | |
| TOTAL INVESTMENTS – 77.1%
(Cost $1,469,722,865) |
| | $ | 1,469,722,865 | |
| | |
| OTHER ASSETS IN EXCESS OF
LIABILITIES – 22.9% |
| | | 436,261,711 | |
| | |
| | NET ASSETS – 100.0% | | | $ | 1,905,984,576 | |
| | |
| | | | |
|
| The percentage shown for each investment category reflects the value of investments in that category as a percentage of net assets. |
| |
| (a) | | Represents an affiliated fund. |
| | |
|
Currency Abbreviations: |
AUD | | —Australian Dollar |
CAD | | —Canadian Dollar |
CHF | | —Swiss Franc |
EUR | | —Euro |
JPY | | —Japanese Yen |
NZD | | —New Zealand Dollar |
USD | | —U.S. Dollar |
|
Investment Abbreviation: |
PLC | | —Public Limited Company |
|
|
| ADDITIONAL INVESTMENT INFORMATION |
FORWARD FOREIGN CURRENCY EXCHANGE CONTRACTS — At February 28, 2021, the Fund had the following forward foreign currency exchange contracts:
FORWARD FOREIGN CURRENCY EXCHANGE CONTRACTS WITH UNREALIZED GAIN
| | | | | | | | | | | | | | | | | | | | |
| Counterparty | | Currency
Purchased | | | Currency
Sold | | | Settlement
Date | | | Unrealized
Gain | |
MS & Co. Int. PLC | | USD | | | 56,291,133 | | | CAD | | | 70,940,000 | | | | 03/23/21 | | | $ | 543,235 | |
| | USD | | | 93,485,207 | | | CHF | | | 84,650,000 | | | | 03/23/21 | | | | 358,043 | |
| | USD | | | 6,281,706 | | | EUR | | | 5,190,000 | | | | 03/23/21 | | | | 15,814 | |
| | | USD | | | 36,169,863 | | | NZD | | | 49,880,000 | | | | 03/23/21 | | | | 128,911 | |
| |
| TOTAL | | | $ | 1,046,003 | |
FORWARD FOREIGN CURRENCY EXCHANGE CONTRACTS WITH UNREALIZED LOSS
| | | | | | | | | | | | | | | | | | | | |
| Counterparty | | Currency
Purchased | | | Currency
Sold | | | Settlement
Date | | | Unrealized
Loss | |
MS & Co. Int. PLC | | AUD | | | 61,490,000 | | | USD | | | 47,811,260 | | | | 03/23/21 | | | $ | (492,714 | ) |
| | CAD | | | 101,560,000 | | | USD | | | 80,050,016 | | | | 03/23/21 | | | | (239,521 | ) |
| | EUR | | | 5,190,000 | | | USD | | | 6,311,715 | | | | 03/23/21 | | | | (45,823 | ) |
| | JPY | | | 4,080,190,000 | | | USD | | | 38,814,904 | | | | 03/23/21 | | | | (526,874 | ) |
| | NZD | | | 7,860,000 | | | USD | | | 5,755,611 | | | | 03/23/21 | | | | (76,343 | ) |
| | | USD | | | 13,885,533 | | | JPY | | | 1,480,940,000 | | | | 03/23/21 | | | | (11,436 | ) |
| |
| TOTAL | | | $ | (1,392,711 | ) |
FUTURES CONTRACTS — At February 28, 2021, the Fund had the following futures contracts:
| | | | | | | | | | | | | | | | |
| Description | | Number of
Contracts | | | Expiration
Date | | | Notional
Amount | | | Unrealized
Appreciation/
(Depreciation) | |
Long position contracts: | | | | | | | | | | | | | | | | |
S&P 500 E-Mini Index | | | 5,961 | | | | 03/19/21 | | | $ | 1,135,332,060 | | | $ | 16,060,820 | |
Ultra Long U.S. Treasury Bonds | | | 1,792 | | | | 06/21/21 | | | | 338,800,000 | | | | (1,204,073 | ) |
| |
| Total | | | $ | 14,856,747 | |
| | |
| The accompanying notes are an integral part of these financial statements. | | 25 |
GOLDMAN SACHS STRATEGIC FACTOR ALLOCATION FUND
Schedule of Investments (continued)
February 28, 2021 (Unaudited)
|
| ADDITIONAL INVESTMENT INFORMATION (continued) |
| | | | | | | | | | | | | | | | |
| Description | | Number of
Contracts | | | Expiration
Date | | | Notional
Amount | | | Unrealized
Appreciation/
(Depreciation) | |
| | | | |
Short position contracts: | | | | | | | | | | | | | | | | |
20 Year U.S. Treasury Bonds | | | (1,466 | ) | | | 06/21/21 | | | $ | (233,414,687 | ) | | $ | 1,487,710 | |
| |
| TOTAL FUTURES CONTRACTS | | | $ | 16,344,457 | |
PURCHASED AND WRITTEN OPTIONS CONTRACTS — At February 28, 2021, the Fund had the following purchased and written options:
EXCHANGE TRADED OPTIONS ON FUTURES
| | | | | | | | | | | | | | | | | | | | | | | | | | |
| Description | | Exercise
Price | | Expiration
Date | | | Number of
Contracts | | | Notional
Amount | | | Market
Value | | | Premiums Paid
(Received)
by Fund | | | Unrealized
Appreciation/
(Depreciation) | |
Written option contracts | | | | | | | | | | | | | | | | | | | | | | | | | | |
Puts | | | | | | | | | | | | | | | | | | | | | | | | | | |
U.S. Treasury Bonds | | $155.000 | | | 03/26/2021 | | | | (698 | ) | | $ | (698,000 | ) | | $ | (436,250 | ) | | $ | (239,589 | ) | | $ | (196,661 | ) |
U.S. Treasury Bonds | | 162.000 | | | 03/26/2021 | | | | (712 | ) | | | (712,000 | ) | | | (2,903,625 | ) | | | (365,765 | ) | | | (2,537,860 | ) |
U.S. Treasury Bonds | | 164.000 | | | 03/26/2021 | | | | (694 | ) | | | (694,000 | ) | | | (3,502,531 | ) | | | (649,299 | ) | | | (2,853,232 | ) |
| | | | | | | |
| TOTAL | | | | | | | | | (2,104 | ) | | $ | (2,104,000 | ) | | $ | (6,842,406 | ) | | $ | (1,254,653 | ) | | $ | (5,587,753 | ) |
EXCHANGE TRADED OPTIONS ON EQUITIES CONTRACTS
| | | | | | | | | | | | | | | | | | | | | | | | | | |
| Description | | Exercise
Price | | Expiration
Date | | | Number of
Contracts | | | Notional
Amount | | | Market
Value | | | Premiums
Paid
(Received)
by Fund | | | Unrealized
Appreciation/
(Depreciation) | |
Purchased option contracts | | | | | | | | | | | | | | | | | | | | | | | | | | |
Puts | | | | | | | | | | | | | | | | | | | | | | | | | | |
S&P 500 Index | | $3,450.000 | | | 03/01/2021 | | | | 759 | | | $ | 75,900 | | | $ | 43,643 | | | $ | 44,022 | | | $ | (379 | ) |
S&P 500 Index | | 2,450.000 | | | 03/05/2021 | | | | 443 | | | | 44,300 | | | | 1,107 | | | | 200,053 | | | | (198,946 | ) |
S&P 500 Index | | 2,500.000 | | | 03/05/2021 | | | | 548 | | | | 54,800 | | | | 4,110 | | | | 77,509 | | | | (73,399 | ) |
S&P 500 Index | | 2,550.000 | | | 03/05/2021 | | | | 368 | | | | 36,800 | | | | 4,600 | | | | 40,019 | | | | (35,419 | ) |
S&P 500 Index | | 2,550.000 | | | 03/12/2021 | | | | 1,445 | | | | 144,500 | | | | 86,700 | | | | 163,191 | | | | (76,491 | ) |
S&P 500 Index | | 2,600.000 | | | 03/12/2021 | | | | 441 | | | | 44,100 | | | | 30,870 | | | | 50,684 | | | | (19,814 | ) |
S&P 500 Index | | 2,535.000 | | | 03/19/2021 | | | | 340 | | | | 34,000 | | | | 38,250 | | | | 32,555 | | | | 5,695 | |
S&P 500 Index | | 2,550.000 | | | 03/19/2021 | | | | 368 | | | | 36,800 | | | | 43,240 | | | | 40,756 | | | | 2,484 | |
S&P 500 Index | | 2,560.000 | | | 03/19/2021 | | | | 338 | | | | 33,800 | | | | 41,405 | | | | 33,833 | | | | 7,572 | |
S&P 500 Index | | 2,565.000 | | | 03/19/2021 | | | | 440 | | | | 44,000 | | | | 55,000 | | | | 52,244 | | | | 2,756 | |
S&P 500 Index | | 2,645.000 | | | 03/19/2021 | | | | 443 | | | | 44,300 | | | | 68,665 | | | | 44,632 | | | | 24,033 | |
S&P 500 Index | | 2,500.000 | | | 03/26/2021 | | | | 309 | | | | 30,900 | | | | 54,848 | | | | 29,435 | | | | 25,413 | |
S&P 500 Index | | 2,550.000 | | | 03/26/2021 | | | | 803 | | | | 80,300 | | | | 162,607 | | | | 79,078 | | | | 83,529 | |
S&P 500 Index | | 2,700.000 | | | 03/26/2021 | | | | 459 | | | | 45,900 | | | | 133,110 | | | | 119,102 | | | | 14,008 | |
S&P 500 Index | | 2,510.000 | | | 03/31/2021 | | | | 400 | | | | 40,000 | | | | 94,000 | | | | 87,579 | | | | 6,421 | |
| | | | | | | |
| Total purchased option contracts | | | | | | | | | 7,904 | | | $ | 790,400 | | | $ | 862,155 | | | $ | 1,094,692 | | | $ | (232,537 | ) |
| | |
| 26 | | The accompanying notes are an integral part of these financial statements. |
GOLDMAN SACHS STRATEGIC FACTOR ALLOCATION FUND
|
| ADDITIONAL INVESTMENT INFORMATION (continued) |
EXCHANGE TRADED OPTIONS ON EQUITIES CONTRACTS (continued)
| | | | | | | | | | | | | | | | | | | | | | | | | | |
| Description | | Exercise
Price | | Expiration
Date | | | Number of
Contracts | | | Notional
Amount | | | Market Value | | | Premiums
Paid
(Received)
by Fund | | | Unrealized
Appreciation/
(Depreciation) | |
|
Written option contracts | |
| | | | | | | |
Puts | | | | | | | | | | | | | | | | | | | | | | | | | | |
S&P 500 Index | | $3,450.000 | | | 03/03/2021 | | | | (1,812 | ) | | $ | (181,200 | ) | | $ | (407,700 | ) | | $ | (498,916 | ) | | $ | 91,216 | |
S&P 500 Index | | 3,460.000 | | | 03/05/2021 | | | | (1,834 | ) | | | (183,400 | ) | | | (779,450 | ) | | | (606,027 | ) | | | (173,423 | ) |
S&P 500 Index | | 3,490.000 | | | 03/01/2021 | | | | (1,814 | ) | | | (181,400 | ) | | | (140,585 | ) | | | (125,166 | ) | | | (15,419 | ) |
| | | | | | | |
S&P 500 Index | | 3,550.000 | | | 03/03/2021 | | | | (1,799 | ) | | | (179,900 | ) | | | (818,545 | ) | | | (221,277 | ) | | | (597,268 | ) |
| | | | | | | |
| Total written option contracts | | | | | | | | | (7,259 | ) | | $ | (725,900 | ) | | $ | (2,146,280 | ) | | $ | (1,451,386 | ) | | $ | (694,894 | ) |
| | | | | | | |
| TOTAL | | | | | | | | | 645 | | | $ | 64,500 | | | $ | (1,284,125 | ) | | $ | (356,694 | ) | | $ | (927,431 | ) |
| | |
|
Abbreviations: |
MS & Co. Int. PLC | | —Morgan Stanley & Co. International PLC |
|
| | |
| The accompanying notes are an integral part of these financial statements. | | 27 |
GOLDMAN SACHS TACTICAL TILT OVERLAY FUND
Consolidated Schedule of Investments
February 28, 2021 (Unaudited)
| | | | | | | | | | | | | | |
Principal
Amount | | | Interest
Rate | | | Maturity
Date | | | Value | |
| | | | | | | | | | | | | | |
|
| Corporate Obligations(a) – 0.3% | |
| Banks – 0.3% | | | | | | | | | | |
| | Morgan Stanley Bank NA(SOFR + 0.300%) | |
| $ | 10,000,000 | | | | 0.320 | % | | | 08/25/21 | | | $ | 10,002,934 | |
| | (Cost $10,003,241) | |
| | |
| | | | | | | | |
| Shares | | Description | | | Value | |
| | | | | | | | |
|
| Exchange Traded Funds – 7.6% | |
| 2,055,666 | | | Alerian MLP ETF(b) | | | $ | 58,483,698 | |
| 2,167,042 | | | Energy Select Sector SPDR Fund | | | | 104,343,072 | |
| 899,202 | |
| Health Care Select Sector
SPDR Fund |
| | | 101,259,137 | |
| |
TOTAL EXCHANGE TRADED FUNDS (Cost $221,236,054) | | | $ | 264,085,907 | |
| |
| | | | | | | | |
| Shares | | Dividend
Rate | | | Value | |
| | | | | | | | |
|
| Investment Companies(c) – 38.7% | |
Goldman Sachs Financial Square Government Fund – Institutional Shares | |
| 1,107,400,307 | | | 0.036 | % | | $ | 1,107,400,307 | |
Goldman Sachs High Yield Floating Rate Fund – Class R6 | |
| 11,018,314 | | | 3.090 | | | | 103,461,967 | |
Goldman Sachs Energy Infrastructure Fund – Class R6 | |
| 8,048,707 | | | 3.980 | | | | 64,228,678 | |
Goldman Sachs MLP Energy Infrastructure Fund – Class R6 | |
| 3,139,521 | | | 7.607 | | | | 63,386,938 | |
| |
| TOTAL INVESTMENT COMPANIES (Cost $1,310,357,996) | | | $ | 1,338,477,890 | |
| |
| TOTAL INVESTMENTS BEFORE SHORT-TERM INVESTMENT (Cost $1,541,597,291) | | | $ | 1,612,566,731 | |
| |
| | | | | | | | | | | | | | |
Principal
Amount | | | Interest
Rate | | | Maturity
Date | | | Value | |
|
| Short-Term Investments – 49.9% | |
| Certificates of Deposit – 17.6% | |
| | Alpine Securitization LLC(d) | |
| $ | 15,000,000 | | | | 0.210 | % | | | 10/12/21 | | | $ | 14,997,405 | |
| Australia & New Zealand Banking Group Ltd.(a)(d) (3M USD
LIBOR + 0.010%) |
|
| | 5,000,000 | | | | 0.200 | | | | 11/29/21 | | | | 5,000,000 | |
| | Banco Santander SA | |
| | 5,050,000 | | | | 0.290 | | | | 10/12/21 | | | | 5,051,370 | |
| | Bank of America Securities, Inc. | |
| | 25,000,000 | | | | 0.200 | | | | 03/01/21 | | | | 25,000,231 | |
| | 4,795,000 | | | | 0.230 | (d) | | | 05/04/21 | | | | 4,795,918 | |
| | Bank of Montreal(a) | |
| | (3M USD LIBOR + 0.040%) | |
| | 5,000,000 | | | | 0.278 | | | | 10/01/21 | | | | 5,001,471 | |
| | (3M USD LIBOR + 0.100%) | |
| | 5,000,000 | | | | 0.294 | | | | 11/17/21 | | | | 5,003,938 | |
| | |
|
| Short-Term Investments – (continued) | |
| Certificates of Deposit – (continued) | |
| | Bank of Nova Scotia(a) | |
| | (SOFR + 0.150%) | |
| 10,000,000 | | | | 0.190 | | | | 03/17/22 | | | | 9,999,623 | |
| | (3M USD LIBOR + 0.030%) | |
| | 18,500,000 | | | | 0.224 | | | | 08/13/21 | | | | 18,503,328 | |
| | Barclays Bank PLC | |
| | 5,000,000 | | | | 0.350 | | | | 12/31/21 | | | | 5,001,615 | |
| | Bayerische Landesbank | |
| | 10,000,000 | | | | 0.001 | | | | 05/05/21 | | | | 10,002,736 | |
| | Canadian Imperial Bank of Commerce(a) | |
| | (3M USD LIBOR + 0.050%) | |
| | 5,825,000 | | | | 0.282 | (d) | | | 08/06/21 | | | | 5,826,754 | |
| | 5,000,000 | | | | 0.303 | | | | 08/06/21 | | | | 5,001,506 | |
| | (3M USD LIBOR + 0.160%) | |
| | 20,000,000 | | | | 0.353 | | | | 08/06/21 | | | | 20,015,491 | |
| | Commonwealth Bank of Australia | |
| | 5,000,000 | | | | 0.188 | | | | 09/02/21 | | | | 5,000,000 | |
| Credit Agricole Corporate & Investment Bank(a) (3M USD
LIBOR + 0.210%) |
|
| | 15,000,000 | | | | 0.401 | | | | 08/09/21 | | | | 15,014,657 | |
| | Credit Industriel et Commercial(a) (3M USD LIBOR + 0.180%) | |
| | 4,500,000 | | | | 0.414 | | | | 06/18/21 | | | | 4,502,834 | |
| | Credit Suisse New York | |
| | 800,000 | | | | 0.340 | | | | 11/01/21 | | | | 800,714 | |
| | 8,000,000 | | | | 0.340 | | | | 11/19/21 | | | | 8,007,188 | |
| | 18,250,000 | | | | 0.460 | | | | 08/10/21 | | | | 18,273,358 | |
| | Deutsche Bank Ag NY | |
| | 6,846,000 | | | | 0.720 | | | | 11/08/21 | | | | 6,845,845 | |
| | First Abu Dhabi Bank USA NV(a) (3M USD LIBOR + 0.170%) | |
| | 9,000,000 | | | | 0.390 | | | | 12/14/21 | | | | 9,004,945 | |
| | HSBC Bank USA NA | |
| | 2,000,000 | | | | 0.330 | | | | 12/24/21 | | | | 2,001,734 | |
| | 3,000,000 | | | | 0.370 | | | | 12/03/21 | | | | 3,003,443 | |
| | (3M USD LIBOR + 0.380%) | |
| | 10,000,000 | | | | 0.592 | (a) | | | 04/29/21 | | | | 10,006,119 | |
| | Landesbank Baden-Wuerttemberg | |
| | 13,600,000 | | | | 0.270 | | | | 04/16/21 | | | | 13,602,293 | |
| | Landesbank Hessen Thuringen | |
| | 10,000,000 | | | | 0.130 | | | | 04/05/21 | | | | 10,000,000 | |
| | Lloyds Bank Corporate Markets PLC | |
| | 5,000,000 | | | | 0.240 | | | | 02/23/22 | | | | 5,000,050 | |
| | (SOFR + 0.190%) | |
| | 8,900,000 | | | | 0.210 | (a) | | | 02/17/22 | | | | 8,899,663 | |
| | Macquarie Bank Ltd.(a)(d) (3M USD LIBOR + 0.030%) | |
| | 8,500,000 | | | | 0.224 | | | | 11/12/21 | | | | 8,500,000 | |
| | Mizuho Bank Ltd. | |
| | 23,800,000 | | | | 0.230 | | | | 11/10/21 | | | | 23,798,977 | |
| | 7,000,000 | | | | 0.230 | | | | 11/17/21 | | | | 6,999,590 | |
| | MUFG Bank Ltd. | |
| | 10,000,000 | | | | 0.210 | | | | 04/07/21 | | | | 10,001,366 | |
| | 5,000,000 | | | | 0.210 | | | | 04/08/21 | | | | 5,000,706 | |
| | 10,000,000 | | | | 0.230 | | | | 10/28/21 | | | | 10,001,960 | |
| | National Australia Bank Ltd.(a)(d) (1M USD LIBOR + 0.100%) | |
| | 4,650,000 | | | | 0.267 | | | | 04/23/21 | | | | 4,650,645 | |
| | National Bank Of Kuwait SAKP | |
| | 11,000,000 | | | | 0.300 | | | | 05/14/21 | | | | 11,001,458 | |
| | |
| | |
| 28 | | The accompanying notes are an integral part of these financial statements. |
GOLDMAN SACHS TACTICAL TILT OVERLAY FUND
| | | | | | | | | | | | | | |
Principal
Amount | | | Interest
Rate | | | Maturity
Date | | | Value | |
|
| Short-Term Investments – (continued) | |
| Certificates of Deposit – (continued) | |
| | National Bank Of Kuwait SAKP – (continued) | |
| $ | 5,000,000 | | | | 0.350 | % | | | 03/19/21 | | | $ | 5,000,612 | |
| | 7,000,000 | | | | 0.390 | | | | 11/16/21 | | | | 7,002,651 | |
| | Natixis SA(a) | |
| | (3M USD LIBOR + 0.030%) | |
| | 16,465,000 | | | | 0.231 | | | | 11/15/21 | | | | 16,466,160 | |
| | (3M USD LIBOR + 0.130%) | |
| | 6,288,000 | | | | 0.360 | | | | 12/09/21 | | | | 6,293,316 | |
| | Nordea Bank ABP(a) (3M USD LIBOR + 0.100%) | |
| | 7,850,000 | | | | 0.330 | | | | 06/09/21 | | | | 7,852,960 | |
| | Norinchukin Bank NY | |
| | 9,967,000 | | | | 0.250 | | | | 11/04/21 | | | | 9,967,553 | |
| | 2,000,000 | | | | 0.300 | | | | 05/20/21 | | | | 2,000,677 | |
| | 25,000,000 | | | | 0.300 | | | | 06/01/21 | | | | 25,009,092 | |
| | 12,200,000 | | | | 0.370 | | | | 12/03/21 | | | | 12,212,103 | |
| | Oversea Chinese Banking | |
| | 17,000,000 | | | | 0.240 | | | | 03/22/21 | | | | 17,001,359 | |
| | 6,500,000 | | | | 3.500 | | | | 04/16/21 | | | | 6,500,354 | |
| | Royal Bank of Canada(a) | |
| | (3M USD LIBOR + 0.090%) | |
| | 10,000,000 | | | | 0.311 | | | | 12/10/21 | | | | 10,006,943 | |
| | (3M USD LIBOR + 0.120%) | |
| | 9,900,000 | | | | 0.356 | | | | 06/18/21 | | | | 9,904,079 | |
| | Societe Generale SA(a)(d) (3M USD LIBOR + 0.110%) | |
| | 5,000,000 | | | | 0.344 | | | | 01/18/22 | | | | 5,000,884 | |
| | Standard Chartered Bank(a) | |
| | (3M USD LIBOR + 0.020%) | |
| | 3,000,000 | | | | 0.202 | | | | 08/23/21 | | | | 3,000,000 | |
| | (3M USD LIBOR + 0.060%) | |
| | 8,000,000 | | | | 0.311 | | | | 06/29/21 | | | | 8,001,819 | |
| | Sumitomo Mitsui Banking Corp. | |
| | 7,000,000 | | | | 0.270 | | | | 05/04/21 | | | | 7,001,861 | |
| | (3M USD LIBOR + 0.355%) | |
| | 5,000,000 | | | | 0.593 | (a) | | | 04/06/21 | | | | 5,001,822 | |
| | Sumitomo Mitsui Trust Bank Ltd. | |
| | 16,000,000 | | | | 0.260 | % | | | 05/10/21 | | | | 16,004,116 | |
| | Svenska Handelsbanken AB(a) | |
| | (3M USD LIBOR + 0.010%) | |
| | 11,000,000 | | | | 0.213 | | | | 02/11/22 | | | | 10,998,962 | |
| | (3M USD LIBOR + 0.120%) | |
| | 14,300,000 | | | | 0.356 | | | | 06/18/21 | | | | 14,306,734 | |
| | (3M USD LIBOR + 0.040%) | |
| | 5,000,000 | | | | 0.231 | (d) | | | 08/09/21 | | | | 5,001,332 | |
| | Toronto Dominion Bank(a) | |
| | (SOFR + 0.200%) | |
| | 8,000,000 | | | | 0.220 | (e) | | | 02/16/22 | | | | 8,001,518 | |
| | (3M USD LIBOR + 0.120%) | |
| | 10,250,000 | | | | 0.428 | (d) | | | 06/17/21 | | | | 10,254,183 | |
| | UBS AG London(a)(d) | |
| | (3M USD LIBOR + 0.120%) | |
| | 15,000,000 | | | | 0.350 | | | | 10/15/21 | | | | 15,003,905 | |
| | (3M USD LIBOR + 0.170%) | |
| | 15,000,000 | | | | 0.445 | | | | 07/14/21 | | | | 15,007,752 | |
| | Westpac Banking Corp.(a) | |
| | (3M USD LIBOR + 0.020%) | |
| | 10,000,000 | | | | 0.208 | (d) | | | 11/24/21 | | | | 10,000,000 | |
| | |
|
| Short-Term Investments – (continued) | |
| Certificates of Deposit – (continued) | |
| | Westpac Banking Corp.(a) – (continued) | |
| | (3M USD LIBOR + 0.050%) | |
| 3,000,000 | | | | 0.246 | | | | 08/03/21 | | | | 3,000,886 | |
| | | | | | | | | | | | | | |
| | | | | 609,922,564 | |
| | |
| Commercial Paper(f) – 32.3% | |
| | ABN AMRO Funding USA LLC(d) | |
| | 12,097,000 | | | | 0.000 | | | | 05/21/21 | | | | 12,090,000 | |
| | 5,000,000 | | | | 0.000 | | | | 05/24/21 | | | | 4,996,931 | |
| | 8,750,000 | | | | 0.000 | | | | 10/15/21 | | | | 8,730,405 | |
| | Agricultural Bank China | |
| | 7,451,000 | | | | 0.000 | | | | 05/12/21 | | | | 7,447,507 | |
| | 3,000,000 | | | | 0.000 | (d) | | | 05/24/21 | | | | 2,998,340 | |
| | Albion Capital Corp.(d) | |
| | 17,000,000 | | | | 0.000 | | | | 04/27/21 | | | | 16,995,183 | |
| | American Electric Power Co., Inc.(d) | |
| | 8,000,000 | | | | 0.000 | | | | 04/29/21 | | | | 7,996,817 | |
| | American Honda Finance Corp. | |
| | 5,000,000 | | | | 0.000 | | | | 04/06/21 | | | | 4,998,846 | |
| | 8,000,000 | | | | 0.000 | | | | 04/09/21 | | | | 7,998,003 | |
| | Antalis S.A(d) | |
| | 10,000,000 | | | | 0.000 | | | | 04/05/21 | | | | 9,998,491 | |
| | 3,000,000 | | | | 0.000 | | | | 05/04/21 | | | | 2,999,246 | |
| | 8,632,000 | | | | 0.000 | | | | 05/06/21 | | | | 8,629,783 | |
| | 10,000,000 | | | | 0.000 | | | | 05/17/21 | | | | 9,997,178 | |
| | ASB Finance Ltd.(d) | |
| | 10,500,000 | | | | 0.000 | | | | 10/22/21 | | | | 10,488,546 | |
| | At&T, Inc. | |
| | 5,681,000 | | | | 0.000 | | | | 12/14/21 | | | | 5,666,305 | |
| | 6,000,000 | | | | 0.000 | (d) | | | 09/21/21 | | | | 5,989,823 | |
| | 8,563,000 | | | | 0.000 | (d) | | | 12/14/21 | | | | 8,540,850 | |
| | 7,306,000 | | | | 0.000 | (d) | | | 12/16/21 | | | | 7,286,972 | |
| | Australia & New Zealand Banking Group Ltd.(d) | |
| | 7,000,000 | | | | 0.000 | | | | 06/28/21 | | | | 6,996,181 | |
| | Banco Santander SA(d) | |
| | 8,000,000 | | | | 0.000 | | | | 07/06/21 | | | | 7,992,051 | |
| | Banco Santander SA(d) | |
| | 10,000,000 | | | | 0.000 | | | | 08/24/21 | | | | 9,991,547 | |
| | Bank Of China Ltd. | |
| | 6,088,000 | | | | 0.000 | | | | 06/02/21 | | | | 6,083,535 | |
| | 18,500,000 | | | | 0.000 | | | | 11/19/21 | | | | 18,444,365 | |
| | Banque Et Caisse Epargen | |
| | 12,500,000 | | | | 0.000 | | | | 04/05/21 | | | | 12,498,878 | |
| | Barclays Capital, Inc.(d) | |
| | 3,000,000 | | | | 0.000 | | | | 08/06/21 | | | | 2,997,263 | |
| | 15,000,000 | | | | 0.000 | | | | 01/24/22 | | | | 14,958,500 | |
| | BAT International Finance PLC(d) | |
| | 8,223,000 | | | | 0.000 | | | | 03/22/21 | | | | 8,222,057 | |
| | 8,250,000 | | | | 0.000 | | | | 04/22/21 | | | | 8,247,202 | |
| | Bedford Row Funding Corp.(d) | |
| | 11,000,000 | | | | 0.000 | | | | 03/09/21 | | | | 10,999,613 | |
| | BNG Bank N.V. | |
| | 17,000,000 | | | | 0.000 | | | | 03/03/21 | | | | 16,999,787 | |
| | 25,000,000 | | | | 0.000 | (d) | | | 01/31/22 | | | | 24,959,037 | |
| | BNP Paribas SA(d) | |
| | 15,000,000 | | | | 0.000 | | | | 07/08/21 | | | | 14,992,080 | |
| | |
| | |
| The accompanying notes are an integral part of these financial statements. | | 29 |
GOLDMAN SACHS TACTICAL TILT OVERLAY FUND
Consolidated Schedule of Investments (continued)
February 28, 2021 (Unaudited)
| | | | | | | | | | | | | | |
Principal
Amount | | | Interest
Rate | | | Maturity
Date | | | Value | |
|
| Short-Term Investments – (continued) | |
| Commercial Paper(f) – (continued) | |
| | BNZ International Funding Ltd.(d) | |
| $ | 20,000,000 | | | | 0.000 | % | | | 08/02/21 | | | $ | 19,987,614 | |
| | Caisse d’Amortissement de la Dette Sociale | |
| | 22,300,000 | | | | 0.000 | (d) | | | 04/20/21 | | | | 22,295,568 | |
| | Caisse Des Depots Et Consignations | |
| | 2,500,000 | | | | 0.000 | | | | 05/24/21 | | | | 2,499,160 | |
| | Can Ast & Can Ltd.(d) | |
| | 17,300,000 | | | | 0.000 | | | | 04/14/21 | | | | 17,296,702 | |
| | Chariot Funding LLC(d) | |
| | 6,000,000 | | | | 0.000 | | | | 04/16/21 | | | | 5,998,808 | |
| | Chevron Corp.(d) | |
| | 16,250,000 | | | | 0.000 | | | | 05/11/21 | | | | 16,247,495 | |
| | China Construction Banking Corp. | |
| | 5,163,000 | | | | 0.000 | (d) | | | 04/12/21 | | | | 5,161,709 | |
| | 7,650,000 | | | | 0.000 | | | | 08/03/21 | | | | 7,637,208 | |
| | Collateralized Commercial Paper V Co. LLC | |
| | 6,000,000 | | | | 0.000 | | | | 04/21/21 | | | | 5,998,668 | |
| | Conocophillips Co.(d) | |
| | 2,750,000 | | | | 0.000 | | | | 04/13/21 | | | | 2,749,526 | |
| | Credit Industriel ET Commercial(d) | |
| | 6,200,000 | | | | 0.000 | | | | 07/01/21 | | | | 6,191,174 | |
| | Deutsche Bank AG(d) | |
| | 3,500,000 | | | | 0.000 | | | | 04/12/21 | | | | 3,499,431 | |
| | Dexia Credit Local SA(d) | |
| | 7,000,000 | | | | 0.000 | | | | 04/22/21 | | | | 6,998,749 | |
| | 9,700,000 | | | | 0.000 | | | | 06/08/21 | | | | 9,695,658 | |
| | Electricite de France SA(d) | |
| | 17,225,000 | | | | 0.000 | | | | 06/28/21 | | | | 17,210,407 | |
| | Enel Finance America(d) | |
| | 10,000,000 | | | | 0.000 | | | | 08/06/21 | | | | 9,986,270 | |
| | 6,850,000 | | | | 0.000 | | | | 02/16/22 | | | | 6,825,210 | |
| | Entergy Corp. | |
| | 9,960,000 | | | | 0.000 | | | | 03/03/21 | | | | 9,959,816 | |
| | 10,000,000 | | | | 0.000 | (d) | | | 05/04/21 | | | | 9,995,310 | |
| | Erste Abwicklungsanstalt(d) | |
| | 10,180,000 | | | | 0.000 | | | | 05/07/21 | | | | 10,177,961 | |
| | Exxon Mobil Corp. | |
| | 7,850,000 | | | | 0.000 | | | | 05/17/21 | | | | 7,848,657 | |
| | Fidelity National Information Services, Inc.(d) | |
| | 17,000,000 | | | | 0.000 | | | | 03/15/21 | | | | 16,998,692 | |
| | First Abu Dhabi Bank PJSC(d) | |
| | 10,000,000 | | | | 0.000 | | | | 03/10/21 | | | | 9,999,693 | |
| | Gotham Fdg Corp.(d) | |
| | 9,611,000 | | | | 0.000 | | | | 07/21/21 | | | | 9,604,458 | |
| | Henkel Corp.(d) | |
| | 7,000,000 | | | | 0.000 | | | | 04/27/21 | | | | 6,998,600 | |
| | 10,750,000 | | | | 0.000 | | | | 07/02/21 | | | | 10,744,432 | |
| | Honeywell International, Inc.(d) | |
| | 14,000,000 | | | | 0.000 | | | | 05/20/21 | | | | 13,996,837 | |
| | 3,000,000 | | | | 0.000 | | | | 06/08/21 | | | | 2,999,082 | |
| | 3,150,000 | | | | 0.000 | | | | 10/18/21 | | | | 3,146,765 | |
| | 5,000,000 | | | | 0.000 | | | | 01/19/22 | | | | 4,991,780 | |
| | HSBC Bank PLC(d) | |
| | 6,045,000 | | | | 0.000 | | | | 08/03/21 | | | | 6,038,924 | |
| | Industrial & Commercial Bank of China Ltd.(d) | |
| | 7,000,000 | | | | 0.000 | | | | 05/07/21 | | | | 6,996,965 | |
| | 9,000,000 | | | | 0.000 | | | | 05/17/21 | | | | 8,995,460 | |
| | |
|
| Short-Term Investments – (continued) | |
| Commercial Paper(f) – (continued) | |
| | ING (U.S.) Funding LLC(d) | |
| 13,000,000 | | | | 0.000 | | | | 07/12/21 | | | | 12,993,272 | |
| | Intercontinental Exchange, Inc.(d) | |
| | 9,458,000 | | | | 0.000 | | | | 06/04/21 | | | | 9,446,282 | |
| | 3,500,000 | | | | 0.000 | | | | 06/22/21 | | | | 3,494,603 | |
| | 7,000,000 | | | | 0.000 | | | | 06/24/21 | | | | 6,988,954 | |
| | Ionic Capital II Trust | |
| | 8,000,000 | | | | 0.000 | | | | 03/05/21 | | | | 7,999,782 | |
| | 5,500,000 | | | | 0.000 | | | | 04/23/21 | | | | 5,498,503 | |
| | 5,000,000 | | | | 0.000 | | | | 06/04/21 | | | | 4,997,359 | |
| | KFW International Finance, Inc.(d) | |
| | 31,400,000 | | | | 0.000 | | | | 01/25/22 | | | | 31,341,910 | |
| | Lime Funding(d) | |
| | 25,000,000 | | | | 0.000 | | | | 05/27/21 | | | | 24,990,000 | |
| | LMA SA LMA Americas(d) | |
| | 5,000,000 | | | | 0.000 | | | | 09/02/21 | | | | 4,995,483 | |
| | LVMH Moet Hennessy Louis Vuitton SE(d) | |
| | 3,000,000 | | | | 0.000 | | | | 08/11/21 | | | | 2,997,856 | |
| | 6,980,000 | | | | 0.000 | | | | 10/05/21 | | | | 6,972,887 | |
| | 3,000,000 | | | | 0.000 | | | | 10/13/21 | | | | 2,996,870 | |
| | 1,000,000 | | | | 0.000 | | | | 11/08/21 | | | | 998,831 | |
| | LVMH Moet Hennessy Louis Vuitton, Inc.(d) | |
| | 8,613,000 | | | | 0.000 | | | | 09/03/21 | | | | 8,605,177 | |
| | 19,500,000 | | | | 0.000 | | | | 07/01/21 | | | | 19,490,385 | |
| | Macquarie Bank Ltd.(d) | |
| | 18,500,000 | | | | 0.000 | | | | 07/26/21 | | | | 18,483,042 | |
| | Manhattan Asset Funding Co. LLC(d) | |
| | 17,217,000 | | | | 0.000 | | | | 05/12/21 | | | | 17,211,440 | |
| | Matchpoint Finance PLC(d) | |
| | 10,483,000 | | | | 0.000 | | | | 04/26/21 | | | | 10,480,423 | |
| | 15,000,000 | | | | 0.000 | | | | 06/08/21 | | | | 14,993,115 | |
| | National Bank of Canada | |
| | 3,000,000 | | | | 0.000 | | | | 03/01/21 | | | | 2,999,978 | |
| | Nationwide Building Society(d) | |
| | 18,000,000 | | | | 0.000 | | | | 03/17/21 | | | | 17,998,499 | |
| | NatWest Markets PLC(d) | |
| | 4,000,000 | | | | 0.000 | | | | 08/02/21 | | | | 3,995,726 | |
| | 6,000,000 | | | | 0.000 | | | | 01/18/22 | | | | 5,981,798 | |
| | 8,050,000 | | | | 0.000 | | | | 01/19/22 | | | | 8,025,431 | |
| | NRW. Bank | |
| | 8,826,000 | | | | 0.000 | | | | 05/10/21 | | | | 8,823,602 | |
| | Oglethorpe Power Corp. | |
| | 8,000,000 | | | | 0.000 | (d) | | | 03/08/21 | | | | 7,999,686 | |
| | 5,000,000 | | | | 0.000 | (d) | | | 03/17/21 | | | | 4,999,617 | |
| | PSP Capital, Inc.(d) | |
| | 24,500,000 | | | | 0.000 | | | | 04/21/21 | | | | 24,496,472 | |
| | Ridgefield Funding Co. LLC(d) | |
| | 5,000,000 | | | | 0.000 | | | | 03/09/21 | | | | 4,999,824 | |
| | Salisbury Receivables Co.(d) | |
| | 8,500,000 | | | | 0.000 | | | | 03/08/21 | | | | 8,499,785 | |
| | Shell International Finance B.V.(d) | |
| | 11,000,000 | | | | 0.000 | | | | 06/14/21 | | | | 10,995,314 | |
| | 11,000,000 | | | | 0.000 | | | | 07/08/21 | | | | 10,993,789 | |
| | Societe Generale SA | |
| | 2,190,000 | | | | 0.000 | | | | 03/04/21 | | | | 2,189,967 | |
| | 12,000,000 | | | | 0.000 | (d) | | | 06/28/21 | | | | 11,992,296 | |
| | |
| | |
| 30 | | The accompanying notes are an integral part of these financial statements. |
GOLDMAN SACHS TACTICAL TILT OVERLAY FUND
| | | | | | | | | | | | | | |
Principal
Amount | | | Interest
Rate | | | Maturity
Date | | | Value | |
|
| Short-Term Investments – (continued) | |
| Commercial Paper(f) – (continued) | |
| | Sumitomo Mitsui Trust Bank Ltd.(d) | |
| $ | 8,000,000 | | | | 0.000 | % | | | 05/28/21 | | | $ | 7,997,149 | |
| | Suncor Energy, Inc.(d) | |
| | 5,000,000 | | | | 0.000 | | | | 03/08/21 | | | | 4,999,786 | |
| | 3,276,000 | | | | 0.000 | | | | 04/08/21 | | | | 3,275,261 | |
| | Swedbank AB | |
| | 10,000,000 | | | | 0.000 | | | | 11/19/21 | | | | 9,986,700 | |
| | The Korea Development Bank | |
| | 19,000,000 | | | | 0.000 | | | | 03/11/21 | | | | 18,999,369 | |
| | The Walt Disney Co.(d) | |
| | 9,115,000 | | | | 0.000 | | | | 06/30/21 | | | | 9,106,492 | |
| | Total Capital Canada Ltd. | |
| | 20,000,000 | | | | 0.000 | (d) | | | 08/03/21 | | | | 19,983,059 | |
| | 2,000,000 | | | | 0.000 | | | | 08/18/21 | | | | 1,998,097 | |
| | Toyota Finance Australia Ltd. | |
| | 16,150,000 | | | | 0.000 | | | | 03/17/21 | | | | 16,148,807 | |
| | United Overseas Bank Ltd.(d) | |
| | 17,000,000 | | | | 0.000 | | | | 05/27/21 | | | | 16,993,625 | |
| | Volkswagen Group of America Finance LLC(d) | |
| | 12,000,000 | | | | 0.000 | | | | 11/10/21 | | | | 11,953,911 | |
| | Waste Management, Inc. | |
| | 2,350,000 | | | | 0.000 | (d) | | | 07/06/21 | | | | 2,347,989 | |
| | 15,000,000 | | | | 0.000 | | | | 09/20/21 | | | | 14,980,173 | |
| | Westpac Banking Corp.(d) | |
| | 11,950,000 | | | | 0.000 | | | | 11/29/21 | | | | 11,934,335 | |
| | | | | | | | | | | | | | |
| | | | | | | | | | | | | 1,115,676,822 | |
| | |
| | TOTAL SHORT-TERM INVESTMENTS | |
| | (Cost $1,725,215,804) | | | $ | 1,725,599,386 | |
| | |
| TOTAL INVESTMENTS BEFORE SECURITIES LENDING
REINVESTMENT |
|
| | (Cost $3,266,813,095) | | | $ | 3,338,166,117 | |
| | |
| | | | | | | | |
| Shares | | | Dividend
Rate | | Value | |
| | | | | | | | |
|
| Securities Lending Reinvestment Vehicle(c) – 0.5% | |
| Goldman Sachs Financial Square Government Fund –
Institutional Shares |
|
| | |
| | 18,906,000 | | | 0.036% | | $ | 18,906,000 | |
| | (Cost $18,906,000) | |
| | |
| TOTAL INVESTMENTS – 97.0%
(Cost $3,285,719,095) | | $ | 3,357,072,117 | |
| | |
| OTHER ASSETS IN EXCESS OF
LIABILITIES – 3.0% | | | 103,148,169 | |
| | |
| | NET ASSETS – 100.0% | | $ | 3,460,220,286 | |
| | |
| | |
|
| The percentage shown for each investment category reflects the value of investments in that category as a percentage of net assets. |
| |
(a) | | Variable rate security. Except for floating rate notes (for which final maturity is disclosed), maturity date disclosed is the next interest reset date. Interest rate disclosed is that which is in effect on February 28, 2021. |
| |
(b) | | All or a portion of security is on loan. |
| |
(c) | | Represents an affiliated fund. |
| |
(d) | | Exempt from registration under Rule 144A of the Securities Act of 1933. |
| |
(e) | | Security with “Call” features with resetting interest rates. Maturity dates disclosed are the final maturity dates. |
| |
(f) | | Issued with a zero coupon. Income is recognized through the accretion of discount. |
| | |
|
Currency Abbreviations: |
EUR | | —Euro |
USD | | —U.S. Dollar |
| | |
Investment Abbreviations: |
ETF | | —Exchange Traded Fund |
LIBOR | | —London Interbank Offered Rate |
LLC | | —Limited Liability Company |
PLC | | —Public Limited Company |
SOFR | | —Secured Overnight Funding Rate |
|
|
| ADDITIONAL INVESTMENT INFORMATION |
FUTURES CONTRACTS — At February 28, 2021, the Fund had the following futures contracts:
| | | | | | | | | | | | | | | | |
| Description | | Number of
Contracts | | | Expiration
Date | | | Notional
Amount | | | Unrealized
Appreciation/
(Depreciation) | |
Long position contracts: | |
2 Year U.S. Treasury Notes | | | 1,241 | | | | 06/30/21 | | | $ | 273,970,142 | | | $ | (204,710 | ) |
5 Year U.S. Treasury Notes | | | 658 | | | | 06/30/21 | | | | 81,571,438 | | | | (633,449 | ) |
10 Year U.S. Treasury Notes | | | 1,766 | | | | 06/21/21 | | | | 234,381,312 | | | | (2,840,422 | ) |
| |
| Total | | | $ | (3,678,581 | ) |
| | | | |
Short position contracts: | | | | | | | | | | | | | | | | |
S&P 500 E-Mini Index | | | (385 | ) | | | 03/19/21 | | | | (73,327,100 | ) | | | (3,267,162 | ) |
| |
| TOTAL FUTURES CONTRACTS | | | $ | (6,945,743 | ) |
| | |
| The accompanying notes are an integral part of these financial statements. | | 31 |
GOLDMAN SACHS TACTICAL TILT OVERLAY FUND
Consolidated Schedule of Investments (continued)
February 28, 2021 (Unaudited)
|
| ADDITIONAL INVESTMENT INFORMATION (continued) |
SWAP CONTRACTS — At February 28, 2021, the Fund had the following swap contracts:
OVER THE COUNTER TOTAL RETURN SWAP CONTRACTS
| | | | | | | | | | | | | | | | | | |
| Reference Obligation/ Index | | Financing Rate
Paid
by the Fund | | Counterparty | | Termination
Date(a) | | Notional
Amount (000s) | | | Value | | | Unrealized
Appreciation/
(Depreciation)* | |
JPGSVENK Index(b) | | 0.070%(c) | | J.P. Morgan Securities LLC | | 04/05/21 | | $ | 104,090 | | | $ | (8,485,780 | ) | | $ | (8,485,780 | ) |
MSGSSUIT Index(b) | | 0.300(c) | | MS & Co. Int. PLC | | 04/05/21 | | | 100,885 | | | | 7,812,666 | | | | 7,812,666 | |
SX7T Index | | 0.130(d) | | Barclays Bank PLC | | 04/06/21 | | EUR | 36,698 | | | | (6,156,169 | ) | | | (6,156,169 | ) |
SX7T Index | | 0.180(d) | | Barclays Bank PLC | | 04/06/21 | | | 218,198 | | | | 36,586,189 | | | | 36,586,189 | |
SX7T Index | | 0.130(d) | | Barclays Bank PLC | | 04/06/21 | | | 71,792 | | | | (12,041,223 | ) | | | (12,041,223 | ) |
| | |
| TOTAL | | | $ | 17,715,683 | | | $ | 17,715,683 | |
| | * | | There are no upfront payments on the swap contracts, therefore the unrealized gain (loss) on the swap contracts is equal to their market value. |
| | (a) | | The Fund pays/receives annual coupon payments in accordance with the swap contract(s). On the termination date of the swap contract(s), the Fund will either receive from or pay to the counterparty an amount equal to the net of the accrued financing fees and the value of the reference security subtracted from the original notional cost (notional multiplied by the price change of the reference security, converted to U.S. Dollars). |
| | (b) | | The top 50 components are shown below. |
| | (c) | | Payments made monthly. |
| | (d) | | Payments made quarterly. |
A basket (JPGSVENK) of common stocks
| | | | | | | | | | | | | | |
| Common Stocks | | Sector | | Shares | | | Value | | | Weight | |
Hormel Foods Corp | | Consumer Staples | | | (5,552 | ) | | $ | (257,446 | ) | | | 3.03 | % |
Royal Caribbean Cruises Ltd | | Consumer Discretionary | | | (2,641 | ) | | | (246,355 | ) | | | 2.90 | |
DexCom Inc | | Health Care | | | (454 | ) | | | (180,547 | ) | | | 2.13 | |
MarketAxess Holdings Inc | | Financials | | | (305 | ) | | | (169,760 | ) | | | 2.00 | |
Twitter Inc | | Communication Services | | | (2,199 | ) | | | (169,423 | ) | | | 2.00 | |
Chipotle Mexican Grill Inc | | Consumer Discretionary | | | (115 | ) | | | (165,953 | ) | | | 1.96 | |
ServiceNow Inc | | Information Technology | | | (311 | ) | | | (165,862 | ) | | | 1.95 | |
Carnival Corp | | Consumer Discretionary | | | (6,158 | ) | | | (164,736 | ) | | | 1.94 | |
salesforce.com Inc | | Information Technology | | | (760 | ) | | | (164,574 | ) | | | 1.94 | |
HollyFrontier Corp | | Energy | | | (4,133 | ) | | | (156,574 | ) | | | 1.85 | |
Norwegian Cruise Line Holdings Ltd | | Consumer Discretionary | | | (5,169 | ) | | | (152,785 | ) | | | 1.80 | |
Occidental Petroleum Corp | | Energy | | | (5,678 | ) | | | (151,095 | ) | | | 1.78 | |
Wynn Resorts Ltd | | Consumer Discretionary | | | (1,138 | ) | | | (149,876 | ) | | | 1.77 | |
Hess Corp | | Energy | | | (2,124 | ) | | | (139,209 | ) | | | 1.64 | |
Under Armour Inc | | Consumer Discretionary | | | (7,513 | ) | | | (136,739 | ) | | | 1.61 | |
ONEOK Inc | | Energy | | | (2,893 | ) | | | (128,130 | ) | | | 1.51 | |
Walt Disney Co/The | | Communication Services | | | (677 | ) | | | (128,014 | ) | | | 1.51 | |
Starbucks Corp | | Consumer Discretionary | | | (1,174 | ) | | | (126,876 | ) | | | 1.50 | |
Global Payments Inc | | Information Technology | | | (633 | ) | | | (125,323 | ) | | | 1.48 | |
Boston Scientific Corp | | Health Care | | | (3,221 | ) | | | (124,891 | ) | | | 1.47 | |
Fidelity National Information Services I | | Information Technology | | | (896 | ) | | | (123,634 | ) | | | 1.46 | |
Invesco Ltd | | Financials | | | (5,410 | ) | | | (121,296 | ) | | | 1.43 | |
Align Technology Inc | | Health Care | | | (213 | ) | | | (120,907 | ) | | | 1.42 | |
CarMax Inc | | Consumer Discretionary | | | (990 | ) | | | (118,352 | ) | | | 1.39 | |
Edwards Lifesciences Corp | | Health Care | | | (1,413 | ) | | | (117,445 | ) | | | 1.38 | |
TransDigm Group Inc | | Industrials | | | (203 | ) | | | (117,068 | ) | | | 1.38 | |
Netflix Inc | | Communication Services | | | (215 | ) | | | (115,737 | ) | | | 1.36 | |
Illumina Inc | | Health Care | | | (261 | ) | | | (114,741 | ) | | | 1.35 | |
Intuitive Surgical Inc | | Health Care | | | (155 | ) | | | (114,333 | ) | | | 1.35 | |
Centene Corp | | Health Care | | | (1,943 | ) | | | (113,718 | ) | | | 1.34 | |
Catalent Inc | | Health Care | | | (985 | ) | | | (112,052 | ) | | | 1.32 | |
Albemarle Corp | | Materials | | | (696 | ) | | | (109,403 | ) | | | 1.29 | |
Paycom Software Inc | | Information Technology | | | (292 | ) | | | (109,291 | ) | | | 1.29 | |
Amazon.com Inc | | Consumer Discretionary | | | (35 | ) | | | (107,121 | ) | | | 1.26 | |
United Airlines Holdings Inc | | Industrials | | | (1,933 | ) | | | (101,818 | ) | | | 1.20 | |
| | |
| 32 | | The accompanying notes are an integral part of these financial statements. |
GOLDMAN SACHS TACTICAL TILT OVERLAY FUND
|
| ADDITIONAL INVESTMENT INFORMATION (continued) |
| | | | | | | | | | | | | | |
| Common Stocks | | Sector | | Shares | | | Value | | | Weight | |
Live Nation Entertainment Inc | | Communication Services | | | (1,142 | ) | | $ | (101,519 | ) | | | 1.20 | % |
Apache Corp | | Energy | | | (5,105 | ) | | | (100,718 | ) | | | 1.19 | |
Alaska Air Group Inc | | Industrials | | | (1,547 | ) | | | (100,593 | ) | | | 1.19 | |
Southwest Airlines Co | | Industrials | | | (1,723 | ) | | | (100,173 | ) | | | 1.18 | |
Incyte Corp | | Health Care | | | (1,273 | ) | | | (100,165 | ) | | | 1.18 | |
MGM Resorts International | | Consumer Discretionary | | | (2,637 | ) | | | (99,652 | ) | | | 1.17 | |
Las Vegas Sands Corp | | Consumer Discretionary | | | (1,573 | ) | | | (98,467 | ) | | | 1.16 | |
Akamai Technologies Inc | | Information Technology | | | (1,037 | ) | | | (97,993 | ) | | | 1.15 | |
Delta Air Lines Inc | | Industrials | | | (2,041 | ) | | | (97,838 | ) | | | 1.15 | |
Expedia Group Inc | | Consumer Discretionary | | | (606 | ) | | | (97,618 | ) | | | 1.15 | |
Marathon Petroleum Corp | | Energy | | | (1,776 | ) | | | (97,027 | ) | | | 1.14 | |
Phillips 66 | | Energy | | | (1,146 | ) | | | (95,135 | ) | | | 1.12 | |
Exxon Mobil Corp | | Energy | | | (1,718 | ) | | | (93,423 | ) | | | 1.10 | |
Diamondback Energy Inc | | Energy | | | (1,331 | ) | | | (92,228 | ) | | | 1.09 | |
Charles Schwab Corp/The | | Financials | | | (1,446 | ) | | | (89,261 | ) | | | 1.05 | |
A basket (MSGSSUIT) of common stocks
| | | | | | | | | | | | | | |
| Common Stocks | | Sector | | Shares | | | Value | | | Weight | |
L Brands Inc | | Consumer Discretionary | | | 4,630 | | | $ | 253,097 | | | | 3.24 | % |
Discovery Inc | | Communication Services | | | 5,538 | | | | 249,207 | | | | 3.19 | |
Capital One Financial Corp | | Financials | | | 1,891 | | | | 227,256 | | | | 2.91 | |
Bank of America Corp | | Financials | | | 6,470 | | | | 224,558 | | | | 2.87 | |
Synchrony Financial | | Financials | | | 5,622 | | | | 217,446 | | | | 2.78 | |
Cboe Global Markets Inc | | Financials | | | 2,051 | | | | 202,956 | | | | 2.60 | |
Globe Life Inc | | Financials | | | 2,125 | | | | 198,484 | | | | 2.54 | |
DXC Technology Co | | Information Technology | | | 7,572 | | | | 190,964 | | | | 2.44 | |
Newmont Corp | | Materials | | | 3,237 | | | | 176,024 | | | | 2.25 | |
Schlumberger NV | | Energy | | | 4,625 | | | | 129,088 | | | | 1.65 | |
Truist Financial Corp | | Financials | | | 2,126 | | | | 121,121 | | | | 1.55 | |
Citizens Financial Group Inc | | Financials | | | 2,771 | | | | 120,356 | | | | 1.54 | |
Chevron Corp | | Energy | | | 1,197 | | | | 119,727 | | | | 1.53 | |
Quanta Services Inc | | Industrials | | | 1,400 | | | | 117,370 | | | | 1.50 | |
Discover Financial Services | | Financials | | | 1,247 | | | | 117,298 | | | | 1.50 | |
M&T Bank Corp | | Financials | | | 773 | | | | 116,637 | | | | 1.49 | |
Principal Financial Group Inc | | Financials | | | 2,055 | | | | 116,256 | | | | 1.49 | |
Citigroup Inc | | Financials | | | 1,746 | | | | 115,022 | | | | 1.47 | |
Huntington Ingalls Industries Inc | | Industrials | | | 651 | | | | 114,437 | | | | 1.46 | |
W R Berkley Corp | | Financials | | | 1,622 | | | | 112,432 | | | | 1.44 | |
Trimble Inc | | Information Technology | | | 1,506 | | | | 111,686 | | | | 1.43 | |
Intel Corp | | Information Technology | | | 1,810 | | | | 110,037 | | | | 1.41 | |
Fidelity National Information Services I | | Information Technology | | | 789 | | | | 108,937 | | | | 1.39 | |
FedEx Corp | | Industrials | | | 426 | | | | 108,521 | | | | 1.39 | |
AbbVie Inc | | Health Care | | | 997 | | | | 107,439 | | | | 1.38 | |
Target Corp | | Consumer Discretionary | | | 558 | | | | 102,306 | | | | 1.31 | |
MSCI Inc | | Financials | | | 246 | | | | 101,771 | | | | 1.30 | |
Alexion Pharmaceuticals Inc | | Health Care | | | 655 | | | | 100,082 | | | | 1.28 | |
Allstate Corp/The | | Financials | | | 938 | | | | 100,034 | | | | 1.28 | |
Dollar General Corp | | Consumer Discretionary | | | 529 | | | | 100,024 | | | | 1.28 | |
Masco Corp | | Industrials | | | 1,852 | | | | 98,570 | | | | 1.26 | |
Autodesk Inc | | Information Technology | | | 356 | | | | 98,337 | | | | 1.26 | |
Vontier Corp | | Information Technology | | | 3,087 | | | | 96,921 | | | | 1.24 | |
Delta Air Lines Inc | | Industrials | | | 1,420 | | | | 68,059 | | | | 0.87 | |
Zebra Technologies Corp | | Information Technology | | | 135 | | | | 67,489 | | | | 0.86 | |
PVH Corp | | Consumer Discretionary | | | 651 | | | | 65,094 | | | | 0.83 | |
Deere & Co | | Industrials | | | 184 | | | | 64,149 | | | | 0.82 | |
NOV Inc | | Energy | | | 4,241 | | | | 64,040 | | | | 0.82 | |
Fifth Third Bancorp | | Financials | | | 1,821 | | | | 63,159 | | | | 0.81 | |
KeyCorp | | Financials | | | 3,129 | | | | 63,016 | | | | 0.81 | |
Comerica Inc | | Financials | | | 923 | | | | 62,857 | | | | 0.80 | |
Martin Marietta Materials Inc | | Materials | | | 182 | | | | 61,238 | | | | 0.78 | |
| | |
| The accompanying notes are an integral part of these financial statements. | | 33 |
GOLDMAN SACHS TACTICAL TILT OVERLAY FUND
Consolidated Schedule of Investments (continued)
February 28, 2021 (Unaudited)
|
| ADDITIONAL INVESTMENT INFORMATION (continued) |
| | | | | | | | | | | | | | |
| Common Stocks | | Sector | | Shares | | �� | Value | | | Weight | |
JPMorgan Chase & Co | | Financials | | | 414 | | | $ | 60,961 | | | | 0.78 | % |
FleetCor Technologies Inc | | Information Technology | | | 215 | | | | 59,612 | | | | 0.76 | |
Mastercard Inc | | Information Technology | | | 167 | | | | 59,083 | | | | 0.76 | |
Mosaic Co/The | | Materials | | | 1,999 | | | | 58,769 | | | | 0.75 | |
Eastman Chemical Co | | Materials | | | 537 | | | | 58,664 | | | | 0.75 | |
Fiserv Inc | | Information Technology | | | 504 | | | | 58,164 | | | | 0.74 | |
Ford Motor Co | | Consumer Discretionary | | | 4,958 | | | | 58,005 | | | | 0.74 | |
Boston Scientific Corp | | Health Care | | | 1,494 | | | | 57,918 | | | | 0.74 | |
PURCHASED AND WRITTEN OPTIONS CONTRACTS — At February 28, 2021, the Fund had the following purchased and written options:
OVER-THE-COUNTER INTEREST RATE SWAPTIONS
| | | | | | | | | | | | | | | | | | | | | | | | | | | | | | |
| Description | | Counterparty | | | Exercise
Price | | Expiration
Date | | | Number of
Contracts | | | Notional
Amount | | | Market Value | | | Premiums Paid
(Received)
by Fund | | | Unrealized
Appreciation/
(Depreciation) | |
Purchased option contracts | |
Calls | |
4M IRS | | | MS & Co. Int. PLC | | | $1.400 | | | 06/02/2021 | | | | 100,000,000 | | | $ | 100,000,000 | | | $ | 886,550 | | | $ | 490,000 | | | $ | 396,550 | |
Written option contracts | |
Calls | |
9M IRS | | | MS & Co. Int. PLC | | | 2.070 | | | 11/24/2021 | | | | (108,400,000 | ) | | | (108,400,000 | ) | | | (9,325,186 | ) | | | (7,284,480 | ) | | | (2,040,706 | ) |
6M IRS | | | Barclays Bank PLC | | | 1.400 | | | 06/02/2021 | | | | (100,000,000 | ) | | | (100,000,000 | ) | | | (886,550 | ) | | | (4,795,000 | ) | | | 3,908,450 | |
| | | | | | | |
| Total written option contracts | | | | | | | | | | (208,400,000 | ) | | $ | (208,400,000 | ) | | $ | (10,211,736 | ) | | $ | (12,079,480 | ) | | $ | 1,867,744 | |
| | | | | | | | |
| TOTAL | | | | | | | | | | | | | (108,400,000 | ) | | $ | (108,400,000 | ) | | $ | (9,325,186 | ) | | $ | (11,589,480 | ) | | $ | 2,264,294 | |
OVER-THE-COUNTER OPTIONS ON EQUITIES
| | | | | | | | | | | | | | | | | | | | | | | | | | | | | | |
| Description | | Counterparty | | Exercise
Rate++ | | | Expiration
Date | | | Number of
Contracts | | | Notional
Amount | | | Market Value | | | Premiums Paid
(Received)
by Fund | | | Unrealized
Appreciation/
(Depreciation) | |
Purchased option contracts | |
Calls | |
Stox Index | | BofA Securities LLC | | $ | 430.546 | | | | 12/17/2021 | | | | 207,495 | | | $ | 207,495 | | | $ | 2,753,992 | | | $ | 3,071,871 | | | $ | (317,879 | ) |
Written option contracts | |
Puts | |
S&P Index | | Barclays Bank PLC | | | 3,520.209 | | | | 12/31/2021 | | | | (27,404 | ) | | | (27,404 | ) | | | (6,492,497 | ) | | | (7,265,549 | ) | | | 773,052 | |
S&P Index | | BofA Securities LLC | | | 3,183.120 | | | | 12/31/2021 | | | | (82,040 | ) | | | (82,040 | ) | | | (12,730,665 | ) | | | (18,004,367 | ) | | | 5,273,702 | |
Stox Index | | BofA Securities LLC | | | 348.537 | | | | 12/17/2021 | | | | (207,495 | ) | | | (207,495 | ) | | | (3,474,166 | ) | | | (3,144,264 | ) | | | (329,902 | ) |
SX7E Index | | BofA Securities LLC | | | 68.565 | | | | 11/12/2021 | | | | (1,971,727 | ) | | | (1,971,727 | ) | | | (9,457,676 | ) | | | (21,451,190 | ) | | | 11,993,514 | |
RUT Index | | MS & Co. Int. PLC | | | 1,803.030 | | | | 12/31/2021 | | | | (110,313 | ) | | | (110,313 | ) | | | (11,633,920 | ) | | | (20,635,635 | ) | | | 9,001,715 | |
| | | | | | |
| Total written option contracts | | | | | | | | (2,398,979 | ) | | $ | (2,398,979 | ) | | $ | (43,788,924 | ) | | $ | (70,501,005 | ) | | $ | 26,712,081 | |
| | | | | | | | |
| TOTAL | | | | | | | | | | | | | (2,191,484 | ) | | $ | (2,191,484 | ) | | $ | (41,034,932 | ) | | $ | (67,429,134 | ) | | $ | 26,394,202 | |
| | |
| 34 | | The accompanying notes are an integral part of these financial statements. |
GOLDMAN SACHS TACTICAL TILT OVERLAY FUND
|
| ADDITIONAL INVESTMENT INFORMATION (continued) |
| | |
|
Abbreviations: |
4M IRS | | —4 Months Interest Rate Swaptions |
6M IRS | | —6 Months Interest Rate Swaptions |
9M IRS | | —9 Months Interest Rate Swaptions |
BofA Securities LLC | | —Bank of America Securities LLC |
MS & Co. Int. PLC | | —Morgan Stanley & Co. International PLC |
|
| | |
| The accompanying notes are an integral part of these financial statements. | | 35 |
GOLDMAN SACHS ALLOCATION FUNDS
Statements of Assets and Liabilities
February 28, 2021 (Unaudited)
| | | | | | | | | | | | | | |
| | | | | Global Managed
Beta Fund | | | Strategic Factor
Allocation Fund | | | Tactical Tilt
Overlay Fund(a) | |
| | Assets: | |
| | Investments of unaffiliated issuers, at value (cost 766,165,279, $0 and $1,956,455,099, respectively) (b) | | $ | 1,066,216,852 | | | $ | — | | | $ | 1,999,688,227 | |
| | Investments of affiliated issuers, at value (cost $623,439,592, $1,469,722,865 and $1,310,357,996, respectively) | | | 712,807,969 | | | | 1,469,722,865 | | | | 1,338,477,890 | |
| | Investments in securities lending reinvestment vehicle — affiliated issuer, at value, (Cost $0, $0 and $18,906,000, respectively) | | | — | | | | — | | | | 18,906,000 | |
| | Purchased options, at value (premium paid $3,790,829, $1,094,692 and $3,561,871, respectively) | | | 13,055,175 | | | | 862,155 | | | | 3,640,542 | |
| | Cash | | | 29,905,311 | | | | 57,656,171 | | | | 67,009,408 | |
| | Foreign currencies, at value (cost $854,239, $0 and $9,762,932, respectively) | | | 856,839 | | | | — | | | | 9,725,370 | |
| | Unrealized gain on swap contracts | | | — | | | | — | | | | 44,398,855 | |
| | Unrealized gain on forward foreign currency exchange contracts | | | 3,276,097 | | | | 1,046,003 | | | | — | |
| | Variation margin on futures contracts | | | — | | | | — | | | | 705,821 | |
| | Receivables: | | | | | | | | | | | | |
| | Investments sold | | | 30,758,703 | | | | 606,027 | | | | 72,895,256 | |
| | Collateral on certain derivative contracts(c) | | | 28,126,848 | | | | 390,068,276 | | | | 42,634,955 | |
| | Fund shares sold | | | 22,000,000 | | | | 11,179,726 | | | | 9,241,124 | |
| | Dividends and interest | | | 220,249 | | | | 34,214 | | | | 589,225 | |
| | Foreign tax reclaims | | | 165,199 | | | | — | | | | — | |
| | Investments sold on an extended-settlement basis | | | 36,138 | | | | — | | | | — | |
| | Reimbursement from investment adviser | | | 14,795 | | | | — | | | | 4,912 | |
| | Securities lending income | | | — | | | | — | | | | 33,642 | |
| | Due from broker — upfront payment | | | — | | | | — | | | | 15,018,382 | |
| | Other assets | | | 14,072 | | | | 30,743 | | | | 52,628 | |
| | Total assets | | | 1,907,454,247 | | | | 1,931,206,180 | | | | 3,623,022,237 | |
| | | | | | | | | | | | | | |
| | Liabilities: | | | | | | | | | | | | |
| | Unrealized loss on swap contracts | | | 576,724 | | | | — | | | | 26,683,172 | |
| | Unrealized loss on forward foreign currency exchange contracts | | | 3,377,401 | | | | 1,392,711 | | | | — | |
| | Variation margin on futures contracts | | | 460,893 | | | | 8,995,442 | | | | — | |
| | Written option contracts, at value (premium received $2,090,717, $2,706,039 and $82,580,485, respectively) | | | 1,943,595 | | | | 8,988,686 | | | | 54,000,660 | |
| | Payables: | | | | | | | | | | | | |
| | Fund shares redeemed | | | 66,139,000 | | | | 4,430,002 | | | | 4,071,057 | |
| | Investments purchased | | | 6,119,371 | | | | 153,316 | | | | 22,099,712 | |
| | Management fees | | | 385,270 | | | | 911,732 | | | | 1,653,874 | |
| | Transfer Agency fees | | | 29,024 | | | | 43,814 | | | | 78,644 | |
| | Collateral on certain derivative contracts(d) | | | — | | | | — | | | | 29,952,370 | |
| | Payable upon return of securities loaned | | | — | | | | — | | | | 18,906,000 | |
| | Investments purchased on an extended — settlement basis | | | — | | | | — | | | | 5,000,000 | |
| | Accrued expenses | | | 403,008 | | | | 305,901 | | | | 356,462 | |
| | Total liabilities | | | 79,434,286 | | | | 25,221,604 | | | | 162,801,951 | |
| | | | | | | | | | | | | | |
| | Net Assets: | | | | | | | | | | | | |
| | Paid-in capital | | | 1,386,124,413 | | | | 1,862,030,712 | | | | 3,620,695,910 | |
| | Total distributable earnings (loss) | | | 441,895,548 | | | | 43,953,864 | | | | (160,475,624 | ) |
| | | NET ASSETS | | $ | 1,828,019,961 | | | $ | 1,905,984,576 | | | $ | 3,460,220,286 | |
| | | Net Assets: | | | | | | | | | | | | |
| | | Institutional | | $ | 1,828,019,961 | | | | 4,885,993 | | | | 2,663,394 | |
| | | Class R6 | | | — | | | | 12,082 | | | | 918,520,896 | |
| | | Class P | | | — | | | | 1,901,086,501 | | | | 2,539,035,996 | |
| | | Total Net Assets | | $ | 1,828,019,961 | | | $ | 1,905,984,576 | | | $ | 3,460,220,286 | |
| | | Shares Outstanding $0.001 par value (unlimited number of shares authorized): | | | | | | | | | | | | |
| | | Institutional | | | 124,814,331 | | | | 428,217 | | | | 258,560 | |
| | | Class R6 | | | — | | | | 1,070 | | | | 92,060,453 | |
| | | Class P | | | — | | | | 168,470,769 | | | | 254,468,888 | |
| | | Net asset value, offering and redemption price per share: | | | | | | | | | | | | |
| | | Institutional | | | $14.65 | | | | 11.41 | | | | 10.30 | |
| | | Class R6 | | | — | | | | 11.29 | | | | 9.98 | |
| | | Class P | | | — | | | | 11.28 | | | | 9.98 | |
| | (a) | | Consolidated Statement of Assets and Liabilities for the Fund is consolidated and includes the balances of a wholly owned subsidiary, Cayman Commodity —TTIF, Ltd. Accordingly, all interfund balances and transactions have been eliminated. |
| | (b) | | Includes loaned securities having market value of $0, $0 and $18,439,652, respectively. |
| | (c) | | Includes amounts segregated for initial margin requirements and/or collateral on |
| | | | | | | | | | | | | | | | |
| Funds | | Futures | | | Forwards | | | Options | | | Swaps | |
| | | | |
Global Managed Beta Fund | | $ | 3,444,402 | | | $ | 9,710,000 | | | $ | 14,972,446 | | | $ | — | |
| | | | |
Strategic Factor Allocation Fund | | | 84,021,185 | | | | 3,120,000 | | | | 302,927,091 | | | | — | |
| | | | |
Tactical Tilt Overlay Fund | | | 7,254,955 | | | | — | | | | — | | | | 35,380,000 | |
| | (d) | | Includes amount segregated for initial margin requirements and/or collateral on swaps. |
| | |
| 36 | | The accompanying notes are an integral part of these financial statements. |
GOLDMAN SACHS ALLOCATION FUNDS
Statements of Operations
For the Six Months Ended February 28, 2021 (Unaudited)
| | | | | | | | | | | | | | |
| | | | | Global Managed
Beta Fund | | | Strategic Factor
Allocation Fund | | | Tactical Tilt
Overlay Fund(a) | |
| | Investment income: | |
| | | | |
| | Dividends — unaffiliated issuers (net of foreign withholding taxes of $48,828, $0 and $0, respectively.) | | $ | 9,078,031 | | | $ | — | | | $ | 5,348,396 | |
| | | | |
| | Dividends — affiliated issuers | | | 5,095,144 | | | | 159,370 | | | | 1,992,845 | |
| | | | |
| | Interest — unaffiliated issuers | | | — | | | | — | | | | 3,438,628 | |
| | | | |
| | Securities lending income — unaffiliated issuers | | | 4,179 | | | | — | | | | 243,209 | |
| | | | |
| | Total investment income | | | 14,177,354 | | | | 159,370 | | | | 11,023,078 | |
| | | | | | | | | | | | | | |
| | Expenses: | |
| | | | |
| | Management fees | | | 2,569,025 | | | | 6,350,452 | | | | 12,465,482 | |
| | | | |
| | Transfer Agency fees(b) | | | 171,268 | | | | 254,227 | | | | 474,844 | |
| | | | |
| | Custody, accounting and administrative services | | | 135,040 | | | | 89,390 | | | | 159,650 | |
| | | | |
| | Professional fees | | | 58,547 | | | | 60,101 | | | | 96,392 | |
| | | | |
| | Printing and mailing costs | | | 18,940 | | | | 28,903 | | | | 34,241 | |
| | | | |
| | Registration fees | | | 12,732 | | | | 22,692 | | | | 29,937 | |
| | | | |
| | Trustee fees | | | 10,573 | | | | 10,657 | | | | 11,746 | |
| | | | |
| | Prime Broker Fees | | | 3,838 | | | | 15,874 | | | | 535 | |
| | | | |
| | Other | | | 21,458 | | | | 20,833 | | | | 32,073 | |
| | | | |
| | Total expenses | | | 3,001,421 | | | | 6,853,129 | | | | 13,304,900 | |
| | | | |
| | Less — expense reductions | | | (2,145,652 | ) | | | (1,049,703 | ) | | | (2,221,421 | ) |
| | | | |
| | Net expenses | | | 855,769 | | | | 5,803,426 | | | | 11,083,479 | |
| | | | |
| | NET INVESTMENT INCOME (LOSS) | | | 13,321,585 | | | | (5,644,056 | ) | | | (60,401 | ) |
| | | | | | | | | | | | | | |
| | Realized and unrealized gain (loss): | |
| | | | |
| | Net realized gain (loss) from: | | | | | | | | | | | | |
| | | | |
| | Investments — unaffiliated issuers | | | 15,402,352 | | | | 89 | | | | 9,186,808 | |
| | | | |
| | Investment — affiliated issuers | | | (24,445 | ) | | | — | | | | 3,811,239 | |
| | | | |
| | Purchased options | | | — | | | | (5,966,717 | ) | | | 51,803,385 | |
| | | | |
| | Futures contracts | | | 47,466,135 | | | | 75,683,447 | | | | (35,803,567 | ) |
| | | | |
| | Written options | | | 5,014,680 | | | | 29,001,985 | | | | (23,729,426 | ) |
| | | | |
| | Swap contracts | | | — | | | | — | | | | 80,014,272 | |
| | | | |
| | Forward foreign currency exchange contracts | | | (13,345,012 | ) | | | 3,641,118 | | | | (3,561,482 | ) |
| | | | |
| | Foreign currency transactions | | | 24,099 | | | | (368,759 | ) | | | 1,672,714 | |
| | | | |
| | Net change in unrealized gain (loss) on: | | | | | | | | | | | | |
| | | | |
| | Investments — unaffiliated issuers | | | 109,384,726 | | | | — | | | | 41,984,347 | |
| | | | |
| | Investments — affiliated issuers | | | 58,998,962 | | | | — | | | | 24,889,825 | |
| | | | |
| | Purchased options | | | 120,756 | | | | 136,649 | | | | (26,149,893 | ) |
| | | | |
| | Futures contracts | | | 1,275,524 | | | | (43,669,808 | ) | | | 4,764,484 | |
| | | | |
| | Written options | | | 241,221 | | | | (5,972,150 | ) | | | 47,700,822 | |
| | | | |
| | Swap contracts | | | (576,724 | ) | | | — | | | | 5,113,696 | |
| | | | |
| | Forward foreign currency exchange contracts | | | 10,614,841 | | | | (2,874,833 | ) | | | 1,745,724 | |
| | | | |
| | Foreign currency translation | | | 50,396 | | | | — | | | | (601,121 | ) |
| | | | |
| | Net realized and unrealized gain | | | 234,647,511 | | | | 49,611,021 | | | | 182,841,827 | |
| | | | |
| | NET INCREASE IN NET ASSETS RESULTING FROM OPERATIONS | | $ | 247,969,096 | | | $ | 43,966,965 | | | $ | 182,781,426 | |
| | (a) | | Statement of Operations for the Fund is consolidated and includes the balances of a wholly owned subsidiary, Cayman Commodity — TTIF Ltd. Accordingly, all interfund balances and transactions have been eliminated. |
| | (b) | | Class specific Transfer Agency fees were as follows: |
| | | | | | | | | | | | |
| | | Institutional | | | Class R6 | | | Class P | |
Global Managed Beta Fund | | $ | 171,268 | | | $ | — | | | $ | — | |
Strategic Factor Allocation Fund | | | 836 | | | | 2 | | | | 253,389 | |
| | | |
Tactical Tilt Overlay Fund | | | 410 | | | | 122,908 | | | | 351,526 | |
| | |
| The accompanying notes are an integral part of these financial statements. | | 37 |
GOLDMAN SACHS ALLOCATION FUNDS
Statements of Changes in Net Assets
| | | | | | | | | | | | | | | | | | | | | | |
| | | | | Global Managed Beta Fund | | | | | | Strategic Factor Allocation Fund | |
| | | | | For the
Six Months Ended
February 28, 2021
(Unaudited) | | | For the Fiscal
Year Ended
August 31, 2020 | | | | | | For the
Six Months Ended
February 28, 2021
(Unaudited) | | | For the Fiscal
Year Ended
August 31, 2020 | |
| | From operations: | | | | | | | | | | | | | |
| | | | | | |
| | Net investment income (loss) | | $ | 13,321,585 | | | $ | 23,074,510 | | | | | | | $ | (5,644,056 | ) | | $ | 2,409,683 | |
| | | | | | |
| | Net realized gain | | | 54,537,809 | | | | 48,102,433 | | | | | | | | 101,991,163 | | | | 96,548,496 | |
| | | | | | |
| | Net change in unrealized gain (loss) | | | 180,109,702 | | | | 135,723,802 | | | | | | | | (52,380,142 | ) | | | 55,906,543 | |
| | | | | | |
| | Net increase in net assets resulting from operations | | | 247,969,096 | | | | 206,900,745 | | | | | | | | 43,966,965 | | | | 154,864,722 | |
| | | | | | | | | | | | | | | | | | | | | | |
| | Distributions to shareholders: | | | | | | | | | | | | | |
| | | | | | |
| | From distributable earnings: | | | | | | | | | | | | | | | | | | | | |
| | | | | | |
| | Institutional Shares | | | (81,014,178 | ) | | | (47,547,059 | ) | | | | | | | (353,924 | ) | | | (106,078 | ) |
| | | | | | |
| | Class R6 Shares | | | — | | | | — | | | | | | | | (899 | ) | | | (289 | ) |
| | | | | | |
| | Class P Shares | | | — | | | | — | | | | | | | | (125,892,465 | ) | | | (42,652,117 | ) |
| | | | | | |
| | Total distributions to shareholders | | | (81,014,178 | ) | | | (47,547,059 | ) | | | | | | | (126,247,288 | ) | | | (42,758,484 | ) |
| | | | | | | | | | | | | | | | | | | | | | |
| | From share transactions: | | | | | | | | | | | | | |
| | | | | | |
| | Proceeds from sales of shares | | | 309,608,800 | | | | 423,801,618 | | | | | | | | 399,533,943 | | | | 281,731,510 | |
| | | | | | |
| | Reinvestment of distributions | | | 81,014,178 | | | | 47,547,059 | | | | | | | | 126,247,288 | | | | 42,758,484 | |
| | | | | | |
| | Cost of shares redeemed | | | (322,845,740 | ) | | | (188,792,678 | ) | | | | | | | (156,571,000 | ) | | | (388,930,874 | ) |
| | | | | | |
| | Net increase (decrease) in net assets resulting from share transactions | | | 67,777,238 | | | | 282,555,999 | | | | | | | | 369,210,231 | | | | (64,440,880 | ) |
| | | | | | |
| | TOTAL INCREASE | | | 234,732,156 | | | | 441,909,685 | | | | | | | | 286,929,908 | | | | 47,665,358 | |
| | | | | | | | | | | | | | | | | | | | | | |
| | Net assets: | | | | | | | | | | | | | |
| | | | | | |
| | Beginning of period | | | 1,593,287,805 | | | | 1,151,378,120 | | | | | | | | 1,619,054,668 | | | | 1,571,389,310 | |
| | | | | | |
| | End of period | | $ | 1,828,019,961 | | | $ | 1,593,287,805 | | | | | | | $ | 1,905,984,576 | | | $ | 1,619,054,668 | |
| | |
| 38 | | The accompanying notes are an integral part of these financial statements. |
GOLDMAN SACHS ALLOCATION FUNDS
Statements of Changes in Net Assets(a)
| | | | | | | | | | |
| | | | | Tactical Tilt Overlay Fund | |
| | | | | For the
Six Months Ended
February 28, 2021
(Unaudited) | | | For the Fiscal
Year Ended
August 31, 2020 | |
| | From operations: | |
| | | |
| | Net investment income | | $ | (60,401 | ) | | $ | 26,187,988 | |
| | | |
| | Net realized gain (loss) | | | 83,393,943 | | | | (16,125,503 | ) |
| | | |
| | Net change in unrealized gain | | | 99,447,884 | | | | 62,561,781 | |
| | | |
| | Net increase in net assets resulting from operations | | | 182,781,426 | | | | 72,624,266 | |
| | | | | | | | | | |
| | Distributions to shareholders: | | | | | | | | |
| | | |
| | From distributable earnings: | | | | | | | | |
| | | |
| | Institutional Shares | | | (88,055 | ) | | | (88,497 | ) |
| | | |
| | Class R6 Shares | | | (41,354,663 | ) | | | (8,832,644 | ) |
| | | |
| | Class P Shares | | | (113,568,116 | ) | | | (33,423,852 | ) |
| | | |
| | Total distributions to shareholders | | | (155,010,834 | ) | | | (42,344,993 | ) |
| | | | | | | | | | |
| | From share transactions: | | | | | | | | |
| | | |
| | Proceeds from sales of shares | | | 492,783,380 | | | | 519,364,648 | |
| | | |
| | Reinvestment of distributions | | | 155,010,834 | | | | 42,344,993 | |
| | | |
| | Cost of shares redeemed | | | (244,729,184 | ) | | | (1,493,766,458 | ) |
| | | |
| | Net increase (decrease) in net assets resulting from share transactions | | | 403,065,030 | | | | (932,056,817 | ) |
| | | |
| | TOTAL INCREASE (DECREASE) | | | 430,835,622 | | | | (901,777,544 | ) |
| | | | | | | | | | |
| | Net assets: | | | | | | | | |
| | | |
| | Beginning of period | | | 3,029,384,664 | | | | 3,931,162,208 | |
| | | |
| | End of period | | $ | 3,460,220,286 | | | $ | 3,029,384,664 | |
| | (a) | | Statement of Changes in Net Assets for the Fund is consolidated and includes the balances of a wholly owned subsidiary, Cayman Commodity — TTIF, Ltd. Accordingly, all interfund balances and transactions have been eliminated. |
| | |
| The accompanying notes are an integral part of these financial statements. | | 39 |
GOLDMAN SACHS GLOBAL MANAGED BETA FUND
Financial Highlights
Selected Share Data for a Share Outstanding Throughout Each Period
| | | | | | | | | | | | | | | | | | | | | | | | | | |
| | | | | Global Managed Beta Fund | |
| | | | | Institutional Shares | |
| | | | | Six Months Ended
February 28, 2021
(Unaudited) | | | Year Ended August 31, | | | Period
November 1, 2016 -
August 31, 2017* | | | Year Ended
October 31, 2016 | |
| | | | | 2020 | | | 2019 | | | 2018 | |
| | Per Share Data | | | | | | | | | | | | | | | | | | | | | | | | |
| | | | | | | |
| | Net asset value, beginning of period | | $ | 13.26 | | | $ | 11.86 | | | $ | 12.23 | | | $ | 11.33 | | | $ | 9.84 | | | $ | 9.68 | |
| | | | | | | |
| | Net investment income(a) | | | 0.11 | | | | 0.22 | | | | 0.29 | | | | 0.25 | | | | 0.15 | | | | 0.18 | |
| | | | | | | |
| | Net realized and unrealized gain (loss) | | | 1.93 | | | | 1.67 | | | | (0.25 | ) | | | 1.00 | | | | 1.54 | | | | 0.11 | |
| | | | | | | |
| | Total from investment operations | | | 2.04 | | | | 1.89 | | | | 0.04 | | | | 1.25 | | | | 1.69 | | | | 0.29 | |
| | | | | | | |
| | Distributions to shareholders from net investment income | | | (0.18 | ) | | | (0.38 | ) | | | (0.29 | ) | | | (0.14 | ) | | | (0.20 | ) | | | (0.11 | ) |
| | | | | | | |
| | Distributions to shareholders from net realized gains | | | (0.47 | ) | | | (0.11 | ) | | | (0.12 | ) | | | (0.21 | ) | | | — | | | | (0.02 | ) |
| | | | | | | |
| | Total distributions | | | (0.65 | ) | | | (0.49 | ) | | | (0.41 | ) | | | (0.35 | ) | | | (0.20 | ) | | | (0.13 | ) |
| | | | | | | |
| | Net asset value, end of period | | $ | 14.65 | | | $ | 13.26 | | | $ | 11.86 | | | $ | 12.23 | | | $ | 11.33 | | | $ | 9.84 | |
| | | | | | | |
| | Total return(b) | | | 15.61 | % | | | 16.13 | % | | | 0.78 | % | | | 11.18 | % | | | 17.43 | % | | | 3.08 | % |
| | | | | | | |
| | Net assets, end of period (in 000s) | | $ | 1,828,020 | | | $ | 1,593,288 | | | $ | 1,151,378 | | | $ | 1,184,276 | | | $ | 442,071 | | | $ | 144,246 | |
| | | | | | | |
| | Ratio of net expenses to average net assets(c) | | | 0.10 | %(f) | | | 0.05 | % | | | 0.05 | % | | | 0.07 | % | | | 0.10 | %(f) | | | 0.17 | % |
| | | | | | | |
| | Ratio of total expenses to average net assets(c) | | | 0.35 | %(f) | | | 0.37 | % | | | 0.37 | % | | | 0.39 | % | | | 0.42 | %(f) | | | 0.48 | % |
| | | | | | | |
| | Ratio of net investment income to average net assets | | | 1.56 | %(f) | | | 1.79 | % | | | 2.49 | % | | | 2.07 | % | | | 1.71 | %(f) | | | 1.90 | % |
| | | | | | | |
| | Portfolio turnover rate(g) | | | 15 | % | | | 45 | % | | | 56 | % | | | 18 | % | | | 44 | % | | | 37 | % |
| | * | | The Fund changed its fiscal year end from October 31 to August 31. |
| | (a) | | Calculated based on the average shares outstanding methodology. |
| | (b) | | Assumes investment at the NAV at the beginning of the period, reinvestment of all dividends and distributions, a complete redemption of the investment at the NAV at the end of the period and no sales or redemption charges (if any). Total returns would be reduced if a sales or redemption charge was taken into account. Returns do not reflect the impact of taxes to shareholders relating to Fund distributions or the redemption of Fund shares. Total returns for periods less than one full year are not annualized. |
| | (c) | | Expense ratios exclude the expenses of the Underlying Funds in which the Fund invests. |
| | (e) | | The Fund’s portfolio turnover rate is calculated in accordance with regulatory requirements, without regard to transactions involving short term investments and certain derivatives. If such transactions were included, the Fund’s portfolio turnover rate may be higher. |
| | |
| 40 | | The accompanying notes are an integral part of these financial statements. |
GOLDMAN SACHS STRATEGIC FACTOR ALLOCATION FUND
Financial Highlights (continued)
Selected Share Data for a Share Outstanding Throughout Each Period
| | | | | | | | | | | | | | | | | | | | | | | | | | |
| | | | | Goldman Sachs Strategic Factor Allocation Fund | |
| | | | | Institutional Shares | |
| | | | | Six Months Ended
February 28, 2021
(Unaudited) | | | Year Ended August 31, | | | Period Ended
August 31, 2016(a) | |
| | | | | 2020 | | | 2019 | | | 2018 | | | 2017 | |
| | Per Share Data | |
| | | | | | | |
| | Net asset value, beginning of period | | $ | 11.98 | | | $ | 11.06 | | | $ | 11.26 | | | $ | 10.96 | | | $ | 10.34 | | | $ | 10.00 | |
| | | | | | | |
| | Net investment income (loss)(b) | | | (0.04 | ) | | | 0.03 | | | | 0.11 | | | | 0.06 | | | | — | (c) | | | (0.01 | ) |
| | | | | | | |
| | Net realized and unrealized gain | | | 0.38 | | | | 1.18 | | | | 0.30 | | | | 0.50 | | | | 0.70 | | | | 0.35 | |
| | | | | | | |
| | Total from investment operations | | | 0.34 | | | | 1.21 | | | | 0.41 | | | | 0.56 | | | | 0.70 | | | | 0.34 | |
| | | | | | | |
| | Distributions to shareholders from net investment income | | | — | | | | (0.15 | ) | | | — | | | | (0.01 | ) | | | — | (c) | | | — | |
| | | | | | | |
| | Distributions to shareholders from net realized gains | | | (0.91 | ) | | | (0.14 | ) | | | (0.61 | ) | | | (0.25 | ) | | | (0.08 | ) | | | — | |
| | | | | | | |
| | Total distributions | | | (0.91 | ) | | | (0.29 | ) | | | (0.61 | ) | | | (0.26 | ) | | | (0.08 | ) | | | — | |
| | | | | | | |
| | Net asset value, end of period | | $ | 11.41 | | | $ | 11.98 | | | $ | 11.06 | | | $ | 11.26 | | | $ | 10.96 | | | $ | 10.34 | |
| | | | | | | |
| | Total return(d) | | | 3.12 | % | | | 11.11 | % | | | 4.15 | % | | | 5.18 | % | | | 6.88 | % | | | 3.40 | % |
| | | | | | | |
| | Net assets, end of period (in 000s) | | $ | 4,886 | | | $ | 3,013 | | | $ | 5,424 | | | $ | 20,035 | | | $ | 1,459,234 | | | $ | 338,592 | |
| | | | | | | |
| | Ratio of net expenses to average net assets | | | 0.70 | %(e) | | | 0.69 | % | | | 0.72 | % | | | 0.71 | % | | | 0.74 | % | | | 0.87 | %(e) |
| | | | | | | |
| | Ratio of total expenses to average net assets | | | 0.82 | %(e) | | | 0.82 | % | | | 0.82 | % | | | 0.80 | % | | | 0.84 | % | | | 1.07 | %(e) |
| | | | | | | |
| | Ratio of net investment income (loss) to average net assets | | | (0.68 | )%(e) | | | 0.26 | % | | | 1.05 | % | | | 0.59 | % | | | 0.01 | % | | | (0.51 | )%(e) |
| | | | | | | |
| | Portfolio turnover rate(f) | | | — | %(g) | | | — | %(g) | | | 962 | % | | | 725 | % | | | 589 | % | | | 86 | % |
| | (a) | | Commenced operations on May 31, 2016. |
| | (b) | | Calculated based on the average shares outstanding methodology. |
| | (c) | | Amount is less than $0.005 per share. |
| | (d) | | Assumes investment at the NAV at the beginning of the period, reinvestment of all dividends and distributions, a complete redemption of the investment at the NAV at the end of the period and no sales or redemption charges (if any). Total returns would be reduced if a sales or redemption charge was taken into account. Returns do not reflect the impact of taxes to shareholders relating to Fund distributions or the redemption of Fund shares. Total returns for periods less than one full year are not annualized. |
| | (f) | | The Fund’s portfolio turnover rate is calculated in accordance with regulatory requirements, without regard to transactions involving short term investments and certain derivatives. If such transactions were included, the Fund’s portfolio turnover rate may be higher. |
| | (g) | | There were no long-term transactions for the period ended February 28, 2021 and for the year ended August 31, 2020. |
| | |
| The accompanying notes are an integral part of these financial statements. | | 41 |
GOLDMAN SACHS STRATEGIC FACTOR ALLOCATION FUND
Financial Highlights (continued)
Selected Share Data for a Share Outstanding Throughout Each Period
| | | | | | | | | | | | | | | | | | |
| | | | | Goldman Sachs Strategic Factor Allocation Fund | |
| | | | | Class R6 Shares | |
| | | | | Six Months Ended
February 28, 2021
(Unaudited) | | | Year Ended August 31, | | | Period Ended
August 31, 2018(a) | |
| | | | | 2020 | | | 2019 | |
| | Per Share Data | |
| | | | | |
| | Net asset value, beginning of period | | $ | 11.87 | | | $ | 10.96 | | | $ | 11.26 | | | $ | 11.10 | |
| | | | | |
| | Net investment income (loss)(b) | | | (0.04 | ) | | | 0.02 | | | | 0.12 | | | | 0.04 | |
| | | | | |
| | Net realized and unrealized gain | | | 0.37 | | | | 1.19 | | | | 0.28 | | | | 0.12 | |
| | | | | |
| | Total from investment operations | | | 0.33 | | | | 1.21 | | | | 0.40 | | | | 0.16 | |
| | | | | |
| | Distributions to shareholders from net investment income | | | — | | | | (0.16 | ) | | | (0.09 | ) | | | — | |
| | | | | |
| | Distributions to shareholders from net realized gains | | | (0.91 | ) | | | (0.14 | ) | | | (0.61 | ) | | | — | |
| | | | | |
| | Total distributions | | | (0.91 | ) | | | (0.30 | ) | | | (0.70 | ) | | | — | |
| | | | | |
| | Net asset value, end of period | | $ | 11.29 | | | $ | 11.87 | | | $ | 10.96 | | | $ | 11.26 | |
| | | | | |
| | Total return(c) | | | 3.14 | % | | | 11.12 | % | | | 4.14 | % | | | 1.44 | % |
| | | | | |
| | Net assets, end of period (in 000s) | | $ | 12 | | | $ | 12 | | | $ | 11 | | | $ | 10 | |
| | | | | |
| | Ratio of net expenses to average net assets | | | 0.67 | %(d) | | | 0.66 | % | | | 0.68 | % | | | 0.69 | %(d) |
| | | | | |
| | Ratio of total expenses to average net assets | | | 0.79 | %(d) | | | 0.80 | % | | | 0.80 | % | | | 0.79 | %(d) |
| | | | | |
| | Ratio of Net investment income (loss) | | | (0.64 | )%(d) | | | 0.15 | % | | | 1.08 | % | | | 0.58 | %(d) |
| | | | | |
| | Portfolio turnover rate(e) | | | — | %(f) | | | — | %(f) | | | 962 | % | | | 725 | % |
| | (a) | | Commenced operations on December 29, 2017. |
| | (b) | | Calculated based on the average shares outstanding methodology. |
| | (c) | | Assumes investment at the NAV at the beginning of the period, reinvestment of all dividends and distributions, a complete redemption of the investment at the NAV at the end of the period and no sales or redemption charges (if any). Total returns would be reduced if a sales or redemption charge was taken into account. Returns do not reflect the impact of taxes to shareholders relating to Fund distributions or the redemption of Fund shares. Total returns for periods less than one full year are not annualized. |
| | (e) | | The Fund’s portfolio turnover rate is calculated in accordance with regulatory requirements, without regard to transactions involving short term investments and certain derivatives. If such transactions were included, the Fund’s portfolio turnover rate may be higher. |
| | (f) | | There were no long-term transactions for the period ended February 28, 2021 and for the year ended August 31, 2020. |
| | |
| 42 | | The accompanying notes are an integral part of these financial statements. |
GOLDMAN SACHS STRATEGIC FACTOR ALLOCATION FUND
Financial Highlights (continued)
Selected Share Data for a Share Outstanding Throughout Each Period
| | | | | | | | | | | | | | | | | | |
| | | | | Goldman Sachs Strategic Factor Allocation Fund | |
| | | | | Class P Shares | |
| | | | | Six Months Ended
February 28, 2021
(Unaudited) | | | Year Ended August 31, | | | Period Ended
August 31, 2018(a) | |
| | | | | 2020 | | | 2019 | |
| | Per Share Data | |
| | | | | |
| | Net asset value, beginning of period | | $ | 11.86 | | | $ | 10.96 | | | $ | 11.26 | | | $ | 10.83 | |
| | | | | |
| | Net investment income (loss)(b) | | | (0.04 | ) | | | 0.02 | | | | 0.11 | | | | 0.02 | |
| | | | | |
| | Net realized and unrealized gain | | | 0.37 | | | | 1.18 | | | | 0.29 | | | | 0.41 | |
| | | | | |
| | Total from investment operations | | | 0.33 | | | | 1.20 | | | | 0.40 | | | | 0.43 | |
| | | | | |
| | Distributions to shareholders from net investment income | | | — | | | | (0.16 | ) | | | (0.09 | ) | | | — | |
| | | | | |
| | Distributions to shareholders from net realized gains | | | (0.91 | ) | | | (0.14 | ) | | | (0.61 | ) | | | — | |
| | | | | |
| | Total distributions | | | (0.91 | ) | | | (0.30 | ) | | | (0.70 | ) | | | — | |
| | | | | |
| | Net asset value, end of period | | $ | 11.28 | | | $ | 11.86 | | | $ | 10.96 | | | $ | 11.26 | |
| | | | | |
| | Total return(c) | | | 3.14 | % | | | 11.03 | % | | | 4.16 | % | | | 3.97 | % |
| | | | | |
| | Net assets, end of period (in 000s) | | $ | 1,901,087 | | | $ | 1,616,030 | | | $ | 1,565,955 | | | $ | 2,467,490 | |
| | | | | |
| | Ratio of net expenses to average net assets | | | 0.69 | %(d) | | | 0.68 | % | | | 0.71 | % | | | 0.71 | %(d) |
| | | | | |
| | Ratio of total expenses to average net assets | | | 0.81 | %(d) | | | 0.82 | % | | | 0.82 | % | | | 0.80 | %(d) |
| | | | | |
| | Ratio of net investment income (loss) to average net assets | | | (0.67 | )%(d) | | | 0.15 | % | | | 1.07 | % | | | 0.40 | %(d) |
| | | | | |
| | Portfolio turnover rate(e) | | | — | %(f) | | | — | %(f) | | | 962 | % | | | 725 | % |
| | (a) | | Commenced operations on April 17, 2018. |
| | (b) | | Calculated based on the average shares outstanding methodology. |
| | (c) | | Assumes investment at the NAV at the beginning of the period, reinvestment of all dividends and distributions, a complete redemption of the investment at the NAV at the end of the period and no sales or redemption charges (if any). Total returns would be reduced if a sales or redemption charge was taken into account. Returns do not reflect the impact of taxes to shareholders relating to Fund distributions or the redemption of Fund shares. Total returns for periods less than one full year are not annualized. |
| | (e) | | The Fund’s portfolio turnover rate is calculated in accordance with regulatory requirements, without regard to transactions involving short term investments and certain derivatives. If such transactions were included, the Fund’s portfolio turnover rate may be higher. |
| | (f) | | There were no long-term transactions for the period ended February 28, 2021 and for the year ended August 31, 2020. |
| | |
| The accompanying notes are an integral part of these financial statements. | | 43 |
GOLDMAN SACHS TACTICAL TILT OVERLAY FUND
Consolidated Financial Highlights (continued)
Selected Share Data for a Share Outstanding Throughout Each Period
| | | | | | | | | | | | | | | | | | | | | | | | | | |
| | | | | Goldman Sachs Tactical Tilt Overlay Fund | |
| | | | | Institutional Shares | |
| | | | | Six Months Ended
February 28, 2021
(Unaudited) | | | Year Ended August 31, | | | Period
November 1, 2016 -
August 31, 2017* | | | Year Ended
October 31, 2016 | |
| | | | | 2020 | | | 2019 | | | 2018 | |
| | Per Share Data | |
| | | | | | | |
| | Net asset value, beginning of period | | $ | 10.20 | | | $ | 9.94 | | | $ | 9.87 | | | $ | 9.73 | | | $ | 9.83 | | | $ | 10.40 | |
| | | | | | | |
| | Net investment income(a) | | | 0.02 | | | | 0.11 | | | | 0.22 | | | | 0.12 | | | | 0.09 | | | | 0.11 | |
| | | | | | | |
| | Net realized and unrealized gain (loss) | | | 0.55 | | | | 0.26 | | | | (0.15 | ) | | | 0.11 | | | | (0.01 | ) | | | (0.22 | ) |
| | | | | | | |
| | Total from investment operations | | | 0.57 | | | | 0.37 | | | | 0.07 | | | | 0.23 | | | | 0.08 | | | | (0.11 | ) |
| | | | | | | |
| | Distributions to shareholders from net investment income | | | (0.47 | ) | | | (0.11 | ) | | | — | | | | (0.09 | ) | | | (0.18 | ) | | | (0.46 | ) |
| | | | | | | |
| | Net asset value, end of period | | $ | 10.30 | | | $ | 10.20 | | | $ | 9.94 | | | $ | 9.87 | | | $ | 9.73 | | | $ | 9.83 | |
| | | | | | | |
| | Total return(b) | | | 5.84 | % | | | 3.72 | % | | | 0.71 | % | | | 2.39 | % | | | 0.82 | % | | | (0.96 | )% |
| | | | | | | |
| | Net assets, end of period (in 000s) | | $ | 2,663 | | | $ | 1,681 | | | $ | 25,673 | | | $ | 23,583 | | | $ | 5,242,928 | | | $ | 5,214,846 | |
| | | | | | | |
| | Ratio of net expenses to average net assets(c) | | | 0.71 | %(d) | | | 0.73 | % | | | 0.74 | % | | | 0.69 | % | | | 0.62 | %(d) | | | 0.59 | % |
| | | | | | | |
| | Ratio of total expenses to average net assets(c) | | | 0.79 | %(d) | | | 0.78 | % | | | 0.79 | % | | | 0.76 | % | | | 0.75 | %(d) | | | 0.77 | % |
| | | | | | | |
| | Ratio of net investment income to average net assets | | | 0.44 | %(d) | | | 1.08 | % | | | 2.17 | % | | | 1.20 | % | | | 1.10 | %(d) | | | 1.15 | % |
| | | | | | | |
| | Portfolio turnover rate(e) | | | 16 | % | | | 70 | % | | | 46 | % | | | 41 | % | | | 28 | % | | | 48 | % |
| | * | | The Fund changed its fiscal year end from October 31 to August 31. |
| | (a) | | Calculated based on the average shares outstanding methodology. |
| | (b) | | Assumes investment at the NAV at the beginning of the period, reinvestment of all dividends and distributions, a complete redemption of the investment at the NAV at the end of the period and no sales or redemption charges (if any). Total returns would be reduced if a sales or redemption charge was taken into account. Returns do not reflect the impact of taxes to shareholders relating to Fund distributions or the redemption of Fund shares. Total returns for periods less than one full year are not annualized. |
| | (c) | | Expense ratios exclude the expenses of the Underlying Funds in which the Fund invests. |
| | (e) | | The Fund’s portfolio turnover rate is calculated in accordance with regulatory requirements, without regard to transactions involving short term investments and certain derivatives. If such transactions were included, the Fund’s portfolio turnover rate may be higher. |
| | |
| 44 | | The accompanying notes are an integral part of these financial statements. |
GOLDMAN SACHS TACTICAL TILT OVERLAY FUND
Consolidated Financial Highlights (continued)
Selected Share Data for a Share Outstanding Throughout Each Period
| | | | | | | | | | | | | | | | | | |
| | | | | Goldman Sachs Tactical Tilt Overlay Fund | |
| | | | | Class R6 Shares | |
| | | | | Six Months Ended
February 28, 2021
(Unaudited) | | | Year Ended August 31, | | | Period Ended
August 31, 2018(a) | |
| | | | | 2020 | | | 2019 | |
| | Per Share Data | |
| | | | | |
| | Net asset value, beginning of period | | $ | 9.91 | | | $ | 9.67 | | | $ | 9.87 | | | $ | 9.81 | |
| | | | | |
| | Net investment income(b) | | | 0.02 | | | | 0.07 | | | | 0.26 | | | | 0.11 | |
| | | | | |
| | Net realized and unrealized gain (loss) | | | 0.54 | | | | 0.28 | | | | (0.20 | ) | | | (0.05 | ) |
| | | | | |
| | Total from investment operations | | | 0.56 | | | | 0.35 | | | | 0.06 | | | | 0.06 | |
| | | | | |
| | Distributions to shareholders from net investment income | | | (0.49 | ) | | | (0.11 | ) | | | (0.26 | ) | | | — | |
| | | | | |
| | Net asset value, end of period | | $ | 9.98 | | | $ | 9.91 | | | $ | 9.67 | | | $ | 9.87 | |
| | | | | |
| | Total return(c) | | | 5.77 | % | | | 3.80 | % | | | 0.58 | % | | | 0.61 | % |
| | | | | |
| | Net assets, end of period (in 000s) | | $ | 918,521 | | | $ | 736,643 | | | $ | 714,633 | | | $ | 343,370 | |
| | | | | |
| | Ratio of net expenses to average net assets(d) | | | 0.70 | %(e) | | | 0.72 | % | | | 0.73 | % | | | 0.69 | %(e) |
| | | | | |
| | Ratio of total expenses to average net assets(d) | | | 0.78 | %(e) | | | 0.78 | % | | | 0.78 | % | | | 0.76 | %(e) |
| | | | | |
| | Ratio of net investment income to average net assets | | | 0.46 | %(e) | | | 0.73 | % | | | 2.65 | % | | | 1.77 | %(e) |
| | | | | |
| | Portfolio turnover rate(f) | | | 16 | % | | | 70 | % | | | 46 | % | | | 41 | % |
| | (a) | | Commenced operations on December 29, 2017. |
| | (b) | | Calculated based on the average shares outstanding methodology. |
| | (c) | | Assumes investment at the NAV at the beginning of the period, reinvestment of all dividends and distributions, a complete redemption of the investment at the NAV at the end of the period and no sales or redemption charges (if any). Total returns would be reduced if a sales or redemption charge was taken into account. Returns do not reflect the impact of taxes to shareholders relating to Fund distributions or the redemption of Fund shares. Total returns for periods less than one full year are not annualized. |
| | (d) | | Expense ratios exclude the expenses of the Underlying Funds in which the Fund invests. |
| | (f) | | The Fund’s portfolio turnover rate is calculated in accordance with regulatory requirements, without regard to transactions involving short term investments and certain derivatives. If such transactions were included, the Fund’s portfolio turnover rate may be higher. |
| | |
| The accompanying notes are an integral part of these financial statements. | | 45 |
GOLDMAN SACHS TACTICAL TILT OVERLAY FUND
Consolidated Financial Highlights (continued)
Selected Share Data for a Share Outstanding Throughout Each Period
| | | | | | | | | | | | | | | | | | |
| | | | | Goldman Sachs Tactical Tilt Overlay Fund | |
| | | | | Class P Shares | |
| | | | | Six Months Ended
February 28, 2021
(Unaudited) | | | Year Ended August 31, | | | Period Ended
August 31, 2018(a) | |
| | | | | 2020 | | | 2019 | |
| | Per Share Data | |
| | | | | |
| | Net asset value, beginning of period | | $ | 9.91 | | | $ | 9.66 | | | $ | 9.87 | | | $ | 9.76 | |
| | | | | |
| | Net investment income(b) | | | 0.02 | | | | 0.08 | | | | 0.20 | | | | 0.14 | |
| | | | | |
| | Net realized and unrealized gain (loss) | | | 0.54 | | | | 0.28 | | | | (0.15 | ) | | | (0.03 | ) |
| | | | | |
| | Total from investment operations | | | 0.56 | | | | 0.36 | | | | 0.05 | | | | 0.11 | |
| | | | | |
| | Distributions to shareholders from net investment income | | | (0.49 | ) | | | (0.11 | ) | | | (0.26 | ) | | | — | |
| | | | | |
| | Net asset value, end of period | | $ | 9.98 | | | $ | 9.91 | | | $ | 9.66 | | | $ | 9.87 | |
| | | | | |
| | Total return(c) | | | 5.76 | % | | | 3.79 | % | | | 0.59 | % | | | 1.13 | % |
| | | | | |
| | Net assets, end of period (in 000s) | | $ | 2,539,036 | | | $ | 2,291,061 | | | $ | 3,190,855 | | | $ | 4,045,246 | |
| | | | | |
| | Ratio of net expenses to average net assets(d) | | | 0.70 | %(e) | | | 0.72 | % | | | 0.72 | % | | | 0.71 | %(e) |
| | | | | |
| | Ratio of total expenses to average net assets(d) | | | 0.78 | %(e) | | | 0.78 | % | | | 0.78 | % | | | 0.77 | %(e) |
| | | | | |
| | Ratio of net investment income to average net assets | | | 0.45 | %(e) | | | 0.78 | % | | | 2.07 | % | | | 3.80 | %(e) |
| | | | | |
| | Portfolio turnover rate(f) | | | 16 | % | | | 70 | % | | | 46 | % | | | 41 | % |
| | (a) | | Commenced operations on April 17, 2018. |
| | (b) | | Calculated based on the average shares outstanding methodology. |
| | (c) | | Assumes investment at the NAV at the beginning of the period, reinvestment of all dividends and distributions, a complete redemption of the investment at the NAV at the end of the period and no sales or redemption charges (if any). Total returns would be reduced if a sales or redemption charge was taken into account. Returns do not reflect the impact of taxes to shareholders relating to Fund distributions or the redemption of Fund shares. Total returns for periods less than one full year are not annualized. |
| | (d) | | Expense ratios exclude the expenses of the Underlying Funds in which the Fund invests. |
| | (f) | | The Fund’s portfolio turnover rate is calculated in accordance with regulatory requirements, without regard to transactions involving short term investments and certain derivatives. If such transactions were included, the Fund’s portfolio turnover rate may be higher. |
| | |
| 46 | | The accompanying notes are an integral part of these financial statements. |
GOLDMAN SACHS ALLOCATION FUNDS
Notes to Financial Statements
February 28, 2021 (Unaudited)
Goldman Sachs Trust (the “Trust”) is a Delaware statutory trust registered under the Investment Company Act of 1940, as amended (the “Act”), as an open-end management investment company. The following table lists those series of the Trust that are included in this report (collectively, the “Funds” or individually a “Fund”), along with their corresponding share classes and respective diversification status under the Act:
| | | | | | |
| Fund | | | | Share Classes Offered | | Diversified/
Non-diversified |
Global Managed Beta Fund | | | | Institutional | | Diversified |
Strategic Factor Allocation Fund | | | | Institutional, R6 and P | | Diversified |
Tactical Tilt Overlay Fund | | | | Institutional, R6 and P | | Diversified |
Goldman Sachs Asset Management, L.P. (“GSAM”), an affiliate of Goldman Sachs & Co. LLC (“Goldman Sachs”), serves as
investment adviser to each of the Global Managed Beta, Strategic Factor Allocation and Tactical Tilt Overlay Funds pursuant to management agreements (the “Agreement”) with the Trust.
|
| 2. SIGNIFICANT ACCOUNTING POLICIES |
The financial statements have been prepared in accordance with accounting principles generally accepted in the United States of America (“GAAP”) and require management to make estimates and assumptions that may affect the reported amounts and disclosures. Actual results may differ from those estimates and assumptions. Each Fund is an investment company under GAAP and follows the accounting and reporting guidance applicable to investment companies.
A. Basis of Consolidation for Goldman Sachs Tactical Tilt Overlay Fund — The Cayman Commodity – TTIF, LLC. (the “Subsidiary”), a Cayman Islands exempted company is currently a wholly-owned subsidiary of the Tactical Tilt Overlay Fund. The Subsidiary acts as an investment vehicle for the Fund to enable the Fund to gain exposure to certain types of commodity-linked derivative instruments. The Fund is the sole shareholder of the Subsidiary and it is intended that the Fund will remain the sole shareholder and will continue to control the Subsidiary. All inter-fund balances and transactions have been eliminated in consolidation. As of February 28, 2021, the Fund’s net assets were $3,460,220,286, of which, $487,503,946, or 14.1%, represented the Subsidiary’s net assets.
B. Investment Valuation — Each Fund’s valuation policies are to value investments at fair value.
C. Investment Income and Investments — Investment income includes interest income, dividend income and securities lending income, if any. Interest income is accrued daily and adjusted for amortization of premiums and accretion of discounts. Dividend income is recognized on ex-dividend date or, for certain foreign securities, as soon as such information is obtained subsequent to the ex-dividend date. Non-cash dividends, if any, are recorded at the fair market value of the securities received. Investment transactions are reflected on trade date. Realized gains and losses are calculated using identified cost. Investment transactions are recorded on the following business day for daily net asset value (“NAV”) calculations. Investment income is recorded net of any foreign withholding taxes, less any amounts reclaimable. The Funds may file withholding tax reclaims in certain jurisdictions to recover a portion of amounts previously withheld. Any foreign capital gains tax is accrued daily based upon net unrealized gains, and is payable upon sale of such investments. Distributions received from a Fund’s investments in U.S. real estate investment trusts (“REITs”) may be characterized as ordinary income, net capital gain and/or a return of capital. A return of capital is recorded by the Fund as a reduction to the cost basis of the REIT.
Distributions from master limited partnerships (“MLPs”) are generally recorded based on the characterization reported on the MLP’s tax return. A Fund records its pro-rata share of the income/loss and capital gains/losses, allocated from the underlying partnerships and adjusts the cost basis of the underlying partnerships accordingly.
47
GOLDMAN SACHS ALLOCATION FUNDS
Notes to Financial Statements (continued)
February 28, 2021 (Unaudited)
|
| 2. SIGNIFICANT ACCOUNTING POLICIES (continued) |
For derivative contracts, realized gains and losses are recorded upon settlement of the contract. Upfront payments, if any, are made or received upon entering into a swap agreement and are reflected in the Statement of Assets and Liabilities. Upfront payments are recognized over the contract’s term/event as realized gains or losses, with the exception of forward starting swap contracts whose realized gains or losses are recognized from the effective start date. For securities with paydown provisions, principal payments received are treated as a proportionate reduction to the cost basis of the securities, and excess or shortfall amounts are recorded as income. For treasury inflation protected securities (“TIPS”), adjustments to principal due to inflation/deflation are reflected as increases/decreases to interest income with a corresponding adjustment to cost.
D. Class Allocations and Expenses for Tactical Tilt Overlay Fund and Strategic Factor Allocation Fund — Investment income, realized and unrealized gain (loss), if any, and non-class specific expenses of each Fund are allocated daily based upon the proportion of net assets of each class. Non-class specific expenses directly incurred by a Fund are charged to that Fund, while such expenses incurred by the Trust are allocated across the applicable Fund on a straight-line and/or pro-rata basis depending upon the nature of the expenses. Class specific expenses, where applicable, are borne by the respective share classes and include Transfer Agency fees.
E. Expenses — Expenses incurred directly by the Funds are charged to the Funds, and certain expenses incurred by the Trust that may not solely relate to the Funds are allocated to the Funds and the other applicable funds of the Trust on a straight-line and/or pro-rata basis, depending upon the nature of the expenses, and are accrued daily.
F. Federal Taxes and Distributions to Shareholders — It is each Fund’s policy to comply with the requirements of the Internal Revenue Code of 1986, as amended (the “Code”), applicable to regulated investment companies and to distribute each year substantially all of its investment company taxable income and capital gains to its shareholders. Accordingly, each Fund is not required to make any provisions for the payment of federal income tax. Distributions to shareholders are recorded on the ex-dividend date. Income and capital gains distributions, if any, are declared and paid at least annually.
The Subsidiary is classified as a controlled foreign corporation under the Code. Therefore, the Tactical Tilt Overlay Fund is required to increase its taxable income by its share of the Subsidiary’s income. Net losses of the Subsidiary cannot be deducted by the Fund in the current period nor carried forward to offset taxable income in future periods.
Net capital losses, if any, are carried forward to future fiscal years and may be used to the extent allowed by the Code to offset any future capital gains. Losses that are carried forward will retain their character as either short-term or long-term capital losses. Utilization of capital loss carryforwards will reduce the requirement of future capital gains distributions.
The characterization of distributions to shareholders for financial reporting purposes is determined in accordance with federal income tax rules, which may differ from GAAP. The source of each Fund’s distributions may be shown in the accompanying financial statements as either from distributable earnings or capital. Certain components of the Fund’s net assets on the Statements of Assets and Liabilities reflect permanent GAAP/tax differences based on the appropriate tax character.
G. Foreign Currency Translation — The accounting records and reporting currency of the Funds are maintained in U.S. dollars. Assets and liabilities denominated in foreign currencies are translated into U.S. dollars using the current exchange rates at the close of each business day. The effect of changes in foreign currency exchange rates on investments is included within net realized and unrealized gain (loss) on investments. Changes in the value of other assets and liabilities as a result of fluctuations in foreign exchange rates are included in the Statements of Operations within net change in unrealized gain (loss) on foreign currency translation. Transactions denominated in foreign currencies are translated into U.S. dollars on the date the transaction occurred, the effects of which are included within net realized gain (loss) on foreign currency transactions.
|
| 3. INVESTMENTS AND FAIR VALUE MEASUREMENTS |
U.S. GAAP defines the fair value of a financial instrument as the amount that would be received to sell an asset or paid to transfer a liability in an orderly transaction between market participants at the measurement date (i.e., the exit price); the Funds’ policy is to use the market approach. GAAP establishes a fair value hierarchy that prioritizes the inputs to valuation techniques used to measure fair value. The hierarchy gives the highest priority to unadjusted quoted prices in active markets for identical assets or
48
GOLDMAN SACHS ALLOCATION FUNDS
|
| 3. INVESTMENTS AND FAIR VALUE MEASUREMENTS (continued) |
liabilities (Level 1 measurements) and the lowest priority to unobservable inputs (Level 3 measurements). The level in the fair value hierarchy within which the fair value measurement in its entirety falls shall be determined based on the lowest level input that is significant to the fair value measurement in its entirety. The levels used for classifying investments are not necessarily an indication of the risk associated with investing in these investments. The three levels of the fair value hierarchy are described below:
Level 1 — Unadjusted quoted prices in active markets that are accessible at the measurement date for identical, unrestricted assets or liabilities;
Level 2 — Quoted prices in markets that are not active or financial instruments for which significant inputs are observable (including, but not limited to, quoted prices for similar investments, interest rates, foreign exchange rates, volatility and credit spreads), either directly or indirectly;
Level 3 — Prices or valuations that require significant unobservable inputs (including GSAM’s assumptions in determining fair value measurement).
The Board of Trustees (“Trustees”) has approved Valuation Procedures that govern the valuation of the fund investments held by the Funds, including investments for which market quotations are not readily available. The Trustees have delegated to GSAM day-to-day responsibility for implementing and maintaining internal controls and procedures related to the valuation of the Funds’ investments. To assess the continuing appropriateness of pricing sources and methodologies, GSAM regularly performs price verification procedures and issues challenges as necessary to third party pricing vendors or brokers, and any differences are reviewed in accordance with the Valuation Procedures.
A. Level 1 and Level 2 Fair Value Investments — The valuation techniques and significant inputs used in determining the fair values for investments classified as Level 1 and Level 2 are as follows:
Equity Securities — Equity securities traded on a United States (“U.S.”) securities exchange or the NASDAQ system, or those located on certain foreign exchanges, including but not limited to the Americas, are valued daily at their last sale price or official closing price on the principal exchange or system on which they are traded. If there is no sale or official closing price or such price is believed by GSAM to not represent fair value, equity securities will be valued at the valid closing bid price for long positions and at the valid closing ask price for short positions (i.e. where there is sufficient volume, during normal exchange trading hours). If no valid bid/ask price is available, the equity security will be valued pursuant to the Valuation Procedures approved by the Trustees and consistent with applicable regulatory guidance. To the extent these investments are actively traded, they are classified as Level 1 of the fair value hierarchy, otherwise they are generally classified as Level 2. Certain equity securities containing unique attributes may be classified as Level 2.
Unlisted equity securities for which market quotations are available are valued at the last sale price on the valuation date, or if no sale occurs, at the last bid price for long positions or the last ask price for short positions, and are generally classified as Level 2. Securities traded on certain foreign securities exchanges are valued daily at fair value determined by an independent fair value service (if available) under Fair Valuation Procedures approved by the Trustees and consistent with applicable regulatory guidance. The independent fair value service takes into account multiple factors including, but not limited to, movements in the securities markets, certain depositary receipts, futures contracts and foreign currency exchange rates that have occurred subsequent to the close of the foreign securities exchange. These investments are generally classified as Level 2 of the fair value hierarchy.
Underlying Funds (including Money Market Funds) — Underlying funds (“Underlying Funds”) include other investment companies and exchange-traded funds (“ETFs”). Investments in the Underlying Funds (except ETFs) are valued at the NAV per share on the day of valuation. ETFs are valued daily at the last sale price or official closing price on the principal exchange or system on which the investment is traded. Because the Funds invest in Underlying Funds that fluctuate in value, the Funds’ shares will correspondingly fluctuate in value. To the extent these investments are actively traded, they are classified as Level 1 of the fair value hierarchy, otherwise they are generally classified as Level 2. For information regarding an Underlying Fund’s accounting policies and investment holdings, please see the Underlying Fund’s shareholder report.
49
GOLDMAN SACHS ALLOCATION FUNDS
Notes to Financial Statements (continued)
February 28, 2021 (Unaudited)
|
| 3. INVESTMENTS AND FAIR VALUE MEASUREMENTS (continued) |
Debt Securities — Debt securities for which market quotations are readily available are valued daily on the basis of quotations supplied by dealers or an independent pricing service approved by the Trustees. The pricing services may use valuation models or matrix pricing, which consider: (i) yield or price with respect to bonds that are considered comparable in characteristics such as rating, interest rate and maturity date or (ii) quotations from securities dealers to determine current value. With the exception of treasury securities of G7 countries, which are generally classified as Level 1, these investments are generally classified as Level 2 of the fair value hierarchy.
i. Commercial Paper — Commercial paper normally represents short-term unsecured promissory notes issued in bearer form by banks or bank holding companies, corporations, finance companies and other issuers. Commercial paper consists of direct U.S. dollar-denominated obligations of domestic or foreign issuers. Asset-backed commercial paper is issued by a special purpose entity that is organized to issue the commercial paper and to purchase trade receivables or other financial assets.
Derivative Contracts — A derivative is an instrument whose value is derived from underlying assets, indices, reference rates or a combination of these factors. A Fund enters into derivative transactions to hedge against changes in interest rates, securities prices, and/or currency exchange rates, to increase total return, or to gain access to certain markets or attain exposure to other underliers. For financial reporting purposes, cash collateral that has been pledged to cover obligations of a Fund and cash collateral received, if any, is reported separately on the Statements of Assets and Liabilities as receivables/payables for collateral on certain derivatives contracts. Non-cash collateral pledged by a Fund, if any, is noted in the Schedules and Consolidated Schedule of Investments.
Exchange-traded derivatives, including futures and options contracts, are generally valued at the last sale or settlement price on the exchange where they are principally traded. Exchange-traded options without settlement prices are generally valued at the midpoint of the bid and ask prices on the exchange where they are principally traded (or, in the absence of two-way trading, at the last bid price for long positions and the last ask price for short positions). Exchange-traded derivatives typically fall within Level 1 of the fair value hierarchy. Over-the-counter (“OTC”) and centrally cleared derivatives are valued using market transactions and other market evidence, including market-based inputs to models, calibration to market-clearing transactions, broker or dealer quotations, or other alternative pricing sources. Where models are used, the selection of a particular model to value OTC and centrally cleared derivatives depends upon the contractual terms of, and specific risks inherent in, the instrument, as well as the availability of pricing information in the market. Valuation models require a variety of inputs, including contractual terms, market prices, yield curves, credit curves, measures of volatility, voluntary and involuntary prepayment rates, loss severity rates and correlations of such inputs. For OTC and centrally cleared derivatives that trade in liquid markets, model inputs can generally be verified and model selection does not involve significant management judgment. OTC and centrally cleared derivatives are classified within Level 2 of the fair value hierarchy when significant inputs are corroborated by market evidence.
i. Forward Contracts —A forward contract is a contract between two parties to buy or sell an asset at a specified price on a future date. A forward contract settlement can occur on a cash or delivery basis. Forward contracts are marked-to-market daily using independent vendor prices, and the change in value, if any, is recorded as an unrealized gain or loss. Cash and certain investments may be used to collateralize forward contracts.
A forward foreign currency exchange contract is a forward contract in which a Fund agrees to receive or deliver a fixed quantity of one currency for another, at a pre-determined price at a future date. All forward foreign currency exchange contracts are marked to market daily by using the outright forward rates or interpolating based upon maturity dates, where available. Non-deliverable forward foreign currency exchange contracts are settled with the counterparty in cash without the delivery of foreign currency.
ii. Futures Contracts — Futures contracts are contracts to buy or sell a standardized quantity of a specified commodity or security. Upon entering into a futures contract, a Fund deposits cash or securities in an account on behalf of the broker in an amount sufficient to meet the initial margin requirement. Subsequent payments are made or received by a Fund equal to the daily change in the contract value and are recorded as variation margin receivable or payable with a corresponding offset to unrealized gains or losses.
50
GOLDMAN SACHS ALLOCATION FUNDS
|
| 3. INVESTMENTS AND FAIR VALUE MEASUREMENTS (continued) |
iii. Options — When a Fund writes call or put options, an amount equal to the premium received is recorded as a liability and is subsequently marked-to-market to reflect the current value of the option written. Swaptions are options on swap contracts.
Upon the purchase of a call option or a put option by a Fund, the premium paid is recorded as an investment and subsequently marked-to-market to reflect the current value of the option. Certain options may be purchased with premiums to be determined on a future date. The premiums for these options are based upon implied volatility parameters at specified terms.
iv. Swap Contracts — Bilateral swap contracts are agreements in which a Fund and a counterparty agree to exchange periodic payments on a specified notional amount or make a net payment upon termination. Bilateral swap transactions are privately negotiated in the OTC market and payments are settled through direct payments between a Fund and the counterparty. By contrast, certain swap transactions are subject to mandatory central clearing. These swaps are executed through a derivatives clearing member (“DCM”), acting in an agency capacity, and submitted to a central counterparty (“CCP”) (“centrally cleared swaps”), in which case all payments are settled with the CCP through the DCM. Swaps are marked-to-market daily using pricing vendor quotations, counterparty or clearinghouse prices or model prices, and the change in value, if any, is recorded as an unrealized gain or loss. Upon entering into a swap contract, a Fund is required to satisfy an initial margin requirement by delivering cash or securities to the counterparty (or in some cases, segregated in a triparty account on behalf of the counterparty), which can be adjusted by any mark-to-market gains or losses pursuant to bilateral or centrally cleared arrangements. For centrally cleared swaps the daily change in valuation, if any, is recorded as a receivable or payable for variation margin.
An interest rate swap is an agreement that obligates two parties to exchange a series of cash flows at specified intervals, based upon or calculated by reference to changes in interest rates on a specified notional principal amount. The payment flows are usually netted against each other, with the difference being paid by one party to the other.
A credit default swap is an agreement that involves one party (the buyer of protection) making a stream of payments to another party (the seller of protection) in exchange for the right to receive protection on a reference security or obligation, including a group of assets or exposure to the performance of an index. A Fund’s investment in credit default swaps may involve greater risks than if a Fund had invested in the referenced obligation directly. Credit events are contract specific but may include bankruptcy, failure to pay, restructuring and obligation acceleration. If a Fund buys protection through a credit default swap and no credit event occurs, its payments are limited to the periodic payments previously made to the counterparty. Upon the occurrence of a specified credit event, a Fund, as a buyer of credit protection, is entitled to receive an amount equal to the notional amount of the swap and deliver to the seller the defaulted reference obligation in a physically settled trade. A Fund may also receive a net settlement amount in the form of cash or securities equal to the notional amount of the swap reduced by the recovery value of the reference obligation in a cash settled trade.
As a seller of protection, a Fund generally receives a payment stream throughout the term of the swap, provided that there is no credit event. In addition, if a Fund sells protection through a credit default swap, a Fund could suffer a loss because the value of the referenced obligation and the premium payments received may be less than the notional amount of the swap paid to the buyer of protection. Upon the occurrence of a specified credit event, a Fund, as a seller of credit protection, may be required to take possession of the defaulted reference obligation and pay the buyer an amount equal to the notional amount of the swap in a physically settled trade. A Fund may also pay a net settlement amount in the form of cash or securities equal to the notional amount of the swap reduced by the recovery value of the reference obligation in a cash settled trade. Recovery values are at times established through the credit event auction process in which market participants are ensured that a transparent price has been set for the defaulted security or obligation. In addition, a Fund is entitled to a return of any assets, which have been pledged as collateral to the counterparty upon settlement.
The maximum potential amount of future payments (undiscounted) that a Fund as seller of protection could be required to make under a credit default swap would be an amount equal to the notional amount of the agreement. These potential amounts would be partially offset by any recovery values of the respective referenced obligations or net amounts received from a settlement of a credit default swap for the same reference security or obligation where the Fund bought credit protection.
51
GOLDMAN SACHS ALLOCATION FUNDS
Notes to Financial Statements (continued)
February 28, 2021 (Unaudited)
|
| 3. INVESTMENTS AND FAIR VALUE MEASUREMENTS (continued) |
A total return swap is an agreement that gives a Fund the right to receive or pay the appreciation or depreciation, as applicable, in the value of a specified security, an index, a basket of securities or indices or other instrument in return for a fee paid to the counterparty, which will typically be an agreed upon interest rate. If the underlying asset declines in value over the term of the swap, a Fund may also be required to pay the dollar value of that decline to the counterparty.
B. Level 3 Fair Value Investments — To the extent that significant inputs to valuation models and other alternative pricing sources are unobservable, or if quotations are not readily available, or if GSAM believes that such quotations do not accurately reflect fair value, the fair value of each Fund’s investments may be determined under Valuation Procedures approved by the Trustees. GSAM, consistent with its procedures and applicable regulatory guidance, may make an adjustment to the most recent valuation prices of either domestic or foreign securities in light of significant events to reflect what it believes to be the fair value of the securities at the time of determining a Fund’s NAV. To the extent investments are valued using single source broker quotations obtained directly from the broker or passed through from third party pricing vendors, such investments are classified as Level 3 investments.
C. Fair Value Hierarchy — The following is a summary of each Fund’s investments and derivatives classified in the fair value hierarchy as of February 28, 2021:
| | | | | | | | | | | | |
|
| GLOBAL MANAGED BETA | |
| | | |
| Investment Type | | Level 1 | | | Level 2 | | | Level 3 | |
| | | |
| Assets | | | | | | | | | | | | |
| | | |
Common Stock and/or Other Equity Investments(a) | | | | | | | | | | | | |
| | | |
Asia | | $ | 974,736 | | | $ | 17,543,590 | | | $ | — | |
| | | |
Australia and Oceania | | | 36,425 | | | | 4,174,310 | | | | — | |
| | | |
Europe | | | 4,770,880 | | | | 37,667,813 | | | | — | |
| | | |
North America | | | 134,836,109 | | | | 28,952 | | | | — | |
| | | |
South America | | | 39,858 | | | | — | | | | — | |
| | | |
Exchange Traded Funds | | | 1,439,191,863 | | | | — | | | | — | |
| | | |
Investment Company | | | 139,760,285 | | | | — | | | | — | |
| | | |
| Total | | $ | 1,719,610,156 | | | $ | 59,414,665 | | | $ | — | |
| | | |
| Derivative Type | | | | | | | | | |
| | | |
| Assets | | | | | | | | | | | | |
| | | |
Forward Foreign Currency Exchange Contracts(b) | | $ | — | | | $ | 3,276,097 | | | $ | — | |
| | | |
Futures Contracts(b) | | | 20,483,735 | | | | — | | | | — | |
| | | |
Purchased Options | | | 13,055,175 | | | | — | | | | — | |
| | | |
| Total | | $ | 33,538,910 | | | $ | 3,276,097 | | | $ | — | |
| | | |
| Liabilities | | | | | | | | | | | | |
| | | |
Forward Foreign Currency Exchange Contracts(b) | | $ | — | | | $ | (3,377,401 | ) | | $ | — | |
| | | |
Total Return Swap Contracts(b) | | | — | | | | (576,724 | ) | | | — | |
| | | |
Written option contracts | | | (1,943,595 | ) | | | — | | | | — | |
| | | |
| Total | | $ | (1,943,595 | ) | | $ | (3,954,125 | ) | | $ | — | |
| (a) | | Amounts are disclosed by continent to highlight the impact of time zone differences between local market close and the calculation of net asset value. Security valuations are based on the principal exchange or system on which they are traded, which may differ from country of domicile. The Funds utilize fair value model prices provided by an independent fair value service for international equities, resulting in a Level 2 classification. |
| (b) | | Amount shown represents unrealized gain (loss) at period end. |
52
GOLDMAN SACHS ALLOCATION FUNDS
|
| 3. INVESTMENTS AND FAIR VALUE MEASUREMENTS (continued) |
| | | | | | | | | | | | |
|
| STRATEGIC FACTOR ALLOCATION | |
| | | |
| Investment Type | | Level 1 | | | Level 2 | | | Level 3 | |
| | | |
| Assets | | | | | | | | | | | | |
| | | |
Investment Company | | $ | 1,469,722,865 | | | $ | — | | | $ | — | |
| | | |
| Total | | $ | 1,469,722,865 | | | $ | — | | | $ | — | |
| | | |
| Derivative Type | | | | | | | | | |
| | | |
| Assets | | | | | | | | | | | | |
| | | |
Forward Foreign Currency Exchange Contracts(a) | | $ | — | | | $ | 1,046,003 | | | $ | — | |
| | | |
Futures Contracts(a) | | | 17,548,530 | | | | — | | | | — | |
| | | |
Purchased Options | | | 862,155 | | | | — | | | | — | |
| | | |
| Total | | $ | 18,410,685 | | | $ | 1,046,003 | | | $ | — | |
| | | |
| Liabilities | | | | | | | | | | | | |
| | | |
Forward Foreign Currency Exchange Contracts(a) | | $ | — | | | $ | (1,392,711 | ) | | $ | — | |
| | | |
Futures Contracts(a) | | | (1,204,073 | ) | | | — | | | | — | |
| | | |
Written option contracts | | | (8,988,686 | ) | | | — | | | | — | |
| | | |
| Total | | $ | (10,192,759 | ) | | $ | (1,392,711 | ) | | $ | — | |
| (a) | | Amount shown represents unrealized gain (loss) at period end. |
| | | | | | | | | | | | |
| | | |
| TACTICAL TILT OVERLAY | | | | | | | | | | | | |
| | | |
| Investment Type | | Level 1 | | | Level 2 | | | Level 3 | |
| | | |
| Assets | | | | | | | | | | | | |
| | | |
Fixed Income | | | | | | | | | | | | |
| | | |
Corporate Obligations | | $ | — | | | $ | 10,002,934 | | | $ | — | |
| | | |
Exchange Traded Funds | | | 264,085,907 | | | | — | | | | — | |
| | | |
Investment Companies | | | 1,338,477,890 | | | | — | | | | — | |
| | | |
Short-term Investments | | | — | | | | 1,725,599,386 | | | | — | |
| | | |
Securities Lending Reinvestment Vehicle | | | 18,906,000 | | | | — | | | | — | |
| | | |
| Total | | $ | 1,621,469,797 | | | $ | 1,735,602,320 | | | $ | — | |
| | | |
| Derivative Type | | | | | | | | | |
| | | |
| Assets | | | | | | | | | | | | |
| | | |
Total Return Swap Contracts(a) | | $ | — | | | $ | 44,398,855 | | | $ | — | |
| | | |
Purchased Options | | | — | | | | 3,640,542 | | | | — | |
| | | |
| Total | | $ | — | | | $ | 48,039,397 | | | $ | — | |
| | | |
| Liabilities | | | | | | | | | | | | |
| | | |
Futures Contracts(a) | | $ | (6,945,743 | ) | | $ | — | | | $ | — | |
| | | |
Total Return Swap Contracts(a) | | | — | | | | (26,683,172 | ) | | | — | |
| | | |
Written option contracts | | | — | | | | (54,000,660 | ) | | | — | |
| | | |
| Total | | $ | (6,945,743 | ) | | $ | (80,683,832 | ) | | $ | — | |
| (a) | | Amount shown represents unrealized gain (loss) at period end. |
For further information regarding security characteristics, see the Schedules and Consolidated Schedules of Investments.
53
GOLDMAN SACHS ALLOCATION FUNDS
Notes to Financial Statements (continued)
February 28, 2021 (Unaudited)
|
| 4. INVESTMENTS IN DERIVATIVES |
The following tables set forth, by certain risk types, the gross value of derivative contracts (not considered to be hedging instruments for accounting disclosure purposes) as of February 28, 2021. These instruments were used as part of a Fund’s investment strategies and to obtain and/or manage exposure related to the risks below. The values in the tables below exclude the effects of cash collateral received or posted pursuant to these derivative contracts, and therefore are not representative of a Fund’s net exposure.
| | | | | | | | | | | | |
| | | |
| Global Managed Beta Fund | | | | | | | | | | |
| Risk | | Statement of Assets
and Liabilities | | Assets | | | Statement of Assets
and Liabilities | | Liabilities | |
Interest rate | | Purchased options, at value | | $ | 13,055,175 | | | — | | | — | |
Commodity | | — | | | — | | | Payable for unrealized loss on swap contracts | | | (576,724) | |
Currency | | Receivable for unrealized gain on forward foreign currency exchange contracts | | | 3,276,097 | | | Payable for unrealized loss on forward foreign currency exchange contracts | | | (3,377,401) | |
Equity | | Variation margin on futures contracts | | | 20,483,735 | (a) | | Written options, at value | | | (1,943,595) | |
| Total | | | | $ | 36,815,007 | | | | | $ | (5,897,720) | |
| | | |
| Strategic Factor Allocation Fund | | | | | | | | | | |
| Risk | | Statement of Assets
and Liabilities | | Assets | | | Statement of Assets
and Liabilities | | Liabilities | |
Interest rate | | Variation margin on futures contracts | | $ | 1,487,710 | (a) | | Variation margin on futures contracts; Written options, at value | | $ | (8,046,479 | )(a) |
Currency | | Receivable for unrealized gain on forward foreign currency exchange contracts | | | 1,046,003 | | | Payable for unrealized loss on forward foreign currency exchange contracts | | | (1,392,711) | |
Equity | | Variation margin on futures Contracts; Purchased options, at value | | | 16,922,975 | (a) | | Written options, at value | | | (2,146,280) | |
| Total | | | | $ | 19,456,688 | | | | | $ | (11,585,470) | |
| | | |
| Tactical Tilt Overlay Fund | | | | | | | | | | |
| Risk | | Consolidated Statement of Assets and Liabilities | | Assets | | | Consolidated Statement of Assets and Liabilities | | Liabilities | |
Interest rate | | Purchased options, at value | | $ | 886,550 | | | Variation margin on futures contracts; Written options, at value | | $ | (13,890,317) | (a) |
Equity | | Receivable for unrealized gain on swap contracts; Purchased options, at value | | | 47,152,847 | | | Payable for unrealized loss on swap contracts; Variation margin on futures contracts; Written options, at value | | | (73,739,258) | (a) |
| Total | | | | $ | 48,039,397 | | | | | $ | (87,629,575) | |
| (a) | | Includes unrealized gain (loss) on futures contracts described in the Additional Investment Information sections of the Consolidated Schedule of Investments. Only current day’s variation margin is reported within the Consolidated Statement of Assets and Liabilities. |
54
GOLDMAN SACHS ALLOCATION FUNDS
|
| 4. INVESTMENTS IN DERIVATIVES (continued) |
The following tables set forth, by certain risk types, each Fund’s gains (losses) related to these derivatives and their indicative volumes for the six months ended February 28, 2021. These gains (losses) should be considered in the context that these derivative contracts may have been executed to create investment opportunities and/or economically hedge certain investments, and accordingly, certain gains (losses) on such derivative contracts may offset certain (losses) gains attributable to investments. These gains (losses) are included in “Net realized gain (loss)” or “Net change in unrealized gain (loss)” on the Statements and Consolidated Statement of Operations:
| | | | | | | | | | | | | | |
|
| Global Managed Beta Fund | |
| Risk | | Statement of Operations | | Net Realized
Gain (Loss) | | | Net Change in
Unrealized
Gain (Loss) | | | Average
Number of
Contracts(a) | |
| Interest Rate | | Net realized gain (loss) from purchased options/Net change in unrealized gain (loss) on purchased options | | $ | — | | | $ | 120,756 | | | | 1 | |
| Commodity | | Net realized gain (loss) from swap contracts/Net change in unrealized gain (loss) on swap contracts | | | — | | | | (576,724 | ) | | | 1 | |
| Currency | | Net realized gain (loss) from forward foreign currency exchange contracts/Net change in unrealized gain (loss) on forward foreign currency exchange contracts | | | (13,345,012 | ) | | | 10,614,841 | | | | 42 | |
| Equity | | Net realized gain (loss) from futures contracts and written options/Net change in unrealized gain (loss) on futures contracts and written options | | | 52,480,815 | | | | 1,516,745 | | | | 1,993 | |
| Total | | | | $ | 39,135,803 | | | $ | 11,675,618 | | | | 2,037 | |
| | | |
| Strategic Factor Allocation Fund | | | | | | | | | | | | |
| Risk | | Statement of Operations | | Net Realized
Gain (Loss) | | | Net Change in
Unrealized
Gain (Loss) | | | Average
Number of
Contracts(a) | |
| Interest Rate | | Net realized gain (loss) from futures contracts and written options/Net change in unrealized gain (loss) on futures contracts and written options | | $ | (42,375,039 | ) | | $ | (3,208,212 | ) | | | 5,568 | |
| Currency | | Net realized gain (loss) from forward foreign currency exchange contracts/Net change in unrealized gain (loss) on forward foreign currency exchange contracts | | | 3,641,118 | | | | (2,874,833 | ) | | | 13 | |
| Equity | | Net realized gain (loss) from futures contracts, purchased options and written options/Net change in unrealized gain (loss) on futures contracts, purchased options and written options | | | 141,093,754 | | | | (46,297,097 | ) | | | 2,142 | |
| Total | | | | $ | 102,359,833 | | | $ | (52,380,142 | ) | | | 7,723 | |
| (a) | | Average number of contracts is based on the average of month end balances for the period February 28, 2021. |
55
GOLDMAN SACHS ALLOCATION FUNDS
Notes to Financial Statements (continued)
February 28, 2021 (Unaudited)
|
| 4. INVESTMENTS IN DERIVATIVES (continued) |
| | | | | | | | | | | | | | |
| | | |
| Tactical Tilt Overlay Fund | | | | | | | | | | | | |
| Risk | | Consolidated Statement of Operations | | Net Realized
Gain (Loss) | | | Net Change in
Unrealized
Gain (Loss) | | | Average
Number of
Contracts(a) | |
| Interest rate | | Net realized gain (loss) from futures contracts, swap contracts, purchased options and written options /Net change in unrealized gain (loss) on futures contracts, purchased options and written options | | $ | 177,941 | | | $ | (7,030,075 | ) | | | 3,475 | |
| Commodity | | Net realized gain (loss) from futures contracts | | | (21,046,751) | | | | — | | | | 2,612 | |
| Currency | | Net realized gain (loss) from forward foreign currency exchange contracts, purchased options and written options /Net change in unrealized gain (loss) on forward foreign currency exchange contracts, purchased options and written options | | | (10,032,499) | | | | 3,556,535 | | | | 2 | |
| Equity | | Net realized gain (loss) from futures contracts, purchased options, swap contracts and written options/Net change in unrealized gain (loss) on swap contracts, futures contracts, purchased options and written options | | | 99,624,491 | | | | 36,648,373 | | | | 7,263 | |
| Total | | | | $ | 68,723,182 | | | $ | 33,174,833 | | | | 13,352 | |
| (a) | | Average number of contracts is based on the average of month end balances for the period February 28, 2021. |
In order to better define its contractual rights and to secure rights that will help a Fund mitigate its counterparty risk, a Fund may enter into an International Swaps and Derivatives Association, Inc. Master Agreement (“ISDA Master Agreement”) or similar agreement with its derivatives counterparties. An ISDA Master Agreement is a bilateral agreement between a Fund and a counterparty that governs OTC derivatives (including forward foreign currency exchange contracts, and certain options and swaps), and typically contains, among other things, collateral posting terms and netting provisions in the event of a default and/or termination event. The provisions of the ISDA Master Agreement typically permit a single net payment in the event of a default (close-out netting) or similar event, including the bankruptcy or insolvency of the counterparty.
Collateral and margin requirements differ between exchange traded derivatives and OTC derivatives. Margin requirements are established by the broker or clearing house for exchange-traded and centrally cleared derivatives (financial futures contracts, options and centrally cleared swaps) pursuant to governing agreements for those instrument types. Brokers can ask for margin in excess of the minimum in certain circumstances. Collateral terms are contract-specific for OTC derivatives. For derivatives traded under an ISDA Master Agreement, the collateral requirements are typically calculated by netting the marked to market amount for each transaction under such agreement and comparing that amount to the value of any collateral currently pledged by a Fund and the counterparty. Additionally, a Fund may be required to post initial margin to the counterparty, the terms of which would be outlined in the confirmation of the OTC transaction.
Generally, the amount of collateral due from or to a counterparty must exceed a minimum transfer amount threshold before a transfer is required to be made. To the extent amounts due to a Fund from its counterparties are not fully collateralized, contractually or otherwise, a Fund bears the risk of loss from counterparty nonperformance. A Fund attempts to mitigate counterparty risk by only entering into agreements with counterparties that the Investment Adviser believes to be of good standing and by monitoring the financial stability of those counterparties.
Additionally, the netting of assets and liabilities and the offsetting of collateral pledged or received are based on contractual netting/set-off provisions in the ISDA Master Agreement or similar agreements. However, in the event of a default or insolvency of a counterparty, a court could determine that such rights are not enforceable due to the restrictions or prohibitions against the right of setoff that may be imposed in accordance with a particular jurisdiction’s bankruptcy or insolvency laws.
56
GOLDMAN SACHS ALLOCATION FUNDS
|
| 4. INVESTMENTS IN DERIVATIVES (continued) |
The following table sets forth the Tactical Tilt Overlay Fund’s net exposure for derivative instruments that are subject to enforceable master netting arrangements or similar agreements as of February 28, 2021:
| | | | | | | | | | | | | | | | | | | | | | | | | | | | | | | | | | | | |
| | | | | | | | |
| Tactical Tilt Overlay Fund | | | | | | | | | | | | | | | | | | | | | | | | | | | | | | | | | |
| | | Derivative Assets(1) | | | Derivative Liabilities(1) | | | Net
Derivative
Asset
(Liabilities) | | | Collateral
(Received)
Pledged(1) | | | Net
Amount(2) | |
| Counterparty | | Options
Purchased | | | Swaps | | | Total | | | Swaps | | | Options
Written | | | Total | |
Barclays Bank PLC | | $ | — | | | $ | 36,586,189 | | | $ | 36,586,189 | | | $ | (18,197,392 | ) | | $ | (7,379,047 | ) | | $ | (25,576,439 | ) | | $ | 11,009,750 | | | $ | (11,009,750 | ) | | $ | — | |
BofA Securities LLC | | | 2,753,992 | | | | — | | | | 2,753,992 | | | | — | | | | (25,662,507 | ) | | | (25,662,507 | ) | | | (22,908,515 | ) | | | 21,600,000 | | | | (1,308,515 | ) |
J.P. Morgan Securities LLC | | | — | | | | — | | | | — | | | | (8,485,780 | ) | | | — | | | | (8,485,780 | ) | | | (8,485,780 | ) | | | 8,485,780 | | | | — | |
MS & Co. Int. PLC | | | 886,550 | | | | 7,812,666 | | | | 8,699,216 | | | | — | | | | (20,959,106 | ) | | | (20,959,106 | ) | | | (12,259,890 | ) | | | — | | | | (12,259,890 | ) |
| | | | | | | | | |
Total | | $ | 3,640,542 | | | $ | 44,398,855 | | | $ | 48,039,397 | | | $ | (26,683,172 | ) | | $ | (54,000,660 | ) | | $ | (80,683,832 | ) | | $ | (32,644,435 | ) | | $ | 19,076,030 | | | $ | (13,568,405 | ) |
| (1) | | Gross amounts available for offset but not netted in the Consolidated Statement of Assets and Liabilities. |
| (2) | | Net amount represents the net amount due (to) from counterparty in the event of a default based on the contractual set-off rights under the agreement. Net amount excludes any over-collateralized amounts. |
|
| 5. AGREEMENTS AND AFFILIATED TRANSACTIONS |
A. Management Agreement — Under the Agreement, GSAM manages each Fund subject to the general supervision of the Trustees.
As compensation for the services rendered pursuant to the Agreement, the assumption of the expenses related thereto and administration of the Funds’ business affairs, including providing facilities, GSAM is entitled to a management fee, accrued daily and paid monthly, equal to an annual percentage rate of the Funds’ average daily net assets.
For the six months ended February 28, 2021, contractual and effective net management fees with GSAM were at the following rates:
| | | | | | | | | | | | | | | | | | | | | | | | | | |
| | | | | Contractual Management Rate | | | Effective Net
Management
Fee Rate*^ | |
| Fund | | | | First
$2 billion | | | Next
$3 billion | | | Next
$3 billion | | | Over
$8 billion | | | Effective
Rate | |
Strategic Factor Allocation | | | | | 0.75 | % | | | 0.68 | % | | | 0.64 | % | | | 0.62 | % | | | 0.75 | % | | | 0.63 | % |
Tactical Tilt Overlay | | | | | 0.75 | % | | | 0.68 | % | | | 0.64 | % | | | 0.62 | % | | | 0.72 | % | | | 0.61 | %(a) |
Global Managed Beta | | | | | 0.30 | % | | | 0.30 | % | | | 0.30 | % | | | 0.30 | % | | | 0.30 | % | | | 0.11 | % |
| * | | GSAM has agreed to waive a portion of its management fee payable by the Fund in an amount equal to any management fee it earns as an investment adviser to any of the affiliated funds in which the Fund invests through at least December 29, 2021. Prior to such date GSAM may not terminate the arrangement without the approval of the Trustees. |
| ^ | | Effective Net Management Rate includes the impact of management fee waivers of affiliated underlying funds, if any. |
| (a) | | Reflects combined management fees paid to GSAM under the Agreement and the Subsidiary Agreement (as defined below) after waivers. |
The Funds invest in Institutional Shares of the Goldman Sachs Financial Square Government Fund (“Government Money Market Fund”). The Tactical Tilt Overlay Fund invests in each of the Goldman Sachs Energy Infrastructure Fund, Goldman Sachs High Yield Floating Rate Fund and the Goldman Sachs MLP Energy Infrastructure Fund, and the Global Managed Beta Fund invests in each of the Goldman Sachs ActiveBeta Emerging Markets Equity ETF, Goldman Sachs MarketBeta International Equity ETF and the Goldman Sachs MarketBeta US Equity ETF, which are affiliated Underlying Funds. GSAM has agreed to waive a portion of its management fee payable by the Funds in an amount equal to the management fee it earns as an investment adviser to the affiliated Underlying Funds in which the Funds invest, except those management fees it earns from the Funds’ investment of cash collateral received in connection with securities lending transactions in the Government Money Market Fund. For the six
57
GOLDMAN SACHS ALLOCATION FUNDS
Notes to Financial Statements (continued)
February 28, 2021 (Unaudited)
|
| 5. AGREEMENTS AND AFFILIATED TRANSACTIONS (continued) |
months ended February 28, 2021, GSAM waived $540,516, $1,049,703 and $796,565 of the Global Managed Beta, Strategic Factor Allocation and Tactical Tilt Overlay Funds’ management fees, respectively.
GSAM had previously agreed to waive all management fees payable by the Global Managed Beta Fund, except those management fees it earns from the Fund’s investment of cash collateral received in connection with securities lending transactions in the Government Money Market Fund. This arrangement terminated on December 29, 2020. For the six months ended February 28, 2021, GSAM waived $1,605,136 of the Global Managed Beta Fund’s management fees.
GSAM also provides management services to the Tactical Tilt Overlay Fund’s Subsidiary pursuant to a Subsidiary Management Agreement (the “Subsidiary Agreement”) and is entitled to a management fee accrued daily and paid monthly, equal to an annual percentage rate of 0.42% of the Subsidiary’s average daily net assets. In consideration of the Subsidiary’s management fee, and for as long as the Subsidiary Agreement remains in effect, GSAM has contractually agreed to waive irrevocably a portion of the Tactical Tilt Overlay Fund’s management fee in an amount equal to the management fee accrued and paid to GSAM by the Subsidiary under the Subsidiary Agreement. For the six months ended February 28, 2021, GSAM waived $1,391,229 of the Tactical Tilt Overlay Fund’s management fee.
B. Transfer Agency Agreement — Goldman Sachs also serves as the transfer agent of the Funds for a fee pursuant to the Transfer Agency Agreement. The fees charged for such transfer agency services are accrued daily and paid monthly at annual rates of 0.04% of the average daily net assets of Institutional Shares for the Tactical Tilt Overlay Fund and Strategic Factor Allocation Fund, 0.02% of the average daily net assets of Institutional Shares for the Global Managed Beta Fund and 0.03% of the average daily net assets of Class R6 Shares and Class P Shares for the Tactical Tilt Overlay Fund and Strategic Factor Allocation Fund.
C. Other Expense Agreements and Affiliated Transactions — GSAM has agreed to reduce or limit certain “Other Expenses” of the Funds (excluding acquired fund fees and expenses, transfer agency fees and expenses, service fees and shareholder administration fees (as applicable), taxes, interest, brokerage fees, expenses of shareholder meetings, litigation and indemnification, and extraordinary expenses) to the extent such expenses exceed, on an annual basis, a percentage rate of the average daily net assets of the Funds. Such Other Expense reimbursements, if any, are accrued daily and paid monthly. In addition, the Funds are not obligated to reimburse GSAM for prior fiscal year expense reimbursements, if any. The Other Expense limitations as an annual percentage rate of average daily net assets for the Global Managed Beta Fund, Strategic Factor Allocation Fund and Tactical Tilt Overlay Fund are 0.204%, 0.164% and 0.164%, respectively. These Other Expense limitations will remain in place through at least December 29, 2021 and prior to such date GSAM may not terminate the arrangement without the approval of the Trustees. In addition, the Funds have entered into certain offset arrangements with the transfer agent, which may result in a reduction of the Funds expenses and are received irrespective of the application of the “Other Expense” limitations described above.
Goldman Sachs may voluntarily waive a portion of any payments under the Tactical Tilt Overlay Fund’s Transfer Agency Agreement, and this waiver is in addition to what is stipulated in any contractual fee waiver arrangements (as applicable). These temporary waivers may be modified or terminated at any time at the option of Goldman Sachs without shareholder approval.
For the six months ended February 28, 2021, these expense reductions, including any fee waivers and Other Expense reimbursements, were as follows:
| | | | | | | | | | | | | | |
Fund | | | | Management
Fee Waiver | | | Other
Expense
Reimbursements | | | Total
Expense
Reductions | |
Global Managed Beta | | | | $ | 2,145,652 | | | $ | — | | | $ | 2,145,652 | |
Strategic Factor Allocation | | | | | 1,049,703 | | | | — | | | | 1,049,703 | |
Tactical Tilt Overlay | | | | | 2,187,795 | | | | 33,626 | | | | 2,221,421 | |
D. Line of Credit Facility — As of February 28, 2021, the Funds participated in a $700,000,000 committed, unsecured revolving line of credit facility (the “facility”) together with other funds of the Trust and certain registered investment companies having management agreements with GSAM or its affiliates. This facility is to be used for temporary emergency purposes, or to allow for
58
GOLDMAN SACHS ALLOCATION FUNDS
|
| 5. AGREEMENTS AND AFFILIATED TRANSACTIONS (continued) |
an orderly liquidation of securities to meet redemption requests. The interest rate on borrowings is based on the federal funds rate. The facility also requires a fee to be paid by each Fund based on the amount of the commitment that has not been utilized. For the six months ended February 28, 2021, the Funds did not have any borrowings under the facility.
E. Other Transactions with Affiliates — For the six months ended February 28, 2021, Goldman Sachs earned $33,664, in brokerage commissions from fund transactions, including futures transactions executed with Goldman Sachs as the Futures Commission Merchant, on behalf of the Tactical Tilt Overlay Fund.
As of February 28, 2021, the Goldman Sachs Tactical Tilt Overlay Fund was the beneficial owner of 9% of the Goldman Sachs Tax-Advantaged Global Equity Portfolio.
As of February 28, 2021, the Goldman Sachs Group, Inc. was the beneficial owner of 100% of Class R6 Shares of the Strategic Factor Allocation Fund.
The table below shows the transactions in and earnings from investments in the Underlying Funds for the six months ended February 28, 2021:
| | | | | | | | | | | | | | | | | | | | | | | | | | | | | | | | |
| |
| Global Managed Beta | | | | | |
| Underlying Funds | | Beginning
Value as of
August 31, 2020 | | | Purchases
at Cost | | | Proceeds
from Sales | | | Net Realized
Gain/(Loss) | | | Change in
Unrealized
Gain/(Loss) | | | Ending
Value as of
February 28, 2021 | | | Shares as of
2/28/2021 | | | Dividend
Income | |
Goldman Sachs ActiveBeta Emerging Markets Equity ETF | | $ | 19,128,445 | | | $ | — | | | $ | — | | | $ | — | | | $ | 3,477,377 | | | $ | 22,605,822 | | | | 574,773 | | | $ | 278,253 | |
Goldman Sachs Financial Square Government Fund — Institutional Shares | | | 122,254,978 | | | | 412,372,013 | | | | (394,866,706 | ) | | | — | | | | — | | | | 139,760,285 | | | | 139,760,285 | | | | 15,009 | |
Goldman Sachs MarketBeta International Equity ETF | | | 240,516,709 | | | | 18,148,462 | | | | (15,072,253 | ) | | | (24,445 | ) | | | 31,562,866 | | | | 275,131,339 | | | | 5,164,778 | | | | 2,696,847 | |
Goldman Sachs MarketBeta US Equity ETF | | | 251,351,804 | | | | — | | | | — | | | | — | | | | 23,958,719 | | | | 275,310,523 | | | | 5,162,182 | | | | 2,105,035 | |
| | | | | | | | |
Total | | $ | 633,251,936 | | | $ | 430,520,475 | | | $ | (409,938,959 | ) | | $ | (24,445 | ) | | $ | 58,998,962 | | | $ | 712,807,969 | | | | | | | $ | 5,095,144 | |
| | | | | | | | | | | | | | | | | | | | | | | | |
|
| Strategic Factor Allocation | |
| Affiliated Investment Company | | Beginning
Value as of
August 31, 2020 | | | Purchases
at Cost | | | Proceeds
from Sales | | | Ending Value as
of February 28, 2021 | | | Shares as of
February 28, 2021 | | | Dividend
Income from
Affiliated
Investment
Companies | |
| | | | | | |
Goldman Sachs Financial Square Government Fund — Institutional Shares | | $ | 1,268,839,085 | | | $ | 2,246,783,234 | | | $ | (2,045,899,454 | ) | | $ | 1,469,722,865 | | | | 1,469,722,865 | | | $ | 159,370 | |
59
GOLDMAN SACHS ALLOCATION FUNDS
Notes to Financial Statements (continued)
February 28, 2021 (Unaudited)
|
| 5. AGREEMENTS AND AFFILIATED TRANSACTIONS (continued) |
| | | | | | | | | | | | | | | | | | | | | | | | | | | | | | | | |
|
| Tactical Tilt Overlay | |
| Affiliated Investment Companies | | Beginning
Value as of
August 31, 2020 | | | Purchases
at Cost | | | Proceeds
from Sales | | | Net Realized
Gain/(Loss)
on sales of
Affiliated
Investment
Companies | | | Change in
Unrealized
Appreciation/
Depreciation | | | Ending
Value as of
February 28, 2021 | | | Shares as of
February 28, 2021 | | | Dividend
Income from
Affiliated
Investment
Companies | |
Goldman Sachs Financial Square Government Fund — Institutional Shares | | $ | 984,873,567 | | | $ | 1,307,138,213 | | | $ | (1,184,611,473 | ) | | $ | — | | | $ | — | | | $ | 1,107,400,307 | | | | 1,107,400,307 | | | $ | 126,500 | |
Goldman Sachs High Yield Floating Rate Fund — Class R6 | | | — | | | | 102,036,919 | | | | — | | | | — | | | | 1,425,048 | | | | 103,461,967 | | | | 11,018,314 | | | | 760,026 | |
Goldman Sachs MLP Energy Infrastructure Fund — Class R6 Shares | | | 49,912,135 | | | | 1,146,698 | | | | — | | | | — | | | | 12,328,105 | | | | 63,386,938 | | | | 3,139,521 | | | | 1,146,697 | |
Goldman Sachs Energy Infrastructure Fund — Class R6 | | | 53,372,145 | | | | 17,908,622 | | | | (22,000,000 | ) | | | 3,811,239 | | | | 11,136,672 | | | | 64,228,678 | | | | 8,048,707 | | | | — | * |
| | | | | | | | |
Total | | $ | 1,088,157,847 | | | $ | 1,428,230,452 | | | $ | (1,206,611,473 | ) | | $ | 3,811,239 | | | $ | 24,889,825 | | | $ | 1,338,477,890 | | | | | | | $ | 1,992,845 | |
| * | | Amount has been reduced due to return of capital adjustment in excess of $40,378. |
|
| 6. PORTFOLIO SECURITIES TRANSACTIONS |
The cost of purchases and proceeds from sales and maturities of long-term securities for the six months ended February 28, 2021, were as follows:
| | | | | | | | | | |
| Fund | | | | Purchases | | | Sales and Maturities | |
Global Managed Beta | | | | $ | 261,544,170 | | | $ | 229,931,643 | |
Tactical Tilt Overlay | | | | | 260,118,810 | | | | 55,611,020 | |
For the six months ended February 28, 2021, there were no purchases and proceeds from sales and maturities of long-term securities for the Strategic Factor Allocation Fund.
The Global Managed Beta Fund and Tactical Tilt Overlay Fund may lend their securities through a securities lending agent, the Bank of New York Mellon (“BNYM”), to certain qualified borrowers. In accordance with the Funds’ securities lending procedures, the Funds receive cash collateral at least equal to the market value of the securities on loan. The market value of the loaned securities is determined at the close of business of the Funds, at their last sale price or official closing price on the principal exchange or system on which they are traded, and any additional required collateral is delivered to the Funds on the next business day. As with other extensions of credit, the Funds may experience delay in the recovery of its securities or incur a loss should the borrower of the securities breach its agreement with the Funds or become insolvent at a time when the collateral is insufficient to cover the cost of repurchasing securities on loan. Dividend income received from securities on loan may not be subject to withholding taxes and therefore withholding taxes paid may differ from the amounts listed in the Statement and/or Consolidated Statement of Operations. Loans of securities are terminable at any time and as such 1) the remaining contractual maturities of the outstanding securities lending transactions are considered to be overnight and continuous and 2) the borrower, after notice, is required to return borrowed securities within the standard time period for settlement of securities transactions.
60
GOLDMAN SACHS ALLOCATION FUNDS
|
| 7. SECURITIES LENDING (continued) |
The Funds invest the cash collateral received in connection with securities lending transactions in the Government Money Market Fund, an affiliated series of the Goldman Sachs Trust. The Government Money Market Fund is registered under the Act as an open end investment company, is subject to Rule 2a-7 under the Act, and is managed by GSAM, for which GSAM may receive a management fee of up to 0.16% on an annualized basis of the average daily net assets of the Government Money Market Fund.
In the event of a default by a borrower with respect to any loan, BNYM may exercise any and all remedies provided under the applicable borrower agreement to make the Funds whole. These remedies include purchasing replacement securities by applying the collateral held from the defaulting broker against the purchase cost of the replacement securities. If BNYM is unable to purchase replacement securities, BNYM will indemnify the Funds by paying the Funds an amount equal to the market value of the securities loaned minus the value of cash collateral received from the borrower for the loan, subject to an exclusion for any shortfalls resulting from a loss of value in such cash collateral due to reinvestment risk. The Funds’ master netting agreements with certain borrowers provide the right, in the event of a default (including bankruptcy or insolvency), for the non-defaulting party to liquidate the collateral and calculate net exposure to the defaulting party or request additional collateral. However, in the event of a default by a borrower, a resolution authority could determine that such rights are not enforceable due to the restrictions or prohibitions against the right of set-off that may be imposed in accordance with a particular jurisdiction’s bankruptcy or insolvency laws. The Funds’ loaned securities were all subject to enforceable Securities Lending Agreements and the value of the collateral was at least equal to the value of the cash received. The amounts of the Funds’ overnight and continuous agreements, which represent the gross amounts of recognized liabilities for securities lending transactions outstanding as of February 28, 2021, are disclosed as “Payable upon return of securities loaned” on the Consolidated Statement of Assets and Liabilities, where applicable.
Both the Funds and BNYM received compensation relating to the lending of the Funds’ securities. The amounts earned, if any, by the Fund’s for the six months ended February 28, 2021, are reported under Investment Income on the Consolidated Statement of Operations.
The following table provides information about the Funds’ investment in the Government Money Market Fund for the six months ended February 28, 2021.
| | | | | | | | | | | | | | | | | | |
| Fund | | | | Beginning Value as of August 31, 2020 | | | Purchases at
Cost | | | Proceeds from
Sales | | | Ending Value as of February 28, 2021 | |
Global Managed Beta | | | | $ | — | | | $ | 224,702,878 | | | $ | (224,702,878 | ) | | $ | — | |
Tactical Tilt Overlay | | | | | 33,053,374 | | | | 469,472,097 | | | | (483,619,471 | ) | | | 18,906,000 | |
As of the Funds’ most recent fiscal year end, August 31, 2020, the Funds capital loss carryforwards and certain timing differences on a tax basis were as follows:
| | | | | | | | | | | | | | |
| | | | | Global Managed
Beta | | | Strategic Factor
Allocation | | | Tactical Tilt
Overlay | |
| | | | |
Capital loss carryforwards: | | | | | | | | | | | | | | |
Perpetual Short-Term | | | | $ | — | | | | $— | | | | $(186,156,489) | |
Total capital loss carryforwards | | | | $ | — | | | | $— | | | | $(186,156,489) | |
Timing differences (Late Year Ordinary Loss Deferral/ Straddle Loss Deferral /Post October Capital Loss Deferral) | | | | | $(10,890,300) | | | | $— | | | | $(177,517,865) | |
61
GOLDMAN SACHS ALLOCATION FUNDS
Notes to Financial Statements (continued)
February 28, 2021 (Unaudited)
|
| 8. TAX INFORMATION (continued) |
As of February 28, 2021, the Funds’ aggregate security unrealized gains and losses based on cost for U.S. federal income tax purposes were as follows:
| | | | | | | | | | | | | | |
| | | | | Global Managed
Beta | | | Strategic Factor
Allocation | | | Tactical Tilt
Overlay | |
Tax Cost | | | | $ | 1,414,203,470 | | | $ | 1,532,680,265 | | | $ | 3,291,670,839 | |
Gross unrealized gain | | | | | 393,224,871 | | | | — | | | | 90,860,901 | |
Gross unrealized loss | | | | | (28,403,520 | ) | | | (62,957,399 | ) | | | (25,459,623 | ) |
Net unrealized gains (losses) | | | | $ | 364,821,351 | | | $ | (62,957,399 | ) | | $ | 65,401,278 | |
The difference between GAAP-basis and tax basis unrealized gains (losses) is attributable primarily to wash sales, net mark to market gains/(losses) on regulated futures contracts, options contracts, net mark to market gains/(losses) on foreign currency contracts, and differences in the tax treatment of swap transactions, partnership investments and passive foreign investment company investments.
GSAM has reviewed each Fund’s tax positions for all open tax years (the current and prior three years, as applicable) and has concluded that no provision for income tax is required in each Fund’s financial statements. Such open tax years remain subject to examination and adjustment by tax authorities.
The Funds’ risks include, but are not limited to, the following:
Credit/Default Risk — An issuer or guarantor of a security held by a Fund or a bank or other financial institution that has entered into a repurchase agreement with a Fund may default on its obligation to pay interest and repay principal or default on any other obligation. Additionally, the credit quality of securities may deteriorate rapidly, which may impair a Fund’s liquidity and cause significant deterioration in NAV.
Derivatives Risk — A Fund’s use of derivatives may result in loss. Derivative instruments, which may pose risks in addition to and greater than those associated with investing directly in securities, currencies or other instruments, may be illiquid or less liquid, volatile, difficult to price and leveraged so that small changes in the value of the underlying instruments may produce disproportionate losses to a Fund. Derivatives are also subject to counterparty risk, which is the risk that the other party in the transaction will not fulfill its contractual obligation. The use of derivatives is a highly specialized activity that involves investment techniques and risks different from those associated with investments in more traditional securities and instruments. Losses from derivatives can also result from a lack of correlation between changes in the value of derivative instruments and the portfolio assets (if any) being hedged.
Dividend-Paying Investments Risk — Each Fund’s investments in dividend-paying securities could cause the Fund to underperform other funds. Securities that pay dividends, as a group, can fall out of favor with the market, causing such securities to underperform securities that do not pay dividends. Depending upon market conditions and political and legislative responses to such conditions, dividend-paying securities that meet a Fund’s investment criteria may not be widely available and/or may be highly concentrated in only a few market sectors. In addition, issuers that have paid regular dividends or distributions to shareholders may not continue to do so at the same level or at all in the future. This may limit the ability of a Fund to produce current income.
Floating and Variable Rate Obligations Risk — Floating rate and variable rate obligations are debt instruments issued by companies or other entities with interest rates that reset periodically (typically, daily, monthly, quarterly, or semiannually) in response to changes in the market rate of interest on which the interest rate is based. For floating and variable rate obligations, there may be a lag between an actual change in the underlying interest rate benchmark and the reset time for an interest payment of such an obligation, which could harm or benefit a Fund, depending on the interest rate environment or other circumstances. In a rising
62
GOLDMAN SACHS ALLOCATION FUNDS
|
| 9. OTHER RISKS (continued) |
interest rate environment, for example, a floating or variable rate obligation that does not reset immediately would prevent a Fund from taking full advantage of rising interest rates in a timely manner. However, in a declining interest rate environment, a Fund may benefit from a lag due to an obligation’s interest rate payment not being immediately impacted by a decline in interest rates.
In 2017, the United Kingdom’s Financial Conduct Authority (“FCA”) warned that LIBOR may cease to be available or appropriate for use by 2021. The unavailability or replacement of LIBOR may affect the value, liquidity or return on certain Fund investments and may result in costs incurred in connection with closing out positions and entering into new trades. Any pricing adjustments to a Fund investment resulting from a substitute reference rate may also adversely affect a Fund’s performance and/or NAV.
Foreign and Emerging Countries Risk — Investing in foreign markets may involve special risks and considerations not typically associated with investing in the U.S. Foreign securities may be subject to risk of loss because of more or less foreign government regulation, less public information and less economic, political and social stability in the countries in which a Fund invests. The imposition of exchange controls (including repatriation restrictions), confiscation of assets and property, trade restrictions (including tariffs) and other government restrictions by the U.S. or other governments, or problems with registration, settlement or custody, may result in losses. Foreign risk also involves the risk of negative foreign currency rate fluctuations, which may cause the value of securities denominated in such foreign currency (or other instruments through which a Fund has exposure to foreign currencies) to decline in value. Currency exchange rates may fluctuate significantly over short periods of time. To the extent that a Fund also invests in securities of issuers located in emerging markets, these risks may be more pronounced.
Foreign Custody Risk — Each Fund invests in foreign securities, and as such the Fund may hold such securities and cash with foreign banks, agents, and securities depositories appointed by a Fund’s custodian (each a “Foreign Custodian”). Some foreign custodians may be recently organized or new to the foreign custody business. In some countries, Foreign Custodians may be subject to little or no regulatory oversight over, or independent evaluation of, their operations. Further, the laws of certain countries may place limitations on a Fund’s ability to recover its assets if a Foreign Custodian enters bankruptcy. Investments in emerging markets may be subject to even greater custody risks than investments in more developed markets. Custody services in emerging market countries are very often undeveloped and may be considerably less well regulated than in more developed countries, and thus may not afford the same level of investor protection as would apply in developed countries.
Geographic Risk — If a Fund focuses its investments in securities of issuers located in a particular country or geographic region, a Fund may be subjected, to a greater extent than if its investments were less focused, to the risks of volatile economic cycles and/or conditions and developments that may be particular to that country or region, such as: adverse securities markets; adverse exchange rates; adverse social, political, regulatory, economic, business, environmental or other developments; or natural disasters.
Interest Rate Risk — When interest rates increase, fixed income securities or instruments held by a Fund will generally decline in value. Long-term fixed income securities or instruments will normally have more price volatility because of this risk than short-term fixed income securities or instruments. The risks associated with changing interest rates may have unpredictable effects on the markets and a Fund’s investments. Fluctuations in interest rates may also affect the liquidity of fixed income securities and instruments held by a Fund.
Investments in Other Investment Companies Risk — As a shareholder of another investment company, including an ETF, each Fund will indirectly bear its proportionate share of any net management fees and other expenses paid by such other investment companies, in addition to the fees and expenses regularly borne by a Fund. ETFs are subject to risks that do not apply to conventional mutual funds, including but not limited to the following: (i) the market price of the ETF’s shares may trade at a premium or a discount to their NAV; and (ii) an active trading market for an ETF’s shares may not develop or be maintained.
Investments in the Underlying Funds Risk — The investments of a Fund may be concentrated in one or more Underlying Funds (including ETFs and other registered investment companies) subject to statutory limitations prescribed by the Act or exemptive relief or regulations thereunder. A Fund’s investment performance is directly related to the investment performance of the Underlying Funds it holds. A Fund is subject to the risk factors associated with the investments of the Underlying Funds and will be affected by the investment policies and practices of the Underlying Funds in direct proportion to the amount of assets
63
GOLDMAN SACHS ALLOCATION FUNDS
Notes to Financial Statements (continued)
February 28, 2021 (Unaudited)
|
| 9. OTHER RISKS (continued) |
allocated to each. If a Fund has a relative concentration of its portfolio in a single Underlying Fund, it may be more susceptible to adverse developments affecting that Underlying Fund, and may be more susceptible to losses because of these developments. A strategy used by the Underlying Funds may fail to produce the intended results.
Large Shareholder Transactions Risk — A Fund may experience adverse effects when certain large shareholders, such as other funds, institutional investors (including those trading by use of non-discretionary mathematical formulas), financial intermediaries (who may make investment decisions on behalf of underlying clients and/or include a Fund in their investment model), individuals, accounts and Goldman Sachs affiliates, purchase or redeem large amounts of shares of a Fund. Such large shareholder redemptions, which may occur rapidly or unexpectedly, may cause a Fund to sell securities at times when it would not otherwise do so, which may negatively impact a Fund’s NAV and liquidity. These transactions may also accelerate the realization of taxable income to shareholders if such sales of investments resulted in gains, and may also increase transaction costs. In addition, a large redemption could result in a Fund’s current expenses being allocated over a smaller asset base, leading to an increase in a Fund’s expense ratio. Similarly, large Fund share purchases may adversely affect a Fund’s performance to the extent that a Fund is delayed in investing new cash or otherwise maintains a larger cash position than it ordinarily would.
Liquidity Risk — A Fund or Underlying Funds may make investments that are illiquid or that may become less liquid in response to market developments or adverse investor perceptions. Illiquid investments may be more difficult to value. To the extent a Fund engages in cash redemptions, then liquidity risk may also refer to the risk that a Fund or Underlying Funds will not be able to pay redemption proceeds within the allowable time period or without significant dilution to remaining investors’ interests because of unusual market conditions, an unusually high volume of redemption requests, or other reasons. To meet redemption requests, a Fund or Underlying Funds may be forced to sell investments at an unfavorable time and/or under unfavorable conditions. If a Fund or Underlying Funds are forced to sell securities at an unfavorable time and/or under unfavorable conditions, such sales may adversely affect a Fund’s or Underlying Funds’ NAV and dilute remaining investors’ interests. Liquidity risk may be the result of, among other things, the reduced number and capacity of traditional market participants to make a market in fixed income securities or the lack of an active market. The potential for liquidity risk may be magnified by a rising interest rate environment or other circumstances where investor redemptions from fixed income mutual funds may be higher than normal, potentially causing increased supply in the market due to selling activity. These risks may be more pronounced in connection with a Fund’s or Underlying Funds’ investments in securities of issuers located in emerging market countries. Redemptions by large shareholders may have a negative impact on a Fund’s or Underlying Funds’ liquidity.
Market and Credit Risks — In the normal course of business, a Fund trades financial instruments and enters into financial transactions where risk of potential loss exists due to changes in the market (market risk). The value of the securities in which a Fund invests may go up or down in response to the prospects of individual companies, particular sectors or governments and/or general economic conditions throughout the world due to increasingly interconnected global economies and financial markets. Events such as war, acts of terrorism, social unrest, natural disasters, the spread of infectious illness or other public health threats could also significantly impact a Fund and its investments. Additionally, a Fund may also be exposed to credit risk in the event that an issuer or guarantor fails to perform or that an institution or entity with which a Fund has unsettled or open transactions defaults.
Sector Risk — To the extent a Fund focuses its investments in securities of issuers in one or more sectors (such as the financial services or telecommunications sectors), a Fund may be subjected, to a greater extent than if its investments were diversified across different sectors, to the risks of volatile economic cycles and/or conditions and developments that may be particular to that sector, such as: adverse economic, business, political, environmental or other developments.
Short Position Risk — A Fund may enter into a short position through a futures contract, an option or swap agreement or through short sales of any instrument that a Fund may purchase for investment. Taking short positions involves leverage of a Fund’s assets and presents various risks, including counterparty risk. If the value of the underlying instrument or market in which a Fund has taken a short position increases, then a Fund will incur a loss equal to the increase in value from the time that the short position was entered into plus any related interest payments or other fees. Taking short positions involves the risk that losses may be disproportionate, may exceed the amount invested, and may be unlimited. To the extent that a Fund uses the
64
GOLDMAN SACHS ALLOCATION FUNDS
|
| 9. OTHER RISKS (continued) |
proceeds it receives from a short position to take additional long positions, the risks associated with the short position, including leverage risks, may be heightened, because doing so increases the exposure of a Fund to the markets and therefore could magnify changes to a Fund’s NAV.
Tax Risk — The Tactical Tilt Overlay Fund will seek to gain exposure to the commodity markets primarily through investments in the Subsidiary and/or commodity index-linked structured notes, as applicable. Historically, the Internal Revenue Service (“IRS”) issued private letter rulings (“PLRs”) in which the IRS specifically concluded that income and gains from investments in commodity index linked structured notes (the “Notes Rulings”) or a wholly-owned foreign subsidiary that invests in commodity-linked instruments are “qualifying income” for purposes of compliance with Subchapter M of the Code. However, the Tactical Tilt Overlay Fund has not received a PLR, and is not able to rely on PLRs issued to other taxpayers. The IRS recently issued final regulations that, would generally treat the Tactical Tilt Overlay Fund’s income inclusion with respect to a subsidiary as qualifying income either if (A) there is a distribution out of the earnings and profits of a subsidiary that are attributable to such income inclusion or (B) such inclusion is derived with respect to the Tactical Tilt Overlay Fund’s business of investing in stock, securities, or currencies.
The IRS also issued a revenue procedure, which states that the IRS will not in the future issue PLRs that would require a determination of whether an asset (such as a commodity index-linked note) is a “security” under the Investment Company Act of 1940. In connection with issuing such revenue procedure, the IRS has revoked the Notes Ruling on a prospective basis. In light of the revocation of the Notes Rulings, the Tactical Tilt Overlay Fund has limited its investments in commodity index-linked structured notes. The Tactical Tilt Overlay Fund has obtained an opinion of counsel that the Fund’s income from investments in the Subsidiary should constitute “qualifying income.” However, no assurances can be provided that the IRS would not be able to successfully assert that the Tactical Tilt Overlay Fund’s income from such investments was not “qualifying income,” in which case the Tactical Tilt Overlay Fund would fail to qualify as a regulated investment company (“RIC”) under Subchapter M of the Code if over 10% of its gross income were derived from these investments. If the Tactical Tilt Overlay Fund failed to qualify as a RIC, it would be subject to federal and state income tax on all of its taxable income at regular corporate tax rates. This would significantly adversely affect the returns to, and could cause substantial losses for, Tactical Tilt Overlay Fund shareholders.
Under the Trust’s organizational documents, its Trustees, officers, employees and agents are indemnified, to the extent permitted by the Act and state law, against certain liabilities that may arise out of performance of their duties to the Funds. Additionally, in the course of business, the Funds enter into contracts that contain a variety of indemnification clauses. The Funds’ maximum exposure under these arrangements is unknown, as this would involve future claims that may be made against the Funds that have not yet occurred. However, GSAM believes the risk of loss under these arrangements to be remote.
In March 2020, the FASB issued Accounting Standard Update (“ASU”) No. 2020-04, “Reference Rate Reform (Topic 848): Facilitation of the Effects of Reference Rate Reform on Financial Reporting.” This ASU provides optional exceptions for applying GAAP to contract modifications, hedging relationships and other transactions affected reference rate reform if certain criteria are met. ASU 2020-04 is elective and is effective on March 12, 2020 through December 31, 2022. As of the financial reporting period, GSAM is currently evaluating the impact, if any, of applying ASU 2020-04.
On October 22, 2020, Goldman Sachs announced a settlement of matters involving 1Malaysia Development Bhd. (1MDB), a Malaysian sovereign wealth fund, with the United States Department of Justice as well as criminal and civil authorities in the UK, Singapore and Hong Kong. Further information regarding the 1MDB settlement can be found at https://www.goldmansachs.com/media-relations/press-releases/current/goldman-sachs-2020-10-22.html. The 1MDB settlement will not materially adversely affect
GSAM’s ability to serve as investment manager.
65
GOLDMAN SACHS ALLOCATION FUNDS
Notes to Financial Statements (continued)
February 28, 2021 (Unaudited)
Subsequent events after the Statements and Consolidated Statement of Assets and Liabilities date have been evaluated, and GSAM has concluded that there is no impact requiring adjustment or disclosure in the financial statements.
|
| 13. SUMMARY OF SHARE TRANSACTIONS |
Share activity is as follows:
| | | | | | | | | | | | | | | | |
| | | Global Managed Beta Fund | |
| | | For the Six Months Ended
February 28, 2021
(Unaudited) | | | For the Fiscal Year Ended
August 31, 2020
| |
| | | Shares | | | Dollars | | | Shares | | | Dollars | |
| | | | |
| Institutional Shares | | | | | | | | | | | | | | | | |
Shares sold | | | 21,952,656 | | | $ | 309,608,800 | | | | 34,576,181 | | | $ | 423,801,618 | |
Reinvestment of distributions | | | 5,764,208 | | | | 81,014,178 | | | | 3,777,434 | | | | 47,547,059 | |
Shares redeemed | | | (23,040,435 | ) | | | (322,845,740 | ) | | | (15,286,879 | ) | | | (188,792,678 | ) |
| | | | |
NET INCREASE | | | 4,676,429 | | | $ | 67,777,238 | | | | 23,066,736 | | | $ | 282,555,999 | |
| | | | | | | | | | | | | | | | |
| | | Strategic Factor Allocation Fund | |
| | | | |
| | | For the Six Months Ended
February 28, 2021
(Unaudited) | | | For the Fiscal Year Ended
August 31, 2020 | |
| | | | |
| | | Shares | | | Dollars | | | Shares | | | Dollars | |
| | | | |
| Institutional Shares | | | | | | | | | | | | | | | | |
Shares sold | | | 173,574 | | | $ | 2,084,488 | | | | 64,498 | | | $ | 728,383 | |
Reinvestment of distributions | | | 31,128 | | | | 353,924 | | | | 9,508 | | | | 106,078 | |
Shares redeemed | | | (27,895 | ) | | | (332,192 | ) | | | (312,978 | ) | | | (3,410,091 | ) |
| | | | 176,807 | | | | 2,106,220 | | | | (238,972 | ) | | | (2,575,630 | ) |
| Class R6 Shares | | | | | | | | | | | | | | | | |
Reinvestment of distributions | | | 80 | | | | 899 | | | | 26 | | | | 289 | |
| | | | 80 | | | | 899 | | | | 26 | | | | 289 | |
| Class P Shares | | | | | | | | | | | | | | | | |
Shares sold | | | 34,424,296 | | | | 397,449,455 | | | | 25,293,706 | | | | 281,003,127 | |
Reinvestment of distributions | | | 11,190,441 | | | | 125,892,465 | | | | 3,863,546 | | | | 42,652,117 | |
Shares redeemed | | | (13,419,347 | ) | | | (156,238,808 | ) | | | (35,803,475 | ) | | | (385,520,783 | ) |
| | | | 32,195,390 | | | | 367,103,112 | | | | (6,646,223 | ) | | | (61,865,539 | ) |
| | | | |
NET INCREASE (DECREASE) | | | 32,372,277 | | | $ | 369,210,231 | | | | (6,885,169 | ) | | $ | (64,440,880 | ) |
66
GOLDMAN SACHS ALLOCATION FUNDS
|
| 13. SUMMARY OF SHARE TRANSACTIONS (continued) |
| | | | | | | | | | | | | | | | |
| |
| | | Goldman Sachs Tactical Tilt Overlay Fund | |
| | | | |
| | | For the Six Months Ended
February 28, 2021
(Unaudited) | | | For the Fiscal Year Ended
August 31, 2020 | |
| | | | |
| | | Shares | | | Dollars | | | Shares | | | Dollars | |
| | | | |
| Institutional Shares | | | | | | | | | | | | | | | | |
Shares sold | | | 213,707 | | | $ | 2,176,314 | | | | 77,802 | | | $ | 781,025 | |
Reinvestment of distributions | | | 8,823 | | | | 88,055 | | | | 8,903 | | | | 88,497 | |
Shares redeemed | | | (128,698 | ) | | | (1,313,444 | ) | | | (2,504,302 | ) | | | (24,669,565 | ) |
| | | | 93,832 | | | | 950,925 | | | | (2,417,597 | ) | | | (23,800,043 | ) |
| Class R6 Shares | | | | | | | | | | | | | | | | |
Shares sold | | | 15,425,866 | | | | 152,202,875 | | | | 13,977,972 | | | | 136,094,944 | |
Reinvestment of distributions | | | 4,276,594 | | | | 41,354,663 | | | | 915,300 | | | | 8,832,644 | |
Shares redeemed | | | (1,973,444 | ) | | | (19,611,288 | ) | | | (14,500,809 | ) | | | (135,252,936 | ) |
| | | | 17,729,016 | | | | 173,946,250 | | | | 392,463 | | | | 9,674,652 | |
| Class P Shares | | | | | | | | | | | | | | | | |
Shares sold | | | 34,083,385 | | | | 338,404,191 | | | | 39,399,977 | | | | 382,488,679 | |
Reinvestment of distributions | | | 11,744,376 | | | | 113,568,116 | | | | 3,463,612 | | | | 33,423,852 | |
Shares redeemed | | | (22,547,294 | ) | | | (223,804,452 | ) | | | (141,859,318 | ) | | | (1,333,843,957 | ) |
| | | | 23,280,467 | | | | 228,167,855 | | | | (98,995,729 | ) | | | (917,931,426 | ) |
| | | | |
NET INCREASE (DECREASE) | | | 41,103,315 | | | $ | 403,065,030 | | | | (101,020,863 | ) | | $ | (932,056,817 | ) |
67
GOLDMAN SACHS ALLOCATION FUNDS
Liquidity Risk Management Program
Each Fund has adopted and implemented a liquidity risk management program (the “Program”) in accordance with Rule 22e-4 under the 1940 Act. The Program seeks to assess and manage each Fund’s liquidity risk, i.e., the risk that a Fund is unable to satisfy redemption requests without significantly diluting remaining investors’ interests in the Fund. The Board of Trustees of the Trust has designated GSAM, each Fund’s investment adviser, to administer the Program. Certain aspects of the Program rely on third parties to perform certain functions, including the provision of market data and application of models.
The Program is comprised of various components designed to support the assessment and/or management of liquidity risk, including: (1) the periodic assessment (no less frequently than annually) of certain factors that influence a Fund’s liquidity risk; (2) the periodic classification (no less frequently than monthly) of a Fund’s investments into one of four liquidity categories that reflect an estimate of their liquidity under current market conditions; (3) a 15% limit on the acquisition of “illiquid investments” (as defined under Rule 22e-4); (4) for a Fund that does not invest primarily in “highly liquid investments” (as defined under Rule 22e-4), the determination of a minimum percentage of the Fund’s assets that will generally be invested in highly liquid investments (a “Highly Liquid Investment Minimum”); and (5) periodic reporting to the Board of Trustees.
At a meeting of the Board of Trustees on February 9-10, 2021, GSAM provided a written report to the Board addressing the operation, and the adequacy and effectiveness of the implementation, of the Program, including, as applicable, the operation of any Highly Liquid Investment Minimum and any material changes to the Program, for the period from January 1, 2020 through December 31, 2020 (the “Reporting Period”). Among other things, the annual report and related materials discussed: (1) the results of stress tests designed to assess liquidity under a hypothetical stressed scenario involving elevated redemptions; (2) an assessment of the methodologies used to classify investments into one of four liquidity categories; and (3) the impact of the COVID-19 pandemic on liquidity and management of liquidity risk during the Reporting Period, including during stressed market conditions caused by the COVID-19 pandemic. The report concluded that the Program continues to be reasonably designed to assess and manage liquidity risk and was adequately and effectively implemented during the Reporting Period.
There can be no assurance that the Program will achieve its objectives under all circumstances in the future. Please refer to your Fund’s prospectus for more information regarding the Fund’s exposure to liquidity risk and other risks to which it may be subject.
68
GOLDMAN SACHS ALLOCATION FUNDS
Fund Expenses — Six Month Period Ended February 28, 2021: (Unaudited)
As a shareholder of Institutional, Class R6 and Class P Shares of the Fund you incur two types of costs: (1) transaction costs and (2) ongoing costs, including management fees and other Fund expenses. This example is intended to help you understand your ongoing costs (in dollars) of investing in Institutional, Class R6 and Class P Shares of the Fund and to compare these costs with the ongoing costs of investing in other mutual funds.
The example is based on an investment of $1,000 invested at the beginning of the period and held for the entire period from September 1, 2020, through February 28, 2021, which represents a period of 181 days in a 365-day year.
Actual Expenses — The first line in the table below provides information about actual account values and actual expenses. You may use the information in this line, together with the amount you invested, to estimate the expenses that you paid over the period. Simply divide your account value by $1,000 (for example, an $8,600 account value divided by $1,000=8.6), then multiply the result by the number in the first line under the heading entitled “Expenses Paid” to estimate the expenses you paid on your account during this period.
Hypothetical Example for Comparison Purposes — The second line in the table below provides information about hypothetical account values and hypothetical expenses based on the Funds’ actual net expense ratios and an assumed rate of return of 5% per year before expenses, which is not the Funds’ actual return. The hypothetical account values and expenses may not be used to estimate the actual ending account balance or expenses you paid for the period. You may use this information to compare the ongoing costs of investing in the Funds and other funds. To do so, compare this 5% hypothetical example with the 5% hypothetical examples that appear in the shareholder reports of the other funds.
Please note that the expenses shown in the table are meant to highlight your ongoing costs only and do not reflect any transactional costs, such as sales charges, redemption fees, or exchange fees. Therefore, the second line of the table is useful in comparing ongoing costs only, and will not help you determine the relative total costs of owning different funds. In addition, if these transactional costs were included, your costs would have been higher
| | | | | | | | | | | | | | | | | | | | | | | | | | | | | | | | | | | | |
| | | Global Managed Beta Fund | | | Strategic Factor Allocation Fund | | | Tactical Tilt Overay Fund | |
| Share Class | | Beginning
Account
Value
9/1/20 | | | Ending
Account
Value
2/28/21 | | | Expenses
Paid for the
6 months ended
2/28/21* | | | Beginning
Account
Value
9/1/20 | | | Ending
Account
Value
2/28/21 | | | Expenses
Paid for the
6 months ended
2/28/21* | | | Beginning
Account
Value
9/1/20 | | | Ending
Account
Value
2/28/21 | | | Expenses
Paid for the
6 months ended
2/28/21* | |
| Institutional | | | | | | | | | | | | | | | | | | | | | | | | | | | | | | | | | | | | |
Actual | | $ | 1,000.00 | | | $ | 1,156.10 | | | $ | 0.53 | | | $ | 1,000.00 | | | $ | 1,031.20 | | | $ | 3.53 | | | $ | 1,000.00 | | | $ | 1,058.40 | | | $ | 3.62 | |
Hypothetical 5% return | | | 1,000.00 | | | | 1,024.30 | + | | | 0.50 | | | | 1,000.00 | | | | 1,021.32 | + | | | 3.51 | | | | 1,000.00 | | | | 1,021.27 | + | | | 3.56 | |
| Class R6 | | | | | | | | | | | | | | | | | | | | | | | | | | | | | | | | | | | | |
Actual | | | — | | | | — | | | | — | | | | 1,000.00 | | | | 1,031.40 | | | | 3.37 | | | | 1,000.00 | | | | 1,057.70 | | | | 3.57 | |
Hypothetical 5% return | | | — | | | | — | | | | — | | | | 1,000.00 | | | | 1,021.47 | + | | | 3.36 | | | | 1,000.00 | | | | 1,021.32 | + | | | 3.51 | |
| Class P | | | | | | | | | | | | | | | | | | | | | | | | | | | | | | | | | | | | |
Actual | | | — | | | | — | | | | — | | | | 1,000.00 | | | | 1,031.40 | | | | 3.48 | | | | 1,000.00 | | | | 1,057.60 | | | | 3.57 | |
Hypothetical 5% return | | | — | | | | — | | | | — | | | | 1,000.00 | | | | 1.021.37 | + | | | 3.46 | | | | 1,000.00 | | | | 1,021.32 | + | | | 3.51 | |
| * | | Expenses are calculated using the Fund’s annualized net expense ratio for each class, which represents the ongoing expenses as a percentage of net assets for the six months ended February 28, 2021. Expenses are calculated by multiplying the annualized net expense ratio by the average account value for the period; then multiplying the result by the number of days in the most recent fiscal half year; and then dividing that result by the number of days in the fiscal year. The annualized net expense ratios for the period were as follows: |
| | | | | | | | | | | | |
| Fund | | Institutional | | | Class R6 | | | Class P | |
Global Managed Beta Fund | | | 0.10 | % | | | — | | | | — | |
Strategic Factor Allocation Fund | | | 0.70 | % | | | 0.67 | % | | | 0.69 | % |
Tactical Tilt Overlay Fund | | | 0.71 | | | | 0.70 | | | | 0.70 | |
| + | | Hypothetical expenses are based on Fund’s actual annualized net expense ratios and an assumed rate of return of 5% per year before expenses. |
69
FUNDS PROFILE
Goldman Sachs Funds
Goldman Sachs is a premier financial services firm, known since 1869 for creating thoughtful and customized investment solutions in complex global markets.
Today, the Asset Management Division of Goldman Sachs serves a diverse set of clients worldwide, including private institutions, public entities and individuals. With approximately $1.95 trillion in assets under supervision as of December 31, 2020, Goldman Sachs Asset Management (“GSAM”) has portfolio management teams located around the world and our investment professionals bring firsthand knowledge of local markets to every investment decision. Assets under supervision includes assets under management and other client assets for which Goldman Sachs does not have full discretion. GSAM leverages the resources of Goldman Sachs & Co. LLC subject to legal, internal and regulatory restrictions.
Money Market
Financial Square FundsSM
| ∎ | | Financial Square Treasury Solutions Fund1 |
| ∎ | | Financial Square Government Fund1 |
| ∎ | | Financial Square Money Market Fund2 |
| ∎ | | Financial Square Prime Obligations Fund2 |
| ∎ | | Financial Square Treasury Instruments Fund1 |
| ∎ | | Financial Square Treasury Obligations Fund1 |
| ∎ | | Financial Square Federal Instruments Fund1 |
Investor FundsSM
| ∎ | | Investor Money Market Fund3 |
| ∎ | | Investor Tax-Exempt Money Market Fund3 |
Fixed Income
Short Duration and Government
| ∎ | | High Quality Floating Rate Fund |
| ∎ | | Short-Term Conservative Income Fund |
| ∎ | | Short Duration Government Fund |
| ∎ | | Short Duration Income Fund |
| ∎ | | Inflation Protected Securities Fund |
Multi-Sector
| ∎ | | Global Core Fixed Income Fund4 |
Municipal and Tax-Free
| ∎ | | High Yield Municipal Fund |
| ∎ | | Dynamic Municipal Income Fund |
| ∎ | | Short Duration Tax-Free Fund |
| ∎ | | Municipal Income Completion Fund |
Single Sector
| ∎ | | Investment Grade Credit Fund |
| ∎ | | High Yield Floating Rate Fund |
| ∎ | | Emerging Markets Debt Fund |
| ∎ | | Local Emerging Markets Debt Fund |
Fixed Income Alternatives
| ∎ | | Long Short Credit Strategies Fund |
Fundamental Equity
| ∎ | | Small/Mid Cap Value Fund |
| ∎ | | Small/Mid Cap Growth Fund |
| ∎ | | Concentrated Growth Fund |
| ∎ | | Technology Opportunities Fund |
| ∎ | | Growth Opportunities Fund |
| ∎ | | Rising Dividend Growth Fund |
Tax-Advantaged Equity
| ∎ | | U.S. Tax-Managed Equity Fund |
| ∎ | | International Tax-Managed Equity Fund |
| ∎ | | U.S. Equity Dividend and Premium Fund |
| ∎ | | International Equity Dividend and Premium Fund |
Equity Insights
| ∎ | | Small Cap Equity Insights Fund |
| ∎ | | U.S. Equity Insights Fund |
| ∎ | | Small Cap Growth Insights Fund |
| ∎ | | Large Cap Growth Insights Fund |
| ∎ | | Large Cap Value Insights Fund |
| ∎ | | Small Cap Value Insights Fund |
| ∎ | | International Small Cap Insights Fund |
| ∎ | | International Equity Insights Fund |
| ∎ | | Emerging Markets Equity Insights Fund |
Fundamental Equity International
| ∎ | | International Equity Income Fund |
| ∎ | | International Equity ESG Fund |
| ∎ | | Emerging Markets Equity Fund |
| ∎ | | ESG Emerging Markets Equity Fund |
Alternative
| ∎ | | Clean Energy Income Fund |
| ∎ | | Real Estate Securities Fund |
| ∎ | | International Real Estate Securities Fund |
| ∎ | | Commodity Strategy Fund |
| ∎ | | Global Real Estate Securities Fund |
| ∎ | | Alternative Premia Fund |
| ∎ | | Absolute Return Tracker Fund |
| ∎ | | Managed Futures Strategy Fund |
| ∎ | | MLP Energy Infrastructure Fund |
| ∎ | | Energy Infrastructure Fund6 |
| ∎ | | Multi-Manager Alternatives Fund |
| ∎ | | Global Infrastructure Fund |
Total Portfolio Solutions
| ∎ | | Global Managed Beta Fund |
| ∎ | | Multi-Manager Non-Core Fixed Income Fund |
| ∎ | | Multi-Manager Global Equity Fund |
| ∎ | | Multi-Manager International Equity Fund |
| ∎ | | Tactical Tilt Overlay Fund |
| ∎ | | Balanced Strategy Portfolio |
| ∎ | | Multi-Manager U.S. Small Cap Equity Fund |
| ∎ | | Multi-Manager Real Assets Strategy Fund |
| ∎ | | Growth and Income Strategy Portfolio |
| ∎ | | Growth Strategy Portfolio |
| ∎ | | Dynamic Global Equity Fund |
| ∎ | | Satellite Strategies Portfolio |
| ∎ | | Enhanced Dividend Global Equity Portfolio |
| ∎ | | Tax-Advantaged Global Equity Portfolio |
| ∎ | | Strategic Factor Allocation Fund |
| ∎ | | Strategic Volatility Premium Fund |
| ∎ | | Target Date Retirement Portfolio |
| ∎ | | Target Date 2025 Portfolio |
| ∎ | | Target Date 2030 Portfolio |
| ∎ | | Target Date 2035 Portfolio |
| ∎ | | Target Date 2040 Portfolio |
| ∎ | | Target Date 2045 Portfolio |
| ∎ | | Target Date 2050 Portfolio |
| ∎ | | Target Date 2055 Portfolio |
| ∎ | | Target Date 2060 Portfolio |
| ∎ | | GQG Partners International Opportunities Fund |
| 1 | | You could lose money by investing in the Fund. Although the Fund seeks to preserve the value of your investment at $1.00 per share, it cannot guarantee it will do so. An investment in the Fund is not a deposit of a bank and is not insured or guaranteed by the Federal Deposit Insurance Corporation or any other government agency. The Fund’s sponsor has no legal obligation to provide financial support to the Fund, and you should not expect that the sponsor will provide financial support to the Fund at any time. |
| 2 | | You could lose money by investing in the Fund. Because the share price of the Fund will fluctuate, when you sell your shares they may be worth more or less than what you originally paid for them. The Fund may impose a fee upon sale of your shares or may temporarily suspend your ability to sell shares if the Fund’s liquidity falls below required minimums because of market conditions or other factors. An investment in the Fund is not a deposit of a bank and is not insured or guaranteed by the Federal Deposit Insurance Corporation or any other government agency. The Fund’s sponsor has no legal obligation to provide financial support to the Fund, and you should not expect that the sponsor will provide financial support to the Fund at any time. |
| 3 | | You could lose money by investing in the Fund. Although the Fund seeks to preserve the value of your investment at $1.00 per share, it cannot guarantee it will do so. The Fund may impose a fee upon sale of your shares or may temporarily suspend your ability to sell shares if the Fund’s liquidity falls below required minimums because of market conditions or other factors. An investment in the Fund is not a deposit of a bank and is not insured or guaranteed by the Federal Deposit Insurance Corporation or any other government agency. The Fund’s sponsor has no legal obligation to provide financial support to the Fund, and you should not expect that the sponsor will provide financial support to the Fund at any time. |
| 4 | | Effective after the close of business on April 30, 2020, the Goldman Sachs Global Income Fund was renamed the Goldman Sachs Global Core Fixed Income Fund. |
| 5 | | Effective after the close on business of August 30, 2020, the Goldman Sachs Blue Chip Fund was renamed the Goldman Sachs U.S. Equity ESG Fund. |
| 6 | | Effective after the close of business on June 26, 2020, the Goldman Sachs MLP & Energy Fund was renamed the Goldman Sachs Energy Infrastructure Fund. |
Financial Square FundsSM and Investor FundsSM are registered service marks of Goldman Sachs & Co. LLC.
| * | | This list covers open-end funds only. Please visit our website at www.GSAMFUNDS.com to learn about our closed-end funds and exchange-traded funds. |
| | |
TRUSTEES Jessica Palmer, Chair Dwight L. Bush Kathryn A. Cassidy Diana M. Daniels Joaquin Delgado James A. McNamara Roy W. Templin Gregory G. Weaver | | OFFICERS James A. McNamara, President Joseph F. DiMaria, Principal Financial Officer, Principal Accounting Officer and Treasurer Caroline L. Kraus, Secretary |
| |
GOLDMAN SACHS & CO. LLC Distributor and Transfer Agent | | GOLDMAN SACHS ASSET MANAGEMENT, L.P. Investment Adviser |
Visit our web site at www.GSAMFUNDS.com to obtain the most recent month-end returns.
Goldman Sachs Asset Management, L.P., 200 West Street, New York, New York 10282
The reports concerning the Fund included in this shareholder report may contain certain forward-looking statements about the factors that may affect the performance of the Fund in the future. These statements are based on Fund management’s predictions and expectations concerning certain future events and their expected impact on the Fund, such as performance of the economy as a whole and of specific industry sectors, changes in the levels of interest rates, the impact of developing world events, and other factors that may influence the future performance of the Fund. Management believes these forward-looking statements to be reasonable, although they are inherently uncertain and difficult to predict. Actual events may cause adjustments in portfolio management strategies from those currently expected to be employed.
A description of the policies and procedures that the Fund uses to determine how to vote proxies relating to portfolio securities and information regarding how a Fund voted proxies relating to portfolio securities during the most recent 12-month period ended June 30 is available (I) without charge, upon request by calling 1-800-621-2550 (for Institutional Shareholders); and (II) on the Securities and Exchange Commission (’’SEC’’) web site at http://www.sec.gov.
The website links provided are for your convenience only and are not an endorsement or recommendation by GSAM of any of these websites or the products or services offered. GSAM is not responsible for the accuracy and validity of the content of these websites.
The Fund will file portfolio holdings information for each month in a fiscal quarter within 60 days after the end of the relevant fiscal quarter on Form N-PORT. Portfolio holdings information for the third month of each fiscal quarter will be made available on the SEC’s web site at http://www.sec.gov. Portfolio holdings information may be obtained upon request and without charge by calling 1-800-621-2550 (for Institutional Shareholders).
Fund holdings and allocations shown are as of February 28, 2021 and may not be representative of future investments. Fund holdings should not be relied on in making investment decisions and should not be construed as research or investment advice regarding particular securities. Current and future holdings are subject to risk.
Economic and market forecasts presented herein reflect our judgment as of the date of this presentation and are subject to change without notice. These forecasts do not take into account the specific investment objectives, restrictions, tax and financial situation or other needs of any specific client. Actual data will vary and may not be reflected here. These forecasts are subject to high levels of uncertainty that may affect actual performance. Accordingly, these forecasts should be viewed as merely representative of a broad range of possible outcomes. These forecasts are estimated, based on assumptions, and are subject to significant revision and may change materially as economic and market conditions change. Goldman Sachs has no obligation to provide updates or changes to these forecasts. Case studies and examples are for illustrative purposes only.
Diversification does not protect an investor from market risk and does not ensure a profit.
This material is not authorized for distribution to prospective investors unless preceded or accompanied by a current Prospectus or summary prospectus, if applicable. Investors should consider the Fund’s objective, risks, and charges and expenses, and read the summary prospectus, if available, and/or the Prospectus carefully before investing or sending money. The summary prospectus, if available, and the Prospectus contain this and other information about the Fund and may be obtained from your authorized dealer or from Goldman Sachs & Co. LLC by calling 1-800-621-2550.
© 2021 Goldman Sachs. All rights reserved. 236972-OTU-1390646ALLOCATESAR-21
(a) As of the end of the period covered by this report, the registrant has adopted a code of ethics that applies to the registrant’s principal executive officer, principal financial officer, principal accounting officer or controller, or persons performing similar functions, regardless of whether these individuals are employed by the registrant or a third party (the “Code of Ethics”).
(b) Not applicable.
(c) During the period covered by this report, no amendments were made to the provisions of the Code of Ethics.
(d) During the period covered by this report, the registrant did not grant any waivers, including an implicit waiver, from any provision of the Code of Ethics.
(e) Not applicable.
(f) A copy of the Code of Ethics is available as provided in Item 13(a)(1) of this report.
| ITEM 3. | AUDIT COMMITTEE FINANCIAL EXPERT. |
The registrant’s board of trustees has determined that the registrant has at least one “audit committee financial expert” (as defined in Item 3 of Form N-CSR) serving on its audit committee. Gregory G. Weaver is the “audit committee financial expert” and is “independent” (as each term is defined in Item 3 of Form N-CSR).
| ITEM 4. | PRINCIPAL ACCOUNTANT FEES AND SERVICES. |
The information required by this Item is only required in an annual report on this Form N-CSR.
| ITEM 5. | AUDIT COMMITTEE OF LISTED REGISTRANTS. |
| ITEM 6. | SCHEDULE OF INVESTMENTS. |
| | Schedule of Investments is included as part of the Report to Shareholders filed under Item 1. |
| ITEM 7. | DISCLOSURE OF PROXY VOTING POLICIES AND PROCEDURES FOR CLOSED-END MANAGEMENT INVESTMENT COMPANIES. |
| ITEM 8. | PORTFOLIO MANAGERS OF CLOSED-END MANAGEMENT INVESTMENT COMPANIES. |
| ITEM 9. | PURCHASES OF EQUITY SECURITIES BY CLOSED-END MANAGEMENT INVESTMENT COMPANY AND AFFILIATED PURCHASERS. |
| ITEM 10. | SUBMISSION OF MATTERS TO A VOTE OF SECURITY HOLDERS. |
| | There have been no material changes to the procedures by which shareholders may recommend nominees to the registrant’s board of trustees. |
| ITEM 11. | CONTROLS AND PROCEDURES. |
| | (a) | The registrant’s principal executive and principal financial officers, or persons performing similar functions have concluded that the registrant’s disclosure controls and procedures (as defined in Rule 30a-3(c) under the Investment Company Act of 1940, as amended (the “1940 Act”)) are effective as of a date within 90 days of the filing of this report that includes the disclosure required by this paragraph, based on the evaluation of these controls and procedures required by Rule 30a-3(b) under the 1940 Act and 15d-15(b) under the Securities Exchange Act of 1934, as amended. |
| | (b) | There were no changes in the registrant’s internal control over financial reporting (as defined in Rule 30a-3(d) under the 1940 Act) that occurred during the period covered by this report that have materially affected, or are reasonably likely to materially affect, the registrant’s internal control over financial reporting. |
| ITEM 12. | DISCLOSURE OF SECURITIES LENDING ACTIVITIES FOR CLOSED-END MANAGEMENT INVESTMENT COMPANIES. |
Not applicable.
SIGNATURES
Pursuant to the requirements of the Securities Exchange Act of 1934 and the Investment Company Act of 1940, the registrant has duly caused this report to be signed on its behalf by the undersigned, thereunto duly authorized.
| | |
| | | Goldman Sachs Trust |
| |
| By: | | /s/ James A. McNamara |
| |
| | |
| | James A. McNamara |
| | President/Chief Executive Officer |
| | Goldman Sachs Trust |
| |
| Date: | | April 29, 2021 |
Pursuant to the requirements of the Securities Exchange Act of 1934 and the Investment Company Act of 1940, this report has been signed below by the following persons on behalf of the registrant and in the capacities and on the dates indicated.
| | |
| By: | | /s/ James A. McNamara |
| |
| | |
| | James A. McNamara |
| | President/Chief Executive Officer |
| | Goldman Sachs Trust |
| |
| Date: | | April 29, 2021 |
| |
| By: | | /s/ Joseph F. DiMaria |
| |
| | |
| | Joseph F. DiMaria |
| | Principal Financial Officer |
| | Goldman Sachs Trust |
| |
| Date: | | April 29, 2021 |