UNITED STATES
SECURITIES AND EXCHANGE COMMISSION
Washington, D.C. 20549
FORM N-CSR
CERTIFIED SHAREHOLDER REPORT OF REGISTERED
MANAGEMENT INVESTMENT COMPANIES
Investment Company Act file number 811-05349
Goldman Sachs Trust
(Exact name of registrant as specified in charter)
71 South Wacker Drive, Chicago, Illinois 60606
(Address of principal executive offices) (Zip code)
| | |
| Caroline Kraus, Esq. | | Copies to: |
| Goldman Sachs & Co. LLC | | Geoffrey R.T. Kenyon, Esq. |
| 200 West Street | | Dechert LLP |
| New York, New York 10282 | | 100 Oliver Street |
| | 40th Floor |
| | Boston, MA 02110-2605 |
(Name and address of agents for service)
Registrant’s telephone number, including area code: (312) 655-4400
Date of fiscal year end: December 31
Date of reporting period: June 30, 2021
| ITEM 1. | REPORTS TO STOCKHOLDERS. |
| | The Semi-Annual Report to Shareholders is filed herewith. |
Goldman Sachs Funds

| | | | |
| | |
| Semi-Annual Report | | | | June 30, 2021 |
| | |
| | | | Fund of Funds Portfolios |
| | | | Balanced Strategy |
| | | | Growth and Income Strategy |
| | | | Growth Strategy |
| | | | Satellite Strategies |

Goldman Sachs Fund of Funds Portfolios
| ∎ | | GROWTH AND INCOME STRATEGY |
| | | | |
| | | |
| NOT FDIC-INSURED | | May Lose Value | | No Bank Guarantee |
FUND BASICS
Balanced Strategy
as of June 30, 2021
| | | | | | | | | | | | | | | | | | |
| | PERFORMANCE REVIEW | |
| | | | | |
| | | January 1, 2021–June 30, 2021 | | Portfolio Total Return
(based on NAV)1 | | | Balanced Strategy
Composite Index2 | | | Bloomberg Barclays Global
Aggregate Bond Index | | | MSCI ACWI
Index | |
| | | | | |
| | Class A | | | 5.39 | % | | | 3.90 | % | | | 1.52 | % | | | 12.30 | % |
| | Class C | | | 4.99 | | | | 3.90 | | | | 1.52 | | | | 12.30 | |
| | Institutional | | | 5.65 | | | | 3.90 | | | | 1.52 | | | | 12.30 | |
| | Service | | | 5.40 | | | | 3.90 | | | | 1.52 | | | | 12.30 | |
| | Investor | | | 5.54 | | | | 3.90 | | | | 1.52 | | | | 12.30 | |
| | Class R6 | | | 5.66 | | | | 3.90 | | | | 1.52 | | | | 12.30 | |
| | Class R | | | 5.30 | | | | 3.90 | | | | 1.52 | | | | 12.30 | |
| | | Class P | | | 5.57 | | | | 3.90 | | | | 1.52 | | | | 12.30 | |
| 1 | | The net asset value (“NAV”) represents the net assets of the class of the Portfolio (ex-dividend) divided by the total number of shares of the class outstanding. The Portfolio’s performance assumes the reinvestment of dividends and other distributions. The Portfolio’s performance does not reflect the deduction of any applicable sales charges. |
| 2 | | The Balanced Strategy Composite Index (“Balanced Composite”) is a composite representation prepared by the Investment Adviser of the performance of the Portfolio’s asset classes weighted according to their respective weightings in the Portfolio’s target range. The Balanced Composite is comprised of a blend of the Bloomberg Barclays Global Aggregate Bond Index (Gross, USD, Hedged) (“Bloomberg Barclays Global Index”) (60%) and the MSCI All Country World Index (Net, USD, Unhedged) (“MSCI® ACWI Index”) (40%). The Bloomberg Barclays Global Index is an unmanaged index, provides a broad-based measure of the global investment grade fixed-rate debt markets and covers the most liquid portion of the global investment grade fixed-rate bond market, including government, credit and collateralized securities. The index figures do not include any deduction for fees, expenses or taxes. It is not possible to invest directly in an unmanaged index. The MSCI® ACWI Index is a free float-adjusted market capitalization weighted index that is designed to measure the equity market performance of developed and emerging markets. The MSCI ACWI captures large and mid cap representation across 23 Developed Markets (DM) and 26 Emerging Markets (EM) countries. DM countries include: Australia, Austria, Belgium, Canada, Denmark, Finland, France, Germany, Hong Kong, Ireland, Israel, Italy, Japan, Netherlands, New Zealand, Norway, Portugal, Singapore, Spain, Sweden, Switzerland, the UK and the US. EM countries include: Argentina, Brazil, Chile, China, Colombia, Czech Republic, Egypt, Greece, Hungary, India, Indonesia, Korea, Malaysia, Mexico, Pakistan, Peru, Philippines, Poland, Qatar, Russia, Saudi Arabia, South Africa, Taiwan, Thailand, Turkey and United Arab Emirates. The index figures do not include any deduction for fees or expenses. It is not possible to invest directly in an unmanaged index. |
The returns set forth in the table above represent past performance. Past performance does not guarantee future results. The Portfolio’s investment return and principal value will fluctuate so that an investor’s shares, when redeemed, may be worth more or less than their original cost. Current performance may be lower or higher than the performance quoted above. Please visit our web site at www.gsamfunds.com to obtain the most recent month-end returns. Performance reflects applicable fee waivers and/or expense limitations in effect during the periods shown. In their absence, performance would be reduced. Returns do not reflect the deduction of taxes that a shareholder would pay on Portfolio distributions or the redemption of Portfolio shares.
1
FUND BASICS
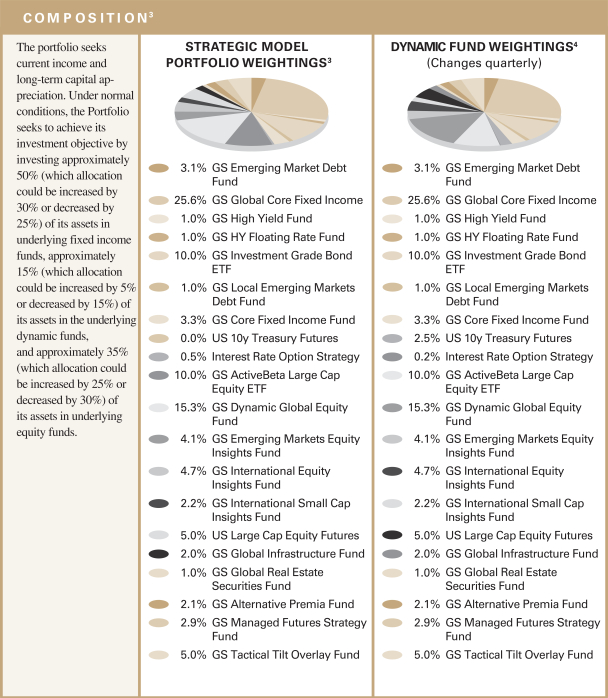
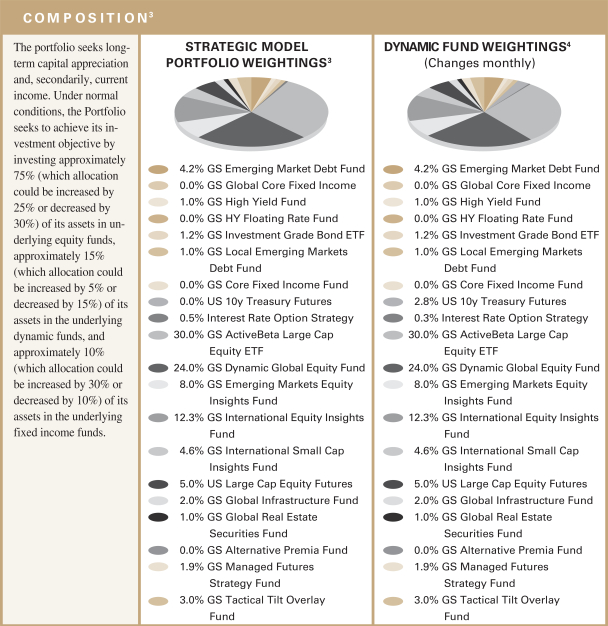
| 3 | | Strategic allocation is the process of determining the areas of the global markets in which to invest, and in what long-term proportion, for each underlying fund. Our global approach attempts to generate strong long-term returns across geographies and asset classes, and is determined through a careful review of market opportunities and risk/return tradeoffs. On a monthly basis or as needed, we shift assets around the strategic allocation, over and under-weighting asset classes and countries relative to the neutral starting point, seeking to benefit from changing short-term conditions in global capital markets. This is called tactical asset allocation. The percentage shown for each underlying fund reflects the value of that underlying fund as a percentage of net assets of the Portfolio. Figures in the above graph may not sum to 100% due to rounding and/or the exclusion of other assets and liabilities. |
| 4 | | Generally, dynamic fund weightings are rebalanced approximately monthly, but they may be rebalanced more or less frequently at the discretion of the Investment Adviser based on the market environment and its macro views. The weightings in the chart above reflect the allocations as of June 30, 2021. Actual Fund weighting in the Portfolio may differ from the figures shown above due to rounding, differences in returns of the underlying funds, or both. The above figures are not indicative of future allocations. |
2
FUND BASICS
|
| OVERALL UNDERLYING FUND WEIGHTINGS5 |
|
| Percentage of Net Assets |
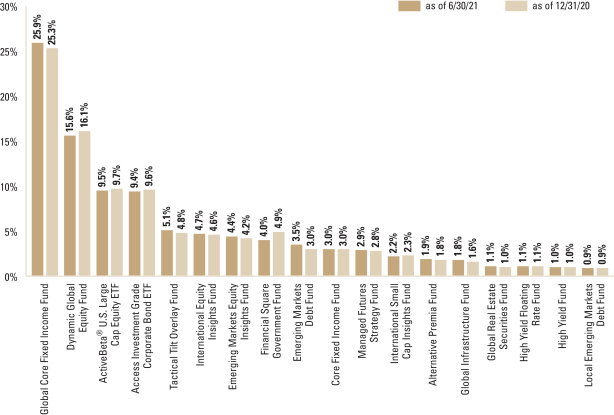
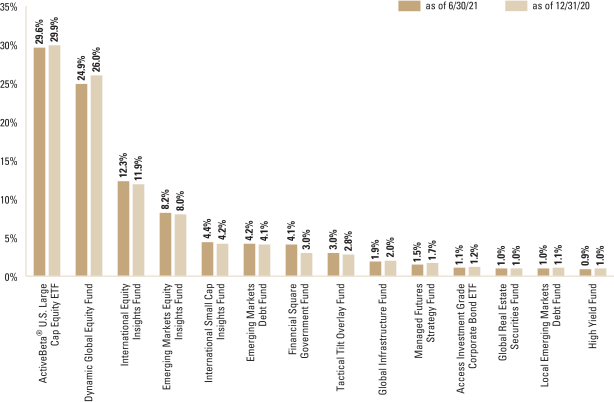
| 5 | | The Portfolio is actively managed and, as such, its composition may differ over time. The percentage shown for each underlying fund reflects the value of that underlying fund as a percentage of net assets of the Portfolio. Figures in the above graph may not sum to 100% due to rounding and/or the exclusion of other assets and liabilities. The graph depicts the Portfolio’s investments but may not represent the Portfolio’s market exposure due to the exclusion of certain derivatives, if any, as listed in the Additional Investment Information section of the Schedule of Investments. |
For more information about the Fund, please refer to www.GSAMFUNDS.com. There, you can learn more about the Fund’s investment strategies, holdings, and performance.
3
FUND BASICS
Growth and Income Strategy
as of June 30, 2021
| | | | | | | | | | | | | | | | | | |
| | PERFORMANCE REVIEW | |
| | | | | |
| | | January 1, 2021–June 30, 2021 | | Portfolio Total Return
(based on NAV)1 | | | Growth and Income
Strategy Composite Index2 | | | Bloomberg Barclays
Global Aggregate
Bond Index | | | MSCI ACWI
Index | |
| | | | | |
| | Class A | | | 8.61 | % | | | 6.67 | % | | | 1.52 | % | | | 12.30 | % |
| | Class C | | | 8.24 | | | | 6.67 | | | | 1.52 | | | | 12.30 | |
| | Institutional | | | 8.83 | | | | 6.67 | | | | 1.52 | | | | 12.30 | |
| | Service | | | 8.49 | | | | 6.67 | | | | 1.52 | | | | 12.30 | |
| | Investor | | | 8.71 | | | | 6.67 | | | | 1.52 | | | | 12.30 | |
| | Class R6 | | | 8.84 | | | | 6.67 | | | | 1.52 | | | | 12.30 | |
| | Class R | | | 8.46 | | | | 6.67 | | | | 1.52 | | | | 12.30 | |
| | | Class P | | | 8.84 | | | | 6.67 | | | | 1.52 | | | | 12.30 | |
| 1 | | The net asset value (“NAV”) represents the net assets of the class of the Portfolio (ex-dividend) divided by the total number of shares of the class outstanding. The Portfolio’s performance assumes the reinvestment of dividends and other distributions. The Portfolio’s performance does not reflect the deduction of any applicable sales charges. |
| 2 | | The Growth and Income Strategy Composite Index (“Growth and Income Composite”) is a composite representation prepared by the Investment Adviser of the performance of the Portfolio’s asset classes weighted according to their respective weightings in the Portfolio’s target range. The Growth and Income Composite is comprised of a blend of the Bloomberg Barclays Global Aggregate Bond Index (Gross, USD, Hedged) (“Bloomberg Barclays Global Index”) (40%) and the MSCI All Country World Index (Net, USD, Unhedged) (“MSCI® ACWI Index”) (60%). The Growth and Income Composite figures do not reflect any deduction for fees, expenses or taxes. The Bloomberg Barclays Global Index is an unmanaged index, provides a broad-based measure of the global investment-grade fixed-rate debt markets and covers the most liquid portion of the global investment grade fixed-rate bond market, including government, credit and collateralized securities. The index figures do not include any deduction for fees, expenses or taxes. It is not possible to invest directly in an unmanaged index. The MSCI ACWI captures large and mid cap representation across 23 Developed Markets (DM) and 26 Emerging Markets (EM) countries. DM countries include: Australia, Austria, Belgium, Canada, Denmark, Finland, France, Germany, Hong Kong, Ireland, Israel, Italy, Japan, Netherlands, New Zealand, Norway, Portugal, Singapore, Spain, Sweden, Switzerland, the UK and the US. EM countries include: Argentina, Brazil, Chile, China, Colombia, Czech Republic, Egypt, Greece, Hungary, India, Indonesia, Korea, Malaysia, Mexico, Pakistan, Peru, Philippines, Poland, Qatar, Russia, Saudi Arabia, South Africa, Taiwan, Thailand, Turkey and United Arab Emirates. The index figures do not include any deduction for fees or expenses. It is not possible to invest directly in an unmanaged index. |
The returns set forth in the table above represent past performance. Past performance does not guarantee future results. The Portfolio’s investment return and principal value will fluctuate so that an investor’s shares, when redeemed, may be worth more or less than their original cost. Current performance may be lower or higher than the performance quoted above. Please visit our web site at www.gsamfunds.com to obtain the most recent month-end returns. Performance reflects applicable fee waivers and/or expense limitations in effect during the periods shown. In their absence, performance would be reduced. Returns do not reflect the deduction of taxes that a shareholder would pay on Portfolio distributions or the redemption of Portfolio shares.
4
FUND BASICS
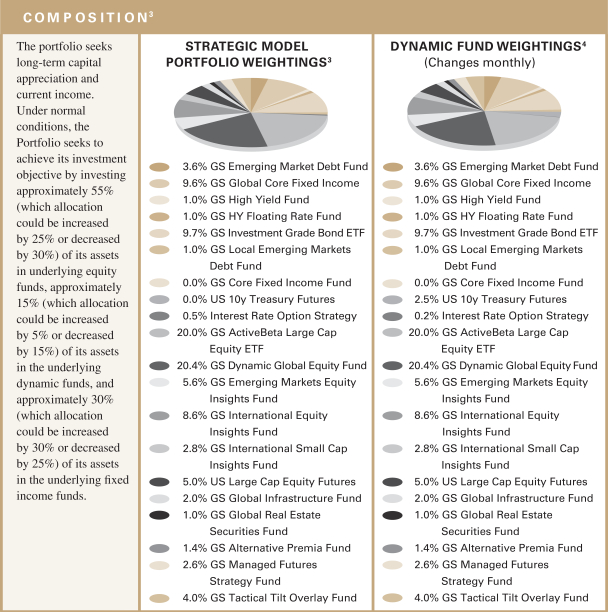
| 3 | | Strategic allocation is the process of determining the areas of the global markets in which to invest, and in what long-term proportion, for each underlying fund. Our global approach attempts to generate strong long-term returns across geographies and asset classes, and is determined through a careful review of market opportunities and risk/return tradeoffs. On a monthly basis or as needed, we shift assets around the strategic allocation, over and under-weighting asset classes and countries relative to the neutral starting point, seeking to benefit from changing short-term conditions in global capital markets. This is called tactical asset allocation. |
| 4 | | Generally, dynamic fund weightings are rebalanced approximately monthly, but they may be rebalanced more or less frequently at the discretion of the Investment Adviser based on the market environment and its macro views. The weightings in the chart above reflect the allocations as of June 30, 2021. Actual underlying fund weighting in the Portfolio may differ from the figures shown above due to rounding, differences in returns of the underlying funds, or both. The above figures are not indicative of future allocations. |
5
FUND BASICS
|
| OVERALL UNDERLYING FUND WEIGHTINGS5 |
|
| Percentage of Net Assets |
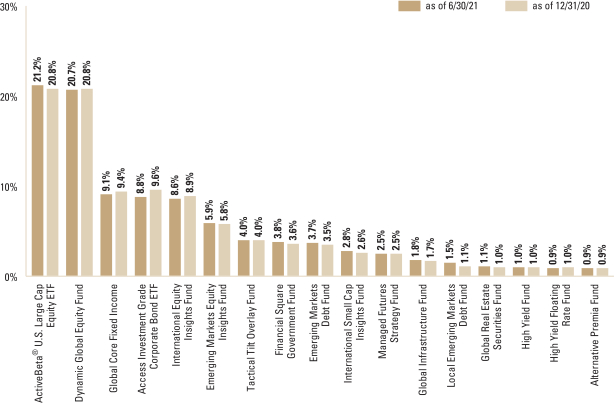
| 5 | | The Portfolio is actively managed and, as such, its composition may differ over time. The percentage shown for each underlying fund reflects the value of that underlying fund as a percentage of net assets of the Portfolio. Figures in the above graph may not sum to 100% due to rounding and/or the exclusion of other assets and liabilities. The graph depicts the Portfolio’s investments but may not represent the Portfolio’s market exposure due to the exclusion of certain derivatives, if any, as listed in the Additional Investment Information section of the Schedule of Investments. |
For more information about the Fund, please refer to www.GSAMFUNDS.com. There, you can learn more about the Fund’s investment strategies, holdings, and performance.
6
FUND BASICS
Growth Strategy
as of June 30, 2021
| | | | | | | | | | | | | | | | | | |
| | PERFORMANCE REVIEW | |
| | | | | |
| | | January 1, 2021–June 30, 2021 | | Portfolio Total Return
(based on NAV)1 | | | Growth Strategy Composite Index2 | | | Bloomberg Barclays
Global Aggregate
Bond Index | | | MSCI ACWI
Index | |
| | | | | |
| | Class A | | | 11.69 | % | | | 9.47 | % | | | 1.52 | % | | | 12.30 | % |
| | Class C | | | 11.28 | | | | 9.47 | | | | 1.52 | | | | 12.30 | |
| | Institutional | | | 11.98 | | | | 9.47 | | | | 1.52 | | | | 12.30 | |
| | Service | | | 11.61 | | | | 9.47 | | | | 1.52 | | | | 12.30 | |
| | Investor | | | 11.88 | | | | 9.47 | | | | 1.52 | | | | 12.30 | |
| | Class R6 | | | 11.92 | | | | 9.47 | | | | 1.52 | | | | 12.30 | |
| | Class R | | | 11.58 | | | | 9.47 | | | | 1.52 | | | | 12.30 | |
| | | Class P | | | 11.92 | | | | 9.47 | | | | 1.52 | | | | 12.30 | |
| 1 | | The net asset value (“NAV”) represents the net assets of the class of the Portfolio (ex-dividend) divided by the total number of shares of the class outstanding. The Portfolio’s performance assumes the reinvestment of dividends and other distributions. The Portfolio’s performance does not reflect the deduction of any applicable sales charges. |
| 2 | | The Growth Strategy Composite Index (“Growth Composite”) is a composite representation prepared by the Investment Advisor of the performance of the Portfolio’s asset classes weighted according to their respective weightings in the Portfolio’s target range. The Growth Composite is comprised of a blend of the Bloomberg Barclays Global Aggregate Bond Index (Gross, USD, Hedged) (“Bloomberg Barclays Global Index”) (20%) and the MSCI All Country World Index (Net, USD, Unhedged) (“MSCI® ACWI Index”) (80%). The Growth Strategy Composite figures do not reflect any deduction for fees, expenses or taxes. The Bloomberg Barclays Global Index is an unmanaged index, provides a broad-based measure of the global investment-grade fixed-rate debt markets and covers the most liquid portion of the global investment grade fixed-rate bond market, including government, credit and collateralized securities. The index figures do not include any deduction for fees, expenses or taxes. It is not possible to invest directly in an unmanaged index. The MSCI ACWI captures large and mid cap representation across 23 Developed Markets (DM) and 26 Emerging Markets (EM) countries. DM countries include: Australia, Austria, Belgium, Canada, Denmark, Finland, France, Germany, Hong Kong, Ireland, Israel, Italy, Japan, Netherlands, New Zealand, Norway, Portugal, Singapore, Spain, Sweden, Switzerland, the UK and the US. EM countries include: Argentina, Brazil, Chile, China, Colombia, Czech Republic, Egypt, Greece, Hungary, India, Indonesia, Korea, Malaysia, Mexico, Pakistan, Peru, Philippines, Poland, Qatar, Russia, Saudi Arabia, South Africa, Taiwan, Thailand, Turkey and United Arab Emirates. The index figures do not include any deduction for fees or expenses. It is not possible to invest directly in an unmanaged index. |
The returns set forth in the table above represent past performance. Past performance does not guarantee future results. The Portfolio’s investment return and principal value will fluctuate so that an investor’s shares, when redeemed, may be worth more or less than their original cost. Current performance may be lower or higher than the performance quoted above. Please visit our web site at www.gsamfunds.com to obtain the most recent month-end returns. Performance reflects applicable fee waivers and/or expense limitations in effect during the periods shown. In their absence, performance would be reduced. Returns do not reflect the deduction of taxes that a shareholder would pay on Portfolio distributions or the redemption of Portfolio shares.
7
FUND BASICS
| 3 | | Strategic allocation is the process of determining the areas of the global markets in which to invest, and in what long-term proportion, for each underlying fund. Our global approach attempts to generate strong long-term returns across geographies and asset classes, and is determined through a careful review of market opportunities and risk/return tradeoffs. On a monthly basis or as needed, we shift assets around the strategic allocation, over and under-weighting asset classes and countries relative to the neutral starting point, seeking to benefit from changing short-term conditions in global capital markets. This is called tactical asset allocation. |
| 4 | | Generally, dynamic fund weightings are rebalanced approximately monthly, but they may be rebalanced more or less frequently at the discretion of the Investment Adviser based on the market environment and its macro views. The weightings in the chart above reflect the allocations as of June 30, 2021. Actual underlying fund weighting in the Portfolio may differ from the figures shown above due to rounding, differences in returns of the underlying funds, or both. The above figures are not indicative of future allocations. |
8
FUND BASICS
|
| OVERALL UNDERLYING FUND WEIGHTINGS5 |
|
| Percentage of Net Assets |
| 5 | | The Portfolio is actively managed and, as such, its composition may differ over time. The percentage shown for each underlying fund reflects the value of that underlying fund as a percentage of net assets of the Portfolio. Figures in the above graph may not sum to 100% due to rounding and/or the exclusion of other assets and liabilities. The graph depicts the Portfolio’s investments but may not represent the Portfolio’s market exposure due to the exclusion of certain derivatives, if any, as listed in the Additional Investment Information section of the Schedule of Investments. |
For more information about the Fund, please refer to www.GSAMFUNDS.com. There, you can learn more about the Fund’s Investment strategies, holdings, and performance.
9
FUND BASICS
Satellite Strategies Portfolio
as of June 30, 2021
| | | | | | | | | | | | | | | | | | | | | | |
| | PERFORMANCE REVIEW | |
| | | | | | |
| | | January 1, 2021–June 30, 2021 | | Fund Total
Return
(based on
NAV)1 | | | Satellite
Strategies
Composite Index2 | | | Bloomberg
Barclays U.S.
Aggregate Bond
Index | | | MSCI® EAFE®
Net Total
Return Index | | | S&P 500®
Index | |
| | | | | | |
| | Class A | | | 8.11 | % | | | 6.43 | % | | | 1.60 | % | | | 8.83 | % | | | 15.25 | % |
| | Class C | | | 7.76 | | | | 6.43 | | | | 1.60 | | | | 8.83 | | | | 15.25 | |
| | Institutional | | | 8.19 | | | | 6.43 | | | | 1.60 | | | | 8.83 | | | | 15.25 | |
| | Service | | | 7.92 | | | | 6.43 | | | | 1.60 | | | | 8.83 | | | | 15.25 | |
| | Investor | | | 8.26 | | | | 6.43 | | | | 1.60 | | | | 8.83 | | | | 15.25 | |
| | Class R6 | | | 8.30 | | | | 6.43 | | | | 1.60 | | | | 8.83 | | | | 15.25 | |
| | Class R | | | 7.98 | | | | 6.43 | | | | 1.60 | | | | 8.83 | | | | 15.25 | |
| | | Class P | | | 8.30 | | | | 6.43 | | | | 1.60 | | | | 8.83 | | | | 15.25 | |
| 1 | | The net asset value (“NAV”) represents the net assets of the class of the Portfolio (ex-dividend) divided by the total number of shares of the class outstanding. The Portfolio’s performance reflects the reinvestment of dividends and other distributions. The Portfolio’s performance does not reflect the deduction of any applicable sales charges. |
| 2 | | The Satellite Strategies Composite Index (“Satellite Composite”) is a composite representation prepared by the Investment Adviser of the performance of the Portfolio’s asset classes weighted according to their respective weightings in the Portfolio’s target range. The Satellite Composite is comprised of the Bloomberg Barclays U.S. Aggregate Bond Index (40%), the S&P 500® Index (30%), and the MSCI® EAFE® Net Total Return Index (30%). The Satellite Composite figures do not reflect any deduction for fees, expenses or taxes. The Bloomberg Barclays U.S. Aggregate Bond Index represents an unmanaged diversified portfolio of fixed income securities, including U.S. Treasuries, investment-grade corporate bonds, and mortgage-backed and asset-backed securities. The S&P 500® Index is the Standard & Poor’s 500 Composite Index of 500 stocks, an unmanaged index of common stock prices. The unmanaged MSCI® EAFE® Index is a market capitalization weighted composite of securities in 21 developed markets. Developed Markets countries in the MSCI EAFE Index include: Australia, Austria, Belgium, Denmark, Finland, France, Germany, Hong Kong, Ireland, Israel, Italy, Japan, the Netherlands, New Zealand, Norway, Portugal, Singapore, Spain, Sweden, Switzerland and the UK. The index figures do not include any deduction for fees, expenses or taxes. It is not possible to invest directly in an unmanaged index. The index figures do not include any deduction for fees, expenses or taxes. It is not possible to invest directly in an index. |
The returns set forth in the table above represent past performance. Past performance does not guarantee future results. The Portfolio’s investment return and principal value will fluctuate so that an investor’s shares, when redeemed, may be worth more or less than their original cost. Current performance may be lower or higher than the performance quoted above. Please visit our web site at www.gsamfunds.com to obtain the most recent month-end returns. Performance reflects applicable fee waivers and/or expense limitations in effect during the periods shown. In their absence, performance would be reduced. Returns do not reflect the deduction of taxes that a shareholder would pay on Portfolio distributions or the redemption of Portfolio shares.
10
FUND BASICS
| | | | | | |
| | TARGET RISK-CONTRIBUTION INVESTMENT PORTFOLIO3 AS OF 6/30/21 |
| |
| | | Percentage of Investment Portfolio |
| |
| | | 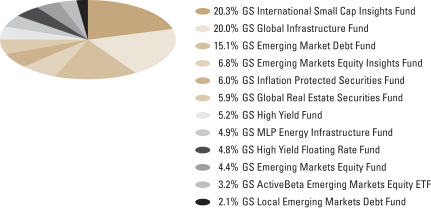 |
| 3 | | Generally, dynamic fund weightings are rebalanced approximately monthly, but they may be rebalanced more or less frequently at the discretion of the Investment Adviser based on the market environment and its macro views. The weightings in the chart above reflect the allocations as of June 30, 2021. Actual underlying fund weighting in the Portfolio may differ from the figures shown above due to rounding, differences in returns of the underlying funds, or both. The above figures are not indicative of future allocations. The percentage shown for each underlying fund reflects the value of that underlying fund as a percentage of net assets of the Portfolio. Figures in the above graph may not sum to 100% due to rounding and/or the exclusion of other assets and liabilities. |
11
FUND BASICS
|
| OVERALL UNDERLYING FUND WEIGHTINGS4 |
|
| Percentage of Net Assets |
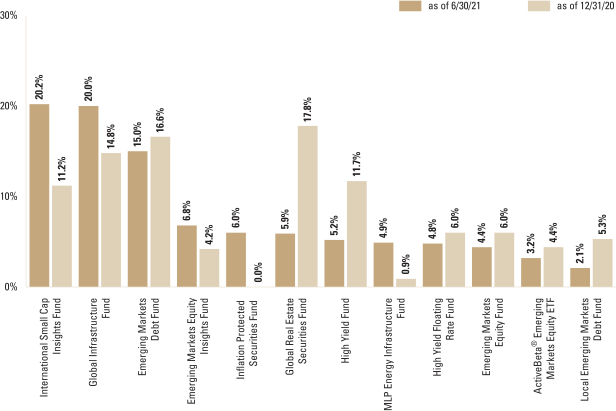
| 4 | | The Portfolio is actively managed and, as such, its composition may differ over time. The percentage shown for each underlying fund reflects the value of that underlying fund as a percentage of net assets of the Portfolio. Figures in the above graph may not sum to 100% due to rounding and/or the exclusion of other assets and liabilities. The graph depicts the Portfolio’s investments but may not represent the Portfolio’s market exposure due to the exclusion of certain derivatives, if any, as listed in the Additional Investment Information section of the Schedule of Investments. |
For more information about the Fund, please refer to www.GSAMFUNDS.com. There, you can learn more about the Fund’s investment strategies, holdings, and performance.
12
GOLDMAN SACHS BALANCED STRATEGY PORTFOLIO
Schedule of Investments
June 30, 2021 (Unaudited)
| | | | | | | | |
| Shares | | | Description | |
Value | |
|
| Underlying Funds(a) – 94.1% | |
| Dynamic – 9.9% | |
| | 2,807,393 | | | Goldman Sachs Tactical Tilt Overlay Fund – Class R6 | | $ | 29,056,522 | |
| | 1,533,395 | | | Goldman Sachs Managed Futures Strategy Fund – Class R6 | | | 16,591,337 | |
| | 1,502,104 | | | Goldman Sachs Alternative Premia Fund – Class R6 | | | 10,574,814 | |
| | | | | | | | |
| | | | | | | 56,222,673 | |
| | |
| Equity – 29.9% | |
| | 3,572,591 | | | Goldman Sachs Dynamic Global Equity Fund – Class R6 | | | 88,314,453 | |
| | 1,755,980 | | | Goldman Sachs International Equity Insights Fund – Class R6 | | | 26,655,771 | |
| | 1,861,469 | | | Goldman Sachs Emerging Markets Equity Insights Fund – Class R6 | | | 24,645,845 | |
| | 873,065 | | | Goldman Sachs International Small Cap Insights Fund – Class R6 | | | 12,493,553 | |
| | 798,912 | | | Goldman Sachs Global Infrastructure Fund – Class R6 | | | 10,274,011 | |
| | 545,695 | | | Goldman Sachs Global Real Estate Securities Fund – Class R6 | | | 6,411,921 | |
| | | | | | | | |
| | | | | | | 168,795,554 | |
| | |
| Exchange Traded Funds – 18.9% | |
| | 625,350 | | | Goldman Sachs ActiveBeta U.S. Large Cap Equity ETF | | | 53,798,861 | |
| | 969,154 | | | Goldman Sachs Access Investment Grade Corporate Bond ETF | | | 53,148,405 | |
| | | | | | | | |
| | | | | | | 106,947,266 | |
| | |
| Fixed Income – 35.4% | |
| | 11,420,574 | | | Goldman Sachs Global Core Fixed Income Fund – Class R6 | | | 146,297,555 | |
| | 1,558,201 | | | Goldman Sachs Core Fixed Income Fund – Class R6 | | | 17,124,624 | |
| | 1,594,093 | | | Goldman Sachs Emerging Markets Debt Fund – Class R6 | | | 19,750,809 | |
| | 673,186 | | | Goldman Sachs High Yield Floating Rate Fund – Class R6 | | | 6,327,953 | |
| | 869,660 | | | Goldman Sachs High Yield Fund – Class R6 | | | 5,678,882 | |
| | 853,426 | | | Goldman Sachs Local Emerging Markets Debt Fund – Class R6 | | | 4,855,995 | |
| | | | | | | | |
| | | | | | | 200,035,818 | |
| | |
| TOTAL UNDERLYING FUNDS – 94.1%
(Cost $465,172,255) | | $ | 532,001,311 | |
| | |
| Shares | | | Dividend
Rate | |
Value | |
|
| Investment Company(a) – 4.0% | |
| Goldman Sachs Financial Square Government Fund –
Institutional Shares |
|
| | 22,431,770 | | | 0.026% | | $ | 22,431,770 | |
| (Cost $22,431,770) | |
| | |
| TOTAL INVESTMENTS – 98.1%
(Cost $487,604,025) | | $ | 554,433,081 | |
| | |
| OTHER ASSETS IN EXCESS OF
LIABILITIES – 1.9% | | | 10,851,922 | |
| | |
| | NET ASSETS – 100.0% | | $ | 565,285,003 | |
| | |
| | |
|
| The percentage shown for each investment category reflects the value of investments in that category as a percentage of net assets. |
| |
(a) | | Represents an Affiliated issuer. |
| | | | |
|
Currency Abbreviations: |
AUD | | —Australian Dollar |
CHF | | —Swiss Franc |
DKK | | —Danish Krone |
EUR | | —Euro |
GBP | | —British Pound |
HKD | | —Hong Kong Dollar |
ILS | | —Israeli Shekel |
JPY | | —Japanese Yen |
NOK | | —Norwegian Krone |
NZD | | —New Zealand Dollar |
SEK | | —Swedish Krona |
SGD | | —Singapore Dollar |
USD | | —U.S. Dollar |
| | | | |
Investment Abbreviation: |
ETF | | —Exchange Traded Fund |
|
| | |
| The accompanying notes are an integral part of these financial statements. | | 13 |
GOLDMAN SACHS BALANCED STRATEGY PORTFOLIO
Schedule of Investments (continued)
June 30, 2021 (Unaudited)
|
| ADDITIONAL INVESTMENT INFORMATION |
FORWARD FOREIGN CURRENCY EXCHANGE CONTRACTS — At June 30, 2021, the Portfolio had the following forward foreign currency exchange contracts:
FORWARD FOREIGN CURRENCY EXCHANGE CONTRACTS WITH UNREALIZED GAIN
| | | | | | | | | | | | | | | | | | | | |
| Counterparty | | Currency
Purchased | | | Currency
Sold | | | Settlement
Date | | | Unrealized
Gain | |
MS & Co. Int. PLC | | SGD | | | 40,000 | | | USD | | | 29,732 | | | | 09/15/21 | | | $ | 14 | |
| | USD | | | 9,712,371 | | | JPY | | | 1,064,000,000 | | | | 09/15/21 | | | | 128,716 | |
| | USD | | | 101,337 | | | NZD | | | 140,000 | | | | 09/15/21 | | | | 3,500 | |
| | USD | | | 956,327 | | | DKK | | | 5,820,000 | | | | 09/15/21 | | | | 26,905 | |
| | USD | | | 246,436 | | | NOK | | | 2,050,000 | | | | 09/15/21 | | | | 8,271 | |
| | USD | | | 415,527 | | | SGD | | | 550,000 | | | | 09/15/21 | | | | 6,519 | |
| | USD | | | 123,174 | | | ILS | | | 400,000 | | | | 09/17/21 | | | | 368 | |
| | USD | | | 1,294,147 | | | HKD | | | 10,040,000 | | | | 09/15/21 | | | | 849 | |
| | USD | | | 12,587,743 | | | EUR | | | 10,300,000 | | | | 09/15/21 | | | | 355,154 | |
| | USD | | | 2,809,613 | | | AUD | | | 3,630,000 | | | | 09/15/21 | | | | 86,404 | |
| | USD | | | 1,385,103 | | | SEK | | | 11,475,000 | | | | 09/15/21 | | | | 43,303 | |
| | USD | | | 5,680,236 | | | GBP | | | 4,010,000 | | | | 09/15/21 | | | | 132,241 | |
| | | USD | | | 3,655,025 | | | CHF | | | 3,280,000 | | | | 09/15/21 | | | | 102,800 | |
| | | | | | |
| TOTAL | | | | | | | | | | | | | | | | | | $ | 895,044 | |
FORWARD FOREIGN CURRENCY EXCHANGE CONTRACTS WITH UNREALIZED LOSS
| | | | | | | | | | | | | | | | | | | | |
| Counterparty | | Currency
Purchased | | | Currency
Sold | | | Settlement
Date | | | Unrealized
Loss | |
MS & Co. Int. PLC | | EUR | | | 140,000 | | | USD | | | 166,874 | | | | 09/15/21 | | | $ | (606 | ) |
| | GBP | | | 240,000 | | | USD | | | 332,485 | | | | 09/15/21 | | | | (436 | ) |
| | HKD | | | 1,410,000 | | | USD | | | 181,670 | | | | 09/15/21 | | | | (41 | ) |
| | AUD | | | 190,000 | | | USD | | | 142,786 | | | | 09/15/21 | | | | (249 | ) |
| | JPY | | | 127,000,000 | | | USD | | | 1,149,624 | | | | 09/15/21 | | | | (5,710 | ) |
| | NOK | | | 50,000 | | | USD | | | 5,844 | | | | 09/15/21 | | | | (35 | ) |
| | | NZD | | | 20,000 | | | USD | | | 13,983 | | | | 09/15/21 | | | | (6 | ) |
| | | | | | |
| TOTAL | | | | | | | | | | | | | | | | | | $ | (7,083 | ) |
FUTURES CONTRACTS — At June 30, 2021, the Portfolio had the following futures contracts:
| | | | | | | | | | | | | | | | |
| Description | | Number of
Contracts | | | Expiration
Date | | | Notional
Amount | | | Unrealized
Appreciation/
(Depreciation) | |
Long position contracts: | | | | | | | | | | | | | | | | |
S&P 500 E-Mini Index | | | 134 | | | | 09/17/21 | | | $ | 28,733,620 | | | $ | 466,067 | |
10 Year U.S. Treasury Notes | | | 143 | | | | 09/21/21 | | | | 18,947,500 | | | | 109,220 | |
| | | | |
| TOTAL FUTURES CONTRACTS | | | | | | | | | | | | | | $ | 575,287 | |
| | |
| 14 | | The accompanying notes are an integral part of these financial statements. |
GOLDMAN SACHS BALANCED STRATEGY PORTFOLIO
|
| ADDITIONAL INVESTMENT INFORMATION (continued) |
PURCHASED OPTIONS CONTRACTS — At June 30, 2021, the Portfolio had the following purchased options:
EXCHANGE TRADED OPTIONS ON FUTURES
| | | | | | | | | | | | | | | | | | | | | | | | | | |
| Description | | Exercise
Price | | Expiration
Date | | | Number of
Contracts | | | Notional
Amount | | | Market
Value | | | Premiums Paid
(Received) by
Portfolio | | | Unrealized
Appreciation/
(Depreciation) | |
Purchased option contracts | | | | | | | | | | | | | | | | | | | | | | | | | | |
Calls | | | | | | | | | | | | | | | | | | | | | | | | | | |
Eurodollar Futures | | $97.750 | | | 03/13/2023 | | | | 89 | | | $ | 222,500 | | | $ | 368,238 | | | $ | 392,012 | | | $ | (23,774 | ) |
Eurodollar Futures | | 97.750 | | | 06/19/2023 | | | | 96 | | | | 240,000 | | | | 369,600 | | | | 391,501 | | | | (21,901 | ) |
Eurodollar Futures | | 99.000 | | | 12/19/2022 | | | | 384 | | | | 960,000 | | | | 547,200 | | | | 546,824 | | | | 376 | |
| | | | | | | |
| TOTAL | | | | | | | | | 569 | | | $ | 1,422,500 | | | $ | 1,285,038 | | | $ | 1,330,337 | | | $ | (45,299 | ) |
| | |
|
Abbreviations: |
MS & Co. Int. PLC—Morgan Stanley & Co. International PLC |
|
| | |
| The accompanying notes are an integral part of these financial statements. | | 15 |
GOLDMAN SACHS GROWTH AND INCOME STRATEGY PORTFOLIO
Schedule of Investments
June 30, 2021 (Unaudited)
| | | | | | | | |
| Shares | | | Description | |
Value | |
|
| Underlying Funds(a) – 94.4% | |
| Dynamic – 7.4% | |
| | 3,795,619 | | | Goldman Sachs Tactical Tilt Overlay Fund – Class R6 | | $ | 39,284,656 | |
| | 2,217,967 | | | Goldman Sachs Managed Futures Strategy Fund – Class R6 | | | 23,998,399 | |
| | 1,235,011 | | | Goldman Sachs Alternative Premia Fund – Class R6 | | | 8,694,477 | |
| | | | | | | | |
| | | | | | | 71,977,532 | |
| | |
| Equity – 40.8% | |
| | 8,174,677 | | | Goldman Sachs Dynamic Global Equity Fund – Class R6 | | | 202,078,012 | |
| | 5,510,697 | | | Goldman Sachs International Equity Insights Fund – Class R6 | | | 83,652,381 | |
| | 4,371,680 | | | Goldman Sachs Emerging Markets Equity Insights Fund – Class R6 | | | 57,881,047 | |
| | 1,880,665 | | | Goldman Sachs International Small Cap Insights Fund – Class R6 | | | 26,912,320 | |
| | 1,367,348 | | | Goldman Sachs Global Infrastructure Fund – Class R6 | | | 17,584,091 | |
| | 878,980 | | | Goldman Sachs Global Real Estate Securities Fund – Class R6 | | | 10,328,014 | |
| | | | | | | | |
| | | | | | | 398,435,865 | |
| | |
| Exchange Traded Funds – 30.0% | |
| | 2,407,185 | | | Goldman Sachs ActiveBeta U.S. Large Cap Equity ETF | | | 207,090,126 | |
| | 1,576,107 | | | Goldman Sachs Access Investment Grade Corporate Bond ETF | | | 86,433,708 | |
| | | | | | | | |
| | | | | | | 293,523,834 | |
| | |
| Fixed Income – 16.2% | |
| | 6,936,258 | | | Goldman Sachs Global Core Fixed Income Fund – Class R6 | | | 88,853,467 | |
| | 2,908,716 | | | Goldman Sachs Emerging Markets Debt Fund – Class R6 | | | 36,038,993 | |
| | 2,511,510 | | | Goldman Sachs Local Emerging Markets Debt Fund – Class R6 | | | 14,290,491 | |
| | 1,515,489 | | | Goldman Sachs High Yield Fund – Class R6 | | | 9,896,142 | |
| | 982,048 | | | Goldman Sachs High Yield Floating Rate Fund – Class R6 | | | 9,231,250 | |
| | | | | | | | |
| | | | | | | 158,310,343 | |
| | |
| | TOTAL UNDERLYING FUNDS – 94.4% | |
| | (Cost $736,924,317) | | $ | 922,247,574 | |
| | |
| | |
| Shares | | | Dividend
Rate | |
Value | |
|
| Investment Company(a) – 3.8% | |
| Goldman Sachs Financial Square Government Fund –
Institutional Shares |
|
| | 36,836,176 | | | 0.026% | | $ | 36,836,176 | |
| | (Cost $36,836,176) | |
| | |
| | TOTAL INVESTMENTS – 98.2% | |
| | (Cost $773,760,493) | | $ | 959,083,750 | |
| | |
| OTHER ASSETS IN EXCESS OF
LIABILITIES – 1.8% | | | 17,571,600 | |
| | |
| | NET ASSETS – 100.0% | | $ | 976,655,350 | |
| | |
| | |
|
| The percentage shown for each investment category reflects the value of investments in that category as a percentage of net assets. |
| |
(a) | | Represents an Affiliated Issuer. |
| | |
|
Currency Abbreviations: |
AUD | | —Australian Dollar |
CHF | | —Swiss Franc |
DKK | �� | —Danish Krone |
EUR | | —Euro |
GBP | | —British Pound |
HKD | | —Hong Kong Dollar |
ILS | | —Israeli Shekel |
JPY | | —Japanese Yen |
NOK | | —Norwegian Krone |
NZD | | —New Zealand Dollar |
SEK | | —Swedish Krona |
SGD | | —Singapore Dollar |
USD | | —U.S. Dollar |
| | |
Investment Abbreviation: |
ETF | | —Exchange Traded Fund |
|
| | |
| 16 | | The accompanying notes are an integral part of these financial statements. |
GOLDMAN SACHS GROWTH AND INCOME STRATEGY PORTFOLIO
|
| ADDITIONAL INVESTMENT INFORMATION |
FORWARD FOREIGN CURRENCY EXCHANGE CONTRACTS — At June 30, 2021, the Portfolio had the following forward foreign currency exchange contracts:
FORWARD FOREIGN CURRENCY EXCHANGE CONTRACTS WITH UNREALIZED GAIN
| | | | | | | | | | | | | | | | | | | | | | | | |
| Counterparty | | Currency Purchased | | | Currency Sold | | | Settlement
Date | | | Unrealized
Gain | |
MS & Co. Int. PLC | | | SGD | | | | 180,000 | | | | USD | | | | 133,796 | | | | 09/15/21 | | | $ | 62 | |
| | | USD | | | | 195,435 | | | | NZD | | | | 270,000 | | | | 09/15/21 | | | | 6,750 | |
| | | USD | | | | 1,861,039 | | | | DKK | | | | 11,320,000 | | | | 09/15/21 | | | | 53,297 | |
| | | USD | | | | 468,830 | | | | NOK | | | | 3,900,000 | | | | 09/15/21 | | | | 15,735 | |
| | | USD | | | | 815,944 | | | | SGD | | | | 1,080,000 | | | | 09/15/21 | | | | 12,800 | |
| | | USD | | | | 246,349 | | | | ILS | | | | 800,000 | | | | 09/17/21 | | | | 737 | |
| | | USD | | | | 2,366,587 | | | | HKD | | | | 18,360,000 | | | | 09/15/21 | | | | 1,552 | |
| | | USD | | | | 17,516,956 | | | | JPY | | | | 1,919,000,000 | | | | 09/15/21 | | | | 232,147 | |
| | | USD | | | | 2,743,538 | | | | SEK | | | | 22,725,000 | | | | 09/15/21 | | | | 86,250 | |
| | | USD | | | | 5,294,146 | | | | AUD | | | | 6,840,000 | | | | 09/15/21 | | | | 162,811 | |
| | | USD | | | | 10,836,361 | | | | GBP | | | | 7,650,000 | | | | 09/15/21 | | | | 252,280 | |
| | | USD | | | | 6,923,585 | | | | CHF | | | | 6,210,000 | | | | 09/15/21 | | | | 198,184 | |
| | | | USD | | | | 24,918,843 | | | | EUR | | | | 20,390,000 | | | | 09/15/21 | | | | 703,068 | |
| | | | | | |
| TOTAL | | | | | | | | | | | | | | | | | | | | | | $ | 1,725,673 | |
FORWARD FOREIGN CURRENCY EXCHANGE CONTRACTS WITH UNREALIZED LOSS
| | | | | | | | | | | | | | | | | | | | | | | | |
| Counterparty | | Currency Purchased | | | Currency Sold | | | Settlement
Date | | | Unrealized
Loss | |
MS & Co. Int. PLC | | | CHF | | | | 400,000 | | | | USD | | | | 435,273 | | | | 09/15/21 | | | $ | (2,075 | ) |
| | | AUD | | | | 750,000 | | | | USD | | | | 563,624 | | | | 09/15/21 | | | | (977 | ) |
| | | GBP | | | | 980,000 | | | | USD | | | | 1,357,624 | | | | 09/15/21 | | | | (1,755 | ) |
| | | HKD | | | | 3,090,000 | | | | USD | | | | 398,095 | | | | 09/15/21 | | | | (58 | ) |
| | | ILS | | | | 120,000 | | | | USD | | | | 36,910 | | | | 09/17/21 | | | | (69 | ) |
| | | DKK | | | | 1,020,000 | | | | USD | | | | 163,486 | | | | 09/15/21 | | | | (597 | ) |
| | | EUR | | | | 2,420,000 | | | | USD | | | | 2,884,483 | | | | 09/15/21 | | | | (10,418 | ) |
| | | JPY | | | | 261,000,000 | | | | USD | | | | 2,362,570 | | | | 09/15/21 | | | | (11,693 | ) |
| | | SEK | | | | 2,400,000 | | | | USD | | | | 281,833 | | | | 09/15/21 | | | | (1,195 | ) |
| | | NOK | | | | 400,000 | | | | USD | | | | 46,754 | | | | 09/15/21 | | | | (283 | ) |
| | | | NZD | | | | 50,000 | | | | USD | | | | 34,956 | | | | 09/15/21 | | | | (14 | ) |
| | | | | | |
| TOTAL | | | | | | | | | | | | | | | | | | | | | | $ | (29,134 | ) |
FUTURES CONTRACTS — At June 30, 2021, the Portfolio had the following futures contracts:
| | | | | | | | | | | | | | |
| Description | | Number of
Contracts | | | Expiration
Date | | Notional
Amount | | | Unrealized
Appreciation/
(Depreciation) | |
Long position contracts: | | | | | | | | | | | | | | |
S&P 500 E-Mini Index | | | 169 | | | 09/17/21 | | $ | 36,238,670 | | | $ | 587,312 | |
10 Year U.S. Treasury Notes | | | 272 | | | 09/21/21 | | | 36,040,000 | | | | 207,747 | |
| | | | |
| TOTAL FUTURES CONTRACTS | | | | | | | | | | | | $ | 795,059 | |
| | |
| The accompanying notes are an integral part of these financial statements. | | 17 |
GOLDMAN SACHS GROWTH AND INCOME STRATEGY PORTFOLIO
Schedule of Investments (continued)
June 30, 2021 (Unaudited)
|
| ADDITIONAL INVESTMENT INFORMATION (continued) |
PURCHASED OPTIONS CONTRACTS — At June 30, 2021, the Portfolio had the following purchased options:
EXCHANGE TRADED OPTIONS ON FUTURES
| | | | | | | | | | | | | | | | | | | | | | | | | | |
| Description | | Exercise
Price | | Expiration
Date | | | Number of
Contracts | | | Notional
Amount | | | Market
Value | | | Premiums Paid
(Received) by
Portfolio | | | Unrealized
Appreciation/
(Depreciation) | |
Purchased option contracts | | | | | | | | | | | | | | | | | | | | | | | | | | |
Calls | | | | | | | | | | | | | | | | | | | | | | | | | | |
Eurodollar Futures | | $97.750 | | | 06/19/2023 | | | | 161 | | | $ | 402,500 | | | $ | 619,850 | | | $ | 656,580 | | | $ | (36,730 | ) |
Eurodollar Futures | | 97.750 | | | 03/13/2023 | | | | 149 | | | | 372,500 | | | | 616,488 | | | | 656,290 | | | | (39,802 | ) |
Eurodollar Futures | | 99.000 | | | 12/19/2022 | | | | 698 | | | | 1,745,000 | | | | 994,650 | | | | 993,966 | | | | 684 | |
| | | | | | | |
| TOTAL | | | | | | | | | 1,008 | | | $ | 2,520,000 | | | $ | 2,230,988 | | | $ | 2,306,836 | | | $ | (75,848 | ) |
| | |
|
Abbreviation: |
MS & Co. Int. PLC | | —Morgan Stanley & Co. International PLC |
|
| | |
| 18 | | The accompanying notes are an integral part of these financial statements. |
GOLDMAN SACHS GROWTH STRATEGY PORTFOLIO
Schedule of Investments
June 30, 2021 (Unaudited)
| | | | | | | | |
| Shares | | | Description | |
Value | |
|
| Underlying Funds(a) – 94.0% | |
| Dynamic – 4.5% | |
| | 2,567,005 | | | Goldman Sachs Tactical Tilt Overlay Fund – Class R6 | | $ | 26,568,500 | |
| | 1,259,834 | | | Goldman Sachs Managed Futures Strategy Fund – Class R6 | | | 13,631,409 | |
| | | | | | | | |
| | | | | | | 40,199,909 | |
| | |
| Equity – 52.7% | |
| | 8,928,945 | | | Goldman Sachs Dynamic Global Equity Fund – Class R6 | | | 220,723,524 | |
| | 7,205,255 | | | Goldman Sachs International Equity Insights Fund – Class R6 | | | 109,375,766 | |
| | 5,498,998 | | | Goldman Sachs Emerging Markets Equity Insights Fund – Class R6 | | | 72,806,727 | |
| | 2,749,882 | | | Goldman Sachs International Small Cap Insights Fund – Class R6 | | | 39,350,805 | |
| | 1,310,624 | | | Goldman Sachs Global Infrastructure Fund – Class R6 | | | 16,854,621 | |
| | 738,802 | | | Goldman Sachs Global Real Estate Securities Fund – Class R6 | | | 8,680,920 | |
| | | | | | | | |
| | | | | | | 467,792,363 | |
| | |
| Exchange Traded Funds – 30.7% | |
| | 3,057,660 | | | Goldman Sachs ActiveBeta U.S. Large Cap Equity ETF | | | 263,050,490 | |
| | 171,088 | | | Goldman Sachs Access Investment Grade Corporate Bond ETF | | | 9,382,466 | |
| | | | | | | | |
| | | | | | | 272,432,956 | |
| | |
| Fixed Income – 6.1% | |
| | 2,996,445 | | | Goldman Sachs Emerging Markets Debt Fund – Class R6 | | | 37,125,957 | |
| | 1,488,560 | | | Goldman Sachs Local Emerging Markets Debt Fund – Class R6 | | | 8,469,906 | |
| | 1,219,218 | | | Goldman Sachs High Yield Fund – Class R6 | | | 7,961,493 | |
| | | | | | | | |
| | | | | | | 53,557,356 | |
| | |
| | TOTAL UNDERLYING FUND – 98.1% | | | | |
| | (Cost $616,262,783) | | $ | 833,982,584 | |
| | |
| Shares | | | Dividend
Rate | | Value | |
|
| Investment Company(a) – 4.1% | |
| Goldman Sachs Financial Square Government Fund –
Institutional Shares |
|
| | 36,197,382 | | | 0.026% | | $ | 36,197,382 | |
| | (Cost $36,197,382) | |
| | |
| | TOTAL INVESTMENTS – 98.1% | | | | |
| | (Cost $652,460,165) | | $ | 870,179,966 | |
| | |
| OTHER ASSETS IN EXCESS OF
LIABILITIES – 1.9% | | | 17,300,615 | |
| | |
| | NET ASSETS – 100.0% | | $ | 887,480,581 | |
| | |
| | |
|
| The percentage shown for each investment category reflects the value of investments in that category as a percentage of net assets. |
|
(a) Represents an Affiliated issuer. |
| | |
|
Currency Abbreviations: |
AUD | | —Australian Dollar |
CHF | | —Swiss Franc |
DKK | | —Danish Krone |
EUR | | —Euro |
GBP | | —British Pound |
HKD | | —Hong Kong Dollar |
ILS | | —Israeli Shekel |
JPY | | —Japanese Yen |
NOK | | —Norwegian Krone |
NZD | | —New Zealand Dollar |
SEK | | —Swedish Krona |
SGD | | —Singapore Dollar |
USD | | —U.S. Dollar |
| | |
Investment Abbreviations: |
ETF | | —Exchange Traded Fund |
|
| | |
| The accompanying notes are an integral part of these financial statements. | | 19 |
GOLDMAN SACHS GROWTH STRATEGY PORTFOLIO
Schedule of Investments (continued)
June 30, 2021 (Unaudited)
|
| ADDITIONAL INVESTMENT INFORMATION |
FORWARD FOREIGN CURRENCY EXCHANGE CONTRACTS — At June 30, 2021, the Portfolio had the following forward foreign currency exchange contracts:
FORWARD FOREIGN CURRENCY EXCHANGE CONTRACTS WITH UNREALIZED GAIN
| | | | | | | | | | | | | | | | | | | | |
| Counterparty | | Currency
Purchased | | | Currency
Sold | | | Settlement
Date | | | Unrealized
Gain | |
MS & Co. Int. PLC | | USD | | | 13,327,126 | | | JPY | | | 1,460,000,000 | | | | 09/15/21 | | | $ | 176,620 | |
| | USD | | | 144,767 | | | NZD | | | 200,000 | | | | 09/15/21 | | | | 5,000 | |
| | USD | | | 1,311,934 | | | DKK | | | 7,980,000 | | | | 09/15/21 | | | | 37,572 | |
| | USD | | | 336,596 | | | NOK | | | 2,800,000 | | | | 09/15/21 | | | | 11,296 | |
| | USD | | | 581,738 | | | SGD | | | 770,000 | | | | 09/15/21 | | | | 9,126 | |
| | USD | | | 172,444 | | | ILS | | | 560,000 | | | | 09/17/21 | | | | 516 | |
| | USD | | | 1,762,050 | | | HKD | | | 13,670,000 | | | | 09/15/21 | | | | 1,156 | |
| | USD | | | 17,635,062 | | | EUR | | | 14,430,000 | | | | 09/15/21 | | | | 497,561 | |
| | USD | | | 3,893,210 | | | AUD | | | 5,030,000 | | | | 09/15/21 | | | | 119,728 | |
| | USD | | | 1,928,626 | | | SEK | | | 15,975,000 | | | | 09/15/21 | | | | 60,631 | |
| | USD | | | 7,826,261 | | | GBP | | | 5,525,000 | | | | 09/15/21 | | | | 182,203 | |
| | | USD | | | 5,039,389 | | | CHF | | | 4,520,000 | | | | 09/15/21 | | | | 144,250 | |
| | | | | | |
| TOTAL | | | | | | | | | | | | | | | | | | $ | 1,245,659 | |
FUTURES CONTRACTS — At June 30, 2021, the Portfolio had the following futures contracts:
| | | | | | | | | | | | | | | | |
| Description | | Number of
Contracts | | | Expiration
Date | | | Notional
Amount | | | Unrealized
Appreciation/
(Depreciation) | |
Long position contracts: | | | | | | | | | | | | | | | | |
S&P 500 E-Mini Index | | | 199 | | | | 09/17/21 | | | $ | 42,671,570 | | | $ | 691,656 | |
10 Year U.S. Treasury Notes | | | 252 | | | | 09/21/21 | | | | 33,390,000 | | | | 192,471 | |
| | | | |
| TOTAL FUTURES CONTRACTS | | | | | | | | | | | | | | $ | 884,127 | |
PURCHASED OPTIONS CONTRACTS — At June 30, 2021, the Portfolio had the following purchased options:
EXCHANGE TRADED OPTIONS ON FUTURES
| | | | | | | | | | | | | | | | | | | | | | | | | | |
| Description | | Exercise
Price | | Expiration
Date | | | Number of
Contracts | | | Notional
Amount | | | Market
Value | | | Premiums Paid
(Received) by
Portfolio | | | Unrealized
Appreciation/
(Depreciation) | |
Purchased option contracts | | | | | | | | | | | | | | | | | | | | | | | | | | |
Calls | | | | | | | | | | | | | | | | | | | | | | | | | | |
Eurodollar Futures | | $97.750 | | | 03/13/2023 | | | | 151 | | | $ | 377,500 | | | $ | 624,763 | | | $ | 665,099 | | | $ | (40,336 | ) |
Eurodollar Futures | | 97.750 | | | 06/19/2023 | | | | 163 | | | | 407,500 | | | | 627,550 | | | | 664,736 | | | | (37,186 | ) |
Eurodollar Futures | | 99.000 | | | 12/19/2022 | | | | 741 | | | | 1,852,500 | | | | 1,055,925 | | | | 1,055,199 | | | | 726 | |
| | | | | | | |
| TOTAL | | | | | | | | | 1,055 | | | $ | 2,637,500 | | | $ | 2,308,238 | | | $ | 2,385,034 | | | $ | (76,796 | ) |
| | |
|
Abbreviations: |
MS & Co. Int. PLC—Morgan Stanley & Co. International PLC |
|
| | |
| 20 | | The accompanying notes are an integral part of these financial statements. |
GOLDMAN SACHS SATELLITE STRATEGIES PORTFOLIO
Schedule of Investments
June 30, 2021 (Unaudited)
| | | | | | | | |
| Shares | | | Description | | Value | |
|
| Underlying Funds(a) – 98.7% | |
| Equity – 62.3% | |
| | 1,924,939 | | | Goldman Sachs International Small Cap Insights Fund – Class R6 | | $ | 27,545,881 | |
| | 2,114,732 | | | Goldman Sachs Global Infrastructure Fund – Class R6 | | | 27,195,448 | |
| | 699,378 | | | Goldman Sachs Emerging Markets Equity Insights Fund – Class R6 | | | 9,259,761 | |
| | 686,502 | | | Goldman Sachs Global Real Estate Securities Fund – Class R6 | | | 8,066,395 | |
| | 262,987 | | | Goldman Sachs MLP Energy Infrastructure Fund – Class R6 | | | 6,648,301 | |
| | 183,295 | | | Goldman Sachs Emerging Markets Equity Fund – Class R6 | | | 6,037,731 | |
| | | | | | | | |
| | | | | | | 84,753,517 | |
| | |
| Exchange Traded Funds – 3.2% | |
| | 105,925 | | | Goldman Sachs ActiveBeta Emerging Markets Equity ETF | | | 4,322,799 | |
| | |
| Fixed Income – 33.2% | |
| | 1,652,298 | | | Goldman Sachs Emerging Markets Debt Fund – Class R6 | | | 20,471,968 | |
| | 701,849 | | | Goldman Sachs Inflation Protected Securities Fund – Class R6 | | | 8,211,638 | |
| | 1,077,712 | | | Goldman Sachs High Yield Fund – Class R6 | | | 7,037,461 | |
| | 699,778 | | | Goldman Sachs High Yield Floating Rate Fund – Class R6 | | | 6,577,912 | |
| | 506,249 | | | Goldman Sachs Local Emerging Markets Debt Fund – Class R6 | | | 2,880,559 | |
| | | | | | | | |
| | | | | | | 45,179,538 | |
| | |
| TOTAL UNDERLYING FUNDS – 98.7%
(Cost $100,121,666) | | $ | 134,255,854 | |
| | |
| OTHER ASSETS IN EXCESS OF
LIABILITIES – 1.3% | | | 1,789,326 | |
| | |
| | NET ASSETS – 100.0% | | $ | 136,045,180 | |
| | |
| | |
|
| The percentage shown for each investment category reflects the value of investments in that category as a percentage of net assets. |
| |
(a) | | Represents an Affiliated issuer. |
| | |
|
Investment Abbreviations: |
ETF | | —Exchange Traded Fund |
|
| | |
| The accompanying notes are an integral part of these financial statements. | | 21 |
GOLDMAN SACHS FUND OF FUNDS PORTFOLIOS
Statements of Assets and Liabilities
June 30, 2021 (Unaudited)
| | | | | | | | | | |
| | | | | Balanced
Strategy
Portfolio | | | Growth
and Income
Strategy
Portfolio | |
| | Assets: | | | | | | | | |
| | Investments in Affiliated Funds, at value (cost $487,604,025 and $773,760,493, respectively) | | $ | 554,433,081 | | | $ | 959,083,750 | |
| | Purchased options, at value (premium paid $1,330,337 and $2,306,836, respectively) | | | 1,285,038 | | | | 2,230,988 | |
| | Cash | | | 9,165,093 | | | | 15,269,887 | |
| | Foreign currencies, at value (cost $20,842 and $45,512, respectively) | | | 25,349 | | | | 45,278 | |
| | Unrealized gain on forward foreign currency exchange contracts | | | 895,044 | | | | 1,725,673 | |
| | Variation margin on futures contracts | | | 89,507 | | | | 139,742 | |
| | Receivables: | | | | | | | | |
| | Collateral on certain derivative contracts(a) | | | 531,183 | | | | 166,128 | |
| | Dividends | | | 386,454 | | | | 505,513 | |
| | Reimbursement from investment adviser | | | 27,813 | | | | 32,465 | |
| | Portfolio shares sold | | | 18,279 | | | | 1,063,128 | |
| | Other assets | | | 65,016 | | | | 65,075 | |
| | Total assets | | | 566,921,857 | | | | 980,327,627 | |
| | | | | | | | | | |
| | Liabilities: | | | | | | | | |
| | Unrealized loss on forward foreign currency exchange contracts | | | 7,083 | | | | 29,134 | |
| | Payables: | | | | | | | | |
| | Collateral on certain derivative contracts(b) | | | 600,000 | | | | 1,550,000 | |
| | Portfolio shares redeemed | | | 468,669 | | | | 1,349,312 | |
| | Investments purchased | | | 266,303 | | | | 304,047 | |
| | Management fees | | | 69,305 | | | | 120,198 | |
| | Distribution and Service fees and Transfer Agency fees | | | 65,192 | | | | 137,116 | |
| | Accrued expenses | | | 160,302 | | | | 182,470 | |
| | Total liabilities | | | 1,636,854 | | | | 3,672,277 | |
| | | | | | | | | | |
| | Net Assets: | | | | | | | | |
| | Paid-in capital | | | 484,019,980 | | | | 774,405,060 | |
| | Total distributable earnings | | | 81,265,023 | | | | 202,250,290 | |
| | | NET ASSETS | | $ | 565,285,003 | | | $ | 976,655,350 | |
| | | Net Assets: | | | | | | | | |
| | | Class A | | $ | 113,563,150 | | | $ | 307,765,276 | |
| | | Class C | | | 7,363,750 | | | | 10,857,399 | |
| | | Institutional | | | 373,350,131 | | | | 383,004,675 | |
| | | Service | | | 404,124 | | | | 2,738,102 | |
| | | Investor | | | 5,337,684 | | | | 8,984,991 | |
| | | Class R6 | | | 1,498,159 | | | | 5,073,447 | |
| | | Class R | | | 10,303,656 | | | | 5,791,226 | |
| | | Class P | | | 53,464,349 | | | | 252,440,234 | |
| | | Total Net Assets | | $ | 565,285,003 | | | $ | 976,655,350 | |
| | | Shares Outstanding $0.001 par value (unlimited number of shares authorized): | | | | | | | | |
| | | Class A | | | 8,549,689 | | | | 18,310,830 | |
| | | Class C | | | 553,527 | | | | 663,561 | |
| | | Institutional | | | 28,112,714 | | | | 22,715,566 | |
| | | Service | | | 30,042 | | | | 163,320 | |
| | | Investor | | | 403,658 | | | | 537,300 | |
| | | Class R6 | | | 112,820 | | | | 301,052 | |
| | | Class R | | | 779,133 | | | | 347,532 | |
| | | Class P | | | 4,024,543 | | | | 14,980,530 | |
| | | Net asset value, offering and redemption price per share:(c) | | | | | | | | |
| | | Class A | | | $13.28 | | | | $16.81 | |
| | | Class C | | | 13.30 | | | | 16.36 | |
| | | Institutional | | | 13.28 | | | | 16.86 | |
| | | Service | | | 13.45 | | | | 16.77 | |
| | | Investor | | | 13.22 | | | | 16.72 | |
| | | Class R6 | | | 13.28 | | | | 16.85 | |
| | | Class R | | | 13.22 | | | | 16.66 | |
| | | Class P | | | 13.28 | | | | 16.85 | |
| | (a) | | Segregated for initial margin and/or collateral on transactions as follows: |
| | | | |
| Portfolio | | Futures | |
Balanced Strategy | | $ | 531,183 | |
| |
Growth and Income Strategy | | | 166,128 | |
| | (b) | | Segregated for initial margin and/or collateral on foreign currency contracts. |
| | (c) | | Maximum public offering price per share for Class A Shares of the Balanced Strategy and Growth and Income Strategy Portfolios is $14.05 and $17.79, respectively. At redemption, Class C Shares may be subject to a contingent deferred sales charge, assessed on the amount equal to the lesser of the current net asset value (“NAV”) or the original purchase price of the shares. |
| | |
| 22 | | The accompanying notes are an integral part of these financial statements. |
GOLDMAN SACHS FUND OF FUNDS PORTFOLIOS
Statements of Assets and Liabilities (continued)
June 30, 2021 (Unaudited)
| | | | | | | | | | |
| | | | | Growth
Strategy
Portfolio | | |
Satellite
Strategies
Portfolio | |
| | Assets: | | | | | | | | |
| | Investments in Affiliated Funds, at value (cost $652,460,165 and $100,121,666, respectively) | | $ | 870,179,966 | | | $ | 134,255,854 | |
| | Purchased options, at value (premium paid $2,385,034 and $0, respectively) | | | 2,308,238 | | | | — | |
| | Cash | | | 14,372,934 | | | | 1,654,013 | |
| | Foreign currencies, at value (cost $57,186 and $0, respectively) | | | 56,845 | | | | — | |
| | Unrealized gain on forward foreign currency exchange contracts | | | 1,245,659 | | | | — | |
| | Variation margin on futures contracts | | | 145,905 | | | | — | |
| | Receivables: | | | | | | | | |
| | Collateral on certain derivative contracts(a) | | | 452,874 | | | | — | |
| | Dividends | | | 367,963 | | | | 385,238 | |
| | Portfolio shares sold | | | 190,800 | | | | 74,234 | |
| | Reimbursement from investment adviser | | | 31,050 | | | | 25,883 | |
| | Other assets | | | 63,754 | | | | 60,242 | |
| | Total assets | | | 889,415,988 | | | | 136,455,464 | |
| | | | | | | | | | |
| | Liabilities: | | | | | | | | |
| | Payables: | | | | | | | | |
| | Collateral on certain derivative contracts(b) | | | 1,110,000 | | | | — | |
| | Portfolio shares redeemed | | | 163,767 | | | | 76,227 | |
| | Investments purchased | | | 182,728 | | | | 124,733 | |
| | Management fees | | | 108,743 | | | | 14,051 | |
| | Distribution and Service fees and Transfer Agency fees | | | 165,636 | | | | 24,118 | |
| | Accrued expenses | | | 204,533 | | | | 171,155 | |
| | Total liabilities | | | 1,935,407 | | | | 410,284 | |
| | | | | | | | | | |
| | Net Assets: | | | | | | | | |
| | Paid-in capital | | | 656,873,310 | | | | 126,391,370 | |
| | Total distributable earnings | | | 230,607,271 | | | | 9,653,810 | |
| | | NET ASSETS | | $ | 887,480,581 | | | $ | 136,045,180 | |
| | | Net Assets: | | | | | | | | |
| | | Class A | | $ | 382,720,135 | | | $ | 49,042,959 | |
| | | Class C | | | 19,612,610 | | | | 2,651,885 | |
| | | Institutional | | | 211,502,923 | | | | 63,366,417 | |
| | | Service | | | 2,371,722 | | | | 137,854 | |
| | | Investor | | | 7,811,424 | | | | 16,197,381 | |
| | | Class R6 | | | 7,038,629 | | | | 874,639 | |
| | | Class R | | | 7,034,102 | | | | 629,509 | |
| | | Class P | | | 249,389,036 | | | | 3,144,536 | |
| | �� | Total Net Assets | | $ | 887,480,581 | | | $ | 136,045,180 | |
| | | Shares Outstanding $0.001 par value (unlimited number of shares authorized): | | | | | | | | |
| | | Class A | | | 19,158,800 | | | | 5,339,706 | |
| | | Class C | | | 964,428 | | | | 288,773 | |
| | | Institutional | | | 10,575,193 | | | | 6,918,434 | |
| | | Service | | | 119,142 | | | | 15,016 | |
| | | Investor | | | 396,684 | | | | 1,768,510 | |
| | | Class R6 | | | 351,868 | | | | 95,327 | |
| | | Class R | | | 363,013 | | | | 68,761 | |
| | | Class P | | | 12,464,378 | | | | 342,737 | |
| | | Net asset value, offering and redemption price per share:(c) | | | | | | | | |
| | | Class A | | | $19.98 | | | | $9.18 | |
| | | Class C | | | 20.34 | | | | 9.18 | |
| | | Institutional | | | 20.00 | | | | 9.16 | |
| | | Service | | | 19.91 | | | | 9.18 | |
| | | Investor | | | 19.69 | | | | 9.16 | |
| | | Class R6 | | | 20.00 | | | | 9.18 | |
| | | Class R | | | 19.38 | | | | 9.16 | |
| | | Class P | | | 20.01 | | | | 9.17 | |
| | (a) | | Segregated for initial margin and/or collateral on transactions as follows: |
| | | | |
| Portfolio | | Futures | |
| |
Growth Strategy | | $ | 452,874 | |
| | (b) | | Segregated for initial margin and/or collateral on foreign currency contracts. |
| | (c) | | Maximum public offering price per share for Class A Shares of the Growth Strategy and Satellite Strategies Portfolios is $21.14 and $9.71, respectively. At redemption, Class C Shares may be subject to a contingent deferred sales charge, assessed on the amount equal to the lesser of the current net asset value (“NAV”) or the original purchase price of the shares. |
| | |
| The accompanying notes are an integral part of these financial statements. | | 23 |
GOLDMAN SACHS FUND OF FUNDS PORTFOLIOS
Statements of Operations
For the Six Months Ended June 30, 2021 (Unaudited)
| | | | | | | | | | |
| | | | | Balanced
Strategy
Portfolio | | | Growth and
Income
Strategy
Portfolio | |
| | Investment income: | |
| | | |
| | Dividends from Affiliated Funds | | $ | 2,920,632 | | | $ | 4,157,226 | |
| | | | | | | | | | |
| | Expenses: | |
| | | |
| | Management fees | | | 418,655 | | | | 705,896 | |
| | | |
| | Distribution and Service (12b-1) fees(a) | | | 194,694 | | | | 433,824 | |
| | | |
| | Transfer Agency fees(a) | | | 182,969 | | | | 354,529 | |
| | | |
| | Registration fees | | | 47,582 | | | | 47,240 | |
| | | |
| | Professional fees | | | 44,595 | | | | 44,595 | |
| | | |
| | Printing and mailing costs | | | 30,621 | | | | 51,423 | |
| | | |
| | Custody, accounting and administrative services | | | 29,987 | | | | 29,956 | |
| | | |
| | Service fees — Class C | | | 10,538 | | | | 15,030 | |
| | | |
| | Trustee fees | | | 9,785 | | | | 10,042 | |
| | | |
| | Shareholder Administration fees — Service Shares | | | 509 | | | | 3,297 | |
| | | |
| | Other | | | 8,875 | | | | 15,829 | |
| | | |
| | Total expenses | | | 978,810 | | | | 1,711,661 | |
| | | |
| | Less — expense reductions | | | (161,701 | ) | | | (183,218 | ) |
| | | |
| | Net expenses | | | 817,109 | | | | 1,528,443 | |
| | | |
| | NET INVESTMENT INCOME | | | 2,103,523 | | | | 2,628,783 | |
| | | |
| | | | | | | | | | |
| | Realized and unrealized gain (loss): | |
| | | |
| | Net realized gain (loss) from: | | | | | | | | |
| | | |
| | Affiliated Funds | | | 6,100,885 | | | | 7,772,200 | |
| | | |
| | Purchased options | | | 352,022 | | | | 572,541 | |
| | | |
| | Futures contracts | | | 3,340,866 | | | | 4,006,556 | |
| | | |
| | Written options | | | 150,941 | | | | 249,262 | |
| | | |
| | Forward foreign currency exchange contracts | | | 31,312 | | | | (83,081 | ) |
| | | |
| | Foreign currency transactions | | | (66 | ) | | | (115 | ) |
| | | |
| | Net change in unrealized gain (loss) on: | | | | | | | | |
| | | |
| | Affiliated Funds | | | 18,082,693 | | | | 63,505,701 | |
| | | |
| | Purchased options | | | (780,156 | ) | | | (1,280,930 | ) |
| | | |
| | Futures contracts | | | (76,165 | ) | | | (40,064 | ) |
| | | |
| | Forward foreign currency exchange contracts | | | 1,256,133 | | | | 2,342,394 | |
| | | |
| | Foreign currency translation | | | 387 | | | | (2,739 | ) |
| | | |
| | Net realized and unrealized gain | | | 28,458,852 | | | | 77,041,725 | |
| | | |
| | NET INCREASE IN NET ASSETS RESULTING FROM OPERATIONS | | $ | 30,562,375 | | | $ | 79,670,508 | |
| | (a) | | Class specific Distribution and/or Service (12b-1) and Transfer Agency fees were as follows: |
| | | | | | | | | | | | | | | | | | | | | | | | | | | | | | | | | | | | | | | | | | | | | | | | |
| | | Distribution and/or Service (12b-1) Fees | | | Transfer Agency Fees | |
| | | Class A | | | Class C | | | Service Class | | | Class R | | | Class A | | | Class C | | | Institutional | | | Service | | | Investor | | | Class R6 | | | Class R | | | Class P | |
Balanced Strategy Portfolio | | | 138,247 | | | | 31,613 | | | | 509 | | | | 24,325 | | | | 83,157 | | | | 6,254 | | | | 74,878 | | | | 81 | | | | 3,840 | | | | 219 | | | | 7,326 | | | | 7,214 | |
Growth and Income Strategy Portfolio | | | 371,739 | | | | 45,092 | | | | 3,297 | | | | 13,696 | | | | 223,886 | | | | 8,917 | | | | 74,059 | | | | 527 | | | | 6,237 | | | | 739 | | | | 4,138 | | | | 36,026 | |
| | |
| 24 | | The accompanying notes are an integral part of these financial statements. |
GOLDMAN SACHS FUND OF FUNDS PORTFOLIOS
Statements of Operations (continued)
For the Six Months Ended June 30, 2021 (Unaudited)
| | | | | | | | | | |
| | | | | Growth
Strategy
Portfolio | | |
Satellite
Strategies
Portfolio | |
| | Investment income: | |
| | | |
| | Dividends from Affiliated Funds | | $ | 2,764,848 | | | $ | 1,674,637 | |
| | | | | | | | | | |
| | Expenses: | |
| | | |
| | Management fees | | | 626,164 | | | | 92,470 | |
| | | |
| | Distribution and Service (12b-1) fees(a) | | | 556,140 | | | | 75,200 | |
| | | |
| | Transfer Agency fees(a) | | | 377,359 | | | | 67,510 | |
| | | |
| | Printing and mailing costs | | | 60,845 | | | | 27,918 | |
| | | |
| | Registration fees | | | 46,258 | | | | 43,403 | |
| | | |
| | Professional fees | | | 44,595 | | | | 40,003 | |
| | | |
| | Custody, accounting and administrative services | | | 28,190 | | | | 27,611 | |
| | | |
| | Service fees — Class C | | | 26,686 | | | | 4,835 | |
| | | |
| | Trustee fees | | | 9,922 | | | | 9,513 | |
| | | |
| | Shareholder Administration fees — Service Shares | | | 2,819 | | | | 165 | |
| | | |
| | Other | | | 7,386 | | | | 14,856 | |
| | | |
| | Total expenses | | | 1,786,364 | | | | 403,484 | |
| | | |
| | Less — expense reductions | | | (188,140 | ) | | | (156,706 | ) |
| | | |
| | Net expenses | | | 1,598,224 | | | | 246,778 | |
| | | |
| | NET INVESTMENT INCOME | | | 1,166,624 | | | | 1,427,859 | |
| | | |
| | | | | | | | | | |
| | Realized and unrealized gain: | |
| | | |
| | Net realized gain (loss) from: | | | | | | | | |
| | | |
| | Affiliated Funds | | | 2,300,524 | | | | 8,223,992 | |
| | | |
| | Purchased options | | | 532,933 | | | | — | |
| | | |
| | Futures contracts | | | 5,637,731 | | | | — | |
| | | |
| | Written options | | | 217,934 | | | | — | |
| | | |
| | Forward foreign currency exchange contracts | | | (22,610 | ) | | | — | |
| | | |
| | Foreign currency transactions | | | (149 | ) | | | — | |
| | | |
| | Net change in unrealized gain (loss) on: | | | | | | | | |
| | | |
| | Affiliated Funds | | | 83,758,382 | | | | 2,302,784 | |
| | | |
| | Purchased options | | | (1,205,891 | ) | | | — | |
| | | |
| | Futures contracts | | | 266,103 | | | | — | |
| | | |
| | Forward foreign currency exchange contracts | | | 1,756,543 | | | | — | |
| | | |
| | Foreign currency translation | | | (2,568 | ) | | | — | |
| | | |
| | Net realized and unrealized gain | | | 93,238,932 | | | | 10,526,776 | |
| | | |
| | NET INCREASE IN NET ASSETS RESULTING FROM OPERATIONS | | $ | 94,405,556 | | | $ | 11,954,635 | |
| | (a) | | Class specific Distribution and/or Service (12b-1) and Transfer Agency fees were as follows: |
| | | | | | | | | | | | | | | | | | | | | | | | | | | | | | | | | | | | | | | | | | | | | | | | |
| | | Distribution and/or Service (12b-1) Fees | | | Transfer Agency Fees | |
| | | Class A | | | Class C | | | Service Class | | | Class R | | | Class A | | | Class C | | | Institutional | | | Service | | | Investor | | | Class R6 | | | Class R | | | Class P | |
Growth Strategy Portfolio | | | 456,756 | | | | 80,059 | | | | 2,819 | | | | 16,506 | | | | 275,789 | | | | 15,967 | | | | 39,739 | | | | 451 | | | | 5,410 | | | | 1,015 | | | | 4,995 | | | | 33,993 | |
Satellite Strategies Portfolio | | | 58,901 | | | | 14,504 | | | | 165 | | | | 1,630 | | | | 35,487 | | | | 2,732 | | | | 15,196 | | | | 26 | | | | 12,986 | | | | 128 | | | | 484 | | | | 471 | |
| | |
| The accompanying notes are an integral part of these financial statements. | | 25 |
GOLDMAN SACHS FUND OF FUNDS PORTFOLIOS
Statements of Changes in Net Assets
| | | | | | | | | | | | | | | | | | | | | | |
| | | | | Balanced Strategy Portfolio | | | | | | Growth and Income Strategy Portfolio | |
| | | | | For the
Six Months Ended
June 30, 2021
(Unaudited) | | | For the Fiscal
Year Ended
December 31, 2020 | | | | | | For the
Six Months Ended
June 30, 2021
(Unaudited) | | | For the Fiscal
Year Ended
December 31, 2020 | |
| | From operations: | | | | | | | | | | | | | | | | | | | | |
| | Net investment income | | $ | 2,103,523 | | | $ | 10,234,390 | | | | | | | $ | 2,628,783 | | | $ | 13,638,689 | |
| | Net realized gain | | | 9,975,960 | | | | 9,873,483 | | | | | | | | 12,517,363 | | | | 16,031,160 | |
| | Net change in unrealized gain | | | 18,482,892 | | | | 32,656,676 | | | | | | | | 64,524,362 | | | | 67,329,095 | |
| | Net increase in net assets resulting from operations | | | 30,562,375 | | | | 52,764,549 | | | | | | | | 79,670,508 | | | | 96,998,944 | |
| | | | | | | | | | | | | | | | | | | | | | |
| | Distributions to shareholders: | | | | | | | | | | | | | | | | | | | | |
| | From distributable earnings: | | | | | | | | | | | | | | | | | | | | |
| | Class A Shares | | | (344,421 | ) | | | (2,073,315 | ) | | | | | | | (787,066 | ) | | | (9,110,698 | ) |
| | Class C Shares | | | (1,728 | ) | | | (110,788 | ) | | | | | | | (3,710 | ) | | | (355,597 | ) |
| | Institutional Shares | | | (1,791,785 | ) | | | (8,390,148 | ) | | | | | | | (1,597,330 | ) | | | (12,189,122 | ) |
| | Service Shares | | | (904 | ) | | | (8,087 | ) | | | | | | | (5,372 | ) | | | (82,395 | ) |
| | Investor Shares | | | (20,930 | ) | | | (133,619 | ) | | | | | | | (32,154 | ) | | | (265,906 | ) |
| | Class R6 Shares | | | (7,136 | ) | | | (36,509 | ) | | | | | | | (21,774 | ) | | | (169,572 | ) |
| | Class R Shares | | | (19,428 | ) | | | (160,141 | ) | | | | | | | (10,264 | ) | | | (152,196 | ) |
| | Class P Shares | | | (247,143 | ) | | | (922,139 | ) | | | | | | | (1,063,756 | ) | | | (7,826,935 | ) |
| | Total distributions to shareholders | | | (2,433,475 | ) | | | (11,834,746 | ) | | | | | | | (3,521,426 | ) | | | (30,152,421 | ) |
| | | | | | | | | | | | | | | | | | | | | | |
| | From share transactions: | | | | | | | | | | | | | | | | | | | | |
| | Proceeds from sales of shares | | | 47,685,643 | | | | 138,023,285 | | | | | | | | 57,262,136 | | | | 110,868,743 | |
| | Reinvestment of distributions | | | 2,396,445 | | | | 11,642,690 | | | | | | | | 3,446,568 | | | | 29,318,345 | |
| | Cost of shares redeemed | | | (81,942,000 | ) | | | (148,350,909 | ) | | | | | | | (81,313,727 | ) | | | (197,903,957 | ) |
| | Net increase (decrease) in net assets resulting from share transactions | | | (31,859,912 | ) | | | 1,315,066 | | | | | | | | (20,605,023 | ) | | | (57,716,869 | ) |
| | TOTAL INCREASE (DECREASE) | | | (3,731,012 | ) | | | 42,244,869 | | | | | | | | 55,544,059 | | | | 9,129,654 | |
| | | | | | | | | | | | | | | | | | | | | | |
| | Net assets: | | | | | | | | | | | | | | | | | | | | |
| | Beginning of period | | | 569,016,015 | | | | 526,771,146 | | | | | | | | 921,111,291 | | | | 911,981,637 | |
| | End of period | | $ | 565,285,003 | | | $ | 569,016,015 | | | | | | | $ | 976,655,350 | | | $ | 921,111,291 | |
| | |
| 26 | | The accompanying notes are an integral part of these financial statements. |
GOLDMAN SACHS FUND OF FUNDS PORTFOLIOS
Statements of Changes in Net Assets (continued)
| | | | | | | | | | | | | | | | | | | | | | |
| | | | | Growth Strategy Portfolio | | | | | | Satellite Strategies Portfolio | |
| | | | | For the
Six Months Ended
June 30, 2021
(Unaudited) | | | For the Fiscal
Year Ended
December 31, 2020 | | | | | | For the
Six Months Ended
June 30, 2021
(Unaudited) | | | For the Fiscal
Year Ended
December 31, 2020 | |
| | From operations: | | | | | | | | | | | | | | | | | | | | |
| | | | | | |
| | Net investment income | | $ | 1,166,624 | | | $ | 9,138,002 | | | | | | | $ | 1,427,859 | | | $ | 3,967,788 | |
| | | | | | |
| | Net realized gain | | | 8,666,363 | | | | 10,540,709 | | | | | | | | 8,223,992 | | | | 12,366,745 | |
| | | | | | |
| | Net change in unrealized gain (loss) | | | 84,572,569 | | | | 71,452,977 | | | | | | | | 2,302,784 | | | | (17,227,251 | ) |
| | | | | | |
| | Net increase (decrease) in net assets resulting from operations | | | 94,405,556 | | | | 91,131,688 | | | | | | | | 11,954,635 | | | | (892,718 | ) |
| | | | | | | | | | | | | | | | | | | | | | |
| | Distributions to shareholders: | | | | | | | | | | | | | | | | | | | | |
| | From distributable earnings: | | | | | | | | | | | | | |
| | Class A Shares | | | — | | | | (10,784,596 | ) | | | | | | | (437,934 | ) | | | (837,479 | ) |
| | Class C Shares | | | — | | | | (496,344 | ) | | | | | | | (9,681 | ) | | | (103,991 | ) |
| | Institutional Shares | | | — | | | | (5,137,868 | ) | | | | | | | (737,149 | ) | | | (2,538,186 | ) |
| | Service Shares | | | — | | | | (62,574 | ) | | | | | | | (1,137 | ) | | | (3,303 | ) |
| | Investor Shares | | | — | | | | (234,991 | ) | | | | | | | (177,851 | ) | | | (410,262 | ) |
| | Class R6 Shares | | | — | | | | (227,886 | ) | | | | | | | (9,280 | ) | | | (54,834 | ) |
| | Class R Shares | | | — | | | | (184,960 | ) | | | | | | | (4,753 | ) | | | (12,690 | ) |
| | Class P Shares | | | — | | | | (7,003,021 | ) | | | | | | | (33,058 | ) | | | (77,222 | ) |
| | Total distributions to shareholders | | | — | | | | (24,132,240 | ) | | | | | | | (1,410,843 | ) | | | (4,037,967 | ) |
| | | | | | | | | | | | | | | | | | | | | | |
| | From share transactions: | | | | | | | | | | | | | | | | | | | | |
| | | | | | |
| | Proceeds from sales of shares | | | 98,901,868 | | | | 99,145,043 | | | | | | | | 8,058,825 | | | | 25,021,685 | |
| | | | | | |
| | Reinvestment of distributions | | | — | | | | 23,183,595 | | | | | | | | 1,291,572 | | | | 3,663,014 | |
| | | | | | |
| | Cost of shares redeemed | | | (81,002,056 | ) | | | (136,535,679 | ) | | | | | | | (59,118,654 | ) | | | (180,205,714 | ) |
| | | | | | |
| | Net increase (decrease) in net assets resulting from share transactions | | | 17,899,812 | | | | (14,207,041 | ) | | | | | | | (49,768,257 | ) | | | (151,521,015 | ) |
| | | | | | |
| | TOTAL INCREASE (DECREASE) | | | 112,305,368 | | | | 52,792,407 | | | | | | | | (39,224,465 | ) | | | (156,451,700 | ) |
| | | | | | | | | | | | | | | | | | | | | | |
| | Net assets: | | | | | | | | | | | | | | | | | | | | |
| | | | | | |
| | Beginning of period | | | 775,175,213 | | | | 722,382,806 | | | | | | | | 175,269,645 | | | | 331,721,345 | |
| | | | | | |
| | End of period | | $ | 887,480,581 | | | $ | 775,175,213 | | | | | | | $ | 136,045,180 | | | $ | 175,269,645 | |
| | |
| The accompanying notes are an integral part of these financial statements. | | 27 |
GOLDMAN SACHS BALANCED STRATEGY PORTFOLIO
Financial Highlights
Selected Share Data for a Share Outstanding Throughout Each Period
| | | | | | | | | | | | | | | | | | | | | | | | | | |
| | | | | Goldman Sachs Balanced Strategy Portfolio | |
| | | | | Class A Shares | |
| | | | | Six Months Ended
June 30, 2021
(Unaudited) | | | Year Ended December 31, | |
| | | | | 2020 | | | 2019 | | | 2018 | | | 2017 | | | 2016 | |
| | Per Share Data | | | | | | | | | | | | | | | | | | | | | | | | |
| | | | | | | |
| | Net asset value, beginning of period | | $ | 12.64 | | | $ | 11.64 | | | $ | 10.32 | | | $ | 11.55 | | | $ | 10.82 | | | $ | 10.41 | |
| | | | | | | |
| | Net investment income(a)(b) | | | 0.03 | | | | 0.20 | | | | 0.20 | | | | 0.16 | | | | 0.16 | | | | 0.11 | |
| | | | | | | |
| | Net realized and unrealized gain (loss) | | | 0.65 | | | | 1.04 | | | | 1.37 | | | | (0.95 | ) | | | 1.05 | | | | 0.41 | |
| | | | | | | |
| | Total from investment operations | | | 0.68 | | | | 1.24 | | | | 1.57 | | | | (0.79 | ) | | | 1.21 | | | | 0.52 | |
| | | | | | | |
| | Distributions to shareholders from net investment income | | | (0.04 | ) | | | (0.24 | ) | | | (0.25 | ) | | | (0.24 | ) | | | (0.27 | ) | | | (0.11 | ) |
| | | | | | | |
| | Distributions to shareholders from net realized gains | | | — | | | | — | | | | — | | | | (0.20 | ) | | | (0.21 | ) | | | — | |
| | | | | | | |
| | Total distributions | | | (0.04 | ) | | | (0.24 | ) | | | (0.25 | ) | | | (0.44 | ) | | | (0.48 | ) | | | (0.11 | ) |
| | | | | | | |
| | Net asset value, end of period | | $ | 13.28 | | | $ | 12.64 | | | $ | 11.64 | | | $ | 10.32 | | | $ | 11.55 | | | $ | 10.82 | |
| | | | | | | |
| | Total return(c) | | | 5.39 | % | | | 10.71 | % | | | 15.24 | % | | | (6.90 | )% | | | 11.19 | % | | | 5.04 | % |
| | | | | | | |
| | Net assets, end of period (in 000s) | | $ | 113,563 | | | $ | 110,057 | | | $ | 106,285 | | | $ | 106,235 | | | $ | 119,662 | | | $ | 129,445 | |
| | | | | | | |
| | Ratio of net expenses to average net assets(d) | | | 0.55 | %(e) | | | 0.57 | % | | | 0.58 | % | | | 0.59 | % | | | 0.62 | % | | | 0.59 | % |
| | | | | | | |
| | Ratio of total expenses to average net assets(d) | | | 0.61 | %(e) | | | 0.64 | % | | | 0.67 | % | | | 0.63 | % | | | 0.68 | % | | | 0.67 | % |
| | | | | | | |
| | Ratio of net investment income to average net assets(b) | | | 0.49 | %(e) | | | 1.71 | % | | | 1.76 | % | | | 1.46 | % | | | 1.40 | % | | | 1.01 | % |
| | | | | | | |
| | Portfolio turnover rate(f) | | | 2 | % | | | 19 | % | | | 55 | % | | | 45 | % | | | 81 | % | | | 76 | % |
| | (a) | | Calculated based on the average shares outstanding methodology. |
| | (b) | | Recognition of net investment income by the Portfolio is affected by the timing of declaration of dividends by the Underlying Funds in which the Portfolio invests. |
| | (c) | | Assumes investment at the NAV at the beginning of the period, reinvestment of all dividends and distributions, a complete redemption of the investment at the NAV at the end of the period and no sales or redemption charges (if any). Total returns would be reduced if a sales or redemption charge was taken into account. Returns do not reflect the impact of taxes to shareholders relating to Portfolio distributions or the redemption of Portfolio shares. Total returns for periods less than one full year are not annualized. |
| | (d) | | Expense ratios exclude the expenses of the Underlying Funds in which the Portfolio invests. |
| | (f) | | The Portfolio’s portfolio turnover rate is calculated in accordance with regulatory requirements, without regard to transactions involving short term investments and certain derivatives. If such transactions were included, the Portfolio’s portfolio turnover rate may be higher. |
| | |
| 28 | | The accompanying notes are an integral part of these financial statements. |
GOLDMAN SACHS BALANCED STRATEGY PORTFOLIO
Financial Highlights (continued)
Selected Share Data for a Share Outstanding Throughout Each Period
| | | | | | | | | | | | | | | | | | | | | | | | | | |
| | | | | Goldman Sachs Balanced Strategy Portfolio | |
| | | | | Class C Shares | |
| | | | | Six Months Ended
June 30, 2021
(Unaudited) | | | Year Ended December 31, | |
| | | | | 2020 | | | 2019 | | | 2018 | | | 2017 | | | 2016 | |
| | Per Share Data | | | | | | | | | | | | | | | | | | | | | | | | |
| | | | | | | |
| | Net asset value, beginning of period | | $ | 12.67 | | | $ | 11.66 | | | $ | 10.34 | | | $ | 11.55 | | | $ | 10.82 | | | $ | 10.41 | |
| | | | | | | |
| | Net investment income (loss)(a)(b) | | | (0.02 | ) | | | 0.10 | | | | 0.10 | | | | 0.05 | | | | 0.07 | | | | 0.03 | |
| | | | | | | |
| | Net realized and unrealized gain (loss) | | | 0.65 | | | | 1.06 | | | | 1.38 | | | | (0.92 | ) | | | 1.05 | | | | 0.42 | |
| | | | | | | |
| | Total from investment operations | | | 0.63 | | | | 1.16 | | | | 1.48 | | | | (0.87 | ) | | | 1.12 | | | | 0.45 | |
| | | | | | | |
| | Distributions to shareholders from net investment income | | | — | (c) | | | (0.15 | ) | | | (0.16 | ) | | | (0.14 | ) | | | (0.18 | ) | | | (0.04 | ) |
| | | | | | | |
| | Distributions to shareholders from net realized gains | | | — | | | | — | | | | — | | | | (0.20 | ) | | | (0.21 | ) | | | — | |
| | | | | | | |
| | Total distributions | | | — | | | | (0.15 | ) | | | (0.16 | ) | | | (0.34 | ) | | | (0.39 | ) | | | (0.04 | ) |
| | | | | | | |
| | Net asset value, end of period | | $ | 13.30 | | | $ | 12.67 | | | $ | 11.66 | | | $ | 10.34 | | | $ | 11.55 | | | $ | 10.82 | |
| | | | | | | |
| | Total return(d) | | | 4.99 | % | | | 9.90 | % | | | 14.30 | % | | | (7.58 | )% | | | 10.30 | % | | | 4.24 | % |
| | | | | | | |
| | Net assets, end of period (in 000s) | | $ | 7,364 | | | $ | 9,575 | | | $ | 10,978 | | | $ | 12,807 | | | $ | 34,542 | | | $ | 47,217 | |
| | | | | | | |
| | Ratio of net expenses to average net assets(e) | | | 1.30 | %(f) | | | 1.32 | % | | | 1.33 | % | | | 1.33 | % | | | 1.37 | % | | | 1.34 | % |
| | | | | | | |
| | Ratio of total expenses to average net assets(e) | | | 1.36 | %(f) | | | 1.39 | % | | | 1.42 | % | | | 1.38 | % | | | 1.42 | % | | | 1.42 | % |
| | | | | | | |
| | Ratio of net investment income (loss) to average net assets(b) | | | (0.27 | )%(f) | | | 0.86 | % | | | 0.93 | % | | | 0.43 | % | | | 0.58 | % | | | 0.27 | % |
| | | | | | | |
| | Portfolio turnover rate(g) | | | 2 | % | | | 19 | % | | | 55 | % | | | 45 | % | | | 81 | % | | | 76 | % |
| | (a) | | Calculated based on the average shares outstanding methodology. |
| | (b) | | Recognition of net investment income by the Portfolio is affected by the timing of declaration of dividends by the Underlying Funds in which the Portfolio invests. |
| | (c) | | Amount is less than $0.005 per share. |
| | (d) | | Assumes investment at the NAV at the beginning of the period, reinvestment of all dividends and distributions, a complete redemption of the investment at the NAV at the end of the period and no sales or redemption charges (if any). Total returns would be reduced if a sales or redemption charge was taken into account. Returns do not reflect the impact of taxes to shareholders relating to Portfolio distributions or the redemption of Portfolio shares. Total returns for periods less than one full year are not annualized. |
| | (e) | | Expense ratios exclude the expenses of the Underlying Funds in which the Portfolio invests. |
| | (g) | | The Portfolio’s portfolio turnover rate is calculated in accordance with regulatory requirements, without regard to transactions involving short term investments and certain derivatives. If such transactions were included, the Portfolio’s portfolio turnover rate may be higher. |
| | |
| The accompanying notes are an integral part of these financial statements. | | 29 |
GOLDMAN SACHS BALANCED STRATEGY PORTFOLIO
Financial Highlights (continued)
Selected Share Data for a Share Outstanding Throughout Each Period
| | | | | | | | | | | | | | | | | | | | | | | | | | |
| | | | | Goldman Sachs Balanced Strategy Portfolio | |
| | | | | Institutional Shares | |
| | | | | Six Months Ended
June 30, 2021
(Unaudited) | | | Year Ended December 31, | |
| | | | | 2020 | | | 2019 | | | 2018 | | | 2017 | | | 2016 | |
| | Per Share Data | | | | | | | | | | | | | | | | | | | | | | | | |
| | | | | | | |
| | Net asset value, beginning of period | | $ | 12.63 | | | $ | 11.64 | | | $ | 10.32 | | | $ | 11.55 | | | $ | 10.82 | | | $ | 10.42 | |
| | | | | | | |
| | Net investment income(a)(b) | | | 0.05 | | | | 0.25 | | | | 0.25 | | | | 0.20 | | | | 0.21 | | | | 0.16 | |
| | | | | | | |
| | Net realized and unrealized gain (loss) | | | 0.66 | | | | 1.02 | | | | 1.36 | | | | (0.95 | ) | | | 1.04 | | | | 0.40 | |
| | | | | | | |
| | Total from investment operations | | | 0.71 | | | | 1.27 | | | | 1.61 | | | | (0.75 | ) | | | 1.25 | | | | 0.56 | |
| | | | | | | |
| | Distributions to shareholders from net investment income | | | (0.06 | ) | | | (0.28 | ) | | | (0.29 | ) | | | (0.28 | ) | | | (0.31 | ) | | | (0.16 | ) |
| | | | | | | |
| | Distributions to shareholders from net realized gains | | | — | | | | — | | | | — | | | | (0.20 | ) | | | (0.21 | ) | | | — | |
| | | | | | | |
| | Total distributions | | | (0.06 | ) | | | (0.28 | ) | | | (0.29 | ) | | | (0.48 | ) | | | (0.52 | ) | | | (0.16 | ) |
| | | | | | | |
| | Net asset value, end of period | | $ | 13.28 | | | $ | 12.63 | | | $ | 11.64 | | | $ | 10.32 | | | $ | 11.55 | | | $ | 10.82 | |
| | | | | | | |
| | Total return(c) | | | 5.65 | % | | | 11.05 | % | | | 15.68 | % | | | (6.53 | )% | | | 11.63 | % | | | 5.36 | % |
| | | | | | | |
| | Net assets, end of period (in 000s) | | $ | 373,350 | | | $ | 388,941 | | | $ | 351,189 | | | $ | 292,183 | | | $ | 353,778 | | | $ | 285,795 | |
| | | | | | | |
| | Ratio of net expenses to average net assets(d) | | | 0.19 | %(e) | | | 0.19 | % | | | 0.20 | % | | | 0.20 | % | | | 0.22 | % | | | 0.19 | % |
| | | | | | | |
| | Ratio of total expenses to average net assets(d) | | | 0.25 | %(e) | | | 0.26 | % | | | 0.28 | % | | | 0.24 | % | | | 0.28 | % | | | 0.27 | % |
| | | | | | | |
| | Ratio of net investment income to average net assets(b) | | | 0.85 | %(e) | | | 2.12 | % | | | 2.19 | % | | | 1.76 | % | | | 1.85 | % | | | 1.46 | % |
| | | | | | | |
| | Portfolio turnover rate(f) | | | 2 | % | | | 19 | % | | | 55 | % | | | 45 | % | | | 81 | % | | | 76 | % |
| | (a) | | Calculated based on the average shares outstanding methodology. |
| | (b) | | Recognition of net investment income by the Portfolio is affected by the timing of declaration of dividends by the Underlying Funds in which the Portfolio invests. |
| | (c) | | Assumes investment at the NAV at the beginning of the period, reinvestment of all dividends and distributions, a complete redemption of the investment at the NAV at the end of the period and no sales or redemption charges (if any). Total returns would be reduced if a sales or redemption charge was taken into account. Returns do not reflect the impact of taxes to shareholders relating to Portfolio distributions or the redemption of Portfolio shares. Total returns for periods less than one full year are not annualized. |
| | (d) | | Expense ratios exclude the expenses of the Underlying Funds in which the Portfolio invests. |
| | (f) | | The Portfolio’s portfolio turnover rate is calculated in accordance with regulatory requirements, without regard to transactions involving short term investments and certain derivatives. If such transactions were included, the Portfolio’s portfolio turnover rate may be higher. |
| | |
| 30 | | The accompanying notes are an integral part of these financial statements. |
GOLDMAN SACHS BALANCED STRATEGY PORTFOLIO
Financial Highlights (continued)
Selected Share Data for a Share Outstanding Throughout Each Period
| | | | | | | | | | | | | | | | | | | | | | | | | | |
| | | | | Goldman Sachs Balanced Strategy Portfolio | |
| | | | | Service Shares | |
| | | | | Six Months Ended
June 30, 2021
(Unaudited) | | | Year Ended December 31, | |
| | | | | 2020 | | | 2019 | | | 2018 | | | 2017 | | | 2016 | |
| | Per Share Data | | | | | | | | | | | | | | | | | | | | | | | | |
| | | | | | | |
| | Net asset value, beginning of period | | $ | 12.79 | | | $ | 11.78 | | | $ | 10.45 | | | $ | 11.68 | | | $ | 10.94 | | | $ | 10.45 | |
| | | | | | | |
| | Net investment income(a)(b) | | | 0.02 | | | | 0.16 | | | | 0.17 | | | | 0.15 | | | | 0.15 | | | | 0.10 | |
| | | | | | | |
| | Net realized and unrealized gain (loss) | | | 0.67 | | | | 1.07 | | | | 1.39 | | | | (0.95 | ) | | | 1.06 | | | | 0.49 | |
| | | | | | | |
| | Total from investment operations | | | 0.69 | | | | 1.23 | | | | 1.56 | | | | (0.80 | ) | | | 1.21 | | | | 0.59 | |
| | | | | | | |
| | Distributions to shareholders from net investment income | | | (0.03 | ) | | | (0.22 | ) | | | (0.23 | ) | | | (0.23 | ) | | | (0.26 | ) | | | (0.10 | ) |
| | | | | | | |
| | Distributions to shareholders from net realized gains | | | — | | | | — | | | | — | | | | (0.20 | ) | | | (0.21 | ) | | | — | |
| | | | | | | |
| | Total distributions | | | (0.03 | ) | | | (0.22 | ) | | | (0.23 | ) | | | (0.43 | ) | | | (0.47 | ) | | | (0.10 | ) |
| | | | | | | |
| | Net asset value, end of period | | $ | 13.45 | | | $ | 12.79 | | | $ | 11.78 | | | $ | 10.45 | | | $ | 11.68 | | | $ | 10.94 | |
| | | | | | | |
| | Total return(c) | | | 5.40 | % | | | 10.52 | % | | | 14.99 | % | | | (6.93 | )% | | | 11.04 | % | | | 5.67 | % |
| | | | | | | |
| | Net assets, end of period (in 000s) | | $ | 404 | | | $ | 421 | | | $ | 532 | | | $ | 667 | | | $ | 833 | | | $ | 831 | |
| | | | | | | |
| | Ratio of net expenses to average net assets(d) | | | 0.69 | %(e) | | | 0.69 | % | | | 0.70 | % | | | 0.70 | % | | | 0.72 | % | | | 0.69 | % |
| | | | | | | |
| | Ratio of total expenses to average net assets(d) | | | 0.75 | %(e) | | | 0.77 | % | | | 0.78 | % | | | 0.74 | % | | | 0.78 | % | | | 0.77 | % |
| | | | | | | |
| | Ratio of net investment income to average net assets(b) | | | 0.35 | %(e) | | | 1.38 | % | | | 1.47 | % | | | 1.31 | % | | | 1.31 | % | | | 0.93 | % |
| | | | | | | |
| | Portfolio turnover rate(f) | | | 2 | % | | | 19 | % | | | 55 | % | | | 45 | % | | | 81 | % | | | 76 | % |
| | (a) | | Calculated based on the average shares outstanding methodology. |
| | (b) | | Recognition of net investment income by the Portfolio is affected by the timing of declaration of dividends by the Underlying Funds in which the Portfolio invests. |
| | (c) | | Assumes investment at the NAV at the beginning of the period, reinvestment of all dividends and distributions, a complete redemption of the investment at the NAV at the end of the period and no sales or redemption charges (if any). Total returns would be reduced if a sales or redemption charge was taken into account. Returns do not reflect the impact of taxes to shareholders relating to Portfolio distributions or the redemption of Portfolio shares. Total returns for periods less than one full year are not annualized. |
| | (d) | | Expense ratios exclude the expenses of the Underlying Funds in which the Portfolio invests. |
| | (f) | | The Portfolio’s portfolio turnover rate is calculated in accordance with regulatory requirements, without regard to transactions involving short term investments and certain derivatives. If such transactions were included, the Portfolio’s portfolio turnover rate may be higher. |
| | |
| The accompanying notes are an integral part of these financial statements. | | 31 |
GOLDMAN SACHS BALANCED STRATEGY PORTFOLIO
Financial Highlights (continued)
Selected Share Data for a Share Outstanding Throughout Each Period
| | | | | | | | | | | | | | | | | | | | | | | | | | |
| | | | | Goldman Sachs Balanced Strategy Portfolio | |
| | | | | Investor Shares | |
| | | | | Six Months Ended
June 30, 2021
(Unaudited) | | | Year Ended December 31, | |
| | | | | 2020 | | | 2019 | | | 2018 | | | 2017 | | | 2016 | |
| | Per Share Data | | | | | | | | | | | | | | | | | | | | | | | | |
| | | | | | | |
| | Net asset value, beginning of period | | $ | 12.58 | | | $ | 11.59 | | | $ | 10.28 | | | $ | 11.50 | | | $ | 10.78 | | | $ | 10.37 | |
| | | | | | | |
| | Net investment income(a)(b) | | | 0.05 | | | | 0.33 | | | | 0.23 | | | | 0.18 | | | | 0.18 | | | | 0.14 | |
| | | | | | | |
| | Net realized and unrealized gain (loss) | | | 0.64 | | | | 0.93 | | | | 1.36 | | | | (0.93 | ) | | | 1.05 | | | | 0.41 | |
| | | | | | | |
| | Total from investment operations | | | 0.69 | | | | 1.26 | | | | 1.59 | | | | (0.75 | ) | | | 1.23 | | | | 0.55 | |
| | | | | | | |
| | Distributions to shareholders from net investment income | | | (0.05 | ) | | | (0.27 | ) | | | (0.28 | ) | | | (0.27 | ) | | | (0.30 | ) | | | (0.14 | ) |
| | | | | | | |
| | Distributions to shareholders from net realized gains | | | — | | | | — | | | | — | | | | (0.20 | ) | | | (0.21 | ) | | | — | |
| | | | | | | |
| | Total distributions | | | (0.05 | ) | | | (0.27 | ) | | | (0.28 | ) | | | (0.47 | ) | | | (0.51 | ) | | | (0.14 | ) |
| | | | | | | |
| | Net asset value, end of period | | $ | 13.22 | | | $ | 12.58 | | | $ | 11.59 | | | $ | 10.28 | | | $ | 11.50 | | | $ | 10.78 | |
| | | | | | | |
| | Total return(c) | | | 5.54 | % | | | 10.97 | % | | | 15.49 | % | | | (6.61 | )% | | | 11.41 | % | | | 5.33 | % |
| | | | | | | |
| | Net assets, end of period (in 000s) | | $ | 5,338 | | | $ | 7,594 | | | $ | 3,663 | | | $ | 2,937 | | | $ | 3,976 | | | $ | 4,810 | |
| | | | | | | |
| | Ratio of net expenses to average net assets(d) | | | 0.30 | %(e) | | | 0.32 | % | | | 0.33 | % | | | 0.34 | % | | | 0.37 | % | | | 0.34 | % |
| | | | | | | |
| | Ratio of total expenses to average net assets(d) | | | 0.36 | %(e) | | | 0.39 | % | | | 0.42 | % | | | 0.38 | % | | | 0.42 | % | | | 0.42 | % |
| | | | | | | |
| | Ratio of net investment income(b) | | | 0.73 | %(e) | | | 2.78 | % | | | 2.07 | % | | | 1.64 | % | | | 1.60 | % | | | 1.30 | % |
| | | | | | | |
| | Portfolio turnover rate(f) | | | 2 | % | | | 19 | % | | | 55 | % | | | 45 | % | | | 81 | % | | | 76 | % |
| | (a) | | Calculated based on the average shares outstanding methodology. |
| | (b) | | Recognition of net investment income by the Portfolio is affected by the timing of declaration of dividends by the Underlying Funds in which the Portfolio invests. |
| | (c) | | Assumes investment at the NAV at the beginning of the period, reinvestment of all dividends and distributions, a complete redemption of the investment at the NAV at the end of the period and no sales or redemption charges (if any). Total returns would be reduced if a sales or redemption charge was taken into account. Returns do not reflect the impact of taxes to shareholders relating to Portfolio distributions or the redemption of Portfolio shares. Total returns for periods less than one full year are not annualized. |
| | (d) | | Expense ratios exclude the expenses of the Underlying Funds in which the Portfolio invests. |
| | (f) | | The Portfolio’s portfolio turnover rate is calculated in accordance with regulatory requirements, without regard to transactions involving short term investments and certain derivatives. If such transactions were included, the Portfolio’s portfolio turnover rate may be higher. |
| | |
| 32 | | The accompanying notes are an integral part of these financial statements. |
GOLDMAN SACHS BALANCED STRATEGY PORTFOLIO
Financial Highlights (continued)
Selected Share Data for a Share Outstanding Throughout Each Period
| | | | | | | | | | | | | | | | | | | | | | | | | | |
| | | | | Goldman Sachs Balanced Strategy Portfolio | |
| | | | | Class R6 Shares | |
| | | | | Six Months Ended
June 30, 2021
(Unaudited) | | | Year Ended December 31, | |
| | | | | 2020 | | | 2019 | | | 2018 | | | 2017 | | | 2016 | |
| | Per Share Data | | | | | | | | | | | | | | | | | | | | | | | | |
| | | | | | | |
| | Net asset value, beginning of period | | $ | 12.63 | | | $ | 11.64 | | | $ | 10.32 | | | $ | 11.55 | | | $ | 10.83 | | | $ | 10.42 | |
| | | | | | | |
| | Net investment income(a)(b) | | | 0.06 | | | | 0.23 | | | | 0.23 | | | | 0.35 | | | | 0.54 | | | | 0.15 | |
| | | | | | | |
| | Net realized and unrealized gain (loss) | | | 0.65 | | | | 1.05 | | | | 1.38 | | | | (1.09 | ) | | | 0.71 | | | | 0.42 | |
| | | | | | | |
| | Total from investment operations | | | 0.71 | | | | 1.28 | | | | 1.61 | | | | (0.74 | ) | | | 1.25 | | | | 0.57 | |
| | | | | | | |
| | Distributions to shareholders from net investment income | | | (0.06 | ) | | | (0.29 | ) | | | (0.29 | ) | | | (0.29 | ) | | | (0.32 | ) | | | (0.16 | ) |
| | | | | | | |
| | Distributions to shareholders from net realized gains | | | — | | | | — | | | | — | | | | (0.20 | ) | | | (0.21 | ) | | | — | |
| | | | | | | |
| | Total distributions | | | (0.06 | ) | | | (0.29 | ) | | | (0.29 | ) | | | (0.49 | ) | | | (0.53 | ) | | | (0.16 | ) |
| | | | | | | |
| | Net asset value, end of period | | $ | 13.28 | | | $ | 12.63 | | | $ | 11.64 | | | $ | 10.32 | | | $ | 11.55 | | | $ | 10.83 | |
| | | | | | | |
| | Total return(c) | | | 5.66 | % | | | 11.06 | % | | | 15.70 | % | | | (6.52 | )% | | | 11.54 | % | | | 5.46 | % |
| | | | | | | |
| | Net assets, end of period (in 000s) | | $ | 1,498 | | | $ | 1,449 | | | $ | 1,766 | | | $ | 2,308 | | | $ | 551 | | | $ | 10 | |
| | | | | | | |
| | Ratio of net expenses to average net assets(d) | | | 0.18 | %(e) | | | 0.18 | % | | | 0.19 | % | | | 0.19 | % | | | 0.31 | % | | | 0.19 | % |
| | | | | | | |
| | Ratio of total expenses to average net assets(d) | | | 0.24 | %(e) | | | 0.26 | % | | | 0.27 | % | | | 0.24 | % | | | 0.39 | % | | | 0.27 | % |
| | | | | | | |
| | Ratio of net investment income(b) | | | 0.86 | %(e) | | | 1.89 | % | | | 2.04 | % | | | 3.10 | % | | | 4.64 | % | | | 1.45 | % |
| | | | | | | |
| | Portfolio turnover rate(f) | | | 2 | % | | | 19 | % | | | 55 | % | | | 45 | % | | | 81 | % | | | 76 | % |
| | (a) | | Calculated based on the average shares outstanding methodology. |
| | (b) | | Recognition of net investment income by the Portfolio is affected by the timing of declaration of dividends by the Underlying Funds in which the Portfolio invests. |
| | (c) | | Assumes investment at the NAV at the beginning of the period, reinvestment of all dividends and distributions, a complete redemption of the investment at the NAV at the end of the period and no sales or redemption charges (if any). Total returns would be reduced if a sales or redemption charge was taken into account. Returns do not reflect the impact of taxes to shareholders relating to Portfolio distributions or the redemption of Portfolio shares. Total returns for periods less than one full year are not annualized. |
| | (d) | | Expense ratios exclude the expenses of the Underlying Funds in which the Portfolio invests. |
| | (f) | | The Portfolio’s portfolio turnover rate is calculated in accordance with regulatory requirements, without regard to transactions involving short term investments and certain derivatives. If such transactions were included, the Portfolio’s portfolio turnover rate may be higher. |
| | |
| The accompanying notes are an integral part of these financial statements. | | 33 |
GOLDMAN SACHS BALANCED STRATEGY PORTFOLIO
Financial Highlights (continued)
Selected Share Data for a Share Outstanding Throughout Each Period
| | | | | | | | | | | | | | | | | | | | | | | | | | |
| | | | | Goldman Sachs Balanced Strategy Portfolio | |
| | | | | Class R Shares | |
| | | | | Six Months Ended
June 30, 2021
(Unaudited) | | | Year Ended December 31, | |
| | | | | 2020 | | | 2019 | | | 2018 | | | 2017 | | | 2016 | |
| | Per Share Data | | | | | | | | | | | | | | | | | | | | | | | | |
| | | | | | | |
| | Net asset value, beginning of period | | $ | 12.58 | | | $ | 11.59 | | | $ | 10.28 | | | $ | 11.50 | | | $ | 10.79 | | | $ | 10.36 | |
| | | | | | | |
| | Net investment income(a)(b) | | | 0.02 | | | | 0.16 | | | | 0.18 | | | | 0.14 | | | | 0.15 | | | | 0.09 | |
| | | | | | | |
| | Net realized and unrealized gain (loss) | | | 0.65 | | | | 1.04 | | | | 1.35 | | | | (0.95 | ) | | | 1.02 | | | | 0.43 | |
| | | | | | | |
| | Total from investment operations | | | 0.67 | | | | 1.20 | | | | 1.53 | | | | (0.81 | ) | | | 1.17 | | | | 0.52 | |
| | | | | | | |
| | Distributions to shareholders from net investment income | | | (0.03 | ) | | | (0.21 | ) | | | (0.22 | ) | | | (0.21 | ) | | | (0.25 | ) | | | (0.09 | ) |
| | | | | | | |
| | Distributions to shareholders from net realized gains | | | — | | | | — | | | | — | | | | (0.20 | ) | | | (0.21 | ) | | | — | |
| | | | | | | |
| | Total distributions | | | (0.03 | ) | | | (0.21 | ) | | | (0.22 | ) | | | (0.41 | ) | | | (0.46 | ) | | | (0.09 | ) |
| | | | | | | |
| | Net asset value, end of period | | $ | 13.22 | | | $ | 12.58 | | | $ | 11.59 | | | $ | 10.28 | | | $ | 11.50 | | | $ | 10.79 | |
| | | | | | | |
| | Total return(c) | | | 5.30 | % | | | 10.39 | % | | | 14.94 | % | | | (7.07 | )% | | | 10.81 | % | | | 5.02 | % |
| | | | | | | |
| | Net assets, end of period (in 000s) | | $ | 10,304 | | | $ | 9,435 | | | $ | 10,241 | | | $ | 8,443 | | | $ | 8,629 | | | $ | 6,110 | |
| | | | | | | |
| | Ratio of net expenses to average net assets(d) | | | 0.80 | %(e) | | | 0.82 | % | | | 0.83 | % | | | 0.84 | % | | | 0.87 | % | | | 0.84 | % |
| | | | | | | |
| | Ratio of total expenses to average net assets(d) | | | 0.86 | %(e) | | | 0.90 | % | | | 0.92 | % | | | 0.88 | % | | | 0.93 | % | | | 0.92 | % |
| | | | | | | |
| | Ratio of net investment income to average net assets(b) | | | 0.25 | %(e) | | | 1.40 | % | | | 1.61 | % | | | 1.23 | % | | | 1.30 | % | | | 0.85 | % |
| | | | | | | |
| | Portfolio turnover rate(f) | | | 2 | % | | | 19 | % | | | 55 | % | | | 45 | % | | | 81 | % | | | 76 | % |
| | (a) | | Calculated based on the average shares outstanding methodology. |
| | (b) | | Recognition of net investment income by the Portfolio is affected by the timing of declaration of dividends by the Underlying Funds in which the Portfolio invests. |
| | (c) | | Assumes investment at the NAV at the beginning of the period, reinvestment of all dividends and distributions, a complete redemption of the investment at the NAV at the end of the period and no sales or redemption charges (if any). Total returns would be reduced if a sales or redemption charge was taken into account. Returns do not reflect the impact of taxes to shareholders relating to Portfolio distributions or the redemption of Portfolio shares. Total returns for periods less than one full year are not annualized. |
| | (d) | | Expense ratios exclude the expenses of the Underlying Funds in which the Portfolio invests. |
| | (f) | | The Portfolio’s portfolio turnover rate is calculated in accordance with regulatory requirements, without regard to transactions involving short term investments and certain derivatives. If such transactions were included, the Portfolio’s portfolio turnover rate may be higher. |
| | |
| 34 | | The accompanying notes are an integral part of these financial statements. |
GOLDMAN SACHS BALANCED STRATEGY PORTFOLIO
Financial Highlights (continued)
Selected Share Data for a Share Outstanding Throughout Each Period
| | | | | | | | | | | | | | | | | | |
| | | | | Goldman Sachs Balanced Strategy Portfolio | |
| | | | | Class P Shares | |
| | | | | Six Months Ended
June 30, 2021
(Unaudited) | | | Year Ended
December 31, | | | Period Ended
December 31, 2018(a) | |
| | | | | 2020 | | | 2019 | |
| | Per Share Data | | | | | | | | | | | | | | | | |
| | | | | |
| | Net asset value, beginning of period | | $ | 12.64 | | | $ | 11.64 | | | $ | 10.32 | | | $ | 11.54 | |
| | | | | |
| | Net investment income(b)(c) | | | 0.06 | | | | 0.25 | | | | 0.24 | | | | 0.20 | |
| | | | | |
| | Net realized and unrealized gain (loss) | | | 0.64 | | | | 1.04 | | | | 1.37 | | | | (0.96 | ) |
| | | | | |
| | Total from investment operations | | | 0.70 | | | | 1.29 | | | | 1.61 | | | | (0.76 | ) |
| | | | | |
| | Distributions to shareholders from net investment income | | | (0.06 | ) | | | (0.29 | ) | | | (0.29 | ) | | | (0.26 | ) |
| | | | | |
| | Distributions to shareholders from net realized gains | | | — | | | | — | | | | — | | | | (0.20 | ) |
| | | | | |
| | Total distributions | | | (0.06 | ) | | | (0.29 | ) | | | (0.29 | ) | | | (0.46 | ) |
| | | | | |
| | Net asset value, end of period | | $ | 13.28 | | | $ | 12.64 | | | $ | 11.64 | | | $ | 10.32 | |
| | | | | |
| | Total return(d) | | | 5.57 | % | | | 11.15 | % | | | 15.69 | % | | | (6.67 | )% |
| | | | | |
| | Net assets, end of period (in 000s) | | $ | 53,464 | | | $ | 41,545 | | | $ | 42,118 | | | $ | 43,098 | |
| | | | | |
| | Ratio of net expenses to average net assets(e) | | | 0.18 | %(f) | | | 0.18 | % | | | 0.19 | % | | | 0.19 | %(f) |
| | | | | |
| | Ratio of total expenses to average net assets(e) | | | 0.24 | %(f) | | | 0.25 | % | | | 0.27 | % | | | 0.24 | %(f) |
| | | | | |
| | Ratio of net investment income to average net assets(c) | | | 0.88 | %(f) | | | 2.10 | % | | | 2.17 | % | | | 2.48 | %(f) |
| | | | | |
| | Portfolio turnover rate(g) | | | 2 | % | | | 19 | % | | | 55 | % | | | 45 | % |
| | (a) | | Class P Shares commenced operations April 17, 2018. |
| | (b) | | Calculated based on the average shares outstanding methodology. |
| | (c) | | Recognition of net investment income by the Portfolio is affected by the timing of declaration of dividends by the Underlying Funds in which the Portfolio invests. |
| | (d) | | Assumes investment at the NAV at the beginning of the period, reinvestment of all dividends and distributions, a complete redemption of the investment at the NAV at the end of the period and no sales or redemption charges (if any). Total returns would be reduced if a sales or redemption charge was taken into account. Returns do not reflect the impact of taxes to shareholders relating to Portfolio distributions or the redemption of Portfolio shares. Total returns for periods less than one full year are not annualized. |
| | (e) | | Expense ratios exclude the expenses of the Underlying Funds in which the Portfolio invests. |
| | (g) | | The Portfolio’s portfolio turnover rate is calculated in accordance with regulatory requirements, without regard to transactions involving short term investments and certain derivatives. If such transactions were included, the Portfolio’s portfolio turnover rate may be higher. |
| | |
| The accompanying notes are an integral part of these financial statements. | | 35 |
GOLDMAN SACHS GROWTH AND INCOME STRATEGY PORTFOLIO
Financial Highlights (continued)
Selected Share Data for a Share Outstanding Throughout Each Period
| | | | | | | | | | | | | | | | | | | | | | | | | | |
| | | | | Goldman Sachs Growth and Income Strategy Portfolio | |
| | | | | Class A Shares | |
| | | | | Six Months Ended
June 30, 2021
(Unaudited) | | | Year Ended December 31, | |
| | | | | 2020 | | | 2019 | | | 2018 | | | 2017 | | | 2016 | |
| | Per Share Data | | | | | | | | | | | | | | | | | | | | | | | | |
| | | | | | | |
| | Net asset value, beginning of period | | $ | 15.51 | | | $ | 14.26 | | | $ | 12.26 | | | $ | 13.81 | | | $ | 12.17 | | | $ | 11.62 | |
| | | | | | | |
| | Net investment income(a)(b) | | | 0.03 | | | | 0.20 | | | | 0.22 | | | | 0.18 | | | | 0.18 | | | | 0.11 | |
| | | | | | | |
| | Net realized and unrealized gain (loss) | | | 1.31 | | | | 1.54 | | | | 2.06 | | | | (1.41 | ) | | | 1.79 | | | | 0.56 | |
| | | | | | | |
| | Total from investment operations | | | 1.34 | | | | 1.74 | | | | 2.28 | | | | (1.23 | ) | | | 1.97 | | | | 0.67 | |
| | | | | | | |
| | Distributions to shareholders from net investment income | | | (0.04 | ) | | | (0.23 | ) | | | (0.28 | ) | | | (0.32 | ) | | | (0.33 | ) | | | (0.12 | ) |
| | | | | | | |
| | Distributions to shareholders from net realized gains | | | — | | | | (0.26 | ) | | | — | | | | — | | | | — | | | | — | |
| | | | | | | |
| | Total distributions | | | (0.04 | ) | | | (0.49 | ) | | | (0.28 | ) | | | (0.32 | ) | | | (0.33 | ) | | | (0.12 | ) |
| | | | | | | |
| | Net asset value, end of period | | $ | 16.81 | | | $ | 15.51 | | | $ | 14.26 | | | $ | 12.26 | | | $ | 13.81 | | | $ | 12.17 | |
| | | | | | | |
| | Total return(c) | | | 8.61 | % | | | 12.29 | % | | | 18.60 | % | | | (8.94 | )% | | | 16.19 | % | | | 5.75 | % |
| | | | | | | |
| | Net assets, end of period (in 000s) | | $ | 307,765 | | | $ | 293,868 | | | $ | 286,721 | | | $ | 272,658 | | | $ | 302,116 | | | $ | 302,858 | |
| | | | | | | |
| | Ratio of net expenses to average net assets(d) | | | 0.55 | %(e) | | | 0.57 | % | | | 0.58 | % | | | 0.59 | % | | | 0.59 | % | | | 0.59 | % |
| | | | | | | |
| | Ratio of total expenses to average net assets(d) | | | 0.59 | %(e) | | | 0.62 | % | | | 0.64 | % | | | 0.61 | % | | | 0.63 | % | | | 0.64 | % |
| | | | | | | |
| | Ratio of net investment income to average net assets(b) | | | 0.33 | %(e) | | | 1.38 | % | | | 1.65 | % | | | 1.29 | % | | | 1.35 | % | | | 0.95 | % |
| | | | | | | |
| | Portfolio turnover rate(f) | | | 2 | % | | | 13 | % | | | 61 | % | | | 32 | % | | | 81 | % | | | 67 | % |
| | (a) | | Calculated based on the average shares outstanding methodology. |
| | (b) | | Recognition of net investment income by the Portfolio is affected by the timing of declaration of dividends by the Underlying Funds in which the Portfolio invests. |
| | (c) | | Assumes investment at the NAV at the beginning of the period, reinvestment of all dividends and distributions, a complete redemption of the investment at the NAV at the end of the period and no sales or redemption charges (if any). Total returns would be reduced if a sales or redemption charge was taken into account. Returns do not reflect the impact of taxes to shareholders relating to Portfolio distributions or the redemption of Portfolio shares. Total returns for periods less than one full year are not annualized. |
| | (d) | | Expense ratios exclude the expenses of the Underlying Funds in which the Portfolio invests. |
| | (f) | | The Portfolio’s portfolio turnover rate is calculated in accordance with regulatory requirements, without regard to transactions involving short term investments and certain derivatives. If such transactions were included, the Portfolio’s portfolio turnover rate may be higher. |
| | |
| 36 | | The accompanying notes are an integral part of these financial statements. |
GOLDMAN SACHS GROWTH AND INCOME STRATEGY PORTFOLIO
Financial Highlights (continued)
Selected Share Data for a Share Outstanding Throughout Each Period
| | | | | | | | | | | | | | | | | | | | | | | | | | |
| | | | | Goldman Sachs Growth and Income Strategy Portfolio | |
| | | | | Class C Shares | |
| | | | | Six Months Ended
June 30, 2021
(Unaudited) | | | Year Ended December 31, | |
| | | | | 2020 | | | 2019 | | | 2018 | | | 2017 | | | 2016 | |
| | Per Share Data | | | | | | | | | | | | | | | | | | | | | | | | |
| | | | | | | |
| | Net asset value, beginning of period | | $ | 15.12 | | | $ | 13.92 | | | $ | 11.98 | | | $ | 13.49 | | | $ | 11.90 | | | $ | 11.42 | |
| | | | | | | |
| | Net investment income (loss)(a)(b) | | | (0.04 | ) | | | 0.06 | | | | 0.09 | | | | 0.01 | | | | 0.06 | | | | 0.02 | |
| | | | | | | |
| | Net realized and unrealized gain (loss) | | | 1.29 | | | | 1.53 | | | | 2.04 | | | | (1.31 | ) | | | 1.76 | | | | 0.54 | |
| | | | | | | |
| | Total from investment operations | | | 1.25 | | | | 1.59 | | | | 2.13 | | | | (1.30 | ) | | | 1.82 | | | | 0.56 | |
| | | | | | | |
| | Distributions to shareholders from net investment income | | | (0.01 | ) | | | (0.13 | ) | | | (0.19 | ) | | | (0.21 | ) | | | (0.23 | ) | | | (0.08 | ) |
| | | | | | | |
| | Distributions to shareholders from net realized gains | | | — | | | | (0.26 | ) | | | — | | | | — | | | | — | | | | — | |
| | | | | | | |
| | Total distributions | | | (0.01 | ) | | | (0.39 | ) | | | (0.19 | ) | | | (0.21 | ) | | | (0.23 | ) | | | (0.08 | ) |
| | | | | | | |
| | Net asset value, end of period | | $ | 16.36 | | | $ | 15.12 | | | $ | 13.92 | | | $ | 11.98 | | | $ | 13.49 | | | $ | 11.90 | |
| | | | | | | |
| | Total return(c) | | | 8.24 | % | | | 11.44 | % | | | 17.78 | % | | | (9.62 | )% | | | 15.31 | % | | | 4.86 | % |
| | | | | | | |
| | Net assets, end of period (in 000s) | | $ | 10,857 | | | $ | 13,454 | | | $ | 19,069 | | | $ | 27,099 | | | $ | 94,118 | | | $ | 121,778 | |
| | | | | | | |
| | Ratio of net expenses to average net assets(d) | | | 1.30 | %(e) | | | 1.32 | % | | | 1.33 | % | | | 1.34 | % | | | 1.34 | % | | | 1.34 | % |
| | | | | | | |
| | Ratio of total expenses to average net assets(d) | | | 1.34 | %(e) | | | 1.37 | % | | | 1.39 | % | | | 1.36 | % | | | 1.38 | % | | | 1.39 | % |
| | | | | | | |
| | Ratio of net investment income (loss) to average net assets(b) | | | (0.45 | )%(e) | | | 0.45 | % | | | 0.66 | % | | | 0.11 | % | | | 0.50 | % | | | 0.18 | % |
| | | | | | | |
| | Portfolio turnover rate(f) | | | 2 | % | | | 13 | % | | | 61 | % | | | 32 | % | | | 81 | % | | | 67 | % |
| | (a) | | Calculated based on the average shares outstanding methodology. |
| | (b) | | Recognition of net investment income by the Portfolio is affected by the timing of declaration of dividends by the Underlying Funds in which the Portfolio invests. |
| | (c) | | Assumes investment at the NAV at the beginning of the period, reinvestment of all dividends and distributions, a complete redemption of the investment at the NAV at the end of the period and no sales or redemption charges (if any). Total returns would be reduced if a sales or redemption charge was taken into account. Returns do not reflect the impact of taxes to shareholders relating to Portfolio distributions or the redemption of Portfolio shares. Total returns for periods less than one full year are not annualized. |
| | (d) | | Expense ratios exclude the expenses of the Underlying Funds in which the Portfolio invests. |
| | (f) | | The Portfolio’s portfolio turnover rate is calculated in accordance with regulatory requirements, without regard to transactions involving short term investments and certain derivatives. If such transactions were included, the Portfolio’s portfolio turnover rate may be higher. |
| | |
| The accompanying notes are an integral part of these financial statements. | | 37 |
GOLDMAN SACHS GROWTH AND INCOME STRATEGY PORTFOLIO
Financial Highlights (continued)
Selected Share Data for a Share Outstanding Throughout Each Period
| | | | | | | | | | | | | | | | | | | | | | | | | | |
| | | | | Goldman Sachs Growth and Income Strategy Portfolio | |
| | | | | Institutional Shares | |
| | | | | Six Months Ended
June 30, 2021
(Unaudited) | | | Year Ended December 31, | |
| | | | | 2020 | | | 2019 | | | 2018 | | | 2017 | | | 2016 | |
| | Per Share Data | | | | | | | | | | | | | | | | | | | | | | | | |
| | | | | | | |
| | Net asset value, beginning of period | | $ | 15.56 | | | $ | 14.31 | | | $ | 12.29 | | | $ | 13.85 | | | $ | 12.21 | | | $ | 11.66 | |
| | | | | | | |
| | Net investment income(a)(b) | | | 0.06 | | | | 0.25 | | | | 0.27 | | | | 0.20 | | | | 0.24 | | | | 0.17 | |
| | | | | | | |
| | Net realized and unrealized gain (loss) | | | 1.31 | | | | 1.54 | | | | 2.08 | | | | (1.39 | ) | | | 1.78 | | | | 0.55 | |
| | | | | | | |
| | Total from investment operations | | | 1.37 | | | | 1.79 | | | | 2.35 | | | | (1.19 | ) | | | 2.02 | | | | 0.72 | |
| | | | | | | |
| | Distributions to shareholders from net investment income | | | (0.07 | ) | | | (0.28 | ) | | | (0.33 | ) | | | (0.37 | ) | | | (0.38 | ) | | | (0.17 | ) |
| | | | | | | |
| | Distributions to shareholders from net realized gains | | | — | | | | (0.26 | ) | | | — | | | | — | | | | — | | | | — | |
| | | | | | | |
| | Total distributions | | | (0.07 | ) | | | (0.54 | ) | | | (0.33 | ) | | | (0.37 | ) | | | (0.38 | ) | | | (0.17 | ) |
| | | | | | | |
| | Net asset value, end of period | | $ | 16.86 | | | $ | 15.56 | | | $ | 14.31 | | | $ | 12.29 | | | $ | 13.85 | | | $ | 12.21 | |
| | | | | | | |
| | Total return(c) | | | 8.83 | % | | | 12.68 | % | | | 19.17 | % | | | (8.63 | )% | | | 16.60 | % | | | 6.15 | % |
| | | | | | | |
| | Net assets, end of period (in 000s) | | $ | 383,005 | | | $ | 364,206 | | | $ | 371,610 | | | $ | 360,006 | | | $ | 574,136 | | | $ | 455,273 | |
| | | | | | | |
| | Ratio of net expenses to average net assets(d) | | | 0.19 | %(e) | | | 0.19 | % | | | 0.20 | % | | | 0.20 | % | | | 0.19 | % | | | 0.19 | % |
| | | | | | | |
| | Ratio of total expenses to average net assets(d) | | | 0.23 | %(e) | | | 0.24 | % | | | 0.25 | % | | | 0.22 | % | | | 0.23 | % | | | 0.24 | % |
| | | | | | | |
| | Ratio of net investment income to average net assets(b) | | | 0.69 | %(e) | | | 1.77 | % | | | 2.01 | % | | | 1.48 | % | | | 1.80 | % | | | 1.42 | % |
| | | | | | | |
| | Portfolio turnover rate(f) | | | 2 | % | | | 13 | % | | | 61 | % | | | 32 | % | | | 81 | % | | | 67 | % |
| | (a) | | Calculated based on the average shares outstanding methodology. |
| | (b) | | Recognition of net investment income by the Portfolio is affected by the timing of declaration of dividends by the Underlying Funds in which the Portfolio invests. |
| | (c) | | Assumes investment at the NAV at the beginning of the period, reinvestment of all dividends and distributions, a complete redemption of the investment at the NAV at the end of the period and no sales or redemption charges (if any). Total returns would be reduced if a sales or redemption charge was taken into account. Returns do not reflect the impact of taxes to shareholders relating to Portfolio distributions or the redemption of Portfolio shares. Total returns for periods less than one full year are not annualized. |
| | (d) | | Expense ratios exclude the expenses of the Underlying Funds in which the Portfolio invests. |
| | (f) | | The Portfolio’s portfolio turnover rate is calculated in accordance with regulatory requirements, without regard to transactions involving short term investments and certain derivatives. If such transactions were included, the Portfolio’s portfolio turnover rate may be higher. |
| | |
| 38 | | The accompanying notes are an integral part of these financial statements. |
GOLDMAN SACHS GROWTH AND INCOME STRATEGY PORTFOLIO
Financial Highlights (continued)
Selected Share Data for a Share Outstanding Throughout Each Period
| | | | | | | | | | | | | | | | | | | | | | | | | | |
| | | | | Goldman Sachs Growth and Income Strategy Portfolio | |
| | | | | Service Shares | |
| | | | | Six Months Ended
June 30, 2021
(Unaudited) | | | Year Ended December 31, | |
| | | | | 2020 | | | 2019 | | | 2018 | | | 2017 | | | 2016 | |
| | Per Share Data | | | | | | | | | | | | | | | | | | | | | | | | |
| | | | | | | |
| | Net asset value, beginning of period | | $ | 15.48 | | | $ | 14.23 | | | $ | 12.23 | | | $ | 13.77 | | | $ | 12.14 | | | $ | 11.60 | |
| | | | | | | |
| | Net investment income(a)(b) | | | 0.02 | | | | 0.16 | | | | 0.21 | | | | 0.15 | | | | 0.17 | | | | 0.11 | |
| | | | | | | |
| | Net realized and unrealized gain (loss) | | | 1.30 | | | | 1.56 | | | | 2.05 | | | | (1.38 | ) | | | 1.77 | | | | 0.54 | |
| | | | | | | |
| | Total from investment operations | | | 1.32 | | | | 1.72 | | | | 2.26 | | | | (1.23 | ) | | | 1.94 | | | | 0.65 | |
| | | | | | | |
| | Distributions to shareholders from net investment income | | | (0.03 | ) | | | (0.21 | ) | | | (0.26 | ) | | | (0.31 | ) | | | (0.31 | ) | | | (0.11 | ) |
| | | | | | | |
| | Distributions to shareholders from net realized gains | | | — | | | | (0.26 | ) | | | — | | | | — | | | | — | | | | — | |
| | | | | | | |
| | Total distributions | | | (0.03 | ) | | | (0.47 | ) | | | (0.26 | ) | | | (0.31 | ) | | | (0.31 | ) | | | (0.11 | ) |
| | | | | | | |
| | Net asset value, end of period | | $ | 16.77 | | | $ | 15.48 | | | $ | 14.23 | | | $ | 12.23 | | | $ | 13.77 | | | $ | 12.14 | |
| | | | | | | |
| | Total return(c) | | | 8.49 | % | | | 12.18 | % | | | 18.51 | % | | | (9.00 | )% | | | 16.03 | % | | | 5.58 | % |
| | | | | | | |
| | Net assets, end of period (in 000s) | | $ | 2,738 | | | $ | 2,669 | | | $ | 2,920 | | | $ | 2,780 | | | $ | 3,414 | | | $ | 3,253 | |
| | | | | | | |
| | Ratio of net expenses to average net assets(d) | | | 0.69 | %(e) | | | 0.69 | % | | | 0.70 | % | | | 0.70 | % | | | 0.69 | % | | | 0.69 | % |
| | | | | | | |
| | Ratio of total expenses to average net assets(d) | | | 0.73 | %(e) | | | 0.74 | % | | | 0.75 | % | | | 0.72 | % | | | 0.73 | % | | | 0.74 | % |
| | | | | | | |
| | Ratio of net investment income to average net assets(b) | | | 0.19 | %(e) | | | 1.17 | % | | | 1.53 | % | | | 1.13 | % | | | 1.27 | % | | | 0.90 | % |
| | | | | | | |
| | Portfolio turnover rate(f) | | | 2 | % | | | 13 | % | | | 61 | % | | | 32 | % | | | 81 | % | | | 67 | % |
| | (a) | | Calculated based on the average shares outstanding methodology. |
| | (b) | | Recognition of net investment income by the Portfolio is affected by the timing of declaration of dividends by the Underlying Funds in which the Portfolio invests. |
| | (c) | | Assumes investment at the NAV at the beginning of the period, reinvestment of all dividends and distributions, a complete redemption of the investment at the NAV at the end of the period and no sales or redemption charges (if any). Total returns would be reduced if a sales or redemption charge was taken into account. Returns do not reflect the impact of taxes to shareholders relating to Portfolio distributions or the redemption of Portfolio shares. Total returns for periods less than one full year are not annualized. |
| | (d) | | Expense ratios exclude the expenses of the Underlying Funds in which the Portfolio invests. |
| | (f) | | The Portfolio’s portfolio turnover rate is calculated in accordance with regulatory requirements, without regard to transactions involving short term investments and certain derivatives. If such transactions were included, the Portfolio’s portfolio turnover rate may be higher. |
| | |
| The accompanying notes are an integral part of these financial statements. | | 39 |
GOLDMAN SACHS GROWTH AND INCOME STRATEGY PORTFOLIO
Financial Highlights (continued)
Selected Share Data for a Share Outstanding Throughout Each Period
| | | | | | | | | | | | | | | | | | | | | | | | | | |
| | | | | Goldman Sachs Growth and Income Strategy Portfolio | |
| | | | | Investor Shares | |
| | | | | Six Months Ended
June 30, 2021
(Unaudited) | | | Year Ended December 31, | |
| | | | | 2020 | | | 2019 | | | 2018 | | | 2017 | | | 2016 | |
| | Per Share Data | | | | | | | | | | | | | | | | | | | | | | | | |
| | | | | | | |
| | Net asset value, beginning of period | | $ | 15.44 | | | $ | 14.19 | | | $ | 12.20 | | | $ | 13.74 | | | $ | 12.12 | | | $ | 11.57 | |
| | | | | | | |
| | Net investment income(a)(b) | | | 0.05 | | | | 0.23 | | | | 0.26 | | | | 0.20 | | | | 0.23 | | | | 0.16 | |
| | | | | | | |
| | Net realized and unrealized gain (loss) | | | 1.29 | | | | 1.54 | | | | 2.04 | | | | (1.38 | ) | | | 1.75 | | | | 0.54 | |
| | | | | | | |
| | Total from investment operations | | | 1.34 | | | | 1.77 | | | | 2.30 | | | | (1.18 | ) | | | 1.98 | | | | 0.70 | |
| | | | | | | |
| | Distributions to shareholders from net investment income | | | (0.06 | ) | | | (0.26 | ) | | | (0.31 | ) | | | (0.36 | ) | | | (0.36 | ) | | | (0.15 | ) |
| | | | | | | |
| | Distributions to shareholders from net realized gains | | | — | | | | (0.26 | ) | | | — | | | | — | | | | — | | | | — | |
| | | | | | | |
| | Total distributions | | | (0.06 | ) | | | (0.52 | ) | | | (0.31 | ) | | | (0.36 | ) | | | (0.36 | ) | | | (0.15 | ) |
| | | | | | | |
| | Net asset value, end of period | | $ | 16.72 | | | $ | 15.44 | | | $ | 14.19 | | | $ | 12.20 | | | $ | 13.74 | | | $ | 12.12 | |
| | | | | | | |
| | Total return(c) | | | 8.71 | % | | | 12.64 | % | | | 18.91 | % | | | (8.68 | )% | | | 16.39 | % | | | 6.04 | % |
| | | | | | | |
| | Net assets, end of period (in 000s) | | $ | 8,985 | | | $ | 7,997 | | | $ | 7,670 | | | $ | 7,366 | | | $ | 7,241 | | | $ | 4,769 | |
| | | | | | | |
| | Ratio of net expenses to average net assets(d) | | | 0.30 | %(e) | | | 0.32 | % | | | 0.33 | % | | | 0.34 | % | | | 0.34 | % | | | 0.34 | % |
| | | | | | | |
| | Ratio of total expenses to average net assets(d) | | | 0.34 | %(e) | | | 0.37 | % | | | 0.39 | % | | | 0.36 | % | | | 0.38 | % | | | 0.39 | % |
| | | | | | | |
| | Ratio of net investment income(b) | | | 0.59 | %(e) | | | 1.64 | % | | | 1.92 | % | | | 1.48 | % | | | 1.72 | % | | | 1.37 | % |
| | | | | | | |
| | Portfolio turnover rate(f) | | | 2 | % | | | 13 | % | | | 61 | % | | | 32 | % | | | 81 | % | | | 67 | % |
| | (a) | | Calculated based on the average shares outstanding methodology. |
| | (b) | | Recognition of net investment income by the Portfolio is affected by the timing of declaration of dividends by the Underlying Funds in which the Portfolio invests. |
| | (c) | | Assumes investment at the NAV at the beginning of the period, reinvestment of all dividends and distributions, a complete redemption of the investment at the NAV at the end of the period and no sales or redemption charges (if any). Total returns would be reduced if a sales or redemption charge was taken into account. Returns do not reflect the impact of taxes to shareholders relating to Portfolio distributions or the redemption of Portfolio shares. Total returns for periods less than one full year are not annualized. |
| | (d) | | Expense ratios exclude the expenses of the Underlying Funds in which the Portfolio invests. |
| | (f) | | The Portfolio’s portfolio turnover rate is calculated in accordance with regulatory requirements, without regard to transactions involving short term investments and certain derivatives. If such transactions were included, the Portfolio’s portfolio turnover rate may be higher. |
| | |
| 40 | | The accompanying notes are an integral part of these financial statements. |
GOLDMAN SACHS GROWTH AND INCOME STRATEGY PORTFOLIO
Financial Highlights (continued)
Selected Share Data for a Share Outstanding Throughout Each Period
| | | | | | | | | | | | | | | | | | | | | | | | | | |
| | | | | Goldman Sachs Growth and Income Strategy Portfolio | |
| | | | | Class R6 Shares | |
| | | | | Six Months Ended
June 30, 2021
(Unaudited) | | | Year Ended December 31, | |
| | | | | 2020 | | | 2019 | | | 2018 | | | 2017 | | | 2016 | |
| | Per Share Data | | | | | | | | | | | | | | | | | | | | | | | | |
| | | | | | | |
| | Net asset value, beginning of period | | $ | 15.55 | | | $ | 14.30 | | | $ | 12.29 | | | $ | 13.85 | | | $ | 12.20 | | | $ | 11.66 | |
| | | | | | | |
| | Net investment income(a)(b) | | | 0.06 | | | | 0.22 | | | | 0.26 | | | | 0.36 | | | | 0.30 | | | | 0.17 | |
| | | | | | | |
| | Net realized and unrealized gain (loss) | | | 1.31 | | | | 1.57 | | | | 2.08 | | | | (1.54 | ) | | | 1.73 | | | | 0.54 | |
| | | | | | | |
| | Total from investment operations | | | 1.37 | | | | 1.79 | | | | 2.34 | | | | (1.18 | ) | | | 2.03 | | | | 0.71 | |
| | | | | | | |
| | Distributions to shareholders from net investment income | | | (0.07 | ) | | | (0.28 | ) | | | (0.33 | ) | | | (0.38 | ) | | | (0.38 | ) | | | (0.17 | ) |
| | | | | | | |
| | Distributions to shareholders from net realized gains | | | — | | | | (0.26 | ) | | | — | | | | — | | | | — | | | | — | |
| | | | | | | |
| | Total distributions | | | (0.07 | ) | | | (0.54 | ) | | | (0.33 | ) | | | (0.38 | ) | | | (0.38 | ) | | | (0.17 | ) |
| | | | | | | |
| | Net asset value, end of period | | $ | 16.85 | | | $ | 15.55 | | | $ | 14.30 | | | $ | 12.29 | | | $ | 13.85 | | | $ | 12.20 | |
| | | | | | | |
| | Total return(c) | | | 8.84 | % | | | 12.70 | % | | | 19.10 | % | | | (8.61 | )% | | | 16.71 | % | | | 6.07 | % |
| | | | | | | |
| | Net assets, end of period (in 000s) | | $ | 5,073 | | | $ | 4,694 | | | $ | 6,300 | | | $ | 6,331 | | | $ | 84 | | | $ | 10 | |
| | | | | | | |
| | Ratio of net expenses to average net assets(d) | | | 0.18 | %(e) | | | 0.18 | % | | | 0.19 | % | | | 0.19 | % | | | 0.18 | % | | | 0.19 | % |
| | | | | | | |
| | Ratio of total expenses to average net assets(d) | | | 0.22 | %(e) | | | 0.23 | % | | | 0.24 | % | | | 0.22 | % | | | 0.22 | % | | | 0.23 | % |
| | | | | | | |
| | Ratio of net investment income(b) | | | 0.70 | %(e) | | | 1.59 | % | | | 1.92 | % | | | 2.67 | % | | | 2.21 | % | | | 1.43 | % |
| | | | | | | |
| | Portfolio turnover rate(f) | | | 2 | % | | | 13 | % | | | 61 | % | | | 32 | % | | | 81 | % | | | 67 | % |
| | (a) | | Calculated based on the average shares outstanding methodology. |
| | (b) | | Recognition of net investment income by the Portfolio is affected by the timing of declaration of dividends by the Underlying Funds in which the Portfolio invests. |
| | (c) | | Assumes investment at the NAV at the beginning of the period, reinvestment of all dividends and distributions, a complete redemption of the investment at the NAV at the end of the period and no sales or redemption charges (if any). Total returns would be reduced if a sales or redemption charge was taken into account. Returns do not reflect the impact of taxes to shareholders relating to Portfolio distributions or the redemption of Portfolio shares. Total returns for periods less than one full year are not annualized. |
| | (d) | | Expense ratios exclude the expenses of the Underlying Funds in which the Portfolio invests. |
| | (f) | | The Portfolio’s portfolio turnover rate is calculated in accordance with regulatory requirements, without regard to transactions involving short term investments and certain derivatives. If such transactions were included, the Portfolio’s portfolio turnover rate may be higher. |
| | |
| The accompanying notes are an integral part of these financial statements. | | 41 |
GOLDMAN SACHS GROWTH AND INCOME STRATEGY PORTFOLIO
Financial Highlights (continued)
Selected Share Data for a Share Outstanding Throughout Each Period
| | | | | | | | | | | | | | | | | | | | | | | | | | |
| | | | | Goldman Sachs Growth and Income Strategy Portfolio | |
| | | | | Class R Shares | |
| | | | | Six Months Ended
June 30, 2021
(Unaudited) | | | Year Ended December 31, | |
| | | | | 2020 | | | 2019 | | | 2018 | | | 2017 | | | 2016 | |
| | Per Share Data | | | | | | | | | | | | | | | | | | | | | | | | |
| | | | | | | |
| | Net asset value, beginning of period | | $ | 15.39 | | | $ | 14.15 | | | $ | 12.17 | | | $ | 13.70 | | | $ | 12.09 | | | $ | 11.56 | |
| | | | | | | |
| | Net investment income(a)(b) | | | 0.01 | | | | 0.16 | | | | 0.20 | | | | 0.13 | | | | 0.18 | | | | 0.09 | |
| | | | | | | |
| | Net realized and unrealized gain (loss) | | | 1.29 | | | | 1.53 | | | | 2.02 | | | | (1.37 | ) | | | 1.73 | | | | 0.54 | |
| | | | | | | |
| | Total from investment operations | | | 1.30 | | | | 1.69 | | | | 2.22 | | | | (1.24 | ) | | | 1.91 | | | | 0.63 | |
| | | | | | | |
| | Distributions to shareholders from net investment income | | | (0.03 | ) | | | (0.19 | ) | | | (0.24 | ) | | | (0.29 | ) | | | (0.30 | ) | | | (0.10 | ) |
| | | | | | | |
| | Distributions to shareholders from net realized gains | | | — | | | | (0.26 | ) | | | — | | | | — | | | | — | | | | — | |
| | | | | | | |
| | Total distributions | | | (0.03 | ) | | | (0.45 | ) | | | (0.24 | ) | | | (0.29 | ) | | | (0.30 | ) | | | (0.10 | ) |
| | | | | | | |
| | Net asset value, end of period | | $ | 16.66 | | | $ | 15.39 | | | $ | 14.15 | | | $ | 12.17 | | | $ | 13.70 | | | $ | 12.09 | |
| | | | | | | |
| | Total return(c) | | | 8.46 | % | | | 12.05 | % | | | 18.30 | % | | | (9.10 | )% | | | 15.83 | % | | | 5.40 | % |
| | | | | | | |
| | Net assets, end of period (in 000s) | | $ | 5,791 | | | $ | 5,270 | | | $ | 4,991 | | | $ | 4,251 | | | $ | 5,441 | | | $ | 2,659 | |
| | | | | | | |
| | Ratio of net expenses to average net assets(d) | | | 0.80 | %(e) | | | 0.82 | % | | | 0.83 | % | | | 0.84 | % | | | 0.84 | % | | | 0.84 | % |
| | | | | | | |
| | Ratio of total expenses to average net assets(d) | | | 0.84 | %(e) | | | 0.87 | % | | | 0.89 | % | | | 0.86 | % | | | 0.88 | % | | | 0.89 | % |
| | | | | | | |
| | Ratio of net investment income to average net assets(b) | | | 0.08 | %(e) | | | 1.15 | % | | | 1.46 | % | | | 1.00 | % | | | 1.35 | % | | | 0.75 | % |
| | | | | | | |
| | Portfolio turnover rate(f) | | | 2 | % | | | 13 | % | | | 61 | % | | | 32 | % | | | 81 | % | | | 67 | % |
| | (a) | | Calculated based on the average shares outstanding methodology. |
| | (b) | | Recognition of net investment income by the Portfolio is affected by the timing of declaration of dividends by the Underlying Funds in which the Portfolio invests. |
| | (c) | | Assumes investment at the NAV at the beginning of the period, reinvestment of all dividends and distributions, a complete redemption of the investment at the NAV at the end of the period and no sales or redemption charges (if any). Total returns would be reduced if a sales or redemption charge was taken into account. Returns do not reflect the impact of taxes to shareholders relating to Portfolio distributions or the redemption of Portfolio shares. Total returns for periods less than one full year are not annualized. |
| | (d) | | Expense ratios exclude the expenses of the Underlying Funds in which the Portfolio invests. |
| | (f) | | The Portfolio’s portfolio turnover rate is calculated in accordance with regulatory requirements, without regard to transactions involving short term investments and certain derivatives. If such transactions were included, the Portfolio’s portfolio turnover rate may be higher. |
| | |
| 42 | | The accompanying notes are an integral part of these financial statements. |
GOLDMAN SACHS GROWTH AND INCOME STRATEGY PORTFOLIO
Financial Highlights (continued)
Selected Share Data for a Share Outstanding Throughout Each Period
| | | | | | | | | | | | | | | | | | |
| | | | | Goldman Sachs Growth and Income Strategy Portfolio | |
| | | | | Class P Shares | |
| | | | | Six Months Ended
June 30, 2021
(Unaudited) | | | Year Ended December 31, | | | Period Ended
December 31, 2018(a) | |
| | | | | 2020 | | | 2019 | |
| | Per Share Data | | | | | | | | | | | | | | | | |
| | | | | |
| | Net asset value, beginning of period | | $ | 15.55 | | | $ | 14.30 | | | $ | 12.29 | | | $ | 13.91 | |
| | | | | |
| | Net investment income(b)(c) | | | 0.06 | | | | 0.26 | | | | 0.29 | | | | 0.23 | |
| | | | | |
| | Net realized and unrealized gain (loss) | | | 1.31 | | | | 1.53 | | | | 2.05 | | | | (1.52 | ) |
| | | | | |
| | Total from investment operations | | | 1.37 | | | | 1.79 | | | | 2.34 | | | | (1.29 | ) |
| | | | | |
| | Distributions to shareholders from net investment income | | | (0.07 | ) | | | (0.28 | ) | | | (0.33 | ) | | | (0.33 | ) |
| | | | | |
| | Distributions to shareholders from net realized gains | | | — | | | | (0.26 | ) | | | — | | | | — | |
| | | | | |
| | Total distributions | | | (0.07 | ) | | | (0.54 | ) | | | (0.33 | ) | | | (0.33 | ) |
| | | | | |
| | Net asset value, end of period | | $ | 16.85 | | | $ | 15.55 | | | $ | 14.30 | | | $ | 12.29 | |
| | | | | |
| | Total return(d) | | | 8.84 | % | | | 12.70 | % | | | 19.10 | % | | | (9.29 | )% |
| | | | | |
| | Net assets, end of period (in 000s) | | $ | 252,440 | | | $ | 228,953 | | | $ | 212,702 | | | $ | 185,028 | |
| | | | | |
| | Ratio of net expenses to average net assets(e) | | | 0.18 | %(f) | | | 0.18 | % | | | 0.19 | % | | | 0.19 | %(f) |
| | | | | |
| | Ratio of total expenses to average net assets(e) | | | 0.22 | %(f) | | | 0.23 | % | | | 0.24 | % | | | 0.22 | %(f) |
| | | | | |
| | Ratio of net investment income to average net assets(c) | | | 0.70 | %(f) | | | 1.80 | % | | | 2.12 | % | | | 2.48 | %(f) |
| | | | | |
| | Portfolio turnover rate(g) | | | 2 | % | | | 13 | % | | | 61 | % | | | 32 | % |
| | (a) | | Class P Shares commenced operations April 17, 2018. |
| | (b) | | Calculated based on the average shares outstanding methodology. |
| | (c) | | Recognition of net investment income by the Portfolio is affected by the timing of declaration of dividends by the Underlying Funds in which the Portfolio invests. |
| | (d) | | Assumes investment at the NAV at the beginning of the period, reinvestment of all dividends and distributions, a complete redemption of the investment at the NAV at the end of the period and no sales or redemption charges (if any). Total returns would be reduced if a sales or redemption charge was taken into account. Returns do not reflect the impact of taxes to shareholders relating to Portfolio distributions or the redemption of Portfolio shares. Total returns for periods less than one full year are not annualized. |
| | (e) | | Expense ratios exclude the expenses of the Underlying Funds in which the Portfolio invests. |
| | (g) | | The Portfolio’s portfolio turnover rate is calculated in accordance with regulatory requirements, without regard to transactions involving short term investments and certain derivatives. If such transactions were included, the Portfolio’s portfolio turnover rate may be higher. |
| | |
| The accompanying notes are an integral part of these financial statements. | | 43 |
GOLDMAN SACHS GROWTH STRATEGY PORTFOLIO
Financial Highlights (continued)
Selected Share Data for a Share Outstanding Throughout Each Period
| | | | | | | | | | | | | | | | | | | | | | | | | | |
| | | | | Goldman Sachs Growth Strategy Portfolio | |
| | | | | Class A Shares | |
| | | | | Six Months Ended
June 30, 2021
(Unaudited) | | | Year Ended December 31, | |
| | | | | 2020 | | | 2019 | | | 2018 | | | 2017 | | | 2016 | |
| | Per Share Data | | | | | | | | | | | | | | | | | | | | | | | | |
| | | | | | | |
| | Net asset value, beginning of period | | $ | 17.88 | | | $ | 16.18 | | | $ | 13.73 | | | $ | 15.83 | | | $ | 13.39 | | | $ | 12.70 | |
| | | | | | | |
| | Net investment income(a)(b) | | | 0.01 | | | | 0.19 | | | | 0.25 | | | | 0.19 | | | | 0.15 | | | | 0.11 | |
| | | | | | | |
| | Net realized and unrealized gain (loss) | | | 2.09 | | | | 2.07 | | | | 2.80 | | | | (1.93 | ) | | | 2.67 | | | | 0.70 | |
| | | | | | | |
| | Total from investment operations | | | 2.10 | | | | 2.26 | | | | 3.05 | | | | (1.74 | ) | | | 2.82 | | | | 0.81 | |
| | | | | | | |
| | Distributions to shareholders from net investment income | | | — | | | | (0.21 | ) | | | (0.32 | ) | | | (0.36 | ) | | | (0.38 | ) | | | (0.12 | ) |
| | | | | | | |
| | Distributions to shareholders from net realized gains | | | — | | | | (0.35 | ) | | | (0.28 | ) | | | — | | | | — | | | | — | |
| | | | | | | |
| | Total distributions | | | — | | | | (0.56 | ) | | | (0.60 | ) | | | (0.36 | ) | | | (0.38 | ) | | | (0.12 | ) |
| | | | | | | |
| | Net asset value, end of period | | $ | 19.98 | | | $ | 17.88 | | | $ | 16.18 | | | $ | 13.73 | | | $ | 15.83 | | | $ | 13.39 | |
| | | | | | | |
| | Total return(c) | | | 11.69 | % | | | 13.96 | % | | | 22.24 | % | | | (10.98 | )% | | | 21.02 | % | | | 6.38 | % |
| | | | | | | |
| | Net assets, end of period (in 000s) | | $ | 382,720 | | | $ | 353,363 | | | $ | 338,384 | | | $ | 308,475 | | | $ | 316,078 | | | $ | 301,331 | |
| | | | | | | |
| | Ratio of net expenses to average net assets(d) | | | 0.55 | %(e) | | | 0.57 | % | | | 0.58 | % | | | 0.59 | % | | | 0.59 | % | | | 0.59 | % |
| | | | | | | |
| | Ratio of total expenses to average net assets(d) | | | 0.60 | %(e) | | | 0.64 | % | | | 0.65 | % | | | 0.62 | % | | | 0.63 | % | | | 0.65 | % |
| | | | | | | |
| | Ratio of net investment income to average net assets(b) | | | 0.11 | %(e) | | | 1.18 | % | | | 1.61 | % | | | 1.19 | % | | | 1.00 | % | | | 0.83 | % |
| | | | | | | |
| | Portfolio turnover rate(f) | | | 2 | % | | | 8 | % | | | 69 | % | | | 29 | % | | | 85 | % | | | 59 | % |
| | (a) | | Calculated based on the average shares outstanding methodology. |
| | (b) | | Recognition of net investment income by the Portfolio is affected by the timing of declaration of dividends by the Underlying Funds in which the Portfolio invests. |
| | (c) | | Assumes investment at the NAV at the beginning of the period, reinvestment of all dividends and distributions, a complete redemption of the investment at the NAV at the end of the period and no sales or redemption charges (if any). Total returns would be reduced if a sales or redemption charge was taken into account. Returns do not reflect the impact of taxes to shareholders relating to Portfolio distributions or the redemption of Portfolio shares. Total returns for periods less than one full year are not annualized. |
| | (d) | | Expense ratios exclude the expenses of the Underlying Funds in which the Portfolio invests. |
| | (f) | | The Portfolio’s portfolio turnover rate is calculated in accordance with regulatory requirements, without regard to transactions involving short term investments and certain derivatives. If such transactions were included, the Portfolio’s portfolio turnover rate may be higher. |
| | |
| 44 | | The accompanying notes are an integral part of these financial statements. |
GOLDMAN SACHS GROWTH STRATEGY PORTFOLIO
Financial Highlights (continued)
Selected Share Data for a Share Outstanding Throughout Each Period
| | | | | | | | | | | | | | | | | | | | | | | | | | |
| | | | | Goldman Sachs Growth Strategy Portfolio | |
| | | | | Class C Shares | |
| | | | | Six Months Ended
June 30, 2021
(Unaudited) | | | Year Ended December 31, | |
| | | | | 2020 | | | 2019 | | | 2018 | | | 2017 | | | 2016 | |
| | Per Share Data | | | | | | | | | | | | | | | | | | | | | | | | |
| | | | | | | |
| | Net asset value, beginning of period | | $ | 18.27 | | | $ | 16.51 | | | $ | 13.98 | | | $ | 15.81 | | | $ | 13.37 | | | $ | 12.68 | |
| | | | | | | |
| | Net investment income (loss)(a)(b) | | | (0.07 | ) | | | 0.05 | | | | 0.10 | | | | (0.03 | ) | | | 0.03 | | | | 0.01 | |
| | | | | | | |
| | Net realized and unrealized gain (loss) | | | 2.14 | | | | 2.11 | | | | 2.87 | | | | (1.80 | ) | | | 2.66 | | | | 0.70 | |
| | | | | | | |
| | Total from investment operations | | | 2.07 | | | | 2.16 | | | | 2.97 | | | | (1.83 | ) | | | 2.69 | | | | 0.71 | |
| | | | | | | |
| | Distributions to shareholders from net investment income | | | — | | | | (0.05 | ) | | | (0.16 | ) | | | — | | | | (0.25 | ) | | | (0.02 | ) |
| | | | | | | |
| | Distributions to shareholders from net realized gains | | | — | | | | (0.35 | ) | | | (0.28 | ) | | | — | | | | — | | | | — | |
| | | | | | | |
| | Total distributions | | | — | | | | (0.40 | ) | | | (0.44 | ) | | | — | | | | (0.25 | ) | | | (0.02 | ) |
| | | | | | | |
| | Net asset value, end of period | | $ | 20.34 | | | $ | 18.27 | | | $ | 16.51 | | | $ | 13.98 | | | $ | 15.81 | | | $ | 13.37 | |
| | | | | | | |
| | Total return(c) | | | 11.28 | % | | | 13.10 | % | | | 21.31 | % | | | (11.58 | )% | | | 20.08 | % | | | 5.57 | % |
| | | | | | | |
| | Net assets, end of period (in 000s) | | $ | 19,613 | | | $ | 22,590 | | | $ | 29,424 | | | $ | 36,201 | | | $ | 126,894 | | | $ | 144,292 | |
| | | | | | | |
| | Ratio of net expenses to average net assets(d) | | | 1.30 | %(e) | | | 1.32 | % | | | 1.33 | % | | | 1.34 | % | | | 1.34 | % | | | 1.34 | % |
| | | | | | | |
| | Ratio of total expenses to average net assets(d) | | | 1.35 | %(e) | | | 1.39 | % | | | 1.40 | % | | | 1.37 | % | | | 1.38 | % | | | 1.40 | % |
| | | | | | | |
| | Ratio of net investment income (loss) to average net assets(b) | | | (0.68 | )%(e) | | | 0.28 | % | | | 0.64 | % | | | (0.20 | )% | | | 0.18 | % | | | 0.08 | % |
| | | | | | | |
| | Portfolio turnover rate(f) | | | 2 | % | | | 8 | % | | | 69 | % | | | 29 | % | | | 85 | % | | | 59 | % |
| | (a) | | Calculated based on the average shares outstanding methodology. |
| | (b) | | Recognition of net investment income by the Portfolio is affected by the timing of declaration of dividends by the Underlying Funds in which the Portfolio invests. |
| | (c) | | Assumes investment at the NAV at the beginning of the period, reinvestment of all dividends and distributions, a complete redemption of the investment at the NAV at the end of the period and no sales or redemption charges (if any). Total returns would be reduced if a sales or redemption charge was taken into account. Returns do not reflect the impact of taxes to shareholders relating to Portfolio distributions or the redemption of Portfolio shares. Total returns for periods less than one full year are not annualized. |
| | (d) | | Expense ratios exclude the expenses of the Underlying Funds in which the Portfolio invests. |
| | (f) | | The Portfolio’s portfolio turnover rate is calculated in accordance with regulatory requirements, without regard to transactions involving short term investments and certain derivatives. If such transactions were included, the Portfolio’s portfolio turnover rate may be higher. |
| | |
| The accompanying notes are an integral part of these financial statements. | | 45 |
GOLDMAN SACHS GROWTH STRATEGY PORTFOLIO
Financial Highlights (continued)
Selected Share Data for a Share Outstanding Throughout Each Period
| | | | | | | | | | | | | | | | | | | | | | | | | | |
| | | | | Goldman Sachs Growth Strategy Portfolio | |
| | | | | Institutional Shares | |
| | | | | Six Months Ended
June 30, 2021
(Unaudited) | | | Year Ended December 31, | |
| | | | | 2020 | | | 2019 | | | 2018 | | | 2017 | | | 2016 | |
| | Per Share Data | | | | | | | | | | | | | | | | | | | | | | | | |
| | | | | | | |
| | Net asset value, beginning of period | | $ | 17.86 | | | $ | 16.17 | | | $ | 13.72 | | | $ | 15.81 | | | $ | 13.37 | | | $ | 12.69 | |
| | | | | | | |
| | Net investment income(a)(b) | | | 0.04 | | | | 0.25 | | | | 0.24 | | | | 0.19 | | | | 0.22 | | | | 0.17 | |
| | | | | | | |
| | Net realized and unrealized gain (loss) | | | 2.10 | | | | 2.06 | | | | 2.87 | | | | (1.87 | ) | | | 2.66 | | | | 0.69 | |
| | | | | | | |
| | Total from investment operations | | | 2.14 | | | | 2.31 | | | | 3.11 | | | | (1.68 | ) | | | 2.88 | | | | 0.86 | |
| | | | | | | |
| | Distributions to shareholders from net investment income | | | — | | | | (0.27 | ) | | | (0.38 | ) | | | (0.41 | ) | | | (0.44 | ) | | | (0.18 | ) |
| | | | | | | |
| | Distributions to shareholders from net realized gains | | | — | | | | (0.35 | ) | | | (0.28 | ) | | | — | | | | — | | | | — | |
| | | | | | | |
| | Total distributions | | | — | | | | (0.62 | ) | | | (0.66 | ) | | | (0.41 | ) | | | (0.44 | ) | | | (0.18 | ) |
| | | | | | | |
| | Net asset value, end of period | | $ | 20.00 | | | $ | 17.86 | | | $ | 16.17 | | | $ | 13.72 | | | $ | 15.81 | | | $ | 13.37 | |
| | | | | | | |
| | Total return(c) | | | 11.98 | % | | | 14.29 | % | | | 22.77 | % | | | (10.65 | )% | | | 21.53 | % | | | 6.76 | % |
| | | | | | | |
| | Net assets, end of period (in 000s) | | $ | 211,503 | | | $ | 169,166 | | | $ | 147,389 | | | $ | 247,863 | | | $ | 455,902 | | | $ | 335,237 | |
| | | | | | | |
| | Ratio of net expenses to average net assets(d) | | | 0.19 | %(e) | | | 0.19 | % | | | 0.20 | % | | | 0.20 | % | | | 0.20 | % | | | 0.19 | % |
| | | | | | | |
| | Ratio of total expenses to average net assets(d) | | | 0.24 | %(e) | | | 0.26 | % | | | 0.26 | % | | | 0.23 | % | | | 0.24 | % | | | 0.25 | % |
| | | | | | | |
| | Ratio of net investment income to average net assets(b) | | | 0.47 | %(e) | | | 1.58 | % | | | 1.59 | % | | | 1.22 | % | | | 1.46 | % | | | 1.33 | % |
| | | | | | | |
| | Portfolio turnover rate(f) | | | 2 | % | | | 8 | % | | | 69 | % | | | 29 | % | | | 85 | % | | | 59 | % |
| | (a) | | Calculated based on the average shares outstanding methodology. |
| | (b) | | Recognition of net investment income by the Portfolio is affected by the timing of declaration of dividends by the Underlying Funds in which the Portfolio invests. |
| | (c) | | Assumes investment at the NAV at the beginning of the period, reinvestment of all dividends and distributions, a complete redemption of the investment at the NAV at the end of the period and no sales or redemption charges (if any). Total returns would be reduced if a sales or redemption charge was taken into account. Returns do not reflect the impact of taxes to shareholders relating to Portfolio distributions or the redemption of Portfolio shares. Total returns for periods less than one full year are not annualized. |
| | (d) | | Expense ratios exclude the expenses of the Underlying Funds in which the Portfolio invests. |
| | (f) | | The Portfolio’s portfolio turnover rate is calculated in accordance with regulatory requirements, without regard to transactions involving short term investments and certain derivatives. If such transactions were included, the Portfolio’s portfolio turnover rate may be higher. |
| | |
| 46 | | The accompanying notes are an integral part of these financial statements. |
GOLDMAN SACHS GROWTH STRATEGY PORTFOLIO
Financial Highlights (continued)
Selected Share Data for a Share Outstanding Throughout Each Period
| | | | | | | | | | | | | | | | | | | | | | | | | | |
| | | | | Goldman Sachs Growth Strategy Portfolio | |
| | | | | Service Shares | |
| | | | | Six Months Ended
June 30, 2021
(Unaudited) | | | Year Ended December 31, | |
| | | | | 2020 | | | 2019 | | | 2018 | | | 2017 | | | 2016 | |
| | Per Share Data | | | | | | | | | | | | | | | | | | | | | | | | |
| | | | | | | |
| | Net asset value, beginning of period | | $ | 17.83 | | | $ | 16.13 | | | $ | 13.69 | | | $ | 15.77 | | | $ | 13.35 | | | $ | 12.67 | |
| | | | | | | |
| | Net investment income (loss)(a)(b) | | | — | (c) | | | 0.15 | | | | 0.22 | | | | 0.15 | | | | 0.15 | | | | 0.10 | |
| | | | | | | |
| | Net realized and unrealized gain (loss) | | | 2.08 | | | | 2.08 | | | | 2.80 | | | | (1.90 | ) | | | 2.64 | | | | 0.69 | |
| | | | | | | |
| | Total from investment operations | | | 2.08 | | | | 2.23 | | | | 3.02 | | | | (1.75 | ) | | | 2.79 | | | | 0.79 | |
| | | | | | | |
| | Distributions to shareholders from net investment income | | | — | | | | (0.18 | ) | | | (0.30 | ) | | | (0.33 | ) | | | (0.37 | ) | | | (0.11 | ) |
| | | | | | | |
| | Distributions to shareholders from net realized gains | | | — | | | | (0.35 | ) | | | (0.28 | ) | | | — | | | | — | | | | — | |
| | | | | | | |
| | Total distributions | | | — | | | | (0.53 | ) | | | (0.58 | ) | | | (0.33 | ) | | | (0.37 | ) | | | (0.11 | ) |
| | | | | | | |
| | Net asset value, end of period | | $ | 19.91 | | | $ | 17.83 | | | $ | 16.13 | | | $ | 13.69 | | | $ | 15.77 | | | $ | 13.35 | |
| | | | | | | |
| | Total return(d) | | | 11.61 | % | | | 13.81 | % | | | 22.10 | % | | | (11.06 | )% | | | 20.88 | % | | | 6.26 | % |
| | | | | | | |
| | Net assets, end of period (in 000s) | | $ | 2,372 | | | $ | 2,120 | | | $ | 2,266 | | | $ | 2,252 | | | $ | 2,888 | | | $ | 2,237 | |
| | | | | | | |
| | Ratio of net expenses to average net assets(e) | | | 0.69 | %(f) | | | 0.69 | % | | | 0.70 | % | | | 0.70 | % | | | 0.70 | % | | | 0.69 | % |
| | | | | | | |
| | Ratio of total expenses to average net assets(e) | | | 0.74 | %(f) | | | 0.76 | % | | | 0.77 | % | | | 0.73 | % | | | 0.74 | % | | | 0.75 | % |
| | | | | | | |
| | Ratio of net investment income (loss) to average net assets(b) | | | (0.03 | )%(f) | | | 0.94 | % | | | 1.47 | % | | | 0.96 | % | | | 1.00 | % | | | 0.81 | % |
| | | | | | | |
| | Portfolio turnover rate(g) | | | 2 | % | | | 8 | % | | | 69 | % | | | 29 | % | | | 85 | % | | | 59 | % |
| | (a) | | Calculated based on the average shares outstanding methodology. |
| | (b) | | Recognition of net investment income by the Portfolio is affected by the timing of declaration of dividends by the Underlying Funds in which the Portfolio invests. |
| | (c) | | Amount is less than $0.005 per share. |
| | (d) | | Assumes investment at the NAV at the beginning of the period, reinvestment of all dividends and distributions, a complete redemption of the investment at the NAV at the end of the period and no sales or redemption charges (if any). Total returns would be reduced if a sales or redemption charge was taken into account. Returns do not reflect the impact of taxes to shareholders relating to Portfolio distributions or the redemption of Portfolio shares. Total returns for periods less than one full year are not annualized. |
| | (e) | | Expense ratios exclude the expenses of the Underlying Funds in which the Portfolio invests. |
| | (g) | | The Portfolio’s portfolio turnover rate is calculated in accordance with regulatory requirements, without regard to transactions involving short term investments and certain derivatives. If such transactions were included, the Portfolio’s portfolio turnover rate may be higher. |
| | |
| The accompanying notes are an integral part of these financial statements. | | 47 |
GOLDMAN SACHS GROWTH STRATEGY PORTFOLIO
Financial Highlights (continued)
Selected Share Data for a Share Outstanding Throughout Each Period
| | | | | | | | | | | | | | | | | | | | | | | | | | |
| | | | | Goldman Sachs Growth Strategy Portfolio | |
| | | | | Investor Shares | |
| | | | | Six Months Ended
June 30, 2021
(Unaudited) | | | Year Ended December 31, | |
| | | | | 2020 | | | 2019 | | | 2018 | | | 2017 | | | 2016 | |
| | Per Share Data | | | | | | | | | | | | | | | | | | | | | | | | |
| | | | | | | |
| | Net asset value, beginning of period | | $ | 17.60 | | | $ | 15.93 | | | $ | 13.53 | | | $ | 15.59 | | | $ | 13.20 | | | $ | 12.52 | |
| | | | | | | |
| | Net investment income(a)(b) | | | 0.03 | | | | 0.22 | | | | 0.28 | | | | 0.18 | | | | 0.23 | | | | 0.15 | |
| | | | | | | |
| | Net realized and unrealized gain (loss) | | | 2.06 | | | | 2.05 | | | | 2.76 | | | | (1.86 | ) | | | 2.58 | | | | 0.69 | |
| | | | | | | |
| | Total from investment operations | | | 2.09 | | | | 2.27 | | | | 3.04 | | | | (1.68 | ) | | | 2.81 | | | | 0.84 | |
| | | | | | | |
| | Distributions to shareholders from net investment income | | | — | | | | (0.25 | ) | | | (0.36 | ) | | | (0.38 | ) | | | (0.42 | ) | | | (0.16 | ) |
| | | | | | | |
| | Distributions to shareholders from net realized gains | | | — | | | | (0.35 | ) | | | (0.28 | ) | | | — | | | | — | | | | — | |
| | | | | | | |
| | Total distributions | | | — | | | | (0.60 | ) | | | (0.64 | ) | | | (0.38 | ) | | | (0.42 | ) | | | (0.16 | ) |
| | | | | | | |
| | Net asset value, end of period | | $ | 19.69 | | | $ | 17.60 | | | $ | 15.93 | | | $ | 13.53 | | | $ | 15.59 | | | $ | 13.20 | |
| | | | | | | |
| | Total return(c) | | | 11.88 | % | | | 14.24 | % | | | 22.50 | % | | | (10.74 | )% | | | 21.30 | % | | | 6.70 | % |
| | | | | | | |
| | Net assets, end of period (in 000s) | | $ | 7,811 | | | $ | 7,004 | | | $ | 7,204 | | | $ | 6,477 | | | $ | 8,008 | | | $ | 4,352 | |
| | | | | | | |
| | Ratio of net expenses to average net assets(d) | | | 0.30 | %(e) | | | 0.32 | % | | | 0.33 | % | | | 0.33 | % | | | 0.34 | % | | | 0.34 | % |
| | | | | | | |
| | Ratio of total expenses to average net assets(d) | | | 0.35 | %(e) | | | 0.39 | % | | | 0.40 | % | | | 0.37 | % | | | 0.39 | % | | | 0.40 | % |
| | | | | | | |
| | Ratio of net investment income(b) | | | 0.36 | %(e) | | | 1.38 | % | | | 1.85 | % | | | 1.14 | % | | | 1.54 | % | | | 1.18 | % |
| | | | | | | |
| | Portfolio turnover rate(f) | | | 2 | % | | | 8 | % | | | 69 | % | | | 29 | % | | | 85 | % | | | 59 | % |
| | (a) | | Calculated based on the average shares outstanding methodology. |
| | (b) | | Recognition of net investment income by the Portfolio is affected by the timing of declaration of dividends by the Underlying Funds in which the Portfolio invests. |
| | (c) | | Assumes investment at the NAV at the beginning of the period, reinvestment of all dividends and distributions, a complete redemption of the investment at the NAV at the end of the period and no sales or redemption charges (if any). Total returns would be reduced if a sales or redemption charge was taken into account. Returns do not reflect the impact of taxes to shareholders relating to Portfolio distributions or the redemption of Portfolio shares. Total returns for periods less than one full year are not annualized. |
| | (d) | | Expense ratios exclude the expenses of the Underlying Funds in which the Portfolio invests. |
| | (f) | | The Portfolio’s portfolio turnover rate is calculated in accordance with regulatory requirements, without regard to transactions involving short term investments and certain derivatives. If such transactions were included, the Portfolio’s portfolio turnover rate may be higher. |
| | |
| 48 | | The accompanying notes are an integral part of these financial statements. |
GOLDMAN SACHS GROWTH STRATEGY PORTFOLIO
Financial Highlights (continued)
Selected Share Data for a Share Outstanding Throughout Each Period
| | | | | | | | | | | | | | | | | | | | | | | | | | |
| | | | | Goldman Sachs Growth Strategy Portfolio | |
| | | | | Class R6 Shares | |
| | | | | Six Months Ended
June 30, 2021
(Unaudited) | | | Year Ended December 31, | |
| | | | | 2020 | | | 2019 | | | 2018 | | | 2017 | | | 2016 | |
| | Per Share Data | | | | | | | | | | | | | | | | | | | | | | | | |
| | | | | | | |
| | Net asset value, beginning of period | | $ | 17.87 | | | $ | 16.17 | | | $ | 13.72 | | | $ | 15.81 | | | $ | 13.37 | | | $ | 12.68 | |
| | | | | | | |
| | Net investment income(a)(b) | | | 0.04 | | | | 0.21 | | | | 0.31 | | | | 0.39 | | | | 0.17 | | | | 0.17 | |
| | | | | | | |
| | Net realized and unrealized gain (loss) | | | 2.09 | | | | 2.11 | | | | 2.80 | | | | (2.06 | ) | | | 2.71 | | | | 0.70 | |
| | | | | | | |
| | Total from investment operations | | | 2.13 | | | | 2.32 | | | | 3.11 | | | | (1.67 | ) | | | 2.88 | | | | 0.87 | |
| | | | | | | |
| | Distributions to shareholders from net investment income | | | — | | | | (0.27 | ) | | | (0.38 | ) | | | (0.42 | ) | | | (0.44 | ) | | | (0.18 | ) |
| | | | | | | |
| | Distributions to shareholders from net realized gains | | | — | | | | (0.35 | ) | | | (0.28 | ) | | | — | | | | — | | | | — | |
| | | | | | | |
| | Total distributions | | | — | | | | (0.62 | ) | | | (0.66 | ) | | | (0.42 | ) | | | (0.44 | ) | | | (0.18 | ) |
| | | | | | | |
| | Net asset value, end of period | | $ | 20.00 | | | $ | 17.87 | | | $ | 16.17 | | | $ | 13.72 | | | $ | 15.81 | | | $ | 13.37 | |
| | | | | | | |
| | Total return(c) | | | 11.92 | % | | | 14.35 | % | | | 22.72 | % | | | (10.55 | )% | | | 21.51 | % | | | 6.76 | % |
| | | | | | | |
| | Net assets, end of period (in 000s) | | $ | 7,039 | | | $ | 6,792 | | | $ | 7,554 | | | $ | 6,603 | | | $ | 964 | | | $ | 10 | |
| | | | | | | |
| | Ratio of net expenses to average net assets(d) | | | 0.18 | %(e) | | | 0.18 | % | | | 0.19 | % | | | 0.19 | % | | | 0.18 | % | | | 0.19 | % |
| | | | | | | |
| | Ratio of total expenses to average net assets(d) | | | 0.23 | %(e) | | | 0.25 | % | | | 0.26 | % | | | 0.22 | % | | | 0.23 | % | | | 0.25 | % |
| | | | | | | |
| | Ratio of net investment income(b) | | | 0.47 | %(e) | | | 1.31 | % | | | 2.00 | % | | | 2.54 | % | | | 1.12 | % | | | 1.33 | % |
| | | | | | | |
| | Portfolio turnover rate(f) | | | 2 | % | | | 8 | % | | | 69 | % | | | 29 | % | | | 85 | % | | | 59 | % |
| | (a) | | Calculated based on the average shares outstanding methodology. |
| | (b) | | Recognition of net investment income by the Portfolio is affected by the timing of declaration of dividends by the Underlying Funds in which the Portfolio invests. |
| | (c) | | Assumes investment at the NAV at the beginning of the period, reinvestment of all dividends and distributions, a complete redemption of the investment at the NAV at the end of the period and no sales or redemption charges (if any). Total returns would be reduced if a sales or redemption charge was taken into account. Returns do not reflect the impact of taxes to shareholders relating to Portfolio distributions or the redemption of Portfolio shares. Total returns for periods less than one full year are not annualized. |
| | (d) | | Expense ratios exclude the expenses of the Underlying Funds in which the Portfolio invests. |
| | (f) | | The Portfolio’s portfolio turnover rate is calculated in accordance with regulatory requirements, without regard to transactions involving short term investments and certain derivatives. If such transactions were included, the Portfolio’s portfolio turnover rate may be higher. |
| | |
| The accompanying notes are an integral part of these financial statements. | | 49 |
GOLDMAN SACHS GROWTH STRATEGY PORTFOLIO
Financial Highlights (continued)
Selected Share Data for a Share Outstanding Throughout Each Period
| | | | | | | | | | | | | | | | | | | | | | | | | | |
| | | | | Goldman Sachs Growth Strategy Portfolio | |
| | | | | Class R Shares | |
| | | | | Six Months Ended
June 30, 2021
(Unaudited) | | | Year Ended December 31, | |
| | | | | 2020 | | | 2019 | | | 2018 | | | 2017 | | | 2016 | |
| | Per Share Data | | | | | | | | | | | | | | | | | | | | | | | | |
| | | | | | | |
| | Net asset value, beginning of period | | $ | 17.36 | | | $ | 15.74 | | | $ | 13.37 | | | $ | 15.42 | | | $ | 13.08 | | | $ | 12.41 | |
| | | | | | | |
| | Net investment income (loss)(a)(b) | | | (0.01 | ) | | | 0.15 | | | | 0.20 | | | | 0.14 | | | | 0.16 | | | | 0.08 | |
| | | | | | | |
| | Net realized and unrealized gain (loss) | | | 2.03 | | | | 1.99 | | | | 2.73 | | | | (1.87 | ) | | | 2.54 | | | | 0.69 | |
| | | | | | | |
| | Total from investment operations | | | 2.02 | | | | 2.14 | | | | 2.93 | | | | (1.73 | ) | | | 2.70 | | | | 0.77 | |
| | | | | | | |
| | Distributions to shareholders from net investment income | | | — | | | | (0.17 | ) | | | (0.28 | ) | | | (0.32 | ) | | | (0.36 | ) | | | (0.10 | ) |
| | | | | | | |
| | Distributions to shareholders from net realized gains | | | — | | | | (0.35 | ) | | | (0.28 | ) | | | — | | | | — | | | | — | |
| | | | | | | |
| | Total distributions | | | — | | | | (0.52 | ) | | | (0.56 | ) | | | (0.32 | ) | | | (0.36 | ) | | | (0.10 | ) |
| | | | | | | |
| | Net asset value, end of period | | $ | 19.38 | | | $ | 17.36 | | | $ | 15.74 | | | $ | 13.37 | | | $ | 15.42 | | | $ | 13.08 | |
| | | | | | | |
| | Total return(c) | | | 11.58 | % | | | 13.61 | % | | | 21.98 | % | | | (11.18 | )% | | | 20.67 | % | | | 6.16 | % |
| | | | | | | |
| | Net assets, end of period (in 000s) | | $ | 7,034 | | | $ | 6,353 | | | $ | 6,400 | | | $ | 5,475 | | | $ | 6,334 | | | $ | 2,548 | |
| | | | | | | |
| | Ratio of net expenses to average net assets(d) | | | 0.80 | %(e) | | | 0.82 | % | | | 0.83 | % | | | 0.84 | % | | | 0.84 | % | | | 0.84 | % |
| | | | | | | |
| | Ratio of total expenses to average net assets(d) | | | 0.85 | %(e) | | | 0.89 | % | | | 0.90 | % | | | 0.87 | % | | | 0.89 | % | | | 0.90 | % |
| | | | | | | |
| | Ratio of net investment income (loss) to average net assets(b) | | | (0.14 | )%(e) | | | 0.94 | % | | | 1.36 | % | | | 0.90 | % | | | 1.06 | % | | | 0.65 | % |
| | | | | | | |
| | Portfolio turnover rate(f) | | | 2 | % | | | 8 | % | | | 69 | % | | | 29 | % | | | 85 | % | | | 59 | % |
| | (a) | | Calculated based on the average shares outstanding methodology. |
| | (b) | | Recognition of net investment income by the Portfolio is affected by the timing of declaration of dividends by the Underlying Funds in which the Portfolio invests. |
| | (c) | | Assumes investment at the NAV at the beginning of the period, reinvestment of all dividends and distributions, a complete redemption of the investment at the NAV at the end of the period and no sales or redemption charges (if any). Total returns would be reduced if a sales or redemption charge was taken into account. Returns do not reflect the impact of taxes to shareholders relating to Portfolio distributions or the redemption of Portfolio shares. Total returns for periods less than one full year are not annualized. |
| | (d) | | Expense ratios exclude the expenses of the Underlying Funds in which the Portfolio invests. |
| | (f) | | The Portfolio’s portfolio turnover rate is calculated in accordance with regulatory requirements, without regard to transactions involving short term investments and certain derivatives. If such transactions were included, the Portfolio’s portfolio turnover rate may be higher. |
| | |
| 50 | | The accompanying notes are an integral part of these financial statements. |
GOLDMAN SACHS GROWTH STRATEGY PORTFOLIO
Financial Highlights (continued)
Selected Share Data for a Share Outstanding Throughout Each Period
| | | | | | | | | | | | | | | | | | |
| | | | | Goldman Sachs Growth Strategy Portfolio | |
| | | | | Class P Shares | |
| | | | | Six Months Ended
June 30, 2021 (Unaudited) | | | Year Ended December 31, | | | Period Ended December 31, 2018(a) | |
| | | | | 2020 | | | 2019 | |
| | Per Share Data | | | | | | | | | | | | | | | | |
| | | | | |
| | Net asset value, beginning of period | | $ | 17.87 | | | $ | 16.17 | | | $ | 13.72 | | | $ | 15.96 | |
| | | | | |
| | Net investment income(b)(c) | | | 0.05 | | | | 0.26 | | | | 0.32 | | | | 0.28 | |
| | | | | |
| | Net realized and unrealized gain (loss) | | | 2.09 | | | | 2.06 | | | | 2.79 | | | | (2.10 | ) |
| | | | | |
| | Total from investment operations | | | 2.14 | | | | 2.32 | | | | 3.11 | | | | (1.82 | ) |
| | | | | |
| | Distributions to shareholders from net investment income | | | — | | | | (0.27 | ) | | | (0.38 | ) | | | (0.42 | ) |
| | | | | |
| | Distributions to shareholders from net realized gains | | | — | | | | (0.35 | ) | | | (0.28 | ) | | | — | |
| | | | | |
| | Total distributions | | | — | | | | (0.62 | ) | | | (0.66 | ) | | | (0.42 | ) |
| | | | | |
| | Net asset value, end of period | | $ | 20.01 | | | $ | 17.87 | | | $ | 16.17 | | | $ | 13.72 | |
| | | | | |
| | Total return(d) | | | 11.92 | % | | | 14.36 | % | | | 22.72 | % | | | (11.39 | )% |
| | | | | |
| | Net assets, end of period (in 000s) | | $ | 249,389 | | | $ | 207,786 | | | $ | 183,763 | | | $ | 148,866 | |
| | | | | |
| | Ratio of net expenses to average net assets(e) | | | 0.18 | %(f) | | | 0.18 | % | | | 0.19 | % | | | 0.19 | %(f) |
| | | | | |
| | Ratio of total expenses to average net assets(e) | | | 0.23 | %(f) | | | 0.25 | % | | | 0.26 | % | | | 0.22 | %(f) |
| | | | | |
| | Ratio of net investment income to average net assets(c) | | | 0.49 | %(f) | | | 1.62 | % | | | 2.08 | % | | | 2.56 | %(f) |
| | | | | |
| | Portfolio turnover rate(g) | | | 2 | % | | | 8 | % | | | 69 | % | | | 29 | % |
| | (a) | | Class P Shares commenced operations April 17, 2018. |
| | (b) | | Calculated based on the average shares outstanding methodology. |
| | (c) | | Recognition of net investment income by the Portfolio is affected by the timing of declaration of dividends by the Underlying Funds in which the Portfolio invests. |
| | (d) | | Assumes investment at the NAV at the beginning of the period, reinvestment of all dividends and distributions, a complete redemption of the investment at the NAV at the end of the period and no sales or redemption charges (if any). Total returns would be reduced if a sales or redemption charge was taken into account. Returns do not reflect the impact of taxes to shareholders relating to Portfolio distributions or the redemption of Portfolio shares. Total returns for periods less than one full year are not annualized. |
| | (e) | | Expense ratios exclude the expenses of the Underlying Funds in which the Portfolio invests. |
| | (g) | | The Portfolio’s portfolio turnover rate is calculated in accordance with regulatory requirements, without regard to transactions involving short term investments and certain derivatives. If such transactions were included, the Portfolio’s portfolio turnover rate may be higher. |
| | |
| The accompanying notes are an integral part of these financial statements. | | 51 |
GOLDMAN SACHS SATELLITE STRATEGIES PORTFOLIO
Financial Highlights (continued)
Selected Share Data for a Share Outstanding Throughout Each Period
| | | | | | | | | | | | | | | | | | | | | | | | | | |
| | | | | Goldman Sachs Satellite Strategies Portfolio | |
| | | | | Class A Shares | |
| | | | | Six Months Ended
June 30, 2021
(Unaudited) | | | Year Ended December 31, | |
| | | | | 2020 | | | 2019 | | | 2018 | | | 2017 | | | 2016 | |
| | Per Share Data | | | | | | | | | | | | | | | | | | | | | | | | |
| | | | | | | |
| | Net asset value, beginning of period | | $ | 8.56 | | | $ | 8.45 | | | $ | 7.38 | | | $ | 8.45 | | | $ | 7.64 | | | $ | 7.45 | |
| | | | | | | |
| | Net investment income(a)(b) | | | 0.08 | | | | 0.15 | | | | 0.27 | | | | 0.19 | | | | 0.20 | | | | 0.20 | |
| | | | | | | |
| | Net realized and unrealized gain (loss) | | | 0.62 | | | | 0.11 | | | | 1.08 | | | | (1.06 | ) | | | 0.88 | | | | 0.24 | |
| | | | | | | |
| | Total from investment operations | | | 0.70 | | | | 0.26 | | | | 1.35 | | | | (0.87 | ) | | | 1.08 | | | | 0.44 | |
| | | | | | | |
| | Distributions to shareholders from net investment income | | | (0.08 | ) | | | (0.15 | ) | | | (0.28 | ) | | | (0.20 | ) | | | (0.27 | ) | | | (0.25 | ) |
| | | | | | | |
| | Distributions to shareholders from return of capital | | | — | | | | — | | | | — | | | | — | | | | — | | | | 0.00 | (c) |
| | | | | | | |
| | Total distributions | | | (0.08 | ) | | | (0.15 | ) | | | (0.28 | ) | | | (0.20 | ) | | | (0.27 | ) | | | (0.25 | ) |
| | | | | | | |
| | Net asset value, end of period | | $ | 9.18 | | | $ | 8.56 | | | $ | 8.45 | | | $ | 7.38 | | | $ | 8.45 | | | $ | 7.64 | |
| | | | | | | |
| | Total return(d) | | | 8.11 | % | | | 3.40 | % | | | 18.38 | % | | | (10.39 | )% | | | 14.28 | % | | | 5.92 | % |
| | | | | | | |
| | Net assets, end of period (in 000s) | | $ | 49,043 | | | $ | 46,265 | | | $ | 46,921 | | | $ | 39,384 | | | $ | 53,090 | | | $ | 84,529 | |
| | | | | | | |
| | Ratio of net expenses to average net assets(e) | | | 0.53 | %(f) | | | 0.55 | % | | | 0.56 | % | | | 0.56 | % | | | 0.57 | % | | | 0.57 | % |
| | | | | | | |
| | Ratio of total expenses to average net assets(e) | | | 0.75 | %(f) | | | 0.75 | % | | | 0.66 | % | | | 0.61 | % | | | 0.61 | % | | | 0.61 | % |
| | | | | | | |
| | Ratio of net investment income to average net assets(b) | | | 1.83 | %(f) | | | 1.90 | % | | | 3.30 | % | | | 2.35 | % | | | 2.42 | % | | | 2.62 | % |
| | | | | | | |
| | Portfolio turnover rate(g) | | | 27 | % | | | 5 | % | | | 6 | % | | | 17 | % | | | 57 | % | | | 22 | % |
| | (a) | | Calculated based on the average shares outstanding methodology. |
| | (b) | | Recognition of net investment income by the Portfolio is affected by the timing of declaration of dividends by the Underlying Funds in which the Portfolio invests. |
| | (c) | | Amount is less than $0.005 per share. |
| | (d) | | Assumes investment at the NAV at the beginning of the period, reinvestment of all dividends and distributions, a complete redemption of the investment at the NAV at the end of the period and no sales or redemption charges (if any). Total returns would be reduced if a sales or redemption charge was taken into account. Returns do not reflect the impact of taxes to shareholders relating to Portfolio distributions or the redemption of Portfolio shares. Total returns for periods less than one full year are not annualized. |
| | (e) | | Expense ratios exclude the expenses of the Underlying Funds in which the Portfolio invests. |
| | (g) | | The Portfolio’s portfolio turnover rate is calculated in accordance with regulatory requirements, without regard to transactions involving short term investments. If such transactions were included, the Portfolio’s portfolio turnover rate may be higher. |
| | |
| 52 | | The accompanying notes are an integral part of these financial statements. |
GOLDMAN SACHS SATELLITE STRATEGIES PORTFOLIO
Financial Highlights (continued)
Selected Share Data for a Share Outstanding Throughout Each Period
| | | | | | | | | | | | | | | | | | | | | | | | | | |
| | | | | Goldman Sachs Satellite Strategies Portfolio | |
| | | | | Class C Shares | |
| | | | | Six Months Ended
June 30, 2021
(Unaudited) | | | Year Ended December 31, | |
| | | | | 2020 | | | 2019 | | | 2018 | | | 2017 | | | 2016 | |
| | Per Share Data | | | | | | | | | | | | | | | | | | | | | | | | |
| | | | | | | |
| | Net asset value, beginning of period | | $ | 8.54 | | | $ | 8.42 | | | $ | 7.34 | | | $ | 8.40 | | | $ | 7.60 | | | $ | 7.41 | |
| | | | | | | |
| | Net investment income(a)(b) | | | 0.03 | | | | 0.07 | | | | 0.16 | | | | 0.12 | | | | 0.14 | | | | 0.15 | |
| | | | | | | |
| | Net realized and unrealized gain (loss) | | | 0.64 | | | | 0.13 | | | | 1.12 | | | | (1.04 | ) | | | 0.87 | | | | 0.23 | |
| | | | | | | |
| | Total from investment operations | | | 0.67 | | | | 0.20 | | | | 1.28 | | | | (0.92 | ) | | | 1.01 | | | | 0.38 | |
| | | | | | | |
| | Distributions to shareholders from net investment income | | | (0.03 | ) | | | (0.08 | ) | | | (0.20 | ) | | | (0.14 | ) | | | (0.21 | ) | | | (0.19 | ) |
| | | | | | | |
| | Distributions to shareholders from return of capital | | | — | | | | — | | | | — | | | | — | | | | — | | | | 0.00 | (c) |
| | | | | | | |
| | Total distributions | | | (0.03 | ) | | | (0.08 | ) | | | (0.20 | ) | | | (0.14 | ) | | | (0.21 | ) | | | (0.19 | ) |
| | | | | | | |
| | Net asset value, end of period | | $ | 9.18 | | | $ | 8.54 | | | $ | 8.42 | | | $ | 7.34 | | | $ | 8.40 | | | $ | 7.60 | |
| | | | | | | |
| | Total return(d) | | | 7.76 | % | | | 2.59 | % | | | 17.55 | % | | | (11.07 | )% | | | 13.37 | % | | | 5.17 | % |
| | | | | | | |
| | Net assets, end of period (in 000s) | | $ | 2,652 | | | $ | 5,772 | | | $ | 16,235 | | | $ | 28,041 | | | $ | 44,710 | | | $ | 53,575 | |
| | | | | | | |
| | Ratio of net expenses to average net assets(e) | | | 1.27 | %(f) | | | 1.30 | % | | | 1.31 | % | | | 1.31 | % | | | 1.32 | % | | | 1.32 | % |
| | | | | | | |
| | Ratio of total expenses to average net assets(e) | | | 1.48 | %(f) | | | 1.49 | % | | | 1.40 | % | | | 1.36 | % | | | 1.36 | % | | | 1.36 | % |
| | | | | | | |
| | Ratio of net investment income to average net assets(b) | | | 0.78 | %(f) | | | 0.95 | % | | | 2.01 | % | | | 1.53 | % | | | 1.78 | % | | | 1.94 | % |
| | | | | | | |
| | Portfolio turnover rate(g) | | | 27 | % | | | 5 | % | | | 6 | % | | | 17 | % | | | 57 | % | | | 22 | % |
| | (a) | | Calculated based on the average shares outstanding methodology. |
| | (b) | | Recognition of net investment income by the Portfolio is affected by the timing of declaration of dividends by the Underlying Funds in which the Portfolio invests. |
| | (c) | | Amount is less than $0.005 per share. |
| | (d) | | Assumes investment at the NAV at the beginning of the period, reinvestment of all dividends and distributions, a complete redemption of the investment at the NAV at the end of the period and no sales or redemption charges (if any). Total returns would be reduced if a sales or redemption charge was taken into account. Returns do not reflect the impact of taxes to shareholders relating to Portfolio distributions or the redemption of Portfolio shares. Total returns for periods less than one full year are not annualized. |
| | (e) | | Expense ratios exclude the expenses of the Underlying Funds in which the Portfolio invests. |
| | (g) | | The Portfolio’s portfolio turnover rate is calculated in accordance with regulatory requirements, without regard to transactions involving short term investments. If such transactions were included, the Portfolio’s portfolio turnover rate may be higher. |
| | |
| The accompanying notes are an integral part of these financial statements. | | 53 |
GOLDMAN SACHS SATELLITE STRATEGIES PORTFOLIO
Financial Highlights (continued)
Selected Share Data for a Share Outstanding Throughout Each Period
| | | | | | | | | | | | | | | | | | | | | | | | | | |
| | | | | Goldman Sachs Satellite Strategies Portfolio | |
| | | | | Institutional Shares | |
| | | | | Six Months Ended
June 30, 2021
(Unaudited) | | | Year Ended December 31, | |
| | | | | 2020 | | | 2019 | | | 2018 | | | 2017 | | | 2016 | |
| | Per Share Data | | | | | | | | | | | | | | | | | | | | | | | | |
| | | | | | | |
| | Net asset value, beginning of period | | $ | 8.54 | | | $ | 8.43 | | | $ | 7.36 | | | $ | 8.43 | | | $ | 7.62 | | | $ | 7.43 | |
| | | | | | | |
| | Net investment income(a)(b) | | | 0.09 | | | | 0.17 | | | | 0.27 | | | | 0.21 | | | | 0.24 | | | | 0.23 | |
| | | | | | | |
| | Net realized and unrealized gain (loss) | | | 0.63 | | | | 0.12 | | | | 1.11 | | | | (1.05 | ) | | | 0.88 | | | | 0.24 | |
| | | | | | | |
| | Total from investment operations | | | 0.72 | | | | 0.29 | | | | 1.38 | | | | (0.84 | ) | | | 1.12 | | | | 0.47 | |
| | | | | | | |
| | Distributions to shareholders from net investment income | | | (0.10 | ) | | | (0.18 | ) | | | (0.31 | ) | | | (0.23 | ) | | | (0.31 | ) | | | (0.28 | ) |
| | | | | | | |
| | Distributions to shareholders from return of capital | | | — | | | | — | | | | — | | | | — | | | | — | | | | 0.00 | (c) |
| | | | | | | |
| | Total distributions | | | (0.10 | ) | | | (0.18 | ) | | | (0.31 | ) | | | (0.23 | ) | | | (0.31 | ) | | | (0.28 | ) |
| | | | | | | |
| | Net asset value, end of period | | $ | 9.16 | | | $ | 8.54 | | | $ | 8.43 | | | $ | 7.36 | | | $ | 8.43 | | | $ | 7.62 | |
| | | | | | | |
| | Total return(d) | | | 8.19 | % | | | 3.81 | % | | | 18.86 | % | | | (10.06 | )% | | | 14.80 | % | | | 6.38 | % |
| | | | | | | |
| | Net assets, end of period (in 000s) | | $ | 63,366 | | | $ | 99,006 | | | $ | 194,783 | | | $ | 260,987 | | | $ | 488,118 | | | $ | 509,681 | |
| | | | | | | |
| | Ratio of net expenses to average net assets(e) | | | 0.17 | %(f) | | | 0.17 | % | | | 0.18 | % | | | 0.17 | % | | | 0.17 | % | | | 0.17 | % |
| | | | | | | |
| | Ratio of total expenses to average net assets(e) | | | 0.38 | %(f) | | | 0.36 | % | | | 0.27 | % | | | 0.22 | % | | | 0.22 | % | | | 0.21 | % |
| | | | | | | |
| | Ratio of net investment income to average net assets(b) | | | 1.99 | %(f) | | | 2.19 | % | | | 3.38 | % | | | 2.62 | % | | | 2.96 | % | | | 3.08 | % |
| | | | | | | |
| | Portfolio turnover rate(g) | | | 27 | % | | | 5 | % | | | 6 | % | | | 17 | % | | | 57 | % | | | 22 | % |
| | (a) | | Calculated based on the average shares outstanding methodology. |
| | (b) | | Recognition of net investment income by the Portfolio is affected by the timing of declaration of dividends by the Underlying Funds in which the Portfolio invests. |
| | (c) | | Amount is less than $0.005 per share. |
| | (d) | | Assumes investment at the NAV at the beginning of the period, reinvestment of all dividends and distributions, a complete redemption of the investment at the NAV at the end of the period and no sales or redemption charges (if any). Total returns would be reduced if a sales or redemption charge was taken into account. Returns do not reflect the impact of taxes to shareholders relating to Portfolio distributions or the redemption of Portfolio shares. Total returns for periods less than one full year are not annualized. |
| | (e) | | Expense ratios exclude the expenses of the Underlying Funds in which the Portfolio invests. |
| | (g) | | The Portfolio’s portfolio turnover rate is calculated in accordance with regulatory requirements, without regard to transactions involving short term investments. If such transactions were included, the Portfolio’s portfolio turnover rate may be higher. |
| | |
| 54 | | The accompanying notes are an integral part of these financial statements. |
GOLDMAN SACHS SATELLITE STRATEGIES PORTFOLIO
Financial Highlights (continued)
Selected Share Data for a Share Outstanding Throughout Each Period
| | | | | | | | | | | | | | | | | | | | | | | | | | |
| | | | | Goldman Sachs Satellite Strategies Portfolio | |
| | | | | Service Shares | |
| | | | | Six Months Ended
June 30, 2021
(Unaudited) | | | Year Ended December 31, | |
| | | | | 2020 | | | 2019 | | | 2018 | | | 2017 | | | 2016 | |
| | Per Share Data | | | | | | | | | | | | | | | | | | | | | | | | |
| | | | | | | |
| | Net asset value, beginning of period | | $ | 8.56 | | | $ | 8.44 | | | $ | 7.37 | | | $ | 8.43 | | | $ | 7.63 | | | $ | 7.43 | |
| | | | | | | |
| | Net investment income(a)(b) | | | 0.07 | | | | 0.13 | | | | 0.25 | | | | 0.18 | | | | 0.20 | | | | 0.18 | |
| | | | | | | |
| | Net realized and unrealized gain (loss) | | | 0.63 | | | | 0.13 | | | | 1.09 | | | | (1.05 | ) | | | 0.86 | | | | 0.26 | |
| | | | | | | |
| | Total from investment operations | | | 0.70 | | | | 0.26 | | | | 1.34 | | | | (0.87 | ) | | | 1.06 | | | | 0.44 | |
| | | | | | | |
| | Distributions to shareholders from net investment income | | | (0.08 | ) | | | (0.14 | ) | | | (0.27 | ) | | | (0.19 | ) | | | (0.26 | ) | | | (0.24 | ) |
| | | | | | | |
| | Distributions to shareholders from return of capital | | | — | | | | — | | | | — | | | | — | | | | — | | | | 0.00 | (c) |
| | | | | | | |
| | Total distributions | | | (0.08 | ) | | | (0.14 | ) | | | (0.27 | ) | | | (0.19 | ) | | | (0.26 | ) | | | (0.24 | ) |
| | | | | | | |
| | Net asset value, end of period | | $ | 9.18 | | | $ | 8.56 | | | $ | 8.44 | | | $ | 7.37 | | | $ | 8.43 | | | $ | 7.63 | |
| | | | | | | |
| | Total return(d) | | | 7.92 | % | | | 3.32 | % | | | 18.25 | % | | | (10.41 | )% | | | 14.06 | % | | | 5.92 | % |
| | | | | | | |
| | Net assets, end of period (in 000s) | | $ | 138 | | | $ | 128 | | | $ | 258 | | | $ | 243 | | | $ | 350 | | | $ | 408 | |
| | | | | | | |
| | Ratio of net expenses to average net assets(e) | | | 0.67 | %(f) | | | 0.67 | % | | | 0.68 | % | | | 0.67 | % | | | 0.67 | % | | | 0.67 | % |
| | | | | | | |
| | Ratio of total expenses to average net assets(e) | | | 0.88 | %(f) | | | 0.86 | % | | | 0.78 | % | | | 0.72 | % | | | 0.72 | % | | | 0.71 | % |
| | | | | | | |
| | Ratio of net investment income to average net assets(b) | | | 1.70 | %(f) | | | 1.62 | % | | | 3.13 | % | | | 2.20 | % | | | 2.41 | % | | | 2.40 | % |
| | | | | | | |
| | Portfolio turnover rate(g) | | | 27 | % | | | 5 | % | | | 6 | % | | | 17 | % | | | 57 | % | | | 22 | % |
| | (a) | | Calculated based on the average shares outstanding methodology. |
| | (b) | | Recognition of net investment income by the Portfolio is affected by the timing of declaration of dividends by the Underlying Funds in which the Portfolio invests. |
| | (c) | | Amount is less than $0.005 per share. |
| | (d) | | Assumes investment at the NAV at the beginning of the period, reinvestment of all dividends and distributions, a complete redemption of the investment at the NAV at the end of the period and no sales or redemption charges (if any). Total returns would be reduced if a sales or redemption charge was taken into account. Returns do not reflect the impact of taxes to shareholders relating to Portfolio distributions or the redemption of Portfolio shares. Total returns for periods less than one full year are not annualized. |
| | (e) | | Expense ratios exclude the expenses of the Underlying Funds in which the Portfolio invests. |
| | (g) | | The Portfolio’s portfolio turnover rate is calculated in accordance with regulatory requirements, without regard to transactions involving short term investments. If such transactions were included, the Portfolio’s portfolio turnover rate may be higher. |
| | |
| The accompanying notes are an integral part of these financial statements. | | 55 |
GOLDMAN SACHS SATELLITE STRATEGIES PORTFOLIO
Financial Highlights (continued)
Selected Share Data for a Share Outstanding Throughout Each Period
| | | | | | | | | | | | | | | | | | | | | | | | | | |
| | | | | Goldman Sachs Satellite Strategies Portfolio | |
| | | | | Investor Shares | |
| | | | | Six Months Ended
June 30, 2021
(Unaudited) | | | Year Ended December 31, | |
| | | | | 2020 | | | 2019 | | | 2018 | | | 2017 | | | 2016 | |
| | Per Share Data | | | | | | | | | | | | | | | | | | | | | | | | |
| | | | | | | |
| | Net asset value, beginning of period | | $ | 8.53 | | | $ | 8.43 | | | $ | 7.36 | | | $ | 8.43 | | | $ | 7.62 | | | $ | 7.43 | |
| | | | | | | |
| | Net investment income(a)(b) | | | 0.09 | | | | 0.16 | | | | 0.27 | | | | 0.20 | | | | 0.22 | | | | 0.23 | |
| | | | | | | |
| | Net realized and unrealized gain (loss) | | | 0.63 | | | | 0.11 | | | | 1.10 | | | | (1.05 | ) | | | 0.88 | | | | 0.23 | |
| | | | | | | |
| | Total from investment operations | | | 0.72 | | | | 0.27 | | | | 1.37 | | | | (0.85 | ) | | | 1.10 | | | | 0.46 | |
| | | | | | | |
| | Distributions to shareholders from net investment income | | | (0.09 | ) | | | (0.17 | ) | | | (0.30 | ) | | | (0.22 | ) | | | (0.29 | ) | | | (0.27 | ) |
| | | | | | | |
| | Distributions to shareholders from return of capital | | | — | | | | — | | | | — | | | | — | | | | — | | | | 0.00 | (c) |
| | | | | | | |
| | Total distributions | | | (0.09 | ) | | | (0.17 | ) | | | (0.30 | ) | | | (0.22 | ) | | | (0.29 | ) | | | (0.27 | ) |
| | | | | | | |
| | Net asset value, end of period | | $ | 9.16 | | | $ | 8.53 | | | $ | 8.43 | | | $ | 7.36 | | | $ | 8.43 | | | $ | 7.62 | |
| | | | | | | |
| | Total return(d) | | | 8.26 | % | | | 3.55 | % | | | 18.71 | % | | | (10.19 | )% | | | 14.62 | % | | | 6.22 | % |
| | | | | | | |
| | Net assets, end of period (in 000s) | | $ | 16,197 | | | $ | 18,816 | | | $ | 22,706 | | | $ | 27,782 | | | $ | 46,011 | | | $ | 58,740 | |
| | | | | | | |
| | Ratio of net expenses to average net assets(e) | | | 0.28 | %(f) | | | 0.30 | % | | | 0.32 | % | | | 0.31 | % | | | 0.32 | % | | | 0.32 | % |
| | | | | | | |
| | Ratio of total expenses to average net assets(e) | | | 0.49 | %(f) | | | 0.50 | % | | | 0.41 | % | | | 0.36 | % | | | 0.36 | % | | | 0.36 | % |
| | | | | | | |
| | Ratio of net investment income(b) | | | 1.99 | %(f) | | | 2.12 | % | | | 3.39 | % | | | 2.53 | % | | | 2.74 | % | | | 3.02 | % |
| | | | | | | |
| | Portfolio turnover rate(g) | | | 27 | % | | | 5 | % | | | 6 | % | | | 17 | % | | | 57 | % | | | 22 | % |
| | (a) | | Calculated based on the average shares outstanding methodology. |
| | (b) | | Recognition of net investment income by the Portfolio is affected by the timing of declaration of dividends by the Underlying Funds in which the Portfolio invests. |
| | (c) | | Amount is less than $0.005 per share. |
| | (d) | | Assumes investment at the NAV at the beginning of the period, reinvestment of all dividends and distributions, a complete redemption of the investment at the NAV at the end of the period and no sales or redemption charges (if any). Total returns would be reduced if a sales or redemption charge was taken into account. Returns do not reflect the impact of taxes to shareholders relating to Portfolio distributions or the redemption of Portfolio shares. Total returns for periods less than one full year are not annualized. |
| | (e) | | Expense ratios exclude the expenses of the Underlying Funds in which the Portfolio invests. |
| | (g) | | The Portfolio’s portfolio turnover rate is calculated in accordance with regulatory requirements, without regard to transactions involving short term investments. If such transactions were included, the Portfolio’s portfolio turnover rate may be higher. |
| | |
| 56 | | The accompanying notes are an integral part of these financial statements. |
GOLDMAN SACHS SATELLITE STRATEGIES PORTFOLIO
Financial Highlights (continued)
Selected Share Data for a Share Outstanding Throughout Each Period
| | | | | | | | | | | | | | | | | | | | | | | | | | |
| | | | | Goldman Sachs Satellite Strategies Portfolio | |
| | | | | Class R6 Shares | |
| | | | | Six Months Ended
June 30, 2021
(Unaudited) | | | Year Ended December 31, | |
| | | | | 2020 | | | 2019 | | | 2018 | | | 2017 | | | 2016 | |
| | Per Share Data | | | | | | | | | | | | | | | | | | | | | | | | |
| | | | | | | |
| | Net asset value, beginning of period | | $ | 8.55 | | | $ | 8.44 | | | $ | 7.36 | | | $ | 8.43 | | | $ | 7.63 | | | $ | 7.44 | |
| | | | | | | |
| | Net investment income(a)(b) | | | 0.10 | | | | 0.14 | | | | 0.29 | | | | 0.23 | | | | 0.25 | | | | 0.63 | |
| | | | | | | |
| | Net realized and unrealized gain (loss) | | | 0.63 | | | | 0.15 | | | | 1.10 | | | | (1.07 | ) | | | 0.86 | | | | (0.15 | ) |
| | | | | | | |
| | Total from investment operations | | | 0.73 | | | | 0.29 | | | | 1.39 | | | | (0.84 | ) | | | 1.11 | | | | 0.48 | |
| | | | | | | |
| | Distributions to shareholders from net investment income | | | (0.10 | ) | | | (0.18 | ) | | | (0.31 | ) | | | (0.23 | ) | | | (0.31 | ) | | | (0.28 | ) |
| | | | | | | |
| | Distributions to shareholders from return of capital | | | — | | | | — | | | | — | | | | — | | | | — | | | | (0.01 | ) |
| | | | | | | |
| | Total distributions | | | (0.10 | ) | | | (0.18 | ) | | | (0.31 | ) | | | (0.23 | ) | | | (0.31 | ) | | | (0.29 | ) |
| | | | | | | |
| | Net asset value, end of period | | $ | 9.18 | | | $ | 8.55 | | | $ | 8.44 | | | $ | 7.36 | | | $ | 8.43 | | | $ | 7.63 | |
| | | | | | | |
| | Total return(c) | | | 8.30 | % | | | 3.79 | % | | | 19.02 | % | | | (10.04 | )% | | | 14.66 | % | | | 6.40 | % |
| | | | | | | |
| | Net assets, end of period (in 000s) | | $ | 875 | | | $ | 815 | | | $ | 45,956 | | | $ | 44,046 | | | $ | 40,326 | | | $ | 33,805 | |
| | | | | | | |
| | Ratio of net expenses to average net assets(d) | | | 0.16 | %(e) | | | 0.16 | % | | | 0.17 | % | | | 0.16 | % | | | 0.16 | % | | | 0.15 | % |
| | | | | | | |
| | Ratio of total expenses to average net assets(d) | | | 0.37 | %(e) | | | 0.33 | % | | | 0.26 | % | | | 0.22 | % | | | 0.20 | % | | | 0.17 | % |
| | | | | | | |
| | Ratio of net investment income(b) | | | 2.19 | %(e) | | | 1.79 | % | | | 3.59 | % | | | 2.88 | % | | | 3.09 | % | | | 8.15 | % |
| | | | | | | |
| | Portfolio turnover rate(f) | | | 27 | % | | | 5 | % | | | 6 | % | | | 17 | % | | | 57 | % | | | 22 | % |
| | (a) | | Calculated based on the average shares outstanding methodology. |
| | (b) | | Recognition of net investment income by the Portfolio is affected by the timing of declaration of dividends by the Underlying Funds in which the Portfolio invests. |
| | (c) | | Assumes investment at the NAV at the beginning of the period, reinvestment of all dividends and distributions, a complete redemption of the investment at the NAV at the end of the period and no sales or redemption charges (if any). Total returns would be reduced if a sales or redemption charge was taken into account. Returns do not reflect the impact of taxes to shareholders relating to Portfolio distributions or the redemption of Portfolio shares. Total returns for periods less than one full year are not annualized. |
| | (d) | | Expense ratios exclude the expenses of the Underlying Funds in which the Portfolio invests. |
| | (f) | | The Portfolio’s portfolio turnover rate is calculated in accordance with regulatory requirements, without regard to transactions involving short term investments. If such transactions were included, the Portfolio’s portfolio turnover rate may be higher. |
| | |
| The accompanying notes are an integral part of these financial statements. | | 57 |
GOLDMAN SACHS SATELLITE STRATEGIES PORTFOLIO
Financial Highlights (continued)
Selected Share Data for a Share Outstanding Throughout Each Period
| | | | | | | | | | | | | | | | | | | | | | | | | | |
| | | | | Goldman Sachs Satellite Strategies Portfolio | |
| | | | | Class R Shares | |
| | | | | Six Months Ended
June 30, 2021
(Unaudited) | | | Year Ended December 31, | |
| | | | | 2020 | | | 2019 | | | 2018 | | | 2017 | | | 2016 | |
| | Per Share Data | | | | | | | | | | | | | | | | | | | | | | | | |
| | | | | | | |
| | Net asset value, beginning of period | | $ | 8.53 | | | $ | 8.42 | | | $ | 7.35 | | | $ | 8.41 | | | $ | 7.61 | | | $ | 7.42 | |
| | | | | | | |
| | Net investment income(a)(b) | | | 0.07 | | | | 0.12 | | | | 0.23 | | | | 0.17 | | | | 0.19 | | | | 0.19 | |
| | | | | | | |
| | Net realized and unrealized gain (loss) | | | 0.63 | | | | 0.12 | | | | 1.09 | | | | (1.05 | ) | | | 0.86 | | | | 0.23 | |
| | | | | | | |
| | Total from investment operations | | | 0.70 | | | | 0.24 | | | | 1.32 | | | | (0.88 | ) | | | 1.05 | | | | 0.42 | |
| | | | | | | |
| | Distributions to shareholders from net investment income | | | (0.07 | ) | | | (0.13 | ) | | | (0.25 | ) | | | (0.18 | ) | | | (0.25 | ) | | | (0.23 | ) |
| | | | | | | |
| | Distributions to shareholders from return of capital | | | — | | | | — | | | | — | | | | — | | | | — | | | | 0.00 | (c) |
| | | | | | | |
| | Total distributions | | | (0.07 | ) | | | (0.13 | ) | | | (0.25 | ) | | | (0.18 | ) | | | (0.25 | ) | | | (0.23 | ) |
| | | | | | | |
| | Net asset value, end of period | | $ | 9.16 | | | $ | 8.53 | | | $ | 8.42 | | | $ | 7.35 | | | $ | 8.41 | | | $ | 7.61 | |
| | | | | | | |
| | Total return(d) | | | 7.98 | % | | | 3.09 | % | | | 18.12 | % | | | (10.56 | )% | | | 13.94 | % | | | 5.71 | % |
| | | | | | | |
| | Net assets, end of period (in 000s) | | $ | 630 | | | $ | 724 | | | $ | 1,140 | | | $ | 1,955 | | | $ | 2,645 | | | $ | 2,788 | |
| | | | | | | |
| | Ratio of net expenses to average net assets(e) | | | 0.78 | %(f) | | | 0.80 | % | | | 0.81 | % | | | 0.81 | % | | | 0.82 | % | | | 0.82 | % |
| | | | | | | |
| | Ratio of total expenses to average net assets(e) | | | 0.99 | %(f) | | | 0.99 | % | | | 0.91 | % | | | 0.86 | % | | | 0.86 | % | | | 0.86 | % |
| | | | | | | |
| | Ratio of net investment income to average net assets(b) | | | 1.51 | %(f) | | | 1.56 | % | | | 2.88 | % | | | 2.09 | % | | | 2.33 | % | | | 2.49 | % |
| | | | | | | |
| | Portfolio turnover rate(g) | | | 27 | % | | | 5 | % | | | 6 | % | | | 17 | % | | | 57 | % | | | 22 | % |
| | (a) | | Calculated based on the average shares outstanding methodology. |
| | (b) | | Recognition of net investment income by the Portfolio is affected by the timing of declaration of dividends by the Underlying Funds in which the Portfolio invests. |
| | (c) | | Amount is less than $0.005 per share. |
| | (d) | | Assumes investment at the NAV at the beginning of the period, reinvestment of all dividends and distributions, a complete redemption of the investment at the NAV at the end of the period and no sales or redemption charges (if any). Total returns would be reduced if a sales or redemption charge was taken into account. Returns do not reflect the impact of taxes to shareholders relating to Portfolio distributions or the redemption of Portfolio shares. Total returns for periods less than one full year are not annualized. |
| | (e) | | Expense ratios exclude the expenses of the Underlying Funds in which the Portfolio invests. |
| | (g) | | The Portfolio’s portfolio turnover rate is calculated in accordance with regulatory requirements, without regard to transactions involving short term investments. If such transactions were included, the Portfolio’s portfolio turnover rate may be higher. |
| | |
| 58 | | The accompanying notes are an integral part of these financial statements. |
GOLDMAN SACHS SATELLITE STRATEGIES PORTFOLIO
Financial Highlights (continued)
Selected Share Data for a Share Outstanding Throughout Each Period
| | | | | | | | | | | | | | | | | | |
| | | | | Goldman Sachs Satellite Strategies Portfolio | |
| | | | | Class P Shares | |
| | | | | Six Months Ended
June 30, 2021
(Unaudited) | | | Year Ended December 31, | | | Period Ended
December 31, 2018(a) | |
| | | | | 2020 | | | 2019 | |
| | Per Share Data | | | | | | | | | | | | | | | | |
| | | | | |
| | Net asset value, beginning of period | | $ | 8.55 | | | $ | 8.44 | | | $ | 7.37 | | | $ | 8.37 | |
| | | | | |
| | Net investment income(b)(c) | | | 0.10 | | | | 0.18 | | | | 0.30 | | | | 0.20 | |
| | | | | |
| | Net realized and unrealized gain (loss) | | | 0.62 | | | | 0.11 | | | | 1.08 | | | | (1.01 | ) |
| | | | | |
| | Total from investment operations | | | 0.72 | | | | 0.29 | | | | 1.38 | | | | (0.81 | ) |
| | | | | |
| | Distributions to shareholders from net investment income | | | (0.10 | ) | | | (0.18 | ) | | | (0.31 | ) | | | (0.19 | ) |
| | | | | |
| | Net asset value, end of period | | $ | 9.17 | | | $ | 8.55 | | | $ | 8.44 | | | $ | 7.37 | |
| | | | | |
| | Total return(d) | | | 8.30 | % | | | 3.82 | % | | | 18.85 | % | | | (9.76 | )% |
| | | | | |
| | Net assets, end of period (in 000s) | | $ | 3,145 | | | $ | 3,743 | | | $ | 3,722 | | | $ | 2,902 | |
| | | | | |
| | Ratio of net expenses to average net assets(e) | | | 0.16 | %(f) | | | 0.16 | % | | | 0.17 | % | | | 0.16 | %(f) |
| | | | | |
| | Ratio of total expenses to average net assets(e) | | | 0.37 | %(f) | | | 0.36 | % | | | 0.27 | % | | | 0.22 | %(f) |
| | | | | |
| | Ratio of net investment income to average net assets(c) | | | 2.17 | %(f) | | | 2.31 | % | | | 3.70 | % | | | 3.51 | %(f) |
| | | | | |
| | Portfolio turnover rate(g) | | | 27 | % | | | 5 | % | | | 6 | % | | | 17 | % |
| | (a) | | Class P Shares commenced operations April 17, 2018. |
| | (b) | | Calculated based on the average shares outstanding methodology. |
| | (c) | | Recognition of net investment income by the Portfolio is affected by the timing of declaration of dividends by the Underlying Funds in which the Portfolio invests. |
| | (d) | | Assumes investment at the NAV at the beginning of the period, reinvestment of all dividends and distributions, a complete redemption of the investment at the NAV at the end of the period and no sales or redemption charges (if any). Total returns would be reduced if a sales or redemption charge was taken into account. Returns do not reflect the impact of taxes to shareholders relating to Portfolio distributions or the redemption of Portfolio shares. Total returns for periods less than one full year are not annualized. |
| | (e) | | Expense ratios exclude the expenses of the Underlying Funds in which the Portfolio invests. |
| | (g) | | The Portfolio’s portfolio turnover rate is calculated in accordance with regulatory requirements, without regard to transactions involving short term investments. If such transactions were included, the Portfolio’s portfolio turnover rate may be higher. |
| | |
| The accompanying notes are an integral part of these financial statements. | | 59 |
GOLDMAN SACHS FUND OF FUNDS PORTFOLIOS
Notes to Financial Statements
June 30, 2021 (Unaudited)
Goldman Sachs Trust (the “Trust”) is a Delaware statutory trust registered under the Investment Company Act of 1940, as amended (the “Act”), as an open-end management investment company. The following table lists those series of the Trust that are included in this report (collectively, the “Portfolios” or individually a “Portfolio”), along with their corresponding share classes and respective diversification status under the Act.
| | | | |
| Portfolio | | Share Classes Offered | | Diversified/
Non-diversified |
All Portfolios | | A, C, Institutional, Service, Investor, R6, R, P | | Diversified |
Class A Shares are sold with a front-end sales charge of up to 5.50%. Class C Shares are sold with a contingent deferred sales charge (“CDSC”) of 1.00%, which is imposed on redemptions made within 12 months of purchase. Institutional, Service, Investor, Class R6, Class R and Class P Shares are not subject to a sales charge.
Goldman Sachs Asset Management, L.P. (“GSAM”), an affiliate of Goldman Sachs & Co. LLC (“Goldman Sachs”), serves as
investment adviser to the Portfolios pursuant to a management agreement (the “Agreement”) with the Trust.
The Portfolios are expected to invest primarily in a combination of domestic and international equity and fixed income underlying funds that currently exist or that may become available for investment in the future for which GSAM or an affiliate now or in the future acts as investment adviser or principal underwriter without considering or canvassing the universe of unaffiliated funds available, and may also invest in unaffiliated exchange-traded funds (“ETFs”) (collectively, the “Underlying Funds”).
|
| 2. SIGNIFICANT ACCOUNTING POLICIES |
The financial statements have been prepared in accordance with accounting principles generally accepted in the United States of America (“GAAP”) and require management to make estimates and assumptions that may affect the reported amounts and disclosures. Actual results may differ from those estimates and assumptions. Each Portfolio is an investment company under GAAP and follows the accounting and reporting guidance applicable to investment companies.
A. Investment Valuation — The valuation policy of the Portfolios and Underlying Funds is to value investments at fair value.
B. Investment Income and Investments — Investment income includes interest income, dividend income and securities lending income, if any. Interest income is accrued daily and adjusted for amortization of premiums and accretion of discounts. Dividend income is recognized on ex-dividend date or, for certain foreign securities, as soon as such information is obtained subsequent to the ex-dividend date. Non-cash dividends, if any, are recorded at the fair market value of the securities received. Investment transactions are reflected on trade date. Realized gains and losses are calculated using identified cost. Investment transactions are recorded on the following business day for daily net asset value (“NAV”) calculations. Income distributions are recognized as capital gains or income in the financial statements in accordance with the character that is distributed.
For derivative contracts, realized gains and losses are recorded upon settlement of the contract.
C. Class Allocations and Expenses — Investment income, realized and unrealized gain (loss), if any, and non-class specific expenses of each Portfolio are allocated daily based upon the proportion of net assets of each class. Non-class specific expenses directly incurred by a Portfolio are charged to that Portfolio, while such expenses incurred by the Trust are allocated across the applicable Portfolios on a straight-line and/or pro-rata basis depending upon the nature of the expenses. Class specific expenses, where applicable, are borne by the respective share classes and include Distribution and Service, Transfer Agency and Service and Shareholder Administration fees.
Expenses included in the accompanying financial statements reflect the expenses of each Portfolio and do not include any expenses associated with the Underlying Funds. Because the Underlying Funds have varied expense and fee levels and the Portfolios may own different proportions of the Underlying Funds at different times, the amount of fees and expenses incurred indirectly by each Portfolio will vary.
D. Federal Taxes and Distributions to Shareholders — It is each Portfolio’s policy to comply with the requirements of the Internal Revenue Code of 1986, as amended (the “Code”), applicable to regulated investment companies and to distribute each
60
GOLDMAN SACHS FUND OF FUNDS PORTFOLIOS
|
| 2. SIGNIFICANT ACCOUNTING POLICIES (continued) |
year substantially all of its investment company taxable income and capital gains to its shareholders. Accordingly, each Portfolio is not required to make any provisions for the payment of federal income tax. Distributions to shareholders are recorded on the ex-dividend date. Income and capital gains distributions, if any, are declared and paid according to the following schedule:
| | | | | | |
| Portfolio | | | | Income Distributions
Declared/Paid | | Capital Gains Distributions
Declared/ Paid |
Balanced Strategy, Growth and Income Strategy and Satellite Strategies | | Quarterly | | Annually |
Growth Strategy | | Annually | | Annually |
Net capital losses, if any, are carried forward to future fiscal years and may be used to the extent allowed by the Code to offset any future capital gains. Losses that are carried forward will retain their character as either short-term or long-term capital losses. Utilization of capital loss carryforwards will reduce the requirement of future capital gains distributions.
The characterization of distributions to shareholders for financial reporting purposes is determined in accordance with federal income tax rules, which may differ from GAAP. The source of each Portfolio’s distributions may be shown in the accompanying financial statements as either from distributable earnings or capital. Certain components of the Portfolios’ net assets on the Statements of Assets and Liabilities reflect permanent GAAP/tax differences based on the appropriate tax character.
E. Foreign Currency Translation — The accounting records and reporting currency of the Portfolios are maintained in U.S. dollars. Assets and liabilities denominated in foreign currencies are translated into U.S. dollars using the current exchange rates at the close of each business day. The effect of changes in foreign currency exchange rates on investments is included within net realized and unrealized gain (loss) on investments. Changes in the value of other assets and liabilities as a result of fluctuations in foreign exchange rates are included in the Statements of Operations within net change in unrealized gain (loss) on foreign currency translation. Transactions denominated in foreign currencies are translated into U.S. dollars on the date the transaction occurred, the effects of which are included within net realized gain (loss) on foreign currency transactions.
| | |
| 3. INVESTMENTS AND FAIR VALUE MEASUREMENTS | | |
U.S. GAAP defines the fair value of a financial instrument as the amount that would be received to sell an asset or paid to transfer a liability in an orderly transaction between market participants at the measurement date (i.e., the exit price); the Portfolios’ policy is to use the market approach. GAAP establishes a fair value hierarchy that prioritizes the inputs to valuation techniques used to measure fair value. The hierarchy gives the highest priority to unadjusted quoted prices in active markets for identical assets or liabilities (Level 1 measurements) and the lowest priority to unobservable inputs (Level 3 measurements). The level in the fair value hierarchy within which the fair value measurement in its entirety falls shall be determined based on the lowest level input that is significant to the fair value measurement in its entirety. The levels used for classifying investments are not necessarily an indication of the risk associated with investing in these investments. The three levels of the fair value hierarchy are described below:
Level 1 — Unadjusted quoted prices in active markets that are accessible at the measurement date for identical, unrestricted assets or liabilities;
Level 2 — Quoted prices in markets that are not active or financial instruments for which significant inputs are observable (including, but not limited to, quoted prices for similar investments, interest rates, foreign exchange rates, volatility and credit spreads), either directly or indirectly;
Level 3 — Prices or valuations that require significant unobservable inputs (including GSAM’s assumptions in determining fair value measurement).
The Board of Trustees (“Trustees”) has approved Valuation Procedures that govern the valuation of the portfolio investments held by the Portfolios’, including investments for which market quotations are not readily available. The Trustees have delegated to GSAM day-to-day responsibility for implementing and maintaining internal controls and procedures related to the valuation of the
61
GOLDMAN SACHS FUND OF FUNDS PORTFOLIOS
Notes to Financial Statements (continued)
June 30, 2021 (Unaudited)
|
| 3. INVESTMENTS AND FAIR VALUE MEASUREMENTS (continued) |
Portfolios, investments. To assess the continuing appropriateness of pricing sources and methodologies, GSAM regularly performs price verification procedures and issues challenges as necessary to third party pricing vendors or brokers, and any differences are reviewed in accordance with the Valuation Procedures.
A. Level 1 and Level 2 Fair Value Investments — The valuation techniques and significant inputs used in determining the fair values for investments classified as Level 1 and Level 2 are as follows:
Underlying Funds (including Money Market Funds) — Underlying Funds include ETFs and other investment companies. Investments in the Underlying Funds (except ETFs) are valued at the NAV per share on the day of valuation. ETFs are valued daily at the last sale price or official closing price on the principal exchange or system on which the investment is traded. Because the Portfolios invest in Underlying Funds that fluctuate in value, the Portfolios’ shares will correspondingly fluctuate in value. To the extent these investments are actively traded, they are classified as Level 1 of the fair value hierarchy, otherwise they are generally classified as Level 2. For information regarding an Underlying Fund’s accounting policies and investment holdings, please see the Underlying Fund’s shareholder report.
Derivative Contracts — A derivative is an instrument whose value is derived from underlying assets, indices, reference rates or a combination of these factors. A Portfolio enters into derivative transactions to hedge against changes in interest rates, securities prices, and/or currency exchange rates, to increase total return, or to gain access to certain markets or attain exposure to other underliers. For financial reporting purposes, cash collateral that has been pledged to cover obligations of a Portfolio and cash collateral received, if any, is reported separately on the Statements of Assets and Liabilities as receivables/payables for collateral on certain derivatives contracts. Non-cash collateral pledged by a Portfolio, if any, is noted in the Schedules of Investments.
Exchange-traded derivatives, including futures and options contracts, are generally valued at the last sale or settlement price on the exchange where they are principally traded. Exchange-traded options without settlement prices are generally valued at the midpoint of the bid and ask prices on the exchange where they are principally traded (or, in the absence of two-way trading, at the last bid price for long positions and the last ask price for short positions). Exchange-traded derivatives typically fall within Level 1 of the fair value hierarchy. Over-the-counter (“OTC”) and centrally cleared derivatives are valued using market transactions and other market evidence, including market-based inputs to models, calibration to market-clearing transactions, broker or dealer quotations, or other alternative pricing sources. Where models are used, the selection of a particular model to value OTC and centrally cleared derivatives depends upon the contractual terms of, and specific risks inherent in, the instrument, as well as the availability of pricing information in the market. Valuation models require a variety of inputs, including contractual terms, market prices, yield curves, credit curves, measures of volatility, voluntary and involuntary prepayment rates, loss severity rates and correlations of such inputs. For OTC and centrally cleared derivatives that trade in liquid markets, model inputs can generally be verified and model selection does not involve significant management judgment. OTC and centrally cleared derivatives are classified within Level 2 of the fair value hierarchy when significant inputs are corroborated by market evidence.
i. Forward Contracts — A forward contract is a contract between two parties to buy or sell an asset at a specified price on a future date. A forward contract settlement can occur on a cash or delivery basis. Forward contracts are marked-to-market daily using independent vendor prices, and the change in value, if any, is recorded as an unrealized gain or loss. Cash and certain investments may be used to collateralize forward contracts.
A forward foreign currency exchange contract is a forward contract in which a Portfolio agrees to receive or deliver a fixed quantity of one currency for another, at a pre-determined price at a future date. All forward foreign currency exchange contracts are marked to market daily by using the outright forward rates or interpolating based upon maturity dates, where available. Non-deliverable forward foreign currency exchange contracts are settled with the counterparty in cash without the delivery of foreign currency.
ii. Futures Contracts — Futures contracts are contracts to buy or sell a standardized quantity of a specified commodity or security. Upon entering into a futures contract, a Portfolio deposits cash or securities in an account on behalf of the broker in an amount sufficient to meet the initial margin requirement. Subsequent payments are made or received by a Portfolio equal to the daily change in the contract value and are recorded as variation margin receivable or payable with a corresponding offset to unrealized gains or losses.
62
GOLDMAN SACHS FUND OF FUNDS PORTFOLIOS
|
| 3. INVESTMENTS AND FAIR VALUE MEASUREMENTS (continued) |
iii. Options — When a Portfolio writes call or put options, an amount equal to the premium received is recorded as a liability and is subsequently marked-to-market to reflect the current value of the option written. Swaptions are options on swap contracts.
Upon the purchase of a call option or a put option by a Portfolio, the premium paid is recorded as an investment and subsequently marked-to-market to reflect the current value of the option. Certain options may be purchased with premiums to be determined on a future date. The premiums for these options are based upon implied volatility parameters at specified terms.
B. Level 3 Fair Value Investments — To the extent that significant inputs to valuation models and other alternative pricing sources are unobservable, or if quotations are not readily available, or if GSAM believes that such quotations do not accurately reflect fair value, the fair value of a Portfolio’s investments may be determined under Valuation Procedures approved by the Trustees. GSAM, consistent with its procedures and applicable regulatory guidance, may make an adjustment to the most recent valuation prices of either domestic or foreign securities in light of significant events to reflect what it believes to be the fair value of the securities at the time of determining a Portfolio’s NAV. To the extent investments are valued using single source broker quotations obtained directly from the broker or passed through from third party pricing vendors, such investments are classified as Level 3 investments.
C. Fair Value Hierarchy — The following is a summary of the Portfolios’ investments and derivatives classified in the fair value hierarchy as of June 30.2021:
| | | | | | | | | | | | |
|
BALANCED STRATEGY PORTFOLIO
| |
| | | |
| Investment Type | | Level 1 | | | Level 2 | | | Level 3 | |
| | | |
| Assets | | | | | | | | | | | | |
| | | |
Underlying Funds | | | | | | | | | | | | |
| | | |
Dynamic | | $ | 56,222,673 | | | $ | — | | | $ | — | |
| | | |
Equity | | | 168,795,554 | | | | — | | | | — | |
| | | |
Exchange Traded Funds | | | 106,947,266 | | | | — | | | | — | |
| | | |
Fixed Income | | | 200,035,818 | | | | — | | | | — | |
| | | |
Investment Company | | | 22,431,770 | | | | — | | | | — | |
| | | |
| Total | | $ | 554,433,081 | | | $ | — | | | $ | — | |
| | | |
| Derivative Type | | | | | | | | | |
| | | |
| Assets | | | | | | | | | | | | |
| | | |
Forward Foreign Currency Exchange Contracts(a) | | $ | — | | | $ | 895,044 | | | $ | — | |
| | | |
Futures Contracts(a) | | | 575,287 | | | | — | | | | — | |
| | | |
Options Purchased | | | 1,285,038 | | | | — | | | | — | |
| | | |
| Total | | $ | 1,860,325 | | | $ | 895,044 | | | $ | — | |
| | | |
| Liabilities | | | | | | | | | | | | |
| | | |
Forward Foreign Currency Exchange Contracts(a) | | $ | — | | | $ | (7,083 | ) | | $ | — | |
63
GOLDMAN SACHS FUND OF FUNDS PORTFOLIOS
Notes to Financial Statements (continued)
June 30, 2021 (Unaudited)
|
| 3. INVESTMENTS AND FAIR VALUE MEASUREMENTS (continued) |
| | | | | | | | | | | | |
| | | |
GROWTH AND INCOME STRATEGY PORTFOLIO
| | | | | | | | | | | | |
| | | |
| Investment Type | | Level 1 | | | Level 2 | | | Level 3 | |
| | | |
| Assets | | | | | | | | | | | | |
| | | |
Underlying Funds | | | | | | | | | | | | |
| | | |
Dynamic | | $ | 71,977,532 | | | $ | — | | | $ | — | |
| | | |
Equity | | | 398,435,865 | | | | — | | | | — | |
| | | |
Exchange Traded Funds | | | 293,523,834 | | | | — | | | | — | |
| | | |
Fixed Income | | | 158,310,343 | | | | — | | | | — | |
| | | |
Investment Company | | | 36,836,176 | | | | — | | | | — | |
| | | |
| Total | | $ | 959,083,750 | | | $ | — | | | $ | — | |
| | | |
| Derivative Type | | | | | | | | | |
| | | |
| Assets | | | | | | | | | | | | |
| | | |
Forward Foreign Currency Exchange Contracts(a) | | $ | — | | | $ | 1,725,673 | | | $ | — | |
| | | |
Futures Contracts(a) | | | 795,059 | | | | — | | | | — | |
| | | |
Options Purchased | | | 2,230,988 | | | | — | | | | — | |
| | | |
| Total | | $ | 3,026,047 | | | $ | 1,725,673 | | | $ | — | |
| | | |
| Liabilities | | | | | | | | | | | | |
| | | |
Forward Foreign Currency Exchange Contracts(a) | | $ | — | | | $ | (29,134 | ) | | $ | — | |
| (a) | | Amount shown represents unrealized gain (loss) at period end. |
| | | | | | | | | | | | |
| | | |
GROWTH STRATEGY PORTFOLIO
| | | | | | | | | | | | |
| | | |
| Investment Type | | Level 1 | | | Level 2 | | | Level 3 | |
| | | |
| Assets | | | | | | | | | | | | |
| | | |
Underlying Funds | | | | | | | | | | | | |
| | | |
Dynamic | | $ | 40,199,909 | | | $ | — | | | $ | — | |
| | | |
Equity | | | 467,792,363 | | | | — | | | | — | |
| | | |
Exchange Traded Funds | | | 272,432,956 | | | | — | | | | — | |
| | | |
Fixed Income | | | 53,557,356 | | | | — | | | | — | |
| | | |
Investment Company | | | 36,197,382 | | | | — | | | | — | |
| | | |
| Total | | $ | 870,179,966 | | | $ | — | | | $ | — | |
| | | |
| Derivative Type | | | | | | | | | |
| | | |
| Assets | | | | | | | | | | | | |
| | | |
Forward Foreign Currency Exchange Contracts(a) | | $ | — | | | $ | 1,245,659 | | | $ | — | |
| | | |
Futures Contracts(a) | | | 884,127 | | | | — | | | | — | |
| | | |
Options Purchased | | | 2,308,238 | | | | — | | | | — | |
| | | |
| Total | | $ | 3,192,365 | | | $ | 1,245,659 | | | $ | — | |
64
GOLDMAN SACHS FUND OF FUNDS PORTFOLIOS
|
| 3. INVESTMENTS AND FAIR VALUE MEASUREMENTS (continued) |
| | | | | | | | | | | | |
|
SATELLITE STRATEGIES PORTFOLIO
| |
| | | |
| Investment Type | | Level 1 | | | Level 2 | | | Level 3 | |
| | | |
| Assets | | | | | | | | | | | | |
| | | |
Underlying Funds | | | | | | | | | | | | |
| | | |
Equity | | $ | 84,753,517 | | | $ | — | | | $ | — | |
| | | |
Exchange Traded Funds | | | 4,322,799 | | | | — | | | | — | |
| | | |
Fixed Income | | | 45,179,538 | | | | — | | | | — | |
| | | |
| Total | | $ | 134,255,854 | | | $ | — | | | $ | — | |
| (a) | | Amount shown represents unrealized gain (loss) at period end. |
For further information regarding security characteristics, see the Schedules of Investments.
|
| 4. INVESTMENTS IN DERIVATIVES |
The following tables set forth, by certain risk types, the gross value of derivative contracts (not considered to be hedging instruments for accounting disclosure purposes) as of June 30, 2021. These instruments were used as part of the Portfolios’ investment strategies and to obtain and/or manage exposure related to the risks below. The values in the tables below exclude the effects of cash collateral received or posted pursuant to these derivative contracts, and therefore are not representative of the Portfolios’ net exposure.
| | | | | | | | | | | | |
| | | |
| Balanced Strategy Portfolio | | | | | | | | | | |
| | | | |
| Risk | | Statement of Assets and Liabilities | | | | | Statement of Assets and Liabilities | | Liabilities | |
Interest rate | | Variation margin on futures contracts; Purchased options, at value | | $ | 1,394,258 | (a) | | | | $ | — | |
Equity | | Variation margin on futures contracts | | | 466,067 | (a) | | | | | — | |
Currency | | Receivable for unrealized gain on forward foreign currency exchange contracts. | | | 895,044 | | | Payable for unrealized loss on forward foreign currency exchange contracts. | | | (7,083) | |
| Total | | | | $ | 2,755,369 | | | | | $ | (7,083) | |
| | | |
| Growth and Income Strategy Portfolio | | | | | | | | | | |
| | | | |
| Risk | | Statement of Assets and Liabilities | | Assets | | | Statement of Assets and Liabilities | | Liabilities | |
Interest rate | | Variation margin on futures contracts; Purchased options, at value | | $ | 2,438,735 | (a) | | | | $ | — | |
Equity | | Variation margin on futures contracts | | | 587,312 | (a) | | | | | — | |
Currency | | Receivable for unrealized gain on forward foreign currency exchange contracts. | | | 1,725,673 | | | Payable for unrealized loss on forward foreign currency exchange contracts. | | | (29,134) | |
| Total | | | | $ | 4,751,720 | | | | | $ | (29,134) | |
65
GOLDMAN SACHS FUND OF FUNDS PORTFOLIOS
Notes to Financial Statements (continued)
June 30, 2021 (Unaudited)
|
| 4. INVESTMENTS IN DERIVATIVES (continued) |
| | | | | | | | | | | | |
| | | |
| Growth Strategy Portfolio | | | | | | | | | | |
| | | | |
| Risk | | Statement of Assets and Liabilities | | Assets | | | Statement of Assets and Liabilities | | Liabilities | |
Equity | | Variation margin on futures contracts | | $ | 884,127 | (a) | | Payable for unrealized loss on purchase options contracts | | $ | 76,797 | |
Currency | | Receivable for unrealized gain on forward foreign currency exchange contracts. | | | 1,245,659 | | | | | | — | |
| Total | | | | $ | 2,129,786 | | | | | $ | 76,797 | |
| (a) | | Includes unrealized gain (loss) on futures contracts described in the Additional Investment Information sections of the Schedules of Investments. Only the variation margin as of June 30, 2021 is reported within the Statements of Assets and Liabilities. |
The following tables set forth, by certain risk types, the Portfolios’ gains (losses) related to these derivatives and their indicative volumes for the six month ended June 30, 2021. These gains (losses) should be considered in the context that these derivative contracts may have been executed to create investment opportunities and/or economically hedge certain investments, and accordingly, certain gains (losses) on such derivative contracts may offset certain (losses) gains attributable to investments. These gains (losses) are included in “Net realized gain (loss)” or “Net change in unrealized gain (loss)” on the Statements of Operations:
| | | | | | | | | | |
| | |
| Balanced Strategy Portfolio | | | | | | | | |
| Risk | | Statement of Operations | | Net
Realized
Gain (Loss) | | | Net Change in
Unrealized
Gain (Loss) | |
| Interest rate | | Net realized gain (loss) from futures contracts and purchased options /Net change in unrealized gain on futures contracts purchased options | | $ | (66,105 | ) | | $ | (401,594 | ) |
| Equity | | Net realized gain (loss) from futures contracts and purchased options /Net change in unrealized gain on futures contracts purchased options | | | 3,909,934 | | | | (454,727 | ) |
| Currency | | Net realized gain from forward foreign currency exchange contracts /Net change in unrealized gain on forward foreign currency exchange contracts | | | 31,312 | | | | 1,256,133 | |
| Total | | | | $ | 3,875,141 | | | $ | 399,812 | |
| | |
| Growth and Income Strategy Portfolio | | | | | | | | |
| Risk | | Statement of Operations | | Net Realized
Gain (Loss) | | | Net Change in
Unrealized
Gain (Loss) | |
| Interest rate | | Net realized gain (loss) from futures contracts and purchased options /Net change in unrealized gain on futures contracts purchased options | | $ | (350,108 | ) | | $ | (1,107,425 | ) |
| Equity | | Net realized gain (loss) from futures contracts and written options/Net change in unrealized gain on futures contracts | | | 5,178,467 | | | | (213,569 | ) |
| Currency | | Net realized gain (loss) from forward foreign currency exchange contracts /Net change in unrealized gain on forward foreign currency exchange contracts | | | (83,081 | ) | | | 2,342,394 | |
| Total | | | | $ | 4,745,278 | | | $ | 1,021,400 | |
66
GOLDMAN SACHS FUND OF FUNDS PORTFOLIOS
|
| 4. INVESTMENTS IN DERIVATIVES (continued) |
| | | | | | | | | | |
| | |
| Growth Strategy Portfolio | | | | | | | | |
| Risk | | Statement of Operations | | Net
Realized
Gain (Loss) | | | Net Change
in Unrealized
Gain (Loss) | |
| Equity | | Net realized gain (loss) from futures contracts and purchased options /Net change in unrealized gain on futures contracts purchased options | | $ | 6,388,598 | | | $ | (939,788 | ) |
| Currency | | Net realized gain (loss) from forward foreign currency exchange contracts /Net change in unrealized gain on forward foreign currency exchange contracts | | | (22,610 | ) | | | 1,756,543 | |
| Total | | | | $ | 6,365,988 | | | $ | 816,755 | |
For the six month ended June 30, 2021, the relevant values for each derivative type was as follows:
| | | | | | | | | | | | | | | | |
| | | Average Number of Contracts, Notional Amounts, or Shares/Units (a) | |
| | | Futures
Contracts | | | Forward
Contacts | | | Purchased
Options | | | Written
Options | |
Balanced Strategy | | | 325 | | | $ | 37,360,149 | | | | 685,833 | | | | (5,324 | ) |
Growth and Income Strategy | | | 496 | | | | 66,804,036 | | | | 1,164,167 | | | | (8,792 | ) |
Growth Strategy | | | 471 | | | | 49,529,690 | | | | 1,166,250 | | | | (7,687 | ) |
| (a) | | Amounts(s) disclosed represent average number of contracts for futures contracts, notional amounts for forward contracts, or shares/units outstanding for purchased options and written options, based on absolute values, which is indicative of volume for this derivative type, for the months that each Fund held such derivatives during the six months ended June 30, 2021. |
|
| 5. AGREEMENTS AND AFFILIATED TRANSACTIONS |
A. Management Agreement — Under the Agreement, GSAM manages the Portfolios, subject to the general supervision of the Trustees.
As compensation for the services rendered pursuant to the Agreement, the assumption of the expenses related thereto and administration of the Portfolios’ business affairs, including providing facilities, GSAM is entitled to a management fee, accrued daily and paid monthly, equal to an annual percentage rate of average daily net assets of 0.124% for the Satellite Strategies Portfolio and 0.15% for each of the other Portfolios.
B. Distribution and/or Service (12b-1) Plans — The Trust, on behalf of Class A and Class R Shares of each applicable Portfolio, has adopted Distribution and Service Plans subject to Rule 12b-1 under the Act. Under the Distribution and Service Plans, Goldman Sachs, which serves as distributor (the “Distributor”), is entitled to a fee accrued daily and paid monthly for distribution services and personal and account maintenance services, which may then be paid by Goldman Sachs to authorized dealers. These fees are equal to an annual percentage rate of the average daily net assets attributable to Class A or Class R Shares of the Portfolio, as applicable, as set forth below.
The Trust, on behalf of Class C Shares of each applicable Portfolio, has adopted a Distribution Plan subject to Rule 12b-1 under the Act. Under the Distribution Plan, Goldman Sachs as Distributor is entitled to a fee accrued daily and paid monthly for distribution services, which may then be paid by Goldman Sachs to authorized dealers. These fees are equal to an annual percentage rate of the average daily net assets attributable to Class C Shares of the Portfolio, as set forth below.
67
GOLDMAN SACHS FUND OF FUNDS PORTFOLIOS
Notes to Financial Statements (continued)
June 30, 2021 (Unaudited)
|
| 5. AGREEMENTS AND AFFILIATED TRANSACTIONS |
The Trust, on behalf of Service Shares of each applicable Portfolio, has adopted a Service Plan subject to Rule 12b-1 under the Act to allow Service Shares to compensate service organizations (including Goldman Sachs) for providing personal and account maintenance services to their customers who are beneficial owners of such shares. The Service Plan provides for compensation to the service organizations equal to an annual percentage rate of the average daily net assets attributable to Service Shares of the Portfolio, as set forth below.
| | | | | | | | | | | | | | | | |
| | | Distribution and/or Service Plan Rates | |
| | | Class A* | | | Class C | | | Class R* | | | Service | |
Distribution and/or Service Plan | | | 0.25 | % | | | 0.75 | % | | | 0.50 | % | | | 0.25 | % |
| * | | With respect to Class A and Class R Shares, the Distributor at its discretion may use compensation for distribution services paid under the Distribution Plan to compensate service organizations for personal and account maintenance services and expenses as long as such total compensation does not exceed the maximum cap on “service fees” imposed by the Financial Industry Regulatory Authority. |
C. Distribution Agreement — Goldman Sachs, as Distributor of the shares of the Portfolios pursuant to a Distribution Agreement, may retain a portion of the Class A Shares’ front end sales charge and Class C Shares’ CDSC. During the six months ended June 30, 2021, Goldman Sachs retained the following amounts:
| | | | | | | | |
| | | Front End
Sales Charge | | | Contingent Deferred
Sales Charge | |
| Portfolio | | Class A | | | Class C | |
Balanced Strategy | | $ | 5,262 | | | $ | 64 | |
Growth and Income Strategy | | | 6,819 | | | | 349 | |
Growth Strategy | | | 7,180 | | | | 404 | |
Satellite Strategies | | | 384 | | | | — | |
D. Service and/or Shareholder Administration Plans — The Trust, on behalf of each applicable Portfolio, has adopted Service Plans to allow Class C Shares and Shareholder Administration Plans to allow Service Shares, respectively, to compensate service organizations (including Goldman Sachs) for providing varying levels of personal and account maintenance or shareholder administration services to their customers who are beneficial owners of such shares. The Service and Shareholder Administration Plans each provide for compensation to the service organizations equal to an annual percentage rate of 0.25 % of the average daily net assets attributable to Class C and Service Shares of the Portfolios, respectively.
E. Transfer Agency Agreement — Goldman Sachs also serves as the transfer agent of the Portfolios for a fee pursuant to the Transfer Agency Agreement. The fees charged for such transfer agency services are accrued daily and paid monthly at annual rates as follows: 0.16% of the average daily net assets of Class A, Class C, Investor and Class R Shares; 0.03% of the average daily net assets of Class R6 and Class P Shares; and 0.04% of the average daily net assets of Institutional and Service Shares.
F. Other Expense Agreements and Affiliated Transactions — GSAM has agreed to reduce or limit certain “Other Expenses” of the Portfolios (excluding acquired fund fees and expenses, transfer agency fees and expenses, service fees and shareholder administration fees (as applicable), taxes, interest, brokerage fees, expenses of shareholder meetings, litigation and indemnification, and extraordinary expenses) to the extent such expenses exceed, on an annual basis, a percentage rate of the average daily net assets of each Portfolio. Such Other Expense reimbursements, if any, are accrued daily and paid monthly. In addition, the Portfolios are not obligated to reimburse GSAM for prior fiscal year expense reimbursements, if any. The Other Expense limitations as an annual percentage rate of average daily net assets are 0.01% for the Satellite Strategies Portfolio and 0.004% for each other Portfolio. These Other Expense limitations will remain in place through at least April 30, 2022 and prior to such date GSAM may not terminate the arrangements without the approval of the Trustees. In addition, the Portfolios have entered into certain offset arrangements with the transfer agent, which may result in a reduction of the Portfolios’ expenses and are received irrespective of the application of the “Other Expense” limitations described above.
68
GOLDMAN SACHS FUND OF FUNDS PORTFOLIOS
|
| 5. AGREEMENTS AND AFFILIATED TRANSACTIONS (continued) |
For the six months ended June 30, 2021, these expense reductions, including any fee waivers and Other Expense reimbursements, were as follows:
| | | | | | |
| Portfolio | | | | Other Expense Reimbursements | |
Balanced Strategy | | | | $ | 161,701 | |
Growth and Income Strategy | | | | | 183,218 | |
Growth Strategy | | | | | 188,140 | |
Satellite Strategies | | | | | 156,706 | |
G. Line of Credit Facility — As of June 30, 2021, the Portfolios participated in a $1,000,000,000 committed, unsecured revolving line of credit facility (the “facility”) together with other funds of the Trust and certain registered investment companies having management agreements with GSAM or its affiliates. This facility is to be used for temporary emergency purposes, or to allow for an orderly liquidation of securities to meet redemption requests. The interest rate on borrowings is based on the federal funds rate. The facility also requires a fee to be paid by the Portfolios based on the amount of the commitment that has not been utilized. For the six months ended June 30, 2021, the Portfolios did not have any borrowings under the facility. Prior to April 26, 2021, the facility was $700,000,000.
H. Other Transactions with Affiliates — The Portfolios invest primarily in the Class R6 Shares of the Underlying Funds
(except certain Underlying Funds that are ETFs). These Underlying Funds are considered to be affiliated with the Portfolios. The
tables below show the transactions in and earnings from investments in these Underlying Funds for the six months ended June 30, 2021 (in thousands):
| | | | | | | | | | | | | | | | | | | | | | | | | | | | | | | | |
|
| Balanced Strategy Portfolio | |
| Underlying Funds | | Market
Value as of
12/31/2020 | | | Purchases
at Cost | | | Proceeds
from Sales | | | Realized
Gain (Loss) | | | Change in
Unrealized
Gain (Loss) | | | Market
Value as of
06/30/2021 | | | Shares as of
06/30/2021 | | | Dividend
Income | |
Goldman Sachs Access Investment Grade Corporate Bond ETF | | $ | 54,505 | | | $ | — | | | $ | — | | | $ | — | | | $ | (1,357 | ) | | $ | 53,148 | | | | 969 | | | $ | 497 | |
Goldman Sachs ActiveBeta U.S. Large Cap Equity ETF | | | 55,178 | | | | — | | | | (8,485 | ) | | | 2,564 | | | | 4,542 | | | | 53,799 | | | | 625 | | | | 305 | |
Goldman Sachs Alternative Premia Fund — Class R6 | | | 10,365 | | | | — | | | | — | | | | — | | | | 210 | | | | 10,575 | | | | 1,502 | | | | — | |
Goldman Sachs Core Fixed Income Fund —Class R6 | | | 17,438 | | | | 164 | | | | — | | | | — | | | | (478 | ) | | | 17,124 | | | | 1,558 | | | | 164 | |
Goldman Sachs Dynamic Global Equity Fund — Class R6 | | | 91,461 | | | | — | | | | (15,250 | ) | | | 2,598 | | | | 9,505 | | | | 88,314 | | | | 3,573 | | | | — | |
Goldman Sachs Emerging Markets Debt Fund — Class R6 | | | 16,969 | | | | 3,333 | | | | — | | | | — | | | | (551 | ) | | | 19,751 | | | | 1,594 | | | | 333 | |
Goldman Sachs Emerging Markets Equity Insights Fund — Class R6 | | | 24,135 | | | | — | | | | (2,500 | ) | | | 364 | | | | 2,647 | | | | 24,646 | | | | 1,861 | | | | — | |
69
GOLDMAN SACHS FUND OF FUNDS PORTFOLIOS
Notes to Financial Statements (continued)
June 30, 2021 (Unaudited)
|
| 5. AGREEMENTS AND AFFILIATED TRANSACTIONS (continued) |
| | | | | | | | | | | | | | | | | | | | | | | | | | | | | | | | |
|
| Balanced Strategy Portfolio (continued) | |
| Underlying Funds | | Market
Value as of
12/31/2020 | | | Purchases
at Cost | | | Proceeds
from Sales | | | Realized
Gain (Loss) | | | Change in
Unrealized
Gain (Loss) | | | Market
Value as of
06/30/2021 | | | Shares as of
06/30/2021 | | | Dividend
Income | |
Goldman Sachs Financial Square Government Fund — Institutional Shares | | $ | 27,862 | | | $ | 50,601 | | | $ | (56,031 | ) | | $ | — | | | $ | — | | | $ | 22,432 | | | | 22,432 | | | $ | 3 | |
Goldman Sachs Global Core Fixed Income Fund — Class R6 | | | 144,088 | | | | 6,565 | | | | — | | | | — | | | | (4,355 | ) | | | 146,298 | | | | 11,421 | | | | 1,063 | |
Goldman Sachs Global Infrastructure Fund — Class R6 | | | 9,319 | | | | 92 | | | | (33 | ) | | | — | | | | 896 | | | | 10,274 | | | | 799 | | | | 137 | |
Goldman Sachs Global Real Estate Securities Fund — Class R6 | | | 5,537 | | | | 51 | | | | (10 | ) | | | 8 | | | | 825 | | | | 6,411 | | | | 546 | | | | 83 | |
Goldman Sachs High Yield Floating Rate Fund — Class R6 | | | 6,144 | | | | 104 | | | | — | | | | — | | | | 80 | | | | 6,328 | | | | 673 | | | | 104 | |
Goldman Sachs High Yield Fund — Class R6 | | | 5,506 | | | | 137 | | | | — | | | | — | | | | 36 | | | | 5,679 | | | | 870 | | | | 137 | |
Goldman Sachs International Equity Insights Fund — Class R6 | | | 26,386 | | | | — | | | | (2,500 | ) | | | 383 | | | | 2,387 | | | | 26,656 | | | | 1,756 | | | | — | |
Goldman Sachs International Small Cap Insights Fund — Class R6 | | | 12,824 | | | | — | | | | (2,000 | ) | | | 184 | | | | 1,486 | | | | 12,494 | | | | 873 | | | | — | |
Goldman Sachs Local Emerging Markets Debt Fund — Class R6 | | | 5,072 | | | | 94 | | | | — | | | | — | | | | (310 | ) | | | 4,856 | | | | 853 | | | | 95 | |
Goldman Sachs Managed Futures Strategy Fund — Class R6 | | | 16,009 | | | | — | | | | — | | | | — | | | | 582 | | | | 16,591 | | | | 1,533 | | | | — | |
Goldman Sachs Tactical Tilt Overlay Fund — Class R6 | | | 27,119 | | | | — | | | | — | | | | — | | | | 1,938 | | | | 29,057 | | | | 2,807 | | | | — | |
| | | | | | | | |
Total | | $ | 555,917 | | | $ | 61,141 | | | $ | (86,809 | ) | | $ | 6,101 | | | $ | 18,083 | | | $ | 554,433 | | | | | | | $ | 2,921 | |
| | | | | | | | | | | | | | | | | | | | | | | | | | | | | | | | |
|
| Growth and Income Strategy Portfolio | |
| Underlying Funds | | Market
Value as of
12/31/2020 | | | Purchases
at Cost | | | Proceeds
from Sales | | | Realized
Gain (Loss) | | | Change in
Unrealized
Gain (Loss) | | | Market
Value as of
06/30/2021 | | | Shares as of
06/30/2021 | | | Dividend
Income | |
Goldman Sachs Access Investment Grade Corporate Bond ETF | | $ | 88,640 | | | $ | — | | | $ | — | | | $ | — | | | $ | (2,206 | ) | | $ | 86,434 | | | | 1,576 | | | $ | 808 | |
Goldman Sachs ActiveBeta U.S. Large Cap Equity ETF | | | 191,211 | | | | — | | | | (9,230 | ) | | | 2,429 | | | | 22,680 | | | | 207,090 | | | | 2,407 | | | | 1,080 | |
Goldman Sachs Alternative Premia Fund — Class R6 | | | 8,522 | | | | — | | | | — | | | | — | | | | 173 | | | | 8,695 | | | | 1,235 | | | | — | |
Goldman Sachs Dynamic Global Equity Fund — Class R6 | | | 191,890 | | | | — | | | | (17,000 | ) | | | 3,491 | | | | 23,697 | | | | 202,078 | | | | 8,175 | | | | — | |
70
GOLDMAN SACHS FUND OF FUNDS PORTFOLIOS
|
| 5. AGREEMENTS AND AFFILIATED TRANSACTIONS (continued) |
| | | | | | | | | | | | | | | | | | | | | | | | | | | | | | | | |
|
| Growth and Income Strategy Portfolio (continued) | |
| Underlying Funds | | Market
Value as of
12/31/2020 | | | Purchases
at Cost | | | Proceeds
from Sales | | | Realized
Gain (Loss) | | | Change in
Unrealized
Gain (Loss) | | | Market
Value as of
06/30/2021 | | | Shares as of
06/30/2021 | | | Dividend
Income | |
Goldman Sachs Emerging Markets Debt Fund — Class R6 | | $ | 31,955 | | | $ | 5,148 | | | $ | — | | | $ | — | | | $ | (1,064 | ) | | $ | 36,039 | | | | 2,909 | | | $ | 648 | |
Goldman Sachs Emerging Markets Equity Insights Fund — Class R6 | | | 53,314 | | | | — | | | | (2,500 | ) | | | 561 | | | | 6,506 | | | | 57,881 | | | | 4,372 | | | | — | |
Goldman Sachs Financial Square Government Fund — Institutional Shares | | | 33,271 | | | | 59,620 | | | | (56,055 | ) | | | — | | | | — | | | | 36,836 | | | | 36,836 | | | | 4 | |
Goldman Sachs Global Core Fixed Income Fund — Class R6 | | | 86,318 | | | | 5,143 | | | | — | | | | — | | | | (2,607 | ) | | | 88,854 | | | | 6,936 | | | | 643 | |
Goldman Sachs Global Infrastructure Fund — Class R6 | | | 15,950 | | | | 157 | | | | (57 | ) | | | — | | | | 1,535 | | | | 17,585 | | | | 1,367 | | | | 234 | |
Goldman Sachs Global Real Estate Securities Fund — Class R6 | | | 8,919 | | | | 83 | | | | (17 | ) | | | 13 | | | | 1,330 | | | | 10,328 | | | | 879 | | | | 133 | |
Goldman Sachs High Yield Floating Rate Fund — Class R6 | | | 8,963 | | | | 152 | | | | — | | | | — | | | | 116 | | | | 9,231 | | | | 982 | | | | 152 | |
Goldman Sachs High Yield Fund — Class R6 | | | 9,595 | | | | 239 | | | | — | | | | — | | | | 62 | | | | 9,896 | | | | 1,515 | | | | 239 | |
Goldman Sachs International Equity Insights Fund — Class R6 | | | 82,040 | | | | — | | | | (7,000 | ) | | | 1,278 | | | | 7,334 | | | | 83,652 | | | | 5,511 | | | | — | |
Goldman Sachs International Small Cap Insights Fund — Class R6 | | | 23,828 | | | | — | | | | — | | | | — | | | | 3,084 | | | | 26,912 | | | | 1,881 | | | | — | |
Goldman Sachs Local Emerging Markets Debt Fund — Class R6 | | | 9,871 | | | | 5,015 | | | | — | | | | — | | | | (596 | ) | | | 14,290 | | | | 2,512 | | | | 216 | |
Goldman Sachs Managed Futures Strategy Fund — Class R6 | | | 23,155 | | | | — | | | | — | | | | — | | | | 843 | | | | 23,998 | | | | 2,218 | | | | — | |
Goldman Sachs Tactical Tilt Overlay Fund — Class R6 | | | 36,666 | | | | — | | | | — | | | | — | | | | 2,619 | | | | 39,285 | | | | 3,796 | | | | — | |
| | | | | | | | |
Total | | $ | 904,108 | | | $ | 75,557 | | | $ | (91,859 | ) | | $ | 7,772 | | | $ | 63,506 | | | $ | 959,084 | | | | | | | $ | 4,157 | |
71
GOLDMAN SACHS FUND OF FUNDS PORTFOLIOS
Notes to Financial Statements (continued)
June 30, 2021 (Unaudited)
|
| 5. AGREEMENTS AND AFFILIATED TRANSACTIONS (continued) |
| | | | | | | | | | | | | | | | | | | | | | | | | | | | | | | | |
|
| Growth Strategy Portfolio | |
| Underlying Funds | | Market Value
12/31/2020 | | | Purchases
at Cost* | | | Proceeds
from Sales | | | Net
Realized
Gain (Loss) | | | Change in
Unrealized
Gain (Loss) | | | Market Value
6/30/2021 | | | Shares as of
6/30/2021 | | | Dividend
Income | |
Goldman Sachs Access Investment Grade Corporate Bond ETF | | $ | 9,622 | | | $ | — | | | $ | — | | | $ | — | | | $ | (240 | ) | | $ | 9,382 | | | | 171 | | | $ | 87 | |
Goldman Sachs ActiveBeta U.S. Large Cap Equity ETF | | | 231,434 | | | | — | | | | — | | | | — | | | | 31,616 | | | | 263,050 | | | | 3,058 | | | | 1,374 | |
Goldman Sachs Dynamic Global Equity Fund — Class R6 | | | 201,458 | | | | — | | | | (9,001 | ) | | | 1,180 | | | | 27,087 | | | | 220,724 | | | | 8,929 | | | | — | |
Goldman Sachs Emerging Markets Debt Fund — Class R6 | | | 31,594 | | | | 6,606 | | | | — | | | | — | | | | (1,074 | ) | | | 37,126 | | | | 2,996 | | | | 606 | |
Goldman Sachs Emerging Markets Equity Insights Fund — Class R6 | | | 62,408 | | | | 7,000 | | | | (5,000 | ) | | | 822 | | | | 7,577 | | | | 72,807 | | | | 5,499 | | | | — | |
Goldman Sachs Financial Square Government Fund — Institutional Shares | | | 23,241 | | | | 72,180 | | | | (59,224 | ) | | | — | | | | — | | | | 36,197 | | | | 36,197 | | | | 6 | |
Goldman Sachs Global Infrastructure Fund — Class R6 | | | 15,288 | | | | 151 | | | | (54 | ) | | | — | | | | 1,470 | | | | 16,855 | | | | 1,311 | | | | 225 | |
Goldman Sachs Global Real Estate Securities Fund — Class R6 | | | 7,497 | | | | 69 | | | | (14 | ) | | | 11 | | | | 1,118 | | | | 8,681 | | | | 739 | | | | 110 | |
Goldman Sachs High Yield Fund — Class R6 | | | 7,720 | | | | 192 | | | | — | | | | — | | | | 49 | | | | 7,961 | | | | 1,219 | | | | 192 | |
Goldman Sachs International Equity Insights Fund — Class R6 | | | 92,110 | | | | 7,000 | | | | — | | | | — | | | | 10,266 | | | | 109,376 | | | | 7,205 | | | | — | |
Goldman Sachs International Small Cap Insights Fund — Class R6 | | | 32,183 | | | | 6,000 | | | | (3,500 | ) | | | 288 | | | | 4,380 | | | | 39,351 | | | | 2,750 | | | | — | |
Goldman Sachs Local Emerging Markets Debt Fund — Class R6 | | | 8,846 | | | | 165 | | | | — | | | | — | | | | (541 | ) | | | 8,470 | | | | 1,489 | | | | 165 | |
Goldman Sachs Managed Futures Strategy Fund — Class R6 | | | 13,153 | | | | — | | | | — | | | | — | | | | 478 | | | | 13,631 | | | | 1,260 | | | | — | |
Goldman Sachs Tactical Tilt Overlay Fund — Class R6 | | | 21,997 | | | | 3,000 | | | | — | | | | — | | | | 1,572 | | | | 26,569 | | | | 2,567 | | | | — | |
| | | | | | | | |
Total | | $ | 758,551 | | | $ | 102,363 | | | $ | (76,793 | ) | | $ | 2,301 | | | $ | 83,758 | | | $ | 870,180 | | | | | | | $ | 2,765 | |
| * | | Includes reinvestment of distributions. |
72
GOLDMAN SACHS FUND OF FUNDS PORTFOLIOS
|
| 5. AGREEMENTS AND AFFILIATED TRANSACTIONS (continued) |
| | | | | | | | | | | | | | | | | | | | | | | | | | | | | | | | |
|
| Satellite Strategies Portfolio | |
| Underlying Funds | | Market
Value
12/31/2020 | | | Purchases
at Cost* | | | Proceeds
from Sales | | | Net
Realized
Gain (Loss) | | | Change in
Unrealized
Gain (Loss) | | | Market
Value
6/30/2021 | | | Shares as
of
6/30/2021 | | | Dividend
Income | |
Goldman Sachs ActiveBeta Emerging Markets Equity ETF | | $ | 7,688 | | | $ | — | | | $ | (3,812 | ) | | $ | 895 | | | $ | (448 | ) | | $ | 4,323 | | | | 106 | | | $ | 22 | |
Goldman Sachs Emerging Markets Debt Fund — Class R6 | | | 29,062 | | | | 443 | | | | (8,065 | ) | | | 729 | | | | (1,697 | ) | | | 20,472 | | | | 1,652 | | | | 443 | |
Goldman Sachs Emerging Markets Equity Fund — Class R6 | | | 10,511 | | | | — | | | | (5,349 | ) | | | 3,865 | | | | (2,989 | ) | | | 6,038 | | | | 183 | | | | — | |
Goldman Sachs Emerging Markets Equity Insights Fund — Class R6 | | | 7,381 | | | | 2,600 | | | | (1,890 | ) | | | 105 | | | | 1,064 | | | | 9,260 | | | | 699 | | | | — | |
Goldman Sachs Global Infrastructure Fund — Class R6 | | | 25,913 | | | | 9,148 | | | | (10,878 | ) | | | 845 | | | | 2,167 | | | | 27,195 | | | | 2,115 | | | | 359 | |
Goldman Sachs Global Real Estate Securities Fund — Class R6 | | | 31,230 | | | | 68 | | | | (24,611 | ) | | | 376 | | | | 1,003 | | | | 8,066 | | | | 687 | | | | 69 | |
Goldman Sachs High Yield Floating Rate Fund — Class R6 | | | 10,511 | | | | 136 | | | | (4,200 | ) | | | (78 | ) | | | 209 | | | | 6,578 | | | | 700 | | | | 136 | |
Goldman Sachs High Yield Fund — Class R6 | | | 20,458 | | | | 279 | | | | (13,665 | ) | | | 1,451 | | | | (1,486 | ) | | | 7,037 | | | | 1,078 | | | | 278 | |
Goldman Sachs Inflation Protected Securities Fund — Class R6 | | | — | | | | 9,035 | | | | (975 | ) | | | 20 | | | | 132 | | | | 8,212 | | | | 702 | | | | 135 | |
Goldman Sachs International Small Cap Insights Fund — Class R6 | | | 19,691 | | | | 11,900 | | | | (7,440 | ) | | | 1,168 | | | | 2,227 | | | | 27,546 | | | | 1,925 | | | | — | |
Goldman Sachs Local Emerging Markets Debt Fund — Class R6 | | | 9,315 | | | | 101 | | | | (6,000 | ) | | | (500 | ) | | | (35 | ) | | | 2,881 | | | | 506 | | | | 101 | |
Goldman Sachs MLP Energy Infrastructure Fund — Class R6 | | | 1,553 | | | | 5,731 | | | | (2,140 | ) | | | (652 | ) | | | 2,156 | | | | 6,648 | | | | 263 | | | | 132 | |
| | | | | | | | |
Total | | $ | 173,313 | | | $ | 39,441 | | | $ | (89,025 | ) | | $ | 8,224 | | | $ | 2,303 | | | $ | 134,256 | | | | | | | $ | 1,675 | |
| * | | Includes reinvestment of distributions. |
73
GOLDMAN SACHS FUND OF FUNDS PORTFOLIOS
Notes to Financial Statements (continued)
June 30, 2021 (Unaudited)
|
| 6. PORTFOLIO SECURITIES TRANSACTIONS |
The cost of purchases and proceeds from sales and maturities of long-term securities for the six months ended June 30, 2021, were as follows:
| | | | | | | | | | |
| Portfolio | | | | Purchases | | | Sales | |
Balanced Strategy | | | | $ | 11,870,961 | | | $ | 31,383,759 | |
Growth and Income Strategy | | | | | 18,243,610 | | | | 36,789,528 | |
Growth Strategy | | | | | 32,567,834 | | | | 18,489,388 | |
Satellite Strategies | | | | | 39,440,863 | | | | 88,876,159 | |
As of the Portfolios’ most recent fiscal year end, December 31, 2020, the Portfolios’ capital loss carryforwards and certain timing differences on a tax basis were as follows:
| | | | | | | | | | | | | | | | | | |
| | | | | Balanced
Strategy | | | Growth and
Income Strategy | | | Growth Strategy | | | Satellite Strategies | |
Capital loss carryforwards: | | | | | | | | | | | | | | | | | | |
Perpetual Long-Term | | | | $ | — | | | $ | — | | | $ | — | | | $ | (27,526,340 | ) |
Perpetual Short-Term | | | | | — | | | | — | | | | — | | | | (598,576 | ) |
Total capital loss carryforwards | | | | $ | — | | | $ | — | | | $ | — | | | $ | (28,124,916 | ) |
Timing differences (Qualified Late Year Ordinary Loss Deferral and Straddle Loss Deferral) | | | | $ | (903,749 | ) | | $ | (1,526,925 | ) | | $ | (1,177,465 | ) | | $ | — | |
As of June 30, 2021, the Portfolios’ aggregate security unrealized gains and losses based on cost for U.S. federal income tax purposes were as follows:
| | | | | | | | | | | | | | | | | | |
| | | | | Balanced
Strategy | | | Growth and
Income Strategy | | | Growth Strategy | | | Satellite Strategies | |
Tax Cost | | | | $ | 490,357,384 | | | $ | 782,482,325 | | | $ | 660,471,179 | | | $ | 104,828,992 | |
Gross unrealized gain | | | | | 71,439,709 | | | | 192,056,034 | | | | 219,806,696 | | | | 34,159,204 | |
Gross unrealized loss | | | | | (7,364,012 | ) | | | (15,454,609 | ) | | | (10,097,909 | ) | | | (4,732,342 | ) |
Net unrealized gains (losses) on securities | | | | $ | 64,075,697 | | | $ | 176,601,425 | | | $ | 209,708,787 | | | $ | 29,426,862 | |
The difference between GAAP-basis and tax basis unrealized gains (losses) is attributable primarily to wash sales, net mark to market gains (losses) on regulated futures contracts, options contracts, and foreign currency contracts.
GSAM has reviewed the Portfolios’ tax positions for all open tax years (the current and prior three years, as applicable) and has concluded that no provision for income tax is required in the Portfolios’ financial statements. Such open tax years remain subject to examination and adjustment by tax authorities.
74
GOLDMAN SACHS FUND OF FUNDS PORTFOLIOS
The Portfolios’ risks include, but are not limited to, the following:
Derivatives Risk — The Portfolios’ use of derivatives may result in loss. Derivative instruments, which may pose risks in addition to and greater than those associated with investing directly in securities, currencies or other instruments, may be illiquid or less liquid, volatile, difficult to price and leveraged so that small changes in the value of the underlying instruments may produce disproportionate losses to the Portfolios. Derivatives are also subject to counterparty risk, which is the risk that the other party in the transaction will not fulfill its contractual obligation. The use of derivatives is a highly specialized activity that involves investment techniques and risks different from those associated with investments in more traditional securities and instruments. Losses from derivatives can also result from a lack of correlation between changes in the value of derivative instruments and the portfolio assets (if any) being hedged.
Dividend-Paying Investments Risk — A Portfolio’s investments in dividend-paying securities could cause a Portfolio to underperform other funds. Securities that pay dividends, as a group, can fall out of favor with the market, causing such securities to underperform securities that do not pay dividends. Depending upon market conditions and political and legislative responses to such conditions, dividend-paying securities that meet a Portfolio’s investment criteria may not be widely available and/or may be highly concentrated in only a few market sectors. In addition, issuers that have paid regular dividends or distributions to shareholders may not continue to do so at the same level or at all in the future. This may limit the ability of a Portfolio to produce current income.
Foreign and Emerging Countries Risk — Investing in foreign markets may involve special risks and considerations not typically associated with investing in the U.S. Foreign securities may be subject to risk of loss because of more or less foreign government regulation, less public information and less economic, political and social stability in the countries in which a Portfolio or an Underlying Fund invests. The imposition of exchange controls (including repatriation restrictions), confiscations of assets and property, trade restrictions (including tariffs) and other government restrictions by the U.S. or other governments, or from problems in share registration, settlement or custody, may also result in losses. Foreign risk also involves the risk of negative foreign currency rate fluctuations, which may cause the value of securities denominated in such foreign currency (or other instruments through which a Portfolio or an Underlying Fund has exposure to foreign currencies) to decline in value. Currency exchange rates may fluctuate significantly over short periods of time. To the extent that a Portfolio or an Underlying Fund also invests in securities of issuers located in emerging markets, these risks may be more pronounced.
Investments in the Underlying Funds Risk —The investments of a Portfolio may be concentrated in one or more Underlying Funds (including ETFs and other registered investment companies) subject to statutory limitations prescribed by the Act or exemptive relief or regulations thereunder. A Portfolios’ investment performance is directly related to the investment performance of the Underlying Funds it holds. A Portfolio is subject to the risk factors associated with the investments of the Underlying Funds and will be affected by the investment policies and practices of the Underlying Funds in direct proportion to the amount of assets allocated to each. If the Portfolio has a relative concentration of its portfolio in a single Underlying Fund, they may be more susceptible to adverse developments affecting that Underlying Fund, and may be more susceptible to losses because of these developments. A strategy used by the Underlying Funds may fail to produce the intended results.
Large Shareholder Transactions Risk — A Portfolio or an Underlying Fund may experience adverse effects when certain large shareholders, such as other funds, institutional investors (including those trading by use of non-discretionary mathematical formulas), financial intermediaries (who may make investment decisions on behalf of underlying clients and/or include a Portfolio in their investment model), individuals, accounts and Goldman Sachs affiliates, purchase or redeem large amounts of shares of a Portfolio or an Underlying Fund. Such large shareholder redemptions, which may occur rapidly or unexpectedly, may cause a Portfolio or an Underlying Fund to sell portfolio securities at times when it would not otherwise do so, which may negatively impact a Portfolio’s NAV or an Underlying Fund and liquidity. These transactions may also accelerate the realization of taxable income to shareholders if such sales of investments resulted in gains, and may also increase transaction costs. In addition, a large redemption could result in a Portfolio’s or an Underlying Fund current expenses being allocated over a smaller asset base, leading to an increase in the Portfolio’s expense or the Underlying Fund’s ratio. Similarly, large Portfolio share purchases may adversely
75
GOLDMAN SACHS FUND OF FUNDS PORTFOLIOS
Notes to Financial Statements (continued)
June 30, 2021 (Unaudited)
|
| 8. OTHER RISKS (continued) |
affect a Portfolio’s or the Underlying Fund’s performance to the extent that the Portfolio or the Underlying Fund’s is delayed in investing new cash or otherwise maintains a larger cash position than it ordinarily would.
Liquidity Risk — A Portfolio or an Underlying Fund may make investments that are illiquid or that may become less liquid in response to market developments or adverse investor perceptions. Illiquid investments may be more difficult to value. Liquidity risk may also refer to the risk that a Portfolio or Underlying Fund will not be able to pay redemption proceeds within the allowable time period or without significant dilution to remaining investors’ interests because of unusual market conditions, an unusually high volume of redemption requests, or other reasons. To meet redemption requests, a Portfolio or Underlying Fund may be forced to sell investments at an unfavorable time and/or under unfavorable conditions. If a Portfolio or Underlying Fund is forced to sell securities at an unfavorable time and/or under unfavorable conditions, such sales may adversely affect the Portfolio’s or Underlying Fund’s NAV and dilute remaining investors’ interests. Liquidity risk may be the result of, among other things, the reduced number and capacity of traditional market participants to make a market in fixed income securities or the lack of an active market. The potential for liquidity risk may be magnified by a rising interest rate environment or other circumstances where investor redemptions from fixed income mutual funds may be higher than normal, potentially causing increased supply in the market due to selling activity. These risks may be more pronounced in connection with a Portfolio investments in securities of issuers located in emerging market countries. Redemptions by large shareholders may have a negative impact on a Portfolio’s or Underlying Fund’s liquidity.
Market and Credit Risks — In the normal course of business, a Portfolio trades financial instruments and enters into financial transactions where risk of potential loss exists due to changes in the market (market risk). The value of the securities in which a Portfolio invests may go up or down in response to the prospects of individual companies, particular sectors or governments and/or general economic conditions throughout the world due to increasingly interconnected global economies and financial markets. Events such as war, acts of terrorism, social unrest, natural disasters, the spread of infectious illness or other public health threats could also significantly impact a Fund and its investments. Additionally, a Portfolio may also be exposed to credit risk in the event that an issuer or guarantor fails to perform or that an institution or entity with which the Portfolio has unsettled or open transactions defaults.
Under the Trust’s organizational documents, its Trustees, officers, employees and agents are indemnified, to the extent permitted by the Act and state law, against certain liabilities that may arise out of performance of their duties to the Portfolios. Additionally, in the course of business, the Portfolios enter into contracts that contain a variety of indemnification clauses. The Portfolios’ maximum exposure under these arrangements is unknown, as this would involve future claims that may be made against the Portfolios that have not yet occurred. However, GSAM believes the risk of loss under these arrangements to be remote.
Subsequent events after the Statement of Assets and Liabilities date have been evaluated, and GSAM has concluded that there is no impact requiring adjustment or disclosure in the financial statements.
76
GOLDMAN SACHS FUND OF FUNDS PORTFOLIOS
Notes to Financial Statements (continued)
June 30, 2021 (Unaudited)
|
| 11. SUMMARY OF SHARE TRANSACTIONS |
Share activity is as follows:
| | | | | | | | | | | | | | | | |
| | | Balanced Strategy Portfolio | |
| | | | |
| | | For the Six Months Ended
June 30, 2021
(Unaudited) | | | For the Fiscal Year Ended
December 31, 2020
| |
| | | | |
| | | Shares | | | Dollars | | | Shares | | | Dollars | |
| | | | |
| Class A Shares | |
Shares sold | | | 443,188 | | | $ | 5,706,726 | | | | 806,106 | | | $ | 9,371,853 | |
Reinvestment of distributions | | | 25,286 | | | | 325,115 | | | | 161,208 | | | | 1,956,189 | |
Shares redeemed | | | (628,955 | ) | | | (8,105,616 | ) | | | (1,388,358 | ) | | | (16,050,087 | ) |
| | | | (160,481 | ) | | | (2,073,775 | ) | | | (421,044 | ) | | | (4,722,045 | ) |
| Class C Shares | |
Shares sold | | | 29,818 | | | | 383,637 | | | | 152,765 | | | | 1,760,807 | |
Reinvestment of distributions | | | 135 | | | | 1,715 | | | | 8,805 | | | | 109,881 | |
Shares redeemed | | | (232,376 | ) | | | (3,005,152 | ) | | | (346,972 | ) | | | (4,036,182 | ) |
| | | | (202,423 | ) | | | (2,619,800 | ) | | | (185,402 | ) | | | (2,165,494 | ) |
| Institutional Shares | |
Shares sold | | | 2,268,479 | | | | 29,339,589 | | | | 9,619,191 | | | | 115,945,581 | |
Reinvestment of distributions | | | 138,005 | | | | 1,780,813 | | | | 692,210 | | | | 8,350,848 | |
Shares redeemed | | | (5,082,587 | ) | | | (65,579,581 | ) | | | (9,699,923 | ) | | | (114,183,314 | ) |
| | | | (2,676,103 | ) | | | (34,459,179 | ) | | | 611,478 | | | | 10,113,115 | |
| Service Shares | |
Shares sold | | | 2 | | | | 31 | | | | 209 | | | | 2,470 | |
Shares redeemed | | | (2,893 | ) | | | (37,496 | ) | | | (12,403 | ) | | | (151,463 | ) |
| | | | (2,891 | ) | | | (37,465 | ) | | | (12,194 | ) | | | (148,993 | ) |
| Investor Shares | |
Shares sold | | | 44,078 | | | | 577,108 | | | | 373,809 | | | | 4,570,701 | |
Reinvestment of distributions | | | 1,629 | | | | 20,930 | | | | 10,916 | | | | 133,619 | |
Shares redeemed | | | (245,833 | ) | | | (3,121,230 | ) | | | (96,997 | ) | | | (1,089,565 | ) |
| | | | (200,126 | ) | | | (2,523,192 | ) | | | 287,728 | | | | 3,614,755 | |
| Class R6 Shares | |
Shares sold | | | 2,247 | | | | 28,974 | | | | 10,357 | | | | 121,259 | |
Reinvestment of distributions | | | 102 | | | | 1,320 | | | | 853 | | | | 10,015 | |
Shares redeemed | | | (4,214 | ) | | | (54,742 | ) | | | (48,256 | ) | | | (581,682 | ) |
| | | | (1,865 | ) | | | (24,448 | ) | | | (37,046 | ) | | | (450,408 | ) |
| Class R Shares | |
Shares sold | | | 35,347 | | | | 456,447 | | | | 108,195 | | | | 1,269,012 | |
Reinvestment of distributions | | | 1,526 | | | | 19,409 | | | | 13,214 | | | | 159,999 | |
Shares redeemed | | | (7,853 | ) | | | (100,182 | ) | | | (254,775 | ) | | | (3,003,397 | ) |
| | | | 29,020 | | | | 375,674 | | | | (133,366 | ) | | | (1,574,386 | ) |
| Class P Shares | |
Shares sold | | | 868,508 | | | | 11,193,131 | | | | 424,684 | | | | 4,981,602 | |
Reinvestment of distributions | | | 19,132 | | | | 247,143 | | | | 76,524 | | | | 922,139 | |
Shares redeemed | | | (150,827 | ) | | | (1,938,001 | ) | | | (831,434 | ) | | | (9,255,219 | ) |
| | | | 736,813 | | | | 9,502,273 | | | | (330,226 | ) | | | (3,351,478 | ) |
| | | | |
NET DECREASE | | | (2,478,056 | ) | | $ | (31,859,912 | ) | | | (220,072 | ) | | $ | 1,315,066 | |
77
GOLDMAN SACHS FUND OF FUNDS PORTFOLIOS
Notes to Financial Statements (continued)
June 30, 2021 (Unaudited)
|
| 11. SUMMARY OF SHARE TRANSACTIONS (continued) |
| | | | | | | | | | | | | | | | |
| | | Growth and Income Strategy Portfolio | |
| | | | |
| | | For the Six Months Ended
June 30, 2021
(Unaudited) | | | For the Fiscal Year Ended
December 31, 2020
| |
| | | | |
| | | Shares | | | Dollars | | | Shares | | | Dollars | |
| | | | |
| Class A Shares | |
Shares sold | | | 572,549 | | | $ | 9,196,940 | | | | 1,001,133 | | | $ | 14,063,210 | |
Reinvestment of distributions | | | 46,307 | | | | 737,240 | | | | 568,375 | | | | 8,516,207 | |
Shares redeemed | | | (1,249,227 | ) | | | (20,127,145 | ) | | | (2,729,843 | ) | | | (38,118,863) | |
| | | | (630,371 | ) | | | (10,192,965 | ) | | | (1,160,335 | ) | | | (15,539,446) | |
| Class C Shares | |
Shares sold | | | 53,040 | | | | 831,701 | | | | 88,895 | | | | 1,236,549 | |
Reinvestment of distributions | | | 240 | | | | 3,697 | | | | 23,505 | | | | 349,075 | |
Shares redeemed | | | (279,306 | ) | | | (4,369,054 | ) | | | (592,480 | ) | | | (8,007,231) | |
| | | | (226,026 | ) | | | (3,533,656 | ) | | | (480,080 | ) | | | (6,421,607) | |
| Institutional Shares | |
Shares sold | | | 1,697,991 | | | | 27,298,374 | | | | 5,182,916 | | | | 76,541,111 | |
Reinvestment of distributions | | | 98,824 | | | | 1,595,350 | | | | 816,050 | | | | 12,170,985 | |
Shares redeemed | | | (2,484,527 | ) | | | (40,039,533 | ) | | | (8,571,487 | ) | | | (120,264,037) | |
| | | | (687,712 | ) | | | (11,145,809 | ) | | | (2,572,521 | ) | | | (31,551,941) | |
| Service Shares | |
Shares sold | | | 8,337 | | | | 133,449 | | | | 4,849 | | | | 69,559 | |
Reinvestment of distributions | | | 43 | | | | 676 | | | | 875 | | | | 13,109 | |
Shares redeemed | | | (17,495 | ) | | | (281,359 | ) | | | (38,494 | ) | | | (554,592) | |
| | | | (9,115 | ) | | | (147,234 | ) | | | (32,770 | ) | | | (471,924) | |
| Investor Shares | |
Shares sold | | | 58,007 | | | | 945,164 | | | | 64,633 | | | | 909,258 | |
Reinvestment of distributions | | | 2,012 | | | | 32,154 | | | | 17,938 | | | | 265,906 | |
Shares redeemed | | | (40,805 | ) | | | (654,269 | ) | | | (104,836 | ) | | | (1,448,110) | |
| | | | 19,214 | | | | 323,049 | | | | (22,265 | ) | | | (272,946) | |
| Class R6 Shares | |
Shares sold | | | 27,191 | | | | 435,362 | | | | 28,686 | | | | 413,366 | |
Reinvestment of distributions | | | 213 | | | | 3,431 | | | | 1,615 | | | | 23,957 | |
Shares redeemed | | | (28,137 | ) | | | (461,079 | ) | | | (169,079 | ) | | | (2,390,358) | |
| | | | (733 | ) | | | (22,286 | ) | | | (138,778 | ) | | | (1,953,035) | |
| Class R Shares | |
Shares sold | | | 20,273 | | | | 323,059 | | | | 50,504 | | | | 698,780 | |
Reinvestment of distributions | | | 653 | | | | 10,264 | | | | 10,189 | | | | 152,171 | |
Shares redeemed | | | (15,866 | ) | | | (251,492 | ) | | | (70,861 | ) | | | (969,139) | |
| | | | 5,060 | | | | 81,831 | | | | (10,168 | ) | | | (118,188) | |
| Class P Shares | |
Shares sold | | | 1,125,787 | | | | 18,098,087 | | | | 1,164,270 | | | | 16,936,910 | |
Reinvestment of distributions | | | 65,927 | | | | 1,063,756 | | | | 524,524 | | | | 7,826,935 | |
Shares redeemed | | | (931,640 | ) | | | (15,129,796 | ) | | | (1,844,068 | ) | | | (26,151,627) | |
| | | | 260,074 | | | | 4,032,047 | | | | (155,274 | ) | | | (1,387,782) | |
| | | | |
NET DECREASE | | | (1,269,609 | ) | | $ | (20,605,023 | ) | | | (4,572,191 | ) | | $ | (57,716,869) | |
78
GOLDMAN SACHS FUND OF FUNDS PORTFOLIOS
June 30, 2021 (Unaudited)
|
| 11. SUMMARY OF SHARE TRANSACTIONS (continued) |
| | | | | | | | | | | | | | | | |
| | | Growth Strategy Portfolio | |
| | | | |
| | | For the Six Months Ended
June 30, 2021
(Unaudited) | | | For the Fiscal Year Ended
December 31, 2020
| |
| | | | |
| | | Shares | | | Dollars | | | Shares | | | Dollars | |
| | | | |
| Class A Shares | | | | | | | | | | | | | | | | |
Shares sold | | | 501,623 | | | $ | 9,433,955 | | | | 952,811 | | | $ | 14,899,877 | |
Reinvestment of distributions | | | — | | | | — | | | | 562,692 | | | | 9,975,598 | |
Shares redeemed | | | (1,110,389 | ) | | | (20,968,818 | ) | | | (2,659,217 | ) | | | (41,661,077) | |
| | | | (608,766 | ) | | | (11,534,863 | ) | | | (1,143,714 | ) | | | (16,785,602) | |
| Class C Shares | | | | | | | | | | | | | | | | |
Shares sold | | | 111,655 | | | | 2,120,701 | | | | 115,961 | | | | 1,857,819 | |
Reinvestment of distributions | | | — | | | | — | | | | 27,434 | | | | 492,028 | |
Shares redeemed | | | (383,988 | ) | | | (7,415,727 | ) | | | (688,823 | ) | | | (10,860,045) | |
| | | | (272,333 | ) | | | (5,295,026 | ) | | | (545,428 | ) | | | (8,510,198) | |
| Institutional Shares | | | | | | | | | | | | | | | | |
Shares sold | | | 3,488,745 | | | | 63,726,627 | | | | 3,336,916 | | | | 56,246,806 | |
Reinvestment of distributions | | | — | | | | — | | | | 288,202 | | | | 5,118,577 | |
Shares redeemed | | | (2,382,980 | ) | | | (44,300,792 | ) | | | (3,273,219 | ) | | | (52,266,823) | |
| | | | 1,105,765 | | | | 19,425,835 | | | | 351,899 | | | | 9,098,560 | |
| Service Shares | | | | | | | | | | | | | | | | |
Shares sold | | | 5,067 | | | | 94,917 | | | | 15,123 | | | | 236,070 | |
Reinvestment of distributions | | | — | | | | — | | | | 882 | | | | 15,576 | |
Shares redeemed | | | (4,872 | ) | | | (93,565 | ) | | | (37,528 | ) | | | (619,839) | |
| | | | 195 | | | | 1,352 | | | | (21,523 | ) | | | (368,193) | |
| Investor Shares | | | | | | | | | | | | | | | | |
Shares sold | | | 44,265 | | | | 838,948 | | | | 93,099 | | | | 1,429,337 | |
Reinvestment of distributions | | | — | | | | — | | | | 13,445 | | | | 234,991 | |
Shares redeemed | | | (45,565 | ) | | | (851,036 | ) | | | (160,653 | ) | | | (2,517,024) | |
| | | | (1,300 | ) | | | (12,088 | ) | | | (54,109 | ) | | | (852,696) | |
| Class R6 Shares | | | | | | | | | | | | | | | | |
Shares sold | | | 22,644 | | | | 429,929 | | | | 256,374 | | | | 3,405,418 | |
Reinvestment of distributions | | | — | | | | — | | | | 9,131 | | | | 162,156 | |
Shares redeemed | | | (50,928 | ) | | | (953,271 | ) | | | (352,598 | ) | | | (5,980,284) | |
| | | | (28,284 | ) | | | (523,342 | ) | | | (87,093 | ) | | | (2,412,710) | |
| Class R Shares | | | | | | | | | | | | | | | | |
Shares sold | | | 17,222 | | | | 315,441 | | | | 71,249 | | | | 1,119,560 | |
Reinvestment of distributions | | | — | | | | — | | | | 10,567 | | | | 181,648 | |
Shares redeemed | | | (20,133 | ) | | | (365,086 | ) | | | (122,574 | ) | | | (1,872,096) | |
| | | | (2,911 | ) | | | (49,645 | ) | | | (40,758 | ) | | | (570,888) | |
| Class P Shares | | | | | | | | | | | | | | | | |
Shares sold | | | 1,157,222 | | | | 21,941,350 | | | | 1,225,584 | | | | 19,950,156 | |
Reinvestment of distributions | | | — | | | | — | | | | 394,137 | | | | 7,003,021 | |
Shares redeemed | | | (319,406 | ) | | | (6,053,761 | ) | | | (1,357,109 | ) | | | (20,758,491) | |
| | | | 837,816 | | | | 15,887,589 | | | | 262,612 | | | | 6,194,686 | |
| | | | |
NET INCREASE (DECREASE) | | | 1,030,182 | | | $ | 17,899,812 | | | | (1,278,114 | ) | | $ | (14,207,041) | |
79
GOLDMAN SACHS FUND OF FUNDS PORTFOLIOS
Notes to Financial Statements (continued)
June 30, 2021
|
| 11. SUMMARY OF SHARE TRANSACTIONS (continued) |
| | | | | | | | | | | | | | | | |
| | | Satellite Strategies Portfolio | |
| | | | |
| | | For the Six Months Ended
June 30, 2021
(Unaudited) | | | For the Fiscal Year Ended
December 31, 2020
| |
| | | | |
| | | Shares | | | Dollars | | | Shares | | | Dollars | |
| | | | |
| Class A Shares | | | | | | | | | | | | | | | | |
Shares sold | | | 406,160 | | | $ | 3,579,884 | | | | 1,145,188 | | | $ | 8,749,162 | |
Reinvestment of distributions | | | 43,327 | | | | 387,880 | | | | 102,102 | | | | 753,943 | |
Shares redeemed | | | (515,359 | ) | | | (4,549,734 | ) | | | (1,394,131 | ) | | | (10,704,125) | |
| | | | (65,872 | ) | | | (581,970 | ) | | | (146,841 | ) | | | (1,201,020) | |
| Class C Shares | | | | | | | | | | | | | | | | |
Shares sold | | | 3,594 | | | | 31,768 | | | | 18,345 | | | | 139,519 | |
Reinvestment of distributions | | | 1,047 | | | | 9,469 | | | | 12,367 | | | | 88,754 | |
Shares redeemed | | | (391,663 | ) | | | (3,439,237 | ) | | | (1,283,127 | ) | | | (9,821,116) | |
| | | | (387,022 | ) | | | (3,398,000 | ) | | | (1,252,415 | ) | | | (9,592,843) | |
| Institutional Shares | | | | | | | | | | | | | | | | |
Shares sold | | | 344,787 | | | | 3,019,118 | | | | 1,571,612 | | | | 12,311,549 | |
Reinvestment of distributions | | | 75,110 | | | | 668,813 | | | | 307,906 | | | | 2,265,956 | |
Shares redeemed | | | (5,100,696 | ) | | | (44,658,911 | ) | | | (13,388,305 | ) | | | (106,106,332) | |
| | | | (4,680,799 | ) | | | (40,970,980 | ) | | | (11,508,787 | ) | | | (91,528,827) | |
| Service Shares | | | | | | | | | | | | | | | | |
Shares sold | | | 120 | | | | 1,069 | | | | 484 | | | | 3,780 | |
Reinvestment of distributions | | | 74 | | | | 665 | | | | 293 | | | | 2,112 | |
Shares redeemed | | | (160 | ) | | | (1,449 | ) | | | (16,356 | ) | | | (128,273) | |
| | | | 34 | | | | 285 | | | | (15,579 | ) | | | (122,381) | |
| Investor Shares | | | | | | | | | | | | | | | | |
Shares sold | | | 117,911 | | | | 1,048,943 | | | | 378,548 | | | | 2,930,215 | |
Reinvestment of distributions | | | 19,965 | | | | 177,850 | | | | 55,617 | | | | 410,262 | |
Shares redeemed | | | (574,036 | ) | | | (5,072,311 | ) | | | (923,864 | ) | | | (6,801,591) | |
| | | | (436,160 | ) | | | (3,845,518 | ) | | | (489,699 | ) | | | (3,461,114) | |
| Class R6 Shares | | | | | | | | | | | | | | | | |
Shares sold | | | 21,919 | | | | 191,188 | | | | 61,994 | | | | 475,643 | |
Reinvestment of distributions | | | 1,016 | | | | 9,084 | | | | 7,453 | | | | 54,297 | |
Shares redeemed | | | (22,959 | ) | | | (202,610 | ) | | | (5,421,875 | ) | | | (45,667,982) | |
| | | | (24 | ) | | | (2,338 | ) | | | (5,352,428 | ) | | | (45,138,042) | |
| Class R Shares | | | | | | | | | | | | | | | | |
Shares sold | | | 2,263 | | | | 19,969 | | | | 13,336 | | | | 96,817 | |
Reinvestment of distributions | | | 532 | | | | 4,753 | | | | 1,423 | | | | 10,468 | |
Shares redeemed | | | (18,915 | ) | | | (164,134 | ) | | | (65,276 | ) | | | (527,686) | |
| | | | (16,120 | ) | | | (139,412 | ) | | | (50,517 | ) | | | (420,401) | |
| Class P Shares | | | | | | | | | | | | | | | | |
Shares sold | | | 19,473 | | | | 166,886 | | | | 41,176 | | | | 315,000 | |
Reinvestment of distributions | | | 3,696 | | | | 33,058 | | | | 10,376 | | | | 77,222 | |
Shares redeemed | | | (118,353 | ) | | | (1,030,268 | ) | | | (54,624 | ) | | | (448,609) | |
| | | | (95,184 | ) | | | (830,324 | ) | | | (3,072 | ) | | | (56,387) | |
| | | | |
NET DECREASE | | | (5,681,147 | ) | | $ | (49,768,257 | ) | | | (18,819,338 | ) | | $ | (151,521,015) | |
80
GOLDMAN SACHS FUND OF FUNDS PORTFOLIOS
Statement Regarding Basis for Approval of Management Agreement (Unaudited)
Background
The Goldman Sachs Balanced Strategy Portfolio, Goldman Sachs Growth and Income Strategy Portfolio, Goldman Sachs Growth Strategy Portfolio, and Goldman Sachs Satellite Strategies Portfolio (the “Portfolios”) are investment portfolios of Goldman Sachs Trust (the “Trust”). The Board of Trustees oversees the management of the Trust and reviews the investment performance and expenses of the Portfolios at regularly scheduled meetings held throughout the year. In addition, the Board of Trustees determines annually whether to approve the continuance of the Trust’s investment management agreement (the “Management Agreement”) with Goldman Sachs Asset Management, L.P. (the “Investment Adviser”) on behalf of the Portfolios.
The Management Agreement was most recently approved for continuation until June 30, 2022 by the Board of Trustees, including those Trustees who are not parties to the Management Agreement or “interested persons” (as defined in the Investment Company Act of 1940, as amended) of any party thereto (the “Independent Trustees”), at a meeting held on June 15-16, 2021 (the “Annual Meeting”).
The review process undertaken by the Trustees spans the course of the year and culminates with the Annual Meeting. To assist the Trustees in their deliberations, the Trustees have established a Contract Review Committee (the “Committee”), comprised of the Independent Trustees. The Committee held two meetings over the course of the year since the Management Agreement was last approved. At those Committee meetings, regularly scheduled Board or other committee meetings, and/or the Annual Meeting, matters relevant to the renewal of the Management Agreement were considered by the Board, or the Independent Trustees, as applicable. With respect to each Portfolio, such matters included:
| | (a) | | the nature and quality of the advisory, administrative, and other services provided to the Portfolio and the underlying funds in which it invests (the “Underlying Funds”) by the Investment Adviser and its affiliates, including information about: |
| | (i) | | the structure, staff, and capabilities of the Investment Adviser and its portfolio management teams; |
| | (ii) | | the groups within the Investment Adviser and its affiliates that support the portfolio management teams or provide other types of necessary services, including fund services groups (e.g., accounting and financial reporting, tax, shareholder services, and operations); controls and risk management groups (e.g., legal, compliance, valuation oversight, credit risk management, internal audit, compliance testing, market risk analysis, finance, and central funding); sales and distribution support groups, and others (e.g., information technology and training); |
| | (iii) | | trends in employee headcount; |
| | (iv) | | the Investment Adviser’s financial resources and ability to hire and retain talented personnel and strengthen its operations; and |
| | (v) | | the parent company’s support of the Investment Adviser and its mutual fund business, as expressed by the firm’s senior management; |
| | (b) | | information on the investment performance of the Portfolio and the Underlying Funds, including comparisons to the performance of similar mutual funds, as provided by a third-party mutual fund data provider engaged as part of the contract review process (the “Outside Data Provider”), and a benchmark performance index; and information on general investment outlooks in the markets in which the Underlying Funds invest; |
| | (c) | | information provided by the Investment Adviser indicating the Investment Adviser’s views on whether the Portfolio’s peer group and/or benchmark index had high, medium, or low relevance given the Portfolio’s particular investment strategy; |
| | (d) | | the terms of the Management Agreement and other agreements with affiliated service providers entered into by the Trust on behalf of the Portfolio; |
| | (e) | | fee and expense information for the Portfolio, including: |
| | (i) | | the relative management fee and expense levels of the Portfolio as compared to those of comparable funds managed by other advisers, as provided by the Outside Data Provider; |
| | (ii) | | the Portfolio’s expense trends over time; and |
| | (iii) | | to the extent the Investment Adviser manages other types of accounts (such as bank collective trusts, private wealth management accounts, institutional separate accounts, sub-advised mutual funds, and non-U.S. funds) having investment objectives and policies similar to those of the Portfolio, comparative information on the advisory fees charged and services provided to those accounts by the Investment Adviser; |
| | (f) | | with respect to the extensive investment performance and expense comparison data provided by the Outside Data Provider, its processes in producing that data for the Portfolio; |
| | (g) | | the undertakings of the Investment Adviser and its affiliates to implement fee waivers and/or expense limitations with respect to the Portfolio and the Underlying Funds; |
81
GOLDMAN SACHS FUND OF FUNDS PORTFOLIOS
Statement Regarding Basis for Approval of Management Agreement (Unaudited) (continued)
| | (h) | | information relating to the profitability of the Management Agreement and the transfer agency and distribution and service arrangements of the Portfolio to the Investment Adviser and its affiliates; |
| | (i) | | whether the Portfolio’s existing management fee schedule, together with the management fee schedules of the Underlying Funds, adequately addressed any economies of scale; |
| | (j) | | a summary of the “fall-out” benefits derived by the Investment Adviser and its affiliates from their relationships with the Portfolio and/or the Underlying Funds, including the fees received by the Investment Adviser’s affiliates from the Portfolio and/or the Underlying Funds for transfer agency, securities lending, portfolio trading, distribution and other services; |
| | (k) | | a summary of potential benefits derived by the Portfolio and/or the Underlying Funds as a result of their relationship with the Investment Adviser; |
| | (l) | | with respect to the applicable Underlying Funds, information regarding commissions paid by the Underlying Funds that are equity funds and broker oversight, an update on the Investment Adviser’s soft dollars practices, other information regarding portfolio trading, and how the Investment Adviser carries out its duty to seek best execution; |
| | (m) | | portfolio manager ownership of Portfolio shares; the manner in which portfolio manager compensation is determined; and the number and types of accounts managed by the portfolio managers; |
| | (n) | | the nature and quality of the services provided to the Portfolio and the Underlying Funds by their unaffiliated service providers, and the Investment Adviser’s general oversight and evaluation (including reports on due diligence) of those service providers as part of the administrative services provided under the Management Agreement; and |
| | (o) | | the Investment Adviser’s processes and policies addressing various types of potential conflicts of interest; its approach to risk management; the annual review of the effectiveness of the Portfolio’s compliance program; and periodic compliance reports. |
The Trustees also received an overview of the Portfolios’ distribution arrangements. They received information regarding the Portfolios’ assets, share purchase and redemption activity, and payment of distribution, service, and shareholder administration fees. Information was also provided to the Trustees relating to revenue sharing payments made by and services provided by the Investment Adviser and its affiliates to intermediaries that promote the sale, distribution, and/or servicing of Portfolio shares. The Independent Trustees also discussed the broad range of other investment choices that are available to Portfolio investors, including the availability of comparable funds managed by other advisers.
The presentations made at the Board and Committee meetings and at the Annual Meeting encompassed the Portfolios and other mutual funds for which the Board of Trustees has responsibility. In evaluating the Management Agreement at the Annual Meeting, the Trustees relied upon their knowledge, resulting from their meetings and other interactions throughout the year, of the Investment Adviser and its affiliates, their services, and the Portfolios. In conjunction with these meetings, the Trustees received written materials and oral presentations on the topics covered, and the Investment Adviser addressed the questions and concerns of the Trustees, including concerns regarding the investment performance of certain of the funds they oversee. The Independent Trustees were advised by their independent legal counsel regarding their responsibilities and other regulatory requirements related to the approval and continuation of mutual fund investment management agreements under applicable law. In addition, the Investment Adviser and its affiliates provided the Independent Trustees with a written response to a formal request for information sent on behalf of the Independent Trustees by their independent legal counsel. During the course of their deliberations, the Independent Trustees met in executive sessions with their independent legal counsel, without representatives of the Investment Adviser or its affiliates present.
Nature, Extent, and Quality of the Services Provided Under the Management Agreement
As part of their review, the Trustees considered the nature, extent, and quality of the services provided to the Portfolios and the Underlying Funds by the Investment Adviser. In this regard, the Trustees considered both the investment advisory services and non-advisory services that are provided by the Investment Adviser and its affiliates. The Trustees noted the transition in the leadership and changes in personnel of various of the Investment Adviser’s portfolio management teams that had occurred in recent periods, and the ongoing recruitment efforts aimed at bringing high quality investment talent to the Investment Adviser. They also noted the Investment Adviser’s commitment to maintaining high quality systems and expending substantial resources to respond to ongoing changes to the market, regulatory and control environment in which the Portfolios and the Underlying Funds and their service providers operate, including changes associated with the COVID-19 pandemic, as well as the efforts of the Investment Adviser and its affiliates to combat cyber security risks. The Trustees also considered information regarding the Investment Adviser’s business continuity planning and remote operations capabilities. The Trustees concluded that the Investment Adviser continued to commit substantial financial and operational resources to the Portfolios and expressed confidence that the Investment Adviser would continue to do so in the future. The Trustees also recognized that the Investment Adviser had made
82
GOLDMAN SACHS FUND OF FUNDS PORTFOLIOS
Statement Regarding Basis for Approval of Management Agreement (Unaudited) (continued)
significant commitments to address regulatory compliance requirements applicable to the Portfolios, the Underlying Funds, and the Investment Adviser and its affiliates.
Investment Performance
The Trustees also considered the investment performance of the Portfolios and the Underlying Funds. In this regard, they compared the investment performance of each Portfolio to its peers using rankings and ratings compiled by the Outside Data Provider as of December 31, 2020, and updated performance information prepared by the Investment Adviser using the peer group identified by the Outside Data Provider as of March 31, 2021. The information on each Portfolio’s investment performance was provided for the one-, three-, five-, and ten-year periods ending on the applicable dates. The Trustees also reviewed each Portfolio’s investment performance relative to its performance benchmark. As part of this review, they considered the investment performance trends of the Portfolios over time, and reviewed the investment performance of each Portfolio in light of its investment objective and policies and market conditions.
In addition, the Trustees considered materials prepared and presentations made by the Investment Adviser’s senior management and portfolio management personnel in which Portfolio performance was assessed. The Trustees also considered the Investment Adviser’s periodic reports with respect to the Underlying Funds’ risk profiles, and how the Investment Adviser’s approach to risk monitoring and management influences portfolio management. They noted the efforts of the portfolio management teams of certain Underlying Funds to continue to enhance the investment models used in managing those Underlying Funds.
The Trustees observed that the Balanced Strategy Portfolio’s Institutional Shares had placed in the top half of the Portfolio’s peer group for the three- and ten-year periods and in the third quartile for the one- and five-year periods, and had outperformed the Portfolio’s benchmark index for the one-year period and underperformed for the three-, five-, and ten-year periods ended March 31, 2021. They noted that the Growth and Income Strategy Portfolio’s Institutional Shares had placed in the top half of the Portfolio’s peer group for the one-, three-, five-, and ten-year periods, and had outperformed the Portfolio’s benchmark index for the one-year period and underperformed for the three-, five-, and ten-year periods ended March 31, 2021. The Trustees observed that the Growth Strategy Portfolio’s Institutional Shares had placed in the top half of the Portfolio’s peer group for the one-, three-, five-, and ten-year periods, and had outperformed the Portfolio’s benchmark index for the one-year period and underperformed for the three-, five-, and ten-year periods ended March 31, 2021. They noted that the Satellite Strategies Portfolio’s Institutional Shares had placed in the third quartile of the Portfolio’s peer group for the one-year period and in the fourth quartile for the three-, five-, and ten-year periods, and had outperformed the Portfolio’s benchmark index for the one-year period and underperformed for the three-, five-, and ten-year periods ended March 31, 2021.
Costs of Services Provided and Competitive Information
The Trustees considered the contractual terms of the Management Agreement and the fee rates payable by each Portfolio thereunder. In this regard, the Trustees considered information on the services rendered by the Investment Adviser to the Portfolios, which included both advisory and administrative services that were directed to the needs and operations of the Portfolios as registered mutual funds.
In particular, the Trustees reviewed analyses prepared by the Outside Data Provider regarding the expense rankings of the Portfolios. The analyses provided a comparison of each Portfolio’s management fee to those of a relevant peer group and category universe; an expense analysis which compared each Portfolio’s overall net and gross expenses to a peer group and a category universe; and data comparing each Portfolio’s net expenses to the peer and category medians. The analyses also compared each Portfolio’s other expenses and fee waivers/reimbursements to those of the peer group and category medians. The Trustees concluded that the comparisons provided by the Outside Data Provider were useful in evaluating the reasonableness of the management fees and total expenses paid by the Portfolios.
In addition, the Trustees considered the Investment Adviser’s undertakings to implement fee waivers and/or expense limitations with respect to the Portfolios and the Underlying Funds. They also considered, to the extent that the Investment Adviser manages other types of accounts having investment objectives and policies similar to those of the Portfolios, comparative fee information for services provided by the Investment Adviser to those accounts, and information that indicated that services provided to the Portfolios differed in various significant respects from the services provided to other types of accounts which, in many cases, operated under less stringent legal and regulatory structures, required fewer services from the Investment Adviser to a smaller number of client contact points, and were less time-intensive.
In addition, the Trustees noted that shareholders are able to redeem their Portfolio shares at any time if shareholders believe that the Portfolio fees and expenses are too high or if they are dissatisfied with the performance of the Portfolio.
83
GOLDMAN SACHS FUND OF FUNDS PORTFOLIOS
Statement Regarding Basis for Approval of Management Agreement (Unaudited) (continued)
Profitability
The Trustees reviewed each Portfolio’s contribution to the Investment Adviser’s revenues and pre-tax profit margins. In this regard the Trustees noted that they had received, among other things, profitability analyses and summaries, revenue and expense schedules by Portfolio and by function (i.e., investment management, transfer agency and distribution and service), and information on the Investment Adviser’s expense allocation methodology. They observed that the profitability and expense figures are substantially similar to those used by the Investment Adviser for many internal purposes, including compensation decisions among various business groups, and are thus subject to a vigorous internal debate about how certain revenue and expenses should be allocated. The Trustees also noted that the internal audit group within the Goldman Sachs organization periodically audits the expense allocation methodology and that the internal audit group was satisfied with the reasonableness, consistency, and accuracy of the Investment Adviser’s expense allocation methodology. Profitability data for each Portfolio was provided for 2020 and 2019, and the Trustees considered this information in relation to the Investment Adviser’s overall profitability.
Economies of Scale
The Trustees considered the information that had been provided regarding whether there have been economies of scale with respect to the management of the Portfolios.
The Trustees noted that, although the Portfolios themselves do not have breakpoints in their management fee schedules, any benefits of the breakpoints in the management fee schedules of certain Underlying Funds, when reached, would pass through to the shareholders in the Portfolios at the specified asset levels. The Trustees considered the amounts of assets in the Portfolios; the Portfolios’ recent purchase and redemption activity; the information provided by the Investment Adviser relating to the costs of the services provided by the Investment Adviser and its affiliates and the profits realized by them; information comparing the fee rates charged by the Investment Adviser with fee rates charged to other funds in the peer groups; and the Investment Adviser’s undertaking to limit certain expenses of the Portfolios and Underlying Funds that exceed specified levels. They also considered the services provided to the Portfolios under the Management Agreement and the fees and expenses borne by the Underlying Funds, and determined that the management fees payable by the Portfolios were not duplicative of the management fees paid at the Underlying Fund level.
Other Benefits to the Investment Adviser and Its Affiliates
The Trustees also considered the other benefits derived by the Investment Adviser and its affiliates from their relationships with the Portfolios and/or the Underlying Funds as stated above, including: (a) transfer agency fees received by Goldman Sachs & Co. LLC (“Goldman Sachs”); (b) brokerage and futures commissions earned by Goldman Sachs for executing securities and futures transactions on behalf of certain Underlying Funds; (c) research received by the Investment Adviser from broker-dealers in exchange for executing certain transactions on behalf of certain Underlying Funds; (d) trading efficiencies resulting from aggregation of orders of the Underlying Funds with those for other funds or accounts managed by the Investment Adviser; (e) fees earned by Goldman Sachs Agency Lending (“GSAL”), an affiliate of the Investment Adviser, as securities lending agent for certain Underlying Funds (and fees earned by the Investment Adviser for managing the fund in which those Underlying Funds’ cash collateral is invested); (f) the Investment Adviser’s ability to leverage the infrastructure designed to service the Portfolios on behalf of its other clients; (g) the Investment Adviser’s ability to cross-market other products and services to Portfolio shareholders; (h) Goldman Sachs’ retention of certain fees as Portfolio Distributor; (i) the Investment Adviser’s ability to negotiate better pricing with custodians on behalf of its other clients, as a result of the relationship with the Portfolios and Underlying Funds; (j) the investment of cash and cash collateral in money market funds managed by the Investment Adviser that will result in increased assets under management for those money market funds; (k) the investment in exchange-traded funds (“ETFs”) managed by the Investment Adviser that will result in increased assets under management for those ETFs and may facilitate the development of the Investment Adviser’s ETF advisory business; and (l) the possibility that the working relationship between the Investment Adviser and the Portfolios’ and Underlying Funds’ third-party service providers may cause those service providers to be more likely to do business with other areas of Goldman Sachs. In the course of considering the foregoing, the Independent Trustees requested and received further information quantifying certain of these fall-out benefits.
Other Benefits to the Portfolios and Their Shareholders
The Trustees also noted that the Portfolios and/or the Underlying Funds receive certain other potential benefits as a result of their relationship with the Investment Adviser, including: (a) trading efficiencies resulting from aggregation of orders of the Underlying Funds with those of other funds or accounts managed by the Investment Adviser; (b) enhanced servicing from vendors due to the volume of business generated by the Investment Adviser and its affiliates; (c) with respect to the Underlying Funds, enhanced servicing from broker-dealers due to the volume of business generated by the Investment Adviser and its affiliates;
84
GOLDMAN SACHS FUND OF FUNDS PORTFOLIOS
Statement Regarding Basis for Approval of Management Agreement (Unaudited) (continued)
(d) with respect to certain Underlying Funds, the Investment Adviser’s ability to negotiate favorable terms with derivatives counterparties as a result of the size and reputation of the Goldman Sachs organization; (e) the advantages received from the Investment Adviser’s knowledge and experience gained from managing other accounts and products; (f) the Investment Adviser’s ability to hire and retain qualified personnel to provide services to the Portfolios and the Underlying Funds because of the reputation of the Goldman Sachs organization; (g) the Portfolios’ and Underlying Funds’ access, through the Investment Adviser, to certain firm-wide resources (e.g., proprietary risk management systems and databases), subject to certain restrictions; (h) with respect to certain Underlying Funds, the ability to participate in the securities lending program administered by GSAL, as measured by the revenue received by the Underlying Funds in connection with the program; and (i) the Portfolios’ access to certain affiliated distribution channels. In addition, the Trustees noted the competitive nature of the mutual fund marketplace, and considered that many of the Portfolios’ shareholders invested in the Portfolios in part because of the Portfolios’ relationship with the Investment Adviser and that those shareholders have a general expectation that the relationship will continue.
Conclusion
In connection with their consideration of the Management Agreement, the Trustees gave weight to each of the factors described above, but did not identify any particular factor as controlling their decision. After deliberation and consideration of all of the information provided, including the factors described above, the Trustees concluded, in the exercise of their business judgment, that the management fees paid by each of the Portfolios were reasonable in light of the services provided to it by the Investment Adviser, the Investment Adviser’s costs and each Portfolio’s current and reasonably foreseeable asset levels. The Trustees unanimously concluded that the Investment Adviser’s continued management likely would benefit each Portfolio and its shareholders and that the Management Agreement should be approved and continued with respect to each Portfolio until June 30, 2022.
85
GOLDMAN SACHS FUND OF FUNDS PORTFOLIOS
Liquidity Risk Management Program (Unaudited)
Each Portfolio has adopted and implemented a liquidity risk management program (the “Program”) in accordance with Rule 22e-4 under the 1940 Act. The Program seeks to assess and manage each Portfolio’s liquidity risk, i.e., the risk that a Portfolio is unable to satisfy redemption requests without significantly diluting remaining investors’ interests in the Portfolio. The Board of Trustees of the Trust has designated GSAM, each Fund’s investment adviser, to administer the Program. Certain aspects of the Program rely on third parties to perform certain functions, including the provision of market data and application of models.
The Program is comprised of various components designed to support the assessment and/or management of liquidity risk, including: (1) the periodic assessment (no less frequently than annually) of certain factors that influence a Portfolio’s liquidity risk; (2) the periodic classification (no less frequently than monthly) of a Portfolio’s investments into one of four liquidity categories that reflect an estimate of their liquidity under current market conditions; (3) a 15% limit on the acquisition of “illiquid investments” (as defined under Rule 22e-4); (4) for a Portfolio that does not invest primarily in “highly liquid investments” (as defined under Rule 22e-4), the determination of a minimum percentage of the Portfolio’s assets that will generally be invested in highly liquid investments (a “Highly Liquid Investment Minimum”); and (5) periodic reporting to the Board of Trustees.
At a meeting of the Board of Trustees on February 9-10, 2021, GSAM provided a written report to the Board addressing the operation, and the adequacy and effectiveness of the implementation, of the Program, including, as applicable, the operation of any Highly Liquid Investment Minimum and any material changes to the Program, for the period from January 1, 2020 through December 31, 2020 (the “Reporting Period”). Among other things, the annual report and related materials discussed: (1) the results of stress tests designed to assess liquidity under a hypothetical stressed scenario involving elevated redemptions; (2) an assessment of the methodologies used to classify investments into one of four liquidity categories; and (3) the impact of the COVID-19 pandemic on liquidity and management of liquidity risk during the Reporting Period, including during stressed market conditions caused by the COVID-19 pandemic. The report concluded that the Program continues to be reasonably designed to assess and manage liquidity risk and was adequately and effectively implemented during the Reporting Period.
There can be no assurance that the Program will achieve its objectives under all circumstances in the future. Please refer to your Portfolio’s prospectus for more information regarding the Portfolio’s exposure to liquidity risk and other risks to which it may be subject.
86
GOLDMAN SACHS FUND OF FUNDS PORTFOLIOS
Portfolio Expenses — Six Month Period Ended June 30, 2021 (Unaudited)
As a shareholder of Class A, Class C, Institutional, Service, Investor, Class R6, Class R or Class P Shares of a Portfolio, you incur two types of costs: (1) transaction costs, including sales charges on purchase payments (with respect to Class A Shares), contingent deferred sales charges on redemptions (with respect to Class C Shares), and (2) ongoing costs, including management fees; distribution and/or service (12b-1) fees (with respect to Class A, Class C, Service and Class R Shares); and other Portfolio expenses.
The Example is intended to help you understand your ongoing costs (in dollars) of investing in Class A, Class C, Institutional, Service, Investor, Class R6, Class R or Class P Shares of the Portfolios and to compare these costs with the ongoing costs of investing in other mutual funds. The Example is based on an investment of $1,000 invested at the beginning of the period and held for the entire period from January 1, 2021 through June 30, 2021, which represents a period of 181 days of a 365 day year.
Actual Expenses — The first line under each share class in the table below provides information about actual account values and actual expenses. You may use the information in this line, together with the amount you invested, to estimate the expenses that you paid over the period. Simply divide your account value by $1,000 (for example, an $8,600 account value divided by $1,000=8.6), then multiply the result by the number in the first line under the heading entitled “Expenses Paid” to estimate the expenses you paid on your account during this period.
Hypothetical Example for Comparison Purposes — The second line under each share class in the table below provides information about hypothetical account values and hypothetical expenses based on the Portfolios’ actual net expense ratios and an assumed rate of return of 5% per year before expenses, which is not the Portfolios’ actual return. The hypothetical account values and expenses may not be used to estimate the actual ending account balance or expenses you paid for the period. You may use this information to compare the ongoing costs of investing in the Portfolios and other funds. To do so, compare this 5% hypothetical example with the 5% hypothetical examples that appear in the shareholder reports of the other funds.
Please note that the expenses shown in the table are meant to highlight your ongoing costs only and do not reflect any transactional costs, such as sales charges, redemption fees, or exchange fees and do not include expenses of Underlying Funds in which the Portfolios invest. Therefore, the second line of the table is useful in comparing ongoing costs only and will not help you determine the relative total costs of owning different funds. In addition, if these transactional costs were included, your costs would have been higher.
| | | | | | | | | | | | | | | | | | | | | | | | | | | | | | | | | | | | | | | | | | | | | | | | |
| | | Balanced Strategy Portfolio | | | Growth and Income Strategy Portfolio | | | Growth Strategy Portfolio | | | Satellite Strategies Portfolio | |
| Share Class | | Beginning
Account Value
1/1/21 | | | Ending
Account Value
6/30/21 | | | Expenses
Paid for the
6 months
ended
6/30/21* | | | Beginning
Account Value
1/1/21 | | | Ending
Account Value
6/30/21 | | | Expenses
Paid for the
6 months
ended
6/30/21* | | | Beginning
Account Value
1/1/21 | | | Ending
Account
Value
6/30/21 | | | Expenses
Paid for the
6 months
ended
6/30/21* | | | Beginning
Account Value
1/1/21 | | | Ending
Account Value
6/30/21 | | | Expenses
Paid for the
6 months
ended
6/30/21* | |
| Class A | | | | | | | | | | | | | | | | | | | | | | | | | | | | | | | | | | | | | | | | | | | | | | | | |
Actual | | $ | 1,000.00 | | | $ | 1,053.90 | | | $ | 2.80 | | | $ | 1,000.00 | | | $ | 1,086.10 | | | $ | 2.84 | | | $ | 1,000.00 | | | $ | 1,116.90 | | | $ | 2.89 | | | $ | 1,000.00 | | | $ | 1,081.10 | | | $ | 2.73 | |
Hypothetical 5% return | | | 1,000.00 | | | | 1,022.07 | + | | | 2.76 | | | | 1,000.00 | | | | 1,022.07 | + | | | 2.76 | | | | 1,000.00 | | | | 1,022.07 | + | | | 2.76 | | | | 1,000.00 | | | | 1,022.07 | + | | | 2.66 | |
| Class C | | | | | | | | | | | | | | | | | | | | | | | | | | | | | | | | | | | | | | | | | | | | | | | | |
Actual | | | 1,000.00 | | | | 1,049.90 | | | | 6.61 | | | | 1,000.00 | | | | 1,082.40 | | | | 6.71 | | | | 1,000.00 | | | | 1,112.80 | | | | 6.81 | | | | 1,000.00 | | | | 1,077.60 | | | | 6.54 | |
Hypothetical 5% return | | | 1,000.00 | | | | 1,018.35 | + | | | 6.51 | | | | 1,000.00 | | | | 1,018.35 | + | | | 6.51 | | | | 1,000.00 | | | | 1,018.35 | + | | | 6.51 | | | | 1,000.00 | | | | 1,018.50 | + | | | 6.36 | |
| Institutional | | | | | | | | | | | | | | | | | | | | | | | | | | | | | | | | | | | | | | | | | | | | | | | | |
Actual | | | 1,000.00 | | | | 1,056.50 | | | | 0.97 | | | | 1,000.00 | | | | 1,088.30 | | | | 0.98 | | | | 1,000.00 | | | | 1,119.80 | | | | 1.00 | | | | 1,000.00 | | | | 1,081.90 | | | | 0.88 | |
Hypothetical 5% return | | | 1,000.00 | | | | 1,023.85 | + | | | 0.95 | | | | 1,000.00 | | | | 1,023.85 | + | | | 0.95 | | | | 1,000.00 | | | | 1,023.85 | + | | | 0.95 | | | | 1,000.00 | | | | 1,023.95 | + | | | 0.85 | |
| Service | | | | | | | | | | | | | | | | | | | | | | | | | | | | | | | | | | | | | | | | | | | | | | | | |
Actual | | | 1,000.00 | | | | 1,054.00 | | | | 3.51 | | | | 1,000.00 | | | | 1,084.90 | | | | 3.57 | | | | 1,000.00 | | | | 1,116.10 | | | | 3.62 | | | | 1,000.00 | | | | 1,079.20 | | | | 3.45 | |
Hypothetical 5% return | | | 1,000.00 | | | | 1,021.37 | + | | | 3.46 | | | | 1,000.00 | | | | 1,021.37 | + | | | 3.46 | | | | 1,000.00 | | | | 1,021.37 | + | | | 3.46 | | | | 1,000.00 | | | | 1,021.37 | + | | | 3.36 | |
| Investor | | | | | | | | | | | | | | | | | | | | | | | | | | | | | | | | | | | | | | | | | | | | | | | | |
Actual | | | 1,000.00 | | | | 1,055.40 | | | | 1.53 | | | | 1,000.00 | | | | 1,087.10 | | | | 1.55 | | | | 1,000.00 | | | | 1,118.80 | | | | 1.58 | | | | 1,000.00 | | | | 1,082.60 | | | | 1.45 | |
Hypothetical 5% return | | | 1,000.00 | | | | 1,023.31 | + | | | 1.51 | | | | 1,000.00 | | | | 1,023.31 | + | | | 1.51 | | | | 1,000.00 | | | | 1,023.31 | + | | | 1.51 | | | | 1,000.00 | | | | 1,023.41 | + | | | 1.40 | |
| Class R6 | | | | | | | | | | | | | | | | | | | | | | | | | | | | | | | | | | | | | | | | | | | | | | | | |
Actual | | | 1,000.00 | | | | 1,056.60 | | | | 0.92 | | | | 1,000.00 | | | | 1,088.40 | | | | 0.93 | | | | 1,000.00 | | | | 1,119.20 | | | | 0.95 | | | | 1,000.00 | | | | 1,083.00 | | | | 0.83 | |
Hypothetical 5% return | | | 1,000.00 | | | | 1,023.90 | + | | | 0.90 | | | | 1,000.00 | | | | 1,023.90 | + | | | 0.90 | | | | 1,000.00 | | | | 1,023.90 | + | | | 0.90 | | | | 1,000.00 | | | | 1,024.00 | + | | | 0.80 | |
| Class R | | | | | | | | | | | | | | | | | | | | | | | | | | | | | | | | | | | | | | | | | | | | | | | | |
Actual | | | 1,000.00 | | | | 1,053.00 | | | | 4.07 | | | | 1,000.00 | | | | 1,084.60 | | | | 4.13 | | | | 1,000.00 | | | | 1,115.80 | | | | 4.20 | | | | 1,000.00 | | | | 1,079.80 | | | | 4.02 | |
Hypothetical 5% return | | | 1,000.00 | | | | 1,020.83 | + | | | 4.01 | | | | 1,000.00 | | | | 1,020.83 | + | | | 4.01 | | | | 1,000.00 | | | | 1,020.83 | + | | | 4.01 | | | | 1,000.00 | | | | 1,020.83 | + | | | 3.91 | |
| Class P | | | | | | | | | | | | | | | | | | | | | | | | | | | | | | | | | | | | | | | | | | | | | | | | |
Actual | | | 1,000.00 | | | | 1,055.70 | | | | 0.92 | | | | 1,000.00 | | | | 1,088.40 | | | | 0.93 | | | | 1,000.00 | | | | 1,119.20 | | | | 0.95 | | | | 1,000.00 | | | | 1,083.00 | | | | 0.83 | |
Hypothetical 5% return | | | 1,000.00 | | | | 1,023.90 | + | | | 0.90 | | | | 1,000.00 | | | | 1,023.90 | + | | | 0.90 | | | | 1,000.00 | | | | 1,023.90 | + | | | 0.90 | | | | 1,000.00 | | | | 1,023.90 | + | | | 0.80 | |
| * | | Expenses for each share class are calculated using each Portfolio’s annualized net expense ratio for each class, which represents the ongoing expenses as a percentage of net assets for the six months ended June 30, 2021. Expenses are calculated by multiplying the annualized net expense ratio by the average account value for the period; then multiplying the result by the number of days in the most recent fiscal half year; and then dividing that result by the number of days in the fiscal year. The annualized net expense ratios for the period were as follows: |
| + | | Hypothetical expenses are based on each Portfolio’s actual annualized net expense ratios and an assumed rate of return of 5% per year before expenses. |
| | | | | | | | | | | | | | | | | | | | | | | | | | | | | | | | |
| Portfolios | | Class A | | | Class C | | | Institutional | | | Service | | | Investor | | | Class R6 | | | Class R | | | Class P | |
Balanced Strategy | | | 0.55 | % | | | 1.30 | % | | | 0.19 | % | | | 0.69 | % | | | 0.30 | % | | | 0.18 | % | | | 0.80 | % | | | 0.18 | % |
Growth and Income Strategy | | | 0.55 | | | | 1.30 | | | | 0.19 | | | | 0.69 | | | | 0.30 | | | | 0.18 | | | | 0.80 | | | | 0.18 | |
Growth Strategy | | | 0.55 | | | | 1.30 | | | | 0.19 | | | | 0.69 | | | | 0.30 | | | | 0.18 | | | | 0.80 | | | | 0.18 | |
Satellite Strategies | | | 0.53 | | | | 1.27 | | | | 0.17 | | | | 0.67 | | | | 0.28 | | | | 0.16 | | | | 0.78 | | | | 0.16 | |
87
FUNDS PROFILE
Goldman Sachs Funds
Goldman Sachs is a premier financial services firm, known since 1869 for creating thoughtful and customized investment solutions in complex global markets.
Today, the Asset Management Division of Goldman Sachs serves a diverse set of clients worldwide, including private institutions, public entities and individuals. With approximately $2.09 trillion in assets under supervision as of June 30, 2021, Goldman Sachs Asset Management has portfolio management teams located around the world and our investment professionals bring firsthand knowledge of local markets to every investment decision. Assets under supervision includes assets under management and other client assets for which Goldman Sachs does not have full discretion. Goldman Sachs Asset Management leverages the resources of Goldman Sachs & Co. LLC subject to legal, internal and regulatory restrictions.
Money Market
Financial Square FundsSM
| ∎ | | Financial Square Treasury Solutions Fund1 |
| ∎ | | Financial Square Government Fund1 |
| ∎ | | Financial Square Money Market Fund2 |
| ∎ | | Financial Square Prime Obligations Fund2 |
| ∎ | | Financial Square Treasury Instruments Fund1 |
| ∎ | | Financial Square Treasury Obligations Fund1 |
| ∎ | | Financial Square Federal Instruments Fund1 |
Investor FundsSM
| ∎ | | Investor Money Market Fund3 |
| ∎ | | Investor Tax-Exempt Money Market Fund3 |
Fixed Income
Short Duration and Government
| ∎ | | High Quality Floating Rate Fund |
| ∎ | | Short-Term Conservative Income Fund |
| ∎ | | Short Duration Government Fund |
| ∎ | | Short Duration Bond Fund4 |
| ∎ | | Inflation Protected Securities Fund |
Multi-Sector
| ∎ | | Global Core Fixed Income Fund |
Municipal and Tax-Free
| ∎ | | High Yield Municipal Fund |
| ∎ | | Dynamic Municipal Income Fund |
| ∎ | | Short Duration Tax-Free Fund |
| ∎ | | Municipal Income Completion Fund |
Single Sector
| ∎ | | Investment Grade Credit Fund |
| ∎ | | High Yield Floating Rate Fund |
| ∎ | | Emerging Markets Debt Fund |
| ∎ | | Local Emerging Markets Debt Fund |
Fixed Income Alternatives
| ∎ | | Long Short Credit Strategies Fund |
Fundamental Equity
| ∎ | | Small/Mid Cap Value Fund |
| ∎ | | Small/Mid Cap Growth Fund |
| ∎ | | Concentrated Growth Fund |
| ∎ | | Technology Opportunities Fund |
| ∎ | | Growth Opportunities Fund |
| ∎ | | Rising Dividend Growth Fund |
Tax-Advantaged Equity
| ∎ | | U.S. Tax-Managed Equity Fund |
| ∎ | | International Tax-Managed Equity Fund |
| ∎ | | U.S. Equity Dividend and Premium Fund |
| ∎ | | International Equity Dividend and Premium Fund |
Equity Insights
| ∎ | | Small Cap Equity Insights Fund |
| ∎ | | U.S. Equity Insights Fund |
| ∎ | | Small Cap Growth Insights Fund |
| ∎ | | Large Cap Growth Insights Fund |
| ∎ | | Large Cap Value Insights Fund |
| ∎ | | Small Cap Value Insights Fund |
| ∎ | | International Small Cap Insights Fund |
| ∎ | | International Equity Insights Fund |
| ∎ | | Emerging Markets Equity Insights Fund |
Fundamental Equity International
| ∎ | | International Equity Income Fund |
| ∎ | | International Equity ESG Fund |
| ∎ | | Emerging Markets Equity Fund |
| ∎ | | ESG Emerging Markets Equity Fund |
Alternative
| ∎ | | Clean Energy Income Fund |
| ∎ | | Real Estate Securities Fund |
| ∎ | | International Real Estate Securities Fund |
| ∎ | | Commodity Strategy Fund |
| ∎ | | Global Real Estate Securities Fund |
| ∎ | | Alternative Premia Fund |
| ∎ | | Absolute Return Tracker Fund |
| ∎ | | Managed Futures Strategy Fund |
| ∎ | | MLP Energy Infrastructure Fund |
| ∎ | | Energy Infrastructure Fund |
| ∎ | | Multi-Manager Alternatives Fund |
| ∎ | | Global Infrastructure Fund |
Total Portfolio Solutions
| ∎ | | Global Managed Beta Fund |
| ∎ | | Multi-Manager Non-Core Fixed Income Fund |
| ∎ | | Multi-Manager Global Equity Fund |
| ∎ | | Multi-Manager International Equity Fund |
| ∎ | | Tactical Tilt Overlay Fund |
| ∎ | | Balanced Strategy Portfolio |
| ∎ | | Multi-Manager U.S. Small Cap Equity Fund |
| ∎ | | Multi-Manager Real Assets Strategy Fund |
| ∎ | | Growth and Income Strategy Portfolio |
| ∎ | | Growth Strategy Portfolio |
| ∎ | | Dynamic Global Equity Fund |
| ∎ | | Satellite Strategies Portfolio |
| ∎ | | Enhanced Dividend Global Equity Portfolio |
| ∎ | | Tax-Advantaged Global Equity Portfolio |
| ∎ | | Strategic Factor Allocation Fund |
| ∎ | | Strategic Volatility Premium Fund |
| ∎ | | Target Date Retirement Portfolio |
| ∎ | | Target Date 2025 Portfolio |
| ∎ | | Target Date 2030 Portfolio |
| ∎ | | Target Date 2035 Portfolio |
| ∎ | | Target Date 2040 Portfolio |
| ∎ | | Target Date 2045 Portfolio |
| ∎ | | Target Date 2050 Portfolio |
| ∎ | | Target Date 2055 Portfolio |
| ∎ | | Target Date 2060 Portfolio |
| ∎ | | GQG Partners International Opportunities Fund |
| 1 | | You could lose money by investing in the Fund. Although the Fund seeks to preserve the value of your investment at $1.00 per share, it cannot guarantee it will do so. An investment in the Fund is not a deposit of a bank and is not insured or guaranteed by the Federal Deposit Insurance Corporation or any other government agency. The Fund’s sponsor has no legal obligation to provide financial support to the Fund, and you should not expect that the sponsor will provide financial support to the Fund at any time. |
| 2 | | You could lose money by investing in the Fund. Because the share price of the Fund will fluctuate, when you sell your shares they may be worth more or less than what you originally paid for them. The Fund may impose a fee upon sale of your shares or may temporarily suspend your ability to sell shares if the Fund’s liquidity falls below required minimums because of market conditions or other factors. An investment in the Fund is not a deposit of a bank and is not insured or guaranteed by the Federal Deposit Insurance Corporation or any other government agency. The Fund’s sponsor has no legal obligation to provide financial support to the Fund, and you should not expect that the sponsor will provide financial support to the Fund at any time. |
| 3 | | You could lose money by investing in the Fund. Although the Fund seeks to preserve the value of your investment at $1.00 per share, it cannot guarantee it will do so. The Fund may impose a fee upon sale of your shares or may temporarily suspend your ability to sell shares if the Fund’s liquidity falls below required minimums because of market conditions or other factors. An investment in the Fund is not a deposit of a bank and is not insured or guaranteed by the Federal Deposit Insurance Corporation or any other government agency. The Fund’s sponsor has no legal obligation to provide financial support to the Fund, and you should not expect that the sponsor will provide financial support to the Fund at any time. |
| 4 | | Effective after the close of business on July 29, 2021, the Goldman Sachs Short Duration Income Fund was renamed the Goldman Sachs Short Duration Bond Fund. |
| 5Effective | | after the close of business on August 30, 2020, the Goldman Sachs Blue Chip Fund was renamed the Goldman Sachs U.S. Equity ESG Fund. |
Financial Square FundsSM and Investor FundsSM are registered service marks of Goldman Sachs & Co. LLC.
| * | | This list covers open-end funds only. Please visit our website at www.GSAMFUNDS.com to learn about our closed-end funds and exchange-traded funds. |
| | |
TRUSTEES Jessica Palmer, Chair Dwight L. Bush Kathryn A. Cassidy Diana M. Daniels Joaquin Delgado James A. McNamara Roy W. Templin Gregory G. Weaver | | OFFICERS James A. McNamara, President Joseph F. DiMaria, Principal Financial Officer, Principal Accounting Officer and Treasurer Caroline L. Kraus, Secretary |
| |
GOLDMAN SACHS & CO. LLC Distributor and Transfer Agent | | GOLDMAN SACHS ASSET MANAGEMENT, L.P. Investment Adviser |
Visit our web site at www.GSAMFUNDS.com to obtain the most recent month-end returns.
Goldman Sachs Asset Management, L.P. 200 West Street, New York, New York 10282
The portfolio risk management process includes an effort to monitor and manage risk, but does not imply low risk.
The reports concerning the Portfolios included in this shareholder report may contain certain forward-looking statements about the factors that may affect the performance of the Portfolios in the future. These statements are based on Portfolio management’s predictions and expectations concerning certain future events and their expected impact on the Portfolios, such as performance of the economy as a whole and of specific industry sectors, changes in the levels of interest rates, the impact of developing world events, and other factors that may influence the future performance of the Portfolios. Management believes these forward-looking statements to be reasonable, although they are inherently uncertain and difficult to predict. Actual events may cause adjustments in portfolio management strategies from those currently expected to be employed.
Diversification does not protect an investor from market risk and does not ensure a profit.
Views and opinions expressed are for informational purposes only and do not constitute a recommendation by GSAM to buy, sell, or hold any security. Views and opinions are current as of the date of this presentation and may be subject to change. They should not be construed as investment advice.
A description of the policies and procedures that the Portfolios use to determine how to vote proxies relating to portfolio securities and information regarding how a Portfolio voted proxies relating to portfolio securities during the most recent 12-month period ended June 30 is available (i) without charge, upon request by calling 1-800-526-7384 (for Retail Shareholders) or 1-800-621-2550 (for Institutional Shareholders); and (ii) on the Securities and Exchange Commission (“SEC”) web site at http://www.sec.gov.
References to indices, benchmarks or other measures of relative market performance over a specified period of time are provided for your information only and do not imply that the portfolio will achieve similar results. The index composition may not reflect the manner in which a portfolio is constructed. While an adviser seeks to design a portfolio which reflects appropriate risk and return features, portfolio characteristics may deviate from those of the benchmark.
The Portfolios will file portfolio holdings information for each month in a fiscal quarter within 60 days after the end of the relevant fiscal quarter on Form N-PORT. Portfolio holdings information for the third month of each fiscal quarter will be made available on the SEC’s web site at http://www.sec.gov. Portfolio holdings information may be obtained upon request and without charge by calling 1-800-526-7384 (for Retail Shareholders) or 1-800-621-2550 (for Institutional Shareholders).
Holdings and allocations shown are as of June 30, 2021 and may not be representative of future investments. Portfolio holdings should not be relied on in making investment decisions and should not be construed as research or investment advice regarding particular securities. Current and future holdings are subject to risk.
This material is not authorized for distribution to prospective investors unless preceded or accompanied by a current prospectus or summary prospectus, if applicable. Investors should consider a Portfolio’s objective, risks, and charges and expenses, and read the summary prospectus, if available, and/or the prospectus carefully before investing or sending money. The summary prospectus, if available, and the prospectus contain this and other information about a Portfolio and may be obtained from your authorized dealer or from Goldman Sachs & Co. LLC by calling (retail – 1-800-526-7384) (institutional – 1-800-621-2550).
© 2021 Goldman Sachs. All rights reserved. 249753-OTU-1459303 FFSAR-21
Goldman Sachs Funds

| | | | |
| | |
| Semi-Annual Report | | | | June 30, 2021 |
| | |
| | | | Global Infrastructure Fund |

Goldman Sachs Global Infrastructure Fund
| | | | |
| | | |
| NOT FDIC-INSURED | | May Lose Value | | No Bank Guarantee |
FUND BASICS
Global Infrastructure Fund
| | | | | | | | | | |
| | PERFORMANCE REVIEW | |
| | | |
| | | January 1, 2020–June 30, 2021 | | Fund Total Return
(based on NAV)1 | | | Dow Jones Brookfield Global
Infrastructure Index
(Net, USD, Unhedged)2 | |
| | Class A | | | 10.06 | % | | | 12.58 | % |
| | Class C | | | 9.69 | | | | 12.58 | |
| | Institutional | | | 10.22 | | | | 12.58 | |
| | Investor | | | 10.18 | | | | 12.58 | |
| | Class R6 | | | 10.25 | | | | 12.58 | |
| | Class R | | | 9.84 | | | | 12.58 | |
| | | Class P | | | 10.26 | | | | 12.58 | |
| 1 | | The net asset value (“NAV”) represents the net assets of the class of the Fund (ex-dividend) divided by the total number of shares of the class outstanding. The Fund’s performance reflects the reinvestment of dividends and other distributions. The Fund’s performance does not reflect the deduction of any applicable sales charges. |
| 2 | | The Dow Jones Brookfield Global Infrastructure Index (Net, USD, Unhedged) intends to measure the stock performance of pure-play infrastructure companies domiciled globally. The index covers all sectors of the infrastructure market. Components are required to have more than 70% of cash flows derived from infrastructure lines of business. It is not possible to invest directly in an index. |
The returns set forth in the table above represent past performance. Past performance does not guarantee future results. The Fund’s investment return and principal value will fluctuate so that an investor’s shares, when redeemed, may be worth more or less than their original cost. Current performance may be lower or higher than the performance quoted above. Please visit our web site at www.GSAMFUNDS.com to obtain the most recent month-end returns. Performance reflects applicable fee waivers and/or expense limitations in effect during the periods shown. In their absence, performance would be reduced. Returns do not reflect the deduction of taxes that a shareholder would pay on Fund distributions or the redemption of Fund shares.
| | | | | | | | | | |
| | TOP 10 HOLDINGS AS OF 6/30/213 |
| | | | |
| | | Holding | | % of Net Assets | | | Line of Business | | Country |
| | | | |
| | American Tower Corp. | | | 10.9 | % | | Equity Real Estate Investment Trusts | | United States |
| | Vinci SA | | | 5.3 | | | Construction & Engineering | | France |
| | Crown Castle International Corp. | | | 5.0 | | | Equity Real Estate Investment Trusts | | United States |
| | National Grid PLC | | | 4.9 | | | Multi-Utilities | | United Kingdom |
| | Enbridge, Inc | | | 4.8 | | | Oil, Gas & Consumable Fuels | | Canada |
| | Cellnex Telecom SA | | | 4.3 | | | Diversified Telecommunication Services | | Spain |
| | SBA Communication Corp. | | | 3.8 | | | Equity Real Estate Investment Trusts | | United States |
| | Sempra Energy | | | 3.8 | | | Multi-Utilities | | United States |
| | Transurban Group | | | 3.1 | | | Transportation Infrastructure | | Australia |
| | | American Water World Co. Inc. | | | 2.9 | | | Water Utilities | | United States |
| 3 | | The top 10 holdings may not be representative of the Fund’s future investments. |
1
FUND BASICS
| | | | |
| | FUND VS. BENCHMARK SECTOR ALLOCATION4 |
| | |
| | | As of June 30, 2021 | | |
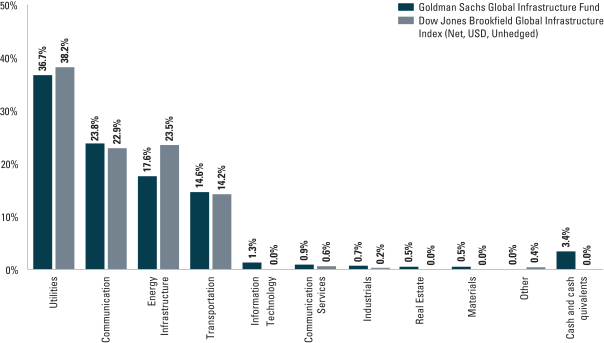
| 4 | | The Fund is actively managed and, as such, its composition may differ over time. Consequently, the Fund’s overall sector allocations may differ from the percentages contained in the graph above. The graph categorizes investments using the Global Industry Classification Standard (“GICS”); however, the sector classifications used by the portfolio management team may differ from GICS. The percentage shown for each investment category reflects the value of investments in that category as a percentage of market value (excluding investments in the securities lending reinvestment vehicle, if any). Underlying sector allocations of exchange traded funds and other investment companies held by the Fund are not reflected in the graph above. The graph depicts the Fund’s investments but may not represent the Fund’s market exposure due to the exclusion of certain derivatives, if any, as listed in the Additional Investment Information section of the Schedule of Investments. |
For more information about your Fund, please refer to www.GSAMFUNDS.com. There, you can learn more about your Fund’s investment strategies, holdings, and performance.
2
GOLDMAN SACHS GLOBAL INFRASTRUCTURE FUND
Schedule of Investments
June 30, 2021 (Unaudited)
| | | | | | | | |
| Shares | | | Description | | Value | |
| |
| Common Stocks – 96.7% | | | |
| Australia – 4.8% | | | |
| | 403,134 | | | APA Group (Gas Utilities) | | $ | 2,689,968 | |
| | 167,363 | | | NEXTDC Ltd. (IT Services)* | | | 1,489,314 | |
| | 707,357 | | | Transurban Group (Transportation Infrastructure) | | | 7,544,036 | |
| | | | | | | | |
| | | | | | | 11,723,318 | |
| | |
| Canada – 13.2% | |
| | 88,037 | | | Boralex, Inc., Class A (Independent Power and Renewable Electricity Producers) | | | 2,681,023 | |
| | 291,235 | | | Enbridge, Inc. (Oil, Gas & Consumable Fuels) | | | 11,660,207 | |
| | 53,268 | | | Fortis, Inc. (Electric Utilities) | | | 2,357,870 | |
| | 64,221 | | | Keyera Corp. (Oil, Gas & Consumable Fuels) | | | 1,725,719 | |
| | 95,150 | | | Northland Power, Inc. (Independent Power and Renewable Electricity Producers) | | | 3,246,122 | |
| | 181,962 | | | Pembina Pipeline Corp. (Oil, Gas & Consumable Fuels) | | | 5,782,094 | |
| | 98,289 | | | TC Energy Corp. (Oil, Gas & Consumable Fuels) | | | 4,863,704 | |
| | | | | | | | |
| | | | | | | 32,316,739 | |
| | |
| China – 3.7% | |
| | 16,348,000 | | | China Tower Corp. Ltd., Class H (Diversified Telecommunication Services)(a) | | | 2,251,185 | |
| | 96,000 | | | ENN Energy Holdings Ltd. (Gas Utilities) | | | 1,824,551 | |
| | 20,461 | | | GDS Holdings Ltd. ADR (IT Services)* | | | 1,605,984 | |
| | 690,000 | | | Guangdong Investment Ltd. (Water Utilities) | | | 991,057 | |
| | 832,000 | | | Jiangsu Expressway Co. Ltd., Class H (Transportation Infrastructure) | | | 941,631 | |
| | 1,686,000 | | | Kunlun Energy Co. Ltd. (Gas Utilities) | | | 1,552,113 | |
| | | | | | | | |
| | | | | | | 9,166,521 | |
| | |
| Denmark – 0.8% | |
| | 13,629 | | | Orsted A/S (Electric Utilities)(a) | | | 1,912,985 | |
| | |
| France – 7.7% | | | |
| | 14,002 | | | Aeroports de Paris (Transportation Infrastructure)* | | | 1,827,700 | |
| | 178,122 | | | Engie SA (Multi-Utilities) | | | 2,442,507 | |
| | 58,682 | | | Veolia Environnement SA (Multi-Utilities) | | | 1,774,004 | |
| | 120,847 | | | Vinci SA (Construction & Engineering) | | | 12,918,259 | |
| | | | | | | | |
| | | | | | | 18,962,470 | |
| | |
| Germany – 0.5% | |
| | 18,996 | | | Vonovia SE (Real Estate Management & Development) | | | 1,227,624 | |
| | |
| |
| Common Stocks – (continued) | | | |
| Hong Kong – 0.9% | |
| | 1,362,619 | | | Hong Kong & China Gas Co. Ltd. (Gas Utilities) | | | 2,115,771 | |
| | |
| Italy – 3.4% | |
| | 237,029 | | | Atlantia SpA (Transportation Infrastructure)* | | | 4,303,964 | |
| | 454,677 | | | Enav SpA (Transportation Infrastructure)*(a) | | | 2,049,910 | |
| | 224,062 | | | Enel SpA (Electric Utilities) | | | 2,082,176 | |
| | | | | | | | |
| | | | | | | 8,436,050 | |
| | |
| Japan – 0.5% | |
| | 29,600 | | | Japan Airport Terminal Co. Ltd. (Transportation Infrastructure)* | | | 1,329,730 | |
| | |
| Spain – 7.3% | | | |
| | 18,956 | | | Aena SME SA (Transportation Infrastructure)*(a) | | | 3,110,316 | |
| | 81,535 | | | Atlantica Sustainable Infrastructure PLC (Independent Power and Renewable Electricity Producers) | | | 3,034,733 | |
| | 163,199 | | | Cellnex Telecom SA (Diversified Telecommunication Services)*(a) | | | 10,409,018 | |
| | 53,406 | | | EDP Renovaveis SA (Independent Power and Renewable Electricity Producers) | | | 1,237,391 | |
| | | | | | | | |
| | | | | | | 17,791,458 | |
| | |
| Thailand – 0.7% | | | |
| | 912,000 | | | Airports of Thailand PCL (Transportation Infrastructure) | | | 1,766,413 | |
| | |
| United Kingdom – 6.1% | | | |
| | 4,166 | | | Linde PLC (Chemicals) | | | 1,204,391 | |
| | 938,069 | | | National Grid PLC (Multi-Utilities) | | | 11,931,913 | |
| | 1,203,088 | | | Tritax EuroBox PLC (Equity Real Estate Investment Trusts)(a) | | | 1,791,757 | |
| | | | | | | | |
| | | | | | | 14,928,061 | |
| | |
| United States – 47.1% | |
| | 81,063 | | | AES Corp. (The) (Independent Power and Renewable Electricity Producers) | | | 2,113,312 | |
| | 31,169 | | | Ameren Corp. (Multi-Utilities) | | | 2,494,767 | |
| | 98,669 | | | American Tower Corp. (Equity Real Estate Investment Trusts (REITs)) | | | 26,654,444 | |
| | 45,681 | | | American Water Works Co., Inc. (Water Utilities) | | | 7,040,812 | |
| | 45,055 | | | Atmos Energy Corp. (Gas Utilities) | | | 4,330,236 | |
| | 164,032 | | | CenterPoint Energy, Inc. (Multi-Utilities) | | | 4,022,065 | |
| | 78,526 | | | Cheniere Energy, Inc. (Oil, Gas & Consumable Fuels)* | | | 6,811,345 | |
| | 51,131 | | | CMS Energy Corp. (Multi-Utilities) | | | 3,020,819 | |
| | 22,694 | | | Consolidated Edison, Inc. (Multi-Utilities) | | | 1,627,614 | |
| | 62,771 | | | Crown Castle International Corp. (Equity Real Estate Investment Trusts (REITs)) | | | 12,246,622 | |
| | |
| | |
| The accompanying notes are an integral part of these financial statements. | | 3 |
GOLDMAN SACHS GLOBAL INFRASTRUCTURE FUND
Schedule of Investments (continued)
June 30, 2021 (Unaudited)
| | | | | | | | |
| Shares | | | Description | | Value | |
| |
| Common Stocks – (continued) | | | |
| United States – (continued) | |
| | 48,420 | | | Edison International (Electric Utilities) | | $ | 2,799,644 | |
| | 52,718 | | | Eversource Energy (Electric Utilities) | | | 4,230,092 | |
| | 115,775 | | | Kinder Morgan, Inc. (Oil, Gas & Consumable Fuels) | | | 2,110,578 | |
| | 27,491 | | | NextEra Energy Partners LP (Independent Power and Renewable Electricity Producers) | | | 2,099,213 | |
| | 48,114 | | | NextEra Energy, Inc. (Electric Utilities) | | | 3,525,794 | |
| | 60,400 | | | ONEOK, Inc. (Oil, Gas & Consumable Fuels) | | | 3,360,656 | |
| | 180,705 | | | PG&E Corp. (Electric Utilities)* | | | 1,837,770 | |
| | 29,134 | | | SBA Communications Corp. (Equity Real Estate Investment Trusts (REITs)) | | | 9,285,006 | |
| | 69,143 | | | Sempra Energy (Multi-Utilities) | | | 9,160,065 | |
| | 109,188 | | | Targa Resources Corp. (Oil, Gas & Consumable Fuels) | | | 4,853,407 | |
| | 82,235 | | | Williams Cos., Inc. (The) (Oil, Gas & Consumable Fuels) | | | 2,183,339 | |
| | | | | | | | |
| | | | | | | 115,807,600 | |
| | |
| | TOTAL COMMON STOCKS | | | | |
| | (Cost $193,831,091) | | $ | 237,484,740 | |
| | |
| | | | | | | | |
| Shares | | | Dividend
Rate | | Value | |
|
| Investment Company – 1.4%(b) | |
| Goldman Sachs Financial Square Government Fund –
Institutional Shares |
|
| | 3,411,446 | | | 0.026% | | $ | 3,411,446 | |
| | (Cost $3,411,446) | | | | |
| | |
| | TOTAL INVESTMENTS – 98.1% | |
| | (Cost $197,242,537) | | $ | 240,896,186 | |
| | |
| OTHER ASSETS IN EXCESS OF
LIABILITIES – 1.9% | | | 4,786,605 | |
| | |
| | NET ASSETS – 100.0% | | $ | 245,682,791 | |
| | |
| | |
|
| The percentage shown for each investment category reflects the value of investments in that category as a percentage of net assets. |
| |
* | | Non-income producing security. |
| |
(a) | | Exempt from registration under Rule 144A of the Securities Act of 1933. |
| |
(b) | | Represents an affiliated issuer. |
| | |
|
Investment Abbreviations: |
ADR | | —American Depositary Receipt |
LP | | —Limited Partnership |
PLC | | —Public Limited Company |
REIT | | —Real Estate Investment Trust |
|
| | |
| 4 | | The accompanying notes are an integral part of these financial statements. |
GOLDMAN SACHS GLOBAL INFRASTRUCTURE FUND
Statement of Assets and Liabilities
June 30, 2021 (Unaudited)
| | | | | | |
| | | | | | |
| | Assets: | |
| | Investments in unaffiliated issuers, at value (cost $193,831,091) | | $ | 237,484,740 | |
| | Investments in affiliated issuers, at value (cost $3,411,446) | | | 3,411,446 | |
| | Cash | | | 233,240 | |
| | Foreign currency, at value (cost $49,982) | | | 49,982 | |
| | Receivables: | | | | |
| | Fund shares sold | | | 2,025,000 | |
| | Investments sold | | | 1,383,715 | |
| | Dividends | | | 1,270,625 | |
| | Foreign tax reclaims | | | 83,375 | |
| | Reimbursement from investment adviser | | | 16,084 | |
| | Other assets | | | 42,395 | |
| | Total assets | | | 246,000,602 | |
| | | | | | |
| | Liabilities: | |
| | |
| | Payables: | | | | |
| | Management fees | | | 177,596 | |
| | Fund shares redeemed | | | 15,558 | |
| | Distribution and Service fees and Transfer Agency fees | | | 7,097 | |
| | Accrued expenses | | | 117,560 | |
| | Total liabilities | | | 317,811 | |
| | | | | | |
| | Net Assets: | |
| | Paid-in capital | | | 206,876,473 | |
| | Total distributable earnings | | | 38,806,318 | |
| | | NET ASSETS | | $ | 245,682,791 | |
| | | Net Assets: | | | | |
| | | Class A | | $ | 534,303 | |
| | | Class C | | | 955,235 | |
| | | Institutional | | | 7,688,011 | |
| | | Investor | | | 222,316 | |
| | | Class R6 | | | 156,971,695 | |
| | | Class R | | | 35,098 | |
| | | Class P | | | 79,276,133 | |
| | | Total Net Assets | | $ | 245,682,791 | |
| | | Shares Outstanding $0.001 par value (unlimited number of shares authorized): | | | | |
| | | Class A | | | 41,526 | |
| | | Class C | | | 74,831 | |
| | | Institutional | | | 596,504 | |
| | | Investor | | | 17,275 | |
| | | Class R6 | | | 12,207,307 | |
| | | Class R | | | 2,729 | |
| | | Class P | | | 6,169,066 | |
| | | Net asset value, offering and redemption price per share:(a) | | | | |
| | | Class A | | | $12.87 | |
| | | Class C | | | 12.77 | |
| | | Institutional | | | 12.89 | |
| | | Investor | | | 12.87 | |
| | | Class R6 | | | 12.86 | |
| | | Class R | | | 12.86 | |
| | | Class P | | | 12.85 | |
| | (a) | | Maximum public offering price per share for Class A Shares is $13.62. At redemption, Class C Shares may be subject to a contingent deferred sales charge, assessed on the amount equal to the lesser of the current net asset value (“NAV”) or the original purchase price of the shares. |
| | |
| The accompanying notes are an integral part of these financial statements. | | 5 |
GOLDMAN SACHS GLOBAL INFRASTRUCTURE FUND
Statement of Operations
For the Six Months Ended June 30, 2021 (Unaudited)
| | | | | | |
| | | | | | |
| | Investment income: | |
| | |
| | Dividends — unaffiliated issuers (net of foreign withholding taxes of $197,459) | | $ | 3,299,161 | |
| | |
| | Dividends — affiliated issuers | | | 638 | |
| | |
| | Total investment income | | | 3,299,799 | |
| | | | | | |
| | Expenses: | |
| | |
| | Management fees | | | 920,746 | |
| | |
| | Registration fees | | | 47,032 | |
| | |
| | Professional fees | | | 46,496 | |
| | |
| | Transfer Agency fees(a) | | | 32,078 | |
| | |
| | Printing and mailing costs | | | 23,390 | |
| | |
| | Custody, accounting and administrative services | | | 14,734 | |
| | |
| | Trustee fees | | | 11,012 | |
| | |
| | Distribution and Service (12b-1) fees(a) | | | 4,017 | |
| | |
| | Service fees — Class C | | | 1,128 | |
| | |
| | Other | | | 3,393 | |
| | |
| | Total expenses | | | 1,104,026 | |
| | |
| | Less — expense reductions | | | (93,361 | ) |
| | |
| | Net expenses | | | 1,010,665 | |
| | |
| | NET INVESTMENT INCOME | | | 2,289,134 | |
| | | | | | |
| | Realized and unrealized gain (loss): | | | | |
| | |
| | Net realized gain from: | | | | |
| | |
| | Investments — unaffiliated issuers | | | 993,869 | |
| | |
| | Foreign currency transactions | | | 69,995 | |
| | |
| | Net change in unrealized gain (loss) on: | | | | |
| | |
| | Investments — unaffiliated issuers | | | 16,983,660 | |
| | |
| | Foreign currency translations | | | (17,220 | ) |
| | |
| | Net realized and unrealized gain | | | 18,030,304 | |
| | |
| | NET INCREASE IN NET ASSETS RESULTING FROM OPERATIONS | | $ | 20,319,438 | |
| | (a) | | Class specific Distribution and/or Service and Transfer Agency fees were as follows: |
| | | | | | | | | | | | | | | | | | | | | | | | | | | | | | | | | | | | | | |
Distribution and/or Service (12b-1) Fees | | | Transfer Agency Fees | |
Class A | | | Class C | | | Class R | | | Class A | | | Class C | | | Institutional | | | Investor | | | Class R6 | | | Class R | | | Class P | |
| $ | 551 | | | $ | 3,383 | | | $ | 83 | | | $ | 352 | | | $ | 722 | | | $ | 1,450 | | | $ | 160 | | | $ | 23,767 | | | $ | 26 | | | $ | 5,601 | |
| | |
| 6 | | The accompanying notes are an integral part of these financial statements. |
GOLDMAN SACHS GLOBAL INFRASTRUCTURE FUND
Statements of Changes in Net Assets
| | | | | | | | | | |
| | | | | For the
Six Months Ended
June 30, 2021
(Unaudited) | | | For the Fiscal
Year Ended
December 31, 2020 | |
| | From operations: | |
| | | |
| | Net investment income | | $ | 2,289,134 | | | $ | 2,593,906 | |
| | | |
| | Net realized gain | | | 1,063,864 | | | | 1,003,524 | |
| | | |
| | Net change in unrealized gain (loss) | | | 16,966,440 | | | | (12,045,226 | ) |
| | | |
| | Net increase (decrease) in net assets resulting from operations | | | 20,319,438 | | | | (8,447,796 | ) |
| | | | | | | | | | |
| | Distributions to shareholders: | | | | | | | | |
| | | |
| | From distributable earnings: | | | | | | | | |
| | | |
| | Class A Shares | | | (3,903 | ) | | | (5,116 | ) |
| | | |
| | Class C Shares | | | (4,788 | ) | | | (7,652 | ) |
| | | |
| | Institutional Shares | | | (68,560 | ) | | | (90,063 | ) |
| | | |
| | Investor Shares | | | (1,862 | ) | | | (2,579 | ) |
| | | |
| | Class R6 Shares | | | (1,429,788 | ) | | | (2,440,099 | ) |
| | | |
| | Class R Shares | | | (217 | ) | | | (355 | ) |
| | | |
| | Class P Shares | | | (643,212 | ) | | | (111,437 | ) |
| | | |
| | From return of capital: | | | | | | | | |
| | | |
| | Class A Shares | | | — | | | | (1,185 | ) |
| | | |
| | Class C Shares | | | — | | | | (1,773 | ) |
| | | |
| | Institutional Shares | | | — | | | | (20,864 | ) |
| | | |
| | Investor Shares | | | — | | | | (597 | ) |
| | | |
| | Class R6 Shares | | | — | | | | (565,276 | ) |
| | | |
| | Class R Shares | | | — | | | | (82 | ) |
| | | |
| | Class P Shares | | | — | | | | (25,815 | ) |
| | | |
| | Total distributions to shareholders | | | (2,152,330 | ) | | | (3,272,893 | ) |
| | | | | | | | | | |
| | From share transactions: | | | | | | | | |
| | | |
| | Proceeds from sales of shares | | | 79,079,096 | | | | 38,721,064 | |
| | | |
| | Reinvestment of distributions | | | 2,152,331 | | | | 3,272,887 | |
| | | |
| | Cost of shares redeemed | | | (34,314,986 | ) | | | (46,559,951 | ) |
| | | |
| | Net increase (decrease) in net assets resulting from share transactions | | | 46,916,441 | | | | (4,566,000 | ) |
| | | |
| | TOTAL INCREASE (DECREASE) | | | 65,083,549 | | | | (16,286,689 | ) |
| | | | | | | | | | |
| | Net assets: | | | | | | | | |
| | | |
| | Beginning of period | | | 180,599,242 | | | | 196,885,931 | |
| | | |
| | End of period | | $ | 245,682,791 | | | $ | 180,599,242 | |
| | |
| The accompanying notes are an integral part of these financial statements. | | 7 |
GOLDMAN SACHS GLOBAL INFRASTRUCTURE FUND
Financial Highlights
Selected Share Data for a Share Outstanding Throughout Each Period
| | | | | | | | | | | | | | | | | | | | | | | | | | |
| | | | | Goldman Sachs Global Infrastructure Fund | |
| | | | | Class A Shares | |
| | | | | Six Months Ended
June 30, 2021
(Unaudited) | | | Year Ended December 31, | | | Period Ended
December 31,
2016(a) | |
| | | | | 2020 | | | 2019 | | | 2018 | | | 2017 | |
| | Per Share Data | | | | | | | | | | | | | | | | | | | | | | | | |
| | | | | | | |
| | Net asset value, beginning of period | | $ | 11.78 | | | $ | 12.47 | | | $ | 9.68 | | | $ | 10.85 | | | $ | 9.89 | | | $ | 10.00 | |
| | | | | | | |
| | Net investment income(b) | | | 0.12 | | | | 0.14 | | | | 0.18 | | | | 0.19 | | | | 0.22 | (c) | | | 0.06 | |
| | | | | | | |
| | Net realized and unrealized gain (loss) | | | 1.06 | | | | (0.64 | ) | | | 2.83 | | | | (1.19 | ) | | | 0.99 | | | | 0.01 | |
| | | | | | | |
| | Total from investment operations | | | 1.18 | | | | (0.50 | ) | | | 3.01 | | | | (1.00 | ) | | | 1.21 | | | | 0.07 | |
| | | | | | | |
| | Distributions to shareholders from net investment income | | | (0.09 | ) | | | (0.16 | ) | | | (0.19 | ) | | | (0.17 | ) | | | (0.20 | ) | | | (0.05 | ) |
| | | | | | | |
| | Distributions to shareholders from net realized gains | | | — | | | | — | | | | — | | | | — | | | | (0.05 | ) | | | (0.12 | ) |
| | | | | | | |
| | Distributions to shareholders from return of capital | | | — | | | | (0.03 | ) | | | (0.03 | ) | | | — | | | | — | (d) | | | (0.01 | ) |
| | | | | | | |
| | Total distributions | | | (0.09 | ) | | | (0.19 | ) | | | (0.22 | ) | | | (0.17 | ) | | | (0.25 | ) | | | (0.18 | ) |
| | | | | | | |
| | Net asset value, end of period | | $ | 12.87 | | | $ | 11.78 | | | $ | 12.47 | | | $ | 9.68 | | | $ | 10.85 | | | $ | 9.89 | |
| | | | | | | |
| | Total Return(e) | | | 10.06 | % | | | (3.97 | )% | | | 31.22 | % | | | (9.31 | )% | | | 12.29 | % | | | 0.69 | % |
| | | | | | | |
| | Net assets, end of period (in 000’s) | | $ | 534 | | | $ | 357 | | | $ | 782 | | | $ | 1,376 | | | $ | 40 | | | $ | 25 | |
| | | | | | | |
| | Ratio of net expenses to average net assets | | | 1.35 | %(f) | | | 1.34 | % | | | 1.36 | % | | | 1.38 | % | | | 1.38 | % | | | 1.40 | %(f) |
| | | | | | | |
| | Ratio of total expenses to average net assets | | | 1.45 | %(f) | | | 1.56 | % | | | 1.51 | % | | | 1.51 | % | | | 6.20 | % | | | 15.63 | %(f) |
| | | | | | | |
| | Ratio of net investment income to average net assets | | | 2.02 | %(f) | | | 1.17 | % | | | 1.53 | % | | | 1.83 | % | | | 2.04 | %(c) | | | 1.19 | %(f) |
| | | | | | | |
| | Portfolio turnover rate(g) | | | 38 | % | | | 57 | % | | | 39 | % | | | 67 | % | | | 103 | % | | | 59 | % |
| | (a) | | Commenced operations on June 27, 2016. |
| | (b) | | Calculated based on the average shares outstanding methodology. |
| | (c) | | Reflects income recognized from special dividends which amounted to $0.08 per share and 0.71% of average net assets. |
| | (d) | | Amount is less than $0.005 per share. |
| | (e) | | Assumes investment at the NAV at the beginning of the period, reinvestment of all dividends and distributions, a complete redemption of the investment at the NAV at the end of the period and no sales or redemption charges (if any). Total returns would be reduced if a sales or redemption charge was taken into account. Returns do not reflect the impact of taxes to shareholders relating to Fund distributions or the redemption of Fund shares. Total returns for periods less than one full year are not annualized. |
| | (g) | | The Fund’s portfolio turnover rate is calculated in accordance with regulatory requirements, without regard to transactions involving short term investments. If such transactions were included, the Fund’s portfolio turnover rate may be higher. |
| | |
| 8 | | The accompanying notes are an integral part of these financial statements. |
GOLDMAN SACHS GLOBAL INFRASTRUCTURE FUND
Financial Highlights (continued)
Selected Share Data for a Share Outstanding Throughout Each Period
| | | | | | | | | | | | | | | | | | | | | | | | | | |
| | | | | Goldman Sachs Global Infrastructure Fund | |
| | | | | Class C Shares | |
| | | | | Six Months Ended
June 30, 2021
(Unaudited) | | | Year Ended December 31, | | | Period Ended
December 31,
2016(a) | |
| | | | | 2020 | | | 2019 | | | 2018 | | | 2017 | |
| | Per Share Data | | | | | | | | | | | | | | | | | | | | | | | | |
| | | | | | | |
| | Net asset value, beginning of period | | $ | 11.70 | | | $ | 12.41 | | | $ | 9.65 | | | $ | 10.84 | | | $ | 9.88 | | | $ | 10.00 | |
| | | | | | | |
| | Net investment income(b) | | | 0.06 | | | | 0.02 | | | | 0.11 | | | | 0.10 | | | | 0.13 | (c) | | | 0.02 | |
| | | | | | | |
| | Net realized and unrealized gain (loss) | | | 1.07 | | | | (0.62 | ) | | | 2.80 | | | | (1.17 | ) | | | 1.00 | | | | 0.01 | |
| | | | | | | |
| | Total from investment operations | | | 1.13 | | | | (0.60 | ) | | | 2.91 | | | | (1.07 | ) | | | 1.13 | | | | 0.03 | |
| | | | | | | |
| | Distributions to shareholders from net investment income | | | (0.06 | ) | | | (0.09 | ) | | | (0.13 | ) | | | (0.12 | ) | | | (0.14 | ) | | | (0.02 | ) |
| | | | | | | |
| | Distributions to shareholders from net realized gains | | | — | | | | — | | | | — | | | | — | | | | (0.03 | ) | | | (0.12 | ) |
| | | | | | | |
| | Distributions to shareholders from return of capital | | | — | | | | (0.02 | ) | | | (0.02 | ) | | | — | | | | — | (d) | | | (0.01 | ) |
| | | | | | | |
| | Total distributions | | | (0.06 | ) | | | (0.11 | ) | | | (0.15 | ) | | | (0.12 | ) | | | (0.17 | ) | | | (0.15 | ) |
| | | | | | | |
| | Net asset value, end of period | | $ | 12.77 | | | $ | 11.70 | | | $ | 12.41 | | | $ | 9.65 | | | $ | 10.84 | | | $ | 9.88 | |
| | | | | | | |
| | Total Return(e) | | | 9.69 | % | | | (4.78 | )% | | | 30.31 | % | | | (9.96 | )% | | | 11.46 | % | | | 0.30 | % |
| | | | | | | |
| | Net assets, end of period (in 000’s) | | $ | 955 | | | $ | 868 | | | $ | 2,607 | | | $ | 1,383 | | | $ | 57 | | | $ | 51 | |
| | | | | | | |
| | Ratio of net expenses to average net assets | | | 2.09 | %(f) | | | 2.09 | % | | | 2.11 | % | | | 2.13 | % | | | 2.14 | % | | | 2.14 | %(f) |
| | | | | | | |
| | Ratio of total expenses to average net assets | | | 2.20 | %(f) | | | 2.30 | % | | | 2.26 | % | | | 2.26 | % | | | 7.06 | % | | | 16.73 | %(f) |
| | | | | | | |
| | Ratio of net investment income to average net assets | | | 1.05 | %(f) | | | 0.21 | % | | | 1.01 | % | | | 1.00 | % | | | 1.24 | %(c) | | | 0.46 | %(f) |
| | | | | | | |
| | Portfolio turnover rate(g) | | | 38 | % | | | 57 | % | | | 39 | % | | | 67 | % | | | 103 | % | | | 59 | % |
| | (a) | | Commenced operations on June 27, 2016. |
| | (b) | | Calculated based on the average shares outstanding methodology. |
| | (c) | | Reflects income recognized from special dividends which amounted to $0.08 per share and 0.71% of average net assets. |
| | (d) | | Amount is less than $0.005 per share. |
| | (e) | | Assumes investment at the NAV at the beginning of the period, reinvestment of all dividends and distributions, a complete redemption of the investment at the NAV at the end of the period and no sales or redemption charges (if any). Total returns would be reduced if a sales or redemption charge was taken into account. Returns do not reflect the impact of taxes to shareholders relating to Fund distributions or the redemption of Fund shares. Total returns for periods less than one full year are not annualized. |
| | (g) | | The Fund’s portfolio turnover rate is calculated in accordance with regulatory requirements, without regard to transactions involving short term investments. If such transactions were included, the Fund’s portfolio turnover rate may be higher. |
| | |
| The accompanying notes are an integral part of these financial statements. | | 9 |
GOLDMAN SACHS GLOBAL INFRASTRUCTURE FUND
Financial Highlights (continued)
Selected Share Data for a Share Outstanding Throughout Each Period
| | | | | | | | | | | | | | | | | | | | | | | | | | |
| | | | | Goldman Sachs Global Infrastructure Fund | |
| | | | | Institutional Shares | |
| | | | | Six Months Ended
June 30, 2021
(Unaudited) | | | Year Ended December 31, | | | Period Ended
December 31,
2016(a) | |
| | | | | 2020 | | | 2019 | | | 2018 | | | 2017 | |
| | Per Share Data | | | | | | | | | | | | | | | | | | | | | | | | |
| | | | | | | |
| | Net asset value, beginning of period | | $ | 11.80 | | | $ | 12.50 | | | $ | 9.71 | | | $ | 10.85 | | | $ | 9.89 | | | $ | 10.00 | |
| | | | | | | |
| | Net investment income(b) | | | 0.13 | | | | 0.21 | | | | 0.19 | | | | 0.06 | | | | 0.29 | (c) | | | 0.08 | |
| | | | | | | |
| | Net realized and unrealized gain (loss) | | | 1.07 | | | | (0.68 | ) | | | 2.87 | | | | (1.02 | ) | | | 0.96 | | | | 0.01 | |
| | | | | | | |
| | Total from investment operations | | | 1.20 | | | | (0.47 | ) | | | 3.06 | | | | (0.96 | ) | | | 1.25 | | | | 0.09 | |
| | | | | | | |
| | Distributions to shareholders from net investment income | | | (0.11 | ) | | | (0.17 | ) | | | (0.24 | ) | | | (0.18 | ) | | | (0.20 | ) | | | (0.07 | ) |
| | | | | | | |
| | Distributions to shareholders from net realized gains | | | — | | | | — | | | | — | | | | — | | | | (0.08 | ) | | | (0.12 | ) |
| | | | | | | |
| | Distributions to shareholders from return of capital | | | — | | | | (0.06 | ) | | | (0.03 | ) | | | — | | | | (0.01 | ) | | | (0.01 | ) |
| | | | | | | |
| | Total distributions | | | (0.11 | ) | | | (0.23 | ) | | | (0.27 | ) | | | (0.18 | ) | | | (0.29 | ) | | | (0.20 | ) |
| | | | | | | |
| | Net asset value, end of period | | $ | 12.89 | | | $ | 11.80 | | | $ | 12.50 | | | $ | 9.71 | | | $ | 10.85 | | | $ | 9.89 | |
| | | | | | | |
| | Total Return(d) | | | 10.22 | % | | | (3.63 | )% | | | 31.66 | % | | | (8.89 | )% | | | 12.72 | % | | | 0.89 | % |
| | | | | | | |
| | Net assets, end of period (in 000’s) | | $ | 7,688 | | | $ | 6,772 | | | $ | 1,264 | | | $ | 1,737 | | | $ | 222,546 | | | $ | 2,906 | |
| | | | | | | |
| | Ratio of net expenses to average net assets | | | 0.99 | %(e) | | | 0.99 | % | | | 1.00 | % | | | 0.99 | % | | | 0.99 | % | | | 0.99 | %(e) |
| | | | | | | |
| | Ratio of total expenses to average net assets | | | 1.08 | %(e) | | | 1.19 | % | | | 1.13 | % | | | 1.06 | % | | | 1.29 | % | | | 15.23 | %(e) |
| | | | | | | |
| | Ratio of net investment income to average net assets | | | 2.15 | %(e) | | | 1.82 | % | | | 1.70 | % | | | 0.54 | % | | | 2.65 | %(c) | | | 1.59 | %(e) |
| | | | | | | |
| | Portfolio turnover rate(f) | | | 38 | % | | | 57 | % | | | 39 | % | | | 67 | % | | | 103 | % | | | 59 | % |
| | (a) | | Commenced operations on June 27, 2016. |
| | (b) | | Calculated based on the average shares outstanding methodology. |
| | (c) | | Reflects income recognized from special dividends which amounted to $0.08 per share and 0.71% of average net assets. |
| | (d) | | Assumes investment at the NAV at the beginning of the period, reinvestment of all dividends and distributions, a complete redemption of the investment at the NAV at the end of the period and no sales or redemption charges (if any). Total returns would be reduced if a sales or redemption charge was taken into account. Returns do not reflect the impact of taxes to shareholders relating to Fund distributions or the redemption of Fund shares. Total returns for periods less than one full year are not annualized. |
| | (f) | | The Fund’s portfolio turnover rate is calculated in accordance with regulatory requirements, without regard to transactions involving short term investments. If such transactions were included, the Fund’s portfolio turnover rate may be higher. |
| | |
| 10 | | The accompanying notes are an integral part of these financial statements. |
GOLDMAN SACHS GLOBAL INFRASTRUCTURE FUND
Financial Highlights (continued)
Selected Share Data for a Share Outstanding Throughout Each Period
| | | | | | | | | | | | | | | | | | | | | | | | | | |
| | | | | Goldman Sachs Global Infrastructure Fund | |
| | | | | Investor Shares | |
| | | | | Six Months Ended
June 30, 2021
(Unaudited) | | | Year Ended December 31, | | | Period Ended
December 31,
2016(a) | |
| | | | | 2020 | | | 2019 | | | 2018 | | | 2017 | |
| | Per Share Data | | | | | | | | | | | | | | | | | | | | | | | | |
| | | | | | | |
| | Net asset value, beginning of period | | $ | 11.78 | | | $ | 12.47 | | | $ | 9.68 | | | $ | 10.85 | | | $ | 9.89 | | | $ | 10.00 | |
| | | | | | | |
| | Net investment income(b) | | | 0.13 | | | | 0.10 | | | | 0.22 | | | | 0.20 | | | | 0.24 | (c) | | | 0.08 | |
| | | | | | | |
| | Net realized and unrealized gain (loss) | | | 1.07 | | | | (0.58 | ) | | | 2.82 | | | | (1.18 | ) | | | 0.99 | | | | — | (d) |
| | | | | | | |
| | Total from investment operations | | | 1.20 | | | | (0.48 | ) | | | 3.04 | | | | (0.98 | ) | | | 1.23 | | | | 0.08 | |
| | | | | | | |
| | Distributions to shareholders from net investment income | | | (0.11 | ) | | | (0.19 | ) | | | (0.22 | ) | | | (0.19 | ) | | | (0.21 | ) | | | (0.06 | ) |
| | | | | | | |
| | Distributions to shareholders from net realized gains | | | — | | | | — | | | | — | | | | — | | | | (0.05 | ) | | | (0.12 | ) |
| | | | | | | |
| | Distributions to shareholders from return of capital | | | — | | | | (0.02 | ) | | | (0.03 | ) | | | — | | | | (0.01 | ) | | | (0.01 | ) |
| | | | | | | |
| | Total distributions | | | (0.11 | ) | | | (0.21 | ) | | | (0.25 | ) | | | (0.19 | ) | | | (0.27 | ) | | | (0.19 | ) |
| | | | | | | |
| | Net asset value, end of period | | $ | 12.87 | | | $ | 11.78 | | | $ | 12.47 | | | $ | 9.68 | | | $ | 10.85 | | | $ | 9.89 | |
| | | | | | | |
| | Total Return(e) | | | 10.18 | % | | | (3.80 | )% | | | 31.49 | % | | | (9.00 | )% | | | 12.56 | % | | | 0.91 | % |
| | | | | | | |
| | Net assets, end of period (in 000’s) | | $ | 222 | | | $ | 181 | | | $ | 929 | | | $ | 279 | | | $ | 28 | | | $ | 25 | |
| | | | | | | |
| | Ratio of net expenses to average net assets | | | 1.10 | %(f) | | | 1.09 | % | | | 1.10 | % | | | 1.13 | % | | | 1.14 | % | | | 0.95 | %(f) |
| | | | | | | |
| | Ratio of total expenses to average net assets | | | 1.20 | %(f) | | | 1.29 | % | | | 1.26 | % | | | 1.25 | % | | | 6.05 | % | | | 15.19 | %(f) |
| | | | | | | |
| | Ratio of net investment income to average net assets | | | 2.10 | %(f) | | | 0.86 | % | | | 1.96 | % | | | 1.95 | % | | | 2.23 | %(c) | | | 1.63 | %(f) |
| | | | | | | |
| | Portfolio turnover rate(g) | | | 38 | % | | | 57 | % | | | 39 | % | | | 67 | % | | | 103 | % | | | 59 | % |
| | (a) | | Commenced operations on June 27, 2016. |
| | (b) | | Calculated based on the average shares outstanding methodology. |
| | (c) | | Reflects income recognized from special dividends which amounted to $0.08 per share and 0.71% of average net assets. |
| | (d) | | Amount is less than $0.005 per share. |
| | (e) | | Assumes investment at the NAV at the beginning of the period, reinvestment of all dividends and distributions, a complete redemption of the investment at the NAV at the end of the period and no sales or redemption charges (if any). Total returns would be reduced if a sales or redemption charge was taken into account. Returns do not reflect the impact of taxes to shareholders relating to Fund distributions or the redemption of Fund shares. Total returns for periods less than one full year are not annualized. |
| | (g) | | The Fund’s portfolio turnover rate is calculated in accordance with regulatory requirements, without regard to transactions involving short term investments. If such transactions were included, the Fund’s portfolio turnover rate may be higher. |
| | |
| The accompanying notes are an integral part of these financial statements. | | 11 |
GOLDMAN SACHS GLOBAL INFRASTRUCTURE FUND
Financial Highlights (continued)
Selected Share Data for a Share Outstanding Throughout Each Period
| | | | | | | | | | | | | | | | | | | | | | | | | | |
| | | | | Goldman Sachs Global Infrastructure Fund | |
| | | | | Class R6 Shares | |
| | | | | Six Months Ended
June 30, 2021
(Unaudited) | | | Year Ended December 31, | | | Period Ended
December 31,
2016(a) | |
| | | | | 2020 | | | 2019 | | | 2018 | | | 2017 | |
| | Per Share Data | | | | | | | | | | | | | | | | | | | | | | | | |
| | | | | | | |
| | Net asset value, beginning of period | | $ | 11.77 | | | $ | 12.47 | | | $ | 9.69 | | | $ | 10.85 | | | $ | 9.89 | | | $ | 10.00 | |
| | | | | | | |
| | Net investment income(b) | | | 0.13 | | | | 0.18 | | | | 0.23 | | | | 0.22 | | | | 0.26 | (c) | | | 0.09 | |
| | | | | | | |
| | Net realized and unrealized gain (loss) | | | 1.08 | | | | (0.65 | ) | | | 2.82 | | | | (1.18 | ) | | | 0.99 | | | | — | (d) |
| | | | | | | |
| | Total from investment operations | | | 1.21 | | | | (0.47 | ) | | | 3.05 | | | | (0.96 | ) | | | 1.25 | | | | 0.09 | |
| | | | | | | |
| | Distributions to shareholders from net investment income | | | (0.12 | ) | | | (0.19 | ) | | | (0.24 | ) | | | (0.20 | ) | | | (0.22 | ) | | | (0.07 | ) |
| | | | | | | |
| | Distributions to shareholders from net realized gains | | | — | | | | — | | | | — | | | | — | | | | (0.06 | ) | | | (0.12 | ) |
| | | | | | | |
| | Distributions to shareholders from return of capital | | | — | | | | (0.04 | ) | | | (0.03 | ) | | | — | | | | (0.01 | ) | | | (0.01 | ) |
| | | | | | | |
| | Total distributions | | | (0.12 | ) | | | (0.23 | ) | | | (0.27 | ) | | | (0.20 | ) | | | (0.29 | ) | | | (0.20 | ) |
| | | | | | | |
| | Net asset value, end of period | | $ | 12.86 | | | $ | 11.77 | | | $ | 12.47 | | | $ | 9.69 | | | $ | 10.85 | | | $ | 9.89 | |
| | | | | | | |
| | Total Return(e) | | | 10.25 | % | | | (3.64 | )% | | | 31.63 | % | | | (8.88 | )% | | | 12.74 | % | | | 0.56 | % |
| | | | | | | |
| | Net assets, end of period (in 000’s) | | $ | 156,972 | | | $ | 160,304 | | | $ | 187,335 | | | $ | 183,306 | | | $ | 28 | | | $ | 25 | |
| | | | | | | |
| | Ratio of net expenses to average net assets | | | 0.98 | %(f) | | | 0.98 | % | | | 0.99 | % | | | 0.98 | % | | | 0.97 | % | | | 1.65 | %(f) |
| | | | | | | |
| | Ratio of total expenses to average net assets | | | 1.07 | %(f) | | | 1.18 | % | | | 1.11 | % | | | 1.10 | % | | | 5.88 | % | | | 15.88 | %(f) |
| | | | | | | |
| | Ratio of net investment income to average net assets | | | 2.09 | %(f) | | | 1.57 | % | | | 1.94 | % | | | 2.17 | % | | | 2.40 | %(c) | | | 0.93 | %(f) |
| | | | | | | |
| | Portfolio turnover rate(g) | | | 38 | % | | | 57 | % | | | 39 | % | | | 67 | % | | | 103 | % | | | 59 | % |
| | (a) | | Commenced operations on June 27, 2016. |
| | (b) | | Calculated based on the average shares outstanding methodology. |
| | (c) | | Reflects income recognized from special dividends which amounted to $0.08 per share and 0.71% of average net assets. |
| | (d) | | Amount is less than $0.005 per share. |
| | (e) | | Assumes investment at the NAV at the beginning of the period, reinvestment of all dividends and distributions, a complete redemption of the investment at the NAV at the end of the period and no sales or redemption charges (if any). Total returns would be reduced if a sales or redemption charge was taken into account. Returns do not reflect the impact of taxes to shareholders relating to Fund distributions or the redemption of Fund shares. Total returns for periods less than one full year are not annualized. |
| | (g) | | The Fund’s portfolio turnover rate is calculated in accordance with regulatory requirements, without regard to transactions involving short term investments. If such transactions were included, the Fund’s portfolio turnover rate may be higher. |
| | |
| 12 | | The accompanying notes are an integral part of these financial statements. |
GOLDMAN SACHS GLOBAL INFRASTRUCTURE FUND
Financial Highlights (continued)
Selected Share Data for a Share Outstanding Throughout Each Period
| | | | | | | | | | | | | | | | | | | | | | | | | | |
| | | | | Goldman Sachs Global Infrastructure Fund | |
| | | | | Class R Shares | |
| | | | | Six Months Ended
June 30, 2021
(Unaudited) | | | Year Ended December 31, | | | Period Ended
December 31,
2016(a) | |
| | | | | 2020 | | | 2019 | | | 2018 | | | 2017 | |
| | Per Share Data | | | | | | | | | | | | | | | | | | | | | | | | |
| | | | | | | |
| | Net asset value, beginning of period | | $ | 11.78 | | | $ | 12.48 | | | $ | 9.69 | | | $ | 10.85 | | | $ | 9.89 | | | $ | 10.00 | |
| | | | | | | |
| | Net investment income(b) | | | 0.09 | | | | 0.12 | | | | 0.16 | | | | 0.14 | | | | 0.18 | (c) | | | 0.05 | |
| | | | | | | |
| | Net realized and unrealized gain (loss) | | | 1.07 | | | | (0.66 | ) | | | 2.82 | | | | (1.16 | ) | | | 1.00 | | | | 0.01 | |
| | | | | | | |
| | Total from investment operations | | | 1.16 | | | | (0.54 | ) | | | 2.98 | | | | (1.02 | ) | | | 1.18 | | | | 0.06 | |
| | | | | | | |
| | Distributions to shareholders from net investment income | | | (0.08 | ) | | | (0.13 | ) | | | (0.17 | ) | | | (0.14 | ) | | | (0.18 | ) | | | (0.04 | ) |
| | | | | | | |
| | Distributions to shareholders from net realized gains | | | — | | | | — | | | | — | | | | — | | | | (0.04 | ) | | | (0.12 | ) |
| | | | | | | |
| | Distributions to shareholders from return of capital | | | — | | | | (0.03 | ) | | | (0.02 | ) | | | — | | | | — | (d) | | | (0.01 | ) |
| | | | | | | |
| | Total distributions | | | (0.08 | ) | | | (0.16 | ) | | | (0.19 | ) | | | (0.14 | ) | | | (0.22 | ) | | | (0.17 | ) |
| | | | | | | |
| | Net asset value, end of period | | $ | 12.86 | | | $ | 11.78 | | | $ | 12.48 | | | $ | 9.69 | | | $ | 10.85 | | | $ | 9.89 | |
| | | | | | | |
| | Total Return(e) | | | 9.84 | % | | | (4.24 | )% | | | 30.94 | % | | | (9.49 | )% | | | 12.00 | % | | | 0.82 | % |
| | | | | | | |
| | Net assets, end of period (in 000’s) | | $ | 35 | | | $ | 32 | | | $ | 33 | | | $ | 25 | | | $ | 28 | | | $ | 25 | |
| | | | | | | |
| | Ratio of net expenses to average net assets | | | 1.59 | %(f) | | | 1.59 | % | | | 1.61 | % | | | 1.63 | % | | | 1.64 | % | | | 1.15 | %(f) |
| | | | | | | |
| | Ratio of total expenses to average net assets | | | 1.70 | %(f) | | | 1.82 | % | | | 1.77 | % | | | 1.75 | % | | | 6.55 | % | | | 15.38 | %(f) |
| | | | | | | |
| | Ratio of net investment income to average net assets | | | 1.55 | %(f) | | | 1.01 | % | | | 1.42 | % | | | 1.30 | % | | | 1.74 | %(c) | | | 1.44 | %(f) |
| | | | | | | |
| | Portfolio turnover rate(g) | | | 38 | % | | | 57 | % | | | 39 | % | | | 67 | % | | | 103 | % | | | 59 | % |
| | (a) | | Commenced operations on June 27, 2016. |
| | (b) | | Calculated based on the average shares outstanding methodology. |
| | (c) | | Reflects income recognized from special dividends which amounted to $0.08 per share and 0.71% of average net assets. |
| | (d) | | Amount is less than $0.005 per share. |
| | (e) | | Assumes investment at the NAV at the beginning of the period, reinvestment of all dividends and distributions, a complete redemption of the investment at the NAV at the end of the period and no sales or redemption charges (if any). Total returns would be reduced if a sales or redemption charge was taken into account. Returns do not reflect the impact of taxes to shareholders relating to Fund distributions or the redemption of Fund shares. Total returns for periods less than one full year are not annualized. |
| | (g) | | The Fund’s portfolio turnover rate is calculated in accordance with regulatory requirements, without regard to transactions involving short term investments. If such transactions were included, the Fund’s portfolio turnover rate may be higher. |
| | |
| The accompanying notes are an integral part of these financial statements. | | 13 |
GOLDMAN SACHS GLOBAL INFRASTRUCTURE FUND
Financial Highlights (continued)
Selected Share Data for a Share Outstanding Throughout Each Period
| | | | | | | | | | | | | | | | | | |
| | | | | Goldman Sachs Global Infrastructure Fund | |
| | | | | Class P Shares | |
| | | | | Six Months Ended
June 30, 2021
(Unaudited) | | | Year Ended December 31, | | | Period Ended
December 31,
2018(a) | |
| | | | | 2020 | | | 2019 | |
| | Per Share Data | | | | | | | | | | | | | | | | |
| | | | | |
| | Net asset value, beginning of period | | $ | 11.76 | | | $ | 12.47 | | | $ | 9.68 | | | $ | 10.47 | |
| | | | | |
| | Net investment income(b) | | | 0.18 | | | | 0.21 | | | | 0.23 | | | | 0.12 | |
| | | | | |
| | Net realized and unrealized gain (loss) | | | 1.03 | | | | (0.69 | ) | | | 2.83 | | | | (0.73 | ) |
| | | | | |
| | Total from investment operations | | | 1.21 | | | | (0.48 | ) | | | 3.06 | | | | (0.61 | ) |
| | | | | |
| | Distributions to shareholders from net investment income | | | (0.12 | ) | | | (0.17 | ) | | | (0.24 | ) | | | (0.18 | ) |
| | | | | |
| | Distributions to shareholders from return of capital | | | — | | | | (0.06 | ) | | | (0.03 | ) | | | — | |
| | | | | |
| | Total distributions | | | — | | | | (0.23 | ) | | | (0.27 | ) | | | (0.18 | ) |
| | | | | |
| | Net asset value, end of period | | $ | 12.85 | | | $ | 11.76 | | | $ | 12.47 | | | $ | 9.68 | |
| | | | | |
| | Total Return(c) | | | 10.26 | % | | | (3.72 | )% | | | 31.77 | % | | | (5.91 | )% |
| | | | | |
| | Net assets, end of period (in 000’s) | | $ | 79,276 | | | $ | 12,085 | | | $ | 3,936 | | | $ | 2,278 | |
| | | | | |
| | Ratio of net expenses to average net assets | | | 0.98 | %(d) | | | 0.98 | % | | | 0.99 | % | | | 0.98 | %(d) |
| | | | | |
| | Ratio of total expenses to average net assets | | | 1.07 | %(d) | | | 1.18 | % | | | 1.12 | % | | | 1.14 | %(d) |
| | | | | |
| | Ratio of net investment income to average net assets | | | 2.90 | %(d) | | | 1.77 | % | | | 1.99 | % | | | 1.68 | %(d) |
| | | | | |
| | Portfolio turnover rate(e) | | | 38 | % | | | 57 | % | | | 39 | % | | | 67 | % |
| | (a) | | Commenced operations on April 17, 2018. |
| | (b) | | Calculated based on the average shares outstanding methodology. |
| | (c) | | Assumes investment at the NAV at the beginning of the period, reinvestment of all dividends and distributions, a complete redemption of the investment at the NAV at the end of the period and no sales or redemption charges (if any). Total returns would be reduced if a sales or redemption charge was taken into account. Returns do not reflect the impact of taxes to shareholders relating to Fund distributions or the redemption of Fund shares. Total returns for periods less than one full year are not annualized. |
| | (e) | | The Fund’s portfolio turnover rate is calculated in accordance with regulatory requirements, without regard to transactions involving short term investments. If such transactions were included, the Fund’s portfolio turnover rate may be higher. |
| | |
| 14 | | The accompanying notes are an integral part of these financial statements. |
GOLDMAN SACHS GLOBAL INFRASTRUCTURE FUND
Notes to Financial Statements
June 30, 2021 (Unaudited)
Goldman Sachs Trust (the “Trust”) is a Delaware statutory trust registered under the Investment Company Act of 1940, as amended (the “Act”), as an open-end management investment company. Goldman Sachs Global Infrastructure Fund (the “Fund”) is a non-diversified portfolio and currently offers seven classes of shares: Class A, Class C, Institutional, Investor, Class R6, Class R, and Class P Shares.
Class A Shares are sold with a front-end sales charge of up to 5.50%. Class C Shares are sold with a contingent deferred sales charge (“CDSC”) of 1.00%, which is imposed on redemptions made within 12 months of purchase. Institutional, Investor, Class R6, Class R, and Class P Shares are not subject to a sales charge.
Goldman Sachs Asset Management, L.P. (“GSAM”), an affiliate of Goldman Sachs & Co. LLC (“Goldman Sachs”), serves as investment adviser to the Fund pursuant to a management agreement (the “Agreement”) with the Trust.
|
| 2. SIGNIFICANT ACCOUNTING POLICIES |
The financial statements have been prepared in accordance with accounting principles generally accepted in the United States of America (“GAAP”) and require management to make estimates and assumptions that may affect the reported amounts and disclosures. Actual results may differ from those estimates and assumptions. The Fund is an investment company under GAAP and follows the accounting and reporting guidance applicable to investment companies.
A. Investment Valuation — The Fund’s valuation policy is to value investments at fair value.
B. Investment Income and Investments — Investment income includes interest income, dividend income, and securities lending income, if any. Interest income is accrued daily and adjusted for amortization of premiums and accretion of discounts. Dividend income is recognized on ex-dividend date or, for certain foreign securities, as soon as such information is obtained subsequent to the ex-dividend date. Non-cash dividends, if any, are recorded at the fair market value of the securities received. Investment transactions are reflected on trade date. Realized gains and losses are calculated using identified cost. Investment transactions are recorded on the following business day for daily net asset value (“NAV”) calculations. Investment income is recorded net of any foreign withholding taxes, less any amounts reclaimable. The Fund may file withholding tax reclaims in certain jurisdictions to recover a portion of amounts previously withheld. Any foreign capital gains tax is accrued daily based upon net unrealized gains, and is payable upon sale of such investments. Distributions received from the Fund’s investments in U.S. real estate investment trusts (“REITs”) may be characterized as ordinary income, net capital gain and/or a return of capital. A return of capital is recorded by the Fund as a reduction to the cost basis of the REIT. The Fund records its pro-rata share of the income/loss and capital gains/losses, allocated from the underlying partnerships and adjusts the cost basis of the underlying partnerships accordingly.
C. Class Allocations and Expenses — Investment income, realized and unrealized gain (loss), if any, and non-class specific expenses of the Fund are allocated daily based upon the proportion of net assets of each class. Non-class specific expenses directly incurred by the Fund are charged to the Fund, while such expenses incurred by the Trust are allocated across the Fund on a straight-line and/or pro-rata basis depending upon the nature of the expenses. Class-specific expenses, where applicable, are borne by the respective share classes and include Distribution and Service, Transfer Agency and Service fees.
D. Federal Taxes and Distributions to Shareholders — It is the Fund’s policy to comply with the requirements of the Internal Revenue Code of 1986, as amended (the “Code”), applicable to regulated investment companies and to distribute each year substantially all of its investment company taxable income and capital gains to its shareholders. Accordingly, the Fund is not required to make any provisions for the payment of federal income tax. Distributions to shareholders are recorded on the ex-dividend date. Net investment income distributions are declared and paid quarterly, and capital gains distributions, if any, are declared and paid at least annually.
Net capital losses, if any, are carried forward to future fiscal years and may be used to the extent allowed by the Code to offset any future capital gains. Losses that are carried forward will retain their character as either short-term or long-term capital losses. Utilization of capital loss carryforwards will reduce the requirement of future capital gains distributions.
15
GOLDMAN SACHS GLOBAL INFRASTRUCTURE FUND
Notes to Financial Statements (continued)
June 30, 2021 (Unaudited)
|
| 2. SIGNIFICANT ACCOUNTING POLICIES (continued) |
The characterization of distributions to shareholders for financial reporting purposes is determined in accordance with federal income tax rules, which may differ from GAAP. The source of the Fund’s distributions may be shown in the accompanying financial statements as either from distributable earnings or capital. Certain components of the Fund’s net assets on the Statement of Assets and Liabilities reflect permanent GAAP/tax differences based on the appropriate tax character.
E. Foreign Currency Translation — The accounting records and reporting currency of the Fund are maintained in U.S. dollars. Assets and liabilities denominated in foreign currencies are translated into U.S. dollars using the current exchange rates at the close of each business day. The effect of changes in foreign currency exchange rates on investments is included within net realized and unrealized gain (loss) on investments. Changes in the value of other assets and liabilities as a result of fluctuations in foreign exchange rates are included in the Statement of Operations within net change in unrealized gain (loss) on foreign currency translation. Transactions denominated in foreign currencies are translated into U.S. dollars on the date the transaction occurred, the effects of which are included within net realized gain (loss) on foreign currency transactions.
|
| 3. INVESTMENTS AND FAIR VALUE MEASUREMENTS |
U.S. GAAP defines the fair value of a financial instrument as the amount that would be received to sell an asset or paid to transfer a liability in an orderly transaction between market participants at the measurement date (i.e., the exit price); the Fund’s policy is to use the market approach. GAAP establishes a fair value hierarchy that prioritizes the inputs to valuation techniques used to measure fair value. The hierarchy gives the highest priority to unadjusted quoted prices in active markets for identical assets or liabilities (Level 1 measurements) and the lowest priority to unobservable inputs (Level 3 measurements). The level in the fair value hierarchy within which the fair value measurement in its entirety falls shall be determined based on the lowest level input that is significant to the fair value measurement in its entirety. The levels used for classifying investments are not necessarily an indication of the risk associated with investing in these investments. The three levels of the fair value hierarchy are described below:
Level 1 — Unadjusted quoted prices in active markets that are accessible at the measurement date for identical, unrestricted assets or liabilities;
Level 2 — Quoted prices in markets that are not active or financial instruments for which significant inputs are observable (including, but not limited to, quoted prices for similar investments, interest rates, foreign exchange rates, volatility and credit spreads), either directly or indirectly;
Level 3 — Prices or valuations that require significant unobservable inputs (including GSAM’s assumptions in determining fair value measurement).
The Board of Trustees (“Trustees”) has approved Valuation Procedures that govern the valuation of the portfolio investments held by the Fund, including investments for which market quotations are not readily available. The Trustees have delegated to GSAM day-to-day responsibility for implementing and maintaining internal controls and procedures related to the valuation of the Fund’s investments. To assess the continuing appropriateness of pricing sources and methodologies, GSAM regularly performs price verification procedures and issues challenges as necessary to third party pricing vendors or brokers, and any differences are reviewed in accordance with the Valuation Procedures.
A. Level 1 and Level 2 Fair Value Investments — The valuation techniques and significant inputs used in determining the fair values for investments classified as Level 1 and Level 2 are as follows:
Equity Securities — Equity securities traded on a United States (“U.S.”) securities exchange or the NASDAQ system, or those located on certain foreign exchanges, including but not limited to the Americas, are valued daily at their last sale price or official closing price on the principal exchange or system on which they are traded. If there is no sale or official closing price or such price is believed by GSAM to not represent fair value, equity securities will be valued at the valid closing bid price for long positions and at the valid closing ask price for short positions (i.e. where there is sufficient volume, during normal exchange trading hours). If no valid bid/ask price is available, the equity security will be valued pursuant to the Valuation Procedures approved by the
16
GOLDMAN SACHS GLOBAL INFRASTRUCTURE FUND
|
| 3. INVESTMENTS AND FAIR VALUE MEASUREMENTS (continued) |
Trustees and consistent with applicable regulatory guidance. To the extent these investments are actively traded, they are classified as Level 1 of the fair value hierarchy, otherwise they are generally classified as Level 2. Certain equity securities containing unique attributes may be classified as Level 2.
Unlisted equity securities for which market quotations are available are valued at the last sale price on the valuation date, or if no sale occurs, at the last bid price for long positions or the last ask price for short positions, and are generally classified as Level 2. Securities traded on certain foreign securities exchanges are valued daily at fair value determined by an independent fair value service (if available) under Fair Valuation Procedures approved by the Trustees and consistent with applicable regulatory guidance. The independent fair value service takes into account multiple factors including, but not limited to, movements in the securities markets, certain depositary receipts, futures contracts and foreign currency exchange rates that have occurred subsequent to the close of the foreign securities exchange. These investments are generally classified as Level 2 of the fair value hierarchy.
Money Market Funds — Investments in the Goldman Sachs Financial Square Government Fund (“Underlying Fund”) are valued at the NAV per share of the Institutional Share class on the day of valuation. These investments are generally classified as Level 1 of the fair value hierarchy. For information regarding the Underlying Fund’s accounting policies and investment holdings, please see the Underlying Fund’s shareholder report.
B. Level 3 Fair Value Investments — To the extent that significant inputs to valuation models and other alternative pricing sources are unobservable, or if quotations are not readily available, or if GSAM believes that such quotations do not accurately reflect fair value, the fair value of the Fund’s investments may be determined under Valuation Procedures approved by the Trustees. GSAM, consistent with its procedures and applicable regulatory guidance, may make an adjustment to the most recent valuation prices of either domestic or foreign securities in light of significant events to reflect what it believes to be the fair value of the securities at the time of determining the Fund’s NAV. To the extent investments are valued using single source broker quotations obtained directly from the broker or passed through from third party pricing vendors, such investments are classified as Level 3 investments.
C. Fair Value Hierarchy — The following is a summary of the Fund’s investments classified in the fair value hierarchy as of June 30, 2021:
| | | | | | | | | | | | |
|
| GLOBAL INFRASTRUCTURE FUND | |
| | | |
| Investment Type | | Level 1 | | | Level 2 | | | Level 3 | |
| | | |
| Assets | | | | | | | | | | | | |
| | | |
Common Stock and/or Other Equity Investments(a) | | | | | | | | | | | | |
| | | |
Asia | | $ | 1,605,984 | | | $ | 12,772,451 | | | $ | — | |
| | | |
Europe | | | 7,268,272 | | | | 55,990,376 | | | | — | |
| | | |
North America | | | 148,124,339 | | | | – | | | | — | |
| | | |
Oceania | | | – | | | | 11,723,318 | | | | — | |
| | | |
Investment Company | | | 3,411,446 | | | | – | | | | — | |
| | | |
| Total | | $ | 160,410,041 | | | $ | 80,486,145 | | | $ | — | |
| (a) | | Amounts are disclosed by continent to highlight the impact of time zone differences between local market close and the calculation of NAV. Security valuations are based on the principal exchange or system on which they are traded, which may differ from country of domicile noted in table. The Fund utilizes fair value model prices provided by an independent third-party (fair value) service for certain international equity securities resulting in a Level 2 classification. |
For further information regarding security characteristics, see the Schedule of Investments.
|
| 4. AGREEMENTS AND AFFILIATED TRANSACTIONS |
A. Management Agreement — Under the Agreement, GSAM manages the Fund, subject to the general supervision of the Trustees.
17
GOLDMAN SACHS GLOBAL INFRASTRUCTURE FUND
Notes to Financial Statements (continued)
June 30, 2021 (Unaudited)
|
| 4. AGREEMENTS AND AFFILIATED TRANSACTIONS (continued) |
As compensation for the services rendered pursuant to the Agreement, the assumption of the expenses related thereto and administration of the Fund’s business affairs, including providing facilities, GSAM is entitled to a management fee, accrued daily and paid monthly, equal to an annual percentage rate of the Fund’s average daily net assets.
For the six months ended June 30, 2021, contractual and effective net management fees with GSAM were at the following rates:
| | | | | | | | | | | | | | | | | | | | | | | | | | |
| Contractual Management Rate | | | | | | Effective Net
Management
Rate* | |
First
$1 billion | | | Next
$1 billion | | | Next
$3 billion | | | Next
$3 billion | | | Over
$8 billion | | | Effective
Rate | |
| | 0.90% | | | | 0.81% | | | | 0.77% | | | | 0.75% | | | | 0.74% | | | | 0.90% | | | | 0.90% | |
| * | | Effective Net Management Rate includes the impact of management fee waivers of affiliated underlying funds, if any. |
The Fund invests in Institutional Shares of the Goldman Sachs Financial Square Government Fund, which is an affiliated Underlying Fund. GSAM has agreed to waive a portion of its management fee payable by the Fund in an amount equal to the management fee it earns as an investment adviser to the affiliated Underlying Fund in which the Fund invests. For the six months ended June 30, 2021, GSAM waived $1,544 of the Fund’s management fee.
B. Distribution and/or Service (12b-1) Plans — The Trust, on behalf of Class A and Class R Shares of the Fund, has adopted Distribution and Service Plans subject to Rule 12b-1 under the Act. Under the Distribution and Service Plans, Goldman Sachs, which serves as distributor (the “Distributor”), is entitled to a fee accrued daily and paid monthly for distribution services and personal and account maintenance services, which may then be paid by Goldman Sachs to authorized dealers. These fees are equal to an annual percentage rate of the average daily net assets attributable to Class A or Class R Shares of the Fund, as applicable, as set forth below.
The Trust, on behalf of Class C Shares of the Fund, has adopted a Distribution Plan subject to Rule 12b-1 under the Act. Under the Distribution Plan, Goldman Sachs as Distributor is entitled to a fee accrued daily and paid monthly for distribution services, which may then be paid by Goldman Sachs to authorized dealers. These fees are equal to an annual percentage rate of the average daily net assets attributable to Class C Shares of the Fund, as set forth below.
| | | | | | | | | | | | |
| | | Distribution and/or Service Plans Rates | |
| | | Class A* | | | Class C | | | Class R* | |
Distribution and/or Service Plans | | | 0.25 | % | | | 0.75 | % | | | 0.50 | % |
| * | | With respect to Class A and Class R Shares, the Distributor at its discretion may use compensation for distribution services paid under the Distribution Plans to compensate service organizations for personal and account maintenance services and expenses as long as such total compensation does not exceed the maximum cap on “service fees” imposed by the Financial Industry Regulatory Authority. |
C. Distribution Agreement — Goldman Sachs, as Distributor of the shares of the Fund pursuant to a Distribution Agreement, may retain a portion of the Class A Shares’ front end sales charge and Class C Shares’ CDSC. During the six months ended June 30, 2021, Goldman Sachs retained $21 for Class A Shares and did not retain any portion of the CDSC for Class C Shares for this Fund.
D. Service Plan — The Trust, on behalf of the Fund, has adopted a Service Plan to allow Class C Shares to compensate service organizations (including Goldman Sachs) for providing varying levels of personal and account maintenance services to their customers who are beneficial owners of such shares. The Service Plan provides for compensation to the service organizations equal to an annual percentage rate of 0.25% of the average daily net assets attributable to Class C Shares of the Fund.
E. Transfer Agency Agreement — Goldman Sachs also serves as the transfer agent of the Fund for a fee pursuant to the Transfer Agency Agreement. The fees charged for such transfer agency services are accrued daily and paid monthly at annual rates as follows: 0.16% of the average daily net assets of Class A, Class C, Investor and Class R Shares; 0.03% of the average daily net assets of Class R6 and Class P Shares; and 0.04% of the average daily net assets of Institutional Shares.
18
GOLDMAN SACHS GLOBAL INFRASTRUCTURE FUND
|
| 4. AGREEMENTS AND AFFILIATED TRANSACTIONS (continued) |
Effective April 30, 2021, Goldman Sachs has agreed to waive a portion of its transfer agency fee equal to 0.01% of the average daily net assets attributable to Class A, Class C, Investor and Class R Shares of the Fund. Prior to April 30, 2021, Goldman Sachs waived a portion of its transfer agency fee equal to 0.02% of the average daily net assets attributable to Class A, Class C, Investor and Class R Shares.
F. Other Expense Agreements and Affiliated Transactions — GSAM has agreed to reduce or limit certain “Other Expenses” of the Fund (excluding acquired fund fees and expenses, transfer agency fees and expenses, service fees and shareholder administration fees (as applicable), taxes, interest, brokerage fees, expenses of shareholder meetings, litigation and indemnification, and extraordinary expenses) to the extent such expenses exceed, on an annual basis, a percentage rate of the average daily net assets of the Fund. Such Other Expense reimbursements, if any, are accrued daily and paid monthly. In addition, the Fund is not obligated to reimburse GSAM for prior fiscal year expense reimbursements, if any. The Other Expense limitation as an annual percentage rate of average daily net assets for the Fund is 0.054%. This Other Expense limitation will remain in place through at least April 30, 2022 and prior to such date GSAM may not terminate the arrangement without the approval of the Trustees. In addition, the Fund has entered into certain offset arrangements with the transfer agent, which may result in a reduction of the Fund’s expenses and are received irrespective of the application of the “Other Expense” limitations described above.
For the six months ended June 30, 2021, these expense reductions, including any fee waivers and Other Expense reimbursements, were as follows:
| | | | | | | | | | | | | | |
Management
Fee Waiver | | | Transfer Agency
Waivers/Credits | | | Other Expense
Reimbursements | | | Total Expense
Reductions | |
| $ | 1,544 | | | $ | 128 | | | $ | 91,689 | | | $ | 93,361 | |
G. Line of Credit Facility — As of June 30, 2021, the Fund participated in a $1,000,000,000 committed, unsecured revolving line of credit facility (the “facility”) together with other funds of the Trust and certain registered investment companies having management agreements with GSAM or its affiliates. This facility is to be used for temporary emergency purposes, or to allow for an orderly liquidation of securities to meet redemption requests. The interest rate on borrowings is based on the federal funds rate. The facility also requires a fee to be paid by the Fund based on the amount of the commitment that has not been utilized. For the six months ended June 30, 2021, the Fund did not have any borrowings under the facility. Prior to April 26, 2021, the facility was $700,000,000.
H. Other Transactions with Affiliates — The following table provides information about the Fund’s investments in the Underlying Fund as of and for the six months ended June 30, 2020:
| | | | | | | | | | | | | | | | | | | | |
| Underlying Fund | | Beginning
Value as of
December 31,
2020 | | Purchases
at Cost | | Proceeds
from Sales | | | Ending
Value as of
June 30,
2021 | | | Shares
as of
June 30,
2021 | | | Dividend
Income | |
Goldman Sachs Financial Square Government Fund — Institutional Shares | | $2,834,469 | | $53,962,016 | | $ | (53,385,039 | ) | | $ | 3,411,446 | | | | 3,411,446 | | | $ | 638 | |
As of June 30, 2021, The Goldman Sachs Group, Inc. was the beneficial owner of approximately the following percentages with respect to each share class of the Fund (as applicable):
| | | | | | | | | | | | | | | | | | | | | | | | |
| | | | | | | | | | | | Percentage of Share Class owned by Goldman Sachs, Inc. | |
| Fund | | | | | | | | | | | Institutional | | | Investor | | | Class R | |
Global Infrastructure Fund | | | | | | | | | | | | | | | 6 | % | | | 18 | % | | | 100 | % |
19
GOLDMAN SACHS GLOBAL INFRASTRUCTURE FUND
Notes to Financial Statements (continued)
June 30, 2021 (Unaudited)
|
| 4. AGREEMENTS AND AFFILIATED TRANSACTIONS (continued) |
As of June 30, 2021, the following Goldman Sachs Fund of Funds Portfolios and Goldman Sachs Global Tax-Aware Equity Portfolio were beneficial owners of 5% or more of total outstanding shares of the Fund:
| | | | | | | | | | | | | | | | | | | | |
| Fund | | Goldman Sachs
Tax-Advantaged
Global Equity | | | Goldman Sachs
Satellite Strategies | | | Goldman Sachs
Dynamic Global
Equity | | | Goldman Sachs
Growth Strategy | | | Goldman Sachs Growth
and Income Strategy | |
Global Infrastructure Fund | | | 25 | % | | | 11 | % | | | 6 | % | | | 7 | % | | | 7 | % |
|
|
5. PORTFOLIO SECURITIES TRANSACTIONS |
The cost of purchases and proceeds from sales and maturities of long-term securities for the six months ended June 30, 2021, were $123,408,936 and $75,966,699.
As of December 31, 2020, the Fund’s capital loss carryforwards and certain timing differences on a tax basis were as follows:
| | | | |
Capital loss carryforwards: | | | | |
Perpetual Short-Term | | $ | (888,676 | ) |
Timing differences (Real Estate Investment Trusts) | | $ | 4,181 | |
As of June 30, 2021, the Fund’s aggregate security unrealized gains and losses based on cost for U.S. federal income tax purposes were as follows:
| | | | |
Tax Cost | | $ | 202,399,066 | |
Gross unrealized gain | | | 41,265,954 | |
Gross unrealized loss | | | (2,768,834 | ) |
Net unrealized gains (losses) on securities | | $ | 38,497,120 | |
The difference between GAAP-basis and tax basis unrealized gains (losses) is attributable primarily to wash sales and differences in the tax treatment of partnership investments.
GSAM has reviewed the Fund’s tax positions for all open tax years (the current and prior three years, as applicable) and has concluded that no provision for income tax is required in the Fund’s financial statements. Such open tax years remain subject to examination and adjustment by tax authorities.
The Fund’s risks include, but are not limited to, the following:
Dividend-Paying Investments Risk — A Fund’s investments in dividend-paying securities could cause a Fund to underperform other funds. Securities that pay dividends, as a group, can fall out of favor with the market, causing such securities to underperform securities that do not pay dividends. Depending upon market conditions and political and legislative responses to such conditions, dividend-paying securities that meet a Fund’s investment criteria may not be widely available and/or may be highly concentrated in only a few market sectors. In addition, issuers that have paid regular dividends or distributions to shareholders may not continue to do so at the same level or at all in the future. This may limit the ability of a Fund to produce current income.
Foreign Countries Risk — Investing in foreign markets may involve special risks and considerations not typically associated with investing in the United States. Foreign securities may be subject to risk of loss because of more or less foreign government
20
GOLDMAN SACHS GLOBAL INFRASTRUCTURE FUND
|
| 7. OTHER RISKS (continued) |
regulation, less public information and less economic, political and social stability in the countries in which the Fund invests. The imposition of exchange controls (including repatriation restrictions), confiscation of assets and property, trade restrictions (including tariffs) and other government restrictions by the United States or other governments, or from problems in share registration, settlement or custody, may also result in losses. Foreign risk also involves the risk of negative foreign currency rate fluctuations, which may cause the value of securities denominated in such foreign currency (or other instruments through which the Fund has exposure to foreign currencies) to decline in value. Currency exchange rates may fluctuate significantly over short periods of time.
Foreign Custody Risk — If the Fund invests in foreign securities, the Fund may hold such securities and cash with foreign banks, agents, and securities depositories appointed by the Fund’s custodian (each a “Foreign Custodian”). Some foreign custodians may be recently organized or new to the foreign custody business. In some countries, Foreign Custodians may be subject to little or no regulatory oversight over, or independent evaluation of, their operations. Further, the laws of certain countries may place limitations on the Fund’s ability to recover its assets if a Foreign Custodian enters bankruptcy.
Geographic Risk — If the Fund focuses its investments in securities of issuers located in a particular country or geographic region, the Fund may be subjected, to a greater extent than if its investments were less focused, to the risks of volatile economic cycles and/ or conditions and developments that may be particular to that country or region, such as: adverse securities markets; adverse exchange rates; adverse social, political, regulatory, economic, business, environmental or other developments; or natural disasters.
Industry Concentration Risk — Concentrating Fund investments in a limited number of issuers conducting business in the same industry or group of industries will subject the Fund to a greater risk of loss as a result of adverse economic, business, political, environmental or other developments than if its investments were diversified across different industries.
Investments in Other Investment Companies Risk — As a shareholder of another investment company, the Fund will indirectly bear its proportionate share of any net management fees and other expenses paid by such other investment companies, in addition to the fees and expenses regularly borne by the Fund.
Large Shareholder Transactions Risk — The Fund may experience adverse effects when certain large shareholders, such as other funds, institutional investors (including those trading by use of non-discretionary mathematical formulas), financial intermediaries (who may make investment decisions on behalf of underlying clients and/or include the Fund in their investment model), individuals, accounts and Goldman Sachs affiliates, purchase or redeem large amounts of shares of the Fund. Such large shareholder redemptions, which may occur rapidly or unexpectedly, may cause the Fund to sell portfolio securities at times when it would not otherwise do so, which may negatively impact the Fund’s NAV and liquidity. These transactions may also accelerate the realization of taxable income to shareholders if such sales of investments resulted in gains, and may also increase transaction costs. In addition, a large redemption could result in the Fund’s current expenses being allocated over a smaller asset base, leading to an increase in the Fund’s expense ratio. Similarly, large Fund share purchases may adversely affect the Fund’s performance to the extent that the Fund is delayed in investing new cash or otherwise maintains a larger cash position than it ordinarily would.
Liquidity Risk — The Fund may make investments that are illiquid or that may become less liquid in response to market developments or adverse investor perceptions. Illiquid investments may be more difficult to value. Liquidity risk may also refer to the risk that the Fund will not be able to pay redemption proceeds within the allowable time period or without significant dilution to remaining investors’ interests because of unusual market conditions, an unusually high volume of redemption requests, or other reasons. To meet redemption requests, the Fund may be forced to sell investments at an unfavorable time and/or under unfavorable conditions. If the Fund is forced to sell securities at an unfavorable time and/or under unfavorable conditions, such sales may adversely affect the Fund’s NAV and dilute remaining investors’ interests. These risks may be more pronounced in connection with the Fund’s investments in securities of issuers located in emerging market countries. Redemptions by large shareholders may have a negative impact on the Fund’s liquidity.
Market and Credit Risks — In the normal course of business, the Fund trades financial instruments and enters into financial transactions where risk of potential loss exists due to changes in the market (market risk). The value of the securities in which the Fund
21
GOLDMAN SACHS GLOBAL INFRASTRUCTURE FUND
Notes to Financial Statements (continued)
June 30, 2021 (Unaudited)
|
| 7. OTHER RISKS (continued) |
invests may go up or down in response to the prospects of individual companies, particular sectors or governments and/or general economic conditions throughout the world due to increasingly interconnected global economies and financial markets. Events such as war, acts of terrorism, social unrest, natural disasters, the spread of infectious illness or other public health threats could also significantly impact the Fund and its investments. Additionally, the Fund may also be exposed to credit risk in the event that an issuer or guarantor fails to perform or that an institution or entity with which the Fund has unsettled or open transactions defaults.
Non-Diversification Risk — The Fund is non-diversified, meaning that it is permitted to invest a larger percentage of its assets in fewer issuers than diversified mutual funds. Thus, the Fund may be more susceptible to adverse developments affecting any single issuer held in its portfolio, and may be more susceptible to greater losses because of these developments.
Under the Trust’s organizational documents, its Trustees, officers, employees and agents are indemnified, to the extent permitted by the Act and state law, against certain liabilities that may arise out of performance of their duties to the Fund. Additionally, in the course of business, the Fund enters into contracts that contain a variety of indemnification clauses. The Fund’s maximum exposure under these arrangements is unknown, as this would involve future claims that may be made against the Fund that have not yet occurred. However, GSAM believes the risk of loss under these arrangements to be remote.
Subsequent events after the Statement of Assets and Liabilities date have been evaluated, and GSAM has concluded that there is no impact requiring adjustment or disclosure in the financial statements.
22
GOLDMAN SACHS GLOBAL INFRASTRUCTURE FUND
|
| 10. SUMMARY OF SHARE TRANSACTIONS |
Share activity is as follows:
| | | | | | | | | | | | | | | | |
| | | Global Infrastructure Fund | |
| | | For the Six Months Ended
June 30, 2021
(Unaudited) | | | For the Fiscal Year Ended
December 31, 2020 | |
| | | Shares | | | Dollars | | | Shares | | | Dollars | |
| | | | |
| Class A Shares | | | | | | | | | | | | | | | | |
Shares sold | | | 15,491 | | | $ | 186,646 | | | | 19,509 | | | $ | 214,521 | |
Reinvestment of distributions | | | 303 | | | | 3,903 | | | | 556 | | | | 6,297 | |
Shares redeemed | | | (4,563 | ) | | | (55,054 | ) | | | (52,450 | ) | | | (618,502 | ) |
| | | | 11,231 | | | | 135,495 | | | | (32,385 | ) | | | (397,684 | ) |
| Class C Shares | | | | | | | | | | | | | | | | |
Shares sold | | | 528 | | | | 6,249 | | | | 3,679 | | | | 42,098 | |
Reinvestment of distributions | | | 373 | | | | 4,788 | | | | 835 | | | | 9,425 | |
Shares redeemed | | | (270 | ) | | | (3,237 | ) | | | (140,458 | ) | | | (1,691,394 | ) |
| | | | 631 | | | | 7,800 | | | | (135,944 | ) | | | (1,639,871 | ) |
| Institutional Shares | | | | | | | | | | | | | | | | |
Shares sold | | | 63,104 | | | | 769,997 | | | | 551,603 | | | | 6,402,366 | |
Reinvestment of distributions | | | 5,345 | | | | 68,561 | | | | 9,718 | | | | 110,927 | |
Shares redeemed | | | (45,937 | ) | | | (581,937 | ) | | | (88,408 | ) | | | (991,768 | ) |
| | | | 22,512 | | | | 256,621 | | | | 472,913 | | | | 5,521,525 | |
| Investor Shares | | | | | | | | | | | | | | | | |
Shares sold | | | 1,981 | | | | 24,027 | | | | 10,374 | | | | 122,405 | |
Reinvestment of distributions | | | 145 | | | | 1,862 | | | | 279 | | | | 3,176 | |
Shares redeemed | | | (219 | ) | | | (2,614 | ) | | | (69,764 | ) | | | (851,790 | ) |
| | | | 1,907 | | | | 23,275 | | | | (59,111 | ) | | | (726,209 | ) |
| Class R6 Shares | | | | | | | | | | | | | | | | |
Shares sold | | | 1,153,316 | | | | 13,353,450 | | | | 1,962,813 | | | | 22,933,180 | |
Reinvestment of distributions | | | 111,838 | | | | 1,429,788 | | | | 266,003 | | | | 3,005,374 | |
Shares redeemed | | | (2,675,833 | ) | | | (32,636,302 | ) | | | (3,628,004 | ) | | | (41,650,565 | ) |
| | | | (1,410,679 | ) | | | (17,853,064 | ) | | | (1,399,188 | ) | | | (15,712,011 | ) |
| Class R Shares | | | | | | | | | | | | | | | | |
Reinvestment of distributions | | | 17 | | | | 217 | | | | 38 | | | | 436 | |
| | | | 17 | | | | 217 | | | | 38 | | | | 436 | |
| Class P Shares | | | | | | | | | | | | | | | | |
Shares sold | | | 5,172,406 | | | | 64,738,727 | | | | 766,138 | | | | 9,006,494 | |
Reinvestment of distributions | | | 50,075 | | | | 643,212 | | | | 11,996 | | | | 137,252 | |
Shares redeemed | | | (80,617 | ) | | | (1,035,842 | ) | | | (66,684 | ) | | | (755,932 | ) |
| | | | 5,141,864 | | | | 64,346,097 | | | | 711,450 | | | | 8,387,814 | |
| | | | |
NET INCREASE/(DECREASE) | | | 3,767,483 | | | $ | 46,916,441 | | | | (442,227 | ) | | $ | (4,566,000 | ) |
23
GOLDMAN SACHS GLOBAL INFRASTRUCTURE FUND
Liquidity Risk Management Program
The Fund has adopted and implemented a liquidity risk management program (the “Program”) in accordance with Rule 22e-4 under the 1940 Act. The Program seeks to assess and manage the Fund’s liquidity risk, i.e., the risk that a Fund is unable to satisfy redemption requests without significantly diluting remaining investors’ interests in the Fund. The Board of Trustees of the Trust has designated GSAM, the Fund’s investment adviser, to administer the Program. Certain aspects of the Program rely on third parties to perform certain functions, including the provision of market data and application of models.
The Program is comprised of various components designed to support the assessment and/or management of liquidity risk, including: (1) the periodic assessment (no less frequently than annually) of certain factors that influence a Fund’s liquidity risk; (2) the periodic classification (no less frequently than monthly) of a Fund’s investments into one of four liquidity categories that reflect an estimate of their liquidity under current market conditions; (3) a 15% limit on the acquisition of “illiquid investments” (as defined under Rule 22e-4); (4) for a Fund that does not invest primarily in “highly liquid investments” (as defined under Rule 22e-4), the determination of a minimum percentage of the Fund’s assets that will generally be invested in highly liquid investments (a “Highly Liquid Investment Minimum”); and (5) periodic reporting to the Board of Trustees.
At a meeting of the Board of Trustees on February 9-10, 2021, GSAM provided a written report to the Board addressing the operation, and the adequacy and effectiveness of the implementation, of the Program, including, as applicable, the operation of any Highly Liquid Investment Minimum and any material changes to the Program, for the period from January 1, 2020 through December 31, 2020 (the “Reporting Period”). Among other things, the annual report and related materials discussed: (1) the results of stress tests designed to assess liquidity under a hypothetical stressed scenario involving elevated redemptions; (2) an assessment of the methodologies used to classify investments into one of four liquidity categories; and (3) the impact of the COVID-19 pandemic on liquidity and management of liquidity risk during the Reporting Period, including during stressed market conditions caused by the COVID-19 pandemic. The report concluded that the Program continues to be reasonably designed to assess and manage liquidity risk and was adequately and effectively implemented during the Reporting Period.
There can be no assurance that the Program will achieve its objectives under all circumstances in the future. Please refer to your Fund’s prospectus for more information regarding the Fund’s exposure to liquidity risk and other risks to which it may be subject.
24
GOLDMAN SACHS GLOBAL INFRASTRUCTURE FUND
|
| |
Fund Expenses — Six Month Period Ended June 30, 2021 (Unaudited) |
As a shareholder of Class A, Class C, Institutional, Investor, Class R6, Class R and Class P Shares of the Fund, you incur two types of costs: (1) transaction costs, including sales charges on purchase payments (with respect to Class A Shares) and contingent deferred sales charges on redemptions (with respect to Class C Shares); and (2) ongoing costs, including management fees; distribution and service (12b-1) fees (with respect to Class A, Class C and Class R Shares); and other Fund expenses. This Example is intended to help you understand your ongoing costs (in dollars) of investing in Class A, Class C, Institutional, Investor, Class R6, Class R and Class P Shares of the Fund and to compare these costs with the ongoing costs of investing in other mutual funds.
The Example is based on an investment of $1,000 invested at the beginning of the period and held for the entire period from January 1, 2021 through June 30, 2021, which represents a period of 181 days in a 365 day year.
Actual Expenses — The first line under each share class in the table below provides information about actual account values and actual expenses. You may use the information in this line, together with the amount you invested, to estimate the expenses that you paid over the period. Simply divide your account value by $1,000 (for example, an $8,600 account value divided by $1,000=8.6), then multiply the result by the number in the first line under the heading entitled “Expenses Paid” to estimate the expenses you paid on your account during this period.
Hypothetical Example for Comparison Purposes — The second line under each share class in the table below provides information about hypothetical account values and hypothetical expenses based on the Fund’s actual net expense ratio and an assumed rate of return of 5% per year before expenses, which is not the Fund’s actual return. The hypothetical account values and expenses may not be used to estimate the actual ending account balance or expenses you paid for the period. You may use this information to compare the ongoing costs of investing in the Fund and other funds. To do so, compare this 5% hypothetical example with the 5% hypothetical examples that appear in the shareholder reports of the other funds.
Please note that the expenses shown in the table are meant to highlight your ongoing costs only and do not reflect any transactional costs, such as sales charges, redemption fees, or exchange fees. Therefore, the second line of the table is useful in comparing ongoing costs only, and will not help you determine the relative total costs of owning different funds. In addition, if these transactional costs were included, your costs would have been higher.
| | | | | | | | | | | | |
| | | Global Infrastructure Fund | |
| Share Class | | Beginning
Account Value
1/1/2021 | | | Ending Account Value
6/30/2021 | | | Expenses Paid for the
6 months ended
6/30/2021* | |
| Class A | | | | | | | | | | | | |
Actual | | $ | 1,000.00 | | | $ | 1,100.57 | | | $ | 7.03 | |
Hypothetical 5% return | | | 1,000.00 | | | | 1,018.10 | + | | | 6.76 | |
| Class C | | | | | | | | | | | | |
Actual | | | 1,000.00 | | | | 1,096.92 | | | | 10.87 | |
Hypothetical 5% return | | | 1,000.00 | | | | 1,014.43 | + | | | 10.44 | |
| Institutional | | | | | | | | | | | | |
Actual | | | 1,000.00 | | | | 1,102.17 | | | | 5.16 | |
Hypothetical 5% return | | | 1,000.00 | | | | 1,019.89 | + | | | 4.96 | |
| Investor | | | | | | | | | | | | |
Actual | | | 1,000.00 | | | | 1,101.82 | | | | 5.73 | |
Hypothetical 5% return | | | 1,000.00 | | | | 1,019.34 | + | | | 5.51 | |
| Class R6 | | | | | | | | | | | | |
Actual | | | 1,000.00 | | | | 1,102.47 | | | | 5.11 | |
Hypothetical 5% return | | | 1,000.00 | | | | 1,019.93 | + | | | 4.91 | |
| Class R | | | | | | | | | | | | |
Actual | | | 1,000.00 | | | | 1,098.43 | | | | 8.27 | |
Hypothetical 5% return | | | 1,000.00 | | | | 1,016.91 | + | | | 7.95 | |
| Class P | | | | | | | | | | | | |
Actual | | | 1,000.00 | | | | 1,102.61 | | | | 5.11 | |
Hypothetical 5% return | | | 1,000.00 | | | | 1,019.93 | + | | | 4.91 | |
| | + | | Hypothetical expenses are based on the Fund’s actual annualized net expense ratios and an assumed rate of return of 5% per year before expenses. | |
| | * | | Expenses for each share class are calculated using the Fund’s annualized net expense ratio for each class, which represents the ongoing expenses as a percentage of net assets for the six months ended June 30, 2021. Expenses are calculated by multiplying the annualized net expense ratio by the average account value for the period; then multiplying the result by the number of days in the most recent fiscal half year; and then dividing that result by the number of days in the fiscal year. The annualized net expense ratios for the period were as follows: | |
| | | | | | | | | | | | | | |
| Fund | | Class A | | Class C | | Institutional | | Investor | | Class R6 | | Class R | | Class P |
Global Infrastructure Fund | | 1.35% | | 2.09% | | 0.99% | | 1.10% | | 0.98% | | 1.59% | | 0.98% |
25
GOLDMAN SACHS GLOBAL INFRASTRUCTURE FUND
Statement Regarding Basis for Approval of Management Agreement (Unaudited)
Background
The Goldman Sachs Global Infrastructure Fund (the “Fund”) is an investment portfolio of Goldman Sachs Trust (the “Trust”). The Board of Trustees oversees the management of the Trust and reviews the investment performance and expenses of the Fund at regularly scheduled meetings held throughout the year. In addition, the Board of Trustees determines annually whether to approve the continuance of the Trust’s investment management agreement (the “Management Agreement”) with Goldman Sachs Asset Management, L.P. (the “Investment Adviser”) on behalf of the Fund.
The Management Agreement was most recently approved for continuation until June 30, 2022 by the Board of Trustees, including those Trustees who are not parties to the Management Agreement or “interested persons” (as defined in the Investment Company Act of 1940, as amended) of any party thereto (the “Independent Trustees”), at a meeting held on June 15-16, 2021 (the “Annual Meeting”).
The review process undertaken by the Trustees spans the course of the year and culminates with the Annual Meeting. To assist the Trustees in their deliberations, the Trustees have established a Contract Review Committee (the “Committee”), comprised of the Independent Trustees. The Committee held two meetings over the course of the year since the Management Agreement was last approved. At those Committee meetings, regularly scheduled Board or other committee meetings, and/or the Annual Meeting, matters relevant to the renewal of the Management Agreement were considered by the Board, or the Independent Trustees, as applicable. With respect to the Fund, such matters included:
| | (a) | | the nature and quality of the advisory, administrative, and other services provided to the Fund by the Investment Adviser and its affiliates, including information about: |
| | (i) | | the structure, staff, and capabilities of the Investment Adviser and its portfolio management teams; |
| | (ii) | | the groups within the Investment Adviser and its affiliates that support the portfolio management teams or provide other types of necessary services, including fund services groups (e.g., accounting and financial reporting, tax, shareholder services, and operations); controls and risk management groups (e.g., legal, compliance, valuation oversight, credit risk management, internal audit, compliance testing, market risk analysis, finance, and central funding); sales and distribution support groups, and others (e.g., information technology and training); |
| | (iii) | | trends in employee headcount; |
| | (iv) | | the Investment Adviser’s financial resources and ability to hire and retain talented personnel and strengthen its operations; and |
| | (v) | | the parent company’s support of the Investment Adviser and its mutual fund business, as expressed by the firm’s senior management; |
| | (b) | | information on the investment performance of the Fund, including comparisons to the performance of similar mutual funds, as provided by a third-party mutual fund data provider engaged as part of the contract review process (the “Outside Data Provider”), and a benchmark performance index; and information on general investment outlooks in the markets in which the Fund invests; |
| | (c) | | information provided by the Investment Adviser indicating the Investment Adviser’s views on whether the Fund’s peer group and/or benchmark index had high, medium, or low relevance given the Fund’s particular investment strategy; |
| | (d) | | the terms of the Management Agreement and other agreements with affiliated service providers entered into by the Trust on behalf of the Fund; |
| | (e) | | fee and expense information for the Fund, including: |
| | (i) | | the relative management fee and expense levels of the Fund as compared to those of comparable funds managed by other advisers, as provided by the Outside Data Provider; |
| | (ii) | | the Fund’s expense trends over time; and |
| | (iii) | | to the extent the Investment Adviser manages other types of accounts (such as bank collective trusts, private wealth management accounts, institutional separate accounts, sub-advised mutual funds, and non-U.S. funds) having investment objectives and policies similar to those of the Fund, comparative information on the advisory fees charged and services provided to those accounts by the Investment Adviser; |
| | (f) | | with respect to the extensive investment performance and expense comparison data provided by the Outside Data Provider, its processes in producing that data for the Fund; |
| | (g) | | the undertakings of the Investment Adviser and its affiliates to implement fee waivers and/or expense limitations; |
| | (h) | | information relating to the profitability of the Management Agreement and the transfer agency and distribution and service arrangements of the Fund to the Investment Adviser and its affiliates; |
| | (i) | | whether the Fund’s existing management fee schedule adequately addressed any economies of scale; |
26
GOLDMAN SACHS GLOBAL INFRASTRUCTURE FUND
Statement Regarding Basis for Approval of Management Agreement (Unaudited) (continued)
| | (j) | | a summary of the “fall-out” benefits derived by the Investment Adviser and its affiliates from their relationships with the Fund, including the fees received by the Investment Adviser’s affiliates from the Fund for transfer agency, portfolio trading, distribution and other services; |
| | (k) | | a summary of potential benefits derived by the Fund as a result of its relationship with the Investment Adviser; |
| | (l) | | information regarding commissions paid by the Fund and broker oversight, an update on the Investment Adviser’s soft dollars practices, other information regarding portfolio trading, and how the Investment Adviser carries out its duty to seek best execution; |
| | (m) | | portfolio manager ownership of Fund shares; the manner in which portfolio manager compensation is determined; and the number and types of accounts managed by the portfolio managers; |
| | (n) | | the nature and quality of the services provided to the Fund by its unaffiliated service providers, and the Investment Adviser’s general oversight and evaluation (including reports on due diligence) of those service providers as part of the administrative services provided under the Management Agreement; and |
| | (o) | | the Investment Adviser’s processes and policies addressing various types of potential conflicts of interest; its approach to risk management; the annual review of the effectiveness of the Fund’s compliance program; and periodic compliance reports. |
The Trustees also received an overview of the Fund’s distribution arrangements. They received information regarding the Fund’s assets, share purchase and redemption activity, and payment of distribution and service fees. Information was also provided to the Trustees relating to revenue sharing payments made by and services provided by the Investment Adviser and its affiliates to intermediaries that promote the sale, distribution, and/or servicing of Fund shares. The Independent Trustees also discussed the broad range of other investment choices that are available to Fund investors, including the availability of comparable funds managed by other advisers.
The presentations made at the Board and Committee meetings and at the Annual Meeting encompassed the Fund and other mutual funds for which the Board of Trustees has responsibility. In evaluating the Management Agreement at the Annual Meeting, the Trustees relied upon their knowledge, resulting from their meetings and other interactions throughout the year, of the Investment Adviser and its affiliates, their services, and the Fund. In conjunction with these meetings, the Trustees received written materials and oral presentations on the topics covered, and the Investment Adviser addressed the questions and concerns of the Trustees, including concerns regarding the investment performance of certain of the funds they oversee. The Independent Trustees were advised by their independent legal counsel regarding their responsibilities and other regulatory requirements related to the approval and continuation of mutual fund investment management agreements under applicable law. In addition, the Investment Adviser and its affiliates provided the Independent Trustees with a written response to a formal request for information sent on behalf of the Independent Trustees by their independent legal counsel. During the course of their deliberations, the Independent Trustees met in executive sessions with their independent legal counsel, without representatives of the Investment Adviser or its affiliates present.
Nature, Extent, and Quality of the Services Provided Under the Management Agreement
As part of their review, the Trustees considered the nature, extent, and quality of the services provided to the Fund by the Investment Adviser. In this regard, the Trustees considered both the investment advisory services and non-advisory services that are provided by the Investment Adviser and its affiliates. The Trustees noted the transition in the leadership and changes in personnel of various of the Investment Adviser’s portfolio management teams that had occurred in recent periods, and the ongoing recruitment efforts aimed at bringing high quality investment talent to the Investment Adviser. They also noted the Investment Adviser’s commitment to maintaining high quality systems and expending substantial resources to respond to ongoing changes to the market, regulatory and control environment in which the Fund and its service providers operate, including changes associated with the COVID-19 pandemic, as well as the efforts of the Investment Adviser and its affiliates to combat cyber security risks. The Trustees also considered information regarding the Investment Adviser’s business continuity planning and remote operations capabilities. The Trustees concluded that the Investment Adviser continued to commit substantial financial and operational resources to the Fund and expressed confidence that the Investment Adviser would continue to do so in the future. The Trustees also recognized that the Investment Adviser had made significant commitments to address regulatory compliance requirements applicable to the Fund and the Investment Adviser and its affiliates.
Investment Performance
The Trustees also considered the investment performance of the Fund. In this regard, they compared the investment performance of the Fund to its peers using rankings and ratings compiled by the Outside Data Provider as of December 31, 2020, and updated performance information prepared by the Investment Adviser using the peer group identified by the Outside Data Provider as of March 31, 2021. The information on the Fund’s investment performance was provided for the one- and three-year
27
GOLDMAN SACHS GLOBAL INFRASTRUCTURE FUND
Statement Regarding Basis for Approval of Management Agreement (Unaudited) (continued)
periods ending on the applicable dates. The Trustees also reviewed the Fund’s investment performance relative to its performance benchmark. As part of this review, they considered the investment performance trends of the Fund over time, and reviewed the investment performance of the Fund in light of its investment objective and policies and market conditions.
In addition, the Trustees considered materials prepared and presentations made by the Investment Adviser’s senior management and portfolio management personnel in which Fund performance was assessed. The Trustees also considered the Investment Adviser’s periodic reports with respect to the Fund’s risk profile, and how the Investment Adviser’s approach to risk monitoring and management influences portfolio management.
The Trustees noted that the Fund’s Institutional Shares had placed in the top half of the Fund’s peer group for the three-year period and in the fourth quartile for the one-year period, and had outperformed the Fund’s benchmark index for the three-year period and underperformed for the one-year period ended March 31, 2021.
Costs of Services Provided and Competitive Information
The Trustees considered the contractual terms of the Management Agreement and the fee rates payable by the Fund thereunder. In this regard, the Trustees considered information on the services rendered by the Investment Adviser to the Fund, which included both advisory and administrative services that were directed to the needs and operations of the Fund as a registered mutual fund.
In particular, the Trustees reviewed analyses prepared by the Outside Data Provider regarding the expense rankings of the Fund. The analyses provided a comparison of the Fund’s management fee and breakpoints to those of a relevant peer group and category universe; an expense analysis which compared the Fund’s overall net and gross expenses to a peer group and a category universe; and data comparing the Fund’s net expenses to the peer and category medians. The analyses also compared the Fund’s other expenses and fee waivers/reimbursements to those of the peer group and category medians. The Trustees concluded that the comparisons provided by the Outside Data Provider were useful in evaluating the reasonableness of the management fees and total expenses paid by the Fund.
In addition, the Trustees considered the Investment Adviser’s undertakings to implement fee waivers and/or expense limitations. They also considered, to the extent that the Investment Adviser manages other types of accounts having investment objectives and policies similar to those of the Fund, comparative fee information for services provided by the Investment Adviser to those accounts, and information that indicated that services provided to the Fund differed in various significant respects from the services provided to other types of accounts which, in many cases, operated under less stringent legal and regulatory structures, required fewer services from the Investment Adviser to a smaller number of client contact points, and were less time-intensive.
In addition, the Trustees noted that shareholders are able to redeem their Fund shares at any time if shareholders believe that the Fund fees and expenses are too high or if they are dissatisfied with the performance of the Fund.
Profitability
The Trustees reviewed the Fund’s contribution to the Investment Adviser’s revenues and pre-tax profit margins. In this regard the Trustees noted that they had received, among other things, profitability analyses and summaries, revenue and expense schedules by Fund and by function (i.e., investment management, transfer agency and distribution and service), and information on the Investment Adviser’s expense allocation methodology. They observed that the profitability and expense figures are substantially similar to those used by the Investment Adviser for many internal purposes, including compensation decisions among various business groups, and are thus subject to a vigorous internal debate about how certain revenue and expenses should be allocated. The Trustees also noted that the internal audit group within the Goldman Sachs organization periodically audits the expense allocation methodology and that the internal audit group was satisfied with the reasonableness, consistency, and accuracy of the Investment Adviser’s expense allocation methodology. Profitability data for the Fund was provided for 2020 and 2019, and the Trustees considered this information in relation to the Investment Adviser’s overall profitability.
Economies of Scale
The Trustees considered the information that had been provided regarding whether there have been economies of scale with respect to the management of the Fund. The Trustees also considered the breakpoints in the fee rate payable under the Management Agreement for the Fund at the following annual percentage rates of the average daily net assets of the Fund:
| | | | |
| |
| First $1 billion | | | 0.90 | % |
| |
| Next $1 billion | | | 0.81 | |
| |
| Next $3 billion | | | 0.77 | |
| |
| Next $3 billion | | | 0.75 | |
| |
| Over $8 billion | | | 0.74 | |
28
GOLDMAN SACHS GLOBAL INFRASTRUCTURE FUND
Statement Regarding Basis for Approval of Management Agreement (Unaudited) (continued)
The Trustees noted that the breakpoints were designed to share potential economies of scale, if any, with the Fund and its shareholders as assets under management reach those asset levels. The Trustees considered the amounts of assets in the Fund; the Fund’s recent share purchase and redemption activity; the information provided by the Investment Adviser relating to the costs of the services provided by the Investment Adviser and its affiliates and their realized profits; information comparing fee rates charged by the Investment Adviser with fee rates charged to other funds in the peer group; the transfer agent’s undertaking to waive certain fees and the Investment Adviser’s undertaking to limit certain expenses of the Fund that exceed a specified level. Upon reviewing these matters at the Annual Meeting, the Trustees concluded that the fee breakpoints represented a means of assuring that benefits of scalability, if any, would be passed along to shareholders at the specified asset levels.
Other Benefits to the Investment Adviser and Its Affiliates
The Trustees also considered the other benefits derived by the Investment Adviser and its affiliates from their relationships with the Fund as stated above, including: (a) transfer agency fees received by Goldman Sachs & Co. LLC (“Goldman Sachs”); (b) brokerage and futures commissions earned by Goldman Sachs for executing securities and futures transactions on behalf of the Fund; (c) research received by the Investment Adviser from broker-dealers in exchange for executing certain transactions on behalf of the Fund; (d) trading efficiencies resulting from aggregation of orders of the Fund with those for other funds or accounts managed by the Investment Adviser; (e) the Investment Adviser’s ability to leverage the infrastructure designed to service the Fund on behalf of its other clients; (f) the Investment Adviser’s ability to cross-market other products and services to Fund shareholders; (g) Goldman Sachs’ retention of certain fees as Fund Distributor; (h) the Investment Adviser’s ability to negotiate better pricing with custodians on behalf of its other clients, as a result of the relationship with the Fund; (i) the investment of cash in money market funds managed by the Investment Adviser that will result in increased assets under management for those money market funds; and (j) the possibility that the working relationship between the Investment Adviser and the Fund’s third-party service providers may cause those service providers to be more likely to do business with other areas of Goldman Sachs. In the course of considering the foregoing, the Independent Trustees requested and received further information quantifying certain of these fall-out benefits.
Other Benefits to the Fund and Its Shareholders
The Trustees also noted that the Fund receives certain other potential benefits as a result of its relationship with the Investment Adviser, including: (a) trading efficiencies resulting from aggregation of orders of the Fund with those of other funds or accounts managed by the Investment Adviser; (b) enhanced servicing from vendors due to the volume of business generated by the Investment Adviser and its affiliates; (c) enhanced servicing from broker-dealers due to the volume of business generated by the Investment Adviser and its affiliates; (d) the Investment Adviser’s ability to negotiate favorable terms with derivatives counterparties on behalf of the Fund as a result of the size and reputation of the Goldman Sachs organization; (e) the advantages received from the Investment Adviser’s knowledge and experience gained from managing other accounts and products; (f) the Investment Adviser’s ability to hire and retain qualified personnel to provide services to the Fund because of the reputation of the Goldman Sachs organization; (g) the Fund’s access, through the Investment Adviser, to certain firm-wide resources (e.g., proprietary risk management systems and databases), subject to certain restrictions; and (h) the Fund’s access to certain affiliated distribution channels. In addition, the Trustees noted the competitive nature of the mutual fund marketplace, and considered that many of the Fund’s shareholders invested in the Fund in part because of the Fund’s relationship with the Investment Adviser and that those shareholders have a general expectation that the relationship will continue.
Conclusion
In connection with their consideration of the Management Agreement, the Trustees gave weight to each of the factors described above, but did not identify any particular factor as controlling their decision. After deliberation and consideration of all of the information provided, including the factors described above, the Trustees concluded, in the exercise of their business judgment, that the management fees paid by the Fund were reasonable in light of the services provided to it by the Investment Adviser, the Investment Adviser’s costs and the Fund’s current and reasonably foreseeable asset levels. The Trustees unanimously concluded that the Investment Adviser’s continued management likely would benefit the Fund and its shareholders and that the Management Agreement should be approved and continued with respect to the Fund until June 30, 2022.
29
FUNDS PROFILE
Goldman Sachs Funds
Goldman Sachs is a premier financial services firm, known since 1869 for creating thoughtful and customized investment solutions in complex global markets.
Today, the Asset Management Division of Goldman Sachs serves a diverse set of clients worldwide, including private institutions, public entities and individuals. With approximately $2.09 trillion in assets under supervision as of June 30, 2021, Goldman Sachs Asset Management has portfolio management teams located around the world and our investment professionals bring firsthand knowledge of local markets to every investment decision. Assets under supervision includes assets under management and other client assets for which Goldman Sachs does not have full discretion. GSAM leverages the resources of Goldman Sachs & Co. LLC subject to legal, internal and regulatory restrictions.
Money Market
Financial Square FundsSM
| ∎ | | Financial Square Treasury Solutions Fund1 |
| ∎ | | Financial Square Government Fund1 |
| ∎ | | Financial Square Money Market Fund2 |
| ∎ | | Financial Square Prime Obligations Fund2 |
| ∎ | | Financial Square Treasury Instruments Fund1 |
| ∎ | | Financial Square Treasury Obligations Fund1 |
| ∎ | | Financial Square Federal Instruments Fund1 |
Investor FundsSM
| ∎ | | Investor Money Market Fund3 |
| ∎ | | Investor Tax-Exempt Money Market Fund3 |
Fixed Income
Short Duration and Government
| ∎ | | High Quality Floating Rate Fund |
| ∎ | | Short-Term Conservative Income Fund |
| ∎ | | Short Duration Government Fund |
| ∎ | | Short Duration Bond Fund4 |
| ∎ | | Inflation Protected Securities Fund |
Multi-Sector
| ∎ | | Global Core Fixed Income Fund |
Municipal and Tax-Free
| ∎ | | High Yield Municipal Fund |
| ∎ | | Dynamic Municipal Income Fund |
| ∎ | | Short Duration Tax-Free Fund |
| ∎ | | Municipal Income Completion Fund |
Single Sector
| ∎ | | Investment Grade Credit Fund |
| ∎ | | High Yield Floating Rate Fund |
| ∎ | | Emerging Markets Debt Fund |
| ∎ | | Local Emerging Markets Debt Fund |
Fixed Income Alternatives
| ∎ | | Long Short Credit Strategies Fund |
Fundamental Equity
| ∎ | | Small/Mid Cap Value Fund |
| ∎ | | Small/Mid Cap Growth Fund |
| ∎ | | Concentrated Growth Fund |
| ∎ | | Technology Opportunities Fund |
| ∎ | | Growth Opportunities Fund |
| ∎ | | Rising Dividend Growth Fund |
Tax-Advantaged Equity
| ∎ | | U.S. Tax-Managed Equity Fund |
| ∎ | | International Tax-Managed Equity Fund |
| ∎ | | U.S. Equity Dividend and Premium Fund |
| ∎ | | International Equity Dividend and Premium Fund |
Equity Insights
| ∎ | | Small Cap Equity Insights Fund |
| ∎ | | U.S. Equity Insights Fund |
| ∎ | | Small Cap Growth Insights Fund |
| ∎ | | Large Cap Growth Insights Fund |
| ∎ | | Large Cap Value Insights Fund |
| ∎ | | Small Cap Value Insights Fund |
| ∎ | | International Small Cap Insights Fund |
| ∎ | | International Equity Insights Fund |
| ∎ | | Emerging Markets Equity Insights Fund |
Fundamental Equity International
| ∎ | | International Equity Income Fund |
| ∎ | | International Equity ESG Fund |
| ∎ | | Emerging Markets Equity Fund |
| ∎ | | ESG Emerging Markets Equity Fund |
Alternative
| ∎ | | Real Estate Securities Fund |
| ∎ | | International Real Estate Securities Fund |
| ∎ | | Commodity Strategy Fund |
| ∎ | | Global Real Estate Securities Fund |
| ∎ | | Alternative Premia Fund |
| ∎ | | Absolute Return Tracker Fund |
| ∎ | | Managed Futures Strategy Fund |
| ∎ | | MLP Energy Infrastructure Fund |
| ∎ | | Energy Infrastructure Fund |
| ∎ | | Multi-Manager Alternatives Fund |
| ∎ | | Global Infrastructure Fund |
| ∎ | | Clean Energy Income Fund |
Total Portfolio Solutions
| ∎ | | Global Managed Beta Fund |
| ∎ | | Multi-Manager Non-Core Fixed Income Fund |
| ∎ | | Multi-Manager Global Equity Fund |
| ∎ | | Multi-Manager International Equity Fund |
| ∎ | | Tactical Tilt Overlay Fund |
| ∎ | | Balanced Strategy Portfolio |
| ∎ | | Multi-Manager U.S. Small Cap Equity Fund |
| ∎ | | Multi-Manager Real Assets Strategy Fund |
| ∎ | | Growth and Income Strategy Portfolio |
| ∎ | | Growth Strategy Portfolio |
| ∎ | | Dynamic Global Equity Fund |
| ∎ | | Satellite Strategies Portfolio |
| ∎ | | Enhanced Dividend Global Equity Portfolio |
| ∎ | | Tax-Advantaged Global Equity Portfolio |
| ∎ | | Strategic Factor Allocation Fund |
| ∎ | | Strategic Volatility Premium Fund |
| ∎ | | Target Date Retirement Portfolio |
| ∎ | | Target Date 2025 Portfolio |
| ∎ | | Target Date 2030 Portfolio |
| ∎ | | Target Date 2035 Portfolio |
| ∎ | | Target Date 2040 Portfolio |
| ∎ | | Target Date 2045 Portfolio |
| ∎ | | Target Date 2050 Portfolio |
| ∎ | | Target Date 2055 Portfolio |
| ∎ | | Target Date 2060 Portfolio |
| ∎ | | GQG Partners International Opportunities Fund |
| 1 | | You could lose money by investing in the Fund. Although the Fund seeks to preserve the value of your investment at $1.00 per share, it cannot guarantee it will do so. An investment in the Fund is not a deposit of a bank and is not insured or guaranteed by the Federal Deposit Insurance Corporation or any other government agency. The Fund’s sponsor has no legal obligation to provide financial support to the Fund, and you should not expect that the sponsor will provide financial support to the Fund at any time. |
| 2 | | You could lose money by investing in the Fund. Because the share price of the Fund will fluctuate, when you sell your shares they may be worth more or less than what you originally paid for them. The Fund may impose a fee upon sale of your shares or may temporarily suspend your ability to sell shares if the Fund’s liquidity falls below required minimums because of market conditions or other factors. An investment in the Fund is not a deposit of a bank and is not insured or guaranteed by the Federal Deposit Insurance Corporation or any other government agency. The Fund’s sponsor has no legal obligation to provide financial support to the Fund, and you should not expect that the sponsor will provide financial support to the Fund at any time. |
| 3 | | You could lose money by investing in the Fund. Although the Fund seeks to preserve the value of your investment at $1.00 per share, it cannot guarantee it will do so. The Fund may impose a fee upon sale of your shares or may temporarily suspend your ability to sell shares if the Fund’s liquidity falls below required minimums because of market conditions or other factors. An investment in the Fund is not a deposit of a bank and is not insured or guaranteed by the Federal Deposit Insurance Corporation or any other government agency. The Fund’s sponsor has no legal obligation to provide financial support to the Fund, and you should not expect that the sponsor will provide financial support to the Fund at any time. |
| 4 | | Effective after the close of business on July 28, 2021, the Goldman Sachs Short Duration Income Fund was renamed the Goldman Sachs Short Duration Bond Fund. |
| 5 | | Effective after the close of business on August 30, 2020, the Goldman Sachs Blue Chip Fund was renamed the Goldman Sachs U.S. Equity ESG Fund. |
Financial Square FundsSM and Investor FundsSM are registered service marks of Goldman Sachs & Co. LLC.
| * | | This list covers open-end funds only. Please visit our website at www.GSAMFUNDS.com to learn about our closed-end funds and exchange-traded funds. |
| | |
TRUSTEES Jessica Palmer, Chair Dwight L. Bush Kathryn A. Cassidy Diana M. Daniels Joaquin Delgado James A. McNamara Roy W. Templin Gregory G. Weaver | | OFFICERS James A. McNamara, President Joseph F. DiMaria, Principal Financial Officer, Principal Accounting Officer and Treasurer Caroline L. Kraus, Secretary |
| |
GOLDMAN SACHS & CO. LLC Distributor and Transfer Agent | | GOLDMAN SACHS ASSET MANAGEMENT, L.P. Investment Adviser |
Visit our web site at www.GSAMFUNDS.com to obtain the most recent month-end returns.
Goldman Sachs Asset Management, L.P. 200 West Street, New York, New York 10282
The report concerning the Fund included in this shareholder report may contain certain forward-looking statements about the factors that may affect the performance of the Fund in the future. These statements are based on Fund management’s predictions and expectations concerning certain future events and their expected impact on the Fund, such as performance of the economy as a whole and of specific industry sectors, changes in the levels of interest rates, the impact of developing world events, and other factors that may influence the future performance of the Fund. Management believes these forward-looking statements to be reasonable, although they are inherently uncertain and difficult to predict. Actual events may cause adjustments in portfolio management strategies from those currently expected to be employed.
A description of the policies and procedures that the Fund uses to determine how to vote proxies relating to portfolio securities and information regarding how the Fund voted proxies relating to portfolio securities during the most recent 12-month period ended June 30 is available (i) without charge, upon request by calling 1-800-526-7384 (for Retail Shareholders) or 1-800-621-2550 (for Institutional Shareholders); and (ii) on the Securities and Exchange Commission (“SEC”) web site at http://www.sec.gov.
The Global Industry Classification Standard (GICS) was developed by and is the exclusive property and a service mark of Morgan Stanley Capital International Inc. (MSCI) and Standard & Poor’s, a division of The McGraw-Hill Companies, Inc. (S&P) and is licensed for use by Goldman Sachs. Neither MSCI, S&P nor any other party involved in making or compiling the GICS or any GICS classifications makes any express or implied warranties or representations with respect to such standard or classification (or the results to be obtained by the use thereof), and all such parties hereby expressly disclaim all warranties of originality, accuracy, completeness, merchantability or fitness for a particular purpose with respect to any of such standard or classification. Without limiting any of the foregoing, in no event shall MSCI, S&P, any of their affiliates or any third party involved in making or compiling the GICS or any GICS classifications have any liability for any direct, indirect, special, punitive, consequential or any other damages (including lost profits) even if notified of the possibility of such damages.
The Fund will file portfolio holdings information for each month in a fiscal quarter within 60 days after the end of the relevant fiscal quarter on Form N-PORT. Portfolio holdings information for the third month of each fiscal quarter will be made available on the SEC’s web site at http://www.sec.gov. Portfolio holdings information may be obtained upon request and without charge by calling 1-800-526-7384 (for Retail Shareholders) or 1-800-621-2550 (for Institutional Shareholders).
Holdings and allocations shown are as of June 30, 2021 and may not be representative of future investments. Fund holdings should not be relied on in making investment decisions and should not be construed as research or investment advice regarding particular securities. Current and future holdings are subject to risk.
This material is not authorized for distribution to prospective investors unless preceded or accompanied by a current prospectus or summary prospectus, if applicable. Investors should consider the Fund’s objective, risks, and charges and expenses, and read the summary prospectus, if available, and/or the prospectus carefully before investing or sending money. The summary prospectus, if available, and the prospectus contain this and other information about the Fund and may be obtained from your authorized dealer or from Goldman Sachs & Co. LLC by calling (retail – 1-800-526-7384) (institutional – 1-800-621-2550).
© 2021 Goldman Sachs. All rights reserved. 250017-OTU-1459887 GBLINFRASAR-21
Goldman Sachs Funds

| | | | |
| | |
| Semi-Annual Report | | | | June 30, 2021 |
| | |
| | | | Real Estate Securities Funds |
| | | | Global Real Estate Securities |
| | | | International Real Estate Securities |
| | | | Real Estate Securities |

Goldman Sachs Real Estate Securities Funds
| ∎ | | GLOBAL REAL ESTATE SECURITIES |
| ∎ | | INTERNATIONAL REAL ESTATE SECURITIES |
| | | | |
| | | |
| NOT FDIC-INSURED | | May Lose Value | | No Bank Guarantee |
FUND BASICS
Global Real Estate Securities Fund
as of June 30, 2021
| | | | | | | | | | |
| | PERFORMANCE REVIEW | |
| | | |
| | | January 1, 2021–June 30, 2021 | | Fund Total Return
(based on NAV)1 | | | FTSE EPRA Nareit
Developed Index
(Net, USD, Unhedged)2 | |
| | | |
| | Class A | | | 15.57 | % | | | 15.71 | % |
| | Class C | | | 15.17 | | | | 15.71 | |
| | Institutional | | | 15.76 | | | | 15.71 | |
| | Investor | | | 15.63 | | | | 15.71 | |
| | Class R6 | | | 15.80 | | | | 15.71 | |
| | Class R | | | 15.40 | | | | 15.71 | |
| | | Class P | | | 15.81 | | | | 15.71 | |
| 1 | | The net asset value (“NAV”) represents the net assets of the class of the Fund (ex-dividend) divided by the total number of shares of the class outstanding. The Fund’s performance reflects the reinvestment of dividends and other distributions. The Fund’s performance does not reflect the deduction of any applicable sales charges. |
| 2 | | The FTSE EPRA Nareit Developed Index (Net, USD, Unhedged) is designed to track the performance of listed real estate companies and REITs worldwide. By making the index constituents free-float adjusted, liquidity, size and revenue screened, the series is suitable for use as the basis for investment products, such as derivatives and Exchange Traded Funds (ETFs). The figures do not reflect any fees or expenses. It is not possible to invest directly in an index. |
The returns set forth in the table above represent past performance. Past performance does not guarantee future results. The Fund’s investment return and principal value will fluctuate so that an investor’s shares, when redeemed, may be worth more or less than their original cost. Current performance may be lower or higher than the performance quoted above. Please visit our web site at www.GSAMFUNDS.com to obtain the most recent month-end returns. Performance reflects applicable fee waivers and/or expense limitations in effect during the periods shown. In their absence, performance would be reduced. Returns do not reflect the deduction of taxes that a shareholder would pay on Fund distributions or the redemption of Fund shares.
| | | | | | | | | | |
| | TOP TEN HOLDINGS AS OF 6/30/213 |
| | | | |
| | | Holding | | % of Net Assets | | | Subsectors | | Country |
| | | | |
| | Public Storage (REIT) | | | 4.4 | % | | Specialized | | United States |
| | Prologis, Inc. (REIT) | | | 3.9 | | | Industrial | | United States |
| | Vonovia SE | | | 3.5 | | | Real Estate Operating Companies | | Germany |
| | Simon Property Group, Inc. (REIT) | | | 3.0 | | | Retail | | United States |
| | AvalonBay Communities, Inc. (REIT) | | | 2.7 | | | Residential | | United States |
| | Alexandria Real Estate Equities, Inc. (REIT) | | | 2.5 | | | Office | | United States |
| | Digital Realty Trust, Inc. (REIT) | | | 2.3 | | | Specialized | | United States |
| | Invitation Homes, Inc. (REIT) | | | 2.3 | | | Residential | | United States |
| | Essex Property Trust, Inc. (REIT) | | | 1.9 | | | Residential | | United States |
| | | Ventas, Inc. (REIT) | | | 1.8 | | | Health Care | | United States |
| 3 | | The top 10 holdings may not be representative of the Fund’s future investments. |
1
FUND BASICS
|
| FUND VS. BENCHMARK COUNTRY ALLOCATION4 |
|
| As of June 30, 2021 |
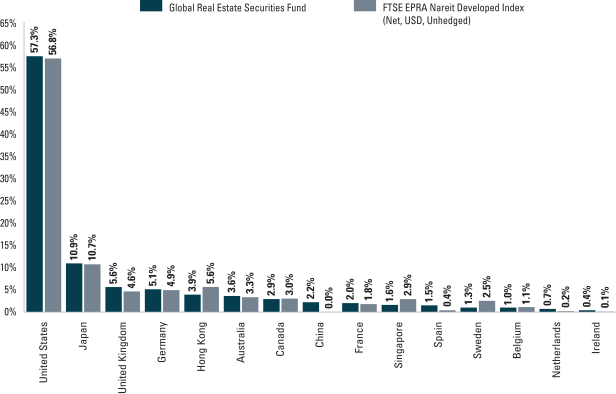
| 4 | | The Fund is actively managed and, as such, its composition may differ over time. Consequently, the Fund’s overall country allocations may differ from percentages contained in the graph above. The percentage shown for each country reflects the value of investments in that country as a percentage of market value. Figures in the above graph may not sum to 100% due to the exclusion of other assets and liabilities. Investments in the securities lending reinvestment vehicle represented 0.9% of the Fund’s net assets at June 30, 2021. |
For more information about your Fund, please refer to www.GSAMFUNDS.com. There, you can learn more about your Fund’s investment strategies, holdings, and performance.
2
FUND BASICS
International Real Estate Securities Fund
as of June 30, 2021
| | | | | | | | | | |
| | PERFORMANCE REVIEW | |
| | | |
| | | January 1, 2021–June 30, 2021 | | Fund Total Return
(based on NAV)1 | | | FTSE EPRA Nareit Developed
Ex US Real Estate Index
(Net, USD, Unhedged)2 | |
| | | |
| | Class A | | | 7.90 | % | | | 9.01 | % |
| | Class C | | | 7.63 | | | | 9.01 | |
| | Institutional | | | 8.22 | | | | 9.01 | |
| | Investor | | | 8.09 | | | | 9.01 | |
| | Class R6 | | | 8.06 | | | | 9.01 | |
| | | Class P | | | 8.07 | | | | 9.01 | |
| 1 | | The net asset value (“NAV”) represents the net assets of the class of the Fund (ex-dividend) divided by the total number of shares of the class outstanding. The Fund’s performance reflects the reinvestment of dividends and other distributions. The Fund’s performance does not reflect the deduction of any applicable sales charges. |
| 2 | | The FTSE EPRA Nareit Developed Ex US Real Estate Index (Net, USD, Unhedged) is a subset of the FTSE EPRA Nareit Developed Index and is designed to track the performance of listed real estate companies and REITs. By making the index constituents free-float adjusted, liquidity, size and revenue screened, the series is suitable for use as the basis for investment products, such as derivatives and Exchange Traded Funds (ETFs). The figures do not reflect any fees or expenses. It is not possible to invest directly in an index. |
The returns set forth in the table above represent past performance. Past performance does not guarantee future results. The Fund’s investment return and principal value will fluctuate so that an investor’s shares, when redeemed, may be worth more or less than their original cost. Current performance may be lower or higher than the performance quoted above. Please visit our web site at www.GSAMFUNDS.com to obtain the most recent month-end returns. Performance reflects applicable fee waivers and/or expense limitations in effect during the periods shown. In their absence, performance would be reduced. Returns do not reflect the deduction of taxes that a shareholder would pay on Fund distributions or the redemption of Fund shares.
| | | | | | | | |
| | TOP TEN HOLDINGS AS OF 6/30/213 |
| | | | |
| | | Holding | | % of Total Net Assets | | Line of Business | | Country |
| | | | |
| | Vonovia SE | | 9.3% | | Real Estate Operating Companies | | Germany |
| | Mitsubishi Estate Co. Ltd. | | 3.8 | | Diversified | | Japan |
| | Segro plc (REIT) | | 3.7 | | Industrial | | United Kingdom |
| | CK Asset Holdings Ltd. | | 3.3 | | Real Estate Development | | Hong Kong |
| | Mitsui Fudosan Co. Ltd. | | 3.1 | | Diversified | | Japan |
| | Link REIT (REIT) | | 3.1 | | Retail | | Hong Kong |
| | Gecina SA (REIT) | | 3.0 | | Diversified | | France |
| | Castellum AB | | 2.8 | | Real Estate Operating Companies | | Sweden |
| | United Urban Investment Corp. (REIT) | | 2.7 | | Diversified | | Japan |
| | | GLP J-REIT (REIT) | | 2.6 | | Industrial | | Japan |
| 3 | | The top 10 holdings may not be representative of the Fund’s future investments. |
3
FUND BASICS
|
| FUND VS. BENCHMARK COUNTRY ALLOCATION5 |
|
| As of June 30, 2021 |
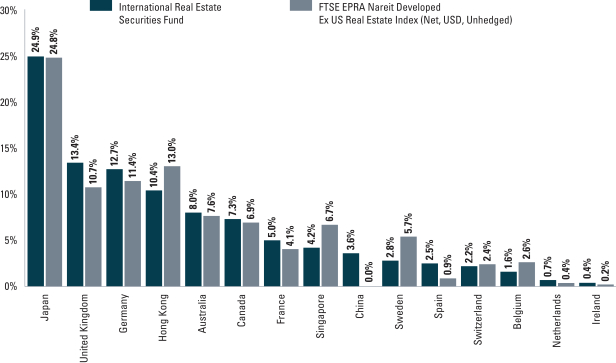
| 5 | | The Fund is actively managed and, as such, its composition may differ over time. Consequently, the Fund’s overall country allocations may differ from percentages contained in the graph above. The graph categorizes investments’ country of domicile as reported by Bloomberg; however, the country/grouping classifications used by the portfolio management team may differ from Bloomberg. The percentage shown for each country reflects the value of investments in that category as a percentage of market value. Figures in the above graph may not sum to 100% due to the exclusion of other assets and liabilities. |
For more information about your Fund, please refer to www.GSAMFUNDS.com. There, you can learn more about your Fund’s investment strategies, holdings, and performance.
4
FUND BASICS
Real Estate Securities Fund
as of June 30, 2021
| | | | | | | | | | |
| | PERFORMANCE REVIEW | |
| | | |
| | | January 1, 2021–June 30, 2021 | | Fund Total Return
(based on NAV)1 | | | Wilshire U.S. Real Estate
Securities Index2 | |
| | | |
| | Class A | | | 22.21 | % | | | 22.70 | % |
| | Class C | | | 22.66 | | | | 22.70 | |
| | Institutional | | | 22.42 | | | | 22.70 | |
| | Service | | | 22.13 | | | | 22.70 | |
| | Investor | | | 22.29 | | | | 22.70 | |
| | Class R6 | | | 22.42 | | | | 22.70 | |
| | Class R | | | 22.02 | | | | 22.70 | |
| | | Class P | | | 22.45 | | | | 22.70 | |
| 1 | | The net asset value (“NAV”) represents the net assets of the class of the Fund (ex-dividend) divided by the total number of shares of the class outstanding. The Fund’s performance reflects the reinvestment of dividends and other distributions. The Fund’s performance does not reflect the deduction of any applicable sales charges. |
| 2 | | The Wilshire U.S. Real Estate Securities Index is an unmanaged market capitalization-weighted index comprised of publicly traded REITs and real estate operating companies. The figures do not reflect any fees or expenses. It is not possible to invest directly in an index. |
The returns set forth in the table above represent past performance. Past performance does not guarantee future results. The Fund’s investment return and principal value will fluctuate so that an investor’s shares, when redeemed, may be worth more or less than their original cost. Current performance may be lower or higher than the performance quoted above. Please visit our web site at www.GSAMFUNDS.com to obtain the most recent month-end returns. Performance reflects applicable fee waivers and/or expense limitations in effect during the periods shown. In their absence, performance would be reduced. Returns do not reflect the deduction of taxes that a shareholder would pay on Fund distributions or the redemption of Fund shares.
| | | | | | | | |
| | TOP TEN HOLDINGS AS OF 6/30/213 |
| | | |
| | | Holding | | % of Total Net Assets | | | Subsectors |
| | | |
| | Prologis, Inc. (REIT) | | | 8.3 | % | | Industrial |
| | Public Storage (REIT) | | | 7.0 | | | Specialized |
| | Equinix, Inc. (REIT) | | | 6.9 | | | Specialized |
| | Simon Property Group, Inc. (REIT) | | | 5.2 | | | Retail |
| | Digital Realty Trust, Inc. (REIT) | | | 4.5 | | | Specialized |
| | AvalonBay Communities, Inc. (REIT) | | | 4.5 | | | Residential |
| | Alexandria Real Estate Equities, Inc. (REIT) | | | 3.7 | | | Office |
| | Invitation Homes, Inc. (REIT) | | | 3.5 | | | Residential |
| | Essex Property Trust, Inc. (REIT) | | | 3.5 | | | Residential |
| | | Duke Realty Corp. (REIT) | | | 3.1 | | | Industrial |
| 3 | | The top 10 holdings may not be representative of the Fund’s future investments. |
5
FUND BASICS
|
| FUND VS. BENCHMARK SECTOR ALLOCATION4 |
|
| As of June 30, 2021 |
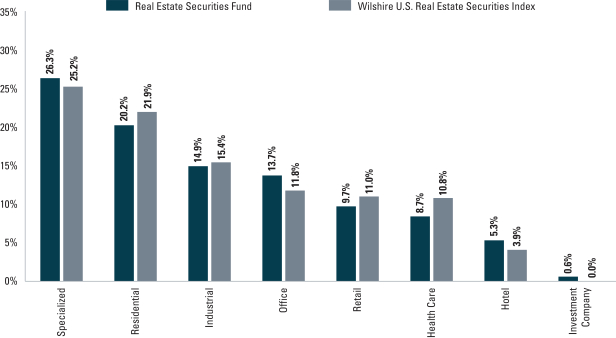
| 4 | | The Fund is actively managed and, as such, its composition may differ over time. Consequently, the Fund’s overall sector allocations may differ from percentages contained in the graph above. The graph categorizes investments using Global Industry Classification Standard (“GICS”); however, the sector classifications used by the portfolio management team may differ from GICS. The percentage shown for each investment category reflects the value of investments in that category as a percentage of market value. Figures in the above graph may not sum to 100% due to the exclusion of other assets and liabilities. |
For more information about your Fund, please refer to www.GSAMFUNDS.com. There, you can learn more about your Fund’s investment strategies, holdings, and performance.
6
GOLDMAN SACHS GLOBAL REAL ESTATE SECURITIES FUND
Schedule of Investments
June 30, 2021 (Unaudited)
| | | | | | | | |
| Shares | | | Description | |
Value | |
|
| Common Stocks – 98.6% | |
| Australia – 3.6% | |
| | 85,697 | | | Goodman Group (REIT) (Industrial) | | $ | 1,356,213 | |
| | 389,694 | | | Ingenia Communities Group (REIT) (Residential) | | | 1,789,078 | |
| | 184,065 | | | NEXTDC Ltd. (Internet Services & Infrastructure)* | | | 1,637,938 | |
| | 581,479 | | | Scentre Group (REIT) (Retail) | | | 1,189,893 | |
| | | | | | | | |
| | | | | | | 5,973,122 | |
| | |
| Belgium – 1.0% | |
| | 42,519 | | | Warehouses De Pauw CVA (REIT) (Industrial) | | | 1,624,201 | |
| | |
| Canada – 2.9% | |
| | 47,457 | | | Canadian Apartment Properties REIT (REIT) (Residential) | | | 2,225,073 | |
| | 138,687 | | | Chartwell Retirement Residences (Health Care) | | | 1,482,416 | |
| | 72,636 | | | Summit Industrial Income REIT (REIT) (Industrial) | | | 1,041,257 | |
| | | | | | | | |
| | | | | | | 4,748,746 | |
| | |
| China – 2.2% | |
| | 16,932 | | | GDS Holdings Ltd. ADR (Internet Services & Infrastructure)* | | | 1,328,993 | |
| | 2,314,000 | | | Shangri-La Asia Ltd. (Hotel)* | | | 2,265,052 | |
| | | | | | | | |
| | | | | | | 3,594,045 | |
| | |
| France – 2.0% | |
| | 14,484 | | | Gecina SA (REIT) (Diversified) | | | 2,219,119 | |
| | 46,054 | | | Klepierre SA (REIT) (Retail) | | | 1,186,524 | |
| | | | | | | | |
| | | | | | | 3,405,643 | |
| | |
| Germany – 5.0% | |
| | 97,489 | | | alstria office REIT-AG (REIT) (Office) | | | 1,801,230 | |
| | 24,493 | | | Instone Real Estate Group AG (Real Estate Development)(a) | | | 737,446 | |
| | 90,804 | | | Vonovia SE (Real Estate Operating Companies) | | | 5,868,257 | |
| | | | | | | | |
| | | | | | | 8,406,933 | |
| | |
| Hong Kong – 3.9% | |
| | 284,500 | | | CK Asset Holdings Ltd. (Real Estate Development) | | | 1,958,218 | |
| | 206,700 | | | Link REIT (REIT) (Retail) | | | 1,999,893 | |
| | 865,000 | | | Swire Properties Ltd. (Real Estate Operating Companies) | | | 2,576,556 | |
| | | | | | | | |
| | | | | | | 6,534,667 | |
| | |
| Ireland – 0.4% | |
| | 147,016 | | | Dalata Hotel Group plc (Hotel)* | | | 669,973 | |
| | |
| Japan – 10.8% | |
| | 1,136 | | | Hulic Reit, Inc. (REIT) (Diversified) | | | 1,911,946 | |
| | 1,466 | | | Japan Metropolitan Fund Invest (REIT) (Retail) | | | 1,589,101 | |
| | |
|
| Common Stocks – (continued) | |
| Japan – (continued) | |
| | 126,200 | | | Keihanshin Building Co. Ltd. (Real Estate Operating Companies) | | | 1,546,884 | |
| | 217 | | | Kenedix Office Investment Corp. (REIT) (Office) | | | 1,528,287 | |
| | 276 | | | Kenedix Retail REIT Corp. (REIT) (Retail) | | | 746,330 | |
| | 174,800 | | | Mitsubishi Estate Co. Ltd. (Diversified) | | | 2,825,393 | |
| | 89,500 | | | Mitsui Fudosan Co. Ltd. (Diversified) | | | 2,069,569 | |
| | 259 | | | Mitsui Fudosan Logistics Park, Inc. (REIT) (Industrial) | | | 1,380,152 | |
| | 154 | | | Nippon Prologis REIT, Inc. (REIT) (Industrial) | | | 489,738 | |
| | 23,000 | | | Open House Co. Ltd. (Homebuilding) | | | 1,080,764 | |
| | 746 | | | Sankei Real Estate, Inc. (REIT) (Office) | | | 896,240 | |
| | 1,386 | | | United Urban Investment Corp. (REIT) (Diversified) | | | 2,001,792 | |
| | | | | | | | |
| | | | | | | 18,066,196 | |
| | |
| Netherlands – 0.7% | |
| | 57,502 | | | CTP NV (Real Estate Operating Companies)*(a) | | | 1,160,503 | |
| | |
| Singapore – 1.6% | |
| | 732,600 | | | Ascendas India Trust (Real Estate Operating Companies) | | | 757,990 | |
| | 561,900 | | | Ascendas REIT (REIT) (Industrial) | | | 1,234,786 | |
| | 2,227,400 | | | ESR-REIT (REIT) (Industrial) | | | 680,112 | |
| | | | | | | | |
| | | | | | | 2,672,888 | |
| | |
| Spain – 1.5% | |
| | 20,873 | | | Cellnex Telecom SA (Integrated Telecommunication Services)(a) | | | 1,331,307 | |
| | 114,018 | | | Merlin Properties Socimi SA (REIT) (Diversified) | | | 1,179,729 | |
| | | | | | | | |
| | | | | | | 2,511,036 | |
| | |
| Sweden – 1.3% | |
| | 83,933 | | | Castellum AB (Real Estate Operating Companies)(b) | | | 2,137,029 | |
| | |
| United Kingdom – 5.6% | |
| | 68,063 | | | Big Yellow Group plc (REIT) (Specialized) | | | 1,229,448 | |
| | 378,811 | | | Capital & Counties Properties plc (REIT) (Retail)* | | | 846,310 | |
| | 19,941 | | | Derwent London plc (REIT) (Office) | | | 914,675 | |
| | 198,726 | | | Segro plc (REIT) (Industrial) | | | 3,008,370 | |
| | 1,033,043 | | | Tritax EuroBox plc (Diversified)(a) | | | 1,538,513 | |
| | 115,760 | | | UNITE Group plc (The) (REIT) (Residential) | | | 1,719,805 | |
| | | | | | | | |
| | | | | | | 9,257,121 | |
| | |
| United States – 56.1% | |
| | 22,654 | | | Alexandria Real Estate Equities, Inc. (REIT) (Office) | | | 4,121,669 | |
| | |
| | |
| The accompanying notes are an integral part of these financial statements. | | 7 |
GOLDMAN SACHS GLOBAL REAL ESTATE SECURITIES FUND
Schedule of Investments (continued)
June 30, 2021 (Unaudited)
| | | | | | | | |
| Shares | | | Description | |
Value | |
|
| Common Stocks – (continued) | |
| United States – (continued) | |
| | 9,605 | | | American Tower Corp. (REIT) (Specialized) | | $ | 2,594,695 | |
| | 35,213 | | | Americold Realty Trust (REIT) (Industrial) | | | 1,332,812 | |
| | 21,919 | | | AvalonBay Communities, Inc. (REIT) (Residential) | | | 4,574,276 | |
| | 18,777 | | | Boston Properties, Inc. (REIT) (Office) | | | 2,151,656 | |
| | 21,930 | | | Camden Property Trust (REIT) (Residential) | | | 2,909,453 | |
| | 11,039 | | | CoreSite Realty Corp. (REIT) (Specialized) | | | 1,485,849 | |
| | 33,907 | | | Cousins Properties, Inc. (REIT) (Office) | | | 1,247,099 | |
| | 59,673 | | | CubeSmart (REIT) (Specialized) | | | 2,764,053 | |
| | 25,182 | | | Digital Realty Trust, Inc. (REIT) (Specialized) | | | 3,788,884 | |
| | 59,721 | | | Duke Realty Corp. (REIT) (Industrial) | | | 2,827,789 | |
| | 13,791 | | | EastGroup Properties, Inc. (REIT) (Industrial) | | | 2,267,930 | |
| | 1,245 | | | Equinix, Inc. (REIT) (Specialized) | | | 999,237 | |
| | 39,366 | | | Equity LifeStyle Properties, Inc. (REIT) (Residential) | | | 2,925,287 | |
| | 16,087 | | | Equity Residential (REIT) (Residential) | | | 1,238,699 | |
| | 10,548 | | | Essex Property Trust, Inc. (REIT) (Residential) | | | 3,164,505 | |
| | 15,356 | | | Federal Realty Investment Trust (REIT) (Retail) | | | 1,799,263 | |
| | 88,007 | | | Healthpeak Properties, Inc. (REIT) (Health Care) | | | 2,929,753 | |
| | 22,664 | | | Highwoods Properties, Inc. (REIT) (Office) | | | 1,023,733 | |
| | 159,958 | | | Host Hotels & Resorts, Inc. (REIT) (Hotel)* | | | 2,733,682 | |
| | 37,640 | | | Hudson Pacific Properties, Inc. (REIT) (Office) | | | 1,047,145 | |
| | 101,426 | | | Invitation Homes, Inc. (REIT) (Residential) | | | 3,782,176 | |
| | 15,936 | | | Kilroy Realty Corp. (REIT) (Office) | | | 1,109,783 | |
| | 22,668 | | | MGM Growth Properties LLC Class A (REIT) (Hotel) | | | 830,102 | |
| | 38,976 | | | Pebblebrook Hotel Trust (REIT) (Hotel) | | | 917,885 | |
| | 54,165 | | | Prologis, Inc. (REIT) (Industrial) | | | 6,474,342 | |
| | 24,595 | | | Public Storage (REIT) (Specialized) | | | 7,395,472 | |
| | 19,298 | | | Realty Income Corp. (REIT) (Retail) | | | 1,287,949 | |
| | 37,704 | | | Regency Centers Corp. (REIT) (Retail) | | | 2,415,695 | |
| | 68,105 | | | RLJ Lodging Trust (REIT) (Hotel) | | | 1,037,239 | |
| | 12,533 | | | Ryman Hospitality Properties, Inc. (REIT) (Hotel)* | | | 989,606 | |
| | 4,574 | | | SBA Communications Corp. (REIT) (Specialized) | | | 1,457,734 | |
| | 37,692 | | | Simon Property Group, Inc. (REIT) (Retail) | | | 4,918,052 | |
| | 56,509 | | | SITE Centers Corp. (REIT) (Retail) | | | 851,026 | |
| | 20,904 | | | STORE Capital Corp. (REIT) (Diversified) | | | 721,397 | |
| | 4,860 | | | Sun Communities, Inc. (REIT) (Residential) | | | 833,004 | |
| | |
|
| Common Stocks – (continued) | |
| United States – (continued) | |
| | 16,431 | | | Terreno Realty Corp. (REIT) (Industrial) | | | 1,060,128 | |
| | 53,333 | | | Ventas, Inc. (REIT) (Health Care) | | | 3,045,314 | |
| | 20,786 | | | Vornado Realty Trust (REIT) (Office) | | | 970,083 | |
| | 33,088 | | | Welltower, Inc. (REIT) (Health Care) | | | 2,749,613 | |
| | 8,988 | | | WP Carey, Inc. (REIT) (Diversified) | | | 670,685 | |
| | | | | | | | |
| | | | | | | 93,444,754 | |
| | |
| | TOTAL COMMON STOCKS | |
| | (Cost $127,160,594) | | $ | 164,206,857 | |
| | |
| | | | | | | | |
| Shares | | | Dividend Rate | | Value | |
|
| Investment Company(c) – 1.0% | |
| Goldman Sachs Financial Square Government Fund –
Institutional Shares |
|
| | 1,592,735 | | | 0.026% | | $ | 1,592,735 | |
| (Cost $1,592,735) | |
| | |
| TOTAL INVESTMENTS BEFORE SECURITIES LENDING
REINVESTMENT VEHICLE |
|
| | (Cost $128,753,329) | | $ | 165,799,592 | |
| | |
| | | | | | | | |
|
| Securities Lending Reinvestment Vehicle(c) – 0.9% | |
| Goldman Sachs Financial Square Government Fund –
Institutional Shares |
|
| | 1,541,853 | | | 0.026% | | $ | 1,541,853 | |
| (Cost $1,541,853) | |
| | |
| | TOTAL INVESTMENTS – 100.5% | |
| | (Cost $130,295,182) | | $ | 167,341,445 | |
| | |
| LIABILITIES IN EXCESS OF
OTHER ASSETS – (0.5)% | | | (757,617 | ) |
| | |
| | NET ASSETS – 100.0% | | $ | 166,583,828 | |
| | |
| | |
|
| The percentage shown for each investment category reflects the value of investments in that category as a percentage of net assets. |
| |
* | | Security is currently in default and/or non-income producing. |
| |
(a) | | Exempt from registration under Rule 144A of the Securities Act of 1933. |
| |
(b) | | All or a portion of security is on loan. |
| |
(c) | | Represents an Affiliated Issuer. |
| | | | |
|
Investment Abbreviations: |
ADR | | —American Depositary Receipt |
CVA | | —Dutch Certification |
REIT | | —Real Estate Investment Trust |
|
| | |
| 8 | | The accompanying notes are an integral part of these financial statements. |
GOLDMAN SACHS INTERNATIONAL REAL ESTATE SECURITIES FUND
Schedule of Investments
June 30, 2021 (Unaudited)
| | | | | | | | |
| Shares | | | Description | |
Value | |
|
| Common Stocks – 99.7% | |
| Australia – 8.0% | |
| | 82,836 | | | Goodman Group (REIT) (Industrial) | | $ | 1,310,936 | |
| | 254,738 | | | Ingenia Communities Group (REIT) (Residential) | | | 1,169,497 | |
| | 96,687 | | | Mirvac Group (REIT) (Diversified) | | | 210,812 | |
| | 75,284 | | | NEXTDC Ltd. (Internet Services & Infrastructure)* | | | 669,929 | |
| | 359,974 | | | Scentre Group (REIT) (Retail) | | | 736,623 | |
| | | | | | | | |
| | | | | | | 4,097,797 | |
| | |
| Belgium – 1.6% | |
| | 21,813 | | | Warehouses De Pauw CVA (REIT) (Industrial) | | | 833,244 | |
| | |
| Canada – 7.3% | |
| | 22,286 | | | Allied Properties REIT (REIT) (Office) | | | 809,926 | |
| | 27,826 | | | Canadian Apartment Properties REIT (REIT) (Residential) | | | 1,304,652 | |
| | 52,418 | | | Chartwell Retirement Residences (Health Care) | | | 560,292 | |
| | 72,388 | | | Summit Industrial Income REIT (REIT) (Industrial) | | | 1,037,702 | |
| | | | | | | | |
| | | | | | | 3,712,572 | |
| | |
| China – 3.6% | |
| | 7,381 | | | GDS Holdings Ltd. ADR (Internet Services & Infrastructure)* | | | 579,335 | |
| | 1,268,000 | | | Shangri-La Asia Ltd. (Hotel)* | | | 1,241,178 | |
| | | | | | | | |
| | | | | | | 1,820,513 | |
| | |
| France – 5.0% | |
| | 9,958 | | | Gecina SA (REIT) (Diversified) | | | 1,525,682 | |
| | 39,341 | | | Klepierre SA (REIT) (Retail) | | | 1,013,572 | |
| | | | | | | | |
| | | | | | | 2,539,254 | |
| | |
| Germany – 12.7% | |
| | 69,596 | | | alstria office REIT-AG (REIT) (Office) | | | 1,285,872 | |
| | 14,237 | | | Instone Real Estate Group AG (Real Estate Development)(a) | | | 428,654 | |
| | 73,895 | | | Vonovia SE (Real Estate Operating Companies) | | | 4,775,504 | |
| | | | | | | | |
| | | | | | | 6,490,030 | |
| | |
| Hong Kong – 10.4% | |
| | 248,000 | | | CK Asset Holdings Ltd. (Real Estate Development) | | | 1,706,988 | |
| | 162,400 | | | Link REIT (REIT) (Retail) | | | 1,571,275 | |
| | 56,975 | | | Sun Hung Kai Properties Ltd. (Diversified) | | | 846,760 | |
| | 401,000 | | | Swire Properties Ltd. (Real Estate Operating Companies) | | | 1,194,450 | |
| | | | | | | | |
| | | | | | | 5,319,473 | |
| | |
| Ireland – 0.4% | |
| | 49,499 | | | Dalata Hotel Group plc (Hotel)* | | | 225,574 | |
| | |
|
| Common Stocks – (continued) | |
| Japan – 24.9% | |
| | 101 | | | Comforia Residential REIT, Inc. (REIT) (Residential) | | | 318,164 | |
| | 766 | | | GLP J-REIT (REIT) (Industrial) | | | 1,321,082 | |
| | 459 | | | Hulic Reit, Inc. (REIT) (Diversified) | | | 772,521 | |
| | 667 | | | Japan Metropolitan Fund Invest (REIT) (Retail) | | | 723,008 | |
| | 45,300 | | | Keihanshin Building Co. Ltd. (Real Estate Operating Companies) | | | 555,260 | |
| | 97 | | | Kenedix Office Investment Corp. (REIT) (Office) | | | 683,151 | |
| | 163 | | | Kenedix Retail REIT Corp. (REIT) (Retail) | | | 440,768 | |
| | 121,100 | | | Mitsubishi Estate Co. Ltd. (Diversified) | | | 1,957,409 | |
| | 69,400 | | | Mitsui Fudosan Co. Ltd. (Diversified) | | | 1,604,783 | |
| | 90 | | | Mitsui Fudosan Logistics Park, Inc. (REIT) (Industrial) | | | 479,590 | |
| | 170 | | | Nippon Prologis REIT, Inc. (REIT) (Industrial) | | | 540,620 | |
| | 10,400 | | | Open House Co. Ltd. (Homebuilding) | | | 488,693 | |
| | 495 | | | Sankei Real Estate, Inc. (REIT) (Office) | | | 594,690 | |
| | 24,500 | | | Sumitomo Realty & Development Co. Ltd. (Diversified) | | | 876,237 | |
| | 959 | | | United Urban Investment Corp. (REIT) (Diversified) | | | 1,385,078 | |
| | | | | | | | |
| | | | | | | 12,741,054 | |
| | |
| Netherlands – 0.7% | |
| | 18,081 | | | CTP NV (Real Estate Operating Companies)*(a) | | | 364,910 | |
| | |
| Singapore – 4.2% | |
| | 441,000 | | | Ascendas India Trust (Real Estate Operating Companies) | | | 456,284 | |
| | 264,900 | | | Ascendas REIT (REIT) (Industrial) | | | 582,123 | |
| | 70,925 | | | CapitaLand Ltd. (Diversified) | | | 195,911 | |
| | 1,078,200 | | | ESR-REIT (REIT) (Industrial) | | | 329,217 | |
| | 318,000 | | | Keppel DC REIT (REIT) (Specialized) | | | 589,383 | |
| | | | | | | | |
| | | | | | | 2,152,918 | |
| | |
| Spain – 2.5% | |
| | 10,940 | | | Cellnex Telecom SA (Integrated Telecommunication Services)(a) | | | 697,767 | |
| | 58,662 | | | Merlin Properties Socimi SA (REIT) (Diversified) | | | 606,968 | |
| | | | | | | | |
| | | | | | | 1,304,735 | |
| | |
| Sweden – 2.8% | |
| | 56,941 | | | Castellum AB (Real Estate Operating Companies) | | | 1,449,782 | |
| | |
| Switzerland – 2.2% | |
| | 8,923 | | | PSP Swiss Property AG (Registered) (Real Estate Operating Companies) | | | 1,133,033 | |
| | |
| United Kingdom – 13.4% | |
| | 59,655 | | | Big Yellow Group plc (REIT) (Specialized) | | | 1,077,571 | |
| | |
| | |
| The accompanying notes are an integral part of these financial statements. | | 9 |
GOLDMAN SACHS INTERNATIONAL REAL ESTATE SECURITIES FUND
Schedule of Investments (continued)
June 30, 2021 (Unaudited)
| | | | | | | | |
| Shares | | | Description | |
Value | |
|
| Common Stocks – (continued) | |
| United Kingdom – (continued) | |
| | 165,480 | | | Capital & Counties Properties plc (REIT) (Retail)* | | $ | 369,703 | |
| | 18,120 | | | Derwent London plc (REIT) (Office) | | | 831,148 | |
| | 125,183 | | | Segro plc (REIT) (Industrial) | | | 1,895,055 | |
| | 267,632 | | | Tritax Big Box REIT plc (REIT) (Industrial) | | | 727,147 | |
| | 542,630 | | | Tritax EuroBox plc (Diversified)(a) | | | 808,140 | |
| | 75,962 | | | UNITE Group plc (The) (REIT) (Residential) | | | 1,128,540 | |
| | | | | | | | |
| | | | | | | 6,837,304 | |
| | |
| | TOTAL COMMON STOCKS | |
| | (Cost $46,861,192) | | $ | 51,022,193 | |
| | |
| | | | | | | | |
| Shares | | | Dividend Rate | | Value | |
|
| Investment Company(b) – 0.0% | |
| Goldman Sachs Financial Square Government Fund –
Institutional Shares |
|
| | 13 | | | 0.026% | | $ | 13 | |
| | (Cost $13) | |
| | |
| | TOTAL INVESTMENTS – 99.7% | |
| | (Cost $46,861,205) | | $ | 51,022,206 | |
| | |
| OTHER ASSETS IN EXCESS OF
LIABILITIES – 0.3% | | | 152,406 | |
| | |
| | NET ASSETS – 100.0% | | $ | 51,174,612 | |
| | |
| | |
|
| The percentage shown for each investment category reflects the value of investments in that category as a percentage of net assets. |
| |
* | | Security is currently in default and/or non-income producing. |
| |
(a) | | Exempt from registration under Rule 144A of the Securities Act of 1933. |
| |
(b) | | Represents an Affiliated Issuer. |
| | | | |
|
Investment Abbreviations: |
ADR | | —American Depositary Receipt |
CVA | | —Dutch Certification |
REIT | | —Real Estate Investment Trust |
|
| | |
| 10 | | The accompanying notes are an integral part of these financial statements. |
GOLDMAN SACHS REAL ESTATE SECURITIES FUND
Schedule of Investments
June 30, 2021 (Unaudited)
| | | | | | | | |
| Shares | | | Description | |
Value | |
|
| Common Stocks – 98.8% | |
| Health Care – 8.7% | |
| | 125,237 | | | Healthpeak Properties, Inc. (REIT) | | $ | 4,169,140 | |
| | 82,022 | | | Ventas, Inc. (REIT) | | | 4,683,456 | |
| | 58,219 | | | Welltower, Inc. (REIT) | | | 4,837,999 | |
| | | | | | | | |
| | | | | | | 13,690,595 | |
| | |
| Hotel – 5.3% | |
| | 261,497 | | | Host Hotels & Resorts, Inc. (REIT)* | | | 4,468,984 | |
| | 53,566 | | | Pebblebrook Hotel Trust (REIT) | | | 1,261,479 | |
| | 63,055 | | | RLJ Lodging Trust (REIT) | | | 960,328 | |
| | 21,868 | | | Ryman Hospitality Properties, Inc. (REIT)* | | | 1,726,697 | |
| | | | | | | | |
| | | | | | | 8,417,488 | |
| | |
| Industrial – 14.9% | |
| | 25,611 | | | Americold Realty Trust (REIT) | | | 969,376 | |
| | 103,926 | | | Duke Realty Corp. (REIT) | | | 4,920,896 | |
| | 19,760 | | | EastGroup Properties, Inc. (REIT) | | | 3,249,532 | |
| | 109,224 | | | Prologis, Inc. (REIT) | | | 13,055,545 | |
| | 19,843 | | | Terreno Realty Corp. (REIT) | | | 1,280,270 | |
| | | | | | | | |
| | | | | | | 23,475,619 | |
| | |
| Office – 13.7% | |
| | 32,371 | | | Alexandria Real Estate Equities, Inc. (REIT) | | | 5,889,580 | |
| | 37,024 | | | Boston Properties, Inc. (REIT) | | | 4,242,580 | |
| | 72,695 | | | Cousins Properties, Inc. (REIT) | | | 2,673,722 | |
| | 60,207 | | | Highwoods Properties, Inc. (REIT) | | | 2,719,550 | |
| | 63,686 | | | Hudson Pacific Properties, Inc. (REIT) | | | 1,771,745 | |
| | 36,656 | | | Kilroy Realty Corp. (REIT) | | | 2,552,724 | |
| | 40,426 | | | Vornado Realty Trust (REIT) | | | 1,886,681 | |
| | | | | | | | |
| | | | | | | 21,736,582 | |
| | |
| Residential – 20.2% | |
| | 33,803 | | | AvalonBay Communities, Inc. (REIT) | | | 7,054,348 | |
| | 29,527 | | | Camden Property Trust (REIT) | | | 3,917,347 | |
| | 58,301 | | | Equity LifeStyle Properties, Inc. (REIT) | | | 4,332,347 | |
| | 40,432 | | | Equity Residential (REIT) | | | 3,113,264 | |
| | 18,268 | | | Essex Property Trust, Inc. (REIT) | | | 5,480,583 | |
| | 148,695 | | | Invitation Homes, Inc. (REIT) | | | 5,544,837 | |
| | 13,740 | | | Sun Communities, Inc. (REIT) | | | 2,355,036 | |
| | | | | | | | |
| | | | | | | 31,797,762 | |
| | |
| Retail – 9.7% | |
| | 21,807 | | | Federal Realty Investment Trust (REIT) | | | 2,555,126 | |
| | 48,780 | | | Regency Centers Corp. (REIT) | | | 3,125,335 | |
| | 63,036 | | | Simon Property Group, Inc. (REIT) | | | 8,224,937 | |
| | 90,786 | | | SITE Centers Corp. (REIT) | | | 1,367,237 | |
| | | | | | | | |
| | | | | | | 15,272,635 | |
| | |
| Specialized – 26.3% | |
| | 10,254 | | | American Tower Corp. (REIT) | | | 2,770,016 | |
| | 17,282 | | | CoreSite Realty Corp. (REIT) | | | 2,326,157 | |
| | 75,145 | | | CubeSmart (REIT) | | | 3,480,716 | |
| | 47,286 | | | Digital Realty Trust, Inc. (REIT) | | | 7,114,652 | |
| | 13,628 | | | Equinix, Inc. (REIT) | | | 10,937,833 | |
| | 12,338 | | | Extra Space Storage, Inc. (REIT) | | | 2,021,211 | |
| | |
|
| Common Stocks – (continued) | |
| Specialized – (continued) | |
| | 36,489 | | | Public Storage (REIT) | | | 10,971,877 | |
| | 5,371 | | | SBA Communications Corp. (REIT) | | | 1,711,738 | |
| | | | | | | | |
| | | | | | | 41,334,200 | |
| | |
| | TOTAL COMMON STOCKS | |
| | (Cost $104,251,841) | | $ | 155,724,881 | |
| | |
| | | | | | | | |
| Shares | | | Dividend
Rate | | Value | |
|
| Investment Company(a) – 0.6% | |
| Goldman Sachs Financial Square Government Fund –
Institutional Shares |
|
| | 949,036 | | | 0.026% | | $ | 949,036 | |
| | (Cost $949,036) | |
| | |
| | TOTAL INVESTMENTS – 99.4% | |
| | (Cost $105,200,877) | | $ | 156,673,917 | |
| | |
| OTHER ASSETS IN EXCESS OF
LIABILITIES – 0.6% | | | 906,461 | |
| | |
| | NET ASSETS – 100.0% | | $ | 157,580,378 | |
| | |
| | |
|
| The percentage shown for each investment category reflects the value of investments in that category as a percentage of net assets. |
| |
* | | Security is currently in default and/or non-income producing. |
| |
(a) | | Represents an Affiliated Issuer. |
| | |
|
Investment Abbreviation: |
REIT | | —Real Estate Investment Trust |
|
| | |
| The accompanying notes are an integral part of these financial statements. | | 11 |
GOLDMAN SACHS REAL ESTATE SECURITIES FUNDS
Statements of Assets and Liabilities
June 30, 2021 (Unaudited)
| | | | | | | | | | | | | | |
| | | | | Global Real Estate
Securities Fund | | | International
Real Estate
Securities Fund | | | Real Estate
Securities Fund | |
| | Assets: | |
| | Investments in unaffiliated issuers, at value (cost $127,160,594, $46,861,192 and $104,251,841)(a) | | $ | 164,206,857 | | | $ | 51,022,193 | | | $ | 155,724,881 | |
| | Investments in affiliated issuers, at value (cost $1,592,735, $13 and $949,036) | | | 1,592,735 | | | | 13 | | | | 949,036 | |
| | Investments in affiliated securities lending reinvestment vehicle, at value (cost $1,541,853, $0 and $0) | | | 1,541,853 | | | | — | | | | — | |
| | Cash | | | 571,353 | | | | 32,938 | | | | 682,512 | |
| | Foreign currencies, at value (cost $121,606, $153,663 and $0) | | | 121,209 | | | | 151,028 | | | | — | |
| | Receivables: | | | | | | | | | | | | |
| | Due from custodian | | | 838,128 | | | | — | | | | — | |
| | Dividends | | | 423,012 | | | | 81,638 | | | | 448,881 | |
| | Foreign tax reclaims | | | 146,532 | | | | 74,914 | | | | — | |
| | Fund shares sold | | | 90,000 | | | | — | | | | 61,715 | |
| | Reimbursement from investment adviser | | | 34,091 | | | | 31,547 | | | | 32,433 | |
| | Securities lending income | | | 257 | | | | 51 | | | | — | |
| | Due from broker | | | — | | | | 34,836 | | | | — | |
| | Other assets | | | 38,986 | | | | 38,175 | | | | 47,170 | |
| | Total assets | | | 169,605,013 | | | | 51,467,333 | | | | 157,946,628 | |
| | | | | | | | | | | | | | |
| | Liabilities: | |
| | Payables: | | | | | | | | | | | | |
| | Payable upon return of securities loaned | | | 1,541,853 | | | | — | | | | — | |
| | Investments purchased | | | 838,112 | | | | — | | | | — | |
| | Fund shares redeemed | | | 305,558 | | | | 6,680 | | | | 47,980 | |
| | Management fees | | | 129,318 | | | | 41,167 | | | | 113,860 | |
| | Distribution and Service fees and Transfer Agency fees | | | 4,297 | | | | 2,076 | | | | 13,559 | |
| | Accrued expenses | | | 202,047 | | | | 242,798 | | | | 190,851 | |
| | Total liabilities | | | 3,021,185 | | | | 292,721 | | | | 366,250 | |
| | | | | | | | | | | | | | |
| | Net Assets: | |
| | Paid-in capital | | | 136,939,210 | | | | 59,838,418 | | | | 98,342,503 | |
| | Total distributable earnings (loss) | | | 29,644,618 | | | | (8,663,806 | ) | | | 59,237,875 | |
| | | NET ASSETS | | $ | 166,583,828 | | | $ | 51,174,612 | | | $ | 157,580,378 | |
| | | Net Assets: | | | | | | | | | | | | |
| | | Class A | | $ | 77,018 | | | $ | 2,150,231 | | | $ | 21,412,812 | |
| | | Class C | | | 57,808 | | | | 30,219 | | | | 1,246,662 | |
| | | Institutional | | | 2,579,200 | | | | 5,756,740 | | | | 37,401,082 | |
| | | Service | | | — | | | | — | | | | 863,758 | |
| | | Investor | | | 36,530 | | | | 73,741 | | | | 2,590,057 | |
| | | Class R6 | | | 116,066,360 | | | | 77,149 | | | | 452,372 | |
| | | Class R | | | 35,480 | | | | — | | | | 947,796 | |
| | | Class P | | | 47,731,432 | | | | 43,086,532 | | | | 92,665,839 | |
| | | Total Net Assets | | $ | 166,583,828 | | | $ | 51,174,612 | | | $ | 157,580,378 | |
| | | Shares outstanding $0.001 par value (unlimited shares authorized): | | | | | | | | | | | | |
| | | Class A | | | 6,546 | | | | 313,954 | | | | 1,598,635 | |
| | | Class C | | | 4,951 | | | | 4,369 | | | | 99,699 | |
| | | Institutional | | | 219,137 | | | | 871,515 | | | | 2,664,819 | |
| | | Service | | | — | | | | — | | | | 63,777 | |
| | | Investor | | | 3,111 | | | | 10,867 | | | | 190,724 | |
| | | Class R6 | | | 9,880,752 | | | | 11,693 | | | | 32,229 | |
| | | Class R | | | 3,028 | | | | — | | | | 71,876 | |
| | | Class P | | | 4,065,842 | | | | 6,539,090 | | | | 6,606,488 | |
| | | Net asset value, offering and redemption price per share:(b) | | | | | | | | | | | | |
| | | Class A | | | $11.77 | | | | $6.85 | | | | $13.39 | |
| | | Class C | | | 11.68 | | | | 6.92 | | | | 12.50 | |
| | | Institutional | | | 11.77 | | | | 6.61 | | | | 14.04 | |
| | | Service | | | — | | | | — | | | | 13.54 | |
| | | Investor | | | 11.74 | | | | 6.79 | | | | 13.58 | |
| | | Class R6 | | | 11.75 | | | | 6.60 | | | | 14.04 | |
| | | Class R | | | 11.72 | | | | — | | | | 13.19 | |
| | | Class P | | | 11.74 | | | | 6.59 | | | | 14.03 | |
| | (a) | | Includes loaned securities having a market value of $1,433,095 for the Global Real Estate Securities Fund. |
| | (b) | | Maximum public offering price per share for Class A Shares of the Global Real Estate Securities, International Real Estate Securities and Real Estate Securities Funds is $12.46, $7.25 and $14.17, respectively. At redemption, Class C Shares may be subject to a contingent deferred sales charge assessed on the amount equal to the lesser of the current NAV or the original purchase price of the shares. |
| | |
| 12 | | The accompanying notes are an integral part of these financial statements. |
GOLDMAN SACHS REAL ESTATE SECURITIES FUNDS
Statements of Operations
For the Six Months Ended June 30, 2021 (Unaudited)
| | | | | | | | | | | | | | |
| | | | | Global Real Estate
Securities Fund | | | International
Real Estate
Securities Fund | | | Real Estate
Securities Fund | |
| | Investment income: | |
| | | | |
| | Dividends — unaffiliated issuers (net of foreign taxes withheld of $15,915, $50,836 and $0) | | $ | 2,052,865 | | | $ | 794,629 | | | $ | 1,407,964 | |
| | | | |
| | Securities lending income — affiliated issuer | | | 4,450 | | | | 1,855 | | | | — | |
| | | | |
| | Dividends — affiliated issuers | | | 171 | | | | 97 | | | | 242 | |
| | | | |
Other income | | | | | — | | | | 46,992 | | | | — | |
| | | | |
| | Total investment income | | | 2,057,486 | | | | 843,573 | | | | 1,408,206 | |
| | | | | | | | | | | | | | |
| | Expenses: | |
| | | | |
| | Management fees | | | 776,647 | | | | 242,640 | | | | 595,498 | |
| | | | |
| | Custody, accounting and administrative services | | | 62,676 | | | | 59,247 | | | | 47,930 | |
| | | | |
| | Registration fees | | | 55,974 | | | | 32,954 | | | | 48,697 | |
| | | | |
| | Professional fees | | | 55,431 | | | | 62,704 | | | | 51,225 | |
| | | | |
| | Transfer Agency fees(a) | | | 25,294 | | | | 9,321 | | | | 37,806 | |
| | | | |
| | Printing and mailing costs | | | 22,399 | | | | 17,513 | | | | 26,141 | |
| | | | |
| | Trustee fees | | | 9,542 | | | | 9,446 | | | | 9,498 | |
| | | | |
| | Distribution and Service (12b-1) fees(a) | | | 367 | | | | 2,707 | | | | 32,688 | |
| | | | |
| | Service fees — Class C | | | 67 | | | | 56 | | | | 1,583 | |
| | | | |
| | Shareholder administration fees — Service Shares | | | — | | | | — | | | | 1,144 | |
| | | | |
| | Other | | | 11,330 | | | | 23,654 | | | | 17,449 | |
| | | | |
| | Total expenses | | | 1,019,727 | | | | 460,242 | | | | 869,659 | |
| | | | |
| | Less — expense reductions | | | (214,826 | ) | | | (205,200 | ) | | | (199,351 | ) |
| | | | |
| | Net expenses | | | 804,901 | | | | 255,042 | | | | 670,308 | |
| | | | |
| | NET INVESTMENT INCOME | | | 1,252,585 | | | | 588,531 | | | | 737,898 | |
| | | | | | | | | | | | | | |
| | Realized and unrealized gain (loss): | |
| | | | |
| | Net realized gain (loss) from: | | | | | | | | | | | | |
| | | | |
| | Investments — unaffiliated issuers | | | 9,890,616 | | | | 1,615,025 | | | | 5,398,491 | |
| | | | |
| | Foreign currency transactions | | | (3,407 | ) | | | (5,504 | ) | | | — | |
| |
| | Net change in unrealized gain (loss) on: | |
| | | | |
| | Investments — unaffiliated issuers | | | 12,614,922 | | | | 1,817,369 | | | | 21,796,816 | |
| | | | |
| | Foreign currency translation | | | (11,495 | ) | | | (10,431 | ) | | | — | |
| | | | |
| | Net realized and unrealized gain | | | 22,490,636 | | | | 3,416,459 | | | | 27,195,307 | |
| | | | |
| | NET INCREASE IN NET ASSETS RESULTING FROM OPERATIONS | | $ | 23,743,221 | | | $ | 4,004,990 | | | $ | 27,933,205 | |
| | (a) | | Class specific Distribution and/or Service, and Transfer Agency fees were as follows: |
| | | | | | | | | | | | | | | | | | | | | | | | | | | | | | | | | | | | | | | | | | | | | | | | |
| | | Distribution and/or (12b-1) Service Fees | | | Transfer Agency Fees | |
Fund | | Class A | | | Class C | | | Service | | | Class R | | | Class A | | | Class C | | | Institutional | | | Service | | | Investor | | | Class R6 | | | Class R | | | Class P | |
Global Real Estate Securities | | $ | 86 | | | $ | 200 | | | $ | — | | | $ | 81 | | | $ | 55 | | | $ | 43 | | | $ | 476 | | | $ | — | | | $ | 27 | | | $ | 18,534 | | | $ | 26 | | | $ | 6,133 | |
International Real Estate Securities | | | 2,540 | | | | 167 | | | | — | | | | — | | | | 1,626 | | | | 36 | | | | 1,054 | | | | — | | | | 56 | | | | 8 | | | | — | | | | 6,541 | |
Real Estate Securities | | | 24,549 | | | | 4,750 | | | | 1,144 | | | | 2,245 | | | | 15,712 | | | | 1,013 | | | | 6,176 | | | | 183 | | | | 1,857 | | | | 101 | | | | 719 | | | | 12,045 | |
| | |
| The accompanying notes are an integral part of these financial statements. | | 13 |
GOLDMAN SACHS REAL ESTATE SECURITIES FUNDS
Statements of Changes in Net Assets
| | | | | | | | | | | | | | | | | | | | | | |
| | | | | Global Real Estate Securities Fund | | | | | | International Real Estate Securities Fund | |
| | | | | For the
Six Months Ended
June 30, 2021
(Unaudited) | | | For the Fiscal Year Ended
December 31, 2020 | | | | | | For the
Six Months Ended
June 30, 2021
(Unaudited) | | | For the Fiscal
Year Ended
December 31, 2020 | |
| | From operations: | |
| | | | | | |
| | Net investment income | | $ | 1,252,585 | | | $ | 2,879,734 | | | | | | | $ | 588,531 | | | $ | 1,121,046 | |
| | | | | | |
| | Net realized gain (loss) | | | 9,887,209 | | | | (10,696,841 | ) | | | | | | | 1,609,521 | | | | (2,625,472 | ) |
| | | | | | |
| | Net change in unrealized gain (loss) | | | 12,603,427 | | | | (9,358,626 | ) | | | | | | | 1,806,938 | | | | (4,726,434 | ) |
| | Net increase (decrease) in net assets resulting from operations | | | 23,743,221 | | | | (17,175,733 | ) | | | | | | | 4,004,990 | | | | (6,230,860 | ) |
| | | | | | | | | | | | | | | | | | | | | | |
| | Distributions to shareholders: | |
| | | | | | |
| | From distributable earnings: | | | | | | | | | | | | | | | | | | | | |
| | | | | | |
| | Class A Shares | | | (494 | ) | | | (609 | ) | | | | | | | (34,286 | ) | | | (15,239 | ) |
| | | | | | |
| | Class C Shares | | | (220 | ) | | | (383 | ) | | | | | | | (284 | ) | | | (232 | ) |
| | | | | | |
| | Institutional Shares | | | (20,554 | ) | | | (31,174 | ) | | | | | | | (104,566 | ) | | | (60,522 | ) |
| | | | | | |
| | Investor Shares | | | (272 | ) | | | (436 | ) | | | | | | | (1,264 | ) | | | (870 | ) |
| | | | | | |
| | Class R6 Shares | | | (970,439 | ) | | | (2,372,452 | ) | | | | | | | (1,411 | ) | | | (120 | ) |
| | | | | | |
| | Class R Shares | | | (188 | ) | | | (323 | ) | | | | | | | — | | | | — | |
| | | | | | |
| | Class P Shares | | | (377,251 | ) | | | (453,308 | ) | | | | | | | (788,584 | ) | | | (532,922 | ) |
| | | | | | |
| | Return of capital | | | | | | | | | | | | | | | | | | | | |
| | | | | | |
| | Class A Shares | | | — | | | | (36 | ) | | | | | | | — | | | | — | |
| | | | | | |
| | Class C Shares | | | — | | | | (41 | ) | | | | | | | — | | | | — | |
| | | | | | |
| | Institutional Shares | | | — | | | | (1,508 | ) | | | | | | | — | | | | — | |
| | | | | | |
| | Investor Shares | | | — | | | | (22 | ) | | | | | | | — | | | | — | |
| | | | | | |
| | Class R6 Shares | | | — | | | | (116,461 | ) | | | | | | | — | | | | — | |
| | | | | | |
| | Class R Shares | | | — | | | | (22 | ) | | | | | | | — | | | | — | |
| | | | | | |
| | Class P Shares | | | — | | | | (22,783 | ) | | | | | | | — | | | | — | |
| | Total distributions to shareholders | | | (1,369,418 | ) | | | (2,999,558 | ) | | | | | | | (930,395 | ) | | | (609,905 | ) |
| | | | | | | | | | | | | | | | | | | | | | |
| | From share transactions: | |
| | | | | | |
| | Proceeds from sales of shares | | | 19,419,304 | | | | 41,090,365 | | | | | | | | 1,954,264 | | | | 19,591,950 | |
| | | | | | |
| | Reinvestment of distributions | | | 1,369,418 | | | | 2,999,558 | | | | | | | | 929,618 | | | | 609,717 | |
| | | | | | |
| | Cost of shares redeemed | | | (56,357,765 | ) | | | (82,690,864 | ) | | | | | | | (6,592,426 | ) | | | (41,602,561 | ) |
| | | | | | |
| | Net decrease in net assets resulting from share transactions | | | (35,569,043 | ) | | | (38,600,941 | ) | | | | | | | (3,708,544 | ) | | | (21,400,894 | ) |
| | | | | | |
| | TOTAL DECREASE | | | (13,195,240 | ) | | | (58,776,232 | ) | | | | | | | (633,949 | ) | | | (28,241,659 | ) |
| | | | | | | | | | | | | | | | | | | | | | |
| | Net Assets: | |
| | Beginning of period | | | 179,779,068 | | | | 238,555,300 | | | | | | | | 51,808,561 | | | | 80,050,220 | |
| | | | | | |
| | End of period | | $ | 166,583,828 | | | $ | 179,779,068 | | | | | | | $ | 51,174,612 | | | $ | 51,808,561 | |
| | |
| 14 | | The accompanying notes are an integral part of these financial statements. |
GOLDMAN SACHS REAL ESTATE SECURITIES FUNDS
Statements of Changes in Net Assets (continued)
| | | | | | | | | | |
| | | | | Real Estate Securities Fund | |
| | | | | For the
Six Months Ended
June 30, 2021
(Unaudited) | | | For the Fiscal
Year Ended
December 31, 2020 | |
| | From operations: | |
| | | |
| | Net investment income | | $ | 737,898 | | | $ | 1,745,185 | |
| | | |
| | Net realized gain | | | 5,398,491 | | | | 12,433,337 | |
| | | |
| | Net change in unrealized gain (loss) | | | 21,796,816 | | | | (26,856,048 | ) |
| | | |
| | Net increase (decrease) in net assets resulting from operations | | | 27,933,205 | | | | (12,677,526 | ) |
| | | | | | | | | | |
| | Distributions to shareholders: | |
| | | |
| | From distributable earnings: | | | | | | | | |
| | | |
| | Class A Shares | | | (136,297 | ) | | | (1,884,068 | ) |
| | | |
| | Class C Shares | | | (4,201 | ) | | | (137,431 | ) |
| | | |
| | Institutional Shares | | | (283,552 | ) | | | (2,203,861 | ) |
| | | |
| | Service Shares | | | (4,907 | ) | | | (90,056 | ) |
| | | |
| | Investor Shares | | | (18,824 | ) | | | (230,536 | ) |
| | | |
| | Class R6 Shares | | | (3,393 | ) | | | (101,806 | ) |
| | | |
| | Class R Shares | | | (5,004 | ) | | | (86,660 | ) |
| | | |
| | Class P Shares | | | (692,430 | ) | | | (6,634,674 | ) |
| | | |
| | Total distributions to shareholders | | | (1,148,608 | ) | | | (11,369,092 | ) |
| | | | | | | | | | |
| | From share transactions: | |
| | | |
| | Proceeds from sales of shares | | | 21,990,041 | | | | 30,451,351 | |
| | | |
| | Reinvestment of distributions | | | 1,138,503 | | | | 11,186,191 | |
| | | |
| | Cost of shares redeemed | | | (11,721,590 | ) | | | (56,542,166 | ) |
| | | |
| | Net increase (decrease) in net assets resulting from share transactions | | | 11,406,954 | | | | (14,904,624 | ) |
| | | |
| | TOTAL INCREASE (DECREASE) | | | 38,191,551 | | | | (38,951,242 | ) |
| | | | | | | | | | |
| | Net Assets: | |
| | | |
| | Beginning of period | | | 119,388,827 | | | | 158,340,069 | |
| | | |
| | End of period | | $ | 157,580,378 | | | $ | 119,388,827 | |
| | |
| The accompanying notes are an integral part of these financial statements. | | 15 |
GOLDMAN SACHS GLOBAL REAL ESTATE SECURITIES FUND
Financial Highlights
Selected Data for a Share Outstanding Throughout Each Period
| | | | | | | | | | | | | | | | | | | | | | | | | | |
| | | | | Goldman Sachs Global Real Estate Securities Fund | |
| | | | | Class A Shares | |
| | | | | Six Months Ended
June 30, 2021
(Unaudited) | | | Year Ended December 31, | |
| | | | | 2020 | | | 2019 | | | 2018 | | | 2017 | | | 2016 | |
| | Per Share Data | | | | | | | | | |
| | | | | | | |
| | Net asset value, beginning of period | | $ | 10.25 | | | $ | 11.14 | | | $ | 9.79 | | | $ | 10.64 | | | $ | 10.05 | | | $ | 10.44 | |
| | | | | | | |
| | Net investment income(a) | | | 0.07 | | | | 0.12 | | | | 0.17 | | | | 0.19 | | | | 0.21 | | | | 0.17 | |
| | | | | | | |
| | Net realized and unrealized gain (loss) | | | 1.53 | | | | (0.88 | ) | | | 2.01 | | | | (0.79 | ) | | | 0.63 | | | | (0.08 | ) |
| | | | | | | |
| | Total from investment operations | | | 1.60 | | | | (0.76 | ) | | | 2.18 | | | | (0.60 | ) | | | 0.84 | | | | 0.09 | |
| | | | | | | |
| | Distributions to shareholders from net investment income | | | (0.08 | ) | | | (0.10 | ) | | | (0.53 | ) | | | (0.20 | ) | | | (0.25 | ) | | | (0.29 | ) |
| | | | | | | |
| | Distributions to shareholders from net realized gains | | | — | | | | (0.02 | ) | | | (0.30 | ) | | | — | | | | — | (b) | | | (0.17 | ) |
| | | | | | | |
| | Distributions to shareholders from return of capital | | | — | | | | (0.01 | ) | | | — | | | | (0.05 | ) | | | — | | | | (0.02 | ) |
| | | | | | | |
| | Total distributions | | | (0.08 | ) | | | (0.13 | ) | | | (0.83 | ) | | | (0.25 | ) | | | (0.25 | ) | | | (0.48 | ) |
| | | | | | | |
| | Net asset value, end of period | | $ | 11.77 | | | $ | 10.25 | | | $ | 11.14 | | | $ | 9.79 | | | $ | 10.64 | | | $ | 10.05 | |
| | | | | | | |
| | Total return(c) | | | 15.57 | % | | | (6.63 | )% | | | 22.47 | % | | | (5.77 | )% | | | 8.50 | % | | | 0.82 | % |
| | | | | | | |
| | Net assets, end of period (in 000s) | | $ | 77 | | | $ | 50 | | | $ | 54 | | | $ | 905 | | | $ | 1,768 | | | $ | 32 | |
| | | | | | | |
| | Ratio of net expenses to average net assets | | | 1.34 | %(d) | | | 1.35 | % | | | 1.36 | % | | | 1.37 | % | | | 1.39 | % | | | 1.44 | % |
| | | | | | | |
| | Ratio of total expenses to average net assets | | | 1.60 | %(d) | | | 1.60 | % | | | 1.52 | % | | | 1.52 | % | | | 1.59 | % | | | 4.34 | % |
| | | | | | | |
| | Ratio of net investment income to average net assets | | | 1.26 | %(d) | | | 1.21 | % | | | 1.55 | % | | | 1.85 | % | | | 2.03 | % | | | 1.57 | % |
| | | | | | | |
| | Portfolio turnover rate(e) | | | 36 | % | | | 75 | % | | | 42 | % | | | 67 | % | | | 58 | % | | | 60 | % |
| | (a) | | Calculated based on the average shares outstanding methodology. |
| | (b) | | Amount is less than $0.005 per share. |
| | (c) | | Assumes investment at the net asset value at the beginning of the period, reinvestment of all distributions, a complete redemption of the investment at the net asset value at the end of the period and no sales or redemption charges (if any). Total returns would be reduced if a sales or redemption charge was taken into account. Returns do not reflect the impact of taxes to shareholders relating to Fund distributions or the redemption of Fund shares. Total returns for periods less than one full year are not annualized. |
| | (e) | | The Fund’s portfolio turnover rate is calculated in accordance with regulatory requirements, without regard to transactions involving short term investments. If such transactions were included, the Fund’s portfolio turnover rate may be higher. |
| | |
| 16 | | The accompanying notes are an integral part of these financial statements. |
GOLDMAN SACHS GLOBAL REAL ESTATE SECURITIES FUND
Financial Highlights (continued)
Selected Data for a Share Outstanding Throughout Each Period
| | | | | | | | | | | | | | | | | | | | | | | | | | |
| | | | | Goldman Sachs Global Real Estate Securities Fund | |
| | | | | Class C Shares | |
| | | | | Six Months Ended
June 30, 2021
(Unaudited) | | | Year Ended December 31, | |
| | | | | 2020 | | | 2019 | | | 2018 | | | 2017 | | | 2016 | |
| | Per Share Data | | | | | | | | | |
| | | | | | | |
| | Net asset value, beginning of period | | $ | 10.18 | | | $ | 11.09 | | | $ | 9.79 | | | $ | 10.64 | | | $ | 10.04 | | | $ | 10.43 | |
| | | | | | | |
| | Net investment income(a) | | | 0.02 | | | | 0.04 | | | | 0.11 | | | | 0.12 | | | | 0.12 | | | | 0.10 | |
| | | | | | | |
| | Net realized and unrealized gain (loss) | | | 1.52 | | | | (0.87 | ) | | | 1.98 | | | | (0.80 | ) | | | 0.65 | | | | (0.09 | ) |
| | | | | | | |
| | Total from investment operations | | | 1.54 | | | | (0.83 | ) | | | 2.09 | | | | (0.68 | ) | | | 0.77 | | | | 0.01 | |
| | | | | | | |
| | Distributions to shareholders from net investment income | | | (0.04 | ) | | | (0.05 | ) | | | (0.49 | ) | | | (0.12 | ) | | | (0.17 | ) | | | (0.21 | ) |
| | | | | | | |
| | Distributions to shareholders from net realized gains | | | — | | | | (0.02 | ) | | | (0.30 | ) | | | — | | | | — | (b) | | | (0.17 | ) |
| | | | | | | |
| | Distributions to shareholders from return of capital | | | — | | | | (0.01 | ) | | | — | | | | (0.05 | ) | | | — | | | | (0.02 | ) |
| | | | | | | |
| | Total distributions | | | (0.04 | ) | | | (0.08 | ) | | | (0.79 | ) | | | (0.17 | ) | | | (0.17 | ) | | | (0.40 | ) |
| | | | | | | |
| | Net asset value, end of period | | $ | 11.68 | | | $ | 10.18 | | | $ | 11.09 | | | $ | 9.79 | | | $ | 10.64 | | | $ | 10.04 | |
| | | | | | | |
| | Total return(c) | | | 15.17 | % | | | (7.39 | )% | | | 21.60 | % | | | (6.45 | )% | | | 7.72 | % | | | 0.11 | % |
| | | | | | | |
| | Net assets, end of period (in 000s) | | $ | 58 | | | $ | 50 | | | $ | 66 | | | $ | 27 | | | $ | 28 | | | $ | 36 | |
| | | | | | | |
| | Ratio of net expenses to average net assets | | | 2.09 | %(d) | | | 2.10 | % | | | 2.11 | % | | | 2.12 | % | | | 2.15 | % | | | 2.15 | % |
| | | | | | | |
| | Ratio of total expenses to average net assets | | | 2.35 | %(d) | | | 2.34 | % | | | 2.29 | % | | | 2.27 | % | | | 2.79 | % | | | 5.31 | % |
| | | | | | | |
| | Ratio of net investment income to average net assets | | | 0.42 | %(d) | | | 0.45 | % | | | 0.96 | % | | | 1.20 | % | | | 1.15 | % | | | 0.93 | % |
| | | | | | | |
| | Portfolio turnover rate(e) | | | 36 | % | | | 75 | % | | | 42 | % | | | 67 | % | | | 58 | % | | | 60 | % |
| | (a) | | Calculated based on the average shares outstanding methodology. |
| | (b) | | Amount is less than $0.005 per share. |
| | (c) | | Assumes investment at the net asset value at the beginning of the period, reinvestment of all distributions, a complete redemption of the investment at the net asset value at the end of the period and no sales or redemption charges (if any). Total returns would be reduced if a sales or redemption charge was taken into account. Returns do not reflect the impact of taxes to shareholders relating to Fund distributions or the redemption of Fund shares. Total returns for periods less than one full year are not annualized. |
| | (e) | | The Fund’s portfolio turnover rate is calculated in accordance with regulatory requirements, without regard to transactions involving short term investments. If such transactions were included, the Fund’s portfolio turnover rate may be higher. |
| | |
| The accompanying notes are an integral part of these financial statements. | | 17 |
GOLDMAN SACHS GLOBAL REAL ESTATE SECURITIES FUND
Financial Highlights (continued)
Selected Data for a Share Outstanding Throughout Each Period
| | | | | | | | | | | | | | | | | | | | | | | | | | |
| | | | | Goldman Sachs Global Real Estate Securities Fund | |
| | | | | Institutional Shares | |
| | | | | Six Months Ended
June 30, 2021
(Unaudited) | | | Year Ended December 31, | |
| | | | | 2020 | | | 2019 | | | 2018 | | | 2017 | | | 2016 | |
| | Per Share Data | | | | | | | | | |
| | | | | | | |
| | Net asset value, beginning of period | | $ | 10.25 | | | $ | 11.13 | | | $ | 9.82 | | | $ | 10.66 | | | $ | 10.06 | | | $ | 10.44 | |
| | | | | | | |
| | Net investment income (loss)(a) | | | 0.08 | | | | 0.15 | | | | 0.22 | | | | (0.03 | ) | | | 0.24 | | | | 0.24 | |
| | | | | | | |
| | Net realized and unrealized gain (loss) | | | 1.53 | | | | (0.87 | ) | | | 2.00 | | | | (0.54 | ) | | | 0.65 | | | | (0.10 | ) |
| | | | | | | |
| | Total from investment operations | | | 1.61 | | | | (0.72 | ) | | | 2.22 | | | | (0.57 | ) | | | 0.89 | | | | 0.14 | |
| | | | | | | |
| | Distributions to shareholders from net investment income | | | (0.09 | ) | | | (0.13 | ) | | | (0.61 | ) | | | (0.22 | ) | | | (0.29 | ) | | | (0.32 | ) |
| | | | | | | |
| | Distributions to shareholders from net realized gains | | | — | | | | (0.02 | ) | | | (0.30 | ) | | | — | | | | — | (b) | | | (0.17 | ) |
| | | | | | | |
| | Distributions to shareholders from return of capital | | | — | | | | (0.01 | ) | | | — | | | | (0.05 | ) | | | — | | | | (0.03 | ) |
| | | | | | | |
| | Total distributions | | | (0.09 | ) | | | (0.16 | ) | | | (0.91 | ) | | | (0.27 | ) | | | (0.29 | ) | | | (0.52 | ) |
| | | | | | | |
| | Net asset value, end of period | | $ | 11.77 | | | $ | 10.25 | | | $ | 11.13 | | | $ | 9.82 | | | $ | 10.66 | | | $ | 10.06 | |
| | | | | | | |
| | Total return(c) | | | 15.76 | % | | | (6.26 | )% | | | 22.91 | % | | | (5.41 | )% | | | 8.96 | % | | | 1.30 | % |
| | | | | | | |
| | Net assets, end of period (in 000s) | | $ | 2,579 | | | $ | 2,150 | | | $ | 2,131 | | | $ | 1,855 | | | $ | 338,527 | | | $ | 27,663 | |
| | | | | | | |
| | Ratio of net expenses to average net assets | | | 0.97 | %(d) | | | 0.97 | % | | | 0.97 | % | | | 1.00 | % | | | 1.00 | % | | | 1.00 | % |
| | | | | | | |
| | Ratio of total expenses to average net assets | | | 1.23 | %(d) | | | 1.22 | % | | | 1.15 | % | | | 1.18 | % | | | 1.24 | % | | | 2.82 | % |
| | | | | | | |
| | Ratio of net investment income (loss) to average net assets | | | 1.55 | %(d) | | | 1.60 | % | | | 1.98 | % | | | (0.26 | )% | | | 2.31 | % | | | 2.23 | % |
| | | | | | | |
| | Portfolio turnover rate(e) | | | 36 | % | | | 75 | % | | | 42 | % | | | 67 | % | | | 58 | % | | | 60 | % |
| | (a) | | Calculated based on the average shares outstanding methodology. |
| | (b) | | Amount is less than $0.005 per share. |
| | (c) | | Assumes investment at the net asset value at the beginning of the period, reinvestment of all distributions, a complete redemption of the investment at the net asset value at the end of the period and no sales or redemption charges (if any). Total returns would be reduced if a sales or redemption charge was taken into account. Returns do not reflect the impact of taxes to shareholders relating to Fund distributions or the redemption of Fund shares. Total returns for periods less than one full year are not annualized. |
| | (e) | | The Fund’s portfolio turnover rate is calculated in accordance with regulatory requirements, without regard to transactions involving short term investments. If such transactions were included, the Fund’s portfolio turnover rate may be higher. |
| | |
| 18 | | The accompanying notes are an integral part of these financial statements. |
GOLDMAN SACHS GLOBAL REAL ESTATE SECURITIES FUND
Financial Highlights (continued)
Selected Data for a Share Outstanding Throughout Each Period
| | | | | | | | | | | | | | | | | | | | | | | | | | |
| | | | | Goldman Sachs Global Real Estate Securities Fund | |
| | | | | Investor Shares(a) | |
| | | | | Six Months Ended
June 30, 2021
(Unaudited) | | | Year Ended December 31, | |
| | | | | 2020 | | | 2019 | | | 2018 | | | 2017 | | | 2016 | |
| | Per Share Data | | | | | | | | | |
| | | | | | | |
| | Net asset value, beginning of period | | $ | 10.23 | | | $ | 11.11 | | | $ | 9.80 | | | $ | 10.65 | | | $ | 10.05 | | | $ | 10.44 | |
| | | | | | | |
| | Net investment income(b) | | | 0.08 | | | | 0.14 | | | | 0.21 | | | | 0.23 | | | | 0.22 | | | | 0.20 | |
| | | | | | | |
| | Net realized and unrealized gain (loss) | | | 1.52 | | | | (0.87 | ) | | | 2.00 | | | | (0.81 | ) | | | 0.65 | | | | (0.09 | ) |
| | | | | | | |
| | Total from investment operations | | | 1.60 | | | | (0.73 | ) | | | 2.21 | | | | (0.58 | ) | | | 0.87 | | | | 0.11 | |
| | | | | | | |
| | Distributions to shareholders from net investment income | | | (0.09 | ) | | | (0.12 | ) | | | (0.60 | ) | | | (0.22 | ) | | | (0.27 | ) | | | (0.31 | ) |
| | | | | | | |
| | Distributions to shareholders from net realized gains | | | — | | | | (0.02 | ) | | | (0.30 | ) | | | — | | | | — | (c) | | | (0.17 | ) |
| | | | | | | |
| | Distributions to shareholders from return of capital | | | — | | | | (0.01 | ) | | | — | | | | (0.05 | ) | | | — | | | | (0.02 | ) |
| | | | | | | |
| | Total distributions | | | (0.09 | ) | | | (0.15 | ) | | | (0.90 | ) | | | (0.27 | ) | | | (0.27 | ) | | | (0.50 | ) |
| | | | | | | |
| | Net asset value, end of period | | $ | 11.74 | | | $ | 10.23 | | | $ | 11.11 | | | $ | 9.80 | | | $ | 10.65 | | | $ | 10.05 | |
| | | | | | | |
| | Total return(d) | | | 15.63 | % | | | (6.37 | )% | | | 22.79 | % | | | (5.50 | )% | | | 8.80 | % | | | 1.05 | % |
| | | | | | | |
| | Net assets, end of period (in 000s) | | $ | 37 | | | $ | 32 | | | $ | 34 | | | $ | 27 | | | $ | 29 | | | $ | 27 | |
| | | | | | | |
| | Ratio of net expenses to average net assets | | | 1.09 | %(e) | | | 1.10 | % | | | 1.11 | % | | | 1.12 | % | | | 1.15 | % | | | 1.15 | % |
| | | | | | | |
| | Ratio of total expenses to average net assets | | | 1.35 | %(e) | | | 1.34 | % | | | 1.29 | % | | | 1.27 | % | | | 1.75 | % | | | 4.22 | % |
| | | | | | | |
| | Ratio of net investment income to average net assets | | | 1.42 | %(e) | | | 1.45 | % | | | 1.85 | % | | | 2.20 | % | | | 2.13 | % | | | 1.85 | % |
| | | | | | | |
| | Portfolio turnover rate(f) | | | 36 | % | | | 75 | % | | | 42 | % | | | 67 | % | | | 58 | % | | | 60 | % |
| | (a) | | Effective August 15, 2017, Class IR changed its name to Investor Shares. |
| | (b) | | Calculated based on the average shares outstanding methodology. |
| | (c) | | Amount is less than $0.005 per share. |
| | (d) | | Assumes investment at the net asset value at the beginning of the period, reinvestment of all distributions, a complete redemption of the investment at the net asset value at the end of the period and no sales or redemption charges (if any). Total returns would be reduced if a sales or redemption charge was taken into account. Returns do not reflect the impact of taxes to shareholders relating to Fund distributions or the redemption of Fund shares. Total returns for periods less than one full year are not annualized. |
| | (f) | | The Fund’s portfolio turnover rate is calculated in accordance with regulatory requirements, without regard to transactions involving short term investments. If such transactions were included, the Fund’s portfolio turnover rate may be higher. |
| | |
| The accompanying notes are an integral part of these financial statements. | | 19 |
GOLDMAN SACHS GLOBAL REAL ESTATE SECURITIES FUND
Financial Highlights (continued)
Selected Data for a Share Outstanding Throughout Each Period
| | | | | | | | | | | | | | | | | | | | | | | | | | |
| | | | | Goldman Sachs Global Real Estate Securities Fund | |
| | | | | Class R6 Shares | |
| | | | | Six Months Ended
June 30, 2021
(Unaudited) | | | Year Ended December 31, | |
| | | | | 2020 | | | 2019 | | | 2018 | | | 2017 | | | 2016 | |
| | Per Share Data | | | | | | | | | |
| | | | | | | |
| | Net asset value, beginning of period | | $ | 10.23 | | | $ | 11.11 | | | $ | 9.80 | | | $ | 10.66 | | | $ | 10.06 | | | $ | 10.44 | |
| | | | | | | |
| | Net investment income(a) | | | 0.08 | | | | 0.15 | | | | 0.21 | | | | 0.29 | | | | 0.24 | | | | 0.21 | |
| | | | | | | |
| | Net realized and unrealized gain (loss) | | | 1.53 | | | | (0.87 | ) | | | 2.01 | | | | (0.86 | ) | | | 0.65 | | | | (0.07 | ) |
| | | | | | | |
| | Total from investment operations | | | 1.61 | | | | (0.72 | ) | | | 2.22 | | | | (0.57 | ) | | | 0.89 | | | | 0.14 | |
| | | | | | | |
| | Distributions to shareholders from net investment income | | | (0.09 | ) | | | (0.13 | ) | | | (0.61 | ) | | | (0.24 | ) | | | (0.29 | ) | | | (0.33 | ) |
| | | | | | | |
| | Distributions to shareholders from net realized gains | | | — | | | | (0.02 | ) | | | (0.30 | ) | | | — | | | | — | (b) | | | (0.17 | ) |
| | | | | | | |
| | Distributions to shareholders from return of capital | | | — | | | | (0.01 | ) | | | — | | | | (0.05 | ) | | | — | | | | (0.02 | ) |
| | | | | | | |
| | Total distributions | | | (0.09 | ) | | | (0.16 | ) | | | (0.91 | ) | | | (0.29 | ) | | | (0.29 | ) | | | (0.52 | ) |
| | | | | | | |
| | Net asset value, end of period | | $ | 11.75 | | | $ | 10.23 | | | $ | 11.11 | | | $ | 9.80 | | | $ | 10.66 | | | $ | 10.06 | |
| | | | | | | |
| | Total return(c) | | | 15.80 | % | | | (6.27 | )% | | | 22.97 | % | | | (5.44 | )% | | | 8.97 | % | | | 1.31 | % |
| | | | | | | |
| | Net assets, end of period (in 000s) | | $ | 116,066 | | | $ | 144,290 | | | $ | 193,139 | | | $ | 259,662 | | | $ | 29 | | | $ | 27 | |
| | | | | | | |
| | Ratio of net expenses to average net assets | | | 0.96 | %(d) | | | 0.96 | % | | | 0.96 | % | | | 0.97 | % | | | 0.99 | % | | | 0.98 | % |
| | | | | | | |
| | Ratio of total expenses to average net assets | | | 1.22 | %(d) | | | 1.20 | % | | | 1.14 | % | | | 1.11 | % | | | 1.59 | % | | | 4.05 | % |
| | | | | | | |
| | Ratio of net investment income to average net assets | | | 1.46 | %(d) | | | 1.58 | % | | | 1.90 | % | | | 2.76 | % | | | 2.29 | % | | | 2.02 | % |
| | | | | | | |
| | Portfolio turnover rate(e) | | | 36 | % | | | 75 | % | | | 42 | % | | | 67 | % | | | 58 | % | | | 60 | % |
| | (a) | | Calculated based on the average shares outstanding methodology. |
| | (b) | | Amount is less than $0.005 per share. |
| | (c) | | Assumes investment at the net asset value at the beginning of the period, reinvestment of all distributions, a complete redemption of the investment at the net asset value at the end of the period and no sales or redemption charges (if any). Total returns would be reduced if a sales or redemption charge was taken into account. Returns do not reflect the impact of taxes to shareholders relating to Fund distributions or the redemption of Fund shares. Total returns for periods less than one full year are not annualized. |
| | (e) | | The Fund’s portfolio turnover rate is calculated in accordance with regulatory requirements, without regard to transactions involving short term investments. If such transactions were included, the Fund’s portfolio turnover rate may be higher. |
| | |
| 20 | | The accompanying notes are an integral part of these financial statements. |
GOLDMAN SACHS GLOBAL REAL ESTATE SECURITIES FUND
Financial Highlights (continued)
Selected Data for a Share Outstanding Throughout Each Period
| | | | | | | | | | | | | | | | | | | | | | | | | | |
| | | | | Goldman Sachs Global Real Estate Securities Fund | |
| | | | | Class R Shares | |
| | | | | Six Months Ended
June 30, 2021
(Unaudited) | | | Year Ended December 31, | |
| | | | | 2020 | | | 2019 | | | 2018 | | | 2017 | | | 2016 | |
| | Per Share Data | | | | | | | | | |
| | | | | | | |
| | Net asset value, beginning of period | | $ | 10.21 | | | $ | 11.10 | | | $ | 9.80 | | | $ | 10.65 | | | $ | 10.05 | | | $ | 10.44 | |
| | | | | | | |
| | Net investment income(a) | | | 0.05 | | | | 0.09 | | | | 0.15 | | | | 0.18 | | | | 0.17 | | | | 0.14 | |
| | | | | | | |
| | Net realized and unrealized gain (loss) | | | 1.52 | | | | (0.87 | ) | | | 1.99 | | | | (0.81 | ) | | | 0.65 | | | | (0.08 | ) |
| | | | | | | |
| | Total from investment operations | | | 1.57 | | | | (0.78 | ) | | | 2.14 | | | | (0.63 | ) | | | 0.82 | | | | 0.06 | |
| | | | | | | |
| | Distributions to shareholders from net investment income | | | (0.06 | ) | | | (0.08 | ) | | | (0.54 | ) | | | (0.17 | ) | | | (0.22 | ) | | | (0.26 | ) |
| | | | | | | |
| | Distributions to shareholders from net realized gains | | | — | | | | (0.02 | ) | | | (0.30 | ) | | | — | | | | — | (b) | | | (0.17 | ) |
| | | | | | | |
| | Distributions to shareholders from return of capital | | | — | | | | (0.01 | ) | | | — | | | | (0.05 | ) | | | — | | | | (0.02 | ) |
| | | | | | | |
| | Total distributions | | | (0.06 | ) | | | (0.11 | ) | | | (0.84 | ) | | | (0.22 | ) | | | (0.22 | ) | | | (0.45 | ) |
| | | | | | | |
| | Net asset value, end of period | | $ | 11.72 | | | $ | 10.21 | | | $ | 11.10 | | | $ | 9.80 | | | $ | 10.65 | | | $ | 10.05 | |
| | | | | | | |
| | Total return(c) | | | 15.40 | % | | | (6.83 | )% | | | 22.10 | % | | | (5.97 | )% | | | 8.26 | % | | | 0.57 | % |
| | | | | | | |
| | Net assets, end of period (in 000s) | | $ | 35 | | | $ | 31 | | | $ | 33 | | | $ | 27 | | | $ | 29 | | | $ | 27 | |
| | | | | | | |
| | Ratio of net expenses to average net assets | | | 1.59 | %(d) | | | 1.60 | % | | | 1.61 | % | | | 1.62 | % | | | 1.65 | % | | | 1.65 | % |
| | | | | | | |
| | Ratio of total expenses to average net assets | | | 1.85 | %(d) | | | 1.84 | % | | | 1.79 | % | | | 1.77 | % | | | 2.25 | % | | | 4.73 | % |
| | | | | | | |
| | Ratio of net investment income to average net assets | | | 0.92 | %(d) | | | 0.95 | % | | | 1.35 | % | | | 1.70 | % | | | 1.63 | % | | | 1.35 | % |
| | | | | | | |
| | Portfolio turnover rate(e) | | | 36 | % | | | 75 | % | | | 42 | % | | | 67 | % | | | 58 | % | | | 60 | % |
| | (a) | | Calculated based on the average shares outstanding methodology. |
| | (b) | | Amount is less than $0.005 per share. |
| | (c) | | Assumes investment at the net asset value at the beginning of the period, reinvestment of all distributions, a complete redemption of the investment at the net asset value at the end of the period and no sales or redemption charges (if any). Total returns would be reduced if a sales or redemption charge was taken into account. Returns do not reflect the impact of taxes to shareholders relating to Fund distributions or the redemption of Fund shares. Total returns for periods less than one full year are not annualized. |
| | (e) | | The Fund’s portfolio turnover rate is calculated in accordance with regulatory requirements, without regard to transactions involving short term investments. If such transactions were included, the Fund’s portfolio turnover rate may be higher. |
| | |
| The accompanying notes are an integral part of these financial statements. | | 21 |
GOLDMAN SACHS GLOBAL REAL ESTATE SECURITIES FUND
Financial Highlights (continued)
Selected Data for a Share Outstanding Throughout Each Period
| | | | | | | | | | | | | | | | | | |
| | | | | Goldman Sachs Global Real Estate Securities Fund | |
| | | | | Class P Shares | |
| | | | | Six Months Ended
June 30, 2021
(Unaudited) | | | Year Ended December 31, | | | April 17, 2018* to
December 31, 2018 | |
| | | | | 2020 | | | 2019 | |
| | Per Share Data | |
| | | | | |
| | Net asset value, beginning of period | | $ | 10.22 | | | $ | 11.11 | | | $ | 9.80 | | | $ | 10.30 | |
| | | | | |
| | Net investment income(a) | | | 0.09 | | | | 0.15 | | | | 0.22 | | | | 0.23 | |
| | | | | |
| | Net realized and unrealized gain (loss) | | | 1.52 | | | | (0.88 | ) | | | 2.01 | | | | (0.50 | ) |
| | | | | |
| | Total from investment operations | | | 1.61 | | | | (0.73 | ) | | | 2.23 | | | | (0.27 | ) |
| | | | | |
| | Distributions to shareholders from net investment income | | | (0.09 | ) | | | (0.13 | ) | | | (0.62 | ) | | | (0.18 | ) |
| | | | | |
| | Distributions to shareholders from net realized gains | | | — | | | | (0.02 | ) | | | (0.30 | ) | | | — | |
| | | | | |
| | Distributions to shareholders from return of capital | | | — | | | | (0.01 | ) | | | — | | | | (0.05 | ) |
| | | | | |
| | Total distributions | | | (0.09 | ) | | | (0.16 | ) | | | (0.92 | ) | | | (0.23 | ) |
| | | | | |
| | Net asset value, end of period | | $ | 11.74 | | | $ | 10.22 | | | $ | 11.11 | | | $ | 9.80 | |
| | | | | |
| | Total return(b) | | | 15.81 | % | | | (6.36 | )% | | | 22.98 | % | | | (2.69 | )% |
| | | | | |
| | Net assets, end of period (in 000s) | | $ | 47,731 | | | $ | 33,176 | | | $ | 43,099 | | | $ | 39,405 | |
| | | | | |
| | Ratio of net expenses to average net assets | | | 0.96 | %(c) | | | 0.96 | % | | | 0.96 | % | | | 0.96 | %(c) |
| | | | | |
| | Ratio of total expenses to average net assets | | | 1.22 | %(c) | | | 1.20 | % | | | 1.14 | % | | | 1.11 | %(c) |
| | | | | |
| | Ratio of net investment income to average net assets | | | 1.62 | %(c) | | | 1.56 | % | | | 1.98 | % | | | 3.15 | %(c) |
| | | | | |
| | Portfolio turnover rate(d) | | | 36 | % | | | 75 | % | | | 42 | % | | | 67 | % |
| | * | | Commencement of operations. |
| | (a) | | Calculated based on the average shares outstanding methodology. |
| | (b) | | Assumes investment at the net asset value at the beginning of the period, reinvestment of all distributions, a complete redemption of the investment at the net asset value at the end of the period and no sales or redemption charges (if any). Total returns would be reduced if a sales or redemption charge was taken into account. Returns do not reflect the impact of taxes to shareholders relating to Fund distributions or the redemption of Fund shares. Total returns for periods less than one full year are not annualized. |
| | (d) | | The Fund’s portfolio turnover rate is calculated in accordance with regulatory requirements, without regard to transactions involving short term investments. If such transactions were included, the Fund’s portfolio turnover rate may be higher. |
| | |
| 22 | | The accompanying notes are an integral part of these financial statements. |
GOLDMAN SACHS INTERNATIONAL REAL ESTATE SECURITIES FUND
Financial Highlights (continued)
Selected Data for a Share Outstanding Throughout Each Period
| | | | | | | | | | | | | | | | | | | | | | | | | | |
| | | | | Goldman Sachs International Real Estate Securities Fund | |
| | | | | Class A Shares | |
| | | | | Six Months Ended
June 30, 2021
(Unaudited) | | | Year Ended December 31, | |
| | | | | 2020 | | | 2019 | | | 2018 | | | 2017 | | | 2016 | |
| | Per Share Data | |
| | | | | | | |
| | Net asset value, beginning of period | | $ | 6.45 | | | $ | 6.66 | | | $ | 5.90 | | | $ | 6.48 | | | $ | 5.73 | | | $ | 6.09 | |
| | | | | | | |
| | Net investment income(a) | | | 0.07 | | | | 0.09 | | | | 0.11 | | | | 0.13 | | | | 0.12 | | | | 0.12 | |
| | | | | | | |
| | Net realized and unrealized gain (loss) | | | 0.44 | | | | (0.26 | ) | | | 1.08 | | | | (0.59 | ) | | | 0.89 | | | | (0.23 | ) |
| | | | | | | |
| | Total from investment operations | | | 0.51 | | | | (0.17 | ) | | | 1.19 | | | | (0.46 | ) | | | 1.01 | | | | (0.11 | ) |
| | | | | | | |
| | Distributions to shareholders from net investment income | | | (0.11 | ) | | | (0.04 | ) | | | (0.43 | ) | | | (0.12 | ) | | | (0.26 | ) | | | (0.25 | ) |
| | | | | | | |
| | Net asset value, end of period | | $ | 6.85 | | | $ | 6.45 | | | $ | 6.66 | | | $ | 5.90 | | | $ | 6.48 | | | $ | 5.73 | |
| | | | | | | |
| | Total return(b) | | | 7.90 | % | | | (2.42 | )% | | | 20.38 | % | | | (7.19 | )% | | | 17.89 | % | | | (1.84 | )% |
| | | | | | | |
| | Net assets, end of period (in 000s) | | $ | 2,150 | | | $ | 2,005 | | | $ | 2,888 | | | $ | 3,081 | | | $ | 4,377 | | | $ | 5,400 | |
| | | | | | | |
| | Ratio of net expenses to average net assets | | | 1.36 | %(c) | | | 1.37 | % | | | 1.38 | % | | | 1.38 | % | | | 1.39 | % | | | 1.39 | % |
| | | | | | | |
| | Ratio of total expenses to average net assets | | | 2.16 | %(c) | | | 2.17 | % | | | 1.89 | % | | | 1.76 | % | | | 1.70 | % | | | 1.62 | % |
| | | | | | | |
| | Ratio of net investment income to average net assets | | | 1.88 | %(c) | | | 1.62 | % | | | 1.72 | % | | | 2.04 | % | | | 2.02 | % | | | 1.90 | % |
| | | | | | | |
| | Portfolio turnover rate(d) | | | 20 | % | | | 55 | % | | | 30 | % | | | 43 | % | | | 38 | % | | | 41 | % |
| | (a) | | Calculated based on the average shares outstanding methodology. |
| | (b) | | Assumes investment at the net asset value at the beginning of the period, reinvestment of all distributions, a complete redemption of the investment at the net asset value at the end of the period and no sales or redemption charges (if any). Total returns would be reduced if a sales or redemption charge was taken into account. Returns do not reflect the impact of taxes to shareholders relating to Fund distributions or the redemption of Fund shares. Total returns for periods less than one full year are not annualized. |
| | (d) | | The Fund’s portfolio turnover rate is calculated in accordance with regulatory requirements, without regard to transactions involving short term investments. If such transactions were included, the Fund’s portfolio turnover rate may be higher. |
| | |
| The accompanying notes are an integral part of these financial statements. | | 23 |
GOLDMAN SACHS INTERNATIONAL REAL ESTATE SECURITIES FUND
Financial Highlights (continued)
Selected Data for a Share Outstanding Throughout Each Period
| | | | | | | | | | | | | | | | | | | | | | | | | | |
| | | | | Goldman Sachs International Real Estate Securities Fund | |
| | | | | Class C Shares | |
| | | | | Six Months Ended
June 30, 2021
(Unaudited) | | | Year Ended December 31, | |
| | | | | 2020 | | | 2019 | | | 2018 | | | 2017 | | | 2016 | |
| | Per Share Data | |
| | | | | | | |
| | Net asset value, beginning of period | | $ | 6.49 | | | $ | 6.72 | | | $ | 5.94 | | | $ | 6.50 | | | $ | 5.73 | | | $ | 6.09 | |
| | | | | | | |
| | Net investment income(a) | | | 0.02 | | | | 0.05 | | | | 0.07 | | | | 0.09 | | | | 0.08 | | | | 0.07 | |
| | | | | | | |
| | Net realized and unrealized gain (loss) | | | 0.48 | | | | (0.27 | ) | | | 1.07 | | | | (0.60 | ) | | | 0.90 | | | | (0.23 | ) |
| | | | | | | |
| | Total from investment operations | | | 0.50 | | | | (0.22 | ) | | | 1.14 | | | | (0.51 | ) | | | 0.98 | | | | (0.16 | ) |
| | | | | | | |
| | Distributions to shareholders from net investment income | | | (0.07 | ) | | | (0.01 | ) | | | (0.36 | ) | | | (0.05 | ) | | | (0.21 | ) | | | (0.20 | ) |
| | | | | | | |
| | Net asset value, end of period | | $ | 6.92 | | | $ | 6.49 | | | $ | 6.72 | | | $ | 5.94 | | | $ | 6.50 | | | $ | 5.73 | |
| | | | | | | |
| | Total return(b) | | | 7.63 | % | | | (3.17 | )% | | | 19.38 | % | | | (7.89 | )% | | | 17.23 | % | | | (2.65 | )% |
| | | | | | | |
| | Net assets, end of period (in 000s) | | $ | 30 | | | $ | 76 | | | $ | 158 | | | $ | 231 | | | $ | 810 | | | $ | 1,148 | |
| | | | | | | |
| | Ratio of net expenses to average net assets | | | 2.11 | %(c) | | | 2.12 | % | | | 2.13 | % | | | 2.13 | % | | | 2.14 | % | | | 2.14 | % |
| | | | | | | |
| | Ratio of total expenses to average net assets | | | 2.93 | %(c) | | | 2.90 | % | | | 2.64 | % | | | 2.49 | % | | | 2.44 | % | | | 2.37 | % |
| | | | | | | |
| | Ratio of net investment income to average net assets | | | 0.64 | %(c) | | | 0.86 | % | | | 0.99 | % | | | 1.38 | % | | | 1.26 | % | | | 1.12 | % |
| | | | | | | |
| | Portfolio turnover rate(d) | | | 20 | % | | | 55 | % | | | 30 | % | | | 43 | % | | | 38 | % | | | 41 | % |
| | (a) | | Calculated based on the average shares outstanding methodology. |
| | (b) | | Assumes investment at the net asset value at the beginning of the period, reinvestment of all distributions, a complete redemption of the investment at the net asset value at the end of the period and no sales or redemption charges (if any). Total returns would be reduced if a sales or redemption charge was taken into account. Returns do not reflect the impact of taxes to shareholders relating to Fund distributions or the redemption of Fund shares. Total returns for periods less than one full year are not annualized. |
| | (d) | | The Fund’s portfolio turnover rate is calculated in accordance with regulatory requirements, without regard to transactions involving short term investments. If such transactions were included, the Fund’s portfolio turnover rate may be higher. |
| | |
| 24 | | The accompanying notes are an integral part of these financial statements. |
GOLDMAN SACHS INTERNATIONAL REAL ESTATE SECURITIES FUND
Financial Highlights (continued)
Selected Data for a Share Outstanding Throughout Each Period
| | | | | | | | | | | | | | | | | | | | | | | | | | |
| | | | | Goldman Sachs International Real Estate Securities Fund | |
| | | | | Institutional Shares | |
| | | | | Six Months Ended
June 30, 2021
(Unaudited) | | | Year Ended December 31, | |
| | | | | 2020 | | | 2019 | | | 2018 | | | 2017 | | | 2016 | |
| | Per Share Data | |
| | | | | | | |
| | Net asset value, beginning of period | | $ | 6.22 | | | $ | 6.43 | | | $ | 5.71 | | | $ | 6.26 | | | $ | 5.54 | | | $ | 5.91 | |
| | | | | | | |
| | Net investment income(a) | | | 0.08 | | | | 0.12 | | | | 0.13 | | | | 0.18 | | | | 0.14 | | | | 0.14 | |
| | | | | | | |
| | Net realized and unrealized gain (loss) | | | 0.43 | | | | (0.27 | ) | | | 1.05 | | | | (0.60 | ) | | | 0.87 | | | | (0.24 | ) |
| | | | | | | |
| | Total from investment operations | | | 0.51 | | | | (0.15 | ) | | | 1.18 | | | | (0.42 | ) | | | 1.01 | | | | (0.10 | ) |
| | | | | | | |
| | Distributions to shareholders from net investment income | | | (0.12 | ) | | | (0.06 | ) | | | (0.46 | ) | | | (0.13 | ) | | | (0.29 | ) | | | (0.27 | ) |
| | | | | | | |
| | Net asset value, end of period | | $ | 6.61 | | | $ | 6.22 | | | $ | 6.43 | | | $ | 5.71 | | | $ | 6.26 | | | $ | 5.54 | |
| | | | | | | |
| | Total return(b) | | | 8.22 | % | | | (2.16 | )% | | | 20.86 | % | | | (6.72 | )% | | | 18.45 | % | | | (1.63 | )% |
| | | | | | | |
| | Net assets, end of period (in 000s) | | $ | 5,757 | | | $ | 4,864 | | | $ | 6,938 | | | $ | 10,138 | | | $ | 117,768 | | | $ | 297,473 | |
| | | | | | | |
| | Ratio of net expenses to average net assets | | | 0.99 | %(c) | | | 0.99 | % | | | 0.99 | % | | | 0.99 | % | | | 0.99 | % | | | 0.99 | % |
| | | | | | | |
| | Ratio of total expenses to average net assets | | | 1.79 | %(c) | | | 1.79 | % | | | 1.50 | % | | | 1.35 | % | | | 1.28 | % | | | 1.22 | % |
| | | | | | | |
| | Ratio of net investment income to average net assets | | | 2.27 | %(c) | | | 2.05 | % | | | 1.97 | % | | | 2.90 | % | | | 2.44 | % | | | 2.28 | % |
| | | | | | | |
| | Portfolio turnover rate(d) | | | 20 | % | | | 55 | % | | | 30 | % | | | 43 | % | | | 38 | % | | | 41 | % |
| | (a) | | Calculated based on the average shares outstanding methodology. |
| | (b) | | Assumes investment at the net asset value at the beginning of the period, reinvestment of all distributions, a complete redemption of the investment at the net asset value at the end of the period and no sales or redemption charges (if any). Total returns would be reduced if a sales or redemption charge was taken into account. Returns do not reflect the impact of taxes to shareholders relating to Fund distributions or the redemption of Fund shares. Total returns for periods less than one full year are not annualized. |
| | (d) | | The Fund’s portfolio turnover rate is calculated in accordance with regulatory requirements, without regard to transactions involving short term investments. If such transactions were included, the Fund’s portfolio turnover rate may be higher. |
| | |
| The accompanying notes are an integral part of these financial statements. | | 25 |
GOLDMAN SACHS INTERNATIONAL REAL ESTATE SECURITIES FUND
Financial Highlights (continued)
Selected Data for a Share Outstanding Throughout Each Period
| | | | | | | | | | | | | | | | | | | | | | | | | | |
| | | | | Goldman Sachs International Real Estate Securities Fund | |
| | | | | Investor Shares(a) | |
| | | | | Six Months Ended
June 30, 2021
(Unaudited) | | | Year Ended December 31, | |
| | | | | 2020 | | | 2019 | | | 2018 | | | 2017 | | | 2016 | |
| | Per Share Data | |
| | | | | | | |
| | Net asset value, beginning of period | | $ | 6.39 | | | $ | 6.60 | | | $ | 5.85 | | | $ | 6.43 | | | $ | 5.68 | | | $ | 6.04 | |
| | | | | | | |
| | Net investment income(b) | | | 0.07 | | | | 0.11 | | | | 0.13 | | | | 0.14 | | | | 0.16 | | | | 0.12 | |
| | | | | | | |
| | Net realized and unrealized gain (loss) | | | 0.45 | | | | (0.27 | ) | | | 1.07 | | | | (0.58 | ) | | | 0.87 | | | | (0.22 | ) |
| | | | | | | |
| | Total from investment operations | | | 0.52 | | | | (0.16 | ) | | | 1.20 | | | | (0.44 | ) | | | 1.03 | | | | (0.10 | ) |
| | | | | | | |
| | Distributions to shareholders from net investment income | | | (0.12 | ) | | | (0.05 | ) | | | (0.45 | ) | | | (0.14 | ) | | | (0.28 | ) | | | (0.26 | ) |
| | | | | | | |
| | Net asset value, end of period | | $ | 6.79 | | | $ | 6.39 | | | $ | 6.60 | | | $ | 5.85 | | | $ | 6.43 | | | $ | 5.68 | |
| | | | | | | |
| | Total return(c) | | | 8.09 | % | | | (2.23 | )% | | | 20.71 | % | | | (7.00 | )% | | | 18.29 | % | | | (1.57 | )% |
| | | | | | | |
| | Net assets, end of period (in 000s) | | $ | 74 | | | $ | 71 | | | $ | 117 | | | $ | 103 | | | $ | 109 | | | $ | 107 | |
| | | | | | | |
| | Ratio of net expenses to average net assets | | | 1.11 | %(d) | | | 1.12 | % | | | 1.13 | % | | | 1.13 | % | | | 1.14 | % | | | 1.14 | % |
| | | | | | | |
| | Ratio of total expenses to average net assets | | | 1.91 | %(d) | | | 1.93 | % | | | 1.65 | % | | | 1.52 | % | | | 1.45 | % | | | 1.37 | % |
| | | | | | | |
| | Ratio of net investment income to average net assets | | | 2.10 | %(d) | | | 1.91 | % | | | 1.94 | % | | | 2.24 | % | | | 2.54 | % | | | 2.05 | % |
| | | | | | | |
| | Portfolio turnover rate(e) | | | 20 | % | | | 55 | % | | | 30 | % | | | 43 | % | | | 38 | % | | | 41 | % |
| | (a) | | Effective August 15, 2017, Class IR changed its name to Investor Shares. |
| | (b) | | Calculated based on the average shares outstanding methodology. |
| | (c) | | Assumes investment at the net asset value at the beginning of the period, reinvestment of all distributions, a complete redemption of the investment at the net asset value at the end of the period and no sales or redemption charges (if any). Total returns would be reduced if a sales or redemption charge was taken into account. Returns do not reflect the impact of taxes to shareholders relating to Fund distributions or the redemption of Fund shares. Total returns for periods less than one full year are not annualized. |
| | (e) | | The Fund’s portfolio turnover rate is calculated in accordance with regulatory requirements, without regard to transactions involving short term investments. If such transactions were included, the Fund’s portfolio turnover rate may be higher. |
| | |
| 26 | | The accompanying notes are an integral part of these financial statements. |
GOLDMAN SACHS INTERNATIONAL REAL ESTATE SECURITIES FUND
Financial Highlights (continued)
Selected Data for a Share Outstanding Throughout Each Period
| | | | | | | | | | | | | | | | | | | | | | | | | | |
| | | | | Goldman Sachs International Real Estate Securities Fund | |
| | | | | Class R6 Shares | |
| | | | | Six Months Ended
June 30, 2021
(Unaudited) | | | Year Ended December 31, | |
| | | | | 2020 | | | 2019 | | | 2018 | | | 2017 | | | 2016 | |
| | Per Share Data | |
| | | | | | | |
| | Net asset value, beginning of period | | $ | 6.22 | | | $ | 6.43 | | | $ | 5.70 | | | $ | 6.26 | | | $ | 5.54 | | | $ | 5.91 | |
| | | | | | | |
| | Net investment income(a) | | | 0.10 | | | | 0.12 | | | | 0.11 | | | | 0.24 | | | | 0.14 | | | | 0.13 | |
| | | | | | | |
| | Net realized and unrealized gain (loss) | | | 0.40 | | | | (0.27 | ) | | | 1.08 | | | | (0.65 | ) | | | 0.87 | | | | (0.23 | ) |
| | | | | | | |
| | Total from investment operations | | | 0.50 | | | | (0.15 | ) | | | 1.19 | | | | (0.41 | ) | | | 1.01 | | | | (0.10 | ) |
| | | | | | | |
| | Distributions to shareholders from net investment income | | | (0.12 | ) | | | (0.06 | ) | | | (0.46 | ) | | | (0.15 | ) | | | (0.29 | ) | | | (0.27 | ) |
| | | | | | | |
| | Net asset value, end of period | | $ | 6.60 | | | $ | 6.22 | | | $ | 6.43 | | | $ | 5.70 | | | $ | 6.26 | | | $ | 5.54 | |
| | | | | | | |
| | Total return(b) | | | 8.06 | % | | | (2.15 | )% | | | 21.05 | % | | | (6.71 | )% | | | 18.48 | % | | | (1.61 | )% |
| | | | | | | |
| | Net assets, end of period (in 000s) | | $ | 77 | | | $ | 12 | | | $ | 12 | | | $ | 202 | | | $ | 11 | | | $ | 9 | |
| | | | | | | |
| | Ratio of net expenses to average net assets | | | 0.98 | %(c) | | | 0.98 | % | | | 0.98 | % | | | 0.98 | % | | | 0.99 | % | | | 1.02 | % |
| | | | | | | |
| | Ratio of total expenses to average net assets | | | 1.76 | %(c) | | | 1.80 | % | | | 1.47 | % | | | 1.29 | % | | | 1.29 | % | | | 1.18 | % |
| | | | | | | |
| | Ratio of net investment income to average net assets | | | 2.92 | %(c) | | | 2.05 | % | | | 1.81 | % | | | 3.86 | % | | | 2.41 | % | | | 2.26 | % |
| | | | | | | |
| | Portfolio turnover rate(d) | | | 20 | % | | | 55 | % | | | 30 | % | | | 43 | % | | | 38 | % | | | 41 | % |
| | (a) | | Calculated based on the average shares outstanding methodology. |
| | (b) | | Assumes investment at the net asset value at the beginning of the period, reinvestment of all distributions, a complete redemption of the investment at the net asset value at the end of the period and no sales or redemption charges (if any). Total returns would be reduced if a sales or redemption charge was taken into account. Returns do not reflect the impact of taxes to shareholders relating to Fund distributions or the redemption of Fund shares. Total returns for periods less than one full year are not annualized. |
| | (d) | | The Fund’s portfolio turnover rate is calculated in accordance with regulatory requirements, without regard to transactions involving short term investments. If such transactions were included, the Fund’s portfolio turnover rate may be higher. |
| | |
| The accompanying notes are an integral part of these financial statements. | | 27 |
GOLDMAN SACHS INTERNATIONAL REAL ESTATE SECURITIES FUND
Financial Highlights (continued)
Selected Data for a Share Outstanding Throughout Each Period
| | | | | | | | | | | | | | | | | | |
| | | | | Goldman Sachs International Real Estate Securities Fund | |
| | | | | Class P Shares | |
| | | | | Six Months Ended
June 30, 2021
(Unaudited) | | | Year Ended December 31, | | | April 17, 2018* to
December 31, 2018 | |
| | | | | 2020 | | | 2019 | |
| | Per Share Data | |
| | | | | |
| | Net asset value, beginning of period | | $ | 6.21 | | | $ | 6.41 | | | $ | 5.70 | | | $ | 6.38 | |
| | | | | |
| | Net investment income(a) | | | 0.07 | | | | 0.11 | | | | 0.13 | | | | 0.08 | |
| | | | | |
| | Net realized and unrealized gain (loss) | | | 0.43 | | | | (0.25 | ) | | | 1.04 | | | | (0.61 | ) |
| | | | | |
| | Total from investment operations | | | 0.50 | | | | (0.14 | ) | | | 1.17 | | | | (0.53 | ) |
| | | | | |
| | Distributions to shareholders from net investment income | | | (0.12 | ) | | | (0.06 | ) | | | (0.46 | ) | | | (0.15 | ) |
| | | | | |
| | Net asset value, end of period | | $ | 6.59 | | | $ | 6.21 | | | $ | 6.41 | | | $ | 5.70 | |
| | | | | |
| | Total return(b) | | | 8.07 | % | | | (2.00 | )% | | | 20.72 | % | | | (8.45 | )% |
| | | | | |
| | Net assets, end of period (in 000s) | | $ | 43,087 | | | $ | 44,780 | | | $ | 69,937 | | | $ | 82,014 | |
| | | | | |
| | Ratio of net expenses to average net assets | | | 0.98 | %(c) | | | 0.98 | % | | | 0.98 | % | | | 0.98 | %(c) |
| | | | | |
| | Ratio of total expenses to average net assets | | | 1.78 | %(c) | | | 1.77 | % | | | 1.50 | % | | | 1.39 | %(c) |
| | | | | |
| | Ratio of net investment income to average net assets | | | 2.22 | %(c) | | | 1.98 | % | | | 2.10 | % | | | 1.85 | %(c) |
| | | | | |
| | Portfolio turnover rate(d) | | | 20 | % | | | 55 | % | | | 30 | % | | | 43 | % |
| | * | | Commencement of operations. |
| | (a) | | Calculated based on the average shares outstanding methodology. |
| | (b) | | Assumes investment at the net asset value at the beginning of the period, reinvestment of all distributions, a complete redemption of the investment at the net asset value at the end of the period and no sales or redemption charges (if any). Total returns would be reduced if a sales or redemption charge was taken into account. Returns do not reflect the impact of taxes to shareholders relating to Fund distributions or the redemption of Fund shares. Total returns for periods less than one full year are not annualized. |
| | (d) | | The Fund’s portfolio turnover rate is calculated in accordance with regulatory requirements, without regard to transactions involving short term investments. If such transactions were included, the Fund’s portfolio turnover rate may be higher. |
| | |
| 28 | | The accompanying notes are an integral part of these financial statements. |
GOLDMAN SACHS REAL ESTATE SECURITIES FUND
Financial Highlights (continued)
Selected Data for a Share Outstanding Throughout Each Period
| | | | | | | | | | | | | | | | | | | | | | | | | | |
| | | | | Goldman Sachs Real Estate Securities Fund | |
| | | | | Class A Shares | |
| | | | | Six Months Ended
June 30, 2021
(Unaudited) | | | Year Ended December 31, | |
| | | | | 2020 | | | 2019 | | | 2018 | | | 2017 | | | 2016 | |
| | Per Share Data | |
| | | | | | | |
| | Net asset value, beginning of period | | $ | 11.03 | | | $ | 13.27 | | | $ | 12.61 | | | $ | 15.53 | | | $ | 18.40 | | | $ | 19.59 | |
| | | | | | | |
| | Net investment income(a) | | | 0.04 | | | | 0.12 | | | | 0.22 | | | | 0.28 | | | | 0.30 | | | | 0.33 | |
| | | | | | | |
| | Net realized and unrealized gain (loss) | | | 2.41 | | | | (1.22 | ) | | | 2.92 | | | | (0.94 | ) | | | 0.06 | | | | 0.71 | |
| | | | | | | |
| | Total from investment operations | | | 2.45 | | | | (1.10 | ) | | | 3.14 | | | | (0.66 | ) | | | 0.36 | | | | 1.04 | |
| | | | | | | |
| | Distributions to shareholders from net investment income | | | (0.09 | ) | | | (0.14 | ) | | | (0.22 | ) | | | (0.37 | ) | | | (0.29 | ) | | | (0.32 | ) |
| | | | | | | |
| | Distributions to shareholders from net realized gains | | | — | | | | (1.00 | ) | | | (2.26 | ) | | | (1.89 | ) | | | (2.94 | ) | | | (1.91 | ) |
| | | | | | | |
| | Total distributions | | | (0.09 | ) | | | (1.14 | ) | | | (2.48 | ) | | | (2.26 | ) | | | (3.23 | ) | | | (2.23 | ) |
| | | | | | | |
| | Net asset value, end of period | | $ | 13.39 | | | $ | 11.03 | | | $ | 13.27 | | | $ | 12.61 | | | $ | 15.53 | | | $ | 18.40 | |
| | | | | | | |
| | Total return(b) | | | 22.21 | % | | | (7.85 | )% | | | 25.49 | % | | | (5.39 | )% | | | 2.11 | % | | | 5.38 | % |
| | | | | | | |
| | Net assets, end of period (in 000s) | | $ | 21,413 | | | $ | 19,177 | | | $ | 27,488 | | | $ | 26,002 | | | $ | 38,120 | | | $ | 54,869 | |
| | | | | | | |
| | Ratio of net expenses to average net assets | | | 1.28 | %(c) | | | 1.29 | % | | | 1.30 | % | | | 1.30 | % | | | 1.31 | % | | | 1.31 | % |
| | | | | | | |
| | Ratio of total expenses to average net assets | | | 1.57 | %(c) | | | 1.62 | % | | | 1.57 | % | | | 1.50 | % | | | 1.54 | % | | | 1.52 | % |
| | | | | | | |
| | Ratio of net investment income to average net assets | | | 0.71 | %(c) | | | 1.06 | % | | | 1.51 | % | | | 1.88 | % | | | 1.65 | % | | | 1.62 | % |
| | | | | | | |
| | Portfolio turnover rate(d) | | | 23 | % | | | 57 | % | | | 37 | % | | | 43 | % | | | 35 | % | | | 31 | % |
| | (a) | | Calculated based on the average shares outstanding methodology. |
| | (b) | | Assumes investment at the net asset value at the beginning of the period, reinvestment of all distributions, a complete redemption of the investment at the net asset value at the end of the period and no sales or redemption charges (if any). Total returns would be reduced if a sales or redemption charge was taken into account. Returns do not reflect the impact of taxes to shareholders relating to Fund distributions or the redemption of Fund shares. Total returns for periods less than one full year are not annualized. |
| | (d) | | The Fund’s portfolio turnover rate is calculated in accordance with regulatory requirements, without regard to transactions involving short term investments. If such transactions were included, the Fund’s portfolio turnover rate may be higher. |
| | |
| The accompanying notes are an integral part of these financial statements. | | 29 |
GOLDMAN SACHS REAL ESTATE SECURITIES FUND
Financial Highlights (continued)
Selected Data for a Share Outstanding Throughout Each Period
| | | | | | | | | | | | | | | | | | | | | | | | | | |
| | | | | Goldman Sachs Real Estate Securities Fund | |
| | | | | Class C Shares | |
| | | | | Six Months Ended
June 30, 2021
(Unaudited) | | | Year Ended December 31, | |
| | | | | 2020 | | | 2019 | | | 2018 | | | 2017 | | | 2016 | |
| | Per Share Data | |
| | | | | | | |
| | Net asset value, beginning of period | | $ | 10.31 | | | $ | 12.50 | | | $ | 11.99 | | | $ | 14.88 | | | $ | 17.79 | | | $ | 19.03 | |
| | | | | | | |
| | Net investment income (loss)(a) | | | (0.01 | ) | | | 0.03 | | | | 0.10 | | | | 0.12 | | | | 0.16 | | | | 0.18 | |
| | | | | | | |
| | Net realized and unrealized gain (loss) | | | 2.24 | | | | (1.14 | ) | | | 2.78 | | | | (0.85 | ) | | | 0.06 | | | | 0.68 | |
| | | | | | | |
| | Total from investment operations | | | 2.23 | | | | (1.11 | ) | | | 2.88 | | | | (0.73 | ) | | | 0.22 | | | | 0.86 | |
| | | | | | | |
| | Distributions to shareholders from net investment income | | | (0.04 | ) | | | (0.08 | ) | | | (0.11 | ) | | | (0.27 | ) | | | (0.19 | ) | | | (0.19 | ) |
| | | | | | | |
| | Distributions to shareholders from net realized gains | | | — | | | | (1.00 | ) | | | (2.26 | ) | | | (1.89 | ) | | | (2.94 | ) | | | (1.91 | ) |
| | | | | | | |
| | Total distributions | | | (0.04 | ) | | | (1.08 | ) | | | (2.37 | ) | | | (2.16 | ) | | | (3.13 | ) | | | (2.10 | ) |
| | | | | | | |
| | Net asset value, end of period | | $ | 12.50 | | | $ | 10.31 | | | $ | 12.50 | | | $ | 11.99 | | | $ | 14.88 | | | $ | 17.79 | |
| | | | | | | |
| | Total return(b) | | | 21.66 | % | | | (8.50 | )% | | | 24.62 | % | | | (6.12 | )% | | | 1.38 | % | | | 4.56 | % |
| | | | | | | |
| | Net assets, end of period (in 000s) | | $ | 1,247 | | | $ | 1,332 | | | $ | 2,615 | | | $ | 3,568 | | | $ | 12,421 | | | $ | 15,578 | |
| | | | | | | |
| | Ratio of net expenses to average net assets | | | 2.03 | %(c) | | | 2.04 | % | | | 2.05 | % | | | 2.05 | % | | | 2.06 | % | | | 2.06 | % |
| | | | | | | |
| | Ratio of total expenses to average net assets | | | 2.33 | %(c) | | | 2.37 | % | | | 2.32 | % | | | 2.25 | % | | | 2.29 | % | | | 2.27 | % |
| | | | | | | |
| | Ratio of net investment income to average net assets | | | (0.11 | )%(c) | | | 0.26 | % | | | 0.69 | % | | | 0.83 | % | | | 0.92 | % | | | 0.91 | % |
| | | | | | | |
| | Portfolio turnover rate(d) | | | 23 | % | | | 57 | % | | | 37 | % | | | 43 | % | | | 35 | % | | | 31 | % |
| | (a) | | Calculated based on the average shares outstanding methodology. |
| | (b) | | Assumes investment at the net asset value at the beginning of the period, reinvestment of all distributions, a complete redemption of the investment at the net asset value at the end of the period and no sales or redemption charges (if any). Total returns would be reduced if a sales or redemption charge was taken into account. Returns do not reflect the impact of taxes to shareholders relating to Fund distributions or the redemption of Fund shares. Total returns for periods less than one full year are not annualized. |
| | (d) | | The Fund’s portfolio turnover rate is calculated in accordance with regulatory requirements, without regard to transactions involving short term investments. If such transactions were included, the Fund’s portfolio turnover rate may be higher. |
| | |
| 30 | | The accompanying notes are an integral part of these financial statements. |
GOLDMAN SACHS REAL ESTATE SECURITIES FUND
Financial Highlights (continued)
Selected Data for a Share Outstanding Throughout Each Period
| | | | | | | | | | | | | | | | | | | | | | | | | | |
| | | | | Goldman Sachs Real Estate Securities Fund | |
| | | | | Institutional Shares | |
| | | | | Six Months Ended
June 30, 2021
(Unaudited) | | | Year Ended December 31, | |
| | | | | 2020 | | | 2019 | | | 2018 | | | 2017 | | | 2016 | |
| | Per Share Data | |
| | | | | | | |
| | Net asset value, beginning of period | | $ | 11.56 | | | $ | 13.83 | | | $ | 13.05 | | | $ | 15.98 | | | $ | 18.81 | | | $ | 19.97 | |
| | | | | | | |
| | Net investment income(a) | | | 0.08 | | | | 0.17 | | | | 0.28 | | | | 0.23 | | | | 0.37 | | | | 0.41 | |
| | | | | | | |
| | Net realized and unrealized gain (loss) | | | 2.51 | | | | (1.26 | ) | | | 3.03 | | | | (0.86 | ) | | | 0.08 | | | | 0.74 | |
| | | | | | | |
| | Total from investment operations | | | 2.59 | | | | (1.09 | ) | | | 3.31 | | | | (0.63 | ) | | | 0.45 | | | | 1.15 | |
| | | | | | | |
| | Distributions to shareholders from net investment income | | | (0.11 | ) | | | (0.18 | ) | | | (0.27 | ) | | | (0.41 | ) | | | (0.34 | ) | | | (0.40 | ) |
| | | | | | | |
| | Distributions to shareholders from net realized gains | | | — | | | | (1.00 | ) | | | (2.26 | ) | | | (1.89 | ) | | | (2.94 | ) | | | (1.91 | ) |
| | | | | | | |
| | Total distributions | | | (0.11 | ) | | | (1.18 | ) | | | (2.53 | ) | | | (2.30 | ) | | | (3.28 | ) | | | (2.31 | ) |
| | | | | | | |
| | Net asset value, end of period | | $ | 14.04 | | | $ | 11.56 | | | $ | 13.83 | | | $ | 13.05 | | | $ | 15.98 | | | $ | 18.81 | |
| | | | | | | |
| | Total return(b) | | | 22.42 | % | | | (7.48 | )% | | | 26.01 | % | | | (5.04 | )% | | | 2.58 | % | | | 5.81 | % |
| | | | | | | |
| | Net assets, end of period (in 000s) | | $ | 37,401 | | | $ | 23,409 | | | $ | 30,069 | | | $ | 31,337 | | | $ | 206,095 | | | $ | 397,211 | |
| | | | | | | |
| | Ratio of net expenses to average net assets | | | 0.91 | %(c) | | | 0.91 | % | | | 0.92 | % | | | 0.91 | % | | | 0.91 | % | | | 0.91 | % |
| | | | | | | |
| | Ratio of total expenses to average net assets | | | 1.20 | %(c) | | | 1.24 | % | | | 1.19 | % | | | 1.12 | % | | | 1.14 | % | | | 1.12 | % |
| | | | | | | |
| | Ratio of net investment income to average net assets | | | 1.22 | %(c) | | | 1.47 | % | | | 1.86 | % | | | 1.50 | % | | | 1.98 | % | | | 2.03 | % |
| | | | | | | |
| | Portfolio turnover rate(d) | | | 23 | % | | | 57 | % | | | 37 | % | | | 43 | % | | | 35 | % | | | 31 | % |
| | (a) | | Calculated based on the average shares outstanding methodology. |
| | (b) | | Assumes investment at the net asset value at the beginning of the period, reinvestment of all distributions, a complete redemption of the investment at the net asset value at the end of the period and no sales or redemption charges (if any). Total returns would be reduced if a sales or redemption charge was taken into account. Returns do not reflect the impact of taxes to shareholders relating to Fund distributions or the redemption of Fund shares. Total returns for periods less than one full year are not annualized. |
| | (d) | | The Fund’s portfolio turnover rate is calculated in accordance with regulatory requirements, without regard to transactions involving short term investments. If such transactions were included, the Fund’s portfolio turnover rate may be higher. |
| | |
| The accompanying notes are an integral part of these financial statements. | | 31 |
GOLDMAN SACHS REAL ESTATE SECURITIES FUND
Financial Highlights (continued)
Selected Data for a Share Outstanding Throughout Each Period
| | | | | | | | | | | | | | | | | | | | | | | | | | |
| | | | | Goldman Sachs Real Estate Securities Fund | |
| | | | | Service Shares | |
| | | | | Six Months Ended
June 30, 2021
(Unaudited) | | | Year Ended December 31, | |
| | | | | 2020 | | | 2019 | | | 2018 | | | 2017 | | | 2016 | |
| | Per Share Data | |
| | | | | | | |
| | Net asset value, beginning of period | | $ | 11.15 | | | $ | 13.40 | | | $ | 12.71 | | | $ | 15.65 | | | $ | 18.52 | | | $ | 19.71 | |
| | | | | | | |
| | Net investment income(a) | | | 0.03 | | | | 0.11 | | | | 0.21 | | | | 0.26 | | | | 0.29 | | | | 0.31 | |
| | | | | | | |
| | Net realized and unrealized gain (loss) | | | 2.43 | | | | (1.23 | ) | | | 2.94 | | | | (0.95 | ) | | | 0.06 | | | | 0.72 | |
| | | | | | | |
| | Total from investment operations | | | 2.46 | | | | (1.12 | ) | | | 3.15 | | | | (0.69 | ) | | | 0.35 | | | | 1.03 | |
| | | | | | | |
| | Distributions to shareholders from net investment income | | | (0.07 | ) | | | (0.13 | ) | | | (0.20 | ) | | | (0.36 | ) | | | (0.28 | ) | | | (0.31 | ) |
| | | | | | | |
| | Distributions to shareholders from net realized gains | | | — | | | | (1.00 | ) | | | (2.26 | ) | | | (1.89 | ) | | | (2.94 | ) | | | (1.91 | ) |
| | | | | | | |
| | Total distributions | | | (0.07 | ) | | | (1.13 | ) | | | (2.46 | ) | | | (2.25 | ) | | | (3.22 | ) | | | (2.22 | ) |
| | | | | | | |
| | Net asset value, end of period | | $ | 13.54 | | | $ | 11.15 | | | $ | 13.40 | | | $ | 12.71 | | | $ | 15.65 | | | $ | 18.52 | |
| | | | | | | |
| | Total return(b) | | | 22.13 | % | | | (7.95 | )% | | | 25.40 | % | | | (5.56 | )% | | | 2.07 | % | | | 5.20 | % |
| | | | | | | |
| | Net assets, end of period (in 000s) | | $ | 864 | | | $ | 940 | | | $ | 1,608 | | | $ | 1,429 | | | $ | 2,446 | | | $ | 2,951 | |
| | | | | | | |
| | Ratio of net expenses to average net assets | | | 1.41 | %(c) | | | 1.41 | % | | | 1.42 | % | | | 1.41 | % | | | 1.41 | % | | | 1.41 | % |
| | | | | | | |
| | Ratio of total expenses to average net assets | | | 1.71 | %(c) | | | 1.74 | % | | | 1.69 | % | | | 1.61 | % | | | 1.64 | % | | | 1.62 | % |
| | | | | | | |
| | Ratio of net investment income to average net assets | | | 0.47 | %(c) | | | 0.95 | % | | | 1.43 | % | | | 1.73 | % | | | 1.60 | % | | | 1.55 | % |
| | | | | | | |
| | Portfolio turnover rate(d) | | | 23 | % | | | 57 | % | | | 37 | % | | | 43 | % | | | 35 | % | | | 31 | % |
| | (a) | | Calculated based on the average shares outstanding methodology. |
| | (b) | | Assumes investment at the net asset value at the beginning of the period, reinvestment of all distributions, a complete redemption of the investment at the net asset value at the end of the period and no sales or redemption charges (if any). Total returns would be reduced if a sales or redemption charge was taken into account. Returns do not reflect the impact of taxes to shareholders relating to Fund distributions or the redemption of Fund shares. Total returns for periods less than one full year are not annualized. |
| | (d) | | The Fund’s portfolio turnover rate is calculated in accordance with regulatory requirements, without regard to transactions involving short term investments. If such transactions were included, the Fund’s portfolio turnover rate may be higher. |
| | |
| 32 | | The accompanying notes are an integral part of these financial statements. |
GOLDMAN SACHS REAL ESTATE SECURITIES FUND
Financial Highlights (continued)
Selected Data for a Share Outstanding Throughout Each Period
| | | | | | | | | | | | | | | | | | | | | | | | | | |
| | | | | Goldman Sachs Real Estate Securities Fund | |
| | | | | Investor Shares(a) | |
| | | | | Six Months Ended
June 30, 2021
(Unaudited) | | | Year Ended December 31, | |
| | | | | 2020 | | | 2019 | | | 2018 | | | 2017 | | | 2016 | |
| | Per Share Data | |
| | | | | | | |
| | Net asset value, beginning of period | | $ | 11.19 | | | $ | 13.43 | | | $ | 12.73 | | | $ | 15.65 | | | $ | 18.50 | | | $ | 19.68 | |
| | | | | | | |
| | Net investment income(b) | | | 0.06 | | | | 0.14 | | | | 0.24 | | | | 0.31 | | | | 0.36 | | | | 0.39 | |
| | | | | | | |
| | Net realized and unrealized gain (loss) | | | 2.43 | | | | (1.22 | ) | | | 2.97 | | | | (0.94 | ) | | | 0.06 | | | | 0.71 | |
| | | | | | | |
| | Total from investment operations | | | 2.49 | | | | (1.08 | ) | | | 3.21 | | | | (0.63 | ) | | | 0.42 | | | | 1.10 | |
| | | | | | | |
| | Distributions to shareholders from net investment income | | | (0.10 | ) | | | (0.16 | ) | | | (0.25 | ) | | | (0.40 | ) | | | (0.33 | ) | | | (0.37 | ) |
| | | | | | | |
| | Distributions to shareholders from net realized gains | | | — | | | | (1.00 | ) | | | (2.26 | ) | | | (1.89 | ) | | | (2.94 | ) | | | (1.91 | ) |
| | | | | | | |
| | Total distributions | | | (0.10 | ) | | | (1.16 | ) | | | (2.51 | ) | | | (2.29 | ) | | | (3.27 | ) | | | (2.28 | ) |
| | | | | | | |
| | Net asset value, end of period | | $ | 13.58 | | | $ | 11.19 | | | $ | 13.43 | | | $ | 12.73 | | | $ | 15.65 | | | $ | 18.50 | |
| | | | | | | |
| | Total return(c) | | | 22.29 | % | | | (7.59 | )% | | | 25.84 | % | | | (5.18 | )% | | | 2.42 | % | | | 5.65 | % |
| | | | | | | |
| | Net assets, end of period (in 000s) | | $ | 2,590 | | | $ | 2,289 | | | $ | 4,532 | | | $ | 7,969 | | | $ | 10,776 | | | $ | 8,467 | |
| | | | | | | |
| | Ratio of net expenses to average net assets | | | 1.03 | %(d) | | | 1.04 | % | | | 1.05 | % | | | 1.05 | % | | | 1.06 | % | | | 1.06 | % |
| | | | | | | |
| | Ratio of total expenses to average net assets | | | 1.32 | %(d) | | | 1.36 | % | | | 1.32 | % | | | 1.25 | % | | | 1.29 | % | | | 1.27 | % |
| | | | | | | |
| | Ratio of net investment income to average net assets | | | 0.97 | %(d) | | | 1.17 | % | | | 1.64 | % | | | 2.10 | % | | | 1.99 | % | | | 1.92 | % |
| | | | | | | |
| | Portfolio turnover rate(e) | | | 23 | % | | | 57 | % | | | 37 | % | | | 43 | % | | | 35 | % | | | 31 | % |
| | (a) | | Effective August 15, 2017, Class IR changed its name to Investor Shares. |
| | (b) | | Calculated based on the average shares outstanding methodology. |
| | (c) | | Assumes investment at the net asset value at the beginning of the period, reinvestment of all distributions, a complete redemption of the investment at the net asset value at the end of the period and no sales or redemption charges (if any). Total returns would be reduced if a sales or redemption charge was taken into account. Returns do not reflect the impact of taxes to shareholders relating to Fund distributions or the redemption of Fund shares. Total returns for periods less than one full year are not annualized. |
| | (e) | | The Fund’s portfolio turnover rate is calculated in accordance with regulatory requirements, without regard to transactions involving short term investments. If such transactions were included, the Fund’s portfolio turnover rate may be higher. |
| | |
| The accompanying notes are an integral part of these financial statements. | | 33 |
GOLDMAN SACHS REAL ESTATE SECURITIES FUND
Financial Highlights (continued)
Selected Data for a Share Outstanding Throughout Each Period
| | | | | | | | | | | | | | | | | | | | | | | | | | |
| | | | | Goldman Sachs Real Estate Securities Fund | |
| | | | | Class R6 Shares | |
| | | | | Six Months Ended
June 30, 2021
(Unaudited) | | | Year Ended December 31, | |
| | | | | 2020 | | | 2019 | | | 2018 | | | 2017 | | | 2016 | |
| | Per Share Data | |
| | | | | | | |
| | Net asset value, beginning of period | | $ | 11.56 | | | $ | 13.83 | | | $ | 13.05 | | | $ | 15.98 | | | $ | 18.81 | | | $ | 19.98 | |
| | | | | | | |
| | Net investment income(a) | | | 0.03 | | | | 0.18 | | | | 0.30 | | | | 0.16 | | | | 0.41 | | | | 0.46 | |
| | | | | | | |
| | Net realized and unrealized gain (loss) | | | 2.56 | | | | (1.27 | ) | | | 3.01 | | | | (0.79 | ) | | | 0.05 | | | | 0.68 | |
| | | | | | | |
| | Total from investment operations | | | 2.59 | | | | (1.09 | ) | | | 3.31 | | | | (0.63 | ) | | | 0.46 | | | | 1.14 | |
| | | | | | | |
| | Distributions to shareholders from net investment income | | | (0.11 | ) | | | (0.18 | ) | | | (0.27 | ) | | | (0.41 | ) | | | (0.35 | ) | | | (0.40 | ) |
| | | | | | | |
| | Distributions to shareholders from net realized gains | | | — | | | | (1.00 | ) | | | (2.26 | ) | | | (1.89 | ) | | | (2.94 | ) | | | (1.91 | ) |
| | | | | | | |
| | Total distributions | | | (0.11 | ) | | | (1.18 | ) | | | (2.53 | ) | | | (2.30 | ) | | | (3.29 | ) | | | (2.31 | ) |
| | | | | | | |
| | Net asset value, end of period | | $ | 14.04 | | | $ | 11.56 | | | $ | 13.83 | | | $ | 13.05 | | | $ | 15.98 | | | $ | 18.81 | |
| | | | | | | |
| | Total return(b) | | | 22.42 | % | | | (7.47 | )% | | | 26.02 | % | | | (5.03 | )% | | | 2.60 | % | | | 5.77 | % |
| | | | | | | |
| | Net assets, end of period (in 000s) | | $ | 452 | | | $ | 1,116 | | | $ | 973 | | | $ | 797 | | | $ | 227 | | | $ | 42 | |
| | | | | | | |
| | Ratio of net expenses to average net assets | | | 0.90 | %(c) | | | 0.90 | % | | | 0.90 | % | | | 0.90 | % | | | 0.90 | % | | | 0.90 | % |
| | | | | | | |
| | Ratio of total expenses to average net assets | | | 1.21 | %(c) | | | 1.24 | % | | | 1.18 | % | | | 1.08 | % | | | 1.14 | % | | | 1.09 | % |
| | | | | | | |
| | Ratio of net investment income to average net assets | | | 0.53 | %(c) | | | 1.52 | % | | | 1.98 | % | | | 1.02 | % | | | 2.23 | % | | | 2.25 | % |
| | | | | | | |
| | Portfolio turnover rate(d) | | | 23 | % | | | 57 | % | | | 37 | % | | | 43 | % | | | 35 | % | | | 31 | % |
| | (a) | | Calculated based on the average shares outstanding methodology. |
| | (b) | | Assumes investment at the net asset value at the beginning of the period, reinvestment of all distributions, a complete redemption of the investment at the net asset value at the end of the period and no sales or redemption charges (if any). Total returns would be reduced if a sales or redemption charge was taken into account. Returns do not reflect the impact of taxes to shareholders relating to Fund distributions or the redemption of Fund shares. Total returns for periods less than one full year are not annualized. |
| | (d) | | The Fund’s portfolio turnover rate is calculated in accordance with regulatory requirements, without regard to transactions involving short term investments. If such transactions were included, the Fund’s portfolio turnover rate may be higher. |
| | |
| 34 | | The accompanying notes are an integral part of these financial statements. |
GOLDMAN SACHS REAL ESTATE SECURITIES FUND
Financial Highlights (continued)
Selected Data for a Share Outstanding Throughout Each Period
| | | | | | | | | | | | | | | | | | | | | | | | | | |
| | | | | Goldman Sachs Real Estate Securities Fund | |
| | | | | Class R Shares | |
| | | | | Six Months Ended
June 30, 2021
(Unaudited) | | | Year Ended December 31, | |
| | | | | 2020 | | | 2019 | | | 2018 | | | 2017 | | | 2016 | |
| | Per Share Data | |
| | | | | | | |
| | Net asset value, beginning of period | | $ | 10.87 | | | $ | 13.09 | | | $ | 12.47 | | | $ | 15.39 | | | $ | 18.27 | | | $ | 19.47 | |
| | | | | | | |
| | Net investment income(a) | | | 0.03 | | | | 0.09 | | | | 0.18 | | | | 0.24 | | | | 0.26 | | | | 0.29 | |
| | | | | | | |
| | Net realized and unrealized gain (loss) | | | 2.36 | | | | (1.19 | ) | | | 2.88 | | | | (0.93 | ) | | | 0.05 | | | | 0.70 | |
| | | | | | | |
| | Total from investment operations | | | 2.39 | | | | (1.10 | ) | | | 3.06 | | | | (0.69 | ) | | | 0.31 | | | | 0.99 | |
| | | | | | | |
| | Distributions to shareholders from net investment income | | | (0.07 | ) | | | (0.12 | ) | | | (0.18 | ) | | | (0.34 | ) | | | (0.25 | ) | | | (0.28 | ) |
| | | | | | | |
| | Distributions to shareholders from net realized gains | | | — | | | | (1.00 | ) | | | (2.26 | ) | | | (1.89 | ) | | | (2.94 | ) | | | (1.91 | ) |
| | | | | | | |
| | Total distributions | | | (0.07 | ) | | | (1.12 | ) | | | (2.44 | ) | | | (2.23 | ) | | | (3.19 | ) | | | (2.19 | ) |
| | | | | | | |
| | Net asset value, end of period | | $ | 13.19 | | | $ | 10.87 | | | $ | 13.09 | | | $ | 12.47 | | | $ | 15.39 | | | $ | 18.27 | |
| | | | | | | |
| | Total return(b) | | | 22.02 | % | | | (8.00 | )% | | | 25.14 | % | | | (5.62 | )% | | | 1.92 | % | | | 5.08 | % |
| | | | | | | |
| | Net assets, end of period (in 000s) | | $ | 948 | | | $ | 910 | | | $ | 1,440 | | | $ | 1,770 | | | $ | 3,092 | | | $ | 4,156 | |
| | | | | | | |
| | Ratio of net expenses to average net assets | | | 1.53 | %(c) | | | 1.54 | % | | | 1.55 | % | | | 1.55 | % | | | 1.56 | % | | | 1.56 | % |
| | | | | | | |
| | Ratio of total expenses to average net assets | | | 1.83 | %(c) | | | 1.87 | % | | | 1.82 | % | | | 1.75 | % | | | 1.79 | % | | | 1.77 | % |
| | | | | | | |
| | Ratio of net investment income to average net assets | | | 0.43 | %(c) | | | 0.79 | % | | | 1.22 | % | | | 1.60 | % | | | 1.45 | % | | | 1.44 | % |
| | | | | | | |
| | Portfolio turnover rate(d) | | | 23 | % | | | 57 | % | | | 37 | % | | | 43 | % | | | 35 | % | | | 31 | % |
| | (a) | | Calculated based on the average shares outstanding methodology. |
| | (b) | | Assumes investment at the net asset value at the beginning of the period, reinvestment of all distributions, a complete redemption of the investment at the net asset value at the end of the period and no sales or redemption charges (if any). Total returns would be reduced if a sales or redemption charge was taken into account. Returns do not reflect the impact of taxes to shareholders relating to Fund distributions or the redemption of Fund shares. Total returns for periods less than one full year are not annualized. |
| | (d) | | The Fund’s portfolio turnover rate is calculated in accordance with regulatory requirements, without regard to transactions involving short term investments. If such transactions were included, the Fund’s portfolio turnover rate may be higher. |
| | |
| The accompanying notes are an integral part of these financial statements. | | 35 |
GOLDMAN SACHS REAL ESTATE SECURITIES FUND
Financial Highlights (continued)
Selected Data for a Share Outstanding Throughout Each Period
| | | | | | | | | | | | | | | | | | |
| | | | | Goldman Sachs Real Estate Securities Fund | |
| | | | | Class P Shares | |
| | | | | Six Months Ended
June 30, 2021
(Unaudited) | | | Year Ended December 31, | | | April 17, 2018* to
December 31, 2018 | |
| | | | | 2020 | | | 2019 | |
| | Per Share Data | | | | |
| | | | | |
| | Net asset value, beginning of period | | $ | 11.55 | | | $ | 13.82 | | | $ | 13.04 | | | $ | 14.90 | |
| | | | | |
| | Net investment income(a) | | | 0.07 | | | | 0.17 | | | | 0.29 | | | | 0.39 | |
| | | | | |
| | Net realized and unrealized gain (loss) | | | 2.52 | | | | (1.26 | ) | | | 3.02 | | | | (0.01 | ) |
| | | | | |
| | Total from investment operations | | | 2.59 | | | | (1.09 | ) | | | 3.31 | | | | 0.38 | |
| | | | | |
| | Distributions to shareholders from net investment income | | | (0.11 | ) | | | (0.18 | ) | | | (0.27 | ) | | | (0.35 | ) |
| | | | | |
| | Distributions to shareholders from net realized gains | | | — | | | | (1.00 | ) | | | (2.26 | ) | | | (1.89 | ) |
| | | | | |
| | Total distributions | | | (0.11 | ) | | | (1.18 | ) | | | (2.53 | ) | | | (2.24 | ) |
| | | | | |
| | Net asset value, end of period | | $ | 14.03 | | | $ | 11.55 | | | $ | 13.82 | | | $ | 13.04 | |
| | | | | |
| | Total return(b) | | | 22.45 | % | | | (7.48 | )% | | | 26.04 | % | | | 1.36 | % |
| | | | | |
| | Net assets, end of period (in 000s) | | $ | 92,666 | | | $ | 70,215 | | | $ | 89,616 | | | $ | 89,479 | |
| | | | | |
| | Ratio of net expenses to average net assets | | | 0.90 | %(c) | | | 0.90 | % | | | 0.91 | % | | | 0.90 | %(c) |
| | | | | |
| | Ratio of total expenses to average net assets | | | 1.19 | %(c) | | | 1.23 | % | | | 1.18 | % | | | 1.07 | %(c) |
| | | | | |
| | Ratio of net investment income to average net assets | | | 1.15 | %(c) | | | 1.47 | % | | | 1.90 | % | | | 3.56 | %(c) |
| | | | | |
| | Portfolio turnover rate(d) | | | 23 | % | | | 57 | % | | | 37 | % | | | 43 | % |
| | * | | Commencement of operations. |
| | (a) | | Calculated based on the average shares outstanding methodology. |
| | (b) | | Assumes investment at the net asset value at the beginning of the period, reinvestment of all distributions, a complete redemption of the investment at the net asset value at the end of the period and no sales or redemption charges (if any). Total returns would be reduced if a sales or redemption charge was taken into account. Returns do not reflect the impact of taxes to shareholders relating to Fund distributions or the redemption of Fund shares. Total returns for periods less than one full year are not annualized. |
| | (d) | | The Fund’s portfolio turnover rate is calculated in accordance with regulatory requirements, without regard to transactions involving short term investments. If such transactions were included, the Fund’s portfolio turnover rate may be higher. |
| | |
| 36 | | The accompanying notes are an integral part of these financial statements. |
GOLDMAN SACHS REAL ESTATE SECURITIES FUNDS
Notes to Financial Statements
June 30, 2021 (Unaudited)
Goldman Sachs Trust (the “Trust”) is a Delaware statutory trust registered under the Investment Company Act of 1940, as amended (the “Act”), as an open-end management investment company. The following table lists those series of the Trust that are included in this report (collectively, the “Funds” or individually a “Fund”), along with their corresponding share classes and respective diversification status under the Act:
| | | | |
| Fund | | Share Classes Offered | | Diversified/ Non-diversified |
Global Real Estate Securities | | A, C, Institutional, Investor, R6, R and P | | Diversified |
International Real Estate Securities | | A, C, Institutional, Investor, R6 and P | | Non-diversified |
Real Estate Securities | | A, C, Institutional, Service, Investor, R6, R and P | | Non-diversified |
Class A Shares of the Global Real Estate Securities, International Real Estate Securities, and Real Estate Securities Funds are sold with a front-end sales charge of up to 5.50%. Class C Shares are sold with a contingent deferred sales charge (“CDSC”) of 1.00%, which is imposed on redemptions made within 12 months of purchase. Institutional, Service, Investor, Class R6, Class R and Class P Shares are not subject to a sales charge.
Goldman Sachs Asset Management, L.P. (“GSAM”), an affiliate of Goldman Sachs & Co. LLC (“Goldman Sachs”), serves as investment adviser to the Funds pursuant to a management agreement (the “Agreement”) with the Trust.
|
| 2. SIGNIFICANT ACCOUNTING POLICIES |
The financial statements have been prepared in accordance with accounting principles generally accepted in the United States of America (“GAAP”) and require management to make estimates and assumptions that may affect the reported amounts and disclosures. Actual results may differ from those estimates and assumptions. Each Fund is an investment company under GAAP and follows the accounting and reporting guidance applicable to investment companies.
A. Investment Valuation — The Funds’ valuation policy is to value investments at fair value.
B. Investment Income and Investments — Investment income includes interest income, dividend income, and securities lending income, if any. Interest income is accrued daily and adjusted for amortization of premiums and accretion of discounts. Dividend income is recognized on ex-dividend date or, for certain foreign securities, as soon as such information is obtained subsequent to the ex-dividend date. Non-cash dividends, if any, are recorded at the fair market value of the securities received. Investment transactions are reflected on trade date. Realized gains and losses are calculated using identified cost. Investment transactions are recorded on the following business day for daily net asset value (“NAV”) calculations. Investment income is recorded net of any foreign withholding taxes, less any amounts reclaimable. The Funds may file withholding tax reclaims in certain jurisdictions to recover a portion of amounts previously withheld. These reclaims are recorded when the amount is known and there are no significant uncertainties on collectability. Such amounts recovered are reflected as other income in the Statements of Operations. Any foreign capital gains tax is accrued daily based upon net unrealized gains, and is payable upon sale of such investments. Distributions received from the Funds’ investments in United States (“U.S.”) real estate investment trusts (“REITs”) may be characterized as ordinary income, net capital gain and/or a return of capital. A return of capital is recorded by the Funds as a reduction to the cost basis of the REIT.
C. Class Allocations and Expenses — Investment income, realized and unrealized gain (loss), if any, and non-class specific expenses of each Fund are allocated daily based upon the proportion of net assets of each class. Non-class specific expenses directly incurred by a Fund are charged to that Fund, while such expenses incurred by the Trust are allocated across the applicable Funds on a straight-line and/or pro-rata basis depending upon the nature of the expenses. Class specific expenses, where applicable, are borne by the respective share classes and include Distribution and Service, Transfer Agency and Service and Shareholder Administration fees.
D. Federal Taxes and Distributions to Shareholders — It is each Fund’s policy to comply with the requirements of the Internal Revenue Code of 1986, as amended (the “Code”), applicable to regulated investment companies and to distribute each
37
GOLDMAN SACHS REAL ESTATE SECURITIES FUNDS
Notes to Financial Statements (continued)
June 30, 2021 (Unaudited)
|
| 2. SIGNIFICANT ACCOUNTING POLICIES (continued) |
year substantially all of its investment company taxable income and capital gains to its shareholders. Accordingly, each Fund is not required to make any provisions for the payment of federal income tax. Distributions to shareholders are recorded on the ex-dividend date. Income and capital gains distributions, if any, are declared and paid according to the following schedule:
| | | | | | |
| Fund | | | | Income Distributions Declared/Paid | | Capital Gains Distributions
Declared/Paid |
Global Real Estate Securities and Real Estate Securities | | | | Quarterly | | Annually |
International Real Estate Securities | | | | Semi-Annually | | Annually |
Net capital losses, if any, are carried forward to future fiscal years and may be used to the extent allowed by the Code to offset any future capital gains. Losses that are carried forward will retain their character as either short-term or long-term capital losses. Utilization of capital loss carryforwards will reduce the requirement of future capital gains distributions.
The characterization of distributions to shareholders for financial reporting purposes is determined in accordance with federal income tax rules, which may differ from GAAP. The source of each Fund’s distributions may be shown in the accompanying financial statements as either from distributable earnings or capital. Certain components of the Funds’ net assets on the Statements of Assets and Liabilities reflect permanent GAAP/tax differences based on the appropriate tax character.
E. Foreign Currency Translation — The accounting records and reporting currency of a Fund are maintained in U.S. dollars. Assets and liabilities denominated in foreign currencies are translated into U.S. dollars using the current exchange rates at the close of each business day. The effect of changes in foreign currency exchange rates on investments is included within net realized and unrealized gain (loss) on investments. Changes in the value of other assets and liabilities as a result of fluctuations in foreign exchange rates are included in the Statements of Operations within net change in unrealized gain (loss) on foreign currency translation. Transactions denominated in foreign currencies are translated into U.S. dollars on the date the transaction occurred, the effects of which are included within net realized gain (loss) on foreign currency transactions.
|
| 3. INVESTMENTS AND FAIR VALUE MEASUREMENTS |
U.S. GAAP defines the fair value of a financial instrument as the amount that would be received to sell an asset or paid to transfer a liability in an orderly transaction between market participants at the measurement date (i.e., the exit price); the Funds’ policy is to use the market approach. GAAP establishes a fair value hierarchy that prioritizes the inputs to valuation techniques used to measure fair value. The hierarchy gives the highest priority to unadjusted quoted prices in active markets for identical assets or liabilities (Level 1 measurements) and the lowest priority to unobservable inputs (Level 3 measurements). The level in the fair value hierarchy within which the fair value measurement in its entirety falls shall be determined based on the lowest level input that is significant to the fair value measurement in its entirety. The levels used for classifying investments are not necessarily an indication of the risk associated with investing in these investments. The three levels of the fair value hierarchy are described below:
Level 1 — Unadjusted quoted prices in active markets that are accessible at the measurement date for identical, unrestricted assets or liabilities;
Level 2 — Quoted prices in markets that are not active or financial instruments for which significant inputs are observable (including, but not limited to, quoted prices for similar investments, interest rates, foreign exchange rates, volatility and credit spreads), either directly or indirectly;
Level 3 — Prices or valuations that require significant unobservable inputs (including GSAM’s assumptions in determining fair value measurement).
The Board of Trustees (“Trustees”) has approved Valuation Procedures that govern the valuation of the portfolio investments held by the Funds, including investments for which market quotations are not readily available. The Trustees have delegated to GSAM day-to-day responsibility for implementing and maintaining internal controls and procedures related to the valuation of the Funds’
38
GOLDMAN SACHS REAL ESTATE SECURITIES FUNDS
|
| 3. INVESTMENTS AND FAIR VALUE MEASUREMENTS (continued) |
investments. To assess the continuing appropriateness of pricing sources and methodologies, GSAM regularly performs price verification procedures and issues challenges as necessary to third party pricing vendors or brokers, and any differences are reviewed in accordance with the Valuation Procedures.
A. Level 1 and Level 2 Fair Value Investments — The valuation techniques and significant inputs used in determining the fair values for investments classified as Level 1 and Level 2 are as follows:
Equity Securities — Equity securities traded on a U.S. securities exchange or the NASDAQ system, or those located on certain foreign exchanges, including but not limited to the Americas, are valued daily at their last sale price or official closing price on the principal exchange or system on which they are traded. If there is no sale or official closing price or such price is believed by GSAM to not represent fair value, equity securities will be valued at the valid closing bid price for long positions and at the valid closing ask price for short positions (i.e. where there is sufficient volume, during normal exchange trading hours). If no valid bid/ask price is available, the equity security will be valued pursuant to the Valuation Procedures approved by the Trustees and consistent with applicable regulatory guidance. To the extent these investments are actively traded, they are classified as Level 1 of the fair value hierarchy, otherwise they are generally classified as Level 2. Certain equity securities containing unique attributes may be classified as Level 2.
Unlisted equity securities for which market quotations are available are valued at the last sale price on the valuation date, or if no sale occurs, at the last bid price for long positions or the last ask price for short positions, and are generally classified as Level 2. Securities traded on certain foreign securities exchanges are valued daily at fair value determined by an independent fair value service (if available) under Fair Valuation Procedures approved by the Trustees and consistent with applicable regulatory guidance. The independent fair value service takes into account multiple factors including, but not limited to, movements in the securities markets, certain depositary receipts, futures contracts and foreign currency exchange rates that have occurred subsequent to the close of the foreign securities exchange. These investments are generally classified as Level 2 of the fair value hierarchy.
Money Market Funds — Investments in the Goldman Sachs Financial Square Government Fund (“Underlying Fund”) are valued at the NAV per share of the Institutional Share class on the day of valuation. These investments are generally classified as Level 1 of the fair value hierarchy. For information regarding the Underlying Fund’s accounting policies and investment holdings, please see the Underlying Fund’s shareholder report.
B. Level 3 Fair Value Investments — To the extent that significant inputs to valuation models and other alternative pricing sources are unobservable, or if quotations are not readily available, or if GSAM believes that such quotations do not accurately reflect fair value, the fair value of a Fund’s investments may be determined under Valuation Procedures approved by the Trustees. GSAM, consistent with its procedures and applicable regulatory guidance, may make an adjustment to the most recent valuation prices of either domestic or foreign securities in light of significant events to reflect what it believes to be the fair value of the securities at the time of determining a Fund’s NAV. To the extent investments are valued using single source broker quotations obtained directly from the broker or passed through from third party pricing vendors, such investments are classified as Level 3 investments.
39
GOLDMAN SACHS REAL ESTATE SECURITIES FUNDS
Notes to Financial Statements (continued)
June 30, 2021 (Unaudited)
|
| 3. INVESTMENTS AND FAIR VALUE MEASUREMENTS (continued) |
C. Fair Value Hierarchy — The following is a summary of the Funds’ investments classified in the fair value hierarchy as of June 30, 2021:
| | | | | | | | | | | | |
| | | |
| GLOBAL REAL ESTATE SECURITIES | | | | | | | | | | | | |
| | | |
| Investment Type | | Level 1 | | | Level 2 | | | Level 3 | |
| | | |
| Assets | | | | | | | | | | | | |
| | | |
Common Stock and/or Other Equity Investments(a) | | | | | | | | | | | | |
| | | |
Asia | | $ | 2,709,145 | | | $ | 28,158,651 | | | $ | — | |
| | | |
Australia and Oceania | | | — | | | | 5,973,122 | | | | — | |
| | | |
Europe | | | 3,258,318 | | | | 25,914,121 | | | | — | |
| | | |
North America | | | 98,193,500 | | | | — | | | | — | |
| | | |
Investment Company | | | 1,592,735 | | | | — | | | | — | |
| | | |
Securities Lending Reinvestment Vehicle | | | 1,541,853 | | | | — | | | | — | |
| | | |
Total | | $ | 107,295,551 | | | $ | 60,045,894 | | | $ | — | |
| | | |
| INTERNATIONAL REAL ESTATE SECURITIES | | | | | | | | | | | | |
| | | |
| Investment Type | | Level 1 | | | Level 2 | | | Level 3 | |
| | | |
| Assets | | | | | | | | | | | | |
| | | |
Common Stock and/or Other Equity Investments(a) | | | | | | | | | | | | |
| | | |
Asia | | $ | 2,380,007 | | | $ | 19,653,951 | | | $ | — | |
| | | |
Australia and Oceania | | | — | | | | 4,097,797 | | | | — | |
| | | |
Europe | | | 1,936,680 | | | | 19,241,186 | | | | — | |
| | | |
North America | | | 3,712,572 | | | | — | | | | — | |
| | | |
Investment Company | | | 13 | | | | — | | | | — | |
| | | |
Total | | $ | 8,029,272 | | | $ | 42,992,934 | | | $ | — | |
| | | |
| REAL ESTATE SECURITIES | | | | | | | | | | | | |
| | | |
| Investment Type | | Level 1 | | | Level 2 | | | Level 3 | |
| | | |
| Assets | | | | | | | | | | | | |
| | | |
Common Stock and/or Other Equity Investments(a) | | | | | | | | | | | | |
| | | |
North America | | $ | 155,724,881 | | | $ | — | | | $ | — | |
| | | |
Investment Company | | | 949,036 | | | | — | | | | — | |
| | | |
Total | | $ | 156,673,917 | | | $ | — | | | $ | — | |
| (a) | | Amounts are disclosed by continent to highlight the impact of time zone differences between local market close and the calculation of NAV. Security valuations are based on the principal exchange or system on which they are traded, which may differ from country of domicile. The Funds utilize fair value model prices provided by an independent third party (fair value) service for certain international equity securities, resulting in a Level 2 classification. |
For further information regarding security characteristics, see the Schedules of Investments.
40
GOLDMAN SACHS REAL ESTATE SECURITIES FUNDS
|
| 4. AGREEMENTS AND AFFILIATED TRANSACTIONS |
A. Management Agreement — Under the Agreement, GSAM manages the Funds, subject to the general supervision of the Trustees.
As compensation for the services rendered pursuant to the Agreement, the assumption of the expenses related thereto and administration of the Funds’ business affairs, including providing facilities, GSAM is entitled to a management fee, accrued daily and paid monthly, equal to an annual percentage rate of each Fund’s average daily net assets.
For the six months ended June 30, 2021, contractual and effective net management fees with GSAM were at the following rates:
| | | | | | | | | | | | | | | | | | | | | | | | | | | | | | |
| | | | | Contractual Management Rate | | | Effective Net
Management
Rate^ | |
| Fund | | | | First
$1 billion | | | Next
$1 billion | | | Next
$3 billion | | | Next
$3 billion | | | Over
$8 billion | | | Effective
Rate | |
Global Real Estate Securities | | | | | 0.93 | % | | | 0.84 | % | | | 0.80 | % | | | 0.78 | % | | | 0.76 | % | | | 0.93 | % | | | 0.93 | % |
International Real Estate Securities | | | | | 0.95 | | | | 0.95 | | | | 0.86 | | | | 0.81 | | | | 0.80 | | | | 0.95 | | | | 0.95 | |
Real Estate Securities | | | | | 0.87 | | | | 0.78 | | | | 0.74 | | | | 0.73 | | | | 0.71 | | | | 0.87 | | | | 0.87 | |
| ^ | | Effective Net Management Rate includes the impact of management fee waivers of affiliated Underlying Funds, if any. The Effective Net Management Rate may not correlate to the Contractual Management Rate as a result of management fee waivers that may be in effect from time to time. |
The Funds invest in Institutional Shares of the Goldman Sachs Financial Square Government Fund, which is an affiliated Underlying Fund. GSAM has agreed to waive a portion of its management fee payable by the Funds in an amount equal to the management fee it earns as an investment adviser to the affiliated Underlying Fund in which the Funds invest, except those management fees it earns from the Funds’ investments of cash collateral received in connection with securities lending transactions in the Goldman Sachs Financial Square Government Fund. For the six months ended June 30, 2021, GSAM waived $247, $136 and $297 of the Global Real Estate Securities, International Real Estate Securities and Real Estate Securities Funds’ management fees, respectively.
B. Distribution and/or Service (12b-1) Plans — The Trust, on behalf of Class A and Class R Shares of each applicable Fund, has adopted Distribution and Service Plans subject to Rule 12b-1 under the Act. Under the Distribution and Service Plans, Goldman Sachs, which serves as distributor (the “Distributor”), is entitled to a fee accrued daily and paid monthly for distribution services and personal and account maintenance services, which may then be paid by Goldman Sachs to authorized dealers. These fees are equal to an annual percentage rate of the average daily net assets attributable to Class A or Class R Shares of the Funds, as applicable, as set forth below.
The Trust, on behalf of Class C Shares of each applicable Fund, has adopted a Distribution Plan subject to Rule 12b-1 under the Act. Under the Distribution Plan, Goldman Sachs as Distributor is entitled to a fee accrued daily and paid monthly for distribution services, which may then be paid by Goldman Sachs to authorized dealers. These fees are equal to an annual percentage rate of the average daily net assets attributable to Class C Shares of the Funds, as set forth below.
The Trust, on behalf of Service Shares of each applicable Fund, has adopted a Service Plan subject to Rule 12b-1 under the Act to allow Service Shares to compensate service organizations (including Goldman Sachs) for providing personal and account maintenance services to their customers who are beneficial owners of such shares. The Service Plan provides for compensation to the service organizations equal to an annual percentage rate of the average daily net assets attributable to Service Shares of the Funds, as set forth below.
| | | | | | | | | | | | | | | | |
| | | Distribution and/or Service Plan Rates | |
| | | Class A* | | | Class C | | | Service | | | Class R* | |
Distribution and/or Service Plans | | | 0.25 | % | | | 0.75 | % | | | 0.25 | % | | | 0.50 | % |
| * | | With respect to Class A and Class R Shares, the Distributor at its discretion may use compensation for distribution services paid under the Distribution and/or Service Plans to compensate service organizations for personal and account maintenance services and expenses as long as such total compensation does not exceed the maximum cap on “service fees” imposed by the Financial Industry Regulatory Authority. |
41
GOLDMAN SACHS REAL ESTATE SECURITIES FUNDS
Notes to Financial Statements (continued)
June 30, 2021 (Unaudited)
|
| 4. AGREEMENTS AND AFFILIATED TRANSACTIONS (continued) |
C. Distribution Agreement — Goldman Sachs, as Distributor of the shares of the Funds pursuant to a Distribution Agreement, may retain a portion of the Class A Shares’ front end sales charge and Class C Shares’ CDSC. During the six months ended June 30, 2021, Goldman Sachs retained the following amounts:
| | | | | | | | | | |
| | | | | Front End
Sales Charge | | | Contingent Deferred
Sales Charge | |
| Fund | | | | Class A | | | Class C | |
International Real Estate Securities | | | | $ | 7 | | | $ | — | |
Real Estate Securities | | | | | 344 | | | | — | |
D. Service and Shareholder Administration Plans — The Trust, on behalf of each applicable Fund, has adopted Service Plans to allow Class C Shares and Shareholder Administration Plans to allow Service Shares, respectively, to compensate service organizations (including Goldman Sachs) for providing varying levels of personal and account maintenance or shareholder administration services to their customers who are beneficial owners of such shares. The Service and Shareholder Administration Plans each provide for compensation to the service organizations equal to an annual percentage rate of 0.25% of the average daily net assets attributable to Class C and Service Shares of the Funds, respectively.
E. Transfer Agency Agreement — Goldman Sachs also serves as the transfer agent of the Funds for a fee pursuant to the Transfer Agency Agreement. The fees charged for such transfer agency services are accrued daily and paid monthly at annual rates as follows: 0.16% of the average daily net assets of Class A, Class C, Investor and Class R Shares; 0.03% of the average daily net assets of Class R6 and Class P Shares; and 0.04% of the average daily net assets of Institutional and Service Shares. Prior to January 1, 2021, the annual rate was 0.17% of the average daily net assets of Class A, Class C, Investor and Class R Shares.
F. Other Expense Agreements and Affiliated Transactions — GSAM has agreed to reduce or limit certain “Other Expenses” of the Funds (excluding acquired fund fees and expenses, transfer agency fees and expenses, service fees and shareholder administration fees (as applicable), taxes, interest, brokerage fees, expenses of shareholder meetings, litigation and indemnification, and extraordinary expenses) to the extent such expenses exceed, on an annual basis, a percentage rate of the average daily net assets of each Fund. Such Other Expense reimbursements, if any, are accrued daily and paid monthly. In addition, the Funds are not obligated to reimburse GSAM for prior fiscal year expense reimbursements, if any. The Other Expense limitation as an annual percentage rate of average daily net assets for each Fund is 0.004%. These Other Expense limitations will remain in place through at least April 30, 2022, and prior to such date GSAM may not terminate the arrangements without the approval of the Trustees. In addition, the Funds have entered into certain offset arrangements with the custodian and the transfer agent, which may result in a reduction of the Funds’ expenses and are received irrespective of the application of the “Other Expense” limitations described above.
For the six months ended June 30, 2021, these expense reductions, including any fee waivers and Other Expense reimbursements, were as follows:
| | | | | | | | | | | | | | |
| Fund | | | | Management
Fee Waiver | | | Other Expense
Reimbursement | | | Total
Expense
Reductions | |
Global Real Estate Securities | | | | $ | 247 | | | $ | 214,579 | | | $ | 214,826 | |
International Real Estate Securities | | | | | 136 | | | | 205,064 | | | | 205,200 | |
Real Estate Securities | | | | | 297 | | | | 199,054 | | | | 199,351 | |
G. Line of Credit Facility — As of June 30, 2021, the Funds participated in a $1,000,000,000 committed, unsecured revolving line of credit facility (the “facility”) together with other funds of the Trust and certain registered investment companies having management agreements with GSAM or its affiliates. This facility is to be used for temporary emergency purposes, or to allow for
42
GOLDMAN SACHS REAL ESTATE SECURITIES FUNDS
|
| 4. AGREEMENTS AND AFFILIATED TRANSACTIONS (continued) |
an orderly liquidation of securities to meet redemption requests. The interest rate on borrowings is based on the federal funds rate. The facility also requires a fee to be paid by the Funds based on the amount of the commitment that has not been utilized. For the six months ended June 30, 2021, the Funds did not have any borrowings under the facility. Prior to April 26, 2021, the facility was $700,000,000.
H. Other Transactions with Affiliates — The following table provides information about the Funds’ investment in the Goldman Sachs Financial Square Government Fund as of and for the six months ended June 30, 2021:
| | | | | | | | | | | | | | | | | | | | | | | | |
| Fund | | Beginning
Value as of
December 31, 2020 | | | Purchases
at Cost | | | Proceeds
from Sales | | | Ending
Value as of
June 30, 2021 | | | Shares as of
June 30, 2021 | | | Dividend
Income | |
Global Real Estate Securities | | $ | 2,365,286 | | | $ | 22,892,466 | | | $ | (23,665,017 | ) | | $ | 1,592,735 | | | | 1,592,735 | | | $ | 171 | |
International Real Estate Securities | | | 1,168,707 | | | | 6,387,932 | | | | (7,556,626 | ) | | | 13 | | | | 13 | | | | 97 | |
Real Estate Securities | | | — | | | | 23,211,963 | | | | (22,262,927 | ) | | | 949,036 | | | | 949,036 | | | | 242 | |
As of June 30, 2021, The Goldman Sachs Group, Inc. was the beneficial owner of the following Funds:
| | | | | | | | | | | | | | | | | | | | | | | | |
| | | Percent of Share Class owned by Goldman Sachs Group, Inc. | |
| Fund | | Class A | | | Class C | | | Institutional | | | Investor | | | Class R6 | | | Class R | |
Global Real Estate Securities | | | 47 | % | | | 60 | % | | | 87 | % | | | 100 | % | | | — | % | | | 100 | % |
International Real Estate Securities | | | — | | | | 41 | | | | — | | | | 16 | | | | 17 | | | | — | |
As of June 30, 2021, the following Goldman Sachs Fund of Funds and Global Tax-Aware Equity Portfolios were beneficial owners of 5% or more of total outstanding shares of the following Fund:
| | | | | | | | | | | | | | | | | | | | | | |
| Fund | | | | Goldman Sachs
Dynamic Global
Equity Portfolio | | | Goldman Sachs
Enhanced Dividend
Global Equity Portfolio | | | Goldman Sachs
Growth and Income
Strategy Portfolio | | | Goldman Sachs
Growth Strategy
Portfolio | | | Goldman Sachs
Tax-Advantaged
Global Equity Portfolio | |
Global Real Estate Securities | | | | | 8 | % | | | 5 | % | | | 6 | % | | | 5 | % | | | 37 | % |
|
| 5. PORTFOLIO SECURITIES TRANSACTIONS |
The cost of purchases and proceeds from sales and maturities of long-term securities for the six months ended June 30, 2021, were as follows:
| | | | | | | | | | |
| Fund | | | | Purchases | | | Sales | |
Global Real Estate Securities | | | | $ | 59,843,687 | | | $ | 93,743,053 | |
International Real Estate Securities | | | | | 9,942,889 | | | | 12,752,236 | |
Real Estate Securities | | | | | 42,534,877 | | | | 31,464,989 | |
Pursuant to exemptive relief granted by the Securities and Exchange Commission (“SEC”) and the terms and conditions contained therein, the Global Real Estate Securities and International Real Estate Securities Funds may lend their securities through a securities lending agent, Goldman Sachs Agency Lending (“GSAL”), a wholly-owned subsidiary of Goldman Sachs, to certain
43
GOLDMAN SACHS REAL ESTATE SECURITIES FUNDS
Notes to Financial Statements (continued)
June 30, 2021 (Unaudited)
|
| 6. SECURITIES LENDING (continued) |
qualified borrowers including Goldman Sachs and affiliates. In accordance with the Funds’ securities lending procedures, the Funds receive cash collateral at least equal to the market value of the securities on loan. The market value of the loaned securities is determined at the close of business of the Funds, at their last sale price or official closing price on the principal exchange or system on which they are traded, and any additional required collateral is delivered to the Funds on the next business day. As with other extensions of credit, the Funds may experience delay in the recovery of their securities or incur a loss should the borrower of the securities breach its agreement with the Funds or become insolvent at a time when the collateral is insufficient to cover the cost of repurchasing securities on loan. Dividend income received from securities on loan may not be subject to withholding taxes and therefore withholding taxes paid may differ from the amounts listed in the Statements of Operations. Loans of securities are terminable at any time and as such 1) the remaining contractual maturities of the outstanding securities lending transactions are considered to be overnight and continuous and 2) the borrower, after notice, is required to return borrowed securities within the standard time period for settlement of securities transactions.
The Global Real Estate Securities and International Real Estate Securities Funds invest the cash collateral received in connection with securities lending transactions in the Goldman Sachs Financial Square Government Fund (“Government Money Market Fund”), an affiliated series of the Goldman Sachs Trust. The Government Money Market Fund is registered under the Act as an open end investment company, is subject to Rule 2a-7 under the Act, and is managed by GSAM, for which GSAM may receive a management fee of up to 0.16% on an annualized basis of the average daily net assets of the Government Money Market Fund.
In the event of a default by a borrower with respect to any loan, GSAL will exercise any and all remedies provided under the applicable borrower agreement to make the Funds whole. These remedies include purchasing replacement securities by applying the collateral held from the defaulting broker against the purchase cost of the replacement securities. If GSAL is unable to purchase replacement securities, GSAL will indemnify the Funds by paying the Funds an amount equal to the market value of the securities loaned minus the value of cash collateral received from the borrower for the loan, subject to an exclusion for any shortfalls resulting from a loss of value in such cash collateral due to reinvestment risk. The Funds’ master netting agreements with certain borrowers provide the right, in the event of a default (including bankruptcy or insolvency), for the non-defaulting party to liquidate the collateral and calculate net exposure to the defaulting party or request additional collateral. However, in the event of a default by a borrower, a resolution authority could determine that such rights are not enforceable due to the restrictions or prohibitions against the right of set-off that may be imposed in accordance with a particular jurisdiction’s bankruptcy or insolvency laws. The Funds’ loaned securities were all subject to enforceable Securities Lending Agreements and the value of the collateral was at least equal to the value of the cash received. The amounts of the Funds’ overnight and continuous agreements, which represent the gross amounts of recognized liabilities for securities lending transactions outstanding as of June 30, 2021, are disclosed as “Payable upon return of securities loaned” on the Statements of Assets and Liabilities, where applicable. The International Real Estate Securities Fund did not have securities on loan as of June 30, 2021.
Each of the Global Real Estate Securities and International Real Estate Securities Funds and GSAL received compensation relating to the lending of the Funds’ securities. The amounts earned, if any, by the Funds for the six months ended June 30, 2021, are reported under Investment Income on the Statements of Operations.
The table below details securities lending activity with affiliates of Goldman Sachs:
| | | | | | |
| | | | | For the six months
ended June 30, 2021 | |
| Fund | | | | Earnings of GSAL
Relating to Securities
Loaned | |
Global Real Estate Securities | | | | $ | 496 | |
International Real Estate Securities | | | | | 205 | |
44
GOLDMAN SACHS REAL ESTATE SECURITIES FUNDS
|
| 6. SECURITIES LENDING (continued) |
The following table provides information about the Funds’ investment in the Government Money Market Fund for the six months ended June 30, 2021:
| | | | | | | | | | | | | | | | | | |
| Fund | | | | Beginning Value as of
December 31, 2020 | | | Purchases
at Cost | | | Proceeds
from Sales | | | Ending Value as of
June 30, 2021 | |
Global Real Estate Securities | | | | $ | — | | | $ | 7,455,472 | | | $ | (5,913,619 | ) | | $ | 1,541,853 | |
International Real Estate Securities | | | | | — | | | | 4,738,714 | | | | (4,738,714 | ) | | | — | |
As of the Funds’ most recent fiscal year end, December 31, 2020, the Funds’ capital loss carryforwards and certain timing differences, on a tax-basis were as follows:
| | | | | | | | | | | | |
| | | Global Real
Estate
Securities | | | International
Real Estate
Securities | | | Real
Estate
Securities | |
Capital loss carryforwards: | | | | | | | | | | | | |
Perpetual short-term | | $ | (1,965,256 | ) | | $ | (352,616 | ) | | $ | — | |
Perpetual long-term | | | (5,981,265 | ) | | | (12,171,625 | ) | | | — | |
Total capital loss carryforwards | | $ | (7,946,521 | ) | | $ | (12,524,241 | ) | | $ | — | |
Timing differences (Real Estate Investment Trusts and Post October Capital Loss Deferral) | | $ | 65,555 | | | $ | — | | | $ | 18,092 | |
As of June 30, 2021, the Funds’ aggregate security unrealized gains and losses based on cost for U.S. federal income tax purposes were as follows:
| | | | | | | | | | | | |
| | | Global Real
Estate Securities | | | International
Real Estate
Securities | | | Real Estate
Securities | |
Tax cost | | $ | 139,587,273 | | | $ | 48,819,633 | | | $ | 106,413,726 | |
Gross unrealized gain | | | 38,127,900 | | | | 7,115,534 | | | | 52,179,174 | |
Gross unrealized loss | | | (10,373,728 | ) | | | (4,912,961 | ) | | | (1,918,983 | ) |
Net unrealized gain | | $ | 27,754,172 | | | $ | 2,202,573 | | | $ | 50,260,191 | |
The difference between GAAP-basis and tax-basis unrealized gains (losses) is attributable primarily to wash sales and differences related to the tax treatment of real estate investment trust investments, partnership investments and passive foreign investment companies.
GSAM has reviewed the Funds’ tax positions for all open tax years (the current and prior three years, as applicable) and has concluded that no provision for income tax is required in the Funds’ financial statements. Such open tax years remain subject to examination and adjustment by tax authorities.
45
GOLDMAN SACHS REAL ESTATE SECURITIES FUNDS
Notes to Financial Statements (continued)
June 30, 2021 (Unaudited)
The Funds’ risks include, but are not limited to, the following:
Dividend-Paying Investments Risk — A Fund’s investments in dividend-paying securities could cause a Fund to underperform other funds. Securities that pay dividends, as a group, can fall out of favor with the market, causing such securities to underperform securities that do not pay dividends. Depending upon market conditions and political and legislative responses to such conditions, dividend-paying securities that meet a Fund’s investment criteria may not be widely available and/or may be highly concentrated in only a few market sectors. In addition, issuers that have paid regular dividends or distributions to shareholders may not continue to do so at the same level or at all in the future. This may limit the ability of a Fund to produce current income.
Foreign and Emerging Countries Risk — Investing in foreign markets may involve special risks and considerations not typically associated with investing in the U.S. Foreign securities may be subject to risk of loss because of more or less foreign government regulation, less public information and less economic, political and social stability in the countries in which a Fund invests. The imposition of exchange controls (including repatriation restrictions), confiscation of assets and property, trade restrictions (including tariffs) and other government restrictions by the U.S. or other governments, or problems with registration, settlement or custody, may also result in losses. Foreign risk also involves the risk of negative foreign currency rate fluctuations, which may cause the value of securities denominated in such foreign currency (or other instruments through which a Fund has exposure to foreign currencies) to decline in value. Currency exchange rates may fluctuate significantly over short periods of time. To the extent that a Fund also invests in securities of issuers located in emerging markets, these risks may be more pronounced.
Foreign Custody Risk — A Fund invests in foreign securities, and as such the Fund may hold such securities and cash with foreign banks, agents, and securities depositories appointed by the Fund’s custodian (each a “Foreign Custodian”). Some foreign custodians may be recently organized or new to the foreign custody business. In some countries, Foreign Custodians may be subject to little or no regulatory oversight over, or independent evaluation of, their operations. Further, the laws of certain countries may place limitations on a Fund’s ability to recover its assets if a Foreign Custodian enters bankruptcy. Investments in emerging markets may be subject to even greater custody risks than investments in more developed markets. Custody services in emerging market countries are very often undeveloped and may be considerably less well regulated than in more developed countries, and thus may not afford the same level of investor protection as would apply in developed countries.
Geographic Risk — If a Fund focuses its investments in securities of issuers located in a particular country or geographic region, the Fund may be subjected, to a greater extent than if its investments were less focused, to the risks of volatile economic cycles and/or conditions and developments that may be particular to that country or region, such as: adverse securities markets; adverse exchange rates; adverse social, political, regulatory, economic, business, environmental or other developments; or natural disasters.
Industry Concentration Risk — Concentrating Fund investments in a limited number of issuers conducting business in the same industry or group of industries will subject a Fund to a greater risk of loss as a result of adverse economic, business, political, environmental or other developments than if its investments were diversified across different industries.
Investments in Other Investment Companies Risk — As a shareholder of another investment company, a Fund will indirectly bear its proportionate share of any net management fees and other expenses paid by such other investment companies, in addition to the fees and expenses regularly borne by the Fund.
Large Shareholder Transactions Risk — A Fund may experience adverse effects when certain large shareholders, such as other funds, institutional investors (including those trading by use of non-discretionary mathematical formulas), financial intermediaries (who may make investment decisions on behalf of underlying clients and/or include a Fund in their investment model), individuals, accounts and Goldman Sachs affiliates, purchase or redeem large amounts of shares of a Fund. Such large shareholder redemptions, which may occur rapidly or unexpectedly, may cause a Fund to sell portfolio securities at times when it would not otherwise do so, which may negatively impact a Fund’s NAV and liquidity. These transactions may also accelerate the realization of taxable income to shareholders if such sales of investments resulted in gains, and may also increase transaction costs. In addition, a large redemption could result in a Fund’s current expenses being allocated over a smaller asset base, leading to an increase in the Fund’s expense ratio. Similarly, large Fund share purchases may adversely affect a Fund’s performance to the extent that the Fund is delayed in investing new cash or otherwise maintains a larger cash position than it ordinarily would.
46
GOLDMAN SACHS REAL ESTATE SECURITIES FUNDS
|
| 8. OTHER RISKS (continued) |
Liquidity Risk — A Fund may make investments that are illiquid or that may become less liquid in response to market developments or adverse investor perceptions. Illiquid investments may be more difficult to value. Liquidity risk may also refer to the risk that a Fund will not be able to pay redemption proceeds within the allowable time period or without significant dilution to remaining investors’ interests because of unusual market conditions, an unusually high volume of redemption requests, or other reasons. To meet redemption requests, a Fund may be forced to sell investments at an unfavorable time and/or under unfavorable conditions. If a Fund is forced to sell securities at an unfavorable time and/or under unfavorable conditions, such sales may adversely affect the Fund’s NAV and dilute remaining investors’ interests. These risks may be more pronounced in connection with a Fund’s investments in securities of issuers located in emerging market countries. Redemptions by large shareholders may have a negative impact on a Fund’s liquidity.
Market and Credit Risks — In the normal course of business, a Fund trades financial instruments and enters into financial transactions where risk of potential loss exists due to changes in the market (market risk). The value of the securities in which a Fund invests may go up or down in response to the prospects of individual companies, particular sectors or governments and/or general economic conditions throughout the world due to increasingly interconnected global economies and financial markets. Events such as war, acts of terrorism, social unrest, natural disasters, the spread of infectious illness or other public health threats could also significantly impact a Fund and its investments. Additionally, a Fund may also be exposed to credit risk in the event that an issuer or guarantor fails to perform or that an institution or entity with which the Fund has unsettled or open transactions defaults.
Non-Diversification Risk — The International Real Estate Securities and Real Estate Securities Funds are non-diversified, meaning that they are permitted to invest a larger percentage of their assets in fewer issuers than diversified mutual funds. Thus, a Fund may be more susceptible to adverse developments affecting any single issuer held in its portfolio, and may be more susceptible to greater losses because of these developments.
Under the Trust’s organizational documents, its Trustees, officers, employees and agents are indemnified, to the extent permitted by the Act and state law, against certain liabilities that may arise out of performance of their duties to the Funds. Additionally, in the course of business, the Funds enter into contracts that contain a variety of indemnification clauses. The Funds’ maximum exposure under these arrangements is unknown, as this would involve future claims that may be made against the Funds that have not yet occurred. However, GSAM believes the risk of loss under these arrangements to be remote.
Subsequent events after the Statements of Assets and Liabilities date have been evaluated, and GSAM has concluded that there is no impact requiring adjustment or disclosure in the financial statements.
47
GOLDMAN SACHS REAL ESTATE SECURITIES FUNDS
Notes to Financial Statements (continued)
June 30, 2021 (Unaudited)
|
| 11. SUMMARY OF SHARE TRANSACTIONS |
Share activity is as follows:
| | | | | | | | | | | | | | | | |
| | | Global Real Estate Securities Fund | |
| | | | |
| | | For the Six Months Ended
June 30, 2021
(Unaudited) | | | For the Fiscal Year Ended
December 31, 2020 | |
| | | | |
| | | Shares | | | Dollars | | | Shares | | | Dollars | |
| | | | |
| Class A Shares | | | | | | | | | | | | | | | | |
Shares sold | | | 1,623 | | | $ | 16,750 | | | | 31 | | | $ | 345 | |
Reinvestment of distributions | | | 42 | | | | 494 | | | | 71 | | | | 645 | |
Shares redeemed | | | (31 | ) | | | (330 | ) | | | (4 | ) | | | (41 | ) |
| | | | 1,634 | | | | 16,914 | | | | 98 | | | | 949 | |
| Class C Shares | | | | | | | | | | | | | | | | |
Reinvestment of distributions | | | 19 | | | | 220 | | | | 45 | | | | 424 | |
Shares redeemed | | | — | | | | — | | | | (1,043 | ) | | | (9,389 | ) |
| | | | 19 | | | | 220 | | | | (998 | ) | | | (8,965 | ) |
| Institutional Shares | | | | | | | | | | | | | | | | |
Shares sold | | | 11,427 | | | | 117,480 | | | | 19,341 | | | | 204,292 | |
Reinvestment of distributions | | | 1,765 | | | | 20,554 | | | | 3,610 | | | | 32,682 | |
Shares redeemed | | | (3,855 | ) | | | (42,245 | ) | | | (4,532 | ) | | | (43,736 | ) |
| | | | 9,337 | | | | 95,789 | | | | 18,419 | | | | 193,238 | |
| Investor Shares | | | | | | | | | | | | | | | | |
Reinvestment of distributions | | | 23 | | | | 272 | | | | 51 | | | | 458 | |
| | | | 23 | | | | 272 | | | | 51 | | | | 458 | |
| Class R6 Shares | | | | | | | | | | | | | | | | |
Shares sold | | | 244,076 | | | | 2,603,451 | | | | 2,017,932 | | | | 18,813,179 | |
Reinvestment of distributions | | | 83,755 | | | | 970,439 | | | | 276,148 | | | | 2,488,913 | |
Shares redeemed | | | (4,553,039 | ) | | | (48,006,302 | ) | | | (5,568,483 | ) | | | (54,042,521 | ) |
| | | | (4,225,208 | ) | | | (44,432,412 | ) | | | (3,274,403 | ) | | | (32,740,429 | ) |
| Class R Shares | | | | | | | | | | | | | | | | |
Reinvestment of distributions | | | 16 | | | | 188 | | | | 38 | | | | 345 | |
| | | | 16 | | | | 188 | | | | 38 | | | | 345 | |
| Class P Shares | | | | | | | | | | | | | | | | |
Shares sold | | | 1,489,618 | | | | 16,681,623 | | | | 2,568,798 | | | | 22,072,549 | |
Reinvestment of distributions | | | 32,431 | | | | 377,251 | | | | 53,027 | | | | 476,091 | |
Shares redeemed | | | (701,275 | ) | | | (8,308,888 | ) | | | (3,257,812 | ) | | | (28,595,177 | ) |
| | | | 820,774 | | | | 8,749,986 | | | | (635,987 | ) | | | (6,046,537 | ) |
| | | | |
NET DECREASE | | | (3,393,405 | ) | | $ | (35,569,043 | ) | | | (3,892,782 | ) | | $ | (38,600,941 | ) |
48
GOLDMAN SACHS REAL ESTATE SECURITIES FUNDS
|
| 11. SUMMARY OF SHARE TRANSACTIONS (continued) |
Share activity is as follows:
| | | | | | | | | | | | | | | | |
| | | International Real Estate Securities Fund | |
| | | | |
| | | For the Six Months Ended
June 30, 2021
(Unaudited) | | | For the Fiscal Year Ended
December 31, 2020 | |
| | | | |
| | | Shares | | | Dollars | | | Shares | | | Dollars | |
| | | | |
| Class A Shares | | | | | | | | | | | | | | | | |
Shares sold | | | 28,164 | | | $ | 191,549 | | | | 14,555 | | | $ | 83,687 | |
Reinvestment of distributions | | | 4,924 | | | | 34,022 | | | | 2,770 | | | | 15,123 | |
Shares redeemed | | | (30,011 | ) | | | (198,962 | ) | | | (139,827 | ) | | | (769,843 | ) |
| | | | 3,077 | | | | 26,609 | | | | (122,502 | ) | | | (671,033 | ) |
| Class C Shares | | | | | | | | | | | | | | | | |
Shares sold | | | 44 | | | | 300 | | | | 551 | | | | 3,383 | |
Reinvestment of distributions | | | 41 | | | | 284 | | | | 42 | | | | 232 | |
Shares redeemed | | | (7,353 | ) | | | (47,930 | ) | | | (12,454 | ) | | | (72,451 | ) |
| | | | (7,268 | ) | | | (47,346 | ) | | | (11,861 | ) | | | (68,836 | ) |
| Institutional Shares | | | | | | | | | | | | | | | | |
Shares sold | | | 79,602 | | | | 505,602 | | | | 20,583 | | | | 123,358 | |
Reinvestment of distributions | | | 15,606 | | | | 104,095 | | | | 11,310 | | | | 60,450 | |
Shares redeemed | | | (5,379 | ) | | | (34,466 | ) | | | (329,293 | ) | | | (1,827,794 | ) |
| | | | 89,829 | | | | 575,231 | | | | (297,400 | ) | | | (1,643,986 | ) |
| Investor Shares | | | | | | | | | | | | | | | | |
Shares sold | | | 1,188 | | | | 8,206 | | | | 1,286 | | | | 7,362 | |
Reinvestment of distributions | | | 178 | | | | 1,223 | | | | 159 | | | | 870 | |
Shares redeemed | | | (1,627 | ) | | | (10,633 | ) | | | (8,032 | ) | | | (49,166 | ) |
| | | | (261 | ) | | | (1,204 | ) | | | (6,587 | ) | | | (40,934 | ) |
| Class R6 Shares | | | | | | | | | | | | | | | | |
Shares sold | | | 9,862 | | | | 62,108 | | | | — | | | | — | |
Reinvestment of distributions | | | 212 | | | | 1,410 | | | | 23 | | | | 120 | |
Shares redeemed | | | (348 | ) | | | (2,300 | ) | | | — | | | | — | |
| | | | 9,726 | | | | 61,218 | | | | 23 | | | | 120 | |
| Class P Shares | | | | | | | | | | | | | | | | |
Shares sold | | | 187,004 | | | | 1,186,499 | | | | 3,763,846 | | | | 19,374,160 | |
Reinvestment of distributions | | | 118,584 | | | | 788,584 | | | | 99,884 | | | | 532,922 | |
Shares redeemed | | | (979,943 | ) | | | (6,298,135 | ) | | | (7,553,506 | ) | | | (38,883,307 | ) |
| | | | (674,355 | ) | | | (4,323,052 | ) | | | (3,689,776 | ) | | | (18,976,225 | ) |
| | | | |
NET DECREASE | | | (579,252 | ) | | $ | (3,708,544 | ) | | | (4,128,103 | ) | | $ | (21,400,894 | ) |
49
GOLDMAN SACHS REAL ESTATE SECURITIES FUNDS
Notes to Financial Statements (continued)
June 30, 2021 (Unaudited)
|
| 11. SUMMARY OF SHARE TRANSACTIONS (continued) |
Share activity is as follows:
| | | | | | | | | | | | | | | | |
| | | Real Estate Securities Fund | |
| | | | |
| | | For the Six Months Ended
June 30, 2021
(Unaudited) | | | For the Fiscal Year Ended
December 31, 2020 | |
| | | | |
| | | Shares | | | Dollars | | | Shares | | | Dollars | |
| | | | |
| Class A Shares | | | | | | | | | | | | | | | | |
Shares sold | | | 157,347 | | | $ | 1,985,742 | | | | 151,591 | | | $ | 1,711,995 | |
Reinvestment of distributions | | | 10,304 | | | | 132,008 | | | | 167,283 | | | | 1,784,623 | |
Shares redeemed | | | (306,929 | ) | | | (3,695,636 | ) | | | (652,041 | ) | | | (7,478,412 | ) |
| | | | (139,278 | ) | | | (1,577,886 | ) | | | (333,167 | ) | | | (3,981,794 | ) |
| Class C Shares | | | | | | | | | | | | | | | | |
Shares sold | | | 3,363 | | | | 37,565 | | | | 12,822 | | | | 136,861 | |
Reinvestment of distributions | | | 351 | | | | 4,201 | | | | 13,271 | | | | 132,433 | |
Shares redeemed | | | (33,294 | ) | | | (379,369 | ) | | | (106,025 | ) | | | (1,084,385 | ) |
| | | | (29,580 | ) | | | (337,603 | ) | | | (79,932 | ) | | | (815,091 | ) |
| Institutional Shares | | | | | | | | | | | | | | | | |
Shares sold | | | 711,882 | | | | 8,797,429 | | | | 203,539 | | | | 2,421,613 | |
Reinvestment of distributions | | | 21,111 | | | | 283,289 | | | | 197,171 | | | | 2,200,981 | |
Shares redeemed | | | (93,742 | ) | | | (1,216,759 | ) | | | (549,710 | ) | | | (6,405,332 | ) |
| | | | 639,251 | | | | 7,863,959 | | | | (149,000 | ) | | | (1,782,738 | ) |
| Service Shares | | | | | | | | | | | | | | | | |
Shares sold | | | 7,905 | | | | 95,498 | | | | 17,117 | | | | 186,599 | |
Reinvestment of distributions | | | 185 | | | | 2,383 | | | | 4,306 | | | | 46,371 | |
Shares redeemed | | | (28,567 | ) | | | (355,877 | ) | | | (57,146 | ) | | | (595,416 | ) |
| | | | (20,477 | ) | | | (257,996 | ) | | | (35,723 | ) | | | (362,446 | ) |
| Investor Shares | | | | | | | | | | | | | | | | |
Shares sold | | | 16,021 | | | | 200,520 | | | | 245,653 | | | | 3,153,946 | |
Reinvestment of distributions | | | 1,449 | | | | 18,824 | | | | 21,337 | | | | 230,536 | |
Shares redeemed | | | (31,413 | ) | | | (368,807 | ) | | | (399,865 | ) | | | (4,922,922 | ) |
| | | | (13,943 | ) | | | (149,463 | ) | | | (132,875 | ) | | | (1,538,440 | ) |
| Class R6 Shares | | | | | | | | | | | | | | | | |
Shares sold | | | 7,140 | | | | 86,547 | | | | 29,934 | | | | 329,275 | |
Reinvestment of distributions | | | 28 | | | | 374 | | | | 6,877 | | | | 76,897 | |
Shares redeemed | | | (71,473 | ) | | | (851,702 | ) | | | (10,623 | ) | | | (127,504 | ) |
| | | | (64,305 | ) | | | (764,781 | ) | | | 26,188 | | | | 278,668 | |
| Class R Shares | | | | | | | | | | | | | | | | |
Shares sold | | | 4,384 | | | | 51,816 | | | | 22,185 | | | | 256,198 | |
Reinvestment of distributions | | | 395 | | | | 4,994 | | | | 7,577 | | | | 79,676 | |
Shares redeemed | | | (16,642 | ) | | | (193,508 | ) | | | (56,007 | ) | | | (628,800 | ) |
| | | | (11,863 | ) | | | (136,698 | ) | | | (26,245 | ) | | | (292,926 | ) |
| Class P Shares | | | | | | | | | | | | | | | | |
Shares sold | | | 837,281 | | | | 10,734,924 | | | | 2,099,373 | | | | 22,254,864 | |
Reinvestment of distributions | | | 51,571 | | | | 692,430 | | | | 594,839 | | | | 6,634,674 | |
Shares redeemed | | | (362,064 | ) | | | (4,659,932 | ) | | | (3,099,620 | ) | | | (35,299,395 | ) |
| | | | 526,788 | | | | 6,767,422 | | | | (405,408 | ) | | | (6,409,857 | ) |
| | | | |
NET INCREASE (DECREASE) | | | 886,593 | | | $ | 11,406,954 | | | | (1,136,162 | ) | | $ | (14,904,624 | ) |
50
GOLDMAN SACHS REAL ESTATE SECURITIES FUNDS
Liquidity Risk Management Program (Unaudited)
Each Fund has adopted and implemented a liquidity risk management program (the “Program”) in accordance with Rule 22e-4 under the 1940 Act. The Program seeks to assess and manage each Fund’s liquidity risk, i.e., the risk that a Fund is unable to satisfy redemption requests without significantly diluting remaining investors’ interests in the Fund. The Board of Trustees of the Trust has designated GSAM, each Fund’s investment adviser, to administer the Program. Certain aspects of the Program rely on third parties to perform certain functions, including the provision of market data and application of models.
The Program is comprised of various components designed to support the assessment and/or management of liquidity risk, including: (1) the periodic assessment (no less frequently than annually) of certain factors that influence a Fund’s liquidity risk; (2) the periodic classification (no less frequently than monthly) of a Fund’s investments into one of four liquidity categories that reflect an estimate of their liquidity under current market conditions; (3) a 15% limit on the acquisition of “illiquid investments” (as defined under Rule 22e-4); (4) for a Fund that does not invest primarily in “highly liquid investments” (as defined under Rule 22e-4), the determination of a minimum percentage of the Fund’s assets that will generally be invested in highly liquid investments (a “Highly Liquid Investment Minimum”); and (5) periodic reporting to the Board of Trustees.
At a meeting of the Board of Trustees on February 9-10, 2021, GSAM provided a written report to the Board addressing the operation, and the adequacy and effectiveness of the implementation, of the Program, including, as applicable, the operation of any Highly Liquid Investment Minimum and any material changes to the Program, for the period from January 1, 2020 through December 31, 2020 (the “Reporting Period”). Among other things, the annual report and related materials discussed: (1) the results of stress tests designed to assess liquidity under a hypothetical stressed scenario involving elevated redemptions; (2) an assessment of the methodologies used to classify investments into one of four liquidity categories; and (3) the impact of the COVID-19 pandemic on liquidity and management of liquidity risk during the Reporting Period, including during stressed market conditions caused by the COVID-19 pandemic. The report concluded that the Program continues to be reasonably designed to assess and manage liquidity risk and was adequately and effectively implemented during the Reporting Period.
There can be no assurance that the Program will achieve its objectives under all circumstances in the future. Please refer to your Fund’s prospectus for more information regarding the Fund’s exposure to liquidity risk and other risks to which it may be subject.
51
GOLDMAN SACHS REAL ESTATE SECURITIES FUNDS
Fund Expenses — Six Month Period Ended June 30, 2021 (Unaudited)
As a shareholder of Class A, Class C, Institutional, Service, Investor, Class R6, Class R or Class P Shares of a Fund you incur two types of costs: (1) transaction costs, including sales charges on purchase payments (with respect to Class A Shares) and contingent deferred sales charges on redemptions (with respect to Class C Shares); and (2) ongoing costs, including management fees; distribution and/or service (12b-1) fees (with respect to Class A, Class C, Service and Class R Shares); and other Fund expenses. This example is intended to help you understand your ongoing costs (in dollars) of investing in Class A, Class C, Institutional, Service, Investor, Class R6, Class R and Class P Shares of the Funds and to compare these costs with the ongoing costs of investing in other mutual funds.
The example is based on an investment of $1,000 invested at the beginning of the period and held for the entire period from January 1, 2021 through June 30, 2021, which represents a period of 181 days of a 365 day year.
Actual Expenses —The first line under each share class in the table below provides information about actual account values and actual expenses. You may use the information in this line, together with the amount you invested, to estimate the expenses that you paid over the period. Simply divide your account value by $1,000 (for example, an $8,600 account value divided by $1,000=8.6), then multiply the result by the number in the first line under the heading entitled “Expenses Paid” to estimate the expenses you paid on your account during this period.
Hypothetical Example for Comparison Purposes — The second line under each share class in the table below provides information about hypothetical account values and hypothetical expenses based on the Funds’ actual net expense ratio and an assumed rate of return of 5% per year before expenses, which is not the Funds’ actual return. The hypothetical account values and expenses may not be used to estimate the actual ending account balance or expenses you paid for the period. You may use this information to compare the ongoing costs of investing in the Funds and other funds. To do so, compare this 5% hypothetical example with the 5% hypothetical examples that appear in the shareholder reports of the other funds.
Please note that the expenses shown in the table are meant to highlight your ongoing costs only and do not reflect any transactional costs, such as sales charges, redemption fees, or exchange fees. Therefore, the second line of the table is useful in comparing ongoing costs only and will not help you determine the relative total costs of owning different funds. In addition, if these transactional costs were included, your costs would have been higher.
| | | | | | | | | | | | | | | | | | | | | | | | | | | | | | | | | | | | |
| | | Global Real Estate Securities Fund | | | International Real Estate Securities Fund | | | Real Estate Securities Fund | |
| Share Class | | Beginning
Account
Value
1/01/21 | | | Ending
Account
Value
6/30/21 | | | Expenses
Paid for the
6 Months Ended
6/30/21* | | | Beginning
Account
Value
1/01/21 | | | Ending
Account
Value
6/30/21 | | | Expenses
Paid for the
6 Months Ended
6/30/21* | | | Beginning
Account
Value
1/01/21 | | | Ending
Account
Value
6/30/21 | | | Expenses
Paid for the
6 Months Ended
6/30/21* | |
| Class A | | | | | | | | | | | | | | | | | | | | | | | | | | | | | | | | | | | | |
| | | | | | | | | | |
Actual | | $ | 1,000 | | | $ | 1,155.70 | | | $ | 7.16 | | | $ | 1,000 | | | $ | 1,079.00 | | | $ | 7.01 | | | $ | 1,000 | | | $ | 1,222.10 | | | $ | 7.05 | |
Hypothetical 5% return | | | 1,000 | | | | 1,018.15 | + | | | 6.71 | | | | 1,000 | | | | 1,018.05 | + | | | 6.81 | | | | 1,000 | | | | 1,018.45 | + | | | 6.41 | |
| Class C | | | | | | | | | | | | | | | | | | | | | | | | | | | | | | | | | | | | |
| | | | | | | | | | |
Actual | | | 1,000 | | | | 1,151.70 | | | | 11.15 | | | | 1,000 | | | | 1,076.30 | | | | 10.86 | | | | 1,000 | | | | 1,216.60 | | | | 11.16 | |
Hypothetical 5% return | | | 1,000 | | | | 1,014.43 | + | | | 10.44 | | | | 1,000 | | | | 1,014.33 | + | | | 10.54 | | | | 1,000 | | | | 1,014.73 | + | | | 10.14 | |
| Institutional | | | | | | | | | | | | | | | | | | | | | | | | | | | | | | | | | | | | |
| | | | | | | | | | |
Actual | | | 1,000 | | | | 1,157.60 | | | | 5.19 | | | | 1,000 | | | | 1,082.20 | | | | 5.11 | | | | 1,000 | | | | 1,224.20 | | | | 5.02 | |
Hypothetical 5% return | | | 1,000 | | | | 1,019.98 | + | | | 4.86 | | | | 1,000 | | | | 1,019.89 | + | | | 4.96 | | | | 1,000 | | | | 1,020.28 | + | | | 4.56 | |
| Service | | | | | | | | | | | | | | | | | | | | | | | | | | | | | | | | | | | | |
| | | | | | | | | | |
Actual | | | N/A | | | | N/A | | | | N/A | | | | N/A | | | | N/A | | | | N/A | | | | 1,000 | | | | 1,221.30 | | | | 7.77 | |
Hypothetical 5% return | | | N/A | | | | N/A | | | | N/A | | | | N/A | | | | N/A | | | | N/A | | | | 1,000 | | | | 1,017.80 | + | | | 7.05 | |
| Investor | | | | | | | | | | | | | | | | | | | | | | | | | | | | | | | | | | | | |
| | | | | | | | | | |
Actual | | | 1,000 | | | | 1,156.30 | | | | 5.83 | | | | 1,000 | | | | 1,080.90 | | | | 5.73 | | | | 1,000 | | | | 1,222.90 | | | | 5.68 | |
Hypothetical 5% return | | | 1,000 | | | | 1,019.39 | + | | | 5.46 | | | | 1,000 | | | | 1,019.29 | + | | | 5.56 | | | | 1,000 | | | | 1,019.69 | + | | | 5.16 | |
| Class R6 | | | | | | | | | | | | | | | | | | | | | | | | | | | | | | | | | | | | |
| | | | | | | | | | |
Actual | | | 1,000 | | | | 1,158.00 | | | | 5.14 | | | | 1,000 | | | | 1,080.60 | | | | 5.06 | | | | 1,000 | | | | 1,224.20 | | | | 4.96 | |
Hypothetical 5% return | | | 1,000 | | | | 1,020.03 | + | | | 4.81 | | | | 1,000 | | | | 1,019.93 | + | | | 4.91 | | | | 1,000 | | | | 1,020.33 | + | | | 4.51 | |
| Class R | | | | | | | | | | | | | | | | | | | | | | | | | | | | | | | | | | | | |
| | | | | | | | | | |
Actual | | | 1,000 | | | | 1,154.00 | | | | 8.49 | | | | N/A | | | | N/A | | | | N/A | | | | 1,000 | | | | 1,220.20 | | | | 8.42 | |
Hypothetical 5% return | | | 1,000 | | | | 1,016.91 | + | | | 7.95 | | | | N/A | | | | N/A | | | | N/A | | | | 1,000 | | | | 1,017.21 | + | | | 7.65 | |
| Class P | | | | | | | | | | | | | | | | | | | | | | | | | | | | | | | | | | | | |
| | | | | | | | | | |
Actual | | | 1,000 | | | | 1,158.10 | | | | 5.14 | | | | 1,000 | | | | 1,080.70 | | | | 5.06 | | | | 1,000 | | | | 1,224.50 | | | | 4.96 | |
Hypothetical 5% return | | | 1,000 | | | | 1,020.03 | + | | | 4.81 | | | | 1,000 | | | | 1,019.93 | + | | | 4.91 | | | | 1,000 | | | | 1,020.33 | + | | | 4.51 | |
| + | | Hypothetical expenses are based on each Fund’s actual annualized net expense ratios and an assumed rate of return of 5% per year before expenses. |
| * | | Expenses are calculated using each Fund’s annualized net expense ratio for each class, which represents the ongoing expenses as a percentage of net assets for the six months ended June 30, 2021. Expenses are calculated by multiplying the annualized net expense ratio by the average account value for the period; then multiplying the result by the number of days in the most recent fiscal half year; and then dividing that result by the number of days in the fiscal year. The annualized net expense ratios for the period were as follows: |
| | | | | | | | | | | | | | | | | | | | | | | | | | | | | | | | |
| Fund | | Class A | | | Class C | | | Institutional | | | Service | | | Investor | | | Class R6 | | | Class R | | | Class P | |
Global Real Estate Securities | | | 1.34 | % | | | 2.09 | % | | | 0.97 | % | | | N/A | | | | 1.09 | % | | | 0.96 | % | | | 1.59 | % | | | 0.96 | % |
International Real Estate Securities | | | 1.36 | | | | 2.11 | | | | 0.99 | | | | N/A | | | | 1.11 | | | | 0.98 | | | | N/A | | | | 0.98 | |
Real Estate Securities | | | 1.28 | | | | 2.03 | | | | 0.91 | | | | 1.41 | | | | 1.03 | | | | 0.90 | | | | 1.53 | | | | 0.90 | |
52
GOLDMAN SACHS REAL ESTATE SECURITIES FUNDS
Statement Regarding Basis for Approval of Management Agreement (Unaudited)
Background
The Goldman Sachs Global Real Estate Securities Fund, Goldman Sachs International Real Estate Securities Fund, and Goldman Sachs Real Estate Securities Fund (the “Funds”) are investment portfolios of Goldman Sachs Trust (the “Trust”). The Board of Trustees oversees the management of the Trust and reviews the investment performance and expenses of the Funds at regularly scheduled meetings held throughout the year. In addition, the Board of Trustees determines annually whether to approve the continuance of the Trust’s investment management agreement (the “Management Agreement”) with Goldman Sachs Asset Management, L.P. (the “Investment Adviser”) on behalf of the Funds.
The Management Agreement was most recently approved for continuation until June 30, 2022 by the Board of Trustees, including those Trustees who are not parties to the Management Agreement or “interested persons” (as defined in the Investment Company Act of 1940, as amended) of any party thereto (the “Independent Trustees”), at a meeting held on June 15-16, 2021 (the “Annual Meeting”).
The review process undertaken by the Trustees spans the course of the year and culminates with the Annual Meeting. To assist the Trustees in their deliberations, the Trustees have established a Contract Review Committee (the “Committee”), comprised of the Independent Trustees. The Committee held two meetings over the course of the year since the Management Agreement was last approved. At those Committee meetings, regularly scheduled Board or other committee meetings, and/or the Annual Meeting, matters relevant to the renewal of the Management Agreement were considered by the Board, or the Independent Trustees, as applicable. With respect to each Fund, such matters included:
| | (a) | | the nature and quality of the advisory, administrative, and other services provided to the Fund by the Investment Adviser and its affiliates, including information about: |
| | (i) | | the structure, staff, and capabilities of the Investment Adviser and its portfolio management teams; |
| | (ii) | | the groups within the Investment Adviser and its affiliates that support the portfolio management teams or provide other types of necessary services, including fund services groups (e.g., accounting and financial reporting, tax, shareholder services, and operations); controls and risk management groups (e.g., legal, compliance, valuation oversight, credit risk management, internal audit, compliance testing, market risk analysis, finance, and central funding); sales and distribution support groups, and others (e.g., information technology and training); |
| | (iii) | | trends in employee headcount; |
| | (iv) | | the Investment Adviser’s financial resources and ability to hire and retain talented personnel and strengthen its operations; and |
| | (v) | | the parent company’s support of the Investment Adviser and its mutual fund business, as expressed by the firm’s senior management; |
| | (b) | | information on the investment performance of the Fund, including comparisons to the performance of similar mutual funds, as provided by a third-party mutual fund data provider engaged as part of the contract review process (the “Outside Data Provider”), and a benchmark performance index; and information on general investment outlooks in the markets in which the Fund invests; |
| | (c) | | information provided by the Investment Adviser indicating the Investment Adviser’s views on whether the Fund’s peer group and/or benchmark index had high, medium, or low relevance given the Fund’s particular investment strategy; |
| | (d) | | the terms of the Management Agreement and other agreements with affiliated service providers entered into by the Trust on behalf of the Fund; |
| | (e) | | fee and expense information for the Fund, including: |
| | (i) | | the relative management fee and expense levels of the Fund as compared to those of comparable funds managed by other advisers, as provided by the Outside Data Provider; |
| | (ii) | | the Fund’s expense trends over time; and |
| | (iii) | | to the extent the Investment Adviser manages other types of accounts (such as bank collective trusts, private wealth management accounts, institutional separate accounts, sub-advised mutual funds, and non-U.S. funds) having investment objectives and policies similar to those of the Fund, comparative information on the advisory fees charged and services provided to those accounts by the Investment Adviser; |
| | (f) | | with respect to the extensive investment performance and expense comparison data provided by the Outside Data Provider, its processes in producing that data for the Fund; |
| | (g) | | the undertakings of the Investment Adviser and its affiliates to implement fee waivers and/or expense limitations; |
| | (h) | | information relating to the profitability of the Management Agreement and the transfer agency and distribution and service arrangements of the Fund to the Investment Adviser and its affiliates; |
| | (i) | | whether the Fund’s existing management fee schedule adequately addressed any economies of scale; |
53
GOLDMAN SACHS REAL ESTATE SECURITIES FUNDS
Statement Regarding Basis for Approval of Management Agreement (Unaudited) (continued)
| | (j) | | a summary of the “fall-out” benefits derived by the Investment Adviser and its affiliates from their relationships with the Fund, including the fees received by the Investment Adviser’s affiliates from the Fund for transfer agency, (in the case of the Global Real Estate Securities Fund and International Real Estate Securities Fund) securities lending, portfolio trading, distribution and other services; |
| | (k) | | a summary of potential benefits derived by the Fund as a result of its relationship with the Investment Adviser; |
| | (l) | | information regarding commissions paid by the Fund and broker oversight, an update on the Investment Adviser’s soft dollars practices, other information regarding portfolio trading, and how the Investment Adviser carries out its duty to seek best execution; |
| | (m) | | portfolio manager ownership of Fund shares; the manner in which portfolio manager compensation is determined; and the number and types of accounts managed by the portfolio managers; |
| | (n) | | the nature and quality of the services provided to the Fund by its unaffiliated service providers, and the Investment Adviser’s general oversight and evaluation (including reports on due diligence) of those service providers as part of the administrative services provided under the Management Agreement; and |
| | (o) | | the Investment Adviser’s processes and policies addressing various types of potential conflicts of interest; its approach to risk management; the annual review of the effectiveness of the Fund’s compliance program; and periodic compliance reports. |
The Trustees also received an overview of the Funds’ distribution arrangements. They received information regarding the Funds’ assets, share purchase and redemption activity, and payment of distribution, service, and shareholder administration fees, as applicable. Information was also provided to the Trustees relating to revenue sharing payments made by and services provided by the Investment Adviser and its affiliates to intermediaries that promote the sale, distribution, and/or servicing of Fund shares. The Independent Trustees also discussed the broad range of other investment choices that are available to Fund investors, including the availability of comparable funds managed by other advisers.
The presentations made at the Board and Committee meetings and at the Annual Meeting encompassed the Funds and other mutual funds for which the Board of Trustees has responsibility. In evaluating the Management Agreement at the Annual Meeting, the Trustees relied upon their knowledge, resulting from their meetings and other interactions throughout the year, of the Investment Adviser and its affiliates, their services, and the Funds. In conjunction with these meetings, the Trustees received written materials and oral presentations on the topics covered, and the Investment Adviser addressed the questions and concerns of the Trustees, including concerns regarding the investment performance of certain of the funds they oversee. The Independent Trustees were advised by their independent legal counsel regarding their responsibilities and other regulatory requirements related to the approval and continuation of mutual fund investment management agreements under applicable law. In addition, the Investment Adviser and its affiliates provided the Independent Trustees with a written response to a formal request for information sent on behalf of the Independent Trustees by their independent legal counsel. During the course of their deliberations, the Independent Trustees met in executive sessions with their independent legal counsel, without representatives of the Investment Adviser or its affiliates present.
Nature, Extent, and Quality of the Services Provided Under the Management Agreement
As part of their review, the Trustees considered the nature, extent, and quality of the services provided to the Funds by the Investment Adviser. In this regard, the Trustees considered both the investment advisory services and non-advisory services that are provided by the Investment Adviser and its affiliates. The Trustees noted the transition in the leadership and changes in personnel of various of the Investment Adviser’s portfolio management teams that had occurred in recent periods, and the ongoing recruitment efforts aimed at bringing high quality investment talent to the Investment Adviser. They also noted the Investment Adviser’s commitment to maintaining high quality systems and expending substantial resources to respond to ongoing changes to the market, regulatory and control environment in which the Funds and their service providers operate, including changes associated with the COVID-19 pandemic, as well as the efforts of the Investment Adviser and its affiliates to combat cyber security risks. The Trustees also considered information regarding the Investment Adviser’s business continuity planning and remote operations capabilities. The Trustees concluded that the Investment Adviser continued to commit substantial financial and operational resources to the Funds and expressed confidence that the Investment Adviser would continue to do so in the future. The Trustees also recognized that the Investment Adviser had made significant commitments to address regulatory compliance requirements applicable to the Funds and the Investment Adviser and its affiliates.
Investment Performance
The Trustees also considered the investment performance of the Funds. In this regard, they compared the investment performance of each Fund to its peers using rankings and ratings compiled by the Outside Data Provider as of December 31, 2020,
54
GOLDMAN SACHS REAL ESTATE SECURITIES FUNDS
Statement Regarding Basis for Approval of Management Agreement (Unaudited) (continued)
and updated performance information prepared by the Investment Adviser using the peer group identified by the Outside Data Provider as of March 31, 2021. The information on each Fund’s investment performance was provided for the one-, three-, five-, and ten-year periods ending on the applicable dates, to the extent that each Fund had been in existence for those periods. The Trustees also reviewed each Fund’s investment performance relative to its performance benchmark. As part of this review, they considered the investment performance trends of the Funds over time, and reviewed the investment performance of each Fund in light of its investment objective and policies and market conditions.
In addition, the Trustees considered materials prepared and presentations made by the Investment Adviser’s senior management and portfolio management personnel in which Fund performance was assessed. The Trustees also considered the Investment Adviser’s periodic reports with respect to the Funds’ risk profiles, and how the Investment Adviser’s approach to risk monitoring and management influences portfolio management.
The Trustees observed that the Real Estate Securities Fund’s Institutional Shares had placed in the third quartile of the Fund’s peer group for the one-, three-, and ten-year periods and in the fourth quartile for the five-year period, and had underperformed the Fund’s benchmark index for the one-, three-, five-, and ten-year periods ended March 31, 2021. They noted that the International Real Estate Securities Fund’s Institutional Shares had placed in the third quartile of the Fund’s peer group for the five-year period and in the fourth quartile for the one-, three- and ten-year periods, and had outperformed the Fund’s benchmark index for the one-, three- and five-year periods and underperformed for the ten-year period ended March 31, 2021. The Trustees considered that the International Real Estate Securities Fund has a “global” peer group and benchmark that contemplates investments in U.S. and non-U.S. securities, whereas the Fund invests only in non-U.S. securities. They noted that the Global Real Estate Securities Fund’s Institutional Shares had placed in the top half of the Fund’s peer group for the one- and three-year periods and in the fourth quartile for the five-year period, and had outperformed the Fund’s benchmark index for the three-year period and underperformed for the one- and five-year periods ended March 31, 2021.
Costs of Services Provided and Competitive Information
The Trustees considered the contractual terms of the Management Agreement and the fee rates payable by each Fund thereunder. In this regard, the Trustees considered information on the services rendered by the Investment Adviser to the Funds, which included both advisory and administrative services that were directed to the needs and operations of the Funds as registered mutual funds.
In particular, the Trustees reviewed analyses prepared by the Outside Data Provider regarding the expense rankings of the Funds. The analyses provided a comparison of each Fund’s management fee and breakpoints to those of a relevant peer group and category universe; an expense analysis which compared each Fund’s overall net and gross expenses to a peer group and a category universe; and data comparing each Fund’s net expenses to the peer and category medians. The analyses also compared each Fund’s other expenses and fee waivers/reimbursements to those of the peer group and category medians. The Trustees concluded that the comparisons provided by the Outside Data Provider were useful in evaluating the reasonableness of the management fees and total expenses paid by the Funds.
In addition, the Trustees considered the Investment Adviser’s undertakings to implement fee waivers and/or expense limitations. The Trustees also noted that certain changes were being made to existing fee waiver or expense limitation arrangements of the Real Estate Securities Fund that would have the effect of decreasing expenses of Class A, Class C, Investor, and Class R Shares of the Fund and total Fund expenses, with such changes taking effect in connection with the Fund’s next annual registration statement update. They also considered, to the extent that the Investment Adviser manages other types of accounts having investment objectives and policies similar to those of the Funds, comparative fee information for services provided by the Investment Adviser to those accounts, and information that indicated that services provided to the Funds differed in various significant respects from the services provided to other types of accounts which, in many cases, operated under less stringent legal and regulatory structures, required fewer services from the Investment Adviser to a smaller number of client contact points, and were less time-intensive.
In addition, the Trustees noted that shareholders are able to redeem their Fund shares at any time if shareholders believe that the Fund fees and expenses are too high or if they are dissatisfied with the performance of the Fund.
Profitability
The Trustees reviewed each Fund’s contribution to the Investment Adviser’s revenues and pre-tax profit margins. In this regard the Trustees noted that they had received, among other things, profitability analyses and summaries, revenue and expense schedules by Fund and by function (i.e., investment management, transfer agency and distribution and service), and information on the Investment Adviser’s expense allocation methodology. They observed that the profitability and expense figures are substantially similar to those used by the Investment Adviser for many internal purposes, including compensation decisions among
55
GOLDMAN SACHS REAL ESTATE SECURITIES FUNDS
Statement Regarding Basis for Approval of Management Agreement (Unaudited) (continued)
various business groups, and are thus subject to a vigorous internal debate about how certain revenue and expenses should be allocated. The Trustees also noted that the internal audit group within the Goldman Sachs organization periodically audits the expense allocation methodology and that the internal audit group was satisfied with the reasonableness, consistency, and accuracy of the Investment Adviser’s expense allocation methodology. Profitability data for each Fund was provided for 2020 and 2019, and the Trustees considered this information in relation to the Investment Adviser’s overall profitability.
Economies of Scale
The Trustees considered the information that had been provided regarding whether there have been economies of scale with respect to the management of the Funds. The Trustees also considered the breakpoints in the fee rate payable under the Management Agreement for each of the Funds at the following annual percentage rates of the average daily net assets of the Funds:
| | | | | | | | | | | | |
| | | Global Real
Estate
Securities Fund | | | International
Real Estate
Securities
Fund | | | Real Estate
Securities Fund | |
| | | |
| First $1 billion | | | 0.93 | % | | | 0.95 | % | | | 0.87 | % |
| | | |
| Next $1 billion | | | 0.84 | | | | 0.95 | | | | 0.78 | |
| | | |
| Next $3 billion | | | 0.80 | | | | 0.86 | | | | 0.74 | |
| | | |
| Next $3 billion | | | 0.78 | | | | 0.81 | | | | 0.73 | |
| | | |
| Over $8 billion | | | 0.76 | | | | 0.80 | | | | 0.71 | |
The Trustees noted that the breakpoints were designed to share potential economies of scale, if any, with the Funds and their shareholders as assets under management reach those asset levels. The Trustees considered the amounts of assets in the Funds; the Funds’ recent share purchase and redemption activity; the information provided by the Investment Adviser relating to the costs of the services provided by the Investment Adviser and its affiliates and their realized profits; information comparing fee rates charged by the Investment Adviser with fee rates charged to other funds in the peer groups; and the Investment Adviser’s undertaking to limit certain expenses of the Funds that exceed specified levels. Upon reviewing these matters at the Annual Meeting, the Trustees concluded that the fee breakpoints represented a means of assuring that benefits of scalability, if any, would be passed along to shareholders at the specified asset levels.
Other Benefits to the Investment Adviser and Its Affiliates
The Trustees also considered the other benefits derived by the Investment Adviser and its affiliates from their relationships with the Funds as stated above, including: (a) transfer agency fees received by Goldman Sachs & Co. LLC (“Goldman Sachs”); (b) brokerage commissions earned by Goldman Sachs for executing securities transactions on behalf of the Funds; (c) research received by the Investment Adviser from broker-dealers in exchange for executing certain transactions on behalf of the Funds; (d) trading efficiencies resulting from aggregation of orders of the Funds with those for other funds or accounts managed by the Investment Adviser; (e) (in the case of the Global Real Estate Securities Fund and International Real Estate Securities Fund) fees earned by Goldman Sachs Agency Lending (“GSAL”), an affiliate of the Investment Adviser, as securities lending agent (and fees earned by the Investment Adviser for managing the fund in which the Funds’ cash collateral is invested); (f) the Investment Adviser’s ability to leverage the infrastructure designed to service the Funds on behalf of its other clients; (g) the Investment Adviser’s ability to cross-market other products and services to Fund shareholders; (h) Goldman Sachs’ retention of certain fees as Fund Distributor; (i) the Investment Adviser’s ability to negotiate better pricing with custodians on behalf of its other clients, as a result of the relationship with the Funds; (j) the investment of cash and cash collateral in money market funds managed by the Investment Adviser that will result in increased assets under management for those money market funds; and (k) the possibility that the working relationship between the Investment Adviser and the Funds’ third-party service providers may cause those service providers to be more likely to do business with other areas of Goldman Sachs. In the course of considering the foregoing, the Independent Trustees requested and received further information quantifying certain of these fall-out benefits.
Other Benefits to the Funds and Their Shareholders
The Trustees also noted that the Funds receive certain other potential benefits as a result of their relationship with the Investment Adviser, including: (a) trading efficiencies resulting from aggregation of orders of the Funds with those of other funds or accounts managed by the Investment Adviser; (b) enhanced servicing from vendors due to the volume of business generated by the Investment Adviser and its affiliates; (c) enhanced servicing from broker-dealers due to the volume of business generated by the Investment Adviser and its affiliates; (d) the advantages received from the Investment Adviser’s knowledge and experience gained from managing other accounts and products; (e) the Investment Adviser’s ability to hire and retain qualified personnel to
56
GOLDMAN SACHS REAL ESTATE SECURITIES FUNDS
Statement Regarding Basis for Approval of Management Agreement (Unaudited) (continued)
provide services to the Funds because of the reputation of the Goldman Sachs organization; (f) the Funds’ access, through the Investment Adviser, to certain firm-wide resources (e.g., proprietary risk management systems and databases), subject to certain restrictions; (g) (in the case of the Global Real Estate Securities Fund and International Real Estate Securities Fund) the Funds’ ability to participate in the securities lending program administered by GSAL, as measured by the revenue received by the Funds in connection with the program; and (h) the Funds’ access to certain affiliated distribution channels. In addition, the Trustees noted the competitive nature of the mutual fund marketplace, and considered that many of the Funds’ shareholders invested in the Funds in part because of the Funds’ relationship with the Investment Adviser and that those shareholders have a general expectation that the relationship will continue.
Conclusion
In connection with their consideration of the Management Agreement, the Trustees gave weight to each of the factors described above, but did not identify any particular factor as controlling their decision. After deliberation and consideration of all of the information provided, including the factors described above, the Trustees concluded, in the exercise of their business judgment, that the management fees paid by each of the Funds were reasonable in light of the services provided to it by the Investment Adviser, the Investment Adviser’s costs and each Fund’s current and reasonably foreseeable asset levels. The Trustees unanimously concluded that the Investment Adviser’s continued management likely would benefit each Fund and its shareholders and that the Management Agreement should be approved and continued with respect to each Fund until June 30, 2022.
57
FUNDS PROFILE
Goldman Sachs Funds
Goldman Sachs is a premier financial services firm, known since 1869 for creating thoughtful and customized investment solutions in complex global markets.
Today, the Asset Management Divison of Goldman Sachs serves a diverse set of clients worldwide, including private institutions, public entities and individuals. With approximately $2.09 trillion in assets under supervision as of June 30, 2021, Goldman Sachs Asset Management has portfolio management teams located around the world and our investment professionals bring firsthand knowledge of local markets to every investment decision. Assets under supervision includes assets under management and other client assets for which Goldman Sachs does not have full discretion. GSAM leverages the resources of Goldman Sachs & Co. LLC subject to legal, internal and regulatory restrictions.
Money Market
Financial Square FundsSM
| ∎ | | Financial Square Treasury Solutions Fund1 |
| ∎ | | Financial Square Government Fund1 |
| ∎ | | Financial Square Money Market Fund2 |
| ∎ | | Financial Square Prime Obligations Fund2 |
| ∎ | | Financial Square Treasury Instruments Fund1 |
| ∎ | | Financial Square Treasury Obligations Fund1 |
| ∎ | | Financial Square Federal Instruments Fund1 |
Investor FundsSM
| ∎ | | Investor Money Market Fund3 |
| ∎ | | Investor Tax-Exempt Money Market Fund3 |
Fixed Income
Short Duration and Government
| ∎ | | High Quality Floating Rate Fund |
| ∎ | | Short-Term Conservative Income Fund |
| ∎ | | Short Duration Government Fund |
| ∎ | | Short Duration Bond Fund4 |
| ∎ | | Inflation Protected Securities Fund |
Multi-Sector
| ∎ | | Global Core Fixed Income Fund |
Municipal and Tax-Free
| ∎ | | High Yield Municipal Fund |
| ∎ | | Dynamic Municipal Income Fund |
| ∎ | | Short Duration Tax-Free Fund |
| ∎ | | Municipal Income Completion Fund |
Single Sector
| ∎ | | Investment Grade Credit Fund |
| ∎ | | High Yield Floating Rate Fund |
| ∎ | | Emerging Markets Debt Fund |
| ∎ | | Local Emerging Markets Debt Fund |
Fixed Income Alternatives
| ∎ | | Long Short Credit Strategies Fund |
Fundamental Equity
| ∎ | | Small/Mid Cap Value Fund |
| ∎ | | Small/Mid Cap Growth Fund |
| ∎ | | Concentrated Growth Fund |
| ∎ | | Technology Opportunities Fund |
| ∎ | | Growth Opportunities Fund |
| ∎ | | Rising Dividend Growth Fund |
Tax-Advantaged Equity
| ∎ | | U.S. Tax-Managed Equity Fund |
| ∎ | | International Tax-Managed Equity Fund |
| ∎ | | U.S. Equity Dividend and Premium Fund |
| ∎ | | International Equity Dividend and Premium Fund |
Equity Insights
| ∎ | | Small Cap Equity Insights Fund |
| ∎ | | U.S. Equity Insights Fund |
| ∎ | | Small Cap Growth Insights Fund |
| ∎ | | Large Cap Growth Insights Fund |
| ∎ | | Large Cap Value Insights Fund |
| ∎ | | Small Cap Value Insights Fund |
| ∎ | | International Small Cap Insights Fund |
| ∎ | | International Equity Insights Fund |
| ∎ | | Emerging Markets Equity Insights Fund |
Fundamental Equity International
| ∎ | | International Equity Income Fund |
| ∎ | | International Equity ESG Fund |
| ∎ | | Emerging Markets Equity Fund |
| ∎ | | ESG Emerging Markets Equity Fund |
Alternative
| ∎ | | Real Estate Securities Fund |
| ∎ | | International Real Estate Securities Fund |
| ∎ | | Commodity Strategy Fund |
| ∎ | | Global Real Estate Securities Fund |
| ∎ | | Alternative Premia Fund |
| ∎ | | Absolute Return Tracker Fund |
| ∎ | | Managed Futures Strategy Fund |
| ∎ | | MLP Energy Infrastructure Fund |
| ∎ | | Energy Infrastructure Fund |
| ∎ | | Multi-Manager Alternatives Fund |
| ∎ | | Global Infrastructure Fund |
| ∎ | | Clean Energy Income Fund |
Total Portfolio Solutions
| ∎ | | Global Managed Beta Fund |
| ∎ | | Multi-Manager Non-Core Fixed Income Fund |
| ∎ | | Multi-Manager Global Equity Fund |
| ∎ | | Multi-Manager International Equity Fund |
| ∎ | | Tactical Tilt Overlay Fund |
| ∎ | | Balanced Strategy Portfolio |
| ∎ | | Multi-Manager U.S. Small Cap Equity Fund |
| ∎ | | Multi-Manager Real Assets Strategy Fund |
| ∎ | | Growth and Income Strategy Portfolio |
| ∎ | | Growth Strategy Portfolio |
| ∎ | | Dynamic Global Equity Fund |
| ∎ | | Satellite Strategies Portfolio |
| ∎ | | Enhanced Dividend Global Equity Portfolio |
| ∎ | | Tax-Advantaged Global Equity Portfolio |
| ∎ | | Strategic Volatility Premium Fund |
| ∎ | | Target Date Retirement Portfolio |
| ∎ | | Target Date 2025 Portfolio |
| ∎ | | Target Date 2030 Portfolio |
| ∎ | | Target Date 2035 Portfolio |
| ∎ | | Target Date 2040 Portfolio |
| ∎ | | Target Date 2045 Portfolio |
| ∎ | | Target Date 2050 Portfolio |
| ∎ | | Target Date 2055 Portfolio |
| ∎ | | Target Date 2060 Portfolio |
| ∎ | | GQG Partners International Opportunities Fund |
| 1 | | You could lose money by investing in the Fund. Although the Fund seeks to preserve the value of your investment at $1.00 per share, it cannot guarantee it will do so. An investment in the Fund is not a deposit of a bank and is not insured or guaranteed by the Federal Deposit Insurance Corporation or any other government agency. The Fund’s sponsor has no legal obligation to provide financial support to the Fund, and you should not expect that the sponsor will provide financial support to the Fund at any time. |
| 2 | | You could lose money by investing in the Fund. Because the share price of the Fund will fluctuate, when you sell your shares they may be worth more or less than what you originally paid for them. The Fund may impose a fee upon sale of your shares or may temporarily suspend your ability to sell shares if the Fund’s liquidity falls below required minimums because of market conditions or other factors. An investment in the Fund is not a deposit of a bank and is not insured or guaranteed by the Federal Deposit Insurance Corporation or any other government agency. The Fund’s sponsor has no legal obligation to provide financial support to the Fund, and you should not expect that the sponsor will provide financial support to the Fund at any time. |
| 3 | | You could lose money by investing in the Fund. Although the Fund seeks to preserve the value of your investment at $1.00 per share, it cannot guarantee it will do so. The Fund may impose a fee upon sale of your shares or may temporarily suspend your ability to sell shares if the Fund’s liquidity falls below required minimums because of market conditions or other factors. An investment in the Fund is not a deposit of a bank and is not insured or guaranteed by the Federal Deposit Insurance Corporation or any other government agency. The Fund’s sponsor has no legal obligation to provide financial support to the Fund, and you should not expect that the sponsor will provide financial support to the Fund at any time. |
| 4 | | Effective after the close of business on July 29, 2021, the Goldman Sachs Short Duration Income Fund was renamed the Goldman Sachs Short Duration Bond Fund. |
| 5 | | Effective after the close of business on August 30, 2020, the Goldman Sachs Blue Chip Fund was renamed the Goldman Sachs U.S. Equity ESG Fund. |
| | | Financial Square FundsSM and Investor FundsSM are registered service marks of Goldman Sachs & Co. LLC. |
| * | | This list covers open-end funds only. Please visit our website at www.GSAMFUNDS.com to learn about our closed-end funds and exchange-traded funds. |
| | |
TRUSTEES Jessica Palmer, Chair Dwight L. Bush Kathryn A. Cassidy Diana M. Daniels Joaquin Delgado James A. McNamara Roy W. Templin Gregory G. Weaver | | OFFICERS James A. McNamara, President Joseph F. DiMaria, Principal Financial Officer,
Principal Accounting Officer and Treasurer Caroline L. Kraus, Secretary |
| |
GOLDMAN SACHS & CO. LLC Distributor and Transfer Agent | | GOLDMAN SACHS ASSET MANAGEMENT, L.P. Investment Adviser |
Visit our web site at www.GSAMFUNDS.com to obtain the most recent month-end returns.
Goldman Sachs Asset Management, L.P. 200 West Street, New York, New York 10282
Economic and market forecasts presented herein reflect our judgment as of the date of this presentation and are subject to change without notice. These forecasts do not take into account the specific investment objectives, restrictions, tax and financial situation or other needs of any specific client. Actual data will vary and may not be reflected here. These forecasts are subject to high levels of uncertainty that may affect actual performance. Accordingly, these forecasts should be viewed as merely representative of a broad range of possible outcomes. These forecasts are estimated, based on assumptions, and are subject to significant revision and may change materially as economic and market conditions change. Goldman Sachs has no obligation to provide updates or changes to these forecasts. Case studies and examples are for illustrative purposes only.
The portfolio risk management process includes an effort to monitor and manage risk, but does not imply low risk.
The reports concerning the Funds included in this shareholder report may contain certain forward-looking statements about the factors that may affect the performance of the Funds in the future. These statements are based on Fund management’s predictions and expectations concerning certain future events and their expected impact on the Funds, such as performance of the economy as a whole and of specific industry sectors, changes in the levels of interest rates, the impact of developing world events, and other factors that may influence the future performance of the Funds. Management believes these forward-looking statements to be reasonable, although they are inherently uncertain and difficult to predict. Actual events may cause adjustments in portfolio management strategies from those currently expected to be employed.
A description of the policies and procedures that the Funds use to determine how to vote proxies relating to portfolio securities and information regarding how a Fund voted proxies relating to portfolio securities during the most recent 12-month period ended June 30 is available (i) without charge, upon request by calling 1-800-526-7384 (for Retail Shareholders) or 1-800-621-2550 (for Institutional Shareholders); and (ii) on the Securities and Exchange Commission (“SEC”) web site at http://www.sec.gov.
The Global Industry Classification Standard (GICS) was developed by and is the exclusive property and a service mark of Morgan Stanley Capital International Inc. (MSCI) and Standard & Poor’s, a division of The McGraw-Hill Companies, Inc. (S&P) and is licensed for use by Goldman Sachs. Neither MSCI, S&P nor any other party involved in making or compiling the GICS or any GICS classifications makes any express or implied warranties or representations with respect to such standard or classification (or the results to be obtained by the use thereof), and all such parties hereby expressly disclaim all warranties of originality, accuracy, completeness, merchantability or fitness for a particular purpose with respect to any of such standard or classification. Without limiting any of the foregoing, in no event shall MSCI, S&P, any of their affiliates or any third party involved in making or compiling the GICS or any GICS classifications have any liability for any direct, indirect, special, punitive, consequential or any other damages (including lost profits) even if notified of the possibility of such damages.
The Funds will file portfolio holdings information for each month in a fiscal quarter within 60 days after the end of the relevant fiscal quarter on Form N-PORT. Portfolio holdings information for the third month of each fiscal quarter will be made available on the SEC’s web site at http://www.sec.gov. Portfolio holdings information may be obtained upon request and without charge by calling 1-800-526-7384 (for Retail Shareholders) or 1-800-621-2550 (for Institutional Shareholders).
Holdings and allocations shown are as of June 30, 2021 and may not be representative of future investments. Fund holdings should not be relied on in making investment decisions and should not be construed as research or investment advice regarding particular securities. Current and future holdings are subject to risk.
This material is not authorized for distribution to prospective investors unless preceded or accompanied by a current prospectus or summary prospectus, if applicable. Investors should consider a Fund’s objective, risks, and charges and expenses, and read the summary prospectus, if available, and/or the prospectus carefully before investing or sending money. The summary prospectus, if available, and the prospectus contain this and other information about a Fund and may be obtained from your authorized dealer or from Goldman Sachs & Co. LLC by calling (retail – 1-800-526-7384) (institutional – 1-800-621-2550).
© 2021 Goldman Sachs. All rights reserved. 248852-OTU-1459314 RESSAR-21
Goldman Sachs Funds

| | | | |
| | |
| Semi-Annual Report | | | | June 30, 2021 |
| | |
| | | | Alternative Funds |
| | | | Absolute Return Tracker |
| | | | Alternative Premia |
| | | | Managed Futures Strategy |

Goldman Sachs Alternative Funds
| ∎ | | ABSOLUTE RETURN TRACKER |
| ∎ | | MANAGED FUTURES STRATEGY |
| | | | |
| | | |
| NOT FDIC-INSURED | | May Lose Value | | No Bank Guarantee |
FUND BASICS
Absolute Return Tracker Fund
as of June 30, 2021
| | | | | | | | | | |
| | PERFORMANCE REVIEW | |
| | | |
| | | January 1, 2021–June 30, 2021 | | Fund Total Return
(based on NAV)1 | | | HFRX Global Hedge
Fund Index2 | |
| | | |
| | Class A | | | 4.95 | % | | | 3.73 | % |
| | Class C | | | 4.64 | | | | 3.73 | |
| | Institutional | | | 5.18 | | | | 3.73 | |
| | Investor | | | 5.14 | | | | 3.73 | |
| | Class R6 | | | 5.19 | | | | 3.73 | |
| | Class R | | | 4.79 | | | | 3.73 | |
| | | Class P | | | 5.29 | | | | 3.73 | |
| 1 | | The net asset value (“NAV”) represents the net assets of the class of the Fund (ex-dividend) divided by the total number of shares of the class outstanding. The Fund’s performance reflects the reinvestment of dividends and other distributions. The Fund’s performance does not reflect the deduction of any applicable sales charges. |
| 2 | | The HFRX Global Hedge Fund Index is designed to be representative of the overall composition of the hedge fund universe. It is comprised of all eligible hedge fund strategies, including but not limited to convertible arbitrage, distressed securities, equity hedge, equity market neutral, event driven, macro, merger arbitrage, and relative value arbitrage. The strategies are asset weighted based on the distribution of assets in the hedge fund industry. The index is investable through products managed by HFR Asset Management, LLC that track HFRX Indices. The HFRX Global Hedge Fund Index is a trademark of HFR. HFR has not participated in the formation of the Fund. HFR does not endorse or approve the Fund or make any recommendation with respect to investing in the Fund. It is not possible to invest directly in an index. |
The returns set forth in the table above represent past performance. Past performance does not guarantee future results. The Fund’s investment return and principal value will fluctuate so that an investor’s shares, when redeemed, may be worth more or less than their original cost. Current performance may be lower or higher than the performance quoted above. Please visit our web site at www.GSAMFUNDS.com to obtain the most recent month-end returns. Performance reflects applicable fee waivers and/or expense limitations in effect during the periods shown. In their absence, performance would be reduced. Returns do not reflect the deduction of taxes that a shareholder would pay on Fund distributions or the redemption of Fund shares.
1
FUND BASICS
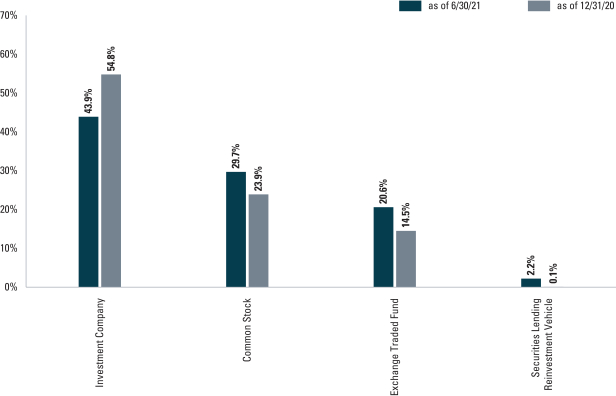
| 3 | | The percentage shown for each investment category reflects the value of investments in that category as a percentage of net assets. Figures in the above graph may not sum to 100% due to the exclusion of other assets and liabilities. Certain of the Fund’s investments reflected in the table above may be held for the purpose of covering derivative positions as required under the Investment Company Act of 1940, as amended, or for satisfying certain margin requirements related to such positions. The above graph depicts the Fund’s investments but may not represent the Fund’s market exposure due to the exclusion of certain derivatives, if any, as listed in the Additional Investment Information section of the Consolidated Schedule of Investments. |
For more information about the Fund, please refer to www.GSAMFUNDS.com. There, you can learn more about the Fund’s investment strategies, holdings, and performance.
2
FUND BASICS
Alternative Premia Fund
as of June 30, 2021
| | | | | | | | | | |
| | PERFORMANCE REVIEW | |
| | | |
| | | January 1, 2021–June 30, 2021 | | Fund Total Return (based on NAV)1 | | | ICE BofAML USD
LIBOR Three-Month
Constant Maturity Index2 | |
| | | |
| | Class A | | | 1.78 | % | | | 0.11 | % |
| | Class C | | | 1.26 | | | | 0.11 | |
| | Institutional | | | 1.88 | | | | 0.11 | |
| | Investor | | | 1.74 | | | | 0.11 | |
| | Class R6 | | | 2.03 | | | | 0.11 | |
| | Class R | | | 1.65 | | | | 0.11 | |
| | | Class P | | | 2.03 | | | | 0.11 | |
| 1 | | The net asset value (“NAV”) represents the net assets of the class of the Fund (ex-dividend) divided by the total number of shares of the class outstanding. The Fund’s performance reflects the reinvestment of dividends and other distributions. The Fund’s performance does not reflect the deduction of any applicable sales charges. |
| 2 | | The ICE BofAML USD LIBOR Three-Month Constant Maturity Index (the “Index”) tracks the performance of a synthetic asset paying LIBOR to a stated maturity. The Index is based on the assumed purchase at par of a synthetic instrument having exactly its stated maturity and with a coupon equal to that day’s fixing rate. That issue is assumed to be sold the following day (priced at a yield equal to the current day fixing rate) and rolled into a new instrument. The Index figure does not reflect any deductions for fees, expenses or taxes. It is not possible to invest directly in an index. |
The returns set forth in the table above represent past performance. Past performance does not guarantee future results. The Fund’s investment return and principal value will fluctuate so that an investor’s shares, when redeemed, may be worth more or less than their original cost. Current performance may be lower or higher than the performance quoted above. Please visit our web site at www.GSAMFUNDS.com to obtain the most recent month-end returns. Performance reflects applicable fee waivers and/or expense limitations in effect during the periods shown. In their absence, performance would be reduced. Returns do not reflect the deduction of taxes that a shareholder would pay on Fund distributions or the redemption of Fund shares
3
FUND BASICS
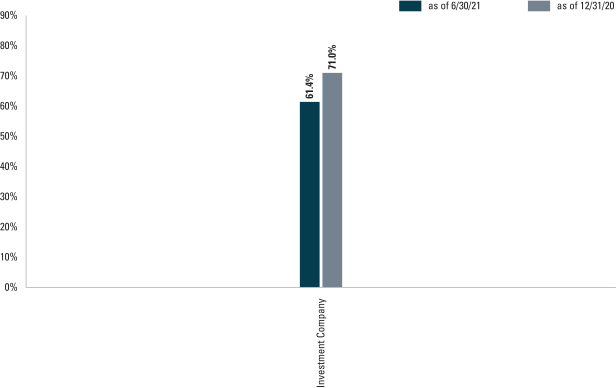
| 3 | | The percentage shown for each investment category reflects the value of investments in that category as a percentage of net assets. Figures in the above graph may not sum to 100% due to the exclusion of other assets and liabilities. Certain of the Fund’s investments reflected in the table above may be held for the purpose of covering derivative positions as required under the Investment Company Act of 1940, as amended, or for satisfying certain margin requirements related to such positions. The above graph may not represent the Fund’s market exposure due to the exclusion of certain derivatives, if any, as listed in the Additional Investment Information section of the Consolidated Schedule of Investments. |
For more information about the Fund, please refer to www.GSAMFUNDS.com. There, you can learn more about the Fund’s investment strategies, holdings, and performance.
4
FUND BASICS
Managed Futures Strategy Fund
as of June 30, 2021
| | | | | | | | | | |
| | PERFORMANCE REVIEW | |
| | | |
| | | January 1, 2021–June 30, 2021 | | Fund Total Return
(based on NAV)1 | | | ICE BofAML USD LIBOR
One-Month Constant Maturity Index2 | |
| | | |
| | Class A | | | 3.46 | % | | | 0.05 | % |
| | Class C | | | 2.94 | | | | 0.05 | |
| | Institutional | | | 3.64 | | | | 0.05 | |
| | Investor | | | 3.49 | | | | 0.05 | |
| | Class R6 | | | 3.64 | | | | 0.05 | |
| | Class R | | | 3.23 | | | | 0.05 | |
| | | Class P | | | 3.65 | | | | 0.05 | |
| 1 | | The net asset value (“NAV”) represents the net assets of the class of the Fund (ex-dividend) divided by the total number of shares of the class outstanding. The Fund’s performance reflects the reinvestment of dividends and other distributions. The Fund’s performance does not reflect the deduction of any applicable sales charges. |
| 2 | | The ICE BofAML USD LIBOR One-Month Constant Maturity Index tracks the performance of a synthetic asset paying LIBOR to a stated maturity. The Index is based on the assumed purchase at par of a synthetic instrument having exactly its stated maturity and with a coupon equal to that day’s fixing rate. That issue is assumed to be sold the following business day (priced at a yield equal to the current day fixing rate) and rolled into a new instrument. The Index figures do not reflect any deduction for fees, expenses or taxes. It is not possible to invest directly in an index. |
The returns set forth in the table above represent past performance. Past performance does not guarantee future results. The Fund’s investment return and principal value will fluctuate so that an investor’s shares, when redeemed, may be worth more or less than their original cost. Current performance may be lower or higher than the performance quoted above. Please visit our web site at www.GSAMFUNDS.com to obtain the most recent month-end returns. Performance reflects applicable fee waivers and/or expense limitations in effect during the periods shown. In their absence, performance would be reduced. Returns do not reflect the deduction of taxes that a shareholder would pay on Fund distributions or the redemption of Fund shares.
5
FUND BASICS
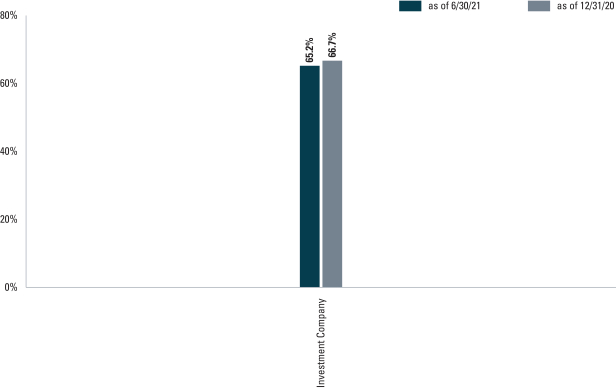
| 3 | | The Fund is actively managed and, as such, its composition may differ over time. The percentage shown for each investment category reflects the value of investments in that category as a percentage of net assets. Figures in the above graph may not sum to 100% due to the exclusion of other assets and liabilities. Certain of the Fund’s investments reflected in the table above may be held for the purpose of covering derivative positions as required under the Investment Company Act of 1940, as amended, or for satisfying certain margin requirements related to such positions. The graph depicts the Fund’s investments but may not represent the Fund’s market exposure due to the exclusion of certain derivatives, if any, as listed in the Additional Investment Information section of the Consolidated Schedule of Investments. |
For more information about the Fund, please refer to www.GSAMFUNDS.com. There, you can learn more about the Fund’s investment strategies, holdings, and performance.
6
GOLDMAN SACHS ABSOLUTE RETURN TRACKER FUND
Consolidated Schedule of Investments
June 30, 2021 (Unaudited)
| | | | | | | | |
Shares | | | Description | | Value | |
| |
| Common Stocks – 29.7% | | | |
| Automobiles & Components – 0.3% | | | |
| | 700 | | | Aisin Corp. | | $ | 30,014 | |
| | 1,118 | | | Aptiv plc* | | | 175,895 | |
| | 3,645 | | | Bayerische Motoren Werke AG | | | 386,427 | |
| | 6,434 | | | BorgWarner, Inc. | | | 312,306 | |
| | 5,200 | | | Bridgestone Corp. | | | 236,352 | |
| | 6,276 | | | Cie Generale des Etablissements Michelin SCA | | | 1,001,621 | |
| | 1,118 | | | Continental AG | | | 164,481 | |
| | 23,743 | | | Daimler AG (Registered) | | | 2,121,642 | |
| | 200 | | | Denso Corp. | | | 13,638 | |
| | 3,682 | | | Faurecia SE | | | 181,008 | |
| | 103,637 | | | Ford Motor Co.* | | | 1,540,046 | |
| | 4,198 | | | General Motors Co.* | | | 248,396 | |
| | 2,941 | | | Honda Motor Co. Ltd. | | | 94,592 | |
| | 7,300 | | | Isuzu Motors Ltd. | | | 96,869 | |
| | 5,900 | | | JTEKT Corp. | | | 60,714 | |
| | 12,300 | | | Mazda Motor Corp.* | | | 116,044 | |
| | 1,102 | | | NGK Spark Plug Co. Ltd. | | | 16,383 | |
| | 700 | | | NHK Spring Co. Ltd. | | | 5,763 | |
| | 700 | | | Nifco, Inc. | | | 26,474 | |
| | 33,400 | | | Nissan Motor Co. Ltd.* | | | 166,388 | |
| | 2,022 | | | NOK Corp. | | | 25,156 | |
| | 5,771 | | | Nokian Renkaat OYJ | | | 233,136 | |
| | 7,422 | | | Renault SA* | | | 300,869 | |
| | 70,025 | | | Stellantis NV | | | 1,377,629 | |
| | 1,600 | | | Subaru Corp. | | | 31,711 | |
| | 5,187 | | | Sumitomo Rubber Industries Ltd. | | | 71,710 | |
| | 4,300 | | | Suzuki Motor Corp. | | | 182,232 | |
| | 298 | | | Tesla, Inc.* | | | 202,551 | |
| | 5,035 | | | TI Fluid Systems plc | | | 21,382 | |
| | 1,340 | | | Tokai Rika Co. Ltd. | | | 21,548 | |
| | 2,000 | | | Toyo Tire Corp. | | | 42,350 | |
| | 300 | | | Toyoda Gosei Co. Ltd. | | | 7,399 | |
| | 600 | | | Toyota Boshoku Corp. | | | 12,454 | |
| | 420 | | | Toyota Industries Corp. | | | 36,320 | |
| | 1,208 | | | TS Tech Co. Ltd. | | | 18,704 | |
| | 17,772 | | | Valeo SA | | | 536,066 | |
| | 4,400 | | | Yamaha Motor Co. Ltd. | | | 119,514 | |
| | 1,226 | | | Yokohama Rubber Co. Ltd. (The) | | | 26,332 | |
| | | | | | | | |
| | | | | | | 10,262,116 | |
| | |
| Banks – 1.2% | | | |
| | 1,052 | | | 77 Bank Ltd. (The) | | | 11,574 | |
| | 2,300 | | | Aozora Bank Ltd. | | | 51,559 | |
| | 200,635 | | | Banco Bilbao Vizcaya Argentaria SA | | | 1,244,536 | |
| | 7,648 | | | Banco BPM SpA | | | 24,653 | |
| | 273,203 | | | Bank of America Corp. | | | 11,264,160 | |
| | 3,937 | | | Bank of Ireland Group plc* | | | 21,126 | |
| | 100 | | | Bank of Kyoto Ltd. (The) | | | 4,549 | |
| | 74,295 | | | Barclays plc | | | 176,308 | |
| | 5,132 | | | BNP Paribas SA | | | 322,082 | |
| | 150,555 | | | CaixaBank SA | | | 463,515 | |
| | 9,847 | | | Citigroup, Inc. | | | 696,675 | |
| | 4,844 | | | Citizens Financial Group, Inc. | | | 222,194 | |
| | 3,513 | | | Close Brothers Group plc | | | 73,622 | |
| | 1,635 | | | Comerica, Inc. | | | 116,641 | |
| | 18,582 | | | Credit Agricole SA | | | 260,512 | |
| | |
| |
| Common Stocks – (continued) | | | |
| Banks – (continued) | | | |
| | 2,984 | | | Fifth Third Bancorp | | | 114,078 | |
| | 23,295 | | | FinecoBank Banca Fineco SpA* | | | 406,529 | |
| | 1,100 | | | Fukuoka Financial Group, Inc. | | | 19,266 | |
| | 2,456 | | | Gunma Bank Ltd. (The) | | | 7,763 | |
| | 6,833 | | | Hachijuni Bank Ltd. (The) | | | 22,088 | |
| | 2,020 | | | Hirogin Holdings, Inc. | | | 10,678 | |
| | 2,038 | | | Hokuhoku Financial Group, Inc. | | | 14,926 | |
| | 49,536 | | | HSBC Holdings plc | | | 285,897 | |
| | 39,843 | | | Huntington Bancshares, Inc. | | | 568,560 | |
| | 767 | | | Iyo Bank Ltd. (The) | | | 3,780 | |
| | 113,629 | | | JPMorgan Chase & Co. | | | 17,673,855 | |
| | 148,689 | | | KeyCorp | | | 3,070,428 | |
| | 18,449 | | | Lloyds Banking Group plc | | | 11,934 | |
| | 706 | | | M&T Bank Corp. | | | 102,589 | |
| | 13,343 | | | Mebuki Financial Group, Inc. | | | 28,214 | |
| | 980 | | | Mediobanca Banca di Credito Finanziario SpA* | | | 11,466 | |
| | 21,343 | | | Mizuho Financial Group, Inc. | | | 305,899 | |
| | 2,954 | | | Natwest Group plc | | | 8,313 | |
| | 2,739 | | | Nishi-Nippon Financial Holdings, Inc. | | | 15,649 | |
| | 761 | | | OSB Group plc | | | 4,884 | |
| | 288 | | | Paragon Banking Group plc | | | 2,030 | |
| | 19,654 | | | PNC Financial Services Group, Inc. (The) | | | 3,749,197 | |
| | 10,787 | | | Raiffeisen Bank International AG | | | 244,849 | |
| | 4,957 | | | Regions Financial Corp. | | | 100,032 | |
| | 28,061 | | | Resona Holdings, Inc. | | | 108,193 | |
| | 19,300 | | | Seven Bank Ltd. | | | 41,030 | |
| | 567 | | | Shiga Bank Ltd. (The) | | | 9,943 | |
| | 1,097 | | | Shinsei Bank Ltd. | | | 14,425 | |
| | 100 | | | Shizuoka Bank Ltd. (The) | | | 776 | |
| | 13,686 | | | Standard Chartered plc | | | 87,341 | |
| | 1,800 | | | Sumitomo Mitsui Financial Group, Inc. | | | 62,050 | |
| | 4,058 | | | Sumitomo Mitsui Trust Holdings, Inc. | | | 129,451 | |
| | 1,318 | | | SVB Financial Group* | | | 733,375 | |
| | 18,632 | | | US Bancorp | | | 1,061,465 | |
| | 1,939 | | | Virgin Money UK plc* | | | 5,333 | |
| | 1,544 | | | Wells Fargo & Co. | | | 69,928 | |
| | 2,796 | | | Yamaguchi Financial Group, Inc. | | | 16,020 | |
| | 3,497 | | | Zions Bancorp NA | | | 184,851 | |
| | | | | | | | |
| | | | | | | 44,260,791 | |
| | |
| Capital Goods – 1.4% | | | |
| | 32,751 | | | 3M Co. | | | 6,505,331 | |
| | 7,447 | | | A O Smith Corp. | | | 536,631 | |
| | 2,299 | | | Aalberts NV | | | 123,823 | |
| | 6,980 | | | ACS Actividades de Construccion y Servicios SA | | | 187,123 | |
| | 2,600 | | | AGC, Inc. | | | 108,915 | |
| | 7,100 | | | Amada Co. Ltd. | | | 72,015 | |
| | 155 | | | AMETEK, Inc. | | | 20,693 | |
| | 777 | | | ANDRITZ AG | | | 43,700 | |
| | 224 | | | Ashtead Group plc | | | 16,650 | |
| | 698 | | | Bodycote plc | | | 8,178 | |
| | 4,468 | | | Brenntag SE | | | 415,848 | |
| | 1,464 | | | Bunzl plc | | | 48,431 | |
| | |
| | |
| The accompanying notes are an integral part of these financial statements. | | 7 |
GOLDMAN SACHS ABSOLUTE RETURN TRACKER FUND
Consolidated Schedule of Investments (continued)
June 30, 2021 (Unaudited)
| | | | | | | | |
Shares | | | Description | | Value | |
| |
| Common Stocks – (continued) | | | |
| Capital Goods – (continued) | | | |
| | 5,424 | | | Carrier Global Corp. | | $ | 263,606 | |
| | 23,701 | | | Caterpillar, Inc. | | | 5,158,049 | |
| | 487 | | | Central Glass Co. Ltd. | | | 9,350 | |
| | 2,391 | | | Chemring Group plc | | | 9,509 | |
| | 4,201 | | | Cie de Saint-Gobain | | | 277,249 | |
| | 11,904 | | | CNH Industrial NV | | | 197,460 | |
| | 3,840 | | | Cummins, Inc. | | | 936,230 | |
| | 1,599 | | | Daikin Industries Ltd. | | | 297,973 | |
| | 469 | | | DCC plc | | | 38,418 | |
| | 5,155 | | | Deere & Co. | | | 1,818,220 | |
| | 146 | | | Diploma plc | | | 5,873 | |
| | 4,366 | | | Dover Corp. | | | 657,520 | |
| | 442 | | | Eaton Corp. plc | | | 65,496 | |
| | 371 | | | Ebara Corp. | | | 18,275 | |
| | 4,450 | | | Eiffage SA | | | 453,262 | |
| | 694 | | | Electrocomponents plc | | | 9,888 | |
| | 11,430 | | | Emerson Electric Co. | | | 1,100,023 | |
| | 12,349 | | | Fastenal Co. | | | 642,148 | |
| | 4,902 | | | Ferguson plc | | | 682,002 | |
| | 3,356 | | | Fortive Corp. | | | 234,047 | |
| | 1,824 | | | Fortune Brands Home & Security, Inc. | | | 181,689 | |
| | 336 | | | Fuji Corp. | | | 7,696 | |
| | 91 | | | Fuji Electric Co. Ltd. | | | 4,248 | |
| | 379 | | | Fujitec Co. Ltd. | | | 8,402 | |
| | 5,480 | | | GEA Group AG | | | 222,050 | |
| | 1,910 | | | Generac Holdings, Inc.* | | | 792,937 | |
| | 20,291 | | | General Dynamics Corp. | | | 3,819,984 | |
| | 473,709 | | | General Electric Co. | | | 6,376,123 | |
| | 152 | | | Genuit Group plc | | | 1,290 | |
| | 1,397 | | | Glory Ltd. | | | 29,014 | |
| | 1,886 | | | GS Yuasa Corp. | | | 48,229 | |
| | 9,000 | | | Hino Motors Ltd. | | | 79,606 | |
| | 2,021 | | | Hitachi Construction Machinery Co. Ltd. | | | 61,895 | |
| | 7,762 | | | Hitachi Ltd. | | | 444,818 | |
| | 224 | | | Honeywell International, Inc. | | | 49,134 | |
| | 300 | | | Hoshizaki Corp. | | | 25,486 | |
| | 20,060 | | | Howden Joinery Group plc | | | 226,858 | |
| | 1,155 | | | Howmet Aerospace, Inc.* | | | 39,813 | |
| | 3,016 | | | Huntington Ingalls Industries, Inc. | | | 635,622 | |
| | 2,095 | | | IDEX Corp. | | | 461,005 | |
| | 39 | | | IMCD NV | | | 6,214 | |
| | 7,331 | | | IMI plc | | | 174,425 | |
| | 5,093 | | | Ingersoll Rand, Inc.* | | | 248,589 | |
| | 2,279 | | | Interpump Group SpA | | | 135,214 | |
| | 3,447 | | | ITOCHU Corp. | | | 99,462 | |
| | 100 | | | Japan Steel Works Ltd. (The) | | | 2,567 | |
| | 400 | | | JGC Holdings Corp. | | | 3,727 | |
| | 335 | | | John Laing Group plc | | | 1,854 | |
| | 17,397 | | | Johnson Controls International plc | | | 1,193,956 | |
| | 3,171 | | | Kajima Corp. | | | 40,239 | |
| | 1,827 | | | Kinden Corp. | | | 29,855 | |
| | 3,325 | | | Kingspan Group plc | | | 314,257 | |
| | 199 | | | KION Group AG | | | 21,245 | |
| | 1,724 | | | Knorr-Bremse AG | | | 198,358 | |
| | 6,800 | | | Komatsu Ltd. | | | 168,460 | |
| | 500 | | | Kubota Corp. | | | 10,115 | |
| | |
| |
| Common Stocks – (continued) | | | |
| Capital Goods – (continued) | | | |
| | 240 | | | Kurita Water Industries Ltd. | | | 11,536 | |
| | 109 | | | Kyudenko Corp. | | | 3,508 | |
| | 136 | | | Legrand SA | | | 14,414 | |
| | 9,855 | | | Leonardo SpA* | | | 79,741 | |
| | 3,992 | | | Lixil Corp. | | | 103,302 | |
| | 5,322 | | | Maeda Corp. | | | 46,168 | |
| | 8,032 | | | Marubeni Corp. | | | 69,946 | |
| | 2,088 | | | Masco Corp. | | | 123,004 | |
| | 255 | | | Meggitt plc* | | | 1,629 | |
| | 22,061 | | | Melrose Industries plc | | | 47,487 | |
| | 3,014 | | | Metso Outotec OYJ | | | 35,021 | |
| | 100 | | | MINEBEA MITSUMI, Inc. | | | 2,642 | |
| | 1,800 | | | MISUMI Group, Inc. | | | 60,915 | |
| | 3,135 | | | Mitsubishi Corp. | | | 85,636 | |
| | 14,275 | | | Mitsubishi Electric Corp. | | | 207,234 | |
| | 4,181 | | | Mitsui & Co. Ltd. | | | 94,180 | |
| | 621 | | | Miura Co. Ltd. | | | 26,966 | |
| | 3,906 | | | MonotaRO Co. Ltd. | | | 92,043 | |
| | 5,276 | | | Morgan Advanced Materials plc | | | 25,763 | |
| | 2,394 | | | Morgan Sindall Group plc | | | 71,365 | |
| | 1,362 | | | Nabtesco Corp. | | | 51,384 | |
| | 1,125 | | | Nagase & Co. Ltd. | | | 16,817 | |
| | 500 | | | NGK Insulators Ltd. | | | 8,415 | |
| | 3,330 | | | Nidec Corp. | | | 382,917 | |
| | 200 | | | Nishimatsu Construction Co. Ltd. | | | 6,236 | |
| | 3,954 | | | Nisshinbo Holdings, Inc. | | | 34,241 | |
| | 12,100 | | | NTN Corp.* | | | 31,630 | |
| | 653 | | | OKUMA Corp. | | | 31,992 | |
| | 10,090 | | | Otis Worldwide Corp. | | | 825,059 | |
| | 2,439 | | | PACCAR, Inc. | | | 217,681 | |
| | 3,196 | | | Parker-Hannifin Corp. | | | 981,524 | |
| | 9,007 | | | Pentair plc | | | 607,882 | |
| | 3,267 | | | Penta-Ocean Construction Co. Ltd. | | | 22,765 | |
| | 11,797 | | | Prysmian SpA | | | 423,348 | |
| | 3,634 | | | QinetiQ Group plc | | | 17,297 | |
| | 3,780 | | | Quanta Services, Inc. | | | 342,355 | |
| | 159 | | | Rational AG | | | 144,050 | |
| | 19,829 | | | Rexel SA* | | | 415,183 | |
| | 2,750 | | | Rheinmetall AG | | | 271,736 | |
| | 2,329 | | | Rockwell Automation, Inc. | | | 666,141 | |
| | 21,694 | | | Rotork plc | | | 102,318 | |
| | 2,236 | | | Sanwa Holdings Corp. | | | 27,500 | |
| | 9,305 | | | Schneider Electric SE | | | 1,466,882 | |
| | 6,900 | | | Shimizu Corp. | | | 53,026 | |
| | 285 | | | Siemens AG (Registered) | | | 45,252 | |
| | 4,247 | | | Siemens Energy AG* | | | 127,933 | |
| | 991 | | | Siemens Gamesa Renewable Energy SA* | | | 33,133 | |
| | 7,015 | | | Signify NV | | | 445,298 | |
| | 1,293 | | | Smiths Group plc | | | 28,477 | |
| | 2,851 | | | Snap-on, Inc. | | | 636,999 | |
| | 15,571 | | | Sojitz Corp. | | | 47,100 | |
| | 36 | | | Spirax-Sarco Engineering plc | | | 6,780 | |
| | 4,363 | | | Stanley Black & Decker, Inc. | | | 894,371 | |
| | 14,640 | | | Sumitomo Corp. | | | 196,300 | |
| | 1,000 | | | Sumitomo Heavy Industries Ltd. | | | 27,652 | |
| | 1,600 | | | Tadano Ltd. | | | 16,690 | |
| | |
| | |
| 8 | | The accompanying notes are an integral part of these financial statements. |
GOLDMAN SACHS ABSOLUTE RETURN TRACKER FUND
| | | | | | | | |
Shares | | | Description | | Value | |
| |
| Common Stocks – (continued) | | | |
| Capital Goods – (continued) | | | |
| | 461 | | | Taisei Corp. | | $ | 15,130 | |
| | 464 | | | Thales SA | | | 47,410 | |
| | 1,300 | | | TOTO Ltd. | | | 67,357 | |
| | 999 | | | Toyota Tsusho Corp. | | | 47,416 | |
| | 4,700 | | | Trane Technologies plc | | | 865,458 | |
| | 11,473 | | | Travis Perkins plc* | | | 268,437 | |
| | 634 | | | Ultra Electronics Holdings plc | | | 20,095 | |
| | 2,661 | | | United Rentals, Inc.* | | | 848,886 | |
| | 878 | | | Valmet OYJ | | | 38,342 | |
| | 3,752 | | | Vesuvius plc | | | 27,467 | |
| | 2,283 | | | Vinci SA | | | 244,048 | |
| | 3,219 | | | Wartsila OYJ Abp | | | 47,825 | |
| | 819 | | | Weir Group plc (The)* | | | 21,024 | |
| | 4,017 | | | Westinghouse Air Brake Technologies Corp. | | | 330,599 | |
| | 80 | | | XP Power Ltd. | | | 6,175 | |
| | 4,583 | | | Xylem, Inc. | | | 549,777 | |
| | 2,400 | | | Yaskawa Electric Corp. | | | 117,205 | |
| | | | | | | | |
| | | | | | | 51,545,887 | |
| | |
| Commercial & Professional Services – 0.3% | | | |
| | 10,625 | | | Aggreko plc | | | 126,809 | |
| | 736 | | | Benefit One, Inc. | | | 23,172 | |
| | 7,060 | | | Biffa plc* | | | 31,740 | |
| | 4,313 | | | Copart, Inc.* | | | 568,583 | |
| | 7,180 | | | Elis SA* | | | 135,482 | |
| | 12,893 | | | Hays plc* | | | 28,286 | |
| | 910 | | | HomeServe plc | | | 12,028 | |
| | 2,448 | | | Jacobs Engineering Group, Inc. | | | 326,612 | |
| | 1,269 | | | Kokuyo Co. Ltd. | | | 19,841 | |
| | 2,753 | | | Leidos Holdings, Inc. | | | 278,328 | |
| | 23,279 | | | Mitie Group plc* | | | 21,897 | |
| | 26,532 | | | Nielsen Holdings plc | | | 654,544 | |
| | 154 | | | Nihon M&A Center, Inc. | | | 3,989 | |
| | 11,773 | | | Pagegroup plc* | | | 91,036 | |
| | 1,720 | | | Persol Holdings Co. Ltd. | | | 33,964 | |
| | 6,091 | | | Randstad NV | | | 466,938 | |
| | 7,989 | | | Recruit Holdings Co. Ltd. | | | 391,771 | |
| | 710 | | | Republic Services, Inc. | | | 78,107 | |
| | 6,936 | | | Robert Half International, Inc. | | | 617,096 | |
| | 13,181 | | | Rollins, Inc. | | | 450,790 | |
| | 18,443 | | | Serco Group plc | | | 34,626 | |
| | 800 | | | SMS Co. Ltd. | | | 23,906 | |
| | 335 | | | Sohgo Security Services Co. Ltd. | | | 15,263 | |
| | 9,735 | | | SPIE SA | | | 224,276 | |
| | 900 | | | TechnoPro Holdings, Inc. | | | 21,281 | |
| | 49 | | | Teleperformance | | | 19,898 | |
| | 592 | | | Toppan, Inc. | | | 9,521 | |
| | 3,379 | | | Verisk Analytics, Inc. | | | 590,379 | |
| | 29,125 | | | Waste Management, Inc. | | | 4,080,704 | |
| | | | | | | | |
| | | | | | | 9,380,867 | |
| | |
| Consumer Durables & Apparel – 0.9% | | | |
| | 3,850 | | | adidas AG | | | 1,436,658 | |
| | 1,200 | | | Asics Corp. | | | 30,427 | |
| | 3,974 | | | Barratt Developments plc | | | 38,264 | |
| | |
| |
| Common Stocks – (continued) | | | |
| Consumer Durables & Apparel – (continued) | | | |
| | 616 | | | Bellway plc | | | 27,598 | |
| | 38,666 | | | Brunswick Corp. | | | 3,851,907 | |
| | 163 | | | Burberry Group plc* | | | 4,662 | |
| | 3,100 | | | Casio Computer Co. Ltd. | | | 52,017 | |
| | 10,133 | | | Coats Group plc | | | 9,545 | |
| | 1,027 | | | Countryside Properties plc* | | | 6,734 | |
| | 4,692 | | | Crest Nicholson Holdings plc* | | | 27,221 | |
| | 3,119 | | | DR Horton, Inc. | | | 281,864 | |
| | 897 | | | EssilorLuxottica SA | | | 165,706 | |
| | 153 | | | Fujitsu General Ltd. | | | 4,052 | |
| | 1,107 | | | Games Workshop Group plc | | | 174,577 | |
| | 681 | | | Garmin Ltd. | | | 98,500 | |
| | 9,521 | | | Hanesbrands, Inc. | | | 177,757 | |
| | 32,978 | | | Hasbro, Inc. | | | 3,117,081 | |
| | 24 | | | Hermes International | | | 35,023 | |
| | 2,848 | | | Iida Group Holdings Co. Ltd. | | | 73,256 | |
| | 1,448 | | | Kering SA | | | 1,268,763 | |
| | 3,465 | | | Leggett & Platt, Inc. | | | 179,522 | |
| | 4,075 | | | Lennar Corp. Class A | | | 404,851 | |
| | 114 | | | LVMH Moet Hennessy Louis Vuitton SE | | | 89,679 | |
| | 1,896 | | | Mohawk Industries, Inc.* | | | 364,392 | |
| | 83 | | | Moncler SpA | | | 5,626 | |
| | 11,344 | | | Newell Brands, Inc. | | | 311,620 | |
| | 68,925 | | | NIKE, Inc. Class B | | | 10,648,223 | |
| | 5,600 | | | Nikon Corp. | | | 59,738 | |
| | 50 | | | NVR, Inc.* | | | 248,665 | |
| | 400 | | | Open House Co. Ltd. | | | 18,796 | |
| | 4,722 | | | Panasonic Corp. | | | 54,372 | |
| | 722 | | | Persimmon plc | | | 29,576 | |
| | 73,610 | | | PulteGroup, Inc. | | | 4,016,898 | |
| | 209 | | | Puma SE | | | 24,944 | |
| | 6,179 | | | PVH Corp.* | | | 664,799 | |
| | 3,698 | | | Ralph Lauren Corp. | | | 435,661 | |
| | 3,290 | | | Redrow plc | | | 27,908 | |
| | 100 | | | Rinnai Corp. | | | 9,518 | |
| | 65 | | | Sangetsu Corp. | | | 907 | |
| | 1,582 | | | SEB SA | | | 286,189 | |
| | 5,524 | | | Sekisui House Ltd. | | | 113,434 | |
| | 4,900 | | | Sharp Corp. | | | 80,839 | |
| | 1,939 | | | Sony Group Corp. | | | 188,019 | |
| | 17,241 | | | Tapestry, Inc.* | | | 749,639 | |
| | 27,526 | | | Under Armour, Inc. Class A* | | | 582,175 | |
| | 9,419 | | | Under Armour, Inc. Class C* | | | 174,911 | |
| | 7,591 | | | VF Corp. | | | 622,766 | |
| | 1,727 | | | Vistry Group plc | | | 28,106 | |
| | 1,627 | | | Whirlpool Corp. | | | 354,718 | |
| | 1,200 | | | Yamaha Corp. | | | 65,145 | |
| | | | | | | | |
| | | | | | | 31,723,248 | |
| | |
| Consumer Services – 0.5% | | | |
| | 15,666 | | | 888 Holdings plc | | | 83,262 | |
| | 395 | | | Benesse Holdings, Inc. | | | 9,810 | |
| | 3,755 | | | Booking Holdings, Inc.* | | | 8,216,278 | |
| | 399 | | | Caesars Entertainment, Inc.* | | | 41,396 | |
| | 581 | | | Chipotle Mexican Grill, Inc.* | | | 900,748 | |
| | |
| | |
| The accompanying notes are an integral part of these financial statements. | | 9 |
GOLDMAN SACHS ABSOLUTE RETURN TRACKER FUND
Consolidated Schedule of Investments (continued)
June 30, 2021 (Unaudited)
| | | | | | | | |
Shares | | | Description | | Value | |
| |
| Common Stocks – (continued) | | | |
| Consumer Services – (continued) | | | |
| | 147 | | | Darden Restaurants, Inc. | | $ | 21,460 | |
| | 15,461 | | | Domino’s Pizza Group plc | | | 83,177 | |
| | 1,415 | | | Domino’s Pizza, Inc. | | | 660,083 | |
| | 1,894 | | | Entain plc* | | | 45,766 | |
| | 4,037 | | | Expedia Group, Inc.* | | | 660,897 | |
| | 3,935 | | | Flutter Entertainment plc* | | | 715,672 | |
| | 1,800 | | | Food & Life Cos. Ltd. | | | 77,600 | |
| | 2,752 | | | Gamesys Group plc | | | 70,193 | |
| | 3,342 | | | Greggs plc* | | | 120,295 | |
| | 5,210 | | | Hilton Worldwide Holdings, Inc.* | | | 628,430 | |
| | 2,087 | | | La Francaise des Jeux SAEM | | | 122,752 | |
| | 7,915 | | | McDonald’s Corp. | | | 1,828,286 | |
| | 815 | | | MGM Resorts International | | | 34,760 | |
| | 1,573 | | | Mitchells & Butlers plc* | | | 6,063 | |
| | 1,522 | | | Penn National Gaming, Inc.* | | | 116,418 | |
| | 5,297 | | | Playtech plc* | | | 31,156 | |
| | 2,795 | | | Restaurant Group plc (The)* | | | 4,957 | |
| | 400 | | | Skylark Holdings Co. Ltd.* | | | 5,554 | |
| | 1,232 | | | Sodexo SA* | | | 115,142 | |
| | 507 | | | Starbucks Corp. | | | 56,688 | |
| | 34,958 | | | Wynn Resorts Ltd.* | | | 4,275,363 | |
| | 6,224 | | | Yum! Brands, Inc. | | | 715,947 | |
| | 800 | | | Zensho Holdings Co. Ltd. | | | 20,545 | |
| | | | | | | | |
| | | | | | | 19,668,698 | |
| | |
| Diversified Financials – 2.2% | | | |
| | 19,920 | | | 3i Group plc | | | 323,279 | |
| | 7,242 | | | AJ Bell plc | | | 43,494 | |
| | 38,497 | | | American Express Co. | | | 6,360,859 | |
| | 151 | | | Ameriprise Financial, Inc. | | | 37,581 | |
| | 1,729 | | | Amundi SA | | | 152,496 | |
| | 15,176 | | | Ashmore Group plc | | | 80,882 | |
| | 82,246 | | | Bank of New York Mellon Corp. (The) | | | 4,213,463 | |
| | 65,161 | | | Berkshire Hathaway, Inc. Class B* | | | 18,109,545 | |
| | 68 | | | BlackRock, Inc. | | | 59,498 | |
| | 296 | | | Brewin Dolphin Holdings plc | | | 1,424 | |
| | 32,617 | | | Capital One Financial Corp. | | | 5,045,524 | |
| | 98,363 | | | Charles Schwab Corp. (The) | | | 7,161,810 | |
| | 18,235 | | | Chrysalis Investments Ltd.* | | | 62,052 | |
| | 4,537 | | | CMC Markets plc | | | 28,870 | |
| | 21,807 | | | CME Group, Inc. | | | 4,637,913 | |
| | 2,529 | | | Credit Saison Co. Ltd. | | | 30,902 | |
| | 4,926 | | | Deutsche Boerse AG | | | 859,815 | |
| | 6,236 | | | Discover Financial Services | | | 737,656 | |
| | 1,311 | | | Euronext NV | | | 142,622 | |
| | 2,451 | | | Franklin Resources, Inc. | | | 78,407 | |
| | 11,809 | | | Hargreaves Lansdown plc | | | 259,850 | |
| | 14,010 | | | IG Group Holdings plc | | | 164,174 | |
| | 4,379 | | | IntegraFin Holdings plc | | | 31,241 | |
| | 244 | | | Intermediate Capital Group plc | | | 7,177 | |
| | 11,903 | | | Invesco Ltd. | | | 318,167 | |
| | 24,568 | | | Investec plc | | | 98,137 | |
| | 4,658 | | | IP Group plc | | | 7,500 | |
| | 600 | | | JAFCO Group Co. Ltd. | | | 37,411 | |
| | 3,543 | | | Japan Exchange Group, Inc. | | | 78,924 | |
| | 767 | | | JTC plc | | | 6,522 | |
| | |
| |
| Common Stocks – (continued) | | | |
| Diversified Financials – (continued) | | | |
| | 61,384 | | | KKR & Co., Inc. | | | 3,636,388 | |
| | 94 | | | Liontrust Asset Management plc | | | 2,448 | |
| | 119,694 | | | M&G plc | | | 379,179 | |
| | 1,112 | | | MarketAxess Holdings, Inc. | | | 515,512 | |
| | 2,613 | | | Moody’s Corp. | | | 946,873 | |
| | 86,152 | | | Morgan Stanley | | | 7,899,277 | |
| | 44 | | | MSCI, Inc. | | | 23,455 | |
| | 5,903 | | | Ninety One plc | | | 17,981 | |
| | 875 | | | Nomura Holdings, Inc. | | | 4,453 | |
| | 5,050 | | | Plus500 Ltd. | | | 93,347 | |
| | 450 | | | Provident Financial plc* | | | 1,445 | |
| | 692 | | | Quilter plc | | | 1,424 | |
| | 20 | | | Rathbone Brothers plc | | | 501 | |
| | 314 | | | Raymond James Financial, Inc. | | | 40,789 | |
| | 17,387 | | | S&P Global, Inc. | | | 7,136,494 | |
| | 3,118 | | | Sanne Group plc | | | 35,885 | |
| | 3,400 | | | SBI Holdings, Inc. | | | 80,310 | |
| | 202 | | | Sofina SA | | | 87,275 | |
| | 13,968 | | | St James’s Place plc | | | 285,600 | |
| | 9,664 | | | Standard Life Aberdeen plc | | | 36,255 | |
| | 43,736 | | | State Street Corp. | | | 3,598,598 | |
| | 5,376 | | | Synchrony Financial | | | 260,843 | |
| | 24,772 | | | T. Rowe Price Group, Inc. | | | 4,904,113 | |
| | 500 | | | Zenkoku Hosho Co. Ltd. | | | 21,451 | |
| | | | | | | | |
| | | | | | | 79,187,091 | |
| | |
| Energy – 0.7% | | | |
| | 6,093 | | | APA Corp. | | | 131,792 | |
| | 28,585 | | | Baker Hughes Co. | | | 653,739 | |
| | 156,245 | | | Cabot Oil & Gas Corp. | | | 2,728,038 | |
| | 15,945 | | | Cairn Energy plc | | | 32,207 | |
| | 76,691 | | | Chevron Corp. | | | 8,032,615 | |
| | 1,100 | | | Cosmo Energy Holdings Co. Ltd. | | | 25,251 | |
| | 712 | | | Diamondback Energy, Inc. | | | 66,850 | |
| | 4,093 | | | ENEOS Holdings, Inc. | | | 17,153 | |
| | 53,795 | | | Exxon Mobil Corp. | | | 3,393,389 | |
| | 35,066 | | | Halliburton Co. | | | 810,726 | |
| | 14,851 | | | HollyFrontier Corp. | | | 488,598 | |
| | 1,000 | | | Iwatani Corp. | | | 59,919 | |
| | 41,533 | | | John Wood Group plc* | | | 126,532 | |
| | 184,365 | | | Kinder Morgan, Inc. | | | 3,360,974 | |
| | 13,787 | | | Marathon Oil Corp. | | | 187,779 | |
| | 15,817 | | | Marathon Petroleum Corp. | | | 955,663 | |
| | 10,420 | | | Neste OYJ | | | 639,184 | |
| | 36,554 | | | NOV, Inc.* | | | 560,007 | |
| | 5,632 | | | Occidental Petroleum Corp. | | | 176,113 | |
| | 727 | | | OMV AG | | | 41,488 | |
| | 1,182 | | | Phillips 66 | | | 101,439 | |
| | 57,880 | | | Repsol SA | | | 727,123 | |
| | 10,714 | | | Royal Dutch Shell plc Class A | | | 214,793 | |
| | 34,079 | | | TechnipFMC plc* | | | 307,736 | |
| | 45,010 | | | Tenaris SA | | | 492,422 | |
| | 43 | | | Thungela Resources Ltd.* | | | 118 | |
| | 7,452 | | | TotalEnergies SE | | | 337,589 | |
| | 388,921 | | | Tullow Oil plc* | | | 320,370 | |
| | 9,814 | | | Valero Energy Corp. | | | 766,277 | |
| | | | | | | | |
| | | | | | | 25,755,884 | |
| | |
| | |
| 10 | | The accompanying notes are an integral part of these financial statements. |
GOLDMAN SACHS ABSOLUTE RETURN TRACKER FUND
| | | | | | | | |
Shares | | | Description | | Value | |
| |
| Common Stocks – (continued) | | | |
| Food & Staples Retailing – 0.3% | | | |
| | 1,012 | | | Aeon Co. Ltd. | | $ | 27,167 | |
| | 240 | | | Ain Holdings, Inc. | | | 14,955 | |
| | 10,767 | | | Carrefour SA | | | 211,888 | |
| | 392 | | | Cosmos Pharmaceutical Corp. | | | 57,597 | |
| | 5,006 | | | Costco Wholesale Corp. | | | 1,980,724 | |
| | 896 | | | Etablissements Franz Colruyt NV | | | 50,104 | |
| | 48,049 | | | J Sainsbury plc | | | 180,851 | |
| | 14,049 | | | Jeronimo Martins SGPS SA | | | 256,209 | |
| | 3,826 | | | Kesko OYJ Class B | | | 141,281 | |
| | 36,527 | | | Koninklijke Ahold Delhaize NV | | | 1,087,758 | |
| | 28,164 | | | Kroger Co. (The) | | | 1,078,963 | |
| | 731 | | | Lawson, Inc. | | | 33,857 | |
| | 6,472 | | | Seven & i Holdings Co. Ltd. | | | 310,014 | |
| | 9,972 | | | Sysco Corp. | | | 775,323 | |
| | 700 | | | Tsuruha Holdings, Inc. | | | 81,470 | |
| | 6,594 | | | Walgreens Boots Alliance, Inc. | | | 346,910 | |
| | 20,566 | | | Walmart, Inc. | | | 2,900,217 | |
| | | | | | | | |
| | | | | | | 9,535,288 | |
| | |
| Food, Beverage & Tobacco – 0.9% | | | |
| | 4,500 | | | Ajinomoto Co., Inc. | | | 116,908 | |
| | 647 | | | Altria Group, Inc. | | | 30,849 | |
| | 2,789 | | | Anheuser-Busch InBev SA/NV | | | 201,056 | |
| | 69,028 | | | Archer-Daniels-Midland Co. | | | 4,183,097 | |
| | 898 | | | Asahi Group Holdings Ltd. | | | 41,971 | |
| | 8,160 | | | British American Tobacco plc | | | 316,817 | |
| | 8,156 | | | Britvic plc | | | 105,714 | |
| | 65,291 | | | Bunge Ltd. | | | 5,102,492 | |
| | 11,298 | | | C&C Group plc* | | | 37,977 | |
| | 3,326 | | | Campbell Soup Co. | | | 151,632 | |
| | 2,100 | | | Coca-Cola Bottlers Japan Holdings, Inc. | | | 32,874 | |
| | 38,715 | | | Coca-Cola Co. (The) | | | 2,094,869 | |
| | 6,838 | | | Coca-Cola HBC AG | | | 247,513 | |
| | 6,154 | | | Conagra Brands, Inc. | | | 223,882 | |
| | 900 | | | Constellation Brands, Inc. Class A | | | 210,501 | |
| | 2,475 | | | Cranswick plc | | | 136,163 | |
| | 16,578 | | | Davide Campari-Milano NV | | | 222,215 | |
| | 1,031 | | | Fuji Oil Holdings, Inc. | | | 24,529 | |
| | 15,263 | | | General Mills, Inc. | | | 929,975 | |
| | 6,626 | | | Glanbia plc | | | 107,916 | |
| | 23,372 | | | Greencore Group plc* | | | 40,632 | |
| | 1,233 | | | Heineken Holding NV | | | 124,420 | |
| | 3,600 | | | Hershey Co. (The) | | | 627,048 | |
| | 7,901 | | | Imperial Brands plc | | | 170,367 | |
| | 507 | | | Ito En Ltd. | | | 30,090 | |
| | 5,687 | | | J M Smucker Co. (The) | | | 736,865 | |
| | 2,552 | | | JDE Peet’s NV* | | | 92,629 | |
| | 10,195 | | | Kellogg Co. | | | 655,844 | |
| | 1,300 | | | Kikkoman Corp. | | | 85,733 | |
| | 7,195 | | | Kraft Heinz Co. (The) | | | 293,412 | |
| | 5,228 | | | Lamb Weston Holdings, Inc. | | | 421,690 | |
| | 974 | | | Maruha Nichiro Corp. | | | 20,739 | |
| | 235 | | | MEIJI Holdings Co. Ltd. | | | 14,082 | |
| | 5,924 | | | Molson Coors Beverage Co. Class B* | | | 318,060 | |
| | 22,777 | | | Mondelez International, Inc. Class A | | | 1,422,196 | |
| | |
| |
| Common Stocks – (continued) | | | |
| Food, Beverage & Tobacco – (continued) | | | |
| | 7,139 | | | Monster Beverage Corp.* | | | 652,148 | |
| | 300 | | | Morinaga Milk Industry Co. Ltd. | | | 15,636 | |
| | 1,584 | | | NH Foods Ltd. | | | 61,574 | |
| | 7,483 | | | Nippon Suisan Kaisha Ltd. | | | 35,685 | |
| | 1,732 | | | Nisshin Seifun Group, Inc. | | | 25,392 | |
| | 1,000 | | | Nissin Foods Holdings Co. Ltd. | | | 72,007 | |
| | 13,906 | | | PepsiCo, Inc. | | | 2,060,452 | |
| | 80,198 | | | Philip Morris International, Inc. | | | 7,948,424 | |
| | 54,101 | | | Premier Foods plc* | | | 82,022 | |
| | 114 | | | Remy Cointreau SA | | | 23,544 | |
| | 734 | | | Suntory Beverage & Food Ltd. | | | 27,666 | |
| | 400 | | | Takara Holdings, Inc. | | | 4,990 | |
| | 8,147 | | | Tate & Lyle plc | | | 83,216 | |
| | 1,482 | | | Toyo Suisan Kaisha Ltd. | | | 57,120 | |
| | 47,722 | | | Tyson Foods, Inc. Class A | | | 3,519,975 | |
| | 3,187 | | | Yamazaki Baking Co. Ltd. | | | 44,985 | |
| | | | | | | | |
| | | | | | | 34,287,593 | |
| | |
| Health Care Equipment & Services – 2.7% | | | |
| | 60,129 | | | Abbott Laboratories | | | 6,970,755 | |
| | 1,592 | | | ABIOMED, Inc.* | | | 496,879 | |
| | 772 | | | Alfresa Holdings Corp. | | | 11,531 | |
| | 50 | | | Align Technology, Inc.* | | | 30,550 | |
| | 1,215 | | | AmerisourceBergen Corp. | | | 139,105 | |
| | 294 | | | Amplifon SpA | | | 14,536 | |
| | 18,655 | | | Anthem, Inc. | | | 7,122,479 | |
| | 21,436 | | | Becton Dickinson and Co. | | | 5,213,021 | |
| | 126,790 | | | Boston Scientific Corp.* | | | 5,421,540 | |
| | 5,643 | | | Cardinal Health, Inc. | | | 322,159 | |
| | 1,002 | | | Carl Zeiss Meditec AG | | | 193,692 | |
| | 74,284 | | | Centene Corp.* | | | 5,417,532 | |
| | 9,556 | | | Cerner Corp. | | | 746,897 | |
| | 22,817 | | | Cigna Corp. | | | 5,409,226 | |
| | 88,405 | | | ConvaTec Group plc | | | 294,231 | |
| | 85,158 | | | CVS Health Corp. | | | 7,105,584 | |
| | 28,080 | | | Danaher Corp. | | | 7,535,549 | |
| | 3,035 | | | DaVita, Inc.* | | | 365,505 | |
| | 8,960 | | | Dentsply Sirona, Inc. | | | 566,810 | |
| | 9,676 | | | Edwards Lifesciences Corp.* | | | 1,002,143 | |
| | 8,786 | | | Fresenius Medical Care AG & Co. KGaA | | | 730,084 | |
| | 5,073 | | | Fresenius SE & Co. KGaA | | | 264,759 | |
| | 1,731 | | | H.U. Group Holdings, Inc. | | | 44,666 | |
| | 25,452 | | | HCA Healthcare, Inc. | | | 5,261,947 | |
| | 5,033 | | | Henry Schein, Inc.* | | | 373,398 | |
| | 81,734 | | | Hologic, Inc.* | | | 5,453,292 | |
| | 2,419 | | | Hoya Corp. | | | 319,962 | |
| | 11,699 | | | Humana, Inc. | | | 5,179,381 | |
| | 108 | | | IDEXX Laboratories, Inc.* | | | 68,207 | |
| | 13,097 | | | Insulet Corp.* | | | 3,595,257 | |
| | 23,043 | | | Koninklijke Philips NV | | | 1,143,720 | |
| | 17,750 | | | Laboratory Corp. of America Holdings* | | | 4,896,338 | |
| | 106 | | | M3, Inc. | | | 7,723 | |
| | 1,931 | | | McKesson Corp. | | | 369,284 | |
| | 13,056 | | | Mediclinic International plc* | | | 53,709 | |
| | |
| | |
| The accompanying notes are an integral part of these financial statements. | | 11 |
GOLDMAN SACHS ABSOLUTE RETURN TRACKER FUND
Consolidated Schedule of Investments (continued)
June 30, 2021 (Unaudited)
| | | | | | | | |
Shares | | | Description | | Value | |
| |
| Common Stocks – (continued) | | | |
| Health Care Equipment & Services – (continued) | | | |
| | 1,470 | | | Medipal Holdings Corp. | | $ | 28,104 | |
| | 13,808 | | | Medtronic plc | | | 1,713,987 | |
| | 200 | | | Nihon Kohden Corp. | | | 5,708 | |
| | 3,100 | | | Nipro Corp. | | | 36,624 | |
| | 8,500 | | | Olympus Corp. | | | 169,073 | |
| | 3,554 | | | Quest Diagnostics, Inc. | | | 469,021 | |
| | 123 | | | ResMed, Inc. | | | 30,322 | |
| | 800 | | | Ship Healthcare Holdings, Inc. | | | 18,692 | |
| | 19,198 | | | Smith & Nephew plc | | | 416,352 | |
| | 111 | | | STERIS plc | | | 22,899 | |
| | 4,335 | | | Stryker Corp. | | | 1,125,930 | |
| | 698 | | | Suzuken Co. Ltd. | | | 20,461 | |
| | 989 | | | Sysmex Corp. | | | 117,330 | |
| | 1,149 | | | Teleflex, Inc. | | | 461,657 | |
| | 895 | | | Toho Holdings Co. Ltd. | | | 14,431 | |
| | 20,436 | | | UDG Healthcare plc | | | 302,197 | |
| | 26,762 | | | UnitedHealth Group, Inc. | | | 10,716,575 | |
| | 2,918 | | | Universal Health Services, Inc. Class B | | | 427,283 | |
| | 132 | | | West Pharmaceutical Services, Inc. | | | 47,401 | |
| | | | | | | | |
| | | | | | | 98,285,498 | |
| | |
| Household & Personal Products – 0.5% | | | |
| | 2,934 | | | Beiersdorf AG | | | 354,151 | |
| | 1,332 | | | Church & Dwight Co., Inc. | | | 113,513 | |
| | 4,167 | | | Clorox Co. (The) | | | 749,685 | |
| | 3,629 | | | Estee Lauder Cos., Inc. (The) Class A | | | 1,154,312 | |
| | 4,715 | | | Henkel AG & Co. KGaA (Preference)(a) | | | 497,970 | |
| | 5,956 | | | Kimberly-Clark Corp. | | | 796,794 | |
| | 400 | | | Kose Corp. | | | 62,839 | |
| | 3,424 | | | L’Oreal SA | | | 1,529,138 | |
| | 1,900 | | | Pigeon Corp. | | | 53,588 | |
| | 1,300 | | | Pola Orbis Holdings, Inc. | | | 34,278 | |
| | 66,123 | | | Procter & Gamble Co. (The) | | | 8,921,976 | |
| | 7,441 | | | PZ Cussons plc | | | 25,223 | |
| | 11,787 | | | Reckitt Benckiser Group plc | | | 1,041,384 | |
| | 20,278 | | | Unilever plc | | | 1,184,916 | |
| | | | | | | | |
| | | | | | | 16,519,767 | |
| | |
| Insurance – 0.8% | | | |
| | 7,459 | | | Admiral Group plc | | | 324,557 | |
| | 20,645 | | | Aflac, Inc. | | | 1,107,811 | |
| | 5,597 | | | Ageas SA/NV | | | 311,032 | |
| | 8,592 | | | Allianz SE (Registered) | | | 2,144,193 | |
| | 9,656 | | | Allstate Corp. (The) | | | 1,259,529 | |
| | 22,875 | | | Aon plc Class A | | | 5,461,635 | |
| | 361 | | | Arthur J Gallagher & Co. | | | 50,569 | |
| | 17,814 | | | Assicurazioni Generali SpA | | | 357,646 | |
| | 1,235 | | | Assurant, Inc. | | | 192,882 | |
| | 114,656 | | | Aviva plc | | | 643,674 | |
| | 2,426 | | | Chubb Ltd. | | | 385,588 | |
| | 7,486 | | | Cincinnati Financial Corp. | | | 873,017 | |
| | 12,393 | | | CNP Assurances | | | 211,219 | |
| | 10,400 | | | Dai-ichi Life Holdings, Inc. | | | 191,352 | |
| | 52,728 | | | Direct Line Insurance Group plc | | | 207,970 | |
| | |
| |
| Common Stocks – (continued) | | | |
| Insurance – (continued) | | | |
| | 1,579 | | | Everest Re Group Ltd. | | | 397,924 | |
| | 78,731 | | | First American Financial Corp. | | | 4,908,878 | |
| | 1,203 | | | Globe Life, Inc. | | | 114,586 | |
| | 6,005 | | | Hartford Financial Services Group, Inc. (The) | | | 372,130 | |
| | 6,492 | | | Japan Post Holdings Co. Ltd.* | | | 53,324 | |
| | 2,688 | | | Japan Post Insurance Co. Ltd. | | | 49,736 | |
| | 38,700 | | | Just Group plc* | | | 49,916 | |
| | 144,261 | | | Legal & General Group plc | | | 514,664 | |
| | 3,923 | | | Lincoln National Corp. | | | 246,521 | |
| | 442 | | | Loews Corp. | | | 24,155 | |
| | 7,145 | | | Marsh & McLennan Cos., Inc. | | | 1,005,159 | |
| | 73,972 | | | MetLife, Inc. | | | 4,427,224 | |
| | 7,764 | | | NN Group NV | | | 366,766 | |
| | 10,932 | | | Phoenix Group Holdings plc | | | 102,335 | |
| | 43,649 | | | Poste Italiane SpA | | | 577,719 | |
| | 6,110 | | | Principal Financial Group, Inc. | | | 386,091 | |
| | 13,417 | | | Progressive Corp. (The) | | | 1,317,684 | |
| | 4,369 | | | Prudential Financial, Inc. | | | 447,691 | |
| | 5,318 | | | Sabre Insurance Group plc | | | 18,780 | |
| | 2,691 | | | Sompo Holdings, Inc. | | | 99,670 | |
| | 9,586 | | | T&D Holdings, Inc. | | | 124,396 | |
| | 2,633 | | | Travelers Cos., Inc. (The) | | | 394,186 | |
| | 14,119 | | | Unum Group | | | 400,980 | |
| | 665 | | | W R Berkley Corp. | | | 49,496 | |
| | | | | | | | |
| | | | | | | 30,172,685 | |
| | |
| Materials – 0.9% | | | |
| | 804 | | | ADEKA Corp. | | | 15,088 | |
| | 3,054 | | | Air Products and Chemicals, Inc. | | | 878,575 | |
| | 500 | | | Air Water, Inc. | | | 7,702 | |
| | 5,319 | | | Akzo Nobel NV | | | 658,603 | |
| | 315 | | | Albemarle Corp. | | | 53,065 | |
| | 39,155 | | | Amcor plc | | | 448,716 | |
| | 438 | | | Anglo American plc | | | 17,430 | |
| | 455 | | | Antofagasta plc | | | 9,048 | |
| | 6,227 | | | ArcelorMittal SA | | | 191,711 | |
| | 2,389 | | | Arkema SA | | | 300,259 | |
| | 11,900 | | | Asahi Kasei Corp. | | | 130,795 | |
| | 228 | | | Avery Dennison Corp. | | | 47,935 | |
| | 378 | | | Ball Corp. | | | 30,626 | |
| | 2,600 | | | BASF SE | | | 205,243 | |
| | 713 | | | BHP Group plc | | | 21,098 | |
| | 3,285 | | | Celanese Corp. | | | 498,006 | |
| | 159,287 | | | Centamin plc | | | 223,429 | |
| | 4,878 | | | CF Industries Holdings, Inc. | | | 250,973 | |
| | 284 | | | Corbion NV | | | 16,264 | |
| | 88,257 | | | Corteva, Inc. | | | 3,914,198 | |
| | 1,853 | | | Covestro AG | | | 119,812 | |
| | 18,801 | | | CRH plc | | | 953,814 | |
| | 87 | | | Croda International plc | | | 8,873 | |
| | 900 | | | Daicel Corp. | | | 7,405 | |
| | 200 | | | Denka Co. Ltd. | | | 6,648 | |
| | 1,311 | | | DIC Corp. | | | 33,161 | |
| | 2,915 | | | Dow, Inc. | | | 184,461 | |
| | 7,184 | | | DS Smith plc | | | 41,593 | |
| | |
| | |
| 12 | | The accompanying notes are an integral part of these financial statements. |
GOLDMAN SACHS ABSOLUTE RETURN TRACKER FUND
| | | | | | | | |
Shares | | | Description | | Value | |
| |
| Common Stocks – (continued) | | | |
| Materials – (continued) | | | |
| | 12,321 | | | DuPont de Nemours, Inc. | | $ | 953,769 | |
| | 5,238 | | | Eastman Chemical Co. | | | 611,537 | |
| | 3,999 | | | Ecolab, Inc. | | | 823,674 | |
| | 18,550 | | | Elementis plc* | | | 38,670 | |
| | 5,766 | | | Essentra plc | | | 24,658 | |
| | 2,028 | | | Evonik Industries AG | | | 68,087 | |
| | 30,448 | | | Evraz plc | | | 249,802 | |
| | 11,307 | | | Ferrexpo plc | | | 67,074 | |
| | 4,947 | | | Freeport-McMoRan, Inc. | | | 183,583 | |
| | 1,184 | | | Fresnillo plc | | | 12,660 | |
| | 1,313 | | | FUCHS PETROLUB SE (Preference)(a) | | | 63,896 | |
| | 29,920 | | | Glencore plc* | | | 128,419 | |
| | 7,512 | | | HeidelbergCement AG | | | 644,954 | |
| | 3,154 | | | Hill & Smith Holdings plc | | | 65,182 | |
| | 17,641 | | | Hochschild Mining plc | | | 37,481 | |
| | 1,089 | | | Huhtamaki OYJ | | | 51,654 | |
| | 5,135 | | | International Paper Co. | | | 314,827 | |
| | 200 | | | JFE Holdings, Inc. | | | 2,346 | |
| | 8,795 | | | Johnson Matthey plc | | | 374,458 | |
| | 2,294 | | | JSR Corp. | | | 69,685 | |
| | 955 | | | Kaneka Corp. | | | 38,531 | |
| | 11,400 | | | Kobe Steel Ltd. | | | 73,226 | |
| | 135 | | | Koninklijke DSM NV | | | 25,236 | |
| | 4,700 | | | Kuraray Co. Ltd. | | | 45,161 | |
| | 645 | | | LANXESS AG | | | 44,266 | |
| | 22,060 | | | Linde plc | | | 6,377,554 | |
| | 414 | | | Lintec Corp. | | | 8,976 | |
| | 138 | | | LyondellBasell Industries NV Class A | | | 14,196 | |
| | 135 | | | Martin Marietta Materials, Inc. | | | 47,494 | |
| | 16,388 | | | Mitsubishi Chemical Holdings Corp. | | | 137,889 | |
| | 331 | | | Mitsubishi Gas Chemical Co., Inc. | | | 7,014 | |
| | 2,358 | | | Mitsui Chemicals, Inc. | | | 81,511 | |
| | 100 | | | Mitsui Mining & Smelting Co. Ltd. | | | 2,775 | |
| | 1,902 | | | Mondi plc | | | 50,076 | |
| | 6,584 | | | Mosaic Co. (The) | | | 210,095 | |
| | 2,160 | | | Newmont Corp. | | | 136,901 | |
| | 1,005 | | | Nippon Light Metal Holdings Co. Ltd. | | | 16,884 | |
| | 1,493 | | | Nippon Paper Industries Co. Ltd. | | | 16,747 | |
| | 323 | | | Nippon Sanso Holdings Corp. | | | 6,631 | |
| | 300 | | | Nippon Steel Corp. | | | 5,072 | |
| | 82 | | | Nitto Denko Corp. | | | 6,107 | |
| | 700 | | | NOF Corp. | | | 36,496 | |
| | 2,073 | | | Nucor Corp. | | | 198,863 | |
| | 1,352 | | | Oji Holdings Corp. | | | 7,770 | |
| | 221 | | | Packaging Corp. of America | | | 29,928 | |
| | 2,638 | | | Petropavlovsk plc* | | | 865 | |
| | 4,651 | | | PPG Industries, Inc. | | | 789,600 | |
| | 1,745 | | | Rengo Co. Ltd. | | | 14,544 | |
| | 1,460 | | | RHI Magnesita NV | | | 81,795 | |
| | 351 | | | Rio Tinto plc | | | 28,988 | |
| | 9,039 | | | Sealed Air Corp. | | | 535,561 | |
| | 25,356 | | | Sherwin-Williams Co. (The) | | | 6,908,242 | |
| | 73 | | | Shin-Etsu Chemical Co. Ltd. | | | 12,210 | |
| | 2,700 | | | Showa Denko KK | | | 80,244 | |
| | 12,252 | | | Smurfit Kappa Group plc | | | 666,424 | |
| | 2,618 | | | Solvay SA | | | 333,228 | |
| | |
| |
| Common Stocks – (continued) | | | |
| Materials – (continued) | | | |
| | 3,345 | | | Stora Enso OYJ Class R | | | 61,083 | |
| | 246 | | | Sumitomo Bakelite Co. Ltd. | | | 10,884 | |
| | 23,510 | | | Sumitomo Chemical Co. Ltd. | | | 124,953 | |
| | 105 | | | Sumitomo Metal Mining Co. Ltd. | | | 4,084 | |
| | 356 | | | Sumitomo Osaka Cement Co. Ltd. | | | 9,699 | |
| | 7,218 | | | Synthomer plc | | | 49,126 | |
| | 819 | | | Taiheiyo Cement Corp. | | | 18,003 | |
| | 4,433 | | | Teijin Ltd. | | | 67,677 | |
| | 3,073 | | | thyssenkrupp AG* | | | 32,096 | |
| | 4,733 | | | Tokai Carbon Co. Ltd. | | | 65,274 | |
| | 1,995 | | | Tokuyama Corp. | | | 40,641 | |
| | 100 | | | Tokyo Ohka Kogyo Co. Ltd. | | | 6,294 | |
| | 2,927 | | | Toray Industries, Inc. | | | 19,511 | |
| | 600 | | | Tosoh Corp. | | | 10,346 | |
| | 784 | | | Toyo Seikan Group Holdings Ltd. | | | 10,734 | |
| | 510 | | | Toyobo Co. Ltd. | | | 6,117 | |
| | 2,579 | | | Ube Industries Ltd. | | | 52,407 | |
| | 1,959 | | | Victrex plc | | | 69,097 | |
| | 3,673 | | | voestalpine AG | | | 149,819 | |
| | 221 | | | Vulcan Materials Co. | | | 38,469 | |
| | 5,491 | | | Westrock Co. | | | 292,231 | |
| | 5,157 | | | Wienerberger AG | | | 198,783 | |
| | 227 | | | Yamato Kogyo Co. Ltd. | | | 7,499 | |
| | 2,500 | | | Zeon Corp. | | | 34,600 | |
| | | | | | | | |
| | | | | | | 32,517,474 | |
| | |
| Media & Entertainment – 3.0% | | | |
| | 54,384 | | | Activision Blizzard, Inc. | | | 5,190,409 | |
| | 8,364 | | | Alphabet, Inc. Class A* | | | 20,423,132 | |
| | 6,283 | | | Alphabet, Inc. Class C* | | | 15,747,209 | |
| | 28,407 | | | Auto Trader Group plc* | | | 248,789 | |
| | 16,766 | | | Bollore SA | | | 89,939 | |
| | 266 | | | Capcom Co. Ltd. | | | 7,775 | |
| | 550 | | | Charter Communications, Inc. Class A* | | | 396,797 | |
| | 717 | | | Cineworld Group plc* | | | 769 | |
| | 170,744 | | | Comcast Corp. Class A | | | 9,735,823 | |
| | 212 | | | CyberAgent, Inc. | | | 4,540 | |
| | 700 | | | DeNA Co. Ltd. | | | 14,922 | |
| | 4,209 | | | Dentsu Group, Inc. | | | 151,010 | |
| | 28,444 | | | Discovery, Inc. Class A*(b) | | | 872,662 | |
| | 15,186 | | | Discovery, Inc. Class C* | | | 440,090 | |
| | 6,535 | | | Electronic Arts, Inc. | | | 939,929 | |
| | 93 | | | Euromoney Institutional Investor plc | | | 1,312 | |
| | 73,676 | | | Facebook, Inc. Class A* | | | 25,617,882 | |
| | 14,175 | | | Fox Corp. Class A | | | 526,318 | |
| | 14,141 | | | Fox Corp. Class B | | | 497,763 | |
| | 181 | | | Future plc | | | 7,842 | |
| | 2,700 | | | GungHo Online Entertainment, Inc. | | | 53,623 | |
| | 23,197 | | | Interpublic Group of Cos., Inc. (The) | | | 753,671 | |
| | 128,768 | | | ITV plc* | | | 223,799 | |
| | 1,400 | | | Kakaku.com, Inc. | | | 42,118 | |
| | 174 | | | Koei Tecmo Holdings Co. Ltd. | | | 8,459 | |
| | 1,300 | | | Konami Holdings Corp. | | | 77,857 | |
| | 24,977 | | | Netflix, Inc.* | | | 13,193,101 | |
| | 33,505 | | | News Corp. Class A | | | 863,424 | |
| | |
| | |
| The accompanying notes are an integral part of these financial statements. | | 13 |
GOLDMAN SACHS ABSOLUTE RETURN TRACKER FUND
Consolidated Schedule of Investments (continued)
June 30, 2021 (Unaudited)
| | | | | | | | |
Shares | | | Description | | Value | |
| |
| Common Stocks – (continued) | | | |
| Media & Entertainment – (continued) | | | |
| | 16,108 | | | News Corp. Class B | | $ | 392,230 | |
| | 5,974 | | | Nexon Co. Ltd. | | | 132,948 | |
| | 800 | | | Nintendo Co. Ltd. | | | 462,938 | |
| | 3,624 | | | Nippon Television Holdings, Inc. | | | 42,272 | |
| | 3,848 | | | Omnicom Group, Inc. | | | 307,802 | |
| | 675 | | | Pearson plc | | | 7,773 | |
| | 11,735 | | | ProSiebenSat.1 Media SE | | | 233,989 | |
| | 505 | | | Publicis Groupe SA | | | 32,317 | |
| | 30,320 | | | Rightmove plc | | | 272,522 | |
| | 20,076 | | | Roku, Inc.* | | | 9,219,903 | |
| | 2,734 | | | Scout24 AG | | | 230,678 | |
| | 1,300 | | | Square Enix Holdings Co. Ltd. | | | 64,200 | |
| | 3,951 | | | Take-Two Interactive Software, Inc.* | | | 699,406 | |
| | 843 | | | TV Asahi Holdings Corp. | | | 13,401 | |
| | 573 | | | WPP plc | | | 7,746 | |
| | | | | | | | |
| | | | | | | 108,251,089 | |
| | |
| Pharmaceuticals, Biotechnology & Life Sciences – 2.2% | |
| | 5,378 | | | Agilent Technologies, Inc. | | | 794,922 | |
| | 6,856 | | | Amgen, Inc. | | | 1,671,150 | |
| | 2,906 | | | Astellas Pharma, Inc. | | | 50,642 | |
| | 10,652 | | | AstraZeneca plc | | | 1,279,776 | |
| | 17,637 | | | Biogen, Inc.* | | | 6,107,164 | |
| | 130 | | | Bio-Rad Laboratories, Inc. Class A* | | | 83,758 | |
| | 33,558 | | | Bristol-Myers Squibb Co. | | | 2,242,346 | |
| | 169 | | | Catalent, Inc.* | | | 18,272 | |
| | 153 | | | Charles River Laboratories International, Inc.* | | | 56,598 | |
| | 5,726 | | | Chugai Pharmaceutical Co. Ltd. | | | 226,959 | |
| | 11,483 | | | Daiichi Sankyo Co. Ltd. | | | 247,724 | |
| | 134 | | | Dechra Pharmaceuticals plc | | | 8,100 | |
| | 2,000 | | | Eisai Co. Ltd. | | | 196,554 | |
| | 29,303 | | | Eli Lilly & Co. | | | 6,725,625 | |
| | 838 | | | Eurofins Scientific SE* | | | 95,849 | |
| | 241 | | | Evotec SE* | | | 10,933 | |
| | 101 | | | Genus plc | | | 6,936 | |
| | 23,688 | | | Gilead Sciences, Inc. | | | 1,631,156 | |
| | 75,853 | | | GlaxoSmithKline plc | | | 1,491,202 | |
| | 5,207 | | | Grifols SA | | | 141,198 | |
| | 2,377 | | | Illumina, Inc.* | | | 1,124,820 | |
| | 5,866 | | | Incyte Corp.* | | | 493,507 | |
| | 3,035 | | | Indivior plc* | | | 6,491 | |
| | 2,770 | | | Ipsen SA | | | 288,238 | |
| | 3,917 | | | IQVIA Holdings, Inc.* | | | 949,167 | |
| | 84,130 | | | Johnson & Johnson | | | 13,859,576 | |
| | 239 | | | Kaken Pharmaceutical Co. Ltd. | | | 10,256 | |
| | 108,237 | | | Merck & Co., Inc. | | | 8,417,591 | |
| | 3,950 | | | Merck KGaA | | | 757,911 | |
| | 4,847 | | | Mettler-Toledo International, Inc.* | | | 6,714,743 | |
| | 253 | | | Mochida Pharmaceutical Co. Ltd. | | | 8,307 | |
| | 10,824 | | | Organon & Co.* | | | 327,534 | |
| | 3,377 | | | Orion OYJ Class B | | | 145,192 | |
| | 3,001 | | | Otsuka Holdings Co. Ltd. | | | 124,608 | |
| | 1,766 | | | PerkinElmer, Inc. | | | 272,688 | |
| | 5,469 | | | Perrigo Co. plc | | | 250,754 | |
| | 183,665 | | | Pfizer, Inc. | | | 7,192,321 | |
| | |
| |
| Common Stocks – (continued) | | | |
| Pharmaceuticals, Biotechnology & Life Sciences – (continued) | |
| | 802 | | | PureTech Health plc* | | | 3,783 | |
| | 879 | | | Santen Pharmaceutical Co. Ltd. | | | 12,132 | |
| | 61 | | | Sartorius Stedim Biotech | | | 28,871 | |
| | 609 | | | Sawai Group Holdings Co. Ltd. | | | 27,171 | |
| | 1,874 | | | Sumitomo Dainippon Pharma Co. Ltd. | | | 39,306 | |
| | 476 | | | Taisho Pharmaceutical Holdings Co. Ltd. | | | 25,481 | |
| | 3,043 | | | Takeda Pharmaceutical Co. Ltd. | | | 102,125 | |
| | 15,848 | | | Thermo Fisher Scientific, Inc. | | | 7,994,841 | |
| | 80 | | | Tsumura & Co. | | | 2,515 | |
| | 4,193 | | | UCB SA | | | 439,140 | |
| | 225 | | | Vectura Group plc | | | 424 | |
| | 31,183 | | | Vertex Pharmaceuticals, Inc.* | | | 6,287,428 | |
| | 32,742 | | | Viatris, Inc. | | | 467,883 | |
| | 1,851 | | | Waters Corp.* | | | 639,724 | |
| | | | | | | | |
| | | | | | | 80,101,392 | |
| | |
| Real Estate – 0.6% | | | |
| | 1,200 | | | alstria office REIT-AG (REIT) | | | 22,171 | |
| | 23,975 | | | American Tower Corp. (REIT) | | | 6,476,607 | |
| | 1,514 | | | Aroundtown SA | | | 11,813 | |
| | 242 | | | Big Yellow Group plc (REIT) | | | 4,371 | |
| | 307 | | | CBRE Group, Inc. Class A* | | | 26,319 | |
| | 1,867 | | | Civitas Social Housing plc (REIT) | | | 2,983 | |
| | 374 | | | CLS Holdings plc | | | 1,244 | |
| | 31,902 | | | Crown Castle International Corp. (REIT) | | | 6,224,080 | |
| | 800 | | | Daito Trust Construction Co. Ltd. | | | 87,282 | |
| | 220 | | | Duke Realty Corp. (REIT) | | | 10,417 | |
| | 1,291 | | | Equinix, Inc. (REIT) | | | 1,036,157 | |
| | 374 | | | Extra Space Storage, Inc. (REIT) | | | 61,269 | |
| | 1,165 | | | GCP Student Living plc (REIT) | | | 2,595 | |
| | 18,533 | | | Grainger plc | | | 73,041 | |
| | 26,063 | | | Host Hotels & Resorts, Inc. (REIT)* | | | 445,417 | |
| | 2,800 | | | Hulic Co. Ltd. | | | 31,455 | |
| | 10,273 | | | Iron Mountain, Inc. (REIT) | | | 434,753 | |
| | 17,080 | | | Kimco Realty Corp. (REIT) | | | 356,118 | |
| | 473 | | | LondonMetric Property plc (REIT) | | | 1,513 | |
| | 1,922 | | | LXI REIT plc (REIT) | | | 3,544 | |
| | 125 | | | Mid-America Apartment Communities, Inc. (REIT) | | | 21,053 | |
| | 212 | | | Public Storage (REIT) | | | 63,746 | |
| | 1,500 | | | Relo Group, Inc. | | | 34,264 | |
| | 360 | | | Safestore Holdings plc (REIT) | | | 4,716 | |
| | 2,844 | | | Savills plc | | | 45,400 | |
| | 2,287 | | | SBA Communications Corp. (REIT) | | | 728,867 | |
| | 501 | | | Segro plc (REIT) | | | 7,584 | |
| | 130 | | | Simon Property Group, Inc. (REIT) | | | 16,962 | |
| | 2,523 | | | Sirius Real Estate Ltd. | | | 3,857 | |
| | 24,510 | | | Sun Communities, Inc. (REIT) | | | 4,201,014 | |
| | 308 | | | TAG Immobilien AG | | | 9,763 | |
| | 72,515 | | | Tritax Big Box REIT plc (REIT) | | | 197,021 | |
| | 2,566 | | | UK Commercial Property REIT Ltd. (REIT) | | | 2,714 | |
| | 290 | | | UNITE Group plc (The) (REIT) | | | 4,308 | |
| | 439 | | | Warehouses De Pauw CVA (REIT) | | | 16,770 | |
| | |
| | |
| 14 | | The accompanying notes are an integral part of these financial statements. |
GOLDMAN SACHS ABSOLUTE RETURN TRACKER FUND
| | | | | | | | |
Shares | | | Description | | Value | |
| |
| Common Stocks – (continued) | | | |
| Real Estate – (continued) | | | |
| | 1,051 | | | Weyerhaeuser Co. (REIT) | | $ | 36,175 | |
| | | | | | | | |
| | | | | | | 20,707,363 | |
| | |
| Retailing – 1.7% | | | |
| | 600 | | | ABC-Mart, Inc. | | | 34,509 | |
| | 1,503 | | | Advance Auto Parts, Inc. | | | 308,325 | |
| | 3,591 | | | Amazon.com, Inc.* | | | 12,353,615 | |
| | 15,509 | | | AO World plc* | | | 54,278 | |
| | 1,003 | | | Autobacs Seven Co. Ltd. | | | 13,359 | |
| | 614 | | | AutoZone, Inc.* | | | 916,223 | |
| | 34,447 | | | B&M European Value Retail SA | | | 273,470 | |
| | 8,603 | | | Best Buy Co., Inc. | | | 989,173 | |
| | 1,358 | | | CarMax, Inc.* | | | 175,386 | |
| | 22,502 | | | Dixons Carphone plc* | | | 40,527 | |
| | 1,525 | | | Dollar General Corp. | | | 329,995 | |
| | 8,782 | | | Dollar Tree, Inc.* | | | 873,809 | |
| | 4,201 | | | Dunelm Group plc | | | 82,637 | |
| | 93,135 | | | eBay, Inc. | | | 6,539,008 | |
| | 338 | | | Etsy, Inc.* | | | 69,574 | |
| | 400 | | | Fast Retailing Co. Ltd. | | | 300,675 | |
| | 2,789 | | | Frasers Group plc* | | | 23,255 | |
| | 1,593 | | | Gap, Inc. (The) | | | 53,605 | |
| | 32,401 | | | Genuine Parts Co. | | | 4,097,755 | |
| | 6,135 | | | HelloFresh SE* | | | 596,378 | |
| | 44,696 | | | Home Depot, Inc. (The) | | | 14,253,107 | |
| | 3,311 | | | Inchcape plc | | | 35,237 | |
| | 500 | | | Izumi Co. Ltd. | | | 18,807 | |
| | 2,118 | | | J Front Retailing Co. Ltd. | | | 18,840 | |
| | 20,741 | | | JD Sports Fashion plc | | | 263,943 | |
| | 71,796 | | | Kingfisher plc | | | 362,361 | |
| | 1,727 | | | K’s Holdings Corp. | | | 19,847 | |
| | 3,897 | | | L Brands, Inc. | | | 280,818 | |
| | 15,020 | | | LKQ Corp.* | | | 739,284 | |
| | 31,028 | | | Lowe’s Cos., Inc. | | | 6,018,501 | |
| | 17,618 | | | Marks & Spencer Group plc* | | | 35,732 | |
| | 3,279 | | | Next plc* | | | 356,866 | |
| | 800 | | | Nitori Holdings Co. Ltd. | | | 141,278 | |
| | 1,661 | | | O’Reilly Automotive, Inc.* | | | 940,475 | |
| | 210 | | | PALTAC Corp. | | | 10,900 | |
| | 15,157 | | | Pets at Home Group plc | | | 95,809 | |
| | 124 | | | Pool Corp. | | | 56,874 | |
| | 1,900 | | | Rakuten Group, Inc. | | | 21,453 | |
| | 1,940 | | | Ross Stores, Inc. | | | 240,560 | |
| | 100 | | | Ryohin Keikaku Co. Ltd. | | | 2,098 | |
| | 904 | | | Shimamura Co. Ltd. | | | 86,729 | |
| | 1,237 | | | Shop Apotheke Europe NV* | | | 232,402 | |
| | 2,375 | | | Takashimaya Co. Ltd. | | | 25,893 | |
| | 8,645 | | | Target Corp. | | | 2,089,842 | |
| | 5,291 | | | TJX Cos., Inc. (The) | | | 356,719 | |
| | 25,852 | | | Tractor Supply Co. | | | 4,810,023 | |
| | 1,759 | | | Ulta Beauty, Inc.* | | | 608,209 | |
| | 2,330 | | | Vivo Energy plc | | | 3,107 | |
| | 1,271 | | | Watches of Switzerland Group plc* | | | 14,698 | |
| | 5,099 | | | Wickes Group plc* | | | 17,352 | |
| | 17,880 | | | Yamada Holdings Co. Ltd. | | | 82,679 | |
| | 5,656 | | | Zalando SE* | | | 684,036 | |
| | |
| |
| Common Stocks – (continued) | | | |
| Retailing – (continued) | | | |
| | 142 | | | ZOZO, Inc. | | | 4,815 | |
| | | | | | | | |
| | | | | | | 61,054,850 | |
| | |
| Semiconductors & Semiconductor Equipment – 1.2% | | | |
| | 1,800 | | | Advantest Corp. | | | 161,616 | |
| | 35,045 | | | Analog Devices, Inc. | | | 6,033,347 | |
| | 579 | | | Applied Materials, Inc. | | | 82,450 | |
| | 115 | | | ASM International NV | | | 37,930 | |
| | 181 | | | ASML Holding NV | | | 124,948 | |
| | 374 | | | BE Semiconductor Industries NV | | | 31,871 | |
| | 5,626 | | | Broadcom, Inc. | | | 2,682,702 | |
| | 360 | | | Enphase Energy, Inc.* | | | 66,107 | |
| | 34,590 | | | Infineon Technologies AG | | | 1,391,322 | |
| | 67,518 | | | Intel Corp. | | | 3,790,460 | |
| | 8,884 | | | Lam Research Corp. | | | 5,780,819 | |
| | 100 | | | Lasertec Corp. | | | 19,342 | |
| | 947 | | | Microchip Technology, Inc. | | | 141,804 | |
| | 100,699 | | | Micron Technology, Inc.* | | | 8,557,401 | |
| | 1,565 | | | Monolithic Power Systems, Inc. | | | 584,449 | |
| | 4,573 | | | NXP Semiconductors NV | | | 940,758 | |
| | 3,400 | | | Qorvo, Inc.* | | | 665,210 | |
| | 2,866 | | | QUALCOMM, Inc. | | | 409,637 | |
| | 15,950 | | | Renesas Electronics Corp.* | | | 172,138 | |
| | 1,166 | | | SCREEN Holdings Co. Ltd. | | | 114,591 | |
| | 831 | | | Skyworks Solutions, Inc. | | | 159,344 | |
| | 153 | | | SOITEC* | | | 33,786 | |
| | 20,500 | | | STMicroelectronics NV | | | 745,289 | |
| | 836 | | | SUMCO Corp. | | | 20,479 | |
| | 4,150 | | | Teradyne, Inc. | | | 555,934 | |
| | 46,783 | | | Texas Instruments, Inc. | | | 8,996,371 | |
| | 1,243 | | | Ulvac, Inc. | | | 62,942 | |
| | | | | | | | |
| | | | | | | 42,363,047 | |
| | |
| Software & Services – 3.5% | | | |
| | 30,199 | | | Accenture plc Class A | | | 8,902,363 | |
| | 21,570 | | | Adobe, Inc.* | | | 12,632,255 | |
| | 598 | | | Adyen NV* | | | 1,466,494 | |
| | 2,571 | | | Akamai Technologies, Inc.* | | | 299,779 | |
| | 1,177 | | | Alten SA | | | 156,223 | |
| | 11,473 | | | Atos SE | | | 698,620 | |
| | 3,469 | | | Autodesk, Inc.* | | | 1,012,601 | |
| | 201 | | | Automatic Data Processing, Inc. | | | 39,923 | |
| | 1,093 | | | Avast plc | | | 7,410 | |
| | 705 | | | Bechtle AG | | | 131,031 | |
| | 39 | | | Broadridge Financial Solutions, Inc. | | | 6,300 | |
| | 6,272 | | | Bytes Technology Group plc* | | | 40,170 | |
| | 5,260 | | | Cadence Design Systems, Inc.* | | | 719,673 | |
| | 1,460 | | | Capgemini SE | | | 280,778 | |
| | 23,702 | | | Capita plc* | | | 12,248 | |
| | 7,233 | | | Citrix Systems, Inc. | | | 848,214 | |
| | 22,136 | | | Cognizant Technology Solutions Corp. Class A | | | 1,533,139 | |
| | 553 | | | Computacenter plc | | | 19,708 | |
| | 58 | | | Dassault Systemes SE | | | 14,076 | |
| | 19,526 | | | DXC Technology Co.* | | | 760,342 | |
| | 9,380 | | | Fair Isaac Corp.* | | | 4,715,138 | |
| | |
| | |
| The accompanying notes are an integral part of these financial statements. | | 15 |
GOLDMAN SACHS ABSOLUTE RETURN TRACKER FUND
Consolidated Schedule of Investments (continued)
June 30, 2021 (Unaudited)
| | | | | | | | |
Shares | | | Description | | Value | |
| |
| Common Stocks – (continued) | | | |
| Software & Services – (continued) | | | |
| | 189 | | | FDM Group Holdings plc | | $ | 2,668 | |
| | 5,002 | | | Fidelity National Information Services, Inc. | | | 708,633 | |
| | 16,600 | | | Finablr plc*(c) | | | — | |
| | 57,100 | | | Fiserv, Inc.* | | | 6,103,419 | |
| | 1,467 | | | FleetCor Technologies, Inc.* | | | 375,640 | |
| | 39 | | | Fortinet, Inc.* | | | 9,289 | |
| | 1,663 | | | Fujitsu Ltd. | | | 311,146 | |
| | 4,189 | | | Gartner, Inc.* | | | 1,014,576 | |
| | 3,148 | | | Global Payments, Inc. | | | 590,376 | |
| | 668 | | | GMO internet, Inc. | | | 18,232 | |
| | 18,169 | | | International Business Machines Corp. | | | 2,663,394 | |
| | 3,285 | | | Intuit, Inc. | | | 1,610,208 | |
| | 3,046 | | | Jack Henry & Associates, Inc. | | | 498,051 | |
| | 2,562 | | | Kainos Group plc | | | 52,274 | |
| | 30,540 | | | Mastercard, Inc. Class A | | | 11,149,849 | |
| | 2,359 | | | Micro Focus International plc | | | 17,862 | |
| | 138,659 | | | Microsoft Corp. | | | 37,562,723 | |
| | 2,699 | | | NCC Group plc | | | 10,977 | |
| | 3,654 | | | NEC Corp. | | | 188,014 | |
| | 1,570 | | | Nemetschek SE | | | 120,178 | |
| | 2,907 | | | Nexi SpA* | | | 63,882 | |
| | 1,606 | | | Nihon Unisys Ltd. | | | 48,328 | |
| | 114 | | | Nomura Research Institute Ltd. | | | 3,765 | |
| | 1,985 | | | NTT Data Corp. | | | 30,987 | |
| | 7,587 | | | Oracle Corp. | | | 590,572 | |
| | 400 | | | Oracle Corp. Japan | | | 30,563 | |
| | 42,485 | | | PayPal Holdings, Inc.* | | | 12,383,528 | |
| | 203 | | | PTC, Inc.* | | | 28,676 | |
| | 31,570 | | | Sage Group plc (The) | | | 299,039 | |
| | 37,974 | | | salesforce.com, Inc.* | | | 9,275,909 | |
| | 21,596 | | | SAP SE | | | 3,033,369 | |
| | 162 | | | SCSK Corp. | | | 9,653 | |
| | 2,802 | | | ServiceNow, Inc.* | | | 1,539,839 | |
| | 267 | | | Softcat plc | | | 6,560 | |
| | 564 | | | Sopra Steria Group SACA | | | 108,523 | |
| | 2,964 | | | Synopsys, Inc.* | | | 817,442 | |
| | 8,708 | | | TeamViewer AG* | | | 327,046 | |
| | 1,800 | | | Trend Micro, Inc. | | | 94,254 | |
| | 33 | | | Tyler Technologies, Inc.* | | | 14,928 | |
| | 2,737 | | | VeriSign, Inc.* | | | 623,188 | |
| | | | | | | | |
| | | | | | | 126,634,045 | |
| | |
| Technology Hardware & Equipment – 2.3% | | | |
| | 2,618 | | | Alps Alpine Co. Ltd. | | | 27,707 | |
| | 432 | | | Amano Corp. | | | 10,925 | |
| | 10,026 | | | Amphenol Corp. Class A | | | 685,879 | |
| | 300,924 | | | Apple, Inc. | | | 41,214,551 | |
| | 183 | | | Azbil Corp. | | | 7,583 | |
| | 4,262 | | | Brother Industries Ltd. | | | 85,127 | |
| | 1,031 | | | Canon Marketing Japan, Inc. | | | 23,940 | |
| | 10,225 | | | Canon, Inc. | | | 231,105 | |
| | 7,620 | | | CDW Corp. | | | 1,330,833 | |
| | 107,546 | | | Ciena Corp.* | | | 6,118,292 | |
| | 212,497 | | | Cisco Systems, Inc. | | | 11,262,341 | |
| | 8,277 | | | Corning, Inc. | | | 338,529 | |
| | |
| |
| Common Stocks – (continued) | | | |
| Technology Hardware & Equipment – (continued) | | | |
| | 46,829 | | | Dell Technologies, Inc. Class C* | | | 4,667,446 | |
| | 5,497 | | | F5 Networks, Inc.* | | | 1,026,070 | |
| | 2,732 | | | FUJIFILM Holdings Corp. | | | 202,082 | |
| | 100 | | | Hamamatsu Photonics KK | | | 6,024 | |
| | 42,997 | | | Hewlett Packard Enterprise Co. | | | 626,896 | |
| | 736 | | | Horiba Ltd. | | | 47,767 | |
| | 28,428 | | | HP, Inc. | | | 858,241 | |
| | 84 | | | Ibiden Co. Ltd. | | | 4,521 | |
| | 19,699 | | | Juniper Networks, Inc. | | | 538,768 | |
| | 3,581 | | | Keysight Technologies, Inc.* | | | 552,942 | |
| | 19,090 | | | Konica Minolta, Inc. | | | 105,762 | |
| | 600 | | | Kyocera Corp. | | | 37,068 | |
| | 3,260 | | | Motorola Solutions, Inc. | | | 706,931 | |
| | 241 | | | Murata Manufacturing Co. Ltd. | | | 18,358 | |
| | 9,628 | | | NetApp, Inc. | | | 787,763 | |
| | 1,497 | | | Nippon Electric Glass Co. Ltd. | | | 35,153 | |
| | 198,602 | | | Nokia OYJ* | | | 1,064,061 | |
| | 1,215 | | | Oki Electric Industry Co. Ltd. | | | 11,122 | |
| | 1,800 | | | Omron Corp. | | | 142,518 | |
| | 383 | | | Oxford Instruments plc | | | 12,252 | |
| | 1,182 | | | Renishaw plc | | | 80,584 | |
| | 11,004 | | | Ricoh Co. Ltd. | | | 123,862 | |
| | 6,654 | | | Seagate Technology Holdings plc | | | 585,086 | |
| | 5,819 | | | Seiko Epson Corp. | | | 102,287 | |
| | 400 | | | Shimadzu Corp. | | | 15,456 | |
| | 4,793 | | | Spectris plc | | | 214,976 | |
| | 2,374 | | | Spirent Communications plc | | | 8,093 | |
| | 81 | | | Taiyo Yuden Co. Ltd. | | | 3,997 | |
| | 3,304 | | | TE Connectivity Ltd. | | | 446,734 | |
| | 1,200 | | | Topcon Corp. | | | 17,853 | |
| | 11,559 | | | Trimble, Inc.* | | | 945,873 | |
| | 2,595 | | | Western Digital Corp.* | | | 184,686 | |
| | 1,144 | | | Yokogawa Electric Corp. | | | 17,109 | |
| | 11,743 | | | Zebra Technologies Corp. Class A* | | | 6,217,801 | |
| | | | | | | | |
| | | | | | | 81,752,954 | |
| | |
| Telecommunication Services – 0.5% | | | |
| | 6,710 | | | Airtel Africa plc | | | 7,166 | |
| | 35,886 | | | AT&T, Inc. | | | 1,032,799 | |
| | 82,037 | | | Deutsche Telekom AG (Registered) | | | 1,735,083 | |
| | 1,206 | | | Freenet AG | | | 28,515 | |
| | 3,400 | | | KDDI Corp. | | | 105,929 | |
| | 163,067 | | | Koninklijke KPN NV | | | 510,017 | |
| | 47,249 | | | Lumen Technologies, Inc. | | | 642,114 | |
| | 19,977 | | | Nippon Telegraph & Telephone Corp. | | | 522,303 | |
| | 10,047 | | | Orange SA | | | 114,664 | |
| | 9,076 | | | Proximus SADP | | | 175,430 | |
| | 2,577 | | | SoftBank Corp. | | | 33,694 | |
| | 325 | | | SoftBank Group Corp. | | | 22,666 | |
| | 238,545 | | | Telecom Italia SpA | | | 118,692 | |
| | 35,269 | | | Telefonica SA | | | 164,617 | |
| | 57,785 | | | T-Mobile US, Inc.* | | | 8,369,002 | |
| | 55,951 | | | Verizon Communications, Inc. | | | 3,134,935 | |
| | 176,463 | | | Vodafone Group plc | | | 295,757 | |
| | | | | | | | |
| | | | | | | 17,013,383 | |
| | |
| | |
| 16 | | The accompanying notes are an integral part of these financial statements. |
GOLDMAN SACHS ABSOLUTE RETURN TRACKER FUND
| | | | | | | | |
Shares | | | Description | | Value | |
| |
| Common Stocks – (continued) | | | |
| Transportation – 0.8% | | | |
| | 2,100 | | | Abertis Infraestructuras SA(c) | | $ | — | |
| | 226 | | | Alaska Air Group, Inc.* | | | 13,630 | |
| | 5,200 | | | ANA Holdings, Inc.* | | | 122,211 | |
| | 5,872 | | | Atlantia SpA* | | | 106,624 | |
| | 4,297 | | | CH Robinson Worldwide, Inc. | | | 402,500 | |
| | 666 | | | Clarkson plc | | | 29,425 | |
| | 135,129 | | | CSX Corp. | | | 4,334,938 | |
| | 224 | | | Delta Air Lines, Inc.* | | | 9,690 | |
| | 24,073 | | | Deutsche Post AG (Registered) | | | 1,639,485 | |
| | 2,600 | | | East Japan Railway Co. | | | 185,417 | |
| | 1,357 | | | Expeditors International of Washington, Inc. | | | 171,796 | |
| | 18,750 | | | FedEx Corp. | | | 5,593,688 | |
| | 80,757 | | | Firstgroup plc* | | | 91,492 | |
| | 1,400 | | | Japan Airport Terminal Co. Ltd. | | | 62,893 | |
| | 675 | | | JB Hunt Transport Services, Inc. | | | 109,991 | |
| | 817 | | | Kamigumi Co. Ltd. | | | 16,580 | |
| | 2,700 | | | Kyushu Railway Co. | | | 60,927 | |
| | 200 | | | Mitsui OSK Lines Ltd. | | | 9,612 | |
| | 185 | | | National Express Group plc* | | | 682 | |
| | 1,136 | | | Nippon Yusen KK | | | 57,650 | |
| | 16,226 | | | Norfolk Southern Corp. | | | 4,306,543 | |
| | 2,581 | | | Old Dominion Freight Line, Inc. | | | 655,058 | |
| | 6,441 | | | Redde Northgate plc | | | 35,578 | |
| | 40,706 | | | Royal Mail plc* | | | 325,479 | |
| | 3,111 | | | SG Holdings Co. Ltd. | | | 81,692 | |
| | 689 | | | Southwest Airlines Co.* | | | 36,579 | |
| | 4,300 | | | Tokyu Corp. | | | 58,523 | |
| | 36,912 | | | Union Pacific Corp. | | | 8,118,056 | |
| | 8,619 | | | United Parcel Service, Inc. Class B | | | 1,792,493 | |
| | 2,000 | | | West Japan Railway Co. | | | 114,290 | |
| | 3,158 | | | Wizz Air Holdings plc* | | | 204,176 | |
| | 902 | | | Yamato Holdings Co. Ltd. | | | 25,629 | |
| | | | | | | | |
| | | | | | | 28,773,327 | |
| | |
| Utilities – 0.3% | | | |
| | 43,346 | | | A2A SpA | | | 88,664 | |
| | 74 | | | Acciona SA | | | 11,176 | |
| | 148,829 | | | AES Corp. (The) | | | 3,879,972 | |
| | 84 | | | Alliant Energy Corp. | | | 4,684 | |
| | 120 | | | Ameren Corp. | | | 9,605 | |
| | 186 | | | American Water Works Co., Inc. | | | 28,668 | |
| | 506 | | | CenterPoint Energy, Inc. | | | 12,407 | |
| | 76,494 | | | Centrica plc* | | | 54,523 | |
| | 2,120 | | | Chubu Electric Power Co., Inc. | | | 25,937 | |
| | 7,450 | | | CMS Energy Corp. | | | 440,146 | |
| | 2,383 | | | Consolidated Edison, Inc. | | | 170,909 | |
| | 7,414 | | | ContourGlobal plc | | | 19,813 | |
| | 7,946 | | | Drax Group plc | | | 46,627 | |
| | 5,541 | | | DTE Energy Co. | | | 718,114 | |
| | 2,968 | | | Duke Energy Corp. | | | 293,001 | |
| | 13,131 | | | Edison International | | | 759,234 | |
| | 1,003 | | | EDP Renovaveis SA | | | 23,239 | |
| | 26 | | | Electricite de France SA | | | 355 | |
| | 163,316 | | | Enel SpA | | | 1,517,675 | |
| | 12,189 | | | Engie SA | | | 167,143 | |
| | |
| |
| Common Stocks – (continued) | | | |
| Utilities – (continued) | | | |
| | 801 | | | Entergy Corp. | | | 79,860 | |
| | 2,210 | | | Evergy, Inc. | | | 133,550 | |
| | 6,126 | | | Exelon Corp. | | | 271,443 | |
| | 3,280 | | | FirstEnergy Corp. | | | 122,049 | |
| | 146 | | | Fortum OYJ | | | 4,028 | |
| | 56,730 | | | Hera SpA | | | 234,529 | |
| | 5,110 | | | Hokkaido Electric Power Co., Inc. | | | 23,164 | |
| | 17,766 | | | Iberdrola SA | | | 216,650 | |
| | 11,261 | | | Italgas SpA | | | 73,660 | |
| | 639 | | | NextEra Energy, Inc. | | | 46,826 | |
| | 1,590 | | | NiSource, Inc. | | | 38,955 | |
| | 7,084 | | | NRG Energy, Inc. | | | 285,485 | |
| | 3,500 | | | Osaka Gas Co. Ltd. | | | 65,306 | |
| | 885 | | | Pinnacle West Capital Corp. | | | 72,543 | |
| | 1,178 | | | Public Service Enterprise Group, Inc. | | | 70,374 | |
| | 2,101 | | | Red Electrica Corp. SA | | | 39,008 | |
| | 3,483 | | | Rubis SCA | | | 154,978 | |
| | 5,488 | | | RWE AG | | | 198,980 | |
| | 377 | | | Southern Co. (The) | | | 22,812 | |
| | 4,664 | | | SSE plc | | | 96,866 | |
| | 871 | | | Telecom Plus plc | | | 13,700 | |
| | 500 | | | Toho Gas Co. Ltd. | | | 24,547 | |
| | 4,990 | | | Tokyo Gas Co. Ltd. | | | 94,120 | |
| | 3,230 | | | Uniper SE | | | 119,004 | |
| | 2,642 | | | Veolia Environnement SA | | | 79,870 | |
| | 315 | | | Verbund AG Class A | | | 29,018 | |
| | | | | | | | |
| | | | | | | 10,883,217 | |
| | |
| | TOTAL COMMON STOCKS | | | | |
| | (Cost $894,646,249) | | $ | 1,070,637,554 | |
| | |
| | | | | | | | |
|
| Exchange Traded Funds – 20.6% | |
| | 36,911 | | | First Trust US Equity Opportunities ETF(b) | | $ | 4,705,045 | |
| | 2,256,291 | | | Invesco Senior Loan ETF | | | 49,976,846 | |
| | 2,276,261 | | | iShares 5-10 Year Investment Grade Corporate Bond ETF(b) | | | 137,759,316 | |
| | 5,734,427 | | | iShares Core MSCI Emerging Markets ETF | | | 384,149,265 | |
| | 80,000 | | | iShares J.P. Morgan USD Emerging Markets Bond ETF | | | 8,996,800 | |
| | 963,441 | | | SPDR Blackstone Senior Loan ETF | | | 44,597,684 | |
| | 920,358 | | | SPDR Bloomberg Barclays Convertible Securities ETF | | | 79,822,649 | |
| | 803,376 | | | VanEck Vectors Fallen Angel High Yield Bond ETF(b) | | | 26,431,070 | |
| | 92,700 | | | Vanguard Real Estate ETF | | | 9,435,933 | |
| | |
| | TOTAL EXCHANGE TRADED FUNDS | | | | |
| | (Cost $654,285,899) | | $ | 745,874,608 | |
| | |
| | |
| The accompanying notes are an integral part of these financial statements. | | 17 |
GOLDMAN SACHS ABSOLUTE RETURN TRACKER FUND
Consolidated Schedule of Investments (continued)
June 30, 2021 (Unaudited)
| | | | | | | | |
| Shares | | | Dividend
Rate | | Value | |
|
| Investment Company(d) – 43.9% | |
| Goldman Sachs Financial Square Government Fund –
Institutional Shares |
|
| | 1,585,357,468 | | | 0.026% | | $ | 1,585,357,468 | |
| | (Cost $1,585,357,468) | | | | |
| | |
| TOTAL INVESTMENTS BEFORE SECURITIES-LENDING
REINVESTMENT VEHICLE |
|
| | (Cost $3,134,289,616) | | $ | 3,401,869,630 | |
| | |
| | | | | | | | |
|
| Securities Lending Reinvestment Vehicle(d) – 2.2% | |
| Goldman Sachs Financial Square Government Fund –
Institutional Shares |
|
| | 77,778,706 | | | 0.026% | | $ | 77,778,706 | |
| | (Cost $77,778,706) | | | | |
| | |
| | TOTAL INVESTMENTS – 96.4% | | | | |
| | (Cost $3,212,068,322) | | $ | 3,479,648,336 | |
| | |
| OTHER ASSETS IN EXCESS OF
LIABILITIES – 3.6% | | | 128,780,709 | |
| | |
| | NET ASSETS – 100.0% | | $ | 3,608,429,045 | |
| | |
| | |
|
| The percentage shown for each investment category reflects the value of investments in that category as a percentage of net assets. |
| |
* | | Security is currently in default and/or non-income producing. |
| |
(a) | | Preference Shares are a special type of equity investment that shares in the earnings of the company, has limited voting rights, and receives a greater dividend than applicable Common Shares. |
| | |
| |
(b) | | All or a portion of security is on loan. |
| |
(c) | | Significant unobservable inputs were used in the valuation of this portfolio security; i.e., Level 3. |
| |
(d) | | Represents an Affiliated Issuer. |
| | |
|
Investment Abbreviations: |
CVA | | —Dutch Certification |
EURIBOR | | —Euro Interbank Offered Rate |
REIT | | —Real Estate Investment Trust |
SPDR | | —Standard and Poor’s Depositary Receipts |
| | |
Currency Abbreviations: |
AUD | | —Australian Dollar |
BRL | | —Brazilian Real |
CAD | | —Canadian Dollar |
CHF | | —Swiss Franc |
CZK | | —Czech Koruna |
EUR | | —Euro |
GBP | | —British Pound |
HUF | | —Hungarian Forint |
IDR | | —Indonesian Rupiah |
ILS | | —Israel New Shekel |
INR | | —Indian Rupee |
JPY | | —Japanese Yen |
KRW | | —South Korean Won |
MXN | | —Mexican Peso |
NOK | | —Norwegian Krone |
NZD | | —New Zealand Dollar |
PHP | | —Philippines Peso |
PLN | | —Polish Zloty |
RUB | | —Russian Ruble |
SEK | | —Swedish Krona |
TWD | | —Taiwan Dollar |
USD | | —United States Dollar |
ZAR | | —South African Rand |
|
|
| ADDITIONAL INVESTMENT INFORMATION |
FORWARD FOREIGN CURRENCY EXCHANGE CONTRACTS — At June 30, 2021, the Fund had the following forward foreign currency exchange contracts:
FORWARD FOREIGN CURRENCY EXCHANGE CONTRACTS WITH UNREALIZED GAIN
| | | | | | | | | | | | | | | | | | | | |
| Counterparty | | Currency
Purchased | | | Currency
Sold | | | Settlement
Date | | | Unrealized
Gain | |
JPMorgan Chase Bank NA | | BRL | | | 20,890,000 | | | USD | | | 4,133,862 | | | | 07/29/2021 | | | $ | 53,802 | |
| | HUF | | | 1,911,600,000 | | | USD | | | 6,435,035 | | | | 07/23/2021 | | | | 13,812 | |
| | ILS | | | 34,060,000 | | | USD | | | 10,435,685 | | | | 07/23/2021 | | | | 13,455 | |
| | KRW | | | 4,797,420,000 | | | USD | | | 4,227,994 | | | | 07/29/2021 | | | | 17,181 | |
| | MXN | | | 99,800,000 | | | USD | | | 4,814,916 | | | | 07/23/2021 | | | | 178,351 | |
| | RUB | | | 560,440,000 | | | USD | | | 7,608,139 | | | | 07/29/2021 | | | | 19,701 | |
| | USD | | | 18,104,424 | | | CHF | | | 16,740,000 | | | | 07/23/2021 | | | | 1,585 | |
| | USD | | | 51,457,963 | | | EUR | | | 43,170,000 | | | | 07/23/2021 | | | | 246,124 | |
| | USD | | | 6,860,982 | | | GBP | | | 4,930,000 | | | | 07/23/2021 | | | | 40,865 | |
| | | USD | | | 58,710,433 | | | JPY | | | 6,468,340,000 | | | | 07/27/2021 | | | | 474,662 | |
| | | |
| TOTAL | | | | | | | | | | $ | 1,059,538 | |
| | |
| 18 | | The accompanying notes are an integral part of these financial statements. |
GOLDMAN SACHS ABSOLUTE RETURN TRACKER FUND
|
| ADDITIONAL INVESTMENT INFORMATION (continued) |
FORWARD FOREIGN CURRENCY EXCHANGE CONTRACTS WITH UNREALIZED LOSS
| | | | | | | | | | | | | | | | | | | | |
| Counterparty | | Currency
Purchased | | | Currency
Sold | | | Settlement
Date | | | Unrealized
Loss | |
JPMorgan Chase Bank NA | | AUD | | | 8,180,000 | | | USD | | | 6,162,504 | | | | 07/23/2021 | | | $ | (27,220 | ) |
| | CAD | | | 25,540,000 | | | USD | | | 20,653,722 | | | | 07/23/2021 | | | | (50,569 | ) |
| | CHF | | | 9,670,000 | | | USD | | | 10,538,005 | | | | 07/23/2021 | | | | (80,750 | ) |
| | CZK | | | 181,020,000 | | | USD | | | 8,449,671 | | | | 07/23/2021 | | | | (33,692 | ) |
| | IDR | | | 168,604,600,000 | | | USD | | | 11,606,227 | | | | 07/29/2021 | | | | (64,399 | ) |
| | INR | | | 1,223,510,000 | | | USD | | | 16,426,922 | | | | 07/29/2021 | | | | (25,679 | ) |
| | NOK | | | 33,020,000 | | | USD | | | 3,849,327 | | | | 07/23/2021 | | | | (13,897 | ) |
| | NZD | | | 5,140,000 | | | USD | | | 3,593,310 | | | | 07/23/2021 | | | | (606 | ) |
| | PHP | | | 724,230,000 | | | USD | | | 14,805,888 | | | | 07/29/2021 | | | | (8,227 | ) |
| | PLN | | | 16,140,000 | | | USD | | | 4,245,750 | | | | 07/23/2021 | | | | (12,385 | ) |
| | SEK | | | 52,070,000 | | | USD | | | 6,103,607 | | | | 07/23/2021 | | | | (18,088 | ) |
| | TWD | | | 314,130,000 | | | USD | | | 11,306,961 | | | | 07/29/2021 | | | | (34,730 | ) |
| | | ZAR | | | 84,850,000 | | | USD | | | 5,930,017 | | | | 07/23/2021 | | | | (4,008 | ) |
| | | | | |
| TOTAL | | | | | | | | | | | | | | | | $ | (374,250 | ) |
FUTURES CONTRACTS — At June 30, 2021, the Fund had the following futures contracts:
| | | | | | | | | | | | | | | | |
| Description | | Number of
Contracts | | | Expiration Date | | | Notional
Amount | | | Unrealized
Appreciation/
(Depreciation) | |
Long position contracts: | | | | | | | | | | | | | | | | |
3 Month Canadian Bankers Acceptance | | | 50 | | | | 09/13/2021 | | | $ | 10,038,016 | | | $ | 1,978 | |
3 Month Canadian Bankers Acceptance | | | 50 | | | | 12/13/2021 | | | | 10,032,470 | | | | (798 | ) |
3 Month Canadian Bankers Acceptance | | | 4 | | | | 03/14/2022 | | | | 801,670 | | | | (817 | ) |
3 Month Eurodollar | | | 4 | | | | 06/13/2022 | | | | 997,300 | | | | (59 | ) |
Amsterdam Exchange Index | | | 53 | | | | 07/16/2021 | | | | 9,166,912 | | | | (11,542 | ) |
Australia 10 Year Bond | | | 76 | | | | 09/15/2021 | | | | 8,050,465 | | | | 385 | |
Brent Crude Oil | | | 153 | | | | 07/30/2021 | | | | 11,415,330 | | | | 403,302 | |
Brent Crude Oil | | | 31 | | | | 10/29/2021 | | | | 2,242,850 | | | | 61,628 | |
CAC 40 10 Euro Index | | | 145 | | | | 07/16/2021 | | | | 11,184,290 | | | | (232,192 | ) |
Canada 10 Year Bond | | | 69 | | | | 09/21/2021 | | | | 8,097,870 | | | | 4,603 | |
Cocoa | | | 87 | | | | 12/15/2021 | | | | 2,113,230 | | | | (20,284 | ) |
Coffee “C” | | | 16 | | | | 09/20/2021 | | | | 958,500 | | | | 850 | |
Coffee “C” | | | 35 | | | | 12/20/2021 | | | | 2,134,781 | | | | 1,202 | |
Copper | | | 33 | | | | 09/28/2021 | | | | 3,537,600 | | | | (226,342 | ) |
Copper | | | 19 | | | | 12/29/2021 | | | | 2,034,662 | | | | (126,827 | ) |
Corn | | | 1 | | | | 09/14/2021 | | | | 29,962 | | | | (1,528 | ) |
Corn | | | 71 | | | | 12/14/2021 | | | | 2,089,175 | | | | (75,661 | ) |
Cotton No. 2 | | | 42 | | | | 12/08/2021 | | | | 1,782,900 | | | | (63,552 | ) |
DAX Index | | | 49 | | | | 09/17/2021 | | | | 22,555,099 | | | | (229,144 | ) |
EURO STOXX 50 Index | | | 3,440 | | | | 09/17/2021 | | | | 165,423,034 | | | | (3,256,921 | ) |
Euro-BTP | | | 139 | | | | 09/08/2021 | | | | 24,955,283 | | | | 154,317 | |
FTSE 100 Index | | | 650 | | | | 09/17/2021 | | | | 62,764,817 | | | | (999,662 | ) |
FTSE/JSE Top 40 Index | | | 108 | | | | 09/16/2021 | | | | 4,528,437 | | | | (116,230 | ) |
FTSE/MIB Index | | | 65 | | | | 09/17/2021 | | | | 9,635,760 | | | | (228,748 | ) |
Hang Seng Index | | | 71 | | | | 07/29/2021 | | | | 13,090,234 | | | | (214,713 | ) |
HSCEI | | | 62 | | | | 07/29/2021 | | | | 4,220,612 | | | | (14,395 | ) |
IBEX 35 Index | | | 69 | | | | 07/16/2021 | | | | 7,190,301 | | | | (278,346 | ) |
Japan 10 Year Bond | | | 14 | | | | 09/13/2021 | | | | 19,122,013 | | | | 7,379 | |
KC HRW Wheat | | | 66 | | | | 12/14/2021 | | | | 2,201,925 | | | | 41,863 | |
| | |
| The accompanying notes are an integral part of these financial statements. | | 19 |
GOLDMAN SACHS ABSOLUTE RETURN TRACKER FUND
Consolidated Schedule of Investments (continued)
June 30, 2021 (Unaudited)
|
| ADDITIONAL INVESTMENT INFORMATION (continued) |
FUTURES CONTRACTS (continued)
| | | | | | | | | | | | | | | | |
| Description | | Number of
Contracts | | | Expiration Date | | | Notional
Amount | | | Unrealized
Appreciation/
(Depreciation) | |
Long position contracts: (continued) | | | | | |
KOSPI 200 Index | | | 103 | | | | 09/09/2021 | | | $ | 10,034,531 | | | $ | 138,072 | |
Lean Hogs | | | 60 | | | | 12/14/2021 | | | | 1,927,800 | | | | (202,989 | ) |
Live Cattle | | | 41 | | | | 12/31/2021 | | | | 2,165,210 | | | | 23,651 | |
LME Aluminum Base Metal | | | 165 | | | | 07/21/2021 | | | | 10,392,938 | | | | (75,171 | ) |
LME Aluminum Base Metal | | | 159 | | | | 08/18/2021 | | | | 10,026,938 | | | | 201,330 | |
LME Aluminum Base Metal | | | 35 | | | | 11/17/2021 | | | | 2,203,250 | | | | 43,030 | |
LME Lead Base Metal | | | 131 | | | | 07/21/2021 | | | | 7,414,600 | | | | 89,168 | |
LME Lead Base Metal | | | 165 | | | | 08/18/2021 | | | | 9,359,625 | | | | 222,163 | |
LME Nickel Base Metal | | | 46 | | | | 07/21/2021 | | | | 5,024,856 | | | | 34,202 | |
LME Nickel Base Metal | | | 76 | | | | 08/18/2021 | | | | 8,302,848 | | | | 17,433 | |
LME Zinc Base Metal | | | 106 | | | | 07/21/2021 | | | | 7,871,162 | | | | (117,914 | ) |
LME Zinc Base Metal | | | 85 | | | | 08/18/2021 | | | | 6,318,156 | | | | (87,918 | ) |
LME Zinc Base Metal | | | 28 | | | | 11/17/2021 | | | | 2,084,250 | | | | (53,461 | ) |
Low Sulphur Gasoil | | | 116 | | | | 08/12/2021 | | | | 6,965,800 | | | | 167,467 | |
Low Sulphur Gasoil | | | 37 | | | | 11/11/2021 | | | | 2,222,775 | | | | 38,776 | |
NASDAQ 100 E-Mini Index | | | 65 | | | | 09/17/2021 | | | | 18,913,700 | | | | 536,452 | |
Natural Gas | | | 21 | | | | 07/28/2021 | | | | 786,030 | | | | 19,472 | |
Natural Gas | | | 67 | | | | 10/27/2021 | | | | 2,508,480 | | | | 251,065 | |
NY Harbor ULSD | | | 71 | | | | 07/30/2021 | | | | 6,345,994 | | | | (28,930 | ) |
NY Harbor ULSD | | | 24 | | | | 10/29/2021 | | | | 2,147,645 | | | | 2,294 | |
OMXS30 Index | | | 260 | | | | 07/16/2021 | | | | 6,884,238 | | | | (45,094 | ) |
RBOB Gasoline | | | 70 | | | | 07/30/2021 | | | | 6,585,306 | | | | 71,358 | |
RBOB Gasoline | | | 25 | | | | 10/29/2021 | | | | 2,159,010 | | | | 39,411 | |
Russell 2000 E-Mini Index | | | 153 | | | | 09/17/2021 | | | | 17,654,670 | | | | (173,858 | ) |
S&P Midcap 400 E-Mini Index | | | 22 | | | | 09/17/2021 | | | | 5,923,280 | | | | (115,880 | ) |
S&P/TSX 60 Index | | | 61 | | | | 09/16/2021 | | | | 11,836,834 | | | | (15,773 | ) |
SET50 Index | | | 837 | | | | 09/29/2021 | | | | 4,948,877 | | | | (20,313 | ) |
Silver | | | 31 | | | | 09/28/2021 | | | | 4,068,750 | | | | (234,446 | ) |
Soybean | | | 48 | | | | 11/12/2021 | | | | 3,343,800 | | | | (153,151 | ) |
Sugar No. 11 | | | 56 | | | | 09/30/2021 | | | | 1,122,061 | | | | 13,622 | |
Sugar No. 11 | | | 108 | | | | 02/28/2022 | | | | 2,186,957 | | | | 22,642 | |
TOPIX Index | | | 223 | | | | 09/09/2021 | | | | 39,001,665 | | | | (400,129 | ) |
U.S. Treasury 2 Year Note | | | 35 | | | | 09/30/2021 | | | | 7,711,484 | | | | (13,184 | ) |
U.S. Treasury 5 Year Note | | | 19 | | | | 09/30/2021 | | | | 2,344,273 | | | | (7,632 | ) |
U.S. Treasury 10 Year Note | | | 146 | | | | 09/21/2021 | | | | 19,333,594 | | | | 49,542 | |
U.S. Treasury Long Bond | | | 105 | | | | 09/21/2021 | | | | 16,852,500 | | | | 141,934 | |
Wheat | | | 62 | | | | 12/14/2021 | | | | 2,125,050 | | | | (24,220 | ) |
WTI Crude Oil | | | 227 | | | | 07/20/2021 | | | | 16,689,040 | | | | 754,314 | |
WTI Crude Oil | | | 32 | | | | 10/20/2021 | | | | 2,267,840 | | | | 76,391 | |
| | | | |
| Total | | | | | | | | | | | | | | $ | (4,236,528 | ) |
| |
Short position contracts: | | | | | |
100 oz Gold | | | (45 | ) | | | 08/27/2021 | | | $ | (7,967,700 | ) | | $ | 4,316 | |
3 Month Euro Euribor | | | (35 | ) | | | 12/13/2021 | | | | (10,430,302 | ) | | | (1,065 | ) |
3 Month Euro Euribor | | | (145 | ) | | | 03/14/2022 | | | | (43,200,504 | ) | | | (1,475 | ) |
3 Month Euro Euribor | | | (131 | ) | | | 06/13/2022 | | | | (39,023,596 | ) | | | (2,779 | ) |
3 Month Euro Euribor | | | (137 | ) | | | 09/19/2022 | | | | (40,802,814 | ) | | | (3,694 | ) |
3 Month Euro Euribor | | | (150 | ) | | | 12/19/2022 | | | | (44,663,497 | ) | | | (3,629 | ) |
3 Month Euro Euribor | | | (133 | ) | | | 03/13/2023 | | | | (39,585,864 | ) | | | (3,572 | ) |
3 Month Euro Euribor | | | (164 | ) | | | 06/19/2023 | | | | (48,795,628 | ) | | | (963 | ) |
| | |
| 20 | | The accompanying notes are an integral part of these financial statements. |
GOLDMAN SACHS ABSOLUTE RETURN TRACKER FUND
|
| ADDITIONAL INVESTMENT INFORMATION (continued) |
FUTURES CONTRACTS (continued)
| | | | | | | | | | | | | | | | |
| Description | | Number of
Contracts | | | Expiration Date | | | Notional
Amount | | | Unrealized
Appreciation/
(Depreciation) | |
Short position contracts: (continued) | | | | | |
3 Month Eurodollar | | | (22 | ) | | | 09/19/2022 | | | $ | (5,479,925 | ) | | $ | (492 | ) |
3 Month Eurodollar | | | (195 | ) | | | 12/19/2022 | | | | (48,496,500 | ) | | | (8,370 | ) |
3 Month Eurodollar | | | (256 | ) | | | 03/13/2023 | | | | (63,590,400 | ) | | | (3,317 | ) |
3 Month Eurodollar | | | (307 | ) | | | 06/19/2023 | | | | (76,151,350 | ) | | | 2,197 | |
3 Month Euroswiss | | | (31 | ) | | | 09/13/2021 | | | | (8,438,935 | ) | | | (767 | ) |
3 Month Euroswiss | | | (86 | ) | | | 12/13/2021 | | | | (23,408,917 | ) | | | (2,854 | ) |
3 Month Euroswiss | | | (70 | ) | | | 03/14/2022 | | | | (19,048,095 | ) | | | (1,956 | ) |
3 Month Sterling | | | (82 | ) | | | 09/15/2021 | | | | (14,165,355 | ) | | | (543 | ) |
3 Month Sterling | | | (69 | ) | | | 12/15/2021 | | | | (11,916,049 | ) | | | (1,480 | ) |
3 Month Sterling | | | (289 | ) | | | 03/16/2022 | | | | (49,851,781 | ) | | | 4,006 | |
3 Month Sterling | | | (348 | ) | | | 06/15/2022 | | | | (59,987,012 | ) | | | 5,879 | |
3 Month Sterling | | | (440 | ) | | | 09/21/2022 | | | | (75,792,391 | ) | | | 19,234 | |
3 Month Sterling | | | (464 | ) | | | 12/21/2022 | | | | (79,870,359 | ) | | | 23,612 | |
3 Month Sterling | | | (455 | ) | | | 03/15/2023 | | | | (78,277,878 | ) | | | 25,878 | |
3 Month Sterling | | | (424 | ) | | | 06/21/2023 | | | | (72,900,671 | ) | | | (10,087 | ) |
CBOE Volatility Index | | | (74 | ) | | | 07/21/2021 | | | | (1,324,844 | ) | | | 345,266 | |
CBOE Volatility Index | | | (72 | ) | | | 08/18/2021 | | | | (1,421,906 | ) | | | 257,959 | |
Cocoa | | | (89 | ) | | | 09/15/2021 | | | | (2,126,210 | ) | | | 11,250 | |
Euro-Bobl | | | (165 | ) | | | 09/08/2021 | | | | (26,240,410 | ) | | | (24,971 | ) |
Euro-Bund | | | (58 | ) | | | 09/08/2021 | | | | (11,866,180 | ) | | | (19,063 | ) |
Euro-Buxl | | | (7 | ) | | | 09/08/2021 | | | | (1,684,619 | ) | | | (30,139 | ) |
Euro-OAT | | | (31 | ) | | | 09/08/2021 | | | | (5,843,091 | ) | | | (16,175 | ) |
Euro-Schatz | | | (467 | ) | | | 09/08/2021 | | | | (62,102,530 | ) | | | (1,714 | ) |
Feeder Cattle | | | (6 | ) | | | 08/26/2021 | | | | (463,950 | ) | | | (17,269 | ) |
KC HRW Wheat | | | (67 | ) | | | 09/14/2021 | | | | (2,209,325 | ) | | | (46,303 | ) |
Lean Hogs | | | (15 | ) | | | 08/13/2021 | | | | (621,600 | ) | | | (4,397 | ) |
Live Cattle | | | (42 | ) | | | 08/31/2021 | | | | (2,065,140 | ) | | | (58,252 | ) |
LME Aluminum Base Metal | | | (165 | ) | | | 07/21/2021 | | | | (10,392,938 | ) | | | (258,696 | ) |
LME Aluminum Base Metal | | | (39 | ) | | | 08/18/2021 | | | | (2,459,438 | ) | | | (105,688 | ) |
LME Lead Base Metal | | | (131 | ) | | | 07/21/2021 | | | | (7,414,600 | ) | | | (257,949 | ) |
LME Lead Base Metal | | | (31 | ) | | | 08/18/2021 | | | | (1,758,475 | ) | | | (70,898 | ) |
LME Nickel Base Metal | | | (46 | ) | | | 07/21/2021 | | | | (5,024,856 | ) | | | (26,155 | ) |
LME Nickel Base Metal | | | (18 | ) | | | 08/18/2021 | | | | (1,966,464 | ) | | | (84,232 | ) |
LME Zinc Base Metal | | | (106 | ) | | | 07/21/2021 | | | | (7,871,162 | ) | | | 89,774 | |
LME Zinc Base Metal | | | (61 | ) | | | 08/18/2021 | | | | (4,534,206 | ) | | | (176,908 | ) |
Long Gilt | | | (18 | ) | | | 09/28/2021 | | | | (3,189,613 | ) | | | (14,949 | ) |
S&P 500 E-Mini Index | | | (583 | ) | | | 09/17/2021 | | | | (125,012,690 | ) | | | (1,287,553 | ) |
Wheat | | | (29 | ) | | | 09/14/2021 | | | | (986,362 | ) | | | (40,379 | ) |
| | | | |
| Total | | | | | | | | | | | | | | $ | (1,799,362 | ) |
| | | | |
| Total Futures Contracts | | | | | | | | | | | | | | $ | (6,035,890 | ) |
| | |
| The accompanying notes are an integral part of these financial statements. | | 21 |
GOLDMAN SACHS ABSOLUTE RETURN TRACKER FUND
Consolidated Schedule of Investments (continued)
June 30, 2021 (Unaudited)
|
| ADDITIONAL INVESTMENT INFORMATION (continued) |
SWAP CONTRACTS — At June 30, 2021, the Fund had the following swap contracts:
CENTRALLY CLEARED CREDIT DEFAULT SWAP CONTRACTS
| | | | | | | | | | | | | | | | | | | | | | | | | | | | |
| Reference Obligation/Index(a) | | Financing Rate
Received (Paid)
by the Fund | | | Credit
Spread at
June 30,
2021(b) | | | Termination
Date | | | Notional
Amount
(000’s) | | | Value | | | Upfront
Premium (Received)
Paid | | | Unrealized
Appreciation/
(Depreciation) | |
Protection Sold: | | | | |
iTraxx Europe Crossover Index | | | 5.000% | | | | 2.320% | | | | 06/20/2026 | | | EUR | 52,900 | | | $ | 7,885,828 | | | $ | 6,486,892 | | | $ | 1,398,936 | |
iTraxx Europe Index | | | 1.000 | | | | 0.468 | | | | 06/20/2026 | | | | 199,650 | | | | 6,378,416 | | | | 5,949,024 | | | | 429,392 | |
Markit CDX North America High Yield Index | | | 5.000 | | | | 2.745 | | | | 06/20/2026 | | | USD | 90,350 | | | | 9,341,186 | | | | 7,314,757 | | | | 2,026,429 | |
Markit CDX North America Investment Grade Index | | | 1.000 | | | | 0.479 | | | | 06/20/2026 | | | | 243,000 | | | | 6,251,121 | | | | 5,797,075 | | | | 454,046 | |
| | | | | | | |
| TOTAL | | | | | | | | | | | | | | | | | | $ | 29,856,551 | | | $ | 25,547,748 | | | $ | 4,308,803 | |
| | (a) | | Payments received quarterly. |
| | (b) | | Credit spread on the referenced obligation, together with the period of expiration, are indicators of payment/performance risk. The likelihood of a credit event occurring which would require a fund or its counterparty to make a payment or otherwise be required to perform under the swap contract is generally greater as the credit spread and term of the swap contract increase. |
OVER THE COUNTER TOTAL RETURN SWAP CONTRACTS
| | | | | | | | | | | | | | | | | | | | | | |
| Referenced Obligation/Index | | Financing Rate
Received (Paid)
by the Fund | | | Counterparty | | Termination
Date | | | Notional
Amount
(000’s) | | | Unrealized
Appreciation/
(Depreciation)(a) | |
MSCI The World Net Return Index(b) | | | 0.075 | % | | Bank of America NA | | | 11/11/2021 | | | | USD | | | | 45,183 | | | $ | (20,757 | ) |
Bloomberg Roll Select Commodity Index Total Return(c) | | | (0.000 | ) | | JPMorgan Chase Bank NA | | | 02/28/2022 | | | | | | | | 10,059 | | | | 143,734 | |
A basket (JPGSMARB) of common stocks(d)* | | | (0.075 | ) | | | | | 08/10/2021 | | | | | | | | 34,072 | | | | 187,143 | |
Cushing 30 MLP Total Return Index(d) | | | (0.075 | ) | | | | | 11/09/2021 | | | | | | | | 7,659 | | | | 436,585 | |
Euro Stoxx Gross Total Return Index(b) | | | 0.550 | | | | | | 09/16/2021 | | | | EUR | | | | 48,955 | | | | 758,128 | |
FTSE 100 Total Return Index(b) | | | 0.054 | | | | | | 09/15/2021 | | | | GBP | | | | 12,342 | | | | 306,282 | |
J.P. Morgan Bespoke Global Healthcare Sector Index(d) | | | (0.075 | ) | | | | | 08/24/2021 | | | | USD | | | | 47,544 | | | | 1,500,375 | |
J.P. Morgan Bespoke Global Materials Sector Index(d) | | | (0.075 | ) | | | | | 08/24/2021 | | | | | | | | 25,123 | | | | (1,320,638 | ) |
J.P. Morgan Bespoke Global Technology Sector Index(d) | | | (0.075 | ) | | | | | 08/24/2021 | | | | | | | | 38,812 | | | | 3,762,721 | |
MSCI The World Growth Net Return Index(d) | | | (0.075 | ) | | | | | 08/11/2021 | | | | | | | | 47,982 | | | | 3,418,063 | |
MSCI The World Growth Net Return Index(d) | | | (0.075 | ) | | | | | 08/25/2021 | | | | | | | | 48,557 | | | | 3,461,253 | |
MSCI The World Net Return Index(b) | | | 0.075 | | | | | | 08/25/2021 | | | | | | | | 232,143 | | | | (6,803,907 | ) |
| | | | | | |
| TOTAL | | | | | | | | | | | | | | | | | | | | $ | 5,828,982 | |
| | (a) | | There are no upfront payments on the swap contracts listed above; therefore the unrealized gains (losses) on the swap contracts are equal to their value. |
| | (b) | | Payments received monthly. |
| | (c) | | Payments made weekly. |
| | (d) | | Payments made monthly. |
| | * | | The components of the basket shown below. |
| | |
| 22 | | The accompanying notes are an integral part of these financial statements. |
GOLDMAN SACHS ABSOLUTE RETURN TRACKER FUND
|
| ADDITIONAL INVESTMENT INFORMATION (continued) |
A basket (JPGSMARB) of common stocks
| | | | | | | | | | | | | | |
| Common Stocks | | Sector | | Shares | | | Value | | | Weight | |
Domtar Corp | | Materials | | | 30,564 | | | $ | 1,679,781 | | | | 4.93 | % |
Coherent Inc | | Information Technology | | | 6,282 | | | | 1,660,597 | | | | 4.87 | |
Cloudera Inc | | Information Technology | | | 104,693 | | | | 1,660,428 | | | | 4.87 | |
Sportsman’s Warehouse Holdings Inc | | Consumer Discretionary | | | 93,159 | | | | 1,655,433 | | | | 4.86 | |
Raven Industries Inc | | Industrials | | | 28,602 | | | | 1,654,632 | | | | 4.86 | |
Aerojet Rocketdyne Holdings Inc | | Industrials | | | 34,238 | | | | 1,653,363 | | | | 4.85 | |
Proofpoint Inc | | Information Technology | | | 9,509 | | | | 1,652,335 | | | | 4.85 | |
W R Grace & Co | | Materials | | | 23,894 | | | | 1,651,540 | | | | 4.85 | |
Shaw Communications Inc | | Communication Services | | | 45,920 | | | | 1,648,998 | | | | 4.84 | |
Constellation Pharmaceuticals Inc | | Health Care | | | 48,784 | | | | 1,648,912 | | | | 4.84 | |
Magellan Health Inc | | Health Care | | | 17,490 | | | | 1,647,513 | | | | 4.84 | |
Kansas City Southern | | Industrials | | | 5,814 | | | | 1,647,401 | | | | 4.84 | |
Change Healthcare Inc | | Health Care | | | 71,474 | | | | 1,646,768 | | | | 4.83 | |
Nuance Communications Inc | | Information Technology | | | 30,211 | | | | 1,644,682 | | | | 4.83 | |
Suez SA | | Utilities | | | 82,016 | | | | 1,644,430 | | | | 4.83 | |
PPD Inc | | Health Care | | | 35,621 | | | | 1,641,788 | | | | 4.82 | |
Slack Technologies Inc | | Information Technology | | | 36,996 | | | | 1,638,923 | | | | 4.81 | |
Magnachip Semiconductor Corp | | Information Technology | | | 68,647 | | | | 1,637,929 | | | | 4.81 | |
PRA Health Sciences Inc | | Health Care | | | 9,844 | | | | 1,626,369 | | | | 4.77 | |
Dialog Semiconductor PLC | | Information Technology | | | 22,522 | | | | 1,476,511 | | | | 4.33 | |
Forterra Inc | | Materials | | | 53,323 | | | | 1,253,625 | | | | 3.68 | |
PURCHASED OPTIONS CONTRACTS & WRITTEN OPTIONS CONTRACTS — At June 30, 2021, the Fund had the following purchased & written options contracts:
EXCHANGE TRADED INDEX OPTIONS
| | | | | | | | | | | | | | | | | | | | | | | | | | | | | | |
| Description | | | | Exercise
Price | | | Expiration
Date | | | Number of
Contracts | | | Notional
Amount | | | Value | | | Premiums
Paid (Received)
by the Fund | | | Unrealized
Appreciation/
Depreciation | |
Purchased options contracts: | | | | | | | | | |
Calls | | | | | | | | | |
CBOE Volatility Index | | | | | 26 USD | | | | 07/21/2021 | | | | 740 | | | $ | 1,171,420 | | | $ | 46,250 | | | $ | 221,855 | | | $ | (175,605 | ) |
| | | | | | 27 USD | | | | 08/18/2021 | | | | 720 | | | | 1,139,760 | | | | 111,600 | | | | 244,990 | | | | (133,390 | ) |
| | | | | |
| Total calls | | | | 1,460 | | | | | | | $ | 157,850 | | | $ | 466,845 | | | $ | (308,995 | ) |
Puts | | | | | | | | | |
S&P 500 Index | | | 3,430 USD | | | | 07/30/2021 | | | | 2 | | | $ | 859,500 | | | $ | 505 | | | $ | 1,852 | | | $ | (1,347 | ) |
| | | | | 3,525 USD | | | | 07/30/2021 | | | | 6 | | | | 2,578,500 | | | | 1,890 | | | | 6,137 | | | | (4,247 | ) |
| | | | | 3,600 USD | | | | 07/30/2021 | | | | 10 | | | | 4,297,500 | | | | 3,750 | | | | 8,608 | | | | (4,858 | ) |
| | | | | 3,665 USD | | | | 07/30/2021 | | | | 15 | | | | 6,446,250 | | | | 6,600 | | | | 11,711 | | | | (5,111 | ) |
| | | | | | 3,790 USD | | | | 07/30/2021 | | | | 20 | | | | 8,595,000 | | | | 12,500 | | | | 13,015 | | | | (515 | ) |
| | | | | |
| Total puts | | | | 53 | | | | | | | $ | 25,245 | | | $ | 41,323 | | | $ | (16,078 | ) |
| | | | | |
| Total purchased options contracts | | | | 1,513 | | | | | | | $ | 183,095 | | | $ | 508,168 | | | $ | (325,073 | ) |
Written options contracts: | | | | | | | | | |
Puts | | | | | | | | | |
S&P 500 Index | | | | | 4,150 USD | | | | 07/30/2021 | | | | 2 | | | $ | (859,500 | ) | | $ | (4,970 | ) | | $ | (14,129 | ) | | $ | 9,159 | |
| | | | | 4,180 USD | | | | 07/30/2021 | | | | 6 | | | | (2,578,500 | ) | | | (17,100 | ) | | | (43,268 | ) | | | 26,168 | |
| | | | | 4,205 USD | | | | 07/30/2021 | | | | 10 | | | | (4,297,500 | ) | | | (32,200 | ) | | | (62,850 | ) | | | 30,650 | |
| | | | | 4,210 USD | | | | 07/30/2021 | | | | 15 | | | | (6,446,250 | ) | | | (49,500 | ) | | | (86,144 | ) | | | 36,644 | |
| | | | | | 4,265 USD | | | | 07/30/2021 | | | | 20 | | | | (8,595,000 | ) | | | (76,900 | ) | | | (94,209 | ) | | | 17,309 | |
| | | | | |
| Total written options contracts | | | | 53 | | | | | | | $ | (180,670 | ) | | $ | (300,600 | ) | | $ | 119,930 | |
| | |
| The accompanying notes are an integral part of these financial statements. | | 23 |
GOLDMAN SACHS ALTERNATIVE PREMIA FUND
Consolidated Schedule of Investments
June 30, 2021 (Unaudited)
| | | | | | | | | | |
Shares | | | Dividend
Rate | | | Value | |
|
| Investment Company(a) – 61.4% | |
| Goldman Sachs Financial Square Government Fund –
Institutional Shares |
|
| | 21,202,425 | | | | 0.026 | % | | $ | 21,202,425 | |
| | |
| | TOTAL INVESTMENTS – 61.4% | |
| | (Cost $21,202,425) | | | $ | 21,202,425 | |
| | |
| OTHER ASSETS IN EXCESS OF
LIABILITIES – 38.6% |
| | | 13,341,029 | |
| | |
| | NET ASSETS – 100.0% | | | $ | 34,543,454 | |
| | |
| | |
|
| The percentage shown for each investment category reflects the value of investments in that category as a percentage of net assets. |
| |
(a) | | Represents an Affiliated Issuer. |
| | |
|
Investment Abbreviations: |
EURIBOR | | —Euro Interbank Offered Rate |
U.S. | | —United States |
| | |
Currency Abbreviations: |
AUD | | — Australian Dollar |
BRL | | — Brazilian Real |
CAD | | — Canadian Dollar |
CHF | | — Swiss Franc |
CLP | | — Chilean Peso |
COP | | — Colombian Peso |
CZK | | — Czech Koruna |
EUR | | — Euro |
GBP | | — British Pound |
HUF | | — Hungarian Forint |
IDR | | — Indonesian Rupiah |
ILS | | — Israel New Shekel |
INR | | — Indian Rupee |
JPY | | — Japanese Yen |
KRW | | — South Korean Won |
MXN | | — Mexican Peso |
NOK | | — Norwegian Krone |
NZD | | — New Zealand Dollar |
PEN | | — Peru Nuevo Sol |
PHP | | — Philippines Peso |
PLN | | — Polish Zloty |
RUB | | — Russian Ruble |
SEK | | — Swedish Krona |
THB | | — Thailand Baht |
TWD | | — Taiwan Dollar |
USD | | — United States Dollar |
ZAR | | — South African Rand |
|
|
| ADDITIONAL INVESTMENT INFORMATION |
FORWARD FOREIGN CURRENCY EXCHANGE CONTRACTS — At June 30, 2021, the Fund had the following forward foreign currency exchange contracts:
FORWARD FOREIGN CURRENCY EXCHANGE CONTRACTS WITH UNREALIZED GAIN
| | | | | | | | | | | | | | | | | | | | | | | | |
| Counterparty | | Currency
Purchased | | | Currency
Sold | | | Settlement
Date | | | Unrealized
Gain | |
Morgan Stanley Co., Inc. | | | BRL | | | | 4,900,000 | | | | USD | | | | 969,096 | | | | 07/29/2021 | | | $ | 13,170 | |
| | | MXN | | | | 29,080,000 | | | | USD | | | | 1,410,817 | | | | 07/23/2021 | | | | 44,135 | |
| | | RUB | | | | 98,810,000 | | | | USD | | | | 1,341,333 | | | | 07/29/2021 | | | | 3,517 | |
| | | THB | | | | 7,620,000 | | | | USD | | | | 237,388 | | | | 07/23/2021 | | | | 349 | |
| | | USD | | | | 406,738 | | | | IDR | | | | 5,936,750,000 | | | | 07/29/2021 | | | | 338 | |
| | | USD | | | | 669,804 | | | | INR | | | | 49,930,000 | | | | 07/29/2021 | | | | 489 | |
| | | USD | | | | 188,350 | | | | PHP | | | | 9,180,000 | | | | 07/29/2021 | | | | 782 | |
| | | USD | | | | 308,085 | | | | PLN | | | | 1,170,000 | | | | 07/23/2021 | | | | 1,206 | |
| | | USD | | | | 309,385 | | | | RUB | | | | 22,720,000 | | | | 07/29/2021 | | | | 155 | |
| | | | USD | | | | 1,322,482 | | | | THB | | | | 41,870,000 | | | | 07/23/2021 | | | | 16,176 | |
| | | | | | |
| TOTAL | | | | | | | | | | | | | | | | | | | | | | $ | 80,317 | |
| | |
| 24 | | The accompanying notes are an integral part of these financial statements. |
GOLDMAN SACHS ALTERNATIVE PREMIA FUND
|
| ADDITIONAL INVESTMENT INFORMATION (continued) |
FORWARD FOREIGN CURRENCY EXCHANGE CONTRACTS WITH UNREALIZED LOSS
| | | | | | | | | | | | | | | | | | | | | | | | |
| Counterparty | | Currency
Purchased | | | Currency
Sold | | | Settlement
Date | | | Unrealized
Loss | |
Morgan Stanley Co., Inc. | | | CZK | | | | 1,120,000 | | | | USD | | | | 52,302 | | | | 07/23/2021 | | | $ | (231) | |
| | | IDR | | | | 19,721,430,000 | | | | USD | | | | 1,357,524 | | | | 07/29/2021 | | | | (7,494 | ) |
| | | INR | | | | 180,890,000 | | | | USD | | | | 2,428,640 | | | | 07/29/2021 | | | | (3,797 | ) |
| | | NOK | | | | 2,120,000 | | | | USD | | | | 247,260 | | | | 07/23/2021 | | | | (1,012 | ) |
| | | PEN | | | | 2,060,000 | | | | USD | | | | 537,228 | | | | 08/02/2021 | | | | (757 | ) |
| | | PHP | | | | 38,820,000 | | | | USD | | | | 793,639 | | | | 07/29/2021 | | | | (458 | ) |
| | | SEK | | | | 30,960,000 | | | | USD | | | | 3,631,504 | | | | 07/23/2021 | | | | (13,151 | ) |
| | | TWD | | | | 12,840,000 | | | | USD | | | | 461,522 | | | | 07/29/2021 | | | | (772 | ) |
| | | USD | | | | 184,706 | | | | BRL | | | | 930,000 | | | | 07/29/2021 | | | | (1,724 | ) |
| | | USD | | | | 578,498 | | | | CLP | | | | 433,330,000 | | | | 07/29/2021 | | | | (11,156 | ) |
| | | USD | | | | 149,607 | | | | COP | | | | 563,400,000 | | | | 07/29/2021 | | | | (316 | ) |
| | | USD | | | | 283,132 | | | | HUF | | | | 83,950,000 | | | | 07/23/2021 | | | | (76 | ) |
| | | USD | | | | 358,239 | | | | ILS | | | | 1,170,000 | | | | 07/23/2021 | | | | (701 | ) |
| | | USD | | | | 245,346 | | | | KRW | | | | 278,050,000 | | | | 07/29/2021 | | | | (697 | ) |
| | | USD | | | | 325,151 | | | | MXN | | | | 6,500,000 | | | | 07/23/2021 | | | | (62 | ) |
| | | USD | | | | 2,144,337 | | | | PEN | | | | 8,500,000 | | | | 08/02/2021 | | | | (69,255 | ) |
| | | USD | | | | 202,014 | | | | PHP | | | | 9,890,000 | | | | 07/29/2021 | | | | (61 | ) |
| | | USD | | | | 1,140,209 | | | | SEK | | | | 9,760,000 | | | | 07/23/2021 | | | | (461 | ) |
| | | USD | | | | 211,333 | | | | TWD | | | | 5,900,000 | | | | 07/29/2021 | | | | (382 | ) |
| | | USD | | | | 296,727 | | | | ZAR | | | | 4,260,000 | | | | 07/23/2021 | | | | (796 | ) |
| | | | ZAR | | | | 15,060,000 | | | | USD | | | | 1,054,265 | | | | 07/23/2021 | | | | (2,459 | ) |
| | | | | | |
| TOTAL | | | | | | | | | | | | | | | | | | | | | | $ | (115,818 | ) |
FUTURES CONTRACTS — At June 30, 2021, the Fund had the following futures contracts:
| | | | | | | | | | | | | | | | |
| Description | | Number of
Contracts | | | Expiration Date | | | Notional
Amount | | | Unrealized
Appreciation/
(Depreciation) | |
Long position contracts: | | | | | | | | | | | | | | | | |
100 oz Gold | | | 2 | | | | 08/27/2021 | | | $ | 354,120 | | | $ | (1,686 | ) |
3 Month Canadian Bankers Acceptance | | | 1 | | | | 09/13/2021 | | | | 200,760 | | | | 58 | |
3 Month Canadian Bankers Acceptance | | | 1 | | | | 12/13/2021 | | | | 200,649 | | | | 37 | |
Amsterdam Exchange Index | | | 1 | | | | 07/16/2021 | | | | 172,961 | | | | (218 | ) |
Australia 10 Year Bond | | | 157 | | | | 09/15/2021 | | | | 16,630,567 | | | | (19,514 | ) |
Brent Crude Oil | | | 21 | | | | 10/29/2021 | | | | 1,519,350 | | | | 52,738 | |
CAC 40 10 Euro Index | | | 2 | | | | 07/16/2021 | | | | 154,266 | | | | (3,208 | ) |
Canada 10 Year Bond | | | 56 | | | | 09/21/2021 | | | | 6,572,185 | | | | 74,335 | |
Cocoa | | | 63 | | | | 12/15/2021 | | | | 1,530,270 | | | | (53,065 | ) |
Coffee “C” | | | 24 | | | | 12/20/2021 | | | | 1,463,850 | | | | 54,393 | |
Copper | | | 14 | | | | 12/29/2021 | | | | 1,499,225 | | | | (122,539 | ) |
Corn | | | 55 | | | | 12/14/2021 | | | | 1,618,375 | | | | (20,361 | ) |
Cotton No. 2 | | | 2 | | | | 12/08/2021 | | | | 84,900 | | | | (2,556 | ) |
DAX Index | | | 1 | | | | 09/17/2021 | | | | 460,308 | | | | (4,922 | ) |
EURO STOXX 50 Index | | | 9 | | | | 09/17/2021 | | | | 432,793 | | | | (7,937 | ) |
Euro-BTP | | | 1 | | | | 09/08/2021 | | | | 179,534 | | | | 1,491 | |
Feeder Cattle | | | 2 | | | | 08/26/2021 | | | | 154,650 | | | | 865 | |
Foreign Exchange AUD/USD | | | 19 | | | | 09/13/2021 | | | | 1,425,285 | | | | (38,110 | ) |
Foreign Exchange CAD/USD | | | 26 | | | | 09/14/2021 | | | | 2,097,290 | | | | (45,674 | ) |
FTSE 100 Index | | | 2 | | | | 09/17/2021 | | | | 193,123 | | | | (3,159 | ) |
FTSE/JSE Top 40 Index | | | 1 | | | | 09/16/2021 | | | | 41,930 | | | | (1,076 | ) |
FTSE/MIB Index | | | 1 | | | | 09/17/2021 | | | | 148,242 | | | | (3,518 | ) |
| | |
| The accompanying notes are an integral part of these financial statements. | | 25 |
GOLDMAN SACHS ALTERNATIVE PREMIA FUND
Consolidated Schedule of Investments (continued)
June 30, 2021 (Unaudited)
|
| ADDITIONAL INVESTMENT INFORMATION (continued) |
| | | | | | | | | | | | | | | | |
| Description | | Number of
Contracts | | | Expiration Date | | | Notional
Amount | | | Unrealized
Appreciation/
(Depreciation) | |
Long position contracts: (continued) | | | | | | | | | | | | | | | | |
Hang Seng Index | | | 1 | | | | 07/29/2021 | | | $ | 184,369 | | | $ | (3,240 | ) |
IBEX 35 Index | | | 1 | | | | 07/16/2021 | | | | 104,207 | | | | (4,037 | ) |
KC HRW Wheat | | | 48 | | | | 12/14/2021 | | | | 1,601,400 | | | | (97,570 | ) |
KOSPI 200 Index | | | 2 | | | | 09/09/2021 | | | | 194,845 | | | | 2,844 | |
Lean Hogs | | | 47 | | | | 12/14/2021 | | | | 1,510,110 | | | | (119,638 | ) |
Live Cattle | | | 29 | | | | 12/31/2021 | | | | 1,531,490 | | | | 30,709 | |
LME Aluminum Base Metal | | | 57 | | | | 07/21/2021 | | | | 3,590,288 | | | | 385,048 | |
LME Aluminum Base Metal | | | 34 | | | | 08/18/2021 | | | | 2,144,125 | | | | 249,873 | |
LME Aluminum Base Metal | | | 27 | | | | 09/15/2021 | | | | 1,704,038 | | | | 164,648 | |
LME Aluminum Base Metal | | | 28 | | | | 10/20/2021 | | | | 1,764,350 | | | | 7,159 | |
LME Aluminum Base Metal | | | 28 | | | | 11/17/2021 | | | | 1,762,600 | | | | 46,830 | |
LME Lead Base Metal | | | 6 | | | | 07/21/2021 | | | | 339,600 | | | | 5,988 | |
LME Lead Base Metal | | | 5 | | | | 08/18/2021 | | | | 283,625 | | | | 9,285 | |
LME Nickel Base Metal | | | 3 | | | | 07/21/2021 | | | | 327,708 | | | | 4,326 | |
LME Nickel Base Metal | | | 2 | | | | 08/18/2021 | | | | 218,496 | | | | 3,210 | |
LME Zinc Base Metal | | | 43 | | | | 07/21/2021 | | | | 3,193,019 | | | | 111,923 | |
LME Zinc Base Metal | | | 26 | | | | 08/18/2021 | | | | 1,932,612 | | | | 107,701 | |
LME Zinc Base Metal | | | 22 | | | | 09/15/2021 | | | | 1,637,350 | | | | 82,608 | |
LME Zinc Base Metal | | | 23 | | | | 10/20/2021 | | | | 1,711,200 | | | | (9,016 | ) |
LME Zinc Base Metal | | | 24 | | | | 11/17/2021 | | | | 1,786,500 | | | | (18,974 | ) |
Low Sulphur Gasoil | | | 25 | | | | 11/11/2021 | | | | 1,501,875 | | | | 38,450 | |
NASDAQ 100 E-Mini Index | | | 1 | | | | 09/17/2021 | | | | 290,980 | | | | 8,654 | |
Natural Gas | | | 42 | | | | 10/27/2021 | | | | 1,572,480 | | | | 229,944 | |
NY Harbor ULSD | | | 17 | | | | 10/29/2021 | | | | 1,521,248 | | | | 1,591 | |
OMXS30 Index | | | 4 | | | | 07/16/2021 | | | | 105,911 | | | | (693 | ) |
RBOB Gasoline | | | 18 | | | | 10/29/2021 | | | | 1,554,487 | | | | 20,144 | |
Russell 2000 E-Mini Index | | | 1 | | | | 09/17/2021 | | | | 115,390 | | | | (1,144 | ) |
S&P 500 E-Mini Index | | | 6 | | | | 09/17/2021 | | | | 1,286,580 | | | | 13,238 | |
S&P/TSX 60 Index | | | 1 | | | | 09/16/2021 | | | | 194,046 | | | | (261 | ) |
SET50 Index | | | 12 | | | | 09/29/2021 | | | | 70,952 | | | | (292 | ) |
Silver | | | 2 | | | | 09/28/2021 | | | | 262,500 | | | | (116 | ) |
Soybean | | | 7 | | | | 11/12/2021 | | | | 487,638 | | | | (3,075 | ) |
Sugar No. 11 | | | 76 | | | | 02/28/2022 | | | | 1,538,970 | | | | 27,402 | |
TOPIX Index | | | 1 | | | | 09/09/2021 | | | | 174,895 | | | | (1,616 | ) |
U.S. Treasury 10 Year Note | | | 8 | | | | 09/21/2021 | | | | 1,059,375 | | | | (813 | ) |
Wheat | | | 46 | | | | 12/14/2021 | | | | 1,576,650 | | | | (117,264 | ) |
WTI Crude Oil | | | 21 | | | | 10/20/2021 | | | | 1,488,270 | | | | 66,382 | |
| | | | |
| Total | | | | | | | | | | | | | | $ | 1,096,582 | |
| | | | |
Short position contracts: | | | | | | | | | | | | | | | | |
3 Month Euro Euribor | | | (1 | ) | | | 12/13/2021 | | | $ | (298,009) | | | $ | (31 | ) |
3 Month Euro Euribor | | | (4 | ) | | | 03/14/2022 | | | | (1,191,738 | ) | | | (6 | ) |
3 Month Euro Euribor | | | (3 | ) | | | 06/13/2022 | | | | (893,670 | ) | | | (49 | ) |
3 Month Euro Euribor | | | (3 | ) | | | 09/19/2022 | | | | (893,492 | ) | | | (79 | ) |
3 Month Euro Euribor | | | (4 | ) | | | 12/19/2022 | | | | (1,191,027 | ) | | | (140 | ) |
3 Month Euro Euribor | | | (3 | ) | | | 03/13/2023 | | | | (892,914 | ) | | | (93 | ) |
3 Month Euro Euribor | | | (4 | ) | | | 06/19/2023 | | | | (1,190,137 | ) | | | (7 | ) |
3 Month Eurodollar | | | (1 | ) | | | 09/19/2022 | | | | (249,088 | ) | | | (2 | ) |
3 Month Eurodollar | | | (5 | ) | | | 12/19/2022 | | | | (1,243,500 | ) | | | (224 | ) |
3 Month Eurodollar | | | (6 | ) | | | 03/13/2023 | | | | (1,490,400 | ) | | | (39 | ) |
3 Month Eurodollar | | | (8 | ) | | | 06/19/2023 | | | | (1,984,400 | ) | | | 56 | |
| | |
| 26 | | The accompanying notes are an integral part of these financial statements. |
GOLDMAN SACHS ALTERNATIVE PREMIA FUND
|
| ADDITIONAL INVESTMENT INFORMATION (continued) |
| | | | | | | | | | | | | | | | |
| Description | | Number of
Contracts | | | Expiration Date | | | Notional
Amount | | | Unrealized
Appreciation/
(Depreciation) | |
Short position contracts: (continued) | | | | | | | | | | | | | | | | |
3 Month Euroswiss | | | (1 | ) | | | 09/13/2021 | | | $ | (272,224 | ) | | $ | (28 | ) |
3 Month Euroswiss | | | (2 | ) | | | 12/13/2021 | | | | (544,393 | ) | | | (58 | ) |
3 Month Euroswiss | | | (2 | ) | | | 03/14/2022 | | | | (544,231 | ) | | | (31 | ) |
3 Month Sterling | | | (2 | ) | | | 09/15/2021 | | | | (345,496 | ) | | | (12 | ) |
3 Month Sterling | | | (2 | ) | | | 12/15/2021 | | | | (345,393 | ) | | | (64 | ) |
3 Month Sterling | | | (7 | ) | | | 03/16/2022 | | | | (1,207,483 | ) | | | 191 | |
3 Month Sterling | | | (9 | ) | | | 06/15/2022 | | | | (1,551,388 | ) | | | 174 | |
3 Month Sterling | | | (11 | ) | | | 09/21/2022 | | | | (1,894,810 | ) | | | 590 | |
3 Month Sterling | | | (12 | ) | | | 12/21/2022 | | | | (2,065,613 | ) | | | 835 | |
3 Month Sterling | | | (11 | ) | | | 03/15/2023 | | | | (1,892,432 | ) | | | 858 | |
3 Month Sterling | | | (11 | ) | | | 06/21/2023 | | | | (1,891,291 | ) | | | (183 | ) |
Brent Crude Oil | | | (16 | ) | | | 07/30/2021 | | | | (1,193,760 | ) | | | (45,732 | ) |
CBOE Volatility Index | | | (36 | ) | | | 07/21/2021 | | | | (644,519 | ) | | | 195,227 | |
CBOE Volatility Index | | | (34 | ) | | | 08/18/2021 | | | | (671,456 | ) | | | 183,217 | |
CBOE Volatility Index | | | (39 | ) | | | 09/15/2021 | | | | (819,546 | ) | | | 23,128 | |
Cocoa | | | (50 | ) | | | 09/15/2021 | | | | (1,194,500 | ) | | | 11,623 | |
Coffee “C” | | | (27 | ) | | | 09/20/2021 | | | | (1,617,469 | ) | | | 2,802 | |
Copper | | | (8 | ) | | | 09/28/2021 | | | | (857,600 | ) | | | 13,965 | |
Corn | | | (56 | ) | | | 09/14/2021 | | | | (1,677,900 | ) | | | 26,086 | |
Euro-Bobl | | | (4 | ) | | | 09/08/2021 | | | | (636,131 | ) | | | (520 | ) |
Euro-Bund | | | (111 | ) | | | 09/08/2021 | | | | (22,709,413 | ) | | | (128,282 | ) |
Euro-Buxl | | | (1 | ) | | | 09/08/2021 | | | | (240,660 | ) | | | (4,142 | ) |
Euro-OAT | | | (1 | ) | | | 09/08/2021 | | | | (188,487 | ) | | | (666 | ) |
Euro-Schatz | | | (12 | ) | | | 09/08/2021 | | | | (1,595,782 | ) | | | 100 | |
Foreign Exchange CHF/USD | | | (25 | ) | | | 09/13/2021 | | | | (3,383,750 | ) | | | 112,447 | |
Foreign Exchange EUR/USD | | | (12 | ) | | | 09/13/2021 | | | | (1,781,400 | ) | | | 29,607 | |
Foreign Exchange GBP/USD | | | (14 | ) | | | 09/13/2021 | | | | (1,210,475 | ) | | | 27,095 | |
Foreign Exchange JPY/USD | | | (16 | ) | | | 09/13/2021 | | | | (1,801,500 | ) | | | 23,279 | |
Foreign Exchange NZD/USD | | | (16 | ) | | | 09/13/2021 | | | | (1,118,240 | ) | | | 18,270 | |
Japan 10 Year Bond | | | (5 | ) | | | 09/13/2021 | | | | (6,829,290 | ) | | | 3,671 | |
KC HRW Wheat | | | (44 | ) | | | 09/14/2021 | | | | (1,450,900 | ) | | | (54,161 | ) |
Lean Hogs | | | (46 | ) | | | 08/13/2021 | | | | (1,906,240 | ) | | | 228,045 | |
Live Cattle | | | (43 | ) | | | 08/31/2021 | | | | (2,114,310 | ) | | | (56,605 | ) |
LME Aluminum Base Metal | | | (57 | ) | | | 07/21/2021 | | | | (3,590,288 | ) | | | (304,429 | ) |
LME Aluminum Base Metal | | | (54 | ) | | | 08/18/2021 | | | | (3,405,375 | ) | | | (242,500 | ) |
LME Aluminum Base Metal | | | (27 | ) | | | 09/15/2021 | | | | (1,704,038 | ) | | | (11,289 | ) |
LME Aluminum Base Metal | | | (28 | ) | | | 10/20/2021 | | | | (1,764,350 | ) | | | (51,625 | ) |
LME Aluminum Base Metal | | | (4 | ) | | | 11/17/2021 | | | | (251,800) | | | | (1,562 | ) |
LME Lead Base Metal | | | (6 | ) | | | 07/21/2021 | | | | (339,600 | ) | | | (13,535 | ) |
LME Lead Base Metal | | | (2 | ) | | | 08/18/2021 | | | | (113,450 | ) | | | (2,555 | ) |
LME Nickel Base Metal | | | (3 | ) | | | 07/21/2021 | | | | (327,708 | ) | | | (10,155 | ) |
LME Nickel Base Metal | | | (1 | ) | | | 08/18/2021 | | | | (109,248 | ) | | | (2,904 | ) |
LME Zinc Base Metal | | | (43 | ) | | | 07/21/2021 | | | | (3,193,019 | ) | | | (106,584 | ) |
LME Zinc Base Metal | | | (46 | ) | | | 08/18/2021 | | | | (3,419,238 | ) | | | (84,180 | ) |
LME Zinc Base Metal | | | (22 | ) | | | 09/15/2021 | | | | (1,637,350 | ) | | | 1,148 | |
LME Zinc Base Metal | | | (23 | ) | | | 10/20/2021 | | | | (1,711,200 | ) | | | 25,198 | |
LME Zinc Base Metal | | | (3 | ) | | | 11/17/2021 | | | | (223,312 | ) | | | (213 | ) |
Long Gilt | | | (58 | ) | | | 09/28/2021 | | | | (10,277,642 | ) | | | (61,910 | ) |
Low Sulphur Gasoil | | | (22 | ) | | | 08/12/2021 | | | | (1,321,100 | ) | | | (34,994 | ) |
Natural Gas | | | (31 | ) | | | 07/28/2021 | | | | (1,160,330 | ) | | | (173,153 | ) |
NY Harbor ULSD | | | (20 | ) | | | 07/30/2021 | | | | (1,787,604 | ) | | | (3,655 | ) |
RBOB Gasoline | | | (16 | ) | | | 07/30/2021 | | | | (1,505,213 | ) | | | (21,103 | ) |
| | |
| The accompanying notes are an integral part of these financial statements. | | 27 |
GOLDMAN SACHS ALTERNATIVE PREMIA FUND
Consolidated Schedule of Investments (continued)
June 30, 2021 (Unaudited)
|
| ADDITIONAL INVESTMENT INFORMATION (continued) |
| | | | | | | | | | | | | | | | |
| Description | | Number of
Contracts | | | Expiration Date | | | Notional
Amount | | | Unrealized
Appreciation/
(Depreciation) | |
Short position contracts: (continued) | | | | | | | | | | | | | | | | |
Sugar No. 11 | | | (74 | ) | | | 09/30/2021 | | | $ | (1,482,723 | ) | | $ | (17,362 | ) |
U.S. Treasury 2 Year Note | | | (2 | ) | | | 09/30/2021 | | | | (440,656 | ) | | | (105 | ) |
U.S. Treasury 5 Year Note | | | (5 | ) | | | 09/30/2021 | | | | (616,914 | ) | | | (314 | ) |
Wheat | | | (48 | ) | | | 09/14/2021 | | | | (1,632,600 | ) | | | 5,524 | |
WTI Crude Oil | | | (21 | ) | | | 07/20/2021 | | | | (1,543,920 | ) | | | (66,178 | ) |
| | | | |
| Total | | | | | | | | | | | | | | $ | (568,323 | ) |
| |
| Total Futures Contracts | | | $ | 528,259 | |
SWAP CONTRACTS — At June 30, 2021, the Fund had the following swap contracts:
CENTRALLY CLEARED CREDIT DEFAULT SWAP CONTRACTS
| | | | | | | | | | | | | | | | | | | | | | | | | | |
| Reference Obligation/Index(a) | | Financing Rate
Received (Paid) by the Fund | | | Credit
Spread at
June 30,
2021(b) | | Termination
Date | | | Notional
Amount(000’s) | | | Value | | | Upfront
Premium (Received)
Paid | | | Unrealized
Appreciation/
(Depreciation) | |
Protection Sold: | | | | |
iTraxx Europe Crossover Index | | | 5.000% | | | 2.320% | | | 06/20/2026 | | | | EUR 350 | | | $ | 52,174 | | | $ | 45,326 | | | $ | 6,848 | |
iTraxx Europe Index | | | 1.000 | | | 0.468 | | | 06/20/2026 | | | | 800 | | | | 25,558 | | | | 22,103 | | | | 3,455 | |
Markit CDX North America High Yield Index | | | 5.000 | | | 2.745 | | | 06/20/2026 | | | | USD 400 | | | | 41,356 | | | | 34,383 | | | | 6,973 | |
Markit CDX North America Investment Grade Index | | | 1.000 | | | 0.479 | | | 06/20/2026 | | | | 950 | | | | 24,439 | | | | 20,785 | | | | 3,654 | |
| | | | | | | |
| TOTAL | | | | | | | | | | | | | | | | $ | 143,527 | | | $ | 122,597 | | | $ | 20,930 | |
| | (a) | | Payments received quarterly. |
| | (b) | | Credit spread on the referenced obligation, together with the period of expiration, are indicators of payment/performance risk. The likelihood of a credit event occurring which would require a fund or its counterparty to make a payment or otherwise be required to perform under the swap contract is generally greater as the credit spread and term of the swap contract increase. |
| | |
| 28 | | The accompanying notes are an integral part of these financial statements. |
GOLDMAN SACHS ALTERNATIVE PREMIA FUND
|
| ADDITIONAL INVESTMENT INFORMATION (continued) |
OVER THE COUNTER TOTAL RETURN SWAP CONTRACTS
| | | | | | | | | | | | | | | | | | | | | | |
| Referenced Obligation/Index | | Financing Rate
Received (Paid) by the Fund | | | Counterparty | | Termination
Date | | | Notional
Amount
(000’s) | | | Unrealized
Appreciation/
(Depreciation)(a) | |
A basket (MLGSFDJP) of common stocks(b)* | | | (0.080 | )% | | Bank of America NA | | | 01/28/2022 | | | | JPY | | | | 2,869,915 | | | $ | (248,100 | ) |
A basket (MLGSFDUS) of common stock(b)* | | | (0.096 | ) | | | | | 09/01/2021 | | | | USD | | | | 47,208 | | | | 68,127 | |
Russell 1000 Index Total Return(c) | | | 0.096 | | | | | | 09/01/2021 | | | | | | | | 34,838 | | | | (29,454 | ) |
S&P 500 Total Return Index(c) | | | 0.096 | | | | | | 09/01/2021 | | | | | | | | 8,658 | | | | (14,783 | ) |
TOPIX Total Retun Index(c) | | | 0.080 | | | | | | 01/28/2022 | | | | JPY | | | | 2,720,333 | | | | 249,015 | |
A basket (JPGSFDEU) of common stocks(b)* | | | (0.564 | ) | | JPMorgan Chase Bank NA | | | 09/16/2021 | | | | EUR | | | | 13,942 | | | | 22,632 | |
A basket (JPGSFDUK) of common stocks(b)* | | | (0.056 | ) | | | | | 11/05/2021 | | | | GBP | | | | 3,484 | | | | (34,896 | ) |
Euro Stoxx Gross Total Return Index(c) | | | 0.564 | | | | | | 09/16/2021 | | | | EUR | | | | 12,874 | | | | 114,496 | |
FTSE 100 Total Return Index(c) | | | 0.056 | | | | | | 11/05/2021 | | | | GBP | | | | 2,821 | | | | 24,076 | |
| | | | | | |
| TOTAL | | | | | | | | | | | | | | | | | | | | $ | 151,113 | |
| | (a) | | There are no upfront payments on the swap contracts listed above; therefore the unrealized gains (losses) on the swap contracts are equal to their value. |
| | (b) | | Payments made weekly. |
| | (c) | | Payments received weekly. |
| | * | | The components of the basket shown below. |
A basket (MLGSFDJP) of common stocks
| | | | | | | | | | | | | | |
| Common Stocks | | Sector | | Shares | | | Value | | | Weight | |
Nippon Telegraph & Telephone Corp | | Communication Services | | | 394 | | | $ | 1,139,408 | | | | 4.37 | % |
Sony Group Corp | | Consumer Discretionary | | | 95 | | | | 1,025,821 | | | | 3.94 | |
Fujitsu Ltd | | Information Technology | | | 39 | | | | 808,449 | | | | 3.10 | |
SoftBank Corp | | Communication Services | | | 486 | | | | 706,970 | | | | 2.71 | |
Mitsubishi Corp | | Industrials | | | 232 | | | | 701,811 | | | | 2.69 | |
East Japan Railway Co | | Industrials | | | 82 | | | | 648,682 | | | | 2.49 | |
Kao Corp | | Consumer Staples | | | 88 | | | | 599,114 | | | | 2.30 | |
Nitori Holdings Co Ltd | | Consumer Discretionary | | | 24 | | | | 481,311 | | | | 1.85 | |
Shiseido Co Ltd | | Consumer Staples | | | 57 | | | | 466,677 | | | | 1.79 | |
Nintendo Co Ltd | | Communication Services | | | 6 | | | | 410,128 | | | | 1.57 | |
Kyocera Corp | | Information Technology | | | 51 | | | | 352,938 | | | | 1.35 | |
Nidec Corp | | Industrials | | | 26 | | | | 340,401 | | | | 1.31 | |
Recruit Holdings Co Ltd | | Industrials | | | 61 | | | | 335,854 | | | | 1.29 | |
Hitachi Ltd | | Industrials | | | 52 | | | | 331,094 | | | | 1.27 | |
Kirin Holdings Co Ltd | | Consumer Staples | | | 137 | | | | 297,741 | | | | 1.14 | |
Hoya Corp | | Health Care | | | 19 | | | | 281,543 | | | | 1.08 | |
Daikin Industries Ltd | | Industrials | | | 13 | | | | 277,839 | | | | 1.07 | |
Daito Trust Construction Co Ltd | | Real Estate | | | 23 | | | | 275,310 | | | | 1.06 | |
Fast Retailing Co Ltd | | Consumer Discretionary | | | 3 | | | | 270,233 | | | | 1.04 | |
Sekisui House Ltd | | Consumer Discretionary | | | 114 | | | | 259,616 | | | | 1.00 | |
Bandai Namco Holdings Inc | | Consumer Discretionary | | | 33 | | | | 256,393 | | | | 0.98 | |
Seven & i Holdings Co Ltd | | Consumer Staples | | | 42 | | | | 222,973 | | | | 0.86 | |
Mizuho Financial Group Inc | | Financials | | | 139 | | | | 220,678 | | | | 0.85 | |
Capcom Co Ltd | | Communication Services | | | 64 | | | | 209,558 | | | | 0.80 | |
Daiichi Sankyo Co Ltd | | Health Care | | | 87 | | | | 208,461 | | | | 0.80 | |
Chugai Pharmaceutical Co Ltd | | Health Care | | | 44 | | | | 194,133 | | | | 0.74 | |
TOTO Ltd | | Industrials | | | 34 | | | | 193,601 | | | | 0.74 | |
Shimamura Co Ltd | | Consumer Discretionary | | | 17 | | | | 185,759 | | | | 0.71 | |
Nikon Corp | | Consumer Discretionary | | | 151 | | | | 178,933 | | | | 0.69 | |
| | |
| The accompanying notes are an integral part of these financial statements. | | 29 |
GOLDMAN SACHS ALTERNATIVE PREMIA FUND
Consolidated Schedule of Investments (continued)
June 30, 2021 (Unaudited)
|
| ADDITIONAL INVESTMENT INFORMATION (continued) |
| | | | | | | | | | | | | | |
| Common Stocks | | Sector | | Shares | | | Value | | | Weight | |
Bridgestone Corp | | Consumer Discretionary | | | 35 | | | $ | 177,215 | | | | 0.68 | % |
Eisai Co Ltd | | Health Care | | | 16 | | | | 176,923 | | | | 0.68 | |
FUJIFILM Holdings Corp | | Information Technology | | | 21 | | | | 175,199 | | | | 0.67 | |
Cosmos Pharmaceutical Corp | | Consumer Staples | | | 10 | | | | 170,610 | | | | 0.65 | |
Pan Pacific International Holdings Corp | | Consumer Discretionary | | | 73 | | | | 168,901 | | | | 0.65 | |
Canon Inc | | Information Technology | | | 66 | | | | 166,421 | | | | 0.64 | |
Advantest Corp | | Information Technology | | | 15 | | | | 152,617 | | | | 0.59 | |
Komatsu Ltd | | Industrials | | | 55 | | | | 150,870 | | | | 0.58 | |
Casio Computer Co Ltd | | Consumer Discretionary | | | 81 | | | | 150,518 | | | | 0.58 | |
Shimizu Corp | | Industrials | | | 176 | | | | 149,797 | | | | 0.57 | |
Olympus Corp | | Health Care | | | 67 | | | | 149,025 | | | | 0.57 | |
Pigeon Corp | | Consumer Staples | | | 48 | | | | 148,957 | | | | 0.57 | |
MEIJI Holdings Co Ltd | | Consumer Staples | | | 22 | | | | 147,540 | | | | 0.57 | |
Mitsubishi Electric Corp | | Industrials | | | 88 | | | | 141,308 | | | | 0.54 | |
Dai-ichi Life Holdings Inc | | Financials | | | 69 | | | | 140,820 | | | | 0.54 | |
Suzuki Motor Corp | | Consumer Discretionary | | | 29 | | | | 136,946 | | | | 0.53 | |
Tsuruha Holdings Inc | | Consumer Staples | | | 11 | | | | 135,585 | | | | 0.52 | |
ZOZO Inc | | Consumer Discretionary | | | 35 | | | | 132,877 | | | | 0.51 | |
Renesas Electronics Corp | | Information Technology | | | 110 | | | | 132,506 | | | | 0.51 | |
Sumitomo Corp | | Industrials | | | 87 | | | | 129,117 | | | | 0.50 | |
NEC Corp | | Information Technology | | | 22 | | | | 128,529 | | | | 0.49 | |
Kajima Corp | | Industrials | | | 90 | | | | 126,934 | | | | 0.49 | |
Nissan Motor Co Ltd | | Consumer Discretionary | | | 228 | | | | 125,499 | | | | 0.48 | |
Nexon Co Ltd | | Communication Services | | | 50 | | | | 123,563 | | | | 0.47 | |
Obayashi Corp | | Industrials | | | 139 | | | | 122,950 | | | | 0.47 | |
Sumitomo Rubber Industries Ltd | | Consumer Discretionary | | | 79 | | | | 121,850 | | | | 0.47 | |
Nippon Express Co Ltd | | Industrials | | | 14 | | | | 119,066 | | | | 0.46 | |
Kakaku.com Inc | | Communication Services | | | 35 | | | | 118,696 | | | | 0.46 | |
Omron Corp | | Information Technology | | | 13 | | | | 115,100 | | | | 0.44 | |
Sysmex Corp | | Health Care | | | 9 | | | | 114,449 | | | | 0.44 | |
Otsuka Corp | | Information Technology | | | 19 | | | | 112,424 | | | | 0.43 | |
Asahi Intecc Co Ltd | | Health Care | | | 41 | | | | 108,450 | | | | 0.42 | |
Suntory Beverage & Food Ltd | | Consumer Staples | | | 26 | | | | 108,262 | | | | 0.42 | |
ANA Holdings Inc | | Industrials | | | 41 | | | | 107,629 | | | | 0.41 | |
Yaskawa Electric Corp | | Industrials | | | 19 | | | | 104,685 | | | | 0.40 | |
Mitsubishi Chemical Holdings Corp | | Materials | | | 106 | | | | 98,750 | | | | 0.38 | |
Asahi Kasei Corp | | Materials | | | 81 | | | | 98,514 | | | | 0.38 | |
Lion Corp | | Consumer Staples | | | 52 | | | | 97,532 | | | | 0.37 | |
Pola Orbis Holdings Inc | | Consumer Staples | | | 33 | | | | 97,497 | | | | 0.37 | |
West Japan Railway Co | | Industrials | | | 15 | | | | 96,571 | | | | 0.37 | |
Sumitomo Chemical Co Ltd | | Materials | | | 163 | | | | 96,181 | | | | 0.37 | |
Sumitomo Mitsui Trust Holdings Inc | | Financials | | | 27 | | | | 94,736 | | | | 0.36 | |
ABC-Mart Inc | | Consumer Discretionary | | | 15 | | | | 94,665 | | | | 0.36 | |
NOF Corp | | Materials | | | 16 | | | | 94,463 | | | | 0.36 | |
Relo Group Inc | | Real Estate | | | 37 | | | | 93,447 | | | | 0.36 | |
SCREEN Holdings Co Ltd | | Information Technology | | | 8 | | | | 93,020 | | | | 0.36 | |
Yamaha Motor Co Ltd | | Consumer Discretionary | | | 31 | | | | 92,410 | | | | 0.35 | |
Oracle Corp Japan | | Information Technology | | | 11 | | | | 91,178 | | | | 0.35 | |
Calbee Inc | | Consumer Staples | | | 36 | | | | 91,107 | | | | 0.35 | |
Ito En Ltd | | Consumer Staples | | | 14 | | | | 90,629 | | | | 0.35 | |
Ajinomoto Co Inc | | Consumer Staples | | | 31 | | | | 90,300 | | | | 0.35 | |
AGC Inc | | Industrials | | | 19 | | | | 89,576 | | | | 0.34 | |
NET One Systems Co Ltd | | Information Technology | | | 24 | | | | 88,851 | | | | 0.34 | |
Kansai Paint Co Ltd | | Materials | | | 31 | | | | 88,473 | | | | 0.34 | |
Nihon Unisys Ltd | | Information Technology | | | 26 | | | | 88,243 | | | | 0.34 | |
Dentsu Group Inc | | Communication Services | | | 22 | | | | 87,505 | | | | 0.34 | |
Otsuka Holdings Co Ltd | | Health Care | | | 19 | | | | 86,510 | | | | 0.33 | |
T&D Holdings Inc | | Financials | | | 59 | | | | 84,873 | | | | 0.33 | |
GungHo Online Entertainment Inc | | Communication Services | | | 38 | | | | 84,750 | | | | 0.33 | |
Sompo Holdings Inc | | Financials | | | 21 | | | | 84,420 | | | | 0.32 | |
Mazda Motor Corp | | Consumer Discretionary | | | 81 | | | | 84,342 | | | | 0.32 | |
| | |
| 30 | | The accompanying notes are an integral part of these financial statements. |
GOLDMAN SACHS ALTERNATIVE PREMIA FUND
|
| ADDITIONAL INVESTMENT INFORMATION (continued) |
| | | | | | | | | | | | | | |
| Common Stocks | | Sector | | Shares | | | Value | | | Weight | |
Hirose Electric Co Ltd | | Information Technology | | | 5 | | | $ | 83,891 | | | | 0.32 | % |
Hoshizaki Corp | | Industrials | | | 9 | | | | 83,410 | | | | 0.32 | |
Hikari Tsushin Inc | | Consumer Discretionary | | | 4 | | | | 82,873 | | | | 0.32 | |
Resona Holdings Inc | | Financials | | | 194 | | | | 82,788 | | | | 0.32 | |
Ricoh Co Ltd | | Information Technology | | | 66 | | | | 81,791 | | | | 0.31 | |
H.U. Group Holdings Inc | | Health Care | | | 28 | | | | 81,557 | | | | 0.31 | |
DeNA Co Ltd | | Communication Services | | | 34 | | | | 80,750 | | | | 0.31 | |
MonotaRO Co Ltd | | Industrials | | | 31 | | | | 80,557 | | | | 0.31 | |
Kikkoman Corp | | Consumer Staples | | | 11 | | | | 80,274 | | | | 0.31 | |
Sega Sammy Holdings Inc | | Consumer Discretionary | | | 53 | | | | 77,437 | | | | 0.30 | |
Food & Life Cos Ltd | | Consumer Discretionary | | | 16 | | | | 77,198 | | | | 0.30 | |
Lixil Corp | | Industrials | | | 27 | | | | 76,787 | | | | 0.29 | |
TIS Inc | | Information Technology | | | 27 | | | | 75,497 | | | | 0.29 | |
Trend Micro Inc/Japan | | Information Technology | | | 13 | | | | 74,165 | | | | 0.28 | |
Konami Holdings Corp | | Communication Services | | | 11 | | | | 72,951 | | | | 0.28 | |
Sugi Holdings Co Ltd | | Consumer Staples | | | 9 | | | | 71,781 | | | | 0.28 | |
SG Holdings Co Ltd | | Industrials | | | 25 | | | | 71,660 | | | | 0.27 | |
Tokyo Gas Co Ltd | | Utilities | | | 33 | | | | 70,021 | | | | 0.27 | |
Sharp Corp/Japan | | Consumer Discretionary | | | 38 | | | | 68,822 | | | | 0.26 | |
Seiko Epson Corp | | Information Technology | | | 35 | | | | 68,520 | | | | 0.26 | |
SBI Holdings Inc/Japan | | Financials | | | 26 | | | | 68,475 | | | | 0.26 | |
Konica Minolta Inc | | Information Technology | | | 111 | | | | 68,278 | | | | 0.26 | |
Isuzu Motors Ltd | | Consumer Discretionary | | | 46 | | | | 67,752 | | | | 0.26 | |
JSR Corp | | Materials | | | 20 | | | | 67,748 | | | | 0.26 | |
Kobayashi Pharmaceutical Co Ltd | | Consumer Staples | | | 7 | | | | 67,431 | | | | 0.26 | |
Medipal Holdings Corp | | Health Care | | | 32 | | | | 67,088 | | | | 0.26 | |
SMS Co Ltd | | Industrials | | | 20 | | | | 66,492 | | | | 0.26 | |
Rinnai Corp | | Consumer Discretionary | | | 6 | | | | 66,436 | | | | 0.25 | |
Nishimatsu Construction Co Ltd | | Industrials | | | 19 | | | | 66,362 | | | | 0.25 | |
USS Co Ltd | | Consumer Discretionary | | | 34 | | | | 66,200 | | | | 0.25 | |
Mitsui Chemicals Inc | | Materials | | | 17 | | | | 65,767 | | | | 0.25 | |
Japan Exchange Group Inc | | Financials | | | 26 | | | | 64,989 | | | | 0.25 | |
SCSK Corp | | Information Technology | | | 10 | | | | 64,987 | | | | 0.25 | |
Fancl Corp | | Consumer Staples | | | 18 | | | | 63,950 | | | | 0.25 | |
Suzuken Co Ltd/Aichi Japan | | Health Care | | | 19 | | | | 63,261 | | | | 0.24 | |
Tokai Carbon Co Ltd | | Materials | | | 41 | | | | 62,591 | | | | 0.24 | |
Iwatani Corp | | Energy | | | 9 | | | | 60,626 | | | | 0.23 | |
Showa Denko KK | | Materials | | | 18 | | | | 59,736 | | | | 0.23 | |
Furukawa Electric Co Ltd | | Industrials | | | 21 | | | | 59,016 | | | | 0.23 | |
Nissin Foods Holdings Co Ltd | | Consumer Staples | | | 7 | | | | 58,716 | | | | 0.23 | |
Nisshin Seifun Group Inc | | Consumer Staples | | | 36 | | | | 58,401 | | | | 0.22 | |
Japan Airport Terminal Co Ltd | | Industrials | | | 11 | | | | 56,452 | | | | 0.22 | |
Daicel Corp | | Materials | | | 61 | | | | 55,391 | | | | 0.21 | |
Yamaha Corp | | Consumer Discretionary | | | 9 | | | | 54,891 | | | | 0.21 | |
Sundrug Co Ltd | | Consumer Staples | | | 15 | | | | 54,003 | | | | 0.21 | |
Square Enix Holdings Co Ltd | | Communication Services | | | 10 | | | | 53,452 | | | | 0.21 | |
Yamada Holdings Co Ltd | | Consumer Discretionary | | | 103 | | | | 52,743 | | | | 0.20 | |
Kyushu Railway Co | | Industrials | | | 21 | | | | 52,371 | | | | 0.20 | |
Amada Co Ltd | | Industrials | | | 47 | | | | 52,368 | | | | 0.20 | |
Kobe Steel Ltd | | Materials | | | 73 | | | | 52,349 | | | | 0.20 | |
Tokyu Corp | | Industrials | | | 34 | | | | 51,764 | | | | 0.20 | |
Brother Industries Ltd | | Information Technology | | | 23 | | | | 51,425 | | | | 0.20 | |
Iida Group Holdings Co Ltd | | Consumer Discretionary | | | 18 | | | | 51,190 | | | | 0.20 | |
Kose Corp | | Consumer Staples | | | 3 | | | | 50,988 | | | | 0.20 | |
MISUMI Group Inc | | Industrials | | | 13 | | | | 50,447 | | | | 0.19 | |
Osaka Gas Co Ltd | | Utilities | | | 24 | | | | 50,242 | | | | 0.19 | |
Kyowa Exeo Corp | | Industrials | | | 18 | | | | 49,993 | | | | 0.19 | |
Hino Motors Ltd | | Industrials | | | 51 | | | | 49,796 | | | | 0.19 | |
Nippon Suisan Kaisha Ltd | | Consumer Staples | | | 94 | | | | 49,569 | | | | 0.19 | |
Sohgo Security Services Co Ltd | | Industrials | | | 10 | | | | 49,529 | | | | 0.19 | |
Nabtesco Corp | | Industrials | | | 12 | | | | 49,391 | | | | 0.19 | |
| | |
| The accompanying notes are an integral part of these financial statements. | | 31 |
GOLDMAN SACHS ALTERNATIVE PREMIA FUND
Consolidated Schedule of Investments (continued)
June 30, 2021 (Unaudited)
|
| ADDITIONAL INVESTMENT INFORMATION (continued) |
| | | | | | | | | | | | | | |
| Common Stocks | | Sector | | Shares | | | Value | | | Weight | |
Nipro Corp | | Health Care | | | 37 | | | $ | 48,445 | | | | 0.19 | % |
Justsystems Corp | | Information Technology | | | 7 | | | | 47,382 | | | | 0.18 | |
Teijin Ltd | | Materials | | | 27 | | | | 46,322 | | | | 0.18 | |
Kusuri no Aoki Holdings Co Ltd | | Consumer Staples | | | 6 | | | | 45,952 | | | | 0.18 | |
Hitachi Metals Ltd | | Materials | | | 21 | | | | 44,543 | | | | 0.17 | |
ITOCHU Corp | | Industrials | | | 14 | | | | 44,091 | | | | 0.17 | |
Aozora Bank Ltd | | Financials | | | 18 | | | | 43,867 | | | | 0.17 | |
Hitachi Construction Machinery Co Ltd | | Industrials | | | 13 | | | | 43,327 | | | | 0.17 | |
Nippon Paper Industries Co Ltd | | Materials | | | 34 | | | | 42,353 | | | | 0.16 | |
SoftBank Group Corp | | Communication Services | | | 5 | | | | 42,234 | | | | 0.16 | |
Sumitomo Osaka Cement Co Ltd | | Materials | | | 14 | | | | 41,311 | | | | 0.16 | |
Ezaki Glico Co Ltd | | Consumer Staples | | | 10 | | | | 40,426 | | | | 0.16 | |
Menicon Co Ltd | | Health Care | | | 5 | | | | 40,360 | | | | 0.15 | |
JAFCO Group Co ltd | | Financials | | | 6 | | �� | | 39,969 | | | | 0.15 | |
Toyo Suisan Kaisha Ltd | | Consumer Staples | | | 9 | | | | 39,764 | | | | 0.15 | |
Fujitsu General Ltd | | Consumer Discretionary | | | 13 | | | | 39,735 | | | | 0.15 | |
Sawai Group Holdings Co Ltd | | Health Care | | | 8 | | | | 39,397 | | | | 0.15 | |
Kewpie Corp | | Consumer Staples | | | 16 | | | | 39,141 | | | | 0.15 | |
Kuraray Co Ltd | | Materials | | | 37 | | | | 39,013 | | | | 0.15 | |
Sankyo Co Ltd | | Consumer Discretionary | | | 14 | | | | 38,956 | | | | 0.15 | |
JTEKT Corp | | Consumer Discretionary | | | 34 | | | | 38,611 | | | | 0.15 | |
Resorttrust Inc | | Consumer Discretionary | | | 21 | | | | 37,339 | | | | 0.14 | |
NH Foods Ltd | | Consumer Staples | | | 9 | | | | 36,813 | | | | 0.14 | |
Ship Healthcare Holdings Inc | | Health Care | | | 14 | | | | 35,532 | | | | 0.14 | |
Ulvac Inc | | Information Technology | | | 6 | | | | 35,466 | | | | 0.14 | |
Ube Industries Ltd | | Materials | | | 16 | | | | 35,119 | | | | 0.13 | |
Seven Bank Ltd | | Financials | | | 146 | | | | 34,534 | | | | 0.13 | |
Kinden Corp | | Industrials | | | 18 | | | | 33,351 | | | | 0.13 | |
Ain Holdings Inc | | Consumer Staples | | | 5 | | | | 33,172 | | | | 0.13 | |
Fuji Corp/Aichi | | Industrials | | | 13 | | | | 33,144 | | | | 0.13 | |
Mitsui & Co Ltd | | Industrials | | | 13 | | | | 32,325 | | | | 0.12 | |
GS Yuasa Corp | | Industrials | | | 11 | | | | 32,166 | | | | 0.12 | |
Nippon Yusen KK | | Industrials | | | 6 | | | | 31,314 | | | | 0.12 | |
Kyudenko Corp | | Industrials | | | 9 | | | | 30,986 | | | | 0.12 | |
Zeon Corp | | Materials | | | 20 | | | | 30,936 | | | | 0.12 | |
Izumi Co Ltd | | Consumer Discretionary | | | 7 | | | | 29,691 | | | | 0.11 | |
Horiba Ltd | | Information Technology | | | 4 | | | | 29,477 | | | | 0.11 | |
Goldwin Inc | | Consumer Discretionary | | | 4 | | | | 29,358 | | | | 0.11 | |
Toyo Tire Corp | | Consumer Discretionary | | | 12 | | | | 28,983 | | | | 0.11 | |
Kaneka Corp | | Materials | | | 6 | | | | 28,867 | | | | 0.11 | |
Tokyo Electron Ltd | | Information Technology | | | 1 | | | | 28,640 | | | | 0.11 | |
Coca-Cola Bottlers Japan Holdings Inc | | Consumer Staples | | | 16 | | | | 28,228 | | | | 0.11 | |
Tsumura & Co | | Health Care | | | 8 | | | | 28,056 | | | | 0.11 | |
Asics Corp | | Consumer Discretionary | | | 10 | | | | 27,997 | | | | 0.11 | |
Tokuyama Corp | | Materials | | | 12 | | | | 27,242 | | | | 0.10 | |
Hulic Co Ltd | | Real Estate | | | 22 | | | | 27,059 | | | | 0.10 | |
Marubeni Corp | | Industrials | | | 28 | | | | 27,029 | | | | 0.10 | |
Yamazaki Baking Co Ltd | | Consumer Staples | | | 17 | | | | 27,022 | | | | 0.10 | |
Maruha Nichiro Corp | | Consumer Staples | | | 11 | | | | 26,934 | | | | 0.10 | |
Shochiku Co Ltd | | Communication Services | | | 2 | | | | 26,889 | | | | 0.10 | |
Morinaga & Co Ltd/Japan | | Consumer Staples | | | 7 | | | | 26,030 | | | | 0.10 | |
Nifco Inc/Japan | | Consumer Discretionary | | | 6 | | | | 25,802 | | | | 0.10 | |
Shin-Etsu Chemical Co Ltd | | Materials | | | 1 | | | | 24,595 | | | | 0.09 | |
Panasonic Corp | | Consumer Discretionary | | | 19 | | | | 24,227 | | | | 0.09 | |
TBS Holdings Inc | | Communication Services | | | 14 | | | | 24,184 | | | | 0.09 | |
KDDI Corp | | Communication Services | | | 7 | | | | 24,138 | | | | 0.09 | |
Miura Co Ltd | | Industrials | | | 5 | | | | 23,492 | | | | 0.09 | |
Persol Holdings Co Ltd | | Industrials | | | 11 | | | | 23,084 | | | | 0.09 | |
Toyota Tsusho Corp | | Industrials | | | 4 | | | | 22,946 | | | | 0.09 | |
Takeda Pharmaceutical Co Ltd | | Health Care | | | 6 | | | | 22,338 | | | | 0.09 | |
Toho Gas Co Ltd | | Utilities | | | 4 | | | | 21,925 | | | | 0.08 | |
| | |
| 32 | | The accompanying notes are an integral part of these financial statements. |
GOLDMAN SACHS ALTERNATIVE PREMIA FUND
|
| ADDITIONAL INVESTMENT INFORMATION (continued) |
| | | | | | | | | | | | | | |
| Common Stocks | | Sector | | Shares | | | Value | | | Weight | |
Honda Motor Co Ltd | | Consumer Discretionary | | | 6 | | | $ | 21,524 | | | | 0.08 | % |
Murata Manufacturing Co Ltd | | Information Technology | | | 2 | | | | 21,172 | | | | 0.08 | |
Toyota Industries Corp | | Consumer Discretionary | | | 2 | | | | 21,080 | | | | 0.08 | |
OKUMA Corp | | Industrials | | | 4 | | | | 20,537 | | | | 0.08 | |
DIC Corp | | Materials | | | 7 | | | | 20,428 | | | | 0.08 | |
Lasertec Corp | | Information Technology | | | 1 | | | | 19,750 | | | | 0.08 | |
Benefit One Inc | | Industrials | | | 6 | | | | 19,737 | | | | 0.08 | |
Zenkoku Hosho Co Ltd | | Financials | | | 4 | | | | 19,730 | | | | 0.08 | |
TechnoPro Holdings Inc | | Industrials | | | 7 | | | | 19,642 | | | | 0.08 | |
Denso Corp | | Consumer Discretionary | | | 3 | | | | 19,062 | | | | 0.07 | |
Zensho Holdings Co Ltd | | Consumer Discretionary | | | 6 | | | | 18,337 | | | | 0.07 | |
Nippon Electric Glass Co Ltd | | Information Technology | | | 7 | | | | 18,114 | | | | 0.07 | |
M3 Inc | | Health Care | | | 2 | | | | 18,008 | | | | 0.07 | |
Japan Post Insurance Co Ltd | | Financials | | | 9 | | | | 17,678 | | | | 0.07 | |
Mitsui OSK Lines Ltd | | Industrials | | | 3 | | | | 17,205 | | | | 0.07 | |
Koei Tecmo Holdings Co Ltd | | Communication Services | | | 3 | | | | 16,297 | | | | 0.06 | |
Kubota Corp | | Industrials | | | 7 | | | | 15,515 | | | | 0.06 | |
Ebara Corp | | Industrials | | | 3 | | | | 14,572 | | | | 0.06 | |
SUMCO Corp | | Information Technology | | | 5 | | | | 14,545 | | | | 0.06 | |
Kurita Water Industries Ltd | | Industrials | | | 3 | | | | 14,275 | | | | 0.05 | |
Sumitomo Mitsui Financial Group Inc | | Financials | | | 4 | | | | 14,159 | | | | 0.05 | |
Nitto Denko Corp | | Materials | | | 2 | | | | 14,109 | | | | 0.05 | |
Open House Co Ltd | | Consumer Discretionary | | | 3 | | | | 13,166 | | | | 0.05 | |
Azbil Corp | | Information Technology | | | 3 | | | | 12,268 | | | | 0.05 | |
Taiyo Yuden Co Ltd | | Information Technology | | | 2 | | | | 12,263 | | | | 0.05 | |
Japan Post Holdings Co Ltd | | Financials | | | 13 | | | | 12,216 | | | | 0.05 | |
Morinaga Milk Industry Co Ltd | | Consumer Staples | | | 2 | | | | 11,976 | | | | 0.05 | |
Astellas Pharma Inc | | Health Care | | | 6 | | | | 11,967 | | | | 0.05 | |
Ibiden Co Ltd | | Information Technology | | | 2 | | | | 11,908 | | | | 0.05 | |
Mitsubishi Gas Chemical Co Inc | | Materials | | | 5 | | | | 11,834 | | | | 0.05 | |
Denka Co Ltd | | Materials | | | 3 | | | | 11,276 | | | | 0.04 | |
Yamato Holdings Co Ltd | | Industrials | | | 4 | | | | 11,070 | | | | 0.04 | |
Penta-Ocean Construction Co Ltd | | Industrials | | | 14 | | | | 10,844 | | | | 0.04 | |
Sojitz Corp | | Industrials | | | 32 | | | | 10,714 | | | | 0.04 | |
TDK Corp | | Information Technology | | | 1 | | | | 9,949 | | | | 0.04 | |
Maeda Corp | | Industrials | | | 10 | | | | 9,936 | | | | 0.04 | |
Fuji Electric Co Ltd | | Industrials | | | 2 | | | | 9,827 | | | | 0.04 | |
Nippon Television Holdings Inc | | Communication Services | | | 7 | | | | 9,610 | | | | 0.04 | |
Asahi Group Holdings Ltd | | Consumer Staples | | | 2 | | | | 9,461 | | | | 0.04 | |
Disco Corp | | Information Technology | | | 0 | | | | 9,229 | | | | 0.04 | |
CyberAgent Inc | | Communication Services | | | 4 | | | | 9,218 | | | | 0.04 | |
Sumitomo Dainippon Pharma Co Ltd | | Health Care | | | 4 | | | | 8,915 | | | | 0.03 | |
Nippon Steel Corp | | Materials | | | 5 | | | | 8,720 | | | | 0.03 | |
Takara Holdings Inc | | Consumer Staples | | | 6 | | | | 8,469 | | | | 0.03 | |
Nomura Holdings Inc | | Financials | | | 14 | | | | 8,121 | | | | 0.03 | |
Nisshinbo Holdings Inc | | Industrials | | | 8 | | | | 7,732 | | | | 0.03 | |
Sanwa Holdings Corp | | Industrials | | | 5 | | | | 7,419 | | | | 0.03 | |
Bank of Kyoto Ltd/The | | Financials | | | 1 | | | | 7,410 | | | | 0.03 | |
Subaru Corp | | Consumer Discretionary | | | 3 | | | | 7,382 | | | | 0.03 | |
Lawson Inc | | Consumer Staples | | | 1 | | | | 7,338 | | | | 0.03 | |
Nihon M&A Center Inc | | Industrials | | | 2 | | | | 7,151 | | | | 0.03 | |
NTN Corp | | Industrials | | | 25 | | | | 7,144 | | | | 0.03 | |
NTT Data Corp | | Information Technology | | | 4 | | | | 6,968 | | | | 0.03 | |
Credit Saison Co Ltd | | Financials | | | 5 | | | | 6,929 | | | | 0.03 | |
Tokyo Ohka Kogyo Co Ltd | | Materials | | | 1 | | | | 6,893 | | | | 0.03 | |
Aisin Corp | | Consumer Discretionary | | | 1 | | | | 6,580 | | | | 0.03 | |
Glory Ltd | | Industrials | | | 3 | | | | 6,494 | | | | 0.02 | |
Sumitomo Metal Mining Co Ltd | | Materials | | | 1 | | | | 6,379 | | | | 0.02 | |
Sumitomo Heavy Industries Ltd | | Industrials | | | 2 | | | | 6,365 | | | | 0.02 | |
Mebuki Financial Group Inc | | Financials | | | 26 | | | | 6,191 | | | | 0.02 | |
Aeon Co Ltd | | Consumer Staples | | | 2 | | | | 6,188 | | | | 0.02 | |
| | |
| The accompanying notes are an integral part of these financial statements. | | 33 |
GOLDMAN SACHS ALTERNATIVE PREMIA FUND
Consolidated Schedule of Investments (continued)
June 30, 2021 (Unaudited)
|
| ADDITIONAL INVESTMENT INFORMATION (continued) |
| | | | | | | | | | | | | | |
| Common Stocks | | Sector | | Shares | | | Value | | | Weight | |
Alps Alpine Co Ltd | | Information Technology | | | 5 | | | $ | 6,153 | | | | 0.02 | % |
Yokohama Rubber Co Ltd/The | | Consumer Discretionary | | | 2 | | | | 5,888 | | | | 0.02 | |
Takashimaya Co Ltd | | Consumer Discretionary | | | 5 | | | | 5,877 | | | | 0.02 | |
Rohm Co Ltd | | Information Technology | | | 1 | | | | 5,729 | | | | 0.02 | |
Chubu Electric Power Co Inc | | Utilities | | | 4 | | | | 5,685 | | | | 0.02 | |
Hamamatsu Photonics KK | | Information Technology | | | 1 | | | | 5,654 | | | | 0.02 | |
NOK Corp | | Consumer Discretionary | | | 4 | | | | 5,515 | | | | 0.02 | |
Taisho Pharmaceutical Holdings Co Ltd | | Health Care | | | 1 | | | | 5,471 | | | | 0.02 | |
Cosmo Energy Holdings Co Ltd | | Energy | | | 2 | | | | 5,358 | | | | 0.02 | |
Fujitec Co Ltd | | Industrials | | | 2 | | | | 5,347 | | | | 0.02 | |
Canon Marketing Japan Inc | | Information Technology | | | 2 | | | | 5,312 | | | | 0.02 | |
Fuji Oil Holdings Inc | | Consumer Staples | | | 2 | | | | 5,304 | | | | 0.02 | |
Hokkaido Electric Power Co Inc | | Utilities | | | 10 | | | | 5,189 | | | | 0.02 | |
Daifuku Co Ltd | | Industrials | | | 1 | | | | 5,128 | | | | 0.02 | |
Shimano Inc | | Consumer Discretionary | | | 0 | | | | 4,983 | | | | 0.02 | |
Tokai Rika Co Ltd | | Consumer Discretionary | | | 3 | | | | 4,913 | | | | 0.02 | |
Hachijuni Bank Ltd/The | | Financials | | | 14 | | | | 4,912 | | | | 0.02 | |
Rakuten Group Inc | | Consumer Discretionary | | | 4 | | | | 4,855 | | | | 0.02 | |
Kokuyo Co Ltd | | Industrials | | | 3 | | | | 4,745 | | | | 0.02 | |
Fukuoka Financial Group Inc | | Financials | | | 2 | | | | 4,597 | | | | 0.02 | |
Nomura Research Institute Ltd | | Information Technology | | | 1 | | | | 4,561 | | | | 0.02 | |
K’s Holdings Corp | | Consumer Discretionary | | | 4 | | | | 4,552 | | | | 0.02 | |
GMO internet Inc | | Information Technology | | | 1 | | | | 4,541 | | | | 0.02 | |
Toray Industries Inc | | Materials | | | 6 | | | | 4,530 | | | | 0.02 | |
ADEKA Corp | | Materials | | | 2 | | | | 4,426 | | | | 0.02 | |
J Front Retailing Co Ltd | | Consumer Discretionary | | | 4 | | | | 4,303 | | | | 0.02 | |
Tosoh Corp | | Materials | | | 2 | | | | 4,149 | | | | 0.02 | |
Taiheiyo Cement Corp | | Materials | | | 2 | | | | 4,142 | | | | 0.02 | |
TS Tech Co Ltd | | Consumer Discretionary | | | 2 | | | | 4,139 | | | | 0.02 | |
JFE Holdings Inc | | Materials | | | 3 | | | | 4,096 | | | | 0.02 | |
Shimadzu Corp | | Information Technology | | | 1 | | | | 3,990 | | | | 0.02 | |
ENEOS Holdings Inc | | Energy | | | 8 | | | | 3,918 | | | | 0.02 | |
Taisei Corp | | Industrials | | | 1 | | | | 3,906 | | | | 0.01 | |
Topcon Corp | | Information Technology | | | 2 | | | | 3,888 | | | | 0.01 | |
Yokogawa Electric Corp | | Information Technology | | | 2 | | | | 3,869 | | | | 0.01 | |
Tadano Ltd | | Industrials | | | 3 | | | | 3,858 | | | | 0.01 | |
Nagase & Co Ltd | | Industrials | | | 2 | | | | 3,837 | | | | 0.01 | |
Nippon Light Metal Holdings Co Ltd | | Materials | | | 2 | | | | 3,837 | | | | 0.01 | |
NGK Spark Plug Co Ltd | | Consumer Discretionary | | | 2 | | | | 3,793 | | | | 0.01 | |
Yamaguchi Financial Group Inc | | Financials | | | 6 | | | | 3,594 | | | | 0.01 | |
Kamigumi Co Ltd | | Industrials | | | 2 | | | | 3,488 | | | | 0.01 | |
Shinsei Bank Ltd | | Financials | | | 2 | | | | 3,461 | | | | 0.01 | |
Nishi-Nippon Financial Holdings Inc | | Financials | | | 5 | | | | 3,412 | | | | 0.01 | |
Hokuhoku Financial Group Inc | | Financials | | | 4 | | | | 3,366 | | | | 0.01 | |
Mitsui Mining & Smelting Co Ltd | | Materials | | | 1 | | | | 3,320 | | | | 0.01 | |
Toho Holdings Co Ltd | | Health Care | | | 2 | | | | 3,312 | | | | 0.01 | |
Rengo Co Ltd | | Materials | | | 3 | | | | 3,190 | | | | 0.01 | |
TV Asahi Holdings Corp | | Communication Services | | | 2 | | | | 2,985 | | | | 0.01 | |
Santen Pharmaceutical Co Ltd | | Health Care | | | 2 | | | | 2,929 | | | | 0.01 | |
77 Bank Ltd/The | | Financials | | | 2 | | | | 2,879 | | | | 0.01 | |
MINEBEA MITSUMI Inc | | Industrials | | | 1 | | | | 2,876 | | | | 0.01 | |
Alfresa Holdings Corp | | Health Care | | | 2 | | | | 2,847 | | | | 0.01 | |
Toyota Boshoku Corp | | Consumer Discretionary | | | 1 | | | | 2,818 | | | | 0.01 | |
Autobacs Seven Co Ltd | | Consumer Discretionary | | | 2 | | | | 2,812 | | | | 0.01 | |
Toyo Seikan Group Holdings Ltd | | Materials | | | 2 | | | | 2,768 | | | | 0.01 | |
Japan Steel Works Ltd/The | | Industrials | | | 1 | | | | 2,752 | | | | 0.01 | |
Oki Electric Industry Co Ltd | | Information Technology | | | 2 | | | | 2,397 | | | | 0.01 | |
Shiga Bank Ltd/The | | Financials | | | 1 | | | | 2,346 | | | | 0.01 | |
Hirogin Holdings Inc | | Financials | | | 4 | | | | 2,318 | | | | 0.01 | |
Amano Corp | | Information Technology | | | 1 | | | | 2,159 | | | | 0.01 | |
TOPPAN INC | | Industrials | | | 1 | | | | 2,017 | | | | 0.01 | |
| | |
| 34 | | The accompanying notes are an integral part of these financial statements. |
GOLDMAN SACHS ALTERNATIVE PREMIA FUND
|
| ADDITIONAL INVESTMENT INFORMATION (continued) |
| | | | | | | | | | | | | | |
| Common Stocks | | Sector | | Shares | | | Value | | | Weight | |
Central Glass Co Ltd | | Industrials | | | 1 | | | $ | 1,962 | | | | 0.01 | % |
PALTAC Corp | | Consumer Discretionary | | | 0 | | | | 1,961 | | | | 0.01 | |
Benesse Holdings Inc | | Consumer Discretionary | | | 1 | | | | 1,959 | | | | 0.01 | |
Ryohin Keikaku Co Ltd | | Consumer Discretionary | | | 1 | | | | 1,911 | | | | 0.01 | |
NGK Insulators Ltd | | Industrials | | | 1 | | | | 1,895 | | | | 0.01 | |
Mochida Pharmaceutical Co Ltd | | Health Care | | | 1 | | | | 1,893 | | | | 0.01 | |
Lintec Corp | | Materials | | | 1 | | | | 1,846 | | | | 0.01 | |
Oji Holdings Corp | | Materials | | | 3 | | | | 1,776 | | | | 0.01 | |
Gunma Bank Ltd/The | | Financials | | | 5 | | | | 1,750 | | | | 0.01 | |
Sumitomo Bakelite Co Ltd | | Materials | | | 0 | | | | 1,718 | | | | 0.01 | |
Toyoda Gosei Co Ltd | | Consumer Discretionary | | | 1 | | | | 1,675 | | | | 0.01 | |
Air Water Inc | | Materials | | | 1 | | | | 1,615 | | | | 0.01 | |
Kaken Pharmaceutical Co Ltd | | Health Care | | | 0 | | | | 1,474 | | | | 0.01 | |
FP Corp | | Materials | | | 0 | | | | 1,453 | | | | 0.01 | |
NHK Spring Co Ltd | | Consumer Discretionary | | | 1 | | | | 1,354 | | | | 0.01 | |
Nippon Sanso Holdings Corp | | Materials | | | 1 | | | | 1,335 | | | | 0.01 | |
Toyobo Co Ltd | | Materials | | | 1 | | | | 1,333 | | | | 0.01 | |
Shizuoka Bank Ltd/The | | Financials | | | 2 | | | | 1,302 | | | | 0.00 | |
Skylark Holdings Co Ltd | | Consumer Discretionary | | | 1 | | | | 1,247 | | | | 0.00 | |
Yamato Kogyo Co Ltd | | Materials | | | 0 | | | | 1,234 | | | | 0.00 | |
Nihon Kohden Corp | | Health Care | | | 0 | | | | 1,199 | | | | 0.00 | |
JGC Holdings Corp | | Industrials | | | 1 | | | | 871 | | | | 0.00 | |
Iyo Bank Ltd/The | | Financials | | | 2 | | | | 836 | | | | 0.00 | |
Sangetsu Corp | | Consumer Discretionary | | | 0 | | | | 377 | | | | 0.00 | |
A basket (MLGSFDUS) of common stocks
| | | | | | | | | | | | | | |
| Common Stocks | | Sector | | Shares | | | Value | | | Weight | |
Microsoft Corp | | Information Technology | | | 6,867 | | | $ | 1,860,274 | | | | 3.98 | % |
Berkshire Hathaway Inc | | Financials | | | 4,663 | | | | 1,295,977 | | | | 2.77 | |
Amazon.com Inc | | Consumer Discretionary | | | 339 | | | | 1,165,566 | | | | 2.49 | |
Alphabet Inc | | Communication Services | | | 381 | | | | 931,420 | | | | 1.99 | |
Walmart Inc | | Consumer Staples | | | 5,761 | | | | 812,441 | | | | 1.74 | |
Facebook Inc | | Communication Services | | | 2,074 | | | | 721,197 | | | | 1.54 | |
Verizon Communications Inc | | Communication Services | | | 12,244 | | | | 686,056 | | | | 1.47 | |
Costco Wholesale Corp | | Consumer Staples | | | 1,713 | | | | 677,907 | | | | 1.45 | |
Apple Inc | | Information Technology | | | 4,828 | | | | 661,268 | | | | 1.41 | |
Accenture PLC | | Information Technology | | | 2,035 | | | | 599,946 | | | | 1.28 | |
Abbott Laboratories | | Health Care | | | 4,696 | | | | 544,371 | | | | 1.16 | |
Johnson & Johnson | | Health Care | | | 3,259 | | | | 536,859 | | | | 1.15 | |
Coca-Cola Co/The | | Consumer Staples | | | 9,856 | | | | 533,322 | | | | 1.14 | |
Union Pacific Corp | | Industrials | | | 2,373 | | | | 521,907 | | | | 1.12 | |
ServiceNow Inc | | Information Technology | | | 874 | | | | 480,476 | | | | 1.03 | |
Charter Communications Inc | | Communication Services | | | 596 | | | | 430,326 | | | | 0.92 | |
S&P Global Inc | | Financials | | | 996 | | | | 408,728 | | | | 0.87 | |
Sherwin-Williams Co/The | | Materials | | | 1,475 | | | | 401,964 | | | | 0.86 | |
JPMorgan Chase & Co | | Financials | | | 2,496 | | | | 388,288 | | | | 0.83 | |
Chipotle Mexican Grill Inc | | Consumer Discretionary | | | 249 | | | | 386,669 | | | | 0.83 | |
Estee Lauder Cos Inc/The | | Consumer Staples | | | 1,173 | | | | 373,182 | | | | 0.80 | |
Illumina Inc | | Health Care | | | 773 | | | | 365,784 | | | | 0.78 | |
Honeywell International Inc | | Industrials | | | 1,584 | | | | 347,556 | | | | 0.74 | |
Stryker Corp | | Health Care | | | 1,255 | | | | 326,039 | | | | 0.70 | |
Edwards Lifesciences Corp | | Health Care | | | 3,095 | | | | 320,517 | | | | 0.69 | |
Home Depot Inc/The | | Consumer Discretionary | | | 966 | | | | 307,903 | | | | 0.66 | |
Aon PLC | | Financials | | | 1,278 | | | | 305,079 | | | | 0.65 | |
Mettler-Toledo International Inc | | Health Care | | | 219 | | | | 302,962 | | | | 0.65 | |
Eaton Corp PLC | | Industrials | | | 2,000 | | | | 296,407 | | | | 0.63 | |
Marsh & McLennan Cos Inc | | Financials | | | 2,104 | | | | 295,981 | | | | 0.63 | |
Zebra Technologies Corp | | Information Technology | | | 558 | | | | 295,678 | | | | 0.63 | |
Vertex Pharmaceuticals Inc | | Health Care | | | 1,448 | | | | 291,932 | | | | 0.62 | |
Fiserv Inc | | Information Technology | | | 2,713 | | | | 290,019 | | | | 0.62 | |
| | |
| The accompanying notes are an integral part of these financial statements. | | 35 |
GOLDMAN SACHS ALTERNATIVE PREMIA FUND
Consolidated Schedule of Investments (continued)
June 30, 2021 (Unaudited)
|
| ADDITIONAL INVESTMENT INFORMATION (continued) |
| | | | | | | | | | | | | | |
| Common Stocks | | Sector | | Shares | | | Value | | | Weight | |
Alphabet Inc | | Communication Services | | | 110 | | | $ | 275,779 | | | | 0.59 | % |
Southern Co/The | | Utilities | | | 4,499 | | | | 272,206 | | | | 0.58 | |
Moody’s Corp | | Financials | | | 744 | | | | 269,474 | | | | 0.58 | |
Netflix Inc | | Communication Services | | | 496 | | | | 262,028 | | | | 0.56 | |
Autodesk Inc | | Information Technology | | | 890 | | | | 259,895 | | | | 0.56 | |
Tractor Supply Co | | Consumer Discretionary | | | 1,397 | | | | 259,834 | | | | 0.56 | |
Air Products and Chemicals Inc | | Materials | | | 884 | | | | 254,291 | | | | 0.54 | |
Otis Worldwide Corp | | Industrials | | | 3,064 | | | | 250,579 | | | | 0.54 | |
Emerson Electric Co | | Industrials | | | 2,585 | | | | 248,768 | | | | 0.53 | |
TJX Cos Inc/The | | Consumer Discretionary | | | 3,655 | | | | 246,417 | | | | 0.53 | |
Cisco Systems Inc/Delaware | | Information Technology | | | 4,435 | | | | 235,045 | | | | 0.50 | |
Constellation Brands Inc | | Consumer Staples | | | 998 | | | | 233,337 | | | | 0.50 | |
VF Corp | | Consumer Discretionary | | | 2,782 | | | | 228,274 | | | | 0.49 | |
NIKE Inc | | Consumer Discretionary | | | 1,476 | | | | 228,000 | | | | 0.49 | |
Baxter International Inc | | Health Care | | | 2,821 | | | | 227,089 | | | | 0.49 | |
Palo Alto Networks Inc | | Information Technology | | | 602 | | | | 223,363 | | | | 0.48 | |
Illinois Tool Works Inc | | Industrials | | | 988 | | | | 220,777 | | | | 0.47 | |
SVB Financial Group | | Financials | | | 395 | | | | 219,903 | | | | 0.47 | |
Dominion Energy Inc | | Utilities | | | 2,953 | | | | 217,288 | | | | 0.46 | |
Fastenal Co | | Industrials | | | 4,166 | | | | 216,640 | | | | 0.46 | |
Philip Morris International Inc | | Consumer Staples | | | 2,151 | | | | 213,201 | | | | 0.46 | |
Ecolab Inc | | Materials | | | 1,029 | | | | 211,905 | | | | 0.45 | |
General Electric Co | | Industrials | | | 15,726 | | | | 211,667 | | | | 0.45 | |
Baker Hughes Co | | Energy | | | 9,254 | | | | 211,635 | | | | 0.45 | |
Cadence Design Systems Inc | | Information Technology | | | 1,540 | | | | 210,767 | | | | 0.45 | |
SBA Communications Corp | | Real Estate | | | 654 | | | | 208,361 | | | | 0.45 | |
Global Payments Inc | | Information Technology | | | 1,109 | | | | 207,991 | | | | 0.44 | |
Hershey Co/The | | Consumer Staples | | | 1,177 | | | | 204,992 | | | | 0.44 | |
Texas Instruments Inc | | Information Technology | | | 1,058 | | | | 203,483 | | | | 0.44 | |
Linde PLC | | Materials | | | 682 | | | | 197,226 | | | | 0.42 | |
Rockwell Automation Inc | | Industrials | | | 680 | | | | 194,469 | | | | 0.42 | |
Mastercard Inc | | Information Technology | | | 529 | | | | 193,161 | | | | 0.41 | |
Marathon Oil Corp | | Energy | | | 14,166 | | | | 192,940 | | | | 0.41 | |
Bank of America Corp | | Financials | | | 4,650 | | | | 191,732 | | | | 0.41 | |
Stanley Black & Decker Inc | | Industrials | | | 891 | | | | 182,702 | | | | 0.39 | |
VeriSign Inc | | Information Technology | | | 785 | | | | 178,820 | | | | 0.38 | |
Keysight Technologies Inc | | Information Technology | | | 1,157 | | | | 178,681 | | | | 0.38 | |
Bristol-Myers Squibb Co | | Health Care | | | 2,671 | | | | 178,481 | | | | 0.38 | |
American Electric Power Co Inc | | Utilities | | | 2,097 | | | | 177,390 | | | | 0.38 | |
eBay Inc | | Consumer Discretionary | | | 2,491 | | | | 174,885 | | | | 0.37 | |
Booking Holdings Inc | | Consumer Discretionary | | | 78 | | | | 171,544 | | | | 0.37 | |
TE Connectivity Ltd | | Information Technology | | | 1,260 | | | | 170,349 | | | | 0.36 | |
Old Dominion Freight Line Inc | | Industrials | | | 655 | | | | 166,163 | | | | 0.36 | |
UnitedHealth Group Inc | | Health Care | | | 413 | | | | 165,232 | | | | 0.35 | |
Amgen Inc | | Health Care | | | 676 | | | | 164,724 | | | | 0.35 | |
Gartner Inc | | Information Technology | | | 677 | | | | 164,009 | | | | 0.35 | |
MSCI Inc | | Financials | | | 307 | | | | 163,750 | | | | 0.35 | |
Monolithic Power Systems Inc | | Information Technology | | | 432 | | | | 161,286 | | | | 0.34 | |
Target Corp | | Consumer Discretionary | | | 666 | | | | 161,038 | | | | 0.34 | |
Micron Technology Inc | | Information Technology | | | 1,714 | | | | 145,637 | | | | 0.31 | |
PPL Corp | | Utilities | | | 5,164 | | | | 144,431 | | | | 0.31 | |
Expeditors International of Washington I | | Industrials | | | 1,133 | | | | 143,424 | | | | 0.31 | |
Copart Inc | | Industrials | | | 1,065 | | | | 140,403 | | | | 0.30 | |
CVS Health Corp | | Health Care | | | 1,681 | | | | 140,243 | | | | 0.30 | |
Ingersoll Rand Inc | | Industrials | | | 2,823 | | | | 137,782 | | | | 0.29 | |
Chevron Corp | | Energy | | | 1,315 | | | | 137,723 | | | | 0.29 | |
Deere & Co | | Industrials | | | 390 | | | | 137,452 | | | | 0.29 | |
salesforce.com Inc | | Information Technology | | | 558 | | | | 136,294 | | | | 0.29 | |
CSX Corp | | Industrials | | | 4,183 | | | | 134,179 | | | | 0.29 | |
American Water Works Co Inc | | Utilities | | | 862 | | | | 132,849 | | | | 0.28 | |
Teleflex Inc | | Health Care | | | 330 | | | | 132,447 | | | | 0.28 | |
| | |
| 36 | | The accompanying notes are an integral part of these financial statements. |
GOLDMAN SACHS ALTERNATIVE PREMIA FUND
|
| ADDITIONAL INVESTMENT INFORMATION (continued) |
| | | | | | | | | | | | | | |
| Common Stocks | | Sector | | Shares | | | Value | | | Weight | |
AvalonBay Communities Inc | | Real Estate | | | 625 | | | $ | 130,410 | | | | 0.28 | % |
AT&T Inc | | Communication Services | | | 4,440 | | | | 127,792 | | | | 0.27 | |
STERIS PLC | | Health Care | | | 619 | | | | 127,687 | | | | 0.27 | |
Jack Henry & Associates Inc | | Information Technology | | | 774 | | | | 126,616 | | | | 0.27 | |
Morgan Stanley | | Financials | | | 1,378 | | | | 126,365 | | | | 0.27 | |
FleetCor Technologies Inc | | Information Technology | | | 492 | | | | 126,084 | | | | 0.27 | |
ResMed Inc | | Health Care | | | 508 | | | | 125,116 | | | | 0.27 | |
Alexandria Real Estate Equities Inc | | Real Estate | | | 685 | | | | 124,622 | | | | 0.27 | |
Biogen Inc | | Health Care | | | 358 | | | | 123,988 | | | | 0.27 | |
AbbVie Inc | | Health Care | | | 1,099 | | | | 123,839 | | | | 0.26 | |
Dexcom Inc | | Health Care | | | 286 | | | | 121,963 | | | | 0.26 | |
Charles Schwab Corp/The | | Financials | | | 1,661 | | | | 120,907 | | | | 0.26 | |
Mondelez International Inc | | Consumer Staples | | | 1,934 | | | | 120,749 | | | | 0.26 | |
Signature Bank/New York NY | | Financials | | | 489 | | | | 120,057 | | | | 0.26 | |
Republic Services Inc | | Industrials | | | 1,089 | | | | 119,787 | | | | 0.26 | |
Adobe Inc | | Information Technology | | | 204 | | | | 119,482 | | | | 0.26 | |
Bio-Techne Corp | | Health Care | | | 263 | | | | 118,286 | | | | 0.25 | |
CMS Energy Corp | | Utilities | | | 1,971 | | | | 116,473 | | | | 0.25 | |
Exxon Mobil Corp | | Energy | | | 1,822 | | | | 114,901 | | | | 0.25 | |
AMETEK Inc | | Industrials | | | 849 | | | | 113,292 | | | | 0.24 | |
Oracle Corp | | Information Technology | | | 1,441 | | | | 112,130 | | | | 0.24 | |
Anthem Inc | | Health Care | | | 289 | | | | 110,453 | | | | 0.24 | |
Celanese Corp | | Materials | | | 729 | | | | 110,443 | | | | 0.24 | |
Black Knight Inc | | Information Technology | | | 1,414 | | | | 110,294 | | | | 0.24 | |
Herbalife Nutrition Ltd | | Consumer Staples | | | 2,037 | | | | 107,411 | | | | 0.23 | |
HCA Healthcare Inc | | Health Care | | | 512 | | | | 105,874 | | | | 0.23 | |
Intel Corp | | Information Technology | | | 1,879 | | | | 105,477 | | | | 0.23 | |
T Rowe Price Group Inc | | Financials | | | 523 | | | | 103,562 | | | | 0.22 | |
Analog Devices Inc | | Information Technology | | | 601 | | | | 103,399 | | | | 0.22 | |
News Corp | | Communication Services | | | 3,978 | | | | 102,517 | | | | 0.22 | |
Nasdaq Inc | | Financials | | | 580 | | | | 102,039 | | | | 0.22 | |
Masco Corp | | Industrials | | | 1,709 | | | | 100,661 | | | | 0.22 | |
Xylem Inc/NY | | Industrials | | | 834 | | | | 100,042 | | | | 0.21 | |
FactSet Research Systems Inc | | Financials | | | 298 | | | | 99,861 | | | | 0.21 | |
Avery Dennison Corp | | Materials | | | 448 | | | | 94,269 | | | | 0.20 | |
Brown-Forman Corp | | Consumer Staples | | | 1,228 | | | | 92,010 | | | | 0.20 | |
Roku Inc | | Communication Services | | | 196 | | | | 89,906 | | | | 0.19 | |
Broadcom Inc | | Information Technology | | | 187 | | | | 89,196 | | | | 0.19 | |
Starbucks Corp | | Consumer Discretionary | | | 789 | | | | 88,222 | | | | 0.19 | |
T-Mobile US Inc | | Communication Services | | | 602 | | | | 87,251 | | | | 0.19 | |
PepsiCo Inc | | Consumer Staples | | | 585 | | | | 86,613 | | | | 0.19 | |
Merck & Co Inc | | Health Care | | | 1,102 | | | | 85,716 | | | | 0.18 | |
Bunge Ltd | | Consumer Staples | | | 1,096 | | | | 85,669 | | | | 0.18 | |
Hologic Inc | | Health Care | | | 1,284 | | | | 85,650 | | | | 0.18 | |
Fair Isaac Corp | | Information Technology | | | 169 | | | | 85,042 | | | | 0.18 | |
Agilent Technologies Inc | | Health Care | | | 571 | | | | 84,370 | | | | 0.18 | |
Duke Realty Corp | | Real Estate | | | 1,761 | | | | 83,383 | | | | 0.18 | |
First American Financial Corp | | Financials | | | 1,334 | | | | 83,156 | | | | 0.18 | |
Electronic Arts Inc | | Communication Services | | | 576 | | | | 82,889 | | | | 0.18 | |
Allegion plc | | Industrials | | | 595 | | | | 82,834 | | | | 0.18 | |
Amcor PLC | | Materials | | | 7,204 | | | | 82,558 | | | | 0.18 | |
Twilio Inc | | Information Technology | | | 209 | | | | 82,405 | | | | 0.18 | |
General Mills Inc | | Consumer Staples | | | 1,323 | | | | 80,620 | | | | 0.17 | |
Kroger Co/The | | Consumer Staples | | | 2,073 | | | | 79,425 | | | | 0.17 | |
Lamb Weston Holdings Inc | | Consumer Staples | | | 981 | | | | 79,101 | | | | 0.17 | |
Monster Beverage Corp | | Consumer Staples | | | 865 | | | | 79,030 | | | | 0.17 | |
EQT Corp | | Energy | | | 3,544 | | | | 78,900 | | | | 0.17 | |
Interactive Brokers Group Inc | | Financials | | | 1,197 | | | | 78,683 | | | | 0.17 | |
CME Group Inc | | Financials | | | 370 | | | | 78,591 | | | | 0.17 | |
AutoZone Inc | | Consumer Discretionary | | | 52 | | | | 77,992 | | | | 0.17 | |
Vertiv Holdings Co | | Industrials | | | 2,837 | | | | 77,439 | | | | 0.17 | |
| | |
| The accompanying notes are an integral part of these financial statements. | | 37 |
GOLDMAN SACHS ALTERNATIVE PREMIA FUND
Consolidated Schedule of Investments (continued)
June 30, 2021 (Unaudited)
|
| ADDITIONAL INVESTMENT INFORMATION (continued) |
| | | | | | | | | | | | | | |
| Common Stocks | | Sector | | Shares | | | Value | | | Weight | |
Manhattan Associates Inc | | Information Technology | | | 534 | | | $ | 77,296 | | | | 0.17 | % |
Capital One Financial Corp | | Financials | | | 499 | | | | 77,162 | | | | 0.16 | |
DocuSign Inc | | Information Technology | | | 270 | | | | 75,367 | | | | 0.16 | |
McDonald’s Corp | | Consumer Discretionary | | | 325 | | | | 75,085 | | | | 0.16 | |
Laboratory Corp of America Holdings | | Health Care | | | 272 | | | | 74,996 | | | | 0.16 | |
CubeSmart | | Real Estate | | | 1,609 | | | | 74,540 | | | | 0.16 | |
MetLife Inc | | Financials | | | 1,243 | | | | 74,389 | | | | 0.16 | |
Activision Blizzard Inc | | Communication Services | | | 777 | | | | 74,124 | | | | 0.16 | |
Best Buy Co Inc | | Consumer Discretionary | | | 644 | | | | 74,065 | | | | 0.16 | |
Amedisys Inc | | Health Care | | | 296 | | | | 72,542 | | | | 0.16 | |
Life Storage Inc | | Real Estate | | | 675 | | | | 72,497 | | | | 0.16 | |
Medtronic PLC | | Health Care | | | 584 | | | | 72,447 | | | | 0.15 | |
Trimble Inc | | Information Technology | | | 884 | | | | 72,370 | | | | 0.15 | |
United Parcel Service Inc | | Industrials | | | 347 | | | | 72,179 | | | | 0.15 | |
Norfolk Southern Corp | | Industrials | | | 271 | | | | 72,037 | | | | 0.15 | |
Sun Communities Inc | | Real Estate | | | 420 | | | | 71,981 | | | | 0.15 | |
Wynn Resorts Ltd | | Consumer Discretionary | | | 585 | | | | 71,603 | | | | 0.15 | |
Wayfair Inc | | Consumer Discretionary | | | 226 | | | | 71,214 | | | | 0.15 | |
Teradyne Inc | | Information Technology | | | 529 | | | | 70,814 | | | | 0.15 | |
Broadridge Financial Solutions Inc | | Information Technology | | | 435 | | | | 70,280 | | | | 0.15 | |
Dollar General Corp | | Consumer Discretionary | | | 314 | | | | 67,958 | | | | 0.15 | |
Zoetis Inc | | Health Care | | | 364 | | | | 67,926 | | | | 0.15 | |
Archer-Daniels-Midland Co | | Consumer Staples | | | 1,119 | | | | 67,792 | | | | 0.14 | |
International Business Machines Corp | | Information Technology | | | 458 | | | | 67,207 | | | | 0.14 | |
Intuit Inc | | Information Technology | | | 137 | | | | 67,194 | | | | 0.14 | |
Domino’s Pizza Inc | | Consumer Discretionary | | | 142 | | | | 66,301 | | | | 0.14 | |
Carrier Global Corp | | Industrials | | | 1,355 | | | | 65,843 | | | | 0.14 | |
Cerner Corp | | Health Care | | | 839 | | | | 65,577 | | | | 0.14 | |
Regeneron Pharmaceuticals Inc | | Health Care | | | 117 | | | | 65,555 | | | | 0.14 | |
Take-Two Interactive Software Inc | | Communication Services | | | 369 | | | | 65,252 | | | | 0.14 | |
Incyte Corp | | Health Care | | | 769 | | | | 64,684 | | | | 0.14 | |
Dolby Laboratories Inc | | Information Technology | | | 655 | | | | 64,351 | | | | 0.14 | |
Gentex Corp | | Consumer Discretionary | | | 1,944 | | | | 64,324 | | | | 0.14 | |
Brunswick Corp/DE | | Consumer Discretionary | | | 645 | | | | 64,262 | | | | 0.14 | |
Crowdstrike Holdings Inc | | Information Technology | | | 253 | | | | 63,601 | | | | 0.14 | |
PNC Financial Services Group Inc/The | | Financials | | | 333 | | | | 63,495 | | | | 0.14 | |
CarMax Inc | | Consumer Discretionary | | | 491 | | | | 63,475 | | | | 0.14 | |
American Financial Group Inc/OH | | Financials | | | 508 | | | | 63,413 | | | | 0.14 | |
Tapestry Inc | | Consumer Discretionary | | | 1,447 | | | | 62,913 | | | | 0.13 | |
RenaissanceRe Holdings Ltd | | Financials | | | 423 | | | | 62,908 | | | | 0.13 | |
Bruker Corp | | Health Care | | | 819 | | | | 62,250 | | | | 0.13 | |
Carter’s Inc | | Consumer Discretionary | | | 601 | | | | 62,011 | | | | 0.13 | |
Corteva Inc | | Materials | | | 1,397 | | | | 61,976 | | | | 0.13 | |
PulteGroup Inc | | Consumer Discretionary | | | 1,134 | | | | 61,872 | | | | 0.13 | |
KKR & Co Inc | | Financials | | | 1,044 | | | | 61,843 | | | | 0.13 | |
Atlassian Corp PLC | | Information Technology | | | 239 | | | | 61,473 | | | | 0.13 | |
Ulta Beauty Inc | | Consumer Discretionary | | | 177 | | | | 61,191 | | | | 0.13 | |
Voya Financial Inc | | Financials | | | 988 | | | | 60,735 | | | | 0.13 | |
IDEXX Laboratories Inc | | Health Care | | | 95 | | | | 60,226 | | | | 0.13 | |
Trex Co Inc | | Industrials | | | 586 | | | | 59,935 | | | | 0.13 | |
Envista Holdings Corp | | Health Care | | | 1,385 | | | | 59,848 | | | | 0.13 | |
General Dynamics Corp | | Industrials | | | 315 | | | | 59,210 | | | | 0.13 | |
Bank of New York Mellon Corp/The | | Financials | | | 1,151 | | | | 58,954 | | | | 0.13 | |
Dollar Tree Inc | | Consumer Discretionary | | | 589 | | | | 58,619 | | | | 0.13 | |
Rollins Inc | | Industrials | | | 1,699 | | | | 58,094 | | | | 0.12 | |
ABIOMED Inc | | Health Care | | | 186 | | | | 57,953 | | | | 0.12 | |
Becton Dickinson and Co | | Health Care | | | 237 | | | | 57,532 | | | | 0.12 | |
New York Times Co/The | | Communication Services | | | 1,303 | | | | 56,745 | | | | 0.12 | |
3M Co | | Industrials | | | 286 | | | | 56,735 | | | | 0.12 | |
American Express Co | | Financials | | | 342 | | | | 56,436 | | | | 0.12 | |
Spotify Technology SA | | Communication Services | | | 204 | | | | 56,226 | | | | 0.12 | |
| | |
| 38 | | The accompanying notes are an integral part of these financial statements. |
GOLDMAN SACHS ALTERNATIVE PREMIA FUND
|
| ADDITIONAL INVESTMENT INFORMATION (continued) |
| | | | | | | | | | | | | | |
| Common Stocks | | Sector | | Shares | | | Value | | | Weight | |
HP Inc | | Information Technology | | | 1,860 | | | $ | 56,168 | | | | 0.12 | % |
Newmont Corp | | Materials | | | 883 | | | | 55,966 | | | | 0.12 | |
Intercontinental Exchange Inc | | Financials | | | 461 | | | | 54,693 | | | | 0.12 | |
Zscaler Inc | | Information Technology | | | 252 | | | | 54,482 | | | | 0.12 | |
Chemed Corp | | Health Care | | | 113 | | | | 53,734 | | | | 0.11 | |
OneMain Holdings Inc | | Financials | | | 888 | | | | 53,176 | | | | 0.11 | |
American International Group Inc | | Financials | | | 1,101 | | | | 52,419 | | | | 0.11 | |
Kellogg Co | | Consumer Staples | | | 811 | | | | 52,203 | | | | 0.11 | |
Gilead Sciences Inc | | Health Care | | | 756 | | | | 52,060 | | | | 0.11 | |
Northern Trust Corp | | Financials | | | 446 | | | | 51,577 | | | | 0.11 | |
Boston Beer Co Inc/The | | Consumer Staples | | | 50 | | | | 51,481 | | | | 0.11 | |
Paychex Inc | | Information Technology | | | 474 | | | | 50,818 | | | | 0.11 | |
Waste Management Inc | | Industrials | | | 362 | | | | 50,747 | | | | 0.11 | |
DR Horton Inc | | Consumer Discretionary | | | 544 | | | | 49,139 | | | | 0.11 | |
CH Robinson Worldwide Inc | | Industrials | | | 510 | | | | 47,798 | | | | 0.10 | |
Hain Celestial Group Inc/The | | Consumer Staples | | | 1,176 | | | | 47,180 | | | | 0.10 | |
Beyond Meat Inc | | Consumer Staples | | | 299 | | | | 47,078 | | | | 0.10 | |
A O Smith Corp | | Industrials | | | 651 | | | | 46,913 | | | | 0.10 | |
ITT Inc | | Industrials | | | 512 | | | | 46,905 | | | | 0.10 | |
J M Smucker Co/The | | Consumer Staples | | | 353 | | | | 45,801 | | | | 0.10 | |
Equifax Inc | | Industrials | | | 189 | | | | 45,241 | | | | 0.10 | |
Crown Castle International Corp | | Real Estate | | | 232 | | | | 45,171 | | | | 0.10 | |
Liberty Broadband Corp | | Communication Services | | | 268 | | | | 45,027 | | | | 0.10 | |
Arista Networks Inc | | Information Technology | | | 124 | | | | 45,015 | | | | 0.10 | |
McKesson Corp | | Health Care | | | 235 | | | | 44,979 | | | | 0.10 | |
Ford Motor Co | | Consumer Discretionary | | | 3,012 | | | | 44,761 | | | | 0.10 | |
Integra LifeSciences Holdings Corp | | Health Care | | | 656 | | | | 44,740 | | | | 0.10 | |
Public Storage | | Real Estate | | | 148 | | | | 44,390 | | | | 0.09 | |
Yum China Holdings Inc | | Consumer Discretionary | | | 667 | | | | 44,194 | | | | 0.09 | |
US Bancorp | | Financials | | | 773 | | | | 44,037 | | | | 0.09 | |
Equinix Inc | | Real Estate | | | 54 | | | | 43,421 | | | | 0.09 | |
Citizens Financial Group Inc | | Financials | | | 943 | | | | 43,238 | | | | 0.09 | |
Lincoln National Corp | | Financials | | | 687 | | | | 43,187 | | | | 0.09 | |
Toro Co/The | | Industrials | | | 390 | | | | 42,821 | | | | 0.09 | |
F5 Networks Inc | | Information Technology | | | 226 | �� | | | 42,190 | | | | 0.09 | |
CoStar Group Inc | | Industrials | | | 504 | | | | 41,768 | | | | 0.09 | |
Hubbell Inc | | Industrials | | | 223 | | | | 41,717 | | | | 0.09 | |
Elastic NV | | Information Technology | | | 284 | | | | 41,433 | | | | 0.09 | |
Horizon Therapeutics Plc | | Health Care | | | 436 | | | | 40,828 | | | | 0.09 | |
Hexcel Corp | | Industrials | | | 653 | | | | 40,768 | | | | 0.09 | |
NXP Semiconductors NV | | Information Technology | | | 198 | | | | 40,651 | | | | 0.09 | |
PACCAR Inc | | Industrials | | | 449 | | | | 40,060 | | | | 0.09 | |
Humana Inc | | Health Care | | | 90 | | | | 39,986 | | | | 0.09 | |
Cardinal Health Inc | | Health Care | | | 681 | | | | 38,895 | | | | 0.08 | |
Progressive Corp/The | | Financials | | | 395 | | | | 38,813 | | | | 0.08 | |
Boston Scientific Corp | | Health Care | | | 905 | | | | 38,718 | | | | 0.08 | |
Charles River Laboratories International | | Health Care | | | 103 | | | | 38,159 | | | | 0.08 | |
Five Below Inc | | Consumer Discretionary | | | 194 | | | | 37,570 | | | | 0.08 | |
Masimo Corp | | Health Care | | | 154 | | | | 37,238 | | | | 0.08 | |
Nordson Corp | | Industrials | | | 170 | | | | 37,237 | | | | 0.08 | |
Zimmer Biomet Holdings Inc | | Health Care | | | 232 | | | | 37,234 | | | | 0.08 | |
McCormick & Co Inc/MD | | Consumer Staples | | | 420 | | | | 37,091 | | | | 0.08 | |
Garmin Ltd | | Consumer Discretionary | | | 256 | | | | 37,069 | | | | 0.08 | |
Insulet Corp | | Health Care | | | 135 | | | | 37,002 | | | | 0.08 | |
BWX Technologies Inc | | Industrials | | | 622 | | | | 36,159 | | | | 0.08 | |
AmerisourceBergen Corp | | Health Care | | | 313 | | | | 35,851 | | | | 0.08 | |
Avalara Inc | | Information Technology | | | 220 | | | | 35,607 | | | | 0.08 | |
Conagra Brands Inc | | Consumer Staples | | | 976 | | | | 35,493 | | | | 0.08 | |
SolarEdge Technologies Inc | | Information Technology | | | 128 | | | | 35,478 | | | | 0.08 | |
Cboe Global Markets Inc | | Financials | | | 294 | | | | 35,041 | | | | 0.07 | |
PTC Inc | | Information Technology | | | 246 | | | | 34,778 | | | | 0.07 | |
| | |
| The accompanying notes are an integral part of these financial statements. | | 39 |
GOLDMAN SACHS ALTERNATIVE PREMIA FUND
Consolidated Schedule of Investments (continued)
June 30, 2021 (Unaudited)
|
| ADDITIONAL INVESTMENT INFORMATION (continued) |
| | | | | | | | | | | | | | |
| Common Stocks | | Sector | | Shares | | | Value | | | Weight | |
Penumbra Inc | | Health Care | | | 126 | | | $ | 34,553 | | | | 0.07 | % |
Synopsys Inc | | Information Technology | | | 125 | | | | 34,392 | | | | 0.07 | |
Viatris Inc | | Health Care | | | 2,404 | | | | 34,350 | | | | 0.07 | |
Five9 Inc | | Information Technology | | | 187 | | | | 34,305 | | | | 0.07 | |
Campbell Soup Co | | Consumer Staples | | | 752 | | | | 34,300 | | | | 0.07 | |
Vistra Corp | | Utilities | | | 1,840 | | | | 34,129 | | | | 0.07 | |
Cooper Cos Inc/The | | Health Care | | | 85 | | | | 33,792 | | | | 0.07 | |
Johnson Controls International plc | | Industrials | | | 491 | | | | 33,699 | | | | 0.07 | |
Westinghouse Air Brake Technologies Corp | | Industrials | | | 409 | | | | 33,657 | | | | 0.07 | |
Capri Holdings Ltd | | Consumer Discretionary | | | 587 | | | | 33,562 | | | | 0.07 | |
Regal Beloit Corp | | Industrials | | | 251 | | | | 33,544 | | | | 0.07 | |
Molina Healthcare Inc | | Health Care | | | 132 | | | | 33,530 | | | | 0.07 | |
Credit Acceptance Corp | | Financials | | | 74 | | | | 33,520 | | | | 0.07 | |
Kimberly-Clark Corp | | Consumer Staples | | | 250 | | | | 33,488 | | | | 0.07 | |
Marathon Petroleum Corp | | Energy | | | 554 | | | | 33,463 | | | | 0.07 | |
Booz Allen Hamilton Holding Corp | | Industrials | | | 388 | | | | 33,078 | | | | 0.07 | |
Guardant Health Inc | | Health Care | | | 266 | | | | 33,024 | | | | 0.07 | |
IQVIA Holdings Inc | | Health Care | | | 136 | | | | 32,996 | | | | 0.07 | |
Tyler Technologies Inc | | Information Technology | | | 72 | | | | 32,769 | | | | 0.07 | |
IPG Photonics Corp | | Information Technology | | | 155 | | | | 32,662 | | | | 0.07 | |
United Therapeutics Corp | | Health Care | | | 181 | | | | 32,490 | | | | 0.07 | |
Quest Diagnostics Inc | | Health Care | | | 243 | | | | 32,007 | | | | 0.07 | |
Akamai Technologies Inc | | Information Technology | | | 274 | | | | 31,968 | | | | 0.07 | |
DaVita Inc | | Health Care | | | 264 | | | | 31,748 | | | | 0.07 | |
Allstate Corp/The | | Financials | | | 243 | | | | 31,696 | | | | 0.07 | |
O’Reilly Automotive Inc | | Consumer Discretionary | | | 56 | | | | 31,670 | | | | 0.07 | |
IDACORP Inc | | Utilities | | | 325 | | | | 31,648 | | | | 0.07 | |
Neurocrine Biosciences Inc | | Health Care | | | 323 | | | | 31,412 | | | | 0.07 | |
Axon Enterprise Inc | | Industrials | | | 177 | | | | 31,207 | | | | 0.07 | |
PPG Industries Inc | | Materials | | | 183 | | | | 31,134 | | | | 0.07 | |
Cognizant Technology Solutions Corp | | Information Technology | | | 449 | | | | 31,087 | | | | 0.07 | |
Generac Holdings Inc | | Industrials | | | 75 | | | | 31,025 | | | | 0.07 | |
Dropbox Inc | | Information Technology | | | 1,023 | | | | 31,016 | | | | 0.07 | |
Flowserve Corp | | Industrials | | | 750 | | | | 30,224 | | | | 0.06 | |
Burlington Stores Inc | | Consumer Discretionary | | | 94 | | | | 30,115 | | | | 0.06 | |
Element Solutions Inc | | Materials | | | 1,270 | | | | 29,681 | | | | 0.06 | |
Yum! Brands Inc | | Consumer Discretionary | | | 257 | | | | 29,586 | | | | 0.06 | |
Berry Global Group Inc | | Materials | | | 452 | | | | 29,483 | | | | 0.06 | |
Motorola Solutions Inc | | Information Technology | | | 136 | | | | 29,428 | | | | 0.06 | |
Discover Financial Services | | Financials | | | 248 | | | | 29,394 | | | | 0.06 | |
Globus Medical Inc | | Health Care | | | 378 | | | | 29,325 | | | | 0.06 | |
Advance Auto Parts Inc | | Consumer Discretionary | | | 142 | | | | 29,156 | | | | 0.06 | |
Trane Technologies PLC | | Industrials | | | 158 | | | | 29,126 | | | | 0.06 | |
Parker-Hannifin Corp | | Industrials | | | 94 | | | | 29,005 | | | | 0.06 | |
Amphenol Corp | | Information Technology | | | 424 | | | | 28,981 | | | | 0.06 | |
DuPont de Nemours Inc | | Materials | | | 374 | | | | 28,925 | | | | 0.06 | |
Hormel Foods Corp | | Consumer Staples | | | 605 | | | | 28,876 | | | | 0.06 | |
QIAGEN NV | | Health Care | | | 596 | | | | 28,857 | | | | 0.06 | |
Ollie’s Bargain Outlet Holdings Inc | | Consumer Discretionary | | | 343 | | | | 28,852 | | | | 0.06 | |
MDU Resources Group Inc | | Utilities | | | 920 | | | | 28,838 | | | | 0.06 | |
Leidos Holdings Inc | | Industrials | | | 284 | | | | 28,738 | | | | 0.06 | |
First Solar Inc | | Information Technology | | | 315 | | | | 28,467 | | | | 0.06 | |
Discovery Inc | | Communication Services | | | 927 | | | | 28,455 | | | | 0.06 | |
Everbridge Inc | | Information Technology | | | 209 | | | | 28,449 | | | | 0.06 | |
Haemonetics Corp | | Health Care | | | 426 | | | | 28,414 | | | | 0.06 | |
Jazz Pharmaceuticals PLC | | Health Care | | | 159 | | | | 28,261 | | | | 0.06 | |
Valero Energy Corp | | Energy | | | 361 | | | | 28,173 | | | | 0.06 | |
Aflac Inc | | Financials | | | 524 | | | | 28,144 | | | | 0.06 | |
Sysco Corp | | Consumer Staples | | | 360 | | | | 28,018 | | | | 0.06 | |
Cummins Inc | | Industrials | | | 114 | | | | 27,833 | | | | 0.06 | |
Federal Realty Investment Trust | | Real Estate | | | 235 | | | | 27,558 | | | | 0.06 | |
| | |
| 40 | | The accompanying notes are an integral part of these financial statements. |
GOLDMAN SACHS ALTERNATIVE PREMIA FUND
|
| ADDITIONAL INVESTMENT INFORMATION (continued) |
| | | | | | | | | | | | | | |
| Common Stocks | | Sector | | Shares | | | Value | | | Weight | |
Lennox International Inc | | Industrials | | | 78 | | | $ | 27,341 | | | | 0.06 | % |
IAA Inc | | Industrials | | | 500 | | | | 27,255 | | | | 0.06 | |
Expedia Group Inc | | Consumer Discretionary | | | 165 | | | | 27,020 | | | | 0.06 | |
Henry Schein Inc | | Health Care | | | 363 | | | | 26,939 | | | | 0.06 | |
Switch Inc | | Information Technology | | | 1,276 | | | | 26,935 | | | | 0.06 | |
Perrigo Co PLC | | Health Care | | | 587 | | | | 26,928 | | | | 0.06 | |
Zynga Inc | | Communication Services | | | 2,527 | | | | 26,863 | | | | 0.06 | |
Medallia Inc | | Information Technology | | | 796 | | | | 26,862 | | | | 0.06 | |
Grocery Outlet Holding Corp | | Consumer Staples | | | 771 | | | | 26,712 | | | | 0.06 | |
AptarGroup Inc | | Materials | | | 189 | | | | 26,668 | | | | 0.06 | |
Acuity Brands Inc | | Industrials | | | 143 | | | | 26,668 | | | | 0.06 | |
Ubiquiti Inc | | Information Technology | | | 85 | | | | 26,622 | | | | 0.06 | |
Halliburton Co | | Energy | | | 1,150 | | | | 26,584 | | | | 0.06 | |
NortonLifeLock Inc | | Information Technology | | | 974 | | | | 26,507 | | | | 0.06 | |
Hilton Worldwide Holdings Inc | | Consumer Discretionary | | | 218 | | | | 26,268 | | | | 0.06 | |
Donaldson Co Inc | | Industrials | | | 413 | | | | 26,214 | | | | 0.06 | |
Skechers USA Inc | | Consumer Discretionary | | | 518 | | | | 25,793 | | | | 0.06 | |
Juniper Networks Inc | | Information Technology | | | 942 | | | | 25,756 | | | | 0.06 | |
Waters Corp | | Health Care | | | 74 | | | | 25,670 | | | | 0.05 | |
Clorox Co/The | | Consumer Staples | | | 143 | | | | 25,652 | | | | 0.05 | |
Cirrus Logic Inc | | Information Technology | | | 301 | | | | 25,640 | | | | 0.05 | |
Alleghany Corp | | Financials | | | 38 | | | | 25,384 | | | | 0.05 | |
Brown & Brown Inc | | Financials | | | 473 | | | | 25,143 | | | | 0.05 | |
Lincoln Electric Holdings Inc | | Industrials | | | 191 | | | | 25,121 | | | | 0.05 | |
Ciena Corp | | Information Technology | | | 437 | | | | 24,857 | | | | 0.05 | |
Verisk Analytics Inc | | Industrials | | | 142 | | | | 24,832 | | | | 0.05 | |
CDW Corp/DE | | Information Technology | | | 142 | | | | 24,823 | | | | 0.05 | |
PagerDuty Inc | | Information Technology | | | 581 | | | | 24,734 | | | | 0.05 | |
Newell Brands Inc | | Consumer Discretionary | | | 900 | | | | 24,723 | | | | 0.05 | |
Ionis Pharmaceuticals Inc | | Health Care | | | 611 | | | | 24,378 | | | | 0.05 | |
Commerce Bancshares Inc/MO | | Financials | | | 326 | | | | 24,304 | | | | 0.05 | |
Casey’s General Stores Inc | | Consumer Staples | | | 124 | | | | 24,094 | | | | 0.05 | |
Americold Realty Trust | | Real Estate | | | 624 | | | | 23,635 | | | | 0.05 | |
CDK Global Inc | | Information Technology | | | 468 | | | | 23,237 | | | | 0.05 | |
United Rentals Inc | | Industrials | | | 72 | | | | 22,962 | | | | 0.05 | |
Edison International | | Utilities | | | 396 | | | | 22,904 | | | | 0.05 | |
Amdocs Ltd | | Information Technology | | | 294 | | | | 22,735 | | | | 0.05 | |
Choice Hotels International Inc | | Consumer Discretionary | | | 191 | | | | 22,670 | | | | 0.05 | |
Citrix Systems Inc | | Information Technology | | | 192 | | | | 22,528 | | | | 0.05 | |
Seagate Technology Holdings PLC | | Information Technology | | | 253 | | | | 22,213 | | | | 0.05 | |
NetApp Inc | | Information Technology | | | 270 | | | | 22,132 | | | | 0.05 | |
MarketAxess Holdings Inc | | Financials | | | 47 | | | | 21,892 | | | | 0.05 | |
Post Holdings Inc | | Consumer Staples | | | 202 | | | | 21,882 | | | | 0.05 | |
Watsco Inc | | Industrials | | | 76 | | | | 21,815 | | | | 0.05 | |
Corporate Office Properties Trust | | Real Estate | | | 779 | | | | 21,802 | | | | 0.05 | |
Cincinnati Financial Corp | | Financials | | | 186 | | | | 21,708 | | | | 0.05 | |
Regency Centers Corp | | Real Estate | | | 336 | | | | 21,502 | | | | 0.05 | |
New York Community Bancorp Inc | | Financials | | | 1,937 | | | | 21,347 | | | | 0.05 | |
Aspen Technology Inc | | Information Technology | | | 155 | | | | 21,314 | | | | 0.05 | |
DTE Energy Co | | Utilities | | | 162 | | | | 20,975 | | | | 0.04 | |
Tyson Foods Inc | | Consumer Staples | | | 284 | | | | 20,933 | | | | 0.04 | |
Dover Corp | | Industrials | | | 137 | | | | 20,576 | | | | 0.04 | |
New Relic Inc | | Information Technology | | | 306 | | | | 20,510 | | | | 0.04 | |
Energizer Holdings Inc | | Consumer Staples | | | 470 | | | | 20,218 | | | | 0.04 | |
SEI Investments Co | | Financials | | | 320 | | | | 19,831 | | | | 0.04 | |
Robert Half International Inc | | Industrials | | | 219 | | | | 19,498 | | | | 0.04 | |
Genuine Parts Co | | Consumer Discretionary | | | 154 | | | | 19,424 | | | | 0.04 | |
DENTSPLY SIRONA Inc | | Health Care | | | 306 | | | | 19,345 | | | | 0.04 | |
Stericycle Inc | | Industrials | | | 269 | | | | 19,256 | | | | 0.04 | |
Madison Square Garden Entertainment Corp | | Communication Services | | | 226 | | | | 19,018 | | | | 0.04 | |
Host Hotels & Resorts Inc | | Real Estate | | | 1,106 | | | | 18,899 | | | | 0.04 | |
| | |
| The accompanying notes are an integral part of these financial statements. | | 41 |
GOLDMAN SACHS ALTERNATIVE PREMIA FUND
Consolidated Schedule of Investments (continued)
June 30, 2021 (Unaudited)
|
| ADDITIONAL INVESTMENT INFORMATION (continued) |
| | | | | | | | | | | | | | |
| Common Stocks | | Sector | | Shares | | | Value | | | Weight | |
Huntington Bancshares Inc/OH | | Financials | | | 1,264 | | | $ | 18,044 | | | | 0.04 | % |
Primerica Inc | | Financials | | | 117 | | | | 17,904 | | | | 0.04 | |
IDEX Corp | | Industrials | | | 81 | | | | 17,857 | | | | 0.04 | |
World Wrestling Entertainment Inc | | Communication Services | | | 308 | | | | 17,836 | | | | 0.04 | |
Vontier Corp | | Information Technology | | | 545 | | | | 17,760 | | | | 0.04 | |
Under Armour Inc | | Consumer Discretionary | | | 834 | | | | 17,648 | | | | 0.04 | |
Sealed Air Corp | | Materials | | | 298 | | | | 17,630 | | | | 0.04 | |
Ingredion Inc | | Consumer Staples | | | 193 | | | | 17,509 | | | | 0.04 | |
Interpublic Group of Cos Inc/The | | Communication Services | | | 538 | | | | 17,488 | | | | 0.04 | |
Eastman Chemical Co | | Materials | | | 149 | | | | 17,450 | | | | 0.04 | |
Pentair PLC | | Industrials | | | 256 | | | | 17,266 | | | | 0.04 | |
LKQ Corp | | Consumer Discretionary | | | 347 | | | | 17,060 | | | | 0.04 | |
NOV Inc | | Energy | | | 1,095 | | | | 16,780 | | | | 0.04 | |
Bank of Hawaii Corp | | Financials | | | 199 | | | | 16,758 | | | | 0.04 | |
HollyFrontier Corp | | Energy | | | 508 | | | | 16,698 | | | | 0.04 | |
Allegro MicroSystems Inc | | Information Technology | | | 600 | | | | 16,611 | | | | 0.04 | |
Iron Mountain Inc | | Real Estate | | | 383 | | | | 16,220 | | | | 0.03 | |
Snap-on Inc | | Industrials | | | 72 | | | | 16,185 | | | | 0.03 | |
National Fuel Gas Co | | Utilities | | | 303 | | | | 15,810 | | | | 0.03 | |
MSA Safety Inc | | Industrials | | | 94 | | | | 15,638 | | | | 0.03 | |
Kimco Realty Corp | | Real Estate | | | 739 | | | | 15,410 | | | | 0.03 | |
Ralph Lauren Corp | | Consumer Discretionary | | | 130 | | | | 15,286 | | | | 0.03 | |
Mercury General Corp | | Financials | | | 235 | | | | 15,246 | | | | 0.03 | |
PVH Corp | | Consumer Discretionary | | | 139 | | | | 14,996 | | | | 0.03 | |
Huntington Ingalls Industries Inc | | Industrials | | | 70 | | | | 14,783 | | | | 0.03 | |
Nielsen Holdings PLC | | Industrials | | | 589 | | | | 14,523 | | | | 0.03 | |
Reynolds Consumer Products Inc | | Consumer Staples | | | 465 | | | | 14,109 | | | | 0.03 | |
Silgan Holdings Inc | | Materials | | | 313 | | | | 12,976 | | | | 0.03 | |
Organon & Co | | Health Care | | | 110 | | | | 3,335 | | | | 0.01 | |
A basket (JPGSFDEU) of common stocks
| | | | | | | | | | | | | | |
| Common Stocks | | Sector | | Shares | | | Value | | | Weight | |
Allianz SE | | Financials | | | 2,394 | | | $ | 503,551 | | | | 3.05 | % |
L’Oreal SA | | Consumer Staples | | | 1,274 | | | | 478,744 | | | | 2.90 | |
adidas AG | | Consumer Discretionary | | | 1,477 | | | | 463,584 | | | | 2.81 | |
Deutsche Post AG | | Industrials | | | 7,923 | | | | 454,448 | | | | 2.75 | |
Infineon Technologies AG | | Information Technology | | | 13,422 | | | | 453,943 | | | | 2.75 | |
Vonovia SE | | Real Estate | | | 7,755 | | | | 422,827 | | | | 2.56 | |
Merck KGaA | | Health Care | | | 2,231 | | | | 360,675 | | | | 2.18 | |
Neste Oyj | | Energy | | | 6,837 | | | | 353,046 | | | | 2.14 | |
Linde PLC | | Materials | | | 1,421 | | | | 345,806 | | | | 2.09 | |
Koninklijke Philips NV | | Health Care | | | 8,247 | | | | 344,634 | | | | 2.09 | |
ASML Holding NV | | Information Technology | | | 586 | | | | 339,752 | | | | 2.06 | |
Siemens AG | | Industrials | | | 2,491 | | | | 332,880 | | | | 2.01 | |
HelloFresh SE | | Consumer Discretionary | | | 3,719 | | | | 304,920 | | | | 1.85 | |
Air Liquide SA | | Materials | | | 2,012 | | | | 297,057 | | | | 1.80 | |
Industria de Diseno Textil SA | | Consumer Discretionary | | | 9,771 | | | | 290,290 | | | | 1.76 | |
Koninklijke Ahold Delhaize NV | | Consumer Staples | | | 11,149 | | | | 279,506 | | | | 1.69 | |
Deutsche Boerse AG | | Financials | | | 1,844 | | | | 271,391 | | | | 1.64 | |
Henkel AG & Co KGaA | | Consumer Staples | | | 2,986 | | | | 265,889 | | | | 1.61 | |
Kone Oyj | | Industrials | | | 3,674 | | | | 252,793 | | | | 1.53 | |
SAP SE | | Information Technology | | | 2,047 | | | | 243,289 | | | | 1.47 | |
Assicurazioni Generali SpA | | Financials | | | 13,572 | | | | 229,434 | | | | 1.39 | |
RWE AG | | Utilities | | | 6,902 | | | | 210,913 | | | | 1.28 | |
Poste Italiane SpA | | Financials | | | 17,648 | | | | 196,773 | | | | 1.19 | |
EssilorLuxottica SA | | Consumer Discretionary | | | 1,204 | | | | 187,337 | | | | 1.13 | |
Ferrari NV | | Consumer Discretionary | | | 1,073 | | | | 186,770 | | | | 1.13 | |
Pernod Ricard SA | | Consumer Staples | | | 983 | | | | 184,002 | | | | 1.11 | |
Siemens Energy AG | | Industrials | | | 7,122 | | | | 181,040 | | | | 1.10 | |
Koninklijke KPN NV | | Communication Services | | | 67,849 | | | | 178,715 | | | | 1.08 | |
| | |
| 42 | | The accompanying notes are an integral part of these financial statements. |
GOLDMAN SACHS ALTERNATIVE PREMIA FUND
|
| ADDITIONAL INVESTMENT INFORMATION (continued) |
| | | | | | | | | | | | | | |
| Common Stocks | | Sector | | Shares | | | Value | | | Weight | |
Beiersdorf AG | | Consumer Staples | | | 1,750 | | | $ | 178,047 | | | | 1.08 | % |
Vivendi SE | | Communication Services | | | 5,869 | | | | 166,258 | | | | 1.01 | |
Tenaris SA | | Energy | | | 17,646 | | | | 162,198 | | | | 0.98 | |
Daimler AG | | Consumer Discretionary | | | 2,116 | | | | 159,312 | | | | 0.96 | |
Fresenius Medical Care AG & Co KGaA | | Health Care | | | 2,133 | | | | 149,390 | | | | 0.90 | |
Enel SpA | | Utilities | | | 18,782 | | | | 147,100 | | | | 0.89 | |
Deutsche Telekom AG | | Communication Services | | | 8,160 | | | | 145,341 | | | | 0.88 | |
Kingspan Group PLC | | Industrials | | | 1,802 | | | | 143,473 | | | | 0.87 | |
Hermes International | | Consumer Discretionary | | | 115 | | | | 141,789 | | | | 0.86 | |
CaixaBank SA | | Financials | | | 54,585 | | | | 141,593 | | | | 0.86 | |
Schneider Electric SE | | Industrials | | | 1,040 | | | | 137,978 | | | | 0.84 | |
Adyen NV | | Information Technology | | | 65 | | | | 134,204 | | | | 0.81 | |
Koninklijke DSM NV | | Materials | | | 835 | | | | 131,372 | | | | 0.80 | |
Heineken NV | | Consumer Staples | | | 1,272 | | | | 130,014 | | | | 0.79 | |
FinecoBank Banca Fineco SpA | | Financials | | | 8,841 | | | | 129,959 | | | | 0.79 | |
Dassault Systemes SE | | Information Technology | | | 626 | | | | 128,094 | | | | 0.78 | |
Scout24 AG | | Communication Services | | | 1,783 | | | | 126,815 | | | | 0.77 | |
Evonik Industries AG | | Materials | | | 4,431 | | | | 125,302 | | | | 0.76 | |
Kering SA | | Consumer Discretionary | | | 168 | | | | 124,018 | | | | 0.75 | |
Sampo Oyj | | Financials | | | 3,064 | | | | 118,775 | | | | 0.72 | |
Sodexo SA | | Consumer Discretionary | | | 1,454 | | | | 114,468 | | | | 0.69 | |
Stellantis NV | | Consumer Discretionary | | | 6,739 | | | | 111,559 | | | | 0.68 | |
Bureau Veritas SA | | Industrials | | | 4,058 | | | | 108,272 | | | | 0.66 | |
MTU Aero Engines AG | | Industrials | | | 517 | | | | 108,104 | | | | 0.65 | |
Siemens Gamesa Renewable Energy SA | | Industrials | | | 3,758 | | | | 105,838 | | | | 0.64 | |
Snam SpA | | Utilities | | | 21,034 | | | | 102,542 | | | | 0.62 | |
Knorr-Bremse AG | | Industrials | | | 1,043 | | | | 101,181 | | | | 0.61 | |
Hannover Rueck SE | | Financials | | | 704 | | | | 99,331 | | | | 0.60 | |
Wolters Kluwer NV | | Industrials | | | 1,167 | | | | 98,871 | | | | 0.60 | |
Banco Bilbao Vizcaya Argentaria SA | | Financials | | | 18,492 | | | | 96,676 | | | | 0.59 | |
QIAGEN NV | | Health Care | | | 2,365 | | | | 96,395 | | | | 0.58 | |
UCB SA | | Health Care | | | 1,070 | | | | 94,368 | | | | 0.57 | |
Brenntag SE | | Industrials | | | 1,196 | | | | 93,754 | | | | 0.57 | |
Randstad NV | | Industrials | | | 1,446 | | | | 93,278 | | | | 0.56 | |
UPM-Kymmene Oyj | | Materials | | | 2,797 | | | | 89,221 | | | | 0.54 | |
LEG Immobilien SE | | Real Estate | | | 725 | | | | 88,071 | | | | 0.53 | |
Mediobanca Banca di Credito Finanziario | | Financials | | | 8,903 | | | | 87,691 | | | | 0.53 | |
Smurfit Kappa Group PLC | | Materials | | | 1,911 | | | | 87,446 | | | | 0.53 | |
Signify NV | | Industrials | | | 1,596 | | | | 85,143 | | | | 0.52 | |
BioMerieux | | Health Care | | | 815 | | | | 79,893 | | | | 0.48 | |
Ubisoft Entertainment SA | | Communication Services | | | 1,321 | | | | 77,983 | | | | 0.47 | |
Groupe Bruxelles Lambert SA | | Financials | | | 824 | | | | 77,731 | | | | 0.47 | |
Endesa SA | | Utilities | | | 3,721 | | | | 76,124 | | | | 0.46 | |
EDP—Energias de Portugal SA | | Utilities | | | 16,840 | | | | 75,274 | | | | 0.46 | |
Eurofins Scientific SE | | Health Care | | | 749 | | | | 72,196 | | | | 0.44 | |
Uniper SE | | Utilities | | | 2,321 | | | | 72,078 | | | | 0.44 | |
Michelin | | Consumer Discretionary | | | 533 | | | | 71,733 | | | | 0.43 | |
Nokia Oyj | | Information Technology | | | 15,500 | | | | 69,991 | | | | 0.42 | |
Symrise AG | | Materials | | | 567 | | | | 66,597 | | | | 0.40 | |
Koninklijke Vopak NV | | Energy | | | 1,683 | | | | 64,456 | | | | 0.39 | |
Zalando SE | | Consumer Discretionary | | | 629 | | | | 64,101 | | | | 0.39 | |
ProSiebenSat.1 Media SE | | Communication Services | | | 3,719 | | | | 62,380 | | | | 0.38 | |
Repsol SA | | Energy | | | 5,863 | | | | 61,877 | | | | 0.37 | |
Umicore SA | | Materials | | | 1,142 | | | | 58,817 | | | | 0.36 | |
Elisa Oyj | | Communication Services | | | 1,117 | | | | 56,195 | | | | 0.34 | |
Grifols SA | | Health Care | | | 2,442 | | | | 55,783 | | | | 0.34 | |
Akzo Nobel NV | | Materials | | | 528 | | | | 55,037 | | | | 0.33 | |
Euronext NV | | Financials | | | 594 | | | | 54,480 | | | | 0.33 | |
Sartorius Stedim Biotech | | Health Care | | | 134 | | | | 53,305 | | | | 0.32 | |
A2A SpA | | Utilities | | | 30,486 | | | | 52,558 | | | | 0.32 | |
Carl Zeiss Meditec AG | | Health Care | | | 312 | | | | 50,808 | | | | 0.31 | |
| | |
| The accompanying notes are an integral part of these financial statements. | | 43 |
GOLDMAN SACHS ALTERNATIVE PREMIA FUND
Consolidated Schedule of Investments (continued)
June 30, 2021 (Unaudited)
|
| ADDITIONAL INVESTMENT INFORMATION (continued) |
| | | | | | | | | | | | | | |
| Common Stocks | | Sector | | Shares | | | Value | | | Weight | |
HeidelbergCement AG | | Materials | | | 684 | | | $ | 49,508 | | | | 0.30 | % |
Amplifon SpA | | Health Care | | | 1,180 | | | | 49,139 | | | | 0.30 | |
Edenred | | Information Technology | | | 1,022 | | | | 49,084 | | | | 0.30 | |
GEA Group AG | | Industrials | | | 1,430 | | | | 48,860 | | | | 0.30 | |
Orion Oyj | | Health Care | | | 1,332 | | | | 48,297 | | | | 0.29 | |
Enagas SA | | Utilities | | | 2,412 | | | | 47,003 | | | | 0.28 | |
Grand City Properties SA | | Real Estate | | | 2,028 | | | | 46,207 | | | | 0.28 | |
Infrastrutture Wireless Italiane SpA | | Communication Services | | | 4,689 | | | | 44,601 | | | | 0.27 | |
Atos SE | | Information Technology | | | 815 | | | | 41,822 | | | | 0.25 | |
Aroundtown SA | | Real Estate | | | 6,300 | | | | 41,454 | | | | 0.25 | |
Sofina SA | | Financials | | | 114 | | | | 41,412 | | | | 0.25 | |
Argenx SE | | Health Care | | | 162 | | | | 41,260 | | | | 0.25 | |
Interpump Group SpA | | Industrials | | | 817 | | | | 40,782 | | | | 0.25 | |
Orpea SA | | Health Care | | | 380 | | | | 40,766 | | | | 0.25 | |
Freenet AG | | Communication Services | | | 1,984 | | | | 39,518 | | | | 0.24 | |
SEB SA | | Consumer Discretionary | | | 252 | | | | 38,407 | | | | 0.23 | |
Gecina SA | | Real Estate | | | 289 | | | | 37,292 | | | | 0.23 | |
Recordati Industria Chimica e Farmaceuti | | Health Care | | | 771 | | | | 37,157 | | | | 0.22 | |
MorphoSys AG | | Health Care | | | 566 | | | | 37,014 | | | | 0.22 | |
La Francaise des Jeux SAEM | | Consumer Discretionary | | | 746 | | | | 36,994 | | | | 0.22 | |
Nemetschek SE | | Information Technology | | | 548 | | | | 35,356 | | | | 0.21 | |
Valmet Oyj | | Industrials | | | 931 | | | | 34,237 | | | | 0.21 | |
Prysmian SpA | | Industrials | | | 1,104 | | | | 33,370 | | | | 0.20 | |
TeamViewer AG | | Information Technology | | | 1,040 | | | | 32,974 | | | | 0.20 | |
Valeo SA | | Consumer Discretionary | | | 1,249 | | | | 31,692 | | | | 0.19 | |
Rubis SCA | | Utilities | | | 845 | | | | 31,662 | | | | 0.19 | |
Aalberts NV | | Industrials | | | 697 | | | | 31,572 | | | | 0.19 | |
Bechtle AG | | Information Technology | | | 200 | | | | 31,384 | | | | 0.19 | |
SOITEC | | Information Technology | | | 165 | | | | 30,730 | | | | 0.19 | |
Italgas SpA | | Utilities | | | 5,405 | | | | 29,790 | | | | 0.18 | |
Heineken Holding NV | | Consumer Staples | | | 345 | | | | 29,330 | | | | 0.18 | |
Fluidra SA | | Industrials | | | 872 | | | | 29,184 | | | | 0.18 | |
Eiffage SA | | Industrials | | | 316 | | | | 27,092 | | | | 0.16 | |
Wienerberger AG | | Materials | | | 801 | | | | 26,045 | | | | 0.16 | |
Huhtamaki Oyj | | Materials | | | 599 | | | | 23,940 | | | | 0.14 | |
Solvay SA | | Materials | | | 211 | | | | 22,644 | | | | 0.14 | |
Kojamo Oyj | | Real Estate | | | 1,156 | | | | 22,271 | | | | 0.13 | |
TechnipFMC PLC | | Energy | | | 2,834 | | | | 21,433 | | | | 0.13 | |
FUCHS PETROLUB SE | | Materials | | | 521 | | | | 21,357 | | | | 0.13 | |
Rexel SA | | Industrials | | | 1,206 | | | | 21,267 | | �� | | 0.13 | |
Arkema SA | | Materials | | | 201 | | | | 21,238 | | | | 0.13 | |
United Internet AG | | Communication Services | | | 608 | | | | 20,963 | | | | 0.13 | |
Davide Campari-Milano NV | | Consumer Staples | | | 1,823 | | | | 20,585 | | | | 0.12 | |
Shop Apotheke Europe NV | | Consumer Discretionary | | | 130 | | | | 20,571 | | | | 0.12 | |
Corbion NV | | Materials | | | 418 | | | | 20,162 | | | | 0.12 | |
Ageas SA/NV | | Financials | | | 426 | | | | 19,947 | | | | 0.12 | |
ACS Actividades de Construccion y Servic | | Industrials | | | 816 | | | | 18,430 | | | | 0.11 | |
Gerresheimer AG | | Health Care | | | 198 | | | | 18,424 | | | | 0.11 | |
Merlin Properties Socimi SA | | Real Estate | | | 2,041 | | | | 17,832 | | | | 0.11 | |
JDE Peet’s NV | | Consumer Staples | | | 569 | | | | 17,404 | | | | 0.11 | |
Proximus SADP | | Communication Services | | | 1,041 | | | | 16,963 | | | | 0.10 | |
Bollore SA | | Communication Services | | | 3,711 | | | | 16,773 | | | | 0.10 | |
Rheinmetall AG | | Industrials | | | 181 | | | | 15,106 | | | | 0.09 | |
Amundi SA | | Financials | | | 199 | | | | 14,793 | | | | 0.09 | |
Nokian Renkaat Oyj | | Consumer Discretionary | | | 429 | | | | 14,594 | | | | 0.09 | |
Elia Group SA/NV | | Utilities | | | 150 | | | | 13,320 | | | | 0.08 | |
Ipsen SA | | Health Care | | | 148 | | | | 12,955 | | | | 0.08 | |
Aedifica SA | | Real Estate | | | 114 | | | | 12,647 | | | | 0.08 | |
Reply SpA | | Information Technology | | | 88 | | | | 12,238 | | | | 0.07 | |
Jeronimo Martins SGPS SA | | Consumer Staples | | | 722 | | | | 11,110 | | | | 0.07 | |
Hera SpA | | Utilities | | | 3,170 | | | | 11,046 | | | | 0.07 | |
| | |
| 44 | | The accompanying notes are an integral part of these financial statements. |
GOLDMAN SACHS ALTERNATIVE PREMIA FUND
|
| ADDITIONAL INVESTMENT INFORMATION (continued) |
| | | | | | | | | | | | | | |
| Common Stocks | | Sector | | Shares | | | Value | | | Weight | |
Rational AG | | Industrials | | | 13 | | | $ | 10,134 | | | | 0.06 | % |
Glanbia PLC | | Consumer Staples | | | 676 | | | | 9,258 | | | | 0.06 | |
SPIE SA | | Industrials | | | 345 | | | | 6,686 | | | | 0.04 | |
A basket (JPGSFDUK) of common stocks
| | | | | | | | | | | | | | |
| Common Stocks | | Sector | | Shares | | | Value | | | Weight | |
Reckitt Benckiser Group PLC | | Consumer Staples | | | 40 | | | $ | 253,750 | | | | 5.27 | % |
Unilever PLC | | Consumer Staples | | | 46 | | | | 195,764 | | | | 4.07 | |
Admiral Group PLC | | Financials | | | 47 | | | | 148,108 | | | | 3.08 | |
Ferguson PLC | | Industrials | | | 14 | | | | 139,226 | | | | 2.89 | |
Sage Group PLC/The | | Information Technology | | | 189 | | | | 129,610 | | | | 2.69 | |
Smith & Nephew PLC | | Health Care | | | 80 | | | | 125,135 | | | | 2.60 | |
Ashtead Group PLC | | Industrials | | | 22 | | | | 116,910 | | | | 2.43 | |
Next PLC | | Consumer Discretionary | | | 15 | | | | 114,209 | | | | 2.37 | |
Spirax-Sarco Engineering PLC | | Industrials | | | 8 | | | | 104,629 | | | | 2.18 | |
Tesco PLC | | Consumer Staples | | | 437 | | | | 97,468 | | | | 2.03 | |
RELX PLC | | Industrials | | | 51 | | | | 97,398 | | | | 2.02 | |
HSBC Holdings PLC | | Financials | | | 229 | | | | 95,768 | | | | 1.99 | |
London Stock Exchange Group PLC | | Financials | | | 12 | | | | 95,763 | | | | 1.99 | |
Hargreaves Lansdown PLC | | Financials | | | 59 | | | | 93,495 | | | | 1.94 | |
Intertek Group PLC | | Industrials | | | 17 | | | | 92,493 | | | | 1.92 | |
AstraZeneca PLC | | Health Care | | | 10 | | | | 85,193 | | | | 1.77 | |
GlaxoSmithKline PLC | | Health Care | | | 60 | | | | 84,519 | | | | 1.76 | |
Coca-Cola HBC AG | | Consumer Staples | | | 31 | | | | 81,858 | | | | 1.70 | |
Smurfit Kappa Group PLC | | Materials | | | 20 | | | | 79,984 | | | | 1.66 | |
Dechra Pharmaceuticals PLC | | Health Care | | | 17 | | | | 75,456 | | | | 1.57 | |
Standard Life Aberdeen PLC | | Financials | | | 260 | | | | 70,524 | | | | 1.47 | |
Schroders PLC | | Financials | | | 20 | | | | 70,174 | | | | 1.46 | |
B&M European Value Retail SA | | Consumer Discretionary | | | 110 | | | | 62,797 | | | | 1.31 | |
Electrocomponents PLC | | Industrials | | | 61 | | | | 62,614 | | | | 1.30 | |
Games Workshop Group PLC | | Consumer Discretionary | | | 5 | | | | 59,696 | | | | 1.24 | |
Auto Trader Group PLC | | Communication Services | | | 89 | | | | 56,159 | | | | 1.17 | |
Travis Perkins PLC | | Industrials | | | 31 | | | | 52,832 | | | | 1.10 | |
Informa PLC | | Communication Services | | | 104 | | | | 51,950 | | | | 1.08 | |
Hikma Pharmaceuticals PLC | | Health Care | | | 21 | | | | 51,375 | | | | 1.07 | |
ConvaTec Group PLC | | Health Care | | | 203 | | | | 48,738 | | | | 1.01 | |
Melrose Industries PLC | | Industrials | | | 297 | | | | 46,141 | | | | 0.96 | |
United Utilities Group PLC | | Utilities | | | 46 | | | | 45,142 | | | | 0.94 | |
Rightmove PLC | | Communication Services | | | 68 | | | | 44,354 | | | | 0.92 | |
Future PLC | | Communication Services | | | 14 | | | | 43,543 | | | | 0.91 | |
Spectris PLC | | Information Technology | | | 13 | | | | 43,057 | | | | 0.90 | |
CRH PLC | | Materials | | | 12 | | | | 42,680 | | | | 0.89 | |
Associated British Foods PLC | | Consumer Staples | | | 18 | | | | 40,921 | | | | 0.85 | |
Flutter Entertainment PLC | | Consumer Discretionary | | | 3 | | | | 40,127 | | | | 0.83 | |
J Sainsbury PLC | | Consumer Staples | | | 147 | | | | 39,937 | | | | 0.83 | |
Weir Group PLC/The | | Industrials | | | 21 | | | | 39,046 | | | | 0.81 | |
DCC PLC | | Industrials | | | 6 | | | | 38,226 | | | | 0.79 | |
British Land Co PLC/The | | Real Estate | | | 76 | | | | 37,567 | | | | 0.78 | |
Halma PLC | | Information Technology | | | 14 | | | | 36,474 | | | | 0.76 | |
Tritax Big Box REIT PLC | | Real Estate | | | 185 | | | | 36,344 | | | | 0.76 | |
Smiths Group PLC | | Industrials | | | 23 | | | | 36,130 | | | | 0.75 | |
Grainger PLC | | Real Estate | | | 126 | | | | 35,903 | | | | 0.75 | |
Fresnillo PLC | | Materials | | | 46 | | | | 35,127 | | | | 0.73 | |
Genus PLC | | Health Care | | | 7 | | | | 32,682 | | | | 0.68 | |
Severn Trent PLC | | Utilities | | | 13 | | | | 31,858 | | | | 0.66 | |
Centamin PLC | | Materials | | | 315 | | | | 31,845 | | | | 0.66 | |
Aviva PLC | | Financials | | | 75 | | | | 30,467 | | | | 0.63 | |
Berkeley Group Holdings PLC | | Consumer Discretionary | | | 7 | | | | 30,342 | | | | 0.63 | |
Legal & General Group PLC | | Financials | | | 116 | | | | 29,897 | | | | 0.62 | |
Land Securities Group PLC | | Real Estate | | | 44 | | | | 29,716 | | | | 0.62 | |
| | |
| The accompanying notes are an integral part of these financial statements. | | 45 |
GOLDMAN SACHS ALTERNATIVE PREMIA FUND
Consolidated Schedule of Investments (continued)
June 30, 2021 (Unaudited)
|
| ADDITIONAL INVESTMENT INFORMATION (continued) |
| | | | | | | | | | | | | | |
| Common Stocks | | Sector | | Shares | | | Value | | | Weight | |
Diploma PLC | | Industrials | | | 10 | | | $ | 29,542 | | | | 0.61 | % |
IG Group Holdings PLC | | Financials | | | 32 | | | | 27,070 | | | | 0.56 | |
Pets at Home Group Plc | | Consumer Discretionary | | | 59 | | | | 26,982 | | | | 0.56 | |
Britvic PLC | | Consumer Staples | | | 29 | | | | 26,915 | | | | 0.56 | |
Pagegroup PLC | | Industrials | | | 46 | | | | 25,752 | | | | 0.54 | |
International Consolidated Airlines Grou | | Industrials | | | 147 | | | | 25,574 | | | | 0.53 | |
Victrex PLC | | Materials | | | 10 | | | | 24,415 | | | | 0.51 | |
Hays PLC | | Industrials | | | 151 | | | | 23,887 | | | | 0.50 | |
Dunelm Group PLC | | Consumer Discretionary | | | 17 | | | | 23,825 | | | | 0.50 | |
Pennon Group PLC | | Utilities | | | 21 | | | | 23,501 | | | | 0.49 | |
Derwent London PLC | | Real Estate | | | 7 | | | | 22,135 | | | | 0.46 | |
Tate & Lyle PLC | | Consumer Staples | | | 30 | | | | 22,076 | | | | 0.46 | |
Kainos Group PLC | | Information Technology | | | 15 | | | | 21,706 | | | | 0.45 | |
3i Group PLC | | Financials | | | 18 | | | | 21,474 | | | | 0.45 | |
Rotork PLC | | Industrials | | | 63 | | | | 21,410 | | | | 0.45 | |
Kingfisher PLC | | Consumer Discretionary | | | 57 | | | | 20,688 | | | | 0.43 | |
Computacenter PLC | | Information Technology | | | 8 | | | | 20,286 | | | | 0.42 | |
St James’s Place PLC | | Financials | | | 13 | | | | 19,218 | | | | 0.40 | |
Hill & Smith Holdings PLC | | Materials | | | 12 | | | | 18,467 | | | | 0.38 | |
Johnson Matthey PLC | | Materials | | | 6 | | | | 18,346 | | | | 0.38 | |
Royal Mail PLC | | Industrials | | | 31 | | | | 18,071 | | | | 0.38 | |
Quilter PLC | | Financials | | | 115 | | | | 17,045 | | | | 0.35 | |
M&G PLC | | Financials | | | 73 | | | | 16,642 | | | | 0.35 | |
JD Sports Fashion PLC | | Consumer Discretionary | | | 18 | | | | 16,463 | | | | 0.34 | |
Evraz PLC | | Materials | | | 28 | | | | 16,363 | | | | 0.34 | |
Cranswick PLC | | Consumer Staples | | | 4 | | | | 16,140 | | | | 0.34 | |
Spirent Communications PLC | | Information Technology | | | 65 | | | | 16,109 | | | | 0.33 | |
Plus500 Ltd | | Financials | | | 12 | | | | 15,975 | | | | 0.33 | |
National Express Group PLC | | Industrials | | | 58 | | | | 15,546 | | | | 0.32 | |
ITV PLC | | Communication Services | | | 124 | | | | 15,531 | | | | 0.32 | |
888 Holdings PLC | | Consumer Discretionary | | | 40 | | | | 15,475 | | | | 0.32 | |
IntegraFin Holdings PLC | | Financials | | | 29 | | | | 14,979 | | | | 0.31 | |
Assura PLC | | Real Estate | | | 199 | | | | 14,710 | | | | 0.31 | |
Wizz Air Holdings Plc | | Industrials | | | 3 | | | | 14,536 | | | | 0.30 | |
Domino’s Pizza Group PLC | | Consumer Discretionary | | | 37 | | | | 14,350 | | | | 0.30 | |
Howden Joinery Group PLC | | Industrials | | | 17 | | | | 14,009 | | | | 0.29 | |
Direct Line Insurance Group PLC | | Financials | | | 49 | | | | 13,879 | | | | 0.29 | |
Softcat PLC | | Information Technology | | | 7 | | | | 11,992 | | | | 0.25 | |
IMI PLC | | Industrials | | | 7 | | | | 11,316 | | | | 0.24 | |
Tullow Oil PLC | | Energy | | | 190 | | | | 11,300 | | | | 0.23 | |
Man Group PLC/Jersey | | Financials | | | 62 | | | | 11,076 | | | | 0.23 | |
Watches of Switzerland Group PLC | | Consumer Discretionary | | | 13 | | | | 10,667 | | | | 0.22 | |
Inchcape PLC | | Consumer Discretionary | | | 13 | | | | 10,016 | | | | 0.21 | |
Clarkson PLC | | Industrials | | | 3 | | | | 9,955 | | | | 0.21 | |
QinetiQ Group PLC | | Industrials | | | 28 | | | | 9,715 | | | | 0.20 | |
Synthomer PLC | | Materials | | | 17 | | | | 8,366 | | | | 0.17 | |
Greggs PLC | | Consumer Discretionary | | | 3 | | | | 7,916 | | | | 0.16 | |
Ninety One PLC | | Financials | | | 34 | | | | 7,548 | | | | 0.16 | |
Bodycote PLC | | Industrials | | | 9 | | | | 7,302 | | | | 0.15 | |
Chemring Group PLC | | Industrials | | | 24 | | | | 6,928 | | | | 0.14 | |
J D Wetherspoon PLC | | Consumer Discretionary | | | 6 | | | | 6,599 | | | | 0.14 | |
Moneysupermarket.com Group PLC | | Consumer Discretionary | | | 25 | | | | 6,364 | | | | 0.13 | |
Energean PLC | | Energy | | | 9 | | | | 6,192 | | | | 0.13 | |
Diversified Energy Co PLC | | Energy | | | 59 | | | | 6,169 | | | | 0.13 | |
Ultra Electronics Holdings PLC | | Industrials | | | 3 | | | | 5,850 | | | | 0.12 | |
XP Power Ltd | | Industrials | | | 1 | | | | 5,723 | | | | 0.12 | |
Workspace Group PLC | | Real Estate | | | 7 | | | | 5,674 | | | | 0.12 | |
Ashmore Group PLC | | Financials | | | 14 | | | | 5,558 | | | | 0.12 | |
Frasers Group PLC | | Consumer Discretionary | | | 9 | | | | 5,421 | | | | 0.11 | |
Brewin Dolphin Holdings PLC | | Financials | | | 15 | | | | 5,341 | | | | 0.11 | |
Renishaw PLC | | Information Technology | | | 1 | | | | 5,291 | | | | 0.11 | |
| | |
| 46 | | The accompanying notes are an integral part of these financial statements. |
GOLDMAN SACHS ALTERNATIVE PREMIA FUND
|
| ADDITIONAL INVESTMENT INFORMATION (continued) |
| | | | | | | | | | | | | | |
| Common Stocks | | Sector | | Shares | | | Value | | | Weight | |
Euromoney Institutional Investor PLC | | Communication Services | | | 5 | | | $ | 5,202 | | | | 0.11 | % |
Tyman PLC | | Industrials | | | 11 | | | | 5,109 | | | | 0.11 | |
TP ICAP Group PLC | | Financials | | | 26 | | | | 5,054 | | | | 0.11 | |
Marshalls PLC | | Materials | | | 7 | | | | 4,948 | | | | 0.10 | |
Indivior PLC | | Health Care | | | 31 | | | | 4,851 | | | | 0.10 | |
Close Brothers Group PLC | | Financials | | | 3 | | | | 4,765 | | | | 0.10 | |
PZ Cussons PLC | | Consumer Staples | | | 19 | | | | 4,655 | | | | 0.10 | |
4imprint Group PLC | | Communication Services | | | 2 | | | | 4,596 | | | | 0.10 | |
Vesuvius PLC | | Industrials | | | 8 | | | | 4,096 | | | | 0.09 | |
RHI Magnesita NV | | Materials | | | 1 | | | | 3,846 | | | | 0.08 | |
Dr. Martens Plc | | Consumer Discretionary | | | 9 | | | | 3,807 | | | | 0.08 | |
UK Commercial Property REIT Ltd | | Real Estate | | | 49 | | | | 3,750 | | | | 0.08 | |
Chrysalis Investments Ltd | | N/A | | | 15 | | | | 3,724 | | | | 0.08 | |
Firstgroup PLC | | Industrials | | | 42 | | | | 3,430 | | | | 0.07 | |
Savills PLC | | Real Estate | | | 3 | | | | 2,957 | | | | 0.06 | |
AJ Bell PLC | | Financials | | | 7 | | | | 2,918 | | | | 0.06 | |
Greencore Group PLC | | Consumer Staples | | | 22 | | | | 2,770 | | | | 0.06 | |
Rank Group PLC | | Consumer Discretionary | | | 16 | | | | 2,719 | | | | 0.06 | |
Bytes Technology Group PLC | | Information Technology | | | 6 | | | | 2,595 | | | | 0.05 | |
Mitie Group PLC | | Industrials | | | 37 | | | | 2,482 | | | | 0.05 | |
Helios Towers PLC | | Communication Services | | | 15 | | | | 2,454 | | | | 0.05 | |
AO World PLC | | Consumer Discretionary | | | 10 | | | | 2,416 | | | | 0.05 | |
NCC Group PLC | | Information Technology | | | 8 | | | | 2,411 | | | | 0.05 | |
Morgan Sindall Group PLC | | Industrials | | | 1 | | | | 2,373 | | | | 0.05 | |
Cairn Energy PLC | | Energy | | | 16 | | | | 2,322 | | | | 0.05 | |
TI Fluid Systems PLC | | Consumer Discretionary | | | 7 | | | | 2,194 | | | | 0.05 | |
Telecom Plus PLC | | Utilities | | | 2 | | | | 2,006 | | | | 0.04 | |
Essentra PLC | | Materials | | | 6 | | | | 1,883 | | | | 0.04 | |
CLS Holdings PLC | | Real Estate | | | 6 | | | | 1,550 | | | | 0.03 | |
CMC Markets PLC | | Financials | | | 3 | | | | 1,483 | | | | 0.03 | |
ContourGlobal PLC | | Utilities | | | 7 | | | | 1,368 | | | | 0.03 | |
Sabre Insurance Group PLC | | Financials | | | 5 | | | | 1,269 | | | | 0.03 | |
PURCHASED OPTIONS CONTRACTS — At June 30, 2021, the Fund had the following purchased options contracts:
EXCHANGE TRADED INDEX OPTIONS
| | | | | | | | | | | | | | | | | | | | | | | | | | |
| Description | | Exercise
Price | | Expiration
Date | | | Number of
Contracts | | | Notional
Amount | | | Value | | | Premiums
Paid (Received)
by the Fund | | | Unrealized
Appreciation/
Depreciation | |
Purchased options contracts: | | | | | | | | | | | | | |
Calls | | | | | | | | | | | | | |
CBOE Volatility Index | | 24 USD | | | 09/15/2021 | | | | 390 | | | $ | 617,370 | | | $ | 109,200 | | | $ | 132,947 | | | $ | (23,747 | ) |
| | 26 USD | | | 07/21/2021 | | | | 360 | | | | 569,880 | | | | 22,500 | | | | 116,415 | | | | (93,915 | ) |
| | | 27 USD | | | 08/18/2021 | | | | 340 | | | | 538,220 | | | | 52,700 | | | | 140,048 | | | | (87,348 | ) |
| | | | | | | |
| Total Purchased Options Contracts | | | | | | | | | 1,090 | | | | | | | $ | 184,400 | | | $ | 389,410 | | | $ | (205,010 | ) |
| | |
| The accompanying notes are an integral part of these financial statements. | | 47 |
GOLDMAN SACHS MANAGED FUTURES STRATEGY FUND
Consolidated Schedule of Investments
June 30, 2021 (Unaudited)
| | | | | | | | | | |
| Shares | | | Dividend Rate | | | Value | |
|
| Investment Company(a) – 65.2% | |
| Goldman Sachs Financial Square Government Fund –
Institutional Shares |
|
| | 171,144,776 | | | | 0.026 | % | | $ | 171,144,776 | |
| | |
| | TOTAL INVESTMENTS – 65.2% | |
| | (Cost $171,144,776) | | | $ | 171,144,776 | |
| | |
| OTHER ASSETS IN EXCESS OF
LIABILITIES – 34.8% |
| | | 91,466,912 | |
| | |
| | NET ASSETS – 100.0% | | | $ | 262,611,688 | |
| | |
| | |
|
| The percentage shown for each investment category reflects the value of investments in that category as a percentage of net assets. |
| |
(a) | | Represents an Affiliated Issuer. |
| | |
|
Investment Abbreviations: |
BA | | —Banker Acceptance Rate |
BBR | | —Bank Bill Reference Rate |
BUBOR | | —Budapest Interbank Offered Rate |
EURIBOR | | —Euro Interbank Offered Rate |
JIBAR | | —Johannesburg Interbank Agreed Rate |
LIBOR | | —London Interbank Offered Rate |
PRIBOR | | —Prague Interbank Offered Rate |
STIBOR | | —Stockholm Interbank Offered Rate |
TIIE | | —Interbank Equilibrium Interest Rate |
WIBOR | | —Warsaw Interbank Offered Rate |
| | |
Currency Abbreviations: |
AUD | | — Australian Dollar |
BRL | | — Brazilian Real |
CAD | | — Canadian Dollar |
CHF | | — Swiss Franc |
CLP | | — Chilean Peso |
COP | | — Colombian Peso |
CZK | | — Czech Koruna |
EUR | | — Euro |
GBP | | — British Pound |
HUF | | — Hungarian Forint |
IDR | | — Indonesian Rupiah |
INR | | — Indian Rupee |
JPY | | — Japanese Yen |
KRW | | — South Korean Won |
MXN | | — Mexican Peso |
NOK | | — Norwegian Krone |
NZD | | — New Zealand Dollar |
PLN | | — Polish Zloty |
RUB | | — Russian Ruble |
SEK | | — Swedish Krona |
USD | | — United States Dollar |
ZAR | | — South African Rand |
|
|
| ADDITIONAL INVESTMENT INFORMATION |
FORWARD FOREIGN CURRENCY EXCHANGE CONTRACTS — At June 30, 2021, the Fund had the following forward foreign currency exchange contracts:
FORWARD FOREIGN CURRENCY EXCHANGE CONTRACTS WITH UNREALIZED GAIN
| | | | | | | | | | | | | | | | | | | | | | |
| Counterparty | | Currency
Purchased | | | Currency
Sold | | | Settlement
Date | | | Unrealized
Gain | |
Morgan Stanley Co., Inc. | | BRL | | | 16,260,000 | | | | USD | | | | 3,137,909 | | | | 07/02/2021 | | | $ | 131,221 | |
| | CAD | | | 2,160,000 | | | | USD | | | | 1,741,986 | | | | 09/15/2021 | | | | 456 | |
| | COP | | | 3,256,000,000 | | | | USD | | | | 856,330 | | | | 09/15/2021 | | | | 7,790 | |
| | MXN | | | 110,250,000 | | | | USD | | | | 5,459,409 | | | | 09/15/2021 | | | | 18,004 | |
| | RUB | | | 545,500,000 | | | | USD | | | | 7,323,327 | | | | 09/15/2021 | | | | 48,387 | |
| | USD | | | 9,040,088 | | | | AUD | | | | 11,909,000 | | | | 09/15/2021 | | | | 106,016 | |
| | USD | | | 3,271,959 | | | | BRL | | | | 16,260,000 | | | | 07/02/2021 | | | | 2,829 | |
| | USD | | | 2,622,580 | | | | CAD | | | | 3,200,000 | | | | 09/15/2021 | | | | 41,185 | |
| | USD | | | 11,341,607 | | | | CHF | | | | 10,158,000 | | | | 09/15/2021 | | | | 340,539 | |
| | USD | | | 3,889,939 | | | | CLP | | | | 2,810,000,000 | | | | 09/15/2021 | | | | 71,590 | |
| | USD | | | 5,104,122 | | | | COP | | | | 19,074,000,000 | | | | 09/15/2021 | | | | 42,015 | |
| | USD | | | 2,789,794 | | | | CZK | | | | 58,324,000 | | | | 09/15/2021 | | | | 79,451 | |
| | USD | | | 21,624,185 | | | | EUR | | | | 17,873,000 | | | | 09/15/2021 | | | | 397,672 | |
| | USD | | | 6,841,966 | | | | GBP | | | | 4,891,250 | | | | 09/15/2021 | | | | 74,725 | |
| | USD | | | 934,750 | | | | HUF | | | | 265,804,000 | | | | 09/15/2021 | | | | 39,035 | |
| | |
| 48 | | The accompanying notes are an integral part of these financial statements. |
GOLDMAN SACHS MANAGED FUTURES STRATEGY FUND
|
| ADDITIONAL INVESTMENT INFORMATION (continued) |
FORWARD FOREIGN CURRENCY EXCHANGE CONTRACTS WITH UNREALIZED GAIN (continued)
| | | | | | | | | | | | | | | | | | | | | | |
| Counterparty | | Currency
Purchased | | | Currency
Sold | | | Settlement
Date | | | Unrealized
Gain | |
| | USD | | | 46,945,706 | | | | JPY | | | | 5,142,949,000 | | | | 09/15/2021 | | | $ | 622,156 | |
| | USD | | | 874,433 | | | | MXN | | | | 17,500,000 | | | | 09/15/2021 | | | | 5,002 | |
| | USD | | | 2,096,408 | | | | NOK | | | | 18,000,000 | | | | 09/15/2021 | | | | 5,199 | |
| | USD | | | 3,321,292 | | | | PLN | | | | 12,577,000 | | | | 09/15/2021 | | | | 22,073 | |
| | USD | | | 4,606,857 | | | | SEK | | | | 38,782,600 | | | | 09/15/2021 | | | | 71,917 | |
| | | USD | | | 173,641 | | | | ZAR | | | | 2,389,000 | | | | 09/15/2021 | | | | 7,976 | |
| | | | |
| TOTAL | | | | | | | | | | | | | | | $ | 2,135,238 | |
FORWARD FOREIGN CURRENCY EXCHANGE CONTRACTS WITH UNREALIZED LOSS
| | | | | | | | | | | | | | | | | | | | | | |
| Counterparty | | Currency
Purchased | | | Currency
Sold | | | Settlement
Date | | | Unrealized
Loss | |
Morgan Stanley Co., Inc. | | AUD | | | 20,830,000 | | | | USD | | | | 16,141,084 | | | | 09/15/2021 | | | $ | (514,522 | ) |
| | BRL | | | 16,260,000 | | | | USD | | | | 3,261,851 | | | | 08/03/2021 | | | | (4,275 | ) |
| | CAD | | | 21,505,000 | | | | USD | | | | 17,824,973 | | | | 09/15/2021 | | | | (477,194 | ) |
| | CHF | | | 5,939,000 | | | | USD | | | | 6,639,821 | | | | 09/15/2021 | | | | (207,911 | ) |
| | CLP | | | 4,220,000,000 | | | | USD | | | | 5,809,871 | | | | 09/15/2021 | | | | (75,554 | ) |
| | CZK | | | 177,125,000 | | | | USD | | | | 8,469,331 | | | | 09/15/2021 | | | | (238,252 | ) |
| | EUR | | | 14,688,000 | | | | USD | | | | 17,910,929 | | | | 09/15/2021 | | | | (467,018 | ) |
| | GBP | | | 27,173,000 | | | | USD | | | | 38,507,270 | | | | 09/15/2021 | | | | (912,338 | ) |
| | HUF | | | 1,903,460,000 | | | | USD | | | | 6,693,881 | | | | 09/15/2021 | | | | (279,541 | ) |
| | IDR | | | 177,660,000,000 | | | | USD | | | | 12,311,850 | | | | 09/15/2021 | | | | (226,173 | ) |
| | INR | | | 1,101,000,000 | | | | USD | | | | 14,841,475 | | | | 09/15/2021 | | | | (171,592 | ) |
| | JPY | | | 492,276,000 | | | | USD | | | | 4,460,315 | | | | 09/15/2021 | | | | (26,290 | ) |
| | KRW | | | 15,280,000,000 | | | | USD | | | | 13,760,902 | | | | 09/15/2021 | | | | (242,793 | ) |
| | NOK | | | 46,000,000 | | | | USD | | | | 5,530,290 | | | | 09/15/2021 | | | | (186,088 | ) |
| | NZD | | | 7,820,000 | | | | USD | | | | 5,662,830 | | | | 09/15/2021 | | | | (197,940 | ) |
| | PLN | | | 28,007,000 | | | | USD | | | | 7,642,687 | | | | 09/15/2021 | | | | (295,846 | ) |
| | SEK | | | 78,919,000 | | | | USD | | | | 9,534,238 | | | | 09/15/2021 | | | | (306,052 | ) |
| | USD | | | 1,629,620 | | | | CLP | | | | 1,230,000,000 | | | | 09/15/2021 | | | | (41,756 | ) |
| | USD | | | 862,287 | | | | COP | | | | 3,256,000,000 | | | | 09/15/2021 | | | | (1,832 | ) |
| | USD | | | 12,844,813 | | | | KRW | | | | 14,540,000,000 | | | | 09/15/2021 | | | | (18,622 | ) |
| | USD | | | 641,710 | | | | MXN | | | | 12,959,000 | | | | 09/15/2021 | | | | (2,116 | ) |
| | USD | | | 3,717,299 | | | | NZD | | | | 5,320,000 | | | | 09/15/2021 | | | | (503 | ) |
| | USD | | | 417,122 | | | | ZAR | | | | 6,052,000 | | | | 09/15/2021 | | | | (2,553 | ) |
| | | ZAR | | | 84,571,000 | | | | USD | | | | 6,153,595 | | | | 09/15/2021 | | | | (289,034 | ) |
| | | | |
| TOTAL | | | | | | | | | | | | | | | $ | (5,185,795 | ) |
FUTURES CONTRACTS — At June 30, 2021, the Fund had the following futures contracts:
| | | | | | | | | | | | | | | | |
| Description | | Number of
Contracts | | | Expiration Date | | | Notional
Amount | | | Unrealized
Appreciation/
(Depreciation) | |
Long position contracts: | | | | | | | | | | | | | | | | |
100 oz Gold | | | 14 | | | | 08/27/2021 | | | $ | 2,478,840 | | | $ | (162,725 | ) |
Amsterdam Exchange Index | | | 50 | | | | 07/16/2021 | | | | 8,648,030 | | | | (4,503 | ) |
BIST 30 Index | | | 1,805 | | | | 08/31/2021 | | | | 3,110,175 | | | | (93,029 | ) |
Brent Crude Oil | | | 20 | | | | 07/30/2021 | | | | 1,492,200 | | | | 66,960 | |
CAC 40 10 Euro Index | | | 110 | | | | 07/16/2021 | | | | 8,484,634 | | | | (44,694 | ) |
Coffee “C” | | | 26 | | | | 09/20/2021 | | | | 1,557,562 | | | | (2,819 | ) |
| | |
| The accompanying notes are an integral part of these financial statements. | | 49 |
GOLDMAN SACHS MANAGED FUTURES STRATEGY FUND
Consolidated Schedule of Investments (continued)
June 30, 2021 (Unaudited)
|
| ADDITIONAL INVESTMENT INFORMATION (continued) |
FUTURES CONTRACTS (continued)
| | | | | | | | | | | | | | | | |
| Description | | Number of
Contracts | | | Expiration Date | | | Notional
Amount | | | Unrealized
Appreciation/
(Depreciation) | |
Long position contracts: (continued) | | | | | | | | | | | | | | | | |
Corn | | | 20 | | | | 09/14/2021 | | | $ | 599,250 | | | $ | (26,950 | ) |
Cotton No. 2 | | | 53 | | | | 12/08/2021 | | | | 2,249,850 | | | | (22,672 | ) |
DAX Index | | | 18 | | | | 09/17/2021 | | | | 8,285,547 | | | | (29,290 | ) |
DJIA CBOT E-Mini Index | | | 25 | | | | 09/17/2021 | | | | 4,299,875 | | | | 7,359 | |
EURO STOXX 50 Index | | | 78 | | | | 09/17/2021 | | | | 3,750,871 | | | | (51,347 | ) |
EURO STOXX 50 Volatility Index | | | 319 | | | | 07/21/2021 | | | | 678,966 | | | | (63,574 | ) |
FTSE 100 Index | | | 89 | | | | 09/17/2021 | | | | 8,593,952 | | | | (39,035 | ) |
FTSE China A50 Index | | | 267 | | | | 07/29/2021 | | | | 4,619,100 | | | | 38,853 | |
FTSE Taiwan Index Equity Index | | | 56 | | | | 07/29/2021 | | | | 3,416,560 | | | | 25,098 | |
FTSE/JSE Top 40 Index | | | 89 | | | | 09/16/2021 | | | | 3,731,768 | | | | (109,665 | ) |
FTSE/MIB Index | | | 58 | | | | 09/17/2021 | | | | 8,598,063 | | | | (70,988 | ) |
Hang Seng Index | | | 29 | | | | 07/29/2021 | | | | 5,346,715 | | | | (28,020 | ) |
HSCEI | | | 24 | | | | 07/29/2021 | | | | 1,633,785 | | | | (22,098 | ) |
IBEX 35 Index | | | 81 | | | | 07/16/2021 | | | | 8,440,789 | | | | (127,374 | ) |
KC HRW Wheat | | | 9 | | | | 09/14/2021 | | | | 296,775 | | | | 1,884 | |
KOSPI 200 Index | | | 44 | | | | 09/09/2021 | | | | 4,286,596 | | | | 78,289 | |
Lean Hogs | | | 27 | | | | 08/13/2021 | | | | 1,118,880 | | | | (161,586 | ) |
LME Aluminum Base Metal | | | 57 | | | | 07/21/2021 | | | | 3,590,288 | | | | 66,799 | |
LME Aluminum Base Metal | | | 46 | | | | 08/18/2021 | | | | 2,900,875 | | | | 115,433 | |
LME Copper Base Metal | | | 11 | | | | 07/21/2021 | | | | 2,574,962 | | | | (184,078 | ) |
LME Copper Base Metal | | | 10 | | | | 08/18/2021 | | | | 2,342,750 | | | | (125,781 | ) |
LME Lead Base Metal | | | 57 | | | | 07/21/2021 | | | | 3,226,200 | | | | 105,987 | |
LME Lead Base Metal | | | 57 | | | | 08/18/2021 | | | | 3,233,325 | | | | 193,268 | |
LME Nickel Base Metal | | | 21 | | | | 07/21/2021 | | | | 2,293,956 | | | | 30,805 | |
LME Nickel Base Metal | | | 21 | | | | 08/18/2021 | | | | 2,294,208 | | | | 61,900 | |
LME Zinc Base Metal | | | 37 | | | | 07/21/2021 | | | | 2,747,481 | | | | 45,211 | |
LME Zinc Base Metal | | | 37 | | | | 08/18/2021 | | | | 2,750,256 | | | | 12,205 | |
Low Sulphur Gasoil | | | 30 | | | | 08/12/2021 | | | | 1,801,500 | | | | 36,115 | |
NASDAQ 100 E-Mini Index | | | 11 | | | | 09/17/2021 | | | | 3,200,780 | | | | 107,333 | |
Natural Gas | | | 52 | | | | 07/28/2021 | | | | 1,946,360 | | | | 323,326 | |
Nikkei 225 Index | | | 12 | | | | 09/09/2021 | | | | 3,108,691 | | | | 15,380 | |
NY Harbor ULSD | | | 18 | | | | 07/30/2021 | | | | 1,608,844 | | | | 4,638 | |
OMXS30 Index | | | 319 | | | | 07/16/2021 | | | | 8,446,431 | | | | (15,480 | ) |
RBOB Gasoline | | | 18 | | | | 07/30/2021 | | | | 1,693,364 | | | | 25,423 | |
S&P 500 E-Mini Index | | | 179 | | | | 09/17/2021 | | | | 38,382,970 | | | | 487,663 | |
S&P/TSX 60 Index | | | 49 | | | | 09/16/2021 | | | | 9,508,277 | | | | 92,213 | |
SET50 Index | | | 1,084 | | | | 09/29/2021 | | | | 6,409,298 | | | | (19,191 | ) |
Silver | | | 10 | | | | 09/28/2021 | | | | 1,312,500 | | | | (48,128 | ) |
Soybean | | | 13 | | | | 11/12/2021 | | | | 905,612 | | | | (49,526 | ) |
SPI 200 Index | | | 106 | | | | 09/16/2021 | | | | 14,354,756 | | | | 10,596 | |
Sugar No. 11 | | | 111 | | | | 09/30/2021 | | | | 2,224,085 | | | | 56,591 | |
TOPIX Index | | | 49 | | | | 09/09/2021 | | | | 8,569,873 | | | | 7,764 | |
Wheat | | | 17 | | | | 09/14/2021 | | | | 578,212 | | | | (16,498 | ) |
WTI Crude Oil | | | 17 | | | | 07/20/2021 | | | | 1,249,840 | | | | 72,544 | |
| | | | |
| Total | | | | | | | | | | | | | | $ | 570,586 | |
| | |
| 50 | | The accompanying notes are an integral part of these financial statements. |
GOLDMAN SACHS MANAGED FUTURES STRATEGY FUND
|
| ADDITIONAL INVESTMENT INFORMATION (continued) |
FUTURES CONTRACTS (continued)
| | | | | | | | | | | | | | | | |
| Description | | Number of
Contracts | | | Expiration Date | | | Notional
Amount | | | Unrealized
Appreciation/
(Depreciation) | |
| | | | |
Short position contracts: | | | | | | | | | | | | | | | | |
CBOE Volatility Index | | | (149 | ) | | | 07/21/2021 | | | $ | (2,667,592 | ) | | $ | 245,007 | |
Feeder Cattle | | | (7 | ) | | | 08/26/2021 | | | | (541,275 | ) | | | (24,506 | ) |
Live Cattle | | | (12 | ) | | | 08/31/2021 | | | | (590,040 | ) | | | (25,061 | ) |
LME Aluminum Base Metal | | | (57 | ) | | | 07/21/2021 | | | | (3,590,288 | ) | | | (149,513 | ) |
LME Copper Base Metal | | | (11 | ) | | | 07/21/2021 | | | | (2,574,962 | ) | | | 148,704 | |
LME Copper Base Metal | | | (4 | ) | | | 08/18/2021 | | | | (937,100 | ) | | | 3,388 | |
LME Lead Base Metal | | | (57 | ) | | | 07/21/2021 | | | | (3,226,200 | ) | | | (198,251 | ) |
LME Lead Base Metal | | | (6 | ) | | | 08/18/2021 | | | | (340,350 | ) | | | 6,282 | |
LME Nickel Base Metal | | | (21 | ) | | | 07/21/2021 | | | | (2,293,956 | ) | | | (57,341 | ) |
LME Nickel Base Metal | | | (3 | ) | | | 08/18/2021 | | | | (327,744 | ) | | | 4,707 | |
LME Zinc Base Metal | | | (37 | ) | | | 07/21/2021 | | | | (2,747,481 | ) | | | 3,217 | |
LME Zinc Base Metal | | | (15 | ) | | | 08/18/2021 | | | | (1,114,969 | ) | | | (9,702 | ) |
MSCI EAFE E-Mini Index | | | (70 | ) | | | 09/17/2021 | | | | (8,064,350 | ) | | | 82,232 | |
MSCI Emerging Markets E-Mini Index | | | (111 | ) | | | 09/17/2021 | | | | (7,574,640 | ) | | | (27,853 | ) |
Russell 2000 E-Mini Index | | | (43 | ) | | | 09/17/2021 | | | | (4,961,770 | ) | | | (3,520 | ) |
| | | | |
| Total | | | | | | | | | | | | | | $ | (2,210 | ) |
| |
| TOTAL FUTURES CONTRACTS | | | $ | 568,376 | |
SWAP CONTRACTS — At June 30, 2021, the Fund had the following swap contracts:
CENTRALLY CLEARED INTEREST RATE SWAP CONTRACTS
| | | | | | | | | | | | | | | | | | | | | | |
| Payments Made by the Fund | | Payments Received by
the Fund | | Termination
Date | | Notional
Amount
(000’s)(a) | | | Value | | | Upfront
Premium
(Received)
Paid | | | Unrealized
Appreciation/
(Depreciation) | |
3 Month BBR(b) | | 0.250% | | 09/15/2022 | | AUD | | | 552,300 | | | $ | 523,304 | | | $ | (98,627 | ) | | $ | 621,931 | |
3 Month BA(c) | | 0.500 | | 09/15/2022 | | CAD | | | 464,810 | | | | (335,348 | ) | | | (99,313 | ) | | | (236,035 | ) |
6 Month LIBOR(c) | | 0.000 | | 09/15/2022 | | CHF | | | 461,610 | | | | 3,388,859 | | | | 3,532,641 | | | | (143,782 | ) |
6 Month EURIBOR(c) | | 0.000 | | 09/15/2022 | | EUR | | | 549,510 | | | | 3,208,774 | | | | 3,303,068 | | | | (94,294 | ) |
0.250%(c) | | 6 Month LIBOR | | 09/15/2022 | | GBP | | | 462,700 | | | | 110,682 | | | | 661,799 | | | | (551,117 | ) |
3 Month STIBOR(b) | | 0.000 | | 09/15/2022 | | SEK | | | 1,321,550 | | | | 51,207 | | | | 51,207 | | | | – | |
3 Month LIBOR(b) | | 0.200 | | 09/15/2022 | | USD | | | 1,814,060 | | | | (116,570 | ) | | | 673,912 | | | | (790,482 | ) |
6 Month EURIBOR(c) | | 0.000 | | 09/15/2023 | | EUR | | | 170,480 | | | | 1,200,991 | | | | 1,270,081 | | | | (69,090 | ) |
6 Month LIBOR(c) | | 0.500 | | 09/15/2023 | | GBP | | | 67,200 | | | | 92,531 | | | | 183,458 | | | | (90,927 | ) |
3 Month LIBOR(b) | | 0.500 | | 09/15/2023 | | USD | | | 236,520 | | | | 456,431 | | | | 519,576 | | | | (63,145 | ) |
1.000(d) | | 6 Month PRIBOR | | 09/15/2026 | | CZK | | | 665,060 | | | | 1,468,323 | | | | 343,195 | | | | 1,125,128 | |
2.000(d) | | 6 Month BUBOR | | 09/15/2026 | | HUF | | | 6,455,520 | | | | 550,470 | | | | (268,175 | ) | | | 818,645 | |
5.750(e) | | 1 Month TIIE | | 09/15/2026 | | MXN | | | 267,510 | | | | 561,911 | | | | 199,475 | | | | 362,436 | |
1.500(d) | | 6 Month WIBOR | | 09/15/2026 | | PLN | | | 88,270 | | | | 5,732 | | | | (399,093 | ) | | | 404,825 | |
3 Month JIBAR(b) | | 6.750 | | 09/15/2026 | | ZAR | | | 220,840 | | | | 370,772 | | | | 426,291 | | | | (55,519 | ) |
2.000(c) | | 3 Month BA | | 09/15/2031 | | CAD | | | 13,560 | | | | (121,749 | ) | | | (60,223 | ) | | | (61,526 | ) |
0.000(d) | | 6 Month LIBOR | | 09/15/2031 | | CHF | | | 17,810 | | | | 74,565 | | | | 100,534 | | | | (25,969 | ) |
6 Month EURIBOR(c) | | 0.250 | | 09/15/2031 | | EUR | | | 29,240 | | | | (144,682 | ) | | | (144,682 | ) | | | – | |
6 Month LIBOR(c) | | 1.000 | | 09/15/2031 | | GBP | | | 14,310 | | | | – | | | | (12,014 | ) | | | 12,014 | |
1.000(d) | | 3 Month STIBOR | | 09/15/2031 | | SEK | | | 153,730 | | | | (376,211 | ) | | | (376,006 | ) | | | (205 | ) |
3 Month LIBOR(b) | | 1.500 | | 09/15/2031 | | USD | | | 33,760 | | | | (37,400 | ) | | | (37,400 | ) | | | – | |
0.500(d) | | 6 Month EURIBOR | | 09/15/2051 | | EUR | | | 18,700 | | | | (101,404 | ) | | | (70,581 | ) | | | (30,823 | ) |
| | |
| The accompanying notes are an integral part of these financial statements. | | 51 |
GOLDMAN SACHS MANAGED FUTURES STRATEGY FUND
Consolidated Schedule of Investments (continued)
June 30, 2021 (Unaudited)
|
| ADDITIONAL INVESTMENT INFORMATION (continued) |
CENTRALLY CLEARED INTEREST RATE SWAP CONTRACTS (continued)
| | | | | | | | | | | | | | | | | | | | | | | | | | |
| Payments Made by the Fund | | Payments Received by
the Fund | | | Termination
Date | | Notional
Amount
(000’s)(a) | | | Value | | | Upfront
Premium
(Received)
Paid | | | Unrealized
Appreciation/
(Depreciation) | |
1.250(c) | | | 6 Month LIBOR | | | 09/15/2051 | | | GBP | | | | 4,720 | | | $ | (40,398 | ) | | $ | (22,079 | ) | | $ | (18,319 | ) |
2.000(c) | | | 3 Month LIBOR | | | 09/15/2051 | | | USD | | | | 19,550 | | | | (822,417 | ) | | | (756,533 | ) | | | (65,884 | ) |
| | | | | | | |
| TOTAL | | | | | | | | | | | | | | | | $ | 9,968,373 | | | $ | 8,920,511 | | | $ | 1,047,862 | |
| | (a) | | Represents forward starting interest rate swaps whose effective dates of commencement of accruals and cash flows occur subsequent to June 30, 2021. |
| | (b) | | Payments made quarterly. |
| | (c) | | Payments made semi-annually. |
| | (d) | | Payments made annually. |
| | (e) | | Payments made monthly. |
| | |
| 52 | | The accompanying notes are an integral part of these financial statements. |
GOLDMAN SACHS ALTERNATIVE FUNDS
Consolidated Statements of Assets and Liabilities(a)
June 30, 2021 (Unaudited)
| | | | | | | | | | | | | | |
| | | | | Absolute Return
Tracker Fund | | | Alternative
Premia Fund | | | Managed Futures
Strategy Fund | |
| | Assets: | |
| | Investments in unaffiliated issuers, at value (cost $1,548,932,148, $0 and $0)(b) | | $ | 1,816,512,162 | | | $ | — | | | $ | — | |
| | Investments in affiliated issuers, at value (cost $1,585,357,468, $21,202,425 and $171,144,776) | | | 1,585,357,468 | | | | 21,202,425 | | | | 171,144,776 | |
| | Investments in affiliated securities lending reinvestment vehicle, at value (cost $77,778,706, $0 and $0) | | | 77,778,706 | | | | — | | | | — | |
| | Purchased Options, at value (premiums paid $508,168, $389,410 and $0) | | | 183,095 | | | | 184,400 | | | | — | |
| | Cash | | | 65,700,962 | | | | 1,420,940 | | | | 13,625,372 | |
| | Foreign currencies, at value (cost $58,265,170, $1,826,853 and $36,220,147) | | | 58,557,147 | | | | 1,971,569 | | | | 37,557,177 | |
| | Receivables: | | | | | | | | | | | | |
| | Collateral on certain derivative contracts(c) | | | 85,820,397 | | | | 9,524,291 | | | | 48,124,131 | |
| | Fund shares sold | | | 7,649,493 | | | | 414 | | | | 547,526 | |
| | Dividends | | | 699,315 | | | | 473 | | | | 3,976 | |
| | Foreign tax reclaims | | | 183,017 | | | | 36,293 | | | | — | |
| | Investments sold | | | 94,209 | | | | 35,560 | | | | 1,409 | |
| | Reimbursement from investment adviser | | | 62,873 | | | | 36,175 | | | | 1,272 | |
| | Securities lending income | | | 11,776 | | | | — | | | | — | |
| | Due from broker | | | — | | | | 3,787 | | | | — | |
| | Unrealized gain on swap contracts | | | 13,974,284 | | | | 478,346 | | | | — | |
| | Unrealized gain on forward foreign currency exchange contracts | | | 1,059,538 | | | | 80,317 | | | | 2,135,238 | |
| | Variation margin on futures | | | — | | | | 503,417 | | | | — | |
| | Other assets | | | 137,589 | | | | 50,238 | | | | 67,496 | |
| | Total assets | | | 3,713,782,031 | | | | 35,528,645 | | | | 273,208,373 | |
| | | | | | | | | | | | | | |
| | Liabilities: | | | | | | | | | | | | |
| | Unrealized loss on swap contracts | | | 8,145,302 | | | | 327,233 | | | | — | |
| | Variation margin on futures | | | 3,163,838 | | | | — | | | | 4,490,371 | |
| | Unrealized loss on forward foreign currency exchange contracts | | | 374,250 | | | | 115,818 | | | | 5,185,795 | |
| | Written options, at value (premiums received $300,600, $0 and $0) | | | 180,670 | | | | — | | | | — | |
| | Variation margin on swaps | | | 138,733 | | | | 92,799 | | | | 130,297 | |
| | Payables: | | | | | | | | | | | | |
| | Payable upon return of securities loaned | | | 77,778,706 | | | | — | | | | — | |
| | Fund shares redeemed | | | 12,829,245 | | | | 12,895 | | | | 275,697 | |
| | Management fees | | | 1,829,097 | | | | 21,477 | | | | 209,653 | |
| | Distribution and Service fees and Transfer Agency fees | | | 165,612 | | | | 3,528 | | | | 29,317 | |
| | Investments purchased | | | 13,016 | | | | — | | | | — | |
| | Collateral on certain derivative contracts(c) | | | — | | | | 10,000 | | | | — | |
| | Accrued expenses | | | 734,517 | | | | 401,441 | | | | 275,555 | |
| | Total liabilities | | | 105,352,986 | | | | 985,191 | | | | 10,596,685 | |
| | | | | | | | | | | | | | |
| | Net Assets: | | | | | | | | | | | | |
| | Paid-in capital | | | 3,270,068,208 | | | | 38,849,589 | | | | 243,405,023 | |
| | Total distributable earnings (loss) | | | 338,360,837 | | | | (4,306,135 | ) | | | 19,206,665 | |
| | | NET ASSETS | | $ | 3,608,429,045 | | | $ | 34,543,454 | | | $ | 262,611,688 | |
| | | Net Assets: | | | | | | | | | | | | |
| | | Class A | | $ | 61,515,551 | | | $ | 6,411,461 | | | $ | 14,324,784 | |
| | | Class C | | | 8,245,402 | | | | 404,397 | | | | 3,640,826 | |
| | | Institutional | | | 3,068,958,891 | | | | 3,912,437 | | | | 53,320,828 | |
| | | Investor | | | 228,546,809 | | | | 1,823,654 | | | | 133,957,119 | |
| | | Class R6 | | | 18,239,611 | | | | 21,967,467 | | | | 56,917,901 | |
| | | Class R | | | 1,568,496 | | | | 11,597 | | | | 439,138 | |
| | | Class P | | | 221,354,285 | | | | 12,441 | | | | 11,092 | |
| | | Total Net Assets | | $ | 3,608,429,045 | | | $ | 34,543,454 | | | $ | 262,611,688 | |
| | | Shares outstanding $0.001 par value (unlimited shares authorized): | | | | | | | | | | | | |
| | | Class A | | | 6,047,204 | | | | 936,903 | | | | 1,369,656 | |
| | | Class C | | | 891,468 | | | | 63,105 | | | | 371,611 | |
| | | Institutional | | | 290,929,032 | | | | 554,454 | | | | 4,936,107 | |
| | | Investor | | | 21,919,790 | | | | 260,182 | | | | 12,548,009 | |
| | | Class R6 | | | 1,731,023 | | | | 3,124,376 | | | | 5,266,269 | |
| | | Class R | | | 159,168 | | | | 1,710 | | | | 42,895 | |
| | | Class P | | | 20,991,034 | | | | 1,767 | | | | 1,028 | |
| | | Net asset value, offering and redemption price per share:(d) | | | | | | | | | | | | |
| | | Class A | | | $10.17 | | | | $6.84 | | | | $10.46 | |
| | | Class C | | | 9.25 | | | | 6.41 | | | | 9.80 | |
| | | Institutional | | | 10.55 | | | | 7.06 | | | | 10.80 | |
| | | Investor | | | 10.43 | | | | 7.01 | | | | 10.68 | |
| | | Class R6 | | | 10.54 | | | | 7.03 | | | | 10.81 | |
| | | Class R | | | 9.85 | | | | 6.78 | | | | 10.24 | |
| | | Class P | | | 10.55 | | | | 7.04 | | | | 10.79 | |
| | (a) | | Statements of Assets and Liabilities for Absolute Return Tracker, Alternative Premia and Managed Futures Strategy Funds are consolidated and include the balances of Cayman Commodity-ART, LLC., Cayman Commodity-AP LLC. and Cayman Commodity-MFS, LLC. (wholly-owned subsidiaries), respectively. Accordingly, all interfund balances and transactions have been eliminated. |
| | (b) | | Includes loaned securities having a market value of $76,287,395 for the Absolute Return Tracker Fund. |
| | (c) | | Segregated for initial margin and/or collateral on transactions as follows: |
| | | | | | | | | | | | | | | | |
| Fund | | Forwards | | | Futures | | | Options | | | Swaps | |
Absolute Return Tracker | | $ | — | | | $ | 47,397,119 | | | $ | 5,975,782 | | | $ | 32,447,496 | |
Alternative Premia | | | (10,000 | ) | | | 3,183,238 | | | | 5,216,865 | | | | 1,124,188 | |
Managed Futures Strategy | | | 9,840,000 | | | | 17,661,764 | | | | — | | | | 20,622,367 | |
| | (d) | | Maximum public offering price per share for Class A Shares of the Absolute Return Tracker, Alternative Premia and Managed Futures Strategy Funds is $10.76, $7.25 and $11.07, respectively. At redemption, Class C Shares may be subject to a contingent deferred sales charge assessed on the amount equal to the lesser of the current NAV or the original purchase price of the shares. |
| | |
| The accompanying notes are an integral part of these financial statements. | | 53 |
GOLDMAN SACHS ALTERNATIVE FUNDS
Consolidated Statements of Operations(a)
For the Six Months Ended June 30, 2021 (Unaudited)
| | | | | | | | | | | | | | |
| | | | | Absolute Return
Tracker Fund | | | Alternative
Premia Fund | | | Managed Futures
Strategy Fund | |
| | Investment income: | |
| | | | |
| | Dividends — unaffiliated issuers (net of foreign taxes withheld of $154,915, $0 and $0) | | $ | 12,047,563 | | | $ | — | | | $ | — | |
| | | | |
| | Dividends — affiliated issuers | | | 251,511 | | | | 11,718 | | | | 86,135 | |
| | | | |
| | Securities lending income — affiliated issuer | | | 77,728 | | | | — | | | | — | |
| | | | |
| | Total investment income | | | 12,376,802 | | | | 11,718 | | | | 86,135 | |
| | | | | | | | | | | | | | |
| | Expenses: | |
| | | | |
| | Management fees | | | 10,947,728 | | | | 145,007 | | | | 1,446,769 | |
| | | | |
| | Transfer Agency fees(b) | | | 857,250 | | | | 10,928 | | | | 145,614 | |
| | | | |
| | Custody, accounting and administrative services | | | 265,334 | | | | 54,151 | | | | 59,417 | |
| | | | |
| | Printing and mailing costs | | | 231,523 | | | | 25,830 | | | | 39,507 | |
| | | | |
| | Distribution and Service (12b-1) fees(b) | | | 113,325 | | | | 11,202 | | | | 30,515 | |
| | | | |
| | Professional fees | | | 112,185 | | | | 114,106 | | | | 89,748 | |
| | | | |
| | Registration fees | | | 63,040 | | | | 41,125 | | | | 49,248 | |
| | | | |
| | Trustee fees | | | 12,031 | | | | 9,436 | | | | 9,615 | |
| | | | |
| | Service fees — Class C | | | 10,864 | | | | 1,200 | | | | 4,346 | |
| | | | |
| | Other | | | 77,362 | | | | 15,740 | | | | 171,831 | |
| | | | |
| | Total expenses | | | 12,690,642 | | | | 428,725 | | | | 2,046,610 | |
| | | | |
| | Less — expense reductions | | | (826,225 | ) | | | (248,229 | ) | | | (160,621 | ) |
| | | | |
| | Net expenses | | | 11,864,417 | | | | 180,496 | | | | 1,885,989 | |
| | | | |
| | NET INVESTMENT INCOME (LOSS) | | | 512,385 | | | | (168,778 | ) | | | (1,799,854 | ) |
| | | | | | | | | | | | | | |
| | Realized and unrealized gain (loss): | |
| | | | |
| | Net realized gain (loss) from: | | | | | | | | | | | | |
| | | | |
| | Investments — unaffiliated issuers | | | 115,647,674 | | | | 21,624 | | | | 647 | |
| | | | |
| | Futures contracts | | | 15,234,078 | | | | 2,081,657 | | | | 16,953,580 | |
| | | | |
| | Purchased options | | | (3,448,211 | ) | | | (747,583 | ) | | | — | |
| | | | |
| | Swap contracts | | | 1,524,388 | | | | (967,285 | ) | | | 2,531,790 | |
| | | | |
| | Forward foreign currency exchange contracts | | | (3,568,456 | ) | | | 172,918 | | | | 4,002,446 | |
| | | | |
| | Foreign currency transactions | | | (589,511 | ) | | | (90,620 | ) | | | (176,775 | ) |
| | | | |
| | Written options | | | 24,988,424 | | | | — | | | | — | |
| | | | |
| | Net change in unrealized gain (loss) on: | | | | | | | | | | | | |
| | | | |
| | Investments — unaffiliated issuers | | | 47,103,908 | | | | — | | | | — | |
| | | | |
| | Futures contracts | | | (11,465,502 | ) | | | 303,353 | | | | (3,646,169 | ) |
| | | | |
| | Purchased options | | | (129,662 | ) | | | (142,293 | ) | | | — | |
| | | | |
| | Swap contracts | | | (6,152,215 | ) | | | 155,483 | | | | (3,145,070 | ) |
| | | | |
| | Forward foreign currency exchange contracts | | | (713,626 | ) | | | (41,887 | ) | | | (5,648,360 | ) |
| | | | |
| | Foreign currency translation | | | (3,027,159 | ) | | | 10,256 | | | | 153,690 | |
| | | | |
| | Written options | | | (1,319,111 | ) | | | — | | | | — | |
| | | | |
| | Net realized and unrealized gain | | | 174,085,019 | | | | 755,623 | | | | 11,025,779 | |
| | | | |
| | NET INCREASE IN NET ASSETS RESULTING FROM OPERATIONS | | $ | 174,597,404 | | | $ | 586,845 | | | $ | 9,225,925 | |
| | (a) | | Statements of Operations for Absolute Return Tracker, Alternative Premia and Managed Futures Strategy Funds are consolidated and include the balances of Cayman Commodity-ART, LLC., Cayman Commodity-AP LLC. and Cayman Commodity-MFS, LLC. (wholly-owned subsidiaries), respectively. Accordingly, all interfund balances and transactions have been eliminated. |
| | (b) | | Class specific Distribution and/or Service, and Transfer Agency fees were as follows: |
| | | | | | | | | | | | | | | | | | | | | | | | | | | | | | | | | | | | | | | | |
| | | Distribution and/or (12b-1) Service Fees | | | Transfer Agency Fees | |
Fund | | Class A | | | Class C | | | Class R | | | Class A | | | Class C | | | Institutional | | | Investor | | | Class R6 | | | Class R | | | Class P | |
Absolute Return Tracker | | $ | 76,693 | | | $ | 32,591 | | | $ | 4,041 | | | $ | 49,084 | | | $ | 6,953 | | | $ | 577,729 | | | $ | 188,172 | | | $ | 2,346 | | | $ | 1,293 | | | $ | 31,673 | |
Alternative Premia | | | 7,573 | | | | 3,600 | | | | 29 | | | | 4,847 | | | | 768 | | | | 796 | | | | 1,493 | | | | 3,013 | | | | 9 | | | | 2 | |
Managed Futures Strategy | | | 16,354 | | | | 13,037 | | | | 1,124 | | | | 10,466 | | | | 2,781 | | | | 10,364 | | | | 113,161 | | | | 8,477 | | | | 360 | | | | 5 | |
| | |
| 54 | | The accompanying notes are an integral part of these financial statements. |
GOLDMAN SACHS ALTERNATIVE FUNDS
Consolidated Statements of Changes in Net Assets(a)
| | | | | | | | | | | | | | | | | | | | | | |
| | | | | Absolute Return Tracker Fund | | | | | | Alternative Premia Fund | |
| | | | | For the
Six Months Ended
June 30, 2021
(Unaudited) | | | For the Fiscal
Year Ended
December 31,
2020 | | | | | | For the
Six Months Ended
June 30, 2021
(Unaudited) | | | For the Fiscal
Year Ended
December 31, 2020 | |
| | From operations: | | | | | | | | | | | | | |
| | | | | | |
| | Net investment income (loss) | | $ | 512,385 | | | $ | 8,780,977 | | | | | | | $ | (168,778 | ) | | $ | (261,382 | ) |
| | | | | | |
| | Net realized gain (loss) | | | 149,788,386 | | | | 9,509,639 | | | | | | | | 470,711 | | | | (3,658,163 | ) |
| | | | | | |
| | Net change in unrealized gain (loss) | | | 24,296,633 | | | | 65,857,178 | | | | | | | | 284,912 | | | | (216,610 | ) |
| | | | | | |
| | Net increase (decrease) in net assets resulting from operations | | | 174,597,404 | | | | 84,147,794 | | | | | | | | 586,845 | | | | (4,136,155 | ) |
| | | | | | | | | | | | | | | | | | | | | | |
| | Distributions to shareholders: | | | | | | | | | | | | | | | | | | | | |
| | | | | | |
| | From distributable earnings: | | | | | | | | | | | | | | | | | | | | |
| | | | | | |
| | Class A Shares | | | — | | | | (386,990 | ) | | | | | | | — | | | | (401,977 | ) |
| | | | | | |
| | Class C Shares | | | — | | | | (67,157 | ) | | | | | | | — | | | | (82,517 | ) |
| | | | | | |
| | Institutional Shares | | | — | | | | (17,700,159 | ) | | | | | | | — | | | | (342,456 | ) |
| | | | | | |
| | Investor Shares | | | — | | | | (1,515,395 | ) | | | | | | | — | | | | (145,793 | ) |
| | | | | | |
| | Class R6 Shares | | | — | | | | (56,391 | ) | | | | | | | — | | | | (1,451,948 | ) |
| | | | | | |
| | Class R Shares | | | — | | | | (10,040 | ) | | | | | | | — | | | | (1,195 | ) |
| | | | | | |
| | Class P Shares | | | — | | | | (1,277,883 | ) | | | | | | | — | | | | (891 | ) |
| | | | | | |
| | Total distributions to shareholders | | | — | | | | (21,014,015 | ) | | | | | | | — | | | | (2,426,777 | ) |
| | | | | | | | | | | | | | | | | | | | | | |
| | From share transactions: | | | | | | | | | | | | | | | | | | | | |
| | | | | | |
| | Proceeds from sales of shares | | | 627,390,465 | | | | 1,411,743,043 | | | | | | | | 3,622,550 | | | | 6,525,219 | |
| | | | | | |
| | Reinvestment of distributions | | | — | | | | 15,612,050 | | | | | | | | — | | | | 2,401,923 | |
| | | | | | |
| | Cost of shares redeemed | | | (663,190,462 | ) | | | (1,572,014,523 | ) | | | | | | | (3,910,894 | ) | | | (20,153,881 | ) |
| | | | | | |
| | Net decrease in net assets resulting from share transactions | | | (35,799,997 | ) | | | (144,659,430 | ) | | | | | | | (288,344 | ) | | | (11,226,739 | ) |
| | | | | | |
| | TOTAL INCREASE (DECREASE) | | | 138,797,407 | | | | (81,525,651 | ) | | | | | | | 298,501 | | | | (17,789,671 | ) |
| | | | | | | | | | | | | | | | | | | | | | |
| | Net Assets: | | | | | | | | | | | | | | | | | | | | |
| | | | | | |
| | Beginning of period | | | 3,469,631,638 | | | | 3,551,157,289 | | | | | | | | 34,244,953 | | | | 52,034,624 | |
| | End of period | | $ | 3,608,429,045 | | | $ | 3,469,631,638 | | | | | | | $ | 34,543,454 | | | $ | 34,244,953 | |
| | (a) | | Statements of Changes in Net Assets for the Absolute Return Tracker and Alternative Premia Funds are consolidated and include the balances of Cayman Commodity-ART, LLC. and Cayman Commodity-AP, LLC. (wholly-owned subsidiaries), respectively. Accordingly, all interfund balances and transactions have been eliminated. |
| | |
| The accompanying notes are an integral part of these financial statements. | | 55 |
GOLDMAN SACHS ALTERNATIVE FUNDS
Consolidated Statements of Changes in Net Assets(a) (continued)
| | | | | | | | | | |
| | | | | Managed Futures Strategy Fund | |
| | | | | For the
Six Months Ended
June 30, 2021
(Unaudited) | | | For the Fiscal
Year Ended
December 31, 2020 | |
| | From operations: | |
| | | |
| | Net investment loss | | $ | (1,799,854 | ) | | $ | (2,471,040 | ) |
| | | |
| | Net realized gain | | | 23,311,688 | | | | 6,934,760 | |
| | | |
| | Net change in unrealized gain (loss) | | | (12,285,909 | ) | | | 11,743,583 | |
| | | |
| | Net increase in net assets resulting from operations | | | 9,225,925 | | | | 16,207,303 | |
| | | | | | | | | | |
| | Distributions to shareholders: | | | | | | | | |
| | | |
| | From distributable earnings: | | | | | | | | |
| | | |
| | Class A Shares | | | — | | | | (142,248 | ) |
| | | |
| | Class C Shares | | | — | | | | (43,078 | ) |
| | | |
| | Institutional Shares | | | — | | | | (573,968 | ) |
| | | |
| | Investor Shares | | | — | | | | (1,830,145 | ) |
| | | |
| | Class R6 Shares | | | — | | | | (659,155 | ) |
| | | |
| | Class R Shares | | | — | | | | (6,810 | ) |
| | | |
| | Class P Shares | | | — | | | | (842 | ) |
| | | |
| | Total distributions to shareholders | | | — | | | | (3,256,246 | ) |
| | | | | | | | | | |
| | From share transactions: | | | | | | | | |
| | | |
| | Proceeds from sales of shares | | | 43,330,122 | | | | 191,383,416 | |
| | | |
| | Reinvestment of distributions | | | — | | | | 3,243,585 | |
| | | |
| | Cost of shares redeemed | | | (60,071,654 | ) | | | (198,235,855 | ) |
| | | |
| | Net decrease in net assets resulting from share transactions | | | (16,741,532 | ) | | | (3,608,854 | ) |
| | | |
| | TOTAL INCREASE (DECREASE) | | | (7,515,607 | ) | | | 9,342,203 | |
| | | | | | | | | | |
| | Net Assets: | | | | | | | | |
| | | |
| | Beginning of period | | | 270,127,295 | | | | 260,785,092 | |
| | End of period | | $ | 262,611,688 | | | $ | 270,127,295 | |
| | (a) | | Statements of Changes in Net Assets for the Managed Futures Strategy Fund are consolidated and include the balances of Cayman Commodity-MFS, LLC. (wholly-owned subsidiary). Accordingly, all interfund balances and transactions have been eliminated. |
| | |
| 56 | | The accompanying notes are an integral part of these financial statements. |
GOLDMAN SACHS ABSOLUTE RETURN TRACKER FUND
Consolidated Financial Highlights
Selected Data for a Share Outstanding Throughout Each Period
| | | | | | | | | | | | | | | | | | | | | | | | | | |
| | | | | Goldman Sachs Absolute Return Tracker Fund | |
| | | | | Class A Shares | |
| | | | | Six Months Ended
June 30, 2021
(Unaudited) | | | Year Ended December 31, | |
| | | | | 2020 | | | 2019 | | | 2018 | | | 2017 | | | 2016 | |
| | Per Share Data | | | | | | | | | | | | | | | | | | | | | | | | |
| | | | | | | |
| | Net asset value, beginning of period | | $ | 9.69 | | | $ | 9.44 | | | $ | 8.84 | | | $ | 9.31 | | | $ | 9.02 | | | $ | 8.67 | |
| | | | | | | |
| | Net investment income (loss)(a) | | | (0.02 | ) | | | (0.01 | ) | | | 0.10 | | | | 0.07 | | | | — | (b) | | | (0.04 | ) |
| | | | | | | |
| | Net realized and unrealized gain (loss) | | | 0.50 | | | | 0.32 | | | | 0.81 | | | | (0.33 | ) | | | 0.62 | | | | 0.43 | |
| | | | | | | |
| | Total from investment operations | | | 0.48 | | | | 0.31 | | | | 0.91 | | | | (0.26 | ) | | | 0.62 | | | | 0.39 | |
| | | | | | | |
| | Distributions to shareholders from net investment income | | | — | | | | (0.01 | ) | | | (0.09 | ) | | | (0.07 | ) | | | — | | | | — | |
| | | | | | | |
| | Distributions to shareholders from net realized gains | | | — | | | | (0.05 | ) | | | (0.22 | ) | | | (0.14 | ) | | | (0.33 | ) | | | (0.04 | ) |
| | | | | | | |
| | Total distributions | | | — | | | | (0.06 | ) | | | (0.31 | ) | | | (0.21 | ) | | | (0.33 | ) | | | (0.04 | ) |
| | | | | | | |
| | Net asset value, end of period | | $ | 10.17 | | | $ | 9.69 | | | $ | 9.44 | | | $ | 8.84 | | | $ | 9.31 | | | $ | 9.02 | |
| | | | | | | |
| | Total return(c) | | | 4.95 | % | | | 3.29 | % | | | 10.36 | % | | | (2.80 | )% | | | 6.93 | % | | | 4.45 | % |
| | | | | | | |
| | Net assets, end of period (in 000s) | | $ | 61,516 | | | $ | 61,642 | | | $ | 80,596 | | | $ | 65,635 | | | $ | 52,427 | | | $ | 38,886 | |
| | | | | | | |
| | Ratio of net expenses to average net assets | | | 1.04 | %(d) | | | 0.96 | % | | | 0.97 | % | | | 1.00 | % | | | 1.03 | % | | | 1.03 | % |
| | | | | | | |
| | Ratio of total expenses to average net assets | | | 1.09 | %(d) | | | 1.11 | % | | | 1.11 | % | | | 1.26 | % | | | 1.61 | % | | | 1.66 | % |
| | | | | | | |
| | Ratio of net investment income (loss) to average net assets | | | (0.33 | )%(d) | | | (0.10 | )% | | | 1.08 | % | | | 0.73 | % | | | (0.04 | )% | | | (0.43 | )% |
| | | | | | | |
| | Portfolio turnover rate(e) | | | 76 | % | | | 193 | % | | | 127 | % | | | 137 | % | | | 76 | % | | | 130 | % |
| | (a) | | Calculated based on the average shares outstanding methodology. |
| | (b) | | Amount is less than $0.005 per share. |
| | (c) | | Assumes investment at the net asset value at the beginning of the period, reinvestment of all distributions, a complete redemption of the investment at the net asset value at the end of the period and no sales or redemption charges (if any). Total returns would be reduced if a sales or redemption charge was taken into account. Returns do not reflect the impact of taxes to shareholders relating to Fund distributions or the redemption of Fund shares. Total returns for periods less than one full year are not annualized. |
| | (e) | | The Fund’s portfolio turnover rate is calculated in accordance with regulatory requirements, without regard to transactions involving short term investments and certain derivatives. If such transactions were included, the Fund’s portfolio turnover rate may be higher. |
| | |
| The accompanying notes are an integral part of these financial statements. | | 57 |
GOLDMAN SACHS ABSOLUTE RETURN TRACKER FUND
Consolidated Financial Highlights (continued)
Selected Data for a Share Outstanding Throughout Each Period
| | | | | | | | | | | | | | | | | | | | | | | | | | |
| | | | | Goldman Sachs Absolute Return Tracker Fund | |
| | | | | Class C Shares | |
| | | | | Six Months Ended
June 30, 2021
(Unaudited) | | | Year Ended December 31, | |
| | | | | 2020 | | | 2019 | | | 2018 | | | 2017 | | | 2016 | |
| | Per Share Data | | | | | | | | | | | | | | | | | | | | | | | | |
| | | | | | | |
| | Net asset value, beginning of period | | $ | 8.84 | | | $ | 8.69 | | | $ | 8.14 | | | $ | 8.61 | | | $ | 8.43 | | | $ | 8.17 | |
| | | | | | | |
| | Net investment income (loss)(a) | | | (0.05 | ) | | | (0.07 | ) | | | 0.03 | | | | — | (b) | | | (0.07 | ) | | | (0.10 | ) |
| | | | | | | |
| | Net realized and unrealized gain (loss) | | | 0.46 | | | | 0.28 | | | | 0.75 | | | | (0.31 | ) | | | 0.58 | | | | 0.40 | |
| | | | | | | |
| | Total from investment operations | | | 0.41 | | | | 0.21 | | | | 0.78 | | | | (0.31 | ) | | | 0.51 | | | | 0.30 | |
| | | | | | | |
| | Distributions to shareholders from net investment income | | | — | | | | (0.01 | ) | | | (0.01 | ) | | | (0.02 | ) | | | — | | | | — | |
| | | | | | | |
| | Distributions to shareholders from net realized gains | | | — | | | | (0.05 | ) | | | (0.22 | ) | | | (0.14 | ) | | | (0.33 | ) | | | (0.04 | ) |
| | | | | | | |
| | Total distributions | | | — | | | | (0.06 | ) | | | (0.23 | ) | | | (0.16 | ) | | | (0.33 | ) | | | (0.04 | ) |
| | | | | | | |
| | Net asset value, end of period | | $ | 9.25 | | | $ | 8.84 | | | $ | 8.69 | | | $ | 8.14 | | | $ | 8.61 | | | $ | 8.43 | |
| | | | | | | |
| | Total return(c) | | | 4.64 | % | | | 2.43 | % | | | 9.69 | % | | | (3.60 | )% | | | 6.10 | % | | | 3.62 | % |
| | | | | | | |
| | Net assets, end of period (in 000s) | | $ | 8,245 | | | $ | 9,638 | | | $ | 15,761 | | | $ | 18,985 | | | $ | 13,718 | | | $ | 13,490 | |
| | | | | | | |
| | Ratio of net expenses to average net assets | | | 1.79 | %(d) | | | 1.71 | % | | | 1.72 | % | | | 1.75 | % | | | 1.78 | % | | | 1.78 | % |
| | | | | | | |
| | Ratio of total expenses to average net assets | | | 1.84 | %(d) | | | 1.86 | % | | | 1.86 | % | | | 2.00 | % | | | 2.36 | % | | | 2.41 | % |
| | | | | | | |
| | Ratio of net investment income (loss) to average net assets | | | (1.09 | )%(d) | | | (0.84 | )% | | | 0.34 | % | | | — | %(e) | | | (0.81 | )% | | | (1.18 | )% |
| | | | | | | |
| | Portfolio turnover rate(f) | | | 76 | % | | | 193 | % | | | 127 | % | | | 137 | % | | | 76 | % | | | 130 | % |
| | (a) | | Calculated based on the average shares outstanding methodology. |
| | (b) | | Amount is less than $0.005 per share. |
| | (c) | | Assumes investment at the net asset value at the beginning of the period, reinvestment of all distributions, a complete redemption of the investment at the net asset value at the end of the period and no sales or redemption charges (if any). Total returns would be reduced if a sales or redemption charge was taken into account. Returns do not reflect the impact of taxes to shareholders relating to Fund distributions or the redemption of Fund shares. Total returns for periods less than one full year are not annualized. |
| | (e) | | Amount is less than 0.005%. |
| | (f) | | The Fund’s portfolio turnover rate is calculated in accordance with regulatory requirements, without regard to transactions involving short term investments and certain derivatives. If such transactions were included, the Fund’s portfolio turnover rate may be higher. |
| | |
| 58 | | The accompanying notes are an integral part of these financial statements. |
GOLDMAN SACHS ABSOLUTE RETURN TRACKER FUND
Consolidated Financial Highlights (continued)
Selected Data for a Share Outstanding Throughout Each Period
| | | | | | | | | | | | | | | | | | | | | | | | | | |
| | | | | Goldman Sachs Absolute Return Tracker Fund | |
| | | | | Institutional Shares | |
| | | | | Six Months Ended
June 30, 2021
(Unaudited) | | | Year Ended December 31, | |
| | | | | 2020 | | | 2019 | | | 2018 | | | 2017 | | | 2016 | |
| | Per Share Data | | | | | | | | | | | | | | | | | | | | | | | | |
| | | | | | | |
| | Net asset value, beginning of period | | $ | 10.03 | | | $ | 9.74 | | | $ | 9.10 | | | $ | 9.58 | | | $ | 9.23 | | | $ | 8.86 | |
| | | | | | | |
| | Net investment income (loss) (a) | | | — | (b) | | | 0.03 | | | | 0.14 | | | | 0.11 | | | | 0.03 | | | | — | (b) |
| | | | | | | |
| | Net realized and unrealized gain (loss) | | | 0.52 | | | | 0.32 | | | | 0.85 | | | | (0.35 | ) | | | 0.65 | | | | 0.43 | |
| | | | | | | |
| | Total from investment operations | | | 0.52 | | | | 0.35 | | | | 0.99 | | | | (0.24 | ) | | | 0.68 | | | | 0.43 | |
| | | | | | | |
| | Distributions to shareholders from net investment income | | | — | | | | (0.01 | ) | | | (0.13 | ) | | | (0.10 | ) | | | — | (b) | | | (0.02 | ) |
| | | | | | | |
| | Distributions to shareholders from net realized gains | | | — | | | | (0.05 | ) | | | (0.22 | ) | | | (0.14 | ) | | | (0.33 | ) | | | (0.04 | ) |
| | | | | | | |
| | Total distributions | | | — | | | | (0.06 | ) | | | (0.35 | ) | | | (0.24 | ) | | | (0.33 | ) | | | (0.06 | ) |
| | | | | | | |
| | Net asset value, end of period | | $ | 10.55 | | | $ | 10.03 | | | $ | 9.74 | | | $ | 9.10 | | | $ | 9.58 | | | $ | 9.23 | |
| | | | | | | |
| | Total return(c) | | | 5.18 | % | | | 3.60 | % | | | 10.91 | % | | | (2.47 | )% | | | 7.46 | % | | | 4.82 | % |
| | | | | | | |
| | Net assets, end of period (in 000s) | | $ | 3,068,959 | | | $ | 2,928,949 | | | $ | 2,852,690 | | | $ | 2,129,116 | | | $ | 1,510,457 | | | $ | 970,838 | |
| | | | | | | |
| | Ratio of net expenses to average net assets | | | 0.67 | %(d) | | | 0.58 | % | | | 0.59 | % | | | 0.61 | % | | | 0.64 | % | | | 0.62 | % |
| | | | | | | |
| | Ratio of total expenses to average net assets | | | 0.72 | %(d) | | | 0.73 | % | | | 0.73 | % | | | 0.88 | % | | | 1.21 | % | | | 1.24 | % |
| | | | | | | |
| | Ratio of net investment income (loss) to average net assets | | | 0.05 | %(d) | | | 0.28 | % | | | 1.46 | % | | | 1.13 | % | | | 0.36 | % | | | (0.02 | )% |
| | | | | | | |
| | Portfolio turnover rate(e) | | | 76 | % | | | 193 | % | | | 127 | % | | | 137 | % | | | 76 | % | | | 130 | % |
| | (a) | | Calculated based on the average shares outstanding methodology. |
| | (b) | | Amount is less than $0.005 per share. |
| | (c) | | Assumes investment at the net asset value at the beginning of the period, reinvestment of all distributions, a complete redemption of the investment at the net asset value at the end of the period and no sales or redemption charges (if any). Total returns would be reduced if a sales or redemption charge was taken into account. Returns do not reflect the impact of taxes to shareholders relating to Fund distributions or the redemption of Fund shares. Total returns for periods less than one full year are not annualized. |
| | (e) | | The Fund’s portfolio turnover rate is calculated in accordance with regulatory requirements, without regard to transactions involving short term investments and certain derivatives. If such transactions were included, the Fund’s portfolio turnover rate may be higher. |
| | |
| The accompanying notes are an integral part of these financial statements. | | 59 |
GOLDMAN SACHS ABSOLUTE RETURN TRACKER FUND
Consolidated Financial Highlights (continued)
Selected Data for a Share Outstanding Throughout Each Period
| | | | | | | | | | | | | | | | | | | | | | | | | | |
| | | | | Goldman Sachs Absolute Return Tracker Fund | |
| | | | | Investor Shares(a) | |
| | | | | Six Months Ended
June 30, 2021
(Unaudited) | | | Year Ended December 31, | |
| | | | | 2020 | | | 2019 | | | 2018 | | | 2017 | | | 2016 | |
| | Per Share Data | | | | | | | | | | | | | | | | | | | | | | | | |
| | | | | | | |
| | Net asset value, beginning of period | | $ | 9.92 | | | $ | 9.64 | | | $ | 9.02 | | | $ | 9.50 | | | $ | 9.17 | | | $ | 8.80 | |
| | | | | | | |
| | Net investment income (loss)(b) | | | — | (c) | | | 0.02 | | | | 0.13 | | | | 0.10 | | | | 0.03 | | | | (0.01 | ) |
| | | | | | | |
| | Net realized and unrealized gain (loss) | | | 0.51 | | | | 0.32 | | | | 0.83 | | | | (0.35 | ) | | | 0.63 | | | | 0.43 | |
| | | | | | | |
| | Total from investment operations | | | 0.51 | | | | 0.34 | | | | 0.96 | | | | (0.25 | ) | | | 0.66 | | | | 0.42 | |
| | | | | | | |
| | Distributions to shareholders from net investment income | | | — | | | | (0.01 | ) | | | (0.12 | ) | | | (0.09 | ) | | | — | | | | (0.01 | ) |
| | | | | | | |
| | Distributions to shareholders from net realized gains | | | — | | | | (0.05 | ) | | | (0.22 | ) | | | (0.14 | ) | | | (0.33 | ) | | | (0.04 | ) |
| | | | | | | |
| | Total distributions | | | — | | | | (0.06 | ) | | | (0.34 | ) | | | (0.23 | ) | | | (0.33 | ) | | | (0.05 | ) |
| | | | | | | |
| | Net asset value, end of period | | $ | 10.43 | | | $ | 9.92 | | | $ | 9.64 | | | $ | 9.02 | | | $ | 9.50 | | | $ | 9.17 | |
| | | | | | | |
| | Total return(d) | | | 5.14 | % | | | 3.54 | % | | | 10.66 | % | | | (2.58 | )% | | | 7.25 | % | | | 4.75 | % |
| | | | | | | |
| | Net assets, end of period (in 000s) | | $ | 228,547 | | | $ | 246,694 | | | $ | 370,779 | | | $ | 254,436 | | | $ | 93,650 | | | $ | 13,245 | |
| | | | | | | |
| | Ratio of net expenses to average net assets | | | 0.79 | %(e) | | | 0.71 | % | | | 0.72 | % | | | 0.75 | % | | | 0.78 | % | | | 0.78 | % |
| | | | | | | |
| | Ratio of total expenses to average net assets | | | 0.84 | %(e) | | | 0.86 | % | | | 0.87 | % | | | 0.98 | % | | | 1.35 | % | | | 1.42 | % |
| | | | | | | |
| | Ratio of net investment income (loss) to average net assets | | | (0.09 | )%(e) | | | 0.16 | % | | | 1.33 | % | | | 1.08 | % | | | 0.28 | % | | | (0.13 | )% |
| | | | | | | |
| | Portfolio turnover rate(f) | | | 76 | % | | | 193 | % | | | 127 | % | | | 137 | % | | | 76 | % | | | 130 | % |
| | (a) | | Effective August 15, 2017, Class IR changed its name to Investor Shares. |
| | (b) | | Calculated based on the average shares outstanding methodology. |
| | (c) | | Amount is less than $0.005 per share. |
| | (d) | | Assumes investment at the net asset value at the beginning of the period, reinvestment of all distributions, a complete redemption of the investment at the net asset value at the end of the period and no sales or redemption charges (if any). Total returns would be reduced if a sales or redemption charge was taken into account. Returns do not reflect the impact of taxes to shareholders relating to Fund distributions or the redemption of Fund shares. Total returns for periods less than one full year are not annualized. |
| | (f) | | The Fund’s portfolio turnover rate is calculated in accordance with regulatory requirements, without regard to transactions involving short term investments and certain derivatives. If such transactions were included, the Fund’s portfolio turnover rate may be higher. |
| | |
| 60 | | The accompanying notes are an integral part of these financial statements. |
GOLDMAN SACHS ABSOLUTE RETURN TRACKER FUND
Consolidated Financial Highlights (continued)
Selected Data for a Share Outstanding Throughout Each Period
| | | | | | | | | | | | | | | | | | | | | | | | | | |
| | | | | Goldman Sachs Absolute Return Tracker Fund | |
| | | | | Class R6 Shares | |
| | | | | Six Months Ended
June 30, 2021
(Unaudited) | | | Year Ended December 31, | |
| | | | | 2020 | | | 2019 | | | 2018 | | | 2017 | | | 2016 | |
| | Per Share Data | | | | | | | | | | | | | | | | | | | | | | | | |
| | | | | | | |
| | Net asset value, beginning of period | | $ | 10.02 | | | $ | 9.72 | | | $ | 9.09 | | | $ | 9.57 | | | $ | 9.23 | | | $ | 8.86 | |
| | | | | | | |
| | Net investment income(a) | | | — | (b) | | | 0.03 | | | | 0.14 | | | | 0.12 | | | | 0.04 | | | | — | (b) |
| | | | | | | |
| | Net realized and unrealized gain (loss) | | | 0.52 | | | | 0.33 | | | | 0.84 | | | | (0.36 | ) | | | 0.63 | | | | 0.43 | |
| | | | | | | |
| | Total from investment operations | | | 0.52 | | | | 0.36 | | | | 0.98 | | | | (0.24 | ) | | | 0.67 | | | | 0.43 | |
| | | | | | | |
| | Distributions to shareholders from net investment income | | | — | | | | (0.01 | ) | | | (0.13 | ) | | | (0.10 | ) | | | — | (b) | | | (0.02 | ) |
| | | | | | | |
| | Distributions to shareholders from net realized gains | | | — | | | | (0.05 | ) | | | (0.22 | ) | | | (0.14 | ) | | | (0.33 | ) | | | (0.04 | ) |
| | | | | | | |
| | Total distributions | | | — | | | | (0.06 | ) | | | (0.35 | ) | | | (0.24 | ) | | | (0.33 | ) | | | (0.06 | ) |
| | | | | | | |
| | Net asset value, end of period | | $ | 10.54 | | | $ | 10.02 | | | $ | 9.72 | | | $ | 9.09 | | | $ | 9.57 | | | $ | 9.23 | |
| | | | | | | |
| | Total return(c) | | | 5.19 | % | | | 3.71 | % | | | 10.82 | % | | | (2.46 | )% | | | 7.36 | % | | | 4.85 | % |
| | | | | | | |
| | Net assets, end of period (in 000s) | | $ | 18,240 | | | $ | 9,353 | | | $ | 9,284 | | | $ | 6,030 | | | $ | 2,226 | | | $ | 27 | |
| | | | | | | |
| | Ratio of net expenses to average net assets | | | 0.67 | %(d) | | | 0.57 | % | | | 0.58 | % | | | 0.60 | % | | | 0.62 | % | | | 0.64 | % |
| | | | | | | |
| | Ratio of total expenses to average net assets | | | 0.71 | %(d) | | | 0.72 | % | | | 0.72 | % | | | 0.84 | % | | | 1.19 | % | | | 1.24 | % |
| | | | | | | |
| | Ratio of net investment income to average net assets | | | 0.07 | %(d) | | | 0.29 | % | | | 1.47 | % | | | 1.20 | % | | | 0.39 | % | | | 0.01 | % |
| | | | | | | |
| | Portfolio turnover rate(e) | | | 76 | % | | | 193 | % | | | 127 | % | | | 137 | % | | | 76 | % | | | 130 | % |
| | (a) | | Calculated based on the average shares outstanding methodology. |
| | (b) | | Amount is less than $0.005 per share. |
| | (c) | | Assumes investment at the net asset value at the beginning of the period, reinvestment of all distributions, a complete redemption of the investment at the net asset value at the end of the period and no sales or redemption charges (if any). Total returns would be reduced if a sales or redemption charge was taken into account. Returns do not reflect the impact of taxes to shareholders relating to Fund distributions or the redemption of Fund shares. Total returns for periods less than one full year are not annualized. |
| | (e) | | The Fund’s portfolio turnover rate is calculated in accordance with regulatory requirements, without regard to transactions involving short term investments and certain derivatives. If such transactions were included, the Fund’s portfolio turnover rate may be higher. |
| | |
| The accompanying notes are an integral part of these financial statements. | | 61 |
GOLDMAN SACHS ABSOLUTE RETURN TRACKER FUND
Consolidated Financial Highlights (continued)
Selected Data for a Share Outstanding Throughout Each Year
| | | | | | | | | | | | | | | | | | | | | | | | | | |
| | | | | Goldman Sachs Absolute Return Tracker Fund | |
| | | | | Class R Shares | |
| | | | | Six Months Ended
June 30, 2021
(Unaudited) | | | Year Ended December 31, | |
| | | | | 2020 | | | 2019 | | | 2018 | | | 2017 | | | 2016 | |
| | Per Share Data | | | | | | | | | | | | | | | | | | | | | | | | |
| | | | | | | |
| | Net asset value, beginning of period | | $ | 9.40 | | | $ | 9.18 | | | $ | 8.61 | | | $ | 9.08 | | | $ | 8.82 | | | $ | 8.50 | |
| | | | | | | |
| | Net investment income (loss)(a) | | | (0.03 | ) | | | (0.03 | ) | | | 0.08 | | | | 0.04 | | | | (0.03 | ) | | | (0.06 | ) |
| | | | | | | |
| | Net realized and unrealized gain (loss) | | | 0.48 | | | | 0.31 | | | | 0.78 | | | | (0.33 | ) | | | 0.62 | | | | 0.42 | |
| | | | | | | |
| | Total from investment operations | | | 0.45 | | | | 0.28 | | | | 0.86 | | | | (0.29 | ) | | | 0.59 | | | | 0.36 | |
| | | | | | | |
| | Distributions to shareholders from net investment income | | | — | | | | (0.01 | ) | | | (0.07 | ) | | | (0.04 | ) | | | — | | | | — | |
| | | | | | | |
| | Distributions to shareholders from net realized gains | | | — | | | | (0.05 | ) | | | (0.22 | ) | | | (0.14 | ) | | | (0.33 | ) | | | (0.04 | ) |
| | | | | | | |
| | Total distributions | | | — | | | | (0.06 | ) | | | (0.29 | ) | | | (0.18 | ) | | | (0.33 | ) | | | (0.04 | ) |
| | | | | | | |
| | Net asset value, end of period | | $ | 9.85 | | | $ | 9.40 | | | $ | 9.18 | | | $ | 8.61 | | | $ | 9.08 | | | $ | 8.82 | |
| | | | | | | |
| | Total return(b) | | | 4.79 | % | | | 3.06 | % | | | 10.06 | % | | | (3.13 | )% | | | 6.74 | % | | | 4.19 | % |
| | | | | | | |
| | Net assets, end of period (in 000s) | | $ | 1,568 | | | $ | 1,562 | | | $ | 2,347 | | | $ | 1,954 | | | $ | 2,150 | | | $ | 2,197 | |
| | | | | | | |
| | Ratio of net expenses to average net assets | | | 1.29 | %(c) | | | 1.21 | % | | | 1.22 | % | | | 1.25 | % | | | 1.28 | % | | | 1.28 | % |
| | | | | | | |
| | Ratio of total expenses to average net assets | | | 1.34 | %(c) | | | 1.36 | % | | | 1.37 | % | | | 1.53 | % | | | 1.86 | % | | | 1.91 | % |
| | | | | | | |
| | Ratio of net investment income (loss) to average net assets | | | (0.58 | )%(c) | | | (0.35 | )% | | | 0.83 | % | | | 0.45 | % | | | (0.31 | )% | | | (0.66 | )% |
| | | | | | | |
| | Portfolio turnover rate(d) | | | 76 | % | | | 193 | % | | | 127 | % | | | 137 | % | | | 76 | % | | | 130 | % |
| | (a) | | Calculated based on the average shares outstanding methodology. |
| | (b) | | Assumes investment at the net asset value at the beginning of the period, reinvestment of all distributions, a complete redemption of the investment at the net asset value at the end of the period and no sales or redemption charges (if any). Total returns would be reduced if a sales or redemption charge was taken into account. Returns do not reflect the impact of taxes to shareholders relating to Fund distributions or the redemption of Fund shares. Total returns for periods less than one full year are not annualized. |
| | (d) | | The Fund’s portfolio turnover rate is calculated in accordance with regulatory requirements, without regard to transactions involving short term investments and certain derivatives. If such transactions were included, the Fund’s portfolio turnover rate may be higher. |
| | |
| 62 | | The accompanying notes are an integral part of these financial statements. |
GOLDMAN SACHS ABSOLUTE RETURN TRACKER FUND
Consolidated Financial Highlights (continued)
Selected Data for a Share Outstanding Throughout Each Period
| | | | | | | | | | | | | | | | | | |
| | | | | Goldman Sachs Absolute Return Tracker Fund | |
| | | | | Class P Shares | |
| | | | | Six Months Ended
June 30, 2021
(Unaudited) | | | Year Ended December 31, | | | April 17, 2018*
to December 31,
2018 | |
| | | | | 2020 | | | 2019 | |
| | Per Share Data | | | | | | | | | | | | | | | | |
| | | | | |
| | Net asset value, beginning of period | | $ | 10.02 | | | $ | 9.73 | | | $ | 9.09 | | | $ | 9.64 | |
| | | | | |
| | Net investment income(a) | | | — | (b) | | | 0.03 | | | | 0.14 | | | | 0.10 | |
| | | | | |
| | Net realized and unrealized gain (loss) | | | 0.53 | | | | 0.32 | | | | 0.85 | | | | (0.41 | ) |
| | | | | |
| | Total from investment operations | | | 0.53 | | | | 0.35 | | | | 0.99 | | | | (0.31 | ) |
| | | | | |
| | Distributions to shareholders from net investment income | | | — | | | | (0.01 | ) | | | (0.13 | ) | | | (0.10 | ) |
| | | | | |
| | Distributions to shareholders from net realized gains | | | — | | | | (0.05 | ) | | | (0.22 | ) | | | (0.14 | ) |
| | | | | |
| | Total distributions | | | — | | | | (0.06 | ) | | | (0.35 | ) | | | (0.24 | ) |
| | | | | |
| | Net asset value, end of period | | $ | 10.55 | | | $ | 10.02 | | | $ | 9.73 | | | $ | 9.09 | |
| | | | | |
| | Total return(c) | | | 5.29 | % | | | 3.61 | % | | | 10.93 | % | | | (3.17 | )% |
| | | | | |
| | Net assets, end of period (in 000s) | | $ | 221,354 | | | $ | 211,794 | | | $ | 219,701 | | | $ | 152,975 | |
| | | | | |
| | Ratio of net expenses to average net assets | | | 0.66 | %(d) | | | 0.57 | % | | | 0.58 | % | | | 0.59 | %(d) |
| | | | | |
| | Ratio of total expenses to average net assets | | | 0.71 | %(d) | | | 0.72 | % | | | 0.72 | % | | | 0.74 | %(d) |
| | | | | |
| | Ratio of net investment income to average net assets | | | 0.05 | %(d) | | | 0.29 | % | | | 1.48 | % | | | 1.41 | %(d) |
| | | | | |
| | Portfolio turnover rate(e) | | | 76 | % | | | 193 | % | | | 127 | % | | | 137 | % |
| | * | | Commencement of operations. |
| | (a) | | Calculated based on the average shares outstanding methodology. |
| | (b) | | Amount is less than $0.005 per share. |
| | (c) | | Assumes investment at the net asset value at the beginning of the period, reinvestment of all distributions, a complete redemption of the investment at the net asset value at the end of the period and no sales or redemption charges (if any). Total returns would be reduced if a sales or redemption charge was taken into account. Returns do not reflect the impact of taxes to shareholders relating to Fund distributions or the redemption of Fund shares. Total returns for periods less than one full year are not annualized. |
| | (e) | | The Fund’s portfolio turnover rate is calculated in accordance with regulatory requirements, without regard to transactions involving short term investments and certain derivatives. If such transactions were included, the Fund’s portfolio turnover rate may be higher. |
| | |
| The accompanying notes are an integral part of these financial statements. | | 63 |
GOLDMAN SACHS ALTERNATIVE PREMIA FUND
Consolidated Financial Highlights (continued)
Selected Data for a Share Outstanding Throughout Each Period
| | | | | | | | | | | | | | | | | | | | | | | | | | |
| | | | | Goldman Sachs Alternative Premia Fund | |
| | | | | Class A Shares | |
| | | | | Six Months Ended
June 30, 2021
(Unaudited) | | | Year Ended December 31, | |
| | | | | 2020 | | | 2019 | | | 2018 | | | 2017 | | | 2016 | |
| | Per Share Data | | | | | | | | | | | | | | | | | | | | | | | | |
| | | | | | | |
| | Net asset value, beginning of period | | $ | 6.73 | | | $ | 7.97 | | | $ | 7.92 | | | $ | 8.91 | | | $ | 10.01 | | | $ | 9.45 | |
| | | | | | | |
| | Net investment income (loss)(a) | | | (0.04 | ) | | | (0.06 | ) | | | 0.05 | | | | 0.03 | | | | (0.01 | ) | | | (0.01 | ) |
| | | | | | | |
| | Net realized and unrealized gain (loss) | | | 0.15 | | | | (0.68 | ) | | | — | (b) | | | (0.58 | ) | | | 1.40 | | | | 0.57 | |
| | | | | | | |
| | Total from investment operations | | | 0.11 | | | | (0.74 | ) | | | 0.05 | | | | (0.55 | ) | | | 1.39 | | | | 0.56 | |
| | | | | | | |
| | Distributions to shareholders from net investment income | | | — | | | | (0.50 | ) | | | — | | | | — | | | | (0.17 | ) | | | — | |
| | | | | | | |
| | Distributions to shareholders from net realized gains | | | — | | | | — | | | | — | | | | (0.44 | ) | | | (2.32 | ) | | | — | |
| | | | | | | |
| | Total distributions | | | — | | | | (0.50 | ) | | | — | | | | (0.44 | ) | | | (2.49 | ) | | | — | |
| | | | | | | |
| | Net asset value, end of period | | $ | 6.84 | | | $ | 6.73 | | | $ | 7.97 | | | $ | 7.92 | | | $ | 8.91 | | | $ | 10.01 | |
| | | | | | | |
| | Total return(c) | | | 1.78 | % | | | (9.23 | )% | | | 0.63 | % | | | (6.18 | )% | | | 14.17 | % | | | 5.91 | % |
| | | | | | | |
| | Net assets, end of period (in 000s) | | $ | 6,411 | | | $ | 5,642 | | | $ | 8,047 | | | $ | 9,166 | | | $ | 13,886 | | | $ | 27,566 | |
| | | | | | | |
| | Ratio of net expenses to average net assets | | | 1.29 | %(d) | | | 1.19 | % | | | 1.13 | % | | | 1.13 | % | | | 1.12 | % | | | 1.15 | % |
| | | | | | | |
| | Ratio of total expenses to average net assets | | | 2.70 | %(d) | | | 2.46 | % | | | 1.95 | % | | | 1.64 | % | | | 1.51 | % | | | 1.45 | % |
| | | | | | | |
| | Ratio of net investment income (loss) to average net assets | | | (1.29 | )%(d) | | | (0.83 | )% | | | 0.60 | % | | | 0.34 | % | | | (0.10 | )% | | | (0.13 | )% |
| | | | | | | |
| | Portfolio turnover rate(e) | | | — | % | | | — | % | | | — | % | | | — | % | | | 349 | % | | | 272 | % |
| | (a) | | Calculated based on the average shares outstanding methodology. |
| | (b) | | Amount is less than $0.005 per share. |
| | (c) | | Assumes investment at the net asset value at the beginning of the period, reinvestment of all distributions, a complete redemption of the investment at the net asset value at the end of the period and no sales or redemption charges (if any). Total returns would be reduced if a sales or redemption charge was taken into account. Returns do not reflect the impact of taxes to shareholders relating to Fund distributions or the redemption of Fund shares. Total returns for periods less than one full year are not annualized. |
| | (e) | | The Fund’s portfolio turnover rate is calculated in accordance with regulatory requirements, without regard to transactions involving short term investments and certain derivatives. If such transactions were included, the Fund’s portfolio turnover rate may be higher. |
| | |
| 64 | | The accompanying notes are an integral part of these financial statements. |
GOLDMAN SACHS ALTERNATIVE PREMIA FUND
Consolidated Financial Highlights (continued)
Selected Data for a Share Outstanding Throughout Each Period
| | | | | | | | | | | | | | | | | | | | | | | | | | |
| | | | | Goldman Sachs Alternative Premia Fund | |
| | | | | Class C Shares | |
| | | | | Six Months Ended
June 30, 2021
(Unaudited) | | | Year Ended December 31, | |
| | | | | 2020 | | | 2019 | | | 2018 | | | 2017 | | | 2016 | |
| | Per Share Data | | | | | | | | | | | | | | | | | | | | | | | | |
| | | | | | | |
| | Net asset value, beginning of period | | $ | 6.33 | | | $ | 7.34 | | | $ | 7.35 | | | $ | 8.36 | | | $ | 9.55 | | | $ | 9.08 | |
| | | | | | | |
| | Net investment loss(a) | | | (0.06 | ) | | | (0.11 | ) | | | (0.01 | ) | | | (0.03 | ) | | | (0.08 | ) | | | (0.08 | ) |
| | | | | | | |
| | Net realized and unrealized gain (loss) | | | 0.14 | | | | (0.61 | ) | | | — | (b) | | | (0.54 | ) | | | 1.32 | | | | 0.55 | |
| | | | | | | |
| | Total from investment operations | | | 0.08 | | | | (0.72 | ) | | | (0.01 | ) | | | (0.57 | ) | | | 1.24 | | | | 0.47 | |
| | | | | | | |
| | Distributions to shareholders from net investment income | | | — | | | | (0.29 | ) | | | — | | | | — | | | | (0.11 | ) | | | — | |
| | | | | | | |
| | Distributions to shareholders from net realized gains | | | — | | | | — | | | | — | | | | (0.44 | ) | | | (2.32 | ) | | | — | |
| | | | | | | |
| | Total distributions | | | — | | | | (0.29 | ) | | | — | | | | (0.44 | ) | | | (2.43 | ) | | | — | |
| | | | | | | |
| | Net asset value, end of period | | $ | 6.41 | | | $ | 6.33 | | | $ | 7.34 | | | $ | 7.35 | | | $ | 8.36 | | | $ | 9.55 | |
| | | | | | | |
| | Total return(c) | | | 1.26 | % | | | (9.82 | )% | | | (0.14 | )% | | | (6.93 | )% | | | 13.37 | % | | | 5.16 | % |
| | | | | | | |
| | Net assets, end of period (in 000s) | | $ | 404 | | | $ | 1,888 | | | $ | 4,335 | | | $ | 8,547 | | | $ | 15,239 | | | $ | 20,123 | |
| | | | | | | |
| | Ratio of net expenses to average net assets | | | 2.02 | %(d) | | | 1.94 | % | | | 1.89 | % | | | 1.88 | % | | | 1.87 | % | | | 1.90 | % |
| | | | | | | |
| | Ratio of total expenses to average net assets | | | 3.48 | %(d) | | | 3.19 | % | | | 2.67 | % | | | 2.39 | % | | | 2.27 | % | | | 2.20 | % |
| | | | | | | |
| | Ratio of net investment loss to average net assets | | | (2.04 | )%(d) | | | (1.54 | )% | | | (0.11 | )% | | | (0.41 | )% | | | (0.84 | )% | | | (0.88 | )% |
| | | | | | | |
| | Portfolio turnover rate(e) | | | — | % | | | — | % | | | — | % | | | — | % | | | 349 | % | | | 272 | % |
| | (a) | | Calculated based on the average shares outstanding methodology. |
| | (b) | | Amount is less than $0.005 per share. |
| | (c) | | Assumes investment at the net asset value at the beginning of the period, reinvestment of all distributions, a complete redemption of the investment at the net asset value at the end of the period and no sales or redemption charges (if any). Total returns would be reduced if a sales or redemption charge was taken into account. Returns do not reflect the impact of taxes to shareholders relating to Fund distributions or the redemption of Fund shares. Total returns for periods less than one full year are not annualized. |
| | (e) | | The Fund’s portfolio turnover rate is calculated in accordance with regulatory requirements, without regard to transactions involving short term investments and certain derivatives. If such transactions were included, the Fund’s portfolio turnover rate may be higher. |
| | |
| The accompanying notes are an integral part of these financial statements. | | 65 |
GOLDMAN SACHS ALTERNATIVE PREMIA FUND
Consolidated Financial Highlights (continued)
Selected Data for a Share Outstanding Throughout Each Period
| | | | | | | | | | | | | | | | | | | | | | | | | | |
| | | | | Goldman Sachs Alternative Premia Fund | |
| | | | | Institutional Shares | |
| | | | | Six Months Ended
June 30, 2021
(Unaudited) | | | Year Ended December 31, | |
| | | | | 2020 | | | 2019 | | | 2018 | | | 2017 | | | 2016 | |
| | Per Share Data | | | | | | | | | | | | | | | | | | | | | | | | |
| | | | | | | |
| | Net asset value, beginning of period | | $ | 6.93 | | | $ | 8.20 | | | $ | 8.11 | | | $ | 9.07 | | | $ | 10.15 | | | $ | 9.54 | |
| | | | | | | |
| | Net investment income (loss)(a) | | | (0.03 | ) | | | (0.03 | ) | | | 0.08 | | | | 0.05 | | | | 0.04 | | | | 0.03 | |
| | | | | | | |
| | Net realized and unrealized gain (loss) | | | 0.16 | | | | (0.70 | ) | | | 0.01 | | | | (0.57 | ) | | | 1.41 | | | | 0.58 | |
| | | | | | | |
| | Total from investment operations | | | 0.13 | | | | (0.73 | ) | | | 0.09 | | | | (0.52 | ) | | | 1.45 | | | | 0.61 | |
| | | | | | | |
| | Distributions to shareholders from net investment income | | | — | | | | (0.54 | ) | | | — | | | | — | | | | (0.21 | ) | | | — | |
| | | | | | | |
| | Distributions to shareholders from net realized gains | | | — | | | | — | | | | — | | | | (0.44 | ) | | | (2.32 | ) | | | — | |
| | | | | | | |
| | Total distributions | | | — | | | | (0.54 | ) | | | — | | | | (0.44 | ) | | | (2.53 | ) | | | — | |
| | | | | | | |
| | Net asset value, end of period | | $ | 7.06 | | | $ | 6.93 | | | $ | 8.20 | | | $ | 8.11 | | | $ | 9.07 | | | $ | 10.15 | |
| | | | | | | |
| | Total return(b) | | | 1.88 | % | | | (8.89 | )% | | | 1.11 | % | | | (5.74 | )% | | | 14.59 | % | | | 6.38 | % |
| | | | | | | |
| | Net assets, end of period (in 000s) | | $ | 3,912 | | | $ | 4,620 | | | $ | 13,006 | | | $ | 32,924 | | | $ | 114,953 | | | $ | 468,924 | |
| | | | | | | |
| | Ratio of net expenses to average net assets | | | 0.92 | %(c) | | | 0.81 | % | | | 0.77 | % | | | 0.73 | % | | | 0.73 | % | | | 0.75 | % |
| | | | | | | |
| | Ratio of total expenses to average net assets | | | 2.33 | %(c) | | | 2.06 | % | | | 1.51 | % | | | 1.27 | % | | | 1.09 | % | | | 1.05 | % |
| | | | | | | |
| | Ratio of net investment income (loss) to average net assets | | | (0.92 | )%(c) | | | (0.43 | )% | | | 1.02 | % | | | 0.52 | % | | | 0.36 | % | | | 0.27 | % |
| | | | | | | |
| | Portfolio turnover rate(d) | | | — | % | | | — | % | | | — | % | | | — | % | | | 349 | % | | | 272 | % |
| | (a) | | Calculated based on the average shares outstanding methodology. |
| | (b) | | Assumes investment at the net asset value at the beginning of the period, reinvestment of all distributions, a complete redemption of the investment at the net asset value at the end of the period and no sales or redemption charges (if any). Total returns would be reduced if a sales or redemption charge was taken into account. Returns do not reflect the impact of taxes to shareholders relating to Fund distributions or the redemption of Fund shares. Total returns for periods less than one full year are not annualized. |
| | (d) | | The Fund’s portfolio turnover rate is calculated in accordance with regulatory requirements, without regard to transactions involving short term investments and certain derivatives. If such transactions were included, the Fund’s portfolio turnover rate may be higher. |
| | |
| 66 | | The accompanying notes are an integral part of these financial statements. |
GOLDMAN SACHS ALTERNATIVE PREMIA FUND
Consolidated Financial Highlights (continued)
Selected Data for a Share Outstanding Throughout Each Period
| | | | | | | | | | | | | | | | | | | | | | | | | | |
| | | | | Goldman Sachs Alternative Premia Fund | |
| | | | | Investor Shares(a) | |
| | | | | Six Months Ended
June 30, 2021
(Unaudited) | | | Year Ended December 31, | |
| | | | | 2020 | | | 2019 | | | 2018 | | | 2017 | | | 2016 | |
| | Per Share Data | | | | | | | | | | | | | | | | | | | | | | | | |
| | | | | | | |
| | Net asset value, beginning of period | | $ | 6.89 | | | $ | 8.12 | | | $ | 8.04 | | | $ | 9.02 | | | $ | 10.11 | | | $ | 9.52 | |
| | | | | | | |
| | Net investment income (loss)(b) | | | (0.04 | ) | | | (0.04 | ) | | | 0.07 | | | | 0.05 | | | | 0.02 | | | | 0.01 | |
| | | | | | | |
| | Net realized and unrealized gain (loss) | | | 0.16 | | | | (0.69 | ) | | | 0.01 | | | | (0.59 | ) | | | 1.41 | | | | 0.58 | |
| | | | | | | |
| | Total from investment operations | | | 0.12 | | | | (0.73 | ) | | | 0.08 | | | | (0.54 | ) | | | 1.43 | | | | 0.59 | |
| | | | | | | |
| | Distributions to shareholders from net investment income | | | — | | | | (0.50 | ) | | | — | | | | — | | | | (0.20 | ) | | | — | |
| | | | | | | |
| | Distributions to shareholders from net realized gains | | | — | | | | — | | | | — | | | | (0.44 | ) | | | (2.32 | ) | | | — | |
| | | | | | | |
| | Total distributions | | | — | | | | (0.50 | ) | | | — | | | | (0.44 | ) | | | (2.52 | ) | | | — | |
| | | | | | | |
| | Net asset value, end of period | | $ | 7.01 | | | $ | 6.89 | | | $ | 8.12 | | | $ | 8.04 | | | $ | 9.02 | | | $ | 10.11 | |
| | | | | | | |
| | Total return(c) | | | 1.74 | % | | | (8.97 | )% | | | 1.00 | % | | | (5.99 | )% | | | 14.47 | % | | | 6.18 | % |
| | | | | | | |
| | Net assets, end of period (in 000s) | | $ | 1,824 | | | $ | 2,096 | | | $ | 3,911 | | | $ | 9,092 | | | $ | 8,910 | | | $ | 5,733 | |
| | | | | | | |
| | Ratio of net expenses to average net assets | | | 1.04 | %(d) | | | 0.93 | % | | | 0.88 | % | | | 0.88 | % | | | 0.86 | % | | | 0.90 | % |
| | | | | | | |
| | Ratio of total expenses to average net assets | | | 2.45 | %(d) | | | 2.19 | % | | | 1.66 | % | | | 1.39 | % | | | 1.28 | % | | | 1.20 | % |
| | | | | | | |
| | Ratio of net investment income (loss) to average net assets | | | (1.04 | )%(d) | | | (0.52 | )% | | | 0.91 | % | | | 0.61 | % | | | 0.20 | % | | | 0.10 | % |
| | | | | | | |
| | Portfolio turnover rate(e) | | | — | % | | | — | % | | | — | % | | | — | % | | | 349 | % | | | 272 | % |
| | (a) | | Effective August 15, 2017, Class IR changed its name to Investor Shares. |
| | (b) | | Calculated based on the average shares outstanding methodology. |
| | (c) | | Assumes investment at the net asset value at the beginning of the period, reinvestment of all distributions, a complete redemption of the investment at the net asset value at the end of the period and no sales or redemption charges (if any). Total returns would be reduced if a sales or redemption charge was taken into account. Returns do not reflect the impact of taxes to shareholders relating to Fund distributions or the redemption of Fund shares. Total returns for periods less than one full year are not annualized. |
| | (e) | | The Fund’s portfolio turnover rate is calculated in accordance with regulatory requirements, without regard to transactions involving short term investments and certain derivatives. If such transactions were included, the Fund’s portfolio turnover rate may be higher. |
| | |
| The accompanying notes are an integral part of these financial statements. | | 67 |
GOLDMAN SACHS ALTERNATIVE PREMIA FUND
Consolidated Financial Highlights (continued)
Selected Data for a Share Outstanding Throughout Each Period
| | | | | | | | | | | | | | | | | | | | | | | | | | |
| | | | | Goldman Sachs Alternative Premia Fund | |
| | | | | Class R6 Shares | |
| | | | | Six Months Ended
June 30, 2021
(Unaudited) | | | Year Ended December 31, | |
| | | | | 2020 | | | 2019 | | | 2018 | | | 2017 | | | 2016 | |
| | Per Share Data | | | | | | | | | | | | | | | | | | | | | | | | |
| | | | | | | |
| | Net asset value, beginning of period | | $ | 6.90 | | | $ | 8.17 | | | $ | 8.09 | | | $ | 9.05 | | | $ | 10.15 | | | $ | 9.54 | |
| | | | | | | |
| | Net investment income (loss)(a) | | | (0.03 | ) | | | (0.04 | ) | | | 0.09 | | | | 0.07 | | | | 0.02 | | | | 0.02 | |
| | | | | | | |
| | Net realized and unrealized gain (loss) | | | 0.16 | | | | (0.69 | ) | | | (0.01 | ) | | | (0.59 | ) | | | 1.42 | | | | 0.59 | |
| | | | | | | |
| | Total from investment operations | | | 0.13 | | | | (0.73 | ) | | | 0.08 | | | | (0.52 | ) | | | 1.44 | | | | 0.61 | |
| | | | | | | |
| | Distributions to shareholders from net investment income | | | — | | | | (0.54 | ) | | | — | | | | — | | | | (0.22 | ) | | | — | |
| | | | | | | |
| | Distributions to shareholders from net realized gains | | | — | | | | — | | | | — | | | | (0.44 | ) | | | (2.32 | ) | | | — | |
| | | | | | | |
| | Total distributions | | | — | | | | (0.54 | ) | | | — | | | | (0.44 | ) | | | (2.54 | ) | | | — | |
| | | | | | | |
| | Net asset value, end of period | | $ | 7.03 | | | $ | 6.90 | | | $ | 8.17 | | | $ | 8.09 | | | $ | 9.05 | | | $ | 10.15 | |
| | | | | | | |
| | Total return(b) | | | 2.03 | % | | | (8.88 | )% | | | 0.99 | % | | | (5.75 | )% | | | 14.48 | % | | | 6.38 | % |
| | | | | | | |
| | Net assets, end of period (in 000s) | | $ | 21,967 | | | $ | 19,963 | | | $ | 22,670 | | | $ | 50,199 | | | $ | 3,074 | | | $ | 10 | |
| | | | | | | |
| | Ratio of net expenses to average net assets | | | 0.91 | %(c) | | | 0.81 | % | | | 0.74 | % | | | 0.72 | % | | | 0.72 | % | | | 0.77 | % |
| | | | | | | |
| | Ratio of total expenses to average net assets | | | 2.32 | %(c) | | | 2.08 | % | | | 1.52 | % | | | 1.24 | % | | | 1.27 | % | | | 1.02 | % |
| | | | | | | |
| | Ratio of net investment income (loss) to average net assets | | | (0.91 | )%(c) | | | (0.46 | )% | | | 1.05 | % | | | 0.82 | % | | | 0.22 | % | | | 0.24 | % |
| | | | | | | |
| | Portfolio turnover rate(d) | | | — | % | | | — | % | | | — | % | | | — | % | | | 349 | % | | | 272 | % |
| | (a) | | Calculated based on the average shares outstanding methodology. |
| | (b) | | Assumes investment at the net asset value at the beginning of the period, reinvestment of all distributions, a complete redemption of the investment at the net asset value at the end of the period and no sales or redemption charges (if any). Total returns would be reduced if a sales or redemption charge was taken into account. Returns do not reflect the impact of taxes to shareholders relating to Fund distributions or the redemption of Fund shares. Total returns for periods less than one full year are not annualized. |
| | (d) | | The Fund’s portfolio turnover rate is calculated in accordance with regulatory requirements, without regard to transactions involving short term investments and certain derivatives. If such transactions were included, the Fund’s portfolio turnover rate may be higher. |
| | |
| 68 | | The accompanying notes are an integral part of these financial statements. |
GOLDMAN SACHS ALTERNATIVE PREMIA FUND
Consolidated Financial Highlights (continued)
Selected Data for a Share Outstanding Throughout Each Period
| | | | | | | | | | | | | | | | | | | | | | | | | | |
| | | | | Goldman Sachs Alternative Premia Fund | |
| | | | | Class R Shares | |
| | | | | Six Months Ended
June 30, 2021
(Unaudited) | | | Year Ended December 31, | |
| | | | | 2020 | | | 2019 | | | 2018 | | | 2017 | | | 2016 | |
| | Per Share Data | | | | | | | | | | | | | | | | | | | | | | | | |
| | | | | | | |
| | Net asset value, beginning of period | | $ | 6.68 | | | $ | 7.78 | | | $ | 7.75 | | | $ | 8.75 | | | $ | 9.89 | | | $ | 9.36 | |
| | | | | | | |
| | Net investment income (loss)(a) | | | (0.05 | ) | | | (0.08 | ) | | | 0.03 | | | | 0.01 | | | | (0.03 | ) | | | (0.04 | ) |
| | | | | | | |
| | Net realized and unrealized gain (loss) | | | 0.15 | | | | (0.66 | ) | | | — | (b) | | | (0.57 | ) | | | 1.37 | | | | 0.57 | |
| | | | | | | |
| | Total from investment operations | | | 0.10 | | | | (0.74 | ) | | | 0.03 | | | | (0.56 | ) | | | 1.34 | | | | 0.53 | |
| | | | | | | |
| | Distributions to shareholders from net investment income | | | — | | | | (0.36 | ) | | | — | | | | — | | | | (0.16 | ) | | | — | |
| | | | | | | |
| | Distributions to shareholders from net realized gains | | | — | | | | — | | | | — | | | | (0.44 | ) | | | (2.32 | ) | | | — | |
| | | | | | | |
| | Total distributions | | | — | | | | (0.36 | ) | | | — | | | | (0.44 | ) | | | (2.48 | ) | | | — | |
| | | | | | | |
| | Net asset value, end of period | | $ | 6.78 | | | $ | 6.68 | | | $ | 7.78 | | | $ | 7.75 | | | $ | 8.75 | | | $ | 9.89 | |
| | | | | | | |
| | Total return(c) | | | 1.65 | % | | | (9.53 | )% | | | 0.39 | % | | | (6.40 | )% | | | 13.89 | % | | | 5.65 | % |
| | | | | | | |
| | Net assets, end of period (in 000s) | | $ | 12 | | | $ | 24 | | | $ | 53 | | | $ | 13 | | | $ | 13 | | | $ | 12 | |
| | | | | | | |
| | Ratio of net expenses to average net assets | | | 1.54 | %(d) | | | 1.46 | % | | | 1.36 | % | | | 1.38 | % | | | 1.36 | % | | | 1.40 | % |
| | | | | | | |
| | Ratio of total expenses to average net assets | | | 2.96 | %(d) | | | 2.71 | % | | | 2.16 | % | | | 1.88 | % | | | 1.77 | % | | | 1.71 | % |
| | | | | | | |
| | Ratio of net investment income (loss) to average net assets | | | (1.54 | )%(d) | | | (1.10 | )% | | | 0.42 | % | | | 0.11 | % | | | (0.33 | )% | | | (0.39 | )% |
| | | | | | | |
| | Portfolio turnover rate(e) | | | — | % | | | — | % | | | — | % | | | — | % | | | 349 | % | | | 272 | % |
| | (a) | | Calculated based on the average shares outstanding methodology. |
| | (b) | | Amount is less than $0.005 per share. |
| | (c) | | Assumes investment at the net asset value at the beginning of the period, reinvestment of all distributions, a complete redemption of the investment at the net asset value at the end of the period and no sales or redemption charges (if any). Total returns would be reduced if a sales or redemption charge was taken into account. Returns do not reflect the impact of taxes to shareholders relating to Fund distributions or the redemption of Fund shares. Total returns for periods less than one full year are not annualized. |
| | (e) | | The Fund’s portfolio turnover rate is calculated in accordance with regulatory requirements, without regard to transactions involving short term investments and certain derivatives. If such transactions were included, the Fund’s portfolio turnover rate may be higher. |
| | |
| The accompanying notes are an integral part of these financial statements. | | 69 |
GOLDMAN SACHS ALTERNATIVE PREMIA FUND
Consolidated Financial Highlights (continued)
Selected Data for a Share Outstanding Throughout Each Period
| | | | | | | | | | | | | | | | | | |
| | | | | Goldman Sachs Alternative Premia Fund | |
| | | | | Class P Shares | |
| | | | | Six Months Ended
June 30, 2021
(Unaudited) | | | Year Ended December 31, | | | April 18, 2018*
to December 31,
2018 | |
| | | | | 2020 | | | 2019 | |
| | Per Share Data | | | | | | | | | | | | | | | | |
| | | | | |
| | Net asset value, beginning of period | | $ | 6.91 | | | $ | 8.19 | | | $ | 8.10 | | | $ | 8.85 | |
| | | | | |
| | Net investment income (loss)(a) | | | (0.03 | ) | | | (0.04 | ) | | | 0.08 | | | | 0.05 | |
| | | | | |
| | Net realized and unrealized gain (loss) | | | 0.16 | | | | (0.70 | ) | | | 0.01 | | | | (0.36 | ) |
| | | | | |
| | Total from investment operations | | | 0.13 | | | | (0.74 | ) | | | 0.09 | | | | (0.31 | ) |
| | | | | |
| | Distributions to shareholders from net investment income | | | — | | | | (0.54 | ) | | | — | | | | — | |
| | | | | |
| | Distributions to shareholders from net realized gains | | | — | | | | — | | | | — | | | | (0.44 | ) |
| | | | | |
| | Total distributions | | | — | | | | (0.54 | ) | | | — | | | | (0.44 | ) |
| | | | | |
| | Net asset value, end of period | | $ | 7.04 | | | $ | 6.91 | | | $ | 8.19 | | | $ | 8.10 | |
| | | | | |
| | Total return(b) | | | 2.03 | % | | | (8.95 | )% | | | 1.11 | % | | | (3.51 | )% |
| | | | | |
| | Net assets, end of period (in 000s) | | $ | 12 | | | $ | 12 | | | $ | 13 | | | $ | 13 | |
| | | | | |
| | Ratio of net expenses to average net assets | | | 0.90 | %(c) | | | 0.80 | % | | | 0.74 | % | | | 0.77 | %(c) |
| | | | | |
| | Ratio of total expenses to average net assets | | | 2.32 | %(c) | | | 2.08 | % | | | 1.56 | % | | | 1.36 | %(c) |
| | | | | |
| | Ratio of net investment income (loss) to average net assets | | | (0.91 | )%(c) | | | (0.46 | )% | | | 0.99 | % | | | 0.83 | %(c) |
| | | | | |
| | Portfolio turnover rate(d) | | | — | % | | | — | % | | | — | % | | | — | % |
| | * | | Commencement of operations. |
| | (a) | | Calculated based on the average shares outstanding methodology. |
| | (b) | | Assumes investment at the net asset value at the beginning of the period, reinvestment of all distributions, a complete redemption of the investment at the net asset value at the end of the period and no sales or redemption charges (if any). Total returns would be reduced if a sales or redemption charge was taken into account. Returns do not reflect the impact of taxes to shareholders relating to Fund distributions or the redemption of Fund shares. Total returns for periods less than one full year are not annualized. |
| | (d) | | The Fund’s portfolio turnover rate is calculated in accordance with regulatory requirements, without regard to transactions involving short term investments and certain derivatives. If such transactions were included, the Fund’s portfolio turnover rate may be higher. |
| | |
| 70 | | The accompanying notes are an integral part of these financial statements. |
GOLDMAN SACHS MANAGED FUTURES STRATEGY FUND
Consolidated Financial Highlights (continued)
Selected Data for a Share Outstanding Throughout Each Period
| | | | | | | | | | | | | | | | | | | | | | | | | | |
| | | | | Goldman Sachs Managed Futures Strategy Fund | |
| | | | | Class A Shares | |
| | | | | Six Months Ended
June 30, 2021
(Unaudited) | | | Year Ended December 31, | |
| | | | | 2020 | | | 2019 | | | 2018 | | | 2017 | | | 2016 | |
| | Per Share Data | | | | | | | | | | | | | | | | | | | | | | | | |
| | | | | | | |
| | Net asset value, beginning of period | | $ | 10.12 | | | $ | 9.61 | | | $ | 10.03 | | | $ | 10.30 | | | $ | 10.12 | | | $ | 10.21 | |
| | | | | | | |
| | Net investment income (loss)(a) | | | (0.08 | ) | | | (0.12 | ) | | | 0.01 | | | | (0.02 | ) | | | (0.10 | ) | | | (0.14 | ) |
| | | | | | | |
| | Net realized and unrealized gain (loss) | | | 0.42 | | | | 0.76 | | | | 0.23 | | | | (0.23 | ) | | | 0.33 | | | | 0.05 | |
| | | | | | | |
| | Total from investment operations | | | 0.34 | | | | 0.64 | | | | 0.24 | | | | (0.25 | ) | | | 0.23 | | | | (0.09 | ) |
| | | | | | | |
| | Distributions to shareholders from net investment income | | | — | | | | — | | | | (0.59 | ) | | | — | | | | — | | | | — | |
| | | | | | | |
| | Distributions to shareholders from net realized gains | | | — | | | | (0.13 | ) | | | (0.07 | ) | | | (0.02 | ) | | | (0.05 | ) | | | — | |
| | | | | | | |
| | Total distributions | | | — | | | | (0.13 | ) | | | (0.66 | ) | | | (0.02 | ) | | | (0.05 | ) | | | — | |
| | | | | | | |
| | Net asset value, end of period | | $ | 10.46 | | | $ | 10.12 | | | $ | 9.61 | | | $ | 10.03 | | | $ | 10.30 | | | $ | 10.12 | |
| | | | | | | |
| | Total return(b) | | | 3.46 | % | | | 6.62 | % | | | 2.28 | % | | | (2.37 | )% | | | 2.29 | % | | | (0.88 | )% |
| | | | | | | |
| | Net assets, end of period (in 000s) | | $ | 14,325 | | | $ | 11,964 | | | $ | 7,712 | | | $ | 8,622 | | | $ | 7,711 | | | $ | 23,174 | |
| | | | | | | |
| | Ratio of net expenses to average net assets | | | 1.57 | %(c) | | | 1.48 | % | | | 1.49 | % | | | 1.47 | % | | | 1.55 | % | | | 1.55 | % |
| | | | | | | |
| | Ratio of total expenses to average net assets | | | 1.60 | %(c) | | | 1.63 | % | | | 1.64 | % | | | 1.62 | % | | | 1.75 | % | | | 1.74 | % |
| | | | | | | |
| | Ratio of net investment income (loss) to average net assets | | | (1.62 | )%(c) | | | (1.21 | )% | | | 0.06 | % | | | (0.19 | )% | | | (1.02 | )% | | | (1.33 | )% |
| | | | | | | |
| | Portfolio turnover rate(d) | | | — | % | | | — | % | | | — | % | | | — | % | | | — | % | | | 529 | % |
| | (a) | | Calculated based on the average shares outstanding methodology. |
| | (b) | | Assumes investment at the net asset value at the beginning of the period, reinvestment of all distributions, a complete redemption of the investment at the net asset value at the end of the period and no sales or redemption charges (if any). Total returns would be reduced if a sales or redemption charge was taken into account. Returns do not reflect the impact of taxes to shareholders relating to Fund distributions or the redemption of Fund shares. Total returns for periods less than one full year are not annualized. |
| | (d) | | The Fund’s portfolio turnover rate is calculated in accordance with regulatory requirements, without regard to transactions involving short term investments and certain derivatives. If such transactions were included, the Fund’s portfolio turnover rate may be higher. |
| | |
| The accompanying notes are an integral part of these financial statements. | | 71 |
GOLDMAN SACHS MANAGED FUTURES STRATEGY FUND
Consolidated Financial Highlights (continued)
Selected Data for a Share Outstanding Throughout Each Period
| | | | | | | | | | | | | | | | | | | | | | | | | | |
| | | | | Goldman Sachs Managed Futures Strategy Fund | |
| | | | | Class C Shares | |
| | | | | Six Months Ended
June 30, 2021
(Unaudited) | | | Year Ended December 31, | |
| | | | | 2020 | | | 2019 | | | 2018 | | | 2017 | | | 2016 | |
| | Per Share Data | | | | | | | | | | | | | | | | | | | | | | | | |
| | | | | | | |
| | Net asset value, beginning of period | | $ | 9.52 | | | $ | 9.11 | | | $ | 9.56 | | | $ | 9.88 | | | $ | 9.79 | | | $ | 9.95 | |
| | | | | | | |
| | Net investment loss(a) | | | (0.12 | ) | | | (0.18 | ) | | | (0.07 | ) | | | (0.09 | ) | | | (0.17 | ) | | | (0.21 | ) |
| | | | | | | |
| | Net realized and unrealized gain (loss) | | | 0.40 | | | | 0.72 | | | | 0.21 | | | | (0.21 | ) | | | 0.31 | | | | 0.05 | |
| | | | | | | |
| | Total from investment operations | | | 0.28 | | | | 0.54 | | | | 0.14 | | | | (0.30 | ) | | | 0.14 | | | | (0.16 | ) |
| | | | | | | |
| | Distributions to shareholders from net investment income | | | — | | | | — | | | | (0.52 | ) | | | — | | | | — | | | | — | |
| | | | | | | |
| | Distributions to shareholders from net realized gains | | | — | | | | (0.13 | ) | | | (0.07 | ) | | | (0.02 | ) | | | (0.05 | ) | | | — | |
| | | | | | | |
| | Total distributions | | | — | | | | (0.13 | ) | | | (0.59 | ) | | | (0.02 | ) | | | (0.05 | ) | | | — | |
| | | | | | | |
| | Net asset value, end of period | | $ | 9.80 | | | $ | 9.52 | | | $ | 9.11 | | | $ | 9.56 | | | $ | 9.88 | | | $ | 9.79 | |
| | | | | | | |
| | Total return(b) | | | 2.94 | % | | | 5.88 | % | | | 1.51 | % | | | (3.08 | )% | | | 1.44 | % | | | (1.60 | )% |
| | | | | | | |
| | Net assets, end of period (in 000s) | | $ | 3,641 | | | $ | 3,335 | | | $ | 3,279 | | | $ | 3,281 | | | $ | 3,480 | | | $ | 4,054 | |
| | | | | | | |
| | Ratio of net expenses to average net assets | | | 2.32 | %(c) | | | 2.22 | % | | | 2.24 | % | | | 2.22 | % | | | 2.29 | % | | | 2.31 | % |
| | | | | | | |
| | Ratio of total expenses to average net assets | | | 2.35 | %(c) | | | 2.37 | % | | | 2.39 | % | | | 2.37 | % | | | 2.48 | % | | | 2.49 | % |
| | | | | | | |
| | Ratio of net investment loss to average net assets | | | (2.37 | )%(c) | | | (1.92 | )% | | | (0.69 | )% | | | (0.95 | )% | | | (1.72 | )% | | | (2.09 | )% |
| | | | | | | |
| | Portfolio turnover rate(d) | | | — | % | | | — | % | | | — | % | | | — | % | | | — | % | | | 529 | % |
| | (a) | | Calculated based on the average shares outstanding methodology. |
| | (b) | | Assumes investment at the net asset value at the beginning of the period, reinvestment of all distributions, a complete redemption of the investment at the net asset value at the end of the period and no sales or redemption charges (if any). Total returns would be reduced if a sales or redemption charge was taken into account. Returns do not reflect the impact of taxes to shareholders relating to Fund distributions or the redemption of Fund shares. Total returns for periods less than one full year are not annualized. |
| | (d) | | The Fund’s portfolio turnover rate is calculated in accordance with regulatory requirements, without regard to transactions involving short term investments and certain derivatives. If such transactions were included, the Fund’s portfolio turnover rate may be higher. |
| | |
| 72 | | The accompanying notes are an integral part of these financial statements. |
GOLDMAN SACHS MANAGED FUTURES STRATEGY FUND
Consolidated Financial Highlights (continued)
Selected Data for a Share Outstanding Throughout Each Period
| | | | | | | | | | | | | | | | | | | | | | | | | | |
| | | | | Goldman Sachs Managed Futures Strategy Fund | |
| | | | | Institutional Shares | |
| | | | | Six Months Ended
June 30, 2021
(Unaudited) | | | Year Ended December 31, | |
| | | | | 2020 | | | 2019 | | | 2018 | | | 2017 | | | 2016 | |
| | Per Share Data | | | | | | | | | | | | | | | | | | | | | | | | |
| | | | | | | |
| | Net asset value, beginning of period | | $ | 10.43 | | | $ | 9.87 | | | $ | 10.28 | | | $ | 10.52 | | | $ | 10.29 | | | $ | 10.36 | |
| | | | | | | |
| | Net investment income (loss)(a) | | | (0.07 | ) | | | (0.07 | ) | | | 0.04 | | | | 0.02 | | | | (0.06 | ) | | | (0.10 | ) |
| | | | | | | |
| | Net realized and unrealized gain (loss) | | | 0.44 | | | | 0.76 | | | | 0.25 | | | | (0.24 | ) | | | 0.34 | | | | 0.04 | |
| | | | | | | |
| | Total from investment operations | | | 0.37 | | | | 0.69 | | | | 0.29 | | | | (0.22 | ) | | | 0.28 | | | | (0.06 | ) |
| | | | | | | |
| | Distributions to shareholders from net investment income | | | — | | | | — | | | | (0.63 | ) | | | — | | | | — | | | | (0.01 | ) |
| | | | | | | |
| | Distributions to shareholders from net realized gains | | | — | | | | (0.13 | ) | | | (0.07 | ) | | | (0.02 | ) | | | (0.05 | ) | | | — | |
| | | | | | | |
| | Total distributions | | | — | | | | (0.13 | ) | | | (0.70 | ) | | | (0.02 | ) | | | (0.05 | ) | | | (0.01 | ) |
| | | | | | | |
| | Net asset value, end of period | | $ | 10.80 | | | $ | 10.43 | | | $ | 9.87 | | | $ | 10.28 | | | $ | 10.52 | | | $ | 10.29 | |
| | | | | | | |
| | Total return(b) | | | 3.64 | % | | | 6.95 | % | | | 2.82 | % | | | (2.13 | )% | | | 2.73 | % | | | (0.57 | )% |
| | | | | | | |
| | Net assets, end of period (in 000s) | | $ | 53,321 | | | $ | 49,052 | | | $ | 90,623 | | | $ | 83,425 | | | $ | 163,971 | | | $ | 110,763 | |
| | | | | | | |
| | Ratio of net expenses to average net assets | | | 1.20 | %(c) | | | 1.07 | % | | | 1.11 | % | | | 1.07 | % | | | 1.14 | % | | | 1.16 | % |
| | | | | | | |
| | Ratio of total expenses to average net assets | | | 1.23 | %(c) | | | 1.24 | % | | | 1.26 | % | | | 1.22 | % | | | 1.33 | % | | | 1.34 | % |
| | | | | | | |
| | Ratio of net investment income (loss) to average net assets | | | (1.25 | )%(c) | | | (0.74 | )% | | | 0.42 | % | | | 0.16 | % | | | (0.54 | )% | | | (0.94 | )% |
| | | | | | | |
| | Portfolio turnover rate(d) | | | — | % | | | — | % | | | — | % | | | — | % | | | — | % | | | 529 | % |
| | (a) | | Calculated based on the average shares outstanding methodology. |
| | (b) | | Assumes investment at the net asset value at the beginning of the period, reinvestment of all distributions, a complete redemption of the investment at the net asset value at the end of the period and no sales or redemption charges (if any). Total returns would be reduced if a sales or redemption charge was taken into account. Returns do not reflect the impact of taxes to shareholders relating to Fund distributions or the redemption of Fund shares. Total returns for periods less than one full year are not annualized. |
| | (d) | | The Fund’s portfolio turnover rate is calculated in accordance with regulatory requirements, without regard to transactions involving short term investments and certain derivatives. If such transactions were included, the Fund’s portfolio turnover rate may be higher. |
| | |
| The accompanying notes are an integral part of these financial statements. | | 73 |
GOLDMAN SACHS MANAGED FUTURES STRATEGY FUND
Consolidated Financial Highlights (continued)
Selected Data for a Share Outstanding Throughout Each Period
| | | | | | | | | | | | | | | | | | | | | | | | | | |
| | | | | Goldman Sachs Managed Futures Strategy Fund | |
| | | | | Investor Shares(a) | |
| | | | | Six Months Ended
June 30, 2021
(Unaudited) | | | Year Ended December 31, | |
| | | | | 2020 | | | 2019 | | | 2018 | | | 2017 | | | 2016 | |
| | Per Share Data | | | | | | | | | | | | | | | | | | | | | | | | |
| | | | | | | |
| | Net asset value, beginning of period | | $ | 10.32 | | | $ | 9.77 | | | $ | 10.19 | | | $ | 10.44 | | | $ | 10.23 | | | $ | 10.30 | |
| | | | | | | |
| | Net investment income (loss)(b) | | | (0.07 | ) | | | (0.10 | ) | | | 0.03 | | | | 0.01 | | | | (0.06 | ) | | | (0.11 | ) |
| | | | | | | |
| | Net realized and unrealized gain (loss) | | | 0.43 | | | | 0.78 | | | | 0.23 | | | | (0.24 | ) | | | 0.32 | | | | 0.04 | |
| | | | | | | |
| | Total from investment operations | | | 0.36 | | | | 0.68 | | | | 0.26 | | | | (0.23 | ) | | | 0.26 | | | | (0.07 | ) |
| | | | | | | |
| | Distributions to shareholders from net investment income | | | — | | | | — | | | | (0.61 | ) | | | — | | | | — | | | | — | |
| | | | | | | |
| | Distributions to shareholders from net realized gains | | | — | | | | (0.13 | ) | | | (0.07 | ) | | | (0.02 | ) | | | (0.05 | ) | | | — | |
| | | | | | | |
| | Total distributions | | | — | | | | (0.13 | ) | | | (0.68 | ) | | | (0.02 | ) | | | (0.05 | ) | | | — | |
| | | | | | | |
| | Net asset value, end of period | | $ | 10.68 | | | $ | 10.32 | | | $ | 9.77 | | | $ | 10.19 | | | $ | 10.44 | | | $ | 10.23 | |
| | | | | | | |
| | Total return(c) | | | 3.49 | % | | | 6.92 | % | | | 2.60 | % | | | (2.24 | )% | | | 2.55 | % | | | (0.68 | )% |
| | | | | | | |
| | Net assets, end of period (in 000s) | | $ | 133,957 | | | $ | 149,762 | | | $ | 106,968 | | | $ | 105,393 | | | $ | 106,431 | | | $ | 20,181 | |
| | | | | | | |
| | Ratio of net expenses to average net assets | | | 1.32 | %(d) | | | 1.22 | % | | | 1.24 | % | | | 1.22 | % | | | 1.26 | % | | | 1.31 | % |
| | | | | | | |
| | Ratio of total expenses to average net assets | | | 1.35 | %(d) | | | 1.38 | % | | | 1.39 | % | | | 1.37 | % | | | 1.45 | % | | | 1.49 | % |
| | | | | | | |
| | Ratio of net investment income (loss) to average net assets | | | (1.37 | )%(d) | | | (0.96 | )% | | | 0.31 | % | | | 0.06 | % | | | (0.60 | )% | | | (1.09 | )% |
| | | | | | | |
| | Portfolio turnover rate(e) | | | — | % | | | — | % | | | — | % | | | — | % | | | — | % | | | 529 | % |
| | (a) | | Effective August 15, 2017, Class IR changed its name to Investor Shares. |
| | (b) | | Calculated based on the average shares outstanding methodology. |
| | (c) | | Assumes investment at the net asset value at the beginning of the period, reinvestment of all distributions, a complete redemption of the investment at the net asset value at the end of the period and no sales or redemption charges (if any). Total returns would be reduced if a sales or redemption charge was taken into account. Returns do not reflect the impact of taxes to shareholders relating to Fund distributions or the redemption of Fund shares. Total returns for periods less than one full year are not annualized. |
| | (e) | | The Fund’s portfolio turnover rate is calculated in accordance with regulatory requirements, without regard to transactions involving short term investments and certain derivatives. If such transactions were included, the Fund’s portfolio turnover rate may be higher. |
| | |
| 74 | | The accompanying notes are an integral part of these financial statements. |
GOLDMAN SACHS MANAGED FUTURES STRATEGY FUND
Consolidated Financial Highlights (continued)
Selected Data for a Share Outstanding Throughout Each Period
| | | | | | | | | | | | | | | | | | |
| | | | | Goldman Sachs Managed Futures Strategy Fund | |
| | | | | Class R6 Shares | |
| | | | | Six Months Ended
June 30, 2021
(Unaudited) | | | Year Ended December 31, | | | May 1, 2018*
to December 31,
2018 | |
| | | | | 2020 | | | 2019 | |
| | Per Share Data | | | | | | | | | | | | | | | | |
| | | | | |
| | Net asset value, beginning of period | | $ | 10.44 | | | $ | 9.87 | | | $ | 10.29 | | | $ | 10.36 | |
| | | | | |
| | Net investment income (loss)(a) | | | (0.07 | ) | | | (0.08 | ) | | | 0.05 | | | | 0.02 | |
| | | | | |
| | Net realized and unrealized gain (loss) | | | 0.44 | | | | 0.78 | | | | 0.23 | | | | (0.07 | ) |
| | | | | |
| | Total from investment operations | | | 0.37 | | | | 0.70 | | | | 0.28 | | | | (0.05 | ) |
| | | | | |
| | Distributions to shareholders from net investment income | | | — | | | | — | | | | (0.63 | ) | | | — | |
| | | | | |
| | Distributions to shareholders from net realized gains | | | — | | | | (0.13 | ) | | | (0.07 | ) | | | (0.02 | ) |
| | | | | |
| | Total distributions | | | — | | | | (0.13 | ) | | | (0.70 | ) | | | (0.02 | ) |
| | | | | |
| | Net asset value, end of period | | $ | 10.81 | | | $ | 10.44 | | | $ | 9.87 | | | $ | 10.29 | |
| | | | | |
| | Total return(b) | | | 3.64 | % | | | 7.05 | % | | | 2.72 | % | | | (0.52 | )% |
| | | | | |
| | Net assets, end of period (in 000s) | | $ | 56,918 | | | $ | 55,439 | | | $ | 51,499 | | | $ | 50,649 | |
| | | | | |
| | Ratio of net expenses to average net assets | | | 1.19 | %(c) | | | 1.08 | % | | | 1.09 | % | | | 1.12 | %(c) |
| | | | | |
| | Ratio of total expenses to average net assets | | | 1.22 | %(c) | | | 1.24 | % | | | 1.23 | % | | | 1.27 | %(c) |
| | | | | |
| | Ratio of net investment income (loss) to average net assets | | | (1.24 | )%(c) | | | (0.79 | )% | | | 0.47 | % | | | 0.31 | %(c) |
| | | | | |
| | Portfolio turnover rate(d) | | | — | % | | | — | % | | | — | % | | | — | % |
| | * | | Commencement of operations. |
| | (a) | | Calculated based on the average shares outstanding methodology. |
| | (b) | | Assumes investment at the net asset value at the beginning of the period, reinvestment of all distributions, a complete redemption of the investment at the net asset value at the end of the period and no sales or redemption charges (if any). Total returns would be reduced if a sales or redemption charge was taken into account. Returns do not reflect the impact of taxes to shareholders relating to Fund distributions or the redemption of Fund shares. Total returns for periods less than one full year are not annualized. |
| | (d) | | The Fund’s portfolio turnover rate is calculated in accordance with regulatory requirements, without regard to transactions involving short term investments and certain derivatives. If such transactions were included, the Fund’s portfolio turnover rate may be higher. |
| | |
| The accompanying notes are an integral part of these financial statements. | | 75 |
GOLDMAN SACHS MANAGED FUTURES STRATEGY FUND
Consolidated Financial Highlights (continued)
Selected Data for a Share Outstanding Throughout Each Period
| | | | | | | | | | | | | | | | | | | | | | | | | | |
| | | | | Goldman Sachs Managed Futures Strategy Fund | |
| | | | | Class R Shares | |
| | | | | Six Months Ended
June 30, 2021
(Unaudited) | | | Year Ended December 31, | |
| | | | | 2020 | | | 2019 | | | 2018 | | | 2017 | | | 2016 | |
| | Per Share Data | | | | | | | | | | | | | | | | | | | | | | | | |
| | | | | | | |
| | Net asset value, beginning of period | | $ | 9.92 | | | $ | 9.45 | | | $ | 9.87 | | | $ | 10.16 | | | $ | 10.00 | | | $ | 10.12 | |
| | | | | | | |
| | Net investment loss(a) | | | (0.09 | ) | | | (0.13 | ) | | | (0.02 | ) | | | (0.04 | ) | | | (0.12 | ) | | | (0.16 | ) |
| | | | | | | |
| | Net realized and unrealized gain (loss) | | | 0.41 | | | | 0.73 | | | | 0.23 | | | | (0.23 | ) | | | 0.33 | | | | 0.04 | |
| | | | | | | |
| | Total from investment operations | | | 0.32 | | | | 0.60 | | | | 0.21 | | | | (0.27 | ) | | | 0.21 | | | | (0.12 | ) |
| | | | | | | |
| | Distributions to shareholders from net investment income | | | — | | | | — | | | | (0.56 | ) | | | — | | | | — | | | | — | |
| | | | | | | |
| | Distributions to shareholders from net realized gains | | | — | | | | (0.13 | ) | | | (0.07 | ) | | | (0.02 | ) | | | (0.05 | ) | | | — | |
| | | | | | | |
| | Total distributions | | | — | | | | (0.13 | ) | | | (0.63 | ) | | | (0.02 | ) | | | (0.05 | ) | | | — | |
| | | | | | | |
| | Net asset value, end of period | | $ | 10.24 | | | $ | 9.92 | | | $ | 9.45 | | | $ | 9.87 | | | $ | 10.16 | | | $ | 10.00 | |
| | | | | | | |
| | Total return(b) | | | 3.23 | % | | | 6.30 | % | | | 2.14 | % | | | (2.70 | )% | | | 2.11 | % | | | (1.18 | )% |
| | | | | | | |
| | Net assets, end of period (in 000s) | | $ | 439 | | | $ | 504 | | | $ | 539 | | | $ | 584 | | | $ | 595 | | | $ | 309 | |
| | | | | | | |
| | Ratio of net expenses to average net assets | | | 1.82 | %(c) | | | 1.72 | % | | | 1.74 | % | | | 1.72 | % | | | 1.79 | % | | | 1.81 | % |
| | | | | | | |
| | Ratio of total expenses to average net assets | | | 1.85 | %(c) | | | 1.87 | % | | | 1.89 | % | | | 1.87 | % | | | 1.98 | % | | | 1.99 | % |
| | | | | | | |
| | Ratio of net investment loss to average net assets | | | (1.87 | )%(c) | | | (1.41 | )% | | | (0.19 | )% | | | (0.44 | )% | | | (1.19 | )% | | | (1.59 | )% |
| | | | | | | |
| | Portfolio turnover rate(d) | | | — | % | | | — | % | | | — | % | | | — | % | | | — | % | | | 529 | % |
| | (a) | | Calculated based on the average shares outstanding methodology. |
| | (b) | | Assumes investment at the net asset value at the beginning of the period, reinvestment of all distributions, a complete redemption of the investment at the net asset value at the end of the period and no sales or redemption charges (if any). Total returns would be reduced if a sales or redemption charge was taken into account. Returns do not reflect the impact of taxes to shareholders relating to Fund distributions or the redemption of Fund shares. Total returns for periods less than one full year are not annualized. |
| | (d) | | The Fund’s portfolio turnover rate is calculated in accordance with regulatory requirements, without regard to transactions involving short term investments and certain derivatives. If such transactions were included, the Fund’s portfolio turnover rate may be higher. |
| | |
| 76 | | The accompanying notes are an integral part of these financial statements. |
GOLDMAN SACHS MANAGED FUTURES STRATEGY FUND
Consolidated Financial Highlights (continued)
Selected Data for a Share Outstanding Throughout Each Period
| | | | | | | | | | | | | | | | | | |
| | | | | Goldman Sachs Managed Futures Strategy Fund | |
| | | | | Class P Shares | |
| | | | | Six Months Ended
June 30, 2021
(Unaudited) | | | Year Ended December 31, | | | April 18, 2018*
to December 31,
2018 | |
| | | | | 2020 | | | 2019 | |
| | Per Share Data | | | | | | | | | | | | | | | | |
| | | | | |
| | Net asset value, beginning of period | | $ | 10.42 | | | $ | 9.86 | | | $ | 10.28 | | | $ | 10.56 | |
| | | | | |
| | Net investment income (loss)(a) | | | (0.06 | ) | | | (0.08 | ) | | | 0.05 | | | | 0.02 | |
| | | | | |
| | Net realized and unrealized gain (loss) | | | 0.43 | | | | 0.77 | | | | 0.23 | | | | (0.28 | ) |
| | | | | |
| | Total from investment operations | | | 0.37 | | | | 0.69 | | | | 0.28 | | | | (0.26 | ) |
| | | | | |
| | Distributions to shareholders from net investment income | | | — | | | | — | | | | (0.63 | ) | | | — | |
| | | | | |
| | Distributions to shareholders from net realized gains | | | — | | | | (0.13 | ) | | | (0.07 | ) | | | (0.02 | ) |
| | | | | |
| | Total distributions | | | — | | | | (0.13 | ) | | | (0.70 | ) | | | (0.02 | ) |
| | | | | |
| | Net asset value, end of period | | $ | 10.79 | | | $ | 10.42 | | | $ | 9.86 | | | $ | 10.28 | |
| | | | | |
| | Total return(b) | | | 3.65 | % | | | 6.95 | % | | | 2.71 | % | | | (2.50 | )% |
| | | | | |
| | Net assets, end of period (in 000s) | | $ | 11 | | | $ | 71 | | | $ | 166 | | | $ | 429 | |
| | | | | |
| | Ratio of net expenses to average net assets | | | 1.17 | %(c) | | | 1.08 | % | | | 1.09 | % | | | 1.12 | %(c) |
| | | | | |
| | Ratio of total expenses to average net assets | | | 1.22 | %(c) | | | 1.24 | % | | | 1.23 | % | | | 1.27 | %(c) |
| | | | | |
| | Ratio of net investment income (loss) to average net assets | | | (1.21 | )%(c) | | | (0.84 | )% | | | 0.49 | % | | | 0.32 | %(c) |
| | | | | |
| | Portfolio turnover rate(d) | | | — | % | | | — | % | | | — | % | | | — | % |
| | * | | Commencement of operations. |
| | (a) | | Calculated based on the average shares outstanding methodology. |
| | (b) | | Assumes investment at the net asset value at the beginning of the period, reinvestment of all distributions, a complete redemption of the investment at the net asset value at the end of the period and no sales or redemption charges (if any). Total returns would be reduced if a sales or redemption charge was taken into account. Returns do not reflect the impact of taxes to shareholders relating to Fund distributions or the redemption of Fund shares. Total returns for periods less than one full year are not annualized. |
| | (d) | | The Fund’s portfolio turnover rate is calculated in accordance with regulatory requirements, without regard to transactions involving short term investments and certain derivatives. If such transactions were included, the Fund’s portfolio turnover rate may be higher. |
| | |
| The accompanying notes are an integral part of these financial statements. | | 77 |
GOLDMAN SACHS ALTERNATIVE FUNDS
Notes to Financial Statements
June 30, 2021 (Unaudited)
Goldman Sachs Trust (the “Trust”) is a Delaware statutory trust registered under the Investment Company Act of 1940, as amended (the “Act”), as an open-end management investment company. The following table lists those series of the Trust that are included in this report (collectively, the “Funds” or individually a “Fund”), along with their corresponding share classes and respective diversification status under the Act:
| | | | |
| Fund | | Share Classes Offered | | Diversified/ Non-diversified |
Absolute Return Tracker, Alternative Premia and Managed Futures Strategy | | A, C, Institutional, Investor, R6, R and P | | Diversified |
Class A Shares of the Absolute Return Tracker, Alternative Premia and Managed Futures Strategy Funds are sold with a front-end sales charge of up to 5.50%. Class C Shares are sold with a contingent deferred sales charge (“CDSC”) of 1.00%, which is imposed on redemptions made within 12 months of purchase. Institutional, Investor, Class R6, Class R and Class P Shares are not subject to a sales charge.
Goldman Sachs Asset Management, L.P. (“GSAM”), an affiliate of Goldman Sachs & Co. LLC (“Goldman Sachs”), serves as Investment Adviser to the Funds pursuant to management agreements (the “Agreements”) with the Trust.
|
| 2. SIGNIFICANT ACCOUNTING POLICIES |
The financial statements have been prepared in accordance with accounting principles generally accepted in the United States of America (“GAAP”) and require management to make estimates and assumptions that may affect the reported amounts and disclosures. Actual results may differ from those estimates and assumptions. Each Fund is an investment company under GAAP and follows the accounting and reporting guidance applicable to investment companies.
A. Basis of Consolidation for Absolute Return Tracker, Alternative Premia and Managed Futures Strategy Funds — Cayman Commodity-ART, LLC., Cayman Commodity-AP, LLC., and Cayman Commodity-MFS, LLC. (each a “Subsidiary” and collectively, the “Subsidiaries”), Cayman Islands exempted companies, are currently wholly-owned subsidiaries of the Absolute Return Tracker, Alternative Premia and Managed Futures Strategy Funds, respectively. The Subsidiaries act as investment vehicles for the Funds to enable the Funds to gain exposure to certain types of commodity-linked derivative instruments. The Funds are the sole shareholders of the Subsidiaries, and it is intended that each Fund will remain the sole shareholder and will continue to control its respective Subsidiary. All inter-fund balances and transactions have been eliminated in consolidation.
As of June 30, 2021, the Fund and Subsidiary net assets were as follows:
| | | | | | | | | | | | | | |
| Fund | | | | Fund Net Assets | | | Subsidiary Net
Assets | | | % Represented
by Subsidiary’s
Net Assets | |
Absolute Return Tracker | | | | $ | 3,608,429,045 | | | $ | 19,648,745 | | | | 1 | % |
Alternative Premia | | | | | 34,543,454 | | | | 7,477,969 | | | | 22 | |
Managed Futures Strategy | | | | | 262,611,688 | | | | 53,262,052 | | | | 20 | |
B. Investment Valuation — The Funds’ valuation policy is to value investments at fair value.
C. Investment Income and Investments — Investment income includes interest income, dividend income, and securities lending income, if any. Interest income is accrued daily and adjusted for amortization of premiums and accretion of discounts. Dividend income is recognized on ex-dividend date or, for certain foreign securities, as soon as such information is obtained subsequent to the ex-dividend date. Non-cash dividends, if any, are recorded at the fair market value of the securities received.
78
GOLDMAN SACHS ALTERNATIVE FUNDS
|
| 2. SIGNIFICANT ACCOUNTING POLICIES (continued) |
Investment transactions are reflected on trade date. Realized gains and losses are calculated using identified cost. Investment transactions are recorded on the following business day for daily net asset value (“NAV”) calculations. Investment income is recorded net of any foreign withholding taxes, less any amounts reclaimable. The Funds may file withholding tax reclaims in certain jurisdictions to recover a portion of amounts previously withheld. Any foreign capital gains tax is accrued daily based upon net unrealized gains, and is payable upon sale of such investments. Distributions received from the Funds’ investments in United States (“U.S.”) real estate investment trusts (“REITs”) may be characterized as ordinary income, net capital gain and/or a return of capital. A return of capital is recorded by the Funds as a reduction to the cost basis of the REIT.
For derivative contracts, realized gains and losses are recorded upon settlement of the contract. Upfront payments, if any, are made or received upon entering into a swap agreement and are reflected in the Consolidated Statements of Assets and Liabilities. Upfront payments are recognized over the contract’s term/event as realized gains or losses, with the exception of forward starting swap contracts whose realized gains or losses are recognized from the effective start date.
D. Class Allocations and Expenses — Investment income, realized and unrealized gain (loss), if any, and non-class specific expenses of each Fund are allocated daily based upon the proportion of net assets of each class. Non-class specific expenses directly incurred by a Fund are charged to that Fund, while such expenses incurred by the Trust are allocated across the applicable Funds on a straight-line and/or pro-rata basis depending upon the nature of the expenses. Class specific expenses, where applicable, are borne by the respective share classes and include Distribution and Service, Transfer Agency and Service fees.
E. Federal Taxes and Distributions to Shareholders — It is each Fund’s policy to comply with the requirements of the Internal Revenue Code of 1986, as amended (the “Code”), applicable to regulated investment companies and to distribute each year substantially all of its investment company taxable income and capital gains to its shareholders. Accordingly, each Fund is not required to make any provisions for the payment of federal income tax. Distributions to shareholders are recorded on the ex-dividend date. Income and capital gains distributions, if any, are declared and paid according to the following schedule:
| | | | | | |
| Fund | | | | Income Distributions Declared/Paid | | Capital Gains Distributions
Declared/Paid |
Absolute Return Tracker, Alternative Premia and Managed Futures Strategy | | | | Annually | | Annually |
The Subsidiaries are classified as controlled foreign corporations under the Code. Therefore, the Funds are required to increase their taxable income by their share of their Subsidiaries’ income. Net losses of a Subsidiary cannot be deducted by the Funds in the current period nor carried forward to offset taxable income in future periods.
Net capital losses, if any, are carried forward to future fiscal years and may be used to the extent allowed by the Code to offset any future capital gains. Losses that are carried forward will retain their character as either short-term or long-term capital losses. Utilization of capital loss carryforwards will reduce the requirement of future capital gains distributions.
The characterization of distributions to shareholders for financial reporting purposes is determined in accordance with federal income tax rules, which may differ from GAAP. The source of each Fund’s distributions may be shown in the accompanying financial statements as either from distributable earnings or capital. Certain components of the Funds’ net assets on the Consolidated Statements of Assets and Liabilities reflect permanent GAAP/tax differences based on the appropriate tax character.
F. Foreign Currency Translation — The accounting records and reporting currency of a Fund are maintained in U.S. dollars. Assets and liabilities denominated in foreign currencies are translated into U.S. dollars using the current exchange rates at the close of each business day. The effect of changes in foreign currency exchange rates on investments is included within net realized and unrealized gain (loss) on investments. Changes in the value of other assets and liabilities as a result of fluctuations in foreign exchange rates are included in the Consolidated Statements of Operations within net change in unrealized gain (loss) on foreign currency translation. Transactions denominated in foreign currencies are translated into U.S. dollars on the date the transaction occurred, the effects of which are included within net realized gain (loss) on foreign currency transactions.
79
GOLDMAN SACHS ALTERNATIVE FUNDS
Notes to Financial Statements (continued)
June 30, 2021 (Unaudited)
|
| 3. INVESTMENTS AND FAIR VALUE MEASUREMENTS |
U.S. GAAP defines the fair value of a financial instrument as the amount that would be received to sell an asset or paid to transfer a liability in an orderly transaction between market participants at the measurement date (i.e., the exit price); the Funds’ policy is to use the market approach. GAAP establishes a fair value hierarchy that prioritizes the inputs to valuation techniques used to measure fair value. The hierarchy gives the highest priority to unadjusted quoted prices in active markets for identical assets or liabilities (Level 1 measurements) and the lowest priority to unobservable inputs (Level 3 measurements). The level in the fair value hierarchy within which the fair value measurement in its entirety falls shall be determined based on the lowest level input that is significant to the fair value measurement in its entirety. The levels used for classifying investments are not necessarily an indication of the risk associated with investing in these investments. The three levels of the fair value hierarchy are described below:
Level 1 — Unadjusted quoted prices in active markets that are accessible at the measurement date for identical, unrestricted assets or liabilities;
Level 2 — Quoted prices in markets that are not active or financial instruments for which significant inputs are observable (including, but not limited to, quoted prices for similar investments, interest rates, foreign exchange rates, volatility and credit spreads), either directly or indirectly;
Level 3 — Prices or valuations that require significant unobservable inputs (including GSAM’s assumptions in determining fair value measurement).
The Board of Trustees (“Trustees”) has approved Valuation Procedures that govern the valuation of the portfolio investments held by the Funds, including investments for which market quotations are not readily available. The Trustees have delegated to GSAM day-to-day responsibility for implementing and maintaining internal controls and procedures related to the valuation of the Funds’ investments. To assess the continuing appropriateness of pricing sources and methodologies, GSAM regularly performs price verification procedures and issues challenges as necessary to third party pricing vendors or brokers, and any differences are reviewed in accordance with the Valuation Procedures.
A. Level 1 and Level 2 Fair Value Investments — The valuation techniques and significant inputs used in determining the fair values for investments classified as Level 1 and Level 2 are as follows:
Equity Securities — Equity securities traded on a U.S. securities exchange or the NASDAQ system, or those located on certain foreign exchanges, including but not limited to the Americas, are valued daily at their last sale price or official closing price on the principal exchange or system on which they are traded. If there is no sale or official closing price or such price is believed by GSAM to not represent fair value, equity securities will be valued at the valid closing bid price for long positions and at the valid closing ask price for short positions (i.e. where there is sufficient volume, during normal exchange trading hours). If no valid bid/ask price is available, the equity security will be valued pursuant to the Valuation Procedures approved by the Trustees and consistent with applicable regulatory guidance. To the extent these investments are actively traded, they are classified as Level 1 of the fair value hierarchy, otherwise they are generally classified as Level 2. Certain equity securities containing unique attributes may be classified as Level 2.
Unlisted equity securities for which market quotations are available are valued at the last sale price on the valuation date, or if no sale occurs, at the last bid price for long positions or the last ask price for short positions, and are generally classified as Level 2. Securities traded on certain foreign securities exchanges are valued daily at fair value determined by an independent fair value service (if available) under Fair Valuation Procedures approved by the Trustees and consistent with applicable regulatory guidance. The independent fair value service takes into account multiple factors including, but not limited to, movements in the securities markets, certain depositary receipts, futures contracts and foreign currency exchange rates that have occurred subsequent to the close of the foreign securities exchange. These investments are generally classified as Level 2 of the fair value hierarchy.
Underlying Funds (including Money Market Funds) — Underlying funds (“Underlying Funds”) include other investment companies and exchange-traded funds (“ETFs”). Investments in the Underlying Funds (except ETFs) are valued at the NAV per share on the day of valuation. ETFs are valued daily at the last sale price or official closing price on the principal exchange or system on which the investment is traded. Because the Funds invest in Underlying Funds that fluctuate in value, the Funds’ shares
80
GOLDMAN SACHS ALTERNATIVE FUNDS
|
| 3. INVESTMENTS AND FAIR VALUE MEASUREMENTS (continued) |
will correspondingly fluctuate in value. To the extent these investments are actively traded, they are classified as Level 1 of the fair value hierarchy, otherwise they are generally classified as Level 2. For information regarding an Underlying Fund’s accounting policies and investment holdings, please see the Underlying Fund’s shareholder report.
Derivative Contracts — A derivative is an instrument whose value is derived from underlying assets, indices, reference rates or a combination of these factors. A Fund enters into derivative transactions to hedge against changes in interest rates, securities prices, and/or currency exchange rates, to increase total return, or to gain access to certain markets or attain exposure to other underliers. For financial reporting purposes, cash collateral that has been pledged to cover obligations of a Fund and cash collateral received, if any, is reported separately on the Consolidated Statements of Assets and Liabilities as receivables/payables for collateral on certain derivatives contracts. Non-cash collateral pledged by a Fund, if any, is noted in the Schedules of Investments.
Exchange-traded derivatives, including futures and options contracts, are generally valued at the last sale or settlement price on the exchange where they are principally traded. Exchange-traded options without settlement prices are generally valued at the midpoint of the bid and ask prices on the exchange where they are principally traded (or, in the absence of two way trading, at the last bid price for long positions and the last ask price for short positions). Exchange-traded derivatives typically fall within Level 1 of the fair value hierarchy. Over-the-counter (“OTC”) and centrally cleared derivatives are valued using market transactions and other market evidence, including market-based inputs to models, calibration to market-clearing transactions, broker or dealer quotations, or other alternative pricing sources. Where models are used, the selection of a particular model to value OTC and centrally cleared derivatives depends upon the contractual terms of, and specific risks inherent in, the instrument, as well as the availability of pricing information in the market. Valuation models require a variety of inputs, including contractual terms, market prices, yield curves, credit curves, measures of volatility, voluntary and involuntary prepayment rates, loss severity rates and correlations of such inputs. For OTC and centrally cleared derivatives that trade in liquid markets, model inputs can generally be verified and model selection does not involve significant management judgment. OTC and centrally cleared derivatives are classified within Level 2 of the fair value hierarchy when significant inputs are corroborated by market evidence.
i. Forward Contracts — A forward contract is a contract between two parties to buy or sell an asset at a specified price on a future date. A forward contract settlement can occur on a cash or delivery basis. Forward contracts are marked-to-market daily using independent vendor prices, and the change in value, if any, is recorded as an unrealized gain or loss. Cash and certain investments may be used to collateralize forward contracts.
A forward foreign currency exchange contract is a forward contract in which a Fund agrees to receive or deliver a fixed quantity of one currency for another, at a pre-determined price at a future date. All forward foreign currency exchange contracts are marked to market daily by using the outright forward rates or interpolating based upon maturity dates, where available. Non-deliverable forward foreign currency exchange contracts are settled with the counterparty in cash without the delivery of foreign currency.
ii. Futures Contracts — Futures contracts are contracts to buy or sell a standardized quantity of a specified commodity or security. Upon entering into a futures contract, a Fund deposits cash or securities in an account on behalf of the broker in an amount sufficient to meet the initial margin requirement. Subsequent payments are made or received by a Fund equal to the daily change in the contract value and are recorded as variation margin receivable or payable with a corresponding offset to unrealized gains or losses.
iii. Options — When a Fund writes call or put options, an amount equal to the premium received is recorded as a liability and is subsequently marked-to-market to reflect the current value of the option written. Swaptions are options on swap contracts.
Upon the purchase of a call option or a put option by a Fund, the premium paid is recorded as an investment and subsequently marked-to-market to reflect the current value of the option. Certain options may be purchased with premiums to be determined on a future date. The premiums for these options are based upon implied volatility parameters at specified terms.
iv. Swap Contracts — Bilateral swap contracts are agreements in which a Fund and a counterparty agree to exchange periodic payments on a specified notional amount or make a net payment upon termination. Bilateral swap transactions are
81
GOLDMAN SACHS ALTERNATIVE FUNDS
Notes to Financial Statements (continued)
June 30, 2021 (Unaudited)
|
| 3. INVESTMENTS AND FAIR VALUE MEASUREMENTS (continued) |
privately negotiated in the OTC market and payments are settled through direct payments between a Fund and the counterparty. By contrast, certain swap transactions are subject to mandatory central clearing. These swaps are executed through a derivatives clearing member (“DCM”), acting in an agency capacity, and submitted to a central counterparty (“CCP”) (“centrally cleared swaps”), in which case all payments are settled with the CCP through the DCM. Swaps are marked-to-market daily using pricing vendor quotations, counterparty or clearinghouse prices or model prices, and the change in value, if any, is recorded as an unrealized gain or loss. Upon entering into a swap contract, a Fund is required to satisfy an initial margin requirement by delivering cash or securities to the counterparty (or in some cases, segregated in a triparty account on behalf of the counterparty), which can be adjusted by any mark-to-market gains or losses pursuant to bilateral or centrally cleared arrangements. For centrally cleared swaps the daily change in valuation, if any, is recorded as a receivable or payable for variation margin.
An interest rate swap is an agreement that obligates two parties to exchange a series of cash flows at specified intervals, based upon or calculated by reference to changes in interest rates on a specified notional principal amount. The payment flows are usually netted against each other, with the difference being paid by one party to the other.
A credit default swap is an agreement that involves one party (the buyer of protection) making a stream of payments to another party (the seller of protection) in exchange for the right to receive protection on a reference security or obligation, including a group of assets or exposure to the performance of an index. A Fund’s investment in credit default swaps may involve greater risks than if the Fund had invested in the referenced obligation directly. Credit events are contract specific but may include bankruptcy, failure to pay, restructuring and obligation acceleration. If a Fund buys protection through a credit default swap and no credit event occurs, its payments are limited to the periodic payments previously made to the counterparty. Upon the occurrence of a specified credit event, a Fund, as a buyer of credit protection, is entitled to receive an amount equal to the notional amount of the swap and deliver to the seller the defaulted reference obligation in a physically settled trade. A Fund may also receive a net settlement amount in the form of cash or securities equal to the notional amount of the swap reduced by the recovery value of the reference obligation in a cash settled trade.
As a seller of protection, a Fund generally receives a payment stream throughout the term of the swap, provided that there is no credit event. In addition, if a Fund sells protection through a credit default swap, a Fund could suffer a loss because the value of the referenced obligation and the premium payments received may be less than the notional amount of the swap paid to the buyer of protection. Upon the occurrence of a specified credit event, a Fund, as a seller of credit protection, may be required to take possession of the defaulted reference obligation and pay the buyer an amount equal to the notional amount of the swap in a physically settled trade. A Fund may also pay a net settlement amount in the form of cash or securities equal to the notional amount of the swap reduced by the recovery value of the reference obligation in a cash settled trade. Recovery values are at times established through the credit event auction process in which market participants are ensured that a transparent price has been set for the defaulted security or obligation. In addition, a Fund is entitled to a return of any assets, which have been pledged as collateral to the counterparty upon settlement.
The maximum potential amount of future payments (undiscounted) that a Fund as seller of protection could be required to make under a credit default swap would be an amount equal to the notional amount of the agreement. These potential amounts would be partially offset by any recovery values of the respective referenced obligations or net amounts received from a settlement of a credit default swap for the same reference security or obligation where a Fund bought credit protection.
A total return swap is an agreement that gives a Fund the right to receive or pay the appreciation or depreciation, as applicable, in the value of a specified security, an index, a basket of securities or indices or other instrument in return for a fee paid to the counterparty, which will typically be an agreed upon interest rate. If the underlying asset declines in value over the term of the swap, a Fund may also be required to pay the dollar value of that decline to the counterparty.
B. Level 3 Fair Value Investments — To the extent that significant inputs to valuation models and other alternative pricing sources are unobservable, or if quotations are not readily available, or if GSAM believes that such quotations do not accurately reflect fair value, the fair value of a Fund’s investments may be determined under Valuation Procedures approved by the Trustees. GSAM, consistent with its procedures and applicable regulatory guidance, may make an adjustment to the most recent valuation prices of either domestic or foreign securities in light of significant events to reflect what it believes to be the fair value of the
82
GOLDMAN SACHS ALTERNATIVE FUNDS
|
| 3. INVESTMENTS AND FAIR VALUE MEASUREMENTS (continued) |
securities at the time of determining a Fund’s NAV To the extent investments are valued using single source broker quotations obtained directly from the broker or passed through from third party pricing vendors, such investments are classified as Level 3 investments.
C. Fair Value Hierarchy — The following is a summary of the Funds’ investments and derivatives classified in the fair value hierarchy as of June 30, 2021:
| | | | | | | | | | | | |
| | | |
| ABSOLUTE RETURN TRACKER | | | | | | | | | | | | |
| | | |
| Investment Type | | Level 1 | | | Level 2 | | | Level 3 | |
| | | |
| Assets | | | | | | | | | | | | |
| | | |
Common Stock and/or Other Equity Investments(a) | | | | | | | | | | | | |
| | | |
Africa | | $ | 3,225 | | | $ | 666,532 | | | $ | — | |
| | | |
Asia | | | 946,933 | | | | 19,687,790 | | | | — | |
| | | |
Australia and Oceania | | | — | | | | 178,505 | | | | — | |
| | | |
Europe | | | 9,437,731 | | | | 76,154,179 | | | | — | |
| | | |
North America | | | 959,476,356 | | | | 4,039,774 | | | | — | |
| | | |
South America | | | — | | | | 46,529 | | | | — | |
| | | |
Exchange Traded Funds | | | 745,874,608 | | | | — | | | | — | |
| | | |
Investment Company | | | 1,585,357,468 | | | | — | | | | — | |
| | | |
Securities Lending Reinvestment Vehicle | | | 77,778,706 | | | | — | | | | — | |
| | | |
| Total | | $ | 3,378,875,027 | | | $ | 100,773,309 | | | $ | — | |
| | | |
| Derivative Type | | | | | | | | | |
| | | |
| Assets | | | | | | | | | | | | |
| | | |
Forward Foreign Currency Exchange Contracts(b) | | $ | — | | | $ | 1,059,538 | | | $ | — | |
| | | |
Futures Contracts(b) | | | 4,420,667 | | | | — | | | | — | |
| | | |
Credit Default Swap Contracts(b) | | | — | | | | 4,308,803 | | | | — | |
| | | |
Total Return Swap Contracts(b) | | | — | | | | 13,974,284 | | | | — | |
| | | |
Purchased Options Contracts | | | 183,095 | | | | — | | | | — | |
| | | |
| Total | | $ | 4,603,762 | | | $ | 19,342,625 | | | $ | — | |
| | | |
| Liabilities | | | | | | | | | | | | |
| | | |
Forward Foreign Currency Exchange Contracts(b) | | $ | — | | | $ | (374,250 | ) | | $ | — | |
| | | |
Futures Contracts(b) | | | (10,456,557 | ) | | | — | | | | — | |
| | | |
Total Return Swap Contracts(b) | | | — | | | | (8,145,302 | ) | | | — | |
| | | |
Written Options Contracts | | | (180,670 | ) | | | — | | | | — | |
| | | |
| Total | | $ | (10,637,227 | ) | | $ | (8,519,552 | ) | | $ | — | |
| (a) | | Amounts are disclosed by continent to highlight the impact of time zone differences between local market close and the calculation of NAV. Security valuations are based on the principal exchange or system on which they are traded, which may differ from country of domicile. The Funds utilize fair value model prices provided by an independent third party (fair value) service for certain international equity securities, resulting in a Level 2 classification. |
| (b) | | Amount shown represents unrealized gain (loss) at period end. |
83
GOLDMAN SACHS ALTERNATIVE FUNDS
Notes to Financial Statements (continued)
June 30, 2021 (Unaudited)
|
| 3. INVESTMENTS AND FAIR VALUE MEASUREMENTS (continued) |
| | | | | | | | | | | | |
| | | |
| ALTERNATIVE PREMIA | | | | | | | | | | | | |
| | | |
| Investment Type | | Level 1 | | | Level 2 | | | Level 3 | |
| | | |
| Assets | | | | | | | | | | | | |
| | | |
Investment Company | | $ | 21,202,425 | | | $ | — | | | $ | — | |
| | | |
| Derivative Type | | | | | | | | | |
| | | |
| Assets | | | | | | | | | | | | |
| | | |
Forward Foreign Currency Exchange Contracts(b) | | $ | — | | | $ | 80,317 | | | $ | — | |
| | | |
Futures Contracts(b) | | | 2,735,010 | | | | — | | | | — | |
| | | |
Credit Default Swap Contracts(b) | | | — | | | | 20,930 | | | | — | |
| | | |
Total Return Swap Contracts(b) | | | — | | | | 478,346 | | | | — | |
| | | |
Purchased Options Contracts | | | 184,400 | | | | — | | | | — | |
| | | |
| Total | | $ | 2,919,410 | | | $ | 579,593 | | | $ | — | |
| | | |
| Liabilities(b) | | | | | | | | | | | | |
| | | |
Forward Foreign Currency Exchange Contracts | | $ | — | | | $ | (115,818 | ) | | $ | — | |
| | | |
Futures Contracts | | | (2,206,751 | ) | | | — | | | | — | |
| | | |
Total Return Swap Contracts | | | — | | | | (327,233 | ) | | | — | |
| | | |
| Total | | $ | (2,206,751 | ) | | $ | (443,051 | ) | | $ | — | |
| | | |
| MANAGED FUTURES STRATEGY | | | | | | | | | | | | |
| | | |
| Investment Type | | Level 1 | | | Level 2 | | | Level 3 | |
| | | |
| Assets | | | | | | | | | | | | |
| | | |
Investment Company | | $ | 171,144,776 | | | $ | — | | | $ | — | |
| | | |
| Derivative Type | | | | | | | | | |
| | | |
| Assets(b) | | | | | | | | | | | | |
| | | |
Forward Foreign Currency Exchange Contracts | | $ | — | | | $ | 2,135,238 | | | $ | — | |
| | | |
Futures Contracts | | | 2,583,174 | | | | — | | | | — | |
| | | |
Interest Rate Swap Contracts | | | — | | | | 3,344,979 | | | | — | |
| | | |
| Total | | $ | 2,583,174 | | | $ | 5,480,217 | | | $ | — | |
| | | |
| Liabilities(b) | | | | | | | | | | | | |
| | | |
Forward Foreign Currency Exchange Contracts | | $ | — | | | $ | (5,185,795 | ) | | $ | — | |
| | | |
Futures Contracts | | | (2,014,798 | ) | | | — | | | | — | |
| | | |
Interest Rate Swap Contracts | | | — | | | | (2,297,117 | ) | | | — | |
| | | |
| Total | | $ | (2,014,798 | ) | | $ | (7,482,912 | ) | | $ | — | |
| (a) | | Amounts are disclosed by continent to highlight the impact of time zone differences between local market close and the calculation of NAV. Security valuations are based on the principal exchange or system on which they are traded, which may differ from country of domicile. The Funds utilize fair value model prices provided by an independent third party (fair value) service for certain international equity securities, resulting in a Level 2 classification. |
| (b) | | Amount shown represents unrealized gain (loss) at period end. |
For further information regarding security characteristics, see the Consolidated Schedules of Investments.
84
GOLDMAN SACHS ALTERNATIVE FUNDS
|
| 4. INVESTMENTS IN DERIVATIVES |
The following tables set forth, by certain risk types, the gross value of derivative contracts (not considered to be hedging instruments for accounting disclosure purposes) as of June 30, 2021. These instruments were used as part of the Funds’ investment strategies and to obtain and/or manage exposure related to the risks below. The values in the tables below exclude the effects of cash collateral received or posted pursuant to these derivative contracts, and therefore are not representative of the Funds’ net exposure.
| | | | | | | | | | | | |
| | | |
| Absolute Return Tracker | | | | | | | | | | |
| Risk | | Consolidated
Statements of Assets
and Liabilities | | Assets | | | Consolidated
Statements of Assets
and Liabilities | | Liabilities | |
Commodity | | Receivable for unrealized gain on swap contracts and variation margin on futures contracts | | $ | 2,845,708 | (a) | | Variation margin on futures contracts | | $ | (2,639,520) | (a) |
Credit | | Variation margin on swap contracts | | | 4,308,803 | (a) | | — | | | — | |
Currency | | Receivable for unrealized gain on forward foreign currency exchange contracts | | | 1,059,538 | | | Payable for unrealized loss on forward foreign currency exchange contracts | | | (374,250) | |
Equity | | Receivable for unrealized gain on swap contracts, Purchased options at value and variation margin on futures contracts | | | 15,291,394 | (a) | | Payable for unrealized loss on swap contracts, Written options at value and variation margin on futures contracts | | | (15,966,465) | (a)(b) |
Interest Rate | | Variation margin on futures contracts | | | 440,944 | (a) | | Variation margin on futures contracts | | | (176,544) | (a) |
| Total | | | | $ | 23,946,387 | | | | | $ | (19,156,779) | |
| | | | | | | | | | | | |
| | | |
| Alternative Premia | | | | | | | | | | |
| Risk | | Consolidated
Statements of Assets
and Liabilities | | Assets(a) | | | Consolidated
Statements of Assets
and Liabilities | | Liabilities(a) | |
Commodity | | Variation margin on futures contracts | | $ | 2,015,608 | | | Variation margin on futures contracts | | $ | (1,870,334) | |
Credit | | Variation margin on swap contracts | | | 20,930 | | | — | | | — | |
Currency | | Receivable for unrealized gain on forward foreign currency exchange contracts and variation margin on futures contracts | | | 291,015 | | | Payable for unrealized loss on forward foreign currency exchange contracts and variation margin on futures contracts | | | (199,602) | |
Equity | | Receivable for unrealized gain on swap contracts, Purchased options at value and variation margin on futures contracts | | | 1,089,054 | | | Payable for unrealized loss on swap contracts and variation margin on futures contracts | | | (362,554) | (b) |
Interest Rate | | Variation margin on futures contracts | | | 82,396 | | | Variation margin on futures contracts | | | (217,312) | |
| Total | | | | $ | 3,499,003 | | | | | $ | (2,649,802) | |
| (a) | | Includes unrealized gain (loss) on futures contracts and centrally cleared swap contracts described in the Additional Investment Information sections of the Consolidated Schedules of Investments. Only the variation margin as of June 30, 2021 is reported within the Consolidated Statements of Assets and Liabilities. |
| (b) | | Aggregate of amounts include $8,145,302 and $327,233 for the Absolute Return Tracker and Alternative Premia Funds, respectively, which represent the payments to be made pursuant to bilateral agreements should counterparties exercise their “right to terminate” provisions based on, among others, the Fund’s performance, their failure to pay on their obligations or failure to pledge collateral. Such amounts do not include incremental charges directly associated with the close-out of the agreements. They also do not reflect the fair value of any assets pledged as collateral which, through the daily margining process, substantially offsets the aforementioned amounts and for which a Fund is entitled to a full return. |
85
GOLDMAN SACHS ALTERNATIVE FUNDS
Notes to Financial Statements (continued)
June 30, 2021 (Unaudited)
|
| 4. INVESTMENTS IN DERIVATIVES (continued) |
| | | | | | | | | | | | |
| | | |
| Managed Futures Strategy | | | | | | | | | | |
| Risk | | Consolidated
Statements of Assets
and Liabilities | | Assets | | | Consolidated
Statements of Assets
and Liabilities | | Liabilities | |
Commodity | | Variation margin on futures contracts | | $ | 1,385,387 | (a) | | Variation margin on futures contracts | | $ | (1,265,137) | (a) |
Currency | | Receivable for unrealized gain on forward foreign currency exchange contracts | | | 2,135,238 | | | Payable for unrealized loss on forward foreign currency exchange contracts | | | (5,185,795) | |
Equity | | Variation margin on futures contracts | | | 1,197,787 | (a) | | Variation margin on futures contracts | | | (749,661) | (a) |
Interest Rate | | Variation margin on swap contracts | | | 3,344,979 | (a) | | Variation margin on swap contracts | | | (2,297,117) | (a) |
| Total | | | | $ | 8,063,391 | | | | | $ | (9,497,710) | |
| (a) | | Includes unrealized gain (loss) on futures contracts and centrally cleared swap contracts described in the Additional Investment Information sections of the Consolidated Schedules of Investments. Only the variation margin as of June 30, 2021, is reported within the Consolidated Statements of Assets and Liabilities. |
The following tables set forth, by certain risk types, the Funds’ gains (losses) related to these derivatives and their indicative volumes for the six months ended June 30, 2021. These gains (losses) should be considered in the context that these derivative contracts may have been executed to create investment opportunities and/or economically hedge certain investments, and accordingly, certain gains (losses) on such derivative contracts may offset certain (losses) gains attributable to investments. These gains (losses) are included in “Net realized gain (loss)” or “Net change in unrealized gain (loss)” on the Consolidated Statements of Operations:
| | | | | | | | | |
| | |
| Absolute Return Tracker | | | | | | | |
| Risk | | Consolidated Statements of Operations | | Net Realized
Gain (Loss) | | Net Change in
Unrealized
Gain (Loss) |
Commodity | | Net realized gain (loss) from futures contracts and swap contracts/Net change in unrealized gain (loss) on futures contracts and swap contracts | | $ 6,371,776 | | | $ | (2,264,340 | ) |
Credit | | Net realized gain (loss) from swap contracts/Net change in unrealized gain (loss) on swap contracts | | 20,534,613 | | | | (12,144,259 | ) |
Currency | | Net realized gain (loss) from forward foreign currency exchange contracts/Net change in unrealized gain (loss) on forward foreign currency exchange contracts | | (3,568,456) | | | | (713,626 | ) |
Equity | | Net realized gain (loss) from futures contracts, purchased options, swap contracts and written options/Net change in unrealized gain (loss) on futures contracts, purchased options, swap contracts and written options | | 23,771,270 | | | | (3,741,076 | ) |
Interest rate | | Net realized gain (loss) from futures contracts/Net change in unrealized gain (loss) on futures contracts | | (12,378,980) | | | | (916,815 | ) |
| Total | | | | $34,730,223 | | | $ | (19,780,116 | ) |
86
GOLDMAN SACHS ALTERNATIVE FUNDS
|
| 4. INVESTMENTS IN DERIVATIVES (continued) |
| | | | | | | | | |
| | |
| Alternative Premia | | | | | | | |
| Risk | | Consolidated
Statements of Operations | | Net Realized
Gain (Loss) | | Net Change in
Unrealized
Gain (Loss) |
Commodity | | Net realized gain (loss) from futures contracts/Net change in unrealized gain (loss) on futures contracts | | $ 108,076 | | | $ | 94,606 | |
Credit | | Net realized gain (loss) from swap contracts/Net change in unrealized gain (loss) on swap contracts | | 10,687 | | | | 18,018 | |
Currency | | Net realized gain (loss) from futures contracts and forward foreign currency exchange contracts/Net change in unrealized gain (loss) on futures contracts and forward foreign currency exchange contracts | | 235,004 | | | | 32,643 | |
Equity | | Net realized gain (loss) from futures contracts, purchased options and swap contracts/Net change in unrealized gain (loss) on futures contracts, purchased options and swap contracts | | (18,094) | | | | 287,332 | |
Interest rate | | Net realized gain (loss) from futures contracts/Net change in unrealized gain (loss) on futures contracts | | 204,034 | | | | (157,943 | ) |
| Total | | | | $ 539,707 | | | $ | 274,656 | |
| | |
| Managed Futures Strategy | | | | | | | |
| Risk | | Consolidated Statements of Operations | | Net Realized
Gain (Loss) | | Net Change in
Unrealized
Gain (Loss) |
Commodity | | Net realized gain (loss) from futures contracts/Net change in unrealized gain (loss) on futures contracts | | $7,568,466 | | | $ | (2,216,850 | ) |
Currency | | Net realized gain (loss) from forward foreign currency exchange contracts/Net change in unrealized gain (loss) on forward foreign currency exchange contracts | | 4,002,446 | | | | (5,648,360 | ) |
Equity | | Net realized gain (loss) from futures contracts/Net change in unrealized gain (loss) on futures contracts | | 11,156,921 | | | | (1,429,319 | ) |
Interest rate | | Net realized gain (loss) from futures contracts and swap contracts/Net change in unrealized gain (loss) on futures contracts and swap contracts | | 759,983 | | | | (3,145,070 | ) |
| Total | | | | $23,487,816 | | | $ | (12,439,599 | ) |
For the six months ended June 30, 2021, the relevant values for each derivative type were as follows:
| | | | | | | | | | | | | | | | | | | | | | |
| | | | | Average number of Contracts or Notional Amounts(1) | |
| Fund | | | | Futures
Contracts | | | Forward
Contracts | | | Swap Agreements | | | Purchased
Options | | | Written
Options | |
Absolute Return Tracker | | | | | 12,734 | | | $ | 285,021,622 | | | $ | 978,582,478 | | | | 1,201 | | | | 845 | |
Alternative Premia | | | | | 2,094 | | | | 19,041,790 | | | | 135,481,544 | | | | 906 | | | | — | |
Managed Futures Strategy | | | | | 6,013 | | | | 406,516,247 | | | | 5,012,482,403 | | | | — | | | | — | |
| (1) | | Amounts disclosed represent average number of contracts for futures contracts, purchased options and written options, notional amounts for forward contracts and swap contracts, based on absolute values, which is indicative of volume of this derivative type, for the months that each Fund held such derivatives during the six months ended June 30, 2021. |
87
GOLDMAN SACHS ALTERNATIVE FUNDS
Notes to Financial Statements (continued)
June 30, 2021 (Unaudited)
|
| 4. INVESTMENTS IN DERIVATIVES (continued) |
In order to better define its contractual rights and to secure rights that will help a Fund mitigate its counterparty risk, a Fund may enter into an International Swaps and Derivatives Association, Inc. Master Agreement (“ISDA Master Agreement”) or similar agreement with its derivatives counterparties. An ISDA Master Agreement is a bilateral agreement between a Fund and a counterparty that governs OTC derivatives (including forward foreign currency exchange contracts, and certain options and swaps), and typically contains, among other things, collateral posting terms and netting provisions in the event of a default and/or termination event. The provisions of the ISDA Master Agreement typically permit a single net payment in the event of a default (close-out netting) or similar event, including the bankruptcy or insolvency of the counterparty.
Collateral and margin requirements differ between exchange traded derivatives and OTC derivatives. Margin requirements are established by the broker or clearing house for exchange-traded and centrally cleared derivatives (financial futures contracts, options and centrally cleared swaps) pursuant to governing agreements for those instrument types. Brokers can ask for margin in excess of the minimum in certain circumstances. Collateral terms are contract-specific for OTC derivatives. For derivatives traded under an ISDA Master Agreement, the collateral requirements are typically calculated by netting the marked to market amount for each transaction under such agreement and comparing that amount to the value of any collateral currently pledged by a Fund and the counterparty. Additionally, a Fund may be required to post initial margin to the counterparty, the terms of which would be outlined in the confirmation of the OTC transaction.
Generally, the amount of collateral due from or to a counterparty must exceed a minimum transfer amount threshold before a transfer is required to be made. To the extent amounts due to a Fund from its counterparties are not fully collateralized, contractually or otherwise, the Fund bears the risk of loss from counterparty nonperformance. A Fund attempts to mitigate counterparty risk by only entering into agreements with counterparties that the Investment Adviser believes to be of good standing and by monitoring the financial stability of those counterparties.
Additionally, the netting of assets and liabilities and the offsetting of collateral pledged or received are based on contractual netting/set-off provisions in the ISDA Master Agreement or similar agreements. However, in the event of a default or insolvency of a counterparty, a court could determine that such rights are not enforceable due to the restrictions or prohibitions against the right of setoff that may be imposed in accordance with a particular jurisdiction’s bankruptcy or insolvency laws.
The following tables set forth the Funds’ net exposure for derivative instruments that are subject to enforceable master netting arrangements or similar agreements as of June 30, 2021:
| | | | | | | | | | | | | | | | | | | | | | | | | | | | | | | | |
| | | | | |
| Alternative Premia | | | | | | | | | | | | | | | | | | | | | |
| | | | | | Derivative Assets(1) | | | Derivative Liabilities(1) | | | Net Derivative
Assets
(Liabilities) | | | Collateral
(Received)
Pledged(1) | | | Net
Amount(2) | |
| Counterparty | | | | | Forwards | | | Swaps | | | Forwards | | | Swaps | |
Bank of America NA | | | | | | $ | — | | | $ | 317,142 | | | | — | | | $ | (292,337 | ) | | $ | 24,805 | | | $ | — | | | $ | 24,805 | |
JPMorgan Chase Bank NA | | | | | | | — | | | | 161,204 | | | | — | | | | (34,896 | ) | | | 126,308 | | | | — | | | | 126,308 | |
Morgan Stanley Co., Inc. | | | | | | | 80,317 | | | | — | | | | (115,818 | ) | | | — | | | | (35,501 | ) | | | 10,000 | | | | (45,501 | ) |
| | | | | | | | |
Total | | | | | | $ | 80,317 | | | $ | 478,346 | | | $ | (115,818 | ) | | $ | (327,233 | ) | | $ | 115,612 | | | $ | 10,000 | | | $ | 105,612 | |
| (1) | | Gross amounts available for offset but not netted in the Consolidated Statements of Assets and Liabilities. |
| (2) | | Net amount represents the net amount due (to) from counterparty in the event of a default based on the contractual set-off rights under the agreement. |
| | | | | | | | | | | | | | | | | | | | | | | | |
| | | | |
| Managed Futures Strategy | | | | | | | | | | | | | | | | | |
| | | | | | Derivative
Assets(1) | | | Derivative
Liabilities(1) | | | Net
Derivative
Assets
(Liabilities) | | | Collateral
(Received)
Pledged(1) | | | Net
Amount(2) | |
| Counterparty | | | | | Forwards | | | Forwards | |
Morgan Stanley Co., Inc. | | | | | | $ | 2,135,238 | | | $ | (5,185,795 | ) | | $ | (3,050,557 | ) | | | (3,050,557 | ) | | $ | — | |
| (1) | | Gross amounts available for offset but not netted in the Consolidated Statements of Assets and Liabilities. |
| (2) | | Net amount represents the net amount due (to) from counterparty in the event of a default based on the contractual set-off rights under the agreement. |
88
GOLDMAN SACHS ALTERNATIVE FUNDS
|
| 5. AGREEMENTS AND AFFILIATED TRANSACTIONS |
A. Management Agreement — Under the Agreement, GSAM manages the Funds, subject to the general supervision of the Trustees.
As compensation for the services rendered pursuant to the Agreement, the assumption of the expenses related thereto and administration of the Funds’ business affairs, including providing facilities, GSAM is entitled to a management fee, accrued daily and paid monthly, equal to an annual percentage rate of each Fund’s average daily net assets.
For the six months ended June 30, 2021, contractual and effective net management fees with GSAM were at the following rates:
| | | | | | | | | | | | | | | | | | | | | | | | | | | | | | |
| | | | | Contractual Management Rate | | | | | | Effective Net Management
Rate^(1) | |
| Fund | | | | First
$1 billion | | | Next
$1 billion | | | Next
$3 billion | | | Next
$3 billion | | | Over
$8 billion | | | Effective
Rate | |
Absolute Return Tracker | | | | | 0.70 | % | | | 0.63 | % | | | 0.60 | % | | | 0.59 | % | | | 0.53 | % | | | 0.64 | % | | | 0.62 | % |
Alternative Premia | | | | | 0.79 | | | | 0.71 | | | | 0.68 | | | | 0.66 | | | | 0.65 | | | | 0.79 | | | | 0.77 | |
Managed Futures Strategy | | | | | 1.00 | | | | 0.90 | | | | 0.86 | | | | 0.84 | | | | 0.82 | | | | 1.00 | | | | 0.97 | |
| ^ | | Effective Net Management Rate includes the impact of management fee waivers of affiliated underlying funds, if any. The Effective Net Management Rate may not correlate to the Contractual Management Rate as a result of management fee waivers that may be in effect from time to time. |
| (1) | | Reflects combined management fees paid to GSAM under the Agreement and the Funds’ Subsidiary Agreements (as defined below) after the waivers. |
GSAM also provides management services to the Subsidiaries pursuant to a Subsidiary Management Agreement (the “Subsidiary Agreement”) and is entitled to a management fee accrued daily and paid monthly, equal to an annual percentage rate of 0.42% of each Subsidiary’s average daily net assets. In consideration of the Subsidiary’s management fee, and for as long as the Subsidiary Agreement remains in effect, GSAM has contractually agreed to waive irrevocably a portion of each Fund’s management fee in an amount equal to the management fee accrued and paid to GSAM by the Subsidiary under the Subsidiary Agreement. For the six months ended June 30, 2021, GSAM waived $36,165, $14,757 and $112,657 of each Fund’s management fee for Absolute Return Tracker, Alternative Premia and Managed Futures Strategy Funds, respectively.
The Funds invest in Institutional Shares of the Goldman Sachs Financial Square Government Fund, which is an affiliated Underlying Fund. GSAM has agreed to waive a portion of its management fee payable by the Funds in an amount equal to the management fee it earns as an investment adviser to the affiliated Underlying Fund in which the Funds invest, except those management fees it earns from the Funds’ investments of cash collateral received in connection with securities lending transactions in the Goldman Sachs Financial Square Government Fund. For the six months ended June 30, 2021, GSAM waived $308,760, $4,096 and $34,743 of the Absolute Return Tracker, Alternative Premia and Managed Futures Strategy Funds’ management fees, respectively.
B. Distribution and/or Service (12b-1) Plans — The Trust, on behalf of Class A and Class R Shares of each applicable Fund, has adopted Distribution and Service Plans subject to Rule 12b-1 under the Act. Under the Distribution and Service Plans, Goldman Sachs, which serves as distributor (the “Distributor”), is entitled to a fee accrued daily and paid monthly for distribution services and personal and account maintenance services, which may then be paid by Goldman Sachs to authorized dealers. These fees are equal to an annual percentage rate of the average daily net assets attributable to Class A or Class R Shares of the Funds, as set forth below.
The Trust, on behalf of Class C Shares of each applicable Fund, has adopted a Distribution Plan subject to Rule 12b-1 under the Act. Under the Distribution Plan, Goldman Sachs as Distributor is entitled to a fee accrued daily and paid monthly for
89
GOLDMAN SACHS ALTERNATIVE FUNDS
Notes to Financial Statements (continued)
June 30, 2021 (Unaudited)
|
| 5. AGREEMENTS AND AFFILIATED TRANSACTIONS (continued) |
distribution services, which may then be paid by Goldman Sachs to authorized dealers. These fees are equal to an annual percentage rate of the average daily net assets attributable to Class C Shares of the Funds, as set forth below.
| | | | | | | | | | | | |
| | | Distribution and/or Service Plan Rates | |
| | | Class A* | | | Class C | | | Class R* | |
Distribution and/or Service Plan | | | 0.25 | % | | | 0.75 | % | | | 0.50 | % |
| * | | With respect to Class A and Class R Shares, the Distributor at its discretion may use compensation for distribution services paid under the Distribution Plan to compensate service organizations for personal and account maintenance services and expenses as long as such total compensation does not exceed the maximum cap on “service fees” imposed by the Financial Industry Regulatory Authority. |
C. Distribution Agreement — Goldman Sachs, as Distributor of the shares of the Funds pursuant to a Distribution Agreement, may retain a portion of the Class A Shares’ front end sales charge and Class C Shares’ CDSC. During the six months ended June 30, 2021, Goldman Sachs retained the following amounts:
| | | | | | | | | | |
| | | | | Front End
Sales Charge | | | Contingent Deferred
Sales Charge | |
| Fund | | | | Class A | | | Class C | |
Absolute Return Tracker | | | | $ | 3,438 | | | $ | — | |
Alternative Premia | | | | | — | | | | | |
Managed Futures Strategy | | | | | 235 | | | | — | |
D. Service Plan — The Trust, on behalf of each applicable Fund, has adopted a Service Plan to allow Class C Shares to compensate service organizations (including Goldman Sachs) for providing varying levels of personal and account maintenance services to their customers who are beneficial owners of such shares. The Service Plan provides for compensation to the service organizations equal to an annual percentage rate of 0.25% of the average daily net assets attributable to Class C Shares of the Funds.
E. Transfer Agency Agreement — Goldman Sachs also serves as the transfer agent of the Funds for a fee pursuant to the Transfer Agency Agreement. The fees charged for such transfer agency services are accrued daily and paid monthly at annual rates as follows: 0.16% of the average daily net assets of Class A, Class C, Investor and Class R Shares; 0.03% of the average daily net assets of Class R6 and Class P Shares; and 0.04% of the average daily net assets of Institutional Shares.
F. Other Expense Agreements and Affiliated Transactions — GSAM has agreed to reduce or limit certain “Other Expenses” of the Funds (excluding acquired fund fees and expenses, transfer agency fees and expenses, service fees and shareholder administration fees (as applicable), taxes, interest, brokerage fees, expenses of shareholder meetings, litigation and indemnification, and extraordinary expenses) to the extent such expenses exceed, on an annual basis, a percentage rate of the average daily net assets of each Fund. Such Other Expense reimbursements, if any, are accrued daily and paid monthly. In addition, the Funds are not obligated to reimburse GSAM for prior fiscal year expense reimbursements, if any. The Other Expense limitations as an annual percentage rate of average daily net assets for the Absolute Return Tracker, Alternative Premia and Managed Futures Strategy Funds are 0.014%, 0.114% and 0.254%, respectively. These Other Expense limitations will remain in place through at least April 30, 2022, and prior to such date GSAM may not terminate the arrangements without the approval of the Trustees. The Subsidiaries also pay certain other expenses, including service and custody fees. GSAM has agreed to reduce or limit each Subsidiary’s expenses (excluding management fees) to 0.004% of the Subsidiary’s average daily net assets for the Absolute Return Tracker, Alternative Premia and Managed Futures Strategy Funds. In addition, the Funds have entered into certain offset arrangements with the custodian and the transfer agent, which may result in a reduction of the Funds’ expenses and are received irrespective of the application of the “Other Expense” limitations described above.
90
GOLDMAN SACHS ALTERNATIVE FUNDS
|
| 5. AGREEMENTS AND AFFILIATED TRANSACTIONS (continued) |
For the six months ended June 30, 2021, these expense reductions, including any fee waivers and Other Expense reimbursements, were as follows:
| | | | | | | | | | | | | | |
| Fund | | | | Management
Fee Waiver | | | Other Expense
Reimbursement | | | Total Expense
Reductions | |
Absolute Return Tracker | | | | $ | 344,925 | | | $ | 481,300 | | | $ | 826,225 | |
Alternative Premia | | | | | 18,853 | | | | 229,376 | | | | 248,229 | |
Managed Futures Strategy | | | | | 147,400 | | | | 13,221 | | | | 160,621 | |
G. Line of Credit Facility — As of June 30, 2021, the Funds participated in a $1,000,000,000 committed, unsecured revolving line of credit facility (the “facility”) together with other funds of the Trust and certain registered investment companies having management agreements with GSAM or its affiliates. This facility is to be used for temporary emergency purposes, or to allow for an orderly liquidation of securities to meet redemption requests. The interest rate on borrowings is based on the federal funds rate. The facility also requires a fee to be paid by the Funds based on the amount of the commitment that has not been utilized. For the six months ended June 30, 2021, the Funds did not have any borrowings under the facility. Prior to April 26, 2021, the facility was $700,000,000.
H. Other Transactions with Affiliates — The following table provides information about the Funds’ investment in the Goldman Sachs Financial Square Government Fund as of and for the six months ended June 30, 2021:
| | | | | | | | | | | | | | | | | | | | | | | | |
| Fund | | Beginning
Value as of
December 31, 2020 | | | Purchases
at Cost | | | Proceeds from Sales | | | Ending
Value as of
June 30, 2021 | | | Shares as of
June 30, 2021 | | | Dividend
Income | |
Absolute Return Tracker | | $ | 1,902,588,303 | | | $ | 852,577,485 | | | $ | (1,169,808,320 | ) | | $ | 1,585,357,468 | | | | 1,585,357,468 | | | $ | 251,511 | |
Alternative Premia | | | 24,297,724 | | | | 23,754,940 | | | | (26,850,239 | ) | | | 21,202,425 | | | | 21,202,425 | | | | 11,718 | |
Managed Futures Strategy | | | 180,241,518 | | | | 145,973,306 | | | | (155,070,048 | ) | | | 171,144,776 | | | | 171,144,776 | | | | 86,135 | |
As of June 30, 2021, the following Goldman Sachs Fund of Funds Portfolios were beneficial owners of 5% or more of total outstanding shares of the following Funds:
| | | | | | | | | | | | | | | | | | |
| Fund | | | | Goldman Sachs
Balanced
Strategy Portfolio | | | Goldman Sachs
Growth
Strategy Portfolio | | | Goldman
Sachs Growth
and Income
Strategy Portfolio | | | Goldman Sachs
Multi-strategy
Alternative Portfolio | |
Alternative Premia | | | | | 30 | % | | | — | % | | | 25 | % | | | 8 | % |
Managed Futures Strategy | | | | | 6 | | | | 5 | | | | 9 | | | | — | |
As of June 30, 2021, The Goldman Sachs Group, Inc. was the beneficial owner of the following Funds:
| | | | | | | | | | |
| Fund | | | | Class R | | | Class P | |
Alternative Premia | | | | | 100 | % | | | 73 | % |
Managed Futures Strategy | | | | | — | | | | 100 | |
91
GOLDMAN SACHS ALTERNATIVE FUNDS
Notes to Financial Statements (continued)
June 30, 2021 (Unaudited)
��
|
| 6. PORTFOLIO SECURITIES TRANSACTIONS |
The cost of purchases and proceeds from sales and maturities of long-term securities for the six months ended June 30, 2021, were as follows:
| | | | | | | | | | |
| Fund | | | | Purchases | | | Sales and Maturities | |
Absolute Return Tracker | | | | $ | 1,487,959,488 | | | $ | 1,167,099,714 | |
Pursuant to exemptive relief granted by the Securities and Exchange Commission (“SEC”) and the terms and conditions contained therein, the Absolute Return Tracker Fund may lend its securities through a securities lending agent, Goldman Sachs Agency Lending (“GSAL”), a wholly-owned subsidiary of Goldman Sachs, to certain qualified borrowers including Goldman Sachs and affiliates. In accordance with the Fund’s securities lending procedures, the Fund receives cash collateral at least equal to the market value of the securities on loan. The market value of the loaned securities is determined at the close of business of the Fund, at their last sale price or official closing price on the principal exchange or system on which they are traded, and any additional required collateral is delivered to the Fund on the next business day. As with other extensions of credit, the Fund may experience delay in the recovery of its securities or incur a loss should the borrower of the securities breach its agreement with the Fund or become insolvent at a time when the collateral is insufficient to cover the cost of repurchasing securities on loan. Dividend income received from securities on loan may not be subject to withholding taxes and therefore withholding taxes paid may differ from the amounts listed in the Consolidated Statements of Operations. Loans of securities are terminable at any time and as such 1) the remaining contractual maturities of the outstanding securities lending transactions are considered to be overnight and continuous and 2) the borrower, after notice, is required to return borrowed securities within the standard time period for settlement of securities transactions.
The Absolute Return Tracker Fund invests the cash collateral received in connection with securities lending transactions in the Goldman Sachs Financial Square Government Fund (“Government Money Market Fund”), an affiliated series of the Goldman Sachs Trust. The Government Money Market Fund is registered under the Act as an open end investment company, is subject to Rule 2a-7 under the Act, and is managed by GSAM, for which GSAM may receive a management fee of up to 0.16% on an annualized basis of the average daily net assets of the Government Money Market Fund.
In the event of a default by a borrower with respect to any loan, GSAL will exercise any and all remedies provided under the applicable borrower agreement to make the Fund whole. These remedies include purchasing replacement securities by applying the collateral held from the defaulting broker against the purchase cost of the replacement securities. If GSAL is unable to purchase replacement securities, GSAL will indemnify the Fund by paying the Fund an amount equal to the market value of the securities loaned minus the value of cash collateral received from the borrower for the loan, subject to an exclusion for any shortfalls resulting from a loss of value in such cash collateral due to reinvestment risk. The Fund’s master netting agreements with certain borrowers provide the right, in the event of a default (including bankruptcy or insolvency), for the non-defaulting party to liquidate the collateral and calculate net exposure to the defaulting party or request additional collateral. However, in the event of a default by a borrower, a resolution authority could determine that such rights are not enforceable due to the restrictions or prohibitions against the right of set-off that may be imposed in accordance with a particular jurisdiction’s bankruptcy or insolvency laws. The Fund’s loaned securities were all subject to enforceable Securities Lending Agreements and the value of the collateral was at least equal to the value of the cash received. The amounts of the Fund’s overnight and continuous agreements, which represent the gross amounts of recognized liabilities for securities lending transactions outstanding as of June 30, 2021, are disclosed as “Payable upon return of securities loaned” on the Consolidated Statements of Assets and Liabilities, where applicable.
Both the Absolute Return Tracker Fund and GSAL received compensation relating to the lending of the Fund’s securities. The amounts earned, if any, by the Fund for the six months ended June 30, 2021, are reported under Investment Income on the Consolidated Statements of Operations.
92
GOLDMAN SACHS ALTERNATIVE FUNDS
|
| 7. SECURITIES LENDING (continued) |
The table below details securities lending activity with affiliates of Goldman Sachs:
| | | | | | | | | | | | | | |
| | | | | For the six months ended June 30, 2021 | | | Amount Payable to
Goldman Sachs
Upon Return of
Securities Loaned as of
June 30, 2021 | |
| Fund | | | | Earnings of GSAL
Relating to
Securities
Loaned | | | Amount Received
by the Fund
from Lending to
Goldman Sachs | |
Absolute Return Tracker | | | | $ | 8,815 | | | $ | 2,466 | | | $ | 15,269,300 | |
The following table provides information about the Fund’s investment in the Government Money Market Fund for the six months ended June 30, 2021:
| | | | | | | | | | | | | | | | | | |
| Fund | | | | Beginning
Value as of
December 31, 2020 | | | Purchases
at Cost | | | Proceeds
from Sales | | | Ending
Value as of
June 30, 2021 | |
Absolute Return Tracker | | | | $ | 2,117,550 | | | $ | 463,308,488 | | | $ | (387,647,332 | ) | | $ | 77,778,706 | |
As of the Funds’ most recent fiscal year end, December 31, 2020, the Funds’ capital loss carryforwards and certain timing differences, on a tax-basis were as follows:
| | | | | | | | | | | | |
| | | Absolute Return
Tracker | | | Alternative
Premia | | | Managed
Futures
Strategy | |
Capital loss carryforwards: | | | | | | | | | | | | |
Perpetual Short-term | | $ | — | | | $ | (3,250,720 | ) | | $ | — | |
Perpetual Long-term | | | — | | | | (1,086,453 | ) | | | — | |
Total capital loss carryforwards | | $ | — | | | $ | (4,337,173 | ) | | $ | — | |
Timing differences (Qualified Late year Loss Deferral, Real Estate Investment Trusts and Straddle Loss Deferral) | | $ | (144,264,466 | ) | | $ | (759,742 | ) | | $ | (212,258 | ) |
As of June 30, 2021, the Funds’ aggregate security unrealized gains and losses based on cost for U.S. federal income tax purposes were as follows:
| | | | | | | | | | | | |
| | | Absolute Return
Tracker | | | Alternative
Premia | | | Managed
Futures
Strategy | |
Tax cost | | $ | 3,222,466,710 | | | $ | 21,710,422 | | | $ | 174,429,415 | |
Gross unrealized gain | | | 298,888,537 | | | | 3,314,603 | | | | 8,063,391 | |
Gross unrealized loss | | | (41,706,911 | ) | | | (3,822,600 | ) | | | (11,348,030 | ) |
Net unrealized gain (loss) | | $ | 257,181,626 | | | $ | (507,997 | ) | | $ | (3,284,639 | ) |
The difference between GAAP-basis and tax-basis unrealized gains (losses) is attributable primarily to wash sales, net mark to market gains (losses) on regulated futures, options and foreign currency contracts, and differences related to the tax treatment of swap transactions, underlying fund investments and passive foreign investment company investments.
93
GOLDMAN SACHS ALTERNATIVE FUNDS
Notes to Financial Statements (continued)
June 30, 2021 (Unaudited)
|
| 8. TAX INFORMATION (continued) |
GSAM has reviewed the Funds’ tax positions for all open tax years (the current and prior three years, as applicable) and has concluded that no provision for income tax is required in the Funds’ financial statements. Such open tax years remain subject to examination and adjustment by tax authorities.
The Funds’ risks include, but are not limited to, the following:
Derivatives Risk — The Funds’ use of derivatives may result in loss. Derivative instruments, which may pose risks in addition to and greater than those associated with investing directly in securities, currencies or other instruments, may be illiquid or less liquid, volatile, difficult to price and leveraged so that small changes in the value of the underlying instruments may produce disproportionate losses to the Funds. Derivatives are also subject to counterparty risk, which is the risk that the other party in the transaction will not fulfill its contractual obligation. The use of derivatives is a highly specialized activity that involves investment techniques and risks different from those associated with investments in more traditional securities and instruments. Losses from derivatives can also result from a lack of correlation between changes in the value of derivative instruments and the portfolio assets (if any) being hedged.
Foreign and Emerging Countries Risk — Investing in foreign markets may involve special risks and considerations not typically associated with investing in the U.S. Foreign securities may be subject to risk of loss because of more or less foreign government regulation, less public information and less economic, political and social stability in the countries in which a Fund invests. The imposition of exchange controls (including repatriation restrictions), confiscation of assets and property, trade restrictions (including tariffs) and other government restrictions by the U.S. or other governments, or problems with registration, settlement or custody, may also result in losses. Foreign risk also involves the risk of negative foreign currency rate fluctuations, which may cause the value of securities denominated in such foreign currency (or other instruments through which a Fund has exposure to foreign currencies) to decline in value. Currency exchange rates may fluctuate significantly over short periods of time. To the extent that a Fund also invests in securities of issuers located in emerging markets, these risks may be more pronounced.
Foreign Custody Risk — A Fund invests in foreign securities, and as such the Fund may hold such securities and cash with foreign banks, agents, and securities depositories appointed by the Fund’s custodian (each a “Foreign Custodian”). Some foreign custodians may be recently organized or new to the foreign custody business. In some countries, Foreign Custodians may be subject to little or no regulatory oversight over, or independent evaluation of, their operations. Further, the laws of certain countries may place limitations on a Fund’s ability to recover its assets if a Foreign Custodian enters bankruptcy. Investments in emerging markets may be subject to even greater custody risks than investments in more developed markets. Custody services in emerging market countries are very often undeveloped and may be considerably less well regulated than in more developed countries, and thus may not afford the same level of investor protection as would apply in developed countries.
Interest Rate Risk — When interest rates increase, fixed income securities or instruments held by a Fund will generally decline in value. Long-term fixed income securities or instruments will normally have more price volatility because of this risk than short-term fixed income securities or instruments. The risks associated with changing interest rates may have unpredictable effects on the markets and a Fund’s investments. Fluctuations in interest rates may also affect the liquidity of fixed income securities and instruments held by the Funds.
Investments in Other Investment Companies Risk — As a shareholder of another investment company, including an exchange-traded fund (“ETF”), a Fund will indirectly bear its proportionate share of any net management fees and other expenses paid by such other investment companies, in addition to the fees and expenses regularly borne by the Fund. ETFs are subject to risks that do not apply to conventional mutual funds, including but not limited to the following: (i) the market price of the ETF’s shares may trade at a premium or a discount to their NAV; and (ii) an active trading market for an ETF’s shares may not develop or be maintained.
94
GOLDMAN SACHS ALTERNATIVE FUNDS
|
| 9. OTHER RISKS (continued) |
Large Shareholder Transactions Risk — A Fund may experience adverse effects when certain large shareholders, such as other funds, institutional investors (including those trading by use of non-discretionary mathematical formulas), financial intermediaries (who may make investment decisions on behalf of underlying clients and/or include a Fund in their investment model), individuals, accounts and Goldman Sachs affiliates, purchase or redeem large amounts of shares of a Fund. Such large shareholder redemptions, which may occur rapidly or unexpectedly, may cause a Fund to sell portfolio securities at times when it would not otherwise do so, which may negatively impact a Fund’s NAV and liquidity. These transactions may also accelerate the realization of taxable income to shareholders if such sales of investments resulted in gains, and may also increase transaction costs. In addition, a large redemption could result in a Fund’s current expenses being allocated over a smaller asset base, leading to an increase in the Fund’s expense ratio. Similarly, large Fund share purchases may adversely affect a Fund’s performance to the extent that the Fund is delayed in investing new cash or otherwise maintains a larger cash position than it ordinarily would.
Liquidity Risk — A Fund may make investments that are illiquid or that may become less liquid in response to market developments or adverse investor perceptions. Illiquid investments may be more difficult to value. Liquidity risk may also refer to the risk that a Fund will not be able to pay redemption proceeds within the allowable time period or without significant dilution to remaining investors’ interests because of unusual market conditions, an unusually high volume of redemption requests, or other reasons. To meet redemption requests, a Fund may be forced to sell investments at an unfavorable time and/or under unfavorable conditions. If a Fund is forced to sell securities at an unfavorable time and/or under unfavorable conditions, such sales may adversely affect the Fund’s NAV and dilute remaining investors’ interests. These risks may be more pronounced in connection with a Fund’s investments in securities of issuers located in emerging market countries. Redemptions by large shareholders may have a negative impact on a Fund’s liquidity.
Market and Credit Risks — In the normal course of business, a Fund trades financial instruments and enters into financial transactions where risk of potential loss exists due to changes in the market (market risk). The value of the securities in which a Fund invests may go up or down in response to the prospects of individual companies, particular sectors or governments and/or general economic conditions throughout the world due to increasingly interconnected global economies and financial markets. Events such as war, acts of terrorism, social unrest, natural disasters, the spread of infectious illness or other public health threats could also significantly impact a Fund and its investments. Additionally, a Fund may also be exposed to credit risk in the event that an issuer or guarantor fails to perform or that an institution or entity with which the Fund has unsettled or open transactions defaults.
Tax Risk — Historically, the Internal Revenue Service (“IRS”) issued private letter rulings (“PLRs”) in which the IRS specifically concluded that income and gains from investments in commodity index-linked structured notes (the “Notes Rulings”) or a wholly-owned foreign subsidiary that invests in commodity-linked instruments are “qualifying income” for purposes of compliance with Subchapter M of the Code. The IRS has issued such PLRs to the Absolute Return Tracker and Alternative Premia Funds. Based on such rulings, these Funds may seek to gain exposure to the commodity markets through investments in commodity-linked notes and/or subsidiaries. The Managed Futures Strategy Fund has not received a PLR, and is not able to rely on PLRs issued to other taxpayers. The IRS recently issued final regulations that would generally treat the Funds’ income inclusion with respect to a subsidiary as qualifying income either if (A) there is a distribution out of the earnings and profits of a subsidiary that are attributable to such income inclusion, or (B) such inclusion is derived with respect to the Funds’ business of investing in stock, securities, or currencies.
The IRS also issued a revenue procedure, which states that the IRS will not in the future issue PLRs that would require a determination of whether an asset (such as a commodity index-linked note) is a “security” under the Investment Company Act of 1940. In connection with issuing such revenue procedure, the IRS has revoked the Notes Ruling on a prospective basis. In light of the revocation of the Notes Rulings, the Funds have limited their investments in commodity index-linked structured notes. The Managed Futures Strategy Fund has obtained an opinion of counsel that the Fund’s income from such investments should constitute “qualifying income.” However, no assurances can be provided that the IRS would not be able to successfully assert that the income from investments in the Subsidiary was not “qualifying income”, in which case the Fund would fail to qualify as a regulated investment company (“RIC”) under Subchapter M of the Code if over 10% of its gross income were derived from these investments. If a Fund failed to qualify as a RIC, it would be subject to federal and state income tax on all of its taxable income at regular corporate tax rates. This would significantly adversely affect the returns to, and could cause substantial losses for, Fund shareholders.
95
GOLDMAN SACHS ALTERNATIVE FUNDS
Notes to Financial Statements (continued)
June 30, 2021 (Unaudited)
Under the Trust’s organizational documents, its Trustees, officers, employees and agents are indemnified, to the extent permitted by the Act and state law, against certain liabilities that may arise out of performance of their duties to the Funds. Additionally, in the course of business, the Funds enter into contracts that contain a variety of indemnification clauses. The Funds’ maximum exposure under these arrangements is unknown, as this would involve future claims that may be made against the Funds that have not yet occurred. However, GSAM believes the risk of loss under these arrangements to be remote.
Subsequent events after the Consolidated Statements of Assets and Liabilities date have been evaluated, and GSAM has concluded that there is no impact requiring adjustment or disclosure in the financial statements.
96
GOLDMAN SACHS ALTERNATIVE FUNDS
|
| 12. SUMMARY OF SHARE TRANSACTIONS |
Share activity is as follows:
| | | | | | | | | | | | | | | | |
| | | Absolute Return Tracker Fund | |
| | | | |
| | | For the Six Months Ended
June 30, 2021
(Unaudited) | | | For the Fiscal Year Ended
December 31, 2020 | |
| | | | |
| | | Shares | | | Dollars | | | Shares | | | Dollars | |
| | | | |
| Class A Shares | | | | | | | | | | | | | | | | |
Shares sold | | | 944,642 | | | $ | 9,369,999 | | | | 2,774,357 | | | $ | 25,185,750 | |
Reinvestment of distributions | | | — | | | | — | | | | 35,723 | | | | 341,674 | |
Shares redeemed | | | (1,260,616 | ) | | | (12,518,253 | ) | | | (4,982,130 | ) | | | (45,622,852 | ) |
| | | | (315,974 | ) | | | (3,148,254 | ) | | | (2,172,050 | ) | | | (20,095,428 | ) |
| Class C Shares | | | | | | | | | | | | | | | | |
Shares sold | | | 50,482 | | | | 456,813 | | | | 223,442 | | | | 1,841,170 | |
Reinvestment of distributions | | | — | | | | — | | | | 6,102 | | | | 53,316 | |
Shares redeemed | | | (249,163 | ) | | | (2,247,225 | ) | | | (953,536 | ) | | | (7,868,021 | ) |
| | | | (198,681 | ) | | | (1,790,412 | ) | | | (723,992 | ) | | | (5,973,535 | ) |
| Institutional Shares | | | | | | | | | | | | | | | | |
Shares sold | | | 52,248,884 | | | | 539,679,172 | | | | 127,122,072 | | | | 1,197,771,733 | |
Reinvestment of distributions | | | — | | | | — | | | | 1,247,946 | | | | 12,357,361 | |
Shares redeemed | | | (53,418,611 | ) | | | (547,352,791 | ) | | | (129,284,677 | ) | | | (1,193,182,095 | ) |
| | | | (1,169,727 | ) | | | (7,673,619 | ) | | | (914,659 | ) | | | 16,946,999 | |
| Investor Shares | | | | | | | | | | | | | | | | |
Shares sold | | | 4,118,149 | | | | 41,979,566 | | | | 15,229,502 | | | | 142,879,584 | |
Reinvestment of distributions | | | — | | | | — | | | | 154,614 | | | | 1,515,394 | |
Shares redeemed | | | (7,074,704 | ) | | | (71,866,464 | ) | | | (28,969,064 | ) | | | (267,111,009 | ) |
| | | | (2,956,555 | ) | | | (29,886,898 | ) | | | (13,584,948 | ) | | | (122,716,031 | ) |
| Class R6 Shares | | | | | | | | | | | | | | | | |
Shares sold | | | 953,725 | | | | 9,686,834 | | | | 292,940 | | | | 2,776,639 | |
Reinvestment of distributions | | | — | | | | — | | | | 5,700 | | | | 56,384 | |
Shares redeemed | | | (156,516 | ) | | | (1,619,998 | ) | | | (319,576 | ) | | | (2,960,447 | ) |
| | | | 797,209 | | | | 8,066,836 | | | | (20,936 | ) | | | (127,424 | ) |
| Class R Shares | | | | | | | | | | | | | | | | |
Shares sold | | | 24,989 | | | | 241,923 | | | | 34,948 | | | | 307,594 | |
Reinvestment of distributions | | | — | | | | — | | | | 1,081 | | | | 10,038 | |
Shares redeemed | | | (32,029 | ) | | | (311,828 | ) | | | (125,366 | ) | | | (1,122,374 | ) |
| | | | (7,040 | ) | | | (69,905 | ) | | | (89,337 | ) | | | (804,742 | ) |
| Class P Shares | | | | | | | | | | | | | | | | |
Shares sold | | | 2,526,480 | | | | 25,976,158 | | | | 4,299,285 | | | | 40,980,573 | |
Reinvestment of distributions | | | — | | | | — | | | | 129,063 | | | | 1,277,883 | |
Shares redeemed | | | (2,665,984 | ) | | | (27,273,903 | ) | | | (5,876,922 | ) | | | (54,147,725 | ) |
| | | | (139,504 | ) | | | (1,297,745 | ) | | | (1,448,574 | ) | | | (11,889,269 | ) |
| | | | |
NET DECREASE | | | (3,990,272 | ) | | $ | (35,799,997 | ) | | | (18,954,496 | ) | | $ | (144,659,430 | ) |
97
GOLDMAN SACHS ALTERNATIVE FUNDS
Notes to Financial Statements (continued)
June 30, 2021 (Unaudited)
|
| 12. SUMMARY OF SHARE TRANSACTIONS (continued) |
Share activity is as follows:
| | | | | | | | | | | | | | | | |
| | | Alternative Premia Fund | |
| | | | |
| | | For the Six Months Ended
June 30, 2021
(Unaudited) | | | For the Fiscal Year Ended
December 31, 2020 | |
| | | | |
| | | Shares | | | Dollars | | | Shares | | | Dollars | |
| | | | |
| Class A Shares | | | | | | | | | | | | | | | | |
Shares sold | | | 219,216 | | | $ | 1,453,439 | | | | 110,964 | | | $ | 827,956 | |
Reinvestment of distributions | | | — | | | | — | | | | 57,228 | | | | 384,570 | |
Shares redeemed | | | (120,540 | ) | | | (803,546 | ) | | | (339,135 | ) | | | (2,579,777 | ) |
| | | | 98,676 | | | | 649,893 | | | | (170,943 | ) | | | (1,367,251 | ) |
| Class C Shares | | | | | | | | | | | | | | | | |
Shares sold | | | 1,326 | | | | 8,285 | | | | 2,828 | | | | 19,634 | |
Reinvestment of distributions | | | — | | | | — | | | | 12,992 | | | | 81,979 | |
Shares redeemed | | | (236,746 | ) | | | (1,473,359 | ) | | | (307,511 | ) | | | (2,163,535 | ) |
| | | | (235,420 | ) | | | (1,465,074 | ) | | | (291,691 | ) | | | (2,061,922 | ) |
| Institutional Shares | | | | | | | | | | | | | | | | |
Shares sold | | | 41,551 | | | | 287,276 | | | | 74,881 | | | | 601,607 | |
Reinvestment of distributions | | | — | | | | — | | | | 48,559 | | | | 335,547 | |
Shares redeemed | | | (154,048 | ) | | | (1,047,990 | ) | | | (1,043,082 | ) | | | (8,036,220 | ) |
| | | | (112,497 | ) | | | (760,714 | ) | | | (919,642 | ) | | | (7,099,066 | ) |
| Investor Shares | | | | | | | | | | | | | | | | |
Shares sold | | | 40,102 | | | | 273,550 | | | | 14,245 | | | | 112,109 | |
Reinvestment of distributions | | | — | | | | — | | | | 21,222 | | | | 145,793 | |
Shares redeemed | | | (84,277 | ) | | | (573,466 | ) | | | (212,846 | ) | | | (1,659,229 | ) |
| | | | (44,175 | ) | | | (299,916 | ) | | | (177,379 | ) | | | (1,401,327 | ) |
| Class R6 Shares | | | | | | | | | | | | | | | | |
Shares sold | | | 232,299 | | | | 1,600,000 | | | | 632,947 | | | | 4,920,000 | |
Reinvestment of distributions | | | — | | | | — | | | | 210,733 | | | | 1,451,948 | |
Shares redeemed | | | — | | | | (373 | ) | | | (724,767 | ) | | | (5,645,935 | ) |
| | | | 232,299 | | | | 1,599,627 | | | | 118,913 | | | | 726,013 | |
| Class R Shares | | | | | | | | | | | | | | | | |
Shares sold | | | — | | | | — | | | | 5,840 | | | | 43,913 | |
Reinvestment of distributions | | | — | | | | — | | | | 179 | | | | 1,195 | |
Shares redeemed | | | (1,823 | ) | | | (12,160 | ) | | | (9,277 | ) | | | (69,185 | ) |
| | | | (1,823 | ) | | | (12,160 | ) | | | (3,258 | ) | | | (24,077 | ) |
| Class P Shares | | | | | | | | | | | | | | | | |
Reinvestment of distributions | | | — | | | | — | | | | 130 | | | | 891 | |
| | | | — | | | | — | | | | 130 | | | | 891 | |
| | | | |
NET DECREASE | | | (62,940 | ) | | $ | (288,344 | ) | | | (1,443,870 | ) | | $ | (11,226,739 | ) |
98
GOLDMAN SACHS ALTERNATIVE FUNDS
|
| 12. SUMMARY OF SHARE TRANSACTIONS (continued) |
Share activity is as follows:
| | | | | | | | | | | | | | | | |
| | | Managed Futures Strategy Fund | |
| | | | |
| | | For the Six Months Ended
June 30, 2021
(Unaudited) | | | For the Fiscal Year Ended
December 31, 2020 | |
| | | | |
| | | Shares | | | Dollars | | | Shares | | | Dollars | |
| | | | |
| Class A Shares | | | | | | | | | | | | | | | | |
Shares sold | | | 329,151 | | | $ | 3,436,643 | | | | 812,401 | | | $ | 7,889,565 | |
Reinvestment of distributions | | | — | | | | — | | | | 14,242 | | | | 141,564 | |
Shares redeemed | | | (141,597 | ) | | | (1,482,319 | ) | | | (446,837 | ) | | | (4,371,545 | ) |
| | | | 187,554 | | | | 1,954,324 | | | | 379,806 | | | | 3,659,584 | |
| Class C Shares | | | | | | | | | | | | | | | | |
Shares sold | | | 48,296 | | | | 474,904 | | | | 80,724 | | | | 740,636 | |
Reinvestment of distributions | | | — | | | | — | | | | 4,607 | | | | 43,078 | |
Shares redeemed | | | (27,156 | ) | | | (267,380 | ) | | | (94,581 | ) | | | (867,923 | ) |
| | | | 21,140 | | | | 207,524 | | | | (9,250 | ) | | | (84,209 | ) |
| Institutional Shares | | | | | | | | | | | | | | | | |
Shares sold | | | 922,170 | | | | 9,933,908 | | | | 7,705,607 | | | | 78,017,186 | |
Reinvestment of distributions | | | — | | | | — | | | | 54,914 | | | | 562,864 | |
Shares redeemed | | | (686,998 | ) | | | (7,427,589 | ) | | | (12,242,752 | ) | | | (121,705,770 | ) |
| | | | 235,172 | | | | 2,506,319 | | | | (4,482,231 | ) | | | (43,125,720 | ) |
| Investor Shares | | | | | | | | | | | | | | | | |
Shares sold | | | 2,768,268 | | | | 29,352,761 | | | | 10,524,025 | | | | 104,023,405 | |
Reinvestment of distributions | | | — | | | | — | | | | 180,402 | | | | 1,829,272 | |
Shares redeemed | | | (4,735,043 | ) | | | (50,138,749 | ) | | | (7,135,351 | ) | | | (70,727,988 | ) |
| | | | (1,966,775 | ) | | | (20,785,988 | ) | | | 3,569,076 | | | | 35,124,689 | |
| Class R6 Shares | | | | | | | | | | | | | | | | |
Shares sold | | | 9,968 | | | | 107,213 | | | | 44,949 | | | | 473,048 | |
Reinvestment of distributions | | | — | | | | — | | | | 64,245 | | | | 659,155 | |
Shares redeemed | | | (54,135 | ) | | | (590,003 | ) | | | (14,423 | ) | | | (150,000 | ) |
| | | | (44,167 | ) | | | (482,790 | ) | | | 94,771 | | | | 982,203 | |
| Class R Shares | | | | | | | | | | | | | | | | |
Shares sold | | | 2,410 | | | | 24,693 | | | | 11,297 | | | | 107,460 | |
Reinvestment of distributions | | | — | | | | — | | | | 698 | | | | 6,810 | |
Shares redeemed | | | (10,324 | ) | | | (104,379 | ) | | | (18,242 | ) | | | (179,559 | ) |
| | | | (7,914 | ) | | | (79,686 | ) | | | (6,247 | ) | | | (65,289 | ) |
| Class P Shares | | | | | | | | | | | | | | | | |
Shares sold | | | — | | | | — | | | | 13,089 | | | | 132,116 | |
Reinvestment of distributions | | | — | | | | — | | | | 82 | | | | 842 | |
Shares redeemed | | | (5,772 | ) | | | (61,235 | ) | | | (23,158 | ) | | | (233,070 | ) |
| | | | (5,772 | ) | | | (61,235 | ) | | | (9,987 | ) | | | (100,112 | ) |
| | | | |
NET DECREASE | | | (1,580,762 | ) | | $ | (16,741,532 | ) | | | (464,062 | ) | | $ | (3,608,854 | ) |
99
GOLDMAN SACHS ALTERNATIVE FUNDS
Liquidity Risk Management Program (Unaudited)
Each Fund has adopted and implemented a liquidity risk management program (the “Program”) in accordance with Rule 22e-4 under the 1940 Act. The Program seeks to assess and manage each Fund’s liquidity risk, i.e., the risk that a Fund is unable to satisfy redemption requests without significantly diluting remaining investors’ interests in the Fund. The Board of Trustees of the Trust has designated GSAM, each Fund’s investment adviser, to administer the Program. Certain aspects of the Program rely on third parties to perform certain functions, including the provision of market data and application of models.
The Program is comprised of various components designed to support the assessment and/or management of liquidity risk, including: (1) the periodic assessment (no less frequently than annually) of certain factors that influence a Fund’s liquidity risk; (2) the periodic classification (no less frequently than monthly) of a Fund’s investments into one of four liquidity categories that reflect an estimate of their liquidity under current market conditions; (3) a 15% limit on the acquisition of “illiquid investments” (as defined under Rule 22e-4); (4) for a Fund that does not invest primarily in “highly liquid investments” (as defined under Rule 22e-4), the determination of a minimum percentage of the Fund’s assets that will generally be invested in highly liquid investments (a “Highly Liquid Investment Minimum”); and (5) periodic reporting to the Board of Trustees.
At a meeting of the Board of Trustees on February 9-10, 2021, GSAM provided a written report to the Board addressing the operation, and the adequacy and effectiveness of the implementation, of the Program, including, as applicable, the operation of any Highly Liquid Investment Minimum and any material changes to the Program, for the period from January 1, 2020 through December 31, 2020 (the “Reporting Period”). Among other things, the annual report and related materials discussed: (1) the results of stress tests designed to assess liquidity under a hypothetical stressed scenario involving elevated redemptions; (2) an assessment of the methodologies used to classify investments into one of four liquidity categories; and (3) the impact of the COVID-19 pandemic on liquidity and management of liquidity risk during the Reporting Period, including during stressed market conditions caused by the COVID-19 pandemic. The report concluded that the Program continues to be reasonably designed to assess and manage liquidity risk and was adequately and effectively implemented during the Reporting Period.
There can be no assurance that the Program will achieve its objectives under all circumstances in the future. Please refer to your Fund’s prospectus for more information regarding the Fund’s exposure to liquidity risk and other risks to which it may be subject.
100
GOLDMAN SACHS ALTERNATIVE FUNDS
Fund Expenses — Six Month Period Ended June 30, 2021 (Unaudited)
As a shareholder of Class A, Class C, Institutional, Investor, Class R6, Class R or Class P Shares of a Fund you incur two types of costs: (1) transaction costs, including sales charges on purchase payments (with respect to Class A Shares) and contingent deferred sales charges on redemptions (with respect to Class C Shares); and (2) ongoing costs, including management fees; distribution and/or service (12b-1) fees (with respect to Class A, Class C and Class R Shares); and other Fund expenses. This example is intended to help you understand your ongoing costs (in dollars) of investing in Class A, Class C, Institutional, Investor, Class R6, Class R and Class P Shares of the Funds and to compare these costs with the ongoing costs of investing in other mutual funds.
The example is based on an investment of $1,000 invested at the beginning of the period and held for the entire period from January 1, 2021 through June 30, 2021, which represents a period of 181 days of a 365 day year.
Actual Expenses — The first line under each share class in the table below provides information about actual account values and actual expenses. You may use the information in this line, together with the amount you invested, to estimate the expenses that you paid over the period. Simply divide your account value by $1,000 (for example, an $8,600 account value divided by $1,000=8.6), then multiply the result by the number in the first line under the heading entitled “Expenses Paid” to estimate the expenses you paid on your account during this period.
Hypothetical Example for Comparison Purposes — The second line under each share class in the table below provides information about hypothetical account values and hypothetical expenses based on the Funds’ actual net expense ratio and an assumed rate of return of 5% per year before expenses, which is not the Funds’ actual return. The hypothetical account values and expenses may not be used to estimate the actual ending account balance or expenses you paid for the period. You may use this information to compare the ongoing costs of investing in the Funds and other funds. To do so, compare this 5% hypothetical example with the 5% hypothetical examples that appear in the shareholder reports of the other funds.
Please note that the expenses shown in the table are meant to highlight your ongoing costs only and do not reflect any transactional costs, such as sales charges, redemption fees, or exchange fees. Therefore, the second line of the table is useful in comparing ongoing costs only, and will not help you determine the relative total costs of owning different funds. In addition, if these transactional costs were included, your costs would have been higher.
| | | | | | | | | | | | | | | | | | | | | | | | | | | | | | | | | | | | |
| | | Absolute Return Tracker Fund | | | Alternative Premia Fund | | | Managed Futures Strategy Fund | |
| Share Class | | Beginning
Account Value
01/01/21 | | | Ending
Account Value
06/30/21 | | | Expenses
Paid for the
6 Months Ended
06/30/21* | | | Beginning
Account Value
01/01/21 | | | Ending
Account Value
06/30/21 | | | Expenses
Paid for the
6 Months Ended
06/30/21* | | | Beginning
Account Value
01/01/21 | | | Ending
Account Value
06/30/21 | | | Expenses
Paid for the
6 Months Ended
06/30/21* | |
| | | | | | | | | | |
| Class A | | | | | | | | | | | | | | | | | | | | | | | | | | | | | | | | | | | | |
Actual | | $ | 1,000 | | | $ | 1,049.50 | | | $ | 5.28 | | | $ | 1,000 | | | $ | 1,017.80 | | | $ | 6.45 | | | $ | 1,000 | | | $ | 1,034.60 | | | $ | 7.92 | |
Hypothetical 5% return | | | 1,000 | | | | 1,019.64 | + | | | 5.21 | | | | 1,000 | | | | 1,018.40 | + | | | 6.46 | | | | 1,000 | | | | 1,017.01 | + | | | 7.85 | |
| Class C | | | | | | | | | | | | | | | | | | | | | | | | | | | | | | | | | | | | |
Actual | | | 1,000 | | | | 1,046.40 | | | | 9.08 | | | | 1,000 | | | | 1,012.60 | | | | 10.08 | | | | 1,000 | | | | 1,029.40 | | | | 11.67 | |
Hypothetical 5% return | | | 1,000 | | | | 1,015.92 | + | | | 8.95 | | | | 1,000 | | | | 1,014.78 | + | | | 10.09 | | | | 1,000 | | | | 1,013.29 | + | | | 11.58 | |
| Institutional | | | | | | | | | | | | | | | | | | | | | | | | | | | | | | | | | | | | |
Actual | | | 1,000 | | | | 1,051.80 | | | | 3.41 | | | | 1,000 | | | | 1,018.80 | | | | 4.61 | | | | 1,000 | | | | 1,036.40 | | | | 6.06 | |
Hypothetical 5% return | | | 1,000 | | | | 1,021.47 | + | | | 3.36 | | | | 1,000 | | | | 1,020.23 | + | | | 4.61 | | | | 1,000 | | | | 1,018.84 | + | | | 6.01 | |
| Investor | | | | | | | | | | | | | | | | | | | | | | | | | | | | | | | | | | | | |
Actual | | | 1,000 | | | | 1,051.40 | | | | 4.02 | | | | 1,000 | | | | 1,017.40 | | | | 5.20 | | | | 1,000 | | | | 1,034.90 | | | | 6.66 | |
Hypothetical 5% return | | | 1,000 | | | | 1,020.88 | + | | | 3.96 | | | | 1,000 | | | | 1,019.64 | + | | | 5.21 | | | | 1,000 | | | | 1,018.25 | + | | | 6.61 | |
| Class R6 | | | | | | | | | | | | | | | | | | | | | | | | | | | | | | | | | | | | |
Actual | | | 1,000 | | | | 1,051.90 | | | | 3.41 | | | | 1,000 | | | | 1,020.30 | | | | 4.56 | | | | 1,000 | | | | 1,036.40 | | | | 6.01 | |
Hypothetical 5% return | | | 1,000 | | | | 1,021.47 | + | | | 3.36 | | | | 1,000 | | | | 1,020.28 | + | | | 4.56 | | | | 1,000 | | | | 1,018.89 | + | | | 5.96 | |
| Class R | | | | | | | | | | | | | | | | | | | | | | | | | | | | | | | | | | | | |
Actual | | | 1,000 | | | | 1,047.90 | | | | 6.55 | | | | 1,000 | | | | 1,016.50 | | | | 7.70 | | | | 1,000 | | | | 1,032.30 | | | | 9.17 | |
Hypothetical 5% return | | | 1,000 | | | | 1,018.40 | + | | | 6.46 | | | | 1,000 | | | | 1,017.16 | + | | | 7.70 | | | | 1,000 | | | | 1,015.77 | + | | | 9.10 | |
| Class P | | | | | | | | | | | | | | | | | | | | | | | | | | | | | | | | | | | | |
Actual | | | 1,000 | | | | 1,052.90 | | | | 3.36 | | | | 1,000 | | | | 1,020.30 | | | | 4.51 | | | | 1,000 | | | | 1,036.50 | | | | 5.91 | |
Hypothetical 5% return | | | 1,000 | | | | 1,021.52 | + | | | 3.31 | | | | 1,000 | | | | 1,020.33 | + | | | 4.51 | | | | 1,000 | | | | 1,018.99 | + | | | 5.86 | |
| + | | Hypothetical expenses are based on each Fund’s actual annualized net expense ratios and an assumed rate of return of 5% per year before expenses. |
| * | | Expenses are calculated using each Fund’s annualized net expense ratio for each class, which represents the ongoing expenses as a percentage of net assets for the six months ended June 30, 2021. Expenses are calculated by multiplying the annualized net expense ratio by the average account value for the period; then multiplying the result by the number of days in the most recent fiscal half year; and then dividing that result by the number of days in the fiscal year. The annualized net expense ratios for the period were as follows: |
| | | | | | | | | | | | | | | | | | | | | | | | | | | | |
| Fund | | Class A | | | Class C | | | Institutional | | | Investor | | | Class R6 | | | Class R | | | Class P | |
Absolute Return Tracker | | | 1.04 | % | | | 1.79 | % | | | 0.67 | % | | | 0.79 | % | | | 0.67 | % | | | 1.29 | % | | | 0.66 | % |
Alternative Premia | | | 1.29 | | | | 2.02 | | | | 0.92 | | | | 1.04 | | | | 0.91 | | | | 1.54 | | | | 0.90 | |
Managed Futures Strategy | | | 1.57 | | | | 2.32 | | | | 1.20 | | | | 1.32 | | | | 1.19 | | | | 1.82 | | | | 1.17 | |
101
GOLDMAN SACHS ALTERNATIVE FUNDS
Statement Regarding Basis for Approval of Management Agreement (Unaudited)
Background
The Goldman Sachs Absolute Return Tracker Fund, Goldman Sachs Alternative Premia Fund, and Goldman Sachs Managed Futures Strategy Fund (the “Funds”) are investment portfolios of Goldman Sachs Trust (the “Trust”). The Board of Trustees oversees the management of the Trust and reviews the investment performance and expenses of the Funds at regularly scheduled meetings held throughout the year. In addition, the Board of Trustees determines annually whether to approve the continuance of the Trust’s investment management agreement (the “Management Agreement”) with Goldman Sachs Asset Management, L.P. (the “Investment Adviser”) on behalf of the Funds.
The Management Agreement was most recently approved for continuation until June 30, 2022 by the Board of Trustees, including those Trustees who are not parties to the Management Agreement or “interested persons” (as defined in the Investment Company Act of 1940, as amended) of any party thereto (the “Independent Trustees”), at a meeting held on June 15-16, 2021 (the “Annual Meeting”).
The review process undertaken by the Trustees spans the course of the year and culminates with the Annual Meeting. To assist the Trustees in their deliberations, the Trustees have established a Contract Review Committee (the “Committee”), comprised of the Independent Trustees. The Committee held two meetings over the course of the year since the Management Agreement was last approved. At those Committee meetings, regularly scheduled Board or other committee meetings, and/or the Annual Meeting, matters relevant to the renewal of the Management Agreement were considered by the Board, or the Independent Trustees, as applicable. With respect to each Fund, such matters included:
| | (a) | | the nature and quality of the advisory, administrative, and other services provided to the Fund by the Investment Adviser and its affiliates, including information about: |
| | (i) | | the structure, staff, and capabilities of the Investment Adviser and its portfolio management teams; |
| | (ii) | | the groups within the Investment Adviser and its affiliates that support the portfolio management teams or provide other types of necessary services, including fund services groups (e.g., accounting and financial reporting, tax, shareholder services, and operations); controls and risk management groups (e.g., legal, compliance, valuation oversight, credit risk management, internal audit, compliance testing, market risk analysis, finance, and central funding); sales and distribution support groups, and others (e.g., information technology and training); |
| | (iii) | | trends in employee headcount; |
| | (iv) | | the Investment Adviser’s financial resources and ability to hire and retain talented personnel and strengthen its operations; and |
| | (v) | | the parent company’s support of the Investment Adviser and its mutual fund business, as expressed by the firm’s senior management; |
| | (b) | | information on the investment performance of the Fund, including comparisons to the performance of similar mutual funds, as provided by a third-party mutual fund data provider engaged as part of the contract review process (the “Outside Data Provider”) and a benchmark performance index; and information on general investment outlooks in the markets in which the Fund invests; |
| | (c) | | information provided by the Investment Adviser indicating the Investment Adviser’s views on whether the Fund’s peer group and/or benchmark index had high, medium, or low relevance given the Fund’s particular investment strategy; |
| | (d) | | the terms of the Management Agreement and other agreements with affiliated service providers entered into by the Trust on behalf of the Fund; |
| | (e) | | fee and expense information for the Fund, including: |
| | (i) | | the relative management fee and expense levels of the Fund as compared to those of comparable funds managed by other advisers, as provided by the Outside Data Provider; |
| | (ii) | | the Fund’s expense trends over time; and |
| | (iii) | | to the extent the Investment Adviser manages other types of accounts (such as bank collective trusts, private wealth management accounts, institutional separate accounts, sub-advised mutual funds, and non-U.S. funds) having investment objectives and policies similar to those of the Fund, comparative information on the advisory fees charged and services provided to those accounts by the Investment Adviser; |
| | (f) | | with respect to the extensive investment performance and expense comparison data provided by the Outside Data Provider, its processes in producing that data for the Fund; |
| | (g) | | the undertakings of the Investment Adviser and its affiliates to implement fee waivers and/or expense limitations; |
| | (h) | | information relating to the profitability of the Management Agreement and the transfer agency and distribution and service arrangements of the Fund to the Investment Adviser and its affiliates; |
| | (i) | | whether the Fund’s existing management fee schedule adequately addressed any economies of scale; |
102
GOLDMAN SACHS ALTERNATIVE FUNDS
Statement Regarding Basis for Approval of Management Agreement (Unaudited) (continued)
| | (j) | | a summary of the “fall-out” benefits derived by the Investment Adviser and its affiliates from their relationships with the Fund, including the fees received by the Investment Adviser’s affiliates from the Fund for transfer agency, (with respect to the Absolute Return Tracker Fund) securities lending, portfolio trading, distribution and other services; |
| | (k) | | a summary of potential benefits derived by the Fund as a result of its relationship with the Investment Adviser; |
| | (l) | | information regarding commissions paid by the Fund and broker oversight, other information regarding portfolio trading, and how the Investment Adviser carries out its duty to seek best execution; |
| | (m) | | portfolio manager ownership of Fund shares; the manner in which portfolio manager compensation is determined; and the number and types of accounts managed by the portfolio managers; |
| | (n) | | the nature and quality of the services provided to the Fund by its unaffiliated service providers, and the Investment Adviser’s general oversight and evaluation (including reports on due diligence) of those service providers as part of the administrative services provided under the Management Agreement; and |
| | (o) | | the Investment Adviser’s processes and policies addressing various types of potential conflicts of interest; its approach to risk management; the annual review of the effectiveness of the Fund’s compliance program; and periodic compliance reports. |
The Trustees also received an overview of the Funds’ distribution arrangements. They received information regarding the Funds’ assets, share purchase and redemption activity, and payment of distribution and service fees. Information was also provided to the Trustees relating to revenue sharing payments made by and services provided by the Investment Adviser and its affiliates to intermediaries that promote the sale, distribution, and/or servicing of Fund shares. The Independent Trustees also discussed the broad range of other investment choices that are available to Fund investors, including the availability of comparable funds managed by other advisers.
The presentations made at the Board and Committee meetings and at the Annual Meeting encompassed the Funds and other mutual funds for which the Board of Trustees has responsibility. In evaluating the Management Agreement at the Annual Meeting, the Trustees relied upon their knowledge, resulting from their meetings and other interactions throughout the year, of the Investment Adviser and its affiliates, their services, and the Funds. In conjunction with these meetings, the Trustees received written materials and oral presentations on the topics covered, and the Investment Adviser addressed the questions and concerns of the Trustees, including concerns regarding the investment performance of certain of the funds they oversee. The Independent Trustees were advised by their independent legal counsel regarding their responsibilities and other regulatory requirements related to the approval and continuation of mutual fund investment management agreements under applicable law. In addition, the Investment Adviser and its affiliates provided the Independent Trustees with a written response to a formal request for information sent on behalf of the Independent Trustees by their independent legal counsel. During the course of their deliberations, the Independent Trustees met in executive sessions with their independent legal counsel, without representatives of the Investment Adviser or its affiliates present.
Nature, Extent, and Quality of the Services Provided Under the Management Agreement
As part of their review, the Trustees considered the nature, extent, and quality of the services provided to the Funds by the Investment Adviser. In this regard, the Trustees considered both the investment advisory services and non-advisory services that are provided by the Investment Adviser and its affiliates. The Trustees noted the transition in the leadership and changes in personnel of various of the Investment Adviser’s portfolio management teams that had occurred in recent periods, and the ongoing recruitment efforts aimed at bringing high quality investment talent to the Investment Adviser. They also noted the Investment Adviser’s commitment to maintaining high quality systems and expending substantial resources to respond to ongoing changes to the market, regulatory and control environment in which the Funds and their service providers operate, including changes associated with the COVID-19 pandemic, as well as the efforts of the Investment Adviser and its affiliates to combat cyber security risks. The Trustees also considered information regarding the Investment Adviser’s business continuity planning and remote operations capabilities. The Trustees concluded that the Investment Adviser continued to commit substantial financial and operational resources to the Funds and expressed confidence that the Investment Adviser would continue to do so in the future. The Trustees also recognized that the Investment Adviser had made significant commitments to address regulatory compliance requirements applicable to the Funds and the Investment Adviser and its affiliates.
Investment Performance
The Trustees also considered the investment performance of the Funds. In this regard, they compared the investment performance of each Fund to its peers using rankings and ratings compiled by the Outside Data Provider as of December 31, 2020, and updated performance information prepared by the Investment Adviser using the peer group identified by the Outside Data Provider as of March 31, 2021. The information on each Fund’s investment performance was provided for the one-, three-,
103
GOLDMAN SACHS ALTERNATIVE FUNDS
Statement Regarding Basis for Approval of Management Agreement (Unaudited) (continued)
five-, and ten-year periods ending on the applicable dates, to the extent that each Fund had been in existence for those periods. The Trustees also reviewed each Fund’s investment performance relative to its performance benchmark. As part of this review, they considered the investment performance trends of the Funds over time, and reviewed the investment performance of each Fund in light of its investment objective and policies and market conditions.
In addition, the Trustees considered materials prepared and presentations made by the Investment Adviser’s senior management and portfolio management personnel in which Fund performance was assessed. The Trustees also considered the Investment Adviser’s periodic reports with respect to the Funds’ risk profiles, and how the Investment Adviser’s approach to risk monitoring and management influences portfolio management. They noted the efforts of each Fund’s portfolio management team to continue to enhance the investment models used in managing the Funds.
The Trustees observed that the Absolute Return Tracker Fund’s Institutional Shares had placed in the top half of the Fund’s peer group for the one-, three-, five-, and ten-year periods; had outperformed the Fund’s benchmark index for the one-, three-, five-, and ten-year periods; and had outperformed the average performance of a group of competitor funds, as determined by the Investment Adviser (the “Competitor Fund Average”), for the one-, three-, and five-year periods ended March 31, 2021. They noted that the Absolute Return Tracker Fund had experienced certain portfolio management changes in 2020. The Board considered that the Alternative Premia Fund’s Institutional Shares had placed in the fourth quartile of the Fund’s peer group for the one- and three-year periods; had underperformed the Fund’s LIBOR-based benchmark by 8.64%, 6.11%, 0.96%, and 0.07%, respectively, for the one-, three-, five-, and ten-year periods, and had underperformed its Competitor Fund Average for the one-year period and outperformed its Competitor Fund Average for the three- and five-year periods ended March 31, 2021. They observed that in October 2017, the Fund had been repositioned from the Dynamic Allocation Fund, which involved changes to the Fund’s investment objective, investment strategy, benchmark, and portfolio management. The Trustees also noted that the Alternative Premia Fund had experienced certain portfolio management changes in 2020 and had certain significant differences from its benchmark index that caused it to be an imperfect basis for comparison. The Board considered that the Managed Futures Strategy Fund’s Institutional Shares had placed in the top half of the Fund’s peer group for the one-, three-, and five-year periods; had outperformed the Fund’s LIBOR-based benchmark index by 6.32%, 1.75%, and 1.10%, respectively, for the one-, three-, and five-year periods; and had outperformed the Fund’s Competitor Fund Average for the one-, three-, and five-year periods ended March 31, 2021.
Costs of Services Provided and Competitive Information
The Trustees considered the contractual terms of the Management Agreement and the fee rates payable by each Fund thereunder. In this regard, the Trustees considered information on the services rendered by the Investment Adviser to the Funds, which included both advisory and administrative services that were directed to the needs and operations of the Funds as registered mutual funds.
In particular, the Trustees reviewed analyses prepared by the Outside Data Provider regarding the expense rankings of the Funds. The analyses provided a comparison of each Fund’s management fee and breakpoints to those of a relevant peer group and category universe; an expense analysis which compared each Fund’s overall net and gross expenses to a peer group and a category universe; and data comparing each Fund’s net expenses to the peer and category medians. The analyses also compared each Fund’s other expenses and fee waivers/reimbursements to those of the peer group and category medians. The Trustees concluded that the comparisons provided by the Outside Data Provider were useful in evaluating the reasonableness of the management fees and total expenses paid by the Funds.
In addition, the Trustees considered the Investment Adviser’s undertakings to implement fee waivers and/or expense limitations. The Trustees noted that the Investment Adviser had agreed to waive a portion of its management fee in an amount equal to the entire management fee paid to the Investment Adviser as the investment adviser to each Fund’s wholly-owned subsidiary. They also considered, to the extent that the Investment Adviser manages other types of accounts having investment objectives and policies similar to those of the Funds, comparative fee information for services provided by the Investment Adviser to those accounts, and information that indicated that services provided to the Funds differed in various significant respects from the services provided to other types of accounts which, in many cases, operated under less stringent legal and regulatory structures, required fewer services from the Investment Adviser to a smaller number of client contact points, and were less time-intensive.
In addition, the Trustees noted that shareholders are able to redeem their Fund shares at any time if shareholders believe that the Fund fees and expenses are too high or if they are dissatisfied with the performance of the Fund.
Profitability
The Trustees reviewed each Fund’s contribution to the Investment Adviser’s revenues and pre-tax profit margins. In this regard the Trustees noted that they had received, among other things, profitability analyses and summaries, revenue and expense
104
GOLDMAN SACHS ALTERNATIVE FUNDS
Statement Regarding Basis for Approval of Management Agreement (Unaudited) (continued)
schedules by Fund and by function (i.e., investment management, transfer agency and distribution and service), and information on the Investment Adviser’s expense allocation methodology. They observed that the profitability and expense figures are substantially similar to those used by the Investment Adviser for many internal purposes, including compensation decisions among various business groups, and are thus subject to a vigorous internal debate about how certain revenue and expenses should be allocated. The Trustees also noted that the internal audit group within the Goldman Sachs organization periodically audits the expense allocation methodology and that the internal audit group was satisfied with the reasonableness, consistency, and accuracy of the Investment Adviser’s expense allocation methodology. Profitability data for each Fund was provided for 2020 and 2019, and the Trustees considered this information in relation to the Investment Adviser’s overall profitability.
Economies of Scale
The Trustees considered the information that had been provided regarding whether there have been economies of scale with respect to the management of the Funds. The Trustees also considered the breakpoints in the fee rate payable under the Management Agreement for each of the Funds at the following annual percentage rates of the average daily net assets of the Funds:
| | | | | | | | | | | | |
| | | Absolute
Return
Tracker Fund | | | Alternative Premia Fund | | | Managed
Futures
Strategy
Fund | |
| | | |
| First $1 billion | | | 0.70 | % | | | 0.79 | % | | | 1.00 | % |
| | | |
| Next $1 billion | | | 0.63 | | | | 0.71 | | | | 0.90 | |
| | | |
| Next $3 billion | | | 0.60 | | | | 0.68 | | | | 0.86 | |
| | | |
| Next $3 billion | | | 0.59 | | | | 0.66 | | | | 0.84 | |
| | | |
| Over $8 billion | | | 0.53 | | | | 0.65 | | | | 0.82 | |
The Trustees noted that the breakpoints were designed to share potential economies of scale, if any, with the Funds and their shareholders as assets under management reach those asset levels. The Trustees considered the amounts of assets in the Funds; the Funds’ recent share purchase and redemption activity; the information provided by the Investment Adviser relating to the costs of the services provided by the Investment Adviser and its affiliates and their realized profits; information comparing fee rates charged by the Investment Adviser with fee rates charged to other funds in the peer groups; and the Investment Adviser’s undertaking to limit certain expenses of the Funds that exceed specified levels. Upon reviewing these matters at the Annual Meeting, the Trustees concluded that the fee breakpoints represented a means of assuring that benefits of scalability, if any, would be passed along to shareholders at the specified asset levels. They also noted that the Investment Adviser had passed along savings to shareholders of the Absolute Return Tracker Fund, which had asset levels above at least the first breakpoint during the prior fiscal year.
Other Benefits to the Investment Adviser and Its Affiliates
The Trustees also considered the other benefits derived by the Investment Adviser and its affiliates from their relationships with the Funds as stated above, including: (a) transfer agency fees received by Goldman Sachs & Co. LLC (“Goldman Sachs”); (b) brokerage and futures commissions earned by Goldman Sachs for executing securities and futures transactions on behalf of the Funds; (c) trading efficiencies resulting from aggregation of orders of the Funds with those for other funds or accounts managed by the Investment Adviser; (d) with respect to the Absolute Return Tracker Fund, fees earned by Goldman Sachs Agency Lending (“GSAL”), an affiliate of the Investment Adviser, as securities lending agent (and fees earned by the Investment Adviser for managing the fund in which the Absolute Return Tracker Fund’s cash collateral is invested); (e) the Investment Adviser’s ability to leverage the infrastructure designed to service the Funds on behalf of its other clients; (f) the Investment Adviser’s ability to cross-market other products and services to Fund shareholders; (g) Goldman Sachs’ retention of certain fees as Fund Distributor; (h) the Investment Adviser’s ability to negotiate better pricing with custodians on behalf of its other clients, as a result of the relationship with the Funds; (i) the investment of cash and cash collateral in money market funds managed by the Investment Adviser that will result in increased assets under management for those money market funds; (j) the investment in exchange-traded funds (“ETFs”) managed by the Investment Adviser that will result in increased assets under management for those ETFs and may facilitate the development of the Investment Adviser’s ETF advisory business; and (k) the possibility that the working relationship between the Investment Adviser and the Funds’ third-party service providers may cause those service providers to be more likely to do business with other areas of Goldman Sachs. In the course of considering the foregoing, the Independent Trustees requested and received further information quantifying certain of these fall-out benefits.
105
GOLDMAN SACHS ALTERNATIVE FUNDS
Statement Regarding Basis for Approval of Management Agreement (Unaudited) (continued)
Other Benefits to the Funds and Their Shareholders
The Trustees also noted that the Funds receive certain other potential benefits as a result of their relationship with the Investment Adviser, including: (a) trading efficiencies resulting from aggregation of orders of the Funds with those of other funds or accounts managed by the Investment Adviser; (b) enhanced servicing from vendors due to the volume of business generated by the Investment Adviser and its affiliates; (c) enhanced servicing from broker-dealers due to the volume of business generated by the Investment Adviser and its affiliates; (d) the Investment Adviser’s ability to negotiate favorable terms with derivatives counterparties on behalf of the Funds as a result of the size and reputation of the Goldman Sachs organization; (e) the advantages received from the Investment Adviser’s knowledge and experience gained from managing other accounts and products; (f) the Investment Adviser’s ability to hire and retain qualified personnel to provide services to the Funds because of the reputation of the Goldman Sachs organization; (g) the Funds’ access, through the Investment Adviser, to certain firm-wide resources (e.g., proprietary risk management systems and databases), subject to certain restrictions; (h) the Absolute Return Tracker Fund’s ability to participate in the securities lending program administered by GSAL, as measured by the revenue received by the Funds in connection with the program; and (i) the Funds’ access to certain affiliated distribution channels. In addition, the Trustees noted the competitive nature of the mutual fund marketplace, and considered that many of the Funds’ shareholders invested in the Funds in part because of the Funds’ relationship with the Investment Adviser and that those shareholders have a general expectation that the relationship will continue.
Conclusion
In connection with their consideration of the Management Agreement, the Trustees gave weight to each of the factors described above, but did not identify any particular factor as controlling their decision. After deliberation and consideration of all of the information provided, including the factors described above, the Trustees concluded, in the exercise of their business judgment, that the management fees paid by each of the Funds were reasonable in light of the services provided to it by the Investment Adviser, the Investment Adviser’s costs and each Fund’s current and reasonably foreseeable asset levels. The Trustees unanimously concluded that the Investment Adviser’s continued management likely would benefit each Fund and its shareholders and that the Management Agreement should be approved and continued with respect to each Fund until June 30, 2022.
106
FUNDS PROFILE
Goldman Sachs Funds
Goldman Sachs is a premier financial services firm, known since 1869 for creating thoughtful and customized investment solutions in complex global markets.
Today, the Asset Management Division of Goldman Sachs serves a diverse set of clients worldwide, including private institutions, public entities and individuals. With approximately $2.09 trillion in assets under supervision as of June 30, 2021, Goldman Sachs Asset Management has portfolio management teams located around the world and our investment professionals bring firsthand knowledge of local markets to every investment decision. Assets under supervision includes assets under management and other client assets for which Goldman Sachs does not have full discretion. Goldman Sachs Asset Management leverages the resources of Goldman Sachs & Co. LLC subject to legal, internal and regulatory restrictions.
Money Market
Financial Square FundsSM
| ∎ | | Financial Square Treasury Solutions Fund1 |
| ∎ | | Financial Square Government Fund1 |
| ∎ | | Financial Square Money Market Fund2 |
| ∎ | | Financial Square Prime Obligations Fund2 |
| ∎ | | Financial Square Treasury Instruments Fund1 |
| ∎ | | Financial Square Treasury Obligations Fund1 |
| ∎ | | Financial Square Federal Instruments Fund1 |
Investor FundsSM
| ∎ | | Investor Money Market Fund3 |
| ∎ | | Investor Tax-Exempt Money Market Fund3 |
Fixed Income
Short Duration and Government
| ∎ | | High Quality Floating Rate Fund |
| ∎ | | Short-Term Conservative Income Fund |
| ∎ | | Short Duration Government Fund |
| ∎ | | Short Duration Bond Fund4 |
| ∎ | | Inflation Protected Securities Fund |
Multi-Sector
| ∎ | | Global Core Fixed Income Fund |
Municipal and Tax-Free
| ∎ | | High Yield Municipal Fund |
| ∎ | | Dynamic Municipal Income Fund |
| ∎ | | Short Duration Tax-Free Fund |
| ∎ | | Municipal Income Completion Fund |
Single Sector
| ∎ | | Investment Grade Credit Fund |
| ∎ | | High Yield Floating Rate Fund |
| ∎ | | Emerging Markets Debt Fund |
| ∎ | | Local Emerging Markets Debt Fund |
Fixed Income Alternatives
| ∎ | | Long Short Credit Strategies Fund |
Fundamental Equity
| ∎ | | Small/Mid Cap Value Fund |
| ∎ | | Small/Mid Cap Growth Fund |
| ∎ | | Concentrated Growth Fund |
| ∎ | | Technology Opportunities Fund |
| ∎ | | Growth Opportunities Fund |
| ∎ | | Rising Dividend Growth Fund |
Tax-Advantaged Equity
| ∎ | | U.S. Tax-Managed Equity Fund |
| ∎ | | International Tax-Managed Equity Fund |
| ∎ | | U.S. Equity Dividend and Premium Fund |
| ∎ | | International Equity Dividend and Premium Fund |
Equity Insights
| ∎ | | Small Cap Equity Insights Fund |
| ∎ | | U.S. Equity Insights Fund |
| ∎ | | Small Cap Growth Insights Fund |
| ∎ | | Large Cap Growth Insights Fund |
| ∎ | | Large Cap Value Insights Fund |
| ∎ | | Small Cap Value Insights Fund |
| ∎ | | International Small Cap Insights Fund |
| ∎ | | International Equity Insights Fund |
| ∎ | | Emerging Markets Equity Insights Fund |
Fundamental Equity International
| ∎ | | International Equity Income Fund |
| ∎ | | International Equity ESG Fund |
| ∎ | | Emerging Markets Equity Fund |
| ∎ | | ESG Emerging Markets Equity Fund |
Alternative
| ∎ | | Real Estate Securities Fund |
| ∎ | | International Real Estate Securities Fund |
| ∎ | | Commodity Strategy Fund |
| ∎ | | Global Real Estate Securities Fund |
| ∎ | | Alternative Premia Fund |
| ∎ | | Absolute Return Tracker Fund |
| ∎ | | Managed Futures Strategy Fund |
| ∎ | | MLP Energy Infrastructure Fund |
| ∎ | | Energy Infrastructure Fund |
| ∎ | | Multi-Manager Alternatives Fund |
| ∎ | | Global Infrastructure Fund |
| ∎ | | Clean Energy Income Fund |
Total Portfolio Solutions
| ∎ | | Global Managed Beta Fund |
| ∎ | | Multi-Manager Non-Core Fixed Income Fund |
| ∎ | | Multi-Manager Global Equity Fund |
| ∎ | | Multi-Manager International Equity Fund |
| ∎ | | Tactical Tilt Overlay Fund |
| ∎ | | Balanced Strategy Portfolio |
| ∎ | | Multi-Manager U.S. Small Cap Equity Fund |
| ∎ | | Multi-Manager Real Assets Strategy Fund |
| ∎ | | Growth and Income Strategy Portfolio |
| ∎ | | Growth Strategy Portfolio |
| ∎ | | Dynamic Global Equity Fund |
| ∎ | | Satellite Strategies Portfolio |
| ∎ | | Enhanced Dividend Global Equity Portfolio |
| ∎ | | Tax-Advantaged Global Equity Portfolio |
| ∎ | | Strategic Factor Allocation Fund |
| ∎ | | Strategic Voltility Premium Fund |
| ∎ | | Target Date Retirement Portfolio |
| ∎ | | Target Date 2025 Portfolio |
| ∎ | | Target Date 2030 Portfolio |
| ∎ | | Target Date 2035 Portfolio |
| ∎ | | Target Date 2040 Portfolio |
| ∎ | | Target Date 2045 Portfolio |
| ∎ | | Target Date 2050 Portfolio |
| ∎ | | Target Date 2055 Portfolio |
| ∎ | | Target Date 2060 Portfolio |
| ∎ | | GQG Partners International Opportunities Fund |
| 1 | | You could lose money by investing in the Fund. Although the Fund seeks to preserve the value of your investment at $1.00 per share, it cannot guarantee it will do so. An investment in the Fund is not a deposit of a bank and is not insured or guaranteed by the Federal Deposit Insurance Corporation or any other government agency. The Fund’s sponsor has no legal obligation to provide financial support to the Fund, and you should not expect that the sponsor will provide financial support to the Fund at any time. |
| 2 | | You could lose money by investing in the Fund. Because the share price of the Fund will fluctuate, when you sell your shares they may be worth more or less than what you originally paid for them. The Fund may impose a fee upon sale of your shares or may temporarily suspend your ability to sell shares if the Fund’s liquidity falls below required minimums because of market conditions or other factors. An investment in the Fund is not a deposit of a bank and is not insured or guaranteed by the Federal Deposit Insurance Corporation or any other government agency. The Fund’s sponsor has no legal obligation to provide financial support to the Fund, and you should not expect that the sponsor will provide financial support to the Fund at any time. |
| 3 | | You could lose money by investing in the Fund. Although the Fund seeks to preserve the value of your investment at $1.00 per share, it cannot guarantee it will do so. The Fund may impose a fee upon sale of your shares or may temporarily suspend your ability to sell shares if the Fund’s liquidity falls below required minimums because of market conditions or other factors. An investment in the Fund is not a deposit of a bank and is not insured or guaranteed by the Federal Deposit Insurance Corporation or any other government agency. The Fund’s sponsor has no legal obligation to provide financial support to the Fund, and you should not expect that the sponsor will provide financial support to the Fund at any time. |
| 4 | | Effective after the close of business on July 29, 2021, the Goldman Sachs Short Duration Income Fund was renamed the Goldman Sachs Short Duration Bond Fund. |
| 5 | | Effective after the close of business on August 30, 2020, the Goldman Sachs Blue Chip Fund was renamed the Goldman Sachs U.S. Equity ESG Fund. |
Financial Square FundsSM and Investor FundsSM are registered service marks of Goldman Sachs & Co. LLC.
| * | | This list covers open-end funds only. Please visit our website at www.GSAMFUNDS.com to learn about our closed-end funds and exchange-traded funds. |
| | |
TRUSTEES Jessica Palmer, Chair Dwight L. Bush Kathryn A. Cassidy Diana M. Daniels Joaquin Delgado James A. McNamara Roy W. Templin Gregory G. Weaver | | OFFICERS James A. McNamara, President Joseph F. DiMaria, Principal Financial Officer, Principal Accounting Officer and Treasurer Caroline L. Kraus, Secretary |
| |
GOLDMAN SACHS & CO. LLC Distributor and Transfer Agent | | GOLDMAN SACHS ASSET MANAGEMENT, L.P. Investment Adviser |
Visit our web site at www.GSAMFUNDS.com to obtain the most recent month-end returns.
Goldman Sachs Asset Management, L.P. 200 West Street, New York, New York 10282
Economic and market forecasts presented herein reflect our judgment as of the date of this presentation and are subject to change without notice. These forecasts do not take into account the specific investment objectives, restrictions, tax and financial situation or other needs of any specific client. Actual data will vary and may not be reflected here. These forecasts are subject to high levels of uncertainty that may affect actual performance. Accordingly, these forecasts should be viewed as merely representative of a broad range of possible outcomes. These forecasts are estimated, based on assumptions, and are subject to significant revision and may change materially as economic and market conditions change. Goldman Sachs has no obligation to provide updates or changes to these forecasts. Case studies and examples are for illustrative purposes only.
The portfolio risk management process includes an effort to monitor and manage risk, but does not imply low risk.
The reports concerning the Funds included in this shareholder report may contain certain forward-looking statements about the factors that may affect the performance of the Funds in the future. These statements are based on Fund management’s predictions and expectations concerning certain future events and their expected impact on the Funds, such as performance of the economy as a whole and of specific industry sectors, changes in the levels of interest rates, the impact of developing world events, and other factors that may influence the future performance of the Funds. Management believes these forward-looking statements to be reasonable, although they are inherently uncertain and difficult to predict. Actual events may cause adjustments in portfolio management strategies from those currently expected to be employed.
A description of the policies and procedures that the Funds use to determine how to vote proxies relating to portfolio securities and information regarding how a Fund voted proxies relating to portfolio securities during the most recent 12-month period ended June 30 is available (i) without charge, upon request by calling 1-800-526-7384 (for Retail Shareholders) or 1-800-621-2550 (for Institutional Shareholders); and (ii) on the Securities and Exchange Commission (“SEC”) web site at http://www.sec.gov.
The Funds will file their portfolio holdings for each month in a fiscal quarter within 60 days after the end of the relevant fiscal quarter on Form N-PORT. Portfolio holdings information for the third month of each fiscal quarter will be made available on the SEC’s web site at http://www.sec.gov. Portfolio holdings information may be obtained upon request and without charge by calling 1-800-526-7384 (for Retail Shareholders) or 1-800-621-2550 (for Institutional Shareholders).
Holdings and allocations shown are as of June 30, 2021 and may not be representative of future investments. Fund holdings should not be relied on in making investment decisions and should not be construed as research or investment advice regarding particular securities. Current and future holdings are subject to risk.
This material is not authorized for distribution to prospective investors unless preceded or accompanied by a current prospectus or summary prospectus, if applicable. Investors should consider the Fund’s objective, risks, and charges and expenses, and read the summary prospectus, if available, and/or the prospectus carefully before investing or sending money. The summary prospectus, if available, and the prospectus contain this and other information about the Fund and may be obtained from your authorized dealer or from Goldman Sachs & Co. LLC by calling (retail – 1-800-526-7384) (institutional – 1-800-621-2550).
© 2021 Goldman Sachs. All rights reserved. 250022-OTU-1460277 SELSATSAR-21
Goldman Sachs Funds

| | | | |
| | |
| Semi-Annual Report | | | | June 30, 2021 |
| | |
| | | | Alternative Funds II |
| | | | Commodity Strategy |
| | | | Defensive Equity |

Goldman Sachs Alternative Funds II
| ∎ | | COMMODITY STRATEGY FUND |
| | | | |
| | | |
| NOT FDIC-INSURED | | May Lose Value | | No Bank Guarantee |
FUND BASICS
Commodity Strategy Fund
as of June 30, 2021
| | | | | | | | |
| | PERFORMANCE REVIEW |
| | | |
| | | January 1, 2021–June 30, 2021 | | Fund Total Return
(based on NAV)1 | | | S&P GSCI®2 |
| | Class A | | | 24.65 | % | | 31.40% |
| | Class C | | | 24.18 | | | 31.40 |
| | Institutional | | | 24.87 | | | 31.40 |
| | Investor | | | 24.84 | | | 31.40 |
| | Class R6 | | | 24.81 | | | 31.40 |
| | Class R | | | 24.48 | | | 31.40 |
| | | Class P | | | 24.81 | | | 31.40 |
| 1 | | The net asset value (“NAV”) represents the net assets of the class of the Fund (ex-dividend) divided by the total number of shares of the class outstanding. The Fund’s performance reflects the reinvestment of dividends and other distributions. The Fund’s performance does not reflect the deduction of any applicable sales charges. |
| 2 | | The S&P GSCI® Total Return Index (Gross, USD, Unhedged) is an unmanaged composite index of commodity sector returns, representing an unleveraged, long-only investment in commodity futures that is broadly diversified across the spectrum of commodities. Individual components qualify for inclusion in the S&P GSCI® on the basis of liquidity and are weighted by their respective world production quantities. The figures for the S&P GSCI® do not include any deduction for fees, expenses or taxes. It is not possible to invest directly in an index. |
The returns set forth in the table above represent past performance. Past performance does not guarantee future results. The Fund’s investment return and principal value will fluctuate so that an investor’s shares, when redeemed, may be worth more or less than their original cost. Current performance may be lower or higher than the performance quoted above. Please visit our web site at www.GSAMFUNDS.com to obtain the most recent month-end returns. Performance reflects applicable fee waivers and/or expense limitations in effect during the periods shown. In their absence, performance would be reduced. Returns do not reflect the deduction of taxes that a shareholder would pay on Fund distributions or the redemption of Fund shares.
At a meeting held on July 23, 2020, the Board of Trustees of the Commodity Strategy Fund approved CoreCommodity Management, LLC (the “Sub-Adviser” or “CoreCommodity”) to serve as sub-adviser to the Commodity Strategy Fund, subject to approval by the Fund’s shareholders. At a special meeting of shareholders of the Fund held on December 18, 2020, the Fund’s shareholders approved a subadvisory agreement with CoreCommodity. Accordingly, effective after the close of business on January 22, 2021, CoreCommodity began sub-advising the Fund.
1
FUND BASICS
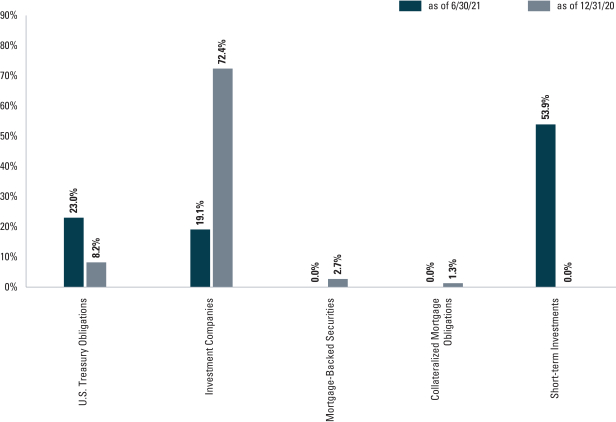
| 3 | | The percentage shown for each investment category reflects the value of investments in that category as a percentage of net assets. Figures in the graph may not sum to 100% due to the exclusion of other assets and liabilities. The graph depicts the Fund’s investments but may not represent the Fund’s market exposure due to the exclusion of certain derivatives, if any, as listed in the Additional Investment Information section of the Consolidated Schedule of Investments. |
For more information about the Fund, please refer to www.GSAMFUNDS.com. There, you can learn more about the Fund’s investment strategies, holdings, and performance.
2
FUND BASICS
Defensive Equity Fund
as of June 30, 2021
| | | | | | | | | | |
| | PERFORMANCE REVIEW | |
| | | |
| | | January 1, 2021–June 30, 2021 | | Fund Total Return
(based on NAV)1 | | | S&P 500 Index2 | |
| | Class A | | | 7.46 | % | | | 15.25 | % |
| | Class C | | | 6.97 | | | | 15.25 | |
| | Institutional | | | 7.56 | | | | 15.25 | |
| | Investor | | | 7.56 | | | | 15.25 | |
| | Class R6 | | | 7.56 | | | | 15.25 | |
| | Class R | | | 7.26 | | | | 15.25 | |
| | | Class P | | | 7.56 | | | | 15.25 | |
| 1 | | The net asset value (“NAV”) represents the net assets of the class of the Fund (ex-dividend) divided by the total number of shares of the class outstanding. The Fund’s performance reflects the reinvestment of dividends and other distributions. The Fund’s performance does not reflect the deduction of any applicable sales charges. |
| 2 | | The S&P 500® Index is an unmanaged composite index of 500 common stock prices. The Index figures do not include any deduction for fees, expenses or taxes. |
The returns set forth in the table above represent past performance. Past performance does not guarantee future results. The Fund’s investment return and principal value will fluctuate so that an investor’s shares, when redeemed, may be worth more or less than their original cost. Current performance may be lower or higher than the performance quoted above. Please visit our web site at www.GSAMFUNDS.com to obtain the most recent month-end returns. Performance reflects applicable fee waivers and/or expense limitations in effect during the periods shown. In their absence, performance would be reduced. Returns do not reflect the deduction of taxes that a shareholder would pay on Fund distributions or the redemption of Fund shares.
| | | | | | | | |
| | TOP 10 HOLDINGS AS OF 6/30/213 |
| | | |
| | | Holding | | % of Net Assets | | | Line of Business |
| | | |
| | Apple, Inc. | | | 5.7 | % | | Technology Hardware, Storage & Peripherals |
| | Microsoft Corp. | | | 5.5 | | | Software |
| | Alphabet, Inc. Class A | | | 3.9 | | | Interactive Media & Services |
| | Berkshire Hathaway, Inc. Class B | | | 1.7 | | | Diversified Financial Services |
| | Johnson & Johnson | | | 1.7 | | | Pharmaceuticals |
| | The Procter & Gamble Co. | | | 1.3 | | | Household Products |
| | Visa, Inc. Class A | | | 1.2 | | | IT Services |
| | Verizon Communications, Inc. | | | 1.1 | | | Diversified Telecommunication Services |
| | Accenture PLC Class A | | | 1.1 | | | IT Services |
| | | Bank of America Corp. | | | 1.0 | | | Banks |
| 3 | | The top 10 holdings may not be representative of the Fund’s future investments. The top 10 holdings exclude investments in money market funds. |
3
FUND BASICS
| | | | |
| | FUND VS. BENCHMARK SECTOR ALLOCATION4 |
| | |
| | | As of June 30, 2021 | | |
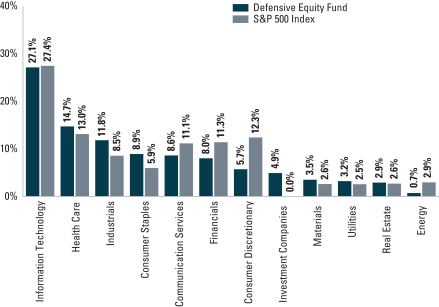
| 4 | | The Fund is actively managed and, as such, its composition may differ over time. Consequently, the Fund’s overall sector allocations may differ from the percentages contained in the graph above. The graph categorizes investments using the Global Industry Classification Standard (“GICS”), however, the sector classifications used by the portfolio management team may differ from GICS. The percentage shown for each investment category reflects the value of investments in that category as a percentage of market value. The graph depicts the Fund’s investments but may not represent the Fund’s market exposure due to the exclusion of certain derivatives, if any, as listed in the Additional Investment Information section of the Schedule of Investments. |
For more information about your Fund, please refer to www.GSAMFUNDS.com. There, you can learn more about your Fund’s investment strategies, holdings, and performance.
4
GOLDMAN SACHS COMMODITY STRATEGY FUND
Consolidated Schedule of Investments
June 30, 2021 (Unaudited)
| | | | | | | | | | | | | | |
Principal
Amount | | | Interest
Rate | | | Maturity
Date | | | Value | |
|
| U.S. Treasury Obligations – 23.0% | |
| | U.S. Treasury Notes | |
| $ | 39,250,000 | | | | 1.750 | % | | | 02/28/22 | | | $ | 39,688,496 | |
| | 47,000,000 | | | | 1.875 | | | | 05/31/22 | | | | 47,765,586 | |
| | |
| | TOTAL U.S. TREASURY OBLIGATIONS | |
| | (Cost $87,467,479) | | | $ | 87,454,082 | |
| | |
| | | | | | | | |
| Shares | | | Dividend
Rate | | Value | |
|
| Investment Company(a) – 19.1% | |
| Goldman Sachs Financial Square Government Fund –
Institutional Shares |
|
| | 72,748,311 | | | 0.026% | | $ | 72,748,311 | |
| | (Cost $72,748,311) | | | | |
| | |
| | | | | | | | | | | | | | |
Principal
Amount | | | Interest
Rate | | | Maturity
Date | | | Value | |
|
| Short-term Investments(b) – 53.9% | |
| U.S. Treasury Obligations – 53.9% | |
| | U.S. Treasury Bills | |
| $ | 45,000,000 | | | | 0.000 | % | | | 07/29/21 | | | $ | 44,998,329 | |
| | 10,000,000 | | | | 0.000 | | | | 10/07/21 | | | | 9,998,794 | |
| | 150,000,000 | | | | 0.000 | | | | 12/30/21 | | | | 149,959,809 | |
| | |
| | TOTAL SHORT-TERM INVESTMENTS | |
| | (Cost $204,928,969) | | | $ | 204,956,932 | |
| | |
| | TOTAL INVESTMENTS – 96.0% | |
| | (Cost $365,144,759) | | | $ | 365,159,325 | |
| | |
| OTHER ASSETS IN EXCESS OF
LIABILITIES – 4.0% |
| | | 15,227,686 | |
| | |
| | NET ASSETS – 100.0% | | | $ | 380,387,011 | |
| | |
| | |
|
| The percentage shown for each investment category reflects the value of investments in that category as a percentage of net assets. |
| |
(a) | | Represents an affiliated issuer. |
| |
(b) | | Issued with a zero coupon. Income is recognized through the accretion of discount. |
| | |
|
Currency Abbreviations: |
USD | | —U.S. Dollar |
|
|
| ADDITIONAL INVESTMENT INFORMATION |
FUTURES CONTRACTS — At June 30, 2021, the Fund had the following futures contracts:
| | | | | | | | | | | | | | | | |
| Description | | Number of
Contracts | | | Expiration
Date | | | Notional
Amount | | | Unrealized
Appreciation/
(Depreciation) | |
Long position contracts: | | | | | | | | | | | | | | | | |
Brent Crude | | | 336 | | | | 07/30/21 | | | $ | 25,072,320 | | | $ | 453,177 | |
Copper | | | 190 | | | | 07/19/21 | | | | 44,476,625 | | | | (2,806,663 | ) |
Corn | | | 127 | | | | 09/14/21 | | | | 3,805,238 | | | | 233,869 | |
Gasoline RBOB | | | 12 | | | | 07/30/21 | | | | 1,129,867 | | | | (19,286 | ) |
Gold 100 Oz | | | 109 | | | | 08/27/21 | | | | 19,310,440 | | | | (784,989 | ) |
Low Sulphur Gas Oil | | | 185 | | | | 07/12/21 | | | | 11,039,875 | | | | 232,559 | |
Natural Gas | | | 515 | | | | 07/28/21 | | | | 18,797,500 | | | | 2,099,228 | |
Nickel | | | 79 | | | | 07/19/21 | | | | 8,629,644 | | | | 133,300 | |
Platinum | | | 75 | | | | 10/27/21 | | | | 4,023,375 | | | | 83,250 | |
Primary Aluminum | | | 16 | | | | 09/13/21 | | | | 1,009,800 | | | | 52,549 | |
Silver | | | 104 | | | | 09/28/21 | | | | 13,620,880 | | | | 63,109 | |
Soybean | | | 166 | | | | 09/14/21 | | | | 6,291,400 | | | | 232,314 | |
Soybean | | | 55 | | | | 11/12/21 | | | | 3,847,250 | | | | 400,923 | |
Wheat | | | 71 | | | | 09/14/21 | | | | 2,372,250 | | | | 185,196 | |
Zinc | | | 140 | | | | 07/19/21 | | | | 10,395,875 | | | | (122,067 | ) |
| | | | |
| Total | | | | | | | | | | | | | | $ | 436,469 | |
| | |
| The accompanying notes are an integral part of these financial statements. | | 5 |
GOLDMAN SACHS COMMODITY STRATEGY FUND
Consolidated Schedule of Investments (continued)
June 30, 2021 (Unaudited)
|
| ADDITIONAL INVESTMENT INFORMATION (continued) |
FUTURES CONTRACTS (continued)
| | | | | | | | | | | | | | | | |
| Description | | Number of
Contracts | | | Expiration
Date | | | Notional
Amount | | | Unrealized
Appreciation/
(Depreciation) | |
Short position contracts: | | | | | | | | | | | | | | | | |
Cattle | | | (27 | ) | | | 08/31/21 | | | $ | (1,325,430 | ) | | $ | (19,409 | ) |
Cocoa | | | (10 | ) | | | 09/15/21 | | | | (238,900 | ) | | | 908 | |
Coffee | | | (23 | ) | | | 09/20/21 | | | | (1,377,844 | ) | | | (60,866 | ) |
Copper | | | (319 | ) | | | 09/28/21 | | | | (34,204,775 | ) | | | (920,421 | ) |
Copper | | | (7 | ) | | | 07/19/21 | | | | (1,638,613 | ) | | | (13,147 | ) |
Cotton No.2 | | | (89 | ) | | | 12/08/21 | | | | (3,778,050 | ) | | | (8,985 | ) |
Crude Oil | | | (449 | ) | | | 07/20/21 | | | | (32,988,030 | ) | | | (817,814 | ) |
FCOJ-A | | | (9 | ) | | | 09/10/21 | | | | (166,252 | ) | | | (5,326 | ) |
Gasoline RBOB | | | (35 | ) | | | 10/29/21 | | | | (3,026,289 | ) | | | 49,528 | |
Lean Hogs | | | (6 | ) | | | 08/13/21 | | | | (247,800 | ) | | | 19,785 | |
Nickel | | | (3 | ) | | | 07/19/21 | | | | (327,708 | ) | | | (8,676 | ) |
NY Harbor ULSD | | | (50 | ) | | | 07/30/21 | | | | (4,469,430 | ) | | | (52,085 | ) |
Primary Aluminum | | | (12 | ) | | | 09/13/21 | | | | (757,350 | ) | | | (39,450 | ) |
Sugar No.11 | | | (140 | ) | | | 09/30/21 | | | | (2,805,152 | ) | | | (190,929 | ) |
Zinc | | | (5 | ) | | | 07/19/21 | �� | | | (371,281 | ) | | | (14,610 | ) |
| | | | |
| Total | | | | | | | | | | | | | | $ | (2,081,497 | ) |
| | | | |
| TOTAL FUTURES CONTRACTS | | | | | | | | | | | | | | $ | (1,645,028 | ) |
SWAP CONTRACTS — At June 30, 2021, the Fund had the following swap contracts:
OVER THE COUNTER TOTAL RETURN SWAP CONTRACTS#
| | | | | | | | | | | | | | | | | | | | | | | | | | |
| Reference Obligation/ Index(a) | | Financing Rate
Paid
by the Fund | | | Counterparty | | Termination
Date | | | Notional
Amount
(000s) | | | Value | | | Upfront
Premiums
(Received)
Paid | | | Unrealized
Appreciation/
(Depreciation) | |
CRB 1M Forward Index | | | 3M USD LIBOR | | | Citibank NA | | | 01/31/22 | | | $ | 128 | | | $ | 2,911,244 | | | $ | 2 | | | $ | 2,911,242 | |
CRB 1M Forward Index | | | 3M USD LIBOR | | | Merrill Lynch & Co., Inc. | | | 01/31/22 | | | | 166 | | | | 3,660,244 | | | | — | | | | 3,660,244 | |
CRB 1M Forward Index | | | 3M USD LIBOR | | | UBS AG (London) | | | 01/31/22 | | | | 10 | | | | 80,450 | | | | — | | | | 80,450 | |
CRB 1M Forward Index | | | 0.300% | | | UBS AG (London) | | | 01/31/22 | | | | 138 | | | | 3,045,241 | | | | — | | | | 3,045,241 | |
| | | | | | | |
| TOTAL | | | | | | | | | | | | | | | | $ | 9,697,179 | | | $ | 2 | | | $ | 9,697,177 | |
| | # | | The Fund pays/receives annual coupon payments in accordance with the swap contract(s). On the termination date of the swap contract(s), the Fund will either receive from or pay to the counterparty an amount equal to the net of the accrued financing fees and the value of the reference security subtracted from the original notional cost (notional multiplied by the price change of the reference security, converted to U.S. Dollars). |
| | (a) | | Payments made monthly. |
| | |
|
Abbreviation: |
CRB 1M Forward Index | | —Commodity Research Bureau 1 Month Forward Index |
|
| | |
| 6 | | The accompanying notes are an integral part of these financial statements. |
GOLDMAN SACHS DEFENSIVE EQUITY FUND
Schedule of Investments
June 30, 2021 (Unaudited)
| | | | | | | | |
| Shares | | | Description | |
Value | |
| |
| Common Stocks – 90.8% | | | |
| Aerospace & Defense – 1.1% | | | |
| | 420 | | | Howmet Aerospace, Inc.* | | $ | 14,478 | |
| | 48 | | | Huntington Ingalls Industries, Inc. | | | 10,116 | |
| | 494 | | | Raytheon Technologies Corp. | | | 42,143 | |
| | | | | | | | |
| | | | | | | 66,737 | |
| | |
| Air Freight & Logistics – 0.4% | | | |
| | 194 | | | C.H. Robinson Worldwide, Inc. | | | 18,172 | |
| | 69 | | | Expeditors International of Washington, Inc. | | | 8,735 | |
| | | | | | | | |
| | | | | | | 26,907 | |
| | |
| Auto Components* – 0.2% | | | |
| | 66 | | | Aptiv PLC | | | 10,384 | |
| | |
| Banks – 1.0% | | | |
| | 1,576 | | | Bank of America Corp. | | | 64,978 | |
| | |
| Beverages – 2.5% | | | |
| | 157 | | | Constellation Brands, Inc. Class A | | | 36,720 | |
| | 177 | | | Monster Beverage Corp.* | | | 16,169 | |
| | 282 | | | PepsiCo, Inc.(a) | | | 41,784 | |
| | 1,117 | | | The Coca-Cola Co. | | | 60,441 | |
| | | | | | | | |
| | | | | | | 155,114 | |
| | |
| Biotechnology – 1.6% | | | |
| | 379 | | | AbbVie, Inc. | | | 42,690 | |
| | 137 | | | Amgen, Inc.(a) | | | 33,394 | |
| | 109 | | | Vertex Pharmaceuticals, Inc.* | | | 21,978 | |
| | | | | | | | |
| | | | | | | 98,062 | |
| | |
| Building Products – 1.0% | | | |
| | 139 | | | A.O. Smith Corp. | | | 10,016 | |
| | 112 | | | Allegion PLC | | | 15,602 | |
| | 331 | | | Masco Corp. | | | 19,499 | |
| | 100 | | | Trane Technologies PLC | | | 18,414 | |
| | | | | | | | |
| | | | | | | 63,531 | |
| | |
| Capital Markets – 2.5% | | | |
| | 73 | | | Ameriprise Financial, Inc. | | | 18,168 | |
| | 151 | | | Cboe Global Markets, Inc. | | | 17,977 | |
| | 63 | | | Moody’s Corp. | | | 22,829 | |
| | 53 | | | MSCI, Inc. | | | 28,253 | |
| | 75 | | | Nasdaq, Inc. | | | 13,185 | |
| | 107 | | | Northern Trust Corp. | | | 12,371 | |
| | 75 | | | Raymond James Financial, Inc. | | | 9,743 | |
| | 81 | | | S&P Global, Inc. | | | 33,247 | |
| | | | | | | | |
| | | | | | | 155,773 | |
| | |
| Chemicals – 2.6% | | | |
| | 107 | | | Air Products & Chemicals, Inc. | | | 30,782 | |
| | 667 | | | Corteva, Inc. | | | 29,581 | |
| | 63 | | | Eastman Chemical Co. | | | 7,355 | |
| | 75 | | | Ecolab, Inc. | | | 15,448 | |
| | 115 | | | Linde PLC | | | 33,247 | |
| | 139 | | | PPG Industries, Inc. | | | 23,598 | |
| | 85 | | | The Sherwin-Williams Co. | | | 23,158 | |
| | | | | | | | |
| | | | | | | 163,169 | |
| | |
| |
| Common Stocks – (continued) | | | |
| Commercial Services & Supplies – 1.3% | | | |
| | 213 | | | Copart, Inc.* | | | 28,080 | |
| | 190 | | | Republic Services, Inc. | | | 20,902 | |
| | 375 | | | Rollins, Inc. | | | 12,825 | |
| | 143 | | | Waste Management, Inc. | | | 20,035 | |
| | | | | | | | |
| | | | | | | 81,842 | |
| | |
| Communications Equipment – 0.5% | | | |
| | 65 | | | F5 Networks, Inc.* | | | 12,133 | |
| | 96 | | | Motorola Solutions, Inc. | | | 20,817 | |
| | | | | | | | |
| | | | | | | 32,950 | |
| | |
| Construction & Engineering – 0.1% | | | |
| | 99 | | | Quanta Services, Inc. | | | 8,966 | |
| | |
| Containers & Packaging – 0.8% | | | |
| | 1,131 | | | Amcor PLC | | | 12,961 | |
| | 76 | | | Avery Dennison Corp. | | | 15,978 | |
| | 108 | | | Ball Corp. | | | 8,750 | |
| | 90 | | | Packaging Corp. of America | | | 12,188 | |
| | | | | | | | |
| | | | | | | 49,877 | |
| | |
| Diversified Financial Services*(a) – 1.7% | | | |
| | 387 | | | Berkshire Hathaway, Inc. Class B | | | 107,555 | |
| | |
| Diversified Telecommunication Services – 1.7% | | | |
| | 1,391 | | | AT&T, Inc. | | | 40,033 | |
| | 1,198 | | | Verizon Communications, Inc.(a) | | | 67,124 | |
| | | | | | | | |
| | | | | | | 107,157 | |
| | |
| Electric Utilities – 1.4% | | | |
| | 272 | | | American Electric Power Co., Inc. | | | 23,009 | |
| | 931 | | | PPL Corp. | | | 26,040 | |
| | 596 | | | The Southern Co. | | | 36,064 | |
| | | | | | | | |
| | | | | | | 85,113 | |
| | |
| Electrical Equipment – 1.0% | | | |
| | 110 | | | AMETEK, Inc. | | | 14,685 | |
| | 245 | | | Emerson Electric Co. | | | 23,579 | |
| | 96 | | | Rockwell Automation, Inc. | | | 27,458 | |
| | | | | | | | |
| | | | | | | 65,722 | |
| | |
| Electronic Equipment, Instruments & Components – 1.5% | | | |
| | 72 | | | CDW Corp. | | | 12,575 | |
| | 105 | | | Keysight Technologies, Inc.*(a) | | | 16,213 | |
| | 234 | | | TE Connectivity Ltd. | | | 31,639 | |
| | 69 | | | Zebra Technologies Corp. Class A* | | | 36,535 | |
| | | | | | | | |
| | | | | | | 96,962 | |
| | |
| Entertainment – 1.6% | | | |
| | 316 | | | Activision Blizzard, Inc. | | | 30,159 | |
| | 83 | | | Electronic Arts, Inc. | | | 11,938 | |
| | 116 | | | Netflix, Inc.* | | | 61,272 | |
| | | | | | | | |
| | | | | | | 103,369 | |
| | |
| Equity Real Estate Investment Trusts (REITs) – 2.7% | | | |
| | 104 | | | Alexandria Real Estate Equities, Inc. | | | 18,922 | |
| | 112 | | | Crown Castle International Corp. | | | 21,851 | |
| | |
| | |
| The accompanying notes are an integral part of these financial statements. | | 7 |
GOLDMAN SACHS DEFENSIVE EQUITY FUND
Schedule of Investments (continued)
June 30, 2021 (Unaudited)
| | | | | | | | |
| Shares | | | Description | |
Value | |
| |
| Common Stocks – (continued) | | | |
| Equity Real Estate Investment Trusts (REITs) – (continued) | | | |
| | 456 | | | Duke Realty Corp. | | $ | 21,592 | |
| | 29 | | | Equinix, Inc. | | | 23,275 | |
| | 53 | | | Extra Space Storage, Inc. | | | 8,683 | |
| | 248 | | | Prologis, Inc. | | | 29,644 | |
| | 60 | | | Public Storage | | | 18,041 | |
| | 92 | | | SBA Communications Corp. | | | 29,320 | |
| | | | | | | | |
| | | | | | | 171,328 | |
| | |
| Food & Staples Retailing – 2.0% | | | |
| | 121 | | | Costco Wholesale Corp.(a) | | | 47,876 | |
| | 186 | | | Sysco Corp. | | | 14,461 | |
| | 447 | | | Walmart, Inc.(a) | | | 63,036 | |
| | | | | | | | |
| | | | | | | 125,373 | |
| | |
| Food Products – 1.8% | | | |
| | 191 | | | Campbell Soup Co. | | | 8,708 | |
| | 181 | | | Conagra Brands, Inc. | | | 6,585 | |
| | 208 | | | General Mills, Inc. | | | 12,673 | |
| | 169 | | | Lamb Weston Holdings, Inc. | | | 13,632 | |
| | 228 | | | McCormick & Co., Inc. | | | 20,137 | |
| | 547 | | | Mondelez International, Inc. Class A | | | 34,155 | |
| | 86 | | | The Hershey Co. | | | 14,979 | |
| | | | | | | | |
| | | | | | | 110,869 | |
| | |
| Health Care Equipment & Supplies – 7.3% | | | |
| | 319 | | | Abbott Laboratories(a) | | | 36,982 | |
| | 40 | | | ABIOMED, Inc.* | | | 12,484 | |
| | 41 | | | Align Technology, Inc.* | | | 25,051 | |
| | 460 | | | Baxter International, Inc.(a) | | | 37,030 | |
| | 61 | | | Becton Dickinson & Co. | | | 14,835 | |
| | 681 | | | Boston Scientific Corp.* | | | 29,120 | |
| | 137 | | | Danaher Corp. | | | 36,765 | |
| | 263 | | | DENTSPLY SIRONA, Inc. | | | 16,637 | |
| | 44 | | | DexCom, Inc.* | | | 18,788 | |
| | 425 | | | Edwards Lifesciences Corp.*(a) | | | 44,017 | |
| | 23 | | | IDEXX Laboratories, Inc.* | | | 14,526 | |
| | 416 | | | Medtronic PLC | | | 51,638 | |
| | 42 | | | ResMed, Inc. | | | 10,354 | |
| | 143 | | | Stryker Corp. | | | 37,141 | |
| | 72 | | | Teleflex, Inc. | | | 28,929 | |
| | 73 | | | The Cooper Cos., Inc. | | | 28,928 | |
| | 41 | | | West Pharmaceutical Services, Inc. | | | 14,723 | |
| | | | | | | | |
| | | | | | | 457,948 | |
| | |
| Health Care Providers & Services – 0.6% | | | |
| | 87 | | | HCA Healthcare, Inc. | | | 17,986 | |
| | 57 | | | McKesson Corp. | | | 10,901 | |
| | 41 | | | Universal Health Services, Inc. Class B | | | 6,004 | |
| | | | | | | | |
| | | | | | | 34,891 | |
| | |
| Health Care Technology – 0.4% | | | |
| | 331 | | | Cerner Corp. | | | 25,871 | |
| | |
| Hotels, Restaurants & Leisure – 2.4% | | | |
| | 14 | | | Chipotle Mexican Grill, Inc.* | | | 21,705 | |
| | 64 | | | Domino’s Pizza, Inc. | | | 29,855 | |
| | 247 | | | Las Vegas Sands Corp.* | | | 13,014 | |
| | |
| |
| Common Stocks – (continued) | | | |
| Hotels, Restaurants & Leisure – (continued) | | | |
| | 152 | | | McDonald’s Corp. | | | 35,111 | |
| | 433 | | | Starbucks Corp. | | | 48,414 | |
| | | | | | | | |
| | | | | | | 148,099 | |
| | |
| Household Durables – 0.2% | | | |
| | 531 | | | Newell Brands, Inc. | | | 14,587 | |
| | |
| Household Products – 1.8% | | | |
| | 195 | | | Colgate-Palmolive Co. | | | 15,863 | |
| | 84 | | | The Clorox Co. | | | 15,113 | |
| | 610 | | | The Procter & Gamble Co.(a) | | | 82,307 | |
| | | | | | | | |
| | | | | | | 113,283 | |
| | |
| Independent Power and Renewable Electricity Producers – 0.2% | |
| | 547 | | | The AES Corp. | | | 14,260 | |
| | |
| Industrial Conglomerates – 1.0% | | | |
| | 241 | | | Honeywell International, Inc.(a) | | | 52,864 | |
| | 26 | | | Roper Technologies, Inc. | | | 12,225 | |
| | | | | | | | |
| | | | | | | 65,089 | |
| | |
| Insurance – 2.4% | | | |
| | 140 | | | Aon PLC Class A | | | 33,426 | |
| | 185 | | | Arthur J. Gallagher & Co. | | | 25,915 | |
| | 196 | | | Chubb Ltd. | | | 31,152 | |
| | 274 | | | Marsh & McLennan Cos., Inc. | | | 38,546 | |
| | 122 | | | The Travelers Cos., Inc. | | | 18,265 | |
| | 78 | | | W.R. Berkley Corp. | | | 5,806 | |
| | | | | | | | |
| | | | | | | 153,110 | |
| | |
| Interactive Media & Services*(a) – 3.9% | | | |
| | 100 | | | Alphabet, Inc. Class A | | | 244,179 | |
| | |
| IT Services – 7.0% | | | |
| | 227 | | | Accenture PLC Class A(a) | | | 66,917 | |
| | 190 | | | Automatic Data Processing, Inc.(a) | | | 37,738 | |
| | 147 | | | Broadridge Financial Solutions, Inc. | | | 23,745 | |
| | 168 | | | Cognizant Technology Solutions Corp. Class A | | | 11,636 | |
| | 268 | | | Fidelity National Information Services, Inc. | | | 37,967 | |
| | 307 | | | Fiserv, Inc.* | | | 32,815 | |
| | 100 | | | FleetCor Technologies, Inc.* | | | 25,606 | |
| | 113 | | | Gartner, Inc.* | | | 27,369 | |
| | 169 | | | Global Payments, Inc. | | | 31,694 | |
| | 74 | | | Jack Henry & Associates, Inc. | | | 12,100 | |
| | 217 | | | Paychex, Inc.(a) | | | 23,284 | |
| | 145 | | | VeriSign, Inc.* | | | 33,015 | |
| | 328 | | | Visa, Inc. Class A | | | 76,693 | |
| | | | | | | | |
| | | | | | | 440,579 | |
| | |
| Life Sciences Tools & Services – 1.4% | | | |
| | 112 | | | Agilent Technologies, Inc. | | | 16,555 | |
| | 53 | | | Charles River Laboratories International, Inc.* | | | 19,606 | |
| | 69 | | | Illumina, Inc.* | | | 32,651 | |
| | 15 | | | Mettler-Toledo International, Inc.* | | | 20,780 | |
| | | | | | | | |
| | | | | | | 89,592 | |
| | |
| | |
| 8 | | The accompanying notes are an integral part of these financial statements. |
GOLDMAN SACHS DEFENSIVE EQUITY FUND
| | | | | | | | |
| Shares | | | Description | |
Value | |
| |
| Common Stocks – (continued) | | | |
| Machinery – 1.9% | | | |
| | 347 | | | Fortive Corp. | | $ | 24,200 | |
| | 146 | | | Illinois Tool Works, Inc. | | | 32,640 | |
| | 260 | | | Ingersoll Rand, Inc.* | | | 12,690 | |
| | 366 | | | Otis Worldwide Corp. | | | 29,928 | |
| | 75 | | | Stanley Black & Decker, Inc. | | | 15,374 | |
| | 60 | | | Xylem, Inc. | | | 7,198 | |
| | | | | | | | |
| | | | | | | 122,030 | |
| | |
| Media – 1.0% | | | |
| | 57 | | | Charter Communications, Inc. Class A*(a) | | | 41,123 | |
| | 247 | | | Fox Corp. Class A | | | 9,171 | |
| | 504 | | | News Corp. Class A | | | 12,988 | |
| | | | | | | | |
| | | | | | | 63,282 | |
| | |
| Multi-Utilities – 1.2% | | | |
| | 381 | | | CMS Energy Corp. | | | 22,510 | |
| | 471 | | | Dominion Energy, Inc. | | | 34,651 | |
| | 320 | | | Public Service Enterprise Group, Inc. | | | 19,117 | |
| | | | | | | | |
| | | | | | | 76,278 | |
| | |
| Multiline Retail – 1.2% | | | |
| | 133 | | | Dollar General Corp.(a) | | | 28,780 | |
| | 132 | | | Dollar Tree, Inc.* | | | 13,134 | |
| | 131 | | | Target Corp. | | | 31,668 | |
| | | | | | | | |
| | | | | | | 73,582 | |
| | |
| Oil, Gas & Consumable Fuels – 0.7% | | | |
| | 348 | | | Chevron Corp. | | | 36,450 | |
| | 581 | | | Marathon Oil Corp. | | | 7,913 | |
| | | | | | | | |
| | | | | | | 44,363 | |
| | |
| Personal Products(a) – 0.5% | | | |
| | 97 | | | The Estee Lauder Cos., Inc. Class A | | | 30,854 | |
| | |
| Pharmaceuticals – 2.8% | | | |
| | 532 | | | Bristol-Myers Squibb Co. | | | 35,548 | |
| | 636 | | | Johnson & Johnson(a) | | | 104,775 | |
| | 473 | | | Merck & Co., Inc. | | | 36,785 | |
| | | | | | | | |
| | | | | | | 177,108 | |
| | |
| Professional Services – 0.8% | | | |
| | 89 | | | Equifax, Inc. | | | 21,316 | |
| | 164 | | | Verisk Analytics, Inc. | | | 28,654 | |
| | | | | | | | |
| | | | | | | 49,970 | |
| | |
| Road & Rail – 1.9% | | | |
| | 1,051 | | | CSX Corp. | | | 33,716 | |
| | 93 | | | Norfolk Southern Corp. | | | 24,683 | |
| | 52 | | | Old Dominion Freight Line, Inc. | | | 13,198 | |
| | 225 | | | Union Pacific Corp.(a) | | | 49,484 | |
| | | | | | | | |
| | | | | | | 121,081 | |
| | |
| Semiconductors & Semiconductor Equipment – 2.1% | | | |
| | 103 | | | Broadcom, Inc. | | | 49,114 | |
| | 44 | | | Monolithic Power Systems, Inc. | | | 16,432 | |
| | 100 | | | Skyworks Solutions, Inc. | | | 19,175 | |
| | 80 | | | Teradyne, Inc. | | | 10,717 | |
| | 180 | | | Texas Instruments, Inc. | | | 34,614 | |
| | | | | | | | |
| | | | | | | 130,052 | |
| | |
| |
| Common Stocks – (continued) | | | |
| Software – 9.1% | | | |
| | 64 | | | ANSYS, Inc.* | | | 22,212 | |
| | 129 | | | Autodesk, Inc.* | | | 37,655 | |
| | 87 | | | Cadence Design Systems, Inc.*(a) | | | 11,903 | |
| | 52 | | | Intuit, Inc. | | | 25,489 | |
| | 1,284 | | | Microsoft Corp.(a) | | | 347,836 | |
| | 30 | | | Paycom Software, Inc.* | | | 10,904 | |
| | 220 | | | salesforce.com, Inc.* | | | 53,739 | |
| | 64 | | | ServiceNow, Inc.*(a) | | | 35,171 | |
| | 43 | | | Synopsys, Inc.* | | | 11,859 | |
| | 35 | | | Tyler Technologies, Inc.* | | | 15,833 | |
| | | | | | | | |
| | | | | | | 572,601 | |
| | |
| Specialty Retail – 0.8% | | | |
| | 321 | | | The TJX Cos., Inc. | | | 21,642 | |
| | 83 | | | Tractor Supply Co. | | | 15,443 | |
| | 47 | | | Ulta Beauty, Inc.* | | | 16,251 | |
| | | | | | | | |
| | | | | | | 53,336 | |
| | |
| Technology Hardware, Storage & Peripherals(a) – 5.7% | | | |
| | 2,617 | | | Apple, Inc. | | | 358,424 | |
| | |
| Textiles, Apparel & Luxury Goods – 0.7% | | | |
| | 287 | | | NIKE, Inc. Class B | | | 44,339 | |
| | |
| Trading Companies & Distributors – 0.6% | | | |
| | 680 | | | Fastenal Co. | | | 35,360 | |
| | |
| Water Utilities – 0.2% | | | |
| | 99 | | | American Water Works Co., Inc. | | | 15,259 | |
| | |
| | TOTAL COMMON STOCKS | |
| | (Cost $5,429,972) | | $ | 5,721,145 | |
| | |
| | | | | | | | |
| Shares | | | Dividend
Rate | | Value | |
|
| Investment Company(b) – 4.7% | |
| Goldman Sachs Financial Square Government Fund –
Institutional Shares |
|
| | 296,143 | | | 0.026% | | $ | 296,143 | |
| | (Cost $296,143) | | | | |
| | |
| | TOTAL INVESTMENTS — 95.5% | | | | |
| | (Cost $5,726,115) | | $ | 6,017,288 | |
| | |
| OTHER ASSETS IN EXCESS OF
LIABILITIES — 4.5% | | | 280,718 | |
| | |
| | NET ASSETS — 100.0% | | $ | 6,298,006 | |
| | |
| | |
|
| The percentage shown for each investment category reflects the value of investments in that category as a percentage of net assets. |
| |
* | | Non-income producing security. |
| |
(a) | | All or a portion of security is segregated as collateral for initial margin requirements on futures transactions. |
| |
(b) | | Represents an affiliated issuer. |
| | | | |
|
Investment Abbreviations: |
PLC | | —Public Limited Company |
|
| | |
| The accompanying notes are an integral part of these financial statements. | | 9 |
GOLDMAN SACHS DEFENSIVE EQUITY FUND
Schedule of Investments (continued)
June 30, 2021 (Unaudited)
|
| ADDITIONAL INVESTMENT INFORMATION |
FUTURES CONTRACTS — At June 30, 2021, the Fund had the following futures contracts:
| | | | | | | | | | | | | | | | |
| Description | | Number of
Contracts | | | Expiration
Date | | | Notional
Amount | | | Unrealized
Appreciation/
(Depreciation) | |
Long position contracts: | | | | | | | | | | | | | | | | |
S&P 500 E-Mini Index | | | 2 | | | | 09/17/21 | | | $ | 428,860 | | | $ | 4,411 | |
PURCHASED AND WRITTEN OPTIONS CONTRACTS — At June 30, 2021, the Fund had the following purchased and written options:
EXCHANGE TRADED OPTIONS ON FUTURES
| | | | | | | | | | | | | | | | | | | | | | | | | | |
| Description | | Exercise
Price | | Expiration
Date | | | Number of
Contracts | | | Notional
Amount | | | Market
Value | | | Premiums Paid
(Received) by
Fund | | | Unrealized
Appreciation/
(Depreciation) | |
Purchased option contracts | | | | | | | | | | | | | | | | | | | | | | | | | | |
Puts | | | | | | | | | | | | | | | | | | | | | | | | | | |
S&P 500 Index | | 4,200.00 | | | 07/30/2021 | | | | 14 | | | $ | 1,400 | | | $ | 43,960 | | | $ | 45,463 | | | $ | (1,503 | ) |
Written option contracts | | | | | | | | | | | | | | | | | | | | | | | | | | |
Calls | | | | | | | | | | | | | | | | | | | | | | | | | | |
S&P 500 Index | | 4,355.00 | | | 07/30/2021 | | | | (14 | ) | | | (1,400 | ) | | | (34,859 | ) | | | (31,747 | ) | | | (3,112 | ) |
Puts | | | | | | | | | | | | | | | | | | | | | | | | | | |
S&P 500 Index | | 3,965.00 | | | 07/30/2021 | | | | (14 | ) | | | (1,400 | ) | | | (16,171 | ) | | | (16,194 | ) | | | 23 | |
| | | | | | | |
| Total written option contracts | | | | | | | | | (28 | ) | | $ | (2,800 | ) | | $ | (51,030 | ) | | $ | (47,941 | ) | | $ | (3,089 | ) |
| | | | | | | |
| TOTAL | | | | | | | | | (14 | ) | | $ | (1,400 | ) | | $ | (7,070 | ) | | $ | (2,478 | ) | | $ | (4,592 | ) |
| | |
| 10 | | The accompanying notes are an integral part of these financial statements. |
GOLDMAN SACHS ALTERNATIVE FUNDS II
Statements of Assets and Liabilities
June 30, 2021 (Unaudited)
| | | | | | | | | | |
| | | | | Commodity
Strategy Fund(a) | | | Defensive
Equity Fund | |
| | Assets: | |
| | Investments of unaffiliated issuers, at value (cost $292,396,448 and $5,429,972, respectively) | | $ | 292,411,014 | | | $ | 5,721,145 | |
| | Investments of affiliated issuers, at value (cost $72,748,311 and $296,143, respectively) | | | 72,748,311 | | | | 296,143 | |
| | Purchased options, at value (premium paid $0 and $45,463, respectively) | | | — | | | | 43,960 | |
| | Cash | | | 1,484,664 | | | | 90,573 | |
| | Unrealized gain on swap contracts | | | 9,697,177 | | | | — | |
| | Variation margin on futures contracts | | | 166,621 | | | | 3,290 | |
| | Upfront payments made on swap contracts | | | 2 | | | | — | |
| | Deferred offering costs | | | — | | | | 53,871 | |
| | Receivables: | |
| | Fund shares sold | | | 4,372,244 | | | | 250,000 | |
| | Dividends and interest | | | 289,510 | | | | 3,143 | |
| | Reimbursement from investment adviser | | | 32,196 | | | | 44,237 | |
| | Investments sold | | | — | | | | 1,258,420 | |
| | Collateral on certain derivative contracts(b) | | | — | | | | 24,200 | |
| | Other assets | | | 536,087 | | | | 27,945 | |
| | Total assets | | | 381,737,826 | | | | 7,816,927 | |
| | | | | | | | | | |
| | Liabilities: | |
| | Written option contracts, at value (premium received $0 and $47,941, respectively) | | | — | | | | 51,030 | |
| | Payables: | |
| | Fund shares redeemed | | | 966,036 | | | | — | |
| | Management fees | | | 143,144 | | | | 2,559 | |
| | Distribution and Service fees and Transfer Agency fees | | | 19,714 | | | | 305 | |
| | Investments purchased | | | 1,519 | | | | 1,324,600 | |
| | Due to broker — upfront payment | | | 35 | | | | — | |
| | Accrued expenses and other liabilities | | | 220,367 | | | | 140,427 | |
| | Total liabilities | | | 1,350,815 | | | | 1,518,921 | |
| | | | | | | | | | |
| | Net Assets: | |
| | Paid-in capital | | | 339,711,135 | | | | 5,781,352 | |
| | Total distributable earnings | | | 40,675,876 | | | | 516,654 | |
| | | NET ASSETS | | $ | 380,387,011 | | | $ | 6,298,006 | |
| | | Net Assets: | |
| | | Class A | | $ | 20,021,478 | | | $ | 355,689 | |
| | | Class C | | | 2,057,948 | | | | 54,447 | |
| | | Institutional | | | 160,722,995 | | | | 5,668,551 | |
| | | Investor | | | 11,039,233 | | | | 54,855 | |
| | | Class R6 | | | 94,073,665 | | | | 54,905 | |
| | | Class R | | | 2,930,768 | | | | 54,651 | |
| | | Class P | | | 89,540,924 | | | | 54,908 | |
| | | Total Net Assets | | $ | 380,387,011 | | | $ | 6,298,006 | |
| | | Shares Outstanding $0.001 par value (unlimited number of shares authorized): | | | | | | | | |
| | | Class A | | | 2,062,494 | | | | 32,502 | |
| | | Class C | | | 226,406 | | | | 5,000 | |
| | | Institutional | | | 16,332,798 | | | | 517,307 | |
| | | Investor | | | 1,121,041 | | | | 5,009 | |
| | | Class R6 | | | 9,538,996 | | | | 5,010 | |
| | | Class R | | | 308,158 | | | | 5,003 | |
| | | Class P | | | 9,082,068 | | | | 5,010 | |
| | | Net asset value, offering and redemption price per share:(c) | | | | | | | | |
| | | Class A | | | $9.71 | | | | $10.94 | |
| | | Class C | | | 9.09 | | | | 10.89 | |
| | | Institutional | | | 9.84 | | | | 10.96 | |
| | | Investor | | | 9.85 | | | | 10.95 | |
| | | Class R6 | | | 9.86 | | | | 10.96 | |
| | | Class R | | | 9.51 | | | | 10.92 | |
| | | Class P | | | 9.86 | | | | 10.96 | |
| | (a) | | Statement of Assets and Liabilities for the Commodity Strategy Fund is consolidated and include the balance of a wholly-owned subsidiary, Cayman Commodity-CSF, Ltd. Accordingly, all interfund balances and transactions have been eliminated. |
| | (b) | | Segregated for initial margin requirements and/or collateral on futures contracts. |
| | (c) | | Maximum public offering price per share for Class A Shares of the Commodity Strategy Fund and Defensive Equity Fund is $10.28 and $11.58, respectively. At redemption, Class C Shares may be subject to a contingent deferred sales charge assessed on the amount equal to the lesser of the current net asset value (“NAV”) or the original purchase price of the shares. |
| | |
| The accompanying notes are an integral part of these financial statements. | | 11 |
GOLDMAN SACHS ALTERNATIVE FUNDS II
Statements of Operations
For the Six Months Ended June 30, 2021 (Unaudited)
| | | | | | | | | | |
| | | | | Commodity
Strategy
Fund(a) | | | Defensive
Equity Fund | |
| | Investment income: | |
| | | |
| | Interest | | $ | 97,478 | | | $ | — | |
| | | |
| | Dividends — affiliated issuers | | | 8,473 | | | | 21 | |
| | | |
| | Dividends — unaffiliated issuers | | | — | | | | 33,565 | |
| | | |
| | Total investment income | | | 105,951 | | | | 33,586 | |
| | | | | | | | | | |
| | Expenses: | |
| | | |
| | Management fees | | | 857,533 | | | | 15,071 | |
| | | |
| | Professional fees | | | 117,836 | | | | 70,625 | |
| | | |
| | Printing and mailing costs | | | 108,356 | | | | 25,441 | |
| | | |
| | Custody, accounting and administrative services | | | 70,147 | | | | 44,586 | |
| | | |
| | Transfer Agency fees(b) | | | 63,515 | | | | 1,264 | |
| | | |
| | Registration fees | | | 40,350 | | | | 11,981 | |
| | | |
| | Distribution and Service (12b-1) fees(b) | | | 33,956 | | | | 408 | |
| | | |
| | Trustee fees | | | 9,707 | | | | 9,412 | |
| | | |
| | Service fees — Class C | | | 1,964 | | | | 65 | |
| | | |
| | Amortization of offering costs | | | — | | | | 98,570 | |
| | | |
| | Other | | | 15,899 | | | | 15,947 | |
| | | |
| | Total expenses | | | 1,319,263 | | | | 293,370 | |
| | | |
| | Less — expense reductions | | | (414,982 | ) | | | (276,505 | ) |
| | | |
| | Net expenses | | | 904,281 | | | | 16,865 | |
| | | |
| | NET INVESTMENT INCOME (LOSS) | | | (798,330 | ) | | | 16,721 | |
| | | | | | | | | | |
| | Realized and unrealized gain (loss): | | | | | | | | |
| |
| | Net realized gain from: | |
| | | |
| | Investments — unaffiliated issuers | | | 3,367,238 | | | | 683,329 | |
| | | |
| | Purchased options | | | — | | | | (431,905 | ) |
| | | |
| | Futures contracts | | | 10,535,209 | | | | 62,555 | |
| | | |
| | Written options | | | — | | | | 140,274 | |
| | | |
| | Swap contracts | | | 44,366,845 | | | | — | |
| |
| | Net change in unrealized gain (loss) on: | |
| | | |
| | Investments — unaffiliated issuers | | | (3,433,063 | ) | | | (45,999 | ) |
| | | |
| | Purchased options | | | — | | | | 698 | |
| | | |
| | Futures contracts | | | (1,769,328 | ) | | | (6,563 | ) |
| | | |
| | Written options | | | — | | | | 369 | |
| | | |
| | Swap contracts | | | 9,697,137 | | | | — | |
| | | |
| | Net realized and unrealized gain | | | 62,764,038 | | | | 402,758 | |
| | | |
| | NET INCREASE IN NET ASSETS RESULTING FROM OPERATIONS | | $ | 61,965,708 | | | $ | 419,479 | |
| | (a) | | Statement of Operations for Commodity Strategy Fund is consolidated and include the balance of a wholly-owned subsidiary, Cayman Commodity-CSF, Ltd. Accordingly, all interfund balances and transactions have been eliminated. |
| | (b) | | Class specific Distribution and/or Service (12b-1) and Transfer Agency fees were as follows: |
| | | | | | | | | | | | | | | | | | | | | | | | | | | | | | | | | | | | | | | | |
| | | Distribution and/or Service (12b-1) Fees | | | Transfer Agency Fees | |
Fund | | Class A | | | Class C | | | Class R | | | Class A | | | Class C | | | Institutional | | | Investor | | | Class R6 | | | Class R | | | Class P | |
Commodity Strategy | | $ | 22,197 | | | $ | 5,890 | | | $ | 5,869 | | | $ | 10,655 | | | $ | 942 | | | $ | 28,918 | | | $ | 3,721 | | | $ | 13,246 | | | $ | 1,409 | | | $ | 4,624 | |
Defensive Equity | | | 84 | | | | 194 | | | | 130 | | | | 54 | | | | 41 | | | | 1,072 | | | | 42 | | | | 7 | | | | 41 | | | | 7 | |
| | |
| 12 | | The accompanying notes are an integral part of these financial statements. |
GOLDMAN SACHS ALTERNATIVE FUNDS II
Statements of Changes in Net Assets
| | | | | | | | | | | | | | | | | | | | | | |
| | | | | Commodity Strategy Fund(a) | | | | | | Defensive Equity Fund | |
| | | | | For the
Six Months Ended
June 30, 2021
(Unaudited) | | | For the Fiscal
Year Ended
December 31, 2020 | | | | | | For the
Six Months Ended
June 30, 2021
(Unaudited) | | | For the
Period Ended
December 31, 2020(b) | |
| | From operations: | | | | | | | | | | | | | | | | | | | | |
| | | | | | |
| | Net investment income (loss) | | $ | (798,330 | ) | | $ | (264,652 | ) | | | | | | $ | 16,721 | | | $ | 10,363 | |
| | | | | | |
| | Net realized gain (loss) | | | 58,269,292 | | | | (52,273,359 | ) | | | | | | | 454,253 | | | | (245,088 | ) |
| | | | | | |
| | Net change in unrealized gain (loss) | | | 4,494,746 | | | | 1,808,856 | | | | | | | | (51,495 | ) | | | 342,487 | |
| | | | | | |
| | Net increase (decrease) in net assets resulting from operations | | | 61,965,708 | | | | (50,729,155 | ) | | | | | | | 419,479 | | | | 107,762 | |
| | | | | | | | | | | | | | | | | | | | | | |
| | Distributions to shareholders: | | | | | | | | | | | | | | | | | | | | |
| | | | | | |
| | From distributable earnings: | | | | | | | | | | | | | | | | | | | | |
| | | | | | |
| | Class A Shares | | | — | | | | (35,886 | ) | | | | | | | — | | | | (108 | ) |
| | | | | | |
| | Class C Shares | | | — | | | | — | | | | | | | | — | | | | (4 | ) |
| | | | | | |
| | Institutional Shares | | | — | | | | (485,058 | ) | | | | | | | — | | | | (10,372 | ) |
| | | | | | |
| | Investor Shares | | | — | | | | (10,293 | ) | | | | | | | — | | | | (89 | ) |
| | | | | | |
| | Class R6 Shares | | | — | | | | (249,795 | ) | | | | | | | — | | | | (105 | ) |
| | | | | | |
| | Class R Shares | | | — | | | | (2,158 | ) | | | | | | | — | | | | (26 | ) |
| | | | | | |
| | Class P Shares | | | — | | | | (2,720 | ) | | | | | | | — | | | | (105 | ) |
| | | | | | |
| | Total distributions to shareholders | | | — | | | | (785,910 | ) | | | | | | | — | | | | (10,809 | ) |
| | | | | | | | | | | | | | | | | | | | | | |
| | From share transactions: | | | | | | | | | | | | | | | | | | | | |
| | | | | | |
| | Proceeds from sales of shares | | | 145,345,704 | | | | 138,603,930 | | | | | | | | 371,017 | | | | 5,427,072 | |
| | | | | | |
| | Reinvestment of distributions | | | — | | | | 614,812 | | | | | | | | — | | | | 10,809 | |
| | | | | | |
| | Cost of shares redeemed | | | (59,688,345 | ) | | | (131,532,145 | ) | | | | | | | (27,254 | ) | | | (70 | ) |
| | | | | | |
| | Net increase in net assets resulting from share transactions | | | 85,657,359 | | | | 7,686,597 | | | | | | | | 343,763 | | | | 5,437,811 | |
| | | | | | |
| | TOTAL INCREASE (DECREASE) | | | 147,623,067 | | | | (43,828,468 | ) | | | | | | | 763,242 | | | | 5,534,764 | |
| | | | | | | | | | | | | | | | | | | | | | |
| | Net assets: | | | | | | | | | | | | | | | | | | | | |
| | | | | | |
| | Beginning of period | | | 232,763,944 | | | | 276,592,412 | | | | | | | | 5,534,764 | | | | – | |
| | | | | | |
| | End of period | | $ | 380,387,011 | | | $ | 232,763,944 | | | | | | | $ | 6,298,006 | | | $ | 5,534,764 | |
| | (a) | | Statements of Changes in Net Assets for the Commodity Strategy Fund is consolidated and include the balance of a wholly-owned subsidiary, Cayman Commodity-CSF, Ltd. Accordingly, all interfund balances and transactions have been eliminated. |
| | (b) | | Commenced operations on September 30, 2020. |
| | |
| The accompanying notes are an integral part of these financial statements. | | 13 |
GOLDMAN SACHS COMMODITY STRATEGY FUND
Consolidated Financial Highlights
Selected Share Data for a Share Outstanding Throughout Each Period
| | | | | | | | | | | | | | | | | | | | | | | | | | |
| | | | | Goldman Sachs Commodity Strategy Fund
| |
| | | | | Class A Shares | |
| | | | | Six Months Ended
June 30, 2021
(Unaudited) | | | Year Ended December 31, | |
| | | | | 2020 | | | 2019 | | | 2018 | | | 2017 | | | 2016 | |
| | Per Share Data | | | | | | | | | | | | | | | | | | | | | | | | |
| | | | | | | |
| | Net asset value, beginning of period | | $ | 7.79 | | | $ | 10.17 | | | $ | 9.66 | | | $ | 11.49 | | | $ | 11.68 | | | $ | 10.49 | |
| | | | | | | |
| | Net investment income (loss)(a) | | | (0.04 | ) | | | (0.03 | ) | | | 0.14 | | | | 0.10 | | | | 0.02 | | | | 0.02 | |
| | | | | | | |
| | Net realized and unrealized gain (loss) | | | 1.96 | | | | (2.33 | ) | | | 1.44 | | | | (1.84 | ) | | | 0.43 | | | | 1.23 | |
| | | | | | | |
| | Total from investment operations | | | 1.92 | | | | (2.36 | ) | | | 1.58 | | | | (1.74 | ) | | | 0.45 | | | | 1.25 | |
| | | | | | | |
| | Distributions to shareholders from net investment income | | | — | | | | (0.02 | ) | | | (0.18 | ) | | | (0.09 | ) | | | (0.52 | ) | | | (0.06 | ) |
| | | | | | | |
| | Distributions to shareholders from return of capital | | | — | | | | — | | | | (0.89 | ) | | | — | | | | (0.12 | ) | | | — | |
| | | | | | | |
| | Total distributions | | | — | | | | (0.02 | ) | | | (1.07 | ) | | | (0.09 | ) | | | (0.64 | ) | | | (0.06 | ) |
| | | | | | | |
| | Net asset value, end of period | | $ | 9.71 | | | $ | 7.79 | | | $ | 10.17 | | | $ | 9.66 | | | $ | 11.49 | | | $ | 11.68 | |
| | | | | | | |
| | Total return(b) | | | 24.65 | % | | | (23.16 | )% | | | 16.31 | % | | | (15.17 | )% | | | 3.95 | % | | | 11.91 | % |
| | | | | | | |
| | Net assets, end of period (in 000s) | | $ | 20,021 | | | $ | 15,324 | | | $ | 22,569 | | | $ | 25,351 | | | $ | 46,809 | | | $ | 60,944 | |
| | | | | | | |
| | Ratio of net expenses to average net assets | | | 0.92 | %(c) | | | 0.80 | % | | | 0.84 | % | | | 0.84 | % | | | 0.86 | % | | | 0.90 | % |
| | | | | | | |
| | Ratio of total expenses to average net assets | | | 1.12 | %(c) | | | 1.28 | % | | | 1.09 | % | | | 1.01 | % | | | 1.01 | % | | | 1.07 | % |
| | | | | | | |
| | Ratio of net investment income (loss) to average net assets | | | (0.85 | )%(c) | | | (0.39 | )% | | | 1.34 | % | | | 0.88 | % | | | 0.16 | % | | | 0.19 | % |
| | | | | | | |
| | Portfolio turnover rate(d) | | | 65 | % | | | 70 | % | | | 52 | % | | | 46 | % | | | 89 | % | | | 145 | % |
| | (a) | | Calculated based on the average shares outstanding methodology. |
| | (b) | | Assumes investment at the net asset value at the beginning of the period, reinvestment of all distributions, a complete redemption of the investment at the net asset value at the end of the period and no sales or redemption charges (if any). Total returns would be reduced if a sales or redemption charge was taken into account. Returns do not reflect the impact of taxes to shareholders relating to Fund distributions or the redemption of Fund shares. Total returns for periods less than one full year are not annualized. |
| | (d) | | The Fund’s portfolio turnover rate is calculated in accordance with regulatory requirements, without regard to transactions involving short term investments and certain derivatives. If such transactions were included, the Fund’s portfolio turnover rate may be higher. |
| | |
| 14 | | The accompanying notes are an integral part of these financial statements. |
GOLDMAN SACHS COMMODITY STRATEGY FUND
Consolidated Financial Highlights (continued)
Selected Share Data for a Share Outstanding Throughout Each Period
| | | | | | | | | | | | | | | | | | | | | | | | | | |
| | | | | Goldman Sachs Commodity Strategy Fund
| |
| | | | | Class C Shares | |
| | | | | Six Months Ended
June 30, 2021
(Unaudited) | | | Year Ended December 31, | |
| | | | | 2020 | | | 2019 | | | 2018 | | | 2017 | | | 2016 | |
| | Per Share Data | | | | | | | | | | | | | | | | | | | | | | | | |
| | | | | | | |
| | Net asset value, beginning of period | | $ | 7.32 | | | $ | 9.61 | | | $ | 9.17 | | | $ | 10.92 | | | $ | 11.15 | | | $ | 10.04 | |
| | | | | | | |
| | Net investment income (loss)(a) | | | (0.07 | ) | | | (0.08 | ) | | | 0.08 | | | | 0.02 | | | | (0.07 | ) | | | (0.06 | ) |
| | | | | | | |
| | Net realized and unrealized gain (loss) | | | 1.84 | | | | (2.21 | ) | | | 1.35 | | | | (1.75 | ) | | | 0.42 | | | | 1.17 | |
| | | | | | | |
| | Total from investment operations | | | 1.77 | | | | (2.29 | ) | | | 1.43 | | | | (1.73 | ) | | | 0.35 | | | | 1.11 | |
| | | | | | | |
| | Distributions to shareholders from net investment income | | | — | | | | — | | | | (0.17 | ) | | | (0.02 | ) | | | (0.46 | ) | | | — | |
| | | | | | | |
| | Distributions to shareholders from return of capital | | | — | | | | — | | | | (0.82 | ) | | | — | | | | (0.12 | ) | | | — | |
| | | | | | | |
| | Total distributions | | | — | | | | — | | | | (0.99 | ) | | | (0.02 | ) | | | (0.58 | ) | | | — | |
| | | | | | | |
| | Net asset value, end of period | | $ | 9.09 | | | $ | 7.32 | | | $ | 9.61 | | | $ | 9.17 | | | $ | 10.92 | | | $ | 11.15 | |
| | | | | | | |
| | Total return(b) | | | 24.18 | % | | | (23.77 | )% | | | 15.54 | % | | | (15.84 | )% | | | 3.16 | % | | | 11.02 | % |
| | | | | | | |
| | Net assets, end of period (in 000s) | | $ | 2,058 | | | $ | 1,340 | | | $ | 2,271 | | | $ | 2,472 | | | $ | 2,949 | | | $ | 3,858 | |
| | | | | | | |
| | Ratio of net expenses to average net assets | | | 1.67 | %(c) | | | 1.55 | % | | | 1.59 | % | | | 1.59 | % | | | 1.61 | % | | | 1.65 | % |
| | | | | | | |
| | Ratio of total expenses to average net assets | | | 1.87 | %(c) | | | 2.03 | % | | | 1.84 | % | | | 1.76 | % | | | 1.76 | % | | | 1.82 | % |
| | | | | | | |
| | Ratio of net investment income (loss) to average net assets | | | (1.60 | )%(c) | | | (1.12 | )% | | | 0.81 | % | | | 0.14 | % | | | (0.68 | )% | | | (0.56 | )% |
| | | | | | | |
| | Portfolio turnover rate(d) | | | 65 | % | | | 70 | % | | | 52 | % | | | 46 | % | | | 89 | % | | | 145 | % |
| | (a) | | Calculated based on the average shares outstanding methodology. |
| | (b) | | Assumes investment at the net asset value at the beginning of the period, reinvestment of all distributions, a complete redemption of the investment at the net asset value at the end of the period and no sales or redemption charges (if any). Total returns would be reduced if a sales or redemption charge was taken into account. Returns do not reflect the impact of taxes to shareholders relating to Fund distributions or the redemption of Fund shares. Total returns for periods less than one full year are not annualized. |
| | (d) | | The Fund’s portfolio turnover rate is calculated in accordance with regulatory requirements, without regard to transactions involving short term investments and certain derivatives. If such transactions were included, the Fund’s portfolio turnover rate may be higher. |
| | |
| The accompanying notes are an integral part of these financial statements. | | 15 |
GOLDMAN SACHS COMMODITY STRATEGY FUND
Consolidated Financial Highlights (continued)
Selected Share Data for a Share Outstanding Throughout Each Period
| | | | | | | | | | | | | | | | | | | | | | | | | | |
| | | | | Goldman Sachs Commodity Strategy Fund
| |
| | | | | Institutional Shares | |
| | | | | Six Months Ended
June 30, 2021
(Unaudited) | | | Year Ended December 31, | |
| | | | | 2020 | | | 2019 | | | 2018 | | | 2017 | | | 2016 | |
| | Per Share Data | | | | | | | | | | | | | | | | | | | | | | | | |
| | | | | | | |
| | Net asset value, beginning of period | | $ | 7.88 | | | $ | 10.28 | | | $ | 9.74 | | | $ | 11.61 | | | $ | 11.80 | | | $ | 10.59 | |
| | | | | | | |
| | Net investment income (loss)(a) | | | (0.02 | ) | | | (0.01 | ) | | | 0.09 | | | | 0.15 | | | | 0.09 | | | | 0.06 | |
| | | | | | | |
| | Net realized and unrealized gain (loss) | | | 1.98 | | | | (2.36 | ) | | | 1.56 | | | | (1.88 | ) | | | 0.40 | | | | 1.25 | |
| | | | | | | |
| | Total from investment operations | | | 1.96 | | | | (2.37 | ) | | | 1.65 | | | | (1.73 | ) | | | 0.49 | | | | 1.31 | |
| | | | | | | |
| | Distributions to shareholders from net investment income | | | — | | | | (0.03 | ) | | | (0.19 | ) | | | (0.14 | ) | | | (0.56 | ) | | | (0.10 | ) |
| | | | | | | |
| | Distributions to shareholders from return of capital | | | — | | | | — | | | | (0.92 | ) | | | — | | | | (0.12 | ) | | | — | |
| | | | | | | |
| | Total distributions | | | — | | | | (0.03 | ) | | | (1.11 | ) | | | (0.14 | ) | | | (0.68 | ) | | | (0.10 | ) |
| | | | | | | |
| | Net asset value, end of period | | $ | 9.84 | | | $ | 7.88 | | | $ | 10.28 | | | $ | 9.74 | | | $ | 11.61 | | | $ | 11.80 | |
| | | | | | | |
| | Total return(b) | | | 24.87 | % | | | (22.96 | )% | | | 16.77 | % | | | (14.89 | )% | | | 4.28 | % | | | 12.32 | % |
| | | | | | | |
| | Net assets, end of period (in 000s) | | $ | 160,723 | | | $ | 127,172 | | | $ | 156,673 | | | $ | 259,239 | | | $ | 314,888 | | | $ | 326,270 | |
| | | | | | | |
| | Ratio of net expenses to average net assets | | | 0.59 | %(c) | | | 0.47 | % | | | 0.50 | % | | | 0.50 | % | | | 0.52 | % | | | 0.56 | % |
| | | | | | | |
| | Ratio of total expenses to average net assets | | | 0.79 | %(c) | | | 0.96 | % | | | 0.74 | % | | | 0.66 | % | | | 0.66 | % | | | 0.72 | % |
| | | | | | | |
| | Ratio of net investment income (loss) to average net assets | | | (0.52 | )%(c) | | | (0.10 | )% | | | 0.81 | % | | | 1.23 | % | | | 0.78 | % | | | 0.53 | % |
| | | | | | | |
| | Portfolio turnover rate(d) | | | 65 | % | | | 70 | % | | | 52 | % | | | 46 | % | | | 89 | % | | | 145 | % |
| | (a) | | Calculated based on the average shares outstanding methodology. |
| | (b) | | Assumes investment at the net asset value at the beginning of the period, reinvestment of all distributions, a complete redemption of the investment at the net asset value at the end of the period and no sales or redemption charges (if any). Total returns would be reduced if a sales or redemption charge was taken into account. Returns do not reflect the impact of taxes to shareholders relating to Fund distributions or the redemption of Fund shares. Total returns for periods less than one full year are not annualized. |
| | (d) | | The Fund’s portfolio turnover rate is calculated in accordance with regulatory requirements, without regard to transactions involving short term investments and certain derivatives. If such transactions were included, the Fund’s portfolio turnover rate may be higher. |
| | |
| 16 | | The accompanying notes are an integral part of these financial statements. |
GOLDMAN SACHS COMMODITY STRATEGY FUND
Consolidated Financial Highlights (continued)
Selected Share Data for a Share Outstanding Throughout Each Period
| | | | | | | | | | | | | | | | | | | | | | | | | | |
| | | | | Goldman Sachs Commodity Strategy Fund
| |
| | | | | Investor Shares | |
| | | | | Six Months Ended
June 30, 2021
(Unaudited) | | | Year Ended December 31, | |
| | | | | 2020 | | | 2019 | | | 2018 | | | 2017 | | | 2016 | |
| | Per Share Data | | | | | | | | | | | | | | | | | | | | | | | | |
| | | | | | | |
| | Net asset value, beginning of period | | $ | 7.89 | | | $ | 10.29 | | | $ | 9.75 | | | $ | 11.61 | | | $ | 11.81 | | | $ | 10.60 | |
| | | | | | | |
| | Net investment income (loss)(a) | | | (0.03 | ) | | | (0.01 | ) | | | (0.04 | ) | | | 0.14 | | | | (0.02 | ) | | | 0.05 | |
| | | | | | | |
| | Net realized and unrealized gain (loss) | | | 1.99 | | | | (2.37 | ) | | | 1.68 | | | | (1.87 | ) | | | 0.49 | | | | 1.25 | |
| | | | | | | |
| | Total from investment operations | | | 1.96 | | | | (2.38 | ) | | | 1.64 | | | | (1.73 | ) | | | 0.47 | | | | 1.30 | |
| | | | | | | |
| | Distributions to shareholders from net investment income | | | — | | | | (0.02 | ) | | | (0.18 | ) | | | (0.13 | ) | | | (0.55 | ) | | | (0.09 | ) |
| | | | | | | |
| | Distributions to shareholders from return of capital | | | — | | | | — | | | | (0.92 | ) | | | — | | | | (0.12 | ) | | | — | |
| | | | | | | |
| | Total distributions | | | — | | | | (0.02 | ) | | | (1.10 | ) | | | (0.13 | ) | | | (0.67 | ) | | | (0.09 | ) |
| | | | | | | |
| | Net asset value, end of period | | $ | 9.85 | | | $ | 7.89 | | | $ | 10.29 | | | $ | 9.75 | | | $ | 11.61 | | | $ | 11.81 | |
| | | | | | | |
| | Total return(b) | | | 24.84 | % | | | (22.99 | )% | | | 16.73 | % | | | (14.97 | )% | | | 4.08 | % | | | 12.21 | % |
| | | | | | | |
| | Net assets, end of period (in 000s) | | $ | 11,039 | | | $ | 3,115 | | | $ | 6,651 | | | $ | 8,272 | | | $ | 8,586 | | | $ | 5,265 | |
| | | | | | | |
| | Ratio of net expenses to average net assets | | | 0.67 | %(c) | | | 0.55 | % | | | 0.59 | % | | | 0.59 | % | | | 0.61 | % | | | 0.65 | % |
| | | | | | | |
| | Ratio of total expenses to average net assets | | | 0.86 | %(c) | | | 1.02 | % | | | 0.83 | % | | | 0.75 | % | | | 0.75 | % | | | 0.82 | % |
| | | | | | | |
| | Ratio of net investment income (loss) to average net assets | | | (0.61 | )%(c) | | | (0.09 | )% | | | (0.36 | )% | | | 1.15 | % | | | (0.18 | )% | | | 0.44 | % |
| | | | | | | |
| | Portfolio turnover rate(d) | | | 65 | % | | | 70 | % | | | 52 | % | | | 46 | % | | | 89 | % | | | 145 | % |
| | (a) | | Calculated based on the average shares outstanding methodology. |
| | (b) | | Assumes investment at the net asset value at the beginning of the period, reinvestment of all distributions, a complete redemption of the investment at the net asset value at the end of the period and no sales or redemption charges (if any). Total returns would be reduced if a sales or redemption charge was taken into account. Returns do not reflect the impact of taxes to shareholders relating to Fund distributions or the redemption of Fund shares. Total returns for periods less than one full year are not annualized. |
| | (d) | | The Fund’s portfolio turnover rate is calculated in accordance with regulatory requirements, without regard to transactions involving short term investments and certain derivatives. If such transactions were included, the Fund’s portfolio turnover rate may be higher. |
| | |
| The accompanying notes are an integral part of these financial statements. | | 17 |
GOLDMAN SACHS COMMODITY STRATEGY FUND
Consolidated Financial Highlights (continued)
Selected Share Data for a Share Outstanding Throughout Each Period
| | | | | | | | | | | | | | | | | | | | | | | | | | |
| | | | | Goldman Sachs Commodity Strategy Fund | |
| | | | | Class R6 Shares | |
| | | | | Six Months Ended
June 30, 2021
(Unaudited) | | | Year Ended December 31, | |
| | | | | 2020 | | | 2019 | | | 2018 | | | 2017 | | | 2016 | |
| | Per Share Data | | | | | | | | | | | | | | | | | | | | | | | | |
| | | | | | | |
| | Net asset value, beginning of period | | $ | 7.90 | | | $ | 10.30 | | | $ | 9.76 | | | $ | 11.62 | | | $ | 11.80 | | | $ | 10.60 | |
| | | | | | | |
| | Net investment income (loss)(a) | | | (0.02 | ) | | | (0.01 | ) | | | 0.38 | | | | 0.14 | | | | (0.45 | ) | | | 0.06 | |
| | | | | | | |
| | Net realized and unrealized gain (loss) | | | 1.98 | | | | (2.36 | ) | | | 1.27 | | | | (1.87 | ) | | | 0.95 | | | | 1.24 | |
| | | | | | | |
| | Total from investment operations | | | 1.96 | | | | (2.37 | ) | | | 1.65 | | | | (1.73 | ) | | | 0.50 | | | | 1.30 | |
| | | | | | | |
| | Distributions to shareholders from net investment income | | | — | | | | (0.03 | ) | | | (0.19 | ) | | | (0.13 | ) | | | (0.56 | ) | | | (0.10 | ) |
| | | | | | | |
| | Distributions to shareholders from return of capital | | | — | | | | — | | | | (0.92 | ) | | | — | | | | (0.12 | ) | | | — | |
| | | | | | | |
| | Total distributions | | | — | | | | (0.03 | ) | | | (1.11 | ) | | | (0.13 | ) | | | (0.68 | ) | | | (0.10 | ) |
| | | | | | | |
| | Net asset value, end of period | | $ | 9.86 | | | $ | 7.90 | | | $ | 10.30 | | | $ | 9.76 | | | $ | 11.62 | | | $ | 11.80 | |
| | | | | | | |
| | Total return(b) | | | 24.81 | % | | | (22.92 | )% | | | 16.87 | % | | | (14.96 | )% | | | 4.29 | % | | | 12.25 | % |
| | | | | | | |
| | Net assets, end of period (in 000s) | | $ | 94,074 | | | $ | 83,227 | | | $ | 85,170 | | | $ | 182 | | | $ | 90 | | | $ | 1,907 | |
| | | | | | | |
| | Ratio of net expenses to average net assets | | | 0.58 | %(c) | | | 0.46 | % | | | 0.49 | % | | | 0.49 | % | | | 0.50 | % | | | 0.54 | % |
| | | | | | | |
| | Ratio of total expenses to average net assets | | | 0.79 | %(c) | | | 0.96 | % | | | 0.75 | % | | | 0.68 | % | | | 0.66 | % | | | 0.72 | % |
| | | | | | | |
| | Ratio of net investment income (loss) to average net assets | | | (0.50 | )%(c) | | | (0.09 | )% | | | 3.52 | % | | | 1.15 | % | | | (4.04 | )% | | | 0.54 | % |
| | | | | | | |
| | Portfolio turnover rate(d) | | | 65 | % | | | 70 | % | | | 52 | % | | | 46 | % | | | 89 | % | | | 145 | % |
| | (a) | | Calculated based on the average shares outstanding methodology. |
| | (b) | | Assumes investment at the net asset value at the beginning of the period, reinvestment of all distributions, a complete redemption of the investment at the net asset value at the end of the period and no sales or redemption charges (if any). Total returns would be reduced if a sales or redemption charge was taken into account. Returns do not reflect the impact of taxes to shareholders relating to Fund distributions or the redemption of Fund shares. Total returns for periods less than one full year are not annualized. |
| | (d) | | The Fund’s portfolio turnover rate is calculated in accordance with regulatory requirements, without regard to transactions involving short term investments and certain derivatives. If such transactions were included, the Fund’s portfolio turnover rate may be higher. |
| | |
| 18 | | The accompanying notes are an integral part of these financial statements. |
GOLDMAN SACHS COMMODITY STRATEGY FUND
Consolidated Financial Highlights (continued)
Selected Share Data for a Share Outstanding Throughout Each Period
| | | | | | | | | | | | | | | | | | | | | | | | | | |
| | | | | Goldman Sachs Commodity Strategy Fund | |
| | | | | Class R Shares | |
| | | | | Six Months Ended
June 30, 2021
(Unaudited) | | | Year Ended December 31, | |
| | | | | 2020 | | | 2019 | | | 2018 | | | 2017 | | | 2016 | |
| | Per Share Data | | | | | | | | | | | | | | | | | | | | | | | | |
| | | | | | | |
| | Net asset value, beginning of period | | $ | 7.64 | | | $ | 9.99 | | | $ | 9.50 | | | $ | 11.31 | | | $ | 11.51 | | | $ | 10.35 | |
| | | | | | | |
| | Net investment income (loss)(a) | | | (0.05 | ) | | | (0.05 | ) | | | 0.16 | | | | 0.07 | | | | (0.04 | ) | | | (0.01 | ) |
| | | | | | | |
| | Net realized and unrealized gain (loss) | | | 1.92 | | | | (2.29 | ) | | | 1.38 | | | | (1.81 | ) | | | 0.45 | | | | 1.21 | |
| | | | | | | |
| | Total from investment operations | | | 1.87 | | | | (2.34 | ) | | | 1.54 | | | | (1.74 | ) | | | 0.41 | | | | 1.20 | |
| | | | | | | |
| | Distributions to shareholders from net investment income | | | — | | | | (0.01 | ) | | | (0.18 | ) | | | (0.07 | ) | | | (0.49 | ) | | | (0.04 | ) |
| | | | | | | |
| | Distributions to shareholders from return of capital | | | — | | | | — | | | | (0.87 | ) | | | — | | | | (0.12 | ) | | | — | |
| | | | | | | |
| | Total distributions | | | — | | | | (0.01 | ) | | | (1.05 | ) | | | (0.07 | ) | | | (0.61 | ) | | | (0.04 | ) |
| | | | | | | |
| | Net asset value, end of period | | $ | 9.51 | | | $ | 7.64 | | | $ | 9.99 | | | $ | 9.50 | | | $ | 11.31 | | | $ | 11.51 | |
| | | | | | | |
| | Total return(b) | | | 24.48 | % | | | (23.36 | )% | | | 16.11 | % | | | (15.40 | )% | | | 3.60 | % | | | 11.60 | % |
| | | | | | | |
| | Net assets, end of period (in 000s) | | $ | 2,931 | | | $ | 1,903 | | | $ | 2,280 | | | $ | 2,233 | | | $ | 2,892 | | | $ | 4,419 | |
| | | | | | | |
| | Ratio of net expenses to average net assets | | | 1.17 | %(c) | | | 1.05 | % | | | 1.09 | % | | | 1.09 | % | | | 1.11 | % | | | 1.14 | % |
| | | | | | | |
| | Ratio of total expenses to average net assets | | | 1.37 | %(c) | | | 1.54 | % | | | 1.34 | % | | | 1.25 | % | | | 1.26 | % | | | 1.34 | % |
| | | | | | | |
| | Ratio of net investment income (loss) to average net assets | | | (1.10 | )%(c) | | | (0.68 | )% | | | 1.53 | % | | | 0.64 | % | | | (0.40 | )% | | | (0.07 | )% |
| | | | | | | |
| | Portfolio turnover rate(d) | | | 65 | % | | | 70 | % | | | 52 | % | | | 46 | % | | | 89 | % | | | 145 | % |
| | (a) | | Calculated based on the average shares outstanding methodology. |
| | (b) | | Assumes investment at the net asset value at the beginning of the period, reinvestment of all distributions, a complete redemption of the investment at the net asset value at the end of the period and no sales or redemption charges (if any). Total returns would be reduced if a sales or redemption charge was taken into account. Returns do not reflect the impact of taxes to shareholders relating to Fund distributions or the redemption of Fund shares. Total returns for periods less than one full year are not annualized. |
| | (d) | | The Fund’s portfolio turnover rate is calculated in accordance with regulatory requirements, without regard to transactions involving short term investments and certain derivatives. If such transactions were included, the Fund’s portfolio turnover rate may be higher. |
| | |
| The accompanying notes are an integral part of these financial statements. | | 19 |
GOLDMAN SACHS COMMODITY STRATEGY FUND
Consolidated Financial Highlights (continued)
Selected Share Data for a Share Outstanding Throughout Each Period
| | | | | | | | | | | | | | | | | | |
| | | | | Goldman Sachs Commodity Strategy Fund | |
| | | | | Class P Shares | |
| | | | | Six Months Ended
June 30, 2021
(Unaudited) | | | Year Ended December 31, | | | Period Ended
December 31, 2018* | |
| | | | | 2020 | | | 2019 | |
| | Per Share Data | | | | | | | | | | | | | | | | |
| | | | | |
| | Net asset value, beginning of period | | $ | 7.90 | | | $ | 10.29 | | | $ | 9.76 | | | $ | 12.11 | |
| | | | | |
| | Net investment income (loss)(a) | | | (0.03 | ) | | | — | (b) | | | (0.25 | ) | | | 0.12 | |
| | | | | |
| | Net realized and unrealized gain (loss) | | | 1.99 | | | | (2.36 | ) | | | 1.89 | | | | (2.33 | ) |
| | | | | |
| | Total from investment operations | | | 1.96 | | | | (2.36 | ) | | | 1.64 | | | | (2.21 | ) |
| | | | | |
| | Distributions to shareholders from net investment income | | | — | | | | (0.03 | ) | | | (0.19 | ) | | | (0.14 | ) |
| | | | | |
| | Distributions to shareholders from return of capital | | | — | | | | — | | | | (0.92 | ) | | | — | |
| | | | | |
| | Total distributions | | | — | | | | (0.03 | ) | | | (1.11 | ) | | | (0.14 | ) |
| | | | | |
| | Net asset value, end of period | | $ | 9.86 | | | $ | 7.90 | | | $ | 10.29 | | | $ | 9.76 | |
| | | | | |
| | Total return(c) | | | 24.81 | % | | | (22.84 | )% | | | 16.73 | % | | | (18.31 | )% |
| | | | | |
| | Net assets, end of period (in 000s) | | $ | 89,541 | | | $ | 684 | | | $ | 977 | | | $ | 3,167 | |
| | | | | |
| | Ratio of net expenses to average net assets | | | 0.59 | %(d) | | | 0.45 | % | | | 0.48 | % | | | 0.45 | %(d) |
| | | | | |
| | Ratio of total expenses to average net assets | | | 0.75 | %(d) | | | 0.94 | % | | | 0.72 | % | | | 0.65 | %(d) |
| | | | | |
| | Ratio of net investment income (loss) to average net assets | | | (0.54 | )%(d) | | | (0.04 | )% | | | (2.28 | )% | | | 1.43 | %(d) |
| | | | | |
| | Portfolio turnover rate(e) | | | 65 | % | | | 70 | % | | | 52 | % | | | 46 | % |
| | * | | Commencement of operations on April 17, 2018. |
| | (a) | | Calculated based on the average shares outstanding methodology. |
| | (b) | | Amount is less than $0.005 per share. |
| | (c) | | Assumes investment at the net asset value at the beginning of the period, reinvestment of all distributions, a complete redemption of the investment at the net asset value at the end of the period and no sales or redemption charges (if any). Total returns would be reduced if a sales or redemption charge was taken into account. Returns do not reflect the impact of taxes to shareholders relating to Fund distributions or the redemption of Fund shares. Total returns for periods less than one full year are not annualized. |
| | (e) | | The Fund’s portfolio turnover rate is calculated in accordance with regulatory requirements, without regard to transactions involving short term investments and certain derivatives. If such transactions were included, the Fund’s portfolio turnover rate may be higher. |
| | |
| 20 | | The accompanying notes are an integral part of these financial statements. |
GOLDMAN SACHS DEFENSIVE EQUITY FUND
Financial Highlights (continued)
Selected Share Data for a Share Outstanding Throughout Each Period
| | | | | | | | | | | | | | |
| | | | | Goldman Sachs Defensive Equity Fund | |
| | | | | Class A Shares | |
| | | | | Six Months Ended
June 30, 2021
(Unaudited) | | | | | | Period Ended
December 31, 2020(a) | |
| | Per Share Data | | | | | | | | | | | | |
| | | | |
| | Net asset value, beginning of period | | $ | 10.19 | | | | | | | $ | 10.00 | |
| | | | |
| | Net investment income(b) | | | 0.01 | | | | | | | | 0.01 | |
| | | | |
| | Net realized and unrealized gain | | | 0.74 | | | | | | | | 0.19 | |
| | | | |
| | Total from investment operations | | | 0.75 | | | | | | | | 0.20 | |
| | | | |
| | Distributions to shareholders from net investment income | | | — | | | | | | | | (0.01 | ) |
| | | | |
| | Distributions to shareholders from net realized gains | | | — | | | | | | | | — | (c) |
| | | | |
| | Total distributions | | | — | | | | | | | | (0.01 | ) |
| | | | |
| | Net asset value, end of period | | $ | 10.94 | | | | | | | $ | 10.19 | |
| | | | |
| | Total return(d) | | | 7.46 | % | | | | | | | 2.04 | % |
| | | | |
| | Net assets, end of period (in 000s) | | $ | 356 | | | | | | | $ | 79 | |
| | | | |
| | Ratio of net expenses to average net assets | | | 0.94 | %(e) | | | | | | | 0.94 | %(e) |
| | | | |
| | Ratio of total expenses to average net assets | | | 8.90 | %(e) | | | | | | | 10.42 | %(e) |
| | | | |
| | Ratio of net investment income to average net assets | | | 0.25 | %(e) | | | | | | | 0.42 | %(e) |
| | | | |
| | Portfolio turnover rate(f) | | | 139 | % | | | | | | | 26 | % |
| | (a) | | Commenced operations on September 30, 2020. |
| | (b) | | Calculated based on the average shares outstanding methodology. |
| | (c) | | Rounds to less than $0.005 per share. |
| | (d) | | Assumes investment at the NAV at the beginning of the period, reinvestment of all dividends and distributions, a complete redemption of the investment at the NAV at the end of the period and no sales or redemption charges (if any). Total returns would be reduced if a sales or redemption charge was taken into account. Returns do not reflect the impact of taxes to shareholders relating to Fund distributions or the redemption of Fund shares. Total returns for periods less than one full year are not annualized. |
| | (f) | | The Fund’s portfolio turnover rate is calculated in accordance with regulatory requirements, without regard to transactions involving short term investments and certain derivatives. If such transactions were included, the Fund’s portfolio turnover rate may be higher. |
| | |
| The accompanying notes are an integral part of these financial statements. | | 21 |
GOLDMAN SACHS DEFENSIVE EQUITY FUND
Financial Highlights (continued)
Selected Share Data for a Share Outstanding Throughout Each Period
| | | | | | | | | | | | | | |
| | | | | Goldman Sachs Defensive Equity Fund
| |
| | | | | Class C Shares | |
| | | | | Six Months Ended
June 30, 2021
(Unaudited) | | | | | | Period Ended
December 31, 2020(a) | |
| | Per Share Data | | | | | | | | | | | | |
| | | | |
| | Net asset value, beginning of period | | $ | 10.18 | | | | | | | $ | 10.00 | |
| | | | |
| | Net investment loss(b) | | | (0.03 | ) | | | | | | | (0.01 | ) |
| | | | |
| | Net realized and unrealized gain | | | 0.74 | | | | | | | | 0.19 | |
| | | | |
| | Total from investment operations | | | 0.71 | | | | | | | | 0.18 | |
| | | | |
| | Distributions to shareholders from net realized gains | | | — | | | | | | | | — | (c) |
| | | | |
| | Net asset value, end of period | | $ | 10.89 | | | | | | | $ | 10.18 | |
| | | | |
| | Total return(d) | | | 6.97 | % | | | | | | | 1.81 | % |
| | | | |
| | Net assets, end of period (in 000s) | | $ | 54 | | | | | | | $ | 51 | |
| | | | |
| | Ratio of net expenses to average net assets | | | 1.69 | %(e) | | | | | | | 1.69 | %(e) |
| | | | |
| | Ratio of total expenses to average net assets | | | 9.67 | %(e) | | | | | | | 11.70 | %(e) |
| | | | |
| | Ratio of net investment loss to average net assets | | | (0.51 | )%(e) | | | | | | | (0.28 | )%(e) |
| | | | |
| | Portfolio turnover rate(f) | | | 139 | % | | | | | | | 26 | % |
| | (a) | | Commenced operations on September 30, 2020. |
| | (b) | | Calculated based on the average shares outstanding methodology. |
| | (c) | | Rounds to less than $0.005 per share. |
| | (d) | | Assumes investment at the NAV at the beginning of the period, reinvestment of all dividends and distributions, a complete redemption of the investment at the NAV at the end of the period and no sales or redemption charges (if any). Total returns would be reduced if a sales or redemption charge was taken into account. Returns do not reflect the impact of taxes to shareholders relating to Fund distributions or the redemption of Fund shares. Total returns for periods less than one full year are not annualized. |
| | (f) | | The Fund’s portfolio turnover rate is calculated in accordance with regulatory requirements, without regard to transactions involving short term investments and certain derivatives. If such transactions were included, the Fund’s portfolio turnover rate may be higher. |
| | |
| 22 | | The accompanying notes are an integral part of these financial statements. |
GOLDMAN SACHS DEFENSIVE EQUITY FUND
Financial Highlights (continued)
Selected Share Data for a Share Outstanding Throughout Each Period
| | | | | | | | | | | | | | |
| | | | | Goldman Sachs Defensive Equity Fund
| |
| | | | | Institutional Shares | |
| | | | | Six Months Ended
June 30, 2021
(Unaudited) | | | | | | Period Ended
December 31, 2020(a) | |
| | Per Share Data | | | | | | | | | | | | |
| | | | |
| | Net asset value, beginning of period | | $ | 10.19 | | | | | | | $ | 10.00 | |
| | | | |
| | Net investment income(b) | | | 0.03 | | | | | | | | 0.02 | |
| | | | |
| | Net realized and unrealized gain | | | 0.74 | | | | | | | | 0.19 | |
| | | | |
| | Total from investment operations | | | 0.77 | | | | | | | | 0.21 | |
| | | | |
| | Distributions to shareholders from net investment income | | | — | | | | | | | | (0.02 | ) |
| | | | |
| | Distributions to shareholders from net realized gains | | | — | | | | | | | | — | (c) |
| | | | |
| | Total distributions | | | — | | | | | | | | (0.02 | ) |
| | | | |
| | Net asset value, end of period | | $ | 10.96 | | | | | | | $ | 10.19 | |
| | | | |
| | Total return(d) | | | 7.56 | % | | | | | | | 2.11 | % |
| | | | |
| | Net assets, end of period (in 000s) | | $ | 5,669 | | | | | | | $ | 5,201 | |
| | | | |
| | Ratio of net expenses to average net assets | | | 0.57 | %(e) | | | | | | | 0.57 | %(e) |
| | | | |
| | Ratio of total expenses to average net assets | | | 8.55 | %(e) | | | | | | | 10.45 | %(e) |
| | | | |
| | Ratio of net investment income to average net assets | | | 0.61 | %(e) | | | | | | | 0.84 | %(e) |
| | | | |
| | Portfolio turnover rate(f) | | | 139 | % | | | | | | | 26 | % |
| | (a) | | Commenced operations on September 30, 2020. |
| | (b) | | Calculated based on the average shares outstanding methodology. |
| | (c) | | Rounds to less than $0.005 per share. |
| | (d) | | Assumes investment at the NAV at the beginning of the period, reinvestment of all dividends and distributions, a complete redemption of the investment at the NAV at the end of the period and no sales or redemption charges (if any). Total returns would be reduced if a sales or redemption charge was taken into account. Returns do not reflect the impact of taxes to shareholders relating to Fund distributions or the redemption of Fund shares. Total returns for periods less than one full year are not annualized. |
| | (f) | | The Fund’s portfolio turnover rate is calculated in accordance with regulatory requirements, without regard to transactions involving short term investments and certain derivatives. If such transactions were included, the Fund’s portfolio turnover rate may be higher. |
| | |
| The accompanying notes are an integral part of these financial statements. | | 23 |
GOLDMAN SACHS DEFENSIVE EQUITY FUND
Financial Highlights (continued)
Selected Share Data for a Share Outstanding Throughout Each Period
| | | | | | | | | | | | | | |
| | | | | Goldman Sachs Defensive Equity Fund | |
| | | | | Investor Shares | |
| | | | | Six Months Ended
June 30, 2021
(Unaudited) | | | | | | Period Ended
December 31, 2020(a) | |
| | Per Share Data | | | | | | | | | | | | |
| | | | |
| | Net asset value, beginning of period | | $ | 10.19 | | | | | | | $ | 10.00 | |
| | | | |
| | Net investment income(b) | | | 0.03 | | | | | | | | 0.02 | |
| | | | |
| | Net realized and unrealized gain | | | 0.73 | | | | | | | | 0.19 | |
| | | | |
| | Total from investment operations | | | 0.76 | | | | | | | | 0.21 | |
| | | | |
| | Distributions to shareholders from net investment income | | | — | | | | | | | | (0.02 | ) |
| | | | |
| | Distributions to shareholders from net realized gains | | | — | | | | | | | | — | (c) |
| | | | |
| | Total distributions | | | — | | | | | | | | (0.02 | ) |
| | | | |
| | Net asset value, end of period | | $ | 10.95 | | | | | | | $ | 10.19 | |
| | | | |
| | Total return(d) | | | 7.56 | % | | | | | | | 2.08 | % |
| | | | |
| | Net assets, end of period (in 000s) | | $ | 55 | | | | | | | $ | 51 | |
| | | | |
| | Ratio of net expenses to average net assets | | | 0.69 | %(e) | | | | | | | 0.69 | %(e) |
| | | | |
| | Ratio of total expenses to average net assets | | | 8.67 | %(e) | | | | | | | 10.70 | %(e) |
| | | | |
| | Ratio of net investment income to average net assets | | | 0.49 | %(e) | | | | | | | 0.72 | %(e) |
| | | | |
| | Portfolio turnover rate(f) | | | 139 | % | | | | | | | 26 | % |
| | (a) | | Commenced operations on September 30, 2020. |
| | (b) | | Calculated based on the average shares outstanding methodology. |
| | (c) | | Rounds to less than $0.005 per share. |
| | (d) | | Assumes investment at the NAV at the beginning of the period, reinvestment of all dividends and distributions, a complete redemption of the investment at the NAV at the end of the period and no sales or redemption charges (if any). Total returns would be reduced if a sales or redemption charge was taken into account. Returns do not reflect the impact of taxes to shareholders relating to Fund distributions or the redemption of Fund shares. Total returns for periods less than one full year are not annualized. |
| | (f) | | The Fund’s portfolio turnover rate is calculated in accordance with regulatory requirements, without regard to transactions involving short term investments and certain derivatives. If such transactions were included, the Fund’s portfolio turnover rate may be higher. |
| | |
| 24 | | The accompanying notes are an integral part of these financial statements. |
GOLDMAN SACHS DEFENSIVE EQUITY FUND
Financial Highlights (continued)
Selected Share Data for a Share Outstanding Throughout Each Period
| | | | | | | | | | | | | | |
| | | | | Goldman Sachs Defensive Equity Fund | |
| | | | | Class R6 Shares | |
| | | | | Six Months Ended
June 30, 2021
(Unaudited) | | | | | | Period Ended
December 31, 2020(a) | |
| | Per Share Data | | | | | | | | | | | | |
| | | | |
| | Net asset value, beginning of period | | $ | 10.19 | | | | | | | $ | 10.00 | |
| | | | |
| | Net investment income(b) | | | 0.03 | | | | | | | | 0.02 | |
| | | | |
| | Net realized and unrealized gain | | | 0.74 | | | | | | | | 0.19 | |
| | | | |
| | Total from investment operations | | | 0.77 | | | | | | | | 0.21 | |
| | | | |
| | Distributions to shareholders from net investment income | | | — | | | | | | | | (0.02 | ) |
| | | | |
| | Distributions to shareholders from net realized gains | | | — | | | | | | | | — | (c) |
| | | | |
| | Total distributions | | | — | | | | | | | | (0.02 | ) |
| | | | |
| | Net asset value, end of period | | $ | 10.96 | | | | | | | $ | 10.19 | |
| | | | |
| | Total return(d) | | | 7.56 | % | | | | | | | 2.11 | % |
| | | | |
| | Net assets, end of period (in 000s) | | $ | 55 | | | | | | | $ | 51 | |
| | | | |
| | Ratio of net expenses to average net assets | | | 0.57 | %(e) | | | | | | | 0.57 | %(e) |
| | | | |
| | Ratio of total expenses to average net assets | | | 8.55 | %(e) | | | | | | | 10.58 | %(e) |
| | | | |
| | Ratio of net investment income to average net assets | | | 0.61 | %(e) | | | | | | | 0.84 | %(e) |
| | | | |
| | Portfolio turnover rate(f) | | | 139 | % | | | | | | | 26 | % |
| | (a) | | Commenced operations on September 30, 2020. |
| | (b) | | Calculated based on the average shares outstanding methodology. |
| | (c) | | Rounds to less than $0.005 per share. |
| | (d) | | Assumes investment at the NAV at the beginning of the period, reinvestment of all dividends and distributions, a complete redemption of the investment at the NAV at the end of the period and no sales or redemption charges (if any). Total returns would be reduced if a sales or redemption charge was taken into account. Returns do not reflect the impact of taxes to shareholders relating to Fund distributions or the redemption of Fund shares. Total returns for periods less than one full year are not annualized. |
| | (f) | | The Fund’s portfolio turnover rate is calculated in accordance with regulatory requirements, without regard to transactions involving short term investments and certain derivatives. If such transactions were included, the Fund’s portfolio turnover rate may be higher. |
| | |
| The accompanying notes are an integral part of these financial statements. | | 25 |
GOLDMAN SACHS DEFENSIVE EQUITY FUND
Financial Highlights (continued)
Selected Share Data for a Share Outstanding Throughout Each Period
| | | | | | | | | | | | | | |
| | | | | Goldman Sachs Defensive Equity Fund | |
| | | | | Class R Shares | |
| | | | | Six Months Ended
June 30, 2021
(Unaudited) | | | | | | Period Ended
December 31, 2020(a) | |
| | Per Share Data | | | | | | | | | | | | |
| | | | |
| | Net asset value, beginning of period | | $ | 10.19 | | | | | | | $ | 10.00 | |
| | | | |
| | Net investment income(b) | | | — | (c) | | | | | | | 0.01 | |
| | | | |
| | Net realized and unrealized gain | | | 0.73 | | | | | | | | 0.19 | |
| | | | |
| | Total from investment operations | | | 0.73 | | | | | | | | 0.20 | |
| | | | |
| | Distributions to shareholders from net investment income | | | — | | | | | | | | (0.01 | ) |
| | | | |
| | Distributions to shareholders from net realized gains | | | — | | | | | | | | — | (d) |
| | | | |
| | Total distributions | | | — | | | | | | | | (0.01 | ) |
| | | | |
| | Net asset value, end of period | | $ | 10.92 | | | | | | | $ | 10.19 | |
| | | | |
| | Total return(e) | | | 7.26 | % | | | | | | | 1.95 | % |
| | | | |
| | Net assets, end of period (in 000s) | | $ | 55 | | | | | | | $ | 51 | |
| | | | |
| | Ratio of net expenses to average net assets | | | 1.19 | %(f) | | | | | | | 1.19 | %(f) |
| | | | |
| | Ratio of total expenses to average net assets | | | 9.17 | %(f) | | | | | | | 11.20 | %(f) |
| | | | |
| | Ratio of net investment income (loss) to average net assets | | | (0.01 | )%(f) | | | | | | | 0.22 | %(f) |
| | | | |
| | Portfolio turnover rate(g) | | | 139 | % | | | | | | | 26 | % |
| | (a) | | Commenced operations on September 30, 2020. |
| | (b) | | Calculated based on the average shares outstanding methodology. |
| | (c) | | Rounds to less than $0.01 per share. |
| | (d) | | Rounds to less than $0.005 per share. |
| | (e) | | Assumes investment at the NAV at the beginning of the period, reinvestment of all dividends and distributions, a complete redemption of the investment at the NAV at the end of the period and no sales or redemption charges (if any). Total returns would be reduced if a sales or redemption charge was taken into account. Returns do not reflect the impact of taxes to shareholders relating to Fund distributions or the redemption of Fund shares. Total returns for periods less than one full year are not annualized. |
| | (g) | | The Fund’s portfolio turnover rate is calculated in accordance with regulatory requirements, without regard to transactions involving short term investments and certain derivatives. If such transactions were included, the Fund’s portfolio turnover rate may be higher. |
| | |
| 26 | | The accompanying notes are an integral part of these financial statements. |
GOLDMAN SACHS DEFENSIVE EQUITY FUND
Financial Highlights (continued)
Selected Share Data for a Share Outstanding Throughout Each Period
| | | | | | | | | | | | | | |
| | | | | Goldman Sachs Defensive Equity Fund | |
| | | | | Class P Shares | |
| | | | | Six Months Ended
June 30, 2021
(Unaudited) | | | | | | Period Ended
December 31, 2020(a) | |
| | Per Share Data | | | | | | | | | | | | |
| | | | |
| | Net asset value, beginning of period | | $ | 10.19 | | | | | | | $ | 10.00 | |
| | | | |
| | Net investment income(b) | | | 0.03 | | | | | | | | 0.02 | |
| | | | |
| | Net realized and unrealized gain | | | 0.74 | | | | | | | | 0.19 | |
| | | | |
| | Total from investment operations | | | 0.77 | | | | | | | | 0.21 | |
| | | | |
| | Distributions to shareholders from net investment income | | | — | | | | | | | | (0.02 | ) |
| | | | |
| | Distributions to shareholders from net realized gains | | | — | | | | | | | | — | (c) |
| | | | |
| | Total distributions | | | — | | | | | | | | (0.02 | ) |
| | | | |
| | Net asset value, end of period | | $ | 10.96 | | | | | | | $ | 10.19 | |
| | | | |
| | Total return(d) | | | 7.56 | % | | | | | | | 2.11 | % |
| | | | |
| | Net assets, end of period (in 000s) | | $ | 55 | | | | | | | $ | 51 | |
| | | | |
| | Ratio of net expenses to average net assets | | | 0.56 | %(e) | | | | | | | 0.56 | %(e) |
| | | | |
| | Ratio of total expenses to average net assets | | | 8.54 | %(e) | | | | | | | 10.57 | %(e) |
| | | | |
| | Ratio of net investment income to average net assets | | | 0.62 | %(e) | | | | | | | 0.85 | %(e) |
| | | | |
| | Portfolio turnover rate(f) | | | 139 | % | | | | | | | 26 | % |
| | (a) | | Commenced operations on September 30, 2020. |
| | (b) | | Calculated based on the average shares outstanding methodology. |
| | (c) | | Rounds to less than $0.005 per share. |
| | (d) | | Assumes investment at the NAV at the beginning of the period, reinvestment of all dividends and distributions, a complete redemption of the investment at the NAV at the end of the period and no sales or redemption charges (if any). Total returns would be reduced if a sales or redemption charge was taken into account. Returns do not reflect the impact of taxes to shareholders relating to Fund distributions or the redemption of Fund shares. Total returns for periods less than one full year are not annualized. |
| | (f) | | The Fund’s portfolio turnover rate is calculated in accordance with regulatory requirements, without regard to transactions involving short term investments and certain derivatives. If such transactions were included, the Fund’s portfolio turnover rate may be higher. |
| | |
| The accompanying notes are an integral part of these financial statements. | | 27 |
GOLDMAN SACHS ALTERNATIVE FUNDS II
Notes to Financial Statements
June 30, 2021 (Unaudited)
Goldman Sachs Trust (the “Trust”) is a Delaware statutory trust registered under the Investment Company Act of 1940, as amended (the “Act”), as an open-end management investment company. The following table lists those series of the Trust that are included in this report (collectively, the “Funds” or individually a “Fund”), along with their corresponding share classes and respective diversification status under the Act:
| | | | |
| Fund | | Shares Classes Offered | | Diversified/
Non-diversified |
Commodity Strategy | | A, C, Institutional, Investor, R6, R and P | | Diversified |
Defensive Equity | | A, C, Institutional, Investor, R6, R and P | | Diversified |
Class A Shares of the Commodity Strategy Fund are sold with a front-end sales charge of up to 4.50%. Class A Shares of the Defensive Equity Fund are sold with a front-end sales charge of up to 5.50%. Class C Shares are sold with a contingent deferred sales charge (“CDSC”) of 1.00%, which is imposed on redemptions made within 12 months of purchase. Institutional, Investor, Class R6, Class R and Class P Shares are not subject to a sales charge.
Goldman Sachs Asset Management, L.P. (“GSAM”), an affiliate of Goldman Sachs & Co. LLC (“Goldman Sachs”), serves as investment adviser to the Funds pursuant to management agreements with the Trust. CoreCommodity Management, LLC (“CoreCommodity” or the “Sub-Adviser”) serves as a sub-adviser to the Commodity Strategy Fund. GSAM compensates the Sub-Adviser directly in accordance with the terms of the Sub-Advisory Agreement. The Commodity Strategy Fund is not charged any separate or additional investment advisory fees by the Sub-Adviser.
|
| 2. SIGNIFICANT ACCOUNTING POLICIES |
The financial statements have been prepared in accordance with accounting principles generally accepted in the United States of America (“GAAP”) and require management to make estimates and assumptions that may affect the reported amounts and disclosures. Actual results may differ from those estimates and assumptions. Each Fund is an investment company under GAAP and follows the accounting and reporting guidance applicable to investment companies.
A. Basis of Consolidation for Commodity Strategy Fund — Cayman Commodity-CSF, Ltd. (the “Subsidiary”), a Cayman Islands exempted company, is currently a wholly-owned subsidiary of the Commodity Strategy Fund. The Subsidiary acts as an investment vehicle for the Fund to enable the Fund to gain exposure to certain types of commodity-linked derivative instruments. The Fund is the sole shareholder of the Subsidiary, and it is intended that the Fund will remain the sole shareholder and will continue to control its Subsidiary. All inter-fund balances and transactions have been eliminated in consolidation. As of June 30, 2021, the Fund’s net assets were $380,387,011, of which $74,284,333, or 19.5%, represented the Subsidiary’s net assets.
B. Investment Valuation — The Funds’ valuation policy is to value investments at fair value.
C. Investment Income and Investments — Investment income includes interest income, dividend income, and securities lending income, if any. Interest income is accrued daily and adjusted for amortization of premiums and accretion of discounts. Dividend income is recognized on ex-dividend date or, for certain foreign securities, as soon as such information is obtained subsequent to the ex-dividend date. Non-cash dividends, if any, are recorded at the fair market value of the securities received. Investment transactions are reflected on trade date. Realized gains and losses are calculated using identified cost. Investment transactions are recorded on the following business day for daily net asset value (“NAV”) calculations. Investment income is recorded net of any foreign withholding taxes, less any amounts reclaimable. The Funds may file withholding tax reclaims in certain jurisdictions to recover a portion of amounts previously withheld. Any foreign capital gains tax is accrued daily based upon net unrealized gains, and is payable upon sale of such investments. Distributions received from the Funds’ investments in United States (“U.S.”) real estate investment trusts (“REITs”) may be characterized as ordinary income, net capital gain and/or a return of capital. A return of capital is recorded by the Funds as a reduction to the cost basis of the REIT.
28
GOLDMAN SACHS ALTERNATIVE FUNDS II
|
| 2. SIGNIFICANT ACCOUNTING POLICIES (continued) |
For derivative contracts, realized gains and losses are recorded upon settlement of the contract. Upfront payments, if any, are made or received upon entering into a swap agreement and are reflected in the Statement and Consolidated Statement of Assets and Liabilities. Upfront payments are recognized over the contract’s term/event as realized gains or losses, with the exception of forward starting swap contracts whose realized gains or losses are recognized from the effective start date. For securities with paydown provisions, principal payments received are treated as a proportionate reduction to the cost basis of the securities, and excess or shortfall amounts are recorded as income.
D. Class Allocations and Expenses — Investment income, realized and unrealized gain (loss), if any, and non-class specific expenses of each Fund are allocated daily based upon the proportion of net assets of each class. Non-class specific expenses directly incurred by a Fund are charged to that Fund, while such expenses incurred by the Trust are allocated across the applicable Funds on a straight-line and/or pro-rata basis depending upon the nature of the expenses. Class-specific expenses, where applicable, are borne by the respective share classes and include Distribution and Service, Transfer Agency and Service fees.
E. Offering Costs — Offering costs paid in connection with the initial offering of shares of the Defensive Equity Fund are being amortized on a straight-line basis over 12 months from the date of commencement of operations.
F. Federal Taxes and Distributions to Shareholders — It is each Fund’s policy to comply with the requirements of the Internal Revenue Code of 1986, as amended (the “Code”), applicable to regulated investment companies and to distribute each year substantially all of its investment company taxable income and capital gains to its shareholders. Accordingly, each Fund is not required to make any provisions for the payment of federal income tax. Distributions to shareholders are recorded on the ex-dividend date. Income and capital gains distributions, if any, are declared and paid according to the following schedule:
| | | | | | |
| Fund | | | | Income Distributions Declared/Paid | | Capital Gains Distributions Declared/Paid |
Commodity Strategy | | | | Semi-Annually | | Annually |
Defensive Equity | | | | Annually | | Annually |
The Subsidiary is classified as a controlled foreign corporation under the Code. Therefore, the Commodity Strategy Fund is required to increase its taxable income by its share of the Subsidiary’s income. Net losses of the Subsidiary cannot be deducted by the Fund in the current period nor carried forward to offset taxable income in future periods. Net capital losses, if any, are carried forward to future fiscal years and may be used to the extent allowed by the Code to offset any future capital gains. Losses that are carried forward will retain their character as either short-term or long-term capital losses. Utilization of capital loss carryforwards will reduce the requirement of future capital gains distributions.
The characterization of distributions to shareholders for financial reporting purposes is determined in accordance with federal income tax rules, which may differ from GAAP. The source of each Fund’s distributions may be shown in the accompanying financial statements as either from distributable earnings or capital. Certain components of the Funds’ net assets on the Statement and Consolidated Statement of Assets and Liabilities reflect permanent GAAP/tax differences based on the appropriate tax character.
|
| 3. INVESTMENTS AND FAIR VALUE MEASUREMENTS |
U.S. GAAP defines the fair value of a financial instrument as the amount that would be received to sell an asset or paid to transfer a liability in an orderly transaction between market participants at the measurement date (i.e., the exit price); the Funds’ policy is to use the market approach. GAAP establishes a fair value hierarchy that prioritizes the inputs to valuation techniques used to measure fair value. The hierarchy gives the highest priority to unadjusted quoted prices in active markets for identical assets or liabilities (Level 1 measurements) and the lowest priority to unobservable inputs (Level 3 measurements). The level in the fair value hierarchy within which the fair value measurement in its entirety falls shall be determined based on the lowest level input that is significant to the fair value measurement in its entirety. The levels used for classifying investments are not necessarily an
29
GOLDMAN SACHS ALTERNATIVE FUNDS II
Notes to Financial Statements (continued)
June 30, 2021 (Unaudited)
|
| 3. INVESTMENTS AND FAIR VALUE MEASUREMENTS (continued) |
indication of the risk associated with investing in these investments. The three levels of the fair value hierarchy are described below:
Level 1 — Unadjusted quoted prices in active markets that are accessible at the measurement date for identical, unrestricted assets or liabilities;
Level 2 — Quoted prices in markets that are not active or financial instruments for which significant inputs are observable (including, but not limited to, quoted prices for similar investments, interest rates, foreign exchange rates, volatility and credit spreads), either directly or indirectly;
Level 3 — Prices or valuations that require significant unobservable inputs (including GSAM’s assumptions in determining fair value measurement).
The Board of Trustees (“Trustees”) has approved Valuation Procedures that govern the valuation of the portfolio investments held by the Funds, including investments for which market quotations are not readily available. The Trustees have delegated to GSAM day-to-day responsibility for implementing and maintaining internal controls and procedures related to the valuation of the Fund’s investments. To assess the continuing appropriateness of pricing sources and methodologies, GSAM regularly performs price verification procedures and issues challenges as necessary to third party pricing vendors or brokers, and any differences are reviewed in accordance with the Valuation Procedures.
A. Level 1 and Level 2 Fair Value Investments — The valuation techniques and significant inputs used in determining the fair values for investments classified as Level 1 and Level 2 are as follows:
Equity Securities — Equity securities traded on a United States (“U.S.”) securities exchange or the NASDAQ system, or those located on certain foreign exchanges, including but not limited to the Americas, are valued daily at their last sale price or official closing price on the principal exchange or system on which they are traded. If there is no sale or official closing price or such price is believed by GSAM to not represent fair value, equity securities will be valued at the valid closing bid price for long positions and at the valid closing ask price for short positions (i.e. where there is sufficient volume, during normal exchange trading hours). If no valid bid/ask price is available, the equity security will be valued pursuant to the Valuation Procedures approved by the Trustees and consistent with applicable regulatory guidance. To the extent these investments are actively traded, they are classified as Level 1 of the fair value hierarchy, otherwise they are generally classified as Level 2. Certain equity securities containing unique attributes may be classified as Level 2.
Unlisted equity securities for which market quotations are available are valued at the last sale price on the valuation date, or if no sale occurs, at the last bid price for long positions or the last ask price for short positions, and are generally classified as Level 2. Securities traded on certain foreign securities exchanges are valued daily at fair value determined by an independent fair value service (if available) under Fair Valuation Procedures approved by the Trustees and consistent with applicable regulatory guidance. The independent fair value service takes into account multiple factors including, but not limited to, movements in the securities markets, certain depositary receipts, futures contracts and foreign currency exchange rates that have occurred subsequent to the close of the foreign securities exchange. These investments are generally classified as Level 2 of the fair value hierarchy.
Money Market Funds — Investments in the Goldman Sachs Financial Square Government Fund (“Underlying Fund”) are valued at the NAV per share of the Institutional Share class on the day of valuation. These investments are generally classified as Level 1 of the fair value hierarchy. For information regarding the Underlying Fund’s accounting policies and investment holdings, please see the Underlying Fund’s shareholder report.
Debt Securities — Debt securities for which market quotations are readily available are valued daily on the basis of quotations supplied by dealers or an independent pricing service approved by the Trustees. The pricing services may use valuation models or matrix pricing, which consider: (i) yield or price with respect to bonds that are considered comparable in characteristics such as rating, interest rate and maturity date or (ii) quotations from securities dealers to determine current value. With the exception of treasury securities of G7 countries, which are generally classified as Level 1, these investments are generally classified as Level 2 of the fair value hierarchy.
30
GOLDMAN SACHS ALTERNATIVE FUNDS II
|
| 3. INVESTMENTS AND FAIR VALUE MEASUREMENTS (continued) |
Derivative Contracts — A derivative is an instrument whose value is derived from underlying assets, indices, reference rates or a combination of these factors. A Fund enters into derivative transactions to hedge against changes in interest rates, securities prices, and/or currency exchange rates, to increase total return, or to gain access to certain markets or attain exposure to other underliers. For financial reporting purposes, cash collateral that has been pledged to cover obligations of a Fund and cash collateral received, if any, is reported separately on the Statement and Consolidated Statement of Assets and Liabilities as receivables/payables for collateral on certain derivatives contracts. Non-cash collateral pledged by a Fund, if any, is noted in the Schedule and Consolidated Schedule of Investments.
Exchange-traded derivatives, including futures and options contracts, are generally valued at the last sale or settlement price on the exchange where they are principally traded. Exchange-traded options without settlement prices are generally valued at the midpoint of the bid and ask prices on the exchange where they are principally traded (or, in the absence of two-way trading, at the last bid price for long positions and the last ask price for short positions). Exchange-traded derivatives typically fall within Level 1 of the fair value hierarchy. Over-the-counter (“OTC”) and centrally cleared derivatives are valued using market transactions and other market evidence, including market-based inputs to models, calibration to market-clearing transactions, broker or dealer quotations, or other alternative pricing sources. Where models are used, the selection of a particular model to value OTC and centrally cleared derivatives depends upon the contractual terms of, and specific risks inherent in, the instrument, as well as the availability of pricing information in the market. Valuation models require a variety of inputs, including contractual terms, market prices, yield curves, credit curves, measures of volatility, voluntary and involuntary prepayment rates, loss severity rates and correlations of such inputs. For OTC and centrally cleared derivatives that trade in liquid markets, model inputs can generally be verified and model selection does not involve significant management judgment. OTC and centrally cleared derivatives are classified within Level 2 of the fair value hierarchy when significant inputs are corroborated by market evidence.
i. Futures Contracts — Futures contracts are contracts to buy or sell a standardized quantity of a specified commodity or security. Upon entering into a futures contract, a Fund deposits cash or securities in an account on behalf of the broker in an amount sufficient to meet the initial margin requirement. Subsequent payments are made or received by a Fund equal to the daily change in the contract value and are recorded as variation margin receivable or payable with a corresponding offset to unrealized gains or losses.
ii. Options — When a Fund writes call or put options, an amount equal to the premium received is recorded as a liability and is subsequently marked-to-market to reflect the current value of the option written. Swaptions are options on swap contracts.
Upon the purchase of a call option or a put option by a Fund, the premium paid is recorded as an investment and subsequently marked-to-market to reflect the current value of the option. Certain options may be purchased with premiums to be determined on a future date. The premiums for these options are based upon implied volatility parameters at specified terms.
iii. Swap Contracts — Bilateral swap contracts are agreements in which a Fund and a counterparty agree to exchange periodic payments on a specified notional amount or make a net payment upon termination. Bilateral swap transactions are privately negotiated in the OTC market and payments are settled through direct payments between a Fund and the counterparty. By contrast, certain swap transactions are subject to mandatory central clearing. These swaps are executed through a derivatives clearing member (“DCM”), acting in an agency capacity, and submitted to a central counterparty (“CCP”) (“centrally cleared swaps”), in which case all payments are settled with the CCP through the DCM. Swaps are marked-to-market daily using pricing vendor quotations, counterparty or clearinghouse prices or model prices, and the change in value, if any, is recorded as an unrealized gain or loss. Upon entering into a swap contract, a Fund is required to satisfy an initial margin requirement by delivering cash or securities to the counterparty (or in some cases, segregated in a triparty account on behalf of the counterparty), which can be adjusted by any mark-to-market gains or losses pursuant to bilateral or centrally cleared arrangements. For centrally cleared swaps the daily change in valuation, if any, is recorded as a receivable or payable for variation margin.
A total return swap is an agreement that gives a Fund the right to receive or pay the appreciation or depreciation, as applicable, in the value of a specified security, an index, a basket of securities or indices or other instrument in return for a fee
31
GOLDMAN SACHS ALTERNATIVE FUNDS II
Notes to Financial Statements (continued)
June 30, 2021 (Unaudited)
|
| 3. INVESTMENTS AND FAIR VALUE MEASUREMENTS (continued) |
paid to the counterparty, which will typically be an agreed upon interest rate. If the underlying asset declines in value over the term of the swap, a Fund may also be required to pay the dollar value of that decline to the counterparty.
B. Level 3 Fair Value Investments — To the extent that significant inputs to valuation models and other alternative pricing sources are unobservable, or if quotations are not readily available, or if GSAM believes that such quotations do not accurately reflect fair value, the fair value of a Fund’s investments may be determined under Valuation Procedures approved by the Trustees. GSAM, consistent with its procedures and applicable regulatory guidance, may make an adjustment to the most recent valuation prices of either domestic or foreign securities in light of significant events to reflect what it believes to be the fair value of the securities at the time of determining a Fund’s NAV. To the extent investments are valued using single source broker quotations obtained directly from the broker or passed through from third party pricing vendors, such investments are classified as Level 3 investments.
C. Fair Value Hierarchy — The following is a summary of the Funds’ investments and derivatives classified in the fair value hierarchy as of June 30, 2021:
| | | | | | | | | | | | |
|
| COMMODITY STRATEGY | |
| | | |
| Investment Type | | Level 1 | | | Level 2 | | | Level 3 | |
| | | |
| Assets | | | | | | | | | | | | |
| | | |
Fixed Income | | | | | | | | | | | | |
| | | |
U.S. Treasury Obligations | | $ | 87,454,082 | | | $ | — | | | $ | — | |
| | | |
Investment Company | | | 72,748,311 | | | | — | | | | — | |
| | | |
Short-term Investments | | | 204,956,932 | | | | — | | | | — | |
| | | |
| Total | | $ | 365,159,325 | | | $ | — | | | $ | — | |
| | | |
| Derivative Type | | | | | | | | | |
| | | |
| Assets(a) | | | | | | | | | | | | |
| | | |
Futures Contracts | | $ | 4,239,695 | | | $ | — | | | $ | — | |
| | | |
Total Return Swap Contracts | | | — | | | | 9,697,177 | | | | — | |
| | | |
| Total | | $ | 4,239,695 | | | $ | 9,697,177 | | | $ | — | |
| | | |
| Liabilities(a) | | | | | | | | | | | | |
| | | |
Futures Contracts | | $ | (5,884,723 | ) | | $ | — | | | $ | — | |
32
GOLDMAN SACHS ALTERNATIVE FUNDS II
|
| 3. INVESTMENTS AND FAIR VALUE MEASUREMENTS (continued) |
| | | | | | | | | | | | |
|
| DEFENSIVE EQUITY | |
| | | |
| Investment Type | | Level 1 | | | Level 2 | | | Level 3 | |
| | | |
| Assets | | | | | | | | | | | | |
| | | |
Common Stock and/or Other Equity Investments(b) | | | | | | | | | | | | |
| | | |
Europe | | $ | 282,035 | | | $ | — | | | $ | — | |
| | | |
North America | | | 5,439,110 | | | | — | | | | — | |
| | | |
Investment Company | | | 296,143 | | | | — | | | | — | |
| | | |
| Total | | $ | 6,017,288 | | | $ | — | | | $ | — | |
| | | |
| Derivative Type | | | | | | | | | |
| | | |
| Assets | | | | | | | | | | | | |
| | | |
Futures Contracts(a) | | $ | 4,411 | | | $ | — | | | $ | — | |
| | | |
Purchased Options | | | 43,960 | | | | — | | | | — | |
| | | |
| Total | | $ | 48,371 | | | $ | — | | | $ | — | |
| | | |
| Liabilities | | | | | | | | | | | | |
| | | |
Written Options Contracts | | $ | (51,030 | ) | | $ | — | | | $ | — | |
| (a) | | Amount shown represents unrealized gain (loss) at period end. |
| (b) | | Amounts are disclosed by continent to highlight the impact of time zone differences between local market close and the calculation of net asset value. Security valuations are based on the principal exchange or system on which they are traded, which may differ from country of domicile. |
For further information regarding security characteristics, see the Schedule and Consolidated Schedule of Investments.
|
| 4. INVESTMENTS IN DERIVATIVES |
The following tables set forth, by certain risk types, the gross value of derivative contracts (not considered to be hedging instruments for accounting disclosure purposes) as of June 30, 2021. These instruments were used as part of the Funds’ investment strategies and to obtain and/or manage exposure related to the risks below. The values in the tables below exclude the effects of cash collateral received or posted pursuant to these derivative contracts, and therefore are not representative of the Funds’ net exposure.
| | | | | | | | | | | | |
| | | |
| COMMODITY STRATEGY | | | | | | | | | | |
| Risk | | Consolidated Statement of Assets
and Liabilities | | Assets | | | Consolidated Statement of Assets
and Liabilities | | Liabilities | |
Commodity | | Receivable for unrealized gain on swap
contracts/Variation margin on futures contracts | | $ | 13,936,872 | (a) | | Variation margin on futures contracts | | $ | (5,884,723) | (a) |
| | | | | | | | | | | | |
| | | |
DEFENSIVE EQUITY | | | | | | | | | | |
| Risk | | Statement of Assets
and Liabilities | | Assets | | | Statement of Assets
and Liabilities | | Liabilities | |
Equity | | Variation margin on futures contracts;
Purchased options, at value | | $ | 48,371 | (a) | | Written options, at value | | $ | (51,030) | |
| (a) | | Includes unrealized gain (loss) on futures contracts described in the Additional Investment Information sections of the Consolidated Schedule of Investments. Only the variation margin as of June 30, 2021 is reported within the Consolidated Statement of Assets and Liabilities. |
33
GOLDMAN SACHS ALTERNATIVE FUNDS II
Notes to Financial Statements (continued)
June 30, 2021 (Unaudited)
|
| 4. INVESTMENTS IN DERIVATIVES (continued) |
The following tables set forth, by certain risk types, the Funds’ gains (losses) related to these derivatives and their indicative volumes for the six months ended June 30, 2021. These gains (losses) should be considered in the context that these derivative contracts may have been executed to create investment opportunities and/or economically hedge certain investments, and accordingly, certain gains (losses) on such derivative contracts may offset certain (losses) gains attributable to investments. These gains (losses) are included in “Net realized gain (loss)” or “Net change in unrealized gain (loss)” on the Statement and Consolidated Statement of Operations:
| | | | | | | | | | |
| | |
| COMMODITY STRATEGY | | | | | | | | |
| Risk | | Consolidated Statement of Operations | | Net
Realized
Gain (Loss) | | | Net Change in
Unrealized
Gain (Loss) | |
| Interest rate | | Net change in unrealized loss on futures contracts | | $ | — | | | $ | (124,300 | ) |
| Commodity | | Net realized gain from swap contracts and futures contracts/ Net change in unrealized gain on swap contracts and futures contracts | | | 54,902,054 | | | | 8,052,109 | |
| Total | | | | $ | 54,902,054 | | | $ | 7,927,809 | |
| | |
| DEFENSIVE EQUITY | | | | | | | | |
| Risk | | Statement of Operations | | Net
Realized
Gain (Loss) | | | Net Change in
Unrealized
Gain (Loss) | |
| Equity | | Net realized gain (loss) from futures contracts, purchased options and written options/Net change in unrealized gain on futures contracts, purchased options and written options | | $ | (229,076 | ) | | $ | (5,496 | ) |
For the six months ended June 30, 2021, the relevant values for each derivative type was as follows:
| | | | | | | | | | | | | | | | | | | | |
| | | | | | Average Number of Contracts, Notional Amounts, or Shares/Units(a) | |
| Fund | | | | | Futures
contracts | | | Swap
Agreements | | | Purchased
Options | | | Written
Options | |
Commodity Strategy | | | | | | | 3,371 | | | $ | 214,492,651 | | | | — | | | | — | |
Defensive Equity | | | | | | | 2 | | | | — | | | | 2,167 | | | | 4,100 | |
| (a) | | Amounts disclosed represent the average number of contracts for futures contracts, notional amounts for swap agreements, or shares/units outstanding for purchased options and written options, based on absolute values, which is indicative of the volume for this derivative type, for the months that each Fund held such derivatives during the six months ended June 30, 2021. |
In order to better define its contractual rights and to secure rights that will help a Fund mitigate its counterparty risk, a Fund may enter into an International Swaps and Derivatives Association, Inc. Master Agreement (“ISDA Master Agreement”) or similar agreement with its derivatives counterparties. An ISDA Master Agreement is a bilateral agreement between a Fund and a counterparty that governs OTC derivatives (including forward foreign currency exchange contracts, and certain options and swaps), and typically contains, among other things, collateral posting terms and netting provisions in the event of a default and/or termination event. The provisions of the ISDA Master Agreement typically permit a single net payment in the event of a default (close-out netting) or similar event, including the bankruptcy or insolvency of the counterparty.
Collateral and margin requirements differ between exchange traded derivatives and OTC derivatives. Margin requirements are established by the broker or clearing house for exchange-traded and centrally cleared derivatives (financial futures contracts, options and centrally cleared swaps) pursuant to governing agreements for those instrument types. Brokers can ask for margin in excess of the minimum in certain circumstances. Collateral terms are contract-specific for OTC derivatives. For derivatives traded under an ISDA Master Agreement, the collateral requirements are typically calculated by netting the marked to market amount for each transaction under such agreement and comparing that amount to the value of any collateral currently pledged by a Fund and the counterparty. Additionally, a Fund may be required to post initial margin to the counterparty, the terms of which would be outlined in the confirmation of the OTC transaction.
34
GOLDMAN SACHS ALTERNATIVE FUNDS II
|
| 4. INVESTMENTS IN DERIVATIVES (continued) |
Generally, the amount of collateral due from or to a counterparty must exceed a minimum transfer amount threshold before a transfer is required to be made. To the extent amounts due to a Fund from its counterparties are not fully collateralized, contractually or otherwise, the Fund bears the risk of loss from counterparty nonperformance. A Fund attempts to mitigate counterparty risk by only entering into agreements with counterparties that the Investment Adviser believes to be of good standing and by monitoring the financial stability of those counterparties.
Additionally, the netting of assets and liabilities and the offsetting of collateral pledged or received are based on contractual netting/set-off provisions in the ISDA Master Agreement or similar agreements. However, in the event of a default or insolvency of a counterparty, a court could determine that such rights are not enforceable due to the restrictions or prohibitions against the right of setoff that may be imposed in accordance with a particular jurisdiction’s bankruptcy or insolvency laws.
The following table sets forth the Commodity Strategy Fund’s net exposure for derivative instruments that are subject to enforceable master netting arrangements or similar agreements as of June 30, 2021:
| | | | | | | | | | | | | | | | | | | | | | |
| | | | | |
| COMMODITY STRATEGY | | | | | | | | | | | | | | | | | | | | |
| | | | | Derivative Assets(1) | | | Net Derivative
Asset
(Liabilities) | | | Collateral
(Received)
Pledged(1) | | | Net
Amount(2) | |
| Counterparty | | | | Swaps | | | Total | |
Citibank NA | | | | $ | 2,911,242 | | | $ | 2,911,242 | | | $ | 2,911,242 | | | $ | — | | | $ | 2,911,242 | |
Merrill Lynch & Co., Inc. | | | | | 3,660,244 | | | | 3,660,244 | | | | 3,660,244 | | | | — | | | | 3,660,244 | |
UBS AG (London) | | | | | 3,125,691 | | | | 3,125,691 | | | | 3,125,691 | | | | — | | | | 3,125,691 | |
| | | | | | |
Total | | | | $ | 9,697,177 | | | $ | 9,697,177 | | | $ | 9,697,177 | | | $ | — | | | $ | 9,697,177 | |
| (1) | | Gross amounts available for offset but not netted in the Consolidated Statement of Assets and Liabilities. |
| (2) | | Net amount represents the net amount due (to) from counterparty in the event of a default based on the contractual set-off rights under the agreement. Net amount excludes any over-collateralized amounts. |
|
| 5. AGREEMENTS AND AFFILIATED TRANSACTIONS |
A. Management Agreement — Under the Agreement, GSAM manages the Funds, subject to the general supervision of the Trustees.
As compensation for the services rendered pursuant to the Agreement, the assumption of the expenses related thereto and administration of the Funds’ business affairs, including providing facilities, GSAM is entitled to a management fee, accrued daily and paid monthly, equal to an annual percentage rate of each Fund’s average daily net assets.
For the six months ended June 30, 2021, contractual and effective net management fees with GSAM were at the following rates:
| | | | | | | | | | | | | | | | | | | | | | | | | | | | | | |
| | | | | Contractual Management Rate | | | | | | Effective Net
Management
Rate^ | |
| Fund | | | | First
$1 billion | | | Next
$1 billion | | | Next
$3 billion | | | Next
$3 billion | | | Over
$8 billion | | | Effective
Rate | |
Commodity Strategy | | | | | 0.50 | % | | | 0.50 | % | | | 0.45 | % | | | 0.43 | % | | | 0.42 | % | | | 0.50 | % | | | 0.40 | %(a) |
Defensive Equity | | | | | 0.53 | | | | 0.48 | | | | 0.45 | | | | 0.44 | | | | 0.43 | | | | 0.53 | | | | 0.53 | |
| ^ | | Effective Net Management Rate includes impact of management fee waivers of affiliated underlying funds, if any. The Effective Net Management Rate may not correlate to the Contractual Management Rate as a result of management fee waivers that may be in effect from time to time. |
| (a) | | Reflects combined management fees paid to GSAM under the Agreement and the Commodity Strategy Fund’s Subsidiary Agreement (as defined below) after the waivers. |
35
GOLDMAN SACHS ALTERNATIVE FUNDS II
Notes to Financial Statements (continued)
June 30, 2021 (Unaudited)
|
| 5. AGREEMENTS AND AFFILIATED TRANSACTIONS (continued) |
The Funds invest in Institutional Shares of the Goldman Sachs Financial Square Government Fund, which is an affiliated Underlying Fund. GSAM has agreed to waive a portion of its management fee payable by the Funds in an amount equal to the management fee it earns as an investment adviser to the affiliated Underlying Fund in which the Funds invest. For the six months ended June 30, 2021, the management fee waived by GSAM was for each Fund as follows:
| | | | | | |
| Fund | | | | Management
Fee Waived | |
Commodity Strategy | | | | $ | 34,458 | |
Defensive Equity | | | | | 56 | |
GSAM also provides management services to the Subsidiary pursuant to a Subsidiary Management Agreement (the “Subsidiary Agreement”) and is entitled to a management fee accrued daily and paid monthly, equal to an annual percentage rate of 0.42% of the Subsidiary’s average daily net assets. In consideration of the Subsidiary’s management fee, and for as long as the Subsidiary Agreement remains in effect, GSAM has contractually agreed to waive irrevocably a portion of the Commodity Strategy Fund’s management fee in an amount equal to the management fee accrued and paid to GSAM by the Subsidiary under the Subsidiary Agreement. For the six months ended June 30, 2021, GSAM waived $127,355 of the Commodity Strategy Fund’s management fee.
B. Distribution and/or Service (12b-1) Plans — The Trust, on behalf of Class A and Class R Shares of each applicable Fund, has adopted Distribution and Service Plans subject to Rule 12b-1 under the Act. Under the Distribution and Service Plans, Goldman Sachs, which serves as distributor (the “Distributor”), is entitled to a fee accrued daily and paid monthly for distribution services and personal and account maintenance services, which may then be paid by Goldman Sachs to authorized dealers. These fees are equal to an annual percentage rate of the average daily net assets attributable to Class A or Class R Shares of the Funds, as applicable, as set forth below.
The Trust, on behalf of Class C Shares of each applicable Fund, has adopted a Distribution Plan subject to Rule 12b-1 under the Act. Under the Distribution Plan, Goldman Sachs as Distributor is entitled to a fee accrued daily and paid monthly for distribution services, which may then be paid by Goldman Sachs to authorized dealers. These fees are equal to an annual percentage rate of the average daily net assets attributable to Class C Shares of the Funds, as set forth below.
| | | | | | | | | | | | |
| | | Distribution and/or Service Plan Rates | |
| | | Class A* | | | Class C | | | Class R* | |
Distribution and/or Service Plan | | | 0.25 | % | | | 0.75 | % | | | 0.50 | % |
| * | | With respect to Class A and Class R Shares, the Distributor at its discretion may use compensation for distribution services paid under the Distribution and/or Service Plan to compensate service organizations for personal and account maintenance services and expenses as long as such total compensation does not exceed the maximum cap on “service fees” imposed by the Financial Industry Regulatory Authority. |
C. Distribution Agreement — Goldman Sachs, as Distributor of the shares of the Funds pursuant to a Distribution Agreement, may retain a portion of the Class A Shares’ front end sales charge and Class C Shares’ CDSC. During the six months ended June 30 2021, Goldman Sachs retained the following amounts:
| | | | | | |
| | | | | Front End
Sales Charge | |
| Fund | | | | Class A | |
Commodity Strategy | | | | $ | 3,217 | |
Defensive Equity | | | | | — | |
D. Service Plan — The Trust, on behalf of each applicable Fund, has adopted a Service Plan to allow Class C Shares to compensate service organizations (including Goldman Sachs) for providing varying levels of personal and account maintenance
36
GOLDMAN SACHS ALTERNATIVE FUNDS II
|
| 5. AGREEMENTS AND AFFILIATED TRANSACTIONS (continued) |
services to their customers who are beneficial owners of such shares. The Service Plan provides for compensation to the service organizations equal to an annual percentage rate of 0.25% of the average daily net assets attributable to Class C Shares of the Funds.
E. Transfer Agency Agreement — Goldman Sachs also serves as the transfer agent of the Funds for a fee pursuant to the Transfer Agency Agreement. The fees charged for such transfer agency services are accrued daily and paid monthly at annual rates as follows: 0.12% of the average daily net assets of Class A, Class C, Investor and Class R Shares of the Commodity Strategy Fund; 0.16% of the average daily net assets of Class A, Class C, Investor and Class R Shares of the Defensive Equity Fund; 0.03% of the average daily net assets of Class R6 and P Shares; and 0.04% of the average daily net assets of Institutional Shares.
F. Other Expense Agreements and Affiliated Transactions — GSAM has agreed to reduce or limit certain “Other Expenses” of the Funds (excluding acquired fund fees and expenses, transfer agency fees and expenses, service fees and shareholder administration fees (as applicable), taxes, interest, brokerage fees, expenses of shareholder meetings, litigation and indemnification, and extraordinary expenses) to the extent such expenses exceed, on an annual basis, a percentage rate of the average daily net assets of each Funds. Such Other Expense reimbursements, if any, are accrued daily and paid monthly. In addition, the Funds are not obligated to reimburse GSAM for prior fiscal year expense reimbursements, if any. The Other Expense limitations as an annual percentage rate of average daily net assets for the Commodity Strategy and Defensive Equity Funds are 0.074% and 0.004%, respectively. These Other Expense limitations will remain in place through at least April 30, 2022, and prior to such date GSAM may not terminate the arrangements without the approval of the Trustees. In addition, the Funds have entered into certain offset arrangements with the transfer agent, which may result in a reduction of the Funds’ expenses and are received irrespective of the application of the “Other Expense” limitations described above. The Subsidiary also pays certain other expenses, including service and custody fees. GSAM has agreed to reduce or limit the Subsidiary’s expenses (excluding management fees) to 0.004% of the Subsidiary’s average daily net assets for the Commodity Strategy Fund.
For the six months ended June 30, 2021, these expense reductions, including any fee waivers and Other Expense reimbursements, were as follows:
| | | | | | | | | | | | | | |
| Fund | | | | Management
Fee Waiver | | | Other
Expense
Reimbursements | | | Total
Expense
Reductions | |
Commodity Strategy | | | | $ | 161,813 | | | $ | 253,169 | | | $ | 414,982 | |
Defensive Equity | | | | | 56 | | | | 276,449 | | | | 276,505 | |
G. Line of Credit Facility — As of June 30, 2021, the Funds participated in a $1,000,000,000 committed, unsecured revolving line of credit facility (the “facility”) together with other funds of the Trust and certain registered investment companies having management agreements with GSAM or its affiliates. This facility is to be used for temporary emergency purposes, or to allow for an orderly liquidation of securities to meet redemption requests. The interest rate on borrowings is based on the federal funds rate. The facility also requires a fee to be paid by the Funds based on the amount of the commitment that has not been utilized. For the six months ended June 30, 2021 , the Funds did not have any borrowings under the facility. Prior to April 26, 2021, the facility was $700,000,000.
H. Other Transactions with Affiliates —For the six months ended June 30, 2021, Goldman Sachs did not earn any brokerage commissions from portfolio transactions on behalf of the Funds.
As of June 30, 2021, The Goldman Sachs Group, Inc. was the beneficial owner of 5% or greater of the following:
| | | | | | | | | | | | | | | | | | | | | | | | | | | | |
| Fund | | | | Class A | | Class C | | | Institutional | | | Investor | | | Class R6 | | | Class R | | | Class P | |
Defensive Equity | | | | 15% | | | 100 | % | | | 91 | % | | | 100 | % | | | 100 | % | | | 100 | % | | | 100 | % |
37
GOLDMAN SACHS ALTERNATIVE FUNDS II
Notes to Financial Statements (continued)
June 30, 2021 (Unaudited)
|
| 5. AGREEMENTS AND AFFILIATED TRANSACTIONS (continued) |
The table below shows the transactions in and earnings from investments in the Underlying Fund for the six months ended June 30, 2021:
| | | | | | | | | | | | | | | | | | | | | | | | | | |
| Fund | | | | Beginning
Value as of
December 31,
2020 | | | Purchases
at Cost | | | Proceeds
from Sales | | | Ending
Value as of
June 30, 2021 | | | Shares as of
June 30,
2021 | | | Dividend
Income | |
Commodity Strategy | | | | $ | 168,485,696 | | | $ | 579,746,138 | | | $ | (675,483,523 | ) | | $ | 72,748,311 | | | | 72,748,311 | | | $ | 8,473 | |
Defensive Equity | | | | | 307,935 | | | | 992,840 | | | | (1,004,632 | ) | | | 296,143 | | | | 296,143 | | | | 21 | |
|
| 6. PORTFOLIO SECURITIES TRANSACTIONS |
The cost of purchases and proceeds from sales and maturities of long-term securities for the six months ended June 30, 2021, were as follows:
| | | | | | | | | | | | | | | | | | |
| Fund | | | | Purchases of
U.S. Government and
Agency Obligations | | | Purchases (Excluding
U.S. Government and
Agency Obligations) | | | Sales and
Maturities of
U.S. Government and
Agency Obligations | | | Sales and
Maturities (Excluding
U.S. Government and
Agency Obligations) | |
Commodity Strategy | | | | $ | 88,457,170 | | | $ | — | | | $ | 26,136,252 | | | $ | 45,768 | |
Defensive Equity | | | | | — | | | | 7,508,262 | | | | — | | | | 7,576,428 | |
As of the Funds’ most recent fiscal year end, December 31, 2020, the Funds’ capital loss carryforwards and certain timing differences on a tax basis were as follows:
| | | | | | | | |
| | | Commodity
Strategy | | | Defensive
Equity | |
Capital loss carryforwards: | | | | | | | | |
Perpetual Short-Term | | $ | (4,526,130 | ) | | $ | — | |
Perpetual Long-Term | | | (17,060,636 | ) | | | — | |
Total capital loss carryforwards | | | (21,586,766 | ) | | | — | |
Timing differences (Post October Loss Deferral, Qualified Late Year Loss Deferral, Real Estate Investment Trusts and Straddle Loss Deferral) | | $ | (3,117,415 | ) | | $ | (234,918 | ) |
As of June 30, 2021, the Funds’ aggregate security unrealized gains and losses based on cost for U.S. federal income tax purposes were as follows:
| | | | | | | | |
| | | Commodity
Strategy | | | Defensive
Equity | |
Tax cost | | $ | 341,112,170 | | | $ | 5,830,934 | |
Gross unrealized gain | | | 24,061,213 | | | | 324,225 | |
Gross unrealized loss | | | (14,058 | ) | | | (137,871 | ) |
| Net unrealized security gain (loss) | | $ | 24,047,155 | | | $ | 186,354 | |
38
GOLDMAN SACHS ALTERNATIVE FUNDS II
|
| 7. TAX INFORMATION (continued) |
The difference between GAAP-basis and tax basis unrealized gains (losses) is attributable primarily to wash sales and net mark to market gains/(losses) on regulated futures, options and foreign currency contracts, market discount accretion and premium amortization, and differences related to the tax treatment of swap transactions and underlying fund investments.
GSAM has reviewed the Funds’ tax positions for all open tax years (the current and prior three years, as applicable) and has concluded that no provision for income tax is required in the Fund’s financial statements. Such open tax years remain subject to examination and adjustment by tax authorities.
The Funds’ risks include, but are not limited to, the following:
Derivatives Risk — The Funds’ use of derivatives may result in loss. Derivative instruments, which may pose risks in addition to and greater than those associated with investing directly in securities, currencies or other instruments, may be illiquid or less liquid, volatile, difficult to price and leveraged so that small changes in the value of the underlying instruments may produce disproportionate losses to the Funds. Derivatives are also subject to counterparty risk, which is the risk that the other party in the transaction will not fulfill its contractual obligation. The use of derivatives is a highly specialized activity that involves investment techniques and risks different from those associated with investments in more traditional securities and instruments. Losses from derivatives can also result from a lack of correlation between changes in the value of derivative instruments and the portfolio assets (if any) being hedged.
Interest Rate Risk — When interest rates increase, fixed income securities or instruments held by the Commodity Strategy Fund will generally decline in value. Long-term fixed income securities or instruments will normally have more price volatility because of this risk than short-term fixed income securities or instruments. The risks associated with changing interest rates may have unpredictable effects on the markets and the Fund’s investments. Fluctuations in interest rates may also affect the liquidity of fixed income securities and instruments held by the Fund.
Investments in Other Investment Companies Risk — As a shareholder of another investment company, a Fund will indirectly bear its proportionate share of any net management fees and other expenses paid by such other investment companies, in addition to the fees and expenses regularly borne by the Fund.
Large Shareholder Transactions Risk — A Fund may experience adverse effects when certain large shareholders, such as other funds, institutional investors (including those trading by use of non-discretionary mathematical formulas), financial intermediaries (who may make investment decisions on behalf of underlying clients and/or include a Fund in their investment model), individuals, accounts and Goldman Sachs affiliates, purchase or redeem large amounts of shares of a Fund. Such large shareholder redemptions, which may occur rapidly or unexpectedly, may cause a Fund to sell portfolio securities at times when it would not otherwise do so, which may negatively impact a Fund’s NAV and liquidity. These transactions may also accelerate the realization of taxable income to shareholders if such sales of investments resulted in gains, and may also increase transaction costs. In addition, a large redemption could result in a Fund’s current expenses being allocated over a smaller asset base, leading to an increase in the Fund’s expense ratio. Similarly, large Fund share purchases may adversely affect a Fund’s performance to the extent that the Fund is delayed in investing new cash or otherwise maintains a larger cash position than it ordinarily would.
Liquidity Risk — A Fund may make investments that are illiquid or that may become less liquid in response to market developments or adverse investor perceptions. Illiquid investments may be more difficult to value. Liquidity risk may also refer to the risk that a Fund will not be able to pay redemption proceeds within the allowable time period or without significant dilution to remaining investors’ interests because of unusual market conditions, an unusually high volume of redemption requests, or other reasons. To meet redemption requests, a Fund may be forced to sell investments at an unfavorable time and/or under unfavorable conditions. If a Fund is forced to sell securities at an unfavorable time and/or under unfavorable conditions, such sales may adversely affect the Fund’s NAV and dilute remaining investors’ interests. Liquidity risk may be the result of, among other things, the reduced number and capacity of traditional market participants to make a market in fixed income securities or the lack of an active market. The potential for liquidity risk may be magnified by a rising interest rate environment or other circumstances where investor
39
GOLDMAN SACHS ALTERNATIVE FUNDS II
Notes to Financial Statements (continued)
June 30, 2021 (Unaudited)
|
| 8. OTHER RISKS (continued) |
redemptions from fixed income mutual funds may be higher than normal, potentially causing increased supply in the market due to selling activity. These risks may be more pronounced in connection with a Fund’s investments in securities of issuers located in emerging market countries. Redemptions by large shareholders may have a negative impact on a Fund’s liquidity.
Market and Credit Risks — In the normal course of business, a Fund trades financial instruments and enters into financial transactions where risk of potential loss exists due to changes in the market (market risk). The value of the securities in which a Fund invests may go up or down in response to the prospects of individual companies, particular sectors or governments and/or general economic conditions throughout the world due to increasingly interconnected global economies and financial markets. Events such as war, acts of terrorism, social unrest, natural disasters, the spread of infectious illness or other public health threats could also significantly impact a Fund and its investments. Additionally, a Fund may also be exposed to credit risk in the event that an issuer or guarantor fails to perform or that an institution or entity with which the Fund has unsettled or open transactions defaults.
Tax Risk — The Commodity Strategy Fund will seek to gain exposure to the commodity markets primarily through investments in the Subsidiary and/or commodity index-linked structured notes, as applicable. Historically, the Internal Revenue Service (“IRS”) issued private letter rulings (“PLRs”) in which the IRS specifically concluded that income and gains from investments in commodity index-linked structured notes (the “Notes Rulings”) or a wholly-owned foreign subsidiary that invests in commodity-linked instruments are “qualifying income” for purposes of compliance with Subchapter M of the Code. The IRS has issued such PLRs to the Commodity Strategy Fund. Based on such rulings, this Fund may seek to gain exposure to the commodity markets through investments in commodity-linked notes and/or subsidiaries. The IRS recently issued final regulations that, would generally treat the Commodity Strategy Fund’s income inclusion with respect to a subsidiary as qualifying income either if (A) there is a distribution out of the earnings and profits of a subsidiary that are attributable to such income inclusion or (B) such inclusion is derived with respect to the Commodity Strategy Fund’s business of investing in stock, securities, or currencies.
The IRS also issued a revenue procedure, which states that the IRS will not in the future issue PLRs that would require a determination of whether an asset (such as a commodity index-linked note) is a “security” under the Investment Company Act of 1940. In connection with issuing such revenue procedure, the IRS has revoked the Notes Ruling on a prospective basis. In light of the revocation of the Notes Rulings, the Commodity Strategy Fund has limited its investments in commodity index-linked structured notes. The Commodity Strategy Fund obtained an opinion of counsel that the Fund’s income from investments in the Subsidiary should constitute “qualifying income.” However, no assurances can be provided that the IRS would not be able to successfully assert that the Commodity Strategy Fund’s income from such investments was not “qualifying income,” in which case the Commodity Strategy Fund would fail to qualify as a regulated investment company (“RIC”) under Subchapter M of the Code if over 10% of its gross income were derived from these investments. If the Commodity Strategy Fund failed to qualify as a RIC, it would be subject to federal and state income tax on all of its taxable income at regular corporate tax rates. This would significantly adversely affect the returns to, and could cause substantial losses for, Commodity Strategy Fund shareholders.
Under the Trust’s organizational documents, its Trustees, officers, employees and agents are indemnified, to the extent permitted by the Act and state law, against certain liabilities that may arise out of performance of their duties to the Funds. Additionally, in the course of business, the Funds enter into contracts that contain a variety of indemnification clauses. The Funds’ maximum exposure under these arrangements is unknown, as this would involve future claims that may be made against the Funds that have not yet occurred. However, GSAM believes the risk of loss under these arrangements to be remote.
Subsequent events after the Statement and Consolidated Statement of Assets and Liabilities date have been evaluated, and GSAM has concluded that there is no impact requiring adjustment or disclosure in the financial statements.
40
GOLDMAN SACHS ALTERNATIVE FUNDS II
|
| 11. SUMMARY OF SHARE TRANSACTIONS |
Share activity is as follows:
| | | | | | | | | | | | | | | | |
| | | Goldman Sachs Commodity Strategy Fund | |
| | | | |
| | | For the Six Months Ended
June 30, 2021
(Unaudited) | | | For the Fiscal Year Ended
December 31, 2020 | |
| | | | |
| | | Shares | | | Dollars | | | Shares | | | Dollars | |
| | | | |
| Class A Shares | | | | | | | | | | | | | | | | |
Shares sold | | | 510,839 | | | $ | 4,567,971 | | | | 948,695 | | | $ | 6,254,977 | |
Reinvestment of distributions | | | — | | | | — | | | | 4,976 | | | | 32,397 | |
Shares redeemed | | | (415,246 | ) | | | (3,671,311 | ) | | | (1,205,352 | ) | | | (8,518,281 | ) |
| | | | 95,593 | | | | 896,660 | | | | (251,681 | ) | | | (2,230,907 | ) |
| Class C Shares | | | | | | | | | | | | | | | | |
Shares sold | | | 71,038 | | | | 620,832 | | | | 47,065 | | | | 265,484 | |
Shares redeemed | | | (27,645 | ) | | | (228,675 | ) | | | (100,448 | ) | | | (638,692 | ) |
| | | | 43,393 | | | | 392,157 | | | | (53,383 | ) | | | (373,208 | ) |
| Institutional Shares | | | | | | | | | | | | | | | | |
Shares sold | | | 3,840,751 | | | | 35,019,332 | | | | 13,805,822 | | | | 89,817,355 | |
Reinvestment of distributions | | | — | | | | — | | | | 48,268 | | | | 317,600 | |
Shares redeemed | | | (3,637,092 | ) | | | (32,980,612 | ) | | | (12,968,538 | ) | | | (93,328,388 | ) |
| | | | 203,659 | | | | 2,038,720 | | | | 885,552 | | | | (3,193,433 | ) |
| Investor Shares | | | | | | | | | | | | | | | | |
Shares sold | | | 807,531 | | | | 7,469,295 | | | | 135,357 | | | | 937,796 | |
Reinvestment of distributions | | | — | | | | — | | | | 1,550 | | | | 10,217 | |
Shares redeemed | | | (81,129 | ) | | | (753,225 | ) | | | (388,664 | ) | | | (3,009,974 | ) |
| | | | 726,402 | | | | 6,716,070 | | | | (251,757 | ) | | | (2,061,961 | ) |
| Class R6 Shares | | | | | | | | | | | | | | | | |
Shares sold | | | 1,222,706 | | | | 10,988,983 | | | | 5,768,180 | | | | 40,531,756 | |
Reinvestment of distributions | | | — | | | | — | | | | 37,905 | | | | 249,794 | |
Shares redeemed | | | (2,216,881 | ) | | | (19,734,470 | ) | | | (3,542,010 | ) | | | (25,266,581 | ) |
| | | | (994,175 | ) | | | (8,745,487 | ) | | | 2,264,075 | | | | 15,514,969 | |
| Class R Shares | | | | | | | | | | | | | | | | |
Shares sold | | | 114,784 | | | | 1,010,055 | | | | 107,409 | | | | 707,673 | |
Reinvestment of distributions | | | — | | | | — | | | | 326 | | | | 2,084 | |
Shares redeemed | | | (55,714 | ) | | | (476,655 | ) | | | (86,869 | ) | | | (619,599 | ) |
| | | | 59,070 | | | | 533,400 | | | | 20,866 | | | | 90,158 | |
| Class P Shares | | | | | | | | | | | | | | | | |
Shares sold | | | 9,185,433 | | | | 85,669,236 | | | | 11,482 | | | | 88,889 | |
Reinvestment of distributions | | | — | | | | — | | | | 413 | | | | 2,720 | |
Shares redeemed | | | (189,945 | ) | | | (1,843,397 | ) | | | (20,254 | ) | | | (150,630 | ) |
| | | | 8,995,488 | | | | 83,825,839 | | | | (8,359 | ) | | | (59,021 | ) |
| | | | |
NET INCREASE | | | 9,129,430 | | | $ | 85,657,359 | | | | 2,605,313 | | | $ | 7,686,597 | |
41
GOLDMAN SACHS ALTERNATIVE FUNDS II
Notes to Financial Statements (continued)
June 30, 2021 (Unaudited)
|
| 11. SUMMARY OF SHARE TRANSACTIONS (continued) |
| | | | | | | | | | | | | | | | |
| | | Goldman Sachs Defensive Equity | |
| | | | |
| | | For the Six Months Ended
June 30, 2021
(Unaudited) | | | For the Period Ended
December 31, 2020(a) | |
| | | | |
| | | Shares | | | Dollars | | | Shares | | | Dollars | |
| | | | |
| Class A Shares | | | | | | | | | | | | | | | | |
Shares sold | | | 27,495 | | | $ | 300,000 | | | | 7,701 | | | $ | 77,020 | |
Reinvestment of distributions | | | — | | | | — | | | | 11 | | | | 108 | |
Shares redeemed | | | (2,704 | ) | | | (27,254 | ) | | | (1 | ) | | | (10 | ) |
| | | | 24,791 | | | | 272,746 | | | | 7,711 | | | | 77,118 | |
| Class C Shares | | | | | | | | | | | | | | | | |
Shares sold | | | — | | | | — | | | | 5,001 | | | | 50,010 | |
Reinvestment of distributions | | | — | | | | — | | | | — | | | | 4 | |
Shares redeemed | | | — | | | | — | | | | (1 | ) | | | (10 | ) |
| | | | — | | | | — | | | | 5,000 | | | | 50,004 | |
| Institutional Shares | | | | | | | | | | | | | | | | |
Shares sold | | | 6,915 | | | | 71,017 | | | | 509,373 | | | | 5,100,002 | |
Reinvestment of distributions | | | — | | | | — | | | | 1,020 | | | | 10,372 | |
Shares redeemed | | | — | | | | — | | | | (1 | ) | | | (10 | ) |
| | | | 6,915 | | | | 71,017 | | | | 510,392 | | | | 5,110,364 | |
| Investor Shares | | | | | | | | | | | | | | | | |
Shares sold | | | — | | | | — | | | | 5,001 | | | | 50,010 | |
Reinvestment of distributions | | | — | | | | — | | | | 9 | | | | 89 | |
Shares redeemed | | | — | | | | — | | | | (1 | ) | | | (10 | ) |
| | | | — | | | | — | | | | 5,009 | | | | 50,089 | |
| Class R6 Shares | | | | | | | | | | | | | | | | |
Shares sold | | | — | | | | — | | | | 5,001 | | | | 50,010 | |
Reinvestment of distributions | | | — | | | | — | | | | 10 | | | | 105 | |
Shares redeemed | | | — | | | | — | | | | (1 | ) | | | (10 | ) |
| | | | — | | | | — | | | | 5,010 | | | | 50,105 | |
| Class R Shares | | | | | | | | | | | | | | | | |
Shares sold | | | — | | | | — | | | | 5,001 | | | | 50,010 | |
Reinvestment of distributions | | | — | | | | — | | | | 3 | | | | 26 | |
Shares redeemed | | | — | | | | — | | | | (1 | ) | | | (10 | ) |
| | | | — | | | | — | | | | 5,003 | | | | 50,026 | |
| Class P Shares | | | | | | | | | | | | | | | | |
Shares sold | | | — | | | | — | | | | 5,001 | | | | 50,010 | |
Reinvestment of distributions | | | — | | | | — | | | | 10 | | | | 105 | |
Shares redeemed | | | — | | | | — | | | | (1 | ) | | | (10 | ) |
| | | | — | | | | — | | | | 5,010 | | | | 50,105 | |
| | | | |
NET INCREASE | | | 31,706 | | | $ | 343,763 | | | | 543,135 | | | $ | 5,437,811 | |
| (a) | | Commenced operations on September 30, 2020. |
42
GOLDMAN SACHS ALTERNATIVE FUNDS II
Liquidity Risk Management Program (Unaudited)
Each Fund has adopted and implemented a liquidity risk management program (the “Program”) in accordance with Rule 22e-4 under the 1940 Act. The Program seeks to assess and manage each Fund’s liquidity risk, i.e., the risk that a Fund is unable to satisfy redemption requests without significantly diluting remaining investors’ interests in the Fund. The Board of Trustees of the Trust has designated GSAM, each Fund’s investment adviser, to administer the Program. Certain aspects of the Program rely on third parties to perform certain functions, including the provision of market data and application of models.
The Program is comprised of various components designed to support the assessment and/or management of liquidity risk, including: (1) the periodic assessment (no less frequently than annually) of certain factors that influence a Fund’s liquidity risk; (2) the periodic classification (no less frequently than monthly) of a Fund’s investments into one of four liquidity categories that reflect an estimate of their liquidity under current market conditions; (3) a 15% limit on the acquisition of “illiquid investments” (as defined under Rule 22e-4); (4) for a Fund that does not invest primarily in “highly liquid investments” (as defined under Rule 22e-4), the determination of a minimum percentage of the Fund’s assets that will generally be invested in highly liquid investments (a “Highly Liquid Investment Minimum”); and (5) periodic reporting to the Board of Trustees.
At a meeting of the Board of Trustees on February 9-10, 2021, GSAM provided a written report to the Board addressing the operation, and the adequacy and effectiveness of the implementation, of the Program, including, as applicable, the operation of any Highly Liquid Investment Minimum and any material changes to the Program, for the period from January 1, 2020 through December 31, 2020 (the “Reporting Period”). Among other things, the annual report and related materials discussed: (1) the results of stress tests designed to assess liquidity under a hypothetical stressed scenario involving elevated redemptions; (2) an assessment of the methodologies used to classify investments into one of four liquidity categories; and (3) the impact of the COVID-19 pandemic on liquidity and management of liquidity risk during the Reporting Period, including during stressed market conditions caused by the COVID-19 pandemic. The report concluded that the Program continues to be reasonably designed to assess and manage liquidity risk and was adequately and effectively implemented during the Reporting Period.
There can be no assurance that the Program will achieve its objectives under all circumstances in the future. Please refer to your Fund’s prospectus for more information regarding the Fund’s exposure to liquidity risk and other risks to which it may be subject.
43
GOLDMAN SACHS ALTERNATIVE FUNDS II
| | |
| | |
Fund Expenses — Six Months Period Ended June 30, 2021 (Unaudited) | | |
As a shareholder of Class A, Class C, Institutional, Investor, Class R6, Class R or Class P Shares of a Fund, you incur two types of costs: (1) transaction costs, including sales charges on purchase payments (with respect to Class A Shares), contingent deferred sales charges on redemptions (with respect to Class C Shares), and (2) ongoing costs, including management fees; distribution and/or service (12b-1) fees (with respect to Class A, Class C, and Class R Shares); and other Fund expenses.
The Example is intended to help you understand your ongoing costs (in dollars) of investing in Class A, Class C, Institutional, Investor, Class R6, Class R or Class P Shares of a Fund and to compare these costs with the ongoing costs of investing in other mutual funds. The Example is based on an investment of $1,000 invested at the beginning of the period and held for the entire period from January 1, 2021 through June 30, 2021, which represents a period of 181 days of a 365 day year.
Actual Expenses — The first line under each share class in the table below provides information about actual account values and actual expenses. You may use the information in this line, together with the amount you invested, to estimate the expenses that you paid over the period. Simply divide your account value by $1,000 (for example, an $8,600 account value divided by $1,000=8.6), then multiply the result by the number in the first line under the heading entitled “Expenses Paid” to estimate the expenses you paid on your account during this period.
Hypothetical Example for Comparison Purposes — The second line under each share class in the table below provides information about hypothetical account values and hypothetical expenses based on the Funds’ actual net expense ratios and an assumed rate of return of 5% per year before expenses, which is not the Funds’ actual return. The hypothetical account values and expenses may not be used to estimate the actual ending account balance or expenses you paid for the period. You may use this information to compare the ongoing costs of investing in the Funds and other funds. To do so, compare this 5% hypothetical example with the 5% hypothetical examples that appear in the shareholder reports of the other funds.
Please note that the expenses shown in the table are meant to highlight your ongoing costs only and do not reflect any transactional costs, such as sales charges, redemption fees, or exchange fees and do not include expenses of Underlying Funds in which the Funds invest. Therefore, the second line of the table is useful in comparing ongoing costs only and will not help you determine the relative total costs of owning different funds. In addition, if these transactional costs were included, your costs would have been higher.
| | | | | | | | | | | | | | | | | | | | | | | | |
| | | Commodity Strategy Fund | | | Defensive Equity Fund | |
| Share Class | | Beginning
Account Value
1/1/21 | | | Ending
Account Value
6/30/21 | | | Expenses
Paid for the
6 months ended
6/30/21* | | | Beginning
Account Value
1/1/21 | | | Ending
Account Value
6/30/21 | | | Expenses
Paid for the
6 months ended
6/30/21* | |
| Class A | | | | | | | | | | | | | | | | | | | | | | | | |
Actual | | $ | 1,000.00 | | | $ | 1,246.50 | | | $ | 5.12 | | | $ | 1,000.00 | | | $ | 1,074.60 | | | $ | 4.84 | |
Hypothetical 5% return | | | 1,000.00 | | | | 1,020.13 | + | | | 4.61 | | | | 1,000.00 | | | | 1,020.13 | + | | | 4.71 | |
| Class C | | | | | | | | | | | | | | | | | | | | | | | | |
Actual | | | 1,000.00 | | | | 1,241.80 | | | | 9.28 | | | | 1,000.00 | | | | 1,069.70 | | | | 8.67 | |
Hypothetical 5% return | | | 1,000.00 | | | | 1,016.51 | + | | | 8.35 | | | | 1,000.00 | | | | 1,016.41 | + | | | 8.45 | |
| Institutional | | | | | | | | | | | | | | | | | | | | | | | | |
Actual | | | 1,000.00 | | | | 1,248.70 | | | | 3.29 | | | | 1,000.00 | | | | 1,075.60 | | | | 2.93 | |
Hypothetical 5% return | | | 1,000.00 | | | | 1,021.87 | + | | | 2.96 | | | | 1,000.00 | | | | 1,021.97 | + | | | 2.86 | |
| Investor | | | | | | | | | | | | | | | | | | | | | | | | |
Actual | | | 1,000.00 | | | | 1,248.40 | | | | 3.74 | | | | 1,000.00 | | | | 1,075.60 | | | | 3.55 | |
Hypothetical 5% return | | | 1,000.00 | | | | 1,021.47 | + | | | 3.36 | | | | 1,000.00 | | | | 1,021.37 | + | | | 3.46 | |
| Class R6 | | | | | | | | | | | | | | | | | | | | | | | | |
Actual | | | 1,000.00 | | | | 1,248.10 | | | | 3.23 | | | | 1,000.00 | | | | 1,075.60 | | | | 2.93 | |
Hypothetical 5% return | | | 1,000.00 | | | | 1,021.92 | + | | | 2.91 | | | | 1,000.00 | | | | 1,021.97 | + | | | 2.86 | |
| Class R | | | | | | | | | | | | | | | | | | | | | | | | |
Actual | | | 1,000.00 | | | | 1,244.80 | | | | 6.51 | | | | 1,000.00 | | | | 1,072.60 | | | | 6.12 | |
Hypothetical 5% return | | | 1,000.00 | | | | 1,018.89 | + | | | 5.86 | | | | 1,000.00 | | | | 1,018.89 | + | | | 5.96 | |
| Class P | | | | | | | | | | | | | | | | | | | | | | | | |
Actual | | | 1,000.00 | | | | 1,248.10 | | | | 3.29 | | | | 1,000.00 | | | | 1,075.60 | | | | 2.88 | |
Hypothetical 5% return | | | 1,000.00 | | | | 1,022.02 | + | | | 2.96 | | | | 1,000.00 | | | | 1,022.02 | | | | 2.81 | |
| | * | | Expenses are calculated using each Fund’s annualized net expense ratio for each class, which represents the ongoing expenses as a percentage of net assets for the six months ended June 30, 2021. Expenses are calculated by multiplying the annualized net expense ratio by the average account value for the period; then multiplying the result by the number of days in the most recent fiscal half year; and then dividing that result by the number of days in the fiscal year. The annualized net expense ratios for the period were as follows: | |
| | | | | | | | | | | | | | | | | | | | | | | | | | | | |
| Fund | | Class A | | | Class C | | | Institutional | | | Investor | | | Class R6 | | | Class R | | | Class P | |
Commodity Strategy | | | 0.92 | % | | | 1.67 | % | | | 0.59 | % | | | 0.67 | % | | | 0.58 | % | | | 1.17 | % | | | 0.59 | % |
Defensive Equity | | | 0.94 | | | | 1.69 | | | | 0.57 | | | | 0.69 | | | | 0.57 | | | | 1.19 | | | | 0.56 | |
| | + | | Hypothetical expenses are based on each Fund’s actual annualized net expense ratios and an assumed rate of return of 5% per year before expenses. | |
44
GOLDMAN SACHS ALTERNATIVE FUNDS II
Statement Regarding Basis for Approval of Management Agreement (Unaudited)
Background
The Goldman Sachs Commodity Strategy Fund and Goldman Sachs Defensive Equity Fund (the “Funds”) are investment portfolios of Goldman Sachs Trust (the “Trust”). The Board of Trustees oversees the management of the Trust and reviews the investment performance and expenses of the Funds at regularly scheduled meetings held throughout the year. In addition, the Board of Trustees determines annually whether to approve the continuance of the Trust’s investment management agreement (the “Management Agreement”) with Goldman Sachs Asset Management, L.P. (the “Investment Adviser”) on behalf of the Funds.
The Management Agreement was most recently approved for continuation until June 30, 2022 by the Board of Trustees, including those Trustees who are not parties to the Management Agreement or “interested persons” (as defined in the Investment Company Act of 1940, as amended) of any party thereto (the “Independent Trustees”), at a meeting held on June 15-16, 2021 (the “Annual Meeting”).
The review process undertaken by the Trustees spans the course of the year and culminates with the Annual Meeting. To assist the Trustees in their deliberations, the Trustees have established a Contract Review Committee (the “Committee”), comprised of the Independent Trustees. The Committee held two meetings over the course of the year since the Management Agreement was last approved. At those Committee meetings, regularly scheduled Board or other committee meetings, and/or the Annual Meeting, matters relevant to the renewal of the Management Agreement were considered by the Board, or the Independent Trustees, as applicable. With respect to each Fund, such matters included:
| | (a) | | the nature and quality of the advisory, administrative, and other services provided to the Fund by the Investment Adviser and its affiliates, including information about: |
| | (i) | | the structure, staff, and capabilities of the Investment Adviser and its portfolio management teams; |
| | (ii) | | the groups within the Investment Adviser and its affiliates that support the portfolio management teams or provide other types of necessary services, including fund services groups (e.g., accounting and financial reporting, tax, shareholder services, and operations); controls and risk management groups (e.g., legal, compliance, valuation oversight, credit risk management, internal audit, compliance testing, market risk analysis, finance, and central funding); sales and distribution support groups, and others (e.g., information technology and training); |
| | (iii) | | trends in employee headcount; |
| | (iv) | | the Investment Adviser’s financial resources and ability to hire and retain talented personnel and strengthen its operations; and |
| | (v) | | the parent company’s support of the Investment Adviser and its mutual fund business, as expressed by the firm’s senior management; |
| | (b) | | information on the investment performance of the Fund, including comparisons to the performance of similar mutual funds, as provided by a third-party mutual fund data provider engaged as part of the contract review process (the “Outside Data Provider”) and a benchmark performance index; and information on general investment outlooks in the markets in which the Fund invests; |
| | (c) | | information provided by the Investment Adviser indicating the Investment Adviser’s views on whether the Fund’s peer group and/or benchmark index had high, medium, or low relevance given the Fund’s particular investment strategy; |
| | (d) | | the terms of the Management Agreement and other agreements with affiliated service providers entered into by the Trust on behalf of the Fund; |
| | (e) | | fee and expense information for the Fund, including: |
| | (i) | | the relative management fee and expense levels of the Fund as compared to those of comparable funds managed by other advisers, as provided by the Outside Data Provider; |
| | (ii) | | the Fund’s expense trends over time (except for the Defensive Equity Fund, which commenced operations on September 30, 2020); and |
| | (iii) | | to the extent the Investment Adviser manages other types of accounts (such as bank collective trusts, private wealth management accounts, institutional separate accounts, sub-advised mutual funds, and non-U.S. funds) having investment objectives and policies similar to those of the Fund, comparative information on the advisory fees charged and services provided to those accounts by the Investment Adviser; |
| | (f) | | with respect to the extensive investment performance and expense comparison data provided by the Outside Data Provider, its processes in producing that data for the Fund; |
| | (g) | | the undertakings of the Investment Adviser and its affiliates to implement fee waivers and/or expense limitations; |
| | (h) | | information relating to the profitability of the Management Agreement and the transfer agency and distribution and service arrangements of the Fund to the Investment Adviser and its affiliates; |
| | (i) | | whether the Fund’s existing management fee schedule adequately addressed any economies of scale; |
45
GOLDMAN SACHS ALTERNATIVE FUNDS II
Statement Regarding Basis for Approval of Management Agreement (Unaudited) (continued)
| | (j) | | a summary of the “fall-out” benefits derived by the Investment Adviser and its affiliates from their relationships with the Fund, including the fees received by the Investment Adviser’s affiliates from the Fund for transfer agency, portfolio trading, distribution and other services; |
| | (k) | | a summary of potential benefits derived by the Fund as a result of its relationship with the Investment Adviser; |
| | (l) | | information regarding commissions paid by the Fund and broker oversight, other information regarding portfolio trading, and how the Investment Adviser carries out its duty to seek best execution; |
| | (m) | | portfolio manager ownership of Fund shares; the manner in which portfolio manager compensation is determined; and the number and types of accounts managed by the portfolio managers; |
| | (n) | | the nature and quality of the services provided to the Fund by its unaffiliated service providers (including CoreCommodity Management, LLC, the Commodity Strategy Fund’s sub-adviser (the “Sub-Adviser”)), and the Investment Adviser’s general oversight and evaluation (including reports on due diligence) of those service providers as part of the administrative services provided under the Management Agreement; and |
| | (o) | | the Investment Adviser’s processes and policies addressing various types of potential conflicts of interest; its approach to risk management; the annual review of the effectiveness of the Fund’s compliance program; and periodic compliance reports. |
The Trustees also received an overview of the Funds’ distribution arrangements. They received information regarding the Funds’ assets, share purchase and redemption activity, and payment of distribution and service fees. Information was also provided to the Trustees relating to revenue sharing payments made by and services provided by the Investment Adviser and its affiliates to intermediaries that promote the sale, distribution, and/or servicing of Fund shares. The Independent Trustees also discussed the broad range of other investment choices that are available to Fund investors, including the availability of comparable funds managed by other advisers.
The presentations made at the Board and Committee meetings and at the Annual Meeting encompassed the Funds and other mutual funds for which the Board of Trustees has responsibility. In evaluating the Management Agreement at the Annual Meeting, the Trustees relied upon their knowledge, resulting from their meetings and other interactions throughout the year, of the Investment Adviser and its affiliates, their services, and the Funds. In conjunction with these meetings, the Trustees received written materials and oral presentations on the topics covered, and the Investment Adviser addressed the questions and concerns of the Trustees, including concerns regarding the investment performance of certain of the funds they oversee. The Independent Trustees were advised by their independent legal counsel regarding their responsibilities and other regulatory requirements related to the approval and continuation of mutual fund investment management agreements under applicable law. In addition, the Investment Adviser and its affiliates provided the Independent Trustees with a written response to a formal request for information sent on behalf of the Independent Trustees by their independent legal counsel. During the course of their deliberations, the Independent Trustees met in executive sessions with their independent legal counsel, without representatives of the Investment Adviser or its affiliates present.
Nature, Extent, and Quality of the Services Provided Under the Management Agreement
As part of their review, the Trustees considered the nature, extent, and quality of the services provided to the Funds by the Investment Adviser. In this regard, the Trustees considered both the investment advisory services and non-advisory services that are provided by the Investment Adviser and its affiliates (including, with respect to the Commodity Strategy Fund, the Investment Adviser’s oversight of the Sub-Adviser). The Trustees noted the transition in the leadership and changes in personnel of various of the Investment Adviser’s portfolio management teams that had occurred in recent periods, and the ongoing recruitment efforts aimed at bringing high quality investment talent to the Investment Adviser. They also noted the Investment Adviser’s commitment to maintaining high quality systems and expending substantial resources to respond to ongoing changes to the market, regulatory and control environment in which the Funds and their service providers operate, including changes associated with the COVID-19 pandemic, as well as the efforts of the Investment Adviser and its affiliates to combat cyber security risks. The Trustees also considered information regarding the Investment Adviser’s business continuity planning and remote operations capabilities. The Trustees concluded that the Investment Adviser continued to commit substantial financial and operational resources to the Funds and expressed confidence that the Investment Adviser would continue to do so in the future. The Trustees also recognized that the Investment Adviser had made significant commitments to address regulatory compliance requirements applicable to the Funds and the Investment Adviser and its affiliates.
Investment Performance
The Trustees also considered the investment performance of the Commodity Strategy Fund. In this regard, they compared the investment performance of the Commodity Strategy Fund to its peers using rankings and ratings compiled by the Outside Data
46
GOLDMAN SACHS ALTERNATIVE FUNDS II
Statement Regarding Basis for Approval of Management Agreement (Unaudited) (continued)
Provider as of December 31, 2020, and updated performance information prepared by the Investment Adviser using the peer group identified by the Outside Data Provider as of March 31, 2021. The information on the Commodity Strategy Fund’s investment performance was provided for the one-, three-, five-, and ten-year periods ending on the applicable dates. The Trustees also reviewed the Commodity Strategy Fund’s investment performance relative to its performance benchmark. As part of this review, they considered the investment performance trends of the Commodity Strategy Fund over time, and reviewed the investment performance of the Commodity Strategy Fund in light of its investment objective and policies and market conditions.
In addition, the Trustees considered materials prepared and presentations made by the Investment Adviser’s senior management and portfolio management personnel in which the Commodity Strategy Fund’s performance was assessed. The Trustees also considered the Investment Adviser’s periodic reports with respect to the Commodity Strategy Fund’s risk profiles, and how the Investment Adviser’s approach to risk monitoring and management influences portfolio management.
The Trustees observed that the Commodity Strategy Fund’s Institutional Shares had placed in the top half of the Fund’s peer group for the one-year period and in the fourth quartile for the three-, five-, and ten-year periods, and had outperformed the Fund’s benchmark index for the one-year period and underperformed for the three-, five-, and ten-year periods ended March 31, 2021. They noted that the Sub-Adviser began sub-advising the Commodity Strategy Fund at the beginning of 2021. The Trustees considered that the Defensive Equity Fund had launched on September 30, 2020 and did not yet have a meaningful performance history.
Costs of Services Provided and Competitive Information
The Trustees considered the contractual terms of the Management Agreement and the fee rates payable by each Fund thereunder and, with respect to the Commodity Strategy Fund, the fee rate payable by the Investment Adviser under the sub-advisory agreement with the Sub-Adviser. In this regard, the Trustees considered information on the services rendered by the Investment Adviser to the Funds, which included both advisory and administrative services that were directed to the needs and operations of the Funds as registered mutual funds.
In particular, the Trustees reviewed analyses prepared by the Outside Data Provider regarding the expense rankings of the Funds. The analyses provided a comparison of each Fund’s management fee and breakpoints to those of a relevant peer group and category universe; an expense analysis which compared each Fund’s overall net and gross expenses to a peer group and a category universe; and data comparing each Fund’s net expenses to the peer and category medians. The analyses also compared each Fund’s other expenses and fee waivers/reimbursements to those of the peer group and category medians. The Trustees concluded that the comparisons provided by the Outside Data Provider were useful in evaluating the reasonableness of the management fees and total expenses paid by the Funds.
In addition, the Trustees considered the Investment Adviser’s undertakings to implement fee waivers and/or expense limitations. With respect to the Commodity Strategy Fund, the Trustees noted that the Investment Adviser had agreed to waive a portion of its management fee in an amount equal to the entire management fee paid to the Investment Adviser as the investment adviser to the Fund’s wholly-owned subsidiary. They also considered, to the extent that the Investment Adviser manages other types of accounts having investment objectives and policies similar to those of the Funds, comparative fee information for services provided by the Investment Adviser to those accounts, and information that indicated that services provided to the Funds differed in various significant respects from the services provided to other types of accounts which, in many cases, operated under less stringent legal and regulatory structures, required fewer services from the Investment Adviser to a smaller number of client contact points, and were less time-intensive.
In addition, the Trustees noted that shareholders are able to redeem their Fund shares at any time if shareholders believe that the Fund fees and expenses are too high or if they are dissatisfied with the performance of the Fund.
Profitability
The Trustees reviewed each Fund’s contribution to the Investment Adviser’s revenues and pre-tax profit margins. In this regard the Trustees noted that they had received, among other things, profitability analyses and summaries, revenue and expense schedules by Fund and by function (i.e., investment management, transfer agency and distribution and service), and information on the Investment Adviser’s expense allocation methodology. They observed that the profitability and expense figures are substantially similar to those used by the Investment Adviser for many internal purposes, including compensation decisions among various business groups, and are thus subject to a vigorous internal debate about how certain revenue and expenses should be allocated. The Trustees also noted that the internal audit group within the Goldman Sachs organization periodically audits the expense allocation methodology and that the internal audit group was satisfied with the reasonableness, consistency, and accuracy of the Investment Adviser’s expense allocation methodology. Profitability data for each Fund was provided for 2020 and (in the
47
GOLDMAN SACHS ALTERNATIVE FUNDS II
Statement Regarding Basis for Approval of Management Agreement (Unaudited) (continued)
case of the Commodity Strategy Fund) 2019, and the Trustees considered this information in relation to the Investment Adviser’s overall profitability.
Economies of Scale
The Trustees considered the information that had been provided regarding whether there have been economies of scale with respect to the management of the Funds. The Trustees also considered the breakpoints in the fee rate payable under the Management Agreement for each of the Funds at the following annual percentage rates of the average daily net assets of the Funds:
| | | | | | | | |
| | | Commodity
Strategy
Fund | | | Defensive
Equity
Fund | |
| | |
| First $1 billion | | | 0.50 | % | | | 0.53 | % |
| | |
| Next $1 billion | | | 0.50 | | | | 0.48 | |
| | |
| Next $3 billion | | | 0.45 | | | | 0.45 | |
| | |
| Next $3 billion | | | 0.43 | | | | 0.44 | |
| | |
| Over $8 billion | | | 0.42 | | | | 0.43 | |
The Trustees noted that the breakpoints were designed to share potential economies of scale, if any, with the Funds and their shareholders as assets under management reach those asset levels. The Trustees considered the amounts of assets in the Funds; the Funds’ recent share purchase and redemption activity; the information provided by the Investment Adviser relating to the costs of the services provided by the Investment Adviser and its affiliates and their realized profits; information comparing fee rates charged by the Investment Adviser with fee rates charged to other funds in the peer groups; and the Investment Adviser’s undertaking to limit certain expenses of the Funds that exceed specified levels. Upon reviewing these matters at the Annual Meeting, the Trustees concluded that the fee breakpoints represented a means of assuring that benefits of scalability, if any, would be passed along to shareholders at the specified asset levels.
Other Benefits to the Investment Adviser and Its Affiliates
The Trustees also considered the other benefits derived by the Investment Adviser and its affiliates from their relationships with the Funds as stated above, including: (a) transfer agency fees received by Goldman Sachs & Co. LLC (“Goldman Sachs”); (b) brokerage and futures commissions earned by Goldman Sachs for executing securities and futures transactions on behalf of the Funds; (c) trading efficiencies resulting from aggregation of orders of the Funds with those for other funds or accounts managed by the Investment Adviser; (d) the Investment Adviser’s ability to leverage the infrastructure designed to service the Funds on behalf of its other clients; (e) the Investment Adviser’s ability to cross-market other products and services to Fund shareholders; (f) Goldman Sachs’ retention of certain fees as Fund Distributor; (g) the Investment Adviser’s ability to negotiate better pricing with custodians on behalf of its other clients, as a result of the relationship with the Funds; (h) the investment of cash and cash collateral in money market funds managed by the Investment Adviser that will result in increased assets under management for those money market funds; (i) the investment in exchange-traded funds (“ETFs”) managed by the Investment Adviser that will result in increased assets under management for those ETFs and may facilitate the development of the Investment Adviser’s ETF advisory business; and (j) the possibility that the working relationship between the Investment Adviser and the Funds’ third-party service providers may cause those service providers to be more likely to do business with other areas of Goldman Sachs. In the course of considering the foregoing, the Independent Trustees requested and received further information quantifying certain of these fall-out benefits.
Other Benefits to the Funds and Their Shareholders
The Trustees also noted that the Funds receive certain other potential benefits as a result of their relationship with the Investment Adviser, including: (a) trading efficiencies resulting from aggregation of orders of the Funds with those of other funds or accounts managed by the Investment Adviser; (b) enhanced servicing from vendors due to the volume of business generated by the Investment Adviser and its affiliates; (c) enhanced servicing from broker-dealers due to the volume of business generated by the Investment Adviser and its affiliates; (d) the Investment Adviser’s ability to negotiate favorable terms with derivatives counterparties on behalf of the Funds as a result of the size and reputation of the Goldman Sachs organization; (e) the advantages received from the Investment Adviser’s knowledge and experience gained from managing other accounts and products; (f) the Investment Adviser’s ability to hire and retain qualified personnel to provide services to the Funds because of the reputation of the Goldman Sachs organization; (g) the Funds’ access, through the Investment Adviser, to certain firm-wide resources (e.g., proprietary risk management systems and databases), subject to certain restrictions; and (h) the Funds’ access to certain affiliated
48
GOLDMAN SACHS ALTERNATIVE FUNDS II
Statement Regarding Basis for Approval of Management Agreement (Unaudited) (continued)
distribution channels. In addition, the Trustees noted the competitive nature of the mutual fund marketplace, and considered that many of the Funds’ shareholders invested in the Funds in part because of the Funds’ relationship with the Investment Adviser and that those shareholders have a general expectation that the relationship will continue.
Conclusion
In connection with their consideration of the Management Agreement, the Trustees gave weight to each of the factors described above, but did not identify any particular factor as controlling their decision. After deliberation and consideration of all of the information provided, including the factors described above, the Trustees concluded, in the exercise of their business judgment, that the management fees paid by each of the Funds were reasonable in light of the services provided to it by the Investment Adviser, the Investment Adviser’s costs and each Fund’s current and reasonably foreseeable asset levels. The Trustees unanimously concluded that the Investment Adviser’s continued management likely would benefit each Fund and its shareholders and that the Management Agreement should be approved and continued with respect to each Fund until June 30, 2022.
49
FUNDS PROFILE
Goldman Sachs Funds
Goldman Sachs is a premier financial services firm, known since 1869 for creating thoughtful and customized investment solutions in complex global markets.
Today, the Asset Management Division of Goldman Sachs serves a diverse set of clients worldwide, including private institutions, public entities and individuals. With approximately $2.09 trillion in assets under supervision as of June 30, 2021, Goldman Sachs Asset Management has portfolio management teams located around the world and our investment professionals bring firsthand knowledge of local markets to every investment decision. Assets under supervision includes assets under management and other client assets for which Goldman Sachs does not have full discretion. Goldman Sachs Asset Management leverages the resources of Goldman Sachs & Co. LLC subject to legal, internal and regulatory restrictions.
Money Market
Financial Square FundsSM
| ∎ | | Financial Square Treasury Solutions Fund1 |
| ∎ | | Financial Square Government Fund1 |
| ∎ | | Financial Square Money Market Fund2 |
| ∎ | | Financial Square Prime Obligations Fund2 |
| ∎ | | Financial Square Treasury Instruments Fund1 |
| ∎ | | Financial Square Treasury Obligations Fund1 |
| ∎ | | Financial Square Federal Instruments Fund1 |
Investor FundsSM
| ∎ | | Investor Money Market Fund3 |
| ∎ | | Investor Tax-Exempt Money Market Fund3 |
Fixed Income
Short Duration and Government
| ∎ | | High Quality Floating Rate Fund |
| ∎ | | Short-Term Conservative Income Fund |
| ∎ | | Short Duration Government Fund |
| ∎ | | Short Duration Bond Fund4 |
| ∎ | | Inflation Protected Securities Fund |
Multi-Sector
| ∎ | | Global Core Fixed Income Fund |
Municipal and Tax-Free
| ∎ | | High Yield Municipal Fund |
| ∎ | | Dynamic Municipal Income Fund |
| ∎ | | Short Duration Tax-Free Fund |
| ∎ | | Municipal Income Completion Fund |
Single Sector
| ∎ | | Investment Grade Credit Fund |
| ∎ | | High Yield Floating Rate Fund |
| ∎ | | Emerging Markets Debt Fund |
| ∎ | | Local Emerging Markets Debt Fund |
Fixed Income Alternatives
| ∎ | | Long Short Credit Strategies Fund |
Fundamental Equity
| ∎ | | Small/Mid Cap Value Fund |
| ∎ | | Small/Mid Cap Growth Fund |
| ∎ | | Concentrated Growth Fund |
| ∎ | | Technology Opportunities Fund |
| ∎ | | Growth Opportunities Fund |
| ∎ | | Rising Dividend Growth Fund |
Tax-Advantaged Equity
| ∎ | | U.S. Tax-Managed Equity Fund |
| ∎ | | International Tax-Managed Equity Fund |
| ∎ | | U.S. Equity Dividend and Premium Fund |
| ∎ | | International Equity Dividend and Premium Fund |
Equity Insights
| ∎ | | Small Cap Equity Insights Fund |
| ∎ | | U.S. Equity Insights Fund |
| ∎ | | Small Cap Growth Insights Fund |
| ∎ | | Large Cap Growth Insights Fund |
| ∎ | | Large Cap Value Insights Fund |
| ∎ | | Small Cap Value Insights Fund |
| ∎ | | International Small Cap Insights Fund |
| ∎ | | International Equity Insights Fund |
| ∎ | | Emerging Markets Equity Insights Fund |
Fundamental Equity International
| ∎ | | International Equity Income Fund |
| ∎ | | International Equity ESG Fund |
| ∎ | | Emerging Markets Equity Fund |
| ∎ | | ESG Emerging Markets Equity Fund |
Alternative
| ∎ | | Clean Energy Income Fund |
| ∎ | | Real Estate Securities Fund |
| ∎ | | International Real Estate Securities Fund |
| ∎ | | Commodity Strategy Fund |
| ∎ | | Global Real Estate Securities Fund |
| ∎ | | Alternative Premia Fund |
| ∎ | | Absolute Return Tracker Fund |
| ∎ | | Managed Futures Strategy Fund |
| ∎ | | MLP Energy Infrastructure Fund |
| ∎ | | Energy Infrastructure Fund |
| ∎ | | Multi-Manager Alternatives Fund |
| ∎ | | Absolute Return Multi-Asset Fund |
| ∎ | | Global Infrastructure Fund |
Total Portfolio Solutions
| ∎ | | Global Managed Beta Fund |
| ∎ | | Multi-Manager Non-Core Fixed Income Fund |
| ∎ | | Multi-Manager Global Equity Fund |
| ∎ | | Multi-Manager International Equity Fund |
| ∎ | | Tactical Tilt Overlay Fund |
| ∎ | | Balanced Strategy Portfolio |
| ∎ | | Multi-Manager U.S. Small Cap Equity Fund |
| ∎ | | Multi-Manager Real Assets Strategy Fund |
| ∎ | | Growth and Income Strategy Portfolio |
| ∎ | | Growth Strategy Portfolio |
| ∎ | | Dynamic Global Equity Fund |
| ∎ | | Satellite Strategies Portfolio |
| ∎ | | Enhanced Dividend Global Equity Portfolio |
| ∎ | | Tax-Advantaged Global Equity Portfolio |
| ∎ | | Strategic Volatility Premium Fund |
| ∎ | | Target Date Retirement Portfolio |
| ∎ | | Target Date 2025 Portfolio |
| ∎ | | Target Date 2030 Portfolio |
| ∎ | | Target Date 2035 Portfolio |
| ∎ | | Target Date 2040 Portfolio |
| ∎ | | Target Date 2045 Portfolio |
| ∎ | | Target Date 2050 Portfolio |
| ∎ | | Target Date 2055 Portfolio |
| ∎ | | Target Date 2060 Portfolio |
| ∎ | | GQG Partners International Opportunities Fund |
| 1 | | You could lose money by investing in the Fund. Although the Fund seeks to preserve the value of your investment at $1.00 per share, it cannot guarantee it will do so. An investment in the Fund is not a deposit of a bank and is not insured or guaranteed by the Federal Deposit Insurance Corporation or any other government agency. The Fund’s sponsor has no legal obligation to provide financial support to the Fund, and you should not expect that the sponsor will provide financial support to the Fund at any time. |
| 2 | | You could lose money by investing in the Fund. Because the share price of the Fund will fluctuate, when you sell your shares they may be worth more or less than what you originally paid for them. The Fund may impose a fee upon sale of your shares or may temporarily suspend your ability to sell shares if the Fund’s liquidity falls below required minimums because of market conditions or other factors. An investment in the Fund is not a deposit of a bank and is not insured or guaranteed by the Federal Deposit Insurance Corporation or any other government agency. The Fund’s sponsor has no legal obligation to provide financial support to the Fund, and you should not expect that the sponsor will provide financial support to the Fund at any time. |
| 3 | | You could lose money by investing in the Fund. Although the Fund seeks to preserve the value of your investment at $1.00 per share, it cannot guarantee it will do so. The Fund may impose a fee upon sale of your shares or may temporarily suspend your ability to sell shares if the Fund’s liquidity falls below required minimums because of market conditions or other factors. An investment in the Fund is not a deposit of a bank and is not insured or guaranteed by the Federal Deposit Insurance Corporation or any other government agency. The Fund’s sponsor has no legal obligation to provide financial support to the Fund, and you should not expect that the sponsor will provide financial support to the Fund at any time. |
| 4 | | Effective after the close of business on July 29, 2021, the Goldman Sachs Short Duration Income Fund was renamed the Goldman Sachs Short Duration Bond Fund. |
| 5 | | Effective after the close on business of August 30, 2020, the Goldman Sachs Blue Chip Fund was renamed the Goldman Sachs U.S. Equity ESG Fund. |
| | | Financial Square FundsSM and Investor FundsSM are registered service marks of Goldman Sachs & Co. LLC. |
| * | | This list covers open-end funds only. Please visit our website at www.GSAMFUNDS.com to learn about our closed-end funds and exchange-traded funds. |
| | |
TRUSTEES Jessica Palmer, Chair Dwight L. Bush Kathryn A. Cassidy Diana M. Daniels Joaquin Delgado James A. McNamara Roy W. Templin Gregory G. Weaver | | OFFICERS James A. McNamara, President Joseph F. DiMaria, Principal Financial Officer, Principal Accounting Officer and Treasurer Caroline L. Kraus, Secretary |
| |
GOLDMAN SACHS & CO. LLC Distributor and Transfer Agent | | GOLDMAN SACHS ASSET MANAGEMENT, L.P. Investment Adviser |
Visit our web site at www.GSAMFUNDS.com to obtain the most recent month-end returns.
Goldman Sachs Asset Management, L.P. 200 West Street, New York, New York 10282
The reports concerning the Fund included in this shareholder report may contain certain forward-looking statements about the factors that may affect the performance of the Fund in the future. These statements are based on Fund management’s predictions and expectations concerning certain future events and their expected impact on the Fund, such as performance of the economy as a whole and of specific industry sectors, changes in the levels of interest rates, the impact of developing world events, and other factors that may influence the future performance of the Fund. Management believes these forward-looking statements to be reasonable, although they are inherently uncertain and difficult to predict. Actual events may cause adjustments in portfolio management strategies from those currently expected to be employed.
A description of the policies and procedures that the Fund uses to determine how to vote proxies relating to portfolio securities and information regarding how the Fund voted proxies relating to portfolio securities during the most recent 12-month period ended June 30 is available (i) without charge, upon request by calling 1-800-526-7384 (for Retail Shareholders) or 1-800-621-2550 (for Institutional Shareholders); and (ii) on the Securities and Exchange Commission (“SEC”) web site at http://www.sec.gov.
The Fund will file portfolio holdings information for each month in a fiscal quarter within 60 days after the end of the relevant fiscal quarter on Form N-PORT. Portfolio holdings information for the third month of each fiscal quarter will be made available on the SEC’s web site at http://www.sec.gov. Portfolio holdings information may be obtained upon request and without charge by calling 1-800-526-7384 (for Retail Shareholders) or 1-800-621-2550 (for Institutional Shareholders).
Goldman Sachs & Co. LLC (‘‘Goldman Sachs’’) does not provide legal, tax or accounting advice. Any statement contained in this communication (including any attachments) concerning U.S. tax matters was not intended or written to be used, and cannot be used, for the purpose of avoiding penalties under the Internal Revenue Code, and was written to support the promotion or marketing of the transaction(s) or matter(s) addressed. Clients of Goldman Sachs should obtain their own independent tax advice based on their particular circumstances.
Holdings and allocations shown are as of June 30, 2021 and may not be representative of future investments. Fund holdings should not be relied on in making investment decisions and should not be construed as research or investment advice regarding particular securities. Current and future holdings are subject to risk.
The Global Industry Classification Standard (GICS) was developed by and is the exclusive property and a service mark of Morgan Stanley Capital International Inc. (MSCI) and Standard & Poor’s, a division of The McGraw-Hill Companies, Inc. (S&P) and is licensed for use by Goldman Sachs. Neither MSCI, S&P nor any other party involved in making or compiling the GICS or any GICS classifications makes any express or implied warranties or representations with respect to such standard or classification (or the results to be obtained by the use thereof), and all such parties hereby expressly disclaim all warranties of originality, accuracy, completeness, merchantability or fitness for a particular purpose with respect to any of such standard or classification. Without limiting any of the foregoing, in no event shall MSCI, S&P, any of their affiliates or any third party involved in making or compiling the GICS or any GICS classifications have any liability for any direct, indirect, special, punitive, consequential or any other damages (including lost profits) even if notified of the possibility of such damages.
The portfolio risk management process includes an effort to monitor and manage risk, but does not imply low risk.
This material is not authorized for distribution to prospective investors unless preceded or accompanied by a current prospectus or summary prospectus, if applicable. Investors should consider a Fund’s objective, risks, and charges and expenses, and read the summary prospectus, if available, and/or the prospectus carefully before investing or sending money. The summary prospectus, if available, and the prospectus contain this and other information about a Fund and may be obtained from your authorized dealer or from Goldman Sachs & Co. LLC by calling (retail – 1-800-526-7384) (institutional – 1-800-621-2550).
© 2021 Goldman Sachs. All rights reserved. 249619-OTU-1459799 SELSAT2SAR-21
Goldman Sachs Funds

| | | | |
| | |
| Semi-Annual Report | | | | June 30, 2021 |
| | |
| | | | Tax-Advantaged Equity Funds |
| | | | U.S. Equity Dividend and Premium |
| | | | International Equity Dividend and Premium |
| | | | U.S. Tax-Managed Equity |
| | | | International Tax-Managed Equity |

Goldman Sachs Tax-Advantaged Equity Funds
| ∎ | | U.S. EQUITY DIVIDEND AND PREMIUM |
| ∎ | | INTERNATIONAL EQUITY DIVIDEND AND PREMIUM |
| ∎ | | U.S. TAX-MANAGED EQUITY |
| ∎ | | INTERNATIONAL TAX-MANAGED EQUITY |
| | | | |
| | | |
| NOT FDIC-INSURED | | May Lose Value | | No Bank Guarantee |
FUND BASICS
U.S. Equity Dividend and Premium Fund
as of June 30, 2021
| | | | | | | | | | | | | | |
| | PERFORMANCE REVIEW | |
| | | | |
| | | January 1, 2021–June 30, 2021 | | Fund Total Return
(based on NAV)1 | | | S&P 500® Index2 | | | Bloomberg Barclays U.S.
Aggregate Bond Index3 | |
| | | | |
| | Class A | | | 12.67 | % | | | 15.25 | % | | | (1.60) | % |
| | Class C | | | 12.23 | | | | 15.25 | | | | (1.60) | |
| | Institutional | | | 12.81 | | | | 15.25 | | | | (1.60) | |
| | Investor | | | 12.83 | | | | 15.25 | | | | (1.60) | |
| | Class R6 | | | 12.83 | | | | 15.25 | | | | (1.60) | |
| | | Class P | | | 12.90 | | | | 15.25 | | | | (1.60) | |
| 1 | | The net asset value (“NAV”) represents the net assets of the class of the Fund (ex-dividend) divided by the total number of shares of the class outstanding. The Fund’s performance reflects the reinvestment of dividends and other distributions. The Fund’s performance does not reflect the deduction of any applicable sales charges. |
| 2 | | The S&P 500® Index is an unmanaged composite index of 500 common stock prices. The Index figures do not include any deduction for fees, expenses or taxes. It is not possible to invest directly in an index. |
| 3 | | The Bloomberg Barclays U.S. Aggregate Bond Index represents an unmanaged diversified portfolio of fixed income securities, including U.S. Treasuries, investment-grade corporate bonds, and mortgage-backed and asset-backed securities. The Index figures do not reflect any deduction for fees, expenses or taxes. It is not possible to invest directly in an index. |
The returns set forth in the table above represent past performance. Past performance does not guarantee future results. The Fund’s investment return and principal value will fluctuate so that an investor’s shares, when redeemed, may be worth more or less than their original cost. Current performance may be lower or higher than the performance quoted above. Please visit our web site at www.GSAMFUNDS.com to obtain the most recent month-end returns. Performance reflects applicable fee waivers and/or expense limitations in effect during the periods shown. In their absence, performance would be reduced. Returns do not reflect the deduction of taxes that a shareholder would pay on Fund distributions or the redemption of Fund shares.
| | | | | | | | |
| | TOP TEN HOLDINGS AS OF 6/30/214,5 |
| | | |
| | | Holding | | % of Net Assets | | | Line of Business |
| | | |
| | Apple, Inc. | | | 6.2 | % | | Technology Hardware & Equipment |
| | Microsoft Corp. | | | 5.6 | | | Software & Services |
| | Amazon.com, Inc. | | | 4.2 | | | Retailing |
| | Alphabet, Inc. Class A | | | 2.6 | | | Media & Entertainment |
| | Facebook, Inc. Class A | | | 2.4 | | | Media & Entertainment |
| | Home Depot, Inc. (The) | | | 1.5 | | | Retailing |
| | JPMorgan Chase & Co. | | | 1.5 | | | Banks |
| | NVIDIA Corp. | | | 1.5 | | | Semiconductors & Semiconductor Equipment |
| | Tesla, Inc. | | | 1.5 | | | Automobiles & Components |
| | | Pfizer, Inc. | | | 1.4 | | | Pharmaceuticals, Biotechnology & Life Sciences |
| 4 | | The top 10 holdings may not be representative of the Fund’s future investments. |
| 5 | | The Fund’s overall top ten holdings differ from the table above due to the exclusion of the Goldman Sachs Financial Square Government Fund (a short-term investment fund) which represents 1.6% of the Fund’s net assets as of June 30, 2021. |
1
FUND BASICS
|
| FUND VS. BENCHMARK SECTOR ALLOCATIONS6 |
|
| As of June 30, 2021 |
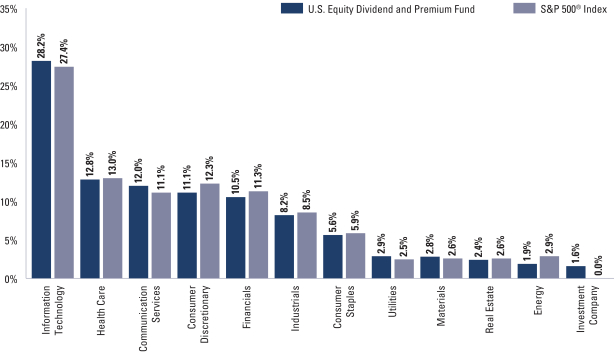
| 6 | | The Fund is actively managed and, as such, its composition may differ over time. Consequently, the Fund’s overall sector allocations may differ from percentages contained in the graph above. The graph categorizes investments using Global Industry Classification Standard (“GICS”); however, the sector classifications used by the portfolio management team may differ from GICS. The percentage shown for each investment category reflects the value of investments in that category as a percentage of market value (excluding investments in the securities lending reinvestment vehicle, if any). Underlying sector allocations of exchange traded funds and other investment companies held by the Fund are not reflected in the graph above. The graph depicts the Fund’s investments but may not represent the Fund’s market exposure due to the exclusion of certain derivatives, if any, as listed in the Additional Investment Information section of the Schedule of Investments. |
For more information about your Fund, please refer to www.GSAMFUNDS.com. There, you can learn more about your Fund’s investment strategies, holdings, and performance.
2
FUND BASICS
International Equity Dividend and Premium Fund
as of June 30, 2021
| | | | | | | | | | | | | | |
| | PERFORMANCE REVIEW | |
| | | | |
| | | January 1, 2021–June 30, 2021 | | Fund Total Return
(based on NAV)1 | | | MSCI EAFE Index
(net, USD, unhedged)2 | | | Bloomberg Barclays Global
Aggregate Bond Index
(gross, USD, unhedged)3 | |
| | Class A | | | 6.59 | % | | | 8.83 | % | | | (3.21) | % |
| | Class C | | | 6.22 | | | | 8.83 | | | | (3.21) | |
| | Institutional | | | 6.76 | | | | 8.83 | | | | (3.21) | |
| | Investor | | | 6.73 | | | | 8.83 | | | | (3.21) | |
| | Class R6 | | | 6.76 | | | | 8.83 | | | | (3.21) | |
| | | Class P | | | 6.75 | | | | 8.83 | | | | (3.21) | |
| 1 | | The net asset value (“NAV”) represents the net assets of the class of the Fund (ex-dividend) divided by the total number of shares of the class outstanding. The Fund’s performance reflects the reinvestment of dividends and other distributions. The Fund’s performance does not reflect the deduction of any applicable sales charges. |
| 2 | | The MSCI EAFE Index (net, USD, unhedged) is an unmanaged market capitalization-weighted composite of securities in 21 developed markets. The Index figures do not include any deduction for fees or expenses. It is not possible to invest directly in an index. |
| 3 | | The Bloomberg Barclays Global Aggregate Bond Index (gross, USD, unhedged) represents an unmanaged diversified portfolio of fixed income securities, including U.S. Treasuries, investment-grade corporate bonds, and mortgage-backed and asset-backed securities. The Index figures do not reflect any deduction for fees, expenses or taxes. It is not possible to invest directly in an index. |
The returns set forth in the table above represent past performance. Past performance does not guarantee future results. The Fund’s investment return and principal value will fluctuate so that an investor’s shares, when redeemed, may be worth more or less than their original cost. Current performance may be lower or higher than the performance quoted above. Please visit our web site at www.GSAMFUNDS.com to obtain the most recent month-end returns. Performance reflects applicable fee waivers and/or expense limitations in effect during the periods shown. In their absence, performance would be reduced. Returns do not reflect the deduction of taxes that a shareholder would pay on Fund distributions or the redemption of Fund shares.
| | | | | | | | | | |
| | TOP TEN HOLDINGS AS OF 6/30/214 |
| | | | |
| | | Company | | % of Net Assets | | | Line of Business | | Country |
| | | | |
| | Nestle SA (Registered) | | | 2.6 | % | | Food, Beverage & Tobacco | | Switzerland |
| | ASML Holding NV | | | 2.3 | | | Semiconductors & Semiconductor Equipment | | Netherlands |
| | Nordea Bank Abp | | | 1.8 | | | Banks | | Finland |
| | LVMH Moet Hennessy Louis Vuitton SE | | | 1.7 | | | Consumer Durables & Apparel | | France |
| | Toyota Motor Corp. | | | 1.7 | | | Automobiles & Components | | Japan |
| | Rio Tinto plc ADR | | | 1.7 | | | Materials | | Australia |
| | Roche Holding AG | | | 1.6 | | | Pharmaceuticals, Biotechnology & Life Sciences | | Switzerland |
| | Zurich Insurance Group AG | | | 1.4 | | | Insurance | | Switzerland |
| | GlaxoSmithKline plc ADR | | | 1.4 | | | Pharmaceuticals, Biotechnology & Life Sciences | | United Kingdom |
| | | Novartis AG (Registered) | | | 1.4 | | | Pharmaceuticals, Biotechnology & Life Sciences | | Switzerland |
| 4 | | The top 10 holdings may not be representative of the Fund’s future investments. |
3
FUND BASICS
|
| FUND VS. BENCHMARK SECTOR ALLOCATIONS5 |
|
| As of June 30, 2021 |
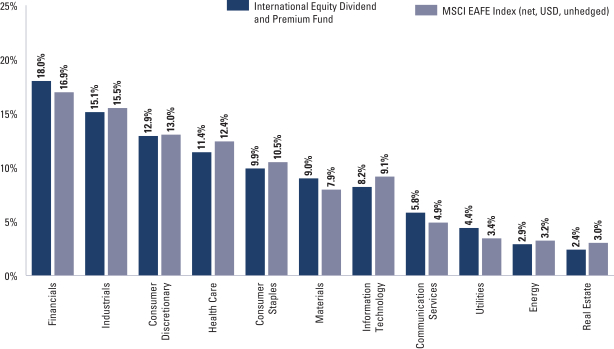
| 5 | | The Fund is actively managed and, as such, its composition may differ over time. Consequently, the Fund’s overall sector allocations may differ from percentages contained in the graph above. The graph categorizes investments using Global Industry Classification Standard (“GICS”); however, the sector classifications used by the portfolio management team may differ from GICS. The percentage shown for each investment category reflects the value of investments in that category as a percentage of market value. The graph depicts the Fund’s investments but may not represent the Fund’s market exposure due to the exclusion of certain derivatives, if any, as listed in the Additional Investment Information section of the Schedule of Investments. |
For more information about your Fund, please refer to www.GSAMFUNDS.com. There, you can learn more about your Fund’s investment strategies, holdings, and performance.
4
FUND BASICS
U.S. Tax-Managed Equity Fund
as of June 30, 2021
| | | | | | | | | | |
| | PERFORMANCE REVIEW | |
| | | |
| | | January 1, 2021– June 30, 2021 | | Fund Total Return
(based on NAV)1 | | | Russell 3000® Index2 | |
| | | |
| | Class A | | | 16.76 | % | | | 15.11 | % |
| | Class C | | | 16.30 | | | | 15.11 | |
| | Institutional | | | 16.93 | | | | 15.11 | |
| | Service | | | 16.66 | | | | 15.11 | |
| | Investor | | | 16.89 | | | | 15.11 | |
| | Class R6 | | | 16.95 | | | | 15.11 | |
| | | Class P | | | 16.95 | | | | 15.11 | |
| 1 | | The net asset value (“NAV”) represents the net assets of the class of the Fund (ex-dividend) divided by the total number of shares of the class outstanding. The Fund’s performance assumes the reinvestment of dividends and other distributions. The Fund’s performance does not reflect the deduction of any applicable sales charges. |
| 2 | �� | The Russell 3000® Index is an unmanaged index that measures the performance of the 3,000 largest U.S. companies based on total market capitalization, which represents approximately 98% of the investable U.S. equity market. Index figures do not reflect any deduction for fees, expenses or taxes. It is not possible to invest directly in an index. |
The returns set forth in the table above represent past performance. Past performance does not guarantee future results. The Fund’s investment return and principal value will fluctuate so that an investor’s shares, when redeemed, may be worth more or less than their original cost. Current performance may be lower or higher than the performance quoted above. Please visit our web site at www.GSAMFUNDS.com to obtain the most recent month-end returns. Performance reflects applicable fee waivers and/or expense limitations in effect during the periods shown. In their absence, performance would be reduced. Returns do not reflect the deduction of taxes that a shareholder would pay on Fund distributions or the redemption of Fund shares.
| | | | | | | | |
| | TOP TEN HOLDINGS AS OF 6/30/213 |
| | | |
| | | Holding | | % of Net Assets | | | Line of Business |
| | | |
| | Microsoft Corp. | | | 5.4 | % | | Software & Services |
| | Apple, Inc. | | | 4.7 | | | Technology Hardware & Equipment |
| | Amazon.com, Inc. | | | 3.7 | | | Retailing |
| | NVIDIA Corp. | | | 2.1 | | | Semiconductors & Semiconductor Equipment |
| | PayPal Holdings, Inc. | | | 2.1 | | | Software & Services |
| | Facebook, Inc. Class A | | | 1.8 | | | Media & Entertainment |
| | Alphabet, Inc. Class A | | | 1.7 | | | Media & Entertainment |
| | Alphabet, Inc. Class C | | | 1.7 | | | Media & Entertainment |
| | Target Corp. | | | 1.6 | | | Retailing |
| | | AbbVie, Inc. | | | 1.4 | | | Pharmaceuticals, Biotechnology & Life Sciences |
| 3 | | The top 10 holdings may not be representative of the Fund’s future investments. |
5
FUND BASICS
|
| FUND VS. BENCHMARK SECTOR ALLOCATIONS4 |
|
| As of June 30, 2021 |
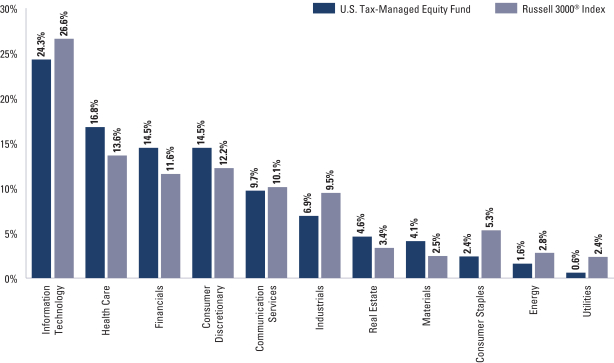
| 4 | | The Fund is actively managed and, as such, its composition may differ over time. Consequently, the Fund’s overall sector allocations may differ from percentages contained in the graph above. The graph categorizes investments using Global Industry Classification Standard (“GICS”); however, the sector classifications used by the portfolio management team may differ from GICS. The percentage shown for each investment category reflects the value of investments in that category as a percentage of market value (excluding investments in the securities lending reinvestment vehicle, if any). Investments in the securities lending reinvestment vehicle represented 0.1% of the Fund’s net assets at June 30, 2021. The graph depicts the Fund’s investments but may not represent the Fund’s market exposure due to the exclusion of certain derivatives, if any, as listed in the Additional Investment Information section of the Schedule of Investments. |
For more information about your Fund, please refer to www.GSAMFUNDS.com. There, you can learn more about your Fund’s investment strategies, holdings, and performance.
6
FUND BASICS
International Tax-Managed Equity Fund
as of June 30, 2021
| | | | | | | | | | |
| | PERFORMANCE REVIEW | |
| | | |
| | | January 1, 2021–June 30, 2021 | | Fund Total Return
(based on NAV)1 | | | MSCI EAFE Index
(net, USD, unhedged)2 | |
| | Class A | | | 8.39 | % | | | 8.83 | % |
| | Class C | | | 8.06 | | | | 8.83 | |
| | Institutional | | | 8.59 | | | | 8.83 | |
| | Investor | | | 8.50 | | | | 8.83 | |
| | Class R6 | | | 8.56 | | | | 8.83 | |
| | | Class P | | | 8.65 | | | | 8.83 | |
| 1 | | The net asset value (“NAV”) represents the net assets of the class of the Fund (ex-dividend) divided by the total number of shares of the class outstanding. The Fund’s performance reflects the reinvestment of dividends and other distributions. The Fund’s performance does not reflect the deduction of any applicable sales charges. |
| 2 | | The MSCI EAFE Index (net, USD, unhedged) is an unmanaged market capitalization-weighted composite of securities in 21 developed markets. The Index figures do not include any deduction for fees or expenses. It is not possible to invest directly in an index. |
The returns set forth in the table above represent past performance. Past performance does not guarantee future results. The Fund’s investment return and principal value will fluctuate so that an investor’s shares, when redeemed, may be worth more or less than their original cost. Current performance may be lower or higher than the performance quoted above. Please visit our web site at www.GSAMFUNDS.com to obtain the most recent month-end returns. Performance reflects applicable fee waivers and/or expense limitations in effect during the periods shown. In their absence, performance would be reduced. Returns do not reflect the deduction of taxes that a shareholder would pay on Fund distributions or the redemption of Fund shares.
| | | | | | | | |
| | TOP TEN HOLDINGS AS OF 6/30/213 |
| | | |
| | | Holding | | % of Net Assets | | | Line of Business |
| | | |
| | Roche Holding AG | | | 2.4 | % | | Pharmaceuticals, Biotechnology & Life Sciences |
| | Novo Nordisk A/S Class B | | | 1.8 | | | Pharmaceuticals, Biotechnology & Life Sciences |
| | Commonwealth Bank of Australia | | | 1.6 | | | Banks |
| | ASML Holding NV | | | 1.5 | | | Semiconductors & Semiconductor Equipment |
| | Schneider Electric SE | | | 1.4 | | | Capital Goods |
| | L’Oreal SA | | | 1.4 | | | Household & Personal Products |
| | Deutsche Post AG (Registered) | | | 1.4 | | | Transportation |
| | Rio Tinto plc ADR(a) | | | 1.4 | | | Materials |
| | Fujitsu Ltd. | | | 1.2 | | | Software & Services |
| | | BHP Group plc | | | 1.2 | | | Materials |
| 3 | | The top 10 holdings may not be representative of the Fund’s future investments. |
7
FUND BASICS
|
| FUND VS. BENCHMARK SECTOR ALLOCATIONS4 |
|
| As of June 30, 2021 |
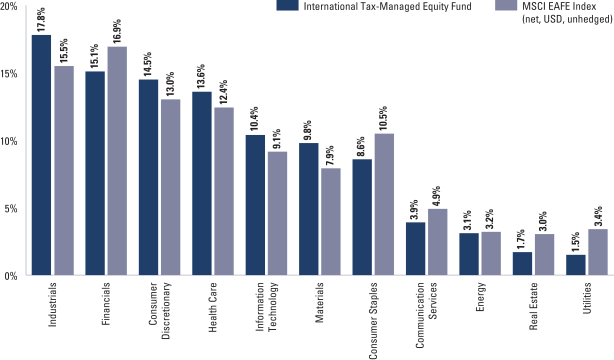
| 4 | | The Fund is actively managed and, as such, its composition may differ over time. Consequently, the Fund’s overall sector allocations may differ from percentages contained in the graph above. The graph categorizes investments using Global Industry Classification Standard (“GICS”); however, the sector classifications used by the portfolio management team may differ from GICS. The percentage shown for each investment category reflects the value of investments in that category as a percentage of market value (excluding investments in the securities lending reinvestment vehicle, if any). Investments in the securities lending reinvestment vehicle represented 0.1% of the Fund’s net assets at June 30, 2021. The graph depicts the Fund’s investments but may not represent the Fund’s market exposure due to the exclusion of certain derivatives, if any, as listed in the Additional Investment Information section of the Schedule of Investments. |
For more information about your Fund, please refer to www.GSAMFUNDS.com. There, you can learn more about your Fund’s investment strategies, holdings, and performance.
8
GOLDMAN SACHS U.S. EQUITY DIVIDEND AND PREMIUM FUND
Schedule of Investments
June 30, 2021 (Unaudited)
| | | | | | | | |
| Shares | | | Description | | Value | |
| |
| Common Stocks – 99.8% | | | |
| Automobiles & Components – 1.6% | | | |
| | 145,419 | | | Gentex Corp. | | $ | 4,811,915 | |
| | 64,040 | | | Tesla, Inc.* | | | 43,527,988 | |
| | 2,072 | | | Thor Industries, Inc. | | | 234,136 | |
| | | | | | | | |
| | | | | | | 48,574,039 | |
| | |
| Banks – 4.5% | | | |
| | 8,100 | | | Bank of America Corp. | | | 333,963 | |
| | 50,000 | | | Credicorp Ltd.* | | | 6,055,500 | |
| | 9,800 | | | Cullen/Frost Bankers, Inc. | | | 1,097,600 | |
| | 2,500 | | | First Hawaiian, Inc. | | | 70,850 | |
| | 240,200 | | | First Horizon Corp. | | | 4,150,656 | |
| | 177,300 | | | FNB Corp. | | | 2,186,109 | |
| | 1,012,100 | | | Huntington Bancshares, Inc. | | | 14,442,667 | |
| | 281,629 | | | JPMorgan Chase & Co.(a)(b) | | | 43,804,575 | |
| | 119,599 | | | New York Community Bancorp, Inc.(b) | | | 1,317,981 | |
| | 210,500 | | | PacWest Bancorp | | | 8,664,180 | |
| | 950,199 | | | People’s United Financial, Inc.(b) | | | 16,286,411 | |
| | 89,800 | | | PNC Financial Services Group, Inc. (The) | | | 17,130,248 | |
| | 198,000 | | | Truist Financial Corp. | | | 10,989,000 | |
| | 346,500 | | | Umpqua Holdings Corp. | | | 6,392,925 | |
| | 400 | | | Webster Financial Corp. | | | 21,336 | |
| | | | | | | | |
| | | | | | | 132,944,001 | |
| | |
| Capital Goods – 6.6% | | | |
| | 107,068 | | | 3M Co. | | | 21,266,917 | |
| | 57,900 | | | Boeing Co. (The)* | | | 13,870,524 | |
| | 73,387 | | | Caterpillar, Inc. | | | 15,971,213 | |
| | 7,865 | | | Crane Co. | | | 726,490 | |
| | 23,562 | | | Cummins, Inc. | | | 5,744,651 | |
| | 641 | | | Donaldson Co., Inc. | | | 40,723 | |
| | 112,062 | | | Eaton Corp. plc | | | 16,605,347 | |
| | 109,961 | | | Emerson Electric Co. | | | 10,582,647 | |
| | 148,698 | | | Fastenal Co. | | | 7,732,296 | |
| | 84,624 | | | Honeywell International, Inc. | | | 18,562,274 | |
| | 14,822 | | | Hubbell, Inc. | | | 2,769,342 | |
| | 72,450 | | | Illinois Tool Works, Inc. | | | 16,196,922 | |
| | 174,638 | | | Johnson Controls International plc | | | 11,985,406 | |
| | 600 | | | Lincoln Electric Holdings, Inc. | | | 79,026 | |
| | 40,534 | | | Lockheed Martin Corp. | | | 15,336,039 | |
| | 57,900 | | | MSC Industrial Direct Co., Inc. Class A | | | 5,195,367 | |
| | 2,143 | | | nVent Electric plc | | | 66,947 | |
| | 18,034 | | | Owens Corning | | | 1,765,529 | |
| | 272,430 | | | Raytheon Technologies Corp. | | | 23,241,003 | |
| | 3,800 | | | Sunrun, Inc.* | | | 211,964 | |
| | 11,852 | | | Timken Co. (The) | | | 955,153 | |
| | 16,956 | | | Trinity Industries, Inc. | | | 455,947 | |
| | 21,399 | | | Watsco, Inc. | | | 6,133,809 | |
| | | | | | | | |
| | | | | | | 195,495,536 | |
| | |
| Commercial & Professional Services – 0.0% | | | |
| | 160 | | | CoStar Group, Inc.* | | | 13,251 | |
| | 9,900 | | | ManpowerGroup, Inc. | | | 1,177,209 | |
| | 500 | | | MSA Safety, Inc. | | | 82,790 | |
| | | | | | | | |
| | | | | | | 1,273,250 | |
| | |
| |
| Common Stocks – (continued) | | | |
| Consumer Durables & Apparel – 1.3% | | | |
| | 2,433 | | | Capri Holdings Ltd.* | | | 139,143 | |
| | 80,003 | | | Garmin Ltd. | | | 11,571,369 | |
| | 427 | | | Lennar Corp. Class B | | | 34,779 | |
| | 2,437 | | | Lululemon Athletica, Inc.* | | | 889,432 | |
| | 143,400 | | | NIKE, Inc. Class B | | | 22,153,866 | |
| | 23,076 | | | Tempur Sealy International, Inc. | | | 904,349 | |
| | 45,420 | | | Toll Brothers, Inc. | | | 2,625,730 | |
| | | | | | | | |
| | | | | | | 38,318,668 | |
| | |
| Consumer Services – 0.7% | | | |
| | 11,871 | | | Aramark | | | 442,195 | |
| | 7,800 | | | Bright Horizons Family Solutions, Inc.* | | | 1,147,458 | |
| | 3,627 | | | Choice Hotels International, Inc. | | | 431,105 | |
| | 33,600 | | | H&R Block, Inc. | | | 788,928 | |
| | 11,719 | | | Hyatt Hotels Corp. Class A* | | | 909,863 | |
| | 15,465 | | | Planet Fitness, Inc. Class A* | | | 1,163,741 | |
| | 30,800 | | | Six Flags Entertainment Corp.* | | | 1,333,024 | |
| | 92,500 | | | Starbucks Corp. | | | 10,342,425 | |
| | 68,700 | | | Travel + Leisure Co. | | | 4,084,215 | |
| | 14,277 | | | Wendy’s Co. (The) | | | 334,367 | |
| | 14,043 | | | Wyndham Hotels & Resorts, Inc. | | | 1,015,169 | |
| | | | | | | | |
| | | | | | | 21,992,490 | |
| | |
| Diversified Financials – 3.6% | | | |
| | 65,098 | | | Ally Financial, Inc. | | | 3,244,484 | |
| | 88,660 | | | American Express Co. | | | 14,649,292 | |
| | 178,000 | | | Apollo Global Management, Inc. | | | 11,071,600 | |
| | 134,800 | | | Ares Management Corp. | | | 8,571,932 | |
| | 74,926 | | | Berkshire Hathaway, Inc. Class B* | | | 20,823,434 | |
| | 17,500 | | | BlackRock, Inc. | | | 15,311,975 | |
| | 54,600 | | | Carlyle Group, Inc. (The) | | | 2,537,808 | |
| | 42,800 | | | CME Group, Inc. | | | 9,102,704 | |
| | 14,800 | | | Equitable Holdings, Inc. | | | 450,660 | |
| | 5,800 | | | Jefferies Financial Group, Inc. | | | 198,360 | |
| | 33,973 | | | KKR & Co., Inc. | | | 2,012,561 | |
| | 5,864 | | | Morgan Stanley | | | 537,670 | |
| | 72,800 | | | T. Rowe Price Group, Inc. | | | 14,412,216 | |
| | 107,700 | | | Virtu Financial, Inc. Class A | | | 2,975,751 | |
| | | | | | | | |
| | | | | | | 105,900,447 | |
| | |
| Energy – 1.9% | | | |
| | 237,098 | | | Chevron Corp. | | | 24,833,645 | |
| | 111,000 | | | ConocoPhillips | | | 6,759,900 | |
| | 395,119 | | | Exxon Mobil Corp.(b) | | | 24,924,106 | |
| | | | | | | | |
| | | | | | | 56,517,651 | |
| | |
| Food & Staples Retailing – 0.6% | | | |
| | 11,454 | | | Costco Wholesale Corp. | | | 4,532,004 | |
| | 137,600 | | | Walgreens Boots Alliance, Inc. | | | 7,239,136 | |
| | 38,141 | | | Walmart, Inc. | | | 5,378,644 | |
| | | | | | | | |
| | | | | | | 17,149,784 | |
| | |
| Food, Beverage & Tobacco – 3.7% | | | |
| | 89,459 | | | Altria Group, Inc. | | | 4,265,405 | |
| | 24,400 | | | Bunge Ltd. | | | 1,906,860 | |
| | |
| | |
| The accompanying notes are an integral part of these financial statements. | | 9 |
GOLDMAN SACHS U.S. EQUITY DIVIDEND AND PREMIUM FUND
Schedule of Investments (continued)
June 30, 2021 (Unaudited)
| | | | | | | | |
| Shares | | | Description | | Value | |
| |
| Common Stocks – (continued) | | | |
| Food, Beverage & Tobacco – (continued) | | | |
| | 572,400 | | | Coca-Cola Co. (The)(a) | | $ | 30,972,564 | |
| | 60,800 | | | Coca-Cola Europacific Partners plc | | | 3,606,656 | |
| | 93,600 | | | Flowers Foods, Inc. | | | 2,265,120 | |
| | 186,134 | | | General Mills, Inc. | | | 11,341,145 | |
| | 5,500 | | | Ingredion, Inc. | | | 497,750 | |
| | 15,800 | | | Keurig Dr Pepper, Inc. | | | 556,792 | |
| | 336,300 | | | Kraft Heinz Co. (The) | | | 13,714,314 | |
| | 151,782 | | | PepsiCo, Inc. | | | 22,489,539 | |
| | 190,954 | | | Philip Morris International, Inc. | | | 18,925,451 | |
| | | | | | | | |
| | | | | | | 110,541,596 | |
| | |
| Health Care Equipment & Services – 5.2% | | | |
| | 165,642 | | | Abbott Laboratories | | | 19,202,877 | |
| | 31,879 | | | Anthem, Inc. | | | 12,171,402 | |
| | 110,000 | | | Cardinal Health, Inc. | | | 6,279,900 | |
| | 26,368 | | | Change Healthcare, Inc.* | | | 607,519 | |
| | 29,200 | | | Cigna Corp. | | | 6,922,444 | |
| | 125,878 | | | CVS Health Corp. | | | 10,503,260 | |
| | 12,300 | | | Danaher Corp. | | | 3,300,828 | |
| | 24,798 | | | Encompass Health Corp. | | | 1,934,988 | |
| | 7,143 | | | Envista Holdings Corp.* | | | 308,649 | |
| | 2,000 | | | Guardant Health, Inc.* | | | 248,380 | |
| | 8,500 | | | Insulet Corp.* | | | 2,333,335 | |
| | 282,253 | | | Medtronic plc | | | 35,036,065 | |
| | 3,000 | | | Novocure Ltd.* | | | 665,460 | |
| | 3,241 | | | Penumbra, Inc.* | | | 888,229 | |
| | 65,840 | | | Stryker Corp. | | | 17,100,623 | |
| | 200 | | | Tandem Diabetes Care, Inc.* | | | 19,480 | |
| | 87,077 | | | UnitedHealth Group, Inc.(a) | | | 34,869,114 | |
| | | | | | | | |
| | | | | | | 152,392,553 | |
| | |
| Household & Personal Products – 1.3% | | | |
| | 97,498 | | | Kimberly-Clark Corp. | | | 13,043,283 | |
| | 5,300 | | | Nu Skin Enterprises, Inc. Class A | | | 300,245 | |
| | 189,798 | | | Procter & Gamble Co. (The)(a) | | | 25,609,444 | |
| | | | | | | | |
| | | | | | | 38,952,972 | |
| | |
| Insurance – 2.7% | | | |
| | 4,800 | | | Axis Capital Holdings Ltd. | | | 235,248 | |
| | 21,400 | | | CNA Financial Corp. | | | 973,486 | |
| | 1,800 | | | Erie Indemnity Co. Class A | | | 348,030 | |
| | 144,400 | | | Fidelity National Financial, Inc. | | | 6,275,624 | |
| | 45,800 | | | First American Financial Corp. | | | 2,855,630 | |
| | 224,799 | | | Mercury General Corp. | | | 14,600,695 | |
| | 632,306 | | | Old Republic International Corp. | | | 15,750,742 | |
| | 141,999 | | | Principal Financial Group, Inc. | | | 8,972,917 | |
| | 279,300 | | | Prudential Financial, Inc. | | | 28,619,871 | |
| | | | | | | | |
| | | | | | | 78,632,243 | |
| | |
| Materials – 2.8% | | | |
| | 43,426 | | | Air Products and Chemicals, Inc. | | | 12,492,792 | |
| | 875,000 | | | Amcor plc | | | 10,027,500 | |
| | 20,103 | | | Ashland Global Holdings, Inc. | | | 1,758,940 | |
| | 31,900 | | | Huntsman Corp. | | | 845,988 | |
| | 40,700 | | | International Flavors & Fragrances, Inc. | | | 6,080,580 | |
| | |
| |
| Common Stocks – (continued) | | | |
| Materials – (continued) | | | |
| | 185,799 | | | International Paper Co. | | | 11,391,337 | |
| | 79,319 | | | Linde plc | | | 22,931,123 | |
| | 65,780 | | | Newmont Corp. | | | 4,169,136 | |
| | 3,399 | | | Reliance Steel & Aluminum Co. | | | 512,909 | |
| | 723 | | | RPM International, Inc. | | | 64,115 | |
| | 23,300 | | | Sonoco Products Co. | | | 1,558,770 | |
| | 152,800 | | | Southern Copper Corp. | | | 9,828,096 | |
| | 41,803 | | | Steel Dynamics, Inc. | | | 2,491,459 | |
| | 2,300 | | | W R Grace & Co. | | | 158,976 | |
| | | | | | | | |
| | | | | | | 84,311,721 | |
| | |
| Media & Entertainment – 9.7% | | | |
| | 54,052 | | | Activision Blizzard, Inc. | | | 5,158,723 | |
| | 31,006 | | | Alphabet, Inc. Class A*(a) | | | 75,710,141 | |
| | 13,128 | | | Alphabet, Inc. Class C*(a) | | | 32,902,969 | |
| | 441,919 | | | Comcast Corp. Class A | | | 25,198,221 | |
| | 206,494 | | | Facebook, Inc. Class A* | | | 71,800,029 | |
| | 391,801 | | | Interpublic Group of Cos., Inc. (The) | | | 12,729,614 | |
| | 38,524 | | | Netflix, Inc.* | | | 20,348,395 | |
| | 4,593 | | | Nexstar Media Group, Inc. Class A | | | 679,213 | |
| | 171,400 | | | Omnicom Group, Inc. | | | 13,710,286 | |
| | 16,900 | | | Pinterest, Inc. Class A* | | | 1,334,255 | |
| | 928 | | | Roku, Inc.* | | | 426,184 | |
| | 16,500 | | | Snap, Inc. Class A* | | | 1,124,310 | |
| | 16,000 | | | TripAdvisor, Inc.* | | | 644,800 | |
| | 700 | | | ViacomCBS, Inc. Class A | | | 33,915 | |
| | 125,050 | | | Walt Disney Co. (The)* | | | 21,980,039 | |
| | 9,275 | | | Zillow Group, Inc. Class A* | | | 1,136,466 | |
| | 21,502 | | | Zillow Group, Inc. Class C* | | | 2,627,974 | |
| | | | | | | | |
| | | | | | | 287,545,534 | |
| | |
| Pharmaceuticals, Biotechnology & Life Sciences – 7.8% | |
| | 2,200 | | | 10X Genomics, Inc. Class A* | | | 430,804 | |
| | 310,486 | | | AbbVie, Inc.(a)(b) | | | 34,973,143 | |
| | 7,200 | | | Adaptive Biotechnologies Corp.* | | | 294,192 | |
| | 5,345 | | | Alnylam Pharmaceuticals, Inc.* | | | 906,084 | |
| | 49,202 | | | Amgen, Inc. | | | 11,992,988 | |
| | 2,432 | | | Bio-Techne Corp. | | | 1,095,032 | |
| | 355,801 | | | Bristol-Myers Squibb Co.(a) | | | 23,774,623 | |
| | 1,553 | | | Bruker Corp. | | | 117,997 | |
| | 6,275 | | | Charles River Laboratories International, Inc.* | | | 2,321,248 | |
| | 78,578 | | | Eli Lilly & Co. | | | 18,035,223 | |
| | 2,608 | | | Exact Sciences Corp.* | | | 324,200 | |
| | 209,994 | | | Gilead Sciences, Inc. | | | 14,460,187 | |
| | 5,100 | | | Iovance Biotherapeutics, Inc.* | | | 132,702 | |
| | 212,934 | | | Johnson & Johnson | | | 35,078,747 | |
| | 373,253 | | | Merck & Co., Inc. | | | 29,027,886 | |
| | 7,485 | | | Moderna, Inc.* | | | 1,758,825 | |
| | 37,325 | | | Organon & Co.* | | | 1,129,454 | |
| | 1,035,199 | | | Pfizer, Inc. | | | 40,538,393 | |
| | 7,600 | | | Repligen Corp.* | | | 1,517,112 | |
| | 1,420 | | | Sage Therapeutics, Inc.* | | | 80,670 | |
| | 2,687 | | | Seagen, Inc.* | | | 424,224 | |
| | 23,701 | | | Thermo Fisher Scientific, Inc. | | | 11,953,993 | |
| | | | | | | | |
| | | | | | | 230,367,727 | |
| | |
| | |
| 10 | | The accompanying notes are an integral part of these financial statements. |
GOLDMAN SACHS U.S. EQUITY DIVIDEND AND PREMIUM FUND
| | | | | | | | |
| Shares | | | Description | | Value | |
| |
| Common Stocks – (continued) | | | |
| Real Estate Investment Trusts – 2.4% | |
| | 1,028 | | | American Campus Communities, Inc. | | $ | 48,028 | |
| | 80,291 | | | American Homes 4 Rent Class A | | | 3,119,305 | |
| | 44,401 | | | American Tower Corp. | | | 11,994,486 | |
| | 1,797 | | | Brandywine Realty Trust | | | 24,637 | |
| | 3,320 | | | Brixmor Property Group, Inc. | | | 75,995 | |
| | 14,887 | | | Camden Property Trust | | | 1,975,058 | |
| | 3,658 | | | Cousins Properties, Inc. | | | 134,541 | |
| | 40,100 | | | Crown Castle International Corp. | | | 7,823,510 | |
| | 22,000 | | | CubeSmart | | | 1,019,040 | |
| | 1,403 | | | EPR Properties* | | | 73,910 | |
| | 8,300 | | | Equinix, Inc. | | | 6,661,580 | |
| | 31,200 | | | Equity LifeStyle Properties, Inc. | | | 2,318,472 | |
| | 7,366 | | | Gaming and Leisure Properties, Inc. | | | 341,267 | |
| | 7,526 | | | Healthcare Trust of America, Inc. Class A | | | 200,944 | |
| | 90,500 | | | Invitation Homes, Inc. | | | 3,374,745 | |
| | 5,456 | | | Lamar Advertising Co. Class A | | | 569,716 | |
| | 37,320 | | | Medical Properties Trust, Inc. | | | 750,132 | |
| | 5,566 | | | National Retail Properties, Inc. | | | 260,881 | |
| | 66,335 | | | Outfront Media, Inc.* | | | 1,594,030 | |
| | 8,383 | | | Park Hotels & Resorts, Inc.* | | | 172,774 | |
| | 102,727 | | | Prologis, Inc. | | | 12,278,958 | |
| | 26,200 | | | SBA Communications Corp. | | | 8,349,940 | |
| | 1,781 | | | Spirit Realty Capital, Inc. | | | 85,203 | |
| | 12,591 | | | STORE Capital Corp. | | | 434,516 | |
| | 29,993 | | | Sun Communities, Inc. | | | 5,140,800 | |
| | 27,532 | | | VEREIT, Inc. | | | 1,264,545 | |
| | 10,400 | | | VICI Properties, Inc. | | | 322,608 | |
| | 1,280 | | | WP Carey, Inc. | | | 95,514 | |
| | | | | | | | |
| | | | | | | 70,505,135 | |
| | |
| Retailing – 7.6% | |
| | 36,186 | | | Amazon.com, Inc.*(a)(b) | | | 124,485,630 | |
| | 4,507 | | | Burlington Stores, Inc.* | | | 1,451,209 | |
| | 6,875 | | | Carvana Co.* | | | 2,075,012 | |
| | 300 | | | Chewy, Inc. Class A* | | | 23,913 | |
| | 41,900 | | | Dick’s Sporting Goods, Inc. | | | 4,197,961 | |
| | 5,281 | | | Five Below, Inc.* | | | 1,020,659 | |
| | 4,000 | | | Floor & Decor Holdings, Inc. Class A* | | | 422,800 | |
| | 14,900 | | | Foot Locker, Inc. | | | 918,287 | |
| | 142,476 | | | Home Depot, Inc. (The) | | | 45,434,172 | |
| | 13,020 | | | Just Eat Takeaway.com NV ADR* | | | 237,745 | |
| | 87,199 | | | Lowe’s Cos., Inc. | | | 16,913,990 | |
| | 1,318 | | | MercadoLibre, Inc.* | | | 2,053,167 | |
| | 277,000 | | | Qurate Retail, Inc. Series A | | | 3,625,930 | |
| | 67,115 | | | Target Corp. | | | 16,224,380 | |
| | 10,900 | | | Vroom, Inc.*(c) | | | 456,274 | |
| | 6,162 | | | Wayfair, Inc. Class A* | | | 1,945,405 | |
| | 16,500 | | | Williams-Sonoma, Inc. | | | 2,634,225 | |
| | | | | | | | |
| | | | | | | 224,120,759 | |
| | |
| Semiconductors & Semiconductor Equipment – 5.8% | |
| | 115,317 | | | Advanced Micro Devices, Inc.* | | | 10,831,726 | |
| | 51,900 | | | Analog Devices, Inc. | | | 8,935,104 | |
| | 56,690 | | | Broadcom, Inc. | | | 27,032,060 | |
| | 1,100 | | | Cree, Inc.* | | | 107,723 | |
| | |
| |
| Common Stocks – (continued) | | | |
| Semiconductors & Semiconductor Equipment – (continued) | |
| | 600 | | | First Solar, Inc.* | | | 54,306 | |
| | 356,609 | | | Intel Corp. | | | 20,020,029 | |
| | 24,453 | | | Lam Research Corp. | | | 15,911,567 | |
| | 47,901 | | | Marvell Technology, Inc. | | | 2,794,065 | |
| | 54,700 | | | NVIDIA Corp. | | | 43,765,470 | |
| | 4,000 | | | NXP Semiconductors NV | | | 822,880 | |
| | 99,397 | | | QUALCOMM, Inc. | | | 14,206,813 | |
| | 1,600 | | | SolarEdge Technologies, Inc.* | | | 442,192 | |
| | 144,350 | | | Texas Instruments, Inc.(a) | | | 27,758,505 | |
| | | | | | | | |
| | | | | | | 172,682,440 | |
| | |
| Software & Services – 14.4% | |
| | 59,600 | | | Accenture plc Class A | | | 17,569,484 | |
| | 37,091 | | | Adobe, Inc.* | | | 21,721,973 | |
| | 9,000 | | | Alteryx, Inc. Class A* | | | 774,180 | |
| | 6,300 | | | Amdocs Ltd. | | | 487,368 | |
| | 4,300 | | | Anaplan, Inc.* | | | 229,190 | |
| | 27,608 | | | Automatic Data Processing, Inc. | | | 5,483,501 | |
| | 3,100 | | | Avalara, Inc.* | | | 501,580 | |
| | 400 | | | Bill.com Holdings, Inc.* | | | 73,272 | |
| | 2,400 | | | Ceridian HCM Holding, Inc.* | | | 230,208 | |
| | 13,500 | | | Cloudflare, Inc. Class A* | | | 1,428,840 | |
| | 9,000 | | | Coupa Software, Inc.* | | | 2,358,990 | |
| | 10,600 | | | Crowdstrike Holdings, Inc. Class A* | | | 2,663,886 | |
| | 10,000 | | | Datadog, Inc. Class A* | | | 1,040,800 | |
| | 11,868 | | | DocuSign, Inc.* | | | 3,317,937 | |
| | 2,700 | | | Dynatrace, Inc.* | | | 157,734 | |
| | 2,400 | | | Everbridge, Inc.* | | | 326,592 | |
| | 32,772 | | | Fidelity National Information Services, Inc. | | | 4,642,809 | |
| | 300 | | | Five9, Inc.* | | | 55,017 | |
| | 10,400 | | | HubSpot, Inc.* | | | 6,060,288 | |
| | 239,001 | | | International Business Machines Corp. | | | 35,035,157 | |
| | 12,900 | | | Intuit, Inc. | | | 6,323,193 | |
| | 62,200 | | | Mastercard, Inc. Class A | | | 22,708,598 | |
| | 615,533 | | | Microsoft Corp.(a)(b) | | | 166,747,890 | |
| | 3,622 | | | MongoDB, Inc.* | | | 1,309,426 | |
| | 4,900 | | | Nutanix, Inc. Class A* | | | 187,278 | |
| | 3,527 | | | Okta, Inc.* | | | 862,986 | |
| | 1,100 | | | PagerDuty, Inc.* | | | 46,838 | |
| | 154,200 | | | Paychex, Inc. | | | 16,545,660 | |
| | 94,300 | | | PayPal Holdings, Inc.* | | | 27,486,564 | |
| | 600 | | | PTC, Inc.* | | | 84,756 | |
| | 70,049 | | | salesforce.com, Inc.* | | | 17,110,869 | |
| | 16,262 | | | ServiceNow, Inc.* | | | 8,936,782 | |
| | 14,000 | | | Slack Technologies, Inc. Class A* | | | 620,200 | |
| | 6,200 | | | Smartsheet, Inc. Class A* | | | 448,384 | |
| | 700 | | | Snowflake, Inc. Class A* | | | 169,260 | |
| | 8,910 | | | Square, Inc. Class A* | | | 2,172,258 | |
| | 34,000 | | | Trade Desk, Inc. (The) Class A* | | | 2,630,240 | |
| | 7,300 | | | Twilio, Inc. Class A* | | | 2,877,368 | |
| | 117,555 | | | Visa, Inc. Class A | | | 27,486,710 | |
| | 511,299 | | | Western Union Co. (The) | | | 11,744,538 | |
| | 12,600 | | | Zendesk, Inc.* | | | 1,818,684 | |
| | 1,800 | | | Zoom Video Communications, Inc. Class A* | | | 696,654 | |
| | |
| | |
| The accompanying notes are an integral part of these financial statements. | | 11 |
GOLDMAN SACHS U.S. EQUITY DIVIDEND AND PREMIUM FUND
Schedule of Investments (continued)
June 30, 2021 (Unaudited)
| | | | | | | | |
| Shares | | | Description | | Value | |
| |
| Common Stocks – (continued) | | | |
| Software & Services – (continued) | |
| | 8,600 | | | Zscaler, Inc.* | | $ | 1,858,116 | |
| | | | | | | | |
| | | | | | | 425,032,058 | |
| | |
| Technology Hardware & Equipment – 8.4% | |
| | 1,331,056 | | | Apple, Inc.(a) | | | 182,301,429 | |
| | 524,848 | | | Cisco Systems, Inc.(a) | | | 27,816,944 | |
| | 181,181 | | | Corning, Inc. | | | 7,410,303 | |
| | 17,559 | | | Flex Ltd.* | | | 313,779 | |
| | 363,000 | | | HP, Inc. | | | 10,958,970 | |
| | 800 | | | Littelfuse, Inc. | | | 203,832 | |
| | 52,430 | | | National Instruments Corp. | | | 2,216,740 | |
| | 93,800 | | | NetApp, Inc. | | | 7,674,716 | |
| | 60,500 | | | TE Connectivity Ltd. | | | 8,180,205 | |
| | | | | | | | |
| | | | | | | 247,076,918 | |
| | |
| Telecommunication Services – 2.4% | |
| | 1,202,828 | | | AT&T, Inc.(a) | | | 34,617,390 | |
| | 674,302 | | | Verizon Communications, Inc.(b) | | | 37,781,141 | |
| | | | | | | | |
| | | | | | | 72,398,531 | |
| | |
| Transportation – 1.8% | |
| | 18,284 | | | JetBlue Airways Corp.* | | | 306,805 | |
| | 17,224 | | | Lyft, Inc. Class A* | | | 1,041,707 | |
| | 22,346 | | | Norfolk Southern Corp. | | | 5,930,852 | |
| | 57,800 | | | Ryder System, Inc. | | | 4,296,274 | |
| | 28,482 | | | Uber Technologies, Inc.* | | | 1,427,518 | |
| | 93,562 | | | Union Pacific Corp. | | | 20,577,091 | |
| | 88,698 | | | United Parcel Service, Inc. Class B | | | 18,446,523 | |
| | | | | | | | |
| | | | | | | 52,026,770 | |
| | |
| Utilities – 3.0% | |
| | 81,100 | | | Consolidated Edison, Inc. | | | 5,816,492 | |
| | 111,097 | | | Dominion Energy, Inc. | | | 8,173,406 | |
| | 183,400 | | | Duke Energy Corp. | | | 18,105,248 | |
| | 56,800 | | | Entergy Corp. | | | 5,662,960 | |
| | 21,700 | | | MDU Resources Group, Inc. | | | 680,078 | |
| | 200,500 | | | OGE Energy Corp. | | | 6,746,825 | |
| | 645,101 | | | PPL Corp. | | | 18,043,475 | |
| | 37,000 | | | Sempra Energy | | | 4,901,760 | |
| | 316,501 | | | Southern Co. (The) | | | 19,151,476 | |
| | | | | | | | |
| | | | | | | 87,281,720 | |
| | |
| | TOTAL COMMON STOCKS | |
| | (Cost $1,958,303,159) | | $ | 2,952,034,543 | |
| | |
| | | | | | | | |
| Shares | | | Dividend
Rate | | Value | |
|
| Investment Company(d) – 1.6% | |
| Goldman Sachs Financial Square Government Fund –
Institutional Shares |
|
| | 47,903,237 | | | 0.026% | | $ | 47,903,237 | |
| | (Cost $47,903,237) | | | | |
| | |
| TOTAL INVESTMENTS BEFORE SECURITIES LENDING
REINVESTMENT VEHICLE |
|
| | (Cost $2,006,206,396) | | $ | 2,999,937,780 | |
| | |
| | | | | | | | |
|
| Securities Lending Reinvestment Vehicle(d) – 0.0% | |
| Goldman Sachs Financial Square Government Fund –
Institutional Shares |
|
| | 188,100 | | | 0.026% | | $ | 188,100 | |
| | (Cost $188,100) | | | | |
| | |
| | TOTAL INVESTMENTS – 101.4% | | | | |
| | (Cost $2,006,394,496) | | $ | 3,000,125,880 | |
| | |
| LIABILITIES IN EXCESS OF
OTHER ASSETS – (1.4)% | | | (42,192,413 | ) |
| | |
| | NET ASSETS – 100.0% | | $ | 2,957,933,467 | |
| | |
| | |
|
| The percentage shown for each investment category reflects the value of investments in that category as a percentage of net assets. |
| |
* | | Security is currently in default and/or non-income producing. |
| |
(a) | | All or a portion of security is segregated as collateral for call options written. |
| |
(b) | | All or a portion of security is segregated as collateral for initial margin requirements on futures transactions. |
| |
(c) | | All or a portion of security is on loan. |
| |
(d) | | Represents an Affiliated Issuer. |
| | |
|
Investment Abbreviation: |
ADR | | —American Depositary Receipt |
| | |
Currency Abbreviation: |
USD | | —United States Dollar |
|
| | |
| 12 | | The accompanying notes are an integral part of these financial statements. |
GOLDMAN SACHS U.S. EQUITY DIVIDEND AND PREMIUM FUND
|
| ADDITIONAL INVESTMENT INFORMATION |
FUTURES CONTRACTS — At June 30, 2021, the Fund had the following futures contracts:
| | | | | | | | | | | | | | | | |
| Description | | Number of
Contracts | | | Expiration Date | | | Notional
Amount | | | Unrealized
Appreciation/
(Depreciation) | |
Long position contracts: | | | | | | | | | | | | | | | | |
S&P 500 E-Mini Index | | | 164 | | | | 09/17/2021 | | | $ | 35,166,520 | | | $ | 425,069 | |
WRITTEN OPTIONS CONTRACTS — At June 30, 2021, the Fund had the following written options contracts:
EXCHANGE TRADED INDEX OPTIONS
| | | | | | | | | | | | | | | | | | | | | | | | | | |
| Description | | Exercise
Price | | Expiration
Date | | | Number of
Contracts | | | Notional
Amount | | | Value | | | Premiums Paid
(Received) by
the Fund | | | Unrealized
Appreciation/
(Depreciation) | |
Written options contracts: | | | | | | | | | | | | | | | | | | | | | | | | | | |
Calls | | | | | | | | | | | | | | | | | | | | | | | | | | |
S&P 500 Index | | 4,225 USD | | | 07/30/2021 | | | | 910 | | | $ | (391,072,500 | ) | | $ | (9,955,400 | ) | | $ | (9,627,818 | ) | | $ | (327,582 | ) |
| | 4,250 USD | | | 08/31/2021 | | | | 907 | | | | (389,783,250 | ) | | | (11,020,050 | ) | | | (8,687,636 | ) | | | (2,332,414 | ) |
| | | 4,325 USD | | | 09/30/2021 | | | | 893 | | | | (383,766,750 | ) | | | (8,858,560 | ) | | | (8,746,221 | ) | | | (112,339 | ) |
| | | | | | |
| Total written options contracts | | | | | | | 2,710 | | | | | | | $ | (29,834,010 | ) | | $ | (27,061,675 | ) | | $ | (2,772,335 | ) |
| | |
| The accompanying notes are an integral part of these financial statements. | | 13 |
GOLDMAN SACHS INTERNATIONAL EQUITY DIVIDEND AND PREMIUM FUND
Schedule of Investments
June 30, 2021 (Unaudited)
| | | | | | | | |
| Shares | | | Description | | Value | |
|
| Common Stocks – 99.1% | |
| Australia – 9.7% | | | |
| | 1,244 | | | Afterpay Ltd. (Software & Services)* | | $ | 110,418 | |
| | 52,943 | | | AGL Energy Ltd. (Utilities) | | | 325,272 | |
| | 51,152 | | | APA Group (Utilities) | | | 341,318 | |
| | 2,405 | | | ASX Ltd. (Diversified Financials) | | | 140,201 | |
| | 462,912 | | | Aurizon Holdings Ltd. (Transportation) | | | 1,289,371 | |
| | 58,793 | | | AusNet Services Ltd. (Utilities) | | | 77,058 | |
| | 26,727 | | | BHP Group Ltd. (Materials) | | | 972,336 | |
| | 5,805 | | | BHP Group plc (Materials) | | | 171,776 | |
| | 10,024 | | | CIMIC Group Ltd. (Capital Goods) | | | 148,496 | |
| | 23,965 | | | Coles Group Ltd. (Food & Staples Retailing) | | | 306,986 | |
| | 27,180 | | | Commonwealth Bank of Australia (Banks) | | | 2,035,310 | |
| | 809 | | | CSL Ltd. (Pharmaceuticals, Biotechnology & Life Sciences) | | | 173,020 | |
| | 80,273 | | | Fortescue Metals Group Ltd. (Materials) | | | 1,402,283 | |
| | 24,786 | | | Magellan Financial Group Ltd. (Diversified Financials) | | | 1,001,049 | |
| | 181,654 | | | Medibank Pvt Ltd. (Insurance) | | | 430,670 | |
| | 121,850 | | | National Australia Bank Ltd. (Banks) | | | 2,395,427 | |
| | 14,680 | | | Rio Tinto Ltd. (Materials) | | | 1,391,746 | |
| | 11,619 | | | Rio Tinto plc (Materials) | | | 959,584 | |
| | 37,882 | | | Rio Tinto plc ADR (Materials)(a)(b) | | | 3,177,921 | |
| | 9,879 | | | Sonic Healthcare Ltd. (Health Care Equipment & Services) | | | 284,668 | |
| | 25,935 | | | Wesfarmers Ltd. (Retailing) | | | 1,149,778 | |
| | | | | | | | |
| | | | | | | 18,284,688 | |
| | |
| Belgium – 1.5% | |
| | 27,782 | | | Ageas SA/NV (Insurance)(b) | | | 1,543,879 | |
| | 1,987 | | | Anheuser-Busch InBev SA/NV (Food, Beverage & Tobacco) | | | 143,240 | |
| | 57,166 | | | Proximus SADP (Telecommunication Services)(b) | | | 1,104,963 | |
| | | | | | | | |
| | | | | | | 2,792,082 | |
| | |
| Brazil – 0.2% | |
| | 6,050 | | | Yara International ASA (Materials) | | | 318,801 | |
| | |
| China – 0.3% | |
| | 4,910 | | | Prosus NV (Retailing)* | | | 481,021 | |
| | |
| Denmark – 1.9% | |
| | 1,065 | | | Ambu A/S Class B (Health Care Equipment & Services) | | | 40,979 | |
| | 6,157 | | | Coloplast A/S Class B (Health Care Equipment & Services) | | | 1,010,876 | |
| | 25,297 | | | Novo Nordisk A/S Class B (Pharmaceuticals, Biotechnology & Life Sciences) | | | 2,117,512 | |
| | 7,861 | | | Tryg A/S (Insurance) | | | 193,088 | |
| | 7,445 | | | Vestas Wind Systems A/S (Capital Goods) | | | 290,891 | |
| | | | | | | | |
| | | | | | | 3,653,346 | |
| | |
| Finland – 3.4% | |
| | 7,106 | | | Kone OYJ Class B (Capital Goods) | | | 579,692 | |
| | 50,367 | | | Neles OYJ (Capital Goods) | | | 726,228 | |
| | |
|
| Common Stocks – (continued) | |
| Finland – (continued) | |
| | 7,263 | | | Neste OYJ (Energy) | | | 445,527 | |
| | 298,364 | | | Nordea Bank Abp (Banks) | | | 3,322,556 | |
| | 4,735 | | | Orion OYJ Class B (Pharmaceuticals, Biotechnology & Life Sciences) | | | 203,579 | |
| | 26,278 | | | Sampo OYJ Class A (Insurance)(b) | | | 1,208,382 | |
| | | | | | | | |
| | | | | | | 6,485,964 | |
| | |
| France – 10.2% | |
| | 11,265 | | | Airbus SE (Capital Goods)* | | | 1,451,527 | |
| | 2,983 | | | BNP Paribas SA (Banks) | | | 187,212 | |
| | 12,106 | | | Bouygues SA (Capital Goods) | | | 448,405 | |
| | 2,794 | | | Capgemini SE (Software & Services)(b) | | | 537,324 | |
| | 125,092 | | | Credit Agricole SA (Banks)(b) | | | 1,753,739 | |
| | 21,499 | | | Danone SA (Food, Beverage & Tobacco)(b) | | | 1,512,561 | |
| | 741 | | | Dassault Systemes SE (Software & Services) | | | 179,838 | |
| | 8,725 | | | Edenred (Software & Services) | | | 497,472 | |
| | 1,617 | | | Kering SA (Consumer Durables & Apparel)(b) | | | 1,416,844 | |
| | 2,385 | | | L’Oreal SA (Household & Personal Products)(b) | | | 1,065,126 | |
| | 4,118 | | | LVMH Moet Hennessy Louis Vuitton SE (Consumer Durables & Apparel) | | | 3,239,454 | |
| | 4,048 | | | Orange SA (Telecommunication Services) | | | 46,199 | |
| | 2,445 | | | Pernod Ricard SA (Food, Beverage & Tobacco) | | | 543,431 | |
| | 3,578 | | | Publicis Groupe SA (Media & Entertainment) | | | 228,974 | |
| | 3,760 | | | Safran SA (Capital Goods) | | | 521,824 | |
| | 22,801 | | | Sanofi (Pharmaceuticals, Biotechnology & Life Sciences)(b) | | | 2,395,532 | |
| | 40,614 | | | TotalEnergies SE (Energy)(b) | | | 1,839,887 | |
| | 1,535 | | | Unibail-Rodamco-Westfield (REIT)* | | | 133,078 | |
| | 2,233 | | | Valeo SA (Automobiles & Components) | | | 67,355 | |
| | 2,177 | | | Vinci SA (Capital Goods) | | | 232,717 | |
| | 21,606 | | | Vivendi SE (Media & Entertainment)(b) | | | 725,943 | |
| | 2,168 | | | Worldline SA (Software & Services)*(c) | | | 203,152 | |
| | | | | | | | |
| | | | | | | 19,227,594 | |
| | |
| Germany – 9.5% | |
| | 1,494 | | | adidas AG (Consumer Durables & Apparel) | | | 557,498 | |
| | 1,868 | | | Allianz SE (Registered) (Insurance) | | | 466,172 | |
| | 10,462 | | | BASF SE (Materials)(b) | | | 825,868 | |
| | 17,239 | | | Bayer AG (Registered) (Pharmaceuticals, Biotechnology & Life Sciences)(b) | | | 1,048,049 | |
| | 3,522 | | | Bayerische Motoren Werke AG (Automobiles & Components)(b) | | | 373,387 | |
| | 12,857 | | | Bayerische Motoren Werke AG (Preference) (Automobiles & Components)(d) | | | 1,156,605 | |
| | 1,259 | | | Deutsche Boerse AG (Diversified Financials) | | | 219,754 | |
| | |
| | |
| 14 | | The accompanying notes are an integral part of these financial statements. |
GOLDMAN SACHS INTERNATIONAL EQUITY DIVIDEND AND PREMIUM FUND
| | | | | | | | |
| Shares | | | Description | | Value | |
|
| Common Stocks – (continued) | |
| Germany – (continued) | |
| | 22,030 | | | Deutsche Post AG (Registered) (Transportation)(b) | | $ | 1,500,347 | |
| | 53,273 | | | Evonik Industries AG (Materials)(b) | | | 1,788,556 | |
| | 808 | | | GEA Group AG (Capital Goods) | | | 32,740 | |
| | 5,368 | | | HelloFresh SE (Retailing)* | | | 521,819 | |
| | 14,750 | | | HOCHTIEF AG (Capital Goods)(b) | | | 1,134,439 | |
| | 8,731 | | | Infineon Technologies AG (Semiconductors & Semiconductor Equipment) | | | 351,189 | |
| | 2,547 | | | Just Eat Takeaway.com NV (Retailing)*(c) | | | 235,556 | |
| | 3,095 | | | LEG Immobilien SE (Real Estate) | | | 445,546 | |
| | 1,694 | | | Porsche Automobil Holding SE (Preference) (Automobiles & Components)(d) | | | 182,186 | |
| | 2,633 | | | Puma SE (Consumer Durables & Apparel) | | | 314,251 | |
| | 13,192 | | | SAP SE (Software & Services)(b) | | | 1,852,945 | |
| | 689 | | | Sartorius AG (Preference) (Health Care Equipment & Services)(d) | | | 358,630 | |
| | 14,147 | | | Siemens AG (Registered) (Capital Goods) | | | 2,246,244 | |
| | 2,182 | | | Siemens Healthineers AG (Health Care Equipment & Services)(c) | | | 133,786 | |
| | 211,846 | | | Telefonica Deutschland Holding AG (Telecommunication Services) | | | 559,215 | |
| | 2,051 | | | Volkswagen AG (Preference) (Automobiles & Components)(d) | | | 514,250 | |
| | 17,336 | | | Vonovia SE (Real Estate)(b) | | | 1,120,348 | |
| | | | | | | | |
| | | | | | | 17,939,380 | |
| | |
| Hong Kong – 2.6% | |
| | 107,800 | | | AIA Group Ltd. (Insurance) | | | 1,337,321 | |
| | 16,700 | | | ASM Pacific Technology Ltd. (Semiconductors & Semiconductor Equipment) | | | 226,222 | |
| | 28,000 | | | Hang Lung Properties Ltd. (Real Estate) | | | 67,908 | |
| | 98 | | | Hong Kong & China Gas Co. Ltd. (Utilities) | | | 152 | |
| | 14,596 | | | Hong Kong Exchanges & Clearing Ltd. (Diversified Financials) | | | 868,897 | |
| | 2,300 | | | Jardine Matheson Holdings Ltd. (Capital Goods) | | | 147,015 | |
| | 187,387 | | | Link REIT (REIT) | | | 1,813,033 | |
| | 23,910 | | | Sino Land Co. Ltd. (Real Estate) | | | 37,693 | |
| | 500 | | | Sun Hung Kai Properties Ltd. (Real Estate) | | | 7,431 | |
| | 400 | | | Swire Properties Ltd. (Real Estate) | | | 1,191 | |
| | 24,000 | | | Techtronic Industries Co. Ltd. (Capital Goods) | | | 418,247 | |
| | | | | | | | |
| | | | | | | 4,925,110 | |
| | |
| Ireland – 0.7% | |
| | 24,567 | | | CRH plc (Materials)(b) | | | 1,242,386 | |
| | |
| Israel – 0.2% | |
| | 12,983 | | | ICL Group Ltd. (Materials) | | | 88,096 | |
| | |
|
| Common Stocks – (continued) | |
| Israel – (continued) | |
| | 710 | | | Wix.com Ltd. (Software & Services)*(a) | | | 206,099 | |
| | | | | | | | |
| | | | | | | 294,195 | |
| | |
| Italy – 0.6% | |
| | 9,895 | | | Enel SpA (Utilities) | | | 91,953 | |
| | 4,925 | | | Eni SpA (Energy)(b) | | | 60,044 | |
| | 1,974 | | | Ferrari NV (Automobiles & Components) | | | 407,525 | |
| | 2,098 | | | Moncler SpA (Consumer Durables & Apparel) | | | 142,219 | |
| | 60,423 | | | Snam SpA (Utilities) | | | 349,532 | |
| | | | | | | | |
| | | | | | | 1,051,273 | |
| | |
| Japan – 22.8% | |
| | 2,400 | | | ABC-Mart, Inc. (Retailing) | | | 138,037 | |
| | 2,400 | | | Advantest Corp. (Semiconductors & Semiconductor Equipment) | | | 215,488 | |
| | 11,300 | | | AGC, Inc. (Capital Goods) | | | 473,362 | |
| | 10,500 | | | Alfresa Holdings Corp. (Health Care Equipment & Services) | | | 156,827 | |
| | 13,000 | | | Asahi Kasei Corp. (Materials) | | | 142,885 | |
| | 7,100 | | | Astellas Pharma, Inc. (Pharmaceuticals, Biotechnology & Life Sciences) | | | 123,729 | |
| | 1,600 | | | Bandai Namco Holdings, Inc. (Consumer Durables & Apparel) | | | 110,735 | |
| | 28,200 | | | Bridgestone Corp. (Automobiles & Components) | | | 1,281,757 | |
| | 22,100 | | | Canon, Inc. (Technology Hardware & Equipment) | | | 499,504 | |
| | 7,900 | | | Casio Computer Co. Ltd. (Consumer Durables & Apparel) | | | 132,559 | |
| | 12,800 | | | Chugai Pharmaceutical Co. Ltd. (Pharmaceuticals, Biotechnology & Life Sciences) | | | 507,349 | |
| | 31,100 | | | Chugoku Electric Power Co., Inc. (The) (Utilities) | | | 283,789 | |
| | 1,500 | | | Dai-ichi Life Holdings, Inc. (Insurance) | | | 27,599 | |
| | 27,400 | | | Daiichi Sankyo Co. Ltd. (Pharmaceuticals, Biotechnology & Life Sciences) | | | 591,103 | |
| | 1,200 | | | Daikin Industries Ltd. (Capital Goods) | | | 223,620 | |
| | 3,200 | | | Daito Trust Construction Co. Ltd. (Real Estate) | | | 349,128 | |
| | 132,700 | | | Daiwa Securities Group, Inc. (Diversified Financials) | | | 729,000 | |
| | 2,900 | | | Denso Corp. (Automobiles & Components) | | | 197,755 | |
| | 1,500 | | | Disco Corp. (Semiconductors & Semiconductor Equipment) | | | 456,074 | |
| | 6,400 | | | Eisai Co. Ltd. (Pharmaceuticals, Biotechnology & Life Sciences) | | | 628,975 | |
| | 2,000 | | | FANUC Corp. (Capital Goods) | | | 479,596 | |
| | 200 | | | Fast Retailing Co. Ltd. (Retailing) | | | 150,338 | |
| | 2,600 | | | Fuji Electric Co. Ltd. (Capital Goods) | | | 121,361 | |
| | 1,300 | | | Hikari Tsushin, Inc. (Retailing) | | | 228,470 | |
| | 28,600 | | | Hino Motors Ltd. (Capital Goods) | | | 252,970 | |
| | |
| | |
| The accompanying notes are an integral part of these financial statements. | | 15 |
GOLDMAN SACHS INTERNATIONAL EQUITY DIVIDEND AND PREMIUM FUND
Schedule of Investments (continued)
June 30, 2021 (Unaudited)
| | | | | | | | |
| Shares | | | Description | | Value | |
|
| Common Stocks – (continued) | |
| Japan – (continued) | |
| | 1,916 | | | Hirose Electric Co. Ltd. (Technology Hardware & Equipment) | | $ | 280,300 | |
| | 1,400 | | | Hitachi Ltd. (Capital Goods) | | | 80,230 | |
| | 1,200 | | | Honda Motor Co. Ltd. (Automobiles & Components) | | | 38,596 | |
| | 3,500 | | | Hoya Corp. (Health Care Equipment & Services) | | | 462,946 | |
| | 3,100 | | | Isuzu Motors Ltd. (Automobiles & Components) | | | 41,136 | |
| | 54,000 | | | ITOCHU Corp. (Capital Goods) | | | 1,558,154 | |
| | 14,200 | | | Japan Exchange Group, Inc. (Diversified Financials) | | | 316,319 | |
| | 11,000 | | | Japan Post Bank Co. Ltd. (Banks) | | | 92,514 | |
| | 16,700 | | | Japan Post Insurance Co. Ltd. (Insurance) | | | 309,001 | |
| | 11,500 | | | Japan Tobacco, Inc. (Food, Beverage & Tobacco) | | | 217,331 | |
| | 6,400 | | | JSR Corp. (Materials) | | | 194,414 | |
| | 12,400 | | | Kajima Corp. (Capital Goods) | | | 157,354 | |
| | 9,300 | | | Kakaku.com, Inc. (Media & Entertainment) | | | 279,782 | |
| | 33,100 | | | Kansai Electric Power Co., Inc. (The) (Utilities) | | | 315,834 | |
| | 1,700 | | | Kao Corp. (Household & Personal Products) | | | 104,822 | |
| | 300 | | | Keyence Corp. (Technology Hardware & Equipment) | | | 151,087 | |
| | 4,600 | | | Kikkoman Corp. (Food, Beverage & Tobacco) | | | 303,362 | |
| | 3,600 | | | Kintetsu Group Holdings Co. Ltd. (Transportation)* | | | 126,537 | |
| | 38,100 | | | Kirin Holdings Co. Ltd. (Food, Beverage & Tobacco) | | | 743,553 | |
| | 12,500 | | | Komatsu Ltd. (Capital Goods) | | | 309,670 | |
| | 2,300 | | | Kose Corp. (Household & Personal Products) | | | 361,323 | |
| | 2,800 | | | Kyushu Railway Co. (Transportation) | | | 63,184 | |
| | 4,100 | | | Lawson, Inc. (Food & Staples Retailing) | | | 189,898 | |
| | 27,300 | | | Lixil Corp. (Capital Goods) | | | 706,452 | |
| | 6,100 | | | M3, Inc. (Health Care Equipment & Services) | | | 444,436 | |
| | 2,100 | | | Makita Corp. (Capital Goods) | | | 98,883 | |
| | 5,000 | | | Mercari, Inc. (Retailing)* | | | 264,317 | |
| | 33,700 | | | Mitsubishi Corp. (Capital Goods) | | | 920,558 | |
| | 23,400 | | | Mitsubishi Electric Corp. (Capital Goods) | | | 339,703 | |
| | 49,600 | | | Mitsubishi HC Capital, Inc. (Diversified Financials) | | | 265,980 | |
| | 162,300 | | | Mitsubishi UFJ Financial Group, Inc. (Banks) | | | 874,190 | |
| | 4,800 | | | Mitsui & Co. Ltd. (Capital Goods) | | | 108,123 | |
| | 2,030 | | | Mizuho Financial Group, Inc. (Banks) | | | 29,095 | |
| | 13,700 | | | MS&AD Insurance Group Holdings, Inc. (Insurance) | | | 396,097 | |
| | 8,800 | | | Murata Manufacturing Co. Ltd. (Technology Hardware & Equipment) | | | 670,339 | |
| | |
|
| Common Stocks – (continued) | |
| Japan – (continued) | |
| | 8,200 | | | Nabtesco Corp. (Capital Goods) | | | 309,362 | |
| | 10,200 | | | NGK Spark Plug Co. Ltd. (Automobiles & Components) | | | 151,639 | |
| | 400 | | | Nidec Corp. (Capital Goods) | | | 45,996 | |
| | 1,600 | | | Nintendo Co. Ltd. (Media & Entertainment) | | | 925,877 | |
| | 3,700 | | | Nippon Express Co. Ltd. (Transportation) | | | 282,142 | |
| | 1,000 | | | Nippon Paint Holdings Co. Ltd. (Materials) | | | 13,528 | |
| | 68 | | | Nippon Prologis REIT, Inc. (REIT) | | | 213,085 | |
| | 5,200 | | | Nippon Yusen KK (Transportation) | | | 263,890 | |
| | 11,600 | | | Nisshin Seifun Group, Inc. (Food, Beverage & Tobacco) | | | 170,063 | |
| | 4,200 | | | Nitto Denko Corp. (Materials) | | | 312,776 | |
| | 51,900 | | | Nomura Holdings, Inc. (Diversified Financials) | | | 264,144 | |
| | 14,700 | | | Nomura Research Institute Ltd. (Software & Services) | | | 485,491 | |
| | 48,300 | | | NSK Ltd. (Capital Goods) | | | 408,542 | |
| | 2,200 | | | Obic Co. Ltd. (Software & Services) | | | 409,154 | |
| | 300 | | | Odakyu Electric Railway Co. Ltd. (Transportation) | | | 7,588 | |
| | 7,400 | | | Olympus Corp. (Health Care Equipment & Services) | | | 147,193 | |
| | 1,700 | | | Omron Corp. (Technology Hardware & Equipment) | | | 134,601 | |
| | 5,400 | | | Otsuka Corp. (Software & Services) | | | 283,070 | |
| | 45,300 | | | Panasonic Corp. (Consumer Durables & Apparel) | | | 521,608 | |
| | 13,200 | | | Pola Orbis Holdings, Inc. (Household & Personal Products) | | | 348,056 | |
| | 19,700 | | | Recruit Holdings Co. Ltd. (Commercial & Professional Services) | | | 966,064 | |
| | 66,300 | | | Resona Holdings, Inc. (Banks) | | | 255,630 | |
| | 1,000 | | | Ryohin Keikaku Co. Ltd. (Retailing) | | | 20,978 | |
| | 17,100 | | | Seiko Epson Corp. (Technology Hardware & Equipment) | | | 300,584 | |
| | 5,000 | | | Shimadzu Corp. (Technology Hardware & Equipment) | | | 193,204 | |
| | 3,900 | | | Shin-Etsu Chemical Co. Ltd. (Materials) | | | 652,317 | |
| | 2,300 | | | Shiseido Co. Ltd. (Household & Personal Products) | | | 169,645 | |
| | 94,500 | | | SoftBank Corp. (Telecommunication Services) | | | 1,235,587 | |
| | 16,500 | | | SoftBank Group Corp. (Telecommunication Services) | | | 1,150,740 | |
| | 3,800 | | | Sompo Holdings, Inc. (Insurance) | | | 140,745 | |
| | 7,500 | | | Sony Group Corp. (Consumer Durables & Apparel) | | | 727,254 | |
| | 28,300 | | | Subaru Corp. (Automobiles & Components) | | | 560,892 | |
| | 6,400 | | | Sumitomo Corp. (Capital Goods) | | | 85,814 | |
| | 1,100 | | | Sumitomo Metal Mining Co. Ltd. (Materials) | | | 42,780 | |
| | 46,600 | | | Sumitomo Mitsui Financial Group, Inc. (Banks) | | | 1,606,394 | |
| | |
| | |
| 16 | | The accompanying notes are an integral part of these financial statements. |
GOLDMAN SACHS INTERNATIONAL EQUITY DIVIDEND AND PREMIUM FUND
| | | | | | | | |
| Shares | | | Description | | Value | |
|
| Common Stocks – (continued) | |
| Japan – (continued) | |
| | 300 | | | Sumitomo Mitsui Trust Holdings, Inc. (Banks) | | $ | 9,570 | |
| | 2,200 | | | Sysmex Corp. (Health Care Equipment & Services) | | | 260,996 | |
| | 38,200 | | | Takeda Pharmaceutical Co. Ltd. (Pharmaceuticals, Biotechnology & Life Sciences) | | | 1,282,014 | |
| | 1,000 | | | TDK Corp. (Technology Hardware & Equipment) | | | 121,055 | |
| | 6,300 | | | Tohoku Electric Power Co., Inc. (Utilities) | | | 49,395 | |
| | 10,900 | | | Tokio Marine Holdings, Inc. (Insurance) | | | 502,057 | |
| | 3,600 | | | Tokyo Electron Ltd. (Semiconductors & Semiconductor Equipment) | | | 1,556,584 | |
| | 300 | | | Tokyo Gas Co. Ltd. (Utilities) | | | 5,658 | |
| | 3,900 | | | TOTO Ltd. (Capital Goods) | | | 202,072 | |
| | 3,800 | | | Toyoda Gosei Co. Ltd. (Automobiles & Components) | | | 93,725 | |
| | 37,020 | | | Toyota Motor Corp. (Automobiles & Components) | | | 3,236,070 | |
| | 57,500 | | | USS Co. Ltd. (Retailing) | | | 1,005,124 | |
| | 3,000 | | | Yamaha Corp. (Consumer Durables & Apparel) | | | 162,862 | |
| | 200 | | | Yamato Holdings Co. Ltd. (Transportation) | | | 5,683 | |
| | 900 | | | Yaskawa Electric Corp. (Capital Goods) | | | 43,952 | |
| | 3,900 | | | ZOZO, Inc. (Retailing) | | | 132,232 | |
| | | | | | | | |
| | | | | | | 42,793,012 | |
| | |
| Luxembourg – 0.0% | |
| | 4,775 | | | SES SA FDR (Media & Entertainment) | | | 36,516 | |
| | |
| Macau – 0.4% | |
| | 37,000 | | | Galaxy Entertainment Group Ltd. (Consumer Services)* | | | 295,855 | |
| | 77,600 | | | Sands China Ltd. (Consumer Services)* | | | 326,631 | |
| | 108,800 | | | Wynn Macau Ltd. (Consumer Services)* | | | 171,131 | |
| | | | | | | | |
| | | | | | | 793,617 | |
| | |
| Netherlands – 4.3% | |
| | 149 | | | Adyen NV (Software & Services)*(c) | | | 363,069 | |
| | 555 | | | Argenx SE (Pharmaceuticals, Biotechnology & Life Sciences)* | | | 167,452 | |
| | 6,132 | | | ASML Holding NV (Semiconductors & Semiconductor Equipment)(b) | | | 4,233,037 | |
| | 4,999 | | | Heineken NV (Food, Beverage & Tobacco) | | | 606,876 | |
| | 6,596 | | | Koninklijke Ahold Delhaize NV (Food & Staples Retailing) | | | 196,426 | |
| | 44,137 | | | Koninklijke KPN NV (Telecommunication Services) | | | 138,045 | |
| | 4,249 | | | NN Group NV (Insurance) | | | 200,720 | |
| | 24,710 | | | Royal Dutch Shell plc Class A (Energy)(b) | | | 496,089 | |
| | 86,152 | | | Royal Dutch Shell plc Class B (Energy)(b) | | | 1,672,451 | |
| | | | | | | | |
| | | | | | | 8,074,165 | |
| | |
|
| Common Stocks – (continued) | |
| New Zealand – 0.8% | |
| | 9,788 | | | Fisher & Paykel Healthcare Corp. Ltd. (Health Care Equipment & Services) | | | 212,932 | |
| | 26,020 | | | Meridian Energy Ltd. (Utilities) | | | 97,015 | |
| | 356,327 | | | Spark New Zealand Ltd. (Telecommunication Services) | | | 1,196,081 | |
| | | | | | | | |
| | | | | | | 1,506,028 | |
| | |
| Norway – 0.4% | |
| | 14,865 | | | DNB ASA (Banks) | | | 323,971 | |
| | 58 | | | Gjensidige Forsikring ASA (Insurance) | | | 1,279 | |
| | 9,166 | | | Orkla ASA (Food, Beverage & Tobacco) | | | 93,412 | |
| | 17,663 | | | Telenor ASA (Telecommunication Services) | | | 297,887 | |
| | | | | | | | |
| | | | | | | 716,549 | |
| | |
| Portugal – 0.1% | |
| | 14,664 | | | Galp Energia SGPS SA (Energy) | | | 159,437 | |
| | |
| Russia – 1.1% | |
| | 31,477 | | | Coca-Cola HBC AG (Food, Beverage & Tobacco) | | | 1,139,362 | |
| | 104,181 | | | Evraz plc (Materials) | | | 854,724 | |
| | | | | | | | |
| | | | | | | 1,994,086 | |
| | |
| Saudi Arabia – 0.1% | |
| | 2,137 | | | Delivery Hero SE (Retailing)*(c) | | | 282,353 | |
| | |
| Singapore – 1.0% | |
| | 2,800 | | | City Developments Ltd. (Real Estate) | | | 15,206 | |
| | 41,946 | | | DBS Group Holdings Ltd. (Banks) | | | 933,186 | |
| | 5,200 | | | Keppel Corp. Ltd. (Capital Goods) | | | 21,205 | |
| | 17,600 | | | Singapore Exchange Ltd. (Diversified Financials) | | | 146,588 | |
| | 211,200 | | | Singapore Technologies Engineering Ltd. (Capital Goods) | | | 609,401 | |
| | 121,600 | | | Singapore Telecommunications Ltd. (Telecommunication Services) | | | 207,082 | |
| | | | | | | | |
| | | | | | | 1,932,668 | |
| | |
| South Africa – 0.0% | |
| | 2 | | | Anglo American plc (Materials) | | | 80 | |
| | |
| Spain – 3.0% | |
| | 205 | | | ACS Actividades de Construccion y Servicios SA (Capital Goods) | | | 5,496 | |
| | 169 | | | Amadeus IT Group SA (Software & Services)* | | | 11,914 | |
| | 34,534 | | | Enagas SA (Utilities) | | | 798,182 | |
| | 98,111 | | | Endesa SA (Utilities)(b) | | | 2,381,722 | |
| | 30,922 | | | Ferrovial SA (Capital Goods) | | | 908,748 | |
| | 29,118 | | | Naturgy Energy Group SA (Utilities) | | | 749,395 | |
| | 45,811 | | | Red Electrica Corp. SA (Utilities) | | | 850,536 | |
| | | | | | | | |
| | | | | | | 5,705,993 | |
| | |
| Sweden – 1.8% | |
| | 4,320 | | | Atlas Copco AB Class A (Capital Goods) | | | 265,284 | |
| | |
| | |
| The accompanying notes are an integral part of these financial statements. | | 17 |
GOLDMAN SACHS INTERNATIONAL EQUITY DIVIDEND AND PREMIUM FUND
Schedule of Investments (continued)
June 30, 2021 (Unaudited)
| | | | | | | | |
| Shares | | | Description | | Value | |
|
| Common Stocks – (continued) | |
| Sweden – (continued) | |
| | 11,277 | | | Atlas Copco AB Class B (Capital Goods) | | $ | 593,920 | |
| | 2,920 | | | Boliden AB (Materials)* | | | 112,360 | |
| | 8,614 | | | Electrolux ABSeries B (Consumer Durables & Apparel) | | | 238,711 | |
| | 6,276 | | | H & M Hennes & Mauritz AB Class B (Retailing)* | | | 149,051 | |
| | 2,714 | | | Lundin Energy AB (Energy) | | | 96,218 | |
| | 11,112 | | | Skandinaviska Enskilda Banken AB Class A (Banks) | | | 143,635 | |
| | 22,571 | | | Svenska Handelsbanken AB Class A (Banks) | | | 254,797 | |
| | 239,872 | | | Telia Co. AB (Telecommunication Services) | | | 1,065,383 | |
| | 16,408 | | | Volvo AB Class B (Capital Goods) | | | 395,423 | |
| | | | | | | | |
| | | | | | | 3,314,782 | |
| | |
| Switzerland – 10.6% | |
| | 17,824 | | | Adecco Group AG (Registered) (Commercial & Professional Services) | | | 1,212,777 | |
| | 1,868 | | | Banque Cantonale Vaudoise (Registered) (Banks) | | | 167,856 | |
| | 90,877 | | | Clariant AG (Registered) (Materials) | | | 1,809,569 | |
| | 313 | | | Geberit AG (Registered) (Capital Goods) | | | 235,117 | |
| | 5,805 | | | Holcim Ltd. (Materials)* | | | 348,927 | |
| | 39,000 | | | Nestle SA (Registered) (Food, Beverage & Tobacco) | | | 4,861,236 | |
| | 28,173 | | | Novartis AG (Registered) (Pharmaceuticals, Biotechnology & Life Sciences) | | | 2,570,127 | |
| | 1,102 | | | Partners Group Holding AG (Diversified Financials) | | | 1,670,573 | |
| | 8,225 | | | Roche Holding AG (Pharmaceuticals, Biotechnology & Life Sciences) | | | 3,099,494 | |
| | 164 | | | SGS SA (Registered) (Commercial & Professional Services) | | | 506,344 | |
| | 18,359 | | | STMicroelectronics NV (Semiconductors & Semiconductor Equipment) | | | 667,654 | |
| | 103 | | | Straumann Holding AG (Registered) (Health Care Equipment & Services) | | | 164,289 | |
| | 6,693 | | | Zurich Insurance Group AG (Insurance) | | | 2,688,347 | |
| | | | | | | | |
| | | | | | | 20,002,310 | |
| | |
| United Kingdom – 10.6% | |
| | 255,575 | | | Aviva plc (Insurance) | | | 1,434,787 | |
| | 246,432 | | | BAE Systems plc (Capital Goods) | | | 1,780,723 | |
| | 82,983 | | | Barclays plc (Banks) | | | 196,925 | |
| | 20,568 | | | BP plc ADR (Energy)(b) | | | 543,407 | |
| | 20,812 | | | British American Tobacco plc (Food, Beverage & Tobacco) | | | 808,038 | |
| | 5,890 | | | Coca-Cola Europacific Partners plc (Food, Beverage & Tobacco) | | | 349,395 | |
| | 3,981 | | | Compass Group plc (Consumer Services)* | | | 83,871 | |
| | |
|
| Common Stocks – (continued) | |
| United Kingdom – (continued) | |
| | 13,945 | | | Diageo plc (Food, Beverage & Tobacco) | | | 668,363 | |
| | 73,976 | | | Direct Line Insurance Group plc (Insurance) | | | 291,777 | |
| | 67,079 | | | GlaxoSmithKline plc ADR (Pharmaceuticals, Biotechnology & Life Sciences)(b) | | | 2,671,086 | |
| | 278,576 | | | HSBC Holdings plc (Banks)(b) | | | 1,607,804 | |
| | 27,552 | | | Imperial Brands plc (Food, Beverage & Tobacco) | | | 594,097 | |
| | 133,695 | | | M&G plc (Diversified Financials) | | | 423,533 | |
| | 41,559 | | | National Grid plc (Utilities) | | | 528,617 | |
| | 30,216 | | | Persimmon plc (Consumer Durables & Apparel) | | | 1,237,757 | |
| | 1,916 | | | Reckitt Benckiser Group plc (Household & Personal Products)(b) | | | 169,279 | |
| | 17,073 | | | RELX plc (Commercial & Professional Services) | | | 452,720 | |
| | 104,341 | | | Rolls-Royce Holdings plc (Capital Goods)* | | | 142,845 | |
| | 22,346 | | | Segro plc (REIT) | | | 338,280 | |
| | 42,819 | | | SSE plc (Utilities) | | | 889,298 | |
| | 9,344 | | | St James’s Place plc (Diversified Financials) | | | 191,054 | |
| | 28,191 | | | Unilever plc (Household & Personal Products)(b) | | | 1,650,147 | |
| | 20,386 | | | Unilever plc ADR (Household & Personal Products)(b) | | | 1,192,581 | |
| | 91,841 | | | Vodafone Group plc ADR (Telecommunication Services)(b) | | | 1,573,236 | |
| | 7,359 | | | Wm Morrison Supermarkets plc (Food & Staples Retailing) | | | 25,113 | |
| | | | | | | | |
| | | | | | | 19,844,733 | |
| | |
| United States – 1.3% | |
| | 7,531 | | | Schneider Electric SE (Capital Goods)(b) | | | 1,187,221 | |
| | 65,321 | | | Stellantis NV (Automobiles & Components)(b) | | | 1,285,085 | |
| | | | | | | | |
| | | | | | | 2,472,306 | |
| | |
| | TOTAL INVESTMENTS – 99.1% | | | | |
| | (Cost $143,367,783) | | $ | 186,324,475 | |
| | |
| OTHER ASSETS IN EXCESS OF
LIABILITIES – 0.9% | | | 1,655,795 | |
| | |
| | NET ASSETS – 100.0% | | $ | 187,980,270 | |
| | |
| | |
|
| The percentage shown for each investment category reflects the value of investments in that category as a percentage of net assets. |
| |
* | | Security is currently in default and/or non-income producing. |
| |
(a) | | All or a portion of security is segregated as collateral for initial margin requirements on futures transactions. |
| |
(b) | | All or a portion of security is segregated as collateral for call options written. |
| | |
| 18 | | The accompanying notes are an integral part of these financial statements. |
GOLDMAN SACHS INTERNATIONAL EQUITY DIVIDEND AND PREMIUM FUND
| | |
| |
(c) | | Exempt from registration under Rule 144A of the Securities Act of 1933. |
| |
(d) | | Preference Shares are a special type of equity investment that shares in the earnings of the company, has limited voting rights, and receives a greater dividend than applicable Common Shares. |
| | |
|
Investment Abbreviations: |
ADR | | —American Depositary Receipt |
FDR | | —Fiduciary Depositary Receipt |
REIT | | —Real Estate Investment Trust |
| | |
Currency Abbreviations: |
EUR | | —Euro |
GBP | | —British Pound |
JPY | | —Japanese Yen |
|
|
| ADDITIONAL INVESTMENT INFORMATION |
FUTURES CONTRACTS — At June 30, 2021, the Fund had the following futures contracts:
| | | | | | | | | | | | | | | | |
| Description | | Number of
Contracts | | | Expiration Date | | | Notional
Amount | | | Unrealized
Appreciation/
(Depreciation) | |
Long position contracts: | | | | | | | | | | | | | | | | |
EURO STOXX 50 Index | | | 1 | | | | 09/17/2021 | | | $ | 48,088 | | | $ | (743 | ) |
WRITTEN OPTIONS CONTRACTS — At June 30, 2021, the Fund had the following written options contracts:
EXCHANGE TRADED INDEX OPTIONS
| | | | | | | | | | | | | | | | | | | | | | | | | | |
| Description | | Exercise
Price | | Expiration
Date | | | Number of
Contracts | | | Notional Amount | | | Value | | | Premiums Paid
(Received) by
the Fund | | | Unrealized
Appreciation/
(Depreciation) | |
Written options contracts: | | | | | | | | | | | | | | | | | | | | | | | | | | |
Calls | | | | | | | | | | | | | | | | | | | | | | | | | | |
EURO STOXX 50 Index | | 4,175 EUR | | | 09/17/2021 | | | | 914 | | | $ | (37,147,702 | ) | | $ | (553,809 | ) | | $ | (1,102,616 | ) | | $ | 548,807 | |
FTSE 100 Index | | 7,175 GBP | | | 09/17/2021 | | | | 131 | | | | (9,219,086 | ) | | | (154,937 | ) | | | (236,435 | ) | | | 81,498 | |
Nikkei 225 Index | | 29,250 JPY | | | 09/10/2021 | | | | 73 | | | | (2,101,781,690 | ) | | | (374,544 | ) | | | (575,046 | ) | | | 200,502 | |
| | | | | | |
| Total written options contracts | | | | | | | 1,118 | | | | | | | $ | (1,083,290 | ) | | $ | (1,914,097 | ) | | $ | 830,807 | |
| | |
| The accompanying notes are an integral part of these financial statements. | | 19 |
GOLDMAN SACHS U.S. TAX-MANAGED EQUITY FUND
Schedule of Investments
June 30, 2021 (Unaudited)
| | | | | | | | |
Shares | | | Description | | Value | |
|
| Common Stocks – 98.2% | |
| Automobiles & Components – 1.7% | | | |
| | 1,037,233 | | | Ford Motor Co.* | | $ | 15,413,282 | |
| | 164,726 | | | General Motors Co.* | | | 9,746,838 | |
| | 21,887 | | | Gentex Corp. | | | 724,241 | |
| | 204,156 | | | Goodyear Tire & Rubber Co. (The)* | | | 3,501,275 | |
| | 16,231 | | | Tesla, Inc.* | | | 11,032,211 | |
| | | | | | | | |
| | | | | | | 40,417,847 | |
| | |
| Banks – 2.3% | |
| | 107,659 | | | Bancorp, Inc. (The)* | | | 2,477,234 | |
| | 144,004 | | | Cadence BanCorp | | | 3,006,803 | |
| | 13,311 | | | Cathay General Bancorp | | | 523,921 | |
| | 62,481 | | | Citigroup, Inc. | | | 4,420,531 | |
| | 11,346 | | | East West Bancorp, Inc. | | | 813,395 | |
| | 23,131 | | | Essent Group Ltd. | | | 1,039,738 | |
| | 40,192 | | | First BanCorp | | | 479,089 | |
| | 56,420 | | | First Hawaiian, Inc. | | | 1,598,943 | |
| | 49,865 | | | First Horizon Corp. | | | 861,667 | |
| | 32,891 | | | Independent Bank Group, Inc. | | | 2,433,276 | |
| | 52,490 | | | International Bancshares Corp. | | | 2,253,921 | |
| | 26,250 | | | Investors Bancorp, Inc. | | | 374,325 | |
| | 49,088 | | | JPMorgan Chase & Co. | | | 7,635,147 | |
| | 80,240 | | | MGIC Investment Corp. | | | 1,091,264 | |
| | 10,646 | | | National Bank Holdings Corp. Class A | | | 401,780 | |
| | 3,532 | | | Origin Bancorp, Inc. | | | 149,969 | |
| | 5,054 | | | PNC Financial Services Group, Inc. (The) | | | 964,101 | |
| | 25,107 | | | Popular, Inc. | | | 1,884,280 | |
| | 28,824 | | | Radian Group, Inc. | | | 641,334 | |
| | 17,309 | | | SVB Financial Group* | | | 9,631,247 | |
| | 13,919 | | | TriState Capital Holdings, Inc.* | | | 283,808 | |
| | 39,488 | | | Umpqua Holdings Corp. | | | 728,554 | |
| | 20,899 | | | Walker & Dunlop, Inc. | | | 2,181,438 | |
| | 71,005 | | | Western Alliance Bancorp | | | 6,592,814 | |
| | | | | | | | |
| | | | | | | 52,468,579 | |
| | |
| Capital Goods – 4.1% | |
| | 13,048 | | | AECOM* | | | 826,199 | |
| | 5,761 | | | AGCO Corp. | | | 751,119 | |
| | 14,624 | | | Allison Transmission Holdings, Inc. | | | 581,158 | |
| | 29,484 | | | AMETEK, Inc. | | | 3,936,114 | |
| | 94,330 | | | Atkore, Inc.* | | | 6,697,430 | |
| | 3,274 | | | Boise Cascade Co. | | | 191,038 | |
| | 32,308 | | | Emerson Electric Co. | | | 3,109,322 | |
| | 5,635 | | | Encore Wire Corp. | | | 427,077 | |
| | 13,565 | | | Fortive Corp. | | | 946,023 | |
| | 36,110 | | | H&E Equipment Services, Inc. | | | 1,201,380 | |
| | 50,186 | | | Hexcel Corp.* | | | 3,131,606 | |
| | 6,443 | | | Honeywell International, Inc. | | | 1,413,272 | |
| | 97,597 | | | Illinois Tool Works, Inc. | | | 21,818,785 | |
| | 96,928 | | | Johnson Controls International plc | | | 6,652,169 | |
| | 26,377 | | | L3Harris Technologies, Inc. | | | 5,701,389 | |
| | 12,408 | | | Lockheed Martin Corp. | | | 4,694,567 | |
| | 12,050 | | | McGrath RentCorp | | | 982,919 | |
| | 71,657 | | | Otis Worldwide Corp. | | | 5,859,393 | |
| | 149,820 | | | Raytheon Technologies Corp. | | | 12,781,144 | |
| | 1,213 | | | RBC Bearings, Inc.* | | | 241,896 | |
| | |
|
| Common Stocks – (continued) | |
| Capital Goods – (continued) | |
| | 25,076 | | | Rush Enterprises, Inc. Class A | | | 1,084,286 | |
| | 30,166 | | | Snap-on, Inc. | | | 6,739,989 | |
| | 10,329 | | | Teledyne Technologies, Inc.* | | | 4,326,095 | |
| | 9,195 | | | Terex Corp. | | | 437,866 | |
| | | | | | | | |
| | | | | | | 94,532,236 | |
| | |
| Commercial & Professional Services – 0.9% | |
| | 11,341 | | | Cimpress plc* | | | 1,229,478 | |
| | 29,156 | | | Cintas Corp. | | | 11,137,592 | |
| | 8,842 | | | Clean Harbors, Inc.* | | | 823,544 | |
| | 71,280 | | | CoStar Group, Inc.* | | | 5,903,410 | |
| | 10,024 | | | IAA, Inc.* | | | 546,709 | |
| | 6,383 | | | ManpowerGroup, Inc. | | | 759,002 | |
| | | | | | | | |
| | | | | | | 20,399,735 | |
| | |
| Consumer Durables & Apparel – 0.9% | |
| | 17,960 | | | G-III Apparel Group Ltd.* | | | 590,166 | |
| | 68,452 | | | Levi Strauss & Co. Class A | | | 1,897,489 | |
| | 85,115 | | | Skechers USA, Inc. Class A* | | | 4,241,280 | |
| | 15,973 | | | Steven Madden Ltd. | | | 698,979 | |
| | 141,371 | | | Tapestry, Inc.* | | | 6,146,811 | |
| | 7,009 | | | Tempur Sealy International, Inc. | | | 274,683 | |
| | 39,213 | | | TRI Pointe Group, Inc.* | | | 840,335 | |
| | 12,109 | | | Whirlpool Corp. | | | 2,640,004 | |
| | 39,938 | | | YETI Holdings, Inc.* | | | 3,667,107 | |
| | | | | | | | |
| | | | | | | 20,996,854 | |
| | |
| Consumer Services – 2.6% | |
| | 18,628 | | | Chipotle Mexican Grill, Inc.* | | | 28,879,733 | |
| | 37,579 | | | frontdoor, Inc.* | | | 1,872,186 | |
| | 2,086 | | | Graham Holdings Co. Class B | | | 1,322,315 | |
| | 129,460 | | | H&R Block, Inc. | | | 3,039,721 | |
| | 142,560 | | | International Game Technology plc* | | | 3,415,738 | |
| | 102,150 | | | Red Rock Resorts, Inc. Class A* | | | 4,341,375 | |
| | 60,042 | | | Terminix Global Holdings, Inc.* | | | 2,864,604 | |
| | 23,953 | | | Vail Resorts, Inc.* | | | 7,581,603 | |
| | 49,027 | | | Yum China Holdings, Inc. | | | 3,248,039 | |
| | 25,926 | | | Yum! Brands, Inc. | | | 2,982,268 | |
| | | | | | | | |
| | | | | | | 59,547,582 | |
| | |
| Diversified Financials – 8.0% | |
| | 489,203 | | | Ally Financial, Inc. | | | 24,381,877 | |
| | 5,634 | | | Artisan Partners Asset Management, Inc. Class A | | | 286,320 | |
| | 38,603 | | | Berkshire Hathaway, Inc. Class B* | | | 10,728,546 | |
| | 59,113 | | | Capital One Financial Corp. | | | 9,144,190 | |
| | 113,657 | | | CME Group, Inc. | | | 24,172,571 | |
| | 96,351 | | | Discover Financial Services | | | 11,397,360 | |
| | 19,961 | | | Interactive Brokers Group, Inc. Class A | | | 1,312,037 | |
| | 60,419 | | | Intercontinental Exchange, Inc. | | | 7,171,735 | |
| | 323,608 | | | Jefferies Financial Group, Inc. | | | 11,067,394 | |
| | 23,105 | | | LPL Financial Holdings, Inc. | | | 3,118,713 | |
| | 112,434 | | | Morgan Stanley | | | 10,309,073 | |
| | 70,228 | | | Navient Corp. | | | 1,357,507 | |
| | 21,215 | | | Oppenheimer Holdings, Inc. Class A | | | 1,078,571 | |
| | 58,063 | | | S&P Global, Inc. | | | 23,831,958 | |
| | |
| | |
| 20 | | The accompanying notes are an integral part of these financial statements. |
GOLDMAN SACHS U.S. TAX-MANAGED EQUITY FUND
| | | | | | | | |
Shares | | | Description | | Value | |
|
| Common Stocks – (continued) | |
| Diversified Financials – (continued) | |
| | 132,885 | | | Santander Consumer USA Holdings, Inc. | | $ | 4,826,383 | |
| | 130,364 | | | Starwood Property Trust, Inc. (REIT) | | | 3,411,626 | |
| | 34,376 | | | State Street Corp. | | | 2,828,457 | |
| | 316,003 | | | Synchrony Financial | | | 15,332,466 | |
| | 56,882 | | | TPG RE Finance Trust, Inc. (REIT) | | | 765,063 | |
| | 327,211 | | | Voya Financial, Inc. | | | 20,123,476 | |
| | | | | | | | |
| | | | | | | 186,645,323 | |
| | |
| Energy – 1.6% | |
| | 15,871 | | | Baker Hughes Co. | | | 362,970 | |
| | 8,224 | | | Cactus, Inc. Class A | | | 301,985 | |
| | 7,426 | | | Core Laboratories NV | | | 289,243 | |
| | 18,968 | | | Diamondback Energy, Inc. | | | 1,780,906 | |
| | 99,446 | | | EOG Resources, Inc. | | | 8,297,774 | |
| | 11,147 | | | Exxon Mobil Corp. | | | 703,153 | |
| | 12,264 | | | Hess Corp. | | | 1,070,892 | |
| | 18,924 | | | Matador Resources Co. | | | 681,453 | |
| | 8,760 | | | ONEOK, Inc. | | | 487,406 | |
| | 103,617 | | | Ovintiv, Inc. | | | 3,260,827 | |
| | 33,190 | | | Pioneer Natural Resources Co. | | | 5,394,039 | |
| | 25,139 | | | Renewable Energy Group, Inc.* | | | 1,567,165 | |
| | 94,650 | | | Schlumberger NV | | | 3,029,746 | |
| | 103,628 | | | Targa Resources Corp. | | | 4,606,265 | �� |
| | 86,052 | | | W&T Offshore, Inc.* | | | 417,352 | |
| | 156,754 | | | Williams Cos., Inc. (The) | | | 4,161,819 | |
| | | | | | | | |
| | | | | | | 36,412,995 | |
| | |
| Food & Staples Retailing – 0.2% | |
| | 3,528 | | | Costco Wholesale Corp. | | | 1,395,924 | |
| | 5,239 | | | Ingles Markets, Inc. Class A | | | 305,276 | |
| | 68,139 | | | Walgreens Boots Alliance, Inc. | | | 3,584,793 | |
| | | | | | | | |
| | | | | | | 5,285,993 | |
| | |
| Food, Beverage & Tobacco – 2.0% | |
| | 7,213 | | | Archer-Daniels-Midland Co. | | | 437,108 | |
| | 7,580 | | | Constellation Brands, Inc. Class A | | | 1,772,886 | |
| | 51,135 | | | Darling Ingredients, Inc.* | | | 3,451,612 | |
| | 4,501 | | | Freshpet, Inc.* | | | 733,483 | |
| | 35,242 | | | Lamb Weston Holdings, Inc. | | | 2,842,620 | |
| | 9,833 | | | Lancaster Colony Corp. | | | 1,902,784 | |
| | 213,411 | | | Monster Beverage Corp.* | | | 19,495,095 | |
| | 159,106 | | | Philip Morris International, Inc. | | | 15,768,996 | |
| | | | | | | | |
| | | | | | | 46,404,584 | |
| | |
| Health Care Equipment & Services – 6.9% | |
| | 3,020 | | | Abbott Laboratories | | | 350,109 | |
| | 730 | | | Align Technology, Inc.* | | | 446,030 | |
| | 77,577 | | | Anthem, Inc. | | | 29,618,899 | |
| | 5,639 | | | Centene Corp.* | | | 411,252 | |
| | 21,748 | | | Cigna Corp. | | | 5,155,798 | |
| | 21,779 | | | Community Health Systems, Inc.* | | | 336,268 | |
| | 5,024 | | | Cooper Cos., Inc. (The) | | | 1,990,860 | |
| | 72,981 | | | Edwards Lifesciences Corp.* | | | 7,558,642 | |
| | 43,603 | | | Encompass Health Corp. | | | 3,402,342 | |
| | 137,014 | | | HCA Healthcare, Inc. | | | 28,326,274 | |
| | |
|
| Common Stocks – (continued) | |
| Health Care Equipment & Services – (continued) | |
| | 58,037 | | | Hologic, Inc.* | | | 3,872,229 | |
| | 34,579 | | | Humana, Inc. | | | 15,308,815 | |
| | 14,459 | | | IDEXX Laboratories, Inc.* | | | 9,131,581 | |
| | 6,269 | | | Molina Healthcare, Inc.* | | | 1,586,433 | |
| | 215,460 | | | Select Medical Holdings Corp. | | | 9,105,340 | |
| | 1,283 | | | STERIS plc | | | 264,683 | |
| | 47,957 | | | UnitedHealth Group, Inc. | | | 19,203,901 | |
| | 51,555 | | | Universal Health Services, Inc. Class B | | | 7,549,199 | |
| | 46,257 | | | West Pharmaceutical Services, Inc. | | | 16,610,889 | |
| | | | | | | | |
| | | | | | | 160,229,544 | |
| | |
| Household & Personal Products – 0.1% | |
| | 41,117 | | | Herbalife Nutrition Ltd.* | | | 2,168,099 | |
| | 8,185 | | | Procter & Gamble Co. (The) | | | 1,104,402 | |
| | | | | | | | |
| | | | | | | 3,272,501 | |
| | |
| Insurance – 4.0% | |
| | 554,017 | | | American Equity Investment Life Holding Co. | | | 17,905,829 | |
| | 35,396 | | | American Financial Group, Inc. | | | 4,414,589 | |
| | 487,843 | | | Arch Capital Group Ltd.* | | | 18,996,606 | |
| | 80,386 | | | Athene Holding Ltd. Class A* | | | 5,426,055 | |
| | 59,191 | | | Brighthouse Financial, Inc.* | | | 2,695,558 | |
| | 18,632 | | | Fidelity National Financial, Inc. | | | 809,747 | |
| | 56,350 | | | First American Financial Corp. | | | 3,513,423 | |
| | 87,149 | | | Globe Life, Inc. | | | 8,300,942 | |
| | 9,425 | | | Goosehead Insurance, Inc. Class A | | | 1,199,803 | |
| | 15,650 | | | Marsh & McLennan Cos., Inc. | | | 2,201,642 | |
| | 209,677 | | | Old Republic International Corp. | | | 5,223,054 | |
| | 22,348 | | | Primerica, Inc. | | | 3,422,373 | |
| | 17,273 | | | Reinsurance Group of America, Inc. | | | 1,969,122 | |
| | 9,861 | | | Stewart Information Services Corp. | | | 559,020 | |
| | 69,160 | | | Trupanion, Inc.* | | | 7,960,316 | |
| | 109,410 | | | W R Berkley Corp. | | | 8,143,386 | |
| | | | | | | | |
| | | | | | | 92,741,465 | |
| | |
| Materials – 4.0% | |
| | 4,937 | | | Air Products and Chemicals, Inc. | | | 1,420,276 | |
| | 37,395 | | | Amcor plc | | | 428,547 | |
| | 78,720 | | | Avient Corp. | | | 3,869,875 | |
| | 328,568 | | | Axalta Coating Systems Ltd.* | | | 10,018,038 | |
| | 119,588 | | | Celanese Corp. | | | 18,129,541 | |
| | 47,477 | | | CF Industries Holdings, Inc. | | | 2,442,692 | |
| | 28,500 | | | Corteva, Inc. | | | 1,263,975 | |
| | 2,903 | | | Crown Holdings, Inc. | | | 296,716 | |
| | 8,601 | | | Dow, Inc. | | | 544,271 | |
| | 29,441 | | | Eagle Materials, Inc. | | | 4,183,860 | |
| | 71,308 | | | Element Solutions, Inc. | | | 1,667,181 | |
| | 4,681 | | | Ingevity Corp.* | | | 380,846 | |
| | 5,609 | | | International Flavors & Fragrances, Inc. | | | 837,985 | |
| | 133,281 | | | Louisiana-Pacific Corp. | | | 8,035,511 | |
| | 128,708 | | | Mosaic Co. (The) | | | 4,107,072 | |
| | 56,853 | | | Olin Corp. | | | 2,630,020 | |
| | 116,961 | | | Sherwin-Williams Co. (The) | | | 31,866,024 | |
| | |
| | |
| The accompanying notes are an integral part of these financial statements. | | 21 |
GOLDMAN SACHS U.S. TAX-MANAGED EQUITY FUND
Schedule of Investments (continued)
June 30, 2021 (Unaudited)
| | | | | | | | |
Shares | | | Description | | Value | |
|
| Common Stocks – (continued) | |
| Materials – (continued) | |
| | 6,280 | | | Southern Copper Corp. | | $ | 403,930 | |
| | 34,799 | | | Summit Materials, Inc. Class A* | | | 1,212,745 | |
| | 44,490 | | | SunCoke Energy, Inc. | | | 317,659 | |
| | | | | | | | |
| | | | | | | 94,056,764 | |
| | |
| Media & Entertainment – 9.4% | |
| | 16,330 | | | Alphabet, Inc. Class A* | | | 39,874,431 | |
| | 15,750 | | | Alphabet, Inc. Class C* | | | 39,474,540 | |
| | 11,277 | | | AMC Entertainment Holdings, Inc. Class A*(a) | | | 639,180 | |
| | 12,147 | | | Cardlytics, Inc.* | | | 1,541,819 | |
| | 285,691 | | | Cinemark Holdings, Inc.* | | | 6,270,917 | |
| | 94,443 | | | Comcast Corp. Class A | | | 5,385,140 | |
| | 119,060 | | | Facebook, Inc. Class A* | | | 41,398,353 | |
| | 17,336 | | | Netflix, Inc.* | | | 9,157,048 | |
| | 111,991 | | | News Corp. Class A | | | 2,886,008 | |
| | 55,380 | | | Nexstar Media Group, Inc. Class A | | | 8,189,594 | |
| | 196,224 | | | Omnicom Group, Inc. | | | 15,695,958 | |
| | 220,769 | | | Pinterest, Inc. Class A* | | | 17,429,712 | |
| | 15,013 | | | Roku, Inc.* | | | 6,894,720 | |
| | 11,879 | | | Spotify Technology SA* | | | 3,273,734 | |
| | 42,395 | | | Take-Two Interactive Software, Inc.* | | | 7,504,763 | |
| | 19,404 | | | World Wrestling Entertainment, Inc. Class A | | | 1,123,298 | |
| | 24,332 | | | Zillow Group, Inc. Class C* | | | 2,973,857 | |
| | 749,749 | | | Zynga, Inc. Class A* | | | 7,969,832 | |
| | | | | | | | |
| | | | | | | 217,682,904 | |
| | |
| Pharmaceuticals, Biotechnology & Life Sciences – 9.6% | |
| | 296,208 | | | AbbVie, Inc. | | | 33,364,869 | |
| | 17,266 | | | Alexion Pharmaceuticals, Inc.* | | | 3,171,937 | |
| | 35,555 | | | Avid Bioservices, Inc.* | | | 911,986 | |
| | 33,463 | | | Biogen, Inc.* | | | 11,587,233 | |
| | 272,719 | | | Gilead Sciences, Inc. | | | 18,779,430 | |
| | 259,726 | | | Horizon Therapeutics plc* | | | 24,320,743 | |
| | 105,565 | | | IQVIA Holdings, Inc.* | | | 25,580,511 | |
| | 24,507 | | | Jazz Pharmaceuticals plc* | | | 4,353,423 | |
| | 94,767 | | | Johnson & Johnson | | | 15,611,916 | |
| | 26,154 | | | Merck & Co., Inc. | | | 2,033,997 | |
| | 8,389 | | | Mettler-Toledo International, Inc.* | | | 11,621,617 | |
| | 74,997 | | | PerkinElmer, Inc. | | | 11,580,287 | |
| | 83,636 | | | Perrigo Co. plc | | | 3,834,711 | |
| | 128,361 | | | Pfizer, Inc. | | | 5,026,617 | |
| | 9,527 | | | Phibro Animal Health Corp. Class A | | | 275,140 | |
| | 93,584 | | | Prestige Consumer Healthcare, Inc.* | | | 4,875,726 | |
| | 22,821 | | | Regeneron Pharmaceuticals, Inc.* | | | 12,746,441 | |
| | 8,738 | | | Sage Therapeutics, Inc.* | | | 496,406 | |
| | 3,494 | | | Thermo Fisher Scientific, Inc. | | | 1,762,618 | |
| | 6,486 | | | Twist Bioscience Corp.* | | | 864,259 | |
| | 1,149 | | | Vertex Pharmaceuticals, Inc.* | | | 231,673 | |
| | 15,927 | | | Viatris, Inc. | | | 227,597 | |
| | 156,407 | | | Zoetis, Inc. | | | 29,148,008 | |
| | | | | | | | |
| | | | | | | 222,407,145 | |
| | |
| Real Estate – 4.5% | |
| | 21,275 | | | Brixmor Property Group, Inc. (REIT) | | | 486,985 | |
| | 85,305 | | | Camden Property Trust (REIT) | | | 11,317,414 | |
| | |
|
| Common Stocks – (continued) | |
| Real Estate – (continued) | |
| | 18,849 | | | CoreSite Realty Corp. (REIT) | | | 2,537,075 | |
| | 5,732 | | | CubeSmart (REIT) | | | 265,506 | |
| | 257,053 | | | Duke Realty Corp. (REIT) | | | 12,171,460 | |
| | 345,029 | | | Equity LifeStyle Properties, Inc. (REIT) | | | 25,639,105 | |
| | 36,707 | | | Extra Space Storage, Inc. (REIT) | | | 6,013,341 | |
| | 126,979 | | | First Industrial Realty Trust, Inc. (REIT) | | | 6,632,113 | |
| | 6,416 | | | Gaming and Leisure Properties, Inc. (REIT) | | | 297,253 | |
| | 352,093 | | | Invitation Homes, Inc. (REIT) | | | 13,129,548 | |
| | 2,070 | | | Jones Lang LaSalle, Inc.* | | | 404,602 | |
| | 17,448 | | | Kilroy Realty Corp. (REIT) | | | 1,215,079 | |
| | 12,030 | | | Lamar Advertising Co. Class A (REIT) | | | 1,256,173 | |
| | 47,715 | | | MGM Growth Properties LLC Class A (REIT) | | | 1,747,323 | |
| | 29,850 | | | Mid-America Apartment Communities, Inc. (REIT) | | | 5,027,337 | |
| | 22,704 | | | National Storage Affiliates Trust (REIT) | | | 1,147,914 | |
| | 22,558 | | | NexPoint Residential Trust, Inc. (REIT) | | | 1,240,239 | |
| | 2,236 | | | PotlatchDeltic Corp. (REIT) | | | 118,843 | |
| | 9,166 | | | Prologis, Inc. (REIT) | | | 1,095,612 | |
| | 1,888 | | | PS Business Parks, Inc. (REIT) | | | 279,575 | |
| | 69,737 | | | Retail Opportunity Investments Corp. (REIT) | | | 1,231,555 | |
| | 93,086 | | | Rexford Industrial Realty, Inc. (REIT) | | | 5,301,248 | |
| | 84,434 | | | SITE Centers Corp. (REIT) | | | 1,271,863 | |
| | 17,864 | | | STORE Capital Corp. (REIT) | | | 616,487 | |
| | 47,424 | | | Tanger Factory Outlet Centers, Inc. (REIT) | | | 893,942 | |
| | 14,722 | | | Terreno Realty Corp. (REIT) | | | 949,864 | |
| | 45,708 | | | Ventas, Inc. (REIT) | | | 2,609,927 | |
| | | | | | | | |
| | | | | | | 104,897,383 | |
| | |
| Retailing – 9.0% | |
| | 24,763 | | | Amazon.com, Inc.* | | | 85,188,682 | |
| | 1,486 | | | Asbury Automotive Group, Inc.* | | | 254,656 | |
| | 2,286 | | | AutoZone, Inc.* | | | 3,411,215 | |
| | 16,448 | | | Boot Barn Holdings, Inc.* | | | 1,382,454 | |
| | 17,163 | | | Buckle, Inc. (The) | | | 853,859 | |
| | 66,497 | | | Dick’s Sporting Goods, Inc. | | | 6,662,335 | |
| | 34,974 | | | eBay, Inc. | | | 2,455,525 | |
| | 17,138 | | | Funko, Inc. Class A* | | | 364,697 | |
| | 765 | | | GameStop Corp. Class A* | | | 163,817 | |
| | 20,996 | | | Groupon, Inc.* | | | 906,187 | |
| | 46,469 | | | Haverty Furniture Cos., Inc. | | | 1,987,015 | |
| | 4,651 | | | Home Depot, Inc. (The) | | | 1,483,157 | |
| | 247,840 | | | Kohl’s Corp. | | | 13,658,462 | |
| | 166,465 | | | L Brands, Inc. | | | 11,995,468 | |
| | 91,859 | | | Lowe’s Cos., Inc. | | | 17,817,890 | |
| | 1,541 | | | MercadoLibre, Inc.* | | | 2,400,554 | |
| | 20,014 | | | Murphy USA, Inc. | | | 2,669,267 | |
| | 1,394 | | | O’Reilly Automotive, Inc.* | | | 789,297 | |
| | |
| | |
| 22 | | The accompanying notes are an integral part of these financial statements. |
GOLDMAN SACHS U.S. TAX-MANAGED EQUITY FUND
| | | | | | | | |
Shares | | | Description | | Value | |
|
| Common Stocks – (continued) | |
| Retailing – (continued) | |
| | 8,426 | | | Penske Automotive Group, Inc. | | $ | 636,079 | |
| | 11,448 | | | Revolve Group, Inc.* | | | 788,767 | |
| | 13,353 | | | Signet Jewelers Ltd.* | | | 1,078,789 | |
| | 149,794 | | | Target Corp. | | | 36,211,202 | |
| | 204,528 | | | TJX Cos., Inc. (The) | | | 13,789,278 | |
| | 13,691 | | | Urban Outfitters, Inc.* | | | 564,343 | |
| | 7,731 | | | Williams-Sonoma, Inc. | | | 1,234,254 | |
| | | | | | | | |
| | | | | | | 208,747,249 | |
| | |
| Semiconductors & Semiconductor Equipment – 4.6% | |
| | 218,165 | | | Applied Materials, Inc. | | | 31,066,696 | |
| | 31,784 | | | Intel Corp. | | | 1,784,354 | |
| | 3,264 | | | KLA Corp. | | | 1,058,222 | |
| | 61,648 | | | NVIDIA Corp. | | | 49,324,565 | |
| | 46,974 | | | NXP Semiconductors NV | | | 9,663,491 | |
| | 13,204 | | | Power Integrations, Inc. | | | 1,083,520 | |
| | 11,970 | | | QUALCOMM, Inc. | | | 1,710,872 | |
| | 63,128 | | | Texas Instruments, Inc. | | | 12,139,514 | |
| | | | | | | | |
| | | | | | | 107,831,234 | |
| | |
| Software & Services – 13.2% | |
| | 44,829 | | | Adobe, Inc.* | | | 26,253,656 | |
| | 18,021 | | | Black Knight, Inc.* | | | 1,405,278 | |
| | 21,888 | | | Cadence Design Systems, Inc.* | | | 2,994,716 | |
| | 17,268 | | | Citrix Systems, Inc. | | | 2,025,018 | |
| | 37,536 | | | Cognizant Technology Solutions Corp. Class A | | | 2,599,743 | |
| | 1,531 | | | Concentrix Corp.* | | | 246,185 | |
| | 33,705 | | | Dolby Laboratories, Inc. Class A | | | 3,312,864 | |
| | 5,074 | | | EPAM Systems, Inc.* | | | 2,592,611 | |
| | 16,958 | | | Fastly, Inc. Class A*(a) | | | 1,010,697 | |
| | 20,345 | | | FireEye, Inc.* | | | 411,376 | |
| | 2,902 | | | FleetCor Technologies, Inc.* | | | 743,086 | |
| | 79,080 | | | Fortinet, Inc.* | | | 18,836,065 | |
| | 8,663 | | | Gartner, Inc.* | | | 2,098,179 | |
| | 9,159 | | | International Business Machines Corp. | | | 1,342,618 | |
| | 3,182 | | | Intuit, Inc. | | | 1,559,721 | |
| | 461,564 | | | Microsoft Corp. | | | 125,037,688 | |
| | 66,295 | | | NortonLifeLock, Inc. | | | 1,804,550 | |
| | 37,008 | | | Okta, Inc.* | | | 9,055,117 | |
| | 75,324 | | | Oracle Corp. | | | 5,863,220 | |
| | 6,494 | | | Palo Alto Networks, Inc.* | | | 2,409,599 | |
| | 166,869 | | | PayPal Holdings, Inc.* | | | 48,638,976 | |
| | 5,663 | | | Perficient, Inc.* | | | 455,419 | |
| | 5,399 | | | ServiceNow, Inc.* | | | 2,967,021 | |
| | 1,609 | | | Square, Inc. Class A* | | | 392,274 | |
| | 78,979 | | | Tenable Holdings, Inc.* | | | 3,265,782 | |
| | 14,865 | | | Twilio, Inc. Class A* | | | 5,859,188 | |
| | 4,947 | | | VeriSign, Inc.* | | | 1,126,382 | |
| | 12,315 | | | Visa, Inc. Class A | | | 2,879,493 | |
| | 629,872 | | | Western Union Co. (The) | | | 14,468,160 | |
| | 27,322 | | | Workday, Inc. Class A* | | | 6,522,854 | |
| | 43,289 | | | Zscaler, Inc.* | | | 9,353,021 | |
| | | | | | | | |
| | | | | | | 307,530,557 | |
| | |
|
| Common Stocks – (continued) | |
| Technology Hardware & Equipment – 6.0% | |
| | 799,518 | | | Apple, Inc. | | | 109,501,985 | |
| | 1,620 | | | Arista Networks, Inc.* | | | 586,942 | |
| | 18,686 | | | Jabil, Inc. | | | 1,086,030 | |
| | 94,239 | | | Keysight Technologies, Inc.* | | | 14,551,444 | |
| | 19,675 | | | Knowles Corp.* | | | 388,385 | |
| | 42,942 | | | NetApp, Inc. | | | 3,513,514 | |
| | 427,709 | | | TTM Technologies, Inc.* | | | 6,116,239 | |
| | 25,865 | | | Vishay Intertechnology, Inc. | | | 583,256 | |
| | 5,426 | | | Vontier Corp. | | | 176,779 | |
| | 34,029 | | | Western Digital Corp.* | | | 2,421,844 | |
| | | | | | | | |
| | | | | | | 138,926,418 | |
| | |
| Telecommunication Services – 0.2% | |
| | 155,401 | | | Liberty Global plc Class C* | | | 4,202,043 | |
| | |
| Transportation – 1.8% | |
| | 6,795 | | | AMERCO | | | 4,004,973 | |
| | 94,059 | | | CSX Corp. | | | 3,017,413 | |
| | 18,420 | | | Norfolk Southern Corp. | | | 4,888,852 | |
| | 53,219 | | | Old Dominion Freight Line, Inc. | | | 13,506,982 | |
| | 36,542 | | | Ryder System, Inc. | | | 2,716,167 | |
| | 61,767 | | | Union Pacific Corp. | | | 13,584,416 | |
| | 3,209 | | | XPO Logistics, Inc.* | | | 448,907 | |
| | | | | | | | |
| | | | | | | 42,167,710 | |
| | |
| Utilities – 0.6% | |
| | 25,070 | | | AES Corp. (The) | | | 653,575 | |
| | 28,619 | | | CMS Energy Corp. | | | 1,690,810 | |
| | 3,186 | | | DTE Energy Co. | | | 412,906 | |
| | 165,814 | | | MDU Resources Group, Inc. | | | 5,196,611 | |
| | 7,182 | | | NorthWestern Corp. | | | 432,500 | |
| | 68,737 | | | NRG Energy, Inc. | | | 2,770,101 | |
| | 43,279 | | | Public Service Enterprise Group, Inc. | | | 2,585,487 | |
| | | | | | | | |
| | | | | | | 13,741,990 | |
| | |
| TOTAL INVESTMENTS BEFORE SECURITIES LENDING
REINVESTMENT VEHICLE |
|
| | (Cost $1,158,939,632) | | $ | 2,281,546,635 | |
| | |
| | | | | | | | |
| Shares | | | Dividend Rate | | Value | |
|
| Securities Lending Reinvestment Vehicle(b) – 0.1% | |
| Goldman Sachs Financial Square Government Fund –
Institutional Shares |
|
| | 1,610,495 | | | 0.026% | | $ | 1,610,495 | |
| | (Cost $1,610,495) | | | | |
| | |
| | TOTAL INVESTMENTS – 98.3% | |
| | (Cost $1,160,550,127) | | $ | 2,283,157,130 | |
| | |
| OTHER ASSETS IN EXCESS OF
LIABILITIES – 1.7% | | | 40,023,313 | |
| | |
| | NET ASSETS – 100.0% | | $ | 2,323,180,443 | |
| | |
| | |
| The accompanying notes are an integral part of these financial statements. | | 23 |
GOLDMAN SACHS U.S. TAX-MANAGED EQUITY FUND
Schedule of Investments (continued)
June 30, 2021 (Unaudited)
| | |
|
| The percentage shown for each investment category reflects the value of investments in that category as a percentage of net assets. |
| |
* | | Security is currently in default and/or non-income producing. |
| |
(a) | | All or a portion of security is on loan. |
| |
(b) | | Represents an Affiliated Issuer. |
| | |
|
Investment Abbreviation: |
REIT | | —Real Estate Investment Trust |
|
|
| ADDITIONAL INVESTMENT INFORMATION |
FUTURES CONTRACTS — At June 30, 2021, the Fund had the following futures contracts:
| | | | | | | | | | | | | | |
| Description | | Number of
Contracts | | | Expiration Date | | Notional
Amount | | | Unrealized
Appreciation/
(Depreciation) | |
Long position contracts: | | | | | | | | | | | | | | |
Russell 2000 E-Mini Index | | | 15 | | | 09/17/2021 | | $ | 1,730,850 | | | $ | (17,240 | ) |
S&P 500 E-Mini Index | | | 84 | | | 09/17/2021 | | | 18,012,120 | | | | 218,244 | |
| | | | |
| Total Futures Contracts | | | | | | | | | | | | $ | 201,004 | |
| | |
| 24 | | The accompanying notes are an integral part of these financial statements. |
GOLDMAN SACHS INTERNATIONAL TAX-MANAGED EQUITY FUND
Schedule of Investments
June 30, 2021 (Unaudited)
| | | | | | | | |
Shares | | | Description | |
Value | |
|
| Common Stocks – 96.9% | |
| Australia – 8.7% | |
| | 64,696 | | | ASX Ltd. (Diversified Financials) | | $ | 3,771,499 | |
| | 317,850 | | | BHP Group plc (Materials) | | | 9,405,491 | |
| | 16,188 | | | Brambles Ltd. (Commercial & Professional Services) | | | 138,925 | |
| | 167,225 | | | Commonwealth Bank of Australia (Banks) | | | 12,522,251 | |
| | 429,493 | | | Fortescue Metals Group Ltd. (Materials) | | | 7,502,782 | |
| | 261,023 | | | Glencore plc (Materials)* | | | 1,120,334 | |
| | 358,204 | | | Goodman Group (REIT) | | | 5,668,822 | |
| | 297,507 | | | Harvey Norman Holdings Ltd. (Retailing) | | | 1,223,646 | |
| | 5,771 | | | JB Hi-Fi Ltd. (Retailing) | | | 218,711 | |
| | 54,405 | | | Mineral Resources Ltd. (Materials) | | | 2,185,232 | |
| | 124,163 | | | Rio Tinto plc ADR (Materials)(a) | | | 10,416,034 | |
| | 10,703 | | | Sonic Healthcare Ltd. (Health Care Equipment & Services) | | | 308,412 | |
| | 534,037 | | | Treasury Wine Estates Ltd. (Food, Beverage & Tobacco) | | | 4,676,186 | |
| | 177,028 | | | Wesfarmers Ltd. (Retailing) | | | 7,848,194 | |
| | | | | | | | |
| | | | | | | 67,006,519 | |
| | |
| Belgium – 0.4% | |
| | 10,088 | | | Bekaert SA (Materials) | | | 450,702 | |
| | 14,673 | | | D’ieteren Group (Retailing) | | | 1,776,457 | |
| | 1,427 | | | UCB SA (Pharmaceuticals, Biotechnology & Life Sciences) | | | 149,452 | |
| | 25,294 | | | Warehouses De Pauw CVA (REIT) | | | 966,216 | |
| | | | | | | | |
| | | | | | | 3,342,827 | |
| | |
| China – 0.9% | |
| | 942,600 | | | Chow Tai Fook Jewellery Group Ltd. (Retailing) | | | 2,153,675 | |
| | 168,100 | | | ENN Energy Holdings Ltd. (Utilities) | | | 3,194,866 | |
| | 73,000 | | | SITC International Holdings Co. Ltd. (Transportation) | | | 305,063 | |
| | 486,000 | | | Tingyi Cayman Islands Holding Corp. (Food, Beverage & Tobacco) | | | 970,264 | |
| | | | | | | | |
| | | | | | | 6,623,868 | |
| | |
| Denmark – 3.0% | |
| | 1,757 | | | AP Moller—Maersk A/S Class A (Transportation) | | | 4,887,276 | |
| | 287 | | | AP Moller—Maersk A/S Class B (Transportation) | | | 826,247 | |
| | 166,815 | | | Novo Nordisk A/S Class B (Pharmaceuticals, Biotechnology & Life Sciences) | | | 13,963,859 | |
| | 4,304 | | | Pandora A/S (Consumer Durables & Apparel) | | | 580,670 | |
| | 10,594 | | | Scandinavian Tobacco Group A/S Class A (Food, Beverage & Tobacco)(b) | | | 216,452 | |
| | 69,020 | | | Vestas Wind Systems A/S (Capital Goods) | | | 2,696,750 | |
| | | | | | | | |
| | | | | | | 23,171,254 | |
| | |
|
| Common Stocks – (continued) | |
| Finland – 2.2% | |
| | 151,573 | | | Kesko OYJ Class B (Food & Staples Retailing) | | | 5,597,048 | |
| | 110,809 | | | Neste OYJ (Energy) | | | 6,797,250 | |
| | 166,314 | | | Nokia OYJ (Technology Hardware & Equipment)* | | | 891,070 | |
| | 53,390 | | | Nokian Renkaat OYJ (Automobiles & Components) | | | 2,156,841 | |
| | 56,671 | | | Tokmanni Group Corp. (Retailing) | | | 1,567,049 | |
| | | | | | | | |
| | | | | | | 17,009,258 | |
| | |
| France – 8.5% | |
| | 26,265 | | | Arkema SA (Materials) | | | 3,301,094 | |
| | 39,153 | | | BNP Paribas SA (Banks) | | | 2,457,228 | |
| | 29,031 | | | Bouygues SA (Capital Goods) | | | 1,075,305 | |
| | 4,992 | | | Christian Dior SE (Consumer Durables & Apparel) | | | 4,029,616 | |
| | 316,222 | | | Credit Agricole SA (Banks) | | | 4,433,302 | |
| | 2,146 | | | Gaztransport Et Technigaz SA (Energy) | | | 173,630 | |
| | 10,696 | | | Gecina SA (REIT) | | | 1,638,753 | |
| | 127 | | | Hermes International (Consumer Durables & Apparel) | | | 185,332 | |
| | 6,649 | | | Kering SA (Consumer Durables & Apparel) | | | 5,825,972 | |
| | 54,234 | | | Legrand SA (Capital Goods) | | | 5,747,900 | |
| | 24,093 | | | L’Oreal SA (Household & Personal Products) | | | 10,759,786 | |
| | 2,837 | | | LVMH Moet Hennessy Louis Vuitton SE (Consumer Durables & Apparel) | | | 2,231,746 | |
| | 4,822 | | | Nexity SA (Real Estate) | | | 241,308 | |
| | 38,375 | | | Rexel SA (Capital Goods)* | | | 803,502 | |
| | 33,650 | | | Sanofi (Pharmaceuticals, Biotechnology & Life Sciences) | | | 3,535,356 | |
| | 16,319 | | | Sartorius Stedim Biotech (Pharmaceuticals, Biotechnology & Life Sciences) | | | 7,723,627 | |
| | 189,427 | | | Societe Generale SA (Banks) | | | 5,603,519 | |
| | 7,145 | | | Teleperformance (Commercial & Professional Services) | | | 2,901,511 | |
| | 2,686 | | | Trigano SA (Automobiles & Components) | | | 555,381 | |
| | 69,348 | | | Vivendi SE (Media & Entertainment) | | | 2,330,033 | |
| | | | | | | | |
| | | | | | | 65,553,901 | |
| | |
| Germany – 8.1% | |
| | 21,545 | | | adidas AG (Consumer Durables & Apparel) | | | 8,039,687 | |
| | 43,117 | | | Aurubis AG (Materials) | | | 4,001,990 | |
| | 49,551 | | | Bayerische Motoren Werke AG (Automobiles & Components) | | | 5,253,176 | |
| | 10,717 | | | Bayerische Motoren Werke AG (Preference) (Automobiles & Components)(c) | | | 964,092 | |
| | 20,925 | | | Daimler AG (Registered) (Automobiles & Components) | | | 1,869,830 | |
| | 154,330 | | | Deutsche Post AG (Registered) (Transportation) | | | 10,510,601 | |
| | |
| | |
| The accompanying notes are an integral part of these financial statements. | | 25 |
GOLDMAN SACHS INTERNATIONAL TAX-MANAGED EQUITY FUND
Schedule of Investments (continued)
June 30, 2021 (Unaudited)
| | | | | | | | |
Shares | | | Description | |
Value | |
|
| Common Stocks – (continued) | |
| Germany – (continued) | |
| | 204,901 | | | Deutsche Telekom AG (Registered) (Telecommunication Services) | | $ | 4,333,658 | |
| | 1,171 | | | Gerresheimer AG (Pharmaceuticals, Biotechnology & Life Sciences) | | | 129,521 | |
| | 24,549 | | | Henkel AG & Co. KGaA (Preference) (Household & Personal Products)(c) | | | 2,592,718 | |
| | 32,072 | | | Merck KGaA (Pharmaceuticals, Biotechnology & Life Sciences) | | | 6,153,855 | |
| | 4,498 | | | Porsche Automobil Holding SE (Preference) (Automobiles & Components)(c) | | | 482,864 | |
| | 15,709 | | | Puma SE (Consumer Durables & Apparel) | | | 1,874,884 | |
| | 51,537 | | | SAF-Holland SE (Automobiles & Components)* | | | 716,820 | |
| | 46,652 | | | Siemens AG (Registered) (Capital Goods) | | | 7,407,348 | |
| | 30,859 | | | Volkswagen AG (Preference) (Automobiles & Components)(c) | | | 7,737,323 | |
| | | | | | | | |
| | | | | | | 62,068,367 | |
| | |
| Hong Kong – 1.0% | |
| | 310,000 | | | AIA Group Ltd. (Insurance) | | | 3,845,729 | |
| | 32,000 | | | Link REIT (REIT) | | | 309,611 | |
| | 221,500 | | | Sun Hung Kai Properties Ltd. (Real Estate) | | | 3,291,922 | |
| | | | | | | | |
| | | | | | | 7,447,262 | |
| | |
| Ireland – 0.2% | |
| | 2,957 | | | Flutter Entertainment plc (Consumer Services)* | | | 538,169 | |
| | 15,867 | | | Smurfit Kappa Group plc (Materials) | | | 863,244 | |
| | | | | | | | |
| | | | | | | 1,401,413 | |
| | |
| Israel – 0.5% | |
| | 190,911 | | | Plus500 Ltd. (Diversified Financials) | | | 3,528,911 | |
| | |
| Italy – 2.1% | |
| | 23,285 | | | Azimut Holding SpA (Diversified Financials) | | | 566,251 | |
| | 17,152 | | | Banca Generali SpA (Diversified Financials)* | | | 732,743 | |
| | 93,386 | | | Banca Mediolanum SpA (Diversified Financials) | | | 909,506 | |
| | 73,342 | | | Banco BPM SpA (Banks) | | | 236,416 | |
| | 458,517 | | | Enel SpA (Utilities) | | | 4,260,942 | |
| | 1,166 | | | Ferrari NV (Automobiles & Components) | | | 240,716 | |
| | 539,535 | | | Intesa Sanpaolo SpA (Banks) | | | 1,492,537 | |
| | 83,698 | | | Poste Italiane SpA (Insurance)(b) | | | 1,107,790 | |
| | 17,300 | | | PRADA SpA (Consumer Durables & Apparel) | | | 131,263 | |
| | 182,792 | | | Prysmian SpA (Capital Goods) | | | 6,559,685 | |
| | | | | | | | |
| | | | | | | 16,237,849 | |
| | |
|
| Common Stocks – (continued) | |
| Japan – 23.0% | |
| | 168,800 | | | Aeon Co. Ltd. (Food & Staples Retailing) | | | 4,531,394 | |
| | 6,500 | | | AGC, Inc. (Capital Goods) | | | 272,288 | |
| | 19,700 | | | Aisan Industry Co. Ltd. (Automobiles & Components) | | | 156,501 | |
| | 6,100 | | | Aisin Corp. (Automobiles & Components) | | | 261,553 | |
| | 345,000 | | | Astellas Pharma, Inc. (Pharmaceuticals, Biotechnology & Life Sciences) | | | 6,012,199 | |
| | 38,800 | | | Autobacs Seven Co. Ltd. (Retailing) | | | 516,761 | |
| | 31,900 | | | Chugai Pharmaceutical Co. Ltd. (Pharmaceuticals, Biotechnology & Life Sciences) | | | 1,264,408 | |
| | 180,700 | | | Daiichi Sankyo Co. Ltd. (Pharmaceuticals, Biotechnology & Life Sciences) | | | 3,898,258 | |
| | 51,300 | | | Dentsu Group, Inc. (Media & Entertainment) | | | 1,840,530 | |
| | 4,500 | | | DIC Corp. (Materials) | | | 113,826 | |
| | 72,400 | | | Ebara Corp. (Capital Goods) | | | 3,566,282 | |
| | 1,257,400 | | | ENEOS Holdings, Inc. (Energy) | | | 5,269,515 | |
| | 9,900 | | | FCC Co. Ltd. (Automobiles & Components) | | | 144,172 | |
| | 50,900 | | | Fujitsu Ltd. (Software & Services) | | | 9,523,337 | |
| | 2,900 | | | Gunze Ltd. (Consumer Durables & Apparel) | | | 120,781 | |
| | 3,500 | | | Halows Co. Ltd. (Food & Staples Retailing) | | | 86,534 | |
| | 17,500 | | | Hikari Tsushin, Inc. (Retailing) | | | 3,075,557 | |
| | 59,400 | | | Hitachi Ltd. (Capital Goods) | | | 3,404,046 | |
| | 121,800 | | | Hitachi Metals Ltd. (Materials) | | | 2,327,591 | |
| | 9,500 | | | I-PEX, Inc. (Technology Hardware & Equipment) | | | 209,997 | |
| | 80,700 | | | Isuzu Motors Ltd. (Automobiles & Components) | | | 1,070,861 | |
| | 15,700 | | | Izumi Co. Ltd. (Retailing) | | | 590,552 | |
| | 551,200 | | | JVCKenwood Corp. (Consumer Durables & Apparel) | | | 1,177,886 | |
| | 5,500 | | | Kaneka Corp. (Materials) | | | 221,907 | |
| | 95,300 | | | Kao Corp. (Household & Personal Products) | | | 5,876,206 | |
| | 14,700 | | | KDDI Corp. (Telecommunication Services) | | | 457,989 | |
| | 180,500 | | | Kirin Holdings Co. Ltd. (Food, Beverage & Tobacco) | | | 3,522,608 | |
| | 7,000 | | | Koei Tecmo Holdings Co. Ltd. (Media & Entertainment) | | | 340,320 | |
| | 67,200 | | | Konami Holdings Corp. (Media & Entertainment) | | | 4,024,602 | |
| | 18,400 | | | K’s Holdings Corp. (Retailing) | | | 211,458 | |
| | 50,300 | | | Kyushu Electric Power Co., Inc. (Utilities) | | | 387,360 | |
| | 7,100 | | | Lawson, Inc. (Food & Staples Retailing) | | | 328,848 | |
| | 2,800 | | | Lintec Corp. (Materials) | | | 60,707 | |
| | |
| | |
| 26 | | The accompanying notes are an integral part of these financial statements. |
GOLDMAN SACHS INTERNATIONAL TAX-MANAGED EQUITY FUND
| | | | | | | | |
Shares | | | Description | |
Value | |
|
| Common Stocks – (continued) | |
| Japan – (continued) | |
| | 50,300 | | | Lixil Corp. (Capital Goods) | | $ | 1,301,632 | |
| | 18,900 | | | M3, Inc. (Health Care Equipment & Services) | | | 1,377,023 | |
| | 441,400 | | | Marubeni Corp. (Capital Goods) | | | 3,843,911 | |
| | 29,800 | | | Marui Group Co. Ltd. (Retailing) | | | 562,251 | |
| | 126,300 | | | Mazda Motor Corp. (Automobiles & Components)* | | | 1,191,578 | |
| | 263,100 | | | Mitsubishi Electric Corp. (Capital Goods) | | | 3,819,486 | |
| | 801,900 | | | Mitsubishi HC Capital, Inc. (Diversified Financials) | | | 4,300,185 | |
| | 1,388,100 | | | Mitsubishi UFJ Financial Group, Inc. (Banks) | | | 7,476,665 | |
| | 272,400 | | | Mitsui & Co. Ltd. (Capital Goods) | | | 6,136,002 | |
| | 10,000 | | | Mitsui Chemicals, Inc. (Materials) | | | 345,678 | |
| | 4,100 | | | Mizuno Corp. (Consumer Durables & Apparel) | | | 87,236 | |
| | 73,300 | | | Nexon Co. Ltd. (Media & Entertainment) | | | 1,631,256 | |
| | 86,600 | | | NGK Insulators Ltd. (Capital Goods) | | | 1,457,459 | |
| | 5,800 | | | Nintendo Co. Ltd. (Media & Entertainment) | | | 3,356,303 | |
| | 141,000 | | | Nippon Telegraph & Telephone Corp. (Telecommunication Services) | | | 3,686,472 | |
| | 131,600 | | | Nippon Yusen KK (Transportation) | | | 6,678,453 | |
| | 75,100 | | | Nitto Denko Corp. (Materials) | | | 5,592,731 | |
| | 194,200 | | | Nomura Research Institute Ltd. (Software & Services) | | | 6,413,772 | |
| | 4,100 | | | Pola Orbis Holdings, Inc. (Household & Personal Products) | | | 108,108 | |
| | 45,300 | | | Rakuten Group, Inc. (Retailing) | | | 511,489 | |
| | 282,400 | | | Ricoh Co. Ltd. (Technology Hardware & Equipment) | | | 3,178,705 | |
| | 3,900 | | | Ricoh Leasing Co. Ltd. (Diversified Financials) | | | 120,925 | |
| | 43,500 | | | Rohm Co. Ltd. (Semiconductors & Semiconductor Equipment) | | | 4,003,208 | |
| | 8,100 | | | S Foods, Inc. (Food, Beverage & Tobacco) | | | 240,012 | |
| | 72,100 | | | Santen Pharmaceutical Co. Ltd. (Pharmaceuticals, Biotechnology & Life Sciences) | | | 995,098 | |
| | 11,400 | | | SCREEN Holdings Co. Ltd. (Semiconductors & Semiconductor Equipment) | | | 1,120,357 | |
| | 35,000 | | | Shikoku Electric Power Co., Inc. (Utilities) | | | 238,398 | |
| | 4,700 | | | Shinko Electric Industries Co. Ltd. (Semiconductors & Semiconductor Equipment) | | | 171,799 | |
| | 44,900 | | | SoftBank Group Corp. (Telecommunication Services) | | | 3,131,408 | |
| | 168,200 | | | Sojitz Corp. (Capital Goods) | | | 508,783 | |
| | 33,100 | | | Square Enix Holdings Co. Ltd. (Media & Entertainment) | | | 1,634,640 | |
| | 58,200 | | | Subaru Corp. (Automobiles & Components) | | | 1,153,494 | |
| | |
|
| Common Stocks – (continued) | |
| Japan – (continued) | |
| | 391,200 | | | Sumitomo Corp. (Capital Goods) | | | 5,245,381 | |
| | 68,900 | | | Sumitomo Dainippon Pharma Co. Ltd. (Pharmaceuticals, Biotechnology & Life Sciences) | | | 1,445,123 | |
| | 111,200 | | | Sumitomo Electric Industries Ltd. (Automobiles & Components) | | | 1,642,416 | |
| | 14,300 | | | Sumitomo Mitsui Financial Group, Inc. (Banks) | | | 492,949 | |
| | 31,800 | | | Suzuki Motor Corp. (Automobiles & Components) | | | 1,347,671 | |
| | 208,300 | | | Takeda Pharmaceutical Co. Ltd. (Pharmaceuticals, Biotechnology & Life Sciences) | | | 6,990,668 | |
| | 174,600 | | | TIS, Inc. (Software & Services) | | | 4,456,016 | |
| | 20,600 | | | Tokyo Electron Ltd. (Semiconductors & Semiconductor Equipment) | | | 8,907,118 | |
| | 31,200 | | | Tosoh Corp. (Materials) | | | 537,976 | |
| | 139,100 | | | Toyo Tire Corp. (Automobiles & Components) | | | 2,945,455 | |
| | 9,600 | | | TS Tech Co. Ltd. (Automobiles & Components) | | | 148,641 | |
| | 17,500 | | | Wacoal Holdings Corp. (Consumer Durables & Apparel) | | | 396,390 | |
| | 234,100 | | | Yamada Holdings Co. Ltd. (Retailing) | | | 1,082,508 | |
| | 21,600 | | | Yellow Hat Ltd. (Retailing) | | | 382,918 | |
| | 9,100 | | | Yokohama Rubber Co. Ltd. (The) (Automobiles & Components) | | | 195,449 | |
| | | | | | | | |
| | | | | | | 177,458,030 | |
| | |
| Luxembourg – 0.8% | |
| | 51,680 | | | Eurofins Scientific SE (Pharmaceuticals, Biotechnology & Life Sciences)* | | | 5,911,093 | |
| | |
| Netherlands – 6.7% | |
| | 25,296 | | | ASM International NV (Semiconductors & Semiconductor Equipment) | | | 8,343,311 | |
| | 17,088 | | | ASML Holding NV (Semiconductors & Semiconductor Equipment) | | | 11,796,175 | |
| | 80,092 | | | BE Semiconductor Industries NV (Semiconductors & Semiconductor Equipment) | | | 6,825,261 | |
| | 91,568 | | | ING Groep NV (Banks) | | | 1,215,506 | |
| | 174,588 | | | Koninklijke Ahold Delhaize NV (Food & Staples Retailing) | | | 5,199,155 | |
| | 35,830 | | | Koninklijke DSM NV (Materials) | | | 6,697,813 | |
| | 53,896 | | | PostNL NV (Transportation) | | | 292,837 | |
| | 12,965 | | | Randstad NV (Commercial & Professional Services) | | | 993,900 | |
| | 33,249 | | | Signify NV (Capital Goods)(b) | | | 2,110,577 | |
| | 11,221 | | | Van Lanschot Kempen NV CVA (Banks) | | | 285,399 | |
| | 82,288 | | | Wolters Kluwer NV (Commercial & Professional Services) | | | 8,271,084 | |
| | | | | | | | |
| | | | | | | 52,031,018 | |
| | |
| | |
| The accompanying notes are an integral part of these financial statements. | | 27 |
GOLDMAN SACHS INTERNATIONAL TAX-MANAGED EQUITY FUND
Schedule of Investments (continued)
June 30, 2021 (Unaudited)
| | | | | | | | |
Shares | | | Description | |
Value | |
|
| Common Stocks – (continued) | |
| New Zealand – 0.4% | |
| | 27,359 | | | Fisher & Paykel Healthcare Corp. Ltd. (Health Care Equipment & Services) | | $ | 595,179 | |
| | 25,463 | | | Xero Ltd. (Software & Services)* | | | 2,619,118 | |
| | | | | | | | |
| | | | | | | 3,214,297 | |
| | |
| Norway – 1.9% | |
| | 42,540 | | | Aker BP ASA (Energy) | | | 1,355,888 | |
| | 194,177 | | | DNB ASA (Banks) | | | 4,231,937 | |
| | 229,330 | | | Europris ASA (Retailing)(b) | | | 1,438,114 | |
| | 44,397 | | | Golden Ocean Group Ltd. (Transportation) | | | 490,558 | |
| | 14,504 | | | Kid ASA (Retailing)(b) | | | 179,233 | |
| | 651,872 | | | Norsk Hydro ASA (Materials) | | | 4,161,811 | |
| | 129,507 | | | Orkla ASA (Food, Beverage & Tobacco) | | | 1,319,825 | |
| | 55,750 | | | SpareBank 1 SMN (Banks) | | | 772,390 | |
| | 41,416 | | | SpareBank 1 SR-Bank ASA (Banks) | | | 547,070 | |
| | | | | | | | |
| | | | | | | 14,496,826 | |
| | |
| Portugal – 0.2% | |
| | 303,868 | | | EDP – Energias de Portugal SA (Utilities) | | | 1,610,592 | |
| | |
| Singapore – 1.0% | |
| | 350,733 | | | DBS Group Holdings Ltd. (Banks) | | | 7,802,866 | |
| | |
| South Africa – 1.0% | |
| | 191,469 | | | Anglo American plc (Materials) | | | 7,619,351 | |
| | |
| Spain – 1.5% | |
| | 29,160 | | | ACS Actividades de Construccion y Servicios SA (Capital Goods) | | | 781,735 | |
| | 565,109 | | | Banco Bilbao Vizcaya Argentaria SA (Banks) | | | 3,505,364 | |
| | 236,837 | | | Banco de Sabadell SA (Banks)* | | | 161,691 | |
| | 844,515 | | | Banco Santander SA (Banks) | | | 3,230,316 | |
| | 340,723 | | | Bankinter SA (Banks) | | | 1,714,192 | |
| | 44,774 | | | EDP Renovaveis SA (Utilities) | | | 1,037,394 | |
| | 161,960 | | | Linea Directa Aseguradora SA Cia de Seguros y Reaseguros (Insurance)* | | | 339,342 | |
| | 14,643 | | | Viscofan SA (Food, Beverage & Tobacco) | | | 1,020,665 | |
| | | | | | | | |
| | | | | | | 11,790,699 | |
| | |
| Sweden – 2.7% | |
| | 148,381 | | | Boliden AB (Materials)* | | | 5,709,629 | |
| | 11,225 | | | Evolution AB (Consumer Services)(b) | | | 1,775,594 | |
| | 119,326 | | | Kinnevik AB Class B (Diversified Financials)* | | | 4,778,283 | |
| | 42,129 | | | Lundin Energy AB (Energy) | | | 1,493,578 | |
| | 21,815 | | | Swedbank AB Class A (Banks) | | | 406,128 | |
| | 712,340 | | | Swedish Match AB (Food, Beverage & Tobacco) | | | 6,074,925 | |
| | 39,278 | | | Volvo AB Class B (Capital Goods) | | | 946,577 | |
| | | | | | | | |
| | | | | | | 21,184,714 | |
| | |
|
| Common Stocks – (continued) | |
| Switzerland – 12.2% | |
| | 73,295 | | | Adecco Group AG (Registered) (Commercial & Professional Services) | | | 4,987,123 | |
| | 10 | | | Chocoladefabriken Lindt & Spruengli AG (Registered) (Food, Beverage & Tobacco) | | | 1,047,284 | |
| | 55,326 | | | Cie Financiere Richemont SA (Consumer Durables & Apparel) | | | 6,707,095 | |
| | 13,425 | | | Kuehne + Nagel International AG (Registered) (Transportation) | | | 4,594,831 | |
| | 11,268 | | | Lonza Group AG (Registered) (Pharmaceuticals, Biotechnology & Life Sciences) | | | 7,988,525 | |
| | 61,625 | | | Nestle SA (Registered) (Food, Beverage & Tobacco) | | | 7,681,376 | |
| | 20,375 | | | Novartis AG (Registered) (Pharmaceuticals, Biotechnology & Life Sciences) | | | 1,858,742 | |
| | 49,106 | | | Roche Holding AG (Pharmaceuticals, Biotechnology & Life Sciences) | | | 18,505,013 | |
| | 20,488 | | | Sonova Holding AG (Registered) (Health Care Equipment & Services) | | | 7,716,904 | |
| | 185,782 | | | STMicroelectronics NV (Semiconductors & Semiconductor Equipment) | | | 6,754,205 | |
| | 1,198 | | | Swatch Group AG (The) (Consumer Durables & Apparel) | | | 411,411 | |
| | 11,728 | | | Swiss Life Holding AG (Registered) (Insurance) | | | 5,705,127 | |
| | 9,401 | | | Tecan Group AG (Registered) (Pharmaceuticals, Biotechnology & Life Sciences) | | | 4,658,381 | |
| | 503,453 | | | UBS Group AG (Registered) (Diversified Financials) | | | 7,711,503 | |
| | 19,596 | | | Zurich Insurance Group AG (Insurance) | | | 7,871,036 | |
| | | | | | | | |
| | | | | | | 94,198,556 | |
| | |
| Ukraine – 0.1% | |
| | 159,031 | | | Ferrexpo plc (Materials) | | | 943,389 | |
| | |
| United Kingdom – 6.9% | |
| | 8,738 | | | AstraZeneca plc ADR (Pharmaceuticals, Biotechnology & Life Sciences)(d) | | | 523,406 | |
| | 1,309,916 | | | Aviva plc (Insurance) | | | 7,353,810 | |
| | 152,511 | | | Barratt Developments plc (Consumer Durables & Apparel) | | | 1,468,480 | |
| | 292,911 | | | BP plc ADR (Energy) | | | 7,738,709 | |
| | 7,821 | | | Clarkson plc (Transportation) | | | 345,545 | |
| | 345,337 | | | CNH Industrial NV (Capital Goods) | | | 5,728,338 | |
| | 194,685 | | | Experian plc (Commercial & Professional Services) | | | 7,516,627 | |
| | 6,524 | | | Games Workshop Group plc (Consumer Durables & Apparel) | | | 1,028,854 | |
| | 62,543 | | | Halfords Group plc (Retailing)* | | | 373,056 | |
| | 62,399 | | | Halma plc (Technology Hardware & Equipment) | | | 2,324,691 | |
| | |
| | |
| 28 | | The accompanying notes are an integral part of these financial statements. |
GOLDMAN SACHS INTERNATIONAL TAX-MANAGED EQUITY FUND
| | | | | | | | |
Shares | | | Description | |
Value | |
|
| Common Stocks – (continued) | |
| United Kingdom – (continued) | |
| | 60,061 | | | IG Group Holdings plc (Diversified Financials) | | $ | 703,814 | |
| | 1,450,071 | | | ITV plc (Media & Entertainment)* | | | 2,520,224 | |
| | 270,098 | | | JD Sports Fashion plc (Retailing) | | | 3,437,172 | |
| | 5,852 | | | Morgan Sindall Group plc (Capital Goods) | | | 174,449 | |
| | 22,740 | | | National Grid plc (Utilities) | | | 289,245 | |
| | 47,782 | | | Next plc (Retailing)* | | | 5,200,296 | |
| | 73,739 | | | Paragon Banking Group plc (Banks) | | | 519,706 | |
| | 65,890 | | | Persimmon plc (Consumer Durables & Apparel) | | | 2,699,094 | |
| | 71,708 | | | Phoenix Group Holdings plc (Insurance) | | | 671,261 | |
| | 2,576 | | | Reckitt Benckiser Group plc (Household & Personal Products) | | | 227,590 | |
| | 42,054 | | | Segro plc (REIT) | | | 636,625 | |
| | 20,090 | | | Unilever plc (Household & Personal Products) | | | 1,174,159 | |
| | 11,361 | | | Unilever plc ADR (Household & Personal Products) | | | 664,618 | |
| | 293 | | | Vistry Group plc (Consumer Durables & Apparel) | | | 4,769 | |
| | | | | | | | |
| | | | | | | 53,324,538 | |
| | |
| United States – 2.9% | |
| | 35,211 | | | Ferguson plc (Capital Goods) | | | 4,898,810 | |
| | 68,853 | | | Schneider Electric SE (Capital Goods) | | | 10,854,298 | |
| | 332,178 | | | Stellantis NV (Automobiles & Components) | | | 6,535,068 | |
| | | | | | | | |
| | | | | | | 22,288,176 | |
| | |
| TOTAL INVESTMENTS BEFORE SECURITIES
LENDING REINVESTMENT VEHICLE
(Cost $517,369,676) | | $ | 747,265,574 | |
| | |
| Shares | | | Dividend Rate | | Value | |
|
| Securities Lending Reinvestment Vehicle(e) – 0.1% | |
| Goldman Sachs Financial Square Government Fund –
Institutional Shares |
|
| | 510,450 | | | 0.026% | | $ | 510,450 | |
| | (Cost $510,450) | | | | |
| | |
| TOTAL INVESTMENTS – 97.0%
(Cost $517,880,126) | | $ | 747,776,024 | |
| | |
| OTHER ASSETS IN EXCESS OF
LIABILITIES – 3.0% | | | 22,903,413 | |
| | |
| | NET ASSETS – 100.0% | | $ | 770,679,437 | |
| | |
| The percentage shown for each investment category
reflects the value of investments in that category as a
percentage of net assets. |
|
| | |
| |
* | | Security is currently in default and/or non-income producing. |
| |
(a) | | All or a portion of security is segregated as collateral for initial margin requirements on futures transactions. |
| |
(b) | | Exempt from registration under Rule 144A of the Securities Act of 1933. |
| |
(c) | | Preference Shares are a special type of equity investment that shares in the earnings of the company, has limited voting rights, and receives a greater dividend than applicable Common Shares. |
| |
(d) | | All or a portion of security is on loan. |
| |
(e) | | Represents an Affiliated Issuer. |
| | |
|
Investment Abbreviations: |
ADR | | —American Depositary Receipt |
CVA | | —Dutch Certification |
REIT | | —Real Estate Investment Trust |
|
|
| ADDITIONAL INVESTMENT INFORMATION |
FUTURES CONTRACTS — At June 30, 2021, the Fund had the following futures contracts:
| | | | | | | | | | | | | | | | |
| Description | | Number of
Contracts | | | Expiration Date | | | Notional
Amount | | | Unrealized
Appreciation/
(Depreciation) | |
Long position contracts: | | | | | | | | | | | | | | | | |
EURO STOXX 50 Index | | | 80 | | | | 09/17/2021 | | | $ | 3,847,047 | | | $ | (62,360 | ) |
FTSE 100 Index | | | 14 | | | | 09/17/2021 | | | | 1,351,858 | | | | (21,029 | ) |
Hang Seng Index | | | 2 | | | | 07/29/2021 | | | | 368,739 | | | | (6,761 | ) |
MSCI Singapore Index | | | 4 | | | | 07/29/2021 | | | | 105,734 | | | | (177 | ) |
SPI 200 Index | | | 4 | | | | 09/16/2021 | | | | 541,689 | | | | (2,625 | ) |
TOPIX Index | | | 10 | | | | 09/09/2021 | | | | 1,748,954 | | | | (13,345 | ) |
| |
| Total Futures Contracts | | | $ | (106,297 | ) |
| | |
| The accompanying notes are an integral part of these financial statements. | | 29 |
GOLDMAN SACHS TAX-ADVANTAGED EQUITY FUNDS
Statements of Assets and Liabilities
June 30, 2021 (Unaudited)
| | | | | | | | | | | | | | | | | | |
| | | | | U.S. Equity
Dividend and
Premium Fund | | | International Equity
Dividend and
Premium Fund | | | U.S. Tax-Managed
Equity Fund | | | International
Tax-Managed
Equity Fund | |
| | Assets: | | | | | | | | | | | | | | | | |
| | Investments in unaffiliated issuers, at value (cost $1,958,303,159, $143,367,783, $1,158,939,632 and $517,369,676)(a) | | $ | 2,952,034,543 | | | $ | 186,324,475 | | | $ | 2,281,546,635 | | | $ | 747,265,574 | |
| | Investments in affiliated issuers, at value (cost $47,903,237, $0, $0 and $0) | | | 47,903,237 | | | | — | | | | — | | | | — | |
| | Investments in affiliated securities lending reinvestment vehicle, at value (cost $188,100, $0, $1,610,495 and $510,450) | | | 188,100 | | | | — | | | | 1,610,495 | | | | 510,450 | |
| | Cash | | | 4,096,238 | | | | — | | | | 34,897,195 | | | | 2,043,680 | |
| | Foreign currencies, at value (cost $0, $347,146, $0 and $11,546,426) | | | — | | | | 345,562 | | | | — | | | | 11,472,545 | |
| | Receivables: | | | | | | | | | | | | | | | | |
| | Investments sold | | | 8,746,221 | | | | — | | | | — | | | | 109,957 | |
| | Fund shares sold | | | 3,118,739 | | | | 878,413 | | | | 7,281,333 | | | | 7,620,635 | |
| | Dividends | | | 2,573,483 | | | | 700,815 | | | | 1,275,613 | | | | 619,398 | |
| | Foreign tax reclaims | | | 134,930 | | | | 1,792,069 | | | | — | | | | 2,455,895 | |
| | Reimbursement from investment adviser | | | 46,479 | | | | 36,981 | | | | — | | | | 43,469 | |
| | Securities lending income | | | 149 | | | | — | | | | 380 | | | | 164 | |
| | Due from custodian | | | — | | | | — | | | | — | | | | 1,112,078 | |
| | Variation margin on futures | | | 54,127 | | | | — | | | | 30,120 | | | | — | |
| | Other assets | | | 63,486 | | | | 34,692 | | | | 69,092 | | | | 52,273 | |
| | Total assets | | | 3,018,959,732 | | | | 190,113,007 | | | | 2,326,710,863 | | | | 773,306,118 | |
| | | | | | | | | | | | | | | | | | |
| | Liabilities: | | | | | | | | | | | | | | | | |
| | Written options, at value (premiums received $27,061,675, $1,914,097, $0 and $0) | | | 29,834,010 | | | | 1,083,290 | | | | — | | | | — | |
| | Variation margin on futures | | | — | | | | 434 | | | | — | | | | 51,717 | |
| | Payables: | | | | | | | | | | | | | | | | |
| | Investments purchased | | | 25,260,750 | | | | — | | | | — | | | | 1,112,078 | |
| | Fund shares redeemed | | | 3,334,635 | | | | 153,113 | | | | 303,294 | | | | 88,727 | |
| | Management fees | | | 1,575,726 | | | | 127,291 | | | | 1,250,865 | | | | 540,529 | |
| | Distribution and Service fees and Transfer Agency fees | | | 273,422 | | | | 6,198 | | | | 102,233 | | | | 22,635 | |
| | Payable upon return of securities loaned | | | 188,100 | | | | — | | | | 1,610,495 | | | | 510,450 | |
| | Due to custodian | | | — | | | | 339,795 | | | | — | | | | — | |
| | Accrued expenses | | | 559,622 | | | | 422,616 | | | | 263,533 | | | | 300,545 | |
| | Total liabilities | | | 61,026,265 | | | | 2,132,737 | | | | 3,530,420 | | | | 2,626,681 | |
| | | | | | | | | | | | | | | | | | |
| | Net Assets: | | | | | | | | | | | | | | | | |
| | Paid-in capital | | | 1,979,998,196 | | | | 231,794,436 | | | | 1,173,346,236 | | | | 596,962,637 | |
| | Total distributable earnings (loss) | | | 977,935,271 | | | | (43,814,166 | ) | | | 1,149,834,207 | | | | 173,716,800 | |
| | | NET ASSETS | | $ | 2,957,933,467 | | | $ | 187,980,270 | | | $ | 2,323,180,443 | | | $ | 770,679,437 | |
| | | Net Assets: | | | | | | | | | | | | | | | | |
| | | Class A | | $ | 165,408,254 | | | $ | 2,209,186 | | | $ | 89,049,107 | | | $ | 7,196,525 | |
| | | Class C | | | 112,526,581 | | | | 386,198 | | | | 20,126,549 | | | | 993,428 | |
| | | Institutional | | | 1,362,322,791 | | | | 5,136,443 | | | | 57,351,319 | | | | 10,900,639 | |
| | | Service | | | — | | | | — | | | | 2,221,082 | | | | — | |
| | | Investor | | | 428,995,916 | | | | 5,103,859 | | | | 18,806,587 | | | | 9,007,307 | |
| | | Class R6 | | | 234,308,937 | | | | 92,394,229 | | | | 1,944,410,980 | | | | 664,363,692 | |
| | | Class P | | | 654,370,988 | | | | 82,750,355 | | | | 191,214,819 | | | | 78,217,846 | |
| | | Total Net Assets | | $ | 2,957,933,467 | | | $ | 187,980,270 | | | $ | 2,323,180,443 | | | $ | 770,679,437 | |
| | | Shares outstanding $0.001 par value (unlimited shares authorized): | | | | | | | | | | | | | | | | |
| | | Class A | | | 10,389,695 | | | | 292,984 | | | | 2,560,842 | | | | 586,504 | |
| | | Class C | | | 7,099,087 | | | | 53,113 | | | | 617,166 | | | | 83,306 | |
| | | Institutional | | | 85,838,421 | | | | 695,705 | | | | 1,606,420 | | | | 888,829 | |
| | | Service | | | — | | | | — | | | | 63,552 | | | | — | |
| | | Investor | | | 27,012,833 | | | | 692,956 | | | | 531,667 | | | | 734,447 | |
| | | Class R6 | | | 14,770,216 | | | | 12,516,659 | | | | 54,943,091 | | | | 54,538,044 | |
| | | Class P | | | 41,239,163 | | | | 11,193,651 | | | | 5,401,872 | | | | 6,418,125 | |
| | | Net asset value, offering and redemption price per share:(b) | | | | | | | | | | | | | | | | |
| | | Class A | | | $15.92 | | | | $7.54 | | | | $34.77 | | | | $12.27 | |
| | | Class C | | | 15.85 | | | | 7.27 | | | | 32.61 | | | | 11.93 | |
| | | Institutional | | | 15.87 | | | | 7.38 | | | | 35.70 | | | | 12.26 | |
| | | Service | | | — | | | | — | | | | 34.95 | | | | — | |
| | | Investor | | | 15.88 | | | | 7.37 | | | | 35.37 | | | | 12.26 | |
| | | Class R6 | | | 15.86 | | | | 7.38 | | | | 35.39 | | | | 12.18 | |
| | | Class P | | | 15.87 | | | | 7.39 | | | | 35.40 | | | | 12.19 | |
| | (a) | | Includes loaned securities having a market value of $184,184, $1,566,036 and $497,170, for the U.S. Equity Dividend and Premium, U.S. Tax-Managed Equity and International Tax-Managed Equity Funds, respectively. |
| | (a) | | Maximum public offering price per share for Class A Shares of the U.S. Equity Dividend and Premium, International Equity Dividend and Premium, U.S. Tax-Managed Equity and International Tax-Managed Equity Funds is $16.85, $7.98, $36.79 and $12.98, respectively. At redemption, Class C Shares may be subject to a contingent deferred sales charge assessed on the amount equal to the lesser of the current NAV or the original purchase price of the shares. |
| | |
| 30 | | The accompanying notes are an integral part of these financial statements. |
GOLDMAN SACHS TAX-ADVANTAGED EQUITY FUNDS
Statements of Operations
For the Six Months Ended June 30, 2021 (Unaudited)
| | | | | | | | | | | | | | | | | | |
| | | | | U.S. Equity
Dividend and
Premium Fund | | | International Equity
Dividend and
Premium Fund | | | U.S. Tax-Managed
Equity Fund | | | International
Tax-Managed
Equity Fund | |
| | Investment income: | | | | | | | | | | | | | | | | |
| | | | | |
| | Dividends — unaffiliated issuers (net of foreign taxes withheld of $0, $408,980, $10,408 and $1,174,320) | | $ | 29,122,237 | | | $ | 3,748,510 | | | $ | 11,740,829 | | | $ | 13,403,791 | |
| | | | | |
| | Securities lending income — affiliated issuer | | | 26,708 | | | | 128 | | | | 1,203 | | | | 885 | |
| | | | | |
| | Dividends — affiliated issuers | | | 10,347 | | | | 65 | | | | 1,059 | | | | — | |
| | | | | |
| | Interest | | | 87 | | | | — | | | | — | | | | — | |
| | | | | |
Other income | | | | | — | | | | 138,454 | | | | — | | | | 61,910 | |
| | | | | |
| | Total investment income | | | 29,159,379 | | | | 3,887,157 | | | | 11,743,091 | | | | 13,466,586 | |
| | | | | | | | | | | | | | | | | | |
| | Expenses: | | | | | | | | | | | | | | | | |
| | | | | |
| | Management fees | | | 9,756,019 | | | | 776,804 | | | | 6,911,821 | | | | 3,193,197 | |
| | | | | |
| | Transfer Agency fees(a) | | | 924,481 | | | | 33,775 | | | | 393,965 | | | | 124,049 | |
| | | | | |
| | Distribution and Service (12b-1) fees(a) | | | 616,304 | | | | 4,457 | | | | 178,220 | | | | 12,386 | |
| | | | | |
| | Custody, accounting and administrative services | | | 167,446 | | | | 74,672 | | | | 105,658 | | | | 137,301 | |
| | | | | |
| | Service fees — Class C | | | 142,632 | | | | 587 | | | | 23,812 | | | | 1,268 | |
| | | | | |
| | Printing and mailing costs | | | 122,719 | | | | 20,614 | | | | 31,650 | | | | 25,287 | |
| | | | | |
| | Registration fees | | | 67,490 | | | | 36,201 | | | | 45,777 | | | | 59,565 | |
| | | | | |
| | Professional fees | | | 53,096 | | | | 69,921 | | | | 52,527 | | | | 66,174 | |
| | | | | |
| | Trustee fees | | | 11,461 | | | | 9,566 | | | | 10,765 | | | | 9,947 | |
| | | | | |
| | Shareholder administration fees — Service Shares | | | — | | | | — | | | | 2,593 | | | | — | |
| | | | | |
| | Other | | | 50,554 | | | | 55,298 | | | | 24,391 | | | | 22,446 | |
| | | | | |
| | Total expenses | | | 11,912,202 | | | | 1,081,895 | | | | 7,781,179 | | | | 3,651,620 | |
| | | | | |
| | Less — expense reductions | | | (921,768 | ) | | | (225,976 | ) | | | (25,023 | ) | | | (273,140 | ) |
| | | | | |
| | Net expenses | | | 10,990,434 | | | | 855,919 | | | | 7,756,156 | | | | 3,378,480 | |
| | | | | |
| | NET INVESTMENT INCOME | | | 18,168,945 | | | | 3,031,238 | | | | 3,986,935 | | | | 10,088,106 | |
| | | | | | | | | | | | | | | | | | |
| | Realized and unrealized gain (loss): | | | | | | | | | | | | | | | | |
| | | | | |
| | Net realized gain (loss) from: | | | | | | | | | | | | | | | | |
| | | | | |
| | Investments — unaffiliated issuers | | | 53,921,005 | | | | 8,585,078 | | | | 4,717,227 | | | | 15,887,293 | |
| | | | | |
| | In-kind transactions from affiliated Underlying Funds | | | — | | | | — | | | | 34,594,991 | | | | 20,045,635 | |
| | | | | |
| | Futures contracts | | | 5,190,981 | | | | 146,392 | | | | 2,680,261 | | | | 1,016,359 | |
| | | | | |
| | Foreign currency transactions | | | (563 | ) | | | (121,974 | ) | | | — | | | | 210,365 | |
| | | | | |
| | Written options | | | (69,260,639 | ) | | | (4,166,797 | ) | | | — | | | | — | |
| | | | | |
| | Net change in unrealized gain (loss) on: | | | | | | | | | | | | | | | | |
| | | | | |
| | Investments — unaffiliated issuers | | | 312,257,060 | | | | 4,230,460 | | | | 285,783,036 | | | | 14,229,948 | |
| | | | | |
| | Futures contracts | | | 162,627 | | | | 17,039 | | | | 201,004 | | | | (223,657 | ) |
| | | | | |
| | Foreign currency translation | | | (1,841 | ) | | | (79,726 | ) | | | — | | | | (275,113 | ) |
| | | | | |
| | Written options | | | 19,320,974 | | | | 997,364 | | | | — | | | | — | |
| | | | | |
| | Net realized and unrealized gain | | | 321,589,604 | | | | 9,607,836 | | | | 327,976,519 | | | | 50,890,830 | |
| | | | | |
| | NET INCREASE IN NET ASSETS RESULTING FROM OPERATIONS | | $ | 339,758,549 | | | $ | 12,639,074 | | | $ | 331,963,454 | | | $ | 60,978,936 | |
| | (a) | | Class specific Distribution and/or Service, and Transfer Agency fees were as follows: |
| | | | | | | | | | | | | | | | | | | | | | | | | | | | | | | | | | | | | | | | |
| | | Distribution and/or (12b-1)
Service Fees | | | Transfer Agency Fees | |
Fund | | Class A | | | Class C | | | Service | | | Class A | | | Class C | | | Institutional | | | Service | | | Investor | | | Class R6 | | | Class P | |
U.S. Equity Dividend and Premium | | $ | 188,409 | | | $ | 427,895 | | | $ | — | | | $ | 120,583 | | | $ | 91,285 | | | $ | 257,786 | | | $ | — | | | $ | 329,067 | | | $ | 32,259 | | | $ | 93,501 | |
International Equity Dividend and Premium | | | 2,696 | | | | 1,761 | | | | — | | | | 1,726 | | | | 375 | | | | 1,027 | | | | — | | | | 3,743 | | | | 14,183 | | | | 12,721 | |
U.S. Tax-Managed Equity | | | 104,192 | | | | 71,435 | | | | 2,593 | | | | 66,683 | | | | 15,240 | | | | 10,301 | | | | 415 | | | | 13,710 | | | | 262,075 | | | | 25,541 | |
International Tax-Managed Equity | | | 8,581 | | | | 3,805 | | | | — | | | | 5,491 | | | | 812 | | | | 2,108 | | | | — | | | | 7,018 | | | | 97,532 | | | | 11,088 | |
| | |
| The accompanying notes are an integral part of these financial statements. | | 31 |
GOLDMAN SACHS TAX-ADVANTAGED EQUITY FUNDS
Statements of Changes in Net Assets
For the Six Months Ended June 30, 2021 (Unaudited)
| | | | | | | | | | | | | | | | | | | | | | |
| | | | | U.S. Equity Dividend and Premium Fund | | | | | | International Equity Dividend and
Premium Fund | |
| | | | | For the
Six Months Ended
June 30, 2021
(Unaudited) | | | For the Fiscal Year Ended
December 31, 2020 | | | | | | For the
Six Months Ended
June 30, 2021
(Unaudited) | | | For the Fiscal
Year Ended
December 31, 2020 | |
| | From operations: | | | | | | | | | | | | | |
| | Net investment income | | $ | 18,168,945 | | | $ | 42,628,482 | | | | | | | $ | 3,031,238 | | | $ | 5,693,933 | |
| | Net realized gain (loss) | | | (10,149,216 | ) | | | 159,096,999 | | | | | | | | 4,442,699 | | | | (39,437,182 | ) |
| | Net change in unrealized gain | | | 331,738,820 | | | | 67,663,187 | | | | | | | | 5,165,137 | | | | 21,956,401 | |
| | Net increase (decrease) in net assets resulting from operations | | | 339,758,549 | | | | 269,388,668 | | | | | | | | 12,639,074 | | | | (11,786,848 | ) |
| | | | | | | | | | | | | | | | | | | | | | |
| | Distributions to shareholders: | | | | | | | | | | | | | |
| | From distributable earnings: | | | | | | | | | | | | | | | | | | | | |
| | Class A Shares | | | (791,585 | ) | | | (8,813,798 | ) | | | | | | | (27,010 | ) | | | (45,797 | ) |
| | Class C Shares | | | (136,446 | ) | | | (7,122,278 | ) | | | | | | | (3,164 | ) | | | (11,424 | ) |
| | Institutional Shares | | | (8,644,732 | ) | | | (86,526,760 | ) | | | | | | | (72,335 | ) | | | (139,608 | ) |
| | Investor Shares | | | (2,543,910 | ) | | | (28,195,263 | ) | | | | | | | (67,780 | ) | | | (108,837 | ) |
| | Class R6 Shares | | | (1,427,267 | ) | | | (14,541,591 | ) | | | | | | | (1,299,749 | ) | | | (2,843,419 | ) |
| | Class P Shares | | | (4,212,086 | ) | | | (41,326,407 | ) | | | | | | | (1,167,791 | ) | | | (2,619,218 | ) |
| | Return of capital | | | | | | | | | | | | | | | | | | | | |
| | Class A Shares | | | — | | | | (34,917 | ) | | | | | | | — | | | | (1,071 | ) |
| | Class C Shares | | | — | | | | (32,721 | ) | | | | | | | — | | | | (382 | ) |
| | Institutional Shares | | | — | | | | (320,645 | ) | | | | | | | — | | | | (2,873 | ) |
| | Investor Shares | | | — | | | | (111,393 | ) | | | | | | | — | | | | (2,391 | ) |
| | Class R6 Shares | | | — | | | | (57,937 | ) | | | | | | | — | | | | (57,728 | ) |
| | Class P Shares | | | — | | | | (157,363 | ) | | | | | | | — | | | | (53,449 | ) |
| | Total distributions to shareholders | | | (17,756,026 | ) | | | (187,241,073 | ) | | | | | | | (2,637,829 | ) | | | (5,886,197 | ) |
| | | | | | | | | | | | | | | | | | | | | | |
| | From share transactions: | | | | | | | | | | | | | |
| | Proceeds from sales of shares | | | 255,049,000 | | | | 650,146,397 | | | | | | | | 7,555,751 | | | | 24,809,273 | |
| | Reinvestment of distributions | | | 16,056,205 | | | | 169,859,628 | | | | | | | | 2,600,090 | | | | 5,825,672 | |
| | Cost of shares redeemed | | | (346,829,622 | ) | | | (1,193,732,492 | ) | | | | | | | (33,023,777 | ) | | | (110,895,820 | ) |
| | Net decrease in net assets resulting from share transactions | | | (75,724,417 | ) | | | (373,726,467 | ) | | | | | | | (22,867,936 | ) | | | (80,260,875 | ) |
| | | | | | |
| | TOTAL INCREASE (DECREASE) | | | 246,278,106 | | | | (291,578,872 | ) | | | | | | | (12,866,691 | ) | | | (97,933,920 | ) |
| | | | | | | | | | | | | | | | | | | | | | |
| | Net Assets: | | | | | | | | | | | | | |
| | Beginning of period | | | 2,711,655,361 | | | | 3,003,234,233 | | | | | | | | 200,846,961 | | | | 298,780,881 | |
| | End of period | | $ | 2,957,933,467 | | | $ | 2,711,655,361 | | | | | | | $ | 187,980,270 | | | $ | 200,846,961 | |
| | |
| 32 | | The accompanying notes are an integral part of these financial statements. |
GOLDMAN SACHS TAX-ADVANTAGED EQUITY FUNDS
Statements of Changes in Net Assets (continued)
For the Six Months Ended June 30, 2021 (Unaudited)
| | | | | | | | | | | | | | | | | | | | | | |
| | | | | U.S. Tax-Managed Equity Fund | | | | | | International Tax-Managed Equity Fund | |
| | | | | For the
Six Months Ended
June 30, 2021
(Unaudited) | | | For the Fiscal
Year Ended
December 31, 2020 | | | | | | For the
Six Months Ended
June 30, 2021
(Unaudited) | | | For the Fiscal
Year Ended
December 31, 2020 | |
| | From operations: | | | | | | | | | | | | | |
| | Net investment income | | $ | 3,986,935 | | | $ | 9,058,310 | | | | | | | $ | 10,088,106 | | | $ | 9,515,616 | |
| | Net realized gain (loss) | | | 41,992,479 | | | | 64,937,751 | | | | | | | | 37,159,652 | | | | (73,126,704 | ) |
| | Net change in unrealized gain | | | 285,984,040 | | | | 173,716,486 | | | | | | | | 13,731,178 | | | | 121,870,409 | |
| | Net increase in net assets resulting from operations | | | 331,963,454 | | | | 247,712,547 | | | | | | | | 60,978,936 | | | | 58,259,321 | |
| | | | | | | | | | | | | | | | | | | | | | |
| | Distributions to shareholders: | | | | | | | | | | | | | |
| | From distributable earnings: | | | | | | | | | | | | | | | | | | | | |
| | Class A Shares | | | — | | | | (227,570 | ) | | | | | | | — | | | | (83,262 | ) |
| | Class C Shares | | | — | | | | — | | | | | | | | — | | | | (4,591 | ) |
| | Institutional Shares | | | — | | | | (272,887 | ) | | | | | | | — | | | | (142,381 | ) |
| | Service Shares | | | — | | | | (3,211 | ) | | | | | | | — | | | | — | |
| | Investor Shares | | | — | | | | (78,104 | ) | | | | | | | — | | | | (120,706 | ) |
| | Class R6 Shares | | | — | | | | (9,022,049 | ) | | | | | | | — | | | | (9,502,533 | ) |
| | Class P Shares | | | — | | | | (892,356 | ) | | | | | | | — | | | | (998,750 | ) |
| | Return of capital | | | | | | | | | | | | | | | | | | | | |
| | Class A Shares | | | — | | | | (95,505 | ) | | | | | | | — | | | | — | |
| | Institutional Shares | | | — | | | | (58,669 | ) | | | | | | | — | | | | — | |
| | Service Shares | | | — | | | | (2,439 | ) | | | | | | | — | | | | — | |
| | Investor Shares | | | — | | | | (19,743 | ) | | | | | | | — | | | | — | |
| | Class R6 Shares | | | — | | | | (1,942,310 | ) | | | | | | | — | | | | — | |
| | Class P Shares | | | — | | | | (188,413 | ) | | | | | | | — | | | | — | |
| | Total distributions to shareholders | | | — | | | | (12,803,256 | ) | | | | | | | — | | | | (10,852,223 | ) |
| | | | | | | | | | | | | | | | | | | | | | |
| | From share transactions: | | | | | | | | | | | | | |
| | Proceeds from sales of shares | | | 224,882,324 | | | | 116,867,565 | | | | | | | | 45,683,502 | | | | 81,613,669 | |
| | Proceeds paid in connection with in-kind transactions | | | (42,000,000 | ) | | | (92,360,000 | ) | | | | | | | (56,160,000 | ) | | | — | |
| | Reinvestment of distributions | | | — | | | | 12,717,767 | | | | | | | | — | | | | 10,851,335 | |
| | Cost of shares redeemed | | | (42,115,659 | ) | | | (291,799,400 | ) | | | | | | | (15,629,167 | ) | | | (175,459,100 | ) |
| | Net increase (decrease) in net assets resulting from share transactions | | | 140,766,665 | | | | (254,574,068 | ) | | | | | | | (26,105,665 | ) | | | (82,994,096 | ) |
| | | | | | |
| | TOTAL INCREASE (DECREASE) | | | 472,730,119 | | | | (19,664,777 | ) | | | | | | | 34,873,271 | | | | (35,586,998 | ) |
| | | | | | | | | | | | | | | | | | | | | | |
| | Net Assets: | | | | | | | | | | | | | |
| | Beginning of period | | | 1,850,450,324 | | | | 1,870,115,101 | | | | | | | | 735,806,166 | | | | 771,393,164 | |
| | End of period | | $ | 2,323,180,443 | | | $ | 1,850,450,324 | | | | | | | $ | 770,679,437 | | | $ | 735,806,166 | |
| | |
| The accompanying notes are an integral part of these financial statements. | | 33 |
GOLDMAN SACHS U.S. EQUITY DIVIDEND AND PREMIUM FUND
Financial Highlights
Selected Data for a Share Outstanding Throughout Each Period
| | | | | | | | | | | | | | | | | | | | | | | | | | |
| | | | | Goldman Sachs U.S. Equity Dividend and Premium Fund | |
| | | | | Class A Shares | |
| | | | | Six Months Ended
June 30, 2021
(Unaudited) | | | Year Ended December 31, | |
| | | | | 2020 | | | 2019 | | | 2018 | | | 2017 | | | 2016 | |
| | Per Share Data | | | | | | | | | | | | | | | | | | | | | | | | |
| | | | | | | |
| | Net asset value, beginning of period | | $ | 14.20 | | | $ | 13.38 | | | $ | 11.46 | | | $ | 13.16 | | | $ | 12.11 | | | $ | 11.34 | |
| | | | | | | |
| | Net investment income(a) | | | 0.08 | | | | 0.18 | | | | 0.21 | | | | 0.21 | | | | 0.19 | | | | 0.20 | |
| | | | | | | |
| | Net realized and unrealized gain (loss) | | | 1.72 | | | | 1.61 | | | | 2.57 | | | | (1.05 | ) | | | 1.61 | | | | 1.21 | |
| | | | | | | |
| | Total from investment operations | | | 1.80 | | | | 1.79 | | | | 2.78 | | | | (0.84 | ) | | | 1.80 | | | | 1.41 | |
| | | | | | | |
| | Distributions to shareholders from net investment income | | | (0.08 | ) | | | (0.19 | ) | | | (0.21 | ) | | | (0.22 | ) | | | (0.19 | ) | | | (0.19 | ) |
| | | | | | | |
| | Distributions to shareholders from net realized gains | | | — | | | | (0.78 | ) | | | (0.65 | ) | | | (0.64 | ) | | | (0.56 | ) | | | (0.45 | ) |
| | | | | | | |
| | Distributions to shareholders from return of capital | | | — | | | | — | (b) | | | — | | | | — | | | | — | | | | — | |
| | | | | | | |
| | Total distributions | | | (0.08 | ) | | | (0.97 | ) | | | (0.86 | ) | | | (0.86 | ) | | | (0.75 | ) | | | (0.64 | ) |
| | | | | | | |
| | Net asset value, end of period | | $ | 15.92 | | | $ | 14.20 | | | $ | 13.38 | | | $ | 11.46 | | | $ | 13.16 | | | $ | 12.11 | |
| | | | | | | |
| | Total return(c) | | | 12.67 | % | | | 13.62 | % | | | 24.62 | % | | | (6.63 | )% | | | 14.83 | % | | | 12.73 | % |
| | | | | | | |
| | Net assets, end of period (in 000s) | | $ | 165,408 | | | $ | 135,937 | | | $ | 195,689 | | | $ | 187,524 | | | $ | 275,451 | | | $ | 294,401 | |
| | | | | | | |
| | Ratio of net expenses to average net assets | | | 1.06 | %(d) | | | 1.09 | % | | | 1.12 | % | | | 1.12 | % | | | 1.13 | % | | | 1.16 | % |
| | | | | | | |
| | Ratio of total expenses to average net assets | | | 1.14 | %(d) | | | 1.15 | % | | | 1.16 | % | | | 1.15 | % | | | 1.15 | % | | | 1.19 | % |
| | | | | | | |
| | Ratio of net investment income to average net assets | | | 1.02 | %(d) | | | 1.41 | % | | | 1.65 | % | | | 1.61 | % | | | 1.47 | % | | | 1.67 | % |
| | | | | | | |
| | Portfolio turnover rate(e) | | | 7 | % | | | 39 | % | | | 26 | % | | | 37 | % | | | 34 | % | | | 23 | % |
| | (a) | | Calculated based on the average shares outstanding methodology. |
| | (b) | | Amount is less than $0.005 per share. |
| | (c) | | Assumes investment at the net asset value at the beginning of the period, reinvestment of all distributions, a complete redemption of the investment at the net asset value at the end of the period and no sales or redemption charges (if any). Total returns would be reduced if a sales or redemption charge was taken into account. Returns do not reflect the impact of taxes to shareholders relating to Fund distributions or the redemption of Fund shares. Total returns for periods less than one full year are not annualized. |
| | (e) | | The Fund’s portfolio turnover rate is calculated in accordance with regulatory requirements, without regard to transactions involving short term investments and certain derivatives. If such transactions were included, the Fund’s portfolio turnover rate may be higher. |
| | |
| 34 | | The accompanying notes are an integral part of these financial statements. |
GOLDMAN SACHS U.S. EQUITY DIVIDEND AND PREMIUM FUND
Financial Highlights (continued)
Selected Data for a Share Outstanding Throughout Each Period
| | | | | | | | | | | | | | | | | | | | | | | | | | |
| | | | | Goldman Sachs U.S. Equity Dividend and Premium Fund | |
| | | | | Class C Shares | |
| | | | | Six Months Ended
June 30, 2021
(Unaudited) | | | Year Ended December 31, | |
| | | | | 2020 | | | 2019 | | | 2018 | | | 2017 | | | 2016 | |
| | Per Share Data | | | | | | | | | | | | | | | | | | | | | | | | |
| | | | | | | |
| | Net asset value, beginning of period | | $ | 14.14 | | | $ | 13.33 | | | $ | 11.41 | | | $ | 13.11 | | | $ | 12.07 | | | $ | 11.31 | |
| | | | | | | |
| | Net investment income(a) | | | 0.02 | | | | 0.08 | | | | 0.12 | | | | 0.11 | | | | 0.10 | | | | 0.11 | |
| | | | | | | |
| | Net realized and unrealized gain (loss) | | | 1.71 | | | | 1.60 | | | | 2.57 | | | | (1.05 | ) | | | 1.60 | | | | 1.21 | |
| | | | | | | |
| | Total from investment operations | | | 1.73 | | | | 1.68 | | | | 2.69 | | | | (0.94 | ) | | | 1.70 | | | | 1.32 | |
| | | | | | | |
| | Distributions to shareholders from net investment income | | | (0.02 | ) | | | (0.09 | ) | | | (0.12 | ) | | | (0.12 | ) | | | (0.10 | ) | | | (0.11 | ) |
| | | | | | | |
| | Distributions to shareholders from net realized gains | | | — | | | | (0.78 | ) | | | (0.65 | ) | | | (0.64 | ) | | | (0.56 | ) | | | (0.45 | ) |
| | | | | | | |
| | Distributions to shareholders from return of capital | | | — | | | | — | (b) | | | — | | | | — | | | | — | | | | — | |
| | | | | | | |
| | Total distributions | | | (0.02 | ) | | | (0.87 | ) | | | (0.77 | ) | | | (0.76 | ) | | | (0.66 | ) | | | (0.56 | ) |
| | | | | | | |
| | Net asset value, end of period | | $ | 15.85 | | | $ | 14.14 | | | $ | 13.33 | | | $ | 11.41 | | | $ | 13.11 | | | $ | 12.07 | |
| | | | | | | |
| | Total return(c) | | | 12.23 | % | | | 12.83 | % | | | 23.72 | % | | | (7.38 | )% | | | 13.99 | % | | | 11.92 | % |
| | | | | | | |
| | Net assets, end of period (in 000s) | | $ | 112,527 | | | $ | 118,819 | | | $ | 141,029 | | | $ | 139,580 | | | $ | 177,178 | | | $ | 142,909 | |
| | | | | | | |
| | Ratio of net expenses to average net assets | | | 1.81 | %(d) | | | 1.84 | % | | | 1.87 | % | | | 1.87 | % | | | 1.88 | % | | | 1.91 | % |
| | | | | | | |
| | Ratio of total expenses to average net assets | | | 1.89 | %(d) | | | 1.90 | % | | | 1.91 | % | | | 1.90 | % | | | 1.90 | % | | | 1.94 | % |
| | | | | | | |
| | Ratio of net investment income to average net assets | | | 0.28 | %(d) | | | 0.64 | % | | | 0.90 | % | | | 0.86 | % | | | 0.76 | % | | | 0.92 | % |
| | | | | | | |
| | Portfolio turnover rate(e) | | | 7 | % | | | 39 | % | | | 26 | % | | | 37 | % | | | 34 | % | | | 23 | % |
| | (a) | | Calculated based on the average shares outstanding methodology. |
| | (b) | | Amount is less than $0.005 per share. |
| | (c) | | Assumes investment at the net asset value at the beginning of the period, reinvestment of all distributions, a complete redemption of the investment at the net asset value at the end of the period and no sales or redemption charges (if any). Total returns would be reduced if a sales or redemption charge was taken into account. Returns do not reflect the impact of taxes to shareholders relating to Fund distributions or the redemption of Fund shares. Total returns for periods less than one full year are not annualized. |
| | (e) | | The Fund’s portfolio turnover rate is calculated in accordance with regulatory requirements, without regard to transactions involving short term investments and certain derivatives. If such transactions were included, the Fund’s portfolio turnover rate may be higher. |
| | |
| The accompanying notes are an integral part of these financial statements. | | 35 |
GOLDMAN SACHS U.S. EQUITY DIVIDEND AND PREMIUM FUND
Financial Highlights (continued)
Selected Data for a Share Outstanding Throughout Each Period
| | | | | | | | | | | | | | | | | | | | | | | | | | |
| | | | | Goldman Sachs U.S. Equity Dividend and Premium Fund | |
| | | | | Institutional Shares | |
| | | | | Six Months Ended
June 30, 2021
(Unaudited) | | | Year Ended December 31, | |
| | | | | 2020 | | | 2019 | | | 2018 | | | 2017 | | | 2016 | |
| | Per Share Data | | | | | | | | | | | | | | | | | | | | | | | | |
| | | | | | | |
| | Net asset value, beginning of period | | $ | 14.16 | | | $ | 13.35 | | | $ | 11.43 | | | $ | 13.13 | | | $ | 12.09 | | | $ | 11.31 | |
| | | | | | | |
| | Net investment income(a) | | | 0.10 | | | | 0.23 | | | | 0.26 | | | | 0.27 | | | | 0.24 | | | | 0.24 | |
| | | | | | | |
| | Net realized and unrealized gain (loss) | | | 1.71 | | | | 1.60 | | | | 2.57 | | | | (1.06 | ) | | | 1.60 | | | | 1.22 | |
| | | | | | | |
| | Total from investment operations | | | 1.81 | | | | 1.83 | | | | 2.83 | | | | (0.79 | ) | | | 1.84 | | | | 1.46 | |
| | | | | | | |
| | Distributions to shareholders from net investment income | | | (0.10 | ) | | | (0.24 | ) | | | (0.26 | ) | | | (0.27 | ) | | | (0.24 | ) | | | (0.23 | ) |
| | | | | | | |
| | Distributions to shareholders from net realized gains | | | — | | | | (0.78 | ) | | | (0.65 | ) | | | (0.64 | ) | | | (0.56 | ) | | | (0.45 | ) |
| | | | | | | |
| | Distributions to shareholders from return of capital | | | — | | | | — | (b) | | | — | | | | — | | | | — | | | | — | |
| | | | | | | |
| | Total distributions | | | (0.10 | ) | | | (1.02 | ) | | | (0.91 | ) | | | (0.91 | ) | | | (0.80 | ) | | | (0.68 | ) |
| | | | | | | |
| | Net asset value, end of period | | $ | 15.87 | | | $ | 14.16 | | | $ | 13.35 | | | $ | 11.43 | | | $ | 13.13 | | | $ | 12.09 | |
| | | | | | | |
| | Total return(c) | | | 12.81 | % | | | 14.12 | % | | | 25.06 | % | | | (6.28 | )% | | | 15.31 | % | | | 13.17 | % |
| | | | | | | |
| | Net assets, end of period (in 000s) | | $ | 1,362,323 | | | $ | 1,252,383 | | | $ | 1,242,858 | | | $ | 1,106,179 | | | $ | 2,565,883 | | | $ | 2,062,756 | |
| | | | | | | |
| | Ratio of net expenses to average net assets | | | 0.71 | %(d) | | | 0.72 | % | | | 0.75 | % | | | 0.74 | % | | | 0.74 | % | | | 0.76 | % |
| | | | | | | |
| | Ratio of total expenses to average net assets | | | 0.77 | %(d) | | | 0.78 | % | | | 0.77 | % | | | 0.76 | % | | | 0.76 | % | | | 0.79 | % |
| | | | | | | |
| | Ratio of net investment income to average net assets | | | 1.37 | %(d) | | | 1.73 | % | | | 2.02 | % | | | 2.01 | % | | | 1.89 | % | | | 2.07 | % |
| | | | | | | |
| | Portfolio turnover rate(e) | | | 7 | % | | | 39 | % | | | 26 | % | | | 37 | % | | | 34 | % | | | 23 | % |
| | (a) | | Calculated based on the average shares outstanding methodology. |
| | (b) | | Amount is less than $0.005 per share. |
| | (c) | | Assumes investment at the net asset value at the beginning of the period, reinvestment of all distributions, a complete redemption of the investment at the net asset value at the end of the period and no sales or redemption charges (if any). Total returns would be reduced if a sales or redemption charge was taken into account. Returns do not reflect the impact of taxes to shareholders relating to Fund distributions or the redemption of Fund shares. Total returns for periods less than one full year are not annualized. |
| | (e) | | The Fund’s portfolio turnover rate is calculated in accordance with regulatory requirements, without regard to transactions involving short term investments and certain derivatives. If such transactions were included, the Fund’s portfolio turnover rate may be higher. |
| | |
| 36 | | The accompanying notes are an integral part of these financial statements. |
GOLDMAN SACHS U.S. EQUITY DIVIDEND AND PREMIUM FUND
Financial Highlights (continued)
Selected Data for a Share Outstanding Throughout Each Period
| | | | | | | | | | | | | | | | | | | | | | | | | | |
| | | | | Goldman Sachs U.S. Equity Dividend and Premium Fund | |
| | | | | Investor Shares(a) | |
| | | | | Six Months Ended
June 30, 2021
(Unaudited) | | | Year Ended December 31, | |
| | | | | 2020 | | | 2019 | | | 2018 | | | 2017 | | | 2016 | |
| | Per Share Data | | | | | | | | | | | | | | | | | | | | | | | | |
| | | | | | | |
| | Net asset value, beginning of period | | $ | 14.17 | | | $ | 13.36 | | | $ | 11.44 | | | $ | 13.14 | | | $ | 12.10 | | | $ | 11.33 | |
| | | | | | | |
| | Net investment income(b) | | | 0.10 | | | | 0.21 | | | | 0.25 | | | | 0.25 | | | | 0.23 | | | | 0.23 | |
| | | | | | | |
| | Net realized and unrealized gain (loss) | | | 1.70 | | | | 1.60 | | | | 2.57 | | | | (1.06 | ) | | | 1.60 | | | | 1.21 | |
| | | | | | | |
| | Total from investment operations | | | 1.80 | | | | 1.81 | | | | 2.82 | | | | (0.81 | ) | | | 1.83 | | | | 1.44 | |
| | | | | | | |
| | Distributions to shareholders from net investment income | | | (0.09 | ) | | | (0.22 | ) | | | (0.25 | ) | | | (0.25 | ) | | | (0.23 | ) | | | (0.22 | ) |
| | | | | | | |
| | Distributions to shareholders from net realized gains | | | — | | | | (0.78 | ) | | | (0.65 | ) | | | (0.64 | ) | | | (0.56 | ) | | | (0.45 | ) |
| | | | | | | |
| | Distributions to shareholders from return of capital | | | — | | | | — | (c) | | | — | | | | — | | | | — | | | | — | |
| | | | | | | |
| | Total distributions | | | (0.09 | ) | | | (1.00 | ) | | | (0.90 | ) | | | (0.89 | ) | | | (0.79 | ) | | | (0.67 | ) |
| | | | | | | |
| | Net asset value, end of period | | $ | 15.88 | | | $ | 14.17 | | | $ | 13.36 | | | $ | 11.44 | | | $ | 13.14 | | | $ | 12.10 | |
| | | | | | | |
| | Total return(d) | | | 12.83 | % | | | 13.90 | % | | | 25.00 | % | | | (6.47 | )% | | | 15.18 | % | | | 12.92 | % |
| | | | | | | |
| | Net assets, end of period (in 000s) | | $ | 428,996 | | | $ | 402,711 | | | $ | 468,254 | | | $ | 432,136 | | | $ | 473,178 | | | $ | 174,527 | |
| | | | | | | |
| | Ratio of net expenses to average net assets | | | 0.81 | %(e) | | | 0.83 | % | | | 0.87 | % | | | 0.87 | % | | | 0.88 | % | | | 0.91 | % |
| | | | | | | |
| | Ratio of total expenses to average net assets | | | 0.89 | %(e) | | | 0.90 | % | | | 0.91 | % | | | 0.90 | % | | | 0.90 | % | | | 0.94 | % |
| | | | | | | |
| | Ratio of net investment income to average net assets | | | 1.27 | %(e) | | | 1.64 | % | | | 1.90 | % | | | 1.86 | % | | | 1.76 | % | | | 1.90 | % |
| | | | | | | |
| | Portfolio turnover rate(f) | | | 7 | % | | | 39 | % | | | 26 | % | | | 37 | % | | | 34 | % | | | 23 | % |
| | (a) | | Effective August 15, 2017, Class IR changed its name to Investor Shares. |
| | (b) | | Calculated based on the average shares outstanding methodology. |
| | (c) | | Amount is less than $0.005 per share. |
| | (d) | | Assumes investment at the net asset value at the beginning of the period, reinvestment of all distributions, a complete redemption of the investment at the net asset value at the end of the period and no sales or redemption charges (if any). Total returns would be reduced if a sales or redemption charge was taken into account. Returns do not reflect the impact of taxes to shareholders relating to Fund distributions or the redemption of Fund shares. Total returns for periods less than one full year are not annualized. |
| | (f) | | The Fund’s portfolio turnover rate is calculated in accordance with regulatory requirements, without regard to transactions involving short term investments and certain derivatives. If such transactions were included, the Fund’s portfolio turnover rate may be higher. |
| | |
| The accompanying notes are an integral part of these financial statements. | | 37 |
GOLDMAN SACHS U.S. EQUITY DIVIDEND AND PREMIUM FUND
Financial Highlights (continued)
Selected Data for a Share Outstanding Throughout Each Period
| | | | | | | | | | | | | | | | | | |
| | | | | Goldman Sachs U.S. Equity Dividend and Premium Fund | |
| | | | | Class R6 Shares | |
| | | | | Six Months Ended
June 30, 2021
(Unaudited) | | | Year Ended December 31, | | | April 30, 2018* to
December 31, 2018 | |
| | | | 2020 | | | 2019 | |
| | Per Share Data | | | | | | | | | | | | | | | | |
| | | | | |
| | Net asset value, beginning of period | | $ | 14.15 | | | $ | 13.34 | | | $ | 11.42 | | | $ | 12.84 | |
| | | | | |
| | Net investment income(a) | | | 0.10 | | | | 0.23 | | | | 0.26 | | | | 0.17 | |
| | | | | |
| | Net realized and unrealized gain (loss) | | | 1.71 | | | | 1.60 | | | | 2.57 | | | | (0.75 | ) |
| | | | | |
| | Total from investment operations | | | 1.81 | | | | 1.83 | | | | 2.83 | | | | (0.58 | ) |
| | | | | |
| | Distributions to shareholders from net investment income | | | (0.10 | ) | | | (0.24 | ) | | | (0.26 | ) | | | (0.20 | ) |
| | | | | |
| | Distributions to shareholders from net realized gains | | | — | | | | (0.78 | ) | | | (0.65 | ) | | | (0.64 | ) |
| | | | | |
| | Distributions to shareholders from return of capital | | | — | | | | — | (b) | | | — | | | | — | |
| | | | | |
| | Total distributions | | | (0.10 | ) | | | (1.02 | ) | | | (0.91 | ) | | | (0.84 | ) |
| | | | | |
| | Net asset value, end of period | | $ | 15.86 | | | $ | 14.15 | | | $ | 13.34 | | | $ | 11.42 | |
| | | | | |
| | Total return(c) | | | 12.83 | % | | | 14.13 | % | | | 25.09 | % | | | (4.78 | )% |
| | | | | |
| | Net assets, end of period (in 000s) | | $ | 234,309 | | | $ | 208,584 | | | $ | 275,973 | | | $ | 252,381 | |
| | | | | |
| | Ratio of net expenses to average net assets | | | 0.70 | %(d) | | | 0.72 | % | | | 0.74 | % | | | 0.73 | %(d) |
| | | | | |
| | Ratio of total expenses to average net assets | | | 0.76 | %(d) | | | 0.77 | % | | | 0.76 | % | | | 0.76 | %(d) |
| | | | | |
| | Ratio of net investment income to average net assets | | | 1.37 | %(d) | | | 1.77 | % | | | 2.03 | % | | | 1.91 | %(d) |
| | | | | |
| | Portfolio turnover rate(e) | | | 7 | % | | | 39 | % | | | 26 | % | | | 37 | % |
| | * | | Commencement of operations. |
| | (a) | | Calculated based on the average shares outstanding methodology. |
| | (b) | | Amount is less than $0.005 per share. |
| | (c) | | Assumes investment at the net asset value at the beginning of the period, reinvestment of all distributions, a complete redemption of the investment at the net asset value at the end of the period and no sales or redemption charges (if any). Total returns would be reduced if a sales or redemption charge was taken into account. Returns do not reflect the impact of taxes to shareholders relating to Fund distributions or the redemption of Fund shares. Total returns for periods less than one full year are not annualized. |
| | (e) | | The Fund’s portfolio turnover rate is calculated in accordance with regulatory requirements, without regard to transactions involving short term investments and certain derivatives. If such transactions were included, the Fund’s portfolio turnover rate may be higher. |
| | |
| 38 | | The accompanying notes are an integral part of these financial statements. |
GOLDMAN SACHS U.S. EQUITY DIVIDEND AND PREMIUM FUND
Financial Highlights (continued)
Selected Data for a Share Outstanding Throughout Each Period
| | | | | | | | | | | | | | | | | | |
| | | | | Goldman Sachs U.S. Equity Dividend and Premium Fund | |
| | | | | Class P Shares | |
| | | | | Six Months Ended
June 30, 2021
(Unaudited) | | | Year Ended December 31, | | | April 17, 2018*
to
December 31, 2018 | |
| | | | 2020 | | | 2019 | |
| | Per Share Data | | | | | | | | | | | | | | | | |
| | | | | |
| | Net asset value, beginning of period | | $ | 14.15 | | | $ | 13.34 | | | $ | 11.43 | | | $ | 13.12 | |
| | | | | |
| | Net investment income(a) | | | 0.10 | | | | 0.23 | | | | 0.26 | | | | 0.18 | |
| | | | | |
| | Net realized and unrealized gain (loss) | | | 1.72 | | | | 1.60 | | | | 2.56 | | | | (1.03 | ) |
| | | | | |
| | Total from investment operations | | | 1.82 | | | | 1.83 | | | | 2.82 | | | | (0.85 | ) |
| | | | | |
| | Distributions to shareholders from net investment income | | | (0.10 | ) | | | (0.24 | ) | | | (0.26 | ) | | | (0.20 | ) |
| | | | | |
| | Distributions to shareholders from net realized gains | | | — | | | | (0.78 | ) | | | (0.65 | ) | | | (0.64 | ) |
| | | | | |
| | Distributions to shareholders from return of capital | | | — | | | | — | (b) | | | — | | | | — | |
| | | | | |
| | Total distributions | | | (0.10 | ) | | | (1.02 | ) | | | (0.91 | ) | | | (0.84 | ) |
| | | | | |
| | Net asset value, end of period | | $ | 15.87 | | | $ | 14.15 | | | $ | 13.34 | | | $ | 11.43 | |
| | | | | |
| | Total return(c) | | | 12.90 | % | | | 14.05 | % | | | 25.07 | % | | | (6.73 | )% |
| | | | | |
| | Net assets, end of period (in 000s) | | $ | 654,371 | | | $ | 593,220 | | | $ | 679,431 | | | $ | 648,424 | |
| | | | | |
| | Ratio of net expenses to average net assets | | | 0.70 | %(d) | | | 0.72 | % | | | 0.74 | % | | | 0.73 | %(d) |
| | | | | |
| | Ratio of total expenses to average net assets | | | 0.76 | %(d) | | | 0.77 | % | | | 0.76 | % | | | 0.76 | %(d) |
| | | | | |
| | Ratio of net investment income to average net assets | | | 1.38 | %(d) | | | 1.76 | % | | | 2.03 | % | | | 1.93 | %(d) |
| | | | | |
| | Portfolio turnover rate(e) | | | 7 | % | | | 39 | % | | | 26 | % | | | 37 | % |
| | * | | Commencement of operations. |
| | (a) | | Calculated based on the average shares outstanding methodology. |
| | (b) | | Amount is less than $0.005 per share. |
| | (c) | | Assumes investment at the net asset value at the beginning of the period, reinvestment of all distributions, a complete redemption of the investment at the net asset value at the end of the period and no sales or redemption charges (if any). Total returns would be reduced if a sales or redemption charge was taken into account. Returns do not reflect the impact of taxes to shareholders relating to Fund distributions or the redemption of Fund shares. Total returns for periods less than one full year are not annualized. |
| | (e) | | The Fund’s portfolio turnover rate is calculated in accordance with regulatory requirements, without regard to transactions involving short term investments and certain derivatives. If such transactions were included, the Fund’s portfolio turnover rate may be higher. |
| | |
| The accompanying notes are an integral part of these financial statements. | | 39 |
GOLDMAN SACHS INTERNATIONAL EQUITY DIVIDEND AND PREMIUM FUND
Financial Highlights (continued)
Selected Data for a Share Outstanding Throughout Each Period
| | | | | | | | | | | | | | | | | | | | | | | | | | |
| | | | | Goldman Sachs International Equity Dividend and Premium Fund | |
| | | | | Class A Shares | |
| | | | | Six Months Ended
June 30, 2021
(Unaudited) | | | Year Ended December 31, | |
| | | | | 2020 | | | 2019 | | | 2018 | | | 2017 | | | 2016 | |
| | Per Share Data | | | | | | | | | | | | | | | | | | | | | | | | |
| | | | | | | |
| | Net asset value, beginning of period | | $ | 7.16 | | | $ | 7.28 | | | $ | 6.55 | | | $ | 7.76 | | | $ | 6.43 | | | $ | 6.56 | |
| | | | | | | |
| | Net investment income(a) | | | 0.11 | | | | 0.15 | | | | 0.20 | | | | 0.20 | | | | 0.15 | | | | 0.18 | |
| | | | | | | |
| | Net realized and unrealized gain (loss) | | | 0.36 | | | | (0.11 | ) | | | 0.73 | | | | (1.22 | ) | | | 1.34 | | | | (0.14 | ) |
| | | | | | | |
| | Total from investment operations | | | 0.47 | | | | 0.04 | | | | 0.93 | | | | (1.02 | ) | | | 1.49 | | | | 0.04 | |
| | | | | | | |
| | Distributions to shareholders from net investment income | | | (0.09 | ) | | | (0.16 | ) | | | (0.20 | ) | | | (0.19 | ) | | | (0.16 | ) | | | (0.17 | ) |
| | | | | | | |
| | Distributions to shareholders from return of capital | | | — | | | | — | (b) | | | — | | | | — | | | | — | | | | — | |
| | | | | | | |
| | Total distributions | | | (0.09 | ) | | | (0.16 | ) | | | (0.20 | ) | | | (0.19 | ) | | | (0.16 | ) | | | (0.17 | ) |
| | | | | | | |
| | Net asset value, end of period | | $ | 7.54 | | | $ | 7.16 | | | $ | 7.28 | | | $ | 6.55 | | | $ | 7.76 | | | $ | 6.43 | |
| | | | | | | |
| | Total return(c) | | | 6.59 | % | | | 0.93 | % | | | 14.42 | % | | | (13.34 | )% | | | 23.36 | % | | | 0.66 | % |
| | | | | | | |
| | Net assets, end of period (in 000s) | | $ | 2,209 | | | $ | 2,050 | | | $ | 2,424 | | | $ | 2,232 | | | $ | 3,962 | | | $ | 5,968 | |
| | | | | | | |
| | Ratio of net expenses to average net assets | | | 1.23 | %(d) | | | 1.27 | % | | | 1.33 | % | | | 1.34 | % | | | 1.34 | % | | | 1.37 | % |
| | | | | | | |
| | Ratio of total expenses to average net assets | | | 1.50 | %(d) | | | 1.48 | % | | | 1.44 | % | | | 1.38 | % | | | 1.34 | % | | | 1.38 | % |
| | | | | | | |
| | Ratio of net investment income to average net assets | | | 2.81 | %(d) | | | 2.39 | % | | | 2.86 | % | | | 2.71 | % | | | 2.16 | % | | | 2.87 | % |
| | | | | | | |
| | Portfolio turnover rate(e) | | | 10 | % | | | 34 | % | | | 9 | % | | | 14 | % | | | 17 | % | | | 18 | % |
| | (a) | | Calculated based on the average shares outstanding methodology. |
| | (b) | | Amount is less than $0.005 per share. |
| | (c) | | Assumes investment at the net asset value at the beginning of the period, reinvestment of all distributions, a complete redemption of the investment at the net asset value at the end of the period and no sales or redemption charges (if any). Total returns would be reduced if a sales or redemption charge was taken into account. Returns do not reflect the impact of taxes to shareholders relating to Fund distributions or the redemption of Fund shares. Total returns for periods less than one full year are not annualized. |
| | (e) | | The Fund’s portfolio turnover rate is calculated in accordance with regulatory requirements, without regard to transactions involving short term investments and certain derivatives. If such transactions were included, the Fund’s portfolio turnover rate may be higher. |
| | |
| 40 | | The accompanying notes are an integral part of these financial statements. |
GOLDMAN SACHS INTERNATIONAL EQUITY DIVIDEND AND PREMIUM FUND
Financial Highlights (continued)
Selected Data for a Share Outstanding Throughout Each Period
| | | | | | | | | | | | | | | | | | | | | | | | | | |
| | | | | Goldman Sachs International Equity Dividend and Premium Fund | |
| | | | | Class C Shares | |
| | | | | Six Months Ended
June 30, 2021
(Unaudited) | | | Year Ended December 31, | |
| | | | | 2020 | | | 2019 | | | 2018 | | | 2017 | | | 2016 | |
| | Per Share Data | | | | | | | | | | | | | | | | | | | | | | | | |
| | | | | | | |
| | Net asset value, beginning of period | | $ | 6.90 | | | $ | 7.02 | | | $ | 6.32 | | | $ | 7.48 | | | $ | 6.21 | | | $ | 6.35 | |
| | | | | | | |
| | Net investment income(a) | | | 0.06 | | | | 0.10 | | | | 0.14 | | | | 0.16 | | | | 0.09 | | | | 0.12 | |
| | | | | | | |
| | Net realized and unrealized gain (loss) | | | 0.37 | | | | (0.11 | ) | | | 0.71 | | | | (1.20 | ) | | | 1.30 | | | | (0.14 | ) |
| | | | | | | |
| | Total from investment operations | | | 0.43 | | | | (0.01 | ) | | | 0.85 | | | | (1.04 | ) | | | 1.39 | | | | (0.02 | ) |
| | | | | | | |
| | Distributions to shareholders from net investment income | | | (0.06 | ) | | | (0.11 | ) | | | (0.15 | ) | | | (0.12 | ) | | | (0.12 | ) | | | (0.12 | ) |
| | | | | | | |
| | Distributions to shareholders from return of capital | | | — | | | | — | (b) | | | — | | | | — | | | | — | | | | — | |
| | | | | | | |
| | Total distributions | | | (0.06 | ) | | | (0.11 | ) | | | (0.15 | ) | | | (0.12 | ) | | | (0.12 | ) | | | (0.12 | ) |
| | | | | | | |
| | Net asset value, end of period | | $ | 7.27 | | | $ | 6.90 | | | $ | 7.02 | | | $ | 6.32 | | | $ | 7.48 | | | $ | 6.21 | |
| | | | | | | |
| | Total return(c) | | | 6.22 | % | | | 0.18 | % | | | 13.54 | % | | | (14.01 | )% | | | 22.50 | % | | | (0.21 | )% |
| | | | | | | |
| | Net assets, end of period (in 000s) | | $ | 386 | | | $ | 621 | | | $ | 815 | | | $ | 1,252 | | | $ | 4,276 | | | $ | 2,549 | |
| | | | | | | |
| | Ratio of net expenses to average net assets | | | 1.98 | %(d) | | | 2.02 | % | | | 2.08 | % | | | 2.09 | % | | | 2.09 | % | | | 2.12 | % |
| | | | | | | |
| | Ratio of total expenses to average net assets | | | 2.25 | %(d) | | | 2.23 | % | | | 2.19 | % | | | 2.11 | % | | | 2.09 | % | | | 2.13 | % |
| | | | | | | |
| | Ratio of net investment income to average net assets | | | 1.75 | %(d) | | | 1.63 | % | | | 2.11 | % | | | 2.24 | % | | | 1.29 | % | | | 2.00 | % |
| | | | | | | |
| | Portfolio turnover rate(e) | | | 10 | % | | | 34 | % | | | 9 | % | | | 14 | % | | | 17 | % | | | 18 | % |
| | (a) | | Calculated based on the average shares outstanding methodology. |
| | (b) | | Amount is less than $0.005 per share. |
| | (c) | | Assumes investment at the net asset value at the beginning of the period, reinvestment of all distributions, a complete redemption of the investment at the net asset value at the end of the period and no sales or redemption charges (if any). Total returns would be reduced if a sales or redemption charge was taken into account. Returns do not reflect the impact of taxes to shareholders relating to Fund distributions or the redemption of Fund shares. Total returns for periods less than one full year are not annualized. |
| | (e) | | The Fund’s portfolio turnover rate is calculated in accordance with regulatory requirements, without regard to transactions involving short term investments and certain derivatives. If such transactions were included, the Fund’s portfolio turnover rate may be higher. |
| | |
| The accompanying notes are an integral part of these financial statements. | | 41 |
GOLDMAN SACHS INTERNATIONAL EQUITY DIVIDEND AND PREMIUM FUND
Financial Highlights (continued)
Selected Data for a Share Outstanding Throughout Each Period
| | | | | | | | | | | | | | | | | | | | | | | | | | |
| | | | | Goldman Sachs International Equity Dividend and Premium Fund | |
| | | | | Institutional Shares | |
| | | | | Six Months Ended
June 30, 2021
(Unaudited) | | | Year Ended December 31, | |
| | | | | 2020 | | | 2019 | | | 2018 | | | 2017 | | | 2016 | |
| | Per Share Data | | | | | | | | | | | | | | | | | | | | | | | | |
| | | | | | | |
| | Net asset value, beginning of period | | $ | 7.01 | | | $ | 7.14 | | | $ | 6.42 | | | $ | 7.62 | | | $ | 6.32 | | | $ | 6.46 | |
| | | | | | | |
| | Net investment income(a) | | | 0.12 | | | | 0.16 | | | | 0.22 | | | | 0.31 | | | | 0.18 | | | | 0.19 | |
| | | | | | | |
| | Net realized and unrealized gain (loss) | | | 0.35 | | | | (0.10 | ) | | | 0.73 | | | | (1.29 | ) | | | 1.31 | | | | (0.14 | ) |
| | | | | | | |
| | Total from investment operations | | | 0.47 | | | | 0.06 | | | | 0.95 | | | | (0.98 | ) | | | 1.49 | | | | 0.05 | |
| | | | | | | |
| | Distributions to shareholders from net investment income | | | (0.10 | ) | | | (0.19 | ) | | | (0.23 | ) | | | (0.22 | ) | | | (0.19 | ) | | | (0.19 | ) |
| | | | | | | |
| | Distributions to shareholders from return of capital | | | — | | | | — | (b) | | | — | | | | — | | | | — | | | | — | |
| | | | | | | |
| | Total distributions | | | (0.10 | ) | | | (0.19 | ) | | | (0.23 | ) | | | (0.22 | ) | | | (0.19 | ) | | | (0.19 | ) |
| | | | | | | |
| | Net asset value, end of period | | $ | 7.38 | | | $ | 7.01 | | | $ | 7.14 | | | $ | 6.42 | | | $ | 7.62 | | | $ | 6.32 | |
| | | | | | | |
| | Total return(c) | | | 6.76 | % | | | 1.18 | % | | | 14.82 | % | | | (12.96 | )% | | | 23.85 | % | | | 0.92 | % |
| | | | | | | |
| | Net assets, end of period (in 000s) | | $ | 5,136 | | | $ | 4,897 | | | $ | 12,005 | | | $ | 15,696 | | | $ | 399,955 | | | $ | 307,311 | |
| | | | | | | |
| | Ratio of net expenses to average net assets | | | 0.89 | %(d) | | | 0.92 | % | | | 0.95 | % | | | 0.95 | % | | | 0.95 | % | | | 0.97 | % |
| | | | | | | |
| | Ratio of total expenses to average net assets | | | 1.13 | %(d) | | | 1.10 | % | | | 1.06 | % | | | 0.95 | % | | | 0.95 | % | | | 0.98 | % |
| | | | | | | |
| | Ratio of net investment income to average net assets | | | 3.15 | %(d) | | | 2.51 | % | | | 3.28 | % | | | 4.12 | % | | | 2.58 | % | | | 3.08 | % |
| | | | | | | |
| | Portfolio turnover rate(e) | | | 10 | % | | | 34 | % | | | 9 | % | | | 14 | % | | | 17 | % | | | 18 | % |
| | (a) | | Calculated based on the average shares outstanding methodology. |
| | (b) | | Amount is less than $0.005 per share. |
| | (c) | | Assumes investment at the net asset value at the beginning of the period, reinvestment of all distributions, a complete redemption of the investment at the net asset value at the end of the period and no sales or redemption charges (if any). Total returns would be reduced if a sales or redemption charge was taken into account. Returns do not reflect the impact of taxes to shareholders relating to Fund distributions or the redemption of Fund shares. Total returns for periods less than one full year are not annualized. |
| | (e) | | The Fund’s portfolio turnover rate is calculated in accordance with regulatory requirements, without regard to transactions involving short term investments and certain derivatives. If such transactions were included, the Fund’s portfolio turnover rate may be higher. |
| | |
| 42 | | The accompanying notes are an integral part of these financial statements. |
GOLDMAN SACHS INTERNATIONAL EQUITY DIVIDEND AND PREMIUM FUND
Financial Highlights (continued)
Selected Data for a Share Outstanding Throughout Each Period
| | | | | | | | | | | | | | | | | | | | | | | | | | |
| | | | | Goldman Sachs International Equity Dividend and Premium Fund | |
| | | | | Investor Shares(a) | |
| | | | | Six Months Ended
June 30, 2021
(Unaudited) | | | Year Ended December 31, | |
| | | | | 2020 | | | 2019 | | | 2018 | | | 2017 | | | 2016 | |
| | Per Share Data | | | | | | | | | | | | | | | | | | | | | | | | |
| | | | | | | |
| | Net asset value, beginning of period | | $ | 7.00 | | | $ | 7.12 | | | $ | 6.41 | | | $ | 7.60 | | | $ | 6.31 | | | $ | 6.44 | |
| | | | | | | |
| | Net investment income(b) | | | 0.11 | | | | 0.15 | | | | 0.21 | | | | 0.20 | | | | 0.17 | | | | 0.17 | |
| | | | | | | |
| | Net realized and unrealized gain (loss) | | | 0.36 | | | | (0.09 | ) | | | 0.72 | | | | (1.18 | ) | | | 1.30 | | | | (0.11 | ) |
| | | | | | | |
| | Total from investment operations | | | 0.47 | | | | 0.06 | | | | 0.93 | | | | (0.98 | ) | | | 1.47 | | | | 0.06 | |
| | | | | | | |
| | Distributions to shareholders from net investment income | | | (0.10 | ) | | | (0.18 | ) | | | (0.22 | ) | | | (0.21 | ) | | | (0.18 | ) | | | (0.19 | ) |
| | | | | | | |
| | Distributions to shareholders from return of capital | | | — | | | | — | (c) | | | — | | | | — | | | | — | | | | — | |
| | | | | | | |
| | Total distributions | | | (0.10 | ) | | | (0.18 | ) | | | (0.22 | ) | | | (0.21 | ) | | | (0.18 | ) | | | (0.19 | ) |
| | | | | | | |
| | Net asset value, end of period | | $ | 7.37 | | | $ | 7.00 | | | $ | 7.12 | | | $ | 6.41 | | | $ | 7.60 | | | $ | 6.31 | |
| | | | | | | |
| | Total return(d) | | | 6.73 | % | | | 1.20 | % | | | 14.71 | % | | | (13.10 | )% | | | 23.58 | % | | | 0.96 | % |
| | | | | | | |
| | Net assets, end of period (in 000s) | | $ | 5,104 | | | $ | 4,288 | | | $ | 8,915 | | | $ | 8,207 | | | $ | 6,048 | | | $ | 2,111 | |
| | | | | | | |
| | Ratio of net expenses to average net assets | | | 0.98 | %(e) | | | 1.03 | % | | | 1.08 | % | | | 1.09 | % | | | 1.09 | % | | | 1.12 | % |
| | | | | | | |
| | Ratio of total expenses to average net assets | | | 1.25 | %(e) | | | 1.23 | % | | | 1.19 | % | | | 1.14 | % | | | 1.09 | % | | | 1.13 | % |
| | | | | | | |
| | Ratio of net investment income to average net assets | | | 3.09 | %(e) | | | 2.39 | % | | | 3.14 | % | | | 2.76 | % | | | 2.36 | % | | | 2.64 | % |
| | | | | | | |
| | Portfolio turnover rate(f) | | | 10 | % | | | 34 | % | | | 9 | % | | | 14 | % | | | 17 | % | | | 18 | % |
| | (a) | | Effective August 15, 2017, Class IR changed its name to Investor Shares. |
| | (b) | | Calculated based on the average shares outstanding methodology. |
| | (c) | | Amount is less than $0.005 per share. |
| | (d) | | Assumes investment at the net asset value at the beginning of the period, reinvestment of all distributions, a complete redemption of the investment at the net asset value at the end of the period and no sales or redemption charges (if any). Total returns would be reduced if a sales or redemption charge was taken into account. Returns do not reflect the impact of taxes to shareholders relating to Fund distributions or the redemption of Fund shares. Total returns for periods less than one full year are not annualized. |
| | (f) | | The Fund’s portfolio turnover rate is calculated in accordance with regulatory requirements, without regard to transactions involving short term investments and certain derivatives. If such transactions were included, the Fund’s portfolio turnover rate may be higher. |
| | |
| The accompanying notes are an integral part of these financial statements. | | 43 |
GOLDMAN SACHS INTERNATIONAL EQUITY DIVIDEND AND PREMIUM FUND
Financial Highlights (continued)
Selected Data for a Share Outstanding Throughout Each Period
| | | | | | | | | | | | | | | | | | |
| | | | | Goldman Sachs International Equity Dividend and Premium Fund | |
| | | | | Class R6 Shares | |
| | | | | Six Months Ended
June 30, 2021
(Unaudited) | | | Year Ended December 31, | | | April 30, 2018* to
December 31, 2018 | |
| | | | | 2020 | | | 2019 | |
| | Per Share Data | | | | | | | | | | | | | | | | |
| | | | | |
| | Net asset value, beginning of period | | $ | 7.01 | | | $ | 7.13 | | | $ | 6.42 | | | $ | 7.60 | |
| | | | | |
| | Net investment income(a) | | | 0.11 | | | | 0.17 | | | | 0.22 | | | | 0.08 | |
| | | | | |
| | Net realized and unrealized gain (loss) | | | 0.36 | | | | (0.10 | ) | | | 0.72 | | | | (1.07 | ) |
| | | | | |
| | Total from investment operations | | | 0.47 | | | | 0.07 | | | | 0.94 | | | | (0.99 | ) |
| | | | | |
| | Distributions to shareholders from net investment income | | | (0.10 | ) | | | (0.19 | ) | | | (0.23 | ) | | | (0.19 | ) |
| | | | | |
| | Distributions to shareholders from return of capital | | | — | | | | — | (b) | | | — | | | | — | |
| | | | | |
| | Total distributions | | | (0.10 | ) | | | (0.19 | ) | | | (0.23 | ) | | | (0.19 | ) |
| | | | | |
| | Net asset value, end of period | | $ | 7.38 | | | $ | 7.01 | | | $ | 7.13 | | | $ | 6.42 | |
| | | | | |
| | Total return(c) | | | 6.76 | % | | | 1.34 | % | | | 14.85 | % | | | (13.25 | )% |
| | | | | |
| | Net assets, end of period (in 000s) | | $ | 92,394 | | | $ | 102,041 | | | $ | 136,241 | | | $ | 125,311 | |
| | | | | |
| | Ratio of net expenses to average net assets | | | 0.88 | %(d) | | | 0.90 | % | | | 0.94 | % | | | 0.93 | %(d) |
| | | | | |
| | Ratio of total expenses to average net assets | | | 1.12 | %(d) | | | 1.10 | % | | | 1.05 | % | | | 1.03 | %(d) |
| | | | | |
| | Ratio of net investment income to average net assets | | | 3.07 | %(d) | | | 2.70 | % | | | 3.23 | % | | | 1.81 | %(d) |
| | | | | |
| | Portfolio turnover rate(e) | | | 10 | % | | | 34 | % | | | 9 | % | | | 14 | % |
| | * | | Commencement of operations. |
| | (a) | | Calculated based on the average shares outstanding methodology. |
| | (b) | | Amount is less than $0.005 per share. |
| | (c) | | Assumes investment at the net asset value at the beginning of the period, reinvestment of all distributions, a complete redemption of the investment at the net asset value at the end of the period and no sales or redemption charges (if any). Total returns would be reduced if a sales or redemption charge was taken into account. Returns do not reflect the impact of taxes to shareholders relating to Fund distributions or the redemption of Fund shares. Total returns for periods less than one full year are not annualized. |
| | (e) | | The Fund’s portfolio turnover rate is calculated in accordance with regulatory requirements, without regard to transactions involving short term investments and certain derivatives. If such transactions were included, the Fund’s portfolio turnover rate may be higher. |
| | |
| 44 | | The accompanying notes are an integral part of these financial statements. |
GOLDMAN SACHS INTERNATIONAL EQUITY DIVIDEND AND PREMIUM FUND
Financial Highlights (continued)
Selected Data for a Share Outstanding Throughout Each Period
| | | | | | | | | | | | | | | | | | |
| | | | | Goldman Sachs International Equity Dividend and Premium Fund | |
| | | | | Class P Shares | |
| | | | | Six Months Ended
June 30, 2021
(Unaudited) | | | Year Ended December 31, | | | April 17, 2018* to December 31, 2018 | |
| | | | | 2020 | | | 2019 | |
| | Per Share Data | | | | | | | | | | | | | | | | |
| | | | | |
| | Net asset value, beginning of period | | $ | 7.02 | | | $ | 7.14 | | | $ | 6.43 | | | $ | 7.71 | |
| | | | | |
| | Net investment income(a) | | | 0.12 | | | | 0.17 | | | | 0.22 | | | | 0.09 | |
| | | | | |
| | Net realized and unrealized gain (loss) | | | 0.35 | | | | (0.10 | ) | | | 0.72 | | | | (1.18 | ) |
| | | | | |
| | Total from investment operations | | | 0.47 | | | | 0.07 | | | | 0.94 | | | | (1.09 | ) |
| | | | | |
| | Distributions to shareholders from net investment income | | | (0.10 | ) | | | (0.19 | ) | | | (0.23 | ) | | | (0.19 | ) |
| | | | | |
| | Distributions to shareholders from return of capital | | | — | | | | — | (b) | | | — | | | | — | |
| | | | | |
| | Total distributions | | | (0.10 | ) | | | (0.19 | ) | | | (0.23 | ) | | | (0.19 | ) |
| | | | | |
| | Net asset value, end of period | | $ | 7.39 | | | $ | 7.02 | | | $ | 7.14 | | | $ | 6.43 | |
| | | | | |
| | Total return(c) | | | 6.75 | % | | | 1.33 | % | | | 14.83 | % | | | (14.35 | )% |
| | | | | |
| | Net assets, end of period (in 000s) | | $ | 82,750 | | | $ | 86,949 | | | $ | 138,381 | | | $ | 162,129 | |
| | | | | |
| | Ratio of net expenses to average net assets | | | 0.88 | %(d) | | | 0.90 | % | | | 0.94 | % | | | 0.93 | %(d) |
| | | | | |
| | Ratio of total expenses to average net assets | | | 1.12 | %(d) | | | 1.10 | % | | | 1.05 | % | | | 1.03 | %(d) |
| | | | | |
| | Ratio of net investment income to average net assets | | | 3.12 | %(d) | | | 2.67 | % | | | 3.26 | % | | | 1.81 | %(d) |
| | | | | |
| | Portfolio turnover rate(e) | | | 10 | % | | | 34 | % | | | 9 | % | | | 14 | % |
| | * | | Commencement of operations. |
| | (a) | | Calculated based on the average shares outstanding methodology. |
| | (b) | | Amount is less than $0.005 per share. |
| | (c) | | Assumes investment at the net asset value at the beginning of the period, reinvestment of all distributions, a complete redemption of the investment at the net asset value at the end of the period and no sales or redemption charges (if any). Total returns would be reduced if a sales or redemption charge was taken into account. Returns do not reflect the impact of taxes to shareholders relating to Fund distributions or the redemption of Fund shares. Total returns for periods less than one full year are not annualized. |
| | (e) | | The Fund’s portfolio turnover rate is calculated in accordance with regulatory requirements, without regard to transactions involving short term investments and certain derivatives. If such transactions were included, the Fund’s portfolio turnover rate may be higher. |
| | |
| The accompanying notes are an integral part of these financial statements. | | 45 |
GOLDMAN SACHS U.S. TAX-MANAGED EQUITY FUND
Financial Highlights (continued)
Selected Data for a Share Outstanding Throughout Each Period
| | | | | | | | | | | | | | | | | | | | | | | | | | |
| | | | | Goldman Sachs U.S. Tax-Managed Equity Fund | |
| | | | | Class A Shares | |
| | | | | Six Months Ended
June 30, 2021
(Unaudited) | | | Year Ended December 31, | |
| | | | | 2020 | | | 2019 | | | 2018 | | | 2017 | | | 2016 | |
| | Per Share Data | | | | | | | | | | | | | | | | | | | | | | | | |
| | | | | | | |
| | Net asset value, beginning of period | | $ | 29.78 | | | $ | 25.54 | | | $ | 20.43 | | | $ | 22.37 | | | $ | 18.75 | | | $ | 17.28 | |
| | | | | | | |
| | Net investment income(a) | | | 0.01 | | | | 0.06 | | | | 0.11 | | | | 0.10 | | | | 0.13 | | | | 0.11 | |
| | | | | | | |
| | Net realized and unrealized gain (loss) | | | 4.98 | | | | 4.31 | | | | 5.09 | | | | (1.93 | ) | | | 3.60 | | | | 1.47 | |
| | | | | | | |
| | Total from investment operations | | | 4.99 | | | | 4.37 | | | | 5.20 | | | | (1.83 | ) | | | 3.73 | | | | 1.58 | |
| | | | | | | |
| | Distributions to shareholders from net investment income | | | — | | | | (0.09 | ) | | | (0.09 | ) | | | (0.11 | ) | | | (0.11 | ) | | | (0.11 | ) |
| | | | | | | |
| | Distributions to shareholders from return of capital | | | — | | | | (0.04 | ) | | | — | | | | — | | | | — | | | | — | |
| | | | | | | |
| | Total distributions | | | — | | | | (0.13 | ) | | | (0.09 | ) | | | (0.11 | ) | | | (0.11 | ) | | | (0.11 | ) |
| | | | | | | |
| | Net asset value, end of period | | $ | 34.77 | | | $ | 29.78 | | | $ | 25.54 | | | $ | 20.43 | | | $ | 22.37 | | | $ | 18.75 | |
| | | | | | | |
| | Total return(b) | | | 16.76 | % | | | 17.06 | % | | | 25.48 | % | | | (8.15 | )% | | | 19.88 | % | | | 9.09 | % |
| | | | | | | |
| | Net assets, end of period (in 000s) | | $ | 89,049 | | | $ | 75,584 | | | $ | 68,427 | | | $ | 57,833 | | | $ | 50,218 | | | $ | 51,206 | |
| | | | | | | |
| | Ratio of net expenses to average net assets | | | 1.06 | %(c) | | | 1.08 | % | | | 1.10 | % | | | 1.14 | % | | | 1.15 | % | | | 1.17 | % |
| | | | | | | |
| | Ratio of total expenses to average net assets | | | 1.10 | %(c) | | | 1.12 | % | | | 1.13 | % | | | 1.14 | % | | | 1.15 | % | | | 1.17 | % |
| | | | | | | |
| | Ratio of net investment income to average net assets | | | 0.07 | %(c) | | | 0.24 | % | | | 0.47 | % | | | 0.44 | % | | | 0.61 | % | | | 0.61 | % |
| | | | | | | |
| | Portfolio turnover rate(d) | | | 45 | % | | | 177 | % | | | 205 | % | | | 152 | % | | | 108 | % | | | 118 | % |
| | (a) | | Calculated based on the average shares outstanding methodology. |
| | (b) | | Assumes investment at the net asset value at the beginning of the period, reinvestment of all distributions, a complete redemption of the investment at the net asset value at the end of the period and no sales or redemption charges (if any). Total returns would be reduced if a sales or redemption charge was taken into account. Returns do not reflect the impact of taxes to shareholders relating to Fund distributions or the redemption of Fund shares. Total returns for periods less than one full year are not annualized. |
| | (d) | | The Fund’s portfolio turnover rate is calculated in accordance with regulatory requirements, without regard to transactions involving short term investments and certain derivatives. If such transactions were included, the Fund’s portfolio turnover rate may be higher. |
| | |
| 46 | | The accompanying notes are an integral part of these financial statements. |
GOLDMAN SACHS U.S. TAX-MANAGED EQUITY FUND
Financial Highlights (continued)
Selected Data for a Share Outstanding Throughout Each Period
| | | | | | | | | | | | | | | | | | | | | | | | | | |
| | | | | Goldman Sachs U.S. Tax-Managed Equity Fund | |
| | | | | Class C Shares | |
| | | | | Six Months Ended
June 30, 2021
(Unaudited) | | | Year Ended December 31, | |
| | | | | 2020 | | | 2019 | | | 2018 | | | 2017 | | | 2016 | |
| | Per Share Data | | | | | | | | | | | | | | | | | | | | | | | | |
| | | | | | | |
| | Net asset value, beginning of period | | $ | 28.04 | | | $ | 24.11 | | | $ | 19.36 | | | $ | 21.24 | | | $ | 17.86 | | | $ | 16.48 | |
| | | | | | | |
| | Net investment loss(a) | | | (0.10 | ) | | | (0.13 | ) | | | (0.06 | ) | | | (0.07 | ) | | | (0.03 | ) | | | (0.02 | ) |
| | | | | | | |
| | Net realized and unrealized gain (loss) | | | 4.67 | | | | 4.06 | | | | 4.81 | | | | (1.81 | ) | | | 3.41 | | | | 1.40 | |
| | | | | | | |
| | Total from investment operations | | | 4.57 | | | | 3.93 | | | | 4.75 | | | | (1.88 | ) | | | 3.38 | | | | 1.38 | |
| | | | | | | |
| | Net asset value, end of period | | $ | 32.61 | | | $ | 28.04 | | | $ | 24.11 | | | $ | 19.36 | | | $ | 21.24 | | | $ | 17.86 | |
| | | | | | | |
| | Total return(b) | | | 16.30 | % | | | 16.25 | % | | | 24.54 | % | | | (8.85 | )% | | | 18.93 | % | | | 8.35 | % |
| | | | | | | |
| | Net assets, end of period (in 000s) | | $ | 20,127 | | | $ | 19,502 | | | $ | 18,341 | | | $ | 14,380 | | | $ | 22,337 | | | $ | 22,512 | |
| | | | | | | |
| | Ratio of net expenses to average net assets | | | 1.81 | %(c) | | | 1.83 | % | | | 1.85 | % | | | 1.88 | % | | | 1.90 | % | | | 1.92 | % |
| | | | | | | |
| | Ratio of total expenses to average net assets | | | 1.85 | %(c) | | | 1.87 | % | | | 1.88 | % | | | 1.89 | % | | | 1.90 | % | | | 1.92 | % |
| | | | | | | |
| | Ratio of net investment loss to average net assets | | | (0.69 | )%(c) | | | (0.53 | )% | | | (0.28 | )% | | | (0.33 | )% | | | (0.14 | )% | | | (0.15 | )% |
| | | | | | | |
| | Portfolio turnover rate(d) | | | 45 | % | | | 177 | % | | | 205 | % | | | 152 | % | | | 108 | % | | | 118 | % |
| | (a) | | Calculated based on the average shares outstanding methodology. |
| | (b) | | Assumes investment at the net asset value at the beginning of the period, reinvestment of all distributions, a complete redemption of the investment at the net asset value at the end of the period and no sales or redemption charges (if any). Total returns would be reduced if a sales or redemption charge was taken into account. Returns do not reflect the impact of taxes to shareholders relating to Fund distributions or the redemption of Fund shares. Total returns for periods less than one full year are not annualized. |
| | (d) | | The Fund’s portfolio turnover rate is calculated in accordance with regulatory requirements, without regard to transactions involving short term investments and certain derivatives. If such transactions were included, the Fund’s portfolio turnover rate may be higher. |
| | |
| The accompanying notes are an integral part of these financial statements. | | 47 |
GOLDMAN SACHS U.S. TAX-MANAGED EQUITY FUND
Financial Highlights (continued)
Selected Data for a Share Outstanding Throughout Each Period
| | | | | | | | | | | | | | | | | | | | | | | | | | |
| | | | | Goldman Sachs U.S. Tax-Managed Equity Fund | |
| | | | | Institutional Shares | |
| | | | | Six Months Ended
June 30, 2021
(Unaudited) | | | Year Ended December 31, | |
| | | | | 2020 | | | 2019 | | | 2018 | | | 2017 | | | 2016 | |
| | Per Share Data | | | | | | | | | | | | | | | | | | | | | | | | |
| | | | | | | |
| | Net asset value, beginning of period | | $ | 30.53 | | | $ | 26.16 | | | $ | 20.91 | | | $ | 22.71 | | | $ | 19.04 | | | $ | 17.53 | |
| | | | | | | |
| | Net investment income(a) | | | 0.07 | | | | 0.15 | | | | 0.20 | | | | 0.19 | | | | 0.21 | | | | 0.18 | |
| | | | | | | |
| | Net realized and unrealized gain (loss) | | | 5.10 | | | | 4.43 | | | | 5.23 | | | | (1.97 | ) | | | 3.65 | | | | 1.51 | |
| | | | | | | |
| | Total from investment operations | | | 5.17 | | | | 4.58 | | | | 5.43 | | | | (1.78 | ) | | | 3.86 | | | | 1.69 | |
| | | | | | | |
| | Distributions to shareholders from net investment income | | | — | | | | (0.17 | ) | | | (0.18 | ) | | | (0.02 | ) | | | (0.19 | ) | | | (0.18 | ) |
| | | | | | | |
| | Distributions to shareholders from return of capital | | | — | | | | (0.04 | ) | | | — | | | | — | | | | — | | | | — | |
| | | | | | | |
| | Total distributions | | | — | | | | (0.21 | ) | | | (0.18 | ) | | | (0.02 | ) | | | (0.19 | ) | | | (0.18 | ) |
| | | | | | | |
| | Net asset value, end of period | | $ | 35.70 | | | $ | 30.53 | | | $ | 26.16 | | | $ | 20.91 | | | $ | 22.71 | | | $ | 19.04 | |
| | | | | | | |
| | Total return(b) | | | 16.93 | % | | | 17.48 | % | | | 25.90 | % | | | (7.78 | )% | | | 20.29 | % | | | 9.61 | % |
| | | | | | | |
| | Net assets, end of period (in 000s) | | $ | 57,351 | | | $ | 47,997 | | | $ | 45,718 | | | $ | 34,812 | | | $ | 1,395,335 | | | $ | 1,057,850 | |
| | | | | | | |
| | Ratio of net expenses to average net assets | | | 0.73 | %(c) | | | 0.74 | % | | | 0.74 | % | | | 0.74 | % | | | 0.75 | % | | | 0.77 | % |
| | | | | | | |
| | Ratio of total expenses to average net assets | | | 0.73 | %(c) | | | 0.75 | % | | | 0.75 | % | | | 0.74 | % | | | 0.75 | % | | | 0.77 | % |
| | | | | | | |
| | Ratio of net investment income to average net assets | | | 0.40 | %(c) | | | 0.56 | % | | | 0.83 | % | | | 0.79 | % | | | 1.02 | % | | | 1.01 | % |
| | | | | | | |
| | Portfolio turnover rate(d) | | | 45 | % | | | 177 | % | | | 205 | % | | | 152 | % | | | 108 | % | | | 118 | % |
| | (a) | | Calculated based on the average shares outstanding methodology. |
| | (b) | | Assumes investment at the net asset value at the beginning of the period, reinvestment of all distributions, a complete redemption of the investment at the net asset value at the end of the period and no sales or redemption charges (if any). Total returns would be reduced if a sales or redemption charge was taken into account. Returns do not reflect the impact of taxes to shareholders relating to Fund distributions or the redemption of Fund shares. Total returns for periods less than one full year are not annualized. |
| | (d) | | The Fund’s portfolio turnover rate is calculated in accordance with regulatory requirements, without regard to transactions involving short term investments and certain derivatives. If such transactions were included, the Fund’s portfolio turnover rate may be higher. |
| | |
| 48 | | The accompanying notes are an integral part of these financial statements. |
GOLDMAN SACHS U.S. TAX-MANAGED EQUITY FUND
Financial Highlights (continued)
Selected Data for a Share Outstanding Throughout Each Period
| | | | | | | | | | | | | | | | | | | | | | | | | | |
| | | | | Goldman Sachs U.S. Tax-Managed Equity Fund | |
| | | | | Service Shares | |
| | | | | Six Months Ended
June 30, 2021
(Unaudited) | | | Year Ended December 31, | |
| | | | | 2020 | | | 2019 | | | 2018 | | | 2017 | | | 2016 | |
| | Per Share Data | | | | | | | | | | | | | | | | | | | | | | | | |
| | | | | | | |
| | Net asset value, beginning of period | | $ | 29.96 | | | $ | 25.70 | | | $ | 20.57 | | | $ | 22.51 | | | $ | 18.88 | | | $ | 17.33 | |
| | | | | | | |
| | Net investment income (loss)(a) | | | (0.02 | ) | | | 0.02 | | | | 0.08 | | | | 0.08 | | | | 0.11 | | | | 0.09 | |
| | | | | | | |
| | Net realized and unrealized gain (loss) | | | 5.01 | | | | 4.33 | | | | 5.13 | | | | (1.94 | ) | | | 3.61 | | | | 1.49 | |
| | | | | | | |
| | Total from investment operations | | | 4.99 | | | | 4.35 | | | | 5.21 | | | | (1.86 | ) | | | 3.72 | | | | 1.58 | |
| | | | | | | |
| | Distributions to shareholders from net investment income | | | — | | | | (0.05 | ) | | | (0.08 | ) | | | (0.08 | ) | | | (0.09 | ) | | | (0.03 | ) |
| | | | | | | |
| | Distributions to shareholders from return of capital | | | — | | | | (0.04 | ) | | | — | | | | — | | | | — | | | | — | |
| | | | | | | |
| | Total distributions | | | — | | | | (0.09 | ) | | | (0.08 | ) | | | (0.08 | ) | | | (0.09 | ) | | | (0.03 | ) |
| | | | | | | |
| | Net asset value, end of period | | $ | 34.95 | | | $ | 29.96 | | | $ | 25.70 | | | $ | 20.57 | | | $ | 22.51 | | | $ | 18.88 | |
| | | | | | | |
| | Total return(b) | | | 16.66 | % | | | 16.87 | % | | | 25.31 | % | | | (8.26 | )% | | | 19.71 | % | | | 9.07 | % |
| | | | | | | |
| | Net assets, end of period (in 000s) | | $ | 2,221 | | | $ | 1,932 | | | $ | 1,649 | | | $ | 732 | | | $ | 736 | | | $ | 614 | |
| | | | | | | |
| | Ratio of net expenses to average net assets | | | 1.23 | %(c) | | | 1.24 | % | | | 1.24 | % | | | 1.25 | % | | | 1.25 | % | | | 1.27 | % |
| | | | | | | |
| | Ratio of total expenses to average net assets | | | 1.23 | %(c) | | | 1.25 | % | | | 1.25 | % | | | 1.25 | % | | | 1.25 | % | | | 1.27 | % |
| | | | | | | |
| | Ratio of net investment income (loss) to average net assets | | | (0.11 | )%(c) | | | 0.08 | % | | | 0.33 | % | | | 0.33 | % | | | 0.52 | % | | | 0.53 | % |
| | | | | | | |
| | Portfolio turnover rate(d) | | | 45 | % | | | 177 | % | | | 205 | % | | | 152 | % | | | 108 | % | | | 118 | % |
| | (a) | | Calculated based on the average shares outstanding methodology. |
| | (b) | | Assumes investment at the net asset value at the beginning of the period, reinvestment of all distributions, a complete redemption of the investment at the net asset value at the end of the period and no sales or redemption charges (if any). Total returns would be reduced if a sales or redemption charge was taken into account. Returns do not reflect the impact of taxes to shareholders relating to Fund distributions or the redemption of Fund shares. Total returns for periods less than one full year are not annualized. |
| | (d) | | The Fund’s portfolio turnover rate is calculated in accordance with regulatory requirements, without regard to transactions involving short term investments and certain derivatives. If such transactions were included, the Fund’s portfolio turnover rate may be higher. |
| | |
| The accompanying notes are an integral part of these financial statements. | | 49 |
GOLDMAN SACHS U.S. TAX-MANAGED EQUITY FUND
Financial Highlights (continued)
Selected Data for a Share Outstanding Throughout Each Period
| | | | | | | | | | | | | | | | | | | | | | | | | | |
| | | | | Goldman Sachs U.S. Tax-Managed Equity Fund | |
| | | | | Investor Shares(a) | |
| | | | | Six Months Ended
June 30, 2021
(Unaudited) | | | Year Ended December 31, | |
| | | | | 2020 | | | 2019 | | | 2018 | | | 2017 | | | 2016 | |
| | Per Share Data | | | | | | | | | | | | | | | | | | | | | | | | |
| | | | | | | |
| | Net asset value, beginning of period | | $ | 30.26 | | | $ | 25.93 | | | $ | 20.73 | | | $ | 22.70 | | | $ | 19.03 | | | $ | 17.54 | |
| | | | | | | |
| | Net investment income(b) | | | 0.05 | | | | 0.12 | | | | 0.17 | | | | 0.16 | | | | 0.18 | | | | 0.15 | |
| | | | | | | |
| | Net realized and unrealized gain (loss) | | | 5.06 | | | | 4.40 | | | | 5.18 | | | | (1.97 | ) | | | 3.65 | | | | 1.50 | |
| | | | | | | |
| | Total from investment operations | | | 5.11 | | | | 4.52 | | | | 5.35 | | | | (1.81 | ) | | | 3.83 | | | | 1.65 | |
| | | | | | | |
| | Distributions to shareholders from net investment income | | | — | | | | (0.15 | ) | | | (0.15 | ) | | | (0.16 | ) | | | (0.16 | ) | | | (0.16 | ) |
| | | | | | | |
| | Distributions to shareholders from return of capital | | | — | | | | (0.04 | ) | | | — | | | | — | | | | — | | | | — | |
| | | | | | | |
| | Total distributions | | | — | | | | (0.19 | ) | | | (0.15 | ) | | | (0.16 | ) | | | (0.16 | ) | | | (0.16 | ) |
| | | | | | | |
| | Net asset value, end of period | | $ | 35.37 | | | $ | 30.26 | | | $ | 25.93 | | | $ | 20.73 | | | $ | 22.70 | | | $ | 19.03 | |
| | | | | | | |
| | Total return(c) | | | 16.89 | % | | | 17.38 | % | | | 25.82 | % | | | (7.95 | )% | | | 20.14 | % | | | 9.40 | % |
| | | | | | | |
| | Net assets, end of period (in 000s) | | $ | 18,807 | | | $ | 15,938 | | | $ | 21,591 | | | $ | 17,894 | | | $ | 17,251 | | | $ | 14,262 | |
| | | | | | | |
| | Ratio of net expenses to average net assets | | | 0.81 | %(d) | | | 0.83 | % | | | 0.85 | % | | | 0.89 | % | | | 0.90 | % | | | 0.92 | % |
| | | | | | | |
| | Ratio of total expenses to average net assets | | | 0.85 | %(d) | | | 0.87 | % | | | 0.88 | % | | | 0.89 | % | | | 0.90 | % | | | 0.93 | % |
| | | | | | | |
| | Ratio of net investment income to average net assets | | | 0.32 | %(d) | | | 0.46 | % | | | 0.72 | % | | | 0.68 | % | | | 0.88 | % | | | 0.84 | % |
| | | | | | | |
| | Portfolio turnover rate(e) | | | 45 | % | | | 177 | % | | | 205 | % | | | 152 | % | | | 108 | % | | | 118 | % |
| | (a) | | Effective August 15, 2017, Class IR changed its name to Investor Shares. |
| | (b) | | Calculated based on the average shares outstanding methodology. |
| | (c) | | Assumes investment at the net asset value at the beginning of the period, reinvestment of all distributions, a complete redemption of the investment at the net asset value at the end of the period and no sales or redemption charges (if any). Total returns would be reduced if a sales or redemption charge was taken into account. Returns do not reflect the impact of taxes to shareholders relating to Fund distributions or the redemption of Fund shares. Total returns for periods less than one full year are not annualized. |
| | (e) | | The Fund’s portfolio turnover rate is calculated in accordance with regulatory requirements, without regard to transactions involving short term investments and certain derivatives. If such transactions were included, the Fund’s portfolio turnover rate may be higher. |
| | |
| 50 | | The accompanying notes are an integral part of these financial statements. |
GOLDMAN SACHS U.S. TAX-MANAGED EQUITY FUND
Financial Highlights (continued)
Selected Data for a Share Outstanding Throughout Each Period
| | | | | | | | | | | | | | | | | | |
| | | | | Goldman Sachs U.S. Tax-Managed Equity Fund | |
| | | | | Class R6 Shares | |
| | | | | Six Months Ended
June 30, 2021
(Unaudited) | | | Year Ended December 31, | | | April 30, 2018* to December 31, 2018 | |
| | | | | 2020 | | | 2019 | |
| | Per Share Data | | | | | | | | | | | | | | | | |
| | | | | |
| | Net asset value, beginning of period | | $ | 30.26 | | | $ | 25.93 | | | $ | 20.73 | | | $ | 22.93 | |
| | | | | |
| | Net investment income(a) | | | 0.07 | | | | 0.15 | | | | 0.20 | | | | 0.13 | |
| | | | | |
| | Net realized and unrealized gain (loss) | | | 5.06 | | | | 4.40 | | | | 5.18 | | | | (2.14 | ) |
| | | | | |
| | Total from investment operations | | | 5.13 | | | | 4.55 | | | | 5.38 | | | | (2.01 | ) |
| | | | | |
| | Distributions to shareholders from net investment income | | | — | | | | (0.18 | ) | | | (0.18 | ) | | | (0.19 | ) |
| | | | | |
| | Distributions to shareholders from return of capital | | | — | | | | (0.04 | ) | | | — | | | | — | |
| | | | | |
| | Total distributions | | | — | | | | (0.22 | ) | | | (0.18 | ) | | | (0.19 | ) |
| | | | | |
| | Net asset value, end of period | | $ | 35.39 | | | $ | 30.26 | | | $ | 25.93 | | | $ | 20.73 | |
| | | | | |
| | Total return(b) | | | 16.95 | % | | | 17.49 | % | | | 25.96 | % | | | (8.72 | )% |
| | | | | |
| | Net assets, end of period (in 000s) | | $ | 1,944,411 | | | $ | 1,536,722 | | | $ | 1,575,990 | | | $ | 1,263,556 | |
| | | | | |
| | Ratio of net expenses to average net assets | | | 0.72 | %(c) | | | 0.73 | % | | | 0.73 | % | | | 0.74 | %(c) |
| | | | | |
| | Ratio of total expenses to average net assets | | | 0.72 | %(c) | | | 0.74 | % | | | 0.74 | % | | | 0.74 | %(c) |
| | | | | |
| | Ratio of net investment income to average net assets | | | 0.41 | %(c) | | | 0.57 | % | | | 0.84 | % | | | 0.85 | %(c) |
| | | | | |
| | Portfolio turnover rate(d) | | | 45 | % | | | 177 | % | | | 205 | % | | | 152 | % |
| | * | | Commencement of operations. |
| | (a) | | Calculated based on the average shares outstanding methodology. |
| | (b) | | Assumes investment at the net asset value at the beginning of the period, reinvestment of all distributions, a complete redemption of the investment at the net asset value at the end of the period and no sales or redemption charges (if any). Total returns would be reduced if a sales or redemption charge was taken into account. Returns do not reflect the impact of taxes to shareholders relating to Fund distributions or the redemption of Fund shares. Total returns for periods less than one full year are not annualized. |
| | (d) | | The Fund’s portfolio turnover rate is calculated in accordance with regulatory requirements, without regard to transactions involving short term investments and certain derivatives. If such transactions were included, the Fund’s portfolio turnover rate may be higher. |
| | |
| The accompanying notes are an integral part of these financial statements. | | 51 |
GOLDMAN SACHS U.S. TAX-MANAGED EQUITY FUND
Financial Highlights (continued)
Selected Data for a Share Outstanding Throughout Each Period
| | | | | | | | | | | | | | | | | | |
| | | | | Goldman Sachs U.S. Tax-Managed Equity Fund | |
| | | | | Class P Shares | |
| | | | | Six Months Ended
June 30, 2021
(Unaudited) | | | Year Ended December 31, | | | April 17, 2018* to December 31, 2018 | |
| | | | | 2020 | | | 2019 | |
| | Per Share Data | | | | | | | | | | | | | | | | |
| | | | | |
| | Net asset value, beginning of period | | $ | 30.27 | | | $ | 25.94 | | | $ | 20.74 | | | $ | 23.43 | |
| | | | | |
| | Net investment income(a) | | | 0.07 | | | | 0.15 | | | | 0.20 | | | | 0.16 | |
| | | | | |
| | Net realized and unrealized gain (loss) | | | 5.06 | | | | 4.40 | | | | 5.18 | | | | (2.66 | ) |
| | | | | |
| | Total from investment operations | | | 5.13 | | | | 4.55 | | | | 5.38 | | | | (2.50 | ) |
| | | | | |
| | Distributions to shareholders from net investment income | | | — | | | | (0.18 | ) | | | (0.18 | ) | | | (0.19 | ) |
| | | | | |
| | Distributions to shareholders from return of capital | | | — | | | | (0.04 | ) | | | — | | | | — | |
| | | | | |
| | Total distributions | | | — | | | | (0.22 | ) | | | (0.18 | ) | | | (0.19 | ) |
| | | | | |
| | Net asset value, end of period | | $ | 35.40 | | | $ | 30.27 | | | $ | 25.94 | | | $ | 20.74 | |
| | | | | |
| | Total return(b) | | | 16.95 | % | | | 17.48 | % | | | 25.94 | % | | | (10.62 | )% |
| | | | | |
| | Net assets, end of period (in 000s) | | $ | 191,215 | | | $ | 152,775 | | | $ | 138,399 | | | $ | 97,892 | |
| | | | | |
| | Ratio of net expenses to average net assets | | | 0.72 | %(c) | | | 0.73 | % | | | 0.73 | % | | | 0.74 | %(c) |
| | | | | |
| | Ratio of total expenses to average net assets | | | 0.72 | %(c) | | | 0.74 | % | | | 0.74 | % | | | 0.75 | %(c) |
| | | | | |
| | Ratio of net investment income to average net assets | | | 0.41 | %(c) | | | 0.59 | % | | | 0.83 | % | | | 0.95 | %(c) |
| | | | | |
| | Portfolio turnover rate(d) | | | 45 | % | | | 177 | % | | | 205 | % | | | 152 | % |
| | * | | Commencement of operations. |
| | (a) | | Calculated based on the average shares outstanding methodology. |
| | (b) | | Assumes investment at the net asset value at the beginning of the period, reinvestment of all distributions, a complete redemption of the investment at the net asset value at the end of the period and no sales or redemption charges (if any). Total returns would be reduced if a sales or redemption charge was taken into account. Returns do not reflect the impact of taxes to shareholders relating to Fund distributions or the redemption of Fund shares. Total returns for periods less than one full year are not annualized. |
| | (d) | | The Fund’s portfolio turnover rate is calculated in accordance with regulatory requirements, without regard to transactions involving short term investments and certain derivatives. If such transactions were included, the Fund’s portfolio turnover rate may be higher. |
| | |
| 52 | | The accompanying notes are an integral part of these financial statements. |
GOLDMAN SACHS INTERNATIONAL TAX-MANAGED EQUITY FUND
Financial Highlights (continued)
Selected Data for a Share Outstanding Throughout Each Period
| | | | | | | | | | | | | | | | | | | | | | | | | | |
| | | | | Goldman Sachs International Tax-Managed Equity Fund | |
| | | | | Class A Shares | |
| | | | | Six Months Ended
June 30, 2021
(Unaudited) | | | Year Ended December 31, | |
| | | | | 2020 | | | 2019 | | | 2018 | | | 2017 | | | 2016 | |
| | Per Share Data | | | | | | | | | | | | | | | | | | | | | | | | |
| | | | | | | |
| | Net asset value, beginning of period | | $ | 11.32 | | | $ | 10.43 | | | $ | 8.93 | | | $ | 10.93 | | | $ | 8.62 | | | $ | 8.67 | |
| | | | | | | |
| | Net investment income(a) | | | 0.14 | | | | 0.10 | | | | 0.18 | | | | 0.18 | | | | 0.11 | | | | 0.12 | |
| | | | | | | |
| | Net realized and unrealized gain (loss) | | | 0.81 | | | | 0.92 | | | | 1.49 | | | | (2.03 | ) | | | 2.38 | | | | (0.04 | ) |
| | | | | | | |
| | Total from investment operations | | | 0.95 | | | | 1.02 | | | | 1.67 | | | | (1.85 | ) | | | 2.49 | | | | 0.08 | |
| | | | | | | |
| | Distributions to shareholders from net investment income | | | — | | | | (0.13 | ) | | | (0.17 | ) | | | (0.15 | ) | | | (0.18 | ) | | | (0.13 | ) |
| | | | | | | |
| | Net asset value, end of period | | $ | 12.27 | | | $ | 11.32 | | | $ | 10.43 | | | $ | 8.93 | | | $ | 10.93 | | | $ | 8.62 | |
| | | | | | | |
| | Total return(b) | | | 8.39 | % | | | 9.75 | % | | | 18.66 | % | | | (16.86 | )% | | | 28.85 | % | | | 0.93 | % |
| | | | | | | |
| | Net assets, end of period (in 000s) | | $ | 7,197 | | | $ | 6,662 | | | $ | 8,419 | | | $ | 8,145 | | | $ | 9,429 | | | $ | 5,082 | |
| | | | | | | |
| | Ratio of net expenses to average net assets | | | 1.22 | %(c) | | | 1.23 | % | | | 1.25 | % | | | 1.29 | % | | | 1.31 | % | | | 1.38 | % |
| | | | | | | |
| | Ratio of total expenses to average net assets | | | 1.34 | %(c) | | | 1.36 | % | | | 1.37 | % | | | 1.37 | % | | | 1.36 | % | | | 1.39 | % |
| | | | | | | |
| | Ratio of net investment income to average net assets | | | 2.37 | %(c) | | | 1.07 | % | | | 1.81 | % | | | 1.69 | % | | | 1.04 | % | | | 1.37 | % |
| | | | | | | |
| | Portfolio turnover rate(d) | | | 67 | % | | | 177 | % | | | 231 | % | | | 177 | % | | | 134 | % | | | 125 | % |
| | (a) | | Calculated based on the average shares outstanding methodology. |
| | (b) | | Assumes investment at the net asset value at the beginning of the period, reinvestment of all distributions, a complete redemption of the investment at the net asset value at the end of the period and no sales or redemption charges (if any). Total returns would be reduced if a sales or redemption charge was taken into account. Returns do not reflect the impact of taxes to shareholders relating to Fund distributions or the redemption of Fund shares. Total returns for periods less than one full year are not annualized. |
| | (d) | | The Fund’s portfolio turnover rate is calculated in accordance with regulatory requirements, without regard to transactions involving short term investments and certain derivatives. If such transactions were included, the Fund’s portfolio turnover rate may be higher. |
| | |
| The accompanying notes are an integral part of these financial statements. | | 53 |
GOLDMAN SACHS INTERNATIONAL TAX-MANAGED EQUITY FUND
Financial Highlights (continued)
Selected Data for a Share Outstanding Throughout Each Period
| | | | | | | | | | | | | | | | | | | | | | | | | | |
| | | | | Goldman Sachs International Tax-Managed Equity Fund | |
| | | | | Class C Shares | |
| | | | | Six Months Ended
June 30, 2021
(Unaudited) | | | Year Ended December 31, | |
| | | | | 2020 | | | 2019 | | | 2018 | | | 2017 | | | 2016 | |
| | Per Share Data | | | | | | | | | | | | | | | | | | | | | | | | |
| | | | | | | |
| | Net asset value, beginning of period | | $ | 11.04 | | | $ | 10.18 | | | $ | 8.68 | | | $ | 10.59 | | | $ | 8.39 | | | $ | 8.45 | |
| | | | | | | |
| | Net investment income(a) | | | 0.09 | | | | 0.03 | | | | 0.12 | | | | 0.10 | | | | 0.04 | | | | 0.06 | |
| | | | | | | |
| | Net realized and unrealized gain (loss) | | | 0.80 | | | | 0.88 | | | | 1.42 | | | | (1.94 | ) | | | 2.30 | | | | (0.05 | ) |
| | | | | | | |
| | Total from investment operations | | | 0.89 | | | | 0.91 | | | | 1.54 | | | | (1.84 | ) | | | 2.34 | | | | 0.01 | |
| | | | | | | |
| | Distributions to shareholders from net investment income | | | — | | | | (0.05 | ) | | | (0.04 | ) | | | (0.07 | ) | | | (0.14 | ) | | | (0.07 | ) |
| | | | | | | |
| | Net asset value, end of period | | $ | 11.93 | | | $ | 11.04 | | | $ | 10.18 | | | $ | 8.68 | | | $ | 10.59 | | | $ | 8.39 | |
| | | | | | | |
| | Total return(b) | | | 8.06 | % | | | 8.89 | % | | | 17.74 | % | | | (17.39 | )% | | | 27.85 | % | | | 0.11 | % |
| | | | | | | |
| | Net assets, end of period (in 000s) | | $ | 993 | | | $ | 1,060 | | | $ | 1,308 | | | $ | 2,551 | | | $ | 2,661 | | | $ | 1,012 | |
| | | | | | | |
| | Ratio of net expenses to average net assets | | | 1.97 | %(c) | | | 1.98 | % | | | 2.01 | % | | | 2.04 | % | | | 2.06 | % | | | 2.13 | % |
| | | | | | | |
| | Ratio of total expenses to average net assets | | | 2.09 | %(c) | | | 2.11 | % | | | 2.12 | % | | | 2.12 | % | | | 2.11 | % | | | 2.14 | % |
| | | | | | | |
| | Ratio of net investment income to average net assets | | | 1.61 | %(c) | | | 0.33 | % | | | 1.25 | % | | | 1.01 | % | | | 0.40 | % | | | 0.67 | % |
| | | | | | | |
| | Portfolio turnover rate(d) | | | 67 | % | | | 177 | % | | | 231 | % | | | 177 | % | | | 134 | % | | | 125 | % |
| | (a) | | Calculated based on the average shares outstanding methodology. |
| | (b) | | Assumes investment at the net asset value at the beginning of the period, reinvestment of all distributions, a complete redemption of the investment at the net asset value at the end of the period and no sales or redemption charges (if any). Total returns would be reduced if a sales or redemption charge was taken into account. Returns do not reflect the impact of taxes to shareholders relating to Fund distributions or the redemption of Fund shares. Total returns for periods less than one full year are not annualized. |
| | (d) | | The Fund’s portfolio turnover rate is calculated in accordance with regulatory requirements, without regard to transactions involving short term investments and certain derivatives. If such transactions were included, the Fund’s portfolio turnover rate may be higher. |
| | |
| 54 | | The accompanying notes are an integral part of these financial statements. |
GOLDMAN SACHS INTERNATIONAL TAX-MANAGED EQUITY FUND
Financial Highlights (continued)
Selected Data for a Share Outstanding Throughout Each Period
| | | | | | | | | | | | | | | | | | | | | | | | | | |
| | | | | Goldman Sachs International Tax-Managed Equity Fund | |
| | | | | Institutional Shares | |
| | | | | Six Months Ended
June 30, 2021
(Unaudited) | | | Year Ended December 31, | |
| | | | | 2020 | | | 2019 | | | 2018 | | | 2017 | | | 2016 | |
| | Per Share Data | | | | | | | | | | | | | | | | | | | | | | | | |
| | | | | | | |
| | Net asset value, beginning of period | | $ | 11.29 | | | $ | 10.40 | | | $ | 8.91 | | | $ | 10.85 | | | $ | 8.54 | | | $ | 8.59 | |
| | | | | | | |
| | Net investment income(a) | | | 0.16 | | | | 0.13 | | | | 0.21 | | | | 0.31 | | | | 0.17 | | | | 0.16 | |
| | | | | | | |
| | Net realized and unrealized gain (loss) | | | 0.81 | | | | 0.92 | | | | 1.48 | | | | (2.10 | ) | | | 2.34 | | | | (0.05 | ) |
| | | | | | | |
| | Total from investment operations | | | 0.97 | | | | 1.05 | | | | 1.69 | | | | (1.79 | ) | | | 2.51 | | | | 0.11 | |
| | | | | | | |
| | Distributions to shareholders from net investment income | | | — | | | | (0.16 | ) | | | (0.20 | ) | | | (0.15 | ) | | | (0.20 | ) | | | (0.16 | ) |
| | | | | | | |
| | Net asset value, end of period | | $ | 12.26 | | | $ | 11.29 | | | $ | 10.40 | | | $ | 8.91 | | | $ | 10.85 | | | $ | 8.54 | |
| | | | | | | |
| | Total return(b) | | | 8.59 | % | | | 10.11 | % | | | 19.01 | % | | | (16.49 | )% | | | 29.42 | % | | | 1.26 | % |
| | | | | | | |
| | Net assets, end of period (in 000s) | | $ | 10,901 | | | $ | 9,998 | | | $ | 15,783 | | | $ | 16,948 | | | $ | 619,288 | | | $ | 519,135 | |
| | | | | | | |
| | Ratio of net expenses to average net assets | | | 0.90 | %(c) | | | 0.90 | % | | | 0.90 | % | | | 0.90 | % | | | 0.92 | % | | | 0.98 | % |
| | | | | | | |
| | Ratio of total expenses to average net assets | | | 0.97 | %(c) | | | 0.99 | % | | | 0.99 | % | | | 0.96 | % | | | 0.97 | % | | | 0.99 | % |
| | | | | | | |
| | Ratio of net investment income to average net assets | | | 2.69 | %(c) | | | 1.36 | % | | | 2.11 | % | | | 2.87 | % | | | 1.74 | % | | | 1.90 | % |
| | | | | | | |
| | Portfolio turnover rate(d) | | | 67 | % | | | 177 | % | | | 231 | % | | | 177 | % | | | 134 | % | | | 125 | % |
| | (a) | | Calculated based on the average shares outstanding methodology. |
| | (b) | | Assumes investment at the net asset value at the beginning of the period, reinvestment of all distributions, a complete redemption of the investment at the net asset value at the end of the period and no sales or redemption charges (if any). Total returns would be reduced if a sales or redemption charge was taken into account. Returns do not reflect the impact of taxes to shareholders relating to Fund distributions or the redemption of Fund shares. Total returns for periods less than one full year are not annualized. |
| | (d) | | The Fund’s portfolio turnover rate is calculated in accordance with regulatory requirements, without regard to transactions involving short term investments and certain derivatives. If such transactions were included, the Fund’s portfolio turnover rate may be higher. |
| | |
| The accompanying notes are an integral part of these financial statements. | | 55 |
GOLDMAN SACHS INTERNATIONAL TAX-MANAGED EQUITY FUND
Financial Highlights (continued)
Selected Data for a Share Outstanding Throughout Each Period
| | | | | | | | | | | | | | | | | | | | | | | | | | |
| | | | | Goldman Sachs International Tax-Managed Equity Fund | |
| | | | | Investor Shares(a) | |
| | | | | Six Months Ended
June 30, 2021
(Unaudited) | | | Year Ended December 31, | |
| | | | | 2020 | | | 2019 | | | 2018 | | | 2017 | | | 2016 | |
| | Per Share Data | | | | | | | | | | | | | | | | | | | | | | | | |
| | | | | | | |
| | Net asset value, beginning of period | | $ | 11.30 | | | $ | 10.40 | | | $ | 8.91 | | | $ | 10.91 | | | $ | 8.61 | | | $ | 8.65 | |
| | | | | | | |
| | Net investment income(b) | | | 0.15 | | | | 0.13 | | | | 0.20 | | | | 0.19 | | | | 0.13 | | | | 0.15 | |
| | | | | | | |
| | Net realized and unrealized gain (loss) | | | 0.81 | | | | 0.92 | | | | 1.48 | | | | (2.00 | ) | | | 2.36 | | | | (0.05 | ) |
| | | | | | | |
| | Total from investment operations | | | 0.96 | | | | 1.05 | | | | 1.68 | | | | (1.81 | ) | | | 2.49 | | | | 0.10 | |
| | | | | | | |
| | Distributions to shareholders from net investment income | | | — | | | | (0.15 | ) | | | (0.19 | ) | | | (0.19 | ) | | | (0.19 | ) | | | (0.14 | ) |
| | | | | | | |
| | Net asset value, end of period | | $ | 12.26 | | | $ | 11.30 | | | $ | 10.40 | | | $ | 8.91 | | | $ | 10.91 | | | $ | 8.61 | |
| | | | | | | |
| | Total return(c) | | | 8.50 | % | | | 10.09 | % | | | 18.90 | % | | | (16.66 | )% | | | 29.09 | % | | | 1.21 | % |
| | | | | | | |
| | Net assets, end of period (in 000s) | | $ | 9,007 | | | $ | 9,085 | | | $ | 18,290 | | | $ | 14,008 | | | $ | 15,547 | | | $ | 1,251 | |
| | | | | | | |
| | Ratio of net expenses to average net assets | | | 0.97 | %(d) | | | 0.98 | % | | | 1.00 | % | | | 1.04 | % | | | 1.05 | % | | | 1.13 | % |
| | | | | | | |
| | Ratio of total expenses to average net assets | | | 1.09 | %(d) | | | 1.11 | % | | | 1.12 | % | | | 1.12 | % | | | 1.11 | % | | | 1.14 | % |
| | | | | | | |
| | Ratio of net investment income to average net assets | | | 2.58 | %(d) | | | 1.38 | % | | | 2.06 | % | | | 1.82 | % | | | 1.30 | % | | | 1.76 | % |
| | | | | | | |
| | Portfolio turnover rate(e) | | | 67 | % | | | 177 | % | | | 231 | % | | | 177 | % | | | 134 | % | | | 125 | % |
| | (a) | | Effective August 15, 2017, Class IR changed its name to Investor Shares. |
| | (b) | | Calculated based on the average shares outstanding methodology. |
| | (c) | | Assumes investment at the net asset value at the beginning of the period, reinvestment of all distributions, a complete redemption of the investment at the net asset value at the end of the period and no sales or redemption charges (if any). Total returns would be reduced if a sales or redemption charge was taken into account. Returns do not reflect the impact of taxes to shareholders relating to Fund distributions or the redemption of Fund shares. Total returns for periods less than one full year are not annualized. |
| | (e) | | The Fund’s portfolio turnover rate is calculated in accordance with regulatory requirements, without regard to transactions involving short term investments and certain derivatives. If such transactions were included, the Fund’s portfolio turnover rate may be higher. |
| | |
| 56 | | The accompanying notes are an integral part of these financial statements. |
GOLDMAN SACHS INTERNATIONAL TAX-MANAGED EQUITY FUND
Financial Highlights (continued)
Selected Data for a Share Outstanding Throughout Each Period
| | | | | | | | | | | | | | | | | | |
| | | | | Goldman Sachs International Tax-Managed Equity Fund | |
| | | | | Class R6 Shares | |
| | | | | Six Months Ended
June 30, 2021
(Unaudited) | | | Year Ended December 31, | | | April 30, 2018* to December 31, 2018 | |
| | | | | 2020 | | | 2019 | |
| | Per Share Data | | | | | | | | | | | | | | | | |
| | | | | |
| | Net asset value, beginning of period | | $ | 11.22 | | | $ | 10.33 | | | $ | 8.85 | | | $ | 10.92 | |
| | | | | |
| | Net investment income(a) | | | 0.16 | | | | 0.14 | | | | 0.21 | | | | 0.08 | |
| | | | | |
| | Net realized and unrealized gain (loss) | | | 0.80 | | | | 0.92 | | | | 1.47 | | | | (1.95 | ) |
| | | | | |
| | Total from investment operations | | | 0.96 | | | | 1.06 | | | | 1.68 | | | | (1.87 | ) |
| | | | | |
| | Distributions to shareholders from net investment income | | | — | | | | (0.17 | ) | | | (0.20 | ) | | | (0.20 | ) |
| | | | | |
| | Net asset value, end of period | | $ | 12.18 | | | $ | 11.22 | | | $ | 10.33 | | | $ | 8.85 | |
| | | | | |
| | Total return(b) | | | 8.56 | % | | | 10.20 | % | | | 19.05 | % | | | (17.07 | )% |
| | | | | |
| | Net assets, end of period (in 000s) | | $ | 664,364 | | | $ | 640,212 | | | $ | 660,555 | | | $ | 530,891 | |
| | | | | |
| | Ratio of net expenses to average net assets | | | 0.89 | %(c) | | | 0.89 | % | | | 0.89 | % | | | 0.89 | %(c) |
| | | | | |
| | Ratio of total expenses to average net assets | | | 0.96 | %(c) | | | 0.97 | % | | | 0.98 | % | | | 0.99 | %(c) |
| | | | | |
| | Ratio of net investment income to average net assets | | | 2.68 | %(c) | | | 1.42 | % | | | 2.12 | % | | | 1.14 | %(c) |
| | | | | |
| | Portfolio turnover rate(d) | | | 67 | % | | | 177 | % | | | 231 | % | | | 177 | % |
| | * | | Commencement of operations. |
| | (a) | | Calculated based on the average shares outstanding methodology. |
| | (b) | | Assumes investment at the net asset value at the beginning of the period, reinvestment of all distributions, a complete redemption of the investment at the net asset value at the end of the period and no sales or redemption charges (if any). Total returns would be reduced if a sales or redemption charge was taken into account. Returns do not reflect the impact of taxes to shareholders relating to Fund distributions or the redemption of Fund shares. Total returns for periods less than one full year are not annualized. |
| | (d) | | The Fund’s portfolio turnover rate is calculated in accordance with regulatory requirements, without regard to transactions involving short term investments and certain derivatives. If such transactions were included, the Fund’s portfolio turnover rate may be higher. |
| | |
| The accompanying notes are an integral part of these financial statements. | | 57 |
GOLDMAN SACHS INTERNATIONAL TAX-MANAGED EQUITY FUND
Financial Highlights (continued)
Selected Data for a Share Outstanding Throughout Each Period
| | | | | | | | | | | | | | | | | | |
| | | | | Goldman Sachs International Tax-Managed Equity Fund | |
| | | | | Class P Shares | |
| | | | | Six Months Ended
June 30, 2021
(Unaudited) | | | Year Ended December 31, | | | April 17, 2018* to December 31, 2018 | |
| | | | | 2020 | | | 2019 | |
| | Per Share Data | | | | | | | | | | | | | | | | |
| | | | | |
| | Net asset value, beginning of period | | $ | 11.22 | | | $ | 10.34 | | | $ | 8.86 | | | $ | 11.07 | |
| | | | | |
| | Net investment income(a) | | | 0.16 | | | | 0.14 | | | | 0.21 | | | | 0.10 | |
| | | | | |
| | Net realized and unrealized gain (loss) | | | 0.81 | | | | 0.91 | | | | 1.47 | | | | (2.11 | ) |
| | | | | |
| | Total from investment operations | | | 0.97 | | | | 1.05 | | | | 1.68 | | | | (2.01 | ) |
| | | | | |
| | Distributions to shareholders from net investment income | | | — | | | | (0.17 | ) | | | (0.20 | ) | | | (0.20 | ) |
| | | | | |
| | Net asset value, end of period | | $ | 12.19 | | | $ | 11.22 | | | $ | 10.34 | | | $ | 8.86 | |
| | | | | |
| | Total return(b) | | | 8.65 | % | | | 10.09 | % | | | 19.02 | % | | | (18.09 | )% |
| | | | | |
| | Net assets, end of period (in 000s) | | $ | 78,218 | | | $ | 68,788 | | | $ | 67,038 | | | $ | 64,578 | |
| | | | | |
| | Ratio of net expenses to average net assets | | | 0.89 | %(c) | | | 0.89 | % | | | 0.89 | % | | | 0.89 | %(c) |
| | | | | |
| | Ratio of total expenses to average net assets | | | 0.96 | %(c) | | | 0.98 | % | | | 0.98 | % | | | 1.00 | %(c) |
| | | | | |
| | Ratio of net investment income to average net assets | | | 2.70 | %(c) | | | 1.45 | % | | | 2.15 | % | | | 1.43 | %(c) |
| | | | | |
| | Portfolio turnover rate(d) | | | 67 | % | | | 177 | % | | | 231 | % | | | 177 | % |
| | * | | Commencement of operations. |
| | (a) | | Calculated based on the average shares outstanding methodology. |
| | (b) | | Assumes investment at the net asset value at the beginning of the period, reinvestment of all distributions, a complete redemption of the investment at the net asset value at the end of the period and no sales or redemption charges (if any). Total returns would be reduced if a sales or redemption charge was taken into account. Returns do not reflect the impact of taxes to shareholders relating to Fund distributions or the redemption of Fund shares. Total returns for periods less than one full year are not annualized. |
| | (d) | | The Fund’s portfolio turnover rate is calculated in accordance with regulatory requirements, without regard to transactions involving short term investments and certain derivatives. If such transactions were included, the Fund’s portfolio turnover rate may be higher. |
| | |
| 58 | | The accompanying notes are an integral part of these financial statements. |
GOLDMAN SACHS TAX-ADVANTAGED EQUITY FUNDS
Notes to Financial Statements
June 30, 2021 (Unaudited)
Goldman Sachs Trust (the “Trust”) is a Delaware statutory trust registered under the Investment Company Act of 1940, as amended (the “Act”), as an open-end management investment company. The following table lists those series of the Trust that are included in this report (collectively, the “Funds” or individually a “Fund”), along with their corresponding share classes and respective diversification status under the Act:
| | | | |
| Fund | | Share Classes Offered | | Diversified/ Non-diversified |
U.S. Equity Dividend and Premium, International Equity Dividend and Premium, International Tax-Managed Equity | | A, C, Institutional, Investor, R6 and P | | Diversified |
U. S. Tax-Managed Equity | | A, C, Institutional, Service, Investor, R6 and P | | Diversified |
Class A Shares are sold with a front-end sales charge of up to 5.50%. Class C Shares are sold with a contingent deferred sales charge (“CDSC”) of 1.00%, which is imposed on redemptions made within 12 months of purchase. Institutional, Service, Investor, Class R6 and Class P Shares are not subject to a sales charge.
Goldman Sachs Asset Management, L.P. (“GSAM”), an affiliate of Goldman Sachs & Co. LLC (“Goldman Sachs”), serves as investment adviser to the Funds pursuant to a management agreement (the “Agreement”) with the Trust.
|
| 2. SIGNIFICANT ACCOUNTING POLICIES |
The financial statements have been prepared in accordance with accounting principles generally accepted in the United States of America (“GAAP”) and require management to make estimates and assumptions that may affect the reported amounts and disclosures. Actual results may differ from those estimates and assumptions. Each Fund is an investment company under GAAP and follows the accounting and reporting guidance applicable to investment companies.
A. Investment Valuation — The Funds’ valuation policy is to value investments at fair value.
B. Investment Income and Investments — Investment income includes interest income, dividend income, and securities lending income, if any. Interest income is accrued daily and adjusted for amortization of premiums and accretion of discounts. Dividend income is recognized on ex-dividend date or, for certain foreign securities, as soon as such information is obtained subsequent to the ex-dividend date. Non-cash dividends, if any, are recorded at the fair market value of the securities received. Investment transactions are reflected on trade date. Realized gains and losses are calculated using identified cost. Investment transactions are recorded on the following business day for daily net asset value (“NAV”) calculations. Investment income is recorded net of any foreign withholding taxes, less any amounts reclaimable. The Funds may file withholding tax reclaims in certain jurisdictions to recover a portion of amounts previously withheld. These reclaims are recorded when the amount is known and there are no significant uncertainties on collectability. Such amounts recovered are reflected as Other income in the Statements of Operations. Any foreign capital gains tax is accrued daily based upon net unrealized gains, and is payable upon sale of such investments. Distributions received from the Funds’ investments in United States (“U.S.”) real estate investment trusts (“REITs”) may be characterized as ordinary income, net capital gain and/or a return of capital. A return of capital is recorded by the Funds as a reduction to the cost basis of the REIT.
For derivative contracts, realized gains and losses are recorded upon settlement of the contract.
C. Class Allocations and Expenses — Investment income, realized and unrealized gain (loss), if any, and non-class specific expenses of each Fund are allocated daily based upon the proportion of net assets of each class. Non-class specific expenses directly incurred by a Fund are charged to that Fund, while such expenses incurred by the Trust are allocated across the applicable Funds on a straight-line and/or pro-rata basis depending upon the nature of the expenses. Class specific expenses, where applicable, are borne by the respective share classes and include Distribution and Service, Transfer Agency and Service and Shareholder Administration fees.
59
GOLDMAN SACHS TAX-ADVANTAGED EQUITY FUNDS
Notes to Financial Statements (continued)
June 30, 2021 (Unaudited)
|
| 2. SIGNIFICANT ACCOUNTING POLICIES (continued) |
D. Federal Taxes and Distributions to Shareholders — It is each Fund’s policy to comply with the requirements of the Internal Revenue Code of 1986, as amended (the “Code”), applicable to regulated investment companies and to distribute each year substantially all of its investment company taxable income and capital gains to its shareholders. Accordingly, each Fund is not required to make any provisions for the payment of federal income tax. Distributions to shareholders are recorded on the ex-dividend date. Income and capital gains distributions, if any, are declared and paid according to the following schedule:
| | | | | | |
| Fund | | | | Income Distributions Declared/Paid | | Capital Gains Distributions
Declared/Paid |
U.S. Equity Dividend and Premium International Equity Dividend and Premium | | | | Quarterly | | Annually |
U.S. Tax-Managed Equity International Tax-Managed Equity | | | | Annually | | Annually |
Net capital losses, if any, are carried forward to future fiscal years and may be used to the extent allowed by the Code to offset any future capital gains. Losses that are carried forward will retain their character as either short-term or long-term capital losses. Utilization of capital loss carryforwards will reduce the requirement of future capital gains distributions.
The characterization of distributions to shareholders for financial reporting purposes is determined in accordance with federal income tax rules, which may differ from GAAP. The source of each Fund’s distributions may be shown in the accompanying financial statements as either from distributable earnings or capital. Certain components of the Funds’ net assets on the Statements of Assets and Liabilities reflect permanent GAAP/tax differences based on the appropriate tax character.
E. Foreign Currency Translation — The accounting records and reporting currency of a Fund are maintained in U.S. dollars. Assets and liabilities denominated in foreign currencies are translated into U.S. dollars using the current exchange rates at the close of each business day. The effect of changes in foreign currency exchange rates on investments is included within net realized and unrealized gain (loss) on investments. Changes in the value of other assets and liabilities as a result of fluctuations in foreign exchange rates are included in the Statements of Operations within net change in unrealized gain (loss) on foreign currency translation. Transactions denominated in foreign currencies are translated into U.S. dollars on the date the transaction occurred, the effects of which are included within net realized gain (loss) on foreign currency transactions.
F. In-Kind Transactions — Each Fund may allow investors, under certain circumstances, to purchase shares with securities instead of cash. In addition, the Trust reserves the right to redeem an investor’s shares by distributing securities instead of cash. These are known as in-kind transactions. Securities included as part of in-kind purchases and redemptions of Fund shares are valued in the same manner as they are valued for purposes of computing a Fund’s NAV, in accordance with the Fund’s Valuation Procedures, and such valuations are as of the date the trade is submitted pursuant to the procedures specified in the Funds’ prospectus.
|
| 3. INVESTMENTS AND FAIR VALUE MEASUREMENTS |
U.S. GAAP defines the fair value of a financial instrument as the amount that would be received to sell an asset or paid to transfer a liability in an orderly transaction between market participants at the measurement date (i.e., the exit price); the Funds’ policy is to use the market approach. GAAP establishes a fair value hierarchy that prioritizes the inputs to valuation techniques used to measure fair value. The hierarchy gives the highest priority to unadjusted quoted prices in active markets for identical assets or liabilities (Level 1 measurements) and the lowest priority to unobservable inputs (Level 3 measurements). The level in the fair value hierarchy within which the fair value measurement in its entirety falls shall be determined based on the lowest level input that is significant to the fair value measurement in its entirety. The levels used for classifying investments are not necessarily an indication of the risk associated with investing in these investments. The three levels of the fair value hierarchy are described below:
Level 1 — Unadjusted quoted prices in active markets that are accessible at the measurement date for identical, unrestricted assets or liabilities;
60
GOLDMAN SACHS TAX-ADVANTAGED EQUITY FUNDS
|
| 3. INVESTMENTS AND FAIR VALUE MEASUREMENTS (continued) |
Level 2 — Quoted prices in markets that are not active or financial instruments for which significant inputs are observable (including, but not limited to, quoted prices for similar investments, interest rates, foreign exchange rates, volatility and credit spreads), either directly or indirectly;
Level 3 — Prices or valuations that require significant unobservable inputs (including GSAM’s assumptions in determining fair value measurement).
The Board of Trustees (“Trustees”) has approved Valuation Procedures that govern the valuation of the portfolio investments held by the Funds, including investments for which market quotations are not readily available. The Trustees have delegated to GSAM day-to-day responsibility for implementing and maintaining internal controls and procedures related to the valuation of the Funds’ investments. To assess the continuing appropriateness of pricing sources and methodologies, GSAM regularly performs price verification procedures and issues challenges as necessary to third party pricing vendors or brokers, and any differences are reviewed in accordance with the Valuation Procedures.
A. Level 1 and Level 2 Fair Value Investments — The valuation techniques and significant inputs used in determining the fair values for investments classified as Level 1 and Level 2 are as follows:
Equity Securities — Equity securities traded on a U.S. securities exchange or the NASDAQ system, or those located on certain foreign exchanges, including but not limited to the Americas, are valued daily at their last sale price or official closing price on the principal exchange or system on which they are traded. If there is no sale or official closing price or such price is believed by GSAM to not represent fair value, equity securities will be valued at the valid closing bid price for long positions and at the valid closing ask price for short positions (i.e. where there is sufficient volume, during normal exchange trading hours). If no valid bid/ask price is available, the equity security will be valued pursuant to the Valuation Procedures approved by the Trustees and consistent with applicable regulatory guidance. To the extent these investments are actively traded, they are classified as Level 1 of the fair value hierarchy, otherwise they are generally classified as Level 2. Certain equity securities containing unique attributes may be classified as Level 2.
Unlisted equity securities for which market quotations are available are valued at the last sale price on the valuation date, or if no sale occurs, at the last bid price for long positions or the last ask price for short positions, and are generally classified as Level 2. Securities traded on certain foreign securities exchanges are valued daily at fair value determined by an independent fair value service (if available) under Fair Valuation Procedures approved by the Trustees and consistent with applicable regulatory guidance. The independent fair value service takes into account multiple factors including, but not limited to, movements in the securities markets, certain depositary receipts, futures contracts and foreign currency exchange rates that have occurred subsequent to the close of the foreign securities exchange. These investments are generally classified as Level 2 of the fair value hierarchy.
Money Market Funds — Investments in the Goldman Sachs Financial Square Government Fund (“Underlying Fund”) are valued at the NAV per share of the Institutional Share class on the day of valuation. These investments are generally classified as Level 1 of the fair value hierarchy. For information regarding the Underlying Fund’s accounting policies and investment holdings, please see the Underlying Fund’s shareholder report.
Derivative Contracts — A derivative is an instrument whose value is derived from underlying assets, indices, reference rates or a combination of these factors. A Fund enters into derivative transactions to hedge against changes in interest rates, securities prices, and/or currency exchange rates, to increase total return, or to gain access to certain markets or attain exposure to other underliers. For financial reporting purposes, cash collateral that has been pledged to cover obligations of a Fund and cash collateral received, if any, is reported separately on the Statements of Assets and Liabilities as receivables/payables for collateral on certain derivatives contracts. Non-cash collateral pledged by a Fund, if any, is noted in the Schedules of Investments.
Exchange-traded derivatives, including futures and options contracts, are generally valued at the last sale or settlement price on the exchange where they are principally traded. Exchange-traded options without settlement prices are generally valued at the midpoint of the bid and ask prices on the exchange where they are principally traded (or, in the absence of two-way trading, at the last bid price for long positions and the last ask price for short positions). Exchange-traded derivatives typically fall within Level 1 of the fair value hierarchy. Over-the-counter (“OTC”) and centrally cleared derivatives are valued using market transactions and
61
GOLDMAN SACHS TAX-ADVANTAGED EQUITY FUNDS
Notes to Financial Statements (continued)
June 30, 2021 (Unaudited)
|
| 3. INVESTMENTS AND FAIR VALUE MEASUREMENTS (continued) |
other market evidence, including market-based inputs to models, calibration to market-clearing transactions, broker or dealer quotations, or other alternative pricing sources. Where models are used, the selection of a particular model to value OTC and centrally cleared derivatives depends upon the contractual terms of, and specific risks inherent in, the instrument, as well as the availability of pricing information in the market. Valuation models require a variety of inputs, including contractual terms, market prices, yield curves, credit curves, measures of volatility, voluntary and involuntary prepayment rates, loss severity rates and correlations of such inputs. For OTC and centrally cleared derivatives that trade in liquid markets, model inputs can generally be verified and model selection does not involve significant management judgment. OTC and centrally cleared derivatives are classified within Level 2 of the fair value hierarchy when significant inputs are corroborated by market evidence.
i. Futures Contracts — Futures contracts are contracts to buy or sell a standardized quantity of a specified commodity or security. Upon entering into a futures contract, a Fund deposits cash or securities in an account on behalf of the broker in an amount sufficient to meet the initial margin requirement. Subsequent payments are made or received by a Fund equal to the daily change in the contract value and are recorded as variation margin receivable or payable with a corresponding offset to unrealized gains or losses.
ii. Options — When a Fund writes call or put options, an amount equal to the premium received is recorded as a liability and is subsequently marked-to-market to reflect the current value of the option written. Swaptions are options on swap contracts.
Upon the purchase of a call option or a put option by a Fund, the premium paid is recorded as an investment and subsequently marked-to-market to reflect the current value of the option. Certain options may be purchased with premiums to be determined on a future date. The premiums for these options are based upon implied volatility parameters at specified terms.
B. Level 3 Fair Value Investments — To the extent that significant inputs to valuation models and other alternative pricing sources are unobservable, or if quotations are not readily available, or if GSAM believes that such quotations do not accurately reflect fair value, the fair value of a Fund’s investments may be determined under Valuation Procedures approved by the Trustees. GSAM, consistent with its procedures and applicable regulatory guidance, may make an adjustment to the most recent valuation prices of either domestic or foreign securities in light of significant events to reflect what it believes to be the fair value of the securities at the time of determining a Fund’s NAV. To the extent investments are valued using single source broker quotations obtained directly from the broker or passed through from third party pricing vendors, such investments are classified as Level 3 investments.
C. Fair Value Hierarchy — The following is a summary of the Funds’ investments and derivatives classified in the fair value hierarchy as of June 30, 2021:
For further information regarding security characteristics, see the Schedules of Investments.
| | | | | | | | | | | | |
|
| U.S. EQUITY DIVIDEND AND PREMIUM | |
| | | |
| Investment Type | | Level 1 | | | Level 2 | | | Level 3 | |
| | | |
| Assets | | | | | | | | | | | | |
| | | |
Common Stock and/or Other Equity Investments(a) | | | | | | | | | | | | |
| | | |
Asia | | $ | 822,880 | | | $ | — | | | $ | — | |
| | | |
Europe | | | 26,775,524 | | | | — | | | | — | |
| | | |
North America | | | 2,906,499,376 | | | | — | | | | — | |
| | | |
South America | | | 17,936,763 | | | | — | | | | — | |
| | | |
Investment Company | | | 47,903,237 | | | | — | | | | — | |
| | | |
Securities Lending Reinvestment Vehicle | | | 188,100 | | | | — | | | | — | |
| | | |
| Total | | $ | 3,000,125,880 | | | $ | — | | | $ | — | |
| (a) | | Amounts are disclosed by continent to highlight the impact of time zone differences between local market close and the calculation of NAV. Security valuations are based on the principal exchange or system on which they are traded, which may differ from country of domicile. The Funds utilize fair value model prices provided by an independent fair value service for certain international equity securities, resulting in a Level 2 classification. |
62
GOLDMAN SACHS TAX-ADVANTAGED EQUITY FUNDS
|
| 3. INVESTMENTS AND FAIR VALUE MEASUREMENTS(continued) |
| | | | | | | | | | | | |
| | | |
| U.S. EQUITY DIVIDEND AND PREMIUM (continued) | | | | | | | | | | | | |
| | | |
| Derivative Type | | Level 1 | | | Level 2 | | | Level 3 | |
| | | |
| Assets(a) | | | | | | | | | | | | |
| | | |
Futures Contracts | | $ | 425,069 | | | $ | — | | | $ | — | |
| | | |
| Liabilities | | | | | | | | | | | | |
| | | |
Written Options Contracts | | $ | (29,834,010 | ) | | $ | — | | | $ | — | |
| | | |
| INTERNATIONAL EQUITY DIVIDEND AND PREMIUM | | | | | | | | | | | | |
| | | |
| Investment Type | | Level 1 | | | Level 2 | | | Level 3 | |
| | | |
| Assets | | | | | | | | | | | | |
| | | |
Common Stock and/or Other Equity Investments(b) | | | | | | | | | | | | |
| | | |
Africa | | $ | — | | | $ | 80 | | | $ | — | |
| | | |
Asia | | | 413,181 | | | | 53,082,881 | | | | — | |
| | | |
Australia and Oceania | | | 3,177,921 | | | | 16,612,795 | | | | — | |
| | | |
Europe | | | 8,731,193 | | | | 101,515,317 | | | | — | |
| | | |
North America | | | — | | | | 2,472,306 | | | | — | |
| | | |
South America | | | — | | | | 318,801 | | | | — | |
| | | |
| Total | | $ | 12,322,295 | | | $ | 174,002,180 | | | $ | — | |
| | | |
| Derivative Type | | | | | | | | | |
| | | |
| Liabilities | | | | | | | | | | | | |
| | | |
Futures Contracts(a) | | $ | (743 | ) | | $ | — | | | $ | — | |
| | | |
Written Options Contracts | | | (1,083,290 | ) | | | — | | | | — | |
| | | |
| Total | | $ | (1,084,033 | ) | | $ | — | | | $ | — | |
| | | |
| U.S. TAX-MANAGED EQUITY | | | | | | | | | | | | |
| | | |
| Investment Type | | Level 1 | | | Level 2 | | | Level 3 | |
| | | |
| Assets | | | | | | | | | | | | |
| | | |
Common Stock and/or Other Equity Investments(b) | | | | | | | | | | | | |
| | | |
Asia | | $ | 12,911,530 | | | $ | — | | | $ | — | |
| | | |
Europe | | | 5,431,521 | | | | — | | | | — | |
| | | |
North America | | | 2,260,399,100 | | | | — | | | | — | |
| | | |
South America | | | 2,804,484 | | | | — | | | | — | |
| | | |
Securities Lending Reinvestment Vehicle | | | 1,610,495 | | | | — | | | | — | |
| | | |
| Total | | $ | 2,283,157,130 | | | $ | — | | | $ | — | |
| | | |
| Derivative Type | | | | | | | | | |
| | | |
| Assets(a) | | | | | | | | | | | | |
| | | |
Futures Contracts | | $ | 218,244 | | | $ | — | | | $ | — | |
| | | |
| Liabilities(a) | | | | | | | | | | | | |
| | | |
Futures Contracts | | $ | (17,240 | ) | | $ | — | | | $ | — | |
| (a) | | Amount shown represents unrealized gain (loss) at period end. |
| (b) | | Amounts are disclosed by continent to highlight the impact of time zone differences between local market close and the calculation of NAV. Security valuations are based on the principal exchange or system on which they are traded, which may differ from country of domicile. The Funds utilize fair value model prices provided by an independent fair value service for certain international equity securities, resulting in a Level 2 classification. |
63
GOLDMAN SACHS TAX-ADVANTAGED EQUITY FUNDS
Notes to Financial Statements (continued)
June 30, 2021 (Unaudited)
|
| 3. INVESTMENTS AND FAIR VALUE MEASUREMENTS(continued) |
| | | | | | | | | | | | |
| | | |
| INTERNATIONAL TAX-MANAGED EQUITY | | | | | | | | | | | | |
| | | |
| Investment Type | | Level 1 | | | Level 2 | | | Level 3 | |
| | | |
| Assets | | | | | | | | | | | | |
| | | |
Common Stock and/or Other Equity Investments(a) | | | | | | | | | | | | |
| | | |
Africa | | $ | — | | | $ | 7,619,351 | | | $ | — | |
| | | |
Asia | | | — | | | | 202,860,937 | | | | — | |
| | | |
Australia and Oceania | | | 10,416,034 | | | | 59,804,782 | | | | — | |
| | | |
Europe | | | 16,913,880 | | | | 427,362,414 | | | | — | |
| | | |
North America | | | — | | | | 22,288,176 | | | | — | |
| | | |
Securities Lending Reinvestment Vehicle | | | 510,450 | | | | — | | | | — | |
| | | |
| Total | | $ | 27,840,364 | | | $ | 719,935,660 | | | $ | — | |
| | | |
| Derivative Type | | | | | | | | | |
| | | |
| Liabilities(b) | | | | | | | | | | | | |
| | | |
Futures Contracts | | $ | (106,297 | ) | | $ | — | | | $ | — | |
| (a) | | Amounts are disclosed by continent to highlight the impact of time zone differences between local market close and the calculation of NAV. Security valuations are based on the principal exchange or system on which they are traded, which may differ from country of domicile. The Funds utilize fair value model prices provided by an independent fair value service for certain international equity securities, resulting in a Level 2 classification. |
| (b) | | Amount shown represents unrealized gain (loss) at period end. |
|
| 4. INVESTMENTS IN DERIVATIVES |
The following table sets forth, by certain risk types, the gross value of derivative contracts (not considered to be hedging instruments for accounting disclosure purposes) as of June 30, 2021. These instruments were used as part of the Funds’ investment strategies and to obtain and/or manage exposure related to the risks below. The values in the tables below exclude the effects of cash collateral received or posted pursuant to these derivative contracts, and therefore are not representative of the Funds’ net exposure.
| | | | | | | | | | | | | | |
| Fund | | Risk | | Statements of Assets
and Liabilities | | Assets | | | Statements of Assets and Liabilities | | Liabilities | |
U.S. Equity Dividend and Premium | | Equity | | Variation margin on futures contracts | | | $425,069(a) | | | Payable for written options, at value | | $ | (29,834,010) | |
International Equity Dividend and Premium | | Equity | | — | | | — | | | Variation margin on futures contracts and payable for written options, at value | | | (1,084,033) | (a) |
U.S. Tax-Managed Equity | | Equity | | Variation margin on futures contracts | | | 218,244(a) | | | Variation margin on futures contracts | | | (17,240) | (a) |
International Tax-Managed Equity | | Equity | | — | | | — | | | Variation margin on futures contracts | | | (106,297) | (a) |
| Total | | | | | | | $643,313 | | | | | $ | (31,041,580) | |
| (a) | | Includes unrealized gain (loss) on futures contracts described in the Additional Investment Information sections of the Schedules of Investments. Only variation margin as of June 30, 2021 is reported within the Statements of Assets and Liabilities. |
64
GOLDMAN SACHS TAX-ADVANTAGED EQUITY FUNDS
|
| 4. INVESTMENTS IN DERIVATIVES (continued) |
The following table sets forth, by certain risk types, the Funds’ gains (losses) related to these derivatives and their indicative volumes for the six months ended June 30, 2021. These gains (losses) should be considered in the context that these derivative contracts may have been executed to create investment opportunities and/or economically hedge certain investments, and accordingly, certain gains (losses) on such derivative contracts may offset certain (losses) gains attributable to investments. These gains (losses) are included in “Net realized gain (loss)” or “Net change in unrealized gain (loss)” on the Statements of Operations:
| | | | | | | | | | | | |
| Fund | | Risk | | Statements of Operations | | Net Realized
Gain (Loss) | | | Net Change in
Unrealized
Gain (Loss) | |
U.S. Equity Dividend and Premium | | Equity | | Net realized gain (loss) from futures contracts and written options/Net change in unrealized gain (loss) on futures contracts and written options | | $ | (64,069,658 | ) | | $ | 19,483,601 | |
International Equity Dividend and Premium | | Equity | | Net realized gain (loss) from futures contracts and written options/Net change in unrealized gain (loss) on futures contracts and written options | | | (4,020,405 | ) | | | 1,014,403 | |
U.S. Tax-Managed Equity | | Equity | | Net realized gain (loss) from futures contracts/Net change in unrealized gain (loss) on futures contracts | | | 2,680,261 | | | | 201,004 | |
International Tax-Managed Equity | | Equity | | Net realized gain (loss) from futures contracts/Net change in unrealized gain (loss) on futures contracts | | | 1,016,359 | | | | (223,657 | ) |
Total | | | | | | $ | (64,393,443 | ) | | $ | 20,475,351 | |
For the six months ended June 30, 2021, the relevant values for each derivative type were as follows:
| | | | | | | | | | |
| | | | | Average number of Contracts(1) | |
| Fund | | | | Futures Contracts | | | Written Options | |
U.S. Equity Dividend and Premium | | | | | 184 | | | | 2,404 | |
International Equity Dividend and Premium | | | | | 14 | | | | 1,053 | |
U.S. Tax-Managed Equity | | | | | 170 | | | | — | |
International Tax-Managed Equity | | | | | 101 | | | | — | |
| (1) | | Amounts disclosed represent average number of contracts for futures and written options, based on absolute values, which is indicative of volume of this derivative type, for the months that the Fund held such derivatives during the six months ended June 30, 2021. |
|
| 5. AGREEMENTS AND AFFILIATED TRANSACTIONS |
A. Management Agreement — Under the Agreement, GSAM manages the Funds, subject to the general supervision of the Trustees.
As compensation for the services rendered pursuant to the Agreement, the assumption of the expenses related thereto and administration of the Funds’ business affairs, including providing facilities, GSAM is entitled to a management fee, accrued daily and paid monthly, equal to an annual percentage rate of each Fund’s average daily net assets.
65
GOLDMAN SACHS TAX-ADVANTAGED EQUITY FUNDS
Notes to Financial Statements (continued)
June 30, 2021 (Unaudited)
|
| 5. AGREEMENTS AND AFFILIATED TRANSACTIONS (continued) |
For the six months ended June 30, 2021, contractual and effective net management fees with GSAM were at the following rates:
| | | | | | | | | | | | | | | | | | | | | | | | | | | | | | |
| | | | | Contractual Management Rate | | | | | | Effective Net
Management
Rate^ | |
| Fund | | | | First
$1 billion | | | Next
$1 billion | | | Next
$3 billion | | | Next
$3 billion | | | Over
$8 billion | | | Effective
Rate | |
U.S. Equity Dividend and Premium | | | | | 0.75 | % | | | 0.68 | % | | | 0.65 | % | | | 0.64 | % | | | 0.63 | % | | | 0.70 | % | | | 0.65 | %* |
International Equity Dividend and Premium | | | | | 0.81 | | | | 0.73 | | | | 0.69 | | | | 0.68 | | | | 0.67 | | | | 0.81 | | | | 0.81 | |
U.S. Tax-Managed Equity | | | | | 0.70 | | | | 0.63 | | | | 0.60 | | | | 0.59 | | | | 0.58 | | | | 0.66 | | | | 0.66 | |
International Tax-Managed Equity | | | | | 0.85 | | | | 0.77 | | | | 0.73 | | | | 0.72 | | | | 0.71 | | | | 0.85 | | | | 0.85 | |
| ^ | | Effective Net Management Rate includes the impact of management fee waivers of affiliated Underlying Funds, if any. |
| * | | GSAM agreed to waive a portion of its management fees in an amount equal to 0.04% as an annual percentage of the Fund’s average daily net assets. This waiver will be effective through at least April 30, 2022, and prior to such date GSAM may not terminate the arrangement without the approval of the Trustees. |
The Funds invest in Institutional Shares of the Goldman Sachs Financial Square Government Fund, which is an affiliated Underlying Fund. GSAM has agreed to waive a portion of its management fee payable by the Funds in an amount equal to the management fee it earns as an investment adviser to the affiliated Underlying Fund in which the Funds invest, except those management fees it earns from the Funds’ investments of cash collateral received in connection with securities lending transactions in the Goldman Sachs Financial Square Government Fund. For the six months ended June 30, 2021, GSAM waived $12,617, $92 and $1,115 of the U.S. Equity Dividend and Premium, International Equity Dividend and Premium and U.S. Tax-Managed Equity Funds’ management fees, respectively.
B. Distribution and/or Service (12b-1) Plans — The Trust, on behalf of Class A Shares of each applicable Fund, has adopted a Distribution and Service Plan subject to Rule 12b-1 under the Act. Under the Distribution and Service Plan, Goldman Sachs, which serves as distributor (the “Distributor”), is entitled to a fee accrued daily and paid monthly for distribution services and personal and account maintenance services, which may then be paid by Goldman Sachs to authorized dealers. These fees are equal to an annual percentage rate of the average daily net assets attributable to Class A Shares of the Funds, as set forth below.
The Trust, on behalf of Class C Shares of each applicable Fund, has adopted a Distribution Plan subject to Rule 12b-1 under the Act. Under the Distribution Plan, Goldman Sachs as Distributor is entitled to a fee accrued daily and paid monthly for distribution services, which may then be paid by Goldman Sachs to authorized dealers. These fees are equal to an annual percentage rate of the average daily net assets attributable to Class C Shares of the Funds, as set forth below.
The Trust, on behalf of Service Shares of each applicable Fund, has adopted a Service Plan subject to Rule 12b-1 under the Act to allow Service Shares to compensate service organizations (including Goldman Sachs) for providing personal and account maintenance services to their customers who are beneficial owners of such shares. The Service Plan provides for compensation to the service organizations equal to an annual percentage rate of the average daily net assets attributable to Service Shares of the Funds, as set forth below.
| | | | | | | | | | | | |
| | | Distribution and/or Service Plan Rates | |
| | | Class A* | | | Class C | | | Service | |
Distribution and/or Service Plan | | | 0.25 | % | | | 0.75 | % | | | 0.25 | % |
| * | | With respect to Class A Shares, the Distributor at its discretion may use compensation for distribution services paid under the Distribution Plan to compensate service organizations for personal and account maintenance services and expenses as long as such total compensation does not exceed the maximum cap on “service fees” imposed by the Financial Industry Regulatory Authority. |
66
GOLDMAN SACHS TAX-ADVANTAGED EQUITY FUNDS
|
| 5. AGREEMENTS AND AFFILIATED TRANSACTIONS (continued) |
C. Distribution Agreement — Goldman Sachs, as Distributor of the shares of the Funds pursuant to a Distribution Agreement, may retain a portion of the Class A Shares’ front end sales charge and Class C Shares’ CDSC. During the six months ended June 30, 2021, Goldman Sachs retained the following amounts:
| | | | | | | | | | |
| | | | | Front End
Sales Charge | | | Contingent Deferred
Sales Charge | |
| Fund | | | | Class A | | | Class C | |
U.S. Equity Dividend and Premium | | | | $ | 7,900 | | | $ | — | |
International Equity Dividend and Premium | | | | | 179 | | | | — | |
U.S. Tax-Managed Equity | | | | | 977 | | | | — | |
International Tax-Managed Equity | | | | | 278 | | | | — | |
D. Service and Shareholder Administration Plans — The Trust, on behalf of each applicable Fund, has adopted Service Plans to allow Class C Shares and Shareholder Administration Plans to allow Service Shares, respectively, to compensate service organizations (including Goldman Sachs) for providing varying levels of personal and account maintenance or shareholder administration services to their customers who are beneficial owners of such shares. The Service and Shareholder Administration Plans each provide for compensation to the service organizations equal to an annual percentage rate of 0.25% of the average daily net assets attributable to Class C and Service Shares of the Funds, respectively.
E. Transfer Agency Agreement — Goldman Sachs also serves as the transfer agent of the Funds for a fee pursuant to the Transfer Agency Agreement. The fees charged for such transfer agency services are accrued daily and paid monthly at annual rates as follows: 0.16% of the average daily net assets of Class A, Class C and Investor Shares; 0.03% of the average daily net assets of Class R6 and Class P Shares; and 0.04% of the average daily net assets of Institutional and Service Shares. Goldman Sachs has agreed to waive a portion of its transfer agency fee equal to 0.02%, 0.03%, 0.04% and 0.05% as an annual percentage rate of the average daily net assets attributable to Class A, Class C and Investor Shares of the U.S. Equity Dividend and Premium, International Equity Dividend and Premium, U.S. Tax-Managed Equity and International Tax-Managed Equity Funds, respectively. This arrangement will remain in effect through at least April 30, 2022, and prior to such date, Goldman Sachs may not terminate the arrangement without the approval of the Board of Trustees.
F. Other Expense Agreements and Affiliated Transactions — GSAM has agreed to reduce or limit certain “Other Expenses” of the Funds (excluding acquired fund fees and expenses, transfer agency fees and expenses, service fees and shareholder administration fees (as applicable), taxes, interest, brokerage fees, expenses of shareholder meetings, litigation and indemnification, and extraordinary expenses) to the extent such expenses exceed, on an annual basis, a percentage rate of the average daily net assets of each Fund. Such Other Expense reimbursements, if any, are accrued daily and paid monthly. In addition, the Funds are not obligated to reimburse GSAM for prior fiscal year expense reimbursements, if any. The Other Expense limitations as an annual percentage rate of average daily net assets for the U.S. Equity Dividend and Premium, International Equity Dividend and Premium, U.S. Tax-Managed Equity and International Tax-Managed Equity Funds are 0.014%, 0.044%, 0.044% and 0.014%, respectively. These Other Expense limitations will remain in place through at least April 30, 2022, and prior to such date GSAM may not terminate the arrangements without the approval of the Trustees. In addition, the Funds have entered into certain offset arrangements with the custodian and the transfer agent, which may result in a reduction of the Funds’ expenses and are received irrespective of the application of the “Other Expense” limitations described above.
67
GOLDMAN SACHS TAX-ADVANTAGED EQUITY FUNDS
Notes to Financial Statements (continued)
June 30, 2021 (Unaudited)
|
| 5. AGREEMENTS AND AFFILIATED TRANSACTIONS (continued) |
For the six months ended June 30, 2021, these expense reductions, including any fee waivers and Other Expense reimbursements, were as follows:
| | | | | | | | | | | | | | | | | | | | |
| | | Fund | | | | Management
Fee Waiver | | | Other Expense
Reimbursement | | | Transfer Agency
Waivers/ Credits | | | Total
Expense
Reductions | |
| | | U.S. Equity Dividend and Premium | | | | $ | 573,322 | | | $ | 280,835 | | | $ | 67,611 | | | $ | 921,768 | |
| | | International Equity Dividend and Premium | | | | | 92 | | | | 224,788 | | | | 1,096 | | | | 225,976 | |
| | | U.S. Tax-Managed Equity | | | | | 1,115 | | | | — | | | | 23,908 | | | | 25,023 | |
| | | International Tax-Managed Equity | | | | | — | | | | 268,977 | | | | 4,163 | | | | 273,140 | |
G. Line of Credit Facility — As of June 30, 2021, the Funds participated in a $1,000,000,000 committed, unsecured revolving line of credit facility (the “facility”) together with other funds of the Trust and certain registered investment companies having management agreements with GSAM or its affiliates. This facility is to be used for temporary emergency purposes, or to allow for an orderly liquidation of securities to meet redemption requests. The interest rate on borrowings is based on the federal funds rate. The facility also requires a fee to be paid by the Funds based on the amount of the commitment that has not been utilized. For the six months ended June 30, 2021, the Funds did not have any borrowings under the facility. Prior to April 26, 2021, the facility was $700,000,000.
H. Other Transactions with Affiliates — The following table provides information about the Funds’ investment in the Goldman Sachs Financial Square Government Fund as of and for the six months ended June 30, 2021:
| | | | | | | | | | | | | | | | | | | | | | | | | | |
| Fund | | | | Beginning Value as of
December 31, 2020 | | | Purchases at
Cost | | | Proceeds from
Sales | | | Ending Value
as of
June 30, 2021 | | | Shares as of
June 30, 2021 | | | Dividend
Income | |
U.S. Equity Dividend and Premium | | | | $ | 61,847,593 | | | $ | 190,525,777 | | | $ | (204,470,133 | ) | | $ | 47,903,237 | | | | 47,903,237 | | | $ | 10,347 | |
International Equity Dividend and Premium | | | | | 30,000 | | | | 8,101,110 | | | | (8,131,110 | ) | | | — | | | | — | | | | 65 | |
U.S. Tax-Managed Equity | | | | | — | | | | 190,463,362 | | | | (190,463,362 | ) | | | — | | | | — | | | | 1,059 | |
As of June 30, 2021, the following Goldman Sachs Global Tax-Aware Equity Portfolios were beneficial owners of 5% or more of total outstanding shares of the following Funds:
| | | | | | | | | | |
| Fund | | | | Goldman Sachs
Enhanced Dividend
Global Equity
Portfolio | | | Goldman Sachs
Tax-Advantaged
Global Equity
Portfolio | |
U.S. Equity Dividend and Premium | | | | | 8 | % | | | — | % |
International Equity Dividend and Premium | | | | | 49 | | | | — | |
U.S. Tax-Managed Equity | | | | | — | | | | 83 | |
International Tax-Managed Equity | | | | | — | | | | 86 | |
68
GOLDMAN SACHS TAX-ADVANTAGED EQUITY FUNDS
|
| 6. PORTFOLIO SECURITIES TRANSACTIONS |
The cost of purchases and proceeds from sales and maturities of long-term securities for the six months ended June 30, 2021, were as follows:
| | | | | | | | | | |
| Fund | | | | Purchases | | | Sales | |
U.S. Equity Dividend and Premium | | | | $ | 198,489,561 | | | $ | 318,406,497 | |
International Equity Dividend and Premium | | | | | 18,701,083 | | | | 42,231,083 | |
U.S. Tax-Managed Equity | | | | | 1,089,210,959 | | | | 924,374,474 | |
International Tax-Managed Equity | | | | | 503,889,519 | | | | 489,496,998 | |
Pursuant to exemptive relief granted by the Securities and Exchange Commission (“SEC”) and the terms and conditions contained therein, the Funds may lend their securities through a securities lending agent, Goldman Sachs Agency Lending (“GSAL”), a wholly-owned subsidiary of Goldman Sachs, to certain qualified borrowers including Goldman Sachs and affiliates. In accordance with the Funds’ securities lending procedures, the Funds receive cash collateral at least equal to the market value of the securities on loan. The market value of the loaned securities is determined at the close of business of the Funds, at their last sale price or official closing price on the principal exchange or system on which they are traded, and any additional required collateral is delivered to the Funds on the next business day. As with other extensions of credit, the Funds may experience delay in the recovery of their securities or incur a loss should the borrower of the securities breach its agreement with the Funds or become insolvent at a time when the collateral is insufficient to cover the cost of repurchasing securities on loan. Dividend income received from securities on loan may not be subject to withholding taxes and therefore withholding taxes paid may differ from the amounts listed in the Statements of Operations. Loans of securities are terminable at any time and as such 1) the remaining contractual maturities of the outstanding securities lending transactions are considered to be overnight and continuous and 2) the borrower, after notice, is required to return borrowed securities within the standard time period for settlement of securities transactions.
The Funds invest the cash collateral received in connection with securities lending transactions in the Goldman Sachs Financial Square Government Fund (“Government Money Market Fund”), an affiliated series of the Goldman Sachs Trust. The Government Money Market Fund is registered under the Act as an open end investment company, is subject to Rule 2a-7 under the Act, and is managed by GSAM, for which GSAM may receive a management fee of up to 0.16% on an annualized basis of the average daily net assets of the Government Money Market Fund.
In the event of a default by a borrower with respect to any loan, GSAL will exercise any and all remedies provided under the applicable borrower agreement to make the Funds whole. These remedies include purchasing replacement securities by applying the collateral held from the defaulting broker against the purchase cost of the replacement securities. If GSAL is unable to purchase replacement securities, GSAL will indemnify the Funds by paying the Funds an amount equal to the market value of the securities loaned minus the value of cash collateral received from the borrower for the loan, subject to an exclusion for any shortfalls resulting from a loss of value in such cash collateral due to reinvestment risk. The Funds’ master netting agreements with certain borrowers provide the right, in the event of a default (including bankruptcy or insolvency), for the non-defaulting party to liquidate the collateral and calculate net exposure to the defaulting party or request additional collateral. However, in the event of a default by a borrower, a resolution authority could determine that such rights are not enforceable due to the restrictions or prohibitions against the right of set-off that may be imposed in accordance with a particular jurisdiction’s bankruptcy or insolvency laws. The Funds’ loaned securities were all subject to enforceable Securities Lending Agreements and the value of the collateral was at least equal to the value of the cash received. The amounts of the Funds’ overnight and continuous agreements, which represent the gross amounts of recognized liabilities for securities lending transactions outstanding as of June 30, 2021, are disclosed as “Payable upon return of securities loaned” on the Statements of Assets and Liabilities, where applicable. The Goldman Sachs International Equity Dividend and Premium Fund did not have securities on loan as of June 30, 2021.
69
GOLDMAN SACHS TAX-ADVANTAGED EQUITY FUNDS
Notes to Financial Statements (continued)
June 30, 2021 (Unaudited)
|
| 7. SECURITIES LENDING (continued) |
Each of the Funds and GSAL received compensation relating to the lending of the Funds’ securities. The amounts earned, if any, by the Funds for the six months ended June 30, 2021, are reported under Investment Income on the Statements of Operations.
The table below details securities lending activity with affiliates of Goldman Sachs:
| | | | | | | | | | |
| | | | | For the six months ended June 30, 2021 | |
| Fund | | | | Earnings of GSAL
Relating to
Securities
Loaned
| | | Amounts Received
by the Funds
from Lending to
Goldman Sachs | |
U.S. Equity Dividend and Premium | | | | $ | 2,961 | | | $ | 133 | |
International Equity Dividend and Premium | | | | | 14 | | | | 38 | |
U.S. Tax-Managed Equity | | | | | 134 | | | | 20 | |
International Tax-Managed Equity | | | | | 100 | | | | 54 | |
The following table provides information about the Funds’ investment in the Government Money Market Fund for the six months ended June 30, 2021:
| | | | | | | | | | | | | | | | | | |
| Fund | | | | Beginning
Value as of
December 31,
2020 | | | Purchases at
Cost | | | Proceeds from
Sales | | | Ending
Value as of
June 30,
2021 | |
U.S. Equity Dividend and Premium | | | | $ | 5,425,300 | | | $ | 5,769,310 | | | $ | (11,006,510 | ) | | $ | 188,100 | |
International Equity Dividend and Premium | | | | | — | | | | 7,862,690 | | | | (7,862,690 | ) | | | — | |
U.S. Tax-Managed Equity | | | | | 1,153,125 | | | | 14,816,931 | | | | (14,359,561 | ) | | | 1,610,495 | |
International Tax-Managed Equity | | | | | — | | | | 34,941,310 | | | | (34,430,860 | ) | | | 510,450 | |
As of the Funds’ most recent fiscal year end, December 31, 2020, the Funds’ capital loss carryforwards and certain timing differences, on a tax-basis were as follows:
| | | | | | | | | | | | | | | | |
| | | U.S. Equity Dividend
and Premium | | | International
Equity Dividend
and Premium | | | U.S.
Tax-Managed
Equity | | | International
Tax-Managed
Equity | |
Capital loss carryforwards: | | | | | | | | | | | | | | | | |
Perpetual Long-term | | $ | — | | | $ | (79,228,902 | ) | | $ | — | | | $ | — | |
Perpetual Short-term | | | — | | | | (9,494,589 | ) | | | (18,834,893 | ) | | | (100,711,883 | ) |
Total capital loss carryforwards | | $ | — | | | $ | (88,723,491 | ) | | $ | (18,834,893 | ) | | $ | (100,711,883 | ) |
Timing differences (Real Estate Investment Trusts/Post October Capital Loss Deferral) | | $ | (25,484,616 | ) | | $ | (3,625,468 | ) | | $ | 344,776 | | | $ | — | |
70
GOLDMAN SACHS TAX-ADVANTAGED EQUITY FUNDS
|
| 8. TAX INFORMATION (continued) |
As of June 30, 2021, the Funds’ aggregate security unrealized gains and losses based on cost for U.S. federal income tax purposes were as follows:
| | | | | | | | | | | | | | | | |
| | | U.S. Equity Dividend and Premium | | | International Equity Dividend and Premium | | | U.S. Tax-Managed Equity | | | International Tax-Managed Equity | |
Tax cost | | $ | 1,984,620,589 | | | $ | 143,472,995 | | | $ | 1,161,013,224 | | | $ | 521,754,513 | |
Gross unrealized gain | | | 1,031,406,429 | | | | 52,405,774 | | | | 1,123,263,548 | | �� | | 232,028,025 | |
Gross unrealized loss | | | (15,901,138 | ) | | | (9,554,294 | ) | | | (1,119,642 | ) | | | (6,006,514 | ) |
Net unrealized gain | | $ | 1,015,505,291 | | | $ | 42,851,480 | | | $ | 1,122,143,906 | | | $ | 226,021,511 | |
The difference between GAAP-basis and tax-basis unrealized gains (losses) is attributable primarily to wash sales, net mark to market gains (losses) on regulated futures and options contracts, net mark to market gains (losses) on foreign currency contracts, and differences in the tax treatment of partnership investments and passive foreign investment company investments.
GSAM has reviewed the Funds’ tax positions for all open tax years (the current and prior three years, as applicable) and has concluded that no provision for income tax is required in the Funds’ financial statements. Such open tax years remain subject to examination and adjustment by tax authorities.
The Funds’ risks include, but are not limited to, the following:
Derivatives Risk — The Funds’ use of derivatives may result in loss. Derivative instruments, which may pose risks in addition to and greater than those associated with investing directly in securities, currencies or other instruments, may be illiquid or less liquid, volatile, difficult to price and leveraged so that small changes in the value of the underlying instruments may produce disproportionate losses to the Funds. Derivatives are also subject to counterparty risk, which is the risk that the other party in the transaction will not fulfill its contractual obligation. The use of derivatives is a highly specialized activity that involves investment techniques and risks different from those associated with investments in more traditional securities and instruments. Losses from derivatives can also result from a lack of correlation between changes in the value of derivative instruments and the portfolio assets (if any) being hedged.
Dividend-Paying Investments Risk — A Fund’s investments in dividend-paying securities could cause a Fund to underperform other funds. Securities that pay dividends, as a group, can fall out of favor with the market, causing such securities to underperform securities that do not pay dividends. Depending upon market conditions and political and legislative responses to such conditions, dividend-paying securities that meet a Fund’s investment criteria may not be widely available and/or may be highly concentrated in only a few market sectors. In addition, issuers that have paid regular dividends or distributions to shareholders may not continue to do so at the same level or at all in the future. This may limit the ability of a Fund to produce current income.
Foreign and Emerging Countries Risk — Investing in foreign markets may involve special risks and considerations not typically associated with investing in the U.S. Foreign securities may be subject to risk of loss because of more or less foreign government regulation, less public information and less economic, political and social stability in the countries in which a Fund invests. The imposition of exchange controls (including repatriation restrictions), confiscation of assets and property, trade restrictions (including tariffs) and other government restrictions by the U.S. or other governments, or problems with registration, settlement or custody, may also result in losses. Foreign risk also involves the risk of negative foreign currency rate fluctuations, which may cause the value of securities denominated in such foreign currency (or other instruments through which a Fund has exposure to foreign currencies) to decline in value. Currency exchange rates may fluctuate significantly over short periods of time. To the extent that a Fund also invests in securities of issuers located in emerging markets, these risks may be more pronounced.
71
GOLDMAN SACHS TAX-ADVANTAGED EQUITY FUNDS
Notes to Financial Statements (continued)
June 30, 2021 (Unaudited)
|
| 9. OTHER RISKS (continued) |
Foreign Custody Risk — A Fund invests in foreign securities, and as such the Fund may hold such securities and cash with foreign banks, agents, and securities depositories appointed by the Fund’s custodian (each a “Foreign Custodian”). Some foreign custodians may be recently organized or new to the foreign custody business. In some countries, Foreign Custodians may be subject to little or no regulatory oversight over, or independent evaluation of, their operations. Further, the laws of certain countries may place limitations on a Fund’s ability to recover its assets if a Foreign Custodian enters bankruptcy. Investments in emerging markets may be subject to even greater custody risks than investments in more developed markets. Custody services in emerging market countries are very often undeveloped and may be considerably less well regulated than in more developed countries, and thus may not afford the same level of investor protection as would apply in developed countries.
Investments in Other Investment Companies Risk — As a shareholder of another investment company, a Fund will indirectly bear its proportionate share of any net management fees and other expenses paid by such other investment companies, in addition to the fees and expenses regularly borne by the Fund.
Large Shareholder Transactions Risk — A Fund may experience adverse effects when certain large shareholders, such as other funds, institutional investors (including those trading by use of non-discretionary mathematical formulas), financial intermediaries (who may make investment decisions on behalf of underlying clients and/or include a Fund in their investment model), individuals, accounts and Goldman Sachs affiliates, purchase or redeem large amounts of shares of a Fund. Such large shareholder redemptions, which may occur rapidly or unexpectedly, may cause a Fund to sell portfolio securities at times when it would not otherwise do so, which may negatively impact a Fund’s NAV and liquidity. These transactions may also accelerate the realization of taxable income to shareholders if such sales of investments resulted in gains, and may also increase transaction costs. In addition, a large redemption could result in a Fund’s current expenses being allocated over a smaller asset base, leading to an increase in the Fund’s expense ratio. Similarly, large Fund share purchases may adversely affect a Fund’s performance to the extent that the Fund is delayed in investing new cash or otherwise maintains a larger cash position than it ordinarily would.
Liquidity Risk — A Fund may make investments that are illiquid or that may become less liquid in response to market developments or adverse investor perceptions. Illiquid investments may be more difficult to value. Liquidity risk may also refer to the risk that a Fund will not be able to pay redemption proceeds within the allowable time period or without significant dilution to remaining investors’ interests because of unusual market conditions, an unusually high volume of redemption requests, or other reasons. To meet redemption requests, a Fund may be forced to sell investments at an unfavorable time and/or under unfavorable conditions.
If a Fund is forced to sell securities at an unfavorable time and/or under unfavorable conditions, such sales may adversely affect the Fund’s NAV and dilute remaining investors’ interests. These risks may be more pronounced in connection with a Fund’s investments in securities of issuers located in emerging market countries. Redemptions by large shareholders may have a negative impact on a Fund’s liquidity.
Market and Credit Risks — In the normal course of business, a Fund trades financial instruments and enters into financial transactions where risk of potential loss exists due to changes in the market (market risk). The value of the securities in which a Fund invests may go up or down in response to the prospects of individual companies, particular sectors or governments and/or general economic conditions throughout the world due to increasingly interconnected global economies and financial markets. Events such as war, acts of terrorism, social unrest, natural disasters, the spread of infectious illness or other public health threats could also significantly impact a Fund and its investments. Additionally, a Fund may also be exposed to credit risk in the event that an issuer or guarantor fails to perform or that an institution or entity with which the Fund has unsettled or open transactions defaults.
Under the Trust’s organizational documents, its Trustees, officers, employees and agents are indemnified, to the extent permitted by the Act and state law, against certain liabilities that may arise out of performance of their duties to the Funds. Additionally, in the course of business, the Funds enter into contracts that contain a variety of indemnification clauses. The Funds’ maximum exposure under these arrangements is unknown, as this would involve future claims that may be made against the Funds that have not yet occurred. However, GSAM believes the risk of loss under these arrangements to be remote.
72
GOLDMAN SACHS TAX-ADVANTAGED EQUITY FUNDS
Subsequent events after the Statements of Assets and Liabilities date have been evaluated, and GSAM has concluded that there is no impact requiring adjustment or disclosure in the financial statements.
|
| 12. SUMMARY OF SHARE TRANSACTIONS |
Share activity is as follows:
| | | | | | | | | | | | | | | | |
| | | U.S. Equity Dividend and Premium Fund | |
| | | For the Six Months Ended
June 30, 2021
(Unaudited) | | | For the Fiscal Year Ended
December 31, 2020 | |
| | | | |
| | | Shares | | | Dollars | | | Shares | | | Dollars | |
| | | | |
| Class A Shares | | | | | | | | | | | | | | | | |
Shares sold | | | 1,799,387 | | | $ | 27,034,365 | | | | 2,601,527 | | | $ | 34,248,716 | |
Reinvestment of distributions | | | 45,805 | | | | 704,895 | | | | 584,009 | | | | 7,945,436 | |
Shares redeemed | | | (1,026,459 | ) | | | (15,454,075 | ) | | | (8,235,498 | ) | | | (98,280,277 | ) |
| | | | 818,733 | | | | 12,285,185 | | | | (5,049,962 | ) | | | (56,086,125 | ) |
| Class C Shares | | | | | | | | | | | | | | | | |
Shares sold | | | 362,470 | | | | 5,462,960 | | | | 833,219 | | | | 11,031,713 | |
Reinvestment of distributions | | | 8,103 | | | | 122,739 | | | | 471,148 | | | | 6,434,889 | |
Shares redeemed | | | (1,674,598 | ) | | | (25,077,708 | ) | | | (3,483,419 | ) | | | (44,305,190 | ) |
| | | | (1,304,025 | ) | | | (19,492,009 | ) | | | (2,179,052 | ) | | | (26,838,588 | ) |
| Institutional Shares | | | | | | | | | | | | | | | | |
Shares sold | | | 8,187,854 | | | | 123,479,969 | | | | 38,250,549 | | | | 483,838,534 | |
Reinvestment of distributions | | | 458,596 | | | | 7,045,947 | | | | 5,239,327 | | | | 71,089,349 | |
Shares redeemed | | | (11,276,881 | ) | | | (168,597,142 | ) | | | (48,141,547 | ) | | | (590,714,675 | ) |
| | | | (2,630,431 | ) | | | (38,071,226 | ) | | | (4,651,671 | ) | | | (35,786,792 | ) |
| Investor Shares | | | | | | | | | | | | | | | | |
Shares sold | | | 2,968,202 | | | | 44,714,985 | | | | 5,801,640 | | | | 73,329,566 | |
Reinvestment of distributions | | | 165,517 | | | | 2,543,727 | | | | 2,092,102 | | | | 28,306,656 | |
Shares redeemed | | | (4,549,088 | ) | | | (68,222,872 | ) | | | (14,526,808 | ) | | | (184,500,914 | ) |
| | | | (1,415,369 | ) | | | (20,964,160 | ) | | | (6,633,066 | ) | | | (82,864,692 | ) |
| Class R6 Shares | | | | | | | | | | | | | | | | |
Shares sold | | | 1,793,779 | | | | 26,972,495 | | | | 426,781 | | | | 5,834,309 | |
Reinvestment of distributions | | | 92,773 | | | | 1,426,811 | | | | 1,083,068 | | | | 14,599,528 | |
Shares redeemed | | | (1,857,673 | ) | | | (27,525,335 | ) | | | (7,453,462 | ) | | | (88,937,447 | ) |
| | | | 28,879 | | | | 873,971 | | | | (5,943,613 | ) | | | (68,503,610 | ) |
| Class P Shares | | | | | | | | | | | | | | | | |
Shares sold | | | 1,825,760 | | | | 27,384,226 | | | | 3,523,930 | | | | 41,863,559 | |
Reinvestment of distributions | | | 274,366 | | | | 4,212,086 | | | | 3,070,150 | | | | 41,483,770 | |
Shares redeemed | | | (2,774,489 | ) | | | (41,952,490 | ) | | | (15,593,577 | ) | | | (186,993,989 | ) |
| | | | (674,363 | ) | | | (10,356,178 | ) | | | (8,999,497 | ) | | | (103,646,660 | ) |
| | | | |
NET DECREASE | | | (5,176,576 | ) | | $ | (75,724,417 | ) | | | (33,456,861 | ) | | $ | (373,726,467 | ) |
73
GOLDMAN SACHS TAX-ADVANTAGED EQUITY FUNDS
Notes to Financial Statements (continued)
June 30, 2021 (Unaudited)
|
| 12. SUMMARY OF SHARE TRANSACTIONS (continued) |
| | | | | | | | | | | | | | | | |
| | | International Equity Dividend and Premium Fund | |
| | | For the Six Months Ended
June 30, 2021
(Unaudited) | | | For the Fiscal Year Ended
December 31, 2020 | |
| | | | |
| | | Shares | | | Dollars | | | Shares | | | Dollars | |
| | | | |
| Class A Shares | | | | | | | | | | | | | | | | |
Shares sold | | | 31,987 | | | $ | 238,959 | | | | 46,550 | | | $ | 307,171 | |
Reinvestment of distributions | | | 3,579 | | | | 26,979 | | | | 7,439 | | | | 46,424 | |
Shares redeemed | | | (28,954 | ) | | | (215,269 | ) | | | (100,693 | ) | | | (611,124 | ) |
| | | | 6,612 | | | | 50,669 | | | | (46,704 | ) | | | (257,529 | ) |
| Class C Shares | | | | | | | | | | | | | | | | |
Shares sold | | | 430 | | | | 3,098 | | | | 6,152 | | | | 39,218 | |
Reinvestment of distributions | | | 417 | | | | 3,049 | | | | 1,935 | | | | 11,582 | |
Shares redeemed | | | (37,717 | ) | | | (268,933 | ) | | | (34,158 | ) | | | (210,609 | ) |
| | | | (36,870 | ) | | | (262,786 | ) | | | (26,071 | ) | | | (159,809 | ) |
| Institutional Shares | | | | | | | | | | | | | | | | |
Shares sold | | | 65,949 | | | | 476,743 | | | | 109,441 | | | | 689,860 | |
Reinvestment of distributions | | | 5,790 | | | | 42,700 | | | | 13,616 | | | | 82,624 | |
Shares redeemed | | | (74,432 | ) | | | (543,268 | ) | | | (1,106,946 | ) | | | (6,253,743 | ) |
| | | | (2,693 | ) | | | (23,825 | ) | | | (983,889 | ) | | | (5,481,259 | ) |
| Investor Shares | | | | | | | | | | | | | | | | |
Shares sold | | | 154,248 | | | | 1,125,741 | | | | 351,438 | | | | 2,270,728 | |
Reinvestment of distributions | | | 9,210 | | | | 67,780 | | | | 18,330 | | | | 111,228 | |
Shares redeemed | | | (83,449 | ) | | | (611,471 | ) | | | (1,009,587 | ) | | | (6,010,595 | ) |
| | | | 80,009 | | | | 582,050 | | | | (639,819 | ) | | | (3,628,639 | ) |
| Class R6 Shares | | | | | | | | | | | | | | | | |
Shares sold | | | 435,279 | | | | 3,204,707 | | | | 1,662,305 | | | | 9,561,833 | |
Reinvestment of distributions | | | 176,309 | | | | 1,299,749 | | | | 475,235 | | | | 2,901,147 | |
Shares redeemed | | | (2,649,957 | ) | | | (19,004,563 | ) | | | (6,685,693 | ) | | | (39,308,643 | ) |
| | | | (2,038,369 | ) | | | (14,500,107 | ) | | | (4,548,153 | ) | | | (26,845,663 | ) |
| Class P Shares | | | | | | | | | | | | | | | | |
Shares sold | | | 341,380 | | | | 2,506,503 | | | | 1,965,602 | | | | 11,940,463 | |
Reinvestment of distributions | | | 157,099 | | | | 1,159,833 | | | | 438,126 | | | | 2,672,667 | |
Shares redeemed | | | (1,689,256 | ) | | | (12,380,273 | ) | | | (9,393,621 | ) | | | (58,501,106 | ) |
| | | | (1,190,777 | ) | | | (8,713,937 | ) | | | (6,989,893 | ) | | | (43,887,976 | ) |
| | | | |
NET DECREASE | | | (3,182,088 | ) | | $ | (22,867,936 | ) | | | (13,234,529 | ) | | $ | (80,260,875 | ) |
74
GOLDMAN SACHS TAX-ADVANTAGED EQUITY FUNDS
|
| 12. SUMMARY OF SHARE TRANSACTIONS (continued) |
| | | | | | | | | | | | | | | | |
| | | U.S. Tax-Managed Equity Fund | |
| | | For the Six Months Ended
June 30, 2021
(Unaudited) | | | For the Fiscal Year Ended
December 31, 2020 | |
| | | | |
| | | Shares | | | Dollars | | | Shares | | | Dollars | |
| | | | |
| Class A Shares | | | | | | | | | | | | | | | | |
Shares sold | | | 152,763 | | | $ | 4,768,231 | | | | 230,549 | | | $ | 5,826,973 | |
Reinvestment of distributions | | | — | | | | — | | | | 10,190 | | | | 300,211 | |
Shares redeemed | | | (129,734 | ) | | | (4,289,268 | ) | | | (382,518 | ) | | | (9,101,459 | ) |
| | | | 23,029 | | | | 478,963 | | | | (141,779 | ) | | | (2,974,275 | ) |
| Class C Shares | | | | | | | | | | | | | | | | |
Shares sold | | | 26,127 | | | | 789,113 | | | | 82,376 | | | | 1,977,542 | |
Shares redeemed | | | (104,576 | ) | | | (3,090,122 | ) | | | (147,321 | ) | | | (3,483,352 | ) |
| | | | (78,449 | ) | | | (2,301,009 | ) | | | (64,945 | ) | | | (1,505,810 | ) |
| Institutional Shares | | | | | | | | | | | | | | | | |
Shares sold | | | 123,976 | | | | 4,155,520 | | | | 254,054 | | | | 6,269,384 | |
Reinvestment of distributions | | | — | | | | — | | | | 8,905 | | | | 268,931 | |
Shares redeemed | | | (89,795 | ) | | | (2,940,825 | ) | | | (438,418 | ) | | | (11,073,817 | ) |
| | | | 34,181 | | | | 1,214,695 | | | | (175,459 | ) | | | (4,535,502 | ) |
| Service Shares | | | | | | | | | | | | | | | | |
Shares sold | | | 4,488 | | | | 145,720 | | | | 12,129 | | | | 243,756 | |
Reinvestment of distributions | | | — | | | | — | | | | 191 | | | | 5,650 | |
Shares redeemed | | | (5,418 | ) | | | (176,898 | ) | | | (12,000 | ) | | | (271,889 | ) |
| | | | (930 | ) | | | (31,178 | ) | | | 320 | | | | (22,483 | ) |
| Investor Shares | | | | | | | | | | | | | | | | |
Shares sold | | | 17,664 | | | | 579,770 | | | | 32,763 | | | | 873,594 | |
Reinvestment of distributions | | | — | | | | — | | | | 3,269 | | | | 97,847 | |
Shares redeemed | | | (12,731 | ) | | | (413,019 | ) | | | (341,975 | ) | | | (7,367,830 | ) |
| | | | 4,933 | | | | 166,751 | | | | (305,943 | ) | | | (6,396,389 | ) |
| Class R6 Shares | | | | | | | | | | | | | | | | |
Shares sold | | | 6,231,908 | | | | 201,001,171 | | | | 3,162,038 | | | | 80,532,569 | |
Reinvestment of distributions | | | — | | | | — | | | | 366,333 | | | | 10,964,359 | |
Shares redeemed | | | (885,179 | ) | | | (29,336,361 | ) | | | (9,922,219 | ) | | | (233,723,879 | ) |
Shares redeemed in connection with in-kind transactions | | | (1,187,783 | ) | | | (42,000,000 | ) | | | (3,599,438 | ) | | | (92,360,000 | ) |
| | | | 4,158,946 | | | | 129,664,810 | | | | (9,993,286 | ) | | | (234,586,951 | ) |
| Class P Shares | | | | | | | | | | | | | | | | |
Shares sold | | | 410,940 | | | | 13,442,799 | | | | 808,573 | | | | 21,143,747 | |
Reinvestment of distributions | | | — | | | | — | | | | 36,098 | | | | 1,080,769 | |
Shares redeemed | | | (56,663 | ) | | | (1,869,166 | ) | | | (1,132,969 | ) | | | (26,777,174 | ) |
| | | | 354,277 | | | | 11,573,633 | | | | (288,298 | ) | | | (4,552,658 | ) |
| | | | |
NET INCREASE (DECREASE) | | | 4,495,987 | | | $ | 140,766,665 | | | | (10,969,390 | ) | | $ | (254,574,068 | ) |
75
GOLDMAN SACHS TAX-ADVANTAGED EQUITY FUNDS
Notes to Financial Statements (continued)
June 30, 2021 (Unaudited)
|
| 12. SUMMARY OF SHARE TRANSACTIONS (continued) |
| | | | | | | | | | | | | | | | |
| | | International Tax-Managed Equity Fund | |
| | | For the Six Months Ended
June 30, 2021
(Unaudited) | | | For the Fiscal Year Ended
December 31, 2020 | |
| | | | |
| | | Shares | | | Dollars | | | Shares | | | Dollars | |
| | | | |
| Class A Shares | | | | | | | | | | | | | | | | |
Shares sold | | | 64,657 | | | $ | 760,967 | | | | 84,208 | | | $ | 821,313 | |
Reinvestment of distributions | | | — | | | | — | | | | 7,405 | | | | 83,156 | |
Shares redeemed | | | (66,884 | ) | | | (785,732 | ) | | | (310,258 | ) | | | (3,026,467 | ) |
| | | | (2,227 | ) | | | (24,765 | ) | | | (218,645 | ) | | | (2,121,998 | ) |
| Class C Shares | | | | | | | | | | | | | | | | |
Shares sold | | | 6,581 | | | | 78,043 | | | | 8,916 | | | | 89,144 | |
Reinvestment of distributions | | | — | | | | — | | | | 419 | | | | 4,591 | |
Shares redeemed | | | (19,281 | ) | | | (221,414 | ) | | | (41,872 | ) | | | (396,482 | ) |
| | | | (12,700 | ) | | | (143,371 | ) | | | (32,537 | ) | | | (302,747 | ) |
| Institutional Shares | | | | | | | | | | | | | | | | |
Shares sold | | | 82,789 | | | | 974,990 | | | | 425,300 | | | | 3,682,625 | |
Reinvestment of distributions | | | — | | | | — | | | | 12,653 | | | | 141,843 | |
Shares redeemed | | | (79,334 | ) | | | (938,553 | ) | | | (1,069,674 | ) | | | (9,576,961 | ) |
| | | | 3,455 | | | | 36,437 | | | | (631,721 | ) | | | (5,752,493 | ) |
| Investor Shares | | | | | | | | | | | | | | | | |
Shares sold | | | 61,162 | | | | 727,411 | | | | 363,286 | | | | 3,346,656 | |
Reinvestment of distributions | | | — | | | | — | | | | 10,746 | | | | 120,463 | |
Shares redeemed | | | (130,987 | ) | | | (1,538,820 | ) | | | (1,327,906 | ) | | | (12,221,352 | ) |
| | | | (69,825 | ) | | | (811,409 | ) | | | (953,874 | ) | | | (8,754,233 | ) |
| Class R6 Shares | | | | | | | | | | | | | | | | |
Shares sold | | | 3,308,379 | | | | 38,759,706 | | | | 5,488,866 | | | | 50,095,940 | |
Reinvestment of distributions | | | — | | | | — | | | | 853,777 | | | | 9,502,533 | |
Shares redeemed | | | (937,603 | ) | | | (11,114,332 | ) | | | (13,180,661 | ) | | | (120,467,112 | ) |
Shares redeemed in connection with in-kind transactions | | | (4,913,386 | ) | | | (56,160,000 | ) | | | — | | | | — | |
| | | | (2,542,610 | ) | | | (28,514,626 | ) | | | (6,838,018 | ) | | | (60,868,639 | ) |
| Class P Shares | | | | | | | | | | | | | | | | |
Shares sold | | | 374,895 | | | | 4,382,385 | | | | 2,908,942 | | | | 23,577,991 | |
Reinvestment of distributions | | | — | | | | — | | | | 89,654 | | | | 998,749 | |
Shares redeemed | | | (87,042 | ) | | | (1,030,316 | ) | | | (3,351,805 | ) | | | (29,770,726 | ) |
| | | | |
| | | | 287,853 | | | | 3,352,069 | | | | (353,209 | ) | | | (5,193,986 | ) |
| | | | |
NET DECREASE | | | (2,336,054 | ) | | $ | (26,105,665 | ) | | | (9,028,004 | ) | | $ | (82,994,096 | ) |
76
GOLDMAN SACHS TAX-ADVANTAGED EQUITY FUNDS
Liquidity Risk Management Program (Unaudited)
Each Fund has adopted and implemented a liquidity risk management program (the “Program”) in accordance with Rule 22e-4 under the 1940 Act. The Program seeks to assess and manage each Fund’s liquidity risk, i.e., the risk that a Fund is unable to satisfy redemption requests without significantly diluting remaining investors’ interests in the Fund. The Board of Trustees of the Trust has designated GSAM, each Fund’s investment adviser, to administer the Program. Certain aspects of the Program rely on third parties to perform certain functions, including the provision of market data and application of models.
The Program is comprised of various components designed to support the assessment and/or management of liquidity risk, including: (1) the periodic assessment (no less frequently than annually) of certain factors that influence a Fund’s liquidity risk; (2) the periodic classification (no less frequently than monthly) of a Fund’s investments into one of four liquidity categories that reflect an estimate of their liquidity under current market conditions; (3) a 15% limit on the acquisition of “illiquid investments” (as defined under Rule 22e-4); (4) for a Fund that does not invest primarily in “highly liquid investments” (as defined under Rule 22e-4), the determination of a minimum percentage of the Fund’s assets that will generally be invested in highly liquid investments (a “Highly Liquid Investment Minimum”); and (5) periodic reporting to the Board of Trustees.
At a meeting of the Board of Trustees on February 9-10, 2021, GSAM provided a written report to the Board addressing the operation, and the adequacy and effectiveness of the implementation, of the Program, including, as applicable, the operation of any Highly Liquid Investment Minimum and any material changes to the Program, for the period from January 1, 2020 through December 31, 2020 (the “Reporting Period”). Among other things, the annual report and related materials discussed: (1) the results of stress tests designed to assess liquidity under a hypothetical stressed scenario involving elevated redemptions; (2) an assessment of the methodologies used to classify investments into one of four liquidity categories; and (3) the impact of the COVID-19 pandemic on liquidity and management of liquidity risk during the Reporting Period, including during stressed market conditions caused by the COVID-19 pandemic. The report concluded that the Program continues to be reasonably designed to assess and manage liquidity risk and was adequately and effectively implemented during the Reporting Period.
There can be no assurance that the Program will achieve its objectives under all circumstances in the future. Please refer to your Fund’s prospectus for more information regarding the Fund’s exposure to liquidity risk and other risks to which it may be subject.
77
GOLDMAN SACHS TAX-ADVANTAGED EQUITY FUNDS
Fund Expenses — Six Month Period Ended June 30, 2021 (Unaudited)
As a shareholder of Class A, Class C, Institutional, Service, Investor, Class R6 or Class P Shares of a Fund you incur two types of costs: (1) transaction costs, including sales charges on purchase payments (with respect to Class A Shares) contingent deferred sales charges on redemptions (with respect to Class C Shares), (if any); and (2) ongoing costs, including management fees; distribution and/or service (12b-1) fees (with respect to Class A, Class C and Service Shares); and other Fund expenses. This example is intended to help you understand your ongoing costs (in dollars) of investing in Class A, Class C, Institutional, Service, Investor, Class R6 and Class P Shares of the Funds and to compare these costs with the ongoing costs of investing in other mutual funds.
The example is based on an investment of $1,000 invested at the beginning of the period and held for the entire period from January 01, 2021 through June 30, 2021, which represents a period of 181 days of a 365 day year.
Actual Expenses — The first line under each share class in the table below provides information about actual account values and actual expenses. You may use the information in this line, together with the amount you invested, to estimate the expenses that you paid over the period. Simply divide your account value by $1,000 (for example, an $8,600 account value divided by $1,000=8.6), then multiply the result by the number in the first line under the heading entitled “Expenses Paid” to estimate the expenses you paid on your account during this period.
Hypothetical Example for Comparison Purposes — The second line under each share class in the table below provides information about hypothetical account values and hypothetical expenses based on the Funds’ actual net expense ratio and an assumed rate of return of 5% per year before expenses, which is not the Funds’ actual return. The hypothetical account values and expenses may not be used to estimate the actual ending account balance or expenses you paid for the period. You may use this information to compare the ongoing costs of investing in the Funds and other funds. To do so, compare this 5% hypothetical example with the 5% hypothetical examples that appear in the shareholder reports of the other funds.
Please note that the expenses shown in the table are meant to highlight your ongoing costs only and do not reflect any transactional costs, such as sales charges, redemption fees or exchange fees. Therefore, the second line of the table is useful in comparing ongoing costs only and will not help you determine the relative total costs of owning different funds. In addition, if these transactional costs were included, your costs would have been higher.
| | | | | | | | | | | | | | | | | | | | | | | | | | | | | | | | | | | | | | | | | | | | | | | | |
| | | U.S. Equity Dividend and Premium Fund | | | International Equity Dividend and Premium Fund | | | U.S. Tax-Managed Equity Fund | | | International Tax-Managed Equity Fund | |
| Share Class | | Beginning
Account
Value
01/01/21 | | | Ending
Account
Value
06/30/21 | | | Expenses
Paid for the
6 Months Ended
06/30/21* | | | Beginning
Account
Value
01/01/21 | | | Ending
Account
Value
06/30/21 | | | Expenses
Paid for the
6 Months Ended
06/30/21* | | | Beginning
Account
Value
01/01/21 | | | Ending
Account
Value
06/30/21 | | | Expenses
Paid for the
6 Months Ended
06/30/21* | | | Beginning
Account
Value
01/01/21 | | | Ending
Account
Value
06/30/21 | | | Expenses
Paid for the
6 Months Ended
06/30/21* | |
| | | | | | | | | | | | | |
| Class A | | | | | | | | | | | | | | | | | | | | | | | | | | | | | | | | | | | | | | | | | | | | | | | | |
Actual | | $ | 1,000 | | | $ | 1,126.70 | | | $ | 5.59 | | | $ | 1,000 | | | $ | 1,065.90 | | | $ | 6.30 | | | $ | 1,000 | | | $ | 1,167.60 | | | $ | 5.70 | | | $ | 1,000 | | | $ | 1,083.90 | | | $ | 6.30 | |
Hypothetical 5% return | | | 1,000 | | | | 1,019.54 | + | | | 5.31 | | | | 1,000 | | | | 1,018.70 | + | | | 6.16 | | | | 1,000 | | | | 1,019.54 | + | | | 5.31 | | | | 1,000 | | | | 1,018.74 | + | | | 6.11 | |
| Class C | | | | | | | | | | | | | | | | | | | | | | | | | | | | | | | | | | | | | | | | | | | | | | | | |
Actual | | | 1,000 | | | | 1,122.30 | | | | 9.52 | | | | 1,000 | | | | 1,062.20 | | | | 10.12 | | | | 1,000 | | | | 1,163.00 | | | | 9.71 | | | | 1,000 | | | | 1,080.60 | | | | 10.16 | |
Hypothetical 5% return | | | 1,000 | | | | 1,015.82 | + | | | 9.05 | | | | 1,000 | | | | 1,014.98 | + | | | 9.89 | | | | 1,000 | | | | 1,015.82 | + | | | 9.05 | | | | 1,000 | | | | 1,015.03 | + | | | 9.84 | |
| Institutional | | | | | | | | | | | | | | | | | | | | | | | | | | | | | | | | | | | | | | | | | | | | | | | | |
Actual | | | 1,000 | | | | 1,128.10 | | | | 3.75 | | | | 1,000 | | | | 1,067.60 | | | | 4.56 | | | | 1,000 | | | | 1,169.30 | | | | 3.93 | | | | 1,000 | | | | 1,085.90 | | | | 4.65 | |
Hypothetical 5% return | | | 1,000 | | | | 1,021.27 | + | | | 3.56 | | | | 1,000 | | | | 1,020.38 | + | | | 4.46 | | | | 1,000 | | | | 1,021.17 | + | | | 3.66 | | | | 1,000 | | | | 1,020.33 | + | | | 4.51 | |
| Service | | | | | | | | | | | | | | | | | | | | | | | | | | | | | | | | | | | | | | | | | | | | | | | | |
Actual | | | N/A | | | | N/A | | | | N/A | | | | N/A | | | | N/A | | | | N/A | | | | 1,000 | | | | 1,166.60 | | | | 6.61 | | | | N/A | | | | N/A | | | | N/A | |
Hypothetical 5% return | | | N/A | | | | N/A | | | | N/A | | | | N/A | | | | N/A | | | | N/A | | | | 1,000 | | | | 1,018.70 | + | | | 6.16 | | | | N/A | | | | N/A | | | | N/A | |
| Investor | | | | | | | | | | | | | | | | | | | | | | | | | | | | | | | | | | | | | | | | | | | | | | | | |
Actual | | | 1,000 | | | | 1,128.30 | | | | 4.27 | | | | 1,000 | | | | 1,067.30 | | | | 5.02 | | | | 1,000 | | | | 1,168.90 | | | | 4.36 | | | | 1,000 | | | | 1,085.00 | | | | 5.01 | |
Hypothetical 5% return | | | 1,000 | | | | 1,020.78 | + | | | 4.06 | | | | 1,000 | | | | 1,019.93 | + | | | 4.91 | | | | 1,000 | | | | 1,020.78 | + | | | 4.06 | | | | 1,000 | | | | 1,019.98 | + | | | 4.86 | |
| Class R6 | | | | | | | | | | | | | | | | | | | | | | | | | | | | | | | | | | | | | | | | | | | | | | | | |
Actual | | | 1,000 | | | | 1,128.30 | | | | 3.69 | | | | 1,000 | | | | 1,067.60 | | | | 4.51 | | | | 1,000 | | | | 1,169.50 | | | | 3.87 | | | | 1,000 | | | | 1,085.60 | | | | 4.60 | |
Hypothetical 5% return | | | 1,000 | | | | 1,021.32 | + | | | 3.51 | | | | 1,000 | | | | 1,020.43 | + | | | 4.41 | | | | 1,000 | | | | 1,021.22 | + | | | 3.61 | | | | 1,000 | | | | 1,020.38 | + | | | 4.46 | |
| Class P | | | | | | | | | | | | | | | | | | | | | | | | | | | | | | | | | | | | | | | | | | | | | | | | |
Actual | | | 1,000 | | | | 1,129.00 | | | | 3.70 | | | | 1,000 | | | | 1,067.50 | | | | 4.51 | | | | 1,000 | | | | 1,169.50 | | | | 3.87 | | | | 1,000 | | | | 1,086.50 | | | | 4.60 | |
Hypothetical 5% return | | | 1,000 | | | | 1,021.32 | + | | | 3.51 | | | | 1,000 | | | | 1,020.43 | + | | | 4.41 | | | | 1,000 | | | | 1,021.22 | + | | | 3.61 | | | | 1,000 | | | | 1,020.38 | + | | | 4.46 | |
| + | | Hypothetical expenses are based on each Fund’s actual annualized net expense ratios and an assumed rate of return of 5% per year before expenses. |
| * | | Expenses are calculated using each Fund’s annualized net expense ratio for each class, which represents the ongoing expenses as a percentage of net assets for the six months ended June 30, 2021 . Expenses are calculated by multiplying the annualized net expense ratio by the average account value for the period; then multiplying the result by the number of days in the most recent fiscal half year; and then dividing that result by the number of days in the fiscal year. The annualized net expense ratios for the period were as follows: |
| | | | | | | | | | | | | | | | | | | | | | | | | | | | |
| Fund | | Class A | | | Class C | | | Institutional | | | Service | | | Investor | | | Class R6 | | | Class P | |
U.S. Equity Dividend and Premium | | | 1.06 | % | | | 1.81 | % | | | 0.71 | % | | | N/A | | | | 0.81 | % | | | 0.70 | % | | | 0.70 | % |
International Equity Dividend and Premium | | | 1.23 | | | | 1.98 | | | | 0.89 | | | | N/A | | | | 0.98 | | | | 0.88 | | | | 0.88 | |
U.S. Tax-Managed Equity | | | 1.06 | | | | 1.81 | | | | 0.73 | | | | 1.23 | % | | | 0.81 | | | | 0.72 | | | | 0.72 | |
International Tax-Managed Equity | | | 1.22 | | | | 1.97 | | | | 0.90 | | | | N/A | | | | 0.97 | | | | 0.89 | | | | 0.89 | |
78
GOLDMAN SACHS TAX-ADVANTAGED EQUITY FUNDS
Statement Regarding Basis for Approval of Management Agreement (Unaudited)
Background
The Goldman Sachs International Equity Dividend and Premium Fund, Goldman Sachs International Tax-Managed Equity Fund, Goldman Sachs U.S. Equity Dividend and Premium Fund, and Goldman Sachs U.S. Tax-Managed Equity Fund (the “Funds”) are investment portfolios of Goldman Sachs Trust (the “Trust”). The Board of Trustees oversees the management of the Trust and reviews the investment performance and expenses of the Funds at regularly scheduled meetings held throughout the year. In addition, the Board of Trustees determines annually whether to approve the continuance of the Trust’s investment management agreement (the “Management Agreement”) with Goldman Sachs Asset Management, L.P. (the “Investment Adviser”) on behalf of the Funds.
The Management Agreement was most recently approved for continuation until June 30, 2022 by the Board of Trustees, including those Trustees who are not parties to the Management Agreement or “interested persons” (as defined in the Investment Company Act of 1940, as amended) of any party thereto (the “Independent Trustees”), at a meeting held on June 15-16, 2021 (the “Annual Meeting”).
The review process undertaken by the Trustees spans the course of the year and culminates with the Annual Meeting. To assist the Trustees in their deliberations, the Trustees have established a Contract Review Committee (the “Committee”), comprised of the Independent Trustees. The Committee held two meetings over the course of the year since the Management Agreement was last approved. At those Committee meetings, regularly scheduled Board or other committee meetings, and/or the Annual Meeting, matters relevant to the renewal of the Management Agreement were considered by the Board, or the Independent Trustees, as applicable. With respect to each Fund, such matters included:
| | (a) | | the nature and quality of the advisory, administrative, and other services provided to the Fund by the Investment Adviser and its affiliates, including information about: |
| | (i) | | the structure, staff, and capabilities of the Investment Adviser and its portfolio management teams; |
| | (ii) | | the groups within the Investment Adviser and its affiliates that support the portfolio management teams or provide other types of necessary services, including fund services groups (e.g., accounting and financial reporting, tax, shareholder services, and operations); controls and risk management groups (e.g., legal, compliance, valuation oversight, credit risk management, internal audit, compliance testing, market risk analysis, finance, and central funding); sales and distribution support groups, and others (e.g., information technology and training); |
| | (iii) | | trends in employee headcount; |
| | (iv) | | the Investment Adviser’s financial resources and ability to hire and retain talented personnel and strengthen its operations; and |
| | (v) | | the parent company’s support of the Investment Adviser and its mutual fund business, as expressed by the firm’s senior management; |
| | (b) | | information on the investment performance of the Fund, including comparisons to the performance of similar mutual funds, as provided by a third-party mutual fund data provider engaged as part of the contract review process (the “Outside Data Provider”), and a benchmark performance index; and information on general investment outlooks in the markets in which the Fund invests; |
| | (c) | | information provided by the Investment Adviser indicating the Investment Adviser’s views on whether the Fund’s peer group and/or benchmark index had high, medium, or low relevance given the Fund’s particular investment strategy; |
| | (d) | | the terms of the Management Agreement and other agreements with affiliated service providers entered into by the Trust on behalf of the Fund; |
| | (e) | | fee and expense information for the Fund, including: |
| | (i) | | the relative management fee and expense levels of the Fund as compared to those of comparable funds managed by other advisers, as provided by the Outside Data Provider; |
| | (ii) | | the Fund’s expense trends over time; and |
| | (iii) | | to the extent the Investment Adviser manages other types of accounts (such as bank collective trusts, private wealth management accounts, institutional separate accounts, sub-advised mutual funds, and non-U.S. funds) having investment objectives and policies similar to those of the Fund, comparative information on the advisory fees charged and services provided to those accounts by the Investment Adviser; |
| | (f) | | with respect to the extensive investment performance and expense comparison data provided by the Outside Data Provider, its processes in producing that data for the Fund; |
| | (g) | | the undertakings of the Investment Adviser and its affiliates to implement fee waivers and/or expense limitations; |
| | (h) | | information relating to the profitability of the Management Agreement and the transfer agency and distribution and service arrangements of the Fund to the Investment Adviser and its affiliates; |
| | (i) | | whether the Fund’s existing management fee schedule adequately addressed any economies of scale; |
79
GOLDMAN SACHS TAX-ADVANTAGED EQUITY FUNDS
Statement Regarding Basis for Approval of Management Agreement (Unaudited) (continued)
| | (j) | | a summary of the “fall-out” benefits derived by the Investment Adviser and its affiliates from their relationships with the Fund, including the fees received by the Investment Adviser’s affiliates from the Fund for transfer agency, securities lending, portfolio trading, distribution and other services; |
| | (k) | | a summary of potential benefits derived by the Fund as a result of its relationship with the Investment Adviser; |
| | (l) | | information regarding commissions paid by the Fund and broker oversight, other information regarding portfolio trading, and how the Investment Adviser carries out its duty to seek best execution; |
| | (m) | | portfolio manager ownership of Fund shares; the manner in which portfolio manager compensation is determined; and the number and types of accounts managed by the portfolio managers; |
| | (n) | | the nature and quality of the services provided to the Fund by its unaffiliated service providers, and the Investment Adviser’s general oversight and evaluation (including reports on due diligence) of those service providers as part of the administrative services provided under the Management Agreement; and |
| | (o) | | the Investment Adviser’s processes and policies addressing various types of potential conflicts of interest; its approach to risk management; the annual review of the effectiveness of the Fund’s compliance program; and periodic compliance reports. |
The Trustees also received an overview of the Funds’ distribution arrangements. They received information regarding the Funds’ assets, share purchase and redemption activity, and payment of distribution, service, and shareholder administration fees, as applicable. Information was also provided to the Trustees relating to revenue sharing payments made by and services provided by the Investment Adviser and its affiliates to intermediaries that promote the sale, distribution, and/or servicing of Fund shares. The Independent Trustees also discussed the broad range of other investment choices that are available to Fund investors, including the availability of comparable funds managed by other advisers.
The presentations made at the Board and Committee meetings and at the Annual Meeting encompassed the Funds and other mutual funds for which the Board of Trustees has responsibility. In evaluating the Management Agreement at the Annual Meeting, the Trustees relied upon their knowledge, resulting from their meetings and other interactions throughout the year, of the Investment Adviser and its affiliates, their services, and the Funds. In conjunction with these meetings, the Trustees received written materials and oral presentations on the topics covered, and the Investment Adviser addressed the questions and concerns of the Trustees, including concerns regarding the investment performance of certain of the funds they oversee. The Independent Trustees were advised by their independent legal counsel regarding their responsibilities and other regulatory requirements related to the approval and continuation of mutual fund investment management agreements under applicable law. In addition, the Investment Adviser and its affiliates provided the Independent Trustees with a written response to a formal request for information sent on behalf of the Independent Trustees by their independent legal counsel. During the course of their deliberations, the Independent Trustees met in executive sessions with their independent legal counsel, without representatives of the Investment Adviser or its affiliates present.
Nature, Extent, and Quality of the Services Provided Under the Management Agreement
As part of their review, the Trustees considered the nature, extent, and quality of the services provided to the Funds by the Investment Adviser. In this regard, the Trustees considered both the investment advisory services and non-advisory services that are provided by the Investment Adviser and its affiliates. The Trustees noted the transition in the leadership and changes in personnel of various of the Investment Adviser’s portfolio management teams that had occurred in recent periods, and the ongoing recruitment efforts aimed at bringing high quality investment talent to the Investment Adviser. They also noted the Investment Adviser’s commitment to maintaining high quality systems and expending substantial resources to respond to ongoing changes to the market, regulatory and control environment in which the Funds and their service providers operate, including changes associated with the COVID-19 pandemic, as well as the efforts of the Investment Adviser and its affiliates to combat cyber security risks. The Trustees also considered information regarding the Investment Adviser’s business continuity planning and remote operations capabilities. The Trustees concluded that the Investment Adviser continued to commit substantial financial and operational resources to the Funds and expressed confidence that the Investment Adviser would continue to do so in the future. The Trustees also recognized that the Investment Adviser had made significant commitments to address regulatory compliance requirements applicable to the Funds and the Investment Adviser and its affiliates.
Investment Performance
The Trustees also considered the investment performance of the Funds. In this regard, they compared the investment performance of each Fund to its peers using rankings and ratings compiled by the Outside Data Provider as of December 31, 2020, and updated performance information prepared by the Investment Adviser using the peer group identified by the Outside Data Provider as of March 31, 2021. The information on each Fund’s investment performance was provided for the one-, three-, five-,
80
GOLDMAN SACHS TAX-ADVANTAGED EQUITY FUNDS
Statement Regarding Basis for Approval of Management Agreement (Unaudited) (continued)
and ten-year periods ending on the applicable dates. The Trustees also reviewed each Fund’s investment performance relative to its performance benchmark. As part of this review, they considered the investment performance trends of the Funds over time, and reviewed the investment performance of each Fund in light of its investment objective and policies and market conditions.
In addition, the Trustees considered materials prepared and presentations made by the Investment Adviser’s senior management and portfolio management personnel in which Fund performance was assessed. The Trustees also considered the Investment Adviser’s periodic reports with respect to the Funds’ risk profiles, and how the Investment Adviser’s approach to risk monitoring and management influences portfolio management. They noted the efforts of the Funds’ portfolio management team to continue to enhance the investment models used in managing the Funds.
The Trustees observed that the International Equity Dividend and Premium Fund’s Institutional Shares had placed in the fourth quartile of the Fund’s peer group for the one-, three-, five-, and ten-year periods, and had underperformed the Fund’s benchmark index for the one-, three-, five-, and ten-year periods ended March 31, 2021. They noted that the International Equity Dividend and Premium Fund had experienced certain portfolio management changes in 2020. The Trustees considered that the International Tax-Managed Equity Fund’s Institutional Shares had placed in the top half of the Fund’s peer group for the ten-year period, in the third quartile for the one- and five-year periods, and in the fourth quartile for the three-year period, and had outperformed the Fund’s benchmark index for the one- and ten-year periods and underperformed for the three- and five-year periods ended March 31, 2021. They noted that the U.S. Equity Dividend and Premium Fund’s Institutional Shares had placed in the fourth quartile of the Fund’s peer group for the one-, three-, five-, and ten-year periods, and had underperformed the Fund’s benchmark index for the one-, three , five-, and ten-year periods ended March 31, 2021. The Trustees considered that the U.S. Equity Dividend and Premium Fund had experienced certain portfolio management changes in 2020. They observed that the U.S. Tax-Managed Equity Fund’s Institutional Shares had placed in the top half of the Fund’s peer group for the one- and ten-year periods, the third quartile for the five-year period, and in the fourth quartile for the three-year period, and had underperformed the Fund’s benchmark index for the one-, three-, five-, and ten-year periods ended March 31, 2021. The Trustees noted that the U.S. Tax-Managed Equity Fund had experienced certain portfolio management changes in 2020.
Costs of Services Provided and Competitive Information
The Trustees considered the contractual terms of the Management Agreement and the fee rates payable by each Fund thereunder. In this regard, the Trustees considered information on the services rendered by the Investment Adviser to the Funds, which included both advisory and administrative services that were directed to the needs and operations of the Funds as registered mutual funds.
In particular, the Trustees reviewed analyses prepared by the Outside Data Provider regarding the expense rankings of the Funds. The analyses provided a comparison of each Fund’s management fee and breakpoints to those of a relevant peer group and category universe; an expense analysis which compared each Fund’s overall net and gross expenses to a peer group and a category universe; and data comparing each Fund’s net expenses to the peer and category medians. The analyses also compared each Fund’s other expenses and fee waivers/reimbursements to those of the peer group and category medians. The Trustees concluded that the comparisons provided by the Outside Data Provider were useful in evaluating the reasonableness of the management fees and total expenses paid by the Funds.
In addition, the Trustees considered the Investment Adviser’s undertakings to implement fee waivers and/or expense limitations. The Trustees also noted that certain changes were being made to existing fee waiver or expense limitation arrangements of the U.S. Equity Dividend and Premium Fund that would have the effect of decreasing expenses of Class A, Class C, and Investor Shares of the Fund, with such changes taking effect in connection with the Fund’s next annual registration statement update. They also considered, to the extent that the Investment Adviser manages other types of accounts having investment objectives and policies similar to those of the Funds, comparative fee information for services provided by the Investment Adviser to those accounts, and information that indicated that services provided to the Funds differed in various significant respects from the services provided to other types of accounts which, in many cases, operated under less stringent legal and regulatory structures, required fewer services from the Investment Adviser to a smaller number of client contact points, and were less time-intensive.
In addition, the Trustees noted that shareholders are able to redeem their Fund shares at any time if shareholders believe that the Fund fees and expenses are too high or if they are dissatisfied with the performance of the Fund.
Profitability
The Trustees reviewed each Fund’s contribution to the Investment Adviser’s revenues and pre-tax profit margins. In this regard the Trustees noted that they had received, among other things, profitability analyses and summaries, revenue and expense schedules by Fund and by function (i.e., investment management, transfer agency and distribution and service), and information on
81
GOLDMAN SACHS TAX-ADVANTAGED EQUITY FUNDS
Statement Regarding Basis for Approval of Management Agreement (Unaudited) (continued)
the Investment Adviser’s expense allocation methodology. They observed that the profitability and expense figures are substantially similar to those used by the Investment Adviser for many internal purposes, including compensation decisions among various business groups, and are thus subject to a vigorous internal debate about how certain revenue and expenses should be allocated. The Trustees also noted that the internal audit group within the Goldman Sachs organization periodically audits the expense allocation methodology and that the internal audit group was satisfied with the reasonableness, consistency, and accuracy of the Investment Adviser’s expense allocation methodology. Profitability data for each Fund was provided for 2020 and 2019, and the Trustees considered this information in relation to the Investment Adviser’s overall profitability.
Economies of Scale
The Trustees considered the information that had been provided regarding whether there have been economies of scale with respect to the management of the Funds. The Trustees also considered the breakpoints in the fee rate payable under the Management Agreement for each of the Funds at the following annual percentage rates of the average daily net assets of the Funds:
| | | | | | | | | | | | | | | | |
| | | International Equity
Dividend and
Premium Fund | | | International
Tax-Managed
Equity Fund | | | U.S. Equity
Dividend and
Premium Fund | | | U.S.
Tax-Managed
Equity Fund | |
| | | | |
| First $1 billion | | | 0.81 | % | | | 0.85 | % | | | 0.75 | % | | | 0.70 | % |
| | | | |
| Next $1 billion | | | 0.73 | | | | 0.77 | | | | 0.68 | | | | 0.63 | |
| | | | |
| Next $3 billion | | | 0.69 | | | | 0.73 | | | | 0.65 | | | | 0.60 | |
| | | | |
| Next $3 billion | | | 0.68 | | | | 0.72 | | | | 0.64 | | | | 0.59 | |
| | | | |
| Over $8 billion | | | 0.67 | | | | 0.71 | | | | 0.63 | | | | 0.58 | |
The Trustees noted that the breakpoints were designed to share potential economies of scale, if any, with the Funds and their shareholders as assets under management reach those asset levels. The Trustees considered the amounts of assets in the Funds; the Funds’ recent share purchase and redemption activity; the information provided by the Investment Adviser relating to the costs of the services provided by the Investment Adviser and its affiliates and their realized profits; information comparing fee rates charged by the Investment Adviser with fee rates charged to other funds in the peer groups; and the Investment Adviser’s undertaking to waive a portion of its management fee with respect to U.S. Equity Dividend and Premium Fund and to limit certain expenses of the Funds that exceed specified levels as well as Goldman Sachs & Co. LLC’s (“Goldman Sachs”) undertaking to waive a portion of its transfer agency fee with respect to each of the Funds. Upon reviewing these matters at the Annual Meeting, the Trustees concluded that the fee breakpoints represented a means of assuring that benefits of scalability, if any, would be passed along to shareholders at the specified asset levels. They also noted that the Investment Adviser had passed along savings to shareholders of the U.S. Equity Dividend and Premium Fund and U.S. Tax-Managed Equity Fund, which had asset levels above at least the first breakpoint during the prior fiscal year.
Other Benefits to the Investment Adviser and Its Affiliates
The Trustees also considered the other benefits derived by the Investment Adviser and its affiliates from their relationships with the Funds as stated above, including: (a) transfer agency fees received by Goldman Sachs; (b) brokerage and futures commissions earned by Goldman Sachs for executing securities and futures transactions on behalf of the Funds; (c) trading efficiencies resulting from aggregation of orders of the Funds with those for other funds or accounts managed by the Investment Adviser; (d) fees earned by Goldman Sachs Agency Lending (“GSAL”), an affiliate of the Investment Adviser, as securities lending agent (and fees earned by the Investment Adviser for managing the fund in which the Funds’ cash collateral is invested); (e) the Investment Adviser’s ability to leverage the infrastructure designed to service the Funds on behalf of its other clients; (f) the Investment Adviser’s ability to cross-market other products and services to Fund shareholders; (g) Goldman Sachs’ retention of certain fees as Fund Distributor; (h) the Investment Adviser’s ability to negotiate better pricing with custodians on behalf of its other clients, as a result of the relationship with the Funds; (i) the investment of cash and cash collateral in money market funds managed by the Investment Adviser that will result in increased assets under management for those money market funds; (j) the investment in exchange-traded funds (“ETFs”) managed by the Investment Adviser that will result in increased assets under management for those ETFs and may facilitate the development of the Investment Adviser’s ETF advisory business; and (k) the possibility that the working relationship between the Investment Adviser and the Funds’ third-party service providers may cause those service providers to be more likely to do business with other areas of Goldman Sachs. In the course of considering the foregoing, the Independent Trustees requested and received further information quantifying certain of these fall-out benefits.
82
GOLDMAN SACHS TAX-ADVANTAGED EQUITY FUNDS
Statement Regarding Basis for Approval of Management Agreement (Unaudited) (continued)
Other Benefits to the Funds and Their Shareholders
The Trustees also noted that the Funds receive certain other potential benefits as a result of their relationship with the Investment Adviser, including: (a) trading efficiencies resulting from aggregation of orders of the Funds with those of other funds or accounts managed by the Investment Adviser; (b) enhanced servicing from vendors due to the volume of business generated by the Investment Adviser and its affiliates; (c) enhanced servicing from broker-dealers due to the volume of business generated by the Investment Adviser and its affiliates; (d) the Investment Adviser’s ability to negotiate favorable terms with derivatives counterparties on behalf of the Funds as a result of the size and reputation of the Goldman Sachs organization; (e) the advantages received from the Investment Adviser’s knowledge and experience gained from managing other accounts and products; (f) the Investment Adviser’s ability to hire and retain qualified personnel to provide services to the Funds because of the reputation of the Goldman Sachs organization; (g) the Funds’ access, through the Investment Adviser, to certain firm-wide resources (e.g., proprietary risk management systems and databases), subject to certain restrictions; (h) the Funds’ ability to participate in the securities lending program administered by GSAL, as measured by the revenue received by the Funds in connection with the program; and (i) the Funds’ access to certain affiliated distribution channels. In addition, the Trustees noted the competitive nature of the mutual fund marketplace, and considered that many of the Funds’ shareholders invested in the Funds in part because of the Funds’ relationship with the Investment Adviser and that those shareholders have a general expectation that the relationship will continue.
Conclusion
In connection with their consideration of the Management Agreement, the Trustees gave weight to each of the factors described above, but did not identify any particular factor as controlling their decision. After deliberation and consideration of all of the information provided, including the factors described above, the Trustees concluded, in the exercise of their business judgment, that the management fees paid by each of the Funds were reasonable in light of the services provided to it by the Investment Adviser, the Investment Adviser’s costs and each Fund’s current and reasonably foreseeable asset levels. The Trustees unanimously concluded that the Investment Adviser’s continued management likely would benefit each Fund and its shareholders and that the Management Agreement should be approved and continued with respect to each Fund until June 30, 2022.
83
FUNDS PROFILE
Goldman Sachs Funds
Goldman Sachs is a premier financial services firm, known since 1869 for creating thoughtful and customized investment solutions in complex global markets.
Today, the Asset Management Division of Goldman Sachs serves a diverse set of clients worldwide, including private institutions, public entities and individuals. With approximately $2.09 trillion in assets under supervision as of June 30, 2021, Goldman Sachs Asset Management has portfolio management teams located around the world and our investment professionals bring firsthand knowledge of local markets to every investment decision. Assets under supervision includes assets under management and other client assets for which Goldman Sachs does not have full discretion. GSAM leverages the resources of Goldman Sachs & Co. LLC subject to legal, internal and regulatory restrictions.
Money Market
Financial Square FundsSM
| ∎ | | Financial Square Treasury Solutions Fund1 |
| ∎ | | Financial Square Government Fund1 |
| ∎ | | Financial Square Money Market Fund2 |
| ∎ | | Financial Square Prime Obligations Fund2 |
| ∎ | | Financial Square Treasury Instruments Fund1 |
| ∎ | | Financial Square Treasury Obligations Fund1 |
| ∎ | | Financial Square Federal Instruments Fund1 |
Investor FundsSM
| ∎ | | Investor Money Market Fund3 |
| ∎ | | Investor Tax-Exempt Money Market Fund3 |
Fixed Income
Short Duration and Government
| ∎ | | High Quality Floating Rate Fund |
| ∎ | | Short-Term Conservative Income Fund |
| ∎ | | Short Duration Government Fund |
| ∎ | | Short Duration Bond Fund4 |
| ∎ | | Inflation Protected Securities Fund |
Multi-Sector
| ∎ | | Global Core Fixed Income Fund |
Municipal and Tax-Free
| ∎ | | High Yield Municipal Fund |
| ∎ | | Dynamic Municipal Income Fund |
| ∎ | | Short Duration Tax-Free Fund |
| ∎ | | Municipal Income Completion Fund |
Single Sector
| ∎ | | Investment Grade Credit Fund |
| ∎ | | High Yield Floating Rate Fund |
| ∎ | | Emerging Markets Debt Fund |
| ∎ | | Local Emerging Markets Debt Fund |
Fixed Income Alternatives
| ∎ | | Long Short Credit Strategies Fund |
Fundamental Equity
| ∎ | | Small/Mid Cap Value Fund |
| ∎ | | Small/Mid Cap Growth Fund |
| ∎ | | Concentrated Growth Fund |
| ∎ | | Technology Opportunities Fund |
| ∎ | | Growth Opportunities Fund |
| ∎ | | Rising Dividend Growth Fund |
Tax-Advantaged Equity
| ∎ | | U.S. Tax-Managed Equity Fund |
| ∎ | | International Tax-Managed Equity Fund |
| ∎ | | U.S. Equity Dividend and Premium Fund |
| ∎ | | International Equity Dividend and Premium Fund |
Equity Insights
| ∎ | | Small Cap Equity Insights Fund |
| ∎ | | U.S. Equity Insights Fund |
| ∎ | | Small Cap Growth Insights Fund |
| ∎ | | Large Cap Growth Insights Fund |
| ∎ | | Large Cap Value Insights Fund |
| ∎ | | Small Cap Value Insights Fund |
| ∎ | | International Small Cap Insights Fund |
| ∎ | | International Equity Insights Fund |
| ∎ | | Emerging Markets Equity Insights Fund |
Fundamental Equity International
| ∎ | | International Equity Income Fund |
| ∎ | | International Equity ESG Fund |
| ∎ | | Emerging Markets Equity Fund |
| ∎ | | ESG Emerging Markets Equity Fund |
Alternative
| ∎ | | Real Estate Securities Fund |
| ∎ | | International Real Estate Securities Fund |
| ∎ | | Commodity Strategy Fund |
| ∎ | | Global Real Estate Securities Fund |
| ∎ | | Alternative Premia Fund |
| ∎ | | Absolute Return Tracker Fund |
| ∎ | | Managed Futures Strategy Fund |
| ∎ | | MLP Energy Infrastructure Fund |
| ∎ | | Energy Infrastructure Fund |
| ∎ | | Multi-Manager Alternatives Fund |
| ∎ | | Global Infrastructure Fund |
| ∎ | | Clean Energy Income Fund |
Total Portfolio Solutions
| ∎ | | Global Managed Beta Fund |
| ∎ | | Multi-Manager Non-Core Fixed Income Fund |
| ∎ | | Multi-Manager Global Equity Fund |
| ∎ | | Multi-Manager International Equity Fund |
| ∎ | | Tactical Tilt Overlay Fund |
| ∎ | | Balanced Strategy Portfolio |
| ∎ | | Multi-Manager U.S. Small Cap Equity Fund |
| ∎ | | Multi-Manager Real Assets Strategy Fund |
| ∎ | | Growth and Income Strategy Portfolio |
| ∎ | | Growth Strategy Portfolio |
| ∎ | | Dynamic Global Equity Fund |
| ∎ | | Satellite Strategies Portfolio |
| ∎ | | Enhanced Dividend Global Equity Portfolio |
| ∎ | | Tax-Advantaged Global Equity Portfolio |
| ∎ | | Strategic Volatility Premium Fund |
| ∎ | | Target Date Retirement Portfolio |
| ∎ | | Target Date 2025 Portfolio |
| ∎ | | Target Date 2030 Portfolio |
| ∎ | | Target Date 2035 Portfolio |
| ∎ | | Target Date 2040 Portfolio |
| ∎ | | Target Date 2045 Portfolio |
| ∎ | | Target Date 2050 Portfolio |
| ∎ | | Target Date 2055 Portfolio |
| ∎ | | Target Date 2060 Portfolio |
| ∎ | | GQG Partners International Opportunities Fund |
| 1 | | You could lose money by investing in the Fund. Although the Fund seeks to preserve the value of your investment at $1.00 per share, it cannot guarantee it will do so. An investment in the Fund is not a deposit of a bank and is not insured or guaranteed by the Federal Deposit Insurance Corporation or any other government agency. The Fund’s sponsor has no legal obligation to provide financial support to the Fund, and you should not expect that the sponsor will provide financial support to the Fund at any time. |
| 2 | | You could lose money by investing in the Fund. Because the share price of the Fund will fluctuate, when you sell your shares they may be worth more or less than what you originally paid for them. The Fund may impose a fee upon sale of your shares or may temporarily suspend your ability to sell shares if the Fund’s liquidity falls below required minimums because of market conditions or other factors. An investment in the Fund is not a deposit of a bank and is not insured or guaranteed by the Federal Deposit Insurance Corporation or any other government agency. The Fund’s sponsor has no legal obligation to provide financial support to the Fund, and you should not expect that the sponsor will provide financial support to the Fund at any time. |
| 3 | | You could lose money by investing in the Fund. Although the Fund seeks to preserve the value of your investment at $1.00 per share, it cannot guarantee it will do so. The Fund may impose a fee upon sale of your shares or may temporarily suspend your ability to sell shares if the Fund’s liquidity falls below required minimums because of market conditions or other factors. An investment in the Fund is not a deposit of a bank and is not insured or guaranteed by the Federal Deposit Insurance Corporation or any other government agency. The Fund’s sponsor has no legal obligation to provide financial support to the Fund, and you should not expect that the sponsor will provide financial support to the Fund at any time. |
| 4 | | Effective after the close of business on July 29, 2021, the Goldman Sachs Short Duration Income Fund was renamed the Goldman Sachs Short Duration Bond Fund. |
| 5 | | Effective after the close of business on August 30, 2020, the Goldman Sachs Blue Chip Fund was renamed the Goldman Sachs U.S. Equity ESG Fund. |
| | | Financial Square FundsSM and Investor FundsSM are registered service marks of Goldman Sachs & Co. LLC. |
| * | | This list covers open-end funds only. Please visit our website at www.GSAMFUNDS.com to learn about our closed-end funds and exchange-traded funds. |
| | |
TRUSTEES Jessica Palmer, Chair Dwight L. Bush Kathryn A. Cassidy Diana M. Daniels Joaquin Delgado James A. McNamara Roy W. Templin Gregory G. Weaver | | OFFICERS James A. McNamara, President Joseph F. DiMaria, Principal Financial Officer, Principal Accounting Officer and Treasurer Caroline L. Kraus, Secretary |
| |
GOLDMAN SACHS & CO. LLC Distributor and Transfer Agent | | GOLDMAN SACHS ASSET MANAGEMENT, L.P. Investment Adviser |
Visit our web site at www.GSAMFUNDS.com to obtain the most recent month-end returns.
Goldman Sachs Asset Management, L.P. 200 West Street, New York, New York 10282
The reports concerning the Funds included in this shareholder report may contain certain forward-looking statements about the factors that may affect the performance of the Funds in the future. These statements are based on Fund management’s predictions and expectations concerning certain future events and their expected impact on the Funds, such as performance of the economy as a whole and of specific industry sectors, changes in the levels of interest rates, the impact of developing world events, and other factors that may influence the future performance of the Funds. Management believes these forward-looking statements to be reasonable, although they are inherently uncertain and difficult to predict. Actual events may cause adjustments in portfolio management strategies from those currently expected to be employed.
A description of the policies and procedures that the Funds use to determine how to vote proxies relating to portfolio securities and information regarding how a Fund voted proxies relating to portfolio securities during the most recent 12-month period ended June 30 is available (i) without charge, upon request by calling 1-800-526-7384 (for Retail Shareholders) or 1-800-621-2550 (for Institutional Shareholders); and (ii) on the Securities and Exchange Commission (“SEC”) web site at http://www.sec.gov.
The Funds will file portfolio holdings information for each month in a fiscal quarter within 60 days after the end of the relevant fiscal quarter on Form N-PORT. Portfolio holdings information for the third month of each fiscal quarter will be made available on the SEC’s web site at http://www.sec.gov. Portfolio holdings information may be obtained upon request and without charge by calling 1-800-526-7384 (for Retail Shareholders) or 1-800-621-2550 (for Institutional Shareholders).
Goldman Sachs & Co. LLC (‘‘Goldman Sachs’’) does not provide legal, tax or accounting advice. Any statement contained in this communication (including any attachments) concerning U.S. tax matters was not intended or written to be used, and cannot be used, for the purpose of avoiding penalties under the Internal Revenue Code, and was written to support the promotion or marketing of the transaction(s) or matter(s) addressed. Clients of Goldman Sachs should obtain their own independent tax advice based on their particular circumstances.
Holdings and allocations shown are as of June 30, 2021 and may not be representative of future investments. Fund holdings should not be relied on in making investment decisions and should not be construed as research or investment advice regarding particular securities. Current and future holdings are subject to risk.
The Global Industry Classification Standard (GICS) was developed by and is the exclusive property and a service mark of Morgan Stanley Capital International Inc. (MSCI) and Standard & Poor’s, a division of The McGraw-Hill Companies, Inc. (S&P) and is licensed for use by Goldman Sachs. Neither MSCI, S&P nor any other party involved in making or compiling the GICS or any GICS classifications makes any express or implied warranties or representations with respect to such standard or classification (or the results to be obtained by the use thereof), and all such parties hereby expressly disclaim all warranties of originality, accuracy, completeness, merchantability or fitness for a particular purpose with respect to any of such standard or classification. Without limiting any of the foregoing, in no event shall MSCI, S&P, any of their affiliates or any third party involved in making or compiling the GICS or any GICS classifications have any liability for any direct, indirect, special, punitive, consequential or any other damages (including lost profits) even if notified of the possibility of such damages.
The portfolio risk management process includes an effort to monitor and manage risk, but does not imply low risk.
This material is not authorized for distribution to prospective investors unless preceded or accompanied by a current prospectus or summary prospectus, if applicable. Investors should consider a Fund’s objective, risks, and charges and expenses, and read the summary prospectus, if available, and/or the prospectus carefully before investing or sending money. The summary prospectus, if available, and the prospectus contain this and other information about a Fund and may be obtained from your authorized dealer or from Goldman Sachs & Co. LLC by calling (retail – 1-800-526-7384) (institutional – 1-800-621-2550).
© 2021 Goldman Sachs. All rights reserved. 248860-OTU-1459316 TAXADVSAR-21
Goldman Sachs Funds

| | | | |
| | |
| Semi-Annual Report | | | | June 30, 2021 |
| | |
| | | | Dynamic Global Equity Fund |

Goldman Sachs Dynamic Global Equity Fund
| | | | |
| | | |
| NOT FDIC-INSURED | | May Lose Value | | No Bank Guarantee |
FUND BASICS
Dynamic Global Equity Fund
as of June 30, 2021
| | | | | | | | | | |
| | PERFORMANCE REVIEW | |
| | | |
| | | January 1, 2021–June 30, 2021 | | Fund Total Return
(based on NAV)1 | | | MSCI® ACWI Index2 | |
| | | |
| | Class A | | | 14.09 | % | | | 12.30 | % |
| | Class C | | | 13.66 | | | | 12.30 | |
| | Institutional | | | 14.29 | | | | 12.30 | |
| | Service | | | 14.00 | | | | 12.30 | |
| | Investor | | | 14.20 | | | | 12.30 | |
| | Class R6 | | | 14.29 | | | | 12.30 | |
| | Class R | | | 13.93 | | | | 12.30 | |
| | | Class P | | | 14.33 | | | | 12.30 | |
| | | | | | | | | |
| | 1 | | The net asset value (“NAV”) represents the net assets of the class of the Fund (ex-dividend) divided by the total number of shares of the class outstanding. The Fund’s performance assumes the reinvestment of dividends and other distributions. The Fund’s performance does not reflect the deduction of any applicable sales charges. |
| | 2 | | The Fund’s benchmark is the MSCI All Country World Index (Net, USD, Unhedged) (“MSCI® ACWI Index”). The MSCI® ACWI Index is a free float-adjusted market capitalization weighted index that is designed to measure the equity market performance of developed and emerging markets. The MSCI® ACWI Index is a free float-adjusted market capitalization weighted index that is designed to measure the equity market performance of developed and emerging markets. The MSCI ACWI captures large and mid cap representation across 23 Developed Markets (DM) and 26 Emerging Markets (EM) countries. DM countries include: Australia, Austria, Belgium, Canada, Denmark, Finland, France, Germany, Hong Kong, Ireland, Israel, Italy, Japan, Netherlands, New Zealand, Norway, Portugal, Singapore, Spain, Sweden, Switzerland, the UK and the US. EM countries include: Argentina, Brazil, Chile, China, Colombia, Czech Republic, Egypt, Greece, Hungary, India, Indonesia, Korea, Malaysia, Mexico, Pakistan, Peru, Philippines, Poland, Qatar, Russia, Saudi Arabia, South Africa, Taiwan, Thailand, Turkey and United Arab Emirates. The index figures do not include any deduction for fees or expenses. It is not possible to invest directly in an unmanaged index. |
The returns set forth in the table above represent past performance. Past performance does not guarantee future results. The Fund’s investment return and principal value will fluctuate so that an investor’s shares, when redeemed, may be worth more or less than their original cost. Current performance may be lower or higher than the performance quoted above. Please visit our web site at www.gsamfunds.com to obtain the most recent month-end returns. Performance reflects applicable fee waivers and/or expense limitations in effect during the periods shown. In their absence, performance would be reduced. Returns do not reflect the deduction of taxes that a shareholder would pay on Fund distributions or the redemption of Fund shares.
Effective May 24, 2021, after the close of the Reporting Period, Christopher Lvoff no longer served as a portfolio manager of the Goldman Sachs Dynamic Global Equity Fund (The “Fund”). Effective the same date, Siwen Wu began serving as a portfolio manager for the Fund. Neil Nuttall continues to serve as portfolio managers for the Fund.
1
FUND BASICS
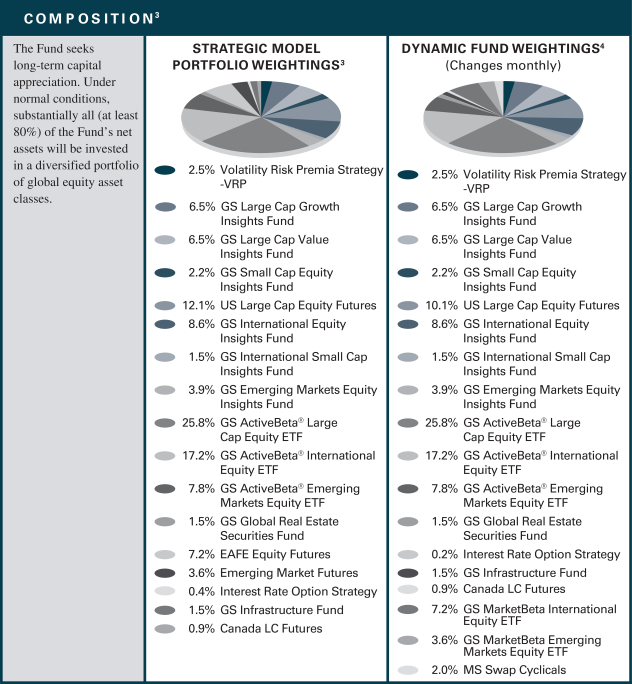
| 3 | | Strategic allocation is the process of determining the areas of the global markets in which to invest, and in what long-term proportion, for each underlying fund. Our global approach attempts to generate strong long-term returns across geographies and asset classes, and is determined through a careful review of market opportunities and risk/return tradeoffs. On a monthly basis or as needed, we shift assets around the strategic allocation, over and under-weighting asset classes and countries relative to the neutral starting point, seeking to benefit from changing short-term conditions in global capital markets. This is called tactical asset allocation. The percentage shown for each weighting reflects the value of that weighting as a percentage of net assets of the Fund. Figures in the above graph may not sum to 100% due to rounding and/or the exclusion of other assets and liabilities. |
| 4 | | Generally, dynamic fund weightings are rebalanced approximately monthly, but they may be rebalanced more or less frequently at the discretion of the Investment Adviser based on the market environment and its macro views. The weightings in the chart above reflect the target allocations as of June 30, 2021. Actual underlying fund weighting in the Fund may differ from the figures shown above due to rounding, timing differences, and/or differences in returns of the underlying funds. The above figures are not indicative of future allocations. |
2
FUND BASICS
|
| OVERALL UNDERLYING FUND WEIGHTINGS5 |
|
| Percentage of Net Assets |
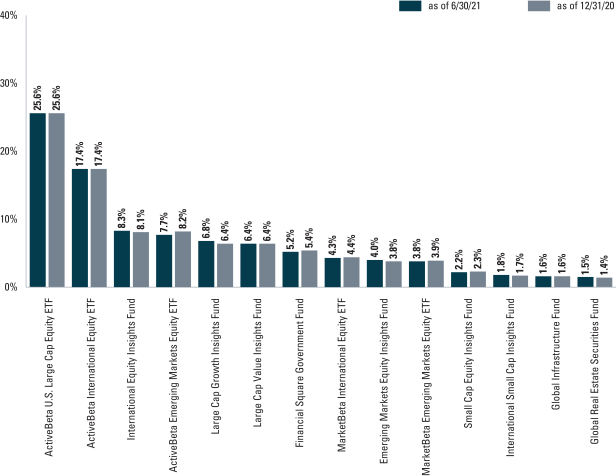
| 5 | | The Portfolio is actively managed and, as such, its composition may differ over time. The percentage shown for each underlying fund reflects the value of that underlying fund as a percentage of net assets of the Portfolio. Figures in the above graph may not sum to 100% due to rounding and/or the exclusion of other assets and liabilities. The graph depicts the Fund’s investments but may not represent the Fund’s market exposure due to the exclusion of certain derivatives, if any, as listed in the Additional Investment Information section of the Schedule of Investments. |
For more information about the Fund, please refer to www.GSAMFUNDS.com. There, you can learn more about the Fund’s investment strategies, holdings, and performance.
3
GOLDMAN SACHS DYNAMIC GLOBAL EQUITY FUND
Schedule of Investments
June 30, 2021 (Unaudited)
| | | | | | | | |
| Shares | | | Description | | Value | |
|
| Underlying Funds(a) – 91.4% | |
| Equity – 32.5% | |
| | 4,861,214 | | | Goldman Sachs International Equity Insights Fund – Class R6 | | $ | 73,793,222 | |
| | 1,313,501 | | | Goldman Sachs Large Cap Growth Insights Fund – Class R6 | | | 60,696,858 | |
| | 2,209,607 | | | Goldman Sachs Large Cap Value Insights Fund – Class R6 | | | 57,449,780 | |
| | 2,676,299 | | | Goldman Sachs Emerging Markets Equity Insights Fund – Class R6 | | | 35,434,201 | |
| | 543,853 | | | Goldman Sachs Small Cap Equity Insights Fund – Class R6 | | | 19,774,485 | |
| | 1,118,012 | | | Goldman Sachs International Small Cap Insights Fund – Class R6 | | | 15,998,753 | |
| | 1,121,420 | | | Goldman Sachs Global Infrastructure Fund – Class R6 | | | 14,421,464 | |
| | 1,123,478 | | | Goldman Sachs Global Real Estate Securities Fund – Class R6 | | | 13,200,864 | |
| | | | | | | | |
| | | | | | | 290,769,627 | |
| | |
| Exchange Traded Funds – 58.9% | | | |
| | 2,662,535 | | | Goldman Sachs ActiveBeta U.S. Large Cap Equity ETF | | | 229,057,886 | |
| | 4,455,305 | | | Goldman Sachs ActiveBeta International Equity ETF | | | 155,623,804 | |
| | 1,675,600 | | | Goldman Sachs ActiveBeta Emerging Markets Equity ETF | | | 68,381,236 | |
| | 685,277 | | | Goldman Sachs MarketBeta International Equity ETF | | | 38,697,592 | |
| | 585,460 | | | Goldman Sachs MarketBeta Emerging Markets Equity ETF | | | 34,360,413 | |
| | | | | | | | |
| | | | | | | 526,120,931 | |
| | |
| | TOTAL UNDERLYING FUNDS – 91.4% | | | | |
| | (Cost $593,725,352) | | $ | 816,890,558 | |
| | |
| | | | | | | | |
| Shares | | | Dividend
Rate | | Value | |
|
| Investment Company(a) – 5.2% | |
| Goldman Sachs Financial Square Government Fund –
Institutional Shares |
|
| | 46,397,273 | | | 0.026% | | $ | 46,397,273 | |
| | (Cost $46,397,273) | | | | |
| | |
| | TOTAL INVESTMENTS – 96.6% | | | | |
| | (Cost $640,122,625) | | $ | 863,287,831 | |
| | |
| OTHER ASSETS IN EXCESS OF
LIABILITIES – 3.4% | | | 30,542,936 | |
| | |
| | NET ASSETS – 100% | | $ | 893,830,767 | |
| | |
| | |
|
| The percentage shown for each investment category reflects the value of investments in that category as a percentage of net assets. |
| |
(a) | | Represents an affiliated issuer. |
| | |
|
Currency Abbreviations: |
AUD | | —Australian Dollar |
CHF | | —Swiss Franc |
DKK | | —Danish Krone |
EUR | | —Euro |
GBP | | —British Pound |
HKD | | —Hong Kong Dollar |
ILS | | —Israeli Shekel |
JPY | | —Japanese Yen |
NOK | | —Norwegian Krone |
NZD | | —New Zealand Dollar |
SEK | | —Swedish Krona |
SGD | | —Singapore Dollar |
USD | | —U.S. Dollar |
|
Investment Abbreviations: |
ETF | | —Exchange Traded Fund |
PLC | | —Public Limited Company |
|
| | |
| 4 | | The accompanying notes are an integral part of these financial statements. |
GOLDMAN SACHS DYNAMIC GLOBAL EQUITY FUND
|
| ADDITIONAL INVESTMENT INFORMATION |
FORWARD FOREIGN CURRENCY EXCHANGE CONTRACTS — At June 30, 2021, the Fund had the following forward foreign currency exchange contracts:
FORWARD FOREIGN CURRENCY EXCHANGE CONTRACTS WITH UNREALIZED GAIN
| | | | | | | | | | | | | | | | | | | | | | |
| Counterparty | | Currency
Purchased | | | Currency
Sold | | | Settlement
Date | | | Unrealized
Gain | |
MS & Co. Int. PLC | | USD | | | 14,468,147 | | | | JPY | | | | 1,585,000,000 | | | | 09/15/21 | | | $ | 191,742 | |
| | USD | | | 152,005 | | | | NZD | | | | 210,000 | | | | 09/15/21 | | | | 5,250 | |
| | USD | | | 1,395,780 | | | | DKK | | | | 8,490,000 | | | | 09/15/21 | | | | 39,973 | |
| | USD | | | 366,649 | | | | NOK | | | | 3,050,000 | | | | 09/15/21 | | | | 12,306 | |
| | USD | | | 619,513 | | | | SGD | | | | 820,000 | | | | 09/15/21 | | | | 9,719 | |
| | USD | | | 184,762 | | | | ILS | | | | 600,000 | | | | 09/17/21 | | | | 552 | |
| | USD | | | 1,927,041 | | | | HKD | | | | 14,950,000 | | | | 09/15/21 | | | | 1,264 | |
| | USD | | | 18,734,962 | | | | EUR | | | | 15,330,000 | | | | 09/15/21 | | | | 528,594 | |
| | USD | | | 2,046,336 | | | | SEK | | | | 16,950,000 | | | | 09/15/21 | | | | 64,331 | |
| | USD | | | 4,187,329 | | | | AUD | | | | 5,410,000 | | | | 09/15/21 | | | | 128,774 | |
| | USD | | | 5,329,265 | | | | CHF | | | | 4,780,000 | | | | 09/15/21 | | | | 152,547 | |
| | | USD | | | 8,463,694 | | | | GBP | | | | 5,975,000 | | | | 09/15/21 | | | | 197,043 | |
| | | | | | |
| TOTAL | | | | | | | | | | | | | | | | | | | | $ | 1,332,095 | |
FUTURES CONTRACTS — At June 30, 2021, the Fund had the following futures contracts:
| | | | | | | | | | | | | | | | |
| Description | | Number of
Contracts | | | Expiration
Date | | | Notional
Amount | | | Unrealized
Appreciation/
(Depreciation) | |
Long position contracts: | | | | | | | | | | | | | | | | |
Mini MSCI EAFE Index | | | 203 | | | | 09/17/21 | | | $ | 23,386,615 | | | $ | (611,036 | ) |
S&P 500 E-Mini Index | | | 423 | | | | 09/17/21 | | | | 90,703,890 | | | | 1,456,090 | |
S&P Toronto Stock Exchange 60 Index | | | 50 | | | | 09/16/21 | | | | 9,702,323 | | | | 64,845 | |
| | | | |
| TOTAL FUTURES CONTRACTS | | | | | | | | | | | | | | $ | 909,899 | |
SWAP CONTRACTS — At June, 30 2021, the Fund had the following swap contracts:
OVER THE COUNTER TOTAL RETURN SWAP CONTRACTS
| | | | | | | | | | | | | | | | | | |
| Reference Obligation/Index | | Financing Rate
Paid
by the Fund(a) | | Counterparty | | Termination
Date(b) | | Notional
Amount
(000s) | | | Value | | | Unrealized
Appreciation/
(Depreciation)* | |
| | | | | | |
MSGSHBC Index(c) | | 0.050% | | Morgan Stanley & Co. | | 08/26/21 | | $ | 17,954 | | | $ | 292,144 | | | $ | 292,144 | |
| | * | | There are no upfront payments on the swap contracts, therefore the unrealized gain (loss) on the swap contracts is equal to their market value. |
| | (a) | | Payments made quarterly. |
| | (b) | | The Fund pays/receives annual coupon payments in accordance with the swap contract(s). On the termination date of the swap contract(s), the Fund will either receive from or pay to the counterparty an amount equal to the net of the accrued financing fees and the value of the reference security subtracted from the original notional cost (notional multiplied by the price change of the reference security, converted to U.S. Dollars). |
| | (c) | | The top 50 components are shown below. |
| | |
| The accompanying notes are an integral part of these financial statements. | | 5 |
GOLDMAN SACHS DYNAMIC GLOBAL EQUITY FUND
Schedule of Investments (continued)
June 30, 2021 (Unaudited)
|
| ADDITIONAL INVESTMENT INFORMATION (continued) |
A basket (MSGSHBC) of common stocks
| | | | | | | | | | | | | | |
| Common Stocks | | Sector | | Shares | | | Value | | | Weight | |
Cleveland-Cliffs Inc | | Basic Materials | | | 481 | | | $ | 10,361 | | | | 3.55 | % |
Freeport-McMoRan Inc | | Basic Materials | | | 273 | | �� | | 10,118 | | | | 3.46 | |
Alcoa Corp | | Basic Materials | | | 241 | | | | 8,875 | | | | 3.04 | |
Marathon Oil Corp | | Energy | | | 609 | | | | 8,293 | | | | 2.84 | |
LyondellBasell Industries NV | | Basic Materials | | | 79 | | | | 8,146 | | | | 2.79 | |
General Motors Co | | Consumer, Cyclical | | | 132 | | | | 7,819 | | | | 2.68 | |
Devon Energy Corp | | Energy | | | 264 | | | | 7,709 | | | | 2.64 | |
Wynn Resorts Ltd | | Consumer, Cyclical | | | 62 | | | | 7,640 | | | | 2.62 | |
Aptiv PLC | | Consumer, Cyclical | | | 47 | | | | 7,428 | | | | 2.54 | |
Marathon Petroleum Corp | | Energy | | | 117 | | | | 7,075 | | | | 2.42 | |
Southwest Airlines Co | | Consumer, Cyclical | | | 133 | | | | 7,045 | | | | 2.41 | |
Applied Materials Inc | | Technology | | | 49 | | | | 6,968 | | | | 2.39 | |
Occidental Petroleum Corp | | Energy | | | 221 | | | | 6,909 | | | | 2.36 | |
Delta Air Lines Inc | | Consumer, Cyclical | | | 156 | | | | 6,758 | | | | 2.31 | |
Valero Energy Corp | | Energy | | | 84 | | | | 6,542 | | | | 2.24 | |
Whirlpool Corp | | Consumer, Cyclical | | | 28 | | | | 6,054 | | | | 2.07 | |
Lam Research Corp | | Technology | | | 9 | | | | 6,040 | | | | 2.07 | |
United Rentals Inc | | Consumer, Non-cyclical | | | 19 | | | | 5,968 | | | | 2.04 | |
NXP Semiconductors NV | | Technology | | | 29 | | | | 5,917 | | | | 2.03 | |
Stanley Black & Decker Inc | | Industrial | | | 28 | | | | 5,766 | | | | 1.97 | |
Parker-Hannifin Corp | | Industrial | | | 18 | | | | 5,596 | | | | 1.92 | |
Eastman Chemical Co | | Basic Materials | | | 47 | | | | 5,481 | | | | 1.88 | |
Micron Technology Inc | | Technology | | | 64 | | | | 5,412 | | | | 1.85 | |
Advanced Micro Devices Inc | | Technology | | | 57 | | | | 5,356 | | | | 1.83 | |
Williams Cos Inc/The | | Energy | | | 199 | | | | 5,282 | | | | 1.81 | |
Halliburton Co | | Energy | | | 227 | | | | 5,257 | | | | 1.80 | |
Microchip Technology Inc | | Technology | | | 34 | | | | 5,058 | | | | 1.73 | |
ON Semiconductor Corp | | Technology | | | 120 | | | | 4,585 | | | | 1.57 | |
TE Connectivity Ltd | | Industrial | | | 33 | | | | 4,423 | | | | 1.51 | |
JetBlue Airways Corp | | Consumer, Cyclical | | | 258 | | | | 4,329 | | | | 1.48 | |
BorgWarner Inc | | Consumer, Cyclical | | | 86 | | | | 4,189 | | | | 1.43 | |
Under Armour Inc | | Consumer, Cyclical | | | 196 | | | | 4,140 | | | | 1.42 | |
TransDigm Group Inc | | Industrial | | | 6 | | | | 3,841 | | | | 1.31 | |
ONEOK Inc | | Energy | | | 67 | | | | 3,741 | | | | 1.28 | |
Teradyne Inc | | Technology | | | 28 | | | | 3,728 | | | | 1.28 | |
Hess Corp | | Energy | | | 41 | | | | 3,596 | | | | 1.23 | |
Masco Corp | | Industrial | | | 57 | | | | 3,344 | | | | 1.14 | |
Axalta Coating Systems Ltd | | Basic Materials | | | 103 | | | | 3,133 | | | | 1.07 | |
CDW Corp/DE | | Communications | | | 17 | | | | 3,007 | | | | 1.03 | |
Harley-Davidson Inc | | Consumer, Cyclical | | | 65 | | | | 2,979 | | | | 1.02 | |
Polaris Inc | | Consumer, Cyclical | | | 21 | | | | 2,941 | | | | 1.01 | |
Baker Hughes Co | | Energy | | | 120 | | | | 2,755 | | | | 0.94 | |
Aramark | | Consumer, Cyclical | | | 71 | | | | 2,653 | | | | 0.91 | |
Brunswick Corp/DE | | Consumer, Cyclical | | | 26 | | | | 2,625 | | | | 0.90 | |
Boyd Gaming Corp | | Consumer, Cyclical | | | 40 | | | | 2,436 | | | | 0.83 | |
Fortune Brands Home & Security Inc | | Industrial | | | 24 | | | | 2,418 | | | | 0.83 | |
Eagle Materials Inc | | Industrial | | | 17 | | | | 2,400 | | | | 0.82 | |
Westinghouse Air Brake Technologies Corp | | Industrial | | | 29 | | | | 2,357 | | | | 0.81 | |
Leggett & Platt Inc | | Consumer, Cyclical | | | 43 | | | | 2,223 | | | | 0.76 | |
Murphy Oil Corp | | Energy | | | 93 | | | | 2,174 | | | | 0.74 | |
| | |
| 6 | | The accompanying notes are an integral part of these financial statements. |
GOLDMAN SACHS DYNAMIC GLOBAL EQUITY FUND
|
| ADDITIONAL INVESTMENT INFORMATION (continued) |
PURCHASED AND WRITTEN OPTIONS CONTRACTS — At June 30, 2021, the Fund had the following purchased and written options:
EXCHANGE TRADED OPTIONS ON FUTURES
| | | | | | | | | | | | | | | | | | | | | | | | | | |
| Description | | Exercise
Price | | Expiration
Date | | | Number of
Contracts | | | Notional
Amount | | | Market
Value | | | Premiums
Paid (Received)
by Fund | | | Unrealized
Appreciation/
(Depreciation) | |
Purchased option contracts | |
Calls | |
Eurodollar Futures | | $97.75 | | | 03/13/2023 | | | | 118 | | | $ | 295,000 | | | $ | 488,225 | | | $ | 519,747 | | | $ | (31,522 | ) |
Eurodollar Futures | | 97.75 | | | 06/19/2023 | | | | 127 | | | | 317,500 | | | | 488,950 | | | | 517,923 | | | | (28,973 | ) |
Eurodollar Futures | | 99.00 | | | 12/19/2022 | | | | 558 | | | | 1,395,000 | | | | 795,150 | | | | 794,603 | | | | 547 | |
| | | | | | | |
| TOTAL | | | | | | | | | 803 | | | $ | 2,007,500 | | | $ | 1,772,325 | | | $ | 1,832,273 | | | $ | (59,948 | ) |
EXCHANGE TRADED OPTIONS ON EQUITIES CONTRACTS
| | | | | | | | | | | | | | | | | | | | | | | | | | |
| Description | | Exercise
Price | | Expiration
Date | | | Number of
Contracts | | | Notional
Amount | | | Market
Value | | | Premiums
Paid (Received)
by Fund | | | Unrealized
Appreciation/
(Depreciation) | |
Written option contracts | |
Calls | |
S&P 500 Index | | $4,290.00 | | | 07/30/2021 | | | | (2 | ) | | $ | (200 | ) | | $ | (12,070 | ) | | $ | (7,525 | ) | | $ | (4,545 | ) |
S&P 500 Index | | 4,300.00 | | | 07/07/2021 | | | | (9 | ) | | | (900 | ) | | | (16,020 | ) | | | (20,131 | ) | | | 4,111 | |
S&P 500 Index | | 4,315.00 | | | 07/21/2021 | | | | (10 | ) | | | (1,000 | ) | | | (31,500 | ) | | | (19,859 | ) | | | (11,641 | ) |
S&P 500 Index | | 4,320.00 | | | 07/14/2021 | | | | (9 | ) | | | (900 | ) | | | (17,145 | ) | | | (15,814 | ) | | | (1,331 | ) |
S&P 500 Index | | 4,330.00 | | | 07/30/2021 | | | | (6 | ) | | | (600 | ) | | | (21,870 | ) | | | (22,435 | ) | | | 565 | |
S&P 500 Index | | 4,335.00 | | | 07/30/2021 | | | | (1 | ) | | | (100 | ) | | | (3,390 | ) | | | (2,209 | ) | | | (1,181 | ) |
S&P 500 Index | | 4,340.00 | | | 07/30/2021 | | | | (3 | ) | | | (300 | ) | | | (9,435 | ) | | | (9,508 | ) | | | 73 | |
S&P 500 Index | | 4,345.00 | | | 07/30/2021 | | | | (1 | ) | | | (100 | ) | | | (2,915 | ) | | | (2,506 | ) | | | (409 | ) |
S&P 500 Index | | 4,355.00 | | | 07/30/2021 | | | | (8 | ) | | | (800 | ) | | | (19,920 | ) | | | (18,593 | ) | | | (1,327 | ) |
S&P 500 Index | | 4,360.00 | | | 07/28/2021 | | | | (9 | ) | | | (900 | ) | | | (18,315 | ) | | | (16,803 | ) | | | (1,512 | ) |
S&P 500 Index | | 4,360.00 | | | 07/30/2021 | | | | (8 | ) | | | (800 | ) | | | (18,360 | ) | | | (16,992 | ) | | | (1,368 | ) |
S&P 500 Index | | 4,365.00 | | | 07/30/2021 | | | | (8 | ) | | | (800 | ) | | | (16,880 | ) | | | (15,651 | ) | | | (1,229 | ) |
S&P 500 Index | | 4,370.00 | | | 07/30/2021 | | | | (8 | ) | | | (800 | ) | | | (15,480 | ) | | | (14,432 | ) | | | (1,048 | ) |
S&P 500 Index | | 4,375.00 | | | 07/30/2021 | | | | (8 | ) | | | (800 | ) | | | (14,160 | ) | | | (13,220 | ) | | | (940 | ) |
S&P 500 Index | | 4,375.00 | | | 08/31/2021 | | | | (2 | ) | | | (200 | ) | | | (9,420 | ) | | | (6,572 | ) | | | (2,848 | ) |
S&P 500 Index | | 4,380.00 | | | 08/31/2021 | | | | (1 | ) | | | (100 | ) | | | (4,500 | ) | | | (4,315 | ) | | | (185 | ) |
S&P 500 Index | | 4,390.00 | | | 08/31/2021 | | | | (1 | ) | | | (100 | ) | | | (4,080 | ) | | | (3,479 | ) | | | (601 | ) |
S&P 500 Index | | 4,410.00 | | | 08/31/2021 | | | | (3 | ) | | | (300 | ) | | | (10,035 | ) | | | (9,453 | ) | | | (582 | ) |
| | | | | | | |
| | | | | | | | | | (97 | ) | | $ | (9,700 | ) | | $ | (245,495 | ) | | $ | (219,497 | ) | | $ | (25,998 | ) |
| | |
| The accompanying notes are an integral part of these financial statements. | | 7 |
GOLDMAN SACHS DYNAMIC GLOBAL EQUITY FUND
Schedule of Investments (continued)
June 30, 2021 (Unaudited)
|
| ADDITIONAL INVESTMENT INFORMATION (continued) |
EXCHANGE TRADED OPTIONS ON EQUITIES CONTRACTS (continued)
| | | | | | | | | | | | | | | | | | | | | | | | | | |
| Description | | Exercise
Price | | Expiration
Date | | | Number of
Contracts | | | Notional
Amount | | | Market
Value | | | Premiums
Paid (Received)
by Fund | | | Unrealized
Appreciation/
(Depreciation) | |
Puts | |
S&P 500 Index | | $3,960.00 | | | 07/30/2021 | | | | (2 | ) | | $ | (200 | ) | | $ | (2,260 | ) | | $ | (22,054 | ) | | $ | 19,794 | |
S&P 500 Index | | 3,980.00 | | | 07/30/2021 | | | | (1 | ) | | | (100 | ) | | | (1,225 | ) | | | (11,249 | ) | | | 10,024 | |
S&P 500 Index | | 4,045.00 | | | 07/30/2021 | | | | (2 | ) | | | (200 | ) | | | (3,160 | ) | | | (13,579 | ) | | | 10,419 | |
S&P 500 Index | | 4,075.00 | | | 07/30/2021 | | | | (3 | ) | | | (300 | ) | | | (5,370 | ) | | | (17,469 | ) | | | 12,099 | |
S&P 500 Index | | 4,080.00 | | | 08/31/2021 | | | | (1 | ) | | | (100 | ) | | | (4,465 | ) | | | (7,987 | ) | | | 3,522 | |
S&P 500 Index | | 4,105.00 | | | 08/31/2021 | | | | (1 | ) | | | (100 | ) | | | (4,820 | ) | | | (7,183 | ) | | | 2,363 | |
S&P 500 Index | | 4,110.00 | | | 08/31/2021 | | | | (2 | ) | | | (200 | ) | | | (9,790 | ) | | | (13,406 | ) | | | 3,616 | |
S&P 500 Index | | 4,115.00 | | | 07/30/2021 | | | | (2 | ) | | | (200 | ) | | | (4,250 | ) | | | (11,268 | ) | | | 7,018 | |
S&P 500 Index | | 4,145.00 | | | 07/30/2021 | | | | (1 | ) | | | (100 | ) | | | (2,425 | ) | | | (4,874 | ) | | | 2,449 | |
S&P 500 Index | | 4,150.00 | | | 07/07/2021 | | | | (9 | ) | | | (900 | ) | | | (1,170 | ) | | | (32,771 | ) | | | 31,601 | |
S&P 500 Index | | 4,155.00 | | | 07/30/2021 | | | | (1 | ) | | | (100 | ) | | | (2,540 | ) | | | (4,501 | ) | | | 1,961 | |
S&P 500 Index | | 4,170.00 | | | 07/14/2021 | | | | (9 | ) | | | (900 | ) | | | (7,784 | ) | | | (31,395 | ) | | | 23,611 | |
S&P 500 Index | | 4,170.00 | | | 07/21/2021 | | | | (10 | ) | | | (1,000 | ) | | | (16,200 | ) | | | (33,288 | ) | | | 17,088 | |
S&P 500 Index | | 4,175.00 | | | 08/31/2021 | | | | (3 | ) | | | (300 | ) | | | (17,970 | ) | | | (18,335 | ) | | | 365 | |
S&P 500 Index | | 4,210.00 | | | 07/30/2021 | | | | (8 | ) | | | (800 | ) | | | (26,400 | ) | | | (27,830 | ) | | | 1,430 | |
S&P 500 Index | | 4,215.00 | | | 07/30/2021 | | | | (8 | ) | | | (800 | ) | | | (27,040 | ) | | | (28,654 | ) | | | 1,614 | |
S&P 500 Index | | 4,220.00 | | | 07/30/2021 | | | | (8 | ) | | | (800 | ) | | | (27,720 | ) | | | (29,204 | ) | | | 1,484 | |
S&P 500 Index | | 4,225.00 | | | 07/28/2021 | | | | (9 | ) | | | (900 | ) | | | (28,890 | ) | | | (30,709 | ) | | | 1,819 | |
S&P 500 Index | | 4,225.00 | | | 07/30/2021 | | | | (8 | ) | | | (800 | ) | | | (28,440 | ) | | | (29,982 | ) | | | 1,542 | |
| | | | | | | |
S&P 500 Index | | 4,230.00 | | | 07/30/2021 | | | | (8 | ) | | | (800 | ) | | | (29,240 | ) | | | (30,832 | ) | | | 1,592 | |
| | | | | | | |
| | | | | | | | | | (96 | ) | | $ | (9,600 | ) | | $ | (251,159 | ) | | $ | (406,570 | ) | | $ | 155,411 | |
| | | | | | | |
| TOTAL | | | | | | | | | (193 | ) | | $ | (19,300 | ) | | $ | (496,654 | ) | | $ | (626,067 | ) | | $ | 129,413 | |
| | |
|
Abbreviations: |
MS & Co. Int. PLC | | —Morgan Stanley & Co. International PLC |
|
| | |
| 8 | | The accompanying notes are an integral part of these financial statements. |
GOLDMAN SACHS DYNAMIC GLOBAL EQUITY FUND
Statement of Assets and Liabilities
June 30, 2021 (Unaudited)
| | | | | | |
| | | | | | |
| | Assets: | | | | |
| | Investments in Affiliated Funds, at value (cost $640,122,625) | | $ | 863,287,831 | |
| | Purchased options, at value (premium paid $1,832,273) | | | 1,772,325 | |
| | Cash | | | 16,364,313 | |
| | Foreign currencies, at value (cost $62,121) | | | 58,594 | |
| | Unrealized gain on forward foreign currency exchange contracts | | | 1,332,095 | |
| | Unrealized gain on swap contracts | | | 292,144 | |
| | Receivables: | | | | |
| | Collateral on certain derivative contracts(a) | | | 12,690,847 | |
| | Investments sold | | | 2,547,969 | |
| | Dividends | | | 377,009 | |
| | Reimbursement from investment adviser | | | 31,234 | |
| | Fund shares sold | | | 5,637 | |
| | Other assets | | | 64,555 | |
| | Total assets | | | 898,824,553 | |
| | | | | | |
| | Liabilities: | | | | |
| | Written option contracts, at value (premium received $626,067) | | | 496,654 | |
| | Variation margin on futures contracts | | | 35,614 | |
| | Payables: | | | | |
| | Investments purchased | | | 2,308,515 | |
| | Collateral on certain derivative contracts(b) | | | 1,580,000 | |
| | Fund shares redeemed | | | 169,157 | |
| | Management fees | | | 111,246 | |
| | Distribution and Service fees and Transfer Agency fees | | | 93,746 | |
| | Accrued expenses | | | 198,854 | |
| | Total liabilities | | | 4,993,786 | |
| | | | | | |
| | Net Assets: | | | | |
| | Paid-in capital | | | 623,604,986 | |
| | Total distributable earnings | | | 270,225,781 | |
| | | NET ASSETS | | $ | 893,830,767 | |
| | | Net Assets: | | | | |
| | | Class A | | $ | 183,284,772 | |
| | | Class C | | | 11,029,470 | |
| | | Institutional | | | 15,919,934 | |
| | | Service | | | 303,331 | |
| | | Investor | | | 5,541,558 | |
| | | Class R6 | | | 519,859,635 | |
| | | Class R | | | 6,341,464 | |
| | | Class P | | | 151,550,603 | |
| | | Total Net Assets | | $ | 893,830,767 | |
| | | Shares Outstanding $0.001 par value (unlimited number of shares authorized): | | | | |
| | | Class A | | | 7,518,958 | |
| | | Class C | | | 468,286 | |
| | | Institutional | | | 643,781 | |
| | | Service | | | 12,457 | |
| | | Investor | | | 230,410 | |
| | | Class R6 | | | 21,017,491 | |
| | | Class R | | | 262,787 | |
| | | Class P | | | 6,124,092 | |
| | | Net asset value, offering and redemption price per share:(c) | | | | |
| | | Class A | | | $24.38 | |
| | | Class C | | | 23.55 | |
| | | Institutional | | | 24.73 | |
| | | Service | | | 24.35 | |
| | | Investor | | | 24.05 | |
| | | Class R6 | | | 24.73 | |
| | | Class R | | | 24.13 | |
| | | Class P | | | 24.75 | |
| | (a) | | Includes segregated cash of $5,584,285 and $7,106,562 relating to initial margin requirements and/or collateral on futures and options transactions, respectively. |
| | (b) | | Includes segregated cash of $390,000 and $1,190,000 relating to initial margin requirements and/or collateral on swaps and forward foreign currency transactions, respectively. |
| | (c) | | Maximum public offering price per share for Class A Shares is $25.80. At redemption, Class C Shares may be subject to a contingent deferred sales charge, assessed on the amount equal to the lesser of the current net asset value (“NAV”) or the original purchase price of the shares. |
| | |
| The accompanying notes are an integral part of these financial statements. | | 9 |
GOLDMAN SACHS DYNAMIC GLOBAL EQUITY FUND
Statement of Operations
For the Six Months Ended June 30, 2021 (Unaudited)
| | | | | | |
| | | | | | |
| | Investment income: | | | | |
| | |
| | Dividends from Affiliated Funds | | $ | 5,126,768 | |
| | |
| | Interest | | | 298 | |
| | |
| | Total investment income | | | 5,127,066 | |
| | | | | | |
| | Expenses: | | | | |
| | |
| | Management fees | | | 647,906 | |
| | |
| | Distribution and Service (12b-1) fees(a) | | | 277,845 | |
| | |
| | Transfer Agency fees(a) | | | 249,646 | |
| | |
| | Professional fees | | | 51,525 | |
| | |
| | Registration fees | | | 40,556 | |
| | |
| | Printing and mailing costs | | | 39,511 | |
| | |
| | Custody, accounting and administrative services | | | 38,167 | |
| | |
| | Service fees — Class C | | | 15,003 | |
| | |
| | Trustee fees | | | 9,980 | |
| | |
| | Shareholder Administration fees — Service Class | | | 354 | |
| | |
| | Other | | | 12,699 | |
| | |
| | Total expenses | | | 1,383,192 | |
| | |
| | Less — expense reductions | | | (178,037 | ) |
| | |
| | Net expenses | | | 1,205,155 | |
| | |
| | NET INVESTMENT INCOME | | | 3,921,911 | |
| | | | | | |
| | Realized and unrealized gain (loss): | | | | |
| |
| | Net realized gain (loss) from: | |
| | |
| | Affiliated Funds | | | 7,262,734 | |
| | |
| | Purchased options | | | 419,582 | |
| | |
| | Futures contracts | | | 19,878,858 | |
| | |
| | Written options | | | 2,937,469 | |
| | |
| | Swap contracts | | | 509,711 | |
| | |
| | Forward foreign currency exchange contracts | | | (174,566 | ) |
| | |
| | Foreign currency transactions | | | (3,099 | ) |
| |
| | Net change in unrealized gain (loss) on: | |
| | |
| | Affiliated Funds | | | 81,776,135 | |
| | |
| | Purchased options | | | (966,724 | ) |
| | |
| | Futures contracts | | | (1,979,392 | ) |
| | |
| | Written options | | | 4,083 | |
| | |
| | Swap contracts | | | 292,144 | |
| | |
| | Forward foreign currency exchange contracts | | | 2,172,454 | |
| | |
| | Foreign currency translation | | | 2,353 | |
| | |
| | Net realized and unrealized gain | | | 112,131,742 | |
| | |
| | NET INCREASE IN NET ASSETS RESULTING FROM OPERATIONS | | $ | 116,053,653 | |
| | (a) | | Class specific Distribution and/or (12b-1) Service and Transfer Agency fees were as follows: |
| | | | | | | | | | | | | | | | | | | | | | | | | | | | | | | | | | | | | | | | | | | | | | |
| Distribution and/or (12b-1) Service Fees | | | Transfer Agency Fees | |
Class A | | | Class C | | | Service | | | Class R | | | Class A | | | Class C | | | Institutional | | | Service | | | Investor | | | Class R6 | | | Class R | | | Class P | |
| $ | 217,487 | | | $ | 45,011 | | | $ | 354 | | | $ | 14,993 | | | $ | 131,492 | | | $ | 8,933 | | | $ | 2,993 | | | $ | 57 | | | $ | 3,929 | | | $ | 76,496 | | | $ | 4,525 | | | $ | 21,221 | |
| | |
| 10 | | The accompanying notes are an integral part of these financial statements. |
GOLDMAN SACHS DYNAMIC GLOBAL EQUITY FUND
Statements of Changes in Net Assets
| | | | | | | | | | |
| | | | | For the
Six Months Ended
June 30, 2021
(Unaudited) | | | For the Fiscal
Year Ended
December 31, 2020 | |
| | From operations: | | | | |
| | | |
| | Net investment income | | $ | 3,921,911 | | | $ | 9,397,445 | |
| | | |
| | Net realized gain | | | 30,830,689 | | | | 13,860,434 | |
| | | |
| | Net change in unrealized gain | | | 81,301,053 | | | | 71,268,212 | |
| | | |
| | Net increase in net assets resulting from operations | | | 116,053,653 | | | | 94,526,091 | |
| | | | | | | | | | |
| | Distributions to shareholders: | | | | |
| | | |
| | From distributable earnings: | | | | | | | | |
| | | |
| | Class A Shares | | | — | | | | (3,838,747 | ) |
| | | |
| | Class C Shares | | | — | | | | (223,898 | ) |
| | | |
| | Institutional Shares | | | — | | | | (368,684 | ) |
| | | |
| | Service Shares | | | — | | | | (5,799 | ) |
| | | |
| | Investor Shares | | | — | | | | (125,539 | ) |
| | | |
| | Class R6 Shares | | | — | | | | (12,747,997 | ) |
| | | |
| | Class R Shares | | | — | | | | (117,416 | ) |
| | | |
| | Class P Shares | | | — | | | | (3,401,510 | ) |
| | | |
| | Total distributions to shareholders | | | — | | | | (20,829,590 | ) |
| | | | | | | | | | |
| | From share transactions: | | | | |
| | | |
| | Proceeds from sales of shares | | | 17,210,310 | | | | 40,734,037 | |
| | | |
| | Reinvestment of distributions | | | — | | | | 20,421,928 | |
| | | |
| | Cost of shares redeemed | | | (66,097,835 | ) | | | (117,245,793 | ) |
| | | |
| | Net decrease in net assets resulting from share transactions | | | (48,887,525 | ) | | | (56,089,828 | ) |
| | | |
| | TOTAL INCREASE | | | 67,166,128 | | | | 17,606,673 | |
| | | | | | | | | | |
| | Net assets: | | | | |
| | | |
| | Beginning of period | | | 826,664,639 | | | | 809,057,966 | |
| | | |
| | End of period | | $ | 893,830,767 | | | $ | 826,664,639 | |
| | |
| The accompanying notes are an integral part of these financial statements. | | 11 |
GOLDMAN SACHS DYNAMIC GLOBAL EQUITY FUND
Financial Highlights
Selected Share Data for a Share Outstanding Throughout Each Period
| | | | | | | | | | | | | | | | | | | | | | | | | | |
| | | | | Goldman Sachs Dynamic Global Equity Fund | |
| | | | | Class A Shares | |
| | | | | Six Months Ended
June 30, 2021
(Unaudited) | | | Year Ended December 31, | |
| | | | | 2020 | | | 2019 | | | 2018 | | | 2017 | | | 2016 | |
| | Per Share Data | | | | | | | | | | | | | | | | | | | | | | | | |
| | | | | | | |
| | Net asset value, beginning of period | | $ | 21.36 | | | $ | 19.32 | | | $ | 16.26 | | | $ | 18.84 | | | $ | 15.25 | | | $ | 14.44 | |
| | | | | | | |
| | Net investment income(a)(b) | | | 0.07 | | | | 0.18 | | | | 0.29 | | | | 0.20 | | | | 0.16 | | | | 0.16 | |
| | | | | | | |
| | Net realized and unrealized gain (loss) | | | 2.95 | | | | 2.36 | | | | 3.86 | | | | (2.35 | ) | | | 3.80 | | | | 0.83 | |
| | | | | | | |
| | Total from investment operations | | | 3.02 | | | | 2.54 | | | | 4.15 | | | | (2.15 | ) | | | 3.96 | | | | 0.99 | |
| | | | | | | |
| | Distributions to shareholders from net investment income | | | — | | | | (0.18 | ) | | | (0.27 | ) | | | (0.43 | ) | | | (0.37 | ) | | | (0.18 | ) |
| | | | | | | |
| | Distributions to shareholders from net realized gains | | | — | | | | (0.32 | ) | | | (0.82 | ) | | | — | | | | — | | | | — | |
| | | | | | | |
| | Total distributions | | | — | | | | (0.50 | ) | | | (1.09 | ) | | | (0.43 | ) | | | (0.37 | ) | | | (0.18 | ) |
| | | | | | | |
| | Net asset value, end of period | | $ | 24.38 | | | $ | 21.36 | | | $ | 19.32 | | | $ | 16.26 | | | $ | 18.84 | | | $ | 15.25 | |
| | | | | | | |
| | Total return(c) | | | 14.09 | % | | | 13.15 | % | | | 25.66 | % | | | (11.40 | )% | | | 25.96 | % | | | 6.81 | % |
| | | | | | | |
| | Net assets, end of period (in 000s) | | $ | 183,285 | | | $ | 166,449 | | | $ | 162,028 | | | $ | 135,758 | | | $ | 137,276 | | | $ | 124,514 | |
| | | | | | | |
| | Ratio of net expenses to average net assets(d) | | | 0.55 | %(e) | | | 0.57 | % | | | 0.58 | % | | | 0.58 | % | | | 0.59 | % | | | 0.59 | % |
| | | | | | | |
| | Ratio of total expenses to average net assets(d) | | | 0.60 | %(e) | | | 0.64 | % | | | 0.66 | % | | | 0.66 | % | | | 0.67 | % | | | 0.69 | % |
| | | | | | | |
| | Ratio of net investment income to average net assets(b) | | | 0.64 | %(e) | | | 0.98 | % | | | 1.56 | % | | | 1.09 | % | | | 0.93 | % | | | 1.12 | % |
| | | | | | | |
| | Portfolio turnover rate(f) | | | 1 | % | | | 12 | % | | | 40 | % | | | 11 | % | | | 53 | % | | | 39 | % |
| | (a) | | Calculated based on the average shares outstanding methodology. |
| | (b) | | Recognition of net investment income by the Fund is affected by the timing of declaration of dividends by the Underlying Funds in which the Fund invests. |
| | (c) | | Assumes investment at the NAV at the beginning of the period, reinvestment of all dividends and distributions, a complete redemption of the investment at the NAV at the end of the period and no sales or redemption charges (if any). Total returns would be reduced if a sales or redemption charge was taken into account. Returns do not reflect the impact of taxes to shareholders relating to Fund distributions or the redemption of Fund shares. Total returns for periods less than one full year are not annualized. |
| | (d) | | Expense ratios exclude the expenses of the Underlying Funds in which the Fund invests. |
| | (f) | | The Fund’s portfolio turnover rate is calculated in accordance with regulatory requirements, without regard to transactions involving short term investments and certain derivatives. If such transactions were included, the Fund’s portfolio turnover rate may be higher. |
| | |
| 12 | | The accompanying notes are an integral part of these financial statements. |
GOLDMAN SACHS DYNAMIC GLOBAL EQUITY FUND
Financial Highlights (continued)
Selected Share Data for a Share Outstanding Throughout Each Period
| | | | | | | | | | | | | | | | | | | | | | | | | | |
| | | | | Goldman Sachs Dynamic Global Equity Fund | |
| | | | | Class C Shares | |
| | | | | Six Months Ended
June 30, 2021
(Unaudited) | | | Year Ended December 31, | |
| | | | | 2020 | | | 2019 | | | 2018 | | | 2017 | | | 2016 | |
| | Per Share Data | | | | | | | | | | | | | | | | | | | | | | | | |
| | | | | | | |
| | Net asset value, beginning of period | | $ | 20.71 | | | $ | 18.74 | | | $ | 15.77 | | | $ | 18.01 | | | $ | 14.58 | | | $ | 13.82 | |
| | | | | | | |
| | Net investment income (loss)(a)(b) | | | (0.03 | ) | | | 0.02 | | | | 0.10 | | | | (0.05 | ) | | | 0.01 | | | | 0.05 | |
| | | | | | | |
| | Net realized and unrealized gain (loss) | | | 2.87 | | | | 2.28 | | | | 3.77 | | | | (2.12 | ) | | | 3.65 | | | | 0.78 | |
| | | | | | | |
| | Total from investment operations | | | 2.84 | | | | 2.30 | | | | 3.87 | | | | (2.17 | ) | | | 3.66 | | | | 0.83 | |
| | | | | | | |
| | Distributions to shareholders from net investment income | | | — | | | | (0.01 | ) | | | (0.08 | ) | | | (0.07 | ) | | | (0.23 | ) | | | (0.07 | ) |
| | | | | | | |
| | Distributions to shareholders from net realized gains | | | — | | | | (0.32 | ) | | | (0.82 | ) | | | — | | | | — | | | | — | |
| | | | | | | |
| | Total distributions | | | — | | | | (0.33 | ) | | | (0.90 | ) | | | (0.07 | ) | | | (0.23 | ) | | | (0.07 | ) |
| | | | | | | |
| | Net asset value, end of period | | $ | 23.55 | | | $ | 20.71 | | | $ | 18.74 | | | $ | 15.77 | | | $ | 18.01 | | | $ | 14.58 | |
| | | | | | | |
| | Total return(c) | | | 13.66 | % | | | 12.29 | % | | | 24.72 | % | | | (12.04 | )% | | | 25.08 | % | | | 5.95 | % |
| | | | | | | |
| | Net assets, end of period (in 000s) | | $ | 11,029 | | | $ | 13,716 | | | $ | 17,348 | | | $ | 23,020 | | | $ | 68,315 | | | $ | 75,027 | |
| | | | | | | |
| | Ratio of net expenses to average net assets(d) | | | 1.30 | %(e) | | | 1.32 | % | | | 1.33 | % | | | 1.33 | % | | | 1.34 | % | | | 1.34 | % |
| | | | | | | |
| | Ratio of total expenses to average net assets(d) | | | 1.34 | %(e) | | | 1.39 | % | | | 1.41 | % | | | 1.40 | % | | | 1.42 | % | | | 1.44 | % |
| | | | | | | |
| | Ratio of net investment income (loss) to average net assets(b) | | | (0.26 | )%(e) | | | 0.13 | % | | | 0.58 | % | | | (0.29 | )% | | | 0.08 | % | | | 0.33 | % |
| | | | | | | |
| | Portfolio turnover rate(f) | | | 1 | % | | | 12 | % | | | 40 | % | | | 11 | % | | | 53 | % | | | 39 | % |
| | (a) | | Calculated based on the average shares outstanding methodology. |
| | (b) | | Recognition of net investment income by the Fund is affected by the timing of declaration of dividends by the Underlying Funds in which the Fund invests. |
| | (c) | | Assumes investment at the NAV at the beginning of the period, reinvestment of all dividends and distributions, a complete redemption of the investment at the NAV at the end of the period and no sales or redemption charges (if any). Total returns would be reduced if a sales or redemption charge was taken into account. Returns do not reflect the impact of taxes to shareholders relating to Fund distributions or the redemption of Fund shares. Total returns for periods less than one full year are not annualized. |
| | (d) | | Expense ratios exclude the expenses of the Underlying Funds in which the Fund invests. |
| | (f) | | The Fund’s portfolio turnover rate is calculated in accordance with regulatory requirements, without regard to transactions involving short term investments and certain derivatives. If such transactions were included, the Fund’s portfolio turnover rate may be higher. |
| | |
| The accompanying notes are an integral part of these financial statements. | | 13 |
GOLDMAN SACHS DYNAMIC GLOBAL EQUITY FUND
Financial Highlights (continued)
Selected Share Data for a Share Outstanding Throughout Each Period
| | | | | | | | | | | | | | | | | | | | | | | | | | |
| | | | | Goldman Sachs Dynamic Global Equity Fund | |
| | | | | Institutional Shares | |
| | | | | Six Months Ended
June 30, 2021
(Unaudited) | | | Year Ended December 31, | |
| | | | | 2020 | | | 2019 | | | 2018 | | | 2017 | | | 2016 | |
| | Per Share Data | | | | | | | | | | | | | | | | | | | | | | | | |
| | | | | | | |
| | Net asset value, beginning of period | | $ | 21.63 | | | $ | 19.55 | | | $ | 16.43 | | | $ | 19.01 | | | $ | 15.38 | | | $ | 14.57 | |
| | | | | | | |
| | Net investment income(a)(b) | | | 0.12 | | | | 0.23 | | | | 0.34 | | | | 0.09 | | | | 0.24 | | | | 0.23 | |
| | | | | | | |
| | Net realized and unrealized gain (loss) | | | 2.98 | | | | 2.42 | | | | 3.93 | | | | (2.20 | ) | | | 3.83 | | | | 0.82 | |
| | | | | | | |
| | Total from investment operations | | | 3.10 | | | | 2.65 | | | | 4.27 | | | | (2.11 | ) | | | 4.07 | | | | 1.05 | |
| | | | | | | |
| | Distributions to shareholders from net investment income | | | — | | | | (0.25 | ) | | | (0.33 | ) | | | (0.47 | ) | | | (0.44 | ) | | | (0.24 | ) |
| | | | | | | |
| | Distributions to shareholders from net realized gains | | | — | | | | (0.32 | ) | | | (0.82 | ) | | | — | | | | — | | | | — | |
| | | | | | | |
| | Total distributions | | | — | | | | (0.57 | ) | | | (1.15 | ) | | | (0.47 | ) | | | (0.44 | ) | | | (0.24 | ) |
| | | | | | | |
| | Net asset value, end of period | | $ | 24.73 | | | $ | 21.63 | | | $ | 19.55 | | | $ | 16.43 | | | $ | 19.01 | | | $ | 15.38 | |
| | | | | | | |
| | Total return(c) | | | 14.29 | % | | | 13.56 | % | | | 26.18 | % | | | (11.07 | )% | | | 26.48 | % | | | 7.18 | % |
| | | | | | | |
| | Net assets, end of period (in 000s) | | $ | 15,920 | | | $ | 14,179 | | | $ | 13,423 | | | $ | 16,974 | | | $ | 155,828 | | | $ | 119,108 | |
| | | | | | | |
| | Ratio of net expenses to average net assets(d) | | | 0.19 | %(e) | | | 0.19 | % | | | 0.20 | % | | | 0.19 | % | | | 0.20 | % | | | 0.19 | % |
| | | | | | | |
| | Ratio of total expenses to average net assets(d) | | | 0.23 | %(e) | | | 0.26 | % | | | 0.28 | % | | | 0.26 | % | | | 0.28 | % | | | 0.29 | % |
| | | | | | | |
| | Ratio of net investment income to average net assets(b) | | | 1.01 | %(e) | | | 1.25 | % | | | 1.82 | % | | | 0.47 | % | | | 1.40 | % | | | 1.55 | % |
| | | | | | | |
| | Portfolio turnover rate(f) | | | 1 | % | | | 12 | % | | | 40 | % | | | 11 | % | | | 53 | % | | | 39 | % |
| | (a) | | Calculated based on the average shares outstanding methodology. |
| | (b) | | Recognition of net investment income by the Fund is affected by the timing of declaration of dividends by the Underlying Funds in which the Fund invests. |
| | (c) | | Assumes investment at the NAV at the beginning of the period, reinvestment of all dividends and distributions, a complete redemption of the investment at the NAV at the end of the period and no sales or redemption charges (if any). Total returns would be reduced if a sales or redemption charge was taken into account. Returns do not reflect the impact of taxes to shareholders relating to Fund distributions or the redemption of Fund shares. Total returns for periods less than one full year are not annualized. |
| | (d) | | Expense ratios exclude the expenses of the Underlying Funds in which the Fund invests. |
| | (f) | | The Fund’s portfolio turnover rate is calculated in accordance with regulatory requirements, without regard to transactions involving short term investments and certain derivatives. If such transactions were included, the Fund’s portfolio turnover rate may be higher. |
| | |
| 14 | | The accompanying notes are an integral part of these financial statements. |
GOLDMAN SACHS DYNAMIC GLOBAL EQUITY FUND
Financial Highlights (continued)
Selected Share Data for a Share Outstanding Throughout Each Period
| | | | | | | | | | | | | | | | | | | | | | | | | | |
| | | | | Goldman Sachs Dynamic Global Equity Fund | |
| | | | | Service Shares | |
| | | | | Six Months Ended
June 30, 2021
(Unaudited) | | | Year Ended December 31, | |
| | | | | 2020 | | | 2019 | | | 2018 | | | 2017 | | | 2016 | |
| | Per Share Data | | | | | | | | | | | | | | | | | | | | | | | | |
| | | | | | | |
| | Net asset value, beginning of period | | $ | 21.35 | | | $ | 19.30 | | | $ | 16.20 | | | $ | 18.75 | | | $ | 15.19 | | | $ | 14.39 | |
| | | | | | | |
| | Net investment income(a)(b) | | | 0.06 | | | | 0.15 | | | | 0.21 | | | | 0.15 | | | | 0.16 | | | | 0.15 | |
| | | | | | | |
| | Net realized and unrealized gain (loss) | | | 2.94 | | | | 2.37 | | | | 3.89 | | | | (2.31 | ) | | | 3.76 | | | | 0.81 | |
| | | | | | | |
| | Total from investment operations | | | 3.00 | | | | 2.52 | | | | 4.10 | | | | (2.16 | ) | | | 3.92 | | | | 0.96 | |
| | | | | | | |
| | Distributions to shareholders from net investment income | | | — | | | | (0.15 | ) | | | (0.18 | ) | | | (0.39 | ) | | | (0.36 | ) | | | (0.16 | ) |
| | | | | | | |
| | Distributions to shareholders from net realized gains | | | — | | | | (0.32 | ) | | | (0.82 | ) | | | — | | | | — | | | | — | |
| | | | | | | |
| | Total distributions | | | — | | | | (0.47 | ) | | | (1.00 | ) | | | (0.39 | ) | | | (0.36 | ) | | | (0.16 | ) |
| | | | | | | |
| | Net asset value, end of period | | $ | 24.35 | | | $ | 21.35 | | | $ | 19.30 | | | $ | 16.20 | | | $ | 18.75 | | | $ | 15.19 | |
| | | | | | | |
| | Total return(c) | | | 14.00 | % | | | 13.04 | % | | | 25.49 | % | | | (11.48 | )% | | | 25.79 | % | | | 6.66 | % |
| | | | | | | |
| | Net assets, end of period (in 000s) | | $ | 303 | | | $ | 269 | | | $ | 380 | | | $ | 543 | | | $ | 684 | | | $ | 470 | |
| | | | | | | |
| | Ratio of net expenses to average net assets(d) | | | 0.69 | %(e) | | | 0.69 | % | | | 0.70 | % | | | 0.69 | % | | | 0.69 | % | | | 0.69 | % |
| | | | | | | |
| | Ratio of total expenses to average net assets(d) | | | 0.73 | %(e) | | | 0.76 | % | | | 0.78 | % | | | 0.77 | % | | | 0.78 | % | | | 0.79 | % |
| | | | | | | |
| | Ratio of net investment income to average net assets(b) | | | 0.51 | %(e) | | | 0.79 | % | | | 1.16 | % | | | 0.80 | % | | | 0.91 | % | | | 1.01 | % |
| | | | | | | |
| | Portfolio turnover rate(f) | | | 1 | % | | | 12 | % | | | 40 | % | | | 11 | % | | | 53 | % | | | 39 | % |
| | (a) | | Calculated based on the average shares outstanding methodology. |
| | (b) | | Recognition of net investment income by the Fund is affected by the timing of declaration of dividends by the Underlying Funds in which the Fund invests. |
| | (c) | | Assumes investment at the NAV at the beginning of the period, reinvestment of all dividends and distributions, a complete redemption of the investment at the NAV at the end of the period and no sales or redemption charges (if any). Total returns would be reduced if a sales or redemption charge was taken into account. Returns do not reflect the impact of taxes to shareholders relating to Fund distributions or the redemption of Fund shares. Total returns for periods less than one full year are not annualized. |
| | (d) | | Expense ratios exclude the expenses of the Underlying Funds in which the Fund invests. |
| | (f) | | The Fund’s portfolio turnover rate is calculated in accordance with regulatory requirements, without regard to transactions involving short term investments and certain derivatives. If such transactions were included, the Fund’s portfolio turnover rate may be higher. |
| | |
| The accompanying notes are an integral part of these financial statements. | | 15 |
GOLDMAN SACHS DYNAMIC GLOBAL EQUITY FUND
Financial Highlights (continued)
Selected Share Data for a Share Outstanding Throughout Each Period
| | | | | | | | | | | | | | | | | | | | | | | | | | |
| | | | | Goldman Sachs Dynamic Global Equity Fund | |
| | | | | Investor Shares | |
| | | | | Six Months Ended
June 30, 2021
(Unaudited) | | | Year Ended December 31, | |
| | | | | 2020 | | | 2019 | | | 2018 | | | 2017 | | | 2016 | |
| | Per Share Data | | | | | | | | | | | | | | | | | | | | | | | | |
| | | | | | | |
| | Net asset value, beginning of period | | $ | 21.05 | | | $ | 19.04 | | | $ | 16.03 | | | $ | 18.58 | | | $ | 15.03 | | | $ | 14.25 | |
| | | | | | | |
| | Net investment income(a)(b) | | | 0.10 | | | | 0.23 | | | | 0.30 | | | | 0.24 | | | | 0.18 | | | | 0.21 | |
| | | | | | | |
| | Net realized and unrealized gain (loss) | | | 2.90 | | | | 2.33 | | | | 3.84 | | | | (2.32 | ) | | | 3.78 | | | | 0.79 | |
| | | | | | | |
| | Total from investment operations | | | 3.00 | | | | 2.56 | | | | 4.14 | | | | (2.08 | ) | | | 3.96 | | | | 1.00 | |
| | | | | | | |
| | Distributions to shareholders from net investment income | | | — | | | | (0.23 | ) | | | (0.31 | ) | | | (0.47 | ) | | | (0.41 | ) | | | (0.22 | ) |
| | | | | | | |
| | Distributions to shareholders from net realized gains | | | — | | | | (0.32 | ) | | | (0.82 | ) | | | — | | | | — | | | | — | |
| | | | | | | |
| | Total distributions | | | — | | | | (0.55 | ) | | | (1.13 | ) | | | (0.47 | ) | | | (0.41 | ) | | | (0.22 | ) |
| | | | | | | |
| | Net asset value, end of period | | $ | 24.05 | | | $ | 21.05 | | | $ | 19.04 | | | $ | 16.03 | | | $ | 18.58 | | | $ | 15.03 | |
| | | | | | | |
| | Total return(c) | | | 14.20 | % | | | 13.44 | % | | | 25.97 | % | | | (11.18 | )% | | | 26.35 | % | | | 6.99 | % |
| | | | | | | |
| | Net assets, end of period (in 000s) | | $ | 5,542 | | | $ | 4,908 | | | $ | 4,517 | | | $ | 5,703 | | | $ | 5,481 | | | $ | 5,663 | |
| | | | | | | |
| | Ratio of net expenses to average net assets(d) | | | 0.30 | %(e) | | | 0.32 | % | | | 0.33 | % | | | 0.33 | % | | | 0.34 | % | | | 0.34 | % |
| | | | | | | |
| | Ratio of total expenses to average net assets(d) | | | 0.35 | %(e) | | | 0.39 | % | | | 0.41 | % | | | 0.41 | % | | | 0.42 | % | | | 0.44 | % |
| | | | | | | |
| | Ratio of net investment income to average net assets(b) | | | 0.89 | %(e) | | | 1.24 | % | | | 1.66 | % | | | 1.28 | % | | | 1.07 | % | | | 1.47 | % |
| | | | | | | |
| | Portfolio turnover rate(f) | | | 1 | % | | | 12 | % | | | 40 | % | | | 11 | % | | | 53 | % | | | 39 | % |
| | (a) | | Calculated based on the average shares outstanding methodology. |
| | (b) | | Recognition of net investment income by the Fund is affected by the timing of declaration of dividends by the Underlying Funds in which the Fund invests. |
| | (c) | | Assumes investment at the NAV at the beginning of the period, reinvestment of all dividends and distributions, a complete redemption of the investment at the NAV at the end of the period and no sales or redemption charges (if any). Total returns would be reduced if a sales or redemption charge was taken into account. Returns do not reflect the impact of taxes to shareholders relating to Fund distributions or the redemption of Fund shares. Total returns for periods less than one full year are not annualized. |
| | (d) | | Expense ratios exclude the expenses of the Underlying Funds in which the Fund invests. |
| | (f) | | The Fund’s portfolio turnover rate is calculated in accordance with regulatory requirements, without regard to transactions involving short term investments and certain derivatives. If such transactions were included, the Fund’s portfolio turnover rate may be higher. |
| | |
| 16 | | The accompanying notes are an integral part of these financial statements. |
GOLDMAN SACHS DYNAMIC GLOBAL EQUITY FUND
Financial Highlights (continued)
Selected Share Data for a Share Outstanding Throughout Each Period
| | | | | | | | | | | | | | | | | | | | | | | | | | |
| | | | | Goldman Sachs Dynamic Global Equity Fund | |
| | | | | Class R6 Shares | |
| | | | | Six Months Ended
June 30, 2021
(Unaudited) | | | Year Ended December 31, | |
| | | | | 2020 | | | 2019 | | | 2018 | | | 2017 | | | 2016 | |
| | Per Share Data | | | | | | | | | | | | | | | | | | | | | | | | |
| | | | | | | |
| | Net asset value, beginning of period | | $ | 21.63 | | | $ | 19.55 | | | $ | 16.44 | | | $ | 19.04 | | | $ | 15.37 | | | $ | 14.57 | |
| | | | | | | |
| | Net investment income(a)(b) | | | 0.12 | | | | 0.25 | | | | 0.49 | | | | 1.61 | | | | 0.12 | | | | 0.24 | |
| | | | | | | |
| | Net realized and unrealized gain (loss) | | | 2.98 | | | | 2.40 | | | | 3.78 | | | | (3.71 | ) | | | 3.96 | | | | 0.80 | |
| | | | | | | |
| | Total from investment operations | | | 3.10 | | | | 2.65 | | | | 4.27 | | | | (2.10 | ) | | | 4.08 | | | | 1.04 | |
| | | | | | | |
| | Distributions to shareholders from net investment income | | | — | | | | (0.25 | ) | | | (0.34 | ) | | | (0.50 | ) | | | (0.41 | ) | | | (0.24 | ) |
| | | | | | | |
| | Distributions to shareholders from net realized gains | | | — | | | | (0.32 | ) | | | (0.82 | ) | | | — | | | | — | | | | — | |
| | | | | | | |
| | Total distributions | | | — | | | | (0.57 | ) | | | (1.16 | ) | | | (0.50 | ) | | | (0.41 | ) | | | (0.24 | ) |
| | | | | | | |
| | Net asset value, end of period | | $ | 24.73 | | | $ | 21.63 | | | $ | 19.55 | | | $ | 16.44 | | | $ | 19.04 | | | $ | 15.37 | |
| | | | | | | |
| | Total return(c) | | | 14.29 | % | | | 13.57 | % | | | 26.14 | % | | | (11.00 | )% | | | 26.54 | % | | | 7.12 | % |
| | | | | | | |
| | Net assets, end of period (in 000s) | | $ | 519,860 | | | $ | 490,832 | | | $ | 478,073 | | | $ | 4,485 | | | $ | 13 | | | $ | 10 | |
| | | | | | | |
| | Ratio of net expenses to average net assets(d) | | | 0.18 | %(e) | | | 0.18 | % | | | 0.19 | % | | | 0.18 | % | | | 0.18 | % | | | 0.19 | % |
| | | | | | | |
| | Ratio of total expenses to average net assets(d) | | | 0.22 | %(e) | | | 0.25 | % | | | 0.26 | % | | | 0.32 | % | | | 0.24 | % | | | 0.28 | % |
| | | | | | | |
| | Ratio of net investment income to average net assets(b) | | | 1.00 | %(e) | | | 1.36 | % | | | 2.55 | % | | | 9.20 | % | | | 0.66 | % | | | 1.63 | % |
| | | | | | | |
| | Portfolio turnover rate(f) | | | 1 | % | | | 12 | % | | | 40 | % | | | 11 | % | | | 53 | % | | | 39 | % |
| | (a) | | Calculated based on the average shares outstanding methodology. |
| | (b) | | Recognition of net investment income by the Fund is affected by the timing of declaration of dividends by the Underlying Funds in which the Fund invests. |
| | (c) | | Assumes investment at the NAV at the beginning of the period, reinvestment of all dividends and distributions, a complete redemption of the investment at the NAV at the end of the period and no sales or redemption charges (if any). Total returns would be reduced if a sales or redemption charge was taken into account. Returns do not reflect the impact of taxes to shareholders relating to Fund distributions or the redemption of Fund shares. Total returns for periods less than one full year are not annualized. |
| | (d) | | Expense ratios exclude the expenses of the Underlying Funds in which the Fund invests. |
| | (f) | | The Fund’s portfolio turnover rate is calculated in accordance with regulatory requirements, without regard to transactions involving short term investments and certain derivatives. If such transactions were included, the Fund’s portfolio turnover rate may be higher. |
| | |
| The accompanying notes are an integral part of these financial statements. | | 17 |
GOLDMAN SACHS DYNAMIC GLOBAL EQUITY FUND
Financial Highlights (continued)
Selected Share Data for a Share Outstanding Throughout Each Period
| | | | | | | | | | | | | | | | | | | | | | | | | | |
| | | | | Goldman Sachs Dynamic Global Equity Fund | |
| | | | | Class R Shares | |
| | | | | Six Months Ended
June 30, 2021
(Unaudited) | | | Year Ended December 31, | |
| | | | | 2020 | | | 2019 | | | 2018 | | | 2017 | | | 2016 | |
| | Per Share Data | | | | | | | | | | | | | | | | | | | | | | | | |
| | | | | | | |
| | Net asset value, beginning of period | | $ | 21.17 | | | $ | 19.15 | | | $ | 16.13 | | | $ | 18.69 | | | $ | 15.15 | | | $ | 14.37 | |
| | | | | | | |
| | Net investment income(a)(b) | | | 0.04 | | | | 0.13 | | | | 0.24 | | | | 0.14 | | | | 0.19 | | | | 0.16 | |
| | | | | | | |
| | Net realized and unrealized gain (loss) | | | 2.92 | | | | 2.34 | | | | 3.82 | | | | (2.32 | ) | | | 3.70 | | | | 0.78 | |
| | | | | | | |
| | Total from investment operations | | | 2.96 | | | | 2.47 | | | | 4.06 | | | | (2.18 | ) | | | 3.89 | | | | 0.94 | |
| | | | | | | |
| | Distributions to shareholders from net investment income | | | — | | | | (0.13 | ) | | | (0.22 | ) | | | (0.38 | ) | | | (0.35 | ) | | | (0.16 | ) |
| | | | | | | |
| | Distributions to shareholders from net realized gains | | | — | | | | (0.32 | ) | | | (0.82 | ) | | | — | | | | — | | | | — | |
| | | | | | | |
| | Total distributions | | | — | | | | (0.45 | ) | | | (1.04 | ) | | | (0.38 | ) | | | (0.35 | ) | | | (0.16 | ) |
| | | | | | | |
| | Net asset value, end of period | | $ | 24.13 | | | $ | 21.17 | | | $ | 19.15 | | | $ | 16.13 | | | $ | 18.69 | | | $ | 15.15 | |
| | | | | | | |
| | Total return(c) | | | 13.93 | % | | | 12.88 | % | | | 25.36 | % | | | (11.63 | )% | | | 25.70 | % | | | 6.49 | % |
| | | | | | | |
| | Net assets, end of period (in 000s) | | $ | 6,341 | | | $ | 5,700 | | | $ | 5,922 | | | $ | 4,938 | | | $ | 5,910 | | | $ | 2,031 | |
| | | | | | | |
| | Ratio of net expenses to average net assets(d) | | | 0.80 | %(e) | | | 0.82 | % | | | 0.83 | % | | | 0.83 | % | | | 0.84 | % | | | 0.84 | % |
| | | | | | | |
| | Ratio of total expenses to average net assets(d) | | | 0.85 | %(e) | | | 0.89 | % | | | 0.91 | % | | | 0.91 | % | | | 0.92 | % | | | 0.94 | % |
| | | | | | | |
| | Ratio of net investment income to average net assets(b) | | | 0.39 | %(e) | | | 0.70 | % | | | 1.31 | % | | | 0.77 | % | | | 1.06 | % | | | 1.10 | % |
| | | | | | | |
| | Portfolio turnover rate(f) | | | 1 | % | | | 12 | % | | | 40 | % | | | 11 | % | | | 53 | % | | | 39 | % |
| | (a) | | Calculated based on the average shares outstanding methodology. |
| | (b) | | Recognition of net investment income by the Fund is affected by the timing of declaration of dividends by the Underlying Funds in which the Fund invests. |
| | (c) | | Assumes investment at the NAV at the beginning of the period, reinvestment of all dividends and distributions, a complete redemption of the investment at the NAV at the end of the period and no sales or redemption charges (if any). Total returns would be reduced if a sales or redemption charge was taken into account. Returns do not reflect the impact of taxes to shareholders relating to Fund distributions or the redemption of Fund shares. Total returns for periods less than one full year are not annualized. |
| | (d) | | Expense ratios exclude the expenses of the Underlying Funds in which the Fund invests. |
| | (f) | | The Fund’s portfolio turnover rate is calculated in accordance with regulatory requirements, without regard to transactions involving short term investments and certain derivatives. If such transactions were included, the Fund’s portfolio turnover rate may be higher. |
| | |
| 18 | | The accompanying notes are an integral part of these financial statements. |
GOLDMAN SACHS DYNAMIC GLOBAL EQUITY FUND
Financial Highlights (continued)
Selected Share Data for a Share Outstanding Throughout Each Period
| | | | | | | | | | | | | | | | | | |
| | | | | Goldman Sachs Dynamic Global Equity Fund | |
| | | | | Class P Shares | |
| | | | | Six Months Ended
June 30, 2021
(Unaudited) | | | Year Ended December 31, | | | Period Ended
December 31, 2018(a) | |
| | | | | 2020 | | | 2019 | |
| | Per Share Data | | | | | | | | | | | | | | | | |
| | | | | |
| | Net asset value, beginning of period | | $ | 21.64 | | | $ | 19.56 | | | $ | 16.44 | | | $ | 19.43 | |
| | | | | |
| | Net investment income(b)(c) | | | 0.12 | | | | 0.26 | | | | 0.37 | | | | 0.31 | |
| | | | | |
| | Net realized and unrealized gain (loss) | | | 2.99 | | | | 2.39 | | | | 3.91 | | | | (2.80 | ) |
| | | | | |
| | Total from investment operations | | | 3.11 | | | | 2.65 | | | | 4.28 | | | | (2.49 | ) |
| | | | | |
| | Distributions to shareholders from net investment income | | | — | | | | (0.25 | ) | | | (0.34 | ) | | | (0.50 | ) |
| | | | | |
| | Distributions to shareholders from net realized gains | | | — | | | | (0.32 | ) | | | (0.82 | ) | | | — | |
| | | | | |
| | Total distributions | | | — | | | | (0.57 | ) | | | (1.16 | ) | | | (0.50 | ) |
| | | | | |
| | Net asset value, end of period | | $ | 24.75 | | | $ | 21.64 | | | $ | 19.56 | | | $ | 16.44 | |
| | | | | |
| | Total return(d) | | | 14.33 | % | | | 13.57 | % | | | 26.19 | % | | | (12.80 | )% |
| | | | | |
| | Net assets, end of period (in 000s) | | $ | 151,551 | | | $ | 130,610 | | | $ | 127,367 | | | $ | 103,074 | |
| | | | | |
| | Ratio of net expenses to average net assets(e) | | | 0.18 | %(f) | | | 0.18 | % | | | 0.19 | % | | | 0.18 | %(f) |
| | | | | |
| | Ratio of total expenses to average net assets(e) | | | 0.22 | %(f) | | | 0.25 | % | | | 0.27 | % | | | 0.27 | %(f) |
| | | | | |
| | Ratio of net investment income to average net assets(c) | | | 1.02 | %(f) | | | 1.37 | % | | | 1.96 | % | | | 2.33 | %(f) |
| | | | | |
| | Portfolio turnover rate(g) | | | 1 | % | | | 12 | % | | | 40 | % | | | 11 | % |
| | (a) | | Commenced operations on April 17, 2018. |
| | (b) | | Calculated based on the average shares outstanding methodology. |
| | (c) | | Recognition of net investment income by the Fund is affected by the timing of declaration of dividends by the Underlying Funds in which the Fund invests. |
| | (d) | | Assumes investment at the NAV at the beginning of the period, reinvestment of all dividends and distributions, a complete redemption of the investment at the NAV at the end of the period and no sales or redemption charges (if any). Total returns would be reduced if a sales or redemption charge was taken into account. Returns do not reflect the impact of taxes to shareholders relating to Fund distributions or the redemption of Fund shares. Total returns for periods less than one full year are not annualized. |
| | (e) | | Expense ratios exclude the expenses of the Underlying Funds in which the Fund invests. |
| | (g) | | The Fund’s portfolio turnover rate is calculated in accordance with regulatory requirements, without regard to transactions involving short term investments and certain derivatives. If such transactions were included, the Fund’s portfolio turnover rate may be higher. |
| | |
| The accompanying notes are an integral part of these financial statements. | | 19 |
GOLDMAN SACHS DYNAMIC GLOBAL EQUITY FUND
Notes to Financial Statements
June 30, 2021 (Unaudited)
Goldman Sachs Trust (the “Trust”) is a Delaware statutory trust registered under the Investment Company Act of 1940, as amended (the “Act”), as an open-end management investment company. The Trust includes the Goldman Sachs Dynamic Global Equity Fund (the “Fund”). The Fund is a diversified fund and currently offers eight classes of shares: Class A, Class C, Institutional, Service, Investor, Class R6, Class R and Class P Shares.
Class A Shares are sold with a front-end sales charge of up to 5.50%. Class C Shares are sold with a contingent deferred sales charge (“CDSC”) of 1.00%, which is imposed on redemptions made within 12 months of purchase. Institutional, Service, Investor, Class R6 and Class R and Class P Shares are not subject to a sales charge.
Goldman Sachs Asset Management, L.P. (“GSAM”), an affiliate of Goldman Sachs & Co. LLC (“Goldman Sachs”), serves as investment adviser to the Fund pursuant to a management agreement (the “Agreement”) with the Trust.
The Fund is expected to invest in a diversified portfolio of global equity asset classes. Such investments may include underlying funds (including exchange-traded funds (“ETFs”)) (collectively, the “Underlying Funds”), futures, forwards, options, swaps and other instruments with similar economic exposures. The Fund may invest in Underlying Funds that currently exist or that may become available for investment in the future for which GSAM or an affiliate now or in the future acts as investment adviser or principal underwriter.
|
| 2. SIGNIFICANT ACCOUNTING POLICIES |
The financial statements have been prepared in accordance with accounting principles generally accepted in the United States of America (“GAAP”) and require management to make estimates and assumptions that may affect the reported amounts and disclosures. Actual results may differ from those estimates and assumptions. The Fund is an investment company under GAAP and follows the accounting and reporting guidance applicable to investment companies.
A. Investment Valuation — The valuation policy of the Fund and Underlying Funds is to value investments at fair value.
B. Investment Income and Investments — Investment income includes interest income, dividend income and securities lending income, if any. Interest income is accrued daily and adjusted for amortization of premiums and accretion of discounts. Dividend income is recognized on ex-dividend date or, for certain foreign securities, as soon as such information is obtained subsequent to the ex-dividend date. Non-cash dividends, if any, are recorded at the fair market value of the securities received. Investment transactions are reflected on trade date. Realized gains and losses are calculated using identified cost. Investment transactions are recorded on the following business day for daily net asset value (“NAV”) calculations. Investment income is recorded net of any foreign withholding taxes, less any amounts reclaimable. The Fund may file withholding tax reclaims in certain jurisdictions to recover a portion of amounts previously withheld. Any foreign capital gains tax is accrued daily based upon net unrealized gains, and is payable upon sale of such investments. Income distributions are recognized as capital gains or income in the financial statements in accordance with the character that is distributed.
For derivative contracts, realized gains and losses are recorded upon settlement of the contract. Upfront payments, if any, are made or received upon entering into a swap agreement and are reflected in the Statement of Assets and Liabilities. Upfront payments are recognized over the contract’s term/event as realized gains or losses, with the exception of forward starting swap contracts whose realized gains or losses are recognized from the effective start date.
C. Class Allocations and Expenses — Investment income, realized and unrealized gain (loss), if any, and non-class specific expenses of the Fund are allocated daily based upon the proportion of net assets of each class. Non-class specific expenses directly incurred by the Fund are charged to the Fund, while such expenses incurred by the Trust are allocated across the Fund on a straight-line and/or pro-rata basis depending upon the nature of the expenses. Class specific expenses, where applicable, are borne by the respective share classes and include Distribution and Service, Transfer Agency and Service and Shareholder Administration fees. Expenses included in the accompanying financial statements reflect the expenses of the Fund and do not include any expenses associated with the Underlying Funds. Because the Underlying Funds have varied expense and fee levels and the Fund may own different proportions of the Underlying Funds at different times, the amount of fees and expenses incurred indirectly by the Fund will vary.
20
GOLDMAN SACHS DYNAMIC GLOBAL EQUITY FUND
|
| 2. SIGNIFICANT ACCOUNTING POLICIES (continued) |
D. Federal Taxes and Distributions to Shareholders — It is the Fund’s policy to comply with the requirements of the Internal Revenue Code of 1986, as amended (the “Code”), applicable to regulated investment companies and to distribute each year substantially all of its investment company taxable income and capital gains to its shareholders. Accordingly, the Fund is not required to make any provisions for the payment of federal income tax. Distributions to shareholders are recorded on the ex-dividend date. Income and capital gains distributions, if any, are declared and paid at least annually.
Net capital losses, if any, are carried forward to future fiscal years and may be used to the extent allowed by the Code to offset any future capital gains. Losses that are carried forward will retain their character as either short-term or long-term capital losses. Utilization of capital loss carryforwards will reduce the requirement of future capital gains distributions.
The characterization of distributions to shareholders for financial reporting purposes is determined in accordance with federal income tax rules, which may differ from GAAP. The source of the Fund’s distributions may be shown in the accompanying financial statements as either from distributable earnings or capital. Certain components of the Fund’s net assets on the Statement of Assets and Liabilities reflect permanent GAAP/tax differences based on the appropriate tax character.
E. Foreign Currency Translation — The accounting records and reporting currency of the Fund are maintained in U.S. dollars. Assets and liabilities denominated in foreign currencies are translated into U.S. dollars using the current exchange rates at the close of each business day. The effect of changes in foreign currency exchange rates on investments is included within net realized and unrealized gain (loss) on investments. Changes in the value of other assets and liabilities as a result of fluctuations in foreign exchange rates are included in the Statement of Operations within net change in unrealized gain (loss) on foreign currency translation. Transactions denominated in foreign currencies are translated into U.S. dollars on the date the transaction occurred, the effects of which are included within net realized gain (loss) on foreign currency transactions.
| | |
| 3. INVESTMENTS AND FAIR VALUE MEASUREMENTS | | |
U.S. GAAP defines the fair value of a financial instrument as the amount that would be received to sell an asset or paid to transfer a liability in an orderly transaction between market participants at the measurement date (i.e., the exit price); the Fund’s policy is to use the market approach. GAAP establishes a fair value hierarchy that prioritizes the inputs to valuation techniques used to measure fair value. The hierarchy gives the highest priority to unadjusted quoted prices in active markets for identical assets or liabilities (Level 1 measurements) and the lowest priority to unobservable inputs (Level 3 measurements). The Level in the fair value hierarchy within which the fair value measurement in its entirety falls shall be determined based on the lowest Level input that is significant to the fair value measurement in its entirety. The levels used for classifying investments are not necessarily an indication of the risk associated with investing in these investments. The three levels of the fair value hierarchy are described below:
Level 1 — Unadjusted quoted prices in active markets that are accessible at the measurement date for identical, unrestricted assets or liabilities;
Level 2 — Quoted prices in markets that are not active or financial instruments for which significant inputs are observable (including, but not limited to, quoted prices for similar investments, interest rates, foreign exchange rates, volatility and credit spreads), either directly or indirectly;
Level 3 — Prices or valuations that require significant unobservable inputs (including GSAM’s assumptions in determining fair value measurement).
The Board of Trustees (“Trustees”) has approved Valuation Procedures that govern the valuation of the portfolio investments held by the Fund, including investments for which market quotations are not readily available. The Trustees have delegated to GSAM day-to-day responsibility for implementing and maintaining internal controls and procedures related to the valuation of the Fund’s investments. To assess the continuing appropriateness of pricing sources and methodologies, GSAM regularly performs price verification procedures and issues challenges as necessary to third party pricing vendors or brokers, and any differences are reviewed in accordance with the Valuation Procedures.
21
GOLDMAN SACHS DYNAMIC GLOBAL EQUITY FUND
Notes to Financial Statements (continued)
June 30, 2021 (Unaudited)
|
| 3. INVESTMENTS AND FAIR VALUE MEASUREMENTS (continued) |
A. Level 1 and Level 2 Fair Value Investments — The valuation techniques and significant inputs used in determining the fair values for investments classified as Level 1 and Level 2 are as follows:
Underlying Funds (including Money Market Funds) — Underlying Funds include other investment companies and exchange-traded funds (“ETFs”). Investments in the Underlying Funds (except ETFs) are valued at the NAV per share on the day of valuation. ETFs are valued daily at the last sale price or official closing price on the principal exchange or system on which the investment is traded. Because the Fund invests in Underlying Funds that fluctuate in value, the Fund’s shares will correspondingly fluctuate in value. To the extent these investments are actively traded, they are classified as Level 1 of the fair value hierarchy, otherwise they are generally classified as Level 2. For information regarding an Underlying Fund’s accounting policies and investment holdings, please see the Underlying Fund’s shareholder report.
Derivative Contracts — A derivative is an instrument whose value is derived from underlying assets, indices, reference rates or a combination of these factors. The Fund enters into derivative transactions to hedge against changes in interest rates, securities prices, and/or currency exchange rates, to increase total return, or to gain access to certain markets or attain exposure to other underliers. For financial reporting purposes, cash collateral that has been pledged to cover obligations of the Fund and cash collateral received, if any, is reported separately on the Statement of Assets and Liabilities as receivables/payables for collateral on certain derivatives contracts. Non-cash collateral pledged by the Fund, if any, is noted in the Schedule of Investments.
Exchange-traded derivatives, including futures and options contracts, are generally valued at the last sale or settlement price on the exchange where they are principally traded. Exchange-traded options without settlement prices are generally valued at the midpoint of the bid and ask prices on the exchange where they are principally traded (or, in the absence of two-way trading, at the last bid price for long positions and the last ask price for short positions). Exchange-traded derivatives typically fall within Level 1 of the fair value hierarchy. Over-the-counter (“OTC”) and centrally cleared derivatives are valued using market transactions and other market evidence, including market-based inputs to models, calibration to market-clearing transactions, broker or dealer quotations, or other alternative pricing sources. Where models are used, the selection of a particular model to value OTC and centrally cleared derivatives depends upon the contractual terms of, and specific risks inherent in, the instrument, as well as the availability of pricing information in the market. Valuation models require a variety of inputs, including contractual terms, market prices, yield curves, credit curves, measures of volatility, voluntary and involuntary prepayment rates, loss severity rates and correlations of such inputs. For OTC and centrally cleared derivatives that trade in liquid markets, model inputs can generally be verified and model selection does not involve significant management judgment. OTC and centrally cleared derivatives are classified within Level 2 of the fair value hierarchy when significant inputs are corroborated by market evidence.
i. Forward Contracts — A forward contract is a contract between two parties to buy or sell an asset at a specified price on a future date. A forward contract settlement can occur on a cash or delivery basis. Forward contracts are marked-to-market daily using independent vendor prices, and the change in value, if any, is recorded as an unrealized gain or loss. Cash and certain investments may be used to collateralize forward contracts.
A forward foreign currency exchange contract is a forward contract in which the Fund agrees to receive or deliver a fixed quantity of one currency for another, at a pre-determined price at a future date. All forward foreign currency exchange contracts are marked to market daily by using the outright forward rates or interpolating based upon maturity dates, where available. Non-deliverable forward foreign currency exchange contracts are settled with the counterparty in cash without the delivery of foreign currency.
ii. Futures Contracts — Futures contracts are contracts to buy or sell a standardized quantity of a specified commodity or security. Upon entering into a futures contract, the Fund deposits cash or securities in an account on behalf of the broker in an amount sufficient to meet the initial margin requirement. Subsequent payments are made or received by the Fund equal to the daily change in the contract value and are recorded as variation margin receivable or payable with a corresponding offset to unrealized gains or losses.
iii. Options — When the Fund writes call or put options, an amount equal to the premium received is recorded as a liability and is subsequently marked-to-market to reflect the current value of the option written. Swaptions are options on swap contracts.
22
GOLDMAN SACHS DYNAMIC GLOBAL EQUITY FUND
|
| 3. INVESTMENTS AND FAIR VALUE MEASUREMENTS (continued) |
Upon the purchase of a call option or a put option by the Fund, the premium paid is recorded as an investment and subsequently marked-to-market to reflect the current value of the option. Certain options may be purchased with premiums to be determined on a future date. The premiums for these options are based upon implied volatility parameters at specified terms.
iv. Swap Contracts — Bilateral swap contracts are agreements in which the Fund and a counterparty agree to exchange periodic payments on a specified notional amount or make a net payment upon termination. Bilateral swap transactions are privately negotiated in the OTC market and payments are settled through direct payments between the Fund and the counterparty. By contrast, certain swap transactions are subject to mandatory central clearing. These swaps are executed through a derivatives clearing member (“DCM”), acting in an agency capacity, and submitted to a central counterparty (“CCP”) (“centrally cleared swaps”), in which case all payments are settled with the CCP through the DCM. Swaps are marked-to-market daily using pricing vendor quotations, counterparty or clearinghouse prices or model prices, and the change in value, if any, is recorded as an unrealized gain or loss. Upon entering into a swap contract, the Fund is required to satisfy an initial margin requirement by delivering cash or securities to the counterparty (or in some cases, segregated in a triparty account on behalf of the counterparty), which can be adjusted by any mark-to-market gains or losses pursuant to bilateral or centrally cleared arrangements. For centrally cleared swaps the daily change in valuation, if any, is recorded as a receivable or payable for variation margin.
A total return swap is an agreement that gives the Fund the right to receive or pay the appreciation or depreciation, as applicable, in the value of a specified security, an index, a basket of securities or indices or other instrument in return for a fee paid to the counterparty, which will typically be an agreed upon interest rate. If the underlying asset declines in value over the term of the swap, the Fund may also be required to pay the dollar value of that decline to the counterparty.
B. Level 3 Fair Value Investments — To the extent that significant inputs to valuation models and other alternative pricing sources are unobservable, or if quotations are not readily available, or if GSAM believes that such quotations do not accurately reflect fair value, the fair value of the Fund’s investments may be determined under Valuation Procedures approved by the Trustees. GSAM, consistent with its procedures and applicable regulatory guidance, may make an adjustment to the most recent valuation prices of either domestic or foreign securities in light of significant events to reflect what it believes to be the fair value of the securities at the time of determining the Fund’s NAV. To the extent investments are valued using single source broker quotations obtained directly from the broker or passed through from third party pricing vendors, such investments are classified as Level 3 investments.
C. Fair Value Hierarchy — The following is a summary of the Fund’s investments and derivatives classified in the fair value hierarchy as of June 30, 2021:
| | | | | | | | | | | | |
| | | |
| Investment Type | | Level 1 | | | Level 2 | | | Level 3 | |
|
| Assets | |
|
Underlying Funds | |
| | | |
Equity | | $ | 290,769,627 | | | $ | — | | | $ | — | |
| | | |
Exchange Traded Funds | | | 526,120,931 | | | | — | | | | — | |
| | | |
Investment Company | | | 46,397,273 | | | | — | | | | — | |
| | | |
| Total | | $ | 863,287,831 | | | $ | — | | | $ | — | |
23
GOLDMAN SACHS DYNAMIC GLOBAL EQUITY FUND
Notes to Financial Statements (continued)
June 30, 2021 (Unaudited)
|
| 3. INVESTMENTS AND FAIR VALUE MEASUREMENTS (continued) |
| | | | | | | | | | | | |
| | | |
| Derivative Type | | Level 1 | | | Level 2 | | | Level 3 | |
|
| Assets | |
| | | |
Forward Foreign Currency Exchange Contracts(a) | | $ | — | | | $ | 1,332,095 | | | $ | — | |
| | | |
Futures Contracts(a) | | | 1,520,935 | | | | — | | | | — | |
| | | |
Total Return Swap Contracts(a) | | | — | | | | 292,144 | | | | — | |
| | | |
Options Purchased Contracts | | | 1,772,325 | | | | — | | | | — | |
| | | |
| Total | | $ | 3,293,260 | | | $ | 1,624,239 | | | $ | — | |
|
| Liabilities | |
| | | |
Futures Contracts(a) | | $ | (611,036 | ) | | $ | — | | | $ | — | |
| | | |
Written Option Contracts | | | (496,654 | ) | | | — | | | | — | |
| | | |
| Total | | $ | (1,107,690 | ) | | $ | — | | | $ | — | |
| (a) | | Amount shown represents unrealized gain (loss) at period end. |
For further information regarding security characteristics, see the Schedule of Investments.
|
| 4. INVESTMENTS IN DERIVATIVES |
The following table sets forth, by certain risk types, the gross value of derivative contracts (not considered to be hedging instruments for accounting disclosure purposes) as of June 30, 2021. These instruments were used as part of the Fund’s investment strategies and to obtain and/or manage exposure related to the risks below. The values in the tables below exclude the effects of cash collateral received or posted pursuant to these derivative contracts, and therefore are not representative of the Fund’s net exposure.
| | | | | | | | | | | | |
| Risk | | Statement of Assets
and Liabilities | | Assets | | | Statement of Assets
and Liabilities | | Liabilities | |
Interest | | Purchased options, at value | | $ | 1,772,325 | | | — | | $ | — | |
Equity | | Variation margin on future contracts; Receivable for unrealized gain on swap contracts | | | 1,813,079 | (a) | | Written options, at value; Variation margin on future contracts | | | (1,107,690) | (a) |
Currency | | Receivable for unrealized gain on forward foreign currency exchange contracts | | | 1,332,095 | | | — | | | — | |
| Total | | | | $ | 4,917,499 | | | | | $ | (1,107,690) | |
| (a) | | Includes unrealized gain (loss) on futures contracts described in the Additional Investment Information sections of the Schedule of Investments. Only the variation margin as of June 30, 2021 is reported within the Statement of Assets and Liabilities. |
The following table sets forth, by certain risk types, the Fund’s gains (losses) related to these derivatives and their indicative volumes for the six months ended June 30, 2021. These gains (losses) should be considered in the context that these derivative contracts may have been executed to create investment opportunities and/or economically hedge certain investments, and
24
GOLDMAN SACHS DYNAMIC GLOBAL EQUITY FUND
|
| 4. INVESTMENTS IN DERIVATIVES (continued) |
accordingly, certain gains (losses) on such derivative contracts may offset certain (losses) gains attributable to investments. These gains (losses) are included in “Net realized gain (loss)” or “Net change in unrealized gain (loss)” on the Statement of Operations:
| | | | | | | | | | |
| Risk | | Statement of Operations | | Net Realized Gain (Loss) | | | Net Change in
Unrealized
Gain (Loss) | |
| Interest | | Net realized gain (loss) from purchased options /Net change in unrealized gain (loss) on purchased options | | $ | 419,582 | | | $ | (966,724 | ) |
| Equity | | Net realized gain (loss) from futures contracts, swaps contracts and written options/Net change in unrealized gain (loss) on futures contracts, swaps contracts and written options | | | 23,326,038 | | | | (1,683,165 | ) |
| Currency | | Net realized gain (loss) from forward foreign currency exchange contracts/Net change in unrealized gain (loss) on forward foreign currency exchange contracts | | | (174,566 | ) | | | 2,172,454 | |
| Total | | | | $ | 23,571,054 | | | $ | (477,435 | ) |
For the six months ended June 30, 2021, the relevant values for each derivative type was as follows:
| | | | | | | | | | | | | | |
| Average Number of Contracts, Notional Amounts(a) | |
Futures
contracts | | Forward
contracts | | Swap
Agreements | | | Purchased
Options | | | Written
Options | |
| 737 | | $61,645,594 | | $ | 14,227,531 | | | | 910,000 | | | | 23,250 | |
| (a) | | Amounts disclosed represent average number of contracts for futures contracts, notional amounts for forward contracts, swap agreements, purchased options and written options, based on absolute values, which is indicative of volume for this derivative type, for the months that the Fund held such derivatives during the period ended June 30, 2021. |
|
| 5. AGREEMENTS AND AFFILIATED TRANSACTIONS |
A. Management Agreement — Under the Agreement, GSAM manages the Fund, subject to the general supervision of the Trustees.
As compensation for the services rendered pursuant to the Agreement, the assumption of the expenses related thereto and administration of the Fund’s business affairs, including providing facilities, GSAM is entitled to a management fee, accrued daily and paid monthly, equal to an annual percentage rate of the Fund’s average daily net assets of 0.15% for the Fund.
B. Distribution and/or Service (12b-1) Plans — The Trust, on behalf of Class A and Class R Shares of the Fund, has adopted Distribution and Service Plans subject to Rule 12b-1 under the Act. Under the Distribution and Service Plans, Goldman Sachs, which serves as distributor (the “Distributor”), is entitled to a fee accrued daily and paid monthly for distribution services and personal and account maintenance services, which may then be paid by Goldman Sachs to authorized dealers. These fees are equal to an annual percentage rate of the average daily net assets attributable to Class A or Class R Shares of the Fund, as applicable, as set forth below.
The Trust, on behalf of Class C Shares of the Fund, has adopted a Distribution Plan subject to Rule 12b-1 under the Act. Under the Distribution Plan, Goldman Sachs as Distributor is entitled to a fee accrued daily and paid monthly for distribution services, which may then be paid by Goldman Sachs to authorized dealers. These fees are equal to an annual percentage rate of the average daily net assets attributable to Class C Shares of the Fund, as set forth below.
The Trust, on behalf of Service Shares of the Fund, has adopted a Service Plan subject to Rule 12b-1 under the Act to allow Service Shares to compensate service organizations (including Goldman Sachs) for providing personal and account maintenance services to their customers who are beneficial owners of such shares. The Service Plan provides for compensation to the service
25
GOLDMAN SACHS DYNAMIC GLOBAL EQUITY FUND
Notes to Financial Statements (continued)
June 30, 2021 (Unaudited)
|
| 5. AGREEMENTS AND AFFILIATED TRANSACTIONS (continued) |
organizations equal to an annual percentage rate of the average daily net assets attributable to Service Shares of the Fund, as set forth below.
| | | | | | | | | | | | | | | | |
| | | Distribution and/or Service Plan Rates | |
| | | Class A* | | | Class C | | | Class R* | | | Service | |
Distribution and/or Service Plan | | | 0.25 | % | | | 0.75 | % | | | 0.50 | % | | | 0.25 | % |
| * | | With respect to Class A and Class R Shares, the Distributor at its discretion may use compensation for distribution services paid under the Distribution and/or Service Plan to compensate service organizations for personal and account maintenance services and expenses as long as such total compensation does not exceed the maximum cap on “service fees” imposed by the Financial Industry Regulatory Authority. |
C. Distribution Agreement — Goldman Sachs, as Distributor of the shares of the Fund pursuant to a Distribution Agreement, may retain a portion of the Class A Shares’ front end sales charge and Class C Shares’ CDSC. During the six months ended June 30, 2021, Goldman Sachs retained $3,085 of the front end sales charges and $321 of the CDSC for this Fund.
D. Service and/or Shareholder Administration Plan — The Trust, on behalf of the Fund, has adopted a Service Plan to allow Class C Shares and a Shareholder Administration Plan to allow Service Shares, respectively, to compensate service organizations (including Goldman Sachs) for providing varying levels of personal and account maintenance or shareholder administration services to their customers who are beneficial owners of such shares. The Service and Shareholder Administration Plans each provide for compensation to the service organizations equal to an annual percentage rate of 0.25% of the average daily net assets attributable to Class C or Service Shares of the Fund, respectively.
E. Transfer Agency Agreement — Goldman Sachs also serves as the transfer agent of the Fund for a fee pursuant to the Transfer Agency Agreement. The fees charged for such transfer agency services are accrued daily and paid monthly at annual rates as follows: 0.16% of the average daily net assets of Class A, Class C, Investor and Class R Shares; 0.03% of the average daily net assets of Class R6 and P Shares; and 0.04% of the average daily net assets of Institutional and Service Shares.
E. Other Expense Agreements and Affiliated Transactions — GSAM has agreed to reduce or limit certain “Other Expenses” of the Fund (excluding acquired fund fees and expenses, transfer agency fees and expenses, service fees and shareholder administration fees (as applicable), taxes, interest, brokerage fees, expenses of shareholder meetings, litigation and indemnification, and extraordinary expenses) to the extent such expenses exceed, on an annual basis, a percentage rate of the average daily net assets of the Fund. Such Other Expense reimbursements, if any, are accrued daily and paid monthly. In addition, the Fund is not obligated to reimburse GSAM for prior fiscal year expense reimbursements, if any. The Other Expense limitation as an annual percentage rate of average daily net assets for the Fund is 0.004%. These Other Expense limitations will remain in place through at least April 30, 2022, and prior to such date GSAM may not terminate the arrangements without the approval of the Trustees. In addition, the Fund has entered into certain offset arrangements with the transfer agent, which may result in a reduction of the Fund’s expenses and are received irrespective of the application of the “Other Expense” limitations described above.
For the six months ended June 30, 2021, these expense reductions, including any fee waivers and Other Expense reimbursements, were $178,037.
F. Line of Credit Facility — As of June 30, 2021, the Fund participated in a $1,000,000,000 committed, unsecured revolving line of credit facility (the “facility”) together with other funds of the Trust and certain registered investment companies having management agreements with GSAM or its affiliates. This facility is to be used for temporary emergency purposes, or to allow for an orderly liquidation of securities to meet redemption requests. The interest rate on borrowings is based on the federal funds rate. The facility also requires a fee to be paid by the Fund based on the amount of the commitment that has not been utilized. For the six months ended June 30, 2021, the Fund did not have any borrowings under the facility. Prior to April 26, 2021, the facility was $700,000,000.
26
GOLDMAN SACHS DYNAMIC GLOBAL EQUITY FUND
|
| 5. AGREEMENTS AND AFFILIATED TRANSACTIONS (continued) |
G. Other Transactions with Affiliates — The Fund invests primarily in Class R6 Shares of the Underlying Funds (except certain Underlying Funds that are ETFs). These Underlying Funds are considered to be affiliated with the Fund. The table below shows the transactions in and earnings from investments in these Underlying Funds for the six months ended June 30, 2021 (in thousands):
| | | | | | | | | | | | | | | | | | | | | | | | | | | | | | | | |
| Underlying Funds | | Market Value
as of
12/31/2020 | | | Purchases
at Cost | | | Proceeds
from Sales | | | Net
Realized
Gain (Loss) | | | Change in
Unrealized
Gain (Loss) | | | Market Value
as of
6/30/2021 | | | Shares
as of
6/30/2021 | | | Dividend
Income | |
Goldman Sachs ActiveBeta Emerging Markets Equity ETF | | $ | 67,905 | | | $ | 2,231 | | | $ | (6,212 | ) | | $ | 1,260 | | | $ | 3,197 | | | $ | 68,381 | | | | 1,676 | | | $ | 341 | |
Goldman Sachs ActiveBeta International Equity ETF | | | 144,159 | | | | — | | | | (2,242 | ) | | | 458 | | | | 13,249 | | | | 155,624 | | | | 4,455 | | | | 2,018 | |
Goldman Sachs ActiveBeta U.S. Large Cap Equity ETF | | | 211,584 | | | | — | | | | (11,130 | ) | | | 3,540 | | | | 25,064 | | | | 229,058 | | | | 2,663 | | | | 1,227 | |
Goldman Sachs Emerging Markets Equity Insights Fund — Class R6 | | | 31,286 | | | | — | | | | — | | | | — | | | | 4,148 | | | | 35,434 | | | | 2,676 | | | | — | |
Goldman Sachs Financial Square Government Fund — Institutional Shares | | | 44,437 | | | | 66,016 | | | | (64,056 | ) | | | — | | | | — | | | | 46,397 | | | | 46,397 | | | | 7 | |
Goldman Sachs Global Infrastructure Fund — Class R6 | | | 13,081 | | | | 128 | | | | (46 | ) | | | — | | | | 1,258 | | | | 14,421 | | | | 1,121 | | | | 193 | |
Goldman Sachs Global Real Estate Securities Fund — Class R6 | | | 11,400 | | | | 106 | | | | (18 | ) | | | 13 | | | | 1,700 | | | | 13,201 | | | | 1,124 | | | | 173 | |
Goldman Sachs International Equity Insights Fund — Class R6 | | | 66,793 | | | | — | | | | — | | | | — | | | | 7,000 | | | | 73,793 | | | | 4,861 | | | | — | |
Goldman Sachs International Small Cap Insights Fund — Class R6 | | | 14,165 | | | | — | | | | — | | | | — | | | | 1,834 | | | | 15,999 | | | | 1,118 | | | | — | |
Goldman Sachs Large Cap Growth Insights Fund — Class R6 | | | 52,882 | | | | — | | | | — | | | | — | | | | 7,815 | | | | 60,697 | | | | 1,314 | | | | — | |
Goldman Sachs Large Cap Value Insights Fund — Class R6 | | | 52,758 | | | | 360 | | | | (5,000 | ) | | | 996 | | | | 8,336 | | | | 57,450 | | | | 2,210 | | | | 540 | |
Goldman Sachs MarketBeta Emerging Markets Equity ETF | | | 32,094 | | | | — | | | | — | | | | — | | | | 2,266 | | | | 34,360 | | | | 585 | | | | 103 | |
Goldman Sachs MarketBeta International Equity ETF | | | 36,046 | | | | — | | | | — | | | | — | | | | 2,652 | | | | 38,698 | | | | 685 | | | | 525 | |
Goldman Sachs Small Cap Equity Insights Fund — Class R6 | | | 19,022 | | | | — | | | | (3,500 | ) | | | 996 | | | | 3,257 | | | | 19,775 | | | | 544 | | | | — | |
| | | | | | | | |
Total | | $ | 797,612 | | | $ | 68,841 | | | $ | (92,204 | ) | | $ | 7,263 | | | $ | 81,776 | | | $ | 863,288 | | | | | | | $ | 5,127 | |
As of June 30, 2021, the Goldman Sachs Growth Strategy, Goldman Sachs Growth and Income Strategy and Goldman Sachs Balanced Strategy Portfolios beneficially owned 25%, 23% and 10%, respectively, of the total outstanding shares of the Fund.
27
GOLDMAN SACHS DYNAMIC GLOBAL EQUITY FUND
Notes to Financial Statements (continued)
June 30, 2021 (Unaudited)
|
| 6. PORTFOLIO SECURITIES TRANSACTIONS |
The cost of purchases and proceeds from sales and maturities of long-term securities for the six months ended June 30, 2021, are $4,657,064 and $28,873,483, respectively.
As of the Fund’s most recent fiscal year end, December 31, 2020, certain timing differences on a tax basis were as follows:
| | | | |
Timing differences (Qualified Late Year Loss Deferral and Straddle Loss Deferral) | | $ | (2,164,833 | ) |
As of June 30, 2021, the Fund’s aggregate security unrealized gains and losses based on cost for U.S. federal income tax purposes were as follows:
| | | | |
Tax Cost | | $ | 648,078,808 | |
Gross unrealized gain | | | 223,424,250 | |
Gross unrealized loss | | | (8,215,227 | ) |
Net unrealized gains (loss) | | $ | 215,209,023 | |
The difference between GAAP-basis and tax basis unrealized gains/(losses) is attributable primarily to wash sales, net mark to market gains/(losses) on regulated futures and options contracts and net mark to market gains/(losses) on foreign currency contracts.
GSAM has reviewed the Fund’s tax positions for all open tax years (the current and prior three years, as applicable) and has concluded that no provision for income tax is required in the Fund’s financial statements. Such open tax years remain subject to examination and adjustment by tax authorities.
The Fund’s risks include, but are not limited to, the following:
Derivatives Risk — The Fund’s use of derivatives may result in loss. Derivative instruments, which may pose risks in addition to and greater than those associated with investing directly in securities, currencies or other instruments, may be illiquid or less liquid, volatile, difficult to price and leveraged so that small changes in the value of the underlying instruments may produce disproportionate losses to the Fund. Derivatives are also subject to counterparty risk, which is the risk that the other party in the transaction will not fulfill its contractual obligation. The use of derivatives is a highly specialized activity that involves investment techniques and risks different from those associated with investments in more traditional securities and instruments. Losses from derivatives can also result from a lack of correlation between changes in the value of derivative instruments and the portfolio assets (if any) being hedged.
Dividend-Paying Investments Risk — The Fund’s investments in dividend-paying securities could cause the Fund to underperform other funds. Securities that pay dividends, as a group, can fall out of favor with the market, causing such securities to underperform securities that do not pay dividends. Depending upon market conditions and political and legislative responses to such conditions, dividend-paying securities that meet a Fund’s investment criteria may not be widely available and/or may be highly concentrated in only a few market sectors. In addition, issuers that have paid regular dividends or distributions to shareholders may not continue to do so at the same level or at all in the future. This may limit the ability of the Fund to produce current income.
28
GOLDMAN SACHS DYNAMIC GLOBAL EQUITY FUND
|
| 8. OTHER RISKS (continued) |
Foreign and Emerging Countries Risk — Investing in foreign markets may involve special risks and considerations not typically associated with investing in the U.S. Foreign securities may be subject to risk of loss because of more or less foreign government regulation, less public information and less economic, political and social stability in the countries in which the Fund invests. The imposition of exchange controls (including repatriation restrictions), confiscation of assets and property, trade restrictions (including tariffs) and other government restrictions by the U.S. or other governments, or problems with registration, settlement or custody, may also result in losses. Foreign risk also involves the risk of negative foreign currency rate fluctuations, which may cause the value of securities denominated in such foreign currency (or other instruments through which the Fund has exposure to foreign currencies) to decline in value. Currency exchange rates may fluctuate significantly over short periods of time. To the extent that the Fund also invests in securities of issuers located in emerging markets, these risks may be more pronounced.
Investments in the Underlying Funds Risk — The investments of the Fund may be concentrated in one or more Underlying Funds (including ETFs and other registered investment companies) subject to statutory limitations prescribed by the Act or exemptive relief or regulations thereunder. The Fund’s investment performance is directly related to the investment performance of the Underlying Funds it holds. The Fund is subject to the risk factors associated with the investments of the Underlying Funds and will be affected by the investment policies and practices of the Underlying Funds in direct proportion to the amount of assets allocated to each. If the Fund has a relative concentration of its portfolio in a single Underlying Fund, it may be more susceptible to adverse developments affecting that Underlying Fund, and may be more susceptible to losses because of these developments. A strategy used by the Underlying Funds may fail to produce the intended results.
Large Shareholder Transactions Risk— The Fund may experience adverse effects when certain large shareholders, such as other funds, institutional investors (including those trading by use of non-discretionary mathematical formulas), financial intermediaries (who may make investment decisions on behalf of underlying clients and/or include the Fund in their investment model), individuals, accounts and Goldman Sachs affiliates, purchase or redeem large amounts of shares of the Fund. Such large shareholder redemptions, which may occur rapidly or unexpectedly, may cause the Fund to sell portfolio securities at times when it would not otherwise do so, which may negatively impact the Fund’s NAV and liquidity. These transactions may also accelerate the realization of taxable income to shareholders if such sales of investments resulted in gains, and may also increase transaction costs. In addition, a large redemption could result in the Fund’s current expenses being allocated over a smaller asset base, leading to an increase in the Fund’s expense ratio. Similarly, large Fund share purchases may adversely affect the Fund’s performance to the extent that the Fund is delayed in investing new cash or otherwise maintains a larger cash position than it ordinarily would.
Liquidity Risk — The Fund may make investments that are illiquid or that may become less liquid in response to market developments or adverse investor perceptions. Illiquid investments may be more difficult to value. Liquidity risk may also refer to the risk that the Fund will not be able to pay redemption proceeds within the allowable time period or without significant dilution to remaining investors’ interests because of unusual market conditions, an unusually high volume of redemption requests, or other reasons. To meet redemption requests, the Fund may be forced to sell investments at an unfavorable time and/or under unfavorable conditions. If the Fund is forced to sell securities at an unfavorable time and/or under unfavorable conditions, such sales may adversely affect the Fund’s NAV and dilute remaining investors’ interests. These risks may be more pronounced in connection with the Fund’s investments in securities of issuers located in emerging market countries. Redemptions by large shareholders may have a negative impact on the Fund’s liquidity.
Market and Credit Risks — In the normal course of business, the Fund trades financial instruments and enters into financial transactions where risk of potential loss exists due to changes in the market (market risk). The value of the securities in which the Fund invests may go up or down in response to the prospects of individual companies, particular sectors or governments and/or general economic conditions throughout the world due to increasingly interconnected global economies and financial markets. Events such as war, acts of terrorism, social unrest, natural disasters, the spread of infectious illness or other public health threats could also significantly impact the Fund and its investments. Additionally, the Fund may also be exposed to credit risk in the event that an issuer or guarantor fails to perform or that an institution or entity with which the Fund has unsettled or open transactions defaults.
29
GOLDMAN SACHS DYNAMIC GLOBAL EQUITY FUND
Notes to Financial Statements (continued)
June 30, 2021 (Unaudited)
Under the Trust’s organizational documents, its Trustees, officers, employees and agents are indemnified, to the extent permitted by the Act and state law, against certain liabilities that may arise out of performance of their duties to the Fund. Additionally, in the course of business, the Fund enters into contracts that contain a variety of indemnification clauses. The Fund’s maximum exposure under these arrangements is unknown, as this would involve future claims that may be made against the Fund that have not yet occurred. However, GSAM believes the risk of loss under these arrangements to be remote.
Subsequent events after the Statement of Assets and Liabilities date have been evaluated, and GSAM has concluded that there is no impact requiring adjustment or disclosure in the financial statements.
30
GOLDMAN SACHS DYNAMIC GLOBAL EQUITY FUND
|
| 11. SUMMARY OF SHARE TRANSACTIONS |
Share activity is as follows:
| | | | | | | | | | | | | | | | |
| | | For the Six Months Ended
June 30, 2021
(Unaudited) | | | For the Fiscal Year Ended
December 31, 2020 | |
| | | Shares | | | Dollars | | | Shares | | | Dollars | |
| | | | |
| Class A Shares | | | | | | | | | | | | | | | | |
Shares sold | | | 265,520 | | | $ | 6,059,724 | | | | 452,591 | | | $ | 8,274,964 | |
Reinvestment of distributions | | | — | | | | — | | | | 166,912 | | | | 3,526,407 | |
Shares redeemed | | | (540,282 | ) | | | (12,358,454 | ) | | | (1,212,679 | ) | | | (22,020,216 | ) |
| | | | (274,762 | ) | | | (6,298,730 | ) | | | (593,176 | ) | | | (10,218,845 | ) |
| Class C Shares | | | | | | | | | | | | | | | | |
Shares sold | | | 21,151 | | | | 470,751 | | | | 28,501 | | | | 498,361 | |
Reinvestment of distributions | | | — | | | | — | | | | 10,959 | | | | 221,848 | |
Shares redeemed | | | (215,082 | ) | | | (4,734,212 | ) | | | (302,838 | ) | | | (5,160,510 | ) |
| | | | (193,931 | ) | | | (4,263,461 | ) | | | (263,378 | ) | | | (4,440,301 | ) |
| Institutional Shares | | | | | | | | | | | | | | | | |
Shares sold | | | 47,113 | | | | 1,083,807 | | | | 651,159 | | | | 12,881,036 | |
Reinvestment of distributions | | | — | | | | — | | | | 16,739 | | | | 359,055 | |
Shares redeemed | | | (58,944 | ) | | | (1,356,189 | ) | | | (699,008 | ) | | | (13,145,115 | ) |
| | | | (11,831 | ) | | | (272,382 | ) | | | (31,110 | ) | | | 94,976 | |
| Service Shares | | | | | | | | | | | | | | | | |
Shares sold | | | 52 | | | | 1,195 | | | | 211 | | | | 3,915 | |
Reinvestment of distributions | | | — | | | | — | | | | 220 | | | | 4,649 | |
Shares redeemed | | | (209 | ) | | | (4,497 | ) | | | (7,507 | ) | | | (113,385 | ) |
| | | | (157 | ) | | | (3,302 | ) | | | (7,076 | ) | | | (104,821 | ) |
| Investor Shares | | | | | | | | | | | | | | | | |
Shares sold | | | 20,993 | | | | 475,606 | | | | 33,472 | | | | 604,166 | |
Reinvestment of distributions | | | — | | | | — | | | | 6,017 | | | | 125,539 | |
Shares redeemed | | | (23,796 | ) | | | (538,233 | ) | | | (43,486 | ) | | | (766,754 | ) |
| | | | (2,803 | ) | | | (62,627 | ) | | | (3,997 | ) | | | (37,049 | ) |
| Class R6 Shares | | | | | | | | | | | | | | | | |
Shares sold | | | 98,159 | | | | 2,198,437 | | | | 383,853 | | | | 7,549,584 | |
Reinvestment of distributions | | | — | | | | — | | | | 590,151 | | | | 12,665,504 | |
Shares redeemed | | | (1,771,429 | ) | | | (42,034,107 | ) | | | (2,735,397 | ) | | | (53,939,479 | ) |
| | | | (1,673,270 | ) | | | (39,835,670 | ) | | | (1,761,393 | ) | | | (33,724,391 | ) |
| Class R Shares | | | | | | | | | | | | | | | | |
Shares sold | | | 13,787 | | | | 312,741 | | | | 34,886 | | | | 626,087 | |
Reinvestment of distributions | | | — | | | | — | | | | 5,623 | | | | 117,416 | |
Shares redeemed | | | (20,284 | ) | | | (458,056 | ) | | | (80,430 | ) | | | (1,469,351 | ) |
| | | | (6,497 | ) | | | (145,315 | ) | | | (39,921 | ) | | | (725,848 | ) |
| Class P Shares | | | | | | | | | | | | | | | | |
Shares sold | | | 288,343 | | | | 6,608,049 | | | | 547,359 | | | | 10,295,924 | |
Reinvestment of distributions | | | — | | | | — | | | | 158,422 | | | | 3,401,510 | |
Shares redeemed | | | (199,369 | ) | | | (4,614,087 | ) | | | (1,182,031 | ) | | | (20,630,983 | ) |
| | | | 88,974 | | | | 1,993,962 | | | | (476,250 | ) | | | (6,933,549 | ) |
| | | | |
NET DECREASE | | | (2,074,277 | ) | | $ | (48,887,525 | ) | | | (3,176,301 | ) | | $ | (56,089,828 | ) |
31
GOLDMAN SACHS DYNAMIC GLOBAL EQUITY FUND
Statement Regarding Basis for Approval of Management Agreement (Unaudited)
Background
The Goldman Sachs Dynamic Global Equity Fund (the “Fund”) is an investment portfolio of Goldman Sachs Trust (the “Trust”). The Board of Trustees oversees the management of the Trust and reviews the investment performance and expenses of the Fund at regularly scheduled meetings held throughout the year. In addition, the Board of Trustees determines annually whether to approve the continuance of the Trust’s investment management agreement (the “Management Agreement”) with Goldman Sachs Asset Management, L.P. (the “Investment Adviser”) on behalf of the Fund.
The Management Agreement was most recently approved for continuation until June 30, 2022 by the Board of Trustees, including those Trustees who are not parties to the Management Agreement or “interested persons” (as defined in the Investment Company Act of 1940, as amended) of any party thereto (the “Independent Trustees”), at a meeting held on June 15-16, 2021 (the “Annual Meeting”).
The review process undertaken by the Trustees spans the course of the year and culminates with the Annual Meeting. To assist the Trustees in their deliberations, the Trustees have established a Contract Review Committee (the “Committee”), comprised of the Independent Trustees. The Committee held two meetings over the course of the year since the Management Agreement was last approved. At those Committee meetings, regularly scheduled Board or other committee meetings, and/or the Annual Meeting, matters relevant to the renewal of the Management Agreement were considered by the Board, or the Independent Trustees, as applicable. With respect to the Fund, such matters included:
| | (a) | | the nature and quality of the advisory, administrative, and other services provided to the Fund and the underlying funds in which it invests (the “Underlying Funds”) by the Investment Adviser and its affiliates, including information about: |
| | (i) | | the structure, staff, and capabilities of the Investment Adviser and its portfolio management teams; |
| | (ii) | | the groups within the Investment Adviser and its affiliates that support the portfolio management teams or provide other types of necessary services, including fund services groups (e.g., accounting and financial reporting, tax, shareholder services, and operations); controls and risk management groups (e.g., legal, compliance, valuation oversight, credit risk management, internal audit, compliance testing, market risk analysis, finance, and central funding); sales and distribution support groups, and others (e.g., information technology and training); |
| | (iii) | | trends in employee headcount; |
| | (iv) | | the Investment Adviser’s financial resources and ability to hire and retain talented personnel and strengthen its operations; and |
| | (v) | | the parent company’s support of the Investment Adviser and its mutual fund business, as expressed by the firm’s senior management; |
| | (b) | | information on the investment performance of the Fund and the Underlying Funds, including comparisons to the performance of similar mutual funds, as provided by a third-party mutual fund data provider engaged as part of the contract review process (the “Outside Data Provider”), and a benchmark performance index; and information on general investment outlooks in the markets in which the Fund and the Underlying Funds invest; |
| | (c) | | information provided by the Investment Adviser indicating the Investment Adviser’s views on whether the Fund’s peer group and/or benchmark index had high, medium, or low relevance given the Fund’s particular investment strategy; |
| | (d) | | the terms of the Management Agreement and other agreements with affiliated service providers entered into by the Trust on behalf of the Fund; |
| | (e) | | fee and expense information for the Fund, including: |
| | (i) | | the relative management fee and expense levels of the Fund as compared to those of comparable funds managed by other advisers, as provided by the Outside Data Provider; |
| | (ii) | | the Fund’s expense trends over time; and |
| | (iii) | | to the extent the Investment Adviser manages other types of accounts (such as bank collective trusts, private wealth management accounts, institutional separate accounts, sub-advised mutual funds, and non-U.S. funds) having investment objectives and policies similar to those of the Fund, comparative information on the advisory fees charged and services provided to those accounts by the Investment Adviser; |
| | (f) | | with respect to the extensive investment performance and expense comparison data provided by the Outside Data Provider, its processes in producing that data for the Fund; |
| | (g) | | the undertakings of the Investment Adviser and its affiliates to implement fee waivers and/or expense limitations with respect to the Fund and the Underlying Funds; |
| | (h) | | information relating to the profitability of the Management Agreement and the transfer agency and distribution and service arrangements of the Fund to the Investment Adviser and its affiliates; |
| | (i) | | whether the Fund’s existing management fee schedule, together with the management fee schedules of the Underlying Funds, adequately addressed any economies of scale; |
32
GOLDMAN SACHS DYNAMIC GLOBAL EQUITY FUND
Statement Regarding Basis for Approval of Management Agreement (Unaudited) (continued)
| | (j) | | a summary of the “fall-out” benefits derived by the Investment Adviser and its affiliates from their relationships with the Fund and/or the Underlying Funds, including the fees received by the Investment Adviser’s affiliates from the Fund and/or the Underlying Funds for transfer agency, securities lending, portfolio trading, distribution and other services; |
| | (k) | | a summary of potential benefits derived by the Fund and/or the Underlying Funds as a result of their relationship with the Investment Adviser; |
| | (l) | | information regarding commissions paid by the Fund and the Underlying Equity Funds and broker oversight, an update on the Investment Adviser’s soft dollars practices, other information regarding portfolio trading, and how the Investment Adviser carries out its duty to seek best execution; |
| | (m) | | portfolio manager ownership of Fund shares; the manner in which portfolio manager compensation is determined; and the number and types of accounts managed by the portfolio managers; |
| | (n) | | the nature and quality of the services provided to the Fund and the Underlying Funds by their unaffiliated service providers, and the Investment Adviser’s general oversight and evaluation (including reports on due diligence) of those service providers as part of the administrative services provided under the Management Agreement; and |
| | (o) | | the Investment Adviser’s processes and policies addressing various types of potential conflicts of interest; its approach to risk management; the annual review of the effectiveness of the Fund’s compliance program; and periodic compliance reports. |
The Trustees also received an overview of the Fund’s distribution arrangements. They received information regarding the Fund’s assets, share purchase and redemption activity, and payment of distribution, service, and shareholder administration fees. Information was also provided to the Trustees relating to revenue sharing payments made by and services provided by the Investment Adviser and its affiliates to intermediaries that promote the sale, distribution, and/or servicing of Fund shares. The Independent Trustees also discussed the broad range of other investment choices that are available to Fund investors, including the availability of comparable funds managed by other advisers.
The presentations made at the Board and Committee meetings and at the Annual Meeting encompassed the Fund and other mutual funds for which the Board of Trustees has responsibility. In evaluating the Management Agreement at the Annual Meeting, the Trustees relied upon their knowledge, resulting from their meetings and other interactions throughout the year, of the Investment Adviser and its affiliates, their services, and the Fund. In conjunction with these meetings, the Trustees received written materials and oral presentations on the topics covered, and the Investment Adviser addressed the questions and concerns of the Trustees, including concerns regarding the investment performance of certain of the funds they oversee. The Independent Trustees were advised by their independent legal counsel regarding their responsibilities and other regulatory requirements related to the approval and continuation of mutual fund investment management agreements under applicable law. In addition, the Investment Adviser and its affiliates provided the Independent Trustees with a written response to a formal request for information sent on behalf of the Independent Trustees by their independent legal counsel. During the course of their deliberations, the Independent Trustees met in executive sessions with their independent legal counsel, without representatives of the Investment Adviser or its affiliates present.
Nature, Extent, and Quality of the Services Provided Under the Management Agreement
As part of their review, the Trustees considered the nature, extent, and quality of the services provided to the Fund and the Underlying Funds by the Investment Adviser. In this regard, the Trustees considered both the investment advisory services and non-advisory services that are provided by the Investment Adviser and its affiliates. The Trustees noted the transition in the leadership and changes in personnel of various of the Investment Adviser’s portfolio management teams that had occurred in recent periods, and the ongoing recruitment efforts aimed at bringing high quality investment talent to the Investment Adviser. They also noted the Investment Adviser’s commitment to maintaining high quality systems and expending substantial resources to respond to ongoing changes to the market, regulatory and control environment in which the Fund and the Underlying Funds and their service providers operate, including changes associated with the COVID-19 pandemic, as well as the efforts of the Investment Adviser and its affiliates to combat cyber security risks. The Trustees also considered information regarding the Investment Adviser’s business continuity planning and remote operations capabilities. The Trustees concluded that the Investment Adviser continued to commit substantial financial and operational resources to the Fund and expressed confidence that the Investment Adviser would continue to do so in the future. The Trustees also recognized that the Investment Adviser had made significant commitments to address regulatory compliance requirements applicable to the Fund, the Underlying Funds, and the Investment Adviser and its affiliates.
Investment Performance
The Trustees also considered the investment performance of the Fund and the Underlying Funds. In this regard, they compared the investment performance of the Fund to its peers using rankings and ratings compiled by the Outside Data Provider as of December 31, 2020, and updated performance information prepared by the Investment Adviser using the peer group identified
33
GOLDMAN SACHS DYNAMIC GLOBAL EQUITY FUND
Statement Regarding Basis for Approval of Management Agreement (Unaudited) (continued)
by the Outside Data Provider as of March 31, 2021. The information on the Fund’s investment performance was provided for the one-, three-, five-, and ten-year periods ending on the applicable dates. The Trustees also reviewed the Fund’s investment performance relative to its performance benchmark. As part of this review, they considered the investment performance trends of the Fund over time, and reviewed the investment performance of the Fund in light of its investment objective and policies and market conditions.
In addition, the Trustees considered materials prepared and presentations made by the Investment Adviser’s senior management and portfolio management personnel in which Fund performance was assessed. The Trustees also considered the Investment Adviser’s periodic reports with respect to the Fund’s and Underlying Funds’ risk profiles, and how the Investment Adviser’s approach to risk monitoring and management influences portfolio management. They noted the efforts of the portfolio management teams of certain Underlying Funds to continue to enhance the investment models used in managing the Underlying Funds.
The Trustees observed that the Fund’s Institutional Shares had placed in the top half of the Fund’s peer group for the one-, five-, and ten-year periods and in the third quartile for the three-year period, and had outperformed the Fund’s benchmark index for the one- and ten-year periods and underperformed for the three- and five-year periods ended March 31, 2021.
Costs of Services Provided and Competitive Information
The Trustees considered the contractual terms of the Management Agreement and the fee rates payable by the Fund thereunder. In this regard, the Trustees considered information on the services rendered by the Investment Adviser to the Fund, which included both advisory and administrative services that were directed to the needs and operations of the Fund as a registered mutual fund.
In particular, the Trustees reviewed analyses prepared by the Outside Data Provider regarding the expense rankings of the Fund. The analyses provided a comparison of the Fund’s management fee to those of a relevant peer group and category universe; an expense analysis which compared the Fund’s overall net and gross expenses to a peer group and a category universe; and data comparing the Fund’s net expenses to the peer and category medians. The analyses also compared the Fund’s other expenses and fee waivers/reimbursements to those of the peer group and category medians. The Trustees concluded that the comparisons provided by the Outside Data Provider were useful in evaluating the reasonableness of the management fees and total expenses paid by the Fund.
In addition, the Trustees considered the Investment Adviser’s undertakings to implement fee waivers and/or expense limitations with respect to the Fund and the Underlying Funds. They also considered, to the extent that the Investment Adviser manages other types of accounts having investment objectives and policies similar to those of the Fund, comparative fee information for services provided by the Investment Adviser to those accounts, and information that indicated that services provided to the Fund differed in various significant respects from the services provided to other types of accounts which, in many cases, operated under less stringent legal and regulatory structures, required fewer services from the Investment Adviser to a smaller number of client contact points, and were less time-intensive.
In addition, the Trustees noted that shareholders are able to redeem their Fund shares at any time if shareholders believe that the Fund fees and expenses are too high or if they are dissatisfied with the performance of the Fund.
Profitability
The Trustees reviewed the Fund’s contribution to the Investment Adviser’s revenues and pre-tax profit margins. In this regard the Trustees noted that they had received, among other things, profitability analyses and summaries, revenue and expense schedules by Fund and by function (i.e., investment management, transfer agency and distribution and service), and information on the Investment Adviser’s expense allocation methodology. They observed that the profitability and expense figures are substantially similar to those used by the Investment Adviser for many internal purposes, including compensation decisions among various business groups, and are thus subject to a vigorous internal debate about how certain revenue and expenses should be allocated. The Trustees also noted that the internal audit group within the Goldman Sachs organization periodically audits the expense allocation methodology and that the internal audit group was satisfied with the reasonableness, consistency, and accuracy of the Investment Adviser’s expense allocation methodology. Profitability data for the Fund was provided for 2020 and 2019, and the Trustees considered this information in relation to the Investment Adviser’s overall profitability.
Economies of Scale
The Trustees considered the information that had been provided regarding whether there have been economies of scale with respect to the management of the Fund.
The Trustees noted that, although the Fund itself does not have breakpoints in its management fee schedules, any benefits of the breakpoints in the management fee schedules of certain Underlying Funds, when reached, would pass through to the shareholders in the Fund at the specified asset levels. The Trustees considered the amounts of assets in the Fund; the Fund’s recent
34
GOLDMAN SACHS DYNAMIC GLOBAL EQUITY FUND
Statement Regarding Basis for Approval of Management Agreement (Unaudited) (continued)
purchase and redemption activity; the information provided by the Investment Adviser relating to the costs of the services provided by the Investment Adviser and its affiliates and the profits realized by them; information comparing the fee rates charged by the Investment Adviser with fee rates charged to other funds in the peer groups; and the Investment Adviser’s undertaking to limit certain expenses of the Fund and Underlying Funds that exceed specified levels. They also considered the services provided to the Fund under the Management Agreement and the fees and expenses borne by the Underlying Funds, and determined that the management fees payable by the Fund were not duplicative of the management fees paid at the Underlying Fund level.
Other Benefits to the Investment Adviser and Its Affiliates
The Trustees also considered the other benefits derived by the Investment Adviser and its affiliates from their relationships with the Fund and/or the Underlying Funds as stated above, including: (a) transfer agency fees received by Goldman Sachs & Co. LLC (“Goldman Sachs”); (b) brokerage and futures commissions earned by Goldman Sachs for executing securities and futures transactions on behalf of the Fund and/or the Underlying Funds; (c) research received by the Investment Adviser from broker-dealers in exchange for executing certain transactions on behalf of the Fund and/or the Underlying Funds; (d) trading efficiencies resulting from aggregation of orders of the Fund and/or the Underlying Funds with those for other funds or accounts managed by the Investment Adviser; (e) fees earned by Goldman Sachs Agency Lending (“GSAL”), an affiliate of the Investment Adviser, as securities lending agent for certain Underlying Funds (and fees earned by the Investment Adviser for managing the fund in which those Underlying Funds’ cash collateral is invested); (f) the Investment Adviser’s ability to leverage the infrastructure designed to service the Fund and the Underlying Funds on behalf of its other clients; (g) the Investment Adviser’s ability to cross-market other products and services to Fund shareholders; (h) Goldman Sachs’ retention of certain fees as Fund Distributor; (i) the Investment Adviser’s ability to negotiate better pricing with custodians on behalf of its other clients, as a result of the relationship with the Fund and Underlying Funds; (j) the investment of cash and cash collateral in money market funds managed by the Investment Adviser that will result in increased assets under management for those money market funds; (k) the investment in exchange-traded funds (“ETFs”) managed by the Investment Adviser that will result in increased assets under management for those ETFs and may facilitate the development of the Investment Adviser’s ETF advisory business; and (l) the possibility that the working relationship between the Investment Adviser and the Fund’s and Underlying Funds’ third-party service providers may cause those service providers to be more likely to do business with other areas of Goldman Sachs. In the course of considering the foregoing, the Independent Trustees requested and received further information quantifying certain of these fall-out benefits.
Other Benefits to the Fund and Its Shareholders
The Trustees also noted that the Fund and/or the Underlying Funds receive certain other potential benefits as a result of their relationship with the Investment Adviser, including: (a) trading efficiencies resulting from aggregation of orders of the Fund and/or the Underlying Funds with those of other funds or accounts managed by the Investment Adviser; (b) enhanced servicing from vendors due to the volume of business generated by the Investment Adviser and its affiliates; (c) enhanced servicing from broker-dealers due to the volume of business generated by the Investment Adviser and its affiliates; (d) with respect to the Fund and certain Underlying Funds, the Investment Adviser’s ability to negotiate favorable terms with derivatives counterparties as a result of the size and reputation of the Goldman Sachs organization; (e) the advantages received from the Investment Adviser’s knowledge and experience gained from managing other accounts and products; (f) the Investment Adviser’s ability to hire and retain qualified personnel to provide services to the Fund and the Underlying Funds because of the reputation of the Goldman Sachs organization; (g) the Fund’s and Underlying Funds’ access, through the Investment Adviser, to certain firm-wide resources (e.g., proprietary risk management systems and databases), subject to certain restrictions; (h) with respect to certain Underlying Funds, the ability to participate in the securities lending program administered by GSAL, as measured by the revenue received by the Underlying Funds in connection with the program; and (i) the Fund’s and Underlying Funds’ access to certain affiliated distribution channels. In addition, the Trustees noted the competitive nature of the mutual fund marketplace, and considered that many of the Fund’s shareholders invested in the Fund in part because of the Fund’s relationship with the Investment Adviser and that those shareholders have a general expectation that the relationship will continue.
Conclusion
In connection with their consideration of the Management Agreement, the Trustees gave weight to each of the factors described above, but did not identify any particular factor as controlling their decision. After deliberation and consideration of all of the information provided, including the factors described above, the Trustees concluded, in the exercise of their business judgment, that the management fees paid by the Fund were reasonable in light of the services provided to it by the Investment Adviser, the Investment Adviser’s costs and the Fund’s current and reasonably foreseeable asset levels. The Trustees unanimously concluded that the Investment Adviser’s continued management likely would benefit the Fund and its shareholders and that the Management Agreement should be approved and continued with respect to the Fund until June 30, 2022.
35
GOLDMAN SACHS DYNAMIC GLOBAL EQUITY FUND
Liquidity Risk Management Program (Unaudited)
The Fund has adopted and implemented a liquidity risk management program (the “Program”) in accordance with Rule 22e-4 under the 1940 Act. The Program seeks to assess and manage the Fund’s liquidity risk, i.e., the risk that a Fund is unable to satisfy redemption requests without significantly diluting remaining investors’ interests in the Fund. The Board of Trustees of the Trust has designated GSAM, the Fund’s investment adviser, to administer the Program. Certain aspects of the Program rely on third parties to perform certain functions, including the provision of market data and application of models.
The Program is comprised of various components designed to support the assessment and/or management of liquidity risk, including: (1) the periodic assessment (no less frequently than annually) of certain factors that influence a Fund’s liquidity risk; (2) the periodic classification (no less frequently than monthly) of a Fund’s investments into one of four liquidity categories that reflect an estimate of their liquidity under current market conditions; (3) a 15% limit on the acquisition of “illiquid investments” (as defined under Rule 22e-4); (4) for a Fund that does not invest primarily in “highly liquid investments” (as defined under Rule 22e-4), the determination of a minimum percentage of the Fund’s assets that will generally be invested in highly liquid investments (a “Highly Liquid Investment Minimum”); and (5) periodic reporting to the Board of Trustees.
At a meeting of the Board of Trustees on February 9-10, 2021, GSAM provided a written report to the Board addressing the operation, and the adequacy and effectiveness of the implementation, of the Program, including, as applicable, the operation of any Highly Liquid Investment Minimum and any material changes to the Program, for the period from January 1, 2020 through December 31, 2020 (the “Reporting Period”). Among other things, the annual report and related materials discussed: (1) the results of stress tests designed to assess liquidity under a hypothetical stressed scenario involving elevated redemptions; (2) an assessment of the methodologies used to classify investments into one of four liquidity categories; and (3) the impact of the COVID-19 pandemic on liquidity and management of liquidity risk during the Reporting Period, including during stressed market conditions caused by the COVID-19 pandemic. The report concluded that the Program continues to be reasonably designed to assess and manage liquidity risk and was adequately and effectively implemented during the Reporting Period.
There can be no assurance that the Program will achieve its objectives under all circumstances in the future. Please refer to your Fund’s prospectus for more information regarding the Fund’s exposure to liquidity risk and other risks to which it may be subject.
36
GOLDMAN SACHS DYNAMIC GLOBAL EQUITY FUND
| | |
| | |
Fund Expenses —Six Months Period Ended June 30, 2021 (Unaudited) | | |
As a shareholder of Class A, Class C, Institutional, Service, Investor, Class R6, Class R or Class P Shares of the Fund, you incur two types of costs: (1) transaction costs, including sales charges on purchase payments (with respect to Class A Shares), contingent deferred sales charges on redemptions (with respect to Class C Shares), and (2) ongoing costs, including management fees; distribution and/or service (12b-1) fees (with respect to Class A, Class C, Service and Class R Shares); and other Fund expenses.
The Example is intended to help you understand your ongoing costs (in dollars) of investing in Class A, Class C, Institutional, Service, Investor, Class R6, Class R or Class P Shares of the Fund and to compare these costs with the ongoing costs of investing in other mutual funds. The Example is based on an investment of $1,000 invested at the beginning of the period and held for the entire period from January 1, 2021 through June 30, 2021, which represents a period of 181 days of a 365 day year.
Actual Expenses — The first line under each share class in the table below provides information about actual account values and actual expenses. You may use the information in this line, together with the amount you invested, to estimate the expenses that you paid over the period. Simply divide your account value by $1,000 (for example, an $8,600 account value divided by $1,000=8.6), then multiply the result by the number in the first line under the heading entitled “Expenses Paid” to estimate the expenses you paid on your account during this period.
Hypothetical Example for Comparison Purposes — The second line under each share class in the table below provides information about hypothetical account values and hypothetical expenses based on the Fund’s actual net expense ratios and an assumed rate of return of 5% per year before expenses, which is not the Fund’s actual return. The hypothetical account values and expenses may not be used to estimate the actual ending account balance or expenses you paid for the period. You may use this information to compare the ongoing costs of investing in the Fund and other funds. To do so, compare this 5% hypothetical example with the 5% hypothetical examples that appear in the shareholder reports of the other funds.
Please note that the expenses shown in the table are meant to highlight your ongoing costs only and do not reflect any transactional costs, such as sales charges, redemption fees, or exchange fees and do not include expenses of Underlying Funds in which the Fund invests. Therefore, the second line of the table is useful in comparing ongoing costs only and will not help you determine the relative total costs of owning different funds. In addition, if these transactional costs were included, your costs would have been higher.
| | | | | | | | | | | | |
| | | Dynamic Global Equity Fund | |
| Share Class | | Beginning
Account Value
1/1/21 | | | Ending
Account Value
6/30/21 | | | Expenses Paid for the
6 months ended
6/30/21* | |
| Class A | | | | | | | | | | | | |
Actual | | $ | 1,000.00 | | | $ | 1,140.90 | | | $ | 2.92 | |
Hypothetical 5% return | | | 1,000.00 | | | | 1,022.07 | + | | | 2.76 | |
| Class C | | | | | | | | | | | | |
Actual | | | 1,000.00 | | | | 1,136.60 | | | | 6.89 | |
Hypothetical 5% return | | | 1,000.00 | | | | 1,018.35 | + | | | 6.51 | |
| Institutional | | | | | | | | | | | | |
Actual | | | 1,000.00 | | | | 1,142.90 | | | | 1.01 | |
Hypothetical 5% return | | | 1,000.00 | | | | 1,023.85 | + | | | 0.95 | |
| Service | | | | | | | | | | | | |
Actual | | | 1,000.00 | | | | 1,140.00 | | | | 3.66 | |
Hypothetical 5% return | | | 1,000.00 | | | | 1,021.37 | + | | | 3.46 | |
| Investor | | | | | | | | | | | | |
Actual | | | 1,000.00 | | | | 1,142.00 | | | | 1.59 | |
Hypothetical 5% return | | | 1,000.00 | | | | 1,023.31 | + | | | 1.51 | |
| Class R6 | | | | | | | | | | | | |
Actual | | | 1,000.00 | | | | 1,142.90 | | | | 0.96 | |
Hypothetical 5% return | | | 1,000.00 | | | | 1,023.90 | + | | | 0.90 | |
| Class R | | | | | | | | | | | | |
Actual | | | 1,000.00 | | | | 1,139.30 | | | | 4.24 | |
Hypothetical 5% return | | | 1,000.00 | | | | 1,020.83 | + | | | 4.01 | |
| Class P | | | | | | | | | | | | |
Actual | | | 1,000.00 | | | | 1,143.30 | | | | 0.96 | |
Hypothetical 5% return | | | 1,000.00 | | | | 1,023.90 | + | | | 0.90 | |
| | + | | Hypothetical expenses are based on the Fund’s actual annualized net expense ratios and an assumed rate of return of 5% per year before expenses. | |
| | * | | Expenses for each share class are calculated using the Fund’s annualized net expense ratio for each class, which represents the ongoing expenses as a percentage of net assets for the six months ended June 30, 2021. Expenses are calculated by multiplying the annualized net expense ratio by the average account value for the period; then multiplying the result by the number of days in the most recent fiscal half year; and then dividing that result by the number of days in the fiscal year. The annualized net expense ratios for the period were as follows: | |
| | | | | | | | | | | | | | | | | | | | | | | | | | | | | | | | |
| Fund | | Class A | | | Class C | | | Institutional | | | Service | | | Investor | | | Class R6 | | | Class R | | | Class P | |
Dynamic Global Equity Fund | | | 0.55 | % | | | 1.30 | % | | | 0.19 | % | | | 0.69 | % | | | 0.30 | % | | | 0.18 | % | | | 0.80 | % | | | 0.18 | % |
37
FUNDS PROFILE
Goldman Sachs Funds
Goldman Sachs is a premier financial services firm, known since 1869 for creating thoughtful and customized investment solutions in complex global markets.
Today, the Asset Management Division of Goldman Sachs serves a diverse set of clients worldwide, including private institutions, public entities and individuals. With approximately $2.09 trillion in assets under supervision as of June 30, 2021, Goldman Sachs Asset Management has portfolio management teams located around the world and our investment professionals bring firsthand knowledge of local markets to every investment decision. Assets under supervision includes assets under management and other client assets for which Goldman Sachs does not have full discretion. Goldman Sachs Asset Management leverages the resources of Goldman Sachs & Co. LLC subject to legal, internal and regulatory restrictions.
Money Market
Financial Square FundsSM
| ∎ | | Financial Square Treasury Solutions Fund1 |
| ∎ | | Financial Square Government Fund1 |
| ∎ | | Financial Square Money Market Fund2 |
| ∎ | | Financial Square Prime Obligations Fund2 |
| ∎ | | Financial Square Treasury Instruments Fund1 |
| ∎ | | Financial Square Treasury Obligations Fund1 |
| ∎ | | Financial Square Federal Instruments Fund1 |
Investor FundsSM
| ∎ | | Investor Money Market Fund3 |
| ∎ | | Investor Tax-Exempt Money Market Fund3 |
Fixed Income
Short Duration and Government
| ∎ | | High Quality Floating Rate Fund |
| ∎ | | Short-Term Conservative Income Fund |
| ∎ | | Short Duration Government Fund |
| ∎ | | Short Duration Bond Fund4 |
| ∎ | | Inflation Protected Securities Fund |
Multi-Sector
| ∎ | | Global Core Fixed Income Fund |
Municipal and Tax-Free
| ∎ | | High Yield Municipal Fund |
| ∎ | | Dynamic Municipal Income Fund |
| ∎ | | Short Duration Tax-Free Fund |
| ∎ | | Municipal Income Completion Fund |
Single Sector
| ∎ | | Investment Grade Credit Fund |
| ∎ | | High Yield Floating Rate Fund |
| ∎ | | Emerging Markets Debt Fund |
| ∎ | | Local Emerging Markets Debt Fund |
Fixed Income Alternatives
| ∎ | | Long Short Credit Strategies Fund |
Fundamental Equity
| ∎ | | Small/Mid Cap Value Fund |
| ∎ | | Small/Mid Cap Growth Fund |
| ∎ | | Concentrated Growth Fund |
| ∎ | | Technology Opportunities Fund |
| ∎ | | Growth Opportunities Fund |
| ∎ | | Rising Dividend Growth Fund |
Tax-Advantaged Equity
| ∎ | | U.S. Tax-Managed Equity Fund |
| ∎ | | International Tax-Managed Equity Fund |
| ∎ | | U.S. Equity Dividend and Premium Fund |
| ∎ | | International Equity Dividend and Premium Fund |
Equity Insights
| ∎ | | Small Cap Equity Insights Fund |
| ∎ | | U.S. Equity Insights Fund |
| ∎ | | Small Cap Growth Insights Fund |
| ∎ | | Large Cap Growth Insights Fund |
| ∎ | | Large Cap Value Insights Fund |
| ∎ | | Small Cap Value Insights Fund |
| ∎ | | International Small Cap Insights Fund |
| ∎ | | International Equity Insights Fund |
| ∎ | | Emerging Markets Equity Insights Fund |
| ∎ | | Clean Energy Income Fund |
Fundamental Equity International
| ∎ | | International Equity Income Fund |
| ∎ | | International Equity ESG Fund |
| ∎ | | Emerging Markets Equity Fund |
| ∎ | | ESG Emerging Markets Equity Fund |
Alternative
| ∎ | | Real Estate Securities Fund |
| ∎ | | International Real Estate Securities Fund |
| ∎ | | Commodity Strategy Fund |
| ∎ | | Global Real Estate Securities Fund |
| ∎ | | Alternative Premia Fund |
| ∎ | | Absolute Return Tracker Fund |
| ∎ | | Managed Futures Strategy Fund |
| ∎ | | MLP Energy Infrastructure Fund |
| ∎ | | Energy Infrastructure Fund |
| ∎ | | Multi-Manager Alternatives Fund |
| ∎ | | Global Infrastructure Fund |
| ∎ | | Clean Energy Income Fund |
Total Portfolio Solutions
| ∎ | | Global Managed Beta Fund |
| ∎ | | Multi-Manager Non-Core Fixed Income Fund |
| ∎ | | Multi-Manager Global Equity Fund |
| ∎ | | Multi-Manager International Equity Fund |
| ∎ | | Tactical Tilt Overlay Fund |
| ∎ | | Balanced Strategy Portfolio |
| ∎ | | Multi-Manager U.S. Small Cap Equity Fund |
| ∎ | | Multi-Manager Real Assets Strategy Fund |
| ∎ | | Growth and Income Strategy Portfolio |
| ∎ | | Growth Strategy Portfolio |
| ∎ | | Dynamic Global Equity Fund |
| ∎ | | Satellite Strategies Portfolio |
| ∎ | | Enhanced Dividend Global Equity Portfolio |
| ∎ | | Tax-Advantaged Global Equity Portfolio |
| ∎ | | Strategic Volatility Premium Fund |
| ∎ | | Target Date Retirement Portfolio |
| ∎ | | Target Date 2025 Portfolio |
| ∎ | | Target Date 2030 Portfolio |
| ∎ | | Target Date 2035 Portfolio |
| ∎ | | Target Date 2040 Portfolio |
| ∎ | | Target Date 2045 Portfolio |
| ∎ | | Target Date 2050 Portfolio |
| ∎ | | Target Date 2055 Portfolio |
| ∎ | | Target Date 2060 Portfolio |
| ∎ | | GQG Partners International Opportunities Fund |
| 1 | | You could lose money by investing in the Fund. Although the Fund seeks to preserve the value of your investment at $1.00 per share, it cannot guarantee it will do so. An investment in the Fund is not a deposit of a bank and is not insured or guaranteed by the Federal Deposit Insurance Corporation or any other government agency. The Fund’s sponsor has no legal obligation to provide financial support to the Fund, and you should not expect that the sponsor will provide financial support to the Fund at any time. |
| 2 | | You could lose money by investing in the Fund. Because the share price of the Fund will fluctuate, when you sell your shares they may be worth more or less than what you originally paid for them. The Fund may impose a fee upon sale of your shares or may temporarily suspend your ability to sell shares if the Fund’s liquidity falls below required minimums because of market conditions or other factors. An investment in the Fund is not a deposit of a bank and is not insured or guaranteed by the Federal Deposit Insurance Corporation or any other government agency. The Fund’s sponsor has no legal obligation to provide financial support to the Fund, and you should not expect that the sponsor will provide financial support to the Fund at any time. |
| 3 | | You could lose money by investing in the Fund. Although the Fund seeks to preserve the value of your investment at $1.00 per share, it cannot guarantee it will do so. The Fund may impose a fee upon sale of your shares or may temporarily suspend your ability to sell shares if the Fund’s liquidity falls below required minimums because of market conditions or other factors. An investment in the Fund is not a deposit of a bank and is not insured or guaranteed by the Federal Deposit Insurance Corporation or any other government agency. The Fund’s sponsor has no legal obligation to provide financial support to the Fund, and you should not expect that the sponsor will provide financial support to the Fund at any time. |
| 4 | | Effective after the close of business on July 29, 2021, the Goldman Sachs Short Duration Income Fund was renamed the Goldman Sachs Short Duration Bond Fund. |
| 5 | | Effective after the close of business on August 30, 2020, the Goldman Sachs Blue Chip Fund was renamed the Goldman Sachs U.S. Equity ESG Fund. |
| | | Financial Square FundsSM and Investor FundsSM are registered service marks of Goldman Sachs & Co. LLC. |
| * | | This list covers open-end funds only. Please visit our website at www.GSAMFUNDS.com to learn about our closed-end funds and exchange-traded funds. |
| | |
TRUSTEES Jessica Palmer, Chair Dwight L. Bush Kathryn A. Cassidy Diana M. Daniels Joaquin Delgado James A. McNamara Roy W. Templin Gregory G. Weaver | | OFFICERS James A. McNamara, President Joseph F. DiMaria, Principal Financial Officer, Principal Accounting Officer and Treasurer Caroline L. Kraus, Secretary |
| |
GOLDMAN SACHS & CO. LLC Distributor and Transfer Agent | | GOLDMAN SACHS ASSET MANAGEMENT, L.P. Investment Adviser |
Visit our web site at www.GSAMFUNDS.com to obtain the most recent month-end returns.
Goldman Sachs Asset Management, L.P. 200 West Street, New York, New York 10282
The portfolio risk management process includes an effort to monitor and manage risk, but does not imply low risk.
The reports concerning the Fund included in this shareholder report may contain certain forward-looking statements about the factors that may affect the performance of the Fund in the future. These statements are based on Fund management’s predictions and expectations concerning certain future events and their expected impact on the Fund, such as performance of the economy as a whole and of specific industry sectors, changes in the levels of interest rates, the impact of developing world events, and other factors that may influence the future performance of the Fund. Management believes these forward-looking statements to be reasonable, although they are inherently uncertain and difficult to predict. Actual events may cause adjustments in portfolio management strategies from those currently expected to be employed.
Diversification does not protect an investor from market risk and does not ensure a profit.
Views and opinions expressed are for informational purposes only and do not constitute a recommendation by GSAM to buy, sell, or hold any security. Views and opinions are current as of the date of this presentation and may be subject to change. They should not be construed as investment advice.
A description of the policies and procedures that the Fund uses to determine how to vote proxies relating to portfolio securities and information regarding how the Fund voted proxies relating to portfolio securities during the most recent 12-month period ended June 30 is available (i) without charge, upon request by calling 1-800-526-7384 (for Retail Shareholders) or 1-800-621-2550 (for Institutional Shareholders); and (ii) on the Securities and Exchange Commission (“SEC”) web site at http://www.sec.gov.
References to indices, benchmarks or other measures of relative market performance over a specified period of time are provided for your information only and do not imply that the portfolio will achieve similar results. The index composition may not reflect the manner in which a portfolio is constructed. While an adviser seeks to design a portfolio which reflects appropriate risk and return features, portfolio characteristics may deviate from those of the benchmark.
The Fund will file its portfolio holdings information for each month in a fiscal quarter within 60 days after the end of the relevant fiscal quarter on Form N-PORT. Portfolio holdings information for the third month of each fiscal quarter will be made available on the SEC’s web site at http://www.sec.gov. Portfolio holdings information may be obtained upon request and without charge by calling 1-800-526-7384 (for Retail Shareholders) or 1-800-621-2550 (for Institutional Shareholders).
Holdings and allocations shown are as of June 30, 2021 and may not be representative of future investments. Fund holdings should not be relied on in making investment decisions and should not be construed as research or investment advice regarding particular securities. Current and future holdings are subject to risk.
This material is not authorized for distribution to prospective investors unless preceded or accompanied by a current prospectus or summary prospectus, if applicable. Investors should consider the Fund’s objective, risks, and charges and expenses, and read the summary prospectus, if available, and/or the prospectus carefully before investing or sending money. The summary prospectus, if available, and the prospectus contain this and other information about the Fund and may be obtained from your authorized dealer or from Goldman Sachs & Co. LLC by calling (retail – 1-800-526-7384) (institutional – 1-800-621-2550).
© 2021 Goldman Sachs. All rights reserved. 250021-OTU-1459885 DYNGLEQSAR-21
(a) As of the end of the period covered by this report, the registrant has adopted a code of ethics that applies to the registrant’s principal executive officer, principal financial officer, principal accounting officer or controller, or persons performing similar functions, regardless of whether these individuals are employed by the registrant or a third party (the “Code of Ethics”).
(b) Not applicable.
(c) During the period covered by this report, no amendments were made to the provisions of the Code of Ethics.
(d) During the period covered by this report, the registrant did not grant any waivers, including an implicit waiver, from any provision of the Code of Ethics.
(e) Not applicable.
(f) A copy of the Code of Ethics is available as provided in Item 13(a)(1) of this report.
| ITEM 3. | AUDIT COMMITTEE FINANCIAL EXPERT. |
The registrant’s board of trustees has determined that the registrant has at least one “audit committee financial expert” (as defined in Item 3 of Form N-CSR) serving on its audit committee. Gregory G. Weaver is the “audit committee financial expert” and is “independent” (as each term is defined in Item 3 of Form N-CSR).
| ITEM 4. | PRINCIPAL ACCOUNTANT FEES AND SERVICES. |
The information required by this Item is only required in an annual report on this Form N-CSR.
| ITEM 5. | AUDIT COMMITTEE OF LISTED REGISTRANTS. |
| ITEM 6. | SCHEDULE OF INVESTMENTS. |
| | Schedule of Investments is included as part of the Report to Shareholders filed under Item 1. |
| ITEM 7. | DISCLOSURE OF PROXY VOTING POLICIES AND PROCEDURES FOR CLOSED-END MANAGEMENT INVESTMENT COMPANIES. |
| ITEM 8. | PORTFOLIO MANAGERS OF CLOSED-END MANAGEMENT INVESTMENT COMPANIES. |
| ITEM 9. | PURCHASES OF EQUITY SECURITIES BY CLOSED-END MANAGEMENT INVESTMENT COMPANY AND AFFILIATED PURCHASERS. |
| ITEM 10. | SUBMISSION OF MATTERS TO A VOTE OF SECURITY HOLDERS. |
| | There have been no material changes to the procedures by which shareholders may recommend nominees to the registrant’s board of trustees. |
| ITEM 11. | CONTROLS AND PROCEDURES. |
| | (a) | The registrant’s principal executive and principal financial officers, or persons performing similar functions have concluded that the registrant’s disclosure controls and procedures (as defined in Rule 30a-3(c) under the Investment Company Act of 1940, as amended (the “1940 Act”)) are effective as of a date within 90 days of the filing of this report that includes the disclosure required by this paragraph, based on the evaluation of these controls and procedures required by Rule 30a-3(b) under the 1940 Act and 15d-15(b) under the Securities Exchange Act of 1934, as amended. |
| | (b) | There were no changes in the registrant’s internal control over financial reporting (as defined in Rule 30a-3(d) under the 1940 Act) that occurred during the period covered by this report that have materially affected, or are reasonably likely to materially affect, the registrant’s internal control over financial reporting. |
| ITEM 12. | DISCLOSURE OF SECURITIES LENDING ACTIVITIES FOR CLOSED-END MANAGEMENT INVESTMENT COMPANIES. |
SIGNATURES
Pursuant to the requirements of the Securities Exchange Act of 1934 and the Investment Company Act of 1940, the registrant has duly caused this report to be signed on its behalf by the undersigned, thereunto duly authorized.
| | |
| | | Goldman Sachs Trust |
| |
| By: | | /s/ James A. McNamara |
| |
| | |
| | James A. McNamara |
| | President/Chief Executive Officer |
| | Goldman Sachs Trust |
| |
| Date: | | August 31, 2021 |
Pursuant to the requirements of the Securities Exchange Act of 1934 and the Investment Company Act of 1940, this report has been signed below by the following persons on behalf of the registrant and in the capacities and on the dates indicated.
| | |
| By: | | /s/ James A. McNamara |
| |
| | |
| | James A. McNamara |
| | President/Chief Executive Officer |
| | Goldman Sachs Trust |
| |
| Date: | | August 31, 2021 |
| |
| By: | | /s/ Joseph F. DiMaria |
| |
| | |
| | Joseph F. DiMaria |
| | Principal Financial Officer |
| | Goldman Sachs Trust |
| |
| Date: | | August 31, 2021 |