UNITED STATES
SECURITIES AND EXCHANGE COMMISSION
Washington, D.C. 20549
FORM N-CSR
CERTIFIED SHAREHOLDER REPORT OF REGISTERED
MANAGEMENT INVESTMENT COMPANIES
Investment Company Act file number 811-05349
Goldman Sachs Trust
(Exact name of registrant as specified in charter)
71 South Wacker Drive,
Chicago, Illinois 60606
(Address of principal executive offices) (Zip code)
| | |
Copies to: |
Caroline Kraus, Esq. | | Geoffrey R.T. Kenyon, Esq. |
Goldman Sachs & Co. LLC | | Dechert LLP |
200 West Street | | One International Place, 40th Floor |
New York, New York 10282 | | 100 Oliver Street |
| | Boston, MA 02110 |
(Name and address of agents for service)
Registrant’s telephone number, including area code: (312) 655-4400
Date of fiscal year end: November 30
Date of reporting period: May 31, 2021
| ITEM 1. | REPORTS TO STOCKHOLDERS. |
| | The Semi-Annual Report to Shareholders is filed herewith. |
Goldman Sachs Funds

| | | | |
| | |
| Semi-Annual Report | | | | May 31, 2021 |
| | |
| | | | MLP Energy Infrastructure Fund |

Goldman Sachs MLP Energy Infrastructure Fund
| | | | |
| | | |
| NOT FDIC-INSURED | | May Lose Value | | No Bank Guarantee |
FUND BASICS
Goldman Sachs MLP Energy Infrastructure Fund
as of May 31, 2021
| | | | | | | | | | |
| | PERFORMANCE REVIEW | |
| | | |
| | | December 1, 2020–May 31, 2021 | | Fund Total Return
(based on NAV)1 | | | Alerian MLP Index
(Total Return, Unhedged, USD)2 | |
| | | |
| | Class A | | | 39.60 | % | | | 44.09 | % |
| | Class C | | | 39.10 | | | | 44.09 | |
| | Institutional | | | 39.86 | | | | 44.09 | |
| | Investor | | | 39.78 | | | | 44.09 | |
| | Class R6 | | | 39.87 | | | | 44.09 | |
| | Class R | | | 39.41 | | | | 44.09 | |
| | | Class P | | | 39.81 | | | | 44.09 | |
| 1 | | The net asset value (“NAV”) represents the net assets of the class of the Fund (ex-dividend) divided by the total number of shares of the class outstanding. The Fund’s performance assumes the reinvestment of dividends and other distributions. The Fund’s performance does not reflect the deduction of any applicable sales charges. |
| 2 | | The Alerian MLP Index (Total Return, Unhedged, USD) is a composite of the 50 most prominent energy master limited partnerships calculated by Standard & Poor’s using a float-adjusted market capitalization methodology. The Alerian MLP Index is disseminated by the New York Stock Exchange real-time on a price return basis (NYSE: AMZ). The corresponding total return index is calculated and disseminated daily through ticker AMZX. The Alerian MLP Index figures do not reflect any deduction for fees, expenses or taxes. It is not possible to invest directly in an index. |
The returns set forth in the table above represent past performance. Past performance does not guarantee future results. The Fund’s investment return and principal value will fluctuate so that an investor’s shares, when redeemed, may be worth more or less than their original cost. Current performance may be lower or higher than the performance quoted above. Please visit our web site at www.GSAMFUNDS.com to obtain the most recent month-end returns. Performance reflects applicable fee waivers and/or expense limitations in effect during the periods shown. In their absence, performance would be reduced. Returns do not reflect the deduction of taxes that a shareholder would pay on Fund distributions or the redemption of Fund shares.
| | | | | | | | |
| | TOP TEN HOLDINGS AS OF 5/31/213 |
| | | |
| | | Holding | | % of Net Assets | | | Line of Business |
| | | |
| | MPLX LP | | | 7.3 | % | | Gathering + Processing |
| | | |
| | Enterprise Products Partners LP | | | 7.2 | | | Pipeline Transportation | Natural Gas |
| | | |
| | Energy Transfer LP | | | 7.2 | | | Pipeline Transportation | Natural Gas |
| | | |
| | Magellan Midstream Partners LP | | | 5.6 | | | Pipeline Transportation | Petroleum |
| | | |
| | Targa Resources Corp. | | | 5.3 | | | Gathering + Processing |
| | | |
| | Western Midstream Partners LP | | | 5.2 | | | Gathering + Processing |
| | | |
| | Plains All American Pipeline LP | | | 5.1 | | | Pipeline Transportation | Petroleum |
| | | |
| | ONEOK, Inc. | | | 4.6 | | | Gathering + Processing |
| | | |
| | Cheniere Energy, Inc. | | | 4.6 | | | Other | Liquefaction |
| | | DCP Midstream LP | | | 4.6 | | | Gathering + Processing |
| 3 | | The top 10 holdings may not be representative of the Fund’s future investments. |
1
FUND BASICS
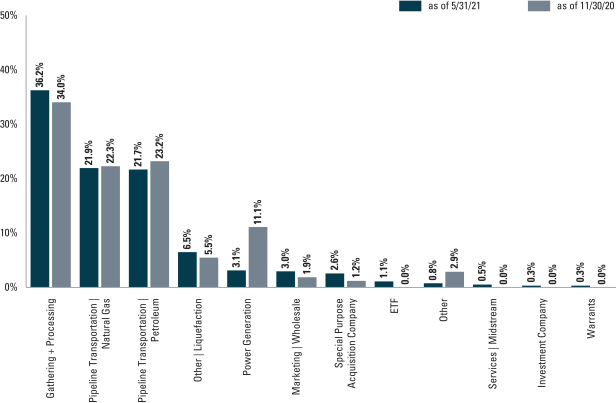
| 4 | | The Fund is actively managed and, as such, its composition may differ over time. Consequently, the Fund’s overall sector allocations may differ from the percentages contained in the graph above. The percentage shown for each investment category reflects the value of investments in that category as a percentage of total net assets. Figures in the above table may not sum to 100% due to the exclusion of other assets and liabilities. The graph depicts the Fund’s investments but may not represent the Fund’s market exposure due to the exclusion of certain derivatives, if any, as listed in the Additional Investment Information section of the Schedule of Investments. |
For more information about your Fund, please refer to www.GSAMFUNDS.com. There, you can learn more about your Fund’s investment strategies, holdings, and performance.
2
GOLDMAN SACHS MLP ENERGY INFRASTRUCTURE FUND
Schedule of Investments
May 31, 2021 (Unaudited)
| | | | | | | | |
| Shares | | | Description | | Value | |
| |
| Common Stocks – 93.7% | | | |
| Gathering + Processing – 36.2% | | | |
| | 987,500 | | | Antero Midstream Corp. | | $ | 9,480,000 | |
| | 1,441,168 | | | Crestwood Equity Partners LP | | | 41,303,875 | |
| | 2,240,500 | | | DCP Midstream LP | | | 56,393,385 | |
| | 382,500 | | | Hess Midstream LP Class A | | | 9,742,275 | |
| | 3,135,000 | | | MPLX LP | | | 89,755,050 | |
| | 1,082,500 | | | ONEOK, Inc. | | | 57,091,050 | |
| | 1,690,000 | | | Targa Resources Corp. | | | 65,673,400 | |
| | 2,000,000 | | | The Williams Cos., Inc. | | | 52,680,000 | |
| | 3,185,000 | | | Western Midstream Partners LP | | | 63,636,300 | |
| | | | | | | | |
| | | | | | | 445,755,335 | |
| | |
| Marketing | Wholesale – 3.0% | | | |
| | 950,000 | | | Gibson Energy, Inc. | | | 18,771,160 | |
| | 515,000 | | | Sunoco LP | | | 18,045,600 | |
| | | | | | | | |
| | | | | | | 36,816,760 | |
| | |
| Other* – 0.8% | | | |
| | 150,000 | | | Darling Ingredients, Inc. | | | 10,269,000 | |
| | |
| Other | Liquefaction – 6.5% | |
| | 490,000 | | | Cheniere Energy Partners LP | | | 20,217,400 | |
| | 664,500 | | | Cheniere Energy, Inc.* | | | 56,416,050 | |
| | 73,288 | | | New Fortress Energy, Inc. | | | 3,085,425 | |
| | | | | | | | |
| | | | | | | 79,718,875 | |
| | |
| Pipeline Transportation | Natural Gas – 21.9% | | | |
| | 8,950,000 | | | Energy Transfer LP | | | 88,605,000 | |
| | 3,775,000 | | | Enterprise Products Partners LP | | | 89,127,750 | |
| | 625,000 | | | Keyera Corp. | | | 15,500,186 | |
| | 1,867,500 | | | Kinder Morgan, Inc. | | | 34,249,950 | |
| | 825,000 | | | TC Energy Corp. | | | 42,124,500 | |
| | | | | | | | |
| | | | | | | 269,607,386 | |
| | |
| Pipeline Transportation | Petroleum – 21.7% | | | |
| | 222,500 | | | BP Midstream Partners LP | | | 3,146,150 | |
| | 837,500 | | | Enbridge, Inc. | | | 32,227,000 | |
| | 285,000 | | | Holly Energy Partners LP | | | 6,061,950 | |
| | 1,412,500 | | | Magellan Midstream Partners LP | | | 69,622,125 | |
| | 1,300,000 | | | NuStar Energy LP | | | 23,855,000 | |
| | 395,000 | | | PBF Logistics LP | | | 6,422,700 | |
| | 1,400,000 | | | Pembina Pipeline Corp. | | | 45,248,000 | |
| | 6,000,000 | | | Plains All American Pipeline LP | | | 63,180,000 | |
| | 875,000 | | | Plains GP Holdings LP Class A | | | 9,546,250 | |
| | 590,000 | | | Shell Midstream Partners LP | | | 8,519,600 | |
| | | | | | | | |
| | | | | | | 267,828,775 | |
| | |
| Power Generation – 3.1% | | | |
| | 392,500 | | | Atlantica Sustainable Infrastructure PLC | | | 14,267,375 | |
| | 170,000 | | | NextEra Energy Partners LP | | | 11,622,900 | |
| | 350,000 | | | Northland Power, Inc. | | | 11,710,608 | |
| | | | | | | | |
| | | | | | | 37,600,883 | |
| | |
| Services | Midstream – 0.5% | | | |
| | 261,386 | | | Rattler Midstream LP | | | 2,755,008 | |
|
| Common Stocks – (continued) | |
| Services | Midstream – (continued) | |
| | 199,151 | | | USA Compression Partners LP | | | 3,072,900 | |
| | | | | | | | |
| | | | | | | 5,827,908 | |
| | |
| | TOTAL COMMON STOCKS | | | | |
| | (Cost $1,240,629,075) | | $ | 1,153,424,922 | |
| | |
| | | | | | | | |
| Units | | | Description | | Value | |
|
| Special Purpose Acquisition Companies* – 2.6% | |
| | 1,755,144 | | | ECP Environmental Growth Opportunities Corp. | | $ | 17,095,103 | |
| | 203,881 | | | ECP Environmental Growth Opportunities Corp. Founder Shares(a)(b) | | | — | |
| | 950,900 | | | Rice Acquisition Corp. | | | 14,967,166 | |
| | |
| | SPECIAL PURPOSE ACQUISITION COMPANIES
| |
| | (Cost $25,589,702) | | $ | 32,062,269 | |
| | |
| | | | | | | | |
| | | | | | | | | | |
| Units | | Expiration
Date | | | Strike
Price | | Value | |
| |
| Warrants* – 0.3% | | | |
| Special Purpose Acquisition Company – 0.3% | |
ECP Environmental Growth Opportunities Corp. | |
| 438,786 | | | 02/11/28 | | | $11.50 | | $ | 359,848 | |
ECP Environmental Growth Opportunities Corp. Private(a)(b) | |
| 333,300 | | | 2/11/28 | | | 11.50 | | | 499,950 | |
Rice Acquisition Corp. | |
| 567,950 | | | 10/26/27 | | | 11.50 | | | 2,686,404 | |
| |
| TOTAL WARRANTS | |
| (Cost $2,172,467) | | $ | 3,546,202 | |
| |
| | | | | | | | | | |
| | | | | | |
| Shares | | Description | | Value | |
|
| Exchange Traded Fund – 1.1% | |
| Stock Funds – 1.1% | |
| 257,000 | | Energy Select Sector SPDR Fund | | $ | 13,417,970 | |
| (Cost $13,418,510) | |
| |
| | | | | | |
| Shares | | Dividend
Rate | | Value | |
| |
| Investment Company(c) – 0.3% | | | |
Goldman Sachs Financial Square Government Fund – Institutional Shares | |
| 3,842,343 | | 0.026% | | $ | 3,842,343 | |
| (Cost $3,842,343) | |
| |
| TOTAL INVESTMENTS – 98.0% | | | | |
| (Cost $1,285,652,097) | | $ | 1,206,293,706 | |
| |
| OTHER ASSETS IN EXCESS OF LIABILITIES – 2.0% | | | 24,869,533 | |
| |
| NET ASSETS – 100.0% | | $ | 1,231,163,239 | |
| |
| | |
| The accompanying notes are an integral part of these financial statements. | | 3 |
GOLDMAN SACHS MLP ENERGY INFRASTRUCTURE FUND
Schedule of Investments (continued)
May 31, 2021 (Unaudited)
| | |
|
| The percentage shown for each investment category reflects the value of investments in that category as a percentage of net assets. |
| |
* | | Non-income producing security. |
| |
(a) | | Restricted securities are not registered under the Securities Act of 1933, as amended, and are subject to legal restrictions on resale. These securities generally may be resold in transactions exempt from registration or to the public if the securities are subsequently registered. Disposal of these securities may involve time consuming negotiations and prompt sale at an acceptable price may be difficult. Total market value of Restricted securities amounts to $499,950, which represents approximately 0.0% of the Fund’s net assets as of May 31, 2021. See additional details below: |
| | | | | | | | | | |
| | | Restricted Security | | Acquisition
Date | | | Cost | |
| | ECP Environmental Growth Opportunities Corp. Private Warrants | | | 2/11/21 | | | $ | 499,950 | |
| | ECP Environmental Growth Opportunities Corp. Founder Shares | | | 2/11/21 | | | | — | |
| | |
| |
(b) | | Significant unobservable inputs were used in the valuation of this portfolio security; i.e., Level 3. |
| |
(c) | | Represents an affiliated fund. |
| | |
|
Investment Abbreviations: |
GP | | —General Partnership |
LP | | —Limited Partnership |
PIPE | | —Private Investment in Public Equity |
PLC | | —Public Limited Company |
|
|
| ADDITIONAL INVESTMENT INFORMATION |
UNFUNDED PIPE COMMITMENT — At May 31, 2021, the Fund had unfunded PIPE commitments pursuant to a subscription agreement with the following issuers:
| | | | | | |
| Issuer | | Shares | | Current
Value | | Unrealized
Gain (Loss) |
| | | |
Rice Acquisition Corp.(a) | | 570,795 | | $5,707,950 | | $— |
| | (a) | | Significant unobservable inputs were used in the valuation of this portfolio security; i.e., Level 3. |
PURCHASED OPTIONS CONTRACTS — At May 31, 2021, the Fund had the following purchased options:
EXCHANGE TRADED OPTIONS ON EQUITIES CONTRACTS
| | | | | | | | | | | | | | | | | | | | | | | | | | |
| Description | | Exercise
Price | | Expiration
Date | | | Number of
Contracts | | | Notional
Amount | | | Market Value | | | Premiums Paid
(Received) by
Portfolio | | | Unrealized
Appreciation/
(Depreciation) | |
Purchased option contracts | | | | | | | | | | | | | | | | | | | | | | | | |
Calls | | | | | | | | | | | | | | | | | | | | | | | | | | |
Phillips 66 Partners LP | | $40.00 | | | 12/17/2021 | | | | 6,500 | | | | 650,000 | | | $ | 2,307,500 | | | $ | 1,188,200 | | | $ | 1,119,300 | |
Phillips 66 Partners LP | | 30.00 | | | 09/17/2021 | | | | 12,500 | | | | 1,250,000 | | | | 12,875,000 | | | | 4,725,000 | | | | 8,150,000 | |
XOP ETF | | 82.00 | | | 09/17/2021 | | | | 2,500 | | | | 250,000 | | | | 2,900,000 | | | | 3,162,550 | | | | (262,550 | ) |
| | | | | |
| TOTAL | | | | 21,500 | | | | 2,150,000 | | | $ | 18,082,500 | | | $ | 9,075,750 | | | $ | 9,006,750 | |
| | |
|
Abbreviations |
XOP ETF | | —SPDR S&P Oil & Gas Exploration & Production ETF |
|
| | |
| 4 | | The accompanying notes are an integral part of these financial statements. |
GOLDMAN SACHS MLP ENERGY INFRASTRUCTURE FUND
Statement of Assets and Liabilities
May 31, 2021 (Unaudited)
| | | | | | |
| | | | | | |
| | Assets: | | | | |
| | Investments of unaffiliated issuers, at value (cost $1,281,809,754) | | $ | 1,202,451,363 | |
| | Purchased options, at value (premium paid $9,075,750) | | | 18,082,500 | |
| | Investments of affiliated issuers, at value (cost $3,842,343) | | | 3,842,343 | |
| | Cash | | | 1,130,729 | |
| | Foreign currencies, at value (cost $23,105) | | | 23,126 | |
| | Receivables: | | | | |
| | Investments sold | | | 13,369,877 | |
| | Fund shares sold | | | 1,157,622 | |
| | Dividends | | | 982,694 | |
| | Collateral on options contracts | | | 250,000 | |
| | Reimbursement from investment adviser | | | 10,294 | |
| | Deferred taxes, net | | | 5,788,647 | |
| | Other assets | | | 88,060 | |
| | Total assets | | | 1,247,177,255 | |
| | | | | | |
| | Liabilities: | | | | |
| | Payables: | | | | |
| | Investments purchased | | | 13,418,625 | |
| | Management fees | | | 1,024,284 | |
| | Fund shares redeemed | | | 983,742 | |
| | Distribution and service fees and transfer agent fees | | | 79,270 | |
| | Deferred taxes, net | | | — | |
| | Accrued expenses | | | 508,095 | |
| | Total liabilities | | | 16,014,016 | |
| | | | | | |
| | Net Assets: | | | | |
| | Paid-in capital | | | 2,434,443,652 | |
| | Total distributable earnings (loss) | | | (1,203,280,413 | ) |
| | | NET ASSETS | | $ | 1,231,163,239 | |
| | | Net Assets: | | | | |
| | | Class A | | $ | 42,108,711 | |
| | | Class C | | | 29,291,293 | |
| | | Institutional | | | 187,170,978 | |
| | | Investor | | | 41,421,727 | |
| | | Class R6 | | | 177,649,986 | |
| | | Class R | | | 660,260 | |
| | | Class P | | | 752,860,284 | |
| | | Total Net Assets | | $ | 1,231,163,239 | |
| | | Shares Outstanding $0.001 par value (unlimited shares authorized): | | | | |
| | | Class A | | | 1,819,269 | |
| | | Class C | | | 1,375,366 | |
| | | Institutional | | | 7,748,223 | |
| | | Investor | | | 1,739,755 | |
| | | Class R6 | | | 7,345,184 | |
| | | Class R | | | 29,315 | |
| | | Class P | | | 31,046,231 | |
| | | Net asset value, offering and redemption price per share:(a) | | | | |
| | | Class A | | | $23.15 | |
| | | Class C | | | 21.30 | |
| | | Institutional | | | 24.16 | |
| | | Investor | | | 23.81 | |
| | | Class R6 | | | 24.19 | |
| | | Class R | | | 22.52 | |
| | | Class P | | | 24.25 | |
| | (a) | | Maximum public offering price per share for Class A Shares is $24.50. At redemption, Class C Shares may be subject to a contingent deferred sales charge, assessed on the amount equal to the lesser of the current net asset value or the original purchase price of the shares. |
| | |
| The accompanying notes are an integral part of these financial statements. | | 5 |
GOLDMAN SACHS MLP ENERGY INFRASTRUCTURE FUND
Statement of Operations
For the Six Months Ended May 31, 2021 (Unaudited)
| | | | | | |
| | | | | | |
| | Investment income: | | | | |
| | |
| | Dividends — unaffiliated issuers (net of tax withholding of $498,873) | | $ | 37,614,696 | |
| | |
| | Dividends — affiliated issuers | | | 709 | |
| | |
| | Less: Return of Capital on Dividends | | | (27,406,531 | ) |
| | |
| | Total investment income | | | 10,208,874 | |
| | | | | | |
| | Expenses: | | | | |
| | |
| | Management fees | | | 5,583,546 | |
| | |
| | Transfer Agency fees(a) | | | 241,180 | |
| | |
| | Professional fees | | | 168,179 | |
| | |
| | Distribution and Service (12b-1) fees(a) | | | 149,980 | |
| | |
| | Custody, accounting and administrative services | | | 86,784 | |
| | |
| | Printing and mailing costs | | | 81,360 | |
| | |
| | Franchise Expense | | | 49,977 | |
| | |
| | Registration fees | | | 35,372 | |
| | |
| | Service Share fees — Class C | | | 33,711 | |
| | |
| | Trustee fees | | | 10,209 | |
| | |
| | Other | | | 21,711 | |
| | |
| | Total operating expenses, before taxes | | | 6,462,009 | |
| | |
| | Less — expense reductions | | | (58,594 | ) |
| | |
| | Net operating expenses, before taxes | | | 6,403,415 | |
| | |
| | NET INVESTMENT INCOME, BEFORE TAXES | | | 3,805,459 | |
| | |
| | Current and deferred tax benefit | | | 77,253 | |
| | |
| | NET INVESTMENT INCOME, NET OF TAXES | | | 3,882,712 | |
| | | | | | |
| | Realized and unrealized gain (loss): | | | | |
| | |
| | Net realized gain (loss) from: | | | | |
| | |
| | Investments — unaffiliated issuers | | | 106,388,193 | |
| | |
| | Purchased options | | | 2,609,985 | |
| | |
| | Written options | | | (3,549,414 | ) |
| | |
| | Foreign currency transactions | | | 44,660 | |
| | |
| | Current and deferred tax benefit | | | 2,122,387 | |
| | |
| | Net change in unrealized gain (loss) on: | | | | |
| | |
| | Investments — unaffiliated issuers | | | 247,548,058 | |
| | |
| | Purchased Options | | | 8,560,826 | |
| | |
| | Written options | | | 217,500 | |
| | |
| | Foreign currency translation | | | (2,588 | ) |
| | |
| | Current and deferred tax benefit | | | 5,158,516 | |
| | |
| | Net realized and unrealized gain, net of taxes | | | 369,098,123 | |
| | |
| | NET INCREASE IN NET ASSETS RESULTING FROM OPERATIONS | | $ | 372,980,835 | |
| | (a) | | Class specific Distribution and/or Service (12b-1), and Transfer Agency fees were as follows: |
| | | | | | | | | | | | | | | | | | | | | | | | | | | | | | | | | | | | | | |
| Distribution and/or Service (12b-1) Fees | | | Transfer Agent Fees | |
Class A | | | Class C | | | Class R | | | Class A | | | Class C | | | Institutional | | | Investor | | | Class R6 | | | Class R | | | Class P | |
| $ | 47,353 | | | $ | 101,133 | | | $ | 1,494 | | | $ | 28,957 | | | $ | 20,541 | | | $ | 38,927 | | | $ | 27,161 | | | $ | 28,997 | | | $ | 445 | | | $ | 96,151 | |
| | |
| 6 | | The accompanying notes are an integral part of these financial statements. |
GOLDMAN SACHS MLP ENERGY INFRASTRUCTURE FUND
Statements of Changes in Net Assets
| | | | | | | | | | |
| | | | | For the
Six Months Ended
May 31, 2021
(Unaudited) | | | For the Fiscal
Year Ended
November 30, 2020 | |
| | From operations: | | | | | |
| | | |
| | Net investment income (loss), net of taxes | | $ | 3,882,712 | | | $ | (5,278,888 | ) |
| | | |
| | Net realized gain (loss), net of taxes | | | 107,615,811 | | | | (534,489,840 | ) |
| | | |
| | Net change in unrealized gain, net of taxes | | | 261,482,312 | | | | 78,270,648 | |
| | | |
| | Net increase (decrease) in net assets resulting from operations | | | 372,980,835 | | | | (461,498,080 | ) |
| | | | | | | | | | |
| | Distributions to shareholders: | | | | | | | | |
| | | |
| | From distributable earnings | | | | | | | | |
| | | |
| | Class A Shares | | | (1,325,539 | ) | | | — | |
| | | |
| | Class C Shares | | | (1,009,005 | ) | | | — | |
| | | |
| | Institutional Shares | | | (6,187,231 | ) | | | — | |
| | | |
| | Investor Shares | | | (1,229,484 | ) | | | — | |
| | | |
| | Class R6 Shares | | | (6,132,879 | ) | | | — | |
| | | |
| | Class R Shares | | | (21,366 | ) | | | — | |
| | | |
| | Class P Shares | | | (22,072,208 | ) | | | — | |
| | | |
| | From return of capital | | | | | | | | |
| | | |
| | Class A Shares | | | — | | | | (3,740,013 | ) |
| | | |
| | Class C Shares | | | — | | | | (3,271,090 | ) |
| | | |
| | Institutional Shares | | | — | | | | (21,684,266 | ) |
| | | |
| | Investor Shares | | | — | | | | (4,311,050 | ) |
| | | |
| | Class R6 Shares | | | — | | | | (14,964,119 | ) |
| | | |
| | Class R Shares | | | — | | | | (83,728 | ) |
| | | |
| | Class P Shares | | | — | | | | (49,952,163 | ) |
| | | |
| | Total distributions to shareholders | | | (37,977,712 | ) | | | (98,006,429 | ) |
| | | | | | | | | | |
| | From share transactions: | | | | | | | | |
| | | |
| | Proceeds from sales of shares | | | 150,951,200 | | | | 969,598,587 | |
| | | |
| | Reinvestment of distributions | | | 35,977,230 | | | | 91,996,502 | |
| | | |
| | Cost of shares redeemed | | | (273,985,150 | ) | | | (1,247,880,583 | ) |
| | | |
| | Net decrease in net assets resulting from share transactions | | | (87,056,720 | ) | | | (186,285,494 | ) |
| | | |
| | TOTAL INCREASE (DECREASE) | | | 247,946,403 | | | | (745,790,003 | ) |
| | | | | | | | | | |
| | Net assets: | | | | | | | | |
| | | |
| | Beginning of period | | | 983,216,836 | | | | 1,729,006,839 | |
| | | |
| | End of period | | $ | 1,231,163,239 | | | $ | 983,216,836 | |
| | |
| The accompanying notes are an integral part of these financial statements. | | 7 |
GOLDMAN SACHS MLP ENERGY INFRASTRUCTURE FUND
Financial Highlights
Selected Share Data for a Share Outstanding Throughout Each Period
| | | | | | | | | | | | | | | | | | | | | | | | | | |
| | | | | Goldman Sachs MLP Energy Infrastructure Fund | |
| | | | | Class A Shares | |
| | | | | Six Months Ended
May 31, 2021
(Unaudited) | | | Year Ended November 30, | |
| | | | | 2020 | | | 2019 | | | 2018 | | | 2017 | | | 2016 | |
| | Per Share Data* | | | | | | | | | | | | | | | | | | | | | | | | |
| | | | | | | |
| | Net asset value, beginning of period | | $ | 17.15 | | | $ | 26.10 | | | $ | 31.90 | | | $ | 34.00 | | | $ | 39.40 | | | $ | 38.10 | |
| | | | | | | |
| | Net investment income (loss)(a) | | | 0.03 | | | | (0.15 | ) | | | (0.30 | ) | | | (0.10 | ) | | | (0.35 | ) | | | (0.30 | ) |
| | | | | | | |
| | Net realized and unrealized gain (loss) | | | 6.69 | | | | (7.86 | ) | | | (3.00 | ) | | | 0.35 | | | | (2.85 | ) | | | 4.00 | |
| | | | | | | |
| | Total from investment operations | | | 6.72 | | | | (8.01 | ) | | | (3.30 | ) | | | 0.25 | | | | (3.20 | ) | | | 3.70 | |
| | | | | | | |
| | Distributions to shareholders from net investment income | | | (0.72 | ) | | | — | | | | (0.15 | ) | | | (0.80 | ) | | | (0.25 | ) | | | — | |
| | | | | | | |
| | Distributions to shareholders from return of capital | | | — | | | | (0.94 | ) | | | (2.35 | ) | | | (1.55 | ) | | | (1.95 | ) | | | (2.40 | ) |
| | | | | | | |
| | Total distributions | | | (0.72 | ) | | | (0.94 | ) | | | (2.50 | ) | | | (2.35 | ) | | | (2.20 | ) | | | (2.40 | ) |
| | | | | | | |
| | Net asset value, end of period | | $ | 23.15 | | | $ | 17.15 | | | $ | 26.10 | | | $ | 31.90 | | | $ | 34.00 | | | $ | 39.40 | |
| | | | | | | |
| | Total return(b) | | | 39.60 | % | | | (27.83 | )% | | | (11.06 | )% | | | 0.23 | % | | | (8.35 | )% | | | 10.23 | % |
| | | | | | | |
| | Net assets, end of period (in 000s) | | $ | 42,109 | | | $ | 34,024 | | | $ | 60,112 | | | $ | 95,120 | | | $ | 115,467 | | | $ | 289,689 | |
| | | | | | | |
| | Ratio of total expenses to average net assets after tax (benefit)/expense(c) | | | 0.82 | %(d) | | | 2.64 | % | | | 1.67 | % | | | 1.67 | % | | | 1.52 | % | | | 1.45 | % |
| | | | | | | |
| | Ratio of net expenses to average net assets after tax (benefit)/expense(c) | | | 0.81 | %(d) | | | 2.61 | % | | | 1.67 | % | | | 1.67 | % | | | 1.52 | % | | | 1.45 | % |
| | | | | | | |
| | Ratio of net expenses to average net assets before tax (benefit)/expense | | | 1.46 | %(d) | | | 1.49 | % | | | 1.44 | % | | | 1.40 | % | | | 1.42 | % | | | 1.45 | % |
| | | | | | | |
| | Ratio of net investment loss to average net assets(e) | | | 0.36 | %(d) | | | (0.81 | )% | | | (1.02 | )% | | | (0.34 | )% | | | (0.85 | )% | | | (0.87 | )% |
| | | | | | | |
| | Portfolio turnover rate(f) | | | 55 | % | | | 139 | % | | | 51 | % | | | 68 | % | | | 42 | % | | | 104 | % |
| | * | | On June 5, 2020, the Fund effected a 5-for-1 reverse share split. All per share data prior to June 5, 2020 has been adjusted to reflect the reverse share split. |
| | (a) | | Calculated based on the average shares outstanding methodology. |
| | (b) | | Assumes investment at the NAV at the beginning of the period, reinvestment of all dividends and distributions, a complete redemption of the investment at the NAV at the end of the period and no sales or redemption charges (if any). Total returns would be reduced if a sales or redemption charge was taken into account. Returns do not reflect the impact of taxes to shareholders relating to Fund distributions or the redemption of Fund shares. Total returns for periods less than one full year are not annualized. |
| | (c) | | Current and deferred tax expense/benefit for the ratio calculation is derived from the net investment income (loss), and realized and unrealized gains (losses). |
| | (d) | | Annualized with the exception of tax expenses. |
| | (e) | | Current and deferred tax benefit for the ratio calculation is derived from net investment income (loss) only. |
| | (f) | | The Fund’s portfolio turnover rate is calculated in accordance with regulatory requirements, without regard to transactions involving short term investments and certain derivatives. If such transactions were included, the Fund’s portfolio turnover rate may be higher. |
| | |
| 8 | | The accompanying notes are an integral part of these financial statements. |
GOLDMAN SACHS MLP ENERGY INFRASTRUCTURE FUND
Financial Highlights (continued)
Selected Share Data for a Share Outstanding Throughout Each Period
| | | | | | | | | | | | | | | | | | | | | | | | | | |
| | | | | Goldman Sachs MLP Energy Infrastructure Fund | |
| | | | | Class C Shares | |
| | | | | Six Months Ended
May 31, 2021
(Unaudited) | | | Year Ended November 30, | |
| | | | | 2020 | | | 2019 | | | 2018 | | | 2017 | | | 2016 | |
| | Per Share Data* | | | | | | | | | | | | | | | | | | | | | | | | |
| | | | | | | |
| | Net asset value, beginning of period | | $ | 15.88 | | | $ | 24.55 | | | $ | 30.35 | | | $ | 32.70 | | | $ | 38.25 | | | $ | 37.30 | |
| | | | | | | |
| | Net investment loss(a) | | | (0.04 | ) | | | (0.29 | ) | | | (0.50 | ) | | | (0.35 | ) | | | (0.60 | ) | | | (0.60 | ) |
| | | | | | | |
| | Net realized and unrealized gain (loss) | | | 6.18 | | | | (7.44 | ) | | | (2.80 | ) | | | 0.35 | | | | (2.75 | ) | | | 3.95 | |
| | | | | | | |
| | Total from investment operations | | | 6.14 | | | | (7.73 | ) | | | (3.30 | ) | | | — | | | | (3.35 | ) | | | 3.35 | |
| | | | | | | |
| | Distributions to shareholders from net investment income | | | (0.72 | ) | | | — | | | | (0.15 | ) | | | (0.80 | ) | | | (0.25 | ) | | | — | |
| | | | | | | |
| | Distributions to shareholders from return of capital | | | — | | | | (0.94 | ) | | | (2.35 | ) | | | (1.55 | ) | | | (1.95 | ) | | | (2.40 | ) |
| | | | | | | |
| | Total distributions | | | (0.72 | ) | | | (0.94 | ) | | | (2.50 | ) | | | (2.35 | ) | | | (2.20 | ) | | | (2.40 | ) |
| | | | | | | |
| | Net asset value, end of period | | $ | 21.30 | | | $ | 15.88 | | | $ | 24.55 | | | $ | 30.35 | | | $ | 32.70 | | | $ | 38.25 | |
| | | | | | | |
| | Total return(b) | | | 39.10 | % | | | (28.47 | )% | | | (11.64 | )% | | | (0.38 | )% | | | (9.15 | )% | | | 9.49 | % |
| | | | | | | |
| | Net assets, end of period (in 000s) | | $ | 29,291 | | | $ | 24,897 | | | $ | 58,044 | | | $ | 92,201 | | | $ | 124,291 | | | $ | 170,575 | |
| | | | | | | |
| | Ratio of total expenses to average net assets after tax (benefit)/expense(c) | | | 1.57 | %(d) | | | 3.39 | % | | | 2.42 | % | | | 2.44 | % | | | 2.28 | % | | | 2.20 | % |
| | | | | | | |
| | Ratio of net expenses to average net assets after tax (benefit)/expense(c) | | | 1.56 | %(d) | | | 3.37 | % | | | 2.42 | % | | | 2.44 | % | | | 2.28 | % | | | 2.20 | % |
| | | | | | | |
| | Ratio of net expenses to average net assets before tax (benefit)/expense | | | 2.21 | %(d) | | | 2.24 | % | | | 2.19 | % | | | 2.15 | % | | | 2.17 | % | | | 2.21 | % |
| | | | | | | |
| | Ratio of net investment loss to average net assets(e) | | | (0.40 | )%(d) | | | (1.63 | )% | | | (1.77 | )% | | | (1.06 | )% | | | (1.60 | )% | | | (1.63 | )% |
| | | | | | | |
| | Portfolio turnover rate(f) | | | 55 | % | | | 139 | % | | | 51 | % | | | 68 | % | | | 42 | % | | | 104 | % |
| | * | | On June 5, 2020, the Fund effected a 5-for-1 reverse share split. All per share data prior to June 5, 2020 has been adjusted to reflect the reverse share split. |
| | (a) | | Calculated based on the average shares outstanding methodology. |
| | (b) | | Assumes investment at the NAV at the beginning of the period, reinvestment of all dividends and distributions, a complete redemption of the investment at the NAV at the end of the period and no sales or redemption charges (if any). Total returns would be reduced if a sales or redemption charge was taken into account. Returns do not reflect the impact of taxes to shareholders relating to Fund distributions or the redemption of Fund shares. Total returns for periods less than one full year are not annualized. |
| | (c) | | Current and deferred tax expense/benefit for the ratio calculation is derived from the net investment income (loss), and realized and unrealized gains (losses). |
| | (d) | | Annualized with the exception of tax expenses. |
| | (e) | | Current and deferred tax benefit for the ratio calculation is derived from net investment income (loss) only. |
| | (f) | | The Fund’s portfolio turnover rate is calculated in accordance with regulatory requirements, without regard to transactions involving short term investments and certain derivatives. If such transactions were included, the Fund’s portfolio turnover rate may be higher. |
| | |
| The accompanying notes are an integral part of these financial statements. | | 9 |
GOLDMAN SACHS MLP ENERGY INFRASTRUCTURE FUND
Financial Highlights (continued)
Selected Share Data for a Share Outstanding Throughout Each Period
| | | | | | | | | | | | | | | | | | | | | | | | | | |
| | | | | Goldman Sachs MLP Energy Infrastructure Fund | |
| | | | | Institutional Shares | |
| | | | | Six Months Ended
May 31, 2021
(Unaudited) | | | Year Ended November 30, | |
| | | | | 2020 | | | 2019 | | | 2018 | | | 2017 | | | 2016 | |
| | Per Share Data* | | | | | | | | | | | | | | | | | | | | | | | | |
| | | | | | | |
| | Net asset value, beginning of period | | $ | 17.84 | | | $ | 26.95 | | | $ | 32.75 | | | $ | 34.75 | | | $ | 40.10 | | | $ | 38.50 | |
| | | | | | | |
| | Net investment income (loss)(a) | | | 0.07 | | | | (0.11 | ) | | | (0.20 | ) | | | 0.10 | | | | (0.15 | ) | | | (0.25 | ) |
| | | | | | | |
| | Net realized and unrealized gain (loss) | | | 6.97 | | | | (8.06 | ) | | | (3.10 | ) | | | 0.25 | | | | (3.00 | ) | | | 4.25 | |
| | | | | | | |
| | Total from investment operations | | | 7.04 | | | | (8.17 | ) | | | (3.30 | ) | | | 0.35 | | | | (3.15 | ) | | | 4.00 | |
| | | | | | | |
| | Distributions to shareholders from net investment income | | | (0.72 | ) | | | — | | | | (0.15 | ) | | | (0.80 | ) | | | (0.25 | ) | | | — | |
| | | | | | | |
| | Distributions to shareholders from return of capital | | | — | | | | (0.94 | ) | | | (2.35 | ) | | | (1.55 | ) | | | (1.95 | ) | | | (2.40 | ) |
| | | | | | | |
| | Total distributions | | | (0.72 | ) | | | (0.94 | ) | | | (2.50 | ) | | | (2.35 | ) | | | (2.20 | ) | | | (2.40 | ) |
| | | | | | | |
| | Net asset value, end of period | | $ | 24.16 | | | $ | 17.84 | | | $ | 26.95 | | | $ | 32.75 | | | $ | 34.75 | | | $ | 40.10 | |
| | | | | | | |
| | Total return(b) | | | 39.86 | % | | | (27.54 | )% | | | (10.77 | )% | | | 0.67 | % | | | (8.21 | )% | | | 10.92 | % |
| | | | | | | |
| | Net assets, end of period (in 000s) | | $ | 187,171 | | | $ | 182,236 | | | $ | 502,633 | | | $ | 651,132 | | | $ | 1,711,829 | | | $ | 1,830,614 | |
| | | | | | | |
| | Ratio of total expenses to average net assets after tax (benefit)/expense(c) | | | 0.46 | %(d) | | | 2.25 | % | | | 1.28 | % | | | 1.43 | % | | | 1.14 | % | | | 1.05 | % |
| | | | | | | |
| | Ratio of net expenses to average net assets after tax
(benefit)/expense(c) | | | 0.45 | %(d) | | | 2.22 | % | | | 1.28 | % | | | 1.43 | % | | | 1.14 | % | | | 1.05 | % |
| | | | | | | |
| | Ratio of net expenses to average net assets before tax (benefit)/expense | | | 1.10 | %(d) | | | 1.10 | % | | | 1.05 | % | | | 1.01 | % | | | 1.03 | % | | | 1.05 | % |
| | | | | | | |
| | Ratio of net investment loss to average net assets(e) | | | 0.73 | %(d) | | | (0.56 | )% | | | (0.61 | )% | | | 0.34 | % | | | (0.42 | )% | | | (0.69 | )% |
| | | | | | | |
| | Portfolio turnover rate(f) | | | 55 | % | | | 139 | % | | | 51 | % | | | 68 | % | | | 42 | % | | | 104 | % |
| | * | | On June 5, 2020, the Fund effected a 5-for-1 reverse share split. All per share data prior to June 5, 2020 has been adjusted to reflect the reverse share split. |
| | (a) | | Calculated based on the average shares outstanding methodology. |
| | (b) | | Assumes investment at the NAV at the beginning of the period, reinvestment of all dividends and distributions, a complete redemption of the investment at the NAV at the end of the period and no sales or redemption charges (if any). Total returns would be reduced if a sales or redemption charge was taken into account. Returns do not reflect the impact of taxes to shareholders relating to Fund distributions or the redemption of Fund shares. Total returns for periods less than one full year are not annualized. |
| | (c) | | Current and deferred tax expense/benefit for the ratio calculation is derived from the net investment income (loss), and realized and unrealized gains (losses). |
| | (d) | | Annualized with the exception of tax expenses. |
| | (e) | | Current and deferred tax benefit for the ratio calculation is derived from net investment income (loss) only. |
| | (f) | | The Fund’s portfolio turnover rate is calculated in accordance with regulatory requirements, without regard to transactions involving short term investments and certain derivatives. If such transactions were included, the Fund’s portfolio turnover rate may be higher. |
| | |
| 10 | | The accompanying notes are an integral part of these financial statements. |
GOLDMAN SACHS MLP ENERGY INFRASTRUCTURE FUND
Financial Highlights (continued)
Selected Share Data for a Share Outstanding Throughout Each Period
| | | | | | | | | | | | | | | | | | | | | | | | | | |
| | | | | Goldman Sachs MLP Energy Infrastructure Fund | |
| | | | | Investor Shares | |
| | | | | Six Months Ended
May 31, 2021
(Unaudited) | | | Year Ended November 30, | |
| | | | | 2020 | | | 2019 | | | 2018 | | | 2017 | | | 2016 | |
| | Per Share Data* | | | | | | | | | | | | | | | | | | | | | | | | |
| | | | | | | |
| | Net asset value, beginning of period | | $ | 17.60 | | | $ | 26.65 | | | $ | 32.50 | | | $ | 34.50 | | | $ | 39.85 | | | $ | 38.35 | |
| | | | | | | |
| | Net investment income (loss)(a) | | | 0.06 | | | | (0.15 | ) | | | (0.25 | ) | | | (0.05 | ) | | | (0.25 | ) | | | (0.20 | ) |
| | | | | | | |
| | Net realized and unrealized gain (loss) | | | 6.87 | | | | (7.96 | ) | | | (3.10 | ) | | | 0.40 | | | | (2.90 | ) | | | 4.10 | |
| | | | | | | |
| | Total from investment operations | | | 6.93 | | | | (8.11 | ) | | | (3.35 | ) | | | 0.35 | | | | (3.15 | ) | | | 3.90 | |
| | | | | | | |
| | Distributions to shareholders from net investment income | | | (0.72 | ) | | | — | | | | (0.15 | ) | | | (0.80 | ) | | | (0.25 | ) | | | — | |
| | | | | | | |
| | Distributions to shareholders from return of capital | | | — | | | | (0.94 | ) | | | (2.35 | ) | | | (1.55 | ) | | | (1.95 | ) | | | (2.40 | ) |
| | | | | | | |
| | Total distributions | | | (0.72 | ) | | | (0.94 | ) | | | (2.50 | ) | | | (2.35 | ) | | | (2.20 | ) | | | (2.40 | ) |
| | | | | | | |
| | Net asset value, end of period | | $ | 23.81 | | | $ | 17.60 | | | $ | 26.65 | | | $ | 32.50 | | | $ | 34.50 | | | $ | 39.85 | |
| | | | | | | |
| | Total return(b) | | | 39.78 | % | | | (27.63 | )% | | | (11.01 | )% | | | 0.68 | % | | | (8.26 | )% | | | 10.69 | % |
| | | | | | | |
| | Net assets, end of period (in 000s) | | $ | 41,422 | | | $ | 32,396 | | | $ | 98,506 | | | $ | 142,664 | | | $ | 156,974 | | | $ | 121,705 | |
| | | | | | | |
| | Ratio of total expenses to average net assets after tax (benefit)/expense(c) | | | 0.57 | %(d) | | | 2.38 | % | | | 1.42 | % | | | 1.43 | % | | | 1.29 | % | | | 1.20 | % |
| | | | | | | |
| | Ratio of net expenses to average net assets after tax (benefit)/expense(c) | | | 0.56 | %(d) | | | 2.36 | % | | | 1.42 | % | | | 1.43 | % | | | 1.29 | % | | | 1.20 | % |
| | | | | | | |
| | Ratio of net expenses to average net assets before tax (benefit)/expense | | | 1.21 | %(d) | | | 1.23 | % | | | 1.19 | % | | | 1.15 | % | | | 1.17 | % | | | 1.20 | % |
| | | | | | | |
| | Ratio of net investment loss to average net assets(e) | | | 0.59 | %(d) | | | (0.73 | )% | | | (0.77 | )% | | | (0.07 | )% | | | (0.63 | )% | | | (0.60 | )% |
| | | | | | | |
| | Portfolio turnover rate(f) | | | 55 | % | | | 139 | % | | | 51 | % | | | 68 | % | | | 42 | % | | | 104 | % |
| | * | | On June 5, 2020, the Fund effected a 5-for-1 reverse share split. All per share data prior to June 5, 2020 has been adjusted to reflect the reverse share split. |
| | (a) | | Calculated based on the average shares outstanding methodology. |
| | (b) | | Assumes investment at the NAV at the beginning of the period, reinvestment of all dividends and distributions, a complete redemption of the investment at the NAV at the end of the period and no sales or redemption charges (if any). Total returns would be reduced if a sales or redemption charge was taken into account. Returns do not reflect the impact of taxes to shareholders relating to Fund distributions or the redemption of Fund shares. Total returns for periods less than one full year are not annualized. |
| | (c) | | Current and deferred tax expense/benefit for the ratio calculation is derived from the net investment income (loss), and realized and unrealized gains (losses). |
| | (d) | | Annualized with the exception of tax expenses. |
| | (e) | | Current and deferred tax benefit for the ratio calculation is derived from net investment income (loss) only. |
| | (f) | | The Fund’s portfolio turnover rate is calculated in accordance with regulatory requirements, without regard to transactions involving short term investments and certain derivatives. If such transactions were included, the Fund’s portfolio turnover rate may be higher. |
| | |
| The accompanying notes are an integral part of these financial statements. | | 11 |
GOLDMAN SACHS MLP ENERGY INFRASTRUCTURE FUND
Financial Highlights (continued)
Selected Share Data for a Share Outstanding Throughout Each Period
| | | | | | | | | | | | | | | | | | |
| | | | | Goldman Sachs MLP Energy Infrastructure Fund | |
| | | | | Class R6 Shares | |
| | | | | Six Months Ended
May 31, 2021
(Unaudited) | | | Year Ended November 30, | | | Period Ended
November 30, 2018(a) | |
| | | | | 2020 | | | 2019 | |
| | Per Share Data* | | | | | | | | | | | | | | | | |
| | | | | |
| | Net asset value, beginning of period | | $ | 17.86 | | | $ | 27.00 | | | $ | 32.75 | | | $ | 32.15 | |
| | | | | |
| | Net investment income (loss)(b) | | | 0.08 | | | | (0.05 | ) | | | (0.20 | ) | | | (0.10 | ) |
| | | | | |
| | Net realized and unrealized gain (loss) | | | 6.97 | | | | (8.15 | ) | | | (3.05 | ) | | | 2.50 | |
| | | | | |
| | Total from investment operations | | | 7.05 | | | | (8.20 | ) | | | (3.25 | ) | | | 2.40 | |
| | | | | |
| | Distributions to shareholders from net investment income | | | (0.72 | ) | | | — | | | | (0.15 | ) | | | (0.65 | ) |
| | | | | |
| | Distributions to shareholders from return of capital | | | — | | | | (0.94 | ) | | | (2.35 | ) | | | (1.15 | ) |
| | | | | |
| | Total distributions | | | (0.72 | ) | | | (0.94 | ) | | | (2.50 | ) | | | (1.80 | ) |
| | | | | |
| | Net asset value, end of period | | $ | 24.19 | | | $ | 17.86 | | | $ | 27.00 | | | $ | 32.75 | |
| | | | | |
| | Total return(c) | | | 39.87 | % | | | (27.60 | )% | | | (10.60 | )% | | | 7.15 | % |
| | | | | |
| | Net assets, end of period (in 000s) | | $ | 177,650 | | | $ | 181,968 | | | $ | 165,252 | | | $ | 205,470 | |
| | | | | |
| | Ratio of total expenses to average net assets after tax (benefit)/expense(d) | | | 0.45 | %(d) | | | 2.26 | % | | | 1.26 | % | | | 1.11 | %(e) |
| | | | | |
| | Ratio of net expenses to average net assets after tax (benefit)/expense(d) | | | 0.44 | %(d) | | | 2.23 | % | | | 1.26 | % | | | 1.11 | %(e) |
| | | | | |
| | Ratio of net expenses to average net assets before tax (benefit)/expense | | | 1.09 | %(d) | | | 1.11 | % | | | 1.04 | % | | | 1.00 | %(e) |
| | | | | |
| | Ratio of net investment loss to average net assets(f) | | | 0.74 | %(d) | | | (0.29 | )% | | | (0.66 | )% | | | (0.46 | )%(e) |
| | | | | |
| | Portfolio turnover rate(g) | | | 55 | % | | | 139 | % | | | 51 | % | | | 68 | % |
| | * | | On June 5, 2020, the Fund effected a 5-for-1 reverse share split. All per share data prior to June 5, 2020 has been adjusted to reflect the reverse share split. |
| | (a) | | Commenced operations on April 2, 2018. |
| | (b) | | Calculated based on the average shares outstanding methodology. |
| | (c) | | Assumes investment at the NAV at the beginning of the period, reinvestment of all dividends and distributions, a complete redemption of the investment at the NAV at the end of the period and no sales or redemption charges (if any). Total returns would be reduced if a sales or redemption charge was taken into account. Returns do not reflect the impact of taxes to shareholders relating to Fund distributions or the redemption of Fund shares. Total returns for periods less than one full year are not annualized. |
| | (d) | | Current and deferred tax expense/benefit for the ratio calculation is derived from the net investment income (loss), and realized and unrealized gains (losses). |
| | (e) | | Annualized with the exception of tax expenses. |
| | (f) | | Current and deferred tax benefit for the ratio calculation is derived from net investment income (loss) only. |
| | (g) | | The Fund’s portfolio turnover rate is calculated in accordance with regulatory requirements, without regard to transactions involving short term investments and certain derivatives. If such transactions were included, the Fund’s portfolio turnover rate may be higher. |
| | |
| 12 | | The accompanying notes are an integral part of these financial statements. |
GOLDMAN SACHS MLP ENERGY INFRASTRUCTURE FUND
Financial Highlights (continued)
Selected Share Data for a Share Outstanding Throughout Each Period
| | | | | | | | | | | | | | | | | | | | | | | | | | |
| | | | | Goldman Sachs MLP Energy Infrastructure Fund | |
| | | | | Class R Shares | |
| | | | | Six Months Ended
May 31, 2021
(Unaudited) | | | Year Ended November 30, | |
| | | | | 2020 | | | 2019 | | | 2018 | | | 2017 | | | 2016 | |
| | Per Share Data* | | | | | | | | | | | | | | | | | | | | | | | | |
| | | | | | | |
| | Net asset value, beginning of period | | $ | 16.72 | | | $ | 25.60 | | | $ | 31.40 | | | $ | 33.55 | | | $ | 39.05 | | | $ | 37.80 | |
| | | | | | | |
| | Net investment income (loss)(a) | | | 0.01 | | | | (0.17 | ) | | | (0.40 | ) | | | (0.20 | ) | | | (0.40 | ) | | | (0.45 | ) |
| | | | | | | |
| | Net realized and unrealized gain (loss) | | | 6.51 | | | | (7.77 | ) | | | (2.90 | ) | | | 0.40 | | | | (2.90 | ) | | | 4.10 | |
| | | | | | | |
| | Total from investment operations | | | 6.52 | | | | (7.94 | ) | | | (3.30 | ) | | | 0.20 | | | | (3.30 | ) | | | 3.65 | |
| | | | | | | |
| | Distributions to shareholders from net investment income | | | (0.72 | ) | | | — | | | | (0.15 | ) | | | (0.80 | ) | | | (0.25 | ) | | | — | |
| | | | | | | |
| | Distributions to shareholders from return of capital | | | — | | | | (0.94 | ) | | | (2.35 | ) | | | (1.55 | ) | | | (1.95 | ) | | | (2.40 | ) |
| | | | | | | |
| | Total distributions | | | (0.72 | ) | | | (0.94 | ) | | | (2.50 | ) | | | (2.35 | ) | | | (2.20 | ) | | | (2.40 | ) |
| | | | | | | |
| | Net asset value, end of period | | $ | 22.52 | | | $ | 16.72 | | | $ | 25.60 | | | $ | 31.40 | | | $ | 33.55 | | | $ | 39.05 | |
| | | | | | | |
| | Total return(b) | | | 39.41 | % | | | (28.11 | )% | | | (11.24 | )% | | | 0.24 | % | | | (8.83 | )% | | | 10.18 | % |
| | | | | | | |
| | Net assets, end of period (in 000s) | | $ | 660 | | | $ | 796 | | | $ | 1,012 | | | $ | 2,254 | | | $ | 2,009 | | | $ | 2,026 | |
| | | | | | | |
| | Ratio of total expenses to average net assets after tax (benefit)/expense(c) | | | 1.07 | %(d) | | | 2.90 | % | | | 1.92 | % | | | 1.93 | % | | | 1.77 | % | | | 1.70 | % |
| | | | | | | |
| | Ratio of net expenses to average net assets after tax (benefit)/expense(c) | | | 1.06 | %(d) | | | 2.87 | % | | | 1.92 | % | | | 1.93 | % | | | 1.77 | % | | | 1.70 | % |
| | | | | | | |
| | Ratio of net expenses to average net assets before tax (benefit)/expense | | | 1.71 | %(d) | | | 1.74 | % | | | 1.69 | % | | | 1.65 | % | | | 1.68 | % | | | 1.70 | % |
| | | | | | | |
| | Ratio of net investment loss to average net assets(e) | | | 0.08 | %(d) | | | (0.94 | )% | | | (1.31 | )% | | | (0.59 | )% | | | (1.06 | )% | | | (1.23 | )% |
| | | | | | | |
| | Portfolio turnover rate(f) | | | 55 | % | | | 139 | % | | | 51 | % | | | 68 | % | | | 42 | % | | | 104 | % |
| | * | | On June 5, 2020, the Fund effected a 5-for-1 reverse share split. All per share data prior to June 5, 2020 has been adjusted to reflect the reverse share split. |
| | (a) | | Calculated based on the average shares outstanding methodology. |
| | (b) | | Assumes investment at the NAV at the beginning of the period, reinvestment of all dividends and distributions, a complete redemption of the investment at the NAV at the end of the period and no sales or redemption charges (if any). Total returns would be reduced if a sales or redemption charge was taken into account. Returns do not reflect the impact of taxes to shareholders relating to Fund distributions or the redemption of Fund shares. Total returns for periods less than one full year are not annualized. |
| | (c) | | Current and deferred tax expense/benefit for the ratio calculation is derived from the net investment income (loss), and realized and unrealized gains (losses). |
| | (d) | | Annualized with the exception of tax expenses. |
| | (e) | | Current and deferred tax benefit for the ratio calculation is derived from net investment income (loss) only. |
| | (f) | | The Fund’s portfolio turnover rate is calculated in accordance with regulatory requirements, without regard to transactions involving short term investments and certain derivatives. If such transactions were included, the Fund’s portfolio turnover rate may be higher. |
| | |
| The accompanying notes are an integral part of these financial statements. | | 13 |
GOLDMAN SACHS MLP ENERGY INFRASTRUCTURE FUND
Financial Highlights (continued)
Selected Share Data for a Share Outstanding Throughout Each Period
| | | | | | | | | | | | | | | | | | |
| | | | | Goldman Sachs MLP Energy Infrastructure Fund | |
| | | | | Class P Shares | |
| | | | | Six Months Ended
May 31, 2021
(Unaudited) | | | Year Ended November 30, | | | Period Ended
November 30, 2018(a) | |
| | | | | 2020 | | | 2019 | |
| | Per Share Data* | | | | | | | | | | | | | | | | |
| | | | | |
| | Net asset value, beginning of period | | $ | 17.91 | | | $ | 27.05 | | | $ | 32.85 | | | $ | 34.80 | |
| | | | | |
| | Net investment income (loss)(b) | | | 0.08 | | | | (0.08 | ) | | | (0.20 | ) | | | (0.15 | ) |
| | | | | |
| | Net realized and unrealized gain (loss) | | | 6.98 | | | | (8.12 | ) | | | (3.10 | ) | | | — | (c) |
| | | | | |
| | Total from investment operations | | | 7.06 | | | | (8.20 | ) | | | (3.30 | ) | | | (0.15 | ) |
| | | | | |
| | Distributions to shareholders from net investment income | | | (0.72 | ) | | | — | | | | (0.15 | ) | | | (0.65 | ) |
| | | | | |
| | Distributions to shareholders from return of capital | | | — | | | | (0.94 | ) | | | (2.35 | ) | | | (1.15 | ) |
| | | | | |
| | Total distributions | | | (0.72 | ) | | | (0.94 | ) | | | (2.50 | ) | | | (1.80 | ) |
| | | | | |
| | Net asset value, end of period | | $ | 24.25 | | | $ | 17.91 | | | $ | 27.05 | | | $ | 32.85 | |
| | | | | |
| | Total return(d) | | | 39.81 | % | | | (27.55 | )% | | | (10.73 | )% | | | (0.72 | )% |
| | | | | |
| | Net assets, end of period (in 000s) | | $ | 752,860 | | | $ | 526,900 | | | $ | 843,448 | | | $ | 1,073,157 | |
| | | | | |
| | Ratio of total expenses to average net assets after tax (benefit)/expense(e) | | | 0.45 | %(f) | | | 2.26 | % | | | 1.27 | % | | | 1.05 | %(f) |
| | | | | |
| | Ratio of net expenses to average net assets after tax (benefit)/expense(e) | | | 0.44 | %(f) | | | 2.23 | % | | | 1.27 | % | | | 1.05 | %(f) |
| | | | | |
| | Ratio of net expenses to average net assets before tax (benefit)/expense | | | 1.09 | %(f) | | | 1.10 | % | | | 1.04 | % | | | 1.00 | %(f) |
| | | | | |
| | Ratio of net investment loss to average net assets(g) | | | 0.72 | %(f) | | | (0.38 | )% | | | (0.61 | )% | | | (0.68 | )%(f) |
| | | | | |
| | Portfolio turnover rate(h) | | | 55 | % | | | 139 | % | | | 51 | % | | | 68 | % |
| | * | | On June 5, 2020, the Fund effected a 5-for-1 reverse share split. All per share data prior to June 5, 2020 has been adjusted to reflect the reverse share split. |
| | (a) | | Commenced operations on April 16, 2018. |
| | (b) | | Calculated based on the average shares outstanding methodology. |
| | (c) | | Less than $0.005 per share. |
| | (d) | | Assumes investment at the NAV at the beginning of the period, reinvestment of all dividends and distributions, a complete redemption of the investment at the NAV at the end of the period and no sales or redemption charges (if any). Total returns would be reduced if a sales or redemption charge was taken into account. Returns do not reflect the impact of taxes to shareholders relating to Fund distributions or the redemption of Fund shares. Total returns for periods less than one full year are not annualized. |
| | (e) | | Current and deferred tax expense/benefit for the ratio calculation is derived from the net investment income (loss), and realized and unrealized gains (losses). |
| | (f) | | Annualized with the exception of tax expenses. |
| | (g) | | Current and deferred tax benefit for the ratio calculation is derived from net investment income (loss) only. |
| | (h) | | The Fund’s portfolio turnover rate is calculated in accordance with regulatory requirements, without regard to transactions involving short term investments and certain derivatives. If such transactions were included, the Fund’s portfolio turnover rate may be higher. |
| | |
| 14 | | The accompanying notes are an integral part of these financial statements. |
GOLDMAN SACHS MLP ENERGY INFRASTRUCTURE FUND
Notes to Financial Statements
May 31, 2021 (Unaudited)
Goldman Sachs Trust (the “Trust”) is a Delaware statutory trust registered under the Investment Company Act of 1940, as amended (the “Act”), as an open-end management investment company. The Trust includes the Goldman Sachs MLP Energy Infrastructure Fund (the “Fund”). The Fund is a non-diversified portfolio under the Act offering seven classes of shares — Class A, Class C, Institutional, Investor, Class R6, Class R and Class P Shares.
Class A Shares are sold with a front-end sales charge of up to 5.50%. Class C Shares are sold with a contingent deferred sales charge (“CDSC”) of 1.00%, which is imposed on redemptions made within 12 months of purchase. Institutional, Investor, Class R6, Class R and Class P shares are not subject to a sales charge.
Goldman Sachs Asset Management, L.P. (“GSAM”), an affiliate of Goldman, Sachs & Co. LLC (“Goldman Sachs”), serves as investment adviser to the Fund pursuant to a management agreement (the “Agreement”) with the Trust.
|
| 2. SIGNIFICANT ACCOUNTING POLICIES |
The financial statements have been prepared in accordance with accounting principles generally accepted in the United States of America (“GAAP”) and require management to make estimates and assumptions that may affect the reported amounts and disclosures. Actual results may differ from those estimates and assumptions. The Fund is an investment company under GAAP and follows the accounting and reporting guidance applicable to investment companies.
A. Investment Valuation — The Fund’s valuation policy is to value investments at fair value.
B. Investment Income and Investments — Investment income includes interest income, dividend income, net of any foreign withholding taxes and less any amounts reclaimable. Interest income is accrued daily and adjusted for amortization of premiums and accretion of discounts. Dividend income is recognized on ex-dividend date or, for certain foreign securities, as soon as such information is obtained subsequent to the ex-dividend date. Investment transactions are reflected on trade date. Realized gains and losses are calculated using identified cost. Non-cash dividends, if any, are recorded at the fair market value of the securities received. Investment transactions are recorded on the following business day for daily net asset value (“NAV”) calculations. Distributions from master limited partnerships (“MLPs”) are generally recorded based on the characterization reported on the Fund’s schedule K-1 received from the MLPs. The Fund records its pro-rata share of the income/loss and capital gains/losses, allocated from the underlying partnerships and adjusts the cost basis of the underlying partnerships accordingly.
C. Class Allocations and Expenses — Investment income, realized and unrealized gain (loss), if any, and non-class specific expenses of the Fund are allocated daily based upon the proportion of net assets of each class. Non-class specific expenses directly incurred by the Fund are charged to the Fund, while such expenses incurred by the Trust are allocated across the applicable Funds on a straight-line and/or pro-rata basis depending upon the nature of the expenses. Class specific expenses, where applicable, are borne by the respective share classes and include Distribution and Service, Transfer Agency and Service and Shareholder Administration fees.
D. Distributions to Shareholders — Over the long term, the Fund makes distributions to its shareholders each fiscal quarter at a rate that is approximately equal to the distributions the Fund receives from the MLPs and other securities in which it invests. To permit the Fund to maintain more stable quarterly distributions, the distribution for any particular quarterly period may be more or less than the amount of total distributable earnings actually earned by the Fund. The Fund estimates that only a portion of the distributions paid to shareholders will be treated as income. The remaining portion of the Fund’s distribution, which may be significant, is expected to be a return of capital. These estimates are based on the Fund’s operating results during the period, and their final federal income tax characterization may differ.
The characterization of distributions to shareholders for financial reporting purposes is determined in accordance with federal income tax rules, which may differ from GAAP. Certain components of the Fund’s net assets on the Statement of Assets and Liabilities reflect permanent GAAP/Tax differences based on the appropriate tax character.
E. Income Taxes — The Fund does not intend to qualify as a regulated investment company pursuant to Subchapter M of the Internal Revenue Code of 1986, as amended, but will rather be taxed as a corporation. As a result, the Fund is obligated to pay
15
GOLDMAN SACHS MLP ENERGY INFRASTRUCTURE FUND
Notes to Financial Statements (continued)
May 31, 2021 (Unaudited)
|
| 2. SIGNIFICANT ACCOUNTING POLICIES (continued) |
federal, state and local income tax on its taxable income. The Fund invests primarily in MLPs, which generally are treated as partnerships for federal income tax purposes. As a limited partner in the MLPs, the Fund must report its allocable share of the MLPs’ taxable income or loss in computing its own taxable income or loss. The Fund’s tax expense or benefit is included in the Statement of Operations based on the component of income or gains/losses to which such expense or benefit relates. Deferred income taxes reflect the net tax effects of temporary differences between the carrying amounts of assets and liabilities for financial reporting purposes and the amounts used for income tax purposes. Such temporary differences are principally: (i) taxes on unrealized gains/losses, which are attributable to the temporary difference between fair market value and tax basis, (ii) the net tax effects of temporary differences between the carrying amounts of assets and liabilities for financial reporting and income tax purposes, and (iii) the net tax benefit of accumulated net operating losses and capital loss carryforwards. The Fund will accrue a deferred income tax liability balance, at the currently effective statutory United States (“U.S.”) federal income tax rate plus an estimated state and local income tax rate, for its future tax liability associated with the capital appreciation of its investments and the distributions received by the Fund on interests of MLPs considered to be return of capital and for any net operating gains. The Fund may also record a deferred tax asset balance, which reflects an estimate of the Fund’s future tax benefit associated with net operating losses, capital loss carryforwards, and/or unrealized losses.
To the extent the Fund has a deferred tax asset, consideration is given to whether or not a valuation allowance, which would offset the value of some or all of the deferred tax asset balance, is required. A valuation allowance is required if based on the evaluation criterion provided by Accounting Standards Codification (“ASC”) 740, Income Taxes (ASC 740) it is more likely than not that some portion, or all, of the deferred tax asset will not be realized. The factors considered in assessing the Fund’s valuation allowance include: the nature, frequency and severity of current and cumulative losses, the duration of the statutory carryforward periods and the associated risks that operating and capital loss carryforwards may expire unutilized. From time to time, as new information becomes available, the Fund will modify its estimates or assumptions regarding the deferred tax liability or asset. Unexpected significant decreases in cash distributions from the Fund’s MLP investments or significant declines in the fair value of its investments may change the Fund’s assessment regarding the recoverability of their deferred tax assets and may result in a valuation allowance. If a valuation allowance is required to reduce any deferred tax asset in the future, it could have a material impact on the Fund’s NAV and results of operations in the period it is recorded. The Fund will rely to some extent on information provided by MLPs, which may not be provided to the Fund on a timely basis, to estimate operating income/loss and gains/losses and current taxes and deferred tax liabilities and/or asset balances for purposes of daily reporting of NAVs and financial statement reporting. In addition, sales of MLP investments will result in allocations to the Fund of taxable ordinary income or loss and capital gain or loss, each in amounts that will not be reported to the Fund until the following year, in magnitudes often not readily estimable before such reporting is made.
It is the Fund’s policy to classify interest and penalties associated with underpayment of federal and state income taxes, if any, as income tax expense on its Statement of Operations. The Fund anticipates filing income tax returns in the U.S. federal jurisdiction and various states, and such returns are subject to examination by the tax jurisdictions. The Fund has reviewed all major jurisdictions and concluded that there is no significant impact on its net assets and no tax liability resulting from unrecognized tax benefits or expenses relating to uncertain tax positions expected to be taken on its tax returns.
Return of Capital Estimates — Distributions received from the Fund’s investments in MLPs generally are comprised of income and return of capital. The Fund records investment income and return of capital based on estimates made at the time such distributions are received. Such estimates are based on historical information available from each MLP and other industry sources. These estimates may subsequently be revised based on information received from MLPs after their tax reporting periods are concluded.
F. Foreign Currency Translation — The accounting records and reporting currency of the Fund are maintained in U.S. dollars. Assets and liabilities denominated in foreign currencies are translated into U.S. dollars using the current exchange rates at the close of each business day. The effect of changes in foreign currency exchange rates on investments is included within net realized and unrealized gain (loss) on investments. Changes in the value of other assets and liabilities as a result of fluctuations in foreign exchange rates are included in the Statement of Operations within net change in unrealized gain (loss) on foreign currency translations. Transactions denominated in foreign currencies are translated into U.S. dollars on the date the transaction occurred, the effects of which are included within net realized gain (loss) on foreign currency transactions.
16
GOLDMAN SACHS MLP ENERGY INFRASTRUCTURE FUND
|
| 3. INVESTMENTS AND FAIR VALUE MEASUREMENTS |
U.S. GAAP defines the fair value of a financial instrument as the amount that would be received to sell an asset or paid to transfer a liability in an orderly transaction between market participants at the measurement date (i.e., the exit price); the Fund’s policy is to use the market approach. GAAP establishes a fair value hierarchy that prioritizes the inputs to valuation techniques used to measure fair value. The hierarchy gives the highest priority to unadjusted quoted prices in active markets for identical assets or liabilities (Level 1 measurements) and the lowest priority to unobservable inputs (Level 3 measurements). The level in the fair value hierarchy within which the fair value measurement in its entirety falls shall be determined based on the lowest level input that is significant to the fair value measurement in its entirety. The levels used for classifying investments are not necessarily an indication of the risk associated with investing in these investments. The three levels of the fair value hierarchy are described below:
Level 1 — Unadjusted quoted prices in active markets that are accessible at the measurement date for identical, unrestricted assets or liabilities;
Level 2 — Quoted prices in markets that are not active or financial instruments for which significant inputs are observable (including, but not limited to, quoted prices for similar investments, interest rates, foreign exchange rates, volatility and credit spreads), either directly or indirectly;
Level 3 — Prices or valuations that require significant unobservable inputs (including GSAM’s assumptions in determining fair value measurement).
The Board of Trustees (“Trustees”) has approved Valuation Procedures that govern the valuation of the portfolio investments held by the Fund, including investments for which market quotations are not readily available. The Trustees have delegated to GSAM day-to-day responsibility for implementing and maintaining internal controls and procedures related to the valuation of the Fund’s portfolio investments. To assess the continuing appropriateness of pricing sources and methodologies, GSAM regularly performs price verification procedures and issues challenges as necessary to third party pricing vendors or brokers, and any differences are reviewed in accordance with the Valuation Procedures.
A. Level 1 and Level 2 Fair Value Investments — The valuation techniques and significant inputs used in determining the fair values for investments classified as Level 1 and Level 2 are as follows:
Equity Securities — Equity securities traded on a United States (“U.S.”) securities exchange or the NASDAQ system, or those located on certain foreign exchanges, including but not limited to the Americas, are valued daily at their last sale price or official closing price on the principal exchange or system on which they are traded. If there is no sale or official closing price or such price is believed by GSAM to not represent fair value, equity securities will be valued at the valid closing bid price for long positions and at the valid closing ask price for short positions (i.e. where there is sufficient volume, during normal exchange trading hours). If no valid bid/ask price is available, the equity security will be valued pursuant to the Valuation Procedures approved by the Trustees and consistent with applicable regulatory guidance. To the extent these investments are actively traded, they are classified as Level 1 of the fair value hierarchy, otherwise they are generally classified as Level 2. Certain equity securities containing unique attributes may be classified as Level 2.
Unlisted equity securities for which market quotations are available are valued at the last sale price on the valuation date, or if no sale occurs, at the last bid price, and are generally classified as Level 2. Securities traded on certain foreign securities exchanges are valued daily at fair value determined by an independent fair value service (if available) under Valuation Procedures approved by the Trustees and consistent with applicable regulatory guidance. The independent fair value service takes into account multiple factors including, but not limited to, movements in the securities markets, certain depositary receipts, futures contracts and foreign currency exchange rates that have occurred subsequent to the close of the foreign securities exchange. These investments are generally classified as Level 2 of the fair value hierarchy.
Private Investments in Public Equities — Private investments in public equities (“PIPEs”) are valued the same as other equity securities as noted above. A Liquidity Value Adjustment (LVA) may be applied to securities which are subject to externally imposed and legally enforceable trading restrictions or which convert to publicly traded securities in the future when certain conditions are met. An LVA is a discount to the market price of an issuer’s common stock, which is based on the length of the lock-up time period and volatility of the underlying security. PIPEs are classified as Level 2 until such time as the trading restriction is removed.
17
GOLDMAN SACHS MLP ENERGY INFRASTRUCTURE FUND
Notes to Financial Statements (continued)
May 31, 2021 (Unaudited)
|
| 3. INVESTMENTS AND FAIR VALUE MEASUREMENTS (continued) |
Investments in an unfunded commitment to purchase a PIPE via a subscription agreement are subject to certain significant contingencies. The Fund is obligated to purchase the PIPE only upon such contingencies being satisfied.
Underlying Funds (including Money Market Funds) — Underlying funds (“Underlying Funds”) include other investment companies and exchange-traded funds (“ETFs”). Investments in the Underlying Funds (except ETFs) are valued at the NAV per share on the day of valuation. ETFs are valued daily at the last sale price or official closing price on the principal exchange or system on which the investment is traded. Because the Fund invests in Underlying Funds that fluctuate in value, the Fund’s shares will correspondingly fluctuate in value. To the extent these investments are actively traded, they are classified as Level 1 of the fair value hierarchy, otherwise they are generally classified as Level 2. For information regarding an Underlying Fund’s accounting policies and investment holdings, please see the Underlying Fund’s shareholder report.
Derivative Contracts — A derivative is an instrument whose value is derived from underlying assets, indices, reference rates or a combination of these factors. The Fund enters into derivative transactions to hedge against changes in interest rates, securities prices, and/or currency exchange rates, to increase total return, or to gain access to certain markets or attain exposure to other underliers. For financial reporting purposes, cash collateral that has been pledged to cover obligations of the Fund and cash collateral received, if any, is reported separately on the Statement of Assets and Liabilities as receivables/payables for collateral on certain derivatives contracts. Non-cash collateral pledged by the Fund, if any, is noted in the Schedule of Investments.
Exchange-traded derivatives, including futures and options contracts, are generally valued at the last sale or settlement price on the exchange where they are principally traded. Exchange-traded options without settlement prices are generally valued at the midpoint of the bid and ask prices on the exchange where they are principally traded (or, in the absence of two-way trading, at the last bid price for long positions and the last ask price for short positions). Exchange-traded derivatives typically fall within Level 1 of the fair value hierarchy. Over-the-counter (“OTC”) and centrally cleared derivatives are valued using market transactions and other market evidence, including market-based inputs to models, calibration to market-clearing transactions, broker or dealer quotations, or other alternative pricing sources. Where models are used, the selection of a particular model to value OTC and centrally cleared derivatives depends upon the contractual terms of, and specific risks inherent in, the instrument, as well as the availability of pricing information in the market. Valuation models require a variety of inputs, including contractual terms, market prices, yield curves, credit curves, measures of volatility, voluntary and involuntary prepayment rates, loss severity rates and correlations of such inputs. For OTC and centrally cleared derivatives that trade in liquid markets, model inputs can generally be verified and model selection does not involve significant management judgment. OTC and centrally cleared derivatives are classified within Level 2 of the fair value hierarchy when significant inputs are corroborated by market evidence.
i. Option Contracts — When the Fund writes call or put option contracts, an amount equal to the premium received is recorded as a liability and is subsequently marked-to-market to reflect the current value of the option written. Swaptions are options on swap contracts.
Upon the purchase of a call option or a put option by the Fund, the premium paid is recorded as an investment and subsequently marked-to-market to reflect the current value of the option. Certain options may be purchased with premiums to be determined on a future date. The premiums for these options are based upon implied volatility parameters at specified terms.
B. Level 3 Fair Value Investments — To the extent that significant inputs to valuation models and other alternative pricing sources are unobservable, or if quotations are not readily available, or if GSAM believes that such quotations do not accurately reflect fair value, the fair value of the Fund’s investments may be determined under Valuation Procedures approved by the Trustees. GSAM, consistent with its procedures and applicable regulatory guidance, may make an adjustment to the most recent valuation prices of either domestic or foreign securities in light of significant events to reflect what it believes to be the fair value of the securities at the time of determining the Fund’s NAV. To the extent investments are valued using single source broker quotations obtained directly from the broker or passed through from third party pricing vendors, such investments are classified as Level 3 investments.
18
GOLDMAN SACHS MLP ENERGY INFRASTRUCTURE FUND
|
| 3. INVESTMENTS AND FAIR VALUE MEASUREMENTS (continued) |
C. Fair Value Hierarchy — The following is a summary of the Fund’s investments and derivatives classified in the fair value hierarchy as of May 31, 2021:
| | | | | | | | | | | | |
| | | |
| Investment Type | | Level 1 | | | Level 2 | | | Level 3 | |
|
| Assets | |
|
Common Stock(a) | |
| | | |
Europe | | $ | 14,267,375 | | | $ | — | | | $ | — | |
| | | |
North America | | | 1,139,157,547 | | | | — | | | | — | |
| | | |
Special Purpose Acquisition Companies | | | 32,062,269 | | | | — | | | | — | |
| | | |
Warrants | | | — | | | | 3,046,252 | | | | 499,950 | |
| | | |
Exchange Traded Fund | | | 13,417,970 | | | | — | | | | — | |
| | | |
Investment Company | | | 3,842,343 | | | | — | | | | — | |
| | | |
Unfunded PIPE Commitment(b) | | | — | | | | — | | | | — | |
| | | |
| Total | | $ | 1,202,747,504 | | | $ | 3,046,252 | | | $ | 499,950 | |
| | | |
| Derivative Type | | | | | | | | | |
| | | |
| Assets | | | | | | | | | | | | |
| | | |
Purchased option contracts | | $ | 18,082,500 | | | $ | — | | | $ | — | |
| (a) | | Amounts are disclosed by continent to highlight the impact of time zone differences between local market close and the calculation of net asset value. Security valuations are based on the principal exchange or system on which they are traded, which may differ from country of domicile. The Fund utilizes fair value model prices provided by an independent fair value service for international equities, resulting in a Level 2 classification. |
| (b) | | Amount shown represents unrealized gain (loss) at period end. |
For further information regarding security characteristics, see the Schedule of Investments.
| | |
| 4. INVESTMENTS IN DERIVATIVES | | |
The following table sets forth, by certain risk types, the gross value of derivative contracts (not considered to be hedging instruments for accounting disclosure purposes) as of May 31, 2021. These instruments were used as part of the Fund’s investment strategies and to obtain and/or manage exposure related to the risks below. The values in the tables below exclude the effects of cash collateral received or posted pursuant to these derivative contracts, and therefore are not representative of the Fund’s net exposure.
| | | | | | | | | | | | |
| Risk | | Statement of Assets and Liabilities | | Assets | | | Statement of Assets and Liabilities | | Liabilities | |
Equity | | Purchased options, at value | | $ | 18,082,500 | | | — | | | — | |
The following table sets forth, by certain risk types, the Fund’s gains (losses) related to these derivatives and their indicative volumes for the six months ended May 31, 2021. These gains (losses) should be considered in the context that these derivative contracts may have been executed to create investment opportunities and/or economically hedge certain investments, and accordingly, certain gains (losses) on such derivative contracts may offset certain (losses) gains attributable to investments. These gains (losses) are included in “Net realized gain (loss)” or “Net change in unrealized gain (loss)” on the Statement of Operations:
| | | | | | | | | | |
| Risk | | Statement of Operations | | Realized
Gain (Loss) | | | Net Change in
Unrealized
Gain (Loss) | |
| Equity | | Net realized gain (loss) on purchased options and written options/Net unrealized gain (loss) on purchased options and written options | | $ | (939,429 | ) | | $ | 8,778,326 | |
19
GOLDMAN SACHS MLP ENERGY INFRASTRUCTURE FUND
Notes to Financial Statements (continued)
May 31, 2021 (Unaudited)
|
| 4. INVESTMENTS IN DERIVATIVES (continued) |
For the six months ended May 31, 2021, the relevant values for each derivative types was as follows:
| | | | | | | | | | | | |
| Average Number of Shares/Units(a) | |
| | | Purchased Options | | | | | Written Options | | | |
| | | 1,445,834 | | | | | | 1,025,000 | | | | |
| (a) | | Amounts disclosed represent average number of shares/units outstanding for purchased options and written options, based on absolute value, which is indicative of volume for this derivative type, for the months that the Fund held such derivatives during the six months ended May 31, 2021. |
Total income taxes are computed by applying the federal statutory rate plus a blended state income tax rate. During the six months ended May 31, 2021, the Fund reevaluated its blended state income tax rate, decreasing the rate from 1.78% to 1.67% due to anticipated changes in state apportionment of income and gains. The reconciliation between the federal statutory income tax rate of 21% and the effective tax rate on net investment income/loss and realized and unrealized gain/loss is as follows:
| | | | | | | | |
Application of statutory income tax rate | | $ | 76,780,763 | | | | 21.00 | % |
State income taxes, net of federal benefit | | | 6,105,899 | | | | 1.67 | % |
Change in estimated deferred tax rate | | | 1,592,695 | | | | 0.44 | % |
Effect of permanent differences | | | 9,180,556 | | | | 2.51 | % |
Change in valuation allowance | | | (101,018,069 | ) | | | -27.63 | % |
Total current and deferred income tax expense/(benefit), net | | $ | (7,358,156 | ) | | | -2.01 | % |
Deferred tax assets and liabilities are measured using effective tax rates expected to apply to taxable income in the years such temporary differences are realized or otherwise settled. At May 31, 2021, components of the Fund’s deferred tax assets and liabilities were as follows:
| | | | |
Deferred Tax Assets: | | | | |
State net operating loss carryforward | | $ | 510,385 | |
Net operating loss carryforward | | | 4,852,834 | |
Capital loss carryforward (tax basis) | | | 202,082,713 | |
Other tax assets | | | 1,013,584 | |
Valuation Allowance | | | (159,597,679 | ) |
Total Deferred Tax Assets | | $ | 48,861,837 | |
| |
| Deferred Tax Liabilities: | | | | |
Net unrealized gains on investment securities (tax basis) | | $ | (29,751,878 | ) |
Book vs tax partnership income to be recognized | | | (19,109,959 | ) |
Total Deferred Tax Liabilities | | $ | (48,861,837 | ) |
Net Deferred Tax Asset/(Liability) | | $ | — | |
At May 31, 2021, the Fund had net operating loss carryforwards, subject to expiration and limitation based on the fiscal year generated, as follows:
| | | | | | | | |
| For the Fiscal Year Ended | | Amount | | | Expiration | |
November 30, 2018 | | $ | 23,108,732 | | | | November 30, 2038 | |
20
GOLDMAN SACHS MLP ENERGY INFRASTRUCTURE FUND
At May 31, 2021, the Fund had capital loss carryforwards, subject to expiration and limitation based on the fiscal year generated, as follows:
| | | | | | | | |
| For the Fiscal Year Ended: | | Amount | | | Expiration | |
November 30, 2016 | | $ | 201,797,833 | | | | November 30, 2021 | |
November 30, 2019 | | $ | 130,792,210 | | | | November 30, 2024 | |
November 30, 2020 | | $ | 558,820,248 | | | | November 30, 2025 | |
The Fund reviews the recoverability of its deferred tax assets based upon the weight of the available evidence. When assessing, the Fund’s management considers available carrybacks, reversing temporary taxable differences, and tax planning, if any. As a result of its analysis of the recoverability of its deferred tax assets, the Fund recorded $159,597,679 of valuation allowances as of May 31, 2021.
For the six months ended May 31, 2021, components of the Fund’s current and deferred tax expense/(benefit) are as follows:
| | | | | | | | | | | | |
| | | Current | | | Deferred | | | Total | |
Federal | | $ | (5,788,647 | ) | | $ | 92,027,458 | | | $ | 86,238,811 | |
State | | | (1,569,509 | ) | | | 8,990,611 | | | | 7,421,102 | |
Valuation Allowance | | | — | | | | (101,018,069 | ) | | | (101,018,069 | ) |
Total | | $ | (7,358,156 | ) | | $ | — | | | $ | (7,358,156 | ) |
For the six months ended May 31, 2021, the Fund does not have any interest or penalties associated with the underpayment of any income taxes. At May 31, 2021, gross unrealized appreciation and depreciation of investments, based on cost, for federal income tax purposes was as follows:
| | | | |
Tax Cost | | $ | 981,791,880 | |
Gross unrealized gain | | | 297,801,953 | |
Gross unrealized loss | | | (73,300,127 | ) |
Net unrealized security gain (loss) | | $ | 224,501,826 | |
Any difference between cost amounts for financial statement and federal income tax purposes is due primarily to wash sales and differences related to the tax treatment of partnership investments.
For the six months ended May 31, 2021, the Fund distributions are estimated to be comprised of 100% from taxable income and 0% return of capital. Shareholders will be informed of the final tax characterization of the distributions in February 2022. The Fund’s tax years ended November 30, 2018 through November 30, 2020 remain open for examination by U.S. and state tax authorities. Management of the Fund is not aware of any tax positions for which it is reasonably possible that the total amounts of unrecognized tax benefits or expenses will significantly change in the next 12 months.
21
GOLDMAN SACHS MLP ENERGY INFRASTRUCTURE FUND
Notes to Financial Statements (continued)
May 31, 2021 (Unaudited)
|
| 6. AGREEMENTS AND AFFILIATED TRANSACTIONS |
A. Management Agreement — Under the Agreement, GSAM manages the Fund, subject to the general supervision of the Trustees.
As compensation for the services rendered pursuant to the Agreement, the assumption of the expenses related thereto and administration of the Fund’s business affairs, including providing facilities, GSAM is entitled to a management fee, accrued daily and paid monthly, equal to an annual percentage rate of the Fund’s average daily net assets. For the six months ended May 31, 2021, contractual and effective net management fees with GSAM were at the following rates:
| | | | | | | | | | | | | | | | | | | | | | |
| Contractual Management Rate | | | | |
First
$1 billion | | | Next
$1 billion | | | Next
$3 billion | | | Next
$3 billion | | | Over
$8 billion | | | Effective Net
Management
Rate^ | |
| | 1.00% | | | | 0.90% | | | | 0.86% | | | | 0.84% | | | | 0.82% | | | | 0.99% | |
| ^ | | Effective Net Management Rate includes the impact of management fee waivers of affiliated Underlying Funds, if any. The Effective Net Management Rate may not correlate to the Contractual Management Rate as a result of management fee waivers that may be in effect from time to time. |
The Fund invests in Institutional Shares of the Goldman Sachs Financial Square Government Fund, which is an affiliated Underlying Fund. GSAM has agreed to waive a portion of its management fee payable by the Fund in an amount equal to the management fee it earns as an investment adviser to any of the affiliated Underlying Funds in which the Fund invests. For the six months ended May 31, 2021, GSAM waived $3,482 of the Fund’s management fee.
B. Distribution and/or Service (12b-1) Plans — The Trust, on behalf of Class A and Class R Shares of the Fund, has adopted Distribution and Service Plans subject to Rule 12b-1 under the Act. Under the Distribution and Service Plans, Goldman Sachs, which serves as distributor (the “Distributor”), is entitled to a fee accrued daily and paid monthly for distribution services and personal and account maintenance services, which may then be paid by Goldman Sachs to authorized dealers. These fees are equal to an annual percentage rate of the average daily net assets attributable to Class A or Class R Shares of the Fund, as set forth below.
The Trust, on behalf of Class C Shares of the Fund, has adopted a Distribution Plan subject to Rule 12b-1 under the Act. Under the Distribution Plan, Goldman Sachs as Distributor is entitled to a fee accrued daily and paid monthly for distribution services, which may then be paid by Goldman Sachs to authorized dealers. These fees are equal to an annual percentage rate of the average daily net assets attributable to Class C Shares of the Fund.
| | | | | | | | | | | | |
| | | Distribution and/or Service Plan Rates | |
| | | Class A* | | | Class C | | | Class R* | |
Distribution and/or Service Plan | | | 0.25 | % | | | 0.75 | % | | | 0.50 | % |
| * | | With respect to Class A and Class R Shares, the Distributor at its discretion may use compensation for distribution services paid under the Distribution Plan to compensate service organizations for personal and account maintenance services and expenses as long as such total compensation does not exceed the maximum cap on “service fees” imposed by the Financial Industry Regulatory Authority. |
C. Distribution Agreement — Goldman Sachs, as Distributor of the shares of the Fund pursuant to a Distribution Agreement, may retain a portion of the Class A Shares’ front end sales charge and Class C Shares’ CDSC. During the six months ended May 31, 2021, Goldman Sachs advised that it retained $5,880 and $0 of the sales charges applicable to Class A and Class C Shares, respectively.
D. Service Plan — The Trust, on behalf of the Fund, has adopted a Service Plan to allow Class C Shares to compensate service organizations (including Goldman Sachs) for providing varying levels of personal and account maintenance services to their customers who are beneficial owners of such shares. The Service Plan provides for compensation to the service organizations equal to an annual percentage rate of 0.25% of the average daily net assets attributable to Class C Shares of the Fund.
E. Transfer Agency Agreement — Goldman Sachs also serves as the transfer agent of the Fund for a fee pursuant to the Transfer Agency Agreement. The fees charged for such transfer agency services are accrued daily and paid monthly at annual rates
22
GOLDMAN SACHS MLP ENERGY INFRASTRUCTURE FUND
|
| 6. AGREEMENTS AND AFFILIATED TRANSACTIONS (continued) |
as follows: 0.16% of the average daily net assets of Class A, Class C, Investor and Class R Shares; 0.03% of the average daily net assets of Class R6 and Class P Shares; and 0.04% of the average daily net assets of Institutional Shares.
F. Other Expense Agreements and Affiliated Transactions — GSAM has agreed to limit certain “Other Expenses” of the Fund (excluding acquired fund fees and expenses, transfer agency fees and expenses, service fees and shareholder administration fees (as applicable), taxes, interest, brokerage fees, shareholder meeting, litigation, indemnification and extraordinary expenses) to the extent such expenses exceed, on an annual basis, a percentage rate of the average daily net assets of the Fund. Such Other Expense reimbursements, if any, are accrued daily and paid monthly. In addition, the Fund is not obligated to reimburse GSAM for prior fiscal year expense reimbursements, if any. The Other Expense limitations as an annual percentage rate of average daily net assets for the Fund is 0.064%. These Other Expense limitations will remain in place through at least March 30, 2022, and prior to such date GSAM may not terminate the arrangements without the approval of the Trustees. For the six months ended May 31, 2021, these expense reductions, including any fee waivers and Other Expense reimbursements, were as follows:
| | | | | | | | | | |
Management
Fee Waiver | | | Other Expense
Reimbursements | | | Total
Expense
Reductions | |
| $ | 3,482 | | | $ | 55,112 | | | $ | 58,594 | |
G. Other Transactions with Affiliates — For the six months ended May 31, 2021, Goldman Sachs earned $214,921 in brokerage commissions from portfolio transactions on behalf of the Fund.
As of May 31, 2021, the Goldman Sachs Tax-Advantaged Global Equity Portfolio was the beneficial owner of 5% of total outstanding shares of the Fund.
The table below shows the transactions in and earnings from investments in all affiliated funds as of and for the six months ended May 31, 2021:
| | | | | | | | | | | | | | | | | | | | | | | | |
| Underlying Fund | | Beginning
Value as of
November 30, 2020 | | | Purchases
at Cost | | | Proceeds
from Sales | | | Ending
Value as of
May 31, 2021 | | | Shares as of
May 31, 2021 | | | Dividend
Income | |
Goldman Sachs Financial Square Government Fund — Institutional Shares | | $ | — | | | $ | 143,768,139 | | | $ | (139,925,796 | ) | | $ | 3,842,343 | | | | 3,842,343 | | | $ | 709 | |
H. Line of Credit Facility — As of May 31, 2021, the Fund participated in a $1,000,000,000 committed, unsecured revolving line of credit facility (the “facility”) together with other funds of the Trust and registered investment companies having management agreements with GSAM or its affiliates (“Other Borrowers”). This facility is to be used for temporary or emergency purposes, or to allow for an orderly liquidation of securities to meet redemption requests. The interest rate on borrowings is based on the federal funds rate. The facility also requires a fee to be paid by the Fund based on the amount of the commitment that has not been utilized. For six months ended May 31, 2021, the Fund did not have any borrowings under the facility. Prior to April 26, 2021, the facility was $700,000,000.
| | |
| 7. PORTFOLIO SECURITIES TRANSACTIONS | | |
The cost of purchases and proceeds from sales and maturities of long-term securities for the six months ended May 31, 2021, were $602,678,643 and $730,571,791, respectively.
23
GOLDMAN SACHS MLP ENERGY INFRASTRUCTURE FUND
Notes to Financial Statements (continued)
May 31, 2021 (Unaudited)
The Fund’s risks include, but are not limited to, the following:
Derivatives Risk — The Fund’s use of derivatives may result in loss. Derivative instruments, which may pose risks in addition to and greater than those associated with investing directly in securities, currencies or other instruments, may be illiquid or less liquid, volatile, difficult to price and leveraged so that small changes in the value of the underlying instruments may produce disproportionate losses to the Fund. Derivatives are also subject to counterparty risk, which is the risk that the other party in the transaction will not fulfill its contractual obligation. The use of derivatives is a highly specialized activity that involves investment techniques and risks different from those associated with investments in more traditional securities and instruments. Losses from derivatives can also result from a lack of correlation between changes in the value of derivative instruments and the portfolio assets (if any) being hedged.
Geographic and Sector Risk — The Fund focuses its investments in the energy sector, and will therefore be susceptible to adverse economic, environmental, business, regulatory or other occurrences affecting that sector. The energy sector has historically experienced substantial price volatility. MLPs and other companies operating in the energy sector are subject to specific risks, including, among others, fluctuations in commodity prices; reduced consumer demand for commodities such as oil, natural gas or petroleum products; reduced availability of natural gas or other commodities for transporting, processing, storing or delivering; slowdowns in new construction; extreme weather or other natural disasters; and threats of attack by terrorists on energy assets. Additionally, changes in the regulatory environment for energy companies may adversely impact their profitability. Over time, depletion of natural gas reserves and other energy reserves may also affect the profitability of energy companies.
Investments in Other Investment Companies Risk — As a shareholder of another investment company, the Fund will indirectly bear its proportionate share of any net management fees and other expenses paid by such other investment companies, in addition to the fees and expenses regularly borne by the Fund.
Large Shareholder Transactions Risk — The Fund may experience adverse effects when certain large shareholders, such as other funds, institutional investors (including those trading by use of non-discretionary mathematical formulas), financial intermediaries (who may make investment decisions on behalf of underlying clients and/or include the Fund in their investment model), individuals, accounts and Goldman Sachs affiliates, purchase or redeem large amounts of shares of a Fund. Such large shareholder redemptions, which may occur rapidly or unexpectedly, may cause the Fund to sell portfolio securities at times when it would not otherwise do so, which may negatively impact the Fund’s NAV and liquidity. These transactions may also accelerate the realization of taxable income to shareholders if such sales of investments resulted in gains, and may also increase transaction costs. In addition, a large redemption could result in the Fund’s current expenses being allocated over a smaller asset base, leading to an increase in the Fund’s expense ratio. Similarly, large Fund share purchases may adversely affect the Fund’s performance to the extent that the Fund is delayed in investing new cash or otherwise maintains a larger cash position than it ordinarily would.
Liquidity Risk — The Fund may make investments that are illiquid or that may become less liquid in response to market developments or adverse investor perceptions. Illiquid investments may be more difficult to value. Liquidity risk may also refer to the risk that the Fund will not be able to pay redemption proceeds within the allowable time period or without significant dilution to remaining investors’ interests because of unusual market conditions, an unusually high volume of redemption requests, or other reasons. To meet redemption requests, the Fund may be forced to sell investments at an unfavorable time and/or under unfavorable conditions. If the Fund is forced to sell securities at an unfavorable time and/or under unfavorable conditions, such sales may adversely affect the Fund’s NAV and dilute remaining investors’ interests. Liquidity risk may be the result of, among other things, the reduced number and capacity of traditional market participants to make a market in fixed income securities or the lack of an active market. The potential for liquidity risk may be magnified by a rising interest rate environment or other circumstances where investor redemptions from fixed income mutual funds may be higher than normal, potentially causing increased supply in the market due to selling activity. Redemptions by large shareholders may have a negative impact on the Fund’s liquidity.
Market and Credit Risks — In the normal course of business, the Fund trades financial instruments and enters into financial transactions where risk of potential loss exists due to changes in the market (market risk). The value of the securities in which the Fund invests may go up or down in response to the prospects of individual companies, particular sectors or governments and/or
24
GOLDMAN SACHS MLP ENERGY INFRASTRUCTURE FUND
|
| 8. OTHER RISKS (continued) |
general economic conditions throughout the world due to increasingly interconnected global economies and financial markets. Events such as war, acts of terrorism, social unrest, natural disasters, the spread of infectious illness or other public health threats could also significantly impact the Fund and its investments. Additionally, the Fund may also be exposed to credit risk in the event that an issuer or guarantor fails to perform or that an institution or entity with which the Fund has unsettled or open transactions defaults.
Master Limited Partnership Risk — Investments in securities of MLPs involve risks that differ from investments in common stock, including risks related to limited control and limited rights to vote on matters affecting the MLP, risks related to potential conflicts of interest between the MLP and the MLP’s general partner, cash flow risks, dilution risks, limited liquidity and risks related to the general partner’s right to require unit-holders to sell their common units at an undesirable time or price.
Non-Diversification Risk — The Fund is non-diversified, meaning that it is permitted to invest a larger percentage of its assets in fewer issuers than diversified mutual funds. Thus, the Fund may be more susceptible to adverse developments affecting any single issuer held in its portfolio, and may be more susceptible to greater losses because of these developments.
Private Investment Risk — The Fund may invest in PIPE securities. PIPE transactions typically involve the purchase of securities directly from a publicly traded company or its affiliates in a private placement transaction, typically at a discount to the market price of the company’s common stock. In a PIPE transaction, the Fund may bear the price risk from the time of pricing until the time of closing. Equity issued in this manner is often subject to transfer restrictions and is therefore less liquid than equity issued through a registered public offering. The Fund may be subject to lock-up agreements that prohibit transfers for a fixed period of time. In addition, because the sale of the securities in a PIPE transaction is not registered under the Securities Act, the securities are “restricted” and cannot be immediately resold into the public markets. The ability of the Fund to freely transfer restricted shares is conditioned upon, among other things, the SEC’s preparedness to declare the resale registration statement effective and the issuer’s right to suspend the Fund’s use of the resale registration statement if the issuer is pursuing a transaction or some other material non-public event is occurring. Accordingly, PIPE securities may be subject to risks associated with illiquid securities.
Special Purpose Acquisition Companies Risk — The Fund may invest in stock, warrants, and other securities of special purpose acquisition companies (“SPACs”) or similar special purpose entities that pool funds to seek potential acquisition opportunities. Because SPACs and similar entities are in essence blank check companies without operating history or ongoing business other than seeking acquisitions, the value of their securities is particularly dependent on the ability of the entity’s management to identify and complete a profitable acquisition. An investment in a SPAC is subject to a variety of risks, including that (i) a portion of the monies raised by the SPAC for the purpose of effecting an acquisition or merger may be expended prior to the transaction for payment of taxes and other purposes; (ii) prior to any acquisition or merger, a SPAC’s assets are typically invested in government securities, money market funds and similar investments whose returns or yields may be significantly lower than those of the Fund’s other investments; (iii) the Fund generally will not receive significant income from its investments in SPACs (both prior to and after any acquisition or merger) and, therefore, the Fund’s investments in SPACs will not significantly contribute to the Fund’s distributions to shareholders; (iv) an attractive acquisition or merger target may not be identified at all, in which case the SPAC will be required to return any remaining monies to shareholders; (v) if an acquisition or merger target is identified, the Fund may elect not to participate in the proposed transaction or the Fund may be required to divest its interests in the SPAC due to regulatory or other considerations, in which case the warrants or other rights with respect to the SPAC held by the Fund may expire worthless or may be repurchased or retired by the SPAC at an unfavorable price; (vi) any proposed merger or acquisition may be unable to obtain the requisite approval, if any, of SPAC shareholders; (vii) under any circumstances in which the Fund receives a refund of all or a portion of its original investment (which typically represents a pro rata share of the proceeds of the SPAC’s assets, less any applicable taxes), the returns on that investment may be negligible, and the Fund may be subject to opportunity costs to the extent that alternative investments would have produced higher returns; (viii) to the extent an acquisition or merger is announced or completed, shareholders who redeem their shares prior to that time may not reap any resulting benefits; (ix) the Fund may be delayed in receiving any redemption or liquidation proceeds from a SPAC to which it is entitled; (x) an acquisition or merger once effected may prove unsuccessful and an investment in the SPAC may lose value; (xi) an investment in a SPAC may be diluted by additional later offerings of interests in the SPAC or by other investors exercising existing rights to
25
GOLDMAN SACHS MLP ENERGY INFRASTRUCTURE FUND
Notes to Financial Statements (continued)
May 31, 2021 (Unaudited)
|
| 8. OTHER RISKS (continued) |
purchase shares of the SPAC; (xii) only a thinly traded market for shares of or interests in a SPAC may develop, or there may be no market at all, leaving the Fund unable to sell its interest in a SPAC or to sell its interest only at a price below what the Fund believes is the SPAC interest’s intrinsic value; and (xiii) the values of investments in SPACs may be highly volatile and may depreciate significantly over time.
Strategy Risk — The Fund’s strategy of investing primarily in MLPs, resulting in its being taxed as a corporation, or a “C” corporation, rather than as a regulated investment company for U.S. federal income tax purposes, is a relatively new investment strategy for funds. This strategy involves complicated accounting, tax and valuation issues. Volatility in the NAV may be experienced because of the use of estimates at various times during a given year that may result in unexpected and potentially significant consequences for the Fund and its shareholders.
Tax Risks — Tax risks associated with investments in the Fund include but are not limited to the following:
Fund Structure Risk. Unlike traditional mutual funds that are structured as regulated investment companies for U.S. federal income tax purposes, the Fund will be taxable as a regular corporation, or “C” corporation, for U.S. federal income tax purposes. This means the Fund generally will be subject to U.S. federal income tax on its taxable income at the rates applicable to corporations (currently a maximum rate of 21%), and will also be subject to state and local income taxes.
MLP Tax Risk. MLPs are generally treated as partnerships for U.S. federal income tax purposes. Partnerships do not pay U.S. federal income tax at the partnership level. Rather, each partner is allocated a share of the partnership’s income, gains, losses, deductions and expenses. A change in current tax law or a change in the underlying business mix of a given MLP could result in an MLP being treated as a corporation for U.S. federal income tax purposes, which would result in the MLP being required to pay U.S. federal income tax (as well as state and local income taxes) on its taxable income. This would have the effect of reducing the amount of cash available for distribution by the MLP and could result in a reduction in the value of the Fund’s investment in the MLP and lower income to the Fund.
To the extent a distribution received by the Fund from an MLP is treated as a return of capital, the Fund’s adjusted tax basis in the interests of the MLP will be reduced, which may increase the Fund’s tax liability upon the sale of the interests in the MLP or upon subsequent distributions in respect of such interests.
Tax Estimation/NAV Risk. In calculating the Fund’s daily NAV, the Fund will, among other things, include its current taxes and deferred tax liability and/or asset balances and related valuation balances, if any. The Fund may accrue a deferred income tax liability balance, at the currently effective statutory U.S. federal income tax rate (currently 21%) plus an estimated state and local income tax rate, for its future tax liability associated with the capital appreciation of its investments and the distributions received by the Fund on interests of MLPs considered to be return of capital and for any net operating gains. Any deferred tax liability balance will reduce the Fund’s NAV which could have an effect on the market price of the shares. The Fund may also record a deferred tax asset balance, which reflects an estimate of the Fund’s future tax benefit associated with net operating losses and/or unrealized losses. Any deferred tax asset balance will increase the Fund’s NAV to the extent it exceeds any valuation allowance which could have an effect on the market price of the shares. The Fund will rely to some extent on information provided by MLPs, which may not be provided to the Fund on a timely basis, to estimate current taxes and deferred tax liability and/or asset balances for purposes of financial statement reporting and determining its NAV. The daily estimate of the Fund’s current taxes and deferred tax liability and/or asset balances used to calculate the Fund’s NAV could vary significantly from the Fund’s actual tax liability or benefit, and, as a result, the determination of the Fund’s actual tax liability or benefit may have a material impact on the Fund’s NAV. From time to time, the Fund may modify its estimates or assumptions regarding its current taxes and deferred tax liability and/or asset balances as new information becomes available, which modifications in estimates or assumptions may have a material impact on the Fund’s NAV.
26
GOLDMAN SACHS MLP ENERGY INFRASTRUCTURE FUND
Under the Trust’s organizational documents, its Trustees, officers, employees and agents are indemnified, to the extent permitted by the Act and state law, against certain liabilities that may arise out of performance of their duties to the Fund. Additionally, in the course of business, the Fund enters into contracts that contain a variety of indemnification clauses. The Fund’s maximum exposure under these arrangements is unknown, as this would involve future claims that may be made against the Funds that have not yet occurred. However, GSAM believes the risk of loss under these arrangements to be remote.
Subsequent events after the Statement of Assets and Liabilities date have been evaluated, and GSAM has concluded that there is no impact requiring adjustment or disclosure in the financial statements.
27
GOLDMAN SACHS MLP ENERGY INFRASTRUCTURE FUND
Notes to Financial Statements (continued)
May 31, 2021 (Unaudited)
|
| 11. SUMMARY OF SHARE TRANSACTIONS |
Share activity is as follows:
| | | | | | | | | | | | | | | | |
| | | MLP Energy Infrastructure Fund | |
| | | For the Six Months Ended
May 31, 2021
(Unaudited) | | | For the Fiscal Year Ended
November 30, 2020
| |
| | | | |
| | | Shares | | | Dollars | | | Shares | | | Dollars | |
| | | | |
| Class A Shares | |
Shares sold | | | 188,115 | | | $ | 3,790,967 | | | | 2,466,485 | | | $ | 11,817,019 | |
Reinvestment of distributions | | | 61,504 | | | | 1,313,057 | | | | 641,677 | | | | 3,702,367 | |
Shares reduced due to reverse split(a) | | | — | | | | — | | | | (8,621,708 | ) | | | — | |
Shares redeemed | | | (414,189 | ) | | | (8,251,538 | ) | | | (4,014,207 | ) | | | (21,505,544 | ) |
| | | | (164,570 | ) | | | (3,147,514 | ) | | | (9,527,753 | ) | | | (5,986,158 | ) |
| Class C Shares | |
Shares sold | | | 59,148 | | | | 1,053,464 | | | | 613,243 | | | | 2,833,737 | |
Reinvestment of distributions | | | 51,024 | | | | 1,003,707 | | | | 618,918 | | | | 3,251,375 | |
Shares reduced due to reverse split(a) | | | — | | | | — | | | | (7,457,743 | ) | | | — | |
Shares redeemed | | | (302,286 | ) | | | (5,559,184 | ) | | | (4,039,149 | ) | | | (19,976,017 | ) |
| | | | (192,114 | ) | | | (3,502,013 | ) | | | (10,264,731 | ) | | | (13,890,905 | ) |
| Institutional Shares | |
Shares sold | | | 894,176 | | | | 18,633,021 | | | | 37,171,754 | | | | 179,771,517 | |
Reinvestment of distributions | | | 189,340 | | | | 4,205,356 | | | | 2,784,973 | | | | 15,731,700 | |
Shares reduced due to reverse split(a) | | | — | | | | — | | | | (40,771,338 | ) | | | — | |
Shares redeemed | | | (3,548,699 | ) | | | (76,596,635 | ) | | | (82,143,437 | ) | | | (345,372,810 | ) |
| | | | (2,465,183 | ) | | | (53,758,258 | ) | | | (82,958,048 | ) | | | (149,869,593 | ) |
| Investor Shares | |
Shares sold | | | 296,555 | | | | 6,220,466 | | | | 4,839,436 | | | | 25,460,118 | |
Reinvestment of distributions | | | 55,879 | | | | 1,229,447 | | | | 776,226 | | | | 4,311,050 | |
Shares reduced due to reverse split(a) | | | — | | | | — | | | | (9,133,496 | ) | | | — | |
Shares redeemed | | | (453,008 | ) | | | (9,164,622 | ) | | | (13,108,521 | ) | | | (68,412,538 | ) |
| | | | (100,574 | ) | | | (1,714,709 | ) | | | (16,626,355 | ) | | | (38,641,370 | ) |
| Class R6 Shares | |
Shares sold | | | 393,550 | | | | 8,369,333 | | | | 26,275,592 | | | | 100,343,017 | |
Reinvestment of distributions | | | 277,843 | | | | 6,132,675 | | | | 2,415,659 | | | | 14,964,119 | |
Shares reduced due to reverse split(a) | | | — | | | | — | | | | (42,783,974 | ) | | | — | |
Shares redeemed | | | (3,513,589 | ) | | | (75,822,416 | ) | | | (6,348,000 | ) | | | (68,769,966 | ) |
| | | | (2,842,196 | ) | | | (61,320,408 | ) | | | (20,440,723 | ) | | | 46,537,170 | |
| Class R Shares | |
Shares sold | | | 6,753 | | | | 128,243 | | | | 118,698 | | | | 539,750 | |
Reinvestment of distributions | | | 1,028 | | | | 21,365 | | | | 14,229 | | | | 83,728 | |
Shares reduced due to reverse split(a) | | | — | | | | — | | | | (212,268 | ) | | | — | |
Shares redeemed | | | (26,049 | ) | | | (479,819 | ) | | | (70,842 | ) | | | (505,060 | ) |
| | | | (18,268 | ) | | | (330,211 | ) | | | (150,183 | ) | | | 118,418 | |
| Class P Shares | |
Shares sold | | | 5,439,831 | | | | 112,755,706 | | | | 131,039,384 | | | | 648,833,429 | |
Reinvestment of distributions | | | 985,560 | | | | 22,071,623 | | | | 8,152,871 | | | | 49,952,163 | |
Shares reduced due to reverse split(a) | | | — | | | | — | | | | (102,974,135 | ) | | | — | |
Shares redeemed | | | (4,802,200 | ) | | | (98,110,936 | ) | | | (162,669,956 | ) | | | (723,338,648 | ) |
| | | | 1,623,191 | | | | 36,716,393 | | | | (126,451,836 | ) | | | (24,553,056 | ) |
| | | | |
NET DECREASE | | | (4,159,714 | ) | | $ | (87,056,720 | ) | | | (266,419,629 | ) | | $ | (186,285,494 | ) |
| (a) | | On June 5, 2020, the Goldman Sachs MLP Energy Infrastructure Fund effected a 5-for-1 reverse share split. |
28
GOLDMAN SACHS MLP ENERGY INFRASTRUCTURE FUND
Liquidity Risk Management Program (Unaudited)
Each Fund has adopted and implemented a liquidity risk management program (the “Program”) in accordance with Rule 22e-4 under the 1940 Act. The Program seeks to assess and manage each Fund’s liquidity risk, i.e., the risk that a Fund is unable to satisfy redemption requests without significantly diluting remaining investors’ interests in the Fund. The Board of Trustees of the Trust has designated GSAM, each Fund’s investment adviser, to administer the Program. Certain aspects of the Program rely on third parties to perform certain functions, including the provision of market data and application of models.
The Program is comprised of various components designed to support the assessment and/or management of liquidity risk, including: (1) the periodic assessment (no less frequently than annually) of certain factors that influence a Fund’s liquidity risk; (2) the periodic classification (no less frequently than monthly) of a Fund’s investments into one of four liquidity categories that reflect an estimate of their liquidity under current market conditions; (3) a 15% limit on the acquisition of “illiquid investments” (as defined under Rule 22e-4); (4) for a Fund that does not invest primarily in “highly liquid investments” (as defined under Rule 22e-4), the determination of a minimum percentage of the Fund’s assets that will generally be invested in highly liquid investments (a “Highly Liquid Investment Minimum”); and (5) periodic reporting to the Board of Trustees.
At a meeting of the Board of Trustees on February 9-10, 2021, GSAM provided a written report to the Board addressing the operation, and the adequacy and effectiveness of the implementation, of the Program, including, as applicable, the operation of any Highly Liquid Investment Minimum and any material changes to the Program, for the period from January 1, 2020 through December 31, 2020 (the “Reporting Period”). Among other things, the annual report and related materials discussed: (1) the results of stress tests designed to assess liquidity under a hypothetical stressed scenario involving elevated redemptions; (2) an assessment of the methodologies used to classify investments into one of four liquidity categories; and (3) the impact of the COVID-19 pandemic on liquidity and management of liquidity risk during the Reporting Period, including during stressed market conditions caused by the COVID-19 pandemic. The report concluded that the Program continues to be reasonably designed to assess and manage liquidity risk and was adequately and effectively implemented during the Reporting Period.
There can be no assurance that the Program will achieve its objectives under all circumstances in the future. Please refer to your Fund’s prospectus for more information regarding the Fund’s exposure to liquidity risk and other risks to which it may be subject.
29
GOLDMAN SACHS MLP ENERGY INFRASTRUCTURE FUND
| | |
| | |
Fund Expenses — Six Month Period Ended May 31, 2021 (Unaudited) | | |
As a shareholder of Class A, Class C, Institutional, Investor, Class R6, Class R and Class P Shares of the Fund, you incur two types of costs: (1) transaction costs, including sales charges on purchase payments (with respect to Class A Shares), contingent deferred sales charges on redemptions (with respect to Class C Shares), and (2) ongoing costs, including management fees; distribution and service (12b-1) fees (with respect to Class A, Class C and Class R Shares); and other Fund expenses. This example is intended to help you understand your ongoing costs (in dollars) of investing in Class A, Class C, Institutional, Investor, Class R6, Class R and Class P Shares of the Fund and to compare these costs with the ongoing costs of investing in other mutual funds.
The example is based on an investment of $1,000 invested at the beginning of the period and held for the entire period from December 1, 2020 through May 31, 2021, which represents a period of 182 days in a 365 day year.
Actual Expenses — The first line under each share class in the table below provides information about actual account values and actual expenses. You may use the information in this line, together with the amount you invested, to estimate the expenses that you paid over the period. Simply divide your account value by $1,000 (for example, an $8,600 account value divided by $1,000=8.6), then multiply the result by the number in the first line under the heading entitled “Expenses Paid” to estimate the expenses you paid on your account during this period.
Hypothetical Example for Comparison Purposes — The second line under each share class in the table below provides information about hypothetical account values and hypothetical expenses based on the Funds’ actual net expense ratios and an assumed rate of return of 5% per year before expenses, which is not the Funds’ actual return. The hypothetical account values and expenses may not be used to estimate the actual ending account balance or expenses you paid for the period. You may use this information to compare the ongoing costs of investing in the Funds and other funds. To do so, compare this 5% hypothetical example with the 5% hypothetical examples that appear in the shareholder reports of the other funds.
Please note that the expenses shown in the table are meant to highlight your ongoing costs only and do not reflect any transactional costs, such as sales charges, redemption fees, or exchange fees. Therefore, the second line of the table is useful in comparing ongoing costs only, and will not help you determine the relative total costs of owning different funds. In addition, if these transactional costs were included, your costs would have been higher.
| | | | | | | | | | | | |
| | | MLP Energy Infrastructure Fund | |
| Share Class | | Beginning
Account Value
12/1/20 | | | Ending
Account Value
5/31/21 | | | Expenses
Paid for the
6 months ended
5/31/21* | |
| Class A | | | | | | | | | | | | |
Actual | | $ | 1,000.00 | | | $ | 1,000.00 | | | $ | 7.28 | |
Hypothetical 5% return | | | 1,000.00 | | | | 1,017.70 | + | | | 7.34 | |
| Class C | | | | | | | | | | | | |
Actual | | | 1,000.00 | | | | 1,000.00 | | | | 11.02 | |
Hypothetical 5% return | | | 1,000.00 | | | | 1,013.96 | + | | | 11.10 | |
| Institutional | | | | | | | | | | | | |
Actual | | | 1,000.00 | | | | 1,000.00 | | | | 5.48 | |
Hypothetical 5% return | | | 1,000.00 | | | | 1,019.50 | + | | | 5.54 | |
| Investor | | | | | | | | | | | | |
Actual | | | 1,000.00 | | | | 1,000.00 | | | | 6.03 | |
Hypothetical 5% return | | | 1,000.00 | | | | 1,018.95 | + | | | 6.09 | |
| Class R6 | | | | | | | | | | | | |
Actual | | | 1,000.00 | | | | 1,000.00 | | | | 5.44 | |
Hypothetical 5% return | | | 1,000.00 | | | | 1,019.55 | + | | | 5.49 | |
| Class R | | | | | | | | | | | | |
Actual | | | 1,000.00 | | | | 1,000.00 | | | | 8.53 | |
Hypothetical 5% return | | | 1,000.00 | | | | 1,016.46 | + | | | 8.60 | |
| Class P | | | | | | | | | | | | |
Actual | | | 1,000.00 | | | | 1,000.00 | | | | 5.44 | |
Hypothetical 5% return | | | 1,000.00 | | | | 1,019.55 | + | | | 5.49 | |
| | * | | Expenses for each share class are calculated using the Fund’s annualized net expense ratio for each class, which represents the ongoing expenses as a percentage of net assets for the six months ended May 31, 2021. Deferred tax benefit (expense) is not included in the ratio calculation. Expenses are calculated by multiplying the annualized net expense ratio by the average account value for the period; then multiplying the result by the number of days in the most recent fiscal half year; and then dividing that result by the number of days in the fiscal year. The annualized net expense ratios for the period were as follows: | |
| | | | | | | | | | | | | | | | | | | | | | | | | | | | |
| Fund | | Class A | | | Class C | | | Institutional | | | Investor | | | Class R6 | | | Class R | | | Class P | |
MLP Energy Infrastructure | | | 1.46 | % | | | 2.21 | % | | | 1.10 | % | | | 1.21 | % | | | 1.09 | % | | | 1.71 | % | | | 1.09 | % |
| | + | | Hypothetical expenses are based on the Fund’s actual annualized net expense ratios and an assumed rate of return of 5% per year before expenses. | |
30
FUNDS PROFILE
Goldman Sachs Funds
Goldman Sachs is a premier financial services firm, known since 1869 for creating thoughtful and customized investment solutions in complex global markets.
Today, the Asset Management Division of Goldman Sachs serves a diverse set of clients worldwide, including private institutions, public entities and individuals. With approximately $2.00 trillion in assets under supervision as of March 31, 2021, Goldman Sachs Asset Management (“GSAM”) has portfolio management teams located around the world and our investment professionals bring firsthand knowledge of local markets to every investment decision. Assets under supervision includes assets under management and other client assets for which Goldman Sachs does not have full discretion. GSAM leverages the resources of Goldman Sachs & Co. LLC subject to legal, internal and regulatory restrictions.
Money Market
Financial Square FundsSM
| ∎ | | Financial Square Treasury Solutions Fund1 |
| ∎ | | Financial Square Government Fund1 |
| ∎ | | Financial Square Money Market Fund2 |
| ∎ | | Financial Square Prime Obligations Fund2 |
| ∎ | | Financial Square Treasury Instruments Fund1 |
| ∎ | | Financial Square Treasury Obligations Fund1 |
| ∎ | | Financial Square Federal Instruments Fund1 |
Investor FundsSM
| ∎ | | Investor Money Market Fund3 |
| ∎ | | Investor Tax-Exempt Money Market Fund3 |
Fixed Income
Short Duration and Government
| ∎ | | High Quality Floating Rate Fund |
| ∎ | | Short-Term Conservative Income Fund |
| ∎ | | Short Duration Government Fund |
| ∎ | | Short Duration Income Fund |
| ∎ | | Inflation Protected Securities Fund |
Multi-Sector
| ∎ | | Global Core Fixed Income Fund |
Municipal and Tax-Free
| ∎ | | High Yield Municipal Fund |
| ∎ | | Dynamic Municipal Income Fund |
| ∎ | | Short Duration Tax-Free Fund |
| ∎ | | Municipal Income Completion Fund |
Single Sector
| ∎ | | Investment Grade Credit Fund |
| ∎ | | High Yield Floating Rate Fund |
| ∎ | | Emerging Markets Debt Fund |
| ∎ | | Local Emerging Markets Debt Fund |
Fixed Income Alternatives
| ∎ | | Long Short Credit Strategies Fund |
Fundamental Equity
| ∎ | | Small/Mid Cap Value Fund |
| ∎ | | Small/Mid Cap Growth Fund |
| ∎ | | Concentrated Growth Fund |
| ∎ | | Technology Opportunities Fund |
| ∎ | | Growth Opportunities Fund |
| ∎ | | Rising Dividend Growth Fund |
Tax-Advantaged Equity
| ∎ | | U.S. Tax-Managed Equity Fund |
| ∎ | | International Tax-Managed Equity Fund |
| ∎ | | U.S. Equity Dividend and Premium Fund |
| ∎ | | International Equity Dividend and Premium Fund |
Equity Insights
| ∎ | | Small Cap Equity Insights Fund |
| ∎ | | U.S. Equity Insights Fund |
| ∎ | | Small Cap Growth Insights Fund |
| ∎ | | Large Cap Growth Insights Fund |
| ∎ | | Large Cap Value Insights Fund |
| ∎ | | Small Cap Value Insights Fund |
| ∎ | | International Small Cap Insights Fund |
| ∎ | | International Equity Insights Fund |
| ∎ | | Emerging Markets Equity Insights Fund |
Fundamental Equity International
| ∎ | | International Equity Income Fund |
| ∎ | | International Equity ESG Fund |
| ∎ | | Emerging Markets Equity Fund |
| ∎ | | ESG Emerging Markets Equity Fund |
Alternative
| ∎ | | Clean Energy Income Fund |
| ∎ | | Real Estate Securities Fund |
| ∎ | | International Real Estate Securities Fund |
| ∎ | | Commodity Strategy Fund |
| ∎ | | Global Real Estate Securities Fund |
| ∎ | | Alternative Premia Fund |
| ∎ | | Absolute Return Tracker Fund |
| ∎ | | Managed Futures Strategy Fund |
| ∎ | | MLP Energy Infrastructure Fund |
| ∎ | | Energy Infrastructure Fund5 |
| ∎ | | Multi-Manager Alternatives Fund |
| ∎ | | Global Infrastructure Fund |
Total Portfolio Solutions
| ∎ | | Global Managed Beta Fund |
| ∎ | | Multi-Manager Non-Core Fixed Income Fund |
| ∎ | | Multi-Manager Global Equity Fund |
| ∎ | | Multi-Manager International Equity Fund |
| ∎ | | Tactical Tilt Overlay Fund |
| ∎ | | Balanced Strategy Portfolio |
| ∎ | | Multi-Manager U.S. Small Cap Equity Fund |
| ∎ | | Multi-Manager Real Assets Strategy Fund |
| ∎ | | Growth and Income Strategy Portfolio |
| ∎ | | Growth Strategy Portfolio |
| ∎ | | Dynamic Global Equity Fund |
| ∎ | | Satellite Strategies Portfolio |
| ∎ | | Enhanced Dividend Global Equity Portfolio |
| ∎ | | Tax-Advantaged Global Equity Portfolio |
| ∎ | | Strategic Factor Allocation Fund |
| ∎ | | Strategic Volatility Premium Fund |
| ∎ | | Target Date Retirement Portfolio |
| ∎ | | Target Date 2025 Portfolio |
| ∎ | | Target Date 2030 Portfolio |
| ∎ | | Target Date 2035 Portfolio |
| ∎ | | Target Date 2040 Portfolio |
| ∎ | | Target Date 2045 Portfolio |
| ∎ | | Target Date 2050 Portfolio |
| ∎ | | Target Date 2055 Portfolio |
| ∎ | | Target Date 2060 Portfolio |
| ∎ | | GQG Partners International Opportunities Fund |
| 1 | | You could lose money by investing in the Fund. Although the Fund seeks to preserve the value of your investment at $1.00 per share, it cannot guarantee it will do so. An investment in the Fund is not a deposit of a bank and is not insured or guaranteed by the Federal Deposit Insurance Corporation or any other government agency. The Fund’s sponsor has no legal obligation to provide financial support to the Fund, and you should not expect that the sponsor will provide financial support to the Fund at any time. |
| 2 | | You could lose money by investing in the Fund. Because the share price of the Fund will fluctuate, when you sell your shares they may be worth more or less than what you originally paid for them. The Fund may impose a fee upon sale of your shares or may temporarily suspend your ability to sell shares if the Fund’s liquidity falls below required minimums because of market conditions or other factors. An investment in the Fund is not a deposit of a bank and is not insured or guaranteed by the Federal Deposit Insurance Corporation or any other government agency. The Fund’s sponsor has no legal obligation to provide financial support to the Fund, and you should not expect that the sponsor will provide financial support to the Fund at any time. |
| 3 | | You could lose money by investing in the Fund. Although the Fund seeks to preserve the value of your investment at $1.00 per share, it cannot guarantee it will do so. The Fund may impose a fee upon sale of your shares or may temporarily suspend your ability to sell shares if the Fund’s liquidity falls below required minimums because of market conditions or other factors. An investment in the Fund is not a deposit of a bank and is not insured or guaranteed by the Federal Deposit Insurance Corporation or any other government agency. The Fund’s sponsor has no legal obligation to provide financial support to the Fund, and you should not expect that the sponsor will provide financial support to the Fund at any time. |
| 4 | | Effective after the close of business on August 30, 2020, the Goldman Sachs Blue Chip Fund was renamed the Goldman Sachs U.S. Equity ESG Fund. |
| 5 | | Effective after the close of business on June 26, 2020, the Goldman Sachs MLP & Energy Fund was renamed the Goldman Sachs Energy Infrastructure Fund. |
| | | Financial Square FundsSM and Investor FundsSM are registered service marks of Goldman Sachs & Co. LLC. |
| * | | This list covers open-end funds only. Please visit our website at www.GSAMFUNDS.com to learn about our closed-end funds and exchange-traded funds. |
| | |
TRUSTEES Jessica Palmer, Chair Dwight L. Bush Kathryn A. Cassidy Diana M. Daniels Joaquin Delgado James A. McNamara Roy W. Templin Gregory G. Weaver | | OFFICERS James A. McNamara, President Joseph F. DiMaria, Principal Financial Officer,
Principal Accounting Officer and Treasurer Caroline L. Kraus, Secretary |
| |
GOLDMAN SACHS & CO. LLC Distributor and Transfer Agent | | GOLDMAN SACHS ASSET MANAGEMENT, L.P. Investment Adviser |
Visit our website at www.GSAMFUNDS.com to obtain the most recent month-end returns.
Goldman Sachs Asset Management, L.P., 200 West Street, New York, New York 10282
Goldman Sachs does not provide legal, tax or accounting advice, unless explicitly agreed between you and Goldman Sachs (generally through certain services offered only to clients of Private Wealth Management). Any statement contained in this presentation concerning U.S. tax matters is not intended or written to be used and cannot be used for the purpose of avoiding penalties imposed on the relevant taxpayer. Notwithstanding anything in this document to the contrary, and except as required to enable compliance with applicable securities law, you may disclose to any person the US federal and state income tax treatment and tax structure of the transaction and all materials of any kind (including tax opinions and other tax analyses) that are provided to you relating to such tax treatment and tax structure, without Goldman Sachs imposing any limitation of any kind. Investors should be aware that a determination of the tax consequences to them should take into account their specific circumstances and that the tax law is subject to change in the future or retroactively and investors are strongly urged to consult with their own tax advisor regarding any potential strategy, investment or transaction.
The reports concerning the Fund included in this shareholder report may contain certain forward-looking statements about the factors that may affect the performance of the Fund in the future. These statements are based on Fund management’s predictions and expectations concerning certain future events and their expected impact on the Fund, such as performance of the economy as a whole and of specific industry sectors, changes in the levels of interest rates, the impact of developing world events, and other factors that may influence the future performance of the Fund. Management believes these forward-looking statements to be reasonable, although they are inherently uncertain and difficult to predict. Actual events may cause adjustments in portfolio management strategies from those currently expected to be employed.
A description of the policies and procedures that the Fund uses to determine how to vote proxies relating to portfolio securities and information regarding how the Fund voted proxies relating to portfolio securities for the most recent 12-month period ended June 30, are available (I) without charge, upon request by calling 1-800-526-7384 (for Retail Shareholders) or 1-800-621-2550 (for Institutional Shareholders); and (II) on the Securities and Exchange Commission (“SEC’’) web site at http://www.sec.gov.
The Fund will file its portfolio holdings for each month in a fiscal quarter within 60 days after the end of the relevant fiscal quarter on Form N-PORT. Portfolio holdings information for the third month of each fiscal quarter will be made available on the SEC’s web site at http://www.sec.gov. Portfolio holdings information may be obtained upon request and without charge by calling 1-800-526-7384 (for Retail Shareholders) or 1-800-621-2550 (for Institutional Shareholders).
Fund holdings and allocations shown are as of May 31, 2021 and may not be representative of future investments. Fund holdings should not be relied on in making investment decisions and should not be construed as research or investment advice regarding particular securities. Current and future holdings are subject to risk.
Economic and market forecasts presented herein reflect our judgment as of the date of this presentation and are subject to change without notice. These forecasts do not take into account the specific investment objectives, restrictions, tax and financial situation or other needs of any specific client. Actual data will vary and may not be reflected here. These forecasts are subject to high levels of uncertainty that may affect actual performance. Accordingly, these forecasts should be viewed as merely representative of a broad range of possible outcomes. These forecasts are estimated, based on assumptions, and are subject to significant revision and may change materially as economic and market conditions change. Goldman Sachs has no obligation to provide updates or changes to these forecasts. Case studies and examples are for illustrative purposes only.
“Alerian MLP Index”, “Alerian MLP Total Return Index”, “AMZ” and “AMZX” are trademarks of Alerian and their use is granted under a license from Alerian.
The portfolio risk management process includes an effort to monitor and manage risk, but does not imply low risk.
This material is not authorized for distribution to prospective investors unless preceded or accompanied by a current Prospectus or summary prospectus, if applicable. Investors should consider the Fund’s objective, risks, and charges and expenses, and read the summary prospectus, if available, and/or the Prospectus carefully before investing or sending money. The summary prospectus, if available, and the Prospectus contain this and other information about the Fund and may be obtained from your authorized dealer or from Goldman Sachs & Co. LLC by calling (retail – 1-800-526-7384) (institutional – 1-800-621-2550).
© 2021 Goldman Sachs. All rights reserved. 244884-OTU-1446387 MLPEISAR-21
Goldman Sachs Funds

| | | | |
| | |
| Semi-Annual Report | | | | May 31, 2021 |
| | |
| | | | Energy Funds |
| | | | Clean Energy Income Fund Energy Infrastructure Fund* |
| | * | | Effective after the close of business on June 26, 2020, the Goldman Sachs MLP & Energy Fund was renamed the Goldman Sachs Energy Infrastructure Fund. | |

Goldman Sachs Energy Fund
| ∎ | | CLEAN ENERGY INCOME FUND |
| ∎ | | ENERGY INFRASTRUCTURE FUND |
TABLE OF CONTENTS
| | | | |
| | | |
| NOT FDIC-INSURED | | May Lose Value | | No Bank Guarantee |
Goldman Sachs Clean Energy Income Fund
as of May 31, 2021
Investment Objective and Principal Investment Strategy (condensed)
The Goldman Sachs Clean Energy Income Fund (the “Fund”) seeks total return through current income and capital appreciation.
Under normal circumstances, the Fund invests at least 80% of its net assets plus any borrowings for investment purposes (measured at the time of purchase) (“Net Assets”) in U.S. and non-U.S. equity securities issued by clean energy companies. The Fund may invest up to 25% of its total assets (measured at the time of purchase) in master limited partnerships that are taxed as partnerships and may invest up to 20% of its Net Assets in securities of companies that are not clean energy companies. Goldman Sachs Asset Management expects the Fund’s investments to be weighted in favor of companies that pay dividends or other current distributions.
| | | | | | | | | | | | | | | | | | | | | | | | | | | |
| | PERFORMANCE REVIEW | |
| | | | | | |
| | | December 1, 2020–May 31, 2021 | | Fund Total Return
(based on NAV)1 | | Clean Energy Income
Composite Index2 | | Eagle North American
Renewables
Infrastructure Index2 | | Indxx Yieldco and
Renewable Energy
Income Index2 | | Eagle Global
Renewables
Infrastructure Index2 |
| | Class A | | | | -0.38 | % | | | | -1.53 | % | | | | -2.03 | % | | | | -2.52 | % | | | | 2.06 | % |
| | Class C | | | | -0.76 | | | | | -1.53 | | | | | -2.03 | | | | | -2.52 | | | | | 2.06 | |
| | Institutional | | | | -0.16 | | | | | -1.53 | | | | | -2.03 | | | | | -2.52 | | | | | 2.06 | |
| | Investor | | | | -0.23 | | | | | -1.53 | | | | | -2.03 | | | | | -2.52 | | | | | 2.06 | |
| | Class R6 | | | | -0.16 | | | | | -1.53 | | | | | -2.03 | | | | | -2.52 | | | | | 2.06 | |
| | Class R | | | | -0.46 | | | | | -1.53 | | | | | -2.03 | | | | | -2.52 | | | | | 2.06 | |
| | | Class P | | | | -0.15 | | | | | -1.53 | | | | | -2.03 | | | | | -2.52 | | | | | 2.06 | |
| 1 | | The net asset value (“NAV”) represents the net assets of the class of the Fund (ex-dividend) divided by the total number of shares of the class outstanding. The Fund’s performance assumes the reinvestment of dividends and other distributions. The Fund’s performance does not reflect the deduction of any applicable sales charges. |
| 2 | | The Clean Energy Income Composite Index is comprised of the Eagle North American Renewables Infrastructure Index (50%), Indxx Yieldco and Renewable Energy Income Index (35%), and Eagle Global Renewables Infrastructure Index (15%). It is not possible to invest directly in an unmanaged index. |
The Indxx Yieldco and Renewable Energy Income Index is designed to track the performance of income-paying renewable energy companies (RECs) and companies categorized as YieldCos listed in Developed and Emerging Markets.
The Eagle Global Renewables Infrastructure Index provides a benchmark that is designed to track the performance of renewables infrastructure or renewables-related infrastructure assets, primarily wind, solar, hydro, biomass, and electric transmission lines. Constituents are companies whose stocks trade globally in OECD (The Organization for Economic Co-operation and Development is an intergovernmental economic organization with 37 member countries, founded in 1961 to stimulate economic progress and world trade.) countries.
The Eagle North American Renewables Infrastructure Index provides a benchmark that is designed to track the performance of renewables infrastructure or renewables related infrastructure assets, primarily wind, solar, hydro, biomass, and electric transmission lines. Constituents are companies whose stocks trade in either the USA and Canada, though assets owned by these companies can have a global reach. The index is a capped, float-adjusted, capitalization-weighted index developed by Eagle Global Advisors, and disseminated real-time on a price-return basis (RENEWNA) and on a total-return basis (RENEWNAT).
The returns set forth in the table above represent past performance. Past performance does not guarantee future results. The Fund’s investment return and principal value will fluctuate so that an investor’s shares, when redeemed, may be worth more or less than their original cost. Current performance may be lower or higher than the performance quoted above. Please visit our web site at www.GSAMFUNDS.com to obtain the most recent month-end returns. Performance reflects applicable fee waivers and/or expense limitations in effect during the periods shown. In their absence, performance would be reduced. Returns do not reflect the deduction of taxes that a shareholder would pay on Fund distributions or the redemption of Fund shares.
1
GOLDMAN SACHS CLEAN ENERGY INCOME FUND
| | | | | | | | |
| | TOP TEN HOLDINGS AS OF 5/31/21‡ |
| | | |
| | | Holding | | % of Net Assets | | | Line of Business |
| | | |
| | Northland Power, Inc. | | | 8.2 | % | | Renewable Power Producer |
| | Brookfield Renewable Partners LP | | | 6.8 | | | Renewable Power Producer |
| | NextEra Energy Partners LP | | | 6.7 | | | Renewable Power Producer |
| | NextEra Energy, Inc. | | | 6.3 | | | Renewable-Focused Power Infrastructure |
| | Atlantica Sustainable Infrastructure PLC | | | 5.3 | | | Renewable Power Producer |
| | Boralex, Inc. Class A | | | 5.2 | | | Renewable Power Producer |
| | Algonquin Power & Utilities Corp. | | | 4.8 | | | Renewable-Focused Power Infrastructure |
| | Enel SpA | | | 4.1 | | | Renewable-Focused Power Infrastructure |
| | SSE PLC | | | 3.7 | | | Renewable-Focused Power Infrastructure |
| | | Innergex Renewable Energy, Inc. | | | 3.4 | | | Renewable Power Producer |
| ‡ | | The top 10 holdings may not be representative of the Fund’s future investments. |
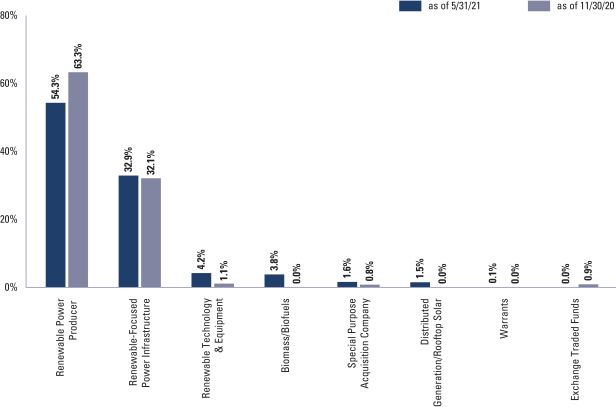
| † | | The Fund is actively managed and, as such, its composition may differ over time. Consequently, the Fund’s overall sector allocations may differ from the percentages contained in the graph above. The percentage shown for each investment category reflects the value of investments in that category as a percentage of total net assets. The graph depicts the Fund’s investments but may not represent the Fund’s market exposure due to the exclusion of certain derivatives, if any, as listed in the Additional Investment Information section of the Schedule of Investments. |
| | | For more information about the Fund, please refer to www.GSAMFUNDS.com. There, you can learn more about the Fund’s investment strategies, holdings, and performance. |
2
Goldman Sachs Energy Infrastructure Fund
as of May 31, 2021
Investment Objective and Principal Investment Strategy (condensed)
The Goldman Sachs Energy Infrastructure Fund (the “Fund”) seeks total return through current income and capital appreciation.
Under normal circumstances, the Fund invests at least 80% of its net assets plus any borrowings for investment purposes (measured at the time of purchase) (“Net Assets”) in U.S. and non-U.S. equity or fixed income securities issued by energy infrastructure companies, including master limited partnerships (“MLPs”) and “C” corporations. The Fund’s investments in MLPs will not exceed 25% of the Fund’s total assets as measured at the time of purchase. The Fund intends to concentrate its investments in the energy sector. The Fund may also invest up to 20% of its Net Assets in non-energy infrastructure investments, including equity and fixed income securities of U.S. and non-U.S. companies.
| | | | | | | | | | |
| | PERFORMANCE REVIEW | |
| | | |
| | | December 1, 2020–May 31, 2021 | | Fund Total Return
(based on NAV)1 | | | Alerian Midstream
Energy Select Index
(total return,
unhedged, USD)2 | |
| | Class A | | | 33.47 | % | | | 38.30 | % |
| | Class C | | | 32.85 | | | | 38.30 | |
| | Institutional | | | 33.62 | | | | 38.30 | |
| | Investor | | | 33.60 | | | | 38.30 | |
| | Class R6 | | | 33.67 | | | | 38.30 | |
| | Class R | | | 33.25 | | | | 38.30 | |
| | | Class P | | | 33.67 | | | | 38.30 | |
| 1 | | The net asset value (“NAV”) represents the net assets of the class of the Fund (ex-dividend) divided by the total number of shares of the class outstanding. The Fund’s performance assumes the reinvestment of dividends and other distributions. The Fund’s performance does not reflect the deduction of any applicable sales charges. |
| 2 | | The Alerian Midstream Energy Select Index (total return, unhedged, USD) is a composite of North American energy infrastructure companies. The capped, float-adjusted, capitalization-weighted index, whose constituents are engaged in midstream activities involving energy commodities, is disseminated real-time on a price-return basis (AMEI) and on a total-return basis (AMEIX). It is not possible to invest directly in an index. |
The returns set forth in the table above represent past performance. Past performance does not guarantee future results. The Fund’s investment return and principal value will fluctuate so that an investor’s shares, when redeemed, may be worth more or less than their original cost. Current performance may be lower or higher than the performance quoted above. Please visit our web site at www.GSAMFUNDS.com to obtain the most recent month-end returns. Performance reflects applicable fee waivers and/or expense limitations in effect during the periods shown. In their absence, performance would be reduced. Returns do not reflect the deduction of taxes that a shareholder would pay on Fund distributions or the redemption of Fund shares.
3
GOLDMAN SACHS ENERGY INFRASTRUCTURE FUND
| | | | | | | | |
| | TOP TEN HOLDINGS AS OF 5/31/21‡ |
| | | |
| | | Holding | | % of Net Assets | | | Line of Business |
| | | |
| | Cheniere Energy, Inc. | | | 7.0 | % | | Other | Liquefaction |
| | TC Energy Corp. | | | 7.0 | | | Pipeline Transportation | Natural Gas |
| | Enbridge, Inc. | | | 6.7 | | | Pipeline Transportation | Petroleum |
| | ONEOK, Inc. | | | 6.0 | | | Gathering + Processing |
| | Targa Resources Corp. | | | 6.0 | | | Gathering + Processing |
| | Pembina Pipeline Corp. | | | 5.5 | | | Pipeline Transportation | Petroleum |
| | Kinder Morgan, Inc. | | | 5.5 | | | Pipeline Transportation | Natural Gas |
| | The Williams Cos., Inc. | | | 5.1 | | | Gathering + Processing |
| | Enterprise Products Partners LP | | | 4.7 | | | Pipeline Transportation | Natural Gas |
| | | Keyera Corp. | | | 4.3 | | | Pipeline Transportation | Natural Gas |
| ‡ | | The top 10 holdings may not be representative of the Fund’s future investments. |
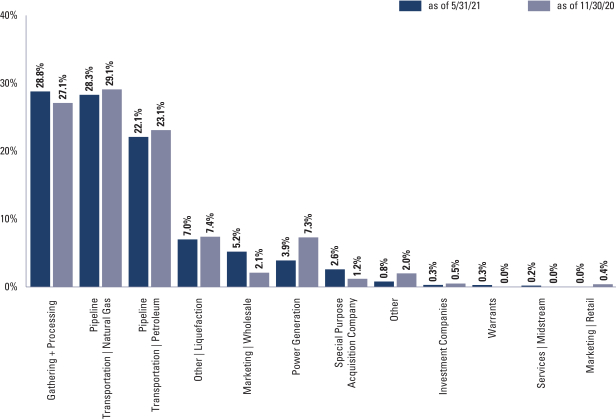
| † | | The Fund is actively managed and, as such, its composition may differ over time. Consequently, the Fund’s overall sector allocations may differ from the percentages contained in the graph above. The percentage shown for each investment category reflects the value of investments in that category as a percentage of total net assets. The graph depicts the Fund’s investments but may not represent the Fund’s market exposure due to the exclusion of certain derivatives, if any, as listed in the Additional Investment Information section of the Schedule of Investments. |
| | | For more information about the Fund, please refer to www.GSAMFUNDS.com. There, you can learn more about the Fund’s investment strategies, holdings, and performance. |
4
GOLDMAN SACHS CLEAN ENERGY INCOME FUND
Schedule of Investments
May 31, 2021 (Unaudited)
| | | | | | | | |
| Shares | | | Description | | Value | |
| |
| Common Stocks – 96.7% | | | |
| Biomass/Biofuels – 3.8% | | | |
| | 195,526 | | | Enviva Partners LP | | $ | 9,561,221 | |
| | 282,976 | | | Green Plains Partners LP | | | 3,520,222 | |
| | 36,839 | | | Renewable Energy Group, Inc.* | | | 2,249,758 | |
| | | | | | | | |
| | | | | | | 15,331,201 | |
| | |
| Distributed Generation/Rooftop Solar* – 1.5% | | | |
| | 129,584 | | | Sunrun, Inc. | | | 5,794,996 | |
| | |
| Renewable Power Producer – 54.3% | |
| | 14,023 | | | Albioma SA | | | 616,467 | |
| | 6,699 | | | Ameresco, Inc. Class A* | | | 360,138 | |
| | 581,125 | | | Atlantica Sustainable Infrastructure PLC | | | 21,123,894 | |
| | 680,885 | | | Boralex, Inc. Class A | | | 20,758,242 | |
| | 82,721 | | | Brookfield Renewable Corp. Class A | | | 3,533,841 | |
| | 685,788 | | | Brookfield Renewable Partners LP | | | 27,248,730 | |
| | 456,055 | | | Clearway Energy, Inc. Class A | | | 11,460,662 | |
| | 368,968 | | | EDP Renovaveis SA | | | 8,773,790 | |
| | 186,806 | | | Hannon Armstrong Sustainable Infrastructure Capital, Inc. | | | 9,192,723 | |
| | 805,133 | | | Innergex Renewable Energy, Inc. | | | 13,496,083 | |
| | 387,551 | | | NextEra Energy Partners LP | | | 26,496,862 | |
| | 976,082 | | | Northland Power, Inc. | | | 32,658,611 | |
| | 148,705 | | | Ormat Technologies, Inc. | | | 10,268,080 | |
| | 70,221 | | | Orsted A/S(a) | | | 10,738,828 | |
| | 176,438 | | | Polaris Infrastructure, Inc. | | | 2,599,724 | |
| | 205,101 | | �� | RWE AG | | | 7,793,828 | |
| | 550,010 | | | TransAlta Renewables, Inc. | | | 8,787,048 | |
| | | | | | | | |
| | | | | | | 215,907,551 | |
| | |
| Renewable Technology & Equipment – 4.2% | | | |
| | 43,173 | | | Ballard Power Systems, Inc.* | | | 747,756 | |
| | 54,736 | | | Enphase Energy, Inc.* | | | 7,829,985 | |
| | 23,756 | | | SolarEdge Technologies, Inc.* | | | 6,129,286 | |
| | 51,694 | | | Vestas Wind Systems A/S | | | 2,020,859 | |
| | | | | | | | |
| | | | | | | 16,727,886 | |
| | |
| Renewable-Focused Power Infrastructure – 32.9% | | | |
| | 1,262,363 | | | Algonquin Power & Utilities Corp. | | | 19,279,498 | |
| | 48,584 | | | Alliant Energy Corp. | | | 2,776,576 | |
| | 103,119 | | | American Electric Power Co., Inc. | | | 8,868,234 | |
| | 42,505 | | | CMS Energy Corp. | | | 2,666,764 | |
| | 127,538 | | | Dominion Energy, Inc. | | | 9,710,743 | |
| | 632,435 | | | EDP – Energias de Portugal SA | | | 3,684,902 | |
| | 172,252 | | | Emera, Inc. | | | 8,056,155 | |
| | 1,637,812 | | | Enel SpA | | | 16,242,670 | |
| | 91,290 | | | Hydro One Ltd.(a) | | | 2,322,962 | |
| | 770,752 | | | Iberdrola SA | | | 10,624,038 | |
| | 50,597 | | | IDACORP, Inc. | | | 4,955,976 | |
| | 344,039 | | | NextEra Energy, Inc. | | | 25,190,536 | |
| | 669,916 | | | SSE PLC | | | 14,621,386 | |
| | 29,596 | | | Xcel Energy, Inc. | | | 2,097,764 | |
| | | | | | | | |
| | | | | | | 131,098,204 | |
| | |
| | TOTAL COMMON STOCKS | | | | |
| | (Cost $407,353,430) | | $ | 384,859,838 | |
| | |
| | | | | | |
|
| Special Purpose Acquisition Company* – 1.6% | |
| 495,004 | | ECP Environmental Growth Opportunities Corp. | | $ | 4,821,339 | |
| 57,500 | | ECP Environmental Growth Opportunities Corp. Founder Shares(b)(c) | | | — | |
| 96,798 | | Rice Acquisition Corp. Class A(d) | | | 1,523,600 | |
| |
| SPECIAL PURPOSE ACQUISITION COMPANY | |
| (Cost $5,690,157) | | $ | 6,344,939 | |
| |
| | | | | | |
| | | | | | | | | | |
| Units | | Expiration
Date | | Strike
Price | | | Value | |
|
| Warrants* – 0.1% | |
| Special Purpose Acquisition Company – 0.1% | |
ECP Environmental Growth Opportunities Corp. | |
| 123,751 | | 02/11/2028 | | $ | 11.50 | | | $ | 101,488 | |
ECP Environmental Growth Opportunities Corp.
Private(b)(c) | |
| 94,001 | | — | | | 11.50 | | | | 141,002 | |
Rice Acquisition Corp. | |
| 48,399 | | 10/26/2027 | | | 11.50 | | | | 228,927 | |
| |
| TOTAL WARRANTS | | | | | | | | |
| (Cost $368,865) | | | | | | $ | 471,417 | |
| |
| | | | | | | | | | |
| | | | | | |
| Shares | | Distribution
Rate | | Value | |
|
| Securities Lending Reinvestment Vehicle – 0.0% | |
Goldman Sachs Financial Square Government Fund – Institutional Shares(e) | |
| 89,375 | | 0.026% | | $ | 89,375 | |
| (Cost $89,375) | | | | | | |
| |
| TOTAL INVESTMENTS – 98.4% | | | | |
| (Cost $413,501,827) | | $ | 391,765,569 | |
| |
OTHER ASSETS IN EXCESS OF
LIABILITIES – 1.6% | | | 6,178,739 | |
| |
| NET ASSETS – 100.0% | | $ | 397,944,308 | |
| |
| | | | |
|
| The percentage shown for each investment category reflects the value of investments in that category as a percentage of net assets. |
| |
* | | Non-income producing security. |
| |
(a) | | Exempt from registration under Rule 144A of the Securities Act of 1933. |
| |
(b) | | Restricted securities are not registered under the Securities Act of 1933, as amended, and are subject to legal restrictions on resale. These securities generally may be resold in transactions exempt from registration or to the public if the securities are subsequently registered. Disposal of these securities may involve time consuming negotiations and prompt sale at an acceptable price may be difficult. Total market value of Restricted securities amounts to $141,002, which |
| | |
| The accompanying notes are an integral part of these financial statements. | | 5 |
GOLDMAN SACHS CLEAN ENERGY INCOME FUND
Schedule of Investments (continued)
May 31, 2021 (Unaudited)
| | | | |
| | represents approximately 0.1% of the Fund’s net assets as of May 31, 2021. See additional details below: |
| | | | | | | | | | |
| | | Restricted Security | | Acquisition
Date | | | Cost | |
| | ECP Environmental Growth Opportunities Corp. Private Warrants | | | 02/11/2021 | | | $ | 141,002 | |
| | ECP Environmental Growth Opportunities Corp. Founder Shares | | | 02/11/2021 | | | | — | |
| | | | | | |
| |
(c) | | Significant unobservable inputs were used in the valuation of this portfolio security; i.e., Level 3. |
| |
(d) | | All or a portion of security is on loan. |
| |
(e) | | Represents an affiliated issuer. |
| | |
|
Investment Abbreviations: |
LP | | —Limited Partnership |
PIPE | | —Private Investment in Public Equity |
PLC | | —Public Limited Company |
|
UNFUNDED PIPE COMMITMENTS — At May 31, 2021, the Fund had unfunded PIPE commitments pursuant to a subscription agreement with the following issuer:
| | | | | | |
| Issuer | | Shares | | Current
Value | | Unrealized
Gain (Loss) |
| | | |
Rice Acquisition Corp.(a) | | 445,550 | | $4,455,500 | | $— |
| | (a) | | Significant unobservable inputs were used in the valuation of this portfolio security; i.e., Level 3. |
| | |
| 6 | | The accompanying notes are an integral part of these financial statements. |
GOLDMAN SACHS ENERGY INFRASTRUCTURE FUND
Schedule of Investments
May 31, 2021 (Unaudited)
| | | | | | | | |
| Shares | | | Description | | Value | |
| |
| Common Stocks – 96.3% | | | |
| Gathering + Processing – 28.8% | | | |
| | 678,151 | | | Antero Midstream Corp. | | $ | 6,510,250 | |
| | 170,418 | | | Crestwood Equity Partners LP | | | 4,884,180 | |
| | 174,578 | | | DCP Midstream LP | | | 4,394,128 | |
| | 239,710 | | | Hess Midstream LP Class A | | | 6,105,414 | |
| | 280,460 | | | MPLX LP | | | 8,029,570 | |
| | 334,751 | | | ONEOK, Inc. | | | 17,654,768 | |
| | 452,289 | | | Targa Resources Corp. | | | 17,575,950 | |
| | 568,704 | | | The Williams Cos., Inc. | | | 14,979,663 | |
| | 207,427 | | | Western Midstream Partners LP | | | 4,144,391 | |
| | | | | | | | |
| | | | | | | 84,278,314 | |
| | |
| Marketing | Wholesale – 5.2% | | | |
| | 592,662 | | | Gibson Energy, Inc. | | | 11,710,477 | |
| | 100,748 | | | Sunoco LP | | | 3,530,210 | |
| | | | | | | | |
| | | | | | | 15,240,687 | |
| | |
| Other* – 0.8% | |
| | 35,704 | | | Darling Ingredients, Inc. | | | 2,444,296 | |
| | |
| Other | Liquefaction* – 7.0% | |
| | 242,165 | | | Cheniere Energy, Inc. | | | 20,559,809 | |
| | |
| Pipeline Transportation | Natural Gas – 28.3% | |
| | 1,020,515 | | | Energy Transfer LP | | | 10,103,099 | |
| | 576,571 | | | Enterprise Products Partners LP | | | 13,612,841 | |
| | 467,011 | | | Equitrans Midstream Corp. | | | 3,848,171 | |
| | 421,883 | | | Inter Pipeline Ltd. | | | 6,174,323 | |
| | 506,563 | | | Keyera Corp. | | | 12,562,913 | |
| | 873,278 | | | Kinder Morgan, Inc. | | | 16,015,919 | |
| | 398,787 | | | TC Energy Corp. | | | 20,370,966 | |
| | | | | | | | |
| | | | | | | 82,688,232 | |
| | |
| Pipeline Transportation | Petroleum – 22.1% | | | |
| | 98,625 | | | BP Midstream Partners LP | | | 1,394,557 | |
| | 26,228 | | | Delek Logistics Partners LP | | | 1,148,524 | |
| | 506,649 | | | Enbridge, Inc. | | | 19,489,242 | |
| | 65,655 | | | Holly Energy Partners LP | | | 1,396,482 | |
| | 88,514 | | | Magellan Midstream Partners LP | | | 4,362,855 | |
| | 225,445 | | | NuStar Energy LP | | | 4,136,916 | |
| | 69,474 | | | PBF Logistics LP | | | 1,129,647 | |
| | 497,666 | | | Pembina Pipeline Corp. | | | 16,086,964 | |
| | 76,644 | | | Phillips 66 Partners LP | | | 3,071,892 | |
| | 1,139,360 | | | Plains GP Holdings LP Class A | | | 12,430,418 | |
| | | | | | | | |
| | | | | | | 64,647,497 | |
| | |
| Power Generation – 3.9% | | | |
| | 39,110 | | | Atlantica Sustainable Infrastructure PLC | | | 1,421,649 | |
| | 27,550 | | | Brookfield Renewable Corp. Class A | | | 1,176,936 | |
| | 2,803 | | | Enphase Energy, Inc.* | | | 400,969 | |
| | 42,728 | | | NextEra Energy Partners LP | | | 2,921,314 | |
| | 34,506 | | | NextEra Energy, Inc. | | | 2,526,529 | |
| | 46,204 | | | Northland Power, Inc. | | | 1,545,934 | |
| | 54,839 | | | The AES Corp. | | | 1,393,459 | |
| | | | | | | | |
| | | | | | | 11,386,790 | |
| | |
| | | | | | |
| |
| Common Stocks – (continued) | | | |
| Services | Midstream – 0.2% | | | |
| 62,304 | | Rattler Midstream LP | | $ | 656,684 | |
| |
| TOTAL COMMON STOCKS | | | | |
| (Cost $174,587,191) | | | | $ | 281,902,309 | |
| |
| | | | | | |
|
| Special Purpose Acquisition Company* – 2.6% | |
| 423,963 | | ECP Environmental Growth Opportunities Corp. | | $ | 4,129,399 | |
| 49,248 | | ECP Environmental Growth Opportunities Corp. Founder Shares(a)(b) | | | — | |
| 227,186 | | Rice Acquisition Corp. Class A | | | 3,575,908 | |
| |
| SPECIAL PURPOSE ACQUISITION COMPANY | |
| (Cost $6,158,963) | | | | $ | 7,705,307 | |
| |
| | | | | | |
| | | | | | | | | | | | |
| Units | | Expiration
Date | | | Strike
Price | | | Value | |
|
| Warrants* – 0.3% | |
| Special Purpose Acquisition Company – 0.3% | |
ECP Environmental Growth Opportunities Corp. | |
| 105,990 | | | 02/11/28 | | | $ | 11.50 | | | $ | 86,922 | |
ECP Environmental Growth Opportunities Corp.
Private(a)(b) | |
| 80,510 | | | — | | | | 11.50 | | | | 120,765 | |
Rice Acquisition Corp. | |
| 136,093 | | | 10/26/27 | | | | 11.50 | | | | 643,720 | |
| |
| TOTAL WARRANTS | | | | | | | | | |
| (Cost $522,373) | | | | | | | | | | $ | 851,407 | |
| |
| | | | | | | | | | | | |
| | | | | | |
| Shares | | Dividend
Rate | | Value | |
|
| Investment Company(c) – 0.3% | |
Goldman Sachs Financial Square Government Fund – Institutional Shares | |
| 693,516 | | 0.026% | | $ | 693,516 | |
| (Cost $693,516) | | | | | | |
| |
TOTAL INVESTMENTS – 99.5%
(Cost $181,962,043) | | $ | 291,152,539 | |
| |
OTHER ASSETS IN EXCESS OF
LIABILITIES – 0.5% | | | 1,562,133 | |
| |
| NET ASSETS – 100.0% | | $ | 292,714,672 | |
| |
| | | | |
|
| The percentage shown for each investment category reflects the value of investments in that category as a percentage of net assets. |
| |
* | | Non-income producing security. |
| | |
| The accompanying notes are an integral part of these financial statements. | | 7 |
GOLDMAN SACHS ENERGY INFRASTRUCTURE FUND
Schedule of Investments (continued)
May 31, 2021 (Unaudited)
| | | | |
| |
(a) | | Restricted securities are not registered under the Securities Act of 1933, as amended, and are subject to legal restrictions on resale. These securities generally may be resold in transactions exempt from registration or to the public if the securities are subsequently registered. Disposal of these securities may involve time consuming negotiations and prompt sale at an acceptable price may be difficult. Total market value of Restricted securities amounts to $120,765, which represents approximately 0.1% of the Fund’s net assets as of May 31, 2021. See additional details below: |
| | | | | | | | | | |
| | | Restricted Security | | Acquisition
Date | | | Cost | |
| | ECP Environmental Growth Opportunities Corp. Private Warrants | | | 02/11/2021 | | | $ | 120,765 | |
| | ECP Environmental Growth Opportunities Corp. Founder Shares | | | 02/11/2021 | | | | — | |
| | | | |
| |
(b) | | Significant unobservable inputs were used in the valuation of this portfolio security; i.e., Level 3. |
| |
(c) | | Represents an Affiliated fund. |
| | |
|
Investment Abbreviations: |
GP | | —General Partnership |
LP | | —Limited Partnership |
PIPE | | —Private Investment in Public Equity |
PLC | | —Public Limited Company |
|
UNFUNDED PIPE COMMITMENTS — At May 31, 2021, the Fund had unfunded PIPE commitments pursuant to a subscription agreement with the following issuer:
| | | | | | |
| Issuer | | Shares | | Current
Value | | Unrealized
Gain (Loss) |
| | | |
Rice Acquisition Corp.(a) | | 120,717 | | $1,207,170 | | $— |
| | (a) | | Significant unobservable inputs were used in the valuation of this portfolio security; i.e., Level 3. |
| | |
| 8 | | The accompanying notes are an integral part of these financial statements. |
GOLDMAN SACHS ENERGY FUNDS
Statements of Assets and Liabilities
May 31, 2021 (Unaudited)
| | | | | | | | | | |
| | | | | Clean Energy
Income Fund | | | Energy Infrastructure
Fund | |
| | Assets: | | | | | | | | |
| | Investments of unaffiliated issuers, at value (cost $413,412,452 and $181,268,527, respectively) | | $ | 391,676,194 | | | $ | 290,459,023 | |
| | Investments of affiliated issuers, at value (cost $0 and $693,516, respectively) | | | — | | | | 693,516 | |
| | Investments in securities lending reinvestment vehicle — affiliated issuer (Cost $89,375 and $0, respectively) | | | 89,375 | | | | — | |
| | Cash | | | 2,967,529 | | | | 1,592,175 | |
| | Foreign currencies, at value (cost $791,542 and $0, respectively) | | | 790,808 | | | | — | |
| | Receivables: | | | | | | | | |
| | Fund shares sold | | | 8,468,653 | | | | — | |
| | Dividends | | | 890,596 | | | | 467,290 | |
| | Foreign tax reclaims | | | 71,500 | | | | — | |
| | Reimbursement from investment adviser | | | 38,711 | | | | 20,545 | |
| | Securities lending income | | | 3,645 | | | | — | |
| | Deferred offering costs | | | 35,966 | | | | — | |
| | Other assets | | | 70,747 | | | | 41,470 | |
| | Total assets | | | 405,103,724 | | | | 293,274,019 | |
| | | | | | | | | | |
| | Liabilities: | | | | | | | | |
| | Payables: | | | | | | | | |
| | Investments purchased | | | 6,593,986 | | | | — | |
| | Management fees | | | 257,850 | | | | 244,706 | |
| | Payable upon return of securities loaned | | | 89,375 | | | | — | |
| | Fund shares redeemed | | | 61,254 | | | | 65,000 | |
| | Distribution and Service fees and Transfer Agency fees | | | 11,731 | | | | 7,634 | |
| | Accrued expenses | | | 145,220 | | | | 242,007 | |
| | Total liabilities | | | 7,159,416 | | | | 559,347 | |
| | | | | | | | | | |
| | Net Assets: | | | | | | | | |
| | Paid-in capital | | | 409,544,297 | | | | 201,190,912 | |
| | Total distributable earnings (loss) | | | (11,599,989 | ) | | | 91,523,760 | |
| | NET ASSETS | | $ | 397,944,308 | | | $ | 292,714,672 | |
| | | Net Assets: | | | | | | | | |
| | | Class A | | $ | 5,095,300 | | | $ | 205,199 | |
| | | Class C | | | 177,637 | | | | 178,896 | |
| | | Institutional | | | 13,555,750 | | | | 3,570,429 | |
| | | Investor | | | 791,328 | | | | 54,533 | |
| | | Class R6 | | | 68,109 | | | | 78,330,183 | |
| | | Class R | | | 71,540 | | | | 53,551 | |
| | | Class P | | | 378,184,644 | | | | 210,321,881 | |
| | | Total Net Assets | | $ | 397,944,308 | | | $ | 292,714,672 | |
| | | Shares Outstanding $0.001 par value (unlimited number of shares authorized): | | | | | | | | |
| | | Class A | | | 378,296 | | | | 21,445 | |
| | | Class C | | | 13,252 | | | | 18,713 | |
| | | Institutional | | | 1,003,245 | | | | 372,271 | |
| | | Investor | | | 58,615 | | | | 5,688 | |
| | | Class R6 | | | 5,040 | | | | 8,176,892 | |
| | | Class R | | | 5,313 | | | | 5,593 | |
| | | Class P | | | 28,003,309 | | | | 21,943,747 | |
| | | Net asset value, offering and redemption price per share:(b) | | | | | | | | |
| | | Class A | | | $13.47 | | | | $9.57 | |
| | | Class C | | | 13.40 | | | | 9.56 | |
| | | Institutional | | | 13.51 | | | | 9.59 | |
| | | Investor | | | 13.50 | | | | 9.59 | |
| | | Class R6 | | | 13.51 | | | | 9.58 | |
| | | Class R | | | 13.47 | | | | 9.57 | |
| | | Class P | | | 13.50 | | | | 9.58 | |
| | (a) | | Includes loaned securities having a market value of $86,570 for the Clean Energy Income Fund and $0 for the Energy Infrastructure Fund, respectively. |
| | (b) | | Maximum public offering price per share for Class A Shares is $14.25 for the Clean Energy Income Fund and $10.13 for the Energy Infrastructure Fund. At redemption, Class C Shares may be subject to a contingent deferred sales charge, assessed on the amount equal to the lesser of the current net asset value or the original purchase price of the shares. |
| | |
| The accompanying notes are an integral part of these financial statements. | | 9 |
GOLDMAN SACHS ENERGY FUNDS
Statements of Operations
For the Six Months Ended May 31, 2021 (Unaudited)
| | | | | | | | | | |
| | | | | Clean Energy
Income Fund | | | Energy Infrastructure
Fund | |
| | Investment income: | | | | | | | | |
| | | |
| | Dividends — unaffiliated issuers (net of foreign withholding taxes of $344,630 and $360,701, respectively) | | $ | 3,374,011 | | | $ | 4,233,003 | |
| | | |
| | Dividends — affiliated issuers | | | 118 | | | | 58 | |
| | | |
| | Securities lending income — unaffiliated issuers | | | 6,483 | | | | — | |
| | | |
| | Total investment income | | | 3,380,612 | | | | 4,233,061 | |
| | | | | | | | | | |
| | Expenses: | | | | | | | | |
| | | |
| | Management fees | | | 1,200,010 | | | | 1,345,616 | |
| | | |
| | Amortization of offering costs | | | 125,276 | | | | — | |
| | | |
| | Professional fees | | | 63,267 | | | | 76,186 | |
| | | |
| | Custody, accounting and administrative services | | | 53,612 | | | | 51,109 | |
| | | |
| | Transfer Agency fees(a) | | | 49,053 | | | | 40,754 | |
| | | |
| | Printing and mailing costs | | | 20,046 | | | | 23,921 | |
| | | |
| | Registration fees | | | 14,799 | | | | 44,089 | |
| | | |
| | Trustee fees | | | 9,520 | | | | 9,619 | |
| | | |
| | Distribution and Service (12b-1) fees(a) | | | 6,787 | | | | 878 | |
| | | |
| | Service Share fees — Class C | | | 202 | | | | 195 | |
| | | |
| | Other | | | 6,799 | | | | 7,113 | |
| | | |
| | Total expenses | | | 1,549,371 | | | | 1,599,480 | |
| | | |
| | Less — expense reductions | | | (212,858 | ) | | | (126,806 | ) |
| | | |
| | Net expenses | | | 1,336,513 | | | | 1,472,674 | |
| | | |
| | NET INVESTMENT INCOME | | | 2,044,099 | | | | 2,760,387 | |
| | | |
| | | | | | | | | | |
| | Realized and unrealized gain (loss): | | | | | | | | |
| | | |
| | Net realized gain from: | | | | | | | | |
| | | |
| | Investments — unaffiliated issuers | | | 12,491,266 | | | | 19,882,974 | |
| | | |
| | Foreign currency transactions | | | 72,031 | | | | 49,681 | |
| | | |
| | Net change in unrealized gain (loss) on: | | | | | | | | |
| | | |
| | Investments — unaffiliated issuers | | | (37,915,531 | ) | | | 54,223,606 | |
| | | |
| | Foreign currency translation | | | 9,362 | | | | (1,770 | ) |
| | | |
| | Net realized and unrealized gain (loss) | | | (25,342,872 | ) | | | 74,154,491 | |
| | | |
| | NET INCREASE (DECREASE) IN NET ASSETS RESULTING FROM OPERATIONS | | $ | (23,298,773 | ) | | $ | 76,914,878 | |
| | (a) | | Class specific Distribution and/or Service (12b-1) and Transfer Agency fees were as follows: |
| | | | | | | | | | | | | | | | | | | | | | | | | | | | | | | | | | | | | | | | |
| | | Distribution and/or Service(12b-1) Fees | | | Transfer Agency Fees | |
Fund | | Class A | | | Class C | | | Class R | | | Class A | | | Class C | | | Institutional | | | Investor | | | Class R6 | | | Class R | | | Class P | |
Clean Energy Income | | $ | 6,003 | | | $ | 605 | | | $ | 179 | | | $ | 3,826 | | | $ | 127 | | | $ | 2,333 | | | $ | 268 | | | $ | 11 | | | $ | 55 | | | $ | 42,433 | |
Energy Infrastructure | | | 176 | | | | 585 | | | | 117 | | | | 110 | | | | 119 | | | | 572 | | | | 36 | | | | 11,825 | | | | 36 | | | | 28,056 | |
| | |
| 10 | | The accompanying notes are an integral part of these financial statements. |
GOLDMAN SACHS ENERGY FUNDS
Statements of Changes in Net Assets
| | | | | | | | | | | | | | | | | | | | | | |
| | | | | Clean Energy Income Fund | | | | | | Energy Infrastructure Fund | |
| | | | | For the
Six Months Ended
May 31, 2021
(Unaudited) | | | For the
Period Ended
November 30, 2020(a) | | | | | | For the
Six Months Ended
May 31, 2021
(Unaudited) | | | For the Fiscal
Year Ended
November 30, 2020 | |
| | From operations: | | | | | | | | | | | | | |
| | Net investment income | | $ | 2,044,099 | | | $ | 292,237 | | | | | | | $ | 2,760,387 | | | $ | 1,397,497 | |
| | Net realized gain (loss) | | | 12,563,297 | | | | 850,358 | | | | | | | | 19,932,655 | | | | (37,388,506 | ) |
| | Net change in unrealized gain (loss) | | | (37,906,169 | ) | | | 11,719,069 | | | | | | | | 54,221,836 | | | | 53,849,043 | |
| | Net increase (decrease) in net assets resulting from operations | | | (23,298,773 | ) | | | 12,861,664 | | | | | | | | 76,914,878 | | | | 17,858,034 | |
| | | | | | | | | | | | | | | | | | | | | | |
| | Distributions to shareholders: | | | | | | | | | | | | | |
| | From distributable earnings: | | | | | | | | | | | | | | | | | | | | |
| | Class A Shares | | | (14,572 | ) | | | (3,603 | ) | | | | | | | (98 | ) | | | (792 | ) |
| | Class C Shares | | | (653 | ) | | | — | | | | | | | | (75 | ) | | | (1,512 | ) |
| | Institutional Shares | | | (47,768 | ) | | | (15,442 | ) | | | | | | | (4,400 | ) | | | (32,726 | ) |
| | Investor Shares | | | (406 | ) | | | (118 | ) | | | | | | | (69 | ) | | | (543 | ) |
| | Class R6 Shares | | | (408 | ) | | | (151 | ) | | | | | | | (144,069 | ) | | | (854,643 | ) |
| | Class R Shares | | | (398 | ) | | | — | | | | | | | | (45 | ) | | | (481 | ) |
| | Class P Shares | | | (824,527 | ) | | | (258,820 | ) | | | | | | | (305,915 | ) | | | (1,985,203 | ) |
| | Return of capital: | | | | | | | | | | | | | | | | | | | | |
| | Class A Shares | | | — | | | | — | | | | | | | | — | | | | (1,960 | ) |
| | Class C Shares | | | — | | | | — | | | | | | | | — | | | | (3,739 | ) |
| | Institutional Shares | | | — | | | | — | | | | | | | | — | | | | (80,937 | ) |
| | Investor Shares | | | — | | | | — | | | | | | | | — | | | | (1,341 | ) |
| | Class R6 Shares | | | — | | | | — | | | | | | | | — | | | | (2,113,673 | ) |
| | Class R Shares | | | — | | | | — | | | | | | | | — | | | | (1,189 | ) |
| | Class P Shares | | | — | | | | — | | | | | | | | — | | | | (4,909,734 | ) |
| | Total distributions to shareholders | | | (888,732 | ) | | | (278,134 | ) | | | | | | | (454,671 | ) | | | (9,988,473 | ) |
| | | | | | | | | | | | | | | | | | | | | | |
| | From share transactions: | | | | | | | | | | | | | |
| | Proceeds from sales of shares | | | 331,960,105 | | | | 111,708,330 | | | | | | | | 16,263,705 | | | | 284,094,043 | |
| | Reinvestment of distributions | | | 888,732 | | | | 278,134 | | | | | | | | 452,978 | | | | 9,846,938 | |
| | Cost of shares redeemed | | | (35,114,811 | ) | | | (172,207 | ) | | | | | | | (42,356,805 | ) | | | (127,843,592 | ) |
| | Net increase (decrease) in net assets resulting from share transactions | | | 297,734,026 | | | | 111,814,257 | | | | | | | | (25,640,122 | ) | | | 166,097,389 | |
| | TOTAL INCREASE | | | 273,546,521 | | | | 124,397,787 | | | | | | | | 50,820,085 | | | | 173,966,950 | |
| | | | | | | | | | | | | | | | | | | | | | |
| | Net assets: | | | | | | | | | | | | | |
| | Beginning of period | | | 124,397,787 | | | | — | | | | | | | | 241,894,587 | | | | 67,927,637 | |
| | End of period | | $ | 397,944,308 | | | $ | 124,397,787 | | | | | | | $ | 292,714,672 | | | $ | 241,894,587 | |
| | (a) | | Commenced operations on June 26, 2020. |
| | |
| The accompanying notes are an integral part of these financial statements. | | 11 |
GOLDMAN SACHS CLEAN ENERGY INCOME FUND
Financial Highlights
Selected Share Data for a Share Outstanding Throughout Each Period
| | | | | | | | | | | | | | |
| | | | | Goldman Sachs Clean Energy Income Fund | |
| | | | | Class A Shares | |
| | | | | Six Months Ended
May 31, 2021
(Unaudited) | | | | | | Period Ended November 30, 2020(a) | |
| | Per Share Data | | | | | | | | | | | | |
| | | | |
| | Net asset value, beginning of period | | $ | 13.60 | | | | | | | $ | 10.00 | |
| | | | |
| | Net investment income(b) | | | 0.07 | | | | | | | | 0.08 | |
| | | | |
| | Net realized and unrealized gain (loss) | | | (0.12 | ) | | | | | | | 3.55 | |
| | | | |
| | Total from investment operations | | | (0.05 | ) | | | | | | | 3.63 | |
| | | | |
| | Distributions to shareholders from net investment income | | | (0.03 | ) | | | | | | | (0.03 | ) |
| | | | |
| | Distributions to shareholders from net realized gains | | | (0.05 | ) | | | | | | | — | |
| | | | |
| | Total distributions | | | (0.08 | ) | | | | | | | (0.03 | ) |
| | | | |
| | Net asset value, end of period | | $ | 13.47 | | | | | | | $ | 13.60 | |
| | | | |
| | Total return(c) | | | (0.38 | )% | | | | | | | 36.27 | % |
| | | | |
| | Net assets, end of period (in 000s) | | $ | 5,095 | | | | | | | $ | 1,882 | |
| | | | |
| | Ratio of net expenses to average net assets | | | 1.26 | %(d) | | | | | | | 1.27 | %(d) |
| | | | |
| | Ratio of total expenses to average net assets | | | 1.36 | %(d) | | | | | | | 2.42 | %(d) |
| | | | |
| | Ratio of net investment income to average net assets | | | 0.97 | %(d) | | | | | | | 1.54 | %(d) |
| | | | |
| | Portfolio turnover rate(e) | | | 33 | % | | | | | | | 10 | % |
| | (a) | | Commenced operations on June 26, 2020. |
| | (b) | | Calculated based on the average shares outstanding methodology. |
| | (c) | | Assumes investment at the NAV at the beginning of the period, reinvestment of all dividends and distributions, a complete redemption of the investment at the NAV at the end of the period and no sales or redemption charges (if any). Total returns would be reduced if a sales or redemption charge was taken into account. Returns do not reflect the impact of taxes to shareholders relating to Fund distributions or the redemption of Fund shares. Total returns for periods less than one full year are not annualized. |
| | (e) | | The Fund’s portfolio turnover rate is calculated in accordance with regulatory requirements, without regard to transactions involving short term investments. If such transactions were included, the Fund’s portfolio turnover rate may be higher. |
| | |
| 12 | | The accompanying notes are an integral part of these financial statements. |
GOLDMAN SACHS CLEAN ENERGY INCOME FUND
Financial Highlights (continued)
Selected Share Data for a Share Outstanding Throughout Each Period
| | | | | | | | | | | | | | |
| | | | | Goldman Sachs Clean Energy Income Fund | |
| | | | | Class C Shares | |
| | | | | Six Months Ended
May 31, 2021
(Unaudited) | | | | | | Period Ended November 30, 2020(a) | |
| | Per Share Data | | | | | | | | | | | | |
| | | | |
| | Net asset value, beginning of period | | $ | 13.58 | | | | | | | $ | 10.00 | |
| | | | |
| | Net investment income(b) | | | 0.02 | | | | | | | | 0.03 | |
| | | | |
| | Net realized and unrealized gain (loss) | | | (0.12 | ) | | | | | | | 3.55 | |
| | | | |
| | Total from investment operations | | | (0.10 | ) | | | | | | | 3.58 | |
| | | | |
| | Distributions to shareholders from net investment income | | | (0.03 | ) | | | | | | | — | |
| | | | |
| | Distributions to shareholders from net realized gains | | | (0.05 | ) | | | | | | | — | |
| | | | |
| | Total distributions | | | (0.08 | ) | | | | | | | — | |
| | | | |
| | Net asset value, end of period | | $ | 13.40 | | | | | | | $ | 13.58 | |
| | | | |
| | Total return(c) | | | (0.76 | )% | | | | | | | 35.80 | % |
| | | | |
| | Net assets, end of period (in 000s) | | $ | 178 | | | | | | | $ | 83 | |
| | | | |
| | Ratio of net expenses to average net assets | | | 2.01 | %(d) | | | | | | | 2.02 | %(d) |
| | | | |
| | Ratio of total expenses to average net assets | | | 2.16 | %(d) | | | | | | | 4.85 | %(d) |
| | | | |
| | Ratio of net investment income to average net assets | | | 0.23 | %(d) | | | | | | | 0.51 | %(d) |
| | | | |
| | Portfolio turnover rate(e) | | | 33 | % | | | | | | | 10 | % |
| | (a) | | Commenced operations on June 26, 2020. |
| | (b) | | Calculated based on the average shares outstanding methodology. |
| | (c) | | Assumes investment at the NAV at the beginning of the period, reinvestment of all dividends and distributions, a complete redemption of the investment at the NAV at the end of the period and no sales or redemption charges (if any). Total returns would be reduced if a sales or redemption charge was taken into account. Returns do not reflect the impact of taxes to shareholders relating to Fund distributions or the redemption of Fund shares. Total returns for periods less than one full year are not annualized. |
| | (e) | | The Fund’s portfolio turnover rate is calculated in accordance with regulatory requirements, without regard to transactions involving short term investments. If such transactions were included, the Fund’s portfolio turnover rate may be higher. |
| | |
| The accompanying notes are an integral part of these financial statements. | | 13 |
GOLDMAN SACHS CLEAN ENERGY INCOME FUND
Financial Highlights (continued)
Selected Share Data for a Share Outstanding Throughout Each Period
| | | | | | | | | | | | | | |
| | | | | Goldman Sachs Clean Energy Income Fund | |
| | | | | Institutional Shares | |
| | | | | Six Months Ended
May 31, 2021
(Unaudited) | | | | | | Period Ended November 30, 2020(a) | |
| | Per Share Data | | | | | | | | | | | | |
| | | | |
| | Net asset value, beginning of period | | $ | 13.61 | | | | | | | $ | 10.00 | |
| | | | |
| | Net investment income(b) | | | 0.09 | | | | | | | | 0.08 | |
| | | | |
| | Net realized and unrealized gain (loss) | | | (0.11 | ) | | | | | | | 3.56 | |
| | | | |
| | Total from investment operations | | | (0.02 | ) | | | | | | | 3.64 | |
| | | | |
| | Distributions to shareholders from net investment income | | | (0.03 | ) | | | | | | | (0.03 | ) |
| | | | |
| | Distributions to shareholders from net realized gains | | | (0.05 | ) | | | | | | | — | |
| | | | |
| | Total distributions | | | (0.08 | ) | | | | | | | (0.03 | ) |
| | | | |
| | Net asset value, end of period | | $ | 13.51 | | | | | | | $ | 13.61 | |
| | | | |
| | Total return(c) | | | (0.16 | )% | | | | | | | 36.40 | % |
| | | | |
| | Net assets, end of period (in 000s) | | $ | 13,556 | | | | | | | $ | 7,070 | |
| | | | |
| | Ratio of net expenses to average net assets | | | 0.89 | %(d) | | | | | | | 0.89 | %(d) |
| | | | |
| | Ratio of total expenses to average net assets | | | 1.00 | %(d) | | | | | | | 3.62 | %(d) |
| | | | |
| | Ratio of net investment income to average net assets | | | 1.32 | %(d) | | | | | | | 1.52 | %(d) |
| | | | |
| | Portfolio turnover rate(e) | | | 33 | % | | | | | | | 10 | % |
| | (a) | | Commenced operations on June 26, 2020. |
| | (b) | | Calculated based on the average shares outstanding methodology. |
| | (c) | | Assumes investment at the NAV at the beginning of the period, reinvestment of all dividends and distributions, a complete redemption of the investment at the NAV at the end of the period and no sales or redemption charges (if any). Total returns would be reduced if a sales or redemption charge was taken into account. Returns do not reflect the impact of taxes to shareholders relating to Fund distributions or the redemption of Fund shares. Total returns for periods less than one full year are not annualized. |
| | (e) | | The Fund’s portfolio turnover rate is calculated in accordance with regulatory requirements, without regard to transactions involving short term investments. If such transactions were included, the Fund’s portfolio turnover rate may be higher. |
| | |
| 14 | | The accompanying notes are an integral part of these financial statements. |
GOLDMAN SACHS CLEAN ENERGY INCOME FUND
Financial Highlights (continued)
Selected Share Data for a Share Outstanding Throughout Each Period
| | | | | | | | | | | | | | |
| | | | | Goldman Sachs Clean Energy Income Fund | |
| | | | | Investor Shares | |
| | | | | Six Months Ended
May 31, 2021
(Unaudited) | | | | | | Period Ended November 30, 2020(a) | |
| | Per Share Data | | | | | | | | | | | | |
| | | | |
| | Net asset value, beginning of period | | $ | 13.61 | | | | | | | $ | 10.00 | |
| | | | |
| | Net investment income(b) | | | 0.10 | | | | | | | | 0.07 | |
| | | | |
| | Net realized and unrealized gain (loss) | | | (0.13 | ) | | | | | | | 3.56 | |
| | | | |
| | Total from investment operations | | | (0.03 | ) | | | | | | | 3.63 | |
| | | | |
| | Distributions to shareholders from net investment income | | | (0.03 | ) | | | | | | | (0.02 | ) |
| | | | |
| | Distributions to shareholders from net realized gains | | | (0.05 | ) | | | | | | | — | |
| | | | |
| | Total distributions | | | (0.08 | ) | | | | | | | (0.02 | ) |
| | | | |
| | Net asset value, end of period | | $ | 13.50 | | | | | | | $ | 13.61 | |
| | | | |
| | Total return(c) | | | (0.23 | )% | | | | | | | 36.33 | % |
| | | | |
| | Net assets, end of period (in 000s) | | $ | 791 | | | | | | | $ | 68 | |
| | | | |
| | Ratio of net expenses to average net assets | | | 1.01 | %(d) | | | | | | | 1.02 | %(d) |
| | | | |
| | Ratio of total expenses to average net assets | | | 1.10 | %(d) | | | | | | | 3.86 | %(d) |
| | | | |
| | Ratio of net investment income to average net assets | | | 1.43 | %(d) | | | | | | | 1.39 | %(d) |
| | | | |
| | Portfolio turnover rate(e) | | | 33 | % | | | | | | | 10 | % |
| | (a) | | Commenced operations on June 26, 2020. |
| | (b) | | Calculated based on the average shares outstanding methodology. |
| | (c) | | Assumes investment at the NAV at the beginning of the period, reinvestment of all dividends and distributions, a complete redemption of the investment at the NAV at the end of the period and no sales or redemption charges (if any). Total returns would be reduced if a sales or redemption charge was taken into account. Returns do not reflect the impact of taxes to shareholders relating to Fund distributions or the redemption of Fund shares. Total returns for periods less than one full year are not annualized. |
| | (e) | | The Fund’s portfolio turnover rate is calculated in accordance with regulatory requirements, without regard to transactions involving short term investments. If such transactions were included, the Fund’s portfolio turnover rate may be higher. |
| | |
| The accompanying notes are an integral part of these financial statements. | | 15 |
GOLDMAN SACHS CLEAN ENERGY INCOME FUND
Financial Highlights (continued)
Selected Share Data for a Share Outstanding Throughout Each Period
| | | | | | | | | | | | | | |
| | | | | Goldman Sachs Clean Energy Income Fund | |
| | | | | Class R6 Shares | |
| | | | | Six Months Ended
May 31, 2021
(Unaudited) | | | | | | Period Ended November 30, 2020(a) | |
| | Per Share Data | | | | | | | | | | | | |
| | | | |
| | Net asset value, beginning of period | | $ | 13.61 | | | | | | | $ | 10.00 | |
| | | | |
| | Net investment income(b) | | | 0.09 | | | | | | | | 0.08 | |
| | | | |
| | Net realized and unrealized gain (loss) | | | (0.11 | ) | | | | | | | 3.56 | |
| | | | |
| | Total from investment operations | | | (0.02 | ) | | | | | | | 3.64 | |
| | | | |
| | Distributions to shareholders from net investment income | | | (0.03 | ) | | | | | | | (0.03 | ) |
| | | | |
| | Distributions to shareholders from net realized gains | | | (0.05 | ) | | | | | | | — | |
| | | | |
| | Total distributions | | | (0.08 | ) | | | | | | | (0.03 | ) |
| | | | |
| | Net asset value, end of period | | $ | 13.51 | | | | | | | $ | 13.61 | |
| | | | |
| | Total return(c) | | | (0.16 | )% | | | | | | | 36.40 | % |
| | | | |
| | Net assets, end of period (in 000s) | | $ | 68 | | | | | | | $ | 68 | |
| | | | |
| | Ratio of net expenses to average net assets | | | 0.88 | %(d) | | | | | | | 0.88 | %(d) |
| | | | |
| | Ratio of total expenses to average net assets | | | 1.00 | %(d) | | | | | | | 3.72 | %(d) |
| | | | |
| | Ratio of net investment income to average net assets | | | 1.26 | %(d) | | | | | | | 1.53 | %(d) |
| | | | |
| | Portfolio turnover rate(e) | | | 33 | % | | | | | | | 10 | % |
| | (a) | | Commenced operations on June 26, 2020. |
| | (b) | | Calculated based on the average shares outstanding methodology. |
| | (c) | | Assumes investment at the NAV at the beginning of the period, reinvestment of all dividends and distributions, a complete redemption of the investment at the NAV at the end of the period and no sales or redemption charges (if any). Total returns would be reduced if a sales or redemption charge was taken into account. Returns do not reflect the impact of taxes to shareholders relating to Fund distributions or the redemption of Fund shares. Total returns for periods less than one full year are not annualized. |
| | (e) | | The Fund’s portfolio turnover rate is calculated in accordance with regulatory requirements, without regard to transactions involving short term investments. If such transactions were included, the Fund’s portfolio turnover rate may be higher. |
| | |
| 16 | | The accompanying notes are an integral part of these financial statements. |
GOLDMAN SACHS CLEAN ENERGY INCOME FUND
Financial Highlights (continued)
Selected Share Data for a Share Outstanding Throughout Each Period
| | | | | | | | | | | | | | |
| | | | | Goldman Sachs Clean Energy Income Fund | |
| | | | | Class R Shares | |
| | | | | Six Months Ended
May 31, 2021
(Unaudited) | | | | | | Period Ended November 30, 2020(a) | |
| | Per Share Data | | | | | | | | | | | | |
| | | | |
| | Net asset value, beginning of period | | $ | 13.61 | | | | | | | $ | 10.00 | |
| | | | |
| | Net investment income(b) | | | 0.05 | | | | | | | | 0.05 | |
| | | | |
| | Net realized and unrealized gain (loss) | | | (0.11 | ) | | | | | | | 3.56 | |
| | | | |
| | Total from investment operations | | | (0.06 | ) | | | | | | | 3.61 | |
| | | | |
| | Distributions to shareholders from net investment income | | | (0.03 | ) | | | | | | | — | |
| | | | |
| | Distributions to shareholders from net realized gains | | | (0.05 | ) | | | | | | | — | |
| | | | |
| | Total distributions | | | (0.08 | ) | | | | | | | — | |
| | | | |
| | Net asset value, end of period | | $ | 13.47 | | | | | | | $ | 13.61 | |
| | | | |
| | Total return(c) | | | (0.46 | )% | | | | | | | 36.10 | % |
| | | | |
| | Net assets, end of period (in 000s) | | $ | 72 | | | | | | | $ | 68 | |
| | | | |
| | Ratio of net expenses to average net assets | | | 1.51 | %(d) | | | | | | | 1.52 | %(d) |
| | | | |
| | Ratio of total expenses to average net assets | | | 1.62 | %(d) | | | | | | | 4.36 | %(d) |
| | | | |
| | Ratio of net investment income to average net assets | | | 0.65 | %(d) | | | | | | | 0.89 | %(d) |
| | | | |
| | Portfolio turnover rate(e) | | | 33 | % | | | | | | | 10 | % |
| | (a) | | Commenced operations on June 26, 2020. |
| | (b) | | Calculated based on the average shares outstanding methodology. |
| | (c) | | Assumes investment at the NAV at the beginning of the period, reinvestment of all dividends and distributions, a complete redemption of the investment at the NAV at the end of the period and no sales or redemption charges (if any). Total returns would be reduced if a sales or redemption charge was taken into account. Returns do not reflect the impact of taxes to shareholders relating to Fund distributions or the redemption of Fund shares. Total returns for periods less than one full year are not annualized. |
| | (e) | | The Fund’s portfolio turnover rate is calculated in accordance with regulatory requirements, without regard to transactions involving short term investments. If such transactions were included, the Fund’s portfolio turnover rate may be higher. |
| | |
| The accompanying notes are an integral part of these financial statements. | | 17 |
GOLDMAN SACHS CLEAN ENERGY INCOME FUND
Financial Highlights (continued)
Selected Share Data for a Share Outstanding Throughout Each Period
| | | | | | | | | | | | | | |
| | | | | Goldman Sachs Clean Energy Income Fund | |
| | | | | Class P Shares | |
| | | | | Six Months Ended
May 31, 2021
(Unaudited) | | | | | | Period Ended November 30, 2020(a) | |
| | Per Share Data | | | | | | | | | | | | |
| | | | |
| | Net asset value, beginning of period | | $ | 13.61 | | | | | | | $ | 10.00 | |
| | | | |
| | Net investment income(b) | | | 0.10 | | | | | | | | 0.08 | |
| | | | |
| | Net realized and unrealized gain (loss) | | | (0.13 | ) | | | | | | | 3.56 | |
| | | | |
| | Total from investment operations | | | (0.03 | ) | | | | | | | 3.64 | |
| | | | |
| | Distributions to shareholders from net investment income | | | (0.03 | ) | | | | | | | (0.03 | ) |
| | | | |
| | Distributions to shareholders from net realized gains | | | (0.05 | ) | | | | | | | — | |
| | | | |
| | Total distributions | | | (0.08 | ) | | | | | | | (0.03 | ) |
| | | | |
| | Net asset value, end of period | | $ | 13.50 | | | | | | | $ | 13.61 | |
| | | | |
| | Total return(c) | | | (0.15 | )% | | | | | | | 36.41 | % |
| | | | |
| | Net assets, end of period (in 000s) | | $ | 378,185 | | | | | | | $ | 115,158 | |
| | | | |
| | Ratio of net expenses to average net assets | | | 0.88 | %(d) | | | | | | | 0.88 | %(d) |
| | | | |
| | Ratio of total expenses to average net assets | | | 0.98 | %(d) | | | | | | | 1.85 | %(d) |
| | | | |
| | Ratio of net investment income to average net assets | | | 1.03 | %(d) | | | | | | | 1.41 | %(d) |
| | | | |
| | Portfolio turnover rate(e) | | | 33 | % | | | | | | | 10 | % |
| | (a) | | Commenced operations on June 26, 2020. |
| | (b) | | Calculated based on the average shares outstanding methodology. |
| | (c) | | Assumes investment at the NAV at the beginning of the period, reinvestment of all dividends and distributions, a complete redemption of the investment at the NAV at the end of the period and no sales or redemption charges (if any). Total returns would be reduced if a sales or redemption charge was taken into account. Returns do not reflect the impact of taxes to shareholders relating to Fund distributions or the redemption of Fund shares. Total returns for periods less than one full year are not annualized. |
| | (e) | | The Fund’s portfolio turnover rate is calculated in accordance with regulatory requirements, without regard to transactions involving short term investments. If such transactions were included, the Fund’s portfolio turnover rate may be higher. |
| | |
| 18 | | The accompanying notes are an integral part of these financial statements. |
GOLDMAN SACHS ENERGY INFRASTRUCTURE FUND
Financial Highlights (continued)
Selected Share Data for a Share Outstanding Throughout Each Period
| | | | | | | | | | | | | | | | | | | | | | |
| | | | | Goldman Sachs Energy Infrastructure Fund | |
| | | | | Class A Shares | |
| | | | | Six Months Ended
May 31, 2021
(Unaudited) | | | Year Ended November 30, | | | Period Ended
November 30, 2017(a) | |
| | | | | 2020 | | | 2019 | | | 2018 | |
| | Per Share Data | | | | | | | | | | | | | | | | | | | | |
| | | | | | |
| | Net asset value, beginning of period | | $ | 7.18 | | | $ | 8.64 | | | $ | 9.26 | | | $ | 9.54 | | | $ | 10.00 | |
| | | | | | |
| | Net investment income(b) | | | 0.06 | | | | 0.03 | | | | 0.12 | | | | 0.11 | | | | 0.01 | |
| | | | | | |
| | Net realized and unrealized gain (loss) | | | 2.34 | | | | (1.16 | )(c) | | | (0.36 | )(c) | | | (0.12 | ) | | | (0.40 | ) |
| | | | | | |
| | Total from investment operations | | | 2.40 | | | | (1.13 | ) | | | (0.24 | ) | | | (0.01 | ) | | | (0.39 | ) |
| | | | | | |
| | Distributions to shareholders from net investment income | | | (0.01 | ) | | | (0.05 | ) | | | (0.23 | ) | | | (0.11 | ) | | | (0.03 | ) |
| | Distributions to shareholders from net realized gains | | | — | | | | (0.05 | ) | | | — | | | | — | | | | — | |
| | Distributions to shareholders from return of capital | | | — | | | | (0.23 | ) | | | (0.15 | ) | | | (0.16 | ) | | | (0.04 | ) |
| | | | | | |
| | Total distributions | | | (0.01 | ) | | | (0.33 | ) | | | (0.38 | ) | | | (0.27 | ) | | | (0.07 | ) |
| | | | | | |
| | Net asset value, end of period | | $ | 9.57 | | | $ | 7.18 | | | $ | 8.64 | | | $ | 9.26 | | | $ | 9.54 | |
| | | | | | |
| | Total return(d) | | | 33.47 | % | | | (13.05 | )% | | | (2.82 | )% | | | (0.21 | )% | | | (3.93 | )% |
| | | | | | |
| | Net assets, end of period (in 000s) | | $ | 205 | | | $ | 68 | | | $ | 55 | | | $ | 48 | | | $ | 48 | |
| | | | | | |
| | Ratio of net expenses to average net assets | | | 1.47 | %(e) | | | 1.48 | % | | | 1.50 | % | | | 1.49 | % | | | 1.49 | %(e) |
| | | | | | |
| | Ratio of total expenses to average net assets | | | 1.56 | %(e) | | | 1.73 | % | | | 2.47 | % | | | 15.71 | %(f) | | | 20.57 | %(e) |
| | | | | | |
| | Ratio of net investment income to average net assets | | | 1.53 | %(e) | | | 0.35 | % | | | 1.24 | % | | | 1.14 | % | | | 0.64 | %(e) |
| | | | | | |
| | Portfolio turnover rate(g) | | | 40 | % | | | 121 | % | | | 59 | % | | | 67 | % | | | 11 | % |
| | (a) | | Commenced operations on September 29, 2017. |
| | (b) | | Calculated based on the average shares outstanding methodology. |
| | (c) | | Calculation of the net gain (loss) per share (both realized and unrealized) does not correlate to the aggregate realized and unrealized gain (loss) presented in the Statement of Operations due to the timing of subscriptions and redemptions of Fund shares in relation to fluctuations in the market value of the portfolio. |
| | (d) | | Assumes investment at the NAV at the beginning of the period, reinvestment of all dividends and distributions, a complete redemption of the investment at the NAV at the end of the period and no sales or redemption charges (if any). Total returns would be reduced if a sales or redemption charge was taken into account. Returns do not reflect the impact of taxes to shareholders relating to Fund distributions or the redemption of Fund shares. Total returns for periods less than one full year are not annualized. |
| | (f) | | The amount reflects certain expense reallocations between the classes due to the timing of sales and redemptions of Fund class shares. |
| | (g) | | The Fund’s portfolio turnover rate is calculated in accordance with regulatory requirements, without regard to transactions involving short term investments. If such transactions were included, the Fund’s portfolio turnover rate may be higher. |
| | |
| The accompanying notes are an integral part of these financial statements. | | 19 |
GOLDMAN SACHS ENERGY INFRASTRUCTURE FUND
Financial Highlights (continued)
Selected Share Data for a Share Outstanding Throughout Each Period
| | | | | | | | | | | | | | | | | | | | | | |
| | | | | Goldman Sachs Energy Infrastructure Fund
| |
| | | | | Class C Shares | |
| | | | | Six Months Ended
May 31, 2021
(Unaudited) | | | Year Ended November 30, | | | Period Ended
November 30, 2017(a) | |
| | | | | 2020 | | | 2019 | | | 2018 | |
| | Per Share Data | | | | | | | | | | | | | | | | | | | | |
| | | | | | |
| | Net asset value, beginning of period | | $ | 7.20 | | | $ | 8.64 | | | $ | 9.26 | | | $ | 9.54 | | | $ | 10.00 | |
| | | | | | |
| | Net investment income (loss)(b) | | | 0.04 | | | | (0.02 | ) | | | 0.08 | | | | 0.04 | | | | — | (c) |
| | | | | | |
| | Net realized and unrealized gain (loss) | | | 2.32 | | | | (1.16 | )(d) | | | (0.39 | )(d) | | | (0.12 | ) | | | (0.41 | ) |
| | | | | | |
| | Total from investment operations | | | 2.36 | | | | (1.18 | ) | | | (0.31 | ) | | | (0.08 | ) | | | (0.41 | ) |
| | | | | | |
| | Distributions to shareholders from net investment income | | | — | (c) | | | (0.02 | ) | | | (0.19 | ) | | | (0.08 | ) | | | (0.02 | ) |
| | Distributions to shareholders from net realized gains | | | — | | | | (0.05 | ) | | | — | | | | — | | | | — | |
| | | | | | |
| | Distributions to shareholders from return of capital | | | — | | | | (0.19 | ) | | | (0.12 | ) | | | (0.12 | ) | | | (0.03 | ) |
| | | | | | |
| | Total distributions | | | — | | | | (0.26 | ) | | | (0.31 | ) | | | (0.20 | ) | | | (0.05 | ) |
| | | | | | |
| | Net asset value, end of period | | $ | 9.56 | | | $ | 7.20 | | | $ | 8.64 | | | $ | 9.26 | | | $ | 9.54 | |
| | | | | | |
| | Total return(e) | | | 32.85 | % | | | (13.60 | )% | | | (3.63 | )% | | | (0.86 | )% | | | (4.04 | )% |
| | | | | | |
| | Net assets, end of period (in 000s) | | $ | 179 | | | $ | 135 | | | $ | 154 | | | $ | 48 | | | $ | 48 | |
| | | | | | |
| | Ratio of net expenses to average net assets | | | 2.22 | %(f) | | | 2.23 | % | | | 2.25 | % | | | 2.24 | % | | | 2.24 | %(f) |
| | | | | | |
| | Ratio of total expenses to average net assets | | | 2.31 | %(f) | | | 2.48 | % | | | 3.17 | % | | | 16.47 | %(g) | | �� | 21.32 | %(f) |
| | | | | | |
| | Ratio of net investment income (loss) to average net assets | | | 0.92 | %(f) | | | (0.34 | )% | | | 0.89 | % | | | 0.39 | % | | | (0.11 | )%(f) |
| | | | | | |
| | Portfolio turnover rate(h) | | | 40 | % | | | 121 | % | | | 59 | % | | | 67 | % | | | 11 | % |
| | (a) | | Commenced operations on September 29, 2017. |
| | (b) | | Calculated based on the average shares outstanding methodology. |
| | (c) | | Amount is less than $0.005 per share. |
| | (d) | | Calculation of the net gain (loss) per share (both realized and unrealized) does not correlate to the aggregate realized and unrealized gain (loss) presented in the Statement of Operations due to the timing of subscriptions and redemptions of Fund shares in relation to fluctuations in the market value of the portfolio. |
| | (e) | | Assumes investment at the NAV at the beginning of the period, reinvestment of all dividends and distributions, a complete redemption of the investment at the NAV at the end of the period and no sales or redemption charges (if any). Total returns would be reduced if a sales or redemption charge was taken into account. Returns do not reflect the impact of taxes to shareholders relating to Fund distributions or the redemption of Fund shares. Total returns for periods less than one full year are not annualized. |
| | (g) | | The amount reflects certain expense reallocations between the classes due to the timing of sales and redemptions of Fund class shares. |
| | (h) | | The Fund’s portfolio turnover rate is calculated in accordance with regulatory requirements, without regard to transactions involving short term investments. If such transactions were included, the Fund’s portfolio turnover rate may be higher. |
| | |
| 20 | | The accompanying notes are an integral part of these financial statements. |
GOLDMAN SACHS ENERGY INFRASTRUCTURE FUND
Financial Highlights (continued)
Selected Share Data for a Share Outstanding Throughout Each Period
| | | | | | | | | | | | | | | | | | | | | | |
| | | | | Goldman Sachs Energy Infrastructure Fund
| |
| | | | | Institutional Shares | |
| | | | | Six Months Ended
May 31, 2021
(Unaudited) | | | Year Ended November 30, | | | Period Ended
November 30, 2017(a) | |
| | | | | 2020 | | | 2019 | | | 2018 | |
| | Per Share Data | | | | | | | | | | | | | | | | | | | | |
| | | | | | |
| | Net asset value, beginning of period | | $ | 7.19 | | | $ | 8.65 | | | $ | 9.26 | | | $ | 9.54 | | | $ | 10.00 | |
| | | | | | |
| | Net investment income(b) | | | 0.08 | | | | 0.05 | | | | 0.15 | | | | 0.15 | | | | 0.02 | |
| | | | | | |
| | Net realized and unrealized gain (loss) | | | 2.33 | | | | (1.16 | )(c) | | | (0.35 | )(c) | | | (0.12 | ) | | | (0.41 | ) |
| | | | | | |
| | Total from investment operations | | | 2.41 | | | | (1.11 | ) | | | (0.20 | ) | | | 0.03 | | | | (0.39 | ) |
| | | | | | |
| | Distributions to shareholders from net investment income | | | (0.01 | ) | | | (0.05 | ) | | | (0.25 | ) | | | (0.12 | ) | | | (0.03 | ) |
| | Distributions to shareholders from net realized gains | | | — | | | | (0.05 | ) | | | — | | | | — | | | | — | |
| | | | | | |
| | Distributions to shareholders from return of capital | | | — | | | | (0.25 | ) | | | (0.16 | ) | | | (0.19 | ) | | | (0.04 | ) |
| | | | | | |
| | Total distributions | | | (0.01 | ) | | | (0.35 | ) | | | (0.41 | ) | | | (0.31 | ) | | | (0.07 | ) |
| | | | | | |
| | Net asset value, end of period | | $ | 9.59 | | | $ | 7.19 | | | $ | 8.65 | | | $ | 9.26 | | | $ | 9.54 | |
| | | | | | |
| | Total return(d) | | | 33.62 | % | | | (12.74 | )% | | | (2.36 | )% | | | 0.18 | % | | | (3.87 | )% |
| | | | | | |
| | Net assets, end of period (in 000s) | | $ | 3,570 | | | $ | 2,415 | | | $ | 2,606 | | | $ | 2,650 | | | $ | 2,644 | |
| | | | | | |
| | Ratio of net expenses to average net assets | | | 1.10 | %(e) | | | 1.10 | % | | | 1.11 | % | | | 1.10 | % | | | 1.10 | %(e) |
| | | | | | |
| | Ratio of total expenses to average net assets | | | 1.20 | %(e) | | | 1.35 | % | | | 2.09 | % | | | 15.32 | %(f) | | | 20.18 | %(e) |
| | | | | | |
| | Ratio of net investment income to average net assets | | | 2.02 | %(e) | | | 0.74 | % | | | 1.62 | % | | | 1.53 | % | | | 1.03 | %(e) |
| | | | | | |
| | Portfolio turnover rate(g) | | | 40 | % | | | 121 | % | | | 59 | % | | | 67 | % | | | 11 | % |
| | (a) | | Commenced operations on September 29, 2017. |
| | (b) | | Calculated based on the average shares outstanding methodology. |
| | (c) | | Calculation of the net gain (loss) per share (both realized and unrealized) does not correlate to the aggregate realized and unrealized gain (loss) presented in the Statement of Operations due to the timing of subscriptions and redemptions of Fund shares in relation to fluctuations in the market value of the portfolio. |
| | (d) | | Assumes investment at the NAV at the beginning of the period, reinvestment of all dividends and distributions, a complete redemption of the investment at the NAV at the end of the period and no sales or redemption charges (if any). Total returns would be reduced if a sales or redemption charge was taken into account. Returns do not reflect the impact of taxes to shareholders relating to Fund distributions or the redemption of Fund shares. Total returns for periods less than one full year are not annualized. |
| | (f) | | The amount reflects certain expense reallocations between the classes due to the timing of sales and redemptions of Fund class shares. |
| | (g) | | The Fund’s portfolio turnover rate is calculated in accordance with regulatory requirements, without regard to transactions involving short term investments. If such transactions were included, the Fund’s portfolio turnover rate may be higher. |
| | |
| The accompanying notes are an integral part of these financial statements. | | 21 |
GOLDMAN SACHS ENERGY INFRASTRUCTURE FUND
Financial Highlights (continued)
Selected Share Data for a Share Outstanding Throughout Each Period
| | | | | | | | | | | | | | | | | | | | | | |
| | | | | Goldman Sachs Energy Infrastructure Fund
| |
| | | | | Investor Shares | |
| | | | | Six Months Ended
May 31, 2021
(Unaudited) | | | Year Ended November 30, | | | Period Ended
November 30, 2017(a) | |
| | | | | 2020 | | | 2019 | | | 2018 | |
| | Per Share Data | | | | | | | | | | | | | | | | | | | | |
| | | | | | |
| | Net asset value, beginning of period | | $ | 7.19 | | | $ | 8.65 | | | $ | 9.26 | | | $ | 9.54 | | | $ | 10.00 | |
| | | | | | |
| | Net investment income(b) | | | 0.08 | | | | 0.04 | | | | 0.14 | | | | 0.14 | | | | 0.01 | |
| | | | | | |
| | Net realized and unrealized gain (loss) | | | 2.33 | | | | (1.16 | )(c) | | | (0.35 | )(c) | | | (0.13 | ) | | | (0.40 | ) |
| | | | | | |
| | Total from investment operations | | | 2.41 | | | | (1.12 | ) | | | (0.21 | ) | | | 0.01 | | | | (0.39 | ) |
| | | | | | |
| | Distributions to shareholders from net investment income | | | (0.01 | ) | | | (0.05 | ) | | | (0.24 | ) | | | (0.11 | ) | | | (0.03 | ) |
| | Distributions to shareholders from net realized gains | | | — | | | | (0.05 | ) | | | — | | | | — | | | | — | |
| | | | | | |
| | Distributions to shareholders from return of capital | | | — | | | | (0.24 | ) | | | (0.16 | ) | | | (0.18 | ) | | | (0.04 | ) |
| | | | | | |
| | Total distributions | | | (0.01 | ) | | | (0.34 | ) | | | (0.40 | ) | | | (0.29 | ) | | | (0.07 | ) |
| | | | | | |
| | Net asset value, end of period | | $ | 9.59 | | | $ | 7.19 | | | $ | 8.65 | | | $ | 9.26 | | | $ | 9.54 | |
| | | | | | |
| | Total return(d) | | | 33.60 | % | | | (12.86 | )% | | | (2.50 | )% | | | 0.04 | % | | | (3.90 | )% |
| | | | | | |
| | Net assets, end of period (in 000s) | | $ | 55 | | | $ | 41 | | | $ | 47 | | | $ | 48 | | | $ | 48 | |
| | | | | | |
| | Ratio of net expenses to average net assets | | | 1.21 | %(e) | | | 1.23 | % | | | 1.25 | % | | | 1.24 | % | | | 1.24 | %(e) |
| | | | | | |
| | Ratio of total expenses to average net assets | | | 1.31 | %(e) | | | 1.49 | % | | | 2.23 | % | | | 15.46 | %(f) | | | 20.32 | %(e) |
| | | | | | |
| | Ratio of net investment income to average net assets | | | 1.92 | %(e) | | | 0.61 | % | | | 1.49 | % | | | 1.39 | % | | | 0.89 | %(e) |
| | | | | | |
| | Portfolio turnover rate(g) | | | 40 | % | | | 121 | % | | | 59 | % | | | 67 | % | | | 11 | % |
| | (a) | | Commenced operations on September 29, 2017. |
| | (b) | | Calculated based on the average shares outstanding methodology. |
| | (c) | | Calculation of the net gain (loss) per share (both realized and unrealized) does not correlate to the aggregate realized and unrealized gain (loss) presented in the Statement of Operations due to the timing of subscriptions and redemptions of Fund shares in relation to fluctuations in the market value of the portfolio. |
| | (d) | | Assumes investment at the NAV at the beginning of the period, reinvestment of all dividends and distributions, a complete redemption of the investment at the NAV at the end of the period and no sales or redemption charges (if any). Total returns would be reduced if a sales or redemption charge was taken into account. Returns do not reflect the impact of taxes to shareholders relating to Fund distributions or the redemption of Fund shares. Total returns for periods less than one full year are not annualized. |
| | (f) | | The amount reflects certain expense reallocations between the classes due to the timing of sales and redemptions of Fund class shares. |
| | (g) | | The Fund’s portfolio turnover rate is calculated in accordance with regulatory requirements, without regard to transactions involving short term investments. If such transactions were included, the Fund’s portfolio turnover rate may be higher. |
| | |
| 22 | | The accompanying notes are an integral part of these financial statements. |
GOLDMAN SACHS ENERGY INFRASTRUCTURE FUND
Financial Highlights (continued)
Selected Share Data for a Share Outstanding Throughout Each Period
| | | | | | | | | | | | | | | | | | | | | | |
| | | | | Goldman Sachs Energy Infrastructure Fund
| |
| | | | | Class R6 Shares | |
| | | | | Six Months Ended
May 31, 2021
(Unaudited) | | | Year Ended November 30, | | | Period Ended
November 30, 2017(a) | |
| | | | | 2020 | | | 2019 | | | 2018 | |
| | Per Share Data | | | | | | | | | | | | | | | | | | | | |
| | | | | | |
| | Net asset value, beginning of period | | $ | 7.18 | | | $ | 8.65 | | | $ | 9.26 | | | $ | 9.54 | | | $ | 10.00 | |
| | | | | | |
| | Net investment income(b) | | | 0.08 | | | | 0.06 | | | | 0.16 | | | | 0.15 | | | | 0.02 | |
| | | | | | |
| | Net realized and unrealized gain (loss) | | | 2.33 | | | | (1.18 | )(c) | | | (0.36 | )(c) | | | (0.12 | ) | | | (0.41 | ) |
| | | | | | |
| | Total from investment operations | | | 2.41 | | | | (1.12 | ) | | | (0.20 | ) | | | 0.03 | | | | (0.39 | ) |
| | | | | | |
| | Distributions to shareholders from net investment income | | | (0.01 | ) | | | (0.05 | ) | | | (0.25 | ) | | | (0.12 | ) | | | (0.03 | ) |
| | Distributions to shareholders from net realized gains | | | — | | | | (0.05 | ) | | | — | | | | — | | | | — | |
| | | | | | |
| | Distributions to shareholders from return of capital | | | — | | | | (0.25 | ) | | | (0.16 | ) | | | (0.19 | ) | | | (0.04 | ) |
| | | | | | |
| | Total distributions | | | (0.01 | ) | | | (0.35 | ) | | | (0.41 | ) | | | (0.31 | ) | | | (0.07 | ) |
| | | | | | |
| | Net asset value, end of period | | $ | 9.58 | | | $ | 7.18 | | | $ | 8.65 | | | $ | 9.26 | | | $ | 9.54 | |
| | | | | | |
| | Total return(d) | | | 33.67 | % | | | (12.83 | )% | | | (2.35 | )% | | | 0.19 | % | | | (3.87 | )% |
| | | | | | |
| | Net assets, end of period (in 000s) | | $ | 78,330 | | | $ | 78,375 | | | $ | 47 | | | $ | 48 | | | $ | 48 | |
| | | | | | |
| | Ratio of net expenses to average net assets | | | 1.09 | %(e) | | | 1.09 | % | | | 1.10 | % | | | 1.09 | % | | | 1.09 | %(e) |
| | | | | | |
| | Ratio of total expenses to average net assets | | | 1.19 | %(e) | | | 1.30 | % | | | 2.08 | % | | | 15.31 | %(f) | | | 20.17 | %(e) |
| | | | | | |
| | Ratio of net investment income to average net assets | | | 2.05 | %(e) | | | 0.92 | % | | | 1.64 | % | | | 1.54 | % | | | 1.04 | %(e) |
| | | | | | |
| | Portfolio turnover rate(g) | | | 40 | % | | | 121 | % | | | 59 | % | | | 67 | % | | | 11 | % |
| | (a) | | Commenced operations on September 29, 2017. |
| | (b) | | Calculated based on the average shares outstanding methodology. |
| | (c) | | Calculation of the net gain (loss) per share (both realized and unrealized) does not correlate to the aggregate realized and unrealized gain (loss) presented in the Statement of Operations due to the timing of subscriptions and redemptions of Fund shares in relation to fluctuations in the market value of the portfolio. |
| | (d) | | Assumes investment at the NAV at the beginning of the period, reinvestment of all dividends and distributions, a complete redemption of the investment at the NAV at the end of the period and no sales or redemption charges (if any). Total returns would be reduced if a sales or redemption charge was taken into account. Returns do not reflect the impact of taxes to shareholders relating to Fund distributions or the redemption of Fund shares. Total returns for periods less than one full year are not annualized. |
| | (f) | | The amount reflects certain expense reallocations between the classes due to the timing of sales and redemptions of Fund class shares. |
| | (g) | | The Fund’s portfolio turnover rate is calculated in accordance with regulatory requirements, without regard to transactions involving short term investments. If such transactions were included, the Fund’s portfolio turnover rate may be higher. |
| | |
| The accompanying notes are an integral part of these financial statements. | | 23 |
GOLDMAN SACHS ENERGY INFRASTRUCTURE FUND
Financial Highlights (continued)
Selected Share Data for a Share Outstanding Throughout Each Period
| | | | | | | | | | | | | | | | | | | | | | |
| | | | | Goldman Sachs Energy Infrastructure Fund
| |
| | | | | Class R Shares | |
| | | | | Six Months Ended
May 31, 2021
(Unaudited) | | | Year Ended November 30, | | | Period Ended
November 30, 2017(a) | |
| | | | | 2020 | | | 2019 | | | 2018 | |
| | Per Share Data | | | | | | | | | | | | | | | | | | | | |
| | | | | | |
| | Net asset value, beginning of period | | $ | 7.19 | | | $ | 8.65 | | | $ | 9.26 | | | $ | 9.54 | | | $ | 10.00 | |
| | | | | | |
| | Net investment income(b) | | | 0.06 | | | | 0.01 | | | | 0.09 | | | | 0.09 | | | | 0.01 | |
| | | | | | |
| | Net realized and unrealized gain (loss) | | | 2.33 | | | | (1.17 | )(c) | | | (0.35 | )(c) | | | (0.12 | ) | | | (0.41 | ) |
| | | | | | |
| | Total from investment operations | | | 2.39 | | | | (1.16 | ) | | | (0.26 | ) | | | (0.03 | ) | | | (0.40 | ) |
| | | | | | |
| | Distributions to shareholders from net investment income | | | (0.01 | ) | | | (0.04 | ) | | | (0.21 | ) | | | (0.10 | ) | | | (0.02 | ) |
| | Distributions to shareholders from net realized gains | | | — | | | | (0.05 | ) | | | — | | | | — | | | | — | |
| | | | | | |
| | Distributions to shareholders from return of capital | | | — | | | | (0.21 | ) | | | (0.14 | ) | | | (0.15 | ) | | | (0.04 | ) |
| | | | | | |
| | Total distributions | | | (0.01 | ) | | | (0.30 | ) | | | (0.35 | ) | | | (0.25 | ) | | | (0.06 | ) |
| | | | | | |
| | Net asset value, end of period | | $ | 9.57 | | | $ | 7.19 | | | $ | 8.65 | | | $ | 9.26 | | | $ | 9.54 | |
| | | | | | |
| | Total return(d) | | | 33.25 | % | | | (13.34 | )% | | | (2.98 | )% | | | (0.46 | )% | | | (3.97 | )% |
| | | | | | |
| | Net assets, end of period (in 000s) | | $ | 54 | | | $ | 40 | | | $ | 49 | | | $ | 49 | | | $ | 48 | |
| | | | | | |
| | Ratio of net expenses to average net assets | | | 1.71 | %(e) | | | 1.73 | % | | | 1.75 | % | | | 1.74 | % | | | 1.74 | %(e) |
| | | | | | |
| | Ratio of total expenses to average net assets | | | 1.81 | %(e) | | | 1.99 | % | | | 2.73 | % | | | 15.94 | %(f) | | | 20.82 | %(e) |
| | | | | | |
| | Ratio of net investment income to average net assets | | | 1.42 | %(e) | | | 0.10 | % | | | 0.99 | % | | | 0.89 | % | | | 0.39 | %(e) |
| | | | | | |
| | Portfolio turnover rate(g) | | | 40 | % | | | 121 | % | | | 59 | % | | | 67 | % | | | 11 | % |
| | (a) | | Commenced operations on September 29, 2017. |
| | (b) | | Calculated based on the average shares outstanding methodology. |
| | (c) | | Calculation of the net gain (loss) per share (both realized and unrealized) does not correlate to the aggregate realized and unrealized gain (loss) presented in the Statement of Operations due to the timing of subscriptions and redemptions of Fund shares in relation to fluctuations in the market value of the portfolio. |
| | (d) | | Assumes investment at the NAV at the beginning of the period, reinvestment of all dividends and distributions, a complete redemption of the investment at the NAV at the end of the period and no sales or redemption charges (if any). Total returns would be reduced if a sales or redemption charge was taken into account. Returns do not reflect the impact of taxes to shareholders relating to Fund distributions or the redemption of Fund shares. Total returns for periods less than one full year are not annualized. |
| | (f) | | The amount reflects certain expense reallocations between the classes due to the timing of sales and redemptions of Fund class shares. |
| | (g) | | The Fund’s portfolio turnover rate is calculated in accordance with regulatory requirements, without regard to transactions involving short term investments. If such transactions were included, the Fund’s portfolio turnover rate may be higher. |
| | |
| 24 | | The accompanying notes are an integral part of these financial statements. |
GOLDMAN SACHS ENERGY INFRASTRUCTURE FUND
Financial Highlights (continued)
Selected Share Data for a Share Outstanding Throughout Each Period
| | | | | | | | | | | | | | | | | | |
| | | | | Goldman Sachs Energy Infrastructure Fund
| |
| | | | | Class P Shares | |
| | | | | Six Months Ended
May 31, 2021
(Unaudited) | | | Year Ended November 30, | | | Period Ended
November 30, 2018(a) | |
| | | | | 2020 | | | 2019 | |
| | Per Share Data | | | | | | | | | | | | | | | | |
| | | | | |
| | Net asset value, beginning of period | | $ | 7.18 | | | $ | 8.64 | | | $ | 9.26 | | | $ | 9.52 | |
| | | | | |
| | Net investment income(b) | | | 0.09 | | | | 0.06 | | | | 0.17 | | | | 0.14 | |
| | | | | |
| | Net realized and unrealized gain (loss) | | | 2.32 | | | | (1.17 | )(c) | | | (0.38 | )(c) | | | (0.09 | ) |
| | | | | |
| | Total from investment operations | | | 2.41 | | | | (1.11 | ) | | | (0.21 | ) | | | 0.05 | |
| | | | | |
| | Distributions to shareholders from net investment income | | | (0.01 | ) | | | (0.05 | ) | | | (0.25 | ) | | | (0.12 | ) |
| | Distributions to shareholders from net realized gains | | | — | | | | (0.05 | ) | | | — | | | | — | |
| | | | | |
| | Distributions to shareholders from return of capital | | | — | | | | (0.25 | ) | | | (0.16 | ) | | | (0.19 | ) |
| | | | | |
| | Total distributions | | | (0.01 | ) | | | (0.35 | ) | | | (0.41 | ) | | | (0.31 | ) |
| | | | | |
| | Net asset value, end of period | | $ | 9.58 | | | $ | 7.18 | | | $ | 8.64 | | | $ | 9.26 | |
| | | | | |
| | Total return(d) | | | 33.67 | % | | | (12.74 | )% | | | (2.46 | )% | | | 0.42 | % |
| | | | | |
| | Net assets, end of period (in 000s) | | $ | 210,322 | | | $ | 160,821 | | | $ | 64,970 | | | $ | 2,640 | |
| | | | | |
| | Ratio of net expenses to average net assets | | | 1.09 | %(e) | | | 1.09 | % | | | 1.10 | % | | | 1.09 | %(e) |
| | | | | |
| | Ratio of total expenses to average net assets | | | 1.19 | %(e) | | | 1.33 | % | | | 1.92 | % | | | 4.04 | %(e)(f) |
| | | | | |
| | Ratio of net investment income to average net assets | | | 2.05 | %(e) | | | 0.84 | % | | | 1.78 | % | | | 2.37 | %(e) |
| | | | | |
| | Portfolio turnover rate(g) | | | 40 | % | | | 121 | % | | | 59 | % | | | 67 | % |
| | (a) | | Commenced operations on April 16, 2018. |
| | (b) | | Calculated based on the average shares outstanding methodology. |
| | (c) | | Calculation of the net gain (loss) per share (both realized and unrealized) does not correlate to the aggregate realized and unrealized gain (loss) presented in the Statement of Operations due to the timing of subscriptions and redemptions of Fund shares in relation to fluctuations in the market value of the portfolio. |
| | (d) | | Assumes investment at the NAV at the beginning of the period, reinvestment of all dividends and distributions, a complete redemption of the investment at the NAV at the end of the period and no sales or redemption charges (if any). Total returns would be reduced if a sales or redemption charge was taken into account. Returns do not reflect the impact of taxes to shareholders relating to Fund distributions or the redemption of Fund shares. Total returns for periods less than one full year are not annualized. |
| | (f) | | The amount reflects certain expense reallocations between the classes due to the timing of sales and redemptions of Fund class shares. |
| | (g) | | The Fund’s portfolio turnover rate is calculated in accordance with regulatory requirements, without regard to transactions involving short term investments. If such transactions were included, the Fund’s portfolio turnover rate may be higher. |
| | |
| The accompanying notes are an integral part of these financial statements. | | 25 |
GOLDMAN SACHS ENERGY FUNDS
Notes to Financial Statements
May 31, 2021 (Unaudited)
Goldman Sachs Trust (the “Trust”) is a Delaware statutory trust registered under the Investment Company Act of 1940, as amended (the “Act”), as an open-end management investment company. The following table lists those series of the Trust that are included in this report (collectively, the “Funds” or individually a “Fund”), along with their corresponding share classes and respective diversification status under the Act:
| | | | |
| Fund | | Share Classes Offered | | Diversified/ Non-diversified |
Clean Energy Income Fund* | | A, C, Institutional, Investor, R6, R and P | | Non-diversified |
Energy Infrastructure Fund** | | A, C, Institutional, Investor, R6, R and P | | Non-diversified |
| * | | Commenced operations on June 26, 2020. |
| ** | | Goldman Sachs MLP & Energy Fund was changed to Goldman Sachs Energy Infrastructure Fund on June 26, 2020. |
Class A Shares are sold with a front-end sales charge of up to 5.50%. Class C Shares are sold with a contingent deferred sales charge (“CDSC”) of 1.00%, which is imposed on redemptions made within 12 months of purchase. Institutional, Investor, Class R6, Class R and Class P Shares are not subject to a sales charge.
Goldman Sachs Asset Management, L.P. (“GSAM”), an affiliate of Goldman Sachs & Co. LLC (“Goldman Sachs”), serves as investment adviser to the Fund pursuant to a management agreement (the “Agreement”) with the Trust.
|
| 2. SIGNIFICANT ACCOUNTING POLICIES |
The financial statements have been prepared in accordance with accounting principles generally accepted in the United States of America (“GAAP”) and require management to make estimates and assumptions that may affect the reported amounts and disclosures. Actual results may differ from those estimates and assumptions. Each Fund is an investment company under GAAP and follows the accounting and reporting guidance applicable to investment companies.
A. Investment Valuation — The Funds’ valuation policy is to value investments at fair value.
B. Investment Income and Investments — Investment income includes interest income, dividend income, and securities lending income, if any. Interest income is accrued daily and adjusted for amortization of premiums and accretion of discounts. Dividend income is recognized on ex-dividend date or, for certain foreign securities, as soon as such information is obtained subsequent to the ex-dividend date. Non-cash dividends, if any, are recorded at the fair market value of the securities received. Investment transactions are reflected on trade date. Realized gains and losses are calculated using identified cost. Investment transactions are recorded on the following business day for daily net asset value (“NAV”) calculations. Investment income is recorded net of any foreign withholding taxes, less any amounts reclaimable. The Funds may file withholding tax reclaims in certain jurisdictions to recover a portion of amounts previously withheld. Any foreign capital gains tax is accrued daily based upon net unrealized gains, and is payable upon sale of such investments. Distributions from master limited partnerships (“MLPs”) are generally recorded based on the characterization reported on the MLP’s tax return. The Fund records its pro-rata share of the income/loss and capital gains/losses, allocated from the underlying partnerships and adjusts the cost basis of the underlying partnerships accordingly.
C. Class Allocations and Expenses — Investment income, realized and unrealized gain (loss), if any, and non-class specific expenses of each Fund are allocated daily based upon the proportion of net assets of each class. Non-class specific expenses directly incurred by a Fund are charged to that Fund, while such expenses incurred by the Trust are allocated across the applicable Funds on a straight-line and/or pro-rata basis depending upon the nature of the expenses. Class specific expenses, where applicable, are borne by the respective share classes and include Distribution and Service, Transfer Agency and Service fees.
D. Federal Taxes and Distributions to Shareholders — It is each Fund’s policy to comply with the requirements of the Internal Revenue Code of 1986, as amended (the “Code”), applicable to regulated investment companies and to distribute each year substantially all of its investment company taxable income and capital gains to its shareholders. Accordingly, each Fund is not
26
GOLDMAN SACHS ENERGY FUNDS
|
| 2. SIGNIFICANT ACCOUNTING POLICIES (continued) |
required to make any provisions for the payment of federal income tax. Distributions to shareholders are recorded on the ex-dividend date. Net investment income distributions, if any, are declared and paid at least semi-annually. Capital gains distributions, if any, are declared and paid annually with respect to the Clean Energy Income Fund and semi-annually with respect to the Energy Infrastructure Fund.
Net capital losses, if any, are carried forward to future fiscal years and may be used to the extent allowed by the Code to offset any future capital gains. Losses that are carried forward will retain their character as either short-term or long-term capital losses. Utilization of capital loss carryforwards will reduce the requirement of future capital gains distributions.
The characterization of distributions to shareholders for financial reporting purposes is determined in accordance with federal income tax rules, which may differ from GAAP. The source of each Fund’s distributions may be shown in the accompanying financial statements as either from distributable earnings or capital. Certain components of the Funds’ net assets on the Statements of Assets and Liabilities reflect permanent GAAP/tax differences based on the appropriate tax character.
E. Offering Costs — Offering costs paid in connection with the initial offering of shares of the Clean Energy Income Fund were amortized on a straight-line basis over 12 months from the date of commencement of operations.
F. Foreign Currency Translation — The accounting records and reporting currency of a Fund are maintained in U.S. dollars. Assets and liabilities denominated in foreign currencies are translated into U.S. dollars using the current exchange rates at the close of each business day. The effect of changes in foreign currency exchange rates on investments is included within net realized and unrealized gain (loss) on investments. Changes in the value of other assets and liabilities as a result of fluctuations in foreign exchange rates are included in the Statements of Operations within net change in unrealized gain (loss) on foreign currency translation. Transactions denominated in foreign currencies are translated into U.S. dollars on the date the transaction occurred, the effects of which are included within net realized gain (loss) on foreign currency transactions.
| | |
| 3. INVESTMENTS AND FAIR VALUE MEASUREMENTS | | |
U.S. GAAP defines the fair value of a financial instrument as the amount that would be received to sell an asset or paid to transfer a liability in an orderly transaction between market participants at the measurement date (i.e., the exit price); the Funds’ policy is to use the market approach. GAAP establishes a fair value hierarchy that prioritizes the inputs to valuation techniques used to measure fair value. The hierarchy gives the highest priority to unadjusted quoted prices in active markets for identical assets or liabilities (Level 1 measurements) and the lowest priority to unobservable inputs (Level 3 measurements). The level in the fair value hierarchy within which the fair value measurement in its entirety falls shall be determined based on the lowest level input that is significant to the fair value measurement in its entirety. The levels used for classifying investments are not necessarily an indication of the risk associated with investing in these investments. The three levels of the fair value hierarchy are described below:
Level 1 — Unadjusted quoted prices in active markets that are accessible at the measurement date for identical, unrestricted assets or liabilities;
Level 2 — Quoted prices in markets that are not active or financial instruments for which significant inputs are observable (including, but not limited to, quoted prices for similar investments, interest rates, foreign exchange rates, volatility and credit spreads), either directly or indirectly;
Level 3 — Prices or valuations that require significant unobservable inputs (including GSAM’s assumptions in determining fair value measurement).
The Board of Trustees (“Trustees”) has approved Valuation Procedures that govern the valuation of the portfolio investments held by the Funds, including investments for which market quotations are not readily available. The Trustees have delegated to GSAM day-to-day responsibility for implementing and maintaining internal controls and procedures related to the valuation of the Funds’ investments. To assess the continuing appropriateness of pricing sources and methodologies, GSAM regularly performs price verification procedures and issues challenges as necessary to third party pricing vendors or brokers, and any differences are reviewed in accordance with the Valuation Procedures.
27
GOLDMAN SACHS ENERGY FUNDS
Notes to Financial Statements (continued)
May 31, 2021 (Unaudited)
|
| 3. INVESTMENTS AND FAIR VALUE MEASUREMENTS (continued) |
A. Level 1 and Level 2 Fair Value Investments — The valuation techniques and significant inputs used in determining the fair values for investments classified as Level 1 and Level 2 are as follows:
Equity Securities — Equity securities traded on a United States (“U.S.”) securities exchange or the NASDAQ system, or those located on certain foreign exchanges, including but not limited to the Americas, are valued daily at their last sale price or official closing price on the principal exchange or system on which they are traded. If there is no sale or official closing price or such price is believed by GSAM to not represent fair value, equity securities will be valued at the valid closing bid price for long positions and at the valid closing ask price for short positions (i.e. where there is sufficient volume, during normal exchange trading hours). If no valid bid/ask price is available, the equity security will be valued pursuant to the Valuation Procedures approved by the Trustees and consistent with applicable regulatory guidance. To the extent these investments are actively traded, they are classified as Level 1 of the fair value hierarchy, otherwise they are generally classified as Level 2. Certain equity securities containing unique attributes may be classified as Level 2.
Unlisted equity securities for which market quotations are available are valued at the last sale price on the valuation date, or if no sale occurs, at the last bid price for long positions or the last ask price for short positions, and are generally classified as Level 2. Securities traded on certain foreign securities exchanges are valued daily at fair value determined by an independent fair value service (if available) under Fair Valuation Procedures approved by the Trustees and consistent with applicable regulatory guidance. The independent fair value service takes into account multiple factors including, but not limited to, movements in the securities markets, certain depositary receipts, futures contracts and foreign currency exchange rates that have occurred subsequent to the close of the foreign securities exchange. These investments are generally classified as Level 2 of the fair value hierarchy.
Private Investments in Public Equities — Private investments in public equities (“PIPEs”) are valued the same as other equity securities as noted above. A Liquidity Value Adjustment (LVA) may be applied to securities which are subject to externally imposed and legally enforceable trading restrictions or which convert to publicly traded securities in the future when certain conditions are met. An LVA is a discount to the market price of an issuer’s common stock, which is based on the length of the lock-up time period and volatility of the underlying security. PIPEs are classified as Level 2 until such time as the trading restriction is removed. Investments in an unfunded commitment to purchase a PIPE via a subscription agreement are subject to certain significant contingencies. The Fund is obligated to purchase the PIPE only upon such contingencies being satisfied.
Money Market Funds — Investments in the Goldman Sachs Financial Square Government Fund (“Underlying Fund”) are valued at the NAV per share of the Institutional Share class on the day of valuation. These investments are generally classified as Level 1 of the fair value hierarchy. For information regarding an Underlying Fund’s accounting policies and investment holdings, please see the Underlying Fund’s shareholder report.
B. Level 3 Fair Value Investments — To the extent that significant inputs to valuation models and other alternative pricing sources are unobservable, or if quotations are not readily available, or if GSAM believes that such quotations do not accurately reflect fair value, the fair value of a Fund’s investments may be determined under Valuation Procedures approved by the Trustees. GSAM, consistent with its procedures and applicable regulatory guidance, may make an adjustment to the most recent valuation prices of either domestic or foreign securities in light of significant events to reflect what it believes to be the fair value of the securities at the time of determining a Fund’s NAV. To the extent investments are valued using single source broker quotations obtained directly from the broker or passed through from third party pricing vendors, such investments are classified as Level 3 investments.
28
GOLDMAN SACHS ENERGY FUNDS
|
| 3. INVESTMENTS AND FAIR VALUE MEASUREMENTS (continued) |
C. Fair Value Hierarchy — The following is a summary of the Funds’ investments classified in the fair value hierarchy as of May 31, 2021:
| | | | | | | | | | | | |
|
CLEAN ENERGY INCOME
| |
| | | |
| Investment Type | | Level 1 | | | Level 2 | | | Level 3 | |
| | | |
| Assets | | | | | | | | | | | | |
| | | |
Common Stock and/or Other Equity Investments(a) | | | | | | | | | | | | |
| | | |
Europe | | $ | 33,582,586 | | | $ | 62,658,076 | | | $ | — | |
| | | |
North America | | | 288,619,176 | | | | — | | | | — | |
| | | |
Special Purpose Acquisition Company | | | 6,344,939 | | | | — | | | | — | |
| | | |
Warrants | | | — | | | | 330,415 | | | | 141,002 | |
| | | |
Securities Lending Reinvestment Vehicle | | | 89,375 | | | | — | | | | — | |
| | | |
Unfunded PIPE Commitment(b) | | | — | | | | — | | | | — | |
| | | |
| Total | | $ | 328,636,076 | | | $ | 62,988,491 | | | $ | 141,002 | |
|
ENERGY INFRASTRUCTURE
| |
| | | |
| Investment Type | | Level 1 | | | Level 2 | | | Level 3 | |
| | | |
| Assets | | | | | | | | | | | | |
| | | |
Common Stock and/or Other Equity Investments(a) | | | | | | | | | | | | |
| | | |
Europe | | $ | 1,421,649 | | | $ | — | | | $ | — | |
| | | |
North America | | | 280,480,660 | | | | — | | | | — | |
| | | |
Special Purpose Acquisition Company | | | 7,705,307 | | | | — | | | | — | |
| | | |
Warrants | | | — | | | | 730,642 | | | | 120,765 | |
| | | |
Investment Company | | | 693,516 | | | | — | | | | — | |
| | | |
Unfunded PIPE Commitment(b) | | | — | | | | — | | | | — | |
| | | |
| Total | | $ | 290,301,132 | | | $ | 730,642 | | | $ | 120,765 | |
| (a) | | Amounts are disclosed by continent to highlight the impact of time zone differences between local market close and the calculation of net asset value. Security valuations are based on the principal exchange or system on which they are traded, which may differ from country of domicile. The Funds utilize fair value model prices provided by an independent fair value service for international equities, resulting in a Level 2 classification. |
| (b) | | Amount shown represents unrealized gain (loss) at period end. |
For further information regarding security characteristics, see the Schedules of Investments.
|
| 4. AGREEMENTS AND AFFILIATED TRANSACTIONS |
A. Management Agreement — Under the Agreement, GSAM manages the Funds, subject to the general supervision of the Trustees.
As compensation for the services rendered pursuant to the Agreement, the assumption of the expenses related thereto and administration of the Funds’ business affairs, including providing facilities, GSAM is entitled to a management fee, accrued daily
29
GOLDMAN SACHS ENERGY FUNDS
Notes to Financial Statements (continued)
May 31, 2021 (Unaudited)
|
| 4. AGREEMENTS AND AFFILIATED TRANSACTIONS (continued) |
and paid monthly, equal to an annual percentage rate of each Fund’s average daily net assets. For the six months ended May 31, 2021, contractual and effective net management fees with GSAM were at the following rates:
| | | | | | | | | | | | | | | | | | | | | | | | |
| | | Contractual Management Rate | | | Effective Net
Management
Rate^ | |
| | | First
$1 billion | | | Next
$1 billion | | | Next
$3 billion | | | Next
$3 billion | | | Over
$8 billion | |
| Clean Energy Income | | | 0.80 | % | | | 0.72 | % | | | 0.68 | % | | | 0.67 | % | | | 0.66 | % | | | 0.80 | % |
| Energy Infrastructure | | | 1.00 | | | | 0.90 | | | | 0.86 | | | | 0.84 | | | | 0.82 | | | | 1.00 | |
| ^ | | Effective Net Management Rate includes impact of management fee waivers of underlying funds, if any. |
The Funds invest in Institutional Shares of the Goldman Sachs Financial Square Government Fund, which is an affiliated Underlying Fund. GSAM has agreed to waive a portion of its management fee payable by the Funds in an amount equal to the management fee it earns as an investment adviser to any of the affiliated Underlying Funds in which the Funds invest, except those management fees it earns from the Funds’ investments of cash collateral received in connection with securities lending transactions in Goldman Sachs Financial Square Government Fund. For the six months ended May 31, 2021, GSAM waived $539 and $451 of the Funds’ management fee for the Clean Energy Income and Energy Infrastructure Funds, respectively.
B. Distribution and/or Service (12b-1) Plans — The Trust, on behalf of Class A and Class R Shares of the Funds, has adopted Distribution and Service Plans subject to Rule 12b-1 under the Act. Under the Distribution and Service Plans, Goldman Sachs, which serves as distributor (the “Distributor”), is entitled to a fee accrued daily and paid monthly for distribution services and personal and account maintenance services, which may then be paid by Goldman Sachs to authorized dealers. These fees are equal to an annual percentage rate of the average daily net assets attributable to Class A or Class R Shares of the Funds, as set forth below.
The Trust, on behalf of Class C Shares of the Funds, has adopted a Distribution Plan subject to Rule 12b-1 under the Act. Under the Distribution Plan, Goldman Sachs as Distributor is entitled to a fee accrued daily and paid monthly for distribution services, which may then be paid by Goldman Sachs to authorized dealers. These fees are equal to an annual percentage rate of the average daily net assets attributable to Class C Shares of the Funds, as set forth below.
| | | | | | | | | | | | |
| | | Distribution and/or Service Plan Rates | |
| | | Class A* | | | Class C | | | Class R* | |
Distribution Plan and/or Service Plan | | | 0.25 | % | | | 0.75 | % | | | 0.50 | % |
| * | | With respect to Class A and Class R Shares, the Distributor at its discretion may use compensation for distribution services paid under the Distribution and Service Plans to compensate service organizations for personal and account maintenance services and expenses as long as such total compensation does not exceed the maximum cap on “service fees” imposed by the Financial Industry Regulatory Authority. |
C. Distribution Agreement — Goldman Sachs, as Distributor of the shares of the Funds pursuant to a Distribution Agreement, may retain a portion of the Class A Shares’ front end sales charge and Class C Shares’ CDSC. During the six-month period ended May, 31, 2021, Goldman Sachs retained $5,412 and $0 of the sales charges for the Clean Energy Income Fund and $129 and $0 of the sales charge for the Energy Infrastructure Fund, respectively.
D. Service Plan — The Trust, on behalf of each applicable Fund, has adopted a Service Plan to allow Class C Shares to compensate service organizations (including Goldman Sachs) for providing varying levels of personal and account maintenance services to their customers who are beneficial owners of such shares. The Service Plan provides for compensation to the service organizations equal to an annual percentage rate of 0.25% of the average daily net assets attributable to Class C Shares of the Funds.
E. Transfer Agency Agreement — Goldman Sachs also serves as the transfer agent of the Funds for a fee pursuant to the Transfer Agency Agreement. The fees charged for such transfer agency services are accrued daily and paid monthly at annual rates as follows: 0.16% of the average daily net assets of Class A, Class C, Investor and Class R Shares; 0.03% of the average daily net assets of Class R6 Shares and Class P Shares; and 0.04% of the average daily net assets of Institutional Shares.
30
GOLDMAN SACHS ENERGY FUNDS
|
| 4. AGREEMENTS AND AFFILIATED TRANSACTIONS (continued) |
F. Other Expense Agreements and Affiliated Transactions — GSAM has agreed to reduce or limit certain “Other Expenses” of the Funds (excluding acquired fund fees and expenses, transfer agency fees and expenses, service fees and shareholder administration fees (as applicable), taxes, interest, brokerage fees, expenses of shareholder meetings, litigation and indemnification, and extraordinary expenses) to the extent such expenses exceed, on an annual basis, a percentage rate of the average daily net assets of each Fund. Such Other Expense reimbursements, if any, are accrued daily and paid monthly. In addition, the Funds are not obligated to reimburse GSAM for prior fiscal year expense reimbursements, if any. The Other Expense limitations as an annual percentage rate of average daily net assets for the Clean Energy Income Fund and Energy Infrastructure Fund are 0.054% and 0.064%, respectively. These Other Expense limitations will remain in place through at least March 30, 2022, and prior to such date GSAM may not terminate the arrangements without the approval of the Trustees. In addition, the Funds have entered into certain offset arrangements with the transfer agent, which may result in a reduction of a Fund’s expenses and are received irrespective of the application of the “Other Expense” limitations described above.
For the six months ended May 31, 2021, these expense reductions, including any fee waivers and Other Expense reimbursements, were as follows:
| | | | | | | | | | | | | | |
| Funds | | | | Management
Fee Waiver | | | Other
Expense
Reimbursements | | | Total
Expense
Reductions | |
Clean Energy Income | | | | $ | 539 | | | $ | 212,319 | | | $ | 212,858 | |
Energy Infrastructure | | | | | 451 | | | | 126,355 | | | | 126,806 | |
G. Line of Credit Facility — As of May 31, 2021, the Funds participated in a $1,000,000,000 committed, unsecured revolving line of credit facility (the “facility”) together with other funds of the Trust and certain registered investment companies having management agreements with GSAM or its affiliates. This facility is to be used for temporary emergency purposes, or to allow for an orderly liquidation of securities to meet redemption requests. The interest rate on borrowings is based on the federal funds rate. The facility also requires a fee to be paid by the Funds based on the amount of the commitment that has not been utilized. For the six months ended May 31, 2021, the Funds did not have any borrowings under the facility. Prior to April 26, 2021, the facility was $700,000,000.
H. Other Transactions with Affiliates — For the six months ended May 31, 2021, Goldman Sachs earned $20,161 in brokerage commissions from portfolio transactions on behalf of the Energy Infrastructure Fund.
As of May 31, 2021, The Goldman Sachs Group, Inc. was the beneficial owner of of 5% or more of total outstanding shares of the following Funds:
| | | | | | | | | | | | | | | | | | | | | | | | | | |
| Fund | | | | Class A | | | Class C | | | Institutional | | | Investor | | | Class R6 | | | Class R | |
Clean Energy Income | | | | | — | % | | | 38 | % | | | 47 | % | | | 9 | % | | | 100 | % | | | 95 | % |
Energy Infrastructure | | | | | 26 | | | | — | | | | 84 | | | | 100 | | | | — | | | | 100 | |
The table below shows the transactions in and earnings from investments in the Goldman Sachs Financial Square Government Fund for the six months ended May 31, 2021:
| | | | | | | | | | | | | | | | | | | | | | | | | | |
| Fund | | Underlying Fund | | Beginning
Value as of
November 30, 2020 | | | Purchases
at Cost | | | Proceeds
from Sales | | | Ending
Value as of
May 31, 2021 | | | Shares as of
May 31, 2021 | | | Dividend
Income | |
Clean Energy Inome | | Goldman Sachs Financial Square Government Fund — Institutional Shares | | $ | — | | | $ | 69,253,474 | | | $ | (69,253,474 | ) | | $ | — | | | | — | | | $ | 118 | |
Energy Infrastructure | | Goldman Sachs Financial Square Government Fund — Institutional Shares | | | 1,125,704 | | | | 18,957,779 | | | | (19,389,967 | ) | | | 693,516 | | | | 693,516 | | | $ | 58 | |
31
GOLDMAN SACHS ENERGY FUNDS
Notes to Financial Statements (continued)
May 31, 2021 (Unaudited)
|
| 5. PORTFOLIO SECURITIES TRANSACTIONS |
The cost of purchases and proceeds from sales and maturities of long-term securities for the six months ended May 31, 2021, were as follows:
| | | | | | | | | | |
| Fund | | | | Purchases | | | Sales | |
Clean Energy Income | | | | $ | 393,000,857 | | | $ | 97,107,976 | |
Energy Infrastructure | | | | | 104,651,696 | | | | 126,015,628 | |
The Clean Energy Income Fund may lend its securities through a securities lending agent, the Bank of New York Mellon (“BNYM”), to certain qualified borrowers. In accordance with the Fund’s securities lending procedures, the Fund receives cash collateral at least equal to the market value of the securities on loan. The market value of the loaned securities is determined at the close of business of the Fund, at its last sale price or official closing price on the principal exchange or system on which they are traded, and any additional required collateral is delivered to the Fund on the next business day. As with other extensions of credit, the Fund may experience delay in the recovery of its securities or incur a loss should the borrower of the securities breach its agreement with the Fund or become insolvent at a time when the collateral is insufficient to cover the cost of repurchasing securities on loan. Dividend income received from securities on loan may not be subject to withholding taxes and therefore withholding taxes paid may differ from the amounts listed in the Statement of Operations. Loans of securities are terminable at any time and as such 1) the remaining contractual maturities of the outstanding securities lending transactions are considered to be overnight and continuous and 2) the borrower, after notice, is required to return borrowed securities within the standard time period for settlement of securities transactions.
The Fund invests the cash collateral received in connection with securities lending transactions in the Government Money Market Fund, an affiliated series of the Goldman Sachs Trust. The Government Money Market Fund is registered under the Act as an open end investment company, is subject to Rule 2a-7 under the Act, and is managed by GSAM, for which GSAM may receive a management fee of up to 0.16% on an annualized basis of the average daily net assets of the Government Money Market Fund.
In the event of a default by a borrower with respect to any loan, BNYM may exercise any and all remedies provided under the applicable borrower agreement to make the Fund whole. These remedies include purchasing replacement securities by applying the collateral held from the defaulting broker against the purchase cost of the replacement securities. If BNYM is unable to purchase replacement securities, BNYM will indemnify the Fund by paying the Fund an amount equal to the market value of the securities loaned minus the value of cash collateral received from the borrower for the loan, subject to an exclusion for any shortfalls resulting from a loss of value in such cash collateral due to reinvestment risk. The Fund’s master netting agreements with certain borrowers provide the right, in the event of a default (including bankruptcy or insolvency), for the non-defaulting party to liquidate the collateral and calculate net exposure to the defaulting party or request additional collateral. However, in the event of a default by a borrower, a resolution authority could determine that such rights are not enforceable due to the restrictions or prohibitions against the right of set-off that may be imposed in accordance with a particular jurisdiction’s bankruptcy or insolvency laws. The Fund’s loaned securities were all subject to enforceable Securities Lending Agreements and the value of the collateral was at least equal to the value of the cash received. The amounts of the Fund’s overnight and continuous agreements, which represent the gross amounts of recognized liabilities for securities lending transactions outstanding as of May 31, 2021, are disclosed as “Payable upon return of securities loaned” on the Statements of Assets and Liabilities, where applicable.
Both the Fund and BNYM received compensation relating to the lending of the Fund’s securities. The amounts earned, if any, by the Fund for the six months ended May 31, 2021, are reported under Investment Income on the Statements of Operations.
32
GOLDMAN SACHS ENERGY FUNDS
|
| 6. SECURITIES LENDING (continued) |
The following table provides information about the Fund’s investment in the Government Money Market Fund for the six months ended May 31, 2021.
| | | | | | | | | | | | | | | | | | |
| Fund | | | | Beginning Value as of November 30, 2020 | | | Purchases at Cost | | | Proceeds from Sales | | | Ending Value as of May 31, 2021 | |
Clean Energy Income | | | | $ | — | | | $ | 3,312,979 | | | $ | (3,223,604 | ) | | $ | 89,375 | |
As of the Funds’ most recent fiscal year end, November 30, 2020, the Funds’ capital loss carryforwards and certain timing differences on a tax basis were as follows:
| | | | | | | | |
| | | Clean Energy
Income | | | Energy
Infrastructure | |
Capital loss carryforwards: | | | | | | | | |
Perpetual Long-Term | | $ | — | | | $ | (1,303,737 | ) |
Total Capital Loss Carryforwards | | | — | | | | (1,303,737 | ) |
Timing differences (Qualified Late Year Loss Deferral/Post October Deferral) | | | (13,132 | ) | | | (170,874 | ) |
As of May 31, 2021, the Funds’ aggregate security unrealized gains and losses based on cost for U.S. federal income tax purposes were as follows:
| | | | | | | | |
| | | Clean Energy
Income | | | Energy
Infrastructure | |
Tax Cost | | $
| 413,507,909
|
| | $
| 220,394,080
|
|
Gross unrealized gain | | | 10,439,441 | | | | 111,831,278 | |
Gross unrealized loss | | | (32,181,781 | ) | | | (41,072,819 | ) |
Net unrealized security gain (loss) | | $ | (21,742,340 | ) | | $ | 70,758,459 | |
The difference between GAAP-basis and tax basis unrealized gains (losses) is attributable primarily to wash sales and differences in the tax treatment of partnership investments.
GSAM has reviewed the Funds’ tax positions for all open tax years (the current and prior three years, as applicable) and has concluded that no provision for income tax is required in the Fund’s financial statements. Such open tax years remain subject to examination and adjustment by tax authorities.
The Funds’ risks include, but are not limited to, the following:
Dividend-Paying Investments Risk — A Fund’s investments in dividend-paying securities could cause a Fund to underperform other funds. Securities that pay dividends, as a group, can fall out of favor with the market, causing such securities to underperform securities that do not pay dividends. Depending upon market conditions and political and legislative responses to such conditions, dividend-paying securities that meet a Fund’s investment criteria may not be widely available and/or may be highly concentrated in only a few market sectors. In addition, issuers that have paid regular dividends or distributions to shareholders may not continue to do so at the same level or at all in the future. This may limit the ability of a Fund to produce current income.
33
GOLDMAN SACHS ENERGY FUNDS
Notes to Financial Statements (continued)
May 31, 2021 (Unaudited)
|
| 8. OTHER RISKS (continued) |
Energy Sector Risk — The Energy Infrastructure Fund concentrates its investments in the energy sector, and will therefore be susceptible to adverse economic, environmental, business, regulatory or other occurrences affecting that sector. The energy sector has historically experienced substantial price volatility. MLPs and other companies operating in the energy sector are subject to specific risks, including, among others: fluctuations in commodity prices; reduced consumer demand for commodities such as oil, natural gas or petroleum products; reduced availability of natural gas or other commodities for transporting, processing, storing or delivering; slowdowns in new construction; extreme weather or other natural disasters; and threats of attack by terrorists on energy assets. Additionally, changes in the regulatory environment for energy companies may adversely impact their profitability. Over time, depletion of natural gas reserves and other energy reserves may also affect the profitability of energy companies.
Foreign Countries Risk — Investing in foreign markets may involve special risks and considerations not typically associated with investing in the U.S. Foreign securities may be subject to risk of loss because of more or less foreign government regulation, less public information and less economic, political and social stability in the countries in which a Fund invests. The imposition of exchange controls (including repatriation restrictions), confiscation of assets and property, trade restrictions (including tariffs) and other government restrictions by the U.S. or other governments, or problems with share registration, settlement or custody, may also result in losses. Foreign risk also involves the risk of negative foreign currency rate fluctuations, which may cause the value of securities denominated in such foreign currency (or other instruments through which a Fund has exposure to foreign currencies) to decline in value. Currency exchange rates may fluctuate significantly over short periods of time.
Foreign Custody Risk — A Fund invests in foreign securities, and as such the Fund may hold such securities and cash with foreign banks, agents, and securities depositories appointed by the Fund’s custodian (each a “Foreign Custodian”). Some foreign custodians may be recently organized or new to the foreign custody business. In some countries, Foreign Custodians may be subject to little or no regulatory oversight over, or independent evaluation of, their operations. Further, the laws of certain countries may place limitations on a Fund’s ability to recover its assets if a Foreign Custodian enters bankruptcy.
Geographic and Sector Risk — The Funds focus their investments in the energy sector, and will therefore be susceptible to adverse economic, environmental, business, regulatory or other occurrences affecting that sector. The energy sector has historically experienced substantial price volatility. MLPs and other companies operating in the energy sector are subject to specific risks, including, among others, fluctuations in commodity prices; reduced consumer demand for commodities such as oil, natural gas or petroleum products; reduced availability of natural gas or other commodities for transporting, processing, storing or delivering; slowdowns in new construction; extreme weather or other natural disasters; and threats of attack by terrorists on energy assets. Additionally, changes in the regulatory environment for energy companies may adversely impact their profitability. Over time, depletion of natural gas reserves and other energy reserves may also affect the profitability of energy companies.
Investments in Other Investment Companies Risk — As a shareholder of another investment company, including an ETF, a Fund will indirectly bear its proportionate share of any net management fees and other expenses paid by such other investment companies, in addition to the fees and expenses regularly borne by the Fund. ETFs are subject to risks that do not apply to conventional mutual funds, including but not limited to the following: (i) the market price of the ETF’s shares may trade at a premium or a discount to their NAV; and (ii) an active trading market for an ETF’s shares may not develop or be maintained.
Clean Energy Sector Risk — The Clean Energy Income Fund concentrates its investments in the clean energy group of industries, and will therefore be susceptible to adverse economic, business, social, political, environmental, regulatory or other developments affecting that group of industries. Clean energy companies may be more volatile than companies operating in more established industries. Certain valuation methods used to value clean energy companies have not been in widespread use for a significant period of time and may further increase the volatility of certain clean energy company share prices. Clean energy companies and other companies operating in the clean energy group of industries are subject to specific risks, including, among others: fluctuations in commodity prices and/or interest rates; changes in governmental or environmental regulation; reduced availability of clean energy sources or other commodities for transporting, processing, storing or delivering; slowdowns in new construction; seasonal weather conditions, extreme weather or other natural disasters; and threats of attack by terrorists on certain clean energy assets. Clean energy companies can be significantly affected by the supply of, and demand for, particular energy products, which may result in overproduction or underproduction. Additionally, changes in the regulatory environment for clean
34
GOLDMAN SACHS ENERGY FUNDS
|
| 8. OTHER RISKS (continued) |
energy companies may adversely impact their profitability. Obsolescence of existing technology, short product cycles, falling prices and profits, competition from new market entrants and general economic conditions can significantly affect companies in the clean energy group of industries. Certain investments may be dependent on U.S. and foreign government policies, including tax incentives and subsidies. Adhering to the clean energy company criteria and applying the Investment Adviser’s supplemental clean energy analysis may also affect the Fund’s performance relative to other energy sector-focused funds that do not adhere to such criteria or apply such analysis.
Large Shareholder Transactions Risk — A Fund may experience adverse effects when certain large shareholders, such as other funds, institutional investors (including those trading by use of non-discretionary mathematical formulas), financial intermediaries (who may make investment decisions on behalf of underlying clients and/or include a Fund in their investment model), individuals, accounts and Goldman Sachs affiliates, purchase or redeem large amounts of shares of the Fund. Such large shareholder redemptions, which may occur rapidly or unexpectedly, may cause a Fund to sell portfolio securities at times when it would not otherwise do so, which may negatively impact a Fund’s NAV and liquidity. These transactions may also accelerate the realization of taxable income to shareholders if such sales of investments resulted in gains, and may also increase transaction costs. In addition, a large redemption could result in the Fund’s current expenses being allocated over a smaller asset base, leading to an increase in the Fund’s expense ratio. Similarly, large Fund share purchases may adversely affect the Fund’s performance to the extent that the Fund is delayed in investing new cash or otherwise maintains a larger cash position than it ordinarily would.
Liquidity Risk — A Fund may make investments that are illiquid or that may become less liquid in response to market developments or adverse investor perceptions. Illiquid investments may be more difficult to value. Liquidity risk may also refer to the risk that a Fund will not be able to pay redemption proceeds within the allowable time period or without significant dilution to remaining investors’ interests because of unusual market conditions, an unusually high volume of redemption requests, or other reasons. To meet redemption requests, a Fund may be forced to sell investments at an unfavorable time and/or under unfavorable conditions. If a Fund is forced to sell securities at an unfavorable time and/or under unfavorable conditions, such sales may adversely affect the Fund’s NAV and dilute remaining investors’ interests. Redemptions by large shareholders may have a negative impact on a Fund’s liquidity.
Market and Credit Risks — In the normal course of business, a Fund trades financial instruments and enters into financial transactions where risk of potential loss exists due to changes in the market (market risk). The value of the securities in which a Fund invests may go up or down in response to the prospects of individual companies, particular sectors or governments and/or general economic conditions throughout the world due to increasingly interconnected global economies and financial markets. Events such as war, acts of terrorism, social unrest, natural disasters, the spread of infectious illness or other public health threats could also significantly impact a Fund and its investments. Additionally, a Fund may also be exposed to credit risk in the event that an issuer or guarantor fails to perform or that an institution or entity with which the Fund has unsettled or open transactions defaults.
Master Limited Partnership Risk — Investments in securities of MLPs involve risks that differ from investments in common stock, including risks related to limited control and limited rights to vote on matters affecting the MLP, risks related to potential conflicts of interest between the MLP and the MLP’s general partner, cash flow risks, dilution risks, limited liquidity and risks related to the general partner’s right to require unit-holders to sell their common units at an undesirable time or price.
Special Purpose Acquisition Companies Risk — A Fund may invest in stock, warrants, and other securities of special purpose acquisition companies (“SPACs”) or similar special purpose entities that pool funds to seek potential acquisition opportunities. Because SPACs and similar entities are in essence blank check companies without operating history or ongoing business other than seeking acquisitions, the value of their securities is particularly dependent on the ability of the entity’s management to identify and complete a profitable acquisition. An investment in a SPAC is subject a variety of risks, including that (i) a portion of the monies raised by the SPAC for the purpose of effecting an acquisition or merger may be expended prior to the transaction for payment of taxes and other purposes; (ii) prior to any acquisition or merger, a SPAC’s assets are typically invested in government securities, money market funds and similar investments whose returns or yields may be significantly lower than those of a Fund’s other investments; (iii) a Fund generally will not receive significant income from its investments in SPACs (both prior to and after any
35
GOLDMAN SACHS ENERGY FUNDS
Notes to Financial Statements (continued)
May 31, 2021 (Unaudited)
|
| 8. OTHER RISKS (continued) |
acquisition or merger) and, therefore, the Fund’s investments in SPACs will not significantly contribute to the Fund’s distributions to shareholders; (iv) an attractive acquisition or merger target may not be identified at all, in which case the SPAC will be required to return any remaining monies to shareholders; (v) if an acquisition or merger target is identified, the Fund may elect not to participate in the proposed transaction or the Fund may be required to divest its interests in the SPAC due to regulatory or other considerations, in which case the warrants or other rights with respect to the SPAC held by a Fund may expire worthless or may be repurchased or retired by the SPAC at an unfavorable price; (vi) any proposed merger or acquisition may be unable to obtain the requisite approval, if any, of SPAC shareholders; (vii) under any circumstances in which the Fund receives a refund of all or a portion of its original investment (which typically represents a pro rata share of the proceeds of the SPAC’s assets, less any applicable taxes), the returns on that investment may be negligible, and a Fund may be subject to opportunity costs to the extent that alternative investments would have produced higher returns; (viii) to the extent an acquisition or merger is announced or completed, shareholders who redeem their shares prior to that time may not reap any resulting benefits; (ix) a Fund may be delayed in receiving any redemption or liquidation proceeds from a SPAC to which it is entitled; (x) an acquisition or merger once effected may prove unsuccessful and an investment in the SPAC may lose value; (xi) an investment in a SPAC may be diluted by additional later offerings of interests in the SPAC or by other investors exercising existing rights to purchase shares of the SPAC; (xii) only thinly traded market for shares of or interests in a SPAC may develop, or there may be no market at all, leaving a Fund unable to sell its interest in a SPAC or to sell its interest only at a price below what the Fund believes is the SPAC interest’s intrinsic value; and (xiii) the values of investments in SPACs may be highly volatile and may depreciate significantly over time.
Non-Diversification Risk — The Funds are non-diversified, meaning that it is permitted to invest a larger percentage of its assets in fewer issuers than diversified mutual funds. Thus, the Funds may be more susceptible to adverse developments affecting any single issuer held in its portfolio, and may be more susceptible to greater losses because of these developments.
Tax Risks — Tax risks associated with investments in the Funds include but are not limited to the following:
Private Investment Risk — The Funds may invest in PIPE securities. PIPE transactions typically involve the purchase of securities directly from a publicly traded company or its affiliates in a private placement transaction, typically at a discount to the market price of the company’s common stock. In a PIPE transaction, the Fund may bear the price risk from the time of pricing until the time of closing. Equity issued in this manner is often subject to transfer restrictions and is therefore less liquid than equity issued through a registered public offering. The Funds may be subject to lock-up agreements that prohibit transfers for a fixed period of time. In addition, because the sale of the securities in a PIPE transaction is not registered under the Securities Act of 1933, as amended, the securities are “restricted” and cannot be immediately resold into the public markets. The ability of the Funds to freely transfer restricted shares is conditioned upon, among other things, the SEC’s preparedness to declare the resale registration statement effective and the issuer’s right to suspend the Funds’ use of the resale registration statement if the issuer is pursuing a transaction or some other material non-public event is occurring. Accordingly, PIPE securities may be subject to risks associated with illiquid securities.
MLP Tax Risk. MLPs are generally treated as partnerships for U.S. federal income tax purposes. Partnerships do not pay U.S. federal income tax at the partnership level. Rather, each partner is allocated a share of the partnership’s income, gains, losses, deductions and expenses. A change in current tax law or a change in the underlying business mix of a given MLP could result in an MLP being treated as a corporation for U.S. federal income tax purposes, which would result in the MLP being required to pay U.S. federal income tax (as well as state and local income taxes) on its taxable income. This would have the effect of reducing the amount of cash available for distribution by the MLP and could result in a reduction in the value of the Fund’s investment in the MLP and lower income to the Fund.
To the extent a distribution received by a Fund from an MLP is treated as a return of capital, a Fund’s adjusted tax basis in the interests of the MLP will be reduced, which may increase a Fund’s tax liability upon the sale of the interests in the MLP or upon subsequent distributions in respect of such interests.
36
GOLDMAN SACHS ENERGY FUNDS
Under the Trust’s organizational documents, its Trustees, officers, employees and agents are indemnified, to the extent permitted by the Act and state law, against certain liabilities that may arise out of performance of their duties to the Funds. Additionally, in the course of business, the Funds enter into contracts that contain a variety of indemnification clauses. The Funds’ maximum exposure under these arrangements is unknown, as this would involve future claims that may be made against the Funds that have not yet occurred. However, GSAM believes the risk of loss under these arrangements to be remote.
Subsequent events after the Statements of Assets and Liabilities date have been evaluated, and GSAM has concluded that there is no impact requiring adjustment or disclosure in the financial statements.
37
GOLDMAN SACHS ENERGY FUNDS
Notes to Financial Statements (continued)
May 31, 2021 (Unaudited)
|
| 11. SUMMARY OF SHARE TRANSACTIONS |
Share activity is as follows:
| | | | | | | | | | | | | | | | |
| | | Clean Energy Income Fund | |
| | | | |
| | | For the Six Months Ended
May 31, 2021
(Unaudited) | | | For the Period Ended
November 30, 2020(a) | |
| | | | |
| | | Shares | | | Dollars | | | Shares | | | Dollars | |
| | | | |
| Class A Shares | | | | | | | | | | | | | | | | |
Shares sold | | | 404,824 | | | $ | 5,994,233 | | | | 144,779 | | | $ | 1,858,540 | |
Reinvestment of distributions | | | 1,043 | | | | 14,572 | | | | 263 | | | | 3,603 | |
Shares redeemed | | | (165,994 | ) | | | (2,354,176 | ) | | | (6,619 | ) | | | (85,807 | ) |
| | | | 239,873 | | | | 3,654,629 | | | | 138,423 | | | | 1,776,336 | |
| Class C Shares | | | | | | | | | | | | | | | | |
Shares sold | | | 10,440 | | | | 155,019 | | | | 6,111 | | | | 65,010 | |
Reinvestment of distributions | | | 47 | | | | 653 | | | | — | | | | — | |
Shares redeemed | | | (3,345 | ) | | | (46,882 | ) | | | (1 | ) | | | (10 | ) |
| | | | 7,142 | | | | 108,790 | | | | 6,110 | | | | 65,000 | |
| Institutional Shares | | | | | | | | | | | | | | | | |
Shares sold | | | 495,093 | | | | 7,165,406 | | | | 518,197 | | | | 5,274,880 | |
Reinvestment of distributions | | | 3,418 | | | | 47,768 | | | | 1,126 | | | | 15,442 | |
Shares redeemed | | | (14,588 | ) | | | (196,413 | ) | | | (1 | ) | | | (10 | ) |
| | | | 483,923 | | | | 7,016,761 | | | | 519,322 | | | | 5,290,312 | |
| Investor Shares | | | | | | | | | | | | | | | | |
Shares sold | | | 60,143 | | | | 849,939 | | | | 5,001 | | | | 50,010 | |
Reinvestment of distributions | | | 29 | | | | 406 | | | | 9 | | | | 118 | |
Shares redeemed | | | (6,566 | ) | | | (93,434 | ) | | | (1 | ) | | | (10 | ) |
| | | | 53,606 | | | | 756,911 | | | | 5,009 | | | | 50,118 | |
| Class R6 Shares | | | | | | | | | | | | | | | | |
Shares sold | | | — | | | | — | | | | 5,001 | | | | 50,010 | |
Reinvestment of distributions | | | 29 | | | | 408 | | | | 11 | | | | 151 | |
Shares redeemed | | | — | | | | — | | | | (1 | ) | | | (10 | ) |
| | | | 29 | | | | 408 | | | | 5,011 | | | | 50,151 | |
| Class R Shares | | | | | | | | | | | | | | | | |
Shares sold | | | 284 | | | | 3,800 | | | | 5,001 | | | | 50,010 | |
Reinvestment of distributions | | | 29 | | | | 398 | | | | — | | | | — | |
Shares redeemed | | | — | | | | — | | | | (1 | ) | | | (10 | ) |
| | | | 313 | | | | 4,198 | | | | 5,000 | | | | 50,000 | |
| Class P Shares | | | | | | | | | | | | | | | | |
Shares sold | | | 21,820,903 | | | | 317,791,708 | | | | 8,450,763 | | | | 104,359,870 | |
Reinvestment of distributions | | | 59,016 | | | | 824,527 | | | | 18,892 | | | | 258,820 | |
Shares redeemed | | | (2,339,827 | ) | | | (32,423,906 | ) | | | (6,438 | ) | | | (86,350 | ) |
| | | | 19,540,092 | | | | 286,192,329 | | | | 8,463,217 | | | | 104,532,340 | |
| | | | |
NET INCREASE | | | 20,324,978 | | | | 297,734,026 | | | | 9,142,092 | | | | 111,814,257 | |
| (a) | | Commenced operations on June 26, 2020. |
38
GOLDMAN SACHS ENERGY FUNDS
|
| 11. SUMMARY OF SHARE TRANSACTIONS (continued) |
| | | | | | | | | | | | | | | | |
| | | Goldman Sachs Energy Infrastructure Fund | |
| | | | |
| | | For the Six Months Ended
May 31, 2021
(Unaudited) | | | For the Fiscal Year Ended
November 30, 2020 | |
| | | | |
| | | Shares | | | Dollars | | | Shares | | | Dollars | |
| | | | |
| Class A Shares | | | | | | | | | | | | | | | | |
Shares sold | | | 27,002 | | | $ | 228,994 | | | | 4,488 | | | $ | 32,000 | |
Reinvestment of distributions | | | 14 | | | | 98 | | | | 381 | | | | 2,752 | |
Shares redeemed | | | (15,040 | ) | | | (124,668 | ) | | | (1,745 | ) | | | (11,832 | ) |
| | | | 11,976 | | | | 104,424 | | | | 3,124 | | | | 22,920 | |
| Class C Shares | | | | | | | | | | | | | | | | |
Shares sold | | | — | | | | — | | | | 5,520 | | | | 51,500 | |
Reinvestment of distributions | | | 10 | | | | 75 | | | | 722 | | | | 5,251 | |
Shares redeemed | | | — | | | | — | | | | (5,402 | ) | | | (34,840 | ) |
| | | | 10 | | | | 75 | | | | 840 | | | | 21,911 | |
| Institutional Shares | | | | | | | | | | | | | | | | |
Shares sold | | | 36,291 | | | | 332,000 | | | | 21,155 | | | | 113,266 | |
Reinvestment of distributions | | | 602 | | | | 4,400 | | | | 15,741 | | | | 113,663 | |
Shares redeemed | | | (550 | ) | | | (4,360 | ) | | | (2,335 | ) | | | (13,845 | ) |
| | | | 36,343 | | | | 332,040 | | | | 34,561 | | | | 213,084 | |
| Investor Shares | | | | | | | | | | | | | | | | |
Reinvestment of distributions | | | 9 | | | | 69 | | | | 260 | | | | 1,884 | |
| | | | 9 | | | | 69 | | | | 260 | | | | 1,884 | |
| Class R6 Shares | | | | | | | | | | | | | | | | |
Shares sold | | | — | | | | — | | | | 10,897,877 | | | | 59,229,000 | |
Reinvestment of distributions | | | 19,477 | | | | 142,376 | | | | 399,579 | | | | 2,826,781 | |
Shares redeemed | | | (2,756,893 | ) | | | (22,000,000 | ) | | | (388,584 | ) | | | (2,786,073 | ) |
| | | | (2,737,416 | ) | | | (21,857,624 | ) | | | 10,908,872 | | | | 59,269,708 | |
| Class R Shares | | | | | | | | | | | | | | | | |
Shares sold | | | — | | | | — | | | | 541 | | | | 3,906 | |
Reinvestment of distributions | | | 6 | | | | 45 | | | | 228 | | | | 1,670 | |
Shares redeemed | | | — | | | | — | | | | (862 | ) | | | (5,827 | ) |
| | | | 6 | | | | 45 | | | | (93 | ) | | | (251 | ) |
| Class P Shares | | | | | | | | | | | | | | | | |
Shares sold | | | 1,981,663 | | | | 15,702,711 | | | | 32,643,587 | | | | 224,664,371 | |
Reinvestment of distributions | | | 41,849 | | | | 305,915 | | | | 967,797 | | | | 6,894,937 | |
Shares redeemed | | | (2,467,788 | ) | | | (20,227,777 | ) | | | (18,741,613 | ) | | | (124,991,175 | ) |
| | | | (444,276 | ) | | | (4,219,151 | ) | | | 14,869,771 | | | | 106,568,133 | |
| | | | |
NET INCREASE (DECREASE) | | | (3,133,348 | ) | | | (25,640,122 | ) | | | 25,817,335 | | | | 166,097,389 | |
39
GOLDMAN SACHS ENERGY FUNDS
Liquidity Risk Management Program
Each Fund has adopted and implemented a liquidity risk management program (the “Program”) in accordance with Rule 22e-4 under the 1940 Act. The Program seeks to assess and manage each Fund’s liquidity risk, i.e., the risk that a Fund is unable to satisfy redemption requests without significantly diluting remaining investors’ interests in the Fund. The Board of Trustees of the Trust has designated GSAM, each Fund’s investment adviser, to administer the Program. Certain aspects of the Program rely on third parties to perform certain functions, including the provision of market data and application of models.
The Program is comprised of various components designed to support the assessment and/or management of liquidity risk, including: (1) the periodic assessment (no less frequently than annually) of certain factors that influence a Fund’s liquidity risk; (2) the periodic classification (no less frequently than monthly) of a Fund’s investments into one of four liquidity categories that reflect an estimate of their liquidity under current market conditions; (3) a 15% limit on the acquisition of “illiquid investments” (as defined under Rule 22e-4); (4) for a Fund that does not invest primarily in “highly liquid investments” (as defined under Rule 22e-4), the determination of a minimum percentage of the Fund’s assets that will generally be invested in highly liquid investments (a “Highly Liquid Investment Minimum”); and (5) periodic reporting to the Board of Trustees.
At a meeting of the Board of Trustees on February 9-10, 2021, GSAM provided a written report to the Board addressing the operation, and the adequacy and effectiveness of the implementation, of the Program, including, as applicable, the operation of any Highly Liquid Investment Minimum and any material changes to the Program, for the period from January 1, 2020 through December 31, 2020 (the “Reporting Period”). Among other things, the annual report and related materials discussed: (1) the results of stress tests designed to assess liquidity under a hypothetical stressed scenario involving elevated redemptions; (2) an assessment of the methodologies used to classify investments into one of four liquidity categories; and (3) the impact of the COVID-19 pandemic on liquidity and management of liquidity risk during the Reporting Period, including during stressed market conditions caused by the COVID-19 pandemic. The report concluded that the Program continues to be reasonably designed to assess and manage liquidity risk and was adequately and effectively implemented during the Reporting Period.
There can be no assurance that the Program will achieve its objectives under all circumstances in the future. Please refer to your Fund’s prospectus for more information regarding the Fund’s exposure to liquidity risk and other risks to which it may be subject.
40
GOLDMAN SACHS ENERGY FUNDS
| | |
| | |
Fund Expenses — Six Month Period Ended May 31, 2021 (Unaudited) | | |
As a shareholder of Class A, Class C, Institutional, Investor, Class R6, Class R and Class P Shares of a Fund, you incur two types of costs: (1) transaction costs, including sales charges on purchase payments (with respect to Class A Shares) and contingent deferred sales charges on redemptions (with respect to Class C Shares); and (2) ongoing costs, including management fees; distribution and/or service (12b-1) fees (with respect to Class A, Class C and Class R Shares); and other Fund expenses. This example is intended to help you understand your ongoing costs (in dollars) of investing in Class A, Class C, Institutional, Investor, Class R6, Class R and Class P Shares of a Fund and to compare these costs with the ongoing costs of investing in other mutual funds.
The example is based on an investment of $1,000 invested at the beginning of the period and held for the entire period from December 1, 2020 through May 31, 2021, which represents a period of 182 days in a 365 day year. This projection assumes that annualized expense ratios were in effect during the period.
Actual Expenses — The first line under each share class in the table below provides information about actual account values and actual expenses. You may use the information in this line, together with the amount you invested, to estimate the expenses that you paid over the period. Simply divide your account value by $1,000 (for example, an $8,600 account value divided by $1,000=8.6), then multiply the result by the number in the first line under the heading entitled “Expenses Paid” to estimate the expenses you paid on your account during this period.
Hypothetical Example for Comparison Purposes — The second line under each share class in the table below provides information about hypothetical account values and hypothetical expenses based on each Fund’s actual net expense ratios and an assumed rate of return of 5% per year before expenses, which is not the Fund’s actual return. The hypothetical account values and expenses may not be used to estimate the actual ending account balance or expenses you paid for the period. You may use this information to compare the ongoing costs of investing in the Fund and other funds. To do so, compare this 5% hypothetical example with the 5% hypothetical examples that appear in the shareholder reports of the other funds.
Please note that the expenses shown in the table are meant to highlight your ongoing costs only and do not reflect any transactional costs, such as sales charges, redemption fees, or exchange fees. Therefore, the second line of the table is useful in comparing ongoing costs only, and will not help you determine the relative total costs of owning different funds. In addition, if these transactional costs were included, your costs would have been higher.
| | | | | | | | | | | | | | | | | | | | | | | | |
| | | Clean Energy Income Fund | | | Energy Infrastructure Fund | |
| Share Class | | Beginning
Account Value
12/1/20 | | | Ending
Account Value
5/31/21 | | | Expenses
Paid for the
6 months
ended
5/31/21* | | | Beginning
Account Value
12/1/20 | | | Ending
Account Value
5/31/21 | | | Expenses
Paid for the
6 months
ended
5/31/21* | |
| Class A | | | | | | | | | | | | | | | | | | | | | | | | |
Actual | | $ | 1,000.00 | | | $ | 996.20 | | | $ | 6.27 | | | $ | 1,000.00 | | | $ | 1,334.70 | | | $ | 8.56 | |
Hypothetical 5% return | | | 1,000.00 | | | | 1,018.65 | + | | | 6.34 | | | | 1,000.00 | | | | 1,017.60 | + | | | 7.39 | |
| Class C | | | | | | | | | | | | | | | | | | | | | | | | |
Actual | | | 1,000.00 | | | | 992.40 | | | | 9.98 | | | | 1,000.00 | | | | 1,328.50 | | | | 12.89 | |
Hypothetical 5% return | | | 1,000.00 | | | | 1,014.91 | + | | | 10.10 | | | | 1,000.00 | | | | 1,013.86 | + | | | 11.15 | |
| Institutional | | | | | | | | | | | | | | | | | | | | | | | | |
Actual | | | 1,000.00 | | | | 998.40 | | | | 4.43 | | | | 1,000.00 | | | | 1,336.20 | | | | 6.41 | |
Hypothetical 5% return | | | 1,000.00 | | | | 1,020.49 | + | | | 4.48 | | | | 1,000.00 | | | | 1,019.45 | + | | | 5.54 | |
| Investor | | | | | | | | | | | | | | | | | | | | | | | | |
Actual | | | 1,000.00 | | | | 997.70 | | | | 5.03 | | | | 1,000.00 | | | | 1,336.00 | | | | 7.05 | |
Hypothetical 5% return | | | 1,000.00 | | | | 1,019.90 | + | | | 5.09 | | | | 1,000.00 | | | | 1,018.90 | + | | | 6.09 | |
| Class R6 | | | | | | | | | | | | | | | | | | | | | | | | |
Actual | | | 1,000.00 | | | | 998.40 | | | | 4.38 | | | | 1,000.00 | | | | 1,336.70 | | | | 6.35 | |
Hypothetical 5% return | | | 1,000.00 | | | | 1,020.54 | + | | | 4.43 | | | | 1,000.00 | | | | 1,019.50 | + | | | 5.49 | |
| Class R | | | | | | | | | | | | | | | | | | | | | | | | |
Actual | | | 1,000.00 | | | | 995.40 | | | | 7.51 | | | | 1,000.00 | | | | 1,332.50 | | | | 9.94 | |
Hypothetical 5% return | | | 1,000.00 | | | | 1,017.40 | + | | | 7.59 | | | | 1,000.00 | | | | 1,016.40 | + | | | 8.60 | |
| Class P | | | | | | | | | | | | | | | | | | | | | | | | |
Actual | | | 1,000.00 | | | | 998.50 | | | | 4.38 | | | | 1,000.00 | | | | 1,336.70 | | | | 6.35 | |
Hypothetical 5% return | | | 1,000.00 | | | | 1,020.54 | + | | | 4.43 | | | | 1,000.00 | | | | 1,019.50 | + | | | 5.49 | |
| | * | | Expenses for each share class are calculated using each Fund’s annualized net expense ratio for each class, which represents the ongoing expenses as a percentage of net assets for the six months ended May 31, 2021. Expenses are calculated by multiplying the annualized net expense ratio by the average account value for the period; then multiplying the result by the number of days in the most recent fiscal half year; and then dividing that result by the number of days in the fiscal year. The annualized net expense ratios for the period were as follows: | |
| | | | | | | | | | | | | | | | | | | | | | | | | | |
| Fund | | Class A | | Class C | | | Institutional | | | Investor | | | Class R6 | | | Class R | | | Class P | |
Clean Energy Income | | 1.26% | | | 2.01 | % | | | 0.89 | % | | | 1.01 | % | | | 0.88 | % | | | 1.51 | % | | | 0.88 | % |
Energy Infrastructure | | 1.47 | | | 2.22 | | | | 1.10 | | | | 1.21 | | | | 1.09 | | | | 1.71 | | | | 1.09 | |
| | + | | Hypothetical expenses are based on each Fund’s actual annualized net expense ratios and an assumed rate of return of 5% per year before expenses. | |
41
FUNDS PROFILE
Goldman Sachs Funds
Goldman Sachs is a premier financial services firm, known since 1869 for creating thoughtful and customized investment solutions in complex global markets.
Today, the Asset Management Division of Goldman Sachs serves a diverse set of clients worldwide, including private institutions, public entities and individuals. With approximately $2.00 trillion in assets under supervision as of March 31, 2021, Goldman Sachs Asset Management (“GSAM”) has portfolio management teams located around the world and our investment professionals bring firsthand knowledge of local markets to every investment decision. Assets under supervision includes assets under management and other client assets for which Goldman Sachs does not have full discretion. GSAM leverages the resources of Goldman Sachs & Co. LLC subject to legal, internal and regulatory restrictions.
Money Market
Financial Square FundsSM
| ∎ | | Financial Square Treasury Solutions Fund1 |
| ∎ | | Financial Square Government Fund1 |
| ∎ | | Financial Square Money Market Fund2 |
| ∎ | | Financial Square Prime Obligations Fund2 |
| ∎ | | Financial Square Treasury Instruments Fund1 |
| ∎ | | Financial Square Treasury Obligations Fund1 |
| ∎ | | Financial Square Federal Instruments Fund1 |
Investor FundsSM
| ∎ | | Investor Money Market Fund3 |
| ∎ | | Investor Tax-Exempt Money Market Fund3 |
Fixed Income
Short Duration and Government
| ∎ | | High Quality Floating Rate Fund |
| ∎ | | Short-Term Conservative Income Fund |
| ∎ | | Short Duration Government Fund |
| ∎ | | Short Duration Income Fund |
| ∎ | | Inflation Protected Securities Fund |
Multi-Sector
| ∎ | | Global Core Fixed Income Fund |
Municipal and Tax-Free
| ∎ | | High Yield Municipal Fund |
| ∎ | | Dynamic Municipal Income Fund |
| ∎ | | Short Duration Tax-Free Fund |
| ∎ | | Municipal Income Completion Fund |
Single Sector
| ∎ | | Investment Grade Credit Fund |
| ∎ | | High Yield Floating Rate Fund |
| ∎ | | Emerging Markets Debt Fund |
| ∎ | | Local Emerging Markets Debt Fund |
Fixed Income Alternatives
| ∎ | | Long Short Credit Strategies Fund |
Fundamental Equity
| ∎ | | Small/Mid Cap Value Fund |
| ∎ | | Small/Mid Cap Growth Fund |
| ∎ | | Concentrated Growth Fund |
| ∎ | | Technology Opportunities Fund |
| ∎ | | Growth Opportunities Fund |
| ∎ | | Rising Dividend Growth Fund |
Tax-Advantaged Equity
| ∎ | | U.S. Tax-Managed Equity Fund |
| ∎ | | International Tax-Managed Equity Fund |
| ∎ | | U.S. Equity Dividend and Premium Fund |
| ∎ | | International Equity Dividend and Premium Fund |
Equity Insights
| ∎ | | Small Cap Equity Insights Fund |
| ∎ | | U.S. Equity Insights Fund |
| ∎ | | Small Cap Growth Insights Fund |
| ∎ | | Large Cap Growth Insights Fund |
| ∎ | | Large Cap Value Insights Fund |
| ∎ | | Small Cap Value Insights Fund |
| ∎ | | International Small Cap Insights Fund |
| ∎ | | International Equity Insights Fund |
| ∎ | | Emerging Markets Equity Insights Fund |
Fundamental Equity International
| ∎ | | International Equity Income Fund |
| ∎ | | International Equity ESG Fund |
| ∎ | | Emerging Markets Equity Fund |
| ∎ | | ESG Emerging Markets Equity Fund |
Alternative
| ∎ | | Clean Energy Income Fund |
| ∎ | | Real Estate Securities Fund |
| ∎ | | International Real Estate Securities Fund |
| ∎ | | Commodity Strategy Fund |
| ∎ | | Global Real Estate Securities Fund |
| ∎ | | Alternative Premia Fund |
| ∎ | | Absolute Return Tracker Fund |
| ∎ | | Managed Futures Strategy Fund |
| ∎ | | MLP Energy Infrastructure Fund |
| ∎ | | Energy Infrastructure Fund5 |
| ∎ | | Multi-Manager Alternatives Fund |
| ∎ | | Global Infrastructure Fund |
Total Portfolio Solutions
| ∎ | | Global Managed Beta Fund |
| ∎ | | Multi-Manager Non-Core Fixed Income Fund |
| ∎ | | Multi-Manager Global Equity Fund |
| ∎ | | Multi-Manager International Equity Fund |
| ∎ | | Tactical Tilt Overlay Fund |
| ∎ | | Balanced Strategy Portfolio |
| ∎ | | Multi-Manager U.S. Small Cap Equity Fund |
| ∎ | | Multi-Manager Real Assets Strategy Fund |
| ∎ | | Growth and Income Strategy Portfolio |
| ∎ | | Growth Strategy Portfolio |
| ∎ | | Dynamic Global Equity Fund |
| ∎ | | Satellite Strategies Portfolio |
| ∎ | | Enhanced Dividend Global Equity Portfolio |
| ∎ | | Tax-Advantaged Global Equity Portfolio |
| ∎ | | Strategic Factor Allocation Fund |
| ∎ | | Strategic Volatility Premium Fund |
| ∎ | | Target Date Retirement Portfolio |
| ∎ | | Target Date 2025 Portfolio |
| ∎ | | Target Date 2030 Portfolio |
| ∎ | | Target Date 2035 Portfolio |
| ∎ | | Target Date 2040 Portfolio |
| ∎ | | Target Date 2045 Portfolio |
| ∎ | | Target Date 2050 Portfolio |
| ∎ | | Target Date 2055 Portfolio |
| ∎ | | Target Date 2060 Portfolio |
| ∎ | | GQG Partners International Opportunities Fund |
| 1 | | You could lose money by investing in the Fund. Although the Fund seeks to preserve the value of your investment at $1.00 per share, it cannot guarantee it will do so. An investment in the Fund is not a deposit of a bank and is not insured or guaranteed by the Federal Deposit Insurance Corporation or any other government agency. The Fund’s sponsor has no legal obligation to provide financial support to the Fund, and you should not expect that the sponsor will provide financial support to the Fund at any time. |
| 2 | | You could lose money by investing in the Fund. Because the share price of the Fund will fluctuate, when you sell your shares they may be worth more or less than what you originally paid for them. The Fund may impose a fee upon sale of your shares or may temporarily suspend your ability to sell shares if the Fund’s liquidity falls below required minimums because of market conditions or other factors. An investment in the Fund is not a deposit of a bank and is not insured or guaranteed by the Federal Deposit Insurance Corporation or any other government agency. The Fund’s sponsor has no legal obligation to provide financial support to the Fund, and you should not expect that the sponsor will provide financial support to the Fund at any time. |
| 3 | | You could lose money by investing in the Fund. Although the Fund seeks to preserve the value of your investment at $1.00 per share, it cannot guarantee it will do so. The Fund may impose a fee upon sale of your shares or may temporarily suspend your ability to sell shares if the Fund’s liquidity falls below required minimums because of market conditions or other factors. An investment in the Fund is not a deposit of a bank and is not insured or guaranteed by the Federal Deposit Insurance Corporation or any other government agency. The Fund’s sponsor has no legal obligation to provide financial support to the Fund, and you should not expect that the sponsor will provide financial support to the Fund at any time. |
| 4 | | Effective after the close of business on August 30, 2020, the Goldman Sachs Blue Chip Fund was renamed the Goldman Sachs U.S. Equity ESG Fund. |
| 5 | | Effective after the close of business on June 26, 2020, the Goldman Sachs MLP & Energy Fund was renamed the Goldman Sachs Energy Infrastructure Fund. |
| | | Financial Square FundsSM and Investor FundsSM are registered service marks of Goldman Sachs & Co. LLC. |
| * | | This list covers open-end funds only. Please visit our website at www.GSAMFUNDS.com to learn about our closed-end funds and exchange-traded funds. |
| | |
TRUSTEES Jessica Palmer, Chair Dwight L. Bush Kathryn A. Cassidy Diana M. Daniels Joaquin Delgado James A. McNamara Roy W. Templin Gregory G. Weaver | | OFFICERS James A. McNamara, President Joseph F. DiMaria, Principal Financial Officer,
Principal Accounting Officer
and Treasurer Caroline L. Kraus, Secretary |
| |
GOLDMAN SACHS & CO. LLC Distributor and Transfer Agent | | GOLDMAN SACHS ASSET MANAGEMENT, L.P. Investment Adviser |
Visit our website at www.GSAMFUNDS.com to obtain the most recent month-end returns.
Goldman Sachs Asset Management, L.P., 200 West Street, New York, New York 10282
Goldman Sachs does not provide legal, tax or accounting advice, unless explicitly agreed between you and Goldman Sachs (generally through certain services offered only to clients of Private Wealth Management). Any statement contained in this presentation concerning U.S. tax matters is not intended or written to be used and cannot be used for the purpose of avoiding penalties imposed on the relevant taxpayer. Notwithstanding anything in this document to the contrary, and except as required to enable compliance with applicable securities law, you may disclose to any person the US federal and state income tax treatment and tax structure of the transaction and all materials of any kind (including tax opinions and other tax analyses) that are provided to you relating to such tax treatment and tax structure, without Goldman Sachs imposing any limitation of any kind. Investors should be aware that a determination of the tax consequences to them should take into account their specific circumstances and that the tax law is subject to change in the future or retroactively and investors are strongly urged to consult with their own tax advisor regarding any potential strategy, investment or transaction.
The reports concerning the Fund included in this shareholder report may contain certain forward-looking statements about the factors that may affect the performance of the Fund in the future. These statements are based on Fund management’s predictions and expectations concerning certain future events and their expected impact on the Fund, such as performance of the economy as a whole and of specific industry sectors, changes in the levels of interest rates, the impact of developing world events, and other factors that may influence the future performance of the Fund. Management believes these forward-looking statements to be reasonable, although they are inherently uncertain and difficult to predict. Actual events may cause adjustments in portfolio management strategies from those currently expected to be employed.
A description of the policies and procedures that the Fund uses to determine how to vote proxies relating to portfolio securities and information regarding how the Fund voted proxies relating to portfolio securities for the most recent 12-month period ended June 30, are available (I) without charge, upon request by calling 1-800-526-7384 (for Retail Shareholders) or 1-800-621-2550 (for Institutional Shareholders); and (II) on the Securities and Exchange Commission (“SEC’’) web site at http://www.sec.gov.
The Fund will file its portfolio holdings for each month in a fiscal quarter within 60 days after the end of the relevant fiscal quarter on Form N-PORT. Portfolio holdings information for the third month of each fiscal quarter will be made available on the SEC’s web site at http://www.sec.gov. Portfolio holdings information may be obtained upon request and without charge by calling 1-800-526-7384 (for Retail Shareholders) or 1-800-621-2550 (for Institutional Shareholders).
Fund holdings and allocations shown are as of May 31, 2021 and may not be representative of future investments. Fund holdings should not be relied on in making investment decisions and should not be construed as research or investment advice regarding particular securities. Current and future holdings are subject to risk.
Economic and market forecasts presented herein reflect our judgment as of the date of this presentation and are subject to change without notice. These forecasts do not take into account the specific investment objectives, restrictions, tax and financial situation or other needs of any specific client. Actual data will vary and may not be reflected here. These forecasts are subject to high levels of uncertainty that may affect actual performance. Accordingly, these forecasts should be viewed as merely representative of a broad range of possible outcomes. These forecasts are estimated, based on assumptions, and are subject to significant revision and may change materially as economic and market conditions change. Goldman Sachs has no obligation to provide updates or changes to these forecasts. Case studies and examples are for illustrative purposes only.
“Alerian Midstream Energy Select Index”, “Alerian MLP Index”, “Alerian MLP Total Return Index”, “AMEI”, “AMEIX”, “AMZ” and “AMZX” are trademarks of Alerian and their use is granted under a license from Alerian.
The portfolio risk management process includes an effort to monitor and manage risk, but does not imply low risk.
This material is not authorized for distribution to prospective investors unless preceded or accompanied by a current Prospectus or summary prospectus, if applicable. Investors should consider the Fund’s objective, risks, and charges and expenses, and read the summary prospectus, if available, and/or the Prospectus carefully before investing or sending money. The summary prospectus, if available, and the Prospectus contain this and other information about the Fund and may be obtained from your authorized dealer or from Goldman Sachs & Co. LLC by calling (retail – 1-800-526-7384) (institutional – 1-800-621-2550).
© 2021 Goldman Sachs. All rights reserved. 244561-OTU-1446365 MLPANDESAR-21
Goldman Sachs Funds

| | | | |
| | |
| Semi-Annual Report | | | | May 31, 2021 |
| | |
| | | | Financial Square FundsSM |
| | | | Federal Instruments |
| | | | Government |
| | | | Money Market |
| | | | Prime Obligations |
| | | | Treasury Instruments |
| | | | Treasury Obligations |
| | | | Treasury Solutions |

Goldman Sachs Financial Square Funds
| ∎ | | FEDERAL INSTRUMENTS FUND |
| ∎ | | TREASURY INSTRUMENTS FUND |
| ∎ | | TREASURY OBLIGATIONS FUND |
| ∎ | | TREASURY SOLUTIONS FUND |
| | | | |
| | | |
| NOT FDIC-INSURED | | May Lose Value | | No Bank Guarantee |
PORTFOLIO RESULTS
GOVERNMENT MONEY MARKET FUNDS
| | ∎ | | Federal Instruments Fund |
| | ∎ | | Treasury Instruments Fund |
| | ∎ | | Treasury Obligations Fund |
| | ∎ | | Treasury Solutions Fund |
You could lose money by investing in the Fund. Although the Fund seeks to preserve the value of your investment at $1.00 per share, it cannot guarantee it will do so. An investment in the Fund is not a deposit of a bank and is not insured or guaranteed by the Federal Deposit Insurance Corporation or any other government agency. The Fund’s sponsor has no legal obligation to provide financial support to the Fund, and you should not expect that the sponsor will provide financial support to the Fund at any time.
INSTITUTIONAL MONEY MARKET FUNDS
You could lose money by investing in the Fund. Because the share price of the Fund will fluctuate, when you sell your shares they may be worth more or less than what you originally paid for them. The Fund may impose a fee upon sale of your shares or may temporarily suspend your ability to sell shares if the Fund’s liquidity falls below required minimums because of market conditions or other factors. An investment in the Fund is not a deposit of a bank and is not insured or guaranteed by the Federal Deposit Insurance Corporation or any other government agency. The Fund’s sponsor has no legal obligation to provide financial support to the Fund, and you should not expect that the sponsor will provide financial support to the Fund at any time.
1
FUND BASICS
Financial Square Funds
as of May 31, 2021
| | | | | | | | | | | | | | |
| | PERFORMANCE REVIEW1,2 | |
| | | | |
| | | December 1, 2020–May 31, 2021 | | Fund Total Return (based on NAV)3 Institutional Shares | | | SEC 7-Day
Current Yield4 | | | iMoneyNet Institutional
Average5 | |
| | | | |
| | Federal Instruments | | | 0.00 | % | | | 0.00 | % | | | 0.02 | %6 |
| | Government | | | 0.01 | | | | 0.02 | | | | 0.02 | 6 |
| | Money Market | | | 0.02 | | | | 0.02 | | | | 0.03 | 7 |
| | Prime Obligations | | | 0.00 | | | | 0.00 | | | | 0.03 | 7 |
| | Treasury Instruments | | | 0.00 | | | | 0.01 | | | | 0.01 | 8 |
| | Treasury Obligations | | | 0.01 | | | | -0.01 | | | | 0.01 | 9 |
| | | Treasury Solutions | | | 0.00 | | | | 0.00 | | | | 0.01 | 9 |
The returns represent past performance. Past performance does not guarantee future results. The Funds’ investment returns will fluctuate. Current performance may be lower or higher than the performance quoted above. Please visit our Web site at www.GSAMFUNDS.com to obtain the most recent month-end returns. Performance reflects applicable fee waivers and/or expense limitations in effect during the periods shown. In their absence, performance would be reduced. Returns do not reflect the deduction of taxes that a shareholder would pay on Fund distributions or the redemption of Fund shares.
| 1 | | Each of the Treasury Obligations, Money Market, Treasury Instruments and Treasury Solutions Funds offers nine separate classes of shares (Institutional, Select, Preferred, Capital, Administration, Service, Cash Management, Premier and Resource), the Federal Instruments Fund offers eight separate classes of shares (Institutional, Select, Preferred, Capital, Administration, Service, Cash Management and Premier), the Prime Obligations Fund offers ten separate classes of shares (Institutional, Select, Preferred, Capital, Administration, Service, Cash Management, Premier, Resource and Drexel Hamilton Class), and the Government Fund offers thirteen separate classes of shares (Institutional, Select, Preferred, Capital, Administration, Service, Cash Management, Premier, Resource, Drexel Hamilton Class, Class R6, Class A and Class C), each of which is subject to different fees and expenses that affect performance and entitles shareholders to different services. The Institutional, Drexel Hamilton Class, and Class R6 Shares do not have distribution and/or service (12b-1) or administration and/or service (non-12b-1) fees. The Select, Preferred, Capital, Administration, Service, Cash Management, Premier, Resource, Class A and Class C Shares offer financial institutions the opportunity to receive fees for providing certain distribution, administrative support and/or shareholder services (as applicable). As an annualized percentage of average daily net assets, these share classes pay combined distribution and/or service (12b-1), administration and/ or service (non-12b-1) fees (as applicable) at the following contractual rates: the Select Shares pay 0.03%, Preferred Shares pay 0.10%, Capital Shares pay 0.15%, Administration Shares pay 0.25%, Service Shares pay 0.50%, Cash Management Shares pay 0.80%, Premier Shares pay 0.35%, Resource Shares pay 0.65%, Class A Shares pay 0.25% and Class C Shares pay 1.00%. If these fees were reflected in the above performance, performance would have been reduced. In addition, the Fund’s performance does not reflect the deduction of any applicable sales charges. |
| 2 | | The investment adviser may contractually agree to waive or reimburse certain fees and expenses until a specified date. The investment adviser may also voluntarily waive certain fees and expenses, and such voluntary waivers may be discontinued or modified at any time without notice. The performance shown above reflects any waivers or reimbursements that were in effect for all or a portion of the periods shown. When waivers or reimbursements are in place, the Fund’s operating expenses are reduced and the Fund’s yield and total returns to the shareholder are increased. |
| 3 | | The net asset value (NAV) represents the net assets of the class of the Fund (ex-dividend) divided by the total number of shares of the class outstanding. A Fund’s total return reflects the reinvestment of dividends and other distributions. |
| 4 | | The SEC 7-Day Current Yield is calculated in accordance with securities industry regulations and does not include net capital gains. SEC 7-Day Current Yield may differ slightly from the actual distribution rate of a given Fund because of the exclusion of distributed capital gains, which are non-recurring. The SEC 7-Day Current Yield more closely reflects a Fund’s current earnings than do the Fund Total Return figures. |
| 5 | | Source: iMoneyNet, Inc. May 2021. The iMoneyNet Institutional Average represents total return. |
| 6 | | Government & Agencies Institutional–Category includes the most broadly based of the government institutional funds. These funds may generally invest in U.S. treasuries, U.S. agencies, repurchase agreements, or government-backed floating rate notes. |
| 7 | | First Tier Institutional–Category includes only non-government institutional funds that also are not holding any second tier securities. Portfolio holdings of First Tier funds include U.S. Treasury, U.S. other, repurchase agreements, time deposits, domestic bank obligations, foreign bank obligations, first tier commercial paper, floating rate notes, and asset-backed commercial paper. |
| 8 | | Treasury Institutional–Category includes only institutional government funds that hold 100 percent in U.S. Treasuries. |
| 9 | | Treasury & Repo Institutional–Category includes only institutional government funds that hold U.S. Treasuries and repurchase agreements backed by the U.S. Treasury. |
2
YIELD SUMMARY
| | | | | | | | | | | | | | | | | | | | | | |
| | SUMMARY OF THE INSTITUTIONAL SHARES1,2 AS OF 5/31/2021 | |
| | | | | | |
| | | Funds | | 7-Day Dist. Yield10 | | | SEC 7-Day Effective Yield11 | | | 30-Day Average Yield12 | | | Weighted Avg. Maturity (days)13 | | | Weighted Avg. Life (days)14 | |
| | | | | | |
| | Federal Instruments | | | 0.01 | % | | | 0.00 | % | | | 0.01 | % | | | 44 | | | | 99 | |
| | Government | | | 0.03 | | | | 0.02 | | | | 0.03 | | | | 25 | | | | 81 | |
| | Money Market | | | 0.08 | | | | 0.02 | | | | 0.08 | | | | 18 | | | | 34 | |
| | Prime Obligations | | | 0.02 | | | | 0.00 | | | | 0.02 | | | | 23 | | | | 45 | |
| | Treasury Instruments | | | 0.01 | | | | 0.01 | | | | 0.01 | | | | 43 | | | | 98 | |
| | Treasury Obligations | | | 0.01 | | | | -0.01 | | | | 0.02 | | | | 25 | | | | 86 | |
| | | Treasury Solutions | | | 0.01 | | | | 0.00 | | | | 0.01 | | | | 27 | | | | 91 | |
| | | The Yields represent past performance. Past performance does not guarantee future results. Current performance may be lower or higher than the performance quoted above. |
| | | Yields reflect fee waivers and expense limitations in effect and will fluctuate as market conditions change. Please visit our Web site at www.GSAMFUNDS.com to obtain the most recent month-end performance. |
| 10 | | The 7-Day Distribution Yield is an annualized measure of a Fund’s dividends per share, divided by the price per share. This yield includes capital gain/loss distribution, if any. This is not an SEC Yield. |
| 11 | | The SEC 7-Day Effective Yield is calculated in accordance with securities industry regulations and does not include net capital gains. The SEC 7-Day Effective Yield assumes reinvestment of dividends for one year. |
| 12 | | The 30-Day Average Yield is a net annualized yield of 30 days back from the current date listed. This yield includes capital gain/loss distribution. This is not an SEC Yield. |
| 13 | | A Fund’s weighted average maturity (WAM) is an average of the effective maturities of all securities held in the portfolio, weighted by each security’s percentage of net assets. This must not exceed 60 days as calculated under SEC Rule 2a-7. |
| 14 | | A Fund’s weighted average life (WAL) is an average of the final maturities of all securities held in the portfolio, weighted by each security’s percentage of net assets. This must not exceed 120 days as calculated under SEC Rule 2a-7. |
For more information about your Fund, please refer to www.GSAMFUNDS.com. There, you can learn more about your Fund’s investment strategies, holdings, and performance.
3
SECTOR ALLOCATIONS
| | | | | | | | | | | | | | | | | | | | | | | | | | | | | | |
| | SECTOR ALLOCATIONS15 | |
| | | | | | | |
| | | As of May 31, 2021 | | | | | | | | | | | | | | | | | | | |
| | | | | | | | |
| | | Security Type
(Percentage of Net Assets) | | Federal
Instruments | | | Government | | | Money
Market | | | Prime
Obligations | | | Treasury
Instruments | | | Treasury
Obligations | | | Treasury
Solutions | |
| | | | | | | | |
| | Certificates of Deposit - Eurodollar | | | — | | | | — | | | | 0.8 | % | | | 0.9 | % | | | — | | | | — | | | | — | |
| | Certificates of Deposit - Yankeedollar | | | — | | | | — | | | | 4.0 | | | | 4.0 | | | | — | | | | — | | | | — | |
| | Commercial Paper & Corporate Obligations | | | — | | | | — | | | | 38.3 | | | | 37.3 | | | | — | | | | — | | | | — | |
| | Medium Term Note | | | — | | | | — | | | | 0.4 | | | | — | | | | — | | | | — | | | | — | |
| | Repurchase Agreements | | | — | | | | 51.9 | % | | | 15.3 | | | | 21.6 | | | | — | | | | 50.7 | % | | | 35.7 | % |
| | Time Deposits | | | — | | | | — | | | | 25.3 | | | | 6.9 | | | | — | | | | — | | | | — | |
| | U.S. Government Agency Obligations | | | 29.4 | % | | | 11.6 | | | | 0.6 | | | | 1.0 | | | | — | | | | — | | | | — | |
| | U.S. Treasury Obligations | | | 70.5 | | | | 37.1 | | | | 7.3 | | | | 16.2 | | | | 104.8 | % | | | 50.2 | | | | 65.3 | |
| | | Variable Rate Municipal Debt Obligations | | | — | | | | — | | | | 8.7 | | | | 10.1 | | | | — | | | | — | | | | — | |
| | | | | | | | | | | | | | | | | | | | | | | | | | | | | | |
| | | | | | | |
| | | As of November 30, 2020 | | | | | | | | | | | | | | | | | | | |
| | | | | | | | |
| | | Security Type
(Percentage of Net Assets) | | Federal
Instruments | | | Government | | | Money
Market | | | Prime
Obligations | | | Treasury
Instruments | | | Treasury
Obligations | | | Treasury
Solutions | |
| | Certificates of Deposit - Eurodollar | | | — | | | | — | | | | 1.1 | % | | | — | | | | — | | | | — | | | | — | |
| | Certificates of Deposit - Yankeedollar | | | — | | | | — | | | | 2.9 | | | | 3.3 | % | | | — | | | | — | | | | — | |
| | Commercial Paper & Corporate Obligations | | | — | | | | — | | | | 18.0 | | | | 18.5 | | | | — | | | | — | | | | — | |
| | Repurchase Agreements | | | — | | | | 32.5 | % | | | 25.8 | | | | 25.5 | | | | — | | | | 35.5 | % | | | — | |
| | Time Deposits | | | — | | | | — | | | | 8.2 | | | | 7.4 | | | | — | | | | — | | | | — | |
| | U.S. Government Agency Obligations | | | 42.9 | % | | | 16.5 | | | | 0.5 | | | | 0.6 | | | | — | | | | — | | | | — | |
| | U.S. Treasury Obligations | | | 68.7 | | | | 53.9 | | | | 32.1 | | | | 34.9 | | | | 105.2 | % | | | 71.5 | | | | 104.2 | % |
| | | Variable Rate Municipal Debt Obligations | | | — | | | | — | | | | 13.5 | | | | 13.1 | | | | — | | | | — | | | | — | |
| 15 | | Each Fund is actively managed and, as such, its portfolio composition may differ over time. The percentage shown for each investment category reflects the value of investments in that category as a percentage of net assets. Figures in the above table may not sum to 100% due to the exclusion of other assets and liabilities. |
For more information about your Fund, please refer to www.GSAMFUNDS.com. There, you can learn more about your Fund’s investment strategies, holdings, and performance.
4
FINANCIAL SQUARE FEDERAL INSTRUMENTS FUND
Schedule of Investments
May 31, 2021 (Unaudited)
| | | | | | | | | | | | | | |
Principal
Amount | | | Interest
Rate | | | Maturity
Date | | | Amortized
Cost | |
|
| U.S. Government Agency Obligations – 29.4% | |
| | Federal Farm Credit Bank (1 Mo. LIBOR + 0.03%) | |
| $ | 8,200,000 | | | | 0.131 | %(a) | | | 09/15/21 | | | $ | 8,199,952 | |
| | Federal Farm Credit Bank (1 Mo. LIBOR + 0.09%) | |
| | 1,100,000 | | | | 0.184 | (a) | | | 09/13/21 | | | | 1,100,000 | |
| | Federal Farm Credit Bank (1 Mo. LIBOR + 0.10%) | |
| | 2,000,000 | | | | 0.193 | (a) | | | 12/23/21 | | | | 2,000,000 | |
| | Federal Farm Credit Bank (1 Mo. LIBOR + 0.13%) | |
| | 1,300,000 | | | | 0.237 | (a) | | | 11/05/21 | | | | 1,300,000 | |
| | Federal Farm Credit Bank (3 Mo. LIBOR – 0.07%) | |
| | 300,000 | | | | 0.124 | (a) | | | 07/02/21 | | | | 300,000 | |
| | Federal Farm Credit Bank (3 Mo. U.S. T-Bill MMY + 0.15%) | |
| | 70,000,000 | | | | 0.166 | (a) | | | 04/18/22 | | | | 70,000,000 | |
| | Federal Farm Credit Bank (3 Mo. U.S. T-Bill MMY + 0.21%) | |
| | 47,115,000 | | | | 0.225 | (a) | | | 03/17/22 | | | | 47,123,771 | |
| | Federal Farm Credit Bank (3 Mo. U.S. T-Bill MMY + 0.25%) | |
| | 19,000,000 | | | | 0.270 | (a) | | | 02/22/22 | | | | 19,012,564 | |
| | Federal Farm Credit Bank (FEDL01 + 0.12%) | |
| | 3,000,000 | | | | 0.175 | (a) | | | 02/14/22 | | | | 3,000,000 | |
| | Federal Farm Credit Bank (FEDL01 + 0.17%) | |
| | 5,400,000 | | | | 0.230 | (a) | | | 01/13/22 | | | | 5,399,754 | |
| | Federal Farm Credit Bank (FEDL01 + 0.20%) | |
| | 4,600,000 | | | | 0.260 | (a) | | | 11/29/21 | | | | 4,599,980 | |
| | Federal Farm Credit Bank (FEDL01 + 0.21%) | |
| | 3,100,000 | | | | 0.270 | (a) | | | 12/13/21 | | | | 3,099,869 | |
| | Federal Farm Credit Bank (Prime Rate – 2.80%) | |
| | 2,700,000 | | | | 0.450 | (a) | | | 11/23/21 | | | | 2,700,913 | |
| | Federal Farm Credit Bank (Prime Rate – 2.87%) | |
| | 2,000,000 | | | | 0.380 | (a) | | | 02/07/22 | | | | 1,999,861 | |
| | Federal Farm Credit Bank (Prime Rate – 2.94%) | |
| | 1,500,000 | | | | 0.310 | (a) | | | 11/08/21 | | | | 1,500,000 | |
| | Federal Farm Credit Bank (Prime Rate – 2.96%) | |
| | 2,700,000 | | | | 0.290 | (a) | | | 12/13/21 | | | | 2,699,928 | |
| | Federal Farm Credit Bank (Prime Rate – 3.02%) | |
| | 4,200,000 | | | | 0.234 | (a) | | | 01/13/22 | | | | 4,200,000 | |
| | Federal Farm Credit Bank (Prime Rate – 3.05%) | |
| | 5,000,000 | | | | 0.200 | (a) | | | 08/13/21 | | | | 4,998,485 | |
| | Federal Farm Credit Bank (Prime Rate – 3.10%) | |
| | 5,200,000 | | | | 0.150 | (a) | | | 12/02/22 | | | | 5,200,000 | |
| | Federal Farm Credit Bank (Prime Rate – 3.11%) | |
| | 3,800,000 | | | | 0.140 | (a) | | | 11/21/22 | | | | 3,799,773 | |
| | Federal Farm Credit Bank (SOFR + 0.13%) | |
| | 1,200,000 | | | | 0.140 | (a) | | | 02/11/22 | | | | 1,200,000 | |
| | Federal Farm Credit Bank (SOFR + 0.18%) | |
| | 8,600,000 | | | | 0.190 | (a) | | | 01/14/22 | | | | 8,594,563 | |
| | Federal Farm Credit Bank (SOFR + 0.28%) | |
| | 35,000,000 | | | | 0.290 | (a) | | | 10/01/21 | | | | 35,000,000 | |
| | Federal Farm Credit Banks Funding Corp. (FEDL01 + 0.00%) | |
| | 2,100,000 | | | | 0.050 | (a) | | | 02/17/23 | | | | 2,100,000 | |
| | Federal Farm Credit Banks Funding Corp. (Prime Rate – 3.13%) | |
| | 1,400,000 | | | | 0.125 | (a) | | | 02/01/23 | | | | 1,400,000 | |
| | Federal Farm Credit Banks Funding Corp. (Prime Rate – 3.14%) | |
| | 6,000,000 | | | | 0.115 | (a) | | | 04/08/22 | | | | 5,999,948 | |
| | Federal Farm Credit Banks Funding Corp. (Prime Rate – 3.15%) | |
| | 2,300,000 | | | | 0.105 | (a) | | | 04/13/23 | | | | 2,299,870 | |
| | Federal Farm Credit Banks Funding Corp. (Prime Rate – 3.16%) | |
| | 4,000,000 | | | | 0.095 | (a) | | | 01/31/22 | | | | 3,999,891 | |
| | |
|
| U.S. Government Agency Obligations – (continued) | |
| | Federal Farm Credit Banks Funding Corp. (Prime Rate – 3.17%) | |
| 1,200,000 | | | | 0.085 | %(a) | | | 11/25/22 | | | | 1,200,000 | |
| | Federal Home Loan Bank (1 Mo. LIBOR + 0.04%) | |
| | 1,600,000 | | | | 0.133 | (a) | | | 06/24/21 | | | | 1,600,000 | |
| | Federal Home Loan Bank (SOFR + 0.12%) | |
| | 2,600,000 | | | | 0.130 | (a) | | | 02/28/22 | | | | 2,600,000 | |
| | Federal Home Loan Bank (SOFR + 0.17%) | |
| | 12,300,000 | | | | 0.180 | (a) | | | 07/21/22 | | | | 12,300,000 | |
| | Federal Home Loan Bank (SOFR + 0.29%) | |
| | 17,500,000 | | | | 0.300 | (a) | | | 10/06/21 | | | | 17,500,000 | |
| | Federal Home Loan Bank (SOFR + 0.31%) | |
| | 75,000,000 | | | | 0.320 | (a) | | | 09/24/21 | | | | 75,000,000 | |
| | Federal Home Loan Bank Discount Notes | |
| | 26,000,000 | | | | 0.000 | | | | 06/18/21 | | | | 26,000,000 | |
| | 52,000,000 | | | | 0.000 | | | | 06/23/21 | | | | 52,000,000 | |
| | 40,000,000 | | | | 0.023 | | | | 06/25/21 | | | | 39,999,387 | |
| | 200,000,000 | | | | 0.000 | | | | 06/29/21 | | | | 200,000,000 | |
| | 60,000,000 | | | | 0.091 | | | | 07/09/21 | | | | 59,994,300 | |
| | 85,000,000 | | | | 0.050 | | | | 09/15/21 | | | | 84,987,736 | |
| | |
| TOTAL U.S. GOVERNMENT AGENCY
OBLIGATIONS |
| | $ | 826,010,545 | |
| | |
| | | | | | | | | | | | | | |
|
| U.S. Treasury Obligations – 70.5% | |
| | United States Treasury Bills | |
| $ | 14,000,000 | | | | 0.001 | % | | | 06/03/21 | | | $ | 13,999,992 | |
| | 50,000,000 | | | | 0.001 | | | | 06/03/21 | | | | 49,999,750 | |
| | 175,000,000 | | | | 0.010 | | | | 06/08/21 | | | | 174,999,659 | |
| | 19,600,000 | | | | 0.091 | | | | 06/10/21 | | | | 19,599,804 | |
| | 42,500,000 | | | | 0.091 | | | | 06/10/21 | | | | 42,499,044 | |
| | 279,965,000 | | | | 0.091 | | | | 06/15/21 | | | | 279,964,562 | |
| | 50,000,000 | | | | 0.086 | | | | 06/17/21 | | | | 49,998,111 | |
| | 10,400,000 | | | | 0.091 | | | | 06/22/21 | | | | 10,399,970 | |
| | 50,000,000 | | | | 0.091 | | | | 06/22/21 | | | | 49,997,375 | |
| | 37,500,000 | | | | 0.091 | | | | 06/24/21 | | | | 37,497,844 | |
| | 4,600,000 | | | | 0.091 | | | | 06/29/21 | | | | 4,599,839 | |
| | 60,000,000 | | | | 0.091 | | | | 06/29/21 | | | | 59,995,800 | |
| | 70,000,000 | | | | 0.091 | | | | 07/08/21 | | | | 69,993,525 | |
| | 20,000,000 | | | | 0.056 | | | | 07/13/21 | | | | 19,998,717 | |
| | 40,000,000 | | | | 0.056 | | | | 07/13/21 | | | | 39,997,667 | |
| | 40,000,000 | | | | 0.091 | | | | 07/15/21 | | | | 39,995,600 | |
| | 25,000,000 | | | | 0.056 | | | | 07/20/21 | | | | 24,998,639 | |
| | 70,400,000 | | | | 0.056 | | | | 07/20/21 | | | | 70,394,730 | |
| | 18,000,000 | | | | 0.096 | | | | 07/22/21 | | | | 17,997,577 | |
| | 35,000,000 | | | | 0.030 | | | | 07/27/21 | | | | 34,998,367 | |
| | 50,000,000 | | | | 0.030 | | | | 08/03/21 | | | | 49,997,375 | |
| | 38,000,000 | | | | 0.071 | | | | 08/05/21 | | | | 37,995,197 | |
| | 30,000,000 | | | | 0.025 | | | | 08/10/21 | | | | 29,998,542 | |
| | 50,000,000 | | | | 0.061 | | | | 08/19/21 | | | | 49,993,417 | |
| | 65,000,000 | | | | 0.061 | | | | 08/19/21 | | | | 64,997,860 | |
| | 4,500,000 | | | | 0.046 | | | | 08/26/21 | | | | 4,499,516 | |
| | 42,400,000 | | | | 0.056 | | | | 09/16/21 | | | | 42,393,069 | |
| | 2,600,000 | | | | 0.015 | | | | 09/21/21 | | | | 2,599,879 | |
| | 28,200,000 | | | | 0.041 | | | | 09/23/21 | | | | 28,196,428 | |
| | 38,000,000 | | | | 0.041 | | | | 09/30/21 | | | | 37,994,891 | |
| | 75,000,000 | | | | 0.035 | | | | 10/07/21 | | | | 74,990,667 | |
| | 75,000,000 | | | | 0.035 | | | | 10/28/21 | | | | 74,989,136 | |
| | |
| | |
| The accompanying notes are an integral part of these financial statements. | | 5 |
FINANCIAL SQUARE FEDERAL INSTRUMENTS FUND
Schedule of Investments (continued)
May 31, 2021 (Unaudited)
| | | | | | | | | | | | | | |
Principal
Amount | | | Interest
Rate | | | Maturity
Date | | | Amortized
Cost | |
|
| U.S. Treasury Obligations – (continued) | |
| | United States Treasury Bills – (continued) | |
| $ | 75,000,000 | | | | 0.035 | % | | | 11/12/21 | | | $ | 74,988,041 | |
| | 5,200,000 | | | | 0.030 | | | | 11/18/21 | | | | 5,199,386 | |
| | 10,400,000 | | | | 0.030 | | | | 11/18/21 | | | | 10,398,735 | |
| | 20,900,000 | | | | 0.030 | | | | 11/18/21 | | | | 20,897,039 | |
| United States Treasury Floating Rate Note (3 Mo. U.S. T-Bill
MMY + 0.03%) |
|
| | 15,000,000 | | | | 0.054 | (a) | | | 04/30/23 | | | | 15,000,388 | |
| United States Treasury Floating Rate Note (3 Mo. U.S. T-Bill
MMY + 0.05%) |
|
| | 10,000,000 | | | | 0.069 | (a) | | | 01/31/23 | | | | 10,000,676 | |
| United States Treasury Floating Rate Note (3 Mo. U.S. T-Bill
MMY + 0.06%) |
|
| | 58,400,000 | | | | 0.075 | (a) | | | 07/31/22 | | | | 58,418,228 | |
| | 13,400,000 | | | | 0.075 | (a) | | | 10/31/22 | | | | 13,404,396 | |
| United States Treasury Floating Rate Note (3 Mo. U.S. T-Bill
MMY + 0.11%) |
|
| | 43,200,000 | | | | 0.134 | (a) | | | 04/30/22 | | | | 43,236,118 | |
| United States Treasury Floating Rate Note (3 Mo. U.S. T-Bill
MMY + 0.15%) |
|
| | 4,300,000 | | | | 0.169 | (a) | | | 01/31/22 | | | | 4,299,926 | |
| United States Treasury Floating Rate Note (3 Mo. U.S. T-Bill
MMY + 0.22%) |
|
| | 39,800,000 | | | | 0.235 | (a) | | | 07/31/21 | | | | 39,804,458 | |
| United States Treasury Floating Rate Note (3 Mo. U.S. T-Bill
MMY + 0.30%) |
|
| | 23,800,000 | | | | 0.315 | (a) | | | 10/31/21 | | | | 23,814,694 | |
| | United States Treasury Notes | |
| | 1,140,000 | | | | 1.125 | | | | 06/30/21 | | | | 1,140,935 | |
| | 1,700,000 | | | | 2.125 | | | | 06/30/21 | | | | 1,702,764 | |
| | 10,060,000 | | | | 2.625 | | | | 07/15/21 | | | | 10,090,783 | |
| | 2,400,000 | | | | 1.125 | | | | 07/31/21 | | | | 2,404,051 | |
| | 2,500,000 | | | | 2.125 | | | | 08/15/21 | | | | 2,510,492 | |
| | 4,400,000 | | | | 1.125 | | | | 08/31/21 | | | | 4,411,158 | |
| | 1,200,000 | | | | 1.500 | | | | 08/31/21 | | | | 1,204,161 | |
| | 2,300,000 | | | | 2.000 | | | | 08/31/21 | | | | 2,310,870 | |
| | 1,800,000 | | | | 1.125 | | | | 09/30/21 | | | | 1,806,525 | |
| | 500,000 | | | | 1.500 | | | | 09/30/21 | | | | 502,363 | |
| | 1,500,000 | | | | 1.250 | | | | 10/31/21 | | | | 1,507,317 | |
| | 1,900,000 | | | | 2.875 | | | | 11/15/21 | | | | 1,924,265 | |
| | 4,200,000 | | | | 8.000 | | | | 11/15/21 | | | | 4,352,008 | |
| | 2,600,000 | | | | 1.500 | | | | 11/30/21 | | | | 2,618,466 | |
| | 400,000 | | | | 1.750 | | | | 11/30/21 | | | | 403,335 | |
| | 2,600,000 | | | | 2.625 | | | | 12/15/21 | | | | 2,635,683 | |
| | 6,800,000 | | | | 2.000 | | | | 12/31/21 | | | | 6,876,366 | |
| | 320,000 | | | | 2.500 | | | | 01/15/22 | | | | 324,824 | |
| | 300,000 | | | | 1.500 | | | | 01/31/22 | | | | 302,838 | |
| | 500,000 | | | | 1.875 | | | | 01/31/22 | | | | 505,982 | |
| | |
| TOTAL U.S. TREASURY
OBLIGATIONS |
| | $ | 1,979,569,820 | |
| | |
| | TOTAL INVESTMENTS – 99.9% | | | $ | 2,805,580,365 | |
| | |
| OTHER ASSETS IN EXCESS OF
LIABILITIES – 0.1% |
| | | 2,148,336 | |
| | |
| | NET ASSETS – 100.0% | | | $ | 2,807,728,701 | |
| | |
| | |
|
| The percentage shown for each investment category reflects the value of investments in that category as a percentage of net assets. |
| |
(a) | | Variable or floating rate security. Except for floating rate notes (for which final maturity is disclosed), maturity date disclosed is the next interest reset date. Interest rate disclosed is that which is in effect on May 31, 2021. |
Interest rates represent either the stated coupon rate, annualized yield on date of purchase for discounted securities, or, for floating rate securities, the current reset rate, which is based upon current interest rate indices.
Maturity dates represent either the final legal maturity date on the security, the demand date for puttable securities, the date of the next interest rate reset for variable rate securities, or the prerefunded date for those types of securities.
| | |
|
Investment Abbreviations: |
FEDL01 | | — US Federal Funds Effective Rate |
LIBOR | | — London Interbank Offered Rates |
MMY | | — Money Market Yield |
Prime | | — Federal Reserve Bank Prime Loan Rate US |
SOFR | | — Secured Overnight Financing Rate |
T-Bill | | — Treasury Bill |
|
| | |
| 6 | | The accompanying notes are an integral part of these financial statements. |
FINANCIAL SQUARE GOVERNMENT FUND
Schedule of Investments
May 31, 2021 (Unaudited)
| | | | | | | | | | | | | | |
Principal Amount | | | Interest
Rate | | | Maturity
Date | | | Amortized Cost | |
|
| U.S. Government Agency Obligations – 11.6% | |
| | Federal Farm Credit Bank (1 Mo. LIBOR + 0.03%) | |
| $ | 545,900,000 | | | | 0.131 | %(a) | | | 09/15/21 | | | $ | 545,896,836 | |
| | Federal Farm Credit Bank (1 Mo. LIBOR + 0.09%) | |
| | 85,100,000 | | | | 0.184 | (a) | | | 09/13/21 | | | | 85,100,000 | |
| | Federal Farm Credit Bank (1 Mo. LIBOR + 0.10%) | |
| | 191,600,000 | | | | 0.195 | (a) | | | 09/09/21 | | | | 191,600,000 | |
| | 107,000,000 | | | | 0.193 | (a) | | | 12/23/21 | | | | 107,000,000 | |
| | Federal Farm Credit Bank (1 Mo. LIBOR + 0.13%) | |
| | 93,100,000 | | | | 0.237 | (a) | | | 11/05/21 | | | | 93,100,000 | |
| | Federal Farm Credit Bank (3 Mo. LIBOR – 0.07%) | |
| | 49,000,000 | | | | 0.124 | (a) | | | 07/02/21 | | | | 49,000,000 | |
| | Federal Farm Credit Bank (FEDL01 + 0.12%) | |
| | 189,100,000 | | | | 0.175 | (a) | | | 02/14/22 | | | | 189,100,000 | |
| | Federal Farm Credit Bank (FEDL01 + 0.17%) | |
| | 367,700,000 | | | | 0.230 | (a) | | | 01/13/22 | | | | 367,683,097 | |
| | Federal Farm Credit Bank (FEDL01 + 0.20%) | |
| | 336,800,000 | | | | 0.260 | (a) | | | 11/29/21 | | | | 336,798,511 | |
| | Federal Farm Credit Bank (FEDL01 + 0.21%) | |
| | 217,000,000 | | | | 0.270 | (a) | | | 12/13/21 | | | | 216,990,794 | |
| | Federal Farm Credit Bank (Prime Rate – 2.80%) | |
| | 123,400,000 | | | | 0.450 | (a) | | | 11/23/21 | | | | 123,441,743 | |
| | Federal Farm Credit Bank (Prime Rate – 2.87%) | |
| | 95,500,000 | | | | 0.380 | (a) | | | 02/07/22 | | | | 95,493,379 | |
| | Federal Farm Credit Bank (Prime Rate – 2.94%) | |
| | 117,700,000 | | | | 0.310 | (a) | | | 11/08/21 | | | | 117,700,000 | |
| | Federal Farm Credit Bank (Prime Rate – 2.96%) | |
| | 193,000,000 | | | | 0.290 | (a) | | | 12/13/21 | | | | 192,994,884 | |
| | Federal Farm Credit Bank (Prime Rate – 3.02%) | |
| | 294,000,000 | | | | 0.234 | (a) | | | 01/13/22 | | | | 294,000,000 | |
| | Federal Farm Credit Bank (Prime Rate – 3.05%) | |
| | 245,000,000 | | | | 0.200 | (a) | | | 08/13/21 | | | | 244,925,739 | |
| | Federal Farm Credit Bank (Prime Rate – 3.10%) | |
| | 228,100,000 | | | | 0.150 | (a) | | | 12/02/22 | | | | 228,100,000 | |
| | Federal Farm Credit Bank (Prime Rate – 3.11%) | |
| | 165,600,000 | | | | 0.140 | (a) | | | 11/21/22 | | | | 165,590,111 | |
| | Federal Farm Credit Bank (SOFR + 0.18%) | |
| | 235,600,000 | | | | 0.190 | (a) | | | 01/14/22 | | | | 235,348,828 | |
| Federal Farm Credit Banks Funding Corp.
(1 Mo. LIBOR + 0.04%) |
|
| | 25,000,000 | | | | 0.150 | (a) | | | 06/03/21 | | | | 25,000,195 | |
| | Federal Farm Credit Banks Funding Corp. (FEDL01 + 0.00%) | |
| | 143,700,000 | | | | 0.050 | (a) | | | 02/17/23 | | | | 143,700,000 | |
| | Federal Farm Credit Banks Funding Corp. (Prime Rate – 3.13%) | |
| | 63,100,000 | | | | 0.125 | (a) | | | 02/01/23 | | | | 63,100,000 | |
| | Federal Farm Credit Banks Funding Corp. (Prime Rate – 3.14%) | |
| | 269,000,000 | | | | 0.115 | (a) | | | 04/08/22 | | | | 268,997,676 | |
| | Federal Farm Credit Banks Funding Corp. (Prime Rate – 3.15%) | |
| | 145,200,000 | | | | 0.105 | (a) | | | 04/13/23 | | | | 145,191,768 | |
| | Federal Farm Credit Banks Funding Corp. (Prime Rate – 3.16%) | |
| | 150,800,000 | | | | 0.095 | (a) | | | 01/31/22 | | | | 150,795,909 | |
| | Federal Farm Credit Banks Funding Corp. (Prime Rate – 3.17%) | |
| | 59,400,000 | | | | 0.085 | (a) | | | 11/25/22 | | | | 59,400,000 | |
| | Federal Farm Credit Discount Notes | |
| | 55,000,000 | | | | 0.010 | | | | 06/01/21 | | | | 55,000,000 | |
| | 6,000,000 | | | | 0.010 | | | | 06/03/21 | | | | 5,999,997 | |
| | 7,000,000 | | | | 0.010 | | | | 07/02/21 | | | | 6,999,940 | |
| | |
|
| U.S. Government Agency Obligations – (continued) | |
| | Federal Home Loan Bank (1 Mo. LIBOR + 0.04%) | |
| 118,200,000 | | | | 0.133 | %(a) | | | 06/24/21 | | | | 118,200,000 | |
| | Federal Home Loan Bank (3 Mo. LIBOR – 0.09%) | |
| | 481,100,000 | | | | 0.109 | (a) | | | 07/06/21 | | | | 481,100,000 | |
| | Federal Home Loan Bank (SOFR + 0.17%) | |
| | 933,500,000 | | | | 0.180 | (a) | | | 07/21/22 | | | | 933,500,000 | |
| | Federal Home Loan Bank (SOFR + 0.29%) | |
| | 958,000,000 | | | | 0.300 | (a) | | | 10/06/21 | | | | 958,000,000 | |
| | Federal Home Loan Bank (SOFR + 0.30%) | |
| | 1,400,000,000 | | | | 0.310 | (a) | | | 09/29/21 | | | | 1,400,000,000 | |
| | Federal Home Loan Bank (SOFR + 0.35%) | |
| | 990,000,000 | | | | 0.360 | (a) | | | 09/23/21 | | | | 990,000,000 | |
| | Federal Home Loan Bank Discount Notes | |
| | 85,000,000 | | | | 0.005 | | | | 06/04/21 | | | | 84,999,965 | |
| | Federal Home Loan Mortgage Corp. (SOFR + 0.29%) | |
| | 1,490,000,000 | | | | 0.300 | (a) | | | 10/01/21 | | | | 1,490,000,000 | |
| | Federal Home Loan Mortgage Corp. (SOFR + 0.30%) | |
| | 3,053,600,000 | | | | 0.310 | (a) | | | 09/24/21 | | | | 3,053,600,000 | |
| | 500,000,000 | | | | 0.310 | (a) | | | 10/25/21 | | | | 500,000,000 | |
| | Federal Home Loan Mortgage Corp. (SOFR + 0.31%) | |
| | 498,000,000 | | | | 0.320 | (a) | | | 01/03/22 | | | | 498,000,000 | |
| | Federal Home Loan Mortgage Corp. (SOFR + 0.32%) | |
| | 745,000,000 | | | | 0.330 | (a) | | | 09/27/21 | | | | 745,000,000 | |
| | 496,500,000 | | | | 0.330 | (a) | | | 09/30/21 | | | | 496,500,000 | |
| | Federal National Mortgage Association (SOFR + 0.10%) | |
| | 117,700,000 | | | | 0.110 | (a) | | | 12/03/21 | | | | 117,549,336 | |
| | Federal National Mortgage Association (SOFR + 0.29%) | |
| | 486,900,000 | | | | 0.300 | (a) | | | 10/04/21 | | | | 486,900,000 | |
| | Federal National Mortgage Association (SOFR + 0.30%) | |
| | 993,500,000 | | | | 0.310 | (a) | | | 09/24/21 | | | | 993,500,000 | |
| | Federal National Mortgage Association (SOFR + 0.34%) | |
| | 1,789,500,000 | | | | 0.350 | (a) | | | 10/20/21 | | | | 1,789,500,000 | |
| | 990,725,000 | | | | 0.350 | (a) | | | 12/30/21 | | | | 990,725,000 | |
| | 993,000,000 | | | | 0.350 | (a) | | | 01/21/22 | | | | 993,000,000 | |
| | Federal National Mortgage Association (SOFR + 0.35%) | |
| | 248,000,000 | | | | 0.360 | (a) | | | 10/15/21 | | | | 248,000,000 | |
| | Federal National Mortgage Association (SOFR + 0.36%) | |
| | 499,000,000 | | | | 0.370 | (a) | | | 01/20/22 | | | | 499,000,000 | |
| | Tennessee Valley Authority Discount Notes | |
| | 140,000,000 | | | | 0.009 | | | | 06/02/21 | | | | 139,999,971 | |
| | U.S. International Development Finance Corp. | |
| | 26,000,000 | | | | 0.000 | | | | 01/26/22 | | | | 26,019,755 | |
| U.S. International Development Finance Corp. (3 Mo. U.S. T-Bill
+ 0.00%)(a) |
|
| | 6,200,000 | | | | 0.008 | | | | 06/07/21 | | | | 6,200,000 | |
| | 41,852,331 | | | | 0.090 | | | | 06/07/21 | | | | 41,852,331 | |
| | 3,000,000 | | | | 0.100 | | | | 06/07/21 | | | | 3,000,000 | |
| | 8,137,500 | | | | 0.100 | | | | 11/15/22 | | | | 8,137,500 | |
| | 857,409 | | | | 0.090 | | | | 06/15/23 | | | | 857,409 | |
| | 6,250,000 | | | | 0.100 | | | | 11/15/23 | | | | 6,250,000 | |
| | 12,600,000 | | | | 0.090 | | | | 03/20/24 | | | | 12,600,000 | |
| | 14,450,000 | | | | 0.090 | | | | 06/15/25 | | | | 14,450,000 | |
| | 34,425,002 | | | | 0.008 | | | | 07/15/25 | | | | 34,425,002 | |
| | 2,236,842 | | | | 0.008 | | | | 08/15/25 | | | | 2,236,842 | |
| | 9,473,684 | | | | 0.090 | | | | 09/15/25 | | | | 9,473,684 | |
| | 82,950,000 | | | | 0.090 | | | | 07/09/26 | | | | 82,950,000 | |
| | 13,750,000 | | | | 0.090 | | | | 09/15/26 | | | | 13,750,000 | |
| | |
| | |
| The accompanying notes are an integral part of these financial statements. | | 7 |
FINANCIAL SQUARE GOVERNMENT FUND
Schedule of Investments (continued)
May 31, 2021 (Unaudited)
| | | | | | | | | | | | | | |
Principal Amount | | | Interest
Rate | | | Maturity
Date | | | Amortized Cost | |
|
| U.S. Government Agency Obligations – (continued) | |
| U.S. International Development Finance Corp. (3 Mo. U.S. T-Bill
+ 0.00%)(a) – (continued) |
|
| $ | 24,769,231 | | | | 0.090 | % | | | 12/15/26 | | | $ | 24,769,231 | |
| | 5,208,334 | | | | 0.100 | | | | 06/20/27 | | | | 5,208,334 | |
| | 9,100,000 | | | | 0.008 | | | | 08/13/27 | | | | 9,100,000 | |
| | 20,000,000 | | | | 0.090 | | | | 08/13/27 | | | | 20,000,000 | |
| | 23,214,286 | | | | 0.100 | | | | 09/20/27 | | | | 23,214,286 | |
| | 43,497,750 | | | | 0.090 | | | | 02/15/28 | | | | 43,497,750 | |
| | 43,000,000 | | | | 0.090 | | | | 09/15/28 | | | | 43,000,000 | |
| | 46,704,546 | | | | 0.090 | | | | 11/15/28 | | | | 46,704,546 | |
| | 33,018,868 | | | | 0.090 | | | | 01/15/30 | | | | 33,018,868 | |
| | 49,500,000 | | | | 0.090 | | | | 03/15/30 | | | | 49,500,000 | |
| | 13,000,000 | | | | 0.090 | | | | 10/15/30 | | | | 13,000,000 | |
| | 30,000,000 | | | | 0.090 | | | | 08/15/31 | | | | 30,000,000 | |
| | 15,551,220 | | | | 0.090 | | | | 09/02/31 | | | | 15,551,220 | |
| | 45,505,560 | | | | 0.090 | | | | 09/30/31 | | | | 45,505,560 | |
| | 30,000,000 | | | | 0.090 | | | | 12/20/31 | | | | 30,000,000 | |
| | 3,348,850 | | | | 0.090 | | | | 05/15/33 | | | | 3,348,850 | |
| | 39,985,795 | | | | 0.090 | | | | 12/15/33 | | | | 39,985,795 | |
| | 3,689,522 | | | | 0.100 | | | | 09/20/38 | | | | 3,689,522 | |
| | 40,503,992 | | | | 0.100 | | | | 07/07/40 | | | | 40,503,993 | |
| | |
| TOTAL U.S. GOVERNMENT
AGENCY OBLIGATIONS |
| | $ | 23,592,924,157 | |
| | |
| | | | | | | | | | | | | | |
|
| U.S. Treasury Obligations – 37.1% | |
| | United States Treasury Bills | |
| $ | 133,800,000 | | | | 0.000 | % | | | 06/01/21 | | | $ | 133,800,000 | |
| | 208,600,000 | | | | 0.000 | | | | 06/01/21 | | | | 208,600,000 | |
| | 466,200,000 | | | | 0.000 | | | | 06/01/21 | | | | 466,200,000 | |
| | 915,000,000 | | | | 0.000 | | | | 06/01/21 | | | | 915,000,000 | |
| | 935,000,000 | | | | 0.000 | | | | 06/01/21 | | | | 935,000,000 | |
| | 985,000,000 | | | | 0.000 | | | | 06/01/21 | | | | 985,000,000 | |
| | 137,800,000 | | | | 0.000 | | | | 06/03/21 | | | | 137,799,992 | |
| | 236,200,000 | | | | 0.000 | | | | 06/03/21 | | | | 236,200,000 | |
| | 500,000,000 | | | | 0.000 | | | | 06/03/21 | | | | 499,999,722 | |
| | 571,550,000 | | | | 0.000 | | | | 06/03/21 | | | | 571,547,142 | |
| | 34,800,000 | | | | 0.000 | | | | 06/10/21 | | | | 34,800,000 | |
| | 59,000,000 | | | | 0.000 | | | | 06/10/21 | | | | 58,999,985 | |
| | 1,715,200,000 | | | | 0.000 | | | | 06/10/21 | | | | 1,715,161,408 | |
| | 413,750,000 | | | | 0.000 | | | | 06/17/21 | | | | 413,734,369 | |
| | 1,141,200,000 | | | | 0.000 | | | | 06/24/21 | | | | 1,141,189,062 | |
| | 1,500,500,000 | | | | 0.000 | | | | 06/24/21 | | | | 1,500,413,721 | |
| | 2,337,500,000 | | | | 0.003 | (b) | | | 06/29/21 | | | | 2,337,495,455 | |
| | 1,241,000,000 | | | | 0.101 | | | | 07/01/21 | | | | 1,240,896,582 | |
| | 1,000,000,000 | | | | 0.081 | | | | 07/06/21 | | | | 999,922,222 | |
| | 1,741,050,000 | | | | 0.081 | | | | 07/06/21 | | | | 1,740,965,366 | |
| | 1,416,700,000 | | | | 0.091 | | | | 07/08/21 | | | | 1,416,568,955 | |
| | 562,409,000 | | | | 0.056 | | | | 07/13/21 | | | | 562,372,912 | |
| | 1,515,800,000 | | | | 0.091 | | | | 07/15/21 | | | | 1,515,633,262 | |
| | 970,477,000 | | | | 0.056 | | | | 07/20/21 | | | | 970,424,163 | |
| | 2,887,100,000 | | | | 0.056 | | | | 07/20/21 | | | | 2,886,883,868 | |
| | 1,427,900,000 | | | | 0.096 | | | | 07/22/21 | | | | 1,427,707,828 | |
| | 3,815,000,000 | | | | 0.030 | | | | 07/27/21 | | | | 3,814,821,967 | |
| | 1,951,350,000 | | | | 0.086 | | | | 07/29/21 | | | | 1,951,082,775 | |
| | 1,602,050,000 | | | | 0.071 | | | | 08/05/21 | | | | 1,601,847,518 | |
| | |
|
| U.S. Treasury Obligations – (continued) | |
| | United States Treasury Bills – (continued) | |
| 794,693,000 | | | | 0.025 | | | | 08/10/21 | | | | 794,654,369 | |
| | 883,400,000 | | | | 0.051 | | | | 08/12/21 | | | | 883,311,659 | |
| | 117,900,000 | | | | 0.061 | | | | 08/19/21 | | | | 117,897,413 | |
| | 3,519,000,000 | | | | 0.061 | | | | 08/19/21 | | | | 3,518,536,670 | |
| | 1,954,700,000 | | | | 0.061 | | | | 09/02/21 | | | | 1,954,397,025 | |
| | 4,816,600,000 | | | | 0.061 | | | | 09/09/21 | | | | 4,815,797,242 | |
| | 201,100,000 | | | | 0.010 | | | | 09/14/21 | | | | 201,094,135 | |
| | 4,166,000,000 | | | | 0.056 | | | | 09/16/21 | | | | 4,165,318,964 | |
| | 262,200,000 | | | | 0.015 | | | | 09/21/21 | | | | 262,187,764 | |
| | 1,858,400,000 | | | | 0.041 | | | | 09/30/21 | | | | 1,858,150,151 | |
| | 569,300,000 | | | | 0.035 | | | | 10/07/21 | | | | 569,229,156 | |
| | 5,005,750,000 | | | | 0.035 | | | | 10/28/21 | | | | 5,005,024,880 | |
| | 3,519,400,000 | | | | 0.035 | | | | 11/12/21 | | | | 3,518,838,841 | |
| | 206,600,000 | | | | 0.030 | | | | 11/18/21 | | | | 206,570,732 | |
| | 243,000,000 | | | | 0.030 | | | | 11/18/21 | | | | 242,971,312 | |
| | 486,000,000 | | | | 0.030 | | | | 11/18/21 | | | | 485,940,904 | |
| United States Treasury Floating Rate Note (3 Mo. U.S. T-Bill
MMY + 0.03%) |
|
| | 5,999,270,000 | | | | 0.054 | (a) | | | 04/30/23 | | | | 5,999,521,953 | |
| United States Treasury Floating Rate Note (3 Mo. U.S. T-Bill
MMY + 0.05%) |
|
| | 3,705,907,000 | | | | 0.069 | (a) | | | 01/31/23 | | | | 3,706,579,766 | |
| United States Treasury Floating Rate Note (3 Mo. U.S. T-Bill
MMY + 0.06%) |
|
| | 1,081,800,000 | | | | 0.075 | (a) | | | 07/31/22 | | | | 1,082,138,415 | |
| | 777,500,000 | | | | 0.075 | (a) | | | 10/31/22 | | | | 777,799,798 | |
| United States Treasury Floating Rate Note (3 Mo. U.S. T-Bill
MMY + 0.15%) |
|
| | 8,050,000 | | | | 0.169 | (a) | | | 01/31/22 | | | | 8,050,000 | |
| United States Treasury Floating Rate Note (3 Mo. U.S. T-Bill
MMY + 0.22%) |
|
| | 28,640,000 | | | | 0.235 | (a) | | | 07/31/21 | | | | 28,636,717 | |
| United States Treasury Floating Rate Note (3 Mo. U.S. T-Bill
MMY + 0.30%) |
|
| | 15,700,000 | | | | 0.315 | (a) | | | 10/31/21 | | | | 15,703,233 | |
| | United States Treasury Notes | |
| | 309,890,000 | | | | 1.125 | (b) | | | 06/30/21 | | | | 310,156,123 | |
| | 80,300,000 | | | | 2.125 | | | | 06/30/21 | | | | 80,430,537 | |
| | 439,200,000 | | | | 2.625 | | | | 07/15/21 | | | | 440,543,921 | |
| | 104,300,000 | | | | 1.125 | | | | 07/31/21 | | | | 104,476,063 | |
| | 112,800,000 | | | | 2.125 | | | | 08/15/21 | | | | 113,273,416 | |
| | 192,200,000 | | | | 1.125 | | | | 08/31/21 | | | | 192,687,401 | |
| | 50,400,000 | | | | 1.500 | | | | 08/31/21 | | | | 50,574,762 | |
| | 99,800,000 | | | | 2.000 | | | | 08/31/21 | | | | 100,271,671 | |
| | 22,500,000 | | | | 1.500 | | | | 09/30/21 | | | | 22,606,348 | |
| | 346,200,000 | | | | 1.250 | | | | 10/31/21 | | | | 347,898,354 | |
| | 84,200,000 | | | | 2.875 | | | | 11/15/21 | | | | 85,275,338 | |
| | 213,000,000 | | | | 8.000 | | | | 11/15/21 | | | | 220,708,966 | |
| | 112,200,000 | | | | 1.500 | | | | 11/30/21 | | | | 112,996,871 | |
| | 15,100,000 | | | | 1.750 | | | | 11/30/21 | | | | 15,225,892 | |
| | 183,000,000 | | | | 2.625 | | | | 12/15/21 | | | | 185,514,619 | |
| | 295,800,000 | | | | 2.000 | | | | 12/31/21 | | | | 299,121,904 | |
| | 117,800,000 | | | | 2.125 | | | | 12/31/21 | | | | 119,209,127 | |
| | 13,858,000 | | | | 2.500 | | | | 01/15/22 | | | | 14,066,924 | |
| | 11,200,000 | | | | 1.500 | | | | 01/31/22 | | | | 11,305,969 | |
| | |
| | |
| 8 | | The accompanying notes are an integral part of these financial statements. |
FINANCIAL SQUARE GOVERNMENT FUND
| | | | | | | | | | | | | | |
Principal Amount | | | Interest
Rate | | | Maturity
Date | | | Amortized Cost | |
|
| U.S. Treasury Obligations – (continued) | |
| | United States Treasury Notes – (continued) | |
| $ | 22,500,000 | | | | 1.875 | % | | | 01/31/22 | | | $ | 22,769,170 | |
| | |
| TOTAL U.S. TREASURY
OBLIGATIONS |
| | $ | 75,487,532,749 | |
| | |
| TOTAL INVESTMENTS BEFORE
REPURCHASE AGREEMENTS |
| | $ | 99,080,456,906 | |
| | |
| | | | | | | | | | | | | | |
|
| Repurchase Agreements(c) – 51.9% | |
| | Banco Santander, S.A. | |
| $ | 1,000,000,000 | | | | 0.010 | % | | | 06/01/21 | | | $ | 1,000,000,000 | |
| | Maturity Value: $1,000,001,111 | |
| Collateralized by Federal Home Loan Mortgage Corp., 3.000% to
5.000%, due 04/01/41 to 04/01/51, Federal National Mortgage
Association, 2.000% to 6.000%, due 07/01/27 to 10/01/50, U.S.
Treasury Bonds, 1.875% to 5.000%, due 05/15/37 to 05/15/51,
a U.S. Treasury Floating Rate Note, 0.064%, due 01/31/23,
U.S. Treasury Inflation-Indexed Notes, 0.250% to 0.625%, due
04/15/23 to 01/15/25, a U.S. Treasury Interest-Only Stripped
Security, 0.000%, due 02/15/28 and U.S. Treasury Notes,
0.125% to 2.625%, due 07/31/21 to 05/15/31. The aggregate
market value of the collateral, including accrued interest, was
$1,026,908,992. |
|
| | |
| | Bank of Montreal | |
| | 250,000,000 | | | | 0.005 | | | | 06/01/21 | | | | 250,000,000 | |
| | Maturity Value: $250,000,139 | |
| Collateralized by Federal Home Loan Mortgage Corp., 2.000% to
4.500%, due 01/01/27 to 05/01/51, Federal National Mortgage
Association, 1.500% to 2.500%, due 06/01/31 to 06/01/51 and
Government National Mortgage Association, 2.500% to
6.000%, due 05/20/35 to 03/20/51. The aggregate market value
of the collateral, including accrued interest, was $257,499,999. |
|
| | 250,000,000 | | | | 0.010 | | | | 06/01/21 | | | | 250,000,000 | |
| | Maturity Value: $250,000,278 | |
| Collateralized by U.S. Treasury Notes, 0.125% to 1.875%, due
01/31/23 to 09/30/27. The aggregate market value of the
collateral, including accrued interest, was $255,000,037. |
|
| | 500,000,000 | | | | 0.010 | | | | 06/03/21 | | | | 500,000,000 | |
| | Maturity Value: $500,000,833 | |
| Collateralized by Federal Home Loan Mortgage Corp., 1.500% to
2.500%, due 06/01/36 to 06/01/51, Federal National Mortgage
Association, 1.500% to 4.000%, due 09/01/34 to 06/01/51 and
Government National Mortgage Association, 2.500% to
6.050%, due 07/15/24 to 05/20/51. The aggregate market value
of the collateral, including accrued interest, was $515,000,001. |
|
| | |
|
| Repurchase Agreements(c) – (continued) | |
| | Bank of Montreal – (continued) | |
| 250,000,000 | | | | 0.020 | %(d) | | | 06/07/21 | | | | 250,000,000 | |
| | Maturity Value: $250,004,306 | |
| | Settlement Date: 05/07/21 | |
| Collateralized by Federal Home Loan Mortgage Corp., 2.500%,
due 06/01/51, Federal National Mortgage Association, 2.000%
to 4.000%, due 02/01/49 to 06/01/51, Federal National
Mortgage Association Stripped Security, 0.000%, due 07/15/37
and Government National Mortgage Association, 2.000% to
8.000%, due 08/20/25 to 05/20/51. The aggregate market value
of the collateral, including accrued interest, was $257,432,363. |
|
| | 450,000,000 | | | | 0.020 | (d) | | | 06/07/21 | | | | 450,000,000 | |
| | Maturity Value: $450,007,751 | |
| | Settlement Date: 05/11/21 | |
| Collateralized by Federal Home Loan Mortgage Corp., 2.000%,
due 06/01/51, Federal National Mortgage Association, 1.500%
to 4.500%, due 04/01/36 to 06/01/51 and Government National
Mortgage Association, 2.500% to 3.000%, due 01/20/51 to
05/20/51. The aggregate market value of the collateral,
including accrued interest, was $463,499,999. |
|
| | 248,500,000 | | | | 0.050 | (d) | | | 06/07/21 | | | | 248,500,000 | |
| | Maturity Value: $248,531,408 | |
| | Settlement Date: 03/18/21 | |
| Collateralized by Federal Home Loan Mortgage Corp., 2.500%,
due 06/01/51, Federal National Mortgage Association, 2.000%
to 3.500%, due 06/01/36 to 06/01/51 and Government National
Mortgage Association, 2.000% to 5.000%, due 10/20/37 to
05/20/51. The aggregate market value of the collateral,
including accrued interest, was $255,955,002. |
|
| | 248,500,000 | | | | 0.050 | (d) | | | 06/07/21 | | | | 248,500,000 | |
| | Maturity Value: $248,531,063 | |
| | Settlement Date: 04/20/21 | |
| Collateralized by Federal Home Loan Mortgage Corp., 2.000% to
2.500%, due 06/01/36 to 06/01/51, Federal National Mortgage
Association, 2.000% to 3.500%, due 06/01/31 to 06/01/51 and
Government National Mortgage Association, 2.000% to
7.500%, due 07/20/29 to 05/20/51. The aggregate market value
of the collateral, including accrued interest, was $255,955,001. |
|
| | 298,000,000 | | | | 0.050 | (d) | | | 06/07/21 | | | | 298,000,000 | |
| | Maturity Value: $298,038,906 | |
| | Settlement Date: 03/19/21 | |
| Collateralized by Federal National Mortgage Association, 2.000%
to 3.500%, due 02/01/48 to 05/01/51 and Government National
Mortgage Association, 2.500% to 3.000%, due 03/20/51 to
04/20/51. The aggregate market value of the collateral,
including accrued interest, was $306,940,001. |
|
| | 99,000,000 | | | | 0.060 | (d) | | | 06/07/21 | | | | 99,000,000 | |
| | Maturity Value: $99,015,015 | |
| | Settlement Date: 03/11/21 | |
| Collateralized by Federal National Mortgage Association, 1.500%
to 2.000%, due 05/01/36 to 05/01/51 and Government National
Mortgage Association, 2.500% to 4.500%, due 08/20/48 to
05/20/51. The aggregate market value of the collateral,
including accrued interest, was $101,970,001. |
|
| | |
| | |
| The accompanying notes are an integral part of these financial statements. | | 9 |
FINANCIAL SQUARE GOVERNMENT FUND
Schedule of Investments (continued)
May 31, 2021 (Unaudited)
| | | | | | | | | | | | | | |
Principal Amount | | | Interest
Rate | | | Maturity
Date | | | Amortized Cost | |
|
| Repurchase Agreements(c) – (continued) | |
| | Bank of Montreal – (continued) | |
| $ | 390,000,000 | | | | 0.110 | %(d) | | | 06/07/21 | | | $ | 390,000,000 | |
| | Maturity Value: $390,215,695 | |
| | Settlement Date: 01/07/21 | |
| Collateralized by U.S. Treasury Bills, 0.000%, due 07/01/21 to
02/24/22, U.S. Treasury Bonds, 1.125% to 6.125%, due
11/15/27 to 02/15/51, U.S. Treasury Floating Rate Notes,
0.064% to 0.070%, due 07/31/22 to 01/31/23, U.S. Treasury
Inflation-Indexed Bonds, 0.750% to 1.000%, due 02/15/42 to
02/15/46, U.S. Treasury Inflation-Indexed Notes, 0.125% to
0.625%, due 07/15/21 to 07/15/29, a U.S. Treasury Interest-
Only Stripped Security, 0.000%, due 02/15/29, U.S. Treasury
Notes, 0.125% to 2.875%, due 07/15/21 to 08/15/28 and a U.S.
Treasury Principal-Only Stripped Security, 0.000%, due
02/15/50. The aggregate market value of the collateral,
including accrued interest, was $397,800,072. |
|
| | |
| | Barclays Bank PLC | |
| | 500,000,000 | | | | 0.010 | | | | 06/01/21 | | | | 500,000,000 | |
| | Maturity Value: $500,000,556 | |
| Shared collateral consisting of a U.S. Treasury Bond, 1.375%, due
11/15/40 and U.S. Treasury Notes, 0.250% to 1.625%, due
12/15/22 to 05/15/31. The aggregate market value of the
collateral, including accrued interest, was $1,020,001,169. |
|
| | 800,000,000 | | | | 0.010 | | | | 06/01/21 | | | | 800,000,000 | |
| | Maturity Value: $800,000,889 | |
| Collateralized by a U.S. Treasury Bill, 0.000%, due 08/26/21,
U.S. Treasury Bonds, 1.125% to 8.000%, due 11/15/21 to
05/15/40 and a U.S. Treasury Note, 2.875%, due 10/31/23. The
aggregate market value of the collateral, including accrued
interest, was $816,000,923. |
|
| | |
| | BNP Paribas | |
| | 261,600,000 | | | | 0.005 | | | | 06/01/21 | | | | 261,600,000 | |
| | Maturity Value: $261,600,145 | |
| Collateralized by Federal Farm Credit Bank, 1.950% to 2.830%,
due 12/19/36 to 08/13/40, Federal Home Loan Mortgage Corp.,
0.000% to 5.500%, due 12/11/25 to 12/01/50, Federal National
Mortgage Association, 2.500% to 6.000%, due 06/01/26 to
06/01/50, Government National Mortgage Association, 4.000%
to 5.000%, due 08/15/35 to 05/20/50, U.S. Treasury Bills,
0.000%, due 08/26/21 to 05/19/22, U.S. Treasury Bonds,
1.625% to 3.750%, due 11/15/43 to 11/15/50, U.S. Treasury
Inflation-Indexed Notes, 0.125%, due 07/15/22 to 01/15/31,
U.S. Treasury Interest-Only Stripped Securities, 0.000%, due
05/15/31 to 02/15/48 and U.S. Treasury Principal-Only
Stripped Securities, 0.000%, due 02/15/44 to 02/15/49. The
aggregate market value of the collateral, including accrued
interest, was $267,238,222. |
|
| | |
|
| Repurchase Agreements(c) – (continued) | |
| | BNP Paribas – (continued) | |
| 350,000,000 | | | | 0.005 | % | | | 06/01/21 | | | | 350,000,000 | |
| | Maturity Value: $350,000,340 | |
| | Settlement Date: 05/25/21 | |
| Collateralized by Federal National Mortgage Association,
3.000%, due 01/01/29, a U.S. Treasury Bill, 0.000%, due
07/15/21, U.S. Treasury Bonds, 1.375% to 8.125%, due
08/15/21 to 02/15/48, a U.S. Treasury Inflation-Indexed Bond,
0.750%, due 02/15/45, U.S. Treasury Interest-Only Stripped
Securities, 0.000%, due 05/15/33 to 05/15/48, U.S. Treasury
Notes, 0.125% to 2.875%, due 10/15/21 to 11/15/25 and U.S.
Treasury Principal-Only Stripped Securities, 0.000%, due
02/15/36 to 08/15/50. The aggregate market value of the
collateral, including accrued interest, was $357,014,182. |
|
| | 1,270,000,000 | | | | 0.005 | | | | 06/03/21 | | | | 1,270,000,000 | |
| | Maturity Value: $1,270,001,058 | |
| Collateralized by U.S. Treasury Bills, 0.000%, due 07/15/21 to
01/27/22, U.S. Treasury Bonds, 2.375% to 8.125%, due
08/15/21 to 11/15/49, a U.S. Treasury Floating Rate Note,
0.315%, due 10/31/21, U.S. Treasury Inflation-Indexed Bonds,
0.125% to 3.875%, due 01/15/25 to 02/15/51, U.S. Treasury
Inflation-Indexed Notes, 0.125% to 0.875%, due 07/15/21 to
01/15/29, U.S. Treasury Interest-Only Stripped Securities,
0.000%, due 11/15/25 to 11/15/47, U.S. Treasury Notes,
0.125% to 2.750%, due 06/30/21 to 03/31/26 and U.S. Treasury
Principal-Only Stripped Securities, 0.000%, due 02/15/40 to
11/15/49. The aggregate market value of the collateral,
including accrued interest, was $1,295,399,999. |
|
| | 420,000,000 | | | | 0.020 | (d) | | | 06/04/21 | | | | 420,000,000 | |
| | Maturity Value: $420,007,467 | |
| | Settlement Date: 05/06/21 | |
| Collateralized by U.S. Treasury Bills, 0.000%, due 12/02/21 to
01/27/22, U.S. Treasury Bonds, 6.000% to 7.250%, due
08/15/22 to 02/15/26, U.S. Treasury Inflation-Indexed Bonds,
1.750% to 2.500%, due 01/15/28 to 01/15/29, U.S. Treasury
Inflation-Indexed Notes, 0.125% to 0.375%, due 01/15/23 to
01/15/31, U.S. Treasury Interest-Only Stripped Securities,
0.000%, due 05/15/31 to 02/15/45, U.S. Treasury Notes,
0.125% to 2.750%, due 05/31/21 to 02/15/26 and a U.S.
Treasury Principal-Only Stripped Security, 0.000%, due
02/15/40. The aggregate market value of the collateral,
including accrued interest, was $428,399,999. |
|
| | |
| | |
| 10 | | The accompanying notes are an integral part of these financial statements. |
FINANCIAL SQUARE GOVERNMENT FUND
| | | | | | | | | | | | | | |
Principal Amount | | | Interest
Rate | | | Maturity
Date | | | Amortized Cost | |
|
| Repurchase Agreements(c) – (continued) | |
| | BNP Paribas – (continued) | |
| $ | 955,000,000 | | | | 0.060 | %(d) | | | 06/07/21 | | | $ | 955,000,000 | |
| | Maturity Value: $955,288,097 | |
| | Settlement Date: 02/19/21 | |
| Shared collateral consisting of Federal Farm Credit Bank,
3.650%, due 04/22/39,Federal Home Loan Bank, 4.000% to
4.200%, due 09/01/28 to 01/24/39,Federal Home Loan
Mortgage Corp., 2.500% to 5.500%, due 06/01/36 to 10/01/36,
Federal Home Loan Mortgage Corp. Stripped Securities,
0.000%, due 03/15/28 to 09/15/29, Federal National Mortgage
Association, 2.000% to 6.500%, due 09/01/28 to 06/01/56,
Federal National Mortgage Association Stripped Securities,
0.000%, due 05/15/22 to 03/23/28, Government National
Mortgage Association, 2.500% to 5.000%, due 10/15/26 to
04/20/51, U.S. Treasury Bills, 0.000%, due 06/10/21 to
04/21/22, U.S. Treasury Bonds, 1.625% to 8.125%, due
08/15/21 to 11/15/50, U.S. Treasury Inflation-Indexed Bonds,
0.250% to 3.625%, due 01/15/28 to 02/15/50, U.S. Treasury
Inflation-Indexed Notes, 0.125% to 0.625%, due 01/15/22 to
01/15/26, U.S. Treasury Interest-Only Stripped Securities,
0.000%, due 11/15/26 to 11/15/48, U.S. Treasury Notes,
0.125% to 2.875%, due 06/30/21 to 02/15/31 and U.S. Treasury
Principal-Only Stripped Securities, 0.000%, due 11/15/27 to
05/15/49. The aggregate market value of the collateral,
including accrued interest, was $1,949,065,888. |
|
| | 955,000,000 | | | | 0.060 | (d) | | | 06/07/21 | | | | 955,000,000 | |
| | Maturity Value: $955,288,097 | |
| | Settlement Date: 02/19/21 | |
| Shared collateral consisting of Federal Farm Credit Bank,
3.650%, due 04/22/39,Federal Home Loan Bank, 4.000% to
4.200%, due 09/01/28 to 01/24/39,Federal Home Loan
Mortgage Corp., 2.500% to 5.500%, due 06/01/36 to 10/01/36,
Federal Home Loan Mortgage Corp. Stripped Securities,
0.000%, due 03/15/28 to 09/15/29, Federal National Mortgage
Association, 2.000% to 6.500%, due 09/01/28 to 06/01/56,
Federal National Mortgage Association Stripped Securities,
0.000%, due 05/15/22 to 03/23/28, Government National
Mortgage Association, 2.500% to 5.000%, due 10/15/26 to
04/20/51, U.S. Treasury Bills, 0.000%, due 06/10/21 to
04/21/22, U.S. Treasury Bonds, 1.625% to 8.125%, due
08/15/21 to 11/15/50, U.S. Treasury Inflation-Indexed Bonds,
0.250% to 3.625%, due 01/15/28 to 02/15/50, U.S. Treasury
Inflation-Indexed Notes, 0.125% to 0.625%, due 01/15/22 to
01/15/26, U.S. Treasury Interest-Only Stripped Securities,
0.000%, due 11/15/26 to 11/15/48, U.S. Treasury Notes,
0.125% to 2.875%, due 06/30/21 to 02/15/31 and U.S. Treasury
Principal-Only Stripped Securities, 0.000%, due 11/15/27 to
05/15/49. The aggregate market value of the collateral,
including accrued interest, was $1,949,065,888. |
|
| | |
|
| Repurchase Agreements(c) – (continued) | |
| | BNP Paribas – (continued) | |
| 1,125,000,000 | | | | 0.060 | %(d) | | | 06/07/21 | | | | 1,125,000,000 | |
| | Maturity Value: $1,125,348,757 | |
| | Settlement Date: 03/05/21 | |
| Collateralized by a U.S. Treasury Bill, 0.000%, due 10/07/21,
U.S. Treasury Bonds, 6.125% to 8.000%, due 11/15/21 to
11/15/27, U.S. Treasury Inflation-Indexed Bonds, 0.750% to
3.875%, due 01/15/26 to 02/15/42, U.S. Treasury Inflation-
Indexed Notes, 0.125% to 0.875%, due 01/15/26 to 07/15/30,
U.S. Treasury Interest-Only Stripped Securities, 0.000%, due
11/15/26 to 05/15/49, U.S. Treasury Notes, 0.250% to 2.250%,
due 04/15/22 to 12/31/25 and U.S. Treasury Principal-Only
Stripped Securities, 0.000%, due 11/15/27 to 11/15/48. The
aggregate market value of the collateral, including accrued
interest, was $1,147,499,996. |
|
| | 2,400,000,000 | | | | 0.060 | (d) | | | 06/07/21 | | | | 2,400,000,000 | |
| | Maturity Value: $2,400,744,015 | |
| | Settlement Date: 03/05/21 | |
| Collateralized by Federal Farm Credit Bank, 1.400% to 3.650%,
due 10/15/21 to 08/13/40,Federal Home Loan Bank, 3.750% to
4.100%, due 12/06/30 to 09/27/35,Federal Home Loan
Mortgage Corp., 0.000% to 8.000%, due 10/01/25 to 06/01/49,
Federal Home Loan Mortgage Corp. Stripped Securities,
0.000%, due 09/15/29 to 03/15/31, Federal National Mortgage
Association, 0.650% to 8.000%, due 09/01/22 to 08/01/58,
Federal National Mortgage Association Stripped Securities,
0.000%, due 01/15/30 to 01/15/33, Government National
Mortgage Association, 2.500% to 7.000%, due 09/15/24 to
05/20/51, U.S. Treasury Bills, 0.000%, due 08/12/21 to
10/28/21, U.S. Treasury Bonds, 2.000% to 6.500%, due
11/15/26 to 02/15/50, U.S. Treasury Inflation-Indexed Bonds,
0.250% to 2.500%, due 01/15/27 to 02/15/50, U.S. Treasury
Inflation-Indexed Notes, 0.375% to 0.625%, due 07/15/23 to
01/15/24, U.S. Treasury Interest-Only Stripped Securities,
0.000%, due 11/15/26 to 02/15/48, U.S. Treasury Notes,
0.250% to 2.875%, due 01/31/22 to 05/15/29 and U.S. Treasury
Principal-Only Stripped Securities, 0.000%, due 05/15/40 to
02/15/51. The aggregate market value of the collateral,
including accrued interest, was $2,454,222,477. |
|
| | |
| | BNP Paribas (Overnight MBS + 0.02%) | |
| | 500,000,000 | | | | 0.025 | (a)(d)(e) | | | 06/01/21 | | | | 500,000,000 | |
| | Maturity Value: $500,673,568 | |
| | Settlement Date: 02/23/16 | |
| Collateralized by Federal Farm Credit Bank, 2.990%, due
07/18/34, Federal National Mortgage Association, 2.000% to
4.500%, due 05/01/34 to 05/01/51, Federal National Mortgage
Association Stripped Securities, 0.000%, due 05/15/22 to
03/23/28, U.S. Treasury Bills, 0.000%, due 09/21/21 to
12/02/21, U.S. Treasury Bonds, 3.000% to 8.125%, due
08/15/21 to 02/15/48, U.S. Treasury Inflation-Indexed Bonds,
0.250% to 3.625%, due 04/15/28 to 02/15/50, U.S. Treasury
Inflation-Indexed Notes, 0.125% to 0.875%, due 07/15/26 to
01/15/29, U.S. Treasury Interest-Only Stripped Securities,
0.000%, due 11/15/26 to 05/15/49, U.S. Treasury Notes,
0.125% to 1.750%, due 05/31/21 to 10/31/22 and U.S. Treasury
Principal-Only Stripped Securities, 0.000%, due 11/15/39 to
08/15/50. The aggregate market value of the collateral,
including accrued interest, was $510,676,045. |
|
| | |
| | |
| The accompanying notes are an integral part of these financial statements. | | 11 |
FINANCIAL SQUARE GOVERNMENT FUND
Schedule of Investments (continued)
May 31, 2021 (Unaudited)
| | | | | | | | | | | | | | |
Principal Amount | | | Interest
Rate | | | Maturity Date | | | Amortized Cost | |
|
| Repurchase Agreements(c) – (continued) | |
| | BNP Paribas (Overnight MBS + 0.02%) – (continued) | |
| $ | 550,000,000 | | | | 0.025 | %(a) (d) (e) | | | 06/01/21 | | | $ | 550,000,000 | |
| | Maturity Value: $550,738,251 | |
| | Settlement Date: 02/23/16 | |
| Collateralized by Federal Farm Credit Bank, 2.990%, due
07/18/34, Federal Home Loan Bank, 3.500% to 4.100%, due
09/14/29 to 10/24/33, Federal Home Loan Mortgage Corp.,
3.000% to 6.500%, due 01/01/28 to 07/01/43, Federal National
Mortgage Association, 2.000% to 5.500%, due 12/01/25 to
08/01/58, Government National Mortgage Association, 3.000%
to 7.000%, due 01/20/33 to 08/20/50, U.S. Treasury Bills,
0.000%, due 08/10/21 to 01/27/22, a U.S. Treasury Bond,
3.000%, due 02/15/48, U.S. Treasury Inflation-Indexed Bonds,
0.750% to 3.625%, due 04/15/28 to 02/15/47, U.S. Treasury
Inflation-Indexed Notes, 0.125% to 0.375%, due 01/15/23 to
07/15/27, U.S. Treasury Interest-Only Stripped Securities,
0.000%, due 05/15/29 to 05/15/49, U.S. Treasury Notes,
0.125% to 2.000%, due 11/15/21 to 11/15/26 and U.S. Treasury
Principal-Only Stripped Securities, 0.000%, due 08/15/23 to
02/15/49. The aggregate market value of the collateral,
including accrued interest, was $561,168,723. |
|
| | |
| | Bofa Securities, Inc. | |
| | 467,300,000 | | | | 0.010 | | | | 06/01/21 | | | | 467,300,000 | |
| | Maturity Value: $467,300,519 | |
| Collateralized by U.S. Treasury Bonds, 5.250% to 7.625%, due
02/15/25 to 08/15/29 and U.S. Treasury Principal-Only
Stripped Securities, 0.000%, due 08/15/21 to 02/15/31. The
aggregate market value of the collateral, including accrued
interest, was $476,646,101. |
|
| | 651,000,000 | | | | 0.010 | | | | 06/01/21 | | | | 651,000,000 | |
| | Maturity Value: $651,000,723 | |
| Collateralized by Federal Home Loan Mortgage Corp., 1.000% to
8.500%, due 06/01/21 to 06/01/51 and Government National
Mortgage Association, 2.500%, due 04/20/51. The aggregate
market value of the collateral, including accrued interest, was
$670,530,001. |
|
| | 500,000,000 | | | | 0.020 | (d) | | | 06/07/21 | | | | 500,000,000 | |
| | Maturity Value: $500,011,390 | |
| | Settlement Date: 05/07/21 | |
| Collateralized by Government National Mortgage Association,
2.500%, due 04/20/51. The market value of the collateral,
including accrued interest, was $515,000,000. |
|
| | |
| | BofA Securities, Inc. | |
| | 400,000,000 | | | | — | | | | 06/01/21 | | | | 400,000,000 | |
| | Maturity Value: $400,000,000 | |
| Collateralized by U.S. Treasury Bonds, 5.250% to 8.125%, due
08/15/21 to 02/15/31 and a U.S. Treasury Note, 0.125%, due
02/28/23. The aggregate market value of the collateral,
including accrued interest, was $408,000,084. |
|
| | |
|
| Repurchase Agreements(c) – (continued) | |
| | Canadian Imperial Bank of Commerce | |
| 415,000,000 | | | | 0.020 | %(d) | | | 06/01/21 | | | | 415,000,000 | |
| | Maturity Value: $415,008,070 | |
| | Settlement Date: 04/27/21 | |
| Collateralized by U.S. Treasury Bonds, 2.375% to 3.000%, due
05/15/43 to 11/15/49, U.S. Treasury Inflation-Indexed Bonds,
0.750% to 2.500%, due 01/15/29 to 02/15/47, U.S. Treasury
Inflation-Indexed Notes, 0.125% to 0.625%, due 10/15/24 to
07/15/29 and U.S. Treasury Notes, 0.125% to 2.625%, due
06/30/22 to 08/15/30. The aggregate market value of the
collateral, including accrued interest, was $423,300,064. |
|
| | 475,000,000 | | | | 0.070 | (d) | | | 06/07/21 | | | | 475,000,000 | |
| | Maturity Value: $475,166,246 | |
| | Settlement Date: 02/05/21 | |
| Collateralized by U.S. Treasury Bonds, 2.375% to 3.000%, due
05/15/43 to 11/15/49, a U.S. Treasury Floating Rate Note,
0.129%, due 04/30/22, a U.S. Treasury Inflation-Indexed Bond,
0.750%, due 02/15/45, a U.S. Treasury Inflation-Indexed Note,
0.125%, due 10/15/24 and U.S. Treasury Notes, 0.125% to
3.125%, due 08/31/22 to 05/15/30. The aggregate market value
of the collateral, including accrued interest, was $484,500,059. |
|
| | 474,500,000 | | | | 0.090 | (d) | | | 06/07/21 | | | | 474,500,000 | |
| | Maturity Value: $474,713,525 | |
| | Settlement Date: 01/28/21 | |
| Collateralized by Federal Home Loan Bank, 2.000% to 3.750%,
due 02/14/34 to 02/26/36, Federal Home Loan Mortgage Corp.,
2.000% to 4.500%, due 01/01/29 to 05/01/51, Federal National
Mortgage Association, 2.000% to 5.500%, due 10/01/28 to
04/01/59, Government National Mortgage Association, 3.000%
to 4.500%, due 09/20/44 to 11/20/50, a U.S. Treasury Floating
Rate Note, 0.129%, due 04/30/22 and U.S. Treasury Notes,
0.625% to 2.625%, due 04/30/24 to 11/30/27. The aggregate
market value of the collateral, including accrued interest, was
$488,625,584. |
|
| | 475,000,000 | | | | 0.090 | (d) | | | 06/07/21 | | | | 475,000,000 | |
| | Maturity Value: $475,213,750 | |
| | Settlement Date: 01/29/21 | |
| Collateralized by Federal Farm Credit Bank, 2.450%, due
03/03/36, Federal Home Loan Bank, 3.750%, due 02/14/34,
Federal Home Loan Mortgage Corp., 2.000% to 4.500%, due
06/01/28 to 05/01/51, Federal National Mortgage Association,
1.500% to 5.500%, due 03/01/28 to 04/01/53, Government
National Mortgage Association, 2.500% to 5.000%, due
01/15/41 to 01/20/51 and U.S. Treasury Notes, 0.125% to
2.875%, due 07/31/22 to 11/30/27. The aggregate market value
of the collateral, including accrued interest, was $489,176,346. |
|
| | |
| | Citigroup Global Markets Inc. | |
| | 840,500,000 | | | | 0.010 | | | | 06/01/21 | | | | 840,500,000 | |
| | Maturity Value: $840,500,934 | |
| Collateralized by Federal Home Loan Mortgage Corp., 2.000% to
3.000%, due 05/01/51 to 06/01/51 and Federal National
Mortgage Association, 2.000% to 3.500%, due 05/01/51 to
06/01/51. The aggregate market value of the collateral,
including accrued interest, was $857,310,957. |
|
| | |
| | |
| 12 | | The accompanying notes are an integral part of these financial statements. |
FINANCIAL SQUARE GOVERNMENT FUND
| | | | | | | | | | | | | | |
Principal Amount | | | Interest
Rate | | | Maturity
Date | | | Amortized Cost | |
|
| Repurchase Agreements(c) – (continued) | |
| | Citigroup Global Markets, Inc. (Overnight MBS + 0.01%) | |
| $ | 1,000,000,000 | | | | 0.020 | %(a) | | | 06/04/21 | | | $ | 1,000,000,000 | |
| | Maturity Value: $1,000,528,376 | |
| | Settlement Date: 11/01/18 | |
| Collateralized by Federal Farm Credit Bank, 0.100% to 4.070%,
due 10/08/21 to 10/15/49, Federal Home Loan Bank, 2.000% to
5.625%, due 06/11/21 to 11/09/38, Federal Home Loan
Mortgage Corp., 0.000% to 9.000%, due 10/01/21 to 05/01/51,
Federal Home Loan Mortgage Corp. Stripped Securities,
0.000%, due 09/15/29 to 07/15/32, Federal National Mortgage
Association, 0.240% to 8.500%, due 06/22/21 to 08/01/51,
Government National Mortgage Association, 1.500% to
10.500%, due 08/15/21 to 04/20/51, Tennessee Valley
Authority, 0.000% to 7.125%, due 08/15/22 to 09/15/65, U.S.
Treasury Bills, 0.000%, due 10/07/21 to 11/26/21, U.S.
Treasury Bonds, 1.125% to 8.000%, due 11/15/21 to 05/15/51,
U.S. Treasury Inflation-Indexed Bonds, 0.250% to 3.875%, due
01/15/27 to 02/15/50, U.S. Treasury Inflation-Indexed Notes,
0.125% to 0.875%, due 07/15/21 to 01/15/30 and U.S. Treasury
Notes, 0.125% to 2.875%, due 08/31/21 to 11/15/30. The
aggregate market value of the collateral, including accrued
interest, was $1,020,000,004. |
|
| | |
| | Credit Agricole Corporate and Investment Bank | |
| | 150,000,000 | | | | — | | | | 06/01/21 | | | | 150,000,000 | |
| | Maturity Value: $150,000,000 | |
| Collateralized by U.S. Treasury Bonds, 1.875% to 2.875%, due
02/15/41 to 11/15/46 and U.S. Treasury Inflation-Indexed
Bonds, 0.750% to 3.875%, due 01/15/27 to 02/15/47. The
aggregate market value of the collateral, including accrued
interest, was $153,000,033. |
|
| | |
| | Daiwa Capital Markets America Inc. | |
| | 46,139,705 | | | | 0.005 | | | | 06/01/21 | | | | 46,139,705 | |
| | Maturity Value: $46,139,731 | |
| Collateralized by a U.S. Treasury Bond, 2.000%, due 02/15/50.
The market value of the collateral, including accrued interest,
was $47,062,499. |
|
| | 58,707,107 | | | | 0.005 | | | | 06/01/21 | | | | 58,707,107 | |
| | Maturity Value: $58,707,140 | |
| Collateralized by a U.S. Treasury Note, 2.750%, due 02/28/25.
The market value of the collateral, including accrued interest,
was $59,881,249. |
|
| | 60,171,568 | | | | 0.005 | | | | 06/01/21 | | | | 60,171,568 | |
| | Maturity Value: $60,171,601 | |
| Collateralized by a U.S. Treasury Bond, 3.375%, due 11/15/48.
The market value of the collateral, including accrued interest,
was $61,374,999. |
|
| | 62,573,528 | | | | 0.005 | | | | 06/01/21 | | | | 62,573,528 | |
| | Maturity Value: $62,573,563 | |
| Collateralized by a U.S. Treasury Note, 2.250%, due 11/15/24.
The market value of the collateral, including accrued interest,
was $63,824,999. |
|
| | 74,219,056 | | | | 0.005 | | | | 06/01/21 | | | | 74,219,056 | |
| | Maturity Value: $74,219,097 | |
| Collateralized by a U.S. Treasury Note, 0.250%, due 10/31/25.
The market value of the collateral, including accrued interest,
was $75,703,437. |
|
| | |
|
| Repurchase Agreements(c) – (continued) | |
| | Daiwa Capital Markets America Inc. – (continued) | |
| 93,137,254 | | | | 0.005 | % | | | 06/01/21 | | | | 93,137,254 | |
| | Maturity Value: $93,137,306 | |
| Collateralized by a U.S. Treasury Note, 0.125%, due 11/30/22.
The market value of the collateral, including accrued interest,
was $94,999,999. |
|
| | 94,892,034 | | | | 0.005 | | | | 06/01/21 | | | | 94,892,034 | |
| | Maturity Value: $94,892,087 | |
| Collateralized by a U.S. Treasury Bond, 3.125%, due 05/15/48.
The market value of the collateral, including accrued interest,
was $96,789,875. |
|
| | 106,624,998 | | | | 0.005 | | | | 06/01/21 | | | | 106,624,998 | |
| | Maturity Value: $106,625,057 | |
| Collateralized by a U.S. Treasury Note, 2.500%, due 05/15/24.
The market value of the collateral, including accrued interest,
was $108,757,498. |
|
| | 111,147,874 | | | | 0.005 | | | | 06/01/21 | | | | 111,147,874 | |
| | Maturity Value: $111,147,936 | |
| Collateralized by a U.S. Treasury Note, 1.500%, due 11/30/24.
The market value of the collateral, including accrued interest,
was $113,370,831. |
|
| | 146,323,527 | | | | 0.005 | | | | 06/01/21 | | | | 146,323,527 | |
| | Maturity Value: $146,323,608 | |
| Collateralized by a U.S. Treasury Bond, 2.250%, due 08/15/49.
The market value of the collateral, including accrued interest,
was $149,249,998. |
|
| | 148,719,925 | | | | 0.005 | | | | 06/01/21 | | | | 148,719,925 | |
| | Maturity Value: $148,720,008 | |
| Collateralized by a U.S. Treasury Note, 2.250%, due 02/15/27.
The market value of the collateral, including accrued interest,
was $151,694,324. |
|
| | 172,941,174 | | | | 0.005 | | | | 06/01/21 | | | | 172,941,174 | |
| | Maturity Value: $172,941,270 | |
| Collateralized by a U.S. Treasury Bond, 3.625%, due 02/15/44.
The market value of the collateral, including accrued interest,
was $176,399,997. |
|
| | 178,017,646 | | | | 0.005 | | | | 06/01/21 | | | | 178,017,646 | |
| | Maturity Value: $178,017,745 | |
| Collateralized by a U.S. Treasury Note, 2.000%, due 05/31/24.
The market value of the collateral, including accrued interest,
was $181,577,999. |
|
| | 191,299,017 | | | | 0.005 | | | | 06/01/21 | | | | 191,299,017 | |
| | Maturity Value: $191,299,123 | |
| Collateralized by a U.S. Treasury Bond, 2.875%, due 11/15/46.
The market value of the collateral, including accrued interest,
was $195,124,997. |
|
| | 257,181,192 | | | | 0.005 | | | | 06/01/21 | | | | 257,181,192 | |
| | Maturity Value: $257,181,335 | |
| Collateralized by a U.S. Treasury Note, 0.125%, due 06/30/22.
The market value of the collateral, including accrued interest,
was $262,324,816. |
|
| | 339,816,173 | | | | 0.005 | | | | 06/01/21 | | | | 339,816,173 | |
| | Maturity Value: $339,816,362 | |
| Collateralized by a U.S. Treasury Bond, 7.625%, due 02/15/25.
The market value of the collateral, including accrued interest,
was $346,612,496. |
|
| | |
| | |
| The accompanying notes are an integral part of these financial statements. | | 13 |
FINANCIAL SQUARE GOVERNMENT FUND
Schedule of Investments (continued)
May 31, 2021 (Unaudited)
| | | | | | | | | | | | | | |
Principal Amount | | | Interest
Rate | | | Maturity
Date | | | Amortized Cost | |
|
| Repurchase Agreements(c) – (continued) | |
| | Daiwa Capital Markets America Inc. – (continued) | |
| $ | 758,088,222 | | | | 0.005 | % | | | 06/01/21 | | | $ | 758,088,222 | |
| | Maturity Value: $758,088,643 | |
| Collateralized by a U.S. Treasury Floating Rate Note, 0.049%,
due 04/30/23. The market value of the collateral, including
accrued interest, was $773,249,986. |
|
| | 1,000,000,000 | | | | 0.010 | | | | 06/01/21 | | | | 1,000,000,000 | |
| | Maturity Value: $1,000,001,111 | |
| Collateralized by Federal Farm Credit Bank, 0.015% to 2.520%,
due 05/26/22 to 04/13/46, Federal Home Loan Mortgage Corp.,
1.500% to 4.000%, due 03/01/36 to 06/01/51, Federal National
Mortgage Association, 1.500% to 6.500%, due 03/01/22 to
06/01/51, Government National Mortgage Association, 2.000%
to 5.000%, due 09/15/33 to 05/20/51, U.S. Treasury Bills,
0.000%, due 07/01/21 to 05/19/22, U.S. Treasury Bonds,
1.875% to 8.000%, due 11/15/21 to 02/15/51, a U.S. Treasury
Floating Rate Note, 0.235%, due 07/31/21, U.S. Treasury
Inflation-Indexed Notes, 0.125% to 0.500%, due 04/15/24 to
04/15/26, U.S. Treasury Interest-Only Stripped Securities,
0.000%, due 02/15/23 to 05/15/23 and U.S. Treasury Notes,
0.125% to 2.875%, due 06/30/21 to 11/15/30. The aggregate
market value of the collateral, including accrued interest, was
$1,023,728,754. |
|
| | |
| | Deutsche Bank Securities Inc. | |
| | 1,500,000,000 | | | | 0.005 | | | | 06/01/21 | | | | 1,500,000,000 | |
| | Maturity Value: $1,500,000,833 | |
| Collateralized by Federal Home Loan Mortgage Corp., 1.500% to
5.500%, due 10/01/29 to 06/01/51 and U.S. Treasury Notes,
0.500% to 3.125%, due 11/30/21 to 11/15/28. The aggregate
market value of the collateral, including accrued interest, was
$1,537,139,627. |
|
| | |
| | Federal Reserve Bank of New York | |
| | 48,000,000,000 | | | | — | | | | 06/01/21 | | | | 48,000,000,000 | |
| | Maturity Value: $48,000,000,000 | |
| Collateralized by a U.S. Treasury Bond, 3.125%, due 02/15/43
and U.S. Treasury Notes, 0.500% to 3.000%, due 10/31/23 to
02/15/30. The aggregate market value of the collateral,
including accrued interest, was $48,000,000,051. |
|
| | |
| | Fixed Income Clearing Corp. | |
| | 265,000,000 | | | | 0.003 | | | | 06/01/21 | | | | 265,000,000 | |
| | Maturity Value: $265,000,074 | |
| Collateralized by U.S. Treasury Notes, 0.125% to 2.750%, due
01/31/23 to 07/31/23. The aggregate market value of the
collateral, including accrued interest, was $270,300,022. |
|
| | 3,300,000,000 | | | | 0.005 | | | | 06/01/21 | | | | 3,300,000,000 | |
| | Maturity Value: $3,300,001,833 | |
| Collateralized by U.S. Treasury Inflation-Indexed Notes, 0.125%
to 0.625%, due 07/15/23 to 01/15/28. The aggregate market
value of the collateral, including accrued interest, was
$3,366,000,021. |
|
| | |
|
| Repurchase Agreements(c) – (continued) | |
| | HSBC Bank PLC | |
| 100,000,000 | | | | 0.010 | | | | 06/01/21 | | | | 100,000,000 | |
| | Maturity Value: $100,000,111 | |
| Collateralized by U.S. Treasury Bonds, 2.875% to 4.250%, due
05/15/39 to 11/15/48, a U.S. Treasury Inflation-Indexed Bond,
1.000%, due 02/15/46, a U.S. Treasury Inflation-Indexed Note,
0.250%, due 07/15/29 and U.S. Treasury Notes, 0.125% to
2.250%, due 05/15/22 to 02/15/27. The aggregate market value
of the collateral, including accrued interest, was $102,000,165. |
|
| | |
| | HSBC Bank PLC (Overnight MBS + 0.01%) | |
| | 1,250,000,000 | | | | 0.020 | (a) | | | 06/04/21 | | | | 1,250,000,000 | |
| | Maturity Value: $1,250,160,430 | |
| | Settlement Date: 10/21/20 | |
| Collateralized by Federal Farm Credit Bank, 1.850% to 4.350%,
due 07/26/24 to 11/27/43, Federal Home Loan Bank, 2.500% to
4.080%, due 12/10/21 to 05/25/33, Federal Home Loan
Mortgage Corp., 0.000% to 6.250%, due 11/15/28 to 07/13/40,
Federal Home Loan Mortgage Corp. Stripped Securities,
0.000%, due 07/15/21 to 07/15/31, Federal National Mortgage
Association, 0.000% to 6.625%, due 01/11/22 to 03/17/31,
Federal National Mortgage Association Stripped Securities,
0.000%, due 11/15/21 to 01/15/37, Tennessee Valley
Authority, 0.000% to 4.250%, due 03/15/34 to 09/15/65, U.S.
Treasury Bonds, 1.125% to 7.625%, due 11/15/22 to 08/15/40,
U.S. Treasury Inflation-Indexed Bonds, 1.000% to 3.625%, due
04/15/28 to 02/15/46, U.S. Treasury Interest-Only Stripped
Securities, 0.000%, due 11/15/21 to 02/15/42, U.S. Treasury
Notes, 1.375% to 2.000%, due 05/31/22 to 08/15/29 and U.S.
Treasury Principal-Only Stripped Securities, 0.000%, due
11/15/24 to 02/15/51. The aggregate market value of the
collateral, including accrued interest, was $1,275,002,831. |
|
| | |
| | HSBC Bank PLC (Overnight Treasury + 0.02%) | |
| | 350,000,000 | | | | 0.030 | | | | 06/03/21 | | | | 350,000,000 | |
| | Maturity Value: $350,050,456 | |
| | Settlement Date: 12/18/20 | |
| Collateralized by U.S. Treasury Bonds, 2.250% to 4.500%, due
05/15/38 to 11/15/49, a U.S. Treasury Inflation-Indexed Bond,
1.000%, due 02/15/46, a U.S. Treasury Inflation-Indexed Note,
0.250%, due 07/15/29 and U.S. Treasury Notes, 0.125% to
2.875%, due 06/30/21 to 05/15/30. The aggregate market value
of the collateral, including accrued interest, was $357,001,213. |
|
| | 400,000,000 | | | | 0.030 | | | | 06/04/21 | | | | 400,000,000 | |
| | Maturity Value: $400,049,665 | |
| | Settlement Date: 01/11/21 | |
| Shared collateral consisting of U.S. Treasury Bonds, 2.250% to
4.750%, due 02/15/37 to 08/15/49, a U.S. Treasury Floating
Rate Note, 0.064%, due 01/31/23, a U.S. Treasury Inflation-
Indexed Bond, 1.000%, due 02/15/46, U.S. Treasury Inflation-
Indexed Notes, 0.125% to 0.750%, due 07/15/28 to 07/15/30
and U.S. Treasury Notes, 0.125% to 3.125%, due 04/15/22 to
02/15/29. The aggregate market value of the collateral,
including accrued interest, was $816,002,843. |
|
| | |
| | |
| 14 | | The accompanying notes are an integral part of these financial statements. |
FINANCIAL SQUARE GOVERNMENT FUND
| | | | | | | | | | | | | | |
Principal Amount | | | Interest
Rate | | | Maturity
Date | | | Amortized Cost | |
|
| Repurchase Agreements(c) – (continued) | |
| | HSBC Bank PLC (Overnight Treasury + 0.02%) – (continued) | |
| $ | 400,000,000 | | | | 0.030 | % | | | 06/04/21 | | | $ | 400,000,000 | |
| | Maturity Value: $400,046,665 | |
| | Settlement Date: 01/20/21 | |
| Shared collateral consisting of U.S. Treasury Bonds, 2.250% to
4.750%, due 02/15/37 to 08/15/49, a U.S. Treasury Floating
Rate Note, 0.064%, due 01/31/23, a U.S. Treasury Inflation-
Indexed Bond, 1.000%, due 02/15/46, U.S. Treasury Inflation-
Indexed Notes, 0.125% to 0.750%, due 07/15/28 to 07/15/30
and U.S. Treasury Notes, 0.125% to 3.125%, due 04/15/22 to
02/15/29. The aggregate market value of the collateral,
including accrued interest, was $816,002,843. |
|
| | 900,000,000 | | | | 0.030 | | | | 06/04/21 | | | | 900,000,000 | |
| | Maturity Value: $900,131,995 | |
| | Settlement Date: 12/15/20 | |
| Collateralized by U.S. Treasury Bonds, 2.250% to 4.500%, due
05/15/38 to 08/15/49, a U.S. Treasury Inflation-Indexed Bond,
1.000%, due 02/15/46, U.S. Treasury Inflation-Indexed Notes,
0.125% to 0.750%, due 07/15/28 to 07/15/30 and U.S. Treasury
Notes, 0.125% to 3.125%, due 06/30/21 to 02/15/29. The
aggregate market value of the collateral, including accrued
interest, was $918,003,103. |
|
| | 1,000,000,000 | | | | 0.030 | | | | 06/04/21 | | | | 1,000,000,000 | |
| | Maturity Value: $1,000,146,661 | |
| | Settlement Date: 12/15/20 | |
| Collateralized by U.S. Treasury Bonds, 2.500% to 4.500%, due
05/15/38 to 05/15/49, a U.S. Treasury Floating Rate Note,
0.064%, due 01/31/23, U.S. Treasury Inflation-Indexed Notes,
0.250% to 0.375%, due 07/15/25 to 07/15/29 and U.S. Treasury
Notes, 0.125% to 3.125%, due 09/30/21 to 02/15/29. The
aggregate market value of the collateral, including accrued
interest, was $1,020,003,425. |
|
| | 1,025,000,000 | | | | 0.030 | | | | 06/04/21 | | | | 1,025,000,000 | |
| | Maturity Value: $1,025,151,181 | |
| | Settlement Date: 12/14/20 | |
| Collateralized by U.S. Treasury Bonds, 1.125% to 4.750%, due
02/15/37 to 05/15/50, U.S. Treasury Floating Rate Notes,
0.064% to 0.070%, due 07/31/22 to 01/31/23, a U.S. Treasury
Inflation-Indexed Bond, 2.375%, due 01/15/25, U.S. Treasury
Inflation-Indexed Notes, 0.125% to 0.375%, due 07/15/25 to
07/15/30 and U.S. Treasury Notes, 0.125% to 3.125%, due
06/30/21 to 02/15/30. The aggregate market value of the
collateral, including accrued interest, was $1,045,503,556. |
|
| | |
| | HSBC Securities (Usa) Inc. | |
| | 100,000,000 | | | | 0.010 | | | | 06/01/21 | | | | 100,000,000 | |
| | Maturity Value: $100,000,111 | |
| Collateralized by Federal Home Loan Mortgage Corp., 2.220% to
4.500%, due 12/01/25 to 07/13/40 and U.S. Treasury Bonds,
3.375% to 8.000%, due 11/15/21 to 05/15/44. The aggregate
market value of the collateral, including accrued interest, was
$102,000,113. |
|
| | |
|
| Repurchase Agreements(c) – (continued) | |
| | J.P. Morgan Securities LLC | |
| 450,000,000 | | | | 0.005 | | | | 06/01/21 | | | | 450,000,000 | |
| | Maturity Value: $450,000,250 | |
| Collateralized by U.S. Treasury Bills, 0.000%, due 07/13/21 to
09/16/21, a U.S. Treasury Bond, 6.000%, due 02/15/26, a U.S.
Treasury Floating Rate Note, 0.315%, due 10/31/21, U.S.
Treasury Notes, 1.125% to 2.750%, due 08/15/21 to 01/31/25
and U.S. Treasury Principal-Only Stripped Securities, 0.000%,
due 08/15/21 to 11/30/21. The aggregate market value of the
collateral, including accrued interest, was $459,000,348. |
|
| | 800,000,000 | | | | 0.005 | | | | 06/01/21 | | | | 800,000,000 | |
| | Maturity Value: $800,000,444 | |
| Collateralized by a U.S. Treasury Bill, 0.000%, due 07/08/21, a
U.S. Treasury Bond, 7.250%, due 08/15/22, a U.S. Treasury
Inflation-Indexed Note, 0.625%, due 07/15/21, U.S. Treasury
Notes, 0.375% to 2.750%, due 01/15/22 to 07/31/23 and a U.S.
Treasury Principal-Only Stripped Security, 0.000%, due
11/15/22. The aggregate market value of the collateral,
including accrued interest, was $816,000,507. |
|
| | 600,000,000 | | | | 0.010 | | | | 06/01/21 | | | | 600,000,000 | |
| | Maturity Value: $600,000,667 | |
| Collateralized by Federal Farm Credit Bank, 1.600% to 5.200%,
due 02/06/26 to 12/19/36, Federal Home Loan Mortgage Corp.,
3.500%, due 08/01/26 to 03/01/48 and Federal National
Mortgage Association, 2.000% to 4.000%, due 05/01/36 to
05/01/51. The aggregate market value of the collateral,
including accrued interest, was $617,194,339. |
|
| | |
| | Joint Account I | |
| | 1,000,000,000 | | | | 0.005 | | | | 06/01/21 | | | | 1,000,000,000 | |
| | Maturity Value: $1,000,000,574 | |
| | Joint Account III | |
| | 1,875,400,000 | | | | 0.013 | | | | 06/01/21 | | | | 1,875,400,000 | |
| | Maturity Value: $1,875,402,605 | |
| | |
| | Mizuho Securities Usa LLC | |
| | 100,000,000 | | | | 0.010 | | | | 06/01/21 | | | | 100,000,000 | |
| | Maturity Value: $100,000,111 | |
| Collateralized by U.S. Treasury Notes, 0.125% to 2.750%, due
11/30/21 to 05/15/26. The aggregate market value of the
collateral, including accrued interest, was $102,000,034. |
|
| | |
| | MUFG Securities Americas Inc. | |
| | 8,000,000 | | | | 0.005 | | | | 06/01/21 | | | | 8,000,000 | |
| | Maturity Value: $8,000,004 | |
| Collateralized by U.S. Treasury Bonds, 2.500% to 4.375%, due
05/15/40 to 11/15/47, a U.S. Treasury Inflation-Indexed Note,
0.625%, due 01/15/26 and U.S. Treasury Notes, 0.125% to
0.250%, due 01/15/24 to 08/31/25. The aggregate market value
of the collateral, including accrued interest, was $8,159,999. |
|
| | 1,300,000,000 | | | | 0.005 | | | | 06/01/21 | | | | 1,300,000,000 | |
| | Maturity Value: $1,300,000,722 | |
| Collateralized by Government National Mortgage Association,
1.500% to 7.500%, due 05/20/24 to 05/20/51 and a U.S.
Treasury Principal-Only Stripped Security, 0.000%, due
05/15/49. The aggregate market value of the collateral,
including accrued interest, was $1,337,566,571. |
|
| | |
| | |
| The accompanying notes are an integral part of these financial statements. | | 15 |
FINANCIAL SQUARE GOVERNMENT FUND
Schedule of Investments (continued)
May 31, 2021 (Unaudited)
| | | | | | | | | | | | | | |
Principal Amount | | | Interest
Rate | | | Maturity
Date | | | Amortized Cost | |
|
| Repurchase Agreements(c) – (continued) | |
| | MUFG Securities Americas Inc. – (continued) | |
| $ | 250,000,000 | | | | 0.090 | % | | | 06/15/21 | | | $ | 250,000,000 | |
| | Maturity Value: $250,057,500 | |
| | Settlement Date: 03/15/21 | |
| Collateralized by Federal Home Loan Mortgage Corp., 2.000% to
5.000%, due 08/01/35 to 06/01/51 and Federal National
Mortgage Association, 2.000% to 4.500%, due 06/01/27 to
04/01/51. The aggregate market value of the collateral,
including accrued interest, was $257,499,999. |
|
| | |
| | MUFG Securities Americas Inc. (Overnight Treasury + 0.01%) | |
| | 400,000,000 | | | | 0.015 | | | | 06/04/21 | | | | 400,000,000 | |
| | Maturity Value: $400,019,502 | |
| | Settlement Date: 02/12/21 | |
| Collateralized by U.S. Treasury Bonds, 1.125% to 4.750%, due
02/15/39 to 08/15/50, U.S. Treasury Interest-Only Stripped
Securities, 0.000%, due 05/15/44 to 08/15/44, U.S. Treasury
Notes, 0.125% to 1.750%, due 01/31/23 to 02/15/30 and U.S.
Treasury Principal-Only Stripped Securities, 0.000%, due
08/15/39 to 11/15/39. The aggregate market value of the
collateral, including accrued interest, was $408,000,002. |
|
| | 420,000,000 | | | | 0.015 | | | | 06/04/21 | | | | 420,000,000 | |
| | Maturity Value: $420,015,576 | |
| | Settlement Date: 03/12/21 | |
| Collateralized by U.S. Treasury Bonds, 1.625% to 4.250%, due
11/15/40 to 11/15/50, a U.S. Treasury Inflation-Indexed Bond,
0.625%, due 02/15/43, a U.S. Treasury Inflation-Indexed Note,
0.125%, due 07/15/30, U.S. Treasury Interest-Only Stripped
Securities, 0.000%, due 08/15/21 to 11/15/38, U.S. Treasury
Notes, 0.125% to 2.250%, due 07/31/22 to 08/15/27 and U.S.
Treasury Principal-Only Stripped Securities, 0.000%, due
11/15/47 to 05/15/49. The aggregate market value of the
collateral, including accrued interest, was $428,399,999. |
|
| | |
| | MUFG Securities Americas, Inc. | |
| | 250,000,000 | | | | 0.130 | | | | 06/30/21 | | | | 250,000,000 | |
| | Maturity Value: $250,150,764 | |
| | Settlement Date: 01/14/21 | |
| Collateralized by Federal Home Loan Mortgage Corp., 1.500% to
4.500%, due 08/01/34 to 06/01/51 and Federal National
Mortgage Association, 2.000% to 5.500%, due 12/01/26 to
05/01/51. The aggregate market value of the collateral,
including accrued interest, was $257,500,002. |
|
| | |
| | MUFG Securities Americas, Inc. (Overnight MBS + 0.08%) | |
| | 250,000,000 | | | | 0.085 | (a) | | | 07/02/21 | | | | 250,000,000 | |
| | Maturity Value: $250,561,942 | |
| | Settlement Date: 11/28/18 | |
| Shared collateral consisting of Federal Home Loan Mortgage
Corp., 2.000% to 4.500%, due 04/01/31 to 06/01/51 and
Federal National Mortgage Association, 2.000% to 6.000%,
due 01/01/24 to 06/01/51. The aggregate market value of the
collateral, including accrued interest, was $515,000,000. |
|
| | |
|
| Repurchase Agreements(c) – (continued) | |
| MUFG Securities Americas, Inc. (Overnight MBS + 0.08%) –
(continued) |
|
| 250,000,000 | | | | 0.085 | %(a) | | | 07/02/21 | | | | 250,000,000 | |
| | Maturity Value: $250,486,387 | |
| | Settlement Date: 04/05/19 | |
| Shared collateral consisting of Federal Home Loan Mortgage
Corp., 2.000% to 4.500%, due 04/01/31 to 06/01/51 and
Federal National Mortgage Association, 2.000% to 6.000%,
due 01/01/24 to 06/01/51. The aggregate market value of the
collateral, including accrued interest, was $515,000,000. |
|
| | |
| | MUFG Securities Americas, Inc. (SOFR + 0.04%) | |
| | 250,000,000 | | | | 0.050 | (a) | | | 07/02/21 | | | | 250,000,000 | |
| | Maturity Value: $250,080,903 | |
| | Settlement Date: 11/16/20 | |
| Collateralized by Federal Home Loan Mortgage Corp., 2.000% to
4.500%, due 09/01/34 to 06/01/51 and Federal National
Mortgage Association, 2.000% to 5.000%, due 01/01/34 to
06/01/51. The aggregate market value of the collateral,
including accrued interest, was $257,499,997. |
|
| | |
| | Nomura Securities International, Inc. | |
| | 2,500,000,000 | | | | 0.010 | | | | 06/01/21 | | | | 2,500,000,000 | |
| | Maturity Value: $2,500,002,778 | |
| Collateralized by Federal Farm Credit Bank, 0.040% to 3.470%,
due 01/18/22 to 03/26/37,Federal Home Loan Bank, 0.000% to
4.170%, due 07/23/21 to 06/29/40,Federal Home Loan
Mortgage Corp., 0.000% to 6.250%, due 06/02/22 to
07/15/32,Federal Home Loan Mortgage Corp. Stripped
Securities, 0.000%, due 07/15/27 to 09/15/29, Federal National
Mortgage Association, 0.375% to 7.125%, due 09/06/22 to
11/15/30, Federal National Mortgage Association Stripped
Securities, 0.000%, due 09/23/27 to 05/15/30, Tennessee
Valley Authority, 0.000% to 5.880%, due 09/15/24 to 09/15/60,
U.S. Treasury Bills, 0.000%, due 07/27/21 to 08/31/21, U.S.
Treasury Bonds, 2.250% to 3.625%, due 02/15/44 to 08/15/49,
a U.S. Treasury Floating Rate Note, 0.235%, due 07/31/21,
U.S. Treasury Inflation-Indexed Bonds, 0.250% to 3.875%, due
04/15/29 to 02/15/50, a U.S. Treasury Inflation-Indexed Note,
0.125%, due 10/15/25, U.S. Treasury Interest-Only Stripped
Securities, 0.000%, due 08/15/21 to 02/15/43, U.S. Treasury
Notes, 0.625% to 2.250%, due 05/31/21 to 08/15/30 and U.S.
Treasury Principal-Only Stripped Securities, 0.000%, due
05/15/41 to 02/15/44. The aggregate market value of the
collateral, including accrued interest, was $2,550,000,097. |
|
| | |
| | Norinchukin Bank (The) | |
| | 670,000,000 | | | | 0.040 | | | | 06/02/21 | | | | 670,000,000 | |
| | Maturity Value: $670,019,356 | |
| | Settlement Date: 05/07/21 | |
| Collateralized by a U.S. Treasury Bond, 6.125%, due 08/15/29
and U.S. Treasury Notes, 0.625% to 2.000%, due 06/30/24 to
08/15/30. The aggregate market value of the collateral,
including accrued interest, was $683,400,036. |
|
| | |
| | |
| 16 | | The accompanying notes are an integral part of these financial statements. |
FINANCIAL SQUARE GOVERNMENT FUND
| | | | | | | | | | | | | | |
Principal Amount | | | Interest
Rate | | | Maturity
Date | | | Amortized Cost | |
|
| Repurchase Agreements(c) – (continued) | |
| | Northwestern Mutual Life Insurance Company | |
| $ | 491,100,000 | | | | 0.030 | % | | | 06/01/21 | | | $ | 491,100,000 | |
| | Maturity Value: $491,101,637 | |
| Collateralized by a U.S. Treasury Bond, 6.375%, due 08/15/27.
The market value of the collateral, including accrued interest,
was $500,922,000. |
|
| | |
| | Prudential Insurance Company of America (The) | |
| | 4,160,000 | | | | 0.030 | | | | 06/01/21 | | | | 4,160,000 | |
| | Maturity Value: $4,160,014 | |
| Collateralized by a U.S. Treasury Interest-Only Stripped Security,
0.000%, due 11/15/39. The market value of the collateral,
including accrued interest, was $4,243,200. |
|
| | 5,586,250 | | | | 0.030 | | | | 06/01/21 | | | | 5,586,250 | |
| | Maturity Value: $5,586,269 | |
| Collateralized by a U.S. Treasury Interest-Only Stripped Security,
0.000%, due 11/15/37. The market value of the collateral,
including accrued interest, was $5,697,975. |
|
| | 6,580,000 | | | | 0.030 | | | | 06/01/21 | | | | 6,580,000 | |
| | Maturity Value: $6,580,022 | |
| Collateralized by a U.S. Treasury Interest-Only Stripped Security,
0.000%, due 02/15/31. The market value of the collateral,
including accrued interest, was $6,711,600. |
|
| | 8,437,500 | | | | 0.030 | | | | 06/01/21 | | | | 8,437,500 | |
| | Maturity Value: $8,437,528 | |
| Collateralized by a U.S. Treasury Interest-Only Stripped Security,
0.000%, due 05/15/26. The market value of the collateral,
including accrued interest, was $8,606,250. |
|
| | 13,125,000 | | | | 0.030 | | | | 06/01/21 | | | | 13,125,000 | |
| | Maturity Value: $13,125,044 | |
| Collateralized by a U.S. Treasury Bond, 2.875%, due 05/15/43.
The market value of the collateral, including accrued interest,
was $13,387,500. |
|
| | 15,437,500 | | | | 0.030 | | | | 06/01/21 | | | | 15,437,500 | |
| | Maturity Value: $15,437,551 | |
| Collateralized by a U.S. Treasury Interest-Only Stripped Security,
0.000%, due 02/15/41. The market value of the collateral,
including accrued interest, was $15,746,250. |
|
| | 19,093,750 | | | | 0.030 | | | | 06/01/21 | | | | 19,093,750 | |
| | Maturity Value: $19,093,814 | |
| Collateralized by a U.S. Treasury Interest-Only Stripped Security,
0.000%, due 11/15/33. The market value of the collateral,
including accrued interest, was $19,475,625. |
|
| | 19,336,250 | | | | 0.030 | | | | 06/01/21 | | | | 19,336,250 | |
| | Maturity Value: $19,336,314 | |
| Collateralized by a U.S. Treasury Bond, 0.000%, due 08/15/41.
The market value of the collateral, including accrued interest,
was $19,722,975. |
|
| | 19,625,000 | | | | 0.030 | | | | 06/01/21 | | | | 19,625,000 | |
| | Maturity Value: $19,625,065 | |
| Collateralized by a U.S. Treasury Interest-Only Stripped Security,
0.000%, due 11/15/32. The market value of the collateral,
including accrued interest, was $20,017,500. |
|
| | |
|
| Repurchase Agreements(c) – (continued) | |
| | Prudential Insurance Company of America (The) – (continued) | |
| 21,945,000 | | | | 0.030 | | | | 06/01/21 | | | | 21,945,000 | |
| | Maturity Value: $21,945,073 | |
| Collateralized by a U.S. Treasury Interest-Only Stripped Security,
0.000%, due 08/15/38. The market value of the collateral,
including accrued interest, was $22,383,900. |
|
| | 22,087,500 | | | | 0.030 | | | | 06/01/21 | | | | 22,087,500 | |
| | Maturity Value: $22,087,574 | |
| Collateralized by a U.S. Treasury Principal-Only Stripped
Security, 0.000%, due 02/15/44. The market value of the
collateral, including accrued interest, was $22,529,250. |
|
| | 23,275,000 | | | | 0.030 | | | | 06/01/21 | | | | 23,275,000 | |
| | Maturity Value: $23,275,078 | |
| Collateralized by a U.S. Treasury Principal-Only Stripped
Security, 0.000%, due 08/15/39. The market value of the
collateral, including accrued interest, was $23,740,500. |
|
| | 25,638,750 | | | | 0.030 | | | | 06/01/21 | | | | 25,638,750 | |
| | Maturity Value: $25,638,835 | |
| Collateralized by a U.S. Treasury Principal-Only Stripped
Security, 0.000%, due 02/15/43. The market value of the
collateral, including accrued interest, was $26,151,525. |
|
| | 28,025,000 | | | | 0.030 | | | | 06/01/21 | | | | 28,025,000 | |
| | Maturity Value: $28,025,093 | |
| Collateralized by a U.S. Treasury Interest-Only Stripped Security,
0.000%, due 02/15/35. The market value of the collateral,
including accrued interest, was $28,585,500. |
|
| | 29,250,000 | | | | 0.030 | | | | 06/01/21 | | | | 29,250,000 | |
| | Maturity Value: $29,250,098 | |
| Collateralized by a U.S. Treasury Bond, 0.000%, due 11/15/43.
The market value of the collateral, including accrued interest,
was $29,835,000. |
|
| | 31,725,000 | | | | 0.030 | | | | 06/01/21 | | | | 31,725,000 | |
| | Maturity Value: $31,725,106 | |
| Collateralized by a U.S. Treasury Interest-Only Stripped Security,
0.000%, due 08/15/36. The market value of the collateral,
including accrued interest, was $32,359,500. |
|
| | 32,970,000 | | | | 0.030 | | | | 06/01/21 | | | | 32,970,000 | |
| | Maturity Value: $32,970,110 | |
| Collateralized by a U.S. Treasury Principal-Only Stripped
Security, 0.000%, due 08/15/43. The market value of the
collateral, including accrued interest, was $33,629,400. |
|
| | 48,600,000 | | | | 0.030 | | | | 06/01/21 | | | | 48,600,000 | |
| | Maturity Value: $48,600,162 | |
| Collateralized by a U.S. Treasury Bond, 2.750%, due 08/15/47.
The market value of the collateral, including accrued interest,
was $49,572,000. |
|
| | 53,437,500 | | | | 0.030 | | | | 06/01/21 | | | | 53,437,500 | |
| | Maturity Value: $53,437,678 | |
| Collateralized by a U.S. Treasury Interest-Only Stripped Security,
0.000%, due 05/15/36. The market value of the collateral,
including accrued interest, was $54,506,250. |
|
| | 79,312,500 | | | | 0.030 | | | | 06/01/21 | | | | 79,312,500 | |
| | Maturity Value: $79,312,764 | |
| Collateralized by a U.S. Treasury Bond, 0.000%, due 08/15/47.
The market value of the collateral, including accrued interest,
was $80,898,750. |
|
| | |
| | |
| The accompanying notes are an integral part of these financial statements. | | 17 |
FINANCIAL SQUARE GOVERNMENT FUND
Schedule of Investments (continued)
May 31, 2021 (Unaudited)
| | | | | | | | | | | | | | |
Principal Amount | | | Interest
Rate | | | Maturity
Date | | | Amortized Cost | |
|
| Repurchase Agreements(c) – (continued) | |
| | Prudential Insurance Company of America (The) – (continued) | |
| $ | 90,375,000 | | | | 0.030 | % | | | 06/01/21 | | | $ | 90,375,000 | |
| | Maturity Value: $90,375,301 | |
| Collateralized by a U.S. Treasury Bond, 0.000%, due 11/15/41.
The market value of the collateral, including accrued interest,
was $92,182,500. |
|
| | 103,000,000 | | | | 0.030 | | | | 06/01/21 | | | | 103,000,000 | |
| | Maturity Value: $103,000,343 | |
| Collateralized by a U.S. Treasury Bond, 2.500%, due 02/15/45.
The market value of the collateral, including accrued interest,
was $105,060,000. |
|
| | 110,125,000 | | | | 0.030 | | | | 06/01/21 | | | | 110,125,000 | |
| | Maturity Value: $110,125,367 | |
| Collateralized by a U.S. Treasury Bond, 2.875%, due 08/15/45.
The market value of the collateral, including accrued interest,
was $112,327,500. |
|
| | 137,062,500 | | | | 0.030 | | | | 06/01/21 | | | | 137,062,500 | |
| | Maturity Value: $137,062,957 | |
| Collateralized by a U.S. Treasury Principal-Only Stripped
Security, 0.000%, due 08/15/27. The market value of the
collateral, including accrued interest, was $139,803,750. |
|
| | |
| | Royal Bank of Canada | |
| | 240,000,000 | | | | 0.070 | (d) | | | 06/07/21 | | | | 240,000,000 | |
| | Maturity Value: $240,084,465 | |
| | Settlement Date: 03/02/21 | |
| Collateralized by Federal Home Loan Mortgage Corp., 2.000% to
4.500%, due 05/01/36 to 05/01/51, Federal National Mortgage
Association, 2.000% to 4.000%, due 09/01/40 to 01/01/58 and
Government National Mortgage Association, 3.000% to
4.500%, due 10/20/49 to 05/20/51. The aggregate market value
of the collateral, including accrued interest, was $244,799,997. |
|
| | 953,500,000 | | | | 0.070 | (d) | | | 06/07/21 | | | | 953,500,000 | |
| | Maturity Value: $953,837,425 | |
| | Settlement Date: 02/08/21 | |
| Collateralized by Federal Home Loan Mortgage Corp., 1.500% to
6.500%, due 01/01/29 to 05/01/51, Federal National Mortgage
Association, 2.000% to 6.000%, due 12/01/24 to 05/01/58 and
Government National Mortgage Association, 4.500%, due
10/20/49. The aggregate market value of the collateral,
including accrued interest, was $972,570,001. |
|
| | 953,500,000 | | | | 0.070 | (d) | | | 06/07/21 | | | | 953,500,000 | |
| | Maturity Value: $953,835,571 | |
| | Settlement Date: 02/09/21 | |
| Collateralized by Federal Home Loan Mortgage Corp., 1.500% to
6.500%, due 05/01/27 to 05/01/51, Federal National Mortgage
Association, 1.000% to 6.500%, due 07/01/23 to 06/01/60 and
Government National Mortgage Association, 3.500%, due
03/20/50. The aggregate market value of the collateral,
including accrued interest, was $972,569,994. |
|
| | |
|
| Repurchase Agreements(c) – (continued) | |
| | Royal Bank of Canada – (continued) | |
| 1,525,000,000 | | | | 0.070 | %(d) | | | 06/07/21 | | | | 1,525,000,000 | |
| | Maturity Value: $1,525,530,773 | |
| | Settlement Date: 02/11/21 | |
| Collateralized by Federal Home Loan Mortgage Corp., 1.500% to
6.423%, due 08/01/28 to 05/01/51, Federal National Mortgage
Association, 1.000% to 7.500%, due 05/01/26 to 08/01/59 and
Government National Mortgage Association, 3.500% to
4.500%, due 10/20/49 to 03/20/50. The aggregate market value
of the collateral, including accrued interest, was
$1,555,500,004. |
|
| | 3,483,000,000 | | | | 0.070 | (d) | | | 06/07/21 | | | | 3,483,000,000 | |
| | Maturity Value: $3,484,219,022 | |
| | Settlement Date: 02/11/21 | |
| Collateralized by Federal Home Loan Mortgage Corp., 1.500% to
7.000%, due 11/01/25 to 05/01/51, Federal National Mortgage
Association, 1.500% to 8.500%, due 05/01/23 to 06/01/60 and
Government National Mortgage Association, 3.000% to
4.500%, due 06/20/48 to 05/20/51. The aggregate market value
of the collateral, including accrued interest, was
$3,552,660,005. |
|
| | |
| | Scotia Capital (USA) Inc. | |
| | 200,000,000 | | | | 0.010 | | | | 06/01/21 | | | | 200,000,000 | |
| | Maturity Value: $200,000,222 | |
| Collateralized by Federal Home Loan Mortgage Corp., 2.000% to
4.000%, due 11/01/34 to 06/01/51, Federal National Mortgage
Association, 2.000% to 6.500%, due 08/01/24 to 10/01/50,
Government National Mortgage Association, 3.000% to
6.500%, due 03/15/33 to 04/20/51 and U.S. Treasury Notes,
0.250% to 2.500%, due 01/31/24 to 05/15/27. The aggregate
market value of the collateral, including accrued interest, was
$205,238,669. |
|
| | |
| | Sumitomo Mitsui Banking Corporation | |
| | 200,000,000 | | | | 0.010 | | | | 06/01/21 | | | | 200,000,000 | |
| | Maturity Value: $200,000,222 | |
| Collateralized by Federal Home Loan Mortgage Corp., 3.500%,
due 05/01/49 to 09/01/49. The aggregate market value of the
collateral, including accrued interest, was $206,000,229. |
|
| | 2,000,000,000 | | | | 0.010 | | | | 06/01/21 | | | | 2,000,000,000 | |
| | Maturity Value: $2,000,002,222 | |
| Collateralized by U.S. Treasury Notes, 0.500% to 2.875%, due
05/31/22 to 02/28/26. The aggregate market value of the
collateral, including accrued interest, was $2,040,002,297. |
|
| | |
| | |
| 18 | | The accompanying notes are an integral part of these financial statements. |
FINANCIAL SQUARE GOVERNMENT FUND
| | | | | | | | | | | | | | |
Principal Amount | | | Interest
Rate | | | Maturity
Date | | | Amortized Cost | |
|
| Repurchase Agreements(c) – (continued) | |
| | Wells Fargo Securities, LLC | |
| $ | 350,000,000 | | | | — | % | | | 06/01/21 | | | $ | 350,000,000 | |
| | Maturity Value: $350,000,000 | |
| Collateralized by U.S. Treasury Inflation-Indexed Bonds, 0.250%
to 2.125%, due 02/15/41 to 02/15/50 and U.S. Treasury
Inflation-Indexed Notes, 0.125% to 0.750%, due 07/15/21 to
01/15/31. The aggregate market value of the collateral,
including accrued interest, was $357,000,048. |
|
| | |
| | TOTAL REPURCHASE AGREEMENTS | | | $ | 105,626,610,000 | |
| | |
| | TOTAL INVESTMENTS – 100.6% | | | $ | 204,707,066,906 | |
| | |
| LIABILITIES IN EXCESS OF OTHER
ASSETS – (0.6)% |
| | | (1,167,284,345 | ) |
| | |
| | NET ASSETS – 100.0% | | | $ | 203,539,782,561 | |
| | |
| | |
|
| The percentage shown for each investment category reflects the value of investments in that category as a percentage of net assets. |
| |
(a) | | Variable or floating rate security. Except for floating rate notes (for which final maturity is disclosed), maturity date disclosed is the next interest reset date. Interest rate disclosed is that which is in effect on May 31, 2021. |
| |
(b) | | All or a portion represents a forward commitment. |
| |
(c) | | Unless noted, all repurchase agreements were entered into on May 31, 2021. Additional information on Joint Repurchase Agreement Account I and III appears in the Additional Investment Information section. |
| |
(d) | | The instrument is subject to a demand feature. |
| |
(e) | | All or a portion represents a forward commitment. Forward settling repurchase agreements will be collateralized at settlement. |
Interest rates represent either the stated coupon rate, annualized yield on date of purchase for discounted securities, or, for floating rate securities, the current reset rate, which is based upon current interest rate indices.
Maturity dates represent either the final legal maturity date on the security, the demand date for puttable securities, the date of the next interest rate reset for variable rate securities, or the prerefunded date for those types of securities.
| | |
|
Investment Abbreviations: |
FEDL01 | | —US Federal Funds Effective Rate |
LIBOR | | —London Interbank Offered Rates |
MMY | | —Money Market Yield |
Prime | | —Federal Reserve Bank Prime Loan Rate US |
SOFR | | —Secured Overnight Financing Rate |
T-Bill | | —Treasury Bill |
|
| | |
| The accompanying notes are an integral part of these financial statements. | | 19 |
FINANCIAL SQUARE MONEY MARKET FUND
Schedule of Investments
May 31, 2021 (Unaudited)
| | | | | | | | | | | | | | |
Principal
Amount | | | Interest
Rate | | | Maturity
Date | | | Value | |
|
| Commercial Paper and Corporate Obligations – 38.3% | |
| | Agricultural Bank of China Ltd. | |
| $ | 6,398,000 | | | | 0.208 | % | | | 08/24/21 | | | $ | 6,395,044 | |
| | Albion Capital LLC | |
| | 50,000,000 | | | | 0.101 | | | | 06/04/21 | | | | 49,999,222 | |
| | 4,251,000 | | | | 0.183 | | | | 07/27/21 | | | | 4,250,079 | |
| | Antalis | |
| | 10,000,000 | | | | 0.172 | | | | 08/04/21 | | | | 9,997,582 | |
| | 6,588,000 | | | | 0.172 | | | | 08/11/21 | | | | 6,586,147 | |
| | 8,420,000 | | | | 0.172 | | | | 08/12/21 | | | | 8,417,583 | |
| | Apple Inc. | |
| | 20,000,000 | | | | 0.030 | | | | 06/17/21 | | | | 19,999,667 | |
| | Banco Santander, S.A. | |
| | 1,500,000 | | | | 0.056 | | | | 07/02/21 | | | | 1,499,894 | |
| | Barclays Bank UK PLC | |
| | 6,000,000 | | | | 0.152 | | | | 07/26/21 | | | | 5,998,820 | |
| | Barclays US CCP Funding LLC | |
| | 16,000,000 | | | | 0.106 | | | | 06/14/21 | | | | 15,999,539 | |
| | 2,463,000 | | | | 0.172 | | | | 08/03/21 | | | | 2,462,289 | |
| | 4,642,000 | | | | 0.172 | | | | 08/04/21 | | | | 4,640,641 | |
| | 18,000,000 | | | | 0.157 | | | | 08/13/21 | | | | 17,993,802 | |
| | Barton Capital S.A. | |
| | 19,000,000 | | | | 0.152 | | | | 07/06/21 | | | | 18,998,230 | |
| | BNP Paribas | |
| | 30,000,000 | | | | 0.020 | | | | 06/01/21 | | | | 29,999,867 | |
| | 10,000,000 | | | | 0.152 | | | | 07/12/21 | | | | 9,999,063 | |
| | 19,000,000 | | | | 0.152 | | | | 07/13/21 | | | | 18,998,179 | |
| | BNZ International Funding Ltd. | |
| | 25,000,000 | | | | 0.142 | | | | 07/27/21 | | | | 24,997,500 | |
| | Cancara Asset Securitisation LLC | |
| | 2,500,000 | | | | 0.147 | | | | 07/14/21 | | | | 2,499,703 | |
| | Chariot Funding LLC | |
| | 35,500,000 | | | | 0.132 | | | | 06/11/21 | | | | 35,499,172 | |
| | 10,400,000 | | | | 0.091 | | | | 07/02/21 | | | | 10,399,363 | |
| | Chesham Finance Ltd. – Series II | |
| | 55,000,000 | | | | 0.132 | | | | 06/01/21 | | | | 54,999,633 | |
| | Chesham Finance Ltd. – Series III | |
| | 20,000,000 | | | | 0.061 | | | | 06/01/21 | | | | 19,999,867 | |
| | Chesham Finance Ltd. – Series V | |
| | 15,000,000 | | | | 0.061 | | | | 06/01/21 | | | | 14,999,900 | |
| | China Construction Bank Corp. | |
| | 5,661,000 | | | | 0.243 | | | | 06/23/21 | | | | 5,660,518 | |
| | Citigroup Global Markets Inc. | |
| | 19,227,000 | | | | 0.132 | | | | 08/02/21 | | | | 19,224,110 | |
| | CNPC Finance (HK) Ltd. | |
| | 58,000,000 | | | | 0.264 | | | | 06/01/21 | | | | 57,999,678 | |
| | Collateralized Commercial Paper V Co., LLC | |
| | 21,872,000 | | | | 0.183 | | | | 06/21/21 | | | | 21,871,373 | |
| | 16,586,000 | | | | 0.152 | | | | 07/16/21 | | | | 16,584,577 | |
| | Columbia Funding Company, LLC | |
| | 20,000,000 | | | | 0.162 | | | | 07/20/21 | | | | 19,996,408 | |
| | Cooeperatieve Rabobank U.A. | |
| | 55,000,000 | | | | 0.030 | | | | 06/01/21 | | | | 54,999,694 | |
| | DBS Bank Ltd. | |
| | 10,826,000 | | | | 0.142 | | | | 07/01/21 | | | | 10,825,253 | |
| | 11,399,000 | | | | 0.147 | | | | 07/09/21 | | | | 11,397,963 | |
| | Dexia Credit Local | |
| | 17,789,000 | | | | 0.157 | | | | 06/15/21 | | | | 17,788,448 | |
| | |
|
| Commercial Paper and Corporate Obligations – (continued) | |
| | Dexia Credit Local – (continued) | |
| 15,000,000 | | | | 0.142 | | | | 07/16/21 | | | | 14,998,367 | |
| DZ Bank AG Deutsche Zentral-Genossenschaftsbank, Frankfurt
Am Main |
|
| | 80,000,000 | | | | 0.020 | | | | 06/01/21 | | | | 79,999,555 | |
| | Federation des Caisses Desjardins du Quebec | |
| | 5,000,000 | | | | 0.147 | | | | 07/02/21 | | | | 4,999,645 | |
| | 15,000,000 | | | | 0.101 | | | | 07/12/21 | | | | 14,998,500 | |
| | Federation Des Caisses Desjardins Du Quebec | |
| | 30,000,000 | | | | 0.066 | | | | 06/18/21 | | | | 29,999,055 | |
| | First Abu Dhabi Bank P.J.S.C. | |
| | 23,824,000 | | | | 0.162 | | | | 08/02/21 | | | | 23,820,419 | |
| | 20,000,000 | | | | 0.152 | | | | 08/19/21 | | | | 19,995,942 | |
| | FMS Wertmanagement | |
| | 18,511,000 | | | | 0.142 | | | | 06/15/21 | | | | 18,510,611 | |
| | 10,000,000 | | | | 0.157 | | | | 06/28/21 | | | | 9,999,561 | |
| | 6,904,000 | | | | 0.147 | | | | 07/08/21 | | | | 6,903,552 | |
| | Industrial & Commercial Bank of China Ltd.-New York Branch | |
| | 7,317,000 | | | | 0.243 | | | | 06/15/21 | | | | 7,316,671 | |
| | 4,099,000 | | | | 0.243 | | | | 06/22/21 | | | | 4,098,726 | |
| | ING (United States) Funding LLC | |
| | 25,000,000 | | | | 0.142 | | | | 07/02/21 | | | | 24,998,055 | |
| | Ionic Capital II Trust | |
| | 13,718,000 | | | | 0.183 | | | | 06/09/21 | | | | 13,717,698 | |
| | 19,000,000 | | | | 0.183 | | | | 07/01/21 | | | | 18,998,511 | |
| | KfW | |
| | 10,000,000 | | | | 0.147 | | | | 06/01/21 | | | | 9,999,956 | |
| | Liberty Street Funding LLC | |
| | 5,000,000 | | | | 0.132 | | | | 08/05/21 | | | | 4,998,984 | |
| | LMA-Americas LLC | |
| | 5,000,000 | | | | 0.152 | | | | 06/09/21 | | | | 4,999,890 | |
| | 5,200,000 | | | | 0.152 | | | | 07/02/21 | | | | 5,199,580 | |
| | 13,000,000 | | | | 0.071 | | | | 07/16/21 | | | | 12,998,355 | |
| | Macquarie Bank Ltd. | |
| | 10,000,000 | | | | 0.152 | | | | 07/16/21 | | | | 9,998,503 | |
| | Matchpoint Finance PLC | |
| | 8,338,000 | | | | 0.152 | | | | 07/06/21 | | | | 8,337,223 | |
| | Mizuho Bank, Ltd.-Singapore Branch | |
| | 37,000,000 | | | | 0.157 | | | | 07/26/21 | | | | 36,993,390 | |
| | Nationwide Building Society | |
| | 20,000,000 | | | | 0.066 | | | | 06/09/21 | | | | 19,999,627 | |
| | 15,000,000 | | | | 0.061 | | | | 07/02/21 | | | | 14,998,935 | |
| | Natixis-New York Branch | |
| | 35,000,000 | | | | 0.020 | | | | 06/01/21 | | | | 34,999,782 | |
| | Nederlandse Waterschapsbank N.V. | |
| | 25,000,000 | | | | 0.056 | | | | 06/25/21 | | | | 24,998,425 | |
| | 21,754,000 | | | | 0.051 | | | | 06/28/21 | | | | 21,752,483 | |
| | 15,000,000 | | | | 0.051 | | | | 06/29/21 | | | | 14,998,893 | |
| | Nieuw Amsterdam Receivables Corp. | |
| | 15,000,000 | | | | 0.132 | | | | 08/02/21 | | | | 14,997,415 | |
| | NRW.Bank | |
| | 30,000,000 | | | | 0.041 | | | | 06/21/21 | | | | 29,998,940 | |
| | 35,000,000 | | | | 0.071 | | | | 07/29/21 | | | | 34,995,720 | |
| | Salisbury Receivables Company LLC | |
| | 10,391,000 | | | | 0.162 | | | | 06/11/21 | | | | 10,390,761 | |
| | Sheffield Receivables Company LLC | |
| | 10,000,000 | | | | 0.142 | | | | 08/02/21 | | | | 9,998,093 | |
| | |
| | |
| 20 | | The accompanying notes are an integral part of these financial statements. |
FINANCIAL SQUARE MONEY MARKET FUND
| | | | | | | | | | | | | | |
Principal
Amount | | | Interest
Rate | | | Maturity
Date | | | Value | |
|
| Commercial Paper and Corporate Obligations – (continued) | |
| | Skandinaviska Enskilda Banken AB (Publ) | |
| $ | 40,000,000 | | | | 0.091 | % | | | 08/25/21 | | | $ | 39,990,111 | |
| | Societe Generale | |
| | 14,500,000 | | | | 0.162 | | | | 06/28/21 | | | | 14,498,637 | |
| | 15,000,000 | | | | 0.106 | | | | 08/24/21 | | | | 14,996,370 | |
| | Starbird Funding Corporation | |
| | 13,750,000 | | | | 0.162 | | | | 07/01/21 | | | | 13,748,922 | |
| | Sumitomo Mitsui Trust Bank, Ltd.-Singapore Branch | |
| | 30,000,000 | | | | 0.091 | | | | 08/31/21 | | | | 29,992,479 | |
| | Versailles Commercial Paper LLC | |
| | 18,511,000 | | | | 0.172 | | | | 06/10/21 | | | | 18,510,686 | |
| | 25,000,000 | | | | 0.162 | | | | 07/01/21 | | | | 24,998,040 | |
| | Victory Receivables Corp. | |
| | 13,100,000 | | | | 0.152 | | | | 07/07/21 | | | | 13,098,734 | |
| | 20,000,000 | | | | 0.142 | | | | 07/27/21 | | | | 19,997,000 | |
| | 13,000,000 | | | | 0.091 | | | | 08/25/21 | | | | 12,996,786 | |
| | |
| TOTAL COMMERCIAL PAPER AND CORPORATE
OBLIGATIONS |
|
| | (Cost $1,453,787,041) | | | $ | 1,453,816,396 | |
| | |
| | | | | | | | | | | | | | |
|
| Certificate of Deposit – 0.8% | |
| | National Bank of Kuwait S.A.K.P | |
| $ | 30,000,000 | | | | 0.070 | % | | | 06/03/21 | | | $ | 29,999,950 | |
| | (Cost $30,000,000) | | | | | |
| | |
| | | | | | | | | | | | | | |
|
| Certificates of Deposit-Yankeedollar – 4.0% | |
| | National Bank of Kuwait S.A.K.P | |
| $ | 10,387,000 | | | | 0.320 | % | | | 06/09/21 | | | $ | 10,387,779 | |
| | 6,682,000 | | | | 0.320 | | | | 06/25/21 | | | | 6,682,914 | |
| | 10,000,000 | | | | 0.300 | | | | 07/08/21 | | | | 10,001,502 | |
| | 5,754,000 | | | | 0.200 | | | | 07/26/21 | | | | 5,754,019 | |
| | 15,000,000 | | | | 0.290 | | | | 08/20/21 | | | | 15,001,189 | |
| | Norinchukin Bank (The) | |
| | 25,100,000 | | | | 0.070 | | | | 07/02/21 | | | | 25,099,463 | |
| | 30,000,000 | | | | 0.170 | | | | 07/06/21 | | | | 30,002,501 | |
| | Sumitomo Mitsui Banking Corp. | |
| | 35,000,000 | | | | 0.080 | | | | 06/14/21 | | | | 35,000,347 | |
| | Sumitomo Mitsui Trust Bank, Ltd. | |
| | 14,500,000 | | | | 0.150 | | | | 07/16/21 | | | | 14,501,322 | |
| | |
| | TOTAL CERTIFICATES OF DEPOSIT-YANKEEDOLLAR | |
| | (Cost $152,423,000) | | | $ | 152,431,036 | |
| | |
| | | | | | | | | | | | | | |
|
| Medium Term Note – 0.4% | |
| | Asian Development Bank | |
| $ | 15,000,000 | | | | 0.380 | % | | | 06/16/21 | | | $ | 15,001,670 | |
| | (Cost $15,001,935) | | | | | |
| | |
| | | | | | | | | | | | | | |
|
| Time Deposits – 25.3% | |
| | Banco Santander, S.A. | |
| $ | 120,000,000 | | | | 0.050 | | | | 06/01/21 | | | $ | 120,000,266 | |
| | Canadian Imperial Bank of Commerce | |
| | 50,000,000 | | | | 0.030 | | | | 06/01/21 | | | | 50,000,000 | |
| | Credit Agricole Corporate and Investment Bank | |
| | 120,000,000 | | | | 0.030 | | | | 06/01/21 | | | | 120,000,000 | |
| | Credit Industriel et Commercial | |
| | 100,000,000 | | | | 0.080 | | | | 06/01/21 | | | | 100,000,555 | |
| | DNB Bank ASA | |
| | 62,000,000 | | | | 0.010 | | | | 06/01/21 | | | | 62,000,000 | |
| | Erste Group Bank AG-New York Branch | |
| | 120,000,000 | | | | 0.050 | | | | 06/01/21 | | | | 120,000,266 | |
| | Nordea Bank ABP | |
| | 120,000,000 | | | | 0.020 | | | | 06/01/21 | | | | 119,999,866 | |
| | Skandinaviska Enskilda Banken AB (Publ) | |
| | 100,000,000 | | | | 0.020 | | | | 06/01/21 | | | | 100,000,000 | |
| | Svenska Handelsbanken AB | |
| | 120,000,000 | | | | 0.020 | | | | 06/01/21 | | | | 119,999,866 | |
| | Swedbank AB | |
| | 50,000,000 | | | | 0.010 | | | | 06/01/21 | | | | 49,999,889 | |
| | |
| | TOTAL TIME DEPOSITS | |
| | (Cost $962,000,000) | | | $ | 962,000,708 | |
| | |
| | | | | | | | | | | | | | |
|
| U.S. Government Agency Obligations – 0.6% | |
| U.S. International Development Finance Corp. (3 Mo. U.S. T-Bill
+ 0.00%) |
|
| $ | 8,500,000 | | | | 0.090 | %(a) | | | 06/07/21 | | | $ | 8,500,000 | |
| | 10,000,000 | | | | 0.100 | (a) | | | 06/07/21 | | | | 10,000,000 | |
| | 2,000,000 | | | | 0.090 | (a) | | | 08/13/27 | | | | 2,000,000 | |
| | U.S. International Development Finance Corp. | |
| | 2,200,000 | | | | 0.008 | (a) | | | 06/07/21 | | | | 2,200,000 | |
| | |
| | TOTAL U.S. GOVERNMENT AGENCY OBLIGATIONS | |
| | (Cost $22,700,000) | | | $ | 22,700,000 | |
| | |
| | | | | | | | | | | | | | |
|
| U.S. Treasury Obligations – 7.3% | |
| | United States Treasury Bills | |
| $ | 79,576,000 | | | | 0.005 | %(b) | | | 07/27/21 | | | $ | 79,575,381 | |
| | 30,000,000 | | | | 0.071 | | | | 08/05/21 | | | | 29,999,296 | |
| | 55,000,000 | | | | 0.061 | | | | 08/19/21 | | | | 54,998,431 | |
| | United States Treasury Floating Rate Note | |
| | 17,000,000 | | | | 0.069 | (a) | | | 01/31/23 | | | | 17,006,277 | |
| | 70,300,000 | | | | 0.054 | (a) | | | 04/30/23 | | | | 70,302,072 | |
| | United States Treasury Notes | |
| | 1,190,000 | | | | 1.125 | | | | 06/30/21 | | | | 1,191,050 | |
| | 10,960,000 | | | | 2.625 | | | | 07/15/21 | | | | 10,994,659 | |
| | 2,500,000 | | | | 1.125 | | | | 07/31/21 | | | | 2,504,566 | |
| | 4,300,000 | | | | 2.125 | | | | 08/15/21 | | | | 4,318,724 | |
| | 4,700,000 | | | | 1.125 | | | | 08/31/21 | | | | 4,712,806 | |
| | 1,200,000 | | | | 1.500 | | | | 08/31/21 | | | | 1,204,382 | |
| | 2,300,000 | | | | 2.000 | | | | 08/31/21 | | | | 2,311,243 | |
| | |
| | TOTAL U.S. TREASURY OBLIGATIONS | |
| | (Cost $279,102,081) | | | $ | 279,118,887 | |
| | |
| | |
| The accompanying notes are an integral part of these financial statements. | | 21 |
FINANCIAL SQUARE MONEY MARKET FUND
Schedule of Investments (continued)
May 31, 2021 (Unaudited)
| | | | | | | | | | | | | | |
Principal
Amount | | | Interest
Rate | | | Maturity
Date | | | Value | |
|
| Variable Rate Municipal Debt Obligations(c) – 8.7% | |
| Alaska Housing Finance Corp. VRDN RB Refunding for State
Capital Project Bonds II Series 2017 B |
|
| $ | 18,600,000 | | | | 0.140 | % | | | 12/01/47 | | | $ | 18,600,000 | |
| Alaska Housing Finance Corp. VRDN RB Refunding for State
Capital Project Bonds II Series 2017 B |
|
| | 45,800,000 | | | | 0.080 | | | | 06/07/21 | | | | 45,800,000 | |
| City of Phoenix IDA Health Care Facilities VRDN RB for Mayo
Clinic Series 2014 B (Northern Trust Co., SPA) (GTY AGMT
– Mayo Clinic) |
|
| | 15,000,000 | | | | 0.020 | | | | 06/01/21 | | | | 15,000,000 | |
| City of Portland, Maine GO VRDN for Taxable Pension Bonds
Series 2001 RMKT (TB Bank N.A., LOC) |
|
| | 30,400,000 | | | | 0.090 | | | | 06/01/26 | | | | 30,400,000 | |
| City of Valdez Marine Terminal VRDN RB Refunding for Exxon
Pipeline Company Project Series 1985 |
|
| | 135,000 | | | | 0.020 | | | | 06/01/21 | | | | 135,000 | |
| Colorado Housing And Finance Authority Single Family
Mortgage Bonds Class I VRDN RB 2021 Refunding Series C-2
(GNMA Collat., FHLB, SPA) |
|
| | 4,480,000 | | | | 0.080 | | | | 06/07/21 | | | | 4,480,000 | |
| Connecticut Housing Finance Authority VRDN RB Housing
Mortgage Finance Program Refunding Series 2016
Subseries E-3 RMKT (State Street Bank & Trust Co., SPA) |
|
| | 5,000,000 | | | | 0.030 | | | | 06/07/21 | | | | 5,000,000 | |
| Connecticut Housing Finance Authority VRDN RB Housing
Mortgage Finance Program Refunding Series 2017
Subseries A-3 RMKT (State Street Bank & Trust Co., SPA) |
|
| | 5,000,000 | | | | 0.030 | | | | 06/07/21 | | | | 5,000,000 | |
| East Baton Rouge Parish IDB, Inc. VRDN RB for ExxonMobil
Project Gulf Opportunity Zone Bonds Series 2010 A |
|
| | 5,000,000 | | | | 0.020 | | | | 06/01/21 | | | | 5,000,000 | |
| Massachusetts Health & Educational Facilities Authority VRDN
RB for Massachusetts General Brigham, Inc. Series P-2 RMKT
(JPMorgan Chase Bank N.A., SPA) |
|
| | 150,000 | | | | 0.050 | | | | 06/07/21 | | | | 150,000 | |
| Michigan Finance Authority VRDN RB Refunding for School
Loan Revolving Fund Series 2019 C (Bank of America N.A.,
LOC) |
|
| | 30,000,000 | | | | 0.100 | | | | 06/07/21 | | | | 30,000,000 | |
| Mississippi Business Finance Commission Gulf Opportunity Zone
VRDN RB for Chevron USA, Inc. Project Series 2009 E
RMKT (GTY AGMT – Chevron Corp.) |
|
| | 3,655,000 | | | | 0.010 | | | | 12/01/30 | | | | 3,655,000 | |
| Mississippi Business Finance Corporation Gulf Opportunity Zone
VRDN RB for Chevron USA, Inc. Project Series 2010 E (GTY
AGMT – Chevron Corp.) |
|
| | 4,195,000 | | | | 0.060 | | | | 12/01/30 | | | | 4,195,000 | |
| Missouri Health & Educational Facilities Authority VRDN RB
Refunding for BJC Health System Series 2008 D |
|
| | 10,000,000 | | | | 0.040 | | | | 06/07/21 | | | | 10,000,000 | |
| New York City Municipal Water Finance Authority Water &
Sewer System VRDN RB Second General Resolution
Series 2019 BB (Industrial & Commercial Bank of China,
SPA) |
|
| | 17,345,000 | | | | 0.100 | | | | 06/07/21 | | | | 17,345,000 | |
| | |
|
| Variable Rate Municipal Debt Obligations(c) – (continued) | |
| Ohio State University/The General Receipts VRDN RB
Series 2014 B-1 |
|
| 6,780,000 | | | | 0.030 | | | | 12/01/39 | | | | 6,780,000 | |
| Philadelphia Hospitals & Higher Education Facilities Authority
VRDN RB Children’s Hospital of Philadelphia Series 2011 A
(Bank of America N.A., SPA) |
|
| | 4,000,000 | | | | 0.010 | | | | 06/01/21 | | | | 4,000,000 | |
| Providence Health & Services Obligated Group VRDN RB
Series 12-E (U.S. Bank N.A., SPA) |
|
| | 59,200,000 | | | | 0.120 | | | | 06/07/21 | | | | 59,200,000 | |
| Providence St. Joseph Health Obligated Group VRDN
Series 16-G (Bank of Tokyo-Mitsubishi UFJ, LOC) |
|
| | 35,950,000 | | | | 0.100 | | | | 10/01/47 | | | | 35,950,000 | |
| Santa Clara Valley Transportation Authority Sales Tax VRDN
RB Refunding for Measure A Series 2008 B RMKT (TD Bank
N.A., SPA) |
|
| | 5,000,000 | | | | 0.030 | | | | 06/07/21 | | | | 5,000,000 | |
| | State of Ohio | |
| | 10,000,000 | | | | 0.040 | | | | 06/07/21 | | | | 10,000,000 | |
| Tarrant County Cultural Education Facilities Finance Corp.
VRDN RB for Texas Health Resources System Series 2012 B |
|
| | 4,610,000 | | | | 0.040 | | | | 11/15/47 | | | | 4,610,000 | |
| The Regents of the University of California Medical Center
Pooled VRDN RB Series 2013 K RMKT |
|
| | 4,000,000 | | | | 0.010 | | | | 06/01/21 | | | | 4,000,000 | |
| University of North Carolina at Chapel Hill VRDN RB Refunding
Series 2001 B |
|
| | 6,210,000 | | | | 0.020 | | | | 12/01/25 | | | | 6,210,000 | |
| | |
| TOTAL VARIABLE RATE MUNICIPAL DEBT
OBLIGATIONS |
|
| | (Cost $330,509,990) | | | $ | 330,510,000 | |
| | |
| TOTAL INVESTMENTS BEFORE REPURCHASE
AGREEMENTS |
|
| | (Cost $3,245,524,047) | | | $ | 3,245,578,647 | |
| | |
| | | | | | | | | | | | | | |
|
| Repurchase Agreements(d) – 15.3% | |
| | BNP Paribas | |
| $ | 14,000,000 | | | | 0.060 | %(e) | | | 06/07/21 | | | $ | 14,000,000 | |
| | Maturity Value: $14,004,340 | |
| | Settlement Date: 03/05/21 | |
| Collateralized by U.S. Treasury Inflation-Indexed Bonds, 3.375%
to 3.625%, due 04/15/28 to 04/15/32, a U.S. Treasury Interest-
Only Stripped Security, 0.000%, due 11/15/47, U.S. Treasury
Notes, 0.125% to 1.875%, due 03/31/22 to 10/31/22 and a U.S.
Treasury Principal-Only Stripped Security, 0.000%, due
02/15/48. The aggregate market value of the collateral,
including accrued interest, was $14,280,000. |
|
| | |
| | |
| 22 | | The accompanying notes are an integral part of these financial statements. |
FINANCIAL SQUARE MONEY MARKET FUND
| | | | | | | | | | | | | | |
Principal
Amount | | | Interest
Rate | | | Maturity
Date | | | Value | |
|
| Repurchase Agreements(d) – (continued) | |
| | BNP Paribas – (continued) | |
| $ | 15,000,000 | | | | 0.060 | %(e) | | | 06/07/21 | | | $ | 15,000,000 | |
| | Maturity Value: $15,004,525 | |
| | Settlement Date: 02/19/21 | |
| Collateralized by Federal Farm Credit Bank, 1.950%, due
08/13/40, Federal Home Loan Mortgage Corp. Stripped
Security, 0.000%, due 09/15/29, Federal National Mortgage
Association, 2.000% to 6.000%, due 11/01/48 to 03/01/51,
Federal National Mortgage Association Stripped Security,
0.000%, due 05/15/22, a U.S. Treasury Inflation-Indexed Note,
0.625%, due 07/15/21 and U.S. Treasury Principal-Only
Stripped Securities, 0.000%, due 05/15/44 to 11/15/49. The
aggregate market value of the collateral, including accrued
interest, was $15,301,182. |
|
| | 31,000,000 | | | | 0.060 | (e) | | | 06/07/21 | | | | 31,000,000 | |
| �� | Maturity Value: $31,009,610 | |
| | Settlement Date: 03/05/21 | |
| Collateralized by Federal Farm Credit Bank, 1.950%, due
08/13/40, Federal Home Loan Mortgage Corp., 4.000%, due
10/01/44, Federal National Mortgage Association, 2.000% to
2.500%, due 12/01/50 to 04/01/51, Government National
Mortgage Association, 3.000% to 4.000%, due 10/15/26 to
11/20/50, U.S. Treasury Bills, 0.000%, due 10/07/21 to
01/27/22, a U.S. Treasury Bond, 8.000%, due 11/15/21, a U.S.
Treasury Inflation-Indexed Bond, 2.375%, due 01/15/27, a U.S.
Treasury Inflation-Indexed Note, 0.375%, due 07/15/27, U.S.
Treasury Interest-Only Stripped Securities, 0.000%, due
08/15/25 to 11/15/47, U.S. Treasury Notes, 0.125% to 2.000%,
due 02/15/22 to 10/31/22 and U.S. Treasury Principal-Only
Stripped Securities, 0.000%, due 05/15/42 to 02/15/49. The
aggregate market value of the collateral, including accrued
interest, was $31,620,943. |
|
| | 32,000,000 | | | | 0.060 | (e) | | | 06/07/21 | | | | 32,000,000 | |
| | Maturity Value: $32,009,654 | |
| | Settlement Date: 02/19/21 | |
| Collateralized by U.S. Treasury Bills, 0.000%, due 07/06/21 to
02/24/22, a U.S. Treasury Bond, 4.500%, due 08/15/39, U.S.
Treasury Floating Rate Notes, 0.049% to 0.315%, due 10/31/21
to 04/30/23, a U.S. Treasury Inflation-Indexed Bond, 2.375%,
due 01/15/27, U.S. Treasury Inflation-Indexed Notes, 0.125%,
due 01/15/22 to 04/15/26, U.S. Treasury Interest-Only Stripped
Securities, 0.000%, due 05/15/31 to 05/15/49, U.S. Treasury
Notes, 0.125% to 1.875%, due 03/31/22 to 08/31/24 and U.S.
Treasury Principal-Only Stripped Securities, 0.000%, due
11/15/42 to 11/15/44. The aggregate market value of the
collateral, including accrued interest, was $32,640,000. |
|
| | |
| | Canadian Imperial Bank of Commerce | |
| | 9,500,000 | | | | 0.090 | (e) | | | 06/07/21 | | | | 9,500,000 | |
| | Maturity Value: $9,504,275 | |
| | Settlement Date: 01/28/21 | |
| Collateralized by Federal Home Loan Mortgage Corp., 2.000% to
4.000%, due 05/01/29 to 10/01/48, Federal National Mortgage
Association, 2.000% to 5.000%, due 01/01/29 to 06/01/51,
Government National Mortgage Association, 4.000% to
5.000%, due 07/15/47 to 09/20/50 and U.S. Treasury Notes,
2.875% to 3.125%, due 08/15/28 to 11/15/28. The aggregate
market value of the collateral, including accrued interest, was
$9,784,946. |
|
| | |
|
| Repurchase Agreements(d) – (continued) | |
| | Canadian Imperial Bank of Commerce – (continued) | |
| 9,500,000 | | | | 0.090 | %(e) | | | 06/07/21 | | | | 9,500,000 | |
| | Maturity Value: $9,504,275 | |
| | Settlement Date: 01/29/21 | |
| Collateralized by Federal Home Loan Mortgage Corp., 3.000% to
4.000%, due 03/01/46 to 06/01/50, Federal National Mortgage
Association, 2.000% to 4.500%, due 07/01/34 to 06/01/51,
Government National Mortgage Association, 4.000% to
5.000%, due 01/20/49 to 09/20/50 and a U.S. Treasury Note,
0.625%, due 11/30/27. The aggregate market value of the
collateral, including accrued interest, was $9,784,947. |
|
| | |
| | ING Financial Markets LLC | |
| | 35,000,000 | | | | 0.180 | | | | 06/01/21 | | | | 35,000,650 | |
| | Maturity Value: $35,000,700 | |
| Collateralized by Federal Home Loan Bank, 0.020%, due
06/04/21, Federal Home Loan Mortgage Corp., 2.000%, due
05/01/51, Government National Mortgage Association, 4.000%
to 5.000%, due 09/20/48 to 12/20/49 and various corporate
security issuers, 0.350% to 6.900%, due 09/15/21 to 03/17/62.
The aggregate market value of the collateral, including accrued
interest, was $37,066,249. |
|
| | |
| | Joint Account III | |
| | 30,000,000 | | | | 0.013 | | | | 06/01/21 | | | | 29,999,999 | |
| | Maturity Value: $30,000,042 | |
| | |
| | MUFG Securities Americas Inc. | |
| | 70,000,000 | | | | 0.210 | | | | 06/01/21 | | | | 70,001,533 | |
| | Maturity Value: $70,001,633 | |
| Collateralized by an Exchange-Traded Fund, various corporate
security issuers, 0.000% to 6.000%, due 02/01/23 to 11/01/35
and various equity securities. The aggregate market value of the
collateral, including accrued interest, was $75,916,172. |
|
| | |
| | Royal Bank of Canada | |
| | 70,000,000 | | | | 0.140 | | | | 06/01/21 | | | | 70,000,988 | |
| | Maturity Value: $70,001,089 | |
| Collateralized by various corporate security issuers, 0.000% to
10.500%, due 02/01/22 to 12/31/99. The aggregate market
value of the collateral, including accrued interest, was
$73,676,783. |
|
| | 3,100,000 | | | | 0.070 | (e) | | | 06/07/21 | | | | 3,100,000 | |
| | Maturity Value: $3,101,091 | |
| | Settlement Date: 03/02/21 | |
| Collateralized by Federal Home Loan Mortgage Corp., 2.000% to
4.500%, due 12/01/29 to 05/01/51, Federal National Mortgage
Association, 2.000% to 3.500%, due 09/01/40 to 05/01/51 and
Government National Mortgage Association, 4.500%, due
10/20/49. The aggregate market value of the collateral,
including accrued interest, was $3,162,001. |
|
| | 16,000,000 | | | | 0.070 | (e) | | | 06/07/21 | | | | 16,000,000 | |
| | Maturity Value: $16,005,662 | |
| | Settlement Date: 02/08/21 | |
| Collateralized by Federal Home Loan Mortgage Corp., 2.000% to
4.500%, due 12/01/29 to 05/01/51, Federal National Mortgage
Association, 2.000% to 7.000%, due 06/01/38 to 08/01/59 and
Government National Mortgage Association, 4.500%, due
10/20/49. The aggregate market value of the collateral,
including accrued interest, was $16,319,995. |
|
| | |
| | |
| The accompanying notes are an integral part of these financial statements. | | 23 |
FINANCIAL SQUARE MONEY MARKET FUND
Schedule of Investments (continued)
May 31, 2021 (Unaudited)
| | | | | | | | | | | | | | |
Principal
Amount | | | Interest
Rate | | | Maturity
Date | | | Value | |
|
| Repurchase Agreements(d) – (continued) | |
| | Royal Bank of Canada – (continued) | |
| $ | 16,000,000 | | | | 0.070 | %(e) | | | 06/07/21 | | | $ | 16,000,000 | |
| | Maturity Value: $16,005,631 | |
| | Settlement Date: 02/09/21 | |
| Collateralized by Federal Home Loan Mortgage Corp., 2.000% to
4.500%, due 12/01/29 to 05/01/51, Federal National Mortgage
Association, 2.000% to 4.000%, due 09/01/40 to 05/01/58 and
Government National Mortgage Association, 4.500%, due
10/20/49. The aggregate market value of the collateral,
including accrued interest, was $16,320,000. |
|
| | 24,000,000 | | | | 0.070 | (e) | | | 06/07/21 | | | | 24,000,000 | |
| | Maturity Value: $24,008,353 | |
| | Settlement Date: 02/11/21 | |
| Collateralized by Federal Home Loan Mortgage Corp., 2.000% to
6.500%, due 12/01/29 to 09/01/50, Federal National Mortgage
Association, 2.000% to 5.500%, due 02/01/31 to 05/01/51 and
Government National Mortgage Association, 4.500%, due
10/20/49. The aggregate market value of the collateral,
including accrued interest, was $24,480,001. |
|
| | 54,000,000 | | | | 0.070 | (e) | | | 06/07/21 | | | | 54,000,000 | |
| | Maturity Value: $54,018,900 | |
| | Settlement Date: 02/11/21 | |
| Collateralized by Federal Home Loan Mortgage Corp., 2.000% to
4.500%, due 12/01/29 to 05/01/51, Federal National Mortgage
Association, 2.000% to 4.500%, due 02/01/26 to 05/01/58 and
Government National Mortgage Association, 4.500%, due
10/20/49. The aggregate market value of the collateral,
including accrued interest, was $55,079,998. |
|
| | |
| | Scotia Capital (USA), Inc. | |
| | 51,000,000 | | | | 0.140 | | | | 06/01/21 | | | | 51,000,720 | |
| | Maturity Value: $51,000,793 | |
| Collateralized by various corporate security issuers, 0.370% to
10.125%, due 06/23/21 to 04/22/52. The aggregate market
value of the collateral, including accrued interest, was
$53,625,419. |
|
| | 51,000,000 | | | | 0.290 | | | | 06/01/21 | | | | 51,001,570 | |
| | Maturity Value: $51,001,643 | |
| Collateralized by various corporate security issuers, 0.460% to
10.125%, due 06/23/21 to 03/01/98. The aggregate market
value of the collateral, including accrued interest, was
$53,651,873. |
|
| | |
| | Wells Fargo Securities LLC | |
| | 22,000,000 | | | | 0.140 | | | | 06/01/21 | | | | 22,000,311 | |
| | Maturity Value: $22,000,342 | |
| Collateralized by various corporate security issuers, 0.000%, due
06/01/21 to 05/12/22. The aggregate market value of the
collateral, including accrued interest, was $23,037,140. |
|
| | |
|
| Repurchase Agreements(d) – (continued) | |
| | Wells Fargo Securities LLC – (continued) | |
| 26,000,000 | | | | 0.190 | % | | | 06/02/21 | | | | 26,000,000 | |
| | Maturity Value: $26,000,961 | |
| | Settlement Date: 05/26/21 | |
| Collateralized by various corporate security issuers, 0.000%, due
06/01/21 to 05/12/22. The aggregate market value of the
collateral, including accrued interest, was $27,225,714. |
|
| | |
| | TOTAL REPURCHASE | |
| | (Cost $579,100,000) | | | $ | 579,105,771 | |
| | |
| | TOTAL INVESTMENTS – 100.7% | |
| | (Cost $3,824,624,047) | | | $ | 3,824,684,418 | |
| | |
| LIABILITIES IN EXCESS OF OTHER
ASSETS – (0.7)% |
| | | (26,511,971 | ) |
| | |
| | NET ASSETS – 100.0% | | | $ | 3,798,172,447 | |
| | |
| | |
|
| The percentage shown for each investment category reflects the value of investments in that category as a percentage of net assets. |
| |
(a) | | Variable or floating rate security. Except for floating rate notes (for which final maturity is disclosed), maturity date disclosed is the next interest reset date. Interest rate disclosed is that which is in effect on May 31, 2021. |
| |
(b) | | All or a portion represents a forward commitment. |
| |
(c) | | Rate shown is that which is in effect on May 31, 2021. Certain variable rate securities are not based on a published reference rate and spread but are determined by the issuer or agent and are based on current market conditions. |
| |
(d) | | Unless noted, all repurchase agreements were entered into on May 31, 2021. Additional information on Joint Repurchase Agreement Account III appears in the Additional Investment Information section. |
| |
(e) | | The instrument is subject to a demand feature. |
Interest rates represent either the stated coupon rate, annualized yield on date of purchase for discounted securities, or, for floating rate securities, the current reset rate, which is based upon current interest rate indices.
Maturity dates represent either the final legal maturity date on the security, the demand date for puttable securities, the date of the next interest rate reset for variable rate securities, or the prerefunded date for those types of securities.
| | |
| 24 | | The accompanying notes are an integral part of these financial statements. |
FINANCIAL SQUARE MONEY MARKET FUND
| | |
|
Investment Abbreviations: |
FHLB | | —Insured by Federal Home Loan Bank |
GNMA | | —Insured by Government National Mortgage Association |
GO | | —General Obligation |
GTY AGMT | | —Guaranty Agreement |
IDA | | —Industrial Development Agency |
IDB | | —Industrial Development Board |
LOC | | —Letter of Credit |
RB | | —Revenue Bond |
RMKT | | —Remarketed |
SPA | | —Stand-by Purchase Agreement |
T-Bill | | —Treasury Bill |
VRDN | | —Variable Rate Demand Notes |
|
| | |
| The accompanying notes are an integral part of these financial statements. | | 25 |
FINANCIAL SQUARE PRIME OBLIGATIONS FUND
Schedule of Investments
May 31, 2021 (Unaudited)
| | | | | | | | | | | | | | |
Principal
Amount | | | Interest
Rate | | | Maturity
Date | | | Value | |
|
| Commercial Paper and Corporate Obligations – 37.3% | |
| | Adventist Health System/West | |
| $ | 7,000,000 | | | | 0.132 | % | | | 08/19/21 | | | $ | 6,998,063 | |
| | Albion Capital LLC | |
| | 19,000,000 | | | | 0.101 | | | | 06/04/21 | | | | 18,999,704 | |
| | 2,839,000 | | | | 0.183 | | | | 07/27/21 | | | | 2,838,385 | |
| | Antalis | |
| | 6,192,000 | | | | 0.172 | | | | 08/11/21 | | | | 6,190,258 | |
| | 4,539,000 | | | | 0.172 | | | | 08/12/21 | | | | 4,537,697 | |
| | Apple Inc. | |
| | 10,000,000 | | | | 0.030 | | | | 06/17/21 | | | | 9,999,833 | |
| | Barclays Bank UK PLC | |
| | 5,000,000 | | | | 0.152 | | | | 07/26/21 | | | | 4,999,017 | |
| | Barclays US CCP Funding LLC | |
| | 9,000,000 | | | | 0.106 | | | | 06/14/21 | | | | 8,999,741 | |
| | 1,673,000 | | | | 0.172 | | | | 08/03/21 | | | | 1,672,517 | |
| | 4,161,000 | | | | 0.172 | | | | 08/04/21 | | | | 4,159,782 | |
| | 9,000,000 | | | | 0.157 | | | | 08/13/21 | | | | 8,996,901 | |
| | Barton Capital S.A. | |
| | 15,000,000 | | | | 0.152 | | | | 07/06/21 | | | | 14,998,603 | |
| | Bedford Row Funding Corp. | |
| | 10,000,000 | | | | 0.132 | | | | 08/04/21 | | | | 9,998,621 | |
| | BNP Paribas | |
| | 15,000,000 | | | | 0.020 | | | | 06/01/21 | | | | 14,999,933 | |
| | 5,000,000 | | | | 0.152 | | | | 07/12/21 | | | | 4,999,531 | |
| | 9,000,000 | | | | 0.152 | | | | 07/13/21 | | | | 8,999,138 | |
| | BNZ International Funding Ltd. | |
| | 15,000,000 | | | | 0.142 | | | | 07/27/21 | | | | 14,998,500 | |
| | Cancara Asset Securitisation LLC | |
| | 1,800,000 | | | | 0.147 | | | | 07/14/21 | | | | 1,799,786 | |
| | Chariot Funding LLC | |
| | 18,700,000 | | | | 0.132 | | | | 06/11/21 | | | | 18,699,564 | |
| | 5,700,000 | | | | 0.091 | | | | 07/02/21 | | | | 5,699,651 | |
| | Chesham Finance Ltd. – Series II | |
| | 15,000,000 | | | | 0.132 | | | | 06/01/21 | | | | 14,999,900 | |
| | Chesham Finance Ltd. – Series III | |
| | 10,000,000 | | | | 0.061 | | | | 06/01/21 | | | | 9,999,933 | |
| | Chesham Finance Ltd. – Series V | |
| | 10,000,000 | | | | 0.061 | | | | 06/01/21 | | | | 9,999,933 | |
| | China Construction Bank Corp. | |
| | 5,271,000 | | | | 0.243 | | | | 06/23/21 | | | | 5,270,551 | |
| | China Construction Bank Corporation | |
| | 7,000,000 | | | | 0.254 | | | | 07/09/21 | | | | 6,998,775 | |
| | Citigroup Global Markets Inc. | |
| | 13,567,000 | | | | 0.132 | | | | 08/02/21 | | | | 13,564,961 | |
| | CNPC Finance (HK) Ltd. | |
| | 28,000,000 | | | | 0.264 | | | | 06/01/21 | | | | 27,999,844 | |
| | Collateralized Commercial Paper V Co., LLC | |
| | 18,235,000 | | | | 0.183 | | | | 06/21/21 | | | | 18,234,477 | |
| | Cooeperatieve Rabobank U.A. | |
| | 25,000,000 | | | | 0.030 | | | | 06/01/21 | | | | 24,999,861 | |
| | DBS Bank Ltd. | |
| | 8,284,000 | | | | 0.142 | | | | 07/01/21 | | | | 8,283,429 | |
| | 8,023,000 | | | | 0.147 | | | | 07/09/21 | | | | 8,022,270 | |
| DZ Bank AG Deutsche Zentral-Genossenschaftsbank, Frankfurt
Am Main |
|
| | 20,000,000 | | | | 0.020 | | | | 06/01/21 | | | | 19,999,889 | |
| | |
|
| Commercial Paper and Corporate Obligations – (continued) | |
| | Federation des Caisses Desjardins du Quebec | |
| 10,000,000 | | | | 0.147 | | | | 07/02/21 | | | | 9,999,290 | |
| | First Abu Dhabi Bank P.J.S.C. | |
| | 10,939,000 | | | | 0.162 | | | | 08/02/21 | | | | 10,937,355 | |
| | 14,000,000 | | | | 0.152 | | | | 08/19/21 | | | | 13,997,160 | |
| | FMS Wertmanagement | |
| | 10,806,000 | | | | 0.142 | | | | 06/15/21 | | | | 10,805,773 | |
| | Industrial & Commercial Bank of China Ltd.-New York Branch | |
| | 7,397,000 | | | | 0.243 | | | | 06/15/21 | | | | 7,396,667 | |
| | 3,591,000 | | | | 0.243 | | | | 06/22/21 | | | | 3,590,761 | |
| | Ionic Capital II Trust | |
| | 9,394,000 | | | | 0.183 | | | | 06/09/21 | | | | 9,393,793 | |
| | 5,000,000 | | | | 0.183 | | | | 07/01/21 | | | | 4,999,608 | |
| | KfW | |
| | 10,000,000 | | | | 0.147 | | | | 06/01/21 | | | | 9,999,956 | |
| | Liberty Street Funding LLC | |
| | 10,000,000 | | | | 0.132 | | | | 08/05/21 | | | | 9,997,968 | |
| | Macquarie Bank Limited | |
| | 3,000,000 | | | | 0.152 | | | | 07/15/21 | | | | 2,999,560 | |
| | Macquarie Bank Ltd. | |
| | 15,000,000 | | | | 0.152 | | | | 07/16/21 | | | | 14,997,754 | |
| | Matchpoint Finance PLC | |
| | 6,783,000 | | | | 0.152 | | | | 07/06/21 | | | | 6,782,368 | |
| | Mizuho Bank, Ltd.-Singapore Branch | |
| | 25,000,000 | | | | 0.157 | | | | 07/26/21 | | | | 24,995,534 | |
| | Nationwide Building Society | |
| | 10,000,000 | | | | 0.061 | | | | 07/01/21 | | | | 9,999,311 | |
| | 10,000,000 | | | | 0.061 | | | | 07/02/21 | | | | 9,999,290 | |
| | Natixis-New York Branch | |
| | 15,000,000 | | | | 0.020 | | | | 06/01/21 | | | | 14,999,907 | |
| | Nederlandse Waterschapsbank N.V. | |
| | 12,000,000 | | | | 0.056 | | | | 06/25/21 | | | | 11,999,244 | |
| | 10,492,000 | | | | 0.051 | | | | 06/28/21 | | | | 10,491,268 | |
| | Nieuw Amsterdam Receivables Corp. | |
| | 8,333,000 | | | | 0.142 | | | | 06/11/21 | | | | 8,332,841 | |
| | 10,000,000 | | | | 0.132 | | | | 08/02/21 | | | | 9,998,277 | |
| | NRW.Bank | |
| | 12,000,000 | | | | 0.041 | | | | 06/21/21 | | | | 11,999,576 | |
| | Salisbury Receivables Company LLC | |
| | 9,408,000 | | | | 0.162 | | | | 06/11/21 | | | | 9,407,784 | |
| | Sumitomo Mitsui Trust Bank, Ltd.-Singapore Branch | |
| | 10,000,000 | | | | 0.091 | | | | 08/31/21 | | | | 9,997,493 | |
| | Versailles Commercial Paper LLC | |
| | 10,006,000 | | | | 0.172 | | | | 06/10/21 | | | | 10,005,830 | |
| | Victory Receivables Corp. | |
| | 21,000,000 | | | | 0.152 | | | | 07/07/21 | | | | 20,997,970 | |
| | 7,000,000 | | | | 0.091 | | | | 08/25/21 | | | | 6,998,270 | |
| | |
| TOTAL COMMERCIAL PAPER AND CORPORATE
OBLIGATIONS |
|
| | (Cost $628,062,282) | | | $ | 628,079,656 | |
| | |
| | | | | | | | | | | | | | |
|
| Certificate of Deposit – 0.9% | |
| | National Bank of Kuwait S.A.K.P | |
| $ | 15,000,000 | | | | 0.070 | % | | | 06/03/21 | | | $ | 14,999,975 | |
| | (Cost $15,000,000) | |
| | |
| | | | | | | | | | | | | | |
| | |
| 26 | | The accompanying notes are an integral part of these financial statements. |
FINANCIAL SQUARE PRIME OBLIGATIONS FUND
| | | | | | | | | | | | | | |
Principal
Amount | | | Interest
Rate | | | Maturity
Date | | | Value | |
|
| Certificates of Deposit-Yankeedollar – 4.0% | |
| | National Bank of Kuwait S.A.K.P | |
| $ | 8,359,000 | | | | 0.320 | % | | | 06/09/21 | | | $ | 8,359,627 | |
| | 4,879,000 | | | | 0.320 | | | | 06/25/21 | | | | 4,879,667 | |
| | 5,000,000 | | | | 0.300 | | | | 07/21/21 | | | | 5,000,824 | |
| | 5,372,000 | | | | 0.200 | | | | 07/26/21 | | | | 5,372,018 | |
| | Norinchukin Bank (The) | |
| | 6,000,000 | | | | 0.070 | | | | 07/02/21 | | | | 5,999,872 | |
| | 18,000,000 | | | | 0.170 | | | | 07/06/21 | | | | 18,001,501 | |
| | Sumitomo Mitsui Banking Corp. | |
| | 19,000,000 | | | | 0.080 | | | | 06/14/21 | | | | 19,000,188 | |
| | |
| | TOTAL CERTIFICATES OF DEPOSIT-YANKEEDOLLAR | |
| | (Cost $66,610,000) | | | $ | 66,613,697 | |
| | |
| | | | | | | | | | | | | | |
|
| Time Deposits – 6.9% | |
| | Credit Agricole Corporate and Investment Bank | |
| $ | 50,000,000 | | | | 0.030 | % | | | 06/01/21 | | | $ | 50,000,000 | |
| | DNB Bank ASA | |
| | 17,000,000 | | | | 0.010 | | | | 06/01/21 | | | | 17,000,000 | |
| | Nordea Bank ABP | |
| | 50,000,000 | | | | 0.020 | | | | 06/01/21 | | | | 49,999,944 | |
| | |
| | TOTAL TIME DEPOSITS | |
| | (Cost $117,000,000) | | | $ | 116,999,944 | |
| | |
| | | | | | | | | | | | | | |
|
| U.S. Government Agency Obligations – 1.0% | |
| U.S. International Development Finance Corp. (3 Mo. U.S. T-Bill
+ 0.00%) |
|
| $ | 7,356,240 | | | | 0.008 | %(a) | | | 06/07/21 | | | $ | 7,356,240 | |
| | 7,500,000 | | | | 0.090 | (a) | | | 06/07/21 | | | | 7,500,000 | |
| | 2,000,000 | | | | 0.090 | (a) | | | 08/13/27 | | | | 2,000,000 | |
| | |
| | TOTAL U.S. GOVERNMENT AGENCY OBLIGATIONS | |
| | (Cost $16,856,240) | | | $ | 16,856,240 | |
| | |
| | | | | | | | | | | | | | |
|
| U.S. Treasury Obligations – 16.2% | |
| | United States Treasury Bills | |
| $ | 15,500,000 | | | | 0.091 | % | | | 07/15/21 | | | $ | 15,500,000 | |
| | 65,000,000 | | | | 0.086 | | | | 07/29/21 | | | | 64,999,581 | |
| | 80,000,000 | | | | 0.071 | | | | 08/05/21 | | | | 79,998,122 | |
| | 37,000,000 | | | | 0.061 | | | | 08/19/21 | | | | 36,998,944 | |
| | United States Treasury Floating Rate Note | |
| | 16,500,000 | | | | 0.069 | (a) | | | 01/31/23 | | | | 16,506,093 | |
| | 40,000,000 | | | | 0.054 | (a) | | | 04/30/23 | | | | 40,001,179 | |
| | United States Treasury Notes | |
| | 890,000 | | | | 1.125 | | | | 06/30/21 | | | | 890,786 | |
| | 7,860,000 | | | | 2.625 | | | | 07/15/21 | | | | 7,884,856 | |
| | 1,800,000 | | | | 1.125 | | | | 07/31/21 | | | | 1,803,287 | |
| | 3,100,000 | | | | 2.125 | | | | 08/15/21 | | | | 3,113,499 | |
| | 3,200,000 | | | | 1.125 | | | | 08/31/21 | | | | 3,208,719 | |
| | 900,000 | | | | 1.500 | | | | 08/31/21 | | | | 903,287 | |
| | 1,600,000 | | | | 2.000 | | | | 08/31/21 | | | | 1,607,821 | |
| | |
| | TOTAL U.S. TREASURY OBLIGATIONS | |
| | (Cost $273,386,511) | | | $ | 273,416,174 | |
| | |
| | | | | | | | | | | | | | |
|
| Variable Rate Municipal Debt Obligations(b) – 10.1% | |
| Alaska Housing Finance Corp. VRDN RB Refunding for State
Capital Project Bonds II Series 2017 B |
|
| 8,000,000 | | | | 0.140 | | | | 12/01/47 | | | | 8,000,000 | |
| Alaska Housing Finance Corp. VRDN RB Refunding for State
Capital Project Bonds II Series 2017 B |
|
| | 25,000,000 | | | | 0.080 | | | | 06/07/21 | | | | 25,000,000 | |
| City of Portland, Maine GO VRDN for Taxable Pension Bonds
Series 2001 RMKT (TB Bank N.A., LOC) |
|
| | 24,800,000 | | | | 0.090 | | | | 06/01/26 | | | | 24,800,000 | |
| Colorado Housing And Finance Authority Single Family
Mortgage Bonds Class I VRDN RB 2021 Refunding Series C-2
(GNMA Collat., FHLB, SPA) |
|
| | 3,290,000 | | | | 0.080 | | | | 06/07/21 | | | | 3,290,000 | |
| Connecticut Housing Finance Authority VRDN RB Housing
Mortgage Finance Program Refunding Series 2017 Subseries
A-3 RMKT (State Street Bank & Trust Co., SPA) |
|
| | 2,000,000 | | | | 0.030 | | | | 06/07/21 | | | | 2,000,000 | |
| East Baton Rouge Parish IDB, Inc. VRDN RB for ExxonMobil
Project Gulf Opportunity Zone Bonds Series 2010 A |
|
| | 5,000,000 | | | | 0.020 | | | | 06/01/21 | | | | 5,000,000 | |
| Michigan Finance Authority VRDN RB Refunding for School
Loan Revolving Fund Series 2019 C (Bank of America N.A.,
LOC) |
|
| | 12,900,000 | | | | 0.100 | | | | 06/07/21 | | | | 12,900,000 | |
| Mississippi Business Finance Commission Gulf Opportunity Zone
VRDN RB for Chevron USA, Inc. Project Series 2009 E
RMKT (GTY AGMT – Chevron Corp.) |
|
| | 3,000,000 | | | | 0.010 | | | | 12/01/30 | | | | 3,000,000 | |
| Mississippi Business Finance Corporation Gulf Opportunity Zone
VRDN RB for Chevron USA, Inc. Project Series 2010 E (GTY
AGMT – Chevron Corp.) |
|
| | 3,000,000 | | | | 0.060 | | | | 12/01/30 | | | | 3,000,000 | |
| New York City Municipal Water Finance Authority Water &
Sewer System VRDN RB Second General Resolution
Series 2019 BB (Industrial & Commercial Bank of China,
SPA) |
|
| | 20,000,000 | | | | 0.100 | | | | 06/07/21 | | | | 20,000,000 | |
| Providence Health & Services Obligated Group VRDN RB
Series 12-E (U.S. Bank N.A., SPA) |
|
| | 31,795,000 | | | | 0.120 | | | | 06/07/21 | | | | 31,795,000 | |
| Providence St. Joseph Health Obligated Group VRDN
Series 16-G (Bank of Tokyo-Mitsubishi UFJ, LOC) |
|
| | 20,000,000 | | | | 0.100 | | | | 10/01/47 | | | | 20,000,000 | |
| State of Texas Veterans Housing Assistance Program Fund II
Series 2003 A |
|
| | 11,000,000 | | | | 0.100 | | | | 06/07/21 | | | | 11,000,000 | |
| State of Texas Veterans VRDN GO Bonds, Series 2012 B RMKT
(State Street Bank & Trust Co., SPA) |
|
| | 500,000 | | | | 0.070 | | | | 06/07/21 | | | | 500,000 | |
| | |
| TOTAL VARIABLE RATE MUNICIPAL DEBT
OBLIGATIONS |
|
| | (Cost $170,285,000) | | | $ | 170,285,000 | |
| | |
| TOTAL INVESTMENTS BEFORE REPURCHASE
AGREEMENTS |
|
| | (Cost $1,287,200,033) | | | $ | 1,287,250,686 | |
| | |
| | | | | | | | | | | | | | |
| | |
| The accompanying notes are an integral part of these financial statements. | | 27 |
FINANCIAL SQUARE PRIME OBLIGATIONS FUND
Schedule of Investments (continued)
May 31, 2021 (Unaudited)
| | | | | | | | | | | | | | |
Principal
Amount | | | Interest
Rate | | | Maturity
Date | | | Value | |
|
| Repurchase Agreements(c) – 21.6% | |
| | BNP Paribas | |
| $ | 13,000,000 | | | | 0.060 | %(d) | | | 06/07/21 | | | $ | 13,000,000 | |
| | Maturity Value: $13,003,922 | |
| | Settlement Date: 02/19/21 | |
| Collateralized by Federal Farm Credit Bank, 1.950%, due
08/13/40, Federal Home Loan Mortgage Corp. Stripped
Security, 0.000%, due 09/15/29, Federal National Mortgage
Association, 2.500% to 6.000%, due 09/01/22 to 09/01/50, U.S.
Treasury Bills, 0.000%, due 06/10/21 to 05/19/22, U.S.
Treasury Inflation-Indexed Bonds, 1.375% to 3.625%, due
04/15/28 to 02/15/44, a U.S. Treasury Inflation-Indexed Note,
0.625%, due 07/15/21, U.S. Treasury Interest-Only Stripped
Securities, 0.000%, due 08/15/27 to 02/15/48 and U.S. Treasury
Notes, 1.750% to 2.125%, due 06/30/22 to 07/15/22. The
aggregate market value of the collateral, including accrued
interest, was $13,260,050. |
|
| | 13,500,000 | | | | 0.060 | (d) | | | 06/07/21 | | | | 13,500,000 | |
| | Maturity Value: $13,504,185 | |
| | Settlement Date: 03/05/21 | |
| Collateralized by U.S. Treasury Inflation-Indexed Bonds, 1.000%
to 3.625%, due 01/15/26 to 02/15/48, a U.S. Treasury Inflation-
Indexed Note, 0.125%, due 01/15/23, U.S. Treasury Interest-
Only Stripped Securities, 0.000%, due 11/15/25 to 11/15/47
and U.S. Treasury Notes, 1.375% to 2.625%, due 09/30/21 to
02/15/29. The aggregate market value of the collateral,
including accrued interest, was $13,770,000. |
|
| | 28,000,000 | | | | 0.060 | (d) | | | 06/07/21 | | | | 28,000,000 | |
| | Maturity Value: $28,008,447 | |
| | Settlement Date: 02/19/21 | |
| Collateralized by U.S. Treasury Bills, 0.000%, due 06/03/21 to
02/24/22, a U.S. Treasury Bond, 1.375%, due 11/15/40, U.S.
Treasury Floating Rate Notes, 0.049% to 0.064%, due 01/31/23
to 04/30/23, U.S. Treasury Inflation-Indexed Bonds, 1.000% to
1.750%, due 01/15/28 to 02/15/46, U.S. Treasury Inflation-
Indexed Notes, 0.125% to 0.625%, due 07/15/21 to 01/15/23,
U.S. Treasury Interest-Only Stripped Securities, 0.000%, due
05/15/25 to 11/15/47, U.S. Treasury Notes, 1.375% to 2.625%,
due 06/30/21 to 01/31/25 and a U.S. Treasury Principal-Only
Stripped Security, 0.000%, due 02/15/44. The aggregate market
value of the collateral, including accrued interest, was
$28,560,010. |
|
| | 30,000,000 | | | | 0.060 | (d) | | | 06/07/21 | | | | 30,000,000 | |
| | Maturity Value: $30,009,300 | |
| | Settlement Date: 03/05/21 | |
| Collateralized by Federal Home Loan Mortgage Corp., 3.000%,
due 03/01/43, Federal National Mortgage Association, 4.000%,
due 03/01/38, U.S. Treasury Bonds, 2.875% to 3.000%, due
05/15/43 to 02/15/49, a U.S. Treasury Inflation-Indexed Note,
0.250%, due 07/15/29, U.S. Treasury Interest-Only Stripped
Securities, 0.000%, due 02/15/26 to 05/15/48 and U.S. Treasury
Notes, 0.250% to 1.500%, due 05/31/21 to 08/31/25. The
aggregate market value of the collateral, including accrued
interest, was $30,600,951. |
|
| | |
|
| Repurchase Agreements(c) – (continued) | |
| | Canadian Imperial Bank of Commerce | |
| 7,000,000 | | | | 0.090 | %(d) | | | 06/07/21 | | | | 7,000,000 | |
| | Maturity Value: $7,003,150 | |
| | Settlement Date: 01/29/21 | |
| Collateralized by Federal Home Loan Mortgage Corp., 2.000% to
4.000%, due 11/01/32 to 05/01/51, Federal National Mortgage
Association, 2.000% to 4.500%, due 10/01/32 to 01/01/51,
Government National Mortgage Association, 2.000% to
4.500%, due 09/20/48 to 02/20/51 and a U.S. Treasury Note,
0.125%, due 12/31/22. The aggregate market value of the
collateral, including accrued interest, was $7,209,979. |
|
| | 7,500,000 | | | | 0.090 | (d) | | | 06/07/21 | | | | 7,500,000 | |
| | Maturity Value: $7,503,375 | |
| | Settlement Date: 01/28/21 | |
| Collateralized by Federal Home Loan Mortgage Corp., 2.000% to
4.000%, due 04/01/29 to 03/01/51, Federal National Mortgage
Association, 2.000% to 4.500%, due 04/01/29 to 01/01/59,
Government National Mortgage Association, 3.000% to
4.500%, due 06/15/46 to 11/20/50 and a U.S. Treasury Note,
0.125%, due 12/31/22. The aggregate market value of the
collateral, including accrued interest, was $7,724,910. |
|
| | |
| | ING Financial Markets LLC | |
| | 9,000,000 | | | | 0.180 | | | | 06/01/21 | | | | 9,000,167 | |
| | Maturity Value: $9,000,180 | |
| Collateralized by Federal Home Loan Mortgage Corp., 2.000%,
due 05/01/51 and various corporate security issuers, 0.350% to
8.000%, due 09/15/21 to 03/22/61. The aggregate market value
of the collateral, including accrued interest, was $9,607,361. |
|
| | |
| | Joint Account III | |
| | 30,000,000 | | | | 0.013 | | | | 06/01/21 | | | | 29,999,998 | |
| | Maturity Value: $30,000,042 | |
| | |
| | MUFG Securities Americas Inc. | |
| | 30,000,000 | | | | 0.210 | | | | 06/01/21 | | | | 30,000,657 | |
| | Maturity Value: $30,000,700 | |
| Collateralized by various corporate security issuers, 0.000% to
3.750%, due 08/15/22 to 07/01/27 and various equity securities.
The aggregate market value of the collateral, including accrued
interest, was $32,650,191. |
|
| | |
| | Royal Bank of Canada | |
| | 3,100,000 | | | | 0.070 | (d) | | | 06/07/21 | | | | 3,100,000 | |
| | Maturity Value: $3,101,091 | |
| | Settlement Date: 03/02/21 | |
| Collateralized by Federal Home Loan Mortgage Corp., 2.000% to
4.500%, due 12/01/29 to 05/01/51, Federal National Mortgage
Association, 2.000% to 3.500%, due 09/01/40 to 05/01/51 and
Government National Mortgage Association, 4.500%, due
10/20/49. The aggregate market value of the collateral,
including accrued interest, was $3,161,999. |
|
| | 14,000,000 | | | | 0.070 | (d) | | | 06/07/21 | | | | 14,000,000 | |
| | Maturity Value: $14,004,954 | |
| | Settlement Date: 02/08/21 | |
| Collateralized by Federal Home Loan Mortgage Corp., 2.000% to
4.500%, due 12/01/29 to 05/01/51, Federal National Mortgage
Association, 2.000% to 4.000%, due 09/01/40 to 05/01/58 and
Government National Mortgage Association, 4.500%, due
10/20/49. The aggregate market value of the collateral,
including accrued interest, was $14,280,001. |
��
|
| | |
| | |
| 28 | | The accompanying notes are an integral part of these financial statements. |
FINANCIAL SQUARE PRIME OBLIGATIONS FUND
| | | | | | | | | | | | | | |
Principal
Amount | | | Interest
Rate | | | Maturity
Date | | | Value | |
|
| Repurchase Agreements(c) – (continued) | |
| | Royal Bank of Canada – (continued) | |
| $ | 14,000,000 | | | | 0.070 | %(d) | | | 06/07/21 | | | $ | 14,000,000 | |
| | Maturity Value: $14,004,927 | |
| | Settlement Date: 02/09/21 | |
| Collateralized by Federal Home Loan Mortgage Corp., 2.000% to
4.500%, due 12/01/29 to 05/01/51, Federal National Mortgage
Association, 2.000% to 4.000%, due 09/01/40 to 05/01/58 and
Government National Mortgage Association, 4.500%, due
10/20/49. The aggregate market value of the collateral,
including accrued interest, was $14,280,000. |
|
| | 23,000,000 | | | | 0.070 | (d) | | | 06/07/21 | | | | 23,000,000 | |
| | Maturity Value: $23,008,005 | |
| | Settlement Date: 02/11/21 | |
| Collateralized by Federal Home Loan Mortgage Corp., 2.000% to
4.500%, due 12/01/29 to 05/01/51, Federal National Mortgage
Association, 2.000% to 4.000%, due 09/01/40 to 05/01/58 and
Government National Mortgage Association, 4.500%, due
10/20/49. The aggregate market value of the collateral,
including accrued interest, was $23,460,000. |
|
| | 51,000,000 | | | | 0.070 | (d) | | | 06/07/21 | | | | 51,000,000 | |
| | Maturity Value: $51,017,850 | |
| | Settlement Date: 02/11/21 | |
| Collateralized by Federal Home Loan Mortgage Corp., 2.000% to
4.500%, due 12/01/29 to 05/01/51, Federal National Mortgage
Association, 2.000% to 4.500%, due 09/01/40 to 05/01/58 and
Government National Mortgage Association, 4.500%, due
10/20/49. The aggregate market value of the collateral,
including accrued interest, was $52,020,002. |
|
| | |
| | Scotia Capital (USA), Inc. | |
| | 25,000,000 | | | | 0.140 | | | | 06/01/21 | | | | 25,000,353 | |
| | Maturity Value: $25,000,389 | |
| Collateralized by various corporate security issuers, 0.000%, due
06/01/21 to 05/12/22. The aggregate market value of the
collateral, including accrued interest, was $26,249,998. |
|
| | 25,000,000 | | | | 0.290 | | | | 06/01/21 | | | | 25,000,770 | |
| | Maturity Value: $25,000,806 | |
| Collateralized by various corporate security issuers, 0.333% to
10.125%, due 06/23/21 to 11/15/28. The aggregate market
value of the collateral, including accrued interest, was
$26,290,965. |
|
| | |
| | Wells Fargo Securities LLC | |
| | 16,000,000 | | | | 0.140 | | | | 06/01/21 | | | | 16,000,226 | |
| | Maturity Value: $16,000,249 | |
| Collateralized by various corporate security issuers, 0.000%, due
06/01/21 to 05/12/22. The aggregate market value of the
collateral, including accrued interest, was $16,776,470. |
|
| | 25,000,000 | | | | 0.190 | | | | 06/02/21 | | | | 25,000,000 | |
| | Maturity Value: $25,000,924 | |
| | Settlement Date: 05/26/21 | |
| Collateralized by various corporate security issuers, 0.000%, due
06/01/21 to 05/12/22. The aggregate market value of the
collateral, including accrued interest, was $26,249,998. |
|
| | |
| | TOTAL REPURCHASE AGREEMENTS | | | | | |
| | (Cost $364,100,000) | | | $ | 364,102,171 | |
| | |
| | TOTAL INVESTMENTS – 98.0% | | | | | |
| | (Cost $1,651,300,033) | | | $ | 1,651,352,857 | |
| | |
| OTHER ASSETS IN EXCESS OF
LIABILITIES – 2.0% |
| | | 34,163,826 | |
| | |
| | NET ASSETS – 100.0% | | | $ | 1,685,516,683 | |
| | |
| | |
|
| The percentage shown for each investment category reflects the value of investments in that category as a percentage of net assets. |
| |
(a) | | Variable or floating rate security. Except for floating rate notes (for which final maturity is disclosed), maturity date disclosed is the next interest reset date. Interest rate disclosed is that which is in effect on May 31, 2021. |
| |
(b) | | Rate shown is that which is in effect on May 31, 2021. Certain variable rate securities are not based on a published reference rate and spread but are determined by the issuer or agent and are based on current market conditions. |
| |
(c) | | Unless noted, all repurchase agreements were entered into on May 31, 2021. Additional information on Joint Repurchase Agreement Account III appears in the Additional Investment Information section. |
| |
(d) | | The instrument is subject to a demand feature. |
Interest rates represent either the stated coupon rate, annualized yield on date of purchase for discounted securities, or, for floating rate securities, the current reset rate, which is based upon current interest rate indices.
Maturity dates represent either the final legal maturity date on the security, the demand date for puttable securities, the date of the next interest rate reset for variable rate securities, or the prerefunded date for those types of securities.
| | |
|
Investment Abbreviations: |
FHLB | | —Insured by Federal Home Loan Bank |
GNMA | | —Insured by Government National Mortgage Association |
GO | | —General Obligation |
GTY AGMT | | —Guaranty Agreement |
IDB | | —Industrial Development Board |
LOC | | —Letter of Credit |
RB | | —Revenue Bond |
RMKT | | —Remarketed |
SPA | | —Stand-by Purchase Agreement |
T-Bill | | —Treasury Bill |
VRDN | | —Variable Rate Demand Notes |
|
| | |
| The accompanying notes are an integral part of these financial statements. | | 29 |
FINANCIAL SQUARE TREASURY INSTRUMENTS FUND
Schedule of Investments
May 31, 2021 (Unaudited)
| | | | | | | | | | | | | | |
Principal Amount | | | Interest Rate | | | Maturity Date | | | Amortized Cost | |
|
| U.S. Treasury Obligations – 104.8% | |
| | United States Treasury Bills | |
| $ | 165,000,000 | | | | 0.005 | % | | | 06/01/21 | | | $ | 165,000,000 | |
| | 1,274,300,000 | | | | 0.005 | | | | 06/01/21 | | | | 1,274,300,000 | |
| | 12,000,000 | | | | 0.001 | | | | 06/03/21 | | | | 12,000,000 | |
| | 163,000,000 | | | | 0.001 | | | | 06/03/21 | | | | 162,999,932 | |
| | 202,055,000 | | | | 0.001 | | | | 06/03/21 | | | | 202,054,326 | |
| | 220,000,000 | | | | 0.001 | | | | 06/03/21 | | | | 219,999,963 | |
| | 550,000,000 | | | | 0.001 | | | | 06/03/21 | | | | 549,999,786 | |
| | 770,111,000 | | | | 0.001 | | | | 06/03/21 | | | | 770,110,786 | |
| | 1,110,000,000 | | | | 0.001 | | | | 06/03/21 | | | | 1,109,994,450 | |
| | 2,182,000,000 | | | | 0.001 | | | | 06/03/21 | | | | 2,181,998,788 | |
| | 65,000,000 | | | | 0.010 | | | | 06/08/21 | | | | 65,000,000 | |
| | 85,000,000 | | | | 0.010 | | | | 06/08/21 | | | | 85,000,000 | |
| | 140,000,000 | | | | 0.010 | | | | 06/08/21 | | | | 140,000,000 | |
| | 187,500,000 | | | | 0.010 | | | | 06/08/21 | | | | 187,500,000 | |
| | 220,000,000 | | | | 0.010 | | | | 06/08/21 | | | | 219,999,872 | |
| | 3,000,000,000 | | | | 0.010 | | | | 06/08/21 | | | | 2,999,994,165 | |
| | 15,000,000 | | | | 0.091 | | | | 06/10/21 | | | | 15,000,000 | |
| | 16,000,000 | | | | 0.091 | | | | 06/10/21 | | | | 16,000,000 | |
| | 27,000,000 | | | | 0.091 | | | | 06/10/21 | | | | 26,999,993 | |
| | 88,000,000 | | | | 0.091 | | | | 06/10/21 | | | | 88,000,000 | |
| | 150,000,000 | | | | 0.091 | | | | 06/10/21 | | | | 150,000,000 | |
| | 157,500,000 | | | | 0.091 | | | | 06/10/21 | | | | 157,500,000 | |
| | 320,000,000 | | | | 0.091 | | | | 06/10/21 | | | | 319,999,800 | |
| | 371,600,000 | | | | 0.091 | | | | 06/10/21 | | | | 371,596,284 | |
| | 1,100,000,000 | | | | 0.091 | | | | 06/10/21 | | | | 1,099,998,625 | |
| | 1,150,000,000 | | | | 0.091 | | | | 06/10/21 | | | | 1,149,974,125 | |
| | 75,000,000 | | | | 0.091 | | | | 06/15/21 | | | | 75,000,000 | |
| | 650,000,000 | | | | 0.091 | | | | 06/15/21 | | | | 649,977,250 | |
| | 725,000,000 | | | | 0.091 | | | | 06/15/21 | | | | 724,999,718 | |
| | 992,000,000 | | | | 0.091 | | | | 06/15/21 | | | | 991,998,896 | |
| | 6,321,900,000 | | | | 0.091 | | | | 06/15/21 | | | | 6,321,900,000 | |
| | 6,000,000 | | | | 0.086 | | | | 06/17/21 | | | | 6,000,000 | |
| | 15,000,000 | | | | 0.086 | | | | 06/17/21 | | | | 15,000,000 | |
| | 44,000,000 | | | | 0.086 | | | | 06/17/21 | | | | 44,000,000 | |
| | 65,000,000 | | | | 0.086 | | | | 06/17/21 | | | | 65,000,000 | |
| | 75,000,000 | | | | 0.086 | | | | 06/17/21 | | | | 75,000,000 | |
| | 215,000,000 | | | | 0.086 | | | | 06/17/21 | | | | 214,999,761 | |
| | 215,000,000 | | | | 0.086 | | | | 06/17/21 | | | | 215,000,000 | |
| | 1,150,000,000 | | | | 0.086 | | | | 06/17/21 | | | | 1,149,956,556 | |
| | 37,500,000 | | | | 0.091 | | | | 06/22/21 | | | | 37,500,000 | |
| | 187,500,000 | | | | 0.091 | | | | 06/22/21 | | | | 187,500,000 | |
| | 187,500,000 | | | | 0.091 | | | | 06/22/21 | | | | 187,500,000 | |
| | 206,900,000 | | | | 0.091 | | | | 06/22/21 | | | | 206,899,397 | |
| | 375,000,000 | | | | 0.091 | | | | 06/22/21 | | | | 375,000,000 | |
| | 1,081,000,000 | | | | 0.091 | | | | 06/22/21 | | | | 1,080,943,247 | |
| | 3,747,600,000 | | | | 0.091 | | | | 06/22/21 | | | | 3,747,600,000 | |
| | 75,000,000 | | | | 0.015 | | | | 06/24/21 | | | | 75,000,000 | |
| | 130,000,000 | | | | 0.015 | | | | 06/24/21 | | | | 130,000,000 | |
| | 485,000,000 | | | | 0.015 | (a) | | | 06/24/21 | | | | 484,999,225 | |
| | 1,350,000,000 | | | | 0.015 | | | | 06/24/21 | | | | 1,349,922,375 | |
| | 1,635,000,000 | | | | 0.015 | | | | 06/24/21 | | | | 1,634,994,777 | |
| | 78,100,000 | | | | 0.091 | | | | 06/29/21 | | | | 78,100,000 | |
| | 300,000,000 | | | | 0.091 | (a) | | | 06/29/21 | | | | 299,989,500 | |
| | 900,000,000 | | | | 0.091 | (a) | | | 06/29/21 | | | | 899,937,000 | |
| | 4,428,820,000 | | | | 0.091 | | | | 06/29/21 | | | | 4,428,820,000 | |
| | 145,000,000 | | | | 0.101 | | | | 07/01/21 | | | | 144,999,879 | |
| | |
|
| U.S. Treasury Obligations – (continued) | |
| | United States Treasury Bills – (continued) | |
| 380,000,000 | | | | 0.101 | | | | 07/01/21 | | | | 379,999,208 | |
| | 400,000,000 | | | | 0.101 | | | | 07/01/21 | | | | 399,999,333 | |
| | 914,750,000 | | | | 0.101 | | | | 07/01/21 | | | | 914,746,189 | |
| | 1,250,000,000 | | | | 0.101 | | | | 07/01/21 | | | | 1,249,895,832 | |
| | 1,000,000,000 | | | | 0.051 | | | | 07/06/21 | | | | 999,951,389 | |
| | 1,500,000,000 | | | | 0.091 | | | | 07/08/21 | | | | 1,499,861,250 | |
| | 2,702,000,000 | | | | 0.091 | | | | 07/08/21 | | | | 2,701,986,115 | |
| | 466,376,000 | | | | 0.056 | | | | 07/13/21 | | | | 466,346,074 | |
| | 1,000,000,000 | | | | 0.056 | | | | 07/13/21 | | | | 999,941,667 | |
| | 1,100,000,000 | | | | 0.091 | | | | 07/15/21 | | | | 1,099,879,000 | |
| | 253,400,000 | | | | 0.056 | | | | 07/20/21 | | | | 253,381,030 | |
| | 1,050,000,000 | | | | 0.056 | | | | 07/20/21 | | | | 1,049,942,833 | |
| | 935,000,000 | | | | 0.096 | | | | 07/22/21 | | | | 934,874,164 | |
| | 1,150,000,000 | | | | 0.030 | | | | 07/27/21 | | | | 1,149,946,333 | |
| | 2,000,000,000 | | | | 0.086 | | | | 07/29/21 | | | | 1,999,726,112 | |
| | 1,500,000,000 | | | | 0.030 | | | | 08/03/21 | | | | 1,499,921,250 | |
| | 1,000,000,000 | | | | 0.071 | | | | 08/05/21 | | | | 999,873,611 | |
| | 1,000,700,000 | | | | 0.025 | | | | 08/10/21 | | | | 1,000,651,355 | |
| | 326,500,000 | | | | 0.051 | | | | 08/12/21 | | | | 326,467,350 | |
| | 43,500,000 | | | | 0.061 | | | | 08/19/21 | | | | 43,499,045 | |
| | 1,500,000,000 | | | | 0.061 | | | | 08/19/21 | | | | 1,499,802,502 | |
| | 2,048,600,000 | | | | 0.061 | | | | 08/19/21 | | | | 2,048,532,561 | |
| | 500,000,000 | | | | 0.046 | | | | 08/26/21 | | | | 499,946,250 | |
| | 225,000,000 | | | | 0.061 | | | | 09/02/21 | | | | 224,965,125 | |
| | 1,569,400,000 | | | | 0.061 | | | | 09/09/21 | | | | 1,569,138,436 | |
| | 65,600,000 | | | | 0.010 | | | | 09/14/21 | | | | 65,598,087 | |
| | 1,179,200,000 | | | | 0.056 | | | | 09/16/21 | | | | 1,179,007,230 | |
| | 73,400,000 | | | | 0.015 | | | | 09/21/21 | | | | 73,396,575 | |
| | 2,355,400,000 | | | | 0.041 | | | | 09/23/21 | | | | 2,355,101,653 | |
| | 1,500,000,000 | | | | 0.041 | | | | 09/30/21 | | | | 1,499,798,336 | |
| | 2,000,000,000 | | | | 0.035 | | | | 10/07/21 | | | | 1,999,751,117 | |
| | 2,550,000,000 | | | | 0.035 | | | | 10/28/21 | | | | 2,549,630,613 | |
| | 2,436,300,000 | | | | 0.035 | | | | 11/12/21 | | | | 2,435,911,538 | |
| | 168,500,000 | | | | 0.030 | | | | 11/18/21 | | | | 168,480,108 | |
| | 337,000,000 | | | | 0.030 | | | | 11/18/21 | | | | 336,959,022 | |
| | 667,100,000 | | | | 0.030 | | | | 11/18/21 | | | | 667,005,493 | |
| United States Treasury Floating Rate Note (3 Mo. U.S. T-Bill
MMY + 0.03%) |
|
| | 2,135,000,000 | | | | 0.054 | (b) | | | 04/30/23 | | | | 2,135,069,768 | |
| United States Treasury Floating Rate Note (3 Mo. U.S. T-Bill
MMY + 0.05%) |
|
| | 1,150,000,000 | | | | 0.069 | (b) | | | 01/31/23 | | | | 1,150,221,476 | |
| United States Treasury Floating Rate Note (3 Mo. U.S. T-Bill
MMY + 0.06%) |
|
| | 2,182,200,000 | | | | 0.075 | (a) (b) | | | 07/31/22 | | | | 2,183,009,754 | |
| | 595,900,000 | | | | 0.075 | (b) | | | 10/31/22 | | | | 596,131,165 | |
| United States Treasury Floating Rate Note (3 Mo. U.S. T-Bill
MMY + 0.11%) |
|
| | 1,416,700,000 | | | | 0.134 | (b) | | | 04/30/22 | | | | 1,417,951,230 | |
| United States Treasury Floating Rate Note (3 Mo. U.S. T-Bill
MMY + 0.15%) |
|
| | 1,868,825,000 | | | | 0.169 | (b) | | | 01/31/22 | | | | 1,868,888,402 | |
| United States Treasury Floating Rate Note (3 Mo. U.S. T-Bill
MMY + 0.22%) |
|
| | 8,728,300,000 | | | | 0.235 | (b) | | | 07/31/21 | | | | 8,729,868,880 | |
| United States Treasury Floating Rate Note (3 Mo. U.S. T-Bill
MMY + 0.30%) |
|
| | 2,410,500,000 | | | | 0.315 | (b) | | | 10/31/21 | | | | 2,411,689,439 | |
| | |
| | |
| 30 | | The accompanying notes are an integral part of these financial statements. |
FINANCIAL SQUARE TREASURY INSTRUMENTS FUND
| | | | | | | | | | | | | | |
Principal Amount | | | Interest Rate | | | Maturity Date | | | Amortized Cost | |
|
| U.S. Treasury Obligations – (continued) | |
| | United States Treasury Notes | |
| $ | 58,520,000 | | | | 1.125 | % | | | 06/30/21 | | | $ | 58,570,523 | |
| | 38,000,000 | | | | 2.125 | | | | 06/30/21 | | | | 38,061,773 | |
| | 210,890,000 | | | | 2.625 | | | | 07/15/21 | | | | 211,535,333 | |
| | 49,000,000 | | | | 1.125 | | | | 07/31/21 | | | | 49,082,714 | |
| | 54,200,000 | | | | 2.125 | | | | 08/15/21 | | | | 54,427,475 | |
| | 90,800,000 | | | | 1.125 | | | | 08/31/21 | | | | 91,030,260 | |
| | 23,900,000 | | | | 1.500 | | | | 08/31/21 | | | | 23,982,873 | |
| | 47,600,000 | | | | 2.000 | | | | 08/31/21 | | | | 47,824,967 | |
| | 147,100,000 | | | | 1.125 | | | | 09/30/21 | | | | 147,633,220 | |
| | 11,600,000 | | | | 1.500 | | | | 09/30/21 | | | | 11,654,828 | |
| | 84,300,000 | | | | 1.250 | | | | 10/31/21 | | | | 84,712,930 | |
| | 43,600,000 | | | | 2.875 | | | | 11/15/21 | | | | 44,156,826 | |
| | 106,650,000 | | | | 8.000 | | | | 11/15/21 | | | | 110,509,912 | |
| | 58,000,000 | | | | 1.500 | | | | 11/30/21 | | | | 58,411,930 | |
| | 7,900,000 | | | | 1.750 | | | | 11/30/21 | | | | 7,965,864 | |
| | 94,100,000 | | | | 2.625 | | | | 12/15/21 | | | | 95,393,023 | |
| | 147,800,000 | | | | 2.000 | | | | 12/31/21 | | | | 149,459,784 | |
| | 60,200,000 | | | | 2.125 | | | | 12/31/21 | | | | 60,920,114 | |
| | 7,163,000 | | | | 2.500 | | | | 01/15/22 | | | | 7,270,990 | |
| | 5,800,000 | | | | 1.500 | | | | 01/31/22 | | | | 5,854,877 | |
| | 11,600,000 | | | | 1.875 | | | | 01/31/22 | | | | 11,738,772 | |
| | |
| | TOTAL INVESTMENTS – 104.8% | | | $ | 100,646,501,364 | |
| | |
| LIABILITIES IN EXCESS OF
OTHER ASSETS – (4.8)% |
| | | (4,611,872,169 | ) |
| | |
| | NET ASSETS – 100.0% | | | $ | 96,034,629,195 | |
| | |
| | |
|
| The percentage shown for each investment category reflects the value of investments in that category as a percentage of net assets. |
| |
(a) | | All or a portion represents a forward commitment. |
| |
(b) | | Variable or floating rate security. Except for floating rate notes (for which final maturity is disclosed), maturity date disclosed is the next interest reset date. Interest rate disclosed is that which is in effect on May 31, 2021. |
Interest rates represent either the stated coupon rate, annualized yield on date of purchase for discounted securities, or, for floating rate securities, the current reset rate, which is based upon interest rate indices.
Maturity dates represent either the final legal maturity date on the security, the demand date for puttable securities, the date of the next interest rate reset for variable rate securities, or the prerefunded date for those types of securities.
| | |
|
Investment Abbreviations: |
MMY | | —Money Market Yield |
T-Bill | | —Treasury Bill |
|
| | |
| The accompanying notes are an integral part of these financial statements. | | 31 |
FINANCIAL SQUARE TREASURY OBLIGATIONS FUND
Schedule of Investments
May 31, 2021 (Unaudited)
| | | | | | | | | | | | | | |
Principal
Amount | | | Interest
Rate | | | Maturity
Date | | | Amortized
Cost | |
|
| U.S. Treasury Obligations – 50.2% | |
| | United States Treasury Bills | |
| $ | 132,100,000 | | | | 0.001 | % | | | 06/01/21 | | | $ | 132,100,000 | |
| | 26,800,000 | | | | 0.005 | | | | 06/01/21 | | | | 26,800,000 | |
| | 85,000,000 | | | | 0.005 | | | | 06/01/21 | | | | 85,000,000 | |
| | 99,300,000 | | | | 0.005 | | | | 06/01/21 | | | | 99,300,000 | |
| | 200,000,000 | | | | 0.005 | | | | 06/01/21 | | | | 200,000,000 | |
| | 200,000,000 | | | | 0.005 | | | | 06/01/21 | | | | 200,000,000 | |
| | 27,500,000 | | | | 0.001 | | | | 06/03/21 | | | | 27,499,998 | |
| | 47,200,000 | | | | 0.001 | | | | 06/03/21 | | | | 47,200,000 | |
| | 132,800,000 | | | | 0.003 | | | | 06/03/21 | | | | 132,799,982 | |
| | 50,000,000 | | | | 0.010 | | | | 06/03/21 | | | | 49,999,972 | |
| | 456,562,500 | | | | 0.091 | | | | 06/03/21 | | | | 456,560,217 | |
| | 11,800,000 | | | | 0.001 | | | | 06/10/21 | | | | 11,799,997 | |
| | 569,500,000 | | | | 0.091 | | | | 06/10/21 | | | | 569,487,186 | |
| | 223,700,000 | | | | 0.086 | | | | 06/17/21 | | | | 223,691,549 | |
| | 500,000,000 | | | | 0.003 | (a) | | | 06/29/21 | | | | 499,999,028 | |
| | 269,400,000 | | | | 0.081 | | | | 07/06/21 | | | | 269,379,047 | |
| | 162,105,000 | | | | 0.041 | | | | 07/20/21 | | | | 162,096,174 | |
| | 768,600,000 | | | | 0.056 | | | | 07/20/21 | | | | 768,542,462 | |
| | 365,400,000 | | | | 0.096 | | | | 07/22/21 | | | | 365,350,823 | |
| | 1,353,100,000 | | | | 0.030 | | | | 07/27/21 | | | | 1,353,036,855 | |
| | 731,100,000 | | | | 0.086 | | | | 07/29/21 | | | | 730,999,880 | |
| | 279,200,000 | | | | 0.071 | | | | 08/05/21 | | | | 279,164,712 | |
| | 152,888,000 | | | | 0.025 | | | | 08/10/21 | | | | 152,880,568 | |
| | 500,000,000 | | | | 0.061 | | | | 08/19/21 | | | | 499,934,167 | |
| | 599,900,000 | | | | 0.061 | | | | 09/09/21 | | | | 599,800,018 | |
| | 25,100,000 | | | | 0.010 | | | | 09/14/21 | | | | 25,099,268 | |
| | 424,100,000 | | | | 0.056 | | | | 09/16/21 | | | | 424,030,670 | |
| | 26,700,000 | | | | 0.015 | | | | 09/21/21 | | | | 26,698,754 | |
| | 262,900,000 | | | | 0.041 | | | | 09/30/21 | | | | 262,864,655 | |
| | 113,100,000 | | | | 0.035 | | | | 10/07/21 | | | | 113,085,926 | |
| | 1,000,000,000 | | | | 0.035 | | | | 10/28/21 | | | | 999,855,143 | |
| | 707,100,000 | | | | 0.035 | | | | 11/12/21 | | | | 706,987,255 | |
| | 48,800,000 | | | | 0.025 | | | | 11/18/21 | | | | 48,794,239 | |
| | 97,600,000 | | | | 0.026 | | | | 11/18/21 | | | | 97,588,132 | |
| | 41,500,000 | | | | 0.030 | | | | 11/18/21 | | | | 41,494,121 | |
| United States Treasury Floating Rate Note (3 Mo. U.S. T-Bill
MMY + 0.03%) |
|
| | 1,385,000,000 | | | | 0.054 | (b) | | | 04/30/23 | | | | 1,385,065,892 | |
| United States Treasury Floating Rate Note (3 Mo. U.S. T-Bill
MMY + 0.05%) |
|
| | 761,800,000 | | | | 0.069 | (b) | | | 01/31/23 | | | | 761,936,048 | |
| United States Treasury Floating Rate Note (3 Mo. U.S. T-Bill
MMY + 0.06%) |
|
| | 194,500,000 | | | | 0.075 | (b) | | | 07/31/22 | | | | 194,560,913 | |
| | 145,500,000 | | | | 0.075 | (b) | | | 10/31/22 | | | | 145,556,063 | |
| United States Treasury Floating Rate Note (3 Mo. U.S. T-Bill
MMY + 0.15%) |
|
| | 674,275,000 | | | | 0.169 | (b) | | | 01/31/22 | | | | 674,266,739 | |
| United States Treasury Floating Rate Note (3 Mo. U.S. T-Bill
MMY + 0.22%) |
|
| | 948,600,000 | | | | 0.235 | (b) | | | 07/31/21 | | | | 948,706,791 | |
| United States Treasury Floating Rate Note (3 Mo. U.S. T-Bill
MMY + 0.30%) |
|
| | 1,850,200,000 | | | | 0.315 | (b) | | | 10/31/21 | | | | 1,851,673,183 | |
| | United States Treasury Notes | |
| | 63,580,000 | | | | 1.125 | (a) | | | 06/30/21 | | | | 63,634,535 | |
| | 23,600,000 | | | | 2.125 | | | | 06/30/21 | | | | 23,638,365 | |
| | 108,240,000 | | | | 2.625 | | | | 07/15/21 | | | | 108,571,238 | |
| | |
|
| U.S. Treasury Obligations – (continued) | |
| | United States Treasury Notes – (continued) | |
| 24,300,000 | | | | 1.125 | | | | 07/31/21 | | | | 24,341,020 | |
| | 29,000,000 | | | | 2.125 | | | | 08/15/21 | | | | 29,121,711 | |
| | 45,900,000 | | | | 1.125 | | | | 08/31/21 | | | | 46,016,398 | |
| | 12,100,000 | | | | 1.500 | | | | 08/31/21 | | | | 12,141,957 | |
| | 27,100,000 | | | | 2.000 | | | | 08/31/21 | | | | 27,228,094 | |
| | 5,800,000 | | | | 1.500 | | | | 09/30/21 | | | | 5,827,414 | |
| | 88,300,000 | | | | 1.250 | | | | 10/31/21 | | | | 88,733,168 | |
| | 21,600,000 | | | | 2.875 | | | | 11/15/21 | | | | 21,875,859 | |
| | 45,750,000 | | | | 8.000 | | | | 11/15/21 | | | | 47,405,799 | |
| | 28,800,000 | | | | 1.500 | | | | 11/30/21 | | | | 29,004,544 | |
| | 3,900,000 | | | | 1.750 | | | | 11/30/21 | | | | 3,932,515 | |
| | 46,800,000 | | | | 2.625 | | | | 12/15/21 | | | | 47,443,078 | |
| | 73,600,000 | | | | 2.000 | | | | 12/31/21 | | | | 74,426,523 | |
| | 30,000,000 | | | | 2.125 | | | | 12/31/21 | | | | 30,358,861 | |
| | 3,560,000 | | | | 2.500 | | | | 01/15/22 | | | | 3,613,671 | |
| | 2,900,000 | | | | 1.500 | | | | 01/31/22 | | | | 2,927,438 | |
| | 5,800,000 | | | | 1.875 | | | | 01/31/22 | | | | 5,869,386 | |
| | |
| TOTAL INVESTMENTS BEFORE
REPURCHASE AGREEMENTS |
| | $ | 17,347,798,001 | |
| | |
| | | | | | | | | | | | | | |
|
| Repurchase Agreements(c) – 50.7% | |
| | Bank of Montreal | |
| $ | 107,000,000 | | | | 0.110 | %(d) | | | 06/07/21 | | | $ | 107,000,000 | |
| | Maturity Value: $107,059,178 | |
| | Settlement Date: 01/07/21 | |
| Collateralized by a U.S. Treasury Bill, 0.000%, due 02/24/22,
U.S. Treasury Bonds, 1.375% to 3.125%, due 02/15/41 to
05/15/51, U.S. Treasury Inflation-Indexed Bonds, 0.750% to
2.125%, due 02/15/41 to 02/15/48, a U.S. Treasury Interest-
Only Stripped Security, 0.000%, due 02/15/29 and U.S.
Treasury Notes, 0.125% to 2.750%, due 10/31/21 to 11/15/30.
The aggregate market value of the collateral, including accrued
interest, was $109,140,006. |
|
| | |
| | Barclays Bank PLC | |
| | 200,000,000 | | | | 0.010 | | | | 06/01/21 | | | | 200,000,000 | |
| | Maturity Value: $200,000,222 | |
| Collateralized by a U.S. Treasury Bill, 0.000%, due 05/19/22 and
a U.S. Treasury Bond, 1.875%, due 02/15/41. The aggregate
market value of the collateral, including accrued interest, was
$204,000,314. |
|
| | |
| | BNP Paribas | |
| | 205,000,000 | | | | 0.060 | (d) | | | 06/01/21 | | | | 205,000,000 | |
| | Maturity Value: $205,063,552 | |
| | Settlement Date: 03/05/21 | |
| Collateralized by U.S. Treasury Bills, 0.000%, due 06/10/21 to
12/30/21, U.S. Treasury Bonds, 2.875% to 8.000%, due
11/15/21 to 11/15/48, U.S. Treasury Inflation-Indexed Bonds,
1.375% to 2.000%, due 01/15/26 to 02/15/44, a U.S. Treasury
Inflation-Indexed Note, 0.375%, due 07/15/23, U.S. Treasury
Interest-Only Stripped Securities, 0.000%, due 02/15/27 to
02/15/48, U.S. Treasury Notes, 0.250% to 2.625%, due
03/31/22 to 02/15/31 and a U.S. Treasury Principal-Only
Stripped Security, 0.000%, due 05/15/40. The aggregate market
value of the collateral, including accrued interest, was
$209,099,999. |
|
| | |
| | |
| 32 | | The accompanying notes are an integral part of these financial statements. |
FINANCIAL SQUARE TREASURY OBLIGATIONS FUND
| | | | | | | | | | | | | | |
Principal
Amount | | | Interest
Rate | | | Maturity
Date | | | Amortized
Cost | |
|
| Repurchase Agreements(c) – (continued) | |
| | BNP Paribas – (continued) | |
| $ | 1,450,000,000 | | | | 0.060 | %(d) | | | 06/01/21 | | | $ | 1,450,000,000 | |
| | Maturity Value: $1,450,437,426 | |
| | Settlement Date: 02/19/21 | |
| Collateralized by a U.S. Treasury Bill, 0.000%, due 12/02/21,
U.S. Treasury Bonds, 2.250% to 7.250%, due 08/15/22 to
08/15/49, a U.S. Treasury Floating Rate Note, 0.315%, due
10/31/21, U.S. Treasury Inflation-Indexed Bonds, 0.625% to
2.500%, due 01/15/28 to 02/15/43, a U.S. Treasury Inflation-
Indexed Note, 0.375%, due 07/15/25, U.S. Treasury Interest-
Only Stripped Securities, 0.000%, due 05/15/25 to 05/15/49,
U.S. Treasury Notes, 0.125% to 2.875%, due 12/31/21 to
05/15/31 and U.S. Treasury Principal-Only Stripped Securities,
0.000%, due 08/15/23 to 02/15/51. The aggregate market value
of the collateral, including accrued interest, was
$1,479,000,001. |
|
| | 150,000,000 | | | | 0.005 | | | | 06/04/21 | | | | 150,000,000 | |
| | Maturity Value: $150,000,146 | |
| | Settlement Date: 05/25/21 | |
| Collateralized by U.S. Treasury Bonds, 3.000%, due 05/15/45 to
02/15/49, U.S. Treasury Inflation-Indexed Bonds, 1.375% to
3.625%, due 04/15/28 to 02/15/44, a U.S. Treasury Inflation-
Indexed Note, 0.125%, due 01/15/23, a U.S. Treasury Interest-
Only Stripped Security, 0.000%, due 11/15/29 and U.S.
Treasury Notes, 0.125% to 2.875%, due 06/30/21 to 08/31/25.
The aggregate market value of the collateral, including accrued
interest, was $153,000,001. |
|
| | 230,000,000 | | | | 0.005 | | | | 06/04/21 | | | | 230,000,000 | |
| | Maturity Value: $230,000,191 | |
| Collateralized by a U.S. Treasury Bond, 5.500%, due 08/15/28, a
U.S. Treasury Inflation-Indexed Bond, 3.625%, due 04/15/28,
U.S. Treasury Inflation-Indexed Notes, 0.250% to 0.750%, due
07/15/27 to 07/15/29, U.S. Treasury Interest-Only Stripped
Securities, 0.000%, due 08/15/31 to 05/15/48, U.S. Treasury
Notes, 0.500% to 2.750%, due 07/31/23 to 02/15/27 and U.S.
Treasury Principal-Only Stripped Securities, 0.000%, due
08/15/29 to 11/15/49. The aggregate market value of the
collateral, including accrued interest, was $234,600,000. |
|
| | 80,000,000 | | | | 0.020 | (d) | | | 06/04/21 | | | | 80,000,000 | |
| | Maturity Value: $80,001,423 | |
| | Settlement Date: 05/06/21 | |
| Collateralized by U.S. Treasury Bills, 0.000%, due 07/06/21 to
09/16/21, U.S. Treasury Bonds, 2.250% to 8.000%, due
11/15/21 to 08/15/46, a U.S. Treasury Floating Rate Note,
0.070%, due 07/31/22, U.S. Treasury Inflation-Indexed Bonds,
0.875% to 1.000%, due 02/15/47 to 02/15/49, U.S. Treasury
Inflation-Indexed Notes, 0.125% to 0.750%, due 04/15/22 to
07/15/28, U.S. Treasury Interest-Only Stripped Securities,
0.000%, due 11/15/26 to 11/15/47, U.S. Treasury Notes,
0.250% to 2.250%, due 09/30/21 to 08/31/25 and U.S. Treasury
Principal-Only Stripped Securities, 0.000%, due 11/15/22 to
05/15/49. The aggregate market value of the collateral,
including accrued interest, was $81,600,000. |
|
| | |
|
| Repurchase Agreements(c) – (continued) | |
| | BNP Paribas (Overnight Treasury + 0.02%) | |
| 700,000,000 | | | | 0.025 | %(b) (d) | | | 06/07/21 | | | | 700,000,000 | |
| | Maturity Value: $700,942,995 | |
| | Settlement Date: 02/23/16 | |
| Collateralized by U.S. Treasury Bills, 0.000%, due 08/12/21 to
11/04/21, U.S. Treasury Bonds, 2.875% to 8.125%, due
08/15/21 to 05/15/47, U.S. Treasury Inflation-Indexed Bonds,
1.000% to 2.000%, due 01/15/26 to 02/15/48, a U.S. Treasury
Inflation-Indexed Note, 0.625%, due 01/15/26, U.S. Treasury
Interest-Only Stripped Securities, 0.000%, due 05/15/25 to
08/15/43, U.S. Treasury Notes, 0.125% to 2.375%, due
10/31/22 to 09/30/27 and U.S. Treasury Principal-Only
Stripped Securities, 0.000%, due 02/15/36 to 05/15/48. The
aggregate market value of the collateral, including accrued
interest, was $713,999,999. |
|
| | |
| | BofA Securities, Inc. | |
| | 100,000,000 | | | | — | | | | 06/04/21 | | | | 100,000,000 | |
| | Maturity Value: $100,000,000 | |
| Collateralized by U.S. Treasury Inflation-Indexed Notes, 0.125%
to 0.625%, due 07/15/21 to 01/15/31 and a U.S. Treasury Note,
0.125%, due 02/28/23. The aggregate market value of the
collateral, including accrued interest, was $102,000,000. |
|
| | |
| | Canadian Imperial Bank of Commerce | |
| | 85,000,000 | | | | 0.020 | (d) | | | 06/01/21 | | | | 85,000,000 | |
| | Maturity Value: $85,001,653 | |
| | Settlement Date: 04/27/21 | |
| Collateralized by U.S. Treasury Bonds, 2.750% to 4.625%, due
02/15/40 to 08/15/47, U.S. Treasury Inflation-Indexed Bonds,
1.000% to 2.500%, due 01/15/29 to 02/15/48, a U.S. Treasury
Inflation-Indexed Note, 0.375%, due 07/15/25 and U.S.
Treasury Notes, 0.125% to 2.875%, due 10/31/22 to 08/15/28.
The aggregate market value of the collateral, including accrued
interest, was $86,700,034. |
|
| | 121,500,000 | | | | 0.070 | (d) | | | 06/01/21 | | | | 121,500,000 | |
| | Maturity Value: $121,542,524 | |
| | Settlement Date: 02/05/21 | |
| Collateralized by U.S. Treasury Bonds, 2.375% to 3.125%, due
05/15/43 to 11/15/49, a U.S. Treasury Inflation-Indexed Bond,
0.750%, due 02/15/45, U.S. Treasury Inflation-Indexed Notes,
0.125%, due 10/15/24 to 01/15/31 and U.S. Treasury Notes,
0.250% to 3.125%, due 01/15/23 to 11/15/28. The aggregate
market value of the collateral, including accrued interest, was
$123,930,025. |
|
| | |
| | Citigroup Global Markets, Inc. | |
| | 6,100,000 | | | | 0.005 | | | | 06/01/21 | | | | 6,100,000 | |
| | Maturity Value: $6,100,004 | |
| Collateralized by a U.S. Treasury Bill, 0.000%, due 06/01/21, a
U.S. Treasury Inflation-Indexed Note, 0.250%, due 07/15/29
and U.S. Treasury Notes, 1.750% to 1.875%, due 07/15/22 to
07/31/26. The aggregate market value of the collateral,
including accrued interest, was $6,222,025. |
|
| | |
| | |
| The accompanying notes are an integral part of these financial statements. | | 33 |
FINANCIAL SQUARE TREASURY OBLIGATIONS FUND
Schedule of Investments (continued)
May 31, 2021 (Unaudited)
| | | | | | | | | | | | | | |
Principal
Amount | | | Interest
Rate | | | Maturity
Date | | | Amortized
Cost | |
|
| Repurchase Agreements(c) – (continued) | |
| | Credit Agricole Corporate and Investment Bank | |
| $ | 100,000,000 | | | | — | % | | | 06/01/21 | | | $ | 100,000,000 | |
| | Maturity Value: $100,000,000 | |
| Collateralized by a U.S. Treasury Bond, 1.875%, due 02/15/41
and U.S. Treasury Inflation-Indexed Bonds, 0.750% to 3.875%,
due 01/15/27 to 02/15/45. The aggregate market value of the
collateral, including accrued interest, was $102,000,075. |
|
| | |
| | Daiwa Capital Markets America, Inc. | |
| | 58,465,685 | | | | 0.005 | | | | 06/01/21 | | | | 58,465,685 | |
| | Maturity Value: $58,465,717 | |
| Collateralized by a U.S. Treasury Note, 0.125%, due 06/30/22.
The market value of the collateral, including accrued interest,
was $59,634,999. |
|
| | 103,069,668 | | | | 0.005 | | | | 06/01/21 | | | | 103,069,668 | |
| | Maturity Value: $103,069,726 | |
| Collateralized by a U.S. Treasury Note, 1.750%, due 04/30/22.
The market value of the collateral, including accrued interest,
was $105,131,061. |
|
| | 438,464,647 | | | | 0.005 | | | | 06/01/21 | | | | 438,464,647 | |
| | Maturity Value: $438,464,890 | |
| Collateralized by a U.S. Treasury Note, 0.125%, due 04/30/22.
The market value of the collateral, including accrued interest,
was $447,233,940. |
|
| | |
| | Federal Reserve Bank of New York | |
| | 8,800,000,000 | | | | — | | | | 06/01/21 | | | | 8,800,000,000 | |
| | Maturity Value: $8,800,000,000 | |
| Collateralized by U.S. Treasury Notes, 0.125% to 2.875%, due
08/15/23 to 02/15/30. The aggregate market value of the
collateral, including accrued interest, was $8,800,000,043. |
|
| | |
| | Fixed Income Clearing Corp. | |
| | 65,000,000 | | | | 0.003 | | | | 06/01/21 | | | | 65,000,000 | |
| | Maturity Value: $65,000,018 | |
| Collateralized by a U.S. Treasury Note, 0.125%, due 01/31/23.
The market value of the collateral, including accrued interest,
was $66,300,075. |
|
| | 700,000,000 | | | | 0.005 | | | | 06/02/21 | | | | 700,000,000 | |
| | Maturity Value: $700,000,389 | |
| Collateralized by a U.S. Treasury Bond, 3.000%, due 02/15/49, a
U.S. Treasury Inflation-Indexed Note, 0.125%, due 01/15/31
and U.S. Treasury Notes, 2.625% to 2.750%, due 06/30/23 to
11/15/23. The aggregate market value of the collateral,
including accrued interest, was $714,000,035. |
|
| | |
| | HSBC Bank PLC (Overnight Treasury + 0.02%) | |
| | 275,000,000 | | | | 0.030 | | | | 06/01/21 | | | | 275,000,000 | |
| | Maturity Value: $275,040,561 | |
| | Settlement Date: 12/14/20 | |
| Collateralized by U.S. Treasury Bonds, 2.875% to 4.250%, due
05/15/39 to 02/15/47, U.S. Treasury Inflation-Indexed Notes,
0.125% to 0.375%, due 07/15/25 to 07/15/30 and U.S. Treasury
Notes, 0.125% to 3.125%, due 11/30/21 to 11/15/28. The
aggregate market value of the collateral, including accrued
interest, was $280,500,964. |
|
| | |
|
| Repurchase Agreements(c) – (continued) | |
| | HSBC Bank PLC (Overnight Treasury + 0.02%) – (continued) | |
| 650,000,000 | | | | 0.030 | | | | 06/03/21 | | | | 650,000,000 | |
| | Maturity Value: $650,093,704 | |
| | Settlement Date: 12/18/20 | |
| Collateralized by U.S. Treasury Bonds, 2.375% to 5.375%, due
02/15/31 to 11/15/49, a U.S. Treasury Inflation-Indexed Bond,
1.000%, due 02/15/46, U.S. Treasury Inflation-Indexed Notes,
0.125% to 0.250%, due 07/15/29 to 07/15/30 and U.S. Treasury
Notes, 0.125% to 3.125%, due 04/15/22 to 02/15/29. The
aggregate market value of the collateral, including accrued
interest, was $663,002,300. |
|
| | 100,000,000 | | | | 0.030 | | | | 06/07/21 | | | | 100,000,000 | |
| | Maturity Value: $100,012,416 | |
| | Settlement Date: 01/11/21 | |
| Shared collateral consisting of U.S. Treasury Bonds, 2.875% to
3.375%, due 11/15/44 to 11/15/48, a U.S. Treasury Inflation-
Indexed Note, 0.250%, due 07/15/29 and U.S. Treasury Notes,
0.125% to 3.125%, due 04/15/22 to 02/15/29. The aggregate
market value of the collateral, including accrued interest, was
$204,000,752. |
|
| | 100,000,000 | | | | 0.030 | | | | 06/07/21 | | | | 100,000,000 | |
| | Maturity Value: $100,011,666 | |
| | Settlement Date: 01/20/21 | |
| Shared collateral consisting of U.S. Treasury Bonds, 2.875% to
3.375%, due 11/15/44 to 11/15/48, a U.S. Treasury Inflation-
Indexed Note, 0.250%, due 07/15/29 and U.S. Treasury Notes,
0.125% to 3.125%, due 04/15/22 to 02/15/29. The aggregate
market value of the collateral, including accrued interest, was
$204,000,752. |
|
| | |
| | J.P. Morgan Securities LLC | |
| | 50,000,000 | | | | 0.005 | | | | 06/01/21 | | | | 50,000,000 | |
| | Maturity Value: $50,000,028 | |
| Collateralized by a U.S. Treasury Bill, 0.000%, due 07/15/21, a
U.S. Treasury Inflation-Indexed Note, 0.125%, due 04/15/22, a
U.S. Treasury Note, 2.125%, due 11/30/24 and a U.S. Treasury
Principal-Only Stripped Security, 0.000%, due 11/15/21. The
aggregate market value of the collateral, including accrued
interest, was $51,000,033. |
|
| | 200,000,000 | | | | 0.005 | | | | 06/01/21 | | | | 200,000,000 | |
| | Maturity Value: $200,000,111 | |
| Collateralized by a U.S. Treasury Bond, 7.625%, due 02/15/25, a
U.S. Treasury Interest-Only Stripped Security, 0.000%, due
07/31/21 and U.S. Treasury Notes, 2.000% to 2.125%, due
08/15/21 to 10/31/22. The aggregate market value of the
collateral, including accrued interest, was $204,000,113. |
|
| | |
| | Joint Account I | |
| | 2,000,000,000 | | | | 0.005 | | | | 06/01/21 | | | | 2,000,000,000 | |
| | Maturity Value: $2,000,001,149 | |
| | MUFG Securities Americas Inc. | |
| | 2,000,000 | | | | 0.005 | | | | 06/04/21 | | | | 2,000,000 | |
| | Maturity Value: $2,000,001 | |
| Collateralized by a U.S. Treasury Inflation-Indexed Note, 0.500%,
due 04/15/24, a U.S. Treasury Interest-Only Stripped Security,
0.000%, due 08/15/21 and a U.S. Treasury Note, 0.125%, due
07/31/22. The aggregate market value of the collateral,
including accrued interest, was $2,040,000. |
|
| | |
| | |
| 34 | | The accompanying notes are an integral part of these financial statements. |
FINANCIAL SQUARE TREASURY OBLIGATIONS FUND
| | | | | | | | | | | | | | |
Principal
Amount | | | Interest
Rate | | | Maturity
Date | | | Amortized
Cost | |
|
| Repurchase Agreements(c) – (continued) | |
| | MUFG Securities Americas Inc. (Overnight Treasury + 0.01%) | |
| $ | 80,000,000 | | | | 0.015 | % | | | 06/01/21 | | | $ | 80,000,000 | |
| | Maturity Value: $80,002,967 | |
| | Settlement Date: 03/12/21 | |
| Collateralized by a U.S. Treasury Bond, 3.000%, due 02/15/49, a
U.S. Treasury Inflation-Indexed Note, 0.250%, due 01/15/25, a
U.S. Treasury Interest-Only Stripped Security, 0.000%, due
11/15/44, a U.S. Treasury Note, 0.125%, due 02/15/24 and a
U.S. Treasury Principal-Only Stripped Security, 0.000%, due
08/15/39. The aggregate market value of the collateral,
including accrued interest, was $81,599,999. |
|
| | 100,000,000 | | | | 0.015 | | | | 06/07/21 | | | | 100,000,000 | |
| | Maturity Value: $100,004,876 | |
| | Settlement Date: 02/12/21 | |
| Collateralized by U.S. Treasury Bonds, 2.375% to 3.625%, due
02/15/43 to 05/15/51, U.S. Treasury Inflation-Indexed Notes,
0.250% to 0.625%, due 01/15/25 to 01/15/26, a U.S. Treasury
Interest-Only Stripped Security, 0.000%, due 11/15/40, U.S.
Treasury Notes, 0.125% to 2.875%, due 02/15/24 to 08/15/30
and a U.S. Treasury Principal-Only Stripped Security, 0.000%,
due 05/15/49. The aggregate market value of the collateral,
including accrued interest, was $102,000,000. |
|
| | |
| | Norinchukin Bank (The) | |
| | 130,000,000 | | | | 0.040 | | | | 06/04/21 | | | | 130,000,000 | |
| | Maturity Value: $130,003,755 | |
| | Settlement Date: 05/07/21 | |
| Collateralized by a U.S. Treasury Bond, 6.125%, due 08/15/29
and U.S. Treasury Notes, 0.625% to 2.000%, due 06/30/24 to
08/15/30. The aggregate market value of the collateral,
including accrued interest, was $132,600,074. |
|
| | |
| | Wells Fargo Securities, LLC | |
| | 150,000,000 | | | | — | | | | 06/01/21 | | | | 150,000,000 | |
| | Maturity Value: $150,000,000 | |
| Collateralized by a U.S. Treasury Bond, 3.375%, due 11/15/48.
The market value of the collateral, including accrued interest,
was $153,000,043. |
|
| | |
| | TOTAL REPURCHASE AGREEMENTS | | | $ | 17,536,600,000 | |
| | |
| | TOTAL INVESTMENTS – 100.9% | | | $ | 34,884,398,001 | |
| | |
| LIABILITIES IN EXCESS OF OTHER
ASSETS – (0.9)% |
| | | (296,882,270 | ) |
| | |
| | NET ASSETS – 100.0% | | | $ | 34,587,515,731 | |
| | |
| | |
|
| The percentage shown for each investment category reflects the value of investments in that category as a percentage of net assets. |
| |
(a) | | All or a portion represents a forward commitment. |
| |
(b) | | Variable or floating rate security. Except for floating rate notes (for which final maturity is disclosed), maturity date disclosed is the next interest reset date. Interest rate disclosed is that which is in effect on May 31, 2021. |
| |
(c) | | Unless noted, all repurchase agreements were entered into on May 31, 2021. Additional information on Joint Repurchase Agreement Account I appears in the Additional Investment Information section. |
| |
(d) | | The instrument is subject to a demand feature. |
Interest rates represent either the stated coupon rate, annualized yield on date of purchase for discounted securities, or, for floating rate securities, the current reset rate, which is based upon current interest rate indices.
Maturity dates represent either the final legal maturity date on the security, the demand date for puttable securities, the date of the next interest rate reset for variable rate securities, or the prerefunded date for those types of securities.
| | |
|
Investment Abbreviations: |
MMY | | —Money Market Yield |
T-Bill | | —Treasury Bill |
|
| | |
| The accompanying notes are an integral part of these financial statements. | | 35 |
FINANCIAL SQUARE TREASURY SOLUTIONS FUND
Schedule of Investments
May 31, 2021 (Unaudited)
| | | | | | | | | | | | | | |
Principal Amount | | | Interest
Rate | | | Maturity
Date | | | Amortized Cost | |
|
| U.S. Treasury Obligations – 65.3% | |
| | United States Treasury Bills | |
| $ | 388,600,000 | | | | 0.001 | % | | | 06/01/21 | | | $ | 388,600,000 | |
| | 26,300,000 | | | | 0.001 | | | | 06/03/21 | | | | 26,299,999 | |
| | 4,200,000 | | | | 0.001 | | | | 06/10/21 | | | | 4,199,999 | |
| | 23,900,000 | | | | 0.091 | | | | 06/10/21 | | | | 23,899,462 | |
| | 87,100,000 | | | | 0.086 | | | | 06/17/21 | | | | 87,096,710 | |
| | 137,300,000 | | | | 0.091 | | | | 06/24/21 | | | | 137,292,105 | |
| | 162,500,000 | | | | 0.003 | (a) | | | 06/29/21 | | | | 162,499,684 | |
| | 337,800,000 | | | | 0.101 | | | | 07/01/21 | | | | 337,771,850 | |
| | 116,000,000 | | | | 0.051 | | | | 07/06/21 | | | | 115,994,361 | |
| | 245,100,000 | | | | 0.091 | | | | 07/08/21 | | | | 245,077,328 | |
| | 137,500,000 | | | | 0.051 | | | | 07/13/21 | | | | 137,491,979 | |
| | 72,120,000 | | | | 0.056 | | | | 07/13/21 | | | | 72,115,372 | |
| | 171,400,000 | | | | 0.091 | | | | 07/15/21 | | | | 171,381,146 | |
| | 118,900,000 | | | | 0.041 | | | | 07/20/21 | | | | 118,893,527 | |
| | 111,400,000 | | | | 0.056 | | | | 07/20/21 | | | | 111,391,660 | |
| | 137,400,000 | | | | 0.096 | | | | 07/22/21 | | | | 137,381,508 | |
| | 82,000,000 | | | | 0.030 | | | | 07/27/21 | | | | 81,996,173 | |
| | 197,500,000 | | | | 0.086 | | | | 07/29/21 | | | | 197,472,954 | |
| | 79,800,000 | | | | 0.071 | | | | 08/05/21 | | | | 79,789,914 | |
| | 44,900,000 | | | | 0.025 | | | | 08/10/21 | | | | 44,897,817 | |
| | 44,100,000 | | | | 0.051 | | | | 08/12/21 | | | | 44,095,590 | |
| | 5,900,000 | | | | 0.010 | | | | 08/19/21 | | | | 5,899,871 | |
| | 250,000,000 | | | | 0.061 | | | | 08/19/21 | | | | 249,967,084 | |
| | 44,000,000 | | | | 0.046 | | | | 08/26/21 | | | | 43,995,270 | |
| | 34,700,000 | | | | 0.061 | | | | 09/02/21 | | | | 34,694,622 | |
| | 168,000,000 | | | | 0.061 | | | | 09/09/21 | | | | 167,972,000 | |
| | 7,000,000 | | | | 0.010 | | | | 09/14/21 | | | | 6,999,796 | |
| | 137,200,000 | | | | 0.056 | | | | 09/16/21 | | | | 137,177,571 | |
| | 8,500,000 | | | | 0.015 | | | | 09/21/21 | | | | 8,499,603 | |
| | 108,800,000 | | | | 0.041 | | | | 09/30/21 | | | | 108,785,373 | |
| | 28,500,000 | | | | 0.038 | | | | 10/07/21 | | | | 28,496,453 | |
| | 275,000,000 | | | | 0.035 | | | | 10/28/21 | | | | 274,960,164 | |
| | 197,600,000 | | | | 0.035 | | | | 11/12/21 | | | | 197,568,493 | |
| | 13,600,000 | | | | 0.025 | | | | 11/18/21 | | | | 13,598,394 | |
| | 27,200,000 | | | | 0.026 | | | | 11/18/21 | | | | 27,196,693 | |
| | 11,600,000 | | | | 0.030 | | | | 11/18/21 | | | | 11,598,357 | |
| United States Treasury Floating Rate Note (3 Mo. U.S. T-Bill
MMY + 0.03%) |
|
| | 295,000,000 | | | | 0.054 | (b) | | | 04/30/23 | | | | 295,011,628 | |
| United States Treasury Floating Rate Note (3 Mo. U.S. T-Bill
MMY + 0.05%) |
|
| | 125,000,000 | | | | 0.069 | (b) | | | 01/31/23 | | | | 125,021,978 | |
| United States Treasury Floating Rate Note (3 Mo. U.S. T-Bill
MMY + 0.06%) |
|
| | 206,300,000 | | | | 0.075 | (b) | | | 07/31/22 | | | | 206,361,255 | |
| | 60,100,000 | | | | 0.075 | (b) | | | 10/31/22 | | | | 60,120,709 | |
| United States Treasury Floating Rate Note (3 Mo. U.S. T-Bill
MMY + 0.11%) |
|
| | 155,100,000 | | | | 0.134 | (b) | | | 04/30/22 | | | | 155,228,208 | |
| United States Treasury Floating Rate Note (3 Mo. U.S. T-Bill
MMY + 0.15%) |
|
| | 310,800,000 | | | | 0.169 | (b) | | | 01/31/22 | | | | 310,797,576 | |
| United States Treasury Floating Rate Note (3 Mo. U.S. T-Bill
MMY + 0.22%) |
|
| | 887,950,000 | | | | 0.235 | (b) | | | 07/31/21 | | | | 888,082,193 | |
| | |
|
| U.S. Treasury Obligations – (continued) | |
| United States Treasury Floating Rate Note (3 Mo. U.S. T-Bill
MMY + 0.30%) |
|
| 557,600,000 | | | | 0.315 | %(b) | | | 10/31/21 | | | | 557,859,622 | |
| | United States Treasury Notes | |
| | 21,880,000 | | | | 1.125 | (a) | | | 06/30/21 | | | | 21,898,788 | |
| | 6,400,000 | | | | 2.125 | | | | 06/30/21 | | | | 6,410,404 | |
| | 32,470,000 | | | | 2.625 | | | | 07/15/21 | | | | 32,569,362 | |
| | 7,500,000 | | | | 1.125 | | | | 07/31/21 | | | | 7,512,660 | |
| | 9,000,000 | | | | 2.125 | | | | 08/15/21 | | | | 9,037,773 | |
| | 13,900,000 | | | | 1.125 | | | | 08/31/21 | | | | 13,935,249 | |
| | 3,700,000 | | | | 1.500 | | | | 08/31/21 | | | | 3,712,830 | |
| | 7,600,000 | | | | 2.000 | | | | 08/31/21 | | | | 7,635,920 | |
| | 1,800,000 | | | | 1.500 | | | | 09/30/21 | | | | 1,808,508 | |
| | 5,300,000 | | | | 1.250 | | | | 10/31/21 | | | | 5,325,853 | |
| | 6,700,000 | | | | 2.875 | | | | 11/15/21 | | | | 6,785,567 | |
| | 15,900,000 | | | | 8.000 | | | | 11/15/21 | | | | 16,475,458 | |
| | 8,900,000 | | | | 1.500 | | | | 11/30/21 | | | | 8,963,210 | |
| | 1,200,000 | | | | 1.750 | | | | 11/30/21 | | | | 1,210,005 | |
| | 8,900,000 | | | | 2.625 | | | | 12/15/21 | | | | 9,022,145 | |
| | 23,700,000 | | | | 2.000 | | | | 12/31/21 | | | | 23,966,157 | |
| | 1,104,000 | | | | 2.500 | | | | 01/15/22 | | | | 1,120,644 | |
| | 900,000 | | | | 1.500 | | | | 01/31/22 | | | | 908,515 | |
| | 1,800,000 | | | | 1.875 | | | | 01/31/22 | | | | 1,821,534 | |
| | |
| TOTAL U.S. TREASURY
OBLIGATIONS |
| | $ | 6,821,652,633 | |
| | |
| | | | | | | | | | | | | | |
|
| Repurchase Agreement(c) – 35.7% | |
| | Federal Reserve Bank of New York | |
| $ | 3,733,000,000 | | | | — | % | | | 06/01/21 | | | $ | 3,733,000,000 | |
| | Maturity Value: $3,733,000,000 | |
| Collateralized by U.S. Treasury Notes, 1.250% to 2.750%, due
08/15/23 to 02/15/30. The aggregate market value of the
collateral, including accrued interest, was $3,733,000,099. |
|
| | |
| | TOTAL INVESTMENTS – 101.0% | | | $ | 10,554,652,633 | |
| | |
| LIABILITIES IN EXCESS OF OTHER
ASSETS – (1.0)% |
| | | (107,616,084 | ) |
| | |
| | NET ASSETS – 100.0% | | | $ | 10,447,036,549 | |
| | |
| | |
|
| The percentage shown for each investment category reflects the value of investments in that category as a percentage of net assets. |
| |
(a) | | All or a portion represents a forward commitment. |
| |
(b) | | Variable or floating rate security. Except for floating rate notes (for which final maturity is disclosed), maturity date disclosed is the next interest reset date. Interest rate disclosed is that which is in effect on May 31, 2021. |
| |
(c) | | Unless noted, all repurchase agreements were entered into on May 31, 2021. Additional information on Joint Repurchase Agreement Account III appears in the Additional Investment Information section. |
| | |
| 36 | | The accompanying notes are an integral part of these financial statements. |
FINANCIAL SQUARE TREASURY SOLUTIONS FUND
Interest rates represent either the stated coupon rate, annualized yield on date of purchase for discounted securities, or, for floating rate securities, the current reset rate, which is based upon current interest rate indices.
Maturity dates represent either the final legal maturity date on the security, the demand date for puttable securities, the date of the next interest rate reset for variable rate securities, or the prerefunded date for those types of securities.
| | |
|
Investment Abbreviations: |
MMY | | — Money Market Yield |
T-Bill | | — Treasury Bill |
|
| | |
| The accompanying notes are an integral part of these financial statements. | | 37 |
GOLDMAN SACHS FUNDS — FINANCIAL SQUARE FUNDS
Schedule of Investments (continued)
May 31, 2021 (Unaudited)
|
| ADDITIONAL INVESTMENT INFORMATION |
JOINT REPURCHASE AGREEMENT ACCOUNT I — At May 31, 2021, certain Funds had undivided interests in the Joint Repurchase Agreement Account I with a maturity date of June 1, 2021, as follows:
| | | | | | | | | | | | |
| Fund | | Principal Amount | | | Maturity Value | | | Collateral Value
Allocation | |
Government | | $ | 1,000,000,000 | | | | $1,000,000,574 | | | $ | 1,019,559,756 | |
Treasury Obligations | | | 2,000,000,000 | | | | 2,000,001,149 | | | | 2,039,119,511 | |
REPURCHASE AGREEMENTS — At May 31, 2021, the Principal Amounts of certain Funds’ interest in the Joint Repurchase Agreement Account I were as follows:
| | | | | | | | | | | | |
| Counterparty | | Interest
Rate | | | Government | | | Treasury
Obligations | |
Bank of Nova Scotia (The) | | | 0.005 | % | | $ | 400,000,000 | | | $ | 800,000,000 | |
BNP Paribus | | | 0.005 | | | | 233,333,333 | | | | 466,666,667 | |
Credit Agricole Corporate and Investment Bank | | | 0.005 | | | | 333,333,334 | | | | 666,666,667 | |
Wells Fargo Securities, LLC | | | 0.010 | | | | 33,333,333 | | | | 66,666,666 | |
| | | |
| TOTAL | | | | | | $ | 1,000,000,000 | | | $ | 2,000,000,000 | |
At May 31, 2021, the Joint Repurchase Agreement Account I was fully collateralized by:
| | | | | | | | |
| Issuer | | Interest Rates | | | Maturity Dates | |
U.S. Treasury Bills | | | 0.000 | % | | | 06/01/21 to 05/19/22 | |
U.S. Treasury Bonds | | | 1.125 to 5.500 | | | | 08/15/28 to 05/15/51 | |
U.S. Treasury Floating Rate Notes | | | 0.070 to 0.315 | | | | 10/31/21 to 10/31/22 | |
U.S. Treasury Inflation-Indexed Bonds | | | 1.000 to 2.500 | | | | 01/15/27 to 02/15/48 | |
U.S. Treasury Inflation-Indexed Notes | | | 0.125 to 0.750 | | | | 07/15/23 to 01/15/31 | |
U.S. Treasury Interest-Only Stripped Securities | | | 0.000 | | | | 05/15/25 to 05/15/49 | |
U.S. Treasury Notes | | | 0.125 to 3.125 | | | | 05/31/21 to 08/15/30 | |
U.S. Treasury Principal-Only Stripped Securities | | | 0.000 | | | | 02/15/36 to 02/15/49 | |
Cash | | | | | | | | |
| | |
| 38 | | The accompanying notes are an integral part of these financial statements. |
GOLDMAN SACHS FUNDS — FINANCIAL SQUARE FUNDS
|
| ADDITIONAL INVESTMENT INFORMATION (continued) |
JOINT REPURCHASE AGREEMENT ACCOUNT III — At May 31, 2021, certain Funds had undivided interests in the Joint Repurchase Agreement Account III with a maturity date of June 1, 2021, as follows:
| | | | | | | | | | | | |
| Fund | | Principal Amount | | | Maturity Value | | | Collateral Value
Allocation | |
Government | | $ | 1,875,400,000 | | | $ | 1,875,402,605 | | | $ | 1,930,849,410 | |
Money Market | | | 30,000,000 | | | | 30,000,042 | | | | 30,887,001 | |
Prime Obligations | | | 30,000,000 | | | | 30,000,042 | | | | 30,887,001 | |
REPURCHASE AGREEMENTS — At May 31, 2021, the Principal Amounts of certain Funds’ interest in the Joint Repurchase Agreement Account III were as follows:
| | | | | | | | | | | | | | | | |
| Counterparty | | Interest
Rate | | | Government | | | Money
Market | | | Prime
Obligations | |
ABN Amro Bank N.V. | | | 0.020 | % | | $ | 468,850,000 | | | $ | 7,500,000 | | | $ | 7,500,000 | |
Bank of America, N.A. | | | 0.010 | | | | 390,708,333 | | | | 6,250,000 | | | | 6,250,000 | |
BofA Securities, Inc. | | | 0.010 | | | | 234,425,000 | | | | 3,750,000 | | | | 3,750,000 | |
Bank of Nova Scotia (The) | | | 0.010 | | | | 781,416,667 | | | | 12,500,000 | | | | 12,500,000 | |
| | | | |
| TOTAL | | | | | | $ | 1,875,400,000 | | | $ | 30,000,000 | | | $ | 30,000,000 | |
At May 31, 2021, the Joint Repurchase Agreement Account III was fully collateralized by:
| | | | | | | | |
| Issuer | | Interest Rates | | | Maturity Dates | |
Federal Home Loan Mortgage Corp. | | | 1.500 to 6.000 | % | | | 10/01/26 to 05/01/51 | |
Federal National Mortgage Association | | | 2.000 to 6.500 | | | | 02/01/25 to 05/01/51 | |
Government National Mortgage Association | | | 2.000 to 3.500 | | | | 04/20/48 to 02/20/51 | |
U.S. Treasury Notes | | | 0.125 to 2.500 | | | | 09/30/22 to 08/15/29 | |
| | |
| The accompanying notes are an integral part of these financial statements. | | 39 |
GOLDMAN SACHS FUNDS — FINANCIAL SQUARE FUNDS
Statements of Assets and Liabilities
May 31, 2021 (Unaudited)
| | | | | | | | | | | | | | | | | | |
| | | | | Federal Instruments Fund | | | Government Fund | | | Money Market Fund | | | Prime Obligations Fund | |
| | Assets: | | | | | | | | | | | | | | | | |
| | Investments, at value (cost $2,805,580,365, $99,080,456,906, $3,245,524,047 and $1,287,200,033) | | $ | 2,805,580,365 | | | $ | 99,080,456,906 | | | $ | 3,245,578,647 | | | $ | 1,287,250,686 | |
| | Repurchase agreements, at value (cost $0, $105,626,610,000, $579,100,000 and $364,100,000) | | | — | | | | 105,626,610,000 | | | | 579,105,771 | | | | 364,102,171 | |
| | Cash | | | 322,961 | | | | 1,515,266 | | | | 345,535 | | | | 564,143 | |
| | Receivables: | | | | | | | | | | | | | | | | |
| | Investments sold | | | 1,616,000 | | | | 1,445,684,062 | | | | 52,799,687 | | | | 31,599,888 | |
| | Interest | | | 474,640 | | | | 31,294,464 | | | | 342,586 | | | | 230,301 | |
| | Reimbursement from investment advisor | | | 3,529 | | | | — | | | | 2,851 | | | | 19,276 | |
| | Fund shares sold | | | — | | | | 19,468,441 | | | | — | | | | 2,801,194 | |
| | Other assets | | | 68,484 | | | | 1,677,907 | | | | 118,016 | | | | 84,979 | |
| | Total assets | | | 2,808,065,979 | | | | 206,206,707,046 | | | | 3,878,293,093 | | | | 1,686,652,638 | |
| | | | | | | | | | | | | | | | | | |
| | Liabilities: | | | | | | | | | | | | | | | | |
| | Payables: | | | | | | | | | | | | | | | | |
| | Management fees | | | 141,810 | | | | 6,238,625 | | | | 222,212 | | | | 146,891 | |
| | Dividend distribution | | | 3,966 | | | | 2,377,783 | | | | 61,953 | | | | 6,123 | |
| | Fund shares redeemed | | | 736 | | | | 57,046,795 | | | | — | | | | 858,109 | |
| | Investments purchased | | | — | | | | 2,598,755,813 | | | | 79,575,381 | | | | — | |
| | Distribution and Service fees and Transfer Agency fees | | | — | | | | 721,624 | | | | — | | | | — | |
| | Accrued expenses | | | 190,766 | | | | 1,783,845 | | | | 261,100 | | | | 124,832 | |
| | Total liabilities | | | 337,278 | | | | 2,666,924,485 | | | | 80,120,646 | | | | 1,135,955 | |
| | | | | | | | | | | | | | | | | | |
| | Net Assets: | | | | | | | | | | | | | | | | |
| | Paid-in capital | | | 2,807,720,795 | | | | 203,538,766,337 | | | | 3,805,000,119 | | | | 1,685,447,788 | |
| | Total distributable earnings (loss) | | | 7,906 | | | | 1,016,224 | | | | (6,827,672 | ) | | | 68,895 | |
| | | NET ASSETS | | $ | 2,807,728,701 | | | $ | 203,539,782,561 | | | $ | 3,798,172,447 | | | $ | 1,685,516,683 | |
| | | Net Assets: | | | | | | | | | | | | | | | | |
| | | Class A Shares | | $ | — | | | $ | 388,308,114 | | | $ | — | | | $ | — | |
| | | Class C Shares | | | — | | | | 5,057,193 | | | | — | | | | — | |
| | | Institutional Shares | | | 2,639,942,285 | | | | 186,788,802,714 | | | | 3,791,637,329 | | | | 1,593,122,422 | |
| | | Capital Shares | | | 527,150 | | | | 1,260,725,940 | | | | 3,091,220 | | | | 911,368 | |
| | | Service Shares | | | 10,564,053 | | | | 916,970,495 | | | | 2,656 | | | | 14,183 | |
| | | Preferred Shares | | | 2,806,501 | | | | 1,117,876,653 | | | | 65,883 | | | | 1,013,557 | |
| | | Select Shares | | | 49,423 | | | | 919,543,845 | | | | 1,699,699 | | | | 17,808,923 | |
| | | Administration Shares | | | 57,085,228 | | | | 6,490,280,084 | | | | 1,672,538 | | | | 6,763,049 | |
| | | Cash Management Shares | | | 96,702,171 | | | | 294,955,916 | | | | 1,034 | | | | 1,035 | |
| | | Premier Shares | | | 51,890 | | | | 211,664,280 | | | | 1,049 | | | | 1,049 | |
| | | Resource Shares | | | — | | | | 83,026,245 | | | | 1,039 | | | | 1,038 | |
| | | Class R6 Shares | | | — | | | | 124,600,933 | | | | — | | | | — | |
| | | Drexel Hamilton Shares | | | — | | | | 4,937,970,149 | | | | — | | | | 65,880,059 | |
| | | Total Net Assets | | $ | 2,807,728,701 | | | $ | 203,539,782,561 | | | $ | 3,798,172,447 | | | $ | 1,685,516,683 | |
| | | Shares outstanding $0.001 par value (unlimited number of shares authorized): | | | | | | | | | | | | | | | | |
| | | Class A Shares | | | — | | | | 388,306,166 | | | | — | | | | — | |
| | | Class C Shares | | | — | | | | 5,057,167 | | | | — | | | | — | |
| | | Institutional Shares | | | 2,639,939,481 | | | | 186,787,865,093 | | | | 3,789,035,045 | | | | 1,591,687,223 | |
| | | Capital Shares | | | 527,149 | | | | 1,260,719,613 | | | | 3,088,668 | | | | 910,626 | |
| | | Service Shares | | | 10,564,042 | | | | 916,965,893 | | | | 2,655 | | | | 14,169 | |
| | | Preferred Shares | | | 2,806,498 | | | | 1,117,871,042 | | | | 65,836 | | | | 1,012,879 | |
| | | Select Shares | | | 49,423 | | | | 919,539,230 | | | | 1,698,698 | | | | 17,793,614 | |
| | | Administration Shares | | | 57,085,167 | | | | 6,490,247,512 | | | | 1,671,523 | | | | 6,757,199 | |
| | | Cash Management Shares | | | 96,702,068 | | | | 294,954,436 | | | | 1,033 | | | | 1,034 | |
| | | Premier Shares | | | 51,890 | | | | 211,663,218 | | | | 1,049 | | | | 1,048 | |
| | | Resource Shares | | | — | | | | 83,025,828 | | | | 1,039 | | | | 1,037 | |
| | | Class R6 Shares | | | — | | | | 124,600,308 | | | | — | | | | — | |
| | | Drexel Hamilton Shares | | | — | | | | 4,937,945,367 | | | | — | | | | 65,825,957 | |
| | | Net asset value, offering and redemption price per share: | | | | | | | | | | | | | | | | |
| | | Class A Shares | | | $— | | | | $1.00 | | | | $— | | | | $— | |
| | | Class C Shares | | | — | | | | 1.00 | | | | — | | | | — | |
| | | Institutional Shares | | | 1.00 | | | | 1.00 | | | | 1.0007 | | | | 1.0009 | |
| | | Capital Shares | | | 1.00 | | | | 1.00 | | | | 1.0008 | | | | 1.0008 | |
| | | Service Shares | | | 1.00 | | | | 1.00 | | | | 1.0006 | | | | 1.0010 | |
| | | Preferred Shares | | | 1.00 | | | | 1.00 | | | | 1.0007 | | | | 1.0007 | |
| | | Select Shares | | | 1.00 | | | | 1.00 | | | | 1.0006 | | | | 1.0009 | |
| | | Administration Shares | | | 1.00 | | | | 1.00 | | | | 1.0006 | | | | 1.0009 | |
| | | Cash Management Shares | | | 1.00 | | | | 1.00 | | | | 1.0008 | | | | 1.0011 | |
| | | Premier Shares | | | 1.00 | | | | 1.00 | | | | 1.0008 | | | | 1.0011 | |
| | | Resource Shares | | | — | | | | 1.00 | | | | 1.0008 | | | | 1.0010 | |
| | | Class R6 Shares | | | — | | | | 1.00 | | | | — | | | | — | |
| | | Drexel Hamilton Shares | | | — | | | | 1.00 | | | | — | | | | 1.0008 | |
| | |
| 40 | | The accompanying notes are an integral part of these financial statements. |
GOLDMAN SACHS FUNDS — FINANCIAL SQUARE FUNDS
Statements of Assets and Liabilities (continued)
May 31, 2021 (Unaudited)
| | | | | | | | | | | | | | |
| | | | | Treasury Instruments Fund | | | Treasury Obligations Fund | | | Treasury Solutions Fund | |
| | Assets: | |
| | Investments, at value (cost $100,646,501,364, $17,347,798,001 and $6,821,652,633) | | $ | 100,646,501,364 | | | $ | 17,347,798,001 | | | $ | 6,821,652,633 | |
| | Repurchase agreements, at value (cost $0, $17,536,600,000 and $3,733,000,000) | | | — | | | | 17,536,600,000 | | | | 3,733,000,000 | |
| | Cash | | | 196,238 | | | | 3,643,825 | | | | 635,331 | |
| | Receivables: | | | | | | | | | | | | |
| | Investments sold | | | 90,964,500 | | | | 247,058,812 | | | | 71,973,375 | |
| | Interest | | | 11,554,262 | | | | 5,582,769 | | | | 1,592,617 | |
| | Fund shares sold | | | 2,543,710 | | | | 1,600,338 | | | | 15,407 | |
| | Other assets | | | 718,372 | | | | 433,716 | | | | 160,644 | |
| | Total assets | | | 100,752,478,446 | | | | 35,142,717,461 | | | | 10,629,030,007 | |
| | | | | | | | | | | | | | |
| | Liabilities: | | | | | | | | | | | | |
| | Payables: | | | | | | | | | | | | |
| | Investments purchased | | | 4,708,917,945 | | | | 552,190,762 | | | | 180,902,550 | |
| | Management fees | | | 3,666,128 | | | | 1,094,010 | | | | 506,886 | |
| | Fund shares redeemed | | | 3,525,025 | | | | 1,011,688 | | | | 286,127 | |
| | Dividend distribution | | | 195,441 | | | | 278,975 | | | | 21,725 | |
| | Accrued expenses | | | 1,544,712 | | | | 626,295 | | | | 276,170 | |
| | Total liabilities | | | 4,717,849,251 | | | | 555,201,730 | | | | 181,993,458 | |
| | | | | | | | | | | | | | |
| | Net Assets: | | | | | | | | | | | | |
| | Paid-in capital | | | 96,034,428,018 | | | | 34,587,271,888 | | | | 10,446,958,831 | |
| | Total distributable earnings (loss) | | | 201,177 | | | | 243,843 | | | | 77,718 | |
| | | NET ASSETS | | $ | 96,034,629,195 | | | $ | 34,587,515,731 | | | $ | 10,447,036,549 | |
| | | Net Assets: | | | | | | | | | | | | |
| | | Institutional Shares | | $ | 93,022,509,083 | | | $ | 29,476,962,270 | | | $ | 9,034,628,683 | |
| | | Capital Shares | | | 595,259,838 | | | | 360,787,389 | | | | 288,149,106 | |
| | | Service Shares | | | 367,714,387 | | | | 1,011,456,349 | | | | 212,351,442 | |
| | | Preferred Shares | | | 94,906,437 | | | | 435,256,299 | | | | 57,465,208 | |
| | | Select Shares | | | 147,959,362 | | | | 224,277,842 | | | | 5,772,633 | |
| | | Administration Shares | | | 1,693,797,969 | | | | 3,033,586,994 | | | | 381,862,849 | |
| | | Cash Management Shares | | | 11,938,450 | | | | 34,072,935 | | | | 346,174,252 | |
| | | Premier Shares | | | 100,542,642 | | | | 11,114,624 | | | | 120,631,348 | |
| | | Resource Shares | | | 1,027 | | | | 1,029 | | | | 1,028 | |
| | | Total Net Assets | | $ | 96,034,629,195 | | | $ | 34,587,515,731 | | | $ | 10,447,036,549 | |
| | | Shares outstanding $0.001 par value (unlimited number of shares authorized): | | | | | | | | | | | | |
| | | Institutional Shares | | | 93,022,316,664 | | | | 29,476,754,458 | | | | 9,034,561,473 | |
| | | Capital Shares | | | 595,258,607 | | | | 360,784,846 | | | | 288,146,963 | |
| | | Service Shares | | | 367,713,627 | | | | 1,011,449,218 | | | | 212,349,862 | |
| | | Preferred Shares | | | 94,906,240 | | | | 435,253,231 | | | | 57,464,781 | |
| | | Select Shares | | | 147,959,056 | | | | 224,276,261 | | | | 5,772,590 | |
| | | Administration Shares | | | 1,693,794,465 | | | | 3,033,565,607 | | | | 381,860,008 | |
| | | Cash Management Shares | | | 11,938,425 | | | | 34,072,694 | | | | 346,171,677 | |
| | | Premier Shares | | | 100,542,434 | | | | 11,114,546 | | | | 120,630,450 | |
| | | Resource Shares | | | 1,027 | | | | 1,029 | | | | 1,028 | |
| | | Net asset value, offering and redemption price per share: | | | | | | | | | | | | |
| | | Institutional Shares | | | $1.00 | | | | $1.00 | | | | $1.00 | |
| | | Capital Shares | | | 1.00 | | | | 1.00 | | | | 1.00 | |
| | | Service Shares | | | 1.00 | | | | 1.00 | | | | 1.00 | |
| | | Preferred Shares | | | 1.00 | | | | 1.00 | | | | 1.00 | |
| | | Select Shares | | | 1.00 | | | | 1.00 | | | | 1.00 | |
| | | Administration Shares | | | 1.00 | | | | 1.00 | | | | 1.00 | |
| | | Cash Management Shares | | | 1.00 | | | | 1.00 | | | | 1.00 | |
| | | Premier Shares | | | 1.00 | | | | 1.00 | | | | 1.00 | |
| | | Resource Shares | | | 1.00 | | | | 1.00 | | | | 1.00 | |
| | |
| The accompanying notes are an integral part of these financial statements. | | 41 |
GOLDMAN SACHS FUNDS — FINANCIAL SQUARE FUNDS
Statements of Operations
For the Six Months Ended May 31, 2021 (Unaudited)
| | | | | | | | | | | | | | | | | | |
| | | | | Federal Instruments Fund | | | Government Fund | | | Money Market Fund | | | Prime Obligations
Fund | |
| | Investment Income: | | | | | | | | | | | | | |
| | | | | |
| | Interest income | | $ | 1,761,719 | | | $ | 99,353,603 | | | $ | 2,231,305 | | | $ | 1,632,814 | |
| | | | | | | | | | | | | | | | | | |
| | Expenses: | | | | | | | | | | | | | |
| | Fund-Level Expenses: | | | | | | | | | | | | | | | | |
| | | | | |
| | Management fees | | | 2,790,142 | | | | 141,316,037 | | | | 2,483,432 | | | | 1,781,534 | |
| | | | | |
| | Transfer Agency fees | | | 164,592 | | | | 8,832,783 | | | | 155,222 | | | | 111,351 | |
| | | | | |
| | Registration fees | | | 94,361 | | | | 8,243,193 | | | | 99,582 | | | | 85,824 | |
| | | | | |
| | Custody, accounting and administrative services | | | 55,918 | | | | 2,759,393 | | | | 71,952 | | | | 55,189 | |
| | | | | |
| | Professional fees | | | 47,400 | | | | 48,739 | | | | 47,644 | | | | 45,881 | |
| | | | | |
| | Printing and mailing fees | | | 17,891 | | | | 576,374 | | | | 29,132 | | | | 29,827 | |
| | | | | |
| | Trustee fees | | | 12,506 | | | | 138,463 | | | | 13,234 | | | | 12,161 | |
| | | | | |
| | Other | | | 20,362 | | | | 455,904 | | | | 43,136 | | | | 45,606 | |
| | Subtotal | | | 3,203,172 | | | | 162,370,886 | | | | 2,943,334 | | | | 2,167,373 | |
| | Class Specific Expenses: | | | | | | | | | | | | | | | | |
| | | | | |
| | Cash Management Share fees | | | 232,137 | | | | 763,611 | | | | 2 | | | | 2 | |
| | | | | |
| | Distribution fees — Cash Management Shares | | | 139,282 | | | | 458,169 | | | | 2 | | | | 2 | |
| | | | | |
| | Administration Share fees | | | 74,260 | | | | 7,428,719 | | | | 6,066 | | | | 49,550 | |
| | | | | |
| | Service Share fees | | | 12,436 | | | | 1,149,338 | | | | 4 | | | | 5 | |
| | | | | |
| | Shareholder Administration Plan fees — Service Shares | | | 12,436 | | | | 1,149,338 | | | | 4 | | | | 5 | |
| | | | | |
| | Preferred Share fees | | | 2,129 | | | | 440,390 | | | | 33 | | | | 956 | |
| | | | | |
| | Capital Share fees | | | 403 | | | | 892,837 | | | | 4,188 | | | | 682 | |
| | | | | |
| | Premier Share fees | | | 91 | | | | 339,276 | | | | 2 | | | | 2 | |
| | | | | |
| | Select Share fees | | | 7 | | | | 84,304 | | | | 280 | | | | 4,132 | |
| | | | | |
| | Distribution fees — Resource Shares | | | — | | | | 72,693 | | | | — | | | | — | |
| | | | | |
| | Resource Share fees | | | — | | | | 242,309 | | | | 2 | | | | 2 | |
| | | | | |
| | Distribution and Service fees — Class A Shares | | | — | | | | 408,824 | | | | — | | | | — | |
| | | | | |
| | Distribution fees — Class C Shares | | | — | | | | 28,078 | | | | — | | | | — | |
| | | | | |
| | Total expenses | | | 3,676,353 | | | | 175,828,772 | | | | 2,953,917 | | | | 2,222,711 | |
| | | | | |
| | Less — expense reductions | | | (1,862,179 | ) | | | (97,575,172 | ) | | | (897,511 | ) | | | (428,207 | ) |
| | | | | |
| | Net expenses | | | 1,814,174 | | | | 78,253,600 | | | | 2,056,406 | | | | 1,794,504 | |
| | | | | |
| | NET INVESTMENT INCOME (LOSS) | | $ | (52,455 | ) | | $ | 21,100,003 | | | $ | 174,899 | | | $ | (161,690 | ) |
| | | | | |
| | Net realized gain from investment transactions | | | 85,671 | | | | 5,418,241 | | | | 270,932 | | | | 160,188 | |
| | | | | |
| | Net change in unrealized loss from investment transactions | | | — | | | | — | | | | (50,649 | ) | | | (28,909 | ) |
| | | | | |
| | Net realized and unrealized gain (loss) | | | 85,671 | | | | 5,418,241 | | | | 220,283 | | | | 131,279 | |
| | | | | |
| | NET INCREASE (DECREASE) IN NET ASSETS RESULTING FROM OPERATIONS | | $ | 33,216 | | | $ | 26,518,244 | | | $ | 395,182 | | | $ | (30,411 | ) |
| | |
| 42 | | The accompanying notes are an integral part of these financial statements. |
GOLDMAN SACHS FUNDS — FINANCIAL SQUARE FUNDS
Statements of Operations (continued)
For the Six Months Ended May 31, 2021 (Unaudited)
| | | | | | | | | | | | | | |
| | | | | Treasury
Instruments Fund | | | Treasury
Obligations Fund | | | Treasury
Solutions Fund | |
| | Investment Income: | | | | | | | | | |
| | | | |
| | Interest income | | $ | 43,297,286 | | | $ | 17,398,015 | | | $ | 6,470,850 | |
| | | | | | | | | | | | | | |
| | Expenses: | | | | | | | | | |
| | Fund-Level Expenses: | | | | | | | | | | | | |
| | | | |
| | Management fees | | | 76,419,777 | | | | 34,869,540 | | | | 10,555,634 | |
| | | | |
| | Transfer Agency fees | | | 4,245,840 | | | | 1,937,318 | | | | 586,462 | |
| | | | |
| | Registration fees | | | 1,964,513 | | | | 755,056 | | | | 277,269 | |
| | | | |
| | Custody, accounting and administrative services | | | 1,303,280 | | | | 583,177 | | | | 188,803 | |
| | | | |
| | Printing and mailing fees | | | 490,116 | | | | 37,713 | | | | 32,894 | |
| | | | |
| | Trustee fees | | | 71,828 | | | | 36,399 | | | | 18,910 | |
| | | | |
| | Professional fees | | | 47,136 | | | | 47,615 | | | | 47,313 | |
| | | | |
| | Shareholder meeting expense | | | — | | | | (1,639 | ) | | | (2,075 | ) |
| | | | |
| | Other | | | 204,323 | | | | 140,876 | | | | 71,295 | |
| | Subtotal | | | 84,746,813 | | | | 38,406,055 | | | | 11,776,505 | |
| | Class Specific Expenses: | | | | | | | | | | | | |
| | | | |
| | Administration Share fees | | | 2,117,370 | | | | 3,126,988 | | | | 576,836 | |
| | | | |
| | Capital Share fees | | | 540,080 | | | | 247,737 | | | | 173,629 | |
| | | | |
| | Service Share fees | | | 390,500 | | | | 1,329,628 | | | | 329,642 | |
| | | | |
| | Shareholder Administration Plan fees — Service Shares | | | 390,500 | | | | 1,329,628 | | | | 329,641 | |
| | | | |
| | Premier Share fees | | | 250,171 | | | | 20,777 | | | | 137,308 | |
| | | | |
| | Preferred Share fees | | | 64,285 | | | | 231,240 | | | | 28,621 | |
| | | | |
| | Select Share fees | | | 30,484 | | | | 30,634 | | | | 869 | |
| | | | |
| | Cash Management Share fees | | | 29,769 | | | | 84,597 | | | | 758,944 | |
| | | | |
| | Distribution fees — Cash Management Shares | | | 17,861 | | | | 50,758 | | | | 455,368 | |
| | | | |
| | Resource Share fees | | | 2 | | | | 2 | | | | 2 | |
| | | | |
| | Total expenses | | | 88,577,835 | | | | 44,858,044 | | | | 14,567,365 | |
| | | | |
| | Less — expense reductions | | | (46,978,080 | ) | | | (31,219,717 | ) | | | (8,138,981 | ) |
| | | | |
| | Net expenses | | | 41,599,755 | | | | 13,638,327 | | | | 6,428,384 | |
| | | | |
| | NET INVESTMENT INCOME | | $ | 1,697,531 | | | $ | 3,759,688 | | | $ | 42,466 | |
| | | | |
| | Net realized gain from investment transactions | | | 610,734 | | | | 1,143,357 | | | | 269,891 | |
| | | | |
| | NET INCREASE IN NET ASSETS RESULTING FROM OPERATIONS | | $ | 2,308,265 | | | $ | 4,903,045 | | | $ | 312,357 | |
| | |
| The accompanying notes are an integral part of these financial statements. | | 43 |
GOLDMAN SACHS FUNDS — FINANCIAL SQUARE FUNDS
Statements of Changes in Net Assets
| | | | | | | | | | | | | | | | | | | | | | | | | | | | | | |
| | | | | Federal Instruments Fund | | | | | | Government Fund | |
| | | | | For the
Six Months Ended
May 31, 2021
(Unaudited) | | | For the Period Ended
November 30, 2020† | | | For the Fiscal
Year Ended
August 31, 2020 | | | | | | For the
Six Months Ended
May 31, 2021
(Unaudited) | | | For the Period
Ended
November 30, 2020† | | | For the Fiscal
Year Ended
August 31, 2020 | |
| | From operations: | | | | | | | | | | | | | | | | | |
| | Net investment income (loss) | | $ | (52,455 | ) | | $ | 55,691 | | | $ | 17,343,724 | | | | | | | $ | 21,100,003 | | | $ | 855,555 | | | $ | 1,141,291,628 | |
| | Net realized gain from investment transactions | | | 85,671 | | | | 78,375 | | | | 966,791 | | | | | | | | 5,418,241 | | | | 2,404,541 | | | | 40,401,445 | |
| | | | | | | | |
| | Net increase in net assets resulting from operations | | | 33,216 | | | | 134,066 | | | | 18,310,515 | | | | | | | | 26,518,244 | | | | 3,260,096 | | | | 1,181,693,073 | |
| | | | | | | | | | | | | | | | | | | | | | | | | | | | | | |
| | Distributions to shareholders: | | | | | | | | | | | | | | | | | |
| | From distributable earnings: | | | | | | | | | | | | | | | | | | | | | | | | | | | | |
| | Class A Shares | | | — | | | | — | | | | — | | | | | | | | (47,893 | ) | | | (7,067 | ) | | | (2,446,431 | ) |
| | Class C Shares | | | — | | | | — | | | | — | | | | | | | | (807 | ) | | | (157 | ) | | | (15,977 | ) |
| | Institutional Shares | | | (97,947 | ) | | | (153,445 | ) | | | (17,708,073 | ) | | | | | | | (23,686,824 | ) | | | (10,101,326 | ) | | | (1,090,135,900 | ) |
| | Capital Shares | | | (16 | ) | | | (19 | ) | | | (8,246 | ) | | | | | | | (171,807 | ) | | | (29,079 | ) | | | (12,087,734 | ) |
| | Service Shares | | | (309 | ) | | | (147 | ) | | | (63,442 | ) | | | | | | | (133,241 | ) | | | (21,453 | ) | | | (4,939,299 | ) |
| | Preferred Shares | | | (133 | ) | | | (143 | ) | | | (50,399 | ) | | | | | | | (127,474 | ) | | | (21,766 | ) | | | (9,976,513 | ) |
| | Select Shares | | | (1 | ) | | | (1 | ) | | | (471 | ) | | | | | | | (83,507 | ) | | | (10,452 | ) | | | (4,341,608 | ) |
| | Administration Shares | | | (1,852 | ) | | | (1,119 | ) | | | (450,857 | ) | | | | | | | (858,765 | ) | | | (127,935 | ) | | | (44,718,381 | ) |
| | Cash Management Shares | | | (2,873 | ) | | | (1,058 | ) | | | (18,572 | ) | | | | | | | (45,290 | ) | | | (4,047 | ) | | | (640,681 | ) |
| | Premier Shares | | | (2 | ) | | | (1 | ) | | | (373 | ) | | | | | | | (27,987 | ) | | | (4,585 | ) | | | (1,394,940 | ) |
| | Resource Shares | | | — | | | | — | | | | — | | | | | | | | (13,937 | ) | | | (2,219 | ) | | | (395,702 | ) |
| | Class R6 Shares | | | — | | | | — | | | | — | | | | | | | | (14,872 | ) | | | (6,378 | ) | | | (942,873 | ) |
| | Drexel Hamilton Shares | | | — | | | | — | | | | — | | | | | | | | (501,393 | ) | | | (129,393 | ) | | | (7,956,702 | ) |
| | Total distributions to shareholders | | | (103,133 | ) | | | (155,933 | ) | | | (18,300,433 | ) | | | | | | | (25,713,797 | ) | | | (10,465,857 | ) | | | (1,179,992,741 | ) |
| | | | | | | | | | | | | | | | | | | | | | | | | | | | | | |
| | From share transactions | | | | | | | | | | | | | | | | | |
| | Proceeds from sales of shares | | | 3,684,312,016 | | | | 2,947,369,126 | | | | 11,735,557,360 | | | | | | | | 671,015,261,200 | | | | 271,552,310,234 | | | | 1,370,830,683,323 | |
| | Reinvestment of distributions | | | 73,743 | | | | 121,757 | | | | 14,243,623 | | | | | | | | 12,099,908 | | | | 5,233,911 | | | | 577,812,056 | |
| | Cost of shares redeemed | | | (4,685,694,191 | ) | | | (3,060,198,196 | ) | | | (9,361,084,182 | ) | | | | | | | (635,568,646,154 | ) | | | (321,675,383,431 | ) | | | (1,263,859,504,231 | ) |
| | Net increase (decrease) in net assets resulting from share transactions | | | (1,001,308,432 | ) | | | (112,707,313 | ) | | | 2,388,716,801 | | | | | | | | 35,458,714,954 | | | | (50,117,839,286 | ) | | | 107,548,991,148 | |
| | NET INCREASE (DECREASE) | | | (1,001,378,349 | ) | | | (112,729,180 | ) | | | 2,388,726,883 | | | | | | | | 35,459,519,401 | | | | (50,125,045,047 | ) | | | 107,550,691,480 | |
| | | | | | | | | | | | | | | | | | | | | | | | | | | | | | |
| | Net assets: | | | | | | | | | | | | | | | | | |
| | Beginning of period | | | 3,809,107,050 | | | | 3,921,836,230 | | | | 1,533,109,347 | | | | | | | | 168,080,263,160 | | | | 218,205,308,207 | | | | 110,654,616,727 | |
| | End of period | | $ | 2,807,728,701 | | | $ | 3,809,107,050 | | | $ | 3,921,836,230 | | | | | | | $ | 203,539,782,561 | | | $ | 168,080,263,160 | | | $ | 218,205,308,207 | |
| | † | | The Funds changed their fiscal year end from August 31 to November 30. |
| | |
| 44 | | The accompanying notes are an integral part of these financial statements. |
GOLDMAN SACHS FUNDS — FINANCIAL SQUARE FUNDS
Statements of Changes in Net Assets (continued)
| | | | | | | | | | | | | | | | | | | | | | | | | | | | | | |
| | | | | Money Market Fund | | | | | | Prime Obligations Fund | |
| | | | | For the
Six Months Ended
May 31, 2021
(Unaudited) | | | For the Period
Ended
November 30, 2020† | | | For the Fiscal
Year Ended
August 31, 2020 | | | | | | For the
Six Months Ended
May 31, 2021
(Unaudited) | | | For the Period
Ended
November 30, 2020† | | | For the Fiscal
Year Ended
August 31, 2020 | |
| | From operations: | | | | | | | | | | | | | | | | | |
| | | | | | | | |
| | Net investment income (loss) | | $ | 174,899 | | | $ | 91,314 | | | $ | 195,364,360 | | | | | | | $ | (161,690 | ) | | $ | (12,179 | ) | | $ | 79,211,502 | |
| | | | | | | | |
| | Net realized gain (loss) from investment transactions | | | 270,932 | | | | 125,878 | | | | (7,538,258 | ) | | | | | | | 160,188 | | | | 92,119 | | | | 604,703 | |
| | | | | | | | |
| | Net change in unrealized loss from investment transactions | | | (50,649 | ) | | | (461,899 | ) | | | (4,400,659 | ) | | | | | | | (28,909 | ) | | | (342,897 | ) | | | (1,341,419 | ) |
| | | | | | | | |
| | Net increase (decrease) in net assets resulting from operations | | | 395,182 | | | | (244,707 | ) | | | 183,425,443 | | | | | | | | (30,411 | ) | | | (262,957 | ) | | | 78,474,786 | |
| | | | | | | | | | | | | | | | | | | | | | | | | | | | | | |
| | Distributions to shareholders: | | | | | | | | | | | | | | | | | |
| | | | | | | | |
| | From distributable earnings: | | | | | | | | | | | | | | | | | | | | | | | | | | | | |
| | | | | | | | |
| | Institutional Shares | | | (842,653 | ) | | | (990,729 | ) | | | (193,310,637 | ) | | | | | | | (256,378 | ) | | | (619,875 | ) | | | (77,559,806 | ) |
| | | | | | | | |
| | Capital Shares | | | (876 | ) | | | (486 | ) | | | (135,656 | ) | | | | | | | (74 | ) | | | (39 | ) | | | (76,698 | ) |
| | | | | | | | |
| | Service Shares | | | (1 | ) | | | (2 | ) | | | (300 | ) | | | | | | | (1 | ) | | | (1 | ) | | | (6,973 | ) |
| | | | | | | | |
| | Preferred Shares | | | (14 | ) | | | (70 | ) | | | (42,411 | ) | | | | | | | (154 | ) | | | (152 | ) | | | (42,649 | ) |
| | | | | | | | |
| | Select Shares | | | (446 | ) | | | (278 | ) | | | (319,301 | ) | | | | | | | (2,271 | ) | | | (5,954 | ) | | | (789,855 | ) |
| | | | | | | | |
| | Administration Shares | | | (1,056 | ) | | | (146 | ) | | | (45,086 | ) | | | | | | | (3,194 | ) | | | (2,152 | ) | | | (444,229 | ) |
| | | | | | | | |
| | Cash Management Shares | | | — | | | | (1 | ) | | | (9 | ) | | | | | | | — | | | | (1 | ) | | | (9 | ) |
| | | | | | | | |
| | Premier Shares | | | — | | | | (1 | ) | | | (11 | ) | | | | | | | — | | | | (1 | ) | | | (11 | ) |
| | | | | | | | |
| | Resource Shares | | | — | | | | (1 | ) | | | (11 | ) | | | | | | | — | | | | (1 | ) | | | (11 | ) |
| | | | | | | | |
| | Drexel Hamilton Shares | | | — | | | | — | | | | — | | | | | | | | (10,788 | ) | | | (15,151 | ) | | | (222,875 | ) |
| | | | | | | | |
| | Total distributions to shareholders | | | (845,046 | ) | | | (991,714 | ) | | | (193,853,422 | ) | | | | | | | (272,860 | ) | | | (643,327 | ) | | | (79,143,116 | ) |
| | | | | | | | | | | | | | | | | | | | | | | | | | | | | | |
| | From share transactions | | | | | | | | | | | | | | | | | |
| | | | | | | | |
| | Proceeds from sales of shares | | | 9,332,039,008 | | | | 4,518,751,604 | | | | 78,480,208,605 | | | | | | | | 3,094,120,014 | | | | 1,598,365,808 | | | | 23,481,618,298 | |
| | | | | | | | |
| | Reinvestment of distributions | | | 600,178 | | | | 711,579 | | | | 103,679,725 | | | | | | | | 204,392 | | | | 449,261 | | | | 46,774,158 | |
| | | | | | | | |
| | Cost of shares redeemed | | | (9,594,404,868 | ) | | | (7,077,678,629 | ) | | | (89,738,454,628 | ) | | | | | | | (4,381,791,148 | ) | | | (3,433,760,005 | ) | | | (24,964,599,237 | ) |
| | | | | | | | |
| | Net decrease in net assets resulting from share transactions | | | (261,765,682 | ) | | | (2,558,215,446 | ) | | | (11,154,566,298 | ) | | | | | | | (1,287,466,742 | ) | | | (1,834,944,936 | ) | | | (1,436,206,781 | ) |
| | | | | | | | |
| | NET DECREASE | | | (262,215,546 | ) | | | (2,559,451,867 | ) | | | (11,164,994,277 | ) | | | | | | | (1,287,770,013 | ) | | | (1,835,851,220 | ) | | | (1,436,875,111 | ) |
| | | | | | | | | | | | | | | | | | | | | | | | | | | | | | |
| | Net assets: | | | | | | | | | | | | | | | | | |
| | | | | | | | |
| | Beginning of period | | | 4,060,387,993 | | | | 6,619,839,860 | | | | 17,784,834,137 | | | | | | | | 2,973,286,696 | | | | 4,809,137,916 | | | | 6,246,013,027 | |
| | | | | | | | |
| | End of period | | $ | 3,798,172,447 | | | $ | 4,060,387,993 | | | $ | 6,619,839,860 | | | | | | | $ | 1,685,516,683 | | | $ | 2,973,286,696 | | | $ | 4,809,137,916 | |
| | † | | The Funds changed their fiscal year end from August 31 to November 30. |
| | |
| The accompanying notes are an integral part of these financial statements. | | 45 |
GOLDMAN SACHS FUNDS — FINANCIAL SQUARE FUNDS
Statements of Changes in Net Assets (continued)
| | | | | | | | | | | | | | | | | | | | | | | | | | | | | | |
| | | | | Treasury Instruments Fund | | | | | | Treasury Obligations Fund | |
| | | | | For the
Six Months Ended
May 31, 2021
(Unaudited) | | | For the Period
Ended
November 30, 2020† | | | For the Fiscal
Year Ended
August 31, 2020 | | | | | | For the
Six Months Ended
May 31, 2021
(Unaudited) | | | For the Period
Ended
November 30, 2020† | | | For the Fiscal
Year Ended
August 31, 2020 | |
| | From operations: | | | | | | | | | | | | | | | | | |
| | Net investment income | | $ | 1,697,531 | | | $ | 741,423 | | | $ | 572,078,874 | | | | | | | $ | 3,759,688 | | | $ | 497,453 | | | $ | 153,535,660 | |
| | Net realized gain from investment transactions | | | 610,734 | | | | 129,652 | | | | 20,901,374 | | | | | | | | 1,143,357 | | | | 358,383 | | | | 6,731,060 | |
| | | | | | | | |
| | Net increase in net assets resulting from operations | | | 2,308,265 | | | | 871,075 | | | | 592,980,248 | | | | | | | | 4,903,045 | | | | 855,836 | | | | 160,266,720 | |
| | | | | | | | | | | | | | | | | | | | | | | | | | | | | | |
| | Distributions to shareholders: | | | | | | | | | | | | | | | | | |
| | From distributable earnings: | | | | | | | | | | | | | | | | | | | | | | | | | | | | |
| | Institutional Shares | | | (2,492,962 | ) | | | (1,172,410 | ) | | | (572,962,578 | ) | | | | | | | (4,368,044 | ) | | | (935,691 | ) | | | (132,077,257 | ) |
| | Capital Shares | | | (21,975 | ) | | | (9,741 | ) | | | (8,336,562 | ) | | | | | | | (41,227 | ) | | | (13,279 | ) | | | (3,428,674 | ) |
| | Service Shares | | | (9,532 | ) | | | (1,765 | ) | | | (176,314 | ) | | | | | | | (134,022 | ) | | | (40,579 | ) | | | (6,461,492 | ) |
| | Preferred Shares | | | (3,923 | ) | | | (1,871 | ) | | | (919,744 | ) | | | | | | | (58,215 | ) | | | (18,987 | ) | | | (3,661,923 | ) |
| | Select Shares | | | (6,203 | ) | | | (6,506 | ) | | | (1,704,555 | ) | | | | | | | (25,843 | ) | | | (8,500 | ) | | | (486,531 | ) |
| | Administration Shares | | | (51,689 | ) | | | (25,304 | ) | | | (13,043,114 | ) | | | | | | | (311,769 | ) | | | (91,693 | ) | | | (14,614,602 | ) |
| | Cash Management Shares | | | (363 | ) | | | (170 | ) | | | (53,744 | ) | | | | | | | (4,088 | ) | | | (633 | ) | | | (108,803 | ) |
| | Premier Shares | | | (4,363 | ) | | | (2,932 | ) | | | (1,019,410 | ) | | | | | | | (1,518 | ) | | | (571 | ) | | | (128,767 | ) |
| | Resource Shares | | | — | | | | (1 | ) | | | (6 | ) | | | | | | | — | | | | (1 | ) | | | (6 | ) |
| | Total distributions to shareholders | | | (2,591,010 | ) | | | (1,220,700 | ) | | | (598,216,027 | ) | | | | | | | (4,944,726 | ) | | | (1,109,934 | ) | | | (160,968,055 | ) |
| | | | | | | | | | | | | | | | | | | | | | | | | | | | | | |
| | From share transactions | | | | | | | | | | | | | | | | | |
| | Proceeds from sales of shares | | | 137,044,887,891 | | | | 60,196,183,321 | | | | 355,916,515,357 | | | | | | | | 195,860,617,038 | | | | 66,608,512,585 | | | | 255,687,212,214 | |
| | Reinvestment of distributions | | | 1,499,466 | | | | 700,269 | | | | 325,529,187 | | | | | | | | 2,310,414 | | | | 429,229 | | | | 66,582,114 | |
| | Cost of shares redeemed | | | (119,927,233,506 | ) | | | (68,435,569,288 | ) | | | (323,780,571,442 | ) | | | | | | | (200,160,868,828 | ) | | | (54,621,016,772 | ) | | | (245,417,780,026 | ) |
| | | | | | | | |
| | Net increase (decrease) in net assets resulting from share transactions | | | 17,119,153,851 | | | | (8,238,685,698 | ) | | | 32,461,473,102 | | | | | | | | (4,297,941,376 | ) | | | 11,987,925,042 | | | | 10,336,014,302 | |
| | NET INCREASE (DECREASE) | | | 17,118,871,106 | | | | (8,239,035,323 | ) | | | 32,456,237,323 | | | | | | | | (4,297,983,057 | ) | | | 11,987,670,945 | | | | 10,335,312,967 | |
| | | | | | | | | | | | | | | | | | | | | | | | | | | | | | |
| | Net assets: | | | | | | | | | | | | | | | | | |
| | Beginning of period | | | 78,915,758,089 | | | | 87,154,793,412 | | | | 54,698,556,089 | | | | | | | | 38,885,498,788 | | | | 26,897,827,843 | | | | 16,562,514,876 | |
| | End of period | | $ | 96,034,629,195 | | | $ | 78,915,758,089 | | | $ | 87,154,793,412 | | | | | | | $ | 34,587,515,731 | | | $ | 38,885,498,788 | | | $ | 26,897,827,843 | |
| | † | | The Funds changed their fiscal year end from August 31 to November 30. |
| | |
| 46 | | The accompanying notes are an integral part of these financial statements. |
GOLDMAN SACHS FUNDS — FINANCIAL SQUARE FUNDS
Statements of Changes in Net Assets (continued)
| | | | | | | | | | | | | | |
| | | | | Treasury Solutions Fund | | | | |
| | | | | For the
Six Months Ended
May 31, 2021
(Unaudited) | | | For the Period
Ended
November 30, 2020† | | | For the Fiscal
Year Ended
August 31, 2020 | |
| | From operations: | | | | | |
| | | | |
| | Net investment income | | $ | 42,466 | | | $ | 63,625 | | | $ | 84,944,805 | |
| | | | |
| | Net realized gain from investment transactions | | | 269,891 | | | | 14,950 | | | | 6,294,118 | |
| | | | |
| | Net increase in net assets resulting from operations | | | 312,357 | | | | 78,575 | | | | 91,238,923 | |
| | | | | | | | | | | | | | |
| | Distributions to shareholders: | | | | | |
| | | | |
| | From distributable earnings: | | | | | | | | | | | | |
| | | | |
| | Institutional Shares | | | (315,146 | ) | | | (156,692 | ) | | | (84,516,483 | ) |
| | | | |
| | Capital Shares | | | (7,064 | ) | | | (3,278 | ) | | | (1,276,222 | ) |
| | | | |
| | Service Shares | | | (8,047 | ) | | | (3,430 | ) | | | (810,330 | ) |
| | | | |
| | Preferred Shares | | | (1,747 | ) | | | (842 | ) | | | (454,175 | ) |
| | | | |
| | Select Shares | | | (177 | ) | | | (101 | ) | | | (93,299 | ) |
| | | | |
| | Administration Shares | | | (14,084 | ) | | | (7,842 | ) | | | (2,714,596 | ) |
| | | | |
| | Cash Management Shares | | | (9,264 | ) | | | (4,387 | ) | | | (1,122,646 | ) |
| | | | |
| | Premier Shares | | | (2,395 | ) | | | (1,520 | ) | | | (950,305 | ) |
| | | | |
| | Resource Shares | | | — | | | | (1 | ) | | | (6 | ) |
| | | | |
| | Total distributions to shareholders | | | (357,924 | ) | | | (178,093 | ) | | | (91,938,062 | ) |
| | | | | | | | | | | | | | |
| | From share transactions | | | | | |
| | | | |
| | Proceeds from sales of shares | | | 18,728,999,476 | | | | 7,511,013,555 | | | | 65,182,195,146 | |
| | | | |
| | Reinvestment of distributions | | | 210,385 | | | | 109,544 | | | | 57,158,747 | |
| | | | |
| | Cost of shares redeemed | | | (20,293,805,826 | ) | | | (8,356,792,865 | ) | | | (60,968,545,207 | ) |
| | | | |
| | Net increase (decrease) in net assets resulting from share transactions | | | (1,564,595,965 | ) | | | (845,669,766 | ) | | | 4,270,808,686 | |
| | | | |
| | NET INCREASE (DECREASE) | | | (1,564,641,532 | ) | | | (845,769,284 | ) | | | 4,270,109,547 | |
| | | | | | | | | | | | | | |
| | Net assets: | | | | | |
| | | | |
| | Beginning of period | | | 12,011,678,081 | | | | 12,857,447,365 | | | | 8,587,337,818 | |
| | | | |
| | End of period | | $ | 10,447,036,549 | | | $ | 12,011,678,081 | | | $ | 12,857,447,365 | |
| | † | | The Funds changed their fiscal year end from August 31 to November 30. |
| | |
| The accompanying notes are an integral part of these financial statements. | | 47 |
Financial Highlights
Selected Data for a Share Outstanding Throughout Each Period
| | | | | | | | | | | | | | | | | | | | | | | | | | | | | | |
| | | Financial Square Federal Instruments Fund —
Institutional Shares | | Six Months Ended
May 31, 2021
(Unaudited) | | | For the
Period Ended
November 30, 2020† | | | Year Ended August 31, | | | Period Ended
August 31, 2016* | |
| | 2020 | | | 2019 | | | 2018 | | | 2017 | |
| | Per Share Data: | | | | | | | | | | | | | | | | | | | | | | | | | | | | |
| | | | | | | | |
| | Net asset value, beginning of period | | $ | 1.00 | | | $ | 1.00 | | | $ | 1.00 | | | $ | 1.00 | | | $ | 1.00 | | | $ | 1.00 | | | $ | 1.00 | |
| | | | | | | | |
| | Net investment income (loss)(a) | | | — | (b) | | | — | (b) | | | 0.007 | | | | 0.021 | | | | 0.013 | | | | 0.005 | | | | 0.002 | |
| | | | | | | | |
| | Net realized gain | | | — | (b) | | | — | (b) | | | 0.003 | | | | 0.001 | | | | — | (b) | | | — | (b) | | | — | (b) |
| | | | | | | | |
| | Total from investment operations | | | — | (b) | | | — | (b) | | | 0.010 | | | | 0.022 | | | | 0.013 | | | | 0.005 | | | | 0.002 | |
| | | | | | | | |
| | Distributions to shareholders from net investment income | | | — | (b) | | | — | (b) | | | (0.010 | ) | | | (0.022 | ) | | | (0.013 | ) | | | (0.005 | ) | | | (0.002 | ) |
| | | | | | | | |
| | Distributions to shareholders from net realized gains | | | — | (b) | | | — | (b) | | | — | (b) | | | — | (b) | | | — | (b) | | | — | (b) | | | — | (b) |
| | | | | | | | |
| | Total distributions(c) | | | — | (b) | | | — | (b) | | | (0.010 | ) | | | (0.022 | ) | | | (0.013 | ) | | | (0.005 | ) | | | (0.002 | ) |
| | | | | | | | |
| | Net asset value, end of period | | $ | 1.00 | | | $ | 1.00 | | | $ | 1.00 | | | $ | 1.00 | | | $ | 1.00 | | | $ | 1.00 | | | $ | 1.00 | |
| | | | | | | | |
| | Total return(d) | | | — | %(e) | | | — | %(e) | | | 0.99 | % | | | 2.18 | % | | | 1.34 | % | | | 0.52 | % | | | 0.16 | % |
| | | | | | | | |
| | Net assets, end of period (in 000’s) | | $ | 2,639,942 | | | $ | 3,639,742 | | | $ | 3,761,104 | | | $ | 1,453,995 | | | $ | 508,647 | | | $ | 556,458 | | | $ | 577,395 | |
| | | | | | | | |
| | Ratio of net expenses to average net assets | | | 0.11 | %(f) | | | 0.14 | %(f) | | | 0.15 | % | | | 0.18 | % | | | 0.20 | % | | | 0.20 | % | | | 0.20 | %(f) |
| | | | | | | | |
| | Ratio of total expenses to average net assets | | | 0.19 | %(f) | | | 0.21 | %(f) | | | 0.21 | % | | | 0.22 | % | | | 0.25 | % | | | 0.28 | % | | | 0.39 | %(f) |
| | | | | | | | |
| | Ratio of net investment income (loss) to average net assets | | | — | %(e)(f) | | | 0.01 | %(f) | | | 0.67 | % | | | 2.15 | % | | | 1.33 | % | | | 0.51 | % | | | 0.19 | %(f) |
| | † | | The Fund changed its fiscal year end from August 31 to November 30. |
| | * | | Commenced operations on October 30, 2015. |
| | (a) | | Calculated based on the average shares outstanding methodology. |
| | (b) | | Amount is less than $0.0005 per share. |
| | (c) | | Distributions may not coincide with the current year net investment income or net realized gains as distributions may be paid from current or prior year earnings. |
| | (d) | | Assumes reinvestment of all distributions. Returns do not reflect the deduction of taxes that a shareholder would pay on Fund distributions. Total returns for periods less than one full year are not annualized. |
| | (e) | | Amount is less than 0.005%. |
| | | | | | | | | | | | | | | | | | | | | | | | | | | | | | |
| | | Financial Square Federal Instruments Fund — Capital Shares | | Six Months Ended
May 31, 2021
(Unaudited) | | | For the
Period Ended
November 30, 2020† | | | Year Ended August 31, | | | Period Ended
August 31, 2016* | |
| | 2020 | | | 2019 | | | 2018 | | | 2017 | |
| | Per Share Data: | | | | | | | | | | | | | | | | | | | | | | | | | | | | |
| | | | | | | | |
| | Net asset value, beginning of period | | $ | 1.00 | | | $ | 1.00 | | | $ | 1.00 | | | $ | 1.00 | | | $ | 1.00 | | | $ | 1.00 | | | $ | 1.00 | |
| | | | | | | | |
| | Net investment income (loss)(a) | | | — | (b) | | | — | (b) | | | 0.007 | | | | 0.019 | | | | 0.012 | | | | 0.003 | | | | — | (b) |
| | | | | | | | |
| | Net realized gain | | | — | (b) | | | — | (b) | | | 0.002 | | | | 0.001 | | | | — | (b) | | | 0.001 | | | | — | (b) |
| | | | | | | | |
| | Total from investment operations | | | — | (b) | | | — | (b) | | | 0.009 | | | | 0.020 | | | | 0.012 | | | | 0.004 | | | | — | (b) |
| | | | | | | | |
| | Distributions to shareholders from net investment income | | | — | (b) | | | — | (b) | | | (0.009 | ) | | | (0.020 | ) | | | (0.012 | ) | | | (0.004 | ) | | | — | (b) |
| | | | | | | | |
| | Distributions to shareholders from net realized gains | | | — | (b) | | | — | (b) | | | — | (b) | | | — | (b) | | | — | (b) | | | — | (b) | | | — | (b) |
| | | | | | | | |
| | Total distributions(c) | | | — | (b) | | | — | (b) | | | (0.009 | ) | | | (0.020 | ) | | | (0.012 | ) | | | (0.004 | ) | | | — | (b) |
| | | | | | | | |
| | Net asset value, end of period | | $ | 1.00 | | | $ | 1.00 | | | $ | 1.00 | | | $ | 1.00 | | | $ | 1.00 | | | $ | 1.00 | | | $ | 1.00 | |
| | | | | | | | |
| | Total return(d) | | | — | %(e) | | | — | %(e) | | | 0.85 | % | | | 2.03 | % | | | 1.19 | % | | | 0.37 | % | | | 0.05 | % |
| | | | | | | | |
| | Net assets, end of period (in 000’s) | | $ | 527 | | | $ | 3,267 | | | $ | 1,135 | | | $ | 626 | | | $ | 5,136 | | | $ | 16,147 | | | $ | 50 | |
| | | | | | | | |
| | Ratio of net expenses to average net assets | | | 0.11 | %(f) | | | 0.15 | %(f) | | | 0.28 | % | | | 0.33 | % | | | 0.35 | % | | | 0.35 | % | | | 0.33 | %(f) |
| | | | | | | | |
| | Ratio of total expenses to average net assets | | | 0.34 | %(f) | | | 0.36 | %(f) | | | 0.36 | % | | | 0.37 | % | | | 0.40 | % | | | 0.43 | % | | | 0.54 | %(f) |
| | | | | | | | |
| | Ratio of net investment income (loss) to average net assets | | | — | %(e)(f) | | | (0.01 | )%(f) | | | 0.74 | % | | | 1.90 | % | | | 1.04 | % | | | 0.31 | % | | | 0.04 | %(f) |
| | † | | The Fund changed its fiscal year end from August 31 to November 30. |
| | * | | Commenced operations on October 30, 2015. |
| | (a) | | Calculated based on the average shares outstanding methodology. |
| | (b) | | Amount is less than $0.0005 per share. |
| | (c) | | Distributions may not coincide with the current year net investment income or net realized gains as distributions may be paid from current or prior year earnings. |
| | (d) | | Assumes reinvestment of all distributions. Returns do not reflect the deduction of taxes that a shareholder would pay on Fund distributions. Total returns for periods less than one full year are not annualized. |
| | (e) | | Amount is less than 0.005%. |
| | |
| 48 | | The accompanying notes are an integral part of these financial statements. |
Financial Highlights (continued)
Selected Data for a Share Outstanding Throughout Each Period
| | | | | | | | | | | | | | | | | | | | | | | | | | | | | | |
| | | Financial Square Federal Instruments Fund —
Service Shares | | Six Months Ended
May 31, 2021
(Unaudited) | | | For the
Period Ended
November 30, 2020† | | | Year Ended August 31, | | | Period Ended
August 31, 2016* | |
| | 2020 | | | 2019 | | | 2018 | | | 2017 | |
| | Per Share Data: | | | | | | | | | | | | | | | | | | | | | | | | | | | | |
| | | | | | | | |
| | Net asset value, beginning of period | | $ | 1.00 | | | $ | 1.00 | | | $ | 1.00 | | | $ | 1.00 | | | $ | 1.00 | | | $ | 1.00 | | | $ | 1.00 | |
| | | | | | | | |
| | Net investment income (loss)(a) | | | — | (b) | | | — | (b) | | | 0.006 | | | | 0.016 | | | | 0.008 | | | | 0.001 | | | | — | (b) |
| | | | | | | | |
| | Net realized gain | | | — | (b) | | | — | (b) | | | — | (b) | | | 0.001 | | | | — | (b) | | | — | (b) | | | — | (b) |
| | | | | | | | |
| | Total from investment operations | | | — | (b) | | | — | (b) | | | 0.006 | | | | 0.017 | | | | 0.008 | | | | 0.001 | | | | — | (b) |
| | | | | | | | |
| | Distributions to shareholders from net investment income | | | — | (b) | | | — | (b) | | | (0.006 | ) | | | (0.017 | ) | | | (0.008 | ) | | | (0.001 | ) | | | — | (b) |
| | | | | | | | |
| | Distributions to shareholders from net realized gains | | | — | (b) | | | — | (b) | | | — | (b) | | | — | (b) | | | — | (b) | | | — | (b) | | | — | (b) |
| | | | | | | | |
| | Total distributions(c) | | | — | (b) | | | — | (b) | | | (0.006 | ) | | | (0.017 | ) | | | (0.008 | ) | | | (0.001 | ) | | | — | (b) |
| | | | | | | | |
| | Net asset value, end of period | | $ | 1.00 | | | $ | 1.00 | | | $ | 1.00 | | | $ | 1.00 | | | $ | 1.00 | | | $ | 1.00 | | | $ | 1.00 | |
| | | | | | | | |
| | Total return(d) | | | — | %(e) | | | — | %(e) | | | 0.63 | % | | | 1.67 | % | | | 0.84 | % | | | 0.10 | % | | | 0.01 | % |
| | | | | | | | |
| | Net assets, end of period (in 000’s) | | $ | 10,564 | | | $ | 10,277 | | | $ | 11,490 | | | $ | 11,493 | | | $ | 11,003 | | | $ | 15,129 | | | $ | 14,949 | |
| | | | | | | | |
| | Ratio of net expenses to average net assets | | | 0.11 | %(f) | | | 0.15 | %(f) | | | 0.50 | % | | | 0.68 | % | | | 0.70 | % | | | 0.62 | % | | | 0.39 | %(f) |
| | | | | | | | |
| | Ratio of total expenses to average net assets | | | 0.69 | %(f) | | | 0.71 | %(f) | | | 0.71 | % | | | 0.72 | % | | | 0.75 | % | | | 0.78 | % | | | 0.89 | %(f) |
| | | | | | | | |
| | Ratio of net investment income (loss) to average net assets | | | — | %(e)(f) | | | (0.01 | )%(f) | | | 0.57 | % | | | 1.64 | % | | | 0.83 | % | | | 0.09 | % | | | (0.01 | )%(f) |
| | † | | The Fund changed its fiscal year end from August 31 to November 30. |
| | * | | Commenced operations on October 30, 2015. |
| | (a) | | Calculated based on the average shares outstanding methodology. |
| | (b) | | Amount is less than $0.0005 per share. |
| | (c) | | Distributions may not coincide with the current year net investment income or net realized gains as distributions may be paid from current or prior year earnings. |
| | (d) | | Assumes reinvestment of all distributions. Returns do not reflect the deduction of taxes that a shareholder would pay on Fund distributions. Total returns for periods less than one full year are not annualized. |
| | (e) | | Amount is less than 0.005%. |
| | | | | | | | | | | | | | | | | | | | | | | | | | | | | | |
| | | Financial Square Federal Instruments Fund —
Preferred Shares | | Six Months Ended
May 31, 2021
(Unaudited) | | | For the
Period Ended
November 30, 2020† | | | Year Ended August 31, | | | Period Ended
August 31, 2016* | |
| | 2020 | | | 2019 | | | 2018 | | | 2017 | |
| | Per Share Data: | | | | | | | | | | | | | | | | | | | | | | | | | | | | |
| | | | | | | | |
| | Net asset value, beginning of period | | $ | 1.00 | | | $ | 1.00 | | | $ | 1.00 | | | $ | 1.00 | | | $ | 1.00 | | | $ | 1.00 | | | $ | 1.00 | |
| | | | | | | | |
| | Net investment income (loss)(a) | | | — | (b) | | | — | (b) | | | 0.004 | | | | 0.021 | | | | 0.012 | | | | 0.004 | | | | 0.001 | |
| | | | | | | | |
| | Net realized gain | | | — | (b) | | | — | (b) | | | 0.005 | | | | — | (b) | | | — | (b) | | | — | (b) | | | — | (b) |
| | | | | | | | |
| | Total from investment operations | | | — | (b) | | | — | (b) | | | 0.009 | | | | 0.021 | | | | 0.012 | | | | 0.004 | | | | 0.001 | |
| | | | | | | | |
| | Distributions to shareholders from net investment income | | | — | (b) | | | — | (b) | | | (0.009 | ) | | | (0.021 | ) | | | (0.012 | ) | | | (0.004 | ) | | | (0.001 | ) |
| | | | | | | | |
| | Distributions to shareholders from net realized gains | | | — | (b) | | | — | (b) | | | — | (b) | | | — | (b) | | | — | (b) | | | — | (b) | | | — | (b) |
| | | | | | | | |
| | Total distributions(c) | | | — | (b) | | | — | (b) | | | (0.009 | ) | | | (0.021 | ) | | | (0.012 | ) | | | (0.004 | ) | | | (0.001 | ) |
| | | | | | | | |
| | Net asset value, end of period | | $ | 1.00 | | | $ | 1.00 | | | $ | 1.00 | | | $ | 1.00 | | | $ | 1.00 | | | $ | 1.00 | | | $ | 1.00 | |
| | | | | | | | |
| | Total return(d) | | | — | %(e) | | | — | %(e) | | | 0.89 | % | | | 2.08 | % | | | 1.24 | % | | | 0.42 | % | | | 0.08 | % |
| | | | | | | | |
| | Net assets, end of period (in 000’s) | | $ | 2,807 | | | $ | 6,019 | | | $ | 22,779 | | | $ | 5,536 | | | $ | 2,386 | | | $ | 50 | | | $ | 50 | |
| | | | | | | | |
| | Ratio of net expenses to average net assets | | | 0.11 | %(f) | | | 0.15 | %(f) | | | 0.24 | % | | | 0.28 | % | | | 0.30 | % | | | 0.30 | % | | | 0.29 | %(f) |
| | | | | | | | |
| | Ratio of total expenses to average net assets | | | 0.29 | %(f) | | | 0.31 | %(f) | | | 0.31 | % | | | 0.32 | % | | | 0.35 | % | | | 0.38 | % | | | 0.49 | %(f) |
| | | | | | | | |
| | Ratio of net investment income (loss) to average net assets | | | — | %(e)(f) | | | (0.01 | )%(f) | | | 0.39 | % | | | 2.09 | % | | | 1.43 | % | | | 0.41 | % | | | 0.08 | %(f) |
| | † | | The Fund changed its fiscal year end from August 31 to November 30. |
| | * | | Commenced operations on October 30, 2015. |
| | (a) | | Calculated based on the average shares outstanding methodology. |
| | (b) | | Amount is less than $0.0005 per share. |
| | (c) | | Distributions may not coincide with the current year net investment income or net realized gains as distributions may be paid from current or prior year earnings. |
| | (d) | | Assumes reinvestment of all distributions. Returns do not reflect the deduction of taxes that a shareholder would pay on Fund distributions. Total returns for periods less than one full year are not annualized. |
| | (e) | | Amount is less than 0.005%. |
| | |
| The accompanying notes are an integral part of these financial statements. | | 49 |
Financial Highlights (continued)
Selected Data for a Share Outstanding Throughout Each Period
| | | | | | | | | | | | | | | | | | | | | | | | | | | | | | |
| | | Financial Square Federal Instruments Fund —
Select Shares | | Six Months Ended
May 31, 2021
(Unaudited) | | | For the
Period Ended
November 30, 2020† | | | Year Ended August 31, | | | Period Ended
August 31, 2016* | |
| | 2020 | | | 2019 | | | 2018 | | | 2017 | |
| | Per Share Data: | | | | | | | | | | | | | | | | | | | | | | | | | | | | |
| | | | | | | | |
| | Net asset value, beginning of period | | $ | 1.00 | | | $ | 1.00 | | | $ | 1.00 | | | $ | 1.00 | | | $ | 1.00 | | | $ | 1.00 | | | $ | 1.00 | |
| | | | | | | | |
| | Net investment income (loss)(a) | | | — | (b) | | | — | | | | 0.010 | | | | 0.021 | | | | 0.013 | | | | 0.005 | | | | 0.001 | |
| | | | | | | | |
| | Net realized gain | | | — | (b) | | | — | (b) | | | — | (b) | | | — | (b) | | | — | (b) | | | — | (b) | | | — | (b) |
| | | | | | | | |
| | Total from investment operations | | | — | (b) | | | — | (b) | | | 0.010 | | | | 0.021 | | | | 0.013 | | | | 0.005 | | | | 0.001 | |
| | | | | | | | |
| | Distributions to shareholders from net investment income | | | — | (b) | | | — | (b) | | | (0.010 | ) | | | (0.021 | ) | | | (0.013 | ) | | | (0.005 | ) | | | (0.001 | ) |
| | | | | | | | |
| | Distributions to shareholders from net realized gains | | | — | (b) | | | — | (b) | | | — | (b) | | | — | (b) | | | — | (b) | | | — | (b) | | | — | (b) |
| | | | | | | | |
| | Total distributions(c) | | | — | (b) | | | — | (b) | | | (0.010 | ) | | | (0.021 | ) | | | (0.013 | ) | | | (0.005 | ) | | | (0.001 | ) |
| | | | | | | | |
| | Net asset value, end of period | | $ | 1.00 | | | $ | 1.00 | | | $ | 1.00 | | | $ | 1.00 | | | $ | 1.00 | | | $ | 1.00 | | | $ | 1.00 | |
| | | | | | | | |
| | Total return(d) | | | — | %(e) | | | — | %(e) | | | 0.96 | % | | | 2.15 | % | | | 1.31 | % | | | 0.49 | % | | | 0.13 | % |
| | | | | | | | |
| | Net assets, end of period (in 000’s) | | $ | 49 | | | $ | 49 | | | $ | 49 | | | $ | 49 | | | $ | 48 | | | $ | 47 | | | $ | 50 | |
| | | | | | | | |
| | Ratio of net expenses to average net assets | | | 0.11 | %(f) | | | 0.15 | %(f) | | | 0.18 | % | | | 0.21 | % | | | 0.23 | % | | | 0.23 | % | | | 0.23 | %(f) |
| | | | | | | | |
| | Ratio of total expenses to average net assets | | | 0.22 | %(f) | | | 0.24 | %(f) | | | 0.24 | % | | | 0.25 | % | | | 0.28 | % | | | 0.31 | % | | | 0.42 | %(f) |
| | | | | | | | |
| | Ratio of net investment income (loss) to average net assets | | | — | %(e)(f) | | | — | %(e)(f) | | | 0.91 | % | | | 2.11 | % | | | 1.30 | % | | | 0.48 | % | | | 0.14 | %(f) |
| | † | | The Fund changed its fiscal year end from August 31 to November 30. |
| | * | | Commenced operations on October 30, 2015. |
| | (a) | | Calculated based on the average shares outstanding methodology. |
| | (b) | | Amount is less than $0.0005 per share. |
| | (c) | | Distributions may not coincide with the current year net investment income or net realized gains as distributions may be paid from current or prior year earnings. |
| | (d) | | Assumes reinvestment of all distributions. Returns do not reflect the deduction of taxes that a shareholder would pay on Fund distributions. Total returns for periods less than one full year are not annualized. |
| | (e) | | Amount is less than 0.005%. |
| | | | | | | | | | | | | | | | | | | | | | | | | | | | | | |
| | | Financial Square Federal Instruments Fund —
Administration Shares | | Six Months Ended
May 31, 2021
(Unaudited) | | | For the
Period Ended
November 30, 2020† | | | Year Ended August 31, | | | Period Ended
August 31, 2016* | |
| | 2020 | | | 2019 | | | 2018 | | | 2017 | |
| | Per Share Data: | | | | | | | | | | | | | | | | | | | | | | | | | | | | |
| | | | | | | | |
| | Net asset value, beginning of period | | $ | 1.00 | | | $ | 1.00 | | | $ | 1.00 | | | $ | 1.00 | | | $ | 1.00 | | | $ | 1.00 | | | $ | 1.00 | |
| | | | | | | | |
| | Net investment income (loss)(a) | | | — | (b) | | | — | (b) | | | 0.007 | | | | 0.019 | | | | 0.011 | | | | 0.003 | | | | — | (b) |
| | | | | | | | |
| | Net realized gain | | | — | (b) | | | — | (b) | | | 0.001 | | | | — | (b) | | | — | (b) | | | — | (b) | | | — | (b) |
| | | | | | | | |
| | Total from investment operations | | | — | (b) | | | — | (b) | | | 0.008 | | | | 0.019 | | | | 0.011 | | | | 0.003 | | | | — | (b) |
| | | | | | | | |
| | Distributions to shareholders from net investment income | | | — | (b) | | | — | (b) | | | (0.008 | ) | | | (0.019 | ) | | | (0.011 | ) | | | (0.003 | ) | | | — | (b) |
| | | | | | | | |
| | Distributions to shareholders from net realized gains | | | — | (b) | | | — | (b) | | | — | (b) | | | — | (b) | | | — | (b) | | | — | (b) | | | — | (b) |
| | | | | | | | |
| | Total distributions(c) | | | — | (b) | | | — | (b) | | | (0.008 | ) | | | (0.019 | ) | | | (0.011 | ) | | | (0.003 | ) | | | — | (b) |
| | | | | | | | |
| | Net asset value, end of period | | $ | 1.00 | | | $ | 1.00 | | | $ | 1.00 | | | $ | 1.00 | | | $ | 1.00 | | | $ | 1.00 | | | $ | 1.00 | |
| | | | | | | | |
| | Total return(d) | | | — | %(e) | | | — | %(e) | | | 0.78 | % | | | 1.93 | % | | | 1.09 | % | | | 0.27 | % | | | 0.01 | % |
| | | | | | | | |
| | Net assets, end of period (in 000’s) | | $ | 57,085 | | | $ | 76,144 | | | $ | 73,011 | | | $ | 61,267 | | | $ | 59,447 | | | $ | 50,768 | | | $ | 43,835 | |
| | | | | | | | |
| | Ratio of net expenses to average net assets | | | 0.11 | %(f) | | | 0.15 | %(f) | | | 0.35 | % | | | 0.43 | % | | | 0.45 | % | | | 0.45 | % | | | 0.39 | %(f) |
| | | | | | | | |
| | Ratio of total expenses to average net assets | | | 0.44 | %(f) | | | 0.46 | %(f) | | | 0.46 | % | | | 0.47 | % | | | 0.50 | % | | | 0.53 | % | | | 0.64 | %(f) |
| | | | | | | | |
| | Ratio of net investment income (loss) to average net assets | | | — | %(e)(f) | | | (0.01 | )%(f) | | | 0.69 | % | | | 1.89 | % | | | 1.08 | % | | | 0.26 | % | | | (0.01 | )%(f) |
| | † | | The Fund changed its fiscal year end from August 31 to November 30. |
| | * | | Commenced operations on October 30, 2015. |
| | (a) | | Calculated based on the average shares outstanding methodology. |
| | (b) | | Amount is less than $0.0005 per share. |
| | (c) | | Distributions may not coincide with the current year net investment income or net realized gains as distributions may be paid from current or prior year earnings. |
| | (d) | | Assumes reinvestment of all distributions. Returns do not reflect the deduction of taxes that a shareholder would pay on Fund distributions. Total returns for periods less than one full year are not annualized. |
| | (e) | | Amount is less than 0.005%. |
| | |
| 50 | | The accompanying notes are an integral part of these financial statements. |
Financial Highlights (continued)
Selected Data for a Share Outstanding Throughout Each Period
| | | | | | | | | | | | | | | | | | | | | | | | | | | | | | |
| | | Financial Square Federal Instruments Fund — Cash
Management Shares | | Six Months Ended
May 31, 2021
(Unaudited) | | | For the
Period Ended
November 30, 2020† | | | Year Ended August 31, | | | Period Ended
August 31, 2016* | |
| | 2020 | | | 2019 | | | 2018 | | | 2017 | |
| | Per Share Data: | | | | | | | | | | | | | | | | | | | | | | | | | | | | |
| | | | | | | | |
| | Net asset value, beginning of period | | $ | 1.00 | | | $ | 1.00 | | | $ | 1.00 | | | $ | 1.00 | | | $ | 1.00 | | | $ | 1.00 | | | $ | 1.00 | |
| | | | | | | | |
| | Net investment income (loss)(a) | | | — | (b) | | | — | (b) | | | 0.002 | | | | 0.013 | | | | 0.005 | | | | — | (b) | | | — | (b) |
| | | | | | | | |
| | Net realized gain | | | — | (b) | | | — | (b) | | | 0.003 | | | | 0.001 | | | | — | (b) | | | — | (b) | | | — | (b) |
| | | | | | | | |
| | Total from investment operations | | | — | (b) | | | — | (b) | | | 0.005 | | | | 0.014 | | | | 0.005 | | | | — | (b) | | | — | (b) |
| | | | | | | | |
| | Distributions to shareholders from net investment income | | | — | (b) | | | — | (b) | | | (0.005 | ) | | | (0.014 | ) | | | (0.005 | ) | | | — | (b) | | | — | (b) |
| | | | | | | | |
| | Distributions to shareholders from net realized gains | | | — | (b) | | | — | (b) | | | — | (b) | | | — | (b) | | | — | (b) | | | — | (b) | | | — | (b) |
| | | | | | | | |
| | Total distributions(c) | | | — | (b) | | | — | (b) | | | (0.005 | ) | | | (0.014 | ) | | | (0.005 | ) | | | — | (b) | | | — | (b) |
| | | | | | | | |
| | Net asset value, end of period | | $ | 1.00 | | | $ | 1.00 | | | $ | 1.00 | | | $ | 1.00 | | | $ | 1.00 | | | $ | 1.00 | | | $ | 1.00 | |
| | | | | | | | |
| | Total return(d) | | | — | %(e) | | | — | %(e) | | | 0.46 | % | | | 1.37 | % | | | 0.53 | % | | | 0.01 | % | | | 0.01 | % |
| | | | | | | | |
| | Net assets, end of period (in 000’s) | | $ | 96,702 | | | $ | 73,555 | | | $ | 52,216 | | | $ | 92 | | | $ | 50 | | | $ | 50 | | | $ | 50 | |
| | | | | | | | |
| | Ratio of net expenses to average net assets | | | 0.11 | %(f) | | | 0.15 | %(f) | | | 0.45 | % | | | 0.98 | % | | | 1.00 | % | | | 0.71 | % | | | 0.38 | %(f) |
| | | | | | | | |
| | Ratio of total expenses to average net assets | | | 0.99 | %(f) | | | 1.01 | %(f) | | | 1.01 | % | | | 1.02 | % | | | 1.05 | % | | | 1.08 | % | | | 1.19 | %(f) |
| | | | | | | | |
| | Ratio of net investment income (loss) to average net assets | | | — | %(e)(f) | | | (0.01 | )%(f) | | | 0.12 | % | | | 1.34 | % | | | 0.53 | % | | | 0.01 | % | | | — | %(e)(f) |
| | † | | The Fund changed its fiscal year end from August 31 to November 30. |
| | * | | Commenced operations on October 30, 2015. |
| | (a) | | Calculated based on the average shares outstanding methodology. |
| | (b) | | Amount is less than $0.0005 per share. |
| | (c) | | Distributions may not coincide with the current year net investment income or net realized gains as distributions may be paid from current or prior year earnings. |
| | (d) | | Assumes reinvestment of all distributions. Returns do not reflect the deduction of taxes that a shareholder would pay on Fund distributions. Total returns for periods less than one full year are not annualized. |
| | (e) | | Amount is less than 0.005%. |
| | | | | | | | | | | | | | | | | | | | | | | | | | | | | | |
| | | Financial Square Federal Instruments Fund —
Premier Shares | | Six Months Ended
May 31, 2021
(Unaudited) | | | For the
Period Ended
November 30, 2020† | | | Year Ended August 31, | | | Period Ended
August 31, 2016* | |
| | 2020 | | | 2019 | | | 2018 | | | 2017 | |
| | Per Share Data: | | | | | | | | | | | | | | | | | | | | | | | | | | | | |
| | | | | | | | |
| | Net asset value, beginning of period | | $ | 1.00 | | | $ | 1.00 | | | $ | 1.00 | | | $ | 1.00 | | | $ | 1.00 | | | $ | 1.00 | | | $ | 1.00 | |
| | | | | | | | |
| | Net investment income (loss)(a) | | | — | (b) | | | — | | | | 0.007 | | | | 0.018 | | | | 0.010 | | | | 0.002 | | | | — | (b) |
| | | | | | | | |
| | Net realized gain | | | — | (b) | | | — | (b) | | | — | (b) | | | — | (b) | | | — | (b) | | | — | (b) | | | — | (b) |
| | | | | | | | |
| | Total from investment operations | | | — | (b) | | | — | (b) | | | 0.007 | | | | 0.018 | | | | 0.010 | | | | 0.002 | | | | — | (b) |
| | | | | | | | |
| | Distributions to shareholders from net investment income | | | — | (b) | | | — | (b) | | | (0.007 | ) | | | (0.018 | ) | | | (0.010 | ) | | | (0.002 | ) | | | — | (b) |
| | | | | | | | |
| | Distributions to shareholders from net realized gains | | | — | (b) | | | — | (b) | | | — | (b) | | | — | (b) | | | — | (b) | | | — | (b) | | | — | (b) |
| | | | | | | | |
| | Total distributions(c) | | | — | (b) | | | — | (b) | | | (0.007 | ) | | | (0.018 | ) | | | (0.010 | ) | | | (0.002 | ) | | | — | (b) |
| | | | | | | | |
| | Net asset value, end of period | | $ | 1.00 | | | $ | 1.00 | | | $ | 1.00 | | | $ | 1.00 | | | $ | 1.00 | | | $ | 1.00 | | | $ | 1.00 | |
| | | | | | | | |
| | Total return(d) | | | — | %(e) | | | — | %(e) | | | 0.72 | % | | | 1.82 | % | | | 0.99 | % | | | 0.19 | % | | | 0.01 | % |
| | | | | | | | |
| | Net assets, end of period (in 000’s) | | $ | 52 | | | $ | 52 | | | $ | 52 | | | $ | 52 | | | $ | 51 | | | $ | 50 | | | $ | 50 | |
| | | | | | | | |
| | Ratio of net expenses to average net assets | | | 0.11 | %(f) | | | 0.15 | %(f) | | | 0.42 | % | | | 0.53 | % | | | 0.55 | % | | | 0.53 | % | | | 0.38 | %(f) |
| | | | | | | | |
| | Ratio of total expenses to average net assets | | | 0.55 | %(f) | | | 0.56 | %(f) | | | 0.56 | % | | | 0.57 | % | | | 0.60 | % | | | 0.63 | % | | | 0.74 | %(f) |
| | | | | | | | |
| | Ratio of net investment income (loss) to average net assets | | | — | %(e)(f) | | | — | %(e)(f) | | | 0.67 | % | | | 1.79 | % | | | 0.99 | % | | | 0.19 | % | | | — | %(e)(f) |
| | † | | The Fund changed its fiscal year end from August 31 to November 30. |
| | * | | Commenced operations on October 30, 2015. |
| | (a) | | Calculated based on the average shares outstanding methodology. |
| | (b) | | Amount is less than $0.0005 per share. |
| | (c) | | Distributions may not coincide with the current year net investment income or net realized gains as distributions may be paid from current or prior year earnings. |
| | (d) | | Assumes reinvestment of all distributions. Returns do not reflect the deduction of taxes that a shareholder would pay on Fund distributions. Total returns for periods less than one full year are not annualized. |
| | (e) | | Amount is less than 0.005%. |
| | |
| The accompanying notes are an integral part of these financial statements. | | 51 |
Financial Highlights (continued)
Selected Data for a Share Outstanding Throughout Each Period
| | | | | | | | | | | | | | | | | | | | | | | | | | | | | | |
| | | Financial Square Government Fund —
Class A Shares | | Six Months Ended
May 31, 2021
(Unaudited) | | | For the
Period Ended
November 30, 2020† | | | Year Ended August 31, | | | Period Ended
August 31, 2016* | |
| | 2020 | | | 2019 | | | 2018 | | | 2017 | |
| | Per Share Data: | | | | | | | | | | | | | | | | | | | | | | | | | | | | |
| | | | | | | | |
| | Net asset value, beginning of period | | $ | 1.00 | | | $ | 1.00 | | | $ | 1.00 | | | $ | 1.00 | | | $ | 1.00 | | | $ | 1.00 | | | $ | 1.00 | |
| | | | | | | | |
| | Net investment income(a) | | | — | (b) | | | — | (b) | | | 0.007 | | | | 0.019 | | | | 0.011 | | | | 0.003 | | | | — | (b) |
| | | | | | | | |
| | Net realized gain | | | — | (b) | | | — | (b) | | | 0.001 | | | | 0.001 | | | | — | (b) | | | — | (b) | | | — | (b) |
| | | | | | | | |
| | Total from investment operations | | | — | (b) | | | — | (b) | | | 0.008 | | | | 0.020 | | | | 0.011 | | | | 0.003 | | | | — | (b) |
| | | | | | | | |
| | Distributions to shareholders from net investment income | | | — | (b) | | | — | (b) | | | (0.008 | ) | | | (0.020 | ) | | | (0.011 | ) | | | (0.003 | ) | | | — | (b) |
| | | | | | | | |
| | Distributions to shareholders from net realized gains | | | — | (b) | | | — | (b) | | | — | (b) | | | — | (b) | | | — | (b) | | | — | (b) | | | — | (b) |
| | | | | | | | |
| | Total distributions(c) | | | — | (b) | | | — | (b) | | | (0.008 | ) | | | (0.020 | ) | | | (0.011 | ) | | | (0.003 | ) | | | — | (b) |
| | | | | | | | |
| | Net asset value, end of period | | $ | 1.00 | | | $ | 1.00 | | | $ | 1.00 | | | $ | 1.00 | | | $ | 1.00 | | | $ | 1.00 | | | $ | 1.00 | |
| | | | | | | | |
| | Total return(d) | | | 0.01 | % | | | — | %(e) | | | 0.76 | % | | | 1.97 | % | | | 1.12 | % | | | 0.30 | % | | | 0.01 | % |
| | | | | | | | |
| | Net assets, end of period (in 000’s) | | $ | 388,038 | | | $ | 282,556 | | | $ | 366,871 | | | $ | 244,295 | | | $ | 69,681 | | | $ | 55,506 | | | $ | 1,563 | |
| | | | | | | | |
| | Ratio of net expenses to average net assets | | | 0.09 | %(f) | | | 0.20 | %(f) | | | 0.39 | % | | | 0.43 | % | | | 0.42 | % | | | 0.43 | % | | | 0.43 | %(f) |
| | | | | | | | |
| | Ratio of total expenses to average net assets | | | 0.43 | %(f) | | | 0.43 | %(f) | | | 0.43 | % | | | 0.43 | % | | | 0.44 | % | | | 0.48 | % | | | 0.48 | %(f) |
| | | | | | | | |
| | Ratio of net investment income (loss) to average net assets | | | 0.02 | %(f) | | | (0.01 | )%(f) | | | 0.69 | % | | | 1.94 | % | | | 1.12 | % | | | 0.34 | % | | | 0.02 | %(f) |
| | † | | The Fund changed its fiscal year end from August 31 to November 30. |
| | * | | Commenced operations on February 29, 2016. |
| | (a) | | Calculated based on the average shares outstanding methodology. |
| | (b) | | Amount is less than $0.0005 per share. |
| | (c) | | Distributions may not coincide with the current year net investment income or net realized gains as distributions may be paid from current or prior year earnings. |
| | (d) | | Assumes reinvestment of all distributions. Returns do not reflect the deduction of taxes that a shareholder would pay on Fund distributions. Total returns for periods less than one full year are not annualized. |
| | (e) | | Amount is less than 0.005%. |
| | | | | | | | | | | | | | | | | | | | | | | | | | | | | | |
| | | Financial Square Government Fund —
Class C Shares | | Six Months Ended
May 31, 2021
(Unaudited) | | | For the
Period Ended
November 30, 2020† | | | Year Ended August 31, | | | Period Ended
August 31, 2016* | |
| | 2020 | | | 2019 | | | 2018 | | | 2017 | |
| | Per Share Data: | | | | | | | | | | | | | | | | | | | | | | | | | | | | |
| | | | | | | | |
| | Net asset value, beginning of period | | $ | 1.00 | | | $ | 1.00 | | | $ | 1.00 | | | $ | 1.00 | | | $ | 1.00 | | | $ | 1.00 | | | $ | 1.00 | |
| | | | | | | | |
| | Net investment income(a) | | | — | (b) | | | — | (b) | | | 0.003 | | | | 0.012 | | | | 0.004 | | | | — | (b) | | | — | (b) |
| | | | | | | | |
| | Net realized gain | | | — | (b) | | | — | (b) | | | — | (b) | | | — | (b) | | | — | (b) | | | — | (b) | | | — | (b) |
| | | | | | | | |
| | Total from investment operations | | | — | (b) | | | — | (b) | | | 0.003 | | | | 0.012 | | | | 0.004 | | | | — | (b) | | | — | (b) |
| | | | | | | | |
| | Distributions to shareholders from net investment income | | | — | (b) | | | — | (b) | | | (0.003 | ) | | | (0.012 | ) | | | (0.004 | ) | | | — | (b) | | | — | (b) |
| | | | | | | | |
| | Distributions to shareholders from net realized gains | | | — | (b) | | | — | (b) | | | — | (b) | | | — | (b) | | | — | (b) | | | — | (b) | | | — | (b) |
| | | | | | | | |
| | Total distributions(c) | | | — | (b) | | | — | (b) | | | (0.003 | ) | | | (0.012 | ) | | | (0.004 | ) | | | — | (b) | | | — | (b) |
| | | | | | | | |
| | Net asset value, end of period | | $ | 1.00 | | | $ | 1.00 | | | $ | 1.00 | | | $ | 1.00 | | | $ | 1.00 | | | $ | 1.00 | | | $ | 1.00 | |
| | | | | | | | |
| | Total return(d) | | | 0.01 | % | | | — | %(e) | | | 0.34 | % | | | 1.21 | % | | | 0.39 | % | | | 0.01 | % | | | 0.01 | % |
| | | | | | | | |
| | Net assets, end of period (in 000’s) | | $ | 5,057 | | | $ | 6,327 | | | $ | 6,529 | | | $ | 4,532 | | | $ | 4,928 | | | $ | 5,937 | | | $ | 413 | |
| | | | | | | | |
| | Ratio of net expenses to average net assets | | | 0.09 | %(f) | | | 0.20 | %(f) | | | 0.73 | % | | | 1.18 | % | | | 1.15 | % | | | 0.70 | % | | | 0.44 | %(f) |
| | | | | | | | |
| | Ratio of total expenses to average net assets | | | 1.18 | %(f) | | | 1.18 | %(f) | | | 1.18 | % | | | 1.18 | % | | | 1.19 | % | | | 1.23 | % | | | 1.23 | %(f) |
| | | | | | | | |
| | Ratio of net investment income (loss) to average net assets | | | 0.02 | %(f) | | | (0.01 | )%(f) | | | 0.25 | % | | | 1.19 | % | | | 0.37 | % | | | 0.01 | % | | | 0.01 | %(f) |
| | † | | The Fund changed its fiscal year end from August 31 to November 30. |
| | * | | Commenced operations on February 29, 2016. |
| | (a) | | Calculated based on the average shares outstanding methodology. |
| | (b) | | Amount is less than $0.0005 per share. |
| | (c) | | Distributions may not coincide with the current year net investment income or net realized gains as distributions may be paid from current or prior year earnings. |
| | (d) | | Assumes reinvestment of all distributions. Returns do not reflect the deduction of taxes that a shareholder would pay on Fund distributions. Total returns for periods less than one full year are not annualized. |
| | (e) | | Amount is less than 0.005%. |
| | |
| 52 | | The accompanying notes are an integral part of these financial statements. |
Financial Highlights (continued)
Selected Data for a Share Outstanding Throughout Each Period
| | | | | | | | | | | | | | | | | | | | | | | | | | | | | | |
| | | Financial Square Government Fund —
Institutional Shares | | Six Months Ended
May 31, 2021
(Unaudited) | | | For the
Period Ended
November 30, 2020† | | | Year Ended August 31, | |
| | | 2020 | | | 2019 | | | 2018 | | | 2017 | | | 2016 | |
| | Per Share Data: | | | | | | | | | | | | | | | | | | | | | | | | | | | | |
| | | | | | | | |
| | Net asset value, beginning of period | | $ | 1.00 | | | $ | 1.00 | | | $ | 1.00 | | | $ | 1.00 | | | $ | 1.00 | | | $ | 1.00 | | | $ | 1.00 | |
| | | | | | | | |
| | Net investment income(a) | | | — | (b) | | | — | (b) | | | 0.007 | | | | 0.022 | | | | 0.014 | | | | 0.006 | | | | 0.002 | |
| | | | | | | | |
| | Net realized gain | | | — | (b) | | | — | (b) | | | 0.003 | | | | — | (b) | | | — | (b) | | | — | (b) | | | — | (b) |
| | | | | | | | |
| | Total from investment operations | | | — | (b) | | | — | (b) | | | 0.010 | | | | 0.022 | | | | 0.014 | | | | 0.006 | | | | 0.002 | |
| | | | | | | | |
| | Distributions to shareholders from net investment income | | | — | (b) | | | — | (b) | | | (0.010 | ) | | | (0.022 | ) | | | (0.014 | ) | | | (0.006 | ) | | | (0.002 | ) |
| | | | | | | | |
| | Distributions to shareholders from net realized gains | | | — | (b) | | | — | (b) | | | — | (b) | | | — | (b) | | | — | (b) | | | — | (b) | | | — | (b) |
| | | | | | | | |
| | Total distributions(c) | | | — | (b) | | | — | (b) | | | (0.010 | ) | | | (0.022 | ) | | | (0.014 | ) | | | (0.006 | ) | | | (0.002 | ) |
| | | | | | | | |
| | Net asset value, end of period | | $ | 1.00 | | | $ | 1.00 | | | $ | 1.00 | | | $ | 1.00 | | | $ | 1.00 | | | $ | 1.00 | | | $ | 1.00 | |
| | | | | | | | |
| | Total return(d) | | | 0.01 | % | | | 0.01 | % | | | 0.97 | % | | | 2.23 | % | | | 1.38 | % | | | 0.55 | % | | | 0.20 | % |
| | | | | | | | |
| | Net assets, end of period (in 000’s) | | $ | 186,788,803 | | | $ | 154,904,106 | | | $ | 204,287,540 | | | $ | 100,539,271 | | | $ | 96,230,361 | | | $ | 79,411,937 | | | $ | 63,804,041 | |
| | | | | | | | |
| | Ratio of net expenses to average net assets | | | 0.09 | %(e) | | | 0.18 | %(e) | | | 0.18 | % | | | 0.18 | % | | | 0.17 | % | | | 0.18 | % | | | 0.18 | % |
| | | | | | | | |
| | Ratio of total expenses to average net assets | | | 0.18 | %(e) | | | 0.18 | %(e) | | | 0.18 | % | | | 0.18 | % | | | 0.19 | % | | | 0.23 | % | | | 0.23 | % |
| | | | | | | | |
| | Ratio of net investment income to average net assets | | | 0.02 | %(e) | | | — | %(e)(f) | | | 0.70 | % | | | 2.19 | % | | | 1.39 | % | | | 0.55 | % | | | 0.21 | % |
| | † | | The Fund changed its fiscal year end from August 31 to November 30. |
| | (a) | | Calculated based on the average shares outstanding methodology. |
| | (b) | | Amount is less than $0.0005 per share. |
| | (c) | | Distributions may not coincide with the current year net investment income or net realized gains as distributions may be paid from current or prior year earnings. |
| | (d) | | Assumes reinvestment of all distributions. Returns do not reflect the deduction of taxes that a shareholder would pay on Fund distributions. Total returns for periods less than one full year are not annualized. |
| | (f) | | Amount is less than 0.005%. |
| | | | | | | | | | | | | | | | | | | | | | | | | | | | | | |
| | | Financial Square Government Fund —
Capital Shares | | Six Months Ended
May 31, 2021
(Unaudited) | | | For the
Period Ended
November 30, 2020† | | | Year Ended August 31, | |
| | | 2020 | | | 2019 | | | 2018 | | | 2017 | | | 2016 | |
| | Per Share Data: | | | | | | | | | | | | | | | | | | | | | | | | | | | | |
| | | | | | | | |
| | Net asset value, beginning of period | | $ | 1.00 | | | $ | 1.00 | | | $ | 1.00 | | | $ | 1.00 | | | $ | 1.00 | | | $ | 1.00 | | | $ | 1.00 | |
| | | | | | | | |
| | Net investment income(a) | | | — | (b) | | | — | (b) | | | 0.008 | | | | 0.021 | | | | 0.012 | | | | 0.004 | | | | 0.001 | |
| | | | | | | | |
| | Net realized gain | | | — | (b) | | | — | (b) | | | — | (b) | | | — | (b) | | | — | (b) | | | — | (b) | | | — | (b) |
| | | | | | | | |
| | Total from investment operations | | | — | (b) | | | — | (b) | | | 0.008 | | | | 0.021 | | | | 0.012 | | | | 0.004 | | | | 0.001 | |
| | | | | | | | |
| | Distributions to shareholders from net investment income | | | — | (b) | | | — | (b) | | | (0.008 | ) | | | (0.021 | ) | | | (0.012 | ) | | | (0.004 | ) | | | (0.001 | ) |
| | | | | | | | |
| | Distributions to shareholders from net realized gains | | | — | (b) | | | — | (b) | | | — | (b) | | | — | (b) | | | — | (b) | | | — | (b) | | | — | (b) |
| | | | | | | | |
| | Total distributions(c) | | | — | (b) | | | — | (b) | | | (0.008 | ) | | | (0.021 | ) | | | (0.012 | ) | | | (0.004 | ) | | | (0.001 | ) |
| | | | | | | | |
| | Net asset value, end of period | | $ | 1.00 | | | $ | 1.00 | | | $ | 1.00 | | | $ | 1.00 | | | $ | 1.00 | | | $ | 1.00 | | | $ | 1.00 | |
| | | | | | | | |
| | Total return(d) | | | 0.01 | % | | | — | %(e) | | | 0.83 | % | | | 2.08 | % | | | 1.22 | % | | | 0.40 | % | | | 0.08 | % |
| | | | | | | | |
| | Net assets, end of period (in 000’s) | | $ | 1,260,726 | | | $ | 1,435,345 | | | $ | 1,291,798 | | | $ | 1,302,391 | | | $ | 1,287,999 | | | $ | 893,496 | | | $ | 1,390,271 | |
| | | | | | | | |
| | Ratio of net expenses to average net assets | | | 0.09 | %(f) | | | 0.19 | %(f) | | | 0.32 | % | | | 0.33 | % | | | 0.32 | % | | | 0.33 | % | | | 0.30 | % |
| | | | | | | | |
| | Ratio of total expenses to average net assets | | | 0.33 | %(f) | | | 0.33 | %(f) | | | 0.33 | % | | | 0.33 | % | | | 0.34 | % | | | 0.38 | % | | | 0.38 | % |
| | | | | | | | |
| | Ratio of net investment income (loss) to average net assets | | | 0.02 | %(f) | | | (0.01 | )%(f) | | | 0.76 | % | | | 2.05 | % | | | 1.24 | % | | | 0.37 | % | | | 0.07 | % |
| | † | | The Fund changed its fiscal year end from August 31 to November 30. |
| | (a) | | Calculated based on the average shares outstanding methodology. |
| | (b) | | Amount is less than $0.0005 per share. |
| | (c) | | Distributions may not coincide with the current year net investment income or net realized gains as distributions may be paid from current or prior year earnings. |
| | (d) | | Assumes reinvestment of all distributions. Returns do not reflect the deduction of taxes that a shareholder would pay on Fund distributions. Total returns for periods less than one full year are not annualized. |
| | (e) | | Amount is less than 0.005%. |
| | |
| The accompanying notes are an integral part of these financial statements. | | 53 |
Financial Highlights (continued)
Selected Data for a Share Outstanding Throughout Each Period
| | | | | | | | | | | | | | | | | | | | | | | | | | | | | | |
| | | Financial Square Government Fund —
Service Shares | | Six Months Ended
May 31, 2021
(Unaudited) | | | For the
Period Ended
November 30, 2020† | | | Year Ended August 31, | |
| | | 2020 | | | 2019 | | | 2018 | | | 2017 | | | 2016 | |
| | Per Share Data: | | | | | | | | | | | | | | | | | | | | | | | | | | | | |
| | | | | | | | |
| | Net asset value, beginning of period | | $ | 1.00 | | | $ | 1.00 | | | $ | 1.00 | | | $ | 1.00 | | | $ | 1.00 | | | $ | 1.00 | | | $ | 1.00 | |
| | | | | | | | |
| | Net investment income(a) | | | — | (b) | | | — | (b) | | | 0.006 | | | | 0.017 | | | | 0.009 | | | | 0.001 | | | | — | (b) |
| | | | | | | | |
| | Net realized gain | | | — | (b) | | | — | (b) | | | — | (b) | | | — | (b) | | | — | (b) | | | — | (b) | | | — | (b) |
| | | | | | | | |
| | Total from investment operations | | | — | (b) | | | — | (b) | | | 0.006 | | | | 0.017 | | | | 0.009 | | | | 0.001 | | | | — | (b) |
| | | | | | | | |
| | Distributions to shareholders from net investment income | | | — | (b) | | | — | (b) | | | (0.006 | ) | | | (0.017 | ) | | | (0.009 | ) | | | (0.001 | ) | | | — | (b) |
| | | | | | | | |
| | Distributions to shareholders from net realized gains | | | — | (b) | | | — | (b) | | | — | (b) | | | — | (b) | | | — | (b) | | | — | (b) | | | — | (b) |
| | | | | | | | |
| | Total distributions(c) | | | — | (b) | | | — | (b) | | | (0.006 | ) | | | (0.017 | ) | | | (0.009 | ) | | | (0.001 | ) | | | — | (b) |
| | | | | | | | |
| | Net asset value, end of period | | $ | 1.00 | | | $ | 1.00 | | | $ | 1.00 | | | $ | 1.00 | | | $ | 1.00 | | | $ | 1.00 | | | $ | 1.00 | |
| | | | | | | | |
| | Total return(d) | | | 0.01 | % | | | — | %(e) | | | 0.61 | % | | | 1.72 | % | | | 0.87 | % | | | 0.12 | % | | | 0.01 | % |
| | | | | | | | |
| | Net assets, end of period (in 000’s) | | $ | 916,970 | | | $ | 860,075 | | | $ | 1,775,966 | | | $ | 665,252 | | | $ | 587,810 | | | $ | 337,219 | | | $ | 368,299 | |
| | | | | | | | |
| | Ratio of net expenses to average net assets | | | 0.09 | %(f) | | | 0.20 | %(f) | | | 0.53 | % | | | 0.68 | % | | | 0.67 | % | | | 0.60 | % | | | 0.36 | % |
| | | | | | | | |
| | Ratio of total expenses to average net assets | | | 0.68 | %(f) | | | 0.68 | %(f) | | | 0.68 | % | | | 0.68 | % | | | 0.69 | % | | | 0.73 | % | | | 0.73 | % |
| | | | | | | | |
| | Ratio of net investment income (loss) to average net assets | | | 0.02 | %(f) | | | (0.01 | )%(f) | | | 0.58 | % | | | 1.69 | % | | | 0.93 | % | | | 0.11 | % | | | (0.01 | )% |
| | † | | The Fund changed its fiscal year end from August 31 to November 30. |
| | (a) | | Calculated based on the average shares outstanding methodology. |
| | (b) | | Amount is less than $0.0005 per share. |
| | (c) | | Distributions may not coincide with the current year net investment income or net realized gains as distributions may be paid from current or prior year earnings. |
| | (d) | | Assumes reinvestment of all distributions. Returns do not reflect the deduction of taxes that a shareholder would pay on Fund distributions. Total returns for periods less than one full year are not annualized. |
| | (e) | | Amount is less than 0.005%. |
| | | | | | | | | | | | | | | | | | | | | | | | | | | | | | |
| | | Financial Square Government Fund —
Preferred Shares | | Six Months Ended
May 31, 2021
(Unaudited) | | | For the
Period Ended
November 30, 2020† | | | Year Ended August 31, | |
| | | 2020 | | | 2019 | | | 2018 | | | 2017 | | | 2016 | |
| | Per Share Data: | | | | | | | | | | | | | | | | | | | | | | | | | | | | |
| | | | | | | | |
| | Net asset value, beginning of period | | $ | 1.00 | | | $ | 1.00 | | | $ | 1.00 | | | $ | 1.00 | | | $ | 1.00 | | | $ | 1.00 | | | $ | 1.00 | |
| | | | | | | | |
| | Net investment income(a) | | | — | (b) | | | — | (b) | | | 0.009 | | | | 0.021 | | | | 0.013 | | | | 0.004 | | | | 0.001 | |
| | | | | | | | |
| | Net realized gain | | | — | (b) | | | — | (b) | | | ��� | (b) | | | — | (b) | | | — | (b) | | | 0.001 | | | | — | (b) |
| | | | | | | | |
| | Total from investment operations | | | — | (b) | | | — | (b) | | | 0.009 | | | | 0.021 | | | | 0.013 | | | | 0.005 | | | | 0.001 | |
| | | | | | | | |
| | Distributions to shareholders from net investment income | | | — | (b) | | | — | (b) | | | (0.009 | ) | | | (0.021 | ) | | | (0.013 | ) | | | (0.005 | ) | | | (0.001 | ) |
| | | | | | | | |
| | Distributions to shareholders from net realized gains | | | — | (b) | | | — | (b) | | | — | (b) | | | — | (b) | | | — | (b) | | | — | (b) | | | — | (b) |
| | | | | | | | |
| | Total distributions(c) | | | — | (b) | | | — | (b) | | | (0.009 | ) | | | (0.021 | ) | | | (0.013 | ) | | | (0.005 | ) | | | (0.001 | ) |
| | | | | | | | |
| | Net asset value, end of period | | $ | 1.00 | | | $ | 1.00 | | | $ | 1.00 | | | $ | 1.00 | | | $ | 1.00 | | | $ | 1.00 | | | $ | 1.00 | |
| | | | | | | | |
| | Total return(d) | | | 0.01 | % | | | — | %(e) | | | 0.88 | % | | | 2.13 | % | | | 1.28 | % | | | 0.45 | % | | | 0.12 | % |
| | | | | | | | |
| | Net assets, end of period (in 000’s) | | $ | 1,117,877 | | | $ | 820,201 | | | $ | 1,627,349 | | | $ | 1,755,404 | | | $ | 1,330,598 | | | $ | 553,781 | | | $ | 536,818 | |
| | | | | | | | |
| | Ratio of net expenses to average net assets | | | 0.09 | %(f) | | | 0.20 | %(f) | | | 0.28 | % | | | 0.28 | % | | | 0.27 | % | | | 0.28 | % | | | 0.27 | % |
| | | | | | | | |
| | Ratio of total expenses to average net assets | | | 0.28 | %(f) | | | 0.28 | %(f) | | | 0.28 | % | | | 0.28 | % | | | 0.29 | % | | | 0.33 | % | | | 0.33 | % |
| | | | | | | | |
| | Ratio of net investment income (loss) to average net assets | | | 0.02 | %(f) | | | (0.01 | )%(f) | | | 0.89 | % | | | 2.08 | % | | | 1.32 | % | | | 0.43 | % | | | 0.13 | % |
| | † | | The Fund changed its fiscal year end from August 31 to November 30. |
| | (a) | | Calculated based on the average shares outstanding methodology. |
| | (b) | | Amount is less than $0.0005 per share. |
| | (c) | | Distributions may not coincide with the current year net investment income or net realized gains as distributions may be paid from current or prior year earnings. |
| | (d) | | Assumes reinvestment of all distributions. Returns do not reflect the deduction of taxes that a shareholder would pay on Fund distributions. Total returns for periods less than one full year are not annualized. |
| | (e) | | Amount is less than 0.005%. |
| | |
| 54 | | The accompanying notes are an integral part of these financial statements. |
Financial Highlights (continued)
Selected Data for a Share Outstanding Throughout Each Period
| | | | | | | | | | | | | | | | | | | | | | | | | | | | | | |
| | | Financial Square Government Fund — Select Shares | | Six Months Ended
May 31, 2021
(Unaudited) | | | For the
Period Ended
November 30, 2020† | | | Year Ended August 31, | |
| | | 2020 | | | 2019 | | | 2018 | | | 2017 | | | 2016 | |
| | Per Share Data: | | | | | | | | | | | | | | | | | | | | | | | | | | | | |
| | | | | | | | |
| | Net asset value, beginning of period | | $ | 1.00 | | | $ | 1.00 | | | $ | 1.00 | | | $ | 1.00 | | | $ | 1.00 | | | $ | 1.00 | | | $ | 1.00 | |
| | | | | | | | |
| | Net investment income(a) | | | — | (b) | | | — | (b) | | | 0.009 | | | | 0.022 | | | | 0.013 | | | | 0.005 | | | | 0.002 | |
| | | | | | | | |
| | Net realized gain | | | — | (b) | | | — | (b) | | | — | (b) | | | — | (b) | | | — | (b) | | | — | (b) | | | — | (b) |
| | | | | | | | |
| | Total from investment operations | | | — | (b) | | | — | (b) | | | 0.009 | | | | 0.022 | | | | 0.013 | | | | 0.005 | | | | 0.002 | |
| | | | | | | | |
| | Distributions to shareholders from net investment income | | | — | (b) | | | — | (b) | | | (0.009 | ) | | | (0.022 | ) | | | (0.013 | ) | | | (0.005 | ) | | | (0.002 | ) |
| | | | | | | | |
| | Distributions to shareholders from net realized gains | | | — | (b) | | | — | (b) | | | — | (b) | | | — | (b) | | | — | (b) | | | — | (b) | | | — | (b) |
| | | | | | | | |
| | Total distributions(c) | | | — | (b) | | | — | (b) | | | (0.009 | ) | | | (0.022 | ) | | | (0.013 | ) | | | (0.005 | ) | | | (0.002 | ) |
| | | | | | | | |
| | Net asset value, end of period | | $ | 1.00 | | | $ | 1.00 | | | $ | 1.00 | | | $ | 1.00 | | | $ | 1.00 | | | $ | 1.00 | | | $ | 1.00 | |
| | | | | | | | |
| | Total return(d) | | | 0.01 | % | | | — | %(e) | | | 0.94 | % | | | 2.20 | % | | | 1.35 | % | | | 0.52 | % | | | 0.17 | % |
| | | | | | | | |
| | Net assets, end of period (in 000’s) | | $ | 919,544 | | | $ | 448,540 | | | $ | 481,493 | | | $ | 825,651 | | | $ | 598,258 | | | $ | 2,921,971 | | | $ | 2,471,275 | |
| | | | | | | | |
| | Ratio of net expenses to average net assets | | | 0.09 | %(f) | | | 0.20 | %(f) | | | 0.21 | % | | | 0.21 | % | | | 0.20 | % | | | 0.21 | % | | | 0.21 | % |
| | | | | | | | |
| | Ratio of total expenses to average net assets | | | 0.21 | %(f) | | | 0.21 | %(f) | | | 0.21 | % | | | 0.21 | % | | | 0.22 | % | | | 0.26 | % | | | 0.26 | % |
| | | | | | | | |
| | Ratio of net investment income (loss) to average net assets | | | 0.02 | %(f) | | | (0.01 | )%(f) | | | 0.86 | % | | | 2.16 | % | | | 1.19 | % | | | 0.52 | % | | | 0.21 | % |
| | † | | The Fund changed its fiscal year end from August 31 to November 30. |
| | (a) | | Calculated based on the average shares outstanding methodology. |
| | (b) | | Amount is less than $0.0005 per share. |
| | (c) | | Distributions may not coincide with the current year net investment income or net realized gains as distributions may be paid from current or prior year earnings. |
| | (d) | | Assumes reinvestment of all distributions. Returns do not reflect the deduction of taxes that a shareholder would pay on Fund distributions. Total returns for periods less than one full year are not annualized. |
| | (e) | | Amount is less than 0.005%. |
| | | | | | | | | | | | | | | | | | | | | | | | | | | | | | |
| | | Financial Square Government Fund —
Administration Shares | | Six Months Ended
May 31, 2021
(Unaudited) | | | For the
Period Ended
November 30, 2020† | | | Year Ended August 31, | |
| | | 2020 | | | 2019 | | | 2018 | | | 2017 | | | 2016 | |
| | Per Share Data: | | | | | | | | | | | | | | | | | | | | | | | | | | | | |
| | | | | | | | |
| | Net asset value, beginning of period | | $ | 1.00 | | | $ | 1.00 | | | $ | 1.00 | | | $ | 1.00 | | | $ | 1.00 | | | $ | 1.00 | | | $ | 1.00 | |
| | | | | | | | |
| | Net investment income(a) | | | — | (b) | | | — | (b) | | | 0.008 | | | | 0.020 | | | | 0.011 | | | | 0.003 | | | | — | (b) |
| | | | | | | | |
| | Net realized gain | | | — | (b) | | | — | (b) | | | — | (b) | | | — | (b) | | | — | (b) | | | — | (b) | | | — | (b) |
| | | | | | | | |
| | Total from investment operations | | | — | (b) | | | — | (b) | | | 0.008 | | | | 0.020 | | | | 0.011 | | | | 0.003 | | | | — | (b) |
| | | | | | | | |
| | Distributions to shareholders from net investment income | | | — | (b) | | | — | (b) | | | (0.008 | ) | | | (0.020 | ) | | | (0.011 | ) | | | (0.003 | ) | | | — | (b) |
| | | | | | | | |
| | Distributions to shareholders from net realized gains | | | — | (b) | | | — | (b) | | | — | (b) | | | — | (b) | | | — | (b) | | | — | (b) | | | — | (b) |
| | | | | | | | |
| | Total distributions(c) | | | — | (b) | | | — | (b) | | | (0.008 | ) | | | (0.020 | ) | | | (0.011 | ) | | | (0.003 | ) | | | — | (b) |
| | | | | | | | |
| | Net asset value, end of period | | $ | 1.00 | | | $ | 1.00 | | | $ | 1.00 | | | $ | 1.00 | | | $ | 1.00 | | | $ | 1.00 | | | $ | 1.00 | |
| | | | | | | | |
| | Total return(d) | | | 0.01 | % | | | — | %(e) | | | 0.76 | % | | | 1.97 | % | | | 1.12 | % | | | 0.30 | % | | | 0.02 | % |
| | | | | | | | |
| | Net assets, end of period (in 000’s) | | $ | 6,490,280 | | | $ | 5,706,517 | | | $ | 5,421,224 | | | $ | 4,862,853 | | | $ | 4,454,065 | | | $ | 4,138,362 | | | $ | 2,673,689 | |
| | | | | | | | |
| | Ratio of net expenses to average net assets | | | 0.09 | %(f) | | | 0.20 | %(f) | | | 0.39 | % | | | 0.43 | % | | | 0.42 | % | | | 0.43 | % | | | 0.36 | % |
| | | | | | | | |
| | Ratio of total expenses to average net assets | | | 0.43 | %(f) | | | 0.43 | %(f) | | | 0.43 | % | | | 0.43 | % | | | 0.44 | % | | | 0.48 | % | | | 0.48 | % |
| | | | | | | | |
| | Ratio of net investment income (loss) to average net assets | | | 0.02 | %(f) | | | (0.01 | )%(f) | | | 0.76 | % | | | 1.95 | % | | | 1.13 | % | | | 0.32 | % | | | 0.01 | % |
| | † | | The Fund changed its fiscal year end from August 31 to November 30. |
| | (a) | | Calculated based on the average shares outstanding methodology. |
| | (b) | | Amount is less than $0.0005 per share. |
| | (c) | | Distributions may not coincide with the current year net investment income or net realized gains as distributions may be paid from current or prior year earnings. |
| | (d) | | Assumes reinvestment of all distributions. Returns do not reflect the deduction of taxes that a shareholder would pay on Fund distributions. Total returns for periods less than one full year are not annualized. |
| | (e) | | Amount is less than 0.005%. |
| | |
| The accompanying notes are an integral part of these financial statements. | | 55 |
Financial Highlights (continued)
Selected Data for a Share Outstanding Throughout Each Period
| | | | | | | | | | | | | | | | | | | | | | | | | | | | | | |
| | | Financial Square Government Fund — Cash
Management Shares | | Six Months Ended
May 31, 2021
(Unaudited) | | | For the
Period Ended
November 30, 2020† | | | Year Ended August 31, | |
| | | 2020 | | | 2019 | | | 2018 | | | 2017 | | | 2016 | |
| | Per Share Data: | | | | | | | | | | | | | | | | | | | | | | | | | | | | |
| | | | | | | | |
| | Net asset value, beginning of period | | $ | 1.00 | | | $ | 1.00 | | | $ | 1.00 | | | $ | 1.00 | | | $ | 1.00 | | | $ | 1.00 | | | $ | 1.00 | |
| | | | | | | | |
| | Net investment income(a) | | | — | (b) | | | — | (b) | | | 0.004 | | | | 0.013 | | | | 0.006 | | | | — | (b) | | | — | (b) |
| | | | | | | | |
| | Net realized gain | | | — | (b) | | | — | (b) | | | 0.001 | | | | 0.001 | | | | — | (b) | | | — | (b) | | | — | (b) |
| | | | | | | | |
| | Total from investment operations | | | — | (b) | | | — | (b) | | | 0.005 | | | | 0.014 | | | | 0.006 | | | | — | (b) | | | — | (b) |
| | | | | | | | |
| | Distributions to shareholders from net investment income | | | — | (b) | | | — | (b) | | | (0.005 | ) | | | (0.014 | ) | | | (0.006 | ) | | | — | (b) | | | — | (b) |
| | | | | | | | |
| | Distributions to shareholders from net realized gains | | | — | (b) | | | — | (b) | | | — | (b) | | | — | (b) | | | — | (b) | | | — | (b) | | | — | (b) |
| | | | | | | | |
| | Total distributions(c) | | | — | (b) | | | — | (b) | | | (0.005 | ) | | | (0.014 | ) | | | (0.006 | ) | | | — | (b) | | | — | (b) |
| | | | | | | | |
| | Net asset value, end of period | | $ | 1.00 | | | $ | 1.00 | | | $ | 1.00 | | | $ | 1.00 | | | $ | 1.00 | | | $ | 1.00 | | | $ | 1.00 | |
| | | | | | | | |
| | Total return(d) | | | 0.01 | % | | | — | %(e) | | | 0.45 | % | | | 1.42 | % | | | 0.57 | % | | | 0.02 | % | | | 0.02 | % |
| | | | | | | | |
| | Net assets, end of period (in 000’s) | | $ | 294,956 | | | $ | 168,903 | | | $ | 198,129 | | | $ | 96,690 | | | $ | 6,573 | | | $ | 3,779 | | | $ | 14 | |
| | | | | | | | |
| | Ratio of net expenses to average net assets | | | 0.09 | %(f) | | | 0.20 | %(f) | | | 0.65 | % | | | 0.98 | % | | | 0.97 | % | | | 0.62 | % | | | 0.35 | % |
| | | | | | | | |
| | Ratio of total expenses to average net assets | | | 0.98 | %(f) | | | 0.98 | %(f) | | | 0.98 | % | | | 0.98 | % | | | 0.99 | % | | | 1.03 | % | | | 1.03 | % |
| | | | | | | | |
| | Ratio of net investment income (loss) to average net assets | | | 0.02 | %(f) | | | (0.01 | )%(f) | | | 0.35 | % | | | 1.35 | % | | | 0.64 | % | | | 0.01 | % | | | 0.06 | % |
| | † | | The Fund changed its fiscal year end from August 31 to November 30. |
| | (a) | | Calculated based on the average shares outstanding methodology. |
| | (b) | | Amount is less than $0.0005 per share. |
| | (c) | | Distributions may not coincide with the current year net investment income or net realized gains as distributions may be paid from current or prior year earnings. |
| | (d) | | Assumes reinvestment of all distributions. Returns do not reflect the deduction of taxes that a shareholder would pay on Fund distributions. Total returns for periods less than one full year are not annualized. |
| | (e) | | Amount is less than 0.005%. |
| | | | | | | | | | | | | | | | | | | | | | | | | | | | | | |
| | | Financial Square Government Fund —
Premier Shares | | Six Months Ended
May 31, 2021
(Unaudited) | | | For the
Period Ended
November 30, 2020† | | | Year Ended August 31, | |
| | | 2020 | | | 2019 | | | 2018 | | | 2017 | | | 2016 | |
| | Per Share Data: | | | | | | | | | | | | | | | | | | | | | | | | | | | | |
| | | | | | | | |
| | Net asset value, beginning of period | | $ | 1.00 | | | $ | 1.00 | | | $ | 1.00 | | | $ | 1.00 | | | $ | 1.00 | | | $ | 1.00 | | | $ | 1.00 | |
| | | | | | | | |
| | Net investment income(a) | | | — | (b) | | | — | (b) | | | 0.007 | | | | 0.019 | | | | 0.010 | | | | 0.003 | | | | — | (b) |
| | | | | | | | |
| | Net realized loss | | | — | (b) | | | — | (b) | | | — | (b) | | | — | (b) | | | — | (b) | | | (0.001 | ) | | | — | (b) |
| | | | | | | | |
| | Total from investment operations | | | — | (b) | | | — | (b) | | | 0.007 | | | | 0.019 | | | | 0.010 | | | | 0.002 | | | | — | (b) |
| | | | | | | | |
| | Distributions to shareholders from net investment income | | | — | (b) | | | — | (b) | | | (0.007 | ) | | | (0.019 | ) | | | (0.010 | ) | | | (0.002 | ) | | | — | (b) |
| | | | | | | | |
| | Distributions to shareholders from net realized gains | | | — | (b) | | | — | (b) | | | — | (b) | | | — | (b) | | | — | (b) | | | — | (b) | | | — | (b) |
| | | | | | | | |
| | Total distributions(c) | | | — | (b) | | | — | (b) | | | (0.007 | ) | | | (0.019 | ) | | | (0.010 | ) | | | (0.002 | ) | | | — | (b) |
| | | | | | | | |
| | Net asset value, end of period | | $ | 1.00 | | | $ | 1.00 | | | $ | 1.00 | | | $ | 1.00 | | | $ | 1.00 | | | $ | 1.00 | | | $ | 1.00 | |
| | | | | | | | |
| | Total return(d) | | | 0.01 | % | | | — | %(e) | | | 0.70 | % | | | 1.87 | % | | | 1.02 | % | | | 0.22 | % | | | 0.02 | % |
| | | | | | | | |
| | Net assets, end of period (in 000’s) | | $ | 211,664 | | | $ | 219,114 | | | $ | 195,822 | | | $ | 190,633 | | | $ | 168,032 | | | $ | 101,311 | | | $ | 1 | |
| | | | | | | | |
| | Ratio of net expenses to average net assets | | | 0.09 | %(f) | | | 0.20 | %(f) | | | 0.46 | % | | | 0.53 | % | | | 0.52 | % | | | 0.52 | % | | | 0.20 | % |
| | | | | | | | |
| | Ratio of total expenses to average net assets | | | 0.53 | %(f) | | | 0.53 | %(f) | | | 0.53 | % | | | 0.53 | % | | | 0.54 | % | | | 0.58 | % | | | 0.58 | % |
| | | | | | | | |
| | Ratio of net investment income (loss) to average net assets | | | 0.02 | %(f) | | | (0.01 | )%(f) | | | 0.70 | % | | | 1.85 | % | | | 0.99 | % | | | 0.28 | % | | | 0.40 | % |
| | † | | The Fund changed its fiscal year end from August 31 to November 30. |
| | (a) | | Calculated based on the average shares outstanding methodology. |
| | (b) | | Amount is less than $0.0005 per share. |
| | (c) | | Distributions may not coincide with the current year net investment income or net realized gains as distributions may be paid from current or prior year earnings. |
| | (d) | | Assumes reinvestment of all distributions. Returns do not reflect the deduction of taxes that a shareholder would pay on Fund distributions. Total returns for periods less than one full year are not annualized. |
| | (e) | | Amount is less than 0.005%. |
| | |
| 56 | | The accompanying notes are an integral part of these financial statements. |
Financial Highlights (continued)
Selected Data for a Share Outstanding Throughout Each Period
| | | | | | | | | | | | | | | | | | | | | | | | | | | | | | |
| | | Financial Square Government Fund — Resource Shares | | Six Months Ended
May 31, 2021
(Unaudited) | | | For the
Period Ended
November 30, 2020† | | | Year Ended August 31, | |
| | | 2020 | | | 2019 | | | 2018 | | | 2017 | | | 2016 | |
| | Per Share Data: | | | | | | | | | | | | | | | | | | | | | | | | | | | | |
| | | | | | | | |
| | Net asset value, beginning of period | | $ | 1.00 | | | $ | 1.00 | | | $ | 1.00 | | | $ | 1.00 | | | $ | 1.00 | | | $ | 1.00 | | | $ | 1.00 | |
| | | | | | | | |
| | Net investment income(a) | | | — | (b) | | | — | (b) | | | 0.005 | | | | 0.015 | | | | 0.007 | | | | 0.001 | | | | — | (b) |
| | | | | | | | |
| | Net realized gain | | | — | (b) | | | — | (b) | | | — | (b) | | | 0.001 | | | | — | (b) | | | — | (b) | | | — | (b) |
| | | | | | | | |
| | Total from investment operations | | | — | (b) | | | — | (b) | | | 0.005 | | | | 0.016 | | | | 0.007 | | | | 0.001 | | | | — | (b) |
| | | | | | | | |
| | Distributions to shareholders from net investment income | | | — | (b) | | | — | (b) | | | (0.005 | ) | | | (0.016 | ) | | | (0.007 | ) | | | (0.001 | ) | | | — | (b) |
| | | | | | | | |
| | Distributions to shareholders from net realized gains | | | — | (b) | | | — | (b) | | | — | (b) | | | — | (b) | | | — | (b) | | | — | (b) | | | — | (b) |
| | | | | | | | |
| | Total distributions(c) | | | — | (b) | | | — | (b) | | | (0.005 | ) | | | (0.016 | ) | | | (0.007 | ) | | | (0.001 | ) | | | — | (b) |
| | | | | | | | |
| | Net asset value, end of period | | $ | 1.00 | | | $ | 1.00 | | | $ | 1.00 | | | $ | 1.00 | | | $ | 1.00 | | | $ | 1.00 | | | $ | 1.00 | |
| | | | | | | | |
| | Total return(d) | | | 0.01 | % | | | — | %(e) | | | 0.53 | % | | | 1.57 | % | | | 0.72 | % | | | 0.05 | % | | | 0.01 | % |
| | | | | | | | |
| | Net assets, end of period (in 000’s) | | $ | 83,026 | | | $ | 93,981 | | | $ | 83,378 | | | $ | 70,841 | | | $ | 70,747 | | | $ | 74,864 | | | $ | 17,634 | |
| | | | | | | | |
| | Ratio of net expenses to average net assets | | | 0.09 | %(f) | | | 0.20 | %(f) | | | 0.60 | % | | | 0.83 | % | | | 0.82 | % | | | 0.69 | % | | | 0.43 | % |
| | | | | | | | |
| | Ratio of total expenses to average net assets | | | 0.83 | %(f) | | | 0.83 | %(f) | | | 0.83 | % | | | 0.83 | % | | | 0.84 | % | | | 0.88 | % | | | 0.88 | % |
| | | | | | | | |
| | Ratio of net investment income (loss) to average net assets | | | 0.02 | %(f) | | | (0.01 | )%(f) | | | 0.47 | % | | | 1.54 | % | | | 0.70 | % | | | 0.06 | % | | | (0.01 | )% |
| | † | | The Fund changed its fiscal year end from August 31 to November 30. |
| | (a) | | Calculated based on the average shares outstanding methodology. |
| | (b) | | Amount is less than $0.0005 per share. |
| | (c) | | Distributions may not coincide with the current year net investment income or net realized gains as distributions may be paid from current or prior year earnings. |
| | (d) | | Assumes reinvestment of all distributions. Returns do not reflect the deduction of taxes that a shareholder would pay on Fund distributions. Total returns for periods less than one full year are not annualized. |
| | (e) | | Amount is less than 0.005%. |
| | | | | | | | | | | | | | | | | | | | | | | | | | | | | | |
| | | Financial Square Government Fund — Class R6 Shares | | Six Months Ended
May 31, 2021
(Unaudited) | | | For the
Period Ended
November 30, 2020† | | | Year Ended August 31, | | | Period Ended
August 31, 2016* | |
| | | 2020 | | | 2019 | | | 2018 | | | 2017 | |
| | Per Share Data: | | | | | | | | | | | | | | | | | | | | | | | | | | | | |
| | | | | | | | |
| | Net asset value, beginning of period | | $ | 1.00 | | | $ | 1.00 | | | $ | 1.00 | | | $ | 1.00 | | | $ | 1.00 | | | $ | 1.00 | | | $ | 1.00 | |
| | | | | | | | |
| | Net investment income(a) | | | — | (b) | | | — | (b) | | | 0.009 | | | | 0.022 | | | | 0.014 | | | | 0.006 | | | | 0.002 | |
| | | | | | | | |
| | Net realized gain | | | — | (b) | | | — | (b) | | | 0.001 | | | | — | (b) | | | — | (b) | | | — | (b) | | | — | (b) |
| | | | | | | | |
| | Total from investment operations | | | — | (b) | | | — | (b) | | | 0.010 | | | | 0.022 | | | | 0.014 | | | | 0.006 | | | | 0.002 | |
| | | | | | | | |
| | Distributions to shareholders from net investment income | | | — | (b) | | | — | (b) | | | (0.010 | ) | | | (0.022 | ) | | | (0.014 | ) | | | (0.006 | ) | | | (0.002 | ) |
| | | | | | | | |
| | Distributions to shareholders from net realized gains | | | — | (b) | | | — | (b) | | | — | (b) | | | — | (b) | | | — | (b) | | | — | (b) | | | — | (b) |
| | | | | | | | |
| | Total distributions(c) | | | — | (b) | | | — | (b) | | | (0.010 | ) | | | (0.022 | ) | | | (0.014 | ) | | | (0.006 | ) | | | (0.002 | ) |
| | | | | | | | |
| | Net asset value, end of period | | $ | 1.00 | | | $ | 1.00 | | | $ | 1.00 | | | $ | 1.00 | | | $ | 1.00 | | | $ | 1.00 | | | $ | 1.00 | |
| | | | | | | | |
| | Total return(d) | | | 0.01 | % | | | 0.01 | % | | | 0.97 | % | | | 2.23 | % | | | 1.38 | % | | | 0.55 | % | | | 0.18 | % |
| | | | | | | | |
| | Net assets, end of period (in 000’s) | | $ | 124,601 | | | $ | 91,630 | | | $ | 115,111 | | | $ | 96,804 | | | $ | 49,441 | | | $ | 12,773 | | | $ | 4,705 | |
| | | | | | | | |
| | Ratio of net expenses to average net assets | | | 0.09 | %(e) | | | 0.18 | %(e) | | | 0.18 | % | | | 0.18 | % | | | 0.17 | % | | | 0.18 | % | | | 0.18 | %(e) |
| | | | | | | | |
| | Ratio of total expenses to average net assets | | | 0.18 | %(e) | | | 0.18 | %(e) | | | 0.18 | % | | | 0.18 | % | | | 0.19 | % | | | 0.23 | % | | | 0.23 | %(e) |
| | | | | | | | |
| | Ratio of net investment income to average net assets | | | 0.02 | %(e) | | | — | %(e)(f) | | | 0.93 | % | | | 2.20 | % | | | 1.54 | % | | | 0.56 | % | | | 0.26 | %(e) |
| | † | | The Fund changed its fiscal year end from August 31 to November 30. |
| | * | | Commenced operations on December 29, 2015. |
| | (a) | | Calculated based on the average shares outstanding methodology. |
| | (b) | | Amount is less than $0.0005 per share. |
| | (c) | | Distributions may not coincide with the current year net investment income or net realized gains as distributions may be paid from current or prior year earnings. |
| | (d) | | Assumes reinvestment of all distributions. Returns do not reflect the deduction of taxes that a shareholder would pay on Fund distributions. Total returns for periods less than one full year are not annualized. |
| | (f) | | Amount is less than 0.005%. |
| | |
| The accompanying notes are an integral part of these financial statements. | | 57 |
Financial Highlights (continued)
Selected Data for a Share Outstanding Throughout Each Period
| | | | | | | | | | | | | | |
| | | Financial Square Government Fund — Drexel Hamilton Class Shares | | Six Months Ended
May 31, 2021
(Unaudited) | | | For the
Period Ended
November 30, 2020† | | | Period Ended
August 31, 2020* | |
| | Per Share Data: | | | | | | | | | | | | |
| | | | |
| | Net asset value, beginning of period | | $ | 1.00 | | | $ | 1.00 | | | $ | 1.00 | |
| | | | |
| | Net investment income(a) | | | — | (b) | | | — | (b) | | | 0.005 | |
| | | | |
| | Net realized gain | | | — | (b) | | | — | (b) | | | 0.004 | |
| | | | |
| | Total from investment operations | | | — | (b) | | | — | (b) | | | 0.009 | |
| | | | |
| | Distributions to shareholders from net investment income | | | — | (b) | | | — | (b) | | | (0.009 | ) |
| | | | |
| | Distributions to shareholders from net realized gains | | | — | (b) | | | — | (b) | | | — | (b) |
| | | | |
| | Total distributions(c) | | | — | (b) | | | — | (b) | | | (0.009 | ) |
| | | | |
| | Net asset value, end of period | | $ | 1.00 | | | $ | 1.00 | | | $ | 1.00 | |
| | | | |
| | Total return(d) | | | 0.01 | % | | | 0.01 | % | | | 0.93 | % |
| | | | |
| | Net assets, end of period (in 000’s) | | $ | 4,937,970 | | | $ | 3,042,967 | | | $ | 2,354,098 | |
| | | | |
| | Ratio of net expenses to average net assets | | | 0.09 | %(e) | | | 0.18 | %(e) | | | 0.18 | %(e) |
| | | | |
| | Ratio of total expenses to average net assets | | | 0.18 | %(e) | | | 0.18 | %(e) | | | 0.18 | %(e) |
| | | | |
| | Ratio of net investment income to average net assets | | | 0.02 | %(e) | | | — | %(e)(f) | | | 0.54 | %(e) |
| | † | | The Fund changed its fiscal year end from August 31 to November 30. |
| | * | | Commenced operations on September 9, 2019. |
| | (a) | | Calculated based on the average shares outstanding methodology. |
| | (b) | | Amount is less than $0.0005 per share. |
| | (c) | | Distributions may not coincide with the current year net investment income or net realized gains as distributions may be paid from current or prior year earnings. |
| | (d) | | Assumes reinvestment of all distributions. Returns do not reflect the deduction of taxes that a shareholder would pay on Fund distributions. Total returns for periods less than one full year are not annualized. |
| | (e) | | Amount is less than 0.005%. |
| | |
| 58 | | The accompanying notes are an integral part of these financial statements. |
Financial Highlights (continued)
Selected Data for a Share Outstanding Throughout Each Period
| | | | | | | | | | | | | | | | | | | | | | | | | | | | | | |
| | | Financial Square Money Market Fund —
Institutional Shares | | Six Months Ended
May 31, 2021
(Unaudited) | | | For the
Period Ended
November 30, 2020† | | | Year Ended August 31, | |
| | | 2020 | | | 2019 | | | 2018 | | | 2017 | | | 2016 | |
| | Per Share Data: | | | | | | | | | | | | | | | | | | | | | | | | | | | | |
| | | | | | | | |
| | Net asset value, beginning of period | | $ | 1.0008 | | | $ | 1.0011 | | | $ | 1.0006 | | | $ | 1.0003 | | | $ | 1.0003 | | | $ | 1.0000 | | | $ | 1.000 | |
| | | | | | | | |
| | Net investment income(a) | | | 0.0001 | | | | — | (c) | | | 0.0152 | | | | 0.0244 | | | | 0.0187 | | | | 0.0071 | | | | 0.003 | |
| | | | | | | | |
| | Net realized and unrealized gain (loss) | | | 0.0001 | | | | (0.0001 | ) | | | (0.0027 | ) | | | 0.0004 | | | | (0.0019 | ) | | | 0.0015 | | | | — | (b) |
| | | | | | | | |
| | Total from investment operations | | | 0.0002 | | | | (0.0001 | ) | | | 0.0125 | | | | 0.0248 | | | | 0.0168 | | | | 0.0086 | | | | 0.003 | |
| | | | | | | | |
| | Distributions to shareholders from net investment income | | | (0.0001) | | | | — | (c) | | | (0.0120 | ) | | | (0.0245 | ) | | | (0.0168 | ) | | | (0.0082 | ) | | | (0.003 | ) |
| | | | | | | | |
| | Distributions to shareholders from net realized gains | | | (0.0002 | ) | | | (0.0002 | ) | | | — | (c) | | | — | (c) | | | — | (c) | | | (0.0001 | ) | | | — | (b) |
| | | | | | | | |
| | Total distributions(d) | | | (0.0003 | ) | | | (0.0002 | ) | | | (0.0120 | ) | | | (0.0245 | ) | | | (0.0168 | ) | | | (0.0083 | ) | | | (0.003 | ) |
| | | | | | | | |
| | Net asset value, end of period | | $ | 1.0007 | | | $ | 1.0008 | | | $ | 1.0011 | | | $ | 1.0006 | | | $ | 1.0003 | | | $ | 1.0003 | | | $ | 1.000 | |
| | | | | | | | |
| | Total return(e) | | | 0.02 | % | | | (0.01 | )% | | | 1.25 | % | | | 2.52 | % | | | 1.68 | % | | | 0.87 | % | | | 0.32 | % |
| | | | | | | | |
| | Net assets, end of period (in 000’s) | | $ | 3,791,637 | | | $ | 4,042,145 | | | $ | 6,595,783 | | | $ | 17,728,767 | | | $ | 11,570,439 | | | $ | 2,542,693 | | | $ | 15,336,774 | |
| | | | | | | | |
| | Ratio of net expenses to average net assets | | | 0.13 | %(f) | | | 0.18 | %(f) | | | 0.15 | % | | | 0.13 | % | | | 0.11 | % | | | 0.18 | % | | | 0.18 | % |
| | | | | | | | |
| | Ratio of total expenses to average net assets | | | 0.19 | %(f) | | | 0.19 | %(f) | | | 0.18 | % | | | 0.18 | % | | | 0.20 | % | | | 0.25 | % | | | 0.23 | % |
| | | | | | | | |
| | Ratio of net investment income to average net assets | | | 0.01 | %(f) | | | 0.01 | %(f) | | | 1.52 | % | | | 2.44 | % | | | 1.87 | % | | | 0.71 | % | | | 0.32 | % |
| | † | | The Fund changed its fiscal year end from August 31 to November 30. |
| | (a) | | Calculated based on the average shares outstanding methodology. |
| | (b) | | Amount is less than $0.0005 per share. |
| | (c) | | Amount is less than $0.00005 per share. |
| | (d) | | Distributions may not coincide with the current year net investment income or net realized gains as distributions may be paid from current or prior year earnings. |
| | (e) | | Assumes investment at the net asset value at the beginning of the year, reinvestment of all dividends and distributions and a complete redemption of the investment at the net asset value at the end of the year. Returns do not reflect the deduction of taxes that a shareholder would pay on Fund distributions or the redemption of Fund shares. Total returns for periods less than one full year are not annualized. |
| | |
| The accompanying notes are an integral part of these financial statements. | | 59 |
Financial Highlights (continued)
Selected Data for a Share Outstanding Throughout Each Period
| | | | | | | | | | | | | | | | | | | | | | | | | | | | | | |
| | | Financial Square Money Market Fund —
Capital Shares | | Six Months Ended
May 31, 2021
(Unaudited) | | | For the
Period Ended
November 30, 2020† | | | Year Ended August 31, | |
| | | 2020 | | | 2019 | | | 2018 | | | 2017 | | | 2016 | |
| | Per Share Data: | | | | | | | | | | | | | | | | | | | | | | | | | | | | |
| | | | | | | | |
| | Net asset value, beginning of period | | $ | 1.0010 | | | $ | 1.0011 | | | $ | 1.0006 | | | $ | 1.0004 | | | $ | 1.0003 | | | $ | 1.0000 | | | $ | 1.000 | |
| | | | | | | | |
| | Net investment income(a) | | | — | (c) | |
| —
| (c)
| | | 0.0100 | | | | 0.0231 | | | | 0.0177 | | | | 0.0020 | | | | 0.002 | |
| | | | | | | | |
| | Net realized and unrealized gain (loss) | | | — | (c) | | | 0.0001 | | | | 0.0010 | | | | 0.0011 | | | | 0.0001 | | | | 0.0051 | | | | — | (b) |
| | | | | | | | |
| | Total from investment operations | | | — | (c) | | | 0.0001 | | | | 0.0110 | | | | 0.0242 | | | | 0.0178 | | | | 0.0071 | | | | 0.002 | |
| | | | | | | | |
| | Distributions to shareholders from net investment income | | | — | (c) | | | — | (c) | | | (0.0105 | ) | | | (0.0240 | ) | | | (0.0177 | ) | | | (0.0068 | ) | | | (0.002 | ) |
| | | | | | | | |
| | Distributions to shareholders from net realized gains | | | (0.0002 | ) | | | (0.0002 | ) | | | — | (c) | | | — | (c) | | | — | (c) | | | — | | | | — | (b) |
| | | | | | | | |
| | Total distributions(d) | | | (0.0002 | ) | | | (0.0002 | ) | | | (0.0105 | ) | | | (0.0240 | ) | | | (0.0177 | ) | | | (0.0068 | ) | | | (0.002 | ) |
| | | | | | | | |
| | Net asset value, end of period | | $ | 1.0008 | | | $ | 1.0010 | | | $ | 1.0011 | | | $ | 1.0006 | | | $ | 1.0004 | | | $ | 1.0003 | | | $ | 1.000 | |
| | | | | | | | |
| | Total return(e) | | | — | %(f) | | | (0.01 | )% | | | 1.10 | % | | | 2.35 | % | | | 1.54 | % | | | 0.72 | % | | | 0.18 | % |
| | | | | | | | |
| | Net assets, end of period (in 000’s) | | $ | 3,091 | | | $ | 11.541 | | | $ | 15,265 | | | $ | 11,720 | | | $ | 1 | | | $ | 1 | | | $ | 108,671 | |
| | | | | | | | |
| | Ratio of net expenses to average net assets | | | 0.15 | %(g) | | | 0.24 | %(g) | | | 0.29 | % | | | 0.28 | % | | | 0.11 | % | | | 0.33 | % | | | 0.33 | % |
| | | | | | | | |
| | Ratio of total expenses to average net assets | | | 0.34 | %(g) | | | 0.34 | %(g) | | | 0.33 | % | | | 0.33 | % | | | 0.35 | % | | | 0.40 | % | | | 0.38 | % |
| | | | | | | | |
| | Ratio of net investment income (loss) to average net assets | | | (0.01 | )%(g) | | | (0.06 | )%(g) | | | 1.00 | % | | | 2.31 | % | | | 1.77 | % | | | 0.20 | % | | | 0.18 | % |
| | † | | The Fund changed its fiscal year end from August 31 to November 30. |
| | (a) | | Calculated based on the average shares outstanding methodology. |
| | (b) | | Amount is less than $0.0005 per share. |
| | (c) | | Amount is less than $0.00005 per share. |
| | (d) | | Distributions may not coincide with the current year net investment income or net realized gains as distributions may be paid from current or prior year earnings. |
| | (e) | | Assumes investment at the net asset value at the beginning of the year, reinvestment of all dividends and distributions and a complete redemption of the investment at the net asset value at the end of the year. Returns do not reflect the deduction of taxes that a shareholder would pay on Fund distributions or the redemption of Fund shares. Total returns for periods less than one full year are not annualized. |
| | (f) | | Amount is less than 0.005%. |
| | |
| 60 | | The accompanying notes are an integral part of these financial statements. |
Financial Highlights (continued)
Selected Data for a Share Outstanding Throughout Each Period
| | | | | | | | | | | | | | | | | | | | | | | | | | | | | | |
| | | Financial Square Money Market Fund —
Service Shares | | Six Months Ended
May 31, 2021
(Unaudited) | | | For the
Period Ended
November 30, 2020† | | | Year Ended August 31, | |
| | | 2020 | | | 2019 | | | 2018 | | | 2017 | | | 2016 | |
| | Per Share Data: | | | | | | | | | | | | | | | | | | | | | | | | | | | | |
| | | | | | | | |
| | Net asset value, beginning of period | | $ | 1.0000 | | | $ | 1.0006 | | | $ | 1.0002 | | | $ | 1.0001 | | | $ | 1.0003 | | | $ | 1.0000 | | | $ | 1.000 | |
| | | | | | | | |
| | Net investment income(a) | |
| —
| (c)
| | | 0.0004 | | | | 0.0126 | | | | 0.0199 | | | | 0.0115 | | | | 0.0011 | | | | — | (b) |
| | | | | | | | |
| | Net realized and unrealized gain (loss) | | | 0.0008 | | | | (0.0004 | ) | | | (0.0041 | ) | | | (0.0003 | ) | | | 0.0001 | | | | 0.0027 | | | | — | (b) |
| | | | | | | | |
| | Total from investment operations | | | 0.0008 | | | | — | | | | 0.0085 | | | | 0.0196 | | | | 0.0116 | | | | 0.0038 | | | | — | (b) |
| | | | | | | | |
| | Distributions to shareholders from net investment income | |
| —
| (c)
| | | (0.0003 | ) | | | (0.0081 | ) | | | (0.0195 | ) | | | (0.0118 | ) | | | (0.0034 | ) | | | — | (b) |
| | | | | | | | |
| | Distributions to shareholders from net realized gains | |
| (0.0002
| )
| | | (0.0003 | ) | | | — | (c) | | | — | (c) | | | — | (c) | | | (0.0001 | ) | | | — | (b) |
| | | | | | | | |
| | Total distributions(d) | |
| (0.0002
| )
| | | (0.0006 | ) | | | (0.0081 | ) | | | (0.0195 | ) | | | (0.0118 | ) | | | (0.0035 | ) | | | — | (b) |
| | | | | | | | |
| | Net asset value, end of period | | $ | 1.0006 | | | $ | 1.0000 | | | $ | 1.0006 | | | $ | 1.0002 | | | $ | 1.0001 | | | $ | 1.0003 | | | $ | 1.000 | |
| | | | | | | | |
| | Total return(e) | | | 0.08 | % | | | (0.06 | )% | | | 0.81 | % | | | 1.99 | % | | | 1.16 | % | | | 0.38 | % | | | 0.01 | % |
| | | | | | | | |
| | Net assets, end of period (in 000’s) | | $ | 3 | | | $ | 3 | | | $ | 3 | | | $ | 8 | | | $ | 128 | | | $ | 67 | | | $ | 17,000 | |
| | | | | | | | |
| | Ratio of net expenses to average net assets | | | 0.15 | %(f) | | | 0.26 | %(f) | | | 0.64 | % | | | 0.63 | % | | | 0.61 | % | | | 0.60 | % | | | 0.49 | % |
| | | | | | | | |
| | Ratio of total expenses to average net assets | | | 0.74 | %(f) | | | 0.69 | %(f) | | | 0.68 | % | | | 0.68 | % | | | 0.70 | % | | | 0.75 | % | | | 0.73 | % |
| | | | | | | | |
| | Ratio of net investment income to average net assets | | | 0.05 | %(f) | | | 0.03 | %(f) | | | 1.26 | % | | | 1.99 | % | | | 1.15 | % | | | 0.11 | % | | | — | %(g) |
| | † | | The Fund changed its fiscal year end from August 31 to November 30. |
| | (a) | | Calculated based on the average shares outstanding methodology. |
| | (b) | | Amount is less than $0.0005 per share. |
| | (c) | | Amount is less than $0.00005 per share. |
| | (d) | | Distributions may not coincide with the current year net investment income or net realized gains as distributions may be paid from current or prior year earnings. |
| | (e) | | Assumes investment at the net asset value at the beginning of the year, reinvestment of all dividends and distributions and a complete redemption of the investment at the net asset value at the end of the year. Returns do not reflect the deduction of taxes that a shareholder would pay on Fund distributions or the redemption of Fund shares. Total returns for periods less than one full year are not annualized. |
| | (g) | | Amount is less than 0.005%. |
| | |
| The accompanying notes are an integral part of these financial statements. | | 61 |
Financial Highlights (continued)
Selected Data for a Share Outstanding Throughout Each Period
| | | | | | | | | | | | | | | | | | | | | | | | | | | | | | |
| | | Financial Square Money Market Fund —
Preferred Shares | | Six Months Ended
May 31, 2021
(Unaudited) | | | For the
Period Ended
November 30, 2020† | | | Year Ended August 31, | |
| | | 2020 | | | 2019 | | | 2018 | | | 2017 | | | 2016 | |
| | Per Share Data: | | | | | | | | | | | | | | | | | | | | | | | | | | | | |
| | | | | | | | |
| | Net asset value, beginning of period | | $ | 1.0008 | | | $ | 1.0011 | | | $ | 1.0006 | | | $ | 1.0002 | | | $ | 1.0003 | | | $ | 1.0000 | | | $ | 1.000 | |
| | | | | | | | |
| | Net investment income(a) | |
| —
| (c)
| | | — | (c) | | | 0.0136 | | | | 0.0231 | | | | 0.0172 | | | | 0.0032 | | | | 0.002 | |
| | | | | | | | |
| | Net realized and unrealized gain (loss) | | | 0.0001 | | | | (0.0001 | ) | | | (0.0021 | ) | | | 0.0008 | | | | (0.0015 | ) | | | 0.0044 | | | | — | (b) |
| | | | | | | | |
| | Total from investment operations | | | 0.0001 | | | | (0.0001 | ) | | | 0.0115 | | | | 0.0239 | | | | 0.0157 | | | | 0.0076 | | | | 0.002 | |
| | | | | | | | |
| | Distributions to shareholders from net investment income | |
| —
| (c)
| |
| —
| (c)
| | | (0.0110 | ) | | | (0.0235 | ) | | | (0.0158 | ) | | | (0.0072 | ) | | | (0.002 | ) |
| | | | | | | | |
| | Distributions to shareholders from net realized gains | |
| (0.0002
| )
| | | (0.0002 | ) | | | — | (c) | | | — | (c) | | | — | (c) | | | (0.0001 | ) | | | — | (b) |
| | | | | | | | |
| | Total distributions(d) | |
| (0.0002
| )
| |
| (0.0002
| )
| | | (0.0110 | ) | | | (0.0235 | ) | | | (0.0158 | ) | | | (0.0073 | ) | | | (0.002 | ) |
| | | | | | | | |
| | Net asset value, end of period | | $ | 1.0007 | | | $ | 1.0008 | | | $ | 1.0011 | | | $ | 1.0006 | | | $ | 1.0002 | | | $ | 1.0003 | | | $ | 1.000 | |
| | | | | | | | |
| | Total return(e) | | | 0.01 | % | | | (0.03 | )% | | | 1.15 | % | | | 2.41 | % | | | 1.58 | % | | | 0.77 | % | | | 0.22 | % |
| | | | | | | | |
| | Net assets, end of period (in 000’s) | | $ | 66 | | | $ | 66 | | | $ | 1,919 | | | $ | 4,901 | | | $ | 2,752 | | | $ | 1,418 | | | $ | 59,053 | |
| | | | | | | | |
| | Ratio of net expenses to average net assets | | | 0.14 | %(f) | | | 0.24 | %(f) | | | 0.25 | % | | | 0.23 | % | | | 0.21 | % | | | 0.28 | % | | | 0.28 | % |
| | | | | | | | |
| | Ratio of total expenses to average net assets | | | 0.29 | %(f) | | | 0.29 | %(f) | | | 0.28 | % | | | 0.28 | % | | | 0.30 | % | | | 0.35 | % | | | 0.33 | % |
| | | | | | | | |
| | Ratio of net investment income (loss) to average net assets | | | — | %(f)(g) | | | (0.05 | )%(f) | | | 1.35 | % | | | 2.31 | % | | | 1.72 | % | | | 0.32 | % | | | 0.20 | % |
| | † | | The Fund changed its fiscal year end from August 31 to November 30. |
| | (a) | | Calculated based on the average shares outstanding methodology. |
| | (b) | | Amount is less than $0.0005 per share. |
| | (c) | | Amount is less than $0.00005 per share. |
| | (d) | | Distributions may not coincide with the current year net investment income or net realized gains as distributions may be paid from current or prior year earnings. |
| | (e) | | Assumes investment at the net asset value at the beginning of the year, reinvestment of all dividends and distributions and a complete redemption of the investment at the net asset value at the end of the year. Returns do not reflect the deduction of taxes that a shareholder would pay on Fund distributions or the redemption of Fund shares. Total returns for periods less than one full year are not annualized. |
| | (g) | | Amount is less than 0.005%. |
| | |
| 62 | | The accompanying notes are an integral part of these financial statements. |
Financial Highlights (continued)
Selected Data for a Share Outstanding Throughout Each Period
| | | | | | | | | | | | | | | | | | | | | | | | | | | | | | |
| | | Financial Square Money Market Fund —
Select Shares | | Six Months Ended
May 31, 2021
(Unaudited) | | | For the
Period Ended
November 30, 2020† | | | Year Ended August 31, | |
| | | 2020 | | | 2019 | | | 2018 | | | 2017 | | | 2016 | |
| | Per Share Data: | | | | | | | | | | | | | | | | | | | | | | | | | | | | |
| | | | | | | | |
| | Net asset value, beginning of period | | $ | 1.0007 | | | $ | 1.0009 | | | $ | 1.0006 | | | $ | 1.0003 | | | $ | 1.0003 | | | $ | 1.0000 | | | $ | 1.000 | |
| | | | | | | | |
| | Net investment income(a) | | | — | (c) | | | — | (c) | | | 0.0163 | | | | 0.0240 | | | | 0.0182 | | | | 0.0040 | | | | 0.003 | |
| | | | | | | | |
| | Net realized and unrealized gain (loss) | | | 0.0001 | | |
| —
| (c)
| | | (0.0043 | ) | | | 0.0005 | | | | (0.0017 | ) | | | 0.0043 | | | | — | (b) |
| | | | | | | | |
| | Total from investment operations | | | 0.0001 | | | | — | (c) | | | 0.0120 | | | | 0.0245 | | | | 0.0165 | | | | 0.0083 | | | | 0.003 | |
| | | | | | | | |
| | Distributions to shareholders from net investment income | |
| —
| (c)
| | | — | (c) | | | (0.0117 | ) | | | (0.0242 | ) | | | (0.0165 | ) | | | (0.0079 | ) | | | (0.003 | ) |
| | | | | | | | |
| | Distributions to shareholders from net realized gains | | | (0.0002 | ) | | | (0.0002 | ) | | | — | (c) | | | — | (c) | | | — | (c) | | | (0.0001 | ) | | | — | (b) |
| | | | | | | | |
| | Total distributions(d) | |
| (0.0002
| )
| | | (0.0002 | ) | | | (0.0117 | ) | | | (0.0242 | ) | | | (0.0165 | ) | | | (0.0080 | ) | | | (0.003 | ) |
| | | | | | | | |
| | Net asset value, end of period | | $ | 1.0006 | | | $ | 1.0007 | | | $ | 1.0009 | | | $ | 1.0006 | | | $ | 1.0003 | | | $ | 1.0003 | | | $ | 1.000 | |
| | | | | | | | |
| | Total return(e) | | | 0.01 | % | | | (0.01 | )% | | | 1.20 | % | | | 2.49 | % | | | 1.65 | % | | | 0.84 | % | | | 0.29 | % |
| | | | | | | | |
| | Net assets, end of period (in 000’s) | | $ | 1,700 | | | $ | 2,361 | | | $ | 2,362 | | | $ | 34,943 | | | $ | 34,354 | | | $ | 9,847 | | | $ | 1,080,075 | |
| | | | | | | | |
| | Ratio of net expenses to average net assets | | | 0.14 | %(f) | | | 0.21 | %(f) | | | 0.18 | % | | | 0.16 | % | | | 0.14 | % | | | 0.21 | % | | | 0.21 | % |
| | | | | | | | |
| | Ratio of total expenses to average net assets | | | 0.22 | %(f) | | | 0.22 | %(f) | | | 0.21 | % | | | 0.21 | % | | | 0.23 | % | | | 0.28 | % | | | 0.26 | % |
| | | | | | | | |
| | Ratio of net investment income (loss) to average net assets | | | 0.01 | %(f) | | | (0.03 | %)(f) | | | 1.63 | % | | | 2.40 | % | | | 1.82 | % | | | 0.40 | % | | | 0.29 | % |
| | † | | The Fund changed its fiscal year end from August 31 to November 30. |
| | (a) | | Calculated based on the average shares outstanding methodology. |
| | (b) | | Amount is less than $0.0005 per share. |
| | (c) | | Amount is less than $0.00005 per share. |
| | (d) | | Distributions may not coincide with the current year net investment income or net realized gains as distributions may be paid from current or prior year earnings. |
| | (e) | | Assumes investment at the net asset value at the beginning of the year, reinvestment of all dividends and distributions and a complete redemption of the investment at the net asset value at the end of the year. Returns do not reflect the deduction of taxes that a shareholder would pay on Fund distributions or the redemption of Fund shares. Total returns for periods less than one full year are not annualized. |
| | |
| The accompanying notes are an integral part of these financial statements. | | 63 |
Financial Highlights (continued)
Selected Data for a Share Outstanding Throughout Each Period
| | | | | | | | | | | | | | | | | | | | | | | | | | | | | | |
| | | Financial Square Money Market Fund —
Administration Shares | | Six Months Ended
May 31, 2021
(Unaudited) | | | For the
Period Ended
November 30, 2020† | | | Year Ended August 31, | |
| | | 2020 | | | 2019 | | | 2018 | | | 2017 | | | 2016 | |
| | Per Share Data: | | | | | | | | | | | | | | | | | | | | | | | | | | | | |
| | | | | | | | |
| | Net asset value, beginning of period | | $ | 1.0007 | | | $ | 1.0010 | | | $ | 1.0005 | | | $ | 1.0003 | | | $ | 1.0003 | | | $ | 1.0000 | | | $ | 1.000 | |
| | | | | | | | |
| | Net investment income(a) | |
| —
| (c)
| | | — | (c) | | | 0.0094 | | | | 0.0214 | | | | 0.0140 | | | | 0.0024 | | | | 0.001 | |
| | | | | | | | |
| | Net realized and unrealized gain (loss) | | | 0.0001 | | | | (0.0001 | ) | | | 0.0007 | | | | 0.0008 | | | | 0.0003 | | | | 0.0037 | | | | — | (b) |
| | | | | | | | |
| | Total from investment operations | | | 0.0001 | | | | (0.0001 | ) | | | 0.0101 | | | | 0.0222 | | | | 0.0143 | | | | 0.0061 | | | | 0.001 | |
| | | | | | | | |
| | Distributions to shareholders from net investment income | |
| —
| (c)
| | | — | (c) | | | (0.0096 | ) | | | (0.0220 | ) | | | (0.0143 | ) | | | (0.0057 | ) | | | (0.001 | ) |
| | | | | | | | |
| | Distributions to shareholders from net realized gains | | | (0.0002 | ) | | | (0.0002 | ) | | | — | (c) | | | — | (c) | | | — | (c) | | | (0.0001 | ) | | | — | (b) |
| | | | | | | | |
| | Total distributions(d) | |
| (0.0002
| )
| | | (0.0002 | ) | | | (0.0096 | ) | | | (0.0220 | ) | | | (0.0143 | ) | | | (0.0058 | ) | | | (0.001 | ) |
| | | | | | | | |
| | Net asset value, end of period | | $ | 1.0006 | | | $ | 1.0007 | | | $ | 1.0010 | | | $ | 1.0005 | | | $ | 1.0003 | | | $ | 1.0003 | | | $ | 1.000 | |
| | | | | | | | |
| | Total return(e) | | | 0.01 | % | | | (0.03 | )% | | | 1.01 | % | | | 2.25 | % | | | 1.43 | % | | | 0.61 | % | | | 0.10 | % |
| | | | | | | | |
| | Net assets, end of period (in 000’s) | | $ | 1,673 | | | $ | 4,270 | | | $ | 4,506 | | | $ | 4,493 | | | $ | 3,218 | | | $ | 5,516 | | | $ | 316,162 | |
| | | | | | | | |
| | Ratio of net expenses to average net assets | | | 0.14 | %(f) | | | 0.24 | %(f) | | | 0.38 | % | | | 0.38 | % | | | 0.36 | % | | | 0.43 | % | | | 0.40 | % |
| | | | | | | | |
| | Ratio of total expenses to average net assets | | | 0.44 | %(f) | | | 0.44 | %(f) | | | 0.43 | % | | | 0.43 | % | | | 0.45 | % | | | 0.50 | % | | | 0.48 | % |
| | | | | | | | |
| | Ratio of net investment income (loss) to average net assets | | | — | %(f)(g) | | | (0.05 | )%(f) | | | 0.93 | % | | | 2.14 | % | | | 1.40 | % | | | 0.24 | % | | | 0.09 | % |
| | † | | The Fund changed its fiscal year end from August 31 to November 30. |
| | (a) | | Calculated based on the average shares outstanding methodology. |
| | (b) | | Amount is less than $0.0005 per share. |
| | (c) | | Amount is less than $0.00005 per share. |
| | (d) | | Distributions may not coincide with the current year net investment income or net realized gains as distributions may be paid from current or prior year earnings. |
| | (e) | | Assumes investment at the net asset value at the beginning of the year, reinvestment of all dividends and distributions and a complete redemption of the investment at the net asset value at the end of the year. Returns do not reflect the deduction of taxes that a shareholder would pay on Fund distributions or the redemption of Fund shares. Total returns for periods less than one full year are not annualized. |
| | (g) | | Amount is less than 0.005%. |
| | |
| 64 | | The accompanying notes are an integral part of these financial statements. |
Financial Highlights (continued)
Selected Data for a Share Outstanding Throughout Each Period
| | | | | | | | | | | | | | | | | | | | | | | | | | | | | | |
| | | Financial Square Money Market Fund — Cash
Management Shares | | Six Months Ended
May 31, 2021
(Unaudited) | | | For the
Period Ended
November 30, 2020† | | | Year Ended August 31, | |
| | | 2020 | | | 2019 | | | 2018 | | | 2017 | | | 2016 | |
| | Per Share Data: | | | | | | | | | | | | | | | | | | | | | | | | | | | | |
| | | | | | | | |
| | Net asset value, beginning of period | | $ | 0.9999 | | | $ | 1.0009 | | | $ | 1.0007 | | | $ | 1.0004 | | | $ | 1.0003 | | | $ | 1.0000 | | | $ | 1.000 | |
| | | | | | | | |
| | Net investment income(a) | |
| 0.0002
|
| | | 0.0009 | | | | 0.0097 | | | | 0.0182 | | | | 0.0106 | | | | 0.0001 | | | | — | (b) |
| | | | | | | | |
| | Net realized and unrealized gain (loss) | | | 0.0009 | | | | (0.0010 | ) | | | (0.0008 | ) | | | 0.0003 | | | | 0.0001 | | | | 0.0017 | | | | — | (b) |
| | | | | | | | |
| | Total from investment operations | | | 0.0011 | | | | (0.0001 | ) | | | 0.0089 | | | | 0.0185 | | | | 0.0107 | | | | 0.0018 | | | | — | (b) |
| | | | | | | | |
| | Distributions to shareholders from net investment income | |
| (0.0002
| )
| | | (0.0009 | ) | | | (0.0087 | ) | | | (0.0182 | ) | | | (0.0106 | ) | | | (0.0015 | ) | | | — | (b) |
| | | | | | | | |
| | Distributions to shareholders from net realized gains | | | — | (c) | | | — | (c) | | | — | (c) | | | — | (c) | | | — | (c) | | | — | (c) | | | — | (b) |
| | | | | | | | |
| | Total distributions(d) | |
| (0.0002
| )
| | | (0.0009 | ) | | | (0.0087 | ) | | | (0.0182 | ) | | | (0.0106 | ) | | | (0.0015 | ) | | | — | (b) |
| | | | | | | | |
| | Net asset value, end of period | | $ | 1.0008 | | | $ | 0.9999 | | | $ | 1.0009 | | | $ | 1.0007 | | | $ | 1.0004 | | | $ | 1.0003 | | | $ | 1.000 | |
| | | | | | | | |
| | Total return(e) | | | 0.11 | % | | | (0.10 | )% | | | 0.60 | % | | | 1.69 | % | | | 0.89 | % | | | 0.18 | % | | | 0.01 | % |
| | | | | | | | |
| | Net assets, end of period (in 000’s) | | $ | 1 | | | $ | 1 | | | $ | 1 | | | $ | 1 | | | $ | 1 | | | $ | 1 | | | $ | 10,742 | |
| | | | | | | | |
| | Ratio of net expenses to average net assets | | | 0.13 | %(f) | | | 0.18 | %(f) | | | 0.68 | % | | | 0.85 | % | | | 0.83 | % | | | 0.50 | % | | | 0.51 | % |
| | | | | | | | |
| | Ratio of total expenses to average net assets | | | 0.90 | %(f) | | | 0.99 | %(f) | | | 0.98 | % | | | 0.98 | % | | | 1.00 | % | | | 1.05 | % | | | 1.03 | % |
| | | | | | | | |
| | Ratio of net investment income to average net assets | | | 0.06 | %(f) | | | — | %(f)(g) | | | 0.89 | % | | | 1.81 | % | | | 1.06 | % | | | 0.01 | % | | | — | %(g) |
| | † | | The Fund changed its fiscal year end from August 31 to November 30. |
| | (a) | | Calculated based on the average shares outstanding methodology. |
| | (b) | | Amount is less than $0.0005 per share. |
| | (c) | | Amount is less than $0.00005 per share. |
| | (d) | | Distributions may not coincide with the current year net investment income or net realized gains as distributions may be paid from current or prior year earnings. |
| | (e) | | Assumes investment at the net asset value at the beginning of the year, reinvestment of all dividends and distributions and a complete redemption of the investment at the net asset value at the end of the year. Returns do not reflect the deduction of taxes that a shareholder would pay on Fund distributions or the redemption of Fund shares. Total returns for periods less than one full year are not annualized. |
| | (g) | | Amount is less than 0.005%. |
| | |
| The accompanying notes are an integral part of these financial statements. | | 65 |
Financial Highlights (continued)
Selected Data for a Share Outstanding Throughout Each Period
| | | | | | | | | | | | | | | | | | | | | | | | | | | | | | |
| | | Financial Square Money Market Fund —
Premier Shares | | Six Months Ended
May 31, 2021
(Unaudited) | | | For the
Period Ended
November 30, 2020† | | | Year Ended August 31, | |
| | | 2020 | | | 2019 | | | 2018 | | | 2017 | | | 2016 | |
| | Per Share Data: | | | | | | | | | | | | | | | | | | | | | | | | | | | | |
| | | | | | | | |
| | Net asset value, beginning of period | | $ | 1.0000 | | | $ | 1.0010 | | | $ | 1.0006 | | | $ | 1.0004 | | | $ | 1.0003 | | | $ | 1.0000 | | | $ | 1.000 | |
| | | | | | | | |
| | Net investment income(a) | |
| 0.0002
|
| | | 0.0009 | | | | 0.0115 | | | | 0.0217 | | | | 0.0142 | | | | 0.0068 | | | | 0.001 | |
| | | | | | | | |
| | Net realized and unrealized gain (loss) | | | 0.0008 | | | | (0.0010 | ) | | | (0.0003 | ) | | | 0.0002 | | | | 0.0001 | | | | (0.0016 | ) | | | — | (b) |
| | | | | | | | |
| | Total from investment operations | | | 0.0010 | | | | (0.0001 | ) | | | 0.0112 | | | | 0.0219 | | | | 0.0143 | | | | 0.0052 | | | | 0.001 | |
| | | | | | | | |
| | Distributions to shareholders from net investment income | |
| (0.0002
| )
| | | (0.0009 | ) | | | (0.0108 | ) | | | (0.0217 | ) | | | (0.0142 | ) | | | (0.0049 | ) | | | (0.001 | ) |
| | | | | | | | |
| | Distributions to shareholders from net realized gains | | | — | (c) | | | — | (c) | | | — | (c) | | | — | (c) | | | — | (c) | | | — | (c) | | | — | (b) |
| | | | | | | | |
| | Total distributions(d) | |
| (0.0002
| )
| | | (0.0009 | ) | | | (0.0108 | ) | | | (0.0217 | ) | | | (0.0142 | ) | | | (0.0049 | ) | | | (0.001 | ) |
| | | | | | | | |
| | Net asset value, end of period | | $ | 1.0008 | | | $ | 1.0000 | | | $ | 1.0010 | | | $ | 1.0006 | | | $ | 1.0004 | | | $ | 1.0003 | | | $ | 1.000 | |
| | | | | | | | |
| | Total return(e) | | | 0.10 | % | | | (0.10 | )% | | | 0.91 | % | | | 2.15 | % | | | 1.35 | % | | | 0.52 | % | | | 0.10 | % |
| | | | | | | | |
| | Net assets, end of period (in 000’s) | | $ | 1 | | | $ | 1 | | | $ | 1 | | | $ | 1 | | | $ | 1 | | | $ | 1 | | | $ | 1 | |
| | | | | | | | |
| | Ratio of net expenses to average net assets | | | 0.13 | %(f) | | | 0.18 | %(f) | | | 0.45 | % | | | 0.48 | % | | | 0.47 | % | | | 0.53 | % | | | 0.19 | % |
| | | | | | | | |
| | Ratio of total expenses to average net assets | | | 0.54 | %(f) | | | 0.54 | %(f) | | | 0.53 | % | | | 0.53 | % | | | 0.55 | % | | | 0.60 | % | | | 0.58 | % |
| | | | | | | | |
| | Ratio of net investment income to average net assets | | | 0.06 | %(f) | | | — | %(f)(g) | | | 1.10 | % | | | 2.17 | % | | | 1.42 | % | | | 0.69 | % | | | 0.37 | % |
| | † | | The Fund changed its fiscal year end from August 31 to November 30. |
| | (a) | | Calculated based on the average shares outstanding methodology. |
| | (b) | | Amount is less than $0.0005 per share. |
| | (c) | | Amount is less than $0.00005 per share. |
| | (d) | | Distributions may not coincide with the current year net investment income or net realized gains as distributions may be paid from current or prior year earnings. |
| | (e) | | Assumes investment at the net asset value at the beginning of the year, reinvestment of all dividends and distributions and a complete redemption of the investment at the net asset value at the end of the year. Returns do not reflect the deduction of taxes that a shareholder would pay on Fund distributions or the redemption of Fund shares. Total returns for periods less than one full year are not annualized. |
| | (g) | | Amount is less than 0.005%. |
| | |
| 66 | | The accompanying notes are an integral part of these financial statements. |
Financial Highlights (continued)
Selected Data for a Share Outstanding Throughout Each Period
| | | | | | | | | | | | | | | | | | | | | | | | | | | | | | |
| | | Financial Square Money Market Fund —
Resource Shares | | Six Months Ended
May 31, 2021
(Unaudited) | | | For the
Period Ended
November 30, 2020† | | | Year Ended August 31, | |
| | | 2020 | | | 2019 | | | 2018 | | | 2017 | | | 2016 | |
| | Per Share Data: | | | | | | | | | | | | | | | | | | | | | | | | | | | | |
| | | | | | | | |
| | Net asset value, beginning of period | | $ | 0.9999 | | | $ | 1.0008 | | | $ | 1.0006 | | | $ | 1.0004 | | | $ | 1.0003 | | | $ | 1.0000 | | | $ | 1.000 | |
| | | | | | | | |
| | Net investment income(a) | |
| 0.0002
|
| | | 0.0009 | | | | 0.0116 | | | | 0.0217 | | | | 0.0142 | | | | 0.0068 | | | | 0.001 | |
| | | | | | | | |
| | Net realized and unrealized gain (loss) | | | 0.0009 | | | | (0.0009 | ) | | | (0.0005 | ) | | | 0.0002 | | | | 0.0001 | | | | (0.0040 | ) | | | — | (b) |
| | | | | | | | |
| | Total from investment operations | | | 0.0011 | | | | — | (c) | | | 0.0111 | | | | 0.0219 | | | | 0.0143 | | | | 0.0028 | | | | 0.001 | |
| | | | | | | | |
| | Distributions to shareholders from net investment income | |
| (0.0002
| )
| | | (0.0009 | ) | | | (0.0109 | ) | | | (0.0217 | ) | | | (0.0142 | ) | | | (0.0025 | ) | | | (0.001 | ) |
| | | | | | | | |
| | Distributions to shareholders from net realized gains | | | — | (c) | | | — | (c) | | | — | (c) | | | — | (c) | | | — | (c) | | | — | (c) | | | — | (b) |
| | | | | | | | |
| | Total distributions(d) | |
| (0.0002
| )
| | | (0.0009 | ) | | | (0.0109 | ) | | | (0.0217 | ) | | | (0.0142 | ) | | | (0.0025 | ) | | | (0.001 | ) |
| | | | | | | | |
| | Net asset value, end of period | | $ | 1.0008 | | | $ | 0.9999 | | | $ | 1.0008 | | | $ | 1.0006 | | | $ | 1.0004 | | | $ | 1.0003 | | | $ | 1.000 | |
| | | | | | | | |
| | Total return(e) | | | 0.11 | % | | | (0.09 | )% | | | 0.69 | % | | | 1.84 | % | | | 1.04 | % | | | 0.28 | % | | | 0.10 | % |
| | | | | | | | |
| | Net assets, end of period (in 000’s) | | $ | 1 | | | $ | 1 | | | $ | 1 | | | $ | 1 | | | $ | 1 | | | $ | 1 | | | $ | 1 | |
| | | | | | | | |
| | Ratio of net expenses to average net assets | | | 0.13 | %(f) | | | 0.18 | %(f) | | | 0.45 | % | | | 0.49 | % | | | 0.47 | % | | | 0.53 | % | | | 0.19 | % |
| | | | | | | | |
| | Ratio of total expenses to average net assets | | | 0.54 | %(f) | | | 0.84 | %(f) | | | 0.83 | % | | | 0.83 | % | | | 0.85 | % | | | 0.90 | % | | | 0.88 | % |
| | | | | | | | |
| | Ratio of net investment income to average net assets | | | 0.06 | %(f) | | | — | %(f)(g) | | | 1.11 | % | | | 2.17 | % | | | 1.42 | % | | | 0.68 | % | | | 0.37 | % |
| | † | | The Fund changed its fiscal year end from August 31 to November 30. |
| | (a) | | Calculated based on the average shares outstanding methodology. |
| | (b) | | Amount is less than $0.0005 per share. |
| | (c) | | Amount is less than $0.00005 per share. |
| | (d) | | Distributions may not coincide with the current year net investment income or net realized gains as distributions may be paid from current or prior year earnings. |
| | (e) | | Assumes investment at the net asset value at the beginning of the year, reinvestment of all dividends and distributions and a complete redemption of the investment at the net asset value at the end of the year. Returns do not reflect the deduction of taxes that a shareholder would pay on Fund distributions or the redemption of Fund shares. Total returns for periods less than one full year are not annualized. |
| | (g) | | Amount is less than 0.005%. |
| | |
| The accompanying notes are an integral part of these financial statements. | | 67 |
Financial Highlights (continued)
Selected Data for a Share Outstanding Throughout Each Period
| | | | | | | | | | | | | | | | | | | | | | | | | | | | | | |
| | | Financial Square Prime Obligations Fund —
Institutional Shares | | Six Months Ended
May 31, 2021
(Unaudited) | | | For the
Period Ended
November 30, 2020† | | | Year Ended August 31, | |
| | | 2020 | | | 2019 | | | 2018 | | | 2017 | | | 2016 | |
| | Per Share Data: | | | | | | | | | | | | | | | | | | | | | | | | | | | | |
| | | | | | | | |
| | Net asset value, beginning of period | | $ | 1.0010 | | | $ | 1.0013 | | | $ | 1.0006 | | | $ | 1.0003 | | | $ | 1.0003 | | | $ | 1.0000 | | | $ | 1.000 | |
| | | | | | | | |
| | Net investment income (loss)(a) | | | — | (c) | | | — | (c) | | | 0.0130 | | | | 0.0243 | | | | 0.0182 | | | | 0.0073 | | | | 0.003 | |
| | | | | | | | |
| | Net realized and unrealized gain (loss) | | | — | (c) | | | (0.0001 | ) | | | (0.0002 | ) | | | 0.0004 | | | | (0.0014 | ) | | | 0.0014 | | | | — | (b) |
| | | | | | | | |
| | Total from investment operations | | | — | (c) | | | (0.0001 | ) | | | 0.0128 | | | | 0.0247 | | | | 0.0168 | | | | 0.0087 | | | | 0.003 | |
| | | | | | | | |
| | Distributions to shareholders from net investment income | | | — | (c) | | | — | (c) | | | (0.0121 | ) | | | (0.0244 | ) | | | (0.0168 | ) | | | (0.0083 | ) | | | (0.003 | ) |
| | | | | | | | |
| | Distributions to shareholders from net realized gains | | | (0.0001 | ) | | | (0.0002 | ) | | | — | (c) | | | — | (c) | | | — | (c) | | | (0.0001 | )(c) | | | — | (b) |
| | | | | | | | |
| | Total distributions(d) | | | (0.0001 | ) | | | (0.0002 | ) | | | (0.0121 | ) | | | (0.0244 | ) | | | (0.0168 | ) | | | (0.0084 | ) | | | (0.003 | ) |
| | | | | | | | |
| | Net asset value, end of period | | $ | 1.0009 | | | $ | 1.0010 | | | $ | 1.0013 | | | $ | 1.0006 | | | $ | 1.0003 | | | $ | 1.0003 | | | $ | 1.000 | |
| | | | | | | | |
| | Total return(e) | | | — | %(f) | | | (0.01 | )% | | | 1.28 | % | | | 2.51 | % | | | 1.68 | % | | | 0.87 | % | | | 0.29 | % |
| | | | | | | | |
| | Net assets, end of period (in 000’s) | | $ | 1,593,122 | | | $ | 2,747,965 | | | $ | 4,619,641 | | | $ | 6,122,574 | | | $ | 3,766,257 | | | $ | 1,467,979 | | | $ | 7,299,656 | |
| | | | | | | | |
| | Ratio of net expenses to average net assets | | | 0.16 | %(g) | | | 0.18 | %(g) | | | 0.16 | % | | | 0.13 | % | | | 0.11 | % | | | 0.18 | % | | | 0.18 | % |
| | | | | | | | |
| | Ratio of total expenses to average net assets | | | 0.19 | %(g) | | | 0.19 | %(g) | | | 0.18 | % | | | 0.18 | % | | | 0.21 | % | | | 0.27 | % | | | 0.23 | % |
| | | | | | | | |
| | Ratio of net investment income (loss) to average net assets | | | (0.01 | )%(g) | | | — | %(f)(g) | | | 1.30 | % | | | 2.43 | % | | | 1.82 | % | | | 0.73 | % | | | 0.31 | % |
| | † | | The Fund changed its fiscal year end from August 31 to November 30. |
| | (a) | | Calculated based on the average shares outstanding methodology. |
| | (b) | | Amount is less than $0.0005 per share. |
| | (c) | | Amount is less than $0.00005 per share. |
| | (d) | | Distributions may not coincide with the current year net investment income or net realized gains as distributions may be paid from current or prior year earnings. |
| | (e) | | Assumes investment at the net asset value at the beginning of the year, reinvestment of all dividends and distributions and a complete redemption of the investment at the net asset value at the end of the year. Returns do not reflect the deduction of taxes that a shareholder would pay on Fund distributions or the redemption of Fund shares. Total returns for periods less than one full year are not annualized. |
| | (f) | | Amount is less than 0.005%. |
| | |
| 68 | | The accompanying notes are an integral part of these financial statements. |
Financial Highlights (continued)
Selected Data for a Share Outstanding Throughout Each Period
| | | | | | | | | | | | | | | | | | | | | | | | | | | | | | |
| | | Financial Square Prime Obligations Fund —
Capital Shares | | Six Months Ended
May 31, 2021
(Unaudited) | | | For the
Period Ended
November 30, 2020† | | | Year Ended August 31, | |
| | | 2020 | | | 2019 | | | 2018 | | | 2017 | | | 2016 | |
| | Per Share Data: | | | | | | | | | | | | | | | | | | | | | | | | | | | | |
| | | | | | | | |
| | Net asset value, beginning of period | | $ | 1.0009 | | | $ | 1.0012 | | | $ | 1.0006 | | | $ | 1.0002 | | | $ | 1.0003 | | | $ | 1.0000 | | | $ | 1.000 | |
| | | | | | | | |
| | Net investment income (loss)(a) | | | — | (c) | | | — | (c) | | | 0.0108 | | | | 0.0227 | | | | 0.0178 | | | | 0.0024 | | | | 0.002 | |
| | | | | | | | |
| | Net realized and unrealized gain (loss) | | | — | (c) | | | (0.0001 | ) | | | 0.0004 | | | | 0.0006 | | | | (0.0026 | ) | | | 0.0048 | | | | — | (b) |
| | | | | | | | |
| | Total from investment operations | | | — | (c) | | | (0.0001 | ) | | | 0.0112 | | | | 0.0233 | | | | 0.0152 | | | | 0.0072 | | | | 0.002 | |
| | | | | | | | |
| | Distributions to shareholders from net investment income | | | — | (c) | | | — | (c) | | | (0.0106 | ) | | | (0.0229 | ) | | | (0.0153 | ) | | | (0.0068 | ) | | | (0.002 | ) |
| | | | | | | | |
| | Distributions to shareholders from net realized gains | | | (0.0001 | ) | | | (0.0002 | ) | | | — | (c) | | | — | (c) | | | — | (c) | | | (0.0001 | )(c) | | | — | (b) |
| | | | | | | | |
| | Total distributions(d) | | | (0.0001 | ) | | | (0.0002 | ) | | | (0.0106 | ) | | | (0.0229 | ) | | | (0.0153 | ) | | | (0.0069 | ) | | | (0.002 | ) |
| | | | | | | | |
| | Net asset value, end of period | | $ | 1.0008 | | | $ | 1.0009 | | | $ | 1.0012 | | | $ | 1.0006 | | | $ | 1.0002 | | | $ | 1.0003 | | | $ | 1.000 | |
| | | | | | | | |
| | Total return(e) | | | — | %(f) | | | (0.03 | )% | | | 1.12 | % | | | 2.35 | % | | | 1.53 | % | | | 0.72 | % | | | 0.16 | % |
| | | | | | | | |
| | Net assets, end of period (in 000’s) | | $ | 911 | | | $ | 911 | | | $ | 1,014 | | | $ | 6,755 | | | $ | 6,829 | | | $ | 407 | | | $ | 140,138 | |
| | | | | | | | |
| | Ratio of net expenses to average net assets | | | 0.17 | %(g) | | | 0.23 | %(g) | | | 0.31 | % | | | 0.28 | % | | | 0.26 | % | | | 0.33 | % | | | 0.31 | % |
| | | | | | | | |
| | Ratio of total expenses to average net assets | | | 0.34 | %(g) | | | 0.34 | %(g) | | | 0.33 | % | | | 0.33 | % | | | 0.36 | % | | | 0.42 | % | | | 0.38 | % |
| | | | | | | | |
| | Ratio of net investment income (loss) to average net assets | | | (0.02 | )%(g) | | | (0.05 | )%(g) | | | 1.07 | % | | | 2.27 | % | | | 1.78 | % | | | 0.24 | % | | | 0.16 | % |
| | † | | The Fund changed its fiscal year end from August 31 to November 30. |
| | (a) | | Calculated based on the average shares outstanding methodology. |
| | (b) | | Amount is less than $0.0005 per share. |
| | (c) | | Amount is less than $0.00005 per share. |
| | (d) | | Distributions may not coincide with the current year net investment income or net realized gains as distributions may be paid from current or prior year earnings. |
| | (e) | | Assumes investment at the net asset value at the beginning of the year, reinvestment of all dividends and distributions and a complete redemption of the investment at the net asset value at the end of the year. Returns do not reflect the deduction of taxes that a shareholder would pay on Fund distributions or the redemption of Fund shares. Total returns for periods less than one full year are not annualized. |
| | (f) | | Amount is less than 0.005%. |
| | |
| The accompanying notes are an integral part of these financial statements. | | 69 |
Financial Highlights (continued)
Selected Data for a Share Outstanding Throughout Each Period
| | | | | | | | | | | | | | | | | | | | | | | | | | | | | | |
| | | Financial Square Prime Obligations Fund —
Service Shares | | Six Months Ended
May 31, 2021
(Unaudited) | | | For the
Period Ended
November 30, 2020† | | | Year Ended August 31, | |
| | | 2020 | | | 2019 | | | 2018 | | | 2017 | | | 2016 | |
| | Per Share Data: | | | | | | | | | | | | | | | | | | | | | | | | | | | | |
| | | | | | | | |
| | Net asset value, beginning of period | | $ | 1.0001 | | | $ | 1.0004 | | | $ | 1.0004 | | | $ | 1.0002 | | | $ | 1.0003 | | | $ | 1.0000 | | | $ | 1.000 | |
| | | | | | | | |
| | Net investment income (loss)(a) | | | — | (c) | | | — | (c) | | | 0.0167 | | | | 0.0197 | | | | 0.0145 | | | | 0.0003 | | | | — | (b) |
| | | | | | | | |
| | Net realized and unrealized gain (loss) | | | 0.0010 | | | | (0.0001 | ) | | | (0.0079 | ) | | | (0.0001 | ) | | | (0.0028 | ) | | | 0.0035 | | | | — | (b) |
| | | | | | | | |
| | Total from investment operations | | | 0.0010 | | | | (0.0001 | ) | | | 0.0088 | | | | 0.0196 | | | | 0.0117 | | | | 0.0038 | | | | — | (b) |
| | | | | | | | |
| | Distributions to shareholders from net investment income | | | — | (c) | | | — | (c) | | | (0.0088 | ) | | | (0.0194 | ) | | | (0.0118 | ) | | | (0.0034 | ) | | | — | (b) |
| | | | | | | | |
| | Distributions to shareholders from net realized gains | | | (0.0001 | ) | | | (0.0002 | ) | | | — | (c) | | | — | (c) | | | — | (c) | | | (0.0001 | )(c) | | | — | (b) |
| | | | | | | | |
| | Total distributions(d) | |
| (0.0001
| )
| | | (0.0002 | ) | | | (0.0088 | ) | | | (0.0194 | ) | | | (0.0118 | ) | | | (0.0035 | ) | | | — | (b) |
| | | | | | | | |
| | Net asset value, end of period | | $ | 1.0010 | | | $ | 1.0001 | | | $ | 1.0004 | | | $ | 1.0004 | | | $ | 1.0002 | | | $ | 1.0003 | | | $ | 1.000 | |
| | | | | | | | |
| | Total return(e) | | | 0.10 | % | | | (0.03 | )% | | | 0.76 | % | | | 2.00 | % | | | 1.16 | % | | | 0.38 | % | | | 0.01 | % |
| | | | | | | | |
| | Net assets, end of period (in 000’s) | | $ | 14 | | | $ | 9 | | | $ | 9 | | | $ | 5,098 | | | $ | 102 | | | $ | 103 | | | $ | 253,231 | |
| | | | | | | | |
| | Ratio of net expenses to average net assets | | | 0.16 | %(f) | | | 0.21 | %(f) | | | 0.66 | % | | | 0.63 | % | | | 0.61 | % | | | 0.59 | % | | | 0.42 | % |
| | | | | | | | |
| | Ratio of total expenses to average net assets | | | 0.69 | %(f) | | | 0.69 | %(f) | | | 0.68 | % | | | 0.68 | % | | | 0.71 | % | | | 0.77 | % | | | 0.73 | % |
| | | | | | | | |
| | Ratio of net investment income (loss) to average net assets | | | (0.01 | )%(f) | | | (0.04 | )%(f) | | | 1.66 | % | | | 1.97 | % | | | 1.45 | % | | | 0.03 | % | | | — | %(g) |
| | † | | The Fund changed its fiscal year end from August 31 to November 30. |
| | (a) | | Calculated based on the average shares outstanding methodology. |
| | (b) | | Amount is less than $0.0005 per share. |
| | (c) | | Amount is less than $0.00005 per share. |
| | (d) | | Distributions may not coincide with the current year net investment income or net realized gains as distributions may be paid from current or prior year earnings. |
| | (e) | | Assumes investment at the net asset value at the beginning of the year, reinvestment of all dividends and distributions and a complete redemption of the investment at the net asset value at the end of the year. Returns do not reflect the deduction of taxes that a shareholder would pay on Fund distributions or the redemption of Fund shares. Total returns for periods less than one full year are not annualized. |
| | (g) | | Amount is less than 0.005%. |
| | |
| 70 | | The accompanying notes are an integral part of these financial statements. |
Financial Highlights (continued)
Selected Data for a Share Outstanding Throughout Each Period
| | | | | | | | | | | | | | | | | | | | | | | | | | | | | | |
| | | Financial Square Prime Obligations Fund —
Preferred Shares | | Six Months Ended
May 31, 2021
(Unaudited) | | | For the
Period Ended
November 30, 2020† | | | Year Ended August 31, | |
| | | 2020 | | | 2019 | | | 2018 | | | 2017 | | | 2016 | |
| | Per Share Data: | | | | | | | | | | | | | | | | | | | | | | | | | | | | |
| | | | | | | | |
| | Net asset value, beginning of period | | $ | 1.0008 | | | $ | 1.0010 | | | $ | 1.0004 | | | $ | 1.0001 | | | $ | 1.0003 | | | $ | 1.0000 | | | $ | 1.000 | |
| | | | | | | | |
| | Net investment income (loss)(a) | |
| —
| (c)
| |
| —
| (c)
| | | 0.0111 | | | | 0.0233 | | | | 0.0142 | | | | 0.0030 | | | | 0.002 | |
| | | | | | | | |
| | Net realized and unrealized gain (loss) | | | — | (c) | | | (0.0001 | ) | | | 0.0006 | | | | 0.0004 | | | | 0.0014 | | | | 0.0047 | | | | — | (b) |
| | | | | | | | |
| | Total from investment operations | | | — | (c) | | | (0.0001 | ) | | | 0.0117 | | | | 0.0237 | | | | 0.0156 | | | | 0.0077 | | | | 0.002 | |
| | | | | | | | |
| | Distributions to shareholders from net investment income | | | — | (c) | | | — | (c) | | | (0.0111 | ) | | | (0.0234 | ) | | | (0.0158 | ) | | | (0.0073 | ) | | | (0.002 | ) |
| | | | | | | | |
| | Distributions to shareholders from net realized gains | | | (0.0001 | ) | | | (0.0001 | ) | | | — | (c) | | | — | (c) | | | — | (c) | | | (0.0001 | ) | | | — | (b) |
| | | | | | | | |
| | Total distributions(d) | |
| (0.0001
| )
| | | (0.0001 | ) | | | (0.0111 | ) | | | (0.0234 | ) | | | (0.0158 | ) | | | (0.0074 | ) | | | (0.002 | ) |
| | | | | | | | |
| | Net asset value, end of period | | $ | 1.0007 | | | $ | 1.0008 | | | $ | 1.0010 | | | $ | 1.0004 | | | $ | 1.0001 | | | $ | 1.0003 | | | $ | 1.000 | |
| | | | | | | | |
| | Total return(e) | | | — | %(f) | | | (0.02 | )% | | | 1.16 | % | | | 2.41 | % | | | 1.57 | % | | | 0.77 | % | | | 0.20 | % |
| | | | | | | | |
| | Net assets, end of period (in 000’s) | | $ | 1,014 | | | $ | 3,364 | | | $ | 3,365 | | | $ | 2,839 | | | $ | 2,624 | | | $ | 1,003 | | | $ | 279,445 | |
| | | | | | | | |
| | Ratio of net expenses to average net assets | | | 0.17 | %(g) | | | 0.22 | %(g) | | | 0.26 | % | | | 0.23 | % | | | 0.21 | % | | | 0.28 | % | | | 0.28 | % |
| | | | | | | | |
| | Ratio of total expenses to average net assets | | | 0.29 | %(g) | | | 0.29 | %(g) | | | 0.28 | % | | | 0.28 | % | | | 0.31 | % | | | 0.37 | % | | | 0.33 | % |
| | | | | | | | |
| | Ratio of net investment income (loss) to average net assets | | | (0.03 | )%(g) | | | (0.05 | )%(g) | | | 1.11 | % | | | 2.33 | % | | | 1.42 | % | | | 0.30 | % | | | 0.19 | % |
| | † | | The Fund changed its fiscal year end from August 31 to November 30. |
| | (a) | | Calculated based on the average shares outstanding methodology. |
| | (b) | | Amount is less than $0.0005 per share. |
| | (c) | | Amount is less than $0.00005 per share. |
| | (d) | | Distributions may not coincide with the current year net investment income or net realized gains as distributions may be paid from current or prior year earnings. |
| | (e) | | Assumes investment at the net asset value at the beginning of the year, reinvestment of all dividends and distributions and a complete redemption of the investment at the net asset value at the end of the year. Returns do not reflect the deduction of taxes that a shareholder would pay on Fund distributions or the redemption of Fund shares. Total returns for periods less than one full year are not annualized. |
| | (f) | | Amount is less than 0.005%. |
| | |
| The accompanying notes are an integral part of these financial statements. | | 71 |
Financial Highlights (continued)
Selected Data for a Share Outstanding Throughout Each Period
| | | | | | | | | | | | | | | | | | | | | | | | | | | | | | |
| | | Financial Square Prime Obligations Fund —
Select Shares | | Six Months Ended
May 31, 2021
(Unaudited) | | | For the
Period Ended
November 30, 2020† | | | Year Ended August 31, | |
| | | 2020 | | | 2019 | | | 2018 | | | 2017 | | | 2016 | |
| | Per Share Data: | | | | | | | | | | | | | | | | | | | | | | | | | | | | |
| | | | | | | | |
| | Net asset value, beginning of period | | $ | 1.0010 | | | $ | 1.0012 | | | $ | 1.0004 | | | $ | 1.0002 | | | $ | 1.0003 | | | $ | 1.0000 | | | $ | 1.000 | |
| | | | | | | | |
| | Net investment income (loss)(a) | |
| —
| (c)
| |
| —
| (c)
| | | 0.0120 | | | | 0.0241 | | | | 0.0181 | | | | 0.0097 | | | | 0.003 | |
| | | | | | | | |
| | Net realized and unrealized gain (loss) | | | — | (c) | | | — | (c) | | | 0.0006 | | | | 0.0002 | | | | (0.0017 | ) | | | (0.0013 | ) | | | — | (b) |
| | | | | | | | |
| | Total from investment operations | | | — | (c) | |
| —
| (c)
| | | 0.0126 | | | | 0.0243 | | | | 0.0164 | | | | 0.0084 | | | | 0.003 | |
| | | | | | | | |
| | Distributions to shareholders from net investment income | | | — | (c) | |
| —
| (c)
| | | (0.0118 | ) | | | (0.0241 | ) | | | (0.0165 | ) | | | (0.0080 | ) | | | (0.003 | ) |
| | | | | | | | |
| | Distributions to shareholders from net realized gains | | | (0.0001 | ) | | | (0.0002 | ) | | | — | (c) | | | — | (c) | | | — | (c) | | | (0.0001 | )(c) | | | — | (b) |
| | | | | | | | |
| | Total distributions(d) | |
| (0.0001
| )
| | | (0.0002 | ) | | | (0.0118 | ) | | | (0.0241 | ) | | | (0.0165 | ) | | | (0.0081 | ) | | | (0.003 | ) |
| | | | | | | | |
| | Net asset value, end of period | | $ | 1.0009 | | | $ | 1.0010 | | | $ | 1.0012 | | | $ | 1.0004 | | | $ | 1.0002 | | | $ | 1.0003 | | | $ | 1.000 | |
| | | | | | | | |
| | Total return(e) | | | — | %(f) | | | (0.01 | )% | | | 1.25 | % | | | 2.48 | % | | | 1.64 | % | | | 0.84 | % | | | 0.26 | % |
| | | | | | | | |
| | Net assets, end of period (in 000’s) | | $ | 17,809 | | | $ | 38,230 | | | $ | 76,327 | | | $ | 98,996 | | | $ | 60,236 | | | $ | 18,082 | | | $ | 9,454 | |
| | | | | | | | |
| | Ratio of net expenses to average net assets | | | 0.17 | %(g) | | | 0.20 | %(g) | | | 0.19 | % | | | 0.16 | % | | | 0.14 | % | | | 0.21 | % | | | 0.21 | % |
| | | | | | | | |
| | Ratio of total expenses to average net assets | | | 0.22 | %(g) | | | 0.22 | %(g) | | | 0.21 | % | | | 0.21 | % | | | 0.24 | % | | | 0.30 | % | | | 0.26 | % |
| | | | | | | | |
| | Ratio of net investment income (loss) to average net assets | | | (0.02 | )%(g) | | | (0.02 | )%(g) | | | 1.19 | % | | | 2.41 | % | | | 1.81 | % | | | 0.97 | % | | | 0.29 | % |
| | † | | The Fund changed its fiscal year end from August 31 to November 30. |
| | (a) | | Calculated based on the average shares outstanding methodology. |
| | (b) | | Amount is less than $0.0005 per share. |
| | (c) | | Amount is less than $0.00005 per share. |
| | (d) | | Distributions may not coincide with the current year net investment income or net realized gains as distributions may be paid from current or prior year earnings. |
| | (e) | | Assumes investment at the net asset value at the beginning of the year, reinvestment of all dividends and distributions and a complete redemption of the investment at the net asset value at the end of the year. Returns do not reflect the deduction of taxes that a shareholder would pay on Fund distributions or the redemption of Fund shares. Total returns for periods less than one full year are not annualized. |
| | (f) | | Amount is less than 0.005%. |
| | |
| 72 | | The accompanying notes are an integral part of these financial statements. |
Financial Highlights (continued)
Selected Data for a Share Outstanding Throughout Each Period
| | | | | | | | | | | | | | | | | | | | | | | | | | | | | | |
| | | Financial Square Prime Obligations Fund —
Administration Shares | | Six Months Ended
May 31, 2021
(Unaudited) | | | For the
Period Ended
November 30, 2020† | | | Year Ended August 31, | |
| | | 2020 | | | 2019 | | | 2018 | | | 2017 | | | 2016 | |
| | Per Share Data: | | | | | | | | | | | | | | | | | | | | | | | | | | | | |
| | | | | | | | |
| | Net asset value, beginning of period | | $ | 1.0010 | | | $ | 1.0012 | | | $ | 1.0005 | | | $ | 1.0002 | | | $ | 1.0003 | | | $ | 1.0000 | | | $ | 1.000 | |
| | | | | | | | |
| | Net investment income (loss)(a) | |
| —
| (c)
| |
| —
| (c)
| | | 0.0121 | | | | 0.0222 | | | | 0.0139 | | | | 0.0015 | | | | 0.001 | |
| | | | | | | | |
| | Net realized and unrealized gain (loss) | | | — | (c) | |
| —
| (c)
| | | (0.0017 | ) | | | — | | | | 0.0003 | | | | 0.0047 | | | | — | (b) |
| | | | | | | | |
| | Total from investment operations | | | — | (c) | |
| —
| (c)
| | | 0.0104 | | | | 0.0222 | | | | 0.0142 | | | | 0.0062 | | | | 0.001 | |
| | | | | | | | |
| | Distributions to shareholders from net investment income | | | — | (c) | |
| —
| (c)
| | | (0.0097 | ) | | | (0.0219 | ) | | | (0.0143 | ) | | | (0.0058 | ) | | | (0.001 | ) |
| | | | | | | | |
| | Distributions to shareholders from net realized gains | | | (0.0001 | ) | | | (0.0002 | ) | | | — | (c) | | | — | (c) | | | — | (c) | | | (0.0001 | )(c) | | | — | (b) |
| | | | | | | | |
| | Total distributions(d) | |
| (0.0001
| )
| | | (0.0002 | ) | | | (0.0097 | ) | | | (0.0219 | ) | | | (0.0143 | ) | | | (0.0059 | ) | | | (0.001 | ) |
| | | | | | | | |
| | Net asset value, end of period | | $ | 1.0009 | | | $ | 1.0010 | | | $ | 1.0012 | | | $ | 1.0005 | | | $ | 1.0002 | | | $ | 1.0003 | | | $ | 1.000 | |
| | | | | | | | |
| | Total return(e) | | | — | %(f) | | | (0.02 | )% | | | 1.03 | % | | | 2.25 | % | | | 1.43 | % | | | 0.62 | % | | | 0.09 | % |
| | | | | | | | |
| | Net assets, end of period (in 000’s) | | $ | 6,763 | | | $ | 81,920 | | | $ | 8,736 | | | $ | 9,748 | | | $ | 7,474 | | | $ | 4,282 | | | $ | 1,250,848 | |
| | | | | | | | |
| | Ratio of net expenses to average net assets | | | 0.17 | %(g) | | | 0.21 | %(g) | | | 0.41 | % | | | 0.38 | % | | | 0.36 | % | | | 0.43 | % | | | 0.38 | % |
| | | | | | | | |
| | Ratio of total expenses to average net assets | | | 0.44 | %(g) | | | 0.44 | %(g) | | | 0.43 | % | | | 0.43 | % | | | 0.46 | % | | | 0.52 | % | | | 0.48 | % |
| | | | | | | | |
| | Ratio of net investment income (loss) to average net assets | | | (0.02 | )%(g) | | | (0.04 | )%(g) | | | 1.21 | % | | | 2.22 | % | | | 1.39 | % | | | 0.15 | % | | | 0.09 | % |
| | † | | The Fund changed its fiscal year end from August 31 to November 30. |
| | (a) | | Calculated based on the average shares outstanding methodology. |
| | (b) | | Amount is less than $0.0005 per share. |
| | (c) | | Amount is less than $0.00005 per share. |
| | (d) | | Distributions may not coincide with the current year net investment income or net realized gains as distributions may be paid from current or prior year earnings. |
| | (e) | | Assumes investment at the net asset value at the beginning of the year, reinvestment of all dividends and distributions and a complete redemption of the investment at the net asset value at the end of the year. Returns do not reflect the deduction of taxes that a shareholder would pay on Fund distributions or the redemption of Fund shares. Total returns for periods less than one full year are not annualized. |
| | (f) | | Amount is less than 0.005%. |
| | |
| The accompanying notes are an integral part of these financial statements. | | 73 |
Financial Highlights (continued)
Selected Data for a Share Outstanding Throughout Each Period
| | | | | | | | | | | | | | | | | | | | | | | | | | | | | | |
| | | Financial Square Prime Obligations Fund — Cash
Management Shares | | Six Months Ended
May 31, 2021
(Unaudited) | | | For the
Period Ended
November 30, 2020† | | | Year Ended August 31, | |
| | | 2020 | | | 2019 | | | 2018 | | | 2017 | | | 2016 | |
| | Per Share Data: | | | | | | | | | | | | | | | | | | | | | | | | | | | | |
| | | | | | | | |
| | Net asset value, beginning of period | | $ | 1.0000 | | | $ | 1.0010 | | | $ | 1.0005 | | | $ | 1.0002 | | | $ | 1.0003 | | | $ | 1.0000 | | | $ | 1.000 | |
| | | | | | | | |
| | Net investment income(a) | |
| —
| (c)
| | | 0.0009 | | | | 0.0087 | | | | 0.0181 | | | | 0.0108 | | | | 0.0051 | | | | 0.001 | |
| | | | | | | | |
| | Net realized and unrealized gain (loss) | | | 0.0012 | | | | (0.0010 | ) | | | 0.0004 | | | | 0.0003 | | | | (0.0001 | ) | | | (0.0033 | ) | | | — | (b) |
| | | | | | | | |
| | Total from investment operations | | | 0.0012 | | | | (0.0001 | ) | | | 0.0091 | | | | 0.0184 | | | | 0.0107 | | | | 0.0018 | | | | 0.001 | |
| | | | | | | | |
| | Distributions to shareholders from net investment income | | | — | (c) | | | (0.0009 | ) | | | (0.0086 | ) | | | (0.0181 | ) | | | (0.0108 | ) | | | (0.0015 | ) | | | (0.001 | ) |
| | | | | | | | |
| | Distributions to shareholders from net realized gains | | | (0.0001 | ) | | | — | (c) | | | — | (c) | | | — | (c) | | | — | (c) | | | — | (c) | | | — | (b) |
| | | | | | | | |
| | Total distributions(d) | |
| (0.0001
| )
| | | (0.0009 | ) | | | (0.0086 | ) | | | (0.0181 | ) | | | (0.0108 | ) | | | (0.0015 | ) | | | (0.001 | ) |
| | | | | | | | |
| | Net asset value, end of period | | $ | 1.0011 | | | $ | 1.0000 | | | $ | 1.0010 | | | $ | 1.0005 | | | $ | 1.0002 | | | $ | 1.0003 | | | $ | 1.000 | |
| | | | | | | | |
| | Total return(e) | | | 0.12 | % | | | (0.10 | )% | | | 0.63 | % | | | 1.69 | % | | | 0.86 | % | | | 0.18 | % | | | 0.09 | % |
| | | | | | | | |
| | Net assets, end of period (in 000’s) | | $ | 1 | | | $ | 1 | | | $ | 1 | | | $ | 1 | | | $ | 1 | | | $ | 1 | | | $ | 1 | |
| | | | | | | | |
| | Ratio of net expenses to average net assets | | | 0.16 | %(f) | | | 0.18 | %(f) | | | 0.70 | % | | | 0.85 | % | | | 0.83 | % | | | 0.73 | % | | | 0.18 | % |
| | | | | | | | |
| | Ratio of total expenses to average net assets | | | 0.90 | %(f) | | | 0.99 | %(f) | | | 0.98 | % | | | 0.98 | % | | | 1.01 | % | | | 1.07 | % | | | 1.03 | % |
| | | | | | | | |
| | Ratio of net investment income to average net assets | | | 0.06 | %(f) | | | — | %(f)(g) | | | 0.87 | % | | | 1.80 | % | | | 1.08 | % | | | 0.51 | % | | | 0.37 | % |
| | † | | The Fund changed its fiscal year end from August 31 to November 30. |
| | (a) | | Calculated based on the average shares outstanding methodology. |
| | (b) | | Amount is less than $0.0005 per share. |
| | (c) | | Amount is less than $0.00005 per share. |
| | (d) | | Distributions may not coincide with the current year net investment income or net realized gains as distributions may be paid from current or prior year earnings. |
| | (e) | | Assumes investment at the net asset value at the beginning of the year, reinvestment of all dividends and distributions and a complete redemption of the investment at the net asset value at the end of the year. Returns do not reflect the deduction of taxes that a shareholder would pay on Fund distributions or the redemption of Fund shares. Total returns for periods less than one full year are not annualized. |
| | (g) | | Amount is less than 0.005%. |
| | |
| 74 | | The accompanying notes are an integral part of these financial statements. |
Financial Highlights (continued)
Selected Data for a Share Outstanding Throughout Each Period
| | | | | | | | | | | | | | | | | | | | | | | | | | | | | | |
| | | Financial Square Prime Obligations Fund —
Premier Shares | | Six Months Ended
May 31, 2021
(Unaudited) | | | For the
Period Ended
November 30, 2020† | | | Year Ended August 31, | |
| | | 2020 | | | 2019 | | | 2018 | | | 2017 | | | 2016 | |
| | Per Share Data: | | | | | | | | | | | | | | | | | | | | | | | | | | | | |
| | | | | | | | |
| | Net asset value, beginning of period | | $ | 1.0000 | | | $ | 1.0009 | | | $ | 1.0005 | | | $ | 1.0002 | | | $ | 1.0003 | | | $ | 1.0000 | | | $ | 1.000 | |
| | | | | | | | |
| | Net investment income(a) | | | — | (c) | | | 0.0009 | | | | 0.0115 | | | | 0.0216 | | | | 0.0144 | | | | 0.0071 | | | | 0.001 | |
| | | | | | | | |
| | Net realized and unrealized gain (loss) | | | 0.0012 | | | | (0.0009 | ) | | | (0.0001 | ) | | | 0.0003 | | | | (0.0001 | ) | | | (0.0018 | ) | | | — | (b) |
| | | | | | | | |
| | Total from investment operations | | | 0.0012 | | | | (0.0009 | ) | | | 0.0114 | | | | 0.0219 | | | | 0.0143 | | | | 0.0053 | | | | 0.001 | |
| | | | | | | | |
| | Distributions to shareholders from net investment income | | | — | (c) | | | (0.0009 | ) | | | (0.0110 | ) | | | (0.0216 | ) | | | (0.0144 | ) | | | (0.0050 | ) | | | (0.001 | ) |
| | | | | | | | |
| | Distributions to shareholders from net realized gains | | | (0.0001 | ) | | | — | (c) | | | — | (c) | | | — | (c) | | | — | (c) | | | — | (c) | | | — | (b) |
| | | | | | | | |
| | Total distributions(d) | | | (0.0001 | ) | | | (0.0009 | ) | | | (0.0110 | ) | | | (0.0216 | ) | | | (0.0144 | ) | | | (0.0050 | ) | | | (0.001 | ) |
| | | | | | | | |
| | Net asset value, end of period | | $ | 1.0011 | | | $ | 1.0000 | | | $ | 1.0009 | | | $ | 1.0005 | | | $ | 1.0002 | | | $ | 1.0003 | | | $ | 1.000 | |
| | | | | | | | |
| | Total return(e) | | | 0.12 | % | | | (0.09 | )% | | | 0.93 | % | | | 2.15 | % | | | 1.32 | % | | | 0.53 | % | | | 0.09 | % |
| | | | | | | | |
| | Net assets, end of period (in 000’s) | | $ | 1 | | | $ | 1 | | | $ | 1 | | | $ | 1 | | | $ | 1 | | | $ | 1 | | | $ | 1 | |
| | | | | | | | |
| | Ratio of net expenses to average net assets | | | 0.16 | %(f) | | | 0.18 | %(f) | | | 0.46 | % | | | 0.49 | % | | | 0.47 | % | | | 0.53 | % | | | 0.18 | % |
| | | | | | | | |
| | Ratio of total expenses to average net assets | | | 0.54 | %(f) | | | 0.54 | %(f) | | | 0.53 | % | | | 0.53 | % | | | 0.56 | % | | | 0.62 | % | | | 0.58 | % |
| | | | | | | | |
| | Ratio of net investment income to average net assets | | | 0.06 | %(f) | | | — | %(f)(g) | | | 1.10 | % | | | 2.16 | % | | | 1.44 | % | | | 0.71 | % | | | 0.36 | % |
| | † | | The Fund changed its fiscal year end from August 31 to November 30. |
| | (a) | | Calculated based on the average shares outstanding methodology. |
| | (b) | | Amount is less than $0.0005 per share. |
| | (c) | | Amount is less than $0.00005 per share. |
| | (d) | | Distributions may not coincide with the current year net investment income or net realized gains as distributions may be paid from current or prior year earnings. |
| | (e) | | Assumes investment at the net asset value at the beginning of the year, reinvestment of all dividends and distributions and a complete redemption of the investment at the net asset value at the end of the year. Returns do not reflect the deduction of taxes that a shareholder would pay on Fund distributions or the redemption of Fund shares. Total returns for periods less than one full year are not annualized. |
| | (g) | | Amount is less than 0.005%. |
| | |
| The accompanying notes are an integral part of these financial statements. | | 75 |
Financial Highlights (continued)
Selected Data for a Share Outstanding Throughout Each Period
| | | | | | | | | | | | | | | | | | | | | | | | | | | | | | |
| | | Financial Square Prime Obligations Fund — Resource
Shares | | Six Months Ended
May 31, 2021
(Unaudited) | | | For the
Period Ended
November 30, 2020† | | | Year Ended August 31, | |
| | | 2020 | | | 2019 | | | 2018 | | | 2017 | | | 2016 | |
| | Per Share Data: | | | | | | | | | | | | | | | | | | | | | | | | | | | | |
| | | | | | | | |
| | Net asset value, beginning of period | | $ | 1.0000 | | | $ | 1.0010 | | | $ | 1.0005 | | | $ | 1.0002 | | | $ | 1.0003 | | | $ | 1.0000 | | | $ | 1.000 | |
| | | | | | | | |
| | Net investment income(a) | | | — | (c) | | | 0.0009 | | | | 0.0106 | | | | 0.0216 | | | | 0.0144 | | | | 0.0002 | | | | — | (b) |
| | | | | | | | |
| | Net realized and unrealized gain (loss) | | | 0.0011 | | | | (0.0010 | ) | | | 0.0008 | | | | 0.0003 | | | | (0.0001 | ) | | | 0.0025 | | | | — | (b) |
| | | | | | | | |
| | Total from investment operations | | | 0.0011 | | | | (0.0001 | ) | | | 0.0114 | | | | 0.0219 | | | | 0.0143 | | | | 0.0027 | | | | — | (b) |
| | | | | | | | |
| | Distributions to shareholders from net investment income | | | — | (c) | | | (0.0009 | ) | | | (0.0109 | ) | | | (0.0216 | ) | | | (0.0144 | ) | | | (0.0024 | ) | | | — | (b) |
| | | | | | | | |
| | Distributions to shareholders from net realized gains | | | (0.0001 | ) | | | — | (c) | | | — | (c) | | | — | (c) | | | — | (c) | | | — | (c) | | | — | (b) |
| | | | | | | | |
| | Total distributions(d) | | | (0.0001 | ) | | | (0.0009 | ) | | | (0.0109 | ) | | | (0.0216 | ) | | | (0.0144 | ) | | | (0.0024 | ) | | | — | (b) |
| | | | | | | | |
| | Net asset value, end of period | | $ | 1.0010 | | | $ | 1.0000 | | | $ | 1.0010 | | | $ | 1.0005 | | | $ | 1.0002 | | | $ | 1.0003 | | | $ | 1.000 | |
| | | | | | | | |
| | Total return(e) | | | 0.11 | % | | | (0.10 | )% | | | 0.73 | % | | | 1.85 | % | | | 1.01 | % | | | 0.27 | % | | | 0.01 | % |
| | | | | | | | |
| | Net assets, end of period (in 000’s) | | $ | 1 | | | $ | 1 | | | $ | 1 | | | $ | 1 | | | $ | 1 | | | $ | 1 | | | $ | 71,804 | |
| | | | | | | | |
| | Ratio of net expenses to average net assets | | | 0.16 | %(f) | | | 0.18 | %(f) | | | 0.47 | % | | | 0.49 | % | | | 0.47 | % | | | 0.52 | % | | | 0.46 | % |
| | | | | | | | |
| | Ratio of total expenses to average net assets | | | 0.55 | %(f) | | | 0.84 | %(f) | | | 0.83 | % | | | 0.83 | % | | | 0.86 | % | | | 0.92 | % | | | 0.88 | % |
| | | | | | | | |
| | Ratio of net investment income to average net assets | | | 0.06 | %(f) | | | — | %(f)(g) | | | 1.10 | % | | | 2.16 | % | | | 1.44 | % | | | 0.02 | % | | | 0.01 | % |
| | † | | The Fund changed its fiscal year end from August 31 to November 30. |
| | (a) | | Calculated based on the average shares outstanding methodology. |
| | (b) | | Amount is less than $0.0005 per share. |
| | (c) | | Amount is less than $0.00005 per share. |
| | (d) | | Distributions may not coincide with the current year net investment income or net realized gains as distributions may be paid from current or prior year earnings. |
| | (e) | | Assumes investment at the net asset value at the beginning of the year, reinvestment of all dividends and distributions and a complete redemption of the investment at the net asset value at the end of the year. Returns do not reflect the deduction of taxes that a shareholder would pay on Fund distributions or the redemption of Fund shares. Total returns for periods less than one full year are not annualized. |
| | (g) | | Amount is less than 0.005%. |
| | | | | | | | | | | | | | |
| | | Financial Square Prime Obligations Fund — Drexel Hamilton Class Shares | | Six Months Ended
May 31, 2021
(Unaudited) | | | For the
Period Ended
November 30, 2020† | | | Period Ended
August 31, 2020* | |
| | Per Share Data: | | | | | | | | | | | | |
| | | | |
| | Net asset value, beginning of period | | $ | 1.0010 | | | $ | 1.0012 | | | $ | 1.0006 | |
| | | | |
| | Net investment income(a) | | | — | (b) | | | — | (b) | | | 0.0080 | |
| | | | |
| | Net realized and unrealized gain (loss) | | | (0.0001 | ) | | | — | | | | 0.0042 | |
| | | | |
| | Total from investment operations | | | (0.0001 | ) | | | — | (b) | | | 0.0122 | |
| | | | |
| | Distributions to shareholders from net investment income | | | (0.0001 | ) | | | — | (b) | | | (0.0116 | ) |
| | | | |
| | Distributions to shareholders from net realized gains | | | — | (b) | | | (0.0002 | ) | | | — | (b) |
| | | | |
| | Total distributions(d) | | | (0.0001 | ) | | | (0.0002 | ) | | | (0.0116 | ) |
| | | | |
| | Net asset value, end of period | | $ | 1.0008 | | | $ | 1.0010 | | | $ | 1.0012 | |
| | | | |
| | Total return(e) | | | (0.01 | )% | | | — | %(c) | | | 1.22 | % |
| | | | |
| | Net assets, end of period (in 000’s) | | $ | 65,880 | | | $ | 100,884 | | | $ | 100,044 | |
| | | | |
| | Ratio of net expenses to average net assets | | | 0.16 | %(f) | | | 0.18 | %(f) | | | 0.16 | %(f) |
| | | | |
| | Ratio of total expenses to average net assets | | | 0.19 | %(f) | | | 0.19 | %(f) | | | 0.18 | %(f) |
| | | | |
| | Ratio of net investment income (loss) to average net assets | | | (0.01 | )%(f) | | | (0.01 | )%(f) | | | 0.78 | %(f) |
| | † | | The Fund changed its fiscal year end from August 31 to November 30. |
| | * | | Commenced operations on September 9, 2019. |
| | (a) | | Calculated based on the average shares outstanding methodology. |
| | (b) | | Amount is less than $0.00005 per share. |
| | (c) | | Amount is less than 0.005%. |
| | (d) | | Distributions may not coincide with the current year net investment income or net realized gains as distributions may be paid from current or prior year earnings. |
| | (e) | | Assumes investment at the net asset value at the beginning of the year, reinvestment of all dividends and distributions and a complete redemption of the investment at the net asset value at the end of the year. Returns do not reflect the deduction of taxes that a shareholder would pay on Fund distributions or the redemption of Fund shares. Total returns for periods less than one full year are not annualized. |
| | |
| 76 | | The accompanying notes are an integral part of these financial statements. |
Financial Highlights (continued)
Selected Data for a Share Outstanding Throughout Each Period
| | | | | | | | | | | | | | | | | | | | | | | | | | | | | | |
| | | Financial Square Treasury Instruments
Fund — Institutional Shares | | Six Months Ended
May 31, 2021 (Unaudited) | | | For the Period Ended
November 30, 2020† | | | Year Ended August 31, | |
| | | 2020 | | | 2019 | | | 2018 | | | 2017 | | | 2016 | |
| | Per Share Data: | | | | | | | | | | | | | | | | | | | | | | | | | | | | |
| | | | | | | | |
| | Net asset value, beginning of period | | $ | 1.00 | | | $ | 1.00 | | | $ | 1.00 | | | $ | 1.00 | | | $ | 1.00 | | | $ | 1.00 | | | $ | 1.00 | |
| | | | | | | | |
| | Net investment income(a) | | | — | (b) | | | — | (b) | | | 0.007 | | | | 0.021 | | | | 0.014 | | | | 0.005 | | | | 0.001 | |
| | | | | | | | |
| | Net realized gain (loss) | | | — | (b) | | | — | (b) | | | 0.002 | | | | — | (b) | | | (0.001 | ) | | | — | (b) | | | — | (b) |
| | | | | | | | |
| | Total from investment operations | | | — | (b) | | | — | (b) | | | 0.009 | | | | 0.021 | | | | 0.013 | | | | 0.005 | | | | 0.001 | |
| | | | | | | | |
| | Distributions to shareholders from net investment income | | | — | (b) | | | — | (b) | | | (0.009 | ) | | | (0.021 | ) | | | (0.013 | ) | | | (0.005 | ) | | | (0.001 | ) |
| | | | | | | | |
| | Distributions to shareholders from net realized gains | | | — | (b) | | | — | (b) | | | — | (b) | | | — | (b) | | | — | (b) | | | — | (b) | | | — | (b) |
| | | | | | | | |
| | Total distributions(c) | | | — | (b) | | | — | (b) | | | (0.009 | ) | | | (0.021 | ) | | | (0.013 | ) | | | (0.005 | ) | | | (0.001 | ) |
| | | | | | | | |
| | Net asset value, end of period | | $ | 1.00 | | | $ | 1.00 | | | $ | 1.00 | | | $ | 1.00 | | | $ | 1.00 | | | $ | 1.00 | | | $ | 1.00 | |
| | | | | | | | |
| | Total return(d) | | | — | %(e) | | | — | %(e) | | | 0.95 | % | | | 2.16 | % | | | 1.34 | % | | | 0.48 | % | | | 0.13 | % |
| | | | | | | | |
| | Net assets, end of period (in 000’s) | | $ | 93,022,509 | | | $ | 75,892,232 | | | $ | 84,038,158 | | | $ | 51,789,901 | | | $ | 51,205,454 | | | $ | 44,355,448 | | | $ | 50,595,412 | |
| | | | | | | | |
| | Ratio of net expenses to average net assets | | | 0.10 | %(f) | | | 0.16 | %(f) | | | 0.20 | % | | | 0.20 | % | | | 0.20 | % | | | 0.20 | % | | | 0.19 | % |
| | | | | | | | |
| | Ratio of total expenses to average net assets | | | 0.20 | %(f) | | | 0.20 | %(f) | | | 0.20 | % | | | 0.20 | % | | | 0.21 | % | | | 0.23 | % | | | 0.23 | % |
| | | | | | | | |
| | Ratio of net investment income to average net assets | | | — | %(e)(f) | | | — | %(e)(f) | | | 0.71 | % | | | 2.11 | % | | | 1.35 | % | | | 0.47 | % | | | 0.14 | % |
| | † | | The Fund changed its fiscal year end from August 31 to November 30. |
| | (a) | | Calculated based on the average shares outstanding methodology. |
| | (b) | | Amount is less than $0.0005 per share. |
| | (c) | | Distributions may not coincide with the current year net investment income or net realized gains as distributions may be paid from current or prior year earnings. |
| | (d) | | Assumes reinvestment of all distributions. Returns do not reflect the deduction of taxes that a shareholder would pay on Fund distributions. Total returns for periods less than one full year are not annualized. |
| | (e) | | Amount is less than 0.005%. |
| | |
| The accompanying notes are an integral part of these financial statements. | | 77 |
Financial Highlights (continued)
Selected Data for a Share Outstanding Throughout Each Period
| | | | | | | | | | | | | | | | | | | | | | | | | | | | | | |
| | | Financial Square Treasury Instruments
Fund — Capital Shares | | Six Months Ended
May 31, 2021 (Unaudited) | | | For the
Period Ended
November 30, 2020† | | | Year Ended August 31, | |
| | | 2020 | | | 2019 | | | 2018 | | | 2017 | | | 2016 | |
| | Per Share Data: | | | | | | | | | | | | | | | | | | | | | | | | | | | | |
| | | | | | | | |
| | Net asset value, beginning of period | | $ | 1.00 | | | $ | 1.00 | | | $ | 1.00 | | | $ | 1.00 | | | $ | 1.00 | | | $ | 1.00 | | | $ | 1.00 | |
| | | | | | | | |
| | Net investment income(a) | | | — | (b) | | | — | (b) | | | 0.009 | | | | 0.020 | | | | 0.011 | | | | 0.004 | | | | — | (b) |
| | | | | | | | |
| | Net realized gain (loss) | | | — | (b) | | | — | (b) | | | (0.001 | ) | | | — | (b) | | | 0.001 | | | | (0.001 | ) | | | — | (b) |
| | | | | | | | |
| | Total from investment operations | | | — | (b) | | | — | (b) | | | 0.008 | | | | 0.020 | | | | 0.012 | | | | 0.003 | | | | — | (b) |
| | | | | | | | |
| | Distributions to shareholders from net investment income | | | — | (b) | | | — | (b) | | | (0.008 | ) | | | (0.020 | ) | | | (0.012 | ) | | | (0.003 | ) | | | — | (b) |
| | | | | | | | |
| | Distributions to shareholders from net realized gains | | | — | (b) | | | — | (b) | | | — | (b) | | | — | (b) | | | — | (b) | | | — | (b) | | | — | (b) |
| | | | | | | | |
| | Total distributions(c) | | | — | (b) | | | — | (b) | | | (0.008 | ) | | | (0.020 | ) | | | (0.012 | ) | | | (0.003 | ) | | | — | (b) |
| | | | | | | | |
| | Net asset value, end of period | | $ | 1.00 | | | $ | 1.00 | | | $ | 1.00 | | | $ | 1.00 | | | $ | 1.00 | | | $ | 1.00 | | | $ | 1.00 | |
| | | | | | | | |
| | Total return(d) | | | — | %(e) | | | — | %(e) | | | 0.82 | % | | | 2.01 | % | | | 1.19 | % | | | 0.33 | % | | | 0.03 | % |
| | | | | | | | |
| | Net assets, end of period (in 000’s) | | $ | 595,260 | | | $ | 675,659 | | | $ | 725,405 | | | $ | 766,401 | | | $ | 374,831 | | | $ | 1,054,817 | | | $ | 495,853 | |
| | | | | | | | |
| | Ratio of net expenses to average net assets | | | 0.10 | %(f) | | | 0.16 | %(f) | | | 0.33 | % | | | 0.35 | % | | | 0.35 | % | | | 0.35 | % | | | 0.30 | % |
| | | | | | | | |
| | Ratio of total expenses to average net assets | | | 0.35 | %(f) | | | 0.35 | %(f) | | | 0.35 | % | | | 0.35 | % | | | 0.36 | % | | | 0.38 | % | | | 0.38 | % |
| | | | | | | | |
| | Ratio of net investment income to average net assets | | | — | %(e)(f) | | | — | %(e)(f) | | | 0.85 | % | | | 1.98 | % | | | 1.08 | % | | | 0.38 | % | | | 0.02 | % |
| | † | | The Fund changed its fiscal year end from August 31 to November 30. |
| | (a) | | Calculated based on the average shares outstanding methodology. |
| | (b) | | Amount is less than $0.0005 per share. |
| | (c) | | Distributions may not coincide with the current year net investment income or net realized gains as distributions may be paid from current or prior year earnings. |
| | (d) | | Assumes reinvestment of all distributions. Returns do not reflect the deduction of taxes that a shareholder would pay on Fund distributions. Total returns for periods less than one full year are not annualized. |
| | (e) | | Amount is less than 0.005%. |
| | |
| 78 | | The accompanying notes are an integral part of these financial statements. |
Financial Highlights (continued)
Selected Data for a Share Outstanding Throughout Each Period
| | | | | | | | | | | | | | | | | | | | | | | | | | | | | | |
| | | Financial Square Treasury Instruments Fund —
Service Shares | | Six Months Ended
May 31, 2021 (Unaudited) | | | For the
Period Ended
November 30, 2020† | | | Year Ended August 31, | |
| | | 2020 | | | 2019 | | | 2018 | | | 2017 | | | 2016 | |
| | Per Share Data: | | | | | | | | | | | | | | | | | | | | | | | | | | | | |
| | | | | | | | |
| | Net asset value, beginning of period | | $ | 1.00 | | | $ | 1.00 | | | $ | 1.00 | | | $ | 1.00 | | | $ | 1.00 | | | $ | 1.00 | | | $ | 1.00 | |
| | | | | | | | |
| | Net investment income(a) | | | — | (b) | | | — | (b) | | | 0.003 | | | | 0.016 | | | | 0.008 | | | | 0.001 | | | | — | (b) |
| | | | | | | | |
| | Net realized gain | | | — | (b) | | | — | (b) | | | 0.003 | | | | — | (b) | | | — | (b) | | | — | (b) | | | — | (b) |
| | | | | | | | |
| | Total from investment operations | | | — | (b) | | | — | (b) | | | 0.006 | | | | 0.016 | | | | 0.008 | | | | 0.001 | | | | — | (b) |
| | | | | | | | |
| | Distributions to shareholders from net investment income | | | — | (b) | | | — | (b) | | | (0.006 | ) | | | (0.016 | ) | | | (0.008 | ) | | | (0.001 | ) | | | — | (b) |
| | | | | | | | |
| | Distributions to shareholders from net realized gains | | | — | (b) | | | — | (b) | | | ��� | (b) | | | — | (b) | | | — | (b) | | | — | (b) | | | — | (b) |
| | | | | | | | |
| | Total distributions(c) | | | — | (b) | | | — | (b) | | | (0.006 | ) | | | (0.016 | ) | | | (0.008 | ) | | | (0.001 | ) | | | — | (b) |
| | | | | | | | |
| | Net asset value, end of period | | $ | 1.00 | | | $ | 1.00 | | | $ | 1.00 | | | $ | 1.00 | | | $ | 1.00 | | | $ | 1.00 | | | $ | 1.00 | |
| | | | | | | | |
| | Total return(d) | | | — | %(e) | | | — | %(e) | | | 0.60 | % | | | 1.65 | % | | | 0.84 | % | | | 0.10 | % | | | — | %(e) |
| | | | | | | | |
| | Net assets, end of period (in 000’s) | | $ | 367,714 | | | $ | 122,542 | | | $ | 116,172 | | | $ | 26,723 | | | $ | 22,063 | | | $ | 47,234 | | | $ | 91,598 | |
| | | | | | | | |
| | Ratio of net expenses to average net assets | | | 0.10 | %(f) | | | 0.16 | %(f) | | | 0.41 | % | | | 0.70 | % | | | 0.70 | % | | | 0.55 | % | | | 0.29 | % |
| | | | | | | | |
| | Ratio of total expenses to average net assets | | | 0.70 | %(f) | | | 0.70 | %(f) | | | 0.70 | % | | | 0.70 | % | | | 0.71 | % | | | 0.73 | % | | | 0.73 | % |
| | | | | | | | |
| | Ratio of net investment income (loss) to average net assets | | | — | %(e)(f) | | | — | %(e)(f) | | | 0.28 | % | | | 1.60 | % | | | 0.79 | % | | | 0.05 | % | | | (0.01 | )% |
| | † | | The Fund changed its fiscal year end from August 31 to November 30. |
| | (a) | | Calculated based on the average shares outstanding methodology. |
| | (b) | | Amount is less than $0.0005 per share. |
| | (c) | | Distributions may not coincide with the current year net investment income or net realized gains as distributions may be paid from current or prior year earnings. |
| | (d) | | Assumes reinvestment of all distributions. Returns do not reflect the deduction of taxes that a shareholder would pay on Fund distributions. Total returns for periods less than one full year are not annualized. |
| | (e) | | Amount is less than 0.005%. |
| | |
| The accompanying notes are an integral part of these financial statements. | | 79 |
Financial Highlights (continued)
Selected Data for a Share Outstanding Throughout Each Period
| | | | | | | | | | | | | | | | | | | | | | | | | | | | | | |
| | | Financial Square Treasury Instruments Fund —
Preferred Shares | | Six Months Ended
May 31, 2021 (Unaudited) | | | For the
Period Ended
November 30, 2020† | | | Year Ended August 31, | |
| | | 2020 | | | 2019 | | | 2018 | | | 2017 | | | 2016 | |
| | Per Share Data: | | | | | | | | | | | | | | | | | | | | | | | | | | | | |
| | | | | | | | |
| | Net asset value, beginning of period | | $ | 1.00 | | | $ | 1.00 | | | $ | 1.00 | | | $ | 1.00 | | | $ | 1.00 | | | $ | 1.00 | | | $ | 1.00 | |
| | | | | | | | |
| | Net investment income(a) | | | — | (b) | | | — | (b) | | | 0.007 | | | | 0.020 | | | | 0.012 | | | | 0.003 | | | | 0.001 | |
| | | | | | | | |
| | Net realized gain | | | — | (b) | | | — | (b) | | | 0.002 | | | | — | (b) | | | — | (b) | | | 0.001 | | | | — | (b) |
| | | | | | | | |
| | Total from investment operations | | | — | (b) | | | — | (b) | | | 0.009 | | | | 0.020 | | | | 0.012 | | | | 0.004 | | | | 0.001 | |
| | | | | | | | |
| | Distributions to shareholders from net investment income | | | — | (b) | | | — | (b) | | | (0.009 | ) | | | (0.020 | ) | | | (0.012 | ) | | | (0.004 | ) | | | (0.001 | ) |
| | | | | | | | |
| | Distributions to shareholders from net realized gains | | | — | (b) | | | — | (b) | | | — | (b) | | | — | (b) | | | — | (b) | | | — | (b) | | | — | (b) |
| | | | | | | | |
| | Total distributions(c) | | | — | (b) | | | — | (b) | | | (0.009 | ) | | | (0.020 | ) | | | (0.012 | ) | | | (0.004 | ) | | | (0.001 | ) |
| | | | | | | | |
| | Net asset value, end of period | | $ | 1.00 | | | $ | 1.00 | | | $ | 1.00 | | | $ | 1.00 | | | $ | 1.00 | | | $ | 1.00 | | | $ | 1.00 | |
| | | | | | | | |
| | Total return(d) | | | — | %(e) | | | — | %(e) | | | 0.86 | % | | | 2.06 | % | | | 1.24 | % | | | 0.38 | % | | | 0.06 | % |
| | | | | | | | |
| | Net assets, end of period (in 000’s) | | $ | 94,906 | | | $ | 137,607 | | | $ | 113,769 | | | $ | 92,406 | | | $ | 45,007 | | | $ | 39,754 | | | $ | 12,735 | |
| | | | | | | | |
| | Ratio of net expenses to average net assets | | | 0.10 | %(f) | | | 0.16 | %(f) | | | 0.29 | % | | | 0.30 | % | | | 0.30 | % | | | 0.30 | % | | | 0.26 | % |
| | | | | | | | |
| | Ratio of total expenses to average net assets | | | 0.30 | %(f) | | | 0.30 | %(f) | | | 0.30 | % | | | 0.30 | % | | | 0.31 | % | | | 0.33 | % | | | 0.33 | % |
| | | | | | | | |
| | Ratio of net investment income to average net assets | | | — | %(e)(f) | | | — | %(e)(f) | | | 0.68 | % | | | 2.02 | % | | | 1.24 | % | | | 0.34 | % | | | 0.05 | % |
| | † | | The Fund changed its fiscal year end from August 31 to November 30. |
| | (a) | | Calculated based on the average shares outstanding methodology. |
| | (b) | | Amount is less than $0.0005 per share. |
| | (c) | | Distributions may not coincide with the current year net investment income or net realized gains as distributions may be paid from current or prior year earnings. |
| | (d) | | Assumes reinvestment of all distributions. Returns do not reflect the deduction of taxes that a shareholder would pay on Fund distributions. Total returns for periods less than one full year are not annualized. |
| | (e) | | Amount is less than 0.005%. |
| | |
| 80 | | The accompanying notes are an integral part of these financial statements. |
Financial Highlights (continued)
Selected Data for a Share Outstanding Throughout Each Period
| | | | | | | | | | | | | | | | | | | | | | | | | | | | | | |
| | | Financial Square Treasury Instruments Fund —
Select Shares | | Six Months Ended
May 31, 2021 (Unaudited) | | | For the
Period Ended
November 30, 2020† | | | Year Ended August 31, | |
| | | 2020 | | | 2019 | | | 2018 | | | 2017 | | | 2016 | |
| | Per Share Data: | | | | | | | | | | | | | | | | | | | | | | | | | | | | |
| | | | | | | | |
| | Net asset value, beginning of period | | $ | 1.00 | | | $ | 1.00 | | | $ | 1.00 | | | $ | 1.00 | | | $ | 1.00 | | | $ | 1.00 | | | $ | 1.00 | |
| | | | | | | | |
| | Net investment income(a) | | | — | (b) | | | — | (b) | | | 0.006 | | | | 0.021 | | | | 0.015 | | | | 0.004 | | | | 0.001 | |
| | | | | | | | |
| | Net realized gain (loss) | | | — | (b) | | | — | (b) | | | 0.003 | | | | — | (b) | | | (0.002 | ) | | | 0.001 | | | | — | (b) |
| | | | | | | | |
| | Total from investment operations | | | — | (b) | | | — | (b) | | | 0.009 | | | | 0.021 | | | | 0.013 | | | | 0.005 | | | | 0.001 | |
| | | | | | | | |
| | Distributions to shareholders from net investment income | | | — | (b) | | | — | (b) | | | (0.009 | ) | | | (0.021 | ) | | | (0.013 | ) | | | (0.005 | ) | | | (0.001 | ) |
| | | | | | | | |
| | Distributions to shareholders from net realized gains | | | — | (b) | | | — | (b) | | | — | (b) | | | — | (b) | | | — | (b) | | | — | (b) | | | — | (b) |
| | | | | | | | |
| | Total distributions(c) | | | — | (b) | | | — | (b) | | | (0.009 | ) | | | (0.021 | ) | | | (0.013 | ) | | | (0.005 | ) | | | (0.001 | ) |
| | | | | | | | |
| | Net asset value, end of period | | $ | 1.00 | | | $ | 1.00 | | | $ | 1.00 | | | $ | 1.00 | | | $ | 1.00 | | | $ | 1.00 | | | $ | 1.00 | |
| | | | | | | | |
| | Total return(d) | | | — | %(e) | | | — | %(e) | | | 0.92 | % | | | 2.13 | % | | | 1.31 | % | | | 0.45 | % | | | 0.11 | % |
| | | | | | | | |
| | Net assets, end of period (in 000’s) | | $ | 147,959 | | | $ | 336,761 | | | $ | 495,422 | | | $ | 141,728 | | | $ | 370,898 | | | $ | 47,839 | | | $ | 21,009 | |
| | | | | | | | |
| | Ratio of net expenses to average net assets | | | 0.10 | %(f) | | | 0.16 | %(f) | | | 0.23 | % | | | 0.23 | % | | | 0.23 | % | | | 0.23 | % | | | 0.21 | % |
| | | | | | | | |
| | Ratio of total expenses to average net assets | | | 0.23 | %(f) | | | 0.23 | %(f) | | | 0.23 | % | | | 0.23 | % | | | 0.24 | % | | | 0.26 | % | | | 0.26 | % |
| | | | | | | | |
| | Ratio of net investment income to average net assets | | | — | %(e)(f) | | | — | %(e)(f) | | | 0.60 | % | | | 2.09 | % | | | 1.49 | % | | | 0.43 | % | | | 0.07 | % |
| | † | | The Fund changed its fiscal year end from August 31 to November 30. |
| | (a) | | Calculated based on the average shares outstanding methodology. |
| | (b) | | Amount is less than $0.0005 per share. |
| | (c) | | Distributions may not coincide with the current year net investment income or net realized gains as distributions may be paid from current or prior year earnings. |
| | (d) | | Assumes reinvestment of all distributions. Returns do not reflect the deduction of taxes that a shareholder would pay on Fund distributions. Total returns for periods less than one full year are not annualized. |
| | (e) | | Amount is less than 0.005%. |
| | |
| The accompanying notes are an integral part of these financial statements. | | 81 |
Financial Highlights (continued)
Selected Data for a Share Outstanding Throughout Each Period
| | | | | | | | | | | | | | | | | | | | | | | | | | | | | | |
| | | Financial Square Treasury Instruments
Fund — Administration Shares | | Six Months Ended
May 31, 2021 (Unaudited) | | | For the
Period Ended
November 30, 2020† | | | Year Ended August 31, | |
| | | 2020 | | | 2019 | | | 2018 | | | 2017 | | | 2016 | |
| | Per Share Data: | | | | | | | | | | | | | | | | | | | | | | | | | | | | |
| | | | | | | | |
| | Net asset value, beginning of period | | $ | 1.00 | | | $ | 1.00 | | | $ | 1.00 | | | $ | 1.00 | | | $ | 1.00 | | | $ | 1.00 | | | $ | 1.00 | |
| | | | | | | | |
| | Net investment income(a) | | | — | (b) | | | — | (b) | | | 0.008 | | | | 0.019 | | | | 0.011 | | | | 0.003 | | | | — | (b) |
| | | | | | | | |
| | Net realized loss | | | — | (b) | | | — | (b) | | | — | (b) | | | — | (b) | | | — | (b) | | | (0.001 | ) | | | — | (b) |
| | | | | | | | |
| | Total from investment operations | | | — | (b) | | | — | (b) | | | 0.008 | | | | 0.019 | | | | 0.011 | | | | 0.002 | | | | — | (b) |
| | | | | | | | |
| | Distributions to shareholders from net investment income | | | — | (b) | | | — | (b) | | | (0.008 | ) | | | (0.019 | ) | | | (0.011 | ) | | | (0.002 | ) | | | — | (b) |
| | | | | | | | |
| | Distributions to shareholders from net realized gains | | | — | (b) | | | — | (b) | | | — | (b) | | | — | (b) | | | — | (b) | | | — | (b) | | | — | (b) |
| | | | | | | | |
| | Total distributions(c) | | | — | (b) | | | — | (b) | | | (0.008 | ) | | | (0.019 | ) | | | (0.011 | ) | | | (0.002 | ) | | | — | (b) |
| | | | | | | | |
| | Net asset value, end of period | | $ | 1.00 | | | $ | 1.00 | | | $ | 1.00 | | | $ | 1.00 | | | $ | 1.00 | | | $ | 1.00 | | | $ | 1.00 | |
| | | | | | | | |
| | Total return(d) | | | — | %(e) | | | — | %(e) | | | 0.75 | % | | | 1.91 | % | | | 1.09 | % | | | 0.24 | % | | | — | %(e) |
| | | | | | | | |
| | Net assets, end of period (in 000’s) | | $ | 1,693,798 | | | $ | 1,578,689 | | | $ | 1,493,968 | | | $ | 1,716,942 | | | $ | 2,361,026 | | | $ | 2,817,291 | | | $ | 2,186,426 | |
| | | | | | | | |
| | Ratio of net expenses to average net assets | | | 0.10 | %(f) | | | 0.16 | %(f) | | | 0.40 | % | | | 0.45 | % | | | 0.45 | % | | | 0.44 | % | | | 0.32 | % |
| | | | | | | | |
| | Ratio of total expenses to average net assets | | | 0.45 | %(f) | | | 0.45 | %(f) | | | 0.45 | % | | | 0.45 | % | | | 0.46 | % | | | 0.48 | % | | | 0.48 | % |
| | | | | | | | |
| | Ratio of net investment income (loss) to average net assets | | | — | %(e)(f) | | | — | %(e)(f) | | | 0.72 | % | | | 1.86 | % | | | 1.07 | % | | | 0.26 | % | | | (0.01 | )% |
| | † | | The Fund changed its fiscal year end from August 31 to November 30. |
| | (a) | | Calculated based on the average shares outstanding methodology. |
| | (b) | | Amount is less than $0.0005 per share. |
| | (c) | | Distributions may not coincide with the current year net investment income or net realized gains as distributions may be paid from current or prior year earnings. |
| | (d) | | Assumes reinvestment of all distributions. Returns do not reflect the deduction of taxes that a shareholder would pay on Fund distributions. Total returns for periods less than one full year are not annualized. |
| | (e) | | Amount is less than 0.005%. |
| | |
| 82 | | The accompanying notes are an integral part of these financial statements. |
Financial Highlights (continued)
Selected Data for a Share Outstanding Throughout Each Period
| | | | | | | | | | | | | | | | | | | | | | | | | | | | | | |
| | | Financial Square Treasury Instruments Fund — Cash
Management Shares | | Six Months Ended
May 31, 2021 (Unaudited) | | | For the
Period Ended
November 30, 2020† | | | Year Ended August 31, | |
| | 2020 | | | 2019 | | | 2018 | | | 2017 | | | 2016 | |
| | Per Share Data: | | | | | | | | | | | | | | | | | | | | | | | | | | | | |
| | | | | | | | |
| | Net asset value, beginning of period | | $ | 1.00 | | | $ | 1.00 | | | $ | 1.00 | | | $ | 1.00 | | | $ | 1.00 | | | $ | 1.00 | | | $ | 1.00 | |
| | | | | | | | |
| | Net investment income(a) | | | — | (b) | | | — | (b) | | | 0.004 | | | | 0.014 | | | | 0.006 | | | | — | (b) | | | — | (b) |
| | | | | | | | |
| | Net realized loss | | | — | (b) | | | — | (b) | | | — | (b) | | | (0.001 | ) | | | (0.001 | ) | | | — | (b) | | | — | (b) |
| | | | | | | | |
| | Total from investment operations | | | — | (b) | | | — | (b) | | | 0.004 | | | | 0.013 | | | | 0.005 | | | | — | (b) | | | — | (b) |
| | | | | | | | |
| | Distributions to shareholders from net investment income | | | — | (b) | | | — | (b) | | | (0.004 | ) | | | (0.013 | ) | | | (0.005 | ) | | | — | (b) | | | — | (b) |
| | | | | | | | |
| | Distributions to shareholders from net realized gains | | | — | (b) | | | — | (b) | | | — | | | | — | (b) | | | — | (b) | | | — | (b) | | | — | (b) |
| | | | | | | | |
| | Total distributions(c) | | | — | (b) | | | — | (b) | | | (0.004 | ) | | | (0.013 | ) | | | (0.005 | ) | | | — | (b) | | | — | (b) |
| | | | | | | | |
| | Net asset value, end of period | | $ | 1.00 | | | $ | 1.00 | | | $ | 1.00 | | | $ | 1.00 | | | $ | 1.00 | | | $ | 1.00 | | | $ | 1.00 | |
| | | | | | | | |
| | Total return(d) | | | — | %(e) | | | — | %(e) | | | 0.43 | % | | | 1.35 | % | | | 0.54 | % | | | 0.01 | % | | | — | %(e) |
| | | | | | | | |
| | Net assets, end of period (in 000’s) | | $ | 11,938 | | | $ | 9,744 | | | $ | 10,781 | | | $ | 12,515 | | | $ | 64 | | | $ | 30 | | | $ | 279 | |
| | | | | | | | |
| | Ratio of net expenses to average net assets | | | 0.10 | %(f) | | | 0.16 | %(f) | | | 0.73 | % | | | 1.00 | % | | | 1.00 | % | | | 0.61 | % | | | 0.35 | % |
| | | | | | | | |
| | Ratio of total expenses to average net assets | | | 1.00 | %(f) | | | 1.00 | %(f) | | | 1.00 | % | | | 1.00 | % | | | 1.01 | % | | | 1.03 | % | | | 1.03 | % |
| | | | | | | | |
| | Ratio of net investment income to average net assets | | | — | %(e)(f) | | | — | %(e)(f) | | | 0.40 | % | | | 1.36 | % | | | 0.60 | % | | | — | %(e) | | | 0.05 | % |
| | † | | The Fund changed its fiscal year end from August 31 to November 30. |
| | (a) | | Calculated based on the average shares outstanding methodology. |
| | (b) | | Amount is less than $0.0005 per share. |
| | (c) | | Distributions may not coincide with the current year net investment income or net realized gains as distributions may be paid from current or prior year earnings. |
| | (d) | | Assumes reinvestment of all distributions. Returns do not reflect the deduction of taxes that a shareholder would pay on Fund distributions. Total returns for periods less than one full year are not annualized. |
| | (e) | | Amount is less than 0.005%. |
| | |
| The accompanying notes are an integral part of these financial statements. | | 83 |
Financial Highlights (continued)
Selected Data for a Share Outstanding Throughout Each Period
| | | | | | | | | | | | | | | | | | | | | | | | | | | | | | |
| | | Financial Square Treasury Instruments
Fund — Premier Shares | | Six Months Ended
May 31, 2021 (Unaudited) | | | For the
Period Ended
November 30, 2020† | | | Year Ended August 31, | |
| | | 2020 | | | 2019 | | | 2018 | | | 2017 | | | 2016 | |
| | Per Share Data: | | | | | | | | | | | | | | | | | | | | | | | | | | | | |
| | | | | | | | |
| | Net asset value, beginning of period | | $ | 1.00 | | | $ | 1.00 | | | $ | 1.00 | | | $ | 1.00 | | | $ | 1.00 | | | $ | 1.00 | | | $ | 1.00 | |
| | | | | | | | |
| | Net investment income(a) | | | — | (b) | | | — | (b) | | | 0.007 | | | | 0.018 | | | | 0.011 | | | | 0.002 | | | | — | (b) |
| | | | | | | | |
| | Net realized loss | | | — | (b) | | | — | (b) | | | — | (b) | | | — | (b) | | | (0.001 | ) | | | — | (b) | | | — | (b) |
| | | | | | | | |
| | Total from investment operations | | | — | (b) | | | — | (b) | | | 0.007 | | | | 0.018 | | | | 0.010 | | | | 0.002 | | | | — | (b) |
| | | | | | | | |
| | Distributions to shareholders from net investment income | | | — | (b) | | | — | (b) | | | (0.007 | ) | | | (0.018 | ) | | | (0.010 | ) | | | (0.002 | ) | | | — | (b) |
| | | | | | | | |
| | Distributions to shareholders from net realized gains | | | — | (b) | | | — | (b) | | | — | (b) | | | — | (b) | | | — | (b) | | | — | (b) | | | — | (b) |
| | | | | | | | |
| | Total distributions(c) | | | — | (b) | | | — | (b) | | | (0.007 | ) | | | (0.018 | ) | | | (0.010 | ) | | | (0.002 | ) | | | — | (b) |
| | | | | | | | |
| | Net asset value, end of period | | $ | 1.00 | | | $ | 1.00 | | | $ | 1.00 | | | $ | 1.00 | | | $ | 1.00 | | | $ | 1.00 | | | $ | 1.00 | |
| | | | | | | | |
| | Total return(d) | | | — | %(e) | | | — | %(e) | | | 0.69 | % | | | 1.80 | % | | | 0.99 | % | | | 0.17 | % | | | — | %(e) |
| | | | | | | | |
| | Net assets, end of period (in 000’s) | | $ | 100,543 | | | $ | 162,524 | | | $ | 161,117 | | | $ | 151,939 | | | $ | 152,344 | | | $ | 56,059 | | | $ | 19,142 | |
| | | | | | | | |
| | Ratio of net expenses to average net assets | | | 0.10 | %(f) | | | 0.16 | %(f) | | | 0.45 | % | | | 0.55 | % | | | 0.55 | % | | | 0.50 | % | | | 0.38 | % |
| | | | | | | | |
| | Ratio of total expenses to average net assets | | | 0.55 | %(f) | | | 0.55 | %(f) | | | 0.55 | % | | | 0.55 | % | | | 0.56 | % | | | 0.58 | % | | | 0.58 | % |
| | | | | | | | |
| | Ratio of net investment income (loss) to average net assets | | | — | %(e)(f) | | | — | %(e)(f) | | | 0.65 | % | | | 1.76 | % | | | 1.12 | % | | | 0.20 | % | | | (0.02 | )% |
| | † | | The Fund changed its fiscal year end from August 31 to November 30. |
| | (a) | | Calculated based on the average shares outstanding methodology. |
| | (b) | | Amount is less than $0.0005 per share. |
| | (c) | | Distributions may not coincide with the current year net investment income or net realized gains as distributions may be paid from current or prior year earnings. |
| | (d) | | Assumes reinvestment of all distributions. Returns do not reflect the deduction of taxes that a shareholder would pay on Fund distributions. Total returns for periods less than one full year are not annualized. |
| | (e) | | Amount is less than 0.005%. |
| | |
| 84 | | The accompanying notes are an integral part of these financial statements. |
Financial Highlights (continued)
Selected Data for a Share Outstanding Throughout Each Period
| | | | | | | | | | | | | | | | | | | | | | | | | | | | | | |
| | | Financial Square Treasury Instruments Fund —
Resource Shares | | Six Months Ended
May 31, 2021 (Unaudited) | | | For the
Period Ended
November 30, 2020† | | | Year Ended August 31, | |
| | | 2020 | | | 2019 | | | 2018 | | | 2017 | | | 2016 | |
| | Per Share Data: | | | | | | | | | | | | | | | | | | | | | | | | | | | | |
| | | | | | | | |
| | Net asset value, beginning of period | | $ | 1.00 | | | $ | 1.00 | | | $ | 1.00 | | | $ | 1.00 | | | $ | 1.00 | | | $ | 1.00 | | | $ | 1.00 | |
| | | | | | | | |
| | Net investment income(a) | | | — | (b) | | | 0.001 | | | | 0.003 | | | | 0.016 | | | | 0.009 | | | | 0.004 | | | | — | (b) |
| | | | | | | | |
| | Net realized gain (loss) | | | — | (b) | | | — | (b) | | | 0.003 | | | | — | (b) | | | — | (b) | | | (0.004 | ) | | | — | (b) |
| | | | | | | | |
| | Total from investment operations | | | — | (b) | | | 0.001 | | | | 0.006 | | | | 0.016 | | | | 0.009 | | | | — | (b) | | | — | (b) |
| | | | | | | | |
| | Distributions to shareholders from net investment income | | | — | (b) | | | (0.001 | ) | | | (0.006 | ) | | | (0.016 | ) | | | (0.009 | ) | | | — | (b) | | | — | (b) |
| | | | | | | | |
| | Distributions to shareholders from net realized gains | | | — | | | | — | (b) | | | — | (b) | | | — | (b) | | | — | (b) | | | — | (b) | | | — | (b) |
| | | | | | | | |
| | Total distributions(c) | | | — | (b) | | | (0.001 | ) | | | (0.006 | ) | | | (0.016 | ) | | | (0.009 | ) | | | — | (b) | | | — | (b) |
| | | | | | | | |
| | Net asset value, end of period | | $ | 1.00 | | | $ | 1.00 | | | $ | 1.00 | | | $ | 1.00 | | | $ | 1.00 | | | $ | 1.00 | | | $ | 1.00 | |
| | | | | | | | |
| | Total return(d) | | | — | %(e) | | | — | %(e) | | | 0.52 | % | | | 1.50 | % | | | 0.69 | % | | | 0.04 | % | | | — | %(e) |
| | | | | | | | |
| | Net assets, end of period (in 000’s) | | $ | 1 | | | $ | 1 | | | $ | 1 | | | $ | 1 | | | $ | 1 | | | $ | 1 | | | $ | 1 | |
| | | | | | | | |
| | Ratio of net expenses to average net assets | | | 0.10 | %(f) | | | 0.16 | %(f) | | | 0.41 | % | | | 0.56 | % | | | 0.55 | % | | | 0.26 | % | | | 0.19 | % |
| | | | | | | | |
| | Ratio of total expenses to average net assets | | | 0.55 | %(f) | | | 0.85 | %(f) | | | 0.85 | % | | | 0.85 | % | | | 0.86 | % | | | 0.88 | % | | | 0.88 | % |
| | | | | | | | |
| | Ratio of net investment income to average net assets | | | 0.06 | %(f) | | | 0.36 | %(f) | | | 0.57 | % | | | 1.61 | % | | | 0.87 | % | | | 0.37 | % | | | 0.37 | % |
| | † | | The Fund changed its fiscal year end from August 31 to November 30. |
| | (a) | | Calculated based on the average shares outstanding methodology. |
| | (b) | | Amount is less than $0.0005 per share. |
| | (c) | | Distributions may not coincide with the current year net investment income or net realized gains as distributions may be paid from current or prior year earnings. |
| | (d) | | Assumes reinvestment of all distributions. Returns do not reflect the deduction of taxes that a shareholder would pay on Fund distributions. Total returns for periods less than one full year are not annualized. |
| | (e) | | Amount is less than 0.005%. |
| | |
| The accompanying notes are an integral part of these financial statements. | | 85 |
Financial Highlights (continued)
Selected Data for a Share Outstanding Throughout Each Period
| | | | | | | | | | | | | | | | | | | | | | | | | | | | | | |
| | | Financial Square Treasury Obligations
Fund — Institutional Shares | | Six Months Ended
May 31, 2021
(Unaudited) | | | For the
Period Ended
November 30, 2020† | | | Year Ended August 31, | |
| | | 2020 | | | 2019 | | | 2018 | | | 2017 | | | 2016 | |
| | Per Share Data: | | | | | | | | | | | | | | | | | | | | | | | | | | | | |
| | | | | | | | |
| | Net asset value, beginning of period | | $ | 1.00 | | | $ | 1.00 | | | $ | 1.00 | | | $ | 1.00 | | | $ | 1.00 | | | $ | 1.00 | | | $ | 1.00 | |
| | | | | | | | |
| | Net investment income(a) | | | — | (b) | | | — | (b) | | | 0.007 | | | | 0.022 | | | | 0.013 | | | | 0.005 | | | | 0.002 | |
| | | | | | | | |
| | Net realized gain | | | — | (b) | | | — | (b) | | | 0.002 | | | | — | (b) | | | 0.001 | | | | — | (b) | | | — | (b) |
| | | | | | | | |
| | Total from investment operations | | | — | (b) | | | — | (b) | | | 0.009 | | | | 0.022 | | | | 0.014 | | | | 0.005 | | | | 0.002 | |
| | | | | | | | |
| | Distributions to shareholders from net investment income | | | — | (b) | | | — | (b) | | | (0.009 | ) | | | (0.022 | ) | | | (0.014 | ) | | | (0.005 | ) | | | (0.002 | ) |
| | | | | | | | |
| | Distributions to shareholders from net realized gains | | | — | (b) | | | — | (b) | | | — | (b) | | | — | (b) | | | — | (b) | | | — | (b) | | | — | (b) |
| | | | | | | | |
| | Total distributions(c) | | | — | (b) | | | — | (b) | | | (0.009 | ) | | | (0.022 | ) | | | (0.014 | ) | | | (0.005 | ) | | | (0.002 | ) |
| | | | | | | | |
| | Net asset value, end of period | | $ | 1.00 | | | $ | 1.00 | | | $ | 1.00 | | | $ | 1.00 | | | $ | 1.00 | | | $ | 1.00 | | | $ | 1.00 | |
| | | | | | | | |
| | Total return(d) | | | 0.01 | % | | | — | %(e) | | | 0.94 | % | | | 2.20 | % | | | 1.37 | % | | | 0.50 | % | | | 0.15 | % |
| | | | | | | | |
| | Net assets, end of period (in 000’s) | | $ | 29,476,962 | | | $ | 34,576,104 | | | $ | 22,518,304 | | | $ | 12,649,125 | | | $ | 10,649,826 | | | $ | 15,091,527 | | | $ | 19,950,969 | |
| | | | | | | | |
| | Ratio of net expenses to average net assets | | | 0.07 | %(f) | | | 0.15 | %(f) | | | 0.20 | % | | | 0.20 | % | | | 0.20 | % | | | 0.20 | % | | | 0.19 | % |
| | | | | | | | |
| | Ratio of total expenses to average net assets | | | 0.20 | %(f) | | | 0.20 | %(f) | | | 0.20 | % | | | 0.20 | % | | | 0.21 | % | | | 0.23 | % | | | 0.23 | % |
| | | | | | | | |
| | Ratio of net investment income to average net assets | | | 0.02 | %(f) | | | 0.01 | %(f) | | | 0.68 | % | | | 2.17 | % | | | 1.31 | % | | | 0.47 | % | | | 0.14 | % |
| | † | | The Fund changed its fiscal year end from August 31 to November 30. |
| | (a) | | Calculated based on the average shares outstanding methodology. |
| | (b) | | Amount is less than $0.0005 per share. |
| | (c) | | Distributions may not coincide with the current year net investment income or net realized gains as distributions may be paid from current or prior year earnings. |
| | (d) | | Assumes reinvestment of all distributions. Returns do not reflect the deduction of taxes that a shareholder would pay on Fund distributions. Total returns for periods less than one full year are not annualized. |
| | (e) | | Amount is less than 0.005%. |
| | | | | | | | | | | | | | | | | | | | | | | | | | | | | | |
| | | Financial Square Treasury Obligations Fund —
Capital Shares | | Six Months Ended
May 31, 2021
(Unaudited) | | | For the
Period Ended
November 30, 2020† | | | Year Ended August 31, | |
| | | 2020 | | | 2019 | | | 2018 | | | 2017 | | | 2016 | |
| | Per Share Data: | | | | | | | | | | | | | | | | | | | | | | | | | | | | |
| | | | | | | | |
| | Net asset value, beginning of period | | $ | 1.00 | | | $ | 1.00 | | | $ | 1.00 | | | $ | 1.00 | | | $ | 1.00 | | | $ | 1.00 | | | $ | 1.00 | |
| | | | | | | | |
| | Net investment income(a) | | | — | (b) | | | — | (b) | | | 0.007 | | | | 0.020 | | | | 0.012 | | | | 0.003 | | | | — | (b) |
| | | | | | | | |
| | Net realized gain | | | — | (b) | | | — | (b) | | | 0.001 | | | | — | (b) | | | — | (b) | | | — | (b) | | | — | (b) |
| | | | | | | | |
| | Total from investment operations | | | — | (b) | | | — | (b) | | | 0.008 | | | | 0.020 | | | | 0.012 | | | | 0.003 | | | | — | (b) |
| | | | | | | | |
| | Distributions to shareholders from net investment income | | | — | (b) | | | — | (b) | | | (0.008 | ) | | | (0.020 | ) | | | (0.012 | ) | | | (0.003 | ) | | | — | (b) |
| | | | | | | | |
| | Distributions to shareholders from net realized gains | | | — | (b) | | | — | (b) | | | — | (b) | | | — | (b) | | | — | (b) | | | — | (b) | | | — | (b) |
| | | | | | | | |
| | Total distributions(c) | | | — | (b) | | | — | (b) | | | (0.008 | ) | | | (0.020 | ) | | | (0.012 | ) | | | (0.003 | ) | | | — | (b) |
| | | | | | | | |
| | Net asset value, end of period | | $ | 1.00 | | | $ | 1.00 | | | $ | 1.00 | | | $ | 1.00 | | | $ | 1.00 | | | $ | 1.00 | | | $ | 1.00 | |
| | | | | | | | |
| | Total return(d) | | | 0.01 | % | | | — | %(e) | | | 0.80 | % | | | 2.05 | % | | | 1.21 | % | | | 0.35 | % | | | 0.05 | % |
| | | | | | | | |
| | Net assets, end of period (in 000’s) | | $ | 360,787 | | | $ | 330,016 | | | $ | 372,260 | | | $ | 390,680 | | | $ | 299,105 | | | $ | 269,417 | | | $ | 404,533 | |
| | | | | | | | |
| | Ratio of net expenses to average net assets | | | 0.07 | %(f) | | | 0.15 | %(f) | | | 0.34 | % | | | 0.35 | % | | | 0.35 | % | | | 0.35 | % | | | 0.30 | % |
| | | | | | | | |
| | Ratio of total expenses to average net assets | | | 0.35 | %(f) | | | 0.35 | %(f) | | | 0.35 | % | | | 0.35 | % | | | 0.36 | % | | | 0.38 | % | | | 0.38 | % |
| | | | | | | | |
| | Ratio of net investment income to average net assets | | | 0.02 | %f) | | | — | %(e)(f) | | | 0.74 | % | | | 2.01 | % | | | 1.19 | % | | | 0.34 | % | | | 0.03 | % |
| | † | | The Fund changed its fiscal year end from August 31 to November 30. |
| | (a) | | Calculated based on the average shares outstanding methodology. |
| | (b) | | Amount is less than $0.0005 per share. |
| | (c) | | Distributions may not coincide with the current year net investment income or net realized gains as distributions may be paid from current or prior year earnings. |
| | (d) | | Assumes reinvestment of all distributions. Returns do not reflect the deduction of taxes that a shareholder would pay on Fund distributions. Total returns for periods less than one full year are not annualized. |
| | (e) | | Amount is less than 0.005%. |
| | |
| 86 | | The accompanying notes are an integral part of these financial statements. |
Financial Highlights (continued)
Selected Data for a Share Outstanding Throughout Each Period
| | | | | | | | | | | | | | | | | | | | | | | | | | | | | | |
| | | Financial Square Treasury Obligations Fund —
Service Shares | | Six Months Ended
May 31, 2021
(Unaudited) | | | For the
Period Ended
November 30, 2020† | | | Year Ended August 31, | |
| | | 2020 | | | 2019 | | | 2018 | | | 2017 | | | 2016 | |
| | Per Share Data: | | | | | | | | | | | | | | | | | | | | | | | | | | | | |
| | | | | | | | |
| | Net asset value, beginning of period | | $ | 1.00 | | | $ | 1.00 | | | $ | 1.00 | | | $ | 1.00 | | | $ | 1.00 | | | $ | 1.00 | | | $ | 1.00 | |
| | | | | | | | |
| | Net investment income(a) | | | — | (b) | | | — | (b) | | | 0.006 | | | | 0.017 | | | | 0.009 | | | | 0.001 | | | | — | (b) |
| | | | | | | | |
| | Net realized gain | | | — | (b) | | | — | (b) | | | — | (b) | | | — | (b) | | | — | (b) | | | — | (b) | | | — | (b) |
| | | | | | | | |
| | Total from investment operations | | | — | (b) | | | — | (b) | | | 0.006 | | | | 0.017 | | | | 0.009 | | | | 0.001 | | | | — | (b) |
| | | | | | | | |
| | Distributions to shareholders from net investment income | | | — | (b) | | | — | (b) | | | (0.006 | ) | | | (0.017 | ) | | | (0.009 | ) | | | (0.001 | ) | | | — | (b) |
| | | | | | | | |
| | Distributions to shareholders from net realized gains | | | — | (b) | | | — | (b) | | | — | (b) | | | — | (b) | | | — | (b) | | | — | (b) | | | — | (b) |
| | | | | | | | |
| | Total distributions(c) | | | — | (b) | | | — | (b) | | | (0.006 | ) | | | (0.017 | ) | | | (0.009 | ) | | | (0.001 | ) | | | — | (b) |
| | | | | | | | |
| | Net asset value, end of period | | $ | 1.00 | | | $ | 1.00 | | | $ | 1.00 | | | $ | 1.00 | | | $ | 1.00 | | | $ | 1.00 | | | $ | 1.00 | |
| | | | | | | | |
| | Total return(d) | | | 0.01 | % | | | — | %(e) | | | 0.59 | % | | | 1.69 | % | | | 0.86 | % | | | 0.11 | % | | | 0.01 | % |
| | | | | | | | |
| | Net assets, end of period (in 000’s) | | $ | 1,011,456 | | | $ | 911,413 | | | $ | 937,649 | | | $ | 936,398 | | | $ | 1,342,308 | | | $ | 954,846 | | | $ | 787,768 | |
| | | | | | | | |
| | Ratio of net expenses to average net assets | | | 0.07 | %(f) | | | 0.15 | %(f) | | | 0.55 | % | | | 0.70 | % | | | 0.70 | % | | | 0.59 | % | | | 0.33 | % |
| | | | | | | | |
| | Ratio of total expenses to average net assets | | | 0.70 | %(f) | | | 0.70 | %(f) | | | 0.70 | % | | | 0.70 | % | | | 0.71 | % | | | 0.73 | % | | | 0.73 | % |
| | | | | | | | |
| | Ratio of net investment income (loss) to average net assets | | | 0.02 | %(f) | | | — | %(e)(f) | | | 0.55 | % | | | 1.67 | % | | | 0.88 | % | | | 0.11 | % | | | (0.01 | )% |
| | † | | The Fund changed its fiscal year end from August 31 to November 30. |
| | (a) | | Calculated based on the average shares outstanding methodology. |
| | (b) | | Amount is less than $0.0005 per share. |
| | (c) | | Distributions may not coincide with the current year net investment income or net realized gains as distributions may be paid from current or prior year earnings. |
| | (d) | | Assumes reinvestment of all distributions. Returns do not reflect the deduction of taxes that a shareholder would pay on Fund distributions. Total returns for periods less than one full year are not annualized. |
| | (e) | | Amount is less than 0.005%. |
| | | | | | | | | | | | | | | | | | | | | | | | | | | | | | |
| | | Financial Square Treasury Obligations Fund —
Preferred Shares | | Six Months Ended
May 31, 2021
(Unaudited) | | | For the
Period Ended
November 30, 2020† | | | Year Ended August 31, | |
| | | 2020 | | | 2019 | | | 2018 | | | 2017 | | | 2016 | |
| | Per Share Data: | | | | | | | | | | | | | | | | | | | | | | | | | | | | |
| | | | | | | | |
| | Net asset value, beginning of period | | $ | 1.00 | | | $ | 1.00 | | | $ | 1.00 | | | $ | 1.00 | | | $ | 1.00 | | | $ | 1.00 | | | $ | 1.00 | |
| | | | | | | | |
| | Net investment income(a) | | | — | (b) | | | — | (b) | | | 0.008 | | | | 0.021 | | | | 0.013 | | | | 0.004 | | | | 0.001 | |
| | | | | | | | |
| | Net realized gain | | | — | (b) | | | — | (b) | | | — | (b) | | | — | (b) | | | — | (b) | | | — | (b) | | | — | (b) |
| | | | | | | | |
| | Total from investment operations | | | — | (b) | | | — | (b) | | | 0.008 | | | | 0.021 | | | | 0.013 | | | | 0.004 | | | | 0.001 | |
| | | | | | | | |
| | Distributions to shareholders from net investment income | | | — | (b) | | | — | (b) | | | (0.008 | ) | | | (0.021 | ) | | | (0.013 | ) | | | (0.004 | ) | | | (0.001 | ) |
| | | | | | | | |
| | Distributions to shareholders from net realized gains | | | — | (b) | | | — | (b) | | | — | (b) | | | — | (b) | | | — | (b) | | | — | (b) | | | — | (b) |
| | | | | | | | |
| | Total distributions(c) | | | — | (b) | | | — | (b) | | | (0.008 | ) | | | (0.021 | ) | | | (0.013 | ) | | | (0.004 | ) | | | (0.001 | ) |
| | | | | | | | |
| | Net asset value, end of period | | $ | 1.00 | | | $ | 1.00 | | | $ | 1.00 | | | $ | 1.00 | | | $ | 1.00 | | | $ | 1.00 | | | $ | 1.00 | |
| | | | | | | | |
| | Total return(d) | | | 0.01 | % | | | — | %(e) | | | 0.84 | % | | | 2.10 | % | | | 1.26 | % | | | 0.40 | % | | | 0.08 | % |
| | | | | | | | |
| | Net assets, end of period (in 000’s) | | $ | 435,256 | | | $ | 440,733 | | | $ | 771,943 | | | $ | 461,459 | | | $ | 173,807 | | | $ | 123,436 | | | $ | 81,542 | |
| | | | | | | | |
| | Ratio of net expenses to average net assets | | | 0.07 | %(f) | | | 0.15 | %(f) | | | 0.30 | % | | | 0.30 | % | | | 0.30 | % | | | 0.30 | % | | | 0.25 | % |
| | | | | | | | |
| | Ratio of total expenses to average net assets | | | 0.30 | %(f) | | | 0.30 | %(f) | | | 0.30 | % | | | 0.30 | % | | | 0.31 | % | | | 0.33 | % | | | 0.33 | % |
| | | | | | | | |
| | Ratio of net investment income (loss) to average net assets | | | 0.02 | %(f) | | | (0.01 | )%(f) | | | 0.76 | % | | | 2.08 | % | | | 1.28 | % | | | 0.40 | % | | | 0.05 | % |
| | † | | The Fund changed its fiscal year end from August 31 to November 30. |
| | (a) | | Calculated based on the average shares outstanding methodology. |
| | (b) | | Amount is less than $0.0005 per share. |
| | (c) | | Distributions may not coincide with the current year net investment income or net realized gains as distributions may be paid from current or prior year earnings. |
| | (d) | | Assumes reinvestment of all distributions. Returns do not reflect the deduction of taxes that a shareholder would pay on Fund distributions. Total returns for periods less than one full year are not annualized. |
| | (e) | | Amount is less than 0.005%. |
| | |
| The accompanying notes are an integral part of these financial statements. | | 87 |
Financial Highlights (continued)
Selected Data for a Share Outstanding Throughout Each Period
| | | | | | | | | | | | | | | | | | | | | | | | | | | | | | |
| | | Financial Square Treasury Obligations Fund —
Select Shares | | Six Months Ended
May 31, 2021
(Unaudited) | | | For the
Period Ended
November 30, 2020† | | | Year Ended August 31, | |
| | | 2020 | | | 2019 | | | 2018 | | | 2017 | | | 2016 | |
| | Per Share Data: | | | | | | | | | | | | | | | | | | | | | | | | | | | | |
| | | | | | | | |
| | Net asset value, beginning of period | | $ | 1.00 | | | $ | 1.00 | | | $ | 1.00 | | | $ | 1.00 | | | $ | 1.00 | | | $ | 1.00 | | | $ | 1.00 | |
| | | | | | | | |
| | Net investment income(a) | | | — | (b) | | | — | (b) | | | 0.007 | | | | 0.021 | | | | 0.015 | | | | 0.005 | | | | 0.001 | |
| | | | | | | | |
| | Net realized gain (loss) | | | — | (b) | | | — | (b) | | | 0.002 | | | | — | (b) | | | (0.002 | ) | | | — | (b) | | | — | (b) |
| | | | | | | | |
| | Total from investment operations | | | — | (b) | | | — | (b) | | | 0.009 | | | | 0.021 | | | | 0.013 | | | | 0.005 | | | | 0.001 | |
| | | | | | | | |
| | Distributions to shareholders from net investment income | | | — | (b) | | | — | (b) | | | (0.009 | ) | | | (0.021 | ) | | | (0.013 | ) | | | (0.005 | ) | | | (0.001 | ) |
| | | | | | | | |
| | Distributions to shareholders from net realized gains | | | — | (b) | | | — | (b) | | | — | (b) | | | — | (b) | | | — | (b) | | | — | (b) | | | — | (b) |
| | | | | | | | |
| | Total distributions(c) | | | — | (b) | | | — | (b) | | | (0.009 | ) | | | (0.021 | ) | | | (0.013 | ) | | | (0.005 | ) | | | (0.001 | ) |
| | | | | | | | |
| | Net asset value, end of period | | $ | 1.00 | | | $ | 1.00 | | | $ | 1.00 | | | $ | 1.00 | | | $ | 1.00 | | | $ | 1.00 | | | $ | 1.00 | |
| | | | | | | | |
| | Total return(d) | | | 0.01 | % | | | — | %(e) | | | 0.91 | % | | | 2.17 | % | | | 1.34 | % | | | 0.47 | % | | | 0.13 | % |
| | | | | | | | |
| | Net assets, end of period (in 000’s) | | $ | 224,278 | | | $ | 213,174 | | | $ | 178,351 | | | $ | 50,890 | | | $ | 134,034 | | | $ | 67,865 | | | $ | 505,162 | |
| | | | | | | | |
| | Ratio of net expenses to average net assets | | | 0.07 | %(f) | | | 0.15 | %(f) | | | 0.23 | % | | | 0.23 | % | | | 0.23 | % | | | 0.23 | % | | | 0.21 | % |
| | | | | | | | |
| | Ratio of total expenses to average net assets | | | 0.23 | %(f) | | | 0.23 | %(f) | | | 0.23 | % | | | 0.23 | % | | | 0.24 | % | | | 0.26 | % | | | 0.26 | % |
| | | | | | | | |
| | Ratio of net investment income to average net assets | | | 0.02 | %(f) | | | — | %(e)(f) | | | 0.70 | % | | | 2.08 | % | | | 1.46 | % | | | 0.46 | % | | | 0.12 | % |
| | † | | The Fund changed its fiscal year end from August 31 to November 30. |
| | (a) | | Calculated based on the average shares outstanding methodology. |
| | (b) | | Amount is less than $0.0005 per share. |
| | (c) | | Distributions may not coincide with the current year net investment income or net realized gains as distributions may be paid from current or prior year earnings. |
| | (d) | | Assumes reinvestment of all distributions. Returns do not reflect the deduction of taxes that a shareholder would pay on Fund distributions. Total returns for periods less than one full year are not annualized. |
| | (e) | | Amount is less than 0.005%. |
| | | | | | | | | | | | | | | | | | | | | | | | | | | | | | |
| | | Financial Square Treasury Obligations
Fund — Administration Shares | | Six Months Ended
May 31, 2021
(Unaudited) | | | For the
Period Ended
November 30, 2020† | | | Year Ended August 31, | |
| | | 2020 | | | 2019 | | | 2018 | | | 2017 | | | 2016 | |
| | Per Share Data: | | | | | | | | | | | | | | | | | | | | | | | | | | | | |
| | | | | | | | |
| | Net asset value, beginning of period | | $ | 1.00 | | | $ | 1.00 | | | $ | 1.00 | | | $ | 1.00 | | | $ | 1.00 | | | $ | 1.00 | | | $ | 1.00 | |
| | | | | | | | |
| | Net investment income(a) | | | — | (b) | | | — | (b) | | | 0.007 | | | | 0.019 | | | | 0.011 | | | | 0.002 | | | | — | (b) |
| | | | | | | | |
| | Net realized gain | | | — | (b) | | | — | (b) | | | — | (b) | | | — | (b) | | | — | (b) | | | 0.001 | | | | — | (b) |
| | | | | | | | |
| | Total from investment operations | | | — | (b) | | | — | (b) | �� | | 0.007 | | | | 0.019 | | | | 0.011 | | | | 0.003 | | | | — | (b) |
| | | | | | | | |
| | Distributions to shareholders from net investment income | | | — | (b) | | | — | (b) | | | (0.007 | ) | | | (0.019 | ) | | | (0.011 | ) | | | (0.003 | ) | | | — | (b) |
| | | | | | | | |
| | Distributions to shareholders from net realized gains | | | — | (b) | | | — | (b) | | | — | (b) | | | — | (b) | | | — | (b) | | | — | (b) | | | — | (b) |
| | | | | | | | |
| | Total distributions(c) | | | — | (b) | | | — | (b) | | | (0.007 | ) | | | (0.019 | ) | | | (0.011 | ) | | | (0.003 | ) | | | — | (b) |
| | | | | | | | |
| | Net asset value, end of period | | $ | 1.00 | | | $ | 1.00 | | | $ | 1.00 | | | $ | 1.00 | | | $ | 1.00 | | | $ | 1.00 | | | $ | 1.00 | |
| | | | | | | | |
| | Total return(d) | | | 0.01 | % | | | — | %(e) | | | 0.73 | % | | | 1.95 | % | | | 1.11 | % | | | 0.26 | % | | | 0.01 | % |
| | | | | | | | |
| | Net assets, end of period (in 000’s) | | $ | 3,033,587 | | | $ | 2,380,299 | | | $ | 2,088,737 | | | $ | 2,034,113 | | | $ | 1,810,200 | | | $ | 1,307,550 | | | $ | 1,543,863 | |
| | | | | | | | |
| | Ratio of net expenses to average net assets | | | 0.07 | %(f) | | | 0.15 | %(f) | | | 0.40 | % | | | 0.45 | % | | | 0.45 | % | | | 0.44 | % | | | 0.33 | % |
| | | | | | | | |
| | Ratio of total expenses to average net assets | | | 0.45 | %(f) | | | 0.45 | %(f) | | | 0.45 | % | | | 0.45 | % | | | 0.46 | % | | | 0.48 | % | | | 0.48 | % |
| | | | | | | | |
| | Ratio of net investment income (loss) to average net assets | | | 0.02 | %(f) | | | — | %(r)(f) | | | 0.65 | % | | | 1.91 | % | | | 1.14 | % | | | 0.25 | % | | | (0.01 | )% |
| | † | | The Fund changed its fiscal year end from August 31 to November 30. |
| | (a) | | Calculated based on the average shares outstanding methodology. |
| | (b) | | Amount is less than $0.0005 per share. |
| | (c) | | Distributions may not coincide with the current year net investment income or net realized gains as distributions may be paid from current or prior year earnings. |
| | (d) | | Assumes reinvestment of all distributions. Returns do not reflect the deduction of taxes that a shareholder would pay on Fund distributions. Total returns for periods less than one full year are not annualized. |
| | (e) | | Amount is less than 0.005%. |
| | |
| 88 | | The accompanying notes are an integral part of these financial statements. |
Financial Highlights (continued)
Selected Data for a Share Outstanding Throughout Each Period
| | | | | | | | | | | | | | | | | | | | | | | | | | | | | | |
| | | Financial Square Treasury Obligations Fund — Cash
Management Shares | | Six Months Ended
May 31, 2021
(Unaudited) | | | For the
Period Ended
November 30, 2020† | | | Year Ended August 31, | |
| | | 2020 | | | 2019 | | | 2018 | | | 2017 | | | 2016 | |
| | Per Share Data: | | | | | | | | | | | | | | | | | | | | | | | | | | | | |
| | | | | | | | |
| | Net asset value, beginning of period | | $ | 1.00 | | | $ | 1.00 | | | $ | 1.00 | | | $ | 1.00 | | | $ | 1.00 | | | $ | 1.00 | | | $ | 1.00 | |
| | | | | | | | |
| | Net investment income(a) | | | — | (b) | | | — | (b) | | | 0.003 | | | | 0.013 | | | | 0.004 | | | | 0.001 | | | | — | (b) |
| | | | | | | | |
| | Net realized gain (loss) | | | — | (b) | | | — | (b) | | | 0.001 | | | | 0.001 | | | | 0.002 | | | | (0.001 | ) | | | — | (b) |
| | | | | | | | |
| | Total from investment operations | | | — | (b) | | | — | (b) | | | 0.004 | | | | 0.014 | | | | 0.006 | | | | — | (b) | | | — | (b) |
| | | | | | | | |
| | Distributions to shareholders from net investment income | | | — | (b) | | | — | (b) | | | (0.004 | ) | | | (0.014 | ) | | | (0.006 | ) | | | — | (b) | | | — | (b) |
| | | | | | | | |
| | Distributions to shareholders from net realized gains | | | — | (b) | | | — | (b) | | | — | (b) | | | — | (b) | | | — | (b) | | | — | (b) | | | — | (b) |
| | | | | | | | |
| | Total distributions(c) | | | — | (b) | | | — | (b) | | | (0.004 | ) | | | (0.014 | ) | | | (0.006 | ) | | | — | (b) | | | — | (b) |
| | | | | | | | |
| | Net asset value, end of period | | $ | 1.00 | | | $ | 1.00 | | | $ | 1.00 | | | $ | 1.00 | | | $ | 1.00 | | | $ | 1.00 | | | $ | 1.00 | |
| | | | | | | | |
| | Total return(d) | | | 0.01 | % | | | — | %(e) | | | 0.43 | % | | | 1.39 | % | | | 0.56 | % | | | 0.02 | % | | | 0.01 | % |
| | | | | | | | |
| | Net assets, end of period (in 000’s) | | $ | 34,073 | | | $ | 20,187 | | | $ | 13,015 | | | $ | 22,364 | | | $ | 48 | | | $ | 154 | | | $ | 1 | |
| | | | | | | | |
| | Ratio of net expenses to average net assets | | | 0.07 | %(f) | | | 0.15 | %(f) | | | 0.68 | % | | | 1.00 | % | | | 1.00 | % | | | 0.97 | % | | | 0.19 | % |
| | | | | | | | |
| | Ratio of total expenses to average net assets | | | 1.00 | %(f) | | | 1.00 | %(f) | | | 1.00 | % | | | 1.00 | % | | | 1.01 | % | | | 1.03 | % | | | 1.03 | % |
| | | | | | | | |
| | Ratio of net investment income to average net assets | | | 0.02 | %(f) | | | 0.01 | %(f) | | | 0.35 | % | | | 1.29 | % | | | 0.43 | % | | | 0.14 | % | | | 0.36 | % |
| | † | | The Fund changed its fiscal year end from August 31 to November 30. |
| | (a) | | Calculated based on the average shares outstanding methodology. |
| | (b) | | Amount is less than $0.0005 per share. |
| | (c) | | Distributions may not coincide with the current year net investment income or net realized gains as distributions may be paid from current or prior year earnings. |
| | (d) | | Assumes reinvestment of all distributions. Returns do not reflect the deduction of taxes that a shareholder would pay on Fund distributions. Total returns for periods less than one full year are not annualized. |
| | (e) | | Amount is less than 0.005%. |
| | | | | | | | | | | | | | | | | | | | | | | | | | | | | | |
| | | Financial Square Treasury Obligations Fund —
Premier Shares | | Six Months Ended
May 31, 2021
(Unaudited) | | | For the
Period Ended
November 30, 2020† | | | Year Ended August 31, | |
| | | 2020 | | | 2019 | | | 2018 | | | 2017 | | | 2016 | |
| | Per Share Data: | | | | | | | | | | | | | | | | | | | | | | | | | | | | |
| | | | | | | | |
| | Net asset value, beginning of period | | $ | 1.00 | | | $ | 1.00 | | | $ | 1.00 | | | $ | 1.00 | | | $ | 1.00 | | | $ | 1.00 | | | $ | 1.00 | |
| | | | | | | | |
| | Net investment income(a) | | | — | (b) | | | — | (b) | | | 0.006 | | | | 0.018 | | | | 0.013 | | | | 0.004 | | | | — | (b) |
| | | | | | | | |
| | Net realized gain (loss) | | | — | (b) | | | — | (b) | | | 0.001 | | | | — | (b) | | | (0.004 | ) | | | (0.002 | ) | | | — | (b) |
| | | | | | | | |
| | Total from investment operations | | | — | (b) | | | — | (b) | | | 0.007 | | | | 0.018 | | | | 0.009 | | | | 0.002 | | | | — | (b) |
| | | | | | | | |
| | Distributions to shareholders from net investment income | | | — | (b) | | | — | (b) | | | (0.007 | ) | | | (0.018 | ) | | | (0.009 | ) | | | (0.002 | ) | | | — | (b) |
| | | | | | | | |
| | Distributions to shareholders from net realized gains | | | — | (b) | | | — | (b) | | | — | (b) | | | — | (b) | | | — | (b) | | | — | (b) | | | — | (b) |
| | | | | | | | |
| | Total distributions(c) | | | — | (b) | | | — | (b) | | | (0.007 | ) | | | (0.018 | ) | | | (0.009 | ) | | | (0.002 | ) | | | — | (b) |
| | | | | | | | |
| | Net asset value, end of period | | $ | 1.00 | | | $ | 1.00 | | | $ | 1.00 | | | $ | 1.00 | | | $ | 1.00 | | | $ | 1.00 | | | $ | 1.00 | |
| | | | | | | | |
| | Total return(d) | | | 0.01 | % | | | — | %(e) | | | 0.68 | % | | | 1.84 | % | | | 1.01 | % | | | 0.19 | % | | | 0.01 | % |
| | | | | | | | |
| | Net assets, end of period (in 000’s) | | $ | 11,115 | | | $ | 13,573 | | | $ | 17,568 | | | $ | 17,485 | | | $ | 16,492 | | | $ | 1 | | | $ | 1 | |
| | | | | | | | |
| | Ratio of net expenses to average net assets | | | 0.07 | %(f) | | | 0.15 | %(f) | | | 0.46 | % | | | 0.55 | % | | | 0.55 | % | | | 0.27 | % | | | 0.19 | % |
| | | | | | | | |
| | Ratio of total expenses to average net assets | | | 0.55 | %(f) | | | 0.55 | %(f) | | | 0.55 | % | | | 0.55 | % | | | 0.56 | % | | | 0.58 | % | | | 0.58 | % |
| | | | | | | | |
| | Ratio of net investment income to average net assets | | | 0.02 | %(f) | | | — | %(e)(f) | | | 0.62 | % | | | 1.82 | % | | | 1.32 | % | | | 0.37 | % | | | 0.36 | % |
| | † | | The Fund changed its fiscal year end from August 31 to November 30. |
| | (a) | | Calculated based on the average shares outstanding methodology. |
| | (b) | | Amount is less than $0.0005 per share. |
| | (c) | | Distributions may not coincide with the current year net investment income or net realized gains as distributions may be paid from current or prior year earnings. |
| | (d) | | Assumes reinvestment of all distributions. Returns do not reflect the deduction of taxes that a shareholder would pay on Fund distributions. Total returns for periods less than one full year are not annualized. |
| | (e) | | Amount is less than 0.005%. |
| | |
| The accompanying notes are an integral part of these financial statements. | | 89 |
Financial Highlights (continued)
Selected Data for a Share Outstanding Throughout Each Period
| | | | | | | | | | | | | | | | | | | | | | | | | | | | | | |
| | | Financial Square Treasury Obligations Fund —
Resource Shares | | Six Months Ended
May 31, 2021
(Unaudited) | | | For the
Period Ended
November 30, 2020† | | | Year Ended August 31, | |
| | | 2020 | | | 2019 | | | 2018 | | | 2017 | | | 2016 | |
| | Per Share Data: | | | | | | | | | | | | | | | | | | | | | | | | | | | | |
| | | | | | | | |
| | Net asset value, beginning of period | | $ | 1.00 | | | $ | 1.00 | | | $ | 1.00 | | | $ | 1.00 | | | $ | 1.00 | | | $ | 1.00 | | | $ | 1.00 | |
| | | | | | | | |
| | Net investment income(a) | | | — | (b) | | | 0.001 | | | | 0.006 | | | | 0.016 | | | | 0.008 | | | | 0.004 | | | | — | (b) |
| | | | | | | | |
| | Net realized loss | | | — | (b) | | | — | (b) | | | — | (b) | | | — | (b) | | | — | (b) | | | (0.004 | ) | | | — | (b) |
| | | | | | | | |
| | Total from investment operations | | | — | (b) | | | 0.001 | | | | 0.006 | | | | 0.016 | | | | 0.008 | | | | — | (b) | | | — | (b) |
| | | | | | | | |
| | Distributions to shareholders from net investment income | | | — | (b) | | | (0.001 | ) | | | (0.006 | ) | | | (0.016 | ) | | | (0.008 | ) | | | — | (b) | | | — | (b) |
| | | | | | | | |
| | Distributions to shareholders from net realized gains | | | — | (b) | | | — | (b) | | | — | (b) | | | — | (b) | | | — | (b) | | | — | (b) | | | — | (b) |
| | | | | | | | |
| | Total distributions(c) | | | — | (b) | | | (0.001 | ) | | | (0.006 | ) | | | (0.016 | ) | | | (0.008 | ) | | | — | (b) | | | — | (b) |
| | | | | | | | |
| | Net asset value, end of period | | $ | 1.00 | | | $ | 1.00 | | | $ | 1.00 | | | $ | 1.00 | | | $ | 1.00 | | | $ | 1.00 | | | $ | 1.00 | |
| | | | | | | | |
| | Total return(d) | | | 0.01 | % | | | — | %(e) | | | 0.51 | % | | | 1.54 | % | | | 0.71 | % | | | 0.05 | % | | | 0.01 | % |
| | | | | | | | |
| | Net assets, end of period (in 000’s) | | $ | 1 | | | $ | 1 | | | $ | 1 | | | $ | 1 | | | $ | 1 | | | $ | 1 | | | $ | 1 | |
| | | | | | | | |
| | Ratio of net expenses to average net assets | | | 0.07 | %(f) | | | 0.15 | %(f) | | | 0.39 | % | | | 0.56 | % | | | 0.56 | % | | | 0.27 | % | | | 0.19 | % |
| | | | | | | | |
| | Ratio of total expenses to average net assets | | | 0.55 | %(f) | | | 0.85 | %(f) | | | 0.85 | % | | | 0.85 | % | | | 0.86 | % | | | 0.88 | % | | | 0.88 | % |
| | | | | | | | |
| | Ratio of net investment income to average net assets | | | 0.06 | %(f) | | | 0.34 | %(f) | | | 0.59 | % | | | 1.59 | % | | | 0.78 | % | | | 0.37 | % | | | 0.36 | % |
| | † | | The Fund changed its fiscal year end from August 31 to November 30. |
| | (a) | | Calculated based on the average shares outstanding methodology. |
| | (b) | | Amount is less than $0.0005 per share. |
| | (c) | | Distributions may not coincide with the current year net investment income or net realized gains as distributions may be paid from current or prior year earnings. |
| | (d) | | Assumes reinvestment of all distributions. Returns do not reflect the deduction of taxes that a shareholder would pay on Fund distributions. Total returns for periods less than one full year are not annualized. |
| | (e) | | Amount is less than 0.005%. |
| | |
| 90 | | The accompanying notes are an integral part of these financial statements. |
Financial Highlights (continued)
Selected Data for a Share Outstanding Throughout Each Period
| | | | | | | | | | | | | | | | | | | | | | | | | | | | | | |
| | | Financial Square Treasury Solutions Fund —
Institutional Shares | | Six Months Ended
May 31, 2021
(Unaudited) | | | For the
Period Ended
November 30, 2020† | | | Year Ended August 31, | |
| | | 2020 | | | 2019 | | | 2018 | | | 2017 | | | 2016 | |
| | Per Share Data: | | | | | | | | | | | | | | | | | | | | | | | | | | | | |
| | | | | | | | |
| | Net asset value, beginning of period | | $ | 1.00 | | | $ | 1.00 | | | $ | 1.00 | | | $ | 1.00 | | | $ | 1.00 | | | $ | 1.00 | | | $ | 1.00 | |
| | | | | | | | |
| | Net investment income(a) | | | — | (b) | | | — | (b) | | | 0.007 | | | | 0.021 | | | | 0.013 | | | | 0.005 | | | | 0.001 | |
| | | | | | | | |
| | Net realized gain | | | — | (b) | | | — | (b) | | | 0.003 | | | | — | (b) | | | — | (b) | | | — | (b) | | | — | (b) |
| | | | | | | | |
| | Total from investment operations | | | — | (b) | | | — | (b) | | | 0.010 | | | | 0.021 | | | | 0.013 | | | | 0.005 | | | | 0.001 | |
| | | | | | | | |
| | Distributions to shareholders from net investment income | | | — | (b) | | | — | (b) | | | (0.010 | ) | | | (0.021 | ) | | | (0.013 | ) | | | (0.005 | ) | | | (0.001 | ) |
| | | | | | | | |
| | Distributions to shareholders from net realized gains | | | — | (b) | | | — | (b) | | | — | (b) | | | — | (b) | | | — | (b) | | | — | (b) | | | — | (b) |
| | | | | | | | |
| | Total distributions(c) | | | — | (b) | | | — | (b) | | | (0.010 | ) | | | (0.021 | ) | | | (0.013 | ) | | | (0.005 | ) | | | (0.001 | ) |
| | | | | | | | |
| | Net asset value, end of period | | $ | 1.00 | | | $ | 1.00 | | | $ | 1.00 | | | $ | 1.00 | | | $ | 1.00 | | | $ | 1.00 | | | $ | 1.00 | |
| | | | | | | | |
| | Total return(d) | | | — | %(e) | | | — | %(e) | | | 0.96 | % | | | 2.17 | % | | | 1.34 | % | | | 0.49 | % | | | 0.14 | % |
| | | | | | | | |
| | Net assets, end of period (in 000’s) | | $ | 9,034,629 | | | $ | 10,518,867 | | | $ | 11,543,913 | | | $ | 7,395,030 | | | $ | 7,667,540 | | | $ | 8,619,492 | | | $ | 9,876,558 | |
| | | | | | | | |
| | Ratio of net expenses to average net assets | | | 0.11 | %(f) | | | 0.17 | %(f) | | | 0.20 | % | | | 0.20 | % | | | 0.20 | % | | | 0.20 | % | | | 0.19 | % |
| | | | | | | | |
| | Ratio of total expenses to average net assets | | | 0.20 | %(f) | | | 0.20 | %(f) | | | 0.20 | % | | | 0.20 | % | | | 0.21 | % | | | 0.23 | % | | | 0.23 | % |
| | | | | | | | |
| | Ratio of net investment income to average net assets | | | — | %(e)(f) | | | — | %(e)(f) | | | 0.70 | % | | | 2.11 | % | | | 1.31 | % | | | 0.48 | % | | | 0.11 | % |
| | † | | The Fund changed its fiscal year end from August 31 to November 30. |
| | (a) | | Calculated based on the average shares outstanding methodology. |
| | (b) | | Amount is less than $0.0005 per share. |
| | (c) | | Distributions may not coincide with the current year net investment income or net realized gains as distributions may be paid from current or prior year earnings. |
| | (d) | | Assumes reinvestment of all distributions. Returns do not reflect the deduction of taxes that a shareholder would pay on Fund distributions. Total returns for periods less than one full year are not annualized. |
| | (e) | | Amount is less than 0.005%. |
| | | | | | | | | | | | | | | | | | | | | | | | | | | | | | |
| | | Financial Square Treasury Solutions Fund —
Capital Shares | | Six Months Ended
May 31, 2021
(Unaudited) | | | For the
Period Ended
November 30, 2020† | | | Year Ended August 31, | |
| | | 2020 | | | 2019 | | | 2018 | | | 2017 | | | 2016 | |
| | Per Share Data: | | | | | | | | | | | | | | | | | | | | | | | | | | | | |
| | | | | | | | |
| | Net asset value, beginning of period | | $ | 1.00 | | | $ | 1.00 | | | $ | 1.00 | | | $ | 1.00 | | | $ | 1.00 | | | $ | 1.00 | | | $ | 1.00 | |
| | | | | | | | |
| | Net investment income(a) | | | — | (b) | | | — | (b) | | | 0.007 | | | | 0.020 | | | | 0.012 | | | | 0.003 | | | | — | (b) |
| | | | | | | | |
| | Net realized gain | | | — | (b) | | | — | (b) | | | 0.001 | | | | — | (b) | | | — | (b) | | | — | (b) | | | — | (b) |
| | | | | | | | |
| | Total from investment operations | | | — | (b) | | | — | (b) | | | 0.008 | | | | 0.020 | | | | 0.012 | | | | 0.003 | | | | — | (b) |
| | | | | | | | |
| | Distributions to shareholders from net investment income | | | — | (b) | | | — | (b) | | | (0.008 | ) | | | (0.020 | ) | | | (0.012 | ) | | | (0.003 | ) | | | — | (b) |
| | | | | | | | |
| | Distributions to shareholders from net realized gains | | | — | (b) | | | — | (b) | | | — | (b) | | | — | (b) | | | — | (b) | | | — | (b) | | | — | (b) |
| | | | | | | | |
| | Total distributions(c) | | | — | (b) | | | — | (b) | | | (0.008 | ) | | | (0.020 | ) | | | (0.012 | ) | | | (0.003 | ) | | | — | (b) |
| | | | | | | | |
| | Net asset value, end of period | | $ | 1.00 | | | $ | 1.00 | | | $ | 1.00 | | | $ | 1.00 | | | $ | 1.00 | | | $ | 1.00 | | | $ | 1.00 | |
| | | | | | | | |
| | Total return(d) | | | — | %(e) | | | — | %(e) | | | 0.83 | % | | | 2.02 | % | | | 1.19 | % | | | 0.34 | % | | | 0.03 | % |
| | | | | | | | |
| | Net assets, end of period (in 000’s) | | $ | 288,149 | | | $ | 234,344 | | | $ | 201,227 | | | $ | 162,212 | | | $ | 165,645 | | | $ | 215,820 | | | $ | 264,092 | |
| | | | | | | | |
| | Ratio of net expenses to average net assets | | | 0.11 | %(f) | | | 0.17 | %(f) | | | 0.32 | % | | | 0.35 | % | | | 0.35 | % | | | 0.35 | % | | | 0.32 | % |
| | | | | | | | |
| | Ratio of total expenses to average net assets | | | 0.35 | %(f) | | | 0.35 | %(f) | | | 0.35 | % | | | 0.35 | % | | | 0.36 | % | | | 0.38 | % | | | 0.38 | % |
| | | | | | | | |
| | Ratio of net investment income to average net assets | | | — | %(e)(f) | | | — | %(e)(f) | | | 0.65 | % | | | 1.97 | % | | | 1.15 | % | | | 0.30 | % | | | 0.01 | % |
| | † | | The Fund changed its fiscal year end from August 31 to November 30. |
| | (a) | | Calculated based on the average shares outstanding methodology. |
| | (b) | | Amount is less than $0.0005 per share. |
| | (c) | | Distributions may not coincide with the current year net investment income or net realized gains as distributions may be paid from current or prior year earnings. |
| | (d) | | Assumes reinvestment of all distributions. Returns do not reflect the deduction of taxes that a shareholder would pay on Fund distributions. Total returns for periods less than one full year are not annualized. |
| | (e) | | Amount is less than 0.005%. |
| | |
| The accompanying notes are an integral part of these financial statements. | | 91 |
Financial Highlights (continued)
Selected Data for a Share Outstanding Throughout Each Period
| | | | | | | | | | | | | | | | | | | | | | | | | | | | | | |
| | | Financial Square Treasury Solutions Fund —
Service Shares | | Six Months Ended
May 31, 2021
(Unaudited) | | | For the
Period Ended
November 30, 2020† | | | Year Ended August 31, | |
| | | 2020 | | | 2019 | | | 2018 | | | 2017 | | | 2016 | |
| | Per Share Data: | | | | | | | | | | | | | | | | | | | | | | | | | | | | |
| | | | | | | | |
| | Net asset value, beginning of period | | $ | 1.00 | | | $ | 1.00 | | | $ | 1.00 | | | $ | 1.00 | | | $ | 1.00 | | | $ | 1.00 | | | $ | 1.00 | |
| | | | | | | | |
| | Net investment income(a) | | | — | (b) | | | — | (b) | | | 0.005 | | | | 0.016 | | | | 0.008 | | | | 0.001 | | | | — | (b) |
| | | | | | | | |
| | Net realized gain | | | — | (b) | | | — | (b) | | | 0.001 | | | | — | (b) | | | — | (b) | | | — | (b) | | | — | (b) |
| | | | | | | | |
| | Total from investment operations | | | — | (b) | | | — | (b) | | | 0.006 | | | | 0.016 | | | | 0.008 | | | | 0.001 | | | | — | (b) |
| | | | | | | | |
| | Distributions to shareholders from net investment income | | | — | (b) | | | — | (b) | | | (0.006 | ) | | | (0.016 | ) | | | (0.008 | ) | | | (0.001 | ) | | | — | (b) |
| | | | | | | | |
| | Distributions to shareholders from net realized gains | | | — | (b) | | | — | (b) | | | — | (b) | | | — | (b) | | | — | (b) | | | — | (b) | | | — | (b) |
| | | | | | | | |
| | Total distributions(c) | | | — | (b) | | | — | (b) | | | (0.006 | ) | | | (0.016 | ) | | | (0.008 | ) | | | (0.001 | ) | | | — | (b) |
| | | | | | | | |
| | Net asset value, end of period | | $ | 1.00 | | | $ | 1.00 | | | $ | 1.00 | | | $ | 1.00 | | | $ | 1.00 | | | $ | 1.00 | | | $ | 1.00 | |
| | | | | | | | |
| | Total return(d) | | | — | %(e) | | | — | %(e) | | | 0.62 | % | | | 1.66 | % | | | 0.84 | % | | | 0.10 | % | | | 0.01 | % |
| | | | | | | | |
| | Net assets, end of period (in 000’s) | | $ | 212,351 | | | $ | 240,184 | | | $ | 208,499 | | | $ | 124,910 | | | $ | 155,808 | | | $ | 144,728 | | | $ | 142,607 | |
| | | | | | | | |
| | Ratio of net expenses to average net assets | | | 0.11 | %(f) | | | 0.17 | %(f) | | | 0.50 | % | | | 0.70 | % | | | 0.70 | % | | | 0.58 | % | | | 0.29 | % |
| | | | | | | | |
| | Ratio of total expenses to average net assets | | | 0.70 | %(f) | | | 0.70 | %(f) | | | 0.70 | % | | | 0.70 | % | | | 0.71 | % | | | 0.73 | % | | | 0.73 | % |
| | | | | | | | |
| | Ratio of net investment income (loss) to average net assets | | | — | %(e)(f) | | | — | %(e)(f) | | | 0.47 | % | | | 1.60 | % | | | 0.83 | % | | | 0.08 | % | | | (0.02 | )% |
| | † | | The Fund changed its fiscal year end from August 31 to November 30. |
| | (a) | | Calculated based on the average shares outstanding methodology. |
| | (b) | | Amount is less than $0.0005 per share. |
| | (c) | | Distributions may not coincide with the current year net investment income or net realized gains as distributions may be paid from current or prior year earnings. |
| | (d) | | Assumes reinvestment of all distributions. Returns do not reflect the deduction of taxes that a shareholder would pay on Fund distributions. Total returns for periods less than one full year are not annualized. |
| | (e) | | Amount is less than 0.005%. |
| | | | | | | | | | | | | | | | | | | | | | | | | | | | | | |
| | | Financial Square Treasury Solutions Fund —
Preferred Shares | | Six Months Ended
May 31, 2021
(Unaudited) | | | For the
Period Ended
November 30, 2020† | | | Year Ended August 31, | |
| | | 2020 | | | 2019 | | | 2018 | | | 2017 | | | 2016 | |
| | Per Share Data: | | | | | | | | | | | | | | | | | | | | | | | | | | | | |
| | | | | | | | |
| | Net asset value, beginning of period | | $ | 1.00 | | | $ | 1.00 | | | $ | 1.00 | | | $ | 1.00 | | | $ | 1.00 | | | $ | 1.00 | | | $ | 1.00 | |
| | | | | | | | |
| | Net investment income(a) | | | — | (b) | | | — | (b) | | | 0.008 | | | | 0.020 | | | | 0.013 | | | | 0.003 | | | | 0.001 | |
| | | | | | | | |
| | Net realized gain (loss) | | | — | (b) | | | — | (b) | | | 0.001 | | | | — | (b) | | | (0.001 | ) | | | 0.001 | | | | — | (b) |
| | | | | | | | |
| | Total from investment operations | | | — | (b) | | | — | (b) | | | 0.009 | | | | 0.020 | | | | 0.012 | | | | 0.004 | | | | 0.001 | |
| | | | | | | | |
| | Distributions to shareholders from net investment income | | | — | (b) | | | — | (b) | | | (0.009 | ) | | | (0.020 | ) | | | (0.012 | ) | | | (0.004 | ) | | | (0.001 | ) |
| | | | | | | | |
| | Distributions to shareholders from net realized gains | | | — | (b) | | | — | (b) | | | — | (b) | | | — | (b) | | | — | (b) | | | — | (b) | | | — | (b) |
| | | | | | | | |
| | Total distributions(c) | | | — | (b) | | | — | (b) | | | (0.009 | ) | | | (0.020 | ) | | | (0.012 | ) | | | (0.004 | ) | | | (0.001 | ) |
| | | | | | | | |
| | Net asset value, end of period | | $ | 1.00 | | | $ | 1.00 | | | $ | 1.00 | | | $ | 1.00 | | | $ | 1.00 | | | $ | 1.00 | | | $ | 1.00 | |
| | | | | | | | |
| | Total return(d) | | | — | %(e) | | | — | %(e) | | | 0.87 | % | | | 2.07 | % | | | 1.24 | % | | | 0.39 | % | | | 0.07 | % |
| | | | | | | | |
| | Net assets, end of period (in 000’s) | | $ | 57,465 | | | $ | 59,340 | | | $ | 52,791 | | | $ | 38,419 | | | $ | 19,545 | | | $ | 14,565 | | | $ | 75,756 | |
| | | | | | | | |
| | Ratio of net expenses to average net assets | | | 0.11 | %(f) | | | 0.17 | %(f) | | | 0.29 | % | | | 0.30 | % | | | 0.30 | % | | | 0.30 | % | | | 0.26 | % |
| | | | | | | | |
| | Ratio of total expenses to average net assets | | | 0.30 | %(f) | | | 0.30 | %(f) | | | 0.30 | % | | | 0.30 | % | | | 0.31 | % | | | 0.33 | % | | | 0.33 | % |
| | | | | | | | |
| | Ratio of net investment income to average net assets | | | — | %(e)(f) | | | — | %(e)(f) | | | 0.78 | % | | | 2.04 | % | | | 1.26 | % | | | 0.25 | % | | | 0.03 | % |
| | † | | The Fund changed its fiscal year end from August 31 to November 30. |
| | (a) | | Calculated based on the average shares outstanding methodology. |
| | (b) | | Amount is less than $0.0005 per share. |
| | (c) | | Distributions may not coincide with the current year net investment income or net realized gains as distributions may be paid from current or prior year earnings. |
| | (d) | | Assumes reinvestment of all distributions. Returns do not reflect the deduction of taxes that a shareholder would pay on Fund distributions. Total returns for periods less than one full year are not annualized. |
| | (e) | | Amount is less than 0.005%. |
| | |
| 92 | | The accompanying notes are an integral part of these financial statements. |
Financial Highlights (continued)
Selected Data for a Share Outstanding Throughout Each Period
| | | | | | | | | | | | | | | | | | | | | | | | | | | | | | |
| | | Financial Square Treasury Solutions Fund —
Select Shares | | Six Months Ended
May 31, 2021
(Unaudited) | | | For the
Period Ended
November 30, 2020† | | | Year Ended August 31, | |
| | | 2020 | | | 2019 | | | 2018 | | | 2017 | | | 2016 | |
| | Per Share Data: | | | | | | | | | | | | | | | | | | | | | | | | | | | | |
| | | | | | | | |
| | Net asset value, beginning of period | | $ | 1.00 | | | $ | 1.00 | | | $ | 1.00 | | | $ | 1.00 | | | $ | 1.00 | | | $ | 1.00 | | | $ | 1.00 | |
| | | | | | | | |
| | Net investment income(a) | | | — | (b) | | | — | (b) | | | 0.009 | | | | 0.021 | | | | 0.013 | | | | 0.004 | | | | 0.001 | |
| | | | | | | | |
| | Net realized gain | | | — | (b) | | | — | (b) | | | — | (b) | | | — | (b) | | | — | (b) | | | 0.001 | | | | — | (b) |
| | | | | | | | |
| | Total from investment operations | | | — | (b) | | | — | (b) | | | 0.009 | | | | 0.021 | | | | 0.013 | | | | 0.005 | | | | 0.001 | |
| | | | | | | | |
| | Distributions to shareholders from net investment income | | | — | (b) | | | — | (b) | | | (0.009 | ) | | | (0.021 | ) | | | (0.013 | ) | | | (0.005 | ) | | | (0.001 | ) |
| | | | | | | | |
| | Distributions to shareholders from net realized gains | | | — | (b) | | | — | (b) | | | — | (b) | | | — | (b) | | | — | (b) | | | — | (b) | | | — | (b) |
| | | | | | | | |
| | Total distributions(c) | | | — | (b) | | | — | (b) | | | (0.009 | ) | | | (0.021 | ) | | | (0.013 | ) | | | (0.005 | ) | | | (0.001 | ) |
| | | | | | | | |
| | Net asset value, end of period | | $ | 1.00 | | | $ | 1.00 | | | $ | 1.00 | | | $ | 1.00 | | | $ | 1.00 | | | $ | 1.00 | | | $ | 1.00 | |
| | | | | | | | |
| | Total return(d) | | | — | %(e) | | | — | %(e) | | | 0.93 | % | | | 2.14 | % | | | 1.31 | % | | | 0.46 | % | | | 0.12 | % |
| | | | | | | | |
| | Net assets, end of period (in 000’s) | | $ | 5,773 | | | $ | 6,547 | | | $ | 7,067 | | | $ | 8,325 | | | $ | 7,439 | | | $ | 7,333 | | | $ | 10,969 | |
| | | | | | | | |
| | Ratio of net expenses to average net assets | | | 0.11 | %(f) | | | 0.17 | %(f) | | | 0.23 | % | | | 0.23 | % | | | 0.23 | % | | | 0.23 | % | | | 0.21 | % |
| | | | | | | | |
| | Ratio of total expenses to average net assets | | | 0.23 | %(f) | | | 0.23 | %(f) | | | 0.23 | % | | | 0.23 | % | | | 0.24 | % | | | 0.26 | % | | | 0.26 | % |
| | | | | | | | |
| | Ratio of net investment income to average net assets | | | — | %(e)(f) | | | — | %(e)(f) | | | 0.91 | % | | | 2.07 | % | | | 1.27 | % | | | 0.42 | % | | | 0.09 | % |
| | † | | The Fund changed its fiscal year end from August 31 to November 30. |
| | (a) | | Calculated based on the average shares outstanding methodology. |
| | (b) | | Amount is less than $0.0005 per share. |
| | (c) | | Distributions may not coincide with the current year net investment income or net realized gains as distributions may be paid from current or prior year earnings. |
| | (d) | | Assumes reinvestment of all distributions. Returns do not reflect the deduction of taxes that a shareholder would pay on Fund distributions. Total returns for periods less than one full year are not annualized. |
| | (e) | | Amount is less than 0.005%. |
| | | | | | | | | | | | | | | | | | | | | | | | | | | | | | |
| | | Financial Square Treasury Solutions Fund —
Administration Shares | | Six Months Ended
May 31, 2021
(Unaudited) | | | For the
Period Ended
November 30, 2020† | | | Year Ended August 31, | |
| | | 2020 | | | 2019 | | | 2018 | | | 2017 | | | 2016 | |
| | Per Share Data: | | | | | | | | | | | | | | | | | | | | | | | | | | | | |
| | | | | | | | |
| | Net asset value, beginning of period | | $ | 1.00 | | | $ | 1.00 | | | $ | 1.00 | | | $ | 1.00 | | | $ | 1.00 | | | $ | 1.00 | | | $ | 1.00 | |
| | | | | | | | |
| | Net investment income(a) | | | — | (b) | | | — | (b) | | | 0.006 | | | | 0.019 | | | | 0.011 | | | | 0.003 | | | | — | (b) |
| | | | | | | | |
| | Net realized gain | | | — | (b) | | | — | (b) | | | 0.002 | | | | — | (b) | | | — | (b) | | | — | (b) | | | — | (b) |
| | | | | | | | |
| | Total from investment operations | | | — | (b) | | | — | (b) | | | 0.008 | | | | 0.019 | | | | 0.011 | | | | 0.003 | | | | — | (b) |
| | | | | | | | |
| | Distributions to shareholders from net investment income | | | — | (b) | | | — | (b) | | | (0.008 | ) | | | (0.019 | ) | | | (0.011 | ) | | | (0.003 | ) | | | — | (b) |
| | | | | | | | |
| | Distributions to shareholders from net realized gains | | | — | (b) | | | — | (b) | | | — | (b) | | | — | (b) | | | — | (b) | | | — | (b) | | | — | (b) |
| | | | | | | | |
| | Total distributions(c) | | | — | (b) | | | — | (b) | | | (0.008 | ) | | | (0.019 | ) | | | (0.011 | ) | | | (0.003 | ) | | | — | (b) |
| | | | | | | | |
| | Net asset value, end of period | | $ | 1.00 | | | $ | 1.00 | | | $ | 1.00 | | | $ | 1.00 | | | $ | 1.00 | | | $ | 1.00 | | | $ | 1.00 | |
| | | | | | | | |
| | Total return(d) | | | — | %(e) | | | — | %(e) | | | 0.77 | % | | | 1.92 | % | | | 1.09 | % | | | 0.25 | % | | | 0.01 | % |
| | | | | | | | |
| | Net assets, end of period (in 000’s) | | $ | 381,863 | | | $ | 610,539 | | | $ | 443,470 | | | $ | 473,937 | | | $ | 360,817 | | | $ | 237,557 | | | $ | 189,870 | |
| | | | | | | | |
| | Ratio of net expenses to average net assets | | | 0.11 | %(f) | | | 0.17 | %(f) | | | 0.38 | % | | | 0.45 | % | | | 0.45 | % | | | 0.44 | % | | | 0.30 | % |
| | | | | | | | |
| | Ratio of total expenses to average net assets | | | 0.45 | %(f) | | | 0.45 | %(f) | | | 0.45 | % | | | 0.45 | % | | | 0.46 | % | | | 0.48 | % | | | 0.48 | % |
| | | | | | | | |
| | Ratio of net investment income (loss) to average net assets | | | — | %(e)(f) | | | — | %(e)(f) | | | 0.61 | % | | | 1.85 | % | | | 1.09 | % | | | 0.28 | % | | | (0.02 | )% |
| | † | | The Fund changed its fiscal year end from August 31 to November 30. |
| | (a) | | Calculated based on the average shares outstanding methodology. |
| | (b) | | Amount is less than $0.0005 per share. |
| | (c) | | Distributions may not coincide with the current year net investment income or net realized gains as distributions may be paid from current or prior year earnings. |
| | (d) | | Assumes reinvestment of all distributions. Returns do not reflect the deduction of taxes that a shareholder would pay on Fund distributions. Total returns for periods less than one full year are not annualized. |
| | (e) | | Amount is less than 0.005%. |
| | |
| The accompanying notes are an integral part of these financial statements. | | 93 |
Financial Highlights (continued)
Selected Data for a Share Outstanding Throughout Each Period
| | | | | | | | | | | | | | | | | | | | | | | | | | | | | | |
| | | Financial Square Treasury Solutions Fund —
Cash Management Shares | | Six Months Ended
May 31, 2021
(Unaudited) | | | For the
Period Ended
November 30, 2020† | | | Year Ended August 31, | |
| | | 2020 | | | 2019 | | | 2018 | | | 2017 | | | 2016 | |
| | Per Share Data: | | | | | | | | | | | | | | | | | | | | | | | | | | | | |
| | | | | | | | |
| | Net asset value, beginning of period | | $ | 1.00 | | | $ | 1.00 | | | $ | 1.00 | | | $ | 1.00 | | | $ | 1.00 | | | $ | 1.00 | | | $ | 1.00 | |
| | | | | | | | |
| | Net investment income(a) | | | — | (b) | | | — | (b) | | | 0.004 | | | | 0.013 | | | | 0.005 | | | | — | (b) | | | — | (b) |
| | | | | | | | |
| | Net realized gain | | | — | (b) | | | — | (b) | | | — | (b) | | | — | (b) | | | — | (b) | | | — | (b) | | | — | (b) |
| | | | | | | | |
| | Total from investment operations | | | — | (b) | | | — | (b) | | | 0.004 | | | | 0.013 | | | | 0.005 | | | | — | (b) | | | — | (b) |
| | | | | | | | |
| | Distributions to shareholders from net investment income | | | — | (b) | | | — | (b) | | | (0.004 | ) | | | (0.013 | ) | | | (0.005 | ) | | | — | (b) | | | — | (b) |
| | | | | | | | |
| | Distributions to shareholders from net realized gains | | | — | (b) | | | — | (b) | | | — | (b) | | | — | (b) | | | — | (b) | | | — | (b) | | | — | (b) |
| | | | | | | | |
| | Total distributions(c) | | | — | (b) | | | — | (b) | | | (0.004 | ) | | | (0.013 | ) | | | (0.005 | ) | | | — | (b) | | | — | (b) |
| | | | | | | | |
| | Net asset value, end of period | | $ | 1.00 | | | $ | 1.00 | | | $ | 1.00 | | | $ | 1.00 | | | $ | 1.00 | | | $ | 1.00 | | | $ | 1.00 | |
| | | | | | | | |
| | Total return(d) | | | — | %(e) | | | — | %(e) | | | 0.45 | % | | | 1.36 | % | | | 0.54 | % | | | 0.01 | % | | | 0.01 | % |
| | | | | | | | |
| | Net assets, end of period (in 000’s) | | $ | 346,174 | | | $ | 262,647 | | | $ | 272,981 | | | $ | 223,501 | | | $ | 23,332 | | | $ | 33,252 | | | $ | 73,211 | |
| | | | | | | | |
| | Ratio of net expenses to average net assets | | | 0.11 | %(f) | | | 0.17 | %(f) | | | 0.70 | % | | | 1.00 | % | | | 1.00 | % | | | 0.62 | % | | | 0.31 | % |
| | | | | | | | |
| | Ratio of total expenses to average net assets | | | 1.00 | %(f) | | | 1.00 | %(f) | | | 1.00 | % | | | 1.00 | % | | | 1.01 | % | | | 1.03 | % | | | 1.03 | % |
| | | | | | | | |
| | Ratio of net investment income (loss) to average net assets | | | — | %(e)(f) | | | — | %(e)(f) | | | 0.37 | % | | | 1.31 | % | | | 0.54 | % | | | — | %(e) | | | (0.20 | )% |
| | † | | The Fund changed its fiscal year end from August 31 to November 30. |
| | (a) | | Calculated based on the average shares outstanding methodology. |
| | (b) | | Amount is less than $0.0005 per share. |
| | (c) | | Distributions may not coincide with the current year net investment income or net realized gains as distributions may be paid from current or prior year earnings. |
| | (d) | | Assumes reinvestment of all distributions. Returns do not reflect the deduction of taxes that a shareholder would pay on Fund distributions. Total returns for periods less than one full year are not annualized. |
| | (e) | | Amount is less than 0.005%. |
| | | | | | | | | | | | | | | | | | | | | | | | | | | | | | |
| | | | | Six Months Ended
May 31, 2021
(Unaudited) | | | For the
Period Ended
November 30, 2020† | | | Year Ended August 31, | |
| | | Financial Square Treasury Solutions Fund — Premier Shares | | 2020 | | | 2019 | | | 2018 | | | 2017 | | | 2016 | |
| | Per Share Data: | | | | | | | | | | | | | | | | | | | | | | | | | | | | |
| | | | | | | | |
| | Net asset value, beginning of period | | $ | 1.00 | | | $ | 1.00 | | | $ | 1.00 | | | $ | 1.00 | | | $ | 1.00 | | | $ | 1.00 | | | $ | 1.00 | |
| | | | | | | | |
| | Net investment income(a) | | | — | (b) | | | — | (b) | | | 0.006 | | | | 0.018 | | | | 0.011 | | | | 0.001 | | | | — | (b) |
| | | | | | | | |
| | Net realized gain (loss) | | | — | (b) | | | — | (b) | | | 0.001 | | | | — | (b) | | | (0.001 | ) | | | 0.001 | | | | — | (b) |
| | | | | | | | |
| | Total from investment operations | | | — | (b) | | | — | (b) | | | 0.007 | | | | 0.018 | | | | 0.010 | | | | 0.002 | | | | — | (b) |
| | | | | | | | |
| | Distributions to shareholders from net investment income | | | — | (b) | | | — | (b) | | | (0.007 | ) | | | (0.018 | ) | | | (0.010 | ) | | | (0.002 | ) | | | — | (b) |
| | | | | | | | |
| | Distributions to shareholders from net realized gains | | | — | (b) | | | — | (b) | | | — | (b) | | | — | (b) | | | — | (b) | | | — | (b) | | | — | (b) |
| | | | | | | | |
| | Total distributions(c) | | | — | (b) | | | — | (b) | | | (0.007 | ) | | | (0.018 | ) | | | (0.010 | ) | | | (0.002 | ) | | | — | (b) |
| | | | | | | | |
| | Net asset value, end of period | | $ | 1.00 | | | $ | 1.00 | | | $ | 1.00 | | | $ | 1.00 | | | $ | 1.00 | | | $ | 1.00 | | | $ | 1.00 | |
| | | | | | | | |
| | Total return(d) | | | — | %(e) | | | — | %(e) | | | 0.71 | % | | | 1.82 | % | | | 0.99 | % | | | 0.18 | % | | | 0.01 | % |
| | | | | | | | |
| | Net assets, end of period (in 000’s) | | $ | 120,631 | | | $ | 79,208 | | | $ | 127,497 | | | $ | 161,003 | | | $ | 45,627 | | | $ | 15,512 | | | $ | 1 | |
| | | | | | | | |
| | Ratio of net expenses to average net assets | | | 0.11 | %(f) | | | 0.17 | %(f) | | | 0.45 | % | | | 0.55 | % | | | 0.55 | % | | | 0.50 | % | | | 0.19 | % |
| | | | | | | | |
| | Ratio of total expenses to average net assets | | | 0.55 | %(f) | | | 0.55 | %(f) | | | 0.55 | % | | | 0.55 | % | | | 0.56 | % | | | 0.58 | % | | | 0.58 | % |
| | | | | | | | |
| | Ratio of net investment income to average net assets | | | — | %(e)(f) | | | — | %(e)(f) | | | 0.63 | % | | | 1.77 | % | | | 1.10 | % | | | 0.13 | % | | | 0.36 | % |
| | † | | The Fund changed its fiscal year end from August 31 to November 30. |
| | (a) | | Calculated based on the average shares outstanding methodology. |
| | (b) | | Amount is less than $0.0005 per share. |
| | (c) | | Distributions may not coincide with the current year net investment income or net realized gains as distributions may be paid from current or prior year earnings. |
| | (d) | | Assumes reinvestment of all distributions. Returns do not reflect the deduction of taxes that a shareholder would pay on Fund distributions. Total returns for periods less than one full year are not annualized. |
| | (e) | | Amount is less than 0.005%. |
| | |
| 94 | | The accompanying notes are an integral part of these financial statements. |
Financial Highlights (continued)
Selected Data for a Share Outstanding Throughout Each Period
| | | | | | | | | | | | | | | | | | | | | | | | | | | | | | |
| | | Financial Square Treasury Solutions Fund —
Resource Shares | | Six Months Ended
May 31, 2021
(Unaudited) | | | For the
Period Ended
November 30, 2020† | | | Year Ended August 31, | |
| | | 2020 | | | 2019 | | | 2018 | | | 2017 | | | 2016 | |
| | Per Share Data: | | | | | | | | | | | | | | | | | | | | | | | | | | | | |
| | | | | | | | |
| | Net asset value, beginning of period | | $ | 1.00 | | | $ | 1.00 | | | $ | 1.00 | | | $ | 1.00 | | | $ | 1.00 | | | $ | 1.00 | | | $ | 1.00 | |
| | | | | | | | |
| | Net investment income(a) | | | — | (b) | | | 0.001 | | | | 0.006 | | | | 0.016 | | | | 0.008 | | | | 0.004 | | | | — | (b) |
| | | | | | | | |
| | Net realized loss | | | — | (b) | | | — | (b) | | | — | (b) | | | — | (b) | | | — | (b) | | | (0.004 | ) | | | — | (b) |
| | | | | | | | |
| | Total from investment operations | | | — | (b) | | | 0.001 | | | | 0.006 | | | | 0.016 | | | | 0.008 | | | | — | (b) | | | — | (b) |
| | | | | | | | |
| | Distributions to shareholders from net investment income | | | — | (b) | | | (0.001 | ) | | | (0.006 | ) | | | (0.016 | ) | | | (0.008 | ) | | | — | (b) | | | — | (b) |
| | | | | | | | |
| | Distributions to shareholders from net realized gains | | | — | (b) | | | — | (b) | | | — | (b) | | | — | (b) | | | — | (b) | | | — | (b) | | | — | (b) |
| | | | | | | | |
| | Total distributions(c) | | | — | (b) | | | (0.001 | ) | | | (0.006 | ) | | | (0.016 | ) | | | (0.008 | ) | | | — | (b) | | | — | (b) |
| | | | | | | | |
| | Net asset value, end of period | | $ | 1.00 | | | $ | 1.00 | | | $ | 1.00 | | | $ | 1.00 | | | $ | 1.00 | | | $ | 1.00 | | | $ | 1.00 | |
| | | | | | | | |
| | Total return(d) | | | — | %(e) | | | — | %(e) | | | 0.53 | % | | | 1.51 | % | | | 0.69 | % | | | 0.05 | % | | | 0.01 | % |
| | | | | | | | |
| | Net assets, end of period (in 000’s) | | $ | 1 | | | $ | 1 | | | $ | 1 | | | $ | 1 | | | $ | 1 | | | $ | 1 | | | $ | 1 | |
| | | | | | | | |
| | Ratio of net expenses to average net assets | | | 0.11 | %(f) | | | 0.17 | %(f) | | | 0.40 | % | | | 0.56 | % | | | 0.55 | % | | | 0.26 | % | | | 0.19 | % |
| | | | | | | | |
| | Ratio of total expenses to average net assets | | | 0.56 | %(f) | | | 0.85 | %(f) | | | 0.85 | % | | | 0.85 | % | | | 0.86 | % | | | 0.88 | % | | | 0.88 | % |
| | | | | | | | |
| | Ratio of net investment income to average net assets | | | 0.06 | %(f) | | | 0.34 | %(f) | | | 0.59 | % | | | 1.59 | % | | | 0.84 | % | | | 0.37 | % | | | 0.37 | % |
| | † | | The Fund changed its fiscal year end from August 31 to November 30. |
| | (a) | | Calculated based on the average shares outstanding methodology. |
| | (b) | | Amount is less than $0.0005 per share. |
| | (c) | | Distributions may not coincide with the current year net investment income or net realized gains as distributions may be paid from current or prior year earnings. |
| | (d) | | Assumes reinvestment of all distributions. Returns do not reflect the deduction of taxes that a shareholder would pay on Fund distributions. Total returns for periods less than one full year are not annualized. |
| | (e) | | Amount is less than 0.005%. |
| | |
| The accompanying notes are an integral part of these financial statements. | | 95 |
GOLDMAN SACHS — FINANCIAL SQUARE FUNDS
Notes to Financial Statements
May 31, 2021 (Unaudited)
Goldman Sachs Trust (the “Trust”) is a Delaware statutory trust registered under the Investment Company Act of 1940, as amended (the “Act”), as an open-end management investment company. The following table lists those series of the Trust that are included in this report (collectively, the “Funds” or individually a “Fund”), along with their corresponding share classes and respective diversification status under the Act:
| | | | |
| Fund* | | Share Classes Offered | | Diversified/
Non-Diversified |
Federal Instruments | | Institutional, Capital, Service, Preferred, Select, Administration, Cash Management, and Premier | | Diversified |
Government | | Class A, Class C, Institutional, Capital, Service, Preferred, Select, Administration, Cash Management, Premier, Resource, Class R6, and Drexel Hamilton Class | | Diversified |
Money Market, Treasury Instruments, Treasury Obligations and Treasury Solutions | | Institutional, Capital, Service, Preferred, Select, Administration, Cash Management, Premier, and Resource | | Diversified |
Prime Obligations | | Institutional, Capital, Service, Preferred, Select, Administration, Cash Management, Premier, Resource, and Drexel Hamilton Class | | Diversified |
Class C Shares may typically be acquired only in an exchange for Class C Shares of another Goldman Sachs Fund. Class C Shares may be subject to a contingent deferred sales charge (“CDSC”) of 1.00% during the first 12 months, measured from the time the original shares subject to the CDSC were acquired.
Goldman Sachs Asset Management, L.P. (“GSAM”), an affiliate of Goldman Sachs & Co. LLC (“Goldman Sachs”), serves as investment adviser to the Funds pursuant to management agreements (the “Agreements”) with the Trust.
The following Funds were designated by the Board of Trustees (“Trustees”) as “institutional money market funds” under Rule 2a-7 under the Act: Financial Square Money Market Fund and Financial Square Prime Obligations Fund (the “Institutional Money Market Funds”). Each of the Institutional Money Market Funds must price its shares at a net asset value (“NAV”) reflecting market-based values of its portfolio securities (i.e., at a “floating” NAV) rounded to the fourth decimal place (e.g., $1.0000).
|
| 2. SIGNIFICANT ACCOUNTING POLICIES |
The financial statements have been prepared in accordance with accounting principles generally accepted in the United States of America (“GAAP”) and require management to make estimates and assumptions that may affect the reported amounts and disclosures. Actual results may differ from those estimates and assumptions. Each Fund is an investment company under GAAP and follows the accounting and reporting guidance applicable to investment companies.
A. Investment Valuation — The investment valuation policy of the Funds, except for the Institutional Money Market Funds, is to use the amortized-cost method permitted by Rule 2a-7 under the Act for valuing portfolio securities. The amortized-cost method of valuation involves valuing a security at its cost and thereafter applying a constant accretion or amortization to maturity of any discount or premium. Normally, a security’s amortized cost will approximate its market value. Under procedures and tolerances approved by the Trustees, GSAM evaluates daily the difference between each Fund’s NAV per share using the amortized costs of its portfolio securities and the Fund’s NAV per share using market-based values of its portfolio securities. The Institutional Money Market Funds’ investment valuation policy is to value its portfolio securities only at market-based values. The market-based value of a portfolio security is determined, where readily available, on the basis of market quotations provided by pricing services or securities dealers, or, where accurate market quotations are not readily available, on the basis of the security’s fair value as
96
GOLDMAN SACHS — FINANCIAL SQUARE FUNDS
|
| 2. SIGNIFICANT ACCOUNTING POLICIES (continued) |
determined in accordance with Valuation Procedures approved by the Trustees. The pricing services may use valuation models or matrix pricing, which may consider (among other things): (i) yield or price with respect to debt securities that are considered comparable in characteristics such as rating, interest rate and maturity date or (ii) quotations from securities dealers to determine current value.
B. Investment Income and Investments — Interest income is accrued daily and adjusted for amortization of premiums and accretion of discounts. Investment transactions are reflected on trade date. Realized gains and losses are calculated using identified cost.
C. Class Allocations and Expenses — Investment income, realized and unrealized gain (loss), if any, and non-class specific expenses of each Fund are allocated daily based upon the proportion of net assets of each class. Class specific expenses, where applicable, are borne by the respective share classes and include Distribution, Service, Distribution and Service, Administration, Service and Administration and Shareholder Administration fees. Non-class specific expenses directly incurred by a Fund are charged to that Fund, while such expenses incurred by the Trust are allocated across the respective Funds on a straight-line and/or pro-rata basis depending upon the nature of the expenses.
D. Federal Taxes and Distributions to Shareholders — It is each Fund’s policy to comply with the requirements of the Internal Revenue Code of 1986, as amended (the “Code”), applicable to regulated investment companies (mutual funds) and to distribute each year substantially all of its investment company taxable and tax exempt income and capital gains to its shareholders. Accordingly, the Funds are not required to make any provisions for the payment of federal income tax. Distributions to shareholders are declared and recorded daily and paid monthly by the Funds and may include short-term capital gains. Long-term capital gain distributions, if any, are declared and paid annually. A Fund may defer or accelerate the timing of the distribution of short-term capital gains (or any portion thereof).
Net capital losses, if any, are carried forward to future fiscal years and may be used to the extent allowed by the Code to offset any future capital gains. Utilization of capital loss carryforwards will reduce the requirement of future capital gains distributions.
The characterization of distributions to shareholders for financial reporting purposes is determined in accordance with federal income tax rules, which may differ from GAAP. The source of each Fund’s distributions may be shown in the accompanying financial statements as either from distributable earnings or capital. Certain components of the Funds’ net assets on the Statements of Assets and Liabilities reflect permanent GAAP/tax differences based on the appropriate tax character.
E. Forward Commitments — A forward commitment involves entering into a contract to purchase or sell securities, typically on an extended settlement basis, for a fixed price at a future date. The purchase of securities on a forward commitment basis involves a risk of loss if the value of the security to be purchased declines before the settlement date. Conversely, the sale of securities on a forward commitment basis involves the risk that the value of the securities sold may increase before the settlement date. Although a Fund will generally purchase securities on a forward commitment basis with the intention of acquiring the securities for its portfolio, the Fund may dispose of forward commitments prior to settlement which may result in a realized gain or loss.
F. Repurchase Agreements — Repurchase agreements involve the purchase of securities subject to the seller’s agreement to repurchase the securities at a mutually agreed upon date and price, under the terms of a Master Repurchase Agreement (“MRA”). During the term of a repurchase agreement, the value of the underlying securities held as collateral on behalf of a Fund, including accrued interest, is required to exceed the value of the repurchase agreement, including accrued interest. The gross value of repurchase agreements is included in the Statements of Assets and Liabilities for financial reporting purposes. The underlying securities for all repurchase agreements are held at the Funds’ custodian or designated sub-custodians under tri-party repurchase agreements.
An MRA governs transactions between a Fund and select counterparties. An MRA contains provisions for, among other things, initiation of the transaction, income payments, events of default, and maintenance of securities for repurchase agreements. An MRA also permits offsetting with collateral to create one single net payment in the event of default or similar events, including the bankruptcy or insolvency of a counterparty.
97
GOLDMAN SACHS — FINANCIAL SQUARE FUNDS
Notes to Financial Statements (continued)
May 31, 2021 (Unaudited)
|
| 2. SIGNIFICANT ACCOUNTING POLICIES (continued) |
If the seller defaults, a Fund could suffer a loss to the extent that the proceeds from the sale of the underlying securities and other collateral held by the Fund are less than the repurchase price and the Fund’s costs associated with delay and enforcement of the repurchase agreement. In addition, in the event of default or insolvency of the seller, a court could determine that a Fund’s interest in the collateral is not enforceable, resulting in additional losses to the Fund.
Pursuant to exemptive relief granted by the Securities and Exchange Commission (“SEC”) and terms and conditions contained therein, the Funds, together with other funds of the Trust and registered investment companies having management agreements with GSAM or its affiliates, may transfer uninvested cash into joint accounts, the daily aggregate balance of which is invested in one or more repurchase agreements. Under these joint accounts, the Funds maintain pro-rata credit exposure to the underlying repurchase agreements’ counterparties. With the exception of certain transaction fees, the Funds are not subject to any expenses in relation to these investments.
|
| 3. INVESTMENTS AND FAIR VALUE MEASUREMENTS |
U.S. GAAP defines the fair value of a financial instrument as the amount that would be received to sell an asset or paid to transfer a liability in an orderly transaction between market participants at the measurement date (i.e., the exit price); the Funds’ policy is to use the market approach. GAAP establishes a fair value hierarchy that prioritizes the inputs to valuation techniques used to measure fair value. The hierarchy gives the highest priority to unadjusted quoted prices in active markets for identical assets or liabilities (Level 1 measurements) and the lowest priority to unobservable inputs (Level 3 measurements). The level in the fair value hierarchy within which the fair value measurement in its entirety falls shall be determined based on the lowest level input that is significant to the fair value measurement in its entirety. The levels used for classifying investments are not necessarily an indication of the risk associated with investing in these investments. The three levels of the fair value hierarchy are described below:
Level 1 — Unadjusted quoted prices in active markets that are accessible at the measurement date for identical, unrestricted assets or liabilities;
Level 2 — Quoted prices in markets that are not active or financial instruments for which significant inputs are observable (including, but not limited to, quoted prices for similar investments, interest rates, foreign exchange rates, volatility and credit spreads), either directly or indirectly;
Level 3 — Prices or valuations that require significant unobservable inputs (including GSAM’s assumptions in determining fair value measurement).
The Trustees have approved Valuation Procedures that govern the valuation of the portfolio investments held by the Funds, including investments for which market quotations are not readily available. The Trustees have delegated to GSAM day-to-day responsibility for implementing and maintaining internal controls and procedures related to the valuation (including both the amortized cost and market-based methods of valuation) of the Funds’ investments. To assess the continuing appropriateness of pricing sources and methodologies related to the market-based method of valuation, GSAM regularly performs price verification procedures and issues challenges as necessary to third party pricing vendors or brokers, and any differences are reviewed in accordance with the Valuation Procedures.
As of May 31, 2021, all investments and repurchase agreements, other than those held by the Institutional Money Market Funds, are classified as Level 2 of the fair value hierarchy. All investments for the Institutional Money Market Funds are classified as Level 2, with the exception of treasury securities of G7 countries which are generally classified as Level 1. Please refer to the Schedules of Investments for further detail.
|
| 4. AGREEMENTS AND AFFILIATED TRANSACTIONS |
A. Management Agreements — Under the Agreements, GSAM manages the Funds, subject to the general supervision of the Trustees.
98
GOLDMAN SACHS — FINANCIAL SQUARE FUNDS
|
| 4. AGREEMENTS AND AFFILIATED TRANSACTIONS (continued) |
As compensation for the services rendered pursuant to the Agreements, the assumption of the expenses related thereto and administration of the Funds’ business affairs, including providing facilities, GSAM is entitled to a management fee, accrued daily and paid monthly, equal to an annual percentage rate of each Fund’s average daily net assets.
B. Administration, Service and/or Shareholder Administration Plans — The Trust, on behalf of each applicable Fund, has adopted Administration, Service and/or Shareholder Administration Plans (the “Plans”) to allow Class C, Select, Preferred, Capital, Administration, Premier, Service, Resource and Cash Management Shares to compensate service organizations (including Goldman Sachs) for providing varying levels of account administration and/or personal and account maintenance services to their customers who are beneficial owners of such shares. The Plans provide for compensation to the service organizations equal to an annual percentage rate of the average daily net assets of such shares, as set forth below.
C. Distribution and/or Service (12b-1) Plans �� The Trust, on behalf of Class A Shares of each applicable Fund, has adopted a Distribution and Service Plan subject to Rule 12b-1 under the Act. Under the Distribution and Service Plan, Goldman Sachs, which serves as distributor (the “Distributor”), is entitled to a fee accrued daily and paid monthly for distribution services and personal and account maintenance services, which may then be paid by Goldman Sachs to authorized dealers. These fees are equal to an annual percentage rate of the average daily net assets attributable to Class A Shares of the Funds, as set forth below.
The Trust, on behalf of Class C, Resource and Cash Management Shares of each applicable Fund, has adopted Distribution Plans subject to Rule 12b-1 under the Act. Under the Distribution Plans, Goldman Sachs as Distributor is entitled to a fee accrued daily and paid monthly for distribution services, which may then be paid by Goldman Sachs to authorized dealers. These fees are equal to an annual percentage rate of the average daily net assets attributable to Class C, Resource and Cash Management Shares of the Funds, as set forth below.
The Trust, on behalf of the Service Shares of each applicable Fund, has adopted a Service Plan subject to Rule 12b-1 under the Act to allow Service Shares to compensate service organizations (including Goldman Sachs) for providing personal and account maintenance services to their customers who are beneficial owners of such shares. The Service Plan provides for compensation to the service organizations equal to an annual percentage rate of the average daily net assets attributable to Service Shares of the Funds, as set forth below.
D. Distribution Agreement — Goldman Sachs, as Distributor of the shares of the Funds pursuant to a Distribution Agreement, may retain a portion of the Class C Shares’ CDSC. During the six months ended May 31, 2021, Goldman Sachs has advised that it retained $1,354 in CDSCs with respect to Class C Shares of the Financial Square Government Fund.
E. Transfer Agency Agreement — Goldman Sachs also serves as the transfer agent of the Funds for a fee pursuant to a Transfer Agency Agreement. The fee charged for such transfer agency services is accrued daily and paid monthly and is equal to an annual percentage rate of each Fund’s average daily net assets, as set forth below.
F. Other Agreements — GSAM has agreed to reduce or limit certain “Other Expenses” of the Funds (excluding transfer agency fees and expenses, administration fees (as applicable), service fees (as applicable), shareholder administration fees (as applicable), taxes, interest, brokerage fees, expenses of shareholder meetings, litigation and indemnification, and extraordinary expenses) to the extent such expenses exceed, on an annual basis, a percentage rate of the average daily net assets of each Fund. Such Other Expense reimbursements, if any, are accrued daily and paid monthly. In addition, the Funds are not obligated to reimburse GSAM for prior fiscal year Other Expense reimbursements, if any. The Other Expense limitations as an annual percentage rate of average daily net assets are 0.014%. These Other Expense limitations will remain in place through at least March 30, 2022, and prior to such date GSAM may not terminate the arrangements without the approval of the Trustees.
In addition, the Funds have entered into certain offset arrangements with the custodian which may result in a reduction of the Funds’ expenses and are received irrespective of the application of the “Other Expense” limitations described above.
G. Total Fund Expenses
Fund Contractual Fees
The contractual management fee rate is 0.18% for the Financial Square Federal Instruments, Financial Square Treasury Instruments, Financial Square Treasury Obligations and Financial Square Treasury Solutions Funds and 0.16% for the Financial
Square Government, Financial Square Money Market and Financial Square Prime Obligations Funds.
99
GOLDMAN SACHS — FINANCIAL SQUARE FUNDS
Notes to Financial Statements (continued)
May 31, 2021 (Unaudited)
|
| 4. AGREEMENTS AND AFFILIATED TRANSACTIONS (continued) |
Other contractual annualized rates for each of the Funds are as follows:
| | | | | | | | | | | | | | | | | | | | | | | | | | | | | | | | | | | | | | | | | | | | | | | | | | | | |
| | | Class A Shares(a) | | | Class C Shares(a) | | | Institutional Shares | | | Capital Shares | | | Service Shares | | | Preferred Shares | | | Select
Shares | | | Administration Shares | | | Cash Management Shares | | | Premier Shares | | | Resource Shares | | | Class R6 Shares | | | Drexel Hamilton
Class Shares | |
Administration, Service and/or Shareholder Administration Fees | | | N/A | | | | 0.25 | % | | | N/A | | | | 0.15 | % | | | 0.25 | % | | | 0.10 | % | | | 0.03 | % | | | 0.25 | % | | | 0.50 | % | | | 0.35 | % | | | 0.50 | % | | | N/A | | | | N/A | |
Distribution and/or Service (12b-1) Fees | | | 0.25 | % | | | 0.75 | (b) | | | N/A | | | | N/A | | | | 0.25 | (c) | | | N/A | | | | N/A | | | | N/A | | | | 0.30 | (b) | | | N/A | | | | 0.15 | (b) | | | N/A | | | | N/A | |
Transfer Agency Fee | | | 0.01 | | | | 0.01 | | | | 0.01 | % | | | 0.01 | | | | 0.01 | | | | 0.01 | | | | 0.01 | | | | 0.01 | | | | 0.01 | | | | 0.01 | | | | 0.01 | | | | 0.01 | % | | | 0.01 | % |
| N/A | | — Fees not applicable to respective share class |
| (a) | | Government Fund only. |
| (b) | | Distribution (12b-1) fee only. |
| (c) | | Service (12b-1) fee only. |
Fund Effective Net Expenses (After Waivers and Reimbursements)
The investment adviser may contractually agree to waive or reimburse certain fees and expenses until a specified date. For the period from December 1, 2020 to December 27, 2020, the investment adviser agreed to not impose a portion of the management fee equal annually to 0.06% of the Financial Square Federal Instruments Fund’s average daily net assets. The investment adviser may also voluntarily waive certain fees and expenses, and such voluntary waivers may be discontinued or modified at any time without notice.
During the six months ended May 31, 2021, GSAM and Goldman Sachs (as applicable) agreed to waive all or a portion of the management fees and respective class-specific fees described above attributable to the Funds. The Funds are not obligated to reimburse GSAM or Goldman Sachs for prior fiscal year fee waivers and/or expense reimbursements, if any.
For the six months ended May 31, 2021, expense reductions including any fee waivers and Other Expense reimbursements were as follows (in thousands):
| | | | | | | | | | | | | | | | | | | | |
| Fund | | | | Management
Fee Waivers | | Transfer
Agency
Waivers | | | Distribution,
Administration,
Service and/or
Shareholder
Administration
Plans Fee Waivers | | | Other Expense
Reimbursements | | | Total
Expense
Reductions | |
Federal Instruments | | | | $ 1,221 | | $ | 149 | | | $ | 473 | | | $ | 19 | | | $ | 1,862 | |
Government | | | | 75,285 | | | 8,833 | | | | 13,457 | | | | — | | | | 97,575 | |
Money Market | | | | 663 | | | 136 | | | | 10 | | | | 89 | | | | 898 | |
Prime Obligations | | | | 202 | | | 55 | | | | 52 | | | | 119 | | | | 428 | |
Treasury Instruments | | | | 38,901 | | | 4,246 | | | | 3,831 | | | | — | | | | 46,978 | |
Treasury Obligations | | | | 22,830 | | | 1,937 | | | | 6,453 | | | | — | | | | 31,220 | |
Treasury Solutions | | | | 4,762 | | | 586 | | | | 2,791 | | | | — | | | | 8,139 | |
For the six months ended May 31, 2021, the net effective management fee rate was 0.07% for the Financial Square Government Fund, 0.12% for the Financial Square Money Market Fund, 0.14% for the Financial Square Prime Obligations Fund, 0.10% for the Financial Square Federal Instruments and Financial Square Treasury Solutions Funds, 0.09% for the Financial Square Treasury Instruments Fund and 0.06% for the Financial Square Treasury Obligations Fund.
H. Other Transactions with Affiliates — A Fund may purchase securities from, or sell securities to, an affiliated fund provided the affiliation is solely due to having a common investment adviser, common officers, or common Trustees.
100
GOLDMAN SACHS — FINANCIAL SQUARE FUNDS
|
| 4. AGREEMENTS AND AFFILIATED TRANSACTIONS (continued) |
For the six months ended May 31, 2021, the purchase and sale transactions and related net realized gain (loss) for the Funds with affiliated funds in compliance with Rule 17a-7 under the Act were as follows:
| | | | | | | | | | | | | | |
| Fund | | | | Purchases | | | Sales | | | Net Realized
Gain (Loss) | |
Money Market | | | | $ | 109,550,000 | | | $ | 208,230,000 | | | $ | — | |
Prime Obligations | | | | | 80,900,000 | | | | 174,490,000 | | | | — | |
As of May 31, 2021, The Goldman Sachs Group, Inc. was the beneficial owner of 5% or more of the outstanding share classes of the following Funds:
| | | | | | | | | | | | | | | | | | | | | | | | | | |
| Fund | | | | Select
Shares | | | Capital
Shares | | | Premier
Shares | | | Service
Shares | | | Resource
Shares | | | Cash
Management
Shares | |
Federal Instruments | | | | | 100 | % | | | 10 | % | | | 100 | % | | | — | % | | | — | % | | | — | % |
Money Market | | | | | — | | | | — | | | | 100 | | | | 39 | | | | 100 | | | | 100 | |
Prime Obligations | | | | | — | | | | — | | | | 100 | | | | — | | | | 100 | | | | 100 | |
Treasury Instruments | | | | | — | | | | — | | | | — | | | | — | | | | 100 | | | | — | |
Treasury Obligations | | | | | — | | | | — | | | | — | | | | — | | | | 100 | | | | — | |
Treasury Solutions | | | | | — | | | | — | | | | — | | | | — | | | | 100 | | | | — | |
I. Line of Credit Facility — As of May 31, 2021, the Funds participated in a $1,000,000,000 committed, unsecured revolving line of credit facility (the “facility”) together with other funds of the Trust and certain registered investment companies having management agreements with GSAM or its affiliates. This facility is to be used for temporary emergency purposes, or to allow for an orderly liquidation of securities to meet redemption requests. The interest rate on borrowings is based on the federal funds rate. The facility also requires a fee to be paid by the Funds based on the amount of the commitment that has not been utilized. For the six months ended May 31, 2021, the Funds did not have any borrowings under the facility. Prior to April 26, 2021, the facility was $700,000,000.
As of the Funds’ most recent fiscal year end, November 30, 2020, the Funds’ capital loss carryforward and certain timing differences on a tax basis were as follows:
| | | | | | | | | | | | | | | | | | | | | | | | | | | | |
| | | Federal
Instruments | | | Government | | | Money
Market | | | Prime
Obligations | | | Treasury
Instruments | | | Treasury
Obligations | | | Treasury
Solutions | |
Capital loss carryforward: | | | | | | | | | | | | | | | | | | | | | | | | | | | | |
Perpetual Short-Term | | $ | — | | | $ | — | | | $ | (7,413,567 | ) | | $ | — | | | $ | — | | | $ | — | | | $ | — | |
Timing differences (Distribution Payable and Post-October Capital Loss Deferral) | | $ | (7,087 | ) | | $ | (1,380,726 | ) | | $ | (63,168 | ) | | $ | (18,036 | ) | | $ | (231,000 | ) | | $ | (542,952 | ) | | $ | (10,023 | ) |
As of May 31, 2021, the aggregate cost for each Fund stated in the accompanying Statements of Assets and Liabilities also represents aggregate cost for U.S. federal income tax purposes.
GSAM has reviewed the Funds’ tax positions for all open tax years (the current and prior three tax years, as applicable) and has concluded that no provision for income tax is required in the Funds’ financial statements. Such open tax years remain subject to examination and adjustment by tax authorities.
101
GOLDMAN SACHS — FINANCIAL SQUARE FUNDS
Notes to Financial Statements (continued)
May 31, 2021 (Unaudited)
The Funds’ risks include, but are not limited to, the following:
Credit/Default Risk — An issuer or guarantor of a security held by a Fund, or a bank or other financial institution that has entered into a repurchase agreement with the Fund, may default on its obligation to pay interest and repay principal or default on any other obligation. Additionally, the credit quality of securities may deteriorate rapidly, which may impair a Fund’s liquidity and cause significant deterioration in NAV.
Floating and Variable Rate Obligations Risk — Floating rate and variable rate obligations are debt instruments issued by companies or other entities with interest rates that reset periodically (typically, daily, monthly, quarterly, or semiannually) in response to changes in the market rate of interest on which the interest rate is based. For floating and variable rate obligations, there may be a lag between an actual change in the underlying interest rate benchmark and the reset time for an interest payment of such an obligation, which could harm or benefit a Fund, depending on the interest rate environment or other circumstances. In a rising interest rate environment, for example, a floating or variable rate obligation that does not reset immediately would prevent a Fund from taking full advantage of rising interest rates in a timely manner. However, in a declining interest rate environment, a Fund may benefit from a lag due to an obligation’s interest rate payment not being immediately impacted by a decline in interest rates.
On March 5, 2021, the United Kingdom’s Financial Conduct Authority (“FCA”) and ICE Benchmark Authority formally announced that certain LIBORs will cease publication after December 31, 2021 while others will cease publication after June 30, 2023. The unavailability or replacement of LIBOR may affect the value, liquidity or return on certain Fund investments and may result in costs incurred in connection with closing out positions and entering into new trades. Any pricing adjustments to the Fund’s investments resulting from a substitute reference rate may adversely affect the Fund’s performance and/or NAV.
Interest Rate Risk — When interest rates increase, the Fund’s yield will tend to be lower than prevailing market rates, and the market value of its investments will generally decline. The risks associated with changing interest rates may have unpredictable effects on the markets and the Fund’s investments. A low or negative interest rate environment poses additional risks to the Fund, because low or negative yields on the Fund’s portfolio holdings may have an adverse impact on the Fund’s ability to provide a positive yield to its shareholders, pay expenses out of current income, or minimize the volatility of the Fund’s NAV per share and/or achieve its investment objective. Fluctuations in interest rates may also affect the liquidity of the Fund’s investments.
Large Shareholder Transactions Risk — A Fund may experience adverse effects when certain large shareholders, such as other funds, institutional investors (including those trading by use of non-discretionary mathematical formulas), financial intermediaries (who may make investment decisions on behalf of underlying clients and/or include a Fund in their investment model), individuals, accounts and Goldman Sachs affiliates, purchase or redeem large amounts of shares of a Fund. Such large shareholder redemptions, which may occur rapidly or unexpectedly, may cause a Fund to sell portfolio securities at times when it would not otherwise do so, which may negatively impact the Fund’s NAV and liquidity. Similarly, large Fund share purchases may adversely affect a Fund’s performance to the extent that the Fund is delayed in investing new cash or otherwise maintains a larger cash position than it ordinarily would. These transactions may also accelerate the realization of taxable income to shareholders if such sales of investments resulted in gains, and may also increase transaction costs. In addition, a large redemption could result in a Fund’s current expenses being allocated over a smaller asset base, leading to an increase in the Fund’s expense ratio.
Market and Credit Risks — In the normal course of business, a Fund trade financial instruments and enter into financial transactions where risk of potential loss exists due to changes in the market (market risk). The value of the securities in which a Fund invests may go up or down in response to the prospects of individual companies, particular sectors or governments and/or general economic conditions throughout the world due to increasingly interconnected global economies and financial markets. Events such as war, acts of terrorism, social unrest, natural disasters, the spread of infectious illness or other public health threats could also significantly impact a Fund and its investments. Additionally, a Fund may also be exposed to credit risk in the event that an issuer or guarantor fails to perform or that an institution or entity with which the Fund has unsettled or open transactions defaults.
102
GOLDMAN SACHS — FINANCIAL SQUARE FUNDS
Under the Trust’s organizational documents, its Trustees, officers, employees and agents are indemnified, to the extent permitted by the Act and state law, against certain liabilities that may arise out of performance of their duties to the Funds. Additionally, in the course of business, the Funds enter into contracts that contain a variety of indemnification clauses. The Funds’ maximum exposure under these arrangements is unknown, as this would involve future claims that may be made against the Funds that have not yet occurred. However, GSAM believes the risk of loss under these arrangements to be remote.
Exemptive Orders — Pursuant to SEC exemptive orders, the Funds may enter into certain principal transactions, including repurchase agreements, with Goldman Sachs.
New Accounting Standards — In March 2020, the FASB issued Accounting Standard Update (“ASU”) No. 2020-04, “Reference Rate Reform (Topic 848): Facilitation of the Effects of Reference Rate Reform on Financial Reporting.” This ASU provides optional exceptions for applying GAAP to contract modifications, hedging relationships and other transactions affected reference rate reform if certain criteria are met. ASU 2020-04 is elective and is effective on March 12, 2020 through December 31, 2022. As of the financial reporting period, GSAM is currently evaluating the impact, if any, of applying ASU 2020-04.
Subsequent events after the Statements of Assets and Liabilities date have been evaluated and GSAM has concluded that there is no impact requiring adjustment or disclosure in the financial statements.
103
GOLDMAN SACHS — FINANCIAL SQUARE FUNDS
Notes to Financial Statements (continued)
May 31, 2021 (Unaudited)
|
| 10. SUMMARY OF SHARE TRANSACTIONS |
Share activity is as follows:
| | | | | | | | | | | | |
| | | Federal Instruments Fund | |
| | | | |
| | | For the Six Months Ended
May 31, 2021
(Unaudited) | | | For the Period Ended
November 30, 2020† | | | For the Fiscal Year Ended
August 31, 2020 | |
| | | | |
| Institutional Shares | | | | | | | | | | | | |
Shares sold | | | 3,502,625,840 | | | | 2,881,388,454 | | | | 11,467,355,746 | |
Reinvestment of distributions | | | 70,493 | | | | 120,380 | | | | 14,134,111 | |
Shares redeemed | | | (4,502,429,543 | ) | | | (3,002,849,041 | ) | | | (9,174,391,868 | ) |
| | | | (999,733,210 | ) | | | (121,340,207 | ) | | | 2,307,097,989 | |
| Capital Shares | | | | | | | | | | | | |
Shares sold | | | 560,073 | | | | 2,157,185 | | | | 501,043 | |
Reinvestment of distributions | | | 17 | | | | 19 | | | | 8,244 | |
Shares redeemed | | | (3,300,009 | ) | | | (25,009 | ) | | | (25 | ) |
| | | | (2,739,919 | ) | | | 2,132,195 | | | | 509,262 | |
| Service Shares | | | | | | | | | | | | |
Shares sold | | | 1,885,894 | | | | 1,685,917 | | | | 3,838,675 | |
Reinvestment of distributions | | | — | | | | — | | | | 7 | |
Shares redeemed | | | (1,599,110 | ) | | | (2,898,000 | ) | | | (3,841,287 | ) |
| | | | 286,784 | | | | (1,212,083 | ) | | | (2,605 | ) |
| Preferred Shares | | | | | | | | | | | | |
Shares sold | | | 4,195,969 | | | | 11,152,032 | | | | 63,137,357 | |
Reinvestment of distributions | | | 126 | | | | 101 | | | | 47,563 | |
Shares redeemed | | | (7,408,680 | ) | | | (27,911,851 | ) | | | (45,941,975 | ) |
| | | | (3,212,585 | ) | | | (16,759,718 | ) | | | 17,242,945 | |
| Select Shares | | | | | | | | | | | | |
Shares sold | | | — | | | | — | | | | — | |
Reinvestment of distributions | | | 2 | | | | 1 | | | | 471 | |
Shares redeemed | | | — | | | | — | | | | — | |
| | | | 2 | | | | 1 | | | | 471 | |
| Administration Shares | | | | | | | | | | | | |
Shares sold | | | 58,124,473 | | | | 16,893,097 | | | | 127,819,134 | |
Reinvestment of distributions | | | 286 | | | | 205 | | | | 34,491 | |
Shares redeemed | | | (77,182,532 | ) | | | (13,760,098 | ) | | | (116,107,893 | ) |
| | | | (19,057,773 | ) | | | 3,133,204 | | | | 11,745,732 | |
| Cash Management Shares | | | | | | | | | | | | |
Shares sold | | | 116,919,767 | | | | 34,092,441 | | | | 72,905,405 | |
Reinvestment of distributions | | | 2,817 | | | | 1,051 | | | | 18,364 | |
Shares redeemed | | | (93,774,317 | ) | | | (12,754,198 | ) | | | (20,801,134 | ) |
| | | | 23,148,267 | | | | 21,339,294 | | | | 52,122,635 | |
| Premier Shares | | | | | | | | | | | | |
Shares sold | | | — | | | | — | | | | — | |
Reinvestment of distributions | | | 2 | | | | 1 | | | | 372 | |
Shares redeemed | | | — | | | | — | | | | — | |
| | | | 2 | | | | 1 | | | | 372 | |
| | | |
NET INCREASE (DECREASE) IN SHARES | | | (1,001,308,432 | ) | | | (112,707,313 | ) | | | 2,388,716,801 | |
| † | | The Funds changed their fiscal year end from August 31 to November 30. |
104
GOLDMAN SACHS — FINANCIAL SQUARE FUNDS
|
| 10. SUMMARY OF SHARE TRANSACTIONS (continued) |
Share activity is as follows:
| | | | | | | | | | | | |
| | | Government Fund | |
| | | | |
| | | For the Six Months Ended
May 31, 2021
(Unaudited) | | | For the Period Ended
November 30, 2020† | | | For the Fiscal Year Ended
August 31, 2020 | |
| | | | |
| Class A Shares | | | | | | | | | | | | |
Shares sold | | | 226,435,299 | | | | 39,423,676 | | | | 478,954,470 | |
Reinvestment of distributions | | | 47,628 | | | | 6,970 | | | | 2,440,074 | |
Shares redeemed | | | (120,732,785 | ) | | | (123,733,027 | ) | | | (358,818,070 | ) |
| | | | 105,750,142 | | | | (84,302,381 | ) | | | 122,576,474 | |
| Class C Shares | �� | | | | | | | | | | | |
Shares sold | | | 908,050 | | | | 1,052,595 | | | | 5,252,082 | |
Reinvestment of distributions | | | 788 | | | | 148 | | | | 15,762 | |
Shares redeemed | | | (2,178,655 | ) | | | (1,254,816 | ) | | | (3,270,626 | ) |
| | | | (1,269,817 | ) | | | (202,073 | ) | | | 1,997,218 | |
| Institutional Shares | | | | | | | | | | | | |
Shares sold | | | 621,382,705,934 | | | | 251,627,804,998 | | | | 1,292,097,399,724 | |
Reinvestment of distributions | | | 11,565,968 | | | | 5,154,007 | | | | 547,567,680 | |
Shares redeemed | | | (589,510,312,778 | ) | | | (301,009,643,252 | ) | | | (1,188,898,448,031 | ) |
| | | | 31,883,959,124 | | | | (49,376,684,247 | ) | | | 103,746,519,373 | |
| Capital Shares | | | | | | | | | | | | |
Shares sold | | | 4,668,053,471 | | | | 2,417,065,442 | | | | 12,087,534,623 | |
Reinvestment of distributions | | | 73,372 | | | | 12,037 | | | | 5,558,480 | |
Shares redeemed | | | (4,842,750,378 | ) | | | (2,273,488,269 | ) | | | (12,103,662,104 | ) |
| | | | (174,623,535 | ) | | | 143,589,210 | | | | (10,569,001 | ) |
| Service Shares | | | | | | | | | | | | |
Shares sold | | | 2,599,692,372 | | | | 794,222,735 | | | | 4,298,412,758 | |
Reinvestment of distributions | | | 32,982 | | | | 5,336 | | | | 1,689,398 | |
Shares redeemed | | | (2,542,833,602 | ) | | | (1,710,060,111 | ) | | | (3,189,413,033 | ) |
| | | | 56,891,752 | | | | (915,832,040 | ) | | | 1,110,689,123 | |
| Preferred Shares | | | | | | | | | | | | |
Shares sold | | | 2,257,175,017 | | | | 925,989,653 | | | | 5,393,398,769 | |
Reinvestment of distributions | | | 26,307 | | | | 4,567 | | | | 2,993,934 | |
Shares redeemed | | | (1,959,530,433 | ) | | | (1,733,087,320 | ) | | | (5,524,411,917 | ) |
| | | | 297,670,891 | | | | (807,093,100 | ) | | | (128,019,214 | ) |
| Select Shares | | | | | | | | | | | | |
Shares sold | | | 3,441,330,058 | | | | 389,583,154 | | | | 3,001,875,360 | |
Reinvestment of distributions | | | 45,077 | | | | 7,563 | | | | 3,062,081 | |
Shares redeemed | | | (2,970,375,393 | ) | | | (422,527,750 | ) | | | (3,349,068,697 | ) |
| | | | 470,999,742 | | | | (32,937,033 | ) | | | (344,131,256 | ) |
| Administration Shares | | | | | | | | | | | | |
Shares sold | | | 13,395,287,807 | | | | 5,789,207,617 | | | | 30,029,817,466 | |
Reinvestment of distributions | | | 199,311 | | | | 27,402 | | | | 11,968,688 | |
Shares redeemed | | | (12,611,749,043 | ) | | | (5,503,765,525 | ) | | | (29,483,351,252 | ) |
| | | | 783,738,075 | | | | 285,469,494 | | | | 558,434,902 | |
| Cash Management Shares | | | | | | | | | | | | |
Shares sold | | | 521,542,225 | | | | 88,554,797 | | | | 699,422,044 | |
Reinvestment of distributions | | | 40,578 | | | | 3,574 | | | | 578,821 | |
Shares redeemed | | | (395,531,413 | ) | | | (117,777,211 | ) | | | (598,564,352 | ) |
| | | | 126,051,390 | | | | (29,218,840 | ) | | | 101,436,513 | |
| Premier Shares | | | | | | | | | | | | |
Shares sold | | | 170,688,922 | | | | 103,701,740 | | | | 486,735,706 | |
Reinvestment of distributions | | | 3,015 | | | | 421 | | | | 341,527 | |
Shares redeemed | | | (178,142,617 | ) | | | (80,403,685 | ) | | | (481,884,655 | ) |
| | | | (7,450,680 | ) | | | 23,298,476 | | | | 5,192,578 | |
| Resource Shares | | | | | | | | | | | | |
Shares sold | | | 100,493,195 | | | | 79,128,457 | | | | 179,483,137 | |
Reinvestment of distributions | | | 13,678 | | | | 2,173 | | | | 387,254 | |
Shares redeemed | | | (111,461,655 | ) | | | (68,524,922 | ) | | | (167,332,878 | ) |
| | | | (10,954,782 | ) | | | 10,605,708 | | | | 12,537,513 | |
| Class R6 Shares | | | | | | | | | | | | |
Shares sold | | | 397,352,310 | | | | 148,795,925 | | | | 1,050,370,547 | |
Reinvestment of distributions | | | 14,784 | | | | 6,348 | | | | 928,983 | |
Shares redeemed | | | (364,396,245 | ) | | | (172,280,270 | ) | | | (1,032,990,632 | ) |
| | | | 32,970,849 | | | | (23,477,997 | ) | | | 18,308,898 | |
| Drexel Hamilton Class Shares | | | | | | | | | | | | |
Shares sold | | | 21,853,596,540 | | | | 9,147,779,445 | | | | 21,022,026,637 | |
Reinvestment of distributions | | | 36,420 | | | | 3,365 | | | | 279,374 | |
Shares redeemed | | | (19,958,651,157 | ) | | | (8,458,837,273 | ) | | | (18,668,287,984 | ) |
| | | | 1,894,981,803 | | | | 688,945,537 | | | | 2,354,018,027 | |
| | | |
NET INCREASE (DECREASE) IN SHARES | | | 35,458,714,954 | | | | (50,117,839,286 | ) | | | 107,548,991,148 | |
| † | | The Funds changed their fiscal year end from August 31 to November 30. |
105
GOLDMAN SACHS — FINANCIAL SQUARE FUNDS
Notes to Financial Statements (continued)
May 31, 2021 (Unaudited)
|
| 10. SUMMARY OF SHARE TRANSACTIONS (continued) |
Share activity is as follows:
| | | | | | | | | | | | | | | | | | | | | | | | |
| | | Money Market Fund | |
| | | | |
| | | For the Six Months Ended
May 31, 2021
(Unaudited) | | | For the Period Ended
November 30, 2020† | | | For the Fiscal Year Ended
August 31, 2020 | |
| | | | |
| | | Shares | | | Dollars | | | Shares | | | Dollars | | | Shares | | | Dollars | |
| | | | |
| Institutional Shares | | | | | | | | | | | | | | | | | | | | | | | | |
Shares sold | | | 9,323,904,514 | | | $ | 9,331,054,342 | | | | 4,513,672,105 | | | $ | 4,517,837,688 | | | | 78,402,872,886 | | | $ | 78,447,354,503 | |
Reinvestment of distributions | | | 597,616 | | | | 598,060 | | | | 710,000 | | | | 710,649 | | | | 103,111,272 | | | | 103,162,872 | |
Shares redeemed | | | (9,574,360,017 | ) | | | (9,581,711,606 | ) | | | (7,064,336,914 | ) | | | (7,070,953,571 | ) | | | (89,635,800,187 | ) | | | (89,673,066,279 | ) |
| | | | (249,857,887 | ) | | | (250,059,204 | ) | | | (2,549,954,809 | ) | | | (2,552,405,234 | ) | | | (11,129,816,029 | ) | | | (11,122,548,904 | ) |
| Capital Shares | | | | | | | | | | | | | | | | | | | | | | | | |
Shares sold | | | — | | | | — | | | | — | | | | — | | | | 10,333,770 | | | | 10,338,077 | |
Reinvestment of distributions | | | 800 | | | | 800 | | | | 461 | | | | 461 | | | | 135,462 | | | | 135,526 | |
Shares redeemed | | | (8,441,812 | ) | | | (8,449,409 | ) | | | (3,718,816 | ) | | | (3,722,775 | ) | | | (6,935,013 | ) | | | (6,939,778 | ) |
| | | | (8,441,012 | ) | | | (8,448,609 | ) | | | (3,718,355 | ) | | | (3,722,314 | ) | | | 3,534,219 | | | | 3,533,825 | |
| Service Shares | | | | | | | | | | | | | | | | | | | | | | | | |
Shares sold | | | — | | | | — | | | | — | | | | — | | | | 291,521 | | | | 291,550 | |
Reinvestment of distributions | | | — | | | | — | | | | — | | | | — | | | | 155 | | | | 155 | |
Shares redeemed | | | — | | | | — | | | | — | | | | — | | | | (296,725 | ) | | | (296,751 | ) |
| | | | — | | | | — | | | | — | | | | — | | | | (5,049 | ) | | | (5,046 | ) |
| Preferred Shares | | | | | | | | | | | | | | | | | | | | | | | | |
Shares sold | | | — | | | | — | | | | 1 | | | | 1 | | | | 842,034 | | | | 842,575 | |
Reinvestment of distributions | | | 14 | | | | 14 | | | | 54 | | | | 54 | | | | 40,518 | | | | 40,538 | |
Shares redeemed | | | — | | | | — | | | | (1,851,319 | ) | | | (1,852,985 | ) | | | (3,863,219 | ) | | | (3,865,370 | ) |
| | | | 14 | | | | 14 | | | | (1,851,264 | ) | | | (1,852,930 | ) | | | (2,980,667 | ) | | | (2,982,257 | ) |
| Select Shares | | | | | | | | | | | | | | | | | | | | | | | | |
Shares sold | | | — | | | | — | | | | 1 | | | | 1 | | | | 16,063,998 | | | | 16,076,882 | |
Reinvestment of distributions | | | 442 | | | | 443 | | | | 277 | | | | 277 | | | | 295,451 | | | | 295,593 | |
Shares redeemed | | | (661,378 | ) | | | (661,787 | ) | | | — | | | | — | | | | (48,923,132 | ) | | | (48,946,886 | ) |
| | | | (660,936 | ) | | | (661,344 | ) | | | 278 | | | | 278 | | | | (32,563,683 | ) | | | (32,574,411 | ) |
| Administration Shares | | | | | | | | | | | | | | | | | | | | | | | | |
Shares sold | | | 983,977 | | | | 984,666 | | | | 913,275 | | | | 913,914 | | | | 5,300,344 | | | | 5,305,018 | |
Reinvestment of distributions | | | 860 | | | | 861 | | | | 138 | | | | 138 | | | | 45,002 | | | | 45,019 | |
Shares redeemed | | | (3,579,912 | ) | | | (3,582,066 | ) | | | (1,148,265 | ) | | | (1,149,298 | ) | | | (5,334,638 | ) | | | (5,339,564 | ) |
| | | | (2,595,075 | ) | | | (2,596,539 | ) | | | (234,852 | ) | | | (235,246 | ) | | | 10,708 | | | | 10,473 | |
| Cash Management Shares | | | | | | | | | | | | | | | | | | | | | | | | |
Shares sold | | | — | | | | — | | | | — | | | | — | | | | — | | | | — | |
Reinvestment of distributions | | | — | | | | — | | | | — | | | | — | | | | 6 | | | | 6 | |
Shares redeemed | | | — | | | | — | | | | — | | | | — | | | | — | | | | — | |
| | | | — | | | | — | | | | — | | | | — | | | | 6 | | | | 6 | |
| Premier Shares | | | | | | | | | | | | | | | | | | | | | | | | |
Shares sold | | | — | | | | — | | | | — | | | | — | | | | — | | | | — | |
Reinvestment of distributions | | | — | | | | — | | | | — | | | | — | | | | 9 | | | | 9 | |
Shares redeemed | | | — | | | | — | | | | — | | | | — | | | | — | | | | — | |
| | | | — | | | | — | | | | — | | | | — | | | | 9 | | | | 9 | |
| Resource Shares | | | | | | | | | | | | | | | | | | | | | | | | |
Shares sold | | | — | | | | — | | | | — | | | | — | | | | — | | | | — | |
Reinvestment of distributions | | | — | | | | — | | | | — | | | | — | | | | 7 | | | | 7 | |
Shares redeemed | | | — | | | | — | | | | — | | | | — | | | | — | | | | — | |
| | | | — | | | | — | | | | — | | | | — | | | | 7 | | | | 7 | |
| | | | | | |
NET DECREASE IN SHARES | | | (261,554,896 | ) | | $ | (261,765,682 | ) | | | (2,555,759,002 | ) | | $ | (2,558,215,446 | ) | | | (11,161,820,479 | ) | | $ | (11,154,566,298 | ) |
| † | | The Funds changed their fiscal year end from August 31 to November 30. |
106
GOLDMAN SACHS — FINANCIAL SQUARE FUNDS
|
| 10. SUMMARY OF SHARE TRANSACTIONS (continued) |
Share activity is as follows:
| | | | | | | | | | | | | | | | | | | | | | | | |
| | | Prime Obligations Fund | |
| | | | |
| | | For the Six Months Ended
May 31, 2021 (Unaudited) | | | For the Period Ended
November 30, 2020† | | | For the Fiscal Year Ended
August 31, 2020 | |
| | | | |
| | | Shares | | | Dollars | | | Shares | | | Dollars | | | Shares | | | Dollars | |
| | | | |
| Institutional Shares | | | | | | | | | | | | | | | | | | | | | | | | |
Shares sold | | | 2,863,117,556 | | | $ | 2,865,828,306 | | | | 1,435,424,024 | | | $ | 1,437,045,564 | | | | 22,881,709,784 | | | $ | 22,898,819,820 | |
Reinvestment of distributions | | | 193,899 | | | | 194,087 | | | | 431,382 | | | | 431,852 | | | | 45,784,060 | | | | 45,812,513 | |
Shares redeemed | | | (4,016,761,150 | ) | | | (4,020,583,537 | ) | | | (3,304,583,089 | ) | | | (3,308,292,025 | ) | | | (24,432,416,641 | ) | | | (24,446,902,006 | ) |
| | | | (1,153,449,695 | ) | | | (1,154,561,144 | ) | | | (1,868,727,683 | ) | | | (1,870,814,609 | ) | | | (1,504,922,797 | ) | | | (1,502,269,673 | ) |
| Capital Shares | | | | | | | | | | | | | | | | | | | | | | | | |
Shares sold | | | — | | | | — | | | | — | | | | — | | | | 11,933,436 | | | | 11,940,022 | |
Reinvestment of distributions | | | 72 | | | | 72 | | | | 37 | | | | 37 | | | | 74,048 | | | | 74,090 | |
Shares redeemed | | | (9 | ) | | | (9 | ) | | | (101,898 | ) | | | (102,000 | ) | | | (17,746,168 | ) | | | (17,761,637 | ) |
| | | | 63 | | | | 63 | | | | (101,861 | ) | | | (101,963 | ) | | | (5,738,684 | ) | | | (5,747,525 | ) |
| Service Shares | | | | | | | | | | | | | | | | | | | | | | | | |
Shares sold | | | 13,988 | | | | 14,010 | | | | 1 | | | | 1 | | | | 34,983 | | | | 35,002 | |
Reinvestment of distributions | | | — | | | | — | | | | — | | | | — | | | | 6,968 | | | | 6,970 | |
Shares redeemed | | | (8,996 | ) | | | (9,005 | ) | | | — | | | | — | | | | (5,128,398 | ) | | | (5,129,968 | ) |
| | | | 4,992 | | | | 5,005 | | | | 1 | | | | 1 | | | | (5,086,447 | ) | | | (5,087,996 | ) |
| Preferred Shares | | | | | | | | | | | | | | | | | | | | | | | | |
Shares sold | | | — | | | | — | | | | 1 | | | | 1 | | | | 3,125,892 | | | | 3,127,254 | |
Reinvestment of distributions | | | 144 | | | | 144 | | | | 151 | | | | 151 | | | | 42,527 | | | | 42,544 | |
Shares redeemed | | | (2,348,566 | ) | | | (2,350,210 | ) | | | — | | | | — | | | | (2,645,320 | ) | | | (2,647,759 | ) |
| | | | (2,348,422 | ) | | | (2,350,066 | ) | | | 152 | | | | 152 | | | | 523,099 | | | | 522,039 | |
| Select Shares | | | | | | | | | | | | | | | | | | | | | | | | |
Shares sold | | | 16,844,044 | | | | 16,859,454 | | | | 30,409,513 | | | | 30,442,429 | | | | 186,158,384 | | | | 186,300,853 | |
Reinvestment of distributions | | | 2,030 | | | | 2,032 | | | | 5,713 | | | | 5,719 | | | | 773,014 | | | | 773,419 | |
Shares redeemed | | | (37,245,076 | ) | | | (37,278,943 | ) | | | (68,458,904 | ) | | | (68,532,168 | ) | | | (209,646,538 | ) | | | (209,786,488 | ) |
| | | | (20,399,002 | ) | | | (20,417,457 | ) | | | (38,043,678 | ) | | | (38,084,020 | ) | | | (22,715,140 | ) | | | (22,712,216 | ) |
| Administration Shares | | | | | | | | | | | | | | | | | | | | | | | | |
Shares sold | | | 164,325,344 | | | | 164,473,238 | | | | 129,889,428 | | | | 130,027,813 | | | | 151,133,246 | | | | 151,197,664 | |
Reinvestment of distributions | | | 336 | | | | 336 | | | | 167 | | | | 168 | | | | 33,411 | | | | 33,429 | |
Shares redeemed | | | (239,406,816 | ) | | | (239,624,438 | ) | | | (56,776,710 | ) | | | (56,833,812 | ) | | | (152,184,059 | ) | | | (152,299,185 | ) |
| | | | (75,081,136 | ) | | | (75,150,864 | ) | | | 73,112,885 | | | | 73,194,169 | | | | (1,017,402 | ) | | | (1,068,092 | ) |
| Cash Management Shares | | | | | | | | | | | | | | | | | | | | | | | | |
Shares sold | | | — | | | | — | | | | — | | | | — | | | | — | | | | — | |
Reinvestment of distributions | | | — | | | | — | | | | — | | | | — | | | | 6 | | | | 6 | |
Shares redeemed | | | — | | | | — | | | | — | | | | — | | | | — | | | | — | |
| | | | — | | | | — | | | | — | | | | — | | | | 6 | | | | 6 | |
| Premier Shares | | | | | | | | | | | | | | | | | | | | | | | | |
Shares sold | | | — | | | | — | | | | — | | | | — | | | | — | | | | — | |
Reinvestment of distributions | | | — | | | | — | | | | — | | | | — | | | | 9 | | | | 9 | |
Shares redeemed | | | — | | | | — | | | | — | | | | — | | | | — | | | | — | |
| | | | — | | | | — | | | | — | | | | — | | | | 9 | | | | 9 | |
| Resource Shares | | | | | | | | | | | | | | | | | | | | | | | | |
Shares sold | | | — | | | | — | | | | — | | | | — | | | | — | | | | — | |
Reinvestment of distributions | | | — | | | | — | | | | — | | | | — | | | | 7 | | | | 7 | |
Shares redeemed | | | — | | | | — | | | | — | | | | — | | | | — | | | | — | |
| | | | — | | | | — | | | | — | | | | — | | | | 7 | | | | 7 | |
| Drexel Hamilton Class Shares | | | | | | | | | | | | | | | | | | | | | | | | |
Shares sold | | | 46,900,214 | | | | 46,945,006 | | | | 849,151 | | | | 850,000 | | | | 229,984,794 | | | | 230,197,683 | |
Reinvestment of distributions | | | 7,715 | | | | 7,721 | | | | 11,322 | | | | 11,334 | | | | 31,132 | | | | 31,171 | |
Shares redeemed | | | (81,868,742 | ) | | | (81,945,006 | ) | | | — | | | | — | | | | (130,089,629 | ) | | | (130,072,194 | ) |
| | | | (34,960,813 | ) | | | (34,992,279.00 | ) | | | 860,473 | | | | 861,334 | | | | 99,926,297 | | | | 100,156,660 | |
| | | | | | |
NET DECREASE IN SHARES | | | (1,286,234,013 | ) | | $ | (1,287,466,742 | ) | | | (1,832,899,711 | ) | | $ | (1,834,944,936 | ) | | | (1,439,031,052 | ) | | $ | (1,436,206,781 | ) |
| † | | The Funds changed their fiscal year end from August 31 to November 30. |
107
GOLDMAN SACHS — FINANCIAL SQUARE FUNDS
Notes to Financial Statements (continued)
May 31, 2021 (Unaudited)
|
| 10. SUMMARY OF SHARE TRANSACTIONS (continued) |
Share activity is as follows:
| | | | | | | | | | | | |
| | | Treasury Instruments Fund | |
| | | | |
| | | For the Six Months Ended
May 31, 2021
(Unaudited) | | | For the Period Ended
November 30, 2020† | | | For the Fiscal Year Ended
August 31, 2020 | |
| | | | |
| Institutional Shares | | | | | | | | | | | | |
Shares sold | | | 127,704,828,563 | | | | 55,184,984,775 | | | | 338,267,495,591 | |
Reinvestment of distributions | | | 1,432,484 | | | | 666,472 | | | | 306,303,068 | |
Shares redeemed | | | (110,575,713,254 | ) | | | (63,331,239,433 | ) | | | (306,320,589,797 | ) |
| | | | 17,130,547,793 | | | | (8,145,588,186 | ) | | | 32,253,208,862 | |
| Capital Shares | | | | | | | | | | | | |
Shares sold | | | 3,251,775,587 | | | | 1,455,719,190 | | | | 6,524,887,948 | |
Reinvestment of distributions | | | 21,927 | | | | 9,710 | | | | 7,826,069 | |
Shares redeemed | | | (3,332,193,353 | ) | | | (1,505,472,694 | ) | | | (6,573,633,623 | ) |
| | | | (80,395,839 | ) | | | (49,743,794 | ) | | | (40,919,606 | ) |
| Service Shares | | | | | | | | | | | | |
Shares sold | | | 334,488,451 | | | | 43,357,273 | | | | 207,581,081 | |
Reinvestment of distributions | | | 11 | | | | 6 | | | | 38,855 | |
Shares redeemed | | | (89,316,295 | ) | | | (36,987,018 | ) | | | (118,168,284 | ) |
| | | | 245,172,167 | | | | 6,370,261 | | | | 89,451,652 | |
| Preferred Shares | | | | | | | | | | | | |
Shares sold | | | 220,576,202 | | | | 98,661,659 | | | | 454,026,887 | |
Reinvestment of distributions | | | 3,420 | | | | 1,658 | | | | 845,797 | |
Shares redeemed | | | (263,279,464 | ) | | | (74,824,911 | ) | | | (433,501,352 | ) |
| | | | (42,699,842 | ) | | | 23,838,406 | | | | 21,371,332 | |
| Select Shares | | | | | | | | | | | | |
Shares sold | | | 32,678,121 | | | | 7,336,570 | | | | 794,705,600 | |
Reinvestment of distributions | | | 5,785 | | | | 6,321 | | | | 1,695,856 | |
Shares redeemed | | | (221,484,198 | ) | | | (166,000,958 | ) | | | (442,695,849 | ) |
| | | | (188,800,292 | ) | | | (158,658,067 | ) | | | 353,705,607 | |
| Administration Shares | | | | | | | | | | | | |
Shares sold | | | 5,383,379,980 | | | | 2,759,172,819 | | | | 9,413,059,439 | |
Reinvestment of distributions | | | 35,487 | | | | 15,938 | | | | 8,768,887 | |
Shares redeemed | | | (5,268,300,355 | ) | | | (2,674,462,736 | ) | | | (9,644,633,665 | ) |
| | | | 115,115,112 | | | | 84,726,021 | | | | (222,805,339 | ) |
| Cash Management Shares | | | | | | | | | | | | |
Shares sold | | | 18,712,818 | | | | 12,742,215 | | | | 70,641,861 | |
Reinvestment of distributions | | | 352 | | | | 164 | | | | 50,579 | |
Shares redeemed | | | (16,518,264 | ) | | | (13,780,025 | ) | | | (72,425,029 | ) |
| | | | 2,194,906 | | | | (1,037,646 | ) | | | (1,732,589 | ) |
| Premier Shares | | | | | | | | | | | | |
Shares sold | | | 98,448,169 | | | | 634,208,820 | | | | 184,116,950 | |
Reinvestment of distributions | | | — | | | | — | | | | 71 | |
Shares redeemed | | | (160,428,323 | ) | | | (632,801,513 | ) | | | (174,923,843 | ) |
| | | | (61,980,154 | ) | | | 1,407,307 | | | | 9,193,178 | |
| Resource Shares | | | | | | | | | | | | |
Shares sold | | | — | | | | — | | | | — | |
Reinvestment of distributions | | | — | | | | — | | | | 5 | |
Shares redeemed | | | — | | | | — | | | | — | |
| | | | — | | | | — | | | | 5 | |
| | | |
NET INCREASE (DECREASE) IN SHARES | | | 17,119,153,851 | | | | (8,238,685,698 | ) | | | 32,461,473,102 | |
| † | | The Funds changed their fiscal year end from August 31 to November 30. |
108
GOLDMAN SACHS — FINANCIAL SQUARE FUNDS
|
| 10. SUMMARY OF SHARE TRANSACTIONS (continued) |
Share activity is as follows:
| | | | | | | | | | | | |
| | | Treasury Obligations Fund | |
| | | | |
| | | For the Six Months Ended
May 31, 2021
(Unaudited) | | | For the Period Ended
November 30, 2020† | | | For the Fiscal Year Ended
August 31, 2020 | |
| | | | |
| Institutional Shares | | | | | | | | | | | | |
Shares sold | | | 183,635,322,643 | | | | 61,073,254,479 | | | | 230,865,756,441 | |
Reinvestment of distributions | | | 2,148,420 | | | | 376,637 | | | | 57,390,240 | |
Shares redeemed | | | (188,736,566,596 | ) | | | (49,015,633,381 | ) | | | (221,053,486,360 | ) |
| | | | (5,099,095,533 | ) | | | 12,057,997,735 | | | | 9,869,660,321 | |
| Capital Shares | | | | | | | | | | | | |
Shares sold | | | 1,050,028,449 | | | | 412,761,752 | | | | 2,726,402,195 | |
Reinvestment of distributions | | | 40,775 | | | | 13,139 | | | | 3,397,548 | |
Shares redeemed | | | (1,019,297,524 | ) | | | (455,014,733 | ) | | | (2,748,197,283 | ) |
| | | | 30,771,700 | | | | (42,239,842 | ) | | | (18,397,540 | ) |
| Service Shares | | | | | | | | | | | | |
Shares sold | | | 3,140,570,655 | | | | 1,382,536,150 | | | | 7,270,577,278 | |
Reinvestment of distributions | | | 7,739 | | | | 2,503 | | | | 429,872 | |
Shares redeemed | | | (3,040,535,378 | ) | | | (1,408,762,262 | ) | | | (7,269,693,083 | ) |
| | | | 100,043,016 | | | | (26,223,609 | ) | | | 1,314,067 | |
| Preferred Shares | | | | | | | | | | | | |
Shares sold | | | 1,098,049,760 | | | | 381,567,066 | | | | 2,114,103,134 | |
Reinvestment of distributions | | | 19,931 | | | | 6,273 | | | | 1,531,265 | |
Shares redeemed | | | (1,103,546,709 | ) | | | (712,770,880 | ) | | | (1,805,131,461 | ) |
| | | | (5,477,018 | ) | | | (331,197,541 | ) | | | 310,502,938 | |
| Select Shares | | | | | | | | | | | | |
Shares sold | | | 524,192,764 | | | | 277,320,037 | | | | 553,086,606 | |
Reinvestment of distributions | | | 24,234 | | | | 8,293 | | | | 445,695 | |
Shares redeemed | | | (513,112,778 | ) | | | (242,503,331 | ) | | | (426,071,325 | ) |
| | | | 11,104,220 | | | | 34,824,999 | | | | 127,460,976 | |
| Administration Shares | | | | | | | | | | | | |
Shares sold | | | 6,253,783,645 | | | | 3,040,933,286 | | | | 11,826,597,612 | |
Reinvestment of distributions | | | 64,053 | | | | 21,254 | | | | 3,165,725 | |
Shares redeemed | | | (5,600,563,306 | ) | | | (2,749,368,350 | ) | | | (11,775,025,397 | ) |
| | | | 653,284,392 | | | | 291,586,190 | | | | 54,737,940 | |
| Cash Management Shares | | | | | | | | | | | | |
Shares sold | | | 134,226,450 | | | | 24,745,925 | | | | 242,339,931 | |
Reinvestment of distributions | | | 3,745 | | | | 560 | | | | 93,028 | |
Shares redeemed | | | (120,344,421 | ) | | | (17,574,065 | ) | | | (251,781,062 | ) |
| | | | 13,885,774 | | | | 7,172,420 | | | | (9,348,103 | ) |
| Premier Shares | | | | | | | | | | | | |
Shares sold | | | 24,442,672 | | | | 15,393,890 | | | | 88,349,017 | |
Reinvestment of distributions | | | 1,517 | | | | 570 | | | | 128,736 | |
Shares redeemed | | | (26,902,116 | ) | | | (19,389,770 | ) | | | (88,394,055 | ) |
| | | | (2,457,927 | ) | | | (3,995,310 | ) | | | 83,698 | |
| Resource Shares | | | | | | | | | | | | |
Shares sold | | | — | | | | — | | | | — | |
Reinvestment of distributions | | | — | | | | — | | | | 5 | |
Shares redeemed | | | — | | | | — | | | | — | |
| | | | — | | | | — | | | | 5 | |
| | | |
NET INCREASE (DECREASE) IN SHARES | | | (4,297,941,376 | ) | | | 11,987,925,042 | | | | 10,336,014,302 | |
| † | | The Funds changed their fiscal year end from August 31 to November 30. |
109
GOLDMAN SACHS — FINANCIAL SQUARE FUNDS
Notes to Financial Statements (continued)
May 31, 2021 (Unaudited)
|
| 10. SUMMARY OF SHARE TRANSACTIONS (continued) |
Share activity is as follows:
| | | | | | | | | | | | |
| | | Treasury Solutions Fund | |
| | | | |
| | | For the Six Months Ended
May 31, 2021
(Unaudited) | | | For the Period Ended
November 30, 2020† | | | For the Fiscal Year Ended
August 31, 2020 | |
| | | | |
| Institutional Shares | | | | | | | | | | | | |
Shares sold | | | 15,046,895,541 | | | | 5,893,160,256 | | | | 58,289,469,409 | |
Reinvestment of distributions | | | 184,688 | | | | 96,601 | | | | 52,958,124 | |
Shares redeemed | | | (16,531,278,235 | ) | | | (6,918,210,754 | ) | | | (54,192,934,647 | ) |
| | | | (1,484,198,006 | ) | | | (1,024,953,897 | ) | | | 4,149,492,886 | |
| Capital Shares | | | | | | | | | | | | |
Shares sold | | | 795,098,402 | | | | 345,375,918 | | | | 1,629,785,876 | |
Reinvestment of distributions | | | 7,031 | | | | 3,265 | | | | 1,257,659 | |
Shares redeemed | | | (741,300,061 | ) | | | (312,261,073 | ) | | | (1,592,015,250 | ) |
| | | | 53,805,372 | | | | 33,118,110 | | | | 39,028,285 | |
| Service Shares | | | | | | | | | | | | |
Shares sold | | | 561,181,890 | | | | 174,601,142 | | | | 660,391,876 | |
Reinvestment of distributions | | | 3,266 | | | | 987 | | | | 136,487 | |
Shares redeemed | | | (589,016,869 | ) | | | (142,915,520 | ) | | | (576,929,878 | ) |
| | | | (27,831,713 | ) | | | 31,686,609 | | | | 83,598,485 | |
| Preferred Shares | | | | | | | | | | | | |
Shares sold | | | 57,711,643 | | | | 35,028,514 | | | | 152,775,517 | |
Reinvestment of distributions | | | 1,491 | | | | 733 | | | | 343,719 | |
Shares redeemed | | | (59,587,714 | ) | | | (28,480,081 | ) | | | (138,743,689 | ) |
| | | | (1,874,580 | ) | | | 6,549,166 | | | | 14,375,547 | |
| Select Shares | | | | | | | | | | | | |
Shares sold | | | — | | | | — | | | | 5,450,000 | |
Reinvestment of distributions | | | 174 | | | | 100 | | | | 93,299 | |
Shares redeemed | | | (775,000 | ) | | | (520,000 | ) | | | (6,800,000 | ) |
| | | | (774,826 | ) | | | (519,900 | ) | | | (1,256,701 | ) |
| Administration Shares | | | | | | | | | | | | |
Shares sold | | | 1,351,080,534 | | | | 635,633,882 | | | | 2,651,967,361 | |
Reinvestment of distributions | | | 11,581 | | | | 6,401 | | | | 2,014,743 | |
Shares redeemed | | | (1,579,764,547 | ) | | | (468,570,619 | ) | | | (2,684,420,997 | ) |
| | | | (228,672,432 | ) | | | 167,069,664 | | | | (30,438,893 | ) |
| Cash Management Shares | | | | | | | | | | | | |
Shares sold | | | 566,733,131 | | | | 265,391,569 | | | | 1,086,664,753 | |
Reinvestment of distributions | | | 1,399 | | | | 1,098 | | | | 185,626 | |
Shares redeemed | | | (483,207,448 | ) | | | (275,724,818 | ) | | | (1,037,350,612 | ) |
| | | | 83,527,082 | | | | (10,332,151 | ) | | | 49,499,767 | |
| Premier Shares | | | | | | | | | | | | |
Shares sold | | | 350,298,335 | | | | 161,822,274 | | | | 705,690,354 | |
Reinvestment of distributions | | | 755 | | | | 359 | | | | 169,085 | |
Shares redeemed | | | (308,875,952 | ) | | | (210,110,000 | ) | | | (739,350,134 | ) |
| | | | 41,423,138 | | | | (48,287,367 | ) | | | (33,490,695 | ) |
| Resource Shares | | | | | | | | | | | | |
Shares sold | | | — | | | | — | | | | — | |
Reinvestment of distributions | | | — | | | | — | | | | 5 | |
Shares redeemed | | | — | | | | — | | | | — | |
| | | | — | | | | — | | | | 5 | |
| | | |
NET INCREASE (DECREASE) IN SHARES | | | (1,564,595,965 | ) | | | (845,669,766 | ) | | | 4,270,808,686 | |
| † | | The Funds changed their fiscal year end from August 31 to November 30. |
110
GOLDMAN SACHS FUNDS — FINANCIAL SQUARE FUNDS
Fund Expenses — Six Month Period Ended May 31, 2021 (Unaudited)
As a shareholder of Class A, Class C, Institutional, Capital, Service, Preferred, Select, Administration, Cash Management, Premier, Resource, Class R6, or Drexel Hamilton Class of a Fund, you incur two types of costs: (1) transaction costs, including contingent deferred sales charges (with respect to Class C Shares); and (2) ongoing costs, including management fees and distribution, service, administration and/or shareholder administration fees (with respect to all share classes except Institutional Shares and Class R6 Shares) and other Fund expenses. This example is intended to help you understand your ongoing costs (in dollars) of investing in Institutional Shares, Select Shares, Preferred Shares. Capital Shares, Administration Shares, Premier Shares, Service Shares, Class A Shares, Class C Shares, Resource Shares, Cash Management Shares, Class R6 Shares, or Drexel Hamilton Class of the Funds and to compare these costs with the ongoing costs of investing in other mutual funds.
The example is based on an investment of $1,000 invested at the beginning of the period and held for the entire period from December 1, 2020 through May 31, 2021, which represents a period of 182 days in a 365-day year.
Actual Expenses — The first line under each share class in the table below provides information about actual account values and actual expenses. You may use the information in this line, together with the amount you invested, to estimate the expenses that you paid over the period. Simply divide your account value by $1,000 (for example, an $8,600 account value divided by $1,000=8.6), then multiply the result by the number in the first line under the column heading entitled “Expenses Paid” to estimate the expenses you paid on your account during this period.
Hypothetical Example for Comparison Purposes — The second line under each share class in the table below provides information about hypothetical account values and hypothetical expenses based on the Funds’ actual net expense ratios and an assumed rate of return of 5% per year before expenses, which is not the Funds’ actual return. The hypothetical account values and expenses may not be used to estimate the actual ending account balance or expenses you paid for the period. You may use this information to compare the ongoing costs of investing in the Funds and other funds. To do so, compare this 5% hypothetical example with the 5% hypothetical examples that appear in the shareholder reports of the other funds.
Please note that the expenses shown in the table are meant to highlight your ongoing costs only and do not reflect any transactional costs, such as sales charges, redemption fees, or exchange fees. Therefore, the second line of the table is useful in comparing ongoing costs only, and will not help you determine the relative total costs of owning different funds. In addition, if these transactional costs were included, your costs would have been higher.
111
GOLDMAN SACHS FUNDS — FINANCIAL SQUARE FUNDS
Fund Expenses — Six Month Period Ended May 31, 2021 (Unaudited) (continued)
| | | | | | | | | | | | | | | | | | | | | | | | | | | | | | | | | | | | |
| | | Federal Instruments Fund | | | Government Fund | | | Money Market Fund | |
| Share Class | | Beginning
Account
Value
12/1/20 | | | Ending
Account
Value
5/31/21 | | | Expenses
Paid for the
6 months ended
5/31/2021* | | | Beginning
Account
Value
12/1/20 | | | Ending
Account
Value
5/31/21 | | | Expenses
Paid for the
6 months ended
5/31/2021* | | | Beginning
Account
Value
12/1/20 | | | Ending
Account
Value
5/31/21 | | | Expenses
Paid for the
6 months ended
5/31/2021* | |
| Class A Shares | | | | | | | | | | | | | | | | | | | | | | | | | | | | | | | | | | | | |
Actual | | | — | | | | — | | | | — | | | $ | 1,000.00 | | | $ | 1,014.40 | | | $ | 0.45 | | | | — | | | | — | | | | — | |
Hypothetical 5% return | | | — | | | | — | | | | — | | | | 1,000.00 | | | | 1,024.48 | + | | | 0.45 | | | | — | | | | — | | | | — | |
| Class C Shares | | | | | | | | | | | | | | | | | | | | | | | | | | | | | | | | | | | | |
Actual | | | — | | | | — | | | | — | | | | 1,000.00 | | | | 1,014.40 | | | | 0.45 | | | | — | | | | — | | | | — | |
Hypothetical 5% return | | | — | | | | — | | | | — | | | | 1,000.00 | | | | 1,024.48 | + | | | 0.45 | | | | — | | | | — | | | | — | |
| Institutional Shares | | | | | | | | | | | | | | | | | | | | | | | | | | | | | | | | | | | | |
Actual | | $ | 1,000.00 | | | $ | 1,003.10 | | | $ | 0.55 | | | | 1,000.00 | | | | 1,014.40 | | | | 0.45 | | | $ | 1,000.00 | | | $ | 1,015.80 | | | $ | 0.65 | |
Hypothetical 5% return | | | 1,000.00 | | | | 1,024.38 | + | | | 0.56 | | | | 1,000.00 | | | | 1,024.48 | + | | | 0.45 | | | | 1,000.00 | | | | 1,024.28 | + | | | 0.66 | |
| Capital Shares | | | | | | | | | | | | | | | | | | | | | | | | | | | | | | | | | | | | |
Actual | | | 1,000.00 | | | | 1,003.10 | | | | 0.55 | | | | 1,000.00 | | | | 1,014.40 | | | | 0.45 | | | | 1,000.00 | | | | 1,001.80 | | | | 0.75 | |
Hypothetical 5% return | | | 1,000.00 | | | | 1,024.38 | + | | | 0.56 | | | | 1,000.00 | | | | 1,024.48 | + | | | 0.45 | | | | 1,000.00 | | | | 1,024.18 | + | | | 0.76 | |
| Service Shares | | | | | | | | | | | | | | | | | | | | | | | | | | | | | | | | | | | | |
Actual | | | 1,000.00 | | | | 1,003.10 | | | | 0.55 | | | | 1,000.00 | | | | 1,014.40 | | | | 0.45 | | | | 1,000.00 | | | | 1,081.80 | | | | 0.78 | |
Hypothetical 5% return | | | 1,000.00 | | | | 1,024.38 | + | | | 0.56 | | | | 1,000.00 | | | | 1,024.48 | + | | | 0.45 | | | | 1,000.00 | | | | 1,024.18 | + | | | 0.76 | |
| Preferred Shares | | | | | | | | | | | | | | | | | | | | | | | | | | | | | | | | | | | | |
Actual | | | 1,000.00 | | | | 1,003.10 | | | | 0.55 | | | | 1,000.00 | | | | 1,014.40 | | | | 0.45 | | | | 1,000.00 | | | | 1,011.80 | | | | 0.70 | |
Hypothetical 5% return | | | 1,000.00 | | | | 1,024.38 | + | | | 0.56 | | | | 1,000.00 | | | | 1,024.48 | + | | | 0.45 | | | | 1,000.00 | | | | 1,024.23 | + | | | 0.71 | |
| Select Shares | | | | | | | | | | | | | | | | | | | | | | | | | | | | | | | | | | | | |
Actual | | | 1,000.00 | | | | 1,003.10 | | | | 0.55 | | | | 1,000.00 | | | | 1,014.40 | | | | 0.45 | | | | 1,000.00 | | | | 1,014.40 | | | | 0.70 | |
Hypothetical 5% return | | | 1,000.00 | | | | 1,024.38 | + | | | 0.56 | | | | 1,000.00 | | | | 1,024.48 | + | | | 0.45 | | | | 1,000.00 | | | | 1,024.23 | + | | | 0.71 | |
| Administration Shares | | | | | | | | | | | | | | | | | | | | | | | | | | | | | | | | | | | | |
Actual | | | 1,000.00 | | | | 1,003.10 | | | | 0.55 | | | | 1,000.00 | | | | 1,014.40 | | | | 0.45 | | | | 1,000.00 | | | | 1,011.80 | | | | 0.70 | |
Hypothetical 5% return | | | 1,000.00 | | | | 1,024.38 | + | | | 0.56 | | | | 1,000.00 | | | | 1,024.48 | + | | | 0.45 | | | | 1,000.00 | | | | 1,024.23 | + | | | 0.71 | |
| Cash Management Shares | | | | | | | | | | | | | | | | | | | | | | | | | | | | | | | | | | | | |
Actual | | | 1,000.00 | | | | 1,003.10 | | | | 0.55 | | | | 1,000.00 | | | | 1,014.40 | | | | 0.45 | | | | 1,000.00 | | | | 1,111.80 | | | | 0.68 | |
Hypothetical 5% return | | | 1,000.00 | | | | 1,024.38 | + | | | 0.56 | | | | 1,000.00 | | | | 1,024.48 | + | | | 0.45 | | | | 1,000.00 | | | | 1,024.28 | + | | | 0.66 | |
| Premier Shares | | | | | | | | | | | | | | | | | | | | | | | | | | | | | | | | | | | | |
Actual | | | 1,000.00 | | | | 1,003.10 | | | | 0.55 | | | | 1,000.00 | | | | 1,014.40 | | | | 0.45 | | | | 1,000.00 | | | | 1,101.80 | | | | 0.68 | |
Hypothetical 5% return | | | 1,000.00 | | | | 1,024.38 | + | | | 0.56 | | | | 1,000.00 | | | | 1,024.48 | + | | | 0.45 | | | | 1,000.00 | | | | 1,024.28 | + | | | 0.66 | |
| Resource Shares | | | | | | | | | | | | | | | | | | | | | | | | | | | | | | | | | | | | |
Actual | | | — | | | | — | | | | — | | | | 1,000.00 | | | | 1,014.40 | | | | 0.45 | | | | 1,000.00 | | | | 1,111.80 | | | | 0.68 | |
Hypothetical 5% return | | | — | | | | — | | | | — | | | | 1,000.00 | | | | 1,024.48 | + | | | 0.45 | | | | 1,000.00 | | | | 1,024.28 | + | | | 0.66 | |
| Class R6 Shares | | | | | | | | | | | | | | | | | | | | | | | | | | | | | | | | | | | | |
Actual | | | — | | | | — | | | | — | | | | 1,000.00 | | | | 1,014.40 | | | | 0.45 | | | | — | | | | — | | | | — | |
Hypothetical 5% return | | | — | | | | — | | | | — | | | | 1,000.00 | | | | 1,024.48 | + | | | 0.45 | | | | — | | | | — | | | | — | |
| Drexel Hamilton Class Shares | | | | | | | | | | | | | | | | | | | | | | | | | | | | | | | | | | | | |
Actual | | | — | | | | — | | | | — | | | | 1,000.00 | | | | 1,014.40 | | | | 0.45 | | | | — | | | | — | | | | — | |
Hypothetical 5% return | | | — | | | | — | | | | — | | | | 1,000.00 | | | | 1,024.48 | + | | | 0.45 | | | | — | | | | — | | | | — | |
| * | | Expenses for each share class are calculated using each Fund’s annualized net expense ratio for each class, which represents the ongoing expenses as a percentage of net assets for the six months ended May 31, 2021. Expenses are calculated by multiplying the annualized net expense ratio by the average account value for the period; then multiplying the result by the number of days in the most recent fiscal half year; and then dividing that result by the number of days in the fiscal year. The annualized net expense ratios for the period were as follows: |
| | | | | | | | | | | | | | | | | | | | | | | | | | | | | | | | | | | | | | | | | | | | | | | | | | | | |
| Fund | | Class A
Shares | | | Class C
Shares | | | Institutional
Shares | | | Capital
Shares | | | Service
Shares | | | Preferred
Shares | | | Select
Shares | | | Administration
Shares | | | Cash Management
Shares | | | Premier
Shares | | | Resource
Shares | | | Class R6
Shares | | | Drexel Hamilton
Class Shares | |
Federal Instruments Fund | | | — | | | | — | | | | 0.11 | % | | | 0.11 | % | | | 0.11 | % | | | 0.11 | % | | | 0.11 | % | | | 0.11 | % | | | 0.11 | % | | | 0.11 | % | | | — | | | | — | | | | — | |
Government Fund | | | 0.09 | % | | | 0.09 | % | | | 0.09 | | | | 0.09 | | | | 0.09 | | | | 0.09 | | | | 0.09 | | | | 0.09 | | | | 0.09 | | | | 0.09 | | | | 0.09 | % | | | 0.09 | % | | | 0.09 | % |
Money Market Fund | | | — | | | | — | | | | 0.13 | | | | 0.15 | | | | 0.15 | | | | 0.14 | | | | 0.14 | | | | 0.14 | | | | 0.13 | | | | 0.13 | | | | 0.13 | | | | — | | | | — | |
| + | | Hypothetical expenses are based on each Fund’s actual annualized net expense ratios and an assumed rate of return of 5% per year before expenses. |
112
GOLDMAN SACHS FUNDS — FINANCIAL SQUARE FUNDS
Fund Expenses — Six Month Period Ended May 31, 2021 (Unaudited) (continued)
| | | | | | | | | | | | | | | | | | | | | | | | | | | | | | | | | | | | |
| | | Prime Obligations Fund | | | Treasury Instruments Fund | | | Treasury Obligations Fund | |
| Share Class | | Beginning
Account
Value
12/1/20 | | | Ending
Account
Value
5/31/21 | | | Expenses
Paid for the
6 months ended
5/31/2021* | | | Beginning
Account
Value
12/1/20 | | | Ending
Account
Value
5/31/21 | | | Expenses
Paid for the
6 months ended
5/31/2021* | | | Beginning
Account
Value
12/1/20 | | | Ending
Account
Value
5/31/21 | | | Expenses
Paid for the
6 months ended
5/31/2021* | |
| Institutional Shares | | | | | | | | | | | | | | | | | | | | | | | | | | | | | | | | | | | | |
Actual | | $ | 1,000.00 | | | $ | 1,001.70 | | | $ | 0.80 | | | $ | 1,000.00 | | | $ | 1,003.00 | | | $ | 0.50 | | | $ | 1,000.00 | | | $ | 1,012.50 | | | $ | 0.35 | |
Hypothetical 5% return | | | 1,000.00 | | | | 1,024.13 | + | | | 0.81 | | | | 1,000.00 | | | | 1,024.43 | + | | | 0.50 | | | | 1,000.00 | | | | 1,024.58 | + | | | 0.35 | |
| Capital Shares | | | | | | | | | | | | | | | | | | | | | | | | | | | | | | | | | | | | |
Actual | | | 1,000.00 | | | | 998.00 | | | | 0.85 | | | | 1,000.00 | | | | 1,003.00 | | | | 0.50 | | | | 1,000.00 | | | | 1,012.50 | | | | 0.35 | |
Hypothetical 5% return | | | 1,000.00 | | | | 1,024.08 | + | | | 0.86 | | | | 1,000.00 | | | | 1,024.43 | + | | | 0.50 | | | | 1,000.00 | | | | 1,024.58 | + | | | 0.35 | |
| Service Shares | | | | | | | | | | | | | | | | | | | | | | | | | | | | | | | | | | | | |
Actual | | | 1,000.00 | | | | 1,098.00 | | | | 0.84 | | | | 1,000.00 | | | | 1,003.00 | | | | 0.50 | | | | 1,000.00 | | | | 1,012.50 | | | | 0.35 | |
Hypothetical 5% return | | | 1,000.00 | | | | 1,024.13 | + | | | 0.81 | | | | 1,000.00 | | | | 1,024.43 | + | | | 0.50 | | | | 1,000.00 | | | | 1,024.58 | + | | | 0.35 | |
| Preferred Shares | | | | | | | | | | | | | | | | | | | | | | | | | | | | | | | | | | | | |
Actual | | | 1,000.00 | | | | 998.00 | | | | 0.85 | | | | 1,000.00 | | | | 1,003.00 | | | | 0.50 | | | | 1,000.00 | | | | 1,012.50 | | | | 0.35 | |
Hypothetical 5% return | | | 1,000.00 | | | | 1,024.08 | + | | | 0.86 | | | | 1,000.00 | | | | 1,024.43 | + | | | 0.50 | | | | 1,000.00 | | | | 1,024.58 | + | | | 0.35 | |
| Select Shares | | | | | | | | | | | | | | | | | | | | | | | | | | | | | | | | | | | | |
Actual | | | 1,000.00 | | | | 998.20 | | | | 0.85 | | | | 1,000.00 | | | | 1,003.00 | | | | 0.50 | | | | 1,000.00 | | | | 1,012.50 | | | | 0.35 | |
Hypothetical 5% return | | | 1,000.00 | | | | 1,024.08 | + | | | 0.86 | | | | 1,000.00 | | | | 1,024.43 | + | | | 0.50 | | | | 1,000.00 | | | | 1,024.58 | + | | | 0.35 | |
| Administration Shares | | | | | | | | | | | | | | | | | | | | | | | | | | | | | | | | | | | | |
Actual | | | 1,000.00 | | | | 998.00 | | | | 0.85 | | | | 1,000.00 | | | | 1,003.00 | | | | 0.50 | | | | 1,000.00 | | | | 1,012.50 | | | | 0.35 | |
Hypothetical 5% return | | | 1,000.00 | | | | 1,024.08 | + | | | 0.86 | | | | 1,000.00 | | | | 1,024.43 | + | | | 0.50 | | | | 1,000.00 | | | | 1,024.58 | + | | | 0.35 | |
| Cash Management Shares | | | | | | | | | | | | | | | | | | | | | | | | | | | | | | | | | | | | |
Actual | | | 1,000.00 | | | | 1,118.00 | | | | 0.84 | | | | 1,000.00 | | | | 1,003.00 | | | | 0.50 | | | | 1,000.00 | | | | 1,012.50 | | | | 0.35 | |
Hypothetical 5% return | | | 1,000.00 | | | | 1,024.13 | + | | | 0.81 | | | | 1,000.00 | | | | 1,024.43 | + | | | 0.50 | | | | 1,000.00 | | | | 1,024.58 | + | | | 0.35 | |
| Premier Shares | | | | | | | | | | | | | | | | | | | | | | | | | | | | | | | | | | | | |
Actual | | | 1,000.00 | | | | 1,118.00 | | | | 0.84 | | | | 1,000.00 | | | | 1,003.00 | | | | 0.50 | | | | 1,000.00 | | | | 1,012.50 | | | | 0.35 | |
Hypothetical 5% return | | | 1,000.00 | | | | 1,024.13 | + | | | 0.81 | | | | 1,000.00 | | | | 1,024.43 | + | | | 0.50 | | | | 1,000.00 | | | | 1,024.58 | + | | | 0.35 | |
| Resource Shares | | | | | | | | | | | | | | | | | | | | | | | | | | | | | | | | | | | | |
Actual | | | 1,000.00 | | | | 1,108.00 | | | | 0.84 | | | | 1,000.00 | | | | 1,003.00 | | | | 0.50 | | | | 1,000.00 | | | | 1,012.50 | | | | 0.35 | |
Hypothetical 5% return | | | 1,000.00 | | | | 1,024.13 | + | | | 0.81 | | | | 1,000.00 | | | | 1,024.43 | + | | | 0.50 | | | | 1,000.00 | | | | 1,024.58 | + | | | 0.35 | |
| Drexel Hamilton Class Shares | | | | | | | | | | | | | | | | | | | | | | | | | | | | | | | | | | | | |
Actual | | | 1,000.00 | | | | 991.70 | | | | 0.79 | | | | — | | | | — | | | | — | | | | — | | | | — | | | | — | |
Hypothetical 5% return | | | 1,000.00 | | | | 1,024.13 | + | | | 0.81 | | | | — | | | | — | | | | — | | | | — | | | | — | | | | — | |
| * | | Expenses for each share class are calculated using each Fund’s annualized net expense ratio for each class, which represents the ongoing expenses as a percentage of net assets for the six months ended May 31, 2021. Expenses are calculated by multiplying the annualized net expense ratio by the average account value for the period; then multiplying the result by the number of days in the most recent fiscal half year; and then dividing that result by the number of days in the fiscal year. The annualized net expense ratios for the period were as follows: |
| | | | | | | | | | | | | | | | | | | | | | | | | | | | | | | | | | | | | | | | |
| Fund | | Institutional
Shares | | | Capital
Shares | | | Service
Shares | | | Preferred
Shares | | | Select
Shares | | | Administration
Shares | | | Cash
Management
Shares | | | Premier
Shares | | | Resource
Shares | | | Drexel
Hamilton
Class Shares | |
Prime Obligations Fund | | | 0.16 | % | | | 0.17 | % | | | 0.16 | % | | | 0.17 | % | | | 0.17 | % | | | 0.17 | % | | | 0.16 | % | | | 0.16 | % | | | 0.16 | % | | | 0.16 | % |
Treasury Instruments Fund | | | 0.10 | | | | 0.10 | | | | 0.10 | | | | 0.10 | | | | 0.10 | | | | 0.10 | | | | 0.10 | | | | 0.10 | | | | 0.10 | | | | — | |
Treasury Obligations Fund | | | 0.07 | | | | 0.07 | | | | 0.07 | | | | 0.07 | | | | 0.07 | | | | 0.07 | | | | 0.07 | | | | 0.07 | | | | 0.07 | | | | — | |
| + | | Hypothetical expenses are based on each Fund’s actual annualized net expense ratios and an assumed rate of return of 5% per year before expenses. |
113
GOLDMAN SACHS FUNDS — FINANCIAL SQUARE FUNDS
Fund Expenses — Six Month Period Ended May 31, 2021 (Unaudited) (continued)
| | | | | | | | | | | | |
| | | Treasury Solutions Fund | |
| Share Class | | Beginning
Account
Value
12/1/20 | | | Ending
Account
Value
5/31/21 | | | Expenses
Paid for the
6 months ended
5/31/2021* | |
| Institutional Shares | | | | | | | | | | | | |
Actual | | $ | 1,000.00 | | | $ | 1,003.00 | | | $ | 0.55 | |
Hypothetical 5% return | | | 1,000.00 | | | | 1,024.38 | + | | | 0.56 | |
| Capital Shares | | | | | | | | | | | | |
Actual | | | 1,000.00 | | | | 1,003.00 | | | | 0.55 | |
Hypothetical 5% return | | | 1,000.00 | | | | 1,024.38 | + | | | 0.56 | |
| Service Shares | | | | | | | | | | | | |
Actual | | | 1,000.00 | | | | 1,003.00 | | | | 0.55 | |
Hypothetical 5% return | | | 1,000.00 | | | | 1,024.38 | + | | | 0.56 | |
| Preferred Shares | | | | | | | | | | | | |
Actual | | | 1,000.00 | | | | 1,003.00 | | | | 0.55 | |
Hypothetical 5% return | | | 1,000.00 | | | | 1,024.38 | + | | | 0.56 | |
| Select Shares | | | | | | | | | | | | |
Actual | | | 1,000.00 | | | | 1,003.00 | | | | 0.55 | |
Hypothetical 5% return | | | 1,000.00 | | | | 1,024.38 | + | | | 0.56 | |
| Administration Shares | | | | | | | | | | | | |
Actual | | | 1,000.00 | | | | 1,003.00 | | | | 0.55 | |
Hypothetical 5% return | | | 1,000.00 | | | | 1,024.38 | + | | | 0.56 | |
| Cash Management Shares | | | | | | | | | | | | |
Actual | | | 1,000.00 | | | | 1,003.00 | | | | 0.55 | |
Hypothetical 5% return | | | 1,000.00 | | | | 1,024.38 | + | | | 0.56 | |
| Premier Shares | | | | | | | | | | | | |
Actual | | | 1,000.00 | | | | 1,003.00 | | | | 0.55 | |
Hypothetical 5% return | | | 1,000.00 | | | | 1,024.38 | + | | | 0.56 | |
| Resource Shares | | | | | | | | | | | | |
Actual | | | 1,000.00 | | | | 1,003.00 | | | | 0.55 | |
Hypothetical 5% return | | | 1,000.00 | | | | 1,024.38 | | | | 0.56 | |
| * | | Expenses for each share class are calculated using each Fund’s annualized net expense ratio for each class, which represents the ongoing expenses as a percentage of net assets for the six months ended May 31, 2021. Expenses are calculated by multiplying the annualized net expense ratio by the average account value for the period; then multiplying the result by the number of days in the most recent fiscal half year; and then dividing that result by the number of days in the fiscal year. The annualized net expense ratios for the period were as follows: |
| | | | | | | | | | | | | | | | | | | | | | | | | | | | | | | | | | | | |
| Fund | | Institutional
Shares | | | Capital
Shares | | | Service
Shares | | | Preferred
Shares | | | Select
Shares | | | Administration
Shares | | | Cash
Management
Shares | | | Premier
Shares | | | Resource
Shares | |
Treasury Solutions Fund | | | 0.11 | % | | | 0.11 | % | | | 0.11 | % | | | 0.11 | % | | | 0.11 | % | | | 0.11 | % | | | 0.11 | % | | | 0.11 | % | | | 0.11 | % |
| + | | Hypothetical expenses are based on each Fund’s actual annualized net expense ratios and an assumed rate of return of 5% per year before expenses. |
114
FUNDS PROFILE
Goldman Sachs Funds
Goldman Sachs is a premier financial services firm, known since 1869 for creating thoughtful and customized investment solutions in complex global markets.
Today, the Asset Management Division of Goldman Sachs serves a diverse set of clients worldwide, including private institutions, public entities and individuals. With approximately $2.2 trillion in assets under supervision as of March 31, 2021, Goldman Sachs Asset Management (“GSAM”) has portfolio management teams located around the world and our investment professionals bring firsthand knowledge of local markets to every investment decision. Assets under supervision includes assets under management and other client assets for which Goldman Sachs does not have full discretion. GSAM leverages the resources of Goldman Sachs & Co. LLC subject to legal, internal and regulatory restrictions.
Money Market
Financial Square FundsSM
| ∎ | | Financial Square Treasury Solutions Fund1 |
| ∎ | | Financial Square Government Fund1 |
| ∎ | | Financial Square Money Market Fund2 |
| ∎ | | Financial Square Prime Obligations Fund2 |
| ∎ | | Financial Square Treasury Instruments Fund1 |
| ∎ | | Financial Square Treasury Obligations Fund1 |
| ∎ | | Financial Square Federal Instruments Fund1 |
Investor FundsSM
| ∎ | | Investor Money Market Fund3 |
| ∎ | | Investor Tax-Exempt Money Market Fund3 |
Fixed Income
Short Duration and Government
| ∎ | | High Quality Floating Rate Fund |
| ∎ | | Short-Term Conservative Income Fund |
| ∎ | | Short Duration Government Fund |
| ∎ | | Short Duration Income Fund |
| ∎ | | Inflation Protected Securities Fund |
Multi-Sector
| ∎ | | Global Core Fixed Income Fund |
Municipal and Tax-Free
| ∎ | | High Yield Municipal Fund |
| ∎ | | Dynamic Municipal Income Fund |
| ∎ | | Short Duration Tax-Free Fund |
| ∎ | | Municipal Income Completion Fund |
Single Sector
| ∎ | | Investment Grade Credit Fund |
| ∎ | | High Yield Floating Rate Fund |
| ∎ | | Emerging Markets Debt Fund |
| ∎ | | Local Emerging Markets Debt Fund |
Fixed Income Alternatives
| ∎ | | Long Short Credit Strategies Fund |
Fundamental Equity
| ∎ | | Small/Mid Cap Value Fund |
| ∎ | | Small/Mid Cap Growth Fund |
| ∎ | | Concentrated Growth Fund |
| ∎ | | Technology Opportunities Fund |
| ∎ | | Growth Opportunities Fund |
| ∎ | | Rising Dividend Growth Fund |
Tax-Advantaged Equity
| ∎ | | U.S. Tax-Managed Equity Fund |
| ∎ | | International Tax-Managed Equity Fund |
| ∎ | | U.S. Equity Dividend and Premium Fund |
| ∎ | | International Equity Dividend and Premium Fund |
Equity Insights
| ∎ | | Small Cap Equity Insights Fund |
| ∎ | | U.S. Equity Insights Fund |
| ∎ | | Small Cap Growth Insights Fund |
| ∎ | | Large Cap Growth Insights Fund |
| ∎ | | Large Cap Value Insights Fund |
| ∎ | | Small Cap Value Insights Fund |
| ∎ | | International Small Cap Insights Fund |
| ∎ | | International Equity Insights Fund |
| ∎ | | Emerging Markets Equity Insights Fund |
Fundamental Equity International
| ∎ | | International Equity Income Fund |
| ∎ | | International Equity ESG Fund |
| ∎ | | Emerging Markets Equity Fund |
| ∎ | | ESG Emerging Markets Equity Fund |
Alternative
| ∎ | | Clean Energy Income Fund |
| ∎ | | Real Estate Securities Fund |
| ∎ | | International Real Estate Securities Fund |
| ∎ | | Commodity Strategy Fund |
| ∎ | | Global Real Estate Securities Fund |
| ∎ | | Alternative Premia Fund |
| ∎ | | Absolute Return Tracker Fund |
| ∎ | | Managed Futures Strategy Fund |
| ∎ | | MLP Energy Infrastructure Fund |
| ∎ | | Energy Infrastructure Fund5 |
| ∎ | | Multi-Manager Alternatives Fund |
| ∎ | | Global Infrastructure Fund |
Total Portfolio Solutions
| ∎ | | Global Managed Beta Fund |
| ∎ | | Multi-Manager Non-Core Fixed Income Fund |
| ∎ | | Multi-Manager Global Equity Fund |
| ∎ | | Multi-Manager International Equity Fund |
| ∎ | | Tactical Tilt Overlay Fund |
| ∎ | | Balanced Strategy Portfolio |
| ∎ | | Multi-Manager U.S. Small Cap Equity Fund |
| ∎ | | Multi-Manager Real Assets Strategy Fund |
| ∎ | | Growth and Income Strategy Portfolio |
| ∎ | | Growth Strategy Portfolio |
| ∎ | | Dynamic Global Equity Fund |
| ∎ | | Satellite Strategies Portfolio |
| ∎ | | Enhanced Dividend Global Equity Portfolio |
| ∎ | | Tax-Advantaged Global Equity Portfolio |
| ∎ | | Strategic Factor Allocation Fund |
| ∎ | | Strategic Volatility Premium Fund |
| ∎ | | Target Date Retirement Portfolio |
| ∎ | | Target Date 2025 Portfolio |
| ∎ | | Target Date 2030 Portfolio |
| ∎ | | Target Date 2035 Portfolio |
| ∎ | | Target Date 2040 Portfolio |
| ∎ | | Target Date 2045 Portfolio |
| ∎ | | Target Date 2050 Portfolio |
| ∎ | | Target Date 2055 Portfolio |
| ∎ | | Target Date 2060 Portfolio |
| ∎ | | GQG Partners International Opportunities Fund |
| 1 | | You could lose money by investing in the Fund. Although the Fund seeks to preserve the value of your investment at $1.00 per share, it cannot guarantee it will do so. An investment in the Fund is not a deposit of a bank and is not insured or guaranteed by the Federal Deposit Insurance Corporation or any other government agency. The Fund’s sponsor has no legal obligation to provide financial support to the Fund, and you should not expect that the sponsor will provide financial support to the Fund at any time. |
| 2 | | You could lose money by investing in the Fund. Because the share price of the Fund will fluctuate, when you sell your shares they may be worth more or less than what you originally paid for them. The Fund may impose a fee upon sale of your shares or may temporarily suspend your ability to sell shares if the Fund’s liquidity falls below required minimums because of market conditions or other factors. An investment in the Fund is not a deposit of a bank and is not insured or guaranteed by the Federal Deposit Insurance Corporation or any other government agency. The Fund’s sponsor has no legal obligation to provide financial support to the Fund, and you should not expect that the sponsor will provide financial support to the Fund at any time. |
| 3 | | You could lose money by investing in the Fund. Although the Fund seeks to preserve the value of your investment at $1.00 per share, it cannot guarantee it will do so. The Fund may impose a fee upon sale of your shares or may temporarily suspend your ability to sell shares if the Fund’s liquidity falls below required minimums because of market conditions or other factors. An investment in the Fund is not a deposit of a bank and is not insured or guaranteed by the Federal Deposit Insurance Corporation or any other government agency. The Fund’s sponsor has no legal obligation to provide financial support to the Fund, and you should not expect that the sponsor will provide financial support to the Fund at any time. |
| 4 | | Effective after the close on business of August 30, 2020, the Goldman Sachs Blue Chip Fund was renamed the Goldman Sachs U.S. Equity ESG Fund. |
| 5 | | Effective after the close of business on June 26, 2020, the Goldman Sachs MLP & Energy Fund was renamed the Goldman Sachs Energy Infrastructure Fund. |
| | | Financial Square FundsSM and Investor FundsSM are registered service marks of Goldman Sachs & Co. LLC. |
| * | | This list covers open-end funds only. Please visit our website at www.GSAMFUNDS.com to learn about our closed-end funds and exchange-traded funds. |
| | |
TRUSTEES Jessica Palmer, Chair Dwight L. Bush Kathryn A. Cassidy Diana M. Daniels Joaquin Delgado James A. McNamara Roy W. Templin Gregory G. Weaver | | OFFICERS James A. McNamara, President Joseph F. DiMaria, Principal Financial Officer, Principal Accounting Officer and Treasurer Caroline L. Kraus, Secretary |
| |
GOLDMAN SACHS & CO. LLC Distributor and Transfer Agent | | GOLDMAN SACHS ASSET MANAGEMENT, L.P. Investment Adviser |
Visit our web site at www.GSAMFUNDS.com to obtain the most recent month-end returns.
Goldman Sachs Asset Management, L.P., 200 West Street, New York, New York 10282
Economic and market forecasts presented herein reflect our judgment as of the date of this presentation and are subject to change without notice. These forecasts do not take into account the specific investment objectives, restrictions, tax and financial situation or other needs of any specific client. Actual data will vary and may not be reflected here. These forecasts are subject to high levels of uncertainty that may affect actual performance. Accordingly, these forecasts should be viewed as merely representative of a broad range of possible outcomes. These forecasts are estimated, based on assumptions, and are subject to significant revision and may change materially as economic and market conditions change. Goldman Sachs has no obligation to provide updates or changes to these forecasts. Case studies and examples are for illustrative purposes only.
The portfolio risk management process includes an effort to monitor and manage risk, but does not imply low risk. The reports concerning the Funds included in this shareholder report may contain certain forward-looking statements about the factors that may affect the performance of the Funds in the future. These statements are based on Fund management’s predictions and expectations concerning certain future events and their expected impact on the Funds, such as performance of the economy as a whole and of specific industry sectors, changes in the levels of interest rates, the impact of developing world events, and other factors that may influence the future performance of the Funds. Management believes these forward-looking statements to be reasonable, although they are inherently uncertain and difficult to predict. Actual events may cause adjustments in portfolio management strategies from those currently expected to be employed.
A description of the policies and procedures that the Funds use to determine how to vote proxies relating to portfolio securities and information regarding how a Fund voted proxies relating to portfolio securities during the most recent 12-month period ended June 30 is available (i) without charge, upon request by calling 1-800-526-7384 (for shareholders of Class A Shares or Class C Shares) or 1-800-621-2550 (for shareholders of all other share classes of a Fund); and (ii) on the Securities and Exchange Commission (“SEC”) web site at http://www.sec.gov.
Goldman Sachs & Co. LLC (“Goldman Sachs’’) does not provide legal, tax or accounting advice. Any statement contained in this communication (including any attachments) concerning U.S. tax matters was not intended or written to be used, and cannot be used, for the purpose of avoiding penalties under the Internal Revenue Code, and was written to support the promotion or marketing of the transaction(s) or matter(s) addressed. Clients of Goldman Sachs should obtain their own independent tax advice based on their particular circumstances. Fund holdings and allocations shown are as of May 31, 2021 and may not be representative of future investments. Fund holdings should not be relied on in making investment decisions and should not be construed as research or investment advice regarding particular securities. Current and future holdings are subject to risk.
Financial Square FundsSM is a registered service mark of Goldman Sachs & Co LLC.
This material is not authorized for distribution to prospective investors unless preceded or accompanied by a current Prospectus or summary prospectus, if applicable. Investors should consider a Fund’s objective, risks, and charges and expenses, and read the summary prospectus, if available, and/or the Prospectus carefully before investing or sending money. The summary prospectus, if available, and the Prospectus contain this and other information about a Fund and may be obtained from your Intermediary or from Goldman Sachs & Co LLC by calling (Class A Shares or Class C Shares – 1-800-526-7384) (all other share classes – 1-800-621-2550).
© 2021 Goldman Sachs. All rights reserved. 244883-OTU-1445690 FSQSAR-21
Goldman Sachs Funds

| | | | |
| | |
| Semi-Annual Report | | | | May 31, 2021 |
| | |
| | | | Investor FundsSM |
| | | | Money Market |
| | | | Tax-Exempt Money Market |

Goldman Sachs Investor Funds
| ∎ | | TAX-EXEMPT MONEY MARKET |
| | | | |
| | | |
| NOT FDIC-INSURED | | May Lose Value | | No Bank Guarantee |
FUND BASICS
Investor Funds
as of May 31, 2021
| | | | | | | | | | | | | | |
| | PERFORMANCE REVIEW1,2 | |
| | | | |
| | | December 1, 2020–May 31, 2021 | | Fund Total Return
(based on NAV)3
Class I Shares | | | SEC 7-Day
Current
Yield4 | | | iMoneyNet
Institutional
Average5 | |
| | | | |
| | Investor Money Market | | | 0.03 | % | | | 0.01 | % | | | 0.02 | %6 |
| | | Investor Tax-Exempt Money Market | | | 0.01 | | | | 0.01 | | | | 0.01 | 7 |
The returns represent past performance. Past performance does not guarantee future results. The Fund’s investment returns will fluctuate. Current performance may be lower or higher than the performance quoted above. Please visit our Web site at www.GSAMFUNDS.com to obtain the most recent month-end returns. Performance reflects applicable fee waivers and/or expense limitations in effect during the periods shown. In their absence, performance would be reduced. Returns do not reflect the deduction of taxes that a shareholder would pay on Fund distributions or the redemption of Fund shares.
| 1 | | The Money Market Fund offers seven separate classes of shares (Class I, Administration, Service, Resource, Cash Management, Class A and Class C Shares) and the Tax-Exempt Money Market Fund offers eleven separate classes of shares (Class I, Select, Preferred, Capital, Administration, Premier, Service, Resource, Cash Management, Class A and Class C Shares), each of which is subject to different fees and expenses that affect performance and entitles shareholders to different services. The Class I Shares do not have distribution and/or service (12b-1) or administration and/or service (non-12b-1) fees. The Select, Preferred, Capital, Administration, Premier, Service, Resource, Cash Management, Class A and Class C Shares offer financial institutions the opportunity to receive fees for providing certain distribution, administrative support and/or shareholder services (as applicable). As an annualized percentage of average daily net assets, these share classes pay combined distribution and/or service (12b-1) or administration and/or service (non-12b-1) fees (as applicable) at the following contractual rates: Select Shares pay 0.03%, Preferred Shares pay 0.10%, Capital Shares pay 0.15%, Administration Shares pay 0.25%, Premier Shares pay 0.35%, Service Shares pay 0.50%, Resource Shares pay 0.65%, Cash Management Shares pay 0.80%, Class A Shares pay 0.25%, and Class C Shares pay 1.00%. If these fees were reflected in the above performance, performance would have been reduced. In addition, the Fund’s performance does not reflect the deduction of any applicable sales charges. |
| 2 | | The investment adviser may contractually agree to waive or reimburse certain fees and expenses until a specified date. The investment adviser may also voluntarily waive certain fees and expenses, and such voluntary waivers may be discontinued or modified at any time without notice. The performance shown above reflects any waivers or reimbursements that were in effect for all or a portion of the periods shown. When waivers or reimbursements are in place, the Fund’s operating expenses are reduced and the Fund’s yield and total returns to the shareholder are increased. |
| 3 | | The net asset value (“NAV”) represents the net assets of the class of the Fund (ex-dividend) divided by the total number of shares of the class outstanding. A Fund’s total return assumes the reinvestment of dividends and other distributions. |
| 4 | | The SEC 7-Day Current Yield is calculated in accordance with securities industry regulations and does not include net capital gains. SEC 7-Day Current Yield may differ slightly from the actual distribution rate of a given Fund because of the exclusion of distributed capital gains, which are non-recurring. The SEC 7-Day Current Yield more closely reflects a Fund’s current earnings than do the Fund Total Return figures. |
| 5 | | Source: iMoneyNet, Inc. May 2021. The iMoneyNet Institutional Average represents total return. |
| 6 | | First Tier Retail–Category includes only non-government retail funds that also are not holding any second-tier securities. Portfolio holdings of first-tier funds include US Treasury, US other, repos, time deposits, domestic bank obligations, foreign bank obligations, first-tier commercial paper, floating rate notes and asset-backed commercial paper. |
| 7 | | Tax-Free National Retail–Category includes all retail national and state tax-free and municipal money funds. Portfolio holdings of tax-free funds include rated and unrated demand notes, rated and unrated general market notes, commercial paper, put bonds—6 months & less, put bonds—over 6 months, alternative minimum tax paper and other tax-free holdings. Consists of all funds in the National Tax-Free Retail and State-Specific Retail categories. |
1
YIELD SUMMARY
| | | | | | | | | | | | | | | | | | | | | | |
| | SUMMARY OF THE CLASS I SHARES AS OF 5/31/21 | |
| | | | | | |
| | | Fund | | 7-Day
Dist. Yield8 | | | SEC 7-Day
Effective
Yield9 | | | 30-Day
Average
Yield10 | | | Weighted
Avg. Maturity
(days)11 | | | Weighted
Avg. Life
(days)12 | |
| | | | | | |
| | Investor Money Market | | | 0.09 | % | | | 0.01 | % | | | 0.09 | % | | | 22 | | | | 40 | |
| | | Investor Tax-Exempt Money Market | | | 0.01 | | | | 0.01 | | | | 0.01 | | | | 8 | | | | 8 | |
The Yields represent past performance. Past performance does not guarantee future results. Current performance may be lower or higher than the performance quoted above.
Yields reflect fee waivers and expense limitations in effect and will fluctuate as market conditions change. Please visit our Web site at www.GSAMFUNDS.com to obtain the most recent month-end performance.
| 8 | | The 7-Day Distribution Yield is an annualized measure of a Fund’s dividends per share, divided by the price per share. This yield includes capital gain/loss distribution, if any. This is not an SEC Yield. |
| 9 | | The SEC 7-Day Effective Yield is calculated in accordance with securities industry regulations and does not include net capital gains. The SEC 7-Day Effective Yield assumes reinvestment of dividends for one year. |
| 10 | | The 30-Day Average Yield is a net annualized yield of 30 days back from the current date listed. This yield includes capital gain/loss distribution. This is not an SEC Yield. |
| 11 | | A Fund’s weighted average maturity (WAM) is an average of the effective maturities of all securities held in the portfolio, weighted by each security’s percentage of net assets. This must not exceed 60 days as calculated under SEC Rule 2a-7. |
| 12 | | A Fund’s weighted average life (WAL) is an average of the final maturities of all securities held in the portfolio, weighted by each security’s percentage of net assets. This must not exceed 120 days as calculated under SEC Rule 2a-7. |
For more information about your Fund, please refer to www.GSAMFUNDS.com. There, you can learn more about your Fund’s investment strategies, holdings, and performance.
2
SECTOR ALLOCATIONS
| | | | | | |
| | INVESTOR MONEY MARKET FUND* | | | | |
| | |
| | | As of May 31, 2021 | | | |
| | |
| | | Security Type | | Percentage of Net Assets | |
| | |
| | Certificates of Deposit - Eurodollar | | | 0.6 | % |
| | |
| | Certificates of Deposit - Yankeedollar | | | 5.3 | |
| | |
| | Commercial Paper & Corporate Obligations | | | 32.2 | |
| | |
| | Repurchase Agreements | | | 25.1 | |
| | |
| | Time Deposits | | | 9.3 | |
| | |
| | U.S. Government Agency Obligations | | | 0.8 | |
| | |
| | U.S. Treasury Obligations | | | 16.2 | |
| | |
| | | Variable Rate Municipal Debt Obligations | | | 8.9 | |
| | |
| | | As of November 30, 2020 | | | |
| | |
| | | Security Type | | Percentage of
Net Assets | |
| | |
| | Certificates of Deposit - Eurodollar | | | 0.5 | % |
| | |
| | Certificates of Deposit - Yankeedollar | | | 4.3 | |
| | |
| | Commercial Paper & Corporate Obligations | | | 15.6 | |
| | |
| | Repurchase Agreements | | | 26.9 | |
| | |
| | U.S. Government Agency Obligations | | | 0.4 | |
| | |
| | U.S. Treasury Obligations | | | 42.0 | |
| | |
| | | Variable Rate Municipal Debt Obligations | | | 11.6 | |
| * | | The Fund is actively managed and, as such, its portfolio composition may differ over time. The percentage shown for each investment category reflects the value (based on amortized cost) of investments in that category as a percentage of net assets. Figures in the above table may not sum to 100% due to the exclusion of other assets and liabilities. |
3
SECTOR ALLOCATIONS
| | | | | | |
| | INVESTOR TAX-EXEMPT MONEY MARKET FUND* | | | | |
| | |
| | | As of May 31, 2021 | | | |
| | |
| | | Security Type | | Percentage of
Net Assets | |
| | |
| | Commercial Paper | | | 11.4 | % |
| | |
| | Revenue Anticipation Notes | | | 0.2 | |
| | |
| | | Variable Rate Obligations | | | 88.1 | |
| | |
| | | As of November 30, 2020 | | | |
| | |
| | | Security Type | | Percentage of
Net Assets | |
| | |
| | Commercial Paper | | | 15.8 | % |
| | |
| | General Obligation | | | 7.5 | |
| | |
| | Revenue Anticipation Notes | | | 1.0 | |
| | |
| | | Variable Rate Obligations | | | 74.2 | |
| * | | The Fund is actively managed and, as such, its portfolio composition may differ over time. The percentage shown for each investment category reflects the value (based on amortized cost) of investments in that category as a percentage of net assets. Figures in the above table may not sum to 100% due to the exclusion of other assets and liabilities. |
4
INVESTOR MONEY MARKET FUND
Schedule of Investments
May 31, 2021 (Unaudited)
| | | | | | | | | | | | | | |
Principal
Amount | | | Interest
Rate | | | Maturity
Date | | | Amortized Cost | |
|
| Commercial Paper and Corporate Obligations – 32.2% | |
| | Adventist Health System/West | |
| $ | 5,000,000 | | | | 0.132 | % | | | 08/19/21 | | | $ | 4,998,574 | |
| | Agricultural Bank of China Ltd. | |
| | 3,365,000 | | | | 0.208 | | | | 08/24/21 | | | | 3,363,390 | |
| | Albion Capital LLC | |
| | 15,000,000 | | | | 0.101 | | | | 06/04/21 | | | | 14,999,875 | |
| | 1,959,000 | | | | 0.183 | | | | 07/27/21 | | | | 1,958,451 | |
| | Antalis | |
| | 5,000,000 | | | | 0.172 | | | | 08/04/21 | | | | 4,998,489 | |
| | 7,323,000 | | | | 0.172 | | | | 08/11/21 | | | | 7,320,545 | |
| | Barclays US CCP Funding LLC | |
| | 8,000,000 | | | | 0.106 | | | | 06/14/21 | | | | 7,999,697 | |
| | 1,823,000 | | | | 0.172 | | | | 08/03/21 | | | | 1,822,458 | |
| | 5,356,000 | | | | 0.172 | | | | 08/04/21 | | | | 5,354,381 | |
| | 8,000,000 | | | | 0.157 | | | | 08/13/21 | | | | 7,997,486 | |
| | Barton Capital S.A. | |
| | 15,000,000 | | | | 0.152 | | | | 07/06/21 | | | | 14,997,813 | |
| | Bedford Row Funding Corp. | |
| | 5,000,000 | | | | 0.132 | | | | 08/04/21 | | | | 4,998,844 | |
| | BNG Bank N.V. | |
| | 12,500,000 | | | | 0.081 | | | | 06/03/21 | | | | 12,499,944 | |
| | BNP Paribas | |
| | 12,000,000 | | | | 0.020 | | | | 06/01/21 | | | | 12,000,000 | |
| | 5,000,000 | | | | 0.152 | | | | 07/12/21 | | | | 4,999,146 | |
| | 7,000,000 | | | | 0.152 | | | | 07/13/21 | | | | 6,998,775 | |
| | BNZ International Funding Ltd. | |
| | 10,000,000 | | | | 0.142 | | | | 07/27/21 | | | | 9,997,822 | |
| | Cancara Asset Securitisation LLC | |
| | 10,000,000 | | | | 0.122 | | | | 07/06/21 | | | | 9,998,833 | |
| | Chariot Funding LLC | |
| | 15,100,000 | | | | 0.132 | | | | 06/11/21 | | | | 15,099,455 | |
| | 5,000,000 | | | | 0.091 | | | | 07/02/21 | | | | 4,999,612 | |
| | Chesham Finance Ltd. – Series II | |
| | 15,000,000 | | | | 0.132 | | | | 06/01/21 | | | | 15,000,000 | |
| | Chesham Finance Ltd. – Series III | |
| | 8,000,000 | | | | 0.061 | | | | 06/01/21 | | | | 8,000,000 | |
| | Chesham Finance Ltd. – Series V | |
| | 4,000,000 | | | | 0.061 | | | | 06/01/21 | | | | 4,000,000 | |
| | China Construction Bank Corp. | |
| | 3,998,000 | | | | 0.243 | | | | 06/23/21 | | | | 3,997,414 | |
| | CNPC Finance (HK) Ltd. | |
| | 15,000,000 | | | | 0.264 | | | | 06/01/21 | | | | 15,000,000 | |
| | Collateralized Commercial Paper V Co., LLC | |
| | 13,624,000 | | | | 0.183 | | | | 06/21/21 | | | | 13,622,637 | |
| | 9,410,000 | | | | 0.152 | | | | 07/16/21 | | | | 9,408,236 | |
| | Columbia Funding Company, LLC | |
| | 5,000,000 | | | | 0.162 | | | | 07/20/21 | | | | 4,998,911 | |
| | DBS Bank Ltd. | |
| | 6,702,000 | | | | 0.142 | | | | 07/01/21 | | | | 6,701,218 | |
| | 5,121,000 | | | | 0.147 | | | | 07/09/21 | | | | 5,120,216 | |
| | Dexia Credit Local | |
| | 7,000,000 | | | | 0.142 | | | | 07/16/21 | | | | 6,998,775 | |
| DZ Bank AG Deutsche Zentral-Genossenschaftsbank, Frankfurt
Am Main |
|
| | 18,000,000 | | | | 0.020 | | | | 06/01/21 | | | | 18,000,000 | |
| | Federation des Caisses Desjardins du Quebec | |
| | 5,000,000 | | | | 0.147 | | | | 07/02/21 | | | | 4,999,376 | |
| | 15,000,000 | | | | 0.101 | | | | 07/12/21 | | | | 14,998,291 | |
| | |
|
| Commercial Paper and Corporate Obligations – (continued) | |
| | First Abu Dhabi Bank P.J.S.C. | |
| 10,000,000 | | | | 0.162 | | | | 07/09/21 | | | | 9,998,311 | |
| | 6,078,000 | | | | 0.162 | | | | 08/02/21 | | | | 6,076,325 | |
| | 5,000,000 | | | | 0.152 | | | | 08/19/21 | | | | 4,998,354 | |
| | FMS Wertmanagement | |
| | 11,138,000 | | | | 0.142 | | | | 06/15/21 | | | | 11,137,394 | |
| | 4,436,000 | | | | 0.147 | | | | 07/08/21 | | | | 4,435,339 | |
| | Industrial & Commercial Bank of China Ltd.-New York Branch | |
| | 5,410,000 | | | | 0.243 | | | | 06/15/21 | | | | 5,409,495 | |
| | 2,811,000 | | | | 0.243 | | | | 06/22/21 | | | | 2,810,607 | |
| | ING (United States) Funding LLC | |
| | 7,000,000 | | | | 0.122 | | | | 08/18/21 | | | | 6,998,180 | |
| | Ionic Capital II Trust | |
| | 9,088,000 | | | | 0.183 | | | | 06/09/21 | | | | 9,087,637 | |
| | 5,000,000 | | | | 0.183 | | | | 07/01/21 | | | | 4,999,250 | |
| | KfW | |
| | 6,000,000 | | | | 0.147 | | | | 06/01/21 | | | | 6,000,000 | |
| | Liberty Street Funding LLC | |
| | 5,000,000 | | | | 0.132 | | | | 08/05/21 | | | | 4,998,826 | |
| | Macquarie Bank Ltd. | |
| | 5,000,000 | | | | 0.152 | | | | 07/16/21 | | | | 4,999,062 | |
| | 7,000,000 | | | | 0.142 | | | | 08/18/21 | | | | 6,997,877 | |
| | Matchpoint Finance PLC | |
| | 6,040,000 | | | | 0.152 | | | | 07/06/21 | | | | 6,039,119 | |
| | Nationwide Building Society | |
| | 15,000,000 | | | | 0.066 | | | | 06/09/21 | | | | 14,999,784 | |
| | 7,000,000 | | | | 0.061 | | | | 07/02/21 | | | | 6,999,638 | |
| | Nederlandse Waterschapsbank N.V. | |
| | 11,000,000 | | | | 0.056 | | | | 06/25/21 | | | | 10,999,597 | |
| | 7,863,000 | | | | 0.051 | | | | 06/28/21 | | | | 7,862,892 | |
| | Nieuw Amsterdam Receivables Corp. | |
| | 5,556,000 | | | | 0.142 | | | | 06/11/21 | | | | 5,555,784 | |
| | 15,000,000 | | | | 0.152 | | | | 07/22/21 | | | | 14,996,812 | |
| | 5,000,000 | | | | 0.132 | | | | 08/02/21 | | | | 4,998,881 | |
| | NRW.Bank | |
| | 10,000,000 | | | | 0.041 | | | | 06/21/21 | | | | 9,999,778 | |
| | Salisbury Receivables Company LLC | |
| | 6,263,000 | | | | 0.162 | | | | 06/11/21 | | | | 6,262,722 | |
| | Sheffield Receivables Company LLC | |
| | 5,000,000 | | | | 0.142 | | | | 08/02/21 | | | | 4,998,794 | |
| | Sumitomo Mitsui Trust Bank, Ltd.-Singapore Branch | |
| | 10,000,000 | | | | 0.091 | | | | 08/31/21 | | | | 9,997,725 | |
| | Versailles Commercial Paper LLC | |
| | 6,338,000 | | | | 0.172 | | | | 06/10/21 | | | | 6,337,731 | |
| | Victory Receivables Corp. | |
| | 10,000,000 | | | | 0.152 | | | | 07/07/21 | | | | 9,998,500 | |
| | 10,000,000 | | | | 0.142 | | | | 07/27/21 | | | | 9,997,822 | |
| | 5,000,000 | | | | 0.142 | | | | 08/03/21 | | | | 4,998,775 | |
| | 5,000,000 | | | | 0.091 | | | | 08/25/21 | | | | 4,998,938 | |
| | |
| TOTAL COMMERCIAL PAPER AND
CORPORATE OBLIGATIONS |
| | $ | 517,238,613 | |
| | |
| | |
|
| Certificate of Deposit-Eurodollar – 0.6% | |
| | Mitsubishi UFJ Trust and Banking Corp.-London Branch | |
| $ | 8,000,000 | | | | 0.195 | % | | | 08/03/21 | | | $ | 7,997,271 | |
| | |
| | |
| The accompanying notes are an integral part of these financial statements. | | 5 |
INVESTOR MONEY MARKET FUND
Schedule of Investments (continued)
May 31, 2021 (Unaudited)
| | | | | | | | | | | | | | |
Principal
Amount | | | Interest
Rate | | | Maturity
Date | | | Amortized Cost | |
|
| Certificates of Deposit-Yankeedollar – 5.3% | |
| | Mitsubishi UFJ Trust and Banking Corp. | |
| $ | 7,500,000 | | | | 0.150 | % | | | 07/16/21 | | | $ | 7,500,000 | |
| | National Bank of Kuwait S.A.K.P | |
| | 18,000,000 | | | | 0.070 | | | | 06/03/21 | | | | 18,000,000 | |
| | 4,696,000 | | | | 0.320 | | | | 06/09/21 | | | | 4,696,000 | |
| | 3,054,000 | | | | 0.320 | | | | 06/25/21 | | | | 3,054,000 | |
| | 3,953,000 | | | | 0.200 | | | | 07/26/21 | | | | 3,953,000 | |
| | 5,000,000 | | | | 0.290 | | | | 08/20/21 | | | | 5,000,000 | |
| | Norinchukin Bank (The) | |
| | 5,000,000 | | | | 0.070 | | | | 07/02/21 | | | | 5,000,000 | |
| | 15,000,000 | | | | 0.170 | | | | 07/06/21 | | | | 15,000,000 | |
| | Sumitomo Mitsui Banking Corp. | |
| | 16,000,000 | | | | 0.080 | | | | 06/14/21 | | | | 16,000,000 | |
| | Sumitomo Mitsui Trust Bank, Ltd. | |
| | 7,500,000 | | | | 0.150 | | | | 07/16/21 | | | | 7,500,000 | |
| | |
| TOTAL CERTIFICATES OF
DEPOSIT-YANKEEDOLLAR |
| | $ | 85,703,000 | |
| | |
| | |
|
| Time Deposits – 9.3% | |
| | Banco Santander, S.A. | |
| $ | 50,000,000 | | | | 0.050 | % | | | 06/01/21 | | | $ | 50,000,000 | |
| | Credit Agricole Corporate And Investment Bank | |
| | 50,000,000 | | | | 0.030 | | | | 06/01/21 | | | | 50,000,000 | |
| | Erste Group Bank AG-New York Branch | |
| | 50,000,000 | | | | 0.050 | | | | 06/01/21 | | | | 50,000,000 | |
| | |
| | TOTAL TIME DEPOSIT | | | $ | 150,000,000 | |
| | |
| | |
|
| U.S. Government Agency Obligations – 0.8% | |
| | U.S. International Development Finance Corp. | |
| $ | 4,000,000 | | | | 0.000 | % | | | 01/26/22 | | | $ | 4,003,039 | |
| U.S. International Development Finance Corp. (3 Mo. U.S. T-Bill
+ 0.00%) |
|
| | 2,200,000 | | | | 0.008 | (a) | | | 06/07/21 | | | | 2,200,000 | |
| | 3,000,000 | | | | 0.090 | (a) | | | 06/07/21 | | | | 3,000,000 | |
| | 4,000,000 | | | | 0.100 | (a) | | | 06/07/21 | | | | 4,000,000 | |
| | |
| TOTAL U.S. GOVERNMENT AGENCY
OBLIGATIONS |
| | $ | 13,203,039 | |
| | |
| | |
|
| U.S. Treasury Obligations – 16.2% | |
| | United States Treasury Bills | |
| $ | 16,000,000 | | | | 0.096 | % | | | 06/01/21 | | | $ | 16,000,000 | |
| | 8,959,000 | | | | 0.091 | | | | 06/22/21 | | | | 8,958,530 | |
| | 22,000,000 | | | | 0.081 | | | | 07/06/21 | | | | 21,998,289 | |
| | 20,000,000 | | | | 0.091 | | | | 07/08/21 | | | | 19,998,150 | |
| | 10,000,000 | | | | 0.091 | | | | 07/15/21 | | | | 9,998,900 | |
| | 20,000,000 | | | | 0.096 | | | | 07/22/21 | | | | 19,997,308 | |
| | 25,000,000 | | | | 0.086 | | | | 07/29/21 | | | | 24,996,576 | |
| | 55,000,000 | | | | 0.071 | | | | 08/05/21 | | | | 54,993,049 | |
| | 27,000,000 | | | | 0.061 | | | | 08/19/21 | | | | 26,996,445 | |
| United States Treasury Floating Rate Note (3 Mo. U.S. T-Bill
MMY + 0.03%) |
|
| | 31,500,000 | | | | 0.054 | (a) | | | 04/30/23 | | | | 31,501,240 | |
| | |
|
| U.S. Treasury Obligations – (continued) | |
| United States Treasury Floating Rate Note (3 Mo. U.S. T-Bill
MMY + 0.05%) |
|
| 12,000,000 | | | | 0.069 | (a) | | | 01/31/23 | | | | 12,000,811 | |
| | United States Treasury Notes | |
| | 560,000 | | | | 1.125 | | | | 06/30/21 | | | | 560,459 | |
| | 4,960,000 | | | | 2.625 | | | | 07/15/21 | | | | 4,975,177 | |
| | 1,200,000 | | | | 1.125 | | | | 07/31/21 | | | | 1,202,026 | |
| | 2,200,000 | | | | 2.125 | | | | 08/15/21 | | | | 2,209,233 | |
| | 2,100,000 | | | | 1.125 | | | | 08/31/21 | | | | 2,105,326 | |
| | 600,000 | | | | 1.500 | | | | 08/31/21 | | | | 602,081 | |
| | 1,100,000 | | | | 2.000 | | | | 08/31/21 | | | | 1,105,199 | |
| | |
| TOTAL U.S. TREASURY
OBLIGATIONS |
| | $ | 260,198,799 | |
| | |
| | |
|
| Variable Rate Municipal Debt Obligations(b) – 8.9% | |
| Alaska Housing Finance Corp. VRDN RB Refunding for State
Capital Project Bonds II Series 2017 B |
|
| $ | 5,000,000 | | | | 0.080 | % | | | 06/07/21 | | | $ | 5,000,000 | |
| Alaska Housing Finance Corp. VRDN RB Refunding for State
Capital Project Bonds II Series 2017 B |
|
| | 2,000,000 | | | | 0.140 | | | | 06/07/21 | | | | 2,000,000 | |
| City of Colorado Springs Utilities System VRDN RB
Series 2008 A (U.S. Bank N.A., SPA) |
|
| | 4,365,000 | | | | 0.070 | | | | 06/07/21 | | | | 4,365,000 | |
| City of Portland, Maine GO VRDN for Taxable Pension Bonds
Series 2001 RMKT (TB Bank N.A., LOC) |
|
| | 10,305,000 | | | | 0.090 | | | | 06/07/21 | | | | 10,305,000 | |
| Colorado Housing And Finance Authority Single Family
Mortgage Bonds Class I VRDN RB 2021 Refunding Series C-2
(GNMA Collat., FHLB, SPA) |
|
| | 2,230,000 | | | | 0.080 | | | | 06/07/21 | | | | 2,230,000 | |
| Connecticut Housing Finance Authority VRDN RB Housing
Mortgage Finance Program Refunding Series 2016
Subseries E-3 RMKT (State Street Bank & Trust Co., SPA) |
|
| | 5,000,000 | | | | 0.030 | | | | 06/07/21 | | | | 5,000,000 | |
| Connecticut Housing Finance Authority VRDN RB Housing
Mortgage Finance Program Refunding Series 2017
Subseries A-3 RMKT (State Street Bank & Trust Co., SPA) |
|
| | 5,000,000 | | | | 0.030 | | | | 06/07/21 | | | | 5,000,000 | |
| East Baton Rouge Parish IDB, Inc. VRDN RB for ExxonMobil
Project Gulf Opportunity Zone Bonds Series 2010 A |
|
| | 5,169,000 | | | | 0.020 | | | | 06/01/21 | | | | 5,168,998 | |
| Michigan Finance Authority VRDN RB Refunding for School
Loan Revolving Fund Series 2019 C (Bank of America N.A.,
LOC) |
|
| | 15,100,000 | | | | 0.100 | | | | 06/07/21 | | | | 15,100,000 | |
| Ohio Higher Educational Facility Commission VRDN RB
Refunding for Cleveland Clinic Health System Series 2008 B-4
RMKT (Barclays Bank PLC, SPA) |
|
| | 5,000,000 | | | | 0.010 | | | | 06/01/21 | | | | 5,000,000 | |
| Providence Health & Services Obligated Group VRDN RB
Series 12-E (U.S. Bank N.A., SPA) |
|
| | 24,880,000 | | | | 0.120 | | | | 06/07/21 | | | | 24,880,000 | |
| Providence St. Joseph Health Obligated Group VRDN
Series 16-G (Bank of Tokyo-Mitsubishi UFJ, LOC) |
|
| | 17,000,000 | | | | 0.100 | | | | 06/07/21 | | | | 17,000,000 | |
| | |
| | |
| 6 | | The accompanying notes are an integral part of these financial statements. |
INVESTOR MONEY MARKET FUND
| | | | | | | | | | | | | | |
Principal
Amount | | | Interest
Rate | | | Maturity
Date | | | Amortized Cost | |
|
| Variable Rate Municipal Debt Obligations(b) – (continued) | |
| Regents of the University of California VRDN RB Taxable
Series 2011 Z-1 |
|
| $ | 15,530,000 | | | | 0.080 | % | | | 06/07/21 | | | $ | 15,530,000 | |
| State of Texas Veterans VRDN GO Bonds, Series 2012 B RMKT
(State Street Bank & Trust Co., SPA) |
|
| | 22,750,000 | | | | 0.070 | | | | 06/07/21 | | | | 22,750,000 | |
| The Regents of the University of California Medical Center
Pooled VRDN RB Series 2013 K RMKT |
|
| | 4,000,000 | | | | 0.010 | | | | 06/01/21 | | | | 4,000,000 | |
| | |
| TOTAL VARIABLE RATE MUNICIPAL
DEBT OBLIGATIONS |
| | $ | 143,328,998 | |
| | |
| TOTAL INVESTMENTS BEFORE
REPURCHASE AGREEMENTS |
| | $ | 1,177,669,720 | |
| | |
| | |
|
| Repurchase Agreements(c) – 25.1% | |
| | BNP Paribas | |
| $ | 10,000,000 | | | | 0.060 | %(d) | | | 06/07/21 | | | $ | 10,000,000 | |
| | Maturity Value: $10,003,017 | |
| | Settlement Date: 02/19/21 | |
| Collateralized by Federal Home Loan Mortgage Corp., 0.000% to
2.125%, due 12/11/25 to 03/01/42, Federal Home Loan
Mortgage Corp. Stripped Securities, 4.000% to 6.500%, due
06/01/31 to 02/15/45, Federal National Mortgage Association,
2.000% to 2.500%, due 12/01/50 to 04/01/51, Federal National
Mortgage Association Stripped Securities, 3.000% to 5.500%,
due 05/25/36 to 02/25/48, Government National Mortgage
Association, 2.319%, due 11/20/34, a U.S. Treasury Bond,
8.125%, due 08/15/21, a U.S. Treasury Inflation-Indexed Bond,
2.375%, due 01/15/25 and U.S. Treasury Notes, 0.500% to
2.250%, due 05/15/22 to 02/28/26. The aggregate market value
of the collateral, including accrued interest, was $10,306,120. |
|
| | 10,000,000 | | | | 0.060 | (d) | | | 06/07/21 | | | | 10,000,000 | |
| | Maturity Value: $10,003,100 | |
| | Settlement Date: 03/05/21 | |
| Collateralized by U.S. Treasury Bills, 0.000%, due 10/07/21 to
01/27/22, a U.S. Treasury Floating Rate Note, 0.064%, due
01/31/23, U.S. Treasury Inflation-Indexed Notes, 0.125% to
0.375%, due 01/15/23 to 01/15/27, U.S. Treasury Interest-Only
Stripped Securities, 0.000%, due 08/15/31 to 02/15/41, U.S.
Treasury Notes, 1.375% to 1.875%, due 03/31/22 to 01/31/25
and a U.S. Treasury Principal-Only Stripped Security, 0.000%,
due 02/15/43. The aggregate market value of the collateral,
including accrued interest, was $10,200,001. |
|
| | 20,000,000 | | | | 0.060 | (d) | | | 06/07/21 | | | | 20,000,000 | |
| | Maturity Value: $20,006,033 | |
| | Settlement Date: 02/19/21 | |
| Collateralized by a U.S. Treasury Bond, 8.000%, due 11/15/21, a
U.S. Treasury Inflation-Indexed Note, 0.750%, due 07/15/28,
U.S. Treasury Interest-Only Stripped Securities, 0.000%, due
02/15/33 to 02/15/48, U.S. Treasury Notes, 1.375% to 1.875%,
due 05/31/21 to 03/31/22 and U.S. Treasury Principal-Only
Stripped Securities, 0.000%, due 11/15/39 to 08/15/50. The
aggregate market value of the collateral, including accrued
interest, was $20,399,999. |
|
| | 22,000,000 | | | | 0.060 | (d) | | | 06/07/21 | | | | 22,000,000 | |
| | |
|
| Repurchase Agreements(c) – (continued) | |
| | Maturity Value: $22,006,820 | |
| | Settlement Date: 03/05/21 | |
| Collateralized by Federal Home Loan Mortgage Corp., 4.500%,
due 11/15/48, Government National Mortgage Association,
2.121%, due 01/20/48, U.S. Treasury Bonds, 2.875% to
3.000%, due 05/15/43 to 05/15/47, a U.S. Treasury Inflation-
Indexed Note, 0.250%, due 07/15/29, U.S. Treasury Interest-
Only Stripped Securities, 0.000%, due 11/15/34 to 02/15/37
and U.S. Treasury Notes, 0.250% to 1.875%, due 03/31/22 to
08/31/25. The aggregate market value of the collateral,
including accrued interest, was $22,440,101. |
|
| | Canadian Imperial Bank of Commerce | |
| 5,000,000 | | | | 0.090 | (d) | | | 06/07/21 | | | | 5,000,000 | |
| | Maturity Value: $5,002,250 | |
| | Settlement Date: 01/28/21 | |
| Collateralized by Federal Home Loan Mortgage Corp., 3.000% to
4.000%, due 07/01/48 to 06/01/50, Federal National Mortgage
Association, 2.000% to 4.500%, due 07/01/34 to 06/01/51,
Government National Mortgage Association, 4.000% to
5.000%, due 01/20/49 to 09/20/50 and a U.S. Treasury Note,
0.625%, due 11/30/27. The aggregate market value of the
collateral, including accrued interest, was $5,149,974. |
|
| | 5,000,000 | | | | 0.090 | (d) | | | 06/07/21 | | | | 5,000,000 | |
| | Maturity Value: $5,002,250 | |
| | Settlement Date: 01/29/21 | |
| Collateralized by Federal Home Loan Mortgage Corp., 3.000% to
4.000%, due 07/01/48 to 06/01/50, Federal National Mortgage
Association, 2.000% to 4.500%, due 10/01/32 to 05/01/51 and a
U.S. Treasury Note, 0.625%, due 11/30/27. The aggregate
market value of the collateral, including accrued interest, was
$5,149,965. |
|
| | |
| | Joint Account III | |
| | 152,000,000 | | | | 0.013 | | | | 06/01/21 | | | | 152,000,000 | |
| | Maturity Value: $152,000,211 | |
| | |
| | Royal Bank of Canada | |
| | 30,000,000 | | | | 0.140 | | | | 06/01/21 | | | | 30,000,000 | |
| | Maturity Value: $30,000,467 | |
| Collateralized by various corporate security issuers, 0.000% to
10.500%, due 09/10/21 to 12/31/99. The aggregate market
value of the collateral, including accrued interest, was
$31,534,745. |
|
| | 2,200,000 | | | | 0.070 | (d) | | | 06/07/21 | | | | 2,200,000 | |
| | Maturity Value: $2,200,774 | |
| | Settlement Date: 03/02/21 | |
| Collateralized by Federal Home Loan Mortgage Corp., 2.000% to
4.500%, due 12/01/29 to 05/01/51, Federal National Mortgage
Association, 2.000% to 4.000%, due 09/01/40 to 06/01/51 and
Government National Mortgage Association, 4.500%, due
10/20/49. The aggregate market value of the collateral,
including accrued interest, was $2,244,000. |
|
| | 10,000,000 | | | | 0.070 | (d) | | | 06/07/21 | | | | 10,000,000 | |
| | Maturity Value: $10,003,539 | |
| | Settlement Date: 02/08/21 | |
| Collateralized by Federal Home Loan Mortgage Corp., 2.000% to
4.500%, due 12/01/29 to 05/01/51, Federal National Mortgage
Association, 2.000% to 4.000%, due 09/01/40 to 05/01/58 and
Government National Mortgage Association, 4.500%, due
10/20/49. The aggregate market value of the collateral,
including accrued interest, was $10,199,999. |
|
| | 10,000,000 | | | | 0.070 | (d) | | | 06/07/21 | | | | 10,000,000 | |
| | |
| | |
| The accompanying notes are an integral part of these financial statements. | | 7 |
INVESTOR MONEY MARKET FUND
Schedule of Investments (continued)
May 31, 2021 (Unaudited)
| | | | | | | | | | | | | | |
Principal
Amount | | | Interest
Rate | | | Maturity
Date | | | Amortized Cost | |
|
| Repurchase Agreements(c) – (continued) | |
| | Maturity Value: $10,003,519 | |
| | Settlement Date: 02/09/21 | |
| Collateralized by Federal Home Loan Mortgage Corp., 2.000% to
5.000%, due 12/01/29 to 05/01/51, Federal National Mortgage
Association, 2.000% to 4.000%, due 09/01/40 to 05/01/58 and
Government National Mortgage Association, 4.500%, due
10/20/49. The aggregate market value of the collateral,
including accrued interest, was $10,200,001. |
|
| $ | 16,000,000 | | | | 0.070 | % (d) | | | 06/07/21 | | | $ | 16,000,000 | |
| | Maturity Value: $16,005,569 | |
| | Settlement Date: 02/11/21 | |
| Collateralized by Federal Home Loan Mortgage Corp., 2.000% to
4.500%, due 12/01/29 to 09/01/50, Federal National Mortgage
Association, 2.000% to 4.000%, due 09/01/40 to 05/01/58 and
Government National Mortgage Association, 4.500%, due
10/20/49. The aggregate market value of the collateral,
including accrued interest, was $16,320,003. |
|
| | 36,000,000 | | | | 0.070 | (d) | | | 06/07/21 | | | | 36,000,000 | |
| | Maturity Value: $36,012,600 | |
| | Settlement Date: 02/11/21 | |
| Collateralized by Federal Home Loan Mortgage Corp., 2.000% to
4.500%, due 12/01/29 to 05/01/51, Federal National Mortgage
Association, 2.000% to 4.500%, due 05/01/26 to 05/01/58 and
Government National Mortgage Association, 4.500%, due
10/20/49. The aggregate market value of the collateral,
including accrued interest, was $36,720,003. |
|
| | |
| | Scotia Capital (USA), Inc. | |
| | 24,000,000 | | | | 0.140 | | | | 06/01/21 | | | | 24,000,000 | |
| | Maturity Value: $24,000,373 | |
| Collateralized by various corporate security issuers, 0.333% to
10.125%, due 07/08/21 to 02/01/31. The aggregate market
value of the collateral, including accrued interest, was
$25,203,931. |
|
| | 24,000,000 | | | | 0.290 | | | | 06/01/21 | | | | 24,000,000 | |
| | Maturity Value: $24,000,773 | |
| Collateralized by various corporate security issuers, 0.333% to
10.125%, due 06/23/21 to 04/15/33. The aggregate market
value of the collateral, including accrued interest, was
$25,446,646. |
|
| | |
| | Wells Fargo Securities LLC | |
| | 7,000,000 | | | | 0.140 | | | | 06/01/21 | | | | 7,000,000 | |
| | Maturity Value: $7,000,109 | |
| Collateralized by various corporate security issuers, 0.000% to
3.750%, due 06/01/21 to 02/08/51. The aggregate market value
of the collateral, including accrued interest, was $7,329,412. |
|
| | 19,000,000 | | | | 0.190 | | | | 06/02/21 | | | | 19,000,000 | |
| | Maturity Value: $19,000,702 | |
| | Settlement Date: 05/26/21 | |
| Collateralized by various corporate security issuers, 0.000% to
3.625%, due 06/01/21 to 10/15/50. The aggregate market value
of the collateral, including accrued interest, was $19,894,524. |
|
| | |
| | TOTAL REPURCHASE AGREEMENTS | | | $ | 402,200,000 | |
| | |
| | TOTAL INVESTMENTS – 98.4% | | | $ | 1,579,869,720 | |
| | |
| OTHER ASSETS IN EXCESS OF
LIABILITIES – 1.6% |
| | | 25,393,562 | |
| | |
| | NET ASSETS – 100.0% | | | $ | 1,605,263,282 | |
| | |
| | |
|
| The percentage shown for each investment category reflects the value of investments in that category as a percentage of net assets. |
| |
(a) | | Variable or floating rate security. Except for floating rate notes (for which final maturity is disclosed), maturity date disclosed is the next interest reset date. Interest rate disclosed is that which is in effect on May 31, 2021. |
| |
(b) | | Rate shown is that which is in effect on May 31, 2021. Certain variable rate securities are not based on a published reference rate and spread but are determined by the issuer or agent and are based on current market conditions. |
| |
(c) | | Unless noted, all repurchase agreements were entered into on May 31, 2021. Additional information on Joint Repurchase Agreement Account III appears in the Additional Investment Information section. |
| |
(d) | | The instrument is subject to a demand feature. |
Interest rates represent either the stated coupon rate, annualized yield on date of purchase for discounted securities, or, for floating rate securities, the current reset rate, which is based upon current interest rate indices.
Maturity dates represent either the final legal maturity date on the security, the demand date for puttable securities, the date of the next interest rate reset for variable rate securities, or the prerefunded date for those types of securities.
| | |
|
Investment Abbreviations: |
FHLB | | —Insured by Federal Home Loan Bank |
GNMA | | —Insured by Government National Mortgage Association |
GO | | —General Obligation |
IDB | | —Industrial Development Board |
LOC | | —Letter of Credit |
RB | | —Revenue Bond |
RMKT | | —Remarketed |
SPA | | —Stand-by Purchase Agreement |
T-Bill | | —Treasury Bill |
VRDN | | —Variable Rate Demand Notes |
|
| | |
| 8 | | The accompanying notes are an integral part of these financial statements. |
INVESTOR TAX-EXEMPT MONEY MARKET FUND
Schedule of Investments
May 31, 2021 (Unaudited)
| | | | | | | | | | | | | | |
Principal
Amount | | | Interest
Rate | | | Maturity
Date | | | Amortized
Cost | |
|
| Municipal Debt Obligations – 99.7% | |
| Alabama – 0.8% | |
| Mobile IDB VRDN PCRB for Alabama Power Co. Barry Plant
Project Series 2008 C RMKT(a) |
|
| $ | 11,500,000 | | | | 0.130 | % | | | 06/07/21 | | | $ | 11,500,000 | |
| | |
| Alaska – 2.7% | |
| Alaska Housing Finance Corp. Home Mortgage VRDN RB
Refunding Series 2009 A RMKT (Wells Fargo Bank N.A.,
SPA)(a) |
|
| | 15,600,000 | | | | 0.050 | | | | 06/07/21 | | | | 15,600,000 | |
| Alaska Housing Finance Corp. VRDN RB Refunding for
Governmental Purpose Series 2001 B RMKT (FHLB, SPA)(a) |
|
| | 10,100,000 | | | | 0.050 | | | | 06/07/21 | | | | 10,100,000 | |
| City of Valdez Marine Terminal VRDN RB Refunding for Exxon
Pipeline Company Project Series 1985(a) |
|
| | 5,200,000 | | | | 0.020 | | | | 06/01/21 | | | | 5,200,000 | |
| City of Valdez Marine Terminal VRDN RB Refunding for
ExxonMobil Project Series 2001 (GTY AGMT - Exxon Mobil
Corp.)(a) |
|
| | 6,710,000 | | | | 0.020 | | | | 06/01/21 | | | | 6,710,000 | |
| | | | | | | | | | | | | | |
| | | | | | | | | | | | | 37,610,000 | |
| | |
| Arizona – 1.1% | |
| Arizona State University VRDN RB Refunding Series 2008 B
RMKT(a) |
|
| | 1,400,000 | | | | 0.050 | | | | 06/07/21 | | | | 1,400,000 | |
| City of Phoenix IDA Health Care Facilities VRDN RB for Mayo
Clinic Series 2014 B (Northern Trust Co., SPA)
(GTY AGMT – Mayo Clinic) |
|
| | 13,250,000 | | | | 0.020 | | | | 06/01/21 | | | | 13,250,000 | |
| | | | | | | | | | | | | | |
| | | | | | | | | | | | | 14,650,000 | |
| | |
| California – 3.8% | |
| Bay Area Toll Authority Toll Bridge VRDN RB Series 2007 A-2
RMKT (Bank of Tokyo-Mitsubishi UFJ, LOC) |
|
| | 16,500,000 | | | | 0.010 | | | | 06/07/21 | | | | 16,500,000 | |
| Metropolitan Water District of Southern California VRDN RB
Partial Refunding Series 2016 B-2 RMKT (Bank of America
N.A., SPA)(a) |
|
| | 2,300,000 | | | | 0.010 | | | | 06/01/21 | | | | 2,300,000 | |
| Metropolitan Water District of Southern California VRDN RB
Series 2017 A (PNC Bank N.A., SPA) |
|
| | 14,400,000 | | | | 0.010 | | | | 06/01/21 | | | | 14,400,000 | |
| San Francisco, California (City & County of) Lease Revenue CP
Series 1-T |
|
| | 10,000,000 | | | | 0.100 | | | | 06/30/21 | | | | 10,000,000 | |
| Santa Clara Valley Transportation Authority Sales Tax VRDN
RB Refunding for Measure A Series 2008 B RMKT (TD Bank
N.A., SPA)(a) |
|
| | 7,180,000 | | | | 0.030 | | | | 06/07/21 | | | | 7,180,000 | |
| The Regents of the University of California Medical Center
Pooled VRDN RB Series 2013 K RMKT(a) |
|
| | 2,500,000 | | | | 0.010 | | | | 06/01/21 | | | | 2,500,000 | |
| | | | | | | | | | | | | | |
| | | | | | | | | | | | | 52,880,000 | |
| | |
|
| Municipal Debt Obligations – (continued) | |
| Colorado – 3.5% | |
| City of Colorado Springs Utilities System VRDN RB for
Subordinate Lien Series 2006 B RMKT (Landesbank Hessen-
Thueringen Girozentrale, SPA)(a) |
|
| 200,000 | | | | 0.070 | | | | 06/07/21 | | | | 200,000 | |
| City of Colorado Springs Utilities System VRDN RB Series 2010
C RMKT (Barclays Bank PLC, SPA)(a) |
|
| | 8,255,000 | | | | 0.040 | | | | 06/07/21 | | | | 8,255,000 | |
| City of Colorado Springs Utilities System VRDN RB Series 2012
A (U.S. Bank N.A., SPA)(a) |
|
| | 5,530,000 | | | | 0.040 | | | | 06/07/21 | | | | 5,530,000 | |
| Colorado Housing & Finance Authority VRDN RB Refunding for
Single Family Mortgage Class I Series 2001 AA-2 (Sumitomo
Mitsui Banking Corp., LOC)(a) |
|
| | 8,500,000 | | | | 0.070 | | | | 06/07/21 | | | | 8,500,000 | |
| University of Colorado Hospital Authority VRDN RB
Series 2019 A(a) |
|
| | 26,850,000 | | | | 0.050 | | | | 06/07/21 | | | | 26,850,000 | |
| | | | | | | | | | | | | | |
| | | | | | | | | | | | | 49,335,000 | |
| | |
| Connecticut – 3.5% | |
| Connecticut Housing Finance Authority VRDN RB Housing
Mortgage Finance Program Refunding Series 2012
Subseries B-3 (Royal Bank of Canada, SPA)(a) |
|
| | 17,130,000 | | | | 0.040 | | | | 06/07/21 | | | | 17,130,000 | |
| Connecticut Housing Finance Authority VRDN RB Housing
Mortgage Finance Program Refunding Series 2013
Subseries B-6 RMKT (Sumitomo Mitsui Banking Corp.,
SPA)(a) |
|
| | 5,000,000 | | | | 0.070 | | | | 06/07/21 | | | | 5,000,000 | |
| Connecticut Housing Finance Authority VRDN RB Housing
Mortgage Finance Program Refunding Series 2016
Subseries E-3 RMKT (State Street Bank & Trust Co., SPA)(a) |
|
| | 10,000,000 | | | | 0.030 | | | | 06/07/21 | | | | 10,000,000 | |
| Connecticut Housing Finance Authority VRDN RB Housing
Mortgage Finance Program Refunding Series 2017
Subseries A-3 RMKT (State Street Bank & Trust Co., SPA)(a) |
|
| | 7,000,000 | | | | 0.030 | | | | 06/07/21 | | | | 7,000,000 | |
| Connecticut Housing Finance Authority VRDN RB Housing
Mortgage Finance Program Refunding Series 2019
Subseries B-3 (Bank of America N.A., SPA)(a) |
|
| | 4,150,000 | | | | 0.050 | | | | 06/07/21 | | | | 4,150,000 | |
| Connecticut State Health & Educational Facilities Authority
VRDN RB for Yale University Series 2001 V-2 |
|
| | 5,485,000 | | | | 0.010 | | | | 06/01/21 | | | | 5,485,000 | |
| | | | | | | | | | | | | | |
| | | | | | | | | | | | | 48,765,000 | |
| | |
| Delaware – 2.0% | |
| University of Delaware VRDN RB Refunding Series 2013 C
RMKT (TD Bank N.A., SPA)(a) |
|
| | 20,475,000 | | | | 0.020 | | | | 06/01/21 | | | | 20,475,000 | |
| University of Delaware VRDN RB Series 2004 B (Bank of
America N.A., SPA)(a) |
|
| | 7,000,000 | | | | 0.020 | | | | 06/01/21 | | | | 7,000,000 | |
| | | | | | | | | | | | | | |
| | | | | | | | | | | | | 27,475,000 | |
| | |
| | |
| The accompanying notes are an integral part of these financial statements. | | 9 |
INVESTOR TAX-EXEMPT MONEY MARKET FUND
Schedule of Investments (continued)
May 31, 2021 (Unaudited)
| | | | | | | | | | | | | | |
Principal
Amount | | | Interest
Rate | | | Maturity
Date | | | Amortized
Cost | |
|
| Municipal Debt Obligations – (continued) | |
| District of Columbia – 2.9% | |
| District of Columbia Water & Sewer Authority Public Utility
Systems VRDN RB Subordinate Lien Series 2014
Subseries B-1 (TD Bank N.A., SPA)(a) |
|
| $ | 10,350,000 | | | | 0.080 | % | | | 06/07/21 | | | $ | 10,350,000 | |
| District of Columbia Water & Sewer Authority Public Utility
Systems VRDN RB Subordinate Lien Series 2014
Subseries B-2 (TD Bank N.A., SPA)(a) |
|
| | 17,150,000 | | | | 0.050 | | | | 06/07/21 | | | | 17,150,000 | |
| Metropolitan Washington Airports Authority Airport System
VRDN RB Refunding Series 2010 C Subseries C-2 RMKT
(Sumitomo Mitsui Banking Corp., LOC)(a) |
|
| | 13,355,000 | | | | 0.030 | | | | 06/07/21 | | | | 13,355,000 | |
| | | | | | | | | | | | | | |
| | | | | | | | | | | | | 40,855,000 | |
| | |
| Florida – 2.4% | |
| Miami-Dade County IDA VRDN RB Florida Power & Light Co.
Refunding Series 2021 |
|
| | 12,385,000 | | | | 0.030 | | | | 06/01/21 | | | | 12,385,000 | |
| Orlando Utilities Commission VRDN RB Water Utility
Improvements Series 2008-2 RMKT (TD Bank N.A., SPA)(a) |
|
| | 20,725,000 | | | | 0.070 | | | | 06/07/21 | | | | 20,725,000 | |
| | | | | | | | | | | | | | |
| | | | | | | | | | | | | 33,110,000 | |
| | |
| Georgia – 1.6% | |
| Fulton County Development Authority VRDN RB Refunding for
Children’s Healthcare of Atlanta Series 2008 (PNC Bank N.A.
SPA)(a) |
|
| | 22,800,000 | | | | 0.060 | | | | 06/07/21 | | | | 22,800,000 | |
| | |
| Illinois – 3.1% | |
| Illinois Finance Authority VRDN RB for Northwestern
University Series 2008 Subseries B(a) |
|
| | 26,560,000 | | | | 0.050 | | | | 06/07/21 | | | | 26,560,000 | |
| Illinois Finance Authority VRDN RB Refunding for
Northwestern Memorial Hospital Series 2007 A-4 (U.S. Bank
N.A., SPA)(a) |
|
| | 7,800,000 | | | | 0.010 | | | | 06/01/21 | | | | 7,800,000 | |
| Illinois Housing Development Authority VRDN Homeowner
Mortgage RB Series 2018 Subseries A-2 (GNMA/FNMA/
FHLMC)(FHLB, SPA)(a) |
|
| | 4,875,000 | | | | 0.040 | | | | 06/07/21 | | | | 4,875,000 | |
| Illinois State Finance Authority VRDN RB Refunding for
Advocate Health Care Series 2008 Subseries C3A (Northern
Trust Co., SPA)(a) |
|
| | 4,000,000 | | | | 0.060 | | | | 06/07/21 | | | | 4,000,000 | |
| | | | | | | | | | | | | | |
| | | | | | | | | | | | | 43,235,000 | |
| | |
| Indiana – 2.7% | |
| Indiana Finance Authority VRDN RB Refunding for Ascension
Health Credit Group Series 2008 E-8 Convertible(a) |
|
| | 25,000,000 | | | | 0.070 | | | | 06/07/21 | | | | 25,000,000 | |
| Indiana Health Facility Financing Authority VRDN RB for
Ascension Health Subordinate Credit Group Series 2005 A-2
RMKT(a) |
|
| | 1,065,000 | | | | 0.040 | | | | 06/07/21 | | | | 1,065,000 | |
| | |
|
| Municipal Debt Obligations – (continued) | |
| Indiana – (continued) | |
| Purdue University VRDN RB for Student Facilities System
Series 2007 C(a) |
|
| 11,800,000 | | | | 0.060 | | | | 06/07/21 | | | | 11,800,000 | |
| | | | | | | | | | | | | | |
| | | | | | | | | | | | | 37,865,000 | |
| | |
| Iowa – 0.3% | |
| Iowa Finance Authority VRDN RB for Archer-Daniels-Midland
Co. Project Series 2012 1A |
|
| | 4,260,000 | | | | 0.080 | | | | 06/07/21 | | | | 4,260,000 | |
| | |
| Louisiana – 1.4% | |
| East Baton Rouge Parish IDB, Inc. VRDN RB for ExxonMobil
Project Gulf Opportunity Zone Bonds Series 2010 A(a) |
|
| | 14,000,000 | | | | 0.020 | | | | 06/01/21 | | | | 14,000,000 | |
| East Baton Rouge Parish IDB, Inc. VRDN RB for ExxonMobil
Project Gulf Opportunity Zone Bonds Series 2010 B(a) |
|
| | 6,000,000 | | | | 0.020 | | | | 06/01/21 | | | | 6,000,000 | |
| | | | | | | | | | | | | | |
| | | | | | | | | | | | | 20,000,000 | |
| | |
| Maryland – 2.0% | |
| Maryland State Economic Development Corp. VRDN RB
Refunding for Howard Hughes Medical Institute Project
Series 2008 B(a) |
|
| | 2,725,000 | | | | 0.060 | | | | 06/07/21 | | | | 2,725,000 | |
| | Montgomery County CP BANS Series 2009 A | |
| | 2,500,000 | | | | 0.100 | | | | 07/08/21 | | | | 2,500,000 | |
| | Montgomery County IAM CP BANS Series 2010 A | |
| | 20,000,000 | | | | 0.100 | | | | 07/08/21 | | | | 20,000,000 | |
| Washington Suburban Sanitary District GO VRDN BANS
Series 2015 A-2 (County Guarantee)(TD Bank N.A., SPA)(a) |
|
| | 1,300,000 | | | | 0.040 | | | | 06/07/21 | | | | 1,300,000 | |
| Washington Suburban Sanitary District GO VRDN BANS
Series B-4 (County Guarantee)(State Street Bank & Trust Co.,
SPA) |
|
| | 1,800,000 | | | | 0.060 | | | | 06/07/21 | | | | 1,800,000 | |
| | | | | | | | | | | | | | |
| | | | | | | | | | | | | 28,325,000 | |
| | |
| Massachusetts – 7.5% | |
| Massachusetts Bay Transportation Authority VRDN RB
Refunding for General Transportation System Series 2000 A-1
(Barclays Bank PLC, SPA)(a) |
|
| | 24,615,000 | | | | 0.050 | | | | 06/07/21 | | | | 24,615,000 | |
| Massachusetts Bay Transportation Authority VRDN RB
Refunding for General Transportation System Series 2000
Subseries A-2 (Barclays Bank PLC, SPA)(a) |
|
| | 13,400,000 | | | | 0.060 | | | | 06/07/21 | | | | 13,400,000 | |
| Massachusetts Development Finance Agency VRDN RB Tufts
University Series 2018 R (U.S. Bank N.A., SPA) |
|
| | 15,600,000 | | | | 0.010 | | | | 06/01/21 | | | | 15,600,000 | |
| Massachusetts Health & Educational Facilities Authority VRDN
RB for Harvard University Series 2000 Y(a) |
|
| | 1,925,000 | | | | 0.030 | | | | 06/07/21 | | | | 1,925,000 | |
| Massachusetts Health & Educational Facilities Authority VRDN
RB for Massachusetts General Brigham, Inc. Series P-2 RMKT
(JPMorgan Chase Bank N.A., SPA)(a) |
|
| | 1,500,000 | | | | 0.050 | | | | 06/07/21 | | | | 1,500,000 | |
| | |
| | |
| 10 | | The accompanying notes are an integral part of these financial statements. |
INVESTOR TAX-EXEMPT MONEY MARKET FUND
| | | | | | | | | | | | | | |
Principal
Amount | | | Interest
Rate | | | Maturity
Date | | | Amortized
Cost | |
|
| Municipal Debt Obligations – (continued) | |
| Massachusetts – (continued) | |
| Massachusetts Health & Educational Facilities Authority VRDN
RB for Massachusetts Institute of Technology Series 2001 J-1 |
|
| $ | 200,000 | | | | 0.030 | % | | | 06/07/21 | | | $ | 200,000 | |
| Massachusetts Health & Educational Facilities Authority VRDN
RB for Massachusetts Institute of Technology Series 2001 J-2 |
|
| | 5,955,000 | | | | 0.030 | | | | 06/07/21 | | | | 5,955,000 | |
| Massachusetts Health & Educational Facilities Authority VRDN
RB for Museum of Fine Arts Series 2007 A-1 RMKT (Bank of
America N.A., SPA)(a) |
|
| | 6,395,000 | | | | 0.020 | | | | 06/01/21 | | | | 6,395,000 | |
| Massachusetts Health & Educational Facilities Authority VRDN
RB Refunding for Harvard University Series 1999 R |
|
| | 8,450,000 | | | | 0.010 | | | | 06/01/21 | | | | 8,450,000 | |
| Massachusetts Health & Educational Facilities Authority VRDN
RB Refunding for Partners Healthcare System Series 2005 F-3
(TD Bank N.A., LOC)(a) |
|
| | 1,400,000 | | | | 0.050 | | | | 06/07/21 | | | | 1,400,000 | |
| Massachusetts Housing Finance Agency VRDN RB Single
Family Housing Refunding Series 200 RMKT (UBS AG, SPA) |
|
| | 6,000,000 | | | | 0.060 | | | | 06/07/21 | | | | 6,000,000 | |
| Massachusetts Water Resources Authority VRDN RB Refunding
Subordinated General Series 2008 A-3 RMKT (Wells Fargo
Bank N.A. SPA)(a) |
|
| | 4,000,000 | | | | 0.060 | | | | 06/07/21 | | | | 4,000,000 | |
| Massachusetts Water Resources Authority VRDN RB Refunding
Subordinated General Series 2008 E (JPMorgan Chase Bank
N.A., SPA)(a) |
|
| | 14,335,000 | | | | 0.050 | | | | 06/07/21 | | | | 14,335,000 | |
| | | | | | | | | | | | | | |
| | | | | | | | | | | | | 103,775,000 | |
| | |
| Michigan – 2.3% | |
| Michigan Finance Authority VRDN RB Refunding for Hospital
Project Ascension Senior Credit Group Series 2016 E-2(a) |
|
| | 10,465,000 | | | | 0.070 | | | | 06/07/21 | | | | 10,465,000 | |
| Michigan State University VRDN RB General Series 2000 A
(Northern Trust Co., SPA)(a) |
|
| | 215,000 | | | | 0.060 | | | | 06/07/21 | | | | 215,000 | |
| Regents of the University of Michigan VRDN RB Refunding
Series General 2008 B RMKT(a) |
|
| | 300,000 | | | | 0.030 | | | | 06/07/21 | | | | 300,000 | |
| | University of Michigan CP Series B | |
| | 15,000,000 | | | | 0.130 | | | | 06/17/21 | | | | 15,000,000 | |
| | University of Michigan CP Series L-1 | |
| | 6,500,000 | | | | 0.080 | | | | 06/02/21 | | | | 6,500,000 | |
| | | | | | | | | | | | | | |
| | | | | | | | | | | | | 32,480,000 | |
| | |
| Minnesota – 2.4% | |
| Minnesota Housing Finance Agency VRDN Residential Housing
Finance RB Refunding Series 2019 D (GNMA/FNMA/
FHLMC) (Royal Bank of Canada, SPA)(a) |
|
| | 8,550,000 | | | | 0.050 | | | | 06/07/21 | | | | 8,550,000 | |
| Rochester Health Care Facilities CP for Mayo Clinic
Series 2021 3-A2 |
|
| | 25,000,000 | | | | 0.130 | | | | 06/07/21 | | | | 25,000,000 | |
| | | | | | | | | | | | | | |
| | | | | | | | | | | | | 33,550,000 | |
| | |
|
| Municipal Debt Obligations – (continued) | |
| Mississippi – 2.7% | |
| Jackson County Port Facilities VRDN RB Refunding for Chevron
USA, Inc. Project Series 1993(a) |
|
| 7,000,000 | | | | 0.010 | | | | 06/01/21 | | | | 7,000,000 | |
| Mississippi Business Finance Commission Gulf Opportunity Zone
VRDN RB for Chevron USA, Inc. Project Series 2010 C (GTY
AGMT – Chevron Corp.)(a) |
|
| | 3,170,000 | | | | 0.060 | | | | 06/07/21 | | | | 3,170,000 | |
| Mississippi Business Finance Commission Gulf Opportunity Zone
VRDN RB for Chevron USA, Inc. Project Series 2010 H (GTY
AGMT – Chevron Corp.)(a) |
|
| | 1,300,000 | | | | 0.010 | | | | 06/01/21 | | | | 1,300,000 | |
| Mississippi Business Finance Commission Gulf Opportunity Zone
VRDN RB for Chevron USA, Inc. Project Series 2010 I (GTY
AGMT- Chevron Corp.) |
|
| | 7,555,000 | | | | 0.010 | | | | 06/01/21 | | | | 7,555,000 | |
| Mississippi Business Finance Commission Gulf Opportunity Zone
VRDN RB for Chevron USA, Inc. Project Series 2010 K (GTY
AGMT – Chevron Corp.)(a) |
|
| | 850,000 | | | | 0.010 | | | | 06/01/21 | | | | 850,000 | |
| Mississippi Business Finance Commission Gulf Opportunity Zone
VRDN RB for Chevron USA, Inc. Project Series 2011 G (GTY
AGMT – Chevron Corp.)(a) |
|
| | 8,070,000 | | | | 0.010 | | | | 06/01/21 | | | | 8,070,000 | |
| Mississippi Development Bank VRDN Special Obligation RB
Jackson County Industrial Water System Project Series 2009
(GTY AGMT – Chevron Corp.)(a) |
|
| | 10,000,000 | | | | 0.010 | | | | 06/01/21 | | | | 10,000,000 | |
| | | | | | | | | | | | | | |
| | | | | | | | | | | | | 37,945,000 | |
| | |
| Missouri – 1.2% | |
| Missouri Health & Educational Facilities Authority VRDN RB
Refunding for Ascension Health Credit Group Series 2003 C-2
RMKT(a) |
|
| | 115,000 | | | | 0.030 | | | | 06/07/21 | | | | 115,000 | |
| Missouri Health & Educational Facilities Authority VRDN RB
Refunding for BJC Health System Series 2008 A (U.S. Bank
N.A., LIQ)(a) |
|
| | 1,350,000 | | | | 0.040 | | | | 06/07/21 | | | | 1,350,000 | |
| Missouri Health & Educational Facilities Authority VRDN RB
Refunding for BJC Health System Series 2008 D(a) |
|
| | 15,000,000 | | | | 0.040 | | | | 06/07/21 | | | | 15,000,000 | |
| | | | | | | | | | | | | | |
| | | | | | | | | | | | | 16,465,000 | |
| | |
| Multi-State – 0.8% | |
| Federal Home Loan Mortgage Corporation Variable Rate
Demand Certificates for Multi-Family Housing
Series 2014-M031 Class A (FHLMC, LIQ)(a)(b) |
|
| | 11,470,000 | | | | 0.092 | | | | 06/07/21 | | | | 11,470,000 | |
| | |
| Nebraska – 0.3% | |
| Nebraska Investment Finance Authority VRDN RB for Single
Family Housing Series 2019 C (FHLB, SPA)(a) |
|
| | 3,675,000 | | | | 0.040 | | | | 06/07/21 | | | | 3,675,000 | |
| | |
| New York – 14.2% | |
| Nassau County IDA VRDN RB Refunding for Cold Spring
Harbor Laboratory Series 1999 (TD Bank N.A., SPA)(a) |
|
| | 5,630,000 | | | | 0.010 | | | | 06/01/21 | | | | 5,630,000 | |
| | |
| | |
| The accompanying notes are an integral part of these financial statements. | | 11 |
INVESTOR TAX-EXEMPT MONEY MARKET FUND
Schedule of Investments (continued)
May 31, 2021 (Unaudited)
| | | | | | | | | | | | | | |
Principal
Amount | | | Interest
Rate | | | Maturity
Date | | | Amortized
Cost | |
|
| Municipal Debt Obligations – (continued) | |
| New York – (continued) | |
| New York City GO VRDN Series 2005 Subseries F-4A RMKT
(Sumitomo Mitsui Banking Corp. LOC)(a) |
|
| $ | 5,680,000 | | | | 0.060 | % | | | 06/07/21 | | | $ | 5,680,000 | |
| New York City GO VRDN Series 2018 Subseries B-5 (Barclays
Bank PLC, SPA)(a) |
|
| | 2,500,000 | | | | 0.010 | | | | 06/01/21 | | | | 2,500,000 | |
| New York City Housing Development Corp. Multi-Family
Housing VRDN RB for 90 Washington Street Series 2005 A
(FNMA, LIQ) (FNMA, LOC)(a) |
|
| | 2,650,000 | | | | 0.040 | | | | 06/07/21 | | | | 2,650,000 | |
| New York City Municipal Water Finance Authority Water &
Sewer System VRDN RB Refunding for Second General
Resolution Series 2009 Subseries BB-1 (UBS AG, SPA)(a) |
|
| | 1,500,000 | | | | 0.030 | | | | 06/01/21 | | | | 1,500,000 | |
| New York City Municipal Water Finance Authority Water &
Sewer System VRDN RB Second General Resolution
Series 2010 CC (Barclays Bank PLC, SPA) |
|
| | 2,255,000 | | | | 0.040 | | | | 06/07/21 | | | | 2,255,000 | |
| New York City Municipal Water Finance Authority Water &
Sewer System VRDN RB Second General Resolution
Series 2019 BB (Industrial & Commercial Bank of China,
SPA)(a) |
|
| | 31,650,000 | | | | 0.100 | | | | 06/07/21 | | | | 31,650,000 | |
| New York City Transitional Finance Authority VRDN RB
Refunding for Future Tax Secured Series 2002 Subseries C-5
(Bank of America N.A., SPA) |
|
| | 5,770,000 | | | | 0.020 | | | | 06/01/21 | | | | 5,770,000 | |
| New York City Transitional Finance Authority VRDN RB
Refunding for Future Tax Secured Series 2011 Subseries A-4
(Barclays Bank PLC, SPA) |
|
| | 9,000,000 | | | | 0.010 | | | | 06/01/21 | | | | 9,000,000 | |
| New York City Transitional Finance Authority VRDN RB
Refunding for Future Tax Secured Series 2013 Subseries A-4
(JPMorgan Chase Bank N.A., SPA) |
|
| | 3,200,000 | | | | 0.010 | | | | 06/01/21 | | | | 3,200,000 | |
| New York City Transitional Finance Authority VRDN RB
Refunding for Future Tax Secured Series 2015 Subseries E-3
(JPMorgan Chase Bank N.A., SPA) |
|
| | 4,400,000 | | | | 0.010 | | | | 06/01/21 | | | | 4,400,000 | |
| New York City Trust for Cultural Resources VRDN RB for
Metropolitan Museum of Art Series 2006 A2 RMKT(a) |
|
| | 27,330,000 | | | | 0.050 | | | | 06/07/21 | | | | 27,330,000 | |
| New York City Trust for Cultural Resources VRDN RB
Refunding for The New York Botanical Garden Series 2009 A
(JPMorgan Chase Bank N.A., LOC)(a) |
|
| | 12,670,000 | | | | 0.050 | | | | 06/07/21 | | | | 12,670,000 | |
| New York State Dormitory Authority Non-State Supported Debt
VRDN RB for Cornell University Series 2004 A RMKT (Bank
of New York Mellon, SPA)(a) |
|
| | 16,595,000 | | | | 0.030 | | | | 06/07/21 | | | | 16,595,000 | |
| New York State Dormitory Authority Non-State Supported Debt
VRDN RB for Rockefeller University Series 2002 A2
Convertible (JPMorgan Chase Bank N.A., SPA) |
|
| | 1,500,000 | | | | 0.050 | | | | 06/07/21 | | | | 1,500,000 | |
| New York State Housing Finance Agency VRDN RB for 10
Barclay Street Series 2004 A (FNMA, LIQ) (FNMA, LOC)(a) |
|
| | 4,600,000 | | | | 0.030 | | | | 06/07/21 | | | | 4,600,000 | |
| | |
|
| Municipal Debt Obligations – (continued) | |
| New York – (continued) | |
| New York State Housing Finance Agency VRDN RB for 100
Maiden Lane Series 2004 A RMKT (FNMA, LIQ)(FNMA,
LOC)(a) |
|
| 9,000,000 | | | | 0.030 | | | | 06/07/21 | | | | 9,000,000 | |
| New York State Housing Finance Agency VRDN RB for 20
River Terrace Housing Series 2002 A RMKT (FNMA,
LIQ)(FNMA, LOC)(a) |
|
| | 4,400,000 | | | | 0.030 | | | | 06/07/21 | | | | 4,400,000 | |
| New York State Housing Finance Agency VRDN RB for 42nd &
10th Housing Series 2010 A (FHLMC, LIQ) (FHLMC, LOC)(a) |
|
| | 26,950,000 | | | | 0.050 | | | | 06/07/21 | | | | 26,950,000 | |
| New York State Housing Finance Agency VRDN RB for Clinton
Park Housing Series 2010 A (FHLMC, LIQ)(a) |
|
| | 200,000 | | | | 0.050 | | | | 06/07/21 | | | | 200,000 | |
| Triborough Bridge & Tunnel Authority VRDN RB Metropolitan
Transportation Authority Bridges & Tunnels Series 2003B-1
RMKT (Bank of America N.A., LOC) |
|
| | 9,525,000 | | | | 0.010 | | | | 06/01/21 | | | | 9,525,000 | |
| Triborough Bridge & Tunnel Authority VRDN RB Refunding for
Metropolitan Transportation Authority Bridges & Tunnels
Series 2018E (Bank of America N.A., LOC) |
|
| | 3,665,000 | | | | 0.100 | | | | 06/07/21 | | | | 3,665,000 | |
| Triborough Bridge & Tunnel Authority VRDN RB Refunding
Series 2005 Subseries B-3 (State Street Bank & Trust Co.,
LOC)(a) |
|
| | 6,320,000 | | | | 0.020 | | | | 06/01/21 | | | | 6,320,000 | |
| | | | | | | | | | | | | | |
| | | | | | | | | | | | | 196,990,000 | |
| | |
| North Carolina – 2.2% | |
| Charlotte-Mecklenburg Hospital Authority (The) VRDN RB
Health Care Refunding Series 2007B (JPMorgan Chase Bank
N.A., SPA) |
|
| | 14,000,000 | | | | 0.010 | | | | 06/01/21 | | | | 14,000,000 | |
| City of Raleigh Combined Enterprise System VRDN RB
Series 2008 A RMKT (Bank of America N.A., SPA)(a) |
|
| | 5,500,000 | | | | 0.060 | | | | 06/07/21 | | | | 5,500,000 | |
| City of Raleigh Combined Enterprise System VRDN RB
Series 2008 B RMKT (Bank of America N.A., SPA)(a) |
|
| | 6,670,000 | | | | 0.060 | | | | 06/07/21 | | | | 6,670,000 | |
| City of Raleigh VRDN COPS for Downtown Improvement
Project Series 2005 B-1 RMKT (PNC Bank N.A., SPA)(a) |
|
| | 4,100,000 | | | | 0.060 | | | | 06/07/21 | | | | 4,100,000 | |
| | | | | | | | | | | | | | |
| | | | | | | | | | | | | 30,270,000 | |
| | |
| Ohio – 7.0% | |
| City of Columbus Sewerage System VRDN RB Refunding
Series 2008 B(a) |
|
| | 36,000,000 | | | | 0.030 | | | | 06/07/21 | | | | 36,000,000 | |
| County of Franklin VRDN RB for OhioHealth Corp. Hospital
Facilities Series 2018C |
|
| | 10,000,000 | | | | 0.030 | | | | 06/07/21 | | | | 10,000,000 | |
| County of Hamilton VRDN RB Refunding for Cincinnati
Children’s Hospital Medical Center Series 2018 AA(a) |
|
| | 12,280,000 | | | | 0.050 | | | | 06/07/21 | | | | 12,280,000 | |
| | |
| | |
| 12 | | The accompanying notes are an integral part of these financial statements. |
INVESTOR TAX-EXEMPT MONEY MARKET FUND
| | | | | | | | | | | | | | |
Principal
Amount | | | Interest
Rate | | | Maturity
Date | | | Amortized
Cost | |
|
| Municipal Debt Obligations – (continued) | |
| Ohio – (continued) | |
| Ohio Higher Educational Facility Commission CP Cleveland
Clinic Health System Series 2008 B-6 |
|
| $ | 1,190,000 | | | | 0.090 | % | | | 06/01/21 | | | $ | 1,190,000 | |
| Ohio Higher Educational Facility Commission VRDN RB
Refunding for Cleveland Clinic Health System Series 2008 B-4
RMKT (Barclays Bank PLC, SPA) |
|
| | 23,900,000 | | | | 0.010 | | | | 06/01/21 | | | | 23,900,000 | |
| | State of Ohio GO VRDN for Common Schools Series 2006 C(a) | |
| | 7,125,000 | | | | 0.040 | | | | 06/07/21 | | | | 7,125,000 | |
| State of Ohio GO VRDN Refunding for Infrastructure
Improvement Series 2004 A (TD Bank N.A., LOC)(a) |
|
| | 6,665,000 | | | | 0.050 | | | | 06/07/21 | | | | 6,665,000 | |
| | | | | | | | | | | | | | |
| | | | | | | | | | | | | 97,160,000 | |
| | |
| Pennsylvania – 0.8% | |
| | City of Philadelphia TRAN 2020-2021 Series A | |
| | 2,515,000 | | | | 4.000 | | | | 06/30/21 | | | | 2,522,710 | |
| Philadelphia Hospitals & Higher Education Facilities Authority
VRDN RB Children’s Hospital of Philadelphia Series 2011 A
(Bank of America N.A., SPA) |
|
| | 1,950,000 | | | | 0.010 | | | | 06/01/21 | | | | 1,950,000 | |
| Philadelphia Hospitals & Higher Education Facilities Authority
VRDN RB Refunding for Children’s Hospital of Philadelphia
Project Series 2002 B (Wells Fargo Bank N.A., SPA) |
|
| | 5,000,000 | | | | 0.010 | | | | 06/01/21 | | | | 5,000,000 | |
| | | | | | | | | | | | | | |
| | | | | | | | | | | | | 9,472,710 | |
| | |
| Rhode Island – 0.0% | |
| Rhode Island Health & Educational Building Corp. Higher
Education Facilities VRDN RB for Brown University
Series 2003 B (Northern Trust Co., SPA)(a) |
|
| | 460,000 | | | | 0.040 | | | | 06/07/21 | | | | 460,000 | |
| | |
| South Carolina – 0.5% | |
| City of Columbia Waterworks & Sewer System VRDN RB
Series 2009 RMKT (Sumitomo Mitsui Banking Corp., LOC)(a) |
|
| | 6,750,000 | | | | 0.050 | | | | 06/07/21 | | | | 6,750,000 | |
| | |
| Texas – 11.5% | |
| Board of Regents of the University of Texas System VRDN RB
Refunding for Financing System Series 2008 B (University of
Texas Investment Management Company, LIQ)(a) |
|
| | 13,000,000 | | | | 0.030 | | | | 06/07/21 | | | | 13,000,000 | |
| Dallas Area Rapid Transit Sr. Subordinated Lien Sales Tax
Revenue CP |
|
| | 13,250,000 | | | | 0.100 | | | | 08/02/21 | | | | 13,250,000 | |
| Dallas Area Rapid Transit Sr. Subordinated Lien Sales Tax
Revenue CP Series IIA |
|
| | 500,000 | | | | 0.120 | | | | 08/02/21 | | | | 500,000 | |
| | El Paso Water & Sewer System CP Series A | |
| | 10,000,000 | | | | 0.110 | | | | 06/08/21 | | | | 10,000,000 | |
| | Gulf Coast IDA VRDN RB for ExxonMobil Project Series 2012(a) | |
| | 10,000,000 | | | | 0.010 | | | | 06/01/21 | | | | 10,000,000 | |
| Harris County Cultural Education Facilities Finance Corp. CP
Series C-1 |
|
| | 25,000,000 | | | | 0.100 | | | | 06/07/21 | | | | 25,000,000 | |
| | |
|
| Municipal Debt Obligations – (continued) | |
| Texas – (continued) | |
| Harris County Cultural Education Facilities Finance Corp. VRDN
RB Refunding for Methodist Hospital System Series 2020B |
|
| 6,000,000 | | | | 0.010 | | | | 06/01/21 | | | | 6,000,000 | |
| Harris County Health Facilities Development Corp. VRDN RB
Refunding for Methodist Hospital System Series 2008 A-2(a) |
|
| | 3,850,000 | | | | 0.010 | | | | 06/01/21 | | | | 3,850,000 | |
| | Houston Texas Utilities System CP Series B-4 | |
| | 15,000,000 | | | | 0.110 | | | | 06/24/21 | | | | 15,000,000 | |
| Port of Port Arthur Navigation District VRDN RB Refunding for
Texaco, Inc. Project Series 1994(a) |
|
| | 10,000,000 | | | | 0.020 | | | | 06/01/21 | | | | 10,000,000 | |
| State of Texas GO VRDN Refunding for Veterans Bonds
Series 2011 C (FHLB, SPA) |
|
| | 31,110,000 | | | | 0.050 | | | | 06/07/21 | | | | 31,110,000 | |
| State of Texas Veterans VRDN GO Bonds, Series 2012 B RMKT
(State Street Bank & Trust Co., SPA) |
|
| | 21,715,000 | | | | 0.070 | | | | 06/07/21 | | | | 21,715,000 | |
| | | | | | | | | | | | | | |
| | | | | | | | | | | | | 159,425,000 | |
| | |
| Utah – 2.9% | |
| Murray City, Utah Hospital VRDN RB for IHC Health Services
Series 2005 D (Wells Fargo Bank N.A., SPA) |
|
| | 10,600,000 | | | | 0.010 | | | | 06/01/21 | | | | 10,600,000 | |
| Utah Water Finance Agency VRDN Program RB Series B-2
RMKT (JPMorgan Chase Bank N.A., SPA) |
|
| | 30,000,000 | | | | 0.090 | | | | 06/07/21 | | | | 30,000,000 | |
| | | | | | | | | | | | | | |
| | | | | | | | | | | | | 40,600,000 | |
| | |
| Virginia – 4.7% | |
| Fairfax County IDA VRDN RB Refunding for Inova Health
System Project Series 2016 C(a) |
|
| | 6,905,000 | | | | 0.060 | | | | 06/07/21 | | | | 6,905,000 | |
| Fairfax County IDA VRDN RB Refunding for Inova Health
System Project Series 2018 C(a) |
|
| | 15,300,000 | | | | 0.060 | | | | 06/07/21 | | | | 15,300,000 | |
| Loudoun County IDA VRDN RB for Howard Hughes Medical
Institute Series 2003 C(a) |
|
| | 2,445,000 | | | | 0.060 | | | | 06/07/21 | | | | 2,445,000 | |
| Loudoun County IDA VRDN RB for Howard Hughes Medical
Institute Series 2003 E(a) |
|
| | 2,405,000 | | | | 0.050 | | | | 06/07/21 | | | | 2,405,000 | |
| Loudoun County IDA VRDN RB for Howard Hughes Medical
Institute Series 2003 F(a) |
|
| | 7,950,000 | | | | 0.050 | | | | 06/07/21 | | | | 7,950,000 | |
| Loudoun County IDA VRDN RB for Howard Hughes Medical
Institute Series 2009 B(a) |
|
| | 14,545,000 | | | | 0.060 | | | | 06/07/21 | | | | 14,545,000 | |
| Virginia College Building Authority Educational Facilities VRDN
RB Refunding for University of Richmond Project Series 2004
RMKT (U.S. Bank N.A., SPA)(a) |
|
| | 16,120,000 | | | | 0.050 | | | | 06/07/21 | | | | 16,120,000 | |
| | | | | | | | | | | | | | |
| | | | | | | | | | | | | 65,670,000 | |
| | |
| Washington – 4.5% | |
| King County GO VRDN RB Refunding Series 2019 A (TD Bank
N.A., SPA)(a) |
|
| | 6,800,000 | | | | 0.010 | | | | 06/01/21 | | | | 6,800,000 | |
| | |
| | |
| The accompanying notes are an integral part of these financial statements. | | 13 |
INVESTOR TAX-EXEMPT MONEY MARKET FUND
Schedule of Investments (continued)
May 31, 2021 (Unaudited)
| | | | | | | | | | | | | | |
Principal
Amount | | | Interest
Rate | | | Maturity
Date | | | Amortized
Cost | |
|
| Municipal Debt Obligations – (continued) | |
| Washington – (continued) | |
| | King County Washington CP Series A | |
| $ | 7,500,000 | | | | 0.110 | % | | | 06/17/21 | | | $ | 7,500,000 | |
| | 7,000,000 | | | | 0.130 | | | | 09/08/21 | | | | 7,000,000 | |
| Port of Tacoma VRDN Subordinate Lien RB Series 2008 B
RMKT (Bank of America N.A., LOC)(a) |
|
| | 11,500,000 | | | | 0.050 | | | | 06/07/21 | | | | 11,500,000 | |
| Washington Health Care Facilities Authority VRDN RB
Refunding for Providence Health & Services Series 2012 C
(U.S. Bank N.A., SPA)(a) |
|
| | 13,000,000 | | | | 0.060 | | | | 06/07/21 | | | | 13,000,000 | |
| Washington Health Care Facilities Authority VRDN RB
Refunding for Providence Health & Services Series 2012 D
(U.S. Bank N.A., SPA) |
|
| | 16,550,000 | | | | 0.060 | | | | 06/07/21 | | | | 16,550,000 | |
| | | | | | | | | | | | | | |
| | | | | | | | | | | | | 62,350,000 | |
| | |
| Wisconsin – 0.4% | |
| Wisconsin Housing & Economic Development Authority VRDN
Home Ownership RB Series 2019 B (FNMA)(FHLB, SPA)(a) |
|
| | 5,100,000 | | | | 0.050 | | | | 06/07/21 | | | | 5,100,000 | |
| | |
| | TOTAL INVESTMENTS – 99.7% | | | $ | 1,386,272,710 | |
| | |
| OTHER ASSETS IN EXCESS OF
LIABILITIES – 0.3% |
| | | 3,996,222 | |
| | |
| | NET ASSETS – 100.0% | | | $ | 1,390,268,932 | |
| | |
| | |
|
| The percentage shown for each investment category reflects the value of investments in that category as a percentage of net assets. |
| |
(a) | | Rate shown is that which is in effect on May 31, 2021. Certain variable rate securities are not based on a published reference rate and spread but are determined by the issuer or agent and are based on current market conditions. |
| |
(b) | | Exempt from registration under Rule 144A of the Securities Act of 1933. |
Interest rates represent either the stated coupon rate, or for floating rate securities, the current reset rate, which is based upon current interest rate indices.
Maturity dates represent either the final legal maturity date on the security, the demand date for puttable securities, or the prerefunded date for those types of securities.
| | |
|
Investment Abbreviations: |
BANS | | —Bond Anticipation Notes |
COPS | | —Certificates of Participation |
CP | | —Commercial Paper |
FHLB | | —Insured by Federal Home Loan Bank |
FHLMC | | —Insured by Federal Home Loan Mortgage Corp. |
FNMA | | —Insured by Federal National Mortgage Association |
GNMA | | —Insured by Government National Mortgage Association |
GO | | —General Obligation |
GTY AGMT | | —Guaranty Agreement |
IDA | | —Industrial Development Agency |
IDB | | —Industrial Development Board |
IHC | | —Intermountain Health Care |
LIQ | | —Liquidity Agreement |
LOC | | —Letter of Credit |
PCRB | | —Pollution Control Revenue Bond |
RB | | —Revenue Bond |
RMKT | | —Remarketed |
SPA | | —Stand-by Purchase Agreement |
VRDN | | —Variable Rate Demand Notes |
|
| | |
| 14 | | The accompanying notes are an integral part of these financial statements. |
GOLDMAN SACHS FUNDS — INVESTOR FUNDS
|
| ADDITIONAL INVESTMENT INFORMATION |
JOINT REPURCHASE AGREEMENT ACCOUNT III — At May 31, 2021, the Investor Money Market Fund had undivided interests in the Joint Repurchase Agreement Account III, with a maturity date of June 1, 2021, as follows:
| | | | |
| Principal Amount | | Maturity Value | | Collateral Value |
| $152,000,000 | | $152,000,211 | | $156,494,140 |
REPURCHASE AGREEMENTS — At May 31, 2021, the Principal Amounts of the Investor Money Market Fund’s interest in the Joint Repurchase Agreement Account III were as follows:
| | | | | | | | |
| Counterparty | | Interest Rate | | | Principal Amount | |
ABN Amro Bank N.V. | | | 0.020 | % | | $ | 38,000,000 | |
Bank of America, N.A. | | | 0.010 | | | | 31,666,667 | |
BofA Securities, Inc. | | | 0.010 | | | | 19,000,000 | |
Bank of Nova Scotia (The) | | | 0.010 | | | | 63,333,333 | |
| | |
| TOTAL | | | | | | $ | 152,000,000 | |
At May 31, 2021, the Joint Repurchase Agreement Account III was fully collateralized by:
| | | | | | | | |
| Issuer | | Interest Rates | | | Maturity Dates | |
Federal Home Loan Mortgage Corp. | | | 1.500 to 6.000 | % | | | 10/01/26 to 05/01/51 | |
Federal National Mortgage Association | | | 2.000 to 6.500 | | | | 02/01/25 to 05/01/51 | |
Government National Mortgage Association | | | 2.000 to 3.500 | | | | 04/20/48 to 02/20/51 | |
U.S. Treasury Notes | | | 0.125 to 2.500 | | | | 09/30/22 to 08/15/29 | |
| | |
| The accompanying notes are an integral part of these financial statements. | | 15 |
GOLDMAN SACHS FUNDS — INVESTOR FUNDS
Statements of Assets and Liabilities
May 31, 2021 (Unaudited)
| | | | | | | | | | |
| | | | | Investor
Money Market
Fund | | | Investor
Tax-Exempt
Money Market
Fund | |
| | Assets: | | | | | | | | |
| | Investments, at value (cost $1,177,669,720 and $1,386,272,710) | | $ | 1,177,669,720 | | | $ | 1,386,272,710 | |
| | Repurchase agreements, at value (cost $402,200,000 and $0) | | | 402,200,000 | | | | — | |
| | Cash | | | 38,600 | | | | 4,433,179 | |
| | Receivables: | | | | | | | | |
| | Investments sold | | | 25,919,826 | | | | — | |
| | Fund shares sold | | | 1,215,355 | | | | 10,667 | |
| | Interest | | | 147,023 | | | | 160,890 | |
| | Reimbursement from investment advisor | | | 22,059 | | | | 13,570 | |
| | Other assets | | | 62,215 | | | | 79,228 | |
| | Total assets | | | 1,607,274,798 | | | | 1,390,970,244 | |
| | | | | | | | | | |
| | Liabilities: | | | | | | | | |
| | Payables: | | | | | | | | |
| | Fund shares redeemed | | | 1,745,728 | | | | 516,164 | |
| | Management fees | | | 115,542 | | | | 51,702 | |
| | Dividend distribution | | | 14,025 | | | | 6,491 | |
| | Accrued expenses | | | 136,221 | | | | 126,955 | |
| | Total liabilities | | | 2,011,516 | | | | 701,312 | |
| | | | | | | | | | |
| | Net Assets: | | | | | | | | |
| | Paid-in capital | | | 1,605,347,746 | | | | 1,390,268,974 | |
| | Total distributable earnings (loss) | | | (84,464 | ) | | | (42 | ) |
| | NET ASSETS | | $ | 1,605,263,282 | | | $ | 1,390,268,932 | |
| | | Net asset value, offering and redemption price per share | | | $1.00 | | | | $1.00 | |
| | | Net Assets: | | | | | | | | |
| | | Class A Shares | | $ | 165,043,171 | | | $ | 9,342,923 | |
| | | Class C Shares | | | 38,983 | | | | 9,056 | |
| | | Class I Shares | | | 1,327,238,502 | | | | 1,376,626,950 | |
| | | Capital Shares | | | — | | | | 1,032 | |
| | | Service Shares | | | 41,101,295 | | | | 840,154 | |
| | | Preferred Shares | | | — | | | | 89,363 | |
| | | Select Shares | | | — | | | | 1,038 | |
| | | Administration Shares | | | 37,516,918 | | | | 304,956 | |
| | | Cash Management Shares | | | 34,313,748 | | | | 1,012 | |
| | | Premier Shares | | | — | | | | 1,026 | |
| | | Resource Shares | | | 10,665 | | | | 3,051,422 | |
| | | Total Net Assets | | $ | 1,605,263,282 | | | $ | 1,390,268,932 | |
| | | Shares outstanding $0.001 par value (unlimited number of shares authorized): | | | | | | | | |
| | | Class A Shares | | | 165,066,295 | | | | 9,342,582 | |
| | | Class C Shares | | | 38,989 | | | | 9,055 | |
| | | Class I Shares | | | 1,327,424,492 | | | | 1,376,576,537 | |
| | | Capital Shares | | | — | | | | 1,032 | |
| | | Service Shares | | | 41,107,053 | | | | 840,124 | |
| | | Preferred Shares | | | — | | | | 89,360 | |
| | | Select Shares | | | — | | | | 1,038 | |
| | | Administration Shares | | | 37,522,173 | | | | 304,945 | |
| | | Cash Management Shares | | | 34,318,554 | | | | 1,012 | |
| | | Premier Shares | | | — | | | | 1,025 | |
| | | Resource Shares | | | 10,666 | | | | 3,051,310 | |
| | |
| 16 | | The accompanying notes are an integral part of these financial statements. |
GOLDMAN SACHS FUNDS — INVESTOR FUNDS
Statements of Operations
For the Six Months Ended May 31, 2021 (Unaudited)
| | | | | | | | | | |
| | | | | Investor
Money Market
Fund | | | Investor
Tax-Exempt
Money Market
Fund | |
| | Investment Income: | | | | | |
| | | |
| | Interest income | | $ | 1,103,761 | | | $ | 480,917 | |
| | | | | | | | | | |
| | Expenses: | | | | | |
| | Fund-Level Expenses: | | | | | | | | |
| | | |
| | Management fees | | | 1,311,431 | | | | 1,145,869 | |
| | | |
| | Registration fees | | | 127,326 | | | | 74,757 | |
| | | |
| | Transfer Agency fees | | | 81,969 | | | | 71,621 | |
| | | |
| | Professional fees | | | 47,618 | | | | 45,676 | |
| | | |
| | Custody, accounting and administrative services | | | 40,048 | | | | 48,580 | |
| | | |
| | Printing and mailing fees | | | 26,930 | | | | 21,474 | |
| | | |
| | Trustee fees | | | 11,105 | | | | 10,696 | |
| | | |
| | Other | | | 16,783 | | | | 24,333 | |
| | | |
| | Subtotal | | | 1,663,210 | | | | 1,443,006 | |
| | Class Specific Expenses: | | | | | | | | |
| | | |
| | Distribution and Service fees — Class A Shares | | | 236,355 | | | | 13,137 | |
| | | |
| | Service Share fees | | | 118,456 | | | | 2,068 | |
| | | |
| | Cash Management Share fees | | | 116,011 | | | | 2 | |
| | | |
| | Distribution fees — Cash Management Shares | | | 69,607 | | | | 2 | |
| | | |
| | Administration Share fees | | | 40,215 | | | | 380 | |
| | | |
| | Distribution fees — Class C Shares | | | 195 | | | | 105 | |
| | | |
| | Resource Share fees | | | 27 | | | | 8,072 | |
| | | |
| | Distribution fees — Resource Shares | | | 7 | | | | 2,422 | |
| | | |
| | Preferred Share fees | | | — | | | | 107 | |
| | | |
| | Premier Share fees | | | — | | | | 2 | |
| | | |
| | Total expenses | | | 2,244,083 | | | | 1,469,303 | |
| | | |
| | Less — expense reductions | | | (961,041 | ) | | | (1,032,105 | ) |
| | | |
| | Net expenses | | | 1,283,042 | | | | 437,198 | |
| | | |
| | NET INVESTMENT INCOME (LOSS) | | $ | (179,281 | ) | | $ | 43,719 | |
| | | |
| | Net realized gain from investment transactions | | | 95,221 | | | | — | |
| | | |
| | NET INCREASE (DECREASE) IN NET ASSETS RESULTING FROM OPERATIONS | | $ | (84,060 | ) | | $ | 43,719 | |
| | |
| The accompanying notes are an integral part of these financial statements. | | 17 |
GOLDMAN SACHS FUNDS — INVESTOR FUNDS
Statements of Changes in Net Assets
| | | | | | | | | | | | | | | | | | | | | | | | | | | | | | |
| | | | | Investor Money Market Fund | | | | | | Investor Tax-Exempt Money Market Fund | |
| | | | | For the
Period Ended
May 31, 2021 | | | For the
Period Ended
November 30, 2020† | | | For the Fiscal
Year Ended
August 31, 2020 | | | | | | For the
Period Ended
May 31, 2021 | | | For the
Period Ended
November 30, 2020† | | | For the Fiscal
Year Ended
August 31, 2020 | |
| | From operations: | | | | | | | | | | | | | | | | | | | | | |
| | | | | | | | |
| | Net investment income (loss) | | $ | (179,281 | ) | | $ | (158,861 | ) | | $ | 21,007,784 | | | | | | | $ | 43,719 | | | $ | 22,631 | | | $ | 11,096,792 | |
| | | | | | | | |
| | Net realized gain from investment transactions | | | 95,221 | | | | 31,683 | | | | 1,236,233 | | | | | | | | — | | | | 78,076 | | | | 7,987 | |
| | | | | | | | |
| | Net increase (decrease) in net assets resulting from operations | | | (84,060 | ) | | | (127,178 | ) | | | 22,244,017 | | | | | | | | 43,719 | | | | 100,707 | | | | 11,104,779 | |
| | | | | | | | | | | | | | | | | | | | | | | | | | | | | | |
| | Distributions to shareholders: | | | | | | | | | | | | | | | | | | | | | |
| | | | | | | | |
| | From distributable earnings: | | | | | | | | | | | | | | | | | | | | | | | | | | | | |
| | | | | | | | |
| | Class A Shares | | | (41,596 | ) | | | (9,371 | ) | | | (2,297,830 | ) | | | | | | | (987 | ) | | | (208 | ) | | | (76,231 | ) |
| | | | | | | | |
| | Class C Shares | | | (9 | ) | | | (2 | ) | | | (63 | ) | | | | | | | (2 | ) | | | (1 | ) | | | (39 | ) |
| | | | | | | | |
| | Class I Shares | | | (383,262 | ) | | | (359,733 | ) | | | (18,363,630 | ) | | | | | | | (121,779 | ) | | | (22,351 | ) | | | (11,004,509 | ) |
| | | | | | | | |
| | Capital Shares | | | — | | | | — | | | | — | | | | | | | | — | | | | (1 | ) | | | (10 | ) |
| | | | | | | | |
| | Service Shares | | | (10,675 | ) | | | (2,182 | ) | | | (314,654 | ) | | | | | | | (71 | ) | | | (12 | ) | | | (4,489 | ) |
| | | | | | | | |
| | Preferred Shares | | | — | | | | — | | | | — | | | | | | | | (22 | ) | | | (3 | ) | | | (1,884 | ) |
| | | | | | | | |
| | Select Shares | | | — | | | | — | | | | — | | | | | | | | — | | | | (1 | ) | | | (10 | ) |
| | | | | | | | |
| | Administration Shares | | | (7,599 | ) | | | (1,317 | ) | | | (335,476 | ) | | | | | | | (26 | ) | | | (5 | ) | | | (1,676 | ) |
| | | | | | | | |
| | Cash Management Shares | | | (10,727 | ) | | | (1,794 | ) | | | (138,019 | ) | | | | | | | — | | | | (1 | ) | | | (6 | ) |
| | | | | | | | |
| | Premier Shares | | | — | | | | — | | | | — | | | | | | | | — | | | | (1 | ) | | | (8 | ) |
| | | | | | | | |
| | Resource Shares | | | (3 | ) | | | (1 | ) | | | (72 | ) | | | | | | | (258 | ) | | | (48 | ) | | | (7,929 | ) |
| | | | | | | | |
| | Total distributions to shareholders | | | (453,871 | ) | | | (374,400 | ) | | | (21,449,744 | ) | | | | | | | (123,145 | ) | | | (22,632 | ) | | | (11,096,791 | ) |
| | | | | | | | | | | | | | | | | | | | | | | | | | | | | | |
| | From share transactions | | | | | | | | | | | | | | | | | | | | | |
| | | | | | | | |
| | Proceeds from sales of shares | | | 747,871,506 | | | | 303,870,341 | | | | 4,020,278,618 | | | | | | | | 910,488,047 | | | | 409,431,141 | | | | 2,567,445,330 | |
| | | | | | | | |
| | Reinvestment of distributions | | | 400,892 | | | | 336,663 | | | | 19,673,459 | | | | | | | | 16,901 | | | | 3,254 | | | | 2,076,003 | |
| | | | | | | | |
| | Cost of shares redeemed | | | (1,022,928,348 | ) | | | (840,527,434 | ) | | | (3,193,030,924 | ) | | | | | | | (896,827,887 | ) | | | (564,972,424 | ) | | | (2,501,565,155 | ) |
| | | | | | | | |
| | Net increase (decrease) in net assets resulting from share transactions | | | (274,655,950 | ) | | | (536,320,430 | ) | | | 846,921,153 | | | | | | | | 13,677,061 | | | | (155,538,029 | ) | | | 67,956,178 | |
| | | | | | | | |
| | NET INCREASE (DECREASE) | | | (275,193,881 | ) | | | (536,822,008 | ) | | | 847,715,426 | | | | | | | | 13,597,635 | | | | (155,459,954 | ) | | | 67,964,166 | |
| | | | | | | | | | | | | | | | | | | | | | | | | | | | | | |
| | Net assets: | | | | | | | | | | | | | | | | | | | | | |
| | | | | | | | |
| | Beginning of period | | | 1,880,457,163 | | | | 2,417,279,171 | | | | 1,569,563,745 | | | | | | | | 1,376,671,297 | | | | 1,532,131,251 | | | | 1,464,167,085 | |
| | | | | | | | |
| | End of period | | $ | 1,605,263,282 | | | $ | 1,880,457,163 | | | $ | 2,417,279,171 | | | | | | | $ | 1,390,268,932 | | | $ | 1,376,671,297 | | | $ | 1,532,131,251 | |
| | † | | The Funds changed their fiscal year end from August 31 to November 30. |
| | |
| 18 | | The accompanying notes are an integral part of these financial statements. |
GOLDMAN SACHS INVESTOR MONEY MARKET FUND
Financial Highlights
| | | | | | | | | | | | | | | | | | | | | | | | | | | | | | |
| | | | | Six Months Ended
May 31, 2021
(Unaudited) | | | For the
Period Ended
November 30, 2020† | | | Year Ended August 31, | | | Period Ended
August 31, 2016* | |
| | | Investor Money Market Fund — Class A Shares | | 2020 | | | 2019 | | | 2018 | | | 2017 | |
| | Per Share Data: | | | | | | | | | | | | | | | | | | | | | | | | | | | | |
| | | | | | | | |
| | Net asset value, beginning of period | | $ | 1.00 | | | $ | 1.00 | | | $ | 1.00 | | | $ | 1.00 | | | $ | 1.00 | | | $ | 1.00 | | | $ | 1.00 | |
| | | | | | | | |
| | Net investment income(a) | | | — | (b) | | | — | (b) | | | 0.009 | | | | 0.021 | | | | 0.016 | | | | 0.008 | | | | 0.001 | |
| | | | | | | | |
| | Net realized gain (loss) | | | — | (b) | | | — | (b) | | | 0.001 | | | | — | (b) | | | (0.003 | ) | | | (0.002 | ) | | | — | (b) |
| | | | | | | | |
| | Total from investment operations | | | — | (b) | | | — | (b) | | | 0.010 | | | | 0.021 | | | | 0.013 | | | | 0.006 | | | | 0.001 | |
| | | | | | | | |
| | Distributions to shareholders from net investment income | | | — | (b) | | | — | (b) | | | (0.010 | ) | | | (0.021 | ) | | | (0.013 | ) | | | (0.006 | ) | | | (0.001 | ) |
| | | | | | | | |
| | Distributions to shareholders from net realized gains | | | — | (b) | | | — | (b) | | | — | (b) | | | — | (b) | | | — | (b) | | | — | (b) | | | — | (b) |
| | | | | | | | |
| | Total distributions(c) | | | — | (b) | | | — | (b) | | | (0.010 | ) | | | (0.021 | ) | | | (0.013 | ) | | | (0.006 | ) | | | (0.001 | ) |
| | | | | | | | |
| | Net asset value, end of period | | $ | 1.00 | | | $ | 1.00 | | | $ | 1.00 | | | $ | 1.00 | | | $ | 1.00 | | | $ | 1.00 | | | $ | 1.00 | |
| | | | | | | | |
| | Total return(d) | | | 0.02 | % | | | — | %(e) | | | 0.98 | % | | | 2.14 | % | | | 1.36 | % | | | 0.62 | % | | | 0.09 | % |
| | | | | | | | |
| | Net assets, end of period (in 000’s) | | $ | 165,043 | | | $ | 221,008 | | | $ | 249,228 | | | $ | 169,451 | | | $ | 7,933 | | | $ | 563 | | | $ | 50 | |
| | | | | | | | |
| | Ratio of net expenses to average net assets | | | 0.17 | %(f) | | | 0.24 | %(f) | | | 0.42 | % | | | 0.43 | % | | | 0.43 | % | | | 0.43 | % | | | 0.43 | %(f) |
| | | | | | | | |
| | Ratio of total expenses to average net assets | | | 0.45 | %(f) | | | 0.47 | %(f) | | | 0.46 | % | | | 0.46 | % | | | 0.54 | % | | | 0.76 | % | | | 5.13 | %(f) |
| | | | | | | | |
| | Ratio of net investment income (loss) to average net assets | | | (0.03 | )%(f) | | | (0.08 | )%(f) | | | 0.88 | % | | | 2.12 | % | | | 1.59 | % | | | 0.81 | % | | | 0.16 | %(f) |
| | † | | The Fund changed its fiscal year end from August 31 to November 30. |
| | * | | Commenced operations on January 29, 2016. |
| | (a) | | Calculated based on the average shares outstanding methodology. |
| | (b) | | Amount is less than $0.0005 per share. |
| | (c) | | Distributions may not coincide with the current year net investment income or net realized gains as distributions may be paid from current or prior year earnings. |
| | (d) | | Assumes reinvestment of all distributions. Returns do not reflect the deduction of taxes that a shareholder would pay on Fund distributions. Total returns for periods less than one full year are not annualized. |
| | (e) | | Amount is less than 0.005%. |
| | | | | | | | | | | | | | | | | | | | | | | | | | | | | | |
| | | | | Six Months Ended
May 31, 2021
(Unaudited) | | | For the
Period Ended
November 30, 2020† | | | Year Ended August 31, | | | Period Ended
August 31, 2016* | |
| | | Investor Money Market Fund — Class C Shares | | 2020 | | | 2019 | | | 2018 | | | 2017 | |
| | Per Share Data: | | | | | | | | | | | | | | | | | | | | | | | | | | | | |
| | | | | | | | |
| | Net asset value, beginning of period | | $ | 1.00 | | | $ | 1.00 | | | $ | 1.00 | | | $ | 1.00 | | | $ | 1.00 | | | $ | 1.00 | | | $ | 1.00 | |
| | | | | | | | |
| | Net investment income(a) | | | — | (b) | | | — | (b) | | | 0.003 | | | | 0.014 | | | | 0.004 | | | | — | (b) | | | — | (b) |
| | | | | | | | |
| | Net realized gain | | | — | (b) | | | — | (b) | | | 0.002 | | | | — | (b) | | | 0.002 | | | | 0.001 | | | | — | (b) |
| | | | | | | | |
| | Total from investment operations | | | — | (b) | | | — | (b) | | | 0.005 | | | | 0.014 | | | | 0.006 | | | | 0.001 | | | | — | (b) |
| | | | | | | | |
| | Distributions to shareholders from net investment income | | | — | (b) | | | — | (b) | | | (0.005 | ) | | | (0.014 | ) | | | (0.006 | ) | | | (0.001 | ) | | | — | (b) |
| | | | | | | | |
| | Distributions to shareholders from net realized gains | | | — | (b) | | | — | (b) | | | — | (b) | | | — | (b) | | | — | (b) | | | — | (b) | | | — | (b) |
| | | | | | | | |
| | Total distributions(c) | | | — | (b) | | | — | (b) | | | (0.005 | ) | | | (0.014 | ) | | | (0.006 | ) | | | (0.001 | ) | | | — | (b) |
| | | | | | | | |
| | Net asset value, end of period | | $ | 1.00 | | | $ | 1.00 | | | $ | 1.00 | | | $ | 1.00 | | | $ | 1.00 | | | $ | 1.00 | | | $ | 1.00 | |
| | | | | | | | |
| | Total return(d) | | | 0.02 | % | | | — | %(e) | | | 0.46 | % | | | 1.38 | % | | | 0.60 | % | | | 0.06 | % | | | 0.05 | % |
| | | | | | | | |
| | Net assets, end of period (in 000’s) | | $ | 39 | | | $ | 39 | | | $ | 53 | | | $ | 10 | | | $ | 10 | | | $ | 64 | | | $ | 50 | |
| | | | | | | | |
| | Ratio of net expenses to average net assets | | | 0.16 | %(f) | | | 0.24 | %(f) | | | 0.79 | % | | | 1.18 | % | | | 1.18 | % | | | 1.02 | % | | | 0.58 | %(f) |
| | | | | | | | |
| | Ratio of total expenses to average net assets | | | 1.20 | %(f) | | | 1.22 | %(f) | | | 1.21 | % | | | 1.21 | % | | | 1.29 | % | | | 1.51 | % | | | 5.88 | %(f) |
| | | | | | | | |
| | Ratio of net investment income (loss) to average net assets | | | (0.03 | )%(f) | | | (0.08 | )%(f) | | | 0.24 | % | | | 1.38 | % | | | 0.40 | % | | | 0.04 | % | | | 0.01 | %(f) |
| | † | | The Fund changed its fiscal year end from August 31 to November 30. |
| | * | | Commenced operations on January 29, 2016. |
| | (a) | | Calculated based on the average shares outstanding methodology. |
| | (b) | | Amount is less than $0.0005 per share. |
| | (c) | | Distributions may not coincide with the current year net investment income or net realized gains as distributions may be paid from current or prior year earnings. |
| | (d) | | Assumes reinvestment of all distributions. Returns do not reflect the deduction of taxes that a shareholder would pay on Fund distributions. Total returns for periods less than one full year are not annualized. |
| | (e) | | Amount is less than 0.005%. |
| | |
| The accompanying notes are an integral part of these financial statements. | | 19 |
GOLDMAN SACHS INVESTOR MONEY MARKET FUND
Financial Highlights (continued)
| | | | | | | | | | | | | | | | | | | | | | | | | | | | | | |
| | | Investor Money Market Fund —
Class I Shares | | Six Months Ended
May 31, 2021
(Unaudited) | | | For the
Period Ended
November 30, 2020† | | | Year Ended August 31, | | | Period Ended
August 31, 2016* | |
| | | 2020 | | | 2019 | | | 2018 | | | 2017 | |
| | Per Share Data: | | | | | | | | | | | | | | | | | | | | | | | | | | | | |
| | | | | | | | |
| | Net asset value, beginning of period | | $ | 1.00 | | | $ | 1.00 | | | $ | 1.00 | | | $ | 1.00 | | | $ | 1.00 | | | $ | 1.00 | | | $ | 1.00 | |
| | | | | | | | |
| | Net investment income(a) | | | — | (b) | | | — | (b) | | | 0.011 | | | | 0.024 | | | | 0.017 | | | | 0.009 | | | | 0.002 | |
| | | | | | | | |
| | Net realized gain (loss) | | | — | (b) | | | — | (b) | | | 0.001 | | | | — | (b) | | | (0.001 | ) | | | — | (b) | | | — | (b) |
| | | | | | | | |
| | Total from investment operations | | | — | (b) | | | — | (b) | | | 0.012 | | | | 0.024 | | | | 0.016 | | | | 0.009 | | | | 0.002 | |
| | | | | | | | |
| | Distributions to shareholders from net investment income | | | — | (b) | | | — | (b) | | | (0.012 | ) | | | (0.024 | ) | | | (0.016 | ) | | | (0.009 | ) | | | (0.002 | ) |
| | | | | | | | |
| | Distributions to shareholders from net realized gains | | | — | (b) | | | — | (b) | | | — | (b) | | | — | (b) | | | — | (b) | | | — | (b) | | | — | (b) |
| | | | | | | | |
| | Total distributions(c) | | | — | (b) | | | — | (b) | | | (0.012 | ) | | | (0.024 | ) | | | (0.016 | ) | | | (0.009 | ) | | | (0.002 | ) |
| | | | | | | | |
| | Net asset value, end of period | | $ | 1.00 | | | $ | 1.00 | | | $ | 1.00 | | | $ | 1.00 | | | $ | 1.00 | | | $ | 1.00 | | | $ | 1.00 | |
| | | | | | | | |
| | Total return(d) | | | 0.03 | % | | | 0.02 | % | | | 1.22 | % | | | 2.40 | % | | | 1.61 | % | | | 0.87 | % | | | 0.24 | % |
| | | | | | | | |
| | Net assets, end of period (in 000’s) | | $ | 1,327,239 | | | $ | 1,527,628 | | | $ | 2,025,657 | | | $ | 1,316,874 | | | $ | 504,770 | | | $ | 216,443 | | | $ | 10,679 | |
| | | | | | | | |
| | Ratio of net expenses to average net assets | | | 0.15 | %(e) | | | 0.18 | %(e) | | | 0.18 | % | | | 0.18 | % | | | 0.18 | % | | | 0.18 | % | | | 0.18 | %(e) |
| | | | | | | | |
| | Ratio of total expenses to average net assets | | | 0.20 | %(e) | | | 0.22 | %(e) | | | 0.21 | % | | | 0.21 | % | | | 0.29 | % | | | 0.51 | % | | | 4.88 | %(e) |
| | | | | | | | |
| | Ratio of net investment income (loss) to average net assets | | | (0.02 | )%(e) | | | (0.02 | )%(e) | | | 1.11 | % | | | 2.37 | % | | | 1.68 | % | | | 0.90 | % | | | 0.41 | %(e) |
| | † | | The Fund changed its fiscal year end from August 31 to November 30. |
| | * | | Commenced operations on January 29, 2016. |
| | (a) | | Calculated based on the average shares outstanding methodology. |
| | (b) | | Amount is less than $0.0005 per share. |
| | (c) | | Distributions may not coincide with the current year net investment income or net realized gains as distributions may be paid from current or prior year earnings. |
| | (d) | | Assumes reinvestment of all distributions. Returns do not reflect the deduction of taxes that a shareholder would pay on Fund distributions. Total returns for periods less than one full year are not annualized. |
| | | | | | | | | | | | | | | | | | | | | | | | | | | | | | |
| | | | | Six Months Ended
May 31, 2021
(Unaudited) | | | For the
Period Ended
November 30, 2020† | | | Year Ended August 31, | | | Period Ended
August 31, 2016* | |
| | | Investor Money Market Fund — Service Shares | | 2020 | | | 2019 | | | 2018 | | | 2017 | |
| | Per Share Data: | | | | | | | | | | | | | | | | | | | | | | | | | | | | |
| | | | | | | | |
| | Net asset value, beginning of period | | $ | 1.00 | | | $ | 1.00 | | | $ | 1.00 | | | $ | 1.00 | | | $ | 1.00 | | | $ | 1.00 | | | $ | 1.00 | |
| | | | | | | | |
| | Net investment income(a) | | | — | (b) | | | — | (b) | | | 0.006 | | | | 0.018 | | | | 0.009 | | | | 0.004 | | | | — | (b) |
| | | | | | | | |
| | Net realized gain | | | — | (b) | | | — | (b) | | | 0.002 | | | | 0.001 | | | | 0.002 | | | | — | (b) | | | — | (b) |
| | | | | | | | |
| | Total from investment operations | | | — | (b) | | | — | (b) | | | 0.008 | | | | 0.019 | | | | 0.011 | | | | 0.004 | | | | — | (b) |
| | | | | | | | |
| | Distributions to shareholders from net investment income | | | — | (b) | | | — | (b) | | | (0.008 | ) | | | (0.019 | ) | | | (0.011 | ) | | | (0.004 | ) | | | — | (b) |
| | | | | | | | |
| | Distributions to shareholders from net realized gains | | | — | (b) | | | — | (b) | | | — | (b) | | | — | (b) | | | — | (b) | | | — | (b) | | | — | (b) |
| | | | | | | | |
| | Total distributions(c) | | | — | (b) | | | — | (b) | | | (0.008 | ) | | | (0.019 | ) | | | (0.011 | ) | | | (0.004 | ) | | | — | (b) |
| | | | | | | | |
| | Net asset value, end of period | | $ | 1.00 | | | $ | 1.00 | | | $ | 1.00 | | | $ | 1.00 | | | $ | 1.00 | | | $ | 1.00 | | | $ | 1.00 | |
| | | | | | | | |
| | Total return(d) | | | 0.02 | % | | | — | %(e) | | | 0.78 | % | | | 1.89 | % | | | 1.11 | % | | | 0.39 | % | | | 0.05 | % |
| | | | | | | | |
| | Net assets, end of period (in 000’s) | | $ | 41,101 | | | $ | 50,167 | | | $ | 56,453 | | | $ | 30,615 | | | $ | 11 | | | $ | 50 | | | $ | 50 | |
| | | | | | | | |
| | Ratio of net expenses to average net assets | | | 0.17 | %(f) | | | 0.24 | %(f) | | | 0.62 | % | | | 0.68 | % | | | 0.68 | % | | | 0.68 | % | | | 0.61 | %(f) |
| | | | | | | | |
| | Ratio of total expenses to average net assets | | | 0.70 | %(f) | | | 0.72 | %(f) | | | 0.71 | % | | | 0.71 | % | | | 0.79 | % | | | 1.01 | % | | | 5.38 | %(f) |
| | | | | | | | |
| | Ratio of net investment income (loss) to average net assets | | | (0.03 | )%(f) | | | (0.08 | )%(f) | | | 0.62 | % | | | 1.75 | % | | | 0.92 | % | | | 0.36 | % | | | 0.02 | %(f) |
| | † | | The Fund changed its fiscal year end from August 31 to November 30. |
| | * | | Commenced operations on May 31, 2016. |
| | (a) | | Calculated based on the average shares outstanding methodology. |
| | (b) | | Amount is less than $0.0005 per share. |
| | (c) | | Distributions may not coincide with the current year net investment income or net realized gains as distributions may be paid from current or prior year earnings. |
| | (d) | | Assumes reinvestment of all distributions. Returns do not reflect the deduction of taxes that a shareholder would pay on Fund distributions. Total returns for periods less than one full year are not annualized. |
| | (e) | | Amount is less than 0.005%. |
| | |
| 20 | | The accompanying notes are an integral part of these financial statements. |
GOLDMAN SACHS INVESTOR MONEY MARKET FUND
Financial Highlights (continued)
| | | | | | | | | | | | | | | | | | | | | | | | | | | | | | |
| | | Investor Money Market Fund —
Administration Shares | | Six Months Ended
May 31, 2021
(Unaudited) | | | For the
Period Ended
November 30, 2020† | | | Year Ended August 31, | | | Period Ended
August 31, 2016* | |
| | | 2020 | | | 2019 | | | 2018 | | | 2017 | |
| | Per Share Data: | | | | | | | | | | | | | | | | | | | | | | | | | | | | |
| | | | | | | | |
| | Net asset value, beginning of period | | $ | 1.00 | | | $ | 1.00 | | | $ | 1.00 | | | $ | 1.00 | | | $ | 1.00 | | | $ | 1.00 | | | $ | 1.00 | |
| | | | | | | | |
| | Net investment income(a) | | | — | (b) | | | — | (b) | | | 0.009 | | | | 0.021 | | | | 0.014 | | | | 0.007 | | | | 0.001 | |
| | | | | | | | |
| | Net realized gain (loss) | | | — | (b) | | | — | (b) | | | 0.001 | | | | — | (b) | | | (0.001 | ) | | | (0.001 | ) | | | — | (b) |
| | | | | | | | |
| | Total from investment operations | | | — | (b) | | | — | (b) | | | 0.010 | | | | 0.021 | | | | 0.013 | | | | 0.006 | | | | 0.001 | |
| | | | | | | | |
| | Distributions to shareholders from net investment income | | | — | (b) | | | — | (b) | | | (0.010 | ) | | | (0.021 | ) | | | (0.013 | ) | | | (0.006 | ) | | | (0.001 | ) |
| | | | | | | | |
| | Distributions to shareholders from net realized gains | | | — | (b) | | | — | (b) | | | — | (b) | | | — | (b) | | | — | (b) | | | — | (b) | | | — | (b) |
| | | | | | | | |
| | Total distributions(c) | | | — | (b) | | | — | (b) | | | (0.010 | ) | | | (0.021 | ) | | | (0.013 | ) | | | (0.006 | ) | | | (0.001 | ) |
| | | | | | | | |
| | Net asset value, end of period | | $ | 1.00 | | | $ | 1.00 | | | $ | 1.00 | | | $ | 1.00 | | | $ | 1.00 | | | $ | 1.00 | | | $ | 1.00 | |
| | | | | | | | |
| | Total return(d) | | | 0.02 | % | | | — | %(e) | | | 0.98 | % | | | 2.14 | % | | | 1.36 | % | | | 0.62 | % | | | 0.09 | % |
| | | | | | | | |
| | Net assets, end of period (in 000’s) | | $ | 37,517 | | | $ | 31,792 | | | $ | 33,860 | | | $ | 31,188 | | | $ | 132,200 | | | $ | 100,351 | | | $ | 50 | |
| | | | | | | | |
| | Ratio of net expenses to average net assets | | | 0.17 | %(f) | | | 0.24 | %(f) | | | 0.42 | % | | | 0.43 | % | | | 0.43 | % | | | 0.43 | % | | | 0.43 | %(f) |
| | | | | | | | |
| | Ratio of total expenses to average net assets | | | 0.45 | %(f) | | | 0.47 | %(f) | | | 0.46 | % | | | 0.46 | % | | | 0.54 | % | | | 0.76 | % | | | 5.13 | %(f) |
| | | | | | | | |
| | Ratio of net investment income (loss) to average net assets | | | (0.03 | )%(f) | | | (0.08 | )%(f) | | | 0.90 | % | | | 2.12 | % | | | 1.37 | % | | | 0.72 | % | | | 0.16 | %(f) |
| | † | | The Fund changed its fiscal year end from August 31 to November 30. |
| | * | | Commenced operations on January 29, 2016. |
| | (a) | | Calculated based on the average shares outstanding methodology. |
| | (b) | | Amount is less than $0.0005 per share. |
| | (c) | | Distributions may not coincide with the current year net investment income or net realized gains as distributions may be paid from current or prior year earnings. |
| | (d) | | Assumes reinvestment of all distributions. Returns do not reflect the deduction of taxes that a shareholder would pay on Fund distributions. Total returns for periods less than one full year are not annualized. |
| | (e) | | Amount is less than 0.005%. |
| | | | | | | | | | | | | | | | | | | | | | | | | | | | | | |
| | | Investor Money Market Fund — Cash
Management Shares | | Six Months Ended
May 31, 2021
(Unaudited) | | | For the
Period Ended
November 30, 2020† | | | Year Ended August 31, | | | Period Ended
August 31, 2016* | |
| | | 2020 | | | 2019 | | | 2018 | | | 2017 | |
| | Per Share Data: | | | | | | | | | | | | | | | | | | | | | | | | | | | | |
| | | | | | | | |
| | Net asset value, beginning of period | | $ | 1.00 | | | $ | 1.00 | | | $ | 1.00 | | | $ | 1.00 | | | $ | 1.00 | | | $ | 1.00 | | | $ | 1.00 | |
| | | | | | | | |
| | Net investment income(a) | | | — | (b) | | | — | (b) | | | 0.004 | | | | 0.016 | | | | 0.009 | | | | 0.002 | | | | — | (b) |
| | | | | | | | |
| | Net realized gain (loss) | | | — | (b) | | | — | (b) | | | 0.002 | | | | — | (b) | | | (0.001 | ) | | | (0.001 | ) | | | — | (b) |
| | | | | | | | |
| | Total from investment operations | | | — | (b) | | | — | (b) | | | 0.006 | | | | 0.016 | | | | 0.008 | | | | 0.001 | | | | — | (b) |
| | | | | | | | |
| | Distributions to shareholders from net investment income | | | — | (b) | | | — | (b) | | | (0.006 | ) | | | (0.016 | ) | | | (0.008 | ) | | | (0.001 | ) | | | — | (b) |
| | | | | | | | |
| | Distributions to shareholders from net realized gains | | | — | (b) | | | — | (b) | | | — | (b) | | | — | (b) | | | — | (b) | | | — | (b) | | | — | (b) |
| | | | | | | | |
| | Total distributions(c) | | | — | (b) | | | — | (b) | | | (0.006 | ) | | | (0.016 | ) | | | (0.008 | ) | | | (0.001 | ) | | | — | (b) |
| | | | | | | | |
| | Net asset value, end of period | | $ | 1.00 | | | $ | 1.00 | | | $ | 1.00 | | | $ | 1.00 | | | $ | 1.00 | | | $ | 1.00 | | | $ | 1.00 | |
| | | | | | | | |
| | Total return(d) | | | 0.02 | % | | | — | %(e) | | | 0.58 | % | | | 1.58 | % | | | 0.81 | % | | | 0.15 | % | | | 0.05 | % |
| | | | | | | | |
| | Net assets, end of period (in 000’s) | | $ | 34,314 | | | $ | 49,812 | | | $ | 52,017 | | | $ | 21,414 | | | $ | 927 | | | $ | 91 | | | $ | 50 | |
| | | | | | | | |
| | Ratio of net expenses to average net assets | | | 0.17 | %(f) | | | 0.24 | %(f) | | | 0.76 | % | | | 0.98 | % | | | 0.98 | % | | | 0.95 | % | | | 0.62 | %(f) |
| | | | | | | | |
| | Ratio of total expenses to average net assets | | | 1.00 | %(f) | | | 1.02 | %(f) | | | 1.01 | % | | | 1.01 | % | | | 1.09 | % | | | 1.31 | % | | | 5.68 | %(f) |
| | | | | | | | |
| | Ratio of net investment income (loss) to average net assets | | | (0.03 | )%(f) | | | (0.08 | )%(f) | | | 0.38 | % | | | 1.60 | % | | | 0.88 | % | | | 0.18 | % | | | 0.01 | %(f) |
| | † | | The Fund changed its fiscal year end from August 31 to November 30. |
| | * | | Commenced operations on May 31, 2016. |
| | (a) | | Calculated based on the average shares outstanding methodology. |
| | (b) | | Amount is less than $0.0005 per share. |
| | (c) | | Distributions may not coincide with the current year net investment income or net realized gains as distributions may be paid from current or prior year earnings. |
| | (d) | | Assumes reinvestment of all distributions. Returns do not reflect the deduction of taxes that a shareholder would pay on Fund distributions. Total returns for periods less than one full year are not annualized. |
| | (e) | | Amount is less than 0.005%. |
| | |
| The accompanying notes are an integral part of these financial statements. | | 21 |
GOLDMAN SACHS INVESTOR MONEY MARKET FUND
Financial Highlights (continued)
| | | | | | | | | | | | | | | | | | | | | | | | | | | | | | |
| | | | | Six Months Ended
May 31, 2021
(Unaudited) | | | For the
Period Ended
November 30, 2020† | | | Year Ended August 31, | | | Period Ended
August 31, 2016* | |
| | | Investor Money Market Fund — Resource Shares | | 2020 | | | 2019 | | | 2018 | | | 2017 | |
| | Per Share Data: | | | | | | | | | | | | | | | | | | | | | | | | | | | | |
| | | | | | | | |
| | Net asset value, beginning of period | | $ | 1.00 | | | $ | 1.00 | | | $ | 1.00 | | | $ | 1.00 | | | $ | 1.00 | | | $ | 1.00 | | | $ | 1.00 | |
| | | | | | | | |
| | Net investment income(a) | | | — | (b) | | | — | (b) | | | 0.007 | | | | 0.017 | | | | 0.008 | | | | 0.002 | | | | — | (b) |
| | | | | | | | |
| | Net realized gain | | | — | (b) | | | — | (b) | | | — | (b) | | | — | (b) | | | 0.002 | | | | 0.001 | | | | — | (b) |
| | | | | | | | |
| | Total from investment operations | | | — | (b) | | | — | (b) | | | 0.007 | | | | 0.017 | | | | 0.010 | | | | 0.003 | | | | — | (b) |
| | | | | | | | |
| | Distributions to shareholders from net investment income | | | — | (b) | | | — | (b) | | | (0.007 | ) | | | (0.017 | ) | | | (0.010 | ) | | | (0.003 | ) | | | — | (b) |
| | | | | | | | |
| | Distributions to shareholders from net realized gains | | | — | (b) | | | — | (b) | | | — | (b) | | | — | (b) | | | — | (b) | | | — | (b) | | | — | (b) |
| | | | | | | | |
| | Total distributions(c) | | | — | (b) | | | — | (b) | | | (0.007 | ) | | | (0.017 | ) | | | (0.010 | ) | | | (0.003 | ) | | | — | (b) |
| | | | | | | | |
| | Net asset value, end of period | | $ | 1.00 | | | $ | 1.00 | | | $ | 1.00 | | | $ | 1.00 | | | $ | 1.00 | | | $ | 1.00 | | | $ | 1.00 | |
| | | | | | | | |
| | Total return(d) | | | 0.02 | % | | | — | %(e) | | | 0.67 | % | | | 1.74 | % | | | 0.96 | % | | | 0.26 | % | | | 0.05 | % |
| | | | | | | | |
| | Net assets, end of period (in 000’s) | | $ | 11 | | | $ | 11 | | | $ | 11 | | | $ | 11 | | | $ | 11 | | | $ | 50 | | | $ | 50 | |
| | | | | | | | |
| | Ratio of net expenses to average net assets | | | 0.16 | %(f) | | | 0.23 | %(f) | | | 0.73 | % | | | 0.81 | % | | | 0.83 | % | | | 0.82 | % | | | 0.62 | %(f) |
| | | | | | | | |
| | Ratio of total expenses to average net assets | | | 0.85 | %(f) | | | 0.87 | %(f) | | | 0.86 | % | | | 0.86 | % | | | 0.94 | % | | | 1.16 | % | | | 5.53 | %(f) |
| | | | | | | | |
| | Ratio of net investment income (loss) to average net assets | | | (0.03 | )%(f) | | | (0.07 | )%(f) | | | 0.66 | % | | | 1.75 | % | | | 0.77 | % | | | 0.22 | % | | | 0.01 | %(f) |
| | † | | The Fund changed its fiscal year end from August 31 to November 30. |
| | * | | Commenced operations on May 31, 2016. |
| | (a) | | Calculated based on the average shares outstanding methodology. |
| | (b) | | Amount is less than $0.0005 per share. |
| | (c) | | Distributions may not coincide with the current year net investment income or net realized gains as distributions may be paid from current or prior year earnings. |
| | (d) | | Assumes reinvestment of all distributions. Returns do not reflect the deduction of taxes that a shareholder would pay on Fund distributions. Total returns for periods less than one full year are not annualized. |
| | (e) | | Amount is less than 0.005%. |
| | |
| 22 | | The accompanying notes are an integral part of these financial statements. |
GOLDMAN SACHS INVESTOR TAX-EXEMPT MONEY MARKET FUND
Financial Highlights (continued)
| | | | | | | | | | | | | | | | | | | | | | | | | | | | | | |
| | | Investor Tax-Exempt Money Market Fund —
Class A Shares | | Six Months Ended
May 31, 2021
(Unaudited) | | | For the
Period Ended
November 30, 2020† | | | Year Ended August 31, | | | Period Ended
August 31, 2016* | |
| | | 2020 | | | 2019 | | | 2018 | | | 2017 | |
| | Per Share Data: | | | | | | | | | | | | | | | | | | | | | | | | | | | | |
| | | | | | | | |
| | Net asset value, beginning of period | | $ | 1.00 | | | $ | 1.00 | | | $ | 1.00 | | | $ | 1.00 | | | $ | 1.00 | | | $ | 1.00 | | | $ | 1.00 | |
| | | | | | | | |
| | Net investment income(a) | | | — | (b) | | | — | (b) | | | 0.005 | | | | 0.012 | | | | 0.008 | | | | 0.004 | | | | — | (b) |
| | | | | | | | |
| | Net realized gain | | | — | | | | — | (b) | | | 0.001 | | | | — | (b) | | | — | (b) | | | — | (b) | | | — | (b) |
| | | | | | | | |
| | Total from investment operations | | | — | (b) | | | — | (b) | | | 0.006 | | | | 0.012 | | | | 0.008 | | | | 0.004 | | | | — | (b) |
| | | | | | | | |
| | Distributions to shareholders from net investment income | | | — | (b) | | | — | (b) | | | (0.006 | ) | | | (0.012 | ) | | | (0.008 | ) | | | (0.003 | ) | | | — | (b) |
| | | | | | | | |
| | Distributions to shareholders from net realized gains | | | — | | | | — | | | | — | | | | — | (b) | | | — | (b) | | | (0.001 | ) | | | — | (b) |
| | | | | | | | |
| | Total distributions(c) | | | — | (b) | | | — | (b) | | | (0.006 | ) | | | (0.012 | ) | | | (0.008 | ) | | | (0.004 | ) | | | — | (b) |
| | | | | | | | |
| | Net asset value, end of period | | $ | 1.00 | | | $ | 1.00 | | | $ | 1.00 | | | $ | 1.00 | | | $ | 1.00 | | | $ | 1.00 | | | $ | 1.00 | |
| | | | | | | | |
| | Total return(d) | | | 0.01 | % | | | — | %(e) | | | 0.55 | % | | | 1.16 | % | | | 0.78 | % | | | 0.38 | % | | | 0.01 | % |
| | | | | | | | |
| | Net assets, end of period (in 000’s) | | $ | 9,343 | | | $ | 10,756 | | | $ | 16,678 | | | $ | 14,846 | | | $ | 2,296 | | | $ | 643 | | | $ | 10 | |
| | | | | | | | |
| | Ratio of net expenses to average net assets | | | 0.06 | %(f) | | | 0.13 | %(f) | | | 0.36 | % | | | 0.43 | % | | | 0.43 | % | | | 0.43 | % | | | 0.30 | %(f) |
| | | | | | | | |
| | Ratio of total expenses to average net assets | | | 0.45 | %(f) | | | 0.48 | %(f) | | | 0.45 | % | | | 0.45 | % | | | 0.47 | % | | | 0.54 | % | | | 0.49 | %(f) |
| | | | | | | | |
| | Ratio of net investment income to average net assets | | | 0.01 | %(f) | | | 0.01 | %(f) | | | 0.42 | % | | | 1.11 | % | | | 0.82 | % | | | 0.35 | % | | | 0.04 | %(f) |
| | † | | The Fund changed its fiscal year end from August 31 to November 30. |
| | * | | Commenced operations on March 31, 2016. |
| | (a) | | Calculated based on the average shares outstanding methodology. |
| | (b) | | Amount is less than $0.0005 per share. |
| | (c) | | Distributions may not coincide with the current year net investment income or net realized gains as distributions may be paid from current or prior year earnings. |
| | (d) | | Assumes reinvestment of all distributions. Returns do not reflect the deduction of taxes that a shareholder would pay on Fund distributions. Total returns for periods less than one full year are not annualized. |
| | (e) | | Amount is less than 0.005%. |
| | | | | | | | | | | | | | | | | | | | | | | | | | | | | | |
| | | Investor Tax-Exempt Money Market Fund —
Class C Shares | | Six Months Ended
May 31, 2021
(Unaudited) | | | For the
Period Ended
November 30, 2020† | | | Year Ended August 31, | | | Period Ended
August 31, 2016* | |
| | | 2020 | | | 2019 | | | 2018 | | | 2017 | |
| | Per Share Data: | | | | | | | | | | | | | | | | | | | | | | | | | | | | |
| | | | | | | | |
| | Net asset value, beginning of period | | $ | 1.00 | | | $ | 1.00 | | | $ | 1.00 | | | $ | 1.00 | | | $ | 1.00 | | | $ | 1.00 | | | $ | 1.00 | |
| | | | | | | | |
| | Net investment income(a) | | | — | | | | — | | | | 0.001 | | | | 0.004 | | | | 0.001 | | | | — | (b) | | | — | (b) |
| | | | | | | | |
| | Net realized gain | | | — | | | | — | (b) | | | — | (b) | | | — | (b) | | | — | (b) | | | 0.001 | | | | — | (b) |
| | | | | | | | |
| | Total from investment operations | | | — | (b) | | | — | (b) | | | 0.001 | | | | 0.004 | | | | 0.001 | | | | 0.001 | | | | — | (b) |
| | | | | | | | |
| | Distributions to shareholders from net investment income | | | — | (b) | | | — | (b) | | | (0.001 | ) | | | (0.004 | ) | | | (0.001 | ) | | | — | (b) | | | — | (b) |
| | | | | | | | |
| | Distributions to shareholders from net realized gains | | | — | | | | — | | | | — | | | | — | (b) | | | — | (b) | | | (0.001 | ) | | | — | (b) |
| | | | | | | | |
| | Total distributions(c) | | | — | (b) | | | — | (b) | | | (0.001 | ) | | | (0.004 | ) | | | (0.001 | ) | | | (0.001 | ) | | | — | (b) |
| | | | | | | | |
| | Net asset value, end of period | | $ | 1.00 | | | $ | 1.00 | | | $ | 1.00 | | | $ | 1.00 | | | $ | 1.00 | | | $ | 1.00 | | | $ | 1.00 | |
| | | | | | | | |
| | Total return(d) | | | 0.01 | % | | | — | %(e) | | | 0.12 | % | | | 0.41 | % | | | 0.13 | % | | | 0.07 | % | | | 0.01 | % |
| | | | | | | | |
| | Net assets, end of period (in 000’s) | | $ | 9 | | | $ | 29 | | | $ | 29 | | | $ | 9 | | | $ | 9 | | | $ | 9 | | | $ | 10 | |
| | | | | | | | |
| | Ratio of net expenses to average net assets | | | 0.06 | %(f) | | | 0.13 | %(f) | | | 0.55 | % | | | 1.19 | % | | | 1.06 | % | | | 0.72 | % | | | 0.31 | %(f) |
| | | | | | | | |
| | Ratio of total expenses to average net assets | | | 1.20 | %(f) | | | 1.23 | %(f) | | | 1.20 | % | | | 1.20 | % | | | 1.22 | % | | | 1.29 | % | | | 1.24 | %(f) |
| | | | | | | | |
| | Ratio of net investment income to average net assets | | | — | %(f)(g) | | | 0.01 | %(f) | | | 0.14 | % | | | 0.39 | % | | | 0.15 | % | | | 0.04 | % | | | 0.04 | %(f) |
| | † | | The Fund changed its fiscal year end from August 31 to November 30. |
| | * | | Commenced operations on March 31, 2016. |
| | (a) | | Calculated based on the average shares outstanding methodology. |
| | (b) | | Amount is less than $0.0005 per share. |
| | (c) | | Distributions may not coincide with the current year net investment income or net realized gains as distributions may be paid from current or prior year earnings. |
| | (d) | | Assumes reinvestment of all distributions. Returns do not reflect the deduction of taxes that a shareholder would pay on Fund distributions. Total returns for periods less than one full year are not annualized. |
| | (e) | | Amount is less than 0.005%. |
| | (g) | | Amount is less than 0.005% of average net assets. |
| | |
| The accompanying notes are an integral part of these financial statements. | | 23 |
GOLDMAN SACHS INVESTOR TAX-EXEMPT MONEY MARKET FUND
Financial Highlights (continued)
| | | | | | | | | | | | | | | | | | | | | | | | | | | | | | |
| | | Investor Tax-Exempt Money Market
Fund — Class I Shares | | Six Months Ended
May 31, 2021
(Unaudited) | | | For the
Period Ended
November 30, 2020† | | | Year Ended August 31, | |
| | | 2020 | | | 2019 | | | 2018 | | | 2017 | | | 2016 | |
| | Per Share Data: | | | | | | | | | | | | | | | | | | | | | | | | | | | | |
| | | | | | | | |
| | Net asset value, beginning of period | | $ | 1.00 | | | $ | 1.00 | | | $ | 1.00 | | | $ | 1.00 | | | $ | 1.00 | | | $ | 1.00 | | | $ | 1.00 | |
| | | | | | | | |
| | Net investment income(a) | | | — | (b) | | | — | (b) | | | 0.007 | | | | 0.014 | | | | 0.010 | | | | 0.006 | | | | 0.001 | |
| | | | | | | | |
| | Net realized gain | | | — | | | | — | (b) | | | — | (b) | | | — | (b) | | | — | (b) | | | 0.001 | | | | — | (b) |
| | | | | | | | |
| | Total from investment operations | | | — | (b) | | | — | (b) | | | 0.007 | | | | 0.014 | | | | 0.010 | | | | 0.007 | | | | 0.001 | |
| | | | | | | | |
| | Distributions to shareholders from net investment income | | | — | (b) | | | — | (b) | | | (0.007 | ) | | | (0.014 | ) | | | (0.010 | ) | | | (0.006 | ) | | | (0.001 | ) |
| | | | | | | | |
| | Distributions to shareholders from net realized gains | | | — | | | | — | | | | — | | | | — | (b) | | | — | (b) | | | (0.001 | ) | | | — | (b) |
| | | | | | | | |
| | Total distributions(c) | | | — | (b) | | | — | (b) | | | (0.007 | ) | | | (0.014 | ) | | | (0.010 | ) | | | (0.007 | ) | | | (0.001 | ) |
| | | | | | | | |
| | Net asset value, end of period | | $ | 1.00 | | | $ | 1.00 | | | $ | 1.00 | | | $ | 1.00 | | | $ | 1.00 | | | $ | 1.00 | | | $ | 1.00 | |
| | | | | | | | |
| | Total return(d) | | | 0.01 | % | | | — | %(e) | | | 0.75 | % | | | 1.42 | % | | | 1.03 | % | | | 0.63 | % | | | 0.11 | % |
| | | | | | | | |
| | Net assets, end of period (in 000’s) | | $ | 1,376,627 | | | $ | 1,361,639 | | | $ | 1,511,106 | | | $ | 1,444,641 | | | $ | 1,052,229 | | | $ | 924,326 | | | $ | 1,387,634 | |
| | | | | | | | |
| | Ratio of net expenses to average net assets | | | 0.06 | %(f) | | | 0.13 | %(f) | | | 0.18 | % | | | 0.18 | % | | | 0.18 | % | | | 0.18 | % | | | 0.11 | % |
| | | | | | | | |
| | Ratio of total expenses to average net assets | | | 0.20 | %(f) | | | 0.23 | %(f) | | | 0.20 | % | | | 0.20 | % | | | 0.22 | % | | | 0.29 | % | | | 0.24 | % |
| | | | | | | | |
| | Ratio of net investment income to average net assets | | | 0.01 | %(f) | | | 0.01 | %(f) | | | 0.73 | % | | | 1.40 | % | | | 1.02 | % | | | 0.57 | % | | | 0.07 | % |
| | † | | The Fund changed its fiscal year end from August 31 to November 30. |
| | (a) | | Calculated based on the average shares outstanding methodology. |
| | (b) | | Amount is less than $0.0005 per share. |
| | (c) | | Distributions may not coincide with the current year net investment income or net realized gains as distributions may be paid from current or prior year earnings. |
| | (d) | | Assumes reinvestment of all distributions. Returns do not reflect the deduction of taxes that a shareholder would pay on Fund distributions. Total returns for periods less than one full year are not annualized. |
| | (e) | | Amount is less than 0.005%. |
| | | | | | | | | | | | | | | | | | | | | | | | | | | | | | |
| | | | | Six Months Ended
May 31, 2021
(Unaudited) | | | For the
Period Ended
November 30, 2020† | | | Year Ended August 31, | |
| | | Investor Tax-Exempt Money Market Fund — Capital Shares | | 2020 | | | 2019 | | | 2018 | | | 2017 | | | 2016 | |
| | Per Share Data: | | | | | | | | | | | | | | | | | | | | | | | | | | | | |
| | | | | | | | |
| | Net asset value, beginning of period | | $ | 1.00 | | | $ | 1.00 | | | $ | 1.00 | | | $ | 1.00 | | | $ | 1.00 | | | $ | 1.00 | | | $ | 1.00 | |
| | | | | | | | |
| | Net investment income(a) | | | — | | | | 0.001 | | | | 0.010 | | | | 0.017 | | | | 0.013 | | | | 0.003 | | | | — | (b) |
| | | | | | | | |
| | Net realized gain | | | — | | | | — | (b) | | | — | (b) | | | — | (b) | | | — | (b) | | | 0.002 | | | | — | (b) |
| | | | | | | | |
| | Total from investment operations | | | — | (b) | | | 0.001 | | | | 0.010 | | | | 0.017 | | | | 0.013 | | | | 0.005 | | | | — | (b) |
| | | | | | | | |
| | Distributions to shareholders from net investment income | | | — | (b) | | | (0.001 | ) | | | (0.010 | ) | | | (0.017 | ) | | | (0.013 | ) | | | (0.004 | ) | | | — | (b) |
| | | | | | | | |
| | Distributions to shareholders from net realized gains | | | — | | | | — | | | | — | | | | — | (b) | | | — | (b) | | | (0.001 | ) | | | — | (b) |
| | | | | | | | |
| | Total distributions(c) | | | — | (b) | | | (0.001 | ) | | | (0.010 | ) | | | (0.017 | ) | | | (0.013 | ) | | | (0.005 | ) | | | — | (b) |
| | | | | | | | |
| | Net asset value, end of period | | $ | 1.00 | | | $ | 1.00 | | | $ | 1.00 | | | $ | 1.00 | | | $ | 1.00 | | | $ | 1.00 | | | $ | 1.00 | |
| | | | | | | | |
| | Total return(d) | | | 0.01 | % | | | — | %(e) | | | 0.62 | % | | | 1.27 | % | | | 0.88 | % | | | 0.48 | % | | | 0.04 | % |
| | | | | | | | |
| | Net assets, end of period (in 000’s) | | $ | 1 | | | $ | 1 | | | $ | 1 | | | $ | 1 | | | $ | 1 | | | $ | 1 | | | $ | 886 | |
| | | | | | | | |
| | Ratio of net expenses to average net assets | | | 0.06 | %(f) | | | 0.13 | %(f) | | | 0.18 | % | | | 0.18 | % | | | 0.18 | % | | | 0.33 | % | | | 0.19 | % |
| | | | | | | | |
| | Ratio of total expenses to average net assets | | | 0.20 | %(f) | | | 0.38 | %(f) | | | 0.35 | % | | | 0.35 | % | | | 0.37 | % | | | 0.44 | % | | | 0.39 | % |
| | | | | | | | |
| | Ratio of net investment income to average net assets | | | 0.06 | %(f) | | | 0.35 | %(f) | | | 0.99 | % | | | 1.69 | % | | | 1.31 | % | | | 0.30 | % | | | 0.04 | % |
| | † | | The Fund changed its fiscal year end from August 31 to November 30. |
| | (a) | | Calculated based on the average shares outstanding methodology. |
| | (b) | | Amount is less than $0.0005 per share. |
| | (c) | | Distributions may not coincide with the current year net investment income or net realized gains as distributions may be paid from current or prior year earnings. |
| | (d) | | Assumes reinvestment of all distributions. Returns do not reflect the deduction of taxes that a shareholder would pay on Fund distributions. Total returns for periods less than one full year are not annualized. |
| | (e) | | Amount is less than 0.005%. |
| | |
| 24 | | The accompanying notes are an integral part of these financial statements. |
GOLDMAN SACHS INVESTOR TAX-EXEMPT MONEY MARKET FUND
Financial Highlights (continued)
| | | | | | | | | | | | | | | | | | | | | | | | | | | | | | |
| | | | | Six Months Ended
May 31, 2021
(Unaudited) | | | For the
Period Ended
November 30, 2020† | | | Year Ended August 31, | |
| | | Investor Tax-Exempt Money Market Fund — Service Shares | | 2020 | | | 2019 | | | 2018 | | | 2017 | | | 2016 | |
| | Per Share Data: | | | | | | | | | | | | | | | | | | | | | | | | | | | | |
| | | | | | | | |
| | Net asset value, beginning of period | | $ | 1.00 | | | $ | 1.00 | | | $ | 1.00 | | | $ | 1.00 | | | $ | 1.00 | | | $ | 1.00 | | | $ | 1.00 | |
| | | | | | | | |
| | Net investment income(a) | | | — | (b) | | | — | (b) | | | 0.005 | | | | 0.009 | | | | 0.005 | | | | — | (b) | | | — | (b) |
| | | | | | | | |
| | Net realized gain (loss) | | | — | | | | — | (b) | | | (0.001 | ) | | | — | (b) | | | — | (b) | | | 0.002 | | | | — | (b) |
| | | | | | | | |
| | Total from investment operations | | | — | (b) | | | — | (b) | | | 0.004 | | | | 0.009 | | | | 0.005 | | | | 0.002 | | | | — | (b) |
| | | | | | | | |
| | Distributions to shareholders from net investment income | | | — | (b) | | | — | (b) | | | (0.004 | ) | | | (0.009 | ) | | | (0.005 | ) | | | (0.001 | ) | | | — | (b) |
| | | | | | | | |
| | Distributions to shareholders from net realized gains | | | — | | | | — | | | | — | | | | — | (b) | | | — | (b) | | | (0.001 | ) | | | — | (b) |
| | | | | | | | |
| | Total distributions(c) | | | — | (b) | | | — | (b) | | | (0.004 | ) | | | (0.009 | ) | | | (0.005 | ) | | | (0.002 | ) | | | — | (b) |
| | | | | | | | |
| | Net asset value, end of period | | $ | 1.00 | | | $ | 1.00 | | | $ | 1.00 | | | $ | 1.00 | | | $ | 1.00 | | | $ | 1.00 | | | $ | 1.00 | |
| | | | | | | | |
| | Total return(d) | | | 0.01 | % | | | — | %(e) | | | 0.39 | % | | | 0.91 | % | | | 0.53 | % | | | 0.15 | % | | | 0.01 | % |
| | | | | | | | |
| | Net assets, end of period (in 000’s) | | $ | 840 | | | $ | 820 | | | $ | 818 | | | $ | 2,102 | | | $ | 836 | | | $ | 841 | | | $ | 58,173 | |
| | | | | | | | |
| | Ratio of net expenses to average net assets | | | 0.06 | %(f) | | | 0.13 | %(f) | | | 0.56 | % | | | 0.68 | % | | | 0.68 | % | | | 0.63 | % | | | 0.21 | % |
| | | | | | | | |
| | Ratio of total expenses to average net assets | | | 0.70 | %(f) | | | 0.73 | %(f) | | | 0.70 | % | | | 0.70 | % | | | 0.72 | % | | | 0.79 | % | | | 0.74 | % |
| | | | | | | | |
| | Ratio of net investment income to average net assets | | | 0.01 | %(f) | | | 0.01 | %(f) | | | 0.45 | % | | | 0.91 | % | | | 0.52 | % | | | 0.04 | % | | | 0.01 | % |
| | † | | The Fund changed its fiscal year end from August 31 to November 30. |
| | (a) | | Calculated based on the average shares outstanding methodology. |
| | (b) | | Amount is less than $0.0005 per share. |
| | (c) | | Distributions may not coincide with the current year net investment income or net realized gains as distributions may be paid from current or prior year earnings. |
| | (d) | | Assumes reinvestment of all distributions. Returns do not reflect the deduction of taxes that a shareholder would pay on Fund distributions. Total returns for periods less than one full year are not annualized. |
| | (e) | | Amount is less than 0.005%. |
| | | | | | | | | | | | | | | | | | | | | | | | | | | | | | |
| | | | | Six Months Ended
May 31, 2021
(Unaudited) | | | For the
Period Ended
November 30, 2020† | | | Year Ended August 31, | |
| | | Investor Tax-Exempt Money Market Fund — Preferred Shares | | 2020 | | | 2019 | | | 2018 | | | 2017 | | | 2016 | |
| | Per Share Data: | | | | | | | | | | | | | | | | | | | | | | | | | | | | |
| | | | | | | | |
| | Net asset value, beginning of period | | $ | 1.00 | | | $ | 1.00 | | | $ | 1.00 | | | $ | 1.00 | | | $ | 1.00 | | | $ | 1.00 | | | $ | 1.00 | |
| | | | | | | | |
| | Net investment income(a) | | | — | (b) | | | — | (b) | | | 0.005 | | | | 0.013 | | | | 0.009 | | | | 0.005 | | | | 0.001 | |
| | | | | | | | |
| | Net realized gain | | | — | | | | — | (b) | | | 0.002 | | | | — | (b) | | | — | (b) | | | 0.001 | | | | — | (b) |
| | | | | | | | |
| | Total from investment operations | | | — | (b) | | | — | (b) | | | 0.007 | | | | 0.013 | | | | 0.009 | | | | 0.006 | | | | 0.001 | |
| | | | | | | | |
| | Distributions to shareholders from net investment income | | | — | (b) | | | — | (b) | | | (0.007 | ) | | | (0.013 | ) | | | (0.009 | ) | | | (0.005 | ) | | | (0.001 | ) |
| | | | | | | | |
| | Distributions to shareholders from net realized gains | | | — | | | | — | | | | — | | | | — | (b) | | | — | (b) | | | (0.001 | ) | | | — | (b) |
| | | | | | | | |
| | Total distributions(c) | | | — | (b) | | | — | (b) | | | (0.007 | ) | | | (0.013 | ) | | | (0.009 | ) | | | (0.006 | ) | | | (0.001 | ) |
| | | | | | | | |
| | Net asset value, end of period | | $ | 1.00 | | | $ | 1.00 | | | $ | 1.00 | | | $ | 1.00 | | | $ | 1.00 | | | $ | 1.00 | | | $ | 1.00 | |
| | | | | | | | |
| | Total return(d) | | | 0.01 | % | | | — | %(e) | | | 0.66 | % | | | 1.32 | % | | | 0.93 | % | | | 0.53 | % | | | 0.06 | % |
| | | | | | | | |
| | Net assets, end of period (in 000’s) | | $ | 89 | | | $ | 278 | | | $ | 91 | | | $ | 61 | | | $ | 68 | | | $ | 37 | | | $ | 46 | |
| | | | | | | | |
| | Ratio of net expenses to average net assets | | | 0.06 | %(f) | | | 0.13 | %(f) | | | 0.26 | % | | | 0.28 | % | | | 0.28 | % | | | 0.28 | % | | | 0.13 | % |
| | | | | | | | |
| | Ratio of total expenses to average net assets | | | 0.30 | %(f) | | | 0.33 | %(f) | | | 0.30 | % | | | 0.30 | % | | | 0.32 | % | | | 0.39 | % | | | 0.34 | % |
| | | | | | | | |
| | Ratio of net investment income to average net assets | | | 0.01 | %(f) | | | 0.01 | %(f) | | | 0.45 | % | | | 1.31 | % | | | 0.93 | % | | | 0.48 | % | | | 0.03 | % |
| | † | | The Fund changed its fiscal year end from August 31 to November 30. |
| | (a) | | Calculated based on the average shares outstanding methodology. |
| | (b) | | Amount is less than $0.0005 per share. |
| | (c) | | Distributions may not coincide with the current year net investment income or net realized gains as distributions may be paid from current or prior year earnings. |
| | (d) | | Assumes reinvestment of all distributions. Returns do not reflect the deduction of taxes that a shareholder would pay on Fund distributions. Total returns for periods less than one full year are not annualized. |
| | (e) | | Amount is less than 0.005%. |
| | |
| The accompanying notes are an integral part of these financial statements. | | 25 |
GOLDMAN SACHS INVESTOR TAX-EXEMPT MONEY MARKET FUND
Financial Highlights (continued)
| | | | | | | | | | | | | | | | | | | | | | | | | | | | | | |
| | | Investor Tax-Exempt Money Market Fund — Select Shares | | Six Months Ended
May 31, 2021
(Unaudited) | | | For the
Period Ended
November 30, 2020† | | | Year Ended August 31, | |
| | | 2020 | | | 2019 | | | 2018 | | | 2017 | | | 2016 | |
| | Per Share Data: | | | | | | | | | | | | | | | | | | | | | | | | | | | | |
| | | | | | | | |
| | Net asset value, beginning of period | | $ | 1.00 | | | $ | 1.00 | | | $ | 1.00 | | | $ | 1.00 | | | $ | 1.00 | | | $ | 1.00 | | | $ | 1.00 | |
| | | | | | | | |
| | Net investment income(a) | | | — | | | | 0.001 | | | | 0.010 | | | | 0.016 | | | | 0.009 | | | | 0.006 | | | | 0.001 | |
| | | | | | | | |
| | Net realized gain | | | — | | | | — | (b) | | | — | (b) | | | — | (b) | | | 0.001 | | | | — | (b) | | | — | (b) |
| | | | | | | | |
| | Total from investment operations | | | — | (b) | | | 0.001 | | | | 0.010 | | | | 0.016 | | | | 0.010 | | | | 0.006 | | | | 0.001 | |
| | | | | | | | |
| | Distributions to shareholders from net investment income | | | — | (b) | | | (0.001 | ) | | | (0.010 | ) | | | (0.016 | ) | | | (0.010 | ) | | | (0.005 | ) | | | (0.001 | ) |
| | | | | | | | |
| | Distributions to shareholders from net realized gains | | | — | | | | — | | | | — | | | | — | (b) | | | — | (b) | | | (0.001 | ) | | | — | (b) |
| | | | | | | | |
| | Total distributions(c) | | | — | (b) | | | (0.001 | ) | | | (0.010 | ) | | | (0.016 | ) | | | (0.010 | ) | | | (0.006 | ) | | | (0.001 | ) |
| | | | | | | | |
| | Net asset value, end of period | | $ | 1.00 | | | $ | 1.00 | | | $ | 1.00 | | | $ | 1.00 | | | $ | 1.00 | | | $ | 1.00 | | | $ | 1.00 | |
| | | | | | | | |
| | Total return(d) | | | 0.01 | % | | | — | %(e) | | | 0.72 | % | | | 1.39 | % | | | 1.00 | % | | | 0.60 | % | | | 0.09 | % |
| | | | | | | | |
| | Net assets, end of period (in 000’s) | | $ | 1 | | | $ | 1 | | | $ | 1 | | | $ | 1 | | | $ | 3 | | | $ | 5,401 | | | $ | — | |
| | | | | | | | |
| | Ratio of net expenses to average net assets | | | 0.06 | %(f) | | | 0.13 | %(f) | | | 0.18 | % | | | 0.18 | % | | | 0.21 | % | | | 0.21 | % | | | 0.11 | % |
| | | | | | | | |
| | Ratio of total expenses to average net assets | | | 0.20 | %(f) | | | 0.26 | %(f) | | | 0.23 | % | | | 0.23 | % | | | 0.25 | % | | | 0.32 | % | | | 0.27 | % |
| | | | | | | | |
| | Ratio of net investment income to average net assets | | | 0.06 | %(f) | | | 0.35 | %(f) | | | 0.97 | % | | | 1.50 | % | | | 0.95 | % | | | 0.62 | % | | | 0.01 | % |
| | † | | The Fund changed its fiscal year end from August 31 to November 30. |
| | (a) | | Calculated based on the average shares outstanding methodology. |
| | (b) | | Amount is less than $0.0005 per share. |
| | (c) | | Distributions may not coincide with the current year net investment income or net realized gains as distributions may be paid from current or prior year earnings. |
| | (d) | | Assumes reinvestment of all distributions. Returns do not reflect the deduction of taxes that a shareholder would pay on Fund distributions. Total returns for periods less than one full year are not annualized. |
| | (e) | | Amount is less than 0.005%. |
| | | | | | | | | | | | | | | | | | | | | | | | | | | | | | |
| | | Investor Tax-Exempt Money Market Fund —
Administration Shares | | Six Months Ended
May 31, 2021
(Unaudited) | | | For the
Period Ended
November 30, 2020† | | | Year Ended August 31, | |
| | | 2020 | | | 2019 | | | 2018 | | | 2017 | | | 2016 | |
| | Per Share Data: | | | | | | | | | | | | | | | | | | | | | | | | | | | | |
| | | | | | | | |
| | Net asset value, beginning of period | | $ | 1.00 | | | $ | 1.00 | | | $ | 1.00 | | | $ | 1.00 | | | $ | 1.00 | | | $ | 1.00 | | | $ | 1.00 | |
| | | | | | | | |
| | Net investment income(a) | | | — | (b) | | | — | (b) | | | 0.006 | | | | 0.012 | | | | 0.008 | | | | 0.003 | | | | — | (b) |
| | | | | | | | |
| | Net realized gain | | | — | | | | — | (b) | | | — | (b) | | | — | (b) | | | — | (b) | | | 0.001 | | | | — | (b) |
| | | | | | | | |
| | Total from investment operations | | | — | (b) | | | — | (b) | | | 0.006 | | | | 0.012 | | | | 0.008 | | | | 0.004 | | | | — | (b) |
| | | | | | | | |
| | Distributions to shareholders from net investment income | | | — | (b) | | | — | (b) | | | (0.006 | ) | | | (0.012 | ) | | | (0.008 | ) | | | (0.003 | ) | | | — | (b) |
| | | | | | | | |
| | Distributions to shareholders from net realized gains | | | — | | | | — | | | | — | | | | — | (b) | | | — | (b) | | | (0.001 | ) | | | — | (b) |
| | | | | | | | |
| | Total distributions(c) | | | — | (b) | | | — | (b) | | | (0.006 | ) | | | (0.012 | ) | | | (0.008 | ) | | | (0.004 | ) | | | — | (b) |
| | | | | | | | |
| | Net asset value, end of period | | $ | 1.00 | | | $ | 1.00 | | | $ | 1.00 | | | $ | 1.00 | | | $ | 1.00 | | | $ | 1.00 | | | $ | 1.00 | |
| | | | | | | | |
| | Total return(d) | | | 0.01 | % | | | — | %(e) | | | 0.55 | % | | | 1.16 | % | | | 0.78 | % | | | 0.38 | % | | | 0.01 | % |
| | | | | | | | |
| | Net assets, end of period (in 000’s) | | $ | 305 | | | $ | 305 | | | $ | 305 | | | $ | 298 | | | $ | 2 | | | $ | 3,575 | | | $ | 13,041 | |
| | | | | | | | |
| | Ratio of net expenses to average net assets | | | 0.06 | %(f) | | | 0.13 | %(f) | | | 0.37 | % | | | 0.43 | % | | | 0.43 | % | | | 0.43 | % | | | 0.18 | % |
| | | | | | | | |
| | Ratio of total expenses to average net assets | | | 0.45 | %(f) | | | 0.48 | %(f) | | | 0.45 | % | | | 0.45 | % | | | 0.47 | % | | | 0.54 | % | | | 0.49 | % |
| | | | | | | | |
| | Ratio of net investment income to average net assets | | | 0.01 | %(f) | | | 0.01 | %(f) | | | 0.55 | % | | | 1.18 | % | | | 0.75 | % | | | 0.30 | % | | | 0.01 | % |
| | † | | The Fund changed its fiscal year end from August 31 to November 30. |
| | (a) | | Calculated based on the average shares outstanding methodology. |
| | (b) | | Amount is less than $0.0005 per share. |
| | (c) | | Distributions may not coincide with the current year net investment income or net realized gains as distributions may be paid from current or prior year earnings. |
| | (d) | | Assumes reinvestment of all distributions. Returns do not reflect the deduction of taxes that a shareholder would pay on Fund distributions. Total returns for periods less than one full year are not annualized. |
| | (e) | | Amount is less than 0.005%. |
| | |
| 26 | | The accompanying notes are an integral part of these financial statements. |
GOLDMAN SACHS INVESTOR TAX-EXEMPT MONEY MARKET FUND
Financial Highlights (continued)
| | | | | | | | | | | | | | | | | | | | | | | | | | | | | | |
| | | Investor Tax-Exempt Money Market Fund — Cash
Management Shares | | Six Months Ended
May 31, 2021
(Unaudited) | | | For the
Period Ended
November 30, 2020† | | | Year Ended August 31, | |
| | | 2020 | | | 2019 | | | 2018 | | | 2017 | | | 2016 | |
| | Per Share Data: | | | | | | | | | | | | | | | | | | | | | | | | | | | | |
| | | | | | | | |
| | Net asset value, beginning of period | | $ | 1.00 | | | $ | 1.00 | | | $ | 1.00 | | | $ | 1.00 | | | $ | 1.00 | | | $ | 1.00 | | | $ | 1.00 | |
| | | | | | | | |
| | Net investment income(a) | | | — | | | | 0.001 | | | | 0.004 | | | | 0.010 | | | | 0.002 | | | | — | (b) | | | — | (b) |
| | | | | | | | |
| | Net realized gain | | | — | | | | — | (b) | | | 0.001 | | | | — | (b) | | | 0.001 | | | | 0.001 | | | | — | (b) |
| | | | | | | | |
| | Total from investment operations | | | — | (b) | | | 0.001 | | | | 0.005 | | | | 0.010 | | | | 0.003 | | | | 0.001 | | | | — | (b) |
| | | | | | | | |
| | Distributions to shareholders from net investment income | | | — | (b) | | | (0.001 | ) | | | (0.005 | ) | | | (0.010 | ) | | | (0.003 | ) | | | — | (b) | | | — | (b) |
| | | | | | | | |
| | Distributions to shareholders from net realized gains | | | — | | | | — | | | | — | | | | — | (b) | | | — | (b) | | | (0.001 | ) | | | — | (b) |
| | | | | | | | |
| | Total distributions(c) | | | — | (b) | | | (0.001 | ) | | | (0.005 | ) | | | (0.010 | ) | | | (0.003 | ) | | | (0.001 | ) | | | — | (b) |
| | | | | | | | |
| | Net asset value, end of period | | $ | 1.00 | | | $ | 1.00 | | | $ | 1.00 | | | $ | 1.00 | | | $ | 1.00 | | | $ | 1.00 | | | $ | 1.00 | |
| | | | | | | | |
| | Total return(d) | | | 0.01 | % | | | — | %(e) | | | 0.22 | % | | | 0.61 | % | | | 0.24 | % | | | 0.09 | % | | | 0.01 | % |
| | | | | | | | |
| | Net assets, end of period (in 000’s) | | $ | 1 | | | $ | 1 | | | $ | 1 | | | $ | 1 | | | $ | 1 | | | $ | 54 | | | $ | 1 | |
| | | | | | | | |
| | Ratio of net expenses to average net assets | | | 0.06 | %(f) | | | 0.13 | %(f) | | | 0.66 | % | | | 0.90 | % | | | 0.96 | % | | | 0.77 | % | | | 0.12 | % |
| | | | | | | | |
| | Ratio of total expenses to average net assets | | | 0.92 | %(f) | | | 1.03 | %(f) | | | 1.00 | % | | | 1.00 | % | | | 1.02 | % | | | 1.09 | % | | | 1.04 | % |
| | | | | | | | |
| | Ratio of net investment income to average net assets | | | 0.06 | %(f) | | | 0.36 | %(f) | | | 0.54 | % | | | 0.96 | % | | | 0.24 | % | | | 0.01 | % | | | 0.37 | % |
| | † | | The Fund changed its fiscal year end from August 31 to November 30. |
| | (a) | | Calculated based on the average shares outstanding methodology. |
| | (b) | | Amount is less than $0.0005 per share. |
| | (c) | | Distributions may not coincide with the current year net investment income or net realized gains as distributions may be paid from current or prior year earnings. |
| | (d) | | Assumes reinvestment of all distributions. Returns do not reflect the deduction of taxes that a shareholder would pay on Fund distributions. Total returns for periods less than one full year are not annualized. |
| | (e) | | Amount is less than 0.005%. |
| | | | | | | | | | | | | | | | | | | | | | | | | | | | | | |
| | | Investor Tax-Exempt Money Market Fund — Premier Shares | | Six Months Ended
May 31, 2021
(Unaudited) | | | For the
Period Ended
November 30, 2020† | | | Year Ended August 31, | |
| | | 2020 | | | 2019 | | | 2018 | | | 2017 | | | 2016 | |
| | Per Share Data: | | | | | | | | | | | | | | | | | | | | | | | | | | | | |
| | | | | | | | |
| | Net asset value, beginning of period | | $ | 1.00 | | | $ | 1.00 | | | $ | 1.00 | | | $ | 1.00 | | | $ | 1.00 | | | $ | 1.00 | | | $ | 1.00 | |
| | | | | | | | |
| | Net investment income(a) | | | — | | | | 0.001 | | | | 0.007 | | | | 0.013 | | | | 0.010 | | | | 0.004 | | | | — | (b) |
| | | | | | | | |
| | Net realized gain (loss) | | | — | | | | — | (b) | | | 0.001 | | | | — | (b) | | | — | (b) | | | (0.001 | ) | | | — | (b) |
| | | | | | | | |
| | Total from investment operations | | | — | (b) | | | 0.001 | | | | 0.008 | | | | 0.013 | | | | 0.010 | | | | 0.003 | | | | — | (b) |
| | | | | | | | |
| | Distributions to shareholders from net investment income | | | — | (b) | | | (0.001 | ) | | | (0.008 | ) | | | (0.013 | ) | | | (0.010 | ) | | | (0.002 | ) | | | — | (b) |
| | | | | | | | |
| | Distributions to shareholders from net realized gains | | | — | | | | — | | | | — | | | | — | (b) | | | — | (b) | | | (0.001 | ) | | | — | (b) |
| | | | | | | | |
| | Total distributions(c) | | | — | (b) | | | (0.001 | ) | | | (0.008 | ) | | | (0.013 | ) | | | (0.010 | ) | | | (0.003 | ) | | | — | (b) |
| | | | | | | | |
| | Net asset value, end of period | | $ | 1.00 | | | $ | 1.00 | | | $ | 1.00 | | | $ | 1.00 | | | $ | 1.00 | | | $ | 1.00 | | | $ | 1.00 | |
| | | | | | | | |
| | Total return(d) | | | 0.01 | % | | | — | %(e) | | | 0.49 | % | | | 1.06 | % | | | 0.68 | % | | | 0.29 | % | | | 0.01 | % |
| | | | | | | | |
| | Net assets, end of period (in 000’s) | | $ | 1 | | | $ | 1 | | | $ | 1 | | | $ | 1 | | | $ | 1 | | | $ | 1 | | | $ | 1 | |
| | | | | | | | |
| | Ratio of net expenses to average net assets | | | 0.06 | %(f) | | | 0.13 | %(f) | | | 0.43 | % | | | 0.54 | % | | | 0.54 | % | | | 0.47 | % | | | 0.12 | % |
| | | | | | | | |
| | Ratio of total expenses to average net assets | | | 0.56 | %(f) | | | 0.58 | %(f) | | | 0.55 | % | | | 0.55 | % | | | 0.57 | % | | | 0.64 | % | | | 0.59 | % |
| | | | | | | | |
| | Ratio of net investment income to average net assets | | | 0.06 | %(f) | | | 0.36 | %(f) | | | 0.75 | % | | | 1.32 | % | | | 0.95 | % | | | 0.43 | % | | | 0.37 | % |
| | † | | The Fund changed its fiscal year end from August 31 to November 30. |
| | (a) | | Calculated based on the average shares outstanding methodology. |
| | (b) | | Amount is less than $0.0005 per share. |
| | (c) | | Distributions may not coincide with the current year net investment income or net realized gains as distributions may be paid from current or prior year earnings. |
| | (d) | | Assumes reinvestment of all distributions. Returns do not reflect the deduction of taxes that a shareholder would pay on Fund distributions. Total returns for periods less than one full year are not annualized. |
| | (e) | | Amount is less than 0.005%. |
| | |
| The accompanying notes are an integral part of these financial statements. | | 27 |
GOLDMAN SACHS INVESTOR TAX-EXEMPT MONEY MARKET FUND
Financial Highlights (continued)
| | | | | | | | | | | | | | | | | | | | | | | | | | | | | | |
| | | Investor Tax-Exempt Money Market Fund —
Resource Shares | | Six Months Ended
May 31, 2021
(Unaudited) | | | For the
Period Ended
November 30, 2020† | | | Year Ended August 31, | |
| | | 2020 | | | 2019 | | | 2018 | | | 2017 | | | 2016 | |
| | Per Share Data: | | | | | | | | | | | | | | | | | | | | | | | | | | | | |
| | | | | | | | |
| | Net asset value, beginning of period | | $ | 1.00 | | | $ | 1.00 | | | $ | 1.00 | | | $ | 1.00 | | | $ | 1.00 | | | $ | 1.00 | | | $ | 1.00 | |
| | | | | | | | |
| | Net investment income(a) | | | — | (b) | | | — | (b) | | | 0.003 | | | | 0.008 | | | | 0.004 | | | | — | (b) | | | — | (b) |
| | | | | | | | |
| | Net realized gain | | | — | | | | — | (b) | | | — | (b) | | | — | (b) | | | — | (b) | | | 0.001 | | | | — | (b) |
| | | | | | | | |
| | Total from investment operations | | | — | (b) | | | — | (b) | | | 0.003 | | | | 0.008 | | | | 0.004 | | | | 0.001 | | | | — | (b) |
| | | | | | | | |
| | Distributions to shareholders from net investment income | | | — | (b) | | | — | (b) | | | (0.003 | ) | | | (0.008 | ) | | | (0.004 | ) | | | — | (b) | | | — | (b) |
| | | | | | | | |
| | Distributions to shareholders from net realized gains | | | — | | | | — | | | | — | | | | — | (b) | | | — | (b) | | | (0.001 | ) | | | — | (b) |
| | | | | | | | |
| | Total distributions(c) | | | — | (b) | | | — | (b) | | | (0.003 | ) | | | (0.008 | ) | | | (0.004 | ) | | | (0.001 | ) | | | — | (b) |
| | | | | | | | |
| | Net asset value, end of period | | $ | 1.00 | | | $ | 1.00 | | | $ | 1.00 | | | $ | 1.00 | | | $ | 1.00 | | | $ | 1.00 | | | $ | 1.00 | |
| | | | | | | | |
| | Total return(d) | | | 0.01 | % | | | — | %(e) | | | 0.30 | % | | | 0.76 | % | | | 0.37 | % | | | 0.08 | % | | | 0.01 | % |
| | | | | | | | |
| | Net assets, end of period (in 000’s) | | $ | 3,051 | | | $ | 2,840 | | | $ | 3,101 | | | $ | 2,206 | | | $ | 2,412 | | | $ | 3,731 | | | $ | 6,469 | |
| | | | | | | | |
| | Ratio of net expenses to average net assets | | | 0.06 | %(f) | | | 0.13 | %(f) | | | 0.61 | % | | | 0.83 | % | | | 0.83 | % | | | 0.73 | % | | | 0.20 | % |
| | | | | | | | |
| | Ratio of total expenses to average net assets | | | 0.85 | %(f) | | | 0.88 | %(f) | | | 0.85 | % | | | 0.85 | % | | | 0.87 | % | | | 0.94 | % | | | 0.89 | % |
| | | | | | | | |
| | Ratio of net investment income to average net assets | | | 0.01 | %(f) | | | 0.01 | %(f) | | | 0.29 | % | | | 0.75 | % | | | 0.36 | % | | | 0.02 | % | | | 0.01 | % |
| | † | | The Fund changed its fiscal year end from August 31 to November 30. |
| | (a) | | Calculated based on the average shares outstanding methodology. |
| | (b) | | Amount is less than $0.0005 per share. |
| | (c) | | Distributions may not coincide with the current year net investment income or net realized gains as distributions may be paid from current or prior year earnings. |
| | (d) | | Assumes reinvestment of all distributions. Returns do not reflect the deduction of taxes that a shareholder would pay on Fund distributions. Total returns for periods less than one full year are not annualized. |
| | (e) | | Amount is less than 0.005%. |
| | |
| 28 | | The accompanying notes are an integral part of these financial statements. |
GOLDMAN SACHS FUNDS — INVESTOR FUNDS
Notes to Financial Statements
May 31, 2021 (Unaudited)
Goldman Sachs Trust (the “Trust”) is a Delaware statutory trust registered under the Investment Company Act of 1940, as amended (the “Act”), as an open-end management investment company. The following table lists those series of the Trust that are included in this report (collectively, the “Funds” or individually a “Fund”), along with their corresponding share classes and respective diversification status under the Act:
| | | | |
| Fund | | Share Classes Offered | | Diversified/
Non-Diversified |
Investor Money Market | | Class A, Class C, Class I, Service, Administration, Cash Management, and Resource | | Diversified |
Investor Tax-Exempt Money Market | | Class A, Class C, Class I, Capital, Service, Preferred, Select, Administration, Cash Management, Premier, and Resource | | Diversified |
Class C Shares may typically be acquired only in an exchange for Class C Shares of another Goldman Sachs Fund. Class C Shares may be subject to a contingent deferred sales charge (“CDSC”) of 1.00% during the first 12 months, measured from the time the original shares subject to the CDSC were acquired.
Goldman Sachs Asset Management, L.P. (“GSAM”), an affiliate of Goldman Sachs & Co. LLC (“Goldman Sachs”), serves as investment adviser to the Funds pursuant to management agreements (the “Agreements”) with the Trust.
|
| 2. SIGNIFICANT ACCOUNTING POLICIES |
The financial statements have been prepared in accordance with accounting principles generally accepted in the United States of America (“GAAP”) and require management to make estimates and assumptions that may affect the reported amounts and disclosures. Actual results may differ from those estimates and assumptions. Each Fund is an investment company under GAAP and follows the accounting and reporting guidance applicable to investment companies.
A. Investment Valuation — The investment valuation policy of the Funds is to use the amortized-cost method permitted by Rule 2a-7 under the Act for valuing portfolio securities. The amortized-cost method of valuation involves valuing a security at its cost and thereafter applying a constant accretion or amortization to maturity of any discount or premium. Normally, a security’s amortized cost will approximate its market value. Under procedures and tolerances approved by the Board of Trustees
(“Trustees”), GSAM evaluates daily the difference between each Fund’s NAV per share using the amortized costs of its portfolio securities and the Fund’s NAV per share using market-based values of its portfolio securities. The market-based value of a portfolio security is determined, where readily available, on the basis of market quotations provided by pricing services or securities dealers, or, where accurate market quotations are not readily available, on the basis of the security’s fair value as determined in accordance with Valuation Procedures approved by the Trustees. The pricing services may use valuation models or matrix pricing, which may consider (among other things): (i) yield or price with respect to debt securities that are considered comparable in characteristics such as rating, interest rate and maturity date or (ii) quotations from securities dealers to determine current value.
B. Investment Income and Investments — Interest income is accrued daily and adjusted for amortization of premiums and accretion of discounts. Investment transactions are reflected on trade date. Realized gains and losses are calculated using identified cost.
C. Class Allocations and Expenses — Investment income, realized and unrealized gain (loss), if any, and non-class specific expenses of each Fund are allocated daily based upon the proportion of net assets of each class. Class specific expenses, where applicable, are borne by the respective share classes and include Distribution, Service, Distribution and Service, Administration, Service and Administration, and Shareholder Administration fees. Non-class specific expenses directly incurred by a Fund are charged to that Fund, while such expenses incurred by the Trust are allocated across the respective Funds on a straight-line and/or pro-rata basis depending upon the nature of the expenses.
29
GOLDMAN SACHS FUNDS — INVESTOR FUNDS
Notes to Financial Statements (continued)
May 31, 2021 (Unaudited)
|
| 2. SIGNIFICANT ACCOUNTING POLICIES (continued) |
D. Federal Taxes and Distributions to Shareholders — It is each Fund’s policy to comply with the requirements of the Internal Revenue Code of 1986, as amended (the “Code”), applicable to regulated investment companies (mutual funds) and to distribute each year substantially all of its investment company taxable and tax-exempt income and capital gains to its shareholders. Accordingly, each Fund is not required to make any provisions for the payment of federal income tax. Distributions to shareholders are declared and recorded daily and paid monthly by the Funds and may include short-term capital gains. Long-term capital gain distributions, if any, are declared and paid annually. A Fund may defer or accelerate the timing of the distribution of short-term capital gains (or any portion thereof).
Net capital losses, if any, are carried forward to future fiscal years and may be used to the extent allowed by the Code to offset any future capital gains. Utilization of capital loss carryforwards will reduce the requirement of future capital gains distributions.
The characterization of distributions to shareholders for financial reporting purposes is determined in accordance with federal income tax rules, which may differ from GAAP. The source of each Fund’s distributions may be shown in the accompanying financial statements as either from distributable earnings or capital. Certain components of the Funds’ net assets on the Statements of Assets and Liabilities reflect permanent GAAP/tax differences based on the appropriate tax character.
E. Forward Commitments — A forward commitment involves entering into a contract to purchase or sell securities, typically on an extended settlement basis, for a fixed price at a future date. The purchase of securities on a forward commitment basis involves a risk of loss if the value of the security to be purchased declines before the settlement date. Conversely, the sale of securities on a forward commitment basis involves the risk that the value of the securities sold may increase before the settlement date. Although a Fund will generally purchase securities on a forward commitment basis with the intention of acquiring the securities for its portfolio, the Fund may dispose of forward commitments prior to settlement which may result in a realized gain or loss.
F. Repurchase Agreements — Repurchase agreements involve the purchase of securities subject to the seller’s agreement to repurchase the securities at a mutually agreed upon date and price, under the terms of a Master Repurchase Agreement (“MRA”). During the term of a repurchase agreement, the value of the underlying securities held as collateral on behalf of a Fund, including accrued interest, is required to exceed the value of the repurchase agreement, including accrued interest. The gross value of repurchase agreements is included in the Statements of Assets and Liabilities for financial reporting purposes. The underlying securities for all repurchase agreements are held at the Funds’ custodian or designated sub-custodians under tri-party repurchase agreements.
An MRA governs transactions between a Fund and select counterparties. An MRA contains provisions for, among other things, initiation of the transaction, income payments, events of default, and maintenance of securities for repurchase agreements. An MRA also permits offsetting with collateral to create one single net payment in the event of default or similar events, including the bankruptcy or insolvency of a counterparty.
If the seller defaults, a Fund could suffer a loss to the extent that the proceeds from the sale of the underlying securities and other collateral held by the Fund are less than the repurchase price and the Fund’s costs associated with delay and enforcement of the repurchase agreement. In addition, in the event of default or insolvency of the seller, a court could determine that a Fund’s interest in the collateral is not enforceable, resulting in additional losses to the Fund.
Pursuant to exemptive relief granted by the Securities and Exchange Commission (“SEC”) and terms and conditions contained therein, the Funds, together with other funds of the Trust and registered investment companies having management agreements with GSAM or its affiliates, may transfer uninvested cash into joint accounts, the daily aggregate balance of which is invested in one or more repurchase agreements. Under these joint accounts, the Funds maintain pro-rata credit exposure to the underlying repurchase agreements’ counterparties. With the exception of certain transaction fees, the Funds are not subject to any expenses in relation to these investments.
30
GOLDMAN SACHS FUNDS — INVESTOR FUNDS
|
| 3. INVESTMENTS AND FAIR VALUE MEASUREMENTS |
U.S. GAAP defines the fair value of a financial instrument as the amount that would be received to sell an asset or paid to transfer a liability in an orderly transaction between market participants at the measurement date (i.e., the exit price); the Funds’ policy is to use the market approach. GAAP establishes a fair value hierarchy that prioritizes the inputs to valuation techniques used to measure fair value. The hierarchy gives the highest priority to unadjusted quoted prices in active markets for identical assets or liabilities (Level 1 measurements) and the lowest priority to unobservable inputs (Level 3 measurements). The level in the fair value hierarchy within which the fair value measurement in its entirety falls shall be determined based on the lowest level input that is significant to the fair value measurement in its entirety. The levels used for classifying investments are not necessarily an indication of the risk associated with investing in these investments. The three levels of the fair value hierarchy are described below:
Level 1 — Unadjusted quoted prices in active markets that are accessible at the measurement date for identical, unrestricted assets or liabilities;
Level 2 — Quoted prices in markets that are not active or financial instruments for which significant inputs are observable (including, but not limited to, quoted prices for similar investments, interest rates, foreign exchange rates, volatility and credit spreads), either directly or indirectly;
Level 3 — Prices or valuations that require significant unobservable inputs (including GSAM’s assumptions in determining fair value measurement).
The Trustees have approved Valuation Procedures that govern the valuation of the portfolio investments held by the Funds, including investments for which market quotations are not readily available. The Trustees have delegated to GSAM day-to-day responsibility for implementing and maintaining internal controls and procedures related to the valuation (including both the amortized cost and market-based methods of valuation) of the Funds’ investments. To assess the continuing appropriateness of pricing sources and methodologies related to the market-based method of valuation, GSAM regularly performs price verification procedures and issues challenges as necessary to third party pricing vendors or brokers, and any differences are reviewed in accordance with the Valuation Procedures.
As of May 31, 2021, all investments are classified as Level 2 of the fair value hierarchy. Please refer to the Schedules of Investments for further detail.
|
| 4. AGREEMENTS AND AFFILIATED TRANSACTIONS |
A. Management Agreements — Under the Agreements, GSAM manages the Funds, subject to the general supervision of the Trustees.
As compensation for the services rendered pursuant to the Agreements, the assumption of the expenses related thereto and administration of the Funds’ business affairs, including providing facilities, GSAM is entitled to a management fee, accrued daily and paid monthly, equal to an annual percentage rate of each Fund’s average daily net assets, as set forth below.
B. Administration, Service and/or Shareholder Administration Plans — The Trust, on behalf of each applicable Fund, has adopted Administration, Service and/or Shareholder Administration Plans (the “Plans”) to allow Class C, Select, Preferred, Capital, Administration, Premier, Service, Resource and Cash Management Shares to compensate service organizations (including Goldman Sachs) for providing varying levels of account administration and/or personal and account maintenance services to their customers who are beneficial owners of such shares. The Plans provide for compensation to the service organizations equal to an annual percentage rate of the average daily net assets of such shares, as set forth below.
C. Distribution and/or Service (12b-1) Plans — The Trust, on behalf of the Class A Shares of each applicable Fund, has adopted a Distribution and Service Plan subject to Rule 12b-1 under the Act. Under the Distribution and Service Plan, Goldman Sachs, which serves as distributor (the “Distributor”), is entitled to a fee accrued daily and paid monthly for distribution services and personal and account maintenance services, which may then be paid by Goldman Sachs to authorized dealers. These fees are equal to an annual percentage rate of the average daily net assets attributable to Class A Shares of the Funds, as set forth below.
31
GOLDMAN SACHS FUNDS — INVESTOR FUNDS
Notes to Financial Statements (continued)
May 31, 2021 (Unaudited)
|
| 4. AGREEMENTS AND AFFILIATED TRANSACTIONS (continued) |
The Trust, on behalf of Class C, Resource and Cash Management Shares of each applicable Fund, has adopted Distribution Plans subject to Rule 12b-1 under the Act. Under the Distribution Plans, Goldman Sachs as Distributor is entitled to a fee accrued daily and paid monthly for distribution services, which may then be paid by Goldman Sachs to authorized dealers. These fees are equal to an annual percentage rate of the average daily net assets attributable to Class C, Resource and Cash Management Shares of the Funds, as set forth below.
The Trust, on behalf of the Service Shares of each applicable Fund, has adopted a Service Plan subject to Rule 12b-1 under the Act to allow Service Shares to compensate service organizations (including Goldman Sachs) for providing personal and account maintenance services to their customers who are beneficial owners of such shares. The Service Plan provides for compensation to the service organizations equal to an annual percentage rate of the average daily net assets attributable to Service Shares of the Funds, as set forth below.
D. Distribution Agreement — Goldman Sachs, as Distributor of the shares of the Funds pursuant to a Distribution Agreement, may retain a portion of the Class C Shares’ CDSC. During the six months ended May 31, 2021, Goldman Sachs has advised that it did not retain any CDSCs with respect to Class C Shares of the Funds.
E. Transfer Agency Agreement — Goldman Sachs also serves as the transfer agent of the Funds for a fee pursuant to a Transfer Agency Agreement. The fee charged for such transfer agency services is accrued daily and paid monthly and is equal to an annual percentage rate of each Fund’s average daily net assets.
F. Other Agreements — GSAM has agreed to limit certain “Other Expenses” of the Funds (excluding transfer agency fees and expenses, administration fees (as applicable), service fees (as applicable), shareholder administration fees (as applicable), taxes, interest, brokerage fees, expenses of shareholder meetings, litigation and indemnification, and extraordinary expenses) to the extent such expenses exceed, on an annual basis, a percentage rate of the average daily net assets of each Fund. Such Other Expense reimbursements, if any, are accrued daily and paid monthly. In addition, the Funds are not obligated to reimburse GSAM for prior fiscal year expense reimbursements, if any. The Other Expense limitations as an annual percentage rate of average daily net assets are 0.014%. These Other Expense limitations will remain in place through at least March 30, 2022, and prior to such date GSAM may not terminate the arrangements without the approval of the Trustees.
In addition, the Funds have entered into certain offset arrangements with the custodian which may result in a reduction of the Funds’ expenses and are received irrespective of the application of the “Other Expense” limitations described above.
G. Total Fund Expenses
Fund Contractual Fees
The contractual management fee rate is 0.16% for the Investor Money Market and Investor Tax-Exempt Money Market Funds.
| | | | | | | | | | | | | | | | | | | | | | | | | | | | | | | | | | | | | | | | | | | | |
| | | Class A
Shares | | | Class C
Shares | | | Class I
Shares | | | Capital
Shares(a) | | | Service
Shares | | | Preferred
Shares(a) | | | Select
Shares(a) | | | Administration
Shares | | | Cash
Management
Shares | | | Premier
Shares(a) | | | Resource
Shares | |
Management Fee(a) | | | 0.16 | % | | | 0.16 | % | | | 0.16 | % | | | 0.16 | % | | | 0.16 | % | | | 0.16 | % | | | 0.16 | % | | | 0.16 | % | | | 0.16 | % | | | 0.16 | % | | | 0.16 | % |
Administration, Service and/or Shareholder Administration Fees | | | N/A | | | | 0.25 | | | | N/A | | | | 0.15 | | | | 0.25 | | | | 0.10 | | | | 0.03 | | | | 0.25 | | | | 0.50 | | | | 0.35 | | | | 0.50 | |
Distribution and/or Service (12b-1) Fees | | | 0.25 | | | | 0.75 | (b) | | | N/A | | | | N/A | | | | 0.25 | (c) | | | N/A | | | | N/A | | | | N/A | | | | 0.30 | (b) | | | N/A | | | | 0.15 | (b) |
Transfer Agency Fee | | | 0.01 | | | | 0.01 | | | | 0.01 | | | | 0.01 | | | | 0.01 | | | | 0.01 | | | | 0.01 | | | | 0.01 | | | | 0.01 | | | | 0.01 | | | | 0.01 | |
N/A – Fees not applicable to respective share class
| (a) | | Tax-Exempt Money Market Fund only. |
| (b) | | Distribution (12b-1) fee only. |
| (c) | | Service (12b-1) fee only. |
32
GOLDMAN SACHS FUNDS — INVESTOR FUNDS
|
| 4. AGREEMENTS AND AFFILIATED TRANSACTIONS (continued) |
Fund Effective Net Expenses (After Waivers and Reimbursements)
The investment adviser may contractually agree to waive or reimburse certain fees and expenses until a specified date. The investment adviser may also voluntarily waive certain fees and expenses, and such voluntary waivers may be discontinued or modified at any time without notice.
During the six months ended May 31, 2021, GSAM and Goldman Sachs (as applicable) agreed to waive all or a portion of the management fees and respective class-specific fees described above attributable to the Funds. The Funds are not obligated to reimburse GSAM or Goldman Sachs for prior fiscal year fee waivers and/or expense reimbursements, if any.
For the six months ended May 31, 2021, expense reductions including any fee waivers and Other Expense reimbursements were as follows (in thousands):
| | | | | | | | | | | | | | | | | | | | |
| Fund | | Management Fee Waivers | | | Transfer
Agent Fee
Waivers | | | Distribution,
Administration,
Service and/or
Shareholder
Administration
Plans Fee Waivers | | | Other Expense
Reimbursements | | | Total
Expense
Reductions | |
Investor Money Market | | $ | 202 | | | $ | 42 | | | $ | 561 | | | $ | 156 | | | $ | 961 | |
Investor Tax-Exempt Money Market | | | 811 | | | | 72 | | | | 26 | | | | 123 | | | | 1,032 | |
For the six months ended May 31, 2021, the net effective management fee rate for each of the Funds was 0.14% for Investor Money Market and 0.05% for Investor Tax-Exempt Money Market.
H. Other Transactions with Affiliates — A Fund may purchase securities from, or sell securities to, an affiliated fund provided the affiliation is solely due to having a common investment adviser, common officers, or common Trustees.
For the six months ended May 31, 2021, the purchase and sale transactions and related net realized gain (loss) for the Funds with affiliated funds in compliance with Rule 17a-7 under the Act were as follows:
| | | | | | | | | | | | | | |
| Fund | | | | Purchases | | | Sales | | | Net Realized
Gain (Loss) | |
Investor Money Market | | | | $ | 176,415,000 | | | $ | 143,550,000 | | | $ | — | |
Investor Tax-Exempt Money Market | | | | | 489,405,000 | | | | 326,115,000 | | | | — | |
As of May 31, 2021, The Goldman Sachs Group, Inc. was the beneficial owner of 5% or more of the outstanding share classes of the following funds:
| | | | | | | | | | | | | | | | | | | | | | | | | | | | | | | | | | | | | | | | | | | | |
| Fund | | Class A
Shares | | | Class C
Shares | | | Class I
Shares | | | Capital
Shares | | | Service
Shares | | | Preferred
Shares | | | Select
Shares | | | Administration
Shares | | | Cash
Management
Shares | | | Premier
Shares | | | Resource
Shares | |
Investor Money Market | | | — | | | | 27 | % | | | — | | | | — | | | | — | | | | — | | | | — | | | | — | | | | — | | | | — | | | | 100 | % |
Investor Tax-Exempt Money Market | | | — | | | | 100 | % | | | — | | | | 100 | % | | | — | | | | — | | | | 100 | % | | | — | | | | 100 | % | | | 100 | % | | | — | |
I. Line of Credit Facility — As of May 31, 2021, the Funds participated in a $1,000,000,000 committed, unsecured revolving line of credit facility (the “facility”) together with other funds of the Trust and registered investment companies having management agreements with GSAM or its affiliates. This facility is to be used for temporary emergency purposes, or to allow for an orderly liquidation of securities to meet redemption requests. The interest rate on borrowings is based on the federal funds rate. The facility also requires a fee to be paid by the Funds based on the amount of the commitment that has not been utilized. For the six months ended May 31, 2021, the Funds did not have any borrowings under the facility. Prior to April 26, 2021 the facility was $700,000,000.
33
GOLDMAN SACHS FUNDS — INVESTOR FUNDS
Notes to Financial Statements (continued)
May 31, 2021 (Unaudited)
As of the Funds’ most recent fiscal year end, November 30, 2020, the Funds’ certain timing differences on a tax basis were as follows:
| | | | | | | | |
| | | Investor
Money Market | | | Investor
Tax-Exempt
Money
Market | |
Timing differences (Distribution Payable) | | $ | (6,981 | ) | | $ | (6,080 | ) |
The aggregate cost for each Fund stated in the accompanying Statements of Assets and Liabilities also represents aggregate cost for U.S. federal income tax purposes.
GSAM has reviewed the Funds’ tax positions for all open tax years (the current and prior three tax years, as applicable) and has concluded that no provision for income tax is required in the Funds’ financial statements. Such open tax years remain subject to examination and adjustment by tax authorities.
The Funds’ risks include, but are not limited to, the following:
Credit/Default Risk – An issuer or guarantor of a security held by a Fund, or a bank or other financial institution that has entered into a repurchase agreement with a Fund, may default on its obligation to pay interest and repay principal or default on any other obligation. Additionally, the credit quality of securities may deteriorate rapidly, which may impair the Fund’s liquidity and cause significant deterioration in NAV.
Floating and Variable Rate Obligations Risk – Floating rate and variable rate obligations are debt instruments issued by
companies or other entities with interest rates that reset periodically (typically daily, monthly, quarterly, or semiannually) in response to changes in the market rate of interest on which the interest rate is based. For floating and variable rate obligations, there may be a lag between an actual change in the underlying interest rate benchmark and the reset time for an interest payment of such an obligation, which could harm or benefit a Fund, depending on the interest rate environment or other circumstances. In a rising interest rate environment, for example, a floating or variable rate obligation that does not reset immediately would prevent a Fund from taking full advantage of rising interest rates in a timely manner. However, in a declining interest rate environment, a Fund may benefit from a lag due to an obligation’s interest rate payment not being immediately impacted by a decline in interest rates.
On March 5, 2021, the United Kingdom’s Financial Conduct Authority (“FCA”) and ICE Benchmark Authority formally announced that certain LIBORs will cease publication after December 31, 2021 while others will cease publication after June 30, 2023. The unavailability or replacement of LIBOR may affect the value, liquidity or return on certain Fund investments and may result in costs incurred in connection with closing out positions and entering into new trades. Any pricing adjustments to the Fund’s investments resulting from a substitute reference rate may adversely affect the Fund’s performance and/or NAV.
Geographic and Sector Risk — The Investor Tax-Exempt Money Market Fund may invest a significant portion of its total assets in certain issuers within the same state, geographic region or economic sector, which may subject the value of the Fund’s investments to risks associated with an adverse economic, business, political or environmental development affecting that state, region or sector.
Interest Rate Risk — When interest rates increase, the Fund’s yield will tend to be lower than prevailing market rates, and the market value of its investments will generally decline. The risks associated with changing interest rates may have unpredictable effects on the markets and the Fund’s investments. A low or negative interest rate environment poses additional risks to the Fund, because low or negative yields on the Fund’s portfolio holdings may have an adverse impact on the Fund’s ability to provide a positive yield to its shareholders, pay expenses out of current income, or minimize the volatility of the Fund’s NAV per share and/or achieve its investment objective. Fluctuations in interest rates may also affect the liquidity of the Fund’s investments.
34
GOLDMAN SACHS FUNDS — INVESTOR FUNDS
|
| 6. OTHER RISKS (continued) |
Large Shareholder Transactions Risk — A Fund may experience adverse effects when certain large shareholders, such as financial intermediaries (who may make investment decisions on behalf of underlying clients) and individuals, purchase or redeem large amounts of shares of a Fund. Such large shareholder redemptions, which may occur rapidly or unexpectedly, may cause a Fund to sell portfolio securities at times when it would not otherwise do so, which may negatively impact the Fund’s NAV and liquidity. Similarly, large Fund share purchases may adversely affect a Fund’s performance to the extent that the Fund is delayed in investing new cash or otherwise maintains a larger cash position than it ordinarily would. These transactions may also accelerate the realization of taxable income to shareholders if such sales of investments resulted in gains, and may also increase transaction costs. In addition, a large redemption could result in a Fund’s current expenses being allocated over a smaller asset base, leading to an increase in the Fund’s expense ratio.
Market and Credit Risks — In the normal course of business, a Fund trades financial instruments and enters into financial transactions where risk of potential loss exists due to changes in the market (market risk). The value of the securities in which a
Fund invests may go up or down in response to the prospects of individual companies, particular sectors or governments and/or general economic conditions throughout the world due to increasingly interconnected global economies and financial markets.
Events such as war, acts of terrorism, social unrest, natural disasters, the spread of infectious illness or other public health threats could also significantly impact a Fund and its investments. Additionally, a Fund may also be exposed to credit risk in the event that an issuer or guarantor fails to perform or that an institution or entity with which the Fund has unsettled or open transactions defaults.
Municipal Securities Risk – Municipal securities are subject to credit/default risk, interest rate risk and certain additional risks. The Fund may be more sensitive to adverse economic, business or political developments if it invests a substantial portion of its assets in the debt securities of similar projects (such as those relating to education, health care, housing, transportation, and utilities), industrial Development bonds, or in particular types of municipal securities (such as general obligation bonds, private activity bonds and moral obligation bonds). While interest earned on municipal securities is generally not subject to federal tax, any interest earned on taxable municipal securities is fully taxable at the federal level and may be subject to tax at the state level.
Under the Trust’s organizational documents, its Trustees, officers, employees and agents are indemnified, to the extent permitted by the Act and state law, against certain liabilities that may arise out of performance of their duties to the Funds. Additionally, in the course of business, the Funds enter into contracts that contain a variety of indemnification clauses. The Funds’ maximum exposure under these arrangements is unknown, as this would involve future claims that may be made against the Funds that have not yet occurred. However, GSAM believes the risk of loss under these arrangements to be remote.
Exemptive Orders — Pursuant to SEC exemptive orders, the Funds may enter into certain principal transactions, including repurchase agreements, with Goldman Sachs.
New Accounting Standards — In March 2020, the FASB issued Accounting Standard Update (“ASU”) No. 2020-04,
“Reference Rate Reform (Topic 848): Facilitation of the Effects of Reference Rate Reform on Financial Reporting.” This ASU provides optional exceptions for applying GAAP to contract modifications, hedging relationships and other transactions affected by reference rate reform if certain criteria are met. ASU 2020-04 is elective and is effective on March 12, 2020 through December 31, 2022. As of the financial reporting period, GSAM is currently evaluating the impact, if any, of applying ASU 2020-04.
Subsequent events after the Statements of Assets and Liabilities date have been evaluated and GSAM has concluded that there is no impact requiring adjustment or disclosure in the financial statements.
35
GOLDMAN SACHS FUNDS — INVESTOR FUNDS
Notes to Financial Statements (continued)
May 31, 2021 (Unaudited)
|
| 10. SUMMARY OF SHARE TRANSACTIONS (AT $1.00 PER SHARE) |
Share activity is as follows:
| | | | | | | | | | | | |
| | | Investor Money Market Fund | |
| | | | |
| | | For the Six Months Ended
May 31, 2021
(Unaudited) | | | For the Fiscal Year Ended
November 30, 2020† | | | For the Fiscal Year Ended
August 31, 2020 | |
| | | | |
| Class A Shares | | | | | | | | | | | | |
Shares sold | | | 18,022,657 | | | | 16,805,199 | | | | 397,334,164 | |
Reinvestment of distributions | | | 41,550 | | | | 9,354 | | | | 2,296,684 | |
Shares redeemed | | | (73,969,198 | ) | | | (44,988,673 | ) | | | (319,934,660 | ) |
| | | | (55,904,991 | ) | | | (28,174,120 | ) | | | 79,696,188 | |
| Class C Shares | | | | | | | | | | | | |
Shares sold | | | — | | | | — | | | | 57,382 | |
Reinvestment of distributions | | | 9 | | | | 1 | | | | 60 | |
Shares redeemed | | | — | | | | (13,651 | ) | | | (15,154 | ) |
| | | | 9 | | | | (13,650 | ) | | | 42,288 | |
| Class I Shares | | | | | | | | | | | | |
Shares sold | | | 581,574,439 | | | | 244,513,031 | | | | 3,317,488,991 | |
Reinvestment of distributions | | | 331,676 | | | | 322,218 | | | | 16,633,231 | |
Shares redeemed | | | (781,855,284 | ) | | | (742,434,339 | ) | | | (2,626,006,125 | ) |
| | | | (199,949,169 | ) | | | (497,599,090 | ) | | | 708,116,097 | |
| Service Shares | | | | | | | | | | | | |
Shares sold | | | 25,912,004 | | | | 14,774,282 | | | | 152,624,789 | |
Reinvestment of distributions | | | 10,534 | | | | 2,158 | | | | 309,238 | |
Shares redeemed | | | (34,974,422 | ) | | | (21,051,684 | ) | | | (127,114,736 | ) |
| | | | (9,051,884 | ) | | | (6,275,244 | ) | | | 25,819,291 | |
| Administration Shares | | | | | | | | | | | | |
Shares sold | | | 44,155,401 | | | | 9,194,711 | | | | 60,612,773 | |
Reinvestment of distributions | | | 6,667 | | | | 1,172 | | | | 298,507 | |
Shares redeemed | | | (38,426,835 | ) | | | (11,257,998 | ) | | | (58,250,110 | ) |
| | | | 5,735,233 | | | | (2,062,115 | ) | | | 2,661,170 | |
| Cash Management Shares | | | | | | | | | | | | |
Shares sold | | | 78,207,005 | | | | 18,583,118 | | | | 92,160,519 | |
Reinvestment of distributions | | | 10,454 | | | | 1,760 | | | | 135,668 | |
Shares redeemed | | | (93,702,609 | ) | | | (20,781,089 | ) | | | (61,710,139 | ) |
| | | | (15,485,150 | ) | | | (2,196,211 | ) | | | 30,586,048 | |
| Resource Shares | | | | | | | | | | | | |
Shares sold | | | — | | | | — | | | | — | |
Reinvestment of distributions | | | 2 | | | | — | | | | 71 | |
Shares redeemed | | | — | | | | — | | | | — | |
| | | | 2 | | | | — | | | | 71 | |
| | | |
NET INCREASE IN SHARES | | | (274,655,950 | ) | | | (536,320,430 | ) | | | 846,921,153 | |
| † | | The Fund changed its fiscal year end from August 31 to November 30. |
36
GOLDMAN SACHS FUNDS — INVESTOR FUNDS
|
| 10. SUMMARY OF SHARE TRANSACTIONS (AT $1.00 PER SHARE) (continued) |
Share activity is as follows:
| | | | | | | | | | | | |
| | | Investor Tax-Exempt Money Market Fund | |
| | | | |
| | | For the Six Months Ended
May 31, 2021
(Unaudited) | | | For the Fiscal Year Ended
November 30, 2020† | | | For the Fiscal Year Ended
August 31, 2020 | |
| | | | |
| Class A Shares | | | | | | | | | | | | |
Shares sold | | | 2,686,074 | | | | 517,326 | | | | 39,422,787 | |
Reinvestment of distributions | | | 966 | | | | 207 | | | | 76,182 | |
Shares redeemed | | | (4,099,897 | ) | | | (6,439,317 | ) | | | (37,666,872 | ) |
| | | | (1,412,857 | ) | | | (5,921,784 | ) | | | 1,832,097 | |
| Class C Shares | | | | | | | | | | | | |
Shares sold | | | — | | | | — | | | | 81,993 | |
Reinvestment of distributions | | | 2 | | | | — | | | | 37 | |
Shares redeemed | | | (19,478 | ) | | | — | | | | (62,543 | ) |
| | | | (19,476 | ) | | | — | | | | 19,487 | |
| Class I Shares | | | | | | | | | | | | |
Shares sold | | | 900,270,876 | | | | 406,405,883 | | | | 2,514,777,537 | |
Reinvestment of distributions | | | 15,592 | | | | 2,986 | | | | 1,987,323 | |
Shares redeemed | | | (885,220,376 | ) | | | (555,953,190 | ) | | | (2,450,307,364 | ) |
| | | | 15,066,092 | | | | (149,544,321 | ) | | | 66,457,496 | |
| Capital Shares | | | | | | | | | | | | |
Shares sold | | | — | | | | — | | | | — | |
Reinvestment of distributions | | | — | | | | — | | | | 6 | |
Shares redeemed | | | — | | | | — | | | | — | |
| | | | — | | | | — | | | | 6 | |
| Service Shares | | | | | | | | | | | | |
Shares sold | | | 184,010 | | | | 44,493 | | | | 1,562,721 | |
Reinvestment of distributions | | | 46 | | | | 8 | | | | 2,073 | |
Shares redeemed | | | (164,059 | ) | | | (41,873 | ) | | | (2,849,099 | ) |
| | | | 19,997 | | | | 2,628 | | | | (1,284,305 | ) |
| Preferred Shares | | | | | | | | | | | | |
Shares sold | | | 18,048 | | | | 202,046 | | | | 1,100,394 | |
Reinvestment of distributions | | | 17 | | | | 1 | | | | 1,436 | |
Shares redeemed | | | (206,462 | ) | | | (15,536 | ) | | | (1,071,605 | ) |
| | | | (188,397 | ) | | | 186,511 | | | | 30,225 | |
| Select Shares | | | | | | | | | | | | |
Shares sold | | | — | | | | — | | | | — | |
Reinvestment of distributions | | | — | | | | — | | | | 8 | |
Shares redeemed | | | — | | | | — | | | | — | |
| | | | — | | | | — | | | | 8 | |
| Administration Shares | | | | | | | | | | | | |
Shares sold | | | — | | | | — | | | | 5,100 | |
Reinvestment of distributions | | | 26 | | | | 5 | | | | 1,674 | |
Shares redeemed | | | — | | | | — | | | | (50 | ) |
| | | | 26 | | | | 5 | | | | 6,724 | |
| Cash Management Shares | | | | | | | | | | | | |
Shares sold | | | — | | | | — | | | | — | |
Reinvestment of distributions | | | — | | | | — | | | | 2 | |
Shares redeemed | | | — | | | | — | | | | — | |
| | | | — | | | | — | | | | 2 | |
| Premier Shares | | | | | | | | | | | | |
Shares sold | | | — | | | | — | | | | — | |
Reinvestment of distributions | | | — | | | | — | | | | 5 | |
Shares redeemed | | | — | | | | — | | | | — | |
| | | | — | | | | — | | | | 5 | |
| Resource Shares | | | | | | | | | | | | |
Shares sold | | | 7,329,039 | | | | 2,261,393 | | | | 10,494,798 | |
Reinvestment of distributions | | | 252 | | | | 47 | | | | 7,257 | |
Shares redeemed | | | (7,117,615 | ) | | | (2,522,508 | ) | | | (9,607,622 | ) |
| | | | 211,676 | | | | (261,068 | ) | | | 894,433 | |
| | | |
NET INCREASE (DECREASE) IN SHARES | | | 13,677,061 | | | | (155,538,029 | ) | | | 67,956,178 | |
| † | | The Fund changed its fiscal year end from August 31 to November 30. |
37
GOLDMAN SACHS FUNDS — INVESTOR FUNDS
| | |
| | |
Fund Expenses — Six Month Period Ended May 31, 2021 (Unaudited) | | |
As a shareholder of Class A Shares, Class C Shares, Class I Shares, Capital Shares, Service Shares, Preferred Shares, Select Shares, Administration Shares, Cash Management Shares, Premier Shares, or Resource Shares of a Fund you incur two types of costs: (1) transaction costs, including contingent deferred sales charges (with respect to Class C Shares); and (2) ongoing costs, including management fees and distribution, service, administration and/or shareholder administration fees (with respect to all share classes except Class I Shares) and other Fund expenses. This example is intended to help you understand your ongoing costs (in dollars) of investing in Class I Shares, Select Shares, Preferred Shares, Capital Shares, Administration Shares, Premier Shares, Service Shares, Resource Shares, Cash Management Shares, Class A Shares, or Class C Shares of the Funds and to compare these costs with the ongoing costs of investing in other mutual funds.
The example is based on an investment of $1,000 invested at the beginning of the period and held for the entire period from December 1, 2020 through May 31, 2021, which represents a period of 182 days in a 365-day year.
Actual Expenses — The first line under each Share class in the table below provides information about actual account values and actual expenses. You may use the information in this line, together with the amount you invested, to estimate the expenses that you paid over the period. Simply divide your account value by $1,000 (for example, an $8,600 account value divided by $1,000=8.6), then multiply the result by the number in the first line under the heading entitled “Expenses Paid” to estimate the expenses you paid on your account during this period.
Hypothetical Example for Comparison Purposes — The second line under each Share class in the table below provides information about hypothetical account values and hypothetical expenses based on the Funds’ actual net expense ratios and an assumed rate of return of 5% per year before expenses, which is not the Funds’ actual return. The hypothetical account values and expenses may not be used to estimate the actual ending account balance or expenses you paid for the period. You may use this information to compare the ongoing costs of investing in the Funds and other funds. To do so, compare this 5% hypothetical example with the 5% hypothetical examples that appear in the shareholder reports of the other funds.
Please note that the expenses shown in the table are meant to highlight your ongoing costs only and do not reflect any transactional costs, such as sales charges, redemption fees, or exchange fees. Therefore, the second line of the table is useful in comparing ongoing costs only, and will not help you determine the relative total costs of owning different funds. In addition, if these transactional costs were included, your costs would have been higher.
| | | | | | | | | | | | | | | | | | | | | | | | |
| | | Investor Money Market Fund | | | Investor Tax-Exempt Money Market Fund | |
| Share Class | | Beginning
Account Value
12/1/20 | | | Ending
Account Value
5/31/21 | | | Expenses
Paid for the
6 months
ended
5/31/2021* | | | Beginning
Account Value
12/1/20 | | | Ending
Account Value
5/31/21 | | | Expenses
Paid for the
6 months
ended
5/31/2021* | |
| Class A Shares | | | | | | | | | | | | | | | | | | | | | | | | |
Actual | | $ | 1,000.00 | | | $ | 1,023.40 | | | $ | 0.86 | | | $ | 1,000.00 | | | $ | 1,008.60 | | | $ | 0.30 | |
Hypothetical 5% return | | | 1,000.00 | | | | 1,024.08 | + | | | 0.86 | | | | 1,000.00 | | | | 1,024.63 | + | | | 0.30 | |
| Class C Shares | | | | | | | | | | | | | | | | | | | | | | | | |
Actual | | | 1,000.00 | | | | 1,023.40 | | | | 0.81 | | | | 1,000.00 | | | | 1,008.60 | | | | 0.30 | |
Hypothetical 5% return | | | 1,000.00 | | | | 1,024.13 | + | | | 0.81 | | | | 1,000.00 | | | | 1,024.63 | + | | | 0.30 | |
| Class I Shares | | | | | | | | | | | | | | | | | | | | | | | | |
Actual | | | 1,000.00 | | | | 1,029.20 | | | | 0.76 | | | | 1,000.00 | | | | 1,008.60 | | | | 0.30 | |
Hypothetical 5% return | | | 1,000.00 | | | | 1,024.18 | + | | | 0.76 | | | | 1,000.00 | | | | 1,024.63 | + | | | 0.30 | |
| Capital Shares | | | | | | | | | | | | | | | | | | | | | | | | |
Actual | | | — | | | | — | | | | — | | | | 1,000.00 | | | | 1,008.60 | | | | 0.30 | |
Hypothetical 5% return | | | — | | | | — | | | | — | | | | 1,000.00 | | | | 1,024.63 | + | | | 0.30 | |
| Service Shares | | | | | | | | | | | | | | | | | | | | | | | | |
Actual | | | 1,000.00 | | | | 1,023.40 | | | | 0.86 | | | | 1,000.00 | | | | 1,008.60 | | | | 0.30 | |
Hypothetical 5% return | | | 1,000.00 | | | | 1,024.08 | + | | | 0.86 | | | | 1,000.00 | | | | 1,024.63 | + | | | 0.30 | |
| Preferred Shares | | | | | | | | | | | | | | | | | | | | | | | | |
Actual | | | — | | | | — | | | | — | | | | 1,000.00 | | | | 1,008.60 | | | | 0.30 | |
Hypothetical 5% return | | | — | | | | — | | | | — | | | | 1,000.00 | | | | 1,024.63 | + | | | 0.30 | |
| Select Shares | | | | | | | | | | | | | | | | | | | | | | | | |
Actual | | | — | | | | — | | | | — | | | | 1,000.00 | | | | 1,008.60 | | | | 0.30 | |
Hypothetical 5% return | | | — | | | | — | | | | — | | | | 1,000.00 | | | | 1,024.63 | + | | | 0.30 | |
Administration Shares | | | | | | | | | | | | | | | | | | | | | | | | |
Actual | | | 1,000.00 | | | | 1,023.40 | | | | 0.86 | | | | 1,000.00 | | | | 1,008.60 | | | | 0.30 | |
Hypothetical 5% return | | | 1,000.00 | | | | 1,024.08 | + | | | 0.86 | | | | 1,000.00 | | | | 1,024.63 | + | | | 0.30 | |
| Cash Management Shares | | | | | | | | | | | | | | | | | | | | | | | | |
Actual | | | 1,000.00 | | | | 1,023.40 | | | | 0.86 | | | | 1,000.00 | | | | 1,008.60 | | | | 0.30 | |
Hypothetical 5% return | | | 1,000.00 | | | | 1,024.08 | + | | | 0.86 | | | | 1,000.00 | | | | 1,024.63 | + | | | 0.30 | |
38
GOLDMAN SACHS FUNDS — INVESTOR FUNDS
| | |
| | |
Fund Expenses — Six Month Period Ended May 31, 2021 (Unaudited) (continued) | | |
| | | | | | | | | | | | | | | | | | | | | | | | |
| | | Investor Money Market Fund | | | Investor Tax-Exempt Money Market Fund | |
| Share Class | | Beginning
Account Value
12/1/20 | | | Ending
Account Value
5/31/21 | | | Expenses
Paid for the
6 months
ended
5/31/2021* | | | Beginning
Account Value
12/1/20 | | | Ending
Account Value
5/31/21 | | | Expenses
Paid for the
6 months
ended
5/31/2021* | |
| Premier Shares | | | | | | | | | | | | | | | | | | | | | | | | |
Actual | | $ | — | | | $ | — | | | $ | — | | | $ | 1,000.00 | | | $ | 1,008.60 | | | $ | 0.30 | |
Hypothetical 5% return | | | — | | | | — | | | | — | | | | 1,000.00 | | | | 1,024.63 | + | | | 0.30 | |
| Resource Shares | | | | | | | | | | | | | | | | | | | | | | | | |
Actual | | | 1,000.00 | | | | 1,023.40 | | | | 0.81 | | | | 1,000.00 | | | | 1,008.60 | | | | 0.30 | |
Hypothetical 5% return | | | 1,000.00 | | | | 1,024.13 | + | | | 0.81 | | | | 1,000.00 | | | | 1,024.63 | + | | | 0.30 | |
| | * | | Expenses for each share class are calculated using the Fund’s annualized net expense ratio for each class, which represents the ongoing expenses as a percentage of net assets for the six months ended 5/31/2021. Expenses are calculated by multiplying the annualized net expense ratio by the average account value for the period; then multiplying the result by the number of days in the most recent fiscal half year; and then dividing that result by the number of days in the fiscal year. The annualized net expense ratios for the period were as follows: | |
| | | | | | | | | | | | | | | | | | | | | | | | | | | | | | | | | | | | | | | | | | | | |
| Fund | | Class A
Shares | | | Class C
Shares | | | Class I
Shares | | | Capital
Shares | | | Service
Shares | | | Preferred
Shares | | | Select
Shares | | | Administration
Shares | | | Cash
Management
Shares | | | Premier
Shares | | | Resource
Shares | |
Investor Money Market Fund | | | 0.17 | % | | | 0.16 | % | | | 0.15 | % | | | — | | | | 0.17 | % | | | — | | | | — | | | | 0.17 | % | | | 0.17 | % | | | — | | | | 0.16 | % |
| | | | | | | | | | | |
Investor Tax-Exempt Money Market Fund | | | 0.06 | | | | 0.06 | | | | 0.06 | | | | 0.06 | % | | | 0.06 | | | | 0.06 | % | | | 0.06 | % | | | 0.06 | | | | 0.06 | | | | 0.06 | % | | | 0.06 | |
| | + | | Hypothetical expenses are based on the Fund’s actual annualized net expense ratios and an assumed rate of return of 5% per year before expenses. | |
39
FUNDS PROFILE
Goldman Sachs Funds
Goldman Sachs is a premier financial services firm, known since 1869 for creating thoughtful and customized investment solutions in complex global markets.
Today, the Asset Management Division of Goldman Sachs serves a diverse set of clients worldwide, including private institutions, public entities and individuals. With approximately $2.20 trillion in assets under supervision as of March 31, 2021, Goldman Sachs Asset Management (“GSAM”) has portfolio management teams located around the world and our investment professionals bring firsthand knowledge of local markets to every investment decision. Assets under supervision includes assets under management and other client assets for which Goldman Sachs does not have full discretion. GSAM leverages the resources of Goldman Sachs & Co. LLC subject to legal, internal and regulatory restrictions.
Money Market
Financial Square FundsSM
| ∎ | | Financial Square Treasury Solutions Fund1 |
| ∎ | | Financial Square Government Fund1 |
| ∎ | | Financial Square Money Market Fund2 |
| ∎ | | Financial Square Prime Obligations Fund2 |
| ∎ | | Financial Square Treasury Instruments Fund1 |
| ∎ | | Financial Square Treasury Obligations Fund1 |
| ∎ | | Financial Square Federal Instruments Fund1 |
Investor FundsSM
| ∎ | | Investor Money Market Fund3 |
| ∎ | | Investor Tax-Exempt Money Market Fund3 |
Fixed Income
Short Duration and Government
| ∎ | | High Quality Floating Rate Fund |
| ∎ | | Short-Term Conservative Income Fund |
| ∎ | | Short Duration Government Fund |
| ∎ | | Short Duration Income Fund |
| ∎ | | Inflation Protected Securities Fund |
Multi-Sector
| ∎ | | Global Core Fixed Income Fund |
Municipal and Tax-Free
| ∎ | | High Yield Municipal Fund |
| ∎ | | Dynamic Municipal Income Fund |
| ∎ | | Short Duration Tax-Free Fund |
| ∎ | | Municipal Income Completion Fund |
Single Sector
| ∎ | | Investment Grade Credit Fund |
| ∎ | | High Yield Floating Rate Fund |
| ∎ | | Emerging Markets Debt Fund |
| ∎ | | Local Emerging Markets Debt Fund |
Fixed Income Alternatives
| ∎ | | Long Short Credit Strategies Fund |
Fundamental Equity
| ∎ | | Small/Mid Cap Value Fund |
| ∎ | | Small/Mid Cap Growth Fund |
| ∎ | | Concentrated Growth Fund |
| ∎ | | Technology Opportunities Fund |
| ∎ | | Growth Opportunities Fund |
| ∎ | | Rising Dividend Growth Fund |
Tax-Advantaged Equity
| ∎ | | U.S. Tax-Managed Equity Fund |
| ∎ | | International Tax-Managed Equity Fund |
| ∎ | | U.S. Equity Dividend and Premium Fund |
| ∎ | | International Equity Dividend and Premium Fund |
Equity Insights
| ∎ | | Small Cap Equity Insights Fund |
| ∎ | | U.S. Equity Insights Fund |
| ∎ | | Small Cap Growth Insights Fund |
| ∎ | | Large Cap Growth Insights Fund |
| ∎ | | Large Cap Value Insights Fund |
| ∎ | | Small Cap Value Insights Fund |
| ∎ | | International Small Cap Insights Fund |
| ∎ | | International Equity Insights Fund |
| ∎ | | Emerging Markets Equity Insights Fund |
Fundamental Equity International
| ∎ | | International Equity Income Fund |
| ∎ | | International Equity ESG Fund |
| ∎ | | Emerging Markets Equity Fund |
| ∎ | | ESG Emerging Markets Equity Fund |
Alternative
| ∎ | | Clean Energy Income Fund |
| ∎ | | Real Estate Securities Fund |
| ∎ | | International Real Estate Securities Fund |
| ∎ | | Commodity Strategy Fund |
| ∎ | | Global Real Estate Securities Fund |
| ∎ | | Alternative Premia Fund |
| ∎ | | Absolute Return Tracker Fund |
| ∎ | | Managed Futures Strategy Fund |
| ∎ | | MLP Energy Infrastructure Fund |
| ∎ | | Energy Infrastructure Fund5 |
| ∎ | | Multi-Manager Alternatives Fund |
| ∎ | | Global Infrastructure Fund |
Total Portfolio Solutions
| ∎ | | Global Managed Beta Fund |
| ∎ | | Multi-Manager Non-Core Fixed Income Fund |
| ∎ | | Multi-Manager Global Equity Fund |
| ∎ | | Multi-Manager International Equity Fund |
| ∎ | | Tactical Tilt Overlay Fund |
| ∎ | | Balanced Strategy Portfolio |
| ∎ | | Multi-Manager U.S. Small Cap Equity Fund |
| ∎ | | Multi-Manager Real Assets Strategy Fund |
| ∎ | | Growth and Income Strategy Portfolio |
| ∎ | | Growth Strategy Portfolio |
| ∎ | | Dynamic Global Equity Fund |
| ∎ | | Satellite Strategies Portfolio |
| ∎ | | Enhanced Dividend Global Equity Portfolio |
| ∎ | | Tax-Advantaged Global Equity Portfolio |
| ∎ | | Strategic Factor Allocation Fund |
| ∎ | | Strategic Volatility Premium Fund |
| ∎ | | Target Date Retirement Portfolio |
| ∎ | | Target Date 2025 Portfolio |
| ∎ | | Target Date 2030 Portfolio |
| ∎ | | Target Date 2035 Portfolio |
| ∎ | | Target Date 2040 Portfolio |
| ∎ | | Target Date 2045 Portfolio |
| ∎ | | Target Date 2050 Portfolio |
| ∎ | | Target Date 2055 Portfolio |
| ∎ | | Target Date 2060 Portfolio |
| ∎ | | GQG Partners International Opportunities Fund |
| 1 | | You could lose money by investing in the Fund. Although the Fund seeks to preserve the value of your investment at $1.00 per share, it cannot guarantee it will do so. An investment in the Fund is not a deposit of a bank and is not insured or guaranteed by the Federal Deposit Insurance Corporation or any other government agency. The Fund’s sponsor has no legal obligation to provide financial support to the Fund, and you should not expect that the sponsor will provide financial support to the Fund at any time. |
| 2 | | You could lose money by investing in the Fund. Because the share price of the Fund will fluctuate, when you sell your shares they may be worth more or less than what you originally paid for them. The Fund may impose a fee upon sale of your shares or may temporarily suspend your ability to sell shares if the Fund’s liquidity falls below required minimums because of market conditions or other factors. An investment in the Fund is not a deposit of a bank and is not insured or guaranteed by the Federal Deposit Insurance Corporation or any other government agency. The Fund’s sponsor has no legal obligation to provide financial support to the Fund, and you should not expect that the sponsor will provide financial support to the Fund at any time. |
| 3 | | You could lose money by investing in the Fund. Although the Fund seeks to preserve the value of your investment at $1.00 per share, it cannot guarantee it will do so. The Fund may impose a fee upon sale of your shares or may temporarily suspend your ability to sell shares if the Fund’s liquidity falls below required minimums because of market conditions or other factors. An investment in the Fund is not a deposit of a bank and is not insured or guaranteed by the Federal Deposit Insurance Corporation or any other government agency. The Fund’s sponsor has no legal obligation to provide financial support to the Fund, and you should not expect that the sponsor will provide financial support to the Fund at any time. |
| 4 | | Effective after the close on business of August 30, 2020, the Goldman Sachs Blue Chip Fund was renamed the Goldman Sachs U.S. Equity ESG Fund. |
| 5 | | Effective after the close of business on June 26, 2020, the Goldman Sachs MLP & Energy Fund was renamed the Goldman Sachs Energy Infrastructure Fund. |
| | | Financial Square FundsSM and Investor FundsSM are registered service marks of Goldman Sachs & Co. LLC. |
| * | | This list covers open-end funds only. Please visit our website at www.GSAMFUNDS.com to learn about our closed-end funds and exchange-traded funds. |
| | |
TRUSTEES Jessica Palmer, Chair Dwight L. Bush Kathryn A. Cassidy Diana M. Daniels Joaquin Delgado James A. McNamara Roy W. Templin Gregory G. Weaver | | OFFICERS James A. McNamara, President Joseph F. DiMaria, Principal Financial Officer, Principal Accounting Officer and Treasurer Caroline L. Kraus, Secretary |
| |
GOLDMAN SACHS & CO. LLC Distributor and Transfer Agent | | GOLDMAN SACHS ASSET MANAGEMENT, L.P. Investment Adviser |
Visit our web site at www.GSAMFUNDS.com to obtain the most recent month-end returns.
Goldman Sachs Asset Management, L.P., 200 West Street, New York, New York 10282
Economic and market forecasts presented herein reflect our judgment as of the date of this presentation and are subject to change without notice. These forecasts do not take into account the specific investment objectives, restrictions, tax and financial situation or other needs of any specific client. Actual data will vary and may not be reflected here. These forecasts are subject to high levels of uncertainty that may affect actual performance. Accordingly, these forecasts should be viewed as merely representative of a broad range of possible outcomes. These forecasts are estimated, based on assumptions, and are subject to significant revision and may change materially as economic and market conditions change. Goldman Sachs has no obligation to provide updates or changes to these forecasts. Case studies and examples are for illustrative purposes only.
The reports concerning the Funds included in this shareholder report may contain certain forward-looking statements about the factors that may affect the performance of the Funds in the future. These statements are based on Fund management’s predictions and expectations concerning certain future events and their expected impact on the Funds, such as performance of the economy as a whole and of specific industry sectors, changes in the levels of interest rates, the impact of developing world events, and other factors that may influence the future performance of the Funds. Management believes these forward-looking statements to be reasonable, although they are inherently uncertain and difficult to predict. Actual events may cause adjustments in portfolio management strategies from those currently expected to be employed.
A description of the policies and procedures that the Funds use to determine how to vote proxies relating to portfolio securities and information regarding how a Fund voted proxies relating to portfolio securities during the most recent 12-month period ended June 30 is available (i) without charge, upon request by calling 1-800-526-7384 (for shareholders of Class A Shares or Class C Shares) or 1-800-621-2550 (for shareholders of all other share classes of a Fund); and (ii) on the Securities and Exchange Commission (“SEC”) web site at http://www.sec.gov.
Goldman Sachs & Co. LLC (‘‘Goldman Sachs’’) does not provide legal, tax or accounting advice. Any statement contained in this communication (including any attachments) concerning U.S. tax matters was not intended or written to be used, and cannot be used, for the purpose of avoiding penalties under the Internal Revenue Code, and was written to support the promotion or marketing of the transaction(s) or matter(s) addressed. Clients of Goldman Sachs should obtain their own independent tax advice based on their particular circumstances.
Fund holdings and allocations shown are as of May 31, 2021 and may not be representative of future investments. Fund holdings should not be relied on in making investment decisions and should not be construed as research or investment advice regarding particular securities. Current and future holdings are subject to risk.
Goldman Sachs Investor FundsSM is a service mark of Goldman Sachs & Co. LLC.
The portfolio risk management process includes an effort to monitor and manage risk, but does not imply low risk.
This material is not authorized for distribution to prospective investors unless preceded or accompanied by a current Prospectus or summary prospectus, if applicable. Investors should consider a Fund’s objective, risks, and charges and expenses, and read the summary prospectus, if available, and/or the Prospectus carefully before investing or sending money. The summary prospectus, if available, and the Prospectus contain this and other information about a Fund and may be obtained from your Intermediary or from Goldman Sachs & Co. LLC by calling (Class A Shares and Class C Shares – 1-800-526-7384) (all other share classes – 1-800-621-2550).
© 2021 Goldman Sachs. All rights reserved. 245180-OTU-1445695 IMMITEMMSAR-21
| (a) | As of the end of the period covered by this report, the registrant has adopted a code of ethics that applies to the registrant’s principal executive officer, principal financial officer, principal accounting officer or controller, or persons performing similar functions, regardless of whether these individuals are employed by the registrant or a third party (the “Code of Ethics”). |
| (c) | During the period covered by this report, no amendments were made to the provisions of the Code of Ethics. |
| (d) | During the period covered by this report, the registrant did not grant any waivers, including an implicit waiver, from any provision of the Code of Ethics. |
| (f) | A copy of the Code of Ethics is available as provided in Item 13(a)(1) of this report. |
| ITEM 3. | AUDIT COMMITTEE FINANCIAL EXPERT. |
| | The registrant’s board of trustees has determined that the registrant has at least one “audit committee financial expert” (as defined in Item 3 of Form N-CSR) serving on its audit committee. Gregory G. Weaver is the “audit committee financial expert” and is “independent” (as each term is defined in Item 3 of Form N-CSR). |
| ITEM 4. | PRINCIPAL ACCOUNTANT FEES AND SERVICES. |
| | The information required by this Item is only required in an annual report on this Form N-CSR. |
| ITEM 5. | AUDIT COMMITTEE OF LISTED REGISTRANTS. |
| ITEM 6. | SCHEDULE OF INVESTMENTS. |
| | Schedule of Investments is included as part of the Report to Shareholders filed under Item 1. |
| ITEM 7. | DISCLOSURE OF PROXY VOTING POLICIES AND PROCEDURES FOR CLOSED-END MANAGEMENT INVESTMENT COMPANIES. |
| ITEM 8. | PORTFOLIO MANAGERS OF CLOSED-END MANAGEMENT INVESTMENT COMPANIES. |
| ITEM 9. | PURCHASES OF EQUITY SECURITIES BY CLOSED-END MANAGEMENT INVESTMENT COMPANY AND AFFILIATED PURCHASERS. |
| ITEM 10. | SUBMISSION OF MATTERS TO A VOTE OF SECURITY HOLDERS. |
| | There have been no material changes to the procedures by which shareholders may recommend nominees to the registrant’s board of trustees. |
| ITEM 11. | CONTROLS AND PROCEDURES. |
| | (a) | The registrant’s principal executive and principal financial officers, or persons performing similar functions have concluded that the registrant’s disclosure controls and procedures (as defined in Rule 30a-3(c) under the Investment Company Act of 1940, as amended (the “1940 Act”)) are effective as of a date within 90 days of the filing of this report that includes the disclosure required by this paragraph, based on the evaluation of these controls and procedures required by Rule 30a-3(b) under the 1940 Act and 15d-15(b) under the Securities Exchange Act of 1934, as amended. |
| | (b) | There were no changes in the registrant’s internal control over financial reporting (as defined in Rule 30a-3(d) under the 1940 Act) that occurred during the period covered by this report that have materially affected, or are reasonably likely to materially affect, the registrant’s internal control over financial reporting. |
| ITEM 12. | DISCLOSURE OF SECURITIES LENDING ACTIVITIES FOR CLOSED-END MANAGEMENT INVESTMENT COMPANIES |
SIGNATURES
Pursuant to the requirements of the Securities Exchange Act of 1934 and the Investment Company Act of 1940, the registrant has duly caused this report to be signed on its behalf by the undersigned, thereunto duly authorized.
| | | | |
| | | | Goldman Sachs Trust |
| | |
| By: | | | | /s/ James A. McNamara |
| | |
| | | | James A. McNamara |
| | | | President/Chief Executive Officer |
| | | | Goldman Sachs Trust |
| | |
| Date: | | | | August 2, 2021 |
Pursuant to the requirements of the Securities Exchange Act of 1934 and the Investment Company Act of 1940, this report has been signed below by the following persons on behalf of the registrant and in the capacities and on the dates indicated.
| | | | |
| | |
| By: | | | | /s/ James A. McNamara |
| | |
| | | | James A. McNamara |
| | | | President/Chief Executive Officer |
| | | | Goldman Sachs Trust |
| | |
| Date: | | | | August 2, 2021 |
| | |
| By: | | | | /s/ Joseph F. DiMaria |
| | |
| | | | Joseph F. DiMaria |
| | | | Principal Financial Officer |
| | | | Goldman Sachs Trust |
| | |
| Date: | | | | August 2, 2021 |