UNITED STATES
SECURITIES AND EXCHANGE COMMISSION
Washington, D.C. 20549
FORM N-CSR
Certified Shareholder Report of
Registered Management Investment Companies
Investment Company Act File Number: 811-05364
American High-Income Trust
(Exact Name of Registrant as Specified in Charter)
333 South Hope Street
Los Angeles, California 90071
(Address of Principal Executive Offices)
Registrant's telephone number, including area code: (213) 486-9200
Date of fiscal year end: September 30
Date of reporting period: September 30, 2013
Courtney R. Taylor
American High-Income Trust
333 South Hope Street
Los Angeles, California 90071
(Name and Address of Agent for Service)
Copies to:
Michael Glazer
Bingham McCutchen LLP
355 South Grand Avenue, Suite 4400
Los Angeles, California 90071
(Counsel for the Registrant)
ITEM 1 – Reports to Stockholders

Invest globally in
high-yield bonds
for a wider range
of opportunities.
Special feature page 4
 | American High-Income Trust® Annual report
for the year ended
September 30, 2013 |
American High-Income Trust seeks a high level of current income and, secondarily, capital appreciation through a diversified, carefully supervised portfolio consisting primarily of lower rated, higher risk corporate bonds.
This fund is one of more than 40 offered by one of the nation’s largest mutual fund families, American Funds, from Capital Group. For more than 80 years, Capital has invested with a long-term focus based on thorough research and attention to risk.
Fund results shown in this report, unless otherwise indicated, are for Class A shares at net asset value. If a sales charge (maximum 3.75%) had been deducted, the results would have been lower. Results are for past periods and are not predictive of results for future periods. Current and future results may be lower or higher than those shown. Share prices and returns will vary, so investors may lose money. Investing for short periods makes losses more likely. Investments are not FDIC-insured, nor are they deposits of or guaranteed by a bank or any other entity, so they may lose value. For current information and month-end results, visit americanfunds.com.
See page 3 for Class A share results with relevant sales charges deducted. For other share class results, visit americanfunds.com and americanfundsretirement.com.
Investment results assume all distributions are reinvested and reflect applicable fees and expenses. When applicable, investment results reflect fee waivers, without which results would have been lower. Visit americanfunds.com for more information.
The fund’s 30-day yield for Class A shares as of October 31, 2013, calculated in accordance with the U.S. Securities and Exchange Commission (SEC) formula, was 5.13%. The fund’s 12-month distribution rate for Class A shares as of that date was 6.20%. Both reflect the 3.75% maximum sales charge. The SEC yield reflects the rate at which the fund is earning income on its current portfolio of securities while the distribution rate reflects the fund’s past dividends paid to shareholders. Accordingly, the fund’s SEC yield and distribution rate may differ.
The return of principal for bond funds and for funds with significant underlying bond holdings is not guaranteed. Fund shares are subject to the same interest rate, inflation and credit risks associated with the underlying bond holdings. High-yield bonds are subject to greater fluctuations in value and risk of loss of income and principal than investment-grade bonds. Bond ratings, which typically range from Aaa/AAA (highest) to D (lowest), are assigned by credit rating agencies such as Moody’s, Standard & Poor’s and/or Fitch as an indication of an issuer’s creditworthiness. Investing in bonds issued outside the U.S. may be subject to additional risks. They include currency fluctuations, political and social instability, differing securities regulations and accounting standards, higher transaction costs, possible changes in taxation, illiquidity and price volatility. These risks may be heightened in connection with investments in developing countries. Refer to the fund prospectus and the Risk Factors section of this report for more information on these and other risks associated with investing in the fund.

Special feature
Contents
Fellow investors:
High-yield bonds recorded solid gains for the fiscal year ended September 30, 2013, as the economy rebounded and investors sought to take on more risk. While much of the fixed-income market sold off later in the period amid concerns about rising interest rates, the high-yield bond market demonstrated some resilience despite elevated volatility in the market.
In this environment of gradually rising interest rates, American High-Income Trust was able to generate a total return of 7.1%, assuming the reinvestment of monthly dividends totaling just over 73 cents a share. Shareholders who reinvested dividends received an income return of 6.8%. Those who elected to take their dividends in cash received an income return of 6.6% and saw the value of their holdings increase by 0.4%.
The Barclays U.S. Corporate High Yield 2% Issuer Capped Index, which covers the universe of fixed-rate, non-investment-grade debt and limits the maximum exposure of any one issuer to 2%, also returned 7.1%. The index is unmanaged and, therefore, has no expenses. The Lipper High Yield Funds Index, a benchmark of similar bond funds, posted a slightly higher total return of 7.4%.
The year in review
Fixed-income markets experienced two distinct phases during the fiscal year. For the first half of the period, yields for U.S. Treasuries and many other categories of bonds remained near historic lows as investors focused on the slow pace of the economic recovery and the possible effects of automatic tax increases and across-the-board federal budget cuts. With the Federal Reserve holding short-term interest rates near zero, investors were drawn to the high-yield market by the relatively attractive yields.
However, many of these conditions reversed during the second half of the fiscal year, creating a challenging and volatile period for bond investors. Home prices increased in March and April at their fastest pace since 2006, triggering greater optimism about the healing economy. During May and June, rising interest rates and indications from the Fed that it might reduce its monthly asset purchases fueled a selloff in Treasuries.
The benchmark 10-year U.S. Treasury bond started the fiscal year with a yield of just over 1.6% and ended the period around 2.6%. This increase of nearly 100 basis points in yield caused negative returns in most parts of the U.S. fixed-income market; the broadest market
Results at a glance
For periods ended September 30, 2013, with all distributions reinvested
| | | Total returns | | Average annual total returns |
| | | 1 year | | 5 years | | 10 years | | Lifetime
(since 2/19/88) |
| | | | | | | | | | | | | | | | | |
| American High-Income Trust (Class A shares) | | | 7.1 | % | | | 10.8 | % | | | 7.4 | % | | | 8.5 | % |
| Barclays U.S. Corporate High Yield 2% Issuer Capped Index* | | | 7.1 | | | | 13.5 | | | | 8.8 | | | | — | |
| Lipper High Yield Funds Index | | | 7.4 | | | | 11.0 | | | | 7.4 | | | | 7.2 | |
| * | This market index did not exist prior to December 31, 1992. It is unmanaged and, therefore, has no expenses. |
| American High-Income Trust | 1 |
measure, the Barclays U.S. Aggregate Bond Index, posted a return of -1.7%, while the Barclays U.S. Treasury Index fell 2.1%. In spite of generally rising rates, high-yield bonds continued to do well as the high current yield was able to offset price declines caused by the increase in interest rates. While there will be periods of interest-rate volatility going forward, we believe high-yield bonds can still provide attractive long-term returns.
During much of the fiscal year, with interest rates still very low by historic standards, credit markets saw a substantial level of new supply. Companies sought to take advantage of the low borrowing costs, with many refinancing their debt — both lowering their interest rates and extending their maturities. Low rates also prompted an increase in leveraged buyouts and other merger-and-acquisition activity. This presented the fund with many attractive investment opportunities, especially in the wireless telecommunication services industry.
For much of the fiscal year, higher yielding bonds (BB and below) generated stronger results than investment-grade issues (BBB and above) as the search for yield continued. However, as interest rates normalized later in the period and the bond market achieved a healthier balance, the interest in higher yielding bonds was not as pronounced. Against the backdrop of rising bond yields, the fund’s focus on lower quality credits proved beneficial as their higher coupons and wider spreads gave them a greater capacity to absorb higher rates compared to higher rated bonds.
Total returns for non-U.S. high-yield bonds outpaced their U.S. counterparts, although emerging markets debt declined as the asset class experienced significant outflows amid concerns that the Fed might soon begin to tighten monetary policy. The fund’s portfolio managers remain optimistic about the fundamentals for many developing economies, but recognize there may be more volatility to come in emerging markets.
In the last couple of years, the fund has increased its exposure to non-U.S. high-yield bonds as a way to gain access to higher quality credits at similar yields to the U.S. corporate bond market. The majority of the exposure has been in U.S. dollar-denominated bonds with only a small percentage invested in local-currency bonds. The U.S. dollar exposure has been split between both corporate and sovereign issuers while the local currency holdings have been concentrated in sovereign debt. For more on the fund’s investments in non-U.S. markets, see the special feature that starts on page 4.
A long-term perspective
As the economy continues to strengthen, we remain alert to the potential impact of rising interest rates and will closely monitor possible Fed action, but these developments are likely to take time. Central bank policies have been beneficial to high-yield bonds and as these policies are eventually unwound it may create higher nominal yields across fixed income, and potentially higher volatility. However, the more positive economic conditions that will lead the Fed to withdraw from quantitative easing should help to improve credit quality for high-yield issuers. These conditions should generally limit spread widening for high-yield bonds, and yields on these bonds may be driven more by changes in underlying Treasury yields. The combined effect of relatively stable spreads due to continuing moderate economic growth and gradually rising Treasury yields should create a constructive investment environment for high-yield bonds.
With these issues in mind and on the heels of several years of strong returns, our investment managers are taking a cautious view of the market. However, higher yields are providing us with more attractive opportunities to add to investments; gradually rising interest rates allow the fund to reinvest at higher yields, benefiting our investors. While volatility in the high-yield market should be expected, it is important to remember that investors who have maintained a long-term perspective have been rewarded with solid returns and a steady source of income. For the past 10-year period ended September 30, 2013, the fund’s investors earned an average annual total return of 7.4%, with dividends reinvested, matching the Lipper High Yield Funds Index. As always, we appreciate your continued support and long-term investment perspective.
Sincerely,

David C. Barclay
President
November 12, 2013
For current information about the fund, visit americanfunds.com.
| 2 | American High-Income Trust |
The value of a long-term perspective
Here’s how a $10,000 investment in American High-Income Trust grew between February 19, 1988, when the fund began operations, and September 30, 2013, the end of its latest fiscal year. As you can see, that $10,000 grew to $78,170 with all distributions reinvested.
Fund results shown reflect deduction of the maximum sales charge of 3.75% on the $10,000 investment.1 Thus, the net amount invested was $9,625.2
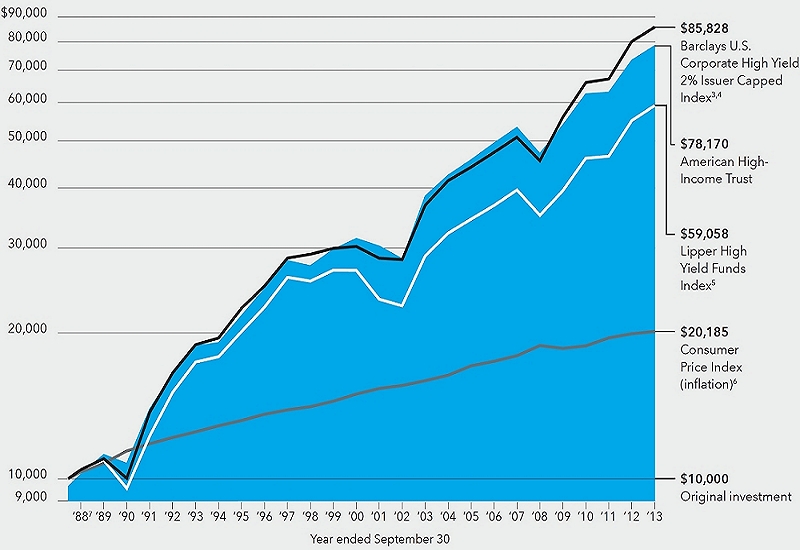
| 1 | As outlined in the prospectus, the sales charge is reduced for accounts (and aggregated investments) of $100,000 or more and is eliminated for purchases of $1 million or more. There is no sales charge on dividends or capital gain distributions that are reinvested in additional shares. |
| 2 | The maximum initial sales charge was 4.75% prior to January 10, 2000. |
| 3 | The market index is unmanaged and, therefore, has no expenses. |
| 4 | From February 19, 1988, through December 31, 1992, the Credit Suisse High Yield Index was used because the Barclays Capital U.S. Corporate High Yield 2% Issuer Capped Index did not yet exist. Since January 1, 1993, the Barclays U.S. Corporate High Yield 2% Issuer Capped Index has been used. |
| 5 | Results of the Lipper High Yield Funds Index do not reflect any sales charges. |
| 6 | Computed from data supplied by the U.S. Department of Labor, Bureau of Labor Statistics. |
| 7 | For the period February 19, 1988 (when the fund began operations) through September 30, 1988. |
Past results are not predictive of results for future periods. The results shown are before taxes on fund distributions and sale of fund shares.
Average annual total returns based on a $1,000 investment (for periods ended September 30, 2013)*
| | 1 year | 5 years | 10 years |
| | | | |
| Class A shares | 3.05% | 9.96% | 7.02% |
*Assumes reinvestment of all distributions and payment of the maximum 3.75% sales charge.
The total annual fund operating expense ratio is 0.66% for Class A shares as of the prospectus dated December 1, 2013 (unaudited).
Investment results assume all distributions are reinvested and reflect applicable fees and expenses. When applicable, investment results reflect fee waivers, without which results would have been lower. Visit americanfunds.com for more information.
| American High-Income Trust | 3 |

Investing globally in the high-yield bond market
When one thinks of the high-yield corporate bond market, the United States is usually the first place that comes to mind. The U.S. has the deepest and most established corporate bond market in the world. It should come as no surprise then that many companies in Europe turned to the U.S. when bank lending dried up there in the aftermath of the euro-zone crisis.
More and more foreign companies are accessing the corporate bond market — both in the U.S. and other countries — creating new investment opportunities for American High-Income Trust. Many of these companies offer higher yields and attractive valuations to the fund’s portfolio managers while also allowing them to diversify their portfolios. In addition to these non-U.S. corporate
| 4 | American High-Income Trust |


David Barclay
“Investing in the non-U.S. high-yield bond market gives the fund a wider range of opportunities and greater diversification. But it is very much a bottom-up process that is driven by our research. It is about finding interesting investment opportunities, wherever they may be.”
bonds, the fund also invests in the sovereign debt of some foreign countries.
Granted, non-U.S. investments in the high-yield market come with a new set of risks, but that is what helps make them attractive for the fund. Our investment professionals apply the same level of in-depth research and rigorous analysis as they do for U.S. investments. It is also important to understand the bankruptcy laws and the currency implications of investing in foreign countries, which is often done in collaboration with our sovereign analysts and economists.
“Investing in the non-U.S. high-yield bond market gives the fund a wider range of opportunities and greater diversification,” says President David Barclay, also a portfolio manager. “But it is very much a bottom-up process that is driven by our research. It is about finding interesting investment opportunities, wherever they may be.”
Opportunities in Europe
The euro-zone crisis has created many opportunities for American High-Income Trust to invest in both sovereign and corporate debt. “The crisis created investment opportunities for us in Europe because the market did not recognize the range of possibilities that existed and the resources available to address these countries’ issues,” explains Marc Linden, another of the fund’s portfolio managers. “To some extent, when everyone thought the crisis was a foregone conclusion and wanted to sell, that’s the time to buy. Sometimes you have to be comfortable taking the opposite side of what the market is telling you.”
While effects of the crisis are still being felt across many parts of Europe, some countries are showing signs of progress, such as Slovenia, one of the fund’s largest sovereign debt holdings. Amid concerns about turmoil in its banking industry earlier this year, Moody’s cut Slovenia’s debt rating to below-investment-grade status. The rating agency argued that the credit-driven banking crisis and deteriorating government finances increased the chances it would require an international rescue. Despite a delay caused by the downgrade, Slovenia issued $3.5 billion in bonds, helping the country to shore up its banking system and avoid a bailout.
“Our sovereign analyst who covers Slovenia had a very high conviction that the country was taking the necessary steps to address its fiscal situation,” recalls Marc. “Slovenia has had some serious issues that needed attention but our view was that it was a manageable situation.”
Italy is another country that experienced its share of problems during the euro-zone crisis. While the fund did not invest in any meaningful way in Italian sovereign debt, portfolio managers kept close tabs on what was happening in the country as they evaluated their investment in a domestic telecom company called Wind. “It was interesting because the correlation between the trading behavior of the Italian government bonds and the Wind bonds became very high,” portfolio manager David Daigle notes. “They were being driven much more by the direction of the sovereign yields than by what was happening with Wind itself.”
David was paying especially close attention at the time because it was the peak of the euro-zone crisis in 2011, when the very future of the currency was in doubt. “If Italy were to have left the euro, that would’ve been a disaster for many companies there, including Wind, which would’ve immediately become insolvent,” he says, noting that the euro zone does not yet have a single set of bankruptcy laws like in the U.S. “Europe is attempting to harmonize its bankruptcy laws, which differ country by country, but that process could take a decade or more.”
| American High-Income Trust | 5 |

“We are not restricted by credit ratings, so if there are high-yield opportunities at investment-grade issuers, we will seek to take advantage of those for the benefit of our investors.” – Abner Goldstine
 | |  |
| | | |
| Abner Goldstine | | David Daigle |
While insolvency is not usually an issue for the fund’s holdings, David says it is important to understand a country’s bankruptcy laws before investing there to make sure we are being adequately compensated for the risk. “The legal framework has to be reasonable for investors, but many countries are not very creditor friendly,” he says. “It doesn’t necessarily keep us from investing there, but it affects the types of companies we buy and makes us more sensitive to financial distress situations.”
Banks under pressure
The European banking system came under extreme pressure during the financial crisis amid concerns about banks’ exposure to euro-zone sovereign debt and access to market funding. To avoid potential bank failures and severe disruptions to the market, governments took equity stakes in many financial companies, helping to increase their capital cushion. Even as the crisis subsided, banks came under further pressure from regulators, who pushed them to issue more equity and other types of securities that offered unusually high yields. American High-Income Trust was able to take advantage of these opportunities to invest in banks at attractive yields.
One such security in which the fund invested is an obligation of Lloyds Banking. As part of a program to inject funds into major British banks, the U.K. government acquired a 40% stake in Lloyds in 2008. A year later, the bank raised additional equity from the public in an effort to improve its balance sheet. Lloyds also issued a subordinated bond maturing in 2020 that, under severe circumstances, could instead become equity; because of the nature of the security, it carried a particularly high yield.
This attracted the interest of portfolio manager Abner Goldstine, who specializes in the financials sector. “It was not until late 2010, as the outlook for European banks began to improve, that we felt confident enough to invest in the Lloyds bond,” he recalls. “It has provided us with income in excess of the high-yield market and is trading well above the fund’s average cost.” While the bulk of bonds issued by Lloyds are rated investment grade, the ones held by American High-Income Trust are not. “We are not restricted by credit ratings,” notes Abner, “so if there are high-yield opportunities at investment-grade issuers, we will seek to take advantage of those for the benefit of our investors.”
The problems in the European banking system also had broader implications for companies that had historically relied on those banks for funding. As lending dried up and regulators made banks raise their own capital requirements, these companies were forced to look elsewhere for funding. Many turned to the corporate bond market — both in Europe and increasingly the U.S. — and investors have been more than willing to help them out in recent years.
“Many of these companies came to the U.S. high-yield market because it is by far
| 6 | American High-Income Trust |

Marc Linden
“It is not uncommon for companies to find they are unable to raise money in Europe and turn to the U.S., which has a much bigger and more robust bond market. But the hurdle is higher for European companies because they have to overcome investors’ concerns about the risk of insolvency in those countries.”
the deepest source of capital for below-investment-grade issuers in the world,” Marc explains. “It is not uncommon for companies to find they are unable to raise money in Europe and turn to the U.S., which has a much bigger and more robust bond market. But the hurdle is higher for European companies because they have to overcome investors’ concerns about the risk of insolvency in those countries. Typically they offer higher yields and the return opportunity is greater.”
With thorough research and in-depth analysis, analysts can determine when the reward of investing in a non-U.S. company is likely to outweigh the risks. It ultimately comes down to many of the same financial characteristics used to evaluate U.S. companies. Schaeffler is a German auto parts company that caught the attention of fund analyst Irina Goedemans when it got locked out of the bank lending market after the crisis and turned to the bond market. “It was a multigenerational family company that traditionally had been financed by banks, but when lenders became nervous about their large loans to the company, Schaeffler had to turn to the bond market,” Irina says. “It was a well-run operation but historically did not have the financial savvy to enter the bond market, so Schaeffler hired a new chief financial officer to guide it through that effort.”
A few years prior to entering the bond market, the company was involved in an ill-timed transaction that left it with too much debt. Schaeffler was trying to buy a stake in a larger German auto parts company, Continental, but ended up biting off more than it could chew. “While the idea was not bad, Continental was too big for Schaeffler’s existing management to handle,” says Irina. “It was a poorly designed deal but the banks involved supported the company at first because they didn’t want it to go bankrupt and hurt the rest of the German auto parts industry. Nonetheless, the banks were nervous and soon urged Schaeffler to find other means of financing. The new CFO helped the company get its finances in shape before entering the bond market.”
Schaeffler first issued bonds in 2012 and then followed up with another offering in 2013, in which American High-Income Trust took part. “In this case, the company was private, but I was able to conduct research on Continental, which is public, as well as Schaeffler’s competitors, which helped me get my arms around how much it was worth,” recalls Irina. “We passed on the first bond offering, because we felt things could still go wrong and if so it would be costly since it is a non-U.S. company. By the time of the 2013 placement, we felt more comfortable investing.”
Collaboration in emerging markets
An increasing number of companies in emerging markets have tapped the bond market in recent years, taking advantage of ultra-low interest rates in the developed world resulting from quantitative easing. They were met with strong demand because of the higher yields typically offered to investors willing to take on more risk, as well as the higher expected growth rates of emerging markets economies versus those of developed countries. This led to rapid growth in emerging-markets corporate debt, which is now a $1.3 trillion market — almost twice the size of the emerging-markets sovereign debt market. However, concerns have since increased about emerging markets debt as the Federal Reserve prepares to start tapering its asset-purchase program, which could send rates higher and cause the U.S. dollar to strengthen, pushing up debt servicing costs.
Despite these concerns, portfolio managers and analysts for American High-Income Trust remain optimistic about the long-term prospects for emerging-markets corporate debt. They continue to find attractive investments and some even see the downturn in emerging markets as a buying opportunity. “The outflows have been pretty indiscriminate over the last several months and that is the time when opportunities can present themselves,” says Marc. “These companies are under pressure in the short term but a lot of them have really strong operations that aren’t affected much by the macro problems.”
One such opportunity the fund has invested in was QGOG Constellation, a Brazilian company that makes high-tech, deep-water drilling rigs. It owns and operates these offshore rigs on behalf of state-owned oil company Petrobras, which has a huge need for them given its large discoveries of oil off the coast of
| American High-Income Trust | 7 |
 | |  |
| | | |
| Damien McCann | | Irina Goedemans |
“The legal framework has to be reasonable for investors, but many countries are not very creditor friendly. It doesn’t necessarily keep us from investing there, but it affects the types of companies we buy and makes us more sensitive to financial distress situations.” – David Daigle
Brazil in recent years. “It offers an indirect, higher return way to invest in the credit quality of Petrobras and Brazil,” says analyst Damien McCann, who consulted closely with our equity analysts who cover Petrobras as well as our sovereign analyst for Brazil before making the investment in QGOG Constellation. “I need to understand our view of a country’s credit quality and that usually factors into my investment decision. While Brazil’s credit quality is gradually deteriorating, its leverage is not excessive. In addition, Petrobras has ample capacity to service its debt and drilling-rig lease obligations.”
Damien says the concerns about Brazil and emerging markets in general are already reflected in the valuation of QGOG Constellation’s bonds, which the fund recently bought. The company issued bonds for the first time after completing the construction of several drilling rigs now used by Petrobras under long-term contracts. American High-Income Trust had previously invested in the bonds of a subsidiary known as QGOG Atlantic/Alaskan Rigs, which holds a mortgage on two of the actual drilling-rig assets, but the latest investment gave the fund access to more diverse cash flows from all of the holding company’s subsidiaries.
In making the investments, Damien also consulted with Capital International Private Equity Funds, our global emerging markets private equity group, which has been a shareholder in QGOG Constellation since 2010. “I have an ongoing dialogue with our private equity associates about QGOG Constellation’s business prospects and management team,” he says. “I want to know what they think about operational strategy, growing the business and managing the balance sheet, as well as how much risk they are willing to take on — these are all important factors to us as bond investors.”
Investing in emerging markets or anywhere outside the U.S. is not a new phenomenon for American High-Income Trust. The fund first started investing in emerging markets debt in the early 1990s and more recently began focusing on emerging-markets corporate debt. “We have a long history of investing in emerging markets and there are now more opportunities than ever before in corporate debt,” says David Barclay, noting that Europe has become another area of focus for the fund. “There are many great investment opportunities outside of the U.S. and we have the capabilities in place to pursue those for the benefit of our investors.” n
| 8 | American High-Income Trust |
Summary investment portfolio September 30, 2013
| Portfolio by type of security | Percent of net assets |

| Bonds, notes & other debt instruments 90.94% | | Principal
amount
(000) | | | Value
(000) | | | Percent
of net
assets | |
| Corporate bonds, notes & loans 83.55% | | | | | | | | | | | | |
| | | | | | | | | | | | | |
| Telecommunication services 14.79% | | | | | | | | | | | | |
| Sprint Nextel Corp.: | | | | | | | | | | | | |
| 8.375% 2017 | | $ | 91,375 | | | $ | 103,711 | | | | | |
| 7.00% 2020 | | | 119,185 | | | | 121,867 | | | | | |
| 6.00%–11.50% 2016–20221 | | | 111,305 | | | | 132,641 | | | | | |
| Sprint Corp.: | | | | | | | | | | | | |
| 7.25% 20211 | | | 42,150 | | | | 42,677 | | | | 2.85 | % |
| 7.875% 20231 | | | 83,375 | | | | 85,251 | | | | | |
| Clearwire Communications and Clearwire Finance, Inc. | | | | | | | | | | | | |
| 12.00%–14.75% 2016–20171 | | | 64,165 | | | | 77,838 | | | | | |
| Sprint Capital Corp. 6.90%–8.75% 2019–2032 | | | 6,800 | | | | 7,000 | | | | | |
| Frontier Communications Corp.: | | | | | | | | | | | | |
| 7.125% 2023 | | | 96,125 | | | | 96,846 | | | | | |
| 7.625% 2024 | | | 97,523 | | | | 98,011 | | | | 1.94 | |
| 8.125%–9.25% 2018–2022 | | | 172,053 | | | | 192,952 | | | | | |
| Wind Acquisition SA: | | | | | | | | | | | | |
| 11.75% 20171 | | | 140,330 | | | | 149,276 | | | | | |
| 7.25% 20181 | | | 97,460 | | | | 101,358 | | | | 1.77 | |
| 7.375%–11.75% 2017–2018 | | € | 73,005 | | | | 104,720 | | | | | |
| NII Capital Corp.: | | | | | | | | | | | | |
| 11.375% 20191 | | $ | 79,395 | | | | 82,571 | | | | | |
| 7.625% 2021 | | | 154,456 | | | | 110,436 | | | | 1.76 | |
| 7.875%–10.00% 2016–20191 | | | 186,256 | | | | 159,687 | | | | | |
| Leap Wireless International, Inc., Term Loan C, 4.75% 20202,3,4 | | | 156,957 | | | | 157,209 | | | | | |
| Cricket Communications, Inc. 7.75% 2020 | | | 140,536 | | | | 159,684 | | | | 1.58 | |
| MetroPCS Wireless, Inc.: | | | | | | | | | | | | |
| 6.25% 20211 | | | 137,025 | | | | 138,224 | | | | | |
| 6.625% 20231 | | | 138,950 | | | | 139,818 | | | | 1.39 | |
| Intelsat Jackson Holding Co. 6.625% 20221 | | | 171,410 | | | | 170,981 | | | | .85 | |
| LightSquared, Term Loan B, 12.00% 20142,4,5,6 | | | 144,713 | | | | 170,761 | | | | .85 | |
| Trilogy International Partners, LLC 10.25% 20161 | | | 92,240 | | | | 89,012 | | | | .45 | |
| Digicel Group Ltd. 6.00% 20211 | | | 87,092 | | | | 82,084 | | | | .41 | |
| Other securities | | | | | | | 188,917 | | | | .94 | |
| | | | | | | | 2,963,532 | | | | 14.79 | |
| American High-Income Trust | 9 |
| Bonds, notes & other debt instruments (continued) | | Principal
amount
(000) | | | Value
(000) | | | Percent
of net
assets | |
| Corporate bonds, notes & loans (continued) | | | | | | | | | | | | |
| | | | | | | | | | | | | |
| Consumer discretionary 13.43% | | | | | | | | | | | | |
| Boyd Gaming Corp.: | | | | | | | | | | | | |
| 9.125% 2018 | | $ | 82,070 | | | $ | 89,661 | | | | | |
| 9.00% 2020 | | | 74,831 | | | | 81,566 | | | | .85 | % |
| Cequel Communications Holdings I, LLC and Cequel Capital Corp. | | | | | | | | | | | | |
| 6.375% 20201 | | | 109,705 | | | | 112,448 | | | | .56 | |
| DISH DBS Corp. 4.625% 2017 | | | 95,950 | | | | 98,589 | | | | .49 | |
| Needle Merger Sub Corp. 8.125% 20191 | | | 83,905 | | | | 86,003 | | | | .43 | |
| Other securities | | | | | | | 2,223,238 | | | | 11.10 | |
| | | | | | | | 2,691,505 | | | | 13.43 | |
| | | | | | | | | | | | | |
| Industrials 10.23% | | | | | | | | | | | | |
| Associated Materials, LLC and AMH New Finance, Inc. 9.125% 2017 | | | 141,692 | | | | 151,256 | | | | .75 | |
| Ply Gem Industries, Inc. 8.25% 2018 | | | 122,785 | | | | 131,994 | | | | .66 | |
| Euramax International, Inc. 9.50% 2016 | | | 85,615 | | | | 82,404 | | | | .41 | |
| CEVA Group PLC 8.375%–11.625% 2016–20171 | | | 40,729 | | | | 41,931 | | | | .21 | |
| Other securities | | | | | | | 1,642,142 | | | | 8.20 | |
| | | | | | | | 2,049,727 | | | | 10.23 | |
| | | | | | | | | | | | | |
| Health care 10.18% | | | | | | | | | | | | |
| Kinetic Concepts, Inc.: | | | | | | | | | | | | |
| Term Loan D1, 4.50% 20182,3,4 | | | 19,750 | | | | 19,904 | | | | | |
| 10.50% 2018 | | | 149,425 | | | | 165,675 | | | | 1.40 | |
| 12.50% 2019 | | | 89,702 | | | | 94,636 | | | | | |
| inVentiv Health Inc.: | | | | | | | | | | | | |
| 9.00% 20181 | | | 135,165 | | | | 136,517 | | | | | |
| 11.00% 20181 | | | 103,250 | | | | 83,891 | | | | 1.31 | |
| 11.00% 20181 | | | 51,390 | | | | 41,754 | | | | | |
| Select Medical Holdings Corp. 6.375% 20211 | | | 121,815 | | | | 116,029 | | | | .58 | |
| Tenet Healthcare Corp. 6.00% 20201 | | | 105,450 | | | | 108,020 | | | | .54 | |
| Patheon Inc., Term Loan B1, 7.25% 20182,3,4 | | | 90,283 | | | | 91,186 | | | | .45 | |
| VWR Funding, Inc. 7.25% 2017 | | | 80,365 | | | | 85,187 | | | | .42 | |
| Other securities | | | | | | | 1,097,614 | | | | 5.48 | |
| | | | | | | | 2,040,413 | | | | 10.18 | |
| | | | | | | | | | | | | |
| Materials 9.20% | | | | | | | | | | | | |
| FMG Resources: | | | | | | | | | | | | |
| 6.00% 20171 | | | 104,317 | | | | 107,447 | | | | | |
| 6.375%–8.25% 2015–20221 | | | 129,460 | | | | 136,287 | | | | 1.22 | |
| Inmet Mining Corp.: | | | | | | | | | | | | |
| 8.75% 20201 | | | 156,170 | | | | 167,883 | | | | | |
| 7.50% 20211 | | | 70,845 | | | | 72,970 | | | | 1.20 | |
| Reynolds Group Inc.: | | | | | | | | | | | | |
| 5.75% 2020 | | | 153,085 | | | | 154,424 | | | | 1.15 | |
| 7.125%–9.875% 2018–2019 | | | 68,995 | | | | 75,015 | | | | | |
| JMC Steel Group Inc. 8.25% 20181 | | | 135,290 | | | | 131,231 | | | | .65 | |
| Other securities | | | | | | | 998,032 | | | | 4.98 | |
| | | | | | | | 1,843,289 | | | | 9.20 | |
| | | | | | | | | | | | | |
| Financials 8.19% | | | | | | | | | | | | |
| Realogy Corp.: | | | | | | | | | | | | |
| 7.875% 20191 | | | 143,060 | | | | 157,008 | | | | | |
| 3.375%–9.00% 2016–20201 | | | 64,335 | | | | 69,541 | | | | 1.50 | |
| 4.50% 2016–20202,3,4 | | | 73,903 | | | | 74,472 | | | | | |
| CIT Group Inc.: | | | | | | | | | | | | |
| 5.00% 2017 | | | 94,495 | | | | 99,810 | | | | 1.00 | |
| 4.25%–5.50% 2015–20191 | | | 97,850 | | | | 101,263 | | | | | |
| Crescent Resources 10.25% 20171 | | | 97,695 | | | | 105,511 | | | | .53 | |
| Other securities | | | | | | | 1,032,607 | | | | 5.16 | |
| | | | | | | | 1,640,212 | | | | 8.19 | |
| 10 | American High-Income Trust |
| | | Principal
amount
(000) | | | Value
(000) | | | Percent
of net
assets | |
| Energy 6.89% | | | | | | | | | | | | |
| PDC Energy Inc. 7.75% 2022 | | $ | 89,575 | | | $ | 95,397 | | | | .48 | % |
| NGPL PipeCo LLC 9.625% 20191 | | | 100,765 | | | | 94,215 | | | | .47 | |
| Sabine Pass Liquefaction, LLC 5.625% 20211 | | | 90,225 | | | | 88,759 | | | | .44 | |
| Other securities | | | | | | | 1,101,542 | | | | 5.50 | |
| | | | | | | | 1,379,913 | | | | 6.89 | |
| | | | | | | | | | | | | |
| Information technology 6.35% | | | | | | | | | | | | |
| First Data Corp.: | | | | | | | | | | | | |
| 11.75% 20211 | | | 125,290 | | | | 121,531 | | | | | |
| 12.625% 2021 | | | 204,626 | | | | 226,112 | | | | 2.98 | |
| 6.75%–11.25% 2016–20221,3,6 | | | 242,257 | | | | 250,083 | | | | | |
| SRA International, Inc., Term Loan B, 6.50% 20182,3,4 | | | 111,487 | | | | 110,790 | | | | .55 | |
| Other securities | | | | | | | 563,912 | | | | 2.82 | |
| | | | | | | | 1,272,428 | | | | 6.35 | |
| | | | | | | | | | | | | |
| Utilities 2.18% | | | | | | | | | | | | |
| Other securities | | | | | | | 436,626 | | | | 2.18 | |
| | | | | | | | | | | | | |
| Consumer staples 2.11% | | | | | | | | | | | | |
| Other securities | | | | | | | 423,167 | | | | 2.11 | |
| | | | | | | | | | | | | |
| Total corporate bonds, notes & loans | | | | | | | 16,740,812 | | | | 83.55 | |
| | | | | | | | | | | | | |
| Bonds & notes of governments & government agencies outside the U.S. 6.59% | | | | | | | | | | | | |
| Slovenia (Republic of) 5.50% 2022 | | | 96,140 | | | | 89,771 | | | | .45 | |
| Other securities | | | | | | | 1,231,479 | | | | 6.14 | |
| | | | | | | | 1,321,250 | | | | 6.59 | |
| | | | | | | | | | | | | |
| Other bonds & notes 0.80% | | | | | | | | | | | | |
| Other securities | | | | | | | 160,179 | | | | .80 | |
| | | | | | | | | | | | | |
Total bonds, notes & other debt instruments
(cost: $17,675,742,000) | | | | | | | 18,222,241 | | | | 90.94 | |
| | | | | | | | | | | | |
| | | Shares or | | | | | | | | | |
| Convertible securities 1.52% | | principal
amount | | | | | | | | | |
| Industrials 0.54% | | | | | | | | | | | | |
| CEVA Group PLC, Series A-2, 2.244% convertible preferred7,8 | | | 21,062 | | | | 27,177 | | | | | |
| CEVA Group PLC, Series A-1, 3.244% convertible preferred7 | | | 47,121 | | | | 81,291 | | | | .54 | |
| | | | | | | | 108,468 | | | | .54 | |
| | | | | | | | | | | | | |
| Telecommunication services 0.11% | | | | | | | | | | | | |
| Leap Wireless International, Inc. 4.50% convertible notes 2014 | | $ | 12,500,000 | | | | 12,781 | | | | .07 | |
| Clearwire Corp. 8.25% convertible notes 20401 | | $ | 7,722,000 | | | | 8,591 | | | | .04 | |
| | | | | | | | 21,372 | | | | .11 | |
| | | | | | | | | | | | | |
| Other 0.87% | | | | | | | | | | | | |
| Other securities | | | | | | | 174,161 | | | | .87 | |
| | | | | | | | | | | | | |
| Total convertible securities (cost: $232,655,000) | | | | | | | 304,001 | | | | 1.52 | |
| | | | | | | | | | | | | |
| Preferred securities 0.97% | | | | | | | | | | | | |
| Financials 0.97% | | | | | | | | | | | | |
| Other securities | | | | | | | 194,179 | | | | .97 | |
| | | | | | | | | | | | | |
| Total preferred securities (cost: $192,326,000) | | | | | | | 194,179 | | | | .97 | |
| | | | | | | | | | | | | |
| Common stocks 2.60% | | Shares | | | | | | | | | |
| Industrials 1.42% | | | | | | | | | | | | |
| Beech Holdings, LLC7,8,9 | | | 16,466,838 | | | | 135,851 | | | | .68 | |
| CEVA Group PLC1,7,9 | | | 59,168 | | | | 76,347 | | | | .38 | |
| Other securities | | | | | | | 72,502 | | | | .36 | |
| | | | | | | | 284,700 | | | | 1.42 | |
| American High-Income Trust | 11 |
| Common stocks (continued) | | Shares | | | Value
(000) | | | Percent
of net
assets | |
| Financials 0.33% | | | | | | | | | | | | |
| CIT Group Inc.9 | | | 124,904 | | | $ | 6,092 | | | | .03 | % |
| Other securities | | | | | | | 59,628 | | | | .30 | |
| | | | | | | | 65,720 | | | | .33 | |
| | | | | | | | | | | | | |
| Telecommunication services 0.13% | | | | | | | | | | | | |
| Frontier Communications Corp., Class B | | | 6,000,000 | | | | 25,020 | | | | .13 | |
| | | | | | | | | | | | | |
| Other 0.72% | | | | | | | | | | | | |
| Other securities | | | | | | | 144,676 | | | | .72 | |
| | | | | | | | | | | | | |
| Total common stocks (cost: $504,215,000) | | | | | | | 520,116 | | | | 2.60 | |
| | | | | | | | | | | | | |
| Warrants 0.03% | | | | | | | | | | | | |
| Other 0.03% | | | | | | | | | | | | |
| Other securities | | | | | | | 5,979 | | | | .03 | |
| | | | | | | | | | | | | |
| Total warrants (cost: $7,329,000) | | | | | | | 5,979 | | | | .03 | |
| | | | | | | | | | | | | |
| Short-term securities 4.25% | | Principal amount
(000) | | | | | | | | | |
Freddie Mac 0.09%–0.12%
due 11/26/2013–5/6/2014 | | $ | 250,000 | | | | 249,923 | | | | 1.25 | |
Fannie Mae 0.10%–0.12%
due 2/18–6/2/2014 | | | 137,100 | | | | 137,035 | | | | .68 | |
Coca-Cola Co. 0.08%–0.15%
due 10/22–12/9/20131 | | | 96,615 | | | | 96,607 | | | | .48 | |
| Other securities | | | | | | | 368,951 | | | | 1.84 | |
| | | | | | | | | | | | | |
| Total short-term securities (cost: $852,428,000) | | | | | | | 852,516 | | | | 4.25 | |
| Total investment securities (cost: $19,464,695,000) | | | | | | | 20,099,032 | | | | 100.31 | |
| Other assets less liabilities | | | | | | | (62,061 | ) | | | (.31 | ) |
| | | | | | | | | | | | | |
| Net assets | | | | | | $ | 20,036,971 | | | | 100.00 | % |
This summary investment portfolio is designed to streamline the report and help investors better focus on the fund’s principal holdings. See the inside back cover for details on how to obtain a complete schedule of portfolio holdings.
“Other securities” includes all issues that are not disclosed separately in the summary investment portfolio, including a portion of a security which was pledged as collateral for net losses on unsettled forward currency contracts. The total value of pledged collateral was $5,220,000, which represented ..03% of the net assets of the fund.
Forward currency contracts
The fund has entered into forward currency contracts to purchase or sell currencies as shown in the following table. The average notional amount of open forward currency contracts was $235,050,000 over the prior 12-month period.
| | | | | | | | | Unrealized
appreciation | |
| | | | | | | Contract amount | | (depreciation) | |
| | | | | | | Receive | | Deliver | | at 9/30/2013 | |
| | Settlement date | | Counterparty | | (000) | | (000) | | (000) | |
| Purchases: | | | | | | | | | | | | |
| Russian rubles | | 10/9/2013 | | Citibank | | RUB323,978 | | $9,636 | | | $347 | |
| | | | | | | | | | | | | |
| Sales: | | | | | | | | | | | | |
| Brazilian reais | | 10/7/2013 | | Citibank | | $15,190 | | BRL35,910 | | | (985 | ) |
| Brazilian reais | | 10/21/2013 | | JPMorgan Chase | | $18,410 | | BRL41,675 | | | (292 | ) |
| Colombian pesos | | 10/28/2013 | | Citibank | | $11,388 | | COP21,552,175 | | | 112 | |
| Euros | | 10/3/2013 | | Citibank | | $11,989 | | €9,000 | | | (187 | ) |
| Euros | | 10/7/2013 | | JPMorgan Chase | | $59,240 | | €45,000 | | | (1,640 | ) |
| Euros | | 10/11/2013 | | Bank of New York Mellon | | $17,185 | | €12,957 | | | (344 | ) |
| Euros | | 10/18/2013 | | JPMorgan Chase | | $19,630 | | €14,750 | | | (325 | ) |
| Euros | | 10/22/2013 | | JPMorgan Chase | | $17,249 | | €12,958 | | | (282 | ) |
| Euros | | 10/28/2013 | | Bank of America, N.A. | | $12,784 | | €9,475 | | | (35 | ) |
| Euros | | 11/8/2013 | | HSBC Bank | | $15,830 | | €11,700 | | | — | 10 |
| Mexican pesos | | 10/23/2013 | | Barclays Bank PLC | | $32,983 | | MXN431,615 | | | 78 | |
| 12 | American High-Income Trust |
| | | | | | | | | | | Unrealized | |
| | | | | | | | | | | appreciation | |
| | | | | | | Contract amount | | (depreciation) | |
| | | | | | | Receive | | Deliver | | at 9/30/2013 | |
| | Settlement date | | Counterparty | | (000) | | (000) | | (000) | |
| Sales: | | | | | | | | | | | | |
| Mexican pesos | | 10/28/2013 | | Citibank | | $17,805 | | MXN229,300 | | | $333 | |
| Russian rubles | | 10/4/2013 | | Citibank | | $35,015 | | RUB1,178,200 | | | (1,322 | ) |
| Turkish lira | | 10/11/2013 | | HSBC Bank | | $2,764 | | TRY5,600 | | | (2 | ) |
| Turkish lira | | 10/21/2013 | | Bank of New York Mellon | | $2,233 | | TRY4,500 | | | 14 | |
| Turkish lira | | 10/21/2013 | | Barclays Bank PLC | | $9,229 | | TRY18,605 | | | 54 | |
| Turkish lira | | 11/6/2013 | | HSBC Bank | | $12,413 | | TRY25,100 | | | 70 | |
| | | | | | | | | | | | | |
| | | | | | | | | | | | (4,753 | ) |
| | | | | | | | | | | | | |
| Forward currency contracts – net | | | | | | | | | $(4,406 | ) |
Investments in affiliates
A company is considered to be an affiliate of the fund under the Investment Company Act of 1940 if the fund’s holdings in that company represent 5% or more of the outstanding voting shares. The value of the fund’s holdings in affiliated companies is included in “Other securities” under the respective industry sectors in the summary investment portfolio. Further details on these holdings and related transactions during the year ended September 30, 2013, appear below.
| | | Beginning
shares or
principal
amount | | | Additions | | | Reductions | | | Ending
shares or
principal
amount | | | Dividends
or interest
income
(000) | | | Value
of affiliates
at 9/30/2013
(000) | |
| Rotech Healthcare Inc., Term Loan, | | | | | | | | | | | | | | | | | | | | | | | | |
| 13.00% 20202,3,4,7 | | | — | | | $ | 43,908,783 | | | | — | | | $ | 43,908,783 | | | $ | 48 | | | $ | 43,909 | |
| Rotech Healthcare Inc.7,9 | | | — | | | | 1,916,275 | | | | — | | | | 1,916,275 | | | | — | | | | 34,225 | |
| Rotech Healthcare Inc., Term Loan A, | | | | | | | | | | | | | | | | | | | | | | | | |
| 5.50% 20182,3,4,7 | | | — | | | $ | 25,900,000 | | | | — | | | $ | 25,900,000 | | | | 12 | | | | 25,900 | |
| Rotech Healthcare Inc., Term Loan B, | | | | | | | | | | | | | | | | | | | | | | | | |
| 10.00% 20192,3,4,7 | | | — | | | $ | 20,825,000 | | | | — | | | $ | 20,825,000 | | | | 17 | | | | 20,825 | |
| Rotech Healthcare Inc. 10.50% 2018 | | $ | 69,465,000 | | | | — | | | $ | 69,465,000 | | | | — | | | | 8,209 | | | | — | |
| Rotech Healthcare Inc. 10.75% 2015 | | $ | 15,145,000 | | | $ | 8,850,000 | | | $ | 23,995,000 | | | | — | | | | 2,154 | | | | — | |
| Rotech Healthcare Inc. 10.50% 2013 | | | — | | | $ | 6,660,000 | | | $ | 6,660,000 | | | | — | | | | 341 | | | | — | |
| Cooper-Standard Holdings Inc.9 | | | 1,238,538 | | | | — | | | | — | | | | 1,238,538 | | | | — | | | | 61,927 | |
| Cooper-Standard Holdings Inc. | | | | | | | | | | | | | | | | | | | | | | | | |
| 7.00% convertible preferred1,7 | | | 99,687 | | | | — | | | | — | | | | 99,687 | | | | 698 | | | | 21,387 | |
Cooper-Standard Holdings Inc.,
warrants, expire 20179 | | | 196,935 | | | | — | | | | — | | | | 196,935 | | | | — | | | | 4,725 | |
| Revel Entertainment, Term Loan B, | | | | | | | | | | | | | | | | | | | | | | | | |
| 14.50% 20182,3,4,6 | | | — | | | $ | 74,244,219 | | | $ | 182,813 | | | $ | 74,061,406 | | | | 3,969 | | | | 70,358 | |
| Revel AC, Inc.7,8,9 | | | — | | | | 908,183 | | | | — | | | | 908,183 | | | | — | | | | 7,747 | |
| Revel AC, Inc. (CVR)7,8,9 | | | — | | | | 43,088,200 | | | | — | | | | 43,088,200 | | | | — | | | | 1,292 | |
Revel Holdings, Inc., warrants,
expire 2021 | | | 16,916 | | | | — | | | | 16,916 | | | | — | | | | — | | | | — | |
| Revel Entertainment, Term Loan B, | | | | | | | | | | | | | | | | | | | | | | | | |
| 9.00% 2017 | | $ | 117,150,000 | | | $ | 7,260,000 | | | $ | 124,410,000 | | | | — | | | | 4,203 | | | | — | |
| Revel Entertainment 12.00% 2018 | | $ | 40,649,246 | | | | — | | | $ | 40,649,246 | | | | — | | | | 676 | | | | — | |
| Revel Entertainment, Term Loan, | | | | | | | | | | | | | | | | | | | | | | | | |
| 8.50% 2014 | | $ | 8,656,110 | | | $ | 9,951,000 | | | $ | 18,607,110 | | | | — | | | | 282 | | | | — | |
| Revel AC, Inc. 12.00% 2018 | | | — | | | $ | 43,088,200 | | | $ | 43,088,200 | | | | — | | | | 1,454 | | | | — | |
| Revel Entertainment, Term Loan, | | | | | | | | | | | | | | | | | | | | | | | | |
| 8.50% 2015 | | | — | | | $ | 19,305,144 | | | $ | 19,305,144 | | | | — | | | | 288 | | | | — | |
| Revel Entertainment, Term Loan, | | | | | | | | | | | | | | | | | | | | | | | | |
| 10.00% 2015 | | | — | | | $ | 32,500,000 | | | $ | 32,500,000 | | | | — | | | | 1,432 | | | | — | |
| Revel Entertainment, Term Loan, | | | | | | | | | | | | | | | | | | | | | | | | |
| 8.50% 2015 | | | — | | | $ | 25,637,721 | | | $ | 25,637,721 | | | | — | | | | 198 | | | | — | |
| American Media, Inc.1,7,9 | | | 1,122,345 | | | | — | | | | — | | | | 1,122,345 | | | | — | | | | 2,806 | |
| Nortek Inc. 10.00% 201811 | | $ | 47,735,000 | | | | — | | | | — | | | $ | 47,735,000 | | | | 4,706 | | | | — | |
| Nortek Inc. 8.50% 202111 | | $ | 47,660,000 | | | $ | 27,690,000 | | | $ | 5,000,000 | | | $ | 70,350,000 | | | | 5,143 | | | | — | |
| Nortek, Inc.9,11 | | | 793,646 | | | | — | | | | 366,800 | | | | 426,846 | | | | — | | | | — | |
| | | | | | | | | | | | | | | | | | | $ | 33,830 | | | $ | 295,101 | |
| American High-Income Trust | 13 |
The following footnotes apply to either the individual securities noted or one or more of the securities aggregated and listed as a single line item.
| 1 | Acquired in a transaction exempt from registration under Rule 144A or section 4(2) of the Securities Act of 1933. May be resold in the U.S. in transactions exempt from registration, normally to qualified institutional buyers. The total value of all such securities, including those in “Other securities,” was $7,500,725,000, which represented 37.43% of the net assets of the fund. |
| 2 | Principal payments may be made periodically. Therefore, the effective maturity date may be earlier than the stated maturity date. |
| 3 | Coupon rate may change periodically. |
| 4 | Loan participations and assignments; may be subject to legal or contractual restrictions on resale. The total value of all such loans, including those in “Other securities,” was $1,578,784,000, which represented 7.88% of the net assets of the fund. |
| 5 | Scheduled interest and/or principal payment was not received. |
| 6 | Payment in kind; the issuer has the option of paying additional securities in lieu of cash. |
| 7 | Valued under fair value procedures adopted by authority of the board of trustees. The total value of all such securities, including those in “Other securities,” was $525,982,000, which represented 2.63% of the net assets of the fund. |
| 8 | Acquired through a private placement transaction exempt from registration under the Securities Act of 1933. May be subject to legal or contractual restrictions on resale. Further details on these holdings appear below. |
| | | Acquisition | | | Cost | | | Value | | | Percent of |
| | | date(s) | | | (000) | | | (000) | | | net assets |
| Beech Holdings, LLC | | | 3/16/2007–2/15/2013 | | | $ | 114,109 | | | $ | 135,851 | | | | .68 | % |
| CEVA Group PLC, Series A-2, 2.244% convertible preferred | | | 5/2/2013 | | | | 20,349 | | | | 27,177 | | | | .13 | |
| Revel AC, Inc. | | | 2/14/2011–1/10/2012 | | | | 45,288 | | | | 7,747 | | | | .04 | |
| Revel AC, Inc. (CVR) | | | 2/15/2011–3/15/2013 | | | | 7,796 | | | | 1,292 | | | | .01 | |
| Other restricted securities | | | 9/17/2009–12/31/2012 | | | | 43,602 | | | | 22,473 | | | | .11 | |
| Total restricted securities | | | | | | $ | 231,144 | | | $ | 194,540 | | | | .97 | % |
| 9 | Security did not produce income during the last 12 months. |
| 10 | Amount less than one thousand. |
| 11 | Unaffiliated issuer at 9/30/2013. |
Key to abbreviations and symbol
CVR = Contingent Value Rights
BRL = Brazilian reais
COP = Colombian pesos
€ = Euros
MXN = Mexican pesos
RUB = Russian rubles
TRY = Turkish lira
See Notes to Financial Statements
| 14 | American High-Income Trust |
Financial statements
Statement of assets and liabilities
| at September 30, 2013 | (dollars in thousands) |
| Assets: | | | | | | | | |
| Investment securities, at value: | | | | | | | | |
| Unaffiliated issuers (cost: $19,140,813) | | $ | 19,803,931 | | | | | |
| Affiliated issuers (cost: $323,882) | | | 295,101 | | | $ | 20,099,032 | |
| Cash denominated in currencies other than U.S. dollars (cost: $13) | | | | | | | 13 | |
| Cash | | | | | | | 9,370 | |
| Unrealized appreciation on open forward currency contracts | | | | | | | 1,008 | |
| Receivables for: | | | | | | | | |
| Sales of investments | | | 119,932 | | | | | |
| Sales of fund’s shares | | | 23,197 | | | | | |
| Dividends and interest | | | 381,084 | | | | | |
| Other | | | 3,011 | | | | 527,224 | |
| | | | | | | | 20,636,647 | |
| Liabilities: | | | | | | | | |
| Unrealized depreciation on open forward currency contracts | | | | | | | 5,414 | |
| Payables for: | | | | | | | | |
| Purchases of investments | | | 507,117 | | | | | |
| Repurchases of fund’s shares | | | 51,701 | | | | | |
| Dividends on fund’s shares | | | 22,236 | | | | | |
| Closed forward currency contracts | | | 461 | | | | | |
| Investment advisory services | | | 4,699 | | | | | |
| Services provided by related parties | | | 7,626 | | | | | |
| Trustees’ deferred compensation | | | 244 | | | | | |
| Other | | | 178 | | | | 594,262 | |
| Net assets at September 30, 2013 | | | | | | $ | 20,036,971 | |
| | | | | | | | | |
| Net assets consist of: | | | | | | | | |
| Capital paid in on shares of beneficial interest | | | | | | $ | 20,303,857 | |
| Distributions in excess of net investment income | | | | | | | (51,545 | ) |
| Accumulated net realized loss | | | | | | | (845,337 | ) |
| Net unrealized appreciation | | | | | | | 629,996 | |
| Net assets at September 30, 2013 | | | | | | $ | 20,036,971 | |
(dollars and shares in thousands, except per-share amounts)
Shares of beneficial interest issued and outstanding (no stated par value) —
unlimited shares authorized (1,785,555 total shares outstanding)
| | | | | | Shares | | | Net asset value | |
| | | Net assets | | | outstanding | | | per share | |
| Class A | | $ | 14,178,077 | | | | 1,263,451 | | | $ | 11.22 | |
| Class B | | | 142,792 | | | | 12,725 | | | | 11.22 | |
| Class C | | | 1,329,765 | | | | 118,499 | | | | 11.22 | |
| Class F-1 | | | 1,417,845 | | | | 126,349 | | | | 11.22 | |
| Class F-2 | | | 935,030 | | | | 83,323 | | | | 11.22 | |
| Class 529-A | | | 357,168 | | | | 31,828 | | | | 11.22 | |
| Class 529-B | | | 9,564 | | | | 852 | | | | 11.22 | |
| Class 529-C | | | 132,383 | | | | 11,797 | | | | 11.22 | |
| Class 529-E | | | 19,686 | | | | 1,754 | | | | 11.22 | |
| Class 529-F-1 | | | 23,511 | | | | 2,095 | | | | 11.22 | |
| Class R-1 | | | 24,293 | | | | 2,165 | | | | 11.22 | |
| Class R-2 | | | 231,020 | | | | 20,587 | | | | 11.22 | |
| Class R-3 | | | 309,927 | | | | 27,619 | | | | 11.22 | |
| Class R-4 | | | 229,840 | | | | 20,482 | | | | 11.22 | |
| Class R-5 | | | 223,878 | | | | 19,950 | | | | 11.22 | |
| Class R-6 | | | 472,192 | | | | 42,079 | | | | 11.22 | |
See Notes to Financial Statements
| American High-Income Trust | 15 |
Statement of operations
| for the year ended September 30, 2013 | (dollars in thousands) |
| Investment income: | | | | | | | | |
| Income: | | | | | | | | |
| Interest (net of non-U.S. taxes of $201; also includes $33,132 from affiliates) | | $ | 1,427,959 | | | | | |
| Dividends (includes $698 from affiliates) | | | 14,223 | | | $ | 1,442,182 | |
| Fees and expenses*: | | | | | | | | |
| Investment advisory services | | | 57,572 | | | | | |
| Distribution services | | | 59,193 | | | | | |
| Transfer agent services | | | 26,579 | | | | | |
| Administrative services | | | 4,391 | | | | | |
| Reports to shareholders | | | 1,038 | | | | | |
| Registration statement and prospectus | | | 815 | | | | | |
| Trustees’ compensation | | | 175 | | | | | |
| Auditing and legal | | | 145 | | | | | |
| Custodian | | | 437 | | | | | |
| State and local taxes | | | 56 | | | | | |
| Other | | | 678 | | | | | |
| Total fees and expenses before waiver | | | 151,079 | | | | | |
| Less investment advisory services waiver | | | 1 | | | | | |
| Total fees and expenses after waiver | | | | | | | 151,078 | |
| Net investment income | | | | | | | 1,291,104 | |
| | | | | | | | | |
| Net realized gain and unrealized appreciation on investments, forward currency contracts and currency: | | | | | | | | |
| Net realized gain (loss) on: | | | | | | | | |
| Investments (includes $117,934 net loss from affiliates) | | | 21,575 | | | | | |
| Forward currency contracts | | | 3,095 | | | | | |
| Currency transactions | | | (2,765 | ) | | | 21,905 | |
| Net unrealized appreciation (depreciation) on: | | | | | | | | |
| Investments | | | 71,764 | | | | | |
| Forward currency contracts | | | (4,948 | ) | | | | |
| Currency translations | | | (70 | ) | | | 66,746 | |
| Net realized gain and unrealized appreciation on investments, forward currency contracts and currency | | | | | | | 88,651 | |
| | | | | | | | | |
| Net increase in net assets resulting from operations | | | | | | $ | 1,379,755 | |
*Additional information related to class-specific fees and expenses is included in the Notes to Financial Statements.
Statements of changes in net assets
(dollars in thousands)
| | | Year ended September 30 | |
| | | 2013 | | | 2012 | |
| Operations: | | | | | | | | |
| Net investment income | | $ | 1,291,104 | | | $ | 1,277,176 | |
| Net realized gain on investments, forward currency contracts and currency transactions | | | 21,905 | | | | 159,155 | |
| Net unrealized appreciation on investments, forward currency contracts and currency translations | | | 66,746 | | | | 1,229,106 | |
| Net increase in net assets resulting from operations | | | 1,379,755 | | | | 2,665,437 | |
| | | | | | | | | |
| Dividends paid or accrued to shareholders from net investment income | | | (1,319,459 | ) | | | (1,345,763 | ) |
| | | | | | | | | |
| Net capital share transactions | | | 168,005 | | | | 2,512,433 | |
| | | | | | | | | |
| Total increase in net assets | | | 228,301 | | | | 3,832,107 | |
| | | | | | | | | |
| Net assets: | | | | | | | | |
| Beginning of year | | | 19,808,670 | | | | 15,976,563 | |
End of year (including distributions in excess of net investment income:
$(51,545) and $(36,445), respectively) | | $ | 20,036,971 | | | $ | 19,808,670 | |
See Notes to Financial Statements
| 16 | American High-Income Trust |
Notes to financial statements
1. Organization
American High-Income Trust (the “fund”) is registered under the Investment Company Act of 1940 as an open-end, diversified management investment company. The fund seeks a high level of current income and, secondarily, capital appreciation through a diversified, carefully supervised portfolio consisting primarily of lower rated, higher risk corporate bonds.
The fund has 16 share classes consisting of five retail share classes (Classes A, B and C, as well as two F share classes, F-1 and F-2), five 529 college savings plan share classes (Classes 529-A, 529-B, 529-C, 529-E and 529-F-1) and six retirement plan share classes (Classes R-1, R-2, R-3, R-4, R-5 and R-6). The 529 college savings plan share classes can be used to save for college education. The retirement plan share classes are generally offered only through eligible employer-sponsored retirement plans. The fund’s share classes are further described below:
| Share class | | Initial sales
charge | | Contingent deferred sales
charge upon redemption | | Conversion feature |
| Classes A and 529-A | | Up to 3.75% | | None (except 1% for certain redemptions within one year of purchase without an initial sales charge) | | None |
| Classes B and 529-B* | | None | | Declines from 5% to 0% for redemptions within six years of purchase | | Classes B and 529-B convert to Classes A and 529-A, respectively, after eight years |
| Class C | | None | | 1% for redemptions within one year of purchase | | Class C converts to Class F-1 after 10 years |
| Class 529-C | | None | | 1% for redemptions within one year of purchase | | None |
| Class 529-E | | None | | None | | None |
| Classes F-1, F-2 and 529-F-1 | | None | | None | | None |
| Classes R-1, R-2, R-3, R-4, R-5 and R-6 | | None | | None | | None |
*Class B and 529-B shares of the fund are not available for purchase.
Holders of all share classes have equal pro rata rights to assets, dividends and liquidation proceeds. Each share class has identical voting rights, except for the exclusive right to vote on matters affecting only its class. Share classes have different fees and expenses (“class-specific fees and expenses”), primarily due to different arrangements for distribution, administrative and shareholder services. Differences in class-specific fees and expenses will result in differences in net investment income and, therefore, the payment of different per-share dividends by each share class.
2. Significant accounting policies
The financial statements have been prepared to comply with accounting principles generally accepted in the United States of America. These principles require management to make estimates and assumptions that affect reported amounts and disclosures. Actual results could differ from those estimates. The fund follows the significant accounting policies described below, as well as the valuation policies described in the next section on valuation.
Security transactions and related investment income — Security transactions are recorded by the fund as of the date the trades are executed with brokers. Realized gains and losses from security transactions are determined based on the specific identified cost of the securities. In the event a security is purchased with a delayed payment date, the fund will segregate liquid assets sufficient to meet its payment obligations. Dividend income is recognized on the ex-dividend date and interest income is recognized on an accrual basis. Market discounts, premiums and original issue discounts on fixed-income securities are amortized daily over the expected life of the security.
Class allocations — Income, fees and expenses (other than class-specific fees and expenses) are allocated daily among the various share classes based on the relative value of their settled shares. Realized and unrealized gains and losses are allocated daily among the various share classes based on their relative net assets. Class-specific fees and expenses, such as distribution, administrative and shareholder services, are charged directly to the respective share class.
Dividends and distributions to shareholders — Dividends to shareholders are declared daily after the determination of the fund’s net investment income and are paid to shareholders monthly. Distributions to shareholders are recorded on the ex-dividend date.
| American High-Income Trust | 17 |
Currency translation — Assets and liabilities, including investment securities, denominated in currencies other than U.S. dollars are translated into U.S. dollars at the exchange rates supplied by one or more pricing vendors on the valuation date. Purchases and sales of investment securities and income and expenses are translated into U.S. dollars at the exchange rates on the dates of such transactions. On the accompanying financial statements, the effects of changes in exchange rates on investment securities are included with the net realized gain or loss and net unrealized appreciation or depreciation on investments. The realized gain or loss and unrealized appreciation or depreciation resulting from all other transactions denominated in currencies other than U.S. dollars are disclosed separately.
3. Valuation
Capital Research and Management Company (“CRMC”), the fund’s investment adviser, values the fund’s investments at fair value as defined by accounting principles generally accepted in the United States of America. The net asset value of each share class of the fund is generally determined as of approximately 4:00 p.m. New York time each day the New York Stock Exchange is open.
Methods and inputs — The fund’s investment adviser uses the following methods and inputs to establish the fair value of the fund’s assets and liabilities. Use of particular methods and inputs may vary over time based on availability and relevance as market and economic conditions evolve.
Equity securities are generally valued at the official closing price of, or the last reported sale price on, the exchange or market on which such securities are traded, as of the close of business on the day the securities are being valued or, lacking any sales, at the last available bid price. Prices for each security are taken from the principal exchange or market on which the security trades.
Fixed-income securities, including short-term securities purchased with more than 60 days left to maturity, are generally valued at prices obtained from one or more pricing vendors. Vendors value such securities based on one or more of the inputs described in the following table. The table provides examples of inputs that are commonly relevant for valuing particular classes of fixed-income securities in which the fund is authorized to invest. However, these classifications are not exclusive, and any of the inputs may be used to value any other class of fixed-income security.
| Fixed-income class | | Examples of standard inputs |
| All | | Benchmark yields, transactions, bids, offers, quotations from dealers and trading systems, new issues, spreads and other relationships observed in the markets among comparable securities; and proprietary pricing models such as yield measures calculated using factors such as cash flows, financial or collateral performance and other reference data (collectively referred to as “standard inputs”) |
| Corporate bonds, notes & loans; convertible securities | | Standard inputs and underlying equity of the issuer |
| Bonds & notes of governments & government agencies | | Standard inputs and interest rate volatilities |
| Mortgage-backed; asset-backed obligations | | Standard inputs and cash flows, prepayment information, default rates, delinquency and loss assumptions, collateral characteristics, credit enhancements and specific deal information |
| Municipal securities | | Standard inputs and, for certain distressed securities, cash flows or liquidation values using a net present value calculation based on inputs that include, but are not limited to, financial statements and debt contracts |
When the fund’s investment adviser deems it appropriate to do so (such as when vendor prices are unavailable or not deemed to be representative), fixed-income securities will be valued in good faith at the mean quoted bid and ask prices that are reasonably and timely available (or bid prices, if ask prices are not available) or at prices for securities of comparable maturity, quality and type.
Securities with both fixed-income and equity characteristics, or equity securities traded principally among fixed-income dealers, are generally valued in the manner described above for either equity or fixed-income securities, depending on which method is deemed most appropriate by the fund’s investment adviser. Short-term securities purchased within 60 days to maturity are valued at amortized cost, which approximates fair value. The value of short-term securities originally purchased with maturities greater than 60 days is determined based on an amortized value to par when they reach 60 days. Forward currency contracts are valued at the mean of representative quoted bid and ask prices, generally based on prices supplied by one or more pricing vendors.
Securities and other assets for which representative market quotations are not readily available or are considered unreliable by the fund’s investment adviser are fair valued as determined in good faith under fair valuation guidelines adopted by authority of
| 18 | American High-Income Trust |
the fund’s board of trustees as further described below. The investment adviser follows fair valuation guidelines, consistent with U.S. Securities and Exchange Commission rules and guidance, to consider relevant principles and factors when making fair value determinations. The investment adviser considers relevant indications of value that are reasonably and timely available to it in determining the fair value to be assigned to a particular security, such as the type and cost of the security; contractual or legal restrictions on resale of the security; relevant financial or business developments of the issuer; actively traded similar or related securities; conversion or exchange rights on the security; related corporate actions; significant events occurring after the close of trading in the security; and changes in overall market conditions. Fair valuations and valuations of investments that are not actively trading involve judgment and may differ materially from valuations that would have been used had greater market activity occurred.
Processes and structure — The fund’s board of trustees has delegated authority to the fund’s investment adviser to make fair value determinations, subject to board oversight. The investment adviser has established a Joint Fair Valuation Committee (the “Fair Valuation Committee”) to administer, implement and oversee the fair valuation process, and to make fair value decisions. The Fair Valuation Committee regularly reviews its own fair value decisions, as well as decisions made under its standing instructions to the investment adviser’s valuation teams. The Fair Valuation Committee reviews changes in fair value measurements from period to period and may, as deemed appropriate, update the fair valuation guidelines to better reflect the results of back testing and address new or evolving issues. The Fair Valuation Committee reports any changes to the fair valuation guidelines to the board of trustees with supplemental information to support the changes. The fund’s board and audit committee also regularly review reports that describe fair value determinations and methods.
The fund’s investment adviser has also established a Fixed-Income Pricing Review Group to administer and oversee the fixed-income valuation process, including the use of fixed-income pricing vendors. This group regularly reviews pricing vendor information and market data. Pricing decisions, processes and controls over security valuation are also subject to additional internal reviews, including an annual control self-evaluation program facilitated by the investment adviser’s compliance group.
Classifications — The fund’s investment adviser classifies the fund’s assets and liabilities into three levels based on the inputs used to value the assets or liabilities. Level 1 values are based on quoted prices in active markets for identical securities. Level 2 values are based on significant observable market inputs, such as quoted prices for similar securities and quoted prices in inactive markets. Level 3 values are based on significant unobservable inputs that reflect the investment adviser’s determination of assumptions that market participants might reasonably use in valuing the securities. The valuation levels are not necessarily an indication of the risk or liquidity associated with the underlying investment. For example, U.S. government securities are reflected as Level 2 because the inputs used to determine fair value may not always be quoted prices in an active market. The following tables present the fund’s valuation levels as of September 30, 2013 (dollars in thousands):
| | | Investment securities |
| | | Level 1 | | | Level 2 | | | Level 3 | | | Total | |
| Assets: | | | | | | | | | | | | | | | | |
| Bonds, notes & other debt instruments: | | | | | | | | | | | | | | | | |
| Corporate bonds, notes & loans | | $ | — | | | $ | 16,650,178 | | | $ | 90,634 | | | $ | 16,740,812 | |
| Bonds & notes of governments & government agencies outside the U.S. | | | — | | | | 1,321,250 | | | | — | | | | 1,321,250 | |
| Other | | | — | | | | 160,179 | | | | — | | | | 160,179 | |
| Convertible securities | | | 52,980 | | | | 142,553 | | | | 108,468 | | | | 304,001 | |
| Preferred securities | | | 76,261 | | | | 117,918 | | | | — | | | | 194,179 | |
| Common stocks | | | 238,856 | | | | 137,143 | | | | 144,117 | | | | 520,116 | |
| Warrants | | | 5,846 | | | | — | | | | 133 | | | | 5,979 | |
| Short-term securities | | | — | | | | 852,516 | | | | — | | | | 852,516 | |
| Total | | $ | 373,943 | | | $ | 19,381,737 | | | $ | 343,352 | | | $ | 20,099,032 | |
| | | Other investments1 |
| | | Level 1 | | | Level 2 | | | Level 3 | | | Total | |
| Assets: | | | | | | | | | | | | | | | | |
| Unrealized appreciation on open forward currency contracts | | $ | — | | | $ | 1,008 | | | $ | — | | | $ | 1,008 | |
| Liabilities: | | | | | | | | | | | | | | | | |
| Unrealized depreciation on open forward currency contracts | | | — | | | | (5,414 | ) | | | — | | | | (5,414 | ) |
| Total | | $ | — | | | $ | (4,406 | ) | | $ | — | | | $ | (4,406 | ) |
See footnote on next page.
| American High-Income Trust | 19 |
The following table reconciles the valuation of the fund’s Level 3 investment securities and related transactions for the year ended September 30, 2013 (dollars in thousands):
| | | Beginning
value at
10/1/2012 | | | Transfers
into
Level 32 | | | Purchases | | | Sales | | | Net
realized
loss3 | | | Unrealized
depreciation3 | | | Transfers
out of
Level 32 | | | Ending
value at
9/30/2013 | |
| Investment securities | | $ | 52,659 | | | $ | 129,817 | | | $ | 659,742 | | | $ | (193,008 | ) | | $ | (83,337 | ) | | $ | (73,933 | ) | | $ | (148,588 | ) | | $ | 343,352 | |
| | | | | | | | | | | | | | | | | | | | | | | | | | | | | | | | | |
| Net unrealized depreciation during the period on Level 3 investment securities held at September 30, 20133: | | | $ | (40,931 | ) |
| 1 | Forward currency contracts are not included in the investment portfolio. |
| 2 | Transfers into or out of Level 3 are based on the beginning market value of the quarter in which they occurred. |
| 3 | Net realized loss and unrealized depreciation are included in the related amounts on investments in the statement of operations. |
Unobservable inputs — The significant unobservable inputs used to value the fund’s Level 3 investments include financial multiples of publicly traded comparable companies, financial performance, and calculated discounts for lack of marketability. The following table provides additional information used by the fund’s investment adviser to fair value securities with significant unobservable inputs (dollars in thousands):
| | | Value at
9/30/2013 | | | Valuation
technique(s) | | Unobservable
input(s) | | Range | | Impact to
valuation from
an increase in
input* |
| Common stocks | | $ | 144,117 | | | Market comparable companies | | EV/EBITDA multiple | | 3.85x–9.30x | | Increase |
| | | | | | | | | EV (EBITDA-CAPEX) multiple | | 13x–15x | | Increase |
| | | | | | | | | DLOM | | 16.66%–23.33% | | Decrease |
| | | | | | | Blend of market quote and market comparable companies | | EV/EBITDA multiple | | 11.53x–13.42x | | Increase |
| | | | | | | Bid price | | Bid price | | N/A | | Increase |
| Convertible securities | | | 108,468 | | | Blend of market quote and market comparable companies | | EV/EBITDA multiple | | 11.53x–13.42x | | Increase |
| Bonds, notes & other debt instruments | | | 90,634 | | | Cost | | N/A | | N/A | | N/A |
| Warrants | | | 133 | | | Black-Scholes model | | Underlying share price | | N/A | | Increase |
| | | $ | 343,352 | | | | | | | | | |
| * | This column represents the directional change in fair value of the Level 3 securities that would result in an increase from the corresponding input. A decrease to the unobservable input would have the opposite effect. Significant increases and decreases in these inputs in isolation could result in significantly higher or lower fair value measurements. |
Key to abbreviations
CAPEX = Capital expenditure
EV = Enterprise value
EBITDA = Earnings before income taxes, depreciation and amortization
DLOM = Discount for lack of marketability
4. Risk factors
Investing in the fund may involve certain risks including, but not limited to, those described below.
Investing in lower rated bonds — Lower rated bonds and other lower rated debt securities generally have higher rates of interest and involve greater risk of default or price declines due to changes in the issuer’s creditworthiness than those of higher quality debt securities. The market prices of these securities may fluctuate more than the prices of higher quality debt securities and may decline significantly in periods of general economic difficulty. These risks may be increased with respect to investments in junk bonds.
Thinly traded securities — There may be little trading in the secondary market for particular bonds or other debt securities, which may make them more difficult to value, acquire or sell.
| 20 | American High-Income Trust |
Investing in bonds — Rising interest rates will generally cause the prices of bonds and other debt securities to fall. Longer maturity debt securities may be subject to greater price fluctuations than shorter maturity debt securities. In addition, falling interest rates may cause an issuer to redeem, call or refinance a debt security before its stated maturity, which may result in the fund having to reinvest the proceeds in lower yielding securities.
Bonds and other debt securities are subject to credit risk, which is the possibility that the credit strength of an issuer will weaken and/or an issuer of a debt security will fail to make timely payments of principal or interest and the security will go into default. Credit risk is gauged, in part, by the credit ratings of the securities in which the fund invests. However, ratings are only the opinions of the rating agencies issuing them and are not guarantees as to credit quality or an evaluation of market risk. The fund’s investment adviser relies on its own credit analysts to research issuers and issues in seeking to mitigate the risks of an issuer defaulting on its obligations.
Market conditions — The prices of, and the income generated by, the securities held by the fund may decline due to market conditions and other factors, including those directly involving the issuers of securities held by the fund.
Investing outside the U.S. — Securities of issuers domiciled outside the U.S., or with significant operations outside the U.S., may lose value because of adverse political, social, economic or market developments in the countries or regions in which the issuers operate. These securities may also lose value due to changes in foreign currency exchange rates against the U.S. dollar and/or currencies of other countries. Securities markets in certain countries may be more volatile and/or less liquid than those in the U.S. Investments outside the U.S. may also be subject to different settlement and accounting practices and different regulatory, legal and reporting standards, and may be more difficult to value, than those in the U.S.
Management — The investment adviser to the fund actively manages the fund’s investments. Consequently, the fund is subject to the risk that the methods and analyses employed by the investment adviser in this process may not produce the desired results. This could cause the fund to lose value or its investment results to lag relevant benchmarks or other funds with similar objectives.
5. Certain investment techniques
Loan transactions — The fund has entered into loan transactions in which the fund acquires a loan either through an agent, by assignment from another holder, or as a participation interest in another holder’s portion of a loan. The loan is often administered by a financial institution that acts as agent for the holders of the loan, and the fund may be required to receive approval from the agent and/or borrower prior to the sale of the investment. The loan’s interest rate and maturity date may change based on the terms of the loan, including potential early payments of principal.
Forward currency contracts — The fund has entered into forward currency contracts, which represent agreements to exchange currencies on specific future dates at predetermined rates. The fund’s investment adviser uses forward currency contracts to manage the fund’s exposure to changes in exchange rates. Upon entering into these contracts, risks may arise from the potential inability of counterparties to meet the terms of their contracts and from possible movements in exchange rates.
On a daily basis, the fund’s investment adviser values forward currency contracts and records unrealized appreciation or depreciation for open forward currency contracts in the fund’s statement of assets and liabilities. Realized gains or losses are recorded at the time the forward currency contract is closed or offset by another contract with the same broker for the same settlement date and currency.
Closed forward currency contracts that have not reached their settlement date are included in the respective receivables or payables for closed forward currency contracts in the fund’s statement of assets and liabilities. Net realized gains or losses from closed forward currency contracts and net unrealized appreciation or depreciation from open forward currency contracts are recorded in the fund’s statement of operations.
Collateral — To reduce the risk to counterparties of forward currency contracts, the fund has entered into a collateral program with certain counterparties. The program calls for the fund to either receive or pledge collateral based on the net gain or loss on unsettled forward currency contracts by counterparty. The purpose of the collateral is to cover potential losses that could occur in the event that either party cannot meet its contractual obligations.
| American High-Income Trust | 21 |
6. Taxation and distributions
Federal income taxation — The fund complies with the requirements under Subchapter M of the Internal Revenue Code applicable to mutual funds and intends to distribute substantially all of its net taxable income and net capital gains each year. The fund is not subject to income taxes to the extent such distributions are made. Therefore, no federal income tax provision is required.
As of and during the period ended September 30, 2013, the fund did not have a liability for any unrecognized tax benefits. The fund recognizes interest and penalties, if any, related to unrecognized tax benefits as income tax expense in the statement of operations. During the period, the fund did not incur any interest or penalties.
The fund is not subject to examination by U.S. federal tax authorities for tax years before 2009 and by state tax authorities and tax authorities outside the U.S. for tax years before 2008.
Non-U.S. taxation — Dividend and interest income are recorded net of non-U.S. taxes paid.
Distributions — Distributions paid to shareholders are based on net investment income and net realized gains determined on a tax basis, which may differ from net investment income and net realized gains for financial reporting purposes. These differences are due primarily to different treatment for items such as currency gains and losses; short-term capital gains and losses; capital losses related to sales of certain securities within 30 days of purchase; unrealized appreciation of certain investments in securities outside the U.S.; cost of investments sold; paydowns on fixed-income securities; net capital losses; and income on certain investments. The fiscal year in which amounts are distributed may differ from the year in which the net investment income and net realized gains are recorded by the fund for financial reporting purposes.
During the year ended September 30, 2013, the fund reclassified $13,289,000 from accumulated net realized loss to distributions in excess of net investment income and $34,000 from distributions in excess of net investment income to capital paid in on shares of beneficial interest to align financial reporting with tax reporting.
Under the Regulated Investment Company Modernization Act of 2010 (the “Act”), net capital losses recognized after September 30, 2011, may be carried forward indefinitely, and their character is retained as short-term and/or long-term losses. Previously, net capital losses were carried forward for eight years and treated as short-term losses. As a transition rule, the Act requires that post-enactment net capital losses be used before pre-enactment net capital losses.
As of September 30, 2013, the tax basis components of distributable earnings, unrealized appreciation (depreciation) and cost of investment securities were as follows (dollars in thousands):
| Undistributed ordinary income | | $ | 37,909 | |
| Capital loss carryforward expiring 2018* | | | (607,968 | ) |
| Gross unrealized appreciation on investment securities | | | 1,076,018 | |
| Gross unrealized depreciation on investment securities | | | (758,035 | ) |
| Net unrealized appreciation on investment securities | | | 317,983 | |
| Cost of investment securities | | | 19,781,049 | |
| * | Reflects the utilization of capital loss carryforward of $232,980,000. The capital loss carryforward will be used to offset any capital gains realized by the fund in future years through the expiration date. The fund will not make distributions from capital gains while a capital loss carryforward remains. |
| 22 | American High-Income Trust |
Tax-basis distributions paid or accrued to shareholders from ordinary income were as follows (dollars in thousands):
| | | Year ended September 30 |
| Share class | | 2013 | | | 2012 | |
| Class A | | $ | 938,643 | | | $ | 948,806 | |
| Class B | | | 10,084 | | | | 15,866 | |
| Class C | | | 81,420 | | | | 89,548 | |
| Class F-1 | | | 95,595 | | | | 109,529 | |
| Class F-2 | | | 66,875 | | | | 60,321 | |
| Class 529-A | | | 23,079 | | | | 22,659 | |
| Class 529-B | | | 645 | | | | 991 | |
| Class 529-C | | | 7,565 | | | | 7,725 | |
| Class 529-E | | | 1,224 | | | | 1,230 | |
| Class 529-F-1 | | | 1,472 | | | | 1,304 | |
| Class R-1 | | | 1,466 | | | | 1,527 | |
| Class R-2 | | | 13,541 | | | | 14,463 | |
| Class R-3 | | | 20,166 | | | | 23,467 | |
| Class R-4 | | | 15,260 | | | | 16,653 | |
| Class R-5 | | | 18,575 | | | | 20,422 | |
| Class R-6 | | | 23,849 | | | | 11,252 | |
| Total | | $ | 1,319,459 | | | $ | 1,345,763 | |
7. Fees and transactions with related parties
CRMC, the fund’s investment adviser, is the parent company of American Funds Distributors,® Inc. (“AFD”), the principal underwriter of the fund’s shares, and American Funds Service Company® (“AFS”), the fund’s transfer agent. CRMC, AFD and AFS are considered related parties to the fund.
Investment advisory services — The fund has an investment advisory and service agreement with CRMC that provides for monthly fees accrued daily. These fees are based on a series of decreasing annual rates beginning with 0.300% on the first $60 million of daily net assets and decreasing to 0.135% on such assets in excess of $15 billion. The agreement also provides for monthly fees, accrued daily, based on a series of decreasing rates beginning with 3.00% on the first $8,333,333 of the fund’s monthly gross income and decreasing to 1.50% on such income in excess of $50 million. CRMC is currently waiving a portion of its investment advisory services fees. For the year ended September 30, 2013, total investment advisory services fees waived by CRMC were $1,000. As a result, the fee shown on the accompanying financial statements of $57,572,000 was reduced to $57,571,000, both of which were equivalent to an annualized rate of 0.281% of average daily net assets.
Class-specific fees and expenses — Expenses that are specific to individual share classes are accrued directly to the respective share class. The principal class-specific fees and expenses are described below:
Distribution services — The fund has plans of distribution for all share classes, except Class F-2, R-5 and R-6 shares. Under the plans, the board of trustees approves certain categories of expenses that are used to finance activities primarily intended to sell fund shares and service existing accounts. The plans provide for payments, based on an annualized percentage of average daily net assets, ranging from 0.30% to 1.00% as noted on the following page. In some cases, the board of trustees has limited the amounts that may be paid to less than the maximum allowed by the plans. All share classes with a plan may use up to 0.25% of average daily net assets to pay service fees, or to compensate AFD for paying service fees, to firms that have entered into agreements with AFD to provide certain shareholder services. The remaining amounts available to be paid under each plan are paid to dealers to compensate them for their sales activities.
| American High-Income Trust | 23 |
For Class A and 529-A shares, distribution-related expenses include the reimbursement of dealer and wholesaler commissions paid by AFD for certain shares sold without a sales charge. These share classes reimburse AFD for amounts billed within the prior 15 months but only to the extent that the overall annual expense limit of 0.30% is not exceeded. As of September 30, 2013, there were no unreimbursed expenses subject to reimbursement for Class A or 529-A shares.
| Share class | | Currently
approved limits | | Plan limits |
| Class A | | | 0.30 | % | | | 0.30 | % |
| Class 529-A | | | 0.30 | | | | 0.50 | |
| Classes B and 529-B | | | 1.00 | | | | 1.00 | |
| Classes C, 529-C and R-1 | | | 1.00 | | | | 1.00 | |
| Class R-2 | | | 0.75 | | | | 1.00 | |
| Classes 529-E and R-3 | | | 0.50 | | | | 0.75 | |
| Classes F-1, 529-F-1 and R-4 | | | 0.25 | | | | 0.50 | |
Transfer agent services — The fund has a shareholder services agreement with AFS under which the fund compensates AFS for providing transfer agent services to each of the fund’s share classes. These services include recordkeeping, shareholder communications and transaction processing. In addition, the fund reimburses AFS for amounts paid to third parties for performing transfer agent services on behalf of fund shareholders.
Administrative services — The fund has an administrative services agreement with CRMC under which the fund compensates CRMC for providing administrative services to Class A, C, F, 529 and R shares. These services include, but are not limited to, coordinating, monitoring, assisting and overseeing third parties that provide services to fund shareholders. Under the agreement, Class A shares pay an annual fee of 0.01% and Class C, F, 529 and R shares pay an annual fee of 0.05% of their respective average daily net assets.
529 plan services — Each 529 share class is subject to service fees to compensate the Commonwealth of Virginia for the maintenance of the 529 college savings plan. The quarterly fee is based on a series of decreasing annual rates beginning with 0.10% on the first $30 billion of the net assets invested in Class 529 shares of the American Funds and decreasing to 0.06% on such assets between $120 billion and $150 billion. The fee for any given calendar quarter is accrued and calculated on the basis of the average net assets of Class 529 shares of the American Funds for the last month of the prior calendar quarter. The fee is included in other expenses on the accompanying financial statements. The Commonwealth of Virginia is not considered a related party.
For the year ended September 30, 2013, class-specific expenses under the agreements were as follows (dollars in thousands):
| Share class | | Distribution
services | | | Transfer agent
services | | | Administrative
services | | | 529 plan
services |
| Class A | | | $32,985 | | | | $18,890 | | | | $1,442 | | | Not applicable |
| Class B | | | 1,740 | | | | 246 | | | | Not applicable | | | Not applicable |
| Class C | | | 14,240 | | | | 1,921 | | | | 713 | | | Not applicable |
| Class F-1 | | | 3,688 | | | | 1,964 | | | | 740 | | | Not applicable |
| Class F-2 | | | Not applicable | | | | 1,103 | | | | 498 | | | Not applicable |
| Class 529-A | | | 769 | | | | 368 | | | | 180 | | | $353 |
| Class 529-B | | | 113 | | | | 14 | | | | 6 | | | 11 |
| Class 529-C | | | 1,332 | | | | 150 | | | | 67 | | | 132 |
| Class 529-E | | | 98 | | | | 11 | | | | 10 | �� | | 20 |
| Class 529-F-1 | | | — | | | | 23 | | | | 11 | | | 22 |
| Class R-1 | | | 256 | | | | 32 | | | | 13 | | | Not applicable |
| Class R-2 | | | 1,762 | | | | 901 | | | | 118 | | | Not applicable |
| Class R-3 | | | 1,624 | | | | 546 | | | | 163 | | | Not applicable |
| Class R-4 | | | 586 | | | | 251 | | | | 118 | | | Not applicable |
| Class R-5 | | | Not applicable | | | | 152 | | | | 137 | | | Not applicable |
| Class R-6 | | | Not applicable | | | | 7 | | | | 175 | | | Not applicable |
| Total class-specific expenses | | | $59,193 | | | | $26,579 | | | | $4,391 | | | $538 |
Trustees’ deferred compensation — Trustees who are unaffiliated with CRMC may elect to defer the cash payment of part or all of their compensation. These deferred amounts, which remain as liabilities of the fund, are treated as if invested in shares of the fund or other American Funds. These amounts represent general, unsecured liabilities of the fund and vary according to the total returns of the selected funds. Trustees’ compensation of $175,000, shown on the accompanying financial statements, includes $140,000 in current fees (either paid in cash or deferred) and a net increase of $35,000 in the value of the deferred amounts.
| 24 | American High-Income Trust |
Affiliated officers and trustees — Officers and certain trustees of the fund are or may be considered to be affiliated with CRMC, AFD and AFS. No affiliated officers or trustees received any compensation directly from the fund.
8. Capital share transactions
Capital share transactions in the fund were as follows (dollars and shares in thousands):
| | | Sales* | | | Reinvestments of
dividends | | | Repurchases* | | | Net increase (decrease) | |
| Share class | | Amount | | | Shares | | | Amount | | | Shares | | | Amount | | | Shares | | | Amount | | | Shares | |
| | | | | | | | | | | | | | | | | | | | | | | | | | | | | | | | | |
| Year ended September 30, 2013 | | | | | | | | | | | | | | | | | |
| | | | | | | | | | | | | | | | | | | | | | | | | | | | | | | | | |
| Class A | | $ | 2,628,077 | | | | 231,117 | | | $ | 865,506 | | | | 76,269 | | | $ | (3,177,929 | ) | | | (280,061 | ) | | $ | 315,654 | | | | 27,325 | |
| Class B | | | 14,865 | | | | 1,310 | | | | 9,316 | | | | 821 | | | | (87,131 | ) | | | (7,673 | ) | | | (62,950 | ) | | | (5,542 | ) |
| Class C | | | 299,510 | | | | 26,331 | | | | 74,224 | | | | 6,541 | | | | (467,704 | ) | | | (41,180 | ) | | | (93,970 | ) | | | (8,308 | ) |
| Class F-1 | | | 501,778 | | | | 44,190 | | | | 92,834 | | | | 8,181 | | | | (765,689 | ) | | | (67,708 | ) | | | (171,077 | ) | | | (15,337 | ) |
| Class F-2 | | | 695,858 | | | | 61,502 | | | | 57,121 | | | | 5,032 | | | | (724,709 | ) | | | (63,918 | ) | | | 28,270 | | | | 2,616 | |
| Class 529-A | | | 65,681 | | | | 5,777 | | | | 22,694 | | | | 2,000 | | | | (73,179 | ) | | | (6,451 | ) | | | 15,196 | | | | 1,326 | |
| Class 529-B | | | 1,145 | | | | 101 | | | | 632 | | | | 56 | | | | (5,599 | ) | | | (494 | ) | | | (3,822 | ) | | | (337 | ) |
| Class 529-C | | | 26,987 | | | | 2,374 | | | | 7,432 | | | | 655 | | | | (30,484 | ) | | | (2,686 | ) | | | 3,935 | | | | 343 | |
| Class 529-E | | | 4,041 | | | | 355 | | | | 1,202 | | | | 106 | | | | (4,477 | ) | | | (395 | ) | | | 766 | | | | 66 | |
| Class 529-F-1 | | | 8,055 | | | | 708 | | | | 1,444 | | | | 127 | | | | (5,578 | ) | | | (491 | ) | | | 3,921 | | | | 344 | |
| Class R-1 | | | 7,445 | | | | 655 | | | | 1,409 | | | | 124 | | | | (9,393 | ) | | | (831 | ) | | | (539 | ) | | | (52 | ) |
| Class R-2 | | | 75,232 | | | | 6,617 | | | | 13,237 | | | | 1,166 | | | | (89,731 | ) | | | (7,900 | ) | | | (1,262 | ) | | | (117 | ) |
| Class R-3 | | | 149,922 | | | | 13,184 | | | | 19,732 | | | | 1,739 | | | | (211,854 | ) | | | (18,746 | ) | | | (42,200 | ) | | | (3,823 | ) |
| Class R-4 | | | 79,556 | | | | 7,001 | | | | 15,002 | | | | 1,322 | | | | (97,263 | ) | | | (8,571 | ) | | | (2,705 | ) | | | (248 | ) |
| Class R-5 | | | 90,198 | | | | 7,936 | | | | 18,090 | | | | 1,593 | | | | (177,028 | ) | | | (15,537 | ) | | | (68,740 | ) | | | (6,008 | ) |
| Class R-6 | | | 333,949 | | | | 29,459 | | | | 22,878 | | | | 2,017 | | | | (109,299 | ) | | | (9,643 | ) | | | 247,528 | | | | 21,833 | |
| Total net increase (decrease) | | $ | 4,982,299 | | | | 438,617 | | | $ | 1,222,753 | | | | 107,749 | | | $ | (6,037,047 | ) | | | (532,285 | ) | | $ | 168,005 | | | | 14,081 | |
| | | | | | | | | | | | | | | | | | | | | | | | | | | | | | | | | |
| Year ended September 30, 2012 | | | | | | | | | | | | | | | | | |
| | | | | | | | | | | | | | | | | | | | | | | | | | | | | | | | | |
| Class A | | $ | 2,950,296 | | | | 270,595 | | | $ | 873,157 | | | | 79,970 | | | $ | (2,148,697 | ) | | | (197,821 | ) | | $ | 1,674,756 | | | | 152,744 | |
| Class B | | | 26,355 | | | | 2,420 | | | | 14,390 | | | | 1,320 | | | | (118,497 | ) | | | (10,933 | ) | | | (77,752 | ) | | | (7,193 | ) |
| Class C | | | 364,739 | | | | 33,439 | | | | 80,091 | | | | 7,338 | | | | (353,351 | ) | | | (32,547 | ) | | | 91,479 | | | | 8,230 | |
| Class F-1 | | | 697,962 | | | | 64,204 | | | | 108,051 | | | | 9,897 | | | | (589,494 | ) | | | (54,444 | ) | | | 216,519 | | | | 19,657 | |
| Class F-2 | | | 504,614 | | | | 46,634 | | | | 50,181 | | | | 4,592 | | | | (275,623 | ) | | | (25,351 | ) | | | 279,172 | | | | 25,875 | |
| Class 529-A | | | 78,742 | | | | 7,226 | | | | 22,698 | | | | 2,078 | | | | (43,253 | ) | | | (3,972 | ) | | | 58,187 | | | | 5,332 | |
| Class 529-B | | | 2,460 | | | | 226 | | | | 987 | | | | 91 | | | | (7,187 | ) | | | (662 | ) | | | (3,740 | ) | | | (345 | ) |
| Class 529-C | | | 30,760 | | | | 2,822 | | | | 7,735 | | | | 708 | | | | (19,864 | ) | | | (1,824 | ) | | | 18,631 | | | | 1,706 | |
| Class 529-E | | | 4,687 | | | | 431 | | | | 1,231 | | | | 113 | | | | (2,982 | ) | | | (273 | ) | | | 2,936 | | | | 271 | |
| Class 529-F-1 | | | 5,877 | | | | 539 | | | | 1,304 | | | | 119 | | | | (3,024 | ) | | | (278 | ) | | | 4,157 | | | | 380 | |
| Class R-1 | | | 8,138 | | | | 746 | | | | 1,514 | | | | 139 | | | | (6,534 | ) | | | (599 | ) | | | 3,118 | | | | 286 | |
| Class R-2 | | | 74,293 | | | | 6,812 | | | | 14,398 | | | | 1,319 | | | | (73,343 | ) | | | (6,747 | ) | | | 15,348 | | | | 1,384 | |
| Class R-3 | | | 181,751 | | | | 16,666 | | | | 23,421 | | | | 2,146 | | | | (141,935 | ) | | | (13,062 | ) | | | 63,237 | | | | 5,750 | |
| Class R-4 | | | 81,945 | | | | 7,516 | | | | 16,629 | | | | 1,523 | | | | (91,436 | ) | | | (8,413 | ) | | | 7,138 | | | | 626 | |
| Class R-5 | | | 101,958 | | | | 9,370 | | | | 20,450 | | | | 1,872 | | | | (74,803 | ) | | | (6,875 | ) | | | 47,605 | | | | 4,367 | |
| Class R-6 | | | 139,385 | | | | 12,686 | | | | 11,239 | | | | 1,028 | | | | (38,982 | ) | | | (3,528 | ) | | | 111,642 | | | | 10,186 | |
| Total net increase (decrease) | | $ | 5,253,962 | | | | 482,332 | | | $ | 1,247,476 | | | | 114,253 | | | $ | (3,989,005 | ) | | | (367,329 | ) | | $ | 2,512,433 | | | | 229,256 | |
* Includes exchanges between share classes of the fund.
9. Investment transactions
The fund made purchases and sales of investment securities, excluding short-term securities and U.S. government obligations, if any, of $12,521,244,000 and $11,664,631,000, respectively, during the year ended September 30, 2013.
| American High-Income Trust | 25 |
Financial highlights
| | | | | | Income from investment operations1 | | | | | | | | | | | | | | | | | | | | | | |
| | | Net asset
value,
beginning
of period | | | Net
investment
income | | | Net gains
(losses) on
securities
(both
realized and
unrealized) | | | Total from
investment
operations | | | Dividends
(from net
investment
income) | | | Net asset
value, end
of period | | | Total
return2,3 | | | Net assets,
end of period
(in millions) | | | Ratio of
expenses to
average net
assets before
reimbursements/
waivers | | | Ratio of
expenses to
average net
assets after
reimbursements/
waivers3 | | | Ratio of
net income
to average
net assets3 | |
| Class A: | | | | | | | | | | | | | | | | | | | | | | | | | | | | | | | | | | | | | | | | | | | | |
| Year ended 9/30/2013 | | $ | 11.18 | | | $ | .72 | | | $ | .06 | | | $ | .78 | | | $ | (.74 | ) | | $ | 11.22 | | | | 7.10 | % | | $ | 14,178 | | | | .66 | % | | | .66 | % | | | 6.37 | % |
| Year ended 9/30/2012 | | | 10.36 | | | | .78 | | | | .86 | | | | 1.64 | | | | (.82 | ) | | | 11.18 | | | | 16.35 | | | | 13,822 | | | | .69 | | | | .69 | | | | 7.17 | |
| Year ended 9/30/2011 | | | 11.13 | | | | .85 | | | | (.74 | ) | | | .11 | | | | (.88 | ) | | | 10.36 | | | | .67 | | | | 11,223 | | | | .67 | | | | .67 | | | | 7.57 | |
| Year ended 9/30/2010 | | | 10.29 | | | | .89 | | | | .78 | | | | 1.67 | | | | (.83 | ) | | | 11.13 | | | | 16.75 | | | | 11,687 | | | | .68 | | | | .68 | | | | 8.26 | |
| Year ended 9/30/2009 | | | 10.01 | | | | .83 | | | | .33 | | | | 1.16 | | | | (.88 | ) | | | 10.29 | | | | 14.03 | | | | 10,274 | | | | .80 | | | | .79 | | | | 9.57 | |
| Class B: | | | | | | | | | | | | | | | | | | | | | | | | | | | | | | | | | | | | | | | | | | | | |
| Year ended 9/30/2013 | | | 11.18 | | | | .63 | | | | .06 | | | | .69 | | | | (.65 | ) | | | 11.22 | | | | 6.29 | | | | 143 | | | | 1.43 | | | | 1.43 | | | | 5.63 | |
| Year ended 9/30/2012 | | | 10.36 | | | | .70 | | | | .86 | | | | 1.56 | | | | (.74 | ) | | | 11.18 | | | | 15.49 | | | | 204 | | | | 1.44 | | | | 1.44 | | | | 6.47 | |
| Year ended 9/30/2011 | | | 11.13 | | | | .77 | | | | (.74 | ) | | | .03 | | | | (.80 | ) | | | 10.36 | | | | (.10 | ) | | | 264 | | | | 1.44 | | | | 1.44 | | | | 6.82 | |
| Year ended 9/30/2010 | | | 10.29 | | | | .80 | | | | .78 | | | | 1.58 | | | | (.74 | ) | | | 11.13 | | | | 15.86 | | | | 452 | | | | 1.46 | | | | 1.46 | | | | 7.50 | |
| Year ended 9/30/2009 | | | 10.01 | | | | .76 | | | | .33 | | | | 1.09 | | | | (.81 | ) | | | 10.29 | | | | 13.18 | | | | 550 | | | | 1.56 | | | | 1.55 | | | | 8.93 | |
| Class C: | | | | | | | | | | | | | | | | | | | | | | | | | | | | | | | | | | | | | | | | | | | | |
| Year ended 9/30/2013 | | | 11.18 | | | | .63 | | | | .06 | | | | .69 | | | | (.65 | ) | | | 11.22 | | | | 6.25 | | | | 1,330 | | | | 1.48 | | | | 1.48 | | | | 5.56 | |
| Year ended 9/30/2012 | | | 10.36 | | | | .70 | | | | .86 | | | | 1.56 | | | | (.74 | ) | | | 11.18 | | | | 15.43 | | | | 1,418 | | | | 1.48 | | | | 1.48 | | | | 6.38 | |
| Year ended 9/30/2011 | | | 11.13 | | | | .76 | | | | (.74 | ) | | | .02 | | | | (.79 | ) | | | 10.36 | | | | (.15 | ) | | | 1,229 | | | | 1.48 | | | | 1.48 | | | | 6.76 | |
| Year ended 9/30/2010 | | | 10.29 | | | | .80 | | | | .78 | | | | 1.58 | | | | (.74 | ) | | | 11.13 | | | | 15.80 | | | | 1,337 | | | | 1.51 | | | | 1.51 | | | | 7.44 | |
| Year ended 9/30/2009 | | | 10.01 | | | | .76 | | | | .33 | | | | 1.09 | | | | (.81 | ) | | | 10.29 | | | | 13.15 | | | | 1,213 | | | | 1.58 | | | | 1.57 | | | | 8.74 | |
| Class F-1: | | | | | | | | | | | | | | | | | | | | | | | | | | | | | | | | | | | | | | | | | | | | |
| Year ended 9/30/2013 | | | 11.18 | | | | .71 | | | | .06 | | | | .77 | | | | (.73 | ) | | | 11.22 | | | | 7.03 | | | | 1,418 | | | | .73 | | | | .73 | | | | 6.32 | |
| Year ended 9/30/2012 | | | 10.36 | | | | .78 | | | | .86 | | | | 1.64 | | | | (.82 | ) | | | 11.18 | | | | 16.32 | | | | 1,584 | | | | .71 | | | | .71 | | | | 7.14 | |
| Year ended 9/30/2011 | | | 11.13 | | | | .85 | | | | (.74 | ) | | | .11 | | | | (.88 | ) | | | 10.36 | | | | .62 | | | | 1,264 | | | | .72 | | | | .72 | | | | 7.52 | |
| Year ended 9/30/2010 | | | 10.29 | | | | .88 | | | | .78 | | | | 1.66 | | | | (.82 | ) | | | 11.13 | | | | 16.69 | | | | 1,457 | | | | .74 | | | | .74 | | | | 8.21 | |
| Year ended 9/30/2009 | | | 10.01 | | | | .83 | | | | .33 | | | | 1.16 | | | | (.88 | ) | | | 10.29 | | | | 14.02 | | | | 1,482 | | | | .81 | | | | .80 | | | | 9.54 | |
| Class F-2: | | | | | | | | | | | | | | | | | | | | | | | | | | | | | | | | | | | | | | | | | | | | |
| Year ended 9/30/2013 | | | 11.18 | | | | .74 | | | | .06 | | | | .80 | | | | (.76 | ) | | | 11.22 | | | | 7.32 | | | | 935 | | | | .46 | | | | .46 | | | | 6.58 | |
| Year ended 9/30/2012 | | | 10.36 | | | | .81 | | | | .86 | | | | 1.67 | | | | (.85 | ) | | | 11.18 | | | | 16.62 | | | | 903 | | | | .46 | | | | .46 | | | | 7.37 | |
| Year ended 9/30/2011 | | | 11.13 | | | | .88 | | | | (.74 | ) | | | .14 | | | | (.91 | ) | | | 10.36 | | | | .88 | | | | 568 | | | | .46 | | | | .46 | | | | 7.77 | |
| Year ended 9/30/2010 | | | 10.29 | | | | .91 | | | | .78 | | | | 1.69 | | | | (.85 | ) | | | 11.13 | | | | 16.98 | | | | 511 | | | | .48 | | | | .48 | | | | 8.44 | |
| Year ended 9/30/2009 | | | 10.01 | | | | .81 | | | | .37 | | | | 1.18 | | | | (.90 | ) | | | 10.29 | | | | 14.32 | | | | 341 | | | | .53 | | | | .53 | | | | 8.99 | |
| Class 529-A: | | | | | | | | | | | | | | | | | | | | | | | | | | | | | | | | | | | | | | | | | | | | |
| Year ended 9/30/2013 | | | 11.18 | | | | .71 | | | | .06 | | | | .77 | | | | (.73 | ) | | | 11.22 | | | | 7.00 | | | | 357 | | | | .76 | | | | .76 | | | | 6.27 | |
| Year ended 9/30/2012 | | | 10.36 | | | | .78 | | | | .86 | | | | 1.64 | | | | (.82 | ) | | | 11.18 | | | | 16.26 | | | | 341 | | | | .77 | | | | .77 | | | | 7.08 | |
| Year ended 9/30/2011 | | | 11.13 | | | | .85 | | | | (.74 | ) | | | .11 | | | | (.88 | ) | | | 10.36 | | | | .59 | | | | 261 | | | | .74 | | | | .74 | | | | 7.50 | |
| Year ended 9/30/2010 | | | 10.29 | | | | .88 | | | | .78 | | | | 1.66 | | | | (.82 | ) | | | 11.13 | | | | 16.66 | | | | 230 | | | | .76 | | | | .76 | | | | 8.18 | |
| Year ended 9/30/2009 | | | 10.01 | | | | .82 | | | | .33 | | | | 1.15 | | | | (.87 | ) | | | 10.29 | | | | 13.99 | | | | 172 | | | | .84 | | | | .83 | | | | 9.50 | |
| Class 529-B: | | | | | | | | | | | | | | | | | | | | | | | | | | | | | | | | | | | | | | | | | | | | |
| Year ended 9/30/2013 | | | 11.18 | | | | .62 | | | | .06 | | | | .68 | | | | (.64 | ) | | | 11.22 | | | | 6.16 | | | | 10 | | | | 1.56 | | | | 1.56 | | | | 5.50 | |
| Year ended 9/30/2012 | | | 10.36 | | | | .69 | | | | .86 | | | | 1.55 | | | | (.73 | ) | | | 11.18 | | | | 15.34 | | | | 13 | | | | 1.57 | | | | 1.57 | | | | 6.32 | |
| Year ended 9/30/2011 | | | 11.13 | | | | .75 | | | | (.74 | ) | | | .01 | | | | (.78 | ) | | | 10.36 | | | | (.22 | ) | | | 16 | | | | 1.55 | | | | 1.55 | | | | 6.70 | |
| Year ended 9/30/2010 | | | 10.29 | | | | .79 | | | | .78 | | | | 1.57 | | | | (.73 | ) | | | 11.13 | | | | 15.74 | | | | 23 | | | | 1.56 | | | | 1.56 | | | | 7.39 | |
| Year ended 9/30/2009 | | | 10.01 | | | | .75 | | | | .33 | | | | 1.08 | | | | (.80 | ) | | | 10.29 | | | | 13.08 | | | | 22 | | | | 1.65 | | | | 1.64 | | | | 8.76 | |
| Class 529-C: | | | | | | | | | | | | | | | | | | | | | | | | | | | | | | | | | | | | | | | | | | | | |
| Year ended 9/30/2013 | | | 11.18 | | | | .62 | | | | .06 | | | | .68 | | | | (.64 | ) | | | 11.22 | | | | 6.17 | | | | 132 | | | | 1.55 | | | | 1.55 | | | | 5.49 | |
| Year ended 9/30/2012 | | | 10.36 | | | | .69 | | | | .86 | | | | 1.55 | | | | (.73 | ) | | | 11.18 | | | | 15.35 | | | | 128 | | | | 1.56 | | | | 1.56 | | | | 6.29 | |
| Year ended 9/30/2011 | | | 11.13 | | | | .76 | | | | (.74 | ) | | | .02 | | | | (.79 | ) | | | 10.36 | | | | (.21 | ) | | | 101 | | | | 1.54 | | | | 1.54 | | | | 6.70 | |
| Year ended 9/30/2010 | | | 10.29 | | | | .79 | | | | .78 | | | | 1.57 | | | | (.73 | ) | | | 11.13 | | | | 15.75 | | | | 91 | | | | 1.56 | | | | 1.56 | | | | 7.39 | |
| Year ended 9/30/2009 | | | 10.01 | | | | .75 | | | | .33 | | | | 1.08 | | | | (.80 | ) | | | 10.29 | | | | 13.08 | | | | 68 | | | | 1.64 | | | | 1.63 | | | | 8.71 | |
| Class 529-E: | | | | | | | | | | | | | | | | | | | | | | | | | | | | | | | | | | | | | | | | | | | | |
| Year ended 9/30/2013 | | | 11.18 | | | | .68 | | | | .06 | | | | .74 | | | | (.70 | ) | | | 11.22 | | | | 6.75 | | | | 20 | | | | .99 | | | | .99 | | | | 6.04 | |
| Year ended 9/30/2012 | | | 10.36 | | | | .75 | | | | .86 | | | | 1.61 | | | | (.79 | ) | | | 11.18 | | | | 15.97 | | | | 19 | | | | 1.02 | | | | 1.02 | | | | 6.83 | |
| Year ended 9/30/2011 | | | 11.13 | | | | .81 | | | | (.74 | ) | | | .07 | | | | (.84 | ) | | | 10.36 | | | | .31 | | | | 15 | | | | 1.02 | | | | 1.02 | | | | 7.22 | |
| Year ended 9/30/2010 | | | 10.29 | | | | .85 | | | | .78 | | | | 1.63 | | | | (.79 | ) | | | 11.13 | | | | 16.34 | | | | 12 | | | | 1.04 | | | | 1.04 | | | | 7.90 | |
| Year ended 9/30/2009 | | | 10.01 | | | | .80 | | | | .33 | | | | 1.13 | | | | (.85 | ) | | | 10.29 | | | | 13.66 | | | | 9 | | | | 1.13 | | | | 1.12 | | | | 9.23 | |
| 26 | American High-Income Trust |
| | | | | | Income from investment operations1 | | | | | | | | | | | | | | | | | | | | | | |
| | | Net asset
value,
beginning
of period | | | Net
investment
income | | | Net gains
(losses) on
securities
(both
realized and
unrealized) | | | Total from
investment
operations | | | Dividends
(from net
investment
income) | | | Net asset
value, end
of period | | | Total
return3 | | | Net assets,
end of period
(in millions) | | | Ratio of
expenses to
average net
assets before
reimbursements/
waivers | | | Ratio of
expenses to
average net
assets after
reimbursements/
waivers3 | | | Ratio of
net income
to average
net assets3 | |
| Class 529-F-1: | | | | | | | | | | | | | | | | | | | | | | | | | | | | | | | | | | | | | | | | | | | | |
| Year ended 9/30/2013 | | $ | 11.18 | | | $ | .73 | | | $ | .06 | | | $ | .79 | | | $ | (.75 | ) | | $ | 11.22 | | | | 7.22 | % | | $ | 23 | | | | .54 | % | | | .54 | % | | | 6.48 | % |
| Year ended 9/30/2012 | | | 10.36 | | | | .80 | | | | .86 | | | | 1.66 | | | | (.84 | ) | | | 11.18 | | | | 16.50 | | | | 20 | | | | .56 | | | | .56 | | | | 7.28 | |
| Year ended 9/30/2011 | | | 11.13 | | | | .87 | | | | (.74 | ) | | | .13 | | | | (.90 | ) | | | 10.36 | | | | .80 | | | | 14 | | | | .53 | | | | .53 | | | | 7.70 | |
| Year ended 9/30/2010 | | | 10.29 | | | | .90 | | | | .78 | | | | 1.68 | | | | (.84 | ) | | | 11.13 | | | | 16.91 | | | | 11 | | | | .55 | | | | .55 | | | | 8.40 | |
| Year ended 9/30/2009 | | | 10.01 | | | | .84 | | | | .33 | | | | 1.17 | | | | (.89 | ) | | | 10.29 | | | | 14.23 | | | | 7 | | | | .63 | | | | .62 | | | | 9.72 | |
| Class R-1: | | | | | | | | | | | | | | | | | | | | | | | | | | | | | | | | | | | | | | | | | | | | |
| Year ended 9/30/2013 | | | 11.18 | | | | .63 | | | | .06 | | | | .69 | | | | (.65 | ) | | | 11.22 | | | | 6.25 | | | | 24 | | | | 1.47 | | | | 1.47 | | | | 5.56 | |
| Year ended 9/30/2012 | | | 10.36 | | | | .70 | | | | .86 | | | | 1.56 | | | | (.74 | ) | | | 11.18 | | | | 15.42 | | | | 25 | | | | 1.50 | | | | 1.50 | | | | 6.36 | |
| Year ended 9/30/2011 | | | 11.13 | | | | .76 | | | | (.74 | ) | | | .02 | | | | (.79 | ) | | | 10.36 | | | | (.17 | ) | | | 20 | | | | 1.50 | | | | 1.50 | | | | 6.74 | |
| Year ended 9/30/2010 | | | 10.29 | | | | .79 | | | | .78 | | | | 1.57 | | | | (.73 | ) | | | 11.13 | | | | 15.78 | | | | 23 | | | | 1.53 | | | | 1.53 | | | | 7.41 | |
| Year ended 9/30/2009 | | | 10.01 | | | | .75 | | | | .33 | | | | 1.08 | | | | (.80 | ) | | | 10.29 | | | | 13.08 | | | | 18 | | | | 1.64 | | | | 1.63 | | | | 8.65 | |
| Class R-2: | | | | | | | | | | | | | | | | | | | | | | | | | | | | | | | | | | | | | | | | | | | | |
| Year ended 9/30/2013 | | | 11.18 | | | | .63 | | | | .06 | | | | .69 | | | | (.65 | ) | | | 11.22 | | | | 6.26 | | | | 231 | | | | 1.47 | | | | 1.47 | | | | 5.57 | |
| Year ended 9/30/2012 | | | 10.36 | | | | .69 | | | | .86 | | | | 1.55 | | | | (.73 | ) | | | 11.18 | | | | 15.38 | | | | 232 | | | | 1.54 | | | | 1.54 | | | | 6.32 | |
| Year ended 9/30/2011 | | | 11.13 | | | | .76 | | | | (.74 | ) | | | .02 | | | | (.79 | ) | | | 10.36 | | | | (.15 | ) | | | 200 | | | | 1.53 | | | | 1.48 | | | | 6.76 | |
| Year ended 9/30/2010 | | | 10.29 | | | | .80 | | | | .78 | | | | 1.58 | | | | (.74 | ) | | | 11.13 | | | | 15.80 | | | | 209 | | | | 1.58 | | | | 1.51 | | | | 7.44 | |
| Year ended 9/30/2009 | | | 10.01 | | | | .76 | | | | .33 | | | | 1.09 | | | | (.81 | ) | | | 10.29 | | | | 13.17 | | | | 170 | | | | 1.79 | | | | 1.56 | | | | 8.81 | |
| Class R-3: | | | | | | | | | | | | | | | | | | | | | | | | | | | | | | | | | | | | | | | | | | | | |
| Year ended 9/30/2013 | | | 11.18 | | | | .68 | | | | .06 | | | | .74 | | | | (.70 | ) | | | 11.22 | | | | 6.74 | | | | 310 | | | | 1.01 | | | | 1.01 | | | | 6.04 | |
| Year ended 9/30/2012 | | | 10.36 | | | | .75 | | | | .86 | | | | 1.61 | | | | (.79 | ) | | | 11.18 | | | | 15.96 | | | | 352 | | | | 1.03 | | | | 1.03 | | | | 6.84 | |
| Year ended 9/30/2011 | | | 11.13 | | | | .81 | | | | (.74 | ) | | | .07 | | | | (.84 | ) | | | 10.36 | | | | .31 | | | | 266 | | | | 1.02 | | | | 1.02 | | | | 7.22 | |
| Year ended 9/30/2010 | | | 10.29 | | | | .85 | | | | .78 | | | | 1.63 | | | | (.79 | ) | | | 11.13 | | | | 16.33 | | | | 316 | | | | 1.05 | | | | 1.05 | | | | 7.90 | |
| Year ended 9/30/2009 | | | 10.01 | | | | .80 | | | | .33 | | | | 1.13 | | | | (.85 | ) | | | 10.29 | | | | 13.66 | | | | 272 | | | | 1.13 | | | | 1.12 | | | | 9.20 | |
| Class R-4: | | | | | | | | | | | | | | | | | | | | | | | | | | | | | | | | | | | | | | | | | | | | |
| Year ended 9/30/2013 | | | 11.18 | | | | .72 | | | | .06 | | | | .78 | | | | (.74 | ) | | | 11.22 | | | | 7.06 | | | | 230 | | | | .70 | | | | .70 | | | | 6.34 | |
| Year ended 9/30/2012 | | | 10.36 | | | | .78 | | | | .86 | | | | 1.64 | | | | (.82 | ) | | | 11.18 | | | | 16.32 | | | | 232 | | | | .72 | | | | .72 | | | | 7.16 | |
| Year ended 9/30/2011 | | | 11.13 | | | | .85 | | | | (.74 | ) | | | .11 | | | | (.88 | ) | | | 10.36 | | | | .61 | | | | 208 | | | | .72 | | | | .72 | | | | 7.52 | |
| Year ended 9/30/2010 | | | 10.29 | | | | .88 | | | | .78 | | | | 1.66 | | | | (.82 | ) | | | 11.13 | | | | 16.68 | | | | 213 | | | | .75 | | | | .75 | | | | 8.19 | |
| Year ended 9/30/2009 | | | 10.01 | | | | .83 | | | | .33 | | | | 1.16 | | | | (.88 | ) | | | 10.29 | | | | 14.02 | | | | 172 | | | | .81 | | | | .80 | | | | 9.56 | |
| Class R-5: | | | | | | | | | | | | | | | | | | | | | | | | | | | | | | | | | | | | | | | | | | | | |
| Year ended 9/30/2013 | | | 11.18 | | | | .75 | | | | .06 | | | | .81 | | | | (.77 | ) | | | 11.22 | | | | 7.38 | | | | 224 | | | | .40 | | | | .40 | | | | 6.66 | |
| Year ended 9/30/2012 | | | 10.36 | | | | .81 | | | | .86 | | | | 1.67 | | | | (.85 | ) | | | 11.18 | | | | 16.67 | | �� | | 290 | | | | .41 | | | | .41 | | | | 7.44 | |
| Year ended 9/30/2011 | | | 11.13 | | | | .88 | | | | (.74 | ) | | | .14 | | | | (.91 | ) | | | 10.36 | | | | .91 | | | | 224 | | | | .42 | | | | .42 | | | | 7.82 | |
| Year ended 9/30/2010 | | | 10.29 | | | | .91 | | | | .78 | | | | 1.69 | | | | (.85 | ) | | | 11.13 | | | | 17.03 | | | | 232 | | | | .44 | | | | .44 | | | | 8.50 | |
| Year ended 9/30/2009 | | | 10.01 | | | | .85 | | | | .33 | | | | 1.18 | | | | (.90 | ) | | | 10.29 | | | | 14.37 | | | | 202 | | | | .51 | | | | .50 | | | | 9.88 | |
| Class R-6: | | | | | | | | | | | | | | | | | | | | | | | | | | | | | | | | | | | | | | | | | | | | |
| Year ended 9/30/2013 | | | 11.18 | | | | .76 | | | | .06 | | | | .82 | | | | (.78 | ) | | | 11.22 | | | | 7.43 | | | | 472 | | | | .35 | | | | .35 | | | | 6.66 | |
| Year ended 9/30/2012 | | | 10.36 | | | | .82 | | | | .86 | | | | 1.68 | | | | (.86 | ) | | | 11.18 | | | | 16.72 | | | | 226 | | | | .36 | | | | .36 | | | | 7.44 | |
| Year ended 9/30/2011 | | | 11.13 | | | | .89 | | | | (.74 | ) | | | .15 | | | | (.92 | ) | | | 10.36 | | | | .96 | | | | 104 | | | | .37 | | | | .37 | | | | 7.86 | |
| Year ended 9/30/2010 | | | 10.29 | | | | .92 | | | | .78 | | | | 1.70 | | | | (.86 | ) | | | 11.13 | | | | 17.09 | | | | 89 | | | | .39 | | | | .39 | | | | 8.56 | |
| Period from 5/1/2009 to 9/30/20094 | | | 8.47 | | | | .33 | | | | 1.83 | | | | 2.16 | | | | (.34 | ) | | | 10.29 | | | | 25.96 | | | | 49 | | | | .18 | | | | .18 | | | | 3.55 | |
| | | Year ended September 30 |
| | | 2013 | | 2012 | | 2011 | | 2010 | | 2009 |
| Portfolio turnover rate for all share classes | | 61% | | 38% | | 51% | | 47% | | 43% |
| 1 | Based on average shares outstanding. |
| 2 | Total returns exclude any applicable sales charges, including contingent deferred sales charges. |
| 3 | This column reflects the impact, if any, of certain reimbursements/waivers from CRMC. During some of the periods shown, CRMC reduced fees for investment advisory services. In addition, during some of the periods shown, CRMC paid a portion of the fund’s transfer agent fees for certain retirement plan share classes. |
| 4 | Based on operations for the period shown and, accordingly, is not representative of a full year. |
See Notes to Financial Statements
| American High-Income Trust | 27 |
Report of Independent Registered Public Accounting Firm
To the Shareholders and Board of Trustees of American High-Income Trust:
We have audited the accompanying statement of assets and liabilities of American High-Income Trust (the “Fund”), including the summary investment portfolio, as of September 30, 2013, and the related statement of operations for the year then ended, the statements of changes in net assets for each of the two years in the period then ended, and the financial highlights for each of the periods presented. These financial statements and financial highlights are the responsibility of the Fund’s management. Our responsibility is to express an opinion on these financial statements and financial highlights based on our audits.
We conducted our audits in accordance with the standards of the Public Company Accounting Oversight Board (United States). Those standards require that we plan and perform the audit to obtain reasonable assurance about whether the financial statements and financial highlights are free of material misstatement. The Fund is not required to have, nor were we engaged to perform, an audit of its internal control over financial reporting. Our audits included consideration of internal control over financial reporting as a basis for designing audit procedures that are appropriate in the circumstances, but not for the purpose of expressing an opinion on the effectiveness of the Fund’s internal control over financial reporting. Accordingly, we express no such opinion. An audit also includes examining, on a test basis, evidence supporting the amounts and disclosures in the financial statements, assessing the accounting principles used and significant estimates made by management, as well as evaluating the overall financial statement presentation. Our procedures included confirmation of securities owned as of September 30, 2013, by correspondence with the custodian and brokers; where replies were not received from brokers, we performed other auditing procedures. We believe that our audits provide a reasonable basis for our opinion.
In our opinion, such financial statements and financial highlights referred to above present fairly, in all material respects, the financial position of American High-Income Trust as of September 30, 2013, the results of its operations for the year then ended, the changes in its net assets for each of the two years in the period then ended, and the financial highlights for each of the periods presented, in conformity with accounting principles generally accepted in the United States of America.
Deloitte & Touche LLP
Costa Mesa, California
November 12, 2013
| 28 | American High-Income Trust |
As a fund shareholder, you incur two types of costs: (1) transaction costs, such as initial sales charges on purchase payments and contingent deferred sales charges on redemptions (loads), and (2) ongoing costs, including management fees, distribution and service (12b-1) fees, and other expenses. This example is intended to help you understand your ongoing costs (in dollars) of investing in the fund so you can compare these costs with the ongoing costs of investing in other mutual funds. The example is based on an investment of $1,000 invested at the beginning of the period and held for the entire six-month period (April 1, 2013, through September 30, 2013).
Actual expenses:
The first line of each share class in the table on the following page provides information about actual account values and actual expenses. You may use the information in this line, together with the amount you invested, to estimate the expenses that you paid over the period. Simply divide your account value by $1,000 (for example, an $8,600 account value divided by $1,000 = 8.6), then multiply the result by the number in the first line under the heading entitled “Expenses paid during period” to estimate the expenses you paid on your account during this period.
Hypothetical example for comparison purposes:
The second line of each share class in the table on the following page provides information about hypothetical account values and hypothetical expenses based on the actual expense ratio for the share class and an assumed rate of return of 5.00% per year before expenses, which is not the actual return of the share class. The hypothetical account values and expenses may not be used to estimate the actual ending account balance or expenses you paid for the period. You may use this information to compare the ongoing costs of investing in the fund and other funds. To do so, compare this 5.00% hypothetical example with the 5.00% hypothetical examples that appear in the shareholder reports of the other funds.
Notes:
There are some account fees that are charged to certain types of accounts, such as individual retirement accounts and 529 college savings plan accounts (generally, a $10 fee is charged to set up the account and an additional $10 fee is charged to the account annually), that would increase the amount of expenses paid on your account. In addition, retirement plan participants may be subject to certain fees charged by the plan sponsor, and Class F-1, F-2 and 529-F-1 shareholders may be subject to fees charged by financial intermediaries, typically ranging from 0.75% to 1.50% of assets annually depending on services offered. You can estimate the impact of these fees by adding the amount of the fees to the total estimated expenses you paid on your account during the period as calculated above. In addition, your ending account value would be lower by the amount of these fees.
Note that the expenses shown in the table on the following page are meant to highlight your ongoing costs only and do not reflect any transactional costs, such as sales charges (loads). Therefore, the second line of each share class in the table is useful in comparing ongoing costs only and will not help you determine the relative total costs of owning different funds. In addition, if these transactional costs were included, your costs would have been higher.
| American High-Income Trust | 29 |
| | | Beginning | | | Ending | | | | | | |
| | | account value | | | account value | | | Expenses paid | | | Annualized |
| | | 4/1/2013 | | | 9/30/2013 | | | during period* | | | expense ratio |
| Class A — actual return | | $ | 1,000.00 | | | $ | 1,010.47 | | | $ | 3.33 | | | | .66 | % |
| Class A — assumed 5% return | | | 1,000.00 | | | | 1,021.76 | | | | 3.35 | | | | .66 | |
| Class B — actual return | | | 1,000.00 | | | | 1,006.59 | | | | 7.19 | | | | 1.43 | |
| Class B — assumed 5% return | | | 1,000.00 | | | | 1,017.90 | | | | 7.23 | | | | 1.43 | |
| Class C — actual return | | | 1,000.00 | | | | 1,006.37 | | | | 7.44 | | | | 1.48 | |
| Class C — assumed 5% return | | | 1,000.00 | | | | 1,017.65 | | | | 7.49 | | | | 1.48 | |
| Class F-1 — actual return | | | 1,000.00 | | | | 1,010.13 | | | | 3.68 | | | | .73 | |
| Class F-1 — assumed 5% return | | | 1,000.00 | | | | 1,021.41 | | | | 3.70 | | | | .73 | |
| Class F-2 — actual return | | | 1,000.00 | | | | 1,011.58 | | | | 2.27 | | | | .45 | |
| Class F-2 — assumed 5% return | | | 1,000.00 | | | | 1,022.81 | | | | 2.28 | | | | .45 | |
| Class 529-A — actual return | | | 1,000.00 | | | | 1,010.01 | | | | 3.78 | | | | .75 | |
| Class 529-A — assumed 5% return | | | 1,000.00 | | | | 1,021.31 | | | | 3.80 | | | | .75 | |
| Class 529-B — actual return | | | 1,000.00 | | | | 1,005.98 | | | | 7.79 | | | | 1.55 | |
| Class 529-B — assumed 5% return | | | 1,000.00 | | | | 1,017.30 | | | | 7.84 | | | | 1.55 | |
| Class 529-C — actual return | | | 1,000.00 | | | | 1,006.03 | | | | 7.74 | | | | 1.54 | |
| Class 529-C — assumed 5% return | | | 1,000.00 | | | | 1,017.35 | | | | 7.79 | | | | 1.54 | |
| Class 529-E — actual return | | | 1,000.00 | | | | 1,008.85 | | | | 4.99 | | | | .99 | |
| Class 529-E — assumed 5% return | | | 1,000.00 | | | | 1,020.10 | | | | 5.01 | | | | .99 | |
| Class 529-F-1 — actual return | | | 1,000.00 | | | | 1,011.08 | | | | 2.72 | | | | .54 | |
| Class 529-F-1 — assumed 5% return | | | 1,000.00 | | | | 1,022.36 | | | | 2.74 | | | | .54 | |
| Class R-1 — actual return | | | 1,000.00 | | | | 1,006.43 | | | | 7.39 | | | | 1.47 | |
| Class R-1 — assumed 5% return | | | 1,000.00 | | | | 1,017.70 | | | | 7.44 | | | | 1.47 | |
| Class R-2 — actual return | | | 1,000.00 | | | | 1,006.37 | | | | 7.44 | | | | 1.48 | |
| Class R-2 — assumed 5% return | | | 1,000.00 | | | | 1,017.65 | | | | 7.49 | | | | 1.48 | |
| Class R-3 — actual return | | | 1,000.00 | | | | 1,008.71 | | | | 5.09 | | | | 1.01 | |
| Class R-3 — assumed 5% return | | | 1,000.00 | | | | 1,020.00 | | | | 5.11 | | | | 1.01 | |
| Class R-4 — actual return | | | 1,000.00 | | | | 1,010.29 | | | | 3.53 | | | | .70 | |
| Class R-4 — assumed 5% return | | | 1,000.00 | | | | 1,021.56 | | | | 3.55 | | | | .70 | |
| Class R-5 — actual return | | | 1,000.00 | | | | 1,011.82 | | | | 2.02 | | | | .40 | |
| Class R-5 — assumed 5% return | | | 1,000.00 | | | | 1,023.06 | | | | 2.03 | | | | .40 | |
| Class R-6 — actual return | | | 1,000.00 | | | | 1,012.10 | | | | 1.71 | | | | .34 | |
| Class R-6 — assumed 5% return | | | 1,000.00 | | | | 1,023.36 | | | | 1.72 | | | | .34 | |
| * | The “expenses paid during period” are equal to the “annualized expense ratio,” multiplied by the average account value over the period, multiplied by the number of days in the period, and divided by 365 (to reflect the one-half year period). |
We are required to advise you of the federal tax status of certain distributions received by shareholders during the fiscal year. The fund hereby designates the following amounts for the fund’s fiscal year ended September 30, 2013:
| Qualified dividend income | | $ | 33,574,000 |
| Corporate dividends received deduction | | $ | 24,534,000 |
| U.S. government income that may be exempt from state taxation | | $ | 1,195,000 |
Individual shareholders should refer to their Form 1099 or other tax information, which will be mailed in January 2014, to determine the calendar year amounts to be included on their 2013 tax returns. Shareholders should consult their tax advisors.
| 30 | American High-Income Trust |
Board of trustees and other officers
“Independent” trustees1
| Name and age | | Year first
elected
a trustee
of the fund2 | | Principal occupation(s) during past five years | | Number of
portfolios in fund
complex overseen
by trustee | | Other directorships3
held by trustee |
| William H. Baribault, 68 | | 2010 | | Chairman of the Board and CEO, Oakwood Enterprises (private investment and consulting) | | 69 | | None |
| James G. Ellis, 66 | | 2006 | | Dean and Professor of Marketing, Marshall School of Business, University of Southern California | | 69 | | Quiksilver, Inc. |
| Leonard R. Fuller, 67 | | 1994 | | President and CEO, Fuller Consulting (financial management consulting firm) | | 69 | | None |
R. Clark Hooper, 67
Chairman of the Board
(Independent and
Non-Executive) | | 2005 | | Private investor | | 71 | | JPMorgan Value Opportunities Fund, Inc.; The Swiss Helvetia Fund, Inc. |
| Merit E. Janow, 55 | | 2010 | | Dean and Professor, Columbia University, School of International and Public Affairs; former Member, World Trade Organization Appellate Body (2003–2007) | | 68 | | The NASDAQ Stock Market LLC; Trimble Navigation Limited |
| Laurel B. Mitchell, Ph.D., 58 | | 2010 | | Clinical Professor and Director, Accounting Program, University of Redlands | | 65 | | None |
| Frank M. Sanchez, 70 | | 1999 | | Principal, The Sanchez Family Corporation dba McDonald’s Restaurants (McDonald’s licensee) | | 65 | | None |
| Margaret Spellings, 56 | | 2010 | | President, George W. Bush Foundation; former President and CEO, Margaret Spellings & Company (public policy and strategic consulting); former President, U.S. Chamber Foundation and Senior Advisor to the President and CEO, U.S. Chamber of Commerce; former U.S. Secretary of Education, U.S. Department of Education | | 69 | | None |
| Steadman Upham, Ph.D., 64 | | 2007 | | President and University Professor, The University of Tulsa | | 68 | | None |
We are saddened by the loss of W. Scott Hedrick who passed away on November 4, 2013. Mr. Hedrick served as an independent board member on the boards of various American Funds since 2007. His wise counsel and friendship will be missed.
“Interested” trustee4,5
Name, age and
position with fund | | Year first
elected
a trustee
or officer
of the fund2 | | Principal occupation(s) during past five years
and positions held with affiliated entities or
the principal underwriter of the fund | | Number of
portfolios in fund
complex overseen
by trustee | | Other directorships3
held by trustee |
| John H. Smet, 57 | | 2011 | | Director, Capital Research and Management Company; Senior Vice President — Capital Fixed Income Investors, Capital Research and Management Company | | 20 | | None |
The fund’s statement of additional information includes further details about fund trustees and is available without charge upon request by calling American Funds Service Company at (800) 421-4225 or by visiting the American Funds website at americanfunds.com. The address for all trustees and officers of the fund is 333 South Hope Street, Los Angeles, CA 90071, Attention: Secretary.
| American High-Income Trust | 31 |
Other officers5
Name, age and
position with fund | | Year first
elected
an officer
of the fund2 | | Principal occupation(s) during past five years and positions held with affiliated entities
or the principal underwriter of the fund |
David C. Barclay, 57
President | | 1995 | | Senior Vice President — Capital Fixed Income Investors, Capital Research and Management Company; Director, Capital Research and Management Company |
David A. Daigle, 46
Senior Vice President | | 2008 | | Senior Vice President — Capital Fixed Income Investors, Capital Research Company;6 Senior Vice President — Capital World Investors, Capital Bank and Trust Company6 |
Jennifer L. Hinman, 55
Senior Vice President | | 2001 | | Senior Vice President — Capital Fixed Income Investors, Capital Research Company;6 Director, Capital International Research, Inc.;6 Director, Capital Strategy Research, Inc.6 |
Kristine M. Nishiyama, 43
Senior Vice President | | 2003 | | Senior Vice President and Senior Counsel — Fund Business Management Group, Capital Research and Management Company; Senior Vice President and General Counsel, Capital Bank and Trust Company6 |
Richard N. Lewis, 40
Vice President | | 2011 | | Senior Vice President — Capital Fixed Income Investors, Capital Research Company6 |
Marcus B. Linden, 47
Vice President | | 2008 | | Senior Vice President — Capital Fixed Income Investors, Capital Research Company6 |
Courtney R. Taylor, 38
Secretary | | 2006 | | Assistant Vice President — Fund Business Management Group, Capital Research and Management Company |
Karl C. Grauman, 45
Treasurer | | 2011 | | Vice President — Fund Business Management Group, Capital Research and Management Company |
Steven I. Koszalka, 49
Assistant Secretary | | 2010 | | Vice President — Fund Business Management Group, Capital Research and Management Company |
Brian C. Janssen, 41
Assistant Treasurer | | 2012 | | Vice President — Fund Business Management Group, Capital Research and Management Company |
Dori Laskin, 62
Assistant Treasurer | | 2010 | | Vice President — Fund Business Management Group, Capital Research and Management Company |
| 1 | The term “independent” trustee refers to a trustee who is not an “interested person” of the fund within the meaning of the Investment Company Act of 1940. |
| 2 | Trustees and officers of the fund serve until their resignation, removal or retirement. |
| 3 | This includes all directorships (other than those in the American Funds or other funds managed by Capital Research and Management Company) that are held by each trustee as a trustee or director of a public company or a registered investment company. |
| 4 | “Interested persons” within the meaning of the Investment Company Act of 1940, on the basis of their affiliation with the fund’s investment adviser, Capital Research and Management Company, or affiliated entities (including the fund’s principal underwriter). |
| 5 | All of the officers listed are officers and/or directors/trustees of one or more of the other funds for which Capital Research and Management Company serves as investment adviser. |
| 6 | Company affiliated with Capital Research and Management Company. |
| 32 | American High-Income Trust |
Offices of the fund and of the investment adviser
Capital Research and Management Company
333 South Hope Street
Los Angeles, CA 90071-1406
6455 Irvine Center Drive
Irvine, CA 92618-4518
Transfer agent for shareholder accounts
American Funds Service Company
(Write to the address near you.)
P.O. Box 6007
Indianapolis, IN 46206-6007
P.O. Box 2280
Norfolk, VA 23501-2280
Custodian of assets
JPMorgan Chase Bank
270 Park Avenue
New York, NY 10017-2070
Counsel
Bingham McCutchen LLP
355 South Grand Avenue, Suite 4400
Los Angeles, CA 90071-3106
Independent registered public accounting firm
Deloitte & Touche LLP
695 Town Center Drive
Suite 1200
Costa Mesa, CA 92626-7188
Principal underwriter
American Funds Distributors, Inc.
333 South Hope Street
Los Angeles, CA 90071-1406
Investors should carefully consider investment objectives, risks, charges and expenses. This and other important information is contained in the fund prospectus and summary prospectus, which can be obtained from your financial professional and should be read carefully before investing. You may also call American Funds Service Company (AFS) at (800) 421-4225 or visit the American Funds website at americanfunds.com.
“American Funds Proxy Voting Procedures and Principles” — which describes how we vote proxies relating to portfolio securities — is available on the American Funds website or upon request by calling AFS. The fund files its proxy voting record with the U.S. Securities and Exchange Commission (SEC) for the 12 months ended June 30 by August 31. The proxy voting record is available free of charge on the SEC website at sec.gov and on the American Funds website.
A complete September 30, 2013, portfolio of American High-Income Trust’s investments is available free of charge by calling AFS or visiting the SEC website (where it is part of Form N-CSR).
American High-Income Trust files a complete list of its portfolio holdings with the SEC for the first and third quarters of each fiscal year on Form N-Q. This filing is available free of charge on the SEC website. You may also review or, for a fee, copy this filing at the SEC’s Public Reference Room in Washington, D.C. Additional information regarding the operation of the Public Reference Room may be obtained by calling the SEC’s Office of Investor Education and Advocacy at (800) SEC-0330. Additionally, the list of portfolio holdings is available on the American Funds website or by calling AFS.
This report is for the information of shareholders of American High-Income Trust, but it also may be used as sales literature when preceded or accompanied by the current prospectus or summary prospectus, which gives details about charges, expenses, investment objectives and operating policies of the fund. If used as sales material after December 31, 2013, this report must be accompanied by an American Funds statistical update for the most recently completed calendar quarter.
The American Funds Advantage
Since 1931, American Funds, part of Capital Group, has helped investors pursue long-term investment success. Our consistent approach — in combination with The Capital SystemSM — has resulted in a superior long-term track record.
| | Aligned with investor success |
| | We base our decisions on a long-term perspective, which we believe aligns our goals with the interests of our clients. Our portfolio managers average 25 years of investment experience, including 20 years at our company, reflecting a career commitment to our long-term approach.1 |
| | |
| | The Capital SystemSM |
| | Our investment process, The Capital System, combines individual accountability with teamwork. Each fund is divided into portions that are managed independently by investment professionals with diverse backgrounds, ages and investment approaches. An extensive global research effort is the backbone of our system. |
| | |
| | Superior long-term track record |
| | Our equity funds have beaten their Lipper peer indexes in 90% of 10-year periods and 96% of 20-year periods. Our fixed-income funds have beaten their Lipper indexes in 58% of 10-year periods and 63% of 20-year periods.2 Our fund management fees have been among the lowest in the industry.3 |
| | 1 | Portfolio manager experience as of December 31, 2012. |
| | 2 | Based on Class A share results for rolling periods through December 31, 2012. Periods covered are the shorter of the fund’s lifetime or since the comparable Lipper index inception date. |
| | 3 | Based on management fees for the 20-year period ended December 31, 2012, versus comparable Lipper categories, excluding funds of funds. |

ITEM 2 – Code of Ethics
The Registrant has adopted a Code of Ethics that applies to its Principal Executive Officer and Principal Financial Officer. The Registrant undertakes to provide to any person without charge, upon request, a copy of the Code of Ethics. Such request can be made to American Funds Service Company at 800/421-9225 or to the Secretary of the Registrant, 333 South Hope Street, Los Angeles, California 90071.
ITEM 3 – Audit Committee Financial Expert
The Registrant’s board has determined that Laurel B. Mitchell, a member of the Registrant’s audit committee, is an “audit committee financial expert” and "independent," as such terms are defined in this Item. This designation will not increase the designee’s duties, obligations or liability as compared to his or her duties, obligations and liability as a member of the audit committee and of the board, nor will it reduce the responsibility of the other audit committee members. There may be other individuals who, through education or experience, would qualify as "audit committee financial experts" if the board had designated them as such. Most importantly, the board believes each member of the audit committee contributes significantly to the effective oversight of the Registrant’s financial statements and condition.
ITEM 4 – Principal Accountant Fees and Services
| | Registrant: |
| | | a) Audit Fees: |
| | | | 2012 | $112,000 |
| | | | 2013 | $124,000 |
| | | | |
| | | b) Audit-Related Fees: |
| | | | 2012 | $ 6,000 |
| | | | 2013 | $ 7,000 |
| | | | The audit-related fees consist of assurance and related services relating to the examination of the Registrant’s investment adviser conducted in accordance with Statement on Standards for Attestation Engagements Number 16 issued by the American Institute of Certified Public Accountants. |
| | | | |
| | | c) Tax Fees: |
| | | | 2012 | $ 7,000 |
| | | | 2013 | $ 8,000 |
| | | | The tax fees consist of professional services relating to the preparation of the Registrant’s tax returns including returns relating to the Registrant’s investments in non-U.S. jurisdictions. |
| | | | |
| | | d) All Other Fees: |
| | | | 2012 | None |
| | | | 2013 | None |
| | | | |
| | Adviser and affiliates (includes only fees for non-audit services billed to the adviser and affiliates for engagements that relate directly to the operations and financial reporting of the Registrant and were subject to the pre-approval policies described below): |
| | | a) Audit Fees: |
| | | | Not Applicable |
| | | | |
| | | b) Audit-Related Fees: |
| | | | 2012 | $ 1,028,000 |
| | | | 2013 | $ 1,046,000 |
| | | | The audit-related fees consist of assurance and related services relating to the examination of the Registrant’s transfer agent, principal underwriter and investment adviser conducted in accordance with Statement on Standards for Attestation Engagements Number 16 issued by the American Institute of Certified Public Accountants. |
| | | | |
| | | c) Tax Fees: |
| | | | 2012 | $ 18,000 |
| | | | 2013 | $ 28,000 |
| | | | The tax fees consist of consulting services relating to the Registrant’s investments. |
| | | | |
| | | d) All Other Fees: |
| | | | 2012 | $ 2,000 |
| | | | 2013 | $ 2,000 |
| | | | The other fees consist of subscription services related to an accounting research tool. |
All audit and permissible non-audit services that the Registrant’s audit committee considers compatible with maintaining the independent registered public accounting firm’s independence are required to be pre-approved by the committee. The pre-approval requirement will extend to all non-audit services provided to the Registrant, the investment adviser, and any entity controlling, controlled by, or under common control with the investment adviser that provides ongoing services to the Registrant, if the engagement relates directly to the operations and financial reporting of the Registrant. The committee will not delegate its responsibility to pre-approve these services to the investment adviser. The committee may delegate to one or more committee members the authority to review and pre-approve audit and permissible non-audit services. Actions taken under any such delegation will be reported to the full committee at its next meeting. The pre-approval requirement is waived with respect to non-audit services if certain conditions are met. The pre-approval requirement was not waived for any of the non-audit services listed above provided to the Registrant, adviser and affiliates.
Aggregate non-audit fees paid to the Registrant’s auditors, including fees for all services billed to the Registrant, adviser and affiliates that provide ongoing services to the Registrant, were $1,582,000 for fiscal year 2012 and $1,545,000 for fiscal year 2013. The non-audit services represented by these amounts were brought to the attention of the committee and considered to be compatible with maintaining the auditors’ independence.
ITEM 5 – Audit Committee of Listed Registrants
Not applicable to this Registrant, insofar as the Registrant is not a listed issuer as defined in Rule 10A-3 under the Securities Exchange Act of 1934.
ITEM 6 – Schedule of Investments
 | American High-Income Trust® Investment portfolio September 30, 2013 |
| Bonds, notes & other debt instruments 90.94% | | |
| Corporate bonds, notes & loans 83.55% | Principal amount | Value |
| Telecommunication services 14.79% | (000) | (000) |
| | | |
| Sprint Nextel Corp. 6.00% 2016 | $ 7,500 | $ 7,969 |
| Clearwire Communications and Clearwire Finance, Inc. 14.75% 20161 | 13,650 | 18,735 |
| Sprint Nextel Corp. 8.375% 2017 | 91,375 | 103,711 |
| Sprint Nextel Corp. 9.125% 2017 | 20,250 | 23,389 |
| Clearwire Communications and Clearwire Finance, Inc. 12.00% 20171 | 50,515 | 59,103 |
| Sprint Nextel Corp. 9.00% 20181 | 31,150 | 36,601 |
| Sprint Capital Corp. 6.90% 2019 | 5,000 | 5,162 |
| Sprint Nextel Corp. 7.00% 2020 | 119,185 | 121,867 |
| Sprint Corp. 7.25% 20211 | 42,150 | 42,677 |
| Sprint Nextel Corp. 11.50% 2021 | 44,405 | 57,282 |
| Sprint Nextel Corp. 6.00% 2022 | 8,000 | 7,400 |
| Sprint Corp. 7.875% 20231 | 83,375 | 85,251 |
| Sprint Capital Corp. 8.75% 2032 | 1,800 | 1,838 |
| Frontier Communications Corp. 8.125% 2018 | 17,151 | 19,123 |
| Frontier Communications Corp. 8.50% 2020 | 72,760 | 80,764 |
| Frontier Communications Corp. 9.25% 2021 | 55,510 | 63,836 |
| Frontier Communications Corp. 8.75% 2022 | 26,632 | 29,229 |
| Frontier Communications Corp. 7.125% 2023 | 96,125 | 96,846 |
| Frontier Communications Corp. 7.625% 2024 | 97,523 | 98,011 |
| Wind Acquisition SA 11.75% 20171 | 140,330 | 149,276 |
| Wind Acquisition SA 11.75% 2017 | €51,090 | 73,696 |
| Wind Acquisition SA 7.25% 20181 | $54,080 | 56,243 |
| Wind Acquisition SA 7.25% 20181 | 43,380 | 45,115 |
| Wind Acquisition SA 7.375% 2018 | €21,915 | 31,024 |
| NII Capital Corp. 10.00% 2016 | $ 19,775 | 19,083 |
| NII Capital Corp. 7.875% 20191 | 77,780 | 70,974 |
| NII Capital Corp. 8.875% 2019 | 88,701 | 69,630 |
| NII Capital Corp. 11.375% 20191 | 79,395 | 82,571 |
| NII Capital Corp. 7.625% 2021 | 154,456 | 110,436 |
| Leap Wireless International, Inc., Term Loan C, 4.75% 20202,3,4 | 156,957 | 157,209 |
| Cricket Communications, Inc. 7.75% 2020 | 140,536 | 159,684 |
| MetroPCS Wireless, Inc. 6.25% 20211 | 137,025 | 138,224 |
| MetroPCS Wireless, Inc. 6.625% 20231 | 138,950 | 139,818 |
| Intelsat Jackson Holding Co. 7.25% 2020 | 6,825 | 7,320 |
| Intelsat Jackson Holding Co. 6.625% 20221 | 171,410 | 170,981 |
| LightSquared, Term Loan B, 12.00% 20142,3,5,6 | 144,713 | 170,761 |
| Digicel Group Ltd. 10.50% 20181 | 10,450 | 11,338 |
| Digicel Group Ltd. 8.25% 20201 | 54,600 | 56,784 |
| Digicel Group Ltd. 6.00% 20211 | 87,092 | 82,084 |
| Trilogy International Partners, LLC 10.25% 20161 | 92,240 | 89,012 |
| Telecom Italia SpA 7.75% 20734 | €18,500 | 25,009 |
| Level 3 Communications, Inc. 8.125% 2019 | $ 4,900 | 5,280 |
| Level 3 Communications, Inc. 11.875% 2019 | 15,525 | 17,931 |
| América Móvil, SAB de CV 5.00% 2020 | 4,350 | 4,700 |
| Bonds, notes & other debt instruments | | |
| | Principal amount | Value |
| Corporate bonds, notes & loans — Telecommunication services (continued) | (000) | (000) |
| | | |
| América Móvil, SAB de CV 6.45% 2022 | MXN159,000 | $ 11,498 |
| América Móvil, SAB de CV 8.46% 2036 | 65,000 | 4,861 |
| Verizon Communications Inc. 4.50% 2020 | $ 12,755 | 13,587 |
| Verizon Communications Inc. 5.15% 2023 | 4,130 | 4,437 |
| SBA Communications Corp. 5.75% 2020 | 13,325 | 13,292 |
| tw telecom holdings inc. 5.375% 20221 | 7,125 | 6,822 |
| Syniverse Holdings, Inc. 9.125% 2019 | 4,600 | 4,980 |
| Crown Castle International Corp. 7.125% 2019 | 1,000 | 1,078 |
| | | 2,963,532 |
| Consumer discretionary 13.43% | | |
| | | |
| MGM Resorts International 5.875% 2014 | 44,560 | 45,618 |
| MGM Resorts International 6.625% 2015 | 10,575 | 11,447 |
| MGM Resorts International 6.875% 2016 | 12,000 | 13,110 |
| MGM Resorts International 7.50% 2016 | 36,400 | 40,859 |
| MGM Resorts International 8.625% 2019 | 27,205 | 31,422 |
| MGM Resorts International 6.75% 2020 | 9,000 | 9,473 |
| MGM Resorts International 7.75% 2022 | 23,200 | 25,259 |
| Boyd Gaming Corp. 9.125% 2018 | 82,070 | 89,661 |
| Boyd Gaming Corp. 9.00% 2020 | 74,831 | 81,566 |
| EchoStar DBS Corp. 7.75% 2015 | 5,000 | 5,475 |
| EchoStar DBS Corp. 7.125% 2016 | 7,000 | 7,709 |
| DISH DBS Corp. 4.625% 2017 | 95,950 | 98,589 |
| DISH DBS Corp. 4.25% 2018 | 35,225 | 35,445 |
| DISH DBS Corp. 7.875% 2019 | 3,550 | 4,065 |
| DISH DBS Corp. 6.75% 2021 | 6,765 | 7,146 |
| DISH DBS Corp. 5.00% 2023 | 6,000 | 5,595 |
| Caesars Entertainment Operating Co. 11.25% 2017 | 34,295 | 34,895 |
| Caesars Entertainment Operating Co. 8.00% 20201,7 | 24,100 | 24,100 |
| Caesars Entertainment Operating Co. 9.00% 2020 | 69,370 | 65,555 |
| Caesars Entertainment Operating Co. 9.00% 2020 | 18,830 | 17,794 |
| Cequel Communications Holdings I, LLC and Cequel Capital Corp. 6.375% 20201 | 109,705 | 112,448 |
| Hilton Worldwide, Term Loan B, 4.00% 20212,3,4 | 45,900 | 45,905 |
| Hilton Hotels Corp. 5.625% 20211 | 65,850 | 66,138 |
| Warner Music Group 11.50% 2018 | 46,250 | 53,534 |
| Warner Music Group 13.75% 2019 | 17,725 | 21,048 |
| Warner Music Group 6.00% 20211 | 32,990 | 34,392 |
| Needle Merger Sub Corp. 8.125% 20191 | 83,905 | 86,003 |
| CityCenter Holdings, LLC and CityCenter Finance Corp. 7.625% 2016 | 60,950 | 64,150 |
| CityCenter Holdings, LLC and CityCenter Finance Corp. 10.75% 20176 | 16,476 | 17,753 |
| Virgin Media Finance PLC 8.375% 20191 | 57,435 | 62,461 |
| UPC Germany GmbH 9.625% 2019 | €10,800 | 16,268 |
| Charter Communications Operating, LLC and Charter Communications Operating Capital Corp. 7.25% 2017 | $70,900 | 75,243 |
| Mediacom LLC and Mediacom Capital Corp. 9.125% 2019 | 26,450 | 29,029 |
| Mediacom LLC and Mediacom Capital Corp. 7.25% 2022 | 19,300 | 20,265 |
| Mediacom Broadband LLC and Mediacom Broadband Corp. 6.375% 2023 | 24,575 | 24,698 |
| Revel Entertainment, Term Loan B, 14.50% 20182,3,4,6,8 | 74,061 | 70,358 |
| Quebecor Media Inc. 5.75% 2023 | 73,300 | 69,452 |
| Toys “R” Us-Delaware, Inc. 7.375% 20161 | 32,805 | 33,297 |
| Toys “R” Us Property Co. II, LLC 8.50% 2017 | 8,800 | 9,262 |
| Toys “R” Us-Delaware, Inc., Term Loan B2, 5.25% 20182,3,4 | 14,025 | 13,474 |
| Toys “R” Us, Inc. 7.375% 2018 | 5,525 | 4,793 |
| Six Flags Entertainment Corp. 5.25% 20211 | 63,000 | 60,165 |
| Gannett Co., Inc. 5.125% 20191 | 17,550 | 17,462 |
| Gannett Co., Inc. 6.375% 20231 | 42,020 | 41,810 |
| Bonds, notes & other debt instruments | | |
| | Principal amount | Value |
| Corporate bonds, notes & loans — Consumer discretionary (continued) | (000) | (000) |
| | | |
| PETCO Animal Supplies, Inc. 9.25% 20181 | $53,750 | $57,916 |
| Schaeffler Holding Finance BV 6.875% 20184,6 | €22,600 | 32,141 |
| Schaeffler Holding Finance BV 6.875% 20181,4,6 | $21,900 | 23,050 |
| Univision Communications Inc., Term Loan C3, 4.00% 20202,3,4 | 32,629 | 32,544 |
| Univision Communications Inc. 8.50% 20211 | 10,795 | 11,874 |
| Univision Communications Inc. 6.75% 20221 | 3,000 | 3,180 |
| Univision Communications Inc. 5.125% 20231 | 6,350 | 6,112 |
| Burger King Corp 0%/11.00% 20191,9 | 54,225 | 47,989 |
| Limited Brands, Inc. 5.25% 2014 | 55 | 57 |
| Limited Brands, Inc. 7.00% 2020 | 10,652 | 11,824 |
| Limited Brands, Inc. 6.625% 2021 | 23,226 | 25,229 |
| Limited Brands, Inc. 5.625% 2022 | 8,655 | 8,915 |
| Michaels Stores, Inc. 7.50% 20181,4,6 | 16,700 | 16,992 |
| Michaels Stores, Inc. 7.75% 2018 | 24,950 | 26,946 |
| Mohegan Tribal Gaming Authority 11.00% 20181,4,6 | 38,375 | 38,279 |
| Laureate Education, Inc. 9.25% 20191 | 34,800 | 37,758 |
| Marina District Finance Co., Inc. 9.50% 2015 | 11,702 | 12,302 |
| Marina District Finance Co., Inc. 9.875% 2018 | 21,000 | 22,890 |
| Clear Channel Worldwide Holdings, Inc. 7.625% 2020 | 31,700 | 32,889 |
| DineEquity, Inc. 9.50% 2018 | 29,275 | 32,715 |
| Local T.V. Finance LLC 9.25% 20151,4,6 | 31,914 | 32,392 |
| Neiman Marcus Group, Inc., Term Loan B, 4.00% 20182,3,4 | 31,198 | 31,175 |
| Sally Holdings LLC and Sally Capital Inc. 6.875% 2019 | 21,625 | 23,787 |
| Sally Holdings LLC and Sally Capital Inc. 5.75% 2022 | 7,250 | 7,304 |
| Playa Resorts Holding BV, Term Loan B, 4.75% 20192,3,4 | 10,575 | 10,661 |
| Playa Resorts Holding BV 8.00% 20201 | 18,425 | 19,530 |
| J.C. Penney Co., Inc. 5.75% 2018 | 33,913 | 26,791 |
| Royal Caribbean Cruises Ltd. 6.875% 2013 | 4,000 | 4,045 |
| Royal Caribbean Cruises Ltd. 11.875% 2015 | 19,225 | 22,637 |
| Jaguar Land Rover PLC 7.75% 20181 | 8,210 | 8,908 |
| Jaguar Land Rover PLC 8.125% 20211 | 15,725 | 17,573 |
| Seneca Gaming Corp. 8.25% 20181 | 22,450 | 24,218 |
| Pinnacle Entertainment, Inc. 6.375% 20211 | 23,600 | 24,190 |
| NBCUniversal Enterprise, Inc. 5.25% (undated)1 | 23,885 | 23,682 |
| Academy Sports 9.25% 20191 | 21,050 | 23,576 |
| McClatchy Co. 9.00% 2022 | 21,750 | 23,055 |
| Cinemark USA, Inc. 5.125% 2022 | 12,475 | 11,758 |
| Cinemark USA, Inc. 4.875% 2023 | 10,750 | 9,944 |
| Cumulus Media Holdings Inc. 7.75% 2019 | 17,315 | 18,051 |
| NCL Corp. Ltd. 5.00% 20181 | 17,350 | 17,393 |
| Ford Motor Credit Co. 8.70% 2014 | 1,000 | 1,076 |
| Ford Motor Credit Co. 5.625% 2015 | 1,000 | 1,083 |
| Ford Motor Credit Co. 7.00% 2015 | 3,000 | 3,263 |
| Ford Motor Credit Co. 8.00% 2016 | 7,000 | 8,295 |
| Ford Motor Credit Co. 6.625% 2017 | 2,600 | 2,999 |
| Carmike Cinemas, Inc. 7.375% 2019 | 14,000 | 15,155 |
| Dynacast International LLC 9.25% 2019 | 12,200 | 13,420 |
| Weather Company, Term Loan, 7.00% 20202,3,4 | 10,000 | 10,287 |
| LBI Media, Inc. 8.50% 20171 | 16,443 | 4,933 |
| LBI Media, Inc. 13.50% 20201,4,6 | 10,809 | 4,925 |
| Grupo Televisa, SAB 6.625% 2040 | 2,500 | 2,722 |
| Grupo Televisa, SAB 7.25% 2043 | MXN97,580 | 6,328 |
| General Motors Financial Co. 3.25% 20181 | $5,960 | 5,811 |
| General Motors Financial Co. 6.75% 2018 | 1,040 | 1,157 |
| Bonds, notes & other debt instruments | | |
| | Principal amount | Value |
| Corporate bonds, notes & loans — Consumer discretionary (continued) | (000) | (000) |
| | | |
| General Motors Financial Co. 4.25% 20231 | $ 1,500 | $ 1,374 |
| Seminole Tribe of Florida 7.804% 20201 | 7,640 | 8,251 |
| McGraw-Hill Companies, Inc. 9.75% 20211 | 6,250 | 6,656 |
| Circus and Eldorado Joint Venture and Silver Legacy Resort Casino 12.00% 20184,6 | 7,673 | 6,473 |
| Burlington Coat Factory Warehouse Corp. 10.00% 2019 | 5,250 | 5,867 |
| Regal Entertainment Group 5.75% 2023 | 5,000 | 4,738 |
| Tenneco Inc. 6.875% 2020 | 4,300 | 4,687 |
| MDC Partners Inc. 6.75% 20201 | 4,000 | 4,070 |
| Automotores Gildemeister SA 6.75% 20231 | 1,875 | 1,472 |
| | | 2,691,505 |
| Industrials 10.23% | | |
| | | |
| Associated Materials, LLC and AMH New Finance, Inc. 9.125% 2017 | 141,692 | 151,256 |
| Associated Materials, LLC 9.125% 20171 | 6,000 | 6,405 |
| Ply Gem Industries, Inc. 9.375% 2017 | 7,140 | 7,568 |
| Ply Gem Industries, Inc. 8.25% 2018 | 122,785 | 131,994 |
| Nortek Inc. 10.00% 2018 | 47,735 | 52,628 |
| Nortek Inc. 8.50% 2021 | 70,350 | 76,857 |
| DAE Aviation Holdings, Inc. 11.25% 20151 | 77,087 | 77,376 |
| DAE Aviation Holdings, Inc. and Standard Aero Ltd., Term Loan B, 6.25% 20182,3,4 | 34,741 | 34,915 |
| DAE Aviation Holdings, Inc., Term Loan B2, 6.25% 20182,3,4 | 15,749 | 15,828 |
| US Investigations Services, Inc., Term Loan B, 5.00% 20152,3,4 | 11,907 | 11,870 |
| US Investigations Services, Inc., Term Loan D, 7.75% 20152,3,4 | 48,540 | 48,257 |
| US Investigations Services, Inc. 10.50% 20151 | 48,330 | 42,893 |
| US Investigations Services, Inc. 11.75% 20161 | 20,350 | 15,466 |
| Navios Maritime Acquisition Corporation and Navios Acquisition Finance (US) Inc. 8.625% 2017 | 37,540 | 39,135 |
| Navios Maritime Holdings Inc. 8.875% 2017 | 5,770 | 6,059 |
| Navios Maritime Holdings Inc. and Navios Maritime Finance II (US) Inc. 8.125% 2019 | 39,860 | 39,760 |
| Navios Logistics Finance (US) Inc., 9.25% 2019 | 3,225 | 3,483 |
| TransDigm Inc. 7.75% 2018 | 48,525 | 51,922 |
| TransDigm Inc. 5.50% 2020 | 35,350 | 34,820 |
| Euramax International, Inc. 9.50% 2016 | 85,615 | 82,404 |
| BE Aerospace, Inc. 5.25% 2022 | 74,130 | 73,945 |
| R.R. Donnelley & Sons Co. 7.25% 2018 | 15,820 | 17,560 |
| R.R. Donnelley & Sons Co. 7.875% 2021 | 23,175 | 24,971 |
| R.R. Donnelley & Sons Co. 7.00% 2022 | 27,125 | 27,396 |
| Brunswick Rail Finance Ltd. 6.50% 2017 | 36,130 | 36,166 |
| Brunswick Rail Finance Ltd. 6.50% 20171 | 31,635 | 31,667 |
| General Electric Capital Corp., Series C, junior subordinated 5.25% (undated)4 | 22,000 | 20,449 |
| General Electric Capital Corp., Series B, junior subordinated 6.25% (undated)4 | 40,100 | 40,665 |
| HD Supply, Inc. 7.50% 20201 | 5,000 | 5,194 |
| HD Supply, Inc. 11.50% 2020 | 44,140 | 52,747 |
| United Rentals, Inc. 7.375% 2020 | 11,625 | 12,584 |
| United Rentals, Inc. 7.625% 2022 | 31,725 | 34,660 |
| United Rentals, Inc. 6.125% 2023 | 9,250 | 9,343 |
| TRAC Intermodal 11.00% 2019 | 47,275 | 53,184 |
| Silver II Borrower S.C.A./Silver II U.S. Holdings, LLC 7.75% 20201 | 50,303 | 51,938 |
| Gardner Denver, Inc. Term Loan B, 4.25% 20202,3,4 | 31,575 | 31,329 |
| Gardner Denver, Inc. 6.875% 20211 | 19,700 | 19,552 |
| JELD-WEN Escrow Corp. 12.25% 20171 | 44,530 | 50,876 |
| Beechcraft Holdings, LLC., Term Loan, 5.75% 20202,3,4 | 47,400 | 47,756 |
| Esterline Technologies Corp. 7.00% 2020 | 42,860 | 46,075 |
| CEVA Group PLC 11.625% 20161 | 25,205 | 26,213 |
| CEVA Group PLC 8.375% 20171 | 15,524 | 15,718 |
| Bonds, notes & other debt instruments | | |
| | Principal amount | Value |
| Corporate bonds, notes & loans — Industrials (continued) | (000) | (000) |
| | | |
| Far East Capital Limited SA 8.00% 20181 | $15,555 | $ 13,679 |
| Far East Capital Limited SA 8.75% 20201 | 30,725 | 26,812 |
| ARAMARK Corp., Term Loan D, 4.00% 20192,3,4 | 26,000 | 26,118 |
| ARAMARK Corp. 5.75% 20201 | 5,000 | 5,075 |
| Watco Companies 6.375% 20231 | 30,285 | 30,134 |
| United Air Lines, 1991 Equipment Trust Certificates, Series A, 10.11% 20062,5,7 | 1,135 | — |
| Continental Airlines, Inc., Series 2001-1, Class B, 7.373% 20172 | 2,370 | 2,548 |
| Continental Airlines, Inc., Series 1998-1, Class B, 6.748% 20182 | 2,795 | 2,917 |
| Continental Airlines, Inc., Series 1997-4B, Class B, 6.90% 20182 | 731 | 749 |
| Continental Airlines, Inc., Series 1997-4, Class A, 6.90% 20192 | 2,539 | 2,702 |
| Continental Airlines, Inc., Series 2000-2, Class B, 8.307% 20192 | 646 | 681 |
| Continental Airlines, Inc., Series 1999-1, Class A, 6.545% 20202 | 2,787 | 3,037 |
| United Air Lines, Inc., Series 2007-1, Class B, 7.336% 20211,2 | 3,110 | 3,234 |
| Continental Airlines, Inc., Series 2001-1, Class A-1, 6.703% 20222 | 4,544 | 4,839 |
| Continental Airlines, Inc., Series 2000-2, Class A-1, 7.707% 20222 | 2,412 | 2,698 |
| Continental Airlines, Inc., Series 2000-1, Class A-1, 8.048% 20222 | 273 | 310 |
| Continental Airlines, Inc., Series 2000-1, Class B, 8.388% 20222 | 3,663 | 3,819 |
| Northwest Airlines, Inc., Term Loan B, 3.75% 20132,3,4 | 3,630 | 3,521 |
| Delta Air Lines, Inc., Series 2010-B, Class 2-B, 6.75% 20171,2 | 7,650 | 8,071 |
| Northwest Airlines, Inc., Term Loan A, 2.00% 20182,3,4 | 7,791 | 7,246 |
| Delta Air Lines, Inc., Series 2002-1, Class G-1, MBIA insured, 6.718% 20242 | 7,911 | 8,604 |
| Nielsen Finance LLC and Nielsen Finance Co. 11.625% 2014 | 2,557 | 2,650 |
| Nielsen Finance LLC and Nielsen Finance Co. 7.75% 2018 | 9,700 | 10,597 |
| Nielsen Finance LLC and Nielsen Finance Co. 4.50% 2020 | 5,570 | 5,389 |
| Nielsen Finance LLC and Nielsen Finance Co. 5.50% 20211 | 8,525 | 8,557 |
| BakerCorp International, Inc. 8.25% 2019 | 23,400 | 23,400 |
| Avianca Holdings SA, 8.375% 20201 | 22,075 | 22,848 |
| Hertz Corp. 4.25% 20181 | 10,000 | 9,875 |
| HDTFS Inc. 5.875% 2020 | 7,800 | 8,073 |
| HDTFS Inc. 6.25% 2022 | 4,600 | 4,773 |
| Iron Mountain Inc. 5.75% 2024 | 21,625 | 19,571 |
| Safway Group Holding 7.00% 20181 | 17,000 | 17,340 |
| Florida East Coast Railway Corp. 8.125% 2017 | 14,645 | 15,432 |
| GenCorp Inc. 7.125% 20211 | 13,220 | 13,914 |
| Milacron LLC 7.75% 20211 | 10,275 | 10,660 |
| Red de Carreteras de Occidente 9.00% 2028 | MXN151,560 | 10,328 |
| ADS Waste Escrow 8.25% 20201 | $9,425 | 9,991 |
| RZD Capital Ltd. 8.30% 2019 | RUB289,500 | 9,006 |
| Builders Firstsource 7.625% 20211 | $ 8,743 | 8,765 |
| ENA Norte Trust 4.95% 20281,2 | 8,049 | 8,136 |
| American Airlines, Inc., Series 2013-2, Class A, 4.95% 20241,2 | 5,667 | 5,702 |
| GOL Linhas Aéreas Inteligentes SA 10.75% 20231 | 5,450 | 4,496 |
| Hawker Beechcraft Acquisition Co., LLC, Letter of Credit, 2.481% 20142,3,4 | 3,547 | 1,935 |
| Odebrecht Finance Ltd 5.125% 20221 | 630 | 611 |
| | | 2,049,727 |
| Health care 10.18% | | |
| | | |
| Kinetic Concepts, Inc., Term Loan D1, 4.50% 20182,3,4 | 19,750 | 19,904 |
| Kinetic Concepts, Inc. 10.50% 2018 | 149,425 | 165,675 |
| Kinetic Concepts, Inc. 12.50% 2019 | 89,702 | 94,636 |
| inVentiv Health Inc. 9.00% 20181 | 135,165 | 136,517 |
| inVentiv Health Inc. 11.00% 20181 | 103,250 | 83,891 |
| inVentiv Health Inc. 11.00% 20181 | 51,390 | 41,754 |
| Tenet Healthcare Corp. 9.25% 2015 | 12,180 | 13,337 |
| Tenet Healthcare Corp. 6.00% 20201 | 105,450 | 108,020 |
| Bonds, notes & other debt instruments | | |
| | Principal amount | Value |
| Corporate bonds, notes & loans — Health care (continued) | (000) | (000) |
| | | |
| Tenet Healthcare Corp. 4.375% 20211 | $ 3,435 | $ 3,173 |
| Tenet Healthcare Corp. 4.50% 2021 | 19,820 | 18,656 |
| Tenet Healthcare Corp. 8.125% 20221 | 48,310 | 50,544 |
| VPI Escrow Corp. 6.75% 20181 | 49,100 | 52,783 |
| VPI Escrow Corp. 6.375% 20201 | 67,315 | 70,344 |
| VPI Escrow Corp. 7.50% 20211 | 48,885 | 52,918 |
| DJO Finance LLC 9.75% 2017 | 29,228 | 29,666 |
| DJO Finance LLC 7.75% 2018 | 20,181 | 20,080 |
| DJO Finance LLC 8.75% 2018 | 7,850 | 8,576 |
| DJO Finance LLC 9.875% 2018 | 57,115 | 60,827 |
| Select Medical Holdings Corp. 6.375% 20211 | 121,815 | 116,029 |
| Patheon Inc., Term Loan B1, 7.25% 20182,3,4 | 90,283 | 91,186 |
| Rotech Healthcare Inc., Term Loan A, 5.50% 20182,3,4,7,8 | 25,900 | 25,900 |
| Rotech Healthcare Inc., Term Loan B, 10.00% 20192,3,4,7,8 | 20,825 | 20,825 |
| Rotech Healthcare Inc., Term Loan, 13.00% 20202,3,4,7,8 | 43,909 | 43,909 |
| VWR Funding, Inc. 7.25% 2017 | 80,365 | 85,187 |
| INC Research LLC, Term Loan B, 6.00% 20182,3,4 | 16,648 | 16,710 |
| INC Research LLC 11.50% 20191 | 53,927 | 58,241 |
| HCA Inc. 6.375% 2015 | 2,000 | 2,115 |
| HCA Inc., Term Loan B5, 2.998% 20172,3,4 | 7,015 | 7,013 |
| HCA Inc. 6.50% 2020 | 36,840 | 40,017 |
| HCA Inc. 7.875% 2020 | 5,050 | 5,457 |
| HCA Inc. 5.875% 2023 | 16,840 | 16,587 |
| PRA Holdings, Inc. 9.50% 20231 | 61,695 | 63,777 |
| Quintiles, Term Loan B-2, 4.00% 20182,3,4 | 60,601 | 60,922 |
| ConvaTec Finance International SA 8.25% 20191,4,6 | 57,090 | 57,233 |
| Centene Corp. 5.75% 2017 | 43,035 | 45,617 |
| Symbion Inc. 8.00% 2016 | 42,375 | 44,918 |
| Catalent Pharma Solutions Inc., Term Loan, 6.50% 20172,3,4 | 19,165 | 19,237 |
| PTS Acquisition Corp. 9.75% 2017 | €16,085 | 22,522 |
| IMS Health Inc. 7.375% 20181,4,6 | $ 32,180 | 33,025 |
| Multiplan Inc. 9.875% 20181 | 28,950 | 32,135 |
| Bausch & Lomb Inc. 9.875% 2015 | 27,064 | 27,267 |
| Surgical Care Affiliates, Inc. 10.00% 20171 | 22,505 | 23,405 |
| HealthSouth Corp. 5.75% 2024 | 21,315 | 20,569 |
| Apria Healthcare Group Inc., Term Loan B, 6.75% 20202,3,4 | 12,985 | 13,131 |
| Accellent Inc. 8.375% 2017 | 7,500 | 7,847 |
| Endo Pharmaceuticals Holdings Inc. 7.00% 2019 | 1,960 | 2,029 |
| Endo Pharmaceuticals Holdings Inc. 7.00% 2020 | 3,500 | 3,605 |
| Grifols Inc. 8.25% 2018 | 2,500 | 2,697 |
| | | 2,040,413 |
| Materials 9.20% | | |
| | | |
| FMG Resources 7.00% 20151 | 14,000 | 14,472 |
| FMG Resources 6.375% 20161 | 3,000 | 3,075 |
| FMG Resources 6.00% 20171 | 104,317 | 107,447 |
| FMG Resources 6.875% 20181 | 47,560 | 49,879 |
| FMG Resources 8.25% 20191 | 46,925 | 50,796 |
| FMG Resources 6.875% 20221 | 17,975 | 18,065 |
| Inmet Mining Corp. 8.75% 20201 | 156,170 | 167,883 |
| Inmet Mining Corp. 7.50% 20211 | 70,845 | 72,970 |
| Reynolds Group Inc. 8.50% 2018 | 3,725 | 3,911 |
| Reynolds Group Inc. 7.125% 2019 | 5,700 | 6,085 |
| Reynolds Group Inc. 7.875% 2019 | 5,805 | 6,415 |
| Reynolds Group Inc. 9.875% 2019 | 53,765 | 58,604 |
| Bonds, notes & other debt instruments | | |
| | Principal amount | Value |
| Corporate bonds, notes & loans — Materials (continued) | (000) | (000) |
| | | |
| Reynolds Group Inc. 5.75% 2020 | $153,085 | $ 154,424 |
| ArcelorMittal 5.00% 20174 | 14,250 | 14,891 |
| ArcelorMittal 10.35% 20194 | 2,000 | 2,470 |
| ArcelorMittal 6.00% 20214 | 42,432 | 43,811 |
| ArcelorMittal 6.75% 20224 | 40,995 | 43,352 |
| ArcelorMittal 7.25% 20414 | 74,295 | 68,723 |
| JMC Steel Group Inc. 8.25% 20181 | 135,290 | 131,231 |
| Ryerson Inc. 9.00% 2017 | 52,705 | 54,813 |
| Ryerson Inc. 11.25% 2018 | 54,525 | 56,570 |
| CEMEX Finance LLC 9.50% 20161 | 3,418 | 3,644 |
| CEMEX Finance LLC 9.50% 2016 | 2,251 | 2,400 |
| CEMEX SAB de CV 9.50% 2018 | 3,500 | 3,910 |
| CEMEX SAB de CV 5.875% 20191 | 2,600 | 2,502 |
| CEMEX España, SA 9.25% 20201 | 7,635 | 8,246 |
| CEMEX Finance LLC 7.25% 20211 | 28,500 | 28,500 |
| CEMEX Finance LLC 9.375% 20221 | 47,820 | 52,602 |
| U.S. Coatings Acquisition Inc. (Flash Dutch 2 BV), Term Loan B, 4.75% 20202,3,4 | 22,129 | 22,230 |
| U.S. Coatings Acquisition Inc. (Flash Dutch 2 BV) 5.75% 2021 | €2,630 | 3,577 |
| U.S. Coatings Acquisition Inc. (Flash Dutch 2 BV) 7.375% 20211 | $33,035 | 34,687 |
| Walter Energy, Inc. 9.50% 20191 | 12,925 | 13,426 |
| Walter Energy, Inc. 9.875% 20201 | 35,525 | 31,173 |
| Walter Energy, Inc. 8.50% 20211 | 12,800 | 10,752 |
| Newpage Corp., Term Loan B, 7.75% 20182,3,4 | 47,322 | 48,131 |
| Ball Corp. 6.75% 2020 | 2,555 | 2,775 |
| Ball Corp. 5.75% 2021 | 16,830 | 17,840 |
| Ball Corp. 5.00% 2022 | 10,790 | 10,520 |
| Ball Corp. 4.00% 2023 | 15,770 | 14,232 |
| Smurfit Kappa Acquisition 7.75% 2019 | €11,610 | 17,113 |
| Smurfit Capital Funding PLC 7.50% 2025 | $ 25,515 | 27,811 |
| LSB Industries, Inc. 7.75% 20191 | 41,265 | 43,019 |
| Taminco Global Chemical Corp. 9.75% 20201 | 37,645 | 42,727 |
| Cliffs Natural Resources Inc. 3.95% 2018 | 35,625 | 35,819 |
| PQ Corp. 8.75% 20181 | 27,365 | 29,281 |
| OMNOVA Solutions Inc. 7.875% 2018 | 25,795 | 27,278 |
| Packaging Dynamics Corp. 8.75% 20161 | 25,345 | 26,359 |
| Georgia Gulf Corp. 4.625% 20211 | 6,000 | 5,782 |
| Georgia Gulf Corp. 4.875% 20231 | 20,160 | 19,177 |
| Glencore Xstrata LLC 4.125% 20231 | 24,730 | 22,931 |
| Sibur Securities Ltd. 3.914% 20181 | 23,465 | 22,495 |
| Crown Holdings, Inc. 4.50% 20231 | 22,115 | 20,346 |
| Consolidated Minerals Ltd. 8.875% 20161 | 17,810 | 18,122 |
| Caraustar, Term Loan, 7.50% 20192,3,4 | 10,108 | 10,297 |
| Graphic Packaging International, Inc. 4.75% 2021 | 9,845 | 9,599 |
| Mirabela Nickel Ltd. 8.75% 20181 | 22,650 | 9,400 |
| Sealed Air Corp. 5.25% 20231 | 8,445 | 8,044 |
| Ardagh Packaging Finance 7.375% 20171 | 1,000 | 1,074 |
| Ardagh Packaging Finance 9.125% 20201 | 1,000 | 1,065 |
| Ardagh Packaging Finance 4.875% 20221 | 1,230 | 1,178 |
| Braskem Finance Ltd. 5.75% 20211 | 2,100 | 2,069 |
| MacDermid Inc., Term Loan B, 7.75% 20202,3,4 | 1,250 | 1,269 |
| | | 1,843,289 |
| Financials 8.19% | | |
| | | |
| Realogy Corp. 3.375% 20161 | 32,050 | 32,210 |
| Realogy Corp., Letter of Credit, 4.50% 20162,3,4 | 8,197 | 8,218 |
| Realogy Corp. 7.875% 20191 | 143,060 | 157,008 |
| Bonds, notes & other debt instruments | | |
| | Principal amount | Value |
| Corporate bonds, notes & loans — Financials (continued) | (000) | (000) |
| | | |
| Realogy Corp., Term Loan B, 4.50% 20202,3,4 | $65,706 | $ 66,254 |
| Realogy Corp. 7.625% 20201 | 3,000 | 3,360 |
| Realogy Corp. 9.00% 20201 | 29,285 | 33,971 |
| CIT Group Inc., Series C, 4.75% 20151 | 54,000 | 56,025 |
| CIT Group Inc. 4.25% 2017 | 31,500 | 32,209 |
| CIT Group Inc. 5.00% 2017 | 94,495 | 99,810 |
| CIT Group Inc., Series C, 5.50% 20191 | 12,350 | 13,029 |
| iStar Financial Inc., 3.875% 2016 | 4,275 | 4,307 |
| iStar Financial Inc., Term Loan B, 4.50% 20172,3,4 | 48,071 | 48,251 |
| iStar Financial Inc., Series B, 9.00% 2017 | 55,740 | 63,544 |
| iStar Financial Inc., 4.875% 2018 | 26,000 | 25,350 |
| Crescent Resources 10.25% 20171 | 97,695 | 105,511 |
| Liberty Mutual Group Inc. 6.50% 20351 | 18,000 | 19,481 |
| Liberty Mutual Group Inc., Series B, 7.00% 20671,4 | 11,185 | 11,409 |
| Liberty Mutual Group Inc., Series A, 7.80% 20871,4 | 39,908 | 43,300 |
| HBOS PLC 6.75% 20181 | 21,550 | 24,059 |
| LBG Capital No.1 PLC, Series 2, 7.875% 20201 | 34,490 | 36,870 |
| HBOS PLC 6.00% 20331 | 12,771 | 12,063 |
| JPMorgan Chase & Co., Series Q, junior subordinated 5.15% (undated)4 | 64,260 | 56,549 |
| Citigroup Inc., Series D, junior subordinated 5.35% (undated)4 | 59,625 | 52,093 |
| MetLife Capital Trust IV, junior subordinated 7.875% 20671,4 | 14,950 | 16,893 |
| MetLife Capital Trust X, junior subordinated 9.25% 20681,4 | 17,645 | 22,497 |
| MetLife Inc., junior subordinated 10.75% 20694 | 7,000 | 10,360 |
| Springleaf Finance Corp., Term Loan B, 5.50% 20172,3,4 | 7,229 | 7,249 |
| Springleaf Finance Corp., Series J, 6.90% 2017 | 40,000 | 42,000 |
| Developers Diversified Realty Corp. 9.625% 2016 | 20,326 | 24,126 |
| Developers Diversified Realty Corp. 7.50% 2017 | 9,940 | 11,622 |
| Developers Diversified Realty Corp. 7.875% 2020 | 6,040 | 7,405 |
| FelCor Lodging Trust Inc. 5.625% 2023 | 45,442 | 42,545 |
| International Lease Finance Corp. 4.875% 2015 | 38,065 | 39,514 |
| RBS Capital Trust II 6.425% noncumulative trust (undated)4 | 8,280 | 7,576 |
| Royal Bank of Scotland Group PLC, junior subordinated 6.99% (undated)1,4,5 | 30,376 | 31,591 |
| Hospitality Properties Trust 6.30% 2016 | 5,940 | 6,467 |
| Hospitality Properties Trust 5.625% 2017 | 8,870 | 9,652 |
| Hospitality Properties Trust 6.70% 2018 | 9,595 | 10,775 |
| Hospitality Properties Trust 5.00% 2022 | 10,000 | 10,009 |
| Bank of America Corp., Series U, junior subordinated 5.20% noncumulative (undated)4 | 36,730 | 32,322 |
| Catlin Insurance Ltd., junior subordinated 7.249% (undated)1,4 | 30,275 | 31,108 |
| American Tower Corp. 7.00% 2017 | 21,825 | 25,154 |
| American Tower Corp. 7.25% 2019 | 3,700 | 4,318 |
| Lazard Group LLC 7.125% 2015 | 22,000 | 23,823 |
| Synovus Financial Corp. 5.125% 2017 | 14,420 | 14,672 |
| Synovus Financial Corp. 7.875% 2019 | 7,585 | 8,552 |
| Host Hotels & Resorts LP 5.875% 2019 | 5,125 | 5,536 |
| Host Hotels & Resorts LP 6.00% 2021 | 10,020 | 10,955 |
| AXA SA, junior subordinated 6.463% (undated)1,4 | 16,244 | 16,285 |
| Prologis, Inc. 6.25% 2017 | 2,750 | 3,127 |
| Prologis, Inc. 6.625% 2018 | 8,570 | 10,033 |
| Prologis, Inc. 6.875% 2020 | 2,373 | 2,802 |
| Unum Group 7.125% 2016 | 12,425 | 14,222 |
| Unum Group 5.625% 2020 | 1,155 | 1,276 |
| Genworth Financial, Inc., junior subordinated 6.15% 20664 | 17,500 | 15,378 |
| BBVA Bancomer SA 4.50% 20161 | 2,100 | 2,205 |
| BBVA Bancomer SA, junior subordinated 7.25% 20201 | 1,700 | 1,816 |
| BBVA Bancomer SA 6.50% 20211 | 9,805 | 10,246 |
| Bonds, notes & other debt instruments | | |
| | Principal amount | Value |
| Corporate bonds, notes & loans — Financials (continued) | (000) | (000) |
| | | |
| Ryman Hospitality Properties, Inc. 5.00% 20211 | $13,600 | $ 12,818 |
| Bank of Ireland 10.0% 2022 | €7,000 | 10,938 |
| General Motors Acceptance Corp. 7.50% 2020 | $ 8,000 | 9,020 |
| QBE Capital Funding III LP 7.25% 20411,4 | 7,650 | 8,075 |
| Zions Bancorporation 6.00% 2015 | 7,310 | 7,833 |
| NASDAQ OMX Group, Inc. 5.25% 2018 | 6,345 | 6,880 |
| TitleMax Finance Corp. 8.50% 20181 | 6,550 | 6,878 |
| PNC Financial Services Group, Inc., Series R, junior subordinated 4.85% (undated)4 | 7,265 | 6,266 |
| BNP Paribas, junior subordinated 7.195% (undated)1,4 | 5,500 | 5,548 |
| VEB Finance Ltd. 6.902% 20201 | 4,950 | 5,445 |
| HSBK (Europe) BV 7.25% 20211 | 5,125 | 5,315 |
| Bank of India 3.625% 20181 | 5,400 | 5,169 |
| Banco de Crédito del Perú 5.375% 20201 | 5,000 | 5,075 |
| Banco Mercantil del Norte, SA, junior subordinated 6.862% 20211,4 | 2,000 | 2,125 |
| Banco Mercantil del Norte SA, junior subordinated 6.862% 20214 | 745 | 792 |
| Banco del Estado de Chile 4.125% 20201 | 2,500 | 2,560 |
| Development Bank of Kazakhstan 5.50% 20151 | 458 | 483 |
| | | 1,640,212 |
| Energy 6.89% | | |
| | | |
| Peabody Energy Corp. 6.00% 2018 | 79,765 | 79,964 |
| Peabody Energy Corp. 6.25% 2021 | 48,200 | 46,995 |
| Alpha Natural Resources, Inc. 9.75% 2018 | 49,705 | 50,699 |
| Alpha Natural Resources, Inc. 6.00% 2019 | 27,750 | 23,310 |
| Alpha Natural Resources, Inc. 6.25% 2021 | 53,910 | 44,476 |
| NGPL PipeCo LLC, Term Loan B, 6.75% 20172,3,4 | 5,525 | 4,955 |
| NGPL PipeCo LLC 7.119% 20171 | 20,200 | 17,927 |
| NGPL PipeCo LLC 9.625% 20191 | 100,765 | 94,215 |
| PDC Energy Inc. 7.75% 2022 | 89,575 | 95,397 |
| Arch Coal, Inc. 7.00% 2019 | 48,301 | 37,916 |
| Arch Coal, Inc. 7.25% 2021 | 71,966 | 54,874 |
| Odebrecht Drilling Norbe VIII/IX Ltd 6.35% 20211,2 | 14,934 | 15,270 |
| Odebrecht Offshore Drilling Finance Ltd. 6.75% 20221,2 | 74,095 | 76,133 |
| Sabine Pass Liquefaction, LLC 5.625% 20211 | 90,225 | 88,759 |
| CONSOL Energy Inc. 8.00% 2017 | 24,920 | 26,602 |
| CONSOL Energy Inc. 8.25% 2020 | 56,600 | 60,986 |
| QGOG Constellation S.A. 6.25% 20191 | 85,595 | 81,529 |
| Samson Investment Co., Term Loan B, 6.00% 20182,3,4 | 2,800 | 2,810 |
| Samson Investment Co. 10.25% 20201 | 57,705 | 61,456 |
| Energy Transfer Partners, L.P. 7.50% 2020 | 52,325 | 56,249 |
| Laredo Petroleum, Inc. 9.50% 2019 | 41,350 | 46,105 |
| Laredo Petroleum, Inc. 7.375% 2022 | 7,675 | 8,174 |
| Regency Energy Partners LP and Regency Energy Finance Corp. 6.50% 2021 | 21,000 | 22,155 |
| Regency Energy Partners LP and Regency Energy Finance Corp. 5.50% 2023 | 22,000 | 21,230 |
| Denbury Resources Inc. 8.25% 2020 | 6,088 | 6,712 |
| Denbury Resources Inc. 4.625% 2023 | 36,100 | 33,212 |
| Teekay Corp. 8.50% 2020 | 31,430 | 33,787 |
| Petrobras International Finance Co. 5.75% 2020 | 6,045 | 6,313 |
| Petrobras International Finance Co. 5.375% 2021 | 14,105 | 14,245 |
| Petrobras Global Finance Co. 4.375% 2023 | 7,000 | 6,476 |
| Access Midstream Partners, L.P. 5.875% 2021 | 9,300 | 9,602 |
| Access Midstream Partners, L.P. 4.875% 2023 | 11,500 | 10,867 |
| Rosetta Resources Inc. 5.625% 2021 | 17,625 | 16,832 |
| Oasis Petroleum Inc. 6.875% 20221 | 15,175 | 16,048 |
| Pemex Project Funding Master Trust 5.75% 2018 | 5,850 | 6,508 |
| Bonds, notes & other debt instruments | | |
| | Principal amount | Value |
| Corporate bonds, notes & loans — Energy (continued) | (000) | (000) |
| | | |
| Pemex Project Funding Master Trust, Series 13, 6.625% 2035 | $ 6,500 | $ 6,897 |
| Petróleos Mexicanos 6.50% 2041 | 2,245 | 2,338 |
| QGOG Atlantic/Alaskan Rigs Ltd. 5.25% 20191,2 | 15,244 | 15,679 |
| TransCanada PipeLines Ltd., junior subordinated 6.35% 20674 | 10,295 | 10,634 |
| Reliance Holdings Ltd. 5.40% 20221 | 5,975 | 6,000 |
| Reliance Holdings Ltd. 6.25% 20401 | 5,000 | 4,594 |
| Transocean Inc. 5.05% 2016 | 5,000 | 5,485 |
| Transocean Inc. 7.35% 2041 | 1,655 | 1,925 |
| Bonanza Creek Energy, Inc. 6.75% 2021 | 6,650 | 6,750 |
| Gazprom OJSC 5.092% 20151 | 2,340 | 2,485 |
| Gazprom OJSC 5.999% 20211 | 1,000 | 1,051 |
| Gazprom OJSC, Series 9, 6.51% 2022 | 1,075 | 1,156 |
| Gazprom OJSC 4.95% 20281 | 2,200 | 1,958 |
| Continental Resources Inc. 7.375% 2020 | 700 | 781 |
| Continental Resources Inc. 7.125% 2021 | 5,000 | 5,612 |
| Ecopetrol SA 5.875% 2023 | 5,850 | 6,099 |
| Ras Laffan Liquefied Natural Gas II 5.298% 20202 | 2,565 | 2,731 |
| Ras Laffan Liquefied Natural Gas II 5.298% 20201,2 | 2,414 | 2,571 |
| Cosan Luxembourg, SA 5.00% 20231 | 5,000 | 4,512 |
| MarkWest Energy Partners, LP 4.50% 2023 | 4,500 | 4,264 |
| Forest Oil Corp. 7.25% 2019 | 4,000 | 4,020 |
| Concho Resources Inc. 5.50% 2023 | 3,000 | 2,978 |
| Transportadora de Gas Internacional 5.70% 20221 | 600 | 605 |
| | | 1,379,913 |
| Information technology 6.35% | | |
| | | |
| First Data Corp. 11.25% 2016 | 68,561 | 68,904 |
| First Data Corp. 7.375% 20191 | 5,000 | 5,287 |
| First Data Corp. 6.75% 20201 | 37,525 | 39,026 |
| First Data Corp. 8.25% 20211 | 53,596 | 55,606 |
| First Data Corp. 11.75% 20211 | 125,290 | 121,531 |
| First Data Corp. 12.625% 2021 | 204,626 | 226,112 |
| First Data Corp. 8.75% 20221,4,6 | 77,575 | 81,260 |
| SRA International, Inc., Term Loan B, 6.50% 20182,3,4 | 111,487 | 110,790 |
| SRA International, Inc. 11.00% 2019 | 75,612 | 79,393 |
| Freescale Semiconductor, Inc. 10.125% 2016 | 12,000 | 12,330 |
| Freescale Semiconductor, Inc. 9.25% 20181 | 27,725 | 30,151 |
| Freescale Semiconductor, Inc. 10.125% 20181 | 10,050 | 11,010 |
| Freescale Semiconductor, Inc. 10.75% 2020 | 17,830 | 19,925 |
| Freescale Semiconductor, Inc. 5.00% 20211 | 54,035 | 51,603 |
| SunGard Data Systems Inc. 7.375% 2018 | 41,675 | 44,280 |
| SunGard Data Systems Inc. 7.625% 2020 | 66,814 | 71,825 |
| Dell, Inc. Term Loan B, 4.50% 20212,3,4 | 67,500 | 66,494 |
| Lawson Software, Inc. 9.375% 2019 | 30,800 | 34,573 |
| Jabil Circuit, Inc. 8.25% 2018 | 16,340 | 19,281 |
| Jabil Circuit, Inc. 5.625% 2020 | 6,000 | 6,210 |
| Hughes Satellite Systems Corp. 6.50% 2019 | 6,650 | 7,066 |
| Hughes Satellite Systems Corp. 7.625% 2021 | 16,850 | 18,240 |
| Global A&T Electronics Ltd. 10.00% 20191 | 24,090 | 20,657 |
| Serena Software, Inc. 10.375% 2016 | 19,694 | 19,891 |
| BMC Software, Inc., Term Loan B, 5.00% 20202,3,4 | 15,500 | 15,537 |
| Alcatel-Lucent USA Inc. 8.875% 20201 | 13,970 | 14,808 |
| Ceridian Corp. 11.25% 2015 | 11,000 | 11,165 |
| Compucom Systems Inc., 7.00% 20211 | 4,825 | 4,753 |
| NXP BV and NXP Funding LLC 9.75% 20181 | 4,192 | 4,720 |
| | | 1,272,428 |
| Bonds, notes & other debt instruments | | |
| Corporate bonds, notes & loans (continued) | Principal amount | Value |
| Utilities 2.18% | (000) | (000) |
| | | |
| TXU, Term Loan, 3.682% 20142,3,4 | $18,302 | $ 12,371 |
| Texas Competitive Electric Holdings Co. LLC, Series A, 10.25% 2015 | 28,113 | 773 |
| TXU, Term Loan, 4.682% 20172,3,4 | 94,878 | 64,042 |
| Texas Competitive Electric Holdings Co. LLC 11.50% 20201 | 28,650 | 19,948 |
| AES Corp. 7.75% 2015 | 5,575 | 6,216 |
| AES Corp. 8.00% 2017 | 34,000 | 39,270 |
| AES Corp. 8.00% 2020 | 16,300 | 18,663 |
| AES Corp. 7.375% 2021 | 5,775 | 6,381 |
| AES Corp. 4.875% 2023 | 5,250 | 4,935 |
| Midwest Generation, LLC, Series B, 8.56% 20162,5 | 21,150 | 21,044 |
| Edison Mission Energy 7.00% 20175 | 3,095 | 2,066 |
| Edison Mission Energy 7.20% 20195 | 19,200 | 12,816 |
| Edison Mission Energy 7.50% 20235 | 8,000 | 5,280 |
| Edison Mission Energy 7.625% 20275 | 14,205 | 9,482 |
| Eskom Holdings SOC Ltd. 6.75% 20231 | 36,250 | 37,407 |
| NRG Energy, Inc. 8.25% 2020 | 6,000 | 6,615 |
| NRG Energy, Inc. 6.625% 2023 | 28,275 | 27,851 |
| CMS Energy Corp. 8.75% 2019 | 21,125 | 27,176 |
| CMS Energy Corp. 5.05% 2022 | 5,750 | 6,172 |
| NV Energy, Inc 6.25% 2020 | 26,150 | 30,575 |
| Entergy Corp. 4.70% 2017 | 21,100 | 22,616 |
| Enel Società per Azioni 8.75% 20731,4 | 15,000 | 15,347 |
| Electricité de France SA 5.25% (undated)1,4 | 15,000 | 14,214 |
| Abu Dhabi National Energy Co. PJSC (TAQA) 4.125% 2017 | 2,000 | 2,098 |
| Abu Dhabi National Energy Co. PJSC (TAQA) 6.165% 20171 | 2,000 | 2,275 |
| Abu Dhabi National Energy Co. PJSC (TAQA) 5.875% 20211 | 4,125 | 4,605 |
| Emgesa SA ESP 8.75% 2021 | COP10,600,000 | 5,946 |
| FirstEnergy Corp., Series A, 2.75% 2018 | $ 5,500 | 5,356 |
| Enersis SA 7.375% 2014 | 5,000 | 5,086 |
| | | 436,626 |
| Consumer staples 2.11% | | |
| | | |
| Marfrig Holdings (Europe) BV 9.875% 20171 | 56,075 | 55,234 |
| Marfrig Holdings (Europe) BV 8.375% 2018 | 1,750 | 1,601 |
| Marfrig Overseas Ltd. 9.50% 20201 | 29,590 | 27,815 |
| Marfrig Overseas Ltd. 9.50% 2020 | 6,915 | 6,500 |
| Stater Bros. Holdings Inc. 7.75% 2015 | 26,230 | 26,361 |
| Stater Bros. Holdings Inc. 7.375% 2018 | 20,275 | 21,542 |
| Rite Aid Corp. 10.25% 2019 | 21,345 | 24,120 |
| Rite Aid Corp. 8.00% 2020 | 18,575 | 20,851 |
| Del Monte Corp. 7.625% 2019 | 41,625 | 43,394 |
| Smithfield Foods, Inc. 7.75% 2017 | 11,500 | 13,139 |
| Smithfield Foods, Inc. 5.25% 20181 | 6,575 | 6,756 |
| Smithfield Foods, Inc. 5.875% 20211 | 5,925 | 6,021 |
| Smithfield Foods, Inc. 6.625% 2022 | 15,130 | 15,641 |
| C&S Group Enterprises LLC 8.375% 20171 | 38,551 | 41,346 |
| Constellation Brands, Inc. 8.375% 2014 | 1,650 | 1,786 |
| Constellation Brands, Inc. 7.25% 2017 | 6,500 | 7,475 |
| Constellation Brands, Inc. 3.75% 2021 | 9,650 | 8,938 |
| Constellation Brands, Inc. 6.00% 2022 | 6,975 | 7,463 |
| Constellation Brands, Inc. 4.25% 2023 | 10,350 | 9,522 |
| BFF International Ltd. 7.25% 20201 | 18,950 | 21,035 |
| Brasil Foods SA 5.875% 20221 | 8,250 | 8,229 |
| Cott Beverages Inc. 8.375% 2017 | 8,700 | 9,124 |
| Cott Beverages Inc. 8.125% 2018 | 13,325 | 14,491 |
| Bonds, notes & other debt instruments | | |
| | Principal amount | Value |
| Corporate bonds, notes & loans — Consumer staples (continued) | (000) | (000) |
| | | |
| Pilgrim’s Pride Corp. 7.875% 2018 | $10,000 | $ 10,925 |
| Post Holdings, Inc. 7.375% 2022 | 7,500 | 7,922 |
| TreeHouse Foods, Inc. 7.75% 2018 | 5,600 | 5,936 |
| | | 423,167 |
| Total corporate bonds, notes & loans | | 16,740,812 |
| Bonds & notes of governments & government agencies outside the U.S. 6.59% | | |
| | | |
| Slovenia (Republic of) 4.75% 20181 | 15,760 | 15,248 |
| Slovenia (Republic of) 5.50% 2022 | 96,140 | 89,771 |
| Slovenia (Republic of) 5.50% 20221 | 16,100 | 15,033 |
| Slovenia (Republic of) 5.85% 20231 | 32,600 | 31,133 |
| Greek Government 2.00%/3.00% 20239 | € 8,685 | 7,343 |
| Greek Government 2.00%/3.00% 20249 | 8,685 | 6,897 |
| Greek Government 2.00%/3.00% 20259 | 8,685 | 6,622 |
| Greek Government 2.00%/3.00% 20269 | 8,685 | 6,421 |
| Greek Government 2.00%/3.00% 20279 | 8,685 | 6,293 |
| Greek Government 2.00%/3.00% 20289 | 8,685 | 6,143 |
| Greek Government 2.00%/3.00% 20299 | 8,685 | 5,984 |
| Greek Government 2.00%/3.00% 20309 | 8,685 | 5,879 |
| Greek Government 2.00%/3.00% 20319 | 8,685 | 5,793 |
| Greek Government 2.00%/3.00% 20329 | 8,685 | 5,775 |
| Greek Government 2.00%/3.00% 20339 | 8,685 | 5,685 |
| Greek Government 2.00%/3.00% 20349 | 8,685 | 5,651 |
| Greek Government 2.00%/3.00% 20359 | 8,685 | 5,626 |
| Greek Government 2.00%/3.00% 20369 | 12,185 | 7,845 |
| Greek Government 2.00%/3.00% 20379 | 15,935 | 10,223 |
| Greek Government 2.00%/3.00% 20389 | 13,135 | 8,446 |
| Greek Government 2.00%/3.00% 20399 | 9,435 | 6,032 |
| Greek Government 2.00%/3.00% 20409 | 13,985 | 8,927 |
| Greek Government 2.00%/3.00% 20419 | 15,685 | 10,039 |
| Greek Government 2.00%/3.00% 20429 | 10,435 | 6,660 |
| United Mexican States Government Global, Series A, 5.625% 2017 | $12,300 | 13,788 |
| United Mexican States Government, Series M10, 7.75% 2017 | MXN120,000 | 10,257 |
| United Mexican States Government 3.50% 201710 | 64,378 | 5,448 |
| United Mexican States Government 4.00% 201910 | 123,804 | 10,846 |
| United Mexican States Government, Series M, 6.50% 2021 | 155,000 | 12,445 |
| United Mexican States Government Global, Series A, 3.625% 2022 | $15,700 | 15,614 |
| United Mexican States Government, Series M20, 10.00% 2024 | MXN150,000 | 15,101 |
| United Mexican States Government, Series M30, 10.00% 2036 | 69,500 | 7,008 |
| United Mexican States Government 4.00% 204010 | 194,620 | 16,317 |
| United Mexican States Government Global 4.75% 2044 | $7,712 | 7,018 |
| Turkey (Republic of) 9.00% 2016 | TRY4,100 | 2,055 |
| Turkey (Republic of) 7.50% 2017 | $14,200 | 16,117 |
| Turkey (Republic of) 6.75% 2018 | 17,000 | 18,876 |
| Turkey (Republic of) 10.50% 2020 | TRY21,050 | 11,197 |
| Turkey (Republic of) 3.00% 202110 | 24,326 | 12,171 |
| Turkey (Republic of) 5.625% 2021 | $20,450 | 21,350 |
| Turkey (Republic of) 9.50% 2022 | TRY5,600 | 2,848 |
| Turkey (Republic of) 6.875% 2036 | $3,200 | 3,413 |
| Turkey (Republic of) 6.75% 2040 | 2,500 | 2,626 |
| Turkey (Republic of) 6.00% 2041 | 3,800 | 3,682 |
| Russian Federation 7.50% 2018 | RUB1,202,900 | 38,415 |
| Russian Federation 5.00% 2020 | $14,300 | 15,347 |
| Russian Federation 12.75% 2028 | 2,000 | 3,450 |
| Bonds, notes & other debt instruments | | |
| | Principal amount | Value |
| Bonds & notes of governments & government agencies outside the U.S. (continued) | (000) | (000) |
| | | |
| Russian Federation 7.50% 20302 | $13,303 | $15,704 |
| Venezuela (Republic of) 8.50% 2014 | 1,250 | 1,253 |
| Venezuela (Republic of) 5.75% 2016 | 3,000 | 2,715 |
| Venezuela (Republic of) 7.65% 2025 | 8,455 | 6,130 |
| Venezuela (Republic of) 11.75% 2026 | 4,180 | 3,877 |
| Venezuela (Republic of) 9.25% 2027 | 42,455 | 34,707 |
| Venezuela (Republic of) 9.25% 2028 | 16,095 | 12,715 |
| Polish Government 3.00% 201610 | PLN16,393 | 5,531 |
| Polish Government, Series 1017, 5.25% 2017 | 36,050 | 12,214 |
| Polish Government 6.375% 2019 | $ 5,835 | 6,824 |
| Polish Government 5.125% 2021 | 14,225 | 15,505 |
| Polish Government, Series 1021, 5.75% 2021 | PLN45,515 | 15,974 |
| Polish Government 5.75% 2022 | 7,695 | 2,700 |
| Polish Government 2.75% 202310 | 6,254 | 2,113 |
| Indonesia (Republic of) 6.875% 20171 | $ 1,000 | 1,110 |
| Indonesia (Republic of) 6.875% 2018 | 10,292 | 11,501 |
| Indonesia (Republic of) 6.875% 20181 | 9,425 | 10,532 |
| Indonesia (Republic of) 4.875% 2021 | 5,600 | 5,572 |
| Indonesia (Republic of) 3.75% 2022 | 15,925 | 14,452 |
| Indonesia (Republic of) 6.625% 20371 | 2,500 | 2,556 |
| Indonesia (Republic of) 5.25% 2042 | 11,450 | 9,887 |
| Hungarian Government 4.125% 2018 | 14,520 | 14,400 |
| Hungarian Government 3.875% 2020 | €4,000 | 5,148 |
| Hungarian Government 6.25% 2020 | $ 5,800 | 6,221 |
| Hungarian Government 6.375% 2021 | 10,900 | 11,649 |
| Hungarian Government 5.375% 2023 | 10,630 | 10,402 |
| Hungarian Government 7.625% 2041 | 4,500 | 4,838 |
| Brazil (Federal Republic of) 10.00% 2017 | BRL19,320 | 8,422 |
| Brazil (Federal Republic of) 6.00% 201710 | 27,414 | 12,889 |
| Brazil (Federal Republic of) 6.00% 201810 | 6,906 | 3,226 |
| Brazil (Federal Republic of) 6.00% 202010 | 23,942 | 11,207 |
| Brazil (Federal Republic of) Global 4.875% 2021 | $3,100 | 3,344 |
| Brazil (Federal Republic of) 6.00% 204510 | BRL22,864 | 10,586 |
| Colombia (Republic of) Global 12.00% 2015 | COP 3,149,000 | 1,893 |
| Colombia (Republic of), Series B, 5.00% 2018 | 14,854,000 | 7,488 |
| Colombia (Republic of) Global 7.375% 2019 | $11,650 | 14,166 |
| Colombia (Republic of) Global 11.75% 2020 | 1,936 | 2,802 |
| Colombia (Republic of) Global 4.375% 2021 | 1,700 | 1,760 |
| Colombia (Republic of) Global 7.75% 2021 | COP 5,522,000 | 3,296 |
| Colombia (Republic of) Global 9.85% 2027 | 18,086,000 | 12,457 |
| Colombia (Republic of) Global 10.375% 2033 | $ 823 | 1,241 |
| Nigeria (Republic of) 5.125% 20181 | 3,875 | 3,943 |
| Nigeria (Republic of) 6.75% 2021 | 8,600 | 9,240 |
| Nigeria (Republic of) 16.39% 2022 | NGN3,550,000 | 25,425 |
| Nigeria (Republic of) 6.375% 20231 | $1,980 | 2,025 |
| Chilean Government 5.50% 2020 | CLP2,592,500 | 5,239 |
| Chilean Government 6.00% 2020 | 2,735,000 | 5,656 |
| Chilean Government 3.00% 202010 | 605,596 | 1,264 |
| Chilean Government 6.00% 2021 | 9,625,000 | 20,035 |
| Chilean Government 6.00% 2022 | 735,000 | 1,533 |
| Chilean Government 6.00% 2022 | 710,000 | 1,484 |
| Chilean Government 3.00% 202210 | 537,038 | 1,134 |
| Chilean Government 3.00% 202210 | 645,084 | 1,353 |
| Chilean Government 6.00% 2023 | 310,000 | 646 |
| Chilean Government 3.00% 202310 | 875,471 | 1,847 |
| Bonds, notes & other debt instruments | | |
| | Principal amount | Value |
| Bonds & notes of governments & government agencies outside the U.S. (continued) | (000) | (000) |
| | | |
| Croatian Government 6.75% 20191 | $ 4,510 | $ 4,831 |
| Croatian Government 6.375% 2021 | 7,000 | 7,264 |
| Croatian Government 6.375% 20211 | 2,810 | 2,916 |
| Croatian Government 5.50% 20231 | 22,545 | 21,700 |
| Philippines (Republic of) 4.95% 2021 | PHP509,000 | 12,801 |
| Philippines (Republic of) 5.50% 2026 | $6,925 | 7,747 |
| Philippines (Republic of) 6.25% 2036 | PHP543,000 | 14,030 |
| Portuguese Government 5.65% 2024 | €27,880 | 34,247 |
| South Africa (Republic of) 5.50% 2020 | $6,200 | 6,688 |
| South Africa (Republic of), Series R-2023, 7.75% 2023 | ZAR165,125 | 16,565 |
| South Africa (Republic of), Series R-214, 6.50% 2041 | 86,000 | 6,460 |
| Uruguay (Republic of) 5.00% 201810 | UYU215,364 | 10,756 |
| Uruguay (Republic of) 4.25% 20272,10 | 200,823 | 9,769 |
| Uruguay (Republic of) 4.375% 20282,10 | 118,058 | 5,971 |
| Iraq (Republic of) 5.80% 20282 | $27,900 | 23,855 |
| Morocco Government 4.25% 20221 | 22,300 | 20,362 |
| Morocco Government 5.50% 20421 | 4,000 | 3,391 |
| Republic of Belarus 8.75% 2015 | 2,805 | 2,721 |
| Republic of Belarus 8.95% 2018 | 20,395 | 19,273 |
| Israeli Government 4.00% 2022 | 13,400 | 13,934 |
| Israeli Government 3.15% 2023 | 7,000 | 6,688 |
| Panama (Republic of) Global 8.875% 2027 | 6,500 | 8,986 |
| Panama (Republic of) Global 6.70% 20362 | 6,440 | 7,390 |
| Dominican Republic 9.04% 20182 | 2,164 | 2,364 |
| Dominican Republic 7.50% 20211,2 | 12,000 | 12,855 |
| Dominican Republic 7.50% 20212 | 450 | 482 |
| Lithuania (Republic of) 6.625% 20221 | 6,225 | 7,322 |
| Lithuania (Republic of) 6.625% 2022 | 3,900 | 4,587 |
| Peru (Republic of) 7.125% 2019 | 8,545 | 10,286 |
| Corporacion Andina de Fomento 4.375% 2022 | 9,215 | 9,230 |
| Bahrain Government 5.50% 2020 | 7,045 | 7,071 |
| Bahrain Government 5.50% 20201 | 255 | 256 |
| State of Qatar 5.25% 2020 | 3,000 | 3,383 |
| State of Qatar 5.75% 2042 | 1,800 | 1,953 |
| El Salvador (Republic of) 7.375% 2019 | 4,800 | 5,244 |
| Argentina (Republic of) 0% 2035 | 56,982 | 4,843 |
| Sri Lanka (Republic of) 6.25% 20211 | 3,300 | 3,176 |
| Gabonese Republic 8.20% 2017 | 2,800 | 3,164 |
| | | 1,321,250 |
| U.S. Treasury bonds & notes 0.73% | | |
| | | |
| U.S. Treasury 1.875% 2014 | 58,000 | 58,439 |
| U.S. Treasury 0.25% 2015 | 21,900 | 21,919 |
| U.S. Treasury 4.00% 2015 | 42,300 | 44,504 |
| U.S. Treasury 3.25% 201611 | 20,000 | 21,444 |
| | | 146,306 |
| Municipals 0.07% | | |
| | | |
| State of New Jersey, Economic Development Authority, Energy Facility Revenue Bonds | | |
| (ACR Energy Partners, LLC Project), Series 2011-B, 12.00% 20301 | 12,385 | 11,716 |
| State of New Jersey, Tobacco Settlement Financing Corp., Tobacco Settlement Asset-backed | | |
| Revenue Refunding Bonds, Series 2007-1-A, 5.00% 2041 | 3,000 | 2,157 |
| | | 13,873 |
| Total bonds, notes & other debt instruments (cost: $17,675,742,000) | | 18,222,241 |
| Convertible securities 1.52% | | |
| | Shares or | Value |
| Industrials 0.54% | principal amount | (000) |
| | | |
| CEVA Group PLC, Series A-2, 2.244% convertible preferred7,12 | 21,062 | $ 27,177 |
| CEVA Group PLC, Series A-1, 3.244% convertible preferred7 | 47,121 | 81,291 |
| | | 108,468 |
| Financials 0.39% | | |
| | | |
| Weyerhaeuser Co., Series A, 6.375% convertible preferred | 1,000,000 | 52,980 |
| Bank of Ireland 10.00% convertible notes 2016 | €17,805,000 | 25,443 |
| | | 78,423 |
| Information technology 0.37% | | |
| | | |
| Linear Technology Corp., Series A, 3.00% convertible notes 2027 | $46,000,000 | 49,076 |
| Liberty Media Corp. 3.50% convertible notes 2031 | $48,500,000 | 25,275 |
| | | 74,351 |
| Consumer discretionary 0.11% | | |
| | | |
| Cooper-Standard Holdings Inc. 7.00% convertible preferred1,7,8 | 99,687 | 21,387 |
| Telecommunication services 0.11% | | |
| | | |
| Leap Wireless International, Inc. 4.50% convertible notes 2014 | $12,500,000 | 12,781 |
| Clearwire Corp. 8.25% convertible notes 20401 | $7,722,000 | 8,591 |
| | | 21,372 |
| Total convertible securities (cost: $232,655,000) | | 304,001 |
| Preferred securities 0.97% | | |
| | | |
| Financials 0.97% | Shares | |
| | | |
| Wells Fargo & Co., Class A, Series Q, 5.85% depositary shares preferred noncumulative | 3,194,855 | 76,261 |
| Goldman Sachs Group, Inc., Series J, 5.50% depositary shares | 2,085,650 | 46,932 |
| Ally Financial Inc., Series G, 7.00%1 | 24,250 | 23,173 |
| Ally Financial Inc., Series 2, 8.125% preferred | 650,000 | 17,408 |
| Swire Pacific Ltd. 8.84% cumulative guaranteed perpetual capital securities1 | 450,000 | 12,825 |
| First Republic Bank, Series A, noncumulative convertible preferred | 400,000 | 9,433 |
| HSBC Holdings PLC, Series 2, 8.00% | 300,000 | 8,147 |
| Total preferred securities (cost: $192,326,000) | | 194,179 |
| Common stocks 2.60% | | |
| | | |
| Industrials 1.42% | | |
| | | |
| Beech Holdings, LLC7,12,13 | 16,466,838 | 135,851 |
| CEVA Group PLC1,7,13 | 59,168 | 76,347 |
| Delta Air Lines, Inc. | 1,799,769 | 42,456 |
| Nortek, Inc.13 | 426,846 | 29,329 |
| United Continental Holdings, Inc.13 | 22,981 | 706 |
| Atrium Corp.1,7,13 | 10,987 | 11 |
| | | 284,700 |
| Consumer discretionary 0.44% | | |
| | | |
| Cooper-Standard Holdings Inc.8,13 | 1,238,538 | 61,927 |
| Ford Motor Co. | 810,210 | 13,668 |
| Revel AC, Inc.7,8,12,13 | 908,183 | 7,747 |
| Revel AC, Inc. (CVR)7,8,12,13 | 43,088,200 | 1,292 |
| American Media, Inc.1,7,8,13 | 1,122,345 | 2,806 |
| Common stocks | | |
| | | Value |
| Consumer discretionary (continued) | Shares | (000) |
| | | |
| Adelphia Recovery Trust, Series ACC-113 | 10,643,283 | $ 30 |
| Adelphia Recovery Trust, Series Arahova7,13 | 1,773,964 | 18 |
| Five Star Travel Corp.1,7,13 | 83,780 | 26 |
| | | 87,514 |
| Financials 0.33% | | |
| | | |
| American Tower Corp. | 538,967 | 39,954 |
| Citigroup Inc. | 405,574 | 19,674 |
| CIT Group Inc.13 | 124,904 | 6,092 |
| | | 65,720 |
| Health care 0.17% | | |
| | | |
| Rotech Healthcare Inc.7,8,13 | 1,916,275 | 34,225 |
| Telecommunication services 0.13% | | |
| | | |
| Frontier Communications Corp., Class B | 6,000,000 | 25,020 |
| Materials 0.11% | | |
| | | |
| NewPage Holdings Inc.7,12,13 | 226,200 | 22,473 |
| Energy 0.00% | | |
| | | |
| General Maritime Corp.1,7,13 | 12,599 | 464 |
| Petroplus Holdings AG7,13 | 3,360,000 | — |
| | | 464 |
| Total common stocks (cost: $504,215,000) | | 520,116 |
| Warrants 0.03% | | |
| | | |
| Consumer discretionary 0.03% | | |
| | | |
| Cooper-Standard Holdings Inc., warrants, expire 20178,13 | 196,935 | 4,725 |
| Charter Communications, Inc., warrants, expire 201413 | 13,390 | 1,121 |
| Liberman Broadcasting, Inc., warrants, expire 20227,12,13 | 10 | — |
| | | 5,846 |
| Energy 0.00% | | |
| | | |
| General Maritime Corp., warrants, expire 20171,7,13 | 19,483 | 133 |
| Total warrants (cost: $7,329,000) | | 5,979 |
| | Principal amount | |
| Short-term securities 4.25% | (000) | |
| | | |
| Freddie Mac 0.09%–0.12% due 11/26/2013–5/6/2014 | $250,000 | 249,923 |
| Fannie Mae 0.10%–0.12% due 2/18–6/2/2014 | 137,100 | 137,035 |
| Coca-Cola Co. 0.08%–0.15% due 10/22–12/9/20131 | 96,615 | 96,607 |
| E.I. duPont de Nemours and Co. 0.05%–0.07% due 10/8–11/12/20131 | 72,400 | 72,396 |
| General Electric Capital Corp. 0.19% due 1/3/2014 | 50,000 | 49,987 |
| General Electric Co. 0.05% due 10/1/2013 | 11,600 | 11,600 |
| Paccar Financial Corp. 0.10%–0.12% due 11/8–11/12/2013 | 54,900 | 54,888 |
| PepsiCo Inc. 0.04% due 11/18/20131 | 36,400 | 36,398 |
| | Principal amount | Value |
| Short-term securities | (000) | (000) |
| | | |
| Wells Fargo & Co. 0.18% due 12/16/2013 | $30,000 | $ 29,987 |
| Procter & Gamble Co. 0.07% due 10/8/20131 | 29,400 | 29,400 |
| Federal Home Loan Bank 0.10%–0.12% due 11/8/2013–1/2/2014 | 27,500 | 27,498 |
| John Deere Financial Ltd. 0.06% due 10/17/20131 | 20,000 | 19,999 |
| Merck & Co. Inc. 0.13% due 10/28/20131 | 20,000 | 19,999 |
| Abbott Laboratories 0.07% due 12/10/20131 | 13,900 | 13,899 |
| ADP Tax Services, Inc. 0.05% due 10/2/20131 | 2,900 | 2,900 |
| Total short-term securities (cost: $852,428,000) | | 852,516 |
| Total investment securities (cost: $19,464,695,000) | | 20,099,032 |
| Other assets less liabilities | | (62,061) |
| Net assets | | $20,036,971 |
| | | |
| 1 | Acquired in a transaction exempt from registration under Rule 144A or section 4(2) of the Securities Act of 1933. May be resold in the U.S. in transactions exempt from registration, normally to qualified institutional buyers. The total value of all such securities was $7,500,725,000, which represented 37.43% of the net assets of the fund. |
| 2 | Principal payments may be made periodically. Therefore, the effective maturity date may be earlier than the stated maturity date. |
| 3 | Loan participations and assignments; may be subject to legal or contractual restrictions on resale. The total value of all such loans was $1,578,784,000, which represented 7.88% of the net assets of the fund. |
| 4 | Coupon rate may change periodically. |
| 5 | Scheduled interest and/or principal payment was not received. |
| 6 | Payment in kind; the issuer has the option of paying additional securities in lieu of cash. |
| 7 | Valued under fair value procedures adopted by authority of the board of trustees. The total value of all such securities was $525,982,000, which represented 2.63% of the net assets of the fund. |
| 8 | Represents an affiliated company as defined under the Investment Company Act of 1940. |
| 9 | Step bond; coupon rate will increase at a later date. |
| 10 | Index-linked bond whose principal amount moves with a government price index. |
| 11 | A portion of this security was pledged as collateral for net losses on unsettled forward currency contracts. The total value of pledged collateral was $5,220,000, which represented .03% of the net assets of the fund. |
| 12 | Acquired through a private placement transaction exempt from registration under the Securities Act of 1933. May be subject to legal or contractual restrictions on resale. Further details on these holdings appear below. |
| | | | | Percent |
| | Acquisition | Cost | Value | of net |
| | date(s) | (000) | (000) | assets |
| | | | | |
| Beech Holdings, LLC | 3/16/2007–2/15/2013 | $ 114,109 | $ 135,851 | .68% |
| CEVA Group PLC, Series A-2, 2.268% convertible preferred | 5/2/2013 | 20,349 | 27,177 | .13 |
| NewPage Holdings Inc. | 9/17/2009–1/9/2012 | 43,602 | 22,473 | .11 |
| Revel AC, Inc. | 2/14/2011–1/10/2012 | 45,288 | 7,747 | .04 |
| Revel AC, Inc. (CVR) | 2/15/2011–3/15/2013 | 7,796 | 1,292 | .01 |
| Liberman Broadcasting, Inc., warrants, expire 2022 | 12/31/2012 | — | — | .00 |
| Total restricted securities | | $231,144 | $194,540 | .97% |
| 13 | Security did not produce income during the last 12 months. |
| Key to abbreviations and symbol | |
| CVR = Contingent Value Rights | PHP = Philippine pesos |
| BRL = Brazilian reais | PLN = Polish zloty |
| CLP = Chilean pesos | RUB = Russian rubles |
| COP = Colombian pesos | TRY = Turkish lira |
| € = Euros | UYU = Uruguayan pesos |
| MXN = Mexican pesos | ZAR = South African rand |
| NGN = Nigerian naira | |
Investments are not FDIC-insured, nor are they deposits of or guaranteed by a bank or any other entity, so they may lose value.
Investors should carefully consider investment objectives, risks, charges and expenses. This and other important information is contained in the fund prospectus and summary prospectus, which can be obtained from your financial professional and should be read carefully before investing. You may also call American Funds Service Company (AFS) at (800) 421-4225 or visit the American Funds website at americanfunds.com.
MFGEFPX-021-1113O-S37711
REPORT OF INDEPENDENT REGISTERED PUBLIC ACCOUNTING FIRM ON INVESTMENT PORTFOLIO
To the Shareholders and Board of Trustees of
American High-Income Trust:
We have audited, in accordance with the standards of the Public Company Accounting Oversight Board (United States), the financial statements of American High-Income Trust (the “Fund”) as of September 30, 2013, and for the year then ended and have issued our report thereon dated November 12, 2013, which report and financial statements are included in Item 1 of this Certified Shareholder Report on Form N-CSR. Our audit also included the Fund’s investment portfolio (the “Schedule”) as of September 30, 2013, appearing in Item 6 of this Form N-CSR. This Schedule is the responsibility of the Fund’s management. Our responsibility is to express an opinion based on our audit. In our opinion, the Schedule referred to above, when considered in relation to the basic financial statements taken as a whole of the Fund referred to above, presents fairly, in all material respects, the information set forth therein.
DELOITTE & TOUCHE LLP
Costa Mesa, California
November 12, 2013
ITEM 7 – Disclosure of Proxy Voting Policies and Procedures for Closed-End Management Investment Companies
Not applicable to this Registrant, insofar as the Registrant is not a closed-end management investment company.
ITEM 8 – Portfolio Managers of Closed-End Management Investment Companies
Not applicable to this Registrant, insofar as the Registrant is not a closed-end management investment company.
ITEM 9 – Purchases of Equity Securities by Closed-End Management Investment Company and Affiliated Purchasers
Not applicable to this Registrant, insofar as the Registrant is not a closed-end management investment company.
ITEM 10 – Submission of Matters to a Vote of Security Holders
There have been no material changes to the procedures by which shareholders may recommend nominees to the Registrant’s board of trustees since the Registrant last submitted a proxy statement to its shareholders. The procedures are as follows. The Registrant has a nominating and governance committee comprised solely of persons who are not considered ‘‘interested persons’’ of the Registrant within the meaning of the Investment Company Act of 1940, as amended. The committee periodically reviews such issues as the board’s composition, responsibilities, committees, compensation and other relevant issues, and recommends any appropriate changes to the full board of trustees. While the committee normally is able to identify from its own resources an ample number of qualified candidates, it will consider shareholder suggestions of persons to be considered as nominees to fill future vacancies on the board. Such suggestions must be sent in writing to the nominating and governance committee of the Registrant, c/o the Registrant’s Secretary, and must be accompanied by complete biographical and occupational data on the prospective nominee, along with a written consent of the prospective nominee for consideration of his or her name by the nominating and governance committee.
ITEM 11 – Controls and Procedures
| (a) | The Registrant’s Principal Executive Officer and Principal Financial Officer have concluded, based on their evaluation of the Registrant’s disclosure controls and procedures (as such term is defined in Rule 30a-3 under the Investment Company Act of 1940), that such controls and procedures are adequate and reasonably designed to achieve the purposes described in paragraph (c) of such rule. |
| | |
| (b) | There were no changes in the Registrant’s internal controls over financial reporting (as defined in Rule 30a-3(d) under the Investment Company Act of 1940) that occurred during the Registrant’s second fiscal quarter of the period covered by this report that has materially affected, or is reasonably likely to materially affect, the Registrant’s internal control over financial reporting. |
ITEM 12 – Exhibits
| (a)(1) | The Code of Ethics that is the subject of the disclosure required by Item 2 is attached as an exhibit hereto. |
| | |
| (a)(2) | The certifications required by Rule 30a-2 of the Investment Company Act of 1940 and Sections 302 and 906 of the Sarbanes-Oxley Act of 2002 are attached as exhibits hereto. |
SIGNATURES
Pursuant to the requirements of the Securities Exchange Act of 1934 and the Investment Company Act of 1940, the Registrant has duly caused this report to be signed on its behalf by the undersigned, thereunto duly authorized.
| | AMERICAN HIGH-INCOME TRUST |
| | |
| | By /s/ David C. Barclay |
| | David C. Barclay, President and Principal Executive Officer |
| | |
| | Date: November 29, 2013 |
Pursuant to the requirements of the Securities Exchange Act of 1934 and the Investment Company Act of 1940, this report has been signed below by the following persons on behalf of the Registrant and in the capacities and on the dates indicated.
| By /s/ David C. Barclay |
David C. Barclay, President and Principal Executive Officer |
| |
| Date: November 29, 2013 |
| By /s/ Karl C. Grauman |
Karl C. Grauman, Treasurer and Principal Financial Officer |
| |
| Date: November 29, 2013 |