UNITED STATES
SECURITIES AND EXCHANGE COMMISSION
Washington, D.C. 20549
FORM N-CSR
Certified Shareholder Report of
Registered Management Investment Companies
Investment Company Act File Number: 811-05364
American High-Income Trust
(Exact Name of Registrant as Specified in Charter)
333 South Hope Street
Los Angeles, California 90071
(Address of Principal Executive Offices)
Registrant's telephone number, including area code: (213) 486-9200
Date of fiscal year end: September 30
Date of reporting period: September 30, 2015
Steven I. Koszalka
American High-Income Trust
333 South Hope Street
Los Angeles, California 90071
(Name and Address of Agent for Service)
ITEM 1 – Reports to Stockholders

Managing risk
and return:
What’s next for
high yield?
Special feature page 4
| | | | |
| |  | | American High-Income Trust®
Annual report
for the year ended
September 30, 2015 |
American High-Income Trust seeks to provide you with a high level of current income. Its secondary investment objective is capital appreciation.
This fund is one of more than 40 offered by one of the nation’s largest mutual fund families, American Funds, from Capital Group. For more than 80 years, Capital has invested with a long-term focus based on thorough research and attention to risk.
Fund results shown in this report, unless otherwise indicated, are for Class A shares at net asset value. If a sales charge (maximum 3.75%) had been deducted, the results would have been lower. Results are for past periods and are not predictive of results for future periods. Current and future results may be lower or higher than those shown. Share prices and returns will vary, so investors may lose money. Investing for short periods makes losses more likely. Investments are not FDIC-insured, nor are they deposits of or guaranteed by a bank or any other entity, so they may lose value. For current information and month-end results, visit americanfunds.com.
See page 3 for Class A share results with relevant sales charges deducted. For other share class results, visit americanfunds.com and americanfundsretirement.com.
Investment results assume all distributions are reinvested and reflect applicable fees and expenses. When applicable, investment results reflect fee waivers, without which results would have been lower. Visit americanfunds.com for more information.
The fund’s 30-day yield for Class A shares as of October 31, 2015, calculated in accordance with the U.S. Securities and Exchange Commission (SEC) formula, was 6.26%. The fund’s 12-month distribution rate for Class A shares as of that date was 6.24%. Both reflect the 3.75% maximum sales charge. The SEC yield reflects the rate at which the fund is earning income on its current portfolio of securities while the distribution rate reflects the fund’s past dividends paid to shareholders. Accordingly, the fund’s SEC yield and distribution rate may differ.
The return of principal for bond funds and for funds with significant underlying bond holdings is not guaranteed. Fund shares are subject to the same interest rate, inflation and credit risks associated with the underlying bond holdings. High-yield bonds are subject to greater fluctuations in value and risk of loss of income and principal than investment-grade bonds. Bond ratings, which typically range from AAA/Aaa (highest) to D (lowest), are assigned by credit rating agencies such as Standard & Poor’s, Moody’s and/or Fitch as an indication of an issuer’s creditworthiness. Investing in bonds issued outside the U.S. may be subject to additional risks. They include currency fluctuations, political and social instability, differing securities regulations and accounting standards, higher transaction costs, possible changes in taxation, illiquidity and price volatility. These risks may be heightened in connection with investments in developing countries. Refer to the fund prospectus and the Risk Factors section of this report for more information on these and other risks associated with investing in the fund.

Fellow investors:
In a challenging year for high-yield securities, American High-Income Trust reported a total return of –5.84% for the 12 months ended September 30, 2015. By comparison, the fund’s benchmark, the unmanaged Barclays U.S. Corporate High Yield 2% Issuer Capped Index returned –3.40%. The Lipper High Yield Funds Average, a benchmark of similar funds, posted a total return of –3.77% for the period.
The fund’s total return assumes a nearly 65 cents a share reinvestment of monthly dividends. Shareholders who reinvested dividends received an income return of 6.01% for the period. Those who elected to take their dividends in cash received an income return of 5.85% and saw the value of their holdings decrease by 5.52%.
High-yield market overview
The unexpected drop in commodities prices was the dominant theme in the high-yield market for the 12-month reporting period. Although commodities only comprise about 14% of the high-yield market, the sharp drop in prices for everything from shale oil to metals created cash flow problems for highly leveraged producers. This in turn impacted their ability to stay current on their debts.
Beyond commodities, growing concerns in the last six months about a slowing global economy, centered on China, reduced investor enthusiasm for lower rated bonds. At the same time, expectations of a long-delayed Federal Reserve rate hike put pressure on the higher quality, more interest-rate sensitive area of the high-yield market.
As a result, spreads widened and default rates rose for the first time since the 2008 financial crisis. All three industry groups (financials, utilities and industrials) recorded negative returns for the period.
Results at a glance
For periods ended September 30, 2015, with all distributions reinvested
| | | | | | | | | |
| | | Cumulative
total returns | | Average annual
total returns |
| | | 1 year | | 5 years | | 10 years | | Lifetime
(since 2/19/88) |
| American High-Income Trust (Class A shares) | | | –5.84 | % | | | 4.39 | % | | | 5.45 | % | | | 7.83 | % |
| Barclays U.S. Corporate High Yield 2% Issuer Capped Index* | | | –3.40 | | | | 6.14 | | | | 7.26 | | | | — | |
| Lipper High Yield Funds Average† | | | –3.77 | | | | 5.18 | | | | 5.87 | | | | 6.98 | |
| * | This market index did not exist prior to December 31, 1992. It is unmanaged and, therefore, has no expenses. Investors cannot invest directly in an index. |
| † | Lipper averages reflect the current composition of all eligible mutual funds (all share classes) within a given category. |
| American High-Income Trust | 1 |
Inside the portfolio
The fund was negatively impacted over this reporting period by the stresses on the high-yield market. Commodities-related companies in particular were the biggest detractor from returns. One example was North American shale oil companies. High-yield bonds had played a leading role in providing financing to develop and implement the mining technology used to extract oil and gas from deep underground shale rock formations. Lower energy prices were in part caused by the cost efficiencies created by these new drilling technologies, but they made it harder for some companies to service their high debt loads.
Other commodity-related companies were hurt by weaker growth in China and other countries. These included mining companies producing iron ore and copper, and companies with exposure to commodity-exporting countries in the developing world like Brazil.
On the positive side, the fund had a relatively overweight position in companies that tend to do better in weaker growth environments, such as life sciences, health care equipment and supplies. The fund’s large exposure to telecommunications services also helped lift returns.
Looking ahead
The high-yield market is beginning to move away from the yield-driven return of the past five years to more historically normal default rates and spreads. In the feature article on page 4, the other portfolio managers and I discuss what that means for the high-yield market, and how to potentially benefit as an investor.
Despite the challenges posed by a changing high-yield market, it is important for investors to maintain a long-term perspective. The last year has been a volatile one for high-yield investors, but over the long run high-yield bonds have provided attractive returns and a steady source of income. For the past 10-year period ended September 30, 2015, the fund’s shareholders earned an average annual total return of 5.45%, with dividends reinvested.
Investment-grade bonds, by contrast, returned 4.64% for the same 10-year period, as measured by the Barclays U.S. Aggregate Index, which is unmanaged and has no expenses.
As always, we appreciate your continued support and long-term investment perspective.
Sincerely,

David C. Barclay
President
November 13, 2015
For current information about the fund, visit americanfunds.com.
| 2 | American High-Income Trust |
The value of a long-term perspective
Here’s how a $10,000 investment in American High-Income Trust grew between February 19, 1988, when the fund began operations, and September 30, 2015, the end of its latest fiscal year. As you can see, that $10,000 grew to $77,235 with all distributions reinvested.
Fund results shown reflect deduction of the maximum sales charge of 3.75% on the $10,000 investment.1 Thus, the net amount invested was $9,625.2

| 1 | As outlined in the prospectus, the sales charge is reduced for accounts (and aggregated investments) of $100,000 or more and is eliminated for purchases of $1 million or more. There is no sales charge on dividends or capital gain distributions that are reinvested in additional shares. |
| 2 | The maximum initial sales charge was 4.75% prior to January 10, 2000. |
| 3 | The market index is unmanaged and, therefore, has no expenses. Investors cannot invest directly in an index. |
| 4 | From February 19, 1988, through December 31, 1992, the Credit Suisse High Yield Index was used because the Barclays U.S. Corporate High Yield 2% Issuer Capped Index did not yet exist. Since January 1, 1993, the Barclays U.S. Corporate High Yield 2% Issuer Capped Index has been used. |
| 5 | Results of the Lipper High Yield Funds Average do not reflect any sales charges. |
| 6 | Computed from data supplied by the U.S. Department of Labor, Bureau of Labor Statistics. |
| 7 | For the period February 19, 1988, commencement of operations, through September 30, 1988. |
Past results are not predictive of results for future periods. The results shown are before taxes on fund distributions and sale of fund shares.
Average annual total returns based on a $1,000 investment (for periods ended September 30, 2015)*
| | 1 year | 5 years | 10 years |
| | | | |
| Class A shares | –9.35% | 3.60% | 5.05% |
* Assumes reinvestment of all distributions and payment of the maximum 3.75% sales charge.
The total annual fund operating expense ratio is 0.67% for Class A shares as of the prospectus dated December 1, 2015 (unaudited).
Investment results assume all distributions are reinvested and reflect applicable fees and expenses. When applicable, investment results reflect fee waivers, without which results would have been lower. Visit americanfunds.com for more information.
| American High-Income Trust | 3 |

Managing risk and return:
What’s next for high yield?
We had a strong market for high-yield bonds post 2008 financial crisis. Historically low interest rates made higher yielding bonds especially attractive, while low default rates for high-yield issuers cushioned the customary risk of investing in less creditworthy bonds.
| 4 | American High-Income Trust |

But that dynamic is changing. Economic weakness in the developing world, sharp drops in commodities prices, and seven years of slow economic recovery are increasing pressure on the high-yield market. “Defaults are still low but we are clearly moving back to historical norms,” says David Barclay, president of American High-Income Trust. “Macro conditions have been the main driver of returns over the last five or so years. The ability to assess the creditworthiness of individual companies has been less important. We’re beginning to see that change. Individual company research will matter more in the market.”
As far as the management team of American High-Income Trust is concerned, that means opportunity. “Higher yield comes from higher risk,” says portfolio manager Abner Goldstine. “Our job is to take risks based on the best information we have about the consequences of those risks.”
Such confidence comes about because the team has worked together in The Capital SystemSM for over 20 years. They know through experience across many market cycles how valuable American Funds’ emphasis on fundamental research can be in navigating a period of potentially higher defaults and stress for borrowers.
Managing risk through in-depth research
“The research process drives the management of the fund,” explains David Barclay. “Success in high yield comes from knowing company-specific credit risk.” That means paying particular attention to a company’s balance sheet and cash flow to make sure it can make its scheduled interest and principal payments.
Adds Abner Goldstine: “Having a core of highly capable analysts dedicated to understanding an issuer’s prospects and its ability to service its debt, to evaluate management, and to determine how the overall economic environment impacts it — that is what gives us an advantage in making investment decisions.”
“The added complexity for high yield,” says portfolio manager David Daigle, “is once you understand a company’s business outlook and competitive dynamics, you then have to decide which of the individual issues within the capital structure in which to invest. We need to analyze the risk of the debt instrument itself, including the covenants, ranking and legal structure. That is a component of the investment process that rarely occurs in equity investing.”
Supporting the team is what Laurentius Harrer, American High-Income Trust’s fourth portfolio manager, terms, “our unique integration with equity. We have a large and experienced team of career equity analysts who not only share insights and data with us, but also actively want to help us succeed. This gives special insight into companies’ business plans and industry dynamics.”
Different viewpoints expressed in one portfolio
Another unique feature of The Capital System is the way, as Abner Goldstine puts it, “individual opinions are expressed in the portfolio. That means different points of view are incorporated. Otherwise you would only need one manager.”
| American High-Income Trust | 5 |
To the extent an investor needs a higher rate of income, high yield can be an important part of their portfolio. That’s particularly true when interest rates in the rest of the bond market are so low, as they are today.
Each of the four managers runs their own independent portfolio, which reflects not only their best ideas but their distinct experiences and perspectives.
“We try to have a balance of managers with different styles so the result is complementary individual portfolios and an appropriately diversified whole,” says David Barclay. “That does require independent judgment, but there is very active communication to question, push and test each other. Idea testing is critical in such an environment.”
A fifth segment of the fund is managed directly by the fund’s investment analysts, each contributing to the portfolio in the area of his or her highest conviction.
“Our process allows us to attract high quality analysts,” says David Daigle, “because they can directly manage money in the research portfolios. I could not have developed my knowledge as a portfolio manager if I did not have the ability to invest as an analyst.”
Diversification in practice: a case study
The price decline this year in commodities like oil, copper and iron ore has captured headlines and affected that small but important segment of the high-yield market. The American High-Income Trust managers approach the situation from different perspectives.
Laurentius Harrer has one theory: “It’s three quarters supply glut and one quarter a geopolitical ramp-up of production by countries like Iraq, Iran, Russia and Saudi Arabia. Demand has been weaker, but structurally it hasn’t changed much. This will take the marginal shale companies out of the market, but the assets will not go away — even if they go bankrupt someone will buy them. But the supply glut is a long-term problem.” His takeaway? “Keep commodity exposure as low as possible.”
Four distinct styles: one diversified portfolio
 | |  | |  | |  |
| | | | | | | |
| David Barclay | | Abner Goldstine | | David Daigle | | Laurentius Harrer |
| | | | | | | |
| “I tend to be more conservative than the other managers in the fund. I look for investments that I hope will be successful over a full cycle, which tends to produce results that are relatively better in bad years and relatively worse in good years.” | | “I look for opportunities that the market is not yet recognizing. I am more case-by-case, bottom-up in my approach. It is important to look for those companies that have the potential to outshine their peers.” | | “I take risk positions across a wide array of risk profiles, everything from investment grade to distressed securities. I tend to be cautious if I am concerned about insufficient asset value to protect shareholders.” | | “My style is to be more concentrated, and if the indicators suggest reward for taking risks, I’m the risk taker of the group.” |
| 6 | American High-Income Trust |

David Daigle, on the other hand, sees opportunity in distressed commodities. “The supply that is coming on today is a function of capital invested two to four years ago, and we will have to live with that for a while. However, there will be a supply response, as capital is becoming constrained for most commodities companies. That will eventually translate into lower supply and higher commodities prices.”
Meanwhile David Barclay uses a different operating principle. “I try not to focus on supply or demand as the main driver. To optimize my portfolio around commodities, I’m trying to focus on companies that have more staying ability. It’s more prudent for me to focus on those that can survive an extended downturn in commodities prices.”
That diversity of opinions leads to diversification in practice, which may prevent over-exposure to one industry or sector, while taking advantage of themes and trends that may drive excess returns.
Income as an outcome, not an objective
Another hot topic in the news holds less interest for the fund managers: whether the Federal Reserve will raise rates. David Barclay explains: “High yield is more insulated from interest rates than other fixed-income sectors. When rates rise, it’s usually because the economy is doing better, and the companies with high-yield debt are better able to pay off their debt. The duration of high-yield bonds is also shorter than that of high-grade corporate bonds, so unexpected changes in rates don’t affect it as much. For that reason, high yield tends to do better in rising rate environments than other bonds.”
What about the current low rates? Do they ever worry about taking on too much risk by reaching for yield? “Income is an outcome, not an objective,” says David Barclay. “We are investing in higher relative income, not a specific level of income. We want sustainable income. We will not sacrifice total return for income. It’s healthy to not have a yield objective. It protects you from seeking too much yield, and taking on too much risk.”
Looking ahead
Beyond the debates about the current market, the fund managers look at the long term, knowing there are no short cuts to success in the high-yield market.
“The high-yield market is larger than ever before,” reports David Barclay, “as it takes on more and more of the lending role banks used to assume. There are more industries to track and more complexity than ever before, but the fundamentals haven’t changed since the fund started. The determinant of our success is and always has been in anticipating how individual levered companies do.”
To the extent an investor needs a higher rate of income, high yield can be an important part of their portfolio. That’s particularly true when interest rates in the rest of the bond market are so low, as they are today. “High yield is risky compared to other parts of the bond market,” says David Barclay, “but it likely will be a higher source of income, which makes sense in a balanced portfolio.” ■
| American High-Income Trust | 7 |
| Summary investment portfolio September 30, 2015 | |
| | |
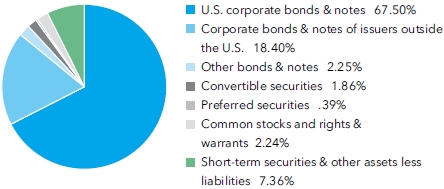
| Investment mix by security type | Percent of net assets |
| Bonds, notes & other debt instruments 88.15% | | Principal amount
(000) | | | Value
(000) | |
| Corporate bonds & notes 85.90% | | | | | | | | |
| Consumer discretionary 13.90% | | | | | | | | |
| Boyd Gaming Corp. 9.00% 2020 | | $ | 79,830 | | | $ | 85,234 | |
| Cequel Communications Holdings I, LLC and Cequel Capital Corp. 6.375% 20201 | | | 141,215 | | | | 133,801 | |
| Playa Resorts Holding BV 8.00% 20201 | | | 96,177 | | | | 97,620 | |
| Other securities | | | | | | | 2,072,239 | |
| | | | | | | | 2,388,894 | |
| | | | | | | | | |
| Telecommunication services 13.81% | | | | | | | | |
| Altice Financing SA 6.625% 20231 | | | 40,960 | | | | 39,424 | |
| Altice Finco SA 6.50%–9.88% 2020–20251 | | | 20,075 | | | | 19,841 | |
| Altice Finco SA, First Lien, 7.75% 20221 | | | 18,950 | | | | 17,292 | |
| Clearwire Communications and Clearwire Finance, Inc. 14.75% 20161 | | | 3,125 | | | | 3,508 | |
| Digicel Group Ltd. 8.25% 20201 | | | 97,200 | | | | 90,396 | |
| Digicel Group Ltd. 6.00% 20211 | | | 96,542 | | | | 88,095 | |
| Digicel Group Ltd. 7.00%–7.13% 2020–20221 | | | 67,275 | | | | 58,835 | |
| Frontier Communications Corp. 11.00% 20251 | | | 140,685 | | | | 136,464 | |
| Frontier Communications Corp. 6.25%–10.50% 2018–20241 | | | 193,359 | | | | 189,528 | |
| Intelsat Jackson Holding Co. 6.625% 2022 | | | 120,775 | | | | 94,808 | |
| Intelsat Jackson Holding Co. 7.25% 2019–2020 | | | 70,200 | | | | 65,187 | |
| Intelsat Luxembourg Holding Co. 6.75%–7.75% 2018–2021 | | | 39,975 | | | | 33,528 | |
| LightSquared, Term Loan, 9.00% 20152,3,4,5,6 | | | 84,404 | | | | 85,240 | |
| MetroPCS Wireless, Inc. 6.25% 2021 | | | 89,045 | | | | 88,956 | |
| MetroPCS Wireless, Inc. 6.625% 2023 | | | 94,185 | | | | 93,479 | |
| Neptune Finco Corp. (Altice NV) 10.13%–10.88% 2023–20251 | | | 38,625 | | | | 39,083 | |
| Numericable Group SA 4.875% 20191 | | | 121,875 | | | | 118,219 | |
| Numericable Group SA 6.00% 20221 | | | 7,965 | | | | 7,696 | |
| SoftBank Corp. 4.50% 20201 | | | 89,010 | | | | 86,420 | |
| Sprint Capital Corp. 6.90% 2019 | | | 26,625 | | | | 23,497 | |
| Sprint Nextel Corp. 7.00% 2020 | | | 199,485 | | | | 167,069 | |
| Sprint Nextel Corp. 7.25% 2021 | | | 130,720 | | | | 107,354 | |
| Sprint Nextel Corp. 6.88%–11.50% 2017–20281 | | | 167,055 | | | | 151,471 | |
| T-Mobile US, Inc. 6.38%–6.73% 2020–2025 | | | 108,030 | | | | 108,011 | |
| Trilogy International Partners, LLC 10.25% 20161 | | | 106,840 | | | | 106,172 | |
| Wind Acquisition SA 4.75% 20201 | | | 89,425 | | | | 88,754 | |
| Wind Acquisition SA 7.375% 20211 | | | 163,450 | | | | 161,815 | |
| Other securities | | | | | | | 103,199 | |
| | | | | | | | 2,373,341 | |
| | | | | | | | | |
| Industrials 12.71% | | | | | | | | |
| Associated Materials, LLC and AMH New Finance, Inc. 9.125% 2017 | | | 181,367 | | | | 146,907 | |
| Builders Firstsource 7.625% 20211 | | | 75,839 | | | | 79,252 | |
| Corporate Risk Holdings LLC 9.50% 20191 | | | 137,028 | | | | 129,491 | |
| DAE Aviation Holdings, Inc. 10.00% 20231 | | | 110,550 | | | | 109,997 | |
| KLX Inc. 5.875% 20221 | | | 82,680 | | | | 80,845 | |
| Nortek Inc. 8.50% 2021 | | | 83,777 | | | | 88,385 | |
| 8 | American High-Income Trust |
| | | Principal amount
(000) | | | Value
(000) |
| Ply Gem Industries, Inc. 6.50% 2022 | | $ | 83,515 | | | $ | 80,488 | |
| Silver II Borrower S.C.A./Silver II U.S. Holdings, LLC 7.75% 20201 | | | 97,233 | | | | 84,836 | |
| Other securities | | | | | | | 1,384,882 | |
| | | | | | | | 2,185,083 | |
| | | | | | | | | |
| Health care 12.04% | | | | | | | | |
| inVentiv Health Inc, Term Loan B4, 7.75% 20182,3,4 | | | 38,955 | | | | 38,971 | |
| inVentiv Health Inc. 9.00% 20181 | | | 161,655 | | | | 167,212 | |
| inVentiv Health Inc. 10.00% 2018 | | | 78,491 | | | | 75,442 | |
| inVentiv Health Inc. 12.00% 20181,5 | | | 116,863 | | | | 114,628 | |
| Kinetic Concepts, Inc. 10.50% 2018 | | | 192,320 | | | | 201,792 | |
| Kinetic Concepts, Inc. 12.50% 2019 | | | 131,037 | | | | 139,391 | |
| Tenet Healthcare Corp. 4.38%–8.13% 2018–2023 | | | 191,865 | | | | 195,381 | |
| VPI Escrow Corp. 6.375% 20201 | | | 87,003 | | | | 86,731 | |
| VPI Escrow Corp. 6.75%–7.50% 2018–20211 | | | 63,710 | | | | 65,032 | |
| VRX Escrow Corp. 6.125% 20251 | | | 138,785 | | | | 133,289 | |
| VRX Escrow Corp. 5.38%–5.88% 2020–20231 | | | 40,095 | | | | 38,899 | |
| Other securities | | | | | | | 812,997 | |
| | | | | | | | 2,069,765 | |
| | | | | | | | | |
| Energy 10.86% | | | | | | | | |
| NGPL PipeCo LLC 7.119% 20171 | | | 157,345 | | | | 150,264 | |
| NGPL PipeCo LLC 9.625% 20191 | | | 125,135 | | | | 119,504 | |
| NGPL PipeCo LLC 7.768% 20371 | | | 32,400 | | | | 27,378 | |
| NGPL PipeCo LLC, Term Loan B, 6.75% 20172,3,4 | | | 24,700 | | | | 22,354 | |
| PDC Energy Inc. 7.75% 2022 | | | 106,350 | | | | 105,818 | |
| Sabine Pass Liquefaction, LLC 5.625% 2021 | | | 88,850 | | | | 82,853 | |
| Sabine Pass Liquefaction, LLC 5.63%–5.75% 2023–20251 | | | 125,700 | | | | 111,902 | |
| Sabine Pass LNG, LP 6.50%–7.50% 2016–2020 | | | 3,000 | | | | 3,000 | |
| Other securities | | | | | | | 1,242,567 | |
| | | | | | | | 1,865,640 | |
| | | | | | | | | |
| Financials 7.34% | | | | | | | | |
| Crescent Resources 10.25% 20171 | | | 119,004 | | | | 122,128 | |
| Realogy Corp. 4.50% 20191 | | | 99,295 | | | | 99,667 | |
| Other securities | | | | | | | 1,039,616 | |
| | | | | | | | 1,261,411 | |
| | | | | | | | | |
| Materials 6.68% | | | | | | | | |
| First Quantum Minerals Ltd. 6.75% 20201 | | | 140,165 | | | | 94,611 | |
| FMG Resources 9.75% 20221 | | | 146,925 | | | | 137,191 | |
| JMC Steel Group Inc. 8.25% 20181 | | | 151,995 | | | | 104,117 | |
| Reynolds Group Holdings, Ltd. 6.00% 20171 | | | 4,750 | | | | 4,667 | |
| Reynolds Group Inc. 5.75% 2020 | | | 167,710 | | | | 169,806 | |
| Reynolds Group Inc. 6.875% 2021 | | | 5,200 | | | | 5,375 | |
| Other securities | | | | | | | 631,679 | |
| | | | | | | | 1,147,446 | |
| | | | | | | | | |
| Information technology 5.95% | | | | | | | | |
| First Data Corp. 11.75% 2021 | | | 136,478 | | | | 151,832 | |
| First Data Corp. 12.625% 2021 | | | 129,546 | | | | 147,521 | |
| First Data Corp. 5.38%–8.75% 2020–20231,5 | | | 78,776 | | | | 80,613 | |
| SRA International, Inc. 11.00% 2019 | | | 82,362 | | | | 87,458 | |
| SRA International, Inc., Term Loan B, 6.50% 20182,3,4 | | | 111,966 | | | | 112,386 | |
| Other securities | | | | | | | 442,872 | |
| | | | | | | | 1,022,682 | |
| | | | | | | | | |
| Other 2.61% | | | | | | | | |
| Other securities | | | | | | | 448,967 | |
| | | | | | | | | |
| Total corporate bonds & notes | | | | | | | 14,763,229 | |
| | | | | | | | | |
| Bonds & notes of governments & government agencies outside the U.S. 1.71% | | | | | | | | |
| India (Republic of) 8.60% 2028 | | INR | 5,710,700 | | | | 91,383 | |
| Other securities | | | | | | | 202,368 | |
| | | | | | | | 293,751 | |
| American High-Income Trust | 9 |
| Bonds, notes & other debt instruments (continued) | | Principal amount
(000) | | | Value
(000) | |
| U.S. Treasury bonds & notes 0.38% | | | | | | | | |
| U.S. Treasury 0.38% | | | | | | | | |
| Other securities | | | | | | $ | 66,174 | |
| | | | | | | | | |
| Other bonds & notes 0.16% | | | | | | | | |
| Other securities | | | | | | | 26,811 | |
| | | | | | | | | |
| Total bonds, notes & other debt instruments (cost: $16,534,414,000) | | | | | | | 15,149,965 | |
| | | | | | | | | |
| Convertible bonds 0.72% | | | | | | | | |
| Other 0.62% | | | | | | | | |
| Other securities | | | | | | | 106,512 | |
| | | | | | | | | |
| Miscellaneous 0.10% | | | | | | | | |
| Other convertible bonds in initial period of acquisition | | | | | | | 16,987 | |
| | | | | | | | | |
| Total convertible bonds (cost: $164,125,000) | | | | | | | 123,499 | |
| | | | | | | | | |
| Convertible stocks 1.14% | | | Shares | | | | | |
| Other 0.75% | | | | | | | | |
| Other securities | | | | | | | 129,717 | |
| | | | | | | | | |
| Miscellaneous 0.39% | | | | | | | | |
| Other convertible stocks in initial period of acquisition | | | | | | | 66,462 | |
| | | | | | | | | |
| Total convertible stocks (cost: $270,352,000) | | | | | | | 196,179 | |
| | | | | | | | | |
| Preferred securities 0.39% | | | | | | | | |
| Financials 0.39% | | | | | | | | |
| Other securities | | | | | | | 66,932 | |
| | | | | | | | | |
| Total preferred securities (cost: $58,071,000) | | | | | | | 66,932 | |
| | | | | | | | | |
| Common stocks 2.23% | | | | | | | | |
| Telecommunication services 0.74% | | | | | | | | |
| NII Holdings, Inc., Class B7,8 | | | 19,451,169 | | | | 126,627 | |
| | | | | | | | | |
| Consumer discretionary 0.59% | | | | | | | | |
| Cooper-Standard Holdings Inc.7,8 | | | 1,659,993 | | | | 96,280 | |
| Other securities | | | | | | | 5,620 | |
| | | | | | | | 101,900 | |
| | | | | | | | | |
| Other 0.60% | | | | | | | | |
| Other securities | | | | | | | 102,620 | |
| | | | | | | | | |
| Miscellaneous 0.30% | | | | | | | | |
| Other common stocks in initial period of acquisition | | | | | | | 51,845 | |
| | | | | | | | | |
| Total common stocks (cost: $575,393,000) | | | | | | | 382,992 | |
| 10 | American High-Income Trust |
| Rights & warrants 0.01% | | Shares | | | Value
(000) | |
| Consumer discretionary 0.01% | | | | | | | | |
| Other securities | | | | | | $ | 1,530 | |
| | | | | | | | | |
| Total rights & warrants (cost: $5,447,000) | | | | | | | 1,530 | |
| | | | | | | | | |
| Short-term securities 5.77% | | Principal amount
(000) | | | | | |
| Apple Inc. 0.15%–0.17% due 10/14/2015–10/20/20151 | | $ | 98,000 | | | | 97,994 | |
| Caterpillar Financial Services Corp. 0.15%–0.17% due 10/19/2015–11/10/2015 | | | 90,000 | | | | 89,987 | |
| Chevron Corp. 0.13%–0.20% due 10/26/2015–12/16/20151 | | | 136,600 | | | | 136,566 | |
| Federal Home Loan Bank 0.10%–0.26% due 10/21/2015–2/1/2016 | | | 466,300 | | | | 466,282 | |
| Other securities | | | | | | | 201,777 | |
| | | | | | | | | |
| Total short-term securities (cost: $992,449,000) | | | | | | | 992,606 | |
| Total investment securities 98.41% (cost: $18,600,251,000) | | | | | | | 16,913,703 | |
| Other assets less liabilities 1.59% | | | | | | | 273,641 | |
| | | | | | | | | |
| Net assets 100.00% | | | | | | $ | 17,187,344 | |
This summary investment portfolio is designed to streamline the report and help investors better focus on the fund’s principal holdings. See the inside back cover for details on how to obtain a complete schedule of portfolio holdings.
As permitted by U.S. Securities and Exchange Commission regulations, “Miscellaneous” securities include holdings in their first year of acquisition that have not previously been publicly disclosed.
“Other securities” includes all issues that are not disclosed separately in the summary investment portfolio. Some securities in “Other securities” (with an aggregate value of $51,512,000, an aggregate cost of $68,125,000, and which represented .30% of the net assets of the fund) were acquired from 12/31/2012 to 11/26/2014 through private placement transactions exempt from registration under the Securities Act of 1933, which may subject them to legal or contractual restrictions on resale. “Other securities” also includes securities which were pledged as collateral. The total value of pledged collateral was $29,401,000, which represented .17% of the net assets of the fund.
Forward currency contracts
The fund has entered into forward currency contracts as shown in the following table. The average month-end notional amount of open forward currency contracts while held was $126,632,000.
| | | | | | | | | | | Unrealized | |
| | | | | | | | | | | appreciation | |
| | | | | | | Contract amount | | (depreciation) | |
| | | | | | | Receive | | Deliver | | at 9/30/2015 | |
| | | Settlement date | | Counterparty | | (000) | | (000) | | | | (000) | |
| Sales: | | | | | | | | | | | | | |
| Euros | | 10/21/2015 | | HSBC Bank | | $9,390 | | €8,300 | | | | $113 | |
| Mexican pesos | | 10/20/2015 | | Citibank | | $11,419 | | MXN189,550 | | | | 225 | |
| Mexican pesos | | 10/28/2015 | | JPMorgan Chase | | $10,561 | | MXN181,650 | | | | (158 | ) |
| South African rand | 10/19/2015 | | Bank of America, N.A. | $10,960 | | ZAR148,300 | | | | 295 | |
| | | | | | | | | | | | | $475 | |
| American High-Income Trust | 11 |
Interest rate swaps
The fund has entered into interest rate swaps as shown in the following table. The average month-end notional amount of interest rate swaps while held was $353,833,000.
| | | | | | | | | | | | | | | Unrealized | |
| | | | | | | | | | | | | | | (depreciation) | |
| | | | | | | | | | | | | | | appreciation | |
| Pay/receive | | | | | | Fixed | | | Expiration | | Notional | | at 9/30/2015 | |
| fixed rate | | Clearinghouse | | Floating rate index | | rate | | | date | | (000) | | (000) | |
| Pay | | LCH.Clearnet | | 3-month USD-LIBOR | | 1.2215 | % | | 5/8/2018 | | $ | 30,000 | | | $ (248 | ) |
| Pay | | LCH.Clearnet | | 3-month USD-LIBOR | | 2.197 | | | 7/22/2021 | | | 20,000 | | | (752 | ) |
| Pay | | CME Group Inc. | | 28-day MXN Equilibrium Interbank Interest Rate | | 6.39 | | | 9/12/2025 | | | MXN478,000 | | | (7 | ) |
| Pay | | CME Group Inc. | | 28-day MXN Equilibrium Interbank Interest Rate | | 6.52 | | | 9/12/2025 | | | 478,000 | | | (303 | ) |
| Pay | | CME Group Inc. | | 28-day MXN Equilibrium Interbank Interest Rate | | 6.5 | | | 9/12/2025 | | | 992,000 | | | (535 | ) |
| Pay | | CME Group Inc. | | 28-day MXN Equilibrium Interbank Interest Rate | | 6.435 | | | 9/15/2025 | | | 774,000 | | | (174 | ) |
| Pay | | CME Group Inc. | | 28-day MXN Equilibrium Interbank Interest Rate | | 6.485 | | | 9/16/2025 | | | 270,000 | | | (124 | ) |
| Pay | | CME Group Inc. | | 28-day MXN Equilibrium Interbank Interest Rate | | 6.495 | | | 9/17/2025 | | | 458,000 | | | (233 | ) |
| Receive | | LCH.Clearnet | | 3-month USD-LIBOR | | 2.1105 | | | 9/28/2025 | | $ | 170,000 | | | 1,559 | |
| Receive | | LCH.Clearnet | | 3-month USD-LIBOR | | 2.1 | | | 9/28/2025 | | | 45,000 | | | 369 | |
| Receive | | LCH.Clearnet | | 3-month USD-LIBOR | | 2.1165 | | | 9/28/2025 | | | 24,800 | | | 241 | |
| Receive | | LCH.Clearnet | | 3-month USD-LIBOR | | 2.098 | | | 9/28/2025 | | | 22,500 | | | 180 | |
| Receive | | LCH.Clearnet | | 3-month USD-LIBOR | | 2.1445 | | | 9/29/2025 | | | 38,850 | | | 479 | |
| Receive | | LCH.Clearnet | | 3-month USD-LIBOR | | 2.058 | | | 9/30/2025 | | | 14,300 | | | 61 | |
| Receive | | LCH.Clearnet | | 3-month USD-LIBOR | | 2.0555 | | | 10/1/2025 | | | 24,550 | | | 97 | |
| Pay | | LCH.Clearnet | | 3-month USD-LIBOR | | 2.7575 | | | 5/22/2045 | | | 10,000 | | | (502 | ) |
| Pay | | LCH.Clearnet | | 3-month USD-LIBOR | | 2.883 | | | 6/22/2045 | | | 4,000 | | | (311 | ) |
| | | | | | | | | | | | | | | | $ (203 | ) |
Credit default swaps
The fund has entered into credit default swaps as shown in the following table. The average month-end notional amount of credit default swaps while held was $77,653,000.
Centrally cleared credit default swaps on credit indices — sell protection
| | | | | | | | | | | | | Unrealized | |
| | | | | | | | | | | | | depreciation | |
| | | | | Receive | | | Expiration | | Notional | | at 9/30/2015 | |
| Referenced index | | Clearinghouse | | fixed rate | | | date | | (000) | | (000) | |
| CDX North American High Yield Index Series 21 | | Intercontinental Exchange, Inc. | | 5.00 | % | | 12/20/2018 | | | $17,280 | | | $ (120 | ) |
| CDX North American High Yield Index Series 22 | | Intercontinental Exchange, Inc. | | 5.00 | | | 6/20/2019 | | | 27,840 | | | (775 | ) |
| CDX North American High Yield Index Series 24 | | Intercontinental Exchange, Inc. | | 5.00 | | | 6/20/2020 | | | 31,680 | | | (1,258 | ) |
| | | | | | | | | | | | | | $ (2,153 | ) |
| 12 | American High-Income Trust |
Investments in affiliates
A company is an affiliate of the fund under the Investment Company Act of 1940 if the fund’s holdings in that company represent 5% or more of the outstanding voting shares. The value of the fund’s affiliated-company holdings is either shown in the summary investment portfolio or included in the value of “Other securities” under the respective industry sectors. Further details on such holdings and related transactions during the year ended September 30, 2015, appear below.
| | Beginning | | | | | | Ending | | | | | | Value of | |
| | shares or | | | | | | shares or | | Interest | | affiliates at | |
| | principal | | | | | | principal | | income | | 9/30/2015 | |
| | amount | | Additions | | Reductions | | amount | | (000) | | (000) | |
| NII Holdings, Inc., Class B1 | | — | | 19,451,172 | | 3 | | | 19,451,169 | | | $ | — | | | $ | 126,627 | |
| Rotech Healthcare Inc., Term Loan, 13.00% 20202,3,4,5,6 | | $48,999,901 | | $5,762,702 | | — | | | $54,762,603 | | | | 4,971 | | | | 54,489 | |
| Rotech Healthcare Inc., Term Loan A, 5.50% 20182,3,4,6 | | $25,641,000 | | — | | $259,000 | | | $25,382,000 | | | | 1,428 | | | | 25,255 | |
| Rotech Healthcare Inc., Term Loan B, 10.00% 20192,3,4,6 | | $20,825,000 | | — | | — | | | $20,825,000 | | | | 2,117 | | | | 20,721 | |
| Rotech Healthcare Inc.6,8 | | 1,916,276 | | — | | — | | | 1,916,276 | | | | — | | | | 13,356 | |
| Cooper-Standard Holdings Inc.8 | | 1,663,543 | | — | | 3,550 | | | 1,659,993 | | | | — | | | | 96,280 | |
| Cooper-Standard Holdings Inc., warrants, expire 20178 | | 48,411 | | — | | — | | | 48,411 | | | | — | | | | 1,530 | |
| Revel AC, Inc.9 | | 908,183 | | — | | 908,183 | | | — | | | | — | | | | — | |
| Revel AC, Inc. (CVR)9 | | 43,088,200 | | — | | 43,088,200 | | | — | | | | — | | | | — | |
| Revel Entertainment, Term Loan B, 10.00% 20152,9,10 | | $15,286,433 | | $1,188,770 | | $16,475,203 | | | — | | | | — | | | | — | |
| Revel Entertainment, Term Loan B, 14.50% 20189,10 | | $82,238,556 | | — | | $82,238,556 | | | — | | | | — | | | | — | |
| | | | | | | | | | | | | $ | 8,516 | | | $ | 338,258 | |
The following footnotes apply to either the individual securities noted or one or more of the securities aggregated and listed as a single line item.
| 1 | Acquired in a transaction exempt from registration under Rule 144A or Section 4(2) of the Securities Act of 1933. May be resold in the U.S. in transactions exempt from registration, normally to qualified institutional buyers. The total value of all such securities, including those in “Other securities,” was $7,694,239,000, which represented 44.77% of the net assets of the fund. |
| 2 | Coupon rate may change periodically. |
| 3 | Loan participations and assignments; may be subject to legal or contractual restrictions on resale. The total value of all such loans , including those in “Other securities,” was $973,658,000, which represented 5.66% of the net assets of the fund. |
| 4 | Principal payments may be made periodically. Therefore, the effective maturity date may be earlier than the stated maturity date. |
| 5 | Payment in kind; the issuer has the option of paying additional securities in lieu of cash. |
| 6 | Valued under fair value procedures adopted by authority of the board of trustees. The total value of all such securities, including those in “Miscellaneous” and “Other securities,” was $367,039,000, which represented 2.14% of the net assets of the fund. |
| 7 | Represents an affiliated company as defined under the Investment Company Act of 1940. |
| 8 | Security did not produce income during the last 12 months. |
| 9 | Unaffiliated issuer at 9/30/2015. |
| 10 | Scheduled interest and/or principal payment was not received. |
Key to abbreviations and symbol
CVR = Contingent Value Rights
€ = Euros
INR = Indian rupees
MXN = Mexican pesos
ZAR = South African rand
See Notes to Financial Statements
| American High-Income Trust | 13 |
Financial statements
| Statement of assets and liabilities | | | | | | | | |
| at September 30, 2015 | | (dollars in thousands) | |
| | | | |
| Assets: | | | | | | | | |
| Investment securities, at value: | | | | | | | | |
| Unaffiliated issuers (cost: $18,096,860) | | $ | 16,575,445 | | | | | |
| Affiliated issuers (cost: $503,391) | | | 338,258 | | | $ | 16,913,703 | |
| Cash denominated in currencies other than U.S. dollars (cost: $1,317) | | | | | | | 1,328 | |
| Cash | | | | | | | 5,926 | |
| Unrealized appreciation on open forward currency contracts | | | | | | | 633 | |
| Receivables for: | | | | | | | | |
| Sales of investments | | | 123,802 | | | | | |
| Sales of fund’s shares | | | 16,142 | | | | | |
| Closed forward currency contracts | | | 27 | | | | | |
| Variation margin | | | 486 | | | | | |
| Dividends and interest | | | 358,137 | | | | | |
| Other | | | 228 | | | | 498,822 | |
| | | | | | | | 17,420,412 | |
| Liabilities: | | | | | | | | |
| Unrealized depreciation on open forward currency contracts | | | | | | | 158 | |
| Payables for: | | | | | | | | |
| Purchases of investments | | | 169,695 | | | | | |
| Repurchases of fund’s shares | | | 45,545 | | | | | |
| Dividends on fund’s shares | | | 5,201 | | | | | |
| Investment advisory services | | | 4,113 | | | | | |
| Services provided by related parties | | | 4,439 | | | | | |
| Trustees’ deferred compensation | | | 288 | | | | | |
| Variation margin | | | 1,273 | | | | | |
| Other | | | 2,356 | | | | 232,910 | |
| Net assets at September 30, 2015 | | | | | | $ | 17,187,344 | |
| | | | | | | | | |
| Net assets consist of: | | | | | | | | |
| Capital paid in on shares of beneficial interest | | | | | | $ | 19,931,392 | |
| Distributions in excess of net investment income | | | | | | | (54,252 | ) |
| Accumulated net realized loss | | | | | | | (1,001,403 | ) |
| Net unrealized depreciation | | | | | | | (1,688,393 | ) |
| Net assets at September 30, 2015 | | | | | | $ | 17,187,344 | |
(dollars and shares in thousands, except per-share amounts)
Shares of beneficial interest issued and outstanding (no stated par value) —
unlimited shares authorized (1,747,837 total shares outstanding)
| | | | | | | Shares | | | Net asset value | |
| | | Net assets | | | outstanding | | | per share | |
| Class A | | $ | 12,032,646 | | | | 1,223,639 | | | $ | 9.83 | |
| Class B | | | 41,538 | | | | 4,224 | | | | 9.83 | |
| Class C | | | 966,690 | | | | 98,306 | | | | 9.83 | |
| Class F-1 | | | 677,044 | | | | 68,851 | | | | 9.83 | |
| Class F-2 | | | 1,281,180 | | | | 130,287 | | | | 9.83 | |
| Class 529-A | | | 312,304 | | | | 31,759 | | | | 9.83 | |
| Class 529-B | | | 2,950 | | | | 300 | | | | 9.83 | |
| Class 529-C | | | 108,207 | | | | 11,004 | | | | 9.83 | |
| Class 529-E | | | 17,058 | | | | 1,735 | | | | 9.83 | |
| Class 529-F-1 | | | 21,568 | | | | 2,193 | | | | 9.83 | |
| Class R-1 | | | 19,177 | | | | 1,950 | | | | 9.83 | |
| Class R-2 | | | 182,850 | | | | 18,595 | | | | 9.83 | |
| Class R-2E | | | 16 | | | | 2 | | | | 9.83 | |
| Class R-3 | | | 209,241 | | | | 21,278 | | | | 9.83 | |
| Class R-4 | | | 180,132 | | | | 18,318 | | | | 9.83 | |
| Class R-5 | | | 88,383 | | | | 8,988 | | | | 9.83 | |
| Class R-6 | | | 1,046,360 | | | | 106,408 | | | | 9.83 | |
See Notes to Financial Statements
| 14 | American High-Income Trust |
| Statement of operations | | | | | | | | |
| for the year ended September 30, 2015 | | (dollars in thousands) | |
| | | | |
| Investment income: | | | | | | | | |
| Income: | | | | | | | | |
| Interest (net of non-U.S. taxes of $231; also includes $8,516 from affiliates) | | $ | 1,243,270 | | | | | |
| Dividends (net of non-U.S. taxes of $21) | | | 18,269 | | | $ | 1,261,539 | |
| Fees and expenses*: | | | | | | | | |
| Investment advisory services | | | 52,805 | | | | | |
| Distribution services | | | 51,391 | | | | | |
| Transfer agent services | | | 23,843 | | | | | |
| Administrative services | | | 4,142 | | | | | |
| Reports to shareholders | | | 1,132 | | | | | |
| Registration statement and prospectus | | | 780 | | | | | |
| Trustees’ compensation | | | 147 | | | | | |
| Auditing and legal | | | 177 | | | | | |
| Custodian | | | 155 | | | | | |
| Other | | | 601 | | | | 135,173 | |
| Net investment income | | | | | | | 1,126,366 | |
| | | | | | | | | |
| Net realized loss and unrealized depreciation: | | | | | | | | |
| Net realized (loss) gain on: | | | | | | | | |
| Investments (net of non-U.S. taxes of $1,645; also includes $146,440 net loss from affiliates) | | | (673,476 | ) | | | | |
| Forward currency contracts | | | 31,647 | | | | | |
| Interest rate swaps | | | 2,510 | | | | | |
| Credit default swaps | | | (1,249 | ) | | | | |
| Currency transactions | | | 1,061 | | | | (639,507 | ) |
| Net unrealized (depreciation) appreciation on: | | | | | | | | |
| Investments (net of non-U.S. taxes of $57) | | | (1,564,561 | ) | | | | |
| Forward currency contracts | | | (1,022 | ) | | | | |
| Interest rate swaps | | | (313 | ) | | | | |
| Credit default swaps | | | (1,104 | ) | | | | |
| Currency translations | | | 638 | | | | (1,566,362 | ) |
| Net realized loss and unrealized depreciation | | | | | | | (2,205,869 | ) |
| Net decrease in net assets resulting from operations | | | | | | $ | (1,079,503 | ) |
| * | Additional information related to class-specific fees and expenses is included in the Notes to Financial Statements. |
| Statements of changes in net assets |
| (dollars in thousands) |
| | | Year ended September 30 | |
| | | 2015 | | | 2014 | |
| Operations: | | | | | | | | |
| Net investment income | | $ | 1,126,366 | | | $ | 1,226,348 | |
| Net realized (loss) gain | | | (639,507 | ) | | | 497,243 | |
| Net unrealized depreciation | | | (1,566,362 | ) | | | (752,027 | ) |
| Net (decrease) increase in net assets resulting from operations | | | (1,079,503 | ) | | | 971,564 | |
| | | | | | | | | |
| Dividends paid or accrued to shareholders from net investment income | | | (1,144,670 | ) | | | (1,224,533 | ) |
| | | | | | | | | |
| Net capital share transactions | | | (654,561 | ) | | | 282,076 | |
| | | | | | | | | |
| Total (decrease) increase in net assets | | | (2,878,734 | ) | | | 29,107 | |
| | | | | | | | | |
| Net assets: | | | | | | | | |
| Beginning of year | | | 20,066,078 | | | | 20,036,971 | |
| End of year (including distributions in excess of net investment income: $(54,252) and $(43,455), respectively) | | $ | 17,187,344 | | | $ | 20,066,078 | |
See Notes to Financial Statements
| American High-Income Trust | 15 |
Notes to financial statements
1. Organization
American High-Income Trust (the “fund”) is registered under the Investment Company Act of 1940 as an open-end, diversified management investment company. The fund seeks to provide a high level of current income. Its secondary investment objective is capital appreciation.
The fund has 17 share classes consisting of five retail share classes (Classes A, B and C, as well as two F share classes, F-1 and F-2), five 529 college savings plan share classes (Classes 529-A, 529-B, 529-C, 529-E and 529-F-1) and seven retirement plan share classes (Classes R-1, R-2, R-2E, R-3, R-4, R-5 and R-6). The 529 college savings plan share classes can be used to save for college education. The retirement plan share classes are generally offered only through eligible employer-sponsored retirement plans. The fund’s share classes are described further in the following table:
| Share class | | Initial sales charge | | Contingent deferred sales
charge upon redemption | | Conversion feature | |
| Classes A and 529-A | | Up to 3.75% | | None (except 1% for certain redemptions within one year of purchase without an initial sales charge) | | None | |
| Classes B and 529-B* | | None | | Declines from 5% to 0% for redemptions within six years of purchase | | Classes B and 529-B convert to Classes A and 529-A, respectively, after eight years | |
| Class C | | None | | 1% for redemptions within one year of purchase | | Class C converts to Class F-1 after 10 years | |
| Class 529-C | | None | | 1% for redemptions within one year of purchase | | None | |
| Class 529-E | | None | | None | | None | |
| Classes F-1, F-2 and 529-F-1 | | None | | None | | None | |
| Classes R-1, R-2, R-2E, R-3, R-4, R-5 and R-6 | | None | | None | | None | |
| * | Class B and 529-B shares of the fund are not available for purchase. |
Holders of all share classes have equal pro rata rights to the assets, dividends and liquidation proceeds of the fund. Each share class has identical voting rights, except for the exclusive right to vote on matters affecting only its class. Share classes have different fees and expenses (“class-specific fees and expenses”), primarily due to different arrangements for distribution, transfer agent and administrative services. Differences in class-specific fees and expenses will result in differences in net investment income and, therefore, the payment of different per-share dividends by each share class.
2. Significant accounting policies
The fund is an investment company that applies the accounting and reporting guidance issued in Topic 946 by the U.S. Financial Accounting Standards Board. The fund’s financial statements have been prepared to comply with U.S. generally accepted accounting principles (“U.S. GAAP”). These principles require the fund’s investment adviser to make estimates and assumptions that affect reported amounts and disclosures. Actual results could differ from those estimates. Subsequent events, if any, have been evaluated through the date of issuance in the preparation of the financial statements. The fund follows the significant accounting policies described in this section, as well as the valuation policies described in the next section on valuation.
Security transactions and related investment income — Security transactions are recorded by the fund as of the date the trades are executed with brokers. Realized gains and losses from security transactions are determined based on the specific identified cost of the securities. In the event a security is purchased with a delayed payment date, the fund will segregate liquid assets sufficient to meet its payment obligations. Dividend income is recognized on the ex-dividend date and interest income is recognized on an accrual basis. Market discounts, premiums and original issue discounts on fixed-income securities are amortized daily over the expected life of the security.
Class allocations — Income, fees and expenses (other than class-specific fees and expenses) are allocated daily among the various share classes based on the relative value of their settled shares. Realized and unrealized gains and losses are allocated daily among the various share classes based on their relative net assets. Class-specific fees and expenses, such as distribution, administrative and shareholder services, are charged directly to the respective share class.
| 16 | American High-Income Trust |
Dividends and distributions to shareholders — Dividends to shareholders are declared daily after the determination of the fund’s net investment income and are paid to shareholders monthly. Distributions to shareholders are recorded on the ex-dividend date.
Currency translation — Assets and liabilities, including investment securities, denominated in currencies other than U.S. dollars are translated into U.S. dollars at the exchange rates supplied by one or more pricing vendors on the valuation date. Purchases and sales of investment securities and income and expenses are translated into U.S. dollars at the exchange rates on the dates of such transactions. The effects of changes in exchange rates on investment securities are included with the net realized gain or loss and net unrealized appreciation or depreciation on investments in the fund’s statement of operations. The realized gain or loss and unrealized appreciation or depreciation resulting from all other transactions denominated in currencies other than U.S. dollars are disclosed separately.
3. Valuation
Capital Research and Management Company (“CRMC”), the fund’s investment adviser, values the fund’s investments at fair value as defined by U.S. GAAP. The net asset value of each share class of the fund is generally determined as of approximately 4:00 p.m. New York time each day the New York Stock Exchange is open.
Methods and inputs — The fund’s investment adviser uses the following methods and inputs to establish the fair value of the fund’s assets and liabilities. Use of particular methods and inputs may vary over time based on availability and relevance as market and economic conditions evolve.
Equity securities are generally valued at the official closing price of, or the last reported sale price on, the exchange or market on which such securities are traded, as of the close of business on the day the securities are being valued or, lacking any sales, at the last available bid price. Prices for each security are taken from the principal exchange or market on which the security trades.
Fixed-income securities, including short-term securities, are generally valued at prices obtained from one or more pricing vendors. Vendors value such securities based on one or more of the inputs described in the following table. The table provides examples of inputs that are commonly relevant for valuing particular classes of fixed-income securities in which the fund is authorized to invest. However, these classifications are not exclusive, and any of the inputs may be used to value any other class of fixed-income security.
| Fixed-income class | Examples of standard inputs |
| All | Benchmark yields, transactions, bids, offers, quotations from dealers and trading systems, new issues, spreads and other relationships observed in the markets among comparable securities; and proprietary pricing models such as yield measures calculated using factors such as cash flows, financial or collateral performance and other reference data (collectively referred to as “standard inputs”) |
| Corporate bonds & notes; convertible securities | Standard inputs and underlying equity of the issuer |
| Bonds & notes of governments & government agencies | Standard inputs and interest rate volatilities |
| Mortgage-backed; asset-backed obligations | Standard inputs and cash flows, prepayment information, default rates, delinquency and loss assumptions, collateral characteristics, credit enhancements and specific deal information |
| Municipal securities | Standard inputs and, for certain distressed securities, cash flows or liquidation values using a net present value calculation based on inputs that include, but are not limited to, financial statements and debt contracts |
When the fund’s investment adviser deems it appropriate to do so (such as when vendor prices are unavailable or deemed to be not representative), fixed-income securities will be valued in good faith at the mean quoted bid and ask prices that are reasonably and timely available (or bid prices, if ask prices are not available) or at prices for securities of comparable maturity, quality and type.
Securities with both fixed-income and equity characteristics, or equity securities traded principally among fixed-income dealers, are generally valued in the manner described for either equity or fixed-income securities, depending on which method is deemed most appropriate by the fund’s investment adviser. Forward currency contracts are valued at the mean of representative quoted bid and ask prices, generally based on prices supplied by one or more pricing vendors. Interest rate swaps are generally valued by pricing vendors based on market inputs that include the index and term of index, reset frequency, payer/receiver, currency and pay frequency. Credit default swaps are generally valued by pricing vendors based on market inputs that include the index and term of index, reset frequency, payer/receiver, currency and pay frequency.
| American High-Income Trust | 17 |
Securities and other assets for which representative market quotations are not readily available or are considered unreliable by the fund’s investment adviser are fair valued as determined in good faith under fair valuation guidelines adopted by authority of the fund’s board of trustees as further described. The investment adviser follows fair valuation guidelines, consistent with U.S. Securities and Exchange Commission rules and guidance, to consider relevant principles and factors when making fair value determinations. The investment adviser considers relevant indications of value that are reasonably and timely available to it in determining the fair value to be assigned to a particular security, such as the type and cost of the security; contractual or legal restrictions on resale of the security; relevant financial or business developments of the issuer; actively traded similar or related securities; conversion or exchange rights on the security; related corporate actions; significant events occurring after the close of trading in the security; and changes in overall market conditions. In addition, the closing prices of equity securities that trade in markets outside U.S. time zones may be adjusted to reflect significant events that occur after the close of local trading but before the net asset value of each share class of the fund is determined. Fair valuations and valuations of investments that are not actively trading involve judgment and may differ materially from valuations that would have been used had greater market activity occurred.
Processes and structure — The fund’s board of trustees has delegated authority to the fund’s investment adviser to make fair value determinations, subject to board oversight. The investment adviser has established a Joint Fair Valuation Committee (the “Fair Valuation Committee”) to administer, implement and oversee the fair valuation process, and to make fair value decisions. The Fair Valuation Committee regularly reviews its own fair value decisions, as well as decisions made under its standing instructions to the investment adviser’s valuation teams. The Fair Valuation Committee reviews changes in fair value measurements from period to period and may, as deemed appropriate, update the fair valuation guidelines to better reflect the results of back testing and address new or evolving issues. The Fair Valuation Committee reports any changes to the fair valuation guidelines to the board of trustees with supplemental information to support the changes. The fund’s board and audit committee also regularly review reports that describe fair value determinations and methods.
The fund’s investment adviser has also established a Fixed-Income Pricing Review Group to administer and oversee the fixed-income valuation process, including the use of fixed-income pricing vendors. This group regularly reviews pricing vendor information and market data. Pricing decisions, processes and controls over security valuation are also subject to additional internal reviews, including an annual control self-evaluation program facilitated by the investment adviser’s compliance group.
Classifications — The fund’s investment adviser classifies the fund’s assets and liabilities into three levels based on the inputs used to value the assets or liabilities. Level 1 values are based on quoted prices in active markets for identical securities. Level 2 values are based on significant observable market inputs, such as quoted prices for similar securities and quoted prices in inactive markets. Certain securities trading outside the U.S. may transfer between Level 1 and Level 2 due to valuation adjustments resulting from significant market movements following the close of local trading. Level 3 values are based on significant unobservable inputs that reflect the investment adviser’s determination of assumptions that market participants might reasonably use in valuing the securities. The valuation levels are not necessarily an indication of the risk or liquidity associated with the underlying investment. For example, U.S. government securities are reflected as Level 2 because the inputs used to determine fair value may not always be quoted prices in an active market. The following tables present the fund’s valuation levels as of September 30, 2015 (dollars in thousands):
| | | Investment securities |
| | | Level 1 | | | Level 2 | | | Level 3 | | | Total | |
| Assets: | | | | | | | | | | | | | | | | |
| Bonds, notes & other debt instruments: | | | | | | | | | | | | | | | | |
| Corporate bonds & notes | | $ | — | | | $ | 14,530,936 | | | $ | 232,293 | | | $ | 14,763,229 | |
| Bonds & notes of governments & government agencies outside the U.S. | | | — | | | | 293,751 | | | | — | | | | 293,751 | |
| U.S. Treasury bonds & notes | | | — | | | | 66,174 | | | | — | | | | 66,174 | |
| Other bonds & notes | | | — | | | | 26,811 | | | | — | | | | 26,811 | |
| Convertible bonds | | | — | | | | 123,499 | | | | — | | | | 123,499 | |
| Convertible stocks | | | 144,667 | | | | 51,512 | | | | — | | | | 196,179 | |
| Preferred securities | | | 31,220 | | | | 35,712 | | | | — | | | | 66,932 | |
| Common stocks | | | 307,650 | | | | 35,501 | | | | 39,841 | | | | 382,992 | |
| Rights & warrants | | | 1,530 | | | | — | | | | — | | | | 1,530 | |
| Short-term securities | | | — | | | | 992,606 | | | | — | | | | 992,606 | |
| Total | | $ | 485,067 | | | $ | 16,156,502 | | | $ | 272,134 | | | $ | 16,913,703 | |
| 18 | American High-Income Trust |
| | | Other investments1 |
| | | Level 1 | | | Level 2 | | | Level 3 | | | Total | |
| Assets: | | | | | | | | | | | | | | | | |
| Unrealized appreciation on open forward currency contracts | | $ | — | | | $ | 633 | | | $ | — | | | $ | 633 | |
| Unrealized appreciation on interest rate swaps | | | — | | | | 2,986 | | | | — | | | | 2,986 | |
| Liabilities: | | | | | | | | | | | | | | | | |
| Unrealized depreciation on open forward currency contracts | | | — | | | | (158 | ) | | | — | | | | (158 | ) |
| Unrealized depreciation on interest rate swaps | | | — | | | | (3,189 | ) | | | — | | | | (3,189 | ) |
| Unrealized depreciation on credit default swaps | | | — | | | | (2,153 | ) | | | — | | | | (2,153 | ) |
| Total | | $ | — | | | $ | (1,881 | ) | | $ | — | | | $ | (1,881 | ) |
| 1 | Forward currency contracts, interest rate swaps and credit default swaps are not included in the investment portfolio. |
The following table reconciles the valuation of the fund’s Level 3 investment securities and related transactions for the year ended September 30, 2015 (dollars in thousands):
| | | Beginning | | | Transfers | | | | | | | | | Net | | | | | | Transfers | | | Ending | |
| | | value at | | | into | | | | | | | | | realized | | | Unrealized | | | out of | | | value at | |
| | | 10/1/2014 | | | Level 32 | | | Purchases | | | Sales | | | loss3 | | | appreciation3 | | | Level 32 | | | 9/30/2015 | |
| Investment securities | | $ | 79,069 | | | $ | 131,875 | | | $ | 223,123 | | | $ | (114,129 | ) | | $ | (198,923 | ) | | $ | 181,287 | | | $ | (30,168 | ) | | $ | 272,134 | |
| | | | | | |
| Net unrealized depreciation during the period on Level 3 investment securities held at September 30, 20153 | | | $ | (7,580 | ) |
| 2 | Transfers into or out of Level 3 are based on the beginning market value of the quarter in which they occurred. |
| 3 | Net realized loss and unrealized appreciation are included in the related amounts on investments in the statement of operations. |
Unobservable inputs — The significant unobservable inputs used to value the fund’s Level 3 investments include estimates of recovery allocation and financial performance and financial multiples of publicly traded comparable companies. The following table provides additional information used by the fund’s investment adviser to fair value securities with significant unobservable inputs (dollars in thousands):
| | | | | | | | | | | | Impact to |
| | | | | | | | | | | | valuation from |
| | | Value at | | | Valuation | | Unobservable | | | | an increase in |
| | | 9/30/2015 | | | techniques | | inputs | | Range | | input* |
| | | | | | | Unchanged vendor price | | N/A | | N/A | | N/A |
| | | | | | | Cost | | N/A | | N/A | | N/A |
Bonds, notes & other
debt instruments | | $ | 232,293 | | | Estimated recovery | | Uncertainty discount | | 5% | | Decrease |
|
|
|
|
|
| Trading of a similar issue adjusted by an estimated yield spread |
| Yield spread |
| 75 bps |
| Decrease |
| Common stocks | | | 39,841 | | | Enterprise valuation | | EV/EBITDA multiple | | 6.0x-10.2x | | Increase |
| | | $ | 272,134 | | | | | | | | | |
| * | This column represents the directional change in fair value of the Level 3 securities that would result in an increase from the corresponding input. A decrease to the unobservable input would have the opposite effect. Significant increases and decreases in these inputs in isolation could result in significantly higher or lower fair value measurements. |
Key to abbreviations
EV = Enterprise value
EBITDA = Earnings before income taxes, depreciation and amortization
4. Risk factors
Investing in the fund may involve certain risks including, but not limited to, those described below.
Market conditions — The prices of, and the income generated by, the securities held by the fund may decline – sometimes rapidly or unpredictably – due to various factors, including events or conditions affecting the general economy or particular industries; overall market changes; local, regional or global political, social or economic instability; governmental or governmental agency responses to economic conditions; and currency exchange rate, interest rate and commodity price fluctuations.
| American High-Income Trust | 19 |
Issuer risks — The values of, and the income generated by, securities held by the fund may also decline in response to various factors directly related to the issuers of such securities, including reduced demand for an issuer’s goods or services, poor management performance and strategic initiatives such as mergers, acquisitions or dispositions and the market response to any such initiatives.
Investing in debt instruments — The prices of, and the income generated by, bonds and other debt securities held by the fund may be affected by changing interest rates and by changes in the effective maturities and credit ratings of these securities.
Rising interest rates will generally cause the prices of bonds and other debt securities to fall. Falling interest rates may cause an issuer to redeem, call or refinance a debt security before its stated maturity, which may result in the fund having to reinvest the proceeds in lower yielding securities. Longer maturity debt securities generally have greater sensitivity to changes in interest rates and may be subject to greater price fluctuations than shorter maturity debt securities.
Bonds and other debt securities are also subject to credit risk, which is the possibility that the credit strength of an issuer will weaken and/or an issuer of a debt security will fail to make timely payments of principal or interest and the security will go into default. Lower quality debt securities generally have higher rates of interest and may be subject to greater price fluctuations than higher quality debt securities. Credit risk is gauged, in part, by the credit ratings of the debt securities in which the fund invests. However, ratings are only the opinions of the rating agencies issuing them and are not guarantees as to credit quality or an evaluation of market risk. The fund’s investment adviser relies on its own credit analysts to research issuers and issues in seeking to mitigate various credit and default risks.
Investing in lower rated bonds — Lower rated bonds and other lower rated debt securities generally have higher rates of interest and involve greater risk of default or price declines due to changes in the issuer’s creditworthiness than those of higher quality debt securities. The market prices of these securities may fluctuate more than the prices of higher quality debt securities and may decline significantly in periods of general economic difficulty. These risks may be increased with respect to investments in junk bonds.
Thinly traded securities — There may be little trading in the secondary market for particular bonds, other debt securities or derivatives, which may make them more difficult to value, acquire or sell.
Investing in derivatives — The use of derivatives involves a variety of risks, which may be different from, or greater than, the risks associated with investing in traditional cash securities, such as stocks and bonds. Changes in the value of a derivative may not correlate perfectly with, and may be more sensitive to market events than, the underlying asset, rate or index, and a derivative instrument may expose the fund to losses in excess of its initial investment. Derivatives may be difficult for the fund to buy or sell at an opportune time or price and may be difficult to terminate or otherwise offset. The fund’s use of derivatives may result in losses to the fund, and investing in derivatives may reduce the fund’s returns and increase the fund’s price volatility. The fund’s counterparty to a derivative transaction (including, if applicable, the fund’s clearing broker, the derivatives exchange or the clearinghouse) may be unable or unwilling to honor its financial obligations in respect of the transaction.
Investing outside the U.S. — Securities of issuers domiciled outside the U.S., or with significant operations outside the U.S., may lose value because of adverse political, social, economic or market developments (including social instability, regional conflicts, terrorism and war) in the countries or regions in which the issuers are domiciled or operate. These securities may also lose value due to changes in foreign currency exchange rates against the U.S. dollar and/or currencies of other countries. Securities markets in certain countries may be more volatile and/or less liquid than those in the U.S. Investments outside the U.S. may also be subject to different accounting practices and different regulatory, legal and reporting standards, and may be more difficult to value, than those in the U.S. In addition, the value of investments outside the U.S. may be reduced by foreign taxes, including foreign withholding taxes on interest and dividends. Further, there may be increased risks of delayed settlement of securities purchased or sold by the fund. The risks of investing outside the U.S. may be heightened in connection with investments in emerging markets.
Management — The investment adviser to the fund actively manages the fund’s investments. Consequently, the fund is subject to the risk that the methods and analyses employed by the investment adviser in this process may not produce the desired results. This could cause the fund to lose value or its investment results to lag relevant benchmarks or other funds with similar objectives.
5. Certain investment techniques
Loan transactions — The fund has entered into loan transactions in which the fund acquires a loan either through an agent, by assignment from another holder, or as a participation interest in another holder’s portion of a loan. The loan is often administered by a financial institution that acts as agent for the holders of the loan, and the fund may be required to receive approval from the agent and/or borrower prior to the sale of the investment. The loan’s interest rate and maturity date may change based on the terms of the loan, including potential early payments of principal.
| 20 | American High-Income Trust |
Unfunded commitments — The fund has participated in transactions that involve unfunded commitments, which may obligate the fund to lend additional sums based upon the terms of the loan agreement. As of September 30, 2015, the fund’s maximum exposure of unfunded loan commitments was $108,066,000, which would represent .63% of the net assets of the fund should such commitments become due. Unrealized appreciation of $836,000 is included in other payables in the fund’s statement of assets and liabilities and net unrealized depreciation on investments in the fund’s statement of operations.
Forward currency contracts — The fund has entered into forward currency contracts, which represent agreements to exchange currencies on specific future dates at predetermined rates. The fund’s investment adviser uses forward currency contracts to manage the fund’s exposure to changes in exchange rates. Upon entering into these contracts, risks may arise from the potential inability of counterparties to meet the terms of their contracts and from possible movements in exchange rates.
On a daily basis, the fund’s investment adviser values forward currency contracts and records unrealized appreciation or depreciation for open forward currency contracts in the fund’s statement of assets and liabilities. Realized gains or losses are recorded at the time the forward currency contract is closed or offset by another contract with the same broker for the same settlement date and currency.
Closed forward currency contracts that have not reached their settlement date are included in the respective receivables or payables for closed forward currency contracts in the fund’s statement of assets and liabilities. Net realized gains or losses from closed forward currency contracts and net unrealized appreciation or depreciation from open forward currency contracts are recorded in the fund’s statement of operations.
Interest rate swaps — The fund has entered into interest rate swap contracts, which are agreements to exchange one stream of future interest payments for another based on a specified notional amount. Typically, interest rate swaps exchange a fixed interest rate for a payment that floats relative to a benchmark or vice versa. The fund’s investment adviser uses interest rate swaps to seek to manage the interest rate sensitivity of the fund by increasing or decreasing the duration of the fund or a portion of the fund’s portfolio. Risks may arise as a result of the fund’s investment adviser incorrectly anticipating changes in interest rates, increased volatility, reduced liquidity and the potential inability of counterparties to meet the terms of their agreements.
Upon entering into an interest rate swap contract, the fund is required to deposit cash, U.S. government securities or other liquid securities, which is known as “initial margin.” Generally, the initial margin required for a particular interest rate swap is set and held as collateral by the clearinghouse on which the contract is cleared. The amount of initial margin required may be significantly modified from time to time by the clearinghouse during the term of the contract.
On a daily basis, the fund’s investment adviser records daily interest accruals related to the exchange of future payments as a receivable and payable in the fund’s statement of assets and liabilities. The fund also pays or receives a “variation margin” based on the increase or decrease in the value of the interest rate swaps, including accrued interest, and records variation margin on interest rate swaps in the statement of assets and liabilities. The fund records realized gains and losses on both the net accrued interest and any gain or loss recognized at the time the interest rate swap is closed or expires. Net realized gains or losses, as well as any net unrealized appreciation or depreciation, from interest rate swaps are recorded in the fund’s statement of operations.
Credit default swap indices — The fund has entered into centrally cleared credit default swap agreements on credit indices (“CDSI”) that involve one party (the protection buyer) making a stream of payments to another party (the protection seller) in exchange for the right to receive a specified return upon the occurrence of a credit event, such as a default or restructuring, with respect to any of the underlying issuers (reference obligations) in the referenced index. The fund’s investment adviser uses credit default swaps to assume exposure to a diversified portfolio of credits or to hedge against existing credit risks. When the fund provides sell protection, its maximum exposure is the notional amount of the credit default swap agreement.
CDSI are portfolios of credit instruments or exposures designed to be representative of some part of the credit market, such as the high-yield or investment-grade credit market. CDSI are generally traded using standardized terms, including a fixed spread and standard maturity dates, and reference all the names in the index. If there is a credit event, it is settled based on that name’s weight in the index. The composition of the underlying issuers or obligations within a particular index may change periodically, usually every six months. A specified credit event may affect all or individual underlying reference obligations included in the index, and will be settled based upon the relative weighting of the affected obligation(s) within the index.
Upon entering into a centrally cleared CDSI contract, the fund is required to deposit with a derivatives clearing member (“DCM”) in a segregated account in the name of the DCM an amount of cash, U.S. government securities or other liquid securities, which is known as “initial margin.” Generally, the initial margin required for a particular credit default swap is set and held as collateral by the clearinghouse on which the contract is cleared. The amount of initial margin required may be significantly modified from time to time by the clearinghouse during the term of the contract. Securities deposited as initial margin are designated on the investment portfolio.
| American High-Income Trust | 21 |
On a daily basis, interest accruals related to the exchange of future payments are recorded as a receivable and payable in the fund’s statement of assets and liabilities. The fund also pays or receives a “variation margin” based on the increase or decrease in the value of the centrally cleared swaps, and records variation margin in the statement of assets and liabilities. The fund records realized gains and losses on both the net accrued interest and any gain or loss recognized at the time the swap is closed or expires. Net realized gains or losses, as well as any net unrealized appreciation or depreciation, from credit default swaps are recorded in the fund’s statement of operations.
The following tables present the financial statement impacts resulting from the fund’s use of forward currency contracts, interest rate swaps and credit default swaps as of, or for the year ended, September 30, 2015 (dollars in thousands):
| | | | | Assets | | | Liabilities | |
| | | | | Location on statement of | | | | | Location on statement of | | | |
| Contract | | Risk type | | assets and liabilities | | Value | | | assets and liabilities | | Value | |
| Forward currency | | Currency | | Unrealized appreciation on open forward currency contracts | | $ | 633 | | | Unrealized depreciation on open forward currency contracts | | $ | 158 | |
| Forward currency | | Currency | | Receivables for closed forward currency contracts | | | 27 | | | Payables for closed forward currency contracts | | | — | |
| Interest rate swaps | | Interest | | Net unrealized appreciation* | | | 2,986 | | | Net unrealized depreciation* | | | 3,189 | |
| Credit default swaps | | Credit | | Net unrealized appreciation* | | | — | | | Net unrealized depreciation* | | | 2,153 | |
| | | | | | | $ | 3,646 | | | | | $ | 5,500 | |
| | | | | | | | | | | | | | | |
| | | | | Net realized gain (loss) | | | Net unrealized depreciation | |
| | | | | Location on statement of | | | | | | Location on statement of | | | | |
| Contract | | Risk type | | operations | | Value | | | operations | | Value | |
| Forward currency | | Currency | | Net realized gain on forward currency contracts | | $ | 31,647 | | | Net unrealized depreciation on forward currency contracts | | $ | (1,022 | ) |
| Interest rate swaps | | Interest | | Net realized gain on interest rate swaps | | | 2,510 | | | Net unrealized depreciation on interest rate swaps | | | (313 | ) |
| Credit default swaps | | Credit | | Net realized loss on credit default swaps | | | (1,249 | ) | | Net unrealized depreciation on credit default swaps | | | (1,104 | ) |
| | | | | | | $ | 32,908 | | | | | $ | (2,439 | ) |
| * | Includes cumulative appreciation/depreciation on interest rate swaps and credit default swaps as reported in the applicable tables following the fund’s investment portfolio. Only the current day’s variation margin is reported within the statement of assets and liabilities. |
Collateral — The fund participates in a collateral program due to its use of forward currency contracts, interest rate swaps and credit default swaps. For forward currency contracts, the program calls for the fund to either receive or pledge collateral based on the net gain or loss on unsettled forward currency contracts by counterparty. For interest rate swaps and credit default swaps, the program calls for the fund to pledge collateral for initial and variation margin by contract. The purpose of the collateral is to cover potential losses that could occur in the event that either party cannot meet its contractual obligations.
Rights of offset — The fund has entered into enforceable master netting agreements with certain counterparties for forward currency contracts, where on any date amounts payable by each party to the other (in the same currency with respect to the same transaction) may be closed or offset by each party’s payment obligation. If an early termination date occurs under these agreements following an event of default or termination event, all obligations of each party to its counterparty are settled net through a single payment in a single currency (“close-out netting”). For financial reporting purposes, the fund does not offset financial assets and financial liabilities that are subject to these master netting arrangements in the statement of assets and liabilities.
| 22 | American High-Income Trust |
The following table presents the fund’s forward currency contracts by counterparty that are subject to master netting agreements but that are not offset in the fund’s statement of assets and liabilities. The net amount column shows the impact of offsetting on the fund’s statement of assets and liabilities as of September 30, 2015 (dollars in thousands) if close-out netting was exercised:
| | | | | | Gross amounts not offset in the | | | | |
| | | Gross amounts | | | statement of assets and liabilities and | | | | |
| | | recognized in the | | | subject to a master netting agreement | | | | |
| | | statement of assets | | | Available | | | Non-cash | | | Cash | | | Net | |
| Counterparty | | and liabilities | | | to offset | | | collateral* | | | collateral | | | amount | |
| Assets: | | | | | | | | | | | | | | | | | | | | |
| Bank of America, N.A. | | $ | 295 | | | $ | — | | | $ | — | | | $ | — | | | $ | 295 | |
| Citibank | | | 225 | | | | — | | | | — | | | | — | | | | 225 | |
| HSBC Bank | | | 113 | | | | — | | | | — | | | | — | | | | 113 | |
| JPMorgan Chase | | | 27 | | | | (27 | ) | | | — | | | | — | | | | — | |
| Total | | $ | 660 | | | $ | (27 | ) | | $ | — | | | $ | — | | | $ | 633 | |
| Liabilities: | | | | | | | | | | | | | | | | | | | | |
| JPMorgan Chase | | $ | 158 | | | $ | (27 | ) | | $ | — | | | $ | — | | | $ | 131 | |
| Total | | $ | 158 | | | $ | (27 | ) | | $ | — | | | $ | — | | | $ | 131 | |
| * | Non-cash collateral is shown on a settlement basis. |
6. Taxation and distributions
Federal income taxation — The fund complies with the requirements under Subchapter M of the Internal Revenue Code applicable to mutual funds and intends to distribute substantially all of its net taxable income and net capital gains each year. The fund is not subject to income taxes to the extent such distributions are made. Therefore, no federal income tax provision is required.
As of and during the period ended September 30, 2015, the fund did not have a liability for any unrecognized tax benefits. The fund recognizes interest and penalties, if any, related to unrecognized tax benefits as income tax expense in the statement of operations. During the period, the fund did not incur any interest or penalties.
The fund is not subject to examination by U.S. federal tax authorities for tax years before 2011 and by state tax authorities for tax years before 2010.
Non-U.S. taxation — Dividend and interest income are recorded net of non-U.S. taxes paid. The fund may file withholding tax reclaims in certain jurisdictions to recover a portion of amounts previously withheld. These reclaims are recorded when the amount is known and there are no significant uncertainties on collectability. Gains realized by the fund on the sale of securities in certain countries are subject to non-U.S. taxes. The fund records a liability based on unrealized gains to provide for potential non-U.S. taxes payable upon the sale of these securities.
Distributions — Distributions paid to shareholders are based on net investment income and net realized gains determined on a tax basis, which may differ from net investment income and net realized gains for financial reporting purposes. These differences are due primarily to different treatment for items such as currency gains and losses; short-term capital gains and losses; capital losses related to sales of certain securities within 30 days of purchase; cost of investments sold; net capital losses; non-U.S. taxes on capital gains; amortization of premiums and discounts; and income on certain investments. The fiscal year in which amounts are distributed may differ from the year in which the net investment income and net realized gains are recorded by the fund for financial reporting purposes.
During the year ended September 30, 2015, the fund reclassified $16,000 from distributions in excess of net investment income to capital paid in on shares of beneficial interest and $7,523,000 from accumulated net realized loss to distributions in excess of net investment income to align financial reporting with tax reporting.
Under the Regulated Investment Company Modernization Act of 2010 (the “Act”), net capital losses recognized after September 30, 2011, may be carried forward indefinitely, and their character is retained as short-term and/or long-term losses. Previously, net capital losses were carried forward for eight years and treated as short-term losses. As a transition rule, the Act requires that post-enactment net capital losses be used before pre-enactment net capital losses.
| American High-Income Trust | 23 |
As of September 30, 2015, the tax-basis components of distributable earnings, unrealized appreciation (depreciation) and cost of investment securities were as follows (dollars in thousands):
| Undistributed ordinary income | | $ | 29,929 | |
| Capital loss carryforward expiring 2018* | | | (209,244 | ) |
| Post-October capital loss deferral† | | | 745,689 | |
| Gross unrealized appreciation on investment securities | | | 253,694 | |
| Gross unrealized depreciation on investment securities | | | (2,054,625 | ) |
| Net unrealized depreciation on investment securities | | | (1,800,931 | ) |
| Cost of investment securities | | | 18,714,634 | |
| * | Reflects the utilization of capital loss carryforward of $15,822,000. The capital loss carryforward will be used to offset any capital gains realized by the fund in future years through the expiration date. The fund will not make distributions from capital gains while a capital loss carryforward remains. |
| † | This deferral is considered incurred in the subsequent year. |
Tax-basis distributions paid or accrued to shareholders from ordinary income were as follows (dollars in thousands):
| | | Year ended September 30 |
| Share class | | 2015 | | | 2014 | |
| Class A | | $ | 810,371 | | | $ | 872,829 | |
| Class B | | | 3,534 | | | | 6,292 | |
| Class C | | | 59,031 | | | | 68,040 | |
| Class F-1 | | | 49,400 | | | | 74,547 | |
| Class F-2 | | | 84,735 | | | | 76,196 | |
| Class 529-A | | | 20,821 | | | | 21,879 | |
| Class 529-B | | | 239 | | | | 416 | |
| Class 529-C | | | 6,418 | | | | 7,031 | |
| Class 529-E | | | 1,111 | | | | 1,161 | |
| Class 529-F-1 | | | 1,442 | | | | 1,535 | |
| Class R-1 | | | 1,148 | | | | 1,266 | |
| Class R-2 | | | 10,949 | | | | 11,854 | |
| Class R-2E* | | | 1 | | | | — | † |
| Class R-3 | | | 13,777 | | | | 16,981 | |
| Class R-4 | | | 12,457 | | | | 14,064 | |
| Class R-5 | | | 6,460 | | | | 10,718 | |
| Class R-6 | | | 62,776 | | | | 39,724 | |
| Total | | $ | 1,144,670 | | | $ | 1,224,533 | |
| * | Class R-2E shares were offered beginning August 29, 2014. |
| † | Amount less than one thousand. |
7. Fees and transactions with related parties
CRMC, the fund’s investment adviser, is the parent company of American Funds Distributors,® Inc. (“AFD”), the principal underwriter of the fund’s shares, and American Funds Service Company® (“AFS”), the fund’s transfer agent. CRMC, AFD and AFS are considered related parties to the fund.
Investment advisory services — The fund has an investment advisory and service agreement with CRMC that provides for monthly fees accrued daily. These fees are based on a series of decreasing annual rates beginning with 0.300% on the first $60 million of daily net assets and decreasing to 0.132% on such assets in excess of $21 billion. The agreement also provides for monthly fees, accrued daily, based on a series of decreasing rates beginning with 3.00% on the first $8,333,333 of the fund’s monthly gross income and decreasing to 1.50% on such income in excess of $50 million. For the year ended September 30, 2015, the investment advisory services fee was $52,805,000, which was equivalent to an annualized rate of 0.277% of average daily net assets.
| 24 | American High-Income Trust |
Class-specific fees and expenses — Expenses that are specific to individual share classes are accrued directly to the respective share class. The principal class-specific fees and expenses are further described below:
Distribution services — The fund has plans of distribution for all share classes, except Class F-2, R-5 and R-6 shares. Under the plans, the board of trustees approves certain categories of expenses that are used to finance activities primarily intended to sell fund shares and service existing accounts. The plans provide for payments, based on an annualized percentage of average daily net assets, ranging from 0.30% to 1.00% as noted below. In some cases, the board of trustees has limited the amounts that may be paid to less than the maximum allowed by the plans. All share classes with a plan may use up to 0.25% of average daily net assets to pay service fees, or to compensate AFD for paying service fees, to firms that have entered into agreements with AFD to provide certain shareholder services. The remaining amounts available to be paid under each plan are paid to dealers to compensate them for their sales activities.
For Class A and 529-A shares, distribution-related expenses include the reimbursement of dealer and wholesaler commissions paid by AFD for certain shares sold without a sales charge. These share classes reimburse AFD for amounts billed within the prior 15 months but only to the extent that the overall annual expense limit of 0.30% is not exceeded. As of September 30, 2015, there were no unreimbursed expenses subject to reimbursement for Class A or 529-A shares.
| | Share class | | Currently approved limits | | Plan limits | |
| | Class A | | | 0.30 | % | | | 0.30 | % | |
| | Class 529-A | | | 0.30 | | | | 0.50 | | |
| | Classes B and 529-B | | | 1.00 | | | | 1.00 | | |
| | Classes C, 529-C and R-1 | | | 1.00 | | | | 1.00 | | |
| | Class R-2 | | | 0.75 | | | | 1.00 | | |
| | Class R-2E | | | 0.60 | | | | 0.85 | | |
| | Classes 529-E and R-3 | | | 0.50 | | | | 0.75 | | |
| | Classes F-1, 529-F-1 and R-4 | | | 0.25 | | | | 0.50 | | |
Transfer agent services — The fund has a shareholder services agreement with AFS under which the fund compensates AFS for providing transfer agent services to each of the fund’s share classes. These services include recordkeeping, shareholder communications and transaction processing. In addition, the fund reimburses AFS for amounts paid to third parties for performing transfer agent services on behalf of fund shareholders.
Administrative services — The fund has an administrative services agreement with CRMC under which the fund compensates CRMC for providing administrative services to Class A, C, F, 529 and R shares. These services include, but are not limited to, coordinating, monitoring, assisting and overseeing third parties that provide services to fund shareholders. Under the agreement, Class A shares pay an annual fee of 0.01% and Class C, F, 529 and R shares pay an annual fee of 0.05% of their respective average daily net assets.
529 plan services — Each 529 share class is subject to service fees to compensate the Virginia College Savings Plan (“Virginia529”) for its oversight and administration of the 529 college savings plan. The quarterly fee is based on a series of decreasing annual rates beginning with 0.10% on the first $30 billion of the net assets invested in Class 529 shares of the American Funds and decreasing to 0.05% on such assets in excess of $70 billion. The fee for any given calendar quarter is accrued and calculated on the basis of the average net assets of Class 529 shares of the American Funds for the last month of the prior calendar quarter. The fee is included in other expenses in the fund’s statement of operations. Virginia529 is not considered a related party to the fund.
| American High-Income Trust | 25 |
For the year ended September 30, 2015, class-specific expenses under the agreements were as follows (dollars in thousands):
| | | | Distribution | | | Transfer agent | | | Administrative | | | 529 plan |
| | Share class | | services | | | services | | | services | | | services |
| | Class A | | | $31,785 | | | | $17,680 | | | | $1,342 | | | Not applicable |
| | Class B | | | 664 | | | | 88 | | | | Not applicable | | | Not applicable |
| | Class C | | | 11,250 | | | | 1,493 | | | | 564 | | | Not applicable |
| | Class F-1 | | | 2,053 | | | | 937 | | | | 412 | | | Not applicable |
| | Class F-2 | | | Not applicable | | | | 1,538 | | | | 678 | | | Not applicable |
| | Class 529-A | | | 782 | | | | 384 | | | | 175 | | | $310 |
| | Class 529-B | | | 46 | | | | 6 | | | | 2 | | | 4 |
| | Class 529-C | | | 1,225 | | | | 146 | | | | 62 | | | 110 |
| | Class 529-E | | | 95 | | | | 11 | | | | 10 | | | 17 |
| | Class 529-F-1 | | | — | | | | 25 | | | | 12 | | | 21 |
| | Class R-1 | | | 219 | | | | 27 | | | | 11 | | | Not applicable |
| | Class R-2 | | | 1,555 | | | | 832 | | | | 105 | | | Not applicable |
| | Class R-2E | | | — | * | | | — | * | | | — | * | | Not applicable |
| | Class R-3 | | | 1,202 | | | | 411 | | | | 121 | | | Not applicable |
| | Class R-4 | | | 515 | | | | 201 | | | | 103 | | | Not applicable |
| | Class R-5 | | | Not applicable | | | | 50 | | | | 51 | | | Not applicable |
| | Class R-6 | | | Not applicable | | | | 14 | | | | 494 | | | Not applicable |
| | Total class-specific expenses | | | $51,391 | | | | $23,843 | | | | $4,142 | | | $462 |
| | * | Amount less than one thousand. |
Trustees’ deferred compensation — Trustees who are unaffiliated with CRMC may elect to defer the cash payment of part or all of their compensation. These deferred amounts, which remain as liabilities of the fund, are treated as if invested in shares of the fund or other American Funds. These amounts represent general, unsecured liabilities of the fund and vary according to the total returns of the selected funds. Trustees’ compensation of $147,000 in the fund’s statement of operations reflects $150,000 in current fees (either paid in cash or deferred) and a net decrease of $3,000 in the value of the deferred amounts.
Affiliated officers and trustees — Officers and certain trustees of the fund are or may be considered to be affiliated with CRMC, AFD and AFS. No affiliated officers or trustees received any compensation directly from the fund.
8. Capital share transactions
Capital share transactions in the fund were as follows (dollars and shares in thousands):
| | | | | | | | | Reinvestments of | | | | | | | | | Net (decrease) |
| | | Sales1 | | | dividends | | | Repurchases1 | | | increase |
| Share class | | Amount | | | Shares | | | Amount | | | Shares | | | Amount | | | Shares | | | Amount | | | Shares | |
| | | | | | | | | | | | | | | | | | | | | | | |
| Year ended September 30, 2015 | | | | | | | | | | | | | | | | | | | | | | |
| | | | | | | | | | | | | | | | | | | | | | | | | | | | | | | | | |
| Class A | | $ | 1,402,305 | | | | 130,451 | | | $ | 761,678 | | | | 71,186 | | | $ | (2,854,879 | ) | | | (266,273 | ) | | $ | (690,896 | ) | | | (64,636 | ) |
| Class B | | | 2,105 | | | | 195 | | | | 3,382 | | | | 315 | | | | (51,467 | ) | | | (4,775 | ) | | | (45,980 | ) | | | (4,265 | ) |
| Class C | | | 159,501 | | | | 14,795 | | | | 55,260 | | | | 5,160 | | | | (356,912 | ) | | | (33,278 | ) | | | (142,151 | ) | | | (13,323 | ) |
| Class F-1 | | | 205,923 | | | | 19,129 | | | | 47,724 | | | | 4,453 | | | | (411,600 | ) | | | (38,308 | ) | | | (157,953 | ) | | | (14,726 | ) |
| Class F-2 | | | 904,278 | | | | 84,306 | | | | 77,231 | | | | 7,221 | | | | (861,762 | ) | | | (80,440 | ) | | | 119,747 | | | | 11,087 | |
| Class 529-A | | | 39,665 | | | | 3,686 | | | | 20,713 | | | | 1,936 | | | | (74,327 | ) | | | (6,967 | ) | | | (13,949 | ) | | | (1,345 | ) |
| Class 529-B | | | 255 | | | | 24 | | | | 236 | | | | 22 | | | | (3,560 | ) | | | (331 | ) | | | (3,069 | ) | | | (285 | ) |
| Class 529-C | | | 15,089 | | | | 1,401 | | | | 6,382 | | | | 596 | | | | (31,617 | ) | | | (2,961 | ) | | | (10,146 | ) | | | (964 | ) |
| Class 529-E | | | 2,434 | | | | 226 | | | | 1,103 | | | | 103 | | | | (4,489 | ) | | | (423 | ) | | | (952 | ) | | | (94 | ) |
| Class 529-F-1 | | | 5,123 | | | | 477 | | | | 1,428 | | | | 134 | | | | (7,251 | ) | | | (675 | ) | | | (700 | ) | | | (64 | ) |
| Class R-1 | | | 4,306 | | | | 401 | | | | 1,128 | | | | 105 | | | | (7,701 | ) | | | (717 | ) | | | (2,267 | ) | | | (211 | ) |
| Class R-2 | | | 46,621 | | | | 4,342 | | | | 10,823 | | | | 1,011 | | | | (74,643 | ) | | | (6,962 | ) | | | (17,199 | ) | | | (1,609 | ) |
| Class R-2E | | | 8 | | | | 1 | | | | — | 2 | | | — | 2 | | | — | | | | — | | | | 8 | | | | 1 | |
| Class R-3 | | | 105,762 | | | | 9,738 | | | | 13,683 | | | | 1,278 | | | | (138,233 | ) | | | (12,862 | ) | | | (18,788 | ) | | | (1,846 | ) |
| Class R-4 | | | 53,228 | | | | 4,953 | | | | 12,386 | | | | 1,157 | | | | (91,637 | ) | | | (8,540 | ) | | | (26,023 | ) | | | (2,430 | ) |
| Class R-5 | | | 34,416 | | | | 3,198 | | | | 6,411 | | | | 599 | | | | (52,013 | ) | | | (4,855 | ) | | | (11,186 | ) | | | (1,058 | ) |
| Class R-6 | | | 434,919 | | | | 40,319 | | | | 62,507 | | | | 5,861 | | | | (130,483 | ) | | | (12,143 | ) | | | 366,943 | | | | 34,037 | |
| Total net increase (decrease) | | $ | 3,415,938 | | | | 317,642 | | | $ | 1,082,075 | | | | 101,137 | | | $ | (5,152,574 | ) | | | (480,510 | ) | | $ | (654,561 | ) | | | (61,731 | ) |
| 26 | American High-Income Trust |
| | | | | | | | | Reinvestments of | | | | | | | | | Net increase |
| | | Sales1 | | | dividends | | | Repurchases1 | | | (decrease) |
| Share class | | Amount | | | Shares | | | Amount | | | Shares | | | Amount | | | Shares | | | Amount | | | Shares | |
| | | | | | | | | | | | | | | | | | | | | | | |
| Year ended September 30, 2014 | | | | | | | | | | | | | | | | | | | | | | |
| | | | | | | | | | | | | | | | | | | | | | | | | | | | | | | | | |
| Class A | | $ | 2,036,059 | | | | 178,281 | | | $ | 829,099 | | | | 72,715 | | | $ | (2,579,536 | ) | | | (226,172 | ) | | $ | 285,622 | | | | 24,824 | |
| Class B | | | 6,628 | | | | 581 | | | | 6,072 | | | | 532 | | | | (61,042 | ) | | | (5,349 | ) | | | (48,342 | ) | | | (4,236 | ) |
| Class C | | | 217,066 | | | | 19,009 | | | | 64,085 | | | | 5,620 | | | | (359,105 | ) | | | (31,499 | ) | | | (77,954 | ) | | | (6,870 | ) |
| Class F-1 | | | 322,180 | | | | 28,230 | | | | 73,767 | | | | 6,466 | | | | (884,532 | ) | | | (77,468 | ) | | | (488,585 | ) | | | (42,772 | ) |
| Class F-2 | | | 1,103,468 | | | | 96,589 | | | | 68,415 | | | | 6,002 | | | | (757,902 | ) | | | (66,714 | ) | | | 413,981 | | | | 35,877 | |
| Class 529-A | | | 57,915 | | | | 5,073 | | | | 22,066 | | | | 1,935 | | | | (65,375 | ) | | | (5,732 | ) | | | 14,606 | | | | 1,276 | |
| Class 529-B | | | 647 | | | | 57 | | | | 420 | | | | 37 | | | | (4,118 | ) | | | (361 | ) | | | (3,051 | ) | | | (267 | ) |
| Class 529-C | | | 24,293 | | | | 2,128 | | | | 7,093 | | | | 622 | | | | (29,420 | ) | | | (2,579 | ) | | | 1,966 | | | | 171 | |
| Class 529-E | | | 3,901 | | | | 342 | | | | 1,169 | | | | 103 | | | | (4,225 | ) | | | (370 | ) | | | 845 | | | | 75 | |
| Class 529-F-1 | | | 6,377 | | | | 558 | | | | 1,542 | | | | 135 | | | | (6,069 | ) | | | (531 | ) | | | 1,850 | | | | 162 | |
| Class R-1 | | | 5,235 | | | | 459 | | | | 1,262 | | | | 111 | | | | (6,550 | ) | | | (574 | ) | | | (53 | ) | | | (4 | ) |
| Class R-2 | | | 59,634 | | | | 5,220 | | | | 11,901 | | | | 1,044 | | | | (75,816 | ) | | | (6,647 | ) | | | (4,281 | ) | | | (383 | ) |
| Class R-2E3 | | | 10 | | | | 1 | | | | — | | | | — | | | | — | | | | — | | | | 10 | | | | 1 | |
| Class R-3 | | | 80,120 | | | | 7,019 | | | | 17,104 | | | | 1,500 | | | | (148,139 | ) | | | (13,014 | ) | | | (50,915 | ) | | | (4,495 | ) |
| Class R-4 | | | 72,631 | | | | 6,364 | | | | 14,190 | | | | 1,245 | | | | (83,751 | ) | | | (7,343 | ) | | | 3,070 | | | | 266 | |
| Class R-5 | | | 46,979 | | | | 4,123 | | | | 10,788 | | | | 946 | | | | (171,224 | ) | | | (14,973 | ) | | | (113,457 | ) | | | (9,904 | ) |
| Class R-6 | | | 418,795 | | | | 36,616 | | | | 38,803 | | | | 3,405 | | | | (110,834 | ) | | | (9,729 | ) | | | 346,764 | | | | 30,292 | |
| Total net increase (decrease) | | $ | 4,461,938 | | | | 390,650 | | | $ | 1,167,776 | | | | 102,418 | | | $ | (5,347,638 | ) | | | (469,055 | ) | | $ | 282,076 | | | | 24,013 | |
| 1 | Includes exchanges between share classes of the fund. |
| 2 | Amount less than one thousand. |
| 3 | Class R-2E shares were offered beginning August 29, 2014. |
9. Investment transactions
The fund made purchases and sales of investment securities, excluding short-term securities and U.S. government obligations, if any, of $8,949,853,000 and $8,658,263,000, respectively, during the year ended September 30, 2015.
| American High-Income Trust | 27 |
Financial highlights
| | | | | | (Loss) income from | | | | | | | | | | | | | | | | | | | | | | |
| | | | | | investment operations1 | | | | | | | | | | | | | | | | | | | | | | |
| | | | | | | | | Net (losses) | | | | | | | | | | | | | | | | | | Ratio of | | | Ratio of | | | | |
| | | Net asset | | | | | | gains on | | | | | | Dividends | | | Net asset | | | | | | | | | expenses | | | expenses | | | Ratio of | |
| | | value, | | | Net | | | securities (both | | | Total from | | | (from net | | | value, | | | | | | Net assets, | | | to average net | | | to average net | | | net income | |
| | | beginning | | | investment | | | realized and | | | investment | | | investment | | | end | | | Total | | | end of period | | | assets before | | | assets after | | | to average | |
| | | of period | | | income | | | unrealized) | | | operations | | | income) | | | of period | | | return2,3 | | | (in millions) | | | reimbursements | | | reimbursements3 | | | net assets3 | |
| Class A: | | | | | | | | | | | | | | | | | | | | | | | | | | | | | | | | | | | | | | | | | | | | |
| Year ended 9/30/2015 | | $ | 11.09 | | | $ | .64 | | | $ | (1.25 | ) | | $ | (.61 | ) | | $ | (.65 | ) | | $ | 9.83 | | | | (5.84 | )% | | $ | 12,033 | | | | .67 | % | | | .67 | % | | | 5.94 | % |
| Year ended 9/30/2014 | | | 11.22 | | | | .68 | | | | (.13 | ) | | | .55 | | | | (.68 | ) | | | 11.09 | | | | 4.93 | | | | 14,286 | | | | .66 | | | | .66 | | | | 5.99 | |
| Year ended 9/30/2013 | | | 11.18 | | | | .72 | | | | .06 | | | | .78 | | | | (.74 | ) | | | 11.22 | | | | 7.10 | | | | 14,178 | | | | .66 | | | | .66 | | | | 6.37 | |
| Year ended 9/30/2012 | | | 10.36 | | | | .78 | | | | .86 | | | | 1.64 | | | | (.82 | ) | | | 11.18 | | | | 16.35 | | | | 13,822 | | | | .69 | | | | .69 | | | | 7.17 | |
| Year ended 9/30/2011 | | | 11.13 | | | | .85 | | | | (.74 | ) | | | .11 | | | | (.88 | ) | | | 10.36 | | | | .67 | | | | 11,223 | | | | .67 | | | | .67 | | | | 7.57 | |
| Class B: | | | | | | | | | | | | | | | | | | | | | | | | | | | | | | | | | | | | | | | | | | | | |
| Year ended 9/30/2015 | | | 11.09 | | | | .56 | | | | (1.25 | ) | | | (.69 | ) | | | (.57 | ) | | | 9.83 | | | | (6.54 | ) | | | 42 | | | | 1.42 | | | | 1.42 | | | | 5.20 | |
| Year ended 9/30/2014 | | | 11.22 | | | | .60 | | | | (.13 | ) | | | .47 | | | | (.60 | ) | | | 11.09 | | | | 4.16 | | | | 94 | | | | 1.41 | | | | 1.41 | | | | 5.26 | |
| Year ended 9/30/2013 | | | 11.18 | | | | .63 | | | | .06 | | | | .69 | | | | (.65 | ) | | | 11.22 | | | | 6.29 | | | | 143 | | | | 1.43 | | | | 1.43 | | | | 5.63 | |
| Year ended 9/30/2012 | | | 10.36 | | | | .70 | | | | .86 | | | | 1.56 | | | | (.74 | ) | | | 11.18 | | | | 15.49 | | | | 204 | | | | 1.44 | | | | 1.44 | | | | 6.47 | |
| Year ended 9/30/2011 | | | 11.13 | | | | .77 | | | | (.74 | ) | | | .03 | | | | (.80 | ) | | | 10.36 | | | | (.10 | ) | | | 264 | | | | 1.44 | | | | 1.44 | | | | 6.82 | |
| Class C: | | | | | | | | | | | | | | | | | | | | | | | | | | | | | | | | | | | | | | | | | | | | |
| Year ended 9/30/2015 | | | 11.09 | | | | .55 | | | | (1.25 | ) | | | (.70 | ) | | | (.56 | ) | | | 9.83 | | | | (6.59 | ) | | | 967 | | | | 1.47 | | | | 1.47 | | | | 5.14 | |
| Year ended 9/30/2014 | | | 11.22 | | | | .59 | | | | (.13 | ) | | | .46 | | | | (.59 | ) | | | 11.09 | | | | 4.11 | | | | 1,238 | | | | 1.46 | | | | 1.46 | | | | 5.20 | |
| Year ended 9/30/2013 | | | 11.18 | | | | .63 | | | | .06 | | | | .69 | | | | (.65 | ) | | | 11.22 | | | | 6.25 | | | | 1,330 | | | | 1.48 | | | | 1.48 | | | | 5.56 | |
| Year ended 9/30/2012 | | | 10.36 | | | | .70 | | | | .86 | | | | 1.56 | | | | (.74 | ) | | | 11.18 | | | | 15.43 | | | | 1,418 | | | | 1.48 | | | | 1.48 | | | | 6.38 | |
| Year ended 9/30/2011 | | | 11.13 | | | | .76 | | | | (.74 | ) | | | .02 | | | | (.79 | ) | | | 10.36 | | | | (.15 | ) | | | 1,229 | | | | 1.48 | | | | 1.48 | | | | 6.76 | |
| Class F-1: | | | | | | | | | | | | | | | | | | | | | | | | | | | | | | | | | | | | | | | | | | | | |
| Year ended 9/30/2015 | | | 11.09 | | | | .63 | | | | (1.25 | ) | | | (.62 | ) | | | (.64 | ) | | | 9.83 | | | | (5.87 | ) | | | 677 | | | | .70 | | | | .70 | | | | 5.91 | |
| Year ended 9/30/2014 | | | 11.22 | | | | .68 | | | | (.13 | ) | | | .55 | | | | (.68 | ) | | | 11.09 | | | | 4.87 | | | | 927 | | | | .71 | | | | .71 | | | | 5.96 | |
| Year ended 9/30/2013 | | | 11.18 | | | | .71 | | | | .06 | | | | .77 | | | | (.73 | ) | | | 11.22 | | | | 7.03 | | | | 1,418 | | | | .73 | | | | .73 | | | | 6.32 | |
| Year ended 9/30/2012 | | | 10.36 | | | | .78 | | | | .86 | | | | 1.64 | | | | (.82 | ) | | | 11.18 | | | | 16.32 | | | | 1,584 | | | | .71 | | | | .71 | | | | 7.14 | |
| Year ended 9/30/2011 | | | 11.13 | | | | .85 | | | | (.74 | ) | | | .11 | | | | (.88 | ) | | | 10.36 | | | | .62 | | | | 1,264 | | | | .72 | | | | .72 | | | | 7.52 | |
| Class F-2: | | | | | | | | | | | | | | | | | | | | | | | | | | | | | | | | | | | | | | | | | | | | |
| Year ended 9/30/2015 | | | 11.09 | | | | .66 | | | | (1.25 | ) | | | (.59 | ) | | | (.67 | ) | | | 9.83 | | | | (5.64 | ) | | | 1,281 | | | | .45 | | | | .45 | | | | 6.15 | |
| Year ended 9/30/2014 | | | 11.22 | | | | .71 | | | | (.13 | ) | | | .58 | | | | (.71 | ) | | | 11.09 | | | | 5.15 | | | | 1,322 | | | | .44 | | | | .44 | | | | 6.21 | |
| Year ended 9/30/2013 | | | 11.18 | | | | .74 | | | | .06 | | | | .80 | | | | (.76 | ) | | | 11.22 | | | | 7.32 | | | | 935 | | | | .46 | | | | .46 | | | | 6.58 | |
| Year ended 9/30/2012 | | | 10.36 | | | | .81 | | | | .86 | | | | 1.67 | | | | (.85 | ) | | | 11.18 | | | | 16.62 | | | | 903 | | | | .46 | | | | .46 | | | | 7.37 | |
| Year ended 9/30/2011 | | | 11.13 | | | | .88 | | | | (.74 | ) | | | .14 | | | | (.91 | ) | | | 10.36 | | | | .88 | | | | 568 | | | | .46 | | | | .46 | | | | 7.77 | |
| Class 529-A: | | | | | | | | | | | | | | | | | | | | | | | | | | | | | | | | | | | | | | | | | | | | |
| Year ended 9/30/2015 | | | 11.09 | | | | .63 | | | | (1.25 | ) | | | (.62 | ) | | | (.64 | ) | | | 9.83 | | | | (5.93 | ) | | | 312 | | | | .76 | | | | .76 | | | | 5.84 | |
| Year ended 9/30/2014 | | | 11.22 | | | | .67 | | | | (.13 | ) | | | .54 | | | | (.67 | ) | | | 11.09 | | | | 4.83 | | | | 367 | | | | .75 | | | | .75 | | | | 5.89 | |
| Year ended 9/30/2013 | | | 11.18 | | | | .71 | | | | .06 | | | | .77 | | | | (.73 | ) | | | 11.22 | | | | 7.00 | | | | 357 | | | | .76 | | | | .76 | | | | 6.27 | |
| Year ended 9/30/2012 | | | 10.36 | | | | .78 | | | | .86 | | | | 1.64 | | | | (.82 | ) | | | 11.18 | | | | 16.26 | | | | 341 | | | | .77 | | | | .77 | | | | 7.08 | |
| Year ended 9/30/2011 | | | 11.13 | | | | .85 | | | | (.74 | ) | | | .11 | | | | (.88 | ) | | | 10.36 | | | | .59 | | | | 261 | | | | .74 | | | | .74 | | | | 7.50 | |
| Class 529-B: | | | | | | | | | | | | | | | | | | | | | | | | | | | | | | | | | | | | | | | | | | | | |
| Year ended 9/30/2015 | | | 11.09 | | | | .54 | | | | (1.25 | ) | | | (.71 | ) | | | (.55 | ) | | | 9.83 | | | | (6.66 | ) | | | 3 | | | | 1.55 | | | | 1.55 | | | | 5.07 | |
| Year ended 9/30/2014 | | | 11.22 | | | | .58 | | | | (.13 | ) | | | .45 | | | | (.58 | ) | | | 11.09 | | | | 4.02 | | | | 6 | | | | 1.55 | | | | 1.55 | | | | 5.12 | |
| Year ended 9/30/2013 | | | 11.18 | | | | .62 | | | | .06 | | | | .68 | | | | (.64 | ) | | | 11.22 | | | | 6.16 | | | | 10 | | | | 1.56 | | | | 1.56 | | | | 5.50 | |
| Year ended 9/30/2012 | | | 10.36 | | | | .69 | | | | .86 | | | | 1.55 | | | | (.73 | ) | | | 11.18 | | | | 15.34 | | | | 13 | | | | 1.57 | | | | 1.57 | | | | 6.32 | |
| Year ended 9/30/2011 | | | 11.13 | | | | .75 | | | | (.74 | ) | | | .01 | | | | (.78 | ) | | | 10.36 | | | | (.22 | ) | | | 16 | | | | 1.55 | | | | 1.55 | | | | 6.70 | |
| 28 | American High-Income Trust |
| | | | | | (Loss) income from | | | | | | | | | | | | | | | | | | | | | | |
| | | | | | investment operations1 | | | | | | | | | | | | | | | | | | | | | | |
| | | | | | | | | Net (losses) | | | | | | | | | | | | | | | | | | Ratio of | | | Ratio of | | | | |
| | | Net asset | | | | | | gains on | | | | | | Dividends | | | Net asset | | | | | | | | | expenses | | | expenses | | | Ratio of | |
| | | value, | | | Net | | | securities (both | | | Total from | | | (from net | | | value, | | | | | | Net assets, | | | to average net | | | to average net | | | net income | |
| | | beginning | | | investment | | | realized and | | | investment | | | investment | | | end | | | Total | | | end of period | | | assets before | | | assets after | | | to average | |
| | | of period | | | income | | | unrealized) | | | operations | | | income) | | | of period | | | return2,3 | | | (in millions) | | | reimbursements | | | reimbursements3 | | | net assets3 | |
| Class 529-C: | | | | | | | | | | | | | | | | | | | | | | | | | | | | | | | | | | | | | | | | | | | | |
| Year ended 9/30/2015 | | $ | 11.09 | | | $ | .55 | | | $ | (1.25 | ) | | $ | (.70 | ) | | $ | (.56 | ) | | $ | 9.83 | | | | (6.65 | )% | | $ | 108 | | | | 1.53 | % | | | 1.53 | % | | | 5.07 | % |
| Year ended 9/30/2014 | | | 11.22 | | | | .58 | | | | (.13 | ) | | | .45 | | | | (.58 | ) | | | 11.09 | | | | 4.03 | | | | 133 | | | | 1.53 | | | | 1.53 | | | | 5.12 | |
| Year ended 9/30/2013 | | | 11.18 | | | | .62 | | | | .06 | | | | .68 | | | | (.64 | ) | | | 11.22 | | | | 6.17 | | | | 132 | | | | 1.55 | | | | 1.55 | | | | 5.49 | |
| Year ended 9/30/2012 | | | 10.36 | | | | .69 | | | | .86 | | | | 1.55 | | | | (.73 | ) | | | 11.18 | | | | 15.35 | | | | 128 | | | | 1.56 | | | | 1.56 | | | | 6.29 | |
| Year ended 9/30/2011 | | | 11.13 | | | | .76 | | | | (.74 | ) | | | .02 | | | | (.79 | ) | | | 10.36 | | | | (.21 | ) | | | 101 | | | | 1.54 | | | | 1.54 | | | | 6.70 | |
| Class 529-E: | | | | | | | | | | | | | | | | | | | | | | | | | | | | | | | | | | | | | | | | | | | | |
| Year ended 9/30/2015 | | | 11.09 | | | | .61 | | | | (1.25 | ) | | | (.64 | ) | | | (.62 | ) | | | 9.83 | | | | (6.12 | ) | | | 17 | | | | .97 | | | | .97 | | | | 5.63 | |
| Year ended 9/30/2014 | | | 11.22 | | | | .65 | | | | (.13 | ) | | | .52 | | | | (.65 | ) | | | 11.09 | | | | 4.60 | | | | 20 | | | | .98 | | | | .98 | | | | 5.67 | |
| Year ended 9/30/2013 | | | 11.18 | | | | .68 | | | | .06 | | | | .74 | | | | (.70 | ) | | | 11.22 | | | | 6.75 | | | | 20 | | | | .99 | | | | .99 | | | | 6.04 | |
| Year ended 9/30/2012 | | | 10.36 | | | | .75 | | | | .86 | | | | 1.61 | | | | (.79 | ) | | | 11.18 | | | | 15.97 | | | | 19 | | | | 1.02 | | | | 1.02 | | | | 6.83 | |
| Year ended 9/30/2011 | | | 11.13 | | | | .81 | | | | (.74 | ) | | | .07 | | | | (.84 | ) | | | 10.36 | | | | .31 | | | | 15 | | | | 1.02 | | | | 1.02 | | | | 7.22 | |
| Class 529-F-1: | | | | | | | | | | | | | | | | | | | | | | | | | | | | | | | | | | | | | | | | | | | | |
| Year ended 9/30/2015 | | | 11.09 | | | | .65 | | | | (1.25 | ) | | | (.60 | ) | | | (.66 | ) | | | 9.83 | | | | (5.71 | ) | | | 22 | | | | .54 | | | | .54 | | | | 6.07 | |
| Year ended 9/30/2014 | | | 11.22 | | | | .70 | | | | (.13 | ) | | | .57 | | | | (.70 | ) | | | 11.09 | | | | 5.06 | | | | 25 | | | | .53 | | | | .53 | | | | 6.11 | |
| Year ended 9/30/2013 | | | 11.18 | | | | .73 | | | | .06 | | | | .79 | | | | (.75 | ) | | | 11.22 | | | | 7.22 | | | | 23 | | | | .54 | | | | .54 | | | | 6.48 | |
| Year ended 9/30/2012 | | | 10.36 | | | | .80 | | | | .86 | | | | 1.66 | | | | (.84 | ) | | | 11.18 | | | | 16.50 | | | | 20 | | | | .56 | | | | .56 | | | | 7.28 | |
| Year ended 9/30/2011 | | | 11.13 | | | | .87 | | | | (.74 | ) | | | .13 | | | | (.90 | ) | | | 10.36 | | | | .80 | | | | 14 | | | | .53 | | | | .53 | | | | 7.70 | |
| Class R-1: | | | | | | | | | | | | | | | | | | | | | | | | | | | | | | | | | | | | | | | | | | | | |
| Year ended 9/30/2015 | | | 11.09 | | | | .55 | | | | (1.25 | ) | | | (.70 | ) | | | (.56 | ) | | | 9.83 | | | | (6.58 | ) | | | 19 | | | | 1.46 | | | | 1.46 | | | | 5.15 | |
| Year ended 9/30/2014 | | | 11.22 | | | | .59 | | | | (.13 | ) | | | .46 | | | | (.59 | ) | | | 11.09 | | | | 4.11 | | | | 24 | | | | 1.46 | | | | 1.46 | | | | 5.19 | |
| Year ended 9/30/2013 | | | 11.18 | | | | .63 | | | | .06 | | | | .69 | | | | (.65 | ) | | | 11.22 | | | | 6.25 | | | | 24 | | | | 1.47 | | | | 1.47 | | | | 5.56 | |
| Year ended 9/30/2012 | | | 10.36 | | | | .70 | | | | .86 | | | | 1.56 | | | | (.74 | ) | | | 11.18 | | | | 15.42 | | | | 25 | | | | 1.50 | | | | 1.50 | | | | 6.36 | |
| Year ended 9/30/2011 | | | 11.13 | | | | .76 | | | | (.74 | ) | | | .02 | | | | (.79 | ) | | | 10.36 | | | | (.17 | ) | | | 20 | | | | 1.50 | | | | 1.50 | | | | 6.74 | |
| Class R-2: | | | | | | | | | | | | | | | | | | | | | | | | | | | | | | | | | | | | | | | | | | | | |
| Year ended 9/30/2015 | | | 11.09 | | | | .55 | | | | (1.25 | ) | | | (.70 | ) | | | (.56 | ) | | | 9.83 | | | | (6.60 | ) | | | 183 | | | | 1.48 | | | | 1.48 | | | | 5.13 | |
| Year ended 9/30/2014 | | | 11.22 | | | | .59 | | | | (.13 | ) | | | .46 | | | | (.59 | ) | | | 11.09 | | | | 4.06 | | | | 224 | | | | 1.50 | | | | 1.50 | | | | 5.15 | |
| Year ended 9/30/2013 | | | 11.18 | | | | .63 | | | | .06 | | | | .69 | | | | (.65 | ) | | | 11.22 | | | | 6.26 | | | | 231 | | | | 1.47 | | | | 1.47 | | | | 5.57 | |
| Year ended 9/30/2012 | | | 10.36 | | | | .69 | | | | .86 | | | | 1.55 | | | | (.73 | ) | | | 11.18 | | | | 15.38 | | | | 232 | | | | 1.54 | | | | 1.54 | | | | 6.32 | |
| Year ended 9/30/2011 | | | 11.13 | | | | .76 | | | | (.74 | ) | | | .02 | | | | (.79 | ) | | | 10.36 | | | | (.15 | ) | | | 200 | | | | 1.53 | | | | 1.48 | | | | 6.76 | |
| Class R-2E: | | | | | | | | | | | | | | | | | | | | | | | | | | | | | | | | | | | | | | | | | | | | |
| Year ended 9/30/2015 | | | 11.09 | | | | .63 | | | | (1.25 | ) | | | (.62 | ) | | | (.64 | ) | | | 9.83 | | | | (5.94 | )4 | | | — | 5 | | | .79 | 4 | | | .79 | 4 | | | 5.76 | 4 |
| Period from 8/29/2014 to 9/30/20146,7 | | | 11.40 | | | | .06 | | | | (.31 | ) | | | (.25 | ) | | | (.06 | ) | | | 11.09 | | | | (2.20 | )8,9 | | | — | 5 | | | .04 | 8,9 | | | .04 | 8,9 | | | .51 | 8,9 |
| Class R-3: | | | | | | | | | | | | | | | | | | | | | | | | | | | | | | | | | | | | | | | | | | | | |
| Year ended 9/30/2015 | | | 11.09 | | | | .60 | | | | (1.25 | ) | | | (.65 | ) | | | (.61 | ) | | | 9.83 | | | | (6.16 | ) | | | 209 | | | | 1.01 | | | | 1.01 | | | | 5.61 | |
| Year ended 9/30/2014 | | | 11.22 | | | | .64 | | | | (.13 | ) | | | .51 | | | | (.64 | ) | | | 11.09 | | | | 4.57 | | | | 256 | | | | 1.01 | | | | 1.01 | | | | 5.65 | |
| Year ended 9/30/2013 | | | 11.18 | | | | .68 | | | | .06 | | | | .74 | | | | (.70 | ) | | | 11.22 | | | | 6.74 | | | | 310 | | | | 1.01 | | | | 1.01 | | | | 6.04 | |
| Year ended 9/30/2012 | | | 10.36 | | | | .75 | | | | .86 | | | | 1.61 | | | | (.79 | ) | | | 11.18 | | | | 15.96 | | | | 352 | | | | 1.03 | | | | 1.03 | | | | 6.84 | |
| Year ended 9/30/2011 | | | 11.13 | | | | .81 | | | | (.74 | ) | | | .07 | | | | (.84 | ) | | | 10.36 | | | | .31 | | | | 266 | | | | 1.02 | | | | 1.02 | | | | 7.22 | |
See page 30 for footnotes.
| American High-Income Trust | 29 |
Financial highlights (continued)
| | | | | | (Loss) income from | | | | | | | | | | | | | | | | | | | | | | |
| | | | | | investment operations1 | | | | | | | | | | | | | | | | | | | | | | |
| | | | | | | | | Net (losses) | | | | | | | | | | | | | | | | | | Ratio of | | | Ratio of | | | | |
| | | Net asset | | | | | | gains on | | | | | | Dividends | | | Net asset | | | | | | | | | expenses | | | expenses | | | Ratio of | |
| | | value, | | | Net | | | securities (both | | | Total from | | | (from net | | | value, | | | | | | Net assets, | | | to average net | | | to average net | | | net income | |
| | | beginning | | | investment | | | realized and | | | investment | | | investment | | | end | | | Total | | | end of period | | | assets before | | | assets after | | | to average | |
| | | of period | | | income | | | unrealized) | | | operations | | | income) | | | of period | | | return2,3 | | | (in millions) | | | reimbursements | | | reimbursements3 | | | net assets3 | |
| Class R-4: | | | | | | | | | | | | | | | | | | | | | | | | | | | | | | | | | | | | | | | | | | | | |
| Year ended 9/30/2015 | | $ | 11.09 | | | $ | .64 | | | $ | (1.25 | ) | | $ | (.61 | ) | | $ | (.65 | ) | | $ | 9.83 | | | | (5.86 | )% | | $ | 180 | | | | .69 | % | | | .69 | % | | | 5.93 | % |
| Year ended 9/30/2014 | | | 11.22 | | | | .68 | | | | (.13 | ) | | | .55 | | | | (.68 | ) | | | 11.09 | | | | 4.90 | | | | 230 | | | | .69 | | | | .69 | | | | 5.96 | |
| Year ended 9/30/2013 | | | 11.18 | | | | .72 | | | | .06 | | | | .78 | | | | (.74 | ) | | | 11.22 | | | | 7.06 | | | | 230 | | | | .70 | | | | .70 | | | | 6.34 | |
| Year ended 9/30/2012 | | | 10.36 | | | | .78 | | | | .86 | | | | 1.64 | | | | (.82 | ) | | | 11.18 | | | | 16.32 | | | | 232 | | | | .72 | | | | .72 | | | | 7.16 | |
| Year ended 9/30/2011 | | | 11.13 | | | | .85 | | | | (.74 | ) | | | .11 | | | | (.88 | ) | | | 10.36 | | | | .61 | | | | 208 | | | | .72 | | | | .72 | | | | 7.52 | |
| Class R-5: | | | | | | | | | | | | | | | | | | | | | | | | | | | | | | | | | | | | | | | | | | | | |
| Year ended 9/30/2015 | | | 11.09 | | | | .67 | | | | (1.25 | ) | | | (.58 | ) | | | (.68 | ) | | | 9.83 | | | | (5.58 | ) | | | 88 | | | | .39 | | | | .39 | | | | 6.23 | |
| Year ended 9/30/2014 | | | 11.22 | | | | .71 | | | | (.13 | ) | | | .58 | | | | (.71 | ) | | | 11.09 | | | | 5.21 | | | | 111 | | | | .39 | | | | .39 | | | | 6.30 | |
| Year ended 9/30/2013 | | | 11.18 | | | | .75 | | | | .06 | | | | .81 | | | | (.77 | ) | | | 11.22 | | | | 7.38 | | | | 224 | | | | .40 | | | | .40 | | | | 6.66 | |
| Year ended 9/30/2012 | | | 10.36 | | | | .81 | | | | .86 | | | | 1.67 | | | | (.85 | ) | | | 11.18 | | | | 16.67 | | | | 290 | | | | .41 | | | | .41 | | | | 7.44 | |
| Year ended 9/30/2011 | | | 11.13 | | | | .88 | | | | (.74 | ) | | | .14 | | | | (.91 | ) | | | 10.36 | | | | .91 | | | | 224 | | | | .42 | | | | .42 | | | | 7.82 | |
| Class R-6: | | | | | | | | | | | | | | | | | | | | | | | | | | | | | | | | | | | | | | | | | | | | |
| Year ended 9/30/2015 | | | 11.09 | | | | .67 | | | | (1.25 | ) | | | (.58 | ) | | | (.68 | ) | | | 9.83 | | | | (5.53 | ) | | | 1,046 | | | | .34 | | | | .34 | | | | 6.26 | |
| Year ended 9/30/2014 | | | 11.22 | | | | .72 | | | | (.13 | ) | | | .59 | | | | (.72 | ) | | | 11.09 | | | | 5.26 | | | | 803 | | | | .34 | | | | .34 | | | | 6.29 | |
| Year ended 9/30/2013 | | | 11.18 | | | | .76 | | | | .06 | | | | .82 | | | | (.78 | ) | | | 11.22 | | | | 7.43 | | | | 472 | | | | .35 | | | | .35 | | | | 6.66 | |
| Year ended 9/30/2012 | | | 10.36 | | | | .82 | | | | .86 | | | | 1.68 | | | | (.86 | ) | | | 11.18 | | | | 16.72 | | | | 226 | | | | .36 | | | | .36 | | | | 7.44 | |
| Year ended 9/30/2011 | | | 11.13 | | | | .89 | | | | (.74 | ) | | | .15 | | | | (.92 | ) | | | 10.36 | | | | .96 | | | | 104 | | | | .37 | | | | .37 | | | | 7.86 | |
| | Year ended September 30 |
| | 2015 | | 2014 | | 2013 | | 2012 | | 2011 |
| Portfolio turnover rate for all share classes | 49% | | 62% | | 61% | | 38% | | 51% |
| 1 | Based on average shares outstanding. |
| 2 | Total returns exclude any applicable sales charges, including contingent deferred sales charges. |
| 3 | This column reflects the impact, if any, of certain reimbursements from CRMC. During one of the periods shown, CRMC paid a portion of the fund’s transfer agent fees for certain retirement plan share classes. |
| 4 | Although the fund has a plan of distribution for Class R-2E shares, fees for distribution services are not paid by the fund on accounts for which a broker-dealer (or other financial intermediary) has not been assigned, including amounts invested in the fund by CRMC and/or its affiliates. If fees for distribution services were charged on these assets, fund expenses would be higher and net income and total return would be lower. |
| 5 | Amount less than $1 million. |
| 6 | Based on operations for the period shown and, accordingly, is not representative of a full year. |
| 7 | Class R-2E shares were offered beginning August 29, 2014. |
| 8 | This class consisted solely of seed capital invested by CRMC; therefore, certain fees were not accrued. |
| 9 | Not annualized. |
See Notes to Financial Statements
| 30 | American High-Income Trust |
Report of Independent Registered Public Accounting Firm
To the Shareholders and Board of Trustees of American High-Income Trust:
We have audited the accompanying statement of assets and liabilities of American High-Income Trust (the “Fund”), including the summary investment portfolio, as of September 30, 2015, and the related statement of operations for the year then ended, the statements of changes in net assets for each of the two years in the period then ended, and the financial highlights for each of the periods presented. These financial statements and financial highlights are the responsibility of the Fund’s management. Our responsibility is to express an opinion on these financial statements and financial highlights based on our audits.
We conducted our audits in accordance with the standards of the Public Company Accounting Oversight Board (United States). Those standards require that we plan and perform the audit to obtain reasonable assurance about whether the financial statements and financial highlights are free of material misstatement. The Fund is not required to have, nor were we engaged to perform, an audit of its internal control over financial reporting. Our audits included consideration of internal control over financial reporting as a basis for designing audit procedures that are appropriate in the circumstances, but not for the purpose of expressing an opinion on the effectiveness of the Fund’s internal control over financial reporting. Accordingly, we express no such opinion. An audit also includes examining, on a test basis, evidence supporting the amounts and disclosures in the financial statements, assessing the accounting principles used and significant estimates made by management, as well as evaluating the overall financial statement presentation. Our procedures included confirmation of securities owned as of September 30, 2015, by correspondence with the custodian, brokers and agent banks; where replies were not received from brokers and agent banks, we performed other auditing procedures. We believe that our audits provide a reasonable basis for our opinion.
In our opinion, such financial statements and financial highlights referred to above present fairly, in all material respects, the financial position of American High-Income Trust as of September 30, 2015, the results of its operations for the year then ended, the changes in its net assets for each of the two years in the period then ended, and the financial highlights for each of the periods presented, in conformity with accounting principles generally accepted in the United States of America.
Deloitte & Touche LLP
Costa Mesa, California
November 13, 2015
| American High-Income Trust | 31 |
As a fund shareholder, you incur two types of costs: (1) transaction costs, such as initial sales charges on purchase payments and contingent deferred sales charges on redemptions (loads), and (2) ongoing costs, including management fees, distribution and service (12b-1) fees, and other expenses. This example is intended to help you understand your ongoing costs (in dollars) of investing in the fund so you can compare these costs with the ongoing costs of investing in other mutual funds. The example is based on an investment of $1,000 invested at the beginning of the period and held for the entire six-month period (April 1, 2015, through September 30, 2015).
Actual expenses:
The first line of each share class in the table on the following page provides information about actual account values and actual expenses. You may use the information in this line, together with the amount you invested, to estimate the expenses that you paid over the period. Simply divide your account value by $1,000 (for example, an $8,600 account value divided by $1,000 = 8.6), then multiply the result by the number in the first line under the heading entitled “Expenses paid during period” to estimate the expenses you paid on your account during this period.
Hypothetical example for comparison purposes:
The second line of each share class in the table on the following page provides information about hypothetical account values and hypothetical expenses based on the actual expense ratio for the share class and an assumed rate of return of 5.00% per year before expenses, which is not the actual return of the share class. The hypothetical account values and expenses may not be used to estimate the actual ending account balance or expenses you paid for the period. You may use this information to compare the ongoing costs of investing in the fund and other funds. To do so, compare this 5.00% hypothetical example with the 5.00% hypothetical examples that appear in the shareholder reports of the other funds.
Notes:
Retirement plan participants may be subject to certain fees charged by the plan sponsor, and Class F-1, F-2 and 529-F-1 shareholders may be subject to fees charged by financial intermediaries, typically ranging from 0.75% to 1.50% of assets annually depending on services offered. You can estimate the impact of these fees by adding the amount of the fees to the total estimated expenses you paid on your account during the period as calculated above. In addition, your ending account value would be lower by the amount of these fees.
Note that the expenses shown in the table on the following page are meant to highlight your ongoing costs only and do not reflect any transactional costs, such as sales charges (loads). Therefore, the second line of each share class in the table is useful in comparing ongoing costs only and will not help you determine the relative total costs of owning different funds. In addition, if these transactional costs were included, your costs would have been higher.
| 32 | American High-Income Trust |
| | | Beginning | | | Ending | | | | | | | |
| | | account value | | | account value | | | Expenses paid | | | Annualized | |
| | | 4/1/2015 | | | 9/30/2015 | | | during period* | | | expense ratio | |
| Class A - actual return | | $ | 1,000.00 | | | $ | 932.61 | | | $ | 3.20 | | | | .66 | % |
| Class A - assumed 5% return | | | 1,000.00 | | | | 1,021.76 | | | | 3.35 | | | | .66 | |
| Class B - actual return | | | 1,000.00 | | | | 929.13 | | | | 6.77 | | | | 1.40 | |
| Class B - assumed 5% return | | | 1,000.00 | | | | 1,018.05 | | | | 7.08 | | | | 1.40 | |
| Class C - actual return | | | 1,000.00 | | | | 928.86 | | | | 7.06 | | | | 1.46 | |
| Class C - assumed 5% return | | | 1,000.00 | | | | 1,017.75 | | | | 7.38 | | | | 1.46 | |
| Class F-1 - actual return | | | 1,000.00 | | | | 932.40 | | | | 3.39 | | | | .70 | |
| Class F-1 - assumed 5% return | | | 1,000.00 | | | | 1,021.56 | | | | 3.55 | | | | .70 | |
| Class F-2 - actual return | | | 1,000.00 | | | | 933.59 | | | | 2.18 | | | | .45 | |
| Class F-2 - assumed 5% return | | | 1,000.00 | | | | 1,022.81 | | | | 2.28 | | | | .45 | |
| Class 529-A - actual return | | | 1,000.00 | | | | 932.17 | | | | 3.63 | | | | .75 | |
| Class 529-A - assumed 5% return | | | 1,000.00 | | | | 1,021.31 | | | | 3.80 | | | | .75 | |
| Class 529-B - actual return | | | 1,000.00 | | | | 928.52 | | | | 7.40 | | | | 1.53 | |
| Class 529-B - assumed 5% return | | | 1,000.00 | | | | 1,017.40 | | | | 7.74 | | | | 1.53 | |
| Class 529-C - actual return | | | 1,000.00 | | | | 928.56 | | | | 7.35 | | | | 1.52 | |
| Class 529-C - assumed 5% return | | | 1,000.00 | | | | 1,017.45 | | | | 7.69 | | | | 1.52 | |
| Class 529-E - actual return | | | 1,000.00 | | | | 931.15 | | | | 4.70 | | | | .97 | |
| Class 529-E - assumed 5% return | | | 1,000.00 | | | | 1,020.21 | | | | 4.91 | | | | .97 | |
| Class 529-F-1 - actual return | | | 1,000.00 | | | | 933.22 | | | | 2.57 | | | | .53 | |
| Class 529-F-1 - assumed 5% return | | | 1,000.00 | | | | 1,022.41 | | | | 2.69 | | | | .53 | |
| Class R-1 - actual return | | | 1,000.00 | | | | 928.86 | | | | 7.06 | | | | 1.46 | |
| Class R-1 - assumed 5% return | | | 1,000.00 | | | | 1,017.75 | | | | 7.38 | | | | 1.46 | |
| Class R-2 - actual return | | | 1,000.00 | | | | 928.82 | | | | 7.11 | | | | 1.47 | |
| Class R-2 - assumed 5% return | | | 1,000.00 | | | | 1,017.70 | | | | 7.44 | | | | 1.47 | |
| Class R-2E - actual return | | | 1,000.00 | | | | 931.28 | | | | 4.55 | | | | .94 | |
| Class R-2E - assumed 5% return | | | 1,000.00 | | | | 1,020.36 | | | | 4.76 | | | | .94 | |
| Class R-3 - actual return | | | 1,000.00 | | | | 930.98 | | | | 4.89 | | | | 1.01 | |
| Class R-3 - assumed 5% return | | | 1,000.00 | | | | 1,020.00 | | | | 5.11 | | | | 1.01 | |
| Class R-4 - actual return | | | 1,000.00 | | | | 932.49 | | | | 3.34 | | | | .69 | |
| Class R-4 - assumed 5% return | | | 1,000.00 | | | | 1,021.61 | | | | 3.50 | | | | .69 | |
| Class R-5 - actual return | | | 1,000.00 | | | | 933.89 | | | | 1.89 | | | | .39 | |
| Class R-5 - assumed 5% return | | | 1,000.00 | | | | 1,023.11 | | | | 1.98 | | | | .39 | |
| Class R-6 - actual return | | | 1,000.00 | | | | 934.11 | | | | 1.65 | | | | .34 | |
| Class R-6 - assumed 5% return | | | 1,000.00 | | | | 1,023.36 | | | | 1.72 | | | | .34 | |
| * | The “expenses paid during period” are equal to the “annualized expense ratio,” multiplied by the average account value over the period, multiplied by the number of days in the period, and divided by 365 (to reflect the one-half year period). |
We are required to advise you of the federal tax status of certain distributions received by shareholders during the fiscal year. The fund hereby designates the following amounts for the fund’s fiscal year ended September 30, 2015:
| Qualified dividend income | | $ | 31,188,000 |
| Corporate dividends received deduction | | $ | 16,160,000 |
| U.S. government income that may be exempt from state taxation | | $ | 2,110,000 |
Individual shareholders should refer to their Form 1099 or other tax information, which will be mailed in January 2016, to determine the calendar year amounts to be included on their 2015 tax returns. Shareholders should consult their tax advisors.
| American High-Income Trust | 33 |
Board of trustees and other officers
Independent trustees1
| Name and year of birth | | Year first
elected
a trustee
of the fund2 | | Principal occupation(s) during past five years | | Number of
portfolios in fund
complex overseen
by trustee | | Other directorships3
held by trustee |
| William H. Baribault, 1945 | | 2010 | | CEO and President, Richard Nixon Foundation; Chairman of the Board and CEO, Oakwood Enterprises (private investment and consulting) | | 79 | | None |
| James G. Ellis, 1947 | | 2006 | | Dean and Professor of Marketing, Marshall School of Business, University of Southern California | | 79 | | Mercury General Corporation |
| Leonard R. Fuller, 1946 | | 1994 | | Private investor; former President and CEO, Fuller Consulting(financial management consulting firm) | | 79 | | None |
| Mary Davis Holt, 1950 | | 2015 | | Partner, Flynn Heath Holt Leadership, LLC (leadership consulting); former COO, Time Life Inc. (1993–2003) | | 76 | | None |
R. Clark Hooper, 1946
Chairman of the Board
(Independent and
Non-Executive) | | 2005 | | Private investor | | 81 | | The Swiss Helvetia Fund, Inc. |
| Merit E. Janow, 1958 | | 2010 | | Dean and Professor, Columbia University, School of International and Public Affairs | | 78 | | MasterCard Incorporated; The NASDAQ Stock Market LLC; Trimble Navigation Limited |
| Laurel B. Mitchell, PhD, 1955 | | 2010 | | Distinguished Professor of Accounting, University of Redlands; former Director, Accounting Program, University of Redlands | | 75 | | None |
| Frank M. Sanchez, 1943 | | 1999 | | Principal, The Sanchez Family Corporation dba McDonald’s Restaurants (McDonald’s licensee) | | 75 | | None |
| Margaret Spellings, 1957 | | 2010 | | President, George W. Bush Foundation; former President and CEO, Margaret Spellings & Company (public policy and strategic consulting); former President, U.S. Chamber Foundation and Senior Advisor to the President and CEO, U.S. Chamber of Commerce | | 79 | | ClubCorp Holdings, Inc. |
| Steadman Upham, PhD, 1949 | | 2007 | | President and University Professor, The University of Tulsa | | 78 | | None |
Interested trustee4,5
Name, year of birth and
position with fund | | Year first
elected
a trustee
or officer
of the fund2 | | Principal occupation(s) during past five years
and positions held with affiliated entities or
the principal underwriter of the fund | | Number of
portfolios in fund
complex overseen
by trustee | | Other directorships3
held by trustee |
John H. Smet, 1956
Vice Chairman of the Board | | 2011 | | Partner — Capital Fixed Income Investors, Capital Research and Management Company; Director, Capital Research and Management Company | | 21 | | None |
The fund’s statement of additional information includes further details about fund trustees and is available without charge upon request by calling American Funds Service Company at (800) 421-4225 or by visiting the American Funds website at americanfunds.com. The address for all trustees and officers of the fund is 333 South Hope Street, Los Angeles, CA 90071, Attention: Secretary.
| 34 | American High-Income Trust |
Other officers5
Name, year of birth and
position with fund | | Year first
elected
an officer
of the fund2 | | Principal occupation(s) during past five years and positions held with affiliated entities
or the principal underwriter of the fund |
David C. Barclay, 1956
President | | 1995 | | Partner — Capital Fixed Income Investors, Capital Research and Management Company |
David A. Daigle, 1967
Senior Vice President | | 2008 | | Partner — Capital Fixed Income Investors, Capital Research and Management Company;
Partner — Capital Fixed Income Investors, Capital Bank and Trust Company6 |
Jennifer L. Hinman, 1958
Senior Vice President | | 2001 | | Partner — Capital Fixed Income Investors, Capital Research and Management Company |
Kristine M. Nishiyama, 1970
Senior Vice President | | 2003 | | Senior Vice President and Senior Counsel — Fund Business Management Group, Capital Research and Management Company; Senior Vice President and General Counsel, Capital Bank and Trust Company6 |
Richard N. Lewis, 1973
Vice President | | 2011 | | Partner — Capital Fixed Income Investors, Capital Research and Management Company |
Steven I. Koszalka, 1964
Secretary | | 2010 | | Vice President — Fund Business Management Group, Capital Research and Management Company |
Brian C. Janssen, 1972
Treasurer | | 2012 | | Vice President — Investment Operations, Capital Research and Management Company |
Jane Y. Chung, 1974
Assistant Secretary | | 2014 | | Associate — Fund Business Management Group, Capital Research and Management Company |
Dori Laskin, 1951
Assistant Treasurer | | 2010 | | Vice President — Investment Operations, Capital Research and Management Company |
Gregory F. Niland, 1971
Assistant Treasurer | | 2015 | | Vice President — Investment Operations, Capital Research and Management Company |
| 1 | The term independent trustee refers to a trustee who is not an “interested person” of the fund within the meaning of the Investment Company Act of 1940. |
| 2 | Trustees and officers of the fund serve until their resignation, removal or retirement. |
| 3 | This includes all directorships/trusteeships (other than those in the American Funds or other funds managed by Capital Research and Management Company or its affiliates) that are held by each trustee as a trustee or director of a public company or a registered investment company. |
| 4 | The term interested trustee refers to a trustee who is an “interested person” within the meaning of the Investment Company Act of 1940, on the basis of their affiliation with the fund’s investment adviser, Capital Research and Management Company, or affiliated entities (including the fund’s principal underwriter). |
| 5 | All of the directors/trustees and/or officers listed are officers and/or directors/trustees of one or more of the other funds for which Capital Research and Management Company serves as investment adviser. |
| 6 | Company affiliated with Capital Research and Management Company. |
| American High-Income Trust | 35 |
Offices of the fund and of the investment adviser
Capital Research and Management Company
333 South Hope Street
Los Angeles, CA 90071-1406
6455 Irvine Center Drive
Irvine, CA 92618-4518
Transfer agent for shareholder accounts
American Funds Service Company
(Write to the address near you.)
P.O. Box 6007
Indianapolis, IN 46206-6007
P.O. Box 2280
Norfolk, VA 23501-2280
Custodian of assets
JPMorgan Chase Bank
270 Park Avenue
New York, NY 10017-2070
Counsel
Morgan, Lewis & Bockius LLP
355 South Grand Avenue, Suite 4400
Los Angeles, CA 90071-3106
Independent registered public accounting firm
Deloitte & Touche LLP
695 Town Center Drive
Suite 1200
Costa Mesa, CA 92626-7188
Principal underwriter
American Funds Distributors, Inc.
333 South Hope Street
Los Angeles, CA 90071-1406
| 36 | American High-Income Trust |
Investors should carefully consider investment objectives, risks, charges and expenses. This and other important information is contained in the fund prospectus and summary prospectus, which can be obtained from your financial professional and should be read carefully before investing. You may also call American Funds Service Company (AFS) at (800) 421-4225 or visit the American Funds website at americanfunds.com.
“American Funds Proxy Voting Procedures and Principles” — which describes how we vote proxies relating to portfolio securities — is available on the American Funds website or upon request by calling AFS. The fund files its proxy voting record with the U.S. Securities and Exchange Commission (SEC) for the 12 months ended June 30 by August 31. The proxy voting record is available free of charge on the SEC website at sec.gov and on the American Funds website.
A complete September 30, 2015, portfolio of American High-Income Trust’s investments is available free of charge by calling AFS or visiting the SEC website (where it is part of Form N-CSR).
American High-Income Trust files a complete list of its portfolio holdings with the SEC for the first and third quarters of each fiscal year on Form N-Q. This filing is available free of charge on the SEC website. You may also review or, for a fee, copy this filing at the SEC’s Public Reference Room in Washington, D.C. Additional information regarding the operation of the Public Reference Room may be obtained by calling the SEC’s Office of Investor Education and Advocacy at (800) SEC-0330. Additionally, the list of portfolio holdings is available by calling AFS.
This report is for the information of shareholders of American High-Income Trust, but it also may be used as sales literature when preceded or accompanied by the current prospectus or summary prospectus, which gives details about charges, expenses, investment objectives and operating policies of the fund. If used as sales material after December 31, 2015, this report must be accompanied by an American Funds statistical update for the most recently completed calendar quarter.
The American Funds Advantage
Since 1931, American Funds, part of Capital Group, has helped investors pursue long-term investment success. Our consistent approach — in combination with The Capital SystemSM — has resulted in a superior long-term track record.
Aligned with investor success
We base our decisions on a long-term perspective, which we believe aligns our goals with the interests of our clients. Our portfolio managers average 27 years of investment experience, including 22 years at our company, reflecting a career commitment to our long-term approach.1
The Capital SystemSM
Our investment process, The Capital System, combines individual accountability with teamwork. Each fund is divided into portions that are managed independently by investment professionals with diverse backgrounds, ages and investment approaches. An extensive global research effort is the backbone of our system.
Superior long-term track record
Our equity funds have beaten their Lipper peer indexes in 91% of 10-year periods and 96% of 20-year periods. Our fixed-income funds have beaten their Lipper indexes in 54% of 10-year periods and 57% of 20-year periods.2 Our fund management fees have been among the lowest in the industry.3
| | 1 | Portfolio manager experience as of December 31, 2014. |
| | 2 | Based on Class A share results for rolling periods through December 31, 2014. Periods covered are the shorter of the fund’s lifetime or since the comparable Lipper index inception date (except SMALLCAP World Fund, for which the Lipper average was used). |
| | 3 | On average, our management fees were in the lowest quintile 70% of the time, based on the 20-year period ended December 31, 2014, versus comparable Lipper categories, excluding funds of funds. |

ITEM 2 – Code of Ethics
The Registrant has adopted a Code of Ethics that applies to its Principal Executive Officer and Principal Financial Officer. The Registrant undertakes to provide to any person without charge, upon request, a copy of the Code of Ethics. Such request can be made to American Funds Service Company at 800/421-9225 or to the Secretary of the Registrant, 333 South Hope Street, Los Angeles, California 90071.
ITEM 3 – Audit Committee Financial Expert
The Registrant’s board has determined that Laurel B. Mitchell, a member of the Registrant’s audit committee, is an “audit committee financial expert” and "independent," as such terms are defined in this Item. This designation will not increase the designee’s duties, obligations or liability as compared to his or her duties, obligations and liability as a member of the audit committee and of the board, nor will it reduce the responsibility of the other audit committee members. There may be other individuals who, through education or experience, would qualify as "audit committee financial experts" if the board had designated them as such. Most importantly, the board believes each member of the audit committee contributes significantly to the effective oversight of the Registrant’s financial statements and condition.
ITEM 4 – Principal Accountant Fees and Services
| | Registrant: |
| | | a) Audit Fees: |
| | | | 2014 | $148,000 |
| | | | 2015 | $162,000 |
| | | | |
| | | b) Audit-Related Fees: |
| | | | 2014 | $ 4,000 |
| | | | 2015 | $ 7,000 |
| | | | The audit-related fees consist of assurance and related services relating to the examination of the Registrant’s investment adviser conducted in accordance with Statement on Standards for Attestation Engagements Number 16 issued by the American Institute of Certified Public Accountants. |
| | | | |
| | | c) Tax Fees: |
| | | | 2014 | $ 8,000 |
| | | | 2015 | None |
| | | | The tax fees consist of professional services relating to the preparation of the Registrant’s tax returns including returns relating to the Registrant’s investments in non-U.S. jurisdictions. |
| | | | |
| | | d) All Other Fees: |
| | | | 2014 | None |
| | | | 2015 | None |
| | | | |
| | Adviser and affiliates (includes only fees for non-audit services billed to the adviser and affiliates for engagements that relate directly to the operations and financial reporting of the Registrant and were subject to the pre-approval policies described below): |
| | | a) Audit Fees: |
| | | | Not Applicable |
| | | | |
| | | b) Audit-Related Fees: |
| | | | 2014 | $ 993,000 |
| | | | 2015 | $1,148,000 |
| | | | The audit-related fees consist of assurance and related services relating to the examination of the Registrant’s transfer agent, principal underwriter and investment adviser conducted in accordance with Statement on Standards for Attestation Engagements Number 16 issued by the American Institute of Certified Public Accountants. |
| | | | |
| | | c) Tax Fees: |
| | | | 2014 | $ 41,000 |
| | | | 2015 | None |
| | | | The tax fees consist of consulting services relating to the Registrant’s investments. |
| | | | |
| | | d) All Other Fees: |
| | | | 2014 | $ 3,000 |
| | | | 2015 | $ 5,000 |
| | | | The other fees consist of subscription services related to an accounting research tool. |
All audit and permissible non-audit services that the Registrant’s audit committee considers compatible with maintaining the independent registered public accounting firm’s independence are required to be pre-approved by the committee. The pre-approval requirement will extend to all non-audit services provided to the Registrant, the investment adviser, and any entity controlling, controlled by, or under common control with the investment adviser that provides ongoing services to the Registrant, if the engagement relates directly to the operations and financial reporting of the Registrant. The committee will not delegate its responsibility to pre-approve these services to the investment adviser. The committee may delegate to one or more committee members the authority to review and pre-approve audit and permissible non-audit services. Actions taken under any such delegation will be reported to the full committee at its next meeting. The pre-approval requirement is waived with respect to non-audit services if certain conditions are met. The pre-approval requirement was not waived for any of the non-audit services listed above provided to the Registrant, adviser and affiliates.
Aggregate non-audit fees paid to the Registrant’s auditors, including fees for all services billed to the Registrant, adviser and affiliates that provide ongoing services to the Registrant, were $1,390,000 for fiscal year 2014 and $1,450,000 for fiscal year 2015. The non-audit services represented by these amounts were brought to the attention of the committee and considered to be compatible with maintaining the auditors’ independence.
ITEM 5 – Audit Committee of Listed Registrants
Not applicable to this Registrant, insofar as the Registrant is not a listed issuer as defined in Rule 10A-3 under the Securities Exchange Act of 1934.
ITEM 6 – Schedule of Investments
American High-Income Trust®
Investment portfolio
September 30, 2015
Bonds, notes & other debt instruments 88.15%
Corporate bonds & notes 85.90%
Consumer discretionary 13.90% | Principal amount
(000) | Value
(000) |
| Boyd Gaming Corp. 9.00% 2020 | $79,830 | $85,234 |
| Boyd Gaming Corp. 6.875% 2023 | 26,925 | 27,464 |
| Burger King Corp. 4.625% 20221 | 1,975 | 1,936 |
| Burger King Corp. 6.00% 20221 | 56,575 | 57,565 |
| Cablevision Systems Corp. 7.75% 2018 | 20,050 | 20,050 |
| CBS Outdoor Americas Inc. 5.25% 2022 | 14,600 | 14,618 |
| CBS Outdoor Americas Inc. 5.625% 2024 | 10,130 | 10,307 |
| CCO Holdings LLC and CCO Holdings Capital Corp. 6.50% 2021 | 8,800 | 8,861 |
| CCO Holdings LLC and CCO Holdings Capital Corp. 6.625% 2022 | 4,500 | 4,545 |
| CCO Holdings LLC and CCO Holdings Capital Corp. 5.375% 20251 | 9,600 | 8,772 |
| CCO Holdings LLC and CCO Holdings Capital Corp. 6.484% 20451 | 1,775 | 1,794 |
| CEC Entertainment, Inc. 8.00% 2022 | 43,425 | 42,991 |
| Cedar Fair, LP 5.25% 2021 | 4,975 | 5,062 |
| Cedar Fair, LP 5.375% 2024 | 26,715 | 26,915 |
| Cengage Learning Acquisitions, Inc., Term Loan B, 7.00% 20202,3,4 | 20,729 | 20,661 |
| Cequel Communications Holdings I, LLC and Cequel Capital Corp. 6.375% 20201 | 141,215 | 133,801 |
| Cequel Communications Holdings I, LLC and Cequel Capital Corp. 5.125% 20211 | 5,775 | 5,104 |
| Clear Channel Worldwide Holdings, Inc. 7.625% 2020 | 45,400 | 45,684 |
| Cumulus Media Holdings Inc. 7.75% 2019 | 59,519 | 42,928 |
| Cumulus Media Inc., Term Loan B, 4.25% 20202,3,4 | 28,455 | 24,827 |
| Delta 2 (Formula One), Term Loan B, 7.75% 20222,3,4 | 60,000 | 57,875 |
| DISH DBS Corp. 4.25% 2018 | 59,900 | 58,328 |
| DISH DBS Corp. 7.875% 2019 | 3,550 | 3,730 |
| DISH DBS Corp. 5.125% 2020 | 3,675 | 3,418 |
| Family Tree Escrow LLC 5.25% 20201 | 15,650 | 16,126 |
| Family Tree Escrow LLC 5.75% 20231 | 20,250 | 21,111 |
| Fiat Chrysler Automobiles NV 5.25% 2023 | 4,750 | 4,453 |
| Gannett Co., Inc. 5.125% 2019 | 14,455 | 14,708 |
| Gannett Co., Inc. 4.875% 20211 | 13,620 | 13,382 |
| Gannett Co., Inc. 5.50% 20241 | 3,000 | 2,925 |
| General Motors Co. 4.00% 2025 | 3,740 | 3,562 |
| Grupo Televisa, SAB 7.25% 2043 | MXN68,660 | 3,450 |
| Guitar Center, Inc. 9.625% 20201 | $10,600 | 8,957 |
| Hilton Worldwide Finance LLC 5.625% 2021 | 13,790 | 14,307 |
| Hilton Worldwide, Term Loan B, 3.50% 20202,3,4 | 9,674 | 9,678 |
| iHeartCommunications, Inc. 9.00% 2019 | 1,900 | 1,632 |
| iHeartCommunications, Inc. 11.25% 2021 | 4,950 | 4,276 |
| iHeartCommunications, Inc. 10.625% 2023 | 55,470 | 47,011 |
| International Game Technology 6.25% 20221 | 24,500 | 22,908 |
| International Game Technology 6.50% 20251 | 31,275 | 28,304 |
| J.C. Penney Co., Inc. 7.95% 2017 | 9,300 | 9,695 |
| J.C. Penney Co., Inc. 5.75% 2018 | 10,110 | 9,781 |
| J.C. Penney Co., Inc. 8.125% 2019 | 21,000 | 21,105 |
| J.C. Penney Co., Inc. 5.65% 2020 | 3,000 | 2,715 |
| La Quinta Properties, Inc., First Lien Term Loan B, 3.75% 20212,3,4 | 3,130 | 3,103 |
| Laureate Education, Inc. 10.00% 20191 | 9,775 | 7,710 |
American High-Income Trust — Page 1 of 18
Bonds, notes & other debt instruments
Corporate bonds & notes (continued)
Consumer discretionary (continued) | Principal amount
(000) | Value
(000) |
| Limited Brands, Inc. 6.625% 2021 | $14,226 | $15,862 |
| Marina District Finance Co. (Borgata), Term Loan B, 6.50% 20182,3,4 | 25,884 | 26,056 |
| McClatchy Co. 9.00% 2022 | 26,750 | 24,175 |
| Mediacom Broadband LLC and Mediacom Broadband Corp. 5.50% 2021 | 10,500 | 10,014 |
| Mediacom Broadband LLC and Mediacom Broadband Corp. 6.375% 2023 | 20,675 | 19,641 |
| Mediacom LLC and Mediacom Capital Corp. 7.25% 2022 | 14,300 | 14,282 |
| Melco Crown Entertainment Ltd. 5.00% 20211 | 3,000 | 2,655 |
| MGM Resorts International 7.50% 2016 | 9,000 | 9,270 |
| MGM Resorts International 8.625% 2019 | 16,275 | 17,943 |
| MGM Resorts International 5.25% 2020 | 17,150 | 16,828 |
| MGM Resorts International 6.75% 2020 | 4,100 | 4,254 |
| MGM Resorts International 7.75% 2022 | 18,950 | 20,253 |
| MGM Resorts International 6.00% 2023 | 76,850 | 74,737 |
| Michaels Stores, Inc. 5.875% 20201 | 34,135 | 35,756 |
| Modular Space Corp., Second Lien, 10.25% 20191 | 8,325 | 5,828 |
| Mohegan Tribal Gaming Authority 11.00% 20181,5 | 18,663 | 18,756 |
| Mohegan Tribal Gaming Authority 9.75% 20211 | 10,000 | 10,225 |
| NBC Universal Enterprise, Inc. 5.25% (undated)1 | 23,885 | 25,288 |
| NCL Corp. Ltd. 5.00% 2018 | 17,350 | 17,654 |
| NCL Corp. Ltd. 5.25% 20191 | 23,912 | 24,495 |
| Needle Merger Sub Corp. 8.125% 20191 | 74,305 | 69,104 |
| Neiman Marcus Group LTD Inc. 8.00% 20211 | 62,875 | 65,076 |
| Neiman Marcus Group LTD Inc. 8.75% 20211,5 | 51,775 | 53,587 |
| Neiman Marcus, Term Loan B, 4.25% 20202,3,4 | 51,064 | 50,092 |
| Netflix, Inc. 5.50% 20221 | 9,700 | 9,846 |
| Party City Holdings Inc. 6.125% 20231 | 4,500 | 4,556 |
| PETCO Animal Supplies, Inc. 9.25% 20181 | 39,900 | 40,598 |
| PETsMART, Inc. 7.125% 20231 | 39,700 | 40,246 |
| Pinnacle Entertainment, Inc. 6.375% 2021 | 33,850 | 35,994 |
| Playa Resorts Holding BV 8.00% 20201 | 96,177 | 97,620 |
| Playa Resorts Holding BV, Term Loan B, 4.00% 20192,3,4 | 5,711 | 5,696 |
| Sally Holdings LLC and Sally Capital Inc. 6.875% 2019 | 21,625 | 22,544 |
| Sally Holdings LLC and Sally Capital Inc. 5.75% 2022 | 7,250 | 7,594 |
| Schaeffler Holding Finance BV 6.25% 20191,5 | 4,000 | 4,255 |
| Seminole Tribe of Florida 7.804% 20201,4 | 6,125 | 6,523 |
| Sirius Minerals PLC 4.625% 20231 | 2,900 | 2,722 |
| Sotheby’s Holdings, Inc. 5.25% 20221 | 10,475 | 9,742 |
| Stackpole Intl. 7.75% 20211 | 56,860 | 62,120 |
| Standard Pacific Corp. 8.375% 2021 | 9,640 | 11,375 |
| Standard Pacific Corp. 5.875% 2024 | 9,450 | 9,734 |
| Station Casinos LLC 7.50% 2021 | 15,575 | 16,276 |
| Tempur Sealy International, Inc. 5.625% 20231 | 5,230 | 5,250 |
| TI Automotive Ltd. 8.75% 20231 | 32,235 | 28,689 |
| Toys "R" Us, Inc. 7.375% 2018 | 5,525 | 3,588 |
| Toys "R" Us-Delaware, Inc., Term Loan B2, 5.25% 20182,3,4 | 3,225 | 2,499 |
| Tribune Media Co. 5.875% 20221 | 6,625 | 6,443 |
| Univision Communications Inc. 8.50% 20211 | 14,883 | 15,534 |
| Univision Communications Inc. 6.75% 20221 | 2,713 | 2,818 |
| Univision Communications Inc. 5.125% 20231 | 13,550 | 12,940 |
| Univision Communications Inc. 5.125% 20251 | 9,900 | 9,306 |
| Univision Communications Inc., Term Loan C3, 4.00% 20202,3,4 | 1,507 | 1,496 |
| VTR Finance BV 6.875% 20241 | 23,000 | 20,930 |
| Warner Music Group 13.75% 2019 | 17,725 | 18,877 |
| Warner Music Group 6.00% 20211 | 10,000 | 10,050 |
American High-Income Trust — Page 2 of 18
Bonds, notes & other debt instruments
Corporate bonds & notes (continued)
Consumer discretionary (continued) | Principal amount
(000) | Value
(000) |
| Warner Music Group 5.625% 20221 | $24,550 | $23,875 |
| Warner Music Group 6.75% 20221 | 80,125 | 75,918 |
| Weather Company, Term Loan, 7.00% 20202,3,4 | 10,000 | 9,413 |
| Wynn Las Vegas, LLC and Wynn Capital Corp. 5.375% 2022 | 22,025 | 20,373 |
| Wynn Macau, Ltd. 5.25% 20211 | 86,775 | 75,765 |
| ZF Friedrichshafen AG 4.00% 20201 | 3,385 | 3,231 |
| ZF Friedrichshafen AG 4.50% 20221 | 19,025 | 18,050 |
| ZF Friedrichshafen AG 4.75% 20251 | 23,115 | 21,208 |
| | | 2,388,894 |
| Telecommunication services 13.81% | | |
| Altice Financing SA 6.625% 20231 | 40,960 | 39,424 |
| Altice Finco SA 9.875% 20201 | 4,350 | 4,665 |
| Altice Finco SA 6.50% 20221 | 14,325 | 13,867 |
| Altice Finco SA 7.625% 20251 | 1,400 | 1,309 |
| Altice Finco SA, First Lien, 7.75% 20221 | 18,950 | 17,292 |
| Clearwire Communications and Clearwire Finance, Inc. 14.75% 20161 | 3,125 | 3,508 |
| Columbus International Inc. 7.375% 20211 | 4,500 | 4,674 |
| Digicel Group Ltd. 7.00% 20201 | 3,800 | 3,771 |
| Digicel Group Ltd. 8.25% 20201 | 97,200 | 90,396 |
| Digicel Group Ltd. 6.00% 20211 | 96,542 | 88,095 |
| Digicel Group Ltd. 7.125% 20221 | 63,475 | 55,064 |
| Frontier Communications Corp. 8.125% 2018 | 38,226 | 39,325 |
| Frontier Communications Corp. 8.50% 2020 | 18,200 | 17,745 |
| Frontier Communications Corp. 8.875% 20201 | 21,950 | 21,566 |
| Frontier Communications Corp. 6.25% 2021 | 1,000 | 837 |
| Frontier Communications Corp. 9.25% 2021 | 39,175 | 37,873 |
| Frontier Communications Corp. 8.75% 2022 | 1,150 | 1,030 |
| Frontier Communications Corp. 10.50% 20221 | 68,735 | 67,017 |
| Frontier Communications Corp. 7.625% 2024 | 4,923 | 4,135 |
| Frontier Communications Corp. 11.00% 20251 | 140,685 | 136,464 |
| Intelsat Jackson Holding Co. 7.25% 2019 | 25,725 | 24,214 |
| Intelsat Jackson Holding Co. 7.25% 2020 | 44,475 | 40,973 |
| Intelsat Jackson Holding Co. 6.625% 2022 | 120,775 | 94,808 |
| Intelsat Luxembourg Holding Co. 6.75% 2018 | 37,675 | 32,024 |
| Intelsat Luxembourg Holding Co. 7.75% 2021 | 2,300 | 1,504 |
| Level 3 Communications, Inc. 5.125% 20231 | 9,150 | 8,761 |
| LightSquared, Term Loan, 9.00% 20152,3,4,5,6 | 84,404 | 85,240 |
| LightSquared, Term Loan, 9.00% 20152,3,4,5,6 | 31,906 | 31,906 |
| MetroPCS Wireless, Inc. 6.25% 2021 | 89,045 | 88,956 |
| MetroPCS Wireless, Inc. 6.625% 2023 | 94,185 | 93,479 |
| Millicom International Cellular SA 6.625% 20211 | 21,960 | 21,828 |
| Neptune Finco Corp. (Altice NV) 10.125% 20231 | 19,400 | 19,618 |
| Neptune Finco Corp. (Altice NV) 10.875% 20251 | 19,225 | 19,465 |
| Numericable Group SA 4.875% 20191 | 121,875 | 118,219 |
| Numericable Group SA 6.00% 20221 | 7,965 | 7,696 |
| Sable International Finance Ltd. 6.875% 20221 | 30,975 | 31,362 |
| SoftBank Corp. 4.50% 20201 | 89,010 | 86,420 |
| Sprint Capital Corp. 6.90% 2019 | 26,625 | 23,497 |
| Sprint Nextel Corp. 8.375% 2017 | 4,425 | 4,423 |
| Sprint Nextel Corp. 9.00% 20181 | 19,050 | 20,050 |
| Sprint Nextel Corp. 7.00% 2020 | 199,485 | 167,069 |
| Sprint Nextel Corp. 7.25% 2021 | 130,720 | 107,354 |
| Sprint Nextel Corp. 11.50% 2021 | 65,605 | 65,113 |
American High-Income Trust — Page 3 of 18
Bonds, notes & other debt instruments
Corporate bonds & notes (continued)
Telecommunication services (continued) | Principal amount
(000) | Value
(000) |
| Sprint Nextel Corp. 7.875% 2023 | $51,600 | $41,893 |
| Sprint Corp. 7.625% 2025 | 16,275 | 12,644 |
| Sprint Nextel Corp. 6.875% 2028 | 10,100 | 7,348 |
| T-Mobile US, Inc. 6.542% 2020 | 46,640 | 47,514 |
| T-Mobile US, Inc. 6.731% 2022 | 40,390 | 40,390 |
| T-Mobile US, Inc. 6.375% 2025 | 21,000 | 20,107 |
| Trilogy International Partners, LLC 10.25% 20161 | 106,840 | 106,172 |
| Wind Acquisition SA 4.75% 20201 | 89,425 | 88,754 |
| Wind Acquisition SA 7.375% 20211 | 163,450 | 161,815 |
| Zayo Group Holdings, Inc. 6.375% 20251 | 4,850 | 4,668 |
| | | 2,373,341 |
| Industrials 12.71% | | |
| AAF Holdings LLC 12.75% 20191,5 | 14,893 | 14,484 |
| ADS Waste Escrow 8.25% 2020 | 6,050 | 6,065 |
| ADT Corp. 4.125% 2019 | 41,925 | 42,344 |
| ADT Corp. 3.50% 2022 | 3,100 | 2,759 |
| AerCap Holdings NV 4.625% 2022 | 2,875 | 2,871 |
| Air Canada 8.75% 20201 | 7,500 | 8,213 |
| Air Canada 7.75% 20211 | 19,600 | 20,678 |
| ARAMARK Corp. 5.75% 2020 | 5,000 | 5,199 |
| Associated Materials, LLC and AMH New Finance, Inc. 9.125% 2017 | 181,367 | 146,907 |
| Avianca Holdings SA, 8.375% 20201 | 5,825 | 4,951 |
| Beacon Roofing Supply, Inc. 6.375% 20231 | 7,450 | 7,506 |
| Beacon Roofing Supply, Inc., Term Loan B, 4.00% 20222,3,4 | 3,050 | 3,050 |
| BlueLine Rental Finance Corp., 7.00% 20191 | 1,400 | 1,351 |
| Brunswick Rail Finance Ltd. 6.50% 2017 | 29,251 | 12,505 |
| Brunswick Rail Finance Ltd. 6.50% 20171 | 9,651 | 4,126 |
| Builders Firstsource 7.625% 20211 | 75,839 | 79,252 |
| Builders Firstsource 10.75% 20231 | 6,150 | 6,173 |
| Cenveo, Inc. 6.00% 20191 | 1,570 | 1,342 |
| CEVA Group PLC 7.00% 20211 | 9,475 | 8,433 |
| CEVA Group PLC 9.00% 20211 | 19,100 | 16,211 |
| CEVA Group PLC, LOC, 6.50% 20212,3,4 | 15,843 | 14,226 |
| CEVA Group PLC, Term Loan B, 6.50% 20212,3,4 | 22,699 | 20,382 |
| CEVA Group PLC, Term Loan, 6.50% 20212,3,4 | 16,457 | 14,777 |
| CEVA Group PLC, Term Loan, 6.50% 20212,3,4 | 2,837 | 2,548 |
| Constellis Holdings 9.75% 20201 | 3,000 | 2,741 |
| Continental Airlines, Inc., Series 2001-1, Class B, 7.373% 20174 | 2,430 | 2,458 |
| Continental Airlines, Inc., Series 1998-1, Class B, 6.748% 20184 | 2,813 | 2,925 |
| Continental Airlines, Inc., Series 1997-4B, Class B, 6.90% 20184 | 367 | 377 |
| Continental Airlines, Inc., Series 1997-4, Class A, 6.90% 20194 | 1,547 | 1,599 |
| Continental Airlines, Inc., Series 2000-2, Class B, 8.307% 20194 | 358 | 382 |
| Continental Airlines, Inc., Series 1999-1, Class A, 6.545% 20204 | 2,302 | 2,485 |
| Continental Airlines, Inc., Series 2001-1, Class A-1, 6.703% 20224 | 5,495 | 5,825 |
| Continental Airlines, Inc., Series 2007-1, Class B, 6.903% 20224 | 3,565 | 3,719 |
| Continental Airlines, Inc., Series 2000-2, Class A-1, 7.707% 20224 | 2,228 | 2,417 |
| Continental Airlines, Inc., Series 2000-1, Class A-1, 8.048% 20224 | 177 | 200 |
| Continental Airlines, Inc., Series 2000-1, Class B, 8.388% 20224 | 509 | 535 |
| Corporate Risk Holdings LLC 9.50% 20191 | 137,028 | 129,491 |
| Corporate Risk Holdings LLC 13.50% 20201,5,6 | 13,178 | 13,040 |
| DAE Aviation Holdings, Inc. 10.00% 20231 | 110,550 | 109,997 |
| Delta Air Lines, Inc., Series 2010-B, Class 2-B, 6.75% 20171 | 7,650 | 7,712 |
| Delta Air Lines, Inc., Series 2002-1, Class G-1, MBIA insured, 6.718% 20244 | 7,554 | 8,668 |
American High-Income Trust — Page 4 of 18
Bonds, notes & other debt instruments
Corporate bonds & notes (continued)
Industrials (continued) | Principal amount
(000) | Value
(000) |
| Eletson Holdings Inc. 9.625% 20221 | $19,450 | $17,700 |
| Euramax International, Inc. 12.00% 20201 | 57,050 | 55,624 |
| Gardner Denver, Inc. 6.875% 20211 | 8,000 | 7,120 |
| Gardner Denver, Inc., Term Loan B, 4.25% 20202,3,4 | 18,123 | 17,204 |
| Gates Global LLC 6.00% 20221 | 58,375 | 47,284 |
| Gates Global LLC, Term Loan B, 4.25% 20212,3,4 | 3,253 | 3,095 |
| General Electric Capital Corp., Series B, junior subordinated 6.25% (undated) | 9,000 | 9,776 |
| Hardwoods Acquisition Inc 7.50% 20211 | 34,850 | 32,759 |
| Hawker Beechcraft Acquisition Co., LLC, LOC, 0.057% 20152,3,4,6,7 | 1,728 | 1,642 |
| HD Supply, Inc. 7.50% 2020 | 50,350 | 52,616 |
| HD Supply, Inc. 11.50% 2020 | 60,176 | 68,300 |
| HD Supply, Inc. 5.25% 20211 | 33,150 | 33,440 |
| HD Supply, Inc., Term Loan B, 3.75% 20212,3,4 | 3,750 | 3,738 |
| HDTFS Inc. 5.875% 2020 | 14,425 | 14,425 |
| HDTFS Inc. 6.25% 2022 | 18,525 | 18,664 |
| Jeld-Wen Escrow Corp., Term Loan B, 5.25% 20212,3,4 | 21,982 | 21,982 |
| KLX Inc. 5.875% 20221 | 82,680 | 80,845 |
| LMI Aerospace Inc. 7.375% 2019 | 49,700 | 48,209 |
| Navios Maritime Acquisition Corp. and Navios Acquisition Finance (US) Inc. 8.125% 20211 | 71,145 | 66,076 |
| Navios Maritime Holdings Inc. 7.375% 20221 | 34,900 | 28,225 |
| Navios Maritime Holdings Inc. and Navios Maritime Finance II (US) Inc. 8.125% 2019 | 39,412 | 29,165 |
| Nielsen Finance LLC and Nielsen Finance Co. 4.50% 2020 | 25,794 | 25,955 |
| Nielsen Finance LLC and Nielsen Finance Co. 5.50% 20211 | 11,200 | 11,186 |
| Nielsen Finance LLC and Nielsen Finance Co. 5.00% 20221 | 44,500 | 43,221 |
| Nortek Inc. 8.50% 2021 | 83,777 | 88,385 |
| Ply Gem Industries, Inc. 6.50% 2022 | 83,515 | 80,488 |
| Ply Gem Industries, Inc. 6.50% 2022 | 27,195 | 25,699 |
| Prime Source, Term Loan B, 4.50% 20222,3,4 | 2,893 | 2,883 |
| PrimeSource Building Products Inc 9.00% 20231 | 19,030 | 18,554 |
| R.R. Donnelley & Sons Co. 7.25% 2018 | 25,900 | 27,402 |
| R.R. Donnelley & Sons Co. 7.625% 2020 | 8,239 | 8,567 |
| R.R. Donnelley & Sons Co. 7.875% 2021 | 42,100 | 43,942 |
| R.R. Donnelley & Sons Co. 7.00% 2022 | 19,225 | 18,720 |
| R.R. Donnelley & Sons Co. 6.50% 2023 | 38,625 | 36,452 |
| Red de Carreteras de Occidente 9.00% 20284 | MXN151,560 | 8,816 |
| Silver II Borrower S.C.A./Silver II U.S. Holdings, LLC 7.75% 20201 | $97,233 | 84,836 |
| Standard Aero Holdings, Inc., Term Loan B, 5.25% 20222,3,4 | 2,875 | 2,879 |
| TRAC Intermodal 11.00% 2019 | 37,865 | 41,178 |
| TransDigm Inc. 5.50% 2020 | 45,510 | 43,604 |
| TransDigm Inc. 7.50% 2021 | 3,400 | 3,562 |
| TransDigm Inc. 6.50% 2024 | 5,200 | 4,913 |
| TransDigm Inc. 6.50% 20251 | 14,300 | 13,496 |
| United Air Lines, 1991 Equipment Trust Certificates, Series A, 10.11% 20064,6,7 | 1,135 | — |
| United Air Lines, Inc., Series 2007-1, Class B, 7.336% 20211,4 | 3,343 | 3,560 |
| United Rentals, Inc. 7.375% 2020 | 11,625 | 12,264 |
| United Rentals, Inc. 7.625% 2022 | 29,825 | 31,838 |
| Univar Inc. 6.75% 20231 | 6,550 | 6,108 |
| Vander Intermediate Holdings, 10.50% 20191,5 | 2,400 | 1,944 |
| Virgin Australia Holdings Ltd. 8.50% 20191 | 55,100 | 56,822 |
| Watco Companies 6.375% 20231 | 22,990 | 22,875 |
| West Corp. 5.375% 20221 | 2,950 | 2,736 |
American High-Income Trust — Page 5 of 18
Bonds, notes & other debt instruments
Corporate bonds & notes (continued)
Industrials (continued) | Principal amount
(000) | Value
(000) |
| XPO Logistics, Inc. 7.875% 20191 | $4,650 | $4,551 |
| XPO Logistics, Inc. 6.50% 20221 | 10,400 | 8,834 |
| | | 2,185,083 |
| Health care 12.04% | | |
| 21st Century Oncology Holdings Inc. 11.00% 20231 | 32,370 | 30,347 |
| Acadia Healthcare Co., Inc. 5.625% 20231 | 3,700 | 3,728 |
| Alere Inc. 6.375% 20231 | 4,340 | 4,416 |
| AMAG Pharmaceuticals, Inc. 7.875% 20231 | 2,375 | 2,286 |
| Centene Corp. 5.75% 2017 | 9,345 | 9,777 |
| Centene Corp. 4.75% 2022 | 30,730 | 30,730 |
| Community Health Systems Inc. 5.125% 2021 | 3,650 | 3,723 |
| Concordia Healthcare Corp. 7.00% 20231 | 12,665 | 11,082 |
| ConvaTec Finance International SA 8.25% 20191,5 | 39,100 | 38,562 |
| DaVita HealthCare Partners Inc. 5.00% 2025 | 21,775 | 20,958 |
| DJO Finance LLC 10.75% 20201 | 38,538 | 38,731 |
| DJO Finco Inc. 8.125% 20211 | 80,545 | 78,733 |
| Endo Finance LLC & Endo Finco Inc. 6.00% 20231 | 18,865 | 18,724 |
| Endo Pharmaceuticals Holdings Inc. 5.75% 20221 | 40,280 | 39,776 |
| Fresenius Medical Care AG & Co. KGAA 5.875% 20221 | 2,500 | 2,694 |
| HCA Inc. 3.75% 2019 | 28,008 | 27,994 |
| HCA Inc. 6.50% 2020 | 24,055 | 26,280 |
| HCA Inc. 4.75% 2023 | 10,205 | 10,266 |
| HCA Inc. 5.00% 2024 | 19,010 | 19,105 |
| HCA Inc. 5.375% 2025 | 1,750 | 1,741 |
| HealthSouth Corp. 5.75% 20241 | 6,925 | 6,856 |
| HealthSouth Corp. 5.75% 20251 | 20,445 | 19,883 |
| Hologic, Inc. 5.25% 20221 | 9,160 | 9,274 |
| inVentiv Health Inc, Term Loan B4, 7.75% 20182,3,4 | 38,955 | 38,971 |
| inVentiv Health Inc. 9.00% 20181 | 161,655 | 167,212 |
| inVentiv Health Inc. 10.00% 2018 | 51,558 | 48,980 |
| inVentiv Health Inc. 10.00% 2018 | 26,933 | 26,462 |
| inVentiv Health Inc. 12.00% 20181,5 | 116,863 | 114,628 |
| Jaguar Holding Co. 6.375% 20231 | 2,325 | 2,267 |
| Kindred Healthcare, Inc. 8.00% 20201 | 37,550 | 39,897 |
| Kindred Healthcare, Inc. 8.75% 20231 | 14,505 | 15,774 |
| Kinetic Concepts, Inc. 10.50% 2018 | 192,320 | 201,792 |
| Kinetic Concepts, Inc. 12.50% 2019 | 131,037 | 139,391 |
| Mallinckrodt PLC 4.875% 20201 | 13,455 | 12,900 |
| Mallinckrodt PLC 5.625% 20231 | 21,390 | 19,545 |
| Multiplan Inc., Term Loan B, 3.75% 20212,3,4 | 3,397 | 3,360 |
| Ortho-Clinical Diagnostics Inc. 6.625% 20221 | 61,675 | 53,195 |
| Ortho-Clinical Diagnostics Inc., Term Loan B, 4.75% 20212,3,4 | 39,815 | 39,358 |
| Patheon Inc. 7.50% 20221 | 9,510 | 9,641 |
| Pharmaceutical Product Development LLC, Term Loan, 4.25% 20222,3,4 | 3,716 | 3,692 |
| PRA Holdings, Inc. 9.50% 20231 | 30,028 | 33,256 |
| Quintiles Transnational Corp. 4.875% 20231 | 19,350 | 19,205 |
| Rotech Healthcare Inc., Term Loan A, 5.50% 20182,3,4,6,8 | 25,382 | 25,255 |
| Rotech Healthcare Inc., Term Loan B, 10.00% 20192,3,4,6,8 | 20,825 | 20,721 |
| Rotech Healthcare Inc., Term Loan, 13.00% 20202,3,4,5,6,8 | 54,763 | 54,489 |
| Sterigenics-Nordion Holdings, LLC 6.50% 20231 | 4,800 | 4,776 |
| Tenet Healthcare Corp. 4.375% 2021 | 8,800 | 8,624 |
| Tenet Healthcare Corp. 8.125% 2022 | 8,000 | 8,523 |
| Tenet Healthcare Corp. 6.75% 2023 | 61,640 | 61,332 |
American High-Income Trust — Page 6 of 18
Bonds, notes & other debt instruments
Corporate bonds & notes (continued)
Health care (continued) | Principal amount
(000) | Value
(000) |
| Tenet Healthcare Corp., First Lien, 6.25% 2018 | $3,000 | $3,210 |
| Tenet Healthcare Corp., First Lien, 4.75% 2020 | 21,345 | 21,652 |
| Tenet Healthcare Corp., First Lien, 6.00% 2020 | 57,640 | 60,954 |
| Tenet Healthcare Corp., First Lien, 4.50% 2021 | 31,440 | 31,086 |
| VPI Escrow Corp. 6.75% 20181 | 57,075 | 58,181 |
| VPI Escrow Corp. 6.375% 20201 | 87,003 | 86,731 |
| VPI Escrow Corp. 7.50% 20211 | 6,635 | 6,851 |
| VRX Escrow Corp. 5.375% 20201 | 27,280 | 26,581 |
| VRX Escrow Corp. 5.875% 20231 | 12,815 | 12,318 |
| VRX Escrow Corp. 6.125% 20251 | 138,785 | 133,289 |
| | | 2,069,765 |
| Energy 10.86% | | |
| Alpha Natural Resources, Inc. 7.50% 20201,7 | 70,800 | 5,133 |
| Alpha Natural Resources, Inc. 7.50% 20201,7 | 53,863 | 3,905 |
| American Energy - Woodford LLC 12.00% 20201,5 | 63,822 | 27,136 |
| American Energy (Marcellus), Term Loan B, 5.25% 20202,3,4 | 60,250 | 34,443 |
| American Energy (Marcellus), Term Loan A, 8.50% 20212,3,4 | 92,023 | 12,116 |
| American Energy (Permian Basin) 7.125% 20201 | 97,475 | 57,510 |
| American Energy (Permian Basin) 7.375% 20211 | 47,350 | 27,700 |
| Antero Resources Corp. 5.375% 2021 | 4,750 | 4,204 |
| Arch Coal, Inc. 7.00% 2019 | 15,150 | 1,212 |
| Arch Coal, Inc. 7.25% 2021 | 2,450 | 159 |
| Arch Coal, Inc., Term Loan B1, 6.25% 20182,3,4 | 4,948 | 2,791 |
| Baytex Energy Corp. 5.125% 20211 | 6,450 | 5,160 |
| Baytex Energy Corp. 5.625% 20241 | 2,050 | 1,630 |
| Blue Racer Midstream LLC / Blue Racer Finance Corp. 6.125% 20221 | 75,770 | 72,360 |
| Bonanza Creek Energy, Inc. 6.75% 2021 | 26,650 | 18,788 |
| Bonanza Creek Energy, Inc. 5.75% 2023 | 9,075 | 5,944 |
| Chesapeake Energy Corp. 7.25% 2018 | 5,525 | 4,600 |
| Chesapeake Energy Corp. 4.875% 2022 | 38,970 | 25,623 |
| Concho Resources Inc. 5.50% 2023 | 2,825 | 2,698 |
| CONSOL Energy Inc. 5.875% 2022 | 52,875 | 35,823 |
| Continental Resources Inc. 5.00% 2022 | 3,900 | 3,417 |
| Denbury Resources Inc. 4.625% 2023 | 59,075 | 32,196 |
| Ecopetrol SA 5.875% 2023 | 12,055 | 11,633 |
| Energy Transfer Partners, LP 7.50% 2020 | 2,325 | 2,354 |
| Energy Transfer Partners, LP 5.875% 2024 | 20,550 | 18,598 |
| Energy Transfer Partners, LP 4.75% 2026 | 3,400 | 3,136 |
| Energy Transfer Partners, LP 5.50% 2027 | 11,250 | 9,394 |
| Ensco PLC 5.75% 2044 | 18,995 | 13,183 |
| EP Energy Corp. 9.375% 2020 | 40,925 | 35,400 |
| EP Energy Corp. 6.375% 2023 | 33,325 | 24,827 |
| Genesis Energy, LP 6.75% 2022 | 13,700 | 12,926 |
| Genesis Energy LP 6.00% 2023 | 2,900 | 2,567 |
| Jupiter Resources Inc. 8.50% 20221 | 103,300 | 58,623 |
| Laredo Petroleum, Inc. 5.625% 2022 | 4,825 | 4,343 |
| MarkWest Energy Partners, LP 4.50% 2023 | 3,500 | 3,229 |
| Matador Resources Co. 6.875% 20231 | 3,075 | 2,967 |
| Murray Energy Corp. 11.25% 20211 | 8,400 | 4,452 |
| Murray Energy Corp., Term Loan B1, 7.00% 20172,3,4 | 2,369 | 2,171 |
| Murray Energy Corp., Term Loan B2, 7.50% 20202,3,4 | 12,469 | 9,736 |
| Newfield Exploration Co. 5.75% 2022 | 2,750 | 2,681 |
| NGL Energy Partners LP 5.125% 2019 | 16,050 | 14,686 |
American High-Income Trust — Page 7 of 18
Bonds, notes & other debt instruments
Corporate bonds & notes (continued)
Energy (continued) | Principal amount
(000) | Value
(000) |
| NGL Energy Partners LP 6.875% 2021 | $66,780 | $63,107 |
| NGPL PipeCo LLC 7.119% 20171 | 157,345 | 150,264 |
| NGPL PipeCo LLC 9.625% 20191 | 125,135 | 119,504 |
| NGPL PipeCo LLC 7.768% 20371 | 32,400 | 27,378 |
| NGPL PipeCo LLC, Term Loan B, 6.75% 20172,3,4 | 24,700 | 22,354 |
| Noble Corp PLC 4.00% 2018 | 375 | 355 |
| Noble Corp PLC 5.95% 2025 | 18,435 | 14,457 |
| Noble Corp PLC 6.95% 2045 | 20,290 | 14,072 |
| Oasis Petroleum Inc. 6.50% 2021 | 8,250 | 6,538 |
| Oasis Petroleum Inc. 6.875% 2022 | 29,275 | 23,127 |
| Odebrecht Drilling Norbe VIII/IX Ltd 6.35% 20211,4 | 5,182 | 1,879 |
| Odebrecht Offshore Drilling Finance Ltd. 6.75% 20221,4 | 11,113 | 3,039 |
| Odebrecht Offshore Drilling Finance Ltd., First Lien, 6.625% 20231,4 | 15,307 | 3,995 |
| PDC Energy Inc. 7.75% 2022 | 106,350 | 105,818 |
| Peabody Energy Corp. 6.00% 2018 | 196,441 | 52,057 |
| Peabody Energy Corp. 6.50% 2020 | 5,500 | 1,169 |
| Peabody Energy Corp. 6.25% 2021 | 50,065 | 10,514 |
| Peabody Energy Corp. 10.00% 20221 | 5,000 | 1,906 |
| Petrobras Global Finance Co. 6.25% 2024 | 16,330 | 11,962 |
| Petrobras Global Finance Co. 6.85% 2115 | 5,200 | 3,302 |
| Petrobras International Finance Co. 5.75% 2020 | 4,030 | 3,033 |
| QGOG Atlantic/Alaskan Rigs Ltd. 5.25% 20191,4 | 4,634 | 2,989 |
| QGOG Constellation SA 6.25% 20191 | 90,420 | 40,237 |
| Range Resources Corp. 5.00% 2023 | 3,800 | 3,380 |
| Range Resources Corp. 4.875% 20251 | 33,650 | 30,075 |
| Regency Energy Partners LP and Regency Energy Finance Corp. 6.50% 2021 | 27,065 | 28,064 |
| Regency Energy Partners LP and Regency Energy Finance Corp. 5.00% 2022 | 1,935 | 1,893 |
| Regency Energy Partners LP and Regency Energy Finance Corp. 5.50% 2023 | 32,200 | 31,314 |
| Rice Energy Inc. 6.25% 2022 | 50,250 | 45,068 |
| Rice Energy Inc. 7.25% 20231 | 15,400 | 14,514 |
| Sabine Pass Liquefaction, LLC 5.625% 2021 | 88,850 | 82,853 |
| Sabine Pass Liquefaction, LLC 5.625% 2023 | 6,300 | 5,686 |
| Sabine Pass Liquefaction, LLC 5.75% 2024 | 61,950 | 55,445 |
| Sabine Pass Liquefaction, LLC 5.625% 20251 | 57,450 | 50,771 |
| Sabine Pass LNG, LP 7.50% 2016 | 1,500 | 1,541 |
| Sabine Pass LNG, LP 6.50% 2020 | 1,500 | 1,459 |
| Samson Investment Co. 9.75% 2020 | 8,950 | 157 |
| Samson Investment Co., Term Loan B, 5.00% 20182,3,4,7 | 2,800 | 413 |
| SandRidge Energy, Inc. 7.50% 2023 | 27,850 | 6,144 |
| Seven Generations Energy Ltd. 6.75% 20231 | 10,350 | 8,953 |
| Shell International Finance BV 4.375% 2045 | 2,425 | 2,398 |
| SM Energy Co. 5.625% 2025 | 37,525 | 32,365 |
| Sunoco LP 5.50% 20201 | 4,400 | 4,356 |
| Targa Resources Corp. 4.125% 20191 | 18,085 | 16,322 |
| Targa Resources Partners LP 6.75% 20241 | 10,675 | 10,208 |
| Teekay Corp. 8.50% 2020 | 41,255 | 40,636 |
| Tesoro Logistics LP 5.50% 20191 | 9,850 | 9,702 |
| Tesoro Logistics LP 5.875% 2020 | 3,475 | 3,388 |
| Tesoro Logistics LP 6.25% 20221 | 8,535 | 8,364 |
| TransCanada PipeLines Ltd., junior subordinated 6.35% 2067 | 10,295 | 8,712 |
| TransCanada PipeLines Ltd., junior subordinated 5.625% 2075 | 7,050 | 6,781 |
| Transocean Inc. 6.875% 2021 | 19,570 | 14,580 |
| Whiting Petroleum Corp. 5.00% 2019 | 4,850 | 4,244 |
American High-Income Trust — Page 8 of 18
Bonds, notes & other debt instruments
Corporate bonds & notes (continued)
Energy (continued) | Principal amount
(000) | Value
(000) |
| WPX Energy Inc. 7.50% 2020 | $10,550 | $9,706 |
| YPF Sociedad Anónima 8.50% 20251 | 24,800 | 21,638 |
| | | 1,865,640 |
| Financials 7.34% | | |
| Ally Financial Inc. 8.00% 2020 | 1,850 | 2,132 |
| Ally Financial Inc. 8.00% 2031 | 37,177 | 44,334 |
| Ally Financial Inc. 8.00% 2031 | 12,442 | 14,460 |
| American International Group, Inc. 8.175% 2068 | 7,305 | 9,679 |
| American Tower Corp. 7.25% 2019 | 3,019 | 3,492 |
| Bank of America Corp., Series AA, 6.10% (undated) | 26,145 | 25,459 |
| Bank of America Corp., Series K, junior subordinated 8.00% noncumulative (undated) | 2,550 | 2,668 |
| Bank of America Corp., Series M, junior subordinated 8.125% noncumulative (undated) | 4,100 | 4,290 |
| Bank of Ireland 10.00% 2022 | €7,000 | 10,380 |
| BNP Paribas, convertible bonds, 7.375% 20491 | $30,250 | 30,477 |
| Catlin Insurance Ltd., junior subordinated 7.249% (undated)1 | 30,275 | 26,301 |
| CIT Group Inc. 4.25% 2017 | 13,000 | 13,195 |
| CIT Group Inc. 5.00% 2017 | 21,400 | 21,922 |
| CIT Group Inc. 3.875% 2019 | 33,355 | 33,251 |
| CIT Group Inc., Series C, 5.50% 20191 | 17,100 | 17,784 |
| Citigroup Inc, Series O, 5.875% (undated) | 2,052 | 2,019 |
| Citigroup Inc., Series P, 5.95% (undated) | 45,367 | 42,815 |
| Citigroup Inc., Series Q, junior subordinated 5.95% (undated) | 50,275 | 49,633 |
| Communications Sales & Leasing, Inc. 6.00% 20231 | 12,465 | 11,125 |
| Communications Sales & Leasing, Inc. 8.25% 2023 | 8,650 | 7,439 |
| Communications Sales & Leasing, Inc., Term Loan B, 5.00% 20222,3,4 | 15,421 | 14,477 |
| Corrections Corporation of America 5.00% 2022 | 4,600 | 4,635 |
| Corrections Corporation of America 4.625% 2023 | 3,750 | 3,619 |
| Credit Agricole SA, convertible bonds, 6.625% 2049 | 7,150 | 6,895 |
| Credit Suisse Group AG, convertible bonds, 7.50% 20491 | 1,850 | 1,932 |
| Crescent Resources 10.25% 20171 | 119,004 | 122,128 |
| Crown Castle International Corp. 4.875% 2022 | 43,125 | 44,936 |
| Equinix, Inc. 5.375% 2022 | 3,600 | 3,600 |
| General Motors Acceptance Corp. 7.50% 2020 | 1,850 | 2,104 |
| Genworth Financial, Inc., junior subordinated 6.15% 2066 | 17,500 | 8,137 |
| Goldman Sachs Group, Inc., Series M, junior subordinated 5.375% (undated) | 3,750 | 3,670 |
| Icahn Enterprises Finance Corp. 3.50% 2017 | 53,000 | 53,298 |
| Icahn Enterprises Finance Corp. 6.00% 2020 | 9,650 | 9,976 |
| International Lease Finance Corp. 8.25% 2020 | 5,900 | 6,918 |
| Iron Mountain Inc. 6.00% 20201 | 26,340 | 26,661 |
| Iron Mountain Inc. 6.00% 2023 | 6,200 | 6,184 |
| Iron Mountain Inc. 5.75% 2024 | 20,000 | 19,375 |
| iStar Financial Inc. 4.00% 2017 | 45,325 | 43,739 |
| iStar Financial Inc. 4.875% 2018 | 37,664 | 36,581 |
| iStar Financial Inc. 5.00% 2019 | 25,520 | 24,356 |
| iStar Financial Inc., Series B, 9.00% 2017 | 37,965 | 40,006 |
| JPMorgan Chase & Co., Series I, junior subordinated 7.90% (undated) | 14,675 | 15,253 |
| Liberty Mutual Group Inc., Series B, 7.00% 20671 | 11,185 | 10,794 |
| Liberty Mutual Group Inc., Series A, 7.80% 20871 | 39,908 | 46,493 |
| MetLife Capital Trust IV, junior subordinated 7.875% 20671 | 14,950 | 18,388 |
| MetLife Capital Trust X, junior subordinated 9.25% 20681 | 15,850 | 21,913 |
| Morgan Stanley, Series J, 5.55% (undated) | 1 | 1 |
| MSCI Inc. 5.75% 20251 | 4,000 | 4,040 |
| National Financial Partners Corp. 9.00% 20211 | 2,900 | 2,809 |
American High-Income Trust — Page 9 of 18
Bonds, notes & other debt instruments
Corporate bonds & notes (continued)
Financials (continued) | Principal amount
(000) | Value
(000) |
| Newstar Financial Inc. 7.25% 20201 | $30,075 | $30,037 |
| Ocwen Financial Corp. 7.125% 20191 | 4,675 | 4,208 |
| Outfront Media Inc. 5.625% 20241 | 1,365 | 1,389 |
| PNC Financial Services Group, Inc., Series O, junior subordinated 6.75% (undated) | 4,150 | 4,508 |
| QBE Capital Funding III LP 7.25% 20411 | 7,650 | 8,558 |
| Realogy Corp. 4.50% 20191 | 99,295 | 99,667 |
| Realogy Corp. 7.625% 20201 | 3,000 | 3,143 |
| Realogy Corp. 9.00% 20201 | 25,214 | 26,695 |
| Realogy Corp. 5.25% 20211 | 21,100 | 21,337 |
| Realogy Corp., LOC, 4.40% 20162,3,4 | 3,759 | 3,738 |
| Royal Bank of Scotland Group PLC, junior subordinated 6.99% (undated)1 | 15,376 | 17,990 |
| Ryman Hospitality Properties, Inc. 5.00% 2021 | 7,435 | 7,472 |
| Ryman Hospitality Properties, Inc. 5.00% 20231 | 2,500 | 2,500 |
| Société Générale, convertible bonds, 8.00% 20491 | 3,700 | 3,650 |
| Société Générale, convertible bonds, 8.25% 2049 | 1,900 | 1,984 |
| Springleaf Finance Corp. 5.25% 2019 | 25,000 | 24,500 |
| State Street Corp., junior subordinated, 5.25% 2049 | 9,075 | 9,120 |
| The GEO Group, Inc. 5.125% 2023 | 1,875 | 1,861 |
| UBS AG, convertible bonds, 7.125% 2049 | 1,850 | 1,904 |
| Wells Fargo & Co., Series K, junior subordinated 7.98% (undated) | 6,475 | 6,847 |
| ZFS Finance (USA) Trust V, junior subordinated, 6.50% 20671 | 4,450 | 4,530 |
| | | 1,261,411 |
| Materials 6.68% | | |
| A. Schulman Inc. 6.875% 20231 | 2,725 | 2,582 |
| Algoma Steel Inc., Term Loan B, 7.50% 20192,3,4 | 14,850 | 11,212 |
| ArcelorMittal 6.125% 2018 | 4,800 | 4,716 |
| ArcelorMittal 10.60% 2019 | 2,000 | 2,168 |
| ArcelorMittal 6.25% 2021 | 29,840 | 26,968 |
| ArcelorMittal 6.125% 2025 | 6,200 | 5,038 |
| ArcelorMittal 7.50% 2041 | 92,610 | 75,014 |
| Berry Plastics Corp. 6.00% 20221 | 4,600 | 4,635 |
| Blue Cube Spinco Inc. (Olin Corp.) 9.75% 20231 | 14,130 | 14,766 |
| Blue Cube Spinco Inc. (Olin Corp.) 10.00% 20251 | 11,555 | 12,061 |
| Building Materials Corp. 6.00% 20251 | 1,850 | 1,878 |
| Celanese Corp. 4.625% 2022 | 4,725 | 4,477 |
| CEMEX Finance LLC 7.25% 20211 | 3,075 | 3,075 |
| CEMEX Finance LLC 9.375% 20221 | 7,500 | 8,015 |
| CEMEX SAB de CV 6.50% 20191 | 6,350 | 6,286 |
| Chemours Co. 6.625% 20231 | 53,010 | 35,782 |
| Chemours Co. 7.00% 20251 | 36,170 | 23,872 |
| Cliffs Natural Resources Inc. 8.25% 20201 | 15,675 | 13,872 |
| First Quantum Minerals Ltd. 6.75% 20201 | 140,165 | 94,611 |
| First Quantum Minerals Ltd. 7.00% 20211 | 93,032 | 60,703 |
| First Quantum Minerals Ltd. 7.25% 20221 | 16,075 | 10,007 |
| FMG Resources 8.25% 20191 | 3,350 | 2,701 |
| FMG Resources 6.875% 20221 | 1,900 | 1,235 |
| FMG Resources 9.75% 20221 | 146,925 | 137,191 |
| Georgia Gulf Corp. 4.625% 2021 | 7,257 | 6,169 |
| Georgia Gulf Corp. 4.875% 2023 | 11,300 | 9,534 |
| Graphic Packaging International, Inc. 4.75% 2021 | 10,390 | 10,338 |
| JMC Steel Group Inc. 8.25% 20181 | 151,995 | 104,117 |
| LSB Industries, Inc. 7.75% 2019 | 45,195 | 43,105 |
| Owens-Illinois, Inc. 5.00% 20221 | 3,920 | 3,739 |
American High-Income Trust — Page 10 of 18
Bonds, notes & other debt instruments
Corporate bonds & notes (continued)
Materials (continued) | Principal amount
(000) | Value
(000) |
| Owens-Illinois, Inc. 5.875% 20231 | $6,820 | $6,888 |
| Owens-Illinois, Inc. 5.375% 20251 | 2,940 | 2,833 |
| Owens-Illinois, Inc. 6.375% 20251 | 3,885 | 3,931 |
| Paperworks Industries Inc. 9.50% 20191 | 9,946 | 9,648 |
| Rayonier Advanced Materials Inc. 5.50% 20241 | 56,507 | 42,663 |
| Reynolds Group Holdings, Ltd. 6.00% 20171 | 4,750 | 4,667 |
| Reynolds Group Inc. 5.75% 2020 | 167,710 | 169,806 |
| Reynolds Group Inc. 6.875% 2021 | 5,200 | 5,375 |
| Ryerson Inc. 9.00% 2017 | 51,605 | 46,186 |
| Ryerson Inc. 11.25% 2018 | 42,846 | 39,097 |
| Sealed Air Corp. 4.875% 20221 | 4,780 | 4,744 |
| Smurfit Capital Funding PLC 7.50% 2025 | 9,965 | 12,182 |
| Tembec Industries Inc. 9.00% 20191 | 22,015 | 16,621 |
| Trinseo SA 6.75% 20221 | 1,445 | 1,391 |
| U.S. Coatings Acquisition Inc. (Flash Dutch 2 BV) 7.375% 20211 | 12,355 | 13,050 |
| Verso Paper Holdings LLC 11.75% 2019 | 2,970 | 564 |
| Walter Energy, Inc. 9.50% 20191,7 | 77,685 | 27,772 |
| Walter Energy, Inc. 11.00% 20201,5,7 | 7,725 | 116 |
| Walter Energy, Inc. 8.50% 20217 | 6,000 | 45 |
| | | 1,147,446 |
| Information technology 5.95% | | |
| Alcatel-Lucent USA Inc. 4.625% 20171 | 11,635 | 11,810 |
| Alcatel-Lucent USA Inc. 6.75% 20201 | 35,184 | 37,075 |
| Alcatel-Lucent USA Inc. 8.875% 20201 | 58,750 | 62,936 |
| Apple Inc. 4.375% 2045 | 2,875 | 2,841 |
| Blue Coat Systems Inc. 8.375% 20231 | 9,950 | 9,975 |
| Blue Coat Systems Inc., Term Loan B, 4.50% 20222,3,4 | 2,950 | 2,933 |
| CommScope Holding Co., Inc. 5.00% 20211 | 2,950 | 2,895 |
| CommScope Inc. 5.50% 20241 | 2,900 | 2,780 |
| Compucom Systems Inc., 7.00% 20211 | 12,825 | 8,016 |
| First Data Corp. 6.75% 20201 | 5,079 | 5,320 |
| First Data Corp. 8.25% 20211 | 24,934 | 25,963 |
| First Data Corp. 11.75% 2021 | 136,478 | 151,832 |
| First Data Corp. 12.625% 2021 | 129,546 | 147,521 |
| First Data Corp. 8.75% 20221,5 | 16,963 | 17,769 |
| First Data Corp. 5.375% 20231 | 31,800 | 31,561 |
| Freescale Semiconductor, Inc. 5.00% 20211 | 56,325 | 57,451 |
| Freescale Semiconductor, Inc. 6.00% 20221 | 60,130 | 62,986 |
| Hughes Satellite Systems Corp. 7.625% 2021 | 6,450 | 6,934 |
| Infor Inc. 5.75% 20201 | 11,850 | 11,813 |
| Infor Inc. 6.50% 20221 | 5,475 | 5,037 |
| Informatica Corp. 7.125% 20231 | 11,025 | 10,556 |
| NXP BV and NXP Funding LLC 4.125% 20201 | 7,000 | 7,035 |
| Serena Software, Inc., Term Loan B, 7.50% 20202,3,4 | 69,718 | 69,773 |
| SRA International, Inc. 11.00% 2019 | 82,362 | 87,458 |
| SRA International, Inc., Term Loan B, 6.50% 20182,3,4 | 111,966 | 112,386 |
| SS&C Technologies Holdings Inc. 5.875% 20231 | 2,850 | 2,907 |
| SunGard Data Systems Inc. 7.625% 2020 | 57,250 | 59,612 |
| TIBCO Software, Inc., Term Loan B, 6.50% 20202,3,4 | 4,975 | 4,966 |
| VeriSign, Inc. 4.625% 2023 | 2,600 | 2,541 |
| | | 1,022,682 |
American High-Income Trust — Page 11 of 18
Bonds, notes & other debt instruments
Corporate bonds & notes (continued)
Utilities 2.10% | Principal amount
(000) | Value
(000) |
| AES Corp. 8.00% 2020 | $15,425 | $17,507 |
| AES Corp. 7.375% 2021 | 18,475 | 19,260 |
| AES Corp. 4.875% 2023 | 10,600 | 9,355 |
| AES Corp. 5.50% 2024 | 13,000 | 11,590 |
| Calpine Corp. 6.00% 20221 | 4,350 | 4,529 |
| Calpine Corp. 5.375% 2023 | 35,040 | 32,850 |
| Calpine Corp. 7.875% 20231 | 2,748 | 2,954 |
| Calpine Corp. 5.50% 2024 | 9,975 | 9,320 |
| Dynegy Finance Inc. 6.75% 2019 | 27,905 | 28,114 |
| Dynegy Finance Inc. 7.375% 2022 | 53,015 | 53,678 |
| Dynegy Finance Inc. 7.625% 2024 | 47,400 | 48,111 |
| Emgesa SA ESP 8.75% 2021 | COP10,600,000 | 3,484 |
| Enel Società per Azioni 8.75% 20731 | $21,100 | 24,306 |
| Indianapolis Power & Light Co. 4.70% 20451 | 2,300 | 2,366 |
| Midwest Generation, LLC, Series B, 8.56% 20164,6,7 | 1,507 | 1,507 |
| NRG Energy, Inc. 7.625% 2018 | 4,375 | 4,616 |
| NRG Energy, Inc. 6.25% 2022 | 34,930 | 31,961 |
| NRG Energy, Inc. 6.625% 2023 | 9,000 | 8,325 |
| Texas Competitive Electric Holdings, Term Loan Strip, 3.75% 20162,3,4 | 11,287 | 11,291 |
| TXU, Term Loan, 3.737% 20142,3,4,7 | 5,802 | 2,224 |
| TXU, Term Loan, 4.65% 20172,3,4,7 | 86,979 | 33,840 |
| | | 361,188 |
| Consumer staples 0.51% | | |
| Constellation Brands, Inc. 3.875% 2019 | 1,250 | 1,278 |
| Constellation Brands, Inc. 6.00% 2022 | 7,225 | 7,911 |
| Constellation Brands, Inc. 4.25% 2023 | 3,000 | 2,996 |
| Energizer SpinCo Inc. 5.50% 20251 | 9,850 | 9,616 |
| H.J Heinz Co. 4.875% 20251 | 9,220 | 9,851 |
| Ingles Markets, Inc. 5.75% 2023 | 5,550 | 5,730 |
| JBS USA LLC 5.875% 20241 | 5,640 | 5,302 |
| Kronos Acquisition Holdings Inc. 9.00% 20231 | 3,000 | 2,700 |
| Pilgrim’s Pride Corp. 5.75% 20251 | 2,900 | 2,857 |
| Post Holdings, Inc. 6.75% 20211 | 3,100 | 3,108 |
| Post Holdings, Inc. 7.75% 20241 | 2,000 | 2,055 |
| Post Holdings, Inc. 8.00% 20251 | 2,000 | 2,064 |
| Reynolds American Inc. 5.85% 2045 | 14,715 | 16,437 |
| Spectrum Brands Escrow Corp. 5.75% 20251 | 4,800 | 4,920 |
| Tops Holding Corp. and Tops Markets, LLC 8.00% 20221 | 10,900 | 10,954 |
| | | 87,779 |
| Total corporate bonds & notes | | 14,763,229 |
| Bonds & notes of governments & government agencies outside the U.S. 1.71% | | |
| Argentina (Republic of) 7.00% 2017 | 7,920 | 7,741 |
| Ghana (Republic of) 7.875% 2023 | 32,505 | 27,142 |
| Ghana (Republic of) 7.875% 20231 | 760 | 635 |
| Ghana (Republic of) 8.125% 20261,4 | 7,365 | 6,150 |
| India (Republic of) 8.60% 2028 | INR5,710,700 | 91,383 |
| Indonesia (Republic of) 8.375% 2034 | IDR311,300,000 | 18,505 |
| Kenya (Rebulic of) 5.875% 20191 | $1,985 | 1,911 |
| Kenya (Republic of) 6.875% 20241 | 32,205 | 29,339 |
| Republic of Senegal 6.25% 20241 | 13,675 | 12,348 |
| South Africa (Republic of), Series R-2023, 7.75% 2023 | ZAR165,125 | 11,563 |
American High-Income Trust — Page 12 of 18
Bonds, notes & other debt instruments
Bonds & notes of governments & government agencies outside the U.S. (continued) | Principal amount
(000) | Value
(000) |
| United Mexican States Government, Series M20, 10.00% 2024 | MXN180,000 | $13,590 |
| Zambia (Republic of) 5.375% 2022 | $31,295 | 22,407 |
| Zambia (Republic of) 8.50% 2024 | 26,405 | 21,256 |
| Zambia (Republic of) 8.97% 20271,4 | 37,460 | 29,781 |
| | | 293,751 |
U.S. Treasury bonds & notes 0.38%
U.S. Treasury 0.38% | | |
| U.S. Treasury 6.25% 20239 | 50,000 | 66,174 |
| Total U.S. Treasury bonds & notes | | 66,174 |
| Asset-backed obligations 0.12% | | |
| Babson CLO Ltd., Series 2012-2-A, Class A-1-R, CLO, 1.514% 20231,2,4 | 8,165 | 8,159 |
| Dryden Senior Loan Fund, Series 2012-23-RA, Class A-1-R, CLO, 1.539% 20231,2,4 | 2,875 | 2,867 |
| Magnetite CLO Ltd. Series 2012-6-A, Class A-R, 1.587% 20231,2,4 | 6,110 | 6,094 |
| Marine Park CLO Ltd., Series 2012-1-A, Class A1-AR, CLO, 1.604% 20231,2,4 | 2,900 | 2,897 |
| | | 20,017 |
| Municipals 0.04% | | |
Territory of Puerto Rico, Aqueduct and Sewer Auth., Rev. Ref. Bonds, Series 2012-A,
5.25% 2042 | 9,980 | 6,794 |
| Total bonds, notes & other debt instruments (cost: $16,534,414,000) | | 15,149,965 |
Convertible bonds 0.72%
Financials 0.43% | | |
| Banco Bilbao Vizcaya Argentaria, SA, convertible notes, 9.00% 2049 | 6,475 | 21,399 |
| Lloyds Banking Group PLC, convertible bonds, 7.00% 2049 | £1,225 | 1,838 |
| Lloyds Banking Group PLC, convertible notes, 7.50% 2049 | $50,009 | 51,197 |
| | | 74,434 |
| Information technology 0.15% | | |
| Liberty Media Corp., convertible notes, 3.50% 2031 | 48,500 | 25,693 |
| Energy 0.04% | | |
| American Energy (Permian Basin), convertible notes, 8.00% 20221,5,6 | 17,500 | 3,938 |
| American Energy Utica, LLC, convertible notes, 3.50% 20211,5,6 | 44,491 | 2,447 |
| | | 6,385 |
| Miscellaneous 0.10% | | |
| Other convertible bonds in initial period of acquisition | | 16,987 |
| Total convertible bonds (cost: $164,125,000) | | 123,499 |
Convertible stocks 1.14%
Industrials 0.30% | Shares | |
| CEVA Group PLC, Series A-1, 3.321% convertible preferred6,10 | 47,121 | 38,875 |
| CEVA Group PLC, Series A-2, 2.321% convertible preferred6,10 | 21,063 | 12,637 |
| | | 51,512 |
American High-Income Trust — Page 13 of 18
Convertible stocks
Financials 0.22% | Shares | Value
(000) |
| Weyerhaeuser Co., Series A, 6.375% convertible preferred | 645,935 | $30,818 |
| American Tower Corp., Series A, convertible preferred | 78,000 | 7,710 |
| | | 38,528 |
| Utilities 0.13% | | |
| Exelon Corp., convertible preferred, units | 525,100 | 22,921 |
| Energy 0.10% | | |
| Chesapeake Energy Corporation 5.75% convertible preferred1 | 33,000 | 13,166 |
| Chesapeake Energy Corporation 5.75% convertible preferred | 9,000 | 3,590 |
| | | 16,756 |
| Miscellaneous 0.39% | | |
| Other convertible stocks in initial period of acquisition | | 66,462 |
| Total convertible stocks (cost: $270,352,000) | | 196,179 |
Preferred securities 0.39%
Financials 0.39% | | |
| Ally Financial Inc., Series G, 7.00%1 | 25,625 | 25,834 |
| Morgan Stanley, Series I, depositary shares | 758,000 | 19,283 |
| Swire Pacific Ltd. 8.84% cumulative guaranteed perpetual capital securities1 | 365,000 | 9,878 |
| Goldman Sachs Group, Inc., Series J, 5.50% depositary shares | 300,000 | 7,344 |
| First Republic Bank, Series A, noncumulative convertible preferred | 178,500 | 4,593 |
| Total preferred securities (cost: $58,071,000) | | 66,932 |
Common stocks 2.23%
Telecommunication services 0.74% | | |
| NII Holdings, Inc., Class B8,11 | 19,451,169 | 126,627 |
| Consumer discretionary 0.59% | | |
| Cooper-Standard Holdings Inc.8,11 | 1,659,993 | 96,280 |
| Ford Motor Co. | 410,210 | 5,567 |
| Adelphia Recovery Trust, Series ACC-111 | 10,643,283 | 26 |
| Adelphia Recovery Trust, Series Arahova6,11 | 1,773,964 | 9 |
| Five Star Travel Corp.1,6,11 | 83,780 | 18 |
| | | 101,900 |
| Industrials 0.29% | | |
| CEVA Group PLC1,6,11 | 59,168 | 35,501 |
| Delta Air Lines, Inc. | 299,769 | 13,450 |
| United Continental Holdings, Inc.11 | 22,981 | 1,219 |
| Quad/Graphics, Inc., Class A | 9,252 | 112 |
| Atrium Corp.1,6,11 | 10,987 | 11 |
| | | 50,293 |
American High-Income Trust — Page 14 of 18
Common stocks
Financials 0.23% | Shares | Value
(000) |
| American Tower Corp. | 323,067 | $28,423 |
| Citigroup Inc. | 205,574 | 10,199 |
| EME Reorganization Trust | 41,998,595 | 210 |
| | | 38,832 |
| Health care 0.08% | | |
| Rotech Healthcare Inc.6,8,11 | 1,916,276 | 13,357 |
| Energy 0.00% | | |
| Gener8 Maritime, Inc.11 | 12,599 | 138 |
| Petroplus Holdings AG6,11 | 3,360,000 | — |
| | | 138 |
| Miscellaneous 0.30% | | |
| Other common stocks in initial period of acquisition | | 51,845 |
| Total common stocks (cost: $575,393,000) | | 382,992 |
Rights & warrants 0.01%
Consumer discretionary 0.01% | | |
| Cooper-Standard Holdings Inc., warrants, expire 20178,11 | 48,411 | 1,530 |
| Liberman Broadcasting, Inc., warrants, expire 20226,10,11 | 10 | — |
| | | 1,530 |
| Energy 0.00% | | |
| Gener8 Maritime, Inc., warrants, expire 20171,6,11 | 19,483 | — |
| Total rights & warrants (cost: $5,447,000) | | 1,530 |
| Short-term securities 5.77% | Principal amount
(000) | |
| Apple Inc. 0.15%–0.17% due 10/14/2015–10/20/20151 | $ 98,000 | 97,994 |
| Caterpillar Financial Services Corp. 0.15%–0.17% due 10/19/2015–11/10/2015 | 90,000 | 89,988 |
| Chevron Corp. 0.13%–0.20% due 10/26/2015–12/16/20151 | 136,600 | 136,566 |
| Emerson Electric Co. 0.21% due 11/13/20151 | 24,500 | 24,496 |
| Federal Home Loan Bank 0.10%–0.26% due 10/21/2015–2/1/2016 | 466,300 | 466,281 |
| Freddie Mac 0.11%–0.24% due 12/17/2015–1/5/2016 | 73,400 | 73,395 |
| General Electric Capital Corp. 0.28%–0.30% due 10/6/2015–12/7/2015 | 50,000 | 49,991 |
| Qualcomm Inc. 0.19% due 10/28/20151 | 35,000 | 34,996 |
| Walt Disney Co. 0.18% due 10/28/20151 | 18,900 | 18,899 |
| Total short-term securities (cost: $992,449,000) | | 992,606 |
| Total investment securities 98.41% (cost: $18,600,251,000) | | 16,913,703 |
| Other assets less liabilities 1.59% | | 273,641 |
| Net assets 100.00% | | $17,187,344 |
As permitted by U.S. Securities and Exchange Commission regulations, “Miscellaneous” securities include holdings in their first year of acquisition that have not previously been publicly disclosed.
American High-Income Trust — Page 15 of 18
Forward currency contracts
The fund has entered into forward currency contracts as shown in the following table. The average month-end notional amount of open forward currency contracts while held was $126,632,000.
| | Settlement
date | Counterparty | Contract amount | Unrealized
appreciation
(depreciation)
at 9/30/2015
(000) |
Receive
(000) | Deliver
(000) |
| Sales: | | | | | |
| Euros | 10/21/2015 | HSBC Bank | $9,390 | €8,300 | $113 |
| Mexican pesos | 10/20/2015 | Citibank | $11,419 | MXN189,550 | 225 |
| Mexican pesos | 10/28/2015 | JPMorgan Chase | $10,561 | MXN181,650 | (158) |
| South African rand | 10/19/2015 | Bank of America, N.A. | $10,960 | ZAR148,300 | 295 |
| | | | | | $475 |
Interest rate swaps
The fund has entered into interest rate swaps as shown in the following table. The average month-end notional amount of interest rate swaps while held was $353,833,000.
Pay/receive
fixed rate | Clearinghouse | Floating rate index | Fixed
rate | Expiration
date | Notional
(000) | Unrealized
(depreciation)
appreciation
at 9/30/2015
(000) |
| Pay | LCH.Clearnet | 3-month USD-LIBOR | 1.2215% | 5/8/2018 | $30,000 | $(248) |
| Pay | LCH.Clearnet | 3-month USD-LIBOR | 2.197 | 7/22/2021 | 20,000 | (752) |
| Pay | CME Group Inc. | 28-day MXN Equilibrium Interbank Interest Rate | 6.39 | 9/12/2025 | MXN478,000 | (7) |
| Pay | CME Group Inc. | 28-day MXN Equilibrium Interbank Interest Rate | 6.52 | 9/12/2025 | 478,000 | (303) |
| Pay | CME Group Inc. | 28-day MXN Equilibrium Interbank Interest Rate | 6.5 | 9/12/2025 | 992,000 | (535) |
| Pay | CME Group Inc. | 28-day MXN Equilibrium Interbank Interest Rate | 6.435 | 9/15/2025 | 774,000 | (174) |
| Pay | CME Group Inc. | 28-day MXN Equilibrium Interbank Interest Rate | 6.485 | 9/16/2025 | 270,000 | (124) |
| Pay | CME Group Inc. | 28-day MXN Equilibrium Interbank Interest Rate | 6.495 | 9/17/2025 | 458,000 | (233) |
| Receive | LCH.Clearnet | 3-month USD-LIBOR | 2.1105 | 9/28/2025 | $170,000 | 1,559 |
| Receive | LCH.Clearnet | 3-month USD-LIBOR | 2.1 | 9/28/2025 | 45,000 | 369 |
| Receive | LCH.Clearnet | 3-month USD-LIBOR | 2.1165 | 9/28/2025 | 24,800 | 241 |
| Receive | LCH.Clearnet | 3-month USD-LIBOR | 2.098 | 9/28/2025 | 22,500 | 180 |
| Receive | LCH.Clearnet | 3-month USD-LIBOR | 2.1445 | 9/29/2025 | 38,850 | 479 |
| Receive | LCH.Clearnet | 3-month USD-LIBOR | 2.058 | 9/30/2025 | 14,300 | 61 |
| Receive | LCH.Clearnet | 3-month USD-LIBOR | 2.0555 | 10/1/2025 | 24,550 | 97 |
| Pay | LCH.Clearnet | 3-month USD-LIBOR | 2.7575 | 5/22/2045 | 10,000 | (502) |
| Pay | LCH.Clearnet | 3-month USD-LIBOR | 2.883 | 6/22/2045 | 4,000 | (311) |
| | | | | | | $(203) |
American High-Income Trust — Page 16 of 18
Credit default swaps
The fund has entered into credit default swaps as shown in the following table. The average month-end notional amount of credit default swaps while held was $77,653,000.
Centrally cleared credit default swaps on credit indices — sell protection
| Referenced index | Clearinghouse | Receive
fixed rate | Expiration
date | Notional
(000) | Unrealized
depreciation
at 9/30/2015
(000) |
| CDX North American High Yield Index Series 21 | Intercontinental Exchange, Inc. | 5.00% | 12/20/2018 | $17,280 | $(120) |
| CDX North American High Yield Index Series 22 | Intercontinental Exchange, Inc. | 5.00 | 6/20/2019 | 27,840 | (775) |
| CDX North American High Yield Index Series 24 | Intercontinental Exchange, Inc. | 5.00 | 6/20/2020 | 31,680 | (1,258) |
| | | | | | $(2,153) |
| 1 | Acquired in a transaction exempt from registration under Rule 144A or Section 4(2) of the Securities Act of 1933. May be resold in the U.S. in transactions exempt from registration, normally to qualified institutional buyers. The total value of all such securities was $7,694,239,000, which represented 44.77% of the net assets of the fund. |
| 2 | Coupon rate may change periodically. |
| 3 | Loan participations and assignments; may be subject to legal or contractual restrictions on resale. The total value of all such loans was $973,658,000, which represented 5.66% of the net assets of the fund. |
| 4 | Principal payments may be made periodically. Therefore, the effective maturity date may be earlier than the stated maturity date. |
| 5 | Payment in kind; the issuer has the option of paying additional securities in lieu of cash. |
| 6 | Valued under fair value procedures adopted by authority of the board of trustees. The total value of all such securities, including those in “Miscellaneous,“ was $367,039,000, which represented 2.14% of the net assets of the fund. |
| 7 | Scheduled interest and/or principal payment was not received. |
| 8 | Represents an affiliated company as defined under the Investment Company Act of 1940. |
| 9 | A portion of this security was pledged as collateral. The total value of pledged collateral was $29,401,000, which represented .17% of the net assets of the fund. |
| 10 | Acquired through a private placement transaction exempt from registration under the Securities Act of 1933. May be subject to legal or contractual restrictions on resale. Further details on these holdings appear below. |
| 11 | Security did not produce income during the last 12 months. |
| Private placement securities | Acquisition
date(s) | Cost
(000) | Value
(000) | Percent
of net
assets |
| CEVA Group PLC, Series A-1, convertible preferred | 5/2/2013-8/22/2014 | $47,776 | $38,875 | .23% |
| CEVA Group PLC, Series A-2, convertible preferred | 5/2/2013 | 20,349 | 12,637 | .07 |
| Liberman Broadcasting, Inc., warrants, expire 2022 | 12/13/2012-11/26/2014 | — | — | .00 |
| Total private placement securities | | $ 68,125 | $ 51,512 | .30 % |
American High-Income Trust — Page 17 of 18
| Key to abbreviations and symbols |
| Auth. = Authority |
| LOC = Letter of Credit |
| Ref. = Refunding |
| Rev. = Revenue |
| COP = Colombian pesos |
| € = Euros |
| £ = British pounds |
| IDR = Indonesian rupiah |
| INR = Indian rupees |
| MXN = Mexican pesos |
| ZAR = South African rand |
Investments are not FDIC-insured, nor are they deposits of or guaranteed by a bank or any other entity, so they may lose value.
Investors should carefully consider investment objectives, risks, charges and expenses. This and other important information is contained in the fund prospectus and summary prospectus, which can be obtained from your financial professional and should be read carefully before investing. You may also call American Funds Service Company (AFS) at (800) 421-4225 or visit the American Funds website at americanfunds.com.
| MFGEFPX-021-1115O-S49160 | American High-Income Trust — Page 18 of 18 |
REPORT OF INDEPENDENT REGISTERED PUBLIC ACCOUNTING FIRM
To the Shareholders and Board of Trustees of
American High-Income Trust:
We have audited the accompanying statement of assets and liabilities of American High-Income Trust (the “Fund”), including the summary schedule of investments, as of September 30, 2015, and the related statements of operations for the year then ended, the statements of changes in net assets for each of the two years in the period then ended (collectively, the “financial statements”), the financial highlights for each of the five years in the period then ended (the financial statements and financial highlights are included in Item 1 of this Form N-CSR), and the schedule of investments in securities as of September 30, 2015 (included in Item 6 of this Form N-CSR). These financial statements, financial highlights, and schedule of investments in securities are the responsibility of the Fund’s management. Our responsibility is to express an opinion on these financial statements, financial highlights, and schedule of investments in securities based on our audits.
We conducted our audits in accordance with the standards of the Public Company Accounting Oversight Board (United States). Those standards require that we plan and perform the audit to obtain reasonable assurance about whether the financial statements, financial highlights, and schedule of investments in securities are free of material misstatement. An audit includes examining, on a test basis, evidence supporting the amounts and disclosures in the financial statements and schedule of investments in securities, assessing the accounting principles used and significant estimates made by management, as well as evaluating the overall financial statement presentation. Our procedures included confirmation of securities owned as of September 30, 2015, by correspondence with the custodian, brokers and agent banks; where replies were not received from brokers and agent banks, we performed other auditing procedures. We believe that our audits provide a reasonable basis for our opinion.
In our opinion, the financial statements, financial highlights, and schedule of investments in securities referred to above present fairly, in all material respects, the financial position of American High-Income Trust as of September 30, 2015, and the results of its operations for the year then ended, the changes in its net assets for each of the two years in the period then ended, and the financial highlights for each of the five years in the period then ended, in conformity with accounting principles generally accepted in the United States of America.
DELOITTE & TOUCHE LLP
Costa Mesa, California
November 13, 2015
ITEM 7 – Disclosure of Proxy Voting Policies and Procedures for Closed-End Management Investment Companies
Not applicable to this Registrant, insofar as the Registrant is not a closed-end management investment company.
ITEM 8 – Portfolio Managers of Closed-End Management Investment Companies
Not applicable to this Registrant, insofar as the Registrant is not a closed-end management investment company.
ITEM 9 – Purchases of Equity Securities by Closed-End Management Investment Company and Affiliated Purchasers
Not applicable to this Registrant, insofar as the Registrant is not a closed-end management investment company.
ITEM 10 – Submission of Matters to a Vote of Security Holders
There have been no material changes to the procedures by which shareholders may recommend nominees to the Registrant’s board of trustees since the Registrant last submitted a proxy statement to its shareholders. The procedures are as follows. The Registrant has a nominating and governance committee comprised solely of persons who are not considered ‘‘interested persons’’ of the Registrant within the meaning of the Investment Company Act of 1940, as amended. The committee periodically reviews such issues as the board’s composition, responsibilities, committees, compensation and other relevant issues, and recommends any appropriate changes to the full board of trustees. While the committee normally is able to identify from its own resources an ample number of qualified candidates, it will consider shareholder suggestions of persons to be considered as nominees to fill future vacancies on the board. Such suggestions must be sent in writing to the nominating and governance committee of the Registrant, c/o the Registrant’s Secretary, and must be accompanied by complete biographical and occupational data on the prospective nominee, along with a written consent of the prospective nominee for consideration of his or her name by the nominating and governance committee.
ITEM 11 – Controls and Procedures
| (a) | The Registrant’s Principal Executive Officer and Principal Financial Officer have concluded, based on their evaluation of the Registrant’s disclosure controls and procedures (as such term is defined in Rule 30a-3 under the Investment Company Act of 1940), that such controls and procedures are adequate and reasonably designed to achieve the purposes described in paragraph (c) of such rule. |
| | |
| (b) | There were no changes in the Registrant’s internal controls over financial reporting (as defined in Rule 30a-3(d) under the Investment Company Act of 1940) that occurred during the Registrant’s second fiscal quarter of the period covered by this report that has materially affected, or is reasonably likely to materially affect, the Registrant’s internal control over financial reporting. |
ITEM 12 – Exhibits
| (a)(1) | The Code of Ethics that is the subject of the disclosure required by Item 2 is attached as an exhibit hereto. |
| | |
| (a)(2) | The certifications required by Rule 30a-2 of the Investment Company Act of 1940 and Sections 302 and 906 of the Sarbanes-Oxley Act of 2002 are attached as exhibits hereto. |
SIGNATURES
Pursuant to the requirements of the Securities Exchange Act of 1934 and the Investment Company Act of 1940, the Registrant has duly caused this report to be signed on its behalf by the undersigned, thereunto duly authorized.
| | AMERICAN HIGH-INCOME TRUST |
| | |
| | By /s/ David C. Barclay |
| | David C. Barclay, President and Principal Executive Officer |
| | |
| | Date: November 30, 2015 |
Pursuant to the requirements of the Securities Exchange Act of 1934 and the Investment Company Act of 1940, this report has been signed below by the following persons on behalf of the Registrant and in the capacities and on the dates indicated.
| By /s/ David C. Barclay |
David C. Barclay, President and Principal Executive Officer |
| |
| Date: November 30, 2015 |
| By /s/ Brian C. Janssen |
Brian C. Janssen, Treasurer and Principal Financial Officer |
| |
| Date: November 30, 2015 |