UNITED STATES
SECURITIES AND EXCHANGE COMMISSION
Washington, D.C. 20549
FORM N-CSR
Certified Shareholder Report of
Registered Management Investment Companies
Investment Company Act File Number: 811-05364
American High-Income Trust
(Exact Name of Registrant as Specified in Charter)
333 South Hope Street
Los Angeles, California 90071
(Address of Principal Executive Offices)
Registrant's telephone number, including area code: (213) 486-9200
Date of fiscal year end: September 30
Date of reporting period: September 30, 2016
Steven I. Koszalka
American High-Income Trust
333 South Hope Street
Los Angeles, California 90071
(Name and Address of Agent for Service)
ITEM 1 – Reports to Stockholders

The search for
sustainable income
in a low-rate
environment
Special feature page 4
 | American High-Income Trust® Annual report
for the year ended
September 30, 2016 |
American High-Income Trust seeks to provide you with a high level of current income. Its secondary investment objective is capital appreciation.
This fund is one of more than 40 offered by one of the nation’s largest mutual fund families, American Funds, from Capital Group. For 85 years, Capital has invested with a long-term focus based on thorough research and attention to risk.
Fund results shown in this report, unless otherwise indicated, are for Class A shares at net asset value. If a sales charge (maximum 3.75%) had been deducted, the results would have been lower. Results are for past periods and are not predictive of results for future periods. Current and future results may be lower or higher than those shown. Share prices and returns will vary, so investors may lose money. Investing for short periods makes losses more likely. Investments are not FDIC-insured, nor are they deposits of or guaranteed by a bank or any other entity, so they may lose value. For current information and month-end results, visit americanfunds.com.
See page 3 for Class A share results with relevant sales charges deducted. For other share class results, visit americanfunds.com and americanfundsretirement.com.
Investment results assume all distributions are reinvested and reflect applicable fees and expenses. When applicable, investment results reflect fee waivers, without which results would have been lower. Visit americanfunds.com for more information.
The fund’s 30-day yield for Class A shares as of October 31, 2016, calculated in accordance with the U.S. Securities and Exchange Commission (SEC) formula, was 5.33%. The fund’s 12-month distribution rate for Class A shares as of that date was 5.55%. Both reflect the 3.75% maximum sales charge. The SEC yield reflects the rate at which the fund is earning income on its current portfolio of securities while the distribution rate reflects the fund’s past dividends paid to shareholders. Accordingly, the fund’s SEC yield and distribution rate may differ.
The return of principal for bond funds and for funds with significant underlying bond holdings is not guaranteed. Fund shares are subject to the same interest rate, inflation and credit risks associated with the underlying bond holdings. High-yield bonds are subject to greater fluctuations in value and risk of loss of income and principal than investment-grade bonds. Bond ratings, which typically range from AAA/Aaa (highest) to D (lowest), are assigned by credit rating agencies such as Standard & Poor’s, Moody’s and/or Fitch as an indication of an issuer’s creditworthiness. Investing in bonds issued outside the U.S. may be subject to additional risks. They include currency fluctuations, political and social instability, differing securities regulations and accounting standards, higher transaction costs, possible changes in taxation, illiquidity and price volatility. These risks may be heightened in connection with investments in developing countries. Refer to the fund prospectus and the Risk Factors section of this report for more information on these and other risks associated with investing in the fund.

Special feature
Contents
Fellow investors:
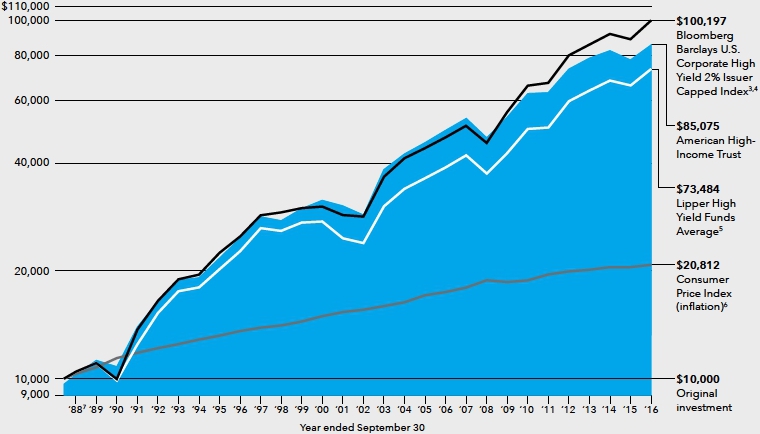
For the 12-month period ended September 30, 2016, American High-Income Trust reported a total return of 10.15%. By comparison, the fund’s benchmark, the unmanaged Bloomberg Barclays U.S. Corporate High Yield 2% Issuer Capped Index, returned 12.74% for the period, while the Lipper High Yield Funds Average, a benchmark of similar funds, posted a total return of 9.32%.
The fund’s total return assumes a nearly 60 cents a share reinvestment of monthly dividends. Shareholders who reinvested dividends received an income return of 6.27% for the period. Those who elected to take their dividends in cash received an income return of 6.09% and saw the value of their holdings increase by 3.56%.
High-yield market overview
The first four and a half months of this reporting period continued the downward cycle in the high-yield market that began in mid-2014 with an unexpected drop in oil prices. What started as a negative reassessment of energy issues eventually extended to other riskier credits, as energy-related weakness dragged the rest of the high-yield market down with it.
Market sentiment shifted direction dramatically in mid-February. Oil prices stabilized, and it pulled not only energy but other risk sectors back up. Investors aggressively moved back into high yield, as the persistence of low (and in some cases negative) interest rates from the world’s central banks intensified a global search for yield. Supporting the rally were strong fundamentals: low valuations, wide spreads between lower- and higher-quality credits, lower defaults than long-term averages, and a relatively modest supply.
Results at a glance
For periods ended September 30, 2016, with all distributions reinvested
| | | Cumulative
total returns | | Average annual total returns |
| | | 1 year | | 5 years | | 10 years | | Lifetime
(since 2/19/88) |
| | | | | | | | | |
| American High-Income Trust (Class A shares) | | | 10.15 | % | | | 6.28 | % | | | 5.63 | % | | | 7.91 | % |
| Bloomberg Barclays U.S. Corporate High Yield 2% Issuer Capped Index* | | | 12.74 | | | | 8.34 | | | | 7.80 | | | | — | |
| Lipper High Yield Funds Average† | | | 9.32 | | | | 7.05 | | | | 6.19 | | | | 7.13 | |
| * | This market index did not exist prior to December 31, 1992. It is unmanaged and, therefore, has no expenses. Investors cannot invest directly in an index. Bloomberg Barclays source: Bloomberg Index Services Ltd. |
| † | Lipper averages reflect the current composition of all eligible mutual funds (all share classes) within a given category. |
| American High-Income Trust | 1 |
Due to the strength of the rally, high-yield valuations returned, by the end of this reporting period, to levels more in line with historical norms.
Inside the portfolio
The commodities sector, especially energy, metals and mining, drove high-yield returns during this reporting period. The sector is relatively large and experienced the most price volatility. This essentially carried the market down and then up over the past two years.
The fund started the fiscal year underweight in commodities, but we took advantage of low valuations to increase our holdings, becoming slightly overweight relative to the index. We’ve generated good returns from tactical exposures to less speculative energy companies, such as midstream pipeline companies that transport oil and natural gas.
Also helping the fund on a relative basis were large positions in select wireless telecommunications services and medical technology companies, and a below-index weighting to financial institutions, a sector that lagged the broader market.
In the last three months, we have reduced overall credit risk by increasing short-term notes and other highly rated securities in the portfolio. This constrained relative performance because the high-yield rally was still ongoing. Going forward, however, we believe this course of action to be prudent.
Looking ahead
We believe the valuation-driven gains experienced this year will start to give way to high-yield markets that are more dependent on the conditions of the overall economy and of individual high-yield credits. The current slow-growth environment, which in our view is likely to continue, is generally positive for high yield because companies can generate profits without too much pressure to invest for growth — and they can use the excess cash flow to service debt. The demand side also looks positive, in our view, because the market increasingly expects low rates to remain in place well into the future.
Long-term investors have been rewarded this year for their patience in staying the course through what has proven to be a few volatile years in the high-yield market. We are pleased with the results, but it doesn’t alter our primary focus, which is to pursue sustainable income over time. In the feature article on page 4, we talk about the importance of income in today’s low-rate environment, as well as how we manage through the cycles of high-yield investing to pursue high income for our shareholders.
Investors who have maintained a long-term perspective have received attractive returns and a steady source of income. As of September 30, 2016, fund shareholders who reinvested dividends earned an average annual total return of 6.28% over five years and 5.63% over 10 years.
For the same time periods, investment-grade bonds, by contrast, returned 3.08% over five years and 4.79% over 10 years, as measured by the Bloomberg Barclays U.S. Aggregate Index, which is unmanaged and has no expenses.
As always, we appreciate your continued support and long-term investment perspective.
Sincerely,

David C. Barclay
President
November 14, 2016
For current information about the fund, visit americanfunds.com.
| 2 | American High-Income Trust |
The value of a long-term perspective
Here’s how a $10,000 investment in American High-Income Trust grew between February 19, 1988, when the fund began operations, and September 30, 2016, the end of its latest fiscal year. As you can see, that $10,000 grew to $85,075 with all distributions reinvested.
Fund results shown reflect deduction of the maximum sales charge of 3.75% on the $10,000 investment.1 Thus, the net amount invested was $9,625.2
| 1 | As outlined in the prospectus, the sales charge is reduced for accounts (and aggregated investments) of $100,000 or more and is eliminated for purchases of $1 million or more. There is no sales charge on dividends or capital gain distributions that are reinvested in additional shares. |
| 2 | The maximum initial sales charge was 4.75% prior to January 10, 2000. |
| 3 | The market index is unmanaged and, therefore, has no expenses. Investors cannot invest directly in an index. |
| 4 | From February 19, 1988, through December 31, 1992, the Credit Suisse High Yield Index was used because the Bloomberg Barclays U.S. Corporate High Yield 2% Issuer Capped Index did not yet exist. Since January 1, 1993, the Bloomberg Barclays U.S. Corporate High Yield 2% Issuer Capped Index has been used. Source: Bloomberg Index Services Ltd. |
| 5 | Results of the Lipper High Yield Funds Average do not reflect any sales charges. |
| 6 | Computed from data supplied by the U.S. Department of Labor, Bureau of Labor Statistics. |
| 7 | For the period February 19, 1988, commencement of operations, through September 30, 1988. |
Past results are not predictive of results for future periods. The results shown are before taxes on fund distributions and sale of fund shares.
Average annual total returns based on a $1,000 investment (for periods ended September 30, 2016)*
| | | 1 year | | 5 years | | 10 years |
| | | | | | | |
| Class A shares | | 6.05% | | 5.48% | | 5.23% |
*Assumes reinvestment of all distributions and payment of the maximum 3.75% sales charge.
The total annual fund operating expense ratio is 0.71% for Class A shares as of the prospectus dated December 1, 2016 (unaudited).
Investment results assume all distributions are reinvested and reflect applicable fees and expenses. When applicable, investment results reflect fee waivers, without which results would have been lower. Visit americanfunds.com for more information.
| American High-Income Trust | 3 |

Degrees above zero: The search for sustainable income in a low-rate environment
Investment income is harder than ever to find. Nearly eight years of historically low rates have sharply reduced the number of meaningful income opportunities for investors and savers. As an example, the average annual five-year CD rate is 0.81%.* Fortunately, American High-Income Trust has been one of the few ways to generate income in a world of zero — and, in some countries, below zero — rates. As of September 30, 2016, the fund’s 12-month distribution rate — the fund’s past dividends paid to shareholders — was 5.88%.
This article discusses how the fund has achieved that higher degree of income, and why it’s important for the fund to continue to try to create an income stream that’s sustainable over the long term for you, its shareholders.
Why is high-yield income typically higher than the income from other bonds?
High-yield bonds can enhance portfolio income by paying a higher rate of interest than other bonds. They must do so, in fact, in order to attract investors. They are lower credit-quality bonds with a greater risk of not being able to pay regular interest over the life of the bond. The issuing company may have taken on a
*As of 9/30/16. Source: bankrate.com.
| 4 | American High-Income Trust |

“You can’t time the cycles, but you can still generate substantial income with a long-term perspective.”
— David Barclay
significant amount of debt relative to its earnings, or may be struggling through a difficult period for its business.
The importance of research in assessing risk
The art of high-yield investing is to determine whether individual companies are good credit risks or bad credit risks. And that takes a lot of research.
“None of the bonds we buy have zero risk,” says the fund’s Principal Investment Officer David Barclay. To assess risk, the fund relies on “in-depth, issuer-focused research that anticipates the company’s ability to pay down debt in the future.”
“The promised return is relatively straightforward, because it’s effectively the yield on the security,” adds portfolio manager David Daigle. “Most of our work goes into evaluating the expected return, or determining the risk relative to the yield.”
The managers focus on two things:
1. The credit risk of the issuer. Is the company credit profile expected to improve or deteriorate? Will the company generate sufficient cash flow to pay down its debt?
2. The structure of the bond itself. What is the legal ranking of the bond within the capital structure? Is the bond guaranteed or secured by collateral? If so, how valuable are the guarantees and collateral? What are the covenants, which restrict what the company can and cannot do with the borrowed money?
This complexity makes high-yield investment analysis somewhat unique. “It’s like equity analysis with some added layers,” says portfolio manager Tara Torrens, who became a portfolio manager after 11 years as an analyst. “The starting point is understanding the industry, the fundamental drivers of the company, visiting with management and competitors, all the things that equity analysts do to gain a good idea of the outlook and downside of a company. We add onto that the things that affect bondholders in particular, like capital structure and covenant analysis.”
Balancing risk and return to achieve sustainable income
Armed with the knowledge of how much risk a bond represents, managers evaluate whether the income generated by the bond is adequate to assume that risk. “The highest current yield is not necessarily the highest sustainable yield,” says David Barclay. “We don’t have a yield target so we don’t need to buy the highest yield bonds. Everything depends on whether we think we are being compensated for the risk on an individual bond. If we are not being compensated, we won’t buy.”
A rational approach to defaults
One of the major reasons high-yield bonds have higher yields is to compensate investors for the greater risk of default, which occurs when the issuer is unable to continue making scheduled payments on its debt. The fund’s portfolio managers believe defaults are an unavoidable part of investing in the high-yield market. “A high-yield fund will always have defaults,” says David Barclay. “But over time, we believe that the extra yield has more than compensated for the loss from defaults.”
Accordingly, “Zero defaults is not the objective of the fund. If it was, we would have lower yields, and a lower total return.”
Instead, the portfolio managers seek to minimize the losses to shareholders from defaults. “We focus more on loss avoidance than we do on default avoidance,” says David Daigle. “We do encounter situations where an issuer can no longer service its debt; in those cases we can either sell the bonds or convert the bonds to equity, and hold on to the equity if we anticipate that it will recover in value. We generally avoid holding non-income producing securities but company defaults often occur when their assets are valued at a cyclical low. If you persistently sell at such a low valuation, it might not be the best approach to maximize long-term value.”
“For most companies, default is based on liquidity,” adds Thomas Chow. “They have no capital to finance maturing debt. So that’s one of the first things we work on with our analysts — looking at financial statements and assessing operationally what’s going on inside the business.”
Fund results shown are for Class A shares at net asset value. If a sales charge (maximum 3.75%) had been deducted, the results would have been lower. Results are for past periods and are not predictive of results for future periods. Current and future results may be lower or higher than those shown. Share prices and returns will vary, so investors may lose money. For current information and month-end results, visit americanfunds.com.
| American High-Income Trust | 5 |

“The high-yield index currently yields about 6.25%, but few such securities generate that much yield. To achieve a portfolio yield approximating the index, you have to take on exposure to higher yielding credits with some meaningful degree of uncertainty regarding fundamental or refinancing risk.”
— Thomas Chow

“High yield is a way to achieve greater income than most any other asset class. Through a cycle, you can see the higher income return that much of the world needs, which is the reason bonds are in people’s portfolios.”
— Tara Torrens

As portfolio manager Thomas Chow puts it, “We have many of the risks associated with equities without the upside that they enjoy, so we have to look at more things than yield to generate returns for our shareholders.”
Adds Tara Torrens: “Focusing only on the highest yield means you’ll be blindly taking risk in an effort to achieve income. While that may work in parts of a market cycle, it doesn’t work through all of a market cycle, and you put investors at risk with that type of strategy. That doesn’t mean we seek the lowest risk either, simply that the reward must be sufficient for the actual risk we are taking.”
Since the yield on most high-yield bonds is higher than on investment-grade bonds (those rated BBB/Baa and above), the key is sustaining it over the life of the bond. If everything goes well, bondholders will receive all their principal back when the bond matures. The biggest risk is that the company becomes unable to service its debt. This leads to default, and the loss of income. For more on this topic, see the discussion on page 5.
Why higher income means more volatility
The high-yield market makes decisions every day about how risky bonds are by bidding their prices up and down. A wide range of factors can influence bond prices, from general economic data to changes in commodity prices. Even small changes — for example an unexpected drop in prices — can disrupt the plans of a company that has issued a significant amount of debt relative to its earnings potential. As David Daigle puts it, “Credit quality varies with economic conditions, so high-yield companies are especially hurt by economic downturns.”
As bond prices decline, yields rise to compensate investors for the higher perceived risks. The difference in yield between that of a high-yield bond and a comparable U.S. Treasury bond is known as the yield spread. “Spreads are the risk premium over what you would think of as the risk-free rate,” explains David Barclay. “They are a compensation for credit risk.”
When the spread is wide, the extra “yield premium” from high-yield bonds becomes enticing for investors. So they buy, driving the price higher. This in turn causes the yields to go back down. With less compensation for risk, investors might start selling the bonds again.
The importance of investing through high-yield cycles
The volatility that results when spreads widen and narrow is a recurring cycle in the high-yield market. “High yield in my view is prone to overreaction on both sides,” says Tara Torrens. “Over time, however, the volatility normalizes and you’re generally left with the income. So
| 6 | American High-Income Trust |

“We generally avoid holding non-income producing securities, but when we do, it’s important to continually evaluate whether to hold or sell.”
— David Daigle
one of our primary investment strategies is to capture the income and minimize the loss. That’s more important than trying to time where we are in the market cycle.”
It’s sometimes challenging for shareholders to focus on the income instead of the price change, especially given the high-yield volatility of the past few years. But high yield doesn’t have the risks or return potential of equities. As Thomas Chow points out, “Unlike the equity markets, double-digit returns in high yield — as have occurred this year — are typically the result of a rebound from a prior year.”
The lesson? Higher-than-average income over the long term should compensate for short-term volatility, if shareholders continue to hold the fund through the market cycles.
Where are we now in the cycle?
The post-2008 environment of near-zero rates and central bank intervention has put higher yielding investments at a premium. While this has been beneficial for high-yield bonds, the economic weakness underlying the low rates has created concern among investors.
“Currently, spreads are not particularly low by historical standards,” David Daigle explains. “However, risk-free rates are quite low by historical standards. If rates and spreads remain near current levels, without a deterioration of economic conditions, we would expect high yield to outperform most other fixed income asset classes.”
“There’s some irrationality in risky markets, including high yield, from artificially low rates,” adds Tara Torrens. “But as long as we stay disciplined and research-focused, and are ready to reduce our risk if necessary, we should be prepared for whatever market condition happens.”
The questions to ask in this environment, according to Thomas Chow, are if these companies will be able to survive a downturn, and are we being compensated for that risk?
Taking a longer term view of income
When American High-Income Trust began in February 1988, the federal funds rate — which establishes the level at which other U.S. interest rates are set — was 6.58%. Today, it’s 0.40%.† If maximizing income was important then, it’s even more important now. And now, like then, there are very few places to go. “Within the public securities market,” says David Barclay, “high yield is one of the very few opportunities for higher-than-average yield.”
As long as rates remain low worldwide, demand for high income will undoubtedly continue. n
Beyond income: Other potential advantages of high yield
High income is a significant benefit in today’s market, but there are other reasons for long-term investors to diversify with high yield, such as:
Capital appreciation potential — Positive events in the economy, industry or issuing company, such as ratings upgrades, improved earnings, or a takeover, can increase the price of a high-yield bond.
Portfolio risk diversification — High-yield bonds are considered a separate asset class, involving different characteristics from those of other securities. A high-yield fund can add diversification to a portfolio, reducing the concentration of risk in any one asset class.
Less interest rate volatility risk than long-term U.S. Treasury bonds — All fixed income securities are impacted by changes in interest rates. If rates move up, bond prices move down (and vice versa). The high-yield market offers yields much higher than those on other fixed income assets such that changes to prevailing rates should not affect the price as much as with other bonds. As David Barclay puts it, “Interest rates have less effect on high yield than on any other fixed income market.”
A fund of high-yield bonds may offer advantages over individual bonds — Hundreds of individual bonds are typically owned by a high-yield fund, which reduces the impact of default if an individual investor owns just a few high-yield bonds. Bond funds also provide daily liquidity, reinvestment of income, continuous managerial oversight and the regular replacement of maturing bonds, allowing high-yield diversification even with a relatively small investment.
†Source: St. Louis Fed, as of 9/30/16 and 2/19/88
| American High-Income Trust | 7 |
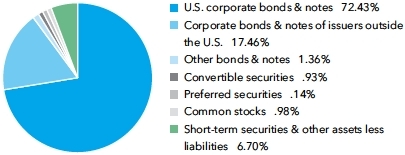
Summary investment portfolio September 30, 2016
| Investment mix by security type | Percent of net assets |
| Bonds, notes & other debt instruments 91.25% | | Principal amount
(000) | | | Value
(000) | |
| Corporate bonds & notes 89.89% | | | | | | | | |
| Energy 14.62% | | | | | | | | |
| Blue Racer Midstream LLC / Blue Racer Finance Corp. 6.125% 20221 | | $ | 71,520 | | | $ | 70,268 | |
| Cheniere Energy, Inc. 7.00% 20241 | | | 16,110 | | | | 17,479 | |
| CONSOL Energy Inc. 5.875% 2022 | | | 79,212 | | | | 73,271 | |
| NGPL PipeCo LLC 7.119% 20171 | | | 148,860 | | | | 156,303 | |
| NGPL PipeCo LLC 9.625% 20191 | | | 99,015 | | | | 104,585 | |
| NGPL PipeCo LLC 7.768% 20371 | | | 19,880 | | | | 21,669 | |
| NGPL PipeCo LLC, Term Loan B, 6.75% 20172,3,4 | | | 1,625 | | | | 1,627 | |
| PDC Energy Inc. 7.75% 2022 | | | 66,275 | | | | 71,080 | |
| Sabine Pass Liquefaction, LLC 5.625% 2021 | | | 65,825 | | | | 70,350 | |
| Sabine Pass Liquefaction, LLC 5.00%–5.75% 2024–20271 | | | 121,880 | | | | 129,407 | |
| Sabine Pass LNG, LP 5.88%–7.50% 2016–20261 | | | 6,350 | | | | 6,720 | |
| Teekay Corp. 8.50% 2020 | | | 103,630 | | | | 90,158 | |
| Other securities | | | | | | | 1,651,550 | |
| | | | | | | | 2,464,467 | |
| | | | | | | | | |
| Health care 13.89% | | | | | | | | |
| Centene Corp. 4.75% 2022 | | | 62,200 | | | | 64,532 | |
| inVentiv Health, Inc. 9.00% 20181 | | | 131,769 | | | | 135,557 | |
| inVentiv Health, Inc. 7.50%–10.00% 2018–20241 | | | 134,016 | | | | 135,374 | |
| inVentiv Health, Inc. 10.00% 20181,5 | | | 94,620 | | | | 97,265 | |
| inVentiv Health, Inc., Term Loan B, 4.75% 20232,3,4 | | | 25,992 | | | | 26,045 | |
| inVentiv Health, Inc., Term Loan B4, 7.75% 20182,3,4 | | | 26,930 | | | | 27,014 | |
| Kinetic Concepts, Inc. 10.50% 2018 | | | 170,455 | | | | 179,233 | |
| Kinetic Concepts, Inc. 12.50% 2019 | | | 133,632 | | | | 133,298 | |
| Kinetic Concepts, Inc. 7.875% 20211 | | | 17,765 | | | | 19,275 | |
| Kinetic Concepts, Inc. 9.625% 20211 | | | 149,230 | | | | 149,603 | |
| Molina Healthcare, Inc. 5.375% 2022 | | | 62,097 | | | | 64,426 | |
| Valeant Pharmaceuticals International Inc. 5.50%–7.00% 2020–20231 | | | 16,130 | | | | 14,130 | |
| VPI Escrow Corp. 6.75% 20181 | | | 66,000 | | | | 66,660 | |
| VPI Escrow Corp. 6.375% 20201 | | | 82,281 | | | | 77,550 | |
| VPI Escrow Corp. 7.50% 20211 | | | 32,320 | | | | 31,391 | |
| VRX Escrow Corp. 5.38%–6.13% 2020–20251 | | | 108,315 | | | | 95,908 | |
| Other securities | | | | | | | 1,024,588 | |
| | | | | | | | 2,341,849 | |
| |
| Consumer discretionary 11.89% | | | | | | | | |
| Cablevision Systems Corp. 5.50%–7.75% 2018–20271 | | | 69,650 | | | | 73,150 | |
| CCO Holdings LLC and CCO Holdings Capital Corp. 5.75% 20261 | | | 70,575 | | | | 74,986 | |
| Clear Channel Worldwide Holdings, Inc. 7.625% 2020 | | | 130,644 | | | | 130,154 | |
| Needle Merger Sub Corp. 8.125% 20191 | | | 70,820 | | | | 70,997 | |
| PETsMART, Inc. 7.125% 20231 | | | 65,050 | | | | 68,465 | |
| Playa Resorts Holding BV 8.00% 20201 | | | 63,074 | | | | 64,651 | |
| Other securities | | | | | | | 1,522,124 | |
| | | | | | | | 2,004,527 | |
| 8 | American High-Income Trust |
| | | Principal amount | | | Value | |
| | | (000) | | | (000) | |
| Telecommunication services 11.80% | | | | | | | | |
| Altice Financing SA 6.625% 20231 | | $ | 18,460 | | | $ | 19,014 | |
| Altice Finco SA 6.50%–9.88% 2020–20221 | | | 8,650 | | | | 9,237 | |
| Altice NV 5.50%–7.50% 20261 | | | 21,175 | | | | 21,960 | |
| Cequel Communications Holdings I, LLC and Cequel Capital Corp. 6.375% 20201 | | | 103,960 | | | | 107,469 | |
| Clearwire Communications and Clearwire Finance, Inc. 14.75% 20161 | | | 3,125 | | | | 3,188 | |
| Frontier Communications Corp. 10.50% 2022 | | | 100,635 | | | | 107,050 | |
| Frontier Communications Corp. 11.00% 2025 | | | 101,037 | | | | 105,710 | |
| Frontier Communications Corp. 7.63%–9.25% 2020–2024 | | | 52,548 | | | | 56,127 | |
| Ligado Networks, Term Loan, 9.75% 20202,3,4,5 | | | 148,144 | | | | 134,251 | |
| MetroPCS Wireless, Inc. 6.25% 2021 | | | 54,060 | | | | 56,932 | |
| MetroPCS Wireless, Inc. 6.625% 2023 | | | 70,985 | | | | 76,486 | |
| Neptune Finco Corp. (Altice NV) 6.63%–10.13% 2023–20251 | | | 22,150 | | | | 24,937 | |
| Numericable Group SA 6.00%–7.38% 2022–20261 | | | 29,440 | | | | 30,132 | |
| Sprint Capital Corp. 6.90% 2019 | | | 31,750 | | | | 33,020 | |
| Sprint Nextel Corp. 7.00% 2020 | | | 66,870 | | | | 67,539 | |
| Sprint Nextel Corp. 11.50% 2021 | | | 68,835 | | | | 79,504 | |
| Sprint Nextel Corp. 6.88%–9.00% 2017–20281 | | | 123,595 | | | | 127,378 | |
| T-Mobile US, Inc. 6.00%–6.73% 2020–2026 | | | 117,165 | | | | 126,022 | |
| Wind Acquisition SA 4.75% 20201 | | | 62,875 | | | | 63,975 | |
| Wind Acquisition SA 7.375% 20211 | | | 112,375 | | | | 117,853 | |
| Other securities | | | | | | | 621,942 | |
| | | | | | | | 1,989,726 | |
| | | | | | | | | |
| Industrials 11.62% | | | | | | | | |
| Associated Materials, LLC and AMH New Finance, Inc. 9.125% 2017 | | | 170,417 | | | | 161,470 | |
| Builders FirstSource, Inc. 5.625% 20241 | | | 71,575 | | | | 73,722 | |
| Corporate Risk Holdings LLC 9.50% 20191,6 | | | 137,693 | | | | 133,562 | |
| Corporate Risk Holdings LLC 11.50% 20201,5,6,7 | | | 14,705 | | | | 15,470 | |
| DAE Aviation Holdings, Inc. 10.00% 20231 | | | 106,405 | | | | 114,651 | |
| Deck Chassis Acquisition Inc. 10.00% 20231 | | | 65,260 | | | | 68,686 | |
| Other securities | | | | | | | 1,390,518 | |
| | | | | | | | 1,958,079 | |
| | | | | | | | | |
| Materials 9.09% | | | | | | | | |
| ArcelorMittal 7.75% 2041 | | | 69,360 | | | | 72,655 | |
| First Quantum Minerals Ltd. 6.75% 20201 | | | 124,165 | | | | 115,473 | |
| First Quantum Minerals Ltd. 7.00% 20211 | | | 83,907 | | | | 76,146 | |
| First Quantum Minerals Ltd. 7.25% 20221 | | | 16,075 | | | | 14,387 | |
| FMG Resources 9.75% 20221 | | | 83,075 | | | | 96,782 | |
| Ryerson Inc. 11.00% 20221 | | | 92,178 | | | | 101,626 | |
| Other securities | | | | | | | 1,055,323 | |
| | | | | | | | 1,532,392 | |
| | | | | | | | | |
| Information technology 5.11% | | | | | | | | |
| First Data Corp. 7.00% 20231 | | | 86,825 | | | | 92,034 | |
| Gogo Inc. 12.50% 20221 | | | 68,725 | | | | 74,051 | |
| Other securities | | | | | | | 695,787 | |
| | | | | | | | 861,872 | |
| | | | | | | | | |
| Financials 4.90% | | | | | | | | |
| CIT Group Inc. 3.875% 2019 | | | 90,760 | | | | 92,916 | |
| Other securities | | | | | | | 732,674 | |
| | | | | | | | 825,590 | |
| | | | | | | | | |
| Utilities 3.78% | | | | | | | | |
| AES Corp. 4.88%–8.00% 2020–2026 | | | 164,690 | | | | 179,387 | |
| Texas Competitive Electric Holdings, Term Loan B, 5.00% 20172,3,4 | | | 64,267 | | | | 64,750 | |
| Other securities | | | | | | | 393,530 | |
| | | | | | | | 637,667 | |
| | | | | | | | | |
| Real estate 2.35% | | | | | | | | |
| Crescent Resources 10.25% 20171 | | | 108,419 | | | | 109,232 | |
| Other securities | | | | | | | 286,699 | |
| | | | | | | | 395,931 | |
| American High-Income Trust | 9 |
| Bonds, notes & other debt instruments (continued) | | Principal amount
(000) | | | Value
(000) | |
| Corporate bonds & notes (continued) | | | | | | | | |
| Consumer staples 0.84% | | | | | | | | |
| Other securities | | | | | | $ | 141,943 | |
| | | | | | | | | |
| Total corporate bonds & notes | | | | | | | 15,154,043 | |
| | | | | | | | | |
| U.S. Treasury bonds & notes 0.98% | | | | | | | | |
| U.S. Treasury 0.98% | | | | | | | | |
| U.S. Treasury 1.125% 2021 | | $ | 100,000 | | | | 99,898 | |
| U.S. Treasury 6.25% 20238 | | | 50,000 | | | | 65,992 | |
| | | | | | | | 165,890 | |
| | | | | | | | | |
| Other bonds & notes 0.38% | | | | | | | | |
| Other securities | | | | | | | 63,671 | |
| | | | | | | | | |
| Total bonds, notes & other debt instruments (cost: $15,347,771,000) | | | | | | | 15,383,604 | |
| |
| Convertible bonds 0.36% | | | | | | | | |
| Other 0.35% | | | | | | | | |
| Other securities | | | | | | | 60,053 | |
| | | | | | | | | |
| Miscellaneous 0.01% | | | | | | | | |
| Other convertible bonds in initial period of acquisition | | | | | | | 1,632 | |
| | | | | | | | | |
| Total convertible bonds (cost: $68,407,000) | | | | | | | 61,685 | |
| | | | | | | | | |
| Convertible stocks 0.57% | | | Shares | | | | | |
| Telecommunication services 0.03% | | | | | | | | |
| Frontier Communications Corp., Series A, convertible preferred | | | 70,000 | | | | 5,874 | |
| | | | | | | | | |
| Other 0.45% | | | | | | | | |
| Other securities | | | | | | | 74,713 | |
| | | | | | | | | |
| Miscellaneous 0.09% | | | | | | | | |
| Other convertible stocks in initial period of acquisition | | | | | | | 15,220 | |
| | | | | | | | | |
| Total convertible stocks (cost: $144,530,000) | | | | | | | 95,807 | |
| | | | | | | | | |
| Preferred securities 0.14% | | | | | | | | |
| Real estate 0.06% | | | | | | | | |
| Other securities | | | | | | | 9,502 | |
| | | | | | | | | |
| Miscellaneous 0.08% | | | | | | | | |
| Other preferred securities in initial period of acquisition | | | | | | | 13,900 | |
| | | | | | | | | |
| Total preferred securities (cost: $22,634,000) | | | | | | | 23,402 | |
| | | | | | | | | |
| Common stocks 0.98% | | | | | | | | |
| Information technology 0.12% | | | | | | | | |
| Corporate Risk Holdings I, Inc.6,7,9,10 | | | 2,380,355 | | | | 20,138 | |
| | | | | | | | | |
| Other 0.86% | | | | | | | | |
| Other securities | | | | | | | 145,306 | |
| | | | | | | | | |
| Total common stocks (cost: $513,004,000) | | | | | | | 165,444 | |
| 10 | American High-Income Trust |
| Short-term securities 6.08% | | Principal amount
(000) | | | Value
(000) | |
| Commercial paper 2.13% | | | | | | | | |
| Caterpillar Financial Services Corp. 0.51% due 11/7/2016 | | $ | 75,000 | | | $ | 74,965 | |
| Coca-Cola Co. 0.52% - 0.58% due 11/9/2016 - 11/18/20161 | | | 99,360 | | | | 99,306 | |
| Other securities | | | | | | | 185,424 | |
| | | | | | | | 359,695 | |
| | | | | | | | | |
| Federal agency discount notes 1.97% | | | | | | | | |
| Federal Home Loan Bank 0.31% - 0.55% due 10/28/2016 - 5/25/2017 | | | 135,700 | | | | 135,487 | |
| Freddie Mac 0.40% - 0.41% due 12/21/2016 - 1/19/2017 | | | 145,400 | | | | 145,269 | |
| Other securities | | | | | | | 49,970 | |
| | | | | | | | 330,726 | |
| | | | | | | | | |
| U.S. Treasury bills 1.19% | | | | | | | | |
| U.S. Treasury Bills 0.35% - 0.40% due 1/5/2017 - 1/12/2017 | | | 200,000 | | | | 199,875 | |
| | | | | | | | | |
| Municipals 0.79% | | | | | | | | |
| Other securities | | | | | | | 134,000 | |
| | | | | | | | | |
| Total short-term securities (cost: $1,024,126,000) | | | | | | | 1,024,296 | |
| Total investment securities 99.38% (cost: $17,120,472,000) | | | | | | | 16,754,238 | |
| Other assets less liabilities 0.62% | | | | | | | 105,042 | |
| | | | | | | | | |
| Net assets 100.00% | | | | | | $ | 16,859,280 | |
This summary investment portfolio is designed to streamline the report and help investors better focus on the fund’s principal holdings. See the inside back cover for details on how to obtain a complete schedule of portfolio holdings.
As permitted by U.S. Securities and Exchange Commission regulations, “Miscellaneous” securities include holdings in their first year of acquisition that have not previously been publicly disclosed.
“Other securities” includes all issues that are not disclosed separately in the summary investment portfolio.
Forward currency contracts
The fund did not hold any forward currency contracts as of September 30, 2016. The average month-end notional amount of open forward currency contracts while held was $20,466,000.
Interest rate swaps
The fund did not hold any interest rate swaps as of September 30, 2016. The average month-end notional amount of interest rate swaps while held was $287,416,000.
Credit default swaps
The fund has entered into credit default swaps as shown in the following table. The average month-end notional amount of credit default swaps while held was $158,528,000.
Centrally cleared credit default swaps on credit indices — sell protection
| Referenced index | | Clearinghouse | | Receive
fixed rate | | | Expiration
date | | Notional
(000) | | | Value
(000) | | | Upfront
premiums
received
(000) | | | Unrealized
appreciation
(depreciation)
at 9/30/2016
(000) | |
| CDX.NA.HY.21 | | ICE | | | 5.00 | % | | 12/20/2018 | | $ | 17,280 | | | $ | 1,120 | | | $ | 1,036 | | | | $ | 83 | |
| CDX.NA.HY.22 | | ICE | | | 5.00 | | | 6/20/2019 | | | 27,840 | | | | 1,981 | | | | 2,168 | | | | (188 | ) |
| CDX.NA.HY.25 | | ICE | | | 5.00 | | | 12/20/2020 | | | 81,180 | | | | 4,745 | | | | 2,452 | | | | 2,293 | |
| CDX.NA.HY.26 | | ICE | | | 5.00 | | | 6/20/2021 | | | 150,000 | | | | 7,733 | | | | 4,210 | | | | | 3,523 | |
| | | | | | | | | | | | | | | | | | | | | | | | $ | 5,711 | |
| American High-Income Trust | 11 |
Investments in affiliates
A company is an affiliate of the fund under the Investment Company Act of 1940 if the fund’s holdings in that company represent 5% or more of the outstanding voting shares. The value of the fund’s affiliated-company holdings is either shown in the summary investment portfolio or included in the value of “Other securities” under the respective industry sectors. Further details on such holdings and related transactions during the year ended September 30, 2016, appear below.
| | | Beginning
shares or
principal
amount | | | Additions | | | Reductions | | | Ending
shares or
principal
amount | | | Interest
income
(000) | | | Value of
affiliates at
9/30/2016
(000) | |
| Corporate Risk Holdings LLC 9.50% 20191 | | $ | 137,028,000 | | | $ | 665,000 | | | | — | | | $ | 137,693,000 | | | $ | 13,083 | | | $ | 133,562 | |
| Corporate Risk Holdings I, Inc.7,9,10 | | | 2,380,354 | | | | 1 | | | | — | | | | 2,380,355 | | | | — | | | | 20,138 | |
| Corporate Risk Holdings LLC 11.50% 20201,5,7 | | $ | 13,177,519 | | | $ | 1,527,771 | | | | — | | | $ | 14,705,290 | | | | 1,785 | | | | 15,470 | |
| Corporate Risk Holdings Corp.7,9,10 | | | 12,034 | | | | 1 | | | | — | | | | 12,035 | | | | — | | | | — | |
| Rotech Healthcare Inc., Term Loan, 13.00% 20202,3,4,5,7 | | $ | 54,762,603 | | | $ | 6,385,939 | | | | — | | | $ | 61,148,542 | | | | 7,019 | | | | 55,825 | |
| Rotech Healthcare Inc., Term Loan A, 5.50% 20182,3,4,7 | | $ | 25,382,000 | | | | — | | | $ | 259,000 | | | $ | 25,123,000 | | | | 1,414 | | | | 24,997 | |
| Rotech Healthcare Inc., Term Loan B, 10.00% 20192,3,4,7 | | $ | 20,825,000 | | | | — | | | | — | | | $ | 20,825,000 | | | | 2,117 | | | | 20,721 | |
| Rotech Healthcare Inc.7,9 | | | 1,916,276 | | | | — | | | | — | | | | 1,916,276 | | | | — | | | | 1,916 | |
| CEVA Group PLC, Series A-1, 3.88% convertible preferred7,9,11 | | | 47,121 | | | | — | | | | — | | | | 47,121 | | | | — | | | | 23,561 | |
| CEVA Group PLC7,9,11 | | | 59,168 | | | | — | | | | — | | | | 59,168 | | | | — | | | | 21,448 | |
| CEVA Logistics U.S. Holdings Inc., Term Loan B, 6.50% 20212,3,4 | | $ | 22,698,670 | | | | — | | | $ | 3,823,127 | | | $ | 18,875,543 | | | | 1,225 | | | | 15,189 | |
| CEVA Logistics Holdings BV, Term Loan, 6.50% 20212,3,4 | | $ | 16,456,536 | | | | — | | | $ | 2,767,280 | | | $ | 13,689,256 | | | | 792 | | | | 11,016 | |
| CEVA Group PLC, Apollo Global Securities LLC LOC, 5.969% 20212,3,4 | | $ | 15,842,980 | | | | — | | | $ | 2,531,896 | | | $ | 13,311,084 | | | | 1,025 | | | | 10,711 | |
| CEVA Group PLC 9.00% 20211 | | $ | 19,100,000 | | | | — | | | $ | 4,425,000 | | | $ | 14,675,000 | | | | 1,495 | | | | 9,539 | |
| CEVA Group PLC, Series A-2, 2.88% convertible preferred7,9,11 | | | 21,062 | | | | — | | | | — | | | | 21,062 | | | | — | | | | 7,635 | |
| CEVA Logistics Canada, ULC, Term Loan, 6.50% 20212,3,4 | | $ | 2,837,334 | | | | — | | | $ | 475,397 | | | $ | 2,361,937 | | | | 133 | | | | 1,901 | |
| CEVA Group PLC 7.00% 20211 | | $ | 9,475,000 | | | | — | | | $ | 8,075,000 | | | $ | 1,400,000 | | | | 219 | | | | 1,141 | |
| NII Holdings, Inc.9 | | | 19,451,169 | | | | — | | | | 1,674,324 | | | | 17,776,845 | | | | — | | | | 59,197 | |
| White Star NR Corporation7,9,11 | | | — | | | | 24,665,117 | | | | — | | | | 24,665,117 | | | | — | | | | 20,965 | |
| Cooper-Standard Holdings Inc.9,12 | | | 1,659,993 | | | | 538,673 | | | | 2,198,666 | | | | — | | | | — | | | | — | |
| Cooper-Standard Holdings Inc.1,7,9,12 | | | — | | | | 448,132 | | | | 448,132 | | | | — | | | | — | | | | — | |
| Cooper-Standard Holdings Inc., warrants, expire 20171,7,9,12 | | | 48,411 | | | | 48,411 | | | | 96,822 | | | | — | | | | — | | | | — | |
| | | | | | | | | | | | | | | | | | | $ | 30,307 | | | $ | 454,932 | |
The following footnotes apply to either the individual securities noted or one or more of the securities aggregated and listed as a single line item.
| 1 | Acquired in a transaction exempt from registration under Rule 144A or Section 4(2) of the Securities Act of 1933. May be resold in the U.S. in transactions exempt from registration, normally to qualified institutional buyers. The total value of all such securities, including those in “Other securities,” was $7,673,130,000, which represented 45.51% of the net assets of the fund. |
| 2 | Loan participations and assignments; may be subject to legal or contractual restrictions on resale. The total value of all such loans, including those in “Other securities,” was $1,019,783,000, which represented 6.05% of the net assets of the fund. |
| 3 | Principal payments may be made periodically. Therefore, the effective maturity date may be earlier than the stated maturity date. |
| 4 | Coupon rate may change periodically. |
| 5 | Payment in kind; the issuer has the option of paying additional securities in lieu of cash. |
| 6 | Represents an affiliated company as defined under the Investment Company Act of 1940. |
| 7 | Valued under fair value procedures adopted by authority of the board of trustees. The total value of all such securities, including those in “Miscellaneous” and “Other securities,” was $259,700,000, which represented 1.54% of the net assets of the fund. |
| 8 | A portion of this security was pledged as collateral. The total value of pledged collateral was $14,731,000, which represented .09% of the net assets of the fund. |
| 9 | Security did not produce income during the last 12 months. |
| 10 | This security was an unaffiliated issuer in its initial period of acquisition at 9/30/2015; it was not publicly disclosed. |
| 11 | Acquired through a private placement transaction exempt from registration under the Securities Act of 1933. May be subject to legal or contractual restrictions on resale. Further details on these holdings appear on the next page. |
| 12 | Unaffiliated issuer at 9/30/2016. |
| 12 | American High-Income Trust |
| Private placement securities | | Acquisition
date(s) | | Cost
(000) | | | Value
(000) | | | Percent
of net
assets | |
| CEVA Group PLC, Series A-1, 3.88% convertible preferred | | 5/2/2013-8/22/2014 | | $ | 47,776 | | | $ | 23,561 | | | | .14 | % |
| CEVA Group PLC | | 8/22/2014 | | | 57,165 | | | | 21,448 | | | | .13 | |
| CEVA Group PLC, Series A-2, 2.88% convertible preferred | | 5/2/2013 | | | 20,349 | | | | 7,635 | | | | .05 | |
| White Star NR Corporation | | 6/30/2016 | | | 16,491 | | | | 20,965 | | | | .12 | |
| Other securities | | 12/13/2012-11/26/2014 | | | — | | | | — | | | | .00 | |
| Total private placement securities | | | | $ | 141,781 | | | $ | 73,609 | | | | .44 | % |
Key to abbreviations
ICE = Intercontinental Exchange Inc.
LOC = Letter of Credit
See Notes to Financial Statements
| American High-Income Trust | 13 |
Financial statements
Statement of assets and liabilities
at September 30, 2016 | (dollars in thousands) |
| | |
| Assets: | | | | | | | | |
| Investment securities, at value: | | | | | | | | |
| Unaffiliated issuers (cost: $16,299,588) | | $ | 16,299,306 | | | | | |
| Affiliated issuers (cost: $820,884) | | | 454,932 | | | $ | 16,754,238 | |
| Cash | | | | | | | 122,573 | |
| Receivables for: | | | | | | | | |
| Sales of investments | | | 149,315 | | | | | |
| Sales of fund’s shares | | | 23,356 | | | | | |
| Variation margin | | | 1,579 | | | | | |
| Dividends and interest | | | 285,651 | | | | | |
| Other | | | 137 | | | | 460,038 | |
| | | | | | | | 17,336,849 | |
| Liabilities: | | | | | | | | |
| Payables for: | | | | | | | | |
| Purchases of investments | | | 423,288 | | | | | |
| Repurchases of fund’s shares | | | 39,598 | | | | | |
| Dividends on fund’s shares | | | 4,196 | | | | | |
| Investment advisory services | | | 3,724 | | | | | |
| Services provided by related parties | | | 4,324 | | | | | |
| Trustees’ deferred compensation | | | 304 | | | | | |
| Other | | | 2,135 | | | | 477,569 | |
| Net assets at September 30, 2016 | | | | | | $ | 16,859,280 | |
| | | | | | | | | |
| Net assets consist of: | | | | | | | | |
| Capital paid in on shares of beneficial interest | | | | | | $ | 19,055,317 | |
| Distributions in excess of net investment income | | | | | | | (52,699 | ) |
| Accumulated net realized loss | | | | | | | (1,782,890 | ) |
| Net unrealized depreciation | | | | | | | (360,448 | ) |
| Net assets at September 30, 2016 | | | | | | $ | 16,859,280 | |
(dollars and shares in thousands, except per-share amounts)
Shares of beneficial interest issued and outstanding (no stated par value) —
unlimited shares authorized (1,656,315 total shares outstanding)
| | | Net assets | | | Shares
outstanding | | | Net asset value
per share | |
| Class A | | $ | 11,897,315 | | | | 1,168,834 | | | $ | 10.18 | |
| Class B | | | 14,955 | | | | 1,469 | | | | 10.18 | |
| Class C | | | 871,348 | | | | 85,604 | | | | 10.18 | |
| Class F-1 | | | 642,448 | | | | 63,117 | | | | 10.18 | |
| Class F-2 | | | 1,171,326 | | | | 115,075 | | | | 10.18 | |
| Class 529-A | | | 314,038 | | | | 30,852 | | | | 10.18 | |
| Class 529-B | | | 964 | | | | 95 | | | | 10.18 | |
| Class 529-C | | | 103,642 | | | | 10,182 | | | | 10.18 | |
| Class 529-E | | | 17,211 | | | | 1,691 | | | | 10.18 | |
| Class 529-F-1 | | | 24,166 | | | | 2,374 | | | | 10.18 | |
| Class R-1 | | | 16,350 | | | | 1,606 | | | | 10.18 | |
| Class R-2 | | | 184,132 | | | | 18,090 | | | | 10.18 | |
| Class R-2E | | | 2,920 | | | | 287 | | | | 10.18 | |
| Class R-3 | | | 194,467 | | | | 19,105 | | | | 10.18 | |
| Class R-4 | | | 158,929 | | | | 15,614 | | | | 10.18 | |
| Class R-5E | | | 10 | | | | 1 | | | | 10.18 | |
| Class R-5 | | | 75,687 | | | | 7,436 | | | | 10.18 | |
| Class R-6 | | | 1,169,372 | | | | 114,883 | | | | 10.18 | |
See Notes to Financial Statements
| 14 | American High-Income Trust |
Statement of operations
for the year ended September 30, 2016 | (dollars in thousands) |
| | |
| Investment income: | | | | | | | | |
| Income: | | | | | | | | |
| Interest (net of non-U.S. taxes of $261; also includes $30,307 from affiliates) | | $ | 1,130,655 | | | | | |
| Dividends (net of non-U.S. taxes of $1) | | | 11,172 | | | $ | 1,141,827 | |
| Fees and expenses*: | | | | | | | | |
| Investment advisory services | | | 47,487 | | | | | |
| Distribution services | | | 43,043 | | | | | |
| Transfer agent services | | | 23,384 | | | | | |
| Administrative services | | | 3,582 | | | | | |
| Reports to shareholders | | | 1,086 | | | | | |
| Registration statement and prospectus | | | 894 | | | | | |
| Trustees’ compensation | | | 169 | | | | | |
| Auditing and legal | | | 212 | | | | | |
| Custodian | | | 71 | | | | | |
| Other | | | 638 | | | | | |
| Total fees and expenses before reimbursement | | | 120,566 | | | | | |
| Less transfer agent services reimbursement | | | — | † | | | | |
| Total fees and expenses after reimbursement | | | | | | | 120,566 | |
| Net investment income | | | | | | | 1,021,261 | |
| | | | | | | | | |
| Net realized loss and unrealized appreciation: | | | | | | | | |
| Net realized (loss) gain on: | | | | | | | | |
| Investments (includes $60,425 net gain from affiliates) | | | (793,336 | ) | | | | |
| Forward currency contracts | | | 1,225 | | | | | |
| Interest rate swaps | | | (9,690 | ) | | | | |
| Credit default swaps | | | 8,811 | | | | | |
| Currency transactions | | | (592 | ) | | | (793,582 | ) |
| Net unrealized appreciation (depreciation) on: | | | | | | | | |
| Investments (net of non-U.S. taxes of $58) | | | 1,320,313 | | | | | |
| Forward currency contracts | | | (475 | ) | | | | |
| Interest rate swaps | | | 203 | | | | | |
| Credit default swaps | | | 7,864 | | | | | |
| Currency translations | | | 40 | | | | 1,327,945 | |
| Net realized loss and unrealized appreciation | | | | | | | 534,363 | |
| | | | | | | | | |
| Net increase in net assets resulting from operations | | | | | | $ | 1,555,624 | |
| | |
| * | Additional information related to class-specific fees and expenses is included in the Notes to Financial Statements. |
| † | Amount less than one thousand. |
See Notes to Financial Statements
| American High-Income Trust | 15 |
Statements of changes in net assets
(dollars in thousands)
| | | Year ended September 30 | |
| | | 2016 | | | 2015 | |
| Operations: | | | | | | | | |
| Net investment income | | $ | 1,021,261 | | | $ | 1,126,366 | |
| Net realized loss | | | (793,582 | ) | | | (639,507 | ) |
| Net unrealized appreciation (depreciation) | | | 1,327,945 | | | | (1,566,362 | ) |
| Net increase (decrease) in net assets resulting from operations | | | 1,555,624 | | | | (1,079,503 | ) |
| | | | | | | | | |
| Dividends paid or accrued to shareholders from net investment income | | | (1,007,578 | ) | | | (1,144,670 | ) |
| | | | | | | | | |
| Net capital share transactions | | | (876,110 | ) | | | (654,561 | ) |
| | | | | | | | | |
| Total decrease in net assets | | | (328,064 | ) | | | (2,878,734 | ) |
| | | | | | | | | |
| Net assets: | | | | | | | | |
| Beginning of year | | | 17,187,344 | | | | 20,066,078 | |
| End of year (including distributions in excess of net investment income: $(52,699) and $(54,252), respectively) | | $ | 16,859,280 | | | $ | 17,187,344 | |
See Notes to Financial Statements
| 16 | American High-Income Trust |
Notes to financial statements
1. Organization
American High-Income Trust (the “fund”) is registered under the Investment Company Act of 1940 as an open-end, diversified management investment company. The fund seeks to provide a high level of current income. Its secondary investment objective is capital appreciation.
The fund has 18 share classes consisting of five retail share classes (Classes A, B and C, as well as two F share classes, F-1 and F-2), five 529 college savings plan share classes (Classes 529-A, 529-B, 529-C, 529-E and 529-F-1) and eight retirement plan share classes (Classes R-1, R-2, R-2E, R-3, R-4, R-5E, R-5 and R-6). The 529 college savings plan share classes can be used to save for college education. The retirement plan share classes are generally offered only through eligible employer-sponsored retirement plans. The fund’s share classes are described further in the following table:
| Share class | | Initial sales charge | | Contingent deferred sales
charge upon redemption | | Conversion feature | |
| Classes A and 529-A | | Up to 3.75% | | None (except 1% for certain redemptions within one year of purchase without an initial sales charge) | | None | |
| Classes B and 529-B* | | None | | Declines from 5% to 0% for redemptions within six years of purchase | | Classes B and 529-B convert to Classes A and 529-A, respectively, after eight years | |
| Class C | | None | | 1% for redemptions within one year of purchase | | Class C converts to Class F-1 after 10 years | |
| Class 529-C | | None | | 1% for redemptions within one year of purchase | | None | |
| Class 529-E | | None | | None | | None | |
| Classes F-1, F-2 and 529-F-1 | | None | | None | | None | |
| Classes R-1, R-2, R-2E, R-3, R-4, R-5E, R-5 and R-6 | | None | | None | | None | |
* Class B and 529-B shares of the fund are not available for purchase.
On November 20, 2015, the fund made an additional retirement plan share class (Class R-5E) available for sale pursuant to an amendment to its registration statement filed with the U.S. Securities and Exchange Commission. Refer to the fund’s prospectus for more details.
Holders of all share classes have equal pro rata rights to the assets, dividends and liquidation proceeds of the fund. Each share class has identical voting rights, except for the exclusive right to vote on matters affecting only its class. Share classes have different fees and expenses (“class-specific fees and expenses”), primarily due to different arrangements for distribution, transfer agent and administrative services. Differences in class-specific fees and expenses will result in differences in net investment income and, therefore, the payment of different per-share dividends by each share class.
2. Significant accounting policies
The fund is an investment company that applies the accounting and reporting guidance issued in Topic 946 by the U.S. Financial Accounting Standards Board. The fund’s financial statements have been prepared to comply with U.S. generally accepted accounting principles (“U.S. GAAP”). These principles require the fund’s investment adviser to make estimates and assumptions that affect reported amounts and disclosures. Actual results could differ from those estimates. Subsequent events, if any, have been evaluated through the date of issuance in the preparation of the financial statements. The fund follows the significant accounting policies described in this section, as well as the valuation policies described in the next section on valuation.
Security transactions and related investment income — Security transactions are recorded by the fund as of the date the trades are executed with brokers. Realized gains and losses from security transactions are determined based on the specific identified cost of the securities. In the event a security is purchased with a delayed payment date, the fund will segregate liquid assets sufficient to meet its payment obligations. Dividend income is recognized on the ex-dividend date and interest income is recognized on an accrual basis. Market discounts, premiums and original issue discounts on fixed-income securities are amortized daily over the expected life of the security.
| American High-Income Trust | 17 |
Class allocations — Income, fees and expenses (other than class-specific fees and expenses) are allocated daily among the various share classes based on the relative value of their settled shares. Realized and unrealized gains and losses are allocated daily among the various share classes based on their relative net assets. Class-specific fees and expenses, such as distribution, administrative and shareholder services, are charged directly to the respective share class.
Dividends and distributions to shareholders — Dividends to shareholders are declared daily after the determination of the fund’s net investment income and are paid to shareholders monthly. Distributions to shareholders are recorded on the ex-dividend date.
Currency translation — Assets and liabilities, including investment securities, denominated in currencies other than U.S. dollars are translated into U.S. dollars at the exchange rates supplied by one or more pricing vendors on the valuation date. Purchases and sales of investment securities and income and expenses are translated into U.S. dollars at the exchange rates on the dates of such transactions. The effects of changes in exchange rates on investment securities are included with the net realized gain or loss and net unrealized appreciation or depreciation on investments in the fund’s statement of operations. The realized gain or loss and unrealized appreciation or depreciation resulting from all other transactions denominated in currencies other than U.S. dollars are disclosed separately.
3. Valuation
Capital Research and Management Company (“CRMC”), the fund’s investment adviser, values the fund’s investments at fair value as defined by U.S. GAAP. The net asset value of each share class of the fund is generally determined as of approximately 4:00 p.m. New York time each day the New York Stock Exchange is open.
Methods and inputs — The fund’s investment adviser uses the following methods and inputs to establish the fair value of the fund’s assets and liabilities. Use of particular methods and inputs may vary over time based on availability and relevance as market and economic conditions evolve.
Equity securities are generally valued at the official closing price of, or the last reported sale price on, the exchange or market on which such securities are traded, as of the close of business on the day the securities are being valued or, lacking any sales, at the last available bid price. Prices for each security are taken from the principal exchange or market on which the security trades.
Fixed-income securities, including short-term securities, are generally valued at prices obtained from one or more pricing vendors. Vendors value such securities based on one or more of the inputs described in the following table. The table provides examples of inputs that are commonly relevant for valuing particular classes of fixed-income securities in which the fund is authorized to invest. However, these classifications are not exclusive, and any of the inputs may be used to value any other class of fixed-income security.
| Fixed-income class | Examples of standard inputs |
| All | Benchmark yields, transactions, bids, offers, quotations from dealers and trading systems, new issues, spreads and other relationships observed in the markets among comparable securities; and proprietary pricing models such as yield measures calculated using factors such as cash flows, financial or collateral performance and other reference data (collectively referred to as “standard inputs”) |
| Corporate bonds & notes; convertible securities | Standard inputs and underlying equity of the issuer |
| Bonds & notes of governments & government agencies | Standard inputs and interest rate volatilities |
| Mortgage-backed; asset-backed obligations | Standard inputs and cash flows, prepayment information, default rates, delinquency and loss assumptions, collateral characteristics, credit enhancements and specific deal information |
| Municipal securities | Standard inputs and, for certain distressed securities, cash flows or liquidation values using a net present value calculation based on inputs that include, but are not limited to, financial statements and debt contracts |
When the fund’s investment adviser deems it appropriate to do so (such as when vendor prices are unavailable or deemed to be not representative), fixed-income securities will be valued in good faith at the mean quoted bid and ask prices that are reasonably and timely available (or bid prices, if ask prices are not available) or at prices for securities of comparable maturity, quality and type.
Securities with both fixed-income and equity characteristics, or equity securities traded principally among fixed-income dealers, are generally valued in the manner described for either equity or fixed-income securities, depending on which method is deemed most appropriate by the fund’s investment adviser. Forward currency contracts are valued at the mean of representative quoted bid and ask
| 18 | American High-Income Trust |
prices, generally based on prices supplied by one or more pricing vendors. Interest rate swaps and credit default swaps are generally valued by pricing vendors based on market inputs that include the index and term of index, reset frequency, payer/receiver, currency and pay frequency.
Securities and other assets for which representative market quotations are not readily available or are considered unreliable by the fund’s investment adviser are fair valued as determined in good faith under fair valuation guidelines adopted by authority of the fund’s board of trustees as further described. The investment adviser follows fair valuation guidelines, consistent with U.S. Securities and Exchange Commission rules and guidance, to consider relevant principles and factors when making fair value determinations. The investment adviser considers relevant indications of value that are reasonably and timely available to it in determining the fair value to be assigned to a particular security, such as the type and cost of the security; contractual or legal restrictions on resale of the security; relevant financial or business developments of the issuer; actively traded similar or related securities; conversion or exchange rights on the security; related corporate actions; significant events occurring after the close of trading in the security; and changes in overall market conditions. In addition, the closing prices of equity securities that trade in markets outside U.S. time zones may be adjusted to reflect significant events that occur after the close of local trading but before the net asset value of each share class of the fund is determined. Fair valuations and valuations of investments that are not actively trading involve judgment and may differ materially from valuations that would have been used had greater market activity occurred.
Processes and structure — The fund’s board of trustees has delegated authority to the fund’s investment adviser to make fair value determinations, subject to board oversight. The investment adviser has established a Joint Fair Valuation Committee (the “Fair Valuation Committee”) to administer, implement and oversee the fair valuation process, and to make fair value decisions. The Fair Valuation Committee regularly reviews its own fair value decisions, as well as decisions made under its standing instructions to the investment adviser’s valuation teams. The Fair Valuation Committee reviews changes in fair value measurements from period to period and may, as deemed appropriate, update the fair valuation guidelines to better reflect the results of back testing and address new or evolving issues. The Fair Valuation Committee reports any changes to the fair valuation guidelines to the board of trustees with supplemental information to support the changes. The fund’s board and audit committee also regularly review reports that describe fair value determinations and methods.
The fund’s investment adviser has also established a Fixed-Income Pricing Review Group to administer and oversee the fixed-income valuation process, including the use of fixed-income pricing vendors. This group regularly reviews pricing vendor information and market data. Pricing decisions, processes and controls over security valuation are also subject to additional internal reviews, including an annual control self-evaluation program facilitated by the investment adviser’s compliance group.
Classifications — The fund’s investment adviser classifies the fund’s assets and liabilities into three levels based on the inputs used to value the assets or liabilities. Level 1 values are based on quoted prices in active markets for identical securities. Level 2 values are based on significant observable market inputs, such as quoted prices for similar securities and quoted prices in inactive markets. Certain securities trading outside the U.S. may transfer between Level 1 and Level 2 due to valuation adjustments resulting from significant market movements following the close of local trading. Level 3 values are based on significant unobservable inputs that reflect the investment adviser’s determination of assumptions that market participants might reasonably use in valuing the securities. The valuation levels are not necessarily an indication of the risk or liquidity associated with the underlying investment. For example, U.S. government securities are reflected as Level 2 because the inputs used to determine fair value may not always be quoted prices in an active market. The following tables present the fund’s valuation levels as of September 30, 2016 (dollars in thousands):
| | | Investment securities | |
| | | Level 1 | | | Level 2 | | | Level 3 | | | Total | |
| Assets: | | | | | | | | | | | | | | | | |
| Bonds, notes & other debt instruments: | | | | | | | | | | | | | | | | |
| Corporate bonds & notes | | $ | — | | | $ | 15,037,030 | | | $ | 117,013 | | | $ | 15,154,043 | |
| U.S. Treasury bonds & notes | | | — | | | | 165,890 | | | | — | | | | 165,890 | |
| Other bonds & notes | | | — | | | | 63,671 | | | | — | | | | 63,671 | |
| Convertible bonds | | | 3,860 | | | | 57,825 | | | | — | | | | 61,685 | |
| Convertible stocks | | | 64,611 | | | | 31,196 | | | | — | | | | 95,807 | |
| Preferred securities | | | 13,900 | | | | 9,502 | | | | — | | | | 23,402 | |
| Common stocks | | | 84,331 | | | | 21,448 | | | | 59,665 | | | | 165,444 | |
| Short-term securities | | | — | | | | 1,024,296 | | | | — | | | | 1,024,296 | |
| Total | | $ | 166,702 | | | $ | 16,410,858 | | | $ | 176,678 | | | $ | 16,754,238 | |
| | |
| American High-Income Trust | 19 |
| | | Other investments1 | |
| | | Level 1 | | | Level 2 | | | Level 3 | | | Total | |
| Assets: | | | | | | | | | | | | | | | | |
| Unrealized appreciation on credit default swaps | | $ | — | | | $ | 5,899 | | | $ | — | | | $ | 5,899 | |
| Liabilities: | | | | | | | | | | | | | | | | |
| Unrealized depreciation on credit default swaps | | | — | | | | (188 | ) | | | — | | | | (188 | ) |
| Total | | $ | — | | | $ | 5,711 | | | $ | — | | | $ | 5,711 | |
| | |
| 1 | Credit default swaps are not included in the investment portfolio. |
The following table reconciles the valuation of the fund’s Level 3 investment securities and related transactions for the year ended September 30, 2016 (dollars in thousands):
| | | Beginning | | | Transfers | | | | | | | | | Net | | | | | | Transfers | | | Ending | |
| | | value at | | | into | | | | | | | | | realized | | | Unrealized | | | out of | | | value at | |
| | | 10/1/2015 | | | level 32 | | | Purchases | | | Sales | | | loss3 | | | depreciation3 | | | level 32 | | | 9/30/2016 | |
| Investment securities | | $ | 272,134 | | | $ | 1,371 | | | $ | 42,138 | | | $ | (120,529 | ) | | $ | (683 | ) | | $ | (17,709 | ) | | $ | (44 | ) | | $ | 176,678 | |
| | | | | | | | | | | | | | | | | | | | | | | | | | | | | | | | | |
| Net unrealized depreciation during the period on Level 3 investment securities held at September 30, 20163 | | | $ | (16,774 | ) |
| | |
| 2 | Transfers into or out of Level 3 are based on the beginning market value of the quarter in which they occurred. |
| 3 | Net realized loss and unrealized depreciation are included in the related amounts on investments in the statement of operations. |
Unobservable inputs — Valuation of the fund’s Level 3 securities is based on significant unobservable inputs that reflect the investment adviser’s determination of assumptions that market participants might reasonably use in valuing the securities. The following table provides additional information used by the fund’s investment adviser to fair value the fund’s Level 3 securities (dollars in thousands):
| | | | | | | | | | | Impact to |
| | | | | | | | | | | valuation from |
| | | Value at | | Valuation | | Unobservable | | | | an increase in |
| | | 9/30/2016 | | techniques | | inputs | | Range | | input* |
| Bonds, notes & other debt instruments | | $ | 117,013 | | Trading of a similar issue adjusted by an estimated yield spread | | Yield spread | | 75 bps | | Decrease |
| | | | | Yield analysis | | Yield risk premium | | 100-500 bps | | Decrease |
| | | | | Enterprise valuation | | EV/EBITDA multiple | | 6.0x - 11.5x | | Increase |
| Common stocks | | 59,665 | | Discounted cash flow | | EV/EBITDA less capital expenditures multiple | | 0x - 10x | | Increase |
| | | | | | | Discount rate | | 20% | | Decrease |
| | | | | Recent transaction | | Arms-length transaction | | N/A | | N/A |
| | | $ | 176,678 | | | | | | | | |
| | |
| * | This column represents the directional change in fair value of the Level 3 securities that would result in an increase from the corresponding input. A decrease to the unobservable input would have the opposite effect. Significant increases and decreases in these inputs in isolation could result in significantly higher or lower fair value measurements. |
Key to abbreviations
EV = Enterprise value
EBITDA = Earnings before income taxes, depreciation and amortization
4. Risk factors
Investing in the fund may involve certain risks including, but not limited to, those described below.
Market conditions — The prices of, and the income generated by, the securities held by the fund may decline — sometimes rapidly or unpredictably — due to various factors, including events or conditions affecting the general economy or particular industries; overall market changes; local, regional or global political, social or economic instability; governmental or governmental agency responses to economic conditions; and currency exchange rate, interest rate and commodity price fluctuations.
Issuer risks — The prices of, and the income generated by, securities held by the fund may also decline in response to various factors directly related to the issuers of such securities, including reduced demand for an issuer’s goods or services, poor management performance and strategic initiatives such as mergers, acquisitions or dispositions and the market response to any such initiatives.
| 20 | American High-Income Trust |
Investing in debt instruments — The prices of, and the income generated by, bonds and other debt securities held by the fund may be affected by changing interest rates and by changes in the effective maturities and credit ratings of these securities.
Rising interest rates will generally cause the prices of bonds and other debt securities to fall. Falling interest rates may cause an issuer to redeem, call or refinance a debt security before its stated maturity, which may result in the fund having to reinvest the proceeds in lower yielding securities. Longer maturity debt securities generally have greater sensitivity to changes in interest rates and may be subject to greater price fluctuations than shorter maturity debt securities.
Bonds and other debt securities are also subject to credit risk, which is the possibility that the credit strength of an issuer will weaken and/or an issuer of a debt security will fail to make timely payments of principal or interest and the security will go into default. Lower quality debt securities generally have higher rates of interest and may be subject to greater price fluctuations than higher quality debt securities. Credit risk is gauged, in part, by the credit ratings of the debt securities in which the fund invests. However, ratings are only the opinions of the rating agencies issuing them and are not guarantees as to credit quality or an evaluation of market risk. The fund’s investment adviser relies on its own credit analysts to research issuers and issues in seeking to mitigate various credit and default risks.
Investing in lower rated debt instruments — Lower rated bonds and other lower rated debt securities generally have higher rates of interest and involve greater risk of default or price declines due to changes in the issuer’s creditworthiness than those of higher quality debt securities. The market prices of these securities may fluctuate more than the prices of higher quality debt securities and may decline significantly in periods of general economic difficulty. These risks may be increased with respect to investments in junk bonds.
Liquidity risk — Certain fund holdings may be deemed to be less liquid or illiquid because they cannot be readily sold without significantly impacting the value of the holdings. Liquidity risk may result from the lack of an active market for a holding, legal or contractual restrictions on resale or the reduced number and capacity of market participants to make a market in such holding. Market prices for less liquid or illiquid holdings may be volatile, and reduced liquidity may have an adverse impact on the market price of such holdings. Additionally, the sale of less liquid or illiquid holdings may involve substantial delays (including delays in settlement) and additional costs and the fund may be unable to sell such holdings when necessary to meet its liquidity needs.
Investing in derivatives — The use of derivatives involves a variety of risks, which may be different from, or greater than, the risks associated with investing in traditional cash securities, such as stocks and bonds. Changes in the value of a derivative may not correlate perfectly with, and may be more sensitive to market events than, the underlying asset, rate or index, and a derivative instrument may expose the fund to losses in excess of its initial investment. Derivatives may be difficult for the fund to buy or sell at an opportune time or price and may be difficult to terminate or otherwise offset. The fund’s use of derivatives may result in losses to the fund, and investing in derivatives may reduce the fund’s returns and increase the fund’s price volatility. The fund’s counterparty to a derivative transaction (including, if applicable, the fund’s clearing broker, the derivatives exchange or the clearinghouse) may be unable or unwilling to honor its financial obligations in respect of the transaction.
Investing outside the U.S. — Securities of issuers domiciled outside the U.S., or with significant operations or revenues outside the U.S., may lose value because of adverse political, social, economic or market developments (including social instability, regional conflicts, terrorism and war) in the countries or regions in which the issuers operate or generate revenue. These securities may also lose value due to changes in foreign currency exchange rates against the U.S. dollar and/or currencies of other countries. Issuers of these securities may be more susceptible to actions of foreign governments, such as the imposition of price controls or punitive taxes, that could adversely impact revenues. Securities markets in certain countries may be more volatile and/or less liquid than those in the U.S. Investments outside the U.S. may also be subject to different accounting practices and different regulatory, legal and reporting standards and practices, and may be more difficult to value, than those in the U.S. In addition, the value of investments outside the U.S. may be reduced by foreign taxes, including foreign withholding taxes on interest and dividends. Further, there may be increased risks of delayed settlement of securities purchased or sold by the fund. The risks of investing outside the U.S. may be heightened in connection with investments in emerging markets.
Management — The investment adviser to the fund actively manages the fund’s investments. Consequently, the fund is subject to the risk that the methods and analyses employed by the investment adviser in this process may not produce the desired results. This could cause the fund to lose value or its investment results to lag relevant benchmarks or other funds with similar objectives.
5. Certain investment techniques
Loan transactions — The fund has entered into loan transactions in which the fund acquires a loan either through an agent, by assignment from another holder, or as a participation interest in another holder’s portion of a loan. The loan is often administered by a financial institution that acts as agent for the holders of the loan, and the fund may be required to receive approval from the agent and/or
| American High-Income Trust | 21 |
borrower prior to the sale of the investment. The loan’s interest rate and maturity date may change based on the terms of the loan, including potential early payments of principal.
Unfunded commitments — The fund has participated in a transaction that involves unfunded commitments, which may obligate the fund to purchase additional shares of the applicable issuer. Under the terms of the commitments, which will expire no later than April 1, 2021, the maximum potential exposure as of September 30, 2016, was $3,916,000. Should such commitments become due in full, these amounts would represent .02% of the net assets of the fund as of September 30, 2016.
Forward currency contracts — The fund has entered into forward currency contracts, which represent agreements to exchange currencies on specific future dates at predetermined rates. The fund’s investment adviser uses forward currency contracts to manage the fund’s exposure to changes in exchange rates. Upon entering into these contracts, risks may arise from the potential inability of counterparties to meet the terms of their contracts and from possible movements in exchange rates.
On a daily basis, the fund’s investment adviser values forward currency contracts and records unrealized appreciation or depreciation for open forward currency contracts in the fund’s statement of assets and liabilities. Realized gains or losses are recorded at the time the forward currency contract is closed or offset by another contract with the same broker for the same settlement date and currency.
Closed forward currency contracts that have not reached their settlement date are included in the respective receivables or payables for closed forward currency contracts in the fund’s statement of assets and liabilities. Net realized gains or losses from closed forward currency contracts and net unrealized appreciation or depreciation from open forward currency contracts are recorded in the fund’s statement of operations.
Interest rate swaps — The fund has entered into interest rate swap contracts, which are agreements to exchange one stream of future interest payments for another based on a specified notional amount. Typically, interest rate swaps exchange a fixed interest rate for a payment that floats relative to a benchmark or vice versa. The fund’s investment adviser uses interest rate swaps to seek to manage the interest rate sensitivity of the fund by increasing or decreasing the duration of the fund or a portion of the fund’s portfolio. Risks may arise as a result of the fund’s investment adviser incorrectly anticipating changes in interest rates, increased volatility, reduced liquidity and the potential inability of counterparties to meet the terms of their agreements.
Upon entering into an interest rate swap contract, the fund is required to deposit cash, U.S. government securities or other liquid securities, which is known as “initial margin.” Generally, the initial margin required for a particular interest rate swap is set and held as collateral by the clearinghouse on which the contract is cleared. The amount of initial margin required may be significantly modified from time to time by the clearinghouse during the term of the contract.
On a daily basis, the fund’s investment adviser records daily interest accruals related to the exchange of future payments as a receivable and payable in the fund’s statement of assets and liabilities. The fund also pays or receives a “variation margin” based on the increase or decrease in the value of the interest rate swaps, including accrued interest, and records variation margin on interest rate swaps in the statement of assets and liabilities. The fund records realized gains and losses on both the net accrued interest and any gain or loss recognized at the time the interest rate swap is closed or expires. Net realized gains or losses, as well as any net unrealized appreciation or depreciation, from interest rate swaps are recorded in the fund’s statement of operations.
Credit default swap indices — The fund has entered into centrally cleared credit default swap agreements on credit indices (“CDSI”) that involve one party (the protection buyer) making a stream of payments to another party (the protection seller) in exchange for the right to receive a specified return upon the occurrence of a credit event, such as a default or restructuring, with respect to any of the underlying issuers (reference obligations) in the referenced index. The fund’s investment adviser uses credit default swaps to assume exposure to a diversified portfolio of credits or to hedge against existing credit risks.
CDSI are portfolios of credit instruments or exposures designed to be representative of some part of the credit market, such as the high-yield or investment-grade credit market. CDSI are generally traded using standardized terms, including a fixed spread and standard maturity dates, and reference all the names in the index. If there is a credit event, it is settled based on that name’s weight in the index. The composition of the underlying issuers or obligations within a particular index may change periodically, usually every six months. A specified credit event may affect all or individual underlying reference obligations included in the index, and will be settled based upon the relative weighting of the affected obligation(s) within the index. The value of each CDSI can be used as a measure of the current payment/performance risk of the CDSI and represents the likelihood of an expected liability or profit should the notional amount of the CDSI be closed or sold as of the period end. An increasing value, as compared to the notional amount of the CDSI, represents a deterioration of the referenced indices’ credit soundness and a greater likelihood of risk of default or other credit event occurring as defined under the terms of the agreement. When the fund provides sell protection, its maximum exposure is the notional amount of the credit default swap agreement.
| 22 | American High-Income Trust |
Upon entering into a centrally cleared CDSI contract, the fund is required to deposit with a derivatives clearing member (“DCM”) in a segregated account in the name of the DCM an amount of cash, U.S. government securities or other liquid securities, which is known as “initial margin.” Generally, the initial margin required for a particular credit default swap is set and held as collateral by the clearinghouse on which the contract is cleared. The amount of initial margin required may be significantly modified from time to time by the clearinghouse during the term of the contract. Securities deposited as initial margin are designated on the investment portfolio.
On a daily basis, interest accruals related to the exchange of future payments are recorded as a receivable and payable in the fund’s statement of assets and liabilities. The fund also pays or receives a “variation margin” based on the increase or decrease in the value of the CDSI, and records variation margin in the statement of assets and liabilities. The fund records realized gains and losses on both the net accrued interest and any gain or loss recognized at the time the swap is closed or expires. Net realized gains or losses, as well as any net unrealized appreciation or depreciation, from credit default swaps are recorded in the fund’s statement of operations.
The following tables present the financial statement impacts resulting from the fund’s use of forward currency contracts, interest rate swaps and credit default swaps as of, or for the year ended, September 30, 2016 (dollars in thousands):
| | | | | Assets | | | Liabilities | |
| Contract | | Risk type | | Location on statement of
assets and liabilities | | Value | | | Location on statement of
assets and liabilities | | Value | |
| Credit default swaps | | Credit | | Net unrealized appreciation* | | $ | 5,899 | | | Net unrealized depreciation* | | $ | 188 | |
| | | | | | | | | | | | | | | |
| | | | | Net realized gain (loss) | | | Net unrealized (depreciation) appreciation | |
| Contract | | Risk type | | Location on statement of
operations | | Value | | | Location on statement of
operations | | Value | |
| Forward currency | | Currency | | Net realized gain on forward currency contracts | | $ | 1,225 | | | Net unrealized depreciation on forward currency contracts | | $ | (475 | ) |
| Interest rate swaps | | Interest | | Net realized loss on interest rate swaps | | | (9,690 | ) | | Net unrealized appreciation on interest rate swaps | | | 203 | |
| Credit default swaps | | Credit | | Net realized gain on credit default swaps | | | 8,811 | | | Net unrealized appreciation on credit default swaps | | | 7,864 | |
| | | | | | | $ | 346 | | | | | $ | 7,592 | |
| | |
| * | Includes cumulative appreciation/depreciation on credit default swaps as reported in the applicable table following the fund’s investment portfolio. Only current day’s variation margin is reported within the statement of assets and liabilities. |
Collateral — The fund participates in a collateral program due to its use of forward currency contracts, interest rate swaps and credit default swaps. For forward currency contracts, the program calls for the fund to either receive or pledge collateral based on the net gain or loss on unsettled forward currency contracts by counterparty. For interest rate swaps and credit default swaps, the program calls for the fund to pledge collateral for initial and variation margin by contract. The purpose of the collateral is to cover potential losses that could occur in the event that either party cannot meet its contractual obligations.
6. Taxation and distributions
Federal income taxation — The fund complies with the requirements under Subchapter M of the Internal Revenue Code applicable to mutual funds and intends to distribute substantially all of its net taxable income and net capital gains each year. The fund is not subject to income taxes to the extent such distributions are made. Therefore, no federal income tax provision is required.
As of and during the period ended September 30, 2016, the fund did not have a liability for any unrecognized tax benefits. The fund recognizes interest and penalties, if any, related to unrecognized tax benefits as income tax expense in the statement of operations. During the period, the fund did not incur any interest or penalties.
The fund is not subject to examination by U.S. federal tax authorities for tax years before 2012, by state tax authorities for tax years before 2011 and by tax authorities outside the U.S. for tax years before 2014.
Non-U.S. taxation — Dividend and interest income are recorded net of non-U.S. taxes paid. The fund may file withholding tax reclaims in certain jurisdictions to recover a portion of amounts previously withheld. These reclaims are recorded when the amount is known and there are no significant uncertainties on collectability. Gains realized by the fund on the sale of securities in certain countries are subject to
| American High-Income Trust | 23 |
non-U.S. taxes. The fund records an estimated deferred tax liability based on unrealized gains to provide for potential non-U.S. taxes payable upon the sale of these securities.
Distributions — Distributions paid to shareholders are based on net investment income and net realized gains determined on a tax basis, which may differ from net investment income and net realized gains for financial reporting purposes. These differences are due primarily to different treatment for items such as currency gains and losses; short-term capital gains and losses; capital losses related to sales of certain securities within 30 days of purchase; deferred expenses; cost of investments sold; net capital losses; amortization of premiums and discounts and income on certain investments. The fiscal year in which amounts are distributed may differ from the year in which the net investment income and net realized gains are recorded by the fund for financial reporting purposes.
During the year ended September 30, 2016, the fund reclassified $12,095,000 from distributions in excess of net investment income to accumulated net realized loss and $35,000 from distributions in excess of net investment income to capital paid in on shares of beneficial interest to align financial reporting with tax reporting.
Under the Regulated Investment Company Modernization Act of 2010 (the “Act”), net capital losses recognized after September 30, 2011, may be carried forward indefinitely, and their character is retained as short-term and/or long-term losses. Previously, net capital losses were carried forward for eight years and treated as short-term losses. As a transition rule, the Act requires that post-enactment net capital losses be used before pre-enactment net capital losses.
As of September 30, 2016, the tax basis components of distributable earnings, unrealized appreciation (depreciation) and cost of investment securities were as follows (dollars in thousands):
| Undistributed ordinary income | | | | | | $ | 26,804 | |
| Capital loss carryforward: | | | | | | | | |
| No expiration | | $ | (1,449,835 | ) | | | | |
| Expiring 2018* | | | (209,244 | ) | | | (1,659,079 | ) |
| | | | | | | | | |
| Gross unrealized appreciation on investment securities | | | | | | | 506,413 | |
| Gross unrealized depreciation on investment securities | | | | | | | (1,066,904 | ) |
| Net unrealized appreciation on investment securities | | | | | | | (560,491 | ) |
| Cost of investment securities | | | | | | | 17,314,729 | |
| | |
| * | The capital loss carryforward will be used to offset any capital gains realized by the fund in the current year or in subsequent years through the expiration date. The fund will not make distributions from capital gains while a capital loss carryforward remains. |
Tax-basis distributions paid or accrued for the following years to shareholders from ordinary income were as follows (dollars in thousands):
| | | Year ended September 30 |
| Share class | | 2016 | | | 2015 | |
| Class A | | $ | 707,118 | | | $ | 810,371 | |
| Class B | | | 1,482 | | | | 3,534 | |
| Class C | | | 47,302 | | | | 59,031 | |
| Class F-1 | | | 39,110 | | | | 49,400 | |
| Class F-2 | | | 80,482 | | | | 84,735 | |
| Class 529-A | | | 18,386 | | | | 20,821 | |
| Class 529-B | | | 99 | | | | 239 | |
| Class 529-C | | | 5,449 | | | | 6,418 | |
| Class 529-E | | | 984 | | | | 1,111 | |
| Class 529-F-1 | | | 1,388 | | | | 1,442 | |
| Class R-1 | | | 915 | | | | 1,148 | |
| Class R-2 | | | 9,513 | | | | 10,949 | |
| Class R-2E | | | 93 | | | | 1 | |
| Class R-3 | | | 11,322 | | | | 13,777 | |
| Class R-4 | | | 10,237 | | | | 12,457 | |
| Class R-5E* | | | — | † | | | | |
| Class R-5 | | | 5,217 | | | | 6,460 | |
| Class R-6 | | | 68,481 | | | | 62,776 | |
| Total | | $ | 1,007,578 | | | $ | 1,144,670 | |
| | |
| * | Class R-5E shares were offered beginning November 20, 2015. |
| † | Amount less than one thousand. |
| | |
| 24 | American High-Income Trust |
7. Fees and transactions with related parties
CRMC, the fund’s investment adviser, is the parent company of American Funds Distributors,® Inc. (“AFD”), the principal underwriter of the fund’s shares, and American Funds Service Company® (“AFS”), the fund’s transfer agent. CRMC, AFD and AFS are considered related parties to the fund.
Investment advisory services — The fund has an investment advisory and service agreement with CRMC that provides for monthly fees accrued daily. These fees are based on a series of decreasing annual rates beginning with 0.300% on the first $60 million of daily net assets and decreasing to 0.132% on such assets in excess of $21 billion. The agreement also provides for monthly fees, accrued daily, based on a series of decreasing rates beginning with 3.00% on the first $8,333,333 of the fund’s monthly gross income and decreasing to 1.50% on such income in excess of $50 million. For the year ended September 30, 2016, the investment advisory services fee was $47,487,000, which was equivalent to an annualized rate of 0.291% of average daily net assets.
Class-specific fees and expenses — Expenses that are specific to individual share classes are accrued directly to the respective share class. The principal class-specific fees and expenses are further described below:
Distribution services — The fund has plans of distribution for all share classes, except Class F-2, R-5E, R-5 and R-6 shares. Under the plans, the board of trustees approves certain categories of expenses that are used to finance activities primarily intended to sell fund shares and service existing accounts. The plans provide for payments, based on an annualized percentage of average daily net assets, ranging from 0.30% to 1.00% as noted in this section. In some cases, the board of trustees has limited the amounts that may be paid to less than the maximum allowed by the plans. All share classes with a plan may use up to 0.25% of average daily net assets to pay service fees, or to compensate AFD for paying service fees, to firms that have entered into agreements with AFD to provide certain shareholder services. The remaining amounts available to be paid under each plan are paid to dealers to compensate them for their sales activities.
For Class A and 529-A shares, distribution-related expenses include the reimbursement of dealer and wholesaler commissions paid by AFD for certain shares sold without a sales charge. These share classes reimburse AFD for amounts billed within the prior 15 months but only to the extent that the overall annual expense limit of 0.30% is not exceeded. As of September 30, 2016, there were no unreimbursed expenses subject to reimbursement for Class A or 529-A shares.
| Share class | | Currently approved limits | | Plan limits |
| Class A | | | 0.30 | % | | | 0.30 | % |
| Class 529-A | | | 0.30 | | | | 0.50 | |
| Classes B and 529-B | | | 1.00 | | | | 1.00 | |
| Classes C, 529-C and R-1 | | | 1.00 | | | | 1.00 | |
| Class R-2 | | | 0.75 | | | | 1.00 | |
| Class R-2E | | | 0.60 | | | | 0.85 | |
| Classes 529-E and R-3 | | | 0.50 | | | | 0.75 | |
| Classes F-1, 529-F-1 and R-4 | | | 0.25 | | | | 0.50 | |
Transfer agent services — The fund has a shareholder services agreement with AFS under which the fund compensates AFS for providing transfer agent services to each of the fund’s share classes. These services include recordkeeping, shareholder communications and transaction processing. In addition, the fund reimburses AFS for amounts paid to third parties for performing transfer agent services on behalf of fund shareholders.
Administrative services — The fund has an administrative services agreement with CRMC under which the fund compensates CRMC for providing administrative services to Class A, C, F, 529 and R shares. These services include, but are not limited to, coordinating, monitoring, assisting and overseeing third parties that provide services to fund shareholders. Under the agreement, Class A shares pay an annual fee of 0.01% and Class C, F, 529 and R shares pay an annual fee of 0.05% of their respective average daily net assets.
529 plan services — Each 529 share class is subject to service fees to compensate the Virginia College Savings Plan (“Virginia529”) for its oversight and administration of the 529 college savings plan. From October 1, 2015 to June 30, 2016, the quarterly fee was based on a series of decreasing annual rates beginning with 0.10% on the first $30 billion of the net assets invested in Class 529 shares of the American Funds and decreasing to 0.05% on such assets in excess of $70 billion. Effective July 1, 2016, the quarterly fee was amended to annual rates of 0.10% on the first $20 billion of the net assets invested in the Class 529 shares of the American Funds, 0.05% on such assets between $20 billion and $100 billion, and 0.03% on such assets over $100 billion. The fee for any given calendar quarter is accrued and calculated on the basis of the average net assets of Class 529 shares of the American Funds for the
| American High-Income Trust | 25 |
last month of the prior calendar quarter. The fee is included in other expenses in the fund’s statement of operations. Virginia529 is not considered a related party to the fund.
For the year ended September 30, 2016, class-specific expenses under the agreements were as follows (dollars in thousands):
| Share class | | Distribution
services | | | Transfer agent
services | | | Administrative
services | | | 529 plan
services |
| Class A | | | $27,849 | | | | $17,575 | | | | $1,142 | | | Not applicable |
| Class B | | | 263 | | | | 46 | | | | Not applicable | | | Not applicable |
| Class C | | | 8,713 | | | | 1,370 | | | | 437 | | | Not applicable |
| Class F-1 | | | 1,570 | | | | 880 | | | | 317 | | | Not applicable |
| Class F-2 | | | Not applicable | | | | 1,476 | | | | 623 | | | Not applicable |
| Class 529-A | | | 685 | | | | 415 | | | | 151 | | | $253 |
| Class 529-B | | | 18 | | | | 3 | | | | 1 | | | 1 |
| Class 529-C | | | 1,001 | | | | 151 | | | | 51 | | | 86 |
| Class 529-E | | | 82 | | | | 11 | | | | 8 | | | 14 |
| Class 529-F-1 | | | — | | | | 30 | | | | 11 | | | 18 |
| Class R-1 | | | 168 | | | | 25 | | | | 8 | | | Not applicable |
| Class R-2 | | | 1,312 | | | | 737 | | | | 88 | | | Not applicable |
| Class R-2E | | | 10 | | | | 3 | | | | 1 | | | Not applicable |
| Class R-3 | | | 961 | | | | 391 | | | | 97 | | | Not applicable |
| Class R-4 | | | 411 | | | | 198 | | | | 83 | | | Not applicable |
| Class R-5E* | | | Not applicable | | | | — | † | | | — | † | | Not applicable |
| Class R-5 | | | Not applicable | | | | 51 | | | | 40 | | | Not applicable |
| Class R-6 | | | Not applicable | | | | 22 | | | | 524 | | | Not applicable |
| Total class-specific expenses | | | $43,043 | | | | $23,384 | | | | $3,582 | | | $372 |
| | |
| * | Class R-5E shares were offered beginning November 20, 2015. |
| † | Amount less than one thousand. |
Trustees’ deferred compensation — Trustees who are unaffiliated with CRMC may elect to defer the cash payment of part or all of their compensation. These deferred amounts, which remain as liabilities of the fund, are treated as if invested in shares of the fund or other American Funds. These amounts represent general, unsecured liabilities of the fund and vary according to the total returns of the selected funds. Trustees’ compensation of $169,000 in the fund’s statement of operations reflects $146,000 in current fees (either paid in cash or deferred) and a net increase of $23,000 in the value of the deferred amounts.
Affiliated officers and trustees — Officers and certain trustees of the fund are or may be considered to be affiliated with CRMC, AFD and AFS. No affiliated officers or trustees received any compensation directly from the fund.
Security transactions with related funds — The fund may purchase from, or sell securities to, other CRMC-managed funds (or funds managed by certain affiliates of CRMC) under procedures adopted by the fund’s board of trustees. The funds involved in such transactions are considered related by virtue of having a common investment adviser (or affiliated investment advisers), common trustees and/or common officers. When such transactions occur, each transaction is executed at the current market price of the security and no brokerage commissions or fees are paid in accordance with Rule 17a-7 of the 1940 Act.
8. Committed line of credit
The fund participates with other funds managed by CRMC in a $500 million credit facility (the “line of credit”) to be utilized for temporary purposes to support shareholder redemptions. The fund has agreed to pay commitment fees on its pro-rata portion of the line of credit, which are reflected in other expenses in the fund’s statement of operations. The fund did not borrow on this line of credit at any time during the year ended September 30, 2016.
| 26 | American High-Income Trust |
9. Capital share transactions
Capital share transactions in the fund were as follows (dollars and shares in thousands):
| | | Sales1 | | | Reinvestments of
dividends | | | Repurchases1 | | | Net (decrease)
increase |
| Share class | | Amount | | | Shares | | | Amount | | | Shares | | | Amount | | | Shares | | | Amount | | | Shares | |
| | | | | | | | | | | | | | | | | | | | | | | | | | |
| Year ended September 30, 2016 | | | | | | | | | | | | | | | | | | | | | | | | | |
| | | | | | | | | | | | | | | | | | | | | | | | | | |
| Class A | | $ | 1,366,457 | | | | 141,284 | | | $ | 665,752 | | | | 68,766 | | | $ | (2,551,946 | ) | | | (264,855 | ) | | $ | (519,737 | ) | | | (54,805 | ) |
| Class B | | | 711 | | | | 74 | | | | 1,420 | | | | 147 | | | | (28,717 | ) | | | (2,976 | ) | | | (26,586 | ) | | | (2,755 | ) |
| Class C | | | 117,761 | | | | 12,133 | | | | 44,189 | | | | 4,569 | | | | (282,911 | ) | | | (29,404 | ) | | | (120,961 | ) | | | (12,702 | ) |
| Class F-1 | | | 311,691 | | | | 32,355 | | | | 37,616 | | | | 3,885 | | | | (405,111 | ) | | | (41,974 | ) | | | (55,804 | ) | | | (5,734 | ) |
| Class F-2 | | | 881,040 | | | | 90,568 | | | | 75,707 | | | | 7,825 | | | | (1,113,122 | ) | | | (113,605 | ) | | | (156,375 | ) | | | (15,212 | ) |
| Class 529-A | | | 37,442 | | | | 3,875 | | | | 18,288 | | | | 1,889 | | | | (64,427 | ) | | | (6,671 | ) | | | (8,697 | ) | | | (907 | ) |
| Class 529-B | | | 92 | | | | 10 | | | | 98 | | | | 10 | | | | (2,163 | ) | | | (225 | ) | | | (1,973 | ) | | | (205 | ) |
| Class 529-C | | | 13,295 | | | | 1,377 | | | | 5,416 | | | | 560 | | | | (26,584 | ) | | | (2,759 | ) | | | (7,873 | ) | | | (822 | ) |
| Class 529-E | | | 1,949 | | | | 202 | | | | 979 | | | | 101 | | | | (3,358 | ) | | | (347 | ) | | | (430 | ) | | | (44 | ) |
| Class 529-F-1 | | | 5,208 | | | | 539 | | | | 1,381 | | | | 143 | | | | (4,832 | ) | | | (501 | ) | | | 1,757 | | | | 181 | |
| Class R-1 | | | 2,544 | | | | 264 | | | | 904 | | | | 93 | | | | (6,783 | ) | | | (701 | ) | | | (3,335 | ) | | | (344 | ) |
| Class R-2 | | | 42,110 | | | | 4,361 | | | | 9,399 | | | | 971 | | | | (56,326 | ) | | | (5,837 | ) | | | (4,817 | ) | | | (505 | ) |
| Class R-2E | | | 3,306 | | | | 346 | | | | 92 | | | | 9 | | | | (681 | ) | | | (70 | ) | | | 2,717 | | | | 285 | |
| Class R-3 | | | 52,396 | | | | 5,418 | | | | 11,225 | | | | 1,161 | | | | (84,525 | ) | | | (8,752 | ) | | | (20,904 | ) | | | (2,173 | ) |
| Class R-4 | | | 44,599 | | | | 4,606 | | | | 10,168 | | | | 1,051 | | | | (80,643 | ) | | | (8,361 | ) | | | (25,876 | ) | | | (2,704 | ) |
| Class R-5E2 | | | 10 | | | | 1 | | | | — | | | | — | | | | — | | | | — | | | | 10 | | | | 1 | |
| Class R-5 | | | 27,495 | | | | 2,869 | | | | 5,191 | | | | 537 | | | | (47,748 | ) | | | (4,958 | ) | | | (15,062 | ) | | | (1,552 | ) |
| Class R-6 | | | 220,130 | | | | 22,882 | | | | 68,407 | | | | 7,061 | | | | (200,701 | ) | | | (21,468 | ) | | | 87,836 | | | | 8,475 | |
| Total net increase (decrease) | | $ | 3,128,236 | | | | 323,164 | | | $ | 956,232 | | | | 98,778 | | | $ | (4,960,578 | ) | | | (513,464 | ) | | $ | (876,110 | ) | | | (91,522 | ) |
| | | | | | | | | | | | | | | | | | | | | | | | | | |
| Year ended September 30, 2015 | | | | | | | | | | | | | | | | | | | | | | | | | |
| | | | | | | | | | | | | | | | | | | | | | | | | | |
| Class A | | $ | 1,402,305 | | | | 130,451 | | | $ | 761,678 | | | | 71,186 | | | $ | (2,854,879 | ) | | | (266,273 | ) | | $ | (690,896 | ) | | | (64,636 | ) |
| Class B | | | 2,105 | | | | 195 | | | | 3,382 | | | | 315 | | | | (51,467 | ) | | | (4,775 | ) | | | (45,980 | ) | | | (4,265 | ) |
| Class C | | | 159,501 | | | | 14,795 | | | | 55,260 | | | | 5,160 | | | | (356,912 | ) | | | (33,278 | ) | | | (142,151 | ) | | | (13,323 | ) |
| Class F-1 | | | 205,923 | | | | 19,129 | | | | 47,724 | | | | 4,453 | | | | (411,600 | ) | | | (38,308 | ) | | | (157,953 | ) | | | (14,726 | ) |
| Class F-2 | | | 904,278 | | | | 84,306 | | | | 77,231 | | | | 7,221 | | | | (861,762 | ) | | | (80,440 | ) | | | 119,747 | | | | 11,087 | |
| Class 529-A | | | 39,665 | | | | 3,686 | | | | 20,713 | | | | 1,936 | | | | (74,327 | ) | | | (6,967 | ) | | | (13,949 | ) | | | (1,345 | ) |
| Class 529-B | | | 255 | | | | 24 | | | | 236 | | | | 22 | | | | (3,560 | ) | | | (331 | ) | | | (3,069 | ) | | | (285 | ) |
| Class 529-C | | | 15,089 | | | | 1,401 | | | | 6,382 | | | | 596 | | | | (31,617 | ) | | | (2,961 | ) | | | (10,146 | ) | | | (964 | ) |
| Class 529-E | | | 2,434 | | | | 226 | | | | 1,103 | | | | 103 | | | | (4,489 | ) | | | (423 | ) | | | (952 | ) | | | (94 | ) |
| Class 529-F-1 | | | 5,123 | | | | 477 | | | | 1,428 | | | | 134 | | | | (7,251 | ) | | | (675 | ) | | | (700 | ) | | | (64 | ) |
| Class R-1 | | | 4,306 | | | | 401 | | | | 1,128 | | | | 105 | | | | (7,701 | ) | | | (717 | ) | | | (2,267 | ) | | | (211 | ) |
| Class R-2 | | | 46,621 | | | | 4,342 | | | | 10,823 | | | | 1,011 | | | | (74,643 | ) | | | (6,962 | ) | | | (17,199 | ) | | | (1,609 | ) |
| Class R-2E | | | 8 | | | | 1 | | | | — | 3 | | | — | 3 | | | — | | | | — | | | | 8 | | | | 1 | |
| Class R-3 | | | 105,762 | | | | 9,738 | | | | 13,683 | | | | 1,278 | | | | (138,233 | ) | | | (12,862 | ) | | | (18,788 | ) | | | (1,846 | ) |
| Class R-4 | | | 53,228 | | | | 4,953 | | | | 12,386 | | | | 1,157 | | | | (91,637 | ) | | | (8,540 | ) | | | (26,023 | ) | | | (2,430 | ) |
| Class R-5 | | | 34,416 | | | | 3,198 | | | | 6,411 | | | | 599 | | | | (52,013 | ) | | | (4,855 | ) | | | (11,186 | ) | | | (1,058 | ) |
| Class R-6 | | | 434,919 | | | | 40,319 | | | | 62,507 | | | | 5,861 | | | | (130,483 | ) | | | (12,143 | ) | | | 366,943 | | | | 34,037 | |
| Total net increase (decrease) | | $ | 3,415,938 | | | | 317,642 | | | $ | 1,082,075 | | | | 101,137 | | | $ | (5,152,574 | ) | | | (480,510 | ) | | $ | (654,561 | ) | | | (61,731 | ) |
| | |
| 1 | Includes exchanges between share classes of the fund. |
| 2 | Class R-5E shares were offered beginning November 20, 2015. |
| 3 | Amount less than one thousand. |
10. Investment transactions
The fund made purchases and sales of investment securities, excluding short-term securities and U.S. government obligations, if any, of $11,323,757,000 and $12,205,445,000, respectively, during the year ended September 30, 2016.
| American High-Income Trust | 27 |
Financial highlights
| | | | | | Income (loss) from
investment operations1 | | | | | | | | | | | | | | | | | | | | | | |
| | | Net asset
value,
beginning
of period | | | Net
investment
income | | | Net gains
(losses) on
securities (both
realized and
unrealized) | | | Total from
investment
operations | | | Dividends
(from net
investment
income) | | | Net asset
value,
end
of period | | | Total
return2,3 | | | Net assets,
end of period
(in millions) | | | Ratio of
expenses
to average net
assets before
reimbursements | | | Ratio of
expenses
to average net
assets after
reimbursements3 | | | Ratio of
net income
to average
net assets3 | |
| Class A: | | | | | | | | | | | | | | | | | | | | | | | | | | | | | | | | | | | | | | | | | | | | |
| Year ended 9/30/2016 | | $ | 9.83 | | | $ | .61 | | | $ | .34 | | | $ | .95 | | | $ | (.60 | ) | | $ | 10.18 | | | | 10.15 | % | | $ | 11,897 | | | | .71 | % | | | .71 | % | | | 6.28 | % |
| Year ended 9/30/2015 | | | 11.09 | | | | .64 | | | | (1.25 | ) | | | (.61 | ) | | | (.65 | ) | | | 9.83 | | | | (5.84 | ) | | | 12,033 | | | | .67 | | | | .67 | | | | 5.94 | |
| Year ended 9/30/2014 | | | 11.22 | | | | .68 | | | | (.13 | ) | | | .55 | | | | (.68 | ) | | | 11.09 | | | | 4.93 | | | | 14,286 | | | | .66 | | | | .66 | | | | 5.99 | |
| Year ended 9/30/2013 | | | 11.18 | | | | .72 | | | | .06 | | | | .78 | | | | (.74 | ) | | | 11.22 | | | | 7.10 | | | | 14,178 | | | | .66 | | | | .66 | | | | 6.37 | |
| Year ended 9/30/2012 | | | 10.36 | | | | .78 | | | | .86 | | | | 1.64 | | | | (.82 | ) | | | 11.18 | | | | 16.35 | | | | 13,822 | | | | .69 | | | | .69 | | | | 7.17 | |
| Class B: | | | | | | | | | | | | | | | | | | | | | | | | | | | | | | | | | | | | | | | | | | | | |
| Year ended 9/30/2016 | | | 9.83 | | | | .53 | | | | .34 | | | | .87 | | | | (.52 | ) | | | 10.18 | | | | 9.32 | | | | 15 | | | | 1.48 | | | | 1.48 | | | | 5.65 | |
| Year ended 9/30/2015 | | | 11.09 | | | | .56 | | | | (1.25 | ) | | | (.69 | ) | | | (.57 | ) | | | 9.83 | | | | (6.54 | ) | | | 42 | | | | 1.42 | | | | 1.42 | | | | 5.20 | |
| Year ended 9/30/2014 | | | 11.22 | | | | .60 | | | | (.13 | ) | | | .47 | | | | (.60 | ) | | | 11.09 | | | | 4.16 | | | | 94 | | | | 1.41 | | | | 1.41 | | | | 5.26 | |
| Year ended 9/30/2013 | | | 11.18 | | | | .63 | | | | .06 | | | | .69 | | | | (.65 | ) | | | 11.22 | | | | 6.29 | | | | 143 | | | | 1.43 | | | | 1.43 | | | | 5.63 | |
| Year ended 9/30/2012 | | | 10.36 | | | | .70 | | | | .86 | | | | 1.56 | | | | (.74 | ) | | | 11.18 | | | | 15.49 | | | | 204 | | | | 1.44 | | | | 1.44 | | | | 6.47 | |
| Class C: | | | | | | | | | | | | | | | | | | | | | | | | | | | | | | | | | | | | | | | | | | | | |
| Year ended 9/30/2016 | | | 9.83 | | | | .53 | | | | .34 | | | | .87 | | | | (.52 | ) | | | 10.18 | | | | 9.28 | | | | 871 | | | | 1.51 | | | | 1.51 | | | | 5.49 | |
| Year ended 9/30/2015 | | | 11.09 | | | | .55 | | | | (1.25 | ) | | | (.70 | ) | | | (.56 | ) | | | 9.83 | | | | (6.59 | ) | | | 967 | | | | 1.47 | | | | 1.47 | | | | 5.14 | |
| Year ended 9/30/2014 | | | 11.22 | | | | .59 | | | | (.13 | ) | | | .46 | | | | (.59 | ) | | | 11.09 | | | | 4.11 | | | | 1,238 | | | | 1.46 | | | | 1.46 | | | | 5.20 | �� |
| Year ended 9/30/2013 | | | 11.18 | | | | .63 | | | | .06 | | | | .69 | | | | (.65 | ) | | | 11.22 | | | | 6.25 | | | | 1,330 | | | | 1.48 | | | | 1.48 | | | | 5.56 | |
| Year ended 9/30/2012 | | | 10.36 | | | | .70 | | | | .86 | | | | 1.56 | | | | (.74 | ) | | | 11.18 | | | | 15.43 | | | | 1,418 | | | | 1.48 | | | | 1.48 | | | | 6.38 | |
| Class F-1: | | | | | | | | | | | | | | | | | | | | | | | | | | | | | | | | | | | | | | | | | | | | |
| Year ended 9/30/2016 | | | 9.83 | | | | .61 | | | | .34 | | | | .95 | | | | (.60 | ) | | | 10.18 | | | | 10.12 | | | | 643 | | | | .74 | | | | .74 | | | | 6.26 | |
| Year ended 9/30/2015 | | | 11.09 | | | | .63 | | | | (1.25 | ) | | | (.62 | ) | | | (.64 | ) | | | 9.83 | | | | (5.87 | ) | | | 677 | | | | .70 | | | | .70 | | | | 5.91 | |
| Year ended 9/30/2014 | | | 11.22 | | | | .68 | | | | (.13 | ) | | | .55 | | | | (.68 | ) | | | 11.09 | | | | 4.87 | | | | 927 | | | | .71 | | | | .71 | | | | 5.96 | |
| Year ended 9/30/2013 | | | 11.18 | | | | .71 | | | | .06 | | | | .77 | | | | (.73 | ) | | | 11.22 | | | | 7.03 | | | | 1,418 | | | | .73 | | | | .73 | | | | 6.32 | |
| Year ended 9/30/2012 | | | 10.36 | | | | .78 | | | | .86 | | | | 1.64 | | | | (.82 | ) | | | 11.18 | | | | 16.32 | | | | 1,584 | | | | .71 | | | | .71 | | | | 7.14 | |
| Class F-2: | | | | | | | | | | | | | | | | | | | | | | | | | | | | | | | | | | | | | | | | | | | | |
| Year ended 9/30/2016 | | | 9.83 | | | | .63 | | | | .34 | | | | .97 | | | | (.62 | ) | | | 10.18 | | | | 10.41 | | | | 1,171 | | | | .48 | | | | .48 | | | | 6.53 | |
| Year ended 9/30/2015 | | | 11.09 | | | | .66 | | | | (1.25 | ) | | | (.59 | ) | | | (.67 | ) | | | 9.83 | | | | (5.64 | ) | | | 1,281 | | | | .45 | | | | .45 | | | | 6.15 | |
| Year ended 9/30/2014 | | | 11.22 | | | | .71 | | | | (.13 | ) | | | .58 | | | | (.71 | ) | | | 11.09 | | | | 5.15 | | | | 1,322 | | | | .44 | | | | .44 | | | | 6.21 | |
| Year ended 9/30/2013 | | | 11.18 | | | | .74 | | | | .06 | | | | .80 | | | | (.76 | ) | | | 11.22 | | | | 7.32 | | | | 935 | | | | .46 | | | | .46 | | | | 6.58 | |
| Year ended 9/30/2012 | | | 10.36 | | | | .81 | | | | .86 | | | | 1.67 | | | | (.85 | ) | | | 11.18 | | | | 16.62 | | | | 903 | | | | .46 | | | | .46 | | | | 7.37 | |
| Class 529-A: | | | | | | | | | | | | | | | | | | | | | | | | | | | | | | | | | | | | | | | | | | | | |
| Year ended 9/30/2016 | | | 9.83 | | | | .60 | | | | .34 | | | | .94 | | | | (.59 | ) | | | 10.18 | | | | 10.05 | | | | 314 | | | | .81 | | | | .81 | | | | 6.18 | |
| Year ended 9/30/2015 | | | 11.09 | | | | .63 | | | | (1.25 | ) | | | (.62 | ) | | | (.64 | ) | | | 9.83 | | | | (5.93 | ) | | | 312 | | | | .76 | | | | .76 | | | | 5.84 | |
| Year ended 9/30/2014 | | | 11.22 | | | | .67 | | | | (.13 | ) | | | .54 | | | | (.67 | ) | | | 11.09 | | | | 4.83 | | | | 367 | | | | .75 | | | | .75 | | | | 5.89 | |
| Year ended 9/30/2013 | | | 11.18 | | | | .71 | | | | .06 | | | | .77 | | | | (.73 | ) | | | 11.22 | | | | 7.00 | | | | 357 | | | | .76 | | | | .76 | | | | 6.27 | |
| Year ended 9/30/2012 | | | 10.36 | | | | .78 | | | | .86 | | | | 1.64 | | | | (.82 | ) | | | 11.18 | | | | 16.26 | | | | 341 | | | | .77 | | | | .77 | | | | 7.08 | |
| Class 529-B: | | | | | | | | | | | | | | | | | | | | | | | | | | | | | | | | | | | | | | | | | | | | |
| Year ended 9/30/2016 | | | 9.83 | | | | .52 | | | | .34 | | | | .86 | | | | (.51 | ) | | | 10.18 | | | | 9.18 | | | | 1 | | | | 1.62 | | | | 1.62 | | | | 5.52 | |
| Year ended 9/30/2015 | | | 11.09 | | | | .54 | | | | (1.25 | ) | | | (.71 | ) | | | (.55 | ) | | | 9.83 | | | | (6.66 | ) | | | 3 | | | | 1.55 | | | | 1.55 | | | | 5.07 | |
| Year ended 9/30/2014 | | | 11.22 | | | | .58 | | | | (.13 | ) | | | .45 | | | | (.58 | ) | | | 11.09 | | | | 4.02 | | | | 6 | | | | 1.55 | | | | 1.55 | | | | 5.12 | |
| Year ended 9/30/2013 | | | 11.18 | | | | .62 | | | | .06 | | | | .68 | | | | (.64 | ) | | | 11.22 | | | | 6.16 | | | | 10 | | | | 1.56 | | | | 1.56 | | | | 5.50 | |
| Year ended 9/30/2012 | | | 10.36 | | | | .69 | | | | .86 | | | | 1.55 | | | | (.73 | ) | | | 11.18 | | | | 15.34 | | | | 13 | | | | 1.57 | | | | 1.57 | | | | 6.32 | |
| 28 | American High-Income Trust |
| | | | | | Income (loss) from
investment operations1 | | | | | | | | | | | | | | | | | | | | | | |
| | | Net asset
value,
beginning
of period | | | Net
investment
income | | | Net gains
(losses) on
securities (both
realized and
unrealized) | | | Total from
investment
operations | | | Dividends
(from net
investment
income) | | | Net asset
value,
end
of period | | | Total
return2,3 | | | Net assets,
end of period
(in millions) | | | Ratio of
expenses
to average net
assets before
reimbursements | | | Ratio of
expenses
to average net
assets after
reimbursements3 | | | Ratio of
net income
to average
net assets3 | |
| Class 529-C: | | | | | | | | | | | | | | | | | | | | | | | | | | | | | | | | | | | | | | | | | | | | |
| Year ended 9/30/2016 | | $ | 9.83 | | | $ | .53 | | | $ | .34 | | | $ | .87 | | | $ | (.52 | ) | | $ | 10.18 | | | | 9.22 | % | | $ | 104 | | | | 1.57 | % | | | 1.57 | % | | | 5.43 | % |
| Year ended 9/30/2015 | | | 11.09 | | | | .55 | | | | (1.25 | ) | | | (.70 | ) | | | (.56 | ) | | | 9.83 | | | | (6.65 | ) | | | 108 | | | | 1.53 | | | | 1.53 | | | | 5.07 | |
| Year ended 9/30/2014 | | | 11.22 | | | | .58 | | | | (.13 | ) | | | .45 | | | | (.58 | ) | | | 11.09 | | | | 4.03 | | | | 133 | | | | 1.53 | | | | 1.53 | | | | 5.12 | |
| Year ended 9/30/2013 | | | 11.18 | | | | .62 | | | | .06 | | | | .68 | | | | (.64 | ) | | | 11.22 | | | | 6.17 | | | | 132 | | | | 1.55 | | | | 1.55 | | | | 5.49 | |
| Year ended 9/30/2012 | | | 10.36 | | | | .69 | | | | .86 | | | | 1.55 | | | | (.73 | ) | | | 11.18 | | | | 15.35 | | | | 128 | | | | 1.56 | | | | 1.56 | | | | 6.29 | |
| Class 529-E: | | | | | | | | | | | | | | | | | | | | | | | | | | | | | | | | | | | | | | | | | | | | |
| Year ended 9/30/2016 | | | 9.83 | | | | .58 | | | | .34 | | | | .92 | | | | (.57 | ) | | | 10.18 | | | | 9.85 | | | | 17 | | | | 1.00 | | | | 1.00 | | | | 5.99 | |
| Year ended 9/30/2015 | | | 11.09 | | | | .61 | | | | (1.25 | ) | | | (.64 | ) | | | (.62 | ) | | | 9.83 | | | | (6.12 | ) | | | 17 | | | | .97 | | | | .97 | | | | 5.63 | |
| Year ended 9/30/2014 | | | 11.22 | | | | .65 | | | | (.13 | ) | | | .52 | | | | (.65 | ) | | | 11.09 | | | | 4.60 | | | | 20 | | | | .98 | | | | .98 | | | | 5.67 | |
| Year ended 9/30/2013 | | | 11.18 | | | | .68 | | | | .06 | | | | .74 | | | | (.70 | ) | | | 11.22 | | | | 6.75 | | | | 20 | | | | .99 | | | | .99 | | | | 6.04 | |
| Year ended 9/30/2012 | | | 10.36 | | | | .75 | | | | .86 | | | | 1.61 | | | | (.79 | ) | | | 11.18 | | | | 15.97 | | | | 19 | | | | 1.02 | | | | 1.02 | | | | 6.83 | |
| Class 529-F-1: | | | | | | | | | | | | | | | | | | | | | | | | | | | | | | | | | | | | | | | | | | | | |
| Year ended 9/30/2016 | | | 9.83 | | | | .62 | | | | .34 | | | | .96 | | | | (.61 | ) | | | 10.18 | | | | 10.30 | | | | 24 | | | | .58 | | | | .58 | | | | 6.40 | |
| Year ended 9/30/2015 | | | 11.09 | | | | .65 | | | | (1.25 | ) | | | (.60 | ) | | | (.66 | ) | | | 9.83 | | | | (5.71 | ) | | | 22 | | | | .54 | | | | .54 | | | | 6.07 | |
| Year ended 9/30/2014 | | | 11.22 | | | | .70 | | | | (.13 | ) | | | .57 | | | | (.70 | ) | | | 11.09 | | | | 5.06 | | | | 25 | | | | .53 | | | | .53 | | | | 6.11 | |
| Year ended 9/30/2013 | | | 11.18 | | | | .73 | | | | .06 | | | | .79 | | | | (.75 | ) | | | 11.22 | | | | 7.22 | | | | 23 | | | | .54 | | | | .54 | | | | 6.48 | |
| Year ended 9/30/2012 | | | 10.36 | | | | .80 | | | | .86 | | | | 1.66 | | | | (.84 | ) | | | 11.18 | | | | 16.50 | | | | 20 | | | | .56 | | | | .56 | | | | 7.28 | |
| Class R-1: | | | | | | | | | | | | | | | | | | | | | | | | | | | | | | | | | | | | | | | | | | | | |
| Year ended 9/30/2016 | | | 9.83 | | | | .53 | | | | .34 | | | | .87 | | | | (.52 | ) | | | 10.18 | | | | 9.29 | | | | 16 | | | | 1.50 | | | | 1.50 | | | | 5.51 | |
| Year ended 9/30/2015 | | | 11.09 | | | | .55 | | | | (1.25 | ) | | | (.70 | ) | | | (.56 | ) | | | 9.83 | | | | (6.58 | ) | | | 19 | | | | 1.46 | | | | 1.46 | | | | 5.15 | |
| Year ended 9/30/2014 | | | 11.22 | | | | .59 | | | | (.13 | ) | | | .46 | | | | (.59 | ) | | | 11.09 | | | | 4.11 | | | | 24 | | | | 1.46 | | | | 1.46 | | | | 5.19 | |
| Year ended 9/30/2013 | | | 11.18 | | | | .63 | | | | .06 | | | | .69 | | | | (.65 | ) | | | 11.22 | | | | 6.25 | | | | 24 | | | | 1.47 | | | | 1.47 | | | | 5.56 | |
| Year ended 9/30/2012 | | | 10.36 | | | | .70 | | | | .86 | | | | 1.56 | | | | (.74 | ) | | | 11.18 | | | | 15.42 | | | | 25 | | | | 1.50 | | | | 1.50 | | | | 6.36 | |
| Class R-2: | | | | | | | | | | | | | | | | | | | | | | | | | | | | | | | | | | | | | | | | | | | | |
| Year ended 9/30/2016 | | | 9.83 | | | | .53 | | | | .34 | | | | .87 | | | | (.52 | ) | | | 10.18 | | | | 9.27 | | | | 184 | | | | 1.52 | | | | 1.52 | | | | 5.47 | |
| Year ended 9/30/2015 | | | 11.09 | | | | .55 | | | | (1.25 | ) | | | (.70 | ) | | | (.56 | ) | | | 9.83 | | | | (6.60 | ) | | | 183 | | | | 1.48 | | | | 1.48 | | | | 5.13 | |
| Year ended 9/30/2014 | | | 11.22 | | | | .59 | | | | (.13 | ) | | | .46 | | | | (.59 | ) | | | 11.09 | | | | 4.06 | | | | 224 | | | | 1.50 | | | | 1.50 | | | | 5.15 | |
| Year ended 9/30/2013 | | | 11.18 | | | | .63 | | | | .06 | | | | .69 | | | | (.65 | ) | | | 11.22 | | | | 6.26 | | | | 231 | | | | 1.47 | | | | 1.47 | | | | 5.57 | |
| Year ended 9/30/2012 | | | 10.36 | | | | .69 | | | | .86 | | | | 1.55 | | | | (.73 | ) | | | 11.18 | | | | 15.38 | | | | 232 | | | | 1.54 | | | | 1.54 | | | | 6.32 | |
| Class R-2E: | | | | | | | | | | | | | | | | | | | | | | | | | | | | | | | | | | | | | | | | | | | | |
| Year ended 9/30/2016 | | | 9.83 | | | | .57 | | | | .34 | | | | .91 | | | | (.56 | ) | | | 10.18 | | | | 9.72 | | | | 3 | | | | 1.16 | | | | 1.16 | | | | 5.66 | |
| Year ended 9/30/2015 | | | 11.09 | | | | .63 | | | | (1.25 | ) | | | (.62 | ) | | | (.64 | ) | | | 9.83 | | | | (5.94 | )4 | | | — | 5 | | | .79 | 4 | | | .79 | 4 | | | 5.76 | 4 |
| Period from 8/29/2014 to 9/30/20146,7 | | | 11.40 | | | | .06 | | | | (.31 | ) | | | (.25 | ) | | | (.06 | ) | | | 11.09 | | | | (2.20 | )4,8 | | | — | 5 | | | .04 | 4,8 | | | .04 | 4,8 | | | .51 | 4,8 |
| Class R-3: | | | | | | | | | | | | | | | | | | | | | | | | | | | | | | | | | | | | | | | | | | | | |
| Year ended 9/30/2016 | | | 9.83 | | | | .58 | | | | .34 | | | | .92 | | | | (.57 | ) | | | 10.18 | | | | 9.78 | | | | 195 | | | | 1.06 | | | | 1.06 | | | | 5.95 | |
| Year ended 9/30/2015 | | | 11.09 | | | | .60 | | | | (1.25 | ) | | | (.65 | ) | | | (.61 | ) | | | 9.83 | | | | (6.16 | ) | | | 209 | | | | 1.01 | | | | 1.01 | | | | 5.61 | |
| Year ended 9/30/2014 | | | 11.22 | | | | .64 | | | | (.13 | ) | | | .51 | | | | (.64 | ) | | | 11.09 | | | | 4.57 | | | | 256 | | | | 1.01 | | | | 1.01 | | | | 5.65 | |
| Year ended 9/30/2013 | | | 11.18 | | | | .68 | | | | .06 | | | | .74 | | | | (.70 | ) | | | 11.22 | | | | 6.74 | | | | 310 | | | | 1.01 | | | | 1.01 | | | | 6.04 | |
| Year ended 9/30/2012 | | | 10.36 | | | | .75 | | | | .86 | | | | 1.61 | | | | (.79 | ) | | | 11.18 | | | | 15.96 | | | | 352 | | | | 1.03 | | | | 1.03 | | | | 6.84 | |
See page 30 for footnotes.
| American High-Income Trust | 29 |
Financial highlights (continued)
| | | | | | Income (loss) from
investment operations1 | | | | | | | | | | | | | | | | | | | | | | |
| | | Net asset
value,
beginning
of period | | | Net
investment
income | | | Net gains
(losses) on
securities (both
realized and
unrealized) | | | Total from
investment
operations | | | Dividends
(from net
investment
income) | | | Net asset
value,
end
of period | | | Total
return2,3 | | | Net assets,
end of period
(in millions) | | | Ratio of
expenses
to average net
assets before
reimbursements | | | Ratio of
expenses
to average net
assets after
reimbursements3 | | | Ratio of
net income
to average
net assets3 | |
| Class R-4: | | | | | | | | | | | | | | | | | | | | | | | | | | | | | | | | | | | | | | | | | | | | |
| Year ended 9/30/2016 | | $ | 9.83 | | | $ | .61 | | | $ | .34 | | | $ | .95 | | | $ | (.60 | ) | | $ | 10.18 | | | | 10.13 | % | | $ | 159 | | | | .73 | % | | | .73 | % | | | 6.29 | % |
| Year ended 9/30/2015 | | | 11.09 | | | | .64 | | | | (1.25 | ) | | | (.61 | ) | | | (.65 | ) | | | 9.83 | | | | (5.86 | ) | | | 180 | | | | .69 | | | | .69 | | | | 5.93 | |
| Year ended 9/30/2014 | | | 11.22 | | | | .68 | | | | (.13 | ) | | | .55 | | | | (.68 | ) | | | 11.09 | | | | 4.90 | | | | 230 | | | | .69 | | | | .69 | | | | 5.96 | |
| Year ended 9/30/2013 | | | 11.18 | | | | .72 | | | | .06 | | | | .78 | | | | (.74 | ) | | | 11.22 | | | | 7.06 | | | | 230 | | | | .70 | | | | .70 | | | | 6.34 | |
| Year ended 9/30/2012 | | | 10.36 | | | | .78 | | | | .86 | | | | 1.64 | | | | (.82 | ) | | | 11.18 | | | | 16.32 | | | | 232 | | | | .72 | | | | .72 | | | | 7.16 | |
| Class R-5E: | | | | | | | | | | | | | | | | | | | | | | | | | | | | | | | | | | | | | | | | | | | | |
| Period from 11/20/2015 to 9/30/20166,9 | | | 9.70 | | | | .53 | | | | .47 | | | | 1.00 | | | | (.52 | ) | | | 10.18 | | | | 10.70 | 8 | | | — | 5 | | | .58 | 10 | | | .57 | 10 | | | 6.37 | 10 |
| Class R-5: | | | | | | | | | | | | | | | | | | | | | | | | | | | | | | | | | | | | | | | | | | | | |
| Year ended 9/30/2016 | | | 9.83 | | | | .64 | | | | .34 | | | | .98 | | | | (.63 | ) | | | 10.18 | | | | 10.47 | | | | 76 | | | | .42 | | | | .42 | | | | 6.61 | |
| Year ended 9/30/2015 | | | 11.09 | | | | .67 | | | | (1.25 | ) | | | (.58 | ) | | | (.68 | ) | | | 9.83 | | | | (5.58 | ) | | | 88 | | | | .39 | | | | .39 | | | | 6.23 | |
| Year ended 9/30/2014 | | | 11.22 | | | | .71 | | | | (.13 | ) | | | .58 | | | | (.71 | ) | | | 11.09 | | | | 5.21 | | | | 111 | | | | .39 | | | | .39 | | | | 6.30 | |
| Year ended 9/30/2013 | | | 11.18 | | | | .75 | | | | .06 | | | | .81 | | | | (.77 | ) | | | 11.22 | | | | 7.38 | | | | 224 | | | | .40 | | | | .40 | | | | 6.66 | |
| Year ended 9/30/2012 | | | 10.36 | | | | .81 | | | | .86 | | | | 1.67 | | | | (.85 | ) | | | 11.18 | | | | 16.67 | | | | 290 | | | | .41 | | | | .41 | | | | 7.44 | |
| Class R-6: | | | | | | | | | | | | | | | | | | | | | | | | | | | | | | | | | | | | | | | | | | | | |
| Year ended 9/30/2016 | | | 9.83 | | | | .64 | | | | .34 | | | | .98 | | | | (.63 | ) | | | 10.18 | | | | 10.54 | | | | 1,169 | | | | .36 | | | | .36 | | | | 6.62 | |
| Year ended 9/30/2015 | | | 11.09 | | | | .67 | | | | (1.25 | ) | | | (.58 | ) | | | (.68 | ) | | | 9.83 | | | | (5.53 | ) | | | 1,046 | | | | .34 | | | | .34 | | | | 6.26 | |
| Year ended 9/30/2014 | | | 11.22 | | | | .72 | | | | (.13 | ) | | | .59 | | | | (.72 | ) | | | 11.09 | | | | 5.26 | | | | 803 | | | | .34 | | | | .34 | | | | 6.29 | |
| Year ended 9/30/2013 | | | 11.18 | | | | .76 | | | | .06 | | | | .82 | | | | (.78 | ) | | | 11.22 | | | | 7.43 | | | | 472 | | | | .35 | | | | .35 | | | | 6.66 | |
| Year ended 9/30/2012 | | | 10.36 | | | | .82 | | | | .86 | | | | 1.68 | | | | (.86 | ) | | | 11.18 | | | | 16.72 | | | | 226 | | | | .36 | | | | .36 | | | | 7.44 | |
| | | Year ended September 30 |
| | | 2016 | | 2015 | | 2014 | | 2013 | | 2012 |
| Portfolio turnover rate for all share classes | | 76% | | 49% | | 62% | | 61% | | 38% |
| 1 | Based on average shares outstanding. |
| 2 | Total returns exclude any applicable sales charges, including contingent deferred sales charges. |
| 3 | This column reflects the impact, if any, of certain reimbursements from CRMC. During some of the periods shown, CRMC paid a portion of the fund’s transfer agent fees for certain retirement plan share classes. |
| 4 | All or a significant portion of assets in this class consisted of seed capital invested by CRMC and/or its affiliates. Fees for distribution services are not charged or accrued on these seed capital assets. If such fees were paid by the fund on seed capital assets, fund expenses would have been higher and net income and total return would have been lower. |
| 5 | Amount less than $1 million. |
| 6 | Based on operations for the period shown and, accordingly, is not representative of a full year. |
| 7 | Class R-2E shares were offered beginning August 29, 2014. |
| 8 | Not annualized. |
| 9 | Class R-5E shares were offered beginning November 20, 2015. |
| 10 | Annualized. |
See Notes to Financial Statements
| 30 | American High-Income Trust |
Report of Independent Registered Public Accounting Firm
To the Shareholders and Board of Trustees of American High-Income Trust:
We have audited the accompanying statement of assets and liabilities of American High-Income Trust (the “Fund”), including the summary investment portfolio, as of September 30, 2016, and the related statement of operations for the year then ended, the statements of changes in net assets for each of the two years in the period then ended, and the financial highlights for each of the periods presented. These financial statements and financial highlights are the responsibility of the Fund’s management. Our responsibility is to express an opinion on these financial statements and financial highlights based on our audits.
We conducted our audits in accordance with the standards of the Public Company Accounting Oversight Board (United States). Those standards require that we plan and perform the audit to obtain reasonable assurance about whether the financial statements and financial highlights are free of material misstatement. The Fund is not required to have, nor were we engaged to perform, an audit of its internal control over financial reporting. Our audits included consideration of internal control over financial reporting as a basis for designing audit procedures that are appropriate in the circumstances, but not for the purpose of expressing an opinion on the effectiveness of the Fund’s internal control over financial reporting. Accordingly, we express no such opinion. An audit also includes examining, on a test basis, evidence supporting the amounts and disclosures in the financial statements, assessing the accounting principles used and significant estimates made by management, as well as evaluating the overall financial statement presentation. Our procedures included confirmation of securities owned as of September 30, 2016, by correspondence with the custodian, brokers, and agent banks; where replies were not received from brokers and agent banks, we performed other auditing procedures. We believe that our audits provide a reasonable basis for our opinion.
In our opinion, such financial statements and financial highlights referred to above present fairly, in all material respects, the financial position of American High-Income Trust as of September 30, 2016, the results of its operations for the year then ended, the changes in its net assets for each of the two years in the period then ended, and the financial highlights for each of the periods presented, in conformity with accounting principles generally accepted in the United States of America.
Deloitte & Touche LLP
Costa Mesa, California
November 14, 2016
| American High-Income Trust | 31 |
As a fund shareholder, you incur two types of costs: (1) transaction costs, such as initial sales charges on purchase payments and contingent deferred sales charges on redemptions (loads), and (2) ongoing costs, including management fees, distribution and service (12b-1) fees, and other expenses. This example is intended to help you understand your ongoing costs (in dollars) of investing in the fund so you can compare these costs with the ongoing costs of investing in other mutual funds. The example is based on an investment of $1,000 invested at the beginning of the period and held for the entire six-month period (April 1, 2016, through September 30, 2016).
Actual expenses:
The first line of each share class in the table on the following page provides information about actual account values and actual expenses. You may use the information in this line, together with the amount you invested, to estimate the expenses that you paid over the period. Simply divide your account value by $1,000 (for example, an $8,600 account value divided by $1,000 = 8.6), then multiply the result by the number in the first line under the heading entitled “Expenses paid during period” to estimate the expenses you paid on your account during this period.
Hypothetical example for comparison purposes:
The second line of each share class in the table on the following page provides information about hypothetical account values and hypothetical expenses based on the actual expense ratio for the share class and an assumed rate of return of 5.00% per year before expenses, which is not the actual return of the share class. The hypothetical account values and expenses may not be used to estimate the actual ending account balance or expenses you paid for the period. You may use this information to compare the ongoing costs of investing in the fund and other funds. To do so, compare this 5.00% hypothetical example with the 5.00% hypothetical examples that appear in the shareholder reports of the other funds.
Notes:
Retirement plan participants may be subject to certain fees charged by the plan sponsor, and Class F-1, F-2 and 529-F-1 shareholders may be subject to fees charged by financial intermediaries, typically ranging from 0.75% to 1.50% of assets annually depending on services offered. You can estimate the impact of these fees by adding the amount of the fees to the total estimated expenses you paid on your account during the period as calculated above. In addition, your ending account value would be lower by the amount of these fees.
Note that the expenses shown in the table on the following page are meant to highlight your ongoing costs only and do not reflect any transactional costs, such as sales charges (loads). Therefore, the second line of each share class in the table is useful in comparing ongoing costs only and will not help you determine the relative total costs of owning different funds. In addition, if these transactional costs were included, your costs would have been higher.
| 32 | American High-Income Trust |
| | | Beginning
account value
4/1/2016 | | | Ending
account value
9/30/2016 | | | Expenses paid
during period* | | | Annualized
expense ratio | |
| Class A - actual return | | $ | 1,000.00 | | | $ | 1,106.69 | | | $ | 3.75 | | | | .71 | % |
| Class A - assumed 5% return | | | 1,000.00 | | | | 1,021.51 | | | | 3.60 | | | | .71 | |
| Class B - actual return | | | 1,000.00 | | | | 1,102.56 | | | | 7.75 | | | | 1.47 | |
| Class B - assumed 5% return | | | 1,000.00 | | | | 1,017.70 | | | | 7.44 | | | | 1.47 | |
| Class C - actual return | | | 1,000.00 | | | | 1,102.40 | | | | 7.91 | | | | 1.50 | |
| Class C - assumed 5% return | | | 1,000.00 | | | | 1,017.55 | | | | 7.59 | | | | 1.50 | |
| Class F-1 - actual return | | | 1,000.00 | | | | 1,106.56 | | | | 3.91 | | | | .74 | |
| Class F-1 - assumed 5% return | | | 1,000.00 | | | | 1,021.36 | | | | 3.75 | | | | .74 | |
| Class F-2 - actual return | | | 1,000.00 | | | | 1,108.01 | | | | 2.48 | | | | .47 | |
| Class F-2 - assumed 5% return | | | 1,000.00 | | | | 1,022.71 | | | | 2.38 | | | | .47 | |
| Class 529-A - actual return | | | 1,000.00 | | | | 1,106.27 | | | | 4.17 | | | | .79 | |
| Class 529-A - assumed 5% return | | | 1,000.00 | | | | 1,021.11 | | | | 4.00 | | | | .79 | |
| Class 529-B - actual return | | | 1,000.00 | | | | 1,101.95 | | | | 8.33 | | | | 1.58 | |
| Class 529-B - assumed 5% return | | | 1,000.00 | | | | 1,017.15 | | | | 7.99 | | | | 1.58 | |
| Class 529-C - actual return | | | 1,000.00 | | | | 1,102.13 | | | | 8.12 | | | | 1.54 | |
| Class 529-C - assumed 5% return | | | 1,000.00 | | | | 1,017.35 | | | | 7.79 | | | | 1.54 | |
| Class 529-E - actual return | | | 1,000.00 | | | | 1,105.22 | | | | 5.17 | | | | .98 | |
| Class 529-E - assumed 5% return | | | 1,000.00 | | | | 1,020.16 | | | | 4.96 | | | | .98 | |
| Class 529-F-1 - actual return | | | 1,000.00 | | | | 1,107.55 | | | | 2.96 | | | | .56 | |
| Class 529-F-1 - assumed 5% return | | | 1,000.00 | | | | 1,022.26 | | | | 2.84 | | | | .56 | |
| Class R-1 - actual return | | | 1,000.00 | | | | 1,102.41 | | | | 7.85 | | | | 1.49 | |
| Class R-1 - assumed 5% return | | | 1,000.00 | | | | 1,017.60 | | | | 7.54 | | | | 1.49 | |
| Class R-2 - actual return | | | 1,000.00 | | | | 1,102.68 | | | | 7.64 | | | | 1.45 | |
| Class R-2 - assumed 5% return | | | 1,000.00 | | | | 1,017.80 | | | | 7.33 | | | | 1.45 | |
| Class R-2E - actual return | | | 1,000.00 | | | | 1,104.10 | | | | 6.28 | | | | 1.19 | |
| Class R-2E - assumed 5% return | | | 1,000.00 | | | | 1,019.10 | | | | 6.02 | | | | 1.19 | |
| Class R-3 - actual return | | | 1,000.00 | | | | 1,104.90 | | | | 5.49 | | | | 1.04 | |
| Class R-3 - assumed 5% return | | | 1,000.00 | | | | 1,019.85 | | | | 5.27 | | | | 1.04 | |
| Class R-4 - actual return | | | 1,000.00 | | | | 1,106.64 | | | | 3.80 | | | | .72 | |
| Class R-4 - assumed 5% return | | | 1,000.00 | | | | 1,021.46 | | | | 3.65 | | | | .72 | |
| Class R-5E - actual return | | | 1,000.00 | | | | 1,107.32 | | | | 3.06 | | | | .58 | |
| Class R-5E - assumed 5% return | | | 1,000.00 | | | | 1,022.16 | | | | 2.94 | | | | .58 | |
| Class R-5 - actual return | | | 1,000.00 | | | | 1,108.32 | | | | 2.22 | | | | .42 | |
| Class R-5 - assumed 5% return | | | 1,000.00 | | | | 1,022.96 | | | | 2.13 | | | | .42 | |
| Class R-6 - actual return | | | 1,000.00 | | | | 1,108.67 | | | | 1.85 | | | | .35 | |
| Class R-6 - assumed 5% return | | | 1,000.00 | | | | 1,023.31 | | | | 1.78 | | | | .35 | |
| * | The “expenses paid during period” are equal to the “annualized expense ratio,” multiplied by the average account value over the period, multiplied by the number of days in the period, and divided by 365 (to reflect the one-half year period). |
We are required to advise you of the federal tax status of certain distributions received by shareholders during the fiscal year. The fund hereby designates the following amounts for the fund’s fiscal year ended September 30, 2016:
| Qualified dividend income | | $ | 40,157,000 | |
| Corporate dividends received deduction | | $ | 22,820,000 | |
| U.S. government income that may be exempt from state taxation | | $ | 3,404,000 | |
Individual shareholders should refer to their Form 1099 or other tax information, which will be mailed in January 2017, to determine the calendar year amounts to be included on their 2016 tax returns. Shareholders should consult their tax advisors.
| American High-Income Trust | 33 |
Board of trustees and other officers
Independent trustees1
| Name and year of birth | | Year first
elected
a trustee
of the fund2 | | Principal occupation(s) during past five years | | Number of
portfolios in fund
complex overseen
by trustee | | Other directorships3
held by trustee |
| William H. Baribault, 1945 | | 2010 | | CEO and President, Richard Nixon Foundation; Chairman of the Board and CEO, Oakwood Enterprises (private investment and consulting) | | 81 | | General Finance Corporation |
| James G. Ellis, 1947 | | 2006 | | Dean and Professor of Marketing, Marshall School of Business, University of Southern California | | 81 | | Mercury General Corporation |
| Leonard R. Fuller, 1946 | | 1994 | | Private investor; former President and CEO, Fuller Consulting (financial management consulting) | | 81 | | None |
| R. Clark Hooper, 1946 | | 2005 | | Private investor | | 81 | | None |
| Chairman of the Board (Independent and Non-Executive) | | | | | | | | |
| Merit E. Janow, 1958 | | 2010 | | Dean and Professor, Columbia University, School of International and Public Affairs | | 80 | | MasterCard Incorporated; Trimble Navigation Limited |
| Laurel B. Mitchell, PhD, 1955 | | 2010 | | Distinguished Professor of Accounting, University of Redlands; former Director, Accounting Program, University of Redlands | | 77 | | None |
| Frank M. Sanchez, 1943 | | 1999 | | Principal, The Sanchez Family Corporation dba McDonald’s Restaurants (McDonald’s licensee) | | 77 | | None |
| Margaret Spellings, 1957 | | 2010 | | President, The University of North Carolina; former President, George W. Bush Foundation; former President and CEO, Margaret Spellings & Company (public policy and strategic consulting); former President, U.S. Chamber Foundation and Senior Advisor to the President and CEO, U.S. Chamber of Commerce | | 82 | | ClubCorp Holdings, Inc. |
| Steadman Upham, PhD, 1949 | | 2007 | | President and University Professor, The University of Tulsa | | 80 | | None |
Interested trustees4,5
Name, year of birth and
position with fund | | Year first
elected
a trustee
or officer
of the fund2 | | Principal occupation(s) during past five years
and positions held with affiliated entities or
the principal underwriter of the fund | | Number of
portfolios in fund
complex overseen
by trustee | | Other directorships3
held by trustee |
John H. Smet, 1956
Vice Chairman of the Board | | 2011 | | Partner — Capital Fixed Income Investors, Capital Research and Management Company; Director, Capital Research and Management Company | | 23 | | None |
| Michael C. Gitlin, 1970 | | 2015 | | Partner — Capital Fixed Income Investors, Capital Research and Management Company; Director, The Capital Group Companies, Inc.;6 served as Head of Fixed Income at a large investment management firm prior to joining Capital Research and Management Company in 2015 | | 19 | | None |
The fund’s statement of additional information includes further details about fund trustees and is available without charge upon request by calling American Funds Service Company at (800) 421-4225 or by visiting the American Funds website at americanfunds.com. The address for all trustees and officers of the fund is 333 South Hope Street, Los Angeles, CA 90071, Attention: Secretary.
| 34 | American High-Income Trust |
Other officers5
Name, year of birth and
position with fund | | Year first
elected
an officer
of the fund2 | | Principal occupation(s) during past five years and positions held with affiliated entities
or the principal underwriter of the fund |
David C. Barclay, 1956
President | | 1995 | | Partner — Capital Fixed Income Investors, Capital Research and Management Company |
David A. Daigle, 1967
Senior Vice President | | 2008 | | Partner — Capital Fixed Income Investors, Capital Research and Management Company;
Partner — Capital Fixed Income Investors, Capital Bank and Trust Company6 |
Abner D. Goldstine, 1929
Senior Vice President | | 2015 | | Partner — Capital Fixed Income Investors, Capital Research and Management Company |
Laurentius Harrer, 1965
Senior Vice President | | 2015 | | Partner — Capital Fixed Income Investors, Capital Research and Management Company;
Partner — Capital Fixed Income Investors, Capital Bank and Trust Company6
Partner — Capital Fixed Income Investors, Capital Guardian Trust Company6 |
Kristine M. Nishiyama, 1970
Senior Vice President | | 2003 | | Senior Vice President and Senior Counsel — Fund Business Management Group, Capital Research and Management Company; Senior Vice President and General Counsel, Capital Bank and Trust Company6 |
Thomas H. Chow, 1966
Vice President | | 2015 | | Vice President — Capital Fixed Income Investors, Capital Research and Management Company |
Steven I. Koszalka, 1964
Secretary | | 2010 | | Vice President — Fund Business Management Group, Capital Research and Management Company |
Brian C. Janssen, 1972
Treasurer | | 2012 | | Vice President — Investment Operations, Capital Research and Management Company |
Jane Y. Chung, 1974
Assistant Secretary | | 2014 | | Associate — Fund Business Management Group, Capital Research and Management Company |
Dori Laskin, 1951
Assistant Treasurer | | 2010 | | Vice President — Investment Operations, Capital Research and Management Company |
Gregory F. Niland, 1971
Assistant Treasurer | | 2015 | | Vice President — Investment Operations, Capital Research and Management Company |
| 1 | The term independent trustee refers to a trustee who is not an “interested person” of the fund within the meaning of the Investment Company Act of 1940. |
| 2 | Trustees and officers of the fund serve until their resignation, removal or retirement. |
| 3 | This includes all directorships/trusteeships (other than those in the American Funds or other funds managed by Capital Research and Management Company or its affiliates) that are held by each trustee as a trustee or director of a public company or a registered investment company. |
| 4 | The term interested trustee refers to a trustee who is an “interested person” within the meaning of the Investment Company Act of 1940, on the basis of their affiliation with the fund’s investment adviser, Capital Research and Management Company, or affiliated entities (including the fund’s principal underwriter). |
| 5 | All of the directors/trustees and/or officers listed, except David A. Daigle, Jennifer L. Hinman and Richard N. Lewis, are officers and/or directors/trustees of one or more of the other funds for which Capital Research and Management Company serves as investment adviser. |
| 6 | Company affiliated with Capital Research and Management Company. |
| American High-Income Trust | 35 |
Offices of the fund and of the investment adviser
Capital Research and Management Company
333 South Hope Street
Los Angeles, CA 90071-1406
6455 Irvine Center Drive Irvine,
CA 92618-4518
Transfer agent for shareholder accounts
American Funds Service Company
(Write to the address near you.)
P.O. Box 6007
Indianapolis, IN 46206-6007
P.O. Box 2280
Norfolk, VA 23501-2280
Custodian of assets
JPMorgan Chase Bank
270 Park Avenue
New York, NY 10017-2070
Counsel
Morgan, Lewis & Bockius LLP
300 South Grand Avenue, 22nd Floor
Los Angeles, CA 90071-3132
Independent registered public accounting firm
Deloitte & Touche LLP
695 Town Center Drive
Suite 1200
Costa Mesa, CA 92626-7188
Principal underwriter
American Funds Distributors, Inc.
333 South Hope Street
Los Angeles, CA 90071-1406
| 36 | American High-Income Trust |
Investors should carefully consider investment objectives, risks, charges and expenses. This and other important information is contained in the fund prospectus and summary prospectus, which can be obtained from your financial professional and should be read carefully before investing. You may also call American Funds Service Company (AFS) at (800) 421-4225 or visit the American Funds website at americanfunds.com.
“American Funds Proxy Voting Procedures and Principles” — which describes how we vote proxies relating to portfolio securities — is available on the American Funds website or upon request by calling AFS. The fund files its proxy voting record with the U.S. Securities and Exchange Commission (SEC) for the 12 months ended June 30 by August 31. The proxy voting record is available free of charge on the SEC website at sec.gov and on the American Funds website.
A complete September 30, 2016, portfolio of American High-Income Trust’s investments is available free of charge by calling AFS or visiting the SEC website (where it is part of Form N-CSR).
American High-Income Trust files a complete list of its portfolio holdings with the SEC for the first and third quarters of each fiscal year on Form N-Q. This filing is available free of charge on the SEC website. You may also review or, for a fee, copy this filing at the SEC’s Public Reference Room in Washington, D.C. Additional information regarding the operation of the Public Reference Room may be obtained by calling the SEC’s Office of Investor Education and Advocacy at (800) SEC-0330. Additionally, the list of portfolio holdings is available by calling AFS.
This report is for the information of shareholders of American High-Income Trust, but it also may be used as sales literature when preceded or accompanied by the current prospectus or summary prospectus, which gives details about charges, expenses, investment objectives and operating policies of the fund. If used as sales material after December 31, 2016, this report must be accompanied by an American Funds statistical update for the most recently completed calendar quarter.
The American Funds Advantage®
Since 1931, American Funds, part of Capital Group, has helped investors pursue long-term investment success. Our consistent approach — in combination with The Capital SystemSM — has resulted in a superior long-term track record.
| | Aligned with investor success |
| | We base our decisions on a long-term perspective, which we believe aligns our goals with the interests of our clients. Our portfolio managers average 27 years of investment experience, including 22 years at our company, reflecting a career commitment to our long-term approach.1 |
| | |
| | The Capital SystemSM |
| | The Capital System combines individual accountability with teamwork. Funds using The Capital System are divided into portions that are managed independently by investment professionals with diverse backgrounds, ages and investment approaches. An extensive global research effort is the backbone of our system. |
| | |
| | Superior long-term track record |
| | Our equity funds have beaten their Lipper peer indexes in 91% of 10-year periods and 95% of 20-year periods. Our fixed income funds have beaten their Lipper indexes in 58% of 10-year periods and 58% of 20-year periods.2 Our fund management fees have been among the lowest in the industry.3 |
| | |
| | 1 | Portfolio manager experience as of December 31, 2015. |
| | 2 | Based on Class A share results for rolling periods through December 31, 2015. Periods covered are the shorter of the fund’s lifetime or since the comparable Lipper index inception date (except Capital Income Builder and SMALLCAP World Fund, for which the Lipper average was used). |
| | 3 | On average, our management fees were in the lowest quintile 68% of the time, based on the 20-year period ended December 31, 2015, versus comparable Lipper categories, excluding funds of funds. |

ITEM 2 – Code of Ethics
The Registrant has adopted a Code of Ethics that applies to its Principal Executive Officer and Principal Financial Officer. The Registrant undertakes to provide to any person without charge, upon request, a copy of the Code of Ethics. Such request can be made to American Funds Service Company at 800/421-9225 or to the Secretary of the Registrant, 333 South Hope Street, Los Angeles, California 90071.
ITEM 3 – Audit Committee Financial Expert
The Registrant’s board has determined that Laurel B. Mitchell, a member of the Registrant’s audit committee, is an “audit committee financial expert” and "independent," as such terms are defined in this Item. This designation will not increase the designee’s duties, obligations or liability as compared to his or her duties, obligations and liability as a member of the audit committee and of the board, nor will it reduce the responsibility of the other audit committee members. There may be other individuals who, through education or experience, would qualify as "audit committee financial experts" if the board had designated them as such. Most importantly, the board believes each member of the audit committee contributes significantly to the effective oversight of the Registrant’s financial statements and condition.
ITEM 4 – Principal Accountant Fees and Services
| | Registrant: |
| | | a) Audit Fees: |
| | | | 2015 | $162,000 |
| | | | 2016 | $169,000 |
| | | | |
| | | b) Audit-Related Fees: |
| | | | 2015 | $ 7,000 |
| | | | 2016 | $ 5,000 |
| | | | The audit-related fees consist of assurance and related services relating to the examination of the Registrant’s investment adviser conducted in accordance with Statement on Standards for Attestation Engagements Number 16 issued by the American Institute of Certified Public Accountants. |
| | | | |
| | | c) Tax Fees: |
| | | | 2015 | None |
| | | | 2016 | $8,000 |
| | | | The tax fees consist of professional services relating to the preparation of the Registrant’s tax returns including returns relating to the Registrant’s investments in non-U.S. jurisdictions. |
| | | | |
| | | d) All Other Fees: |
| | | | 2015 | None |
| | | | 2016 | None |
| | | | |
| | Adviser and affiliates (includes only fees for non-audit services billed to the adviser and affiliates for engagements that relate directly to the operations and financial reporting of the Registrant and were subject to the pre-approval policies described below): |
| | | a) Audit Fees: |
| | | | Not Applicable |
| | | | |
| | | b) Audit-Related Fees: |
| | | | 2015 | $1,148,000 |
| | | | 2016 | $1,169,000 |
| | | | The audit-related fees consist of assurance and related services relating to the examination of the Registrant’s transfer agent, principal underwriter and investment adviser conducted in accordance with Statement on Standards for Attestation Engagements Number 16 issued by the American Institute of Certified Public Accountants. |
| | | | |
| | | c) Tax Fees: |
| | | | 2015 | None |
| | | | 2016 | None |
| | | | The tax fees consist of consulting services relating to the Registrant’s investments. |
| | | | |
| | | d) All Other Fees: |
| | | | 2015 | $ 5,000 |
| | | | 2016 | $ 3,000 |
| | | | The other fees consist of subscription services related to an accounting research tool. |
| | | | |
All audit and permissible non-audit services that the Registrant’s audit committee considers compatible with maintaining the independent registered public accounting firm’s independence are required to be pre-approved by the committee. The pre-approval requirement will extend to all non-audit services provided to the Registrant, the investment adviser, and any entity controlling, controlled by, or under common control with the investment adviser that provides ongoing services to the Registrant, if the engagement relates directly to the operations and financial reporting of the Registrant. The committee will not delegate its responsibility to pre-approve these services to the investment adviser. The committee may delegate to one or more committee members the authority to review and pre-approve audit and permissible non-audit services. Actions taken under any such delegation will be reported to the full committee at its next meeting. The pre-approval requirement is waived with respect to non-audit services if certain conditions are met. The pre-approval requirement was not waived for any of the non-audit services listed above provided to the Registrant, adviser and affiliates.
Aggregate non-audit fees paid to the Registrant’s auditors, including fees for all services billed to the Registrant, adviser and affiliates that provide ongoing services to the Registrant, were $1,450,000 for fiscal year 2015 and $1,235,000 for fiscal year 2016. The non-audit services represented by these amounts were brought to the attention of the committee and considered to be compatible with maintaining the auditors’ independence.
ITEM 5 – Audit Committee of Listed Registrants
Not applicable to this Registrant, insofar as the Registrant is not a listed issuer as defined in Rule 10A-3 under the Securities Exchange Act of 1934.
ITEM 6 – Schedule of Investments
American High-Income Trust®
Investment portfolio
September 30, 2016
Bonds, notes & other debt instruments 91.25%
Corporate bonds & notes 89.89%
Energy 14.62% | Principal amount
(000) | Value
(000) |
| American Energy (Marcellus), Term Loan A, 8.50% 20211,2,3 | $33,833 | $2,918 |
| American Energy (Marcellus), Term Loan B, 5.25% 20201,2,3 | 47,750 | 26,501 |
| American Energy (Permian Basin) 7.125% 20204 | 45,960 | 32,747 |
| American Energy (Permian Basin) 7.375% 20214 | 12,305 | 8,767 |
| Antero Resources Corp. 5.375% 20244 | 24,665 | 25,035 |
| Ascent Resources Utica, LLC, 15.00% 20191,2,3,5,6 | 12,399 | 4,712 |
| Baytex Energy Corp. 5.125% 20214 | 6,450 | 5,402 |
| Blue Racer Midstream LLC / Blue Racer Finance Corp. 6.125% 20224 | 71,520 | 70,268 |
| California Resources Corp., Term Loan B1, 11.375% 20211,2,3 | 9,525 | 10,029 |
| Cheniere Energy, Inc. 7.00% 20244 | 16,110 | 17,479 |
| Chesapeake Energy Corp. 3.930% 20193 | 48,975 | 46,036 |
| Chesapeake Energy Corp. 4.875% 2022 | 30,425 | 25,709 |
| Chesapeake Energy Corp. 8.00% 20224 | 11,558 | 11,731 |
| Chesapeake Energy Corp., Term Loan, 8.50% 20211,2,3 | 28,000 | 29,414 |
| Concho Resources Inc. 5.50% 2023 | 9,650 | 10,000 |
| CONSOL Energy Inc. 5.875% 2022 | 79,212 | 73,271 |
| DCP Midstream Operating LP 4.95% 2022 | 31,458 | 32,205 |
| DCP Midstream Operating LP 3.875% 2023 | 15,265 | 14,654 |
| Denbury Resources Inc. 9.00% 20214 | 14,920 | 15,703 |
| Diamond Offshore Drilling, Inc. 4.875% 2043 | 14,960 | 10,467 |
| Ecopetrol SA 5.875% 2045 | 10,350 | 9,574 |
| Enbridge Energy Partners, LP 4.375% 2020 | 5,830 | 6,155 |
| Enbridge Energy Partners, LP 5.875% 2025 | 6,035 | 6,954 |
| Enbridge Energy Partners, LP 7.375% 2045 | 26,100 | 33,184 |
| Energy Transfer Partners, LP 7.50% 2020 | 28,440 | 31,355 |
| Energy Transfer Partners, LP 5.875% 2024 | 26,915 | 28,059 |
| Energy Transfer Partners, LP 4.75% 2026 | 3,400 | 3,521 |
| Energy Transfer Partners, LP 5.50% 2027 | 31,051 | 31,051 |
| EnLink Midstream Partners, LP 5.05% 2045 | 6,020 | 5,360 |
| Ensco PLC 5.75% 2044 | 29,320 | 18,052 |
| EP Energy Corp. 9.375% 2020 | 18,250 | 13,049 |
| EP Energy Corp. 6.375% 2023 | 4,400 | 2,640 |
| Extraction Oil & Gas Holdings LLC 7.875% 20214 | 29,625 | 30,884 |
| Genesis Energy, LP 6.75% 2022 | 20,100 | 20,811 |
| Holly Energy Partners, LP 6.00% 20244 | 15,815 | 16,448 |
| Jupiter Resources Inc. 8.50% 20224 | 40,850 | 34,518 |
| Kinder Morgan Energy Partners, LP 5.40% 2044 | 325 | 328 |
| Kinder Morgan, Inc. 4.30% 2025 | 9,375 | 9,766 |
| Kinder Morgan, Inc. 5.55% 2045 | 10,721 | 11,063 |
| Laredo Petroleum, Inc. 5.625% 2022 | 4,825 | 4,704 |
| Laredo Petroleum, Inc. 7.375% 2022 | 8,450 | 8,777 |
| Magellan Midstream Partners, LP 4.25% 2046 | 11,010 | 10,999 |
| Matador Resources Co. 6.875% 2023 | 725 | 754 |
| MPLX LP 4.50% 2023 | 3,500 | 3,575 |
| Murphy Oil Corp. 6.875% 2024 | 18,625 | 19,283 |
| Murray Energy Corp., Term Loan B1, 7.75% 20171,2,3 | 5,699 | 5,521 |
American High-Income Trust — Page 1 of 20
Bonds, notes & other debt instruments
Corporate bonds & notes (continued)
Energy (continued) | Principal amount
(000) | Value
(000) |
| Newfield Exploration Co. 5.625% 2024 | $6,300 | $6,489 |
| NGL Energy Partners LP 5.125% 2019 | 16,050 | 15,167 |
| NGL Energy Partners LP 6.875% 2021 | 52,707 | 50,203 |
| NGPL PipeCo LLC 7.119% 20174 | 148,860 | 156,303 |
| NGPL PipeCo LLC 9.625% 20194 | 99,015 | 104,585 |
| NGPL PipeCo LLC 7.768% 20374 | 19,880 | 21,669 |
| NGPL PipeCo LLC, Term Loan B, 6.75% 20171,2,3 | 1,625 | 1,627 |
| Noble Corp. PLC 5.25% 2018 | 375 | 370 |
| Noble Corp. PLC 7.20% 2025 | 18,435 | 14,610 |
| Noble Corp. PLC 8.20% 2045 | 20,290 | 14,482 |
| Oasis Petroleum Inc. 6.50% 2021 | 2,750 | 2,640 |
| Odebrecht Drilling Norbe VIII/IX Ltd 6.35% 20212,4 | 4,740 | 1,493 |
| Odebrecht Offshore Drilling Finance Ltd. 6.75% 20222,4 | 10,493 | 2,046 |
| ONEOK, Inc. 4.25% 2022 | 11,300 | 11,131 |
| ONEOK, Inc. 7.50% 2023 | 9,475 | 10,636 |
| Parsley Energy, Inc. 6.25% 20244 | 2,550 | 2,646 |
| PBF Energy Inc. 7.00% 20234 | 9,050 | 8,575 |
| PDC Energy Inc. 7.75% 2022 | 66,275 | 71,080 |
| Peabody Energy Corp. 6.00% 20187 | 175,200 | 42,486 |
| Peabody Energy Corp. 6.50% 20207 | 5,500 | 1,334 |
| Peabody Energy Corp. 6.25% 20217 | 50,065 | 12,141 |
| Peabody Energy Corp., Term Loan, 10.00% 20171,2,3 | 8,000 | 8,400 |
| Petrobras Global Finance Co. 3.00% 2019 | 21,658 | 21,279 |
| Petrobras Global Finance Co. 8.375% 2021 | 21,360 | 23,458 |
| Petrobras Global Finance Co. 6.25% 2024 | 3,715 | 3,641 |
| Petrobras Global Finance Co. 8.75% 2026 | 13,100 | 14,508 |
| Petrobras Global Finance Co. 6.85% 2115 | 11,500 | 9,787 |
| Petrobras International Finance Co. 5.75% 2020 | 25,705 | 26,553 |
| Petróleos Mexicanos 4.625% 20234 | 12,000 | 12,074 |
| Petróleos Mexicanos 6.875% 20264 | 13,275 | 15,000 |
| QGOG Atlantic/Alaskan Rigs Ltd. 5.25% 20192,4 | 2,950 | 2,581 |
| QGOG Constellation SA 6.25% 20194 | 90,420 | 41,593 |
| Range Resources Corp. 5.00% 20234 | 9,950 | 9,776 |
| Range Resources Corp. 4.875% 2025 | 19,275 | 18,600 |
| Regency Energy Partners LP and Regency Energy Finance Corp. 6.50% 2021 | 27,065 | 28,009 |
| Regency Energy Partners LP and Regency Energy Finance Corp. 5.00% 2022 | 1,935 | 2,045 |
| Regency Energy Partners LP and Regency Energy Finance Corp. 5.50% 2023 | 15,225 | 15,735 |
| Rice Energy Inc. 6.25% 2022 | 8,600 | 8,923 |
| Rice Energy Inc. 7.25% 2023 | 7,525 | 8,089 |
| Sabine Pass Liquefaction, LLC 5.625% 2021 | 65,825 | 70,350 |
| Sabine Pass Liquefaction, LLC 5.75% 2024 | 41,590 | 44,969 |
| Sabine Pass Liquefaction, LLC 5.625% 2025 | 37,850 | 40,831 |
| Sabine Pass Liquefaction, LLC 5.00% 20274 | 42,440 | 43,607 |
| Sabine Pass LNG, LP 7.50% 2016 | 1,500 | 1,513 |
| Sabine Pass LNG, LP 6.50% 2020 | 1,500 | 1,553 |
| Sabine Pass LNG, LP 5.875% 20264 | 3,350 | 3,654 |
| Seven Generations Energy Ltd. 6.75% 20234 | 18,775 | 19,573 |
| SM Energy Co. 5.625% 2025 | 33,350 | 31,516 |
| SM Energy Co. 6.75% 2026 | 6,000 | 6,071 |
| Southwestern Energy Co. 4.10% 2022 | 38,175 | 34,835 |
| Southwestern Energy Co. 6.70% 2025 | 14,945 | 15,001 |
| Sunoco LP 5.50% 20204 | 13,600 | 13,719 |
| Sunoco LP 6.25% 20214 | 38,190 | 39,431 |
| Tallgrass Energy Partners, LP 5.50% 20244 | 9,225 | 9,317 |
American High-Income Trust — Page 2 of 20
Bonds, notes & other debt instruments
Corporate bonds & notes (continued)
Energy (continued) | Principal amount
(000) | Value
(000) |
| Targa Resources Corp. 4.125% 2019 | $29,385 | $29,943 |
| Targa Resources Corp. 5.125% 20254 | 16,150 | 16,211 |
| Targa Resources Partners LP 6.75% 2024 | 15,000 | 16,125 |
| Targa Resources Partners LP 5.375% 20274 | 16,150 | 16,291 |
| Teekay Corp. 8.50% 2020 | 103,630 | 90,158 |
| Tesoro Logistics LP 5.50% 2019 | 20,360 | 21,785 |
| Tesoro Logistics LP 6.125% 2021 | 2,400 | 2,511 |
| Tesoro Logistics LP 6.25% 2022 | 8,535 | 9,154 |
| Tesoro Logistics LP 6.375% 2024 | 10,320 | 11,120 |
| TransCanada PipeLines Ltd., junior subordinated 6.35% 2067 | 10,295 | 8,215 |
| Transocean Inc. 3.75% 2017 | 825 | 833 |
| Transocean Inc. 8.125% 2021 | 14,800 | 14,208 |
| Transocean Inc. 9.00% 20234 | 42,875 | 41,910 |
| Weatherford International PLC 7.75% 2021 | 13,450 | 13,366 |
| Weatherford International PLC 4.50% 2022 | 23,980 | 20,383 |
| Weatherford International PLC 8.25% 2023 | 46,550 | 46,201 |
| Weatherford International PLC 6.75% 2040 | 22,370 | 16,098 |
| Williams Companies, Inc. 3.70% 2023 | 28,710 | 27,992 |
| Williams Partners LP 3.60% 2022 | 2,795 | 2,847 |
| YPF Sociedad Anónima 8.50% 20214 | 19,650 | 21,979 |
| | | 2,464,467 |
| Health care 13.89% | | |
| Alere Inc. 6.50% 2020 | 4,340 | 4,362 |
| AMN Healthcare Services, Inc. 5.125% 20244 | 9,125 | 9,239 |
| Centene Corp. 5.75% 2017 | 9,345 | 9,590 |
| Centene Corp. 5.625% 2021 | 46,195 | 49,198 |
| Centene Corp. 4.75% 2022 | 62,200 | 64,532 |
| Centene Corp. 6.125% 2024 | 38,594 | 41,971 |
| Community Health Systems Inc. 5.125% 2021 | 9,935 | 9,860 |
| Concordia Healthcare Corp., Term Loan B, 5.25% 20211,2,3 | 5,692 | 5,114 |
| Concordia Healthcare Corp. 9.50% 20224 | 52,927 | 36,917 |
| Concordia Healthcare Corp. 7.00% 20234 | 18,588 | 11,989 |
| ConvaTec Finance International SA 8.25% 20194,6 | 25,175 | 25,150 |
| DaVita HealthCare Partners Inc. 5.125% 2024 | 7,840 | 8,011 |
| DaVita HealthCare Partners Inc. 5.00% 2025 | 16,675 | 16,779 |
| DJO Finance LLC 10.75% 20204 | 35,043 | 29,261 |
| DJO Finco Inc. 8.125% 20214 | 49,495 | 46,154 |
| Endo Finance LLC & Endo Finco Inc. 6.00% 20234 | 18,865 | 17,261 |
| Endo Pharmaceuticals Holdings Inc. 5.75% 20224 | 12,035 | 11,223 |
| Fresenius Medical Care AG & Co. KGAA 5.875% 20224 | 6,850 | 7,792 |
| HCA Inc. 3.75% 2019 | 11,563 | 11,953 |
| HCA Inc. 6.50% 2020 | 32,125 | 35,659 |
| HCA Inc. 4.75% 2023 | 2,160 | 2,257 |
| HCA Inc. 5.00% 2024 | 19,010 | 20,198 |
| HCA Inc. 5.375% 2025 | 3,750 | 3,877 |
| HCA Inc. 5.25% 2026 | 24,500 | 26,092 |
| HCA Inc. 5.875% 2026 | 12,000 | 12,810 |
| HCA Inc. 4.50% 2027 | 14,500 | 14,591 |
| Healthsouth Corp. 5.75% 2024 | 8,675 | 9,027 |
| Healthsouth Corp. 5.75% 2025 | 29,665 | 31,074 |
| Hologic, Inc. 5.25% 20224 | 9,360 | 9,968 |
| IMS Health Holdings, Inc. 5.00% 20264 | 24,215 | 25,244 |
| inVentiv Health, Inc. 9.00% 20184 | 131,769 | 135,557 |
American High-Income Trust — Page 3 of 20
Bonds, notes & other debt instruments
Corporate bonds & notes (continued)
Health care (continued) | Principal amount
(000) | Value
(000) |
| inVentiv Health, Inc. 10.00% 20184,6 | $94,620 | $97,265 |
| inVentiv Health, Inc. 10.00% 2018 | 55,558 | 55,697 |
| inVentiv Health, Inc. 10.00% 2018 | 23,933 | 23,993 |
| inVentiv Health, Inc. 7.50% 20244 | 54,525 | 55,684 |
| inVentiv Health, Inc., Term Loan B, 4.75% 20231,2,3 | 25,992 | 26,045 |
| inVentiv Health, Inc., Term Loan B4, 7.75% 20181,2,3 | 26,930 | 27,014 |
| Jaguar Holding Co. 6.375% 20234 | 11,600 | 12,093 |
| Kindred Healthcare, Inc. 8.00% 2020 | 22,950 | 23,466 |
| Kindred Healthcare, Inc. 8.75% 2023 | 14,911 | 14,967 |
| Kinetic Concepts, Inc. 10.50% 2018 | 170,455 | 179,233 |
| Kinetic Concepts, Inc. 12.50% 2019 | 133,632 | 133,298 |
| Kinetic Concepts, Inc. 7.875% 20214 | 17,765 | 19,275 |
| Kinetic Concepts, Inc. 9.625% 20214 | 149,230 | 149,603 |
| LifePoint Health, Inc. 5.375% 20244 | 3,200 | 3,208 |
| Mallinckrodt PLC 4.875% 20204 | 29,510 | 30,248 |
| Mallinckrodt PLC 5.75% 20224 | 5,345 | 5,298 |
| Mallinckrodt PLC 5.625% 20234 | 11,986 | 11,537 |
| MEDNAX, Inc. 5.25% 20234 | 3,780 | 3,983 |
| Molina Healthcare, Inc. 5.375% 2022 | 62,097 | 64,426 |
| Ortho-Clinical Diagnostics Inc., Term Loan B, 4.75% 20211,2,3 | 30,842 | 30,296 |
| Prestige Brands International Inc. 6.375% 20244 | 14,010 | 14,956 |
| Quintiles Transnational Corp. 4.875% 20234 | 21,100 | 21,786 |
| RegionalCare Hospital Partners Holdings, Inc. 8.25% 20234 | 22,575 | 23,365 |
| Rotech Healthcare Inc., Term Loan, 13.00% 20201,2,3,5,6,8 | 61,149 | 55,825 |
| Rotech Healthcare Inc., Term Loan A, 5.50% 20181,2,3,5,8 | 25,123 | 24,997 |
| Rotech Healthcare Inc., Term Loan B, 10.00% 20191,2,3,5,8 | 20,825 | 20,721 |
| Teleflex Inc. 4.875% 2026 | 16,600 | 17,222 |
| Tenet Healthcare Corp. 4.375% 2021 | 10,768 | 10,768 |
| Tenet Healthcare Corp. 8.125% 2022 | 9,535 | 9,583 |
| Tenet Healthcare Corp. 6.75% 2023 | 24,980 | 23,294 |
| Tenet Healthcare Corp., First Lien, 6.25% 2018 | 3,000 | 3,218 |
| Tenet Healthcare Corp., First Lien, 4.75% 2020 | 17,095 | 17,437 |
| Tenet Healthcare Corp., First Lien, 6.00% 2020 | 55,740 | 59,084 |
| Tenet Healthcare Corp., First Lien, 4.50% 2021 | 32,730 | 33,098 |
| Valeant Pharmaceuticals International Inc. 7.00% 20204 | 2,155 | 2,112 |
| Valeant Pharmaceuticals International Inc. 5.50% 20234 | 13,975 | 12,018 |
| Vizient Inc. 10.375% 20244 | 10,015 | 11,517 |
| VPI Escrow Corp. 6.75% 20184 | 66,000 | 66,660 |
| VPI Escrow Corp. 6.375% 20204 | 82,281 | 77,550 |
| VPI Escrow Corp. 7.50% 20214 | 32,320 | 31,391 |
| VRX Escrow Corp. 5.375% 20204 | 34,375 | 31,969 |
| VRX Escrow Corp. 5.875% 20234 | 12,815 | 11,142 |
| VRX Escrow Corp. 6.125% 20254 | 61,125 | 52,797 |
| | | 2,341,849 |
| Consumer discretionary 11.89% | | |
| Adient Global Holdings Ltd. 3.50% 2024 | €8,435 | 9,482 |
| Adient Global Holdings Ltd. 4.875% 20264 | $4,710 | 4,722 |
| Boyd Gaming Corp. 6.875% 2023 | 6,075 | 6,624 |
| Boyd Gaming Corp. 6.375% 20264 | 18,675 | 20,122 |
| Brinker International, Inc. 5.00% 20244 | 8,600 | 8,732 |
| Burger King Corp. 6.00% 20224 | 40,675 | 42,709 |
| Cablevision Systems Corp. 7.75% 2018 | 16,850 | 17,903 |
| Cablevision Systems Corp. 6.75% 2021 | 32,200 | 34,132 |
American High-Income Trust — Page 4 of 20
Bonds, notes & other debt instruments
Corporate bonds & notes (continued)
Consumer discretionary (continued) | Principal amount
(000) | Value
(000) |
| Cablevision Systems Corp. 5.50% 20274 | $20,600 | $21,115 |
| CBS Outdoor Americas Inc. 5.25% 2022 | 10,800 | 11,273 |
| CCO Holdings LLC and CCO Holdings Capital Corp. 6.625% 2022 | 4,500 | 4,725 |
| CCO Holdings LLC and CCO Holdings Capital Corp. 5.875% 20244 | 5,000 | 5,347 |
| CCO Holdings LLC and CCO Holdings Capital Corp. 4.908% 20254 | 7,000 | 7,741 |
| CCO Holdings LLC and CCO Holdings Capital Corp. 5.375% 20254 | 9,600 | 10,092 |
| CCO Holdings LLC and CCO Holdings Capital Corp. 5.50% 20264 | 14,575 | 15,304 |
| CCO Holdings LLC and CCO Holdings Capital Corp. 5.75% 20264 | 70,575 | 74,986 |
| Cedar Fair, LP 5.375% 2024 | 8,440 | 8,946 |
| Cengage Learning Acquisitions, Inc., Term Loan B, 5.25% 20231,2,3 | 23,492 | 23,513 |
| Cengage Learning Acquisitions, Inc. 9.50% 20244 | 2,825 | 2,882 |
| Clear Channel Worldwide Holdings, Inc. 7.625% 2020 | 130,644 | 130,154 |
| Cumulus Media Holdings Inc. 7.75% 2019 | 65,114 | 26,697 |
| Cumulus Media Inc., Term Loan B, 4.25% 20201,2,3 | 24,265 | 17,046 |
| Delta 2 (Formula One), Term Loan B, 7.75% 20221,2,3 | 11,200 | 11,253 |
| DISH DBS Corp. 4.625% 2017 | 2,500 | 2,550 |
| DISH DBS Corp. 4.25% 2018 | 23,150 | 23,787 |
| DISH DBS Corp. 7.875% 2019 | 9,550 | 10,720 |
| DISH DBS Corp. 5.875% 2022 | 7,350 | 7,589 |
| DISH DBS Corp. 7.75% 20264 | 9,625 | 10,251 |
| Dollar Tree Inc. 5.25% 2020 | 6,925 | 7,219 |
| Dollar Tree Inc. 5.75% 2023 | 19,525 | 21,111 |
| Gannett Co., Inc. 5.125% 2019 | 14,885 | 15,294 |
| Gannett Co., Inc. 4.875% 20214 | 5,890 | 6,140 |
| Gannett Co., Inc. 5.50% 20244 | 1,365 | 1,414 |
| General Motors Co. 4.00% 2025 | 2,300 | 2,357 |
| General Motors Financial Co. 5.25% 2026 | 1,280 | 1,404 |
| Goodyear Tire & Rubber Co. 5.00% 2026 | 7,735 | 7,957 |
| Hilton Worldwide Finance LLC 5.625% 2021 | 13,790 | 14,205 |
| Hilton Worldwide Holdings Inc. 4.25% 20244 | 8,975 | 9,199 |
| Hilton Worldwide, Term Loan B, 3.50% 20201,2,3 | 840 | 845 |
| Hilton Worldwide, Term Loan B, 3.025% 20231,2,3 | 8,589 | 8,663 |
| iHeartCommunications, Inc. 9.00% 2019 | 1,900 | 1,511 |
| iHeartCommunications, Inc. 10.625% 2023 | 19,255 | 14,441 |
| iHeartCommunications, Inc., Term Loan D, 7.27% 20191,2,3 | 19,200 | 14,788 |
| International Game Technology 6.25% 20224 | 9,500 | 10,159 |
| Lamar Media Corp. 5.75% 2026 | 550 | 595 |
| Landry’s, Inc. 6.75% 20244 | 12,350 | 12,597 |
| Landry’s, Inc., Term Loan B, 4.00% 20231,2,3 | 8,900 | 8,956 |
| Lear Corp., 5.25% 2025 | 1,900 | 2,071 |
| Limited Brands, Inc. 6.625% 2021 | 20,976 | 24,280 |
| Limited Brands, Inc. 6.875% 2035 | 28,300 | 30,988 |
| McClatchy Co. 9.00% 2022 | 30,100 | 31,078 |
| McGraw-Hill Global Education Holdings, LLC, Term Loan B, 5.00% 20221,2,3 | 17,192 | 17,304 |
| McGraw-Hill Global Education Holdings, LLC 7.875% 20244 | 13,100 | 14,197 |
| MDC Partners Inc. 6.50% 20244 | 7,575 | 6,988 |
| Mediacom Broadband LLC and Mediacom Broadband Corp. 5.50% 2021 | 10,500 | 10,907 |
| Mediacom Broadband LLC and Mediacom Broadband Corp. 6.375% 2023 | 14,600 | 15,476 |
| Mediacom LLC and Mediacom Capital Corp. 7.25% 2022 | 10,300 | 10,828 |
| Melco Crown Entertainment Ltd. 5.00% 20214 | 8,575 | 8,641 |
| MGM Growth Properties LLC 5.625% 20244 | 12,275 | 13,345 |
| MGM Resorts International 8.625% 2019 | 6,275 | 7,106 |
| MGM Resorts International 6.75% 2020 | 2,900 | 3,263 |
| MGM Resorts International 7.75% 2022 | 8,950 | 10,404 |
American High-Income Trust — Page 5 of 20
Bonds, notes & other debt instruments
Corporate bonds & notes (continued)
Consumer discretionary (continued) | Principal amount
(000) | Value
(000) |
| MGM Resorts International 6.00% 2023 | $31,775 | $34,555 |
| Michaels Stores, Inc. 5.875% 20204 | 12,585 | 13,073 |
| Mohegan Tribal Gaming Authority 11.00% 20184,6 | 5,195 | 5,221 |
| Mohegan Tribal Gaming Authority 7.875% 20244 | 11,500 | 11,543 |
| Mohegan Tribal Gaming Authority, Term Loan B, 5.50% 20231,2,3 | 15,505 | 15,350 |
| NBC Universal Enterprise, Inc. 5.25% 20494 | 23,885 | 25,557 |
| NCL Corp. Ltd. 5.25% 20194 | 10,262 | 10,416 |
| Needle Merger Sub Corp. 8.125% 20194 | 70,820 | 70,997 |
| Neiman Marcus Group LTD Inc. 8.00% 20214 | 43,945 | 36,694 |
| Neiman Marcus Group LTD Inc. 8.75% 20214,6 | 59,055 | 46,949 |
| Neiman Marcus, Term Loan B, 4.25% 20201,2,3 | 67,446 | 62,520 |
| Netflix, Inc. 5.75% 2024 | 6,650 | 7,182 |
| Newell Rubbermaid Inc. 5.00% 20234 | 4,560 | 4,858 |
| PETCO Animal Supplies, Inc., Term Loan B-1, 5.00% 20231,2,3 | 5,672 | 5,731 |
| PETsMART, Inc. 7.125% 20234 | 65,050 | 68,465 |
| Pinnacle Entertainment, Inc. 5.625% 20244 | 1,200 | 1,209 |
| Playa Resorts Holding BV 8.00% 20204 | 63,074 | 64,651 |
| Playa Resorts Holding BV, Term Loan B, 4.00% 20191,2,3 | 5,652 | 5,670 |
| Rivers Pittsburgh Borrower LP/Rivers Pittsburgh Finance Corp. 6.125% 20214 | 17,900 | 18,527 |
| Sally Holdings LLC and Sally Capital Inc. 5.75% 2022 | 7,250 | 7,594 |
| Sally Holdings LLC and Sally Capital Inc. 5.625% 2025 | 17,270 | 18,673 |
| Schaeffler Finance BV 4.25% 20214 | 5,680 | 5,850 |
| Schaeffler Finance BV 4.75% 20214 | 1,390 | 1,443 |
| Schaeffler Holding Finance BV 7.625% 20184,6 | 802 | 819 |
| Schaeffler Holding Finance BV 6.25% 20194,6 | 4,000 | 4,155 |
| Schaeffler Verwaltungs 4.125% 20214,6 | 2,650 | 2,683 |
| Schaeffler Verwaltungs 4.50% 20234,6 | 21,710 | 21,968 |
| Schaeffler Verwaltungs 4.75% 20264,6 | 19,365 | 19,510 |
| Sotheby’s Holdings, Inc. 5.25% 20224 | 16,025 | 15,985 |
| Standard Pacific Corp. 8.375% 2021 | 9,640 | 11,496 |
| Tenneco Inc. 5.00% 2026 | 11,050 | 11,230 |
| TI Automotive Ltd. 8.75% 20234 | 38,065 | 41,586 |
| Tribune Media Co. 5.875% 2022 | 14,195 | 14,435 |
| Uber Technologies, Inc. 5.00% 20231,2,3 | 39,700 | 39,779 |
| Univision Communications Inc. 8.50% 20214 | 13,937 | 14,429 |
| Univision Communications Inc. 6.75% 20224 | 16,098 | 17,144 |
| Univision Communications Inc. 5.125% 20234 | 14,590 | 14,845 |
| Univision Communications Inc. 5.125% 20254 | 20,450 | 20,654 |
| Univision Communications Inc., Term Loan C3, 4.00% 20201,2,3 | 1,491 | 1,494 |
| Warner Music Group 6.00% 20214 | 10,000 | 10,400 |
| Warner Music Group 5.625% 20224 | 20,700 | 21,502 |
| Warner Music Group 6.75% 20224 | 15,900 | 16,934 |
| Warner Music Group 5.00% 20234 | 16,410 | 16,697 |
| Wynn Las Vegas, LLC and Wynn Capital Corp. 5.375% 2022 | 15,150 | 15,737 |
| Wynn Las Vegas, LLC and Wynn Capital Corp. 4.25% 20234 | 12,625 | 12,167 |
| Wynn Las Vegas, LLC and Wynn Capital Corp. 5.50% 20254 | 34,730 | 35,121 |
| Wynn Macau, Ltd. 5.25% 20214 | 58,000 | 58,870 |
| YUM! Brands, Inc. 5.00% 20244 | 21,105 | 22,107 |
| YUM! Brands, Inc. 5.25% 20264 | 2,825 | 2,995 |
| ZF Friedrichshafen AG 4.00% 20204 | 2,935 | 3,126 |
| ZF Friedrichshafen AG 4.50% 20224 | 23,175 | 24,594 |
| ZF Friedrichshafen AG 4.75% 20254 | 31,515 | 33,209 |
| | | 2,004,527 |
American High-Income Trust — Page 6 of 20
Bonds, notes & other debt instruments
Corporate bonds & notes (continued)
Telecommunication services 11.80% | Principal amount
(000) | Value
(000) |
| Altice Financing SA 6.625% 20234 | $18,460 | $19,014 |
| Altice Finco SA 9.875% 20204 | 4,350 | 4,638 |
| Altice Finco SA 6.50% 20224 | 625 | 662 |
| Altice Finco SA, First Lien, 7.75% 20224 | 3,675 | 3,937 |
| Altice NV 5.50% 20264 | 16,175 | 16,741 |
| Altice NV 7.50% 20264 | 5,000 | 5,219 |
| CenturyLink, Inc. 7.50% 2024 | 38,620 | 41,323 |
| CenturyLink, Inc. 5.625% 2025 | 7,100 | 6,825 |
| CenturyLink, Inc., Series T, 5.80% 2022 | 1,330 | 1,368 |
| Cequel Communications Holdings I, LLC and Cequel Capital Corp. 6.375% 20204 | 103,960 | 107,469 |
| Cincinnati Bell Inc. 7.00% 20244 | 8,500 | 8,734 |
| Clearwire Communications and Clearwire Finance, Inc. 14.75% 20164 | 3,125 | 3,188 |
| Columbus International Inc. 7.375% 20214 | 11,925 | 12,697 |
| Digicel Group Ltd. 8.25% 20204 | 73,500 | 64,221 |
| Digicel Group Ltd. 6.00% 20214 | 36,125 | 32,332 |
| Digicel Group Ltd. 7.125% 20224 | 26,550 | 20,568 |
| Frontier Communications Corp. 8.50% 2020 | 10,000 | 10,850 |
| Frontier Communications Corp. 8.875% 2020 | 25,300 | 27,387 |
| Frontier Communications Corp. 9.25% 2021 | 11,175 | 12,083 |
| Frontier Communications Corp. 8.75% 2022 | 1,150 | 1,179 |
| Frontier Communications Corp. 10.50% 2022 | 100,635 | 107,050 |
| Frontier Communications Corp. 7.625% 2024 | 4,923 | 4,628 |
| Frontier Communications Corp. 11.00% 2025 | 101,037 | 105,710 |
| Inmarsat PLC 4.875% 20224 | 25,090 | 23,961 |
| Inmarsat PLC 6.50% 20244 | 22,675 | 22,760 |
| Intelsat Jackson Holding Co. 7.25% 2019 | 60,400 | 48,924 |
| Intelsat Jackson Holding Co. 7.25% 2020 | 45,975 | 35,860 |
| Level 3 Communications, Inc. 5.125% 2023 | 14,225 | 14,705 |
| Ligado Networks, Term Loan, 9.75% 20201,2,3,6 | 148,144 | 134,251 |
| MetroPCS Wireless, Inc. 6.25% 2021 | 54,060 | 56,932 |
| MetroPCS Wireless, Inc. 6.625% 2023 | 70,985 | 76,486 |
| Neptune Finco Corp. (Altice NV) 10.125% 20234 | 12,350 | 14,280 |
| Neptune Finco Corp. (Altice NV) 6.625% 20254 | 9,800 | 10,657 |
| Numericable Group SA 6.00% 20224 | 7,965 | 8,154 |
| Numericable Group SA 7.375% 20264 | 21,475 | 21,978 |
| Sable International Finance Ltd. 6.875% 20224 | 13,295 | 13,860 |
| SBA Communications Corp. 5.625% 2019 | 1,675 | 1,722 |
| SBA Communications Corp. 4.875% 20244 | 23,000 | 23,230 |
| SoftBank Corp. 4.50% 20204 | 59,300 | 61,524 |
| Sprint Capital Corp. 6.90% 2019 | 31,750 | 33,020 |
| Sprint Nextel Corp. 8.375% 2017 | 4,425 | 4,608 |
| Sprint Nextel Corp. 9.00% 20184 | 26,050 | 28,818 |
| Sprint Nextel Corp. 7.00% 2020 | 66,870 | 67,539 |
| Sprint Nextel Corp. 7.25% 2021 | 48,545 | 49,030 |
| Sprint Nextel Corp. 11.50% 2021 | 68,835 | 79,504 |
| Sprint Nextel Corp. 7.875% 2023 | 39,900 | 40,498 |
| Sprint Nextel Corp. 6.875% 2028 | 4,675 | 4,424 |
| T-Mobile US, Inc. 6.542% 2020 | 16,000 | 16,560 |
| T-Mobile US, Inc. 6.731% 2022 | 37,840 | 39,874 |
| T-Mobile US, Inc. 6.00% 2024 | 5,500 | 5,899 |
| T-Mobile US, Inc. 6.375% 2025 | 26,800 | 29,212 |
| T-Mobile US, Inc. 6.50% 2026 | 31,025 | 34,477 |
| Trilogy International Partners, LLC 13.375% 20194 | 60,475 | 60,702 |
| Wind Acquisition SA 4.75% 20204 | 62,875 | 63,975 |
American High-Income Trust — Page 7 of 20
Bonds, notes & other debt instruments
Corporate bonds & notes (continued)
Telecommunication services (continued) | Principal amount
(000) | Value
(000) |
| Wind Acquisition SA 7.375% 20214 | $112,375 | $117,853 |
| Windstream Holdings, Inc. 7.75% 2021 | 59,177 | 59,177 |
| Zayo Group Holdings, Inc. 6.00% 2023 | 22,600 | 23,786 |
| Zayo Group Holdings, Inc. 6.375% 2025 | 12,550 | 13,413 |
| Ziggo Bond Finance BV 5.50% 20274 | 30,250 | 30,250 |
| | | 1,989,726 |
| Industrials 11.62% | | |
| ADS Waste Escrow 8.25% 2020 | 6,050 | 6,360 |
| ADT Corp. 3.50% 2022 | 29,125 | 28,178 |
| AerCap Holdings NV 2.75% 2017 | 5,603 | 5,633 |
| AerCap Holdings NV 3.75% 2019 | 5,200 | 5,324 |
| Aircastle Ltd. 5.00% 2023 | 14,825 | 15,529 |
| Allison Transmission Holdings, Inc. 5.00% 20244 | 23,025 | 23,610 |
| American Airlines, Inc., 5.50% 20194 | 23,900 | 24,916 |
| ABC Supply Co., Inc. 5.625% 20214 | 1,500 | 1,560 |
| American Builders & Contractors Supply Co. Inc. 5.75% 20234 | 19,350 | 20,172 |
| ARAMARK Corp. 5.75% 2020 | 1,124 | 1,156 |
| ARAMARK Corp. 5.125% 20244 | 6,500 | 6,776 |
| ARAMARK Corp. 5.125% 2024 | 5,900 | 6,151 |
| ARAMARK Corp. 4.75% 20264 | 3,825 | 3,854 |
| Associated Materials, LLC and AMH New Finance, Inc. 9.125% 2017 | 170,417 | 161,470 |
| Avianca Holdings SA, 8.375% 20204 | 5,825 | 5,577 |
| Bombardier Inc. 7.75% 20204 | 6,090 | 6,254 |
| Brunswick Rail Finance Ltd. 6.50% 2017 | 29,251 | 15,576 |
| Brunswick Rail Finance Ltd. 6.50% 20174 | 9,651 | 5,139 |
| Builders Firstsource, Inc. 10.75% 20234 | 33,315 | 38,396 |
| Builders FirstSource, Inc. 5.625% 20244 | 71,575 | 73,722 |
| CEVA Group PLC 7.00% 20214,8 | 1,400 | 1,141 |
| CEVA Group PLC 9.00% 20214,8 | 14,675 | 9,539 |
| CEVA Group PLC, Apollo Global Securities LLC LOC, 5.969% 20211,2,3,8 | 13,311 | 10,711 |
| CEVA Logistics Canada, ULC, Term Loan, 6.50% 20211,2,3,8 | 2,362 | 1,901 |
| CEVA Logistics Holdings BV, Term Loan, 6.50% 20211,2,3,8 | 13,689 | 11,016 |
| CEVA Logistics U.S. Holdings Inc., Term Loan B, 6.50% 20211,2,3,8 | 18,876 | 15,189 |
| Cloud Crane LLC, 10.125% 20244 | 10,865 | 11,300 |
| Constellis Holdings 9.75% 20204 | 8,300 | 8,196 |
| Continental Airlines, Inc., Series 1998-1, Class B, 6.748% 20182 | 2,777 | 2,843 |
| Continental Airlines, Inc., Series 1997-4B, Class B, 6.90% 20182 | 176 | 179 |
| Continental Airlines, Inc., Series 1997-4, Class A, 6.90% 20192 | 663 | 674 |
| Continental Airlines, Inc., Series 2000-2, Class B, 8.307% 20192 | 170 | 181 |
| Continental Airlines, Inc., Series 1999-1, Class A, 6.545% 20202 | 2,000 | 2,118 |
| Continental Airlines, Inc., Series 2001-1, Class A1, 6.703% 20222 | 1,938 | 2,078 |
| Continental Airlines, Inc., Series 2007-1, Class B, 6.903% 20222 | 2,401 | 2,547 |
| Continental Airlines, Inc., Series 2000-2, Class A-1, 7.707% 20222 | 1,654 | 1,802 |
| Continental Airlines, Inc., Series 2000-1, Class A1, 8.048% 20222 | 149 | 167 |
| Continental Airlines, Inc., Series 2000-1, Class B, 8.388% 20222 | 80 | 83 |
| Corporate Risk Holdings LLC 9.50% 20194,8 | 137,693 | 133,562 |
| Corporate Risk Holdings LLC 11.50% 20204,5,6,8 | 14,705 | 15,470 |
| Covanta Holding Corp. 5.875% 2024 | 7,500 | 7,556 |
| DAE Aviation Holdings, Inc. 10.00% 20234 | 106,405 | 114,651 |
| Deck Chassis Acquisition Inc. 10.00% 20234 | 65,260 | 68,686 |
| Delta Air Lines, Inc., Series 2002-1, Class G1, MBIA insured, 6.718% 20242 | 7,183 | 8,296 |
| Eletson Holdings Inc. 9.625% 20224 | 8,800 | 6,292 |
| Euramax International, Inc. 12.00% 20204 | 43,400 | 44,593 |
American High-Income Trust — Page 8 of 20
Bonds, notes & other debt instruments
Corporate bonds & notes (continued)
Industrials (continued) | Principal amount
(000) | Value
(000) |
| FBM Finance, Inc. 8.25% 20214 | $28,730 | $30,166 |
| Gardner Denver, Inc. 6.875% 20214 | 12,650 | 11,923 |
| Gardner Denver, Inc., Term Loan B, 4.25% 20201,2,3 | 10,218 | 9,922 |
| Gates Global LLC 6.00% 20224 | 52,825 | 50,448 |
| Gates Global LLC, Term Loan B, 4.25% 20211,2,3 | 10,528 | 10,388 |
| General Electric Co. 5.00% (undated) | 13,079 | 13,925 |
| Hardwoods Acquisition Inc 7.50% 20214 | 35,330 | 26,762 |
| HD Supply, Inc. 7.50% 2020 | 43,609 | 45,299 |
| HD Supply, Inc. 5.25% 20214 | 9,450 | 10,029 |
| HD Supply, Inc. 5.75% 20244 | 18,375 | 19,340 |
| HDTFS Inc. 6.75% 2019 | 10,000 | 10,232 |
| HDTFS Inc. 5.875% 2020 | 26,075 | 26,955 |
| HDTFS Inc. 6.25% 2022 | 1,000 | 1,035 |
| HDTFS Inc. 5.50% 20244 | 19,825 | 19,775 |
| KLX Inc. 5.875% 20224 | 16,485 | 17,144 |
| LMI Aerospace Inc. 7.375% 2019 | 46,170 | 46,632 |
| LSC Communications, Inc. 8.75% 20234 | 44,975 | 44,975 |
| LSC Communications, Inc., Term Loan B, 7.00% 20221,2,3,5 | 25,925 | 25,666 |
| Navios Maritime Acquisition Corp. and Navios Acquisition Finance (US) Inc. 8.125% 20214 | 58,895 | 43,582 |
| Navios Maritime Holdings Inc. 7.375% 20224 | 40,575 | 19,780 |
| Navios Maritime Holdings Inc. and Navios Maritime Finance II (US) Inc. 8.125% 2019 | 39,412 | 21,874 |
| Nielsen Finance LLC and Nielsen Finance Co. 4.50% 2020 | 8,370 | 8,579 |
| Nielsen Finance LLC and Nielsen Finance Co. 5.50% 20214 | 3,950 | 4,128 |
| Nielsen Finance LLC and Nielsen Finance Co. 5.00% 20224 | 13,500 | 13,989 |
| Ply Gem Industries, Inc. 6.50% 2022 | 36,130 | 37,349 |
| Ply Gem Industries, Inc. 6.50% 2022 | 14,320 | 14,606 |
| Prime Security Services Borrower, LLC 9.25% 20234 | 28,600 | 31,245 |
| Prime Security Services Borrower, LLC, Term Loan, 4.75% 20221,2,3 | 4,289 | 4,338 |
| PrimeSource Building Products Inc 9.00% 20234 | 20,211 | 19,706 |
| R.R. Donnelley & Sons Co. 7.625% 2020 | 11,750 | 12,778 |
| R.R. Donnelley & Sons Co. 7.875% 2021 | 39,200 | 43,022 |
| R.R. Donnelley & Sons Co. 7.00% 2022 | 1,500 | 1,571 |
| R.R. Donnelley & Sons Co. 6.50% 2023 | 20,350 | 20,706 |
| Sensata Technologies Holding NV 5.00% 20254 | 19,200 | 19,728 |
| Silver II Borrower S.C.A./Silver II U.S. Holdings, LLC 7.75% 20204 | 78,103 | 62,287 |
| SPX FLOW, Inc. 5.625% 20244 | 10,300 | 10,480 |
| TRAC Intermodal 11.00% 2019 | 18,374 | 19,408 |
| TransDigm Inc. 5.50% 2020 | 45,510 | 46,904 |
| TransDigm Inc. 6.50% 2024 | 5,200 | 5,499 |
| TransDigm Inc. 6.50% 2025 | 11,400 | 11,941 |
| United Air Lines, Inc., Series 2007-1, Class B, 7.336% 20212,4 | 3,031 | 3,197 |
| United Continental Holdings, Inc. 6.00% 2020 | 14,150 | 15,247 |
| United Rentals, Inc. 7.625% 2022 | 12,200 | 13,054 |
| United Rentals, Inc. 5.50% 2025 | 11,400 | 11,728 |
| United Rentals, Inc. 5.875% 2026 | 7,375 | 7,633 |
| Univar Inc. 6.75% 20234 | 1,625 | 1,682 |
| Virgin Australia Holdings Ltd. 8.50% 20194 | 45,305 | 46,834 |
| Watco Companies 6.375% 20234 | 19,240 | 19,529 |
| XPO Logistics, Inc. 6.125% 20234 | 8,675 | 8,935 |
| | | 1,958,079 |
American High-Income Trust — Page 9 of 20
Bonds, notes & other debt instruments
Corporate bonds & notes (continued)
Materials 9.09% | Principal amount
(000) | Value
(000) |
| AK Steel Holding Corp. 7.50% 2023 | $2,700 | $2,882 |
| Alcoa Inc. 5.72% 2019 | 2,000 | 2,150 |
| Alcoa Inc. 6.75% 20244 | 13,425 | 13,979 |
| Alcoa Inc. 7.00% 20264 | 9,850 | 10,207 |
| Aleris International, Inc. 9.50% 20214 | 24,695 | 26,671 |
| Anglo American Capital PLC 4.125% 20214 | 7,175 | 7,247 |
| ArcelorMittal 10.85% 2019 | 13,825 | 16,797 |
| ArcelorMittal 6.125% 2025 | 7,000 | 7,665 |
| ArcelorMittal 7.75% 2041 | 69,360 | 72,655 |
| Ardagh Packaging Finance 6.25% 20194 | 14,050 | 14,419 |
| Ardagh Packaging Finance 6.75% 20214 | 5,485 | 5,691 |
| Ardagh Packaging Finance 6.625% 20236 | €20,225 | 21,925 |
| Ardagh Packaging Finance 7.25% 20244 | $5,935 | 6,365 |
| Ashland Inc. 4.75% 2022 | 8,350 | 8,715 |
| Ashland Inc. 5.50% 20244 | 11,640 | 12,222 |
| Ball Corp. 4.375% 2020 | 17,775 | 19,064 |
| BHP Billiton Finance Ltd. 6.25% 20754 | 8,240 | 8,940 |
| BHP Billiton Finance Ltd. 6.75% 20754 | 6,300 | 7,151 |
| Blue Cube Spinco Inc. (Olin Corp.) 9.75% 20234 | 320 | 378 |
| Blue Cube Spinco Inc. (Olin Corp.) 10.00% 20254 | 260 | 308 |
| CEMEX Finance LLC 9.375% 20224 | 7,500 | 8,269 |
| CEMEX SAB de CV 6.50% 20194 | 2,455 | 2,608 |
| CEMEX SAB de CV 7.75% 20264 | 10,475 | 11,648 |
| Chemours Co. 6.625% 2023 | 44,533 | 43,754 |
| Chemours Co. 7.00% 2025 | 59,215 | 58,475 |
| Cliffs Natural Resources Inc. 8.25% 20204 | 37,605 | 40,096 |
| Crown Holdings, Inc. 4.50% 2023 | 3,000 | 3,139 |
| Crown Holdings, Inc. 4.25% 20264 | 3,000 | 3,000 |
| Crown Holdings, Inc. 7.375% 2026 | 2,000 | 2,248 |
| CVR Partners, LP 9.25% 20234 | 8,225 | 7,978 |
| First Quantum Minerals Ltd. 6.75% 20204 | 124,165 | 115,473 |
| First Quantum Minerals Ltd. 7.00% 20214 | 83,907 | 76,146 |
| First Quantum Minerals Ltd. 7.25% 20224 | 16,075 | 14,387 |
| FMG Resources 3.75% 20191,2,3 | 32,864 | 32,870 |
| FMG Resources 9.75% 20224 | 83,075 | 96,782 |
| Freeport-McMoRan Copper & Gold Inc. 3.55% 2022 | 32,020 | 29,298 |
| Freeport-McMoRan Inc. 6.50% 2020 | 22,550 | 23,226 |
| Freeport-McMoRan Inc. 6.75% 2022 | 9,650 | 9,915 |
| Georgia Gulf Corp. 4.625% 2021 | 23,307 | 24,560 |
| Georgia Gulf Corp. 4.875% 2023 | 6,300 | 6,568 |
| Huntsman International LLC 4.875% 2020 | 23,800 | 24,990 |
| INEOS Group Holdings SA 5.375% 2024 | €11,350 | 12,497 |
| INEOS Group Holdings SA 5.625% 20244 | $8,825 | 8,682 |
| Kaiser Aluminum Corp. 5.875% 2024 | 4,800 | 5,028 |
| Louisiana-Pacific Corp. 4.875% 20244 | 14,105 | 14,140 |
| Novelis Corp. 6.25% 20244 | 14,950 | 15,922 |
| Novelis Corp. 5.875% 20264 | 41,175 | 42,256 |
| Owens-Illinois, Inc. 5.00% 20224 | 3,920 | 4,170 |
| Owens-Illinois, Inc. 5.875% 20234 | 17,735 | 19,076 |
| Owens-Illinois, Inc. 5.375% 20254 | 2,940 | 3,065 |
| Owens-Illinois, Inc. 6.375% 20254 | 10,190 | 11,241 |
| Paperworks Industries Inc. 9.50% 20194 | 9,946 | 9,374 |
| Platform Specialty Products Corp. 10.375% 20214 | 39,400 | 42,650 |
| Platform Specialty Products Corp. 6.50% 20224 | 630 | 616 |
American High-Income Trust — Page 10 of 20
Bonds, notes & other debt instruments
Corporate bonds & notes (continued)
Materials (continued) | Principal amount
(000) | Value
(000) |
| Platform Specialty Products Corp., Term Loan B-1, 5.50% 20201,2,3 | $11,593 | $11,653 |
| Rayonier Advanced Materials Inc. 5.50% 20244 | 50,330 | 46,304 |
| Reynolds Group Inc. 9.875% 2019 | 11,650 | 12,014 |
| Reynolds Group Inc. 5.75% 2020 | 57,450 | 59,317 |
| Reynolds Group Inc. 8.25% 2021 | 1,700 | 1,774 |
| Reynolds Group Inc. 7.00% 20244 | 11,245 | 12,081 |
| Ryerson Inc. 11.25% 2018 | 7,486 | 7,715 |
| Ryerson Inc. 11.00% 20224 | 92,178 | 101,626 |
| Sealed Air Corp. 4.875% 20224 | 5,250 | 5,532 |
| Smurfit Capital Funding PLC 7.50% 2025 | 7,965 | 9,598 |
| Summit Materials, Inc. 8.50% 20224 | 3,925 | 4,298 |
| Summit Materials, Inc. 6.125% 2023 | 23,200 | 23,780 |
| Teck Resources Ltd. 4.50% 2021 | 11,700 | 11,641 |
| Teck Resources Ltd. 8.00% 20214 | 27,875 | 30,558 |
| Teck Resources Ltd. 8.50% 20244 | 2,775 | 3,184 |
| Tembec Industries Inc. 9.00% 20194 | 9,835 | 7,499 |
| United States Steel Corp. 8.375% 20214 | 9,020 | 9,888 |
| Vale Overseas Ltd. 5.875% 2021 | 9,375 | 9,839 |
| Vale Overseas Ltd. 6.25% 2026 | 13,745 | 14,394 |
| Vale Overseas Ltd. 6.875% 2039 | 13,185 | 12,822 |
| Vale SA 5.625% 2042 | 2,566 | 2,168 |
| Zekelman Industries Inc. 9.875% 20234 | 19,635 | 20,764 |
| Zekelman Industries Inc., Term Loan B, 6.00% 20211,2,3 | 23,975 | 24,365 |
| | | 1,532,392 |
| Information technology 5.11% | | |
| Alcatel-Lucent USA Inc. 6.45% 2029 | 16,200 | 18,002 |
| Blackboard Inc. 7.75% 20194 | 400 | 400 |
| Blackboard Inc., Term Loan B, 4.75% 20181,2,3 | 7,680 | 7,668 |
| BMC Software, Inc., Term Loan B, 5.00% 20201,2,3 | 9,824 | 9,494 |
| BMC Software, Inc. 8.125% 20214 | 36,150 | 32,987 |
| Camelot Finance SA 7.875% 20244 | 39,205 | 40,528 |
| Camelot Finance SA, Term Loan B, 4.75% 20231,2,3 | 25,900 | 25,945 |
| CommScope Holding Co., Inc. 4.375% 20204 | 1,500 | 1,549 |
| CommScope Inc. 6.00% 20254 | 3,750 | 4,017 |
| Dell Inc. 6.02% 20264 | 16,175 | 17,775 |
| Dell Inc. 8.35% 20464 | 16,190 | 19,453 |
| Dell Inc., Term Loan B, 4.00% 20211,2,3 | 33,100 | 33,329 |
| EchoStar Corp. 5.25% 20264 | 13,200 | 13,068 |
| EchoStar Corp. 6.625% 20264 | 40,930 | 39,600 |
| Ellucian, Inc. 9.00% 20234 | 11,975 | 12,634 |
| First Data Corp. 6.75% 20204 | 5,079 | 5,258 |
| First Data Corp. 5.375% 20234 | 17,650 | 18,224 |
| First Data Corp. 7.00% 20234 | 86,825 | 92,034 |
| First Data Corp. 5.00% 20244 | 37,425 | 38,127 |
| First Data Corp. 5.75% 20244 | 1,150 | 1,186 |
| Gogo Inc. 12.50% 20224 | 68,725 | 74,051 |
| Hughes Satellite Systems Corp. 7.625% 2021 | 9,850 | 10,540 |
| Infor (US), Inc. 6.50% 2022 | 28,750 | 29,253 |
| Infor Inc. 5.75% 20204 | 18,275 | 19,257 |
| Infor Software 7.125% 20214,6 | 11,650 | 11,359 |
| Informatica Corp. 7.125% 20234 | 5,600 | 5,236 |
| JDA Software Group, Inc. 7.375% 20244 | 11,725 | 12,077 |
| JDA Software Group, Inc., Term Loan B, 4.50% 20231,2,3 | 15,475 | 15,436 |
American High-Income Trust — Page 11 of 20
Bonds, notes & other debt instruments
Corporate bonds & notes (continued)
Information technology (continued) | Principal amount
(000) | Value
(000) |
| Match Group, Inc. 6.375% 2024 | $7,050 | $7,676 |
| Micron Technology, Inc. 5.25% 20234 | 5,205 | 5,127 |
| Micron Technology, Inc. 7.50% 20234 | 6,925 | 7,709 |
| NXP BV and NXP Funding LLC 4.125% 20204 | 7,000 | 7,446 |
| NXP BV and NXP Funding LLC 4.125% 20214 | 11,700 | 12,563 |
| NXP BV and NXP Funding LLC 4.625% 20234 | 9,700 | 10,634 |
| PTC Inc. 6.00% 2024 | 11,975 | 12,843 |
| Qorvo, Inc. 6.75% 2023 | 5,000 | 5,413 |
| Qorvo, Inc. 7.00% 2025 | 24,950 | 27,164 |
| RP Crown Parent, LLC, Term Loan B, 6.00% 20181,2,3 | 4,065 | 4,063 |
| Seagate Technology LLC 4.75% 2023 | 31,450 | 31,155 |
| Solera Holdings, Inc. 10.50% 20244 | 26,225 | 29,372 |
| Solera Holdings, Inc., Term Loan B, 5.75% 20231,2,3 | 19,502 | 19,724 |
| VeriSign, Inc. 4.625% 2023 | 4,600 | 4,686 |
| Western Digital Corp. 7.375% 20234 | 36,800 | 40,480 |
| Western Digital Corp. 10.50% 20244 | 18,800 | 21,878 |
| Western Digital Corp., Term Loan B1, 4.50% 20231,2,3 | 5,387 | 5,452 |
| | | 861,872 |
| Financials 4.90% | | |
| Ally Financial Inc. 8.00% 2020 | 8,825 | 10,105 |
| Ally Financial Inc. 8.00% 2031 | 47,469 | 58,862 |
| Bank of America Corp. junior subordinated 6.25% noncumulative (undated) | 7,425 | 7,741 |
| Bank of America Corp., Series AA, 6.10% (undated) | 15,000 | 15,638 |
| Bank of America Corp., Series DD, 6.30% (undated) | 15,795 | 17,197 |
| Bank of America Corp., Series K, junior subordinated 8.00% noncumulative (undated) | 11,075 | 11,310 |
| Bank of America Corp., Series M, junior subordinated 8.125% noncumulative (undated) | 11,550 | 11,860 |
| CIT Group Inc. 4.25% 2017 | 13,000 | 13,260 |
| CIT Group Inc. 3.875% 2019 | 90,760 | 92,916 |
| CIT Group Inc., Series C, 5.50% 20194 | 30,350 | 32,171 |
| Citigroup Inc. 2.287% 20233 | 3,801 | 3,822 |
| Citigroup Inc., Series Q, junior subordinated 5.95% (undated) | 10,141 | 10,344 |
| Citigroup Inc., Series P, 5.95% (undated) | 8,167 | 8,341 |
| Citigroup Inc., Series R, junior subordinated 6.125% (undated) | 9,050 | 9,423 |
| Citigroup Inc., Series T, 6.25% (undated) | 16,375 | 17,659 |
| Credit Agricole SA, convertible bonds, 6.625% 2049 | 5,500 | 5,284 |
| Credit Agricole SA, Contingent Convertible, 7.875% (undated)4 | 7,300 | 7,332 |
| Credit Agricole SA, Contingent Convertible, 8.125% (undated)4 | 4,500 | 4,786 |
| Credit Agricole SA 8.375% (undated)4 | 12,875 | 14,591 |
| General Motors Acceptance Corp. 7.50% 2020 | 8,900 | 10,146 |
| Goldman Sachs Group, Inc. 2.241% 20213 | 24,020 | 23,924 |
| Goldman Sachs Group, Inc. 5.30% (undated) | 6,675 | 6,859 |
| Icahn Enterprises Finance Corp. 3.50% 2017 | 35,600 | 35,732 |
| International Lease Finance Corp. 8.25% 2020 | 5,900 | 7,021 |
| iStar Financial Inc. 4.00% 2017 | 30,600 | 30,791 |
| iStar Financial Inc. 4.875% 2018 | 30,264 | 30,529 |
| iStar Financial Inc. 5.00% 2019 | 23,300 | 23,326 |
| iStar Financial Inc. 6.50% 2021 | 8,000 | 8,140 |
| iStar Financial Inc., Series B, 9.00% 2017 | 37,965 | 39,389 |
| JPMorgan Chase & Co., Series I, junior subordinated 7.90% (undated) | 23,405 | 24,078 |
| Liberty Mutual Group Inc., Series A, 7.80% 20874 | 9,190 | 10,775 |
| MetLife Capital Trust IV, junior subordinated 7.875% 20674 | 13,950 | 17,571 |
| MetLife Capital Trust X, junior subordinated 9.25% 20684 | 500 | 721 |
| MGIC Investment Corp. 5.75% 2023 | 15,225 | 15,872 |
American High-Income Trust — Page 12 of 20
Bonds, notes & other debt instruments
Corporate bonds & notes (continued)
Financials (continued) | Principal amount
(000) | Value
(000) |
| Morgan Stanley, Series J, 5.55% (undated) | $1 | $1 |
| MSCI Inc. 5.75% 20254 | 11,290 | 12,109 |
| MSCI Inc. 4.75% 20264 | 7,600 | 7,714 |
| Navient Corp. 4.875% 2019 | 12,900 | 12,884 |
| OneMain Financial Holdings, LLC 6.75% 20194 | 5,820 | 6,153 |
| OneMain Financial Holdings, LLC 7.25% 20214 | 10,955 | 11,585 |
| PNC Financial Services Group, Inc., Series O, junior subordinated 6.75% (undated) | 9,830 | 11,022 |
| Royal Bank of Scotland Group PLC, junior subordinated 6.99% (undated)4 | 15,376 | 17,221 |
| Société Générale, Contingent Convertible, 7.375% (undated)4 | 13,950 | 13,706 |
| Springleaf Finance Corp. 8.25% 2020 | 18,650 | 20,515 |
| State Street Corp., junior subordinated, 5.25% 2049 | 12,850 | 13,589 |
| UBS AG 6.875% (undated) | 6,700 | 6,546 |
| UBS AG, Contingent Convertible, 6.875% (undated) | 9,650 | 9,547 |
| US Bancorp., junior subordinated 5.125% (undated) | 12,610 | 13,297 |
| Wells Fargo & Co., Series K, junior subordinated 7.98% (undated) | 13,980 | 14,628 |
| ZFS Finance (USA) Trust V, junior subordinated, 6.50% 20674 | 17,350 | 17,557 |
| | | 825,590 |
| Utilities 3.78% | | |
| AES Corp. 8.00% 2020 | 21,175 | 25,039 |
| AES Corp. 7.375% 2021 | 44,350 | 51,002 |
| AES Corp. 4.875% 2023 | 12,100 | 12,418 |
| AES Corp. 5.50% 2024 | 34,050 | 35,412 |
| AES Corp. 5.50% 2025 | 22,630 | 23,422 |
| AES Corp. 6.00% 2026 | 30,385 | 32,094 |
| Calpine Corp. 6.00% 20224 | 10,900 | 11,425 |
| Calpine Corp. 5.375% 2023 | 15,940 | 15,960 |
| Calpine Corp. 7.875% 20234 | 3,666 | 3,877 |
| Calpine Corp. 5.50% 2024 | 955 | 948 |
| Calpine Corp. 5.875% 20244 | 21,700 | 23,029 |
| Calpine Corp. 5.75% 2025 | 10,615 | 10,509 |
| Calpine Corp. 5.25% 20264 | 10,725 | 10,886 |
| Dominion Resources, Inc. 2.962% 2019 | 1,500 | 1,541 |
| Dominion Resources, Inc. 4.104% 2021 | 9,630 | 10,325 |
| Dynegy Finance Inc. 6.75% 2019 | 1,565 | 1,612 |
| Dynegy Finance Inc. 7.375% 2022 | 20,930 | 20,773 |
| Dynegy Finance Inc. 7.625% 2024 | 7,135 | 7,042 |
| Emera Inc. 6.75% 2076 | 16,125 | 17,374 |
| Enel Società per Azioni 8.75% 20734 | 26,812 | 31,571 |
| FirstEnergy Corp. 7.375% 2031 | 8,070 | 10,519 |
| NRG Energy, Inc. 6.25% 2022 | 50,015 | 51,015 |
| NRG Energy, Inc. 6.625% 2023 | 9,000 | 9,135 |
| NRG Energy, Inc. 7.25% 20264 | 38,800 | 39,673 |
| NRG Energy, Inc. 6.625% 20274 | 60,150 | 59,022 |
| Talen Energy Corp. 4.625% 20194 | 29,300 | 27,688 |
| Texas Competitive Electric Holdings, Term Loan B, 5.00% 20171,2,3 | 64,267 | 64,750 |
| TXU, Term Loan, 4.65% 20171,2,3,7 | 44,582 | 13,138 |
| TXU, Term Loan, 3.737% 20241,2,3,7 | 5,802 | 1,701 |
| Texas Competitive Electric Holdings, Term Loan C, 5.00% 20171,2,3 | 14,658 | 14,767 |
| | | 637,667 |
American High-Income Trust — Page 13 of 20
Bonds, notes & other debt instruments
Corporate bonds & notes (continued)
Real estate 2.35% | Principal amount
(000) | Value
(000) |
| American Tower Corp. 7.25% 2019 | $3,019 | $3,389 |
| Communications Sales & Leasing, Inc. 6.00% 20234 | 30,155 | 31,361 |
| Communications Sales & Leasing, Inc. 8.25% 2023 | 25,563 | 26,956 |
| Crescent Resources 10.25% 20174 | 108,419 | 109,232 |
| Crescent Resources 8.875% 20214 | 31,025 | 31,568 |
| Crown Castle International Corp. 4.875% 2022 | 7,650 | 8,553 |
| Equinix, Inc. 5.875% 2026 | 8,650 | 9,320 |
| Gaming and Leisure Properties, Inc. 4.375% 2021 | 5,150 | 5,433 |
| Gaming and Leisure Properties, Inc. 5.375% 2026 | 8,700 | 9,374 |
| Howard Hughes Corp. 6.875% 20214 | 3,000 | 3,169 |
| Iron Mountain Inc. 6.00% 20204 | 25,915 | 27,405 |
| Iron Mountain Inc. 6.00% 2023 | 3,450 | 3,700 |
| Iron Mountain Inc. 5.75% 2024 | 33,800 | 34,899 |
| Realogy Corp. 4.50% 20194 | 46,235 | 48,316 |
| Realogy Corp. 5.25% 20214 | 6,575 | 6,951 |
| Realogy Corp. 4.875% 20234 | 35,550 | 36,305 |
| | | 395,931 |
| Consumer staples 0.84% | | |
| Albertson’s Cos LLC 5.75% 20254 | 11,500 | 11,500 |
| B&G Foods, Inc. 4.625% 2021 | 5,250 | 5,434 |
| Central Garden & Pet Co. 6.125% 2023 | 1,300 | 1,401 |
| Constellation Brands, Inc. 3.875% 2019 | 1,250 | 1,319 |
| Constellation Brands, Inc. 6.00% 2022 | 10,225 | 11,797 |
| Constellation Brands, Inc. 4.25% 2023 | 3,000 | 3,191 |
| Constellation Brands, Inc. 4.75% 2025 | 625 | 680 |
| Darling Ingredients Inc. 5.375% 2022 | 9,250 | 9,690 |
| Kronos Acquisition Holdings Inc. 9.00% 20234 | 14,825 | 15,353 |
| Pinnacle Foods Inc. 5.875% 20244 | 4,875 | 5,229 |
| Post Holdings, Inc. 6.00% 20224 | 5,250 | 5,565 |
| Post Holdings, Inc. 7.75% 20244 | 6,475 | 7,284 |
| Post Holdings, Inc. 8.00% 20254 | 8,400 | 9,655 |
| Post Holdings, Inc. 5.00% 20264 | 12,275 | 12,244 |
| Revlon, Inc. 6.25% 20244 | 6,575 | 6,805 |
| Reynolds American Inc. 5.85% 2045 | 8,750 | 11,402 |
| Spectrum Brands Inc. 6.625% 2022 | 3,500 | 3,806 |
| SUPERVALU Inc. 6.75% 2021 | 5,500 | 5,170 |
| TreeHouse Foods, Inc. 6.00% 20244 | 4,975 | 5,379 |
| US Foods Holding Corp. 5.875% 20244 | 8,650 | 9,039 |
| | | 141,943 |
| Total corporate bonds & notes | | 15,154,043 |
U.S. Treasury bonds & notes 0.98%
U.S. Treasury 0.98% | | |
| U.S. Treasury 1.125% 2021 | 100,000 | 99,898 |
| U.S. Treasury 6.25% 20239 | 50,000 | 65,992 |
| Total U.S. Treasury bonds & notes | | 165,890 |
| Asset-backed obligations 0.27% | | |
| AmeriCredit Automobile Receivables Trust, Series 2016-1, Class C, 2.89% 20222 | 3,725 | 3,829 |
| Babson CLO Ltd., Series 2012-2A, Class A1R, CLO, 2.057% 20232,3,4 | 6,894 | 6,896 |
| Dryden Senior Loan Fund, Series 2012-23RA, Class A1R, CLO, 1.930% 20232,3,4 | 2,875 | 2,867 |
| Madison Park Funding Ltd., CLO, Series 2012-8-A, Class A-R, 1.952% 20222,3,4 | 10,664 | 10,663 |
American High-Income Trust — Page 14 of 20
Bonds, notes & other debt instruments
Asset-backed obligations (continued) | Principal amount
(000) | Value
(000) |
| Madison Park Funding Ltd., CLO, Series 2012-9-A, Class A-R, 2.107% 20222,3,4 | $10,040 | $10,040 |
| Magnetite CLO Ltd., Series 2012-6-A, Class AR, 2.10% 20232,3,4 | 6,110 | 6,104 |
| Magnetite CLO Ltd., Series 2014-9-A, Class A-1, 2.135% 20262,3,4 | 1,586 | 1,588 |
| Marine Park CLO Ltd., Series 2012-1-A, Class A1AR, CLO, 2.081% 20232,3,4 | 2,900 | 2,898 |
| | | 44,885 |
| Bonds & notes of governments & government agencies outside the U.S. 0.11% | | |
| Argentine Republic 21.20% 2018 | ARS118,500 | 7,816 |
| Argentine Republic 18.20% 2021 | 115,630 | 7,521 |
| Argentine Republic 7.50% 20264 | $3,050 | 3,449 |
| | | 18,786 |
| Total bonds, notes & other debt instruments (cost: $15,347,771,000) | | 15,383,604 |
Convertible bonds 0.36%
Financials 0.20% | | |
| Australia and New Zealand Banking Group Ltd., Contingent Convertible, 6.75% (undated)4 | 8,600 | 9,479 |
| Banco Bilbao Vizcaya Argentaria, SA, contingent convertible, 6.75% (undated) | €12,000 | 12,519 |
| Standard Chartered PLC, Contingent Convertible, 7.50% (undated)4 | $11,500 | 11,425 |
| | | 33,423 |
| Information technology 0.10% | | |
| Liberty Media Corp., convertible notes, 3.50% 2031 | 31,190 | 16,472 |
| Energy 0.03% | | |
| American Energy (Permian Basin), convertible notes, 8.00% 20224,6 | 19,019 | 2,283 |
| Chesapeake Energy Corp. convertible notes 5.50% 20264 | 4 | 3,860 |
| | | 6,143 |
| Consumer discretionary 0.02% | | |
| DISH DBS Corp. 3.375% 20264 | 3,650 | 4,015 |
| Miscellaneous 0.01% | | |
| Other convertible bonds in initial period of acquisition | | 1,632 |
| Total convertible bonds (cost: $68,407,000) | | 61,685 |
Convertible stocks 0.57%
Industrials 0.19% | Shares | |
| CEVA Group PLC, Series A-1, 3.88% convertible preferred5,8,10,11 | 47,121 | 23,561 |
| CEVA Group PLC, Series A-2, 2.88% convertible preferred5,8,10,11 | 21,062 | 7,635 |
| | | 31,196 |
| Energy 0.14% | | |
| Chesapeake Energy Corporation 5.75% convertible preferred4 | 12,000 | 6,000 |
| Chesapeake Energy Corporation 5.75% convertible preferred | 9,000 | 4,500 |
| Southwestern Energy Co., Series B, 6.25% convertible preferred 2018 | 309,450 | 9,769 |
| Anadarko Petroleum Corp. 7.50% convertible preferred 2018, units | 78,351 | 3,263 |
| | | 23,532 |
American High-Income Trust — Page 15 of 20
Convertible stocks
Real estate 0.07% | Shares | Value
(000) |
| American Tower Corp. REIT, Series A, convertible preferred | 78,000 | $8,649 |
| American Tower Corp. REIT, Series B, 5.50% depository share, convertible preferred 2018 | 30,000 | 3,288 |
| | | 11,937 |
| Utilities 0.05% | | |
| Dominion Resources, Inc., convertible preferred, Series A, units | 111,420 | 5,560 |
| Dominion Resources, Inc., convertible preferred, Series A, units | 50,000 | 2,488 |
| | | 8,048 |
| Telecommunication services 0.03% | | |
| Frontier Communications Corp., Series A, convertible preferred | 70,000 | 5,874 |
| Miscellaneous 0.09% | | |
| Other convertible stocks in initial period of acquisition | | 15,220 |
| Total convertible stocks (cost: $144,530,000) | | 95,807 |
Preferred securities 0.14%
Real estate 0.06% | | |
| Swire Pacific Ltd. 8.84% cumulative guaranteed perpetual capital securities4 | 365,000 | 9,502 |
| Miscellaneous 0.08% | | |
| Other preferred securities in initial period of acquisition | | 13,900 |
| Total preferred securities (cost: $22,634,000) | | 23,402 |
Common stocks 0.98%
Telecommunication services 0.35% | | |
| NII Holdings, Inc.8,10 | 17,776,845 | 59,197 |
| Energy 0.14% | | |
| White Star NR Corporation5,8,10,11 | 24,665,117 | 20,965 |
| Denbury Resources Inc.4,10 | 270,000 | 872 |
| Denbury Resources Inc.10 | 260,000 | 840 |
| Southwestern Energy Co.10 | 74,275 | 1,028 |
| Gener8 Maritime, Inc.10 | 12,599 | 65 |
| Petroplus Holdings AG5,10 | 3,360,000 | — |
| Ascent Resources - Utica, LLC, Class A5,10 | 71,159,269 | — |
| | | 23,770 |
| Real estate 0.13% | | |
| OUTFRONT Media Inc. REIT | 660,645 | 15,624 |
| American Tower Corp. REIT | 57,087 | 6,470 |
| | | 22,094 |
| Industrials 0.13% | | |
| CEVA Group PLC5,8,10,11 | 59,168 | 21,448 |
| Quad/Graphics, Inc., Class A | 528 | 14 |
| Atrium Corp.4,5,10 | 10,987 | 11 |
| | | 21,473 |
American High-Income Trust — Page 16 of 20
Common stocks
Information technology 0.12% | Shares | Value
(000) |
| Corporate Risk Holdings I, Inc.5,8,10 | 2,380,355 | $20,138 |
| Corporate Risk Holdings Corp.5,10 | 12,035 | — |
| Materials 0.10% | | |
| Warrior Met Coal, LLC, Class B4,5,10 | 97,899 | 11,944 |
| Warrior Met Coal, LLC, Class A4,5,10 | 38,446 | 4,690 |
| Health care 0.01% | | |
| Rotech Healthcare Inc.5,8,10 | 1,916,276 | 1,916 |
| Financials 0.00% | | |
| EME Reorganization Trust10 | 41,998,595 | 193 |
| Consumer discretionary 0.00% | | |
| Adelphia Recovery Trust, Series Arahova10 | 1,773,964 | 18 |
| Adelphia Recovery Trust, Series ACC-110 | 10,643,283 | 10 |
| Five Star Travel Corp.4,5,10 | 83,780 | 1 |
| | | 29 |
| Total common stocks (cost: $513,004,000) | | 165,444 |
Rights & warrants 0.00%
Energy 0.00% | | |
| Gener8 Maritime, Inc., warrants, expire 20174,5,10 | 19,483 | — |
| Consumer discretionary 0.00% | | |
| Liberman Broadcasting, Inc., warrants, expire 20225,10,11 | 10 | — |
| Total rights & warrants (cost: $0) | | — |
Short-term securities 6.08%
Commercial paper 2.13% | Principal amount
(000) | |
| Caterpillar Financial Services Corp. 0.51% due 11/7/2016 | $75,000 | 74,965 |
| Chevron Corp. 0.44% - 0.45% due 11/3/2016 - 11/8/20164 | | |
| Coca-Cola Co. 0.52% - 0.58% due 11/9/2016 - 11/18/20164 | | |
| ExxonMobil Corp. 0.44% - 0.50% due 10/19/2016 - 11/1/2016 | | |
| Intel Corp. 0.48% due 10/28/2016 | 25,000 | 24,992 |
| Microsoft Corp. 0.50% due 10/25/20164 | 27,400 | 27,392 |
| Pfizer Inc. 0.60% due 12/6/20164 | 30,300 | 30,271 |
| Wal-Mart Stores, Inc. 0.39% due 10/3/20164 | 32,500 | 32,499 |
| | | 359,695 |
| Federal agency discount notes 1.97% | | |
| Fannie Mae 0.40% due 12/16/2016 | 50,000 | 49,970 |
| Federal Home Loan Bank 0.31% - 0.55% due 10/28/2016 - 5/25/2017 | | |
| Freddie Mac 0.40% - 0.41% due 12/21/2016 - 1/19/2017 | | |
| | | 330,726 |
American High-Income Trust — Page 17 of 20
Short-term securities
U.S. Treasury bills 1.19% | Principal amount
(000) | Value
(000) |
| U.S. Treasury Bills 0.35% - 0.40% due 1/5/2017 - 1/12/2017 | | |
| Municipals 0.79% | | |
| City of New York, G.O. Bonds, Fiscal 2006, Series 2005-F-4A, 0.88% 20353 | $12,000 | $12,000 |
| City of New York, G.O. Bonds, Series 2004-H-6, 0.81% 20343 | 20,150 | 20,150 |
| City of New York, G.O. Bonds, Series 2006-I-7, 0.81% 20363 | 14,600 | 14,600 |
| Commonwealth of Massachusetts, G.O. Demand Bonds (Central Artery/Ted Williams Tunnel Infrastructure Loan Act of 2000), Series 2000-A, 0.88% 20303 | 32,600 | 32,600 |
| New York City Transitional Fin. Auth., Future Tax Secured Bonds, Series 2010-F-5, 0.83% 20353 | 21,150 | 21,150 |
| State of New York, Urban Dev. Corp., State Personal Income Tax Rev. Bonds (State Facs. and Equipment), Series 2004-A-3B, 0.85% 20333 | 19,000 | 19,000 |
| State of South Carolina, York County, National Rural Utilities Cooperative Fin. Corp., Pollution Control Rev. Commercial Paper, Series 2000, 0.75% 10/3/2016 | 14,500 | 14,500 |
| | | 134,000 |
| Total short-term securities (cost: $1,024,126,000) | | 1,024,296 |
| Total investment securities 99.38% (cost: $17,120,472,000) | | 16,754,238 |
| Other assets less liabilities 0.62% | | 105,042 |
| Net assets 100.00% | | $16,859,280 |
As permitted by U.S. Securities and Exchange Commission regulations, “Miscellaneous” securities include holdings in their first year of acquisition that have not previously been publicly disclosed.
Forward currency contracts
The fund did not hold any forward currency contracts as of September 30, 2016. The average month-end notional amount of open forward currency contracts while held was $20,466,000.
Interest rate swaps
The fund did not hold any interest rate swaps as of September 30, 2016. The average month-end notional amount of interest rate swaps while held was $287,416,000.
American High-Income Trust — Page 18 of 20
Credit default swaps
The fund has entered into credit default swaps as shown in the following table. The average month-end notional amount of credit default swaps while held was $158,528,000.
Centrally cleared credit default swaps on credit indices — sell protection
| Referenced index | Clearinghouse | Receive
fixed rate | Expiration
date | Notional
(000) | Value
(000) | Upfront
premiums
received
(000) | Unrealized
appreciation
(depreciation)
at 9/30/2016
(000) |
| CDX.NA.HY.21 | ICE | 5.00% | 12/20/2018 | $17,280 | $1,120 | $1,036 | $83 |
| CDX.NA.HY.22 | ICE | 5.00 | 6/20/2019 | 27,840 | 1,981 | 2,168 | (188) |
| CDX.NA.HY.25 | ICE | 5.00 | 12/20/2020 | 81,180 | 4,745 | 2,452 | 2,293 |
| CDX.NA.HY.26 | ICE | 5.00 | 6/20/2021 | 150,000 | 7,733 | 4,210 | 3,523 |
| | | | | | | | $5,711 |
The following footnotes apply to either the individual securities noted or one or more of the securities aggregated and listed as a single line item.
| 1 | Loan participations and assignments; may be subject to legal or contractual restrictions on resale. The total value of all such loans, including those in "Other securities," was $1,019,783,000, which represented 6.05% of the net assets of the fund. |
| 2 | Principal payments may be made periodically. Therefore, the effective maturity date may be earlier than the stated maturity date. |
| 3 | Coupon rate may change periodically. |
| 4 | Acquired in a transaction exempt from registration under Rule 144A or Section 4(2) of the Securities Act of 1933. May be resold in the U.S. in transactions exempt from registration, normally to qualified institutional buyers. The total value of all such securities was $7,673,130,000, which represented 45.51% of the net assets of the fund. |
| 5 | Valued under fair value procedures adopted by authority of the board of trustees. The total value of all such securities, including those in “Miscellaneous,“ was $259,700,000, which represented 1.54% of the net assets of the fund. |
| 6 | Payment in kind; the issuer has the option of paying additional securities in lieu of cash. |
| 7 | Scheduled interest and/or principal payment was not received. |
| 8 | Represents an affiliated company as defined under the Investment Company Act of 1940. |
| 9 | A portion of this security was pledged as collateral. The total value of pledged collateral was $14,731,000, which represented .09% of the net assets of the fund. |
| 10 | Security did not produce income during the last 12 months. |
| 11 | Acquired through a private placement transaction exempt from registration under the Securities Act of 1933. May be subject to legal or contractual restrictions on resale. Further details on these holdings appear below. |
| Private placement securities | Acquisition
date(s) | Cost
(000) | Value
(000) | Percent
of net
assets |
| CEVA Group PLC, Series A-1, 3.88% convertible preferred | 5/2/2013-8/22/2014 | $47,776 | $23,561 | .14% |
| CEVA Group PLC | 8/22/2014 | 57,165 | 21,448 | .13 |
| CEVA Group PLC, Series A-2, 2.88% convertible preferred | 5/2/2013 | 20,349 | 7,635 | .05 |
| White Star NR Corporation | 6/30/2016 | 16,491 | 20,965 | .12 |
| Liberman Broadcasting, Inc., warrants, expire 2022 | 12/13/2012-11/26/2014 | — | — | .00 |
| Total private placement securities | | $141,781 | $73,609 | .44% |
| Key to abbreviations |
| Auth. = Authority |
| CLO = Collateralized Loan Obligations |
| Dev. = Development |
| Facs. = Facilities |
| Fin. = Finance |
| G.O. = General Obligation |
| ICE = Intercontinental Exchange, Inc. |
| LOC = Letter of Credit |
| Rev. = Revenue |
American High-Income Trust — Page 19 of 20
Investments are not FDIC-insured, nor are they deposits of or guaranteed by a bank or any other entity, so they may lose value.
Investors should carefully consider investment objectives, risks, charges and expenses. This and other important information is contained in the fund prospectus and summary prospectus, which can be obtained from your financial professional and should be read carefully before investing. You may also call American Funds Service Company (AFS) at (800) 421-4225 or visit the American Funds website at americanfunds.com.
| MFGEFPX-021-1116O-S54075 | American High-Income Trust — Page 20 of 20 |
REPORT OF INDEPENDENT REGISTERED PUBLIC ACCOUNTING FIRM
To the Shareholders and Board of Trustees of
American High-Income Trust Fund:
We have audited the accompanying statement of assets and liabilities of American High-Income Trust Fund (the “Fund”), including the summary schedule of investments, as of September 30, 2016, and the related statements of operations for the year then ended, the statements of changes in net assets for each of the two years in the period then ended (collectively, the “financial statements”), the financial highlights for each of the five years in the period then ended (the financial statements and financial highlights are included in Item 1 of this Form N-CSR), and the schedule of investments in securities as of September 30, 2016 (included in Item 6 of this Form N-CSR). These financial statements, financial highlights, and schedule of investments in securities are the responsibility of the Fund’s management. Our responsibility is to express an opinion on these financial statements, financial highlights, and schedule of investments in securities based on our audits.
We conducted our audits in accordance with the standards of the Public Company Accounting Oversight Board (United States). Those standards require that we plan and perform the audit to obtain reasonable assurance about whether the financial statements, financial highlights, and schedule of investments in securities are free of material misstatement. An audit includes examining, on a test basis, evidence supporting the amounts and disclosures in the financial statements and schedule of investments in securities, assessing the accounting principles used and significant estimates made by management, as well as evaluating the overall financial statement presentation. Our procedures included confirmation of securities owned as of September 30, 2016, by correspondence with the custodian and brokers; where replies were not received from brokers, we performed other auditing procedures. We believe that our audits provide a reasonable basis for our opinion.
In our opinion, the financial statements, financial highlights, and schedule of investments in securities referred to above present fairly, in all material respects, the financial position of American High-Income Trust Fund as of September 30, 2016, and the results of its operations for the year then ended, the changes in its net assets for each of the two years in the period then ended, and the financial highlights for each of the five years in the period then ended, in conformity with accounting principles generally accepted in the United States of America.
DELOITTE & TOUCHE LLP
Costa Mesa, California
November 14, 2016
ITEM 7 – Disclosure of Proxy Voting Policies and Procedures for Closed-End Management Investment Companies
Not applicable to this Registrant, insofar as the Registrant is not a closed-end management investment company.
ITEM 8 – Portfolio Managers of Closed-End Management Investment Companies
Not applicable to this Registrant, insofar as the Registrant is not a closed-end management investment company.
ITEM 9 – Purchases of Equity Securities by Closed-End Management Investment Company and Affiliated Purchasers
Not applicable to this Registrant, insofar as the Registrant is not a closed-end management investment company.
ITEM 10 – Submission of Matters to a Vote of Security Holders
There have been no material changes to the procedures by which shareholders may recommend nominees to the Registrant’s board of trustees since the Registrant last submitted a proxy statement to its shareholders. The procedures are as follows. The Registrant has a nominating and governance committee comprised solely of persons who are not considered ‘‘interested persons’’ of the Registrant within the meaning of the Investment Company Act of 1940, as amended. The committee periodically reviews such issues as the board’s composition, responsibilities, committees, compensation and other relevant issues, and recommends any appropriate changes to the full board of trustees. While the committee normally is able to identify from its own resources an ample number of qualified candidates, it will consider shareholder suggestions of persons to be considered as nominees to fill future vacancies on the board. Such suggestions must be sent in writing to the nominating and governance committee of the Registrant, c/o the Registrant’s Secretary, and must be accompanied by complete biographical and occupational data on the prospective nominee, along with a written consent of the prospective nominee for consideration of his or her name by the nominating and governance committee.
ITEM 11 – Controls and Procedures
| (a) | The Registrant’s Principal Executive Officer and Principal Financial Officer have concluded, based on their evaluation of the Registrant’s disclosure controls and procedures (as such term is defined in Rule 30a-3 under the Investment Company Act of 1940), that such controls and procedures are adequate and reasonably designed to achieve the purposes described in paragraph (c) of such rule. |
| | |
| (b) | There were no changes in the Registrant’s internal controls over financial reporting (as defined in Rule 30a-3(d) under the Investment Company Act of 1940) that occurred during the Registrant’s second fiscal quarter of the period covered by this report that has materially affected, or is reasonably likely to materially affect, the Registrant’s internal control over financial reporting. |
ITEM 12 – Exhibits
| (a)(1) | The Code of Ethics that is the subject of the disclosure required by Item 2 is attached as an exhibit hereto. |
| | |
| (a)(2) | The certifications required by Rule 30a-2 of the Investment Company Act of 1940 and Sections 302 and 906 of the Sarbanes-Oxley Act of 2002 are attached as exhibits hereto. |
SIGNATURES
Pursuant to the requirements of the Securities Exchange Act of 1934 and the Investment Company Act of 1940, the Registrant has duly caused this report to be signed on its behalf by the undersigned, thereunto duly authorized.
| | AMERICAN HIGH-INCOME TRUST |
| | |
| | By /s/ David C. Barclay |
| | David C. Barclay, President and Principal Executive Officer |
| | |
| | Date: November 30, 2016 |
Pursuant to the requirements of the Securities Exchange Act of 1934 and the Investment Company Act of 1940, this report has been signed below by the following persons on behalf of the Registrant and in the capacities and on the dates indicated.
| By /s/ David C. Barclay |
David C. Barclay, President and Principal Executive Officer |
| |
| Date: November 30, 2016 |
| By /s/ Brian C. Janssen |
Brian C. Janssen, Treasurer and Principal Financial Officer |
| |
| Date: November 30, 2016 |