UNITED STATES
SECURITIES AND EXCHANGE COMMISSION
Washington, D.C. 20549
FORM N-CSR
Certified Shareholder Report of
Registered Management Investment Companies
Investment Company Act File Number: 811-05364
American High-Income Trust
(Exact Name of Registrant as Specified in Charter)
333 South Hope Street
Los Angeles, California 90071
(Address of Principal Executive Offices)
Registrant's telephone number, including area code: (213) 486-9200
Date of fiscal year end: September 30
Date of reporting period: September 30, 2014
Courtney R. Taylor
American High-Income Trust
333 South Hope Street
Los Angeles, California 90071
(Name and Address of Agent for Service)
Copies to:
Michael Glazer
Morgan, Lewis & Bockius LLP
355 South Grand Avenue, Suite 4400
Los Angeles, California 90071
(Counsel for the Registrant)
ITEM 1 – Reports to Stockholders

An asset class with a
historically compelling
risk/reward profile.
Special feature page 4
 | American High-Income Trust® |
| |
Annual report
for the year ended
September 30, 2014 |
| |
| |
| |
American High-Income Trust seeks a high level of current income and, secondarily, capital appreciation through a diversified, carefully supervised portfolio consisting primarily of lower rated, higher risk corporate bonds.
This fund is one of more than 40 offered by one of the nation’s largest mutual fund families, American Funds, from Capital Group. For more than 80 years, Capital has invested with a long-term focus based on thorough research and attention to risk.
Fund results shown in this report, unless otherwise indicated, are for Class A shares at net asset value. If a sales charge (maximum 3.75%) had been deducted, the results would have been lower. Results are for past periods and are not predictive of results for future periods. Current and future results may be lower or higher than those shown. Share prices and returns will vary, so investors may lose money. Investing for short periods makes losses more likely. Investments are not FDIC-insured, nor are they deposits of or guaranteed by a bank or any other entity, so they may lose value. For current information and month-end results, visit americanfunds.com.
See page 3 for Class A share results with relevant sales charges deducted. For other share class results, visit americanfunds.com and americanfundsretirement.com.
Investment results assume all distributions are reinvested and reflect applicable fees and expenses. When applicable, investment results reflect fee waivers, without which results would have been lower. Visit americanfunds.com for more information.
The fund’s 30-day yield for Class A shares as of October 31, 2014, calculated in accordance with the U.S. Securities and Exchange Commission (SEC) formula, was 5.31%. The fund’s 12-month distribution rate for Class A shares as of that date was 5.97%. Both reflect the 3.75% maximum sales charge. The SEC yield reflects the rate at which the fund is earning income on its current portfolio of securities while the distribution rate reflects the fund’s past dividends paid to shareholders. Accordingly, the fund’s SEC yield and distribution rate may differ.
The return of principal for bond funds and for funds with significant underlying bond holdings is not guaranteed. Fund shares are subject to the same interest rate, inflation and credit risks associated with the underlying bond holdings. High-yield bonds are subject to greater fluctuations in value and risk of loss of income and principal than investment-grade bonds. Bond ratings, which typically range from AAA/Aaa (highest) to D (lowest), are assigned by credit rating agencies such as Standard & Poor’s, Moody’s and/or Fitch as an indication of an issuer’s creditworthiness. Investing in bonds issued outside the U.S. may be subject to additional risks. They include currency fluctuations, political and social instability, differing securities regulations and accounting standards, higher transaction costs, possible changes in taxation, illiquidity and price volatility. These risks may be heightened in connection with investments in developing countries. Refer to the fund prospectus and the Risk Factors section of this report for more information on these and other risks associated with investing in the fund.

Fellow investors:
For the 12 months ended September 30, 2014, American High-Income Trust produced a total return of 4.93%. In comparison, the unmanaged Barclays U.S. Corporate High Yield 2% Issuer Capped Index gained 7.19%. The Lipper High Yield Funds Index (a peer group of funds) rose 6.84%.
Income is a key element of the fund’s total return, which reflects dividends totaling over 68 cents a share for the 12-month period. This amounts to an income return of 6.26% for investors who reinvested dividends and an income return of 6.09% for investors who took dividends in cash. The fund paid no capital gain distribution for the past fiscal year.
High-yield market overview
The high-yield market has been somewhat volatile for the past fiscal year. Like many other bonds, high-yield issues declined last year in response to the Federal Reserve initiating plans to “taper” or scale back its purchase of mortgage-backed securities and U.S. Treasuries. After a subsequent period of stability and then gains in late 2013 and the first half of 2014, high-yield bonds stumbled again in July 2014. For that month, the Barclays U.S. Corporate High Yield 2% Issuer Capped Index declined 1.33%, while American High-Income Trust declined 1.55%. The high-yield market also has been weak in September, with the Barclays index down 2.10% and the fund down 2.20%.
Still, there has been typically strong issuance this September, and the stock market was strong for most of the summer indicating a continued interest in the asset class on the part of investors. High-yield bond markets often rise and fall together with the stock market, and when they rise together, that often indicates investor confidence and economic strength. Many companies have already completed refinancing of their debt at lower rates and longer maturities, and more of the new debt issuance is related to merger and acquisition activity.
The strong issuance and strong stock market make the downdraft in July difficult to explain, especially in the context of low default rates and a generally healthy economy. Yield spreads (the difference in yield between high-yield bonds and U.S. Treasuries of comparable maturities) are within a normal historical range. In other words, investors are getting paid the excess yield above comparable U.S. Treasuries that they’ve historically demanded to assume the risk of owning high-yield bonds. However, yields are low in absolute terms across all parts of the bond market. It may be that investors are
Results at a glance
For periods ended September 30, 2014, with all distributions reinvested
| | | Cumulative
total returns | | Average annual
total returns |
| | | 1 year | | 5 years | | 10 years | | Lifetime
(since 2/19/88) |
| | | | | | | | | |
| American High-Income Trust (Class A shares) | | | 4.93 | % | | | 8.97 | % | | | 6.86 | % | | | 8.38 | % |
| Barclays U.S. Corporate High Yield 2% Issuer Capped Index* | | | 7.19 | | | | 10.52 | | | | 8.32 | | | | — | |
| Lipper High Yield Funds Index | | | 6.84 | | | | 9.93 | | | | 6.95 | | | | 7.17 | |
| * | This market index did not exist prior to December 31, 1992. It is unmanaged and, therefore, has no expenses. Investors cannot invest directly in an index. |
| American High-Income Trust | 1 |
simply unwilling to accept absolute yields below 5% from high-yield bonds regardless of the premium they may offer to an investor over U.S. Treasuries. Still, high-yield bonds in general and the fund specifically have been the beneficiaries of Federal Reserve policy, as low interest rates encourage investors to buy higher yielding securities, including high-yield bonds and stocks with dividends.
Inside the portfolio
American High-Income Trust has a broader view of the high-yield universe than its benchmark (Barclays U.S. Corporate High Yield 2% Issuer Capped Index) in that roughly 25% of the fund is in investments that are not part of the index. These holdings consist partly of emerging markets sovereign bonds that have lower yields and longer durations — but also lower risk profiles — than many of the domestic corporate bonds in the index. The fund’s non-index holdings also consist of emerging markets corporate bonds.
Additionally, around one-third of this non-index part of the fund’s portfolio is in floating rate bank loans. These bank loans are debt issued by companies that are generally below investment grade (BB/Ba and below). However, they are often the highest security in a company’s capital structure, so they often enjoy the backing of collateral and high recovery rates when defaults do occur. Also, their coupons float with interest rate movements, so they have limited interest rate risk. For these benefits, investors in these instruments generally sacrifice some current yield in comparison to high-yield bonds.
Both emerging markets debt and bank loans have been a drag on the fund’s results versus its benchmark since the end of the financial crisis, as domestic high-yield bonds have performed extremely well. However, investors should remember that many of the non-index holdings diversify the fund. For example, if interest rates eventually rise (usually a detriment to bonds) the bank loans have the potential to provide some protection for the fund. Finally, the fund’s non-index holdings have helped it perform well over long periods of time as the comparison between the fund’s lifetime results (8.38%) and the Lipper High Yield Funds Index’s results over the same period (7.17%) indicate. The fund owns different securities with different risk profiles that are not always correlated with high-yield bonds, but, over time, they have contributed to solid results.
Looking ahead
Because the fund offers high current yield, it has been the beneficiary of the Federal Reserve’s low interest rate policy since the financial crisis. Despite the Fed’s tapering, or scaling back, of its monthly purchases of bonds, we expect the environment for high-yield bonds to be favorable in the near-term.
By purchasing U.S. Treasuries and agency-backed mortgages, the Fed has kept interest rates low on the highest rated bonds, and pushed investors seeking returns in excess of inflation into high-yield bonds. Still, defaults are low, and companies have extended their maturities for several years. While they will have to make interest payments, many issuers won’t be under the burden of refinancing their debt for several years. Finally, the economy is showing some signs of improvement, with declining unemployment and rising corporate profits. This bodes well for the asset class. There likely will be hiccups along the way, as there have been this past summer. However, high-yield investors who have maintained their exposure to the asset class have been rewarded with attractive risk-adjusted returns over long periods of time, as the feature beginning on page 4 shows.
Sincerely,

David C. Barclay
President
November 12, 2014
For current information about the fund, visit americanfunds.com.
| 2 | American High-Income Trust |
The value of a long-term perspective
Here’s how a $10,000 investment in American High-Income Trust grew between February 19, 1988, when the fund began operations, and September 30, 2014, the end of its latest fiscal year. As you can see, that $10,000 grew to $82,023 with all distributions reinvested.
Fund results shown reflect deduction of the maximum sales charge of 3.75% on the $10,000 investment.1 Thus, the net amount invested was $9,625.2

| 1 | As outlined in the prospectus, the sales charge is reduced for accounts (and aggregated investments) of $100,000 or more and is eliminated for purchases of $1 million or more. There is no sales charge on dividends or capital gain distributions that are reinvested in additional shares. |
| 2 | The maximum initial sales charge was 4.75% prior to January 10, 2000. |
| 3 | The market index is unmanaged and, therefore, has no expenses. Investors cannot invest directly in an index. |
| 4 | From February 19, 1988, through December 31, 1992, the Credit Suisse High Yield Index was used because the Barclays U.S. Corporate High Yield 2% Issuer Capped Index did not yet exist. Since January 1, 1993, the Barclays U.S. Corporate High Yield 2% Issuer Capped Index has been used. |
| 5 | Results of the Lipper High Yield Funds Index do not reflect any sales charges. |
| 6 | Computed from data supplied by the U.S. Department of Labor, Bureau of Labor Statistics. |
| 7 | For the period February 19, 1988, commencement of operations, through September 30, 1988. |
Past results are not predictive of results for future periods. The results shown are before taxes on fund distributions and sale of fund shares.
Average annual total returns based on a $1,000 investment (for periods ended September 30, 2014)*
| | | 1 year | | 5 years | | 10 years |
| | | | | | | |
| Class A shares | | | 0.97 | % | | | 8.15 | % | | | 6.45 | % |
*Assumes reinvestment of all distributions and payment of the maximum 3.75% sales charge.
The total annual fund operating expense ratio is 0.66% for Class A shares as of the prospectus dated December 1, 2014 (unaudited).
Investment results assume all distributions are reinvested and reflect applicable fees and expenses. When applicable, investment results reflect fee waivers, without which results would have been lower. Visit americanfunds.com for more information.
| American High-Income Trust | 3 |

| 4 | American High-Income Trust |
High-yield bonds:
The potential for better reward and lower risk than you might think
High-yield bonds have been good to long-term investors for the past two decades, providing returns that have rivaled those of stocks without delivering all the volatility of stocks. They have offered a compelling risk/reward profile, and should play a role in most diversified portfolios.
Long-term reward usually comes with a bumpy ride
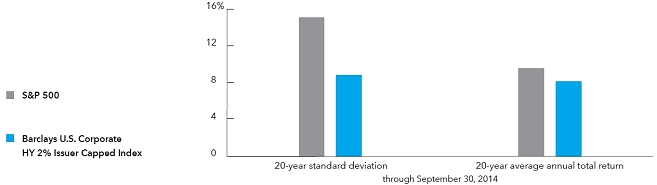
It isn’t easy to generate strong long-term returns and a smooth ride, but we’ll show that high-yield bonds have delivered more return and absorbed market shocks more deftly than you might have thought. In the chart below we show the 20-year annualized returns of major asset classes (various kinds of stocks and bonds) along with their volatility as measured by a common finance metric called “standard deviation.” Standard deviation of returns refers to how much an investment’s returns have differed or deviated in a given calendar year from the investment’s long-term average return.
Generally speaking, investments that have tended to produce higher returns over time, such as stocks, have done so with higher volatility or higher deviation from their long-term average returns in any given calendar year, as portfolio manager David Barclay notes.
For example, though Standard & Poor’s 500 Composite Index (the main domestic stock index) has achieved a nearly 10% average annual total return for almost a century, it has rarely produced a return in the 8%-12% range (i.e, close to its long-term average) in a given calendar year, and it has sometimes produced returns as high as around 50% and as low as around -40% in a given calendar year. (S&P 500 returns are reported for the period from January 1, 1926, to December 31, 2013.) Therefore, stocks are said to have a high standard deviation of returns. Unfortunately, higher overall returns typically materialize from asset classes that give investors some periodic discomfort, observes portfolio manager David Daigle.
Standard deviation: The amount that an investment’s annual returns deviate in a given year from the investment’s long-term average return
Fund results shown are for Class A shares at net asset value. If a sales charge (maximum 3.75%) had been deducted, the results would have been lower. Results are for past periods and are not predictive of results for future periods. Current and future results may be lower or higher than those shown. Share prices and returns will vary, so investors may lose money. For current information and month-end results, visit americanfunds.com.
20-year volatility/return (through September 30, 2014)

The market indexes are unmanaged and, therefore, have no expenses. Results for the MSCI All Country World ex USA Index reflect dividends gross of withholding taxes through December 31, 2000, and dividends net of withholding taxes thereafter.
| American High-Income Trust | 5 |

David Daigle
“As long as the companies issuing the bonds remain solvent and able to pay interest on their debt, high-yield bonds tend to maintain greater price stability than stocks.”
Equity-like returns with less risk
So, just as is usually the case, you’ve had to incur more volatility for achieving greater returns for the past 20 years. The S&P 500 has delivered an average annual total return of 9.58% for the past 20-year period through September 30, 2014, with a standard deviation of 15.13%. By contrast, the Barclays U.S. Aggregate Index (the main U.S. bond index) has produced a 6.13% average annual total return for the past 20 years with a standard deviation of less than 3.55%. (The market indexes shown in this report are unmanaged and, therefore, have no expenses. Investors cannot invest directly in an index.) This extra volatility associated with stocks versus bonds makes sense. For example, within only the past seven calendar years (including the financial crisis of 2008), annual returns on the S&P 500 have ranged from as low as -37% in 2008 to as high as 32% in 2013.
The chart on page 5 also shows that high-yield bonds represented by the Barclays U.S. Corporate HY 2% Issuer Capped Index have delivered a 8.04% average annual total return for the 20-year period ended September 30, 2014, with a standard deviation of 8.82%. This risk/reward profile sits in between stocks (represented by the S&P 500) and investment-grade bonds (rated BBB/Baa and above, and represented by the Barclays U.S. Aggregate Index). This makes sense since high-yield bonds are riskier than investment-grade bonds, but generally less risky than stocks.
The benefit of high-yield bonds, however, is that they can achieve most of the returns of stocks without all of the risk of stocks. The chart below shows that high-yield bonds have achieved more than 80% of the returns of stocks over the past 20 years ended September 30, 2014 (8.04% for the Barclays U.S. Corporate HY 2% Issuer Capped Index versus 9.58% for the S&P 500), but have achieved their returns by delivering less than 60% of the volatility of stocks measured by standard deviation of returns (8.82% versus 15.13%,
High-yield bonds have delivered equity-like returns with less volatility
| 6 | American High-Income Trust |

respectively). In other words, high-yield bonds have historically provided an attractive risk/reward profile.
How have high-yield bonds delivered solid returns with surprisingly lower volatility than stocks?
The simple answer to the question of how high-yield bonds have managed to deliver strong returns with more modest volatility than one might expect is the yield they offer. High current yield can buttress an investment in a variety of circumstances.
Yield serves as a shock absorber
One reason high-yield bonds have been less volatile than stocks is the fact that high current yield can mitigate volatility. According to David Daigle, “As long as the companies issuing the bonds remain solvent and able to pay interest on their debt, high-yield bonds tend to maintain greater price stability than stocks.” Historically, high-yield bonds have defaulted at a greater rate than investment-grade bonds, but averaging peaks and troughs in past default cycles shows that more than 95% of high-yield bonds have avoided default and continued generating high yields. In the 2008 financial crisis, the Barclays U.S. Corporate HY 2% Issuer Capped Index lost 25.88%, which was significantly better than the 36.99% loss of the S&P 500 for the year ended December 31, 2008. The interest payments of high-yield bonds may support their prices — at least compared to those of stocks — in times of distress.
Moreover, high-yield bonds have bounced back relatively quickly in years after poor returns. After 2008, for example, the Barclays U.S. Corporate HY 2% Issuer Capped Index rose 58.76% in 2009, more than offsetting the 2008 loss.
Yield also absorbs the shocks of rising rates
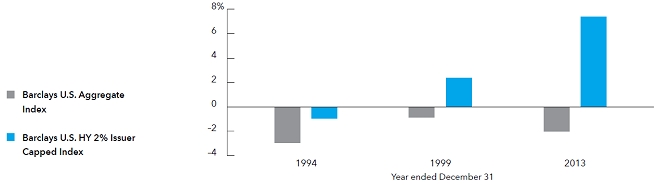
Finally, the higher interest payments of high-yield bonds make them relatively resilient, though not totally immune, to interest rate hikes compared to investment-grade bonds, David Daigle notes. This is because in a climate of rising rates, high-yield investors get more money back in the form of a higher coupon payment every year to invest at the new, higher rates. All bonds, including high-yield bonds, generally suffer losses when rates go up. However, as the chart below shows, in the three calendar years over the past 20, when investment-grade bonds (measured by the Barclays U.S. Aggregate Index) declined because of interest rate increases (1994, 1999 and 2013), the high-yield index posted a modest negative return (–0.96%) only in 1994 and positive returns in 1999 and 2013.
Altogether, high-yield bonds have offered an attractive risk/reward profile, have bounced back strongly from down years, and have exhibited less interest rate sensitivity than investment-grade bonds. They likely will continue to provide some painful volatility at times, as they did in 2008, but investors who’ve been able to maintain their allocations through difficult periods have been rewarded. n
High-yield bonds have shown resilience during rate increases
| American High-Income Trust | 7 |
Summary investment portfolio September 30, 2014
| Portfolio by type of security | Percent of net assets |

| Bonds, notes & other debt instruments 92.18% | | Principal amount
(000) | | | Value
(000) | |
| Corporate bonds, notes & loans 88.16% | | | | | | | | |
| Telecommunication services 16.32% | | | | | | | | |
| Clearwire Communications and Clearwire Finance, Inc. 14.75% 20161 | | $ | 13,650 | | | $ | 16,994 | |
| Digicel Group Ltd. 8.25% 20201 | | | 101,475 | | | | 105,037 | |
| Digicel Group Ltd. 6.00% 20211 | | | 97,092 | | | | 96,364 | |
| Digicel Group Ltd. 7.125% 20221 | | | 59,275 | | | | 59,305 | |
| Frontier Communications Corp. 6.25%—9.25% 2018—2025 | | | 297,066 | | | | 317,767 | |
| Intelsat Jackson Holding Co. 7.25% 2020 | | | 31,325 | | | | 33,126 | |
| Intelsat Jackson Holding Co. 6.625% 2022 | | | 180,950 | | | | 184,569 | |
| Intelsat Luxembourg Holding Co. 6.75% 2018 | | | 7,600 | | | | 7,847 | |
| LightSquared, Term Loan B, 12.00% 20142,3,4,5 | | | 115,770 | | | | 159,184 | |
| MetroPCS Wireless, Inc. 6.25% 2021 | | | 164,375 | | | | 166,635 | |
| MetroPCS Wireless, Inc. 6.625% 2023 | | | 139,200 | | | | 143,028 | |
| NII Capital Corp. 7.875% 20191,2 | | | 127,080 | | | | 86,097 | |
| NII Capital Corp. 11.375% 20191,2 | | | 196,970 | | | | 133,447 | |
| NII Capital Corp. 7.63%—10.00% 2016—20212 | | | 486,997 | | | | 122,634 | |
| Numerical Group SA, First Lien, 4.875% 20191 | | | 94,575 | | | | 93,747 | |
| Numerical Group SA, First Lien, 6.00% 20221 | | | 113,575 | | | | 114,569 | |
| Numerical Group SA, First Lien, 6.25% 20241 | | | 27,925 | | | | 27,890 | |
| Sprint Capital Corp. 6.90%—8.75% 2019—2032 | | | 6,800 | | | | 7,254 | |
| Sprint Corp. 7.25% 20211 | | | 98,925 | | | | 103,253 | |
| Sprint Corp. 7.875% 20231 | | | 81,450 | | | | 86,744 | |
| Sprint Nextel Corp. 7.00% 2020 | | | 174,385 | | | | 182,668 | |
| Sprint Nextel Corp. 8.38%—11.50% 2017—20211 | | | 107,965 | | | | 132,060 | |
| T-Mobile US, Inc. 6.542% 2020 | | | 108,475 | | | | 111,594 | |
| T-Mobile US, Inc. 6.38%—6.73% 2022—2025 | | | 87,325 | | | | 88,286 | |
| Trilogy International Partners, LLC 10.25% 20161 | | | 106,840 | | | | 109,578 | |
| Wind Acquisition SA 4.75% 20201 | | | 79,975 | | | | 77,276 | |
| Wind Acquisition SA 7.375% 20211 | | | 132,900 | | | | 133,897 | |
| Other securities | | | | | | | 373,272 | |
| | | | | | | | 3,274,122 | |
| | | | | | | | | |
| Consumer discretionary 14.40% | | | | | | | | |
| Boyd Gaming Corp. 9.125% 2018 | | | 82,070 | | | | 85,968 | |
| Boyd Gaming Corp. 9.00% 2020 | | | 81,555 | | | | 85,939 | |
| Cequel Communications Holdings I, LLC and Cequel Capital Corp. 6.375% 20201 | | | 116,350 | | | | 120,277 | |
| Other securities | | | | | | | 2,598,023 | |
| | | | | | | | 2,890,207 | |
| | | | | | | | | |
| Industrials 13.23% | | | | | | | | |
| Altegrity, Inc. 9.50% 20191 | | | 151,950 | | | | 140,554 | |
| Associated Materials, LLC and AMH New Finance, Inc. 9.125% 2017 | | | 167,367 | | | | 164,647 | |
| BE Aerospace, Inc. 5.25% 2022 | | | 106,698 | | | | 115,501 | |
| CEVA Group PLC 4.00%—9.00% 2018—20211 | | | 70,825 | | | | 68,284 | |
| CEVA Group PLC, LOC, 6.50% 20214,5,6 | | | 15,843 | | | | 15,394 | |
| 8 | American High-Income Trust |
| | | Principal amount
(000) | | | Value
(000) | |
| CEVA Group PLC, Term Loan 6.50% 20214,5,6 | | $ | 42,419 | | | $ | 41,217 | |
| Euramax International, Inc. 9.50% 2016 | | | 87,565 | | | | 85,814 | |
| Jeld-Wen Escrow Corp. 12.25% 20171 | | | 89,060 | | | | 94,960 | |
| Nortek Inc. 8.50% 2021 | | | 83,777 | | | | 90,479 | |
| Ply Gem Industries, Inc. 6.50% 2022 | | | 89,350 | | | | 85,218 | |
| Other securities | | | | | | | 1,753,505 | |
| | | | | | | | 2,655,573 | |
| | | | | | | | | |
| Health care 11.45% | | | | | | | | |
| inVentiv Health Inc, Term Loan B4, 7.75% 20184,5,6 | | | 57,910 | | | | 57,669 | |
| inVentiv Health Inc. 9.00% 20181 | | | 174,065 | | | | 181,463 | |
| inVentiv Health Inc. 11.00% 20181 | | | 72,376 | | | | 58,624 | |
| inVentiv Health Inc. 12.00% 20181,3,6 | | | 104,008 | | | | 96,727 | |
| Kinetic Concepts, Inc. 10.50% 2018 | | | 162,000 | | | | 176,580 | |
| Kinetic Concepts, Inc. 12.50% 2019 | | | 151,837 | | | | 169,678 | |
| Other securities | | | | | | | 1,556,114 | |
| | | | | | | | 2,296,855 | |
| | | | | | | | | |
| Energy 10.55% | | | | | | | | |
| American Energy (Permian Basin) 7.125% 20201 | | | 97,475 | | | | 89,677 | |
| Jupiter Resources Inc. 8.50% 20221 | | | 97,475 | | | | 86,753 | |
| NGPL PipeCo LLC 7.119% 20171 | | | 137,395 | | | | 138,082 | |
| NGPL PipeCo LLC 9.625% 20191 | | | 126,850 | | | | 135,095 | |
| NGPL PipeCo LLC, Term Loan B, 6.75% 20174,5,6 | | | 11,001 | | | | 10,983 | |
| PDC Energy Inc. 7.75% 2022 | | | 101,050 | | | | 108,629 | |
| Peabody Energy Corp. 6.00% 2018 | | | 126,672 | | | | 124,772 | |
| Sabine Pass Liquefaction, LLC 5.75% 20241 | | | 89,275 | | | | 90,949 | |
| Samson Investment Co. 9.75% 2020 | | | 214,715 | | | | 195,927 | |
| Other securities | | | | | | | 1,137,055 | |
| | | | | | | | 2,117,922 | |
| | | | | | | | | |
| Materials 8.01% | | | | | | | | |
| First Quantum Minerals Ltd. 6.75% 20201 | | | 139,162 | | | | 142,293 | |
| First Quantum Minerals Ltd. 7.00% 20211 | | | 138,096 | | | | 140,685 | |
| First Quantum Minerals Ltd. 7.25% 20221 | | | 8,575 | | | | 8,789 | |
| FMG Resources 6.00% 20171 | | | 104,092 | | | | 105,198 | |
| JMC Steel Group Inc. 8.25% 20181 | | | 141,540 | | | | 143,486 | |
| Reynolds Group Inc. 5.75% 2020 | | | 184,460 | | | | 188,610 | |
| Reynolds Group Inc. 7.13%—9.88% 2019 | | | 55,015 | | | | 59,148 | |
| Other securities | | | | | | | 818,624 | |
| | | | | | | | 1,606,833 | |
| | | | | | | | | |
| Information technology 6.25% | | | | | | | | |
| First Data Corp. 11.75% 2021 | | | 125,353 | | | | 145,723 | |
| First Data Corp. 12.625% 2021 | | | 102,696 | | | | 123,235 | |
| First Data Corp. 6.75%—14.50% 2019—20221,3,6 | | | 82,892 | | | | 88,042 | |
| SRA International, Inc. 11.00% 2019 | | | 77,912 | | | | 83,366 | |
| SRA International, Inc., Term Loan B, 6.50% 20184,5,6 | | | 123,232 | | | | 123,386 | |
| Other securities | | | | | | | 690,787 | |
| | | | | | | | 1,254,539 | |
| | | | | | | | | |
| Financials 5.47% | | | | | | | | |
| Crescent Resources 10.25% 20171 | | | 117,010 | | | | 127,541 | |
| Realogy Corp. 4.50% 20191 | | | 101,820 | | | | 98,765 | |
| Other securities | | | | | | | 871,723 | |
| | | | | | | | 1,098,029 | |
| | | | | | | | | |
| Other 2.48% | | | | | | | | |
| Other securities | | | | | | | 496,978 | |
| | | | | | | | | |
| Total corporate bonds, notes & loans | | | | | | | 17,691,058 | |
| | | | | | | | | |
| Bonds & notes of governments & government agencies outside the U.S. 3.05% | | | | | | | | |
| India (Republic of) 7.28% 2019 | | INR | 5,550,000 | | | | 86,143 | |
| Other securities | | | | | | | 526,263 | |
| | | | | | | | 612,406 | |
| American High-Income Trust | 9 |
| Bonds, notes & other debt instruments (continued) | | Principal amount
(000) | | | Value
(000) | |
| Other 0.97% | | | | | | | | |
| Other securities | | | | | | $ | 194,356 | |
| | | | | | | | | |
| Total bonds, notes & other debt instruments (cost: $18,680,053,000) | | | | | | | 18,497,820 | |
| | | | | | | | | |
| Convertible bonds 0.96% | | | | | | | | |
| Telecommunication services 0.04% | | | | | | | | |
| Clearwire Corp. 8.25% convertible notes 20401 | | $ | 7,722 | | | | 8,658 | |
| | | | | | | | | |
| | | | | | | | | |
| Other 0.92% | | | | | | | | |
| Other securities | | | | | | | 182,939 | |
| | | | | | | | | |
| Total convertible bonds (cost: $167,950,000) | | | | | | | 191,597 | |
| | | | | | | | | |
| Convertible stocks 1.39% | | Shares | | | | | |
| Industrials 0.48% | | | | | | | | |
| CEVA Group PLC, Series A-1, 3.23% convertible preferred7 | | | 47,121 | | | | 73,038 | |
| CEVA Group PLC, Series A-2, 2.23% convertible preferred7,8 | | | 21,063 | | | | 23,169 | |
| | | | | | | | 96,207 | |
| | | | | | | | | |
| Other 0.91% | | | | | | | | |
| Other securities | | | | | | | 183,414 | |
| | | | | | | | | |
| Total convertible stocks (cost: $248,907,000) | | | | | | | 279,621 | |
| | | | | | | | | |
| Preferred securities 0.51% | | | | | | | | |
| Financials 0.51% | | | | | | | | |
| Other securities | | | | | | | 102,174 | |
| | | | | | | | | |
| Total preferred securities (cost: $89,535,000) | | | | | | | 102,174 | |
| | | | | | | | | |
| Common stocks 1.50% | | | | | | | | |
| Consumer discretionary 0.55% | | | | | | | | |
| Cooper-Standard Holdings Inc.9,10 | | | 1,663,543 | | | | 103,805 | |
| Other securities | | | | | | | 6,130 | |
| | | | | | | | 109,935 | |
| | | | | | | | | |
| Industrials 0.38% | | | | | | | | |
| CEVA Group PLC1,7,10 | | | 59,168 | | | | 65,085 | |
| Other securities | | | | | | | 12,101 | |
| | | | | | | | 77,186 | |
| Other 0.57% | | | | | | | | |
| Other securities | | | | | | | 114,254 | |
| | | | | | | | | |
| Total common stocks (cost: $304,412,000) | | | | | | | 301,375 | |
| | | | | | | | | |
| Rights & warrants 0.01% | | | | | | | | |
| Other 0.01% | | | | | | | | |
| Other securities | | | | | | | 1,847 | |
| | | | | | | | | |
| Total rights & warrants (cost: $5,447,000) | | | | | | | 1,847 | |
| | | | | | | | | |
| Short-term securities 2.49% | | Principal amount
(000) | | | | | |
| Freddie Mac 0.09%—0.11% due 2/3/2015—3/19/2015 | | $ | 159,200 | | | | 159,174 | |
| Other securities | | | | | | | 340,744 | |
| | | | | | | | | |
| Total short-term securities (cost: $499,860,000) | | | | | | | 499,918 | |
| Total investment securities 99.04% (cost: $19,996,164,000) | | | | | | | 19,874,352 | |
| Other assets less liabilities 0.96% | | | | | | | 191,726 | |
| | | | | | | | | |
| Net assets 100.00% | | | | | | $ | 20,066,078 | |
| 10 | American High-Income Trust |
This summary investment portfolio is designed to streamline the report and help investors better focus on the fund’s principal holdings. See the inside back cover for details on how to obtain a complete schedule of portfolio holdings.
“Other securities” includes all issues that are not disclosed separately in the summary investment portfolio, including securities which were pledged as collateral. The total value of pledged collateral was $4,875,000, which represented .02% of the net assets of the fund.
Forward currency contracts
The fund has entered into forward currency contracts to sell currencies as shown in the following table. The average notional amount of open forward currency contracts was $258,968,000 over the prior 12-month period.
| | | | | | | | | Unrealized | |
| | | | | | | Contract amount | | appreciation | |
| | | Settlement | | | | Receive | | Deliver | | at 9/30/2014 | |
| | | date | | Counterparty | | (000) | | (000) | | (000) | |
| Sales: | | | | | | | | | | | | | |
| Euros | | 10/16/2014 | | UBS AG | | $19,057 | | €14,750 | | | $ | 425 | |
| Euros | | 10/20/2014 | | HSBC Bank | | $15,177 | | €11,700 | | | | 398 | |
| Euros | | 10/22/2014 | | Citibank | | $11,307 | | €8,750 | | | | 254 | |
| Euros | | 10/27/2014 | | Bank of America, N.A. | | $7,329 | | €5,700 | | | | 128 | |
| Euros | | 10/31/2014 | | JPMorgan Chase | | $65,983 | | €52,000 | | | | 291 | |
| | | | | | | | | | | | $ | 1,496 | |
Interest rate swaps
The fund has entered into an interest rate swap as shown in the following table. The fund entered into the interest rate swap in July 2014. The average notional amount of interest rate swaps was $20,000,000 over the prior three-month period.
| | | | | | | | | | | | | Unrealized | |
| | | | | | | | | | | Notional | | appreciation at | |
| Pay/receive | | | | Floating rate | | Fixed | | Expiration | | amount | | 9/30/2014 | |
| floating rate | | Clearinghouse | | index | | rate | | date | | (000) | | (000) | |
| Receive | | LCH.Clearnet | | 3-month USD-LIBOR | | 2.197 | % | 7/22/2021 | | $20,000 | | | $ | 110 | |
Credit default swaps
The fund has entered into credit default swaps as shown in the following table. The average notional amount of credit default swaps was $116,538,000 over the prior 12-month period.
Centrally cleared credit default swaps on credit indices — sell protection
| | | | | | | | | | | | Unrealized | |
| | | | | | | | | | | | appreciation | |
| | | | | | | | | | Notional | | (depreciation) | |
| | | | | Receive | | | Expiration | | amount | | at 9/30/2014 | |
| Referenced index | | Clearinghouse | | fixed rate | | | date | | (000) | | (000) | |
| CDX North American High Yield Index Series 21 | | Intercontinental Exchange, Inc. | | 5.00 | % | | 12/20/2018 | | $17,820 | | | $ | 161 | |
| CDX North American High Yield Index Series 22 | | Intercontinental Exchange, Inc. | | 5.00 | | | 6/20/2019 | | 28,710 | | | | (527 | ) |
| CDX North American High Yield Index Series 22 | | Intercontinental Exchange, Inc. | | 5.00 | | | 6/20/2019 | | 31,680 | | | | (683 | ) |
| | | | | | | | | | | | | $ | (1,049 | ) |
| American High-Income Trust | 11 |
Investments in affiliates
A company is an affiliate of the fund under the Investment Company Act of 1940 if the fund’s holdings in that company represent 5% or more of the outstanding voting shares. The value of the fund’s affiliated-company holdings is either shown in the summary investment portfolio or included in the value of “Other securities” under the respective industry sectors. Further details on such holdings and related transactions during the year ended September 30, 2014, appear below.
| | | Beginning | | | | | | | | | Ending | | | | | | Value of | |
| | | shares or | | | | | | | | | shares or | | | Interest | | | affiliates at | |
| | | principal | | | | | | | | | principal | | | income | | | 9/30/2014 | |
| | | amount | | | Additions | | | Reductions | | | amount | | | (000) | | | (000) | |
| Rotech Healthcare Inc., Term Loan, 13.00% 20203,4,5,6 | | $ | 43,908,783 | | | $ | 5,091,118 | | | | — | | | $ | 48,999,901 | | | $ | 6,027 | | | $ | 48,755 | |
| Rotech Healthcare Inc., Term Loan A, 5.50% 20184,5,6 | | $ | 25,900,000 | | | | — | | | $ | 259,000 | | | $ | 25,641,000 | | | | 1,439 | | | | 25,513 | |
| Rotech Healthcare Inc.7,10 | | | 1,916,275 | | | | 1 | | | | — | | | | 1,916,276 | | | | — | | | | 21,654 | |
| Rotech Healthcare Inc., Term Loan B, 10.00% 20194,5,6 | | $ | 20,825,000 | | | | — | | | | — | | | $ | 20,825,000 | | | | 2,111 | | | | 20,721 | |
| Cooper-Standard Holdings Inc.10 | | | 1,238,538 | | | | 432,805 | | | | 7,800 | | | | 1,663,543 | | | | — | | | | 103,805 | |
| Cooper-Standard Holdings Inc., warrants, expire 201710 | | | 196,935 | | | | — | | | | 148,524 | | | | 48,411 | | | | — | | | | 1,759 | |
| Cooper-Standard Holdings Inc. 7.00% convertible preferred | | | 99,687 | | | | — | | | | 99,687 | | | | — | | | | — | | | | — | |
| Revel AC, Inc.7,8,10 | | | 908,183 | | | | — | | | | — | | | | 908,183 | | | | — | | | | — | |
| Revel AC, Inc. (CVR)7,8,10 | | | 43,088,200 | | | | — | | | | — | | | | 43,088,200 | | | | — | | | | — | |
| Mirabela Nickel Ltd.10,11 | | | — | | | | 54,468,461 | | | | 19,800,138 | | | | 34,668,323 | | | | — | | | | — | |
| Mirabela Nickel Ltd., convertible notes 9.50% 20191,3,7,11 | | | — | | | $ | 10,975,000 | | | | — | | | $ | 10,975,000 | | | | 290 | | | | — | |
| Revel Entertainment, Term Loan B, 10.00% 20152,3,4,5,6,7 | | | — | | | $ | 15,286,433 | | | | — | | | $ | 15,286,433 | | | | 785 | | | | — | |
| Revel Entertainment, Term Loan B, 14.50% 20182,3,4,5,6,7 | | $ | 74,061,406 | | | $ | 8,542,775 | | | $ | 365,625 | | | $ | 82,238,556 | | | | 3,463 | | | | — | |
| American Media, Inc.1,7,10,11 | | | 1,122,345 | | | | — | | | | 1,122,345 | | | | — | | | | — | | | | — | |
| | | | | | | | | | | | | | | | | | | $ | 14,115 | | | $ | 222,207 | |
The following footnotes apply to either the individual securities noted or one or more of the securities aggregated and listed as a single line item.
| 1 | Acquired in a transaction exempt from registration under Rule 144A or Section 4(2) of the Securities Act of 1933. May be resold in the U.S. in transactions exempt from registration, normally to qualified institutional buyers. The total value of all such securities, including those in “Other securities,” was $8,211,270,000, which represented 40.92% of the net assets of the fund. |
| 2 | Scheduled interest and/or principal payment was not received. |
| 3 | Payment in kind; the issuer has the option of paying additional securities in lieu of cash. |
| 4 | Loan participations and assignments; may be subject to legal or contractual restrictions on resale. The total value of all such loans, including those in “Other securities,” was $1,765,216,000, which represented 8.80% of the net assets of the fund. |
| 5 | Principal payments may be made periodically. Therefore, the effective maturity date may be earlier than the stated maturity date. |
| 6 | Coupon rate may change periodically. |
| 7 | Valued under fair value procedures adopted by authority of the board of trustees. The total value of all such securities including those in “Other securities,” was $245,733,000, which represented 1.22% of the net assets of the fund. |
| 8 | Acquired through a private placement transaction exempt from registration under the Securities Act of 1933. May be subject to legal or contractual restrictions on resale. Further details on these holdings appear below. |
| 9 | Represents an affiliated company as defined under the Investment Company Act of 1940. |
| 10 | Security did not produce income during the last 12 months. |
| 11 | Unaffiliated issuer at 9/30/2014. |
| | | | | | | | | | | Percent | |
| | | Acquisition | | Cost | | | Value | | | of net | |
| Private placement securities | | date | | (000) | | | (000) | | | assets | |
| CEVA Group PLC, Series A-2, 2.23% convertible preferred | | 5/2/2013 | | $ | 20,349 | | | $ | 23,169 | | | | .12 | % |
| Other private placement securities | | | | | 85,159 | | | | 19,054 | | | | .09 | |
| Total private placement securities | | | | $ | 105,508 | | | $ | 42,223 | | | | .21 | % |
Key to abbreviations and symbol
CVR = Contingent Value Rights
LOC = Letter of Credit
€ = Euros
INR = Indian rupees
See Notes to Financial Statements
| 12 | American High-Income Trust |
Financial statements
| Statement of assets and liabilities | | | | | | | | |
| at September 30, 2014 | | | (dollars in thousands) |
| | | | | | | | | |
| Assets: | | | | | | | | |
| Investment securities, at value: | | | | | | | | |
| Unaffiliated issuers (cost: $19,667,742) | | $ | 19,652,145 | | | | | |
| Affiliated issuers (cost: $328,422) | | | 222,207 | | | $ | 19,874,352 | |
| Cash denominated in currencies other than U.S. dollars (cost: $5) | | | | | | | 5 | |
| Cash | | | | | | | 224 | |
| Unrealized appreciation on open forward currency contracts | | | | | | | 1,496 | |
| Receivables for: | | | | | | | | |
| Sales of investments | | | 172,453 | | | | | |
| Sales of fund’s shares | | | 24,144 | | | | | |
| Variation margin | | | 377 | | | | | |
| Dividends and interest | | | 402,235 | | | | 599,209 | |
| | | | | | | | 20,475,286 | |
| Liabilities: | | | | | | | | |
| Payables for: | | | | | | | | |
| Purchases of investments | | | 336,359 | | | | | |
| Repurchases of fund’s shares | | | 53,090 | | | | | |
| Dividends on fund’s shares | | | 6,909 | | | | | |
| Investment advisory services | | | 4,645 | | | | | |
| Services provided by related parties | | | 6,865 | | | | | |
| Trustees’ deferred compensation | | | 293 | | | | | |
| Other | | | 1,047 | | | | 409,208 | |
| Net assets at September 30, 2014 | | | | | | $ | 20,066,078 | |
| | | | | | | | | |
| Net assets consist of: | | | | | | | | |
| Capital paid in on shares of beneficial interest | | | | | | $ | 20,585,937 | |
| Distributions in excess of net investment income | | | | | | | (43,455 | ) |
| Accumulated net realized loss | | | | | | | (354,373 | ) |
| Net unrealized depreciation | | | | | | | (122,031 | ) |
| Net assets at September 30, 2014 | | | | | | $ | 20,066,078 | |
(dollars and shares in thousands, except per-share amounts)
Shares of beneficial interest issued and outstanding (no stated par value) —
unlimited shares authorized (1,809,568 total shares outstanding)
| | | Net assets | | | Shares
outstanding | | | Net asset
value per share | |
| Class A | | $ | 14,285,523 | | | | 1,288,275 | | | $ | 11.09 | |
| Class B | | | 94,138 | | | | 8,489 | | | | 11.09 | |
| Class C | | | 1,237,844 | | | | 111,629 | | | | 11.09 | |
| Class F-1 | | | 926,771 | | | | 83,577 | | | | 11.09 | |
| Class F-2 | | | 1,321,800 | | | | 119,200 | | | | 11.09 | |
| Class 529-A | | | 367,091 | | | | 33,104 | | | | 11.09 | |
| Class 529-B | | | 6,487 | | | | 585 | | | | 11.09 | |
| Class 529-C | | | 132,708 | | | | 11,968 | | | | 11.09 | |
| Class 529-E | | | 20,276 | | | | 1,829 | | | | 11.09 | |
| Class 529-F-1 | | | 25,033 | | | | 2,257 | | | | 11.09 | |
| Class R-1 | | | 23,960 | | | | 2,161 | | | | 11.09 | |
| Class R-2 | | | 224,045 | | | | 20,204 | | | | 11.09 | |
| Class R-2E | | | 10 | | | | 1 | | | | 11.09 | |
| Class R-3 | | | 256,416 | | | | 23,124 | | | | 11.09 | |
| Class R-4 | | | 230,073 | | | | 20,748 | | | | 11.09 | |
| Class R-5 | | | 111,396 | | | | 10,046 | | | | 11.09 | |
| Class R-6 | | | 802,507 | | | | 72,371 | | | | 11.09 | |
See Notes to Financial Statements
| American High-Income Trust | 13 |
| Statement of operations | | | | | | | | |
| for the year ended September 30, 2014 | | | (dollars in thousands) |
| | | | | | | | | |
| Investment income: | | | | | | | | |
| Income: | | | | | | | | |
| Interest (net of non-U.S. taxes of $135; also includes $14,115 from affiliates) | | $ | 1,358,159 | | | | | |
| Dividends | | | 15,481 | | | $ | 1,373,640 | |
| Fees and expenses*: | | | | | | | | |
| Investment advisory services | | | 56,797 | | | | | |
| Distribution services | | | 58,353 | | | | | |
| Transfer agent services | | | 24,699 | | | | | |
| Administrative services | | | 4,435 | | | | | |
| Reports to shareholders | | | 1,061 | | | | | |
| Registration statement and prospectus | | | 660 | | | | | |
| Trustees’ compensation | | | 176 | | | | | |
| Auditing and legal | | | 167 | | | | | |
| Custodian | | | 224 | | | | | |
| Other | | | 720 | | | | 147,292 | |
| Net investment income | | | | | | | 1,226,348 | |
| | | | | | | | | |
| Net realized gain and unrealized depreciation on investments, forward currency contracts, interest rate swaps, credit default swaps and currency: | | | | | | | | |
| Net realized gain (loss) on: | | | | | | | | |
| Investments (net of non-U.S. taxes of $5; also includes $20,722 net gain from affiliates) | | | 490,793 | | | | | |
| Forward currency contracts | | | 4,239 | | | | | |
| Interest rate swaps | | | (74 | ) | | | | |
| Credit default swaps | | | 5,557 | | | | | |
| Currency transactions | | | (3,272 | ) | | | 497,243 | |
| Net unrealized (depreciation) appreciation on: | | | | | | | | |
| Investments (net of non-U.S. taxes of $232) | | | (756,381 | ) | | | | |
| Forward currency contracts | | | 5,902 | | | | | |
| Interest rate swaps | | | 110 | | | | | |
| Credit default swaps | | | (1,049 | ) | | | | |
| Currency translations | | | (609 | ) | | | (752,027 | ) |
| Net realized gain and unrealized depreciation on investments, forward currency contracts, interest rate swaps, credit default swaps and currency | | | | | | | (254,784 | ) |
| | | | | | | | | |
| Net increase in net assets resulting from operations | | | | | | $ | 971,564 | |
*Additional information related to class-specific fees and expenses is included in the Notes to Financial Statements.
See Notes to Financial Statements
| 14 | American High-Income Trust |
| Statements of changes in net assets | | | | | | | | |
| | | | | | | | | |
| | | | (dollars in thousands) |
| | | | | |
| | | Year ended September 30 | |
| | | 2014 | | | 2013 | |
| Operations: | | | | | | | | |
| Net investment income | | $ | 1,226,348 | | | $ | 1,291,104 | |
| Net realized gain on investments, forward currency contracts, interest rate swaps, credit default swaps and currency transactions | | | 497,243 | | | | 21,905 | |
| Net unrealized (depreciation) appreciation on investments, forward currency contracts, interest rate swaps, credit default swaps and currency translations | | | (752,027 | ) | | | 66,746 | |
| Net increase in net assets resulting from operations | | | 971,564 | | | | 1,379,755 | |
| | | | | | | | | |
| Dividends paid or accrued to shareholders from net investment income | | | (1,224,533 | ) | | | (1,319,459 | ) |
| | | | | | | | | |
| Net capital share transactions | | | 282,076 | | | | 168,005 | |
| | | | | | | | | |
| Total increase in net assets | | | 29,107 | | | | 228,301 | |
| | | | | | | | | |
| Net assets: | | | | | | | | |
| Beginning of year | | | 20,036,971 | | | | 19,808,670 | |
| End of year (including distributions in excess of net investment income: $(43,455) and $(51,545), respectively) | | $ | 20,066,078 | | | $ | 20,036,971 | |
See Notes to Financial Statements
| American High-Income Trust | 15 |
Notes to financial statements
1. Organization
American High-Income Trust (the “fund”) is registered under the Investment Company Act of 1940 as an open-end, diversified management investment company. The fund seeks a high level of current income and, secondarily, capital appreciation through a diversified, carefully supervised portfolio consisting primarily of lower rated, higher risk corporate bonds.
The fund has 17 share classes consisting of five retail share classes (Classes A, B and C, as well as two F share classes, F-1 and F-2), five 529 college savings plan share classes (Classes 529-A, 529-B, 529-C, 529-E and 529-F-1) and seven retirement plan share classes (Classes R-1, R-2, R-2E, R-3, R-4, R-5 and R-6). The 529 college savings plan share classes can be used to save for college education. The retirement plan share classes are generally offered only through eligible employer-sponsored retirement plans. The fund’s share classes are described further in the following table:
| Share class | | Initial sales charge | | Contingent deferred sales
charge upon redemption | | Conversion feature | |
| Classes A and 529-A | | Up to 3.75% | | None (except 1% for certain redemptions within one year of purchase without an initial sales charge) | | None | |
| Classes B and 529-B* | | None | | Declines from 5% to 0% for redemptions within six years of purchase | | Classes B and 529-B convert to Classes A and 529-A, respectively, after eight years | |
| Class C | | None | | 1% for redemptions within one year of purchase | | Class C converts to Class F-1 after 10 years | |
| Class 529-C | | None | | 1% for redemptions within one year of purchase | | None | |
| Class 529-E | | None | | None | | None | |
| Classes F-1, F-2 and 529-F-1 | | None | | None | | None | |
| Classes R-1, R-2, R-2E, R-3, R-4, R-5 and R-6 | | None | | None | | None | |
*Class B and 529-B shares of the fund are not available for purchase.
On August 29, 2014, the fund made an additional retirement plan share class (Class R-2E) available for sale pursuant to an amendment to its registration statement filed with the U.S. Securities and Exchange Commission. Refer to the fund’s prospectus for more details.
Holders of all share classes have equal pro rata rights to the assets, dividends and liquidation proceeds of the fund. Each share class has identical voting rights, except for the exclusive right to vote on matters affecting only its class. Share classes have different fees and expenses (“class-specific fees and expenses”), primarily due to different arrangements for distribution, transfer agent and administrative services. Differences in class-specific fees and expenses will result in differences in net investment income and, therefore, the payment of different per-share dividends by each share class.
2. Significant accounting policies
The fund is an investment company that applies the accounting and reporting guidance issued in Topic 946 by the U.S. Financial Accounting Standards Board. The fund’s financial statements have been prepared to comply with U.S. generally accepted accounting principles (“U.S. GAAP”). These principles require the fund’s investment adviser to make estimates and assumptions that affect reported amounts and disclosures. Actual results could differ from those estimates. The fund follows the significant accounting policies described in this section, as well as the valuation policies described in the next section on valuation.
Security transactions and related investment income — Security transactions are recorded by the fund as of the date the trades are executed with brokers. Realized gains and losses from security transactions are determined based on the specific identified cost of the securities. In the event a security is purchased with a delayed payment date, the fund will segregate liquid assets sufficient to meet its payment obligations. Dividend income is recognized on the ex-dividend date and interest income is recognized on an accrual basis. Market discounts, premiums and original issue discounts on fixed-income securities are amortized daily over the expected life of the security.
| 16 | American High-Income Trust |
Class allocations — Income, fees and expenses (other than class-specific fees and expenses) are allocated daily among the various share classes based on the relative value of their settled shares. Realized and unrealized gains and losses are allocated daily among the various share classes based on their relative net assets. Class-specific fees and expenses, such as distribution, administrative and shareholder services, are charged directly to the respective share class.
Dividends and distributions to shareholders — Dividends to shareholders are declared daily after the determination of the fund’s net investment income and are paid to shareholders monthly. Distributions to shareholders are recorded on the ex-dividend date.
Currency translation — Assets and liabilities, including investment securities, denominated in currencies other than U.S. dollars are translated into U.S. dollars at the exchange rates supplied by one or more pricing vendors on the valuation date. Purchases and sales of investment securities and income and expenses are translated into U.S. dollars at the exchange rates on the dates of such transactions. The effects of changes in exchange rates on investment securities are included with the net realized gain or loss and net unrealized appreciation or depreciation on investments in the fund’s statement of operations. The realized gain or loss and unrealized appreciation or depreciation resulting from all other transactions denominated in currencies other than U.S. dollars are disclosed separately.
3. Valuation
Capital Research and Management Company (“CRMC”), the fund’s investment adviser, values the fund’s investments at fair value as defined by U.S. GAAP. The net asset value of each share class of the fund is generally determined as of approximately 4:00 p.m. New York time each day the New York Stock Exchange is open.
Methods and inputs — The fund’s investment adviser uses the following methods and inputs to establish the fair value of the fund’s assets and liabilities. Use of particular methods and inputs may vary over time based on availability and relevance as market and economic conditions evolve.
Equity securities are generally valued at the official closing price of, or the last reported sale price on, the exchange or market on which such securities are traded, as of the close of business on the day the securities are being valued or, lacking any sales, at the last available bid price. Prices for each security are taken from the principal exchange or market on which the security trades.
Fixed-income securities, including short-term securities, are generally valued at prices obtained from one or more pricing vendors. Vendors value such securities based on one or more of the inputs described in the following table. The table provides examples of inputs that are commonly relevant for valuing particular classes of fixed-income securities in which the fund is authorized to invest. However, these classifications are not exclusive, and any of the inputs may be used to value any other class of fixed-income security.
| Fixed-income class | Examples of standard inputs |
| All | Benchmark yields, transactions, bids, offers, quotations from dealers and trading systems, new issues, spreads and other relationships observed in the markets among comparable securities; and proprietary pricing models such as yield measures calculated using factors such as cash flows, financial or collateral performance and other reference data (collectively referred to as “standard inputs”) |
| Corporate bonds & notes; convertible securities | Standard inputs and underlying equity of the issuer |
| Bonds & notes of governments & government agencies | Standard inputs and interest rate volatilities |
| Mortgage-backed; asset-backed obligations | Standard inputs and cash flows, prepayment information, default rates, delinquency and loss assumptions, collateral characteristics, credit enhancements and specific deal information |
| Municipal securities | Standard inputs and, for certain distressed securities, cash flows or liquidation values using a net present value calculation based on inputs that include, but are not limited to, financial statements and debt contracts |
When the fund’s investment adviser deems it appropriate to do so (such as when vendor prices are unavailable or deemed to be not representative), fixed-income securities will be valued in good faith at the mean quoted bid and ask prices that are reasonably and timely available (or bid prices, if ask prices are not available) or at prices for securities of comparable maturity, quality and type.
Securities with both fixed-income and equity characteristics, or equity securities traded principally among fixed-income dealers, are generally valued in the manner described for either equity or fixed-income securities, depending on which method is deemed most appropriate by the fund’s investment adviser. Forward currency contracts are valued at the mean of representative quoted bid and ask
| American High-Income Trust | 17 |
prices, generally based on prices supplied by one or more pricing vendors. Interest rate swaps are generally valued by pricing vendors based on market inputs that include the index and term of index, reset frequency, payer/receiver, currency, and pay frequency. Credit default swaps are generally valued by pricing vendors based on market inputs that include the index and term of index, reset frequency, payer/receiver, currency and pay frequency.
Securities and other assets for which representative market quotations are not readily available or are considered unreliable by the fund’s investment adviser are fair valued as determined in good faith under fair valuation guidelines adopted by authority of the fund’s board of trustees as further described. The investment adviser follows fair valuation guidelines, consistent with U.S. Securities and Exchange Commission rules and guidance, to consider relevant principles and factors when making fair value determinations. The investment adviser considers relevant indications of value that are reasonably and timely available to it in determining the fair value to be assigned to a particular security, such as the type and cost of the security; contractual or legal restrictions on resale of the security; relevant financial or business developments of the issuer; actively traded similar or related securities; conversion or exchange rights on the security; related corporate actions; significant events occurring after the close of trading in the security; and changes in overall market conditions. Fair valuations and valuations of investments that are not actively trading involve judgment and may differ materially from valuations that would have been used had greater market activity occurred.
Processes and structure — The fund’s board of trustees has delegated authority to the fund’s investment adviser to make fair value determinations, subject to board oversight. The investment adviser has established a Joint Fair Valuation Committee (the “Fair Valuation Committee”) to administer, implement and oversee the fair valuation process, and to make fair value decisions. The Fair Valuation Committee regularly reviews its own fair value decisions, as well as decisions made under its standing instructions to the investment adviser’s valuation teams. The Fair Valuation Committee reviews changes in fair value measurements from period to period and may, as deemed appropriate, update the fair valuation guidelines to better reflect the results of back testing and address new or evolving issues. The Fair Valuation Committee reports any changes to the fair valuation guidelines to the board of trustees with supplemental information to support the changes. The fund’s board and audit committee also regularly review reports that describe fair value determinations and methods.
The fund’s investment adviser has also established a Fixed-Income Pricing Review Group to administer and oversee the fixed-income valuation process, including the use of fixed-income pricing vendors. This group regularly reviews pricing vendor information and market data. Pricing decisions, processes and controls over security valuation are also subject to additional internal reviews, including an annual control self-evaluation program facilitated by the investment adviser’s compliance group.
Classifications — The fund’s investment adviser classifies the fund’s assets and liabilities into three levels based on the inputs used to value the assets or liabilities. Level 1 values are based on quoted prices in active markets for identical securities. Level 2 values are based on significant observable market inputs, such as quoted prices for similar securities and quoted prices in inactive markets. Level 3 values are based on significant unobservable inputs that reflect the investment adviser’s determination of assumptions that market participants might reasonably use in valuing the securities. The valuation levels are not necessarily an indication of the risk or liquidity associated with the underlying investment. For example, U.S. government securities are reflected as Level 2 because the inputs used to determine fair value may not always be quoted prices in an active market. The following tables present the fund’s valuation levels as of September 30, 2014 (dollars in thousands):
| | | Investment securities | |
| | | Level 1 | | | Level 2 | | | Level 3 | | | Total | |
| Assets: | | | | | | | | | | | | | | | | |
| Bonds, notes & other debt instruments: | | | | | | | | | | | | | | | | |
| Corporate bonds, notes & loans | | $ | — | | | $ | 17,664,272 | | | $ | 26,786 | | | $ | 17,691,058 | |
| Bonds & notes of governments & government agencies outside the U.S. | | | — | | | | 612,406 | | | | — | | | | 612,406 | |
| Other | | | — | | | | 194,356 | | | | — | | | | 194,356 | |
| Convertible bonds | | | — | | | | 180,622 | | | | 10,975 | | | | 191,597 | |
| Convertible stocks | | | 183,414 | | | | 96,207 | | | | — | | | | 279,621 | |
| Preferred securities | | | 70,783 | | | | 31,391 | | | | — | | | | 102,174 | |
| Common stocks | | | 195,070 | | | | 65,085 | | | | 41,220 | | | | 301,375 | |
| Rights & warrants | | | 1,759 | | | | — | | | | 88 | | | | 1,847 | |
| Short-term securities | | | — | | | | 499,918 | | | | — | | | | 499,918 | |
| Total | | $ | 451,026 | | | $ | 19,344,257 | | | $ | 79,069 | | | $ | 19,874,352 | |
| 18 | American High-Income Trust |
| | | Other investments* | |
| | | Level 1 | | | Level 2 | | | Level 3 | | | Total | |
| Assets: | | | | | | | | | | | | | | | | |
| Unrealized appreciation on open forward currency contracts | | $ | — | | | $ | 1,496 | | | $ | — | | | $ | 1,496 | |
| Unrealized appreciation on interest rate swaps | | | — | | | | 110 | | | | — | | | | 110 | |
| Unrealized appreciation on credit default swaps | | | — | | | | 161 | | | | — | | | | 161 | |
| Liabilities: | | | | | | | | | | | | | | | | |
| Unrealized depreciation on credit default swaps | | | — | | | | (1,210 | ) | | | — | | | | (1,210 | ) |
| Total | | $ | — | | | $ | 557 | | | $ | — | | | $ | 557 | |
*Forward currency contracts, interest rate swaps and credit default swaps are not included in the investment portfolio.
4. Risk factors
Investing in the fund may involve certain risks including, but not limited to, those described below.
Market conditions — The prices of, and the income generated by, the securities held by the fund may decline – sometimes rapidly or unpredictably – due to various factors, including events or conditions affecting the general economy or particular industries; overall market changes; local, regional or global political, social or economic instability; governmental or governmental agency responses to economic conditions; and currency, interest rate and commodity price fluctuations.
Issuer risks — The values of, and the income generated by, securities held by the fund may also decline in response to various factors directly related to the issuers of such securities, including reduced demand for an issuer’s goods or services, poor management performance and strategic initiatives such as mergers, acquisitions or dispositions and the market response to any such initiatives.
Investing in lower rated bonds — Lower rated bonds and other lower rated debt securities generally have higher rates of interest and involve greater risk of default or price declines due to changes in the issuer’s creditworthiness than those of higher quality debt securities. The market prices of these securities may fluctuate more than the prices of higher quality debt securities and may decline significantly in periods of general economic difficulty. These risks may be increased with respect to investments in junk bonds.
Thinly traded securities — There may be little trading in the secondary market for particular bonds or other debt securities, which may make them more difficult to value, acquire or sell.
Investing in debt instruments — The prices of, and the income generated by, bonds and other debt securities held by the fund may be affected by changing interest rates and by changes in the effective maturities and credit ratings of these securities.
Rising interest rates will generally cause the prices of bonds and other debt securities to fall. Falling interest rates may cause an issuer to redeem, call or refinance a debt security before its stated maturity, which may result in the fund having to reinvest the proceeds in lower yielding securities. Longer maturity debt securities generally have greater sensitivity to changes in interest rates and may be subject to greater price fluctuations than shorter maturity debt securities.
Bonds and other debt securities are also subject to credit risk, which is the possibility that the credit strength of an issuer will weaken and/or an issuer of a debt security will fail to make timely payments of principal or interest and the security will go into default. Lower quality debt securities generally have higher rates of interest and may be subject to greater price fluctuations than higher quality debt securities. Credit risk is gauged, in part, by the credit ratings of the debt securities in which the fund invests. However, ratings are only the opinions of the rating agencies issuing them and are not guarantees as to credit quality or an evaluation of market risk. The fund’s investment adviser relies on its own credit analysts to research issuers and issues in seeking to mitigate various credit and default risks.
Investing outside the U.S. — Securities of issuers domiciled outside the U.S., or with significant operations outside the U.S., may lose value because of adverse political, social, economic or market developments (including social instability, regional conflicts, terrorism and war) in the countries or regions in which the issuers are domiciled or operate. These securities may also lose value due to changes in foreign currency exchange rates against the U.S. dollar and/or currencies of other countries. Securities markets in certain countries may be more volatile and/or less liquid than those in the U.S. Investments outside the U.S. may also be subject to different accounting practices and different regulatory, legal and reporting standards, and may be more difficult to value, than those in the U.S. In addition, the value of
| American High-Income Trust | 19 |
investments outside the U.S. may be reduced by foreign taxes, including foreign withholding taxes on interest and dividends. Further, there may be increased risks of delayed settlement of securities purchased or sold by the fund. The risks of investing outside the U.S. may be heightened in connection with investments in emerging markets.
Management — The investment adviser to the fund actively manages the fund’s investments. Consequently, the fund is subject to the risk that the methods and analyses employed by the investment adviser in this process may not produce the desired results. This could cause the fund to lose value or its investment results to lag relevant benchmarks or other funds with similar objectives.
5. Certain investment techniques
Loan transactions — The fund has entered into loan transactions in which the fund acquires a loan either through an agent, by assignment from another holder, or as a participation interest in another holder’s portion of a loan. The loan is often administered by a financial institution that acts as agent for the holders of the loan, and the fund may be required to receive approval from the agent and/or borrower prior to the sale of the investment. The loan’s interest rate and maturity date may change based on the terms of the loan, including potential early payments of principal.
Forward currency contracts — The fund has entered into forward currency contracts, which represent agreements to exchange currencies on specific future dates at predetermined rates. The fund’s investment adviser uses forward currency contracts to manage the fund’s exposure to changes in exchange rates. Upon entering into these contracts, risks may arise from the potential inability of counterparties to meet the terms of their contracts and from possible movements in exchange rates.
On a daily basis, the fund’s investment adviser values forward currency contracts and records unrealized appreciation or depreciation for open forward currency contracts in the fund’s statement of assets and liabilities. Realized gains or losses are recorded at the time the forward currency contract is closed or offset by another contract with the same broker for the same settlement date and currency.
Closed forward currency contracts that have not reached their settlement date are included in the respective receivables or payables for closed forward currency contracts in the fund’s statement of assets and liabilities. Net realized gains or losses from closed forward currency contracts and net unrealized appreciation or depreciation from open forward currency contracts are recorded in the fund’s statement of operations.
Interest rate swaps — The fund has entered into interest rate swap contracts, which are agreements to exchange one stream of future interest payments for another based on a specified notional amount. Typically, interest rate swaps exchange a fixed interest rate for a payment that floats relative to a benchmark or vice versa. The fund’s investment adviser uses interest rate swaps to manage the interest rate sensitivity of the fund by increasing or decreasing the duration of the fund or a portion of the fund’s portfolio. Risks may arise as a result of the fund’s investment adviser incorrectly anticipating changes in interest rates, increased volatility, reduced liquidity and the potential inability of counterparties to meet the terms of their agreements.
Upon entering into an interest rate swap contract, the fund is required to deposit cash, U.S. government securities or other liquid securities, which is known as “initial margin.” Generally, the initial margin required for a particular interest rate swap is set and held as collateral by the clearinghouse on which the contract is cleared. The amount of initial margin required may be significantly modified from time to time by the clearinghouse during the term of the contract.
On a daily basis, the fund’s investment adviser records daily interest accruals related to the exchange of future payments as a receivable and payable in the fund’s statement of assets and liabilities. The fund also pays or receives a “variation margin” based on the increase or decrease in the value of the interest rate swaps, including accrued interest, and records variation margin on interest rate swaps in the statement of assets and liabilities. The fund records realized gains and losses on both the net accrued interest and any gain or loss recognized at the time the interest rate swap is closed or expires. Net realized gains or losses, as well as any net unrealized appreciation or depreciation, from interest rate swaps are recorded in the fund’s statement of operations.
Credit default swap indices — The fund has entered into centrally cleared credit default swap agreements on credit indices (“CDSI”) which involve one party (the protection buyer) making a stream of payments to another party (the protection seller) in exchange for the right to receive a specified return upon the occurrence of a credit event, such as a default or restructuring, with respect to any of the underlying issuers (reference obligations) in the referenced index. The fund’s investment advisor uses credit default swaps to assume exposure to a diversified portfolio of credits or to hedge against existing credit risks. When the fund provides sell protection, its maximum exposure is the notional amount of the credit default swap agreement.
| 20 | American High-Income Trust |
CDSI are portfolios of credit instruments or exposures designed to be representative of some part of the credit market, such as the high yield or investment grade credit market. CDSI are generally traded using standardized terms including a fixed spread and standard maturity dates and references all the names in the index. If there is a credit event it is settled based on that name’s weight in the index. The composition of the underlying issuers or obligations within a particular index may change periodically, usually every six months. A specified credit event may affect all or individual underlying reference obligations included in the index and will be settled based upon the relative weighting of the affected obligation(s) within the index.
Upon entering into a centrally cleared CDSI contract, the fund is required to deposit with a derivatives clearing member (“DCM”) in a segregated account in the name of the DCM an amount of cash, U.S. government securities, or other liquid securities, which is known as “initial margin.” Generally, the initial margin required for a particular credit default swap is set and held as collateral by the clearinghouse on which the contract is cleared. The amount of initial margin required may be significantly modified from time to time by the clearinghouse during the term of the contract. Securities deposited as initial margin are designated on the investment portfolio.
On a daily basis, interest accruals related to the exchange of future payments are recorded as a receivable and payable in the fund’s statement of assets and liabilities. The fund also pays or receives a “variation margin” based on the increase or decrease in the value of the centrally cleared swaps and records variation margin in the statement of assets and liabilities. The fund records realized gains and losses on both the net accrued interest and any gain or loss recognized at the time the swap is closed or expires. Net realized gains or losses, as well as any net unrealized appreciation or depreciation, from credit default swaps are recorded in the fund’s statement of operations.
The following tables present the financial statement impacts resulting from the fund’s use of forward currency contracts, interest rate swaps and credit default swaps as of September 30, 2014 (dollars in thousands):
| | | Assets | | | Liabilities | |
| Contract | | Location on statement of
assets and liabilities | | | Value | | | Location on statement of
assets and liabilities | | Value | |
| Forward currency | | Unrealized appreciation on open
forward currency contracts | | $ | 1,496 | | | Unrealized depreciation on open
forward currency contracts | $ | — | |
| Interest rate swaps | | Variation margin | | | — | * | | Variation margin | | — | |
| Credit default swaps | | Variation margin | | | 377 | | | Variation margin | | — | |
| | | | | $ | 1,873 | | | | $ | — | |
| | | Net realized gain (loss) | | | Net unrealized appreciation (depreciation) | |
| Contract | | Location on statement of operations | | | Value | | | Location on statement of operations | | Value | |
| Forward currency | | Net realized gain on forward
currency contracts | | $ | 4,239 | | | Net unrealized appreciation on
forward currency contracts | $ | 5,902 | |
| Interest rate swaps | | Net realized loss on interest rate
swaps | | | (74 | ) | | Net unrealized appreciation on
interest rate swaps | | 110 | |
| Credit default swaps | | Net realized gain on credit default
swaps | | | 5,557 | | | Net unrealized depreciation on
credit default swaps | | (1,049 | ) |
| | | | | $ | 9,722 | | | | $ | 4,963 | |
*Amount less than one thousand.
Collateral — The fund participates in a collateral program due to its use of forward currency contracts, interest rate swaps and credit default swaps. For forward currency contracts, the program calls for the fund to either receive or pledge collateral based on the net gain or loss on unsettled forward currency contracts by counterparty. For interest rate swaps and credit default swaps, the program calls for the fund to pledge collateral for initial and variation margin by contract. The purpose of the collateral is to cover potential losses that could occur in the event that either party cannot meet its contractual obligations.
Rights of offset — The fund has entered into enforceable master netting agreements with certain counterparties for forward currency contracts, where amounts payable by each party to the other in the same currency, with the same settlement date and with the same counterparty are settled net of each party’s payment obligation. For financial reporting purposes, the fund does not offset financial assets and financial liabilities that are subject to netting arrangements in the statement of assets and liabilities.
| American High-Income Trust | 21 |
The following table presents the fund’s forward currency contracts by counterparty, including those that are subject to potential offset on the statement of assets and liabilities as of September 30, 2014 (dollars in thousands):
| | | Gross amounts
recognized in the | | Gross amounts not offset in the
statement of assets and liabilities and
subject to a master netting agreement | | | |
| Counterparty | | statement of assets
and liabilities | | Available
to offset | | Non-cash
collateral | * | | Cash
collateral | | Net
amount | |
| | | | | | | | | | | | | |
| Assets: | | | | | | | | | | | | | | | | | |
| Bank of America, N.A. | | $ | 128 | | $ | — | | $ | (128 | ) | | $ | — | | $ | — | |
| Citibank | | | 254 | | | — | | | (254 | ) | | | — | | | — | |
| HSBC Bank | | | 398 | | | — | | | (341 | ) | | | — | | | 57 | |
| JPMorgan Chase | | | 291 | | | — | | | (291 | ) | | | — | | | — | |
| UBS AG | | | 425 | | | — | | | (261 | ) | | | — | | | 164 | |
| Total | | $ | 1,496 | | $ | — | | $ | (1,275 | ) | | $ | — | | $ | 221 | |
*Non-cash collateral is shown on a settlement basis.
6. Taxation and distributions
Federal income taxation — The fund complies with the requirements under Subchapter M of the Internal Revenue Code applicable to mutual funds and intends to distribute substantially all of its net taxable income and net capital gains each year. The fund is not subject to income taxes to the extent such distributions are made. Therefore, no federal income tax provision is required.
As of and during the period ended September 30, 2014, the fund did not have a liability for any unrecognized tax benefits. The fund recognizes interest and penalties, if any, related to unrecognized tax benefits as income tax expense in the statement of operations. During the period, the fund did not incur any interest or penalties.
The fund is not subject to examination by U.S. federal tax authorities for tax years before 2010 and by state tax authorities and tax authorities outside the U.S for tax years before 2009.
Non-U.S. taxation — Dividend and interest income are recorded net of non-U.S. taxes paid.
Distributions — Distributions paid to shareholders are based on net investment income and net realized gains determined on a tax basis, which may differ from net investment income and net realized gains for financial reporting purposes. These differences are due primarily to different treatment for items such as currency gains and losses; short-term capital gains and losses; capital losses related to sales of certain securities within 30 days of purchase; cost of investments sold; net capital losses and income on certain investments. The fiscal year in which amounts are distributed may differ from the year in which the net investment income and net realized gains are recorded by the fund for financial reporting purposes.
During the year ended September 30, 2014, the fund reclassified $4,000 from distributions in excess of net investment income to capital paid in on shares of beneficial interest and $6,279,000 from accumulated net realized loss to distributions in excess of net investment income to align financial reporting with tax reporting.
Under the Regulated Investment Company Modernization Act of 2010 (the “Act”), net capital losses recognized after September 30, 2011, may be carried forward indefinitely, and their character is retained as short-term and/or long-term losses. Previously, net capital losses were carried forward for eight years and treated as short-term losses. As a transition rule, the Act requires that post-enactment net capital losses be used before pre-enactment net capital losses.
| 22 | American High-Income Trust |
As of September 30, 2014, the tax basis components of distributable earnings, unrealized appreciation (depreciation) and cost of investment securities were as follows (dollars in thousands):
| Undistributed ordinary income | | $ | 34,640 | |
| Capital loss carryforward expiring 2018* | | | (225,066 | ) |
| Gross unrealized appreciation on investment securities | | | 765,934 | |
| Gross unrealized depreciation on investment securities | | | (1,086,241 | ) |
| Net unrealized depreciation on investment securities | | | (320,307 | ) |
| Cost of investment securities | | | 20,194,659 | |
| * | Reflects the utilization of capital loss carryforward of $382,902,000. The capital loss carryforward will be used to offset any capital gains realized by the fund in future years through the expiration date. The fund will not make distributions from capital gains while a capital loss carryforward remains. |
Tax-basis distributions paid or accrued to shareholders from ordinary income were as follows (dollars in thousands):
| | | Year ended September 30 | |
| Share class | | 2014 | | | 2013 | |
| Class A | | $ | 872,829 | | | $ | 938,643 | |
| Class B | | | 6,292 | | | | 10,084 | |
| Class C | | | 68,040 | | | | 81,420 | |
| Class F-1 | | | 74,547 | | | | 95,595 | |
| Class F-2 | | | 76,196 | | | | 66,875 | |
| Class 529-A | | | 21,879 | | | | 23,079 | |
| Class 529-B | | | 416 | | | | 645 | |
| Class 529-C | | | 7,031 | | | | 7,565 | |
| Class 529-E | | | 1,161 | | | | 1,224 | |
| Class 529-F-1 | | | 1,535 | | | | 1,472 | |
| Class R-1 | | | 1,266 | | | | 1,466 | |
| Class R-2 | | | 11,854 | | | | 13,541 | |
| Class R-2E* | | | — | † | | | | |
| Class R-3 | | | 16,981 | | | | 20,166 | |
| Class R-4 | | | 14,064 | | | | 15,260 | |
| Class R-5 | | | 10,718 | | | | 18,575 | |
| Class R-6 | | | 39,724 | | | | 23,849 | |
| Total | | $ | 1,224,533 | | | $ | 1,319,459 | |
*Class R-2E shares were offered beginning August 29, 2014.
†Amount less than one thousand.
7. Fees and transactions with related parties
CRMC, the fund’s investment adviser, is the parent company of American Funds Distributors,® Inc. (“AFD”), the principal underwriter of the fund’s shares, and American Funds Service Company® (“AFS”), the fund’s transfer agent. CRMC, AFD and AFS are considered related parties to the fund.
Investment advisory services — The fund has an investment advisory and service agreement with CRMC that provides for monthly fees accrued daily. At the beginning of the year, these fees were based on a series of decreasing annual rates beginning with 0.300% on the first $60 million of daily net assets and decreasing to 0.135% on such assets in excess of $15 billion.
On March 10, 2014, the board of trustees approved an amended agreement effective April 1, 2014, decreasing the annual rate on net assets in excess of $21 billion from 0.135% to 0.132%. The agreement also provides for monthly fees, accrued daily, based on a series of decreasing rates beginning with 3.00% on the first $8,333,333 of the fund’s monthly gross income and decreasing to 1.50% on such income in excess of $50 million. For the year ended September 30, 2014, the investment advisory services fee was $56,797,000, which was equivalent to an annualized rate of 0.275% of average daily net assets.
| American High-Income Trust | 23 |
Class-specific fees and expenses — Expenses that are specific to individual share classes are accrued directly to the respective share class. The principal class-specific fees and expenses are further described below:
Distribution services — The fund has plans of distribution for all share classes, except Class F-2, R-5 and R-6 shares. Under the plans, the board of trustees approves certain categories of expenses that are used to finance activities primarily intended to sell fund shares and service existing accounts. The plans provide for payments, based on an annualized percentage of average daily net assets, ranging from 0.30% to 1.00% as noted in this section. In some cases, the board of trustees has limited the amounts that may be paid to less than the maximum allowed by the plans. All share classes with a plan may use up to 0.25% of average daily net assets to pay service fees, or to compensate AFD for paying service fees, to firms that have entered into agreements with AFD to provide certain shareholder services. The remaining amounts available to be paid under each plan are paid to dealers to compensate them for their sales activities.
For Class A and 529-A shares, distribution-related expenses include the reimbursement of dealer and wholesaler commissions paid by AFD for certain shares sold without a sales charge. These share classes reimburse AFD for amounts billed within the prior 15 months but only to the extent that the overall annual expense limit of 0.30% is not exceeded. As of September 30, 2014, there were no unreimbursed expenses subject to reimbursement for Class A or 529-A shares.
| Share class | | Currently approved limits | | Plan limits | |
| Class A | | | 0.30 | % | | | 0.30 | % | |
| Class 529-A | | | 0.30 | | | | 0.50 | | |
| Classes B and 529-B | | | 1.00 | | | | 1.00 | | |
| Classes C, 529-C and R-1 | | | 1.00 | | | | 1.00 | | |
| Class R-2 | | | 0.75 | | | | 1.00 | | |
| Class R-2E | | | 0.60 | | | | 0.85 | | |
| Classes 529-E and R-3 | | | 0.50 | | | | 0.75 | | |
| Classes F-1, 529-F-1 and R-4 | | | 0.25 | | | | 0.50 | | |
Transfer agent services — The fund has a shareholder services agreement with AFS under which the fund compensates AFS for providing transfer agent services to each of the fund’s share classes. These services include recordkeeping, shareholder communications and transaction processing. In addition, the fund reimburses AFS for amounts paid to third parties for performing transfer agent services on behalf of fund shareholders.
Administrative services — The fund has an administrative services agreement with CRMC under which the fund compensates CRMC for providing administrative services to Class A, C, F, 529 and R shares. These services include, but are not limited to, coordinating, monitoring, assisting and overseeing third parties that provide services to fund shareholders. Under the agreement, Class A shares pay an annual fee of 0.01% and Class C, F, 529 and R shares pay an annual fee of 0.05% of their respective average daily net assets.
529 plan services — Each 529 share class is subject to service fees to compensate the Virginia College Savings Plan (“Virginia529”) for its oversight and administration of the 529 college savings plan. During the period October 1, 2013, to March 31, 2014, the quarterly fee was based on a series of decreasing annual rates beginning with 0.10% on the first $30 billion of the net assets invested in Class 529 shares of the American Funds and decreasing to 0.06% on such assets between $120 billion and $150 billion. Effective April 1, 2014, the quarterly fee was amended to provide for reduced annual rates of 0.07%, 0.06% and 0.05% over $30 billion, $50 billion and $70 billion, respectively, of the net assets invested in Class 529 shares of the American Funds. The fee for any given calendar quarter is accrued and calculated on the basis of the average net assets of Class 529 shares of the American Funds for the last month of the prior calendar quarter. The fee is included in other expenses in the fund’s statement of operations. Virginia529 is not considered a related party to the fund.
| 24 | American High-Income Trust |
For the year ended September 30, 2014, class-specific expenses under the agreements were as follows (dollars in thousands):
| Share class | | Distribution
services | | Transfer agent
services | | | Administrative
services | | 529 plan
services |
| Class A | | | $34,513 | | $17,721 | | | $1,459 | | Not applicable |
| Class B | | | 1,198 | | 150 | | | Not applicable | | Not applicable |
| Class C | | | 13,084 | | 1,598 | | | 655 | | Not applicable |
| Class F-1 | | | 3,144 | | 1,540 | | | 630 | | Not applicable |
| Class F-2 | | | Not applicable | | 1,260 | | | 613 | | Not applicable |
| Class 529-A | | | 821 | | 376 | | | 186 | | $347 |
| Class 529-B | | | 81 | | 10 | | | 4 | | 8 |
| Class 529-C | | | 1,361 | | 151 | | | 69 | | 128 |
| Class 529-E | | | 102 | | 11 | | | 10 | | 19 |
| Class 529-F-1 | | | — | | 26 | | | 13 | | 23 |
| Class R-1 | | | 244 | | 30 | | | 12 | | Not applicable |
| Class R-2 | | | 1,710 | | 961 | | | 115 | | Not applicable |
| Class R-2E* | | | — | | — | † | | — | † | Not applicable |
| Class R-3 | | | 1,506 | | 517 | | | 151 | | Not applicable |
| Class R-4 | | | 589 | | 248 | | | 118 | | Not applicable |
| Class R-5 | | | Not applicable | | 90 | | | 86 | | Not applicable |
| Class R-6 | | | Not applicable | | 10 | | | 314 | | Not applicable |
| Total class-specific expenses | | | $58,353 | | $24,699 | | | $4,435 | | $525 |
*Class R-2E shares were offered beginning August 29, 2014.
†Amount less than one thousand.
Trustees’ deferred compensation — Trustees who are unaffiliated with CRMC may elect to defer the cash payment of part or all of their compensation. These deferred amounts, which remain as liabilities of the fund, are treated as if invested in shares of the fund or other American Funds. These amounts represent general, unsecured liabilities of the fund and vary according to the total returns of the selected funds. Trustees’ compensation of $176,000 in the fund’s statement of operations includes $125,000 in current fees (either paid in cash or deferred) and a net increase of $51,000 in the value of the deferred amounts.
Affiliated officers and trustees — Officers and certain trustees of the fund are or may be considered to be affiliated with CRMC, AFD and AFS. No affiliated officers or trustees received any compensation directly from the fund.
8. Capital share transactions
Capital share transactions in the fund were as follows (dollars and shares in thousands):
| | | Sales* | | Reinvestments of
dividends | | Repurchases* | | Net increase
(decrease) | |
| Share class | | Amount | | Shares | | Amount | | Shares | | Amount | | Shares | | Amount | | Shares | |
| | | | | | | | | | | | | |
| Year ended September 30, 2014 | | | | | | | | | | | | |
| | | | | | | | | | | | | | | | | | | | | | | | | | |
| Class A | | $ | 2,036,059 | | | 178,281 | | $ | 829,099 | | | 72,715 | | $ | (2,579,536 | ) | | (226,172 | ) | $ | 285,622 | | | 24,824 | |
| Class B | | | 6,628 | | | 581 | | | 6,072 | | | 532 | | | (61,042 | ) | | (5,349 | ) | | (48,342 | ) | | (4,236 | ) |
| Class C | | | 217,066 | | | 19,009 | | | 64,085 | | | 5,620 | | | (359,105 | ) | | (31,499 | ) | | (77,954 | ) | | (6,870 | ) |
| Class F-1 | | | 322,180 | | | 28,230 | | | 73,767 | | | 6,466 | | | (884,532 | ) | | (77,468 | ) | | (488,585 | ) | | (42,772 | ) |
| Class F-2 | | | 1,103,468 | | | 96,589 | | | 68,415 | | | 6,002 | | | (757,902 | ) | | (66,714 | ) | | 413,981 | | | 35,877 | |
| Class 529-A | | | 57,915 | | | 5,073 | | | 22,066 | | | 1,935 | | | (65,375 | ) | | (5,732 | ) | | 14,606 | | | 1,276 | |
| Class 529-B | | | 647 | | | 57 | | | 420 | | | 37 | | | (4,118 | ) | | (361 | ) | | (3,051 | ) | | (267 | ) |
| Class 529-C | | | 24,293 | | | 2,128 | | | 7,093 | | | 622 | | | (29,420 | ) | | (2,579 | ) | | 1,966 | | | 171 | |
| Class 529-E | | | 3,901 | | | 342 | | | 1,169 | | | 103 | | | (4,225 | ) | | (370 | ) | | 845 | | | 75 | |
| Class 529-F-1 | | | 6,377 | | | 558 | | | 1,542 | | | 135 | | | (6,069 | ) | | (531 | ) | | 1,850 | | | 162 | |
| Class R-1 | | | 5,235 | | | 459 | | | 1,262 | | | 111 | | | (6,550 | ) | | (574 | ) | | (53 | ) | | (4 | ) |
| Class R-2 | | | 59,634 | | | 5,220 | | | 11,901 | | | 1,044 | | | (75,816 | ) | | (6,647 | ) | | (4,281 | ) | | (383 | ) |
| Class R-2E† | | | 10 | | | 1 | | | — | | | — | | | — | | | — | | | 10 | | | 1 | |
| Class R-3 | | | 80,120 | | | 7,019 | | | 17,104 | | | 1,500 | | | (148,139 | ) | | (13,014 | ) | | (50,915 | ) | | (4,495 | ) |
| Class R-4 | | | 72,631 | | | 6,364 | | | 14,190 | | | 1,245 | | | (83,751 | ) | | (7,343 | ) | | 3,070 | | | 266 | |
| Class R-5 | | | 46,979 | | | 4,123 | | | 10,788 | | | 946 | | | (171,224 | ) | | (14,973 | ) | | (113,457 | ) | | (9,904 | ) |
| Class R-6 | | | 418,795 | | | 36,616 | | | 38,803 | | | 3,405 | | | (110,834 | ) | | (9,729 | ) | | 346,764 | | | 30,292 | |
| Total net increase (decrease) | | $ | 4,461,938 | | | 390,650 | | $ | 1,167,776 | | | 102,418 | | $ | (5,347,638 | ) | | (469,055 | ) | $ | 282,076 | | | 24,013 | |
See footnotes on page 26.
| American High-Income Trust | 25 |
| | | Sales* | | Reinvestments of
dividends | | Repurchases* | | Net increase
(decrease) | |
| Share class | | Amount | | Shares | | Amount | | Shares | | Amount | | Shares | | Amount | | Shares | |
| | | | | | | | | | | | | |
| Year ended September 30, 2013 | | | | | | | | | | | | |
| | | | | | | | | | | | | | | | | | | | | | | | | | |
| Class A | | $ | 2,628,077 | | | 231,117 | | $ | 865,506 | | | 76,269 | | $ | (3,177,929 | ) | | (280,061 | ) | $ | 315,654 | | | 27,325 | |
| Class B | | | 14,865 | | | 1,310 | | | 9,316 | | | 821 | | | (87,131 | ) | | (7,673 | ) | | (62,950 | ) | | (5,542 | ) |
| Class C | | | 299,510 | | | 26,331 | | | 74,224 | | | 6,541 | | | (467,704 | ) | | (41,180 | ) | | (93,970 | ) | | (8,308 | ) |
| Class F-1 | | | 501,778 | | | 44,190 | | | 92,834 | | | 8,181 | | | (765,689 | ) | | (67,708 | ) | | (171,077 | ) | | (15,337 | ) |
| Class F-2 | | | 695,858 | | | 61,502 | | | 57,121 | | | 5,032 | | | (724,709 | ) | | (63,918 | ) | | 28,270 | | | 2,616 | |
| Class 529-A | | | 65,681 | | | 5,777 | | | 22,694 | | | 2,000 | | | (73,179 | ) | | (6,451 | ) | | 15,196 | | | 1,326 | |
| Class 529-B | | | 1,145 | | | 101 | | | 632 | | | 56 | | | (5,599 | ) | | (494 | ) | | (3,822 | ) | | (337 | ) |
| Class 529-C | | | 26,987 | | | 2,374 | | | 7,432 | | | 655 | | | (30,484 | ) | | (2,686 | ) | | 3,935 | | | 343 | |
| Class 529-E | | | 4,041 | | | 355 | | | 1,202 | | | 106 | | | (4,477 | ) | | (395 | ) | | 766 | | | 66 | |
| Class 529-F-1 | | | 8,055 | | | 708 | | | 1,444 | | | 127 | | | (5,578 | ) | | (491 | ) | | 3,921 | | | 344 | |
| Class R-1 | | | 7,445 | | | 655 | | | 1,409 | | | 124 | | | (9,393 | ) | | (831 | ) | | (539 | ) | | (52 | ) |
| Class R-2 | | | 75,232 | | | 6,617 | | | 13,237 | | | 1,166 | | | (89,731 | ) | | (7,900 | ) | | (1,262 | ) | | (117 | ) |
| Class R-3 | | | 149,922 | | | 13,184 | | | 19,732 | | | 1,739 | | | (211,854 | ) | | (18,746 | ) | | (42,200 | ) | | (3,823 | ) |
| Class R-4 | | | 79,556 | | | 7,001 | | | 15,002 | | | 1,322 | | | (97,263 | ) | | (8,571 | ) | | (2,705 | ) | | (248 | ) |
| Class R-5 | | | 90,198 | | | 7,936 | | | 18,090 | | | 1,593 | | | (177,028 | ) | | (15,537 | ) | | (68,740 | ) | | (6,008 | ) |
| Class R-6 | | | 333,949 | | | 29,459 | | | 22,878 | | | 2,017 | | | (109,299 | ) | | (9,643 | ) | | 247,528 | | | 21,833 | |
| Total net increase (decrease) | | $ | 4,982,299 | | | 438,617 | | $ | 1,222,753 | | | 107,749 | | $ | (6,037,047 | ) | | (532,285 | ) | $ | 168,005 | | | 14,081 | |
*Includes exchanges between share classes of the fund.
†Class R-2E shares were offered beginning August 29, 2014.
9. Investment transactions
The fund made purchases and sales of investment securities, excluding short-term securities and U.S. government obligations, if any, of $12,418,622,000 and $12,046,577,000, respectively, during the year ended September 30, 2014.
| 26 | American High-Income Trust |
Financial highlights
| | | | | | Income (loss) from
investment operations1 | | | | | | | | | | | | | | | | | | | | | | |
| | | Net asset
value,
beginning
of period | | | Net
investment
income | | | Net gains
(losses) on
securities
(both
realized and
unrealized) | | | Total from
investment
operations | | | Dividends
(from net
investment
income) | | | Net asset
value,
end
of period | | | Total
return2,3 | | | Net assets,
end of period
(in millions) | | | Ratio of
expenses
to average net
assets before
reimbursements | | | Ratio of
expenses
to average net
assets after
reimbursements3 | | | Ratio of
net income
(loss) to
average
net assets3 | |
| Class A: | | | | | | | | | | | | | | | | | | | | | | | | | | | | | | | | | | | | | | | | | | | | |
| Year ended 9/30/2014 | | $ | 11.22 | | | $ | .68 | | | $ | (.13 | ) | | $ | .55 | | | $ | (.68 | ) | | $ | 11.09 | | | | 4.93 | % | | $ | 14,286 | | | | .66 | % | | | .66 | % | | | 5.99 | % |
| Year ended 9/30/2013 | | | 11.18 | | | | .72 | | | | .06 | | | | .78 | | | | (.74 | ) | | | 11.22 | | | | 7.10 | �� | | | 14,178 | | | | .66 | | | | .66 | | | | 6.37 | |
| Year ended 9/30/2012 | | | 10.36 | | | | .78 | | | | .86 | | | | 1.64 | | | | (.82 | ) | | | 11.18 | | | | 16.35 | | | | 13,822 | | | | .69 | | | | .69 | | | | 7.17 | |
| Year ended 9/30/2011 | | | 11.13 | | | | .85 | | | | (.74 | ) | | | .11 | | | | (.88 | ) | | | 10.36 | | | | .67 | | | | 11,223 | | | | .67 | | | | .67 | | | | 7.57 | |
| Year ended 9/30/2010 | | | 10.29 | | | | .89 | | | | .78 | | | | 1.67 | | | | (.83 | ) | | | 11.13 | | | | 16.75 | | | | 11,687 | | | | .68 | | | | .68 | | | | 8.26 | |
| Class B: | | | | | | | | | | | | | | | | | | | | | | | | | | | | | | | | | | | | | | | | | | | | |
| Year ended 9/30/2014 | | | 11.22 | | | | .60 | | | | (.13 | ) | | | .47 | | | | (.60 | ) | | | 11.09 | | | | 4.16 | | | | 94 | | | | 1.41 | | | | 1.41 | | | | 5.26 | |
| Year ended 9/30/2013 | | | 11.18 | | | | .63 | | | | .06 | | | | .69 | | | | (.65 | ) | | | 11.22 | | | | 6.29 | | | | 143 | | | | 1.43 | | | | 1.43 | | | | 5.63 | |
| Year ended 9/30/2012 | | | 10.36 | | | | .70 | | | | .86 | | | | 1.56 | | | | (.74 | ) | | | 11.18 | | | | 15.49 | | | | 204 | | | | 1.44 | | | | 1.44 | | | | 6.47 | |
| Year ended 9/30/2011 | | | 11.13 | | | | .77 | | | | (.74 | ) | | | .03 | | | | (.80 | ) | | | 10.36 | | | | (.10 | ) | | | 264 | | | | 1.44 | | | | 1.44 | | | | 6.82 | |
| Year ended 9/30/2010 | | | 10.29 | | | | .80 | | | | .78 | | | | 1.58 | | | | (.74 | ) | | | 11.13 | | | | 15.86 | | | | 452 | | | | 1.46 | | | | 1.46 | | | | 7.50 | |
| Class C: | | | | | | | | | | | | | | | | | | | | | | | | | | | | | | | | | | | | | | | | | | | | |
| Year ended 9/30/2014 | | | 11.22 | | | | .59 | | | | (.13 | ) | | | .46 | | | | (.59 | ) | | | 11.09 | | | | 4.11 | | | | 1,238 | | | | 1.46 | | | | 1.46 | | | | 5.20 | |
| Year ended 9/30/2013 | | | 11.18 | | | | .63 | | | | .06 | | | | .69 | | | | (.65 | ) | | | 11.22 | | | | 6.25 | | | | 1,330 | | | | 1.48 | | | | 1.48 | | | | 5.56 | |
| Year ended 9/30/2012 | | | 10.36 | | | | .70 | | | | .86 | | | | 1.56 | | | | (.74 | ) | | | 11.18 | | | | 15.43 | | | | 1,418 | | | | 1.48 | | | | 1.48 | | | | 6.38 | |
| Year ended 9/30/2011 | | | 11.13 | | | | .76 | | | | (.74 | ) | | | .02 | | | | (.79 | ) | | | 10.36 | | | | (.15 | ) | | | 1,229 | | | | 1.48 | | | | 1.48 | | | | 6.76 | |
| Year ended 9/30/2010 | | | 10.29 | | | | .80 | | | | .78 | | | | 1.58 | | | | (.74 | ) | | | 11.13 | | | | 15.80 | | | | 1,337 | | | | 1.51 | | | | 1.51 | | | | 7.44 | |
| Class F-1: | | | | | | | | | | | | | | | | | | | | | | | | | | | | | | | | | | | | | | | | | | | | |
| Year ended 9/30/2014 | | | 11.22 | | | | .68 | | | | (.13 | ) | | | .55 | | | | (.68 | ) | | | 11.09 | | | | 4.87 | | | | 927 | | | | .71 | | | | .71 | | | | 5.96 | |
| Year ended 9/30/2013 | | | 11.18 | | | | .71 | | | | .06 | | | | .77 | | | | (.73 | ) | | | 11.22 | | | | 7.03 | | | | 1,418 | | | | .73 | | | | .73 | | | | 6.32 | |
| Year ended 9/30/2012 | | | 10.36 | | | | .78 | | | | .86 | | | | 1.64 | | | | (.82 | ) | | | 11.18 | | | | 16.32 | | | | 1,584 | | | | .71 | | | | .71 | | | | 7.14 | |
| Year ended 9/30/2011 | | | 11.13 | | | | .85 | | | | (.74 | ) | | | .11 | | | | (.88 | ) | | | 10.36 | | | | .62 | | | | 1,264 | | | | .72 | | | | .72 | | | | 7.52 | |
| Year ended 9/30/2010 | | | 10.29 | | | | .88 | | | | .78 | | | | 1.66 | | | | (.82 | ) | | | 11.13 | | | | 16.69 | | | | 1,457 | | | | .74 | | | | .74 | | | | 8.21 | |
| Class F-2: | | | | | | | | | | | | | | | | | | | | | | | | | | | | | | | | | | | | | | | | | | | | |
| Year ended 9/30/2014 | | | 11.22 | | | | .71 | | | | (.13 | ) | | | .58 | | | | (.71 | ) | | | 11.09 | | | | 5.15 | | | | 1,322 | | | | .44 | | | | .44 | | | | 6.21 | |
| Year ended 9/30/2013 | | | 11.18 | | | | .74 | | | | .06 | | | | .80 | | | | (.76 | ) | | | 11.22 | | | | 7.32 | | | | 935 | | | | .46 | | | | .46 | | | | 6.58 | |
| Year ended 9/30/2012 | | | 10.36 | | | | .81 | | | | .86 | | | | 1.67 | | | | (.85 | ) | | | 11.18 | | | | 16.62 | | | | 903 | | | | .46 | | | | .46 | | | | 7.37 | |
| Year ended 9/30/2011 | | | 11.13 | | | | .88 | | | | (.74 | ) | | | .14 | | | | (.91 | ) | | | 10.36 | | | | .88 | | | | 568 | | | | .46 | | | | .46 | | | | 7.77 | |
| Year ended 9/30/2010 | | | 10.29 | | | | .91 | | | | .78 | | | | 1.69 | | | | (.85 | ) | | | 11.13 | | | | 16.98 | | | | 511 | | | | .48 | | | | .48 | | | | 8.44 | |
| Class 529-A: | | | | | | | | | | | | | | | | | | | | | | | | | | | | | | | | | | | | | | | | | | | | |
| Year ended 9/30/2014 | | | 11.22 | | | | .67 | | | | (.13 | ) | | | .54 | | | | (.67 | ) | | | 11.09 | | | | 4.83 | | | | 367 | | | | .75 | | | | .75 | | | | 5.89 | |
| Year ended 9/30/2013 | | | 11.18 | | | | .71 | | | | .06 | | | | .77 | | | | (.73 | ) | | | 11.22 | | | | 7.00 | | | | 357 | | | | .76 | | | | .76 | | | | 6.27 | |
| Year ended 9/30/2012 | | | 10.36 | | | | .78 | | | | .86 | | | | 1.64 | | | | (.82 | ) | | | 11.18 | | | | 16.26 | | | | 341 | | | | .77 | | | | .77 | | | | 7.08 | |
| Year ended 9/30/2011 | | | 11.13 | | | | .85 | | | | (.74 | ) | | | .11 | | | | (.88 | ) | | | 10.36 | | | | .59 | | | | 261 | | | | .74 | | | | .74 | | | | 7.50 | |
| Year ended 9/30/2010 | | | 10.29 | | | | .88 | | | | .78 | | | | 1.66 | | | | (.82 | ) | | | 11.13 | | | | 16.66 | | | | 230 | | | | .76 | | | | .76 | | | | 8.18 | |
| Class 529-B: | | | | | | | | | | | | | | | | | | | | | | | | | | | | | | | | | | | | | | | | | | | | |
| Year ended 9/30/2014 | | | 11.22 | | | | .58 | | | | (.13 | ) | | | .45 | | | | (.58 | ) | | | 11.09 | | | | 4.02 | | | | 6 | | | | 1.55 | | | | 1.55 | | | | 5.12 | |
| Year ended 9/30/2013 | | | 11.18 | | | | .62 | | | | .06 | | | | .68 | | | | (.64 | ) | | | 11.22 | | | | 6.16 | | | | 10 | | | | 1.56 | | | | 1.56 | | | | 5.50 | |
| Year ended 9/30/2012 | | | 10.36 | | | | .69 | | | | .86 | | | | 1.55 | | | | (.73 | ) | | | 11.18 | | | | 15.34 | | | | 13 | | | | 1.57 | | | | 1.57 | | | | 6.32 | |
| Year ended 9/30/2011 | | | 11.13 | | | | .75 | | | | (.74 | ) | | | .01 | | | | (.78 | ) | | | 10.36 | | | | (.22 | ) | | | 16 | | | | 1.55 | | | | 1.55 | | | | 6.70 | |
| Year ended 9/30/2010 | | | 10.29 | | | | .79 | | | | .78 | | | | 1.57 | | | | (.73 | ) | | | 11.13 | | | | 15.74 | | | | 23 | | | | 1.56 | | | | 1.56 | | | | 7.39 | |
See footnotes on page 29.
| American High-Income Trust | 27 |
Financial highlights (continued)
| | | | | | Income (loss) from
investment operations1 | | | | | | | | | | | | | | | | | | | | | | |
| | | Net asset
value,
beginning
of period | | | Net
investment
income | | | Net gains
(losses) on
securities
(both
realized and
unrealized) | | | Total from
investment
operations | | | Dividends
(from net
investment
income) | | | Net asset
value,
end
of period | | | Total
return2,3 | | | Net assets,
end of period
(in millions) | | | Ratio of
expenses
to average net
assets before
reimbursements | | | Ratio of
expenses
to average net
assets after
reimbursements3 | | | Ratio of
net income
(loss) to
average
net assets3 | |
| Class 529-C: | | | | | | | | | | | | | | | | | | | | | | | | | | | | | | | | | | | | | | | | | | | | |
| Year ended 9/30/2014 | | $ | 11.22 | | | $ | .58 | | | $ | (.13 | ) | | $ | .45 | | | $ | (.58 | ) | | $ | 11.09 | | | | 4.03 | % | | $ | 133 | | | | 1.53 | % | | | 1.53 | % | | | 5.12 | % |
| Year ended 9/30/2013 | | | 11.18 | | | | .62 | | | | .06 | | | | .68 | | | | (.64 | ) | | | 11.22 | | | | 6.17 | | | | 132 | | | | 1.55 | | | | 1.55 | | | | 5.49 | |
| Year ended 9/30/2012 | | | 10.36 | | | | .69 | | | | .86 | | | | 1.55 | | | | (.73 | ) | | | 11.18 | | | | 15.35 | | | | 128 | | | | 1.56 | | | | 1.56 | | | | 6.29 | |
| Year ended 9/30/2011 | | | 11.13 | | | | .76 | | | | (.74 | ) | | | .02 | | | | (.79 | ) | | | 10.36 | | | | (.21 | ) | | | 101 | | | | 1.54 | | | | 1.54 | | | | 6.70 | |
| Year ended 9/30/2010 | | | 10.29 | | | | .79 | | | | .78 | | | | 1.57 | | | | (.73 | ) | | | 11.13 | | | | 15.75 | | | | 91 | | | | 1.56 | | | | 1.56 | | | | 7.39 | |
| Class 529-E: | | | | | | | | | | | | | | | | | | | | | | | | | | | | | | | | | | | | | | | | | | | | |
| Year ended 9/30/2014 | | | 11.22 | | | | .65 | | | | (.13 | ) | | | .52 | | | | (.65 | ) | | | 11.09 | | | | 4.60 | | | | 20 | | | | .98 | | | | .98 | | | | 5.67 | |
| Year ended 9/30/2013 | | | 11.18 | | | | .68 | | | | .06 | | | | .74 | | | | (.70 | ) | | | 11.22 | | | | 6.75 | | | | 20 | | | | .99 | | | | .99 | | | | 6.04 | |
| Year ended 9/30/2012 | | | 10.36 | | | | .75 | | | | .86 | | | | 1.61 | | | | (.79 | ) | | | 11.18 | | | | 15.97 | | | | 19 | | | | 1.02 | | | | 1.02 | | | | 6.83 | |
| Year ended 9/30/2011 | | | 11.13 | | | | .81 | | | | (.74 | ) | | | .07 | | | | (.84 | ) | | | 10.36 | | | | .31 | | | | 15 | | | | 1.02 | | | | 1.02 | | | | 7.22 | |
| Year ended 9/30/2010 | | | 10.29 | | | | .85 | | | | .78 | | | | 1.63 | | | | (.79 | ) | | | 11.13 | | | | 16.34 | | | | 12 | | | | 1.04 | | | | 1.04 | | | | 7.90 | |
| Class 529-F-1: | | | | | | | | | | | | | | | | | | | | | | | | | | | | | | | | | | | | | | | | | | | | |
| Year ended 9/30/2014 | | | 11.22 | | | | .70 | | | | (.13 | ) | | | .57 | | | | (.70 | ) | | | 11.09 | | | | 5.06 | | | | 25 | | | | .53 | | | | .53 | | | | 6.11 | |
| Year ended 9/30/2013 | | | 11.18 | | | | .73 | | | | .06 | | | | .79 | | | | (.75 | ) | | | 11.22 | | | | 7.22 | | | | 23 | | | | .54 | | | | .54 | | | | 6.48 | |
| Year ended 9/30/2012 | | | 10.36 | | | | .80 | | | | .86 | | | | 1.66 | | | | (.84 | ) | | | 11.18 | | | | 16.50 | | | | 20 | | | | .56 | | | | .56 | | | | 7.28 | |
| Year ended 9/30/2011 | | | 11.13 | | | | .87 | | | | (.74 | ) | | | .13 | | | | (.90 | ) | | | 10.36 | | | | .80 | | | | 14 | | | | .53 | | | | .53 | | | | 7.70 | |
| Year ended 9/30/2010 | | | 10.29 | | | | .90 | | | | .78 | | | | 1.68 | | | | (.84 | ) | | | 11.13 | | | | 16.91 | | | | 11 | | | | .55 | | | | .55 | | | | 8.40 | |
| Class R-1: | | | | | | | | | | | | | | | | | | | | | | | | | | | | | | | | | | | | | | | | | | | | |
| Year ended 9/30/2014 | | | 11.22 | | | | .59 | | | | (.13 | ) | | | .46 | | | | (.59 | ) | | | 11.09 | | | | 4.11 | | | | 24 | | | | 1.46 | | | | 1.46 | | | | 5.19 | |
| Year ended 9/30/2013 | | | 11.18 | | | | .63 | | | | .06 | | | | .69 | | | | (.65 | ) | | | 11.22 | | | | 6.25 | | | | 24 | | | | 1.47 | | | | 1.47 | | | | 5.56 | |
| Year ended 9/30/2012 | | | 10.36 | | | | .70 | | | | .86 | | | | 1.56 | | | | (.74 | ) | | | 11.18 | | | | 15.42 | | | | 25 | | | | 1.50 | | | | 1.50 | | | | 6.36 | |
| Year ended 9/30/2011 | | | 11.13 | | | | .76 | | | | (.74 | ) | | | .02 | | | | (.79 | ) | | | 10.36 | | | | (.17 | ) | | | 20 | | | | 1.50 | | | | 1.50 | | | | 6.74 | |
| Year ended 9/30/2010 | | | 10.29 | | | | .79 | | | | .78 | | | | 1.57 | | | | (.73 | ) | | | 11.13 | | | | 15.78 | | | | 23 | | | | 1.53 | | | | 1.53 | | | | 7.41 | |
| Class R-2: | | | | | | | | | | | | | | | | | | | | | | | | | | | | | | | | | | | | | | | | | | | | |
| Year ended 9/30/2014 | | | 11.22 | | | | .59 | | | | (.13 | ) | | | .46 | | | | (.59 | ) | | | 11.09 | | | | 4.06 | | | | 224 | | | | 1.50 | | | | 1.50 | | | | 5.15 | |
| Year ended 9/30/2013 | | | 11.18 | | | | .63 | | | | .06 | | | | .69 | | | | (.65 | ) | | | 11.22 | | | | 6.26 | | | | 231 | | | | 1.47 | | | | 1.47 | | | | 5.57 | |
| Year ended 9/30/2012 | | | 10.36 | | | | .69 | | | | .86 | | | | 1.55 | | | | (.73 | ) | | | 11.18 | | | | 15.38 | | | | 232 | | | | 1.54 | | | | 1.54 | | | | 6.32 | |
| Year ended 9/30/2011 | | | 11.13 | | | | .76 | | | | (.74 | ) | | | .02 | | | | (.79 | ) | | | 10.36 | | | | (.15 | ) | | | 200 | | | | 1.53 | | | | 1.48 | | | | 6.76 | |
| Year ended 9/30/2010 | | | 10.29 | | | | .80 | | | | .78 | | | | 1.58 | | | | (.74 | ) | | | 11.13 | | | | 15.80 | | | | 209 | | | | 1.58 | | | | 1.51 | | | | 7.44 | |
| Class R-2E: | | | | | | | | | | | | | | | | | | | | | | | | | | | | | | | | | | | | | | | | | | | | |
| Period from 8/29/2014 to 9/30/20144,5 | | | 11.40 | | | | .06 | | | | (.31 | ) | | | (.25 | ) | | | (.06 | ) | | | 11.09 | | | | (2.20 | ) | | | — | 6 | | | .04 | 7 | | | .04 | 7 | | | .51 | 7 |
| Class R-3: | | | | | | | | | | | | | | | | | | | | | | | | | | | | | | | | | | | | | | | | | | | | |
| Year ended 9/30/2014 | | | 11.22 | | | | .64 | | | | (.13 | ) | | | .51 | | | | (.64 | ) | | | 11.09 | | | | 4.57 | | | | 256 | | | | 1.01 | | | | 1.01 | | | | 5.65 | |
| Year ended 9/30/2013 | | | 11.18 | | | | .68 | | | | .06 | | | | .74 | | | | (.70 | ) | | | 11.22 | | | | 6.74 | | | | 310 | | | | 1.01 | | | | 1.01 | | | | 6.04 | |
| Year ended 9/30/2012 | | | 10.36 | | | | .75 | | | | .86 | | | | 1.61 | | | | (.79 | ) | | | 11.18 | | | | 15.96 | | | | 352 | | | | 1.03 | | | | 1.03 | | | | 6.84 | |
| Year ended 9/30/2011 | | | 11.13 | | | | .81 | | | | (.74 | ) | | | .07 | | | | (.84 | ) | | | 10.36 | | | | .31 | | | | 266 | | | | 1.02 | | | | 1.02 | | | | 7.22 | |
| Year ended 9/30/2010 | | | 10.29 | | | | .85 | | | | .78 | | | | 1.63 | | | | (.79 | ) | | | 11.13 | | | | 16.33 | | | | 316 | | | | 1.05 | | | | 1.05 | | | | 7.90 | |
| 28 | American High-Income Trust |
| | | | | | Income (loss) from
investment operations1 | | | | | | | | | | | | | | | | | | | | | | |
| | | Net asset
value,
beginning
of period | | | Net
investment
income | | | Net gains
(losses) on
securities
(both
realized and
unrealized) | | | Total from
investment
operations | | | Dividends
(from net
investment
income) | | | Net asset
value,
end
of period | | | Total
return2,3 | | | Net assets,
end of period
(in millions) | | | Ratio of
expenses
to average net
assets before
reimbursements | | | Ratio of
expenses
to average net
assets after
reimbursements3 | | | Ratio of
net income
(loss) to
average
net assets3 | |
| Class R-4: | | | | | | | | | | | | | | | | | | | | | | | | | | | | | | | | | | | | | | | | | | | | |
| Year ended 9/30/2014 | | $ | 11.22 | | | $ | .68 | | | $ | (.13 | ) | | $ | .55 | | | $ | (.68 | ) | | $ | 11.09 | | | | 4.90 | % | | $ | 230 | | | | .69 | % | | | .69 | % | | | 5.96 | % |
| Year ended 9/30/2013 | | | 11.18 | | | | .72 | | | | .06 | | | | .78 | | | | (.74 | ) | | | 11.22 | | | | 7.06 | | | | 230 | | | | .70 | | | | .70 | | | | 6.34 | |
| Year ended 9/30/2012 | | | 10.36 | | | | .78 | | | | .86 | | | | 1.64 | | | | (.82 | ) | | | 11.18 | | | | 16.32 | | | | 232 | | | | .72 | | | | .72 | | | | 7.16 | |
| Year ended 9/30/2011 | | | 11.13 | | | | .85 | | | | (.74 | ) | | | .11 | | | | (.88 | ) | | | 10.36 | | | | .61 | | | | 208 | | | | .72 | | | | .72 | | | | 7.52 | |
| Year ended 9/30/2010 | | | 10.29 | | | | .88 | | | | .78 | | | | 1.66 | | | | (.82 | ) | | | 11.13 | | | | 16.68 | | | | 213 | | | | .75 | | | | .75 | | | | 8.19 | |
| Class R-5: | | | | | | | | | | | | | | | | | | | | | | | | | | | | | | | | | | | | | | | | | | | | |
| Year ended 9/30/2014 | | | 11.22 | | | | .71 | | | | (.13 | ) | | | .58 | | | | (.71 | ) | | | 11.09 | | | | 5.21 | | | | 111 | | | | .39 | | | | .39 | | | | 6.30 | |
| Year ended 9/30/2013 | | | 11.18 | | | | .75 | | | | .06 | | | | .81 | | | | (.77 | ) | | | 11.22 | | | | 7.38 | | | | 224 | | | | .40 | | | | .40 | | | | 6.66 | |
| Year ended 9/30/2012 | | | 10.36 | | | | .81 | | | | .86 | | | | 1.67 | | | | (.85 | ) | | | 11.18 | | | | 16.67 | | | | 290 | | | | .41 | | | | .41 | | | | 7.44 | |
| Year ended 9/30/2011 | | | 11.13 | | | | .88 | | | | (.74 | ) | | | .14 | | | | (.91 | ) | | | 10.36 | | | | .91 | | | | 224 | | | | .42 | | | | .42 | | | | 7.82 | |
| Year ended 9/30/2010 | | | 10.29 | | | | .91 | | | | .78 | | | | 1.69 | | | | (.85 | ) | | | 11.13 | | | | 17.03 | | | | 232 | | | | .44 | | | | .44 | | | | 8.50 | |
| Class R-6: | | | | | | | | | | | | | | | | | | | | | | | | | | | | | | | | | | | | | | | | | | | | |
| Year ended 9/30/2014 | | | 11.22 | | | | .72 | | | | (.13 | ) | | | .59 | | | | (.72 | ) | | | 11.09 | | | | 5.26 | | | | 803 | | | | .34 | | | | .34 | | | | 6.29 | |
| Year ended 9/30/2013 | | | 11.18 | | | | .76 | | | | .06 | | | | .82 | | | | (.78 | ) | | | 11.22 | | | | 7.43 | | | | 472 | | | | .35 | | | | .35 | | | | 6.66 | |
| Year ended 9/30/2012 | | | 10.36 | | | | .82 | | | | .86 | | | | 1.68 | | | | (.86 | ) | | | 11.18 | | | | 16.72 | | | | 226 | | | | .36 | | | | .36 | | | | 7.44 | |
| Year ended 9/30/2011 | | | 11.13 | | | | .89 | | | | (.74 | ) | | | .15 | | | | (.92 | ) | | | 10.36 | | | | .96 | | | | 104 | | | | .37 | | | | .37 | | | | 7.86 | |
| Year ended 9/30/2010 | | | 10.29 | | | | .92 | | | | .78 | | | | 1.70 | | | | (.86 | ) | | | 11.13 | | | | 17.09 | | | | 89 | | | | .39 | | | | .39 | | | | 8.56 | |
| | | Year ended September 30 |
| | | 2014 | | 2013 | | 2012 | | 2011 | | 2010 |
| Portfolio turnover rate for all share classes | | 62% | | 61% | | 38% | | 51% | | 47% |
| 1 | Based on average shares outstanding. |
| 2 | Total returns exclude any applicable sales charges, including contingent deferred sales charges. |
| 3 | This column reflects the impact, if any, of certain reimbursements from CRMC. During some of the periods shown, CRMC paid a portion of the fund’s transfer agent fees for certain retirement plan share classes. |
| 4 | Based on operations for the period shown and, accordingly, is not representative of a full year. |
| 5 | Class R-2E shares were offered beginning August 29, 2014. |
| 6 | Amount less than $1 million. |
| 7 | Class R-2E assets consisted solely of seed capital invested by CRMC; therefore, certain fees were not accrued. |
See Notes to Financial Statements
| American High-Income Trust | 29 |
Report of Independent Registered Public Accounting Firm
To the Shareholders and Board of Trustees of American High-Income Trust:
We have audited the accompanying statement of assets and liabilities of American High-Income Trust (the “Fund”), including the summary investment portfolio, as of September 30, 2014, and the related statement of operations for the year then ended, the statements of changes in net assets for each of the two years in the period then ended, and the financial highlights for each of the periods presented. These financial statements and financial highlights are the responsibility of the Fund’s management. Our responsibility is to express an opinion on these financial statements and financial highlights based on our audits.
We conducted our audits in accordance with the standards of the Public Company Accounting Oversight Board (United States). Those standards require that we plan and perform the audit to obtain reasonable assurance about whether the financial statements and financial highlights are free of material misstatement. The Fund is not required to have, nor were we engaged to perform, an audit of its internal control over financial reporting. Our audits included consideration of internal control over financial reporting as a basis for designing audit procedures that are appropriate in the circumstances, but not for the purpose of expressing an opinion on the effectiveness of the Fund’s internal control over financial reporting. Accordingly, we express no such opinion. An audit also includes examining, on a test basis, evidence supporting the amounts and disclosures in the financial statements, assessing the accounting principles used and significant estimates made by management, as well as evaluating the overall financial statement presentation. Our procedures included confirmation of securities owned as of September 30, 2014, by correspondence with the custodian and brokers; where replies were not received from brokers, we performed other auditing procedures. We believe that our audits provide a reasonable basis for our opinion.
In our opinion, such financial statements and financial highlights referred to above present fairly, in all material respects, the financial position of American High-Income Trust as of September 30, 2014, the results of its operations for the year then ended, the changes in its net assets for each of the two years in the period then ended, and the financial highlights for each of the periods presented, in conformity with accounting principles generally accepted in the United States of America.
Deloitte & Touche LLP
Costa Mesa, California
November 12, 2014
| 30 | American High-Income Trust |
As a fund shareholder, you incur two types of costs: (1) transaction costs, such as initial sales charges on purchase payments and contingent deferred sales charges on redemptions (loads), and (2) ongoing costs, including management fees, distribution and service (12b-1) fees, and other expenses. This example is intended to help you understand your ongoing costs (in dollars) of investing in the fund so you can compare these costs with the ongoing costs of investing in other mutual funds. The example is based on an investment of $1,000 invested at the beginning of the period and held for the entire six-month period (April 1, 2014, through September 30, 2014).
Actual expenses:
The first line of each share class in the table on the following page provides information about actual account values and actual expenses. You may use the information in this line, together with the amount you invested, to estimate the expenses that you paid over the period. Simply divide your account value by $1,000 (for example, an $8,600 account value divided by $1,000 = 8.6), then multiply the result by the number in the first line under the heading entitled “Expenses paid during period” to estimate the expenses you paid on your account during this period.
Hypothetical example for comparison purposes:
The second line of each share class in the table on the following page provides information about hypothetical account values and hypothetical expenses based on the actual expense ratio for the share class and an assumed rate of return of 5.00% per year before expenses, which is not the actual return of the share class. The hypothetical account values and expenses may not be used to estimate the actual ending account balance or expenses you paid for the period. You may use this information to compare the ongoing costs of investing in the fund and other funds. To do so, compare this 5.00% hypothetical example with the 5.00% hypothetical examples that appear in the shareholder reports of the other funds.
Notes:
Retirement plan participants may be subject to certain fees charged by the plan sponsor, and Class F-1, F-2 and 529-F-1 shareholders may be subject to fees charged by financial intermediaries, typically ranging from 0.75% to 1.50% of assets annually depending on services offered. You can estimate the impact of these fees by adding the amount of the fees to the total estimated expenses you paid on your account during the period as calculated above. In addition, your ending account value would be lower by the amount of these fees.
Note that the expenses shown in the table on the following page are meant to highlight your ongoing costs only and do not reflect any transactional costs, such as sales charges (loads). Therefore, the second line of each share class in the table is useful in comparing ongoing costs only and will not help you determine the relative total costs of owning different funds. In addition, if these transactional costs were included, your costs would have been higher.
| American High-Income Trust | 31 |
| | | Beginning
account value
4/1/2014 | | | Ending
account value
9/30/2014 | | | Expenses paid
during period* | | | Annualized
expense ratio | |
| Class A - actual return | | $ | 1,000.00 | | | $ | 996.14 | | | $ | 3.25 | | | | .65 | % |
| Class A - assumed 5% return | | | 1,000.00 | | | | 1,021.81 | | | | 3.29 | | | | .65 | |
| Class B - actual return | | | 1,000.00 | | | | 992.41 | | | | 6.99 | | | | 1.40 | |
| Class B - assumed 5% return | | | 1,000.00 | | | | 1,018.05 | | | | 7.08 | | | | 1.40 | |
| Class C - actual return | | | 1,000.00 | | | | 992.17 | | | | 7.24 | | | | 1.45 | |
| Class C - assumed 5% return | | | 1,000.00 | | | | 1,017.80 | | | | 7.33 | | | | 1.45 | |
| Class F-1 - actual return | | | 1,000.00 | | | | 995.84 | | | | 3.55 | | | | .71 | |
| Class F-1 - assumed 5% return | | | 1,000.00 | | | | 1,021.51 | | | | 3.60 | | | | .71 | |
| Class F-2 - actual return | | | 1,000.00 | | | | 997.23 | | | | 2.20 | | | | .44 | |
| Class F-2 - assumed 5% return | | | 1,000.00 | | | | 1,022.86 | | | | 2.23 | | | | .44 | |
| Class 529-A - actual return | | | 1,000.00 | | | | 995.67 | | | | 3.70 | | | | .74 | |
| Class 529-A - assumed 5% return | | | 1,000.00 | | | | 1,021.36 | | | | 3.75 | | | | .74 | |
| Class 529-B - actual return | | | 1,000.00 | | | | 991.75 | | | | 7.64 | | | | 1.53 | |
| Class 529-B - assumed 5% return | | | 1,000.00 | | | | 1,017.40 | | | | 7.74 | | | | 1.53 | |
| Class 529-C - actual return | | | 1,000.00 | | | | 991.81 | | | | 7.59 | | | | 1.52 | |
| Class 529-C - assumed 5% return | | | 1,000.00 | | | | 1,017.45 | | | | 7.69 | | | | 1.52 | |
| Class 529-E - actual return | | | 1,000.00 | | | | 994.56 | | | | 4.85 | | | | .97 | |
| Class 529-E - assumed 5% return | | | 1,000.00 | | | | 1,020.21 | | | | 4.91 | | | | .97 | |
| Class 529-F-1 - actual return | | | 1,000.00 | | | | 996.79 | | | | 2.60 | | | | .52 | |
| Class 529-F-1 - assumed 5% return | | | 1,000.00 | | | | 1,022.46 | | | | 2.64 | | | | .52 | |
| Class R-1 - actual return | | | 1,000.00 | | | | 992.16 | | | | 7.24 | | | | 1.45 | |
| Class R-1 - assumed 5% return | | | 1,000.00 | | | | 1,017.80 | | | | 7.33 | | | | 1.45 | |
| Class R-2 - actual return | | | 1,000.00 | | | | 991.93 | | | | 7.49 | | | | 1.50 | |
| Class R-2 - assumed 5% return | | | 1,000.00 | | | | 1,017.55 | | | | 7.59 | | | | 1.50 | |
| Class R-2E - actual return† | | | 1,000.00 | | | | 978.05 | | | | .47 | | | | .54 | |
| Class R-2E - assumed 5% return† | | | 1,000.00 | | | | 1,022.36 | | | | 2.74 | | | | .54 | |
| Class R-3 - actual return | | | 1,000.00 | | | | 994.37 | | | | 5.05 | | | | 1.01 | |
| Class R-3 - assumed 5% return | | | 1,000.00 | | | | 1,020.00 | | | | 5.11 | | | | 1.01 | |
| Class R-4 - actual return | | | 1,000.00 | | | | 995.96 | | | | 3.45 | | | | .69 | |
| Class R-4 - assumed 5% return | | | 1,000.00 | | | | 1,021.61 | | | | 3.50 | | | | .69 | |
| Class R-5 - actual return | | | 1,000.00 | | | | 997.46 | | | | 1.95 | | | | .39 | |
| Class R-5 - assumed 5% return | | | 1,000.00 | | | | 1,023.11 | | | | 1.98 | | | | .39 | |
| Class R-6 - actual return | | | 1,000.00 | | | | 997.73 | | | | 1.65 | | | | .33 | |
| Class R-6 - assumed 5% return | | | 1,000.00 | | | | 1,023.41 | | | | 1.67 | | | | .33 | |
| * | The “expenses paid during period” are equal to the “annualized expense ratio,” multiplied by the average account value over the period, multiplied by the number of days in the period, and divided by 365 (to reflect the one-half year period). |
| † | The period for the “annualized expense ratio” and “actual return” line is based on the number of days since the initial sale of the share class on August 29, 2014. The “assumed 5% return” line is based on 183 days. |
| 32 | American High-Income Trust |
We are required to advise you of the federal tax status of certain distributions received by shareholders during the fiscal year. The fund hereby designates the following amounts for the fund’s fiscal year ended September 30, 2014:
| Qualified dividend income | $ 23,313,000 |
| Corporate dividends received deduction | $ 12,445,000 |
| U.S. government income that may be exempt from state taxation | $ 2,216,000 |
Individual shareholders should refer to their Form 1099 or other tax information, which will be mailed in January 2015, to determine the calendar year amounts to be included on their 2014 tax returns. Shareholders should consult their tax advisors.
| American High-Income Trust | 33 |
Board of trustees and other officers
“Independent” trustees1
| Name and age | | Year first
elected
a trustee
of the fund2 | | Principal occupation(s) during past five years | | Number of
portfolios in fund
complex overseen
by trustee | | Other directorships3
held by trustee |
| William H. Baribault, 69 | | 2010 | | CEO and President, Richard Nixon Foundation; former Chairman of the Board and CEO, Oakwood Enterprises (private investment and consulting) | | 70 | | None |
| James G. Ellis, 67 | | 2006 | | Dean and Professor of Marketing, Marshall School of Business, University of Southern California | | 70 | | Mercury General Corp. |
| Leonard R. Fuller, 68 | | 1994 | | President and CEO, Fuller Consulting (financial management consulting firm) | | 70 | | None |
R. Clark Hooper, 68
Chairman of the Board
(Independent and
Non-Executive) | | 2005 | | Private investor | | 72 | | The Swiss Helvetia Fund, Inc. |
| Merit E. Janow, 56 | | 2010 | | Dean and Professor, Columbia University, School of International and Public Affairs | | 69 | | MasterCard Incorporated;
The NASDAQ Stock Market LLC;
Trimble Navigation Limited |
| Laurel B. Mitchell, Ph.D., 59 | | 2010 | | Clinical Professor and Director, Accounting Program, University of Redlands | | 69 | | None |
| Frank M. Sanchez, 71 | | 1999 | | Principal, The Sanchez Family Corporation dba McDonald’s Restaurants (McDonald’s licensee) | | 69 | | None |
| Margaret Spellings, 57 | | 2010 | | President, George W. Bush Foundation; former President and CEO, Margaret Spellings & Company (public policy and strategic consulting); former President, U.S. Chamber Foundation and Senior Advisor to the President and CEO, U.S. Chamber of Commerce; former U.S. Secretary of Education, U.S. Department of Education | | 70 | | None |
| Steadman Upham, Ph.D., 65 | | 2007 | | President and University Professor, The University of Tulsa | | 69 | | None |
“Interested” trustee4,5
Name, age and
position with fund | | Year first
elected
a trustee
or officer
of the fund2 | | Principal occupation(s) during past five years
and positions held with affiliated entities or
the principal underwriter of the fund | | Number of
portfolios in fund
complex overseen
by trustee | | Other directorships3
held by trustee |
John H. Smet, 58
Vice Chairman of the Board | | 2011 | | Senior Vice President — Capital Fixed Income Investors, Capital Research and Management Company; Director, Capital Research and Management Company | | 20 | | None |
The fund’s statement of additional information includes further details about fund trustees and is available without charge upon request by calling American Funds Service Company at (800) 421-4225 or by visiting the American Funds website at americanfunds.com. The address for all trustees and officers of the fund is 333 South Hope Street, Los Angeles, CA 90071, Attention: Secretary.
| 34 | American High-Income Trust |
Other officers5
Name, age and
position with fund | | Year first
elected
an officer
of the fund2 | | Principal occupation(s) during past five years and positions held with affiliated entities
or the principal underwriter of the fund |
David C. Barclay, 58
President | | 1995 | | Senior Vice President — Capital Fixed Income Investors, Capital Research and Management Company; Director, Capital Research and Management Company |
David A. Daigle, 47
Senior Vice President | | 2008 | | Senior Vice President — Capital Fixed Income Investors, Capital Research and Management Company; Senior Vice President — Capital World Investors, Capital Bank and Trust Company6 |
Jennifer L. Hinman, 56
Senior Vice President | | 2001 | | Senior Vice President — Capital Fixed Income Investors, Capital Research and Management Company |
Kristine M. Nishiyama, 44
Senior Vice President | | 2003 | | Senior Vice President and Senior Counsel — Fund Business Management Group, Capital Research and Management Company; Senior Vice President and General Counsel, Capital Bank and Trust Company6 |
Richard N. Lewis, 41
Vice President | | 2011 | | Senior Vice President — Capital Fixed Income Investors, Capital Research and Management Company |
Courtney R. Taylor, 39
Secretary | | 2006 | | Assistant Vice President — Fund Business Management Group, Capital Research and Management Company |
Karl C. Grauman, 46
Treasurer | | 2011 | | Vice President — Investment Operations, Capital Research and Management Company |
Steven I. Koszalka, 50
Assistant Secretary | | 2010 | | Vice President — Fund Business Management Group, Capital Research and Management Company |
Brian C. Janssen, 42
Assistant Treasurer | | 2012 | | Vice President — Investment Operations, Capital Research and Management Company |
Dori Laskin, 63
Assistant Treasurer | | 2010 | | Vice President — Investment Operations, Capital Research and Management Company |
| 1 | The term “independent” trustee refers to a trustee who is not an “interested person” of the fund within the meaning of the Investment Company Act of 1940. |
| 2 | Trustees and officers of the fund serve until their resignation, removal or retirement. |
| 3 | This includes all directorships (other than those in the American Funds or other funds managed by Capital Research and Management Company) that are held by each trustee as a trustee or director of a public company or a registered investment company. |
| 4 | The term “interested” trustee refers to a trustee who is an “interested person” within the meaning of the Investment Company Act of 1940, on the basis of their affiliation with the fund’s investment adviser, Capital Research and Management Company, or affiliated entities (including the fund’s principal underwriter). |
| 5 | All of the directors/trustees and/or officers listed are officers and/or directors/trustees of one or more of the other funds for which Capital Research and Management Company serves as investment adviser. |
| 6 | Company affiliated with Capital Research and Management Company. |
| American High-Income Trust | 35 |
Offices of the fund and of the investment adviser
Capital Research and Management Company
333 South Hope Street
Los Angeles, CA 90071-1406
6455 Irvine Center Drive
Irvine, CA 92618-4518
Transfer agent for shareholder accounts
American Funds Service Company
(Write to the address near you.)
P.O. Box 6007
Indianapolis, IN 46206-6007
P.O. Box 2280
Norfolk, VA 23501-2280
Custodian of assets
JPMorgan Chase Bank
270 Park Avenue
New York, NY 10017-2070
Counsel
Bingham McCutchen LLP
355 South Grand Avenue, Suite 4400
Los Angeles, CA 90071-3106
Independent registered public accounting firm
Deloitte & Touche LLP
695 Town Center Drive
Suite 1200
Costa Mesa, CA 92626-7188
Principal underwriter
American Funds Distributors, Inc.
333 South Hope Street
Los Angeles, CA 90071-1406
| 36 | American High-Income Trust |
Investors should carefully consider investment objectives, risks, charges and expenses. This and other important information is contained in the fund prospectus and summary prospectus, which can be obtained from your financial professional and should be read carefully before investing. You may also call American Funds Service Company (AFS) at (800) 421-4225 or visit the American Funds website at americanfunds.com.
“American Funds Proxy Voting Procedures and Principles” — which describes how we vote proxies relating to portfolio securities — is available on the American Funds website or upon request by calling AFS. The fund files its proxy voting record with the U.S. Securities and Exchange Commission (SEC) for the 12 months ended June 30 by August 31. The proxy voting record is available free of charge on the SEC website at sec.gov and on the American Funds website.
A complete September 30, 2014, portfolio of American High-Income Trust’s investments is available free of charge by calling AFS or visiting the SEC website (where it is part of Form N-CSR).
American High-Income Trust files a complete list of its portfolio holdings with the SEC for the first and third quarters of each fiscal year on Form N-Q. This filing is available free of charge on the SEC website. You may also review or, for a fee, copy this filing at the SEC’s Public Reference Room in Washington, D.C. Additional information regarding the operation of the Public Reference Room may be obtained by calling the SEC’s Office of Investor Education and Advocacy at (800) SEC-0330. Additionally, the list of portfolio holdings is available by calling AFS.
This report is for the information of shareholders of American High-Income Trust, but it also may be used as sales literature when preceded or accompanied by the current prospectus or summary prospectus, which gives details about charges, expenses, investment objectives and operating policies of the fund. If used as sales material after December 31, 2014, this report must be accompanied by an American Funds statistical update for the most recently completed calendar quarter.
The American Funds Advantage
Since 1931, American Funds, part of Capital Group, has helped investors pursue long-term investment success. Our consistent approach — in combination with The Capital SystemSM — has resulted in a superior long-term track record.
| | Aligned with investor success |
| | We base our decisions on a long-term perspective, which we believe aligns our goals with the interests of our clients. Our portfolio managers average 26 years of investment experience, including 21 years at our company, reflecting a career commitment to our long-term approach.1 |
| | |
| | The Capital SystemSM |
| | Our investment process, The Capital System, combines individual accountability with teamwork. Each fund is divided into portions that are managed independently by investment professionals with diverse backgrounds, ages and investment approaches. An extensive global research effort is the backbone of our system. |
| | |
| | Superior long-term track record |
| | Our equity funds have beaten their Lipper peer indexes in 90% of 10-year periods and 96% of 20-year periods. Our fixed-income funds have beaten their Lipper indexes in 56% of 10-year periods and 57% of 20-year periods.2 Our fund management fees have been among the lowest in the industry.3 |
| | |
| | 1 | Portfolio manager experience as of December 31, 2013. |
| | 2 | Based on Class A share results for rolling periods through December 31, 2013. Periods covered are the shorter of the fund’s lifetime or since the comparable Lipper index inception date (except SMALLCAP World Fund, for which the Lipper average was used). |
| | 3 | Based on management fees for the 20-year period ended December 31, 2013, versus comparable Lipper categories, excluding funds of funds. |

ITEM 2 – Code of Ethics
The Registrant has adopted a Code of Ethics that applies to its Principal Executive Officer and Principal Financial Officer. The Registrant undertakes to provide to any person without charge, upon request, a copy of the Code of Ethics. Such request can be made to American Funds Service Company at 800/421-9225 or to the Secretary of the Registrant, 333 South Hope Street, Los Angeles, California 90071.
ITEM 3 – Audit Committee Financial Expert
The Registrant’s board has determined that Laurel B. Mitchell, a member of the Registrant’s audit committee, is an “audit committee financial expert” and "independent," as such terms are defined in this Item. This designation will not increase the designee’s duties, obligations or liability as compared to his or her duties, obligations and liability as a member of the audit committee and of the board, nor will it reduce the responsibility of the other audit committee members. There may be other individuals who, through education or experience, would qualify as "audit committee financial experts" if the board had designated them as such. Most importantly, the board believes each member of the audit committee contributes significantly to the effective oversight of the Registrant’s financial statements and condition.
ITEM 4 – Principal Accountant Fees and Services
| | Registrant: |
| | | a) Audit Fees: |
| | | | 2013 | $124,000 |
| | | | 2014 | $148,000 |
| | | | |
| | | b) Audit-Related Fees: |
| | | | 2013 | $ 7,000 |
| | | | 2014 | $ 4,000 |
| | | | The audit-related fees consist of assurance and related services relating to the examination of the Registrant’s investment adviser conducted in accordance with Statement on Standards for Attestation Engagements Number 16 issued by the American Institute of Certified Public Accountants. |
| | | | |
| | | c) Tax Fees: |
| | | | 2013 | $ 8,000 |
| | | | 2014 | $ 8,000 |
| | | | The tax fees consist of professional services relating to the preparation of the Registrant’s tax returns including returns relating to the Registrant’s investments in non-U.S. jurisdictions. |
| | | | |
| | | d) All Other Fees: |
| | | | 2013 | None |
| | | | 2014 | None |
| | | | |
| | Adviser and affiliates (includes only fees for non-audit services billed to the adviser and affiliates for engagements that relate directly to the operations and financial reporting of the Registrant and were subject to the pre-approval policies described below): |
| | | a) Audit Fees: |
| | | | Not Applicable |
| | | | |
| | | b) Audit-Related Fees: |
| | | | 2013 | $ 1,046,000 |
| | | | 2014 | $ 993,000 |
| | | | The audit-related fees consist of assurance and related services relating to the examination of the Registrant’s transfer agent, principal underwriter and investment adviser conducted in accordance with Statement on Standards for Attestation Engagements Number 16 issued by the American Institute of Certified Public Accountants. |
| | | | |
| | | c) Tax Fees: |
| | | | 2013 | $ 28,000 |
| | | | 2014 | $ 41,000 |
| | | | The tax fees consist of consulting services relating to the Registrant’s investments. |
| | | | |
| | | d) All Other Fees: |
| | | | 2013 | $ 2,000 |
| | | | 2014 | $ 3,000 |
| | | | The other fees consist of subscription services related to an accounting research tool. |
| | | | |
All audit and permissible non-audit services that the Registrant’s audit committee considers compatible with maintaining the independent registered public accounting firm’s independence are required to be pre-approved by the committee. The pre-approval requirement will extend to all non-audit services provided to the Registrant, the investment adviser, and any entity controlling, controlled by, or under common control with the investment adviser that provides ongoing services to the Registrant, if the engagement relates directly to the operations and financial reporting of the Registrant. The committee will not delegate its responsibility to pre-approve these services to the investment adviser. The committee may delegate to one or more committee members the authority to review and pre-approve audit and permissible non-audit services. Actions taken under any such delegation will be reported to the full committee at its next meeting. The pre-approval requirement is waived with respect to non-audit services if certain conditions are met. The pre-approval requirement was not waived for any of the non-audit services listed above provided to the Registrant, adviser and affiliates.
Aggregate non-audit fees paid to the Registrant’s auditors, including fees for all services billed to the Registrant, adviser and affiliates that provide ongoing services to the Registrant, were $1,545,000 for fiscal year 2013 and $1,390,000 for fiscal year 2014. The non-audit services represented by these amounts were brought to the attention of the committee and considered to be compatible with maintaining the auditors’ independence.
ITEM 5 – Audit Committee of Listed Registrants
Not applicable to this Registrant, insofar as the Registrant is not a listed issuer as defined in Rule 10A-3 under the Securities Exchange Act of 1934.
ITEM 6 – Schedule of Investments
American High-Income Trust®
Investment portfolio
September 30, 2014
Bonds, notes & other debt instruments 92.18%
Corporate bonds, notes & loans 88.16%
Telecommunication services 16.32% | Principal amount
(000) | Value
(000) |
| Altice Finco SA 6.50% 20221 | $32,700 | $33,599 |
| Altice Finco SA, First Lien, 7.25% 2022 | €26,375 | 34,604 |
| Altice Finco SA, First Lien, 7.75% 20221 | $73,525 | 76,098 |
| Altice Finco SA 8.125% 20241 | 10,375 | 11,153 |
| Clearwire Communications and Clearwire Finance, Inc. 14.75% 20161 | 13,650 | 16,994 |
| Crown Castle International Corp. 4.875% 2022 | 32,450 | 31,618 |
| Digicel Group Ltd. 8.25% 20201 | 101,475 | 105,037 |
| Digicel Group Ltd. 6.00% 20211 | 97,092 | 96,364 |
| Digicel Group Ltd. 7.125% 20221 | 59,275 | 59,305 |
| Frontier Communications Corp. 8.125% 2018 | 38,226 | 42,909 |
| Frontier Communications Corp. 8.50% 2020 | 29,867 | 33,302 |
| Frontier Communications Corp. 6.25% 2021 | 48,125 | 47,914 |
| Frontier Communications Corp. 9.25% 2021 | 51,625 | 59,175 |
| Frontier Communications Corp. 8.75% 2022 | 16,925 | 19,125 |
| Frontier Communications Corp. 7.125% 2023 | 44,650 | 45,766 |
| Frontier Communications Corp. 7.625% 2024 | 49,598 | 51,706 |
| Frontier Communications Corp. 6.875% 2025 | 18,050 | 17,870 |
| Intelsat Jackson Holding Co. 7.25% 2020 | 31,325 | 33,126 |
| Intelsat Jackson Holding Co. 6.625% 2022 | 180,950 | 184,569 |
| Intelsat Luxembourg Holding Co. 6.75% 2018 | 7,600 | 7,847 |
| Level 3 Communications, Inc. 8.125% 2019 | 4,900 | 5,243 |
| Level 3 Communications, Inc. 11.875% 2019 | 15,525 | 16,845 |
| LightSquared, Term Loan B, 12.00% 20142,3,4,5 | 115,770 | 159,184 |
| LightSquared, Term Loan, 15.00% 20143,4,5,6 | 24,639 | 24,639 |
| MetroPCS Wireless, Inc. 6.25% 2021 | 164,375 | 166,635 |
| MetroPCS Wireless, Inc. 6.625% 2023 | 139,200 | 143,028 |
| Millicom International Cellular SA 4.75% 20201 | 5,000 | 4,788 |
| Millicom International Cellular SA 6.625% 20211 | 27,210 | 28,366 |
| NII Capital Corp. 10.00% 20162 | 159,100 | 46,934 |
| NII Capital Corp. 7.875% 20191,2 | 127,080 | 86,097 |
| NII Capital Corp. 8.875% 2019 | 112,001 | 33,600 |
| NII Capital Corp. 11.375% 20191,2 | 196,970 | 133,447 |
| NII Capital Corp. 7.625% 2021 | 215,896 | 42,100 |
| Numerical Group SA, First Lien, 4.875% 20191 | 94,575 | 93,747 |
| Numerical Group SA, First Lien, 6.00% 20221 | 113,575 | 114,569 |
| Numerical Group SA, First Lien, 6.25% 20241 | 27,925 | 27,890 |
| SoftBank Corp. 4.50% 20201 | 76,560 | 76,656 |
| Sprint Capital Corp. 6.90% 2019 | 5,000 | 5,281 |
| Sprint Capital Corp. 8.75% 2032 | 1,800 | 1,973 |
| Sprint Corp. 7.25% 20211 | 98,925 | 103,253 |
| Sprint Corp. 7.875% 20231 | 81,450 | 86,744 |
| Sprint Nextel Corp. 8.375% 2017 | 18,375 | 20,603 |
| Sprint Nextel Corp. 9.125% 2017 | 8,135 | 9,193 |
| Sprint Nextel Corp. 9.00% 20181 | 19,050 | 22,074 |
| Sprint Nextel Corp. 7.00% 2020 | 174,385 | 182,668 |
| Sprint Nextel Corp. 11.50% 2021 | 62,405 | 80,190 |
American High-Income Trust — Page 1 of 15
Bonds, notes & other debt instruments
Corporate bonds, notes & loans (continued)
Telecommunication services (continued) | Principal amount
(000) | Value
(000) |
| Telecom Italia Capital SA 6.999% 2018 | $26,250 | $29,663 |
| T-Mobile US, Inc. 6.542% 2020 | 108,475 | 111,594 |
| T-Mobile US, Inc. 6.731% 2022 | 36,600 | 37,561 |
| T-Mobile US, Inc. 6.375% 2025 | 50,725 | 50,725 |
| Trilogy International Partners, LLC 10.25% 20161 | 106,840 | 109,578 |
| Wind Acquisition SA 4.75% 20201 | 79,975 | 77,276 |
| Wind Acquisition SA 7.375% 20211 | 132,900 | 133,897 |
| | | 3,274,122 |
| Consumer discretionary 14.40% | | |
| Academy Sports 9.25% 20191 | 19,550 | 20,772 |
| Automotores Gildemeister SA 8.25% 20211 | 4,795 | 3,333 |
| Automotores Gildemeister SA 8.25% 2021 | 415 | 288 |
| Automotores Gildemeister SA 6.75% 2023 | 3,000 | 2,030 |
| Automotores Gildemeister SA 6.75% 20231 | 1,875 | 1,269 |
| Boyd Gaming Corp. 9.125% 2018 | 82,070 | 85,968 |
| Boyd Gaming Corp. 9.00% 2020 | 81,555 | 85,939 |
| Burger King Corp 0%/11.00% 20191,7 | 54,225 | 50,700 |
| Burger King Corp. 6.00% 20221 | 78,300 | 78,202 |
| Caesars Entertainment Operating Co. 11.25% 2017 | 23,020 | 17,869 |
| Caesars Entertainment Operating Co. 9.00% 2020 | 15,755 | 12,250 |
| Caesars Entertainment,Term Loan B, 7.00% 20204,5,6 | 14,888 | 14,296 |
| Carmike Cinemas, Inc. 7.375% 2019 | 14,000 | 14,910 |
| CBS Outdoor Americas Inc. 5.25% 20221 | 6,000 | 6,008 |
| CBS Outdoor Americas Inc. 5.625% 20241 | 6,000 | 6,030 |
| CEC Entertainment, Inc. 8.00% 20221 | 28,325 | 26,625 |
| Cedar Fair, LP 5.375% 20241 | 26,200 | 25,447 |
| Cengage Learning Acquisitions, Inc., Term Loan B, 7.00% 20204,5,6 | 24,863 | 24,900 |
| Cequel Communications Holdings I, LLC and Cequel Capital Corp. 6.375% 20201 | 116,350 | 120,277 |
| Cinemark USA, Inc. 5.125% 2022 | 11,475 | 11,332 |
| CityCenter Holdings, Term Loan B, 4.25% 20204,5,6 | 9,275 | 9,191 |
| Clear Channel Worldwide Holdings, Inc. 7.625% 2020 | 54,650 | 56,973 |
| Cooper-Standard Holdings Inc., Term Loan B, 4.00% 20214,5,6 | 14,289 | 14,146 |
| Cumulus Media Holdings Inc. 7.75% 2019 | 27,599 | 28,392 |
| Cumulus Media Inc., Term Loan B, 4.25% 20204,5,6 | 32,402 | 31,916 |
| Delta 2 (Formula One), Term Loan B, 4.75% 20214,5,6 | 30,325 | 29,946 |
| Delta 2 (Formula One), Term Loan B, 7.75% 20224,5,6 | 47,400 | 47,311 |
| DineEquity, Inc. 9.50% 2018 | 29,275 | 30,849 |
| DISH DBS Corp. 4.625% 2017 | 62,625 | 64,034 |
| DISH DBS Corp. 4.25% 2018 | 68,900 | 69,244 |
| DISH DBS Corp. 7.875% 2019 | 3,550 | 4,020 |
| DISH DBS Corp. 5.125% 2020 | 35,550 | 35,728 |
| Dynacast International LLC 9.25% 2019 | 12,200 | 13,115 |
| Fiat SpA 8.25% 2021 | 41,600 | 45,552 |
| Ford Motor Credit Co. 8.70% 2014 | 1,000 | 1,000 |
| Ford Motor Credit Co. 7.00% 2015 | 3,000 | 3,104 |
| Ford Motor Credit Co. 8.00% 2016 | 7,000 | 7,970 |
| Gannett Co., Inc. 5.125% 20191 | 14,455 | 14,636 |
| Gannett Co., Inc. 4.875% 20211 | 13,620 | 13,211 |
| Gannett Co., Inc. 6.375% 20231 | 14,205 | 14,809 |
| General Motors Financial Co. 3.00% 2017 | 27,375 | 27,683 |
| General Motors Financial Co. 3.25% 2018 | 30,845 | 31,231 |
| General Motors Financial Co. 6.75% 2018 | 1,040 | 1,163 |
| General Motors Financial Co. 3.50% 2019 | 12,595 | 12,706 |
American High-Income Trust — Page 2 of 15
Bonds, notes & other debt instruments
Corporate bonds, notes & loans (continued)
Consumer discretionary (continued) | Principal amount
(000) | Value
(000) |
| General Motors Financial Co. 4.375% 2021 | $2,900 | $2,969 |
| General Motors Financial Co. 4.25% 2023 | 1,500 | 1,509 |
| Group 1 Automotive, Inc. 5.00% 20221 | 1,015 | 987 |
| Grupo Televisa, SAB 7.25% 2043 | MXN68,660 | 4,327 |
| Guitar Center, Inc. 9.625% 20201 | $10,600 | 8,162 |
| Hilton Hotels Corp. 5.625% 20211 | 21,700 | 22,392 |
| Hilton Worldwide, Term Loan B, 3.50% 20204,5,6 | 11,855 | 11,690 |
| J.C. Penney Co., Inc., Series A, 6.875% 2015 | 11,820 | 12,352 |
| J.C. Penney Co., Inc. 7.65% 2016 | 12,189 | 12,798 |
| J.C. Penney Co., Inc. 7.95% 2017 | 8,000 | 8,360 |
| J.C. Penney Co., Inc. 5.75% 2018 | 10,110 | 9,529 |
| J.C. Penney Co., Inc. 8.125% 2019 | 12,000 | 11,760 |
| Jaguar Land Rover PLC 8.125% 20211 | 18,425 | 20,244 |
| K. Hovnanian Enterprises, Inc. 7.00% 20191 | 10,000 | 9,831 |
| La Quinta Properties, Inc., First Lien Term Loan B, 4.00% 20214,5,6 | 17,590 | 17,383 |
| Laureate Education, Inc. 9.25% 20191 | 9,775 | 9,873 |
| Limited Brands, Inc. 6.625% 2021 | 14,226 | 15,755 |
| Marina District Finance Co. (Borgata), Term Loan B, 6.75% 20184,5,6 | 49,625 | 49,734 |
| Marina District Finance Co., Inc. 9.875% 2018 | 21,000 | 22,076 |
| McClatchy Co. 9.00% 2022 | 26,750 | 29,024 |
| MDC Partners Inc. 6.75% 20201 | 4,000 | 4,140 |
| Mediacom Broadband LLC and Mediacom Broadband Corp. 5.50% 20211 | 10,500 | 10,421 |
| Mediacom Broadband LLC and Mediacom Broadband Corp. 6.375% 2023 | 19,575 | 20,064 |
| Mediacom LLC and Mediacom Capital Corp. 7.25% 2022 | 19,300 | 20,362 |
| MGM Resorts International 6.625% 2015 | 5,575 | 5,742 |
| MGM Resorts International 7.50% 2016 | 9,000 | 9,630 |
| MGM Resorts International 8.625% 2019 | 35,330 | 40,015 |
| MGM Resorts International 5.25% 2020 | 17,150 | 17,193 |
| MGM Resorts International 6.75% 2020 | 4,100 | 4,377 |
| MGM Resorts International 7.75% 2022 | 18,950 | 21,129 |
| Michaels Stores, Inc. 7.50% 20181,3,6 | 7,524 | 7,693 |
| Michaels Stores, Inc. 5.875% 20201 | 30,710 | 30,633 |
| Modular Space Corp., Second Lien, 10.25% 20191 | 8,325 | 8,429 |
| Mohegan Tribal Gaming Authority 11.00% 20181,3,6 | 48,125 | 48,125 |
| NBC Universal Enterprise, Inc. 5.25% (undated)1 | 23,885 | 24,960 |
| NCL Corp. Ltd. 5.00% 2018 | 17,350 | 17,610 |
| Needle Merger Sub Corp. 8.125% 20191 | 83,905 | 80,129 |
| Neiman Marcus Group LTD Inc. 8.00% 20211 | 60,450 | 63,170 |
| Neiman Marcus Group LTD Inc. 8.75% 20211,3,6 | 54,795 | 57,946 |
| Neiman Marcus, Term Loan B, 4.25% 20204,5,6 | 57,538 | 56,639 |
| PETCO Animal Supplies, Inc. 9.25% 20181 | 53,750 | 56,706 |
| Pinnacle Entertainment, Inc. 6.375% 2021 | 33,850 | 35,542 |
| Playa Resorts Holding BV 8.00% 20201 | 74,607 | 78,337 |
| Playa Resorts Holding BV, Term Loan B, 4.00% 20194,5,6 | 5,769 | 5,697 |
| Revel Entertainment, Term Loan B, 10.00% 20152,3,4,5,6,8,9 | 15,286 | — |
| Revel Entertainment, Term Loan B, 14.50% 20182,3,4,5,6,8,9 | 82,239 | — |
| Royal Caribbean Cruises Ltd. 11.875% 2015 | 3,300 | 3,564 |
| Sally Holdings LLC and Sally Capital Inc. 6.875% 2019 | 21,625 | 23,031 |
| Sally Holdings LLC and Sally Capital Inc. 5.75% 2022 | 7,250 | 7,431 |
| Schaeffler Holding Finance BV 6.875% 20183,6 | €19,000 | 25,210 |
| Schaeffler Holding Finance BV 6.875% 20181,3,6 | $19,300 | 20,169 |
| Seminole Tribe of Florida 7.804% 20201,5 | 6,915 | 7,503 |
| Seneca Gaming Corp. 8.25% 20181 | 22,450 | 23,572 |
| Six Flags Entertainment Corp. 5.25% 20211 | 62,735 | 61,167 |
American High-Income Trust — Page 3 of 15
Bonds, notes & other debt instruments
Corporate bonds, notes & loans (continued)
Consumer discretionary (continued) | Principal amount
(000) | Value
(000) |
| Stackpole Intl. 7.75% 20211 | $45,660 | $46,231 |
| Station Casinos LLC 7.50% 2021 | 9,400 | 9,847 |
| Time Inc. 5.75% 20221 | 47,875 | 45,960 |
| Time Inc., Term Loan B, 4.25% 20214,5,6 | 39,277 | 38,884 |
| Toys "R" Us, Inc. 7.375% 2018 | 5,525 | 3,881 |
| Toys "R" Us-Delaware, Inc. 7.375% 20161 | 4,000 | 4,000 |
| Toys "R" Us-Delaware, Inc., Term Loan B2, 5.25% 20184,5,6 | 3,324 | 3,105 |
| Univision Communications Inc. 6.875% 20191 | 4,230 | 4,420 |
| Univision Communications Inc. 8.50% 20211 | 10,795 | 11,470 |
| Univision Communications Inc. 6.75% 20221 | 2,713 | 2,916 |
| Univision Communications Inc., Term Loan C3, 4.00% 20204,5,6 | 24,001 | 23,579 |
| Univision Communications Inc., Term Loan D, 4.00% 20204,5,6 | 5,955 | 5,850 |
| UPC Germany GmbH 9.625% 2019 | €10,800 | 14,554 |
| Virgin Media Finance PLC 8.375% 20191 | $25,025 | 26,201 |
| VTR Finance BV 6.875% 20241 | 23,000 | 23,862 |
| Warner Music Group 13.75% 2019 | 17,725 | 20,650 |
| Warner Music Group 6.00% 20211 | 32,990 | 33,567 |
| Warner Music Group 5.625% 20221 | 14,750 | 14,787 |
| Warner Music Group 6.75% 20221 | 84,500 | 81,331 |
| Weather Company, Term Loan, 7.00% 20204,5,6 | 10,000 | 9,842 |
| Wynn Macau, Ltd. 5.25% 20211 | 74,025 | 71,804 |
| | | 2,890,207 |
| Industrials 13.23% | | |
| AAF Holdings LLC 12.75% 20191,3,5,6 | 49,670 | 49,062 |
| ADS Waste Escrow 8.25% 2020 | 6,050 | 6,337 |
| ADT Corp. 4.125% 2019 | 53,225 | 52,294 |
| AECOM Technology Corp. 5.75% 20221 | 20,250 | 20,503 |
| AECOM Technology Corp. 5.875% 20241 | 18,750 | 19,125 |
| AerCap Holdings NV 2.75% 20171 | 27,350 | 26,735 |
| Air Canada 7.75% 20211 | 16,000 | 16,360 |
| Allegiant Travel Co. 5.50% 2019 | 24,250 | 24,856 |
| Altegrity, Inc. 9.50% 20191 | 151,950 | 140,554 |
| ARAMARK Corp. 5.75% 2020 | 5,000 | 5,150 |
| Associated Materials, LLC and AMH New Finance, Inc. 9.125% 2017 | 167,367 | 164,647 |
| Avianca Holdings SA, 8.375% 20201 | 14,075 | 15,095 |
| BakerCorp International, Inc. 8.25% 2019 | 21,400 | 21,186 |
| BE Aerospace, Inc. 5.25% 2022 | 106,698 | 115,501 |
| Brunswick Rail Finance Ltd. 6.50% 2017 | 29,251 | 27,277 |
| Brunswick Rail Finance Ltd. 6.50% 20171 | 9,651 | 9,000 |
| Builders Firstsource 7.625% 20211 | 32,139 | 32,782 |
| CEVA Group PLC 4.00% 20181 | 42,250 | 39,662 |
| CEVA Group PLC 7.00% 20211 | 9,475 | 9,522 |
| CEVA Group PLC 9.00% 20211 | 19,100 | 19,100 |
| CEVA Group PLC, LOC, 6.50% 20214,5,6 | 15,843 | 15,394 |
| CEVA Group PLC, Term Loan B, 6.50% 20214,5,6 | 22,929 | 22,279 |
| CEVA Group PLC, Term Loan, 6.50% 20214,5,6 | 16,624 | 16,153 |
| CEVA Group PLC, Term Loan, 6.50% 20214,5,6 | 2,866 | 2,785 |
| Continental Airlines, Inc., Series 2001-1, Class B, 7.373% 20175 | 2,430 | 2,558 |
| Continental Airlines, Inc., Series 1998-1, Class B, 6.748% 20185 | 2,813 | 3,009 |
| Continental Airlines, Inc., Series 1997-4B, Class B, 6.90% 20185 | 550 | 583 |
| Continental Airlines, Inc., Series 1997-4, Class A, 6.90% 20195 | 2,443 | 2,594 |
| Continental Airlines, Inc., Series 2000-2, Class B, 8.307% 20195 | 506 | 553 |
| Continental Airlines, Inc., Series 1999-1, Class A, 6.545% 20205 | 2,494 | 2,780 |
American High-Income Trust — Page 4 of 15
Bonds, notes & other debt instruments
Corporate bonds, notes & loans (continued)
Industrials (continued) | Principal amount
(000) | Value
(000) |
| Continental Airlines, Inc., Series 2001-1, Class A-1, 6.703% 20225 | $5,546 | $6,087 |
| Continental Airlines, Inc., Series 2007-1, Class B, 6.903% 20225 | 3,652 | 3,892 |
| Continental Airlines, Inc., Series 2000-2, Class A-1, 7.707% 20225 | 2,712 | 3,059 |
| Continental Airlines, Inc., Series 2000-1, Class A-1, 8.048% 20225 | 250 | 287 |
| Continental Airlines, Inc., Series 2000-1, Class B, 8.388% 20225 | 2,471 | 2,607 |
| DAE Aviation Holdings, Inc. and Standard Aero Ltd., Term Loan B-1, 5.00% 20184,5,6 | 40,010 | 40,150 |
| DAE Aviation Holdings, Inc. and Standard Aero Ltd., Term Loan B-2, 5.00% 20184,5,6 | 17,457 | 17,518 |
| Delta Air Lines, Inc., Series 2010-B, Class 2-B, 6.75% 20171 | 7,650 | 8,061 |
| Delta Air Lines, Inc., Series 2002-1, Class G-1, MBIA insured, 6.718% 20245 | 7,926 | 9,233 |
| Eletson Holdings Inc. 9.625% 20221 | 19,450 | 19,936 |
| ENA Norte Trust 4.95% 20281,5 | 2,591 | 2,697 |
| Esterline Technologies Corp. 7.00% 2020 | 44,860 | 47,776 |
| Euramax International, Inc. 9.50% 2016 | 87,565 | 85,814 |
| Far East Capital Limited SA 8.00% 20181 | 15,555 | 10,461 |
| Far East Capital Limited SA 8.75% 20201 | 26,960 | 18,131 |
| Far East Capital Limited S.A., 8.75% 2020 | 9,600 | 6,456 |
| Gardner Denver, Inc. 6.875% 20211 | 6,000 | 6,045 |
| Gardner Denver, Inc. Term Loan B, 4.25% 20204,5,6 | 79,314 | 77,872 |
| Gates Global LLC 6.00% 20221 | 46,375 | 43,824 |
| Gates Global LLC, Term Loan B, 4.25% 20214,5,6 | 46,125 | 45,417 |
| Hardwoods Acquisition Inc 7.50% 20211 | 29,550 | 29,254 |
| Hawker Beechcraft Acquisition Co., LLC, LOC, 0.009% 20154,5,6,8 | 2,260 | 2,147 |
| HD Supply, Inc. 7.50% 2020 | 5,000 | 5,213 |
| HD Supply, Inc. 11.50% 2020 | 49,715 | 57,483 |
| HDTFS Inc. 4.25% 2018 | 11,400 | 11,258 |
| HDTFS Inc. 6.75% 2019 | 450 | 467 |
| HDTFS Inc. 5.875% 2020 | 7,800 | 7,956 |
| HDTFS Inc. 6.25% 2022 | 4,600 | 4,681 |
| Iron Mountain Inc. 6.00% 2023 | 950 | 979 |
| Iron Mountain Inc. 5.75% 2024 | 33,430 | 32,970 |
| Jeld-Wen Escrow Corp. 12.25% 20171 | 89,060 | 94,960 |
| Jeld-Wen Escrow Corp., Term Loan B, 5.25% 20214,5,6 | 41,500 | 41,318 |
| LMI Aerospace Inc. 7.375% 20191 | 49,700 | 49,948 |
| Milacron LLC 7.75% 20211 | 10,275 | 10,866 |
| Navios Maritime Acquisition Corp. and Navios Acquisition Finance (US) Inc. 8.125% 20211 | 69,895 | 67,798 |
| Navios Maritime Holdings Inc. 7.375% 20221 | 33,550 | 31,998 |
| Navios Maritime Holdings Inc. and Navios Maritime Finance II (US) Inc. 8.125% 2019 | 33,535 | 31,774 |
| Nielsen Finance LLC and Nielsen Finance Co. 4.50% 2020 | 41,024 | 39,896 |
| Nielsen Finance LLC and Nielsen Finance Co. 5.50% 20211 | 18,120 | 18,301 |
| Nielsen Finance LLC and Nielsen Finance Co. 5.00% 20221 | 45,600 | 45,144 |
| Nortek Inc. 10.00% 2018 | 47,735 | 50,480 |
| Nortek Inc. 8.50% 2021 | 83,777 | 90,479 |
| Ply Gem Industries, Inc. 6.50% 2022 | 89,350 | 85,218 |
| Ply Gem Industries, Inc. 6.50% 20221 | 24,825 | 23,677 |
| Ply Gem Industries, Inc., Term Loan B1, 4.00% 20214,5,6 | 27,537 | 27,101 |
| R.R. Donnelley & Sons Co. 7.25% 2018 | 25,900 | 28,878 |
| R.R. Donnelley & Sons Co. 7.875% 2021 | 30,600 | 33,736 |
| R.R. Donnelley & Sons Co. 7.00% 2022 | 30,000 | 31,800 |
| R.R. Donnelley & Sons Co. 6.50% 2023 | 40,275 | 40,376 |
| R.R. Donnelley & Sons Co. 6.00% 2024 | 20,000 | 19,800 |
| Red de Carreteras de Occidente 9.00% 20285 | MXN151,560 | 10,860 |
| Safway Group Holding 7.00% 20181 | $17,000 | 17,382 |
| Silver II Borrower S.C.A./Silver II U.S. Holdings, LLC 7.75% 20201 | 51,953 | 54,161 |
| TRAC Intermodal 11.00% 2019 | 74,730 | 82,950 |
American High-Income Trust — Page 5 of 15
Bonds, notes & other debt instruments
Corporate bonds, notes & loans (continued)
Industrials (continued) | Principal amount
(000) | Value
(000) |
| TransDigm Inc. 5.50% 2020 | $38,600 | $37,635 |
| United Air Lines, 1991 Equipment Trust Certificates, Series A, 10.11% 20062,5,8 | 1,135 | — |
| United Air Lines, Inc., Series 2007-1, Class B, 7.336% 20211,5 | 3,628 | 3,945 |
| United Rentals, Inc. 7.375% 2020 | 11,625 | 12,410 |
| United Rentals, Inc. 7.625% 2022 | 25,575 | 28,069 |
| US Investigations Services, Inc. 13.00% 20201,3 | 53,108 | 22,166 |
| US Investigations Services, Inc. 14.00% 20201,3 | 4,358 | 1,821 |
| US Investigations Services, Inc. 15.00% 20211,3 | 10,239 | 2,957 |
| Watco Companies 6.375% 20231 | 26,240 | 26,502 |
| | | 2,655,573 |
| Health care 11.45% | | |
| Catalent Pharma Solutions Inc., Term Loan, 6.50% 20174,5,6 | 2,822 | 2,830 |
| Centene Corp. 5.75% 2017 | 43,035 | 45,778 |
| Centene Corp. 4.75% 2022 | 29,190 | 29,299 |
| Community Health Systems, Inc. 5.125% 2018 | 7,090 | 7,303 |
| ConvaTec Finance International SA 8.25% 20191,3,6 | 60,940 | 62,044 |
| CRC Health Corp, Term Loan, 5.25% 20214,5,6 | 9,602 | 9,582 |
| DJO Finance LLC 9.75% 2017 | 38,538 | 39,309 |
| DJO Finance LLC 7.75% 2018 | 29,321 | 29,614 |
| DJO Finance LLC 8.75% 2018 | 25,875 | 27,427 |
| DJO Finance LLC 9.875% 2018 | 68,130 | 71,707 |
| Endo Pharmaceuticals Holdings Inc. 5.75% 20221 | 42,135 | 41,714 |
| Forest Laboratories, Inc. 5.00% 20211 | 59,113 | 63,295 |
| Grifols Worldwide Operations Ltd. 5.25% 20221 | 3,000 | 2,970 |
| HCA Inc. 3.75% 2019 | 81,915 | 80,277 |
| HCA Inc. 6.50% 2020 | 19,240 | 21,044 |
| HCA Inc. 5.00% 2024 | 22,050 | 21,747 |
| INC Research LLC 11.50% 20191 | 61,127 | 67,851 |
| inVentiv Health Inc, Term Loan B4, 7.75% 20184,5,6 | 57,910 | 57,669 |
| inVentiv Health Inc. 9.00% 20181 | 174,065 | 181,463 |
| inVentiv Health Inc. 11.00% 20181 | 49,193 | 39,846 |
| inVentiv Health Inc. 11.00% 20181 | 23,183 | 18,778 |
| inVentiv Health Inc. 12.00% 20181,3,6 | 104,008 | 96,727 |
| Kindred Healthcare Inc., Term Loan B, 4.00% 20214,5,6 | 31,471 | 30,979 |
| Kinetic Concepts, Inc. 10.50% 2018 | 162,000 | 176,580 |
| Kinetic Concepts, Inc. 12.50% 2019 | 151,837 | 169,678 |
| Multiplan Inc., Term Loan B, 4.00% 20214,5,6 | 70,875 | 69,334 |
| Ortho-Clinical Diagnostics Inc. 6.625% 20221 | 61,675 | 56,278 |
| Ortho-Clinical Diagnostics Inc., Term Loan B, 4.75% 20214,5,6 | 64,049 | 63,439 |
| Patheon Inc. 7.50% 20221 | 9,510 | 9,641 |
| Patheon Inc., Term Loan B, 4.25% 20214,5,6 | 24,454 | 24,008 |
| PRA Holdings, Inc. 9.50% 20231 | 48,520 | 53,129 |
| Rotech Healthcare Inc., Term Loan A, 5.50% 20184,5,6,9 | 25,641 | 25,513 |
| Rotech Healthcare Inc., Term Loan B, 10.00% 20194,5,6,9 | 20,825 | 20,721 |
| Rotech Healthcare Inc., Term Loan, 13.00% 20203,4,5,6,9 | 49,000 | 48,755 |
| Select Medical Holdings Corp. 6.375% 2021 | 62,050 | 62,360 |
| Symbion Inc. 8.00% 2016 | 43,375 | 45,002 |
| Tenet Healthcare Corp., First Lien, 6.25% 2018 | 3,000 | 3,199 |
| Tenet Healthcare Corp., First Lien, 4.75% 2020 | 19,395 | 19,346 |
| Tenet Healthcare Corp., First Lien, 6.00% 2020 | 55,285 | 58,602 |
| Tenet Healthcare Corp., First Lien, 4.50% 2021 | 19,820 | 19,399 |
| Tenet Healthcare Corp. 8.125% 2022 | 38,465 | 42,311 |
| VPI Escrow Corp. 6.75% 20181 | 60,675 | 64,164 |
American High-Income Trust — Page 6 of 15
Bonds, notes & other debt instruments
Corporate bonds, notes & loans (continued)
Health care (continued) | Principal amount
(000) | Value
(000) |
| VPI Escrow Corp. 6.375% 20201 | $75,983 | $78,357 |
| VPI Escrow Corp. 5.625% 20211 | 1,750 | 1,748 |
| VPI Escrow Corp. 7.50% 20211 | 48,370 | 51,937 |
| VWR Funding, Inc. 7.25% 2017 | 80,479 | 84,101 |
| | | 2,296,855 |
| Energy 10.55% | | |
| Access Midstream Partners, L.P. 5.875% 2021 | 9,300 | 9,858 |
| Alpha Natural Resources, Inc. 9.75% 2018 | 53,105 | 39,032 |
| Alpha Natural Resources, Inc. 6.00% 2019 | 35,300 | 21,533 |
| Alpha Natural Resources, Inc. 7.50% 20201 | 55,500 | 49,811 |
| Alpha Natural Resources, Inc. 6.25% 2021 | 54,160 | 31,751 |
| American Energy (Marcellus), Term Loan B, 5.25% 20204,5,6 | 29,725 | 29,552 |
| American Energy (Marcellus), Term Loan A, 8.50% 20214,5,6 | 38,360 | 38,192 |
| American Energy (Permian Basin) 7.125% 20201 | 97,475 | 89,677 |
| American Energy (Permian Basin) 7.375% 20211 | 46,100 | 42,412 |
| American Energy (Woodford LLC), 9.00% 20221 | 57,925 | 54,015 |
| Arch Coal, Inc. 7.00% 2019 | 85,016 | 45,590 |
| Arch Coal, Inc. 8.00% 20191 | 14,400 | 12,420 |
| Arch Coal, Inc. 9.875% 2019 | 16,269 | 9,517 |
| Arch Coal, Inc. 7.25% 2021 | 71,966 | 35,083 |
| Arch Coal, Inc., Term Loan B1, 6.25% 20184,5,6 | 32,370 | 29,675 |
| Athlon Energy Inc. 6.00% 20221 | 32,850 | 35,314 |
| Bonanza Creek Energy, Inc. 6.75% 2021 | 18,650 | 19,303 |
| California Resources Corp. 5.00% 20201 | 9,975 | 10,150 |
| CONSOL Energy Inc. 8.25% 2020 | 61,600 | 64,911 |
| CONSOL Energy Inc. 5.875% 20221 | 20,700 | 20,467 |
| Denbury Resources Inc. 4.625% 2023 | 36,550 | 33,991 |
| Ecopetrol SA 5.875% 2023 | 3,050 | 3,374 |
| Jupiter Resources Inc. 8.50% 20221 | 97,475 | 86,753 |
| Kinder Morgan Energy Partners, LP 5.00% 20211 | 2,500 | 2,619 |
| Laredo Petroleum, Inc. 9.50% 2019 | 33,850 | 36,135 |
| Laredo Petroleum, Inc. 7.375% 2022 | 3,375 | 3,561 |
| NGL Energy Partners LP 5.125% 20191 | 13,350 | 13,133 |
| NGPL PipeCo LLC 7.119% 20171 | 137,395 | 138,082 |
| NGPL PipeCo LLC 9.625% 20191 | 126,850 | 135,095 |
| NGPL PipeCo LLC, Term Loan B, 6.75% 20174,5,6 | 11,001 | 10,983 |
| Oasis Petroleum Inc. 6.875% 2022 | 7,100 | 7,526 |
| Odebrecht Drilling Norbe VIII/IX Ltd 6.35% 20211,5 | 5,530 | 5,718 |
| Odebrecht Offshore Drilling Finance Ltd. 6.75% 20221,5 | 6,027 | 6,268 |
| Odebrecht Offshore Drilling Finance Ltd., First Lien, 6.625% 20231,5 | 3,109 | 3,218 |
| PDC Energy Inc. 7.75% 2022 | 101,050 | 108,629 |
| Peabody Energy Corp. 6.00% 2018 | 126,672 | 124,772 |
| Peabody Energy Corp. 6.25% 2021 | 50,065 | 46,748 |
| Petrobras International Finance Co. 5.75% 2020 | 4,030 | 4,228 |
| QGOG Atlantic/Alaskan Rigs Ltd. 5.25% 20191,5 | 6,220 | 6,484 |
| QGOG Constellation SA 6.25% 20191 | 84,225 | 84,436 |
| Regency Energy Partners LP and Regency Energy Finance Corp. 6.50% 2021 | 32,650 | 34,446 |
| Regency Energy Partners LP and Regency Energy Finance Corp. 5.00% 2022 | 1,935 | 1,913 |
| Regency Energy Partners LP and Regency Energy Finance Corp. 5.875% 2022 | 4,275 | 4,478 |
| Regency Energy Partners LP and Regency Energy Finance Corp. 5.50% 2023 | 16,100 | 16,422 |
| Rice Energy Inc. 6.25% 20221 | 69,070 | 67,689 |
| RSP Permian Inc 6.625% 20221 | 12,925 | 13,022 |
| Sabine Pass Liquefaction, LLC 5.625% 2021 | 82,125 | 84,794 |
American High-Income Trust — Page 7 of 15
Bonds, notes & other debt instruments
Corporate bonds, notes & loans (continued)
Energy (continued) | Principal amount
(000) | Value
(000) |
| Sabine Pass Liquefaction, LLC 5.75% 20241 | $89,275 | $90,949 |
| Samson Investment Co. 9.75% 2020 | 214,715 | 195,927 |
| Samson Investment Co., Term Loan B, 5.00% 20184,5,6 | 2,800 | 2,727 |
| Teekay Corp. 8.50% 2020 | 40,255 | 44,884 |
| TransCanada PipeLines Ltd., junior subordinated 6.35% 20676 | 10,295 | 10,655 |
| | | 2,117,922 |
| Materials 8.01% | | |
| ArcelorMittal 5.00% 20176 | 14,250 | 14,783 |
| ArcelorMittal 10.35% 20196 | 2,000 | 2,448 |
| ArcelorMittal 6.00% 20216 | 42,622 | 44,966 |
| ArcelorMittal 6.75% 20226 | 8,275 | 8,927 |
| ArcelorMittal 7.25% 20416 | 53,670 | 54,475 |
| Ball Corp. 5.75% 2021 | 5,330 | 5,550 |
| CEMEX Finance LLC 7.25% 20211 | 2,700 | 2,862 |
| CEMEX Finance LLC 9.375% 20221 | 31,675 | 35,872 |
| CEMEX SAB de CV 9.50% 2018 | 3,500 | 3,911 |
| First Quantum Minerals Ltd. 6.75% 20201 | 139,162 | 142,293 |
| First Quantum Minerals Ltd. 7.00% 20211 | 138,096 | 140,685 |
| First Quantum Minerals Ltd. 7.25% 20221 | 8,575 | 8,789 |
| FMG Resources 6.00% 20171 | 104,092 | 105,198 |
| FMG Resources 6.875% 20181,5 | 46,834 | 48,239 |
| FMG Resources 8.25% 20191 | 7,750 | 8,041 |
| Georgia Gulf Corp. 4.625% 2021 | 6,000 | 5,790 |
| Georgia Gulf Corp. 4.875% 2023 | 17,160 | 16,538 |
| Graphic Packaging International, Inc. 4.75% 2021 | 14,845 | 14,882 |
| JMC Steel Group Inc. 8.25% 20181 | 141,540 | 143,486 |
| LSB Industries, Inc. 7.75% 2019 | 59,495 | 63,362 |
| Momentive Performance Materials Inc., Term Loan B, 4.00% 20154,5,6 | 10,025 | 10,037 |
| OMNOVA Solutions Inc. 7.875% 2018 | 32,250 | 32,895 |
| Packaging Dynamics Corp. 8.75% 20161 | 11,628 | 11,802 |
| Paperworks Industries Inc. 9.50% 20191 | 10,000 | 10,213 |
| PQ Corp. 8.75% 20181 | 27,365 | 29,144 |
| Rayonier Advanced Materials Inc. 5.50% 20241 | 51,205 | 48,901 |
| Reynolds Group Inc. 7.125% 2019 | 5,700 | 5,921 |
| Reynolds Group Inc. 7.875% 2019 | 5,805 | 6,182 |
| Reynolds Group Inc. 9.875% 2019 | 43,510 | 47,045 |
| Reynolds Group Inc. 5.75% 2020 | 184,460 | 188,610 |
| Ryerson Inc. 9.00% 2017 | 42,230 | 44,658 |
| Ryerson Inc. 11.25% 2018 | 47,657 | 52,661 |
| Smurfit Capital Funding PLC 7.50% 2025 | 21,265 | 24,348 |
| Solenis, Term Loan, 7.75% 20224,5,6 | 31,745 | 31,163 |
| Taminco Global Chemical Corp. 9.75% 20201 | 22,955 | 25,308 |
| Tembec Industries Inc. 9.00% 20191 | 41,515 | 41,930 |
| U.S. Coatings Acquisition Inc. (Flash Dutch 2 BV) 5.75% 2021 | €2,630 | 3,526 |
| U.S. Coatings Acquisition Inc. (Flash Dutch 2 BV) 7.375% 20211 | $33,035 | 35,595 |
| U.S. Coatings Acquisition Inc. (Flash Dutch 2 BV), Term Loan B, 3.75% 20204,5,6 | 11,555 | 11,334 |
| Walter Energy, Inc. 9.50% 20191 | 68,535 | 62,024 |
| Walter Energy, Inc. 9.875% 2020 | 15,100 | 4,908 |
| Walter Energy, Inc. 11.00% 20201,3,6 | 7,500 | 3,563 |
| Walter Energy, Inc. 8.50% 2021 | 12,800 | 3,968 |
| | | 1,606,833 |
American High-Income Trust — Page 8 of 15
Bonds, notes & other debt instruments
Corporate bonds, notes & loans (continued)
Information technology 6.25% | Principal amount
(000) | Value
(000) |
| Advanced Micro Devices, Inc. 6.75% 2019 | $15,000 | $15,225 |
| Alcatel-Lucent USA Inc. 4.625% 20171 | 59,300 | 60,264 |
| Alcatel-Lucent USA Inc. 6.75% 20201 | 57,183 | 58,470 |
| Alcatel-Lucent USA Inc. 8.875% 20201 | 44,615 | 48,519 |
| Avago Technologies Ltd., Term Loan B, 3.75% 20214,5,6 | 7,968 | 7,906 |
| Ceridian LLC / Comdata Inc. 8.125% 20171 | 44,375 | 44,541 |
| Compucom Systems Inc., 7.00% 20211 | 12,825 | 12,216 |
| Dell, Inc. Term Loan B, 4.50% 20204,5,6 | 30,664 | 30,480 |
| First Data Corp. 7.375% 20191 | 5,000 | 5,269 |
| First Data Corp. 14.50% 20191,3 | 13,566 | 14,279 |
| First Data Corp. 6.75% 20201 | 5,079 | 5,396 |
| First Data Corp. 8.25% 20211 | 42,284 | 45,032 |
| First Data Corp. 11.75% 2021 | 125,353 | 145,723 |
| First Data Corp. 12.625% 2021 | 102,696 | 123,235 |
| First Data Corp. 8.75% 20221,3,6 | 16,963 | 18,066 |
| Freescale Semiconductor, Inc. 10.75% 2020 | 17,830 | 19,836 |
| Freescale Semiconductor, Inc. 5.00% 20211 | 60,000 | 59,250 |
| Freescale Semiconductor, Inc. 6.00% 20221 | 60,155 | 61,208 |
| Freescale Semiconductor, Inc., Term Loan B4, 4.25% 20204,5,6 | 26,249 | 25,883 |
| Global A&T Electronics Ltd. 10.00% 20191 | 21,040 | 19,199 |
| Hughes Satellite Systems Corp. 6.50% 2019 | 6,650 | 7,170 |
| Hughes Satellite Systems Corp. 7.625% 2021 | 11,975 | 13,232 |
| Lawson Software, Inc. 9.375% 2019 | 30,800 | 33,379 |
| NXP BV and NXP Funding LLC 3.50% 20161 | 12,170 | 12,231 |
| NXP BV and NXP Funding LLC 3.75% 20181 | 27,000 | 26,662 |
| Serena Software, Inc. Term Loan B 7.50% 20204,5,6 | 74,600 | 75,004 |
| SRA International, Inc. 11.00% 2019 | 77,912 | 83,366 |
| SRA International, Inc., Term Loan B, 6.50% 20184,5,6 | 123,232 | 123,386 |
| SunGard Data Systems Inc. 7.625% 2020 | 57,250 | 60,112 |
| | | 1,254,539 |
| Financials 5.47% | | |
| Ally Financial Inc. 8.00% 2031 | 33,000 | 41,312 |
| American Tower Corp. 7.00% 2017 | 5,825 | 6,636 |
| American Tower Corp. 7.25% 2019 | 3,700 | 4,419 |
| AXA SA, junior subordinated 6.463% (undated)1,6 | 14,244 | 15,019 |
| Bank of America Corp. junior subordinated 6.25% noncumulative (undated)6 | 10,000 | 9,987 |
| Bank of Ireland 10.0% 2022 | €7,000 | 11,339 |
| Catlin Insurance Ltd., junior subordinated 7.249% (undated)1,6 | $30,275 | 31,335 |
| CIT Group Inc. 4.25% 2017 | 31,500 | 31,894 |
| CIT Group Inc. 5.00% 2017 | 67,470 | 69,325 |
| CIT Group Inc. 5.25% 2018 | 4,275 | 4,414 |
| CIT Group Inc. 3.875% 2019 | 35,355 | 34,825 |
| CIT Group Inc., Series C, 5.50% 20191 | 16,675 | 17,457 |
| Crescent Resources 10.25% 20171 | 117,010 | 127,541 |
| Genworth Financial, Inc., junior subordinated 6.15% 20666 | 17,500 | 15,444 |
| Goldman Sachs Group, Inc., Series L, 5.70% 20496 | 9,630 | 9,817 |
| Hospitality Properties Trust 5.625% 2017 | 2,170 | 2,354 |
| Hospitality Properties Trust 6.70% 2018 | 2,945 | 3,289 |
| Icahn Enterprises Finance Corp. 3.50% 2017 | 58,000 | 57,565 |
| Icahn Enterprises Finance Corp. 6.00% 2020 | 9,650 | 9,964 |
| International Lease Finance Corp. 4.875% 2015 | 38,065 | 38,707 |
| International Lease Finance Corp. 8.625% 2015 | 4,250 | 4,500 |
| iStar Financial Inc. 3.875% 2016 | 4,275 | 4,296 |
American High-Income Trust — Page 9 of 15
Bonds, notes & other debt instruments
Corporate bonds, notes & loans (continued)
Financials (continued) | Principal amount
(000) | Value
(000) |
| iStar Financial Inc. 4.00% 2017 | $44,525 | $43,412 |
| iStar Financial Inc., Series B, 9.00% 2017 | 34,965 | 39,117 |
| iStar Financial Inc. 4.875% 2018 | 37,664 | 36,816 |
| iStar Financial Inc. 5.00% 2019 | 56,550 | 54,712 |
| JPMorgan Chase & Co., Series-V, junior subordinated, perpetual, 5.00% (undated)6 | 30,000 | 29,358 |
| Liberty Mutual Group Inc., Series B, 7.00% 20671,6 | 11,185 | 11,912 |
| Liberty Mutual Group Inc., Series A, 7.80% 20871,6 | 39,908 | 47,141 |
| MetLife Capital Trust IV, junior subordinated 7.875% 20671,6 | 14,950 | 19,211 |
| MetLife Capital Trust X, junior subordinated 9.25% 20681,6 | 12,500 | 18,094 |
| Ocwen Financial Corp. 6.625% 20191 | 17,650 | 17,076 |
| Popular, Inc. 7.00% 2019 | 20,995 | 21,126 |
| QBE Capital Funding III LP 7.25% 20411,6 | 7,650 | 8,350 |
| Realogy Corp. 4.50% 20191 | 101,820 | 98,765 |
| Realogy Corp. 7.625% 20201 | 3,000 | 3,225 |
| Realogy Corp. 9.00% 20201 | 28,785 | 31,592 |
| Realogy Corp., LOC, 4.50% 20164,5,6 | 3,806 | 3,771 |
| Royal Bank of Scotland Group PLC, junior subordinated 6.99% (undated)1,6 | 15,376 | 17,634 |
| Ryman Hospitality Properties, Inc. 5.00% 2021 | 13,600 | 13,328 |
| Springleaf Finance Corp., Series J, 6.90% 2017 | 30,000 | 31,950 |
| | | 1,098,029 |
| Consumer staples 1.31% | | |
| Brasil Foods SA 5.875% 20221 | 8,250 | 8,931 |
| C&S Group Enterprises LLC 5.375% 20221 | 42,500 | 40,481 |
| Constellation Brands, Inc. 8.375% 2014 | 1,650 | 1,672 |
| Constellation Brands, Inc. 7.25% 2017 | 6,500 | 7,243 |
| Constellation Brands, Inc. 3.75% 2021 | 5,650 | 5,558 |
| Constellation Brands, Inc. 6.00% 2022 | 6,975 | 7,638 |
| Constellation Brands, Inc. 4.25% 2023 | 10,350 | 10,130 |
| Del Monte Corp. 7.625% 2019 | 29,821 | 29,635 |
| Ingles Markets, Inc. 5.75% 2023 | 17,925 | 18,059 |
| Pilgrim’s Pride Corp. 7.875% 2018 | 10,000 | 10,500 |
| Post Holdings, Inc. 6.75% 20211 | 8,825 | 8,384 |
| Post Holdings, Inc. 7.375% 2022 | 25,000 | 24,812 |
| Rite Aid Corp. 10.25% 2019 | 9,645 | 10,175 |
| Rite Aid Corp. 8.00% 2020 | 14,000 | 15,050 |
| Smithfield Foods, Inc. 7.75% 2017 | 7,850 | 8,733 |
| Smithfield Foods, Inc. 5.25% 20181 | 2,775 | 2,789 |
| Smithfield Foods, Inc. 5.875% 20211 | 6,475 | 6,572 |
| Smithfield Foods, Inc. 6.625% 2022 | 20,130 | 21,338 |
| Stater Bros. Holdings Inc., Term Loan B, 4.75% 20214,5,6 | 10,000 | 9,988 |
| TreeHouse Foods, Inc. 4.875% 2022 | 15,000 | 14,813 |
| | | 262,501 |
| Utilities 1.17% | | |
| AES Corp. 8.00% 2017 | 4,238 | 4,768 |
| AES Corp. 8.00% 2020 | 18,650 | 21,494 |
| AES Corp. 7.375% 2021 | 2,375 | 2,672 |
| AES Corp. 4.875% 2023 | 7,000 | 6,685 |
| AES Corp. 5.50% 2024 | 13,000 | 12,708 |
| Calpine Corp. 5.375% 2023 | 34,500 | 33,508 |
| Calpine Corp. 7.875% 20231 | 2,000 | 2,195 |
| Emgesa SA ESP 8.75% 2021 | COP10,600,000 | 5,705 |
| Enel Società per Azioni 8.75% 20731,6 | $15,000 | 17,512 |
American High-Income Trust — Page 10 of 15
Bonds, notes & other debt instruments
Corporate bonds, notes & loans (continued)
Utilities (continued) | Principal amount
(000) | Value
(000) |
| Midwest Generation, LLC, Series B, 8.56% 20162,5,8 | $5,241 | $5,372 |
| NRG Energy, Inc. 6.25% 20221 | 25,500 | 26,281 |
| NRG Energy, Inc. 6.625% 2023 | 9,000 | 9,338 |
| Texas Competitive Electric Holdings, Term Loan Strip, 3.75% 20164,5,6 | 11,287 | 11,308 |
| TXU, Term Loan, 3.737% 20142,4,5,6 | 5,802 | 4,326 |
| TXU, Term Loan, 4.65% 20172,4,5,6 | 94,878 | 70,605 |
| | | 234,477 |
| Total corporate bonds, notes & loans | | 17,691,058 |
| Bonds & notes of governments & government agencies outside the U.S. 3.05% | | |
| Argentina (Republic of) 7.00% 2017 | 43,475 | 37,376 |
| Croatian Government 6.75% 20191 | 4,510 | 4,995 |
| Croatian Government 6.375% 20211 | 2,810 | 3,063 |
| Croatian Government 5.50% 20231 | 10,200 | 10,557 |
| Ghana (Republic of) 7.875% 2023 | 32,505 | 32,749 |
| Ghana (Republic of) 8.125% 20261,5 | 4,000 | 4,020 |
| Greek Government 2.00%/3.00% 20237 | €3,110 | 3,136 |
| Greek Government 2.00%/3.00% 20247 | 3,110 | 3,063 |
| Greek Government 2.00%/3.00% 20257 | 3,110 | 2,947 |
| Greek Government 2.00%/3.00% 20267 | 3,110 | 2,846 |
| Greek Government 2.00%/3.00% 20277 | 3,110 | 2,778 |
| Greek Government 2.00%/3.00% 20287 | 3,110 | 2,708 |
| Greek Government 2.00%/3.00% 20297 | 7,000 | 6,005 |
| Greek Government 2.00%/3.00% 20307 | 7,000 | 5,882 |
| Greek Government 2.00%/3.00% 20317 | 7,000 | 5,793 |
| Greek Government 2.00%/3.00% 20327 | 7,000 | 5,699 |
| Greek Government 2.00%/3.00% 20337 | 7,000 | 5,630 |
| Greek Government 2.00%/3.00% 20347 | 7,000 | 5,551 |
| Greek Government 2.00%/3.00% 20357 | 7,000 | 5,517 |
| Greek Government 2.00%/3.00% 20367 | 14,485 | 11,282 |
| Greek Government 2.00%/3.00% 20377 | 18,235 | 14,125 |
| Greek Government 2.00%/3.00% 20387 | 15,435 | 11,858 |
| Greek Government 2.00%/3.00% 20397 | 11,735 | 8,946 |
| Greek Government 2.00%/3.00% 20407 | 16,285 | 12,408 |
| Greek Government 2.00%/3.00% 20417 | 17,985 | 13,715 |
| Greek Government 2.00%/3.00% 20427 | 12,735 | 9,713 |
| Hungarian Government 4.125% 2018 | $10,020 | 10,421 |
| Hungarian Government 6.25% 2020 | 5,800 | 6,474 |
| India (Republic of) 7.28% 2019 | INR5,550,000 | 86,143 |
| Kenya (Rebulic of) 5.875 20191 | $1,985 | 2,047 |
| Kenya (Republic of) 6.875% 20241 | 32,205 | 33,960 |
| Nigeria (Republic of) 6.75% 2021 | 7,840 | 8,595 |
| Nigeria (Republic of) 6.375% 2023 | 8,960 | 9,643 |
| Portuguese Government 3.85% 2021 | €1,650 | 2,279 |
| Portuguese Government 5.125% 20241 | $1,600 | 1,676 |
| Portuguese Government 5.65% 2024 | €53,935 | 81,958 |
| Republic of Senegal 6.25% 20241 | $13,675 | 13,709 |
| Serbia (Republic of) 4.875% 2020 | 3,195 | 3,191 |
| Slovenia (Republic of) 5.50% 20221 | 14,600 | 15,914 |
| Slovenia (Republic of) 5.85% 20231 | 11,135 | 12,443 |
| South Africa (Republic of), Series R-2023, 7.75% 2023 | ZAR165,125 | 14,313 |
| United Mexican States Government, Series M20, 10.00% 2024 | MXN180,000 | 17,339 |
American High-Income Trust — Page 11 of 15
Bonds, notes & other debt instruments
Bonds & notes of governments & government agencies outside the U.S. (continued) | Principal amount
(000) | Value
(000) |
| Zambia (Republic of) 5.375% 2022 | $31,295 | $29,887 |
| Zambia (Republic of) 8.50% 2024 | 26,405 | 30,052 |
| | | 612,406 |
U.S. Treasury bonds & notes 0.65%
U.S. Treasury 0.65% | | |
| U.S. Treasury 0.25% 2015 | 21,900 | 21,918 |
| U.S. Treasury 4.00% 2015 | 42,300 | 42,924 |
| U.S. Treasury 6.25% 202310 | 50,000 | 65,489 |
| Total U.S. Treasury bonds & notes | | 130,331 |
| Municipals 0.32% | | |
State of New Jersey, Econ. Dev. Auth., Energy Fac. Rev. Bonds (ACR Energy Partners, LLC Project),
Series 2011-B, 12.00% 20301,2 | 12,385 | 6,819 |
| State of Ohio, Buckeye Tobacco Settlement Fncg. Auth., Tobacco Settlement Asset-backed Bonds, Current Interest Bonds, Series 2007-A-2, 5.875% 2047 | 10,000 | 7,859 |
| State of Ohio, Buckeye Tobacco Settlement Fncg. Auth., Tobacco Settlement Asset-backed Bonds, Current Interest Bonds, Series 2007-A-2, 6.50% 2047 | 10,000 | 8,500 |
| Puerto Rico Aqueduct and Sewer Auth., Rev. Ref. Bonds, Series 2012-A, 5.25% 2042 | 9,980 | 7,123 |
| Puerto Rico Public Improvement Ref. Bonds (G.O. Bonds), Series 2014-A, 8.00% 2035 | 38,250 | 33,724 |
| | | 64,025 |
| Total bonds, notes & other debt instruments (cost: $18,680,053,000) | | 18,497,820 |
Convertible bonds 0.96%
Financials 0.47% | | |
| Bank of Ireland 10.00% convertible notes 2016 | €17,805 | 24,244 |
| HSBC Holdings PLC 6.375% convertible notes 20496 | $4,822 | 4,822 |
| Lloyds Banking Group PLC 7.50% convertible notes 20496 | 41,859 | 43,220 |
| Banco Bilbao Vizcaya Argentaria, SA 9.00% convertible notes 20496 | 20,200 | 21,513 |
| | | 93,799 |
| Energy 0.25% | | |
| American Energy Utica, LLC 3.50% convertible notes 20211,3,6 | 43,726 | 50,941 |
| Information technology 0.14% | | |
| Liberty Media Corp. 3.50% convertible notes 2031 | 48,500 | 27,224 |
| Materials 0.06% | | |
| Mirabela Nickel Ltd. 9.50% convertible notes 20191,3,8 | 10,975 | 10,975 |
| Telecommunication services 0.04% | | |
| Clearwire Corp. 8.25% convertible notes 20401 | 7,722 | 8,658 |
| Total convertible bonds (cost: $167,950,000) | | 191,597 |
American High-Income Trust — Page 12 of 15
Convertible stocks 1.39%
Industrials 0.48% | Shares | Value
(000) |
| CEVA Group PLC, Series A-1, 3.23% convertible preferred8 | 47,121 | $73,038 |
| CEVA Group PLC, Series A-2, 2.23% convertible preferred8,11 | 21,063 | 23,169 |
| | | 96,207 |
| Utilities 0.35% | | |
| Exelon Corp., convertible preferred, units | 909,000 | 46,177 |
| Dominion Resources, Inc., convertible preferred, Series A, units | 500,000 | 24,950 |
| | | 71,127 |
| Financials 0.32% | | |
| Weyerhaeuser Co., Series A, 6.375% convertible preferred | 1,000,000 | 54,030 |
| American Tower Corp., Series A, convertible preferred | 100,000 | 10,850 |
| | | 64,880 |
| Energy 0.24% | | |
| Chesapeake Energy Corporation 5.75% convertible preferred1 | 33,000 | 37,248 |
| Chesapeake Energy Corporation 5.75% convertible preferred | 9,000 | 10,159 |
| | | 47,407 |
| Total convertible stocks (cost: $248,907,000) | | 279,621 |
Preferred securities 0.51%
Financials 0.51% | | |
| Ally Financial Inc., Series G, 7.00%1 | 21,250 | 21,376 |
| Ally Financial Inc., Series 2, 8.125% preferred | 650,000 | 17,296 |
| Morgan Stanley, Series I, depositary shares | 816,000 | 20,457 |
| Citigroup Inc., Series K, depositary shares | 506,675 | 13,346 |
| First Republic Bank, Series A, noncumulative convertible preferred | 400,000 | 10,184 |
| Swire Pacific Ltd. 8.84% cumulative guaranteed perpetual capital securities1 | 365,000 | 10,015 |
| Goldman Sachs Group, Inc., Series J, 5.50% depositary shares | 400,000 | 9,500 |
| Total preferred securities (cost: $89,535,000) | | 102,174 |
Common stocks 1.50%
Consumer discretionary 0.55% | | |
| Cooper-Standard Holdings Inc.9,12 | 1,663,543 | 103,805 |
| Ford Motor Co. | 410,210 | 6,067 |
| Adelphia Recovery Trust, Series ACC-18,12 | 10,643,283 | 23 |
| Adelphia Recovery Trust, Series Arahova8,12 | 1,773,964 | 22 |
| Five Star Travel Corp.1,8,12 | 83,780 | 18 |
| Revel AC, Inc. (CVR)8,9,11,12 | 43,088,200 | — |
| Revel AC, Inc.8,9,11,12 | 908,183 | — |
| | | 109,935 |
| Industrials 0.38% | | |
| CEVA Group PLC1,8,12 | 59,168 | 65,085 |
| Delta Air Lines, Inc. | 299,769 | 10,837 |
| United Continental Holdings, Inc.12 | 22,981 | 1,075 |
| Quad/Graphics, Inc., Class A | 9,252 | 178 |
| Atrium Corp.1,8,12 | 10,987 | 11 |
| | | 77,186 |
American High-Income Trust — Page 13 of 15
Common stocks
Financials 0.33% | Shares | Value
(000) |
| American Tower Corp. | 538,967 | $50,463 |
| Citigroup Inc. | 205,574 | 10,653 |
| EME Reorganization Trust | 41,998,595 | 5,779 |
| | | 66,895 |
| Health care 0.11% | | |
| Rotech Healthcare Inc.8,9,12 | 1,916,276 | 21,654 |
| Materials 0.11% | | |
| NewPage Holdings Inc.8,11 | 206,200 | 19,054 |
| Mirabela Nickel Ltd.12 | 34,668,323 | 2,003 |
| | | 21,057 |
| Utilities 0.02% | | |
| NRG Energy, Inc. | 138,105 | 4,210 |
| Energy 0.00% | | |
| General Maritime Corp.1,8,12 | 12,599 | 438 |
| Petroplus Holdings AG8,12 | 3,360,000 | — |
| | | 438 |
| Total common stocks (cost: $304,412,000) | | 301,375 |
Rights & warrants 0.01%
Consumer discretionary 0.01% | | |
| Cooper-Standard Holdings Inc., warrants, expire 20179,12 | 48,411 | 1,759 |
| Liberman Broadcasting, Inc., warrants, expire 20228,11,12 | 10 | — |
| | | 1,759 |
| Energy 0.00% | | |
| General Maritime Corp., warrants, expire 20171,8,12 | 19,483 | 88 |
| Total rights & warrants (cost: $5,447,000) | | 1,847 |
| Short-term securities 2.49% | Principal amount
(000) | |
| Apple Inc. 0.13% due 1/14/20151 | $ 50,000 | 49,973 |
| Coca-Cola Co. 0.11% due 10/20/20141 | 15,000 | 15,000 |
| E.I. duPont de Nemours and Co. 0.09% due 10/7/20141 | 16,000 | 16,000 |
| Fannie Mae 0.07% due 1/5/2015 | 21,400 | 21,399 |
| Federal Home Loan Bank 0.09%—0.10% due 1/30/2015—2/25/2015 | 60,400 | 60,391 |
| Freddie Mac 0.09%—0.11% due 2/3/2015—3/19/2015 | 159,200 | 159,174 |
| General Electric Capital Corp. 0.13%—0.17% due 12/4/2014—12/23/2014 | 71,500 | 71,488 |
| IBM Corp. 0.07% due 10/3/20141 | 16,800 | 16,800 |
| John Deere Financial Ltd. 0.09% due 10/15/20141 | 38,800 | 38,799 |
| National Rural Utilities Cooperative Finance Corp. 0.09% due 10/8/2014 | 26,900 | 26,899 |
| Procter & Gamble Co. 0.12% due 12/16/2014—1/8/20151 | 24,000 | 23,995 |
| Total short-term securities (cost: $499,860,000) | | 499,918 |
| Total investment securities 99.04% (cost: $19,996,164,000) | | 19,874,352 |
| Other assets less liabilities 0.96% | | 191,726 |
| Net assets 100.00% | | $20,066,078 |
American High-Income Trust — Page 14 of 15
| 1 | Acquired in a transaction exempt from registration under Rule 144A or Section 4(2) of the Securities Act of 1933. May be resold in the U.S. in transactions exempt from registration, normally to qualified institutional buyers. The total value of all such securities was $8,211,270,000, which represented 40.92% of the net assets of the fund. |
| 2 | Scheduled interest and/or principal payment was not received. |
| 3 | Payment in kind; the issuer has the option of paying additional securities in lieu of cash. |
| 4 | Loan participations and assignments; may be subject to legal or contractual restrictions on resale. The total value of all such loans was $1,765,216,000, which represented 8.80% of the net assets of the fund. |
| 5 | Principal payments may be made periodically. Therefore, the effective maturity date may be earlier than the stated maturity date. |
| 6 | Coupon rate may change periodically. |
| 7 | Step bond; coupon rate will increase at a later date. |
| 8 | Valued under fair value procedures adopted by authority of the board of trustees. The total value of all such securities was $245,733,000, which represented 1.22% of the net assets of the fund. |
| 9 | Represents an affiliated company as defined under the Investment Company Act of 1940. |
| 10 | A portion of this security was pledged as collateral. The total value of pledged collateral was $4,875,000, which represented .02% of the net assets of the fund. |
| 11 | Acquired through a private placement transaction exempt from registration under the Securities Act of 1933. May be subject to legal or contractual restrictions on resale. Further details on these holdings appear below. |
| 12 | Security did not produce income during the last 12 months. |
| Private placement securities | Acquisition
date(s) | Cost
(000) | Value
(000) | Percent
of net
assets |
| CEVA Group PLC, Series A-2, 2.23% convertible preferred | 5/2/2013 | $20,349 | $23,169 | .12% |
| NewPage Holdings Inc. | 8/1/2011-1/9/2012 | 32,075 | 19,054 | .09 |
| Revel AC, Inc. (CVR) | 2/15/2011-3/15/2013 | 7,796 | - | .00 |
| Liberman Broadcasting, Inc., warrants, expire 2022 | 12/13/2012 | - | - | .00 |
| Revel AC, Inc. | 2/14/2011-1/10/2012 | 45,288 | - | .00 |
| Total private placement securities | | $ 105,508 | $ 42,223 | .21% |
| Key to abbreviations and symbol |
| Auth. = Authority |
| CVR = Contingent Value Rights |
| Dev. = Development |
| Econ. = Economic |
| Fac. = Facility |
| Fncg. = Financing |
| G.O. = General Obligation |
| LOC = Letter of Credit |
| Ref. = Refunding |
| Rev. = Revenue |
| COP = Colombian pesos |
| € = Euros |
| INR = Indian rupees |
| MXN = Mexican pesos |
| ZAR = South African rand |
Investments are not FDIC-insured, nor are they deposits of or guaranteed by a bank or any other entity, so they may lose value.
Investors should carefully consider investment objectives, risks, charges and expenses. This and other important information is contained in the fund prospectus and summary prospectus, which can be obtained from your financial professional and should be read carefully before investing. You may also call American Funds Service Company (AFS) at (800) 421-4225 or visit the American Funds website at americanfunds.com.
| MFGEFPX-021-1114O-S42229 | American High-Income Trust — Page 15 of 15 |
REPORT OF INDEPENDENT REGISTERED PUBLIC ACCOUNTING FIRM
To the Shareholders and Board of Trustees of
American High-Income Trust:
We have audited the accompanying statement of assets and liabilities of American High-Income Trust (the “Fund”), including the summary schedule of investments, as of September 30, 2014, and the related statements of operations for the year then ended, the statements of changes in net assets for each of the two years in the period then ended (collectively, the “financial statements”), the financial highlights for each of the five years in the period then ended (the financial statements and financial highlights are included in Item 1 of this Form N-CSR), and the schedule of investments in securities as of September 30, 2014 (included in Item 6 of this Form N-CSR). These financial statements, financial highlights, and schedule of investments in securities are the responsibility of the Fund’s management. Our responsibility is to express an opinion on these financial statements, financial highlights, and schedule of investments in securities based on our audits.
We conducted our audits in accordance with the standards of the Public Company Accounting Oversight Board (United States). Those standards require that we plan and perform the audit to obtain reasonable assurance about whether the financial statements, financial highlights, and schedule of investments in securities are free of material misstatement. An audit includes examining, on a test basis, evidence supporting the amounts and disclosures in the financial statements and schedule of investments in securities. Our procedures included confirmation of securities owned as of September 30, 2014, by correspondence with the custodian and brokers; where replies were not received from brokers, we performed other auditing procedures. An audit also includes assessing the accounting principles used and significant estimates made by management, as well as evaluating the overall financial statement presentation. We believe that our audits provide a reasonable basis for our opinion.
In our opinion, the financial statements, financial highlights, and schedule of investments in securities referred to above present fairly, in all material respects, the financial position of American High-Income Trust as of September 30, 2014, and the results of its operations for the year then ended, the changes in its net assets for each of the two years in the period then ended, and the financial highlights for each of the five years in the period then ended, in conformity with accounting principles generally accepted in the United States of America.
DELOITTE & TOUCHE LLP
Costa Mesa, California
November 12, 2014
ITEM 7 – Disclosure of Proxy Voting Policies and Procedures for Closed-End Management Investment Companies
Not applicable to this Registrant, insofar as the Registrant is not a closed-end management investment company.
ITEM 8 – Portfolio Managers of Closed-End Management Investment Companies
Not applicable to this Registrant, insofar as the Registrant is not a closed-end management investment company.
ITEM 9 – Purchases of Equity Securities by Closed-End Management Investment Company and Affiliated Purchasers
Not applicable to this Registrant, insofar as the Registrant is not a closed-end management investment company.
ITEM 10 – Submission of Matters to a Vote of Security Holders
There have been no material changes to the procedures by which shareholders may recommend nominees to the Registrant’s board of trustees since the Registrant last submitted a proxy statement to its shareholders. The procedures are as follows. The Registrant has a nominating and governance committee comprised solely of persons who are not considered ‘‘interested persons’’ of the Registrant within the meaning of the Investment Company Act of 1940, as amended. The committee periodically reviews such issues as the board’s composition, responsibilities, committees, compensation and other relevant issues, and recommends any appropriate changes to the full board of trustees. While the committee normally is able to identify from its own resources an ample number of qualified candidates, it will consider shareholder suggestions of persons to be considered as nominees to fill future vacancies on the board. Such suggestions must be sent in writing to the nominating and governance committee of the Registrant, c/o the Registrant’s Secretary, and must be accompanied by complete biographical and occupational data on the prospective nominee, along with a written consent of the prospective nominee for consideration of his or her name by the nominating and governance committee.
ITEM 11 – Controls and Procedures
| (a) | The Registrant’s Principal Executive Officer and Principal Financial Officer have concluded, based on their evaluation of the Registrant’s disclosure controls and procedures (as such term is defined in Rule 30a-3 under the Investment Company Act of 1940), that such controls and procedures are adequate and reasonably designed to achieve the purposes described in paragraph (c) of such rule. |
| | |
| (b) | There were no changes in the Registrant’s internal controls over financial reporting (as defined in Rule 30a-3(d) under the Investment Company Act of 1940) that occurred during the Registrant’s second fiscal quarter of the period covered by this report that has materially affected, or is reasonably likely to materially affect, the Registrant’s internal control over financial reporting. |
ITEM 12 – Exhibits
| (a)(1) | The Code of Ethics that is the subject of the disclosure required by Item 2 is attached as an exhibit hereto. |
| | |
| (a)(2) | The certifications required by Rule 30a-2 of the Investment Company Act of 1940 and Sections 302 and 906 of the Sarbanes-Oxley Act of 2002 are attached as exhibits hereto. |
SIGNATURES
Pursuant to the requirements of the Securities Exchange Act of 1934 and the Investment Company Act of 1940, the Registrant has duly caused this report to be signed on its behalf by the undersigned, thereunto duly authorized.
| | AMERICAN HIGH-INCOME TRUST |
| | |
| | By /s/ David C. Barclay |
| | David C. Barclay, President and Principal Executive Officer |
| | |
| | Date: November 28, 2014 |
Pursuant to the requirements of the Securities Exchange Act of 1934 and the Investment Company Act of 1940, this report has been signed below by the following persons on behalf of the Registrant and in the capacities and on the dates indicated.
| By /s/ David C. Barclay |
David C. Barclay, President and Principal Executive Officer |
| |
| Date: November 28, 2014 |
| By /s/ Karl C. Grauman |
Karl C. Grauman, Treasurer and Principal Financial Officer |
| |
| Date: November 28, 2014 |
