UNITED STATES
SECURITIES AND EXCHANGE COMMISSION
WASHINGTON, D.C. 20549
FORM N-CSR
CERTIFIED SHAREHOLDER REPORT OF REGISTERED
MANAGEMENT INVESTMENT COMPANIES
Investment Company Act file number: 811-05398
ALLIANCEBERNSTEIN VARIABLE PRODUCTS SERIES FUND, INC.
(Exact name of registrant as specified in charter)
1345 Avenue of the Americas, New York, New York 10105
(Address of principal executive offices) (Zip code)
Joseph J. Mantineo
AllianceBernstein L.P.
1345 Avenue of the Americas
New York, New York 10105
(Name and address of agent for service)
Registrant’s telephone number, including area code: (800) 221-5672
Date of fiscal year end: December 31, 2013
Date of reporting period: December 31, 2013
ITEM 1. REPORTS TO STOCKHOLDERS.
AllianceBernstein
Variable Products Series Fund, Inc.
 | AllianceBernstein Balanced Wealth Strategy Portfolio |
December 31, 2013
Annual Report

ANNUAL REPORT
Investment Products Offered
| Ø | Are Not FDIC Insured |
| Ø | May Lose Value |
| Ø | Are Not Bank Guaranteed |
AllianceBernstein Investments, Inc. (ABI) is the distributor of the AllianceBernstein family of mutual funds. ABI is a member of FINRA and is an affiliate of AllianceBernstein L.P., the manager of the funds.
You may obtain a description of the Fund’s proxy voting policies and procedures, and information regarding how the Fund voted proxies relating to portfolio securities during the most recent 12-month period ended June 30, without charge. Simply visit AllianceBernstein’s website at www.alliancebernstein.com or go to the Securities and Exchange Commission’s (the “Commission”) website at www.sec.gov, or call AllianceBernstein at (800) 227-4618.
The Fund files its complete schedule of portfolio holdings with the Commission for the first and third quarters of each fiscal year on Form N-Q. The Fund’s Forms N-Q are available on the Commission’s website at www.sec.gov. The Fund’s Forms N-Q may also be reviewed and copied at the Commission’s Public Reference Room in Washington, DC; information on the operation of the Public Reference Room may be obtained by calling (800) SEC-0330.
AllianceBernstein® and the AB Logo are registered trademarks and service marks used by permission of the owner, AllianceBernstein L.P.
| BALANCED WEALTH STRATEGY | ||
| PORTFOLIO | AllianceBernstein Variable Products Series Fund |
LETTER TO INVESTORS
February 7, 2014
The following is an update of AllianceBernstein Variable Products Series Fund—AllianceBernstein Balanced Wealth Strategy Portfolio (the “Portfolio”) for the annual reporting period ended December 31, 2013.
INVESTMENT OBJECTIVE AND POLICIES
The Portfolio’s investment objective is to maximize total return consistent with the determination of reasonable risk as determined by AllianceBernstein L.P. (the “Adviser”). The Portfolio invests in a portfolio of equity and debt securities that is designed as a solution for investors who seek a moderate tilt toward equity returns but also want the risk diversification offered by debt securities and the broad diversification of their equity risk across styles, capitalization ranges and geographic regions. The Portfolio targets a weighting of 60% equity securities and 40% debt securities with a goal of providing moderate upside potential without excessive volatility. In managing the Portfolio, the Adviser efficiently diversifies between the debt and equity components to produce the desired risk/return profile. Investments in real estate investment trusts, or REITs, are deemed to be 50% equity and 50% fixed-income for purposes of the overall target blend of the Portfolio.
The Portfolio’s equity component is diversified between growth and value equity investment styles, and between U.S. and non-U.S. markets. The Adviser’s targeted blend for the non-REIT portion of the Portfolio’s equity component is an equal weighting of growth and value stocks (50% each). In addition to blending growth and value styles, the Adviser blends each style-based portion of the Portfolio’s equity component across U.S. and non-U.S. issuers and various capitalization ranges. Within each of the value and growth portions of the Portfolio, the Adviser normally targets a blend of approximately 70% in equities of U.S. companies and the remaining 30% in equities of companies outside the United States. The Adviser will allow the relative weightings of the Portfolio’s investments in equity and debt, growth and value, and U.S. and non-U.S. components to vary in response to market conditions, but ordinarily, only by ±5% of the Portfolio’s net assets. Beyond those ranges, the Adviser will rebalance the Portfolio toward the targeted blend. However, under extraordinary circumstances, such as when market conditions favoring one investment style are compelling, the range may expand to ±10% of the Portfolio’s net assets. The Portfolio’s targeted blend may change from time to time without notice to shareholders based on the Adviser’s assessment of underlying market conditions.
The Portfolio’s debt securities will primarily be investment-grade debt securities, but are expected to include lower-rated securities (“junk bonds”) and preferred stock. The Portfolio will not invest more than 25% of its total assets in securities rated, at the time of purchase, below investment grade.
The Portfolio also may enter into forward commitments, make short sales of securities or maintain a short position and invest in rights or warrants.
Currencies can have a dramatic impact on equity returns, significantly adding to returns in some years and greatly diminishing them in others. Currency and equity positions are evaluated separately. The Adviser may seek to hedge the currency exposure resulting from securities positions when it finds the currency exposure unattractive. To hedge all or a portion of its currency risk, the Portfolio may, from time to time, invest in currency-related derivatives, including forward currency exchange contracts, futures, options on futures, swaps and options. The Adviser may also seek investment opportunities by taking long or short positions in currencies through the use of currency-related derivatives. The Portfolio may enter into other derivatives transactions, such as options, futures contracts, forwards and swaps.
INVESTMENT RESULTS
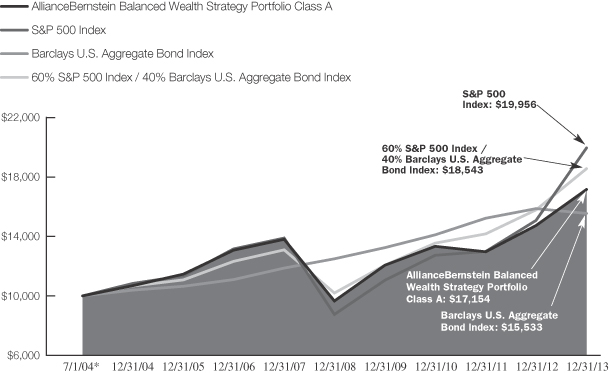
The table on page 5 shows the Portfolio’s performance compared to its primary benchmark, the Standard & Poor’s (“S&P”) 500 Index and its secondary benchmark, the Barclays U.S. Aggregate Bond Index and its blended benchmark, the 60% / 40% blend of the S&P 500 Index and the Barclays U.S. Aggregate Bond Index, respectively, for the one- and five-year periods ended December 31, 2013 and since the Portfolio’s inception on July 1, 2004.
For the annual period, all share classes of the Portfolio underperformed the primary and blended benchmarks, and outperformed the secondary benchmark. The Portfolio’s U.S. growth holdings detracted, while the U.S. and non-U.S. value holdings, as well as the non-U.S. growth holdings contributed. Fixed-income holdings contributed to relative performance as did REIT holdings.
The Portfolio used derivatives, including futures, currencies, credit default swaps and interest rate swaps, for hedging purposes, which had no material impact on performance.
MARKET REVIEW AND INVESTMENT STRATEGY
2013 was marked as a year of intense speculation that kept financial markets on edge. At the end of the year, the U.S. Federal Reserve (the “Fed”) took its first steps toward ending a key component of its stimulus campaign. Amid data suggesting that the U.S. economy was gaining momentum, the Fed announced that it would gradually
1
| AllianceBernstein Variable Products Series Fund |
wind down its massive bond-purchasing program by late 2014. At the same time, it strengthened its commitment to keeping short-term interest rates near zero until late 2015. Markets reacted positively to news of this shift in monetary policy, as investors were enthusiastic about the gradual pace of the changes and relieved that a major source of uncertainty had been removed.
Heading into 2014, the Multi-Asset Solution Team (the “Team”) remains bullish on developed-market equities, although regional and sector performance may vary significantly. The current rally in the global equity markets has been underpinned by excess liquidity in the financial system that has kept borrowing costs down and encouraged risk-taking. With the monetary policy environment beginning to normalize as a result of the Fed’s decision to scale back its stimulus campaign, the Team believes a transition has begun toward a phase where fundamentals are the primary determinant of valuations. Thus, in the Team’s view, companies will need to substantially grow their earnings to sustain their current valuations and continue their strong stock price performance.
2
| BALANCED WEALTH STRATEGY PORTFOLIO | ||
| DISCLOSURESAND RISKS | AllianceBernstein Variable Products Series Fund | |
Benchmark Disclosure
The unmanaged S&P® 500 Index and the unmanaged Barclays U.S. Aggregate Bond Index do not reflect fees and expenses associated with the active management of a mutual fund portfolio. The S&P 500 Index includes 500 U.S. stocks and is a common representation of the performance of the overall U.S. stock market. The Barclays U.S. Aggregate Bond Index represents the performance of securities within the U.S. investment grade fixed rate bond market, with index components for government and corporate securities, mortgage pass-through securities, asset-backed securities, and commercial mortgage backed securities. An investor cannot invest directly in an index, and its results are not indicative of the performance for any specific investment, including the Portfolio.
A Word About Risk
Market Risk: The value of the Portfolio’s assets will fluctuate as the stock or bond market fluctuates. The value of its investments may decline, sometimes rapidly and unpredictably, simply because of economic changes or other events that affect large portions of the market.
Interest Rate Risk: Changes in interest rates will affect the value of investments in fixed-income securities. When interest rates-rise, the value of investments in fixed-income securities tends to fall and this decrease in value may not be offset by higher income from new investments. Interest rate risk is generally greater for fixed-income securities with longer maturities or durations.
Credit Risk: An issuer or guarantor of a fixed-income security, or the counterparty to a derivatives or other contract, may be unable or unwilling to make timely payments of interest or principal, or to otherwise honor its obligations. The issuer or guarantor may default, causing a loss of the full principal amount of a security. The degree of risk for a particular security may be reflected in its credit rating. There is the possibility that the credit rating of a fixed-income security may be downgraded after purchase, which may adversely affect the value of the security.
Below Investment Grade Security Risk: Investments in fixed-income securities with lower ratings (“junk bonds”) tend to have a higher probability that an issuer will default or fail to meet its payment obligations. These securities may be subject to greater price volatility due to such factors as specific corporate developments, interest rate sensitivity, negative perceptions of the junk bond market generally and less secondary market liquidity.
Foreign (Non-U.S.) Risk: Investments in securities of non-U.S. issuers may involve more risk than those of U.S. issuers. These securities may fluctuate more widely in price and may be less liquid due to adverse market, economic, political, regulatory or other factors.
Currency Risk: Fluctuations in currency exchange rates may negatively affect the value of the Portfolio’s investments or reduce its returns.
Allocation Risk: The allocation of investments among the different investment styles, such as growth or value, equity or debt securities, or U.S. or non-U.S. securities may have a more significant effect on the Portfolio’s net asset value, or NAV, when one of these investment strategies is performing more poorly than others.
Capitalization Risk: Investments in small- and mid-capitalization companies may be more volatile than investments in large-capitalization companies. Investments in small-capitalization companies may have additional risks because these companies have limited product lines, markets or financial resources.
Derivatives Risk: Derivatives may be illiquid, difficult to price, and leveraged so that small changes may produce disproportionate losses for the Portfolio, and may be subject to counterparty risk to a greater degree than more traditional investments.
Real Estate Risk: The Portfolio’s investments in the real estate market have many of the same risks as direct ownership of real estate, including the risk that the value of real estate could decline due to a variety of factors that affect the real estate market generally. Investments in REITs may have additional risks. REITs are dependent on the capability of their managers, may have limited diversification, and could be significantly affected by changes in tax laws.
Management Risk: The Portfolio is subject to management risk because it is an actively managed investment fund. The Adviser will apply its investment techniques and risk analyses in making investment decisions for the Portfolio, but there is no guarantee that its techniques will produce the intended results.
These risks are fully discussed in the Variable Products prospectus.
(Disclosures, Risks and Note about Historical Performance continued on next page)
3
| BALANCED WEALTH STRATEGY PORTFOLIO | ||
| DISCLOSURESAND RISKS | ||
| (continued from previous page) | AllianceBernstein Variable Products Series Fund | |
An Important Note About Historical Performance
The investment return and principal value of an investment in the Portfolio will fluctuate, so that shares, when redeemed, may be worth more or less than their original cost. Performance shown on the following page represents past performance and does not guarantee future results. Current performance may be lower or higher than the performance information shown. Please contact your Financial Advisor or Insurance Agent Representative at your financial institution to obtain portfolio performance information current to the most recent month end.
Investors should consider the investment objectives, risks, charges and expenses of the Portfolio carefully before investing. For additional copies of the Portfolio’s prospectus or summary prospectus, which contains this and other information, call your financial advisor or 800.984.7654. Please read the prospectus and/or summary prospectus carefully before investing.
All fees and expenses related to the operation of the Portfolio have been deducted, but no adjustment has been made for insurance company separate account or annuity contract charges, which would reduce total return to a contract owner. Performance assumes reinvestment of distributions and does not account for taxes.
There are additional fees and expenses associated with all Variable Products. These fees can include mortality and expense risk charges, administrative charges, and other charges that can significantly reduce investment returns. Those fees and expenses are not reflected in this annual report. You should consult your Variable Products prospectus for a description of those fees and expenses and speak to your insurance agent or financial representative if you have any questions. You should read the prospectus before investing or sending money.
4
| BALANCED WEALTH STRATEGY PORTFOLIO | ||
| HISTORICAL PERFORMANCE | AllianceBernstein Variable Products Series Fund | |
| THE PORTFOLIO VS. ITS BENCHMARKS | NAV Returns | |||||||||||
| PERIODS ENDED DECEMBER 31, 2013 (unaudited) | 1 Year | 5 Years* | Since Inception* | |||||||||
AllianceBernstein Balanced Wealth Strategy Portfolio Class A | 16.49% | 12.19% | 5.84% | |||||||||
AllianceBernstein Balanced Wealth Strategy Portfolio Class B | 16.27% | 11.90% | 5.57% | |||||||||
Primary Benchmark: S&P 500 Index | 32.39% | 17.94% | 7.54% | |||||||||
Secondary Benchmark: Barclays U.S. Aggregate Bond Index | -2.02% | 4.44% | 4.74% | |||||||||
Blended Benchmark: 60% S&P 500 Index / 40% Barclays U.S. Aggregate Bond Index | 17.56% | 12.71% | 6.71% | |||||||||
* Average annual returns. The Portfolio’s inception date is 7/1/04.
Please keep in mind that high, double-digit returns are highly unusual and cannot be sustained. Investors should also be aware that these returns were primarily achieved during favorable market conditions. |
| |||||||||||
The Portfolio’s current prospectus fee table shows the Portfolio’s total annual operating expense ratios as 0.65% and 0.90% for Class A and Class B, respectively, gross of any fee waivers or expense reimbursements. These waivers/ reimbursements extend through the Portfolio’s current fiscal year and may be extended by the Adviser for additional one-year terms. Absent reimbursements or waivers, performance would have been lower.
ALLIANCEBERNSTEIN BALANCED WEALTH STRATEGY PORTFOLIO CLASS A
GROWTH OF A $10,000 INVESTMENT
7/1/04* – 12/31/13 (unaudited)
| * | Since inception of the Portfolio’s Class A shares on 7/1/2004. |
This chart illustrates the total value of an assumed $10,000 investment in AllianceBernstein Balanced Wealth Strategy Portfolio Class A shares (from 7/1/04* to 12/31/13) as compared to the performance of the Portfolio’s primary, secondary and blended benchmarks. The chart assumes the reinvestment of dividends and capital gains distributions.
See Disclosures, Risks and Note about Historical Performance on pages 3-4.
5
| BALANCED WEALTH STRATEGY PORTFOLIO | ||
| EXPENSE EXAMPLE (unaudited) | AllianceBernstein Variable Products Series Fund | |
As a shareholder of the Fund, you incur two types of costs: (1) transaction costs, including sales charges (loads) on purchase payments, contingent deferred sales charges on redemptions and (2) ongoing costs, including management fees; distribution (12b-1) fees; and other Fund expenses. This example is intended to help you understand your ongoing costs (in dollars) of investing in the Fund and to compare these costs with the ongoing costs of investing in other mutual funds.
The Example is based on an investment of $1,000 invested at the beginning of the period and held for the entire period as indicated below.
Actual Expenses
The table below provides information about actual account values and actual expenses. You may use the information in this line, together with the amount you invested, to estimate the expenses that you paid over the period. Simply divide your account value by $1,000 (for example, an $8,600 account value divided by $1,000 = 8.6), then multiply the result by the number in the first line under the heading entitled “Expenses Paid During Period” to estimate the expenses you paid on your account during this period. The estimate of expenses does not include fees or other expenses of any variable insurance product. If such expenses were included, the estimate of expenses you paid during the period would be higher and your ending account value would be lower.
Hypothetical Example for Comparison Purposes
The table below provides information about hypothetical account values and hypothetical expenses based on the Fund’s actual expense ratio and an assumed annual rate of return of 5% before expenses, which is not the Fund’s actual return. The hypothetical account values and expenses may not be used to estimate the actual ending account balance or expenses you paid for the period. You may use this information to compare the ongoing costs of investing in the Fund and other funds by comparing this 5% hypothetical example with the 5% hypothetical examples that appear in the shareholder reports of other funds. The estimate of expenses does not include fees or other expenses of any variable insurance product. If such expenses were included, the estimate of expenses you paid during the period would be higher and your ending account value would be lower.
Please note that the expenses shown in the table are meant to highlight your ongoing costs only and do not reflect any transactional costs, such as sales charges (loads), or contingent deferred sales charges on redemptions. Therefore, the second line of each class’ table is useful in comparing ongoing costs only, and will not help you determine the relative total costs of owning different funds. In addition, if these transactional costs were included, your costs would have been higher.
| Beginning Account Value July 1, 2013 | Ending Account Value December 31, 2013 | Expenses Paid During Period* | Annualized Expense Ratio* | |||||||||||||
Class A | ||||||||||||||||
Actual | $ | 1,000 | $ | 1,106.50 | $ | 3.50 | 0.66 | % | ||||||||
Hypothetical (5% annual return before expenses) | $ | 1,000 | $ | 1,021.88 | $ | 3.36 | 0.66 | % | ||||||||
Class B | ||||||||||||||||
Actual | $ | 1,000 | $ | 1,105.70 | $ | 4.78 | 0.90 | % | ||||||||
Hypothetical (5% annual return before expenses) | $ | 1,000 | $ | 1,020.67 | $ | 4.58 | 0.90 | % | ||||||||
| * | Expenses are equal to each classes’ annualized expense ratios, multiplied by the average account value over the period, multiplied by 184/365 (to reflect the one-half year period). |
6
| BALANCED WEALTH STRATEGY PORTFOLIO | ||
| TEN LARGEST HOLDINGS* | ||
| December 31, 2013 (unaudited) | AllianceBernstein Variable Products Series Fund | |
| COMPANY | U.S. $ VALUE | PERCENT OF NET ASSETS | ||||||
Federal National Mortgage Association | $ | 28,869,784 | 7.3 | % | ||||
U.S. Treasury Bonds & Notes | 16,310,433 | 4.2 | ||||||
U.S. Treasury Inflation Index | 3,857,094 | 1.0 | ||||||
Apple, Inc. | 3,518,160 | 0.9 | ||||||
Google, Inc.—Class A | 3,451,787 | 0.9 | ||||||
Cognizant Technology Solutions Corp.—Class A | 3,445,438 | 0.9 | ||||||
Federal Home Loan Mortgage Corp. Gold | 3,395,291 | 0.9 | ||||||
Pfizer, Inc. | 2,903,724 | 0.7 | ||||||
JP Morgan Chase Commercial Mortgage Securities Trust | 2,871,219 | 0.7 | ||||||
Visa, Inc.—Class A | 2,870,345 | 0.7 | ||||||
|
|
|
| |||||
| $ | 71,493,275 | 18.2 | % | |||||
SECURITY TYPE BREAKDOWN**
December 31, 2013 (unaudited)
| SECURITY TYPE | U.S. $ VALUE | PERCENT OF TOTAL INVESTMENTS | ||||||
Common Stocks | $ | 254,293,239 | 62.1 | % | ||||
Corporates—Investment Grades | 35,673,779 | 8.7 | ||||||
Mortgage Pass-Throughs | 29,187,550 | 7.1 | ||||||
Asset-Backed Securities | 17,265,710 | 4.2 | ||||||
Governments—Treasuries | 16,310,433 | 4.0 | ||||||
Commercial Mortgage-Backed Securities | 12,172,826 | 3.0 | ||||||
Corporates—Non-Investment Grades | 5,094,148 | 1.2 | ||||||
Agencies | 3,889,567 | 1.0 | ||||||
Inflation-Linked Securities | 3,857,094 | 0.9 | ||||||
Local Governments—Municipal Bonds | 2,949,765 | 0.7 | ||||||
Quasi-Sovereigns | 2,761,095 | 0.7 | ||||||
Collateralized Mortgage Obligations | 2,321,240 | 0.6 | ||||||
Emerging Markets—Corporate Bonds | 861,624 | 0.2 | ||||||
Other*** | 1,594,472 | 0.4 | ||||||
Short-Term Investments | 21,444,387 | 5.2 | ||||||
|
|
|
| |||||
Total Investments | $ | 409,676,929 | 100.0 | % | ||||
| * | Long-term investments. |
| ** | The Portfolio’s security type breakdown is expressed as a percentage of total investments (excluding security lending collateral) and may vary over time. The Portfolio also enters into derivative transactions, which may be used for hedging or investment purposes (see “Portfolio of Investments” section of the report for additional details). |
| *** | “Other” represents less than 0.2% weightings in the following security types: Governments—Sovereign Bonds, Preferred Stocks and Warrants. |
7
| BALANCED WEALTH STRATEGY PORTFOLIO | ||
| PORTFOLIOOF INVESTMENTS | ||
| December 31, 2013 | AllianceBernstein Variable Products Series Fund | |
| Company | Shares | U.S. $ Value | ||||||
COMMON STOCKS–64.8% | ||||||||
FINANCIALS–10.5% | ||||||||
CAPITAL MARKETS–1.2% | ||||||||
Affiliated Managers Group, Inc.(a) | 3,750 | $ | 813,300 | |||||
BlackRock, Inc.–Class A | 1,970 | 623,446 | ||||||
Daiwa Securities Group, Inc. | 17,000 | 170,264 | ||||||
Deutsche Bank AG (REG) | 9,346 | 448,995 | ||||||
E*Trade Financial Corp.(a) | 13,000 | 255,320 | ||||||
Goldman Sachs Group, Inc. (The) | 3,800 | 673,588 | ||||||
Macquarie Group Ltd. | 8,609 | 422,533 | ||||||
State Street Corp. | 4,100 | 300,899 | ||||||
UBS AG(a) | 46,962 | 899,197 | ||||||
|
| |||||||
| 4,607,542 | ||||||||
|
| |||||||
COMMERCIAL BANKS–2.2% | ||||||||
Banco do Brasil SA | 9,600 | 99,484 | ||||||
Bank Hapoalim BM | 20,060 | 112,398 | ||||||
Barclays PLC | 68,422 | 309,396 | ||||||
BNP Paribas SA | 3,170 | 247,283 | ||||||
China Construction Bank Corp.–Class H | 144,000 | 109,024 | ||||||
CIT Group, Inc. | 17,700 | 922,701 | ||||||
Fifth Third Bancorp | 13,200 | 277,596 | ||||||
HSBC Holdings PLC | 57,220 | 627,941 | ||||||
Industrial & Commercial Bank of China Ltd.–Class H | 162,000 | 109,854 | ||||||
KBC Groep NV | 4,420 | 251,301 | ||||||
KeyCorp | 15,100 | 202,642 | ||||||
Lloyds Banking Group PLC(a) | 364,260 | 477,977 | ||||||
Mitsubishi UFJ Financial Group, Inc. | 65,300 | 433,552 | ||||||
National Australia Bank Ltd. | 12,730 | 397,329 | ||||||
Regions Financial Corp. | 20,700 | 204,723 | ||||||
Sberbank of Russia (Sponsored ADR) | 9,683 | 121,715 | ||||||
Societe Generale SA | 8,592 | 499,629 | ||||||
Sumitomo Mitsui Financial | 6,200 | 322,421 | ||||||
SunTrust Banks, Inc. | 7,700 | 283,437 | ||||||
UniCredit SpA | 53,230 | 392,659 | ||||||
Wells Fargo & Co. | 51,600 | 2,342,640 | ||||||
|
| |||||||
| 8,745,702 | ||||||||
|
| |||||||
CONSUMER FINANCE–0.6% | ||||||||
Capital One Financial Corp. | 15,900 | 1,218,099 | ||||||
Discover Financial Services | 15,500 | 867,225 | ||||||
Muthoot Finance Ltd. | 39,211 | 68,624 | ||||||
Shriram Transport Finance Co., Ltd. | 13,055 | 141,636 | ||||||
|
| |||||||
| 2,295,584 | ||||||||
|
| |||||||
DIVERSIFIED FINANCIAL SERVICES–2.5% | ||||||||
Bank of America Corp. | 145,100 | 2,259,207 | ||||||
Berkshire Hathaway, Inc.– | 5,300 | 628,368 | ||||||
Citigroup, Inc. | 42,200 | 2,199,042 | ||||||
ING Groep NV(a) | 20,880 | 291,663 | ||||||
ING US, Inc. | 6,100 | $ | 214,415 | |||||
IntercontinentalExchange | 11,013 | 2,477,044 | ||||||
JPMorgan Chase & Co. | 22,900 | 1,339,192 | ||||||
ORIX Corp. | 20,400 | 358,466 | ||||||
|
| |||||||
| 9,767,397 | ||||||||
|
| |||||||
INSURANCE–3.3% | ||||||||
Admiral Group PLC | 44,150 | 959,696 | ||||||
Aegon NV | 18,579 | 176,064 | ||||||
Ageas | 2,177 | 92,835 | ||||||
AIA Group Ltd. | 196,000 | 986,564 | ||||||
American Financial Group, Inc./OH | 11,700 | 675,324 | ||||||
American International Group, Inc. | 27,800 | 1,419,190 | ||||||
Aon PLC | 10,600 | 889,234 | ||||||
Assurant, Inc. | 6,700 | 444,679 | ||||||
Aviva PLC | 22,540 | 168,632 | ||||||
BB Seguridade Participacoes SA | 7,500 | 77,885 | ||||||
Chubb Corp. (The) | 10,300 | 995,289 | ||||||
Everest Re Group Ltd. | 1,700 | 264,979 | ||||||
Genworth Financial, Inc.– | 45,100 | 700,403 | ||||||
Lancashire Holdings Ltd. | 32,020 | 430,443 | ||||||
Lincoln National Corp. | 18,200 | 939,484 | ||||||
Muenchener Rueckversicherungs AG | 1,490 | 328,649 | ||||||
PartnerRe Ltd. | 8,500 | 896,155 | ||||||
Prudential PLC | 31,700 | 708,305 | ||||||
Reinsurance Group of America, Inc.–Class A | 8,700 | 673,467 | ||||||
Travelers Cos., Inc. (The) | 6,300 | 570,402 | ||||||
Unum Group | 2,300 | 80,684 | ||||||
XL Group PLC | 12,500 | 398,000 | ||||||
|
| |||||||
| 12,876,363 | ||||||||
|
| |||||||
REAL ESTATE MANAGEMENT & DEVELOPMENT–0.6% | ||||||||
Daito Trust Construction Co., Ltd. | 6,200 | 579,625 | ||||||
Global Logistic Properties Ltd. | 484,000 | 1,110,265 | ||||||
GLP J-Reit | 251 | 245,159 | ||||||
Hang Lung Group Ltd. | 15,000 | 76,172 | ||||||
Hang Lung Properties Ltd. | 170,000 | 541,080 | ||||||
|
| |||||||
| 2,552,301 | ||||||||
|
| |||||||
THRIFTS & MORTGAGE FINANCE–0.1% | ||||||||
Housing Development Finance Corp. | 30,740 | 397,463 | ||||||
|
| |||||||
| 41,242,352 | ||||||||
|
| |||||||
CONSUMER DISCRETIONARY–9.7% | ||||||||
AUTO COMPONENTS–0.7% | ||||||||
Cie Generale des Etablissements Michelin–Class B | 3,880 | 412,834 | ||||||
GKN PLC | 39,480 | 244,647 | ||||||
8
| AllianceBernstein Variable Products Series Fund |
| Company | Shares | U.S. $ Value | ||||||
Lear Corp. | 5,200 | $ | 421,044 | |||||
Magna International, Inc.–Class A | 4,600 | 377,476 | ||||||
Nokian Renkaat Oyj | 1,593 | 76,391 | ||||||
TRW Automotive Holdings Corp.(a) | 8,700 | 647,193 | ||||||
Valeo SA | 5,110 | 566,297 | ||||||
|
| |||||||
| 2,745,882 | ||||||||
|
| |||||||
AUTOMOBILES–1.5% | ||||||||
Bayerische Motoren Werke AG | 2,120 | 248,957 | ||||||
Ford Motor Co. | 55,200 | 851,736 | ||||||
General Motors Co.(a) | 22,400 | 915,488 | ||||||
Honda Motor Co., Ltd. | 9,600 | 396,260 | ||||||
Hyundai Motor Co.(a) | 710 | 159,372 | ||||||
Hyundai Motor Co. (Preference Shares)(a) | 2,810 | 333,317 | ||||||
Mazda Motor Corp.(a) | 54,000 | 279,831 | ||||||
Nissan Motor Co., Ltd. | 73,900 | 619,282 | ||||||
Renault SA | 1,550 | 124,739 | ||||||
Tata Motors Ltd. | 23,030 | 140,892 | ||||||
Toyota Motor Corp. | 21,900 | 1,335,354 | ||||||
Volkswagen AG (Preference Shares) | 1,610 | 453,084 | ||||||
|
| |||||||
| 5,858,312 | ||||||||
|
| |||||||
DISTRIBUTORS–0.1% | ||||||||
LKQ Corp.(a) | 17,740 | 583,646 | ||||||
|
| |||||||
DIVERSIFIED CONSUMER SERVICES–0.2% | ||||||||
Estacio Participacoes SA | 53,900 | 466,292 | ||||||
Kroton Educacional SA | 20,900 | 347,794 | ||||||
|
| |||||||
| 814,086 | ||||||||
|
| |||||||
HOTELS, RESTAURANTS & LEISURE–1.1% | ||||||||
Chipotle Mexican Grill, Inc.– | 820 | 436,880 | ||||||
Ladbrokes PLC | 38,530 | 114,503 | ||||||
Melco Crown Entertainment Ltd. (ADR)(a) | 8,000 | 313,760 | ||||||
Melco International Development Ltd. | 36,000 | 133,029 | ||||||
Merlin Entertainments PLC(a) | 32,302 | 191,229 | ||||||
Sodexo | 12,249 | 1,242,145 | ||||||
Starbucks Corp. | 19,380 | 1,519,198 | ||||||
Whitbread PLC | 6,020 | 374,651 | ||||||
William Hill PLC | 10,965 | 73,096 | ||||||
|
| |||||||
| 4,398,491 | ||||||||
|
| |||||||
HOUSEHOLD DURABLES–0.2% | ||||||||
PulteGroup, Inc. | 41,800 | 851,466 | ||||||
|
| |||||||
INTERNET & CATALOG RETAIL–0.8% | ||||||||
Amazon.com, Inc.(a) | 3,310 | 1,319,995 | ||||||
priceline.com, Inc.(a) | 1,690 | 1,964,456 | ||||||
|
| |||||||
| 3,284,451 | ||||||||
|
| |||||||
LEISURE EQUIPMENT & PRODUCTS–0.3% | ||||||||
Polaris Industries, Inc. | 6,780 | 987,439 | ||||||
|
| |||||||
MEDIA–2.1% | ||||||||
Comcast Corp.–Class A | 35,070 | $ | 1,822,413 | |||||
Gannett Co., Inc. | 23,300 | 689,214 | ||||||
Liberty Global PLC–Series C(a) | 15,310 | 1,290,939 | ||||||
Liberty Media Corp.(a) | 7,390 | 1,082,266 | ||||||
Time Warner, Inc. | 7,900 | 550,788 | ||||||
Twenty-First Century Fox, Inc.–Class A | 21,800 | 766,924 | ||||||
Viacom, Inc.–Class B | 7,100 | 620,114 | ||||||
Walt Disney Co. (The) | 18,268 | 1,395,675 | ||||||
|
| |||||||
| 8,218,333 | ||||||||
|
| |||||||
MULTILINE RETAIL–0.2% | ||||||||
Macy’s, Inc. | 12,400 | 662,160 | ||||||
Myer Holdings Ltd.(b) | 49,190 | 121,170 | ||||||
|
| |||||||
| 783,330 | ||||||||
|
| |||||||
SPECIALTY RETAIL–1.3% | ||||||||
Belle International Holdings Ltd. | 51,000 | 59,250 | ||||||
GameStop Corp.–Class A | 13,500 | 665,010 | ||||||
Home Depot, Inc. (The) | 13,210 | 1,087,711 | ||||||
Kingfisher PLC | 27,550 | 175,880 | ||||||
O’Reilly Automotive, Inc.(a) | 5,430 | 698,895 | ||||||
Shimamura Co., Ltd. | 1,500 | 140,605 | ||||||
Sports Direct International PLC(a) | 41,429 | 491,816 | ||||||
Staples, Inc. | 9,100 | 144,599 | ||||||
TJX Cos., Inc. | 19,000 | 1,210,870 | ||||||
World Duty Free SpA(a) | 10,040 | 126,242 | ||||||
Yamada Denki Co., Ltd. | 84,900 | 277,706 | ||||||
|
| |||||||
| 5,078,584 | ||||||||
|
| |||||||
TEXTILES, APPAREL & LUXURY | ||||||||
Cie Financiere Richemont SA | 10,850 | 1,083,887 | ||||||
Hugo Boss AG | 950 | 135,305 | ||||||
Li & Fung Ltd. | 434,000 | 562,117 | ||||||
LVMH Moet Hennessy Louis Vuitton SA | 1,556 | 284,272 | ||||||
Michael Kors Holdings Ltd.(a) | 7,500 | 608,925 | ||||||
NIKE, Inc.–Class B | 8,661 | 681,101 | ||||||
Samsonite International SA | 110,100 | 334,383 | ||||||
VF Corp. | 13,600 | 847,824 | ||||||
|
| |||||||
| 4,537,814 | ||||||||
|
| |||||||
| 38,141,834 | ||||||||
|
| |||||||
INFORMATION TECHNOLOGY–7.9% | ||||||||
COMMUNICATIONS EQUIPMENT–0.6% | ||||||||
Cisco Systems, Inc. | 37,300 | 837,385 | ||||||
QUALCOMM, Inc. | 9,335 | 693,123 | ||||||
Harris Corp. | 10,200 | 712,062 | ||||||
Telefonaktiebolaget LM Ericsson–Class B | 15,494 | 189,174 | ||||||
|
| |||||||
| 2,431,744 | ||||||||
|
| |||||||
COMPUTERS & | ||||||||
Apple, Inc. | 6,270 | 3,518,160 | ||||||
9
| BALANCED WEALTH STRATEGY PORTFOLIO | ||
| PORTFOLIOOF INVESTMENTS | ||
| (continued) | AllianceBernstein Variable Products Series Fund | |
| Company | Shares | U.S. $ Value | ||||||
Catcher Technology Co., Ltd. | 30,000 | $ | 195,351 | |||||
Hewlett-Packard Co. | 59,500 | 1,664,810 | ||||||
|
| |||||||
| 5,378,321 | ||||||||
|
| |||||||
ELECTRONIC EQUIPMENT, INSTRUMENTS & COMPONENTS–0.5% | ||||||||
Amphenol Corp.–Class A | 13,280 | 1,184,310 | ||||||
Arrow Electronics, Inc.(a) | 8,400 | 455,700 | ||||||
LG Display Co., Ltd.(a) | 10,520 | 254,041 | ||||||
|
| |||||||
| 1,894,051 | ||||||||
|
| |||||||
INTERNET SOFTWARE & SERVICES–1.8% | ||||||||
Facebook, Inc.–Class A(a) | 21,990 | 1,201,974 | ||||||
LinkedIn Corp.–Class A(a) | 3,110 | 674,341 | ||||||
eBay, Inc.(a) | 22,663 | 1,243,972 | ||||||
Google, Inc.–Class A(a) | 3,080 | 3,451,787 | ||||||
Telecity Group PLC | 45,783 | 550,759 | ||||||
|
| |||||||
| 7,122,833 | ||||||||
|
| |||||||
IT SERVICES–1.8% | ||||||||
Amdocs Ltd. | 8,500 | 350,540 | ||||||
HCL Technologies Ltd. | 4,820 | 98,732 | ||||||
Visa, Inc.–Class A | 12,890 | 2,870,345 | ||||||
Cognizant Technology Solutions Corp.–Class A(a) | 34,120 | 3,445,438 | ||||||
Tata Consultancy Services Ltd. | 5,040 | 177,316 | ||||||
Fujitsu Ltd.(a) | 52,000 | 269,499 | ||||||
|
| |||||||
| 7,211,870 | ||||||||
|
| |||||||
OFFICE ELECTRONICS–0.3% | ||||||||
Xerox Corp. | 84,100 | 1,023,497 | ||||||
|
| |||||||
SEMICONDUCTORS & SEMICONDUCTOR EQUIPMENT–0.7% | ||||||||
Sumco Corp. | 28,800 | 254,071 | ||||||
Applied Materials, Inc. | 36,500 | 645,685 | ||||||
Tokyo Electron Ltd. | 3,200 | 176,329 | ||||||
NVIDIA Corp. | 7,100 | 113,742 | ||||||
Micron Technology, Inc.(a) | 18,800 | 409,088 | ||||||
SK Hynix, Inc.(a) | 7,070 | 247,291 | ||||||
Samsung Electronics Co., Ltd. | 220 | 286,670 | ||||||
Samsung Electronics Co., Ltd. (Preference Shares) | 440 | 423,151 | ||||||
Taiwan Semiconductor Manufacturing Co., Ltd. | 31,000 | 109,460 | ||||||
|
| |||||||
| 2,665,487 | ||||||||
|
| |||||||
SOFTWARE–0.8% | ||||||||
Electronic Arts, Inc.(a) | 36,500 | 837,310 | ||||||
Dassault Systemes | 640 | 79,443 | ||||||
Symantec Corp. | 8,300 | 195,714 | ||||||
CA, Inc. | 3,000 | 100,950 | ||||||
ANSYS, Inc.(a) | 17,135 | 1,494,172 | ||||||
Red Hat, Inc.(a) | 9,300 | 521,172 | ||||||
|
| |||||||
| 3,228,761 | ||||||||
|
| |||||||
| 30,956,564 | ||||||||
|
| |||||||
HEALTH CARE–7.3% | ||||||||
BIOTECHNOLOGY–1.9% | ||||||||
Actelion Ltd.(a) | 6,320 | $ | 536,067 | |||||
Biogen Idec, Inc.(a) | 8,458 | 2,366,125 | ||||||
Celgene Corp.(a) | 9,310 | 1,573,018 | ||||||
Gilead Sciences, Inc.(a) | 20,130 | 1,512,770 | ||||||
Quintiles Transnational Holdings, Inc.(a) | 23,853 | 1,105,348 | ||||||
Vertex Pharmaceuticals, Inc.(a) | 5,300 | 393,790 | ||||||
|
| |||||||
| 7,487,118 | ||||||||
|
| |||||||
HEALTH CARE EQUIPMENT & | ||||||||
Intuitive Surgical, Inc.(a) | 2,870 | 1,102,310 | ||||||
Medtronic, Inc. | 22,300 | 1,279,797 | ||||||
|
| |||||||
| 2,382,107 | ||||||||
|
| |||||||
HEALTH CARE PROVIDERS & SERVICES–1.0% | ||||||||
Aetna, Inc. | 11,400 | 781,926 | ||||||
Health Net, Inc./CA(a) | 15,100 | 448,017 | ||||||
McKesson Corp. | 5,130 | 827,982 | ||||||
UnitedHealth Group, Inc. | 22,651 | 1,705,620 | ||||||
WellPoint, Inc. | 2,500 | 230,975 | ||||||
|
| |||||||
| 3,994,520 | ||||||||
|
| |||||||
LIFE SCIENCES TOOLS & SERVICES–0.7% | ||||||||
Eurofins Scientific SE | 4,269 | 1,155,449 | ||||||
Illumina, Inc.(a) | 7,132 | 788,942 | ||||||
Mettler-Toledo International, Inc.(a) | 2,509 | 608,658 | ||||||
|
| |||||||
| 2,553,049 | ||||||||
|
| |||||||
PHARMACEUTICALS–3.1% | ||||||||
Allergan, Inc./United States | 12,613 | 1,401,052 | ||||||
Astellas Pharma, Inc. | 4,000 | 237,147 | ||||||
Daiichi Sankyo Co., Ltd. | 18,100 | 330,958 | ||||||
GlaxoSmithKline PLC | 36,280 | 969,310 | ||||||
GlaxoSmithKline PLC (Sponsored ADR) | 14,500 | 774,155 | ||||||
Johnson & Johnson | 24,600 | 2,253,114 | ||||||
Merck & Co., Inc. | 18,700 | 935,935 | ||||||
Novartis AG | 8,234 | 659,949 | ||||||
Pfizer, Inc. | 94,800 | 2,903,724 | ||||||
Roche Holding AG | 3,100 | 868,391 | ||||||
Roche Holding AG | 8,300 | 582,660 | ||||||
Teva Pharmaceutical Industries Ltd. | 2,770 | 110,832 | ||||||
|
| |||||||
| 12,027,227 | ||||||||
|
| |||||||
| 28,444,021 | ||||||||
|
| |||||||
INDUSTRIALS–7.1% | ||||||||
AEROSPACE & | ||||||||
Boeing Co. (The) | 17,810 | 2,430,887 | ||||||
European Aeronautic Defence and Space Co. NV | 8,470 | 650,243 | ||||||
10
| AllianceBernstein Variable Products Series Fund |
| Company | Shares | U.S. $ Value | ||||||
MTU Aero Engines AG | 1,693 | $ | 166,373 | |||||
Northrop Grumman Corp. | 4,100 | 469,901 | ||||||
Precision Castparts Corp. | 5,204 | 1,401,437 | ||||||
Safran SA | 3,690 | 256,560 | ||||||
Thales SA | 2,020 | 130,176 | ||||||
Zodiac Aerospace | 1,490 | 264,043 | ||||||
|
| |||||||
| 5,769,620 | ||||||||
|
| |||||||
AIR FREIGHT & | ||||||||
Expeditors International of Washington, Inc. | 13,970 | 618,172 | ||||||
|
| |||||||
AIRLINES–0.6% | ||||||||
Copa Holdings SA–Class A | 9,150 | 1,465,006 | ||||||
Delta Air Lines, Inc. | 10,700 | 293,929 | ||||||
Japan Airlines Co., Ltd. | 2,000 | 98,663 | ||||||
Qantas Airways Ltd.(a) | 177,000 | 173,622 | ||||||
Turk Hava Yollari | 49,857 | 149,476 | ||||||
|
| |||||||
| 2,180,696 | ||||||||
|
| |||||||
BUILDING PRODUCTS–0.1% | ||||||||
Asahi Glass Co., Ltd.(b) | 28,000 | 174,350 | ||||||
|
| |||||||
COMMERCIAL SERVICES & SUPPLIES–0.2% | ||||||||
Babcock International Group PLC | 15,900 | 357,274 | ||||||
Edenred | 13,649 | 457,001 | ||||||
|
| |||||||
| 814,275 | ||||||||
|
| |||||||
ELECTRICAL | ||||||||
AMETEK, Inc. | 20,332 | 1,070,887 | ||||||
Sumitomo Electric Industries Ltd. | 22,600 | 377,782 | ||||||
|
| |||||||
| 1,448,669 | ||||||||
|
| |||||||
INDUSTRIAL CONGLOMERATES–1.4% | ||||||||
Bidvest Group Ltd. | 4,750 | 121,687 | ||||||
Danaher Corp. | 29,909 | 2,308,975 | ||||||
General Electric Co. | 87,000 | 2,438,610 | ||||||
Hutchison Whampoa Ltd. | 20,000 | 272,773 | ||||||
Siemens AG | 1,720 | 235,844 | ||||||
Toshiba Corp. | 58,000 | 244,169 | ||||||
|
| |||||||
| 5,622,058 | ||||||||
|
| |||||||
INDUSTRIAL WAREHOUSE DISTRIBUTION–0.5% | ||||||||
Granite Real Estate Investment Trust | 10,340 | 377,306 | ||||||
Hansteen Holdings PLC | 75,450 | 135,187 | ||||||
Hopewell Holdings Ltd. | 50,500 | 171,562 | ||||||
Japan Logistics Fund, Inc. | 11 | 116,573 | ||||||
Mapletree Logistics Trust | 263,000 | 220,129 | ||||||
Nippon Prologis REIT, Inc. | 17 | 162,842 | ||||||
ProLogis, Inc. | 7,703 | 284,626 | ||||||
STAG Industrial, Inc. | 17,670 | 360,291 | ||||||
|
| |||||||
| 1,828,516 | ||||||||
|
| |||||||
MACHINERY–0.8% | ||||||||
Flowserve Corp. | 8,357 | 658,782 | ||||||
IHI Corp. | 32,000 | 138,389 | ||||||
Illinois Tool Works, Inc. | 12,100 | $ | 1,017,368 | |||||
Komatsu Ltd. | 18,700 | 383,935 | ||||||
Parker Hannifin Corp. | 8,350 | 1,074,144 | ||||||
|
| |||||||
| 3,272,618 | ||||||||
|
| |||||||
MARINE –0.1% | ||||||||
AP Moeller–Maersk A/S– | 21 | 227,261 | ||||||
Nippon Yusen KK | 97,000 | 310,150 | ||||||
|
| |||||||
| 537,411 | ||||||||
|
| |||||||
MIXED OFFICE | ||||||||
Goodman Group | 38,440 | 162,861 | ||||||
|
| |||||||
PROFESSIONAL | ||||||||
Bureau Veritas SA | 36,689 | 1,071,125 | ||||||
Capita PLC | 54,811 | 943,473 | ||||||
Intertek Group PLC | 23,452 | 1,223,991 | ||||||
SGS SA | 326 | 750,534 | ||||||
Verisk Analytics, Inc.– | 6,030 | 396,292 | ||||||
|
| |||||||
| 4,385,415 | ||||||||
|
| |||||||
ROAD & RAIL–0.0% | ||||||||
Central Japan Railway Co. | 1,400 | 164,993 | ||||||
|
| |||||||
TRADING COMPANIES & DISTRIBUTORS–0.2% | ||||||||
Mitsubishi Corp. | 12,300 | 236,134 | ||||||
WW Grainger, Inc. | 2,721 | 694,998 | ||||||
|
| |||||||
| 931,132 | ||||||||
|
| |||||||
TRANSPORTATION INFRASTRUCTURE–0.0% | ||||||||
Sydney Airport | 8,157 | 27,723 | ||||||
|
| |||||||
| 27,938,509 | ||||||||
|
| |||||||
CONSUMER STAPLES–4.8% | ||||||||
BEVERAGES–0.7% | ||||||||
Anheuser-Busch InBev NV | 3,800 | 404,078 | ||||||
Asahi Group Holdings Ltd. | 4,100 | 115,701 | ||||||
Carlsberg A/S–Class B | 2,260 | 250,077 | ||||||
Diageo PLC | 28,070 | 930,200 | ||||||
Monster Beverage Corp.(a) | 10,665 | 722,767 | ||||||
SABMiller PLC (London) | 4,240 | 218,254 | ||||||
|
| |||||||
| 2,641,077 | ||||||||
|
| |||||||
FOOD & STAPLES | ||||||||
Costco Wholesale Corp. | 14,940 | 1,778,009 | ||||||
CVS Caremark Corp. | 11,730 | 839,516 | ||||||
Jeronimo Martins SGPS SA | 23,655 | 462,544 | ||||||
Koninklijke Ahold NV | 25,140 | 451,794 | ||||||
Kroger Co. (The) | 27,400 | 1,083,122 | ||||||
Olam International Ltd. | 526,412 | 642,136 | ||||||
Sugi Holdings Co., Ltd. | 2,100 | 85,312 | ||||||
Tsuruha Holdings, Inc. | 900 | 82,637 | ||||||
|
| |||||||
| 5,425,070 | ||||||||
|
| |||||||
11
| BALANCED WEALTH STRATEGY PORTFOLIO | ||
| PORTFOLIOOF INVESTMENTS | ||
| (continued) | AllianceBernstein Variable Products Series Fund | |
| Company | Shares | U.S. $ Value | ||||||
FOOD PRODUCTS–0.9% | ||||||||
Danone | 1,950 | $ | 140,677 | |||||
Green Mountain Coffee Roasters, Inc.(a)(b) | 9,600 | 725,568 | ||||||
Hershey Co. (The) | 13,150 | 1,278,574 | ||||||
Mead Johnson Nutrition Co.–Class A | 12,870 | 1,077,991 | ||||||
Nestle SA | 2,790 | 204,479 | ||||||
|
| |||||||
| 3,427,289 | ||||||||
|
| |||||||
HOUSEHOLD | ||||||||
Henkel AG & Co. KGaA | 8,841 | 921,753 | ||||||
LG Household & Health Care Ltd.(a) | 690 | 358,790 | ||||||
Procter & Gamble Co. (The) | 9,500 | 773,395 | ||||||
Reckitt Benckiser Group PLC | 1,630 | 129,480 | ||||||
|
| |||||||
| 2,183,418 | ||||||||
|
| |||||||
TOBACCO–1.3% | ||||||||
British American Tobacco PLC | 28,879 | 1,550,053 | ||||||
Imperial Tobacco Group PLC | 9,690 | 375,663 | ||||||
Japan Tobacco, Inc. | 42,500 | 1,382,897 | ||||||
Philip Morris International, Inc. | 20,645 | 1,798,799 | ||||||
|
| |||||||
| 5,107,412 | ||||||||
|
| |||||||
| 18,784,266 | ||||||||
|
| |||||||
ENERGY–4.8% | ||||||||
ENERGY EQUIPMENT & SERVICES–1.2% | ||||||||
Aker Solutions ASA | 15,320 | 274,283 | ||||||
Halliburton Co. | 15,100 | 766,325 | ||||||
Nabors Industries Ltd. | 23,900 | 406,061 | ||||||
Oceaneering International, Inc. | 8,699 | 686,177 | ||||||
Saipem SpA | 9,770 | 209,524 | ||||||
Schlumberger Ltd. | 25,224 | 2,272,935 | ||||||
Seadrill Ltd. | 5,140 | 210,660 | ||||||
|
| |||||||
| 4,825,965 | ||||||||
|
| |||||||
OIL, GAS & CONSUMABLE | ||||||||
BG Group PLC | 46,691 | 1,004,713 | ||||||
Chesapeake Energy Corp. | 7,200 | 195,408 | ||||||
Chevron Corp. | 16,300 | 2,036,033 | ||||||
ENI SpA | 15,640 | 377,920 | ||||||
Exxon Mobil Corp. | 25,300 | 2,560,360 | ||||||
Gazprom OAO (Sponsored ADR) | 13,690 | 118,419 | ||||||
Hess Corp. | 17,400 | 1,444,200 | ||||||
JX Holdings, Inc. | 44,300 | 228,120 | ||||||
LUKOIL OAO (London) (Sponsored ADR) | 2,500 | 157,800 | ||||||
Marathon Petroleum Corp. | 14,000 | 1,284,220 | ||||||
Noble Energy, Inc. | 12,322 | 839,251 | ||||||
Occidental Petroleum Corp. | 15,000 | 1,426,500 | ||||||
Phillips 66 | 5,300 | 408,789 | ||||||
Royal Dutch Shell PLC (Euronext Amsterdam)–Class A | 12,955 | 462,529 | ||||||
Valero Energy Corp. | 26,100 | 1,315,440 | ||||||
|
| |||||||
| 13,859,702 | ||||||||
|
| |||||||
| 18,685,667 | ||||||||
|
| |||||||
EQUITY: OTHER–4.2% | ||||||||
DIVERSIFIED/SPECIALTY–3.7% | ||||||||
Activia Properties, Inc. | 13 | $ | 102,445 | |||||
Altisource Residential Corp. | 5,620 | 169,218 | ||||||
Armada Hoffler Properties, Inc. | 20,322 | 188,588 | ||||||
Australand Property Group | 60,480 | 208,250 | ||||||
British Land Co. PLC | 51,158 | 533,347 | ||||||
Buzzi Unicem SpA | 10,250 | 184,489 | ||||||
Chambers Street Properties(b) | 49,690 | 380,129 | ||||||
Cheung Kong Holdings Ltd. | 23,000 | 364,175 | ||||||
Cofinimmo | 1,600 | 197,604 | ||||||
Corrections Corp. of America | 8,444 | 270,799 | ||||||
Country Garden Holdings Co., Ltd. | 835,000 | 505,093 | ||||||
CTT-Correios de Portugal SA(a) | 23,234 | 178,673 | ||||||
Digital Realty Trust, Inc.(b) | 4,330 | 212,690 | ||||||
Dundee Real Estate Investment Trust | 7,896 | 214,227 | ||||||
Fibra Uno Administracion SA de CV | 57,730 | 186,192 | ||||||
Geo Group, Inc. (The) | 10,570 | 340,565 | ||||||
Gramercy Property Trust, Inc.(a) | 48,450 | 278,588 | ||||||
Henderson Land Development Co., Ltd. | 21,400 | 122,343 | ||||||
ICADE | 3,569 | 332,241 | ||||||
Japan Hotel REIT Investment Corp.(b) | 385 | 184,572 | ||||||
Kennedy-Wilson Holdings, Inc. | 17,540 | 390,265 | ||||||
Land Securities Group PLC | 36,838 | 588,469 | ||||||
Lend Lease Group | 59,270 | 591,497 | ||||||
LPN Development PCL | 194,300 | 91,651 | ||||||
Mapletree Commercial Trust | 185,000 | 174,913 | ||||||
Mexico Real Estate Management SA de CV(a) | 82,160 | 163,420 | ||||||
Mitchells & Butlers PLC(a) | 27,500 | 192,417 | ||||||
Mitsubishi Estate Co., Ltd. | 52,000 | 1,556,154 | ||||||
Mitsui Fudosan Co., Ltd. | 34,100 | 1,230,009 | ||||||
New World Development Co., Ltd. | 127,438 | 161,863 | ||||||
Regal Entertainment Group–Class A | 33,880 | 658,966 | ||||||
Sekisui House SI Investment Co.(b) | 18 | 87,437 | ||||||
Spirit Realty Capital, Inc. | 46,390 | 456,014 | ||||||
Sumitomo Realty & Development Co., Ltd. | 14,000 | 697,584 | ||||||
Sun Hung Kai Properties Ltd. | 50,708 | 644,794 | ||||||
Supalai PCL | 195,400 | 86,818 | ||||||
Swire Properties Ltd. | 108,600 | 275,014 | ||||||
Top REIT, Inc. | 24 | 112,724 | ||||||
UOL Group Ltd. | 54,516 | 268,323 | ||||||
Vornado Realty Trust | 1,690 | 150,055 | ||||||
Wharf Holdings Ltd. | 85,000 | 650,015 | ||||||
Wheelock & Co., Ltd. | 36,000 | 165,847 | ||||||
|
| |||||||
| 14,548,477 | ||||||||
|
| |||||||
HEALTH CARE–0.5% | ||||||||
Chartwell Retirement Residences | 20,060 | 188,656 | ||||||
HCP, Inc. | 6,510 | 236,443 | ||||||
12
| AllianceBernstein Variable Products Series Fund |
| Company | Shares | U.S. $ Value | ||||||
Health Care REIT, Inc. | 3,930 | $ | 210,530 | |||||
LTC Properties, Inc. | 10,150 | 359,209 | ||||||
Medical Properties Trust, Inc. | 32,715 | 399,777 | ||||||
Omega Healthcare Investors, Inc. | 3,860 | 115,028 | ||||||
Ventas, Inc. | 4,240 | 242,867 | ||||||
|
| |||||||
| 1,752,510 | ||||||||
|
| |||||||
TRIPLE NET–0.0% | ||||||||
National Retail Properties, Inc.(b) | 3,760 | 114,041 | ||||||
|
| |||||||
| 16,415,028 | ||||||||
|
| |||||||
RETAIL–1.8% | ||||||||
REGIONAL MALL–0.7% | ||||||||
General Growth Properties, Inc. | 18,370 | 368,686 | ||||||
Simon Property Group, Inc. | 12,516 | 1,904,435 | ||||||
Westfield Group | 66,860 | 603,566 | ||||||
|
| |||||||
| 2,876,687 | ||||||||
|
| |||||||
SHOPPING CENTER/OTHER RETAIL–1.1% | ||||||||
Aeon Mall Co., Ltd. | 18,800 | 526,650 | ||||||
DDR Corp. | 19,380 | 297,871 | ||||||
Frontier Real Estate Investment Corp.(b) | 38 | 187,626 | ||||||
Fukuoka REIT Co. | 11 | 89,038 | ||||||
Kimco Realty Corp. | 4,870 | 96,183 | ||||||
Kite Realty Group Trust | 56,810 | 373,242 | ||||||
Klepierre | 8,553 | 396,451 | ||||||
Link REIT (The) | 19,268 | 93,699 | ||||||
Ramco-Gershenson Properties Trust | 24,570 | 386,732 | ||||||
RioCan Real Estate Investment Trust (Toronto) | 4,973 | 115,963 | ||||||
Unibail-Rodamco SE | 3,589 | 919,714 | ||||||
Vastned Retail NV | 8,380 | 380,309 | ||||||
Westfield Retail Trust | 159,090 | 422,644 | ||||||
|
| |||||||
| 4,286,122 | ||||||||
|
| |||||||
| 7,162,809 | ||||||||
|
| |||||||
MATERIALS–1.6% | ||||||||
CHEMICALS–1.1% | ||||||||
Arkema SA | 3,113 | 363,468 | ||||||
BASF SE | 1,060 | 113,138 | ||||||
Denki Kagaku Kogyo KK | 59,000 | 243,864 | ||||||
Essentra PLC | 63,156 | 899,677 | ||||||
Incitec Pivot Ltd. | 73,261 | 175,748 | ||||||
Koninklijke DSM NV | 3,718 | 292,600 | ||||||
LyondellBasell Industries NV–Class A | 15,600 | 1,252,368 | ||||||
Monsanto Co. | 8,269 | 963,752 | ||||||
Nippon Shokubai Co., Ltd. | 13,000 | 143,626 | ||||||
|
| |||||||
| 4,448,241 | ||||||||
|
| |||||||
METALS & MINING–0.4% | ||||||||
BHP Billiton PLC | 24,400 | 757,129 | ||||||
Dowa Holdings Co., Ltd. | 11,000 | 107,623 | ||||||
Glencore Xstrata PLC(a) | 27,211 | 141,567 | ||||||
MMC Norilsk Nickel OJSC (ADR) | 16,674 | 277,122 | ||||||
Rio Tinto PLC | 5,490 | 310,238 | ||||||
|
| |||||||
| 1,593,679 | ||||||||
|
| |||||||
PAPER & FOREST | ||||||||
Mondi PLC | 17,020 | $ | 295,442 | |||||
|
| |||||||
| 6,337,362 | ||||||||
|
| |||||||
RESIDENTIAL–1.4% | ||||||||
MULTI-FAMILY–1.3% | ||||||||
Associated Estates Realty Corp. | 23,650 | 379,582 | ||||||
AvalonBay Communities, Inc. | 2,750 | 325,132 | ||||||
Berkeley Group Holdings PLC | 5,000 | 220,441 | ||||||
Brookfield Residential Properties, Inc.(a) | 15,931 | 385,371 | ||||||
China Overseas Land & Investment Ltd. | 96,000 | 270,974 | ||||||
China Vanke Co., Ltd.–Class B | 101,660 | 158,727 | ||||||
Comforia Residential REIT, Inc. | 15 | 105,756 | ||||||
Deutsche Annington Immobilien SE(a) | 6,191 | 153,305 | ||||||
Equity Residential | 8,130 | 421,703 | ||||||
Home Properties, Inc. | 1,840 | 98,661 | ||||||
KWG Property Holding Ltd. | 300,000 | 167,600 | ||||||
LEG Immobilien AG(a) | 5,559 | 328,795 | ||||||
Mid-America Apartment Communities, Inc. | 7,200 | 437,328 | ||||||
Post Properties, Inc. | 2,030 | 91,817 | ||||||
Rossi Residencial SA(a) | 145,840 | 126,355 | ||||||
Sekisui Chemical Co., Ltd. | 8,000 | 98,172 | ||||||
Stockland(b) | 169,729 | 548,753 | ||||||
Sun Communities, Inc. | 5,340 | 227,698 | ||||||
Taylor Wimpey PLC | 212,080 | 392,772 | ||||||
Wing Tai Holdings Ltd. | 125,000 | 195,258 | ||||||
|
| |||||||
| 5,134,200 | ||||||||
|
| |||||||
SELF STORAGE–0.1% | ||||||||
Public Storage | 2,590 | 389,847 | ||||||
|
| |||||||
| 5,524,047 | ||||||||
|
| |||||||
TELECOMMUNICATION SERVICES–1.1% | ||||||||
DIVERSIFIED TELECOMMUNICATION SERVICES–0.6% | ||||||||
AT&T, Inc. | 45,400 | 1,596,264 | ||||||
Bezeq The Israeli Telecommunication Corp., Ltd. | 63,518 | 107,718 | ||||||
Telenor ASA | 6,620 | 158,175 | ||||||
Vivendi SA | 24,044 | 634,218 | ||||||
|
| |||||||
| 2,496,375 | ||||||||
|
| |||||||
WIRELESS TELECOMMUNICATION SERVICES–0.5% | ||||||||
NTT DoCoMo, Inc. | 11,400 | 187,716 | ||||||
Turkcell Iletisim Hizmetleri AS(a) | 21,330 | 113,043 | ||||||
Vodafone Group PLC | 215,423 | 848,161 | ||||||
Vodafone Group PLC (Sponsored ADR) | 21,400 | 841,234 | ||||||
|
| |||||||
| 1,990,154 | ||||||||
|
| |||||||
| 4,486,529 | ||||||||
|
| |||||||
13
| BALANCED WEALTH STRATEGY PORTFOLIO | ||
| PORTFOLIOOF INVESTMENTS | ||
| (continued) | AllianceBernstein Variable Products Series Fund | |
| Company | Shares | U.S. $ Value | ||||||
OFFICE–1.0% | ||||||||
OFFICE–1.0% | ||||||||
Allied Properties Real Estate Investment Trust | 7,776 | $ | 239,813 | |||||
Boston Properties, Inc. | 1,774 | 178,056 | ||||||
CapitaCommercial Trust | 222,000 | 255,664 | ||||||
Cominar Real Estate Investment Trust | 15,513 | 269,296 | ||||||
Cousins Properties, Inc. | 44,362 | 456,929 | ||||||
Investa Office Fund | 47,710 | 133,615 | ||||||
Japan Excellent, Inc.(b) | 150 | 175,760 | ||||||
Japan Real Estate Investment Corp. | 60 | 321,004 | ||||||
Kenedix Realty Investment Corp.–Class A | 48 | 227,816 | ||||||
Orix JREIT, Inc. | 195 | 243,955 | ||||||
Parkway Properties, Inc./MD | 22,358 | 431,286 | ||||||
SL Green Realty Corp. | 6,808 | 628,923 | ||||||
Tokyo Tatemono Co., Ltd. | 24,000 | 266,879 | ||||||
Workspace Group PLC | 25,280 | 221,033 | ||||||
|
| |||||||
| 4,050,029 | ||||||||
|
| |||||||
UTILITIES–0.9% | ||||||||
ELECTRIC UTILITIES–0.4% | ||||||||
Edison International | 18,900 | 875,070 | ||||||
EDP–Energias de Portugal SA | 61,520 | 225,969 | ||||||
Electricite de France | 6,510 | 230,305 | ||||||
Enel SpA | 51,731 | 225,723 | ||||||
|
| |||||||
| 1,557,067 | ||||||||
|
| |||||||
GAS UTILITIES–0.2% | ||||||||
Atmos Energy Corp. | 13,100 | 595,002 | ||||||
UGI Corp. | 4,300 | 178,278 | ||||||
|
| |||||||
| 773,280 | ||||||||
|
| |||||||
INDEPENDENT POWER PRODUCERS & ENERGY TRADERS–0.1% | ||||||||
APR Energy PLC | 29,787 | 468,595 | ||||||
|
| |||||||
MULTI-UTILITIES–0.2% | ||||||||
CenterPoint Energy, Inc. | 19,800 | 458,964 | ||||||
DTE Energy Co. | 1,400 | 92,946 | ||||||
National Grid PLC | 20,520 | 268,385 | ||||||
|
| |||||||
| 820,295 | ||||||||
|
| |||||||
| 3,619,237 | ||||||||
|
| |||||||
LODGING–0.5% | ||||||||
LODGING–0.5% | ||||||||
Ashford Hospitality Prime, Inc. | 8,864 | 161,325 | ||||||
Ashford Hospitality Trust, Inc. | 45,361 | 375,589 | ||||||
Chesapeake Lodging Trust | 5,330 | 134,796 | ||||||
DiamondRock Hospitality Co. | 36,350 | 419,842 | ||||||
Hersha Hospitality Trust | 67,830 | 377,813 | ||||||
Host Hotels & Resorts, Inc. | 9,400 | 182,736 | ||||||
InterContinental Hotels Group PLC | 6,061 | 202,173 | ||||||
|
| |||||||
| 1,854,274 | ||||||||
|
| |||||||
| Company | Shares | U.S. $ Value | ||||||||||
MORTGAGE–0.2% | ||||||||||||
MORTGAGE–0.2% | ||||||||||||
NorthStar Realty Finance Corp. | 22,410 | $ | 301,414 | |||||||||
Starwood Property Trust, Inc. | 12,610 | 349,297 | ||||||||||
|
| |||||||||||
| 650,711 | ||||||||||||
|
| |||||||||||
Total Common Stocks | 254,293,239 | |||||||||||
|
| |||||||||||
| Principal Amount (000) | ||||||||||||
CORPORATES–INVESTMENT GRADES–9.1% |
| |||||||||||
INDUSTRIAL–4.5% | ||||||||||||
BASIC–0.7% | ||||||||||||
Barrick Gold Corp. | U.S.$ | 45 | 40,675 | |||||||||
Barrick North America Finance LLC | 225 | 216,640 | ||||||||||
Basell Finance Co. BV | 145 | 183,090 | ||||||||||
Cia Minera Milpo SAA | 240 | 215,139 | ||||||||||
Dow Chemical Co. (The) | 183 | 160,680 | ||||||||||
Dow Chemical Co/The | 165 | 170,440 | ||||||||||
Gerdau Trade, Inc. | 395 | 369,864 | ||||||||||
Glencore Funding LLC | 330 | 308,390 | ||||||||||
International Paper Co. | 55 | 66,808 | ||||||||||
LyondellBasell Industries NV | 435 | 487,493 | ||||||||||
Rio Tinto Finance USA PLC | ||||||||||||
2.875%, 8/21/22 | 257 | 239,531 | ||||||||||
3.50%, 3/22/22 | 76 | 74,580 | ||||||||||
Sociedad Quimica y Minera de Chile SA | 237 | 206,037 | ||||||||||
|
| |||||||||||
| 2,739,367 | ||||||||||||
|
| |||||||||||
CAPITAL GOODS–0.2% | ||||||||||||
Embraer SA | 130 | 130,000 | ||||||||||
Odebrecht Finance Ltd. | 200 | 195,750 | ||||||||||
Owens Corning | 178 | 197,525 | ||||||||||
Republic Services, Inc. | ||||||||||||
3.80%, 5/15/18 | 17 | 18,005 | ||||||||||
5.25%, 11/15/21 | 165 | 179,890 | ||||||||||
5.50%, 9/15/19 | 233 | 262,180 | ||||||||||
|
| |||||||||||
| 983,350 | ||||||||||||
|
| |||||||||||
14
| AllianceBernstein Variable Products Series Fund |
Principal | U.S. $ Value | |||||||||||
COMMUNICATIONS– | ||||||||||||
21st Century Fox America, Inc. | ||||||||||||
3.00%, 9/15/22 | U.S.$ | 400 | $ | 376,021 | ||||||||
6.15%, 2/15/41 | 130 | 144,888 | ||||||||||
CBS Corp. | 250 | 281,193 | ||||||||||
Comcast Corp. | 451 | 503,122 | ||||||||||
DirecTV Holdings LLC/DirecTV Financing Co., Inc. | ||||||||||||
3.80%, 3/15/22 | 215 | 206,537 | ||||||||||
4.75%, 10/01/14 | 155 | 159,611 | ||||||||||
Globo Comunicacao e | 221 | 228,735 | ||||||||||
NBCUniversal Enterprise, Inc. | 233 | 230,670 | ||||||||||
Omnicom Group, Inc. | 165 | 159,785 | ||||||||||
Reed Elsevier Capital, Inc. | 435 | 545,368 | ||||||||||
Time Warner Cable, Inc. | 145 | 147,407 | ||||||||||
Time Warner Entertainment | 121 | 139,172 | ||||||||||
WPP Finance 2010 | 77 | 80,046 | ||||||||||
WPP Finance UK | 350 | 367,416 | ||||||||||
|
| |||||||||||
| 3,569,971 | ||||||||||||
|
| |||||||||||
COMMUNICATIONS– |
| |||||||||||
American Tower Corp. | 380 | 401,840 | ||||||||||
AT&T, Inc. | 23 | 19,510 | ||||||||||
Deutsche Telekom | 490 | 467,603 | ||||||||||
Rogers Communications, Inc. | CAD | 46 | 42,274 | |||||||||
Telefonica Emisiones SAU | U.S.$ | 185 | 195,201 | |||||||||
United States Cellular Corp. | 28 | 26,543 | ||||||||||
Verizon Communications, Inc. | 297 | 347,478 | ||||||||||
|
| |||||||||||
| 1,500,449 | ||||||||||||
|
| |||||||||||
CONSUMER CYCLICAL– | ||||||||||||
Ford Motor Credit Co. LLC | 915 | 1,037,344 | ||||||||||
| Principal Amount (000) | U.S. $ Value | |||||||||||
Harley-Davidson Funding Corp. | U.S.$ | 341 | $ | 356,129 | ||||||||
|
| |||||||||||
| 1,393,473 | ||||||||||||
|
| |||||||||||
CONSUMER CYCLICAL–ENTERTAINMENT–0.1% |
| |||||||||||
Time Warner, Inc. | 123 | 130,588 | ||||||||||
7.625%, 4/15/31 | 110 | 139,212 | ||||||||||
Viacom, Inc. | 83 | 94,398 | ||||||||||
|
| |||||||||||
| 364,198 | ||||||||||||
|
| |||||||||||
CONSUMER CYCLICAL–RETAILERS–0.1% |
| |||||||||||
Macy’s Retail Holdings, Inc. | 201 | 198,121 | ||||||||||
|
| |||||||||||
CONSUMER | ||||||||||||
Ahold Finance USA LLC | 295 | 349,330 | ||||||||||
Bunge Ltd. Finance Corp. | 69 | 73,039 | ||||||||||
8.50%, 6/15/19 | 153 | 187,958 | ||||||||||
Reynolds American, Inc. | 220 | 202,778 | ||||||||||
Thermo Fisher Scientific, Inc. | 121 | 119,850 | ||||||||||
|
| |||||||||||
| 932,955 | ||||||||||||
|
| |||||||||||
ENERGY–0.8% | ||||||||||||
Anadarko Petroleum Corp. | 254 | 285,226 | ||||||||||
Encana Corp. | 140 | 139,004 | ||||||||||
Hess Corp. | 39 | 49,701 | ||||||||||
Marathon Petroleum Corp. | 163 | 176,573 | ||||||||||
Nabors Industries, Inc. | 180 | 180,590 | ||||||||||
Noble Energy, Inc. | 374 | 464,862 | ||||||||||
Noble Holding | 270 | 263,956 | ||||||||||
4.90%, 8/01/20 | 36 | 37,994 | ||||||||||
Reliance Holdings USA, Inc. | 315 | 317,936 | ||||||||||
Transocean, Inc. | 409 | 387,661 | ||||||||||
6.375%, 12/15/21 | 2 | 2,247 | ||||||||||
6.50%, 11/15/20 | 185 | 211,259 | ||||||||||
Valero Energy Corp. | 175 | 199,889 | ||||||||||
Weatherford International | 285 | 366,186 | ||||||||||
|
| |||||||||||
| 3,083,084 | ||||||||||||
|
| |||||||||||
15
| BALANCED WEALTH STRATEGY PORTFOLIO | ||
| PORTFOLIOOF INVESTMENTS | ||
| (continued) | AllianceBernstein Variable Products Series Fund | |
| Principal Amount (000) | U.S. $ Value | |||||||||||
TECHNOLOGY–0.4% |
| |||||||||||
Agilent Technologies, Inc. | U.S.$ | 71 | $ | 76,544 | ||||||||
Baidu, Inc. | 380 | 377,378 | ||||||||||
Hewlett-Packard Co. | 114 | 117,383 | ||||||||||
Motorola Solutions, Inc. | 300 | 277,544 | ||||||||||
7.50%, 5/15/25 | 35 | 41,522 | ||||||||||
Telefonaktiebolaget LM Ericsson | 495 | 481,125 | ||||||||||
Total System Services, Inc. | 141 | 137,177 | ||||||||||
3.75%, 6/01/23 | 139 | 128,488 | ||||||||||
|
| |||||||||||
| 1,637,161 | ||||||||||||
|
| |||||||||||
TRANSPORTATION– |
| |||||||||||
Southwest Airlines Co. | 307 | 316,803 | ||||||||||
5.75%, 12/15/16 | 155 | 172,680 | ||||||||||
|
| |||||||||||
| 489,483 | ||||||||||||
|
| |||||||||||
TRANSPORTATION– |
| |||||||||||
Asciano Finance Ltd. | 470 | 480,636 | ||||||||||
Ryder System, Inc. | 127 | 140,690 | ||||||||||
7.20%, 9/01/15 | 127 | 139,417 | ||||||||||
|
| |||||||||||
| 760,743 | ||||||||||||
|
| |||||||||||
| 17,652,355 | ||||||||||||
|
| |||||||||||
FINANCIAL |
| |||||||||||
BANKING–2.3% | ||||||||||||
ABN AMRO Bank NV | 485 | 482,671 | ||||||||||
Bank of America Corp. | 259 | 296,216 | ||||||||||
7.375%, 5/15/14 | 150 | 153,733 | ||||||||||
Barclays Bank PLC | EUR | 160 | 259,057 | |||||||||
BNP Paribas SA | U.S.$ | 128 | 130,720 | |||||||||
BPCE SA | 262 | 269,928 | ||||||||||
Citigroup, Inc. | 420 | 399,216 | ||||||||||
Compass Bank | 314 | 321,363 | ||||||||||
Countrywide Financial Corp. | 92 | 101,522 | ||||||||||
Credit Suisse AG | 267 | 279,467 | ||||||||||
| Principal Amount (000) | U.S. $ Value | |||||||||||
Danske Bank A/S | GBP | 182 | $ | 305,150 | ||||||||
Goldman Sachs Group, Inc. (The) | U.S.$ | 335 | 377,105 | |||||||||
Series D | 440 | 504,494 | ||||||||||
ING Bank NV | 480 | 484,734 | ||||||||||
LBG Capital No.2 PLC | EUR | 140 | 288,415 | |||||||||
Macquarie Bank Ltd. | U.S.$ | 90 | 97,600 | |||||||||
Macquarie Group Ltd. | 194 | 208,901 | ||||||||||
Morgan Stanley | 350 | 391,440 | ||||||||||
Murray Street Investment | 44 | 47,383 | ||||||||||
National Capital Trust II Delaware | 91 | 93,844 | ||||||||||
Nationwide Building Society | 465 | 532,178 | ||||||||||
PNC Bank NA | 685 | 664,339 | ||||||||||
Rabobank Capital Funding Trust III | 190 | 198,075 | ||||||||||
Royal Bank of Scotland PLC (The) | 215 | 251,718 | ||||||||||
Skandinaviska Enskilda | 185 | 188,700 | ||||||||||
Societe Generale SA | 245 | 245,113 | ||||||||||
SouthTrust Corp. | 225 | 230,530 | ||||||||||
Standard Chartered PLC | 470 | 476,110 | ||||||||||
UBS AG/Stamford CT | 380 | 435,220 | ||||||||||
Unicredit Luxembourg | 230 | 244,714 | ||||||||||
Wachovia Bank NA | 250 | 285,429 | ||||||||||
|
| |||||||||||
| 9,245,085 | ||||||||||||
|
| |||||||||||
BROKERAGE–0.1% | ||||||||||||
Nomura Holdings, Inc. | 468 | 471,869 | ||||||||||
|
| |||||||||||
16
| AllianceBernstein Variable Products Series Fund |
| Principal Amount (000) | U.S. $ Value | |||||||||||
INSURANCE–0.8% | ||||||||||||
Allied World Assurance | U.S.$ | 160 | $ | 183,680 | ||||||||
American International Group, Inc. | ||||||||||||
4.875%, 6/01/22 | 155 | 166,597 | ||||||||||
6.40%, 12/15/20 | 300 | 354,558 | ||||||||||
Coventry Health Care, Inc. | 90 | 101,753 | ||||||||||
6.125%, 1/15/15 | 40 | 42,241 | ||||||||||
6.30%, 8/15/14 | 275 | 284,660 | ||||||||||
Hartford Financial Services Group, Inc. | 95 | 98,695 | ||||||||||
5.125%, 4/15/22 | 180 | 196,058 | ||||||||||
5.50%, 3/30/20 | 242 | 271,998 | ||||||||||
Humana, Inc. | 40 | 44,697 | ||||||||||
7.20%, 6/15/18 | 285 | 337,169 | ||||||||||
Lincoln National Corp. | 98 | 126,141 | ||||||||||
Massachusetts Mutual Life Insurance Co. | 90 | 128,976 | ||||||||||
MetLife, Inc. | 112 | 138,825 | ||||||||||
10.75%, 8/01/39 | 70 | 103,250 | ||||||||||
Prudential Financial, Inc. | 200 | 196,000 | ||||||||||
XLIT Ltd. | 135 | 139,145 | ||||||||||
6.375%, 11/15/24 | 157 | 179,949 | ||||||||||
|
| |||||||||||
| 3,094,392 | ||||||||||||
|
| |||||||||||
OTHER FINANCE–0.1% | ||||||||||||
ORIX Corp. | 336 | 350,301 | ||||||||||
|
| |||||||||||
REITS–0.2% | ||||||||||||
ERP Operating LP | 105 | 108,341 | ||||||||||
Health Care REIT, Inc. | 505 | 538,146 | ||||||||||
|
| |||||||||||
| 646,487 | ||||||||||||
|
| |||||||||||
| 13,808,134 | ||||||||||||
|
| |||||||||||
UTILITY–0.9% | ||||||||||||
ELECTRIC–0.1% | ||||||||||||
CMS Energy Corp. | 155 | 167,333 | ||||||||||
Constellation Energy | 89 | 94,705 | ||||||||||
Pacific Gas & Electric Co. | 38 | 43,529 | ||||||||||
TECO Finance, Inc. | 100 | 106,028 | ||||||||||
5.15%, 3/15/20 | 125 | 137,087 | ||||||||||
|
| |||||||||||
| 548,682 | ||||||||||||
|
| |||||||||||
NATURAL GAS–0.8% | ||||||||||||
DCP Midstream LLC | U.S.$ | 137 | $ | 143,186 | ||||||||
Energy Transfer Partners LP | 295 | 346,119 | ||||||||||
Enterprise Products Operating LLC | 185 | 205,790 | ||||||||||
Kinder Morgan Energy | 679 | 671,470 | ||||||||||
3.95%, 9/01/22 | 424 | 413,171 | ||||||||||
Talent Yield Investments Ltd. | 490 | 481,778 | ||||||||||
TransCanada PipeLines Ltd. | 120 | 123,265 | ||||||||||
Williams Cos., Inc. (The) | 434 | 378,799 | ||||||||||
Williams Partners LP | 298 | 325,855 | ||||||||||
|
| |||||||||||
| 3,089,433 | ||||||||||||
|
| |||||||||||
| 3,638,115 | ||||||||||||
|
| |||||||||||
NON CORPORATE |
| |||||||||||
AGENCIES–NOT GOVERNMENT GUARANTEED–0.2% |
| |||||||||||
CNOOC Finance 2013 Ltd. | 286 | 255,450 | ||||||||||
Gazprom OAO Via Gaz | 290 | 319,725 | ||||||||||
|
| |||||||||||
| 575,175 | ||||||||||||
|
| |||||||||||
Total Corporates–Investment Grades | 35,673,779 | |||||||||||
|
| |||||||||||
MORTGAGE PASS- |
| |||||||||||
AGENCY FIXED RATE | ||||||||||||
Federal Home Loan Mortgage Corp. Gold | 855 | 878,045 | ||||||||||
4.50%, 10/01/39 | 1,839 | 1,948,525 | ||||||||||
Series 2005 | 470 | 514,646 | ||||||||||
Series 2007 | 49 | 54,075 | ||||||||||
Federal National Mortgage Association | 2,894 | 2,751,145 | ||||||||||
3.50%, 1/01/44, TBA | 7,350 | 7,301,192 | ||||||||||
4.00%, 1/01/44, TBA | 3,103 | 3,193,636 | ||||||||||
4.50%, 8/01/40 | 536 | 567,694 | ||||||||||
4.50%, 1/25/44, TBA | 1,095 | 1,160,229 | ||||||||||
5.00%, 12/01/39 | 304 | 332,199 | ||||||||||
5.00%, 1/25/44, TBA | 790 | 857,952 | ||||||||||
Series 2004 | 177 | 195,270 | ||||||||||
17
| BALANCED WEALTH STRATEGY PORTFOLIO | ||
| PORTFOLIOOF INVESTMENTS | ||
| (continued) | AllianceBernstein Variable Products Series Fund | |
| Principal Amount (000) | U.S. $ Value | |||||||||||
Series 2005 | ||||||||||||
4.50%, 8/01/35 | U.S.$ | 122 | $ | 129,892 | ||||||||
Series 2007 | 110 | 116,554 | ||||||||||
5.50%, 1/01/37-8/01/37 | 650 | 715,272 | ||||||||||
Series 2008 | 286 | 314,438 | ||||||||||
Series 2012 | ||||||||||||
3.00%, 11/01/42 | 658 | 625,728 | ||||||||||
Series 2013 | ||||||||||||
3.50%, 12/01/42 | 1,874 | 1,866,002 | ||||||||||
|
| |||||||||||
| 23,522,494 | ||||||||||||
|
| |||||||||||
AGENCY FIXED |
| |||||||||||
Federal National Mortgage Association | 3,375 | 3,340,195 | ||||||||||
3.50%, 2/01/29, TBA | 965 | 1,006,578 | ||||||||||
|
| |||||||||||
| 4,346,773 | ||||||||||||
|
| |||||||||||
AGENCY ARMS–0.3% | ||||||||||||
Federal Home Loan Mortgage Corp. | 708 | 753,685 | ||||||||||
Series 2008 | ||||||||||||
2.469%, 11/01/37(f) | 55 | 58,357 | ||||||||||
Federal National Mortgage Association | 280 | 299,437 | ||||||||||
Series 2007 | ||||||||||||
2.376%, 3/01/34(f) | 195 | 206,804 | ||||||||||
|
| |||||||||||
| 1,318,283 | ||||||||||||
|
| |||||||||||
Total Mortgage Pass-Throughs | 29,187,550 | |||||||||||
|
| |||||||||||
ASSET-BACKED SECURITIES–4.4% | ||||||||||||
AUTOS–FIXED | ||||||||||||
Ally Master Owner Trust | 775 | 778,527 | ||||||||||
Series 2013-1, Class A2 | 390 | 390,403 | ||||||||||
AmeriCredit Automobile Receivables Trust | ||||||||||||
Series 2012-4, Class A2 | ||||||||||||
0.49%, 4/08/16 | 288 | 287,879 | ||||||||||
Series 2013-1, Class A2 | ||||||||||||
0.49%, 6/08/16 | 276 | 275,864 | ||||||||||
Series 2013-3, Class A3 | ||||||||||||
0.92%, 4/09/18 | 670 | 669,962 | ||||||||||
Series 2013-4, Class A3 | ||||||||||||
0.96%, 4/09/18 | 275 | 275,416 | ||||||||||
Series 2013-5, Class A2A | ||||||||||||
0.65%, 3/08/17 | U.S.$ | 186 | $ | 185,991 | ||||||||
Capital Auto Receivables Asset Trust | 570 | 571,834 | ||||||||||
Capital Auto Receivables Asset Trust/Ally | 364 | 363,738 | ||||||||||
Carfinance Capital Auto Trust | 259 | 258,551 | ||||||||||
CarMax Auto Owner Trust | 127 | 127,191 | ||||||||||
Exeter Automobile Receivables Trust | ||||||||||||
Series 2012-2A, Class A | ||||||||||||
1.30%, 6/15/17(c) | 206 | 206,642 | ||||||||||
Series 2013-1A, Class A | ||||||||||||
1.29%, 10/16/17(c) | 192 | 192,125 | ||||||||||
Fifth Third Auto Trust | 386 | 385,797 | ||||||||||
Flagship Credit Auto Trust | 160 | 160,012 | ||||||||||
Ford Auto Securitization Trust | CAD | 164 | 154,765 | |||||||||
Series 2013-R1A, Class A2 | ||||||||||||
1.676%, 9/15/16(c) | 341 | 321,245 | ||||||||||
Series 2013-R4A, Class A1 | ||||||||||||
1.487%, 8/15/15(c) | 221 | 207,637 | ||||||||||
Ford Credit Auto Lease Trust Series 2012-B, Class A2 | U.S.$ | 195 | 195,148 | |||||||||
Ford Credit Auto Owner Trust Series 2012-D, Class B | 155 | 153,284 | ||||||||||
Ford Credit Floorplan Master Owner Trust | 590 | 590,790 | ||||||||||
Series 2013-1, Class A1 | ||||||||||||
0.85%, 1/15/18 | 279 | 278,955 | ||||||||||
Hertz Vehicle Financing LLC | 345 | 344,336 | ||||||||||
Huntington Auto Trust | 126 | 126,539 | ||||||||||
18
| AllianceBernstein Variable Products Series Fund |
| Principal Amount (000) | U.S. $ Value | |||||||||||
Hyundai Auto Receivables Trust | U.S.$ | 140 | $ | 142,188 | ||||||||
M&T Bank Auto | 416 | 417,052 | ||||||||||
Mercedes-Benz Master | 714 | 714,505 | ||||||||||
Navistar Financial Corp. | 102 | 101,515 | ||||||||||
Nissan Auto Lease Trust | 146 | 146,105 | ||||||||||
Santander Drive Auto Receivables Trust | 457 | 457,996 | ||||||||||
Series 2012-6, Class A2 | ||||||||||||
0.47%, 9/15/15 | 62 | 62,441 | ||||||||||
Series 2013-3, Class C | ||||||||||||
1.81%, 4/15/19 | 489 | 482,911 | ||||||||||
Series 2013-4, Class A3 | ||||||||||||
1.11%, 12/15/17 | 540 | 542,547 | ||||||||||
Series 2013-5, Class A2A | ||||||||||||
0.64%, 4/17/17 | 286 | 285,932 | ||||||||||
SMART Trust/Australia | 169 | 169,551 | ||||||||||
Volkswagen Auto Loan Enhanced Trust | 147 | 147,222 | ||||||||||
World Omni Automobile Lease Securitization Trust | 572 | 573,557 | ||||||||||
|
| |||||||||||
| 11,746,153 | ||||||||||||
|
| |||||||||||
OTHER ABS–FIXED | ||||||||||||
CIT Equipment Collateral | 184 | 184,151 | ||||||||||
Series 2013-VT1, Class A3 | ||||||||||||
1.13%, 7/20/20(c) | 466 | 465,915 | ||||||||||
CNH Equipment Trust | 269 | 269,306 | ||||||||||
Series 2013-C, Class A2 | ||||||||||||
0.63%, 1/17/17 | 378 | 377,707 | ||||||||||
Series 2013-D, Class A2 | ||||||||||||
0.49%, 3/15/17 | U.S.$ | 465 | $ | 465,077 | ||||||||
GE Equipment Midticket LLC | 98 | 98,480 | ||||||||||
|
| |||||||||||
| 1,860,636 | ||||||||||||
|
| |||||||||||
CREDIT CARDS–FLOATING Rate–0.3% | ||||||||||||
First National Master | 346 | 346,000 | ||||||||||
Gracechurch Card Funding PLC | 490 | 492,486 | ||||||||||
Penarth Master Issuer PLC | 545 | 545,129 | ||||||||||
|
| |||||||||||
| 1,383,615 | ||||||||||||
|
| |||||||||||
CREDIT CARDS–FIXED RATE–0.3% | ||||||||||||
Dryrock Issuance Trust | 560 | 559,837 | ||||||||||
World Financial Network Credit Card Master Trust | 310 | 309,454 | ||||||||||
Series 2013-A, Class A | ||||||||||||
1.61%, 12/15/21 | 246 | 241,339 | ||||||||||
|
| |||||||||||
| 1,110,630 | ||||||||||||
|
| |||||||||||
AUTOS–FLOATING RATE–0.2% |
| |||||||||||
GE Dealer Floorplan Master Note Trust | 790 | 792,117 | ||||||||||
|
| |||||||||||
HOME EQUITY LOANS–FLOATING RATE–0.1% | ||||||||||||
GSAA Home Equity Trust | 413 | 279,922 | ||||||||||
Residential Asset Securities Corp. Trust | 1 | 902 | ||||||||||
|
| |||||||||||
| 280,824 | ||||||||||||
|
| |||||||||||
HOME EQUITY LOANS–FIXED |
| |||||||||||
Credit-Based Asset Servicing and Securitization LLC | 93 | 91,735 | ||||||||||
|
| |||||||||||
Total Asset-Backed Securities | 17,265,710 | |||||||||||
|
| |||||||||||
19
| BALANCED WEALTH STRATEGY PORTFOLIO | ||
| PORTFOLIOOF INVESTMENTS | ||
| (continued) | AllianceBernstein Variable Products Series Fund | |
| Principal Amount (000) | U.S. $ Value | |||||||||||
GOVERNMENTS– |
| |||||||||||
UNITED STATES–4.1% | ||||||||||||
U.S. Treasury Bonds | ||||||||||||
2.75%, 8/15/42 | U.S.$ | 280 | $ | 221,856 | ||||||||
3.125%, 2/15/43 | 670 | 573,688 | ||||||||||
3.625%, 8/15/43 | 1,195 | 1,128,528 | ||||||||||
4.625%, 2/15/40 | 3,835 | 4,331,153 | ||||||||||
5.375%, 2/15/31 | 5 | 6,127 | ||||||||||
U.S. Treasury Notes | ||||||||||||
0.75%, 6/30/17 | 775 | 766,826 | ||||||||||
0.875%, 11/30/16 | 890 | 892,851 | ||||||||||
1.00%, 3/31/17 | 2,790 | 2,796,105 | ||||||||||
1.25%, 10/31/18 | 1,115 | 1,093,136 | ||||||||||
1.50%, 12/31/18 | 835 | 825,606 | ||||||||||
1.625%, 11/15/22 | 955 | 862,036 | ||||||||||
1.75%, 10/31/20-5/15/22 | 2,015 | 1,904,004 | ||||||||||
2.00%, 11/15/21 | 645 | 615,622 | ||||||||||
2.50%, 8/15/23 | 305 | 292,895 | ||||||||||
|
| |||||||||||
Total Governments–Treasuries | 16,310,433 | |||||||||||
|
| |||||||||||
COMMERCIAL MORTGAGE-BACKED SECURITIES–3.1% |
| |||||||||||
NON-AGENCY FIXED RATE |
| |||||||||||
Banc of America Commercial Mortgage Trust | 635 | 692,385 | ||||||||||
CGRBS Commercial Mortgage Trust | 495 | 470,171 | ||||||||||
Citigroup Commercial Mortgage Trust | 81 | 81,744 | ||||||||||
Series 2006-C4, Class A1A | 265 | 287,765 | ||||||||||
COBALT CMBS Commercial Mortgage Trust | 312 | 344,888 | ||||||||||
Commercial Mortgage Pass-Through Certificates | 238 | 229,509 | ||||||||||
Credit Suisse Commercial Mortgage Trust | 602 | 655,869 | ||||||||||
Series 2006-C3, Class AJ | 190 | 187,797 | ||||||||||
Credit Suisse First Boston Mortgage Securities Corp. | 233 | 239,421 | ||||||||||
| Principal Amount (000) | U.S. $ Value | |||||||||||
Extended Stay America Trust | U.S.$ | 330 | $ | 324,630 | ||||||||
GS Mortgage Securities Corp. II Series 2004-GG2, | 62 | 62,604 | ||||||||||
Series 2013-KING, Class A | 510 | 501,488 | ||||||||||
JP Morgan Chase Commercial Mortgage Securities Trust | 533 | 540,329 | ||||||||||
Series 2005-CB11, Class A4 | 168 | 174,717 | ||||||||||
Series 2007-CB18, | 608 | 666,226 | ||||||||||
Series 2007-CB19, | 175 | 187,854 | ||||||||||
Series 2007-LD12, | 280 | 310,357 | ||||||||||
Series 2007-LDPX, | 597 | 657,962 | ||||||||||
Series 2010-C2, Class A1 | 326 | 333,774 | ||||||||||
LB-UBS Commercial Mortgage Trust | 9 | 9,438 | ||||||||||
Series 2006-C1, Class A4 | 620 | 662,182 | ||||||||||
Merrill Lynch Mortgage Trust | 292 | 292,085 | ||||||||||
Series 2006-C2, Class A1A | 322 | 353,309 | ||||||||||
ML-CFC Commercial Mortgage Trust | 611 | 666,566 | ||||||||||
Motel 6 Trust | 480 | 475,173 | ||||||||||
UBS-Barclays Commercial Mortgage Trust | 86 | 81,809 | ||||||||||
Series 2012-C4, Class A5 | 168 | 156,498 | ||||||||||
20
| AllianceBernstein Variable Products Series Fund |
| Principal Amount (000) | U.S. $ Value | |||||||||||
Wachovia Bank Commercial Mortgage Trust | U.S.$ | 840 | $ | 919,211 | ||||||||
WF-RBS Commercial Mortgage Trust | 456 | 437,659 | ||||||||||
|
| |||||||||||
| 11,003,420 | ||||||||||||
|
| |||||||||||
NON-AGENCY FLOATING RATE CMBS–0.3% | ||||||||||||
Banc of America Commercial Mortgage Trust | 150 | 159,915 | ||||||||||
Extended Stay America Trust Series 2013-ESFL, Class A2FL | 250 | 248,675 | ||||||||||
GS Mortgage Securities | 505 | 502,942 | ||||||||||
GS Mortgage Securities Trust Series 2013-G1, Class A2 3.557%, 4/10/31(c)(f) | 276 | 257,874 | ||||||||||
|
| |||||||||||
| 1,169,406 | ||||||||||||
|
| |||||||||||
Total Commercial Mortgage-Backed Securities | 12,172,826 | |||||||||||
|
| |||||||||||
CORPORATES–NON-INVESTMENT GRADES–1.3% |
| |||||||||||
INDUSTRIAL–0.7% | ||||||||||||
BASIC–0.0% | ||||||||||||
Eagle Spinco, Inc. | 40 | 39,200 | ||||||||||
|
| |||||||||||
CAPITAL GOODS–0.2% | ||||||||||||
B/E Aerospace, Inc. | 159 | 161,385 | ||||||||||
Ball Corp. | 290 | 287,100 | ||||||||||
Sealed Air Corp. | 171 | 166,297 | ||||||||||
|
| |||||||||||
| 614,782 | ||||||||||||
|
| |||||||||||
COMMUNICATIONS–MEDIA–0.1% |
| |||||||||||
DISH DBS Corp. | 210 | 195,825 | ||||||||||
Sirius XM Holdings, Inc. | 215 | 194,575 | ||||||||||
|
| |||||||||||
| 390,400 | ||||||||||||
|
| |||||||||||
COMMUNICATIONS–TELECOMMUNICATIONS–0.1% |
| |||||||||||
MetroPCS Wireless, Inc. | 195 | 201,337 | ||||||||||
Sprint Corp. | 205 | 220,375 | ||||||||||
Telecom Italia Capital SA | U.S.$ | 65 | $ | 56,306 | ||||||||
7.175%, 6/18/19 | 95 | 106,638 | ||||||||||
|
| |||||||||||
| 584,656 | ||||||||||||
|
| |||||||||||
CONSUMER CYCLICAL– |
| |||||||||||
Dana Holding Corp. | 76 | 76,190 | ||||||||||
|
| |||||||||||
CONSUMER |
| |||||||||||
MCE Finance Ltd. | 210 | 205,275 | ||||||||||
Wynn Las Vegas LLC/Wynn Las Vegas Capital Corp. 5.375%, 3/15/22 | 295 | 297,950 | ||||||||||
|
| |||||||||||
| 503,225 | ||||||||||||
|
| |||||||||||
CONSUMER |
| |||||||||||
HCA, Inc. | 210 | 197,400 | ||||||||||
|
| |||||||||||
ENERGY–0.1% | ||||||||||||
Cimarex Energy Co. | 145 | 153,338 | ||||||||||
Denbury Resources, Inc. | 210 | 189,525 | ||||||||||
|
| |||||||||||
| 342,863 | ||||||||||||
|
| |||||||||||
| 2,748,716 | ||||||||||||
|
| |||||||||||
FINANCIAL |
| |||||||||||
BANKING–0.5% | ||||||||||||
ABN AMRO Bank NV | EUR | 90 | 123,132 | |||||||||
Barclays Bank PLC | U.S.$ | 480 | 511,200 | |||||||||
Citigroup, Inc. | 278 | 257,247 | ||||||||||
HBOS Capital Funding LP | 194 | 193,273 | ||||||||||
LBG Capital No.1 PLC | 235 | 250,920 | ||||||||||
Societe Generale SA | EUR | 102 | 140,322 | |||||||||
5.922%, 4/05/17(c) | U.S.$ | 100 | 104,500 | |||||||||
7.875%, 12/18/23(c) | 200 | 201,500 | ||||||||||
|
| |||||||||||
| 1,782,094 | ||||||||||||
|
| |||||||||||
FINANCE–0.1% | ||||||||||||
Aviation Capital Group Corp. | 173 | 193,828 | ||||||||||
SLM Corp. | 38 | 40,185 | ||||||||||
Series A | ||||||||||||
5.375%, 5/15/14 | 270 | 274,725 | ||||||||||
|
| |||||||||||
| 508,738 | ||||||||||||
|
| |||||||||||
| 2,290,832 | ||||||||||||
|
| |||||||||||
21
| BALANCED WEALTH STRATEGY PORTFOLIO | ||
| PORTFOLIOOF INVESTMENTS | ||
| (continued) | AllianceBernstein Variable Products Series Fund | |
| Principal Amount (000) | U.S. $ Value | |||||||||||
UTILITY–0.0% | ||||||||||||
NATURAL GAS–0.0% | ||||||||||||
Regency Energy Partners LP/Regency Energy Finance Corp. | U.S.$ | 60 | $ | 54,600 | ||||||||
|
| |||||||||||
Total Corporates–Non- | 5,094,148 | |||||||||||
|
| |||||||||||
AGENCIES–1.0% | ||||||||||||
AGENCY DEBENTURES–1.0% |
| |||||||||||
Federal National Mortgage Association | 740 | 927,696 | ||||||||||
6.625%, 11/15/30 | 2,277 | 2,961,871 | ||||||||||
|
| |||||||||||
Total Agencies | 3,889,567 | |||||||||||
|
| |||||||||||
INFLATION-LINKED SECURITIES–1.0% | ||||||||||||
UNITED STATES–1.0% | ||||||||||||
U.S. Treasury Inflation Index 0.125%, 4/15/16 (TIPS) | 3,756 | 3,857,094 | ||||||||||
|
| |||||||||||
LOCAL GOVERNMENTS–MUNICIPAL BONDS–0.7% |
| |||||||||||
UNITED STATES–0.7% | ||||||||||||
Broward Cnty FL Arpt System Revenue (Fort Lauderdale Hollywood Intl Arpt Fl) | 485 | 479,854 | ||||||||||
California GO | 345 | 451,215 | ||||||||||
City Public Service Board of | 485 | 493,478 | ||||||||||
Contra Costa CA Community College District | 485 | 501,776 | ||||||||||
Metropolitan Trnsp Auth NY | 515 | 519,187 | ||||||||||
University of Massachusetts Building Authority | 485 | 504,255 | ||||||||||
|
| |||||||||||
Total Local Governments–Municipal Bonds | 2,949,765 | |||||||||||
|
| |||||||||||
QUASI-SOVEREIGNS–0.7% | ||||||||||||
QUASI-SOVEREIGN BONDS–0.7% | ||||||||||||
CHINA – 0.1% | ||||||||||||
Sinopec Group Overseas Development 2013 Ltd. | 480 | 473,081 | ||||||||||
|
| |||||||||||
INDONESIA–0.1% | ||||||||||||
Perusahaan Listrik Negara PT | U.S.$ | 250 | $ | 240,625 | ||||||||
|
| |||||||||||
KAZAKHSTAN–0.1% | ||||||||||||
KazMunayGas National Co. JSC | 251 | 281,747 | ||||||||||
|
| |||||||||||
MALAYSIA–0.1% | ||||||||||||
Petronas Capital Ltd. | 460 | 504,183 | ||||||||||
|
| |||||||||||
MEXICO–0.1% | ||||||||||||
Petroleos Mexicanos | 265 | 271,956 | ||||||||||
|
| |||||||||||
SOUTH KOREA–0.1% | ||||||||||||
Korea National Oil Corp. | 485 | 499,509 | ||||||||||
|
| |||||||||||
UNITED ARAB | ||||||||||||
IPIC GMTN Ltd. | 465 | 489,994 | ||||||||||
|
| |||||||||||
Total Quasi-Sovereigns | 2,761,095 | |||||||||||
|
| |||||||||||
COLLATERALIZED MORTGAGE | ||||||||||||
NON-AGENCY FLOATING |
| |||||||||||
Deutsche Alt-A Securities Mortgage Loan Trust | 435 | 249,016 | ||||||||||
HomeBanc Mortgage Trust | 232 | 193,133 | ||||||||||
IndyMac Index Mortgage Loan Trust | 326 | 243,528 | ||||||||||
Series 2006-AR27, | ||||||||||||
0.365%, 10/25/36(d) | 348 | 294,217 | ||||||||||
|
| |||||||||||
| 979,894 | ||||||||||||
|
| |||||||||||
AGENCY FIXED | ||||||||||||
Federal Home Loan Mortgage Corp. | 1,701 | 330,773 | ||||||||||
Series 4182, Class DI | 1,590 | 283,423 | ||||||||||
Freddie Mac Strips | 1,130 | 179,981 | ||||||||||
|
| |||||||||||
| 794,177 | ||||||||||||
|
| |||||||||||
22
| AllianceBernstein Variable Products Series Fund |
| Principal Amount (000) | U.S. $ Value | |||||||||||
NON-AGENCY FIXED | ||||||||||||
Citigroup Mortgage Loan Trust, Inc. | U.S.$ | 34 | $ | 32,389 | ||||||||
Countrywide Home Loan Mortgage Pass-Through Trust | 339 | 272,290 | ||||||||||
First Horizon Alternative Mortgage Securities Trust | 281 | 238,209 | ||||||||||
Merrill Lynch Mortgage Investors Trust | 4 | 4,281 | ||||||||||
|
| |||||||||||
| 547,169 | ||||||||||||
|
| |||||||||||
Total Collateralized Mortgage Obligations | 2,321,240 | |||||||||||
|
| |||||||||||
EMERGING MARKETS– |
| |||||||||||
INDUSTRIAL–0.2% | ||||||||||||
CAPITAL GOODS–0.1% | ||||||||||||
Cemex SAB de CV | 200 | 206,172 | ||||||||||
|
| |||||||||||
COMMUNICATIONS– |
| |||||||||||
Mobile Telesystems OJSC via MTS International Funding Ltd. | 200 | 184,481 | ||||||||||
VimpelCom Holdings BV | 200 | 199,954 | ||||||||||
|
| |||||||||||
| 384,435 | ||||||||||||
|
| |||||||||||
CONSUMER NON-CYCLICAL–0.0% | ||||||||||||
Marfrig Overseas Ltd. | 195 | 181,350 | ||||||||||
|
| |||||||||||
ENERGY – 0.0% | ||||||||||||
Pacific Rubiales Energy Corp. | 100 | 89,667 | ||||||||||
|
| |||||||||||
Total Emerging Markets–Corporate Bonds | 861,624 | |||||||||||
|
| |||||||||||
GOVERNMENTS–SOVEREIGN |
| |||||||||||
QATAR–0.1% | ||||||||||||
Qatar Government International Bond | U.S.$ | 270 | $ | 285,795 | ||||||||
|
| |||||||||||
RUSSIA–0.1% | ||||||||||||
Russian Foreign Bond–Eurobond | 222 | 258,267 | ||||||||||
|
| |||||||||||
TURKEY–0.0% | ||||||||||||
Turkey Government International Bond | 275 | 210,512 | ||||||||||
|
| |||||||||||
Total Governments–Sovereign Bonds | 754,574 | |||||||||||
|
| |||||||||||
| Shares | ||||||||||||
PREFERRED STOCKS–0.2% |
| |||||||||||
FINANCIAL INSTITUTIONS–0.2% | ||||||||||||
BANKING–0.1% | ||||||||||||
Morgan Stanley | 15,000 | 392,100 | ||||||||||
|
| |||||||||||
INSURANCE–0.1% | ||||||||||||
Allstate Corp. (The) | 9,175 | 221,209 | ||||||||||
|
| |||||||||||
Total Preferred Stocks | 613,309 | |||||||||||
|
| |||||||||||
WARRANTS–0.1% | ||||||||||||
CONSUMER | ||||||||||||
FOOD & STAPLES RETAILING–0.0% | ||||||||||||
Olam International Ltd., expiring 1/29/18(a) | 72,151 | 18,038 | ||||||||||
|
| |||||||||||
FINANCIALS–0.1% | ||||||||||||
REAL ESTATE MANAGEMENT & DEVELOPMENT–0.1% | ||||||||||||
Emaar Properties PJSC, Merrill Lynch Intl & Co., expiring 10/01/15(a) | 100,260 | 208,551 | ||||||||||
|
| |||||||||||
Total Warrants | 226,589 | |||||||||||
|
| |||||||||||
| Principal Amount (000) | ||||||||||||
SHORT-TERM INVESTMENTS–5.5% | ||||||||||||
TIME DEPOSIT–4.5% | ||||||||||||
State Street Time Deposit | U.S.$ | 17,646 | 17,646,162 | |||||||||
|
| |||||||||||
23
| BALANCED WEALTH STRATEGY PORTFOLIO | ||
| PORTFOLIOOF INVESTMENTS | ||
| (continued) | AllianceBernstein Variable Products Series Fund | |
| Principal Amount (000) | U.S. $ Value | |||||||||||
GOVERNMENTS–TREASURIES–1.0% | ||||||||||||
JAPAN–1.0% | ||||||||||||
Japan Treasury Discount Bill | JPY | 220,000 | $ | 2,089,033 | ||||||||
Zero Coupon, 1/20/14 | 180,000 | 1,709,192 | ||||||||||
|
| |||||||||||
Total Governments–Treasuries | 3,798,225 | |||||||||||
|
| |||||||||||
Total Short-Term Investments | 21,444,387 | |||||||||||
|
| |||||||||||
Total Investments Before Security Lending Collateral for Securities | 409,676,929 | |||||||||||
|
| |||||||||||
INVESTMENTS OF CASH COLLATERAL FOR SECURITIES LOANED–0.7% | ||||||||||||
INVESTMENT | ||||||||||||
AllianceBernstein Exchange Reserves–Class I, 0.07%(h) (cost $2,812,758) | 2,812,758 | $ | 2,812,758 | |||||||||
|
| |||||||||||
TOTAL INVESTMENTS–105.1% | 412,489,687 | |||||||||||
Other assets less | (19,912,960 | ) | ||||||||||
|
| |||||||||||
Net Assets–100.0% | $ | 392,576,727 | ||||||||||
|
| |||||||||||
FUTURES (see Note D)
| Type | Number of Contracts | Expiration Month | Original Value | Value at December 31, 2013 | Unrealized Appreciation/ (Depreciation) | |||||||||||||||
Purchased Contracts | ||||||||||||||||||||
Euro STOXX 50 Index Futures | 2 | March 2014 | $ | 81,637 | $ | 85,513 | $ | 3,876 | ||||||||||||
FTSE 100 Index Futures | 1 | March 2014 | 106,943 | 110,908 | 3,965 | |||||||||||||||
TOPIX Index Futures | 1 | March 2014 | 116,861 | 123,682 | 6,821 | |||||||||||||||
|
| |||||||||||||||||||
| $ | 14,662 | |||||||||||||||||||
|
| |||||||||||||||||||
FORWARD CURRENCY EXCHANGE CONTRACTS (see Note D)
| Counterparty | Contracts to Deliver (000) | In Exchange For (000) | Settlement Date | Unrealized Appreciation/ (Depreciation) | ||||||||||||
Barclays Bank PLC Wholesale | JPY | 220,000 | USD | 2,169 | 1/14/14 | $ | 80,325 | |||||||||
Barclays Bank PLC Wholesale | JPY | 180,000 | USD | 1,775 | 1/21/14 | 65,726 | ||||||||||
Barclays Bank PLC Wholesale | GBP | 516 | USD | 821 | 2/18/14 | (33,501 | ) | |||||||||
Barclays Bank PLC Wholesale | USD | 408 | CHF | 371 | 2/18/14 | 8,405 | ||||||||||
Barclays Bank PLC Wholesale | USD | 100 | CNY | 613 | 2/18/14 | 444 | ||||||||||
Barclays Bank PLC Wholesale | USD | 531 | JPY | 52,310 | 2/18/14 | (33,696 | ) | |||||||||
Barclays Bank PLC Wholesale | JPY | 45,601 | USD | 442 | 3/18/14 | 8,777 | ||||||||||
Barclays Bank PLC Wholesale | USD | 905 | SEK | 5,914 | 3/18/14 | 13,328 | ||||||||||
BNP Paribas SA | USD | 253 | KRW | 270,656 | 2/18/14 | 3,749 | ||||||||||
BNP Paribas SA | USD | 869 | NZD | 1,045 | 2/18/14 | (11,821 | ) | |||||||||
Citibank, NA | NOK | 2,298 | USD | 387 | 2/18/14 | 8,539 | ||||||||||
Citibank, NA | USD | 2,279 | SEK | 14,570 | 2/18/14 | (15,832 | ) | |||||||||
Credit Suisse International | CHF | 976 | USD | 1,099 | 2/18/14 | 4,848 | ||||||||||
Credit Suisse International | EUR | 984 | USD | 1,324 | 2/18/14 | (29,868 | ) | |||||||||
Credit Suisse International | JPY | 194,460 | USD | 1,961 | 2/18/14 | 113,594 | ||||||||||
24
| AllianceBernstein Variable Products Series Fund |
| Counterparty | Contracts to Deliver (000) | In Exchange For (000) | Settlement Date | Unrealized Appreciation/ (Depreciation) | ||||||||||||
Credit Suisse International | USD | 228 | CHF | 207 | 2/18/14 | $ | 4,441 | |||||||||
Credit Suisse International | USD | 523 | NOK | 3,214 | 2/18/14 | 6,347 | ||||||||||
Credit Suisse International | JPY | 61,987 | USD | 613 | 3/18/14 | 23,782 | ||||||||||
Credit Suisse International | USD | 483 | NOK | 2,973 | 3/18/14 | 5,858 | ||||||||||
Deutsche Bank AG London | JPY | 257,988 | USD | 2,653 | 2/18/14 | 202,321 | ||||||||||
Goldman Sachs Bank USA | CAD | 822 | USD | 770 | 1/16/14 | (3,410 | ) | |||||||||
Goldman Sachs Bank USA | CHF | 442 | USD | 494 | 2/18/14 | (1,389 | ) | |||||||||
Goldman Sachs Bank USA | GBP | 658 | USD | 1,059 | 2/18/14 | (30,358 | ) | |||||||||
Goldman Sachs Bank USA | JPY | 34,768 | USD | 344 | 2/18/14 | 14,059 | ||||||||||
Goldman Sachs Bank USA | USD | 1,405 | AUD | 1,494 | 2/18/14 | (75,140 | ) | |||||||||
Goldman Sachs Bank USA | USD | 2,528 | EUR | 1,835 | 2/18/14 | (3,846 | ) | |||||||||
Goldman Sachs Bank USA | AUD | 1,208 | USD | 1,068 | 3/18/14 | (5,151 | ) | |||||||||
HSBC Bank USA | USD | 1,338 | GBP | 828 | 2/18/14 | 32,411 | ||||||||||
Royal Bank of Scotland PLC | EUR | 562 | USD | 758 | 2/18/14 | (14,983 | ) | |||||||||
Royal Bank of Scotland PLC | SEK | 3,826 | USD | 575 | 2/18/14 | (18,896 | ) | |||||||||
Royal Bank of Scotland PLC | USD | 196 | EUR | 145 | 2/18/14 | 3,299 | ||||||||||
Royal Bank of Scotland PLC | CAD | 1,284 | USD | 1,204 | 3/18/14 | (2,337 | ) | |||||||||
Royal Bank of Scotland PLC | USD | 834 | NZD | 1,015 | 3/18/14 | (3,380 | ) | |||||||||
Standard Chartered Bank | CNY | 4,989 | USD | 814 | 2/18/14 | (3,171 | ) | |||||||||
Standard Chartered Bank | EUR | 486 | USD | 668 | 2/18/14 | (658 | ) | |||||||||
Standard Chartered Bank | HKD | 31,031 | USD | 4,004 | 2/18/14 | 1,931 | ||||||||||
Standard Chartered Bank | KRW | 1,613,462 | USD | 1,507 | 2/18/14 | (24,959 | ) | |||||||||
Standard Chartered Bank | USD | 240 | CNY | 1,470 | 2/18/14 | 710 | ||||||||||
Standard Chartered Bank | USD | 1,643 | JPY | 168,537 | 2/18/14 | (41,978 | ) | |||||||||
Standard Chartered Bank | USD | 409 | KRW | 438,974 | 2/18/14 | 7,956 | ||||||||||
Standard Chartered Bank | USD | 449 | SGD | 559 | 2/18/14 | (6,088 | ) | |||||||||
Standard Chartered Bank | EUR | 668 | USD | 918 | 3/18/14 | (900 | ) | |||||||||
Standard Chartered Bank | USD | 748 | JPY | 76,730 | 3/18/14 | (19,104 | ) | |||||||||
State Street Bank & Trust Co. | USD | 51 | CAD | 54 | 1/16/14 | (45 | ) | |||||||||
State Street Bank & Trust Co. | GBP | 188 | USD | 305 | 1/30/14 | (5,737 | ) | |||||||||
State Street Bank & Trust Co. | AUD | 736 | USD | 687 | 2/18/14 | 32,498 | ||||||||||
State Street Bank & Trust Co. | AUD | 464 | USD | 412 | 2/18/14 | (1,283 | ) | |||||||||
State Street Bank & Trust Co. | CHF | 444 | USD | 486 | 2/18/14 | (12,400 | ) | |||||||||
State Street Bank & Trust Co. | EUR | 355 | USD | 479 | 2/18/14 | (9,345 | ) | |||||||||
State Street Bank & Trust Co. | GBP | 170 | USD | 273 | 2/18/14 | (8,632 | ) | |||||||||
State Street Bank & Trust Co. | NOK | 1,941 | USD | 322 | 2/18/14 | 2,822 | ||||||||||
State Street Bank & Trust Co. | NOK | 1,276 | USD | 208 | 2/18/14 | (2,037 | ) | |||||||||
State Street Bank & Trust Co. | SEK | 3,346 | USD | 505 | 2/18/14 | (15,052 | ) | |||||||||
State Street Bank & Trust Co. | SGD | 203 | USD | 163 | 2/18/14 | 2,015 | ||||||||||
State Street Bank & Trust Co. | USD | 657 | AUD | 719 | 2/18/14 | (16,774 | ) | |||||||||
State Street Bank & Trust Co. | USD | 1,773 | CHF | 1,629 | 2/18/14 | 54,160 | ||||||||||
State Street Bank & Trust Co. | USD | 1,705 | EUR | 1,275 | 2/18/14 | 48,608 | ||||||||||
State Street Bank & Trust Co. | USD | 1,210 | GBP | 749 | 2/18/14 | 29,805 | ||||||||||
State Street Bank & Trust Co. | USD | 397 | HKD | 3,079 | 2/18/14 | 3 | ||||||||||
State Street Bank & Trust Co. | USD | 1,440 | HKD | 11,161 | 2/18/14 | (457 | ) | |||||||||
State Street Bank & Trust Co. | USD | 658 | JPY | 65,933 | 2/18/14 | (32,176 | ) | |||||||||
State Street Bank & Trust Co. | USD | 451 | NOK | 2,768 | 2/18/14 | 5,273 | ||||||||||
State Street Bank & Trust Co. | USD | 405 | NOK | 2,455 | 2/18/14 | (1,128 | ) | |||||||||
State Street Bank & Trust Co. | USD | 197 | NZD | 241 | 2/18/14 | 955 | ||||||||||
State Street Bank & Trust Co. | USD | 485 | NZD | 588 | 2/18/14 | (3,393 | ) | |||||||||
25
| BALANCED WEALTH STRATEGY PORTFOLIO | ||
| PORTFOLIOOF INVESTMENTS | ||
| (continued) | AllianceBernstein Variable Products Series Fund | |
| Counterparty | Contracts to Deliver (000) | In Exchange For (000) | Settlement Date | Unrealized Appreciation/ (Depreciation) | ||||||||||||
State Street Bank & Trust Co. | USD | 1,459 | SEK | 9,574 | 2/18/14 | $ | 27,871 | |||||||||
State Street Bank & Trust Co. | GBP | 66 | USD | 107 | 3/18/14 | (1,907 | ) | |||||||||
State Street Bank & Trust Co. | NZD | 279 | USD | 229 | 3/18/14 | 823 | ||||||||||
State Street Bank & Trust Co. | USD | 417 | EUR | 304 | 3/18/14 | 927 | ||||||||||
UBS AG | EUR | 603 | USD | 829 | 1/30/14 | (399 | ) | |||||||||
UBS AG | GBP | 450 | USD | 717 | 2/18/14 | (28,212 | ) | |||||||||
UBS AG | NZD | 1,127 | USD | 926 | 2/18/14 | 1,678 | ||||||||||
UBS AG | USD | 698 | AUD | 773 | 3/18/14 | (10,977 | ) | |||||||||
|
| |||||||||||||||
| $ | 287,868 | |||||||||||||||
|
| |||||||||||||||
CENTRALLY CLEARED CREDIT DEFAULT SWAPS (see Note D)
Clearing Agent/ Referenced Obligation | Fixed Rate (Pay) Receive | Implied Credit Spread at December 31, 2013 | Notional Amount (000) | Market Value | Upfront Premiums Paid (Received) | Unrealized Appreciation/ (Depreciation) | ||||||||||||||||||
Buy Contracts | ||||||||||||||||||||||||
Morgan Stanley & Co., LLC/(INTRCONX): | ||||||||||||||||||||||||
CDX-NAHY Series 21, 5 Year Index, 12/20/18* | (5.00 | )% | 0.47 | % | $ | 2,900 | $ | (252,243 | ) | $ | (116,063 | ) | $ | (136,180 | ) | |||||||||
| * | Termination date |
CREDIT DEFAULT SWAPS (see Note D)
| Swap Counterparty & Referenced Obligation | Fixed Rate (Pay) Receive | Implied Credit Spread at December 31, 2013 | Notional Amount (000) | Market Value | Upfront Premiums Paid (Received) | Unrealized Appreciation/ (Depreciation) | ||||||||||||||||||
Sale Contracts | ||||||||||||||||||||||||
BNP Paribas SA: | ||||||||||||||||||||||||
Anadarko Petroleum Corp. 5.95%, 9/15/16, 9/20/17* | 1.00 | % | 3.03 | % | $ | 530 | $ | 10,384 | $ | (13,345 | ) | $ | 23,729 | |||||||||||
| * | Termination date |
26
| AllianceBernstein Variable Products Series Fund |
INTEREST RATE SWAPS (see Note D)
| Rate Type | ||||||||||||||||||||
| Swap Counterparty | Notional Amount (000) | Termination Date | Payments made by the Fund | Payments received by the Fund | Unrealized Appreciation/ (Depreciation) | |||||||||||||||
JPMorgan Chase Bank, NA | $ | 1,970 | 1/30/17 | 1.059 | % | 3 Month LIBOR | $ | (17,099 | ) | |||||||||||
JPMorgan Chase Bank, NA | 2,200 | 2/07/22 | 2.043 | % | 3 Month LIBOR | 99,005 | ||||||||||||||
|
| |||||||||||||||||||
| $ | 81,906 | |||||||||||||||||||
|
| |||||||||||||||||||
| (a) | Non-income producing security. |
| (b) | Represents entire or partial securities out on loan. See Note E for securities lending information. |
| (c) | Security is exempt from registration under Rule 144A of the Securities Act of 1933. These securities are considered liquid and may be resold in transactions exempt from registration, normally to qualified institutional buyers. At December 31, 2013, the aggregate market value of these securities amounted to $24,189,254 or 6.2% of net assets. |
| (d) | Floating Rate Security. Stated interest rate was in effect at December 31, 2013. |
| (e) | Coupon rate adjusts periodically based upon a predetermined schedule. Stated interest rate in effect at December 31, 2013. |
| (f) | Variable rate coupon, rate shown as of December 31, 2013. |
| (g) | IO - Interest Only |
| (h) | Investment in affiliated money market mutual fund. The rate shown represents the 7-day yield as of period end. |
Currency Abbreviations:
AUD—Australian Dollar
CAD—Canadian Dollar
CHF—Swiss Franc
CNY—Chinese Yuan Renminbi
EUR—Euro
GBP—Great British Pound
HKD—Hong Kong Dollar
JPY—Japanese Yen
KRW—South Korean Won
NOK—Norwegian Krone
NZD—New Zealand Dollar
SEK—Swedish Krona
SGD—Singapore Dollar
USD—United States Dollar
Glossary:
ABS—Asset-Backed Securities
ADR—American Depositary Receipt
ARMs—Adjustable Rate Mortgages
CMBS—Commercial Mortgage-Backed Securities
FTSE—Financial Times Stock Exchange
GO—General Obligation
INTRCONX—Inter-Continental Exchange
JSC—Joint Stock Company
LIBOR—London Interbank Offered Rates
OJSC—Open Joint Stock Company
PJSC—Public Joint Stock Company
REG—Registered Shares
REIT—Real Estate Investment Trust
TBA—To Be Announced
TOPIX—Tokyo Price Index
See notes to financial statements.
27
| BALANCED WEALTH STRATEGY PORTFOLIO | ||
| STATEMENTOF ASSETS & LIABILITIES | ||
| December 31, 2013 | AllianceBernstein Variable Products Series Fund | |
ASSETS | ||||
Investments in securities, at value | $ | 409,676,929 | (a) | |
Affiliated issuers (cost $2,812,758—investment of cash collateral for securities loaned) | 2,812,758 | |||
Cash | 287,152 | (b)(c) | ||
Foreign currencies, at value (cost $490,173) | 488,607 | |||
Interest and dividends receivable | 1,388,089 | |||
Receivable for investment securities sold and foreign currency transactions | 1,262,849 | |||
Unrealized appreciation of forward currency exchange contracts | 818,288 | |||
Unrealized appreciation on interest rate swaps | 99,005 | |||
Unrealized appreciation on credit default swaps | 23,729 | |||
Receivable for capital stock sold | 22,726 | |||
Receivable for variation margin on futures | 53 | |||
|
| |||
Total assets | 416,880,185 | |||
|
| |||
LIABILITIES | ||||
Payable for investment securities purchased and foreign currency transactions | 20,056,050 | |||
Payable for collateral received on securities loaned | 2,812,758 | |||
Unrealized depreciation of forward currency exchange contracts | 530,420 | |||
Payable for capital stock redeemed | 330,389 | |||
Advisory fee payable | 175,484 | |||
Upfront premium received on centrally cleared credit default swaps | 116,063 | |||
Distribution fee payable | 71,367 | |||
Unrealized depreciation on interest rate swaps | 17,099 | |||
Administrative fee payable | 14,445 | |||
Upfront premium received on credit default swaps | 13,345 | |||
Payable for variation margin on centrally cleared credit default swaps | 8,353 | |||
Transfer Agent fee payable | 112 | |||
Accrued expenses | 157,573 | |||
|
| |||
Total liabilities | 24,303,458 | |||
|
| |||
NET ASSETS | $ | 392,576,727 | ||
|
| |||
COMPOSITION OF NET ASSETS | ||||
Capital stock, at par | $ | 28,739 | ||
Additional paid-in capital | 269,118,057 | |||
Undistributed net investment income | 8,255,542 | |||
Accumulated net realized gain on investment and foreign currency transactions | 52,505,140 | |||
Net unrealized appreciation on investments and foreign currency denominated assets and liabilities | 62,669,249 | |||
|
| |||
| $ | 392,576,727 | |||
|
|
Net Asset Value Per Share—1 billion shares of capital stock authorized, $.001 par value
| Class | Net Assets | Shares Outstanding | Net Asset Value | |||||||||
A | $ | 41,221,518 | 2,992,828 | $ | 13.77 | |||||||
B | $ | 351,355,209 | 25,745,977 | $ | 13.65 | |||||||
| (a) | Includes securities on loan with a value of $2,530,271 (see Note E). |
| (b) | An amount of $15,927 has been segregated to collateralize margin requirements for open futures outstanding at December 31, 2013. |
| (c) | An amount of $93,360 has been segregated to collateralize margin requirements for open centrally cleared swaps outstanding at December 31, 2013. |
See notes to financial statements.
28
| BALANCED WEALTH STRATEGY PORTFOLIO | ||
| STATEMENTOF OPERATIONS | ||
| Year Ended December 31, 2013 | AllianceBernstein Variable Products Series Fund | |
INVESTMENT INCOME | ||||
Dividends | ||||
Unaffiliated issuers (net of foreign taxes withheld of $241,106) | $ | 7,199,895 | ||
Affiliated issuers | 3,147 | |||
Interest | 5,677,120 | |||
Securities lending income | 79,768 | |||
|
| |||
| $ | 12,959,930 | |||
|
| |||
EXPENSES | ||||
Advisory fee (see Note B) | 2,977,291 | |||
Distribution fee—Class B | 1,249,284 | |||
Transfer agency—Class A | 719 | |||
Transfer agency—Class B | 8,159 | |||
Custodian | 300,050 | |||
Audit | 56,378 | |||
Administrative | 55,156 | |||
Legal | 44,099 | |||
Printing | 42,425 | |||
Directors’ fees | 4,539 | |||
Miscellaneous | 47,760 | |||
|
| |||
Total expenses | 4,785,860 | |||
|
| |||
Net investment income | 8,174,070 | |||
|
| |||
REALIZED AND UNREALIZED GAIN (LOSS) ON INVESTMENT AND FOREIGN CURRENCY TRANSACTIONS | ||||
Net realized gain (loss) on: | ||||
Investment transactions | 68,452,183 | (a) | ||
Futures | 61,313 | |||
Swaps | (45,060 | ) | ||
Foreign currency transactions | 851,589 | |||
Net change in unrealized appreciation/depreciation of: | ||||
Investments | 4,368,124 | (b) | ||
Futures | 5,920 | |||
Swaps | 70,490 | |||
Foreign currency denominated assets and liabilities | (590,782 | ) | ||
|
| |||
Net gain on investment and foreign currency transactions | 73,173,777 | |||
|
| |||
NET INCREASE IN NET ASSETS FROM OPERATIONS | $ | 81,347,847 | ||
|
|
| (a) | Net of foreign capital gains taxes of $5,684. |
| (b) | Net of decrease in accrued foreign capital gains taxes of $1,157. |
See notes to financial statements.
29
| BALANCED WEALTH STRATEGY PORTFOLIO | ||
| STATEMENTOF CHANGESIN NET ASSETS | AllianceBernstein Variable Products Series Fund | |
| Year Ended December 31, 2013 | Year Ended December 31, 2012 | |||||||
INCREASE IN NET ASSETS FROM OPERATIONS | ||||||||
Net investment income | $ | 8,174,070 | $ | 9,337,388 | ||||
Net realized gain on investment and foreign currency transactions | 69,320,025 | 19,738,955 | ||||||
Net change in unrealized appreciation/depreciation of investments and foreign currency denominated assets and liabilities | 3,853,752 | 40,255,467 | ||||||
|
|
|
| |||||
Net increase in net assets from operations | 81,347,847 | 69,331,810 | ||||||
DIVIDENDS TO SHAREHOLDERS FROM | ||||||||
Net investment income | ||||||||
Class A | (1,021,098 | ) | (924,872 | ) | ||||
Class B | (11,602,037 | ) | (9,652,511 | ) | ||||
CAPITAL STOCK TRANSACTIONS | ||||||||
Net decrease | (226,090,311 | ) | (47,254,527 | ) | ||||
|
|
|
| |||||
Total increase (decrease) | (157,365,599 | ) | 11,499,900 | |||||
NET ASSETS | ||||||||
Beginning of period | 549,942,326 | 538,442,426 | ||||||
|
|
|
| |||||
End of period (including undistributed net investment income of $8,255,542 and $8,736,115, respectively) | $ | 392,576,727 | $ | 549,942,326 | ||||
|
|
|
| |||||
See notes to financial statements.
30
| BALANCED WEALTH STRATEGY PORTFOLIO | ||
| NOTES TO FINANCIAL STATEMENTS | ||
| December 31, 2013 | AllianceBernstein Variable Products Series Fund | |
NOTE A: Significant Accounting Policies
The AllianceBernstein Balanced Wealth Strategy Portfolio (the “Portfolio”) is a series of AllianceBernstein Variable Products Series Fund, Inc. (the “Fund”). The Portfolio’s investment objective is to maximize total return consistent with the Adviser’s determination of reasonable risk. The Portfolio is diversified as defined under the Investment Company Act of 1940. The Fund was incorporated in the State of Maryland on November 17, 1987, as an open-end series investment company. The Fund offers thirteen separately managed pools of assets which have differing investment objectives and policies. The Portfolio offers Class A and Class B shares. Both classes of shares have identical voting, dividend, liquidating and other rights, except that Class B shares bear a distribution expense and have exclusive voting rights with respect to the Class B distribution plan.
The Portfolio offers and sells its shares only to separate accounts of certain life insurance companies for the purpose of funding variable annuity contracts and variable life insurance policies. Sales are made without a sales charge at the Portfolio’s net asset value per share.
The financial statements have been prepared in conformity with U.S. generally accepted accounting principles (“U.S. GAAP”) which require management to make certain estimates and assumptions that affect the reported amounts of assets and liabilities in the financial statements and amounts of income and expenses during the reporting period. Actual results could differ from those estimates. The following is a summary of significant accounting policies followed by the Portfolio.
1. Security Valuation
Portfolio securities are valued at their current market value determined on the basis of market quotations or, if market quotations are not readily available or are deemed unreliable, at “fair value” as determined in accordance with procedures established by and under the general supervision of the Fund’s Board of Directors (the “Board”).
In general, the market values of securities which are readily available and deemed reliable are determined as follows: securities listed on a national securities exchange (other than securities listed on the NASDAQ Stock Market, Inc. (“NASDAQ”)) or on a foreign securities exchange are valued at the last sale price at the close of the exchange or foreign securities exchange. If there has been no sale on such day, the securities are valued at the last traded price from the previous day. Securities listed on more than one exchange are valued by reference to the principal exchange on which the securities are traded; securities listed only on NASDAQ are valued in accordance with the NASDAQ Official Closing Price; listed or over the counter (“OTC”) market put or call options are valued at the mid level between the current bid and ask prices. If either a current bid or current ask price is unavailable, AllianceBernstein L.P. (the “Adviser”) will have discretion to determine the best valuation (e.g. last trade price in the case of listed options); open futures are valued using the closing settlement price or, in the absence of such a price, the most recent quoted bid price. If there are no quotations available for the day of valuation, the last available closing settlement price is used; U.S. government securities and other debt instruments having 60 days or less remaining until maturity are valued at amortized cost if their original maturity was 60 days or less; or by amortizing their fair value as of the 61st day prior to maturity if their original term to maturity exceeded 60 days; fixed-income securities, including mortgage-backed and asset-backed securities, may be valued on the basis of prices provided by a pricing service or at a price obtained from one or more of the major broker-dealers. In cases where broker-dealer quotes are obtained, the Adviser may establish procedures whereby changes in market yields or spreads are used to adjust, on a daily basis, a recently obtained quoted price on a security. Swaps and other derivatives are valued daily, primarily using independent pricing services, independent pricing models using market inputs, as well as third party broker-dealers or counterparties. Investment companies are valued at their net asset value each day.
Securities for which market quotations are not readily available (including restricted securities) or are deemed unreliable are valued at fair value. Factors considered in making this determination may include, but are not limited to, information obtained by contacting the issuer, analysts, analysis of the issuer’s financial statements or other available documents. In addition, the Portfolio may use fair value pricing for securities primarily traded in non-U.S. markets because most foreign markets close well before the Portfolio values its securities at 4:00 p.m., Eastern Time. The earlier close of these foreign markets gives rise to the possibility that significant events, including broad market moves, may have occurred in the interim and may materially affect the value of those securities. To account for this, the Portfolio may frequently value many of its foreign equity securities using fair value prices based on third party vendor modeling tools to the extent available.
31
| BALANCED WEALTH STRATEGY PORTFOLIO | ||
| NOTES TO FINANCIAL STATEMENTS | ||
| (continued) | AllianceBernstein Variable Products Series Fund | |
2. Fair Value Measurements
In accordance with U.S. GAAP regarding fair value measurements, fair value is defined as the price that the Portfolio would receive to sell an asset or pay to transfer a liability in an orderly transaction between market participants at the measurement date. U.S. GAAP establishes a framework for measuring fair value, and a three-level hierarchy for fair value measurements based upon the transparency of inputs to the valuation of an asset or liability (including those valued based on their market values as described in Note A.1 above). Inputs may be observable or unobservable and refer broadly to the assumptions that market participants would use in pricing the asset or liability. Observable inputs reflect the assumptions market participants would use in pricing the asset or liability based on market data obtained from sources independent of the Portfolio. Unobservable inputs reflect the Portfolio’s own assumptions about the assumptions that market participants would use in pricing the asset or liability based on the best information available in the circumstances. Each investment is assigned a level based upon the observability of the inputs which are significant to the overall valuation. The three-tier hierarchy of inputs is summarized below.
| • | Level 1—quoted prices in active markets for identical investments |
| • | Level 2—other significant observable inputs (including quoted prices for similar investments, interest rates, prepayment speeds, credit risk, etc.) |
| • | Level 3—significant unobservable inputs (including the Portfolio’s own assumptions in determining the fair value of investments) |
The fair value of debt instruments, such as bonds, and over-the-counter derivatives is generally based on market price quotations, recently executed market transactions (where observable) or industry recognized modeling techniques and are generally classified as Level 2. Pricing vendor inputs to Level 2 valuations may include quoted prices for similar investments in active markets, interest rate curves, coupon rates, currency rates, yield curves, option adjusted spreads, default rates, credit spreads and other unique security features in order to estimate the relevant cash flows which are then discounted to calculate fair values. If these inputs are unobservable and significant to the fair value, these investments will be classified as Level 3. In addition, non-agency rated investments are classified as Level 3.
Where readily available market prices or relevant bid prices are not available for certain equity investments, such investments may be valued based on similar publicly traded investments, movements in relevant indices since last available prices or based upon underlying company fundamentals and comparable company data (such as multiples to earnings or other multiples to equity). Where an investment is valued using an observable input, such as another publicly traded security, the investment will be classified as Level 2. If management determines that an adjustment is appropriate based on restrictions on resale, illiquidity or uncertainty, and such adjustment is a significant component of the valuation, the investment will be classified as Level 3. An investment will also be classified as Level 3 where management uses company fundamentals and other significant inputs to determine the valuation.
Options and warrants are valued using market-based inputs to models, broker or dealer quotations, or alternative pricing sources with reasonable levels of price transparency, where such inputs and models are available. Alternatively the values may be obtained through unobservable management determined inputs and/or management’s proprietary models. Where models are used, the selection of a particular model to value an option or a warrant depends upon the contractual terms of, and specific risks inherent in, the option or warrant as well as the availability of pricing information in the market. Valuation models require a variety of inputs, including contractual terms, market prices, measures of volatility and correlations of such inputs. Exchange traded options will be classified as Level 2. For options or warrants that do not trade on exchange but trade in liquid markets, inputs can generally be verified and model selection does not involve significant management judgment. Options and warrants are classified within Level 2 on the fair value hierarchy when all of the significant inputs can be corroborated to market evidence. Otherwise such instruments are classified as Level 3.
Valuations of mortgage-backed or other asset-backed securities, by pricing vendors, are based on both proprietary and industry recognized models and discounted cash flow techniques. Significant inputs to the valuation of these instruments are value of the collateral, the rates and timing of delinquencies, the rates and timing of prepayments, and default and loss expectations, which are driven in part by housing prices for residential mortgages. Significant inputs are determined based on relative value analyses, which incorporate comparisons to instruments with similar collateral and risk profiles, including relevant indices. Mortgage and asset-backed securities for which management has collected current observable data through pricing services are generally categorized within Level 2. Those investments for which current observable data has not been provided are classified as Level 3.
32
| AllianceBernstein Variable Products Series Fund | ||
Other fixed income investments, including non-U.S. government and corporate debt, are generally valued using quoted market prices, if available, which are typically impacted by current interest rates, maturity dates and any perceived credit risk of the issuer. Additionally, in the absence of quoted market prices, these inputs are used by pricing vendors to derive a valuation based upon industry or proprietary models which incorporate issuer specific data with relevant yield/spread comparisons with more widely quoted bonds with similar key characteristics. Those investments for which there are observable inputs are classified as Level 2. Where the inputs are not observable, the investments are classified as Level 3.
The following table summarizes the valuation of the Portfolio’s investments by the above fair value hierarchy levels as of December 31, 2013:
| Level 1 | Level 2 | Level 3 | Total | |||||||||||||
Investments in Securities: | ||||||||||||||||
Assets: | ||||||||||||||||
Common Stocks: | ||||||||||||||||
Financials | $ | 27,672,307 | $ | 13,570,045 | $ | –0 | – | $ | 41,242,352 | |||||||
Consumer Discretionary | 27,146,762 | 10,995,072 | –0 | – | 38,141,834 | |||||||||||
Information Technology | 27,724,720 | 3,231,844 | –0 | – | 30,956,564 | |||||||||||
Health Care | 23,575,918 | 4,868,103 | –0 | – | 28,444,021 | |||||||||||
Industrials | 17,496,798 | 10,441,711 | –0 | – | 27,938,509 | |||||||||||
Consumer Staples | 10,077,741 | 8,706,525 | –0 | – | 18,784,266 | |||||||||||
Energy | 15,917,918 | 2,767,749 | –0 | – | 18,685,667 | |||||||||||
Equity: Other | 6,104,940 | 10,310,088 | –0 | – | 16,415,028 | |||||||||||
Retail | 3,635,365 | 3,527,444 | –0 | – | 7,162,809 | |||||||||||
Materials | 2,216,120 | 4,121,242 | –0 | – | 6,337,362 | |||||||||||
Residential | 2,910,444 | 2,613,603 | –0 | – | 5,524,047 | |||||||||||
Telecommunication Services | 2,437,498 | 2,049,031 | –0 | – | 4,486,529 | |||||||||||
Office | 2,425,336 | 1,624,693 | –0 | – | 4,050,029 | |||||||||||
Utilities | 2,668,855 | 950,382 | –0 | – | 3,619,237 | |||||||||||
Lodging | 1,652,101 | 202,173 | –0 | – | 1,854,274 | |||||||||||
Mortgage | 650,711 | –0 | – | –0 | – | 650,711 | ||||||||||
Corporates—Investment Grades | –0 | – | 35,673,779 | –0 | – | 35,673,779 | ||||||||||
Mortgage Pass-Throughs | –0 | – | 29,187,550 | –0 | – | 29,187,550 | ||||||||||
Asset-Backed Securities | –0 | – | 15,032,515 | 2,233,195 | 17,265,710 | |||||||||||
Governments—Treasuries | –0 | – | 16,310,433 | –0 | – | 16,310,433 | ||||||||||
Commercial Mortgage-Backed Securities | –0 | – | 11,326,903 | 845,923 | 12,172,826 | |||||||||||
Corporates—Non-Investment Grades | –0 | – | 5,094,148 | –0 | – | 5,094,148 | ||||||||||
Agencies | –0 | – | 3,889,567 | –0 | – | 3,889,567 | ||||||||||
Inflation-Linked Securities | –0 | – | 3,857,094 | –0 | – | 3,857,094 | ||||||||||
Local Governments—Municipal Bonds | –0 | – | 2,949,765 | –0 | – | 2,949,765 | ||||||||||
Quasi-Sovereigns | –0 | – | 2,761,095 | –0 | – | 2,761,095 | ||||||||||
Collateralized Mortgage Obligations | –0 | – | 794,177 | 1,527,063 | 2,321,240 | |||||||||||
Emerging Markets—Corporate Bonds | –0 | – | 861,624 | –0 | – | 861,624 | ||||||||||
Governments—Sovereign Bonds | –0 | – | 754,574 | –0 | – | 754,574 | ||||||||||
Preferred Stocks | 613,309 | –0 | – | –0 | – | 613,309 | ||||||||||
Warrants | 18,038 | 208,551 | –0 | – | 226,589 | |||||||||||
Short-Term Investments: | ||||||||||||||||
Time Deposits | –0 | – | 17,646,162 | –0 | – | 17,646,162 | ||||||||||
Government—Treasuries | –0 | – | 3,798,225 | –0 | – | 3,798,225 | ||||||||||
Investments of Cash Collateral for Securities Loaned in Affiliated Money Market Fund | 2,812,758 | –0 | – | –0 | – | 2,812,758 | ||||||||||
|
|
|
|
|
|
|
| |||||||||
Total Investments in Securities | 177,757,639 | 230,125,867 | 4,606,181 | 412,489,687 | ||||||||||||
33
| BALANCED WEALTH STRATEGY PORTFOLIO | ||
| NOTES TO FINANCIAL STATEMENTS | ||
| (continued) | AllianceBernstein Variable Products Series Fund | |
| Level 1 | Level 2 | Level 3 | Total | |||||||||||||
Other Financial Instruments*: | ||||||||||||||||
Assets: | ||||||||||||||||
Futures | $ | –0 | – | $ | 14,662 | $ | –0 | – | $ | 14,662 | # | |||||
Forward Currency Exchange Contracts | –0 | – | 818,288 | –0 | – | 818,288 | ||||||||||
Credit Default Swaps | –0 | – | 23,729 | –0 | – | 23,729 | ||||||||||
Interest Rate Swaps | –0 | – | 99,005 | –0 | – | 99,005 | ||||||||||
Liabilities: | ||||||||||||||||
Forward Currency Exchange Contracts | –0 | – | (530,420 | ) | –0 | – | (530,420 | ) | ||||||||
Centrally Cleared Credit Default Swaps | –0 | – | (136,180 | ) | –0 | – | (136,180 | )# | ||||||||
Interest Rate Swaps | –0 | – | (17,099 | ) | –0 | – | (17,099 | ) | ||||||||
|
|
|
|
|
|
|
| |||||||||
Total+ | $ | 177,757,639 | $ | 230,397,852 | $ | 4,606,181 | $ | 412,761,672 | ||||||||
|
|
|
|
|
|
|
| |||||||||
| * | Other financial instruments are derivative instruments, such as futures, forwards and swaps, which are valued at the unrealized appreciation/depreciation on the instrument. |
| # | Only variation margin receivable/payable at period end is reported within the statement of assets and liabilities. This amount reflects cumulative appreciation/depreciation of exchange traded derivatives reported in the portfolio of investments. |
| + | There were de minimis transfers under 1% of net assets between Level 1 and Level 2 during the reporting period. |
The Portfolio recognizes all transfers between levels of the fair value hierarchy assuming the financial instruments were transferred at the beginning of the reporting period.
The following is a reconciliation of investments in which significant unobservable inputs (Level 3) were used in determining fair value.
| Common Stock - Residential | Asset-Backed Securities | Commercial Mortgage- Backed Securities | ||||||||||
Balance as of 12/31/12 | $ | 297,587 | $ | 1,397,999 | $ | 1,601,699 | ||||||
Accrued discounts/(premiums) | –0 | – | 4,444 | 4,155 | ||||||||
Realized gain (loss) | –0 | – | 11,643 | 72,412 | ||||||||
Change in unrealized appreciation/depreciation | –0 | – | (14,632 | ) | (72,574 | ) | ||||||
Purchases | –0 | – | 1,605,996 | 547,879 | ||||||||
Sales | –0 | – | (772,255 | ) | (1,307,648 | ) | ||||||
Transfers in to Level 3 | –0 | – | –0 | – | –0 | – | ||||||
Transfers out of Level 3 | (297,587 | ) | –0 | – | –0 | – | ||||||
|
|
|
|
|
| |||||||
Balance as of 12/31/13 | $ | –0– | $ | 2,233,195 | $ | 845,923 | ||||||
|
|
|
|
|
| |||||||
Net change in unrealized appreciation/depreciation from Investments held as of 12/31/13* | $ | –0– | $ | (11,308 | ) | $ | (14,211 | ) | ||||
|
|
|
|
|
| |||||||
| Collateralized Mortgage Obligation | Rights^ | Total | ||||||||||
Balance as of 12/31/12 | $ | 60,916 | $ | –0 | – | $ | 3,358,201 | |||||
Accrued discounts/(premiums) | 10,008 | –0 | – | 18,607 | ||||||||
Realized gain (loss) | 7,533 | –0 | – | 91,588 | ||||||||
Change in unrealized appreciation/depreciation | (63,729 | ) | –0 | – | (150,935 | ) | ||||||
Purchases | 1,660,677 | –0 | – | 3,814,552 | ||||||||
Sales | (148,342 | ) | –0 | – | (2,228,245 | ) | ||||||
Transfers in to Level 3 | –0 | – | –0 | – | –0 | – | ||||||
Transfers out of Level 3 | –0 | – | –0 | – | (297,587 | ) | ||||||
|
|
|
|
|
| |||||||
Balance as of 12/31/13 | $ | 1,527,063 | $ | –0 | – | $ | 4,606,181 | + | ||||
|
|
|
|
|
| |||||||
Net change in unrealized appreciation/depreciation from Investments held as of 12/31/13* | $ | (63,729 | ) | $ | –0 | – | $ | (89,248 | ) | |||
|
|
|
|
|
| |||||||
| ^ | The Portfolio held rights with zero market value that were exercised during the reporting period. |
| * | The unrealized appreciation/depreciation is included in net change in unrealized appreciation/depreciation of investments in the accompanying statement of operations. |
| + | There were de minimis transfers under 1% of net assets during the reporting period. |
34
| AllianceBernstein Variable Products Series Fund |
The following presents information about significant unobservable inputs related to the Portfolio with material categories of Level 3 investments at December 31, 2013:
Quantitative Information about Level 3 Fair Value Measurements | ||||||||
Fair Value at | Valuation Technique | Unobservable Input | Range/ Weighted | |||||
Asset-Backed Securities | $2,233,195 | Third Party Vendor | Evaluated Quotes | $67.83-$100.26 / $95.98 | ||||
Commercial Mortgage-Backed Securities | $ 845,923 | Third Party Vendor | Evaluated Quotes | $98.84-$110.84 / $106.65 | ||||
Collateralized Mortgage Obligations | $1,527,063 | Third Party Vendor | Evaluated Quotes | $57.26-$99.96 / $77.89 | ||||
The Adviser has established a Valuation Committee (the “Committee”) which is responsible for overseeing the pricing and valuation of all securities held in the Portfolio. The Committee operates under pricing and valuation policies and procedures established by the Adviser and approved by the Board, including pricing policies which set forth the mechanisms and processes to be employed on a daily basis to implement these policies and procedures. In particular, the pricing policies describe how to determine market quotations for securities and other instruments. The Committee’s responsibilities include: 1) fair value and liquidity determinations (and oversight of any third parties to whom any responsibility for fair value and liquidity determinations is delegated), and 2) regular monitoring of the Adviser’s pricing and valuation policies and procedures and modification or enhancement of these policies and procedures (or recommendation of the modification of these policies and procedures) as the Committee believes appropriate.
The Committee is also responsible for monitoring the implementation of the pricing policies by the Adviser’s Pricing Group (the “Pricing Group”) and a third party which performs certain pricing functions in accordance with the pricing policies. The Pricing Group is responsible for the oversight of the third party on a day-to-day basis. The Committee and the Pricing Group perform a series of activities to provide reasonable assurance of the accuracy of prices including: 1) periodic vendor due diligence meetings, review of methodologies, new developments and processes at vendors, 2) daily comparison of security valuation versus prior day for all securities that exceeded established thresholds, and 3) daily review of unpriced, stale, and variance reports with exceptions reviewed by senior management and the Committee.
In addition, several processes outside of the pricing process are used to monitor valuation issues including: 1) performance and performance attribution reports are monitored for anomalous impacts based upon benchmark performance, and 2) portfolio managers review all portfolios for performance and analytics (which are generated using the Adviser’s prices).
3. Currency Translation
Assets and liabilities denominated in foreign currencies and commitments under forward currency exchange contracts are translated into U.S. dollars at the mean of the quoted bid and ask prices of such currencies against the U.S. dollar. Purchases and sales of portfolio securities are translated into U.S. dollars at the rates of exchange prevailing when such securities were acquired or sold. Income and expenses are translated into U.S. dollars at rates of exchange prevailing when accrued.
Net realized gain or loss on foreign currency transactions represents foreign exchange gains and losses from sales and maturities of foreign fixed income investments, foreign currency exchange contracts, holding of foreign currencies, currency gains or losses realized between the trade and settlement dates on foreign investment transactions, and the difference between the amounts of dividends, interest and foreign withholding taxes recorded on the Portfolio’s books and the U.S. dollar equivalent amounts actually received or paid. Net unrealized currency gains and losses from valuing foreign currency denominated assets and liabilities at period end exchange rates are reflected as a component of net unrealized appreciation or depreciation of foreign currency denominated assets and liabilities.
4. Taxes
It is the Portfolio’s policy to meet the requirements of the Internal Revenue Code applicable to regulated investment companies and to distribute all of its investment company taxable income and net realized gains, if any, to shareholders. Therefore, no provisions for federal income or excise taxes are required. The Portfolio may be subject to taxes imposed by countries in which it invests. Such taxes are generally based on income and/or capital gains earned or repatriated. Taxes are accrued and applied to net investment income, net realized gains and net unrealized appreciation/depreciation as such income and/or gains are earned.
35
| BALANCED WEALTH STRATEGY PORTFOLIO | ||
| NOTES TO FINANCIAL STATEMENTS | ||
| (continued) | AllianceBernstein Variable Products Series Fund | |
In accordance with U.S. GAAP requirements regarding accounting for uncertainties in income taxes, management has analyzed the Portfolio’s tax positions taken or expected to be taken on federal and state income tax returns for all open tax years (the current and the prior three tax years) and has concluded that no provision for income tax is required in the Portfolio’s financial statements.
5. Investment Income and Investment Transactions
Dividend income is recorded on the ex-dividend date or as soon as the Portfolio is informed of the dividend. Interest income is accrued daily. Investment transactions are accounted for on the date the securities are purchased or sold. Investment gains or losses are determined on the identified cost basis. The Portfolio amortizes premiums and accretes discounts as adjustments to interest income.
6. Class Allocations
All income earned and expenses incurred by the Portfolio are borne on a pro-rata basis by each outstanding class of shares, based on the proportionate interest in the Portfolio represented by the net assets of such class, except for class specific expenses which are allocated to the respective class. Expenses of the Fund are charged proportionately to each Portfolio or based on other appropriate methods. Realized and unrealized gains and losses are allocated among the various share classes based on respective net assets.
7. Dividends and Distributions
Dividends and distributions to shareholders, if any, are recorded on the ex-dividend date. Income dividends and capital gains distributions are determined in accordance with federal tax regulations and may differ from those determined in accordance with U.S. GAAP. To the extent these differences are permanent, such amounts are reclassified within the capital accounts based on their federal tax basis treatment; temporary differences do not require such reclassification.
8. Repurchase Agreements
It is the Portfolio’s policy that its custodian or designated subcustodian take control of securities as collateral under repurchase agreements and to determine on a daily basis that the value of such securities are sufficient to cover the value of the repurchase agreements. If the seller defaults and the value of the collateral declines or if bankruptcy proceedings are commenced with respect to the seller of the security, realization of collateral by the Portfolio may be delayed or limited.
NOTE B: Advisory Fee and Other Transactions with Affiliates
Under the terms of the investment advisory agreement, the Portfolio pays the Adviser an advisory fee at an annual rate of .55% of the first $2.5 billion, .45% of the next $2.5 billion and .40% in excess of $5 billion, of the Portfolio’s average daily net assets. The fee is accrued daily and paid monthly. The Adviser has agreed to waive its fees and bear certain expenses to the extent necessary to limit total operating expenses on an annual basis to .75% and 1.00% of daily average net assets for Class A and Class B shares, respectively. For the year ended December 31, 2013, there were no expenses waived by the Adviser.
Pursuant to the investment advisory agreement, the Portfolio may reimburse the Adviser for certain legal and accounting services provided to the Portfolio by the Adviser. For the year ended December 31, 2013, the reimbursement for such services amounted to $55,156.
Brokerage commissions paid on investment transactions for the year ended December 31, 2013 amounted to $477,345, of which $676 and $60, respectively, was paid to Sanford C. Bernstein & Co. LLC and Sanford C. Bernstein Limited, affiliates of the Adviser.
The Portfolio compensates AllianceBernstein Investor Services, Inc. (“ABIS”), a wholly-owned subsidiary of the Adviser, under a Transfer Agency Agreement for providing personnel and facilities to perform transfer agency services for the Portfolio. Such compensation retained by ABIS amounted to $1,385 for the year ended December 31, 2013.
NOTE C: Distribution Plan
The Portfolio has adopted a Distribution Plan (the “Plan”) for Class B shares pursuant to Rule 12b-1 under the Investment Company Act of 1940. Under the Plan, the Portfolio pays distribution and servicing fees to AllianceBernstein Investments, Inc. (the “Distributor”), a wholly-owned subsidiary of the Adviser, at an annual rate of up to .50% of the Portfolio’s average daily net assets attributable to Class B shares. The fees are accrued daily and paid monthly. The Board currently limits payments under the Plan to .25% of the Portfolio’s average daily net assets attributable to Class B shares. The Plan provides that the Distributor will use such payments in their entirety for distribution assistance and promotional activities.
36
| AllianceBernstein Variable Products Series Fund |
The Portfolio is not obligated under the Plan to pay any distribution and servicing fees in excess of the amounts set forth above. The purpose of the payments to the Distributor under the Plan is to compensate the Distributor for its distribution services with respect to the sale of the Portfolio’s Class B shares. Since the Distributor’s compensation is not directly tied to its expenses, the amount of compensation received by it under the Plan during any year may be more or less than its actual expenses. For this reason, the Plan is characterized by the staff of the Securities and Exchange Commission as being of the “compensation” variety.
In the event that the Plan is terminated or not continued, no distribution or servicing fees (other than current amounts accrued but not yet paid) would be owed by the Portfolio to the Distributor.
The Plan also provides that the Adviser may use its own resources to finance the distribution of the Portfolio’s shares.
NOTE D: Investment Transactions
Purchases and sales of investment securities (excluding short-term investments) for the year ended December 31, 2013 were as follows:
| Purchases | Sales | |||||||
Investment securities (excluding U.S. government securities) | $ | 269,873,732 | $ | 450,603,086 | ||||
U.S. government securities | 338,239,515 | 358,291,895 | ||||||
The cost of investments for federal income tax purposes, gross unrealized appreciation and unrealized depreciation (excluding futures, swaps and foreign currency transactions) are as follows:
Cost | $ | 356,488,176 | ||
|
| |||
Gross unrealized appreciation | $ | 67,224,870 | ||
Gross unrealized depreciation | (11,223,359 | ) | ||
|
| |||
Net unrealized appreciation | $ | 56,001,511 | ||
|
|
1. Derivative Financial Instruments
The Portfolio may use derivatives in an effort to earn income and enhance returns, to replace more traditional direct investments, to obtain exposure to otherwise inaccessible markets (collectively, “investment purposes”), or to hedge or adjust the risk profile of its portfolio.
The principal types of derivatives utilized by the Portfolio, as well as the methods in which they may be used are:
| • | Futures |
The Portfolio may buy or sell futures for investment purposes or for the purpose of hedging its portfolio against adverse effects of potential movements in the market. The Portfolio bears the market risk that arises from changes in the value of these instruments and the imperfect correlation between movements in the price of the futures and movements in the price of the assets, reference rates or indices which they are designed to track. Among other things, the Portfolio may purchase or sell futures for foreign currencies or options thereon for non-hedging purposes as a means of making direct investment in foreign currencies, as described below under “Currency Transactions”.
At the time the Portfolio enters into futures, the Portfolio deposits and maintains as collateral an initial margin with the broker, as required by the exchange on which the transaction is effected. Pursuant to the contract, the Portfolio agrees to receive from or pay to the broker an amount of cash equal to the daily fluctuation in the value of the contract. Such receipts or payments are known as variation margin and are recorded by the Portfolio as unrealized gains or losses. Risks may arise from the potential inability of a counterparty to meet the terms of the contract. The credit/counterparty risk for exchange-traded futures is generally less than privately negotiated futures, since the clearinghouse, which is the issuer or counterparty to each exchange-traded future, has robust risk mitigation standards, including the requirement to provide initial and variation margin. When the contract is closed, the Portfolio records a realized gain or loss equal to the difference between the value of the contract at the time it was opened and the time it was closed.
Use of long futures subjects the Portfolio to risk of loss in excess of the amounts shown on the statement of assets and liabilities, up to the notional value of the futures. Use of short futures subjects the Portfolio to unlimited risk of loss. Under some circumstances, futures exchanges may establish daily limits on the amount that the price of futures can vary from the previous day’s settlement price, which could effectively prevent liquidation of unfavorable positions.
37
| BALANCED WEALTH STRATEGY PORTFOLIO | ||
| NOTES TO FINANCIAL STATEMENTS | ||
| (continued) | AllianceBernstein Variable Products Series Fund | |
During the year ended December 31, 2013, the Portfolio held futures for hedging purposes.
| • | Forward Currency Exchange Contracts |
The Portfolio may enter into forward currency exchange contracts in order to hedge its exposure to changes in foreign currency exchange rates on its foreign portfolio holdings, to hedge certain firm purchase and sale commitments denominated in foreign currencies and for non-hedging purposes as a means of making direct investments in foreign currencies, as described below under “Currency Transactions”.
A forward currency exchange contract is a commitment to purchase or sell a foreign currency at a future date at a negotiated forward rate. The gain or loss arising from the difference between the original contract and the closing of such contract would be included in net realized gain or loss on foreign currency transactions. Fluctuations in the value of open forward currency exchange contracts are recorded for financial reporting purposes as unrealized appreciation and/or depreciation by the Portfolio. Risks may arise from the potential inability of a counterparty to meet the terms of a contract and from unanticipated movements in the value of a foreign currency relative to the U.S. dollar.
During the year ended December 31, 2013, the Portfolio held forward currency exchange contracts for hedging purposes.
| • | Swaps |
The Portfolio may enter into swaps to hedge its exposure to interest rates, credit risk, or currencies. The Portfolio may also enter into swaps for non-hedging purposes as a means of gaining market exposures, including by making direct investments in foreign currencies, as described below under “Currency Transactions”. A swap is an agreement that obligates two parties to exchange a series of cash flows at specified intervals based upon or calculated by reference to changes in specified prices or rates for a specified amount of an underlying asset. The payment flows are usually netted against each other, with the difference being paid by one party to the other. In addition, collateral may be pledged or received by the Portfolio in accordance with the terms of the respective swaps to provide value and recourse to the Portfolio or its counterparties in the event of default, bankruptcy or insolvency by one of the parties to the swap.
Risks may arise as a result of the failure of the counterparty to the swap to comply with the terms of the swap. The loss incurred by the failure of a counterparty is generally limited to the net interim payment to be received by the Portfolio, and/or the termination value at the end of the contract. Therefore, the Portfolio considers the creditworthiness of each counterparty to a swap in evaluating potential counterparty risk. This risk is mitigated by having a netting arrangement between the Portfolio and the counterparty and by the posting of collateral by the counterparty to the Portfolio to cover the Portfolio’s exposure to the counterparty. Additionally, risks may arise from unanticipated movements in interest rates or in the value of the underlying securities. The Portfolio accrues for the interim payments on swaps on a daily basis, with the net amount recorded within unrealized appreciation/depreciation of swaps on the statement of assets and liabilities, where applicable. Once the interim payments are settled in cash, the net amount is recorded as realized gain/(loss) on swaps on the statement of operations, in addition to any realized gain/(loss) recorded upon the termination of swaps. Upfront premiums paid or received are recognized as cost or proceeds on the statement of assets and liabilities and are amortized on a straight line basis over the life of the contract. Amortized upfront premiums are included in net realized gain/(loss) from swaps on the statement of operations. Fluctuations in the value of swaps are recorded as a component of net change in unrealized appreciation/depreciation of swaps on the statement of operations.
Certain standardized swaps, including certain interest rate swaps and credit default swaps, are (or soon will be) subject to mandatory central clearing. Cleared swaps are transacted through futures commission merchants (“FCMs”) that are members of central clearinghouses, with the clearinghouse serving as central counterparty, similar to transactions in futures contracts. Centralized clearing will be required for additional categories of swaps on a phased-in basis based on requirements published by the Securities Exchange Commission and Commodity Futures Trading Commission.
At the time the Portfolio enters into a centrally cleared swap, the Portfolio deposits and maintains as collateral an initial margin with the broker, as required by the exchange on which the transaction is effected. Pursuant to the contract, the Portfolio agrees to receive from or pay to the broker an amount of cash equal to the daily fluctuation in
38
| AllianceBernstein Variable Products Series Fund |
the value of the contract. Such receipts or payments are known as variation margin and are recorded by the Portfolio as unrealized gains or losses. Risks may arise from the potential inability of a counterparty to meet the terms of the contract. The credit/counterparty risk for exchange-traded swaps is generally less than privately negotiated swaps, since the clearinghouse, which is the issuer or counterparty to each exchange-traded swap, has robust risk mitigation standards, including the requirement to provide initial and variation margin. When the contract is closed, the Portfolio records a realized gain or loss equal to the difference between the value of the contract at the time it was opened and the time it was closed.
Interest Rate Swaps:
The Portfolio is subject to interest rate risk exposure in the normal course of pursuing its investment objectives. Because the Portfolio holds fixed rate bonds, the value of these bonds may decrease if interest rates rise. To help hedge against this risk and to maintain its ability to generate income at prevailing market rates, the Portfolio may enter into interest rate swaps. Interest rate swaps are agreements between two parties to exchange cash flows based on a notional amount. The Portfolio may elect to pay a fixed rate and receive a floating rate, or, receive a fixed rate and pay a floating rate on a notional amount.
In addition, the Portfolio may also enter into interest rate swap transactions to preserve a return or spread on a particular investment or portion of its portfolio, or protecting against an increase in the price of securities the Portfolio anticipates purchasing at a later date. Interest rate swaps involve the exchange by a Portfolio with another party of their respective commitments to pay or receive interest (e.g., an exchange of floating rate payments for fixed rate payments) computed based on a contractually-based principal (or “notional”) amount. Interest rate swaps are entered into on a net basis (i.e., the two payment streams are netted out, with the Portfolio receiving or paying, as the case may be, only the net amount of the two payments).
During the year ended December 31, 2013, the Portfolio held interest rate swaps for hedging purposes.
Credit Default Swaps:
The Portfolio may enter into credit default swaps, including to manage its exposure to the market or certain sectors of the market, to reduce its risk exposure to defaults by corporate and sovereign issuers held by the Portfolio, or to create exposure to corporate or sovereign issuers to which it is not otherwise exposed. The Portfolio may purchase credit protection (“Buy Contract”) or provide credit protection (“Sale Contract”) on the referenced obligation of the credit default swap. During the term of the swap, the Portfolio receives/(pays) fixed payments from/(to) the respective counterparty, calculated at the agreed upon rate applied to the notional amount. If the Portfolio is a buyer/(seller) of protection and a credit event occurs, as defined under the terms of the swap, the Portfolio will either (i) receive from the seller/(pay to the buyer) of protection an amount equal to the notional amount of the swap (the “Maximum Payout Amount”) and deliver/(take delivery of) the referenced obligation or (ii) receive/(pay) a net settlement amount in the form of cash or securities equal to the notional amount of the swap less the recovery value of the referenced obligation.
Credit default swaps may involve greater risks than if a Portfolio had invested in the referenced obligation directly. Credit default swaps are subject to general market risk, liquidity risk, counterparty risk and credit risk. If the Portfolio is a buyer of protection and no credit event occurs, it will lose the payments it made to its counterparty. If the Portfolio is a seller of protection and a credit event occurs, the value of the referenced obligation received by the Portfolio coupled with the periodic payments previously received, may be less than the Maximum Payout Amount it pays to the buyer, resulting in a net loss to the Portfolio.
During the year ended December 31, 2013, the Portfolio held credit default swaps for hedging purposes.
Implied credit spreads utilized in determining the market value of credit default swaps on issuers as of period end are disclosed in the portfolio of investments. The implied spreads serve as an indicator of the current status of the payment/performance risk and typically reflect the likelihood of default by the issuer of the referenced obligation. The implied credit spread of a particular reference obligation also reflects the cost of buying/selling protection and may reflect upfront payments required to be made to enter into the agreement. Widening credit spreads typically represent a deterioration of the referenced obligation’s credit soundness and greater likelihood of default or other credit event occurring as defined under the terms of the agreement. A credit spread identified as “Defaulted” indicates a credit event has occurred for the referenced obligation.
39
| BALANCED WEALTH STRATEGY PORTFOLIO | ||
| NOTES TO FINANCIAL STATEMENTS | ||
| (continued) | AllianceBernstein Variable Products Series Fund | |
At December 31, 2013, the Portfolio had a Sale Contract outstanding with a Maximum Payout Amount of $530,000, with net unrealized appreciation of $23,729, and a term of less than 4 years, as reflected in the portfolio of investments.
In certain circumstances Maximum Payout Amounts may be partially offset by recovery values of the respective referenced obligations, upfront premium received upon entering into the agreement, or net amounts received from settlement of buy protection credit default swaps entered into by the Portfolio for the same reference obligation with the same counterparty. As of December 31, 2013, the Portfolio did not have Buy Contracts outstanding with respect to the same referenced obligation and same counterparty for its Sale Contracts outstanding.
The Portfolio typically enters into International Swaps and Derivatives Association, Inc. Master Agreements (“ISDA Master Agreement”) or similar master agreements (collectively, “Master Agreements”) with its OTC derivative contract counterparties in order to, among other things, reduce its credit risk to counterparties. ISDA Master Agreements include provisions for general obligations, representations, collateral and events of default or termination. Under an ISDA Master Agreement, the Portfolio typically may offset with the counterparty certain derivative financial instrument’s payables and/or receivables with collateral held and/or posted and create one single net payment (close-out netting) in the event of default or termination.
Various master agreements govern the terms of certain transactions with counterparties, including transactions such as exchange-traded derivative transactions, repurchase and reverse repurchase agreements. These master agreements typically attempt to reduce the counterparty risk associated with such transactions by specifying credit protection mechanisms and providing standardization that improves legal certainty. Cross-termination provisions under Master Agreements typically provide that a default in connection with one transaction between the Portfolio and a counterparty gives the non-defaulting party the right to terminate any other transactions in place with the defaulting party to create one single net payment due to/due from the defaulting party. In the event of a default by a Master Agreements counterparty, the return of collateral with market value in excess of the Portfolio’s net liability, held by the defaulting party, may be delayed or denied.
The Portfolio’s Master Agreements may contain provisions for early termination of OTC derivative transactions in the event the net assets of the Portfolio decline below specific levels (“net asset contingent features”). If these levels are triggered, the Portfolio’s counterparty has the right to terminate such transaction and require the Portfolio to pay or receive a settlement amount in connection with the terminated transaction. As of December 31, 2013, the Portfolio had OTC derivatives with contingent features in net liability positions in the amount of $272,996. If a trigger event had occurred at December 31, 2013, for those derivatives in a net liability position, $272,996 would be required to be posted by the Portfolio.
At December 31, 2013, the Portfolio had entered into the following derivatives:
Asset Derivatives | Liability Derivatives | |||||||||||
Derivative Type | Statement of Assets and | Fair Value | Statement of Assets and | Fair Value | ||||||||
Equity contracts | Receivable/Payable for variation margin on futures | $ | 14,662 | * | ||||||||
Foreign exchange contracts | Unrealized appreciation of forward currency exchange contracts | 818,288 | Unrealized depreciation of forward currency exchange contracts | $ | 530,420 | |||||||
Interest rate contracts | Unrealized appreciation on interest rate swaps | 99,005 | Unrealized depreciation on interest rate swaps | 17,099 | ||||||||
Credit contracts | Unrealized appreciation on credit default swaps | 23,729 | ||||||||||
Credit contracts | Receivable/Payable for variation margin on centrally cleared credit default swaps | 136,180 | * | |||||||||
|
|
|
| |||||||||
Total | $ | 955,684 | $ | 683,699 | ||||||||
|
|
|
| |||||||||
| * | Only variation margin receivable/payable at period end is reported within the statement of assets and liabilities. This amount reflects cumulative appreciation/(depreciation) of exchange-traded derivatives as reported in the portfolio of investments. |
40
| AllianceBernstein Variable Products Series Fund |
The effect of derivative instruments on the statement of operations for the year ended December 31, 2013:
Derivative Type | Location of Gain or (Loss) on Derivatives | Realized Gain or (Loss) on Derivatives | Change in Unrealized Appreciation or (Depreciation) | |||||||
Equity contracts | Net realized gain (loss) on futures; Net change in unrealized appreciation/depreciation of futures | $ | 61,313 | $ | 5,920 | |||||
Foreign exchange contracts | Net realized gain (loss) on foreign currency transactions; Net change in unrealized appreciation/depreciation of foreign currency denominated assets and liabilities | 889,539 | (586,061 | ) | ||||||
Interest rate contracts | Net realized gain (loss) on swaps; Net change in unrealized appreciation/depreciation of swaps | (53,641 | ) | 209,774 | ||||||
Credit contracts | Net realized gain (loss) on swaps; Net change in unrealized appreciation/depreciation of swaps | 8,581 | (139,284 | ) | ||||||
|
|
|
| |||||||
Total | $ | 905,792 | $ | (509,651 | ) | |||||
|
|
|
| |||||||
The following table represents the volume of the Portfolio’s derivative transactions during the year ended
December 31, 2013:
Futures: | ||||
Average original value of buy contracts | $ | 251,234 | ||
Forward Currency Exchange Contracts: | ||||
Average principal amount of buy contracts | $ | 35,584,420 | ||
Average principal amount of sale contracts | $ | 44,280,853 | ||
Interest Rate Swaps: | ||||
Average notional amount | $ | 4,170,000 | ||
Credit Default Swaps: | ||||
Average notional amount of sale contracts | $ | 585,385 | ||
Centrally Cleared Credit Default Swaps: | ||||
Average notional amount of buy contracts | $ | 2,900,000 | (a) |
| (a) | Positions were open for three months during the year. |
For financial reporting purposes, the Portfolio does not offset derivative assets and derivative liabilities that are subject to netting arrangements in the statement of assets and liabilities.
All derivatives held during the reporting period were subject to netting arrangements. The following table presents the Portfolio’s derivative assets and liabilities by counterparty net of amounts available for offset under Master Agreements (“MA”) and net of the related collateral received/ pledged by the Portfolio as of December 31, 2013:
| Counterparty | Derivative Assets Subject to MA | Derivative Available for Offset | Cash Collateral Received | Securities Collateral Received | Net Amount of Derivatives Assets | |||||||||||||||
Barclays Bank PLC Wholesale | $ | 177,005 | $ | (67,197) | $ | –0 | – | $ | –0 | – | $ | 109,808 | ||||||||
BNP Paribas SA | 14,133 | (11,821 | ) | –0 | – | –0 | – | 2,312 | ||||||||||||
Citibank, NA | 8,539 | (8,539 | ) | –0 | – | –0 | – | –0 | – | |||||||||||
Credit Suisse International | 158,870 | (29,868 | ) | –0 | – | –0 | – | 129,002 | ||||||||||||
Deutsche Bank AG London | 202,321 | –0 | – | –0 | – | –0 | – | 202,321 | ||||||||||||
41
| BALANCED WEALTH STRATEGY PORTFOLIO | ||
| NOTES TO FINANCIAL STATEMENTS | ||
| (continued) | AllianceBernstein Variable Products Series Fund | |
| Counterparty | Derivative Assets Subject to MA | Derivative Available for Offset | Cash Collateral Received | Securities Collateral Received | Net Amount of Derivatives Assets | |||||||||||||||
Exchange-Traded Goldman Sachs Co.* | $ | 53 | $ | –0 | – | $ | –0 | – | $ | –0 | – | $ | 53 | |||||||
Goldman Sachs Capital Markets LP | 14,059 | (14,059 | ) | –0 | – | –0 | – | –0 | – | |||||||||||
HSBC Bank USA | 32,411 | –0 | – | –0 | – | –0 | – | 32,411 | ||||||||||||
JPMorgan Chase Bank, NA | 99,005 | (17,099 | ) | –0 | – | –0 | – | 81,906 | ||||||||||||
Royal Bank of Scotland PLC | 3,299 | (3,299 | ) | –0 | – | –0 | – | –0 | – | |||||||||||
Standard Chartered Bank | 10,597 | (10,597 | ) | –0 | – | –0 | – | –0 | – | |||||||||||
State Street Bank & Trust Co. | 205,760 | (110,366 | ) | –0 | – | –0 | – | 95,394 | ||||||||||||
UBS AG | 1,678 | (1,678 | ) | –0 | – | –0 | – | –0 | – | |||||||||||
|
|
|
|
|
|
|
|
|
| |||||||||||
Total | $ | 927,730 | $ | (274,523 | ) | $ | –0 | – | $ | –0 | – | $ | 653,207 | |||||||
|
|
|
|
|
|
|
|
|
| |||||||||||
| Counterparty | Derivative Liabilities Subject to MA | Derivative Available for Offset | Cash Collateral Pledged | Securities Collateral Pledged | Net Amount of Derivatives Liabilities | |||||||||||||||
Barclays Bank PLC Wholesale | $ | 67,197 | $ | (67,197 | ) | $ | –0 | – | $ | –0 | – | $ | –0 | – | ||||||
BNP Paribas SA | 11,821 | (11,821 | ) | –0 | – | –0 | – | –0 | – | |||||||||||
Citibank, NA | 15,832 | (8,539 | ) | –0 | – | –0 | – | 7,293 | ||||||||||||
Credit Suisse International | 29,868 | (29,868 | ) | –0 | – | –0 | – | –0 | – | |||||||||||
Exchange-Traded Morgan Stanley & Co. LLC/(INTRCONX)* | 8,353 | –0 | – | (8,353 | ) | –0 | – | –0 | – | |||||||||||
Goldman Sachs Bank USA | 119,294 | (14,059 | ) | –0 | – | –0 | – | 105,235 | ||||||||||||
JPMorgan Chase Bank, NA | 17,099 | (17,099 | ) | –0 | – | –0 | – | –0 | – | |||||||||||
Royal Bank of Scotland PLC | 39,596 | (3,299 | ) | –0 | – | –0 | – | 36,297 | ||||||||||||
Standard Chartered Bank | 96,858 | (10,597 | ) | –0 | – | –0 | – | 86,261 | ||||||||||||
State Street Bank & Trust Co. | 110,366 | (110,366 | ) | –0 | – | –0 | – | –0 | – | |||||||||||
UBS AG | 39,588 | (1,678 | ) | –0 | – | –0 | – | 37,910 | ||||||||||||
|
|
|
|
|
|
|
|
|
| |||||||||||
Total | $ | 555,872 | $ | (274,523) | $ | (8,353) | $ | –0 | – | $ | 272,996 | |||||||||
|
|
|
|
|
|
|
|
|
| |||||||||||
| * | In addition to the amounts reflected above, cash collateral has been posted for initial margin requirements for open futures and centrally cleared swaps outstanding at December 31, 2013. |
2. Currency Transactions
The Portfolio may invest in non-U.S. dollar securities on a currency hedged or unhedged basis. The Portfolio may seek investment opportunities by taking long or short positions in currencies through the use of currency-related derivatives, including forward currency exchange contracts, futures and options on futures, swaps, and other options. The Portfolio may
42
| AllianceBernstein Variable Products Series Fund |
enter into transactions for investment opportunities when it anticipates that a foreign currency will appreciate or depreciate in value but securities denominated in that currency are not held by the Portfolio and do not present attractive investment opportunities. Such transactions may also be used when the Adviser believes that it may be more efficient than a direct investment in a foreign currency-denominated security. The Portfolio may also conduct currency exchange contracts on a spot basis (i.e., for cash at the spot rate prevailing in the currency exchange market for buying or selling currencies).
3. Dollar Rolls
The Portfolio may enter into dollar rolls. Dollar rolls involve sales by the Portfolio of securities for delivery in the current month and the Portfolio’s simultaneously contracting to repurchase substantially similar (same type and coupon) securities on a specified future date. During the roll period, the Portfolio forgoes principal and interest paid on the securities. The Portfolio is compensated by the difference between the current sales price and the lower forward price for the future purchase (often referred to as the “drop”) as well as by the interest earned on the cash proceeds of the initial sale. Dollar rolls involve the risk that the market value of the securities the Portfolio is obligated to repurchase under the agreement may decline below the repurchase price. Dollar rolls are speculative techniques and may be considered to be borrowings by the Portfolio. For the year ended December 31, 2013, the Portfolio earned drop income of $584,976 which is included in interest income in the accompanying statement of operations.
NOTE E : Securities Lending
The Portfolio may enter into securities lending transactions. Under the Portfolio’s securities lending program, all loans of securities will be collateralized continually by cash. The Portfolio will be compensated for the loan from a portion of the net return from the income earned on cash collateral after a rebate is paid to the borrower (in some cases, this rebate may be a “negative rebate” or fee paid by the borrower to the Portfolio in connection with the loan), and payments are made for fees of the securities lending agent and for certain other administrative expenses. It is the policy of the Portfolio to receive collateral consisting of cash in an amount exceeding the value of the securities loaned. The Portfolio will have the right to call a loan and obtain the securities loaned at any time on notice to the borrower within the normal and customary settlement time for the securities. While the securities are on loan, the borrower is obligated to pay the Portfolio amounts equal to any income or other distributions from the securities. The Portfolio will not have the right to vote any securities during the existence of a loan, but will have the right to regain ownership of loaned securities in order to exercise voting or other ownership rights. The lending agent has agreed to indemnify the Portfolio in the case of default of any securities borrower. Collateral received and securities loaned are marked to market daily to ensure that the securities loaned are secured by collateral. The lending agent will invest the cash collateral received in AllianceBernstein Exchange Reserves, an eligible money market vehicle, in accordance with the investment restrictions of the Portfolio, and as approved by the Board. The collateral received on securities loaned is recorded as an asset as well as a corresponding liability in the statement of assets and liabilities. When the Portfolio lends securities, its investment performance will continue to reflect changes in the value of the securities loaned. At December 31, 2013, the Portfolio had securities on loan with a value of $2,530,271 and had received cash collateral which has been invested into AllianceBernstein Exchange Reserves of $2,812,758. The cash collateral will be adjusted on the next business day to maintain the required collateral amount. The Portfolio earned securities lending income of $79,768 and $3,147 from the borrowers and AllianceBernstein Exchange Reserves, respectively, for the year ended December 31, 2013; these amounts are reflected in the statement of operations. A principal risk of lending portfolio securities is that the borrower will fail to return the loaned securities upon termination of the loan and that the collateral will not be sufficient to replace the loaned securities. A summary of the Portfolio’s transactions in shares of AllianceBernstein Exchange Reserves for the year ended December 31, 2013 is as follows:
Market Value December 31, 2012 (000) | Purchases at Cost (000) | Sales Proceeds (000) | Market Value December 31, 2013 (000) | |||||||||||
| $ | 5,278 | $ | 72,447 | $ | 74,912 | $ | 2,813 | |||||||
43
| BALANCED WEALTH STRATEGY PORTFOLIO | ||
| NOTES TO FINANCIAL STATEMENTS | ||
| (continued) | AllianceBernstein Variable Products Series Fund | |
NOTE F : Capital Stock
Each class consists of 500,000,000 authorized shares. Transactions in capital shares for each class were as follows:
| SHARES | AMOUNT | |||||||||||||||||
| Year Ended December 31, 2013 | Year Ended December 31, 2012 |
| Year Ended December 31, 2013 | Year Ended December 31, 2012 | ||||||||||||||
Class A | ||||||||||||||||||
Shares sold | 80,998 | 59,264 | $ | 1,056,312 | $ | 696,079 | ||||||||||||
Shares issued in reinvestment of dividends | 79,898 | 80,006 | 1,021,098 | 924,871 | ||||||||||||||
Shares redeemed | (616,652 | ) | (1,774,706 | ) | (7,969,589 | ) | (20,596,189 | ) | ||||||||||
|
|
|
|
|
|
|
|
| ||||||||||
Net decrease | (455,756 | ) | (1,635,436 | ) | $ | (5,892,179 | ) | $ | (18,975,239 | ) | ||||||||
|
|
|
|
|
|
|
|
| ||||||||||
Class B | ||||||||||||||||||
Shares sold | 4,378,738 | 3,910,605 | $ | 56,132,152 | $ | 45,197,855 | ||||||||||||
Shares issued in reinvestment of dividends | 914,987 | 841,544 | 11,602,037 | 9,652,511 | ||||||||||||||
Shares redeemed | (21,843,744 | ) | (7,177,099 | ) | (287,932,321 | ) | (83,129,654 | ) | ||||||||||
|
|
|
|
|
|
|
|
| ||||||||||
Net decrease | (16,550,019 | ) | (2,424,950 | ) | $ | (220,198,132 | ) | $ | (28,279,288 | ) | ||||||||
|
|
|
|
|
|
|
|
| ||||||||||
NOTE G : Risks Involved in Investing in the Portfolio
Interest Rate Risk and Credit Risk—Interest rate risk is the risk that changes in interest rates will affect the value of the Portfolio’s investments in fixed-income debt securities such as bonds or notes. Increases in interest rates may cause the value of the Portfolio’s investments to decline. Credit risk is the risk that the issuer or guarantor of a debt security, or the counterparty to a derivative contract, will be unable or unwilling to make timely principal and/or interest payments, or to otherwise honor its obligations. The degree of risk for a particular security may be reflected in its credit risk rating. Credit risk is greater for medium quality and lower-rated securities. Lower-rated debt securities and similar unrated securities (commonly known as “junk bonds”) have speculative elements or are predominantly speculative risks.
Foreign Securities Risk—Investing in securities of foreign companies or foreign governments involves special risks which include changes in foreign currency exchange rates and the possibility of future political and economic developments which could adversely affect the value of such securities. Moreover, securities of many foreign companies or foreign governments and their markets may be less liquid and their prices more volatile than those of comparable U.S. companies or of the U.S. government.
Currency Risk—This is the risk that changes in foreign currency exchange rates may negatively affect the value of the Portfolio’s investments or reduce the returns of the Portfolio. For example, the value of the Portfolio’s investments in foreign currency-denominated securities or currencies may decrease if the U.S. dollar is strong (i.e., gaining value relative to other currencies) and other currencies are weak (i.e., losing value relative to the U.S. dollar). Currency markets are generally not as regulated as securities markets. Independent of the Portfolio’s investments denominated in foreign currencies, the Portfolio’s positions in various foreign currencies may cause the Portfolio to experience investment losses due to the changes in exchange rates and interest rates.
Derivatives Risk—The Portfolio may enter into derivative transactions such as forwards, options, futures and swaps. Derivatives may be illiquid, difficult to price, and leveraged so that small changes may produce disproportionate losses for the Portfolio, and subject to counterparty risk to a greater degree than more traditional investments. Derivatives may result in significant losses, including losses that are far greater than the value of the derivatives reflected in the statement of assets and liabilities.
Indemnification Risk—In the ordinary course of business, the Portfolio enters into contracts that contain a variety of indemnifications. The Portfolio’s maximum exposure under these arrangements is unknown. However, the Portfolio has not had prior claims or losses pursuant to these indemnification provisions and expects the risk of loss thereunder to be remote. Therefore, the Portfolio has not accrued any liability in connection with these indemnification provisions.
NOTE H : Joint Credit Facility
A number of open-end mutual funds managed by the Adviser, including the Portfolio, participate in a $140 million revolving credit facility (the “Facility”) intended to provide short-term financing, if necessary, subject to certain restrictions in con-
44
| AllianceBernstein Variable Products Series Fund |
nection with abnormal redemption activity. Commitment fees related to the Facility are paid by the participating funds and are included in miscellaneous expenses in the statement of operations. The Portfolio did not utilize the Facility during the year ended December 31, 2013.
NOTE I : Distributions to Shareholders
The tax character of distributions paid during the fiscal years ended December 31, 2013 and December 31, 2012 were as follows:
| 2013 | 2012 | |||||||
Distributions paid from: | ||||||||
Ordinary income | $ | 12,623,135 | $ | 10,577,383 | ||||
|
|
|
| |||||
Total taxable distributions paid | $ | 12,623,135 | $ | 10,577,383 | ||||
|
|
|
| |||||
As of December 31, 2013, the components of accumulated earnings/(deficit) on a tax basis were as follows:
Undistributed ordinary income | $ | 12,697,868 | ||
Undistributed capital gains | 54,486,946 | |||
Accumulated capital and other losses | –0 | –(a) | ||
Unrealized appreciation/(depreciation) | 56,245,116 | (b) | ||
|
| |||
Total accumulated earnings/(deficit) | $ | 123,429,930 | ||
|
|
| (a) | During the fiscal year ended December 31, 2013, the Portfolio utilized $8,325,654 of capital loss carryforwards to offset current year net realized gains. |
| (b) | The differences between book-basis and tax-basis unrealized appreciation/(depreciation) are attributable primarily to the tax deferral of losses on wash sales, the tax treatment of swaps, passive foreign investment companies (PFICs) and Treasury inflation-protected securities, and the realization for tax purposes of gains/losses on certain derivative instruments. |
For tax purposes, net capital losses may be carried over to offset future capital gains, if any. Funds are permitted to carry forward capital losses incurred in taxable years beginning after December 22, 2010 for an indefinite period, and such losses will retain their character as either short-term or long-term capital losses. As of December 31, 2013, the Portfolio did not have any capital loss carryforwards.
During the current fiscal year, permanent differences primarily due to reclassifications of foreign currency and foreign capital gains tax, the tax treatment of swaps and passive foreign investment companies (PFICs), paydown gain/loss reclassification, the tax treatment of partnership investments, and return of capital distributions received from underlying securities resulted in a net increase in undistributed net investment income and a net decrease in accumulated net realized gain on investment and foreign currency transactions. These reclassifications had no effect on net assets.
NOTE J : Subsequent Events
Management has evaluated subsequent events for possible recognition or disclosure in the financial statements through the date the financial statements are issued. Management has determined that there are no material events that would require disclosure in the Portfolio’s financial statements through this date.
45
| BALANCED WEALTH STRATEGY PORTFOLIO | ||
| FINANCIAL HIGHLIGHTS | AllianceBernstein Variable Products Series Fund | |
Selected Data For A Share Of Capital Stock Outstanding Throughout Each Period
| CLASS A | ||||||||||||||||||||
| Year Ended December 31, | ||||||||||||||||||||
| 2013 | 2012 | 2011 | 2010 | 2009 | ||||||||||||||||
Net asset value, beginning of period | $12.12 | $10.90 | $11.48 | $10.66 | $8.63 | |||||||||||||||
|
|
|
|
|
|
|
|
|
| |||||||||||
Income From Investment Operations | ||||||||||||||||||||
Net investment income (a) | .23 | .22 | .23 | .23 | .24 | |||||||||||||||
Net realized and unrealized gain (loss) | 1.74 | 1.25 | (.53 | ) | .88 | 1.89 | ||||||||||||||
|
|
|
|
|
|
|
|
|
| |||||||||||
Net increase (decrease) in net asset value from operations | 1.97 | 1.47 | (.30 | ) | 1.11 | 2.13 | ||||||||||||||
|
|
|
|
|
|
|
|
|
| |||||||||||
Less: Dividends | ||||||||||||||||||||
Dividends from net investment income | (.32 | ) | (.25 | ) | (.28 | ) | (.29 | ) | (.10 | ) | ||||||||||
|
|
|
|
|
|
|
|
|
| |||||||||||
Net asset value, end of period | $13.77 | $12.12 | $10.90 | $11.48 | $10.66 | |||||||||||||||
|
|
|
|
|
|
|
|
|
| |||||||||||
Total Return | ||||||||||||||||||||
Total investment return based on | 16.49 | % | 13.63 | % | (2.81 | )%* | 10.61 | %* | 24.88 | %* | ||||||||||
Ratios/Supplemental Data | ||||||||||||||||||||
Net assets, end of period (000’s omitted) | $41,222 | $41,801 | $55,395 | $68,914 | $73,120 | |||||||||||||||
Ratio to average net assets of: | ||||||||||||||||||||
Expenses | .65 | % | .65 | % | .66 | % | .68 | %+ | .69 | % | ||||||||||
Net investment income | 1.76 | % | 1.91 | % | 2.03 | % | 2.14 | %+ | 2.66 | % | ||||||||||
Portfolio turnover rate** | 117 | % | 90 | % | 94 | % | 101 | % | 85 | % | ||||||||||
See footnote summary on page 47.
46
| AllianceBernstein Variable Products Series Fund |
Selected Data For A Share Of Capital Stock Outstanding Throughout Each Period
| CLASS B | ||||||||||||||||||||
| Year Ended December 31, | ||||||||||||||||||||
| 2013 | 2012 | 2011 | 2010 | 2009 | ||||||||||||||||
Net asset value, beginning of period | $12.01 | $10.80 | $11.38 | $10.58 | $8.58 | |||||||||||||||
|
|
|
|
|
|
|
|
|
| |||||||||||
Income From Investment Operations | ||||||||||||||||||||
Net investment income (a) | .19 | .19 | .20 | .20 | .22 | |||||||||||||||
Net realized and unrealized gain (loss) | 1.74 | 1.24 | (.53 | ) | .87 | 1.86 | ||||||||||||||
|
|
|
|
|
|
|
|
|
| |||||||||||
Net increase (decrease) in net asset value from operations | 1.93 | 1.43 | (.33 | ) | 1.07 | 2.08 | ||||||||||||||
|
|
|
|
|
|
|
|
|
| |||||||||||
Less: Dividends | ||||||||||||||||||||
Dividends from net investment income | (.29 | ) | (.22 | ) | (.25 | ) | (.27 | ) | (.08 | ) | ||||||||||
|
|
|
|
|
|
|
|
|
| |||||||||||
Net asset value, end of period | $13.65 | $12.01 | $10.80 | $11.38 | $10.58 | |||||||||||||||
|
|
|
|
|
|
|
|
|
| |||||||||||
Total Return | ||||||||||||||||||||
Total investment return based on | 16.27 | % | 13.38 | % | (3.06 | )%* | 10.30 | %* | 24.45 | %* | ||||||||||
Ratios/Supplemental Data | ||||||||||||||||||||
Net assets, end of period (000’s omitted) | $351,355 | $508,141 | $483,047 | $518,572 | $458,669 | |||||||||||||||
Ratio to average net assets of: | ||||||||||||||||||||
Expenses | .90 | % | .90 | % | .91 | % | .93 | %+ | .95 | % | ||||||||||
Net investment income | 1.49 | % | 1.67 | % | 1.78 | % | 1.89 | %+ | 2.36 | % | ||||||||||
Portfolio turnover rate** | 117 | % | 90 | % | 94 | % | 101 | % | 85 | % | ||||||||||
| (a) | Based on average shares outstanding. |
| (b) | Total investment return is calculated assuming an initial investment made at the net asset value at the beginning of the period, reinvestment of all dividends and distributions at net asset value during the period, and redemption on the last day of the period. Total return does not reflect (i) insurance company’s separate account related expense charges and (ii) the deductions of taxes that a shareholder would pay on Portfolio distributions or the redemption of Portfolio shares. Total investment return calculated for a period of less than one year is not annualized. |
| * | Includes the impact of proceeds received and credited to the Portfolio resulting from class action settlements, which enhanced the Portfolio’s performance for the years ended December 31, 2011, December 31, 2010 and December 31, 2009 by 0.02%, 0.03% and 0.06%, respectively. |
| + | The ratio includes expenses attributable to costs of proxy solicitation. |
| ** | The Portfolio accounts for dollar roll transactions as purchases and sales. |
See notes to financial statements.
47
| REPORTOF INDEPENDENT REGISTERED | ||
| PUBLIC ACCOUNTING FIRM | AllianceBernstein Variable Products Series Fund | |
To the Board of Directors and Shareholders of AllianceBernstein Balanced Wealth Strategy Portfolio:
We have audited the accompanying statement of assets and liabilities, including the portfolio of investments, of AllianceBernstein Balanced Wealth Strategy Portfolio (one of the funds constituting AllianceBernstein Variable Products Series Fund, Inc. (the “Fund”)) as of December 31, 2013, and the related statement of operations for the year then ended, the statements of changes in net assets for each of the two years in the period then ended, and the financial highlights for each of the five years in the period then ended. These financial statements and financial highlights are the responsibility of the Fund’s management. Our responsibility is to express an opinion on these financial statements and financial highlights based on our audits.
We conducted our audits in accordance with the standards of the Public Company Accounting Oversight Board (United States). Those standards require that we plan and perform the audit to obtain reasonable assurance about whether the financial statements and financial highlights are free of material misstatement. We were not engaged to perform an audit of the Fund’s internal control over financial reporting. Our audits included consideration of internal control over financial reporting as a basis for designing audit procedures that are appropriate in the circumstances, but not for the purpose of expressing an opinion on the effectiveness of the Fund’s internal control over financial reporting. Accordingly, we express no such opinion. An audit also includes examining, on a test basis, evidence supporting the amounts and disclosures in the financial statements and financial highlights, assessing the accounting principles used and significant estimates made by management, and evaluating the overall financial statement presentation. Our procedures included confirmation of securities owned as of December 31, 2013, by correspondence with the custodian and others, or by other appropriate auditing procedures where replies from others were not received. We believe that our audits provide a reasonable basis for our opinion.
In our opinion, the financial statements and financial highlights referred to above present fairly, in all material respects, the financial position of AllianceBernstein Balanced Wealth Strategy Portfolio (one of the funds constituting AllianceBernstein Variable Products Series Fund, Inc.) at December 31, 2013, the results of its operations for the year then ended, the changes in its net assets for each of the two years in the period then ended, and the financial highlights for each of the five years in the period then ended, in conformity with U.S. generally accepted accounting principles.

New York, New York
February 14, 2014
48
| 2013 TAX INFORMATION (unaudited) | AllianceBernstein Variable Products Series Fund |
For Federal income tax purposes, the following information is furnished with respect to the distributions paid by the Portfolio during the taxable year ended December 31, 2013. For corporate shareholders, 27.27% of dividends paid qualify for the dividends received deduction.
49
| BALANCED WEALTH | ||
| STRATEGY PORTFOLIO | AllianceBernstein Variable Products Series Fund |
| BOARDOF DIRECTORS | ||
| Marshall C. Turner, Jr.(1), Chairman | Nancy P. Jacklin(1) | |
John H. Dobkin(1) | Robert M. Keith, President and Chief Executive Officer | |
| Michael J. Downey(1) | Garry L. Moody(1) | |
| William H. Foulk, Jr.(1) | Earl D. Weiner(1) | |
| D. James Guzy(1) | ||
| OFFICERS | ||
Philip L. Kirstein, Senior Vice President and Daniel J. Loewy(2), Vice President Christopher H. Nikolich(2), Vice President Patrick J. Rudden(2), Vice President Vadim Zlotnikov(2), Vice President | Emilie D. Wrapp, Secretary Joseph J. Mantineo, Treasurer and Phyllis J. Clarke, Controller Vincent S. Noto, Chief Compliance Officer | |
CUSTODIAN AND ACCOUNTING AGENT State Street Bank and Trust Company One Lincoln Street Boston, MA 02111 | LEGAL COUNSEL Seward & Kissel LLP One Battery Park Plaza New York, NY 10004 | |
DISTRIBUTOR AllianceBernstein Investments, Inc. 1345 Avenue of the Americas New York, NY 10105 | TRANSFER AGENT AllianceBernstein Investor Services, Inc. P.O. Box 786003 San Antonio, TX 78278-6003 Toll-Free 1-(800) 221-5672 | |
INDEPENDENT REGISTERED PUBLIC ACCOUNTING FIRM Ernst & Young LLP 5 Times Square New York, NY 10036 |
| (1) | Member of the Audit Committee, the Governance and Nominating Committee and the Independent Directors Committee. Mr. Foulk is the sole member of the Fair Value Pricing Committee. |
| (2) | The day-to-day management of, and investment decisions for, the Portfolio’s portfolio are made by the Multi-Asset Solutions Team, comprised of senior portfolio managers. Significant day-to-day responsibilities for coordinating the Portfolio’s investments reside with Messrs. Daniel J. Loewy, Christopher H. Nikolich, Patrick J. Rudden and Vadim Zlotnikov. |
50
| BALANCED WEALTH | ||
| STRATEGY PORTFOLIO | AllianceBernstein Variable Products Series Fund |
MANAGEMENTOFTHE FUND
Board of Directors Information
The business and affairs of the Fund are managed under the direction of the Board of Directors. Certain information concerning the Fund’s Directors is set forth below.
NAME, ADDRESS* (YEAR FIRST ELECTED**) | PRINCIPAL OCCUPATION(S) DURING PAST FIVE YEARS AND OTHER | PORTFOLIOS IN FUND COMPLEX OVERSEEN BY DIRECTOR | OTHER DIRECTORSHIPS HELD BY DIRECTOR IN THE PAST FIVE YEARS | |||||
| INTERESTED DIRECTOR | ||||||||
Robert M. Keith, # 1345 Avenue of the Americas New York, NY 10105 53 (2010) | Senior Vice President of AllianceBernstein L.P. (the “Adviser”) and the head of AllianceBernstein Investments, Inc. (“ABI”) since July 2008; Director of ABI and President of the AllianceBernstein Mutual Funds. Previously, he served as Executive Managing Director of ABI from December 2006 to June 2008. Prior to joining ABI in 2006, Executive Managing Director of Bernstein Global Wealth Management, and prior thereto, Senior Managing Director and Global Head of Client Service and Sales of the Adviser’s institutional investment management business since 2004. Prior thereto, he was Managing Director and Head of North American Client Service and Sales in the Adviser’s institutional investment management business, with which he had been associated since prior to 2004. | 100 | None | |||||
| DISINTERESTED DIRECTORS | ||||||||
Marshall C. Turner, Jr., ## Chairman of the Board 72 (2005) | Private Investor since prior to 2009. Former CEO of Dupont Photomasks, Inc. (components of semi-conductor manufacturing), 2003-2006, and interim CEO 1999-2000. Interim CEO of MEMC Electronic Materials, Inc. (semi-conductor and solar cell substrates) from November 2008 until March 2009. He has extensive operating and early-stage investment experience, including prior service as general partner of three institutional venture capital partnerships, and serves on the boards of three education and science-related non-profit organizations. He has served as a director of one AllianceBernstein fund since 1992, and director or trustee of multiple AllianceBernstein funds since 2005. He is Chairman of the AllianceBernstein Funds since January 2014. | 100 | Xilinx, Inc. (programmable logic semi-conductors) and SunEdison, Inc. (semi-conductor substrates, solar materials and solar power plants) since prior to 2009 | |||||
John H. Dobkin, ## 72 (1992) | Independent Consultant since prior to 2009. Formerly, President of Save Venice, Inc. (preservation organization) from 2001–2002; Senior Advisor from June 1999-June 2000 and President of Historic Hudson Valley (historic preservation) from December 1989-May 1999. Previously, Director of the National Academy of Design. He has served as a director or trustee of various AllianceBernstein Funds since 1992, and as Chairman of the Audit Committees of a number of such Funds from 2001-2008. | 100 | None | |||||
51
| BALANCED WEALTH STRATEGY PORTFOLIO | ||
| MANAGEMENTOFTHE FUND | ||
| (continued) | AllianceBernstein Variable Products Series Fund | |
NAME, ADDRESS* (YEAR FIRST ELECTED**) | PRINCIPAL OCCUPATION(S) DURING PAST FIVE YEARS AND OTHER | PORTFOLIOS IN FUND COMPLEX OVERSEEN BY DIRECTOR | OTHER DIRECTORSHIPS HELD BY DIRECTOR IN THE PAST FIVE YEARS | |||||
DISINTERESTED DIRECTORS (continued) | ||||||||
Michael J. Downey, ## 70 (2005) | Private Investor since prior to 2009. Formerly, managing partner of Lexington Capital, LLC (investment advisory firm) from December 1997 until December 2003. From 1987 until 1993, Chairman and CEO of Prudential Mutual Fund Management, director of the Prudential mutual funds, and member of the Executive Committee of Prudential Securities Inc. He has served as a director or trustee of the AllianceBernstein Funds since 2005 and is a director and Chairman of one other registered investment company. | 100 | Asia Pacific Fund, Inc. since prior to 2009, Prospect Acquisition Corp. (financial services) from 2007 until 2009, and The Merger Fund since prior to 2009 to 2013 | |||||
William H. Foulk, Jr., ##, ### 81 (1990) | Investment Adviser and an Independent Consultant since prior to 2009. Previously, he was Senior Manager of Barrett Associates, Inc., a registered investment adviser. He was formerly Deputy Comptroller and Chief Investment Officer of the State of New York and, prior thereto, Chief Investment Officer of the New York Bank for Savings. He has served as a director or trustee of various AllianceBernstein Funds since 1983, and has been Chairman of the Independent Directors Committee of the AllianceBernstein Funds since 2003. He served as Chairman of such Funds from 2003 through December 2013. He is also active in a number of mutual fund related organizations and committees. | 100 | None | |||||
D. James Guzy, ## 77 (2005) | Chairman of the Board of PLX Technology (semi-conductors) and of SRC Computers Inc., with which he has been associated since prior to 2009. He was a director of Intel Corporation (semi-conductors) from 1969 until 2008, and served as Chairman of the Finance Committee of such company for several years until May 2008. He was a Director of Cirrus Logic Corporation (semi-conductors) from 1984 until July 2011. He has served as a director or trustee of one or more of the AllianceBernstein Funds since 1982. | 100 | PLX Technology (semi-conductors) since prior to 2009, and Cirrus Logic Corporation (semi-conductors) since prior to 2009 until July 2011 | |||||
Nancy P. Jacklin, ## 65 (2006) | Professorial Lecturer at the Johns Hopkins School of Advanced International Studies since 2008. Formerly, U.S. Executive Director of the International Monetary Fund (December 2002-May 2006); Partner, Clifford Chance (1992-2002); Sector Counsel, International Banking and Finance, and Associate General Counsel, Citicorp (1985-1992); Assistant General Counsel (International), Federal Reserve Board of Governors (1982-1985); and Attorney Advisor, U.S. Department of the Treasury (1973-1982). Member of the Bar of the District of Columbia and of New York; and member of the Council on Foreign Relations. She has served as a director or trustee of the AllianceBernstein Funds since 2006. | 100 | None | |||||
52
| AllianceBernstein Variable Products Series Fund |
NAME, ADDRESS* (YEAR FIRST ELECTED**) | PRINCIPAL OCCUPATION(S) DURING PAST FIVE YEARS AND OTHER | PORTFOLIOS IN FUND COMPLEX OVERSEEN BY DIRECTOR | OTHER DIRECTORSHIPS HELD BY DIRECTOR IN THE PAST FIVE YEARS | |||||
DISINTERESTED DIRECTORS (continued) | ||||||||
Garry L. Moody, ## 61 (2008) | Independent Consultant. Formerly, Partner, Deloitte & Touche LLP (1995-2008) where he held a number of senior positions, including Vice Chairman, and U.S. and Global Investment Management Practice Managing Partner; President, Fidelity Accounting and Custody Services Company (1993-1995); and Partner, Ernst & Young LLP (1975-1993), where he served as the National Director of Mutual Fund Tax Services and Managing Partner of its Chicago Office Tax department. He is a member of both the Governing Council of the Independent Directors Council (IDC), an organization of independent directors of mutual funds, and the Trustee Advisory Board of BoardIQ, a biweekly publication focused on issues and news affecting directors of mutual funds. He has served as a director or trustee, and as Chairman of the Audit Committee, of the AllianceBernstein Funds since 2008. | 100 | Greenbacker Renewable Energy Company LLC (renewable energy and energy efficiency projects) from August 2013 to January 2014 | |||||
Earl D. Weiner, ## 74 (2007) | Of Counsel, and Partner prior to January 2007, of the law firm Sullivan & Cromwell LLP and member of ABA Federal Regulation of Securities Committee Task Force to draft editions of the Fund Director’s Guidebook. He also serves as a director or trustee of various non-profit organizations and has served as Chairman or Vice Chairman of a number of them. He has served as a director or trustee of the AllianceBernstein Funds since 2007 and is Chairman of the Governance and Nominating Committees of the Funds. | 100 | None | |||||
| * | The address for the Fund’s disinterested Directors is c/o AllianceBernstein L.P., Attention: Philip L. Kirstein, 1345 Avenue of the Americas, New York, NY 10105. |
| ** | There is no stated term of office for the Fund’s Directors. |
| *** | The information above includes each Director’s principal occupation during the last five years and other information relating to the experience, attributes and skills relevant to each Director’s qualifications to serve as a Director, which led to the conclusion that each Director should serve as a Director for the Fund. |
| # | Mr. Keith is an “interested person” of the Fund as defined in the “1940 Act”, due to his position as a Senior Vice President of the Adviser. |
| ## | Member of the Audit Committee, the Governance and Nominating Committee and the Independent Directors Committee. |
| ### | Member of the Fair Value Pricing Committee. |
53
| BALANCED WEALTH STRATEGY PORTFOLIO | ||
| MANAGEMENTOFTHE FUND | ||
| (continued) | AllianceBernstein Variable Products Series Fund | |
Officer Information
Certain information concerning the Portfolio’s Officers is listed below.
| NAME, ADDRESS* AND AGE | PRINCIPAL POSITION(S) HELD WITH FUND | PRINCIPAL OCCUPATION DURING PAST FIVE YEARS | ||
| Robert M. Keith 53 | President and Chief Executive Officer | See biography above. | ||
| Philip L. Kirstein 68 | Senior Vice President and Independent Compliance Officer | Senior Vice President and Independent Compliance Officer of the AllianceBernstein Funds, with which he has been associated since October 2004. Prior thereto, he was Of Counsel to Kirkpatrick & Lockhart, LLP from October 2003 to October 2004, and General Counsel of Merrill Lynch Investment Managers, L.P. since prior to March 2003. | ||
| Daniel J. Loewy 39 | Vice President | Senior Vice President of the Adviser**, with which he has been associated since prior to 2009. | ||
| Christopher H. Nikolich 44 | Vice President | Senior Vice President of the Adviser**, with which he has been associated since prior to 2009. | ||
| Patrick J. Rudden 51 | Vice President | Senior Vice President of the Adviser**, with which he has been associated since prior to 2009. | ||
| Vadim Zlotnikov 51 | Vice President | Senior Vice President of the Adviser**, with which he has been associated since prior to 2009. | ||
| Emilie D. Wrapp 58 | Secretary | Senior Vice President, Assistant General Counsel and Assistant Secretary of ABI**, with which she has been associated since prior to 2009. | ||
| Joseph J. Mantineo 54 | Treasurer and Chief Financial Officer | Senior Vice President of AllianceBernstein Investor Services, Inc. (“ABIS”)**, with which he has been associated since prior to 2009. | ||
Phyllis J. Clarke | Controller | Vice President of the ABIS**, with which she has been associated since prior to 2009. | ||
| Vincent S. Noto 49 | Chief Compliance Officer | Chief Compliance Officer of the AllianceBernstein Funds, and Vice President of ABIS**, with which he has been associated since prior to 2009. |
| * | The address for each of the Portfolio’s Officers is 1345 Avenue of the Americas, New York, NY 10105. |
| ** | The Adviser, ABI, and ABIS are affiliates of the Fund. |
| The Fund’s Statement of Additional Information (“SAI”) has additional information about the Fund’s Directors and Officers and is available without charge upon request. Contact your financial representative or AllianceBernstein at (800) 227-4618, or visit www.alliancebernstein.com, for a free prospectus or SAI. |
54
| BALANCED WEALTH STRATEGY PORTFOLIO | ||
| CONTINUANCE DISCLOSURE | AllianceBernstein Variable Products Series Fund | |
INFORMATION REGARDING THE REVIEW AND APPROVAL OF THE PORTFOLIO’S ADVISORY AGREEMENT
The disinterested directors (the “directors”) of AllianceBernstein Variable Products Series Fund, Inc. (the “Fund”) unanimously approved the continuance of the Fund’s Advisory Agreement with the Adviser in respect of AllianceBernstein Balanced Wealth Strategy Portfolio (the “Portfolio”) at a meeting held on August 6-8, 2013.
Prior to approval of the continuance of the Advisory Agreement, the directors had requested from the Adviser, and received and evaluated, extensive materials. They reviewed the proposed continuance of the Advisory Agreement with the Adviser and with experienced counsel who are independent of the Adviser, who advised on the relevant legal standards. The directors also reviewed an independent evaluation prepared by the Fund’s Senior Officer (who is also the Fund’s Independent Compliance Officer) of the reasonableness of the advisory fee, in which the Senior Officer concluded that the contractual fee for the Portfolio was reasonable. The directors also discussed the proposed continuance in private sessions with counsel and the Fund’s Senior Officer.
The directors considered their knowledge of the nature and quality of the services provided by the Adviser to the Portfolio gained from their experience as directors or trustees of most of the registered investment companies advised by the Adviser, their overall confidence in the Adviser’s integrity and competence they have gained from that experience, the Adviser’s initiative in identifying and raising potential issues with the directors and its responsiveness, frankness and attention to concerns raised by the directors in the past, including the Adviser’s willingness to consider and implement organizational and operational changes designed to improve investment results and the services provided to the AllianceBernstein Funds. The directors noted that they have four regular meetings each year, at each of which they receive presentations from the Adviser on the investment results of the Portfolio and review extensive materials and information presented by the Adviser.
The directors also considered all other factors they believed relevant, including the specific matters discussed below. In their deliberations, the directors did not identify any particular information that was all-important or controlling, and different directors may have attributed different weights to the various factors. The directors determined that the selection of the Adviser to manage the Portfolio and the overall arrangements between the Portfolio and the Adviser, as provided in the Advisory Agreement, including the advisory fee, were fair and reasonable in light of the services performed, expenses incurred and such other matters as the directors considered relevant in the exercise of their business judgment. The material factors and conclusions that formed the basis for the directors’ determinations included the following:
Nature, Extent and Quality of Services Provided
The directors considered the scope and quality of services provided by the Adviser under the Advisory Agreement, including the quality of the investment research capabilities of the Adviser and the other resources it has dedicated to performing services for the Portfolio. They noted the professional experience and qualifications of the Portfolio’s portfolio management team and other senior personnel of the Adviser. The directors also considered that the Advisory Agreement provides that the Portfolio will reimburse the Adviser for the cost to it of providing certain clerical, accounting, administrative and other services to the Portfolio by employees of the Adviser or its affiliates. Requests for these reimbursements are made on a quarterly basis and subject to approval by the directors. Reimbursements, to the extent requested and paid, result in a higher rate of total compensation from the Portfolio to the Adviser than the fee rate stated in the Portfolio’s Advisory Agreement. The directors noted that the methodology used to determine the reimbursement amounts had been reviewed by an independent consultant retained by the Fund’s Senior Officer. The quality of administrative and other services, including the Adviser’s role in coordinating the activities of the Portfolio’s other service providers, also were considered. The directors concluded that, overall, they were satisfied with the nature, extent and quality of services provided to the Portfolio under the Advisory Agreement.
Costs of Services Provided and Profitability
The directors reviewed a schedule of the revenues, expenses and related notes indicating the profitability of the Portfolio to the Adviser for calendar years 2011 and 2012 that had been prepared with an expense allocation methodology arrived at in consultation with an independent consultant retained by the Fund’s Senior Officer. The directors noted the assumptions and methods of allocation used by the Adviser in preparing fund-specific profitability data and understood that there are a number of potentially acceptable allocation methodologies for information of this type. The directors noted that the profitability information reflected all revenues and expenses of the Adviser’s relationship with the Portfolio, including those relating to its subsidiaries which provide transfer agency, distribution and brokerage services to the Portfolio. The directors recognized that it is difficult to make comparisons of profitability of the Advisory Agreement with advisory contracts for unaffiliated funds
55
| BALANCED WEALTH STRATEGY PORTFOLIO | ||
| CONTINUANCE DISCLOSURE | ||
| (continued) | AllianceBernstein Variable Products Series Fund | |
because comparative information is not generally publicly available and is affected by numerous factors. The directors focused on the profitability of the Adviser’s relationship with the Portfolio before taxes and distribution expenses. The directors concluded that they were satisfied that the Adviser’s level of profitability from its relationship with the Portfolio was not unreasonable.
Fall-Out Benefits
The directors considered the other benefits to the Adviser and its affiliates from their relationships with the Portfolio, including but not limited to benefits relating to soft dollar arrangements (whereby the Adviser receives brokerage and research services from brokers that execute transactions for certain clients, including the Portfolio); 12b-1 fees and sales charges received by the Fund’s principal underwriter (which is a wholly owned subsidiary of the Adviser) in respect of the Portfolio’s Class B shares; transfer agency fees paid by the Portfolio to a wholly owned subsidiary of the Adviser; and brokerage commissions paid by the Portfolio to brokers affiliated with the Adviser. The directors recognized that the Adviser’s profitability would be somewhat lower without these benefits. The directors also understood that the Adviser also might derive reputational and other benefits from its association with the Portfolio.
Investment Results
In addition to the information reviewed by the directors in connection with the meeting, the directors receive detailed performance information for the Portfolio at each regular Board meeting during the year. At the August 2013 meeting, the directors reviewed information prepared by Lipper showing the performance of the Class A Shares of the Portfolio as compared with that of a group of similar funds selected by Lipper (the “Performance Group”) and as compared with that of a broader array of funds selected by Lipper (the “Performance Universe”), and information prepared by the Adviser showing performance of the Class A Shares as compared with the Standard & Poor’s (S&P) 500 Stock Index, the Barclays Capital (BC) U.S. Aggregate Bond Index and the Portfolio’s composite benchmark (60% S&P 500 Stock Index/40% BC U.S. Aggregate Bond Index), in each case for the 1-, 3- and 5-year periods ended May 31, 2013 and (in the case of comparisons with the indices) the since inception period (July 2004 inception). The directors noted that the Portfolio was in the 3rd quintile of the Performance Group and the Performance Universe for the 1-year period, in the 5th quintile of the Performance Group and the 4th quintile of the Performance Universe for the 3-year period, and in the 4th quintile of the Performance Group and 5th quintile of the Performance Universe for the 5-year period. The Portfolio lagged the S&P 500 Index in all periods. It outperformed the BC U.S. Aggregate Bond Index in the 1- and 3-year periods and the period since inception, but lagged it in the 5-year period. It outperformed its composite benchmark in the 1-year period but lagged it in all other periods. Based on their review, the directors concluded that the Portfolio’s recent performance was acceptable.
Advisory Fees and Other Expenses
The directors considered the advisory fee rate paid by the Portfolio to the Adviser and information prepared by Lipper concerning advisory fee rates paid by other funds in the same Lipper category as the Portfolio at a common asset level. The directors recognized that it is difficult to make comparisons of advisory fees because there are variations in the services that are included in the fees paid by other funds.
The Adviser informed the directors that there were no institutional products managed by it that have a substantially similar investment style. The directors reviewed the relevant advisory fee information from the Adviser’s Form ADV and noted that the Adviser charged institutional clients lower fees for advising comparably sized institutional accounts using strategies that differ from those of the Portfolio but which invest in equity and debt securities. The directors also noted that the Adviser advises a portfolio of another AllianceBernstein fund with a somewhat similar investment style for the same fee schedule as the Portfolio.
The Adviser reviewed with the directors the significantly greater scope of the services it provides to the Portfolio relative to institutional clients. The Adviser also noted that because mutual funds are constantly issuing and redeeming shares, they are more difficult to manage than an institutional account, where the assets tend to be relatively stable. In light of the substantial differences in services rendered by the Adviser to institutional clients as compared to funds such as the Portfolio, the directors considered these fee comparisons inapt and did not place significant weight on them in their deliberations.
The directors also considered the total expense ratio of the Class A shares of the Portfolio in comparison to the fees and expenses of funds within two comparison groups created by Lipper: an Expense Group and an Expense Universe. Lipper described an Expense Group as a representative sample of funds comparable to the Portfolio and an Expense Universe as a broader group, consisting of all funds in the Portfolio’s investment classification/objective. The Class A expense ratio of the
56
| AllianceBernstein Variable Products Series Fund |
Portfolio was based on the Portfolio’s latest fiscal year. The directors noted that it was likely that the expense ratios of some of the other funds in the Portfolio’s Lipper category were lowered by waivers or reimbursements by those funds’ investment advisers, which in some cases might be voluntary or temporary. The directors view the expense ratio information as relevant to their evaluation of the Adviser’s services because the Adviser is responsible for coordinating services provided to the Portfolio by others.
The directors noted that, at the Portfolio’s current size, its contractual effective advisory fee rate of 55 basis points was the same as the Expense Group median. The directors noted that the administrative expense reimbursement was 1 basis point in the Portfolio’s latest fiscal year, and that as a result the rate of total compensation received by the Adviser pursuant to the Advisory Agreement was close to the Expense Group median. The directors also noted that the Portfolio’s total expense ratio, which had been capped by the Adviser (although the expense ratio was currently lower than the cap), was lower than the Expense Group and the Expense Universe medians. The directors concluded that the Portfolio’s expense ratio was satisfactory.
Economies of Scale
The directors noted that the advisory fee schedule for the Portfolio contains breakpoints that reduce the fee rates on assets above specified levels. The directors took into consideration prior presentations by an independent consultant on economies of scale in the mutual fund industry and for the AllianceBernstein Funds, and by the Adviser concerning certain of its views on economies of scale. The directors also had requested and received from the Adviser certain updates on economies of scale at the May 2013 meeting. The directors believe that economies of scale may be realized (if at all) by the Adviser across a variety of products and services, and not only in respect of a single fund.
The directors noted that there is no established methodology for setting breakpoints that give effect to fund-specific services provided by a fund’s adviser and to the economies of scale that an adviser may realize in its overall mutual fund business or those components of it which directly or indirectly affect a fund’s operations. The directors observed that in the mutual fund industry as a whole, as well as among funds similar to the Portfolio, there is no uniformity or pattern in the fees and asset levels at which breakpoints (if any) apply. The directors also noted that the advisory agreements for many funds do not have breakpoints at all. Having taken these factors into account, the directors concluded that the Portfolio’s shareholders would benefit from a sharing of economies of scale in the event the Portfolio’s net assets exceed a breakpoint in the future.
57
| BALANCED WEALTH STRATEGY PORTFOLIO | ||
| SENIOR OFFICER FEE EVALUATION | AllianceBernstein Variable Products Series Fund | |
THE FOLLOWING IS NOT PART OF THE SHAREHOLDER REPORT OR THE FINANCIAL STATEMENTS
SUMMARY OF SENIOR OFFICER’S EVALUATION OF INVESTMENT ADVISORY AGREEMENT1
The following is a summary of the evaluation of the Investment Advisory Agreement between AllianceBernstein L.P. (the “Adviser”) and the AllianceBernstein Variable Products Series Fund (the “Fund”), in respect of AllianceBernstein Balanced Wealth Strategy Portfolio (the “Portfolio”).2 The evaluation of the Investment Advisory Agreement was prepared by Philip L. Kirstein, the Senior Officer of the Fund, for the Directors of the Fund, as required by the August 2004 agreement between the Adviser and the New York State Attorney General (the “NYAG”). The purpose of the summary is to provide shareholders with a synopsis of the independent evaluation of the reasonableness of the advisory fees proposed to be paid by the Portfolio which was provided to the Directors in connection with their review of the proposed approval of the continuance of the Investment Advisory Agreement.
The Senior Officer’s evaluation considered the following factors:
| 1. | Management fees charged to institutional and other clients of the Adviser for like services; |
| 2. | Management fees charged by other mutual fund companies for like services; |
| 3. | Costs to the Adviser and its affiliates of supplying services pursuant to the advisory agreement, excluding any intra-corporate profit; |
| 4. | Profit margins of the Adviser and its affiliates from supplying such services; |
| 5. | Possible economies of scale as the Portfolio grows larger; and |
| 6. | Nature and quality of the Adviser’s services including the performance of the Portfolio. |
These factors, with the exception of the first factor, are generally referred to as the “Gartenberg factors,” which were articulated by the United States Court of Appeals for the Second Circuit in 1982. Gartenberg v. Merrill Lynch Asset Management, Inc., 694 F. 2d 923 (2d Cir. 1982). The first factor is an additional factor required to be considered by the Assurance of Discontinuance between the NYAG and the Adviser. On March 30, 2010, the Supreme Court held the Gartenberg decision was correct in its basic formulation of what §36(b) requires: to face liability under §36(b), “an investment adviser must charge a fee that is so disproportionately large that it bears no reasonable relationship to the services rendered and could not have been the product of arm’s length bargaining.” Jones v. Harris Associates L.P., 130 S. Ct. 1418 (2010). In the Jones decision, the Court stated the Gartenberg approach fully incorporates the correct understanding of fiduciary duty within the context of section 36(b) and noted with approval that “Gartenberg insists that all relevant circumstances be taken into account” and “uses the range of fees that might result from arm’s-length bargaining as the benchmark for reviewing challenged fees.”
PORTFOLIO ADVISORY FEES, NET ASSETS & EXPENSE RATIOS
The Adviser proposed that the Portfolio pays the advisory fee set forth in the table below for receiving the services to be provided pursuant to the Investment Advisory Agreement. The fee schedule below, implemented in January 2004 in consideration of the Adviser’s settlement with the NYAG in December 2003, is based on a master schedule that contemplates eight categories of funds with almost all funds in each category having the same advisory fee schedule.3
| Portfolio | Net Assets 06/30/13 ($MM) | Advisory Fee Based on % of Average Daily Net Assets | Category | |||||
Balanced Wealth Strategy Portfolio | $554.6 | 0.55% on 1st $2.5 billion 0.45% on next $2.5 billion 0.40% on the balance | Balanced | |||||
The Adviser is reimbursed as specified in the Investment Advisory Agreement for certain clerical, legal, accounting, administrative and other services provided to the Portfolio. During the Portfolio’s most recently completed fiscal year, the Adviser received $45,528 (0.008% of the Portfolio’s average daily net assets) for providing such services.
| 1 | The information in the fee evaluation was completed on July 25, 2013 and discussed with the Board of Directors on August 6-8, 2013. |
| 2 | Future references to the Fund and the Portfolio do not include “AllianceBernstein.” References in the fee summary pertaining to performance and expense ratios refer to the Class A shares of the Portfolio. |
| 3 | Most of the AllianceBernstein Mutual Funds, which the Adviser manages, were affected by the Adviser’s settlement with the NYAG. |
58
| AllianceBernstein Variable Products Series Fund |
The Adviser agreed to waive that portion of its management fees and/or reimburse the Portfolio for that portion of its total operating expenses to the degree necessary to limit the Portfolio’s expense ratios to the amounts set forth below for the Portfolio’s current fiscal year. The agreement for such reimbursement is terminable by the Adviser upon at least 60 days’ notice prior to the Portfolio’s prospectus update. All share classes of the Portfolio were operating below their expense caps during the most recently completed fiscal year. Accordingly, the expense limitation was of no effect. Set forth below are the Portfolio’s gross expense ratios for the most recently completed fiscal year:
| Portfolio | Expense Cap Pursuant to Expense Limitation Undertaking | Gross Expense Ratio (12/31/12) | Fiscal Year End | |||||
Balanced Wealth Strategy Portfolio | Class A 0.75% Class B 1.00% |
| 0.65% 0.90% |
| December 31 | |||
I. ADVISORY FEES CHARGED TO INSTITUTIONAL AND OTHER CLIENTS
The advisory fees charged to investment companies which the Adviser manages and sponsors are normally higher than those charged to similar sized institutional accounts, including pension plans and sub-advised investment companies. The fee differential reflects, among other things, different services provided to such clients, and different liabilities assumed. Services provided by the Adviser to the Portfolio that are not provided to non-investment company clients and sub-advised investment companies include providing office space and personnel to serve as Fund Officers, who among other responsibilities make the certifications required under the Sarbanes–Oxley Act of 2002, and coordinating with and monitoring the Portfolio’s third party service providers such as Fund counsel, auditors, custodians, transfer agents and pricing services. The accounting, administrative, legal and compliance requirements for the Portfolio are more costly than those for institutional assets due to the greater complexities and time required for investment companies, although as previously noted, the Adviser is reimbursed for providing such services. Also, retail mutual funds managed by the Adviser are widely held. Servicing the Portfolio’s investors is more time consuming and labor intensive compared to institutional clients since the Adviser needs to communicate with a more extensive network of financial intermediaries and shareholders. The Adviser also believes that it incurs substantial entrepreneurial risk when offering a new mutual fund since establishing a new mutual fund requires a large upfront investment, and it may take a long time for the fund to achieve profitability since the fund must be priced to scale from inception in order to be competitive and assets are acquired one account at a time. In addition, managing the cash flow of an investment company may be more difficult than managing a stable pool of assets, such as an institutional account with little cash movement in either direction, particularly, if a fund is in net redemption and the Adviser is frequently forced to sell securities to raise cash for redemptions. However, managing a fund with positive cash flow may be easier at times than managing a stable pool of assets. Finally, in recent years, investment advisers have been sued by institutional clients and have suffered reputational damage both by the attendant publicity and outcomes other than complete victories. Accordingly, the legal and reputational risks associated with institutional accounts are greater than previously thought, although still not equal to those related to the mutual fund industry.
Notwithstanding the Adviser’s view that managing an investment company is not comparable to managing other institutional accounts because the services provided are different, the Supreme Court has indicated consideration should be given to the advisory fees charged to institutional accounts that have a substantially similar investment style as the Portfolio.4 However, the Adviser represented that there is no category in the Form ADV for institutional products that has a similar investment style as the Portfolio.
The Adviser manages The AllianceBernstein Portfolios—Balanced Wealth Strategy (“TAP—Balanced Wealth Strategy”), a retail mutual fund which has a substantially similar investment style as the Portfolio5 The Adviser also manages
| 4 | The Supreme Court stated that “courts may give such comparisons the weight that they merit in light of the similarities and differences between the services that the clients in question require, but the courts must be wary of inapt comparisons.” Among the significant differences the Supreme Court noted that may exist between services provided to mutual funds and institutional accounts are “higher marketing costs.” Jones v. Harris at 1428. |
| 5 | The AllianceBernstein Mutual Fund was also affected by the settlement between the Adviser and the NYAG. As a result, the Portfolio has the same breakpoints in its advisory fee schedule as the AllianceBernstein Mutual Fund. |
59
| BALANCED WEALTH STRATEGY PORTFOLIO | ||
| SENIOR OFFICER FEE EVALUATION | ||
| (continued) | AllianceBernstein Variable Products Series Fund | |
AllianceBernstein Global Risk Allocation Fund, Inc. (“Global Risk Allocation Fund, Inc.”), a retail mutual fund in the Balanced category. The advisory fee schedules of TAP – Balanced Wealth Strategy and Global Risk Allocation Fund, Inc. are shown in the table below6
| Portfolio | AllianceBernstein Mutual Fund | Fee Schedule | ||
Balanced Wealth Strategy Portfolio | TAP—Balanced Wealth Strategy | 0.55% on first $2.5 billion 0.45% on next $2.5 billion 0.40% on the balance | ||
| Global Risk Allocation Fund, Inc7 | 0.60% on first $200 million 0.50% on next $200 million 0.40% on the balance | |||
The AllianceBernstein Investment Trust Management mutual funds (“ITM”), which are offered to investors in Japan, have an “all-in” fee to compensate the Adviser for investment advisory as well as fund accounting and administrative services, but not for distribution services. The fee schedule of the ITM mutual fund that has a somewhat similar investment style as the Portfolio is as follows:
| Portfolio | ITM Mutual Fund | Fee | ||
Balanced Wealth Strategy Portfolio | Alliance Global Balance Neutral8 | 0.70% |
The Adviser represented that it does not sub-advise any registered investment company with a substantially similar investment style as the Portfolio.
II. MANAGEMENT FEES CHARGED BY OTHER MUTUAL FUND COMPANIES FOR LIKE SERVICES.
Lipper, Inc. (“Lipper”), an analytical service that is not affiliated with the Adviser, compared the fees charged to the Portfolio with fees charged to other investment companies for similar services offered by other investment advisers.9 Lipper’s analysis included the Portfolio’s contractual management fee10 estimated at the approximate current asset level of the Portfolio to the median of the Portfolio’s Lipper Expense Group (“EG”)11.
Lipper describes an EG as a representative sample of comparable funds. Lipper’s standard methodology for screening funds to be included in an EG entails the consideration of several fund criteria, including fund type, investment classification/objective, load type and similar 12b-1/non-12b-1 service fees, asset (size) comparability, expense components and attributes. An EG will typically consist of seven to twenty funds.
| Portfolio | Contractual Management Fee12 | Lipper EG Median (%) | Lipper EG Rank | |||||||||
Balanced Wealth Strategy Portfolio | 0.550 | 0.550 | 6/13 | |||||||||
| 6 | There was no change to the advisory fee schedule of AllianceBernstein Global Risk Allocation Fund, Inc. since the retail mutual fund had already lower breakpoints than that of the NYAG related category. |
| 7 | Prior to October 8, 2012, AllianceBernstein Global Risk Allocation Fund, Inc. was known as AllianceBernstein Balanced Shares, Inc. and had a different investment strategy that was similar to the Portfolio. The advisory fee schedule of the retail mutual fund was not affected by the NYAG settlement since the retail mutual fund had lower breakpoints than that of the NYAG related category |
| 8 | This ITM is privately placed or institutional. |
| 9 | The Supreme Court cautioned against accepting mutual fund fee comparisons without careful scrutiny since “these comparisons are problematic because these fees, like those challenged, may not be the product of the negotiations conducted at arm’s length.” Jones v. Harris at 1429. |
| 10 | The contractual management fee is calculated by Lipper using the Portfolio’s contractual management fee rate at a hypothetical asset level. The hypothetical asset level is based on the combined net assets of all classes of the Portfolio, rounded up to the next $25 million. Lipper’s total expense ratio information is based on the most recent annual report except as otherwise noted. A ranking of “1” would mean that the Portfolio had the lowest effective fee rate in the Lipper peer group. |
| 11 | Lipper does not consider average account size when constructing EGs. Funds with relatively small average account sizes tend to have higher transfer agent expense ratios than comparable sized funds that have relatively large average account sizes. In addition, there are limitations in Lipper’s expense category data because different funds categorize expenses differently. |
| 12 | The contractual management fee does not reflect any expense reimbursements made by the Portfolio to the Adviser for certain clerical, legal, accounting, administrative and other services. In addition, the contractual management fee does not reflect any advisory fee waivers for expense caps that would effectively reduce the actual management fee. |
60
| AllianceBernstein Variable Products Series Fund |
Lipper also compared the Portfolio’s most recently completed fiscal year total expense ratio to the medians of the Portfolio’s EG and Lipper Expense Universe (“EU”). The EU is a broader group compared to the EG, consisting of all funds that have the same investment classification/objective and load type as the subject Portfolio.13
| Portfolio | Total Expense Ratio | Lipper EG Median (%) | Lipper EG | Lipper Median (%) | Lipper EU Rank | |||||||||||||||
Balanced Wealth Strategy Portfolio | 0.650 | 0.711 | 5/13 | 0.712 | 12/28 | |||||||||||||||
Based on this analysis, the Portfolio has a more favorable ranking on a total expense ratio basis than on a contractual management fee basis.
III. COSTS TO THE ADVISER AND ITS AFFILIATES OF SUPPLYING SERVICES PURSUANT TO THE ADVISORY FEE ARRANGEMENT, EXCLUDING ANY INTRA-CORPORATE PROFIT.
The Adviser utilizes two profitability reporting systems, which operate independently but are aligned with each other, to estimate the Adviser’s profitability in connection with investment advisory services provided to the Portfolio. The Senior Officer has retained a consultant to provide independent advice regarding the alignment of the two profitability systems as well as the methodologies and allocations utilized by both profitability systems.
IV. PROFIT MARGINS OF THE ADVISER AND ITS AFFILIATES FOR SUPPLYING SUCH SERVICES.
The Portfolio’s profitability information, prepared by the Adviser for the Board of Directors, was reviewed by the Senior Officer and the consultant. The Adviser’s profitability from providing investment advisory services to the Portfolio increased during calendar year 2012, relative to 2011.
In addition to the Adviser’s direct profits from managing the Portfolio, certain of the Adviser’s affiliates have business relationships with the Portfolio and may earn a profit from providing other services to the Portfolio. The courts have referred to this type of business opportunity as “fall-out benefits” to the Adviser and indicated that such benefits should be factored into the evaluation of the total relationship between the Portfolio and the Adviser. Neither case law nor common business practice precludes the Adviser’s affiliates from earning a reasonable profit on this type of relationship. These affiliates provide transfer agent, distribution and brokerage related services to the Portfolio and receive transfer agent fees, Rule 12b-1 payments, and brokerage commissions. In addition, the Adviser benefits from soft dollar arrangements which offset expenses the Adviser would otherwise incur.
The Portfolio has adopted a distribution plan for Class B shares pursuant to Rule 12b-1 under the 40 Act. Under the distribution plan, the Portfolio pays distribution and servicing fees to its principal underwriter and distributor, AllianceBernstein Investments, Inc. (“ABI”), an affiliate of the Adviser, at an annual rate of up to 0.50% of the Portfolio’s average daily net assets attributable to Class B shares. The current annual rate that the Portfolio pays to ABI for 12b-1 fees is 0.25%. During the fiscal year ended December 31, 2012, ABI received $1,266,577 in Rule 12b-1 fees from the Portfolio.
During the fiscal year ended December 31, 2011, the Adviser incurred distribution expenses in the amount of $2,982,355 in connection with activities primarily intended to result in the sale of the Portfolio’s Class B shares. This amount includes the 12b-1 fees paid by the Portfolio to the Adviser.
Financial intermediaries, such as insurers, market and sell shares of the Portfolio and typically receive compensation from ABI, the Advisers and/or the Portfolio for selling shares of the Portfolio. These financial intermediaries receive compensation in any or all of the following forms: 12b-1 fees, defrayal of costs for educational seminars and training, additional distribution support, recordkeeping and/or administrative services. Payments related to providing contract-holder recordkeeping and/or administrative services will generally not exceed 0.35% of the average daily net assets of the Portfolio attributable to the relevant intermediary over the year.
| 13 | Except for asset (size) comparability, Lipper uses the same criteria for selecting an EG when selecting an EU. Unlike the EG, the EU allows for the same adviser to be represented by more than just one fund. |
| 14 | Most recently completed fiscal year Class A total expense ratio. |
61
| BALANCED WEALTH STRATEGY PORTFOLIO | ||
| SENIOR OFFICER FEE EVALUATION | ||
| (continued) | AllianceBernstein Variable Products Series Fund | |
The transfer agent of the Portfolio is AllianceBernstein Investor Services, Inc. (“ABIS”). During the most recently completed fiscal year, ABIS received a fee of approximately $1,385 from the Portfolio15
The Portfolio effected brokerage transactions through the Adviser’s affiliate, Sanford C. Bernstein & Co., LLC (“SCB & Co.”) and its U.K. affiliate, Sanford C. Bernstein Limited (“SCB Ltd.”), collectively “SCB,” and paid commissions for such transactions during the Portfolio’s most recently completed fiscal year. The Adviser represented that SCB’s profitability from business conducted with the Portfolio is comparable to the profitability of SCB’s dealings with other similar third party clients. In the ordinary course of business, SCB receives and pays liquidity rebates from electronic communications networks (“ECNs”) derived from trading for its clients. These credits and charges are not being passed onto any SCB client. The Adviser also receives certain soft dollar benefits from brokers that execute agency trades for its clients. These soft dollar benefits reduce the Adviser’s cost of doing business and increase its profitability.
V. POSSIBLE ECONOMIES OF SCALE
The Adviser has indicated that economies of scale are being shared with shareholders through pricing to scale, breakpoints, fee reductions/waivers and enhancement to services.
In May 2012, an independent consultant, retained by the Senior Officer, provided the Board of Directors information on the Adviser’s firm-wide average costs from 2005 through 2011 and the potential economies of scale. The independent consultant noted that from 2005 through 2007 the Adviser experienced significant growth in assets under management (“AUM”). During this period, operating expenses increased, in part to keep up with growth, and in part reflecting market returns. However, from 2008 through the first quarter of 2009, AUM rapidly and significantly decreased due to declines in market value and client withdrawals. When AUM rapidly decreased, some operating expenses categories, including base compensation and office space, adjusted more slowly during this period, resulting in an increase in average costs. Since 2009, AUM has experienced less significant changes. The independent consultant noted that changes in operating expenses reflect changes in business composition and business practices in response to changes in financial markets. Finally, the independent consultant concluded that the increase in average cost and the decline in net operating margin across the Adviser since late 2008 are inconsistent with the view that there are currently reductions in average costs due to economies of scale that can be shared with the AllianceBernstein Mutual Funds managed by the Adviser through lower fees.
Previously, in February 2008, the independent consultant provided the Board of Directors an update of the Deli16 study on advisory fees and various fund characteristics.17 The independent consultant first reiterated the results of his previous two dimensional comparison analysis (fund size and family size) with the Board of Directors.18 The independent consultant then discussed the results of the regression model that was utilized to study the effects of various factors on advisory fees. The regression model output indicated that the bulk of the variation in fees predicted were explained by various factors, but substantially by fund AUM, family AUM, index fund indicator and investment style. The independent consultant also compared the advisory fees of the AllianceBernstein Mutual Funds to similar funds managed by 19 other large asset managers, regardless of the fund size and each Adviser’s proportion of mutual fund assets to non-mutual fund assets.
VI. NATURE AND QUALITY OF THE ADVISER’S SERVICES, INCLUDING THE PERFORMANCE OF THE PORTFOLIO
With assets under management of approximately $435 billion as of June 30, 2013, the Adviser has the investment experience to manage and provide non-investment services (described in Section I) to the Portfolio.
| 15 | The Fund (which includes the Portfolio and other series of the Fund) paid ABIS a flat fee of $18,000 in 2012. |
| 16 | The Deli study, originally published in 2002 based on 1997 data and updated for the February 2008 Presentation, may be of diminished value due to the age of the data used in the presentation and the changes experienced in the industry over the last four years. |
| 17 | As mentioned previously, the Supreme Court cautioned against accepting mutual fund fee comparisons without careful scrutiny since the fees may not be the product of negotiations conducted at arm’s length. See Jones V. Harris at 1429. |
| 18 | The two dimensional analysis showed patterns of lower advisory fees for funds with larger asset sizes and funds from larger family sizes compared to funds with smaller asset sizes and funds from smaller family sizes, which according to the independent consultant is indicative of a sharing of economies of scale and scope. However, in less liquid and active markets, such is not the case, as the empirical analysis showed potential for diseconomies of scale in those markets. The empirical analysis also showed diminishing economies of scale and scope as funds surpassed a certain high level of assets. |
62
| AllianceBernstein Variable Products Series Fund |
The information prepared by Lipper shows the 1, 3 and 5 year net performance returns and rankings19 of the Portfolio relative to its Lipper Performance Group (“PG”) and Lipper Performance Universe (“PU”)20 for the periods ended May 31, 2013.21
| Portfolio | Portfolio Return (%) | Lipper PG Median (%) | Lipper PU Median (%) | Lipper PG Rank | Lipper PU Rank | |||||||||||||||
Balanced Wealth Strategy Portfolio | ||||||||||||||||||||
1 year | 18.20 | 18.15 | 18.29 | 6/13 | 15/28 | |||||||||||||||
3 year | 10.18 | 10.76 | 11.10 | 9/11 | 19/26 | |||||||||||||||
5 year | 3.26 | 5.08 | 5.27 | 8/11 | 20/24 | |||||||||||||||
Set forth below are the 1, 3 and 5 year and since inception net performance returns of the Portfolio (in bold) versus its benchmark for the periods ended May 31, 201322.
| Periods Ending May 31, 2013 Annualized Net Performance (%) | ||||||||||||||||
1 Year (%) | 3 Year (%) | 5 Year (%) | Since (%) | |||||||||||||
Balanced Wealth Strategy Portfolio | 18.20 | 10.18 | 3.26 | 5.25 | ||||||||||||
60% S&P 500 Stock Index / 40% Barclays Capital U.S. Aggregate Bond Index | 16.12 | 12.11 | 5.91 | 6.42 | ||||||||||||
S&P 500 Stock Index | 27.28 | 16.87 | 5.43 | 6.38 | ||||||||||||
Barclays Capital U.S. Aggregate Bond Index | 0.91 | 4.59 | 5.50 | 5.18 | ||||||||||||
Inception Date: July 1, 2004 | ||||||||||||||||
CONCLUSION:
Based on the factors discussed above the Senior Officer’s conclusion is that the proposed advisory fee for the Portfolio is reasonable and within the range of what would have been negotiated at arm’s-length in light of all the surrounding circumstances. This conclusion in respect of the Portfolio is based on an evaluation of all of these factors and no single factor was dispositive.
Dated:
| 19 | The performance rankings are for the Class A shares of the Portfolio. The performance returns of the Portfolio shown were provided by Lipper. |
| 20 | The Portfolio’s PG/PU is identical to the Portfolio’s EG/EU. |
| 21 | The current Lipper investment classification/objective dictates the PG and PU throughout the life of the fund even if a fund had a different investment classification/objective at a different point in time. |
| 22 | The performance returns shown in the table are for the Class A shares of the Portfolio. The performance returns for the Portfolio and the benchmark were provided by the Adviser. |
63
VPS-BW-0151-1213
AllianceBernstein
Variable Products Series Fund, Inc.
 | AllianceBernstein Dynamic Asset Allocation Portfolio |
December 31, 2013
Annual Report

ANNUAL REPORT
Investment Products Offered
| Ø | Are Not FDIC Insured |
| Ø | May Lose Value |
| Ø | Are Not Bank Guaranteed |
AllianceBernstein Investments, Inc. (ABI) is the distributor of the AllianceBernstein family of mutual funds. ABI is a member of FINRA and is an affiliate of AllianceBernstein L.P., the manager of the funds.
You may obtain a description of the Fund’s proxy voting policies and procedures, and information regarding how the Fund voted proxies relating to portfolio securities during the most recent 12-month period ended June 30, without charge. Simply visit AllianceBernstein’s website at www.alliancebernstein.com or go to the Securities and Exchange Commission’s (the “Commission”) website at www.sec.gov, or call AllianceBernstein at (800) 227-4618.
The Fund files its complete schedule of portfolio holdings with the Commission for the first and third quarters of each fiscal year on Form N-Q. The Fund’s Forms N-Q are available on the Commission’s website at www.sec.gov. The Fund’s Forms N-Q may also be reviewed and copied at the Commission’s Public Reference Room in Washington, DC; information on the operation of the Public Reference Room may be obtained by calling (800) SEC-0330.
AllianceBernstein® and the AB Logo are registered trademarks and service marks used by permission of the owner, AllianceBernstein L.P.
| DYNAMIC ASSET ALLOCATION | ||
| PORTFOLIO | AllianceBernstein Variable Products Series Fund |
LETTER TO INVESTORS
February 7, 2014
The following is an update of AllianceBernstein Variable Products Series Fund—AllianceBernstein Dynamic Asset Allocation Portfolio (the “Portfolio”) for the annual reporting period ended December 31, 2013.
INVESTMENT OBJECTIVE AND POLICIES
The Portfolio’s investment objective is to maximize total return consistent with what AllianceBernstein L.P (the “Adviser”) determines to be reasonable risk. The Portfolio invests in a globally diversified portfolio of equity and debt securities, including exchange-traded funds (“ETFs”), and other financial instruments, and expects to enter into derivatives transactions, such as options, futures, forwards, or swap agreements to achieve market exposure. The Portfolio’s neutral weighting, from which it will make its tactical asset allocations, is 60% equity exposure and 40% debt exposure. Within these broad components, the Portfolio may invest in any type of security, including common and preferred stocks, warrants and convertible securities, government and corporate fixed-income securities, commodities, currencies, real estate-related securities and inflation-protected securities. The Portfolio may invest in U.S., non-U.S. and emerging market issuers. The Portfolio may invest in securities of companies across the capitalization spectrum, including smaller capitalization companies. The Portfolio expects its investments in fixed-income securities to have a broad range of maturities and quality levels. The Portfolio is expected to be highly diversified across industries, sectors and countries, and will choose its positions from several market indices worldwide in a manner that is intended to track the performance (before fees and expenses) of those indices.
The Adviser will continuously monitor the risks presented by the Portfolio’s asset allocation and may make frequent adjustments to the Portfolio’s exposures to different asset classes. Using its proprietary Dynamic Asset Allocation techniques, the Adviser will adjust the Portfolio’s exposure to the equity and debt markets, and to segments within those markets, in response to the Adviser’s assessment of the relative risks and returns of those segments. For example, when the Adviser determines that equity market volatility is particularly low and that, therefore, the equity markets present reasonable return opportunities, the Adviser may increase the Portfolio’s equity exposure to as much as 80%. Conversely, when the Adviser determines that the risks in the equity markets are disproportionately greater than the potential returns offered, the Adviser may reduce the Portfolio’s equity exposure significantly below the target percentage or may even decide to eliminate equity exposure altogether by increasing the Portfolio’s fixed-income exposure to 100%. This investment strategy is intended to reduce the Portfolio’s overall investment risk, but may at times result in the Portfolio underperforming the markets.
The Portfolio expects to utilize derivatives and to invest in ETFs to a significant extent. Derivatives and ETFs may provide more efficient and economical exposure to market segments than direct investments, and the Portfolio’s market exposures may at times be achieved almost entirely through the use of derivatives or through the investments in ETFs. Derivatives transactions and ETFs may also be a quicker and more efficient way to alter the Portfolio’s exposure than buying and selling direct investments. As a result, the Adviser expects to use derivatives as one of the primary tools for adjusting the Portfolio’s exposure levels from its neutral weighting. The Adviser also expects to use direct investments and ETFs to adjust the Portfolio’s exposure levels. In determining when and to what extent to enter into derivatives transactions or to invest in ETFs, the Adviser will consider factors such as the relative risks and returns expected of potential investments and the cost of such transactions. The Adviser will consider the impact of derivatives and ETFs in making its assessment of the Portfolio’s risks.
Currency exchange rate fluctuations can have a dramatic impact on returns, significantly adding to returns in some years and greatly diminishing them in others. To the extent that the Portfolio invests in non-U.S. dollar-denominated investments, the Adviser will integrate the risks of foreign currency exposures into its investment and asset allocation decision making. The Adviser may seek to hedge all or a portion of the currency exposure resulting from the Portfolio’s investments or decide not to hedge this exposure. The Adviser may also seek investment opportunities through currencies and currency-related derivatives.
INVESTMENT RESULTS
The table on page 5 shows the Portfolio’s performance compared to its primary benchmark, the Morgan Stanley Capital International (“MSCI”) World Index, its secondary benchmark, the Barclays U.S. Treasury Index and its blended benchmark, a 60% / 40% blend of the MSCI World Index and the Barclays U.S. Treasury Index, respectively, for the one-year period ended December 31, 2013, and since the Portfolio’s inception on April 1, 2011.
All share classes of the Portfolio underperformed the primary and blended benchmarks for the annual period, and outperformed the secondary benchmark. Throughout the reporting period, the Portfolio was overweight in risk
1
| AllianceBernstein Variable Products Series Fund |
assets with global equity and global real estate investment trusts (“REITs”) holdings all in excess of benchmark weights; although the degree and composition of the overweight varied as market conditions changed. The Portfolio’s overweight to equities and underweight to fixed income added to performance. Holdings in REITs and emerging equities detracted as these areas materially lagged developed-market equities.
Derivatives used during the period included futures, forwards, total return swaps and purchased and written options for hedging and investment purposes, as well as credit default swaps for investment purposes. Swaptions and interest rate swaps were used for hedging purposes. Futures, forwards, swaptions, credit default swaps and total return swaps added to performance while purchased and written options and interest rate swaps detracted from performance.
MARKET REVIEW AND INVESTMENT STRATEGY
2013 was a banner year for U.S. stocks, with returns for the S&P 500 Index topping 30%. Developed international markets were up more than 20%, and emerging markets posted a small loss for the year. Bond returns were modestly negative, as yields on 10-year Treasuries rose by a full percentage or more over the year from extremely low levels, driving prices down. The U.S. stock market reacted to generally positive economic news, which included stronger consumer and business spending and was further propelled by accommodative monetary policy. By contrast, emerging-market equities were held back by concerns around domestic economic growth and falling commodity prices which hurt local producers. The Portfolio’s overweight to risk assets was supported by the Team’s view that easy money policies of central banks would continue to provide liquidity to markets creating conditions with low interest rates and where equity volatility was also likely to remain low. The Portfolio maintained a modest allocation to emerging market equities and REITs for diversification, and remained underweight bonds through most of the year.
In December, the Federal Reserve (the “Fed”) announced a carefully paced reduction in the massive bond-buying it has conducted during the third phase of its quantitative easing program (QE3). The markets and the U.S. economy appeared to be generally ready for the news, as bond yields had risen since May 2013, when the Fed first broached the subject. Furthermore, the Fed has indicated that it is unlikely to raise short-term rates before 2015. Even after the Fed’s announcement, some macroeconomic uncertainty still overhangs the markets. The compromise that was reached on the federal budget has moved U.S. Congress beyond the crisis-driven budget process that prevailed in the recent past, but in the view of the Dynamic Asset Allocation Team this will only modestly reduce the deficit, and it does not address the debt-ceiling issue that may reemerge early in 2014.
2
| DYNAMIC ASSET ALLOCATION PORTFOLIO | ||
| DISCLOSURESAND RISKS | AllianceBernstein Variable Products Series Fund | |
Benchmark Disclosure
The unmanaged MSCI World Index and the unmanaged Barclays U.S. Treasury Index do not reflect fees and expenses associated with the active management of a mutual fund portfolio. The MSCI World Index (free float-adjusted, market capitalization weighted) represents the equity market performance of developed markets. The Barclays U.S. Treasury Index represents the performance of U.S. Treasuries within the U.S. government fixed income market. MSCI makes no express or implied warranties or representations, and shall have no liability whatsoever with respect to any MSCI data contained herein. The MSCI data may not be further redistributed or used as a basis for other indices, any securities or financial products. This report is not approved, reviewed or produced by MSCI. An investor cannot invest directly in an index, and its results are not indicative of the performance for any specific investment, including the Portfolio.
A Word About Risk
Market Risk: The value of the Portfolio’s assets will fluctuate as the stock or bond market fluctuates. The value of its investments may decline, sometimes rapidly and unpredictably, simply because of economic changes or other events that affect large portions of the market.
Interest Rate Risk: Changes in interest rates will affect the value of the Portfolio’s investments in fixed-income securities. When interest rates rise, the value of investments in fixed-income securities tends to fall and this decrease in value may not be offset by higher income from new investments. Interest rate risk is generally greater for fixed-income securities with longer maturities or durations.
Credit Risk: An issuer or guarantor of a fixed-income security, or the counterparty to a derivatives or other contract, may be unable or unwilling to make timely payments of interest or principal, or to otherwise honor its obligations. The issuer or guarantor may default, causing a loss of the full principal amount of a security. The degree of risk for a particular security may be reflected in its credit rating. There is the possibility that the credit rating of a fixed-income security may be downgraded after purchase, which may adversely affect the value of the security. Investments in fixed-income securities with lower ratings tend to have a higher probability that an issuer will default or fail to meet its payment obligations.
Allocation Risk: The allocation of investments among different global asset classes may have a significant effect on the Portfolio’s net asset value, or NAV, when one of these asset classes is performing more poorly than others. As both the direct investments and derivative positions will be periodically adjusted to reflect the Adviser’s view of market and economic conditions, there will be transaction costs which may be, over time, significant. In addition, there is a risk that certain asset allocation decisions may not achieve the desired results and, as a result, the Portfolio may incur significant losses.
Foreign (Non-U.S.) Risk: The Portfolio’s investments in securities of non-U.S. issuers may involve more risk than those of U.S. issuers. These securities may fluctuate more widely in price and may be less liquid due to adverse market, economic, political, regulatory or other factors.
Emerging Market Risk: Investments in emerging market countries may have more risk because the markets are less developed and less liquid as well as being subject to increased economic, political, regulatory or other uncertainties.
Currency Risk: Fluctuations in currency exchange rates may negatively affect the value of the Portfolio’s investments or reduce its returns.
ETF Risk: ETFs are investment companies. When the Portfolio invests in an ETF, the Portfolio bears its share of the ETF’s expenses and runs the risk that the ETF may not achieve its investment objective.
Derivatives Risk: Derivatives may be illiquid, difficult to price, and leveraged so that small changes may produce disproportionate losses for the Portfolio, and may be subject to counterparty risk to a greater degree than more traditional investments.
Leverage Risk: When the Portfolio borrows money or otherwise leverages its portfolio, it may be more volatile because leverage tends to exaggerate the effect of any increase or decrease in the value of the Portfolio’s investments. The Portfolio may create leverage through the use of reverse repurchase agreements, forward commitments, or by borrowing money.
Liquidity Risk: Liquidity risk exists when a particular instrument is difficult to purchase or sell. If a derivative transaction is particularly large or if the relevant market is illiquid (as is the case with many privately negotiated derivatives), it may not be possible to initiate a transaction or liquidate a position at an advantageous price.
(Disclosures, Risks and Note about Historical Performance continued on next page)
3
| DYNAMIC ASSET ALLOCATION PORTFOLIO | ||
| DISCLOSURESAND RISKS | ||
| (continued from previous page) | AllianceBernstein Variable Products Series Fund | |
Capitalization Risk: Investments in small- and mid-capitalization companies may be more volatile than investments in large-capitalization companies. Investments in small-capitalization companies may have additional risks because these companies have limited product lines, markets or financial resources.
Real Estate Risk: The Portfolio’s investments in real estate securities have many of the same risks as direct ownership of real estate, including the risk that the value of real estate could decline due to a variety of factors that affect the real estate market generally. Investments in real estate investment trusts, or REITs, may have additional risks. REITs are dependent on the capability of their managers, may have limited diversification, and could be significantly affected by changes in taxes.
Commodity Risk: Investing in commodities and commodity-linked derivative instruments may subject the Portfolio to greater volatility than investments in traditional securities. The value of commodity-linked derivative instruments may be affected by overall market movements, commodity index volatility, changes in interest rates, or factors affecting a particular industry or commodity, such as drought, floods, weather, livestock disease, embargoes, tariffs and international economic, political and regulatory developments.
Management Risk: The Portfolio is subject to management risk because it is an actively managed investment fund. The Adviser will apply its investment techniques and risk analyses in making investment decisions for the Portfolio, but there is no guarantee that its techniques will produce the intended results.
These risks are fully discussed in the Variable Products prospectus.
An Important Note About Historical Performance
The investment return and principal value of an investment in the Portfolio will fluctuate, so that shares, when redeemed, may be worth more or less than their original cost. Performance shown on the following page represents past performance and does not guarantee future results. Current performance may be lower or higher than the performance information shown. Please contact your Financial Advisor or Insurance Agent Representative at your financial institution to obtain portfolio performance information current to the most recent month-end.
Investors should consider the investment objectives, risks, charges and expenses of the Portfolio carefully before investing. For additional copies of the Portfolio’s prospectus or summary prospectus, which contains this and other information, call your financial advisor or 800.984.7654. Please read the prospectus and/or summary prospectus carefully before investing.
All fees and expenses related to the operation of the Portfolio have been deducted, but no adjustment has been made for insurance company separate account or annuity contract charges, which would reduce total return to a contract owner. Performance assumes reinvestment of distributions and does not account for taxes.
There are additional fees and expenses associated with all Variable Products. These fees can include mortality and expense risk charges, administrative charges, and other charges that can significantly reduce investment returns. Those fees and expenses are not reflected in this annual report. You should consult your Variable Products prospectus for a description of those fees and expenses and speak to your insurance agent or financial representative if you have any questions. You should read the prospectus before investing or sending money.
4
| DYNAMIC ASSET ALLOCATION PORTFOLIO | ||
| HISTORICAL PERFORMANCE | AllianceBernstein Variable Products Series Fund | |
| THE PORTFOLIO VS. ITS BENCHMARKS | NAV Returns | |||||||
| PERIODS ENDED DECEMBER 31, 2013 (unaudited) | 1 Year | Since Inception* | ||||||
AllianceBernstein Dynamic Asset Allocation Portfolio Class A | 12.31% | 6.37% | ||||||
AllianceBernstein Dynamic Asset Allocation Portfolio Class B | 12.04% | 6.12% | ||||||
Primary Benchmark: MSCI World Index | 26.68% | 10.49% | ||||||
Secondary Benchmark: Barclays U.S. Treasury Index | -2.75% | 3.22% | ||||||
Blended Benchmark: 60% MSCI World Index / 40% Barclays U.S. Treasury Index | 14.13% | 7.86% | ||||||
* Average annual total returns: inception date: 4/1/2011. |
| |||||||
The Portfolio’s current prospectus fee table shows the Portfolio’s total annual operating expense ratios as 1.24% and 1.31% for Class A and Class B, respectively, gross of any fee waivers or expense reimbursements. Contractual fee waivers and/or expense reimbursements limit the Portfolio’s annual operating expense ratios to 0.85% and 1.10% for Class A and Class B, respectively, excluding any acquired fund fees and expenses. These waivers/reimbursements extend through the Portfolio’s current fiscal year and may be extended by the Adviser for additional one-year terms. Absent reimbursements or waivers, performance would have been lower. The Financial Highlights section of this report sets forth expense ratio data for the current reporting period; the expense ratios shown above may differ from the expense ratios in the Financial Highlights section since they are based on different time periods.
ALLIANCEBERNSTEIN DYNAMIC ASSET ALLOCATION PORTFOLIO CLASS A GROWTH OF A $10,000 INVESTMENT
4/1/2011* – 12/31/13 (unaudited)
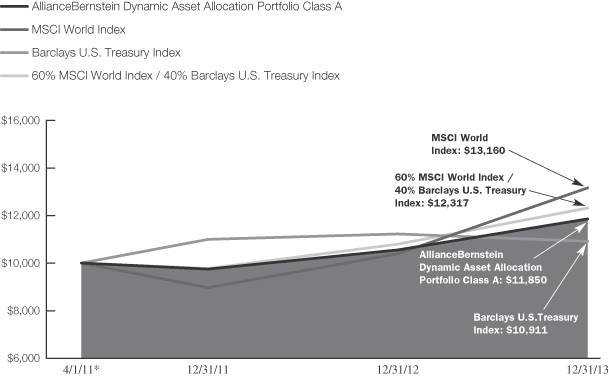
| * | Since inception of the Portfolio’s Class A shares on 4/1/2011. |
This chart illustrates the total value of an assumed $10,000 investment in AllianceBernstein Dynamic Asset Allocation Portfolio Class A shares (from 4/1/2011* to 12/31/13) as compared to the performance of the Portfolio to its primary, secondary and blended benchmark. The chart assumes the reinvestment of dividends and capital gains distributions.
See Disclosures, Risks and Note about Historical Performance on pages 3-4.
5
| DYNAMIC ASSET ALLOCATION PORTFOLIO | ||
| EXPENSE EXAMPLE (unaudited) | AllianceBernstein Variable Products Series Fund | |
As a shareholder of the Fund, you incur two types of costs: (1) transaction costs, including sales charges (loads) on purchase payments, contingent deferred sales charges on redemptions and (2) ongoing costs, including management fees; distribution (12b-1) fees; and other Fund expenses. This example is intended to help you understand your ongoing costs (in dollars) of investing in the Fund and to compare these costs with the ongoing costs of investing in other mutual funds.
The Example is based on an investment of $1,000 invested at the beginning of the period and held for the entire period as indicated below.
Actual Expenses
The table below provides information about actual account values and actual expenses. You may use the information in this line, together with the amount you invested, to estimate the expenses that you paid over the period. Simply divide your account value by $1,000 (for example, an $8,600 account value divided by $1,000 = 8.6), then multiply the result by the number in the first line under the heading entitled “Expenses Paid During Period” to estimate the expenses you paid on your account during this period. The estimate of expenses does not include fees or other expenses of any variable insurance product. If such expenses were included, the estimate of expenses you paid during the period would be higher and your ending account value would be lower.
Hypothetical Example for Comparison Purposes
The table below provides information about hypothetical account values and hypothetical expenses based on the Fund’s actual expense ratio and an assumed annual rate of return of 5% before expenses, which is not the Fund’s actual return. The hypothetical account values and expenses may not be used to estimate the actual ending account balance or expenses you paid for the period. You may use this information to compare the ongoing costs of investing in the Fund and other funds by comparing this 5% hypothetical example with the 5% hypothetical examples that appear in the shareholder reports of other funds. The estimate of expenses does not include fees or other expenses of any variable insurance product. If such expenses were included, the estimate of expenses you paid during the period would be higher and your ending account value would be lower.
Please note that the expenses shown in the table are meant to highlight your ongoing costs only and do not reflect any transactional costs, such as sales charges (loads), or contingent deferred sales charges on redemptions. Therefore, the second line of each class’ table is useful in comparing ongoing costs only, and will not help you determine the relative total costs of owning different funds. In addition, if these transactional costs were included, your costs would have been higher.
| Beginning Account Value July 1, 2013 | Ending Account Value December 31, 2013 | Expenses Paid During Period* | Annualized Expense Ratio* | |||||||||||||
Class A | ||||||||||||||||
Actual | $ | 1,000 | $ | 1,085.90 | $ | 4.47 | 0.85 | % | ||||||||
Hypothetical (5% annual return before expenses) | $ | 1,000 | $ | 1,020.92 | $ | 4.33 | 0.85 | % | ||||||||
Class B | ||||||||||||||||
Actual | $ | 1,000 | $ | 1,084.20 | $ | 5.78 | 1.10 | % | ||||||||
Hypothetical (5% annual return before expenses) | $ | 1,000 | $ | 1,019.66 | $ | 5.60 | 1.10 | % | ||||||||
| * | Expenses are equal to each classes’ annualized expense ratios, multiplied by the average account value over the period, multiplied by 184/365 (to reflect the one-half year period). |
6
| DYNAMIC ASSET ALLOCATION PORTFOLIO | ||
| TEN LARGEST HOLDINGS* | ||
| December 31, 2013 (unaudited) | AllianceBernstein Variable Products Series Fund | |
| COMPANY | U.S. $ VALUE | PERCENT OF NET ASSETS | ||||||
U.S. Treasury Bonds & Notes | $ | 89,840,119 | 23.1 | % | ||||
iShares Core MSCI Emerging Markets ETF | 12,201,457 | 3.1 | ||||||
Vanguard REIT ETF | 8,031,264 | 2.1 | ||||||
SPDR S&P 500 ETF Trust | 5,507,783 | 1.4 | ||||||
iShares MSCI EAFE ETF | 2,691,587 | 0.7 | ||||||
Apple, Inc. | 1,858,957 | 0.5 | ||||||
Exxon Mobil Corp. | 1,622,944 | 0.4 | ||||||
Google, Inc.—Class A | 1,153,211 | 0.3 | ||||||
Nestle SA | 1,055,376 | 0.3 | ||||||
Microsoft Corp. | 1,043,548 | 0.3 | ||||||
|
|
|
| |||||
| $ | 125,006,246 | 32.2 | % | |||||
PORTFOLIO BREAKDOWN**
December 31, 2013 (unaudited)
| ASSET CLASSES | CURRENT ALLOCATION | |||
Equities | ||||
U.S. Large Cap | 23.5 | % | ||
International Large Cap | 25.4 | |||
U.S. Mid-Cap | 2.8 | |||
U.S. Small-Cap | 2.7 | |||
Emerging Market Equities | 5.0 | |||
Real Estate Equities | 4.9 | |||
|
| |||
Sub-total | 64.3 | |||
|
| |||
Fixed Income | ||||
U.S. Bonds | 33.6 | |||
|
| |||
Cash | 2.1 | |||
|
| |||
Total | 100.0 | % | ||
SECURITY TYPE BREAKDOWN†
December 31, 2013 (unaudited)
| SECURITY TYPE | U.S. $ VALUE | PERCENT OF TOTAL INVESTMENTS | ||||||
Common Stocks | $ | 119,639,731 | 31.4 | % | ||||
Governments—Treasuries | 89,840,119 | 23.6 | ||||||
Investment Companies | 28,432,091 | 7.4 | ||||||
Options Purchased—Puts | 275,109 | 0.1 | ||||||
Rights | 2,607 | 0.0 | ||||||
Short-Term Investments | 143,077,599 | 37.5 | ||||||
|
|
|
| |||||
Total Investments | $ | 381,267,256 | 100.0 | % | ||||
| * | Long-term investments. |
| ** | All data are as of December 31, 2013. The Portfolio breakdown is expressed as an approximate percentage of the Portfolio’s total investments inclusive of derivative exposure, based on the Adviser’s internal classification guidelines. |
| † | The Portfolio’s security type breakdown is expressed as a percentage of total investments (excluding security lending collateral) and may vary over time. The Portfolio also enters into derivative transactions, which may be used for hedging or investment purposes (see “Portfolio of Investments” section of the report for additional details). |
7
| DYNAMIC ASSET ALLOCATION PORTFOLIO | ||
| PORTFOLIOOF INVESTMENTS | ||
| December 31, 2013 | AllianceBernstein Variable Products Series Fund | |
| Company | Shares | U.S. $ Value | ||||||
COMMON STOCKS–30.8% | ||||||||
FINANCIALS–6.4% | ||||||||
CAPITAL MARKETS–0.7% | ||||||||
3i Group PLC | 4,278 | $ | 27,336 | |||||
Aberdeen Asset Management PLC | 3,678 | 30,585 | ||||||
Ameriprise Financial, Inc. | 745 | 85,712 | ||||||
Bank of New York Mellon Corp. (The) | 4,215 | 147,272 | ||||||
BlackRock, Inc.–Class A | 477 | 150,956 | ||||||
Charles Schwab Corp. (The) | 4,240 | 110,240 | ||||||
Credit Suisse Group AG(a) | 6,750 | 208,328 | ||||||
Daiwa Securities Group, Inc. | 7,000 | 70,109 | ||||||
Deutsche Bank AG (REG) | 4,552 | 218,684 | ||||||
E*Trade Financial Corp.(a) | 1,020 | 20,033 | ||||||
Franklin Resources, Inc. | 1,470 | 84,863 | ||||||
Goldman Sachs Group, Inc. (The) | 1,538 | 272,626 | ||||||
Hargreaves Lansdown PLC | 1,481 | 33,266 | ||||||
ICAP PLC | 4,211 | 31,540 | ||||||
Invesco Ltd. | 1,580 | 57,512 | ||||||
Julius Baer Group Ltd.(a) | 1,220 | 58,628 | ||||||
Legg Mason, Inc. | 360 | 15,653 | ||||||
Macquarie Group Ltd. | 1,286 | 63,140 | ||||||
Morgan Stanley | 5,070 | 158,995 | ||||||
Nomura Holdings, Inc. | 16,200 | 125,191 | ||||||
Northern Trust Corp. | 810 | 50,131 | ||||||
Partners Group Holding AG | 158 | 42,137 | ||||||
Schroders PLC | 729 | 31,441 | ||||||
State Street Corp. | 1,585 | 116,323 | ||||||
T Rowe Price Group, Inc. | 975 | 81,676 | ||||||
UBS AG(a) | 16,277 | 311,661 | ||||||
|
| |||||||
| 2,604,038 | ||||||||
|
| |||||||
COMMERCIAL BANKS–2.4% | ||||||||
Aozora Bank Ltd. | 6,000 | 17,003 | ||||||
Australia & New Zealand Banking Group Ltd. | 12,253 | 353,722 | ||||||
Banco Bilbao Vizcaya Argentaria SA | 25,822 | 319,432 | ||||||
Banco de Sabadell SA | 11,894 | 31,058 | ||||||
Banco Espirito Santo SA(a) | 10,016 | 14,304 | ||||||
Banco Popular Espanol SA(a) | 7,493 | 45,259 | ||||||
Banco Santander SA | 50,835 | 457,133 | ||||||
Bank Hapoalim BM | 4,812 | 26,962 | ||||||
Bank Leumi Le-Israel BM(a) | 6,125 | 25,012 | ||||||
Bank of East Asia Ltd. | 9,600 | 40,752 | ||||||
Bank of Ireland(a) | 104,450 | 36,403 | ||||||
Bank of Kyoto Ltd. (The) | 2,000 | 16,719 | ||||||
Bank of Yokohama Ltd. (The) | 5,000 | 27,896 | ||||||
Bankia SA(a) | 14,003 | 23,772 | ||||||
Barclays PLC | 68,219 | 308,478 | ||||||
BB&T Corp. | 2,550 | 95,166 | ||||||
Bendigo and Adelaide Bank Ltd. | 3,446 | 36,225 | ||||||
BNP Paribas SA | 4,438 | 346,196 | ||||||
BOC Hong Kong Holdings Ltd. | 10,000 | 32,117 | ||||||
CaixaBank SA | 7,628 | 39,733 | ||||||
Chiba Bank Ltd. (The) | 3,000 | 20,246 | ||||||
Comerica, Inc. | 650 | $ | 30,901 | |||||
Commerzbank AG(a) | 2,916 | 47,074 | ||||||
Commonwealth Bank of Australia | 7,198 | 501,536 | ||||||
Credit Agricole SA(a) | 4,067 | 52,135 | ||||||
Danske Bank A/S(a) | 2,928 | 67,261 | ||||||
DBS Group Holdings Ltd. | 8,000 | 108,718 | ||||||
DnB ASA | 4,364 | 78,326 | ||||||
Erste Group Bank AG | 1,151 | 40,124 | ||||||
Fifth Third Bancorp | 3,240 | 68,137 | ||||||
Fukuoka Financial Group, Inc. | 4,000 | 17,558 | ||||||
Hang Seng Bank Ltd. | 2,100 | 34,134 | ||||||
HSBC Holdings PLC | 83,173 | 912,753 | ||||||
Huntington Bancshares, Inc./OH | 3,015 | 29,095 | ||||||
Intesa Sanpaolo SpA | 40,386 | 99,337 | ||||||
Joyo Bank Ltd. (The) | 3,000 | 15,340 | ||||||
KBC Groep NV | 1,024 | 58,220 | ||||||
KeyCorp | 3,275 | 43,950 | ||||||
Lloyds Banking Group PLC(a) | 222,634 | 292,137 | ||||||
M&T Bank Corp. | 465 | 54,135 | ||||||
Mitsubishi UFJ Financial Group, Inc. | 56,900 | 377,782 | ||||||
Mizrahi Tefahot Bank Ltd. | 973 | 12,736 | ||||||
Mizuho Financial Group, Inc. | 102,500 | 222,531 | ||||||
National Australia Bank Ltd. | 10,463 | 326,572 | ||||||
Natixis | 9,006 | 52,984 | ||||||
Nordea Bank AB | 12,659 | 170,679 | ||||||
Oversea-Chinese Banking Corp., Ltd. | 12,000 | 97,263 | ||||||
PNC Financial Services Group, Inc. (The) | 1,930 | 149,729 | ||||||
Raiffeisen Bank International AG | 176 | 6,215 | ||||||
Regions Financial Corp. | 5,025 | 49,697 | ||||||
Resona Holdings, Inc. | 8,400 | 42,861 | ||||||
Royal Bank of Scotland Group PLC(a) | 9,565 | 53,868 | ||||||
Seven Bank Ltd. | 5,324 | 20,823 | ||||||
Shinsei Bank Ltd. | 12,000 | 29,375 | ||||||
Shizuoka Bank Ltd. (The) | 4,000 | 42,725 | ||||||
Skandinaviska Enskilda Banken AB–Class A | 4,967 | 65,620 | ||||||
Societe Generale SA | 3,136 | 182,360 | ||||||
Standard Chartered PLC | 10,809 | 244,142 | ||||||
Sumitomo Mitsui Financial Group, Inc. | 5,700 | 296,419 | ||||||
Sumitomo Mitsui Trust Holdings, Inc. | 15,000 | 79,368 | ||||||
SunTrust Banks, Inc. | 1,940 | 71,411 | ||||||
Suruga Bank Ltd. | 1,000 | 17,957 | ||||||
Svenska Handelsbanken AB–Class A | 2,228 | 109,544 | ||||||
Swedbank AB–Class A | 4,044 | 113,917 | ||||||
UniCredit SpA | 15,077 | 111,218 | ||||||
Unione di Banche Italiane SCPA | 5,202 | 35,266 | ||||||
United Overseas Bank Ltd. | 6,000 | 101,322 | ||||||
US Bancorp | 6,665 | 269,266 | ||||||
Wells Fargo & Co. | 17,575 | 797,905 | ||||||
8
| AllianceBernstein Variable Products Series Fund |
| Company | Shares | U.S. $ Value | ||||||
Westpac Banking Corp. | 13,859 | $ | 401,754 | |||||
Zions Bancorporation | 630 | 18,875 | ||||||
|
| |||||||
| 9,436,643 | ||||||||
|
| |||||||
CONSUMER FINANCE–0.2% | ||||||||
Acom Co., Ltd.(a)(b) | 6,200 | 21,125 | ||||||
AEON Financial Service Co., Ltd. | 800 | 21,452 | ||||||
American Express Co. | 3,360 | 304,853 | ||||||
Capital One Financial Corp. | 2,113 | 161,877 | ||||||
Credit Saison Co., Ltd. | 700 | 18,453 | ||||||
Discover Financial Services | 1,760 | 98,472 | ||||||
SLM Corp. | 1,600 | 42,048 | ||||||
|
| |||||||
| 668,280 | ||||||||
|
| |||||||
DIVERSIFIED FINANCIAL SERVICES–1.1% | ||||||||
ASX Ltd. | 1,453 | 47,782 | ||||||
Bank of America Corp. | 39,145 | 609,488 | ||||||
Berkshire Hathaway, Inc.–Class B(a) | 6,630 | 786,053 | ||||||
Citigroup, Inc. | 11,129 | 579,932 | ||||||
CME Group, Inc./IL–Class A | 1,150 | 90,229 | ||||||
Deutsche Boerse AG | 862 | 71,437 | ||||||
Eurazeo SA | 78 | 6,117 | ||||||
Exor SpA | 1,279 | 50,835 | ||||||
Groupe Bruxelles Lambert SA | 360 | 33,070 | ||||||
Hong Kong Exchanges and Clearing Ltd. | 4,900 | 81,842 | ||||||
ING Groep NV(a) | 17,105 | 238,931 | ||||||
IntercontinentalExchange Group, Inc. | 416 | 93,567 | ||||||
Investment AB Kinnevik–Class B | 2,015 | 93,418 | ||||||
Investor AB–Class B | 1,705 | 58,760 | ||||||
Japan Exchange Group, Inc. | 900 | 25,581 | ||||||
JPMorgan Chase & Co. | 13,765 | 804,977 | ||||||
Leucadia National Corp. | 1,105 | 31,316 | ||||||
London Stock Exchange Group PLC | 969 | 27,875 | ||||||
McGraw Hill Financial, Inc. | 1,010 | 78,982 | ||||||
Mitsubishi UFJ Lease & Finance Co., Ltd. | 3,500 | 21,517 | ||||||
Moody’s Corp. | 695 | 54,537 | ||||||
NASDAQ OMX Group, Inc. (The) | 410 | 16,318 | ||||||
ORIX Corp. | 5,580 | 98,051 | ||||||
Pargesa Holding SA | 18 | 1,450 | ||||||
Pohjola Bank PLC | 654 | 13,113 | ||||||
Resolution Ltd. | 6,320 | 37,097 | ||||||
Singapore Exchange Ltd. | 3,000 | 17,300 | ||||||
Wendel SA | 398 | 58,013 | ||||||
|
| |||||||
| 4,127,588 | ||||||||
|
| |||||||
INSURANCE–1.2% | ||||||||
ACE Ltd. | 1,235 | 127,860 | ||||||
Admiral Group PLC | 819 | 17,803 | ||||||
Aegon NV | 6,317 | 59,863 | ||||||
Aflac, Inc. | 1,705 | 113,894 | ||||||
Ageas | 943 | 40,213 | ||||||
AIA Group Ltd. | 53,781 | $ | 270,706 | |||||
Allianz SE | 2,036 | 366,329 | ||||||
Allstate Corp. (The) | 1,650 | 89,991 | ||||||
American International Group, Inc. | 5,402 | 275,772 | ||||||
AMP Ltd. | 13,149 | 51,681 | ||||||
Aon PLC | 1,115 | 93,537 | ||||||
Assicurazioni Generali SpA | 5,214 | 122,499 | ||||||
Assurant, Inc. | 260 | 17,256 | ||||||
Aviva PLC | 13,159 | 98,448 | ||||||
Chubb Corp. (The) | 910 | 87,933 | ||||||
Cincinnati Financial Corp. | 510 | 26,709 | ||||||
CNP Assurances | 1,570 | 32,195 | ||||||
Dai-ichi Life Insurance Co., Ltd. (The) | 3,800 | 63,585 | ||||||
Direct Line Insurance Group PLC | 6,949 | 28,722 | ||||||
Genworth Financial, Inc.–Class A(a) | 1,785 | 27,721 | ||||||
Gjensidige Forsikring ASA | 1,479 | 28,287 | ||||||
Hannover Rueck SE | 377 | 32,411 | ||||||
Hartford Financial Services Group, Inc. | 1,625 | 58,874 | ||||||
Insurance Australia Group Ltd. | 6,220 | 32,385 | ||||||
Legal & General Group PLC | 26,411 | 97,627 | ||||||
Lincoln National Corp. | 940 | 48,523 | ||||||
Loews Corp. | 1,090 | 52,582 | ||||||
Mapfre SA | 3,353 | 14,382 | ||||||
Marsh & McLennan Cos., Inc. | 1,990 | 96,236 | ||||||
MetLife, Inc. | 4,120 | 222,150 | ||||||
MS&AD Insurance Group Holdings | 2,300 | 61,822 | ||||||
Muenchener Rueckversicherungs AG | 801 | 176,677 | ||||||
NKSJ Holdings, Inc. | 1,000 | 27,834 | ||||||
Old Mutual PLC | 21,822 | 68,469 | ||||||
Principal Financial Group, Inc. | 990 | 48,817 | ||||||
Progressive Corp. (The) | 1,995 | 54,404 | ||||||
Prudential Financial, Inc. | 1,715 | 158,157 | ||||||
Prudential PLC | 11,428 | 255,347 | ||||||
QBE Insurance Group Ltd. | 5,358 | 55,272 | ||||||
RSA Insurance Group PLC | 16,295 | 24,663 | ||||||
Sampo–Class A | 1,871 | 91,965 | ||||||
SCOR SE | 935 | 34,199 | ||||||
Sony Financial Holdings, Inc. | 875 | 15,939 | ||||||
Standard Life PLC | 10,591 | 63,248 | ||||||
Suncorp Group Ltd. | 5,745 | 67,434 | ||||||
Swiss Life Holding AG(a) | 249 | 51,767 | ||||||
Swiss Re AG(a) | 1,573 | 145,012 | ||||||
T&D Holdings, Inc. | 2,600 | 36,391 | ||||||
Tokio Marine Holdings, Inc. | 3,100 | 103,756 | ||||||
Torchmark Corp. | 335 | 26,180 | ||||||
Travelers Cos., Inc. (The) | 1,330 | 120,418 | ||||||
Tryg A/S | 183 | 17,696 | ||||||
Unum Group | 920 | 32,274 | ||||||
Vienna Insurance Group AG Wiener Versicherung Gruppe | 190 | 9,496 | ||||||
XL Group PLC | 1,010 | 32,158 | ||||||
Zurich Insurance Group AG(a) | 662 | 192,022 | ||||||
|
| |||||||
| 4,667,591 | ||||||||
|
| |||||||
9
| DYNAMIC ASSET ALLOCATION PORTFOLIO | ||
| PORTFOLIOOF INVESTMENTS | ||
| (continued) | AllianceBernstein Variable Products Series Fund | |
| Company | Shares | U.S. $ Value | ||||||
REAL ESTATE INVESTMENT TRUSTS (REITs)–0.5% | ||||||||
American Tower Corp. | 1,465 | $ | 116,936 | |||||
Apartment Investment & Management Co.–Class A | 525 | 13,603 | ||||||
AvalonBay Communities, Inc. | 445 | 52,612 | ||||||
Boston Properties, Inc. | 550 | 55,203 | ||||||
British Land Co. PLC | 4,209 | 43,881 | ||||||
CapitaMall Trust | 14,000 | 21,187 | ||||||
CFS Retail Property Trust Group | 11,279 | 19,633 | ||||||
Dexus Property Group | 23,282 | 20,939 | ||||||
Equity Residential | 1,240 | 64,319 | ||||||
Fonciere Des Regions | 329 | 28,401 | ||||||
Gecina SA | 253 | 33,499 | ||||||
Goodman Group | 5,915 | 25,060 | ||||||
GPT Group | 6,698 | 20,370 | ||||||
Hammerson PLC | 2,197 | 18,290 | ||||||
HCP, Inc. | 1,630 | 59,202 | ||||||
Health Care REIT, Inc. | 1,025 | 54,909 | ||||||
Host Hotels & Resorts, Inc. | 2,750 | 53,460 | ||||||
ICADE | 449 | 41,798 | ||||||
Intu Properties PLC | 3,529 | 18,116 | ||||||
Japan Real Estate Investment Corp. | 4 | 21,400 | ||||||
Japan Retail Fund Investment Corp. | 8 | 16,278 | ||||||
Kimco Realty Corp. | 1,480 | 29,230 | ||||||
Klepierre | 695 | 32,215 | ||||||
Land Securities Group PLC | 3,497 | 55,863 | ||||||
Link REIT (The) | 6,000 | 29,178 | ||||||
Macerich Co. (The) | 510 | 30,034 | ||||||
Mirvac Group(b) | 12,834 | 19,299 | ||||||
Nippon Building Fund, Inc.(b) | 6 | 34,861 | ||||||
Plum Creek Timber Co., Inc. | 630 | 29,301 | ||||||
ProLogis, Inc. | 1,820 | 67,249 | ||||||
Public Storage | 530 | 79,776 | ||||||
Simon Property Group, Inc. | 1,166 | 177,419 | ||||||
Stockland(b) | 6,911 | 22,344 | ||||||
Unibail-Rodamco SE | 613 | 157,087 | ||||||
Ventas, Inc. | 1,091 | 62,492 | ||||||
Vornado Realty Trust | 635 | 56,382 | ||||||
Westfield Group | 9,308 | 84,026 | ||||||
Westfield Retail Trust | 23,944 | 63,610 | ||||||
Weyerhaeuser Co. | 2,090 | 65,981 | ||||||
|
| |||||||
| 1,895,443 | ||||||||
|
| |||||||
REAL ESTATE MANAGEMENT & DEVELOPMENT–0.3% | ||||||||
Aeon Mall Co., Ltd. | 700 | 19,609 | ||||||
CapitaLand Ltd. | 11,000 | 26,515 | ||||||
CapitaMalls Asia Ltd. | 21,164 | 32,986 | ||||||
CBRE Group, Inc.–Class A(a) | 1,015 | 26,694 | ||||||
Cheung Kong Holdings Ltd. | 6,000 | 95,002 | ||||||
City Developments Ltd. | 3,000 | 22,923 | ||||||
Daito Trust Construction Co., Ltd. | 300 | 28,046 | ||||||
Daiwa House Industry Co., Ltd.(b) | 3,000 | 58,126 | ||||||
Global Logistic Properties Ltd. | 14,661 | 33,631 | ||||||
Hang Lung Properties Ltd. | 14,000 | 44,560 | ||||||
Henderson Land Development Co., Ltd. | 4,400 | $ | 25,155 | |||||
Hulic Co., Ltd. | 2,197 | 32,514 | ||||||
IMMOFINANZ AG(a) | 4,285 | 19,856 | ||||||
Kerry Properties Ltd. | 8,500 | 29,596 | ||||||
Lend Lease Group | 3,450 | 34,430 | ||||||
Mitsubishi Estate Co., Ltd. | 6,000 | 179,556 | ||||||
Mitsui Fudosan Co., Ltd. | 4,000 | 144,283 | ||||||
New World Development Co., Ltd. | 22,000 | 27,943 | ||||||
Nomura Real Estate Holdings, Inc. | 800 | 18,026 | ||||||
NTT Urban Development Corp. | 1,600 | 18,443 | ||||||
Sino Land Co., Ltd. | 16,000 | 21,942 | ||||||
Sumitomo Realty & Development Co., Ltd. | 2,000 | 99,655 | ||||||
Sun Hung Kai Properties Ltd. | 7,000 | 89,011 | ||||||
Swire Pacific Ltd.–Class A | 2,000 | 23,564 | ||||||
Swire Properties Ltd. | 25,389 | 64,294 | ||||||
Tokyo Tatemono Co., Ltd. | 3,000 | 33,360 | ||||||
Tokyu Fudosan Holdings Corp.(a) | 2,000 | 18,802 | ||||||
Wharf Holdings Ltd. | 4,000 | 30,589 | ||||||
Wheelock & Co., Ltd. | 6,000 | 27,641 | ||||||
|
| |||||||
| 1,326,752 | ||||||||
|
| |||||||
THRIFTS & MORTGAGE FINANCE–0.0% | ||||||||
Hudson City Bancorp, Inc. | 1,730 | 16,314 | ||||||
People’s United Financial, Inc. | 1,165 | 17,615 | ||||||
|
| |||||||
| 33,929 | ||||||||
|
| |||||||
| 24,760,264 | ||||||||
|
| |||||||
CONSUMER DISCRETIONARY–3.8% | ||||||||
AUTO COMPONENTS–0.2% | ||||||||
Aisin Seiki Co., Ltd. | 900 | 36,590 | ||||||
BorgWarner, Inc. | 880 | 49,201 | ||||||
Bridgestone Corp.(b) | 2,900 | 109,872 | ||||||
Cie Generale des Etablissements Michelin–Class B | 815 | 86,716 | ||||||
Continental AG | 499 | 109,625 | ||||||
Delphi Automotive PLC | 1,041 | 62,595 | ||||||
Denso Corp. | 2,200 | 116,223 | ||||||
GKN PLC | 7,308 | 45,286 | ||||||
Goodyear Tire & Rubber Co. (The) | 860 | 20,511 | ||||||
Johnson Controls, Inc. | 2,480 | 127,224 | ||||||
NGK Spark Plug Co., Ltd. | 1,000 | 23,701 | ||||||
NOK Corp. | 700 | 11,465 | ||||||
Nokian Renkaat Oyj | 503 | 24,121 | ||||||
Stanley Electric Co., Ltd. | 500 | 11,463 | ||||||
Sumitomo Rubber Industries Ltd. | 1,200 | 17,082 | ||||||
Toyota Industries Corp. | 700 | 31,643 | ||||||
|
| |||||||
| 883,318 | ||||||||
|
| |||||||
AUTOMOBILES–0.7% | ||||||||
Bayerische Motoren Werke AG | 1,478 | 173,565 | ||||||
Daihatsu Motor Co., Ltd. | 1,000 | 16,963 | ||||||
Daimler AG | 4,296 | 372,826 | ||||||
Fiat SpA(a) | 5,440 | 44,526 | ||||||
Ford Motor Co. | 14,470 | 223,272 | ||||||
10
| AllianceBernstein Variable Products Series Fund |
| Company | Shares | U.S. $ Value | ||||||
Fuji Heavy Industries Ltd. | 3,000 | $ | 86,217 | |||||
General Motors Co.(a) | 4,163 | 170,142 | ||||||
Harley-Davidson, Inc. | 800 | 55,392 | ||||||
Honda Motor Co., Ltd. | 7,300 | 301,323 | ||||||
Isuzu Motors Ltd. | 5,000 | 31,185 | ||||||
Mazda Motor Corp.(a) | 11,000 | 57,003 | ||||||
Mitsubishi Motors Corp.(a)(b) | 1,400 | 15,062 | ||||||
Nissan Motor Co., Ltd. | 11,100 | 93,018 | ||||||
Porsche Automobil Holding SE (Preference Shares) | 684 | 71,404 | ||||||
Renault SA | 857 | 68,968 | ||||||
Suzuki Motor Corp. | 1,600 | 43,115 | ||||||
Toyota Motor Corp. | 12,300 | 749,993 | ||||||
Volkswagen AG | 140 | 38,012 | ||||||
Volkswagen AG (Preference Shares) | 646 | 181,796 | ||||||
Yamaha Motor Co., Ltd. | 1,200 | 18,041 | ||||||
|
| |||||||
| 2,811,823 | ||||||||
|
| |||||||
DISTRIBUTORS–0.0% | ||||||||
Genuine Parts Co. | 560 | 46,586 | ||||||
Jardine Cycle & Carriage Ltd. | 1,000 | 28,571 | ||||||
|
| |||||||
| 75,157 | ||||||||
|
| |||||||
DIVERSIFIED CONSUMER SERVICES–0.0% | ||||||||
Benesse Holdings, Inc. | 300 | 12,052 | ||||||
Gree, Inc.(b) | 682 | 6,729 | ||||||
H&R Block, Inc. | 970 | 28,169 | ||||||
|
| |||||||
| 46,950 | ||||||||
|
| |||||||
HOTELS, RESTAURANTS & LEISURE–0.5% | ||||||||
Accor SA | 750 | 35,422 | ||||||
Carnival Corp. | 1,585 | 63,669 | ||||||
Carnival PLC | 818 | 33,864 | ||||||
Chipotle Mexican Grill, Inc.–Class A(a) | 144 | 76,720 | ||||||
Compass Group PLC | 8,127 | 130,478 | ||||||
Crown Resorts Ltd. | 2,537 | 38,278 | ||||||
Darden Restaurants, Inc. | 470 | 25,554 | ||||||
Flight Centre Travel Group Ltd. | 471 | 20,059 | ||||||
Galaxy Entertainment Group Ltd.(a) | 8,911 | 80,228 | ||||||
Genting Singapore PLC | 22,000 | 26,162 | ||||||
InterContinental Hotels Group PLC | 1,228 | 40,962 | ||||||
International Game Technology | 880 | 15,981 | ||||||
Marriott International, Inc./DE–Class A | 795 | 39,241 | ||||||
McDonald’s Corp. | 3,680 | 357,070 | ||||||
McDonald’s Holdings Co. Japan Ltd.(b) | 500 | 12,768 | ||||||
Oriental Land Co., Ltd./Japan | 200 | 28,843 | ||||||
Sands China Ltd. | 7,700 | 63,353 | ||||||
SJM Holdings Ltd. | 13,014 | 43,578 | ||||||
Sodexo | 292 | 29,611 | ||||||
Starbucks Corp. | 2,760 | 216,356 | ||||||
Starwood Hotels & Resorts Worldwide, Inc. | 695 | 55,218 | ||||||
Tatts Group Ltd. | 6,512 | $ | 18,054 | |||||
TUI Travel PLC | 2,386 | 16,355 | ||||||
Whitbread PLC | 801 | 49,850 | ||||||
William Hill PLC | 3,391 | 22,606 | ||||||
Wyndham Worldwide Corp. | 500 | 36,845 | ||||||
Wynn Macau Ltd. | 10,107 | 46,008 | ||||||
Wynn Resorts Ltd. | 310 | 60,205 | ||||||
Yum! Brands, Inc. | 1,645 | 124,379 | ||||||
|
| |||||||
| 1,807,717 | ||||||||
|
| |||||||
HOUSEHOLD DURABLES–0.2% | ||||||||
DR Horton, Inc. | 1,005 | 22,432 | ||||||
Electrolux AB–Class B | 2,430 | 63,502 | ||||||
Garmin Ltd.(b) | 420 | 19,412 | ||||||
Harman International Industries, Inc. | 240 | 19,644 | ||||||
Iida Group Holdings Co., Ltd.(a) | 867 | 17,306 | ||||||
Leggett & Platt, Inc. | 475 | 14,697 | ||||||
Lennar Corp.–Class A | 600 | 23,736 | ||||||
Mohawk Industries, Inc.(a) | 250 | 37,225 | ||||||
Newell Rubbermaid, Inc. | 1,025 | 33,220 | ||||||
Panasonic Corp. | 9,900 | 115,406 | ||||||
Persimmon PLC(a) | 1,354 | 27,837 | ||||||
PulteGroup, Inc. | 1,235 | 25,157 | ||||||
Rinnai Corp. | 200 | 15,582 | ||||||
Sekisui Chemical Co., Ltd. | 2,000 | 24,543 | ||||||
Sekisui House Ltd. | 2,000 | 27,986 | ||||||
Sharp Corp./Japan(a) | 9,000 | 28,655 | ||||||
Sony Corp.(b) | 4,500 | 77,572 | ||||||
Whirlpool Corp. | 300 | 47,058 | ||||||
|
| |||||||
| 640,970 | ||||||||
|
| |||||||
INTERNET & CATALOG RETAIL–0.2% | ||||||||
Amazon.com, Inc.(a) | 1,360 | 542,354 | ||||||
Expedia, Inc. | 382 | 26,610 | ||||||
NetFlix, Inc.(a) | 226 | 83,206 | ||||||
priceline.com, Inc.(a) | 217 | 252,241 | ||||||
Rakuten, Inc. | 3,245 | 48,427 | ||||||
TripAdvisor, Inc.(a) | 412 | 34,126 | ||||||
|
| |||||||
| 986,964 | ||||||||
|
| |||||||
LEISURE EQUIPMENT & PRODUCTS–0.1% | ||||||||
Hasbro, Inc. | 400 | 22,004 | ||||||
Mattel, Inc. | 1,235 | 58,761 | ||||||
Namco Bandai Holdings, Inc. | 900 | 19,982 | ||||||
Nikon Corp. | 1,500 | 28,666 | ||||||
Sankyo Co., Ltd. | 300 | 13,836 | ||||||
Sega Sammy Holdings, Inc. | 700 | 17,840 | ||||||
Shimano, Inc. | 400 | 34,340 | ||||||
|
| |||||||
| 195,429 | ||||||||
|
| |||||||
MEDIA–0.8% | ||||||||
Axel Springer SE | 401 | 25,817 | ||||||
British Sky Broadcasting Group PLC | 4,358 | 60,908 | ||||||
Cablevision Systems Corp.–Class A | 780 | 13,985 | ||||||
CBS Corp.–Class B | 2,040 | 130,030 | ||||||
11
| DYNAMIC ASSET ALLOCATION PORTFOLIO | ||
| PORTFOLIOOF INVESTMENTS | ||
| (continued) | AllianceBernstein Variable Products Series Fund | |
| Company | Shares | U.S. $ Value | ||||||
Comcast Corp.–Class A | 9,570 | $ | 497,305 | |||||
Dentsu, Inc. | 1,000 | 40,899 | ||||||
DIRECTV(a) | 1,765 | 121,944 | ||||||
Discovery Communications, Inc.–Class A(a) | 845 | 76,405 | ||||||
Eutelsat Communications SA | 1,052 | 32,825 | ||||||
Gannett Co., Inc. | 800 | 23,664 | ||||||
Graham Holdings Co.–Class B | 61 | 40,463 | ||||||
Interpublic Group of Cos., Inc. (The) | 1,495 | 26,461 | ||||||
ITV PLC | 16,647 | 53,572 | ||||||
JCDecaux SA | 1,374 | 56,723 | ||||||
Kabel Deutschland Holding AG | 90 | 11,666 | ||||||
Lagardere SCA | 1,458 | 54,199 | ||||||
News Corp.–Class A(a) | 1,808 | 32,580 | ||||||
Omnicom Group, Inc. | 960 | 71,395 | ||||||
Pearson PLC | 3,650 | 81,380 | ||||||
ProSiebenSat.1 Media AG | 637 | 31,631 | ||||||
Publicis Groupe SA | 807 | 73,942 | ||||||
Reed Elsevier NV | 2,970 | 63,124 | ||||||
Reed Elsevier PLC | 5,173 | 77,148 | ||||||
RTL Group SA | 312 | 39,896 | ||||||
Scripps Networks Interactive, Inc.–Class A | 420 | 36,292 | ||||||
SES SA | 971 | 31,457 | ||||||
Singapore Press Holdings Ltd.(b) | 6,000 | 19,606 | ||||||
Telenet Group Holding NV | 194 | 11,576 | ||||||
Time Warner Cable, Inc.–Class A | 1,065 | 144,307 | ||||||
Time Warner, Inc. | 3,295 | 229,727 | ||||||
Toho Co., Ltd./Tokyo | 1,000 | 22,000 | ||||||
Twenty-First Century Fox, Inc.–Class A | 7,185 | 252,768 | ||||||
Viacom, Inc.–Class B | 1,510 | 131,883 | ||||||
Walt Disney Co. (The) | 6,014 | 459,470 | ||||||
WPP PLC | 5,882 | 134,721 | ||||||
|
| |||||||
| 3,211,769 | ||||||||
|
| |||||||
MULTILINE RETAIL–0.2% | ||||||||
Dollar General Corp.(a) | 1,070 | 64,543 | ||||||
Dollar Tree, Inc.(a) | 770 | 43,443 | ||||||
Don Quijote Holdings Co., Ltd. | 500 | 30,310 | ||||||
Family Dollar Stores, Inc. | 355 | 23,064 | ||||||
Isetan Mitsukoshi Holdings Ltd. | 1,300 | 18,506 | ||||||
J Front Retailing Co., Ltd. | 3,000 | 22,759 | ||||||
Kohl’s Corp. | 730 | 41,428 | ||||||
Macy’s, Inc. | 1,335 | 71,289 | ||||||
Marks & Spencer Group PLC | 7,213 | 51,796 | ||||||
Next PLC | 713 | 64,449 | ||||||
Nordstrom, Inc. | 520 | 32,136 | ||||||
Target Corp. | 2,305 | 145,837 | ||||||
|
| |||||||
| 609,560 | ||||||||
|
| |||||||
SPECIALTY RETAIL–0.5% | ||||||||
AutoNation, Inc.(a) | 215 | 10,683 | ||||||
AutoZone, Inc.(a) | 125 | 59,743 | ||||||
Bed Bath & Beyond, Inc.(a) | 775 | 62,232 | ||||||
Best Buy Co., Inc. | 1,000 | 39,880 | ||||||
CarMax, Inc.(a) | 820 | 38,556 | ||||||
Fast Retailing Co., Ltd. | 200 | 82,605 | ||||||
GameStop Corp.–Class A | 415 | $ | 20,443 | |||||
Gap, Inc. (The) | 955 | 37,321 | ||||||
Hennes & Mauritz AB–Class B | 4,231 | 194,865 | ||||||
Home Depot, Inc. (The) | 5,180 | 426,521 | ||||||
Inditex SA | 974 | 160,818 | ||||||
Kingfisher PLC | 10,966 | 70,007 | ||||||
L Brands, Inc. | 905 | 55,974 | ||||||
Lowe’s Cos., Inc. | 3,840 | 190,272 | ||||||
Nitori Holdings Co., Ltd. | 200 | 18,935 | ||||||
O’Reilly Automotive, Inc.(a) | 410 | 52,771 | ||||||
PetSmart, Inc. | 380 | 27,645 | ||||||
Ross Stores, Inc. | 780 | 58,445 | ||||||
Sanrio Co., Ltd. | 500 | 21,054 | ||||||
Shimamura Co., Ltd. | 200 | 18,747 | ||||||
Staples, Inc. | 2,395 | 38,057 | ||||||
Tiffany & Co. | 405 | 37,576 | ||||||
TJX Cos., Inc. | 2,620 | 166,973 | ||||||
Urban Outfitters, Inc.(a) | 385 | 14,284 | ||||||
USS Co., Ltd. | 1,310 | 17,969 | ||||||
Yamada Denki Co., Ltd. | 2,700 | 8,832 | ||||||
|
| |||||||
| 1,931,208 | ||||||||
|
| |||||||
TEXTILES, APPAREL & LUXURY GOODS–0.4% | ||||||||
Adidas AG | 932 | 118,847 | ||||||
Burberry Group PLC | 1,975 | 49,761 | ||||||
Christian Dior SA | 166 | 31,421 | ||||||
Cie Financiere Richemont SA | 2,331 | 232,861 | ||||||
Coach, Inc. | 1,030 | 57,814 | ||||||
Fossil Group, Inc.(a) | 169 | 20,270 | ||||||
Hugo Boss AG | 198 | 28,200 | ||||||
Kering | 338 | 71,446 | ||||||
Li & Fung Ltd. | 48,000 | 62,170 | ||||||
Luxottica Group SpA | 759 | 40,676 | ||||||
LVMH Moet Hennessy Louis Vuitton SA | 1,134 | 207,175 | ||||||
Michael Kors Holdings Ltd.(a) | 659 | 53,504 | ||||||
NIKE, Inc.–Class B | 2,760 | 217,046 | ||||||
PVH Corp. | 295 | 40,126 | ||||||
Ralph Lauren Corp. | 240 | 42,377 | ||||||
Swatch Group AG (The) | 137 | 90,804 | ||||||
Swatch Group AG (The) (REG) | 522 | 58,841 | ||||||
VF Corp. | 1,260 | 78,548 | ||||||
|
| |||||||
| 1,501,887 | ||||||||
|
| |||||||
| 14,702,752 | ||||||||
|
| |||||||
INDUSTRIALS–3.7% | ||||||||
AEROSPACE & DEFENSE–0.6% | ||||||||
BAE Systems PLC | 14,460 | 104,326 | ||||||
Boeing Co. (The) | 2,560 | 349,414 | ||||||
Cobham PLC | 7,675 | 34,938 | ||||||
European Aeronautic Defence and Space Co. NV | 2,598 | 199,449 | ||||||
General Dynamics Corp. | 1,210 | 115,615 | ||||||
Honeywell International, Inc. | 2,905 | 265,430 | ||||||
L-3 Communications Holdings, Inc. | 325 | 34,729 | ||||||
Lockheed Martin Corp. | 1,000 | 148,660 | ||||||
12
| AllianceBernstein Variable Products Series Fund |
| Company | Shares | U.S. $ Value | ||||||
Meggitt PLC | 2,537 | $ | 22,213 | |||||
Northrop Grumman Corp. | 840 | 96,272 | ||||||
Precision Castparts Corp. | 540 | 145,422 | ||||||
Raytheon Co. | 1,200 | 108,840 | ||||||
Rockwell Collins, Inc. | 500 | 36,960 | ||||||
Rolls-Royce Holdings PLC(a) | 8,396 | 177,587 | ||||||
Safran SA | 1,117 | 77,663 | ||||||
Singapore Technologies Engineering Ltd. | 19,000 | 59,799 | ||||||
Textron, Inc. | 1,005 | 36,944 | ||||||
Thales SA | 694 | 44,724 | ||||||
United Technologies Corp. | 3,125 | 355,625 | ||||||
Zodiac Aerospace | 227 | 40,227 | ||||||
|
| |||||||
| 2,454,837 | ||||||||
|
| |||||||
AIR FREIGHT & LOGISTICS–0.2% | ||||||||
CH Robinson Worldwide, Inc. | 565 | 32,962 | ||||||
Deutsche Post AG | 4,049 | 147,890 | ||||||
Expeditors International of Washington, Inc. | 720 | 31,860 | ||||||
FedEx Corp. | 1,115 | 160,304 | ||||||
Kerry Logistics Network Ltd.(a) | 4,250 | 6,029 | ||||||
Kuehne & Nagel International AG | 432 | 56,782 | ||||||
United Parcel Service, Inc.–Class B | 2,605 | 273,733 | ||||||
Yamato Holdings Co., Ltd. | 1,600 | 32,357 | ||||||
|
| |||||||
| 741,917 | ||||||||
|
| |||||||
AIRLINES–0.1% | ||||||||
ANA Holdings, Inc.(b) | 16,000 | 31,966 | ||||||
Cathay Pacific Airways Ltd. | 20,000 | 42,480 | ||||||
Delta Air Lines, Inc. | 3,102 | 85,212 | ||||||
Deutsche Lufthansa AG (REG)(a) | 1,092 | 23,147 | ||||||
International Consolidated Airlines Group SA(a) | 4,346 | 28,950 | ||||||
Japan Airlines Co., Ltd. | 472 | 23,284 | ||||||
Singapore Airlines Ltd. | 3,000 | 24,777 | ||||||
Southwest Airlines Co. | 2,555 | 48,136 | ||||||
|
| |||||||
| 307,952 | ||||||||
|
| |||||||
BUILDING PRODUCTS–0.1% | ||||||||
Allegion PLC(a) | 285 | 12,594 | ||||||
Asahi Glass Co., Ltd.(b) | 4,000 | 24,907 | ||||||
Assa Abloy AB–Class B | 1,164 | 61,627 | ||||||
Cie de St-Gobain | 1,779 | 98,000 | ||||||
Daikin Industries Ltd. | 1,000 | 62,403 | ||||||
Geberit AG | 168 | 50,968 | ||||||
LIXIL Group Corp. | 1,200 | 32,943 | ||||||
Masco Corp. | 1,305 | 29,715 | ||||||
TOTO Ltd. | 2,000 | 31,722 | ||||||
|
| |||||||
| 404,879 | ||||||||
|
| |||||||
COMMERCIAL SERVICES & SUPPLIES–0.2% | ||||||||
ADT Corp. (The) | 697 | 28,208 | ||||||
Aggreko PLC | 1,199 | 34,004 | ||||||
Babcock International Group PLC | 1,614 | 36,267 | ||||||
Brambles Ltd. | 6,954 | $ | 56,974 | |||||
Cintas Corp. | 335 | 19,963 | ||||||
Dai Nippon Printing Co., Ltd. | 2,000 | 21,244 | ||||||
Edenred | 818 | 27,389 | ||||||
G4S PLC | 6,839 | 29,757 | ||||||
Iron Mountain, Inc. | 614 | 18,635 | ||||||
Pitney Bowes, Inc. | 705 | 16,426 | ||||||
Republic Services, Inc.–Class A | 950 | 31,540 | ||||||
Secom Co., Ltd. | 900 | 54,301 | ||||||
Societe BIC SA | 221 | 27,084 | ||||||
Stericycle, Inc.(a) | 310 | 36,013 | ||||||
Toppan Printing Co., Ltd. | 2,000 | 16,009 | ||||||
Tyco International Ltd. | 1,695 | 69,563 | ||||||
Waste Management, Inc. | 1,595 | 71,568 | ||||||
|
| |||||||
| 594,945 | ||||||||
|
| |||||||
CONSTRUCTION & ENGINEERING–0.2% | ||||||||
ACS Actividades de Construccion y Servicios SA | 667 | 22,992 | ||||||
Bouygues SA(b) | 1,650 | 62,396 | ||||||
Chiyoda Corp. | 1,000 | 14,517 | ||||||
Ferrovial SA | 1,470 | 28,477 | ||||||
Fluor Corp. | 615 | 49,378 | ||||||
Jacobs Engineering Group, Inc.(a) | 465 | 29,290 | ||||||
JGC Corp. | 1,000 | 39,244 | ||||||
Kajima Corp. | 7,000 | 26,327 | ||||||
Leighton Holdings Ltd.(b) | 1,344 | 19,410 | ||||||
Obayashi Corp. | 3,000 | 17,111 | ||||||
OCI(a) | 320 | 14,411 | ||||||
Quanta Services, Inc.(a) | 765 | 24,143 | ||||||
Shimizu Corp. | 4,000 | 20,212 | ||||||
Taisei Corp. | 5,000 | 22,755 | ||||||
Vinci SA | 2,135 | 140,336 | ||||||
|
| |||||||
| 530,999 | ||||||||
|
| |||||||
ELECTRICAL EQUIPMENT–0.3% | ||||||||
ABB Ltd. (REG)(a) | 9,800 | 259,112 | ||||||
Alstom SA | 154 | 5,616 | ||||||
AMETEK, Inc. | 899 | 47,350 | ||||||
Eaton Corp. PLC | 1,744 | 132,753 | ||||||
Emerson Electric Co. | 2,600 | 182,468 | ||||||
First Solar, Inc.(a) | 270 | 14,753 | ||||||
Fuji Electric Co., Ltd. | 4,000 | 18,742 | ||||||
Legrand SA | 827 | 45,578 | ||||||
Mitsubishi Electric Corp. | 9,000 | 113,170 | ||||||
Nidec Corp. | 500 | 49,257 | ||||||
Osram Licht AG(a) | 292 | 16,470 | ||||||
Prysmian SpA | 1,074 | 27,652 | ||||||
Rockwell Automation, Inc. | 530 | 62,625 | ||||||
Roper Industries, Inc. | 375 | 52,005 | ||||||
Schneider Electric SA | 2,356 | 205,541 | ||||||
Sumitomo Electric Industries Ltd. | 3,400 | 56,835 | ||||||
|
| |||||||
| 1,289,927 | ||||||||
|
| |||||||
INDUSTRIAL CONGLOMERATES–0.6% | ||||||||
3M Co. | 2,355 | 330,289 | ||||||
Danaher Corp. | 2,190 | 169,068 | ||||||
13
| DYNAMIC ASSET ALLOCATION PORTFOLIO | ||
| PORTFOLIOOF INVESTMENTS | ||
| (continued) | AllianceBernstein Variable Products Series Fund | |
| Company | Shares | U.S. $ Value | ||||||
General Electric Co. | 37,120 | $ | 1,040,473 | |||||
Hutchison Whampoa Ltd. | 10,000 | 136,387 | ||||||
Keppel Corp., Ltd. | 4,000 | 35,531 | ||||||
Koninklijke Philips NV | 3,341 | 123,019 | ||||||
Siemens AG | 3,541 | 485,537 | ||||||
Smiths Group PLC | 2,461 | 60,431 | ||||||
Toshiba Corp. | 18,000 | 75,777 | ||||||
|
| |||||||
| 2,456,512 | ||||||||
|
| |||||||
MACHINERY–0.7% | ||||||||
Alfa Laval AB | 3,611 | 92,778 | ||||||
Amada Co., Ltd. | 3,000 | 26,494 | ||||||
Andritz AG | 375 | 23,501 | ||||||
Atlas Copco AB–Class A | 1,805 | 50,118 | ||||||
Atlas Copco AB–Class B | 1,715 | 43,597 | ||||||
Caterpillar, Inc. | 2,335 | 212,041 | ||||||
CNH Industrial NV(a) | 2,876 | 32,780 | ||||||
Cummins, Inc. | 650 | 91,630 | ||||||
Deere & Co. | 1,385 | 126,492 | ||||||
Dover Corp. | 635 | 61,303 | ||||||
FANUC Corp. | 900 | 164,916 | ||||||
Flowserve Corp. | 510 | 40,203 | ||||||
GEA Group AG | 896 | 42,726 | ||||||
Hino Motors Ltd. | 2,000 | 31,505 | ||||||
Hitachi Construction Machinery Co., Ltd.(b) | 700 | 14,979 | ||||||
IHI Corp. | 6,000 | 25,948 | ||||||
Illinois Tool Works, Inc. | 1,475 | 124,018 | ||||||
IMI PLC | 1,172 | 29,680 | ||||||
Ingersoll-Rand PLC | 955 | 58,828 | ||||||
Invensys PLC | 3,174 | 26,829 | ||||||
Joy Global, Inc. | 385 | 22,519 | ||||||
JTEKT Corp. | 1,400 | 23,888 | ||||||
Kawasaki Heavy Industries Ltd. | 5,000 | 20,999 | ||||||
Komatsu Ltd. | 4,200 | 86,231 | ||||||
Kone Oyj–Class B | 1,392 | 62,777 | ||||||
Kubota Corp. | 5,000 | 82,936 | ||||||
Makita Corp. | 400 | 21,037 | ||||||
MAN SE | 407 | 49,972 | ||||||
Melrose Industries PLC | 5,848 | 29,669 | ||||||
Metso Oyj | 571 | 24,417 | ||||||
Mitsubishi Heavy Industries Ltd. | 14,000 | 86,710 | ||||||
NGK Insulators Ltd. | 1,000 | 19,031 | ||||||
NSK Ltd. | 2,000 | 24,925 | ||||||
PACCAR, Inc. | 1,310 | 77,513 | ||||||
Pall Corp. | 395 | 33,713 | ||||||
Parker Hannifin Corp. | 545 | 70,109 | ||||||
Pentair Ltd. | 710 | 55,146 | ||||||
Sandvik AB | 2,698 | 38,079 | ||||||
Scania AB–Class B | 5,123 | 100,407 | ||||||
Schindler Holding AG (REG) | 271 | 39,979 | ||||||
SembCorp Marine Ltd.(b) | 7,000 | 24,750 | ||||||
SKF AB–Class B | 1,658 | 43,482 | ||||||
SMC Corp./Japan | 200 | 50,478 | ||||||
Snap-On, Inc. | 220 | 24,094 | ||||||
Stanley Black & Decker, Inc. | 565 | 45,590 | ||||||
Sumitomo Heavy Industries Ltd. | 6,000 | 27,647 | ||||||
Vallourec SA | 641 | 34,970 | ||||||
Volvo AB–Class B | 6,759 | $ | 88,937 | |||||
Wartsila Oyj Abp | 793 | 39,096 | ||||||
Weir Group PLC (The) | 950 | 33,636 | ||||||
Xylem, Inc./NY | 635 | 21,971 | ||||||
Zardoya Otis SA | 1,239 | 22,432 | ||||||
|
| |||||||
| 2,747,506 | ||||||||
|
| |||||||
MARINE–0.0% | ||||||||
AP Moeller–Maersk A/S–Class A | 3 | 30,903 | ||||||
AP Moeller–Maersk A/S–Class B | 6 | 64,932 | ||||||
Mitsui OSK Lines Ltd. | 4,000 | 18,053 | ||||||
Nippon Yusen KK | 5,000 | 15,987 | ||||||
|
| |||||||
| 129,875 | ||||||||
|
| |||||||
PROFESSIONAL SERVICES–0.1% | ||||||||
Adecco SA(a) | 590 | 46,838 | ||||||
Bureau Veritas SA | 1,236 | 36,085 | ||||||
Capita PLC | 2,937 | 50,555 | ||||||
Dun & Bradstreet Corp. (The) | 165 | 20,254 | ||||||
Equifax, Inc. | 455 | 31,436 | ||||||
Experian PLC | 4,508 | 83,273 | ||||||
Intertek Group PLC | 720 | 37,578 | ||||||
Nielsen Holdings NV | 916 | 42,035 | ||||||
Randstad Holding NV | 1,613 | 104,673 | ||||||
Robert Half International, Inc. | 485 | 20,365 | ||||||
SGS SA | 24 | 55,254 | ||||||
|
| |||||||
| 528,346 | ||||||||
|
| |||||||
ROAD & RAIL–0.3% | ||||||||
Asciano Ltd. | 8,374 | 43,172 | ||||||
Aurizon Holdings Ltd. | 6,403 | 27,965 | ||||||
Central Japan Railway Co. | 644 | 75,897 | ||||||
CSX Corp. | 3,710 | 106,737 | ||||||
DSV A/S | 511 | 16,777 | ||||||
East Japan Railway Co. | 1,500 | 119,487 | ||||||
Hankyu Hanshin Holdings, Inc. | 5,000 | 27,017 | ||||||
Kansas City Southern | 420 | 52,008 | ||||||
Keikyu Corp.(b) | 2,000 | 16,490 | ||||||
Keisei Electric Railway Co., Ltd. | 2,000 | 18,403 | ||||||
Kintetsu Corp. | 8,000 | 28,071 | ||||||
MTR Corp., Ltd. | 7,000 | 26,531 | ||||||
Nippon Express Co., Ltd. | 3,000 | 14,522 | ||||||
Norfolk Southern Corp. | 1,140 | 105,826 | ||||||
Odakyu Electric Railway Co., Ltd. | 2,000 | 18,088 | ||||||
Ryder System, Inc. | 165 | 12,174 | ||||||
Tobu Railway Co., Ltd. | 3,000 | 14,547 | ||||||
Tokyu Corp. | 5,000 | 32,395 | ||||||
Union Pacific Corp. | 1,725 | 289,800 | ||||||
West Japan Railway Co. | 751 | 32,540 | ||||||
|
| |||||||
| 1,078,447 | ||||||||
|
| |||||||
TRADING COMPANIES & DISTRIBUTORS–0.2% | ||||||||
Brenntag AG | 189 | 35,078 | ||||||
Bunzl PLC | 1,482 | 35,614 | ||||||
Fastenal Co. | 980 | 46,560 | ||||||
ITOCHU Corp. | 7,000 | 86,538 | ||||||
Marubeni Corp. | 7,000 | 50,393 | ||||||
14
| AllianceBernstein Variable Products Series Fund |
| Company | Shares | U.S. $ Value | ||||||
Mitsubishi Corp. | 6,300 | $ | 120,947 | |||||
Mitsui & Co., Ltd. | 7,800 | 108,741 | ||||||
Sumitomo Corp. | 5,000 | 62,841 | ||||||
Toyota Tsusho Corp. | 700 | 17,359 | ||||||
Travis Perkins PLC | 1,092 | 33,922 | ||||||
Wolseley PLC | 1,423 | 80,902 | ||||||
WW Grainger, Inc. | 230 | 58,746 | ||||||
|
| |||||||
| 737,641 | ||||||||
|
| |||||||
TRANSPORTATION INFRASTRUCTURE–0.1% | ||||||||
Abertis Infraestructuras SA | 1,637 | 36,412 | ||||||
Aeroports de Paris | 305 | 34,633 | ||||||
Atlantia SpA(b) | 2,911 | 65,206 | ||||||
Auckland International Airport Ltd. | 4,070 | 11,820 | ||||||
Hutchison Port Holdings Trust–Class U | 43,553 | 29,434 | ||||||
Mitsubishi Logistics Corp. | 1,000 | 15,830 | ||||||
Sydney Airport | 15,829 | 53,797 | ||||||
Transurban Group | 3,826 | 23,397 | ||||||
|
| |||||||
| 270,529 | ||||||||
|
| |||||||
| 14,274,312 | ||||||||
|
| |||||||
INFORMATION TECHNOLOGY–3.6% | ||||||||
COMMUNICATIONS EQUIPMENT–0.4% | ||||||||
Alcatel-Lucent(a) | 12,407 | 55,059 | ||||||
Cisco Systems, Inc. | 19,620 | 440,469 | ||||||
F5 Networks, Inc.(a) | 280 | 25,441 | ||||||
Harris Corp. | 395 | 27,575 | ||||||
Juniper Networks, Inc.(a) | 1,840 | 41,529 | ||||||
Motorola Solutions, Inc. | 845 | 57,037 | ||||||
Nokia Oyj(a) | 16,723 | 135,122 | ||||||
QUALCOMM, Inc. | 6,200 | 460,350 | ||||||
Telefonaktiebolaget LM Ericsson–Class B | 13,589 | 165,914 | ||||||
|
| |||||||
| 1,408,496 | ||||||||
|
| |||||||
COMPUTERS & PERIPHERALS–0.7% | ||||||||
Apple, Inc. | 3,313 | 1,858,957 | ||||||
EMC Corp./MA | 7,535 | 189,505 | ||||||
Gemalto NV(b) | 323 | 35,548 | ||||||
Hewlett-Packard Co. | 7,040 | 196,979 | ||||||
NEC Corp. | 9,000 | 20,315 | ||||||
NetApp, Inc. | 1,240 | 51,014 | ||||||
SanDisk Corp. | 820 | 57,843 | ||||||
Seagate Technology PLC | 1,180 | 66,269 | ||||||
Western Digital Corp. | 780 | 65,442 | ||||||
|
| |||||||
| 2,541,872 | ||||||||
|
| |||||||
ELECTRONIC EQUIPMENT, INSTRUMENTS & COMPONENTS–0.2% | ||||||||
Amphenol Corp.–Class A | 575 | 51,278 | ||||||
Corning, Inc. | 5,285 | 94,179 | ||||||
FLIR Systems, Inc. | 510 | 15,351 | ||||||
Fujifilm Holdings Corp. | 2,100 | 59,609 | ||||||
Hamamatsu Photonics KK | 600 | $ | 24,009 | |||||
Hexagon AB–Class B | 938 | 29,671 | ||||||
Hirose Electric Co., Ltd. | 100 | 14,255 | ||||||
Hitachi High-Technologies Corp. | 600 | 15,106 | ||||||
Hitachi Ltd. | 22,000 | 166,807 | ||||||
Hoya Corp. | 1,900 | 52,843 | ||||||
Jabil Circuit, Inc. | 655 | 11,423 | ||||||
Keyence Corp. | 200 | 85,637 | ||||||
Kyocera Corp. | 1,400 | 69,988 | ||||||
Murata Manufacturing Co., Ltd. | 900 | 80,040 | ||||||
Omron Corp. | 700 | 30,935 | ||||||
TDK Corp. | 900 | 43,177 | ||||||
TE Connectivity Ltd. | 1,510 | 83,216 | ||||||
|
| |||||||
| 927,524 | ||||||||
|
| |||||||
INTERNET SOFTWARE & SERVICES–0.5% | ||||||||
Akamai Technologies, Inc.(a) | 635 | 29,959 | ||||||
Dena Co., Ltd.(b) | 529 | 11,151 | ||||||
eBay, Inc.(a) | 4,275 | 234,655 | ||||||
Facebook, Inc.–Class A(a) | 6,060 | 331,240 | ||||||
Google, Inc.–Class A(a) | 1,029 | 1,153,211 | ||||||
Kakaku.com, Inc. | 961 | 16,881 | ||||||
United Internet AG | 1,223 | 52,136 | ||||||
VeriSign, Inc.(a) | 465 | 27,798 | ||||||
Yahoo Japan Corp. | 6,408 | 35,734 | ||||||
Yahoo!, Inc.(a) | 3,455 | 139,720 | ||||||
|
| |||||||
| 2,032,485 | ||||||||
|
| |||||||
IT SERVICES–0.6% | ||||||||
Accenture PLC–Class A | 2,345 | 192,806 | ||||||
Amadeus IT Holding SA–Class A | 1,699 | 72,777 | ||||||
Automatic Data Processing, Inc. | 1,770 | 143,034 | ||||||
Cap Gemini SA | 854 | 57,803 | ||||||
Cognizant Technology Solutions Corp.–Class A(a) | 1,115 | 112,593 | ||||||
Computer Sciences Corp. | 520 | 29,057 | ||||||
Computershare Ltd. | 1,449 | 14,766 | ||||||
Fidelity National Information Services, Inc. | 1,050 | 56,364 | ||||||
Fiserv, Inc.(a) | 960 | 56,688 | ||||||
Fujitsu Ltd.(a) | 8,000 | 41,461 | ||||||
International Business Machines Corp. | 3,745 | 702,450 | ||||||
MasterCard, Inc.–Class A | 385 | 321,652 | ||||||
Nomura Research Institute Ltd. | 600 | 18,962 | ||||||
NTT Data Corp. | 500 | 18,472 | ||||||
Otsuka Corp.(b) | 200 | 25,551 | ||||||
Paychex, Inc. | 1,195 | 54,408 | ||||||
Teradata Corp.(a) | 585 | 26,612 | ||||||
Total System Services, Inc. | 600 | 19,968 | ||||||
Visa, Inc.–Class A | 1,865 | 415,298 | ||||||
Western Union Co. (The)–Class W | 2,020 | 34,845 | ||||||
|
| |||||||
| 2,415,567 | ||||||||
|
| |||||||
OFFICE ELECTRONICS–0.1% | ||||||||
Canon, Inc.(b) | 5,100 | 162,733 | ||||||
Konica Minolta, Inc. | 2,000 | 19,987 | ||||||
15
| DYNAMIC ASSET ALLOCATION PORTFOLIO | ||
| PORTFOLIOOF INVESTMENTS | ||
| (continued) | AllianceBernstein Variable Products Series Fund | |
| Company | Shares | U.S. $ Value | ||||||
Ricoh Co., Ltd. | 3,000 | $ | 31,904 | |||||
Xerox Corp. | 4,245 | 51,662 | ||||||
|
| |||||||
| 266,286 | ||||||||
|
| |||||||
SEMICONDUCTORS & SEMICONDUCTOR EQUIPMENT–0.4% | ||||||||
Altera Corp. | 1,160 | 37,735 | ||||||
Analog Devices, Inc. | 1,130 | 57,551 | ||||||
Applied Materials, Inc. | 4,385 | 77,571 | ||||||
ARM Holdings PLC | 6,241 | 113,479 | ||||||
ASM Pacific Technology Ltd. | 900 | 7,521 | ||||||
ASML Holding NV | 1,801 | 168,685 | ||||||
Broadcom Corp.–Class A | 1,970 | 58,410 | ||||||
Infineon Technologies AG | 3,026 | 32,322 | ||||||
Intel Corp. | 18,240 | 473,510 | ||||||
KLA-Tencor Corp. | 610 | 39,321 | ||||||
Lam Research Corp.(a) | 579 | 31,527 | ||||||
Linear Technology Corp. | 840 | 38,262 | ||||||
LSI Corp. | 1,970 | 21,709 | ||||||
Microchip Technology, Inc. | 695 | 31,101 | ||||||
Micron Technology, Inc.(a) | 3,820 | 83,123 | ||||||
NVIDIA Corp. | 2,085 | 33,402 | ||||||
Rohm Co., Ltd. | 400 | 19,511 | ||||||
STMicroelectronics NV | 4,174 | 33,508 | ||||||
Texas Instruments, Inc. | 3,975 | 174,542 | ||||||
Tokyo Electron Ltd. | 800 | 44,082 | ||||||
Xilinx, Inc. | 985 | 45,231 | ||||||
|
| |||||||
| 1,622,103 | ||||||||
|
| |||||||
SOFTWARE–0.7% | ||||||||
Adobe Systems, Inc.(a) | 1,700 | 101,796 | ||||||
Autodesk, Inc.(a) | 815 | 41,019 | ||||||
CA, Inc. | 1,185 | 39,875 | ||||||
Citrix Systems, Inc.(a) | 690 | 43,643 | ||||||
Dassault Systemes | 243 | 30,163 | ||||||
Electronic Arts, Inc.(a) | 1,125 | 25,808 | ||||||
GungHo Online Entertainment, Inc.(a)(b) | 4,000 | 28,812 | ||||||
Intuit, Inc. | 1,060 | 80,899 | ||||||
Microsoft Corp. | 27,880 | 1,043,548 | ||||||
Nexon Co., Ltd.(b) | 2,595 | 23,978 | ||||||
NICE Systems Ltd. | 208 | 8,506 | ||||||
Nintendo Co., Ltd. | 500 | 66,927 | ||||||
Oracle Corp. | 12,880 | 492,789 | ||||||
Oracle Corp. Japan | 500 | 18,277 | ||||||
Red Hat, Inc.(a) | 680 | 38,107 | ||||||
Sage Group PLC (The) | 4,400 | 29,454 | ||||||
Salesforce.com, Inc.(a) | 2,024 | 111,705 | ||||||
SAP AG | 4,114 | 356,772 | ||||||
Symantec Corp. | 2,535 | 59,775 | ||||||
Trend Micro, Inc./Japan(b) | 500 | 17,522 | ||||||
|
| |||||||
| 2,659,375 | ||||||||
|
| |||||||
| 13,873,708 | ||||||||
|
| |||||||
HEALTH CARE–3.6% | ||||||||
BIOTECHNOLOGY–0.5% | ||||||||
Actelion Ltd.(a) | 608 | 51,571 | ||||||
Alexion Pharmaceuticals, Inc.(a) | 730 | 97,134 | ||||||
Amgen, Inc. | 2,753 | $ | 314,282 | |||||
Biogen Idec, Inc.(a) | 865 | 241,984 | ||||||
Celgene Corp.(a) | 1,540 | 260,198 | ||||||
CSL Ltd. | 2,196 | 135,377 | ||||||
Gilead Sciences, Inc.(a) | 5,630 | 423,094 | ||||||
Grifols SA | 757 | 36,225 | ||||||
Novozymes A/S–Class B | 858 | 36,242 | ||||||
Regeneron Pharmaceuticals, Inc.(a) | 290 | 79,820 | ||||||
Vertex Pharmaceuticals, Inc.(a) | 857 | 63,675 | ||||||
|
| |||||||
| 1,739,602 | ||||||||
|
| |||||||
HEALTH CARE EQUIPMENT & SUPPLIES–0.4% | ||||||||
Abbott Laboratories | 5,665 | 217,139 | ||||||
Baxter International, Inc. | 1,980 | 137,709 | ||||||
Becton Dickinson and Co. | 730 | 80,658 | ||||||
Boston Scientific Corp.(a) | 4,860 | 58,417 | ||||||
CareFusion Corp.(a) | 740 | 29,467 | ||||||
Coloplast A/S–Class B | 496 | 32,883 | ||||||
Covidien PLC | 1,675 | 114,067 | ||||||
CR Bard, Inc. | 315 | 42,191 | ||||||
DENTSPLY International, Inc. | 530 | 25,694 | ||||||
Edwards Lifesciences Corp.(a) | 395 | 25,975 | ||||||
Essilor International SA | 954 | 101,513 | ||||||
Getinge AB–Class B | 2,013 | 69,002 | ||||||
Intuitive Surgical, Inc.(a) | 155 | 59,532 | ||||||
Medtronic, Inc. | 3,660 | 210,047 | ||||||
Olympus Corp.(a) | 900 | 28,545 | ||||||
Smith & Nephew PLC | 3,373 | 48,175 | ||||||
Sonova Holding AG(a) | 351 | 47,331 | ||||||
St Jude Medical, Inc. | 1,065 | 65,977 | ||||||
Stryker Corp. | 1,075 | 80,775 | ||||||
Sysmex Corp. | 200 | 11,813 | ||||||
Terumo Corp. | 700 | 33,796 | ||||||
Varian Medical Systems, Inc.(a) | 395 | 30,688 | ||||||
William Demant Holding | 158 | 15,355 | ||||||
Zimmer Holdings, Inc. | 635 | 59,176 | ||||||
|
| |||||||
| 1,625,925 | ||||||||
|
| |||||||
HEALTH CARE PROVIDERS & SERVICES–0.4% | ||||||||
Aetna, Inc. | 1,367 | 93,763 | ||||||
AmerisourceBergen Corp.–Class A | 835 | 58,709 | ||||||
Cardinal Health, Inc. | 1,245 | 83,178 | ||||||
CIGNA Corp. | 1,015 | 88,792 | ||||||
DaVita HealthCare Partners, Inc.(a) | 650 | 41,191 | ||||||
Express Scripts Holding Co.(a) | 2,939 | 206,435 | ||||||
Fresenius Medical Care AG & Co. KGaA | 961 | 68,544 | ||||||
Fresenius SE & Co. KGaA | 558 | 85,806 | ||||||
Humana, Inc. | 565 | 58,319 | ||||||
Laboratory Corp. of America Holdings(a) | 325 | 29,695 | ||||||
McKesson Corp. | 865 | 139,611 | ||||||
Medipal Holdings Corp. | 1,500 | 19,802 | ||||||
16
| AllianceBernstein Variable Products Series Fund |
| Company | Shares | U.S. $ Value | ||||||
Patterson Cos., Inc. | 260 | $ | 10,712 | |||||
Quest Diagnostics, Inc. | 500 | 26,770 | ||||||
Ramsay Health Care Ltd. | 1,156 | 44,739 | ||||||
Ryman Healthcare Ltd. | 1,663 | 10,744 | ||||||
Sonic Healthcare Ltd. | 1,715 | 25,451 | ||||||
Suzuken Co., Ltd./Aichi Japan | 600 | 19,436 | ||||||
Tenet Healthcare Corp.(a) | 343 | 14,447 | ||||||
UnitedHealth Group, Inc. | 3,685 | 277,481 | ||||||
WellPoint, Inc. | 1,100 | 101,629 | ||||||
|
| |||||||
| 1,505,254 | ||||||||
|
| |||||||
HEALTH CARE TECHNOLOGY–0.0% | ||||||||
Cerner Corp.(a) | 1,080 | 60,199 | ||||||
M3, Inc.(b) | 6 | 15,026 | ||||||
|
| |||||||
| 75,225 | ||||||||
|
| |||||||
LIFE SCIENCES TOOLS & SERVICES–0.1% | ||||||||
Agilent Technologies, Inc. | 1,195 | 68,342 | ||||||
Life Technologies Corp.(a) | 615 | 46,617 | ||||||
PerkinElmer, Inc. | 405 | 16,698 | ||||||
QIAGEN NV(a) | 2,306 | 53,836 | ||||||
Thermo Fisher Scientific, Inc. | 1,335 | 148,653 | ||||||
Waters Corp.(a) | 295 | 29,500 | ||||||
|
| |||||||
| 363,646 | ||||||||
|
| |||||||
PHARMACEUTICALS–2.2% | ||||||||
AbbVie, Inc. | 5,845 | 308,674 | ||||||
Actavis PLC(a) | 638 | 107,184 | ||||||
Allergan, Inc./United States | 1,100 | 122,188 | ||||||
Astellas Pharma, Inc. | 1,900 | 112,645 | ||||||
AstraZeneca PLC | 5,591 | 331,697 | ||||||
Bayer AG | 3,693 | 518,536 | ||||||
Bristol-Myers Squibb Co. | 6,015 | 319,697 | ||||||
Chugai Pharmaceutical Co., Ltd.(b) | 1,000 | 22,135 | ||||||
Daiichi Sankyo Co., Ltd. | 3,000 | 54,855 | ||||||
Dainippon Sumitomo Pharma Co., Ltd. | 1,400 | 21,928 | ||||||
Eisai Co., Ltd. | 1,100 | 42,633 | ||||||
Eli Lilly & Co. | 3,615 | 184,365 | ||||||
Forest Laboratories, Inc.(a) | 865 | 51,926 | ||||||
GlaxoSmithKline PLC | 21,996 | 587,677 | ||||||
Hisamitsu Pharmaceutical Co., Inc. | 300 | 15,118 | ||||||
Hospira, Inc.(a) | 580 | 23,942 | ||||||
Johnson & Johnson | 10,355 | 948,414 | ||||||
Kyowa Hakko Kirin Co., Ltd. | 1,000 | 11,035 | ||||||
Merck & Co., Inc. | 10,705 | 535,785 | ||||||
Merck KGaA | 204 | 36,603 | ||||||
Mitsubishi Tanabe Pharma Corp. | 1,000 | 13,947 | ||||||
Mylan, Inc./PA(a) | 1,405 | 60,977 | ||||||
Novartis AG | 10,271 | 823,214 | ||||||
Novo Nordisk A/S–Class B | 1,778 | 325,911 | ||||||
Ono Pharmaceutical Co., Ltd. | 400 | 35,062 | ||||||
Orion Oyj–Class B | 465 | 13,070 | ||||||
Otsuka Holdings Co., Ltd. | 1,619 | 46,747 | ||||||
Perrigo Co. PLC | 634 | 97,294 | ||||||
Pfizer, Inc. | 23,786 | $ | 728,565 | |||||
Roche Holding AG | 3,137 | 878,756 | ||||||
Sanofi | 5,321 | 568,255 | ||||||
Santen Pharmaceutical Co., Ltd. | 500 | 23,296 | ||||||
Shionogi & Co., Ltd. | 1,000 | 21,710 | ||||||
Shire PLC | 2,474 | 116,593 | ||||||
Taisho Pharmaceutical Holdings Co., Ltd. | 172 | 11,823 | ||||||
Takeda Pharmaceutical Co., Ltd. | 3,500 | 160,528 | ||||||
Teva Pharmaceutical Industries Ltd. | 3,794 | 151,803 | ||||||
UCB SA | 579 | 43,137 | ||||||
Zoetis, Inc. | 1,796 | 58,711 | ||||||
|
| |||||||
| 8,536,436 | ||||||||
|
| |||||||
| 13,846,088 | ||||||||
|
| |||||||
CONSUMER STAPLES–3.2% | ||||||||
BEVERAGES–0.7% | ||||||||
Anheuser-Busch InBev NV | 3,588 | 381,534 | ||||||
Asahi Group Holdings Ltd. | 1,700 | 47,973 | ||||||
Beam, Inc. | 600 | 40,836 | ||||||
Brown-Forman Corp.–Class B | 602 | 45,493 | ||||||
Carlsberg A/S–Class B | 478 | 52,892 | ||||||
Coca-Cola Amatil Ltd. | 1,634 | 17,578 | ||||||
Coca-Cola Co. (The) | 13,930 | 575,448 | ||||||
Coca-Cola Enterprises, Inc. | 850 | 37,511 | ||||||
Coca-Cola HBC AG(a) | 892 | 26,107 | ||||||
Constellation Brands, Inc.–Class A(a) | 620 | 43,636 | ||||||
Diageo PLC | 11,209 | 371,450 | ||||||
Dr Pepper Snapple Group, Inc. | 720 | 35,078 | ||||||
Heineken NV | 1,245 | 84,145 | ||||||
Kirin Holdings Co., Ltd.(b) | 4,000 | 57,606 | ||||||
Molson Coors Brewing Co.–Class B | 550 | 30,883 | ||||||
Monster Beverage Corp.(a) | 510 | 34,563 | ||||||
PepsiCo, Inc. | 5,625 | 466,538 | ||||||
Pernod Ricard SA | 946 | 107,779 | ||||||
Remy Cointreau SA | 195 | 16,380 | ||||||
SABMiller PLC (London) | 4,293 | 220,982 | ||||||
Suntory Beverage & Food Ltd. | 848 | 27,053 | ||||||
Treasury Wine Estates Ltd. | 5,315 | 22,924 | ||||||
|
| |||||||
| 2,744,389 | ||||||||
|
| |||||||
FOOD & STAPLES RETAILING–0.7% | ||||||||
Aeon Co., Ltd. | 2,700 | 36,603 | ||||||
Carrefour SA | 2,692 | 106,854 | ||||||
Casino Guichard Perrachon SA | 482 | 55,616 | ||||||
Colruyt SA | 393 | 21,958 | ||||||
Costco Wholesale Corp. | 1,615 | 192,201 | ||||||
CVS Caremark Corp. | 4,380 | 313,477 | ||||||
Delhaize Group SA | 404 | 24,035 | ||||||
Distribuidora Internacional de Alimentacion SA | 2,417 | 21,642 | ||||||
FamilyMart Co., Ltd. | 400 | 18,275 | ||||||
J Sainsbury PLC | 5,506 | 33,324 | ||||||
Jeronimo Martins SGPS SA | 1,190 | 23,269 | ||||||
17
| DYNAMIC ASSET ALLOCATION PORTFOLIO | ||
| PORTFOLIOOF INVESTMENTS | ||
| (continued) | AllianceBernstein Variable Products Series Fund | |
| Company | Shares | U.S. $ Value | ||||||
Koninklijke Ahold NV | 5,918 | $ | 106,353 | |||||
Kroger Co. (The) | 1,865 | 73,723 | ||||||
Lawson, Inc. | 200 | 14,967 | ||||||
Metro AG | 1,551 | 75,192 | ||||||
Safeway, Inc. | 895 | 29,150 | ||||||
Seven & I Holdings Co., Ltd. | 3,400 | 135,376 | ||||||
Sysco Corp. | 2,105 | 75,990 | ||||||
Tesco PLC | 36,078 | 200,353 | ||||||
Wal-Mart Stores, Inc. | 5,963 | 469,228 | ||||||
Walgreen Co. | 3,195 | 183,521 | ||||||
Wesfarmers Ltd. | 4,439 | 174,777 | ||||||
Whole Foods Market, Inc. | 1,370 | 79,227 | ||||||
WM Morrison Supermarkets PLC | 9,857 | 42,669 | ||||||
Woolworths Ltd. | 5,562 | 168,425 | ||||||
|
| |||||||
| 2,676,205 | ||||||||
|
| |||||||
FOOD PRODUCTS–0.8% | ||||||||
Ajinomoto Co., Inc. | 3,000 | 43,430 | ||||||
Archer-Daniels-Midland Co. | 2,415 | 104,811 | ||||||
Associated British Foods PLC | 1,705 | 69,147 | ||||||
Campbell Soup Co. | 625 | 27,050 | ||||||
ConAgra Foods, Inc. | 1,535 | 51,729 | ||||||
Danone | 2,553 | 184,178 | ||||||
General Mills, Inc. | 2,335 | 116,540 | ||||||
Golden Agri-Resources Ltd. | 48,000 | 20,779 | ||||||
Hershey Co. (The) | 550 | 53,476 | ||||||
Hormel Foods Corp. | 475 | 21,456 | ||||||
JM Smucker Co. (The) | 395 | 40,930 | ||||||
Kellogg Co. | 915 | 55,879 | ||||||
Kerry Group PLC–Class A | 781 | 54,258 | ||||||
Kraft Foods Group, Inc. | 2,178 | 117,438 | ||||||
Lindt & Spruengli AG (REG) | 1 | 53,921 | ||||||
McCormick & Co., Inc./MD | 475 | 32,737 | ||||||
Mead Johnson Nutrition Co.–Class A | 760 | 63,658 | ||||||
MEIJI Holdings Co., Ltd. | 300 | 19,283 | ||||||
Mondelez International, Inc.–Class A | 6,435 | 227,155 | ||||||
Nestle SA | 14,400 | 1,055,376 | ||||||
Nippon Meat Packers, Inc. | 1,000 | 17,188 | ||||||
Nissin Foods Holdings Co., Ltd.(b) | 400 | 16,881 | ||||||
Orkla ASA | 2,074 | 16,211 | ||||||
Tate & Lyle PLC | 2,078 | 27,875 | ||||||
Toyo Suisan Kaisha Ltd. | 1,000 | 30,041 | ||||||
Tyson Foods, Inc.–Class A | 975 | 32,624 | ||||||
Unilever NV | 7,274 | 292,453 | ||||||
Unilever PLC | 5,731 | 235,807 | ||||||
Wilmar International Ltd. | 9,000 | 24,447 | ||||||
Yakult Honsha Co., Ltd. | 400 | 20,211 | ||||||
|
| |||||||
| 3,126,969 | ||||||||
|
| |||||||
HOUSEHOLD PRODUCTS–0.4% | ||||||||
Clorox Co. (The) | 470 | 43,597 | ||||||
Colgate-Palmolive Co. | 3,200 | 208,672 | ||||||
Henkel AG & Co. KGaA | 579 | 60,366 | ||||||
Henkel AG & Co. KGaA (Preference Shares) | 796 | 92,523 | ||||||
Kimberly-Clark Corp. | 1,415 | 147,811 | ||||||
Procter & Gamble Co. (The) | 9,965 | $ | 811,251 | |||||
Reckitt Benckiser Group PLC | 2,888 | 229,411 | ||||||
Svenska Cellulosa AB SCA–Class B | 2,115 | 65,158 | ||||||
Unicharm Corp. | 500 | 28,529 | ||||||
|
| |||||||
| 1,687,318 | ||||||||
|
| |||||||
PERSONAL PRODUCTS–0.1% | ||||||||
Avon Products, Inc. | 1,555 | 26,777 | ||||||
Beiersdorf AG | 310 | 31,429 | ||||||
Estee Lauder Cos., Inc. (The)–Class A | 940 | 70,801 | ||||||
Kao Corp. | 2,300 | 72,408 | ||||||
L’Oreal SA | 1,080 | 189,662 | ||||||
Shiseido Co., Ltd. | 1,600 | 25,730 | ||||||
|
| |||||||
| 416,807 | ||||||||
|
| |||||||
TOBACCO–0.5% | ||||||||
Altria Group, Inc. | 7,310 | 280,631 | ||||||
British American Tobacco PLC | 8,392 | 450,433 | ||||||
Imperial Tobacco Group PLC | 4,350 | 168,641 | ||||||
Japan Tobacco, Inc. | 4,912 | 159,830 | ||||||
Lorillard, Inc. | 1,340 | 67,911 | ||||||
Philip Morris International, Inc. | 5,900 | 514,067 | ||||||
Reynolds American, Inc. | 1,135 | 56,739 | ||||||
Swedish Match AB | 831 | 26,718 | ||||||
|
| |||||||
| 1,724,970 | ||||||||
|
| |||||||
| 12,376,658 | ||||||||
|
| |||||||
ENERGY–2.6% | ||||||||
ENERGY EQUIPMENT & SERVICES–0.4% | ||||||||
Aker Solutions ASA | 1,244 | 22,272 | ||||||
AMEC PLC | 1,606 | 28,996 | ||||||
Baker Hughes, Inc. | 1,610 | 88,969 | ||||||
Cameron International Corp.(a) | 870 | 51,791 | ||||||
CGG SA(a) | 1,620 | 28,115 | ||||||
Diamond Offshore Drilling, Inc. | 240 | 13,661 | ||||||
Ensco PLC–Class A | 850 | 48,603 | ||||||
FMC Technologies, Inc.(a) | 860 | 44,901 | ||||||
Fugro NV | 538 | 32,092 | ||||||
Halliburton Co. | 3,090 | 156,817 | ||||||
Helmerich & Payne, Inc. | 385 | 32,371 | ||||||
Nabors Industries Ltd. | 915 | 15,546 | ||||||
National Oilwell Varco, Inc. | 1,555 | 123,669 | ||||||
Noble Corp. PLC | 925 | 34,660 | ||||||
Petrofac Ltd. | 697 | 14,127 | ||||||
Rowan Cos., PLC(a) | 455 | 16,089 | ||||||
Saipem SpA | 1,479 | 31,718 | ||||||
Schlumberger Ltd. | 4,835 | 435,682 | ||||||
Seadrill Ltd. | 1,676 | 68,690 | ||||||
Subsea 7 SA | 1,066 | 20,436 | ||||||
Technip SA | 267 | 25,702 | ||||||
Tenaris SA | 1,269 | 27,652 | ||||||
Transocean Ltd. (Zurich) | 1,255 | 61,419 | ||||||
Transocean Ltd. | 1,250 | 61,775 | ||||||
WorleyParsons Ltd. | 885 | 13,165 | ||||||
|
| |||||||
| 1,498,918 | ||||||||
|
| |||||||
18
| AllianceBernstein Variable Products Series Fund |
| Company | Shares | U.S. $ Value | ||||||
FINANCIAL DATA & SYSTEMS–0.0% | ||||||||
Alliance Data Systems Corp.(a) | 180 | $ | 47,327 | |||||
|
| |||||||
MULTI-FAMILY–0.0% | ||||||||
Deutsche Wohnen AG | 1,334 | 25,759 | ||||||
|
| |||||||
OIL, GAS & CONSUMABLE FUELS–2.2% | ||||||||
Anadarko Petroleum Corp. | 1,845 | 146,345 | ||||||
Apache Corp. | 1,445 | 124,183 | ||||||
BG Group PLC | 15,199 | 327,057 | ||||||
BP PLC | 84,788 | 687,132 | ||||||
Cabot Oil & Gas Corp. | 1,540 | 59,690 | ||||||
Caltex Australia Ltd. | 1,410 | 25,339 | ||||||
Chesapeake Energy Corp. | 1,845 | 50,073 | ||||||
Chevron Corp. | 7,080 | 884,363 | ||||||
ConocoPhillips | 4,470 | 315,806 | ||||||
Consol Energy, Inc. | 840 | 31,954 | ||||||
Delek Group Ltd. | 5 | 1,910 | ||||||
Denbury Resources, Inc.(a) | 1,310 | 21,523 | ||||||
Devon Energy Corp. | 1,370 | 84,762 | ||||||
ENI SpA | 11,360 | 274,499 | ||||||
EOG Resources, Inc. | 1,005 | 168,679 | ||||||
EQT Corp. | 540 | 48,481 | ||||||
Exxon Mobil Corp. | 16,037 | 1,622,944 | ||||||
Galp Energia SGPS SA | 1,550 | 25,403 | ||||||
Hess Corp. | 1,040 | 86,320 | ||||||
Idemitsu Kosan Co., Ltd. | 1,200 | 27,319 | ||||||
Inpex Corp. | 4,000 | 51,305 | ||||||
JX Holdings, Inc. | 10,000 | 51,495 | ||||||
Kinder Morgan, Inc./DE | 2,425 | 87,300 | ||||||
Koninklijke Vopak NV | 502 | 29,388 | ||||||
Lundin Petroleum AB(a) | 856 | 16,658 | ||||||
Marathon Oil Corp. | 2,555 | 90,192 | ||||||
Marathon Petroleum Corp. | 1,112 | 102,004 | ||||||
Murphy Oil Corp. | 655 | 42,496 | ||||||
Neste Oil Oyj(b) | 572 | 11,312 | ||||||
Newfield Exploration Co.(a) | 470 | 11,576 | ||||||
Noble Energy, Inc. | 1,300 | 88,543 | ||||||
Occidental Petroleum Corp. | 2,950 | 280,545 | ||||||
OMV AG | 658 | 31,492 | ||||||
Origin Energy Ltd. | 4,903 | 61,791 | ||||||
Peabody Energy Corp. | 945 | 18,456 | ||||||
Phillips 66 | 2,210 | 170,457 | ||||||
Pioneer Natural Resources Co. | 515 | 94,796 | ||||||
QEP Resources, Inc. | 625 | 19,156 | ||||||
Range Resources Corp. | 600 | 50,586 | ||||||
Repsol SA | 3,820 | 96,391 | ||||||
Royal Dutch Shell PLC–Class A | 16,959 | 607,781 | ||||||
Royal Dutch Shell PLC–Class B | 11,041 | 416,468 | ||||||
Santos Ltd. | 4,317 | 56,578 | ||||||
Southwestern Energy Co.(a) | 1,245 | 48,966 | ||||||
Spectra Energy Corp. | 2,435 | 86,735 | ||||||
Statoil ASA | 4,983 | 121,169 | ||||||
Tesoro Corp. | 475 | 27,788 | ||||||
TonenGeneral Sekiyu KK(b) | 2,000 | 18,352 | ||||||
Total SA | 9,552 | 586,296 | ||||||
Tullow Oil PLC | 4,387 | 62,263 | ||||||
Valero Energy Corp. | 1,975 | $ | 99,540 | |||||
Williams Cos., Inc. (The) | 2,505 | 96,618 | ||||||
Woodside Petroleum Ltd. | 2,943 | 102,500 | ||||||
WPX Energy, Inc.(a) | 695 | 14,164 | ||||||
|
| |||||||
| 8,764,939 | ||||||||
|
| |||||||
| 10,336,943 | ||||||||
|
| |||||||
MATERIALS–1.7% | ||||||||
CHEMICALS–0.9% | ||||||||
Air Liquide SA | 1,392 | 197,015 | ||||||
Air Products & Chemicals, Inc. | 770 | 86,071 | ||||||
Air Water, Inc. | 1,000 | 13,553 | ||||||
Airgas, Inc. | 240 | 26,844 | ||||||
Akzo Nobel NV | 704 | 54,592 | ||||||
Arkema SA | 450 | 52,541 | ||||||
Asahi Kasei Corp. | 6,000 | 47,063 | ||||||
BASF SE | 4,101 | 437,716 | ||||||
CF Industries Holdings, Inc. | 240 | 55,930 | ||||||
Croda International PLC | 549 | 22,379 | ||||||
Dow Chemical Co. (The) | 4,425 | 196,470 | ||||||
Eastman Chemical Co. | 580 | 46,806 | ||||||
Ecolab, Inc. | 990 | 103,227 | ||||||
EI du Pont de Nemours & Co. | 3,395 | 220,573 | ||||||
EMS-Chemie Holding AG | 109 | 38,867 | ||||||
FMC Corp. | 480 | 36,221 | ||||||
Givaudan SA(a) | 37 | 52,931 | ||||||
Hitachi Chemical Co., Ltd. | 900 | 14,353 | ||||||
Incitec Pivot Ltd. | 7,611 | 18,258 | ||||||
International Flavors & Fragrances, Inc. | 300 | 25,794 | ||||||
Israel Chemicals Ltd. | 1,432 | 11,944 | ||||||
Israel Corp., Ltd. (The)(a) | 16 | 8,425 | ||||||
Johnson Matthey PLC | 915 | 49,788 | ||||||
JSR Corp. | 800 | 15,506 | ||||||
K&S AG(b) | 1,472 | 45,356 | ||||||
Kansai Paint Co., Ltd. | 1,000 | 14,788 | ||||||
Kuraray Co., Ltd. | 1,000 | 11,937 | ||||||
Lanxess AG | 509 | 34,011 | ||||||
Linde AG | 827 | 173,162 | ||||||
LyondellBasell Industries NV–Class A | 1,599 | 128,368 | ||||||
Mitsubishi Chemical Holdings Corp. | 6,000 | 27,766 | ||||||
Mitsubishi Gas Chemical Co., Inc. | 2,000 | 14,743 | ||||||
Monsanto Co. | 1,940 | 226,107 | ||||||
Mosaic Co. (The) | 1,230 | 58,142 | ||||||
Nippon Paint Co., Ltd. | 1,000 | 16,638 | ||||||
Nitto Denko Corp. | 600 | 25,371 | ||||||
Orica Ltd. | 2,259 | 48,306 | ||||||
PPG Industries, Inc. | 550 | 104,313 | ||||||
Praxair, Inc. | 1,090 | 141,733 | ||||||
Sherwin-Williams Co. (The) | 315 | 57,802 | ||||||
Shin-Etsu Chemical Co., Ltd. | 1,800 | 105,281 | ||||||
Showa Denko KK | 7,000 | 9,928 | ||||||
Sigma-Aldrich Corp. | 455 | 42,775 | ||||||
Sika AG | 6 | 21,381 | ||||||
Solvay SA | 236 | 37,352 | ||||||
19
| DYNAMIC ASSET ALLOCATION PORTFOLIO | ||
| PORTFOLIOOF INVESTMENTS | ||
| (continued) | AllianceBernstein Variable Products Series Fund | |
| Company | Shares | U.S. $ Value | ||||||
Sumitomo Chemical Co., Ltd. | 7,000 | $ | 27,474 | |||||
Syngenta AG | 416 | 165,858 | ||||||
Teijin Ltd. | 5,000 | 11,137 | ||||||
Toray Industries, Inc. | 7,000 | 48,489 | ||||||
Umicore SA | 509 | 23,783 | ||||||
Yara International ASA | 541 | 23,332 | ||||||
|
| |||||||
| 3,478,200 | ||||||||
|
| |||||||
CONSTRUCTION MATERIALS–0.1% | ||||||||
CRH PLC | 3,257 | 82,539 | ||||||
Fletcher Building Ltd. | 3,064 | 21,471 | ||||||
HeidelbergCement AG | 440 | 33,411 | ||||||
Holcim Ltd.(a) | 816 | 61,008 | ||||||
James Hardie Industries PLC | 3,449 | 40,028 | ||||||
Lafarge SA | 832 | 62,450 | ||||||
Taiheiyo Cement Corp. | 5,000 | 19,229 | ||||||
Vulcan Materials Co. | 465 | 27,630 | ||||||
|
| |||||||
| 347,766 | ||||||||
|
| |||||||
CONTAINERS & PACKAGING–0.1% | ||||||||
Amcor Ltd./Australia | 5,378 | 50,799 | ||||||
Avery Dennison Corp. | 335 | 16,814 | ||||||
Ball Corp. | 510 | 26,347 | ||||||
Bemis Co., Inc. | 330 | 13,517 | ||||||
MeadWestvaco Corp. | 620 | 22,897 | ||||||
Orora Ltd.(a) | 5,378 | 5,570 | ||||||
Owens-Illinois, Inc.(a) | 560 | 20,037 | ||||||
Rexam PLC | 3,528 | 31,040 | ||||||
Sealed Air Corp. | 690 | 23,494 | ||||||
Toyo Seikan Group Holdings Ltd. | 1,700 | 36,598 | ||||||
|
| |||||||
| 247,113 | ||||||||
|
| |||||||
METALS & MINING–0.6% | ||||||||
Alcoa, Inc. | 3,920 | 41,670 | ||||||
Allegheny Technologies, Inc. | 385 | 13,718 | ||||||
Anglo American PLC | 6,223 | 136,192 | ||||||
Antofagasta PLC | 1,060 | 14,532 | ||||||
ArcelorMittal (Euronext Amsterdam) | 8,908 | 159,116 | ||||||
BHP Billiton Ltd. | 14,341 | 488,927 | ||||||
BHP Billiton PLC | 9,431 | 292,643 | ||||||
Boliden AB | 1,652 | 25,328 | ||||||
Cliffs Natural Resources, Inc.(b) | 530 | 13,891 | ||||||
Fortescue Metals Group Ltd. | 6,938 | 36,243 | ||||||
Freeport-McMoRan Copper & Gold, Inc. | 3,775 | 142,468 | ||||||
Fresnillo PLC | 1,459 | 18,141 | ||||||
Glencore Xstrata PLC(a) | 47,381 | 246,502 | ||||||
Hitachi Metals Ltd. | 1,000 | 14,149 | ||||||
Iluka Resources Ltd. | 2,008 | 15,560 | ||||||
JFE Holdings, Inc. | 2,200 | 52,426 | ||||||
Kobe Steel Ltd.(a) | 12,000 | 20,573 | ||||||
Mitsubishi Materials Corp. | 7,000 | 25,875 | ||||||
Newcrest Mining Ltd. | 2,055 | 14,431 | ||||||
Newmont Mining Corp. | 1,795 | 41,339 | ||||||
Nippon Steel & Sumitomo Metal Corp. | 34,000 | 114,029 | ||||||
Norsk Hydro ASA | 6,514 | $ | 29,140 | |||||
Nucor Corp. | 1,160 | 61,921 | ||||||
Randgold Resources Ltd. | 390 | 24,524 | ||||||
Rio Tinto Ltd. | 1,946 | 119,109 | ||||||
Rio Tinto PLC | 5,676 | 320,749 | ||||||
Sumitomo Metal Mining Co., Ltd. | 2,000 | 26,207 | ||||||
ThyssenKrupp AG(a) | 1,305 | 31,822 | ||||||
United States Steel Corp.(b) | 530 | 15,635 | ||||||
Voestalpine AG | 442 | 21,240 | ||||||
| �� | |||||||
| 2,578,100 | ||||||||
|
| |||||||
PAPER & FOREST PRODUCTS–0.0% | ||||||||
International Paper Co. | 1,615 | 79,183 | ||||||
OJI Holdings Corp. | 4,000 | 20,518 | ||||||
Stora Enso Oyj–Class R | 2,457 | 24,690 | ||||||
UPM-Kymmene Oyj | 2,358 | 39,992 | ||||||
|
| |||||||
| 164,383 | ||||||||
|
| |||||||
| 6,815,562 | ||||||||
|
| |||||||
TELECOMMUNICATION SERVICES–1.2% | ||||||||
DIVERSIFIED TELECOMMUNICATION SERVICES–0.8% | ||||||||
AT&T, Inc. | 19,328 | 679,573 | ||||||
Belgacom SA | 795 | 23,526 | ||||||
Bezeq The Israeli Telecommunication Corp., Ltd. | 7,158 | 12,139 | ||||||
BT Group PLC | 35,190 | 221,906 | ||||||
CenturyLink, Inc. | 2,140 | 68,159 | ||||||
Deutsche Telekom AG | 12,543 | 216,118 | ||||||
Elisa Oyj | 635 | 16,825 | ||||||
Frontier Communications Corp.(b) | 3,660 | 17,019 | ||||||
HKT Trust/HKT Ltd. | 18,882 | 18,707 | ||||||
Iliad SA | 163 | 33,397 | ||||||
Inmarsat PLC | 1,541 | 19,321 | ||||||
Koninklijke KPN NV(a) | 2,757 | 8,908 | ||||||
Nippon Telegraph & Telephone | 1,900 | 102,335 | ||||||
Orange SA | 8,280 | 102,797 | ||||||
Portugal Telecom SGPS SA | 2,560 | 11,145 | ||||||
Singapore Telecommunications | 36,000 | 104,096 | ||||||
Swisscom AG | 104 | 54,963 | ||||||
TDC A/S | 3,390 | 32,883 | ||||||
Telecom Corp. of New Zealand Ltd. | 6,995 | 13,278 | ||||||
Telecom Italia SpA (ordinary shares) | 64,157 | 63,974 | ||||||
Telecom Italia SpA (savings shares) | 16,898 | 13,259 | ||||||
Telefonica SA | 18,290 | 299,055 | ||||||
Telekom Austria AG | 1,044 | 7,905 | ||||||
Telenor ASA | 2,746 | 65,612 | ||||||
TeliaSonera AB | 10,613 | 88,517 | ||||||
20
| AllianceBernstein Variable Products Series Fund |
| Company | Shares | U.S. $ Value | ||||||
Telstra Corp., Ltd. | 20,376 | $ | 95,637 | |||||
Verizon Communications, Inc. | 10,495 | 515,724 | ||||||
Vivendi SA | 4,619 | 121,837 | ||||||
Windstream Holdings, Inc.(b) | 2,175 | 17,357 | ||||||
Ziggo NV | 1,595 | 72,936 | ||||||
|
| |||||||
| 3,118,908 | ||||||||
|
| |||||||
WIRELESS | ||||||||
Crown Castle International Corp.(a) | 1,220 | 89,585 | ||||||
KDDI Corp. | 2,403 | 148,061 | ||||||
Millicom International Cellular SA | 641 | 63,873 | ||||||
NTT DoCoMo, Inc. | 6,800 | 111,971 | ||||||
Softbank Corp. | 4,300 | 377,328 | ||||||
StarHub Ltd. | 4,000 | 13,635 | ||||||
Vodafone Group PLC | 217,360 | 855,788 | ||||||
|
| |||||||
| 1,660,241 | ||||||||
|
| |||||||
| 4,779,149 | ||||||||
|
| |||||||
UTILITIES–1.0% | ||||||||
ELECTRIC UTILITIES–0.5% | ||||||||
American Electric Power Co., Inc. | 1,775 | 82,963 | ||||||
Cheung Kong Infrastructure Holdings Ltd. | 7,000 | 44,384 | ||||||
Chubu Electric Power Co., Inc. | 2,900 | 37,491 | ||||||
Chugoku Electric Power Co., Inc. | 1,300 | 20,241 | ||||||
CLP Holdings Ltd. | 5,000 | 39,547 | ||||||
Contact Energy Ltd. | 2,149 | 9,074 | ||||||
Duke Energy Corp. | 2,582 | 178,184 | ||||||
Edison International | 1,165 | 53,940 | ||||||
EDP–Energias de Portugal SA | 8,962 | 32,918 | ||||||
Electricite de France | 1,042 | 36,863 | ||||||
Enel SpA | 29,393 | 128,253 | ||||||
Entergy Corp. | 625 | 39,544 | ||||||
Exelon Corp. | 3,097 | 84,827 | ||||||
FirstEnergy Corp. | 1,535 | 50,624 | ||||||
Fortum Oyj | 1,983 | 45,367 | ||||||
Hokkaido Electric Power Co., Inc.(a)(b) | 1,800 | 20,714 | ||||||
Hokuriku Electric Power Co. | 1,600 | 21,729 | ||||||
Iberdrola SA | 21,215 | 135,389 | ||||||
Kansai Electric Power Co., Inc. (The)(a) | 3,100 | 35,679 | ||||||
Kyushu Electric Power Co., Inc.(a) | 1,900 | 24,266 | ||||||
NextEra Energy, Inc. | 1,595 | 136,564 | ||||||
Northeast Utilities | 1,160 | 49,172 | ||||||
Pepco Holdings, Inc. | 890 | 17,026 | ||||||
Pinnacle West Capital Corp. | 385 | 20,374 | ||||||
Power Assets Holdings Ltd. | 3,500 | 27,884 | ||||||
PPL Corp. | 2,295 | 69,057 | ||||||
Red Electrica Corp. SA(b) | 483 | 32,245 | ||||||
Shikoku Electric Power Co., Inc.(a)(b) | 700 | 10,497 | ||||||
Southern Co. (The) | 3,210 | $ | 131,963 | |||||
SP AusNet | 12,753 | 14,201 | ||||||
SSE PLC | 4,306 | 97,850 | ||||||
Tohoku Electric Power Co., Inc.(a) | 1,400 | 15,771 | ||||||
Tokyo Electric Power Co., Inc.(a) | 5,500 | 27,099 | ||||||
Xcel Energy, Inc. | 1,820 | 50,851 | ||||||
|
| |||||||
| 1,822,551 | ||||||||
|
| |||||||
GAS UTILITIES–0.1% | ||||||||
AGL Resources, Inc. | 398 | 18,797 | ||||||
APA Group | 2,828 | 15,178 | ||||||
Enagas SA | 853 | 22,282 | ||||||
Gas Natural SDG SA | 1,513 | 38,943 | ||||||
Hong Kong & China Gas Co., Ltd. | 29,400 | 67,654 | ||||||
ONEOK, Inc. | 770 | 47,879 | ||||||
Osaka Gas Co., Ltd. | 8,000 | 31,421 | ||||||
Snam SpA | 6,059 | 33,866 | ||||||
Toho Gas Co., Ltd. | 2,000 | 9,736 | ||||||
Tokyo Gas Co., Ltd. | 11,000 | 54,216 | ||||||
|
| |||||||
| 339,972 | ||||||||
|
| |||||||
INDEPENDENT POWER | ||||||||
AES Corp./VA | 2,385 | 34,606 | ||||||
Electric Power Development Co., Ltd. | 500 | 14,579 | ||||||
Enel Green Power SpA | 25,579 | 64,352 | ||||||
NRG Energy, Inc. | 1,140 | 32,741 | ||||||
|
| |||||||
| 146,278 | ||||||||
|
| |||||||
MULTI-UTILITIES–0.4% | ||||||||
AGL Energy Ltd. | 3,037 | 40,826 | ||||||
Ameren Corp. | 860 | 31,098 | ||||||
CenterPoint Energy, Inc. | 1,545 | 35,813 | ||||||
Centrica PLC | 23,112 | 133,278 | ||||||
CMS Energy Corp. | 970 | 25,967 | ||||||
Consolidated Edison, Inc. | 1,080 | 59,703 | ||||||
Dominion Resources, Inc./VA | 2,135 | 138,113 | ||||||
DTE Energy Co. | 620 | 41,162 | ||||||
E.ON SE | 8,042 | 148,680 | ||||||
GDF Suez | 5,926 | 139,376 | ||||||
Integrys Energy Group, Inc. | 300 | 16,323 | ||||||
National Grid PLC | 16,377 | 214,198 | ||||||
NiSource, Inc. | 1,105 | 36,332 | ||||||
PG&E Corp. | 1,625 | 65,455 | ||||||
Public Service Enterprise Group, | 1,855 | 59,434 | ||||||
RWE AG | 2,185 | 80,056 | ||||||
SCANA Corp. | 495 | 23,230 | ||||||
Sempra Energy | 860 | 77,194 | ||||||
Suez Environnement Co. | 1,324 | 23,743 | ||||||
TECO Energy, Inc. | 725 | 12,499 | ||||||
United Utilities Group PLC | 2,853 | 31,764 | ||||||
Veolia Environnement SA | 1,552 | 25,348 | ||||||
Wisconsin Energy Corp. | 800 | 33,072 | ||||||
|
| |||||||
| 1,492,664 | ||||||||
|
| |||||||
21
| DYNAMIC ASSET ALLOCATION PORTFOLIO | ||
| PORTFOLIOOF INVESTMENTS | ||
| (continued) | AllianceBernstein Variable Products Series Fund | |
| Company | Shares | U.S. $ Value | ||||||
WATER UTILITIES–0.0% | ||||||||
Severn Trent PLC | 1,196 | $ | 33,814 | |||||
|
| |||||||
| 3,835,279 | ||||||||
|
| |||||||
PRODUCER DURABLES–0.0% | ||||||||
REGIONAL MALL–0.0% | ||||||||
General Growth Properties, Inc. | 1,944 | 39,016 | ||||||
|
| |||||||
Total Common Stocks | 119,639,731 | |||||||
|
| |||||||
| Principal Amount (000) | ||||||||
GOVERNMENTS– | ||||||||
UNITED STATES–23.2% | ||||||||
U.S. Treasury Bonds | $ | 775 | 614,067 | |||||
3.125%, 11/15/41-2/15/43 | 2,825 | 2,428,052 | ||||||
3.50%, 2/15/39 | 152 | 143,141 | ||||||
3.625%, 8/15/43 | 1,735 | 1,638,491 | ||||||
3.75%, 8/15/41 | 220 | 214,466 | ||||||
3.875%, 8/15/40 | 280 | 280,087 | ||||||
4.25%, 5/15/39 | 240 | 255,937 | ||||||
4.375%, 11/15/39-5/15/41 | 1,258 | 1,366,635 | ||||||
4.50%, 8/15/39 | 220 | 243,856 | ||||||
4.75%, 2/15/37-2/15/41 | 266 | 306,049 | ||||||
5.375%, 2/15/31 | 650 | 796,555 | ||||||
6.00%, 2/15/26 | 134 | 171,059 | ||||||
6.25%, 8/15/23-5/15/30 | 724 | 960,751 | ||||||
6.875%, 8/15/25 | 325 | 442,508 | ||||||
7.25%, 5/15/16-8/15/22 | 883 | 1,172,263 | ||||||
7.50%, 11/15/16 | 92 | 109,624 | ||||||
7.625%, 2/15/25 | 55 | 78,573 | ||||||
8.00%, 11/15/21 | 123 | 170,855 | ||||||
U.S. Treasury Notes | 10,970 | 10,974,296 | ||||||
0.375%, 11/15/14-4/15/15 | 3,350 | 3,357,657 | ||||||
0.50%, 7/31/17 | 1,540 | 1,507,635 | ||||||
0.75%, 2/28/18-3/31/18 | 5,625 | 5,470,733 | ||||||
0.875%, 11/30/16-4/30/17 | 2,315 | 2,316,104 | ||||||
1.00%, 9/30/16-5/31/18 | 5,000 | 4,953,061 | ||||||
1.25%, 8/31/15-4/30/19 | 3,360 | 3,328,152 | ||||||
1.375%, 11/30/15-2/28/19 | 13,322 | 13,461,448 | ||||||
1.625%, 8/15/22-11/15/22 | 2,090 | 1,891,971 | ||||||
1.75%, 7/31/15-5/15/23 | 6,350 | 6,328,513 | ||||||
1.875%, 10/31/17 | 1,100 | 1,127,500 | ||||||
2.00%, 4/30/16-2/15/23 | 3,760 | 3,592,491 | ||||||
2.125%, 12/31/15-8/15/21 | 825 | 826,453 | ||||||
2.25%, 1/31/15-11/30/17 | 739 | 764,533 | ||||||
2.375%, 7/31/17 | 416 | 434,374 | ||||||
2.50%, 3/31/15-8/15/23 | 1,653 | 1,597,473 | ||||||
2.625%, 1/31/18-11/15/20 | 2,010 | 2,073,532 | ||||||
2.75%, 5/31/17-2/15/19 | 2,665 | 2,812,992 | ||||||
3.00%, 2/28/17 | 889 | 947,341 | ||||||
3.125%, 10/31/16-5/15/21 | 1,111 | 1,176,102 | ||||||
3.25%, 7/31/16(c) | 1,147 | 1,224,871 | ||||||
3.375%, 11/15/19 | $ | 1,055 | $ | 1,134,784 | ||||
3.625%, 2/15/20-2/15/21 | 1,425 | 1,548,282 | ||||||
3.75%, 11/15/18 | 5,100 | 5,596,852 | ||||||
|
| |||||||
Total Governments–Treasuries | 89,840,119 | |||||||
|
| |||||||
| Shares | ||||||||
INVESTMENT COMPANIES–7.3% | ||||||||
FUNDS AND INVESTMENT TRUSTS–7.3% | ||||||||
iShares Core MSCI Emerging Markets ETF | 244,960 | 12,201,457 | ||||||
iShares MSCI EAFE ETF | 40,137 | 2,691,587 | ||||||
SPDR S&P 500 ETF Trust | 29,825 | 5,507,783 | ||||||
Vanguard REIT ETF | 124,400 | 8,031,264 | ||||||
|
| |||||||
Total Investment Companies | 28,432,091 | |||||||
|
| |||||||
| Notional Amount (000) | ||||||||
OPTIONS PURCHASED–PUTS–0.1% | ||||||||
SWAPTIONS–0.1% | ||||||||
IRS Swaption, Morgan Stanley Capital Services LLC, Expiration: May 2014, Pay 3.14%, Receive 3-month LIBOR (BBA)(a) | 2,710 | 59,563 | ||||||
IRS Swaption, JPMorgan Chase Bank NA, Expiration: May 2014, Pay 3.12%, Receive 3-month LIBOR (BBA)(a) | 2,510 | 60,299 | ||||||
IRS Swaption, Citibank NA, Expiration: May 2014, Pay 3.95%, Receive 3-month LIBOR (BBA)(a) | 1,730 | 64,885 | ||||||
IRS Swaption, Deutsche Bank AG New York, Expiration: May 2014, Pay 1.95%, Receive 3-month LIBOR (BBA)(a) | 7,770 | 90,362 | ||||||
|
| |||||||
Total Options Purchased–Puts | 275,109 | |||||||
|
| |||||||
| Shares | ||||||||
RIGHTS–0.0% | ||||||||
ENERGY–0.0% | ||||||||
OIL, GAS & CONSUMABLE FUELS–0.0% | ||||||||
Repsol SA, expiring 1/15/14(a) | 3,820 | 2,607 | ||||||
|
| |||||||
22
| AllianceBernstein Variable Products Series Fund |
| Company | Shares | U.S. $ Value | ||||||
SHORT-TERM INVESTMENTS–36.9% | ||||||||
INVESTMENT COMPANIES–36.9% | ||||||||
AllianceBernstein Fixed-Income Shares, Inc.–Government STIF Portfolio, 0.08%(d)* | 143,077,599 | $ | 143,077,599 | |||||
|
| |||||||
Total Investments Before Security Lending Collateral for Securities Loaned–98.3% | 381,267,256 | |||||||
|
| |||||||
INVESTMENTS OF CASH COLLATERAL FOR SECURITIES LOANED–0.3% | ||||||||
INVESTMENT COMPANIES–0.3% | ||||||||
AllianceBernstein Exchange Reserves–Class I, 0.07%(d) | 1,053,809 | $ | 1,053,809 | |||||
|
| |||||||
TOTAL INVESTMENTS–98.6% | 382,321,065 | |||||||
Other assets less liabilities–1.4% | 5,466,832 | |||||||
|
| |||||||
NET ASSETS–100.0% | $ | 387,787,897 | ||||||
|
| |||||||
FUTURES (see Note D)
| Type | Number of Contracts | Expiration Month | Original Value | Value at December 31, 2013 | Unrealized Appreciation/ (Depreciation) | |||||||||||||||
Purchased Contracts | ||||||||||||||||||||
Euro STOXX 50 Index Futures | 314 | March 2014 | $ | 12,763,129 | $ | 13,425,615 | $ | 662,486 | ||||||||||||
FTSE 100 Index Futures | 65 | March 2014 | 6,967,117 | 7,208,971 | 241,854 | |||||||||||||||
Mini MSCI EAFE Futures | 2 | March 2014 | 182,335 | 191,780 | 9,445 | |||||||||||||||
Russell 2000 Mini Futures | 60 | March 2014 | 6,762,457 | 6,968,400 | 205,943 | |||||||||||||||
S&P 500 E Mini Futures | 267 | March 2014 | 24,022,344 | 24,578,685 | 556,341 | |||||||||||||||
S&P Mid Cap 400 E Mini Futures | 80 | March 2014 | 10,461,675 | 10,715,200 | 253,525 | |||||||||||||||
SPI 200 Futures | 16 | March 2014 | 1,809,413 | 1,899,377 | 89,964 | |||||||||||||||
TOPIX Index Futures | 99 | March 2014 | 11,676,021 | 12,244,564 | 568,543 | |||||||||||||||
U.S. T-Note 10 Yr (CBT) Futures | 152 | March 2014 | 19,039,125 | 18,703,125 | (336,000 | ) | ||||||||||||||
U.S. Ultra Bond (CBT) Futures | 41 | March 2014 | 5,631,426 | 5,586,250 | (45,176 | ) | ||||||||||||||
Sold Contracts | ||||||||||||||||||||
Hang Seng Index Futures | 7 | January 2014 | 1,041,523 | 1,053,164 | (11,641 | ) | ||||||||||||||
|
| |||||||||||||||||||
| $ | 2,195,284 | |||||||||||||||||||
|
| |||||||||||||||||||
FORWARD CURRENCY EXCHANGE CONTRACTS (see Note D)
| Counterparty | Contracts to (000) | In Exchange (000) | Settlement Date | Unrealized Appreciation/ (Depreciation) | ||||||||||||
Bank of America, NA | USD | 3,897 | EUR | 2,849 | 3/18/14 | $ | 22,334 | |||||||||
Barclays Bank PLC Wholesale | USD | 296 | CHF | 264 | 3/18/14 | (281 | ) | |||||||||
Barclays Bank PLC Wholesale | USD | 425 | EUR | 318 | 3/18/14 | 12,487 | ||||||||||
Barclays Bank PLC Wholesale | USD | 812 | SEK | 5,306 | 3/18/14 | 11,958 | ||||||||||
BNP Paribas SA | JPY | 270,747 | USD | 2,703 | 3/18/14 | 131,426 | ||||||||||
Credit Suisse International | GBP | 2,219 | USD | 3,625 | 3/18/14 | (48,091 | ) | |||||||||
Credit Suisse International | USD | 1,439 | CHF | 1,288 | 3/18/14 | 5,441 | ||||||||||
Credit Suisse International | USD | 702 | GBP | 430 | 3/18/14 | 9,894 | ||||||||||
Credit Suisse International | USD | 772 | JPY | 78,510 | 3/18/14 | (26,428 | ) | |||||||||
HSBC Bank USA | USD | 1,607 | EUR | 1,171 | 3/18/14 | 4,074 | ||||||||||
23
| DYNAMIC ASSET ALLOCATION PORTFOLIO | ||
| PORTFOLIOOF INVESTMENTS | ||
| (continued) | AllianceBernstein Variable Products Series Fund | |
| Counterparty | Contracts to (000) | In Exchange (000) | Settlement Date | Unrealized Appreciation/ (Depreciation) | ||||||||||||
Royal Bank of Scotland PLC | CAD | 302 | USD | 283 | 3/18/14 | $ | (550 | ) | ||||||||
Royal Bank of Scotland PLC | USD | 2,604 | GBP | 1,588 | 3/18/14 | 24,386 | ||||||||||
Standard Chartered Bank | GBP | 233 | USD | 385 | 3/18/14 | (858 | ) | |||||||||
Standard Chartered Bank | JPY | 38,320 | USD | 371 | 3/18/14 | 7,211 | ||||||||||
State Street Bank & Trust Co. | USD | 352 | CHF | 322 | 3/18/14 | 8,848 | ||||||||||
State Street Bank & Trust Co. | USD | 886 | EUR | 648 | 3/18/14 | 5,378 | ||||||||||
State Street Bank & Trust Co. | USD | 487 | GBP | 304 | 3/18/14 | 16,286 | ||||||||||
State Street Bank & Trust Co. | USD | 451 | JPY | 44,645 | 3/18/14 | (27,281 | ) | |||||||||
Westpac Banking Corp. | AUD | 2,733 | USD | 2,424 | 3/18/14 | (4,109 | ) | |||||||||
|
| |||||||||||||||
| $ | 152,125 | |||||||||||||||
|
| |||||||||||||||
CENTRALLY CLEARED INTEREST RATE SWAPS (see Note D)
| Rate Type | ||||||||||||||||||||
| Clearing Agent/ (Exchange) | Notional Amount (000) | Termination Date | Payments made by the Fund | Payments received by the Fund | Unrealized Appreciation/ (Depreciation) | |||||||||||||||
Citigroup Global Markets, Inc./(CME Group) | $ | 3,460 | 11/04/18 | 3 Month LIBOR | 1.453 | % | $ | (37,302 | ) | |||||||||||
Citigroup Global Markets, Inc./(CME Group) | 970 | 11/01/23 | 3 Month LIBOR | 2.617 | % | (34,808 | ) | |||||||||||||
Citigroup Global Markets, Inc./(CME Group) | 1,220 | 11/05/23 | 3 Month LIBOR | 2.760 | % | (28,610 | ) | |||||||||||||
Citigroup Global Markets, Inc./(CME Group) | 600 | 11/04/43 | 3 Month LIBOR | 3.580 | % | (36,937 | ) | |||||||||||||
|
| |||||||||||||||||||
| $ | (137,657 | ) | ||||||||||||||||||
|
| |||||||||||||||||||
TOTAL RETURN SWAPS (see Note D)
Receive/Pay Total Return on Reference Index | Index | # of Shares or Units | Rate Paid by the Fund | Notional Amount (000) | Maturity Date | Counterparty | Unrealized Appreciation/ (Depreciation) | |||||||||||||||||
Receive Total Return on Reference Index |
| |||||||||||||||||||||||
Receive | FTSE EPRA/NAREIT Developed Real Estate Index | 238 | 0.55 | % | $ | 850 | 3/20/14 | Deutsche Bank AG London | $ | 24,042 | ||||||||||||||
Receive | FTSE EPRA/NAREIT Developed Real Estate Index | 237 | 0.55 | % | 846 | 4/22/14 | Deutsche Bank AG London | 23,941 | ||||||||||||||||
Receive | FTSE EPRA/NAREIT Developed Real Estate Index | 330 | 0.55 | % | 1,179 | 4/22/14 | Deutsche Bank AG London | 33,336 | ||||||||||||||||
Receive | FTSE EPRA/NAREIT Developed Real Estate Index | 340 | 0.55 | % | 1,214 | 5/20/14 | Deutsche Bank AG London | 34,346 | ||||||||||||||||
24
| AllianceBernstein Variable Products Series Fund |
Receive/Pay Total Return on Reference Index | Index | # of Shares or Units | Rate Paid by the Fund | Notional Amount (000) | Maturity Date | Counterparty | Unrealized Appreciation/ (Depreciation) | |||||||||||||||||
Receive Total Return on Reference Index (continued) |
| |||||||||||||||||||||||
Receive | FTSE EPRA/NAREIT Developed Real Estate Index | 38 | 0.55 | % | $ | 136 | 7/18/14 | Deutsche Bank AG London | $ | 3,839 | ||||||||||||||
Receive | FTSE EPRA/NAREIT Developed Real Estate Index | 292 | 0.55 | % | 1,043 | 7/18/14 | Deutsche Bank AG London | 29,497 | ||||||||||||||||
Receive | FTSE EPRA/NAREIT Developed Real Estate Index | 256 | 0.58 | % | 914 | 8/20/14 | Deutsche Bank AG London | 25,850 | ||||||||||||||||
Receive | FTSE EPRA/NAREIT Developed Real Estate Index | 99 | 0.68 | % | 354 | 8/20/14 | Deutsche Bank AG London | 9,984 | ||||||||||||||||
Receive | FTSE EPRA/NAREIT Developed Real Estate Index | 18 | 0.68 | % | 64 | 10/20/14 | Deutsche Bank AG London | 1,815 | ||||||||||||||||
Receive | FTSE EPRA/NAREIT Developed Real Estate Index | 73 | 0.68 | % | 261 | 10/20/14 | Deutsche Bank AG London | 7,362 | ||||||||||||||||
Receive | FTSE EPRA/NAREIT Developed Real Estate Index | 181 | 0.68 | % | 646 | 10/20/14 | Deutsche Bank AG London | 18,254 | ||||||||||||||||
Receive | FTSE EPRA/NAREIT Developed Real Estate Index | 151 | 0.45 | % | 539 | 1/15/14 | JPMorgan Chase Bank, NA | 15,273 | ||||||||||||||||
Receive | FTSE EPRA/NAREIT Developed Real Estate Index | 330 | 0.17 | % | 1,179 | 4/15/14 | Morgan Stanley Capital Services, LLC | 33,498 | ||||||||||||||||
Receive | FTSE EPRA/NAREIT Developed Real Estate Index | 233 | 0.55 | % | 832 | 5/15/14 | UBS AG | 23,537 | ||||||||||||||||
Receive | FTSE EPRA/NAREIT Developed Real Estate Index | 49 | 0.72 | % | 175 | 8/15/14 | UBS AG | 4,939 | ||||||||||||||||
Receive | FTSE EPRA/NAREIT Developed Real Estate Index | 132 | 0.67 | % | 471 | 10/15/14 | UBS AG | 13,314 | ||||||||||||||||
25
| DYNAMIC ASSET ALLOCATION PORTFOLIO | ||
| PORTFOLIOOF INVESTMENTS | ||
| (continued) | AllianceBernstein Variable Products Series Fund | |
Receive/Pay Total Return on Reference Index | Index | # of Shares or Units | Rate Paid by the Fund | Notional Amount (000) | Maturity Date | Counterparty | Unrealized Appreciation/ (Depreciation) | |||||||||||||||||
Receive Total Return on Reference Index (continued) |
| |||||||||||||||||||||||
Receive | MSCI AC Far East Ex Japan Index | 6,741 | 0.45 | % | $ | 2,343 | 10/15/14 | Bank of America, NA | $ | 31,413 | ||||||||||||||
Receive | MSCI AC Far East Ex Japan Index | 8,220 | 0.40 | % | 2,857 | 11/17/14 | Bank of America, NA | 38,357 | ||||||||||||||||
Receive | MSCI AC Far East Ex Japan Index | 6,978 | 0.51 | % | 2,425 | 12/15/14 | Bank of America, NA | 32,460 | ||||||||||||||||
Receive | MSCI Emerging Markets Index | 4,237 | 0.32 | % | 1,717 | 8/5/14 | Deutsche Bank AG London | 22,027 | ||||||||||||||||
Receive | Russell 2000 Total Return Index | 109 | 0.02 | % | 568 | 10/15/14 | Bank of America, NA | 22,668 | ||||||||||||||||
Receive | Russell 2000 Total Return Index | 30 | 1.00 | % | 156 | 3/17/14 | JPMorgan Chase Bank, NA | 5,556 | ||||||||||||||||
Receive | Russell 2000 Total Return Index | 487 | 1.00 | % | 2,537 | 2/18/14 | UBS AG | 101,640 | ||||||||||||||||
Receive | Russell 2000 Total Return Index | 65 | 1.00 | % | 339 | 10/15/14 | UBS AG | 13,480 | ||||||||||||||||
|
| |||||||||||||||||||||||
| $ | 570,428 | |||||||||||||||||||||||
|
| |||||||||||||||||||||||
| * | To obtain a copy of the fund’s financial statements, please go to the Securities Exchange Commission’s website at www.sec.gov, or call AllianceBernstein at (800) 227-4618. |
| (a) | Non-income producing security. |
| (b) | Represents entire or partial securities out on loan. See Note E for securities lending information. |
| (c) | Position, or a portion thereof, has been segregated to collateralize OTC derivatives outstanding. The aggregate market value of these securities amounted to $925,862. |
| (d) | Investment in affiliated money market mutual fund. The rate shown represents the 7-day yield as of period end. |
Currency Abbreviation:
AUD—Australian Dollar
CAD—Canadian Dollar
CHF—Swiss Franc
EUR—Euro
GBP—Great British Pound
JPY—Japanese Yen
SEK—Swedish Krona
USD—United States Dollar
Glossary:
AC—All Country
ASX—Australian Stock Exchange
CBT—Chicago Board of Trade
CME—Chicago Mercantile Exchange
EAFE—Europe, Australia, and Far East
EPRA—European Public Real Estate Association
26
| AllianceBernstein Variable Products Series Fund |
ETF—Exchange Traded Fund
FTSE—Financial Times Stock Exchange
IRS—Interest Rate Swaption
LIBOR—London Interbank Offered Rates
MSCI—Morgan Stanley Capital International
NAREIT—National Association of Real Estate Investment Trusts
REG—Registered Shares
REIT—Real Estate Investment Trust
RTP—Real Time Pricing
SPDR—Standard & Poor’s Depository Receipt
SPI—Share Price Index
TOPIX—Tokyo Price Index
See notes to financial statements.
27
| DYNAMIC ASSET ALLOCATION PORTFOLIO | ||
| STATEMENTOF ASSETS & LIABILITIES | ||
| December 31, 2013 | AllianceBernstein Variable Products Series Fund | |
ASSETS | ||||
Investments in securities, at value | ||||
Unaffiliated issuers (cost $215,425,811) | $ | 238,189,657 | (a) | |
Affiliated issuers (cost $144,131,408—including investment of cash collateral for securities loaned of $1,053,809) | 144,131,408 | |||
Cash at broker | 4,258,121 | (b)(c) | ||
Foreign currencies, at value (cost $61,302) | 61,602 | |||
Receivable for investment securities sold | 3,846,013 | |||
Receivable for capital stock sold | 1,581,900 | |||
Interest and dividends receivable | 613,336 | |||
Unrealized appreciation on total return swaps | 570,428 | |||
Unrealized appreciation of forward currency exchange contracts | 259,723 | |||
Receivable for variation margin on futures | 78,706 | |||
|
| |||
Total assets | 393,590,894 | |||
|
| |||
LIABILITIES | ||||
Due to custodian | 112,814 | |||
Payable for investment securities purchased | 3,864,975 | |||
Payable for collateral received on securities loaned | 1,053,809 | |||
Advisory fee payable | 189,910 | |||
Cash collateral received from broker | 150,000 | |||
Unrealized depreciation of forward currency exchange contracts | 107,598 | |||
Distribution fee payable | 77,199 | |||
Payable for capital stock redeemed | 60,296 | |||
Payable for variation margin on centrally cleared interest rate swaps | 24,233 | |||
Administrative fee payable | 13,886 | |||
Transfer Agent fee payable | 112 | |||
Accrued expenses | 148,165 | |||
|
| |||
Total liabilities | 5,802,997 | |||
|
| |||
NET ASSETS | $ | 387,787,897 | ||
|
| |||
COMPOSITION OF NET ASSETS | ||||
Capital stock, at par | $ | 33,202 | ||
Additional paid-in capital | 346,448,842 | |||
Undistributed net investment income | 737,363 | |||
Accumulated net realized gain on investment and foreign currency transactions | 15,022,519 | |||
Net unrealized appreciation on investments and foreign currency denominated assets and liabilities | 25,545,971 | |||
|
| |||
| $ | 387,787,897 | |||
|
|
Net Asset Value Per Share—1 billion shares of capital stock authorized, $.001 par value
| Class | Net Assets | Shares Outstanding | Net Asset Value | |||||||||
A | $ | 268,679 | 22,895 | $ | 11.74 | |||||||
B | $ | 387,519,218 | 33,179,467 | $ | 11.68 | |||||||
| (a) | Includes securities on loan with a value of $969,570 (see Note E). |
| (b) | An amount of $168,663 has been segregated to collateralize margin requirements for open centrally cleared swaps outstanding at December 31, 2013. |
| (c) | An amount of $4,089,458 has been segregated to collateralize margin requirements for open futures outstanding at December 31, 2013. |
See notes to financial statements.
28
| DYNAMIC ASSET ALLOCATION PORTFOLIO | ||
| STATEMENTOF OPERATIONS | ||
| Year Ended December 31, 2013 | AllianceBernstein Variable Products Series Fund | |
INVESTMENT INCOME | ||||
Dividends | ||||
Unaffiliated issuers (net of foreign taxes withheld of $94,027) | $ | 2,482,161 | ||
Affiliated issuers | 119,763 | |||
Interest | 757,563 | |||
Securities lending income | 40,266 | |||
|
| |||
| 3,399,753 | ||||
|
| |||
EXPENSES | ||||
Advisory fee (see Note B) | 2,061,530 | |||
Distribution fee—Class B | 735,941 | |||
Transfer agency—Class A | 2 | |||
Transfer agency—Class B | 5,063 | |||
Custodian | 286,281 | |||
Audit | 58,219 | |||
Administrative | 54,422 | |||
Legal | 33,436 | |||
Printing | 25,255 | |||
Directors’ fees | 4,528 | |||
Miscellaneous | 81,954 | |||
|
| |||
Total expenses | 3,346,631 | |||
Less: expenses waived by the Adviser (see Note B) | (106,958 | ) | ||
|
| |||
Net expenses | 3,239,673 | |||
|
| |||
Net investment income | 160,080 | |||
|
| |||
REALIZED AND UNREALIZED GAIN (LOSS) ON INVESTMENT AND FOREIGN CURRENCY TRANSACTIONS | ||||
Net realized gain (loss) on: | ||||
Investment transactions | (964,528 | ) | ||
Futures | 16,250,393 | |||
Options written | (44,625 | ) | ||
Swaps | 672,152 | |||
Foreign currency transactions | 138,971 | |||
Net change in unrealized appreciation/depreciation of: | ||||
Investments | 15,173,021 | |||
Futures | 1,770,695 | |||
Options written | (30,147 | ) | ||
Swaps | 227,102 | |||
Foreign currency denominated assets and liabilities | 124,314 | |||
|
| |||
Net gain on investment and foreign currency transactions | 33,317,348 | |||
|
| |||
NET INCREASE IN NET ASSETS FROM OPERATIONS | $ | 33,477,428 | ||
|
|
See notes to financial statements.
29
| DYNAMIC ASSET ALLOCATION PORTFOLIO | ||
| STATEMENTOF CHANGESIN NET ASSETS | AllianceBernstein Variable Products Series Fund | |
| Year Ended December 31, 2013 | Year Ended December 31, 2012 | |||||||
INCREASE IN NET ASSETS FROM OPERATIONS | ||||||||
Net investment income | $ | 160,080 | $ | 163,817 | ||||
Net realized gain on investment and foreign currency transactions | 16,052,363 | 2,203,409 | ||||||
Net change in unrealized appreciation/depreciation of investments and foreign currency denominated assets and liabilities | 17,264,985 | 7,907,137 | ||||||
|
|
|
| |||||
Net increase in net assets from operations | 33,477,428 | 10,274,363 | ||||||
DIVIDENDS AND DISTRIBUTIONS TO SHAREHOLDERS FROM | ||||||||
Net investment income | ||||||||
Class A | (813 | ) | (24 | ) | ||||
Class B | (815,668 | ) | (211,036 | ) | ||||
Net realized gain on investment transactions | ||||||||
Class A | (794 | ) | (10 | ) | ||||
Class B | (1,125,059 | ) | (97,401 | ) | ||||
CAPITAL STOCK TRANSACTIONS | ||||||||
Net increase | 135,563,246 | 149,294,486 | ||||||
|
|
|
| |||||
Total increase | 167,098,340 | 159,260,378 | ||||||
NET ASSETS | ||||||||
Beginning of period | 220,689,557 | 61,429,179 | ||||||
|
|
|
| |||||
End of period (including undistributed net investment income of $737,363 and $320,176, respectively) | $ | 387,787,897 | $ | 220,689,557 | ||||
|
|
|
| |||||
See notes to financial statements.
30
| DYNAMIC ASSET ALLOCATION PORTFOLIO | ||
| NOTES TO FINANCIAL STATEMENTS | ||
| December 31, 2013 | AllianceBernstein Variable Products Series Fund | |
NOTE A: Significant Accounting Policies
The AllianceBernstein Dynamic Asset Allocation Portfolio (the “Portfolio”) is a series of AllianceBernstein Variable Products Series Fund, Inc. (the “Fund”). The Portfolio’s investment objective is to maximize total return consistent with the Adviser’s determination of reasonable risk. The Portfolio is diversified as defined under the Investment Company Act of 1940. The Fund was incorporated in the State of Maryland on November 17, 1987, as an open-end series investment company. The Fund offers thirteen separately managed pools of assets which have differing investment objectives and policies. The Portfolio offers Class A and Class B shares. Both classes of shares have identical voting, dividend, liquidating and other rights, except that Class B shares bear a distribution expense and have exclusive voting rights with respect to the Class B distribution plan.
The Portfolio offers and sells its shares only to separate accounts of certain life insurance companies for the purpose of funding variable annuity contracts and variable life insurance policies. Sales are made without a sales charge at the Portfolio’s net asset value per share.
The financial statements have been prepared in conformity with U.S. generally accepted accounting principles (“U.S. GAAP”) which require management to make certain estimates and assumptions that affect the reported amounts of assets and liabilities in the financial statements and amounts of income and expenses during the reporting period. Actual results could differ from those estimates. The following is a summary of significant accounting policies followed by the Portfolio.
1. Security Valuation
Portfolio securities are valued at their current market value determined on the basis of market quotations or, if market quotations are not readily available or are deemed unreliable, at “fair value” as determined in accordance with procedures established by and under the general supervision of the Fund’s Board of Directors (the “Board”).
In general, the market values of securities which are readily available and deemed reliable are determined as follows: securities listed on a national securities exchange (other than securities listed on the NASDAQ Stock Market, Inc. (“NASDAQ”)) or on a foreign securities exchange are valued at the last sale price at the close of the exchange or foreign securities exchange. If there has been no sale on such day, the securities are valued at the last traded price from the previous day. Securities listed on more than one exchange are valued by reference to the principal exchange on which the securities are traded; securities listed only on NASDAQ are valued in accordance with the NASDAQ Official Closing Price; listed or over the counter (“OTC”) market put or call options are valued at the mid level between the current bid and ask prices. If either a current bid or current ask price is unavailable, AllianceBernstein L.P. (the “Adviser”) will have discretion to determine the best valuation (e.g. last trade price in the case of listed options); open futures are valued using the closing settlement price or, in the absence of such a price, the most recent quoted bid price. If there are no quotations available for the day of valuation, the last available closing settlement price is used; U.S. government securities and other debt instruments having 60 days or less remaining until maturity are valued at amortized cost if their original maturity was 60 days or less; or by amortizing their fair value as of the 61st day prior to maturity if their original term to maturity exceeded 60 days; fixed-income securities, including mortgage-backed and asset-backed securities, may be valued on the basis of prices provided by a pricing service or at a price obtained from one or more of the major broker-dealers. In cases where broker-dealer quotes are obtained, the Adviser may establish procedures whereby changes in market yields or spreads are used to adjust, on a daily basis, a recently obtained quoted price on a security. Swaps and other derivatives are valued daily, primarily using independent pricing services, independent pricing models using market inputs, as well as third party broker-dealers or counterparties. Investment companies are valued at their net asset value each day.
Securities for which market quotations are not readily available (including restricted securities) or are deemed unreliable are valued at fair value. Factors considered in making this determination may include, but are not limited to, information obtained by contacting the issuer, analysts, analysis of the issuer’s financial statements or other available documents. In addition, the Portfolio may use fair value pricing for securities primarily traded in non-U.S. markets because most foreign markets close well before the Portfolio values its securities at 4:00 p.m., Eastern Time. The earlier close of these foreign markets gives rise to the possibility that significant events, including broad market moves, may have occurred in the interim and may materially affect the value of those securities. To account for this, the Portfolio may frequently value many of its foreign equity securities using fair value prices based on third party vendor modeling tools to the extent available.
31
| DYNAMIC ASSET ALLOCATION PORTFOLIO | ||
| NOTES TO FINANCIAL STATEMENTS | ||
| (continued) | AllianceBernstein Variable Products Series Fund | |
2. Fair Value Measurements
In accordance with U.S. GAAP regarding fair value measurements, fair value is defined as the price that the Portfolio would receive to sell an asset or pay to transfer a liability in an orderly transaction between market participants at the measurement date. U.S. GAAP establishes a framework for measuring fair value, and a three-level hierarchy for fair value measurements based upon the transparency of inputs to the valuation of an asset or liability (including those valued based on their market values as described in Note A.1 above). Inputs may be observable or unobservable and refer broadly to the assumptions that market participants would use in pricing the asset or liability. Observable inputs reflect the assumptions market participants would use in pricing the asset or liability based on market data obtained from sources independent of the Portfolio. Unobservable inputs reflect the Portfolio’s own assumptions about the assumptions that market participants would use in pricing the asset or liability based on the best information available in the circumstances. Each investment is assigned a level based upon the observability of the inputs which are significant to the overall valuation. The three-tier hierarchy of inputs is summarized below.
| • | Level 1—quoted prices in active markets for identical investments |
| • | Level 2—other significant observable inputs (including quoted prices for similar investments, interest rates, prepayment speeds, credit risk, etc.) |
| • | Level 3—significant unobservable inputs (including the Portfolio’s own assumptions in determining the fair value of investments) |
The fair value of debt instruments, such as bonds, and over-the-counter derivatives is generally based on market price quotations, recently executed market transactions (where observable) or industry recognized modeling techniques and are generally classified as Level 2. Pricing vendor inputs to Level 2 valuations may include quoted prices for similar investments in active markets, interest rate curves, coupon rates, currency rates, yield curves, option adjusted spreads, default rates, credit spreads and other unique security features in order to estimate the relevant cash flows which are then discounted to calculate fair values. If these inputs are unobservable and significant to the fair value, these investments will be classified as Level 3. In addition, non-agency rated investments are classified as Level 3.
Where readily available market prices or relevant bid prices are not available for certain equity investments, such investments may be valued based on similar publicly traded investments, movements in relevant indices since last available prices or based upon underlying company fundamentals and comparable company data (such as multiples to earnings or other multiples to equity). Where an investment is valued using an observable input, such as another publicly traded security, the investment will be classified as Level 2. If management determines that an adjustment is appropriate based on restrictions on resale, illiquidity or uncertainty, and such adjustment is a significant component of the valuation, the investment will be classified as Level 3. An investment will also be classified as Level 3 where management uses company fundamentals and other significant inputs to determine the valuation.
Options and warrants are valued using market-based inputs to models, broker or dealer quotations, or alternative pricing sources with reasonable levels of price transparency, where such inputs and models are available. Alternatively the values may be obtained through unobservable management determined inputs and/or management’s proprietary models. Where models are used, the selection of a particular model to value an option or a warrant depends upon the contractual terms of, and specific risks inherent in, the option or warrant as well as the availability of pricing information in the market. Valuation models require a variety of inputs, including contractual terms, market prices, measures of volatility and correlations of such inputs. Exchange traded options will be classified as Level 2. For options or warrants that do not trade on exchange but trade in liquid markets, inputs can generally be verified and model selection does not involve significant management judgment. Options and warrants are classified within Level 2 on the fair value hierarchy when all of the significant inputs can be corroborated to market evidence. Otherwise such instruments are classified as Level 3.
Other fixed income investments, including non-U.S. government and corporate debt, are generally valued using quoted market prices, if available, which are typically impacted by current interest rates, maturity dates and any perceived credit risk of the issuer. Additionally, in the absence of quoted market prices, these inputs are used by pricing vendors to derive a valuation based upon industry or proprietary models which incorporate issuer specific data with relevant yield/spread comparisons with more widely quoted bonds with similar key characteristics. Those investments for which there are observable inputs are classified as Level 2. Where the inputs are not observable, the investments are classified as Level 3.
32
| AllianceBernstein Variable Products Series Fund |
The following table summarizes the valuation of the Portfolio’s investments by the above fair value hierarchy levels as of December 31, 2013:
| Level 1 | Level 2 | Level 3 | Total | |||||||||||||
Investments in Securities: | ||||||||||||||||
Assets: | ||||||||||||||||
Common Stocks: | ||||||||||||||||
Financials | $ | 10,018,112 | $ | 14,742,152 | $ | –0 | – | $ | 24,760,264 | |||||||
Consumer Discretionary | 7,821,774 | 6,880,978 | –0 | – | 14,702,752 | |||||||||||
Industrials | 6,765,711 | 7,508,601 | –0 | – | 14,274,312 | |||||||||||
Information Technology | 11,247,520 | 2,626,188 | –0 | – | 13,873,708 | |||||||||||
Health Care | 8,207,428 | 5,638,660 | –0 | – | 13,846,088 | |||||||||||
Consumer Staples | 6,008,422 | 6,368,236 | –0 | – | 12,376,658 | |||||||||||
Energy | 6,292,521 | 4,044,422 | –0 | – | 10,336,943 | |||||||||||
Materials | 2,123,307 | 4,692,255 | –0 | – | 6,815,562 | |||||||||||
Telecommunication Services | 1,445,030 | 3,334,119 | –0 | – | 4,779,149 | |||||||||||
Utilities | 1,799,874 | 2,035,405 | –0 | – | 3,835,279 | |||||||||||
Producer Durables | 39,016 | –0 | – | –0 | – | 39,016 | ||||||||||
Governments—Treasuries | –0 | – | 89,840,119 | –0 | – | 89,840,119 | ||||||||||
Investment Companies | 28,432,091 | –0 | – | –0 | – | 28,432,091 | ||||||||||
Options Purchased—Puts | –0 | – | 275,109 | –0 | – | 275,109 | ||||||||||
Rights | 2,607 | –0 | – | –0 | – | 2,607 | ||||||||||
Short-Term Investments | 143,077,599 | –0 | – | –0 | – | 143,077,599 | ||||||||||
Investments of Cash Collateral for Securities Loaned in Affiliated Money Market Fund | 1,053,809 | –0 | – | –0 | – | 1,053,809 | ||||||||||
|
|
|
|
|
|
|
| |||||||||
Total Investments in Securities | 234,334,821 | 147,986,244 | –0 | – | 382,321,065 | |||||||||||
Other Financial Instruments*: | ||||||||||||||||
Assets: | ||||||||||||||||
Futures | 1,025,254 | 1,562,847 | –0 | – | 2,588,101 | # | ||||||||||
Forward Currency Exchange Contracts | –0 | – | 259,723 | –0 | – | 259,723 | ||||||||||
Total Return Swaps | –0 | – | 570,428 | –0 | – | 570,428 | ||||||||||
Liabilities: | ||||||||||||||||
Futures | (381,176 | ) | (11,641 | ) | –0 | – | (392,817 | )# | ||||||||
Forward Currency Exchange Contracts | –0 | – | (107,598 | ) | –0 | – | (107,598 | ) | ||||||||
Centrally Cleared Interest Rate Swaps | –0 | – | (137,657 | ) | –0 | – | (137,657 | )# | ||||||||
|
|
|
|
|
|
|
| |||||||||
Total^ | $ | 234,978,899 | $ | 150,122,346 | $ | –0 | – | $ | 385,101,245 | |||||||
|
|
|
|
|
|
|
| |||||||||
| * | Other financial instruments are derivative instruments, such as futures, forwards and swaps, which are valued at the unrealized appreciation/depreciation on the instrument. |
| # | Only variation margin receivable/payable at period end is reported within the statement of assets and liabilities. This amount reflects cumulative appreciation/(depreciation) of exchange traded derivatives as reported in the portfolio of investments. |
| ^ | There were de minimis transfers under 1% of net assets between Level 1 and Level 2 during the reporting period. |
The Portfolio recognizes all transfers between levels of the fair value hierarchy assuming the financial instruments were transferred at the beginning of the reporting period.
The Adviser has established a Valuation Committee (the “Committee”) which is responsible for overseeing the pricing and valuation of all securities held in the Portfolio. The Committee operates under pricing and valuation policies and procedures established by the Adviser and approved by the Board, including pricing policies which set forth the mechanisms and processes to be employed on a daily basis to implement these policies and procedures. In particular, the pricing policies describe how to determine market quotations for securities and other instruments. The Committee’s responsibilities include: 1) fair value and liquidity determinations (and oversight of any third parties to whom any responsibility for fair value and liquidity determinations is delegated), and 2) regular monitoring of the Adviser’s pricing and valuation policies and procedures and modification or enhancement of these policies and procedures (or recommendation of the modification of these policies and procedures) as the Committee believes appropriate.
33
| DYNAMIC ASSET ALLOCATION PORTFOLIO | ||
| NOTES TO FINANCIAL STATEMENTS | ||
| (continued) | AllianceBernstein Variable Products Series Fund | |
The Committee is also responsible for monitoring the implementation of the pricing policies by the Adviser’s Pricing Group (the “Pricing Group”) and a third party which performs certain pricing functions in accordance with the pricing policies. The Pricing Group is responsible for the oversight of the third party on a day-to-day basis. The Committee and the Pricing Group perform a series of activities to provide reasonable assurance of the accuracy of prices including: 1) periodic vendor due diligence meetings, review of methodologies, new developments and processes at vendors, 2) daily comparison of security valuation versus prior day for all securities that exceeded established thresholds, and 3) daily review of unpriced, stale, and variance reports with exceptions reviewed by senior management and the Committee.
In addition, several processes outside of the pricing process are used to monitor valuation issues including: 1) performance and performance attribution reports are monitored for anomalous impacts based upon benchmark performance, and 2) portfolio managers review all portfolios for performance and analytics (which are generated using the Adviser’s prices).
3. Currency Translation
Assets and liabilities denominated in foreign currencies and commitments under forward currency exchange contracts are translated into U.S. dollars at the mean of the quoted bid and ask prices of such currencies against the U.S. dollar. Purchases and sales of portfolio securities are translated into U.S. dollars at the rates of exchange prevailing when such securities were acquired or sold. Income and expenses are translated into U.S. dollars at rates of exchange prevailing when accrued.
Net realized gain or loss on foreign currency transactions represents foreign exchange gains and losses from sales and maturities of foreign fixed income investments, foreign currency exchange contracts, holding of foreign currencies, currency gains or losses realized between the trade and settlement dates on foreign investment transactions, and the difference between the amounts of dividends, interest and foreign withholding taxes recorded on the Portfolio’s books and the U.S. dollar equivalent amounts actually received or paid. Net unrealized currency gains and losses from valuing foreign currency denominated assets and liabilities at period end exchange rates are reflected as a component of net unrealized appreciation or depreciation of foreign currency denominated assets and liabilities.
4. Taxes
It is the Portfolio’s policy to meet the requirements of the Internal Revenue Code applicable to regulated investment companies and to distribute all of its investment company taxable income and net realized gains, if any, to shareholders. Therefore, no provisions for federal income or excise taxes are required. The Portfolio may be subject to taxes imposed by countries in which it invests. Such taxes are generally based on income and/or capital gains earned or repatriated. Taxes are accrued and applied to net investment income, net realized gains and net unrealized appreciation/depreciation as such income and/or gains are earned.
In accordance with U.S. GAAP requirements regarding accounting for uncertainties in income taxes, management has analyzed the Portfolio’s tax positions taken or expected to be taken on federal and state income tax returns for all open tax years (all years since inception of the Portfolio) and has concluded that no provision for income tax is required in the Portfolio’s financial statements.
5. Investment Income and Investment Transactions
Dividend income is recorded on the ex-dividend date or as soon as the Portfolio is informed of the dividend. Interest income is accrued daily. Investment transactions are accounted for on the date the securities are purchased or sold. Investment gains or losses are determined on the identified cost basis. The Portfolio amortizes premiums and accretes discounts as adjustments to interest income.
6. Class Allocations
All income earned and expenses incurred by the Portfolio are borne on a pro-rata basis by each outstanding class of shares, based on the proportionate interest in the Portfolio represented by the net assets of such class, except for class specific expenses which are allocated to the respective class. Expenses of the Fund are charged proportionately to each Portfolio or based on other appropriate methods. Realized and unrealized gains and losses are allocated among the various share classes based on respective net assets.
7. Dividends and Distributions
Dividends and distributions to shareholders, if any, are recorded on the ex-dividend date. Income dividends and capital gains distributions are determined in accordance with federal tax regulations and may differ from those determined in accordance with U.S. GAAP. To the extent these differences are permanent, such amounts are reclassified within the capital accounts based on their federal tax basis treatment; temporary differences do not require such reclassification.
34
| AllianceBernstein Variable Products Series Fund |
NOTE B: Advisory Fee and Other Transactions with Affiliates
Under the terms of the investment advisory agreement, the Portfolio pays the Adviser an advisory fee at an annual rate of .70% of the Portfolio’s average daily net assets. The Adviser has agreed to waive its fees and bear certain expenses to the extent necessary to limit total operating expenses on an annual basis to .85% and 1.10% of daily average net assets for Class A and Class B shares, respectively. Under the agreement, fees waived and expenses borne by the Adviser are subject to repayment by the Fund until April 1, 2014. No repayment will be made that would cause the Portfolio’s total annualized operating expenses to exceed the net fee percentage set forth above or would exceed the amount of offering expenses as recorded by the Portfolio on or before April 1, 2012. This fee waiver and/or reimbursement will remain in effect until May 1, 2014 and then may be extended by the Adviser for additional one-year terms. For the year ended December 31, 2013, the amount of such fees waived was $106,958.
Pursuant to the investment advisory agreement, the Portfolio may reimburse the Adviser for certain legal and accounting services provided to the Portfolio by the Adviser. For the year ended December 31, 2013, the reimbursement for such services amounted to $54,422.
The Portfolio compensates AllianceBernstein Investor Services, Inc. (“ABIS”), a wholly-owned subsidiary of the Adviser, under a Transfer Agency Agreement for providing personnel and facilities to perform transfer agency services for the Portfolio. Such compensation retained by ABIS amounted to $1,385 for the year ended December 31, 2013.
The Portfolio may invest in the AllianceBernstein Fixed-Income Shares, Inc.—Government STIF Portfolio (“Government STIF Portfolio”), an open-end management investment company managed by the Adviser. The Government STIF Portfolio is offered as a cash management option to mutual funds and other institutional accounts of the Adviser, and is not available for direct purchase by members of the public. The Government STIF Portfolio pays no investment management fees but does bear its own expenses. A summary of the Portfolio’s transactions in shares of the Government STIF Portfolio for the year ended December 31, 2013 is as follows:
Market Value December 31, 2012 (000) | Purchases at Cost (000) | Sales Proceeds (000) | Market Value December 31, 2013 (000) | Dividend Income (000) | ||||||||||||||
| $ | 95,467 | $ | 193,873 | $ | 146,262 | $ | 143,078 | $ | 119 | |||||||||
Brokerage commissions paid on investment transactions for the year ended December 31, 2013 amounted to $144,333, of which $0 and $0, respectively, was paid to Sanford C. Bernstein & Co. LLC and Sanford C. Bernstein Limited, affiliates of the Adviser.
NOTE C: Distribution Plan
The Portfolio has adopted a Distribution Plan (the “Plan”) for Class B shares pursuant to Rule 12b-1 under the Investment Company Act of 1940. Under the Plan, the Portfolio pays distribution and servicing fees to AllianceBernstein Investments, Inc. (the “Distributor”), a wholly-owned subsidiary of the Adviser, at an annual rate of up to .50% of the Portfolio’s average daily net assets attributable to Class B shares. The fees are accrued daily and paid monthly. The Board currently limits payments under the Plan to .25% of the Portfolio’s average daily net assets attributable to Class B shares. The Plan provides that the Distributor will use such payments in their entirety for distribution assistance and promotional activities.
The Portfolio is not obligated under the Plan to pay any distribution and servicing fees in excess of the amounts set forth above. The purpose of the payments to the Distributor under the Plan is to compensate the Distributor for its distribution services with respect to the sale of the Portfolio’s Class B shares. Since the Distributor’s compensation is not directly tied to its expenses, the amount of compensation received by it under the Plan during any year may be more or less than its actual expenses. For this reason, the Plan is characterized by the staff of the Securities and Exchange Commission as being of the “compensation” variety.
In the event that the Plan is terminated or not continued, no distribution or servicing fees (other than current amounts accrued but not yet paid) would be owed by the Portfolio to the Distributor.
The Plan also provides that the Adviser may use its own resources to finance the distribution of the Portfolio’s shares.
35
| DYNAMIC ASSET ALLOCATION PORTFOLIO | ||
| NOTES TO FINANCIAL STATEMENTS | ||
| (continued) | AllianceBernstein Variable Products Series Fund | |
NOTE D: Investment Transactions
Purchases and sales of investment securities (excluding short-term investments) for the year ended December 31, 2013 were as follows:
| Purchases | Sales | |||||||
Investment securities (excluding U.S. government securities) | $ | 131,597,910 | $ | 70,430,457 | ||||
U.S. government securities | 60,532,259 | 17,320,824 | ||||||
The cost of investments for federal income tax purposes, gross unrealized appreciation and unrealized depreciation (excluding futures, foreign currency, written options and swap transactions) are as follows:
Cost | $ | 359,741,490 | ||
|
| |||
Gross unrealized appreciation | $ | 26,721,351 | ||
Gross unrealized depreciation | (4,141,776 | ) | ||
|
| |||
Net unrealized appreciation | $ | 22,579,575 | ||
|
|
1. Derivative Financial Instruments
The Portfolio may use derivatives in an effort to earn income and enhance returns, to replace more traditional direct investments, to obtain exposure to otherwise inaccessible markets (collectively, “investment purposes”), or to hedge or adjust the risk profile of its portfolio.
The principal types of derivatives utilized by the Portfolio, as well as the methods in which they may be used are:
| • | Futures |
The Portfolio may buy or sell futures for investment purposes or for the purpose of hedging its portfolio against adverse effects of potential movements in the market. The Portfolio bears the market risk that arises from changes in the value of these instruments and the imperfect correlation between movements in the price of the futures and movements in the price of the assets, reference rates or indices which they are designed to track. Among other things, the Portfolio may purchase or sell futures for foreign currencies or options thereon for non-hedging purposes as a means of making direct investment in foreign currencies, as described below under “Currency Transactions”.
At the time the Portfolio enters into futures, the Portfolio deposits and maintains as collateral an initial margin with the broker, as required by the exchange on which the transaction is effected. Pursuant to the contract, the Portfolio agrees to receive from or pay to the broker an amount of cash equal to the daily fluctuation in the value of the contract. Such receipts or payments are known as variation margin and are recorded by the Portfolio as unrealized gains or losses. Risks may arise from the potential inability of a counterparty to meet the terms of the contract. The credit/counterparty risk for exchange-traded futures is generally less than privately negotiated futures, since the clearinghouse, which is the issuer or counterparty to each exchange-traded future, has robust risk mitigation standards, including the requirement to provide initial and variation margin. When the contract is closed, the Portfolio records a realized gain or loss equal to the difference between the value of the contract at the time it was opened and the time it was closed.
Use of long futures subjects the Portfolio to risk of loss in excess of the amounts shown on the statement of assets and liabilities, up to the notional value of the futures. Use of short futures subjects the Portfolio to unlimited risk of loss. Under some circumstances, futures exchanges may establish daily limits on the amount that the price of futures can vary from the previous day’s settlement price, which could effectively prevent liquidation of unfavorable positions.
During the year ended December 31, 2013, the Portfolio held futures for hedging and non-hedging purposes.
| • | Forward Currency Exchange Contracts |
The Portfolio may enter into forward currency exchange contracts in order to hedge its exposure to changes in foreign currency exchange rates on its foreign portfolio holdings, to hedge certain firm purchase and sale commitments denominated in foreign currencies and for non-hedging purposes as a means of making direct investments in foreign currencies, as described below under “Currency Transactions”.
A forward currency exchange contract is a commitment to purchase or sell a foreign currency at a future date at a negotiated forward rate. The gain or loss arising from the difference between the original contract and the closing of
36
| AllianceBernstein Variable Products Series Fund |
such contract would be included in net realized gain or loss on foreign currency transactions. Fluctuations in the value of open forward currency exchange contracts are recorded for financial reporting purposes as unrealized appreciation and/or depreciation by the Portfolio. Risks may arise from the potential inability of a counterparty to meet the terms of a contract and from unanticipated movements in the value of a foreign currency relative to the U.S. dollar.
During the year ended December 31, 2013, the Portfolio held forward currency exchange contracts for hedging and non-hedging purposes.
| • | Option Transactions |
For hedging and investment purposes, the Portfolio may purchase and write (sell) put and call options on U.S. and foreign securities, including government securities, and foreign currencies that are traded on U.S. and foreign securities exchanges and over-the-counter markets. Among other things, the Portfolio may use options transactions for non-hedging purposes as a means of making direct investments in foreign currencies, as described below under “Currency Transactions” and may use options strategies involving the purchase and/or writing of various combinations of call and/or put options, for hedging and investment purposes.
The risk associated with purchasing an option is that the Portfolio pays a premium whether or not the option is exercised. Additionally, the Portfolio bears the risk of loss of the premium and change in market value should the counterparty not perform under the contract. Put and call options purchased are accounted for in the same manner as portfolio securities. The cost of securities acquired through the exercise of call options is increased by premiums paid. The proceeds from securities sold through the exercise of put options are decreased by the premiums paid.
When the Portfolio writes an option, the premium received by the Portfolio is recorded as a liability and is subsequently adjusted to the current market value of the option written. Premiums received from written options which expire unexercised are recorded by the Portfolio on the expiration date as realized gains from options written. The difference between the premium received and the amount paid on effecting a closing purchase transaction, including brokerage commissions, is also treated as a realized gain, or if the premium received is less than the amount paid for the closing purchase transaction, as a realized loss. If a call option is exercised, the premium received is added to the proceeds from the sale of the underlying security or currency in determining whether the Portfolio has realized a gain or loss. If a put option is exercised, the premium received reduces the cost basis of the security or currency purchased by the Portfolio. In writing an option, the Portfolio bears the market risk of an unfavorable change in the price of the security or currency underlying the written option. Exercise of an option written by the Portfolio could result in the Portfolio selling or buying a security or currency at a price different from the current market value.
The Portfolio may also invest in options on swap agreements, also called “swaptions”. A swaption is an option that gives the buyer the right, but not the obligation, to enter into a swap on a future date in exchange for paying a market-based “premium”. A receiver swaption gives the owner the right to receive the total return of a specified asset, reference rate, or index. A payer swaption gives the owner the right to pay the total return on a specified asset, reference rate, or index. Swaptions also include options that allow an existing swap to be terminated or extended by one of the counterparties.
During the year ended December 31, 2013, the Portfolio held purchased options for hedging and non-hedging purposes. During the year ended December 31, 2013, the Portfolio held purchased swaptions for hedging purposes. During the year ended December 31, 2013, the Portfolio held written options for hedging and non-hedging purposes.
For the year ended December 31, 2013, the Portfolio had the following transactions in written options:
| Number of Contracts | Premiums Received | |||||||
Options written outstanding as of 12/31/12 | 913 | $ | 157,642 | |||||
Options written | 27,398 | 309,295 | ||||||
Options expired | –0 | – | –0 | – | ||||
Options bought back | (28,311 | ) | (466,937 | ) | ||||
Options exercised | –0 | – | –0 | – | ||||
|
|
|
| |||||
Options written outstanding as of 12/31/13 | –0 | – | $ | –0 | – | |||
|
|
|
| |||||
37
| DYNAMIC ASSET ALLOCATION PORTFOLIO | ||
| NOTES TO FINANCIAL STATEMENTS | ||
| (continued) | AllianceBernstein Variable Products Series Fund | |
| • | Swaps |
The Portfolio may enter into swaps to hedge its exposure to interest rates, credit risk, equity markets and currencies. The Portfolio may also enter into swaps for non-hedging purposes as a means of gaining market exposures, including by making direct investments in foreign currencies, as described below under “Currency Transactions” or in order to take a “long” or “short” position with respect to an underlying referenced asset described below under “Total Return Swaps”. A swap is an agreement that obligates two parties to exchange a series of cash flows at specified intervals based upon or calculated by reference to changes in specified prices or rates for a specified amount of an underlying asset. The payment flows are usually netted against each other, with the difference being paid by one party to the other. In addition, collateral may be pledged or received by the Portfolio in accordance with the terms of the respective swaps to provide value and recourse to the Portfolio or its counterparties in the event of default, bankruptcy or insolvency by one of the parties to the swap.
Risks may arise as a result of the failure of the counterparty to the swap to comply with the terms of the swap. The loss incurred by the failure of a counterparty is generally limited to the net interim payment to be received by the Portfolio, and/or the termination value at the end of the contract. Therefore, the Portfolio considers the creditworthiness of each counterparty to a swap in evaluating potential counterparty risk. This risk is mitigated by having a netting arrangement between the Portfolio and the counterparty and by the posting of collateral by the counterparty to the Portfolio to cover the Portfolio’s exposure to the counterparty. Additionally, risks may arise from unanticipated movements in interest rates or in the value of the underlying securities. The Portfolio accrues for the interim payments on swaps on a daily basis, with the net amount recorded within unrealized appreciation/depreciation of swaps on the statement of assets and liabilities, where applicable. Once the interim payments are settled in cash, the net amount is recorded as realized gain/(loss) on swaps on the statement of operations, in addition to any realized gain/(loss) recorded upon the termination of swaps. Upfront premiums paid or received are recognized as cost or proceeds on the statement of assets and liabilities and are amortized on a straight line basis over the life of the contract. Amortized upfront premiums are included in net realized gain/(loss) from swaps on the statement of operations. Fluctuations in the value of swaps are recorded as a component of net change in unrealized appreciation/depreciation of swaps on the statement of operations.
Certain standardized swaps, including certain interest rate swaps and credit default swaps, are (or soon will be) subject to mandatory central clearing. Cleared swaps are transacted through futures commission merchants (“FCMs”) that are members of central clearinghouses, with the clearinghouse serving as central counterparty, similar to transactions in futures contracts. Centralized clearing will be required for additional categories of swaps on a phased-in basis based on requirements published by the Securities Exchange Commission and Commodity Futures Trading Commission.
At the time the Portfolio enters into a centrally cleared swap, the Portfolio deposits and maintains as collateral an initial margin with the broker, as required by the exchange on which the transaction is effected. Pursuant to the contract, the Portfolio agrees to receive from or pay to the broker an amount of cash equal to the daily fluctuation in the value of the contract. Such receipts or payments are known as variation margin and are recorded by the Portfolio as unrealized gains or losses. Risks may arise from the potential inability of a counterparty to meet the terms of the contract. The credit/counterparty risk for exchange-traded swaps is generally less than privately negotiated swaps, since the clearinghouse, which is the issuer or counterparty to each exchange-traded swap, has robust risk mitigation standards, including the requirement to provide initial and variation margin. When the contract is closed, the Portfolio records a realized gain or loss equal to the difference between the value of the contract at the time it was opened and the time it was closed.
Interest Rate Swaps:
The Portfolio is subject to interest rate risk exposure in the normal course of pursuing its investment objectives. Because the Portfolio holds fixed rate bonds, the value of these bonds may decrease if interest rates rise. To help hedge against this risk and to maintain its ability to generate income at prevailing market rates, the Portfolio may enter into interest rate swaps. Interest rate swaps are agreements between two parties to exchange cash flows based on a notional amount. The Portfolio may elect to pay a fixed rate and receive a floating rate, or, receive a fixed rate and pay a floating rate on a notional amount.
38
| AllianceBernstein Variable Products Series Fund |
In addition, a Portfolio may also enter into interest rate swap transactions to preserve a return or spread on a particular investment or portion of its portfolio, or protecting against an increase in the price of securities the Portfolio anticipates purchasing at a later date. Interest rate swaps involve the exchange by a Portfolio with another party of their respective commitments to pay or receive interest (e.g., an exchange of floating rate payments for fixed rate payments) computed based on a contractually-based principal (or “notional”) amount. Interest rate swaps are entered into on a net basis (i.e., the two payment streams are netted out, with the Portfolio receiving or paying, as the case may be, only the net amount of the two payments).
During the year ended December 31, 2013, the Portfolio held interest rate swaps for hedging purposes.
Credit Default Swaps:
The Portfolio may enter into credit default swaps, including to manage its exposure to the market or certain sectors of the market, to reduce its risk exposure to defaults by corporate and sovereign issuers held by the Portfolio, or to create exposure to corporate or sovereign issuers to which it is not otherwise exposed. The Portfolio may purchase credit protection (“Buy Contract”) or provide credit protection (“Sale Contract”) on the referenced obligation of the credit default swap. During the term of the swap, the Portfolio receives/(pays) fixed payments from/(to) the respective counterparty, calculated at the agreed upon rate applied to the notional amount. If the Portfolio is a buyer/(seller) of protection and a credit event occurs, as defined under the terms of the swap, the Portfolio will either (i) receive from the seller/(pay to the buyer) of protection an amount equal to the notional amount of the swap (the “Maximum Payout Amount”) and deliver/(take delivery of) the referenced obligation or (ii) receive/(pay) a net settlement amount in the form of cash or securities equal to the notional amount of the swap less the recovery value of the referenced obligation.
Credit default swaps may involve greater risks than if a Portfolio had invested in the referenced obligation directly. Credit default swaps are subject to general market risk, liquidity risk, counterparty risk and credit risk. If the Portfolio is a buyer of protection and no credit event occurs, it will lose the payments it made to its counterparty. If the Portfolio is a seller of protection and a credit event occurs, the value of the referenced obligation received by the Portfolio coupled with the periodic payments previously received, may be less than the Maximum Payout Amount it pays to the buyer, resulting in a net loss to the Portfolio.
During the year ended December 31, 2013, the Portfolio held credit default swaps for non-hedging purposes.
Implied credit spreads utilized in determining the market value of credit default swaps on issuers as of period end are disclosed in the portfolio of investments. The implied spreads serve as an indicator of the current status of the payment/performance risk and typically reflect the likelihood of default by the issuer of the referenced obligation. The implied credit spread of a particular reference obligation also reflects the cost of buying/selling protection and may reflect upfront payments required to be made to enter into the agreement. Widening credit spreads typically represent a deterioration of the referenced obligation’s credit soundness and greater likelihood of default or other credit event occurring as defined under the terms of the agreement. A credit spread identified as “Defaulted” indicates a credit event has occurred for the referenced obligation.
Total Return Swaps:
The Portfolio may enter into total return swaps in order take a “long” or “short” position with respect to an underlying referenced asset. The Portfolio is subject to market price volatility of the underlying referenced asset. A total return swap involves commitments to pay interest in exchange for a market linked return based on a notional amount. To the extent that the total return of the security, group of securities or index underlying the transaction exceeds or falls short of the offsetting interest obligation, the Portfolio will receive a payment from or make a payment to the counterparty.
During the year ended December 31, 2013, the Portfolio held total return swaps for hedging and non-hedging purposes.
The Portfolio typically enters into International Swaps and Derivatives Association, Inc. Master Agreements (“ISDA Master Agreement”) or similar master agreements (collectively, “Master Agreements”) with its OTC derivative contract counterparties in order to, among other things, reduce its credit risk to counterparties. ISDA Master Agreements include provisions for general obligations, representations, collateral and events of default or termination. Under an ISDA Master Agreement, the Portfolio typically may offset with the counterparty certain derivative financial instrument’s payables and/or receivables with collateral held and/or posted and create one single net payment (close-out netting) in the event of default or termination.
39
| DYNAMIC ASSET ALLOCATION PORTFOLIO | ||
| NOTES TO FINANCIAL STATEMENTS | ||
| (continued) | AllianceBernstein Variable Products Series Fund | |
Various master agreements govern the terms of certain transactions with counterparties, including transactions such as exchange-traded derivative transactions, repurchase and reverse repurchase agreements. These master agreements typically attempt to reduce the counterparty risk associated with such transactions by specifying credit protection mechanisms and providing standardization that improves legal certainty. Cross-termination provisions under Master Agreements typically provide that a default in connection with one transaction between the Portfolio and a counterparty gives the non-defaulting party the right to terminate any other transactions in place with the defaulting party to create one single net payment due to/due from the defaulting party. In the event of a default by a Master Agreements counterparty, the return of collateral with market value in excess of the Portfolio’s net liability, held by the defaulting party, may be delayed or denied.
The Portfolio’s Master Agreements may contain provisions for early termination of OTC derivative transactions in the event the net assets of the Portfolio decline below specific levels (“net asset contingent features”). If these levels are triggered, the Portfolio’s counterparty has the right to terminate such transaction and require the Portfolio to pay or receive a settlement amount in connection with the terminated transaction. As of December 31, 2013 the Portfolio had OTC derivatives with contingent features in net liability positions in the amount of $63,293. If a trigger event had occurred at December 31, 2013, for those derivatives in a net liability position, $63,293 would be required to be posted by the Portfolio.
At December 31, 2013, the Portfolio had entered into the following derivatives:
Asset Derivatives | Liability Derivatives | |||||||||||
Derivative Type | Statement of Assets and Liabilities Location | Fair Value | Statement of Assets and Liabilities Location | Fair Value | ||||||||
Interest rate contracts | Receivable/Payable for variation margin on futures | $ | 381,176 | * | ||||||||
Equity contracts | Receivable/Payable for variation margin on futures | $ | 2,588,101 | * | Receivable/Payable for variation margin on futures | 11,641 | * | |||||
Foreign exchange contracts | Unrealized appreciation of forward currency exchange contracts | 259,723 | Unrealized depreciation of forward currency exchange contracts | 107,598 | ||||||||
Interest rate contracts | Investments in securities, at value | 275,109 | ||||||||||
Interest rate contracts | Receivable/Payable for variation margin on centrally cleared interest rate swaps | 137,657 | * | |||||||||
Equity contracts | Unrealized appreciation of total return swaps | 570,428 | ||||||||||
|
|
|
| |||||||||
Total | $ | 3,693,361 | $ | 638,072 | ||||||||
|
|
|
| |||||||||
| * | Only variation margin receivable/payable at period end is reported within the statement of assets and liabilities. This amount reflects cumulative appreciation/(depreciation) of exchange-traded derivatives as reported in the portfolio of investments. |
The effect of derivative instruments on the statement of operations for the year ended December 31, 2013:
Derivative Type | Location of Gain or (Loss) on Derivatives | Realized Gain or (Loss) on Derivatives | Change in Unrealized Appreciation or (Depreciation) | |||||||
Interest rate contracts | Net realized gain (loss) on futures; Net change in unrealized appreciation/depreciation of futures | $ | (464,207 | ) | $ | (326,622 | ) | |||
Equity contracts | Net realized gain (loss) on futures; Net change in unrealized appreciation/depreciation of futures | 16,714,600 | 2,097,317 | |||||||
Foreign exchange contracts | Net realized gain (loss) on foreign currency transactions; Net change in unrealized appreciation/depreciation of foreign currency denominated assets and liabilities | 75,288 | 123,088 | |||||||
40
| AllianceBernstein Variable Products Series Fund |
Derivative Type | Location of Gain or (Loss) on Derivatives | Realized Gain or (Loss) on Derivatives | Change in Unrealized Appreciation or (Depreciation) | |||||||
Interest rate contracts | Net realized gain (loss) on investment transactions; Net change in unrealized appreciation/depreciation of investments | $ | 28,258 | $ | 103,983 | |||||
Equity contracts | Net realized gain (loss) on investment transactions; Net change in unrealized appreciation/depreciation of investments | (1,236,776 | ) | 111,217 | ||||||
Equity contracts | Net realized gain (loss) on options written; Net change in unrealized appreciation/depreciation of options written | (44,625 | ) | (30,147 | ) | |||||
Interest rate contracts | Net realized gain (loss) on swaps; Net change in unrealized appreciation/depreciation of swaps | (34,291 | ) | (137,657 | ) | |||||
Credit contracts | Net realized gain (loss) on swaps; Net change in unrealized appreciation/depreciation of swaps | 390,926 | 45,541 | |||||||
Equity contracts | Net realized gain (loss) on swaps; Net change in unrealized appreciation/depreciation of swaps | 315,517 | 319,218 | |||||||
|
|
|
| |||||||
Total | $ | 15,744,690 | $ | 2,305,938 | ||||||
|
|
|
| |||||||
The following table represents the volume of the Portfolio’s derivative transactions during the year ended December 31, 2013:
Futures: | ||||
Average original value of buy contracts | $ | 90,827,684 | ||
Average original value of sale contracts | $ | 1,145,911 | (a) | |
Forward Currency Exchange Contracts: | ||||
Average principal amount of buy contracts | $ | 21,259,578 | ||
Average principal amount of sale contracts | $ | 13,261,987 | ||
Purchased Options: | ||||
Average monthly cost | $ | 370,866 | (b) | |
Centrally Cleared Interest Rate Swaps: | ||||
Average notional amount | $ | 8,056,667 | (a) | |
Credit Default Swaps: | ||||
Average notional amount of sale contracts | $ | 4,829,548 | (c) | |
Total Return Swaps: | ||||
Average notional amount | $ | 22,375,221 |
| (a) | Positions were open for three months during the year. |
| (b) | Positions were open for eleven months during the year. |
| (c) | Positions were open for four months during the year. |
41
| DYNAMIC ASSET ALLOCATION PORTFOLIO | ||
| NOTES TO FINANCIAL STATEMENTS | ||
| (continued) | AllianceBernstein Variable Products Series Fund | |
For financial reporting purposes, the Portfolio does not offset derivative assets and derivative liabilities that are subject to netting arrangements in the statement of assets and liabilities.
All derivatives held during the reporting period were subject to netting arrangements. The following table presents the Portfolio’s derivative assets and liabilities by counterparty net of amounts available for offset under Master Agreements (“MA”) and net of the related collateral received/ pledged by the Portfolio as of December 31, 2013:
Counterparty | Derivative Assets Subject to MA | Derivative Available for Offset | Cash Collateral Received | Securities Collateral Received | Net Amount of Derivatives Assets | |||||||||||||||
Bank of America, NA* | $ | 147,232 | $ | –0 | – | $ | –0 | – | $ | –0 | – | $ | 147,232 | |||||||
Barclays Bank PLC Wholesale | 24,445 | (281 | ) | –0 | – | –0 | – | 24,164 | ||||||||||||
BNP Paribas SA | 131,426 | –0 | – | –0 | – | –0 | – | 131,426 | ||||||||||||
Citibank, NA | 64,885 | –0 | – | –0 | – | –0 | – | 64,885 | ||||||||||||
Credit Suisse International | 15,335 | (15,335 | ) | –0 | – | –0 | – | –0 | – | |||||||||||
Deutsche Bank AG London | 324,655 | –0 | – | (150,000 | ) | –0 | – | 174,655 | ||||||||||||
Exchange-Traded Morgan Stanley & Co. LLC* | 78,706 | –0 | – | –0 | – | –0 | – | 78,706 | ||||||||||||
HSBC Bank USA | 4,074 | –0 | – | –0 | – | –0 | – | 4,074 | ||||||||||||
JPMorgan Chase Bank, NA | 81,128 | –0 | – | –0 | – | –0 | – | 81,128 | ||||||||||||
Morgan Stanley Capital Services, LLC* | 93,061 | –0 | – | –0 | – | –0 | – | 93,061 | ||||||||||||
Royal Bank of Scotland PLC | 24,386 | (550 | ) | –0 | – | –0 | – | 23,836 | ||||||||||||
Standard Chartered Bank | 7,211 | (858 | ) | –0 | – | –0 | – | 6,353 | ||||||||||||
State Street Bank & Trust Co. | 30,512 | (27,281 | ) | –0 | – | –0 | – | 3,231 | ||||||||||||
UBS AG | 156,910 | –0 | – | –0 | – | –0 | – | 156,910 | ||||||||||||
|
|
|
|
|
|
|
|
|
| |||||||||||
Total | $ | 1,183,966 | $ | (44,305 | ) | $ | (150,000 | ) | $ | –0 | – | $ | 989,661 | |||||||
|
|
|
|
|
|
|
|
|
| |||||||||||
Counterparty | Derivative Liabilities Subject to MA | Derivative Available for Offset | Cash Collateral Pledged | Securities Collateral Pledged | Net Amount of Derivatives Liabilities | |||||||||||||||
Barclays Bank PLC Wholesale | $ | 281 | $ | (281 | ) | $ | –0 | – | $ | –0 | – | $ | –0 | – | ||||||
Exchange-Traded Citigroup Global Markets, Inc./(CME Group)** | 24,233 | –0 | – | (24,233 | ) | –0 | – | –0 | – | |||||||||||
Credit Suisse International | 74,519 | (15,335 | ) | –0 | – | –0 | – | 59,184 | ||||||||||||
Royal Bank of Scotland PLC | 550 | (550 | ) | –0 | – | –0 | – | –0 | – | |||||||||||
Standard Chartered Bank | 858 | (858 | ) | –0 | – | –0 | – | –0 | – | |||||||||||
State Street Bank & Trust Co. | 27,281 | (27,281 | ) | –0 | – | –0 | – | –0 | – | |||||||||||
Westpac Banking Corp. | 4,109 | –0 | – | –0 | – | –0 | – | 4,109 | ||||||||||||
|
|
|
|
|
|
|
|
|
| |||||||||||
Total | $ | 131,831 | $ | (44,305 | ) | $ | (24,233 | ) | $ | –0 | – | $ | 63,293 | |||||||
|
|
|
|
|
|
|
|
|
| |||||||||||
| * | Securities have been segregated to collateralize OTC derivatives outstanding at December 31, 2013. |
| ** | In addition to the amounts reflected above, cash collateral has been posted for initial margin requirements for open futures and centrally cleared swaps outstanding at December 31, 2013. |
2. Currency Transactions
The Portfolio may invest in non-U.S. dollar securities on a currency hedged or unhedged basis. The Portfolio may seek investment opportunities by taking long or short positions in currencies through the use of currency-related derivatives, including forward currency exchange contracts, futures and options on futures, swaps, and other options. The Portfolio may enter into transactions for investment opportunities when it anticipates that a foreign currency will appreciate or depreciate in value but securities denominated in that currency are not held by the Portfolio and do not present attractive investment opportunities. Such transactions may also be used when the Adviser believes that it may be more efficient than a direct investment in a foreign currency-denominated security. The Portfolio may also conduct currency exchange contracts on a spot basis (i.e., for cash at the spot rate prevailing in the currency exchange market for buying or selling currencies).
42
| AllianceBernstein Variable Products Series Fund |
NOTE E: Securities Lending
The Portfolio may enter into securities lending transactions. Under the Portfolio’s securities lending program, all loans of securities will be collateralized continually by cash. The Portfolio will be compensated for the loan from a portion of the net return from the income earned on cash collateral after a rebate is paid to the borrower (in some cases, this rebate may be a “negative rebate” or fee paid by the borrower to the Portfolio in connection with the loan), and payments are made for fees of the securities lending agent and for certain other administrative expenses. It is the policy of the Portfolio to receive collateral consisting of cash in an amount exceeding the value of the securities loaned. The Portfolio will have the right to call a loan and obtain the securities loaned at any time on notice to the borrower within the normal and customary settlement time for the securities. While the securities are on loan, the borrower is obligated to pay the Portfolio amounts equal to any income or other distributions from the securities. The Portfolio will not have the right to vote any securities during the existence of a loan, but will have the right to regain ownership of loaned securities in order to exercise voting or other ownership rights. The lending agent has agreed to indemnify the Portfolio in the case of default of any securities borrower. Collateral received and securities loaned are marked to market daily to ensure that the securities loaned are secured by collateral. The lending agent will invest the cash collateral received in AllianceBernstein Exchange Reserves, an eligible money market vehicle, in accordance with the investment restrictions of the Portfolio, and as approved by the Board. The collateral received on securities loaned is recorded as an asset as well as a corresponding liability in the statement of assets and liabilities. When the Portfolio lends securities, its investment performance will continue to reflect changes in the value of the securities loaned. At December 31, 2013, the Portfolio had securities on loan with a value of $969,570 and had received cash collateral which has been invested into AllianceBernstein Exchange Reserves of $1,053,809. The cash collateral will be adjusted on the next business day to maintain the required collateral amount. The Portfolio earned securities lending income of $40,266 and $988 from the borrowers and AllianceBernstein Exchange Reserves, respectively, for the year ended December 31, 2013; these amounts are reflected in the statement of operations. A principal risk of lending portfolio securities is that the borrower will fail to return the loaned securities upon termination of the loan and that the collateral will not be sufficient to replace the loaned securities. A summary of the Portfolio’s transactions in shares of AllianceBernstein Exchange Reserves for the year ended December 31, 2013 is as follows:
Market Value December 31, 2012 (000) | Purchases at Cost (000) | Sales Proceeds (000) | Market Value December 31, 2013 (000) | |||||||||||
| $ | 640 | $ | 32,826 | $ | 32,412 | $ | 1,054 | |||||||
NOTE F: Capital Stock
Each class consists of 500,000,000 authorized shares. Transactions in capital shares for each class were as follows:
| SHARES | AMOUNT | |||||||||||||||||
| Year Ended December 31, 2013 | Year Ended December 31, 2012 | Year Ended December 31, 2013 | Year Ended December 31, 2012 | |||||||||||||||
Class A | ||||||||||||||||||
Shares sold | 21,276 | 1,563 | $ | 239,297 | $ | 15,829 | ||||||||||||
Shares issued in reinvestment of dividends and distributions | 138 | 1 | 1,526 | 13 | ||||||||||||||
Shares redeemed | (1,016 | ) | (998,067 | ) | (11,385 | ) | (10,218,988 | ) | ||||||||||
|
|
|
|
|
|
|
| |||||||||||
Net increase (decrease) | 20,398 | (996,503 | ) | $ | 229,438 | $ | (10,203,146 | ) | ||||||||||
|
|
|
|
|
|
|
| |||||||||||
Class B | ||||||||||||||||||
Shares sold | 15,088,582 | 17,210,237 | $ | 168,096,951 | $ | 174,568,892 | ||||||||||||
Shares issued in reinvestment of dividends and distributions | 175,631 | 30,508 | 1,940,727 | 308,437 | ||||||||||||||
Shares redeemed | (3,121,224 | ) | (1,511,344 | ) | (34,703,870 | ) | (15,379,697 | ) | ||||||||||
|
|
|
|
|
|
|
| |||||||||||
Net increase | 12,142,989 | 15,729,401 | $ | 135,333,808 | $ | 159,497,632 | ||||||||||||
|
|
|
|
|
|
|
| |||||||||||
NOTE G: Risks Involved in Investing in the Portfolio
Interest Rate Risk and Credit Risk—Interest rate risk is the risk that changes in interest rates will affect the value of the Portfolio’s investments in fixed-income debt securities such as bonds or notes. Increases in interest rates may cause the value of
43
| DYNAMIC ASSET ALLOCATION PORTFOLIO | ||
| NOTES TO FINANCIAL STATEMENTS | ||
| (continued) | AllianceBernstein Variable Products Series Fund | |
the Portfolio’s investments to decline. Credit risk is the risk that the issuer or guarantor of a debt security, or the counterparty to a derivative contract, will be unable or unwilling to make timely principal and/or interest payments, or to otherwise honor its obligations. The degree of risk for a particular security may be reflected in its credit risk rating. Credit risk is greater for medium quality and lower-rated securities. Lower-rated debt securities and similar unrated securities (commonly known as “junk bonds”) have speculative elements or are predominantly speculative risks.
Foreign Securities Risk—Investing in securities of foreign companies or foreign governments involves special risks which include changes in foreign currency exchange rates and the possibility of future political and economic developments which could adversely affect the value of such securities. Moreover, securities of many foreign companies or foreign governments and their markets may be less liquid and their prices more volatile than those of comparable U.S. companies or of the U.S. government.
Currency Risk—This is the risk that changes in foreign currency exchange rates may negatively affect the value of the Portfolio’s investments or reduce the returns of the Portfolio. For example, the value of the Portfolio’s investments in foreign currency-denominated securities or currencies may decrease if the U.S. dollar is strong (i.e., gaining value relative to other currencies) and other currencies are weak (i.e., losing value relative to the U.S. dollar). Currency markets are generally not as regulated as securities markets. Independent of the Portfolio’s investments denominated in foreign currencies, the Portfolio’s positions in various foreign currencies may cause the Portfolio to experience investment losses due to the changes in exchange rates and interest rates.
ETF Risk—ETFs are investment companies. When the Portfolio invests in an ETF, the Portfolio bears its share of the ETFs expenses and runs the risk that the ETF may not achieve its investment objectives.
Derivatives Risk—The Portfolio may enter into derivative transactions such as forwards, options, futures and swaps. Derivatives may be illiquid, difficult to price, and leveraged so that small changes may produce disproportionate losses for the Portfolio, and subject to counterparty risk to a greater degree than more traditional investments. Derivatives may result in significant losses, including losses that are far greater than the value of the derivatives reflected in the statement of assets and liabilities.
Indemnification Risk—In the ordinary course of business, the Portfolio enters into contracts that contain a variety of indemnifications. The Portfolio’s maximum exposure under these arrangements is unknown. However, the Portfolio has not had prior claims or losses pursuant to these indemnification provisions and expects the risk of loss thereunder to be remote. Therefore, the Portfolio has not accrued any liability in connection with these indemnification provisions.
NOTE H: Joint Credit Facility
A number of open-end mutual funds managed by the Adviser, including the Portfolio, participate in a $140 million revolving credit facility (the “Facility”) intended to provide short-term financing, if necessary, subject to certain restrictions in connection with abnormal redemption activity. Commitment fees related to the Facility are paid by the participating funds and are included in miscellaneous expenses in the statement of operations. The Portfolio did not utilize the Facility during the year ended December 31, 2013.
NOTE I: Distributions to Shareholders
The tax character of distributions paid during the fiscal years ended December 31, 2013 and December 31, 2012 were as follows:
| 2013 | 2012 | |||||||
Distributions paid from: | ||||||||
Ordinary income | $ | 1,548,285 | $ | 308,471 | ||||
Net long-term capital gains | 394,049 | –0 | – | |||||
|
|
|
| |||||
Total taxable distributions paid | $ | 1,942,334 | $ | 308,471 | ||||
|
|
|
| |||||
44
| AllianceBernstein Variable Products Series Fund |
As of December 31, 2013, the components of accumulated earnings/(deficit) on a tax basis were as follows:
Undistributed ordinary income | $ | 10,229,636 | ||
Undistributed net capital gain | 8,039,709 | |||
Accumulated capital and other losses | (21,594 | )(a) | ||
Unrealized appreciation/(depreciation) | 23,072,425 | (b) | ||
|
| |||
Total accumulated earnings/(deficit) | $ | 41,320,176 | (c) | |
|
|
| (a) | As of December 31, 2013, the Portfolio had cumulative deferred losses on straddles of $21,594. |
| (b) | The differences between book-basis and tax-basis unrealized appreciation/(depreciation) are attributable primarily to the tax deferral of losses on wash sales, the tax treatment of swaps and passive foreign investment companies (PFICs), return of capital distributions received from underlying securities, and the realization for tax purposes of gains/losses on certain derivative instruments. |
| (c) | The differences between book-basis and tax-basis components of accumulated earnings/(deficit) are attributable primarily to the amortization of offering costs and the tax deferral of dividend income from real estate investment trust (REIT) securities. |
For tax purposes, net capital losses may be carried over to offset future capital gains, if any. Funds are permitted to carry forward capital losses incurred in taxable years beginning after December 22, 2010 for an indefinite period, and such losses will retain their character as either short-term or long-term capital losses. As of December 31, 2013, the Portfolio did not have any capital loss carryforwards.
During the current fiscal year, permanent differences primarily due to foreign currency reclassifications and the tax treatment of swaps and passive foreign investment companies (PFICs) resulted in a net decrease in distributions in excess of net investment income and a net decrease in accumulated net realized gain on investment and foreign currency transactions. These reclassifications had no effect on net assets.
NOTE J: Subsequent Events
Management has evaluated subsequent events for possible recognition or disclosure in the financial statements through the date the financial statements are issued. Management has determined that there are no material events that would require disclosure in the Portfolio’s financial statements through this date.
45
| DYNAMIC ASSET ALLOCATION PORTFOLIO | ||
| FINANCIAL HIGHLIGHTS | AllianceBernstein Variable Products Series Fund | |
Selected Data For A Share Of Capital Stock Outstanding Throughout Each Period
| CLASS A | ||||||||||||
| Year Ended December 31, | April 1, 2011(a) to December 31, 2011 | |||||||||||
| 2013 | 2012 | |||||||||||
Net asset value, beginning of period | $10.53 | $9.75 | $10.00 | |||||||||
|
|
|
|
|
| |||||||
Income From Investment Operations | ||||||||||||
Net investment income (loss) (b)(c) | .03 | (.01 | ) | .03 | ||||||||
Net realized and unrealized gain (loss) on investment and foreign currency transactions | 1.26 | .81 | (.28 | ) | ||||||||
|
|
|
|
|
| |||||||
Net increase (decrease) in net asset value from operations | 1.29 | .80 | (.25 | ) | ||||||||
|
|
|
|
|
| |||||||
Less: Dividends and Distributions | ||||||||||||
Dividends from net investment income | (.04 | ) | (.01 | ) | –0 | – | ||||||
Distributions from net realized gain on investment transactions | (.04 | ) | (.01 | ) | –0 | – | ||||||
|
|
|
|
|
| |||||||
Total dividends and distributions | (.08 | ) | (.02 | ) | –0 | – | ||||||
|
|
|
|
|
| |||||||
Net asset value, end of period | $11.74 | $10.53 | $9.75 | |||||||||
|
|
|
|
|
| |||||||
Total Return | ||||||||||||
Total investment return based on net asset value (d) | 12.31 | % | 8.22 | % | (2.50 | )% | ||||||
Ratios/Supplemental Data | ||||||||||||
Net assets, end of period (000’s omitted) | $269 | $27 | $9,742 | |||||||||
Ratio to average net assets of: | ||||||||||||
Expenses, net of waivers/reimbursements | .85 | % | .85 | % | .85 | %^ | ||||||
Expenses, before waivers/reimbursements | .89 | % | 1.22 | % | 2.53 | %^ | ||||||
Net investment income (loss) (c) | .31 | % | (.14 | )% | .36 | %^ | ||||||
Portfolio turnover rate | 52 | % | 51 | % | 68 | % | ||||||
See footnote summary on page 47.
46
| AllianceBernstein Variable Products Series Fund |
Selected Data For A Share Of Capital Stock Outstanding Throughout Each Period
| CLASS B | ||||||||||||
| Year Ended December 31, | April 1, 2011(a) to December 31, 2011 | |||||||||||
| 2013 | 2012 | |||||||||||
Net asset value, beginning of period | $10.49 | $9.74 | $10.00 | |||||||||
|
|
|
|
|
| |||||||
Income From Investment Operations | ||||||||||||
Net investment income (b)(c) | .01 | .01 | .06 | |||||||||
Net realized and unrealized gain (loss) on investment and foreign currency transactions | 1.25 | .76 | (.32 | ) | ||||||||
|
|
|
|
|
| |||||||
Net increase (decrease) in net asset value from operations | 1.26 | .77 | (.26 | ) | ||||||||
|
|
|
|
|
| |||||||
Less: Dividends and Distributions | ||||||||||||
Dividends from net investment income | (.03 | ) | (.01 | ) | –0 | – | ||||||
Distributions from net realized gain on investment transactions | (.04 | ) | (.01 | ) | –0 | – | ||||||
|
|
|
|
|
| |||||||
Total dividends and distributions | (.07 | ) | (.02 | ) | –0 | – | ||||||
|
|
|
|
|
| |||||||
Net asset value, end of period | $11.68 | $10.49 | $9.74 | |||||||||
|
|
|
|
|
| |||||||
Total Return | ||||||||||||
Total investment return based on net asset value (d) | 12.04 | % | 7.90 | % | (2.60 | )% | ||||||
Ratios/Supplemental Data | ||||||||||||
Net assets, end of period (000’s omitted) | $387,519 | $220,663 | $51,687 | |||||||||
Ratio to average net assets of: | ||||||||||||
Expenses, net of waivers/reimbursements | 1.10 | % | 1.10 | % | 1.10 | %^ | ||||||
Expenses, before waivers/reimbursements | 1.14 | % | 1.29 | % | 2.45 | %^ | ||||||
Net investment income (c) | .05 | % | .12 | % | 1.02 | %^ | ||||||
Portfolio turnover rate | 52 | % | 51 | % | 68 | % | ||||||
| (a) | Commencement of operations. |
| (b) | Based on average shares outstanding. |
| (c) | Net of fees waived and expenses reimbursed by the Adviser. |
| (d) | Total investment return is calculated assuming an initial investment made at the net asset value at the beginning of the period, reinvestment of all dividends and distributions at net asset value during the period, and redemption on the last day of the period. Total return does not reflect (i) insurance company’s separate account related expense charges and (ii) the deductions of taxes that a shareholder would pay on Portfolio distributions or the redemption of Portfolio shares. Total investment return calculated for a period of less than one year is not annualized. |
| ^ | Annualized. |
See notes to financial statements.
47
| REPORTOF INDEPENDENT REGISTERED | ||
| PUBLIC ACCOUNTING FIRM | AllianceBernstein Variable Products Series Fund | |
To the Board of Directors and Shareholders of AllianceBernstein Dynamic Asset Allocation Portfolio:
We have audited the accompanying statement of assets and liabilities, including the portfolio of investments, of AllianceBernstein Dynamic Asset Allocation Portfolio (one of the funds constituting the AllianceBernstein Variable Products Series Fund, Inc. (the “Fund”)) as of December 31, 2013, and the related statement of operations for the year then ended, the statements of changes in net assets for each of the two years in the period then ended, and the financial highlights for each of the two years in the period then ended and the period April 1, 2011 (commencement of operations) through December 31, 2011. These financial statements and financial highlights are the responsibility of the Fund’s management. Our responsibility is to express an opinion on these financial statements and financial highlights based on our audits.
We conducted our audits in accordance with the standards of the Public Company Accounting Oversight Board (United States). Those standards require that we plan and perform the audit to obtain reasonable assurance about whether the financial statements and financial highlights are free of material misstatement. We were not engaged to perform an audit of the Fund’s internal control over financial reporting. Our audits included consideration of internal control over financial reporting as a basis for designing audit procedures that are appropriate in the circumstances, but not for the purpose of expressing an opinion on the effectiveness of the Fund’s internal control over financial reporting. Accordingly, we express no such opinion. An audit also includes examining, on a test basis, evidence supporting the amounts and disclosures in the financial statements and financial highlights, assessing the accounting principles used and significant estimates made by management, and evaluating the overall financial statement presentation. Our procedures included confirmation of securities owned as of December 31, 2013, by correspondence with the custodian and others, or by other appropriate auditing procedures where replies from others were not received. We believe that our audits provide a reasonable basis for our opinion.
In our opinion, the financial statements and financial highlights referred to above present fairly, in all material respects, the financial position of AllianceBernstein Dynamic Asset Allocation Portfolio (one of the funds constituting AllianceBernstein Variable Products Series Fund, Inc.) at December 31, 2013, the results of its operations for the year then ended, the changes in its net assets for each of the two years in the period then ended, and the financial highlights for each of the two years in the period then ended and the period April 1, 2011 (commencement of operations) through December 31, 2011, in conformity with U.S. generally accepted accounting principles.

New York, New York
February 14, 2014
48
| 2013 FEDERAL TAX INFORMATION (unaudited) | AllianceBernstein Variable Products Series Fund | |
For Federal income tax purposes, the following information is furnished with respect to the distributions paid by the Portfolio during the taxable year ended December 31, 2013. For corporate shareholders, 32.18% of dividends paid qualify for the dividends received deduction.
49
| DYNAMIC ASSET | ||
| ALLOCATION PORTFOLIO | AllianceBernstein Variable Products Series Fund | |
| BOARDOF DIRECTORS | ||
Marshall C. Turner, Jr.(1), Chairman John H. Dobkin(1) Michael J. Downey(1) William H. Foulk, Jr.(1) D. James Guzy(1) | Nancy P. Jacklin(1) Robert M. Keith, President and Garry L. Moody(1) Earl D. Weiner(1) | |
| OFFICERS | ||
Philip L. Kirstein, Senior Vice President and Daniel J. Loewy(2), Vice President Vadim Zlotnikov (2), Vice President | Emilie D. Wrapp, Secretary Joseph J. Mantineo, Treasurer and Phyllis J. Clarke, Controller Vincent S. Noto, Chief Compliance Officer | |
| CUSTODIANAND ACCOUNTING AGENT | LEGAL COUNSEL | |
| State Street Bank and Trust Company | Seward & Kissel LLP | |
| One Lincoln Street | One Battery Park Plaza | |
| Boston, MA 02111 | New York, NY 10004 | |
| DISTRIBUTOR | TRANSFER AGENT | |
| AllianceBernstein Investments, Inc. | AllianceBernstein Investor Services, Inc. | |
| 1345 Avenue of the Americas | P.O. Box 786003 | |
| New York, NY 10105 | San Antonio, TX 78278-6003 | |
| Toll-Free 1-(800) 221-5672 | ||
| INDEPENDENT REGISTERED PUBLIC | ||
| ACCOUNTING FIRM | ||
| Ernst & Young LLP | ||
| 5 Times Square | ||
| New York, NY 10036 |
| (1) | Member of the Audit Committee, the Governance and Nominating Committee and the Independent Directors Committee. Mr. Foulk is the sole member of the Fair Value Pricing Committee. |
| (2) | The day-to-day management of, and investment decisions for, the Portfolio’s portfolio are made by the Adviser’s Dynamic Asset Allocation Team. Daniel J. Loewy and Vadim Zlotnikov are the investment professionals primarily responsible for the day-to-day management of the Portfolio’s portfolio. |
50
| DYNAMIC ASSET ALLOCATION PORTFOLIO | ||
| MANAGEMENTOFTHE FUND | AllianceBernstein Variable Products Series Fund | |
Board of Directors Information
The business and affairs of the Fund are managed under the direction of the Board of Directors. Certain information concerning the Fund’s Directors is set forth below.
| NAME, ADDRESS*, AGE, (YEAR FIRST ELECTED**) | PRINCIPAL OCCUPATION(S) DURING PAST FIVE YEARS AND OTHER RELEVANT QUALIFICATIONS*** | PORTFOLIOS IN FUND COMPLEX OVERSEEN BY DIRECTOR | OTHER DIRECTORSHIP HELD BY DIRECTOR IN THE PAST FIVE YEARS | |||||
| INTERESTED DIRECTOR | ||||||||
Robert M. Keith, # 1345 Avenue of the Americas New York, NY 10105 53 (2010) | Senior Vice President of AllianceBernstein L.P. (the “Adviser”) and the head of AllianceBernstein Investments, Inc. (“ABI”) since July 2008; Director of ABI and President of the AllianceBernstein Mutual Funds. Previously, he served as Executive Managing Director of ABI from December 2006 to June 2008. Prior to joining ABI in 2006, Executive Managing Director of Bernstein Global Wealth Management, and prior thereto, Senior Managing Director and Global Head of Client Service and Sales of the Adviser’s institutional investment management business since 2004. Prior thereto, he was Managing Director and Head of North American Client Service and Sales in the Adviser’s institutional investment management business, with which he had been associated since prior to 2004. | 100 | None | |||||
| DISINTERESTED DIRECTORS | ||||||||
Marshall C. Turner, Jr., ## Chairman of the Board 72 (2005) | Private Investor since prior to 2009. Former CEO of Dupont Photomasks, Inc. (components of semi-conductor manufacturing), 2003–2006, and interim CEO 1999–2000. Interim CEO of MEMC Electronic Materials, Inc. (semi-conductor and solar cell substrates) from November 2008 until March 2009. He has extensive operating and early-stage investment experience, including prior service as general partner of three institutional venture capital partnerships, and serves on the boards of three education and science-related non-profit organizations. He has served as a director of one AllianceBernstein fund since 1992, and director or trustee of multiple AllianceBernstein funds since 2005. He is Chairman of the AllianceBernstein Funds since January 2014. | 100 | Xilinx, Inc. (programmable logic semi-conductors) and SunEdison, Inc. (semi-conductor substrates, solar materials and solar power plants) since prior to 2009 | |||||
John H. Dobkin, ## 72 (1992) | Independent Consultant since prior to 2009. Formerly, President of Save Venice, Inc. (preservation organization) from 2001–2002; Senior Advisor from June 1999–June 2000 and President of Historic Hudson Valley (historic preservation) from December 1989–May 1999. Previously, Director of the National Academy of Design. He has served as a director or trustee of various AllianceBernstein Funds since 1992, and as Chairman of the Audit Committees of a number of such Funds from 2001–2008. | 100 | None | |||||
51
| DYNAMIC ASSET ALLOCATION PORTFOLIO | ||
| MANAGEMENTOFTHE FUND | ||
| (continued) | AllianceBernstein Variable Products Series Fund | |
| NAME, ADDRESS*, AGE, (YEAR FIRST ELECTED**) | PRINCIPAL OCCUPATION(S) DURING PAST FIVE YEARS AND OTHER RELEVANT QUALIFICATIONS*** | PORTFOLIOS IN FUND COMPLEX OVERSEEN BY DIRECTOR | OTHER DIRECTORSHIP HELD BY DIRECTOR IN THE PAST FIVE YEARS | |||||
DISINTERESTED DIRECTORS (continued) | ||||||||
Michael J. Downey, ## 70 (2005) | Private Investor since prior to 2009. Formerly, managing partner of Lexington Capital, LLC (investment advisory firm) from December 1997 until December 2003. From 1987 until 1993, Chairman and CEO of Prudential Mutual Fund Management, director of the Prudential mutual funds, and member of the Executive Committee of Prudential Securities Inc. He has served as a director or trustee of the AllianceBernstein Funds since 2005 and is a director and Chairman of one other registered investment company. | 100 | Asia Pacific Fund, Inc. since prior to 2009, Prospect Acquisition Corp. (financial services) from 2007 until 2009, and The Merger Fund since prior to 2009 until 2013 | |||||
William H. Foulk, Jr., ##, ### 81 (1990) | Investment Adviser and an Independent Consultant since prior to 2009. Previously, he was Senior Manager of Barrett Associates, Inc., a registered investment adviser. He was formerly Deputy Comptroller and Chief Investment Officer of the State of New York and, prior thereto, Chief Investment Officer of the New York Bank for Savings. He has served as a director or trustee of various AllianceBernstein Funds since 1983, and has been Chairman of the Independent Directors Committee of the AllianceBernstein Funds since 2003. He served as Chairman of such Funds from 2003 through December 2013. He is also active in a number of mutual fund related organizations and committees. | 100 | None | |||||
D. James Guzy, ## 77 (2005) | Chairman of the Board of PLX Technology (semi-conductors) and of SRC Computers Inc., with which he has been associated since prior to 2009. He was a director of Intel Corporation (semi-conductors) from 1969 until 2008, and served as Chairman of the Finance Committee of such company for several years until May 2008. He was a Director of Cirrus Logic Corporation (semi-conductors) from 1984 until July 2011. He has served as a director or trustee of one or more of the AllianceBernstein Funds since 1982. | 100 | PLX Technology (semi-conductors) since prior to 2009, and Cirrus Logic Corporation (semi-conductors) since prior to 2009 until July 2011 | |||||
Nancy P. Jacklin, ## 65 (2006) | Professorial Lecturer at the Johns Hopkins School of Advanced International Studies since 2008. Formerly, U.S. Executive Director of the International Monetary Fund (December 2002–May 2006); Partner, Clifford Chance (1992–2002); Sector Counsel, International Banking and Finance, and Associate General Counsel, Citicorp (1985–1992); Assistant General Counsel (International), Federal Reserve Board of Governors (1982–1985); and Attorney Advisor, U.S. Department of the Treasury (1973–1982). Member of the Bar of the District of Columbia and of New York; and member of the Council on Foreign Relations. She has served as a director or trustee of the AllianceBernstein Funds since 2006. | 100 | None | |||||
52
| AllianceBernstein Variable Products Series Fund |
| NAME, ADDRESS*, AGE, (YEAR FIRST ELECTED**) | PRINCIPAL OCCUPATION(S) DURING PAST FIVE YEARS AND OTHER RELEVANT QUALIFICATIONS*** | PORTFOLIOS IN FUND COMPLEX OVERSEEN BY DIRECTOR | OTHER DIRECTORSHIP HELD BY DIRECTOR IN THE PAST FIVE YEARS | |||||
DISINTERESTED DIRECTORS (continued) | ||||||||
Garry L. Moody, ## 61 (2008) | Independent Consultant. Formerly, Partner, Deloitte & Touche LLP (1995–2008) where he held a number of senior positions, including Vice Chairman, and U.S. and Global Investment Management Practice Managing Partner; President, Fidelity Accounting and Custody Services Company (1993–1995); and Partner, Ernst & Young LLP (1975–1993), where he served as the National Director of Mutual Fund Tax Services and Managing Partner of its Chicago Office Tax department. He is a member of both the Governing Council of the Independent Directors Council (IDC), an organization of independent directors of mutual funds, and the Trustee Advisory Board of BoardIQ, a biweekly publication focused on issues and news affecting directors of mutual funds. He has served as a director or trustee, and as Chairman of the Audit Committee, of the AllianceBernstein Funds since 2008. | 100 | Greenbacker Renewable Energy Company LLC (renewable energy and energy efficiency projects) from August 2013 to January 2014 | |||||
Earl D. Weiner, ## 74 (2007) | Of Counsel, and Partner prior to January 2007, of the law firm Sullivan & Cromwell LLP and member of ABA Federal Regulation of Securities Committee Task Force to draft editions of the Fund Director’s Guidebook. He also serves as a director or trustee of various non-profit organizations and has served as Chairman or Vice Chairman of a number of them. He has served as a director or trustee of the AllianceBernstein Funds since 2007 and is Chairman of the Governance and Nominating Committees of the Funds. | 100 | None | |||||
| * | The address for each of the Fund’s disinterested Directors is c/o AllianceBernstein L.P., Attention: Philip L. Kirstein, 1345 Avenue of the Americas, New York, NY 10105. |
| ** | There is no stated term of office for the Fund’s Directors. |
| *** | The information above includes each Director’s principal occupation during the last five years and other information relating to the experience, attributes and skills relevant to each Director’s qualifications to serve as a Director, which led to the conclusion that each Director should serve as a Director for the Fund. |
| # | Mr. Keith is an “interested person” of the Fund, as defined in the 1940 Act, due to his position as a Senior Vice President of the Adviser. |
| ## | Member of the Audit Committee, the Governance and Nominating Committee and the Independent Directors Committee. |
| ### | Member of the Fair Value Pricing Committee. |
53
| DYNAMIC ASSET ALLOCATION PORTFOLIO | ||
| MANAGEMENTOFTHE FUND | ||
| (continued) | AllianceBernstein Variable Products Series Fund | |
Officer Information
Certain information concerning the Portfolio’s Officers is listed below.
| NAME, ADDRESS* AND AGE | PRINCIPAL POSITION(S) HELD WITH FUND | PRINCIPAL OCCUPATION DURING PAST FIVE YEARS | ||
Robert M. Keith 53 | President and Chief Executive Officer | See biography above. | ||
Philip L. Kirstein 68 | Senior Vice President and Independent Compliance Officer | Senior Vice President and Independent Compliance Officer of the AllianceBernstein Funds, with which he has been associated since October 2004. Prior thereto, he was Of Counsel to Kirkpatrick & Lockhart, LLP from October 2003 to October 2004, and General Counsel of Merrill Lynch Investment Managers, L.P. since prior to March 2003. | ||
Daniel J. Loewy 39 | Vice President | Senior Vice President of the Adviser,** with which he has been associated since prior to 2009. | ||
Vadim Zlotnikov 51 | Vice President | Senior Vice President of the Adviser,** with which he has been associated since prior to 2009. | ||
Emilie D. Wrapp 58 | Secretary | Senior Vice President, Assistant General Counsel, and Assistant Secretary of ABI,** with which she has been associated since prior to 2009. | ||
Joseph J. Mantineo 54 | Treasurer and Chief Financial Officer | Senior Vice President of ABIS,** with which he has been associated since prior to 2009. | ||
Phyllis J. Clarke 53 | Controller | Vice President of ABIS,** with which she has been associated since prior to 2009. | ||
Vincent S. Noto 49 | Chief Compliance Officer | Chief Compliance Officer of the AllianceBernstein Funds, and Vice President of ABIS,** with which he has been associated since prior to 2009. |
| * | The address for each of the Portfolio’s Officers is 1345 Avenue of the Americas, New York, NY 10105. |
| ** | The Adviser, ABIS and ABI are affiliates of the Fund. |
| The Fund’s Statement of Additional Information (“SAI”) has additional information about the Fund’s Directors and Officers and is available without charge upon request. Contact your financial representative or AllianceBernstein at (800) 227-4618, or visit www.alliancebernstein.com, for a free prospectus or SAI. |
54
| DYNAMIC ASSET ALLOCATION PORTFOLIO | ||
| CONTINUANCE DISCLOSURE | AllianceBernstein Variable Products Series Fund | |
INFORMATION REGARDING THE REVIEW AND APPROVAL OF THE PORTFOLIO’S ADVISORY AGREEMENT
The disinterested directors (the “directors”) of AllianceBernstein Variable Products Series Fund, Inc. (the “Fund”) unanimously approved the continuance of the Fund’s Advisory Agreement with the Adviser in respect of AllianceBernstein Dynamic Asset Allocation Portfolio (the “Portfolio”) at a meeting held on August 6-8, 2013.
Prior to approval of the continuance of the Advisory Agreement, the directors had requested from the Adviser, and received and evaluated, extensive materials. They reviewed the proposed continuance of the Advisory Agreement with the Adviser and with experienced counsel who are independent of the Adviser, who advised on the relevant legal standards. The directors also reviewed an independent evaluation prepared by the Fund’s Senior Officer (who is also the Fund’s Independent Compliance Officer) of the reasonableness of the advisory fee, in which the Senior Officer concluded that the contractual fee for the Portfolio was reasonable. The directors also discussed the proposed continuance in private sessions with counsel and the Fund’s Senior Officer.
The directors considered their knowledge of the nature and quality of the services to be provided by the Adviser to the Portfolio gained from their experience as directors or trustees of most of the registered investment companies advised by the Adviser, their overall confidence in the Adviser’s integrity and competence they have gained from that experience, the Adviser’s initiative in identifying and raising potential issues with the directors and its responsiveness, frankness and attention to concerns raised by the directors in the past, including the Adviser’s willingness to consider and implement organizational and operational changes designed to improve investment results and the services provided to the AllianceBernstein Funds. The directors noted that they have four regular meetings each year, at each of which they receive presentations from the Adviser on the investment results of the Portfolio and review extensive materials and information presented by the Adviser.
The directors also considered all other factors they believed relevant, including the specific matters discussed below. In their deliberations, the directors did not identify any particular information that was all-important or controlling, and different directors may have attributed different weights to the various factors. The directors determined that the selection of the Adviser to manage the Portfolio and the overall arrangements between the Portfolio and the Adviser, as provided in the Advisory Agreement, including the advisory fee, were fair and reasonable in light of the services performed, expenses incurred and such other matters as the directors considered relevant in the exercise of their business judgment. The material factors and conclusions that formed the basis for the directors’ determinations included the following:
Nature, Extent and Quality of Services Provided
The directors considered the scope and quality of services provided by the Adviser under the Advisory Agreement, including the quality of the investment research capabilities of the Adviser and the other resources it has dedicated to performing services for the Portfolio. They noted the professional experience and qualifications of the Portfolio’s portfolio management team and other senior personnel of the Adviser. The directors also considered that the Advisory Agreement provides that the Portfolio will reimburse the Adviser for the cost to it of providing certain clerical, accounting, administrative and other services to the Portfolio by employees of the Adviser or its affiliates. Requests for these reimbursements are made on a quarterly basis and subject to approval by the directors. Reimbursements, to the extent requested and paid, result in a higher rate of total compensation from the Portfolio to the Adviser than the fee rate stated in the Advisory Agreement. The directors noted that the methodology used to determine the reimbursement amounts had been reviewed by an independent consultant retained by the Fund’s Senior Officer. The quality of administrative and other services, including the Adviser’s role in coordinating the activities of the Portfolio’s other service providers, also were considered. The directors concluded that, overall, they were satisfied with the nature, extent and quality of services provided to the Portfolio under the Advisory Agreement.
Costs of Services Provided and Profitability
The directors reviewed a schedule of the revenues, expenses and related notes indicating the profitability of the Portfolio to the Adviser for the fiscal period ended December 2011 and calendar year 2012 that had been prepared with an expense allocation methodology arrived at in consultation with an independent consultant retained by the Fund’s Senior Officer. The directors noted the assumptions and methods of allocation used by the Adviser in preparing fund-specific profitability data and understood that there are a number of potentially acceptable allocation methodologies for information of this type. The directors noted that the profitability information reflected all revenues and expenses of the Adviser’s relationship with the Portfolio, including those relating to its subsidiaries which provide transfer agency, distribution and brokerage services to the Portfolio. The directors recognized that it is difficult to make comparisons of profitability of the Advisory Agreement with
55
| DYNAMIC ASSET ALLOCATION PORTFOLIO | ||
| CONTINUANCE DISCLOSURE | ||
| (continued) | AllianceBernstein Variable Products Series Fund | |
advisory contracts for unaffiliated funds because comparative information is not generally publicly available and is affected by numerous factors. The directors focused on the profitability of the Adviser’s relationship with the Portfolio before taxes and distribution expenses. The directors noted that the Adviser’s relationship with the Portfolio (April 2011 inception) was not profitable to it in 2011. The directors were satisfied that the Adviser’s level of profitability from its relationship with the Portfolio in 2012 was not unreasonable.
Fall-Out Benefits
The directors considered the other benefits to the Adviser and its affiliates from their relationships with the Portfolio, including but not limited to benefits relating to soft dollar arrangements (whereby the Adviser receives brokerage and research services from brokers that execute transactions for certain clients, including the Portfolio); 12b-1 fees and sales charges received by the Fund’s principal underwriter (which is a wholly owned subsidiary of the Adviser) in respect of the Portfolio’s Class B shares; transfer agency fees paid by the Portfolio to a wholly owned subsidiary of the Adviser; and brokerage commissions paid by the Portfolio to brokers affiliated with the Adviser. The directors recognized that the Portfolio’s unprofitability to the Adviser would be exacerbated without these benefits. The directors understood that the Adviser also might derive reputational and other benefits from its association with the Portfolio.
Investment Results
In addition to the information reviewed by the directors in connection with the meeting, the directors receive detailed performance information for the Portfolio at each regular Board meeting during the year. At the August 2013 meeting, the directors reviewed information prepared by Lipper showing the performance of the Class A Shares of the Portfolio as compared with that of a group of similar funds selected by Lipper (the “Performance Group”) and as compared with that of a broader array of funds selected by Lipper (the “Performance Universe”), and information prepared by the Adviser showing performance of the Class A Shares as compared with the Morgan Stanley Capital International (MSCI) World Index, the Barclays Capital (BC) U.S. Treasury Index and its composite index (a 60%/40% blend of the MSCI World Index and the BC U.S. Treasury Index), in each case for the 1-year period ended May 31, 2013 and (in the case of comparison with the indices) the since inception period (April 2011 inception). The directors noted that the Portfolio was in the 5th quintile of the Performance Group and 4th quintile of the Performance Universe for the 1-year period. It outperformed the BC U.S. Treasury Index in the 1-year period and the period since inception but lagged the MSCI World Index and its composite index in both periods. Based on their review, the directors concluded that the Portfolio’s performance in its short period of operations was acceptable.
Advisory Fees and Other Expenses
The directors considered the advisory fee rate paid by the Portfolio to the Adviser and information prepared by Lipper concerning advisory fee rates paid by other funds in the same Lipper category as the Portfolio at a common asset level. The directors recognized that it is difficult to make comparisons of advisory fees because there are variations in the services that are included in the fees paid by other funds.
The directors also considered the fees the Adviser charges non-fund clients pursuing a substantially similar investment style. For this purpose, they reviewed the relevant fee information from the Adviser’s Form ADV and the evaluation from the Fund’s Senior Officer. The directors noted that the institutional fee schedule and the Portfolio’s fee schedule started at different rates and that the institutional fee schedule had breakpoints. The application of the institutional fee schedule to the Portfolio’s net assets would result in a fee rate lower than the rate being paid by the Portfolio. The directors noted that the Adviser may, in some cases, agree to fee rates with large institutional clients that are lower than those reviewed by the directors and that they had previously discussed with the Adviser its policies in respect of such arrangements. The directors also reviewed information that indicated that the Portfolio’s fee rate is higher than the sub-advisory fee rate earned by the Adviser for sub-advising other registered investment companies pursuing a similar investment style.
The Adviser reviewed with the directors the significantly greater scope of the services it provides to the AllianceBernstein Funds relative to institutional clients and sub-advised funds. The Adviser noted that because mutual funds are constantly issuing and redeeming shares, they are more difficult to manage than an institutional account, where the assets tend to be relatively stable. In light of the substantial differences in services rendered by the Adviser to institutional clients as compared to funds such as the Portfolio, the directors considered these fee comparisons inapt and did not place significant weight on them in their deliberations.
56
| AllianceBernstein Variable Products Series Fund |
The directors noted that the Portfolio may invest in shares of exchange-traded funds (“ETFs”). The directors noted that ETFs pay advisory fees pursuant to their advisory contracts, and that the Adviser had provided, and they had reviewed, information about the expense ratios of the relevant ETFs. The Adviser explained how it uses ETFs when they represent the least expensive way to obtain desired exposures for a fund or to temporarily “equitize” cash inflows pending purchases of underlying securities. The directors concluded that the advisory fee for the Portfolio would be paid for services that would be in addition to, rather than duplicative of, the services to be provided under the advisory contracts of the ETFs.
The directors also considered the total expense ratio of the Class A shares of the Portfolio in comparison to the fees and expenses of funds within two comparison groups created by Lipper: an Expense Group and an Expense Universe. Lipper described an Expense Group as a representative sample of funds similar to the Portfolio and an Expense Universe as a broader group, consisting of all funds in the investment classification/objective with a similar load type as the Portfolio.
The total expense ratio of the Portfolio reflected fee waivers and/or expense reimbursements as a result of an expense cap by the Adviser. The directors noted that it was likely that the expense ratios of some of the other funds in the Portfolio’s Lipper category also were lowered by waivers or reimbursements by those funds’ investment advisers, which in some cases might be voluntary or temporary. The directors view the expense ratio information as relevant to their evaluation of the Adviser’s services because the Adviser is responsible for coordinating services provided to the Portfolio by others.
The information reviewed by the directors showed that, at the Portfolio’s current size, its contractual effective advisory fee rate of 70 basis points was the same as the Expense Group median. The directors noted that the administrative expense reimbursement was 3.5 basis points in the Portfolio’s latest fiscal year, and that as a result the rate of total compensation received by the Adviser pursuant to the Advisory Agreement was higher than the Expense Group median. The directors noted that the Portfolio’s total expense ratio, giving effect to a cap by the Adviser, was higher than the Expense Group and the Expense Universe medians. The directors concluded that the Portfolio’s expense ratio was acceptable.
Economies of Scale
The directors noted that the advisory fee schedule for the Portfolio does not contain breakpoints that reduce the fee rates on assets above specified levels and that they had previously discussed their strong preference for breakpoints in advisory contracts with the Adviser. The directors also considered prior presentations by an independent consultant on economies of scale in the mutual fund industry and for the AllianceBernstein Funds, and by the Adviser concerning certain of its views on economies of scale. The directors also had requested and received from the Adviser certain updates on economies of scale at the May 2013 meeting. The directors believe that economies of scale may be realized (if at all) by the Adviser across a variety of products and services, and not only in respect of a single fund. The directors noted that there is no established methodology for setting breakpoints that give effect to the fund-specific services provided by a fund’s adviser and to the economies of scale that an adviser may realize in its overall mutual fund business or those components of it which directly or indirectly affect a fund’s operations. The directors observed that in the mutual fund industry as a whole, as well as among funds similar to the Portfolio, there is no uniformity or pattern in the fees and asset levels at which breakpoints (if any) apply. The directors also noted that the advisory agreements for many funds do not have breakpoints at all. The directors informed the Adviser that they would monitor the Portfolio’s assets level and its profitability to the Adviser and anticipated revisiting the question of breakpoints in the future if circumstances warranted doing so.
57
| DYNAMIC ASSET ALLOCATION PORTFOLIO | ||
| SENIOR OFFICER FEE EVALUATION | AllianceBernstein Variable Products Series Fund | |
THE FOLLOWING IS NOT PART OF THE SHAREHOLDER REPORT OR THE FINANCIAL STATEMENTS
SUMMARY OF SENIOR OFFICER’S EVALUATION OF INVESTMENT ADVISORY AGREEMENT1
The following is a summary of the evaluation of the Investment Advisory Agreement between AllianceBernstein L.P. (the “Adviser”) and the AllianceBernstein Variable Products Series Fund (the “Fund”), in respect of AllianceBernstein Dynamic Asset Allocation Portfolio (the “Portfolio”).2,3 The evaluation of the Investment Advisory Agreement was prepared by Philip L. Kirstein, the Senior Officer of the Fund, for the Directors of the Fund, as required by the August 2004 agreement between the Adviser and the New York State Attorney General (the “NYAG”). The purpose of the summary is to provide shareholders with a synopsis of the independent evaluation of the reasonableness of the advisory fees proposed to be paid by the Portfolio which was provided to the Directors in connection with their review of the proposed approval of the continuance of the Investment Advisory Agreement.
The Senior Officer’s evaluation considered the following factors:
| 1. | Management fees charged to institutional and other clients of the Adviser for like services; |
| 2. | Management fees charged by other mutual fund companies for like services; |
| 3. | Costs to the Adviser and its affiliates of supplying services pursuant to the advisory agreement, excluding any intra-corporate profit; |
| 4. | Profit margins of the Adviser and its affiliates from supplying such services; |
| 5. | Possible economies of scale as the Portfolio grows larger; and |
| 6. | Nature and quality of the Adviser’s services including the performance of the Portfolio. |
These factors, with the exception of the first factor, are generally referred to as the “Gartenberg factors,” which were articulated by the United States Court of Appeals for the Second Circuit in 1982. Gartenberg v. Merrill Lynch Asset Management, Inc., 694 F. 2d 923 (2d Cir. 1982). The first factor is an additional factor required to be considered by the Assurance of Discontinuance between the NYAG and the Adviser. On March 30, 2010, the Supreme Court held the Gartenberg decision was correct in its basic formulation of what §36(b) requires: to face liability under §36(b), “an investment adviser must charge a fee that is so disproportionately large that it bears no reasonable relationship to the services rendered and could not have been the product of arm’s length bargaining.” Jones v. Harris Associates L.P., 130 S. Ct. 1418 (2010). In the Jones decision, the Court stated the Gartenberg approach fully incorporates the correct understanding of fiduciary duty within the context of section 36(b) and noted with approval that “Gartenberg insists that all relevant circumstances be taken into account” and “uses the range of fees that might result from arm’s-length bargaining as the benchmark for reviewing challenged fees.”
PORTFOLIO ADVISORY FEES, NET ASSETS & EXPENSE RATIOS
The Adviser proposed that the Portfolio pays the advisory fee set forth in the table below for receiving the services to be provided pursuant to the Investment Advisory Agreement.
| Portfolio | Net Assets 06/30/13 ($MM) | Advisory Fee | ||||
Dynamic Asset Allocation Portfolio | $ | 278.1 | 0.70% of Average Daily Net Assets | |||
The Adviser is reimbursed as specified in the Investment Advisory Agreement for certain clerical, legal, accounting, administrative and other services provided to the Portfolio. During the Portfolio’s most recently completed fiscal year, the Adviser received $49,297 (0.035% of the Portfolio’s average daily net assets) for such services.
| 1 | The information in the fee evaluation was completed on July 25, 2013 and discussed with the Board of Directors on August 6-8, 2013. |
| 2 | Future references to the Fund and the Portfolio do not include “AllianceBernstein.” References in the fee summary pertaining to performance and expense ratios refer to the Class A shares of the Portfolio. |
| 3 | The Portfolio commenced operation on April 1, 2011. |
58
| AllianceBernstein Variable Products Series Fund |
The Adviser agreed to waive that portion of its management fees and/or reimburse the Portfolio for that portion of its total operating expenses to the degree necessary to limit the Portfolio’s expense ratios to the amounts set forth below for the Portfolio’s current fiscal year. The agreement for such reimbursement is terminable by the Adviser upon at least 60 days’ notice prior to the Portfolio’s prospectus update. Set forth below are the Portfolio’s gross expense ratios for the most recently completed fiscal year:
| Portfolio | Expense Cap Pursuant to Expense Limitation Undertaking | Gross Expense Ratio (12/31/12) | Fiscal Year End | |||||
Dynamic Asset Allocation Portfolio | Class A 0.85% | 1.22% | December 31 | |||||
| Class B 1.10% | 1.29% | |||||||
I. ADVISORY FEES CHARGED TO INSTITUTIONAL AND OTHER CLIENTS
The advisory fees charged to investment companies which the Adviser manages and sponsors are normally higher than those charged to similar sized institutional accounts, including pension plans and sub-advised investment companies. The fee differential reflects, among other things, different services provided to such clients, and different liabilities assumed. Services provided by the Adviser to the Portfolio that are not provided to non-investment company clients and sub-advised investment companies include providing office space and personnel to serve as Fund Officers, who among other responsibilities make the certifications required under the Sarbanes–Oxley Act of 2002, and coordinating with and monitoring the Portfolio’s third party service providers such as Fund counsel, auditors, custodians, transfer agents and pricing services. The accounting, administrative, legal and compliance requirements for the Portfolio are more costly than those for institutional assets due to the greater complexities and time required for investment companies, although as previously noted, the Adviser is reimbursed by the Portfolio for providing such services. Also, retail mutual funds managed by the Adviser are widely held. Servicing the Portfolio’s investors is more time consuming and labor intensive compared to institutional clients since the Adviser needs to communicate with a more extensive network of financial intermediaries and shareholders. The Adviser also believes that it incurs substantial entrepreneurial risk when offering a new mutual fund, since establishing a new mutual fund requires a large upfront investment, and it may take a long time for the fund to achieve profitability since the fund must be priced to scale from inception in order to be competitive and assets are acquired one account at a time. In addition, managing the cash flow of an investment company may be more difficult than managing that of a stable pool of assets, such as an institutional account with little cash movement in either direction, particularly, if a fund is in net redemption and the Adviser is frequently forced to sell securities to raise cash for redemptions. However, managing a fund with positive cash flow may be easier at times than managing a stable pool of assets. In recent years, investment advisers have been sued by institutional clients and have suffered reputational damage both by the attendant publicity and outcomes other than complete victories. Accordingly, the legal and reputational risks associated with institutional accounts are greater than previously thought, although still not equal to those related to the mutual fund industry.
Notwithstanding the Adviser’s view that managing an investment company is not comparable to managing other institutional accounts because the services provided are different, the Supreme Court has indicated consideration should be given to the advisory fees charged to institutional accounts that have a substantially similar investment style as the Portfolio.4 In
| 4 | The Supreme Court stated that “courts may give such comparisons the weight that they merit in light of the similarities and differences between the services that the clients in question require, but the courts must be wary of inapt comparisons.” Among the significant differences the Supreme Court noted that may exist between services provided to mutual funds and institutional accounts are “higher marketing costs.” Jones v. Harris at 1428. |
59
| DYNAMIC ASSET ALLOCATION PORTFOLIO | ||
| SENIOR OFFICER FEE EVALUATION | ||
| (continued) | AllianceBernstein Variable Products Series Fund | |
addition to the AllianceBernstein institutional fee schedule, set forth below is what would have been the effective advisory fee of the Portfolio had the AllianceBernstein institutional fee schedule been applicable to the Portfolio versus the Portfolio’s advisory fee based on June 30, 2013 net assets:5
| Portfolio | Net Assets 6/30/13 ($MM) | AllianceBernstein Institutional Fee Schedule | Effective AB Inst. Adv. Fee | Portfolio Advisory Fee | ||||||||||
Dynamic Asset Allocation Portfolio | $ | 278.1 | Dynamic Balanced 0.50% on 1st $500 million 0.40% on the balance | 0.400 | % | 0.700 | % | |||||||
| Minimum account size: $250m | ||||||||||||||
The Adviser manages AllianceBernstein Dynamic All Market Fund—(“Dynamic All Market Fund”), a retail mutual fund which has a somewhat similar investment style as the Portfolio. The advisory fee schedule of Dynamic All Market Fund is set forth below.
| Portfolio | AB Fund | Fee Schedule | ||
Dynamic Asset Allocation Portfolio | Dynamic All Market Fund | 0.60% (flat fee) |
The Adviser manages the Sanford C. Bernstein Fund, Inc. Overlay Portfolios (the “Overlay Portfolios”), which utilize the Adviser’s dynamic asset allocation strategy. Unlike the Portfolio, the Overlay Portfolios are not designed as stand-alone investments and are used in conjunction with globally diversified Private Client portfolios.6 The advisory fee schedules of the Overlay Portfolios are set forth below.
| Portfolio | Overlay Portfolio | Fee7 | ||
Dynamic Asset Allocation Portfolio | Overlay A Portfolio Tax-Aware Overlay A Portfolio | 0.90% (flat rate) | ||
Overlay B Portfolio Tax-Aware Overlay B Portfolio Tax-Aware Overlay C Portfolio Tax-Aware Overlay N Portfolio | 0.65% (flat rate) | |||
The Adviser provides sub-advisory services to certain other investment companies managed by other fund families that have an investment style similar to that of the Portfolio. The Adviser charges the fees set forth below for the sub-advisory relationship that has a somewhat similar investment style as the Portfolio. Also shown is the Portfolio’s advisory fee and what would have been the effective advisory fees of the Portfolio had the fee schedules of the sub-advisory relationships been applicable to the Portfolio based on June 30, 2013 net assets.
| 5 | The Adviser has indicated that with respect to institutional accounts with assets greater than $300 million, it will negotiate a fee schedule. Discounts that are negotiated vary based upon each client relationship. |
| 6 | Overlay A Portfolio and Tax-Aware Overlay A Portfolio are intended for use in Private Client accounts that have a higher equity weighting. The other Overlay Portfolios are intended for use in Private Client accounts that have a higher fixed income weighting. The Overlay Portfolios will gain exposure to various asset classes through direct investments in equity and debt securities as well as derivatives. |
| 7 | The advisory fees of each Overlay Portfolio are based on the percentage of each portfolio’s average daily net assets, not an aggregate of the assets in the portfolios shown. |
60
| AllianceBernstein Variable Products Series Fund |
| Portfolio | Fee Schedule | Effective Sub-Adv. Fee | Portfolio Advisory Fee | |||||||||
Dynamic Asset Allocation Portfolio | Client #1 | 0.40% on 1st $250 million 0.35% on next $250 million 0.325% on next $500 million 0.30% on the balance | 0.395% | 0.700% | ||||||||
| Client #2 | 0.40% on first $100 million 0.35% on next $100 million 0.30% on the balance | 0.354% | 0.700% | |||||||||
| Client #38 | 0.35% on first $400 million 0.30% on the balance | 0.350% | 0.700% | |||||||||
| Client #4 | 0.18% on first $500 million 0.15% on next $1 billion 0.12% on the balance | 0.180% | 0.700% | |||||||||
It is fair to note that the services the Adviser provides pursuant to sub-advisory agreements are generally confined to the services related to the investment process; in other words, they are not as comprehensive as the services provided to the Portfolio by the Adviser. In addition, to the extent that certain of these sub-advisory relationships are with affiliates of the Adviser, the fee schedules may not reflect arm’s length bargaining or negotiations.
While it appears that the sub-advisory relationship is paying a lower fee than the Portfolio, it is difficult to evaluate the relevance of such a lower fee due to differences in terms of the services provided, risks involved and other competitive factors between the Portfolio and the sub-advisory relationship. There could be various business reasons why an investment adviser would be willing to provide a sub-advisory relationship investment related services at a different fee level than an investment company it is sponsoring where the investment adviser is providing all the services, not just investment management, generally required by a registered investment company.
II. MANAGEMENT FEES CHARGED BY OTHER MUTUAL FUND COMPANIES FOR LIKE SERVICES.
Lipper, Inc. (“Lipper”), an analytical service that is not affiliated with the Adviser, compared the fees charged to the Portfolio with fees charged to other investment companies for similar services offered by other investment advisers.9 Lipper’s analysis included the Portfolio’s contractual management fee10 estimated at the approximate current asset level of the Portfolio to the median of the Portfolio’s Lipper Expense Group (“EG”).11
Lipper describes an EG as a representative sample of comparable funds. Lipper’s standard methodology for screening funds to be included in an EG entails the consideration of several fund criteria, including fund type, investment classification/objective, load type and similar 12b-1/non-12b-1 service fees, asset (size) comparability, expense components and attributes. An EG will typically consist of seven to twenty funds.
| Portfolio | Contractual Fee12 | Lipper EG Median (%) | Lipper EG Rank | |||||||||
Dynamic Asset Allocation Portfolio | 0.700 | 0.700 | 4/7 | |||||||||
| 8 | The client is an affiliate of the Adviser. |
| 9 | The Supreme Court cautioned against accepting mutual fund fee comparisons without careful scrutiny since “these comparisons are problematic because these fees, like those challenged, may not be the product of the negotiations conducted at arm’s length.” Jones v. Harris at 1429. |
| 10 | The contractual management fee is calculated by Lipper using the Portfolio’s contractual management fee rate at a hypothetical asset level. The hypothetical asset level is based on the combined net assets of all classes of the Portfolio, rounded up to the next $25 million. Lipper’s total expense ratio information is based on the most recent annual report except as otherwise noted. A ranking of “1” would mean that the Portfolio had the lowest effective fee rate in the Lipper peer group. |
| 11 | Lipper does not consider average account size when constructing EGs. Funds with relatively small average account sizes tend to have higher transfer agent expense ratios than comparable sized funds that have relatively large average account sizes. In addition, there are limitations in Lipper’s expense category data because different funds categorize expenses differently. |
| 12 | The contractual management fee would not reflect any expense reimbursements made by the Portfolio to the Adviser for certain clerical, legal, accounting, administrative and other services. In addition, the contractual management fee does not reflect any advisory fee waivers for expense caps that would effectively reduce the actual management fee. |
61
| DYNAMIC ASSET ALLOCATION PORTFOLIO | ||
| SENIOR OFFICER FEE EVALUATION | ||
| (continued) | AllianceBernstein Variable Products Series Fund | |
Lipper also compared the Portfolio’s most recently completed fiscal year total expense ratio to the medians of the Portfolio’s EG and Lipper Expense Universe (“EU”). The EU is a broader group compared to the EG, consisting of all funds that have the same investment classification/objective and load type as the subject Portfolio.13
| Portfolio | Total Expense | Lipper EG Median (%) | Lipper Rank | Lipper EU Median (%) | Lipper Rank | |||||||||||||||
Dynamic Asset Allocation Portfolio | 0.856 | 0.730 | 5/7 | 0.734 | 6/9 | |||||||||||||||
Based on this analysis, the Portfolio has a more favorable ranking on a contractual management fee basis than on a total expense ratio basis.
III. COSTS TO THE ADVISER AND ITS AFFILIATES OF SUPPLYING SERVICES PURSUANT TO THE ADVISORY FEE ARRANGEMENT, EXCLUDING ANY INTRA-CORPORATE PROFIT.
The Adviser utilizes two profitability reporting systems, which operate independently but are aligned with each other, to estimate the Adviser’s profitability in connection with investment advisory services provided to the Portfolio. The Senior Officer has retained a consultant to provide independent advice regarding the alignment of the two profitability systems as well as the methodologies and allocations utilized by both profitability systems.
IV. PROFIT MARGINS OF THE ADVISER AND ITS AFFILIATES FOR SUPPLYING SUCH SERVICES.
The Portfolio’s profitability information, prepared by the Adviser for the Board of Directors, was reviewed by the Senior Officer and the consultant. The Adviser’s profitability from providing investment advisory services to the Portfolio was positive for calendar year 2012.
In addition to the Adviser’s direct profits from managing the Portfolio, certain of the Adviser’s affiliates have business relationships with the Portfolio and may earn a profit from providing other services to the Portfolio. The courts have referred to this type of business opportunity as “fall-out benefits” to the Adviser and indicated that such benefits should be factored into the evaluation of the total relationship between the Portfolio and the Adviser. Neither case law nor common business practice precludes the Adviser’s affiliates from earning a reasonable profit on this type of relationship. These affiliates provide transfer agent, distribution and brokerage related services to the Portfolio and receive transfer agent fees, Rule 12b-1 payments, and brokerage commissions. In addition, the Adviser benefits from soft dollar arrangements which offset expenses the Adviser would otherwise incur.
The Portfolio has adopted a distribution plan for Class B shares pursuant to Rule 12b-1 under the 40 Act. Under the distribution plan, the Portfolio pays distribution and servicing fees to its principal underwriter and distributor, AllianceBernstein Investments, Inc. (“ABI”), an affiliate of the Adviser, at an annual rate of up to 0.50% of the Portfolio’s average daily net assets attributable to Class B shares. The current annual rate that the Portfolio pays to ABI for 12b-1 fees is 0.25%. During the fiscal year ended December 31, 2012, ABI received $347,719 in Rule 12b-1 fees from the Portfolio.
During the fiscal year ended December 31, 2012, the Adviser incurred distribution expenses in the amount of $901,573 in connection with activities primarily intended to result in the sale of the Portfolio’s Class B shares. This amount includes the 12b-1 fees paid by the Portfolio to the Adviser.
Financial intermediaries, such as insurers, market and sell shares of the Portfolio and typically receive compensation from ABI, the Advisers and/or the Portfolio for selling shares of the Portfolio. These financial intermediaries receive compensation in any or all of the following forms: 12b-1 fees, defrayal of costs for educational seminars and training, additional distribution support, recordkeeping and/or administrative services. Payments related to providing contract-holder recordkeeping and/or administrative services will generally not exceed 0.35% of the average daily net assets of the Portfolio attributable to the relevant intermediary over the year.
The transfer agent of the Portfolio is AllianceBernstein Investor Services, Inc. (“ABIS”). During the most recently completed fiscal year, ABIS received a fee of approximately $1,385 from the Portfolio.15
| 13 | Except for asset (size) comparability, Lipper uses the same criteria for selecting an EG when selecting an EU. Unlike the EG, the EU allows for the same adviser to be represented by more than just one fund. |
| 14 | Most recently completed fiscal year Class A total expense ratio. |
| 15 | The Fund (which includes the Portfolio and other series of the Fund) paid ABIS a flat fee of $18,000 in 2010. |
62
| AllianceBernstein Variable Products Series Fund |
The Portfolio did not effect any brokerage transactions through the Adviser’s affiliate, Sanford C. Bernstein & Co., LLC (“SCB & Co.”) and/or its U.K. affiliate, Sanford C. Bernstein Limited (“SCB Ltd.”), collectively “SCB,” and pay commissions for such transactions during the Portfolio’s most recently completed fiscal year. The Adviser represented that SCB’s profitability from any future business conducted with the Portfolio would be comparable to the profitability of SCB’s dealings with other similar third party clients. In the ordinary course of business, SCB receives and pays liquidity rebates from electronic communications networks (“ECNs”) derived from trading for its clients. These credits and charges are not being passed onto any SCB client. The Adviser also receives certain soft dollar benefits from brokers that execute agency trades for its clients. These soft dollar benefits reduce the Adviser’s cost of doing business and increase its profitability.
V. POSSIBLE ECONOMIES OF SCALE
The Adviser has indicated that economies of scale are being shared with shareholders through pricing to scale, breakpoints, fee reductions/waivers and enhancement to services.
In May 2012, an independent consultant, retained by the Senior Officer, provided the Board of Directors information on the Adviser’s firm-wide average costs from 2005 through 2011 and the potential economies of scale. The independent consultant noted that from 2005 through 2007 the Adviser experienced significant growth in assets under management (“AUM”). During this period, operating expenses increased, in part to keep up with growth, and in part reflecting market returns. However, from 2008 through the first quarter of 2009, AUM rapidly and significantly decreased due to declines in market value and client withdrawals. When AUM rapidly decreased, some operating expenses categories, including base compensation and office space, adjusted more slowly during this period, resulting in an increase in average costs. Since 2009, AUM has experienced less significant changes. The independent consultant noted that changes in operating expenses reflect changes in business composition and business practices in response to changes in financial markets. Finally, the independent consultant concluded that the increase in average cost and the decline in net operating margin across the Adviser since late 2008 are inconsistent with the view that there are currently reductions in average costs due to economies of scale that can be shared with the AllianceBernstein Mutual Funds managed by the Adviser through lower fees.
Previously, in February 2008, the independent consultant provided the Board of Directors an update of the Deli16 study on advisory fees and various fund characteristics.17 The independent consultant first reiterated the results of his previous two dimensional comparison analysis (fund size and family size) with the Board of Directors.18 The independent consultant then discussed the results of the regression model that was utilized to study the effects of various factors on advisory fees. The regression model output indicated that the bulk of the variation in fees predicted were explained by various factors, but substantially by fund AUM, family AUM, index fund indicator and investment style. The independent consultant also compared the advisory fees of the AllianceBernstein Mutual Funds to similar funds managed by 19 other large asset managers, regardless of the fund size and each Adviser’s proportion of mutual fund assets to non-mutual fund assets.
VI. NATURE AND QUALITY OF THE ADVISER’S SERVICES, INCLUDING THE PERFORMANCE OF THE PORTFOLIO
With assets under management of approximately $435 billion as of June 30, 2013, the Adviser has the investment experience to manage and provide non-investment services (described in Section I) to the Portfolio.
| 16 | The Deli study, originally published in 2002 based on 1997 data and updated for the February 2008 Presentation, may be of diminished value due to the age of the data used in the presentation and the changes experienced in the industry over the last four years. |
| 17 | As mentioned previously, the Supreme Court cautioned against accepting mutual fund fee comparisons without careful scrutiny since the fees may not be the product of negotiations conducted at arm’s length. See Jones V. Harris at 1429. |
| 18 | The two dimensional analysis showed patterns of lower advisory fees for funds with larger asset sizes and funds from larger family sizes compared to funds with smaller asset sizes and funds from smaller family sizes, which according to the independent consultant is indicative of a sharing of economies of scale and scope. However, in less liquid and active markets, such is not the case, as the empirical analysis showed potential for diseconomies of scale in those markets. The empirical analysis also showed diminishing economies of scale and scope as funds surpassed a certain high level of assets. |
63
| DYNAMIC ASSET ALLOCATION PORTFOLIO | ||
| SENIOR OFFICER FEE EVALUATION | ||
| (continued) | AllianceBernstein Variable Products Series Fund | |
The information prepared by Lipper shows the 1 year net performance ranking and return19 of the Portfolio relative to its Lipper Performance Group (“PG”) and Lipper Performance Universe (“PU”)20 for the periods ended May 31, 2013.21
| Portfolio | Portfolio Return (%) | PG Median (%) | PU Median (%) | PG Rank | PU Rank | |||||||||||||||
Dynamic Asset Allocation Portfolio | ||||||||||||||||||||
1 year | 13.82 | 16.78 | 16.64 | 6/7 | 7/9 | |||||||||||||||
Set forth below are the 1 year and since inception net performance returns of the Portfolio (in bold) versus its benchmark for the periods ended May 31, 2013.22
| Periods Ending May 31, 2013 Annualized Net Performance (%) | ||||||||
1 Year (%) | Since- Inception (%) | |||||||
Dynamic Asset Allocation Portfolio | 13.82 | 5.13 | ||||||
60% MSCI World Index / 40% Barclay’s Capital U.S. Treasury | 15.56 | 6.48 | ||||||
MSCI World Index | 27.77 | 6.87 | ||||||
Barclay’s Capital U.S. Treasury | –0.89 | 4.96 | ||||||
Inception Date: April 1, 2011 | ||||||||
CONCLUSION:
Based on the factors discussed above the Senior Officer’s conclusion is that the proposed advisory fee for the Portfolio is reasonable and within the range of what would have been negotiated at arm’s-length in light of all the surrounding circumstances. However, the Senior Officer recommended that the Directors discuss with the Adviser the proposed advisory fee schedule of the Portfolio, which lack potential for sharing economies of scale through breakpoints, should the Portfolio’s assets, which currently remain low, grow to a substantial level. This conclusion in respect of the Portfolio is based on an evaluation of all of these factors and no single factor was dispositive.
Dated: September 5, 2013
| 19 | The performance rankings are for the Class A shares of the Portfolio. The performance return of the Portfolio shown was provided by Lipper. |
| 20 | The Portfolio’s PG/PU is identical to the Portfolio’s EG/EU. |
| 21 | The current Lipper investment classification/objective dictates the PG and PU throughout the life of the fund even if a fund had a different investment classification/objective at a different point in time. |
| 22 | The performance returns shown in the table are for the Class A shares of the Portfolio. The performance returns for the Portfolio and the benchmark were provided by the Adviser. |
64
VPS-DAA-0151-1213
AllianceBernstein
Variable Products Series Fund, Inc.
 | AllianceBernstein Global Thematic Growth Portfolio |
December 31, 2013
Annual Report

ANNUAL REPORT
Investment Products Offered
| Ø | Are Not FDIC Insured |
| Ø | May Lose Value |
| Ø | Are Not Bank Guaranteed |
AllianceBernstein Investments, Inc. (ABI) is the distributor of the AllianceBernstein family of mutual funds. ABI is a member of FINRA and is an affiliate of AllianceBernstein L.P., the manager of the funds.
You may obtain a description of the Fund’s proxy voting policies and procedures, and information regarding how the Fund voted proxies relating to portfolio securities during the most recent 12-month period ended June 30, without charge. Simply visit AllianceBernstein’s website at www.alliancebernstein.com or go to the Securities and Exchange Commission’s (the “Commission”) website at www.sec.gov, or call AllianceBernstein at (800) 227-4618.
The Fund files its complete schedule of portfolio holdings with the Commission for the first and third quarters of each fiscal year on Form N-Q. The Fund’s Forms N-Q are available on the Commission’s website at www.sec.gov. The Fund’s Forms N-Q may also be reviewed and copied at the Commission’s Public Reference Room in Washington, DC; information on the operation of the Public Reference Room may be obtained by calling (800) SEC-0330.
AllianceBernstein® and the AB Logo are registered trademarks and service marks used by permission of the owner, AllianceBernstein L.P.
| GLOBAL THEMATIC GROWTH | ||
| PORTFOLIO | AllianceBernstein Variable Products Series Fund |
LETTER TO INVESTORS
February 7, 2014
The following is an update of AllianceBernstein Variable Products Series Fund—AllianceBernstein Global Thematic Growth Portfolio (the “Portfolio”) for the annual reporting period ended December 31, 2013.
INVESTMENT OBJECTIVE AND POLICIES
The Portfolio’s investment objective is long-term growth of capital. The Portfolio pursues opportunistic growth by investing in a global universe of companies in multiple industries that may benefit from innovation. AllianceBernstein L.P. (the “Adviser”) employs a combination of “top-down” and “bottom-up” investment processes with the goal of identifying the most attractive securities worldwide, fitting into broader themes, which are developments that have broad effects across industries and companies. Drawing on the global fundamental and quantitative research capabilities of the Adviser, the Adviser seeks to identify long-term secular growth trends that will affect multiple industries. The Adviser will assess the effects of these trends, in the context of the business cycle, on entire industries and on individual companies. The Adviser normally considers a large universe of mid- to large-capitalization companies worldwide for investment.
The Portfolio invests in securities issued by U.S. and non-U.S. companies from multiple industry sectors in an attempt to maximize opportunity, which should also tend to reduce risk. The Portfolio invests in both developed and emerging market countries. Under normal market conditions, the Portfolio invests significantly (at least 40%— unless market conditions are not deemed favorable by the Adviser) in securities of non-U.S. companies. In addition, the Portfolio invests, under normal circumstances, in the equity securities of companies located in at least three countries. The percentage of the Portfolio’s assets invested in securities of companies in a particular country or denominated in a particular currency varies in accordance with the Adviser’s assessment of the appreciation potential of such securities.
The Portfolio may invest in any company and industry and in any type of equity security, listed and unlisted, with potential for capital appreciation. It invests in well-known, established companies as well as new, smaller or less-seasoned companies. Investments in new, smaller or less-seasoned companies may offer more reward but may also entail more risk than is generally true of larger, established companies. The Portfolio may also invest in synthetic foreign equity securities, which are various types of warrants used internationally that entitle a holder to buy or sell underlying securities, real estate investment trusts and zero coupon bonds.
The Portfolio may, at times, invest in shares of exchange-traded funds, or ETFs, in lieu of making direct investments in equity securities. ETFs may provide more efficient and economical exposure to the type of companies and geographic locations in which the Portfolio seeks to invest than direct investments.
Currencies can have a dramatic impact on equity returns, significantly adding to returns in some years and greatly diminishing them in others. Currency and equity positions are evaluated separately. The Adviser may seek to hedge the currency exposure resulting from securities positions when it finds the currency exposure unattractive. To hedge a portion of its currency risk, the Portfolio may from time to time invest in currency-related derivatives, including forward currency exchange contracts, futures, options on futures, swaps and options. The Adviser may also seek investment opportunities by taking long or short positions in currencies through the use of currency-related derivatives.
The Portfolio may enter into other derivatives transactions, such as options, futures, forwards and swaps. The Portfolio may use options strategies involving the purchase and/or writing of various combinations of call and/or put options, including on individual securities and stock indices, futures contracts (including futures contracts on individual securities and stock indices) or shares of ETFs. These transactions may be used, for example, to earn extra income, to adjust exposure to individual securities or markets, or to protect all or a portion of the Portfolio’s portfolio from a decline in value, sometimes within certain ranges.
INVESTMENT RESULTS
The table on page 5 shows the Portfolio’s performance compared to its benchmark, the Morgan Stanley Capital International (“MSCI”) All Country (“AC”) World Index (net) for the one-, five- and 10-year periods ended December 31, 2013.
For the annual period, both share classes of the Portfolio outperformed the benchmark, helped by strong stock selection. The Portfolio’s holdings in the consumer discretionary and technology sectors benefited returns, as did an overweight in the consumer discretionary sector. Detracting from returns was stock selection in the financials sector and an underweight in the industrials sector.
The Portfolio did not employ leverage during this time period, but did employ derivatives for hedging purposes in the form of futures and written options, which had an immaterial impact on performance; and currencies and purchased options; which detracted from performance.
1
| AllianceBernstein Variable Products Series Fund |
MARKET REVIEW AND INVESTMENT STRATEGY
The current rally in the global equity markets has been underpinned by excess liquidity in the financial system that has kept borrowing costs down and encouraged risk-taking. The monetary policy environment has begun to normalize as a result of the U.S. Federal Reserve’s decision to scale back its stimulus campaign, and the Global Thematic Growth Oversight Group (the “Team”) has begun to transition toward a phase where fundamentals will be the primary determinant of valuations. Thus, the Team believes companies will need to produce strong earnings growth in order to justify future stock performance.
The Team continues to investigate some of the most powerful long-term themes at work in the world. The Team combines this unique, top-down perspective with a search for companies possessing strong businesses with high growth rates that produce healthy returns on equity and whose valuations, in the Team’s view, do not adequately capture their upside potential.
2
| DISCLOSURESAND RISKS | AllianceBernstein Variable Products Series Fund |
Benchmark Disclosure
The unmanaged MSCI AC World Index (net) does not reflect fees and expenses associated with the active management of a mutual fund portfolio. The MSCI AC World Index (net; free float-adjusted, market capitalization weighted) represents the equity market performance of developed and emerging markets. Net returns reflect the reinvestment of dividends after deduction of non-U.S. withholding tax. MSCI makes no express or implied warranties or representations, and shall have no liability whatsoever with respect to any MSCI data contained herein. The MSCI data may not be further redistributed or used as a basis for other indices, any securities or financial products This report is not approved, reviewed or produced by MSCI. An investor cannot invest directly in an index, and its results are not indicative of the performance for any specific investment, including the Portfolio.
A Word About Risk
Market Risk: The value of the Portfolio’s assets will fluctuate as the stock or bond market fluctuates. The value of its investments may decline, sometimes rapidly and unpredictably, simply because of economic changes or other events that affect large portions of the market. It includes the risk that a particular style of investing, such as value, may underperform the market generally.
Foreign (Non-U.S.) Risk: Investments in securities of non-U.S. issuers may involve more risk than those of U.S. issuers. These securities may fluctuate more widely in price and may be less liquid due to adverse market, economic, political, regulatory or other factors.
Emerging Market Risk: Investments in emerging market countries may have more risk because the markets are less developed and less liquid as well as being subject to increased economic, political, regulatory or other uncertainties.
Currency Risk: Fluctuations in currency exchange rates may negatively affect the value of the Portfolio’s investments or reduce its returns.
Capitalization Risk: Investments in small- and mid-capitalization companies may be more volatile than investments in large-capitalization companies. Investments in small-capitalization companies may have additional risks because these companies have limited product lines, markets or financial resources.
Focused Portfolio Risk: Investments in a limited number of companies may have more risk because changes in the value of a single security may have a more significant effect, either negative or positive, on the Portfolio’s net asset value (“NAV”).
Derivatives Risk: Derivatives may be illiquid, difficult to price, and leveraged so that small changes may produce disproportionate losses for the Portfolio, and may be subject to counterparty risk to a greater degree than more traditional investments.
Leverage Risk: To the extent the Portfolio uses leveraging techniques, its net asset value, or NAV, may be more volatile because leverage tends to exaggerate the effect of changes in interest rates and any increase or decrease in the value of the Portfolio’s investments.
Management Risk: The Portfolio is subject to management risk because it is an actively managed investment fund. The Adviser will apply its investment techniques and risk analyses in making investment decisions for the Portfolio, but there is no guarantee that its techniques will produce the intended results.
These risks are fully discussed in the Variable Products prospectus.
An Important Note About Historical Performance
The investment return and principal value of an investment in the Portfolio will fluctuate, so that shares, when redeemed, may be worth more or less than their original cost. Performance shown on the following page represents past performance and does not guarantee future results. Current performance may be lower or higher than the performance information shown. Please contact your Financial Advisor or Insurance Agent Representative at your financial institution to obtain portfolio performance information current to the most recent month end.
Investors should consider the investment objectives, risks, charges and expenses of the Portfolio carefully before investing. For additional copies of the Portfolio’s prospectus or summary prospectus, which contains this and other information, call your financial advisor or 800.984.7654. Please read the prospectus and/or summary prospectus carefully before investing.
(Disclosures and Risks continued on next page)
3
| DISCLOSURESAND RISKS | ||
| (continued from previous page) | AllianceBernstein Variable Products Series Fund |
All fees and expenses related to the operation of the Portfolio have been deducted, but no adjustment has been made for insurance company separate account or annuity contract charges, which would reduce total return to a contract owner. Performance assumes reinvestment of distributions and does not account for taxes.
There are additional fees and expenses associated with all Variable Products. These fees can include mortality and expense risk charges, administrative charges, and other charges that can significantly reduce investment returns. Those fees and expenses are not reflected in this annual report. You should consult your Variable Products prospectus for a description of those fees and expenses and speak to your insurance agent or financial representative if you have any questions. You should read the prospectus before investing or sending money.
4
| HISTORICAL PERFORMANCE | ||
| THE PORTFOLIO VS. ITS BENCHMARK | AllianceBernstein Variable Products Series Fund |
| PERIODS ENDED DECEMBER 31, 2013 (unaudited) | NAV Returns | |||||||||||
| 1 Year | 5 Years* | 10 Years* | ||||||||||
AllianceBernstein Global Thematic Growth Portfolio Class A** | 23.26% | 14.42% | 3.96% | |||||||||
AllianceBernstein Global Thematic Growth Portfolio Class B** | 22.93% | 14.13% | 3.71% | |||||||||
MSCI AC World Index (net) | 22.80% | 14.92% | 7.17% | |||||||||
* Average annual returns.
** Includes the impact of proceeds received and credited to the Fund resulting from class action settlements, which enhanced the performance of all share classes of the Fund for the annual period ended December 31, 2013, by 0.05%.
|
| |||||||||||
| Please keep in mind that high, double-digit returns are highly unusual and cannot be sustained. Investors should also be aware that these returns were primarily achieved during favorable market conditions. | ||||||||||||
The Portfolio’s current prospectus fee table shows the Portfolio’s total annual operating expense ratios as 0.99% and 1.24% for Class A and Class B, respectively. The Financial Highlights section of this report sets forth expense ratio data for the current reporting period; the expense ratios shown above may differ from the expense ratios in the Financial Highlights section since they are based on different time periods.
ALLIANCEBERNSTEIN GLOBAL THEMATIC GROWTH PORTFOLIO CLASS A GROWTH OF A $10,000 INVESTMENT
12/31/03 – 12/31/13 (unaudited)
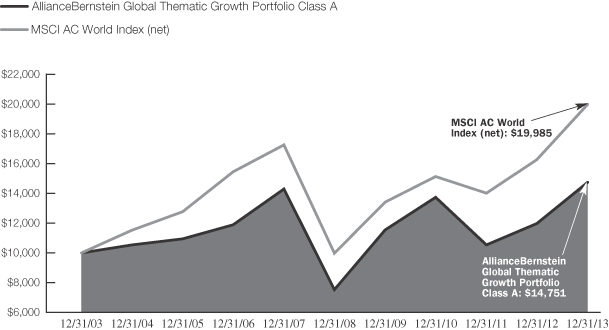
This chart illustrates the total value of an assumed $10,000 investment in AllianceBernstein Global Thematic Growth Portfolio Class A shares (from 12/31/03 to 12/31/13) as compared to the performance of the Portfolio’s benchmark, the MSCI AC World Index (net). The chart assumes the reinvestment of dividends and capital gains distributions.
See Disclosures, Risks and Note about Historical Performance on pages 3-4.
5
| GLOBAL THEMATIC GROWTH PORTFOLIO | ||
| EXPENSE EXAMPLE (unaudited) | AllianceBernstein Variable Products Series Fund | |
As a shareholder of the Fund, you incur two types of costs: (1) transaction costs, including sales charges (loads) on purchase payments, contingent deferred sales charges on redemptions and (2) ongoing costs, including management fees; distribution (12b-1) fees; and other Fund expenses. This example is intended to help you understand your ongoing costs (in dollars) of investing in the Fund and to compare these costs with the ongoing costs of investing in other mutual funds.
The Example is based on an investment of $1,000 invested at the beginning of the period and held for the entire period as indicated below.
Actual Expenses
The first line of each class’ table below provides information about actual account values and actual expenses. You may use the information in this line, together with the amount you invested, to estimate the expenses that you paid over the period. Simply divide your account value by $1,000 (for example, an $8,600 account value divided by $1,000 = 8.6), then multiply the result by the number in the first line under the heading entitled “Expenses Paid During Period” to estimate the expenses you paid on your account during this period. The estimate of expenses does not include fees or other expenses of any variable insurance product. If such expenses were included, the estimate of expenses you paid during the period would be higher and your ending account value would be lower.
Hypothetical Example for Comparison Purposes
The second line of each class’ table below provides information about hypothetical account values and hypothetical expenses based on the Fund’s actual expense ratio and an assumed annual rate of return of 5% before expenses, which is not the Fund’s actual return. The hypothetical account values and expenses may not be used to estimate the actual ending account balance or expenses you paid for the period. You may use this information to compare the ongoing costs of investing in the Fund and other funds by comparing this 5% hypothetical example with the 5% hypothetical examples that appear in the shareholder reports of other funds. The estimate of expenses does not include fees or other expenses of any variable insurance product. If such expenses were included, the estimate of expenses you paid during the period would be higher and your ending account value would be lower.
Please note that the expenses shown in the table are meant to highlight your ongoing costs only and do not reflect any transactional costs, such as sales charges (loads), or contingent deferred sales charges on redemptions. Therefore, the second line of each classes’ table is useful in comparing ongoing costs only, and will not help you determine the relative total costs of owning different funds. In addition, if these transactional costs were included, your costs would have been higher.
| Beginning Account Value July 1, 2013 | Ending Account Value December 31, 2013 | Expenses Paid During Period* | Annualized Expense Ratio* | |||||||||||||
Class A | ||||||||||||||||
Actual | $ | 1,000 | $ | 1,199.90 | $ | 5.27 | 0.95 | % | ||||||||
Hypothetical (5% annual return before expenses) | $ | 1,000 | $ | 1,020.42 | $ | 4.84 | 0.95 | % | ||||||||
Class B | ||||||||||||||||
Actual | $ | 1,000 | $ | 1,198.60 | $ | 6.65 | 1.20 | % | ||||||||
Hypothetical (5% annual return before expenses) | $ | 1,000 | $ | 1,019.16 | $ | 6.11 | 1.20 | % | ||||||||
| * | Expenses are equal to each classes’ annualized expense ratios, multiplied by the average account value over the period, multiplied by 184/365 (to reflect the one-half year period). |
6
| GLOBAL THEMATIC GROWTH PORTFOLIO | ||
| TEN LARGEST HOLDINGS* | ||
| December 31, 2013 (unaudited) | AllianceBernstein Variable Products Series Fund | |
| COMPANY | U.S. $ VALUE | PERCENT OF NET ASSETS | ||||||
Illumina, Inc. | $ | 4,301,016 | 3.2 | % | ||||
Amazon.com, Inc. | 4,236,346 | 3.2 | ||||||
Tencent Holdings Ltd. | 3,178,303 | 2.4 | ||||||
Cie Financiere Richemont SA | 2,607,322 | 1.9 | ||||||
Apple, Inc. | 2,488,523 | 1.9 | ||||||
Schlumberger Ltd. | 2,438,376 | 1.8 | ||||||
AIA Group Ltd. | 2,430,168 | 1.8 | ||||||
Melco Crown Entertainment Ltd. (ADR) | 2,371,633 | 1.8 | ||||||
Roche Holding AG | 2,339,053 | 1.7 | ||||||
Diageo PLC | 2,224,592 | 1.7 | ||||||
|
|
|
| |||||
| $ | 28,615,332 | 21.4 | % | |||||
SECTOR BREAKDOWN**
December 31, 2013 (unaudited)
| SECTOR | U.S. $ VALUE | PERCENT OF TOTAL INVESTMENTS | ||||||
Information Technology | $ | 39,678,721 | 29.7 | % | ||||
Consumer Discretionary | 25,986,422 | 19.5 | ||||||
Health Care | 18,320,784 | 13.7 | ||||||
Consumer Staples | 15,589,389 | 11.7 | ||||||
Financials | 12,779,488 | 9.6 | ||||||
Energy | 12,690,556 | 9.5 | ||||||
Telecommunication Services | 2,679,101 | 2.0 | ||||||
Industrials | 2,562,589 | 1.9 | ||||||
Materials | 1,821,676 | 1.4 | ||||||
Short-Term Investments | 1,301,417 | 1.0 | ||||||
|
|
|
| |||||
Total Investments | $ | 133,410,143 | 100.0 | % | ||||
| * | Long-term investments. |
| ** | The Portfolio’s sector breakdown is expressed as a percentage of total investments (excluding security lending collateral) and may vary over time. The Portfolio also enters into derivatives transactions, which may be used for hedging or investment purpose (see “Portfolio of Investments” section of the report for additional details). |
Please note: The sector classifications presented herein are based on the Global Industry Classification Standard (GICS) which was developed by Morgan Stanley Capital International and Standard & Poor’s. The components are divided into sector, industry group, and industry sub-indices as classified by the GICS for each of the market capitalization indices in the broad market. These sector classifications are broadly defined. The “Portfolio of Investments” section of the report reflects more specific industry information and is consistent with the investment restrictions discussed in the Portfolio’s prospectus.
7
| GLOBAL THEMATIC GROWTH PORTFOLIO | ||
| COUNTRY BREAKDOWN* | ||
| December 31, 2013 | AllianceBernstein Variable Products Series Fund | |
| COUNTRY | U.S.$ VALUE | PERCENT OF TOTAL INVESTMENTS | ||||||
United States | $ | 72,471,903 | 54.3 | % | ||||
Hong Kong | 8,798,772 | 6.6 | ||||||
Switzerland | 8,112,527 | 6.1 | ||||||
Japan | 6,017,789 | 4.5 | ||||||
United Kingdom | 5,377,216 | 4.0 | ||||||
Brazil | 4,768,610 | 3.6 | ||||||
France | 4,658,794 | 3.5 | ||||||
China | 3,178,303 | 2.4 | ||||||
Russia | 3,097,041 | 2.3 | ||||||
India | 2,615,796 | 2.0 | ||||||
Netherlands | 2,042,507 | 1.5 | ||||||
Belgium | 1,987,423 | 1.5 | ||||||
Singapore | 1,839,737 | 1.4 | ||||||
Other | 7,142,308 | 5.3 | ||||||
Short-Term Investments | 1,301,417 | 1.0 | ||||||
|
|
|
| |||||
Total Investments | $ | 133,410,143 | 100.0 | % | ||||
| * | All data are as of December 31, 2013. The Portfolio’s country breakdown is expressed as a percentage of total investments (excluding security lending collateral) and may vary over time. “Other” country weightings represent 1.0% or less in the following countries: Indonesia, Italy, Mexico, Philippines, Sweden and Taiwan. |
8
| GLOBAL THEMATIC GROWTH PORTFOLIO | ||
| PORTFOLIOOF INVESTMENTS | ||
| December 31, 2013 | AllianceBernstein Variable Products Series Fund | |
| Company | Shares | U.S. $ Value | ||||||
COMMON STOCKS–98.9% | ||||||||
INFORMATION TECHNOLOGY–29.7% | ||||||||
COMMUNICATIONS EQUIPMENT–0.6% | ||||||||
CalAmp Corp.(a) | 27,470 | $ | 768,336 | |||||
|
| |||||||
COMPUTERS & | ||||||||
Apple, Inc. | 4,435 | 2,488,523 | ||||||
Silicon Graphics International Corp.(a) | 134,402 | 1,802,331 | ||||||
Stratasys Ltd.(a) | 12,190 | 1,641,993 | ||||||
|
| |||||||
| 5,932,847 | ||||||||
|
| |||||||
ELECTRONIC EQUIPMENT, INSTRUMENTS & COMPONENTS–1.0% | ||||||||
InvenSense, Inc.(a)(b) | 65,860 | 1,368,571 | ||||||
|
| |||||||
INTERNET SOFTWARE & SERVICES–10.1% | ||||||||
Cornerstone OnDemand, Inc.(a) | 35,745 | 1,906,639 | ||||||
eBay, Inc.(a) | 22,170 | 1,216,911 | ||||||
Google, Inc.–Class A(a) | 1,711 | 1,917,535 | ||||||
LinkedIn Corp.–Class A(a) | 8,447 | 1,831,563 | ||||||
Tencent Holdings Ltd. | 49,700 | 3,178,303 | ||||||
Yandex NV–Class A(a) | 33,420 | 1,442,073 | ||||||
Yelp, Inc.(a) | 29,316 | 2,021,338 | ||||||
|
| |||||||
| 13,514,362 | ||||||||
|
| |||||||
IT SERVICES–2.8% | ||||||||
QIWI PLC (Sponsored ADR) | 29,553 | 1,654,968 | ||||||
Visa, Inc.–Class A | 9,540 | 2,124,367 | ||||||
|
| |||||||
| 3,779,335 | ||||||||
|
| |||||||
SEMICONDUCTORS & SEMICONDUCTOR EQUIPMENT–4.4% | ||||||||
Avago Technologies Ltd. | 23,250 | 1,229,692 | ||||||
MediaTek, Inc. | 82,000 | 1,222,200 | ||||||
NVIDIA Corp. | 81,778 | 1,310,084 | ||||||
NXP Semiconductor NV(a) | 44,470 | 2,042,507 | ||||||
|
| |||||||
| 5,804,483 | ||||||||
|
| |||||||
SOFTWARE–6.4% | ||||||||
NetSuite, Inc.(a) | 14,279 | 1,471,022 | ||||||
Red Hat, Inc.(a) | 38,178 | 2,139,495 | ||||||
Salesforce.com, Inc.(a) | 32,752 | 1,807,583 | ||||||
ServiceNow, Inc.(a) | 21,160 | 1,185,172 | ||||||
Splunk, Inc.(a) | 27,778 | 1,907,515 | ||||||
|
| |||||||
| 8,510,787 | ||||||||
|
| |||||||
| 39,678,721 | ||||||||
|
| |||||||
CONSUMER DISCRETIONARY–19.4% | ||||||||
AUTOMOBILES–2.1% | ||||||||
Harley-Davidson, Inc. | 27,290 | 1,889,560 | ||||||
Nissan Motor Co., Ltd. | 114,300 | 957,834 | ||||||
|
| |||||||
| 2,847,394 | ||||||||
|
| |||||||
| Company | Shares | U.S. $ Value | ||||||
DIVERSIFIED CONSUMER SERVICES–1.1% | ||||||||
Kroton Educacional SA | 86,100 | $ | 1,432,780 | |||||
|
| |||||||
HOTELS, RESTAURANTS & LEISURE–2.9% | ||||||||
Melco Crown Entertainment Ltd. (ADR)(a) | 60,470 | 2,371,633 | ||||||
Yum! Brands, Inc. | 20,000 | 1,512,200 | ||||||
|
| |||||||
| 3,883,833 | ||||||||
|
| |||||||
INTERNET & CATALOG RETAIL–4.7% | ||||||||
Amazon.com, Inc.(a)* | 10,623 | 4,236,346 | ||||||
priceline.com, Inc.(a) | 1,770 | 2,057,448 | ||||||
|
| |||||||
| 6,293,794 | ||||||||
|
| |||||||
MEDIA–1.0% | ||||||||
Walt Disney Co. (The) | 18,150 | 1,386,660 | ||||||
|
| |||||||
MULTILINE RETAIL–1.4% | ||||||||
Lojas Renner SA | 37,000 | 959,087 | ||||||
Matahari Department Store Tbk PT(a) | 943,000 | 853,394 | ||||||
|
| |||||||
| 1,812,481 | ||||||||
|
| |||||||
SPECIALTY RETAIL–0.6% | ||||||||
Belle International Holdings Ltd. | 731,000 | 849,248 | ||||||
|
| |||||||
TEXTILES, APPAREL & LUXURY GOODS–5.6% | ||||||||
Cie Financiere Richemont SA | 26,100 | 2,607,322 | ||||||
NIKE, Inc.–Class B | 28,120 | 2,211,357 | ||||||
Prada SpA | 143,300 | 1,275,425 | ||||||
Samsonite International SA | 456,400 | 1,386,128 | ||||||
|
| |||||||
| 7,480,232 | ||||||||
|
| |||||||
| 25,986,422 | ||||||||
|
| |||||||
HEALTH CARE–13.7% | ||||||||
BIOTECHNOLOGY–2.6% | ||||||||
Cepheid, Inc.(a) | 40,997 | 1,915,380 | ||||||
Quintiles Transnational Holdings, Inc.(a) | 32,858 | 1,522,639 | ||||||
|
| |||||||
| 3,438,019 | ||||||||
|
| |||||||
HEALTH CARE EQUIPMENT & SUPPLIES–3.0% | ||||||||
Elekta AB–Class B | 75,660 | 1,157,834 | ||||||
Essilor International SA | 16,040 | 1,706,773 | ||||||
Intuitive Surgical, Inc.(a) | 2,993 | 1,149,552 | ||||||
|
| |||||||
| 4,014,159 | ||||||||
|
| |||||||
HEALTH CARE PROVIDERS & SERVICES–0.7% | ||||||||
Odontoprev SA | 226,800 | 944,980 | ||||||
|
| |||||||
LIFE SCIENCES TOOLS & SERVICES–3.2% | ||||||||
Illumina, Inc.(a) | 38,881 | 4,301,016 | ||||||
|
| |||||||
PHARMACEUTICALS–4.2% | ||||||||
Bristol-Myers Squibb Co. | 37,190 | 1,976,649 | ||||||
Roche Holding AG | 8,350 | 2,339,053 | ||||||
9
| GLOBAL THEMATIC GROWTH PORTFOLIO | ||
| PORTFOLIOOF INVESTMENTS | ||
| (continued) | AllianceBernstein Variable Products Series Fund | |
| Company | Shares | U.S. $ Value | ||||||||
Sun Pharmaceutical Industries Ltd. | 142,260 | $ | 1,306,908 | |||||||
|
| |||||||||
| 5,622,610 | ||||||||||
|
| |||||||||
| 18,320,784 | ||||||||||
|
| |||||||||
CONSUMER STAPLES–11.7% | ||||||||||
BEVERAGES–3.1% | ||||||||||
Anheuser-Busch InBev NV | 18,690 | 1,987,423 | ||||||||
Diageo PLC | 67,130 | 2,224,592 | ||||||||
|
| |||||||||
| 4,212,015 | ||||||||||
|
| |||||||||
FOOD & STAPLES | ||||||||||
Raia Drogasil SA | 109,500 | 685,985 | ||||||||
|
| |||||||||
FOOD PRODUCTS–4.6% | ||||||||||
Danone | 23,400 | 1,688,119 | ||||||||
Mead Johnson Nutrition Co.–Class A | 21,380 | 1,790,789 | ||||||||
Nestle SA | 21,920 | 1,606,517 | ||||||||
Universal Robina Corp. | 394,641 | 1,008,113 | ||||||||
|
| |||||||||
| 6,093,538 | ||||||||||
|
| |||||||||
HOUSEHOLD PRODUCTS–1.4% | ||||||||||
Unicharm Corp. | 31,900 | 1,820,167 | ||||||||
|
| |||||||||
PERSONAL PRODUCTS–1.2% | ||||||||||
Estee Lauder Cos., Inc. (The)–Class A | 21,600 | 1,626,912 | ||||||||
|
| |||||||||
TOBACCO–0.9% | ||||||||||
British American Tobacco PLC | 21,440 | 1,150,772 | ||||||||
|
| |||||||||
| 15,589,389 | ||||||||||
|
| |||||||||
FINANCIALS–9.6% | ||||||||||
CAPITAL MARKETS–1.2% | ||||||||||
UBS AG(a) | 81,020 | 1,559,635 | ||||||||
|
| |||||||||
COMMERCIAL BANKS–2.2% | ||||||||||
BOC Hong Kong Holdings Ltd. | 548,500 | 1,761,595 | ||||||||
Grupo Financiero Banorte SAB de CV–Class O | 157,940 | 1,104,909 | ||||||||
|
| |||||||||
| 2,866,504 | ||||||||||
|
| |||||||||
DIVERSIFIED FINANCIAL SERVICES–1.5% | ||||||||||
IntercontinentalExchange Group, Inc. | 9,020 | 2,028,778 | ||||||||
|
| |||||||||
INSURANCE–1.8% | ||||||||||
AIA Group Ltd. | 482,800 | 2,430,168 | ||||||||
|
| |||||||||
REAL ESTATE MANAGEMENT & DEVELOPMENT–1.9% | ||||||||||
BR Malls Participacoes SA | 103,400 | 745,778 | ||||||||
Global Logistic Properties Ltd. | 802,000 | 1,839,737 | ||||||||
|
| |||||||||
| 2,585,515 | ||||||||||
|
| |||||||||
THRIFTS & MORTGAGE FINANCE–1.0% | ||||||||||
Housing Development Finance Corp. | 101,230 | 1,308,888 | ||||||||
|
| |||||||||
| 12,779,488 | ||||||||||
|
| |||||||||
ENERGY–9.5% | ||||||||||
ENERGY EQUIPMENT & SERVICES–5.4% | ||||||||||
National Oilwell Varco, Inc. | 20,120 | $ | 1,600,144 | |||||||
Oceaneering International, Inc. | 24,070 | 1,898,642 | ||||||||
Schlumberger Ltd. | 27,060 | 2,438,376 | ||||||||
Technip SA | 13,130 | 1,263,902 | ||||||||
|
| |||||||||
| 7,201,064 | ||||||||||
|
| |||||||||
OIL, GAS & CONSUMABLE | ||||||||||
BG Group PLC | 93,030 | 2,001,852 | ||||||||
Concho Resources, Inc.(a) | 16,470 | 1,778,760 | ||||||||
Noble Energy, Inc. | 25,090 | 1,708,880 | ||||||||
|
| |||||||||
| 5,489,492 | ||||||||||
|
| |||||||||
| 12,690,556 | ||||||||||
|
| |||||||||
TELECOMMUNICATION | ||||||||||
WIRELESS TELECOMMUNICATION SERVICES–2.0% | ||||||||||
Softbank Corp. | 24,600 | 2,158,668 | ||||||||
Tower Bersama Infrastructure Tbk PT(a) | 1,090,500 | 520,433 | ||||||||
|
| |||||||||
| 2,679,101 | ||||||||||
|
| |||||||||
INDUSTRIALS–1.9% | ||||||||||
MACHINERY–1.9% | ||||||||||
FANUC Corp. | 5,900 | 1,081,120 | ||||||||
Proto Labs, Inc.(a) | 20,813 | 1,481,469 | ||||||||
|
| |||||||||
| 2,562,589 | ||||||||||
|
| |||||||||
MATERIALS–1.4% | ||||||||||
CHEMICALS–1.4% | ||||||||||
Monsanto Co. | 15,630 | 1,821,676 | ||||||||
|
| |||||||||
Total Common Stocks | 132,108,726 | |||||||||
|
| |||||||||
| Principal Amount (000) | ||||||||||
SHORT-TERM INVESTMENTS–1.0% | ||||||||||
TIME DEPOSIT–1.0% | ||||||||||
State Street Time Deposit | U.S.$ | 1,301 | 1,301,417 | |||||||
|
| |||||||||
TOTAL INVESTMENTS BEFORE SECURITY LENDING COLLATERAL FOR SECURITIES | 133,410,143 | |||||||||
|
| |||||||||
10
| AllianceBernstein Variable Products Series Fund | ||
| Company | Shares | U.S. $ Value | ||||||
INVESTMENTS OF CASH COLLATERAL FOR SECURITIES | ||||||||
INVESTMENT | ||||||||
AllianceBernstein Exchange Reserves–Class I, | 1,350,130 | $ | 1,350,130 | |||||
|
| |||||||
TOTAL INVESTMENTS–100.9% | $ | 134,760,273 | ||||||
Other assets less | (1,177,182 | ) | ||||||
|
| |||||||
NET ASSETS–100.0% | $ | 133,583,091 | ||||||
|
| |||||||
FORWARD CURRENCY EXCHANGE CONTRACTS (see Note D)
| Counterparty | Contracts to Deliver (000) | In Exchange For (000) | Settlement Date | Unrealized Appreciation/ (Depreciation) | ||||||||||||||||||||
Barclays Bank PLC Wholesale | USD | 379 | NOK | 2,339 | 3/18/14 | $ | 5,071 | |||||||||||||||||
BNP Paribas SA | USD | 3,822 | AUD | 4,232 | 3/18/14 | (61,582 | ) | |||||||||||||||||
BNP Paribas SA | USD | 1,129 | JPY | 115,975 | 3/18/14 | (27,063 | ) | |||||||||||||||||
Credit Suisse International | CHF | 1,803 | USD | 2,031 | 3/18/14 | 8,977 | ||||||||||||||||||
Goldman Sachs Bank USA | HKD | 47,282 | USD | 6,099 | 3/18/14 | 1,380 | ||||||||||||||||||
HSBC Bank USA | USD | 1,987 | GBP | 1,227 | 3/18/14 | 44,198 | ||||||||||||||||||
State Street Bank & Trust Co. | USD | 6,639 | EUR | 4,833 | 3/18/14 | 10,050 | ||||||||||||||||||
State Street Bank & Trust Co. | USD | 348 | SEK | 2,283 | 3/18/14 | 6,222 | ||||||||||||||||||
UBS AG | CHF | 859 | USD | 946 | 3/18/14 | (17,877 | ) | |||||||||||||||||
UBS AG | USD | 3,414 | GBP | 2,082 | 3/18/14 | 32,253 | ||||||||||||||||||
|
| |||||||||||||||||||||||
| $ | 1,629 | |||||||||||||||||||||||
|
| |||||||||||||||||||||||
| (a) | Non-income producing security. |
| (b) | Represents entire or partial securities out on loan. See Note E for securities lending information. |
| (c) | Investment in affiliated money market mutual fund. The rate shown represents the 7-day yield as of period end. |
| * | Position, or a portion thereof has been segregated for collateral with counterparty. The aggregate market value of these securities amounted to $757,701. |
Currency Abbreviations:
AUD—Australian Dollar
CHF—Swiss Franc
EUR—Euro
GBP—Great British Pound
HKD—Hong Kong Dollar
JPY—Japanese Yen
NOK—Norwegian Krone
SEK—Swedish Krona
USD—United States Dollar
Glossary:
ADR—American Depositary Receipt
See notes to financial statements.
11
| GLOBAL THEMATIC GROWTH PORTFOLIO | ||
| STATEMENTOF ASSETS & LIABILITIES | ||
| December 31, 2013 | AllianceBernstein Variable Products Series Fund | |
ASSETS | ||||
Investments in securities, at value | ||||
Unaffiliated issuers (cost $106,211,992) | $ | 133,410,143 | (a) | |
Affiliated issuers (cost $1,350,130—investment of cash collateral for securities loaned) | 1,350,130 | |||
Foreign currencies, at value (cost $251,250) | 247,618 | |||
Unrealized appreciation of forward currency exchange contracts | 108,151 | |||
Dividends and interest receivable | 89,323 | |||
Receivable for capital stock sold | 57,506 | |||
|
| |||
Total assets | 135,262,871 | |||
|
| |||
LIABILITIES | ||||
Payable for collateral received on securities loaned | 1,350,130 | |||
Unrealized depreciation of forward currency exchange contracts | 106,522 | |||
Advisory fee payable | 80,347 | |||
Audit fee payable | 35,442 | |||
Printing fee payable | 31,143 | |||
Distribution fee payable | 20,353 | |||
Administrative fee payable | 13,886 | |||
Payable for capital stock redeemed | 13,164 | |||
Transfer Agent fee payable | 112 | |||
Accrued expenses | 28,681 | |||
|
| |||
Total liabilities | 1,679,780 | |||
|
| |||
NET ASSETS | $ | 133,583,091 | ||
|
| |||
COMPOSITION OF NET ASSETS | ||||
Capital stock, at par | $ | 6,576 | ||
Additional paid-in capital | 166,961,864 | |||
Distributions in excess of net investment income | (36,593 | ) | ||
Accumulated net realized loss on investment and foreign currency transactions | (60,546,820 | ) | ||
Net unrealized appreciation on investments and foreign currency denominated assets and liabilities | 27,198,064 | |||
|
| |||
| $ | 133,583,091 | |||
|
|
Net Asset Value Per Share—1 billion shares of capital stock authorized, $.001 par value
| Class | Net Assets | Shares Outstanding | Net Asset Value | |||||||||
A | $ | 32,195,201 | 1,551,696 | $ | 20.75 | |||||||
B | $ | 101,387,890 | 5,024,107 | $ | 20.18 | |||||||
| (a) | Includes securities on loan with a value of $1,368,571 (see Note E). |
See notes to financial statements.
12
| GLOBAL THEMATIC GROWTH PORTFOLIO | ||
| STATEMENTOF OPERATIONS | ||
| Year Ended December 31, 2013 | AllianceBernstein Variable Products Series Fund | |
INVESTMENT INCOME | ||||
Dividends | ||||
Unaffiliated issuers (net of foreign taxes withheld of $29,284) | $ | 1,077,936 | ||
Affiliated issuers | 10,323 | |||
Interest | 132 | |||
Securities lending income | 448,856 | |||
|
| |||
| $ | 1,537,247 | |||
|
| |||
EXPENSES | ||||
Advisory fee (see Note B) | 982,709 | |||
Distribution fee—Class B | 235,491 | |||
Transfer agency—Class A | 2,791 | |||
Transfer agency—Class B | 7,396 | |||
Custodian | 115,650 | |||
Administrative | 54,101 | |||
Printing | 39,733 | |||
Legal | 31,805 | |||
Audit | 30,346 | |||
Directors’ fees | 4,519 | |||
Miscellaneous | 11,991 | |||
|
| |||
Total expenses | 1,516,532 | |||
|
| |||
Net investment income | 20,715 | |||
|
| |||
REALIZED AND UNREALIZED GAIN (LOSS) ON INVESTMENT AND FOREIGN CURRENCY TRANSACTIONS | ||||
Net realized gain (loss) on: | ||||
Investment transactions | 11,857,113 | |||
Futures | 25,167 | |||
Options written | (4,909 | ) | ||
Foreign currency transactions | (1,748,280 | ) | ||
Net change in unrealized appreciation/depreciation of: | ||||
Investments | 16,782,225 | |||
Options written | 8,213 | |||
Foreign currency denominated assets and liabilities | 136,563 | |||
|
| |||
Net gain on investment and foreign currency transactions | 27,056,092 | |||
|
| |||
NET INCREASE IN NET ASSETS FROM OPERATIONS | $ | 27,076,807 | ||
|
|
See notes to financial statements.
13
| GLOBAL THEMATIC GROWTH PORTFOLIO | ||
| STATEMENT OF CHANGES IN NET ASSETS | AllianceBernstein Variable Products Series Fund | |
| Year Ended December 31, 2013 | Year Ended December 31, 2012 | |||||||
INCREASE (DECREASE) IN NET ASSETS FROM OPERATIONS | ||||||||
Net investment income | $ | 20,715 | $ | 904,627 | ||||
Net realized gain (loss) on investment and foreign currency transactions | 10,129,091 | (13,674,729 | ) | |||||
Net change in unrealized appreciation/depreciation of investments and foreign currency denominated assets and liabilities | 16,927,001 | 29,700,515 | ||||||
|
|
|
| |||||
Net increase in net assets from operations | 27,076,807 | 16,930,413 | ||||||
DIVIDENDS AND DISTRIBUTIONS TO SHAREHOLDERS FROM | ||||||||
Net investment income | ||||||||
Class A | (74,183 | ) | –0 | – | ||||
Class B | (19,394 | ) | –0 | – | ||||
Tax return of capital | ||||||||
Class A | (6,024 | ) | –0 | – | ||||
Class B | (1,575 | ) | –0 | – | ||||
CAPITAL STOCK TRANSACTIONS | ||||||||
Net decrease | (25,487,404 | ) | (26,013,414 | ) | ||||
|
|
|
| |||||
Total increase (decrease) | 1,488,227 | (9,083,001 | ) | |||||
NET ASSETS | ||||||||
Beginning of period | 132,094,864 | 141,177,865 | ||||||
|
|
|
| |||||
End of period (including distributions in excess of net investment income of ($36,593) and ($172,224), respectively) | $ | 133,583,091 | $ | 132,094,864 | ||||
|
|
|
| |||||
See notes to financial statements.
14
| GLOBAL THEMATIC GROWTH PORTFOLIO | ||
| NOTES TO FINANCIAL STATEMENTS | ||
| December 31, 2013 | AllianceBernstein Variable Products Series Fund | |
NOTE A : Significant Accounting Policies
The AllianceBernstein Global Thematic Growth Portfolio (the “Portfolio”), formerly AllianceBernstein Global Technology Portfolio, is a series of AllianceBernstein Variable Products Series Fund, Inc. (the “Fund”). The Portfolio’s investment objective is long-term growth of capital. The Portfolio is diversified as defined under the Investment Company Act of 1940. The Fund was incorporated in the State of Maryland on November 17, 1987, as an open-end series investment company. The Fund offers thirteen separately managed pools of assets which have differing investment objectives and policies. The Portfolio offers Class A and Class B shares. Both classes of shares have identical voting, dividend, liquidating and other rights, except that Class B shares bear a distribution expense and have exclusive voting rights with respect to the Class B distribution plan.
The Portfolio offers and sells its shares only to separate accounts of certain life insurance companies for the purpose of funding variable annuity contracts and variable life insurance policies. Sales are made without a sales charge at the Portfolio’s net asset value per share.
The financial statements have been prepared in conformity with U.S. generally accepted accounting principles (“U.S. GAAP”) which require management to make certain estimates and assumptions that affect the reported amounts of assets and liabilities in the financial statements and amounts of income and expenses during the reporting period. Actual results could differ from those estimates. The following is a summary of significant accounting policies followed by the Portfolio.
1. Security Valuation
Portfolio securities are valued at their current market value determined on the basis of market quotations or, if market quotations are not readily available or are deemed unreliable, at “fair value” as determined in accordance with procedures established by and under the general supervision of the Fund’s Board of Directors (the “Board”).
In general, the market values of securities which are readily available and deemed reliable are determined as follows: securities listed on a national securities exchange (other than securities listed on the NASDAQ Stock Market, Inc. (“NASDAQ”)) or on a foreign securities exchange are valued at the last sale price at the close of the exchange or foreign securities exchange. If there has been no sale on such day, the securities are valued at the last traded price from the previous day. Securities listed on more than one exchange are valued by reference to the principal exchange on which the securities are traded; securities listed only on NASDAQ are valued in accordance with the NASDAQ Official Closing Price; listed or over the counter (“OTC”) market put or call options are valued at the mid level between the current bid and ask prices. If either a current bid or current ask price is unavailable, AllianceBernstein L.P. (the “Adviser”) will have discretion to determine the best valuation (e.g. last trade price in the case of listed options); open futures are valued using the closing settlement price or, in the absence of such a price, the most recent quoted bid price. If there are no quotations available for the day of valuation, the last available closing settlement price is used; U.S. government securities and other debt instruments having 60 days or less remaining until maturity are valued at amortized cost if their original maturity was 60 days or less; or by amortizing their fair value as of the 61st day prior to maturity if their original term to maturity exceeded 60 days; fixed-income securities, including mortgage-backed and asset-backed securities, may be valued on the basis of prices provided by a pricing service or at a price obtained from one or more of the major broker-dealers. In cases where broker-dealer quotes are obtained, the Adviser may establish procedures whereby changes in market yields or spreads are used to adjust, on a daily basis, a recently obtained quoted price on a security. Swaps and other derivatives are valued daily, primarily using independent pricing services, independent pricing models using market inputs, as well as third party broker-dealers or counterparties. Investment companies are valued at their net asset value each day.
Securities for which market quotations are not readily available (including restricted securities) or are deemed unreliable are valued at fair value. Factors considered in making this determination may include, but are not limited to, information obtained by contacting the issuer, analysts, analysis of the issuer’s financial statements or other available documents. In addition, the Portfolio may use fair value pricing for securities primarily traded in non-U.S. markets because most foreign markets close well before the Portfolio values its securities at 4:00 p.m., Eastern Time. The earlier close of these foreign markets gives rise to the possibility that significant events, including broad market moves, may have occurred in the interim and may materially affect the value of those securities. To account for this, the Portfolio may frequently value many of its foreign equity securities using fair value prices based on third party vendor modeling tools to the extent available.
2. Fair Value Measurements
In accordance with U.S. GAAP regarding fair value measurements, fair value is defined as the price that the Portfolio would receive to sell an asset or pay to transfer a liability in an orderly transaction between market participants at the measurement date. U.S. GAAP establishes a framework for measuring fair value, and a three-level hierarchy for fair value measurements based upon the transparency of inputs to the valuation of an asset or liability (including those valued based on their market values as
15
| GLOBAL THEMATIC GROWTH PORTFOLIO | ||
| NOTES TO FINANCIAL STATEMENTS | ||
| (continued) | AllianceBernstein Variable Products Series Fund | |
described in Note A.1 above). Inputs may be observable or unobservable and refer broadly to the assumptions that market participants would use in pricing the asset or liability. Observable inputs reflect the assumptions market participants would use in pricing the asset or liability based on market data obtained from sources independent of the Portfolio. Unobservable inputs reflect the Portfolio’s own assumptions about the assumptions that market participants would use in pricing the asset or liability based on the best information available in the circumstances. Each investment is assigned a level based upon the observability of the inputs which are significant to the overall valuation. The three-tier hierarchy of inputs is summarized below.
| • | Level 1—quoted prices in active markets for identical investments |
| • | Level 2—other significant observable inputs (including quoted prices for similar investments, interest rates, prepayment speeds, credit risk, etc.) |
| • | Level 3—significant unobservable inputs (including the Portfolio’s own assumptions in determining the fair value of investments) |
Where readily available market prices or relevant bid prices are not available for certain equity investments, such investments may be valued based on similar publicly traded investments, movements in relevant indices since last available prices or based upon underlying company fundamentals and comparable company data (such as multiples to earnings or other multiples to equity). Where an investment is valued using an observable input, such as another publicly traded security, the investment will be classified as Level 2. If management determines that an adjustment is appropriate based on restrictions on resale, illiquidity or uncertainty, and such adjustment is a significant component of the valuation, the investment will be classified as Level 3. An investment will also be classified as Level 3 where management uses company fundamentals and other significant inputs to determine the valuation.
The following table summarizes the valuation of the Portfolio’s investments by the above fair value hierarchy levels as of December 31, 2013:
| Level 1 | Level 2 | Level 3 | Total | |||||||||||||
Investments in Securities: | ||||||||||||||||
Assets: | ||||||||||||||||
Common Stocks: | ||||||||||||||||
Information Technology | $ | 35,278,218 | $ | 4,400,503 | $ | –0 | – | $ | 39,678,721 | |||||||
Consumer Discretionary | 17,097,984 | 8,888,438 | –0 | – | 25,986,422 | |||||||||||
Health Care | 11,810,216 | 6,510,568 | –0 | – | 18,320,784 | |||||||||||
Consumer Staples | 4,103,686 | 11,485,703 | –0 | – | 15,589,389 | |||||||||||
Financials | 4,693,322 | 8,086,166 | –0 | – | 12,779,488 | |||||||||||
Energy | 9,424,802 | 3,265,754 | –0 | – | 12,690,556 | |||||||||||
Telecommunication Services | –0 | – | 2,679,101 | –0 | – | 2,679,101 | ||||||||||
Industrials | 1,481,469 | 1,081,120 | –0 | – | 2,562,589 | |||||||||||
Materials | 1,821,676 | –0 | – | –0 | – | 1,821,676 | ||||||||||
Short-Term Investments | –0 | – | 1,301,417 | –0 | – | 1,301,417 | ||||||||||
Investments of Cash Collateral for Securities Loaned in Affiliated Money Market Fund | 1,350,130 | –0 | – | –0 | – | 1,350,130 | ||||||||||
|
|
|
|
|
|
|
| |||||||||
Total Investments in Securities | 87,061,503 | 47,698,770 | + | –0 | – | 134,760,273 | ||||||||||
Other Financial Instruments* : | ||||||||||||||||
Assets: | ||||||||||||||||
Forward Currency Exchange Contracts | –0 | – | 108,151 | –0 | – | 108,151 | ||||||||||
Liabilities: | ||||||||||||||||
Forward Currency Exchange Contracts | –0 | – | (106,522 | ) | –0 | – | (106,522 | ) | ||||||||
|
|
|
|
|
|
|
| |||||||||
Total^ | $ | 87,061,503 | $ | 47,700,399 | $ | –0 | – | $ | 134,761,902 | |||||||
|
|
|
|
|
|
|
| |||||||||
| * | Other financial instruments are derivative instruments, such as futures, forwards and swaps, which are valued at the unrealized appreciation/depreciation on the instrument. |
| + | A significant portion of the Portfolio’s foreign equity investments are categorized as Level 2 investments since they are valued using fair value prices based on third party vendor modeling tools to the extent available, see Note A.1. |
| ^ | There were no transfers between Level 1 and Level 2 during the reporting period. |
The Portfolio recognizes all transfers between levels of the fair value hierarchy assuming the financial instruments were transferred at the beginning of the reporting period.
16
| AllianceBernstein Variable Products Series Fund |
The Adviser has established a Valuation Committee (the “Committee”) which is responsible for overseeing the pricing and valuation of all securities held in the Portfolio. The Committee operates under pricing and valuation policies and procedures established by the Adviser and approved by the Board, including pricing policies which set forth the mechanisms and processes to be employed on a daily basis to implement these policies and procedures. In particular, the pricing policies describe how to determine market quotations for securities and other instruments. The Committee’s responsibilities include: 1) fair value and liquidity determinations (and oversight of any third parties to whom any responsibility for fair value and liquidity determinations is delegated), and 2) regular monitoring of the Adviser’s pricing and valuation policies and procedures and modification or enhancement of these policies and procedures (or recommendation of the modification of these policies and procedures) as the Committee believes appropriate.
The Committee is also responsible for monitoring the implementation of the pricing policies by the Adviser’s Pricing Group (the “Pricing Group”) and a third party which performs certain pricing functions in accordance with the pricing policies. The Pricing Group is responsible for the oversight of the third party on a day-to-day basis. The Committee and the Pricing Group perform a series of activities to provide reasonable assurance of the accuracy of prices including: 1) periodic vendor due diligence meetings, review of methodologies, new developments and processes at vendors, 2) daily comparison of security valuation versus prior day for all securities that exceeded established thresholds, and 3) daily review of unpriced, stale, and variance reports with exceptions reviewed by senior management and the Committee.
In addition, several processes outside of the pricing process are used to monitor valuation issues including: 1) performance and performance attribution reports are monitored for anomalous impacts based upon benchmark performance, and 2) portfolio managers review all portfolios for performance and analytics (which are generated using the Adviser’s prices).
3. Currency Translation
Assets and liabilities denominated in foreign currencies and commitments under forward currency exchange contracts are translated into U.S. dollars at the mean of the quoted bid and ask prices of such currencies against the U.S. dollar. Purchases and sales of portfolio securities are translated into U.S. dollars at the rates of exchange prevailing when such securities were acquired or sold. Income and expenses are translated into U.S. dollars at rates of exchange prevailing when accrued.
Net realized gain or loss on foreign currency transactions represents foreign exchange gains and losses from sales and maturities of foreign fixed income investments, foreign currency exchange contracts, holding of foreign currencies, currency gains or losses realized between the trade and settlement dates on foreign investment transactions, and the difference between the amounts of dividends, interest and foreign withholding taxes recorded on the Portfolio’s books and the U.S. dollar equivalent amounts actually received or paid. Net unrealized currency gains and losses from valuing foreign currency denominated assets and liabilities at period end exchange rates are reflected as a component of net unrealized appreciation or depreciation of foreign currency denominated assets and liabilities.
4. Taxes
It is the Portfolio’s policy to meet the requirements of the Internal Revenue Code applicable to regulated investment companies and to distribute all of its investment company taxable income and net realized gains, if any, to shareholders. Therefore, no provisions for federal income or excise taxes are required. The Portfolio may be subject to taxes imposed by countries in which it invests. Such taxes are generally based on income and/or capital gains earned or repatriated. Taxes are accrued and applied to net investment income, net realized gains and net unrealized appreciation/depreciation as such income and/or gains are earned.
In accordance with U.S. GAAP requirements regarding accounting for uncertainties in income taxes, management has analyzed the Portfolio’s tax positions taken or expected to be taken on federal and state income tax returns for all open tax years (the current and the prior three tax years) and has concluded that no provision for income tax is required in the Portfolio’s financial statements.
5. Investment Income and Investment Transactions
Dividend income is recorded on the ex-dividend date or as soon as the Portfolio is informed of the dividend. Interest income is accrued daily. Investment transactions are accounted for on the date the securities are purchased or sold. Investment gains or losses are determined on the identified cost basis. The Portfolio amortizes premiums and accretes discounts as adjustments to interest income.
17
| GLOBAL THEMATIC GROWTH PORTFOLIO | ||
| NOTES TO FINANCIAL STATEMENTS | ||
| (continued) | AllianceBernstein Variable Products Series Fund | |
6. Class Allocations
All income earned and expenses incurred by the Portfolio are borne on a pro-rata basis by each outstanding class of shares, based on the proportionate interest in the Portfolio represented by the net assets of such class, except for class specific expenses which are allocated to the respective class. Expenses of the Fund are charged proportionately to each Portfolio or based on other appropriate methods. Realized and unrealized gains and losses are allocated among the various share classes based on respective net assets.
7. Dividends and Distributions
Dividends and distributions to shareholders, if any, are recorded on the ex-dividend date. Income dividends and capital gains distributions are determined in accordance with federal tax regulations and may differ from those determined in accordance with U.S. GAAP. To the extent these differences are permanent, such amounts are reclassified within the capital accounts based on their federal tax basis treatment; temporary differences do not require such reclassification.
NOTE B : Advisory Fee and Other Transactions with Affiliates
Under the terms of the investment advisory agreement, the Portfolio pays the Adviser an advisory fee at an annual rate of .75% of the first $2.5 billion, .65% of the next $2.5 billion and .60% in excess of $5 billion, of the Portfolio’s average daily net assets. The fee is accrued daily and paid monthly.
Pursuant to the investment advisory agreement, the Portfolio may reimburse the Adviser for certain legal and accounting services provided to the Portfolio by the Adviser. For the year ended December 31, 2013, the reimbursement for such services amounted to $54,101.
Brokerage commissions paid on investment transactions for the year ended December 31, 2013 amounted to $248,709, of which $633 and $20, respectively, was paid to Sanford C. Bernstein & Co. LLC and Sanford C. Bernstein Limited, affiliates of the Adviser.
The Portfolio compensates AllianceBernstein Investor Services, Inc. (“ABIS”), a wholly-owned subsidiary of the Adviser, under a Transfer Agency Agreement for providing personnel and facilities to perform transfer agency services for the Portfolio. Such compensation retained by ABIS amounted to $1,385 for the year ended December 31, 2013.
NOTE C : Distribution Plan
The Portfolio has adopted a Distribution Plan (the “Plan”) for Class B shares pursuant to Rule 12b-1 under the Investment Company Act of 1940. Under the Plan, the Portfolio pays distribution and servicing fees to AllianceBernstein Investments, Inc. (the “Distributor”), a wholly-owned subsidiary of the Adviser, at an annual rate of up to .50% of the Portfolio’s average daily net assets attributable to Class B shares. The fees are accrued daily and paid monthly. The Board currently limits payments under the Plan to .25% of the Portfolio’s average daily net assets attributable to Class B shares. The Plan provides that the Distributor will use such payments in their entirety for distribution assistance and promotional activities.
The Portfolio is not obligated under the Plan to pay any distribution and servicing fees in excess of the amounts set forth above. The purpose of the payments to the Distributor under the Plan is to compensate the Distributor for its distribution services with respect to the sale of the Portfolio’s Class B shares. Since the Distributor’s compensation is not directly tied to its expenses, the amount of compensation received by it under the Plan during any year may be more or less than its actual expenses. For this reason, the Plan is characterized by the staff of the Securities and Exchange Commission as being of the “compensation” variety.
In the event that the Plan is terminated or not continued, no distribution or servicing fees (other than current amounts accrued but not yet paid) would be owed by the Portfolio to the Distributor.
The Plan also provides that the Adviser may use its own resources to finance the distribution of the Portfolio’s shares.
NOTE D : Investment Transactions
Purchases and sales of investment securities (excluding short-term investments) for the year ended December 31, 2013 were as follows:
| Purchases | Sales | |||||||
Investment securities (excluding U.S. government securities) | $ | 123,790,265 | $ | 151,691,396 | ||||
U.S. government securities | –0 | – | –0 | – | ||||
18
| AllianceBernstein Variable Products Series Fund |
The cost of investments for federal income tax purposes, gross unrealized appreciation and unrealized depreciation (excluding foreign currency transactions) are as follows:
Cost | $ | 108,172,740 | ||
|
| |||
Gross unrealized appreciation | $ | 30,068,545 | ||
Gross unrealized depreciation | (3,481,012 | ) | ||
|
| |||
Net unrealized appreciation | $ | 26,587,533 | ||
|
|
1. Derivative Financial Instruments
The Portfolio may use derivatives in an effort to earn income and enhance returns, to replace more traditional direct investments, to obtain exposure to otherwise inaccessible markets (collectively, “investment purposes”), or to hedge or adjust the risk profile of its portfolio.
The principal types of derivatives utilized by the Portfolio, as well as the methods in which they may be used are:
| • | Futures |
The Portfolio may buy or sell futures for investment purposes or for the purpose of hedging its portfolio against adverse effects of potential movements in the market. The Portfolio bears the market risk that arises from changes in the value of these instruments and the imperfect correlation between movements in the price of the futures and movements in the price of the assets, reference rates or indices which they are designed to track. Among other things, the Portfolio may purchase or sell futures for foreign currencies or options thereon for non-hedging purposes as a means of making direct investment in foreign currencies, as described below under “Currency Transactions”.
At the time the Portfolio enters into futures, the Portfolio deposits and maintains as collateral an initial margin with the broker, as required by the exchange on which the transaction is effected. Pursuant to the contract, the Portfolio agrees to receive from or pay to the broker an amount of cash equal to the daily fluctuation in the value of the contract. Such receipts or payments are known as variation margin and are recorded by the Portfolio as unrealized gains or losses. Risks may arise from the potential inability of a counterparty to meet the terms of the contract. The credit/counterparty risk for exchange-traded futures is generally less than privately negotiated futures, since the clearinghouse, which is the issuer or counterparty to each exchange-traded future, has robust risk mitigation standards, including the requirement to provide initial and variation margin. When the contract is closed, the Portfolio records a realized gain or loss equal to the difference between the value of the contract at the time it was opened and the time it was closed.
During the year ended December 31, 2013, the Portfolio held futures for hedging purposes.
| • | Forward Currency Exchange Contracts |
The Portfolio may enter into forward currency exchange contracts in order to hedge its exposure to changes in foreign currency exchange rates on its foreign portfolio holdings, to hedge certain firm purchase and sale commitments denominated in foreign currencies and for non-hedging purposes as a means of making direct investments in foreign currencies, as described below under “Currency Transactions”.
A forward currency exchange contract is a commitment to purchase or sell a foreign currency at a future date at a negotiated forward rate. The gain or loss arising from the difference between the original contract and the closing of such contract would be included in net realized gain or loss on foreign currency transactions. Fluctuations in the value of open forward currency exchange contracts are recorded for financial reporting purposes as unrealized appreciation and/or depreciation by the Portfolio. Risks may arise from the potential inability of a counterparty to meet the terms of a contract and from unanticipated movements in the value of a foreign currency relative to the U.S. dollar.
During the year ended December 31, 2013, the Portfolio held forward currency exchange contracts for hedging purposes.
| • | Option Transactions |
For hedging and investment purposes, the Portfolio may purchase and write (sell) put and call options on U.S. and foreign securities, including government securities, and foreign currencies that are traded on U.S. and foreign
19
| GLOBAL THEMATIC GROWTH PORTFOLIO | ||
| NOTES TO FINANCIAL STATEMENTS | ||
| (continued) | AllianceBernstein Variable Products Series Fund | |
securities exchanges and over-the-counter markets. Among other things, the Portfolio may use options transactions for non-hedging purposes as a means of making direct investments in foreign currencies, as described below under “Currency Transactions” and may use options strategies involving the purchase and/or writing of various combinations of call and/or put options, for hedging and investment purposes.
The risk associated with purchasing an option is that the Portfolio pays a premium whether or not the option is exercised. Additionally, the Portfolio bears the risk of loss of the premium and change in market value should the counterparty not perform under the contract. Put and call options purchased are accounted for in the same manner as portfolio securities. The cost of securities acquired through the exercise of call options is increased by premiums paid. The proceeds from securities sold through the exercise of put options are decreased by the premiums paid.
When the Portfolio writes an option, the premium received by the Portfolio is recorded as a liability and is subsequently adjusted to the current market value of the option written. Premiums received from written options which expire unexercised are recorded by the Portfolio on the expiration date as realized gains from options written. The difference between the premium received and the amount paid on effecting a closing purchase transaction, including brokerage commissions, is also treated as a realized gain, or if the premium received is less than the amount paid for the closing purchase transaction, as a realized loss. If a call option is exercised, the premium received is added to the proceeds from the sale of the underlying security or currency in determining whether the Portfolio has realized a gain or loss. If a put option is exercised, the premium received reduces the cost basis of the security or currency purchased by the Portfolio. In writing an option, the Portfolio bears the market risk of an unfavorable change in the price of the security or currency underlying the written option. Exercise of an option written by the Portfolio could result in the Portfolio selling or buying a security or currency at a price different from the current market value.
During the year ended December 31, 2013, the Portfolio held purchased options for hedging purposes. During the year ended December 31, 2013, the Portfolio held written options for hedging purposes.
For the year ended December 31, 2013, the Portfolio had the following transactions in written options:
| Number of Contracts | Premiums Received | |||||||
Options written outstanding as of 12/31/12 | 1,825 | $ | 20,440 | |||||
Options written | –0 | – | –0 | – | ||||
Options expired | –0 | – | –0 | – | ||||
Options bought back | (1,825 | ) | (20,440 | ) | ||||
Options exercised | –0 | – | –0 | – | ||||
|
|
|
| |||||
Options written outstanding as of 12/31/13 | –0 | – | $ | –0 | – | |||
|
|
|
| |||||
The Portfolio typically enters into International Swaps and Derivatives Association, Inc. Master Agreements (“ISDA Master Agreement”) or similar master agreements (collectively, “Master Agreements”) with its OTC derivative contract counterparties in order to, among other things, reduce its credit risk to counterparties. ISDA Master Agreements include provisions for general obligations, representations, collateral and events of default or termination. Under an ISDA Master Agreement, the Portfolio typically may offset with the counterparty certain derivative financial instrument’s payables and/or receivables with collateral held and/or posted and create one single net payment (close-out netting) in the event of default or termination.
Various master agreements govern the terms of certain transactions with counterparties, including transactions such as exchange-traded derivative transactions, repurchase and reverse repurchase agreements. These master agreements typically attempt to reduce the counterparty risk associated with such transactions by specifying credit protection mechanisms and providing standardization that improves legal certainty. Cross-termination provisions under Master Agreements typically provide that a default in connection with one transaction between the Portfolio and a counterparty gives the non-defaulting party the right to terminate any other transactions in place with the defaulting party to create one single net payment due to/due from the defaulting party. In the event of a default by a Master Agreements counterparty, the return of collateral with market value in excess of the Portfolio’s net liability, held by the defaulting party, may be delayed or denied.
20
| AllianceBernstein Variable Products Series Fund |
The Portfolio’s Master Agreements may contain provisions for early termination of OTC derivative transactions in the event the net assets of the Portfolio decline below specific levels (“net asset contingent features”). If these levels are triggered, the Portfolio’s counterparty has the right to terminate such transaction and require the Portfolio to pay or receive a settlement amount in connection with the terminated transaction. As of December 31, 2013, the Portfolio had OTC derivatives with contingent features in net liability positions in the amount of $88,645. If a trigger event had occurred at December 31, 2013, for those derivatives in a net liability position, $88,645 would be required to be posted by the Portfolio.
At December 31, 2013, the Portfolio had entered into the following derivatives:
Asset Derivatives | Liability Derivatives | |||||||||||
Derivative Type | Statement of Assets and Liabilities Location | Fair Value | Statement of Assets and Liabilities Location | Fair Value | ||||||||
Foreign exchange contracts | Unrealized appreciation of forward currency exchange contracts | $ | 108,151 | Unrealized depreciation of forward currency exchange contracts | $ | 106,522 | ||||||
|
|
|
| |||||||||
Total | $ | 108,151 | $ | 106,522 | ||||||||
|
|
|
| |||||||||
The effect of derivative instruments on the statement of operations for the year ended December 31, 2013:
Derivative Type | Location of Gain or (Loss) on Derivatives | Realized Gain or (Loss) on Derivatives | Change in Unrealized Appreciation or (Depreciation) | |||||||
Equity contracts | Net realized gain (loss) on futures; Net change in unrealized appreciation/depreciation of futures | $ | 25,167 | $ | –0 | – | ||||
Foreign exchange contracts | Net realized gain (loss) on foreign currency transactions; Net change in unrealized appreciation/depreciation of foreign currency denominated assets and liabilities | (1,708,511 | ) | 137,983 | ||||||
Equity contracts | Net realized gain (loss) on investment transactions; Net change in unrealized appreciation/depreciation of investments | (1,697,704 | ) | 1,571,169 | ||||||
Equity contracts | Net realized gain (loss) on options written; Net change in unrealized appreciation/depreciation of options written | (4,909 | ) | 8,213 | ||||||
|
|
|
| |||||||
Total | $ | (3,385,957 | ) | $ | 1,717,365 | |||||
|
|
|
| |||||||
The following table represents the volume of the Portfolio’s derivative transactions during the year ended December 31, 2013:
Futures: | ||||
Average original value of buy contracts | $ | 4,969,514 | (a) | |
Forward Currency Exchange Contracts: | ||||
Average principal amount of buy contracts | $ | 27,944,340 | ||
Average principal amount of sale contracts | $ | 16,305,155 | (b) | |
Purchased Options: | ||||
Average monthly cost | $ | 418,513 | (c) |
| (a) | Positions were open for less than one month during the year. |
| (b) | Positions were open for nine months during the year. |
| (c) | Positions were open for six months during the year. |
21
| GLOBAL THEMATIC GROWTH PORTFOLIO | ||
| NOTES TO FINANCIAL STATEMENTS | ||
| (continued) | AllianceBernstein Variable Products Series Fund | |
For financial reporting purposes, the Portfolio does not offset derivative assets and derivative liabilities that are subject to netting arrangements in the statement of assets and liabilities.
All derivatives held during the reporting period were subject to netting arrangements. The following table presents the Portfolio’s derivative assets and liabilities by counterparty net of amounts available for offset under Master Agreements (“MA”) and net of the related collateral received/ pledged by the Portfolio as of December 31, 2013:
Counterparty | Derivative Assets Subject to MA | Derivative Available for Offset | Collateral Received | Net Amount of Derivatives Assets | ||||||||||||
Barclays Bank PLC Wholesale | $ | 5,071 | $ | –0 | – | $ | –0 | – | $ | 5,071 | ||||||
Credit Suisse International | 8,977 | –0 | – | –0 | – | 8,977 | ||||||||||
Goldman Sachs Bank USA | 1,380 | –0 | – | –0 | – | 1,380 | ||||||||||
HSBC Bank USA | 44,198 | –0 | – | –0 | – | 44,198 | ||||||||||
State Street Bank & Trust Co. | 16,272 | –0 | – | –0 | – | 16,272 | ||||||||||
UBS AG | 32,253 | (17,877 | ) | –0 | – | 14,376 | ||||||||||
|
|
|
|
|
|
|
| |||||||||
Total | $ | 108,151 | $ | (17,877 | ) | $ | –0 | – | $ | 90,274 | ||||||
|
|
|
|
|
|
|
| |||||||||
Counterparty | Derivative Liabilities Subject to MA | Derivative Available for Offset | Collateral Pledged | Net Amount of Derivatives Liabilities | ||||||||||||
BNP Paribas SA | $ | 88,645 | $ | –0 | – | $ | –0 | – | $ | 88,645 | ||||||
UBS AG | 17,877 | (17,877 | ) | –0 | – | –0 | – | |||||||||
|
|
|
|
|
|
|
| |||||||||
Total | $ | 106,522 | $ | (17,877 | ) | $ | –0 | – | $ | 88,645 | ||||||
|
|
|
|
|
|
|
| |||||||||
2. Currency Transactions
The Portfolio may invest in non-U.S. dollar securities on a currency hedged or unhedged basis. The Portfolio may seek investment opportunities by taking long or short positions in currencies through the use of currency-related derivatives, including forward currency exchange contracts, futures and options on futures, swaps, and other options. The Portfolio may enter into transactions for investment opportunities when it anticipates that a foreign currency will appreciate or depreciate in value but securities denominated in that currency are not held by the Portfolio and do not present attractive investment opportunities. Such transactions may also be used when the Adviser believes that it may be more efficient than a direct investment in a foreign currency-denominated security. The Portfolio may also conduct currency exchange contracts on a spot basis (i.e., for cash at the spot rate prevailing in the currency exchange market for buying or selling currencies).
NOTE E : Securities Lending
The Portfolio may enter into securities lending transactions. Under the Portfolio’s securities lending program, all loans of securities will be collateralized continually by cash. The Portfolio will be compensated for the loan from a portion of the net return from the income earned on cash collateral after a rebate is paid to the borrower (in some cases, this rebate may be a “negative rebate” or fee paid by the borrower to the Portfolio in connection with the loan), and payments are made for fees of the securities lending agent and for certain other administrative expenses. It is the policy of the Portfolio to receive collateral consisting of cash in an amount exceeding the value of the securities loaned. The Portfolio will have the right to call a loan and obtain the securities loaned at any time on notice to the borrower within the normal and customary settlement time for the securities. While the securities are on loan, the borrower is obligated to pay the Portfolio amounts equal to any income or other distributions from the securities. The Portfolio will not have the right to vote any securities during the existence of a loan, but will have the right to regain ownership of loaned securities in order to exercise voting or other ownership rights. The lending agent has agreed to indemnify the Portfolio in the case of default of any securities borrower. Collateral received and securities loaned are marked to market daily to ensure that the securities loaned are secured by collateral. The lending agent will invest the cash collateral received in AllianceBernstein Exchange Reserves, an eligible money market vehicle, in accordance with the investment restrictions of the Portfolio, and as approved by the Board. The collateral received on securities loaned is recorded as an asset as well as a corresponding liability in the statement of assets and liabilities. When the Portfolio lends securities, its investment performance will continue to reflect changes in the value of the securities loaned. At December 31, 2013, the Portfolio had securities on loan with a value of $1,368,571 and had received cash collateral which has been invested into AllianceBernstein Exchange Reserves of $1,350,130. The cash collateral will be adjusted on the next business day to maintain the required collateral amount. The Portfolio earned securities
22
| AllianceBernstein Variable Products Series Fund |
lending income of $448,856 and $10,323 from the borrowers and AllianceBernstein Exchange Reserves, respectively, for the year ended December 31, 2013; these amounts are reflected in the statement of operations. A principal risk of lending portfolio securities is that the borrower will fail to return the loaned securities upon termination of the loan and that the collateral will not be sufficient to replace the loaned securities. A summary of the Portfolio’s transactions in shares of AllianceBernstein Exchange Reserves for the year ended December 31, 2013 is as follows:
Market Value December 31, 2012 (000) | Purchases at Cost (000) | Sales Proceeds (000) | Market Value December 31, 2013 (000) | |||||||||||
| $ | 28,576 | $ | 86,343 | $ | 113,569 | $ | 1,350 | |||||||
NOTE F : Capital Stock
Each class consists of 500,000,000 authorized shares. Transactions in capital shares for each class were as follows:
| SHARES | AMOUNT | |||||||||||||||||
| Year Ended December 31, 2013 | Year Ended December 31, 2012 | Year Ended December 31, 2013 | Year Ended December 31, 2012 | |||||||||||||||
Class A | ||||||||||||||||||
Shares sold | 144,991 | 206,409 | $ | 2,658,807 | $ | 3,436,905 | ||||||||||||
Shares issued in reinvestment of dividends | 4,357 | –0 | – | 80,207 | –0 | – | ||||||||||||
Shares redeemed | (980,306 | ) | (653,840 | ) | (18,090,881 | ) | (10,577,026 | ) | ||||||||||
|
|
|
|
|
|
|
| |||||||||||
Net decrease | (830,958 | ) | (447,431 | ) | $ | (15,351,867 | ) | $ | (7,140,121 | ) | ||||||||
|
|
|
|
|
|
|
| |||||||||||
Class B | ||||||||||||||||||
Shares sold | 638,321 | 754,582 | $ | 11,410,760 | $ | 12,036,869 | ||||||||||||
Shares issued in reinvestment of dividends | 1,169 | –0 | – | 20,969 | –0 | – | ||||||||||||
Shares redeemed | (1,208,972 | ) | (1,992,891 | ) | (21,567,266 | ) | (30,910,162 | ) | ||||||||||
|
|
|
|
|
|
|
| |||||||||||
Net decrease | (569,482 | ) | (1,238,309 | ) | $ | (10,135,537 | ) | $ | (18,873,293 | ) | ||||||||
|
|
|
|
|
|
|
| |||||||||||
NOTE G : Risks Involved in Investing in the Portfolio
Foreign Securities Risk—Investing in securities of foreign companies or foreign governments involves special risks which include changes in foreign currency exchange rates and the possibility of future political and economic developments which could adversely affect the value of such securities. Moreover, securities of many foreign companies or foreign governments and their markets may be less liquid and their prices more volatile than those of comparable U.S. companies or of the U.S. government.
Currency Risk—This is the risk that changes in foreign currency exchange rates may negatively affect the value of the Portfolio’s investments or reduce the returns of the Portfolio. For example, the value of the Portfolio’s investments in foreign currency-denominated securities or currencies may decrease if the U.S. dollar is strong (i.e., gaining value relative to other currencies) and other currencies are weak (i.e., losing value relative to the U.S. dollar). Currency markets are generally not as regulated as securities markets. Independent of the Portfolio’s investments denominated in foreign currencies, the Portfolio’s positions in various foreign currencies may cause the Portfolio to experience investment losses due to the changes in exchange rates and interest rates.
Derivatives Risk—The Portfolio may enter into derivative transactions such as forwards, options, futures and swaps. Derivatives may be illiquid, difficult to price, and leveraged so that small changes may produce disproportionate losses for the Portfolio, and subject to counterparty risk to a greater degree than more traditional investments. Derivatives may result in significant losses, including losses that are far greater than the value of the derivatives reflected in the statement of assets and liabilities.
Indemnification Risk—In the ordinary course of business, the Portfolio enters into contracts that contain a variety of indemnifications. The Portfolio’s maximum exposure under these arrangements is unknown. However, the Portfolio has not had prior claims or losses pursuant to these indemnification provisions and expects the risk of loss thereunder to be remote. Therefore, the Portfolio has not accrued any liability in connection with these indemnification provisions.
23
| GLOBAL THEMATIC GROWTH PORTFOLIO | ||
| NOTES TO FINANCIAL STATEMENTS | ||
| (continued) | AllianceBernstein Variable Products Series Fund | |
NOTE H : Joint Credit Facility
A number of open-end mutual funds managed by the Adviser, including the Portfolio, participate in a $140 million revolving credit facility (the “Facility”) intended to provide short-term financing, if necessary, subject to certain restrictions in connection with abnormal redemption activity. Commitment fees related to the Facility are paid by the participating funds and are included in miscellaneous expenses in the statement of operations. The Portfolio did not utilize the Facility during the year ended December 31, 2013.
NOTE I: Distributions to Shareholders
The tax character of distributions paid during the fiscal years ended December 31, 2013 and December 31, 2012 were as follows:
| 2013 | 2012 | |||||||
Distributions paid from: | ||||||||
Ordinary income | $ | 93,577 | $ | –0 | – | |||
|
|
|
| |||||
Total taxable distributions | $ | 93,577 | $ | –0 | – | |||
Tax return of capital | 7,599 | –0 | – | |||||
|
|
|
| |||||
Total distributions paid | $ | 101,176 | $ | –0 | – | |||
|
|
|
| |||||
As of December 31, 2013, the components of accumulated earnings/(deficit) on a tax basis were as follows:
Accumulated capital and other losses | $ | (59,972,547 | )(a) | |
Unrealized appreciation/(depreciation) | 26,587,198 | (b) | ||
|
| |||
Total accumulated earnings/(deficit) | $ | (33,385,349 | ) | |
|
|
| (a) | As of December 31, 2013, the Portfolio had a net capital loss carryforward of $59,936,202. During the fiscal year, the Portfolio utilized $7,576,730 of capital loss carryforwards to offset current year net realized gains. At December 31, 2013, the Portfolio had a qualified late-year ordinary loss deferral of $36,345 which is deemed to arise on January 1, 2014. |
| (b) | The differences between book-basis and tax-basis unrealized appreciation/(depreciation) are attributable primarily to the tax deferral of losses on wash sales and the realization for tax purposes of gains/losses on certain derivative instruments. |
For tax purposes, net capital losses may be carried over to offset future capital gains, if any. Funds are permitted to carry forward capital losses incurred in taxable years beginning after December 22, 2010 for an indefinite period. These post-enactment capital losses must be utilized prior to the pre-enactment capital losses, which are subject to expiration. Post-enactment capital loss carryforwards will retain their character as either short-term or long-term capital losses rather than being considered short-term as under previous regulation.
As of December 31, 2013, the Portfolio had a net capital loss carryforward of $59,936,202 which will expire as follows:
SHORT-TERM | LONG-TERM | EXPIRATION | ||
| $28,312,496 | n/a | 2016 | ||
| 18,800,560 | n/a | 2017 | ||
| 10,133,887 | $2,689,259 | No expiration |
During the current fiscal year, permanent differences primarily due to foreign currency reclassifications, the tax treatment of passive foreign investment companies (PFICs) and the disallowance of a net operating loss resulted in a net decrease in distributions in excess of net investment income, a net decrease in accumulated net realized loss on investment and foreign currency transactions, and a net decrease in additional paid-in capital. These reclassifications had no effect on net assets.
NOTE J : Subsequent Events
Management has evaluated subsequent events for possible recognition or disclosure in the financial statements through the date the financial statements are issued. Management has determined that there are no material events that would require disclosure in the Portfolio’s financial statements through this date.
24
| GLOBAL THEMATIC GROWTH PORTFOLIO | ||
| FINANCIAL HIGHLIGHTS | AllianceBernstein Variable Products Series Fund | |
Selected Data For A Share Of Capital Stock Outstanding Throughout Each Period
| CLASS A | ||||||||||||||||||||
| Year Ended December 31, | ||||||||||||||||||||
| 2013 | 2012 | 2011 | 2010 | 2009 | ||||||||||||||||
Net asset value, beginning of period | $16.88 | $14.87 | $19.47 | $16.73 | $10.90 | |||||||||||||||
|
|
|
|
|
|
|
|
|
| |||||||||||
Income From Investment Operations | ||||||||||||||||||||
Net investment income (a) | .04 | .13 | .02 | .12 | .07 | |||||||||||||||
Net realized and unrealized gain (loss) on investment and foreign currency transactions | 3.88 | 1.88 | (4.52 | ) | 2.98 | 5.76 | ||||||||||||||
Contributions from Adviser | –0 | – | –0 | – | –0 | – | –0 | – | .00 | (b) | ||||||||||
|
|
|
|
|
|
|
|
|
| |||||||||||
Net increase (decrease) in net asset value from operations | 3.92 | 2.01 | (4.50 | ) | 3.10 | 5.83 | ||||||||||||||
|
|
|
|
|
|
|
|
|
| |||||||||||
Less: Dividends and Distributions | ||||||||||||||||||||
Dividends from net investment income | (.05 | ) | –0 | – | (.10 | ) | (.36 | ) | –0 | – | ||||||||||
Tax return of capital | .00 | (b) | –0 | – | –0 | – | –0 | – | –0 | – | ||||||||||
|
|
|
|
|
|
|
|
|
| |||||||||||
Total dividends and distributions | (.05 | ) | –0 | – | (.10 | ) | (.36 | ) | –0 | – | ||||||||||
|
|
|
|
|
|
|
|
|
| |||||||||||
Net asset value, end of period | $20.75 | $16.88 | $14.87 | $19.47 | $16.73 | |||||||||||||||
|
|
|
|
|
|
|
|
|
| |||||||||||
Total Return | ||||||||||||||||||||
Total investment return based on net asset value (c)* | 23.26 | % | 13.52 | % | (23.23 | )% | 18.93 | % | 53.49 | %† | ||||||||||
Ratios/Supplemental Data | ||||||||||||||||||||
Net assets, end of period | $32,195 | $40,231 | $42,094 | $66,302 | $65,358 | |||||||||||||||
Ratio to average net assets of: | ||||||||||||||||||||
Expenses | .98 | % | .99 | % | .94 | % | .99 | %+ | 1.00 | % | ||||||||||
Net investment income | .22 | % | .83 | % | .10 | % | .69 | %+ | .52 | % | ||||||||||
Portfolio turnover rate | 96 | % | 152 | % | 163 | % | 117 | % | 215 | % | ||||||||||
See footnote summary on page 26.
25
| GLOBAL THEMATIC GROWTH PORTFOLIO | ||
| FINANCIAL HIGHLIGHTS | ||
| (continued) | AllianceBernstein Variable Products Series Fund | |
Selected Data For A Share Of Capital Stock Outstanding Throughout Each Period
| CLASS B | ||||||||||||||||||||
| Year Ended December 31, | ||||||||||||||||||||
| 2013 | 2012 | 2011 | 2010 | 2009 | ||||||||||||||||
Net asset value, beginning of period | $16.42 | $14.50 | $18.99 | $16.34 | $10.67 | |||||||||||||||
|
|
|
|
|
|
|
|
|
| |||||||||||
Income From Investment Operations | ||||||||||||||||||||
Net investment income (loss) (a) | (.01 | ) | .09 | (.03 | ) | .07 | .04 | |||||||||||||
Net realized and unrealized gain (loss) on investment and foreign currency transactions | 3.77 | 1.83 | (4.40 | ) | 2.90 | 5.63 | ||||||||||||||
Contributions from Adviser | –0 | – | –0 | – | –0 | – | –0 | – | .00 | (b) | ||||||||||
|
|
|
|
|
|
|
|
|
| |||||||||||
Net increase (decrease) in net asset value from operations | 3.76 | 1.92 | (4.43 | ) | 2.97 | 5.67 | ||||||||||||||
|
|
|
|
|
|
|
|
|
| |||||||||||
Less: Dividends and Distributions | ||||||||||||||||||||
Dividends from net investment income | .00 | (b) | –0 | – | (.06 | ) | (.32 | ) | –0 | – | ||||||||||
Tax return of capital | .00 | (b) | –0 | – | –0 | – | –0 | – | –0 | – | ||||||||||
|
|
|
|
|
|
|
|
|
| |||||||||||
Total dividends and distributions | .00 | (b) | –0 | – | (.06 | ) | (.32 | ) | –0 | – | ||||||||||
|
|
|
|
|
|
|
|
|
| |||||||||||
Net asset value, end of period | $20.18 | $16.42 | $14.50 | $18.99 | $16.34 | |||||||||||||||
|
|
|
|
|
|
|
|
|
| |||||||||||
Total Return | ||||||||||||||||||||
Total investment return based on net asset value (c)* | 22.93 | % | 13.24 | % | (23.41 | )% | 18.58 | % | 53.14 | %† | ||||||||||
Ratios/Supplemental Data | ||||||||||||||||||||
Net assets, end of period | $101,388 | $91,864 | $99,084 | $141,649 | $141,536 | |||||||||||||||
Ratio to average net assets of: | ||||||||||||||||||||
Expenses | 1.23 | % | 1.24 | % | 1.19 | % | 1.24 | %+ | 1.25 | % | ||||||||||
Net investment income (loss) | (.06 | )% | .58 | % | (.14 | )% | .44 | %+ | .27 | % | ||||||||||
Portfolio turnover rate | 96 | % | 152 | % | 163 | % | 117 | % | 215 | % | ||||||||||
| (a) | Based on average shares outstanding. |
| (b) | Amount is less than $.005. |
| (c) | Total investment return is calculated assuming an initial investment made at the net asset value at the beginning of the period, reinvestment of all dividends and distributions at net asset value during the period, and redemption on the last day of the period. Total return does not reflect (i) insurance company’s separate account related expense charges and (ii) the deductions of taxes that a shareholder would pay on Portfolio distributions or the redemption of Portfolio shares. Total investment return calculated for a period of less than one year is not annualized. |
| * | Includes the impact of proceeds received and credited to the Portfolio resulting from class action settlements, which enhanced the Portfolio’s performance for the years ended December 31, 2013, December 31, 2012, December 31, 2011, December 31, 2010 and December 31, 2009 by 0.05%, 0.07%, 0.04%, 0.04% and 0.15%, respectively. |
| † | Includes the impact of reimbursements from the Adviser, which enhanced the Portfolio’s performance for the year ended December 31, 2009 by 0.01%. |
| + | The ratio includes expenses attributable to costs of proxy solicitation. |
See notes to financial statements.
26
| REPORT OF INDEPENDENT REGISTERED | ||
| PUBLIC ACCOUNTING FIRM | AllianceBernstein Variable Products Series Fund | |
To the Board of Directors and Shareholders of AllianceBernstein Global Thematic Growth Portfolio:
We have audited the accompanying statement of assets and liabilities, including the portfolio of investments, of AllianceBernstein Global Thematic Growth Portfolio (one of the funds constituting AllianceBernstein Variable Products Series Fund, Inc. (the “Fund”)) as of December 31, 2013, and the related statement of operations for the year then ended, the statements of changes in net assets for each of the two years in the period then ended, and the financial highlights for each of the five years in the period then ended. These financial statements and financial highlights are the responsibility of the Fund’s management. Our responsibility is to express an opinion on these financial statements and financial highlights based on our audits.
We conducted our audits in accordance with the standards of the Public Company Accounting Oversight Board (United States). Those standards require that we plan and perform the audit to obtain reasonable assurance about whether the financial statements and financial highlights are free of material misstatement. We were not engaged to perform an audit of the Fund’s internal control over financial reporting. Our audits included consideration of internal control over financial reporting as a basis for designing audit procedures that are appropriate in the circumstances, but not for the purpose of expressing an opinion on the effectiveness of the Fund’s internal control over financial reporting. Accordingly, we express no such opinion. An audit also includes examining, on a test basis, evidence supporting the amounts and disclosures in the financial statements and financial highlights, assessing the accounting principles used and significant estimates made by management, and evaluating the overall financial statement presentation. Our procedures included confirmation of securities owned as of December 31, 2013, by correspondence with the custodian and others, or by other appropriate auditing procedures where replies from others were not received. We believe that our audits provide a reasonable basis for our opinion.
In our opinion, the financial statements and financial highlights referred to above present fairly, in all material respects, the financial position of AllianceBernstein Global Thematic Growth Portfolio (one of the funds constituting AllianceBernstein Variable Products Series Fund, Inc.) at December 31, 2013, the results of its operations for the year then ended, the changes in its net assets for each of the two years in the period then ended, and the financial highlights for each of the five years in the period then ended, in conformity with U.S. generally accepted accounting principles.

New York, New York
February 14, 2014
27
| 2013 FEDERAL TAX INFORMATION | ||
| (Unaudited) | AllianceBernstein Variable Products Series Fund |
For Federal income tax purposes, the following information is furnished with respect to the distributions paid by the Portfolio during the taxable year ended December 31, 2013. For corporate shareholders, 100% of dividends paid qualify for the dividends received deduction.
28
| GLOBAL THEMATIC GROWTH | ||
| PORTFOLIO | AllianceBernstein Variable Products Series Fund |
| BOARDOF DIRECTORS | ||
Marshall C. Turner, Jr.(1), Chairman John H. Dobkin(1) | Robert M. Keith, President and Chief Executive Officer | |
| Michael J. Downey(1) | Garry L. Moody(1) | |
| William H. Foulk, Jr.(1) | Earl D. Weiner(1) | |
| D. James Guzy(1) | ||
| Nancy P. Jacklin(1) | ||
| OFFICERS | ||
Philip L. Kirstein, Senior Vice President and | Joseph J. Mantineo, Treasurer and | |
Daniel C. Roarty(2), Vice President | Phyllis J. Clarke, Controller | |
Tassos M. Stassopoulos(2), Vice President Emilie D. Wrapp, Secretary | Vincent S. Noto, Chief Compliance Officer | |
| CUSTODIAN and ACCOUNTING AGENT | LEGAL COUNSEL | |
| State Street Bank and Trust Company | Seward & Kissel LLP | |
| One Lincoln Street | One Battery Park Plaza | |
| Boston, MA 02111 | New York, NY 10004 | |
| DISTRIBUTOR | TRANSFER AGENT | |
| AllianceBernstein Investments, Inc. | AllianceBernstein Investor Services, Inc. | |
| 1345 Avenue of the Americas | P.O. Box 786003 | |
| New York, NY 10105 | San Antonio, TX 78278-6003 | |
| Toll-Free 1-(800) 221-5672 | ||
| INDEPENDENT REGISTERED PUBLIC | ||
| ACCOUNTING FIRM | ||
| Ernst & Young LLP | ||
| 5 Times Square | ||
| New York, NY 10036 |
| (1) | Member of the Audit Committee, the Governance and Nominating Committee and the Independent Directors Committee. Mr. Foulk is the sole member of the Fair Value Pricing Committee. |
| (2) | The day-to-day management of, and investment decisions for, the Portfolio’s portfolio are made by the Adviser’s Global Growth and Thematic Investment Team. Messrs. Roarty and Stassopoulos are the investment professionals with the most significant responsibility for the day-to-day management of the Portfolio’s portfolio. |
29
| GLOBAL THEMATIC GROWTH | ||
| PORTFOLIO | AllianceBernstein Variable Products Series Fund | |
MANAGEMENTOFTHE FUND
Board of Directors Information
The business and affairs of the Fund are managed under the direction of the Board of Directors. Certain information concerning the Fund’s Directors is set forth below.
NAME, ADDRESS,* AGE (YEAR FIRST ELECTED**) | PRINCIPAL OCCUPATION(S) DURING PAST FIVE YEARS | PORTFOLIOS IN FUND COMPLEX OVERSEEN BY DIRECTOR | OTHER DIRECTORSHIP HELD BY DIRECTOR IN THE PAST FIVE YEARS | |||||
| INTERESTED DIRECTOR | ||||||||
Robert M. Keith, # 1345 Avenue of the Americas New York, NY 10105 53 (2010) | Senior Vice President of AllianceBernstein L.P. (the “Adviser”) and the head of AllianceBernstein Investments , Inc. (“ABI”) since July 2008; Director of ABI and President of the AllianceBernstein Mutual Funds. Previously, he served as Executive Managing Director of ABI from December 2006 to June 2008. Prior to joining ABI in 2006, Executive Managing Director of Bernstein Global Wealth Management, and prior thereto, Senior Managing Director and Global Head of Client Service and Sales of the Adviser’s institutional investment management business since 2004. Prior thereto, he was Managing Director and Head of North American Client Service and Sales in the Adviser’s institutional investment management business, with which he had been associated since prior to 2004. | 100 | None | |||||
| DISINTERESTED DIRECTORS | ||||||||
Marshall C. Turner, Jr., ## Chairman of the Board 72 (2005) | Private Investor since prior to 2009. Former CEO of Dupont Photomasks, Inc. (components of semi-conductor manufacturing), 2003-2006, and interim CEO 1999-2000. Interim CEO of MEMC Electronic Materials, Inc. (semi-conductor and solar cell substrates) from November 2008 until March 2009. He has extensive operating and early-stage investment experience, including prior service as general partner of three institutional venture capital partnerships, and serves on the boards of three education and science-related non-profit organizations. He has served as a director of one AllianceBernstein fund since 1992, and director or trustee of multiple AllianceBernstein funds since 2005. He is Chairman of the AllianceBernstein Funds since January 2014. | 100 | Xilinx, Inc. (programmable logic semi-conductors) and SunEdison, Inc. (semi-conductor substrates, solar materials and solar power plants) since prior to 2009 | |||||
John H. Dobkin, ## 72 (1992) | Independent Consultant since prior to 2009. Formerly, President of Save Venice, Inc. (preservation organization) from 2001–2002; Senior Advisor from June 1999-June 2000 and President of Historic Hudson Valley (historic preservation) from December 1989-May 1999. Previously, Director of the National Academy of Design. He has served as a director or trustee of various AllianceBernstein Funds since 1992, and as Chairman of the Audit Committees of a number of such Funds from 2001-2008. | 100 | None | |||||
30
| AllianceBernstein Variable Products Series Fund |
NAME, ADDRESS,* AGE (YEAR FIRST ELECTED**) | PRINCIPAL OCCUPATION(S) DURING PAST FIVE YEARS | PORTFOLIOS IN FUND COMPLEX OVERSEEN BY DIRECTOR | OTHER DIRECTORSHIP HELD BY DIRECTOR IN THE PAST FIVE YEARS | |||||
DISINTERESTED DIRECTORS (continued) | ||||||||
Michael J. Downey, ## 70 (2005) | Private Investor since prior to 2009. Formerly, managing partner of Lexington Capital, LLC (investment advisory firm) from December 1997 until December 2003. From 1987 until 1993, Chairman and CEO of Prudential Mutual Fund Management, director of the Prudential mutual funds, and member of the Executive Committee of Prudential Securities Inc. He has served as a director or trustee of the AllianceBernstein Funds since 2005 and is a director and Chairman of one other registered investment company. | 100 | Asia Pacific Fund, Inc. since prior to 2009, Prospect Acquisition Corp. (financial services) from 2007 until 2009, and The Merger Fund since prior to 2009 to 2013 | |||||
William H. Foulk, Jr., ##, ### 81 (1990) | Investment Adviser and an Independent Consultant since prior to 2009. Previously, he was Senior Manager of Barrett Associates, Inc., a registered investment adviser. He was formerly Deputy Comptroller and Chief Investment Officer of the State of New York and, prior thereto, Chief Investment Officer of the New York Bank for Savings. He has served as a director or trustee of various AllianceBernstein Funds since 1983, and has been Chairman of the Independent Directors Committee of the AllianceBernstein Funds since 2003. He served as Chairman of such Funds from 2003 through December 2013. He is also active in a number of mutual fund related organizations and committees. | 100 | None | |||||
D. James Guzy, ## 77 (2005) | Chairman of the Board of PLX Technology (semi-conductors) and of SRC Computers Inc., with which he has been associated since prior to 2009. He was a director of Intel Corporation (semi-conductors) from 1969 until 2008, and served as Chairman of the Finance Committee of such company for several years until May 2008. He was a Director of Cirrus Logic Corporation (semi-conductors) from 1984 until July 2011. He has served as a director or trustee of one or more of the AllianceBernstein Funds since 1982. | 100 | PLX Technology (semi-conductors) since prior to 2009, and Cirrus Logic Corporation (semi-conductors) since prior to 2009 until July 2011 | |||||
Nancy P. Jacklin, ## 65 (2006) | Professorial Lecturer at the Johns Hopkins School of Advanced International Studies since 2008. Formerly, U.S. Executive Director of the International Monetary Fund (December 2002-May 2006); Partner, Clifford Chance (1992-2002); Sector Counsel, International Banking and Finance, and Associate General Counsel, Citicorp (1985-1992); Assistant General Counsel (International), Federal Reserve Board of Governors (1982-1985); and Attorney Advisor, U.S. Department of the Treasury (1973-1982). Member of the Bar of the District of Columbia and of New York; and member of the Council on Foreign Relations. She has served as a director or trustee of the AllianceBernstein Funds since 2006. | 100 | None | |||||
31
| GLOBAL THEMATIC GROWTH PORTFOLIO | ||
| MANAGEMENTOFTHE FUND | ||
| (continued) | AllianceBernstein Variable Products Series Fund | |
NAME, ADDRESS,* AGE (YEAR FIRST ELECTED**) | PRINCIPAL OCCUPATION(S) DURING PAST FIVE YEARS | PORTFOLIOS IN FUND COMPLEX OVERSEEN BY DIRECTOR | OTHER DIRECTORSHIP HELD BY DIRECTOR IN THE PAST FIVE YEARS | |||||
DISINTERESTED DIRECTORS (continued) | ||||||||
Garry L. Moody, ## 61 (2008) | Independent Consultant. Formerly, Partner, Deloitte & Touche LLP (1995-2008) where he held a number of senior positions, including Vice Chairman, and U.S. and Global Investment Management Practice Managing Partner; President, Fidelity Accounting and Custody Services Company (1993-1995); and Partner, Ernst & Young LLP (1975-1993), where he served as the National Director of Mutual Fund Tax Services and Managing Partner of its Chicago Office Tax department. He is a member of both the Governing Council of the Independent Directors Council (IDC), an organization of independent directors of mutual funds, and the Trustee Advisory Board of BoardIQ, a biweekly publication focused on issues and news affecting directors of mutual funds. He has served as a director or trustee, and as Chairman of the Audit Committee, of the AllianceBernstein Funds since 2008. | 100 | Greenbacker Renewable Energy Company LLC (renewable energy and energy efficiency projects) from August 2013 to January 2014 | |||||
Earl D. Weiner, ## 74 (2007) | Of Counsel, and Partner prior to January 2007, of the law firm Sullivan & Cromwell LLP and member of ABA Federal Regulation of Securities Committee Task Force to draft editions of the Fund Director’s Guidebook. He also serves as a director or trustee of various non-profit organizations and has served as Chairman or Vice Chairman of a number of them. He has served as a director or trustee of the AllianceBernstein Funds since 2007 and is Chairman of the Governance and Nominating Committees of the Funds. | 100 | None | |||||
| * | The address for each of the Fund’s disinterested Directors is c/o AllianceBernstein L.P., Attention: Philip L. Kirstein, 1345 Avenue of the Americas, New York, N.Y. 10105 |
| ** | There is no stated term of office for the Fund’s Directors. |
| *** | The information above includes each Director’s principal occupation during the last five years and other information relating to the experience, attributes, and skills relevant to each Director’s qualifications to serve as a Director, which led to the conclusion that each Director should serve as a Director for the Fund. |
| # | Mr. Keith is an “interested person” of the Fund, as defined in the 1940 Act, due to this position as a Senior Vice President of the Adviser. |
| ## | Member of the Audit Committee, the Governance and Nominating Committee and the Independent Directors Committee. |
| ### | Member of the Fair Value Pricing Committee. |
32
| AllianceBernstein Variable Products Series Fund |
Officer Information
Certain information concerning the Portfolio’s Officers is listed below.
NAME, ADDRESS,* AGE | PRINCIPAL POSITION(S) HELD WITH FUND | PRINCIPAL OCCUPATION DURING PAST FIVE YEARS | ||
Robert M. Keith 53 | President and Chief Executive Officer | See biography above. | ||
| Philip L. Kirstein 68 | Senior Vice President and Independent Compliance Officer | Senior Vice President and Independent Compliance Officer of the AllianceBernstein Funds, with which he has been associated since October 2004. Prior thereto, he was Of Counsel to Kirkpatrick & Lockhart, LLP from October 2003 to October 2004, and General Counsel of Merrill Lynch Investment Managers, L.P. since prior to March 2003. | ||
| Daniel C. Roarty 42 | Vice President | Senior Vice President of the Adviser**, and Technology Sector Head, with which he has been associated since May 2011. Prior thereto, he was in research and portfolio management at Nuveen Investments since prior to 2009. | ||
| Tassos M. Stassopoulos 45 | Vice President | Senior Vice President of the Adviser**, with which he has been associated since prior to 2009. | ||
| Emilie D. Wrapp 58 | Secretary | Senior Vice President, Assistant General Counsel and Assistant Secretary of ABI**, with which she has been associated since prior to 2009. | ||
| Joseph J. Mantineo 54 | Treasurer and Chief Financial Officer | Senior Vice President of AllianceBernstein Investor Services, Inc. (“ABIS”)**, with which he has been associated since prior to 2009. | ||
| Phyllis J. Clarke 53 | Controller | Vice President of ABIS**, with which she has been associated since prior to 2009. | ||
| Vincent S. Noto 49 | Chief Compliance Officer | Chief Compliance Officer of the AllianceBernstein Funds, and Vice President of ABIS**, with which he has been associated since prior to 2009. |
| * | The address for each of the Portfolio’s Officers is 1345 Avenue of the Americas, New York, NY 10105. |
| ** | The Adviser, ABI and ABIS are affiliates of the Fund. |
| The Fund’s Statement of Additional Information (“SAI”) has additional information about the Fund’s Directors and Officers and is available without charge upon request. Contact your financial representative or AllianceBernstein at (800) 227-4618, or visit www.alliancebernstein.com, for a free prospectus or SAI. |
33
| GLOBAL THEMATIC GROWTH PORTFOLIO | ||
| SENIOR OFFICER FEE EVALUATION | AllianceBernstein Variable Products Series Fund | |
THE FOLLOWING IS NOT PART OF THE SHAREHOLDER REPORT OR THE FINANCIAL STATEMENTS
SUMMARY OF SENIOR OFFICER’S EVALUATION OF INVESTMENT ADVISORY AGREEMENT1
The following is a summary of the evaluation of the Investment Advisory Agreement between AllianceBernstein L.P. (the “Adviser”) and the AllianceBernstein Variable Products Series Fund (the “Fund”), in respect of AllianceBernstein Global Thematic Growth Portfolio (the “Portfolio”).2 The evaluation of the Investment Advisory Agreement was prepared by Philip L. Kirstein, the Senior Officer of the Fund, for the Directors of the Fund, as required by a September 2004 agreement between the Adviser and the New York State Attorney General (the “NYAG”). The Senior Officer’s evaluation of the Investment Advisory Agreement is not meant to diminish the responsibility or authority of the Board of Directors of the Fund to perform its duties pursuant to Section 15 of the Investment Company Act of 1940 (the “40 Act”) and applicable state law. The purpose of the summary is to provide shareholders with a synopsis of the independent evaluation of the reasonableness of the advisory fees proposed to be paid by the Portfolio which was provided to the Directors in connection with their review of the proposed approval of the continuance of the Investment Advisory Agreement. The Senior Officer’s evaluation considered the following factors:
| 1. | Advisory fees charged to institutional and other clients of the Adviser for like services; |
| 2. | Advisory fees charged by other mutual fund companies for like services; |
| 3. | Costs to the Adviser and its affiliates of supplying services pursuant to the advisory agreement, excluding any intra-corporate profit; |
| 4. | Profit margins of the Adviser and its affiliates from supplying such services; |
| 5. | Possible economies of scale as the Portfolio grows larger; and |
| 6. | Nature and quality of the Adviser’s services including the performance of the Portfolio. |
These factors, with the exception of the first factor, are generally referred to as the “Gartenberg factors,” which were articulated by the United States Court of Appeals for the Second Circuit in 1982. Gartenberg v. Merrill Lynch Asset Management, Inc., 694 F. 2d 923 (2d Cir. 1982). On March 30, 2010, the Supreme Court held the Gartenberg decision was correct in its basic formulation of what §36(b) requires: to face liability under §36(b), “an investment adviser must charge a fee that is so disproportionately large that it bears no reasonable relationship to the services rendered and could not have been the product of arm’s length bargaining.” Jones v. Harris Associates L.P., 130 S. Ct. 1418 (2010). In Jones, the Court stated the Gartenberg approach fully incorporates the correct understanding of fiduciary duty within the context of section 36(b) and noted with approval that “Gartenberg insists that all relevant circumstances be taken into account” and “uses the range of fees that might result from arm’s length bargaining as the benchmark for reviewing challenged fees.”3
PORTFOLIO ADVISORY FEES, NET ASSETS & EXPENSE RATIOS
The Adviser proposed that the Portfolio pays the advisory fee set forth in the table below for receiving the services to be provided pursuant to the Investment Advisory Agreement. The fee schedule below, implemented in January 2004 in consideration of the Adviser’s settlement with the NYAG in December 2003, is based on a master schedule that contemplates eight categories of funds with almost all funds in each category having the same advisory fee schedule.
| Category | Advisory Fee Based on % of Average Daily Net Assets | Net Assets 03/31/13 ($MIL) | Portfolio | |||||
Specialty | 0.75% on 1st $2.5 billion 0.65% on next $2.5 billion 0.60% on the balance | $ | 130.9 | Global Thematic Growth Portfolio | ||||
| 1 | The information in the fee summary was completed on April 22, 2013 and discussed with the Board of Directors on April 30-May 2, 2013. |
| 2 | Future references to the Fund and the Portfolio do not include “AllianceBernstein.” References in the fee summary pertaining to performance and expense ratio rankings refer to the Class A shares of the Portfolio. |
| 3 | Jones v. Harris at 1427. |
34
| AllianceBernstein Variable Products Series Fund |
The Adviser is reimbursed as specified in the Investment Advisory Agreement for certain clerical, legal, accounting, administrative and other services provided to the Portfolio. During the Portfolio’s most recently completed fiscal year, the Adviser received $45,432 (0.033% of the Portfolio’s average daily net assets) for such services.
Set forth below are the Portfolio’s total expense ratios for the most recently completed fiscal year:
| Portfolio | Total Expense Ratio | Fiscal Year | ||||
Global Thematic Growth Portfolio | Class A 0.99% | December 31 | ||||
| Class B 1.24% | ||||||
I. ADVISORY FEES CHARGED TO INSTITUTIONAL AND OTHER CLIENTS
The advisory fees charged to investment companies which the Adviser manages and sponsors are normally higher than those charged to similar sized institutional accounts, including pension plans and sub-advised investment companies. The fee differential reflects, among other things, different services provided to such clients, and different liabilities assumed. Services provided by the Adviser to the Portfolio that are not provided to non-investment company clients and sub-advised investment companies include providing office space and personnel to serve as Fund Officers, who among other responsibilities make the certifications required under the Sarbanes–Oxley Act of 2002, and coordinating with and monitoring the Portfolio’s third party service providers such as Fund counsel, auditors, custodians, transfer agents and pricing services. The accounting, administrative, legal and compliance requirements for the Portfolio are more costly than those for institutional assets due to the greater complexities and time required for investment companies, although as previously noted, the Adviser is reimbursed for providing such services. Also, retail mutual funds managed by the Adviser are widely held. Servicing the Portfolio’s investors is more time consuming and labor intensive compared to institutional clients since the Adviser needs to communicate with a more extensive network of financial intermediaries and shareholders. The Adviser also believes that it incurs substantial entrepreneurial risk when offering a new mutual fund, since establishing a new mutual fund requires a large upfront investment, and it may take a long time for the fund to achieve profitability since the fund must be priced to scale from inception in order to be competitive and assets are acquired one account at a time. In addition, managing the cash flow of an investment company may be more difficult than managing that of a stable pool of assets, such as an institutional account with little cash movement in either direction, particularly, if a fund is in net redemption and the Adviser is frequently forced to sell securities to raise cash for redemptions. However, managing a fund with positive cash flow may be easier at times than managing a stable pool of assets. In recent years, investment advisers have been sued by institutional clients and have suffered reputational damage both by the attendant publicity and outcomes other than complete victories. Accordingly, the legal and reputational risks associated with institutional accounts are greater than previously thought, although still not equal to those related to the mutual fund industry.
Notwithstanding the Adviser’s view that managing an investment company is not comparable to managing other institutional accounts because the services provided are different, the Supreme Court has indicated consideration should be given to the advisory fees charged to institutional accounts that have a substantially similar investment style as the Portfolio.4 In addition to the AllianceBernstein institutional fee schedule, set forth below is what would have been the effective advisory fee of the Portfolio had the AllianceBernstein institutional fee schedule been applicable to the Portfolio versus the Portfolio’s advisory fee based on March 31, 2013 net assets:5
| Portfolio | Net Assets 3/31/13 ($MIL) | AllianceBernstein Fee Schedule | Effective AB Inst. Adv. Fee | Portfolio Advisory Fee | ||||||||
Global Thematic Growth Portfolio | $130.9 | Global Thematic Research Schedule | 0.553 | % | 0.750 | % | ||||||
| 0.80% on 1st $25m | ||||||||||||
| 0.60% on next $25m | ||||||||||||
| 0.50% on next $50m | ||||||||||||
| 0.40% on the balance | ||||||||||||
| Minimum account size $25m | ||||||||||||
| 4 | The Supreme Court stated that “courts may give such comparisons the weight that they merit in light of the similarities and differences between the services that the clients in question require, but the courts must be wary of inapt comparisons.” Among the significant differences the Supreme Court noted that may exist between services provided to mutual funds and institutional accounts are “higher marketing costs.” Jones v. Harris at 1428. |
| 5 | The Adviser has indicated that with respect to institutional accounts with assets greater than $300 million, it will negotiate a fee schedule. Discounts that are negotiated vary based upon each client relationship. |
35
| GLOBAL THEMATIC GROWTH PORTFOLIO | ||
| SENIOR OFFICER FEE EVALUATION | ||
| (continued) | AllianceBernstein Variable Products Series Fund | |
The Adviser also manages AllianceBernstein Global Thematic Growth Fund, Inc. (“Global Thematic Growth Fund, Inc.”), a retail mutual fund, which has a substantially similar investment style as the Portfolio. Set forth below is the fee schedule of Global Thematic Growth Fund, Inc. and what would have been the effective advisory fee of the Portfolio had the fee schedule of the retail mutual fund been applicable to the Portfolio:6
| Portfolio | AllianceBernstein Mutual Fund | Fee Schedule | ABMF Effective | Portfolio Advisory | ||||||||
Global Thematic Growth Portfolio7 | Global Thematic Growth Fund, Inc. | 0.75% on first $2.5 billion 0.65% on next $2.5 billion | 0.750 | % | 0.750 | % | ||||||
| 0.60% on the balance | ||||||||||||
The Adviser also manages and sponsors retail mutual funds, which are organized in jurisdictions outside the United States, generally Luxembourg and Japan, and sold to non-United States resident investors. The Adviser charges the fees set forth for Thematic Research Growth Portfolio, which is a Luxembourg fund that has a somewhat similar investment style as the Portfolio.
| Fund | Fee8 | |||
Thematic Research Growth Portfolio Class A | 1.70 | % | ||
Class I (Institutional) | 0.90 | % | ||
The Adviser represented that it does not sub-advise any registered investment company with a substantially similar investment style as the Portfolio.
II. MANAGEMENT FEES CHARGED BY OTHER MUTUAL FUND COMPANIES FOR LIKE SERVICES.
Lipper Inc. (“Lipper”), an analytical service that is not affiliated with the Adviser, compared the fees charged to the Portfolio with fees charged to other investment companies for similar services offered by other investment advisers.9 Lipper’s analysis included the comparison of the Portfolio’s contractual management fee, estimated at the approximate current asset level of the Portfolio, to the median of the Portfolio’s Lipper Expense Group (“EG”) and the Portfolio’s contractual management fee ranking.10,11
Lipper describes an EG as a representative sample of comparable funds. Lipper’s standard methodology for screening funds to be included in an EG entails the consideration of several fund criteria, including fund type, investment classification/objective, load type and similar 12b-1/non-12b-1 service fees, asset (size) comparability, expense components and attributes. An EG will typically consist of seven to twenty funds.
The Portfolio’s original EG had an insufficient number of peers. Consequently, Lipper expanded the Portfolio’s EG to include peers that have a similar but not the same Lipper classification/objective as the Portfolio. However, because Lipper had expanded the Portfolio’s EG, under Lipper’s standard guidelines, the Portfolio’s Lipper Expense Universe (“EU”) was also
| 6 | The retail mutual fund was also affected by the settlement between the Adviser and the NYAG. As a result, the Portfolio has the same breakpoints in its advisory fee schedule as the retail mutual fund. |
| 7 | The advisory fees of AllianceBernstein Global Thematic Growth Fund, Inc. are based on the mutual fund’s net assets at the end of each quarter and are paid to the Adviser quarterly, in contrast to the Portfolio, whose advisory fees are based on the Portfolio’s average daily net assets and are paid on a monthly basis. |
| 8 | Class A shares of the fund are charged an “all-in” fee, which includes investment advisory services and distribution related services, unlike Class I shares, whose fee is for only investment advisory services. |
| 9 | The Supreme Court cautioned against accepting mutual fund fee comparisons without careful scrutiny since “these comparisons are problematic because these fees, like those challenged, may not be the product of negotiations conducted at arm’s length.” Jones v. Harris at 1429. |
| 10 | Lipper does not consider average account size when constructing EGs. Funds with relatively small average account sizes tend to have higher transfer agent expense ratio than comparable sized funds that have relatively large average account sizes. Note that there are limitations on Lipper expense category data because different funds categorize expenses differently. |
| 11 | The contractual management fee is calculated by Lipper using the Portfolio’s contractual management fee rate at a hypothetical asset level. The hypothetical asset level is based on the combined net assets of all classes of the Portfolio, rounded up to the next $25 million. Lipper’s total expense ratio information is based on the most recent annual report except as otherwise noted. A ranking of “1” would mean that the Portfolio had the lowest effective fee rate in the Lipper peer group. |
36
| AllianceBernstein Variable Products Series Fund |
expanded to include universes of those peers that had a similar but not the same Lipper investment objective/classification. A “normal” EU will include funds that have the same investment objective/classification as the subject portfolio.12,13
| Portfolio | Contractual Management Fee (%)14 | Lipper EG Median (%) | Lipper EG Rank | |||||||||
Global Thematic Growth Portfolio | 0.750 | 0.796 | 4/10 | |||||||||
Set forth below is a comparison of the Portfolio’s total expense ratio and the medians of the Portfolio’s EG and EU.15 The Portfolio’s total expense ratio ranking is also shown in the table below.
| Portfolio | Expense Ratio (%)16 | Lipper EG Median (%) | Lipper EG Rank | Lipper EU Median (%) | Lipper Rank | |||||||||||||||
Global Thematic Growth Portfolio | 0.990 | 0.957 | 7/10 | 0.869 | 19/26 | |||||||||||||||
Based on this analysis, the Portfolio has a more favorable ranking on a management fee basis than it does on a total expense ratio basis.
III. COSTS TO THE ADVISER AND ITS AFFILIATES OF SUPPLYING SERVICES PURSUANT TO THE ADVISORY FEE ARRANGEMENT, EXCLUDING ANY INTRA-CORPORATE PROFIT.
The Adviser utilizes two profitability reporting systems, which operate independently but are aligned with each other, to estimate the Adviser’s profitability in connection with investment advisory services provided to the Portfolio. The Senior Officer has retained a consultant to provide independent advice regarding the alignment of the two profitability systems as well as the methodologies and allocations utilized by both profitability systems.
IV. PROFIT MARGINS OF THE ADVISER AND ITS AFFILIATES FOR SUPPLYING SUCH SERVICES.
The Portfolio’s profitability information, prepared by the Adviser for the Board of Directors, was reviewed by the Senior Officer and the consultant. The Adviser’s profitability from providing investment advisory services to the Portfolio increased during calendar year 2012, relative to 2011.
In addition to the Adviser’s direct profits from managing the Portfolio, certain of the Adviser’s affiliates have business relationships with the Portfolio and may earn a profit from providing other services to the Portfolio. The courts have referred to this type of business opportunity as “fall-out benefits” to the Adviser and indicated that such benefits should be factored into the evaluation of the total relationship between the Portfolio and the Adviser. Neither case law nor common business practice precludes the Adviser’s affiliates from earning a reasonable profit on this type of relationship provided the affiliates’ charges and services are competitive. These affiliates provide transfer agent, distribution and brokerage related services to the Portfolio and receive transfer agent fees, Rule 12b-1 payments, and brokerage commissions. In addition, the Adviser benefits from soft dollar arrangements which offset expenses the Adviser would otherwise incur.
The Portfolio has adopted a distribution plan for Class B shares pursuant to Rule 12b-1 under the 40 Act. Under the distribution plan, the Portfolio pays distribution and servicing fees to its principal underwriter, AllianceBernstein Investments, Inc. (“ABI”), the Portfolio’s distributor and an affiliate of the adviser, at an annual rate of up to 0.50% of the Portfolio’s average daily net assets attributable to Class B shares. The current annual rate that the Portfolio pays to ABI for 12b-1 fees is 0.25%. During the fiscal year ended December 31, 2012, ABI received $242,265 in Rule 12b-1 fees.
During the fiscal year ended December 31, 2012, the Adviser incurred distribution expenses in the amount of $694,202 in connection with activities primarily intended to result in the sale of the Portfolio’s Class B shares. This amount includes the 12b-1 fees paid by the Portfolio to the Adviser.
| 12 | Except for asset size comparability, Lipper uses the same criteria for selecting an EG peer when selecting an EU peer. Unlike the EG, the EU allows for the same adviser to be represented by more than just one fund. |
| 13 | The Portfolio’s EG includes the Portfolio, three other variable insurance product (“VIP”) Global Growth funds (“GLGE”) and six VIP Global Core funds (“GLCE”). |
| 14 | The contractual management fee does not reflect any expense reimbursements made by the Portfolio to the Adviser for certain clerical, legal, accounting, administrative and other services. |
| 15 | The Portfolio’s EU includes the Portfolio, EG and all other VIP GLGE and VIP GLCE funds, excluding outliers. |
| 16 | Most recently completed fiscal year end Class A total expense ratio. |
37
| GLOBAL THEMATIC GROWTH PORTFOLIO | ||
| SENIOR OFFICER FEE EVALUATION | ||
| (continued) | AllianceBernstein Variable Products Series Fund | |
Financial intermediaries, such as insurers, market and sell shares of the Portfolio and typically receive compensation from ABI, the Advisers and/or the Portfolio for selling shares of the Portfolio. These financial intermediaries receive compensation in any or all of the following forms: 12b-1 fees, defrayal of costs for educational seminars and training, additional distribution support, recordkeeping and/or administrative services. Payments related to providing contract-holder recordkeeping and/or administrative services will generally not exceed 0.35% of the average daily net assets of the Portfolio attributable to the relevant intermediary over the year. With respect to the Fund, which includes the Portfolio and other Portfolios of the Fund not discussed in this summary, ABI paid approximately $600,000 in 2012 and expects to pay approximately $600,000 in 2013 for educational support and distribution assistance (revenue sharing payments).
The transfer agent of the Portfolio is AllianceBernstein Investor Services, Inc. (“ABIS”). During the most recently completed fiscal year, ABIS received a fee of $1,385 from the Portfolio.17
The Portfolio effected brokerage transactions through the Adviser’s affiliate, Sanford C. Bernstein & Co., LLC (“SCB & Co.”) and/or its U.K. affiliate, Sanford C. Bernstein Limited (“SCB Ltd.”), collectively “SCB,” and paid commissions during the Portfolio’s most recently completed fiscal year. The Adviser represented that SCB’s profitability from business conducted with the Portfolio is comparable to the profitability of SCB’s dealings with other similar third party clients. In the ordinary course of business, SCB receives and pays liquidity rebates from electronic communications networks (“ECNs”) derived from trading for its clients, including the Portfolio. These credits and charges are not being passed onto any SCB client. The Adviser also receives certain soft dollar benefits from brokers that execute agency trades for the Portfolio and other clients. These soft dollar benefits reduce the Adviser’s cost of doing business and increase its profitability.
V. POSSIBLE ECONOMIES OF SCALE
The Adviser has indicated that economies of scale are being shared with shareholders through pricing to scale, breakpoints, fee reductions/waivers and enhancement to services.
In May 2012, an independent consultant, retained by the Senior Officer, provided the Board of Directors information on the Adviser’s firm-wide average costs from 2005 through 2011 and the potential economies of scale. The independent consultant noted that from 2005 through 2007 the Adviser experienced significant growth in assets under management (“AUM”). During this period, operating expenses increased, in part to keep up with growth, and in part reflecting market returns. However, from 2008 through the first quarter of 2009, AUM rapidly and significantly decreased due to declines in market value and client withdrawals. When AUM rapidly decreased, some operating expenses categories, including base compensation and office space, adjusted more slowly during this period, resulting in an increase in average costs. Since 2009, AUM has experienced less significant changes. The independent consultant noted that changes in operating expenses reflect changes in business composition and business practices in response to changes in financial markets. Finally, the independent consultant concluded that the increase in average cost and the decline in net operating margin across the Adviser since late 2008 are inconsistent with the view that there are currently reductions in average costs due to economies of scale that can be shared with the AllianceBernstein Mutual Funds managed by the Adviser through lower fees.
Previously in February 2008, the independent consultant provided the Board of Directors an update of the Deli study on advisory fees and various fund characteristics.18,19 The independent consultant first reiterated the results of his previous two dimensional comparison analysis (fund size and family size) with the Board of Directors.20 The independent consultant then discussed the results of the regression model that was utilized to study the effects of various factors on advisory fees. The regression model output indicated that the bulk of the variation in fees predicted were explained by various factors, but substantially by fund AUM, family AUM, index fund indicator and investment style. The independent consultant also compared the advisory fees of the AllianceBernstein Mutual Funds to similar funds managed by 19 other large asset managers, regardless of the fund size and each Adviser’s proportion of mutual fund assets to non-mutual fund assets.
| 17 | The Fund, which includes the Portfolio and other Portfolios of the Fund paid ABIS a flat fee of $18,000 in 2012. |
| 18 | The Deli study, originally published in 2002 based on 1997 data and updated for the February 2008 Presentation, may be of diminished value due to the age of the data used in the presentation and the changes experienced in the industry over the last four years. |
| 19 | As mentioned previously, the Supreme Court cautioned against accepting mutual fund fee comparisons without careful scrutiny since the fees may not be the product of negotiations conducted at arm’s length. See Jones V. Harris at 1429. |
| 20 | The two dimensional analysis showed patterns of lower advisory fees for funds with larger asset sizes and funds from larger family sizes compared to funds with smaller asset sizes and funds from smaller family sizes, which according to the independent consultant is indicative of a sharing of economies of scale and scope. However, in less liquid and active markets, such is not the case, as the empirical analysis showed potential for diseconomies of scale in those markets. The empirical analysis also showed diminishing economies of scale and scope as funds surpassed a certain high level of assets. |
38
| AllianceBernstein Variable Products Series Fund |
VI. NATURE AND QUALITY OF THE ADVISER’S SERVICES, INCLUDING THE PERFORMANCE OF THE PORTFOLIO
With assets under management of approximately $443 billion as of March 31, 2013, the Adviser has the investment experience to manage and provide non-investment services (described in Section I) to the Portfolio.
The information prepared by Lipper shows the 1, 3, 5 and 10 year performance returns and rankings of the Portfolio21 relative to its Lipper Performance Group (“PG”) and Lipper Performance Universe (“PU”)22 for the periods ended February 28, 2013.23
| Portfolio (%) | PG Median (%) | PU Median (%) | PG Rank | PU Rank | ||||||||||||||||
Global Thematic Growth Portfolio24 | ||||||||||||||||||||
1 year | – | 0.98 | 10.42 | 11.09 | 4/4 | 11/11 | ||||||||||||||
3 year | 3.30 | 10.98 | 10.70 | 4/4 | 11/11 | |||||||||||||||
5 year | 0.38 | 3.13 | 3.09 | 4/4 | 10/11 | |||||||||||||||
10 year | 5.80 | 10.39 | 10.38 | 3/3 | 9/9 | |||||||||||||||
Set forth below are the 1, 3, 5, 10 year and since inception performance returns of the Portfolio (in bold)26 versus its benchmarks.27 Portfolio and benchmark volatility and reward-to-variability ratio (“Sharpe Ratio”) information is also shown.28
Periods Ending February 28, 2013 Annualized Performance | ||||||||||||||||||||||||||||||||
1 Year (%) | 3 Year (%) | 5 Year | 10 Year (%) | Since Inception (%) | Annualized | Risk Period (Year) | ||||||||||||||||||||||||||
Volatility (%) | Sharpe (%) | |||||||||||||||||||||||||||||||
Global Thematic Growth Portfolio24 | – | 0.98 | 3.30 | 0.38 | 5.80 | 4.23 | 24.63 | 0.12 | 5 | |||||||||||||||||||||||
MSCI AC World Index | 9.29 | 9.38 | 1.39 | 9.12 | N/A | 21.18 | 0.15 | 5 | ||||||||||||||||||||||||
MSCI World (Net) Index25 | 10.69 | 9.81 | 1.56 | 8.59 | 5.63 | N/A | N/A | N/A | ||||||||||||||||||||||||
Inception Date: January 11, 1996 | ||||||||||||||||||||||||||||||||
CONCLUSION:
Based on the factors discussed above the Senior Officer’s conclusion is that the proposed advisory fee for the Portfolio is reasonable and within the range of what would have been negotiated at arm’s-length in light of all the surrounding circumstances. This conclusion in respect of the Portfolio is based on an evaluation of all of these factors and no single factor was dispositive.
Dated: May 29, 2013
| 21 | The performance rankings are for the Class A shares of the Portfolio. The Portfolio’s performance returns shown were provided by Lipper. |
| 22 | The Portfolio’s PG/PU is not identical to the Portfolio’s EG/EU as the criteria for including/excluding a fund in/from a PG/PU is somewhat different from that of an EG/EU. |
| 23 | The current Lipper investment classification/objective dictates the PG and PU throughout the life of the fund even if a fund had a different investment classification/objective at a different point in time. |
| 24 | The Portfolio’s Lipper classification changed in 2009 from VA Science/Technology Funds to VA Global Growth as a result of changes to the Portfolio’s strategy. |
| 25 | Benchmark since inception date is the nearest month end after the Portfolio’s inception date. |
| 26 | The performance returns and risk measures shown in the table are for the Class A shares of the Portfolio. |
| 27 | The Adviser provided Portfolio and benchmark performance return information for periods through February 28, 2013. |
| 28 | Portfolio and benchmark volatility and Sharpe Ratio information was obtained through Lipper LANA, a database maintained by Lipper. Volatility is a statistical measure of the tendency of a market price or yield to vary over time. The Sharpe Ratio is a risk adjusted measure of return that divides a portfolio’s return in excess of the riskless return by the portfolio’s standard deviation. A portfolio with a greater volatility would be viewed as more risky than a portfolio with equivalent performance but lower volatility; for that reason, a greater return would be demanded for the more risky portfolio. A portfolio with a higher Sharpe Ratio would be viewed as better performing than a portfolio with a lower Sharpe Ratio. |
39
VPS-GTG-0151-1213
AllianceBernstein
Variable Products Series Fund, Inc.
 | AllianceBernstein Growth Portfolio |
December 31, 2013
Annual Report

ANNUAL REPORT
Investment Products Offered
| Ø | Are Not FDIC Insured |
| Ø | May Lose Value |
| Ø | Are Not Bank Guaranteed |
AllianceBernstein Investments, Inc. (ABI) is the distributor of the AllianceBernstein family of mutual funds. ABI is a member of FINRA and is an affiliate of AllianceBernstein L.P., the manager of the funds.
You may obtain a description of the Fund’s proxy voting policies and procedures, and information regarding how the Fund voted proxies relating to portfolio securities during the most recent 12-month period ended June 30, without charge. Simply visit AllianceBernstein’s website at www.alliancebernstein.com or go to the Securities and Exchange Commission’s (the “Commission”) website at www.sec.gov, or call AllianceBernstein at (800) 227-4618.
The Fund files its complete schedule of portfolio holdings with the Commission for the first and third quarters of each fiscal year on Form N-Q. The Fund’s Forms N-Q are available on the Commission’s website at www.sec.gov. The Fund’s Forms N-Q may also be reviewed and copied at the Commission’s Public Reference Room in Washington, DC; information on the operation of the Public Reference Room may be obtained by calling (800) SEC-0330.
AllianceBernstein® and the AB Logo are registered trademarks and service marks used by permission of the owner, AllianceBernstein L.P.
| GROWTH PORTFOLIO | AllianceBernstein Variable Products Series Fund |
LETTER TO INVESTORS
February 7, 2014
The following is an update of AllianceBernstein Variable Products Series Fund—AllianceBernstein Growth Portfolio (the “Portfolio”) for the annual reporting period ended December 31, 2013.
INVESTMENT OBJECTIVE AND POLICIES
The Portfolio’s investment objective is long-term growth of capital. The Portfolio invests primarily in a domestic portfolio of equity securities of companies within various market sectors. AllianceBernstein L.P. (the “Adviser”) seeks to identify companies or industries for which other investors have underestimated earnings potential—for example, some hidden earnings driver (including, but not limited to, reduced competition, market share gain, better margin trend, increased customer base or similar factors) that would cause a company to grow faster than market forecasts.
In managing the Portfolio, the Adviser allocates investments among broad sector groups and selects specific investments based on the fundamental company research conducted by the Adviser’s large internal research staff, assessing the current and forecasted investment opportunities and conditions, as well as diversification and risk considerations. The Adviser’s research focus is on companies with high sustainable growth prospects, high or improving return on invested capital, transparent business models, and strong and lasting competitive advantages. The Portfolio has the flexibility to invest across the capitalization spectrum. The Portfolio is designed for those seeking exposure to companies of various sizes, and typically has substantial investments in both large-capitalization companies and mid-capitalization companies, and may also invest in small-capitalization companies.
The Portfolio may enter into derivatives transactions, such as options, futures contracts, forwards and swaps. The Portfolio may use options strategies involving the purchase and/or writing of various combinations of call and/or put options, including on individual securities and stock indices, futures contracts (including futures contracts on individual securities and stock indices) or shares of exchange-traded funds.
INVESTMENT RESULTS
The table on page 3 shows the Portfolio’s performance compared to its benchmark, the Russell 1000 Growth Index, and the broad market, as represented by the Standard & Poor’s (“S&P”) 500 Index, for the one-, five- and 10-year periods ended December 31, 2013.
All share classes of the Portfolio outperformed both the benchmark and the S&P 500 Index for the annual period. Versus the benchmark, stock selection was the leading driver of returns. Stock selection contributed most in the financials and consumer sectors. During the annual reporting period, the Portfolio altered its investment policies and is now emphasizing mid- and smaller-capitalization companies. Operational cash held during this transition period was the leading detractor from returns.
The Portfolio did not utilize derivatives during the annual period.
MARKET REVIEW AND INVESTMENT STRATEGY
Global equities rallied in 2013, driven by macroeconomic improvements in key developed countries and the accommodative monetary policies of major central banks. During the year, investors worried about how the U.S. Federal Reserve (the “Fed”) would rein in its asset purchase program—and how that would affect interest rates. Yet in December, stocks continued to rise after the Fed announced plans to taper the program by $10 billion a month. In the fourth quarter, solid data on jobs, consumer spending and housing provided fresh evidence that the U.S. economy was on the mend.
Despite new uncertainties and mixed macroeconomic signals, the Growth Investment Team believes the environment still appears favorable for stock pickers, as investors increasingly reward companies for their fundamental strengths.
1
| GROWTH PORTFOLIO | ||
| DISCLOSURESAND RISKS | AllianceBernstein Variable Products Series Fund |
Benchmark Disclosure
Neither the unmanaged Russell 1000® Growth Index nor the unmanaged S&P 500® Index reflect fees and expenses associated with the active management of a mutual fund portfolio. The Russell 1000 Growth Index represents the performance of 1,000 large-cap growth companies within the U.S. The S&P 500 Index includes 500 U.S. stocks and is a common representation of the performance of the overall U.S. stock market. An investor cannot invest directly in an index, and its results are not indicative of the performance for any specific investment, including the Portfolio.
A Word About Risk
Market Risk: The value of the Portfolio’s assets will fluctuate as the stock or bond market fluctuates. The value of its investments may decline, sometimes rapidly and unpredictably, simply because of economic changes or other events that affect large portions of the market. It includes the risk that a particular style of investing, such as growth, may underperform the market generally.
Capitalization Risk: Investments in small- and mid-capitalization companies may be more volatile than investments in large-capitalization companies. Investments in small-capitalization companies may have additional risks because these companies have limited product lines, markets or financial resources.
Derivatives Risk: Derivatives may be illiquid, difficult to price, and leveraged so that small changes may produce disproportionate losses for the Portfolio, and may be subject to counterparty risk to a greater degree than more traditional investments.
Management Risk: The Portfolio is subject to management risk because it is an actively managed investment fund. The Adviser will apply its investment techniques and risk analyses in making investment decisions for the Portfolio, but there is no guarantee that its techniques will produce the intended results.
These risks are fully discussed in the Variable Products prospectus.
An Important Note About Historical Performance
The investment return and principal value of an investment in the Portfolio will fluctuate, so that shares, when redeemed, may be worth more or less than their original cost. Performance shown on the following page represents past performance and does not guarantee future results. Current performance may be lower or higher than the performance information shown. Please contact your Financial Advisor or Insurance Agent Representative at your financial institution to obtain portfolio performance information current to the most recent month-end.
Investors should consider the investment objectives, risks, charges and expenses of the Portfolio carefully before investing. For additional copies of the Portfolio’s prospectus or summary prospectus, which contains this and other information, call your financial advisor or 800.984.7654. Please read the prospectus and/or summary prospectus carefully before investing.
All fees and expenses related to the operation of the Portfolio have been deducted, but no adjustment has been made for insurance company separate account or annuity contract charges, which would reduce total return to a contract owner. Performance assumes reinvestment of distributions and does not account for taxes.
There are additional fees and expenses associated with all Variable Products. These fees can include mortality and expense risk charges, administrative charges, and other charges that can significantly reduce investment returns. Those fees and expenses are not reflected in this annual report. You should consult your Variable Products prospectus for a description of those fees and expenses and speak to your insurance agent or financial representative if you have any questions. You should read the prospectus before investing or sending money.
2
| GROWTH PORTFOLIO | ||
| HISTORICAL PERFORMANCE | AllianceBernstein Variable Products Series Fund |
| THE PORTFOLIO VS. ITS BENCHMARKS | NAV Returns | |||||||||||
| PERIODS ENDED DECEMBER 31, 2013 (unaudited) | 1 Year | 5 Years* | 10 Years* | |||||||||
AllianceBernstein Growth Portfolio Class A** | 34.01% | 18.80% | 6.95% | |||||||||
AllianceBernstein Growth Portfolio Class B** | 33.72% | 18.51% | 6.69% | |||||||||
Russell 1000 Growth Index | 33.48% | 20.39% | 7.83% | |||||||||
S&P 500 Index | 32.39% | 17.94% | 7.41% | |||||||||
* Average annual returns.
** Includes the impact of proceeds received and credited to the Portfolio resulting from class action settlements, which enhanced the performance of all share classes of the Portfolio for the annual period ended December 31, 2013, by 0.06%.
Please keep in mind that high, double-digit returns are highly unusual and cannot be sustained. Investors should also be aware that these returns were primarily achieved during favorable market conditions. |
| |||||||||||
The Portfolio’s current prospectus fee table shows the Portfolio’s total annual expense ratios as 1.06% and 1.31% for Class A and Class B, respectively. The Financial Highlights section of this report sets forth expense ratio data for the current reporting period; the expense ratios shown above may differ from the expense ratios in the Financial Highlights section since they are based on different time periods.
ALLIANCEBERNSTEIN GROWTH PORTFOLIO CLASS A
GROWTH OF A $10,000 INVESTMENT
12/31/03 – 12/31/13 (unaudited)
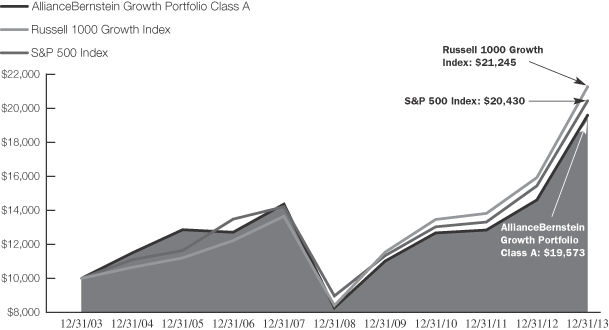
This chart illustrates the total value of an assumed $10,000 investment in AllianceBernstein Growth Portfolio Class A shares (from 12/31/03 to 12/31/13) as compared to the performance of the Portfolio’s benchmark, the Russell 1000 Growth Index, and the broad market, as represented by the S&P 500 Index. The chart assumes the reinvestment of dividends and capital gains distributions.
See Disclosures, Risks and Note about Historical Performance on page 2.
3
| GROWTH PORTFOLIO | ||
| EXPENSE EXAMPLE (unaudited) | AllianceBernstein Variable Products Series Fund |
As a shareholder of the Fund, you incur two types of costs: (1) transaction costs, including sales charges (loads) on purchase payments, contingent deferred sales charges on redemptions and (2) ongoing costs, including management fees; distribution (12b-1) fees; and other Fund expenses. This example is intended to help you understand your ongoing costs (in dollars) of investing in the Fund and to compare these costs with the ongoing costs of investing in other mutual funds.
The Example is based on an investment of $1,000 invested at the beginning of the period and held for the entire period as indicated below.
Actual Expenses
The table below provides information about actual account values and actual expenses. You may use the information in this line, together with the amount you invested, to estimate the expenses that you paid over the period. Simply divide your account value by $1,000 (for example, an $8,600 account value divided by $1,000 = 8.6), then multiply the result by the number in the first line under the heading entitled “Expenses Paid During Period” to estimate the expenses you paid on your account during this period. The estimate of expenses does not include fees or other expenses of any variable insurance product. If such expenses were included, the estimate of expenses you paid during the period would be higher and your ending account value would be lower.
Hypothetical Example for Comparison Purposes
The table below provides information about hypothetical account values and hypothetical expenses based on the Fund’s actual expense ratio and an assumed annual rate of return of 5% before expenses, which is not the Fund’s actual return. The hypothetical account values and expenses may not be used to estimate the actual ending account balance or expenses you paid for the period. You may use this information to compare the ongoing costs of investing in the Fund and other funds by comparing this 5% hypothetical example with the 5% hypothetical examples that appear in the shareholder reports of other funds. The estimate of expenses does not include fees or other expenses of any variable insurance product. If such expenses were included, the estimate of expenses you paid during the period would be higher and your ending account value would be lower.
Please note that the expenses shown in the table are meant to highlight your ongoing costs only and do not reflect any transactional costs, such as sales charges (loads), or contingent deferred sales charges on redemptions. Therefore, the second line of each class’ table is useful in comparing ongoing costs only, and will not help you determine the relative total costs of owning different funds. In addition, if these transactional costs were included, your costs would have been higher.
| Beginning Account Value July 1, 2013 | Ending Account Value December 31, 2013 | Expenses Paid During Period* | Annualized Expense Ratio* | |||||||||||||
Class A | ||||||||||||||||
Actual | $ | 1,000 | $ | 1,224.60 | $ | 6.00 | 1.07 | % | ||||||||
Hypothetical (5% annual return before expenses) | $ | 1,000 | $ | 1,019.81 | $ | 5.45 | 1.07 | % | ||||||||
Class B | ||||||||||||||||
Actual | $ | 1,000 | $ | 1,223.10 | $ | 7.40 | 1.32 | % | ||||||||
Hypothetical (5% annual return before expenses) | $ | 1,000 | $ | 1,018.55 | $ | 6.72 | 1.32 | % | ||||||||
| * | Expenses are equal to each classes’ annualized expense ratios, multiplied by the average account value over the period, multiplied by 184/365 (to reflect the one-half year period). |
4
| GROWTH PORTFOLIO | ||
| TEN LARGEST HOLDINGS* | ||
| December 31, 2013 (unaudited) | AllianceBernstein Variable Products Series Fund | |
| COMPANY | U.S. $ VALUE | PERCENT OF NET ASSETS | ||||||
Google, Inc.—Class A | $ | 3,924,726 | 4.8 | % | ||||
Apple, Inc. | 3,773,465 | 4.7 | ||||||
IntercontinentalExchange Group, Inc. | 2,561,839 | 3.2 | ||||||
Biogen Idec, Inc. | 2,500,965 | 3.1 | ||||||
Visa, Inc.—Class A | 2,473,975 | 3.1 | ||||||
Schlumberger Ltd. | 2,427,113 | 3.0 | ||||||
Gilead Sciences, Inc. | 2,396,533 | 3.0 | ||||||
Cognizant Technology Solutions Corp.—Class A | 2,113,511 | 2.6 | ||||||
Comcast Corp.—Class A | 1,929,980 | 2.4 | ||||||
Boeing Co. (The) | 1,786,654 | 2.2 | ||||||
|
|
|
| |||||
| $ | 25,888,761 | 32.1 | % | |||||
SECTOR BREAKDOWN**
December 31, 2013 (unaudited)
| SECTOR | U.S. $ VALUE | PERCENT OF TOTAL INVESTMENTS | ||||||
Information Technology | $ | 19,188,335 | 23.6 | % | ||||
Consumer Discretionary | 15,053,027 | 18.6 | ||||||
Health Care | 14,879,456 | 18.3 | ||||||
Industrials | 11,328,524 | 14.0 | ||||||
Consumer Staples | 8,610,455 | 10.6 | ||||||
Financials | 5,022,969 | 6.2 | ||||||
Energy | 4,585,324 | 5.7 | ||||||
Short-Term Investments | 2,461,234 | 3.0 | ||||||
|
|
|
| |||||
Total Investments | $ | 81,129,324 | 100.0 | % | ||||
| * | Long-term investments. |
| ** | The Portfolio’s sector breakdown is expressed as a percentage of total investments (excluding security collateral) and may vary over time. |
Please note: The sector classifications presented herein are based on the Global Industry Classification Standard (GICS) which was developed by Morgan Stanley Capital International and Standard & Poor’s. The components are divided into sector, industry group, and industry sub-indices as classified by the GICS for each of the market capitalization indices in the broad market. These sector classifications are broadly defined. The “Portfolio of Investments” section of the report reflects more specific industry information and is consistent with the investment restrictions discussed in the Portfolio’s prospectus.
5
| GROWTH PORTFOLIO | ||
| PORTFOLIOOF INVESTMENTS | ||
| December 31, 2013 | AllianceBernstein Variable Products Series Fund |
| Company | Shares | U.S. $ Value | ||||||
COMMON STOCKS–97.5% | ||||||||
INFORMATION TECHNOLOGY–23.8% | ||||||||
COMPUTERS & | ||||||||
Apple, Inc. | 6,725 | $ | 3,773,465 | |||||
|
| |||||||
INTERNET SOFTWARE & SERVICES–8.8% | ||||||||
eBay, Inc.(a) | 27,530 | 1,511,122 | ||||||
Facebook, Inc.–Class A(a) | 16,800 | 918,288 | ||||||
Google, Inc.–Class A(a) | 3,502 | 3,924,726 | ||||||
LinkedIn Corp.–Class A(a) | 3,450 | 748,063 | ||||||
|
| |||||||
| 7,102,199 | ||||||||
|
| |||||||
IT SERVICES–5.7% | ||||||||
Cognizant Technology Solutions Corp.–Class A(a) | 20,930 | 2,113,511 | ||||||
Visa, Inc.–Class A | 11,110 | 2,473,975 | ||||||
|
| |||||||
| 4,587,486 | ||||||||
|
| |||||||
SOFTWARE–4.6% | ||||||||
ANSYS, Inc.(a) | 13,680 | 1,192,896 | ||||||
Aspen Technology, Inc.(a) | 21,910 | 915,838 | ||||||
Cadence Design Systems, Inc.(a) | 33,450 | 468,969 | ||||||
ServiceNow, Inc.(a) | 7,150 | 400,472 | ||||||
TIBCO Software, Inc.(a) | 33,230 | 747,010 | ||||||
|
| |||||||
| 3,725,185 | ||||||||
|
| |||||||
| 19,188,335 | ||||||||
|
| |||||||
CONSUMER | ||||||||
AUTOMOBILES–1.6% | ||||||||
Harley-Davidson, Inc. | 18,590 | 1,287,172 | ||||||
|
| |||||||
DISTRIBUTORS–0.6% | ||||||||
LKQ Corp.(a) | 14,330 | 471,457 | ||||||
|
| |||||||
HOTELS, RESTAURANTS & LEISURE–1.8% | ||||||||
Starbucks Corp. | 18,170 | 1,424,346 | ||||||
|
| |||||||
INTERNET & CATALOG | ||||||||
Amazon.com, Inc.(a) | 3,270 | 1,304,043 | ||||||
priceline.com, Inc.(a) | 1,495 | 1,737,788 | ||||||
|
| |||||||
| 3,041,831 | ||||||||
|
| |||||||
LEISURE EQUIPMENT & PRODUCTS–0.8% | ||||||||
Polaris Industries, Inc. | 4,630 | 674,313 | ||||||
|
| |||||||
MEDIA–5.4% | ||||||||
AMC Networks, Inc.–Class A(a) | 8,329 | 567,288 | ||||||
Comcast Corp.–Class A | 37,140 | 1,929,980 | ||||||
Liberty Media Corp.(a) | 6,210 | 909,455 | ||||||
Viacom, Inc.–Class B | 10,350 | 903,969 | ||||||
|
| |||||||
| 4,310,692 | ||||||||
|
| |||||||
SPECIALTY RETAIL–3.2% | ||||||||
Lowe’s Cos., Inc. | 28,730 | 1,423,571 | ||||||
Lumber Liquidators Holdings, Inc.(a) | 8,020 | 825,178 | ||||||
Tractor Supply Co. | 4,610 | 357,644 | ||||||
|
| |||||||
| 2,606,393 | ||||||||
|
| |||||||
TEXTILES, APPAREL & LUXURY GOODS–1.5% | ||||||||
Michael Kors Holdings Ltd.(a) | 10,197 | 827,895 | ||||||
NIKE, Inc.–Class B | 5,200 | 408,928 | ||||||
|
| |||||||
| 1,236,823 | ||||||||
|
| |||||||
| 15,053,027 | ||||||||
|
| |||||||
HEALTH CARE–18.4% | ||||||||
BIOTECHNOLOGY–9.3% | ||||||||
Biogen Idec, Inc.(a) | 8,940 | 2,500,965 | ||||||
Celgene Corp.(a) | 6,480 | 1,094,861 | ||||||
Gilead Sciences, Inc.(a) | 31,890 | 2,396,533 | ||||||
Quintiles Transnational Holdings, Inc.(a) | 24,444 | 1,132,735 | ||||||
Vertex Pharmaceuticals, Inc.(a) | 5,700 | 423,510 | ||||||
|
| |||||||
| 7,548,604 | ||||||||
|
| |||||||
HEALTH CARE EQUIPMENT & SUPPLIES–1.6% | ||||||||
HeartWare International, Inc.(a) | 5,830 | 547,787 | ||||||
Intuitive Surgical, Inc.(a) | 1,950 | 748,956 | ||||||
|
| |||||||
| 1,296,743 | ||||||||
|
| |||||||
HEALTH CARE PROVIDERS & SERVICES–3.1% | ||||||||
McKesson Corp. | 8,260 | 1,333,164 | ||||||
UnitedHealth Group, Inc. | 15,340 | 1,155,102 | ||||||
|
| |||||||
| 2,488,266 | ||||||||
|
| |||||||
LIFE SCIENCES TOOLS & SERVICES–1.3% | ||||||||
Illumina, Inc.(a) | 9,730 | 1,076,333 | ||||||
|
| |||||||
PHARMACEUTICALS–3.1% | ||||||||
Allergan, Inc./United States | 14,600 | 1,621,768 | ||||||
Bristol-Myers Squibb Co. | 15,950 | 847,742 | ||||||
|
| |||||||
| 2,469,510 | ||||||||
|
| |||||||
| 14,879,456 | ||||||||
|
| |||||||
INDUSTRIALS–14.0% | ||||||||
AEROSPACE & DEFENSE–3.8% | ||||||||
Boeing Co. (The) | 13,090 | 1,786,654 | ||||||
Precision Castparts Corp. | 4,620 | 1,244,166 | ||||||
|
| |||||||
| 3,030,820 | ||||||||
|
| |||||||
AIR FREIGHT & | ||||||||
Expeditors International of Washington, Inc. | 15,580 | 689,415 | ||||||
|
| |||||||
AIRLINES–1.9% | ||||||||
Copa Holdings SA–Class A | 9,610 | 1,538,657 | ||||||
|
| |||||||
ELECTRICAL EQUIPMENT–1.0% | ||||||||
AMETEK, Inc. | 15,670 | 825,339 | ||||||
|
| |||||||
INDUSTRIAL | ||||||||
Danaher Corp. | 21,220 | 1,638,184 | ||||||
|
| |||||||
MACHINERY–1.0% | ||||||||
Parker Hannifin Corp. | 6,560 | 843,878 | ||||||
|
| |||||||
6
| AllianceBernstein Variable Products Series Fund |
| Company | Shares | U.S. $ Value | ||||||
MARINE–0.7% | ||||||||
Kirby Corp.(a) | 5,750 | $ | 570,687 | |||||
|
| |||||||
PROFESSIONAL SERVICES–0.7% | ||||||||
Robert Half International, Inc. | 13,130 | 551,329 | ||||||
|
| |||||||
ROAD & RAIL–0.8% | ||||||||
JB Hunt Transport Services, Inc. | 8,200 | 633,860 | ||||||
|
| |||||||
TRADING COMPANIES & | ||||||||
WW Grainger, Inc. | 3,940 | 1,006,355 | ||||||
|
| |||||||
| 11,328,524 | ||||||||
|
| |||||||
CONSUMER STAPLES – 10.7% | ||||||||
BEVERAGES–1.0% | ||||||||
Monster Beverage Corp.(a) | 11,620 | 787,487 | ||||||
|
| |||||||
FOOD & STAPLES | ||||||||
Costco Wholesale Corp. | 13,260 | 1,578,073 | ||||||
CVS Caremark Corp. | 23,370 | 1,672,591 | ||||||
|
| |||||||
| 3,250,664 | ||||||||
|
| |||||||
FOOD PRODUCTS–3.4% | ||||||||
Green Mountain Coffee Roasters, Inc.(a)(b) | 10,380 | 784,520 | ||||||
Hershey Co. (The) | 11,470 | 1,115,228 | ||||||
Mead Johnson Nutrition Co.–Class A | 9,980 | 835,925 | ||||||
|
| |||||||
| 2,735,673 | ||||||||
|
| |||||||
PERSONAL PRODUCTS–0.7% | ||||||||
Estee Lauder Cos., Inc. (The)–Class A | 7,900 | 595,028 | ||||||
|
| |||||||
TOBACCO–1.6% | ||||||||
Philip Morris International, Inc. | 14,250 | 1,241,603 | ||||||
|
| |||||||
| 8,610,455 | ||||||||
|
| |||||||
FINANCIALS–6.2% | ||||||||
CAPITAL MARKETS–3.0% | ||||||||
Affiliated Managers Group, Inc.(a) | 7,160 | 1,552,861 | ||||||
BlackRock, Inc.–Class A | 2,870 | 908,269 | ||||||
|
| |||||||
| 2,461,130 | ||||||||
|
| |||||||
DIVERSIFIED FINANCIAL SERVICES–3.2% | ||||||||
IntercontinentalExchange Group, Inc. | 11,390 | 2,561,839 | ||||||
|
| |||||||
| 5,022,969 | ||||||||
|
| |||||||
ENERGY–5.7% | ||||||||
ENERGY EQUIPMENT & | ||||||||
Oceaneering International, Inc. | 9,430 | 743,838 | ||||||
Schlumberger Ltd. | 26,935 | 2,427,113 | ||||||
|
| |||||||
| 3,170,951 | ||||||||
|
| |||||||
OIL, GAS & CONSUMABLE FUELS–1.8% | ||||||||
Antero Resources Corp.(a) | 5,192 | 329,381 | ||||||
Noble Energy, Inc. | 15,930 | 1,084,992 | ||||||
|
| |||||||
| 1,414,373 | ||||||||
|
| |||||||
| 4,585,324 | ||||||||
|
| |||||||
Total Common Stocks | 78,668,090 | |||||||
|
| |||||||
| Principal Amount (000) | ||||||||
SHORT-TERM INVESTMENTS–3.1% | ||||||||
TIME DEPOSIT–3.1% | ||||||||
State Street Time Deposit | $ | 2,461 | 2,461,234 | |||||
|
| |||||||
Total Investments Before Security Lending Collateral for Securities Loaned–100.6% | 81,129,324 | |||||||
|
| |||||||
| Shares | ||||||||
INVESTMENTS OF CASH COLLATERAL FOR SECURITIES | ||||||||
INVESTMENT | ||||||||
AllianceBernstein Exchange Reserves–Class I, 0.07%(c) | 799,260 | 799,260 | ||||||
|
| |||||||
TOTAL | 81,928,584 | |||||||
Other assets less liabilities–(1.6)% | (1,285,328 | ) | ||||||
|
| |||||||
NET ASSETS–100.0% | $ | 80,643,256 | ||||||
|
| |||||||
| (a) | Non-income producing security. |
| (b) | Represents entire or partial securities out on loan. See Note E for securities lending information. |
| (c) | Investment in affiliated money market mutual fund. The rate shown represents the 7-day yield as of period end. |
See notes to financial statements.
7
| GROWTH PORTFOLIO | ||
| STATEMENTOF ASSETS & LIABILITIES | ||
| December 31, 2013 | AllianceBernstein Variable Products Series Fund | |
ASSETS | ||||
Investments in securities, at value | ||||
Unaffiliated issuers (cost $57,976,068) | $ | 81,129,324 | (a) | |
Affiliated issuers (cost $799,260—investment of cash collateral for securities loaned) | 799,260 | |||
Cash | 28,369 | |||
Foreign currencies, at value (cost $15,784) | 16,542 | |||
Receivable for investment securities sold | 320,034 | |||
Dividends and interest receivable | 41,589 | |||
Receivable for capital stock sold | 10,974 | |||
|
| |||
Total assets | 82,346,092 | |||
|
| |||
LIABILITIES | ||||
Payable for collateral received on securities loaned | 799,260 | |||
Payable for investment securities purchased | 746,144 | |||
Advisory fee payable | 48,912 | |||
Payable for capital stock redeemed | 21,800 | |||
Administrative fee payable | 13,885 | |||
Distribution fee payable | 10,505 | |||
Transfer Agent fee payable | 112 | |||
Accrued expenses | 62,218 | |||
|
| |||
Total liabilities | 1,702,836 | |||
|
| |||
NET ASSETS | $ | 80,643,256 | ||
|
| |||
COMPOSITION OF NET ASSETS | ||||
Capital stock, at par | $ | 2,652 | ||
Additional paid-in capital | 56,180,398 | |||
Accumulated net realized gain on investment and foreign currency transactions | 1,306,192 | |||
Net unrealized appreciation on investments and foreign currency denominated assets and liabilities | 23,154,014 | |||
|
| |||
| $ | 80,643,256 | |||
|
|
Net Asset Value Per Share—1 billion shares of capital stock authorized, $.001 par value
| Class | Net Assets | Shares Outstanding | Net Asset Value | |||||||||
A | $ | 28,649,702 | 923,229 | $ | 31.03 | |||||||
B | $ | 51,993,554 | 1,728,531 | $ | 30.08 | |||||||
| (a) | Includes securities on loan with a value of $784,520 (see Note E). |
See notes to financial statements.
8
| GROWTH PORTFOLIO | ||
| STATEMENTOF OPERATIONS | ||
| Year Ended December 31, 2013 | AllianceBernstein Variable Products Series Fund |
INVESTMENT INCOME | ||||
Dividends | ||||
Unaffiliated issuers (net of foreign taxes withheld of $1,011) | $ | 723,435 | ||
Affiliated issuers | 473 | |||
Interest | 145 | |||
Securities lending income | 3,696 | |||
|
| |||
| 727,749 | ||||
|
| |||
EXPENSES | ||||
Advisory fee (see Note B) | 567,821 | |||
Distribution fee—Class B | 122,506 | |||
Transfer agency—Class A | 2,183 | |||
Transfer agency—Class B | 4,021 | |||
Custodian | 75,899 | |||
Administrative | 54,090 | |||
Audit | 36,426 | |||
Legal | 31,233 | |||
Printing | 24,939 | |||
Directors’ fees | 4,526 | |||
Miscellaneous | 4,107 | |||
|
| |||
Total expenses | 927,751 | |||
|
| |||
Net investment loss | (200,002 | ) | ||
|
| |||
REALIZED AND UNREALIZED GAIN ON INVESTMENT AND FOREIGN CURRENCY TRANSACTIONS | ||||
Net realized gain on: | ||||
Investment transactions | 11,065,461 | |||
Foreign currency transactions | 4,583 | |||
Net change in unrealized appreciation/depreciation of: | ||||
Investments | 11,286,928 | |||
Foreign currency denominated assets and liabilities | 371 | |||
|
| |||
Net gain on investment and foreign currency transactions | 22,357,343 | |||
|
| |||
NET INCREASE IN NET ASSETS FROM OPERATIONS | $ | 22,157,341 | ||
|
|
See notes to financial statements.
9
| GROWTH PORTFOLIO | ||
| STATEMENTOF CHANGESIN NET ASSETS | AllianceBernstein Variable Products Series Fund |
| Year Ended December 31, 2013 | Year Ended December 31, 2012 | |||||||
INCREASE (DECREASE) IN NET ASSETS FROM OPERATIONS | ||||||||
Net investment income (loss) | $ | (200,002 | ) | $ | 88,999 | |||
Net realized gain on investment and foreign currency transactions | 11,070,044 | 7,721,679 | ||||||
Net change in unrealized appreciation/depreciation of investments and foreign currency denominated assets and liabilities | 11,287,299 | 2,746,887 | ||||||
|
|
|
| |||||
Net increase in net assets from operations | 22,157,341 | 10,557,565 | ||||||
DIVIDENDS TO SHAREHOLDERS FROM | ||||||||
Net investment income | ||||||||
Class A | (74,011 | ) | (15,259 | ) | ||||
Class B | (12,958 | ) | –0 | – | ||||
CAPITAL STOCK TRANSACTIONS | ||||||||
Net decrease | (13,595,024 | ) | (20,321,277 | ) | ||||
|
|
|
| |||||
Total increase (decrease) | 8,475,348 | (9,778,971 | ) | |||||
NET ASSETS | ||||||||
Beginning of period | 72,167,908 | 81,946,879 | ||||||
|
|
|
| |||||
End of period (including undistributed net investment income of $–0– and $87,985, respectively) | $ | 80,643,256 | $ | 72,167,908 | ||||
|
|
|
| |||||
See notes to financial statements.
10
| GROWTH PORTFOLIO | ||
| NOTES TO FINANCIAL STATEMENTS | ||
| December 31, 2013 | AllianceBernstein Variable Products Series Fund | |
NOTE A: Significant Accounting Policies
The AllianceBernstein Growth Portfolio (the “Portfolio”) is a series of AllianceBernstein Variable Products Series Fund, Inc. (the “Fund”). The Portfolio’s investment objective is long-term growth of capital. The Portfolio is diversified as defined under the Investment Company Act of 1940. The Fund was incorporated in the State of Maryland on November 17, 1987, as an open-end series investment company. The Fund offers thirteen separately managed pools of assets which have differing investment objectives and policies. The Portfolio offers Class A and Class B shares. Both classes of shares have identical voting, dividend, liquidating and other rights, except that Class B shares bear a distribution expense and have exclusive voting rights with respect to the Class B distribution plan.
The Portfolio offers and sells its shares only to separate accounts of certain life insurance companies for the purpose of funding variable annuity contracts and variable life insurance policies. Sales are made without a sales charge at the Portfolio’s net asset value per share.
The financial statements have been prepared in conformity with U.S. generally accepted accounting principles (“U.S. GAAP”) which require management to make certain estimates and assumptions that affect the reported amounts of assets and liabilities in the financial statements and amounts of income and expenses during the reporting period. Actual results could differ from those estimates. The following is a summary of significant accounting policies followed by the Portfolio.
1. Security Valuation
Portfolio securities are valued at their current market value determined on the basis of market quotations or, if market quotations are not readily available or are deemed unreliable, at “fair value” as determined in accordance with procedures established by and under the general supervision of the Fund’s Board of Directors (the “Board”).
In general, the market values of securities which are readily available and deemed reliable are determined as follows: securities listed on a national securities exchange (other than securities listed on the NASDAQ Stock Market, Inc. (“NASDAQ”)) or on a foreign securities exchange are valued at the last sale price at the close of the exchange or foreign securities exchange. If there has been no sale on such day, the securities are valued at the last traded price from the previous day. Securities listed on more than one exchange are valued by reference to the principal exchange on which the securities are traded; securities listed only on NASDAQ are valued in accordance with the NASDAQ Official Closing Price; listed or over the counter (“OTC”) market put or call options are valued at the mid level between the current bid and ask prices. If either a current bid or current ask price is unavailable, AllianceBernstein L.P. (the “Adviser”) will have discretion to determine the best valuation (e.g. last trade price in the case of listed options); open futures are valued using the closing settlement price or, in the absence of such a price, the most recent quoted bid price. If there are no quotations available for the day of valuation, the last available closing settlement price is used; U.S. government securities and other debt instruments having 60 days or less remaining until maturity are valued at amortized cost if their original maturity was 60 days or less; or by amortizing their fair value as of the 61st day prior to maturity if their original term to maturity exceeded 60 days; fixed-income securities, including mortgage-backed and asset-backed securities, may be valued on the basis of prices provided by a pricing service or at a price obtained from one or more of the major broker-dealers. In cases where broker-dealer quotes are obtained, the Adviser may establish procedures whereby changes in market yields or spreads are used to adjust, on a daily basis, a recently obtained quoted price on a security. Swaps and other derivatives are valued daily, primarily using independent pricing services, independent pricing models using market inputs, as well as third party broker-dealers or counterparties. Investment companies are valued at their net asset value each day.
Securities for which market quotations are not readily available (including restricted securities) or are deemed unreliable are valued at fair value. Factors considered in making this determination may include, but are not limited to, information obtained by contacting the issuer, analysts, analysis of the issuer’s financial statements or other available documents. In addition, the Portfolio may use fair value pricing for securities primarily traded in non-U.S. markets because most foreign markets close well before the Portfolio values its securities at 4:00 p.m., Eastern Time. The earlier close of these foreign markets gives rise to the possibility that significant events, including broad market moves, may have occurred in the interim and may materially affect the value of those securities. To account for this, the Portfolio may frequently value many of its foreign equity securities using fair value prices based on third party vendor modeling tools to the extent available.
2. Fair Value Measurements
In accordance with U.S. GAAP regarding fair value measurements, fair value is defined as the price that the Portfolio would receive to sell an asset or pay to transfer a liability in an orderly transaction between market participants at the measurement
11
| GROWTH PORTFOLIO | ||
| NOTES TO FINANCIAL STATEMENTS | ||
| (continued) | AllianceBernstein Variable Products Series Fund | |
date. U.S. GAAP establishes a framework for measuring fair value, and a three-level hierarchy for fair value measurements based upon the transparency of inputs to the valuation of an asset or liability (including those valued based on their market values as described in Note A.1 above). Inputs may be observable or unobservable and refer broadly to the assumptions that market participants would use in pricing the asset or liability. Observable inputs reflect the assumptions market participants would use in pricing the asset or liability based on market data obtained from sources independent of the Portfolio. Unobservable inputs reflect the Portfolio’s own assumptions about the assumptions that market participants would use in pricing the asset or liability based on the best information available in the circumstances. Each investment is assigned a level based upon the observability of the inputs which are significant to the overall valuation. The three-tier hierarchy of inputs is summarized below.
| • | Level 1—quoted prices in active markets for identical investments |
| • | Level 2—other significant observable inputs (including quoted prices for similar investments, interest rates, prepayment speeds, credit risk, etc.) |
| • | Level 3—significant unobservable inputs (including the Portfolio’s own assumptions in determining the fair value of investments) |
Where readily available market prices or relevant bid prices are not available for certain equity investments, such investments may be valued based on similar publicly traded investments, movements in relevant indices since last available prices or based upon underlying company fundamentals and comparable company data (such as multiples to earnings or other multiples to equity). Where an investment is valued using an observable input, such as another publicly traded security, the investment will be classified as Level 2. If management determines that an adjustment is appropriate based on restrictions on resale, illiquidity or uncertainty, and such adjustment is a significant component of the valuation, the investment will be classified as Level 3. An investment will also be classified as Level 3 where management uses company fundamentals and other significant inputs to determine the valuation.
The following table summarizes the valuation of the Portfolio’s investments by the above fair value hierarchy levels as of December 31, 2013:
| Level 1 | Level 2 | Level 3 | Total | |||||||||||||
Investments in Securities: | ||||||||||||||||
Assets: | ||||||||||||||||
Common Stocks* | $ | 78,668,090 | $ | –0 | – | $ | –0 | – | $ | 78,668,090 | ||||||
Short-Term Investments | –0 | – | 2,461,234 | –0 | – | 2,461,234 | ||||||||||
Investments of Cash Collateral for Securities Loaned in Affiliated Money Market Fund | 799,260 | –0 | – | –0 | – | 799,260 | ||||||||||
|
|
|
|
|
|
|
| |||||||||
Total Investments in Securities | 79,467,350 | 2,461,234 | –0 | – | 81,928,584 | |||||||||||
Other Financial Instruments** | –0 | – | –0 | – | –0 | – | –0 | – | ||||||||
|
|
|
|
|
|
|
| |||||||||
Total^ | $ | 79,467,350 | $ | 2,461,234 | $ | –0 | – | $ | 81,928,584 | |||||||
|
|
|
|
|
|
|
| |||||||||
| * | See Portfolio of Investments for sector classifications. |
| ** | Other financial instruments are derivative instruments, such as futures, forwards and swaps, which are valued at the unrealized appreciation/depreciation on the instrument. |
| ^ | There were no transfers between Level 1 and Level 2 during the reporting period. |
The Portfolio recognizes all transfers between levels of the fair value hierarchy assuming the financial instruments were transferred at the beginning of the reporting period.
The Adviser has established a Valuation Committee (the “Committee”) which is responsible for overseeing the pricing and valuation of all securities held in the Portfolio. The Committee operates under pricing and valuation policies and procedures established by the Adviser and approved by the Board, including pricing policies which set forth the mechanisms and processes to be employed on a daily basis to implement these policies and procedures. In particular, the pricing policies describe how to determine market quotations for securities and other instruments. The Committee’s responsibilities include: 1) fair value and liquidity determinations (and oversight of any third parties to whom any responsibility for fair value and liquidity determinations is delegated), and 2) regular monitoring of the Adviser’s pricing and valuation policies and procedures and modification or enhancement of these policies and procedures (or recommendation of the modification of these policies and procedures) as the Committee believes appropriate.
12
| AllianceBernstein Variable Products Series Fund |
The Committee is also responsible for monitoring the implementation of the pricing policies by the Adviser’s Pricing Group (the “Pricing Group”) and a third party which performs certain pricing functions in accordance with the pricing policies. The Pricing Group is responsible for the oversight of the third party on a day-to-day basis. The Committee and the Pricing Group perform a series of activities to provide reasonable assurance of the accuracy of prices including: 1) periodic vendor due diligence meetings, review of methodologies, new developments and processes at vendors, 2) daily comparison of security valuation versus prior day for all securities that exceeded established thresholds, and 3) daily review of unpriced, stale, and variance reports with exceptions reviewed by senior management and the Committee.
In addition, several processes outside of the pricing process are used to monitor valuation issues including: 1) performance and performance attribution reports are monitored for anomalous impacts based upon benchmark performance, and 2) portfolio managers review all portfolios for performance and analytics (which are generated using the Adviser’s prices).
3. Currency Translation
Assets and liabilities denominated in foreign currencies and commitments under forward currency exchange contracts are translated into U.S. dollars at the mean of the quoted bid and ask prices of such currencies against the U.S. dollar. Purchases and sales of portfolio securities are translated into U.S. dollars at the rates of exchange prevailing when such securities were acquired or sold. Income and expenses are translated into U.S. dollars at rates of exchange prevailing when accrued.
Net realized gain or loss on foreign currency transactions represents foreign exchange gains and losses from sales and maturities of foreign fixed income investments, foreign currency exchange contracts, holding of foreign currencies, currency gains or losses realized between the trade and settlement dates on foreign investment transactions, and the difference between the amounts of dividends, interest and foreign withholding taxes recorded on the Portfolio’s books and the U.S. dollar equivalent amounts actually received or paid. Net unrealized currency gains and losses from valuing foreign currency denominated assets and liabilities at period end exchange rates are reflected as a component of net unrealized appreciation or depreciation of foreign currency denominated assets and liabilities.
4. Taxes
It is the Portfolio’s policy to meet the requirements of the Internal Revenue Code applicable to regulated investment companies and to distribute all of its investment company taxable income and net realized gains, if any, to shareholders. Therefore, no provisions for federal income or excise taxes are required. The Portfolio may be subject to taxes imposed by countries in which it invests. Such taxes are generally based on income and/or capital gains earned or repatriated. Taxes are accrued and applied to net investment income, net realized gains and net unrealized appreciation/depreciation as such income and/or gains are earned.
In accordance with U.S. GAAP requirements regarding accounting for uncertainties in income taxes, management has analyzed the Portfolio’s tax positions taken or expected to be taken on federal and state income tax returns for all open tax years (the current and the prior three tax years) and has concluded that no provision for income tax is required in the Portfolio’s financial statements.
5. Investment Income and Investment Transactions
Dividend income is recorded on the ex-dividend date or as soon as the Portfolio is informed of the dividend. Interest income is accrued daily. Investment transactions are accounted for on the date the securities are purchased or sold. Investment gains or losses are determined on the identified cost basis. The Portfolio amortizes premiums and accretes discounts as adjustments to interest income.
6. Class Allocations
All income earned and expenses incurred by the Portfolio are borne on a pro-rata basis by each outstanding class of shares, based on the proportionate interest in the Portfolio represented by the net assets of such class, except for class specific expenses which are allocated to the respective class. Expenses of the Fund are charged proportionately to each Portfolio or based on other appropriate methods. Realized and unrealized gains and losses are allocated among the various share classes based on respective net assets.
7. Dividends and Distributions
Dividends and distributions to shareholders, if any, are recorded on the ex-dividend date. Income dividends and capital gains distributions are determined in accordance with federal tax regulations and may differ from those determined in accordance with U.S. GAAP. To the extent these differences are permanent, such amounts are reclassified within the capital accounts based on their federal tax basis treatment; temporary differences do not require such reclassification.
13
| GROWTH PORTFOLIO | ||
| NOTES TO FINANCIAL STATEMENTS | ||
| (continued) | AllianceBernstein Variable Products Series Fund | |
NOTE B: Advisory Fee and Other Transactions with Affiliates
Under the terms of the investment advisory agreement, the Portfolio pays the Adviser an advisory fee at an annual rate of .75% of the first $2.5 billion, .65% of the next $2.5 billion and .60% in excess of $5 billion, of the Portfolio’s average daily net assets. The fee is accrued daily and paid monthly.
Pursuant to the investment advisory agreement, the Portfolio may reimburse the Adviser for certain legal and accounting services provided to the Portfolio by the Adviser. For the year ended December 31, 2013, the reimbursement for such services amounted to $54,090.
Brokerage commissions paid on investment transactions for the year ended December 31, 2013 amounted to $54,411, of which $513 and $0, respectively, was paid to Sanford C. Bernstein & Co. LLC and Sanford C. Bernstein Limited, affiliates of the Adviser.
The Portfolio compensates AllianceBernstein Investor Services, Inc. (“ABIS”), a wholly-owned subsidiary of the Adviser, under a Transfer Agency Agreement for providing personnel and facilities to perform transfer agency services for the Portfolio. Such compensation retained by ABIS amounted to $1,385 for the year ended December 31, 2013.
NOTE C: Distribution Plan
The Portfolio has adopted a Distribution Plan (the “Plan”) for Class B shares pursuant to Rule 12b-1 under the Investment Company Act of 1940. Under the Plan, the Portfolio pays distribution and servicing fees to AllianceBernstein Investments, Inc. (the “Distributor”), a wholly-owned subsidiary of the Adviser, at an annual rate of up to .50% of the Portfolio’s average daily net assets attributable to Class B shares. The fees are accrued daily and paid monthly. The Board currently limits payments under the Plan to .25% of the Portfolio’s average daily net assets attributable to Class B shares. The Plan provides that the Distributor will use such payments in their entirety for distribution assistance and promotional activities.
The Portfolio is not obligated under the Plan to pay any distribution and servicing fees in excess of the amounts set forth above. The purpose of the payments to the Distributor under the Plan is to compensate the Distributor for its distribution services with respect to the sale of the Portfolio’s Class B shares. Since the Distributor’s compensation is not directly tied to its expenses, the amount of compensation received by it under the Plan during any year may be more or less than its actual expenses. For this reason, the Plan is characterized by the staff of the Securities and Exchange Commission as being of the “compensation” variety.
In the event that the Plan is terminated or not continued, no distribution or servicing fees (other than current amounts accrued but not yet paid) would be owed by the Portfolio to the Distributor.
The Plan also provides that the Adviser may use its own resources to finance the distribution of the Portfolio’s shares.
NOTE D: Investment Transactions
Purchases and sales of investment securities (excluding short-term investments) for the year ended December 31, 2013 were as follows:
| Purchases | Sales | |||||||
Investment securities (excluding U.S. government securities) | $ | 46,913,234 | $ | 61,918,036 | ||||
U.S. government securities | –0 | – | –0 | – | ||||
The cost of investments for federal income tax purposes, gross unrealized appreciation and unrealized depreciation (excluding foreign currency transactions) are as follows:
Cost | $ | 58,867,529 | ||
|
| |||
Gross unrealized appreciation | 23,404,760 | |||
Gross unrealized depreciation | (343,705 | ) | ||
|
| |||
Net unrealized appreciation | $ | 23,061,055 | ||
|
|
1. Derivative Financial Instruments
The Portfolio may use derivatives in an effort to earn income and enhance returns, to replace more traditional direct investments, to obtain exposure to otherwise inaccessible markets (collectively, “investment purposes”), or to hedge or adjust the risk profile of its portfolio.
14
| AllianceBernstein Variable Products Series Fund |
The Portfolio did not engage in derivatives transactions for the year ended December 31, 2013.
2. Currency Transactions
The Portfolio may invest in non-U.S. dollar securities on a currency hedged or unhedged basis. The Portfolio may seek investment opportunities by taking long or short positions in currencies through the use of currency-related derivatives, including forward currency exchange contracts, futures and options on futures, swaps, and other options. The Portfolio may enter into transactions for investment opportunities when it anticipates that a foreign currency will appreciate or depreciate in value but securities denominated in that currency are not held by the Portfolio and do not present attractive investment opportunities. Such transactions may also be used when the Adviser believes that it may be more efficient than a direct investment in a foreign currency-denominated security. The Portfolio may also conduct currency exchange contracts on a spot basis (i.e., for cash at the spot rate prevailing in the currency exchange market for buying or selling currencies).
NOTE E: Securities Lending
The Portfolio may enter into securities lending transactions. Under the Portfolio’s securities lending program, all loans of securities will be collateralized continually by cash. The Portfolio will be compensated for the loan from a portion of the net return from the income earned on cash collateral after a rebate is paid to the borrower (in some cases, this rebate may be a “negative rebate” or fee paid by the borrower to the Portfolio in connection with the loan), and payments are made for fees of the securities lending agent and for certain other administrative expenses. It is the policy of the Portfolio to receive collateral consisting of cash in an amount exceeding the value of the securities loaned. The Portfolio will have the right to call a loan and obtain the securities loaned at any time on notice to the borrower within the normal and customary settlement time for the securities. While the securities are on loan, the borrower is obligated to pay the Portfolio amounts equal to any income or other distributions from the securities. The Portfolio will not have the right to vote any securities during the existence of a loan, but will have the right to regain ownership of loaned securities in order to exercise voting or other ownership rights. The lending agent has agreed to indemnify the Portfolio in the case of default of any securities borrower. Collateral received and securities loaned are marked to market daily to ensure that the securities loaned are secured by collateral. The lending agent will invest the cash collateral received in AllianceBernstein Exchange Reserves, an eligible money market vehicle, in accordance with the investment restrictions of the Portfolio, and as approved by the Board. The collateral received on securities loaned is recorded as an asset as well as a corresponding liability in the statement of assets and liabilities. When the Portfolio lends securities, its investment performance will continue to reflect changes in the value of the securities loaned. At December 31, 2013, the Portfolio had securities on loan with a value of $784,520 and had received cash collateral which has been invested into AllianceBernstein Exchange Reserves of $799,260. The cash collateral will be adjusted on the next business day to maintain the required collateral amount. The Portfolio earned securities lending income of $3,696 and $473 from the borrowers and AllianceBernstein Exchange Reserves, respectively, for the year ended December 31, 2013; these amounts are reflected in the statement of operations. A principal risk of lending portfolio securities is that the borrower will fail to return the loaned securities upon termination of the loan and that the collateral will not be sufficient to replace the loaned securities. A summary of the Portfolio’s transactions in shares of AllianceBernstein Exchange Reserves for the year ended December 31, 2013 is as follows:
Market Value December 31, 2012 (000) | Purchases at Cost (000) | Sales Proceeds (000) | Market Value December 31, 2013 (000) | |||||||||||
| $ | 1,398 | $ | 10,654 | $ | 11,253 | $ | 799 | |||||||
15
| GROWTH PORTFOLIO | ||
| NOTES TO FINANCIAL STATEMENTS | ||
| (continued) | AllianceBernstein Variable Products Series Fund | |
NOTE F: Capital Stock
Each class consists of 500,000,000 authorized shares. Transactions in capital shares for each class were as follows:
| SHARES | AMOUNT | |||||||||||||||||
| Year Ended December 31, 2013 | Year Ended December 31, 2012 | Year Ended December 31, 2013 | Year Ended December 31, 2012 | |||||||||||||||
Class A | ||||||||||||||||||
Shares sold | 64,176 | 11,826 | $ | 1,713,830 | $ | 270,544 | ||||||||||||
Shares issued in reinvestment of dividends | 2,773 | 667 | 74,011 | 15,259 | ||||||||||||||
Shares redeemed | (230,016 | ) | (437,480 | ) | (6,162,190 | ) | (9,789,368 | ) | ||||||||||
|
|
|
|
|
|
|
| |||||||||||
Net decrease | (163,067 | ) | (424,987 | ) | $ | (4,374,349 | ) | $ | (9,503,565 | ) | ||||||||
|
|
|
|
|
|
|
| |||||||||||
Class B | ||||||||||||||||||
Shares sold | 45,133 | 41,092 | $ | 1,138,194 | $ | 902,096 | ||||||||||||
Shares issued in reinvestment of dividends | 500 | –0 | – | 12,958 | –0 | – | ||||||||||||
Shares redeemed | (403,357 | ) | (534,612 | ) | (10,371,827 | ) | (11,719,808 | ) | ||||||||||
|
|
|
|
|
|
|
| |||||||||||
Net decrease | (357,724 | ) | (493,520 | ) | $ | (9,220,675 | ) | $ | (10,817,712 | ) | ||||||||
|
|
|
|
|
|
|
| |||||||||||
NOTE G: Risks Involved in Investing in the Portfolio
Foreign Securities Risk—Investing in securities of foreign companies or foreign governments involves special risks which include changes in foreign currency exchange rates and the possibility of future political and economic developments which could adversely affect the value of such securities. Moreover, securities of many foreign companies or foreign governments and their markets may be less liquid and their prices more volatile than those of comparable U.S. companies or of the U.S. government.
Currency Risk—This is the risk that changes in foreign currency exchange rates may negatively affect the value of the Portfolio’s investments or reduce the returns of the Portfolio. For example, the value of the Portfolio’s investments in foreign currency-denominated securities or currencies may decrease if the U.S. dollar is strong (i.e., gaining value relative to other currencies) and other currencies are weak (i.e., losing value relative to the U.S. dollar). Currency markets are generally not as regulated as securities markets. Independent of the Portfolio’s investments denominated in foreign currencies, the Portfolio’s positions in various foreign currencies may cause the Portfolio to experience investment losses due to the changes in exchange rates and interest rates.
Derivatives Risk—The Portfolio may enter into derivative transactions such as forwards, options, futures and swaps. Derivatives may be illiquid, difficult to price, and leveraged so that small changes may produce disproportionate losses for the Portfolio, and subject to counterparty risk to a greater degree than more traditional investments. Derivatives may result in significant losses, including losses that are far greater than the value of the derivatives reflected in the statement of assets and liabilities.
Indemnification Risk—In the ordinary course of business, the Portfolio enters into contracts that contain a variety of indemnifications. The Portfolio’s maximum exposure under these arrangements is unknown. However, the Portfolio has not had prior claims or losses pursuant to these indemnification provisions and expects the risk of loss thereunder to be remote. Therefore, the Portfolio has not accrued any liability in connection with these indemnification provisions.
NOTE H: Joint Credit Facility
A number of open-end mutual funds managed by the Adviser, including the Portfolio, participate in a $140 million revolving credit facility (the “Facility”) intended to provide short-term financing, if necessary, subject to certain restrictions in connection with abnormal redemption activity. Commitment fees related to the Facility are paid by the participating funds and are included in miscellaneous expenses in the statement of operations. The Portfolio did not utilize the Facility during the year ended December 31, 2013.
16
| AllianceBernstein Variable Products Series Fund |
NOTE I: Distributions to Shareholders
The tax character of distributions paid during the fiscal years ended December 31, 2013 and December 31, 2012 were as follows:
| 2013 | 2012 | |||||||
Distributions paid from: | ||||||||
Ordinary income | $ | 84,956 | $ | 15,259 | ||||
Net long-term capital gains | 2,013 | –0 | – | |||||
|
|
|
| |||||
Total taxable distributions paid | $ | 86,969 | $ | 15,259 | ||||
|
|
|
| |||||
As of December 31, 2013, the components of accumulated earnings/(deficit) on a tax basis were as follows:
Undistributed capital gains | $ | 1,398,394 | ||
Accumulated capital and other losses | –0 | –(a) | ||
Unrealized appreciation/(depreciation) | 23,061,813 | (b) | ||
|
| |||
Total accumulated earnings/(deficit) | $ | 24,460,207 | ||
|
|
| (a) | During the fiscal year ended December 31, 2013, the Portfolio utilized $9,116,078 of capital loss carryforwards to offset current year net realized gains. |
| (b) | The difference between book-basis and tax-basis unrealized appreciation/(depreciation) is attributable primarily to the tax deferral of losses on wash sales. |
For tax purposes, net capital losses may be carried over to offset future capital gains, if any. Funds are permitted to carry forward capital losses incurred in taxable years beginning after December 22, 2010 for an indefinite period, and such losses will retain their character as either short-term or long-term capital losses. As of December 31, 2013, the Portfolio did not have any capital loss carryforwards.
During the current fiscal year, permanent differences primarily due to foreign currency reclassifications, the redesignation of dividends, return of capital distributions received from underlying securities, and the disallowance of a net operating loss resulted in a net decrease in distributions in excess of net investment income, a net decrease in accumulated net realized gain on investment and foreign currency transactions, and a net decrease in additional paid-in capital. These reclassifications had no effect on net assets.
NOTE J: Subsequent Events
Management has evaluated subsequent events for possible recognition or disclosure in the financial statements through the date the financial statements are issued. Management has determined that there are no material events that would require disclosure in the Portfolio’s financial statements through this date.
17
| GROWTH PORTFOLIO | ||
| FINANCIAL HIGHLIGHTS | AllianceBernstein Variable Products Series Fund |
Selected Data For A Share Of Capital Stock Outstanding Throughout Each Period
| CLASS A | ||||||||||||||||||||
| Year Ended December 31, | ||||||||||||||||||||
| 2013 | 2012 | 2011 | 2010 | 2009 | ||||||||||||||||
Net asset value, beginning of period | $23.22 | $20.40 | $20.15 | $17.56 | $13.19 | |||||||||||||||
|
|
|
|
|
|
|
|
|
| |||||||||||
Income From Investment Operations | ||||||||||||||||||||
Net investment income (loss) (a) | (.03 | ) | .06 | .03 | .03 | .04 | ||||||||||||||
Net realized and unrealized gain on investment and foreign currency transactions | 7.92 | 2.77 | .22 | 2.61 | 4.33 | |||||||||||||||
|
|
|
|
|
|
|
|
|
| |||||||||||
Net increase in net asset value from operations | 7.89 | 2.83 | .25 | 2.64 | 4.37 | |||||||||||||||
|
|
|
|
|
|
|
|
|
| |||||||||||
Less: Dividends | ||||||||||||||||||||
Dividends from net investment income | (.08 | ) | (.01 | ) | –0 | – | (.05 | ) | –0 | – | ||||||||||
|
|
|
|
|
|
|
|
|
| |||||||||||
Net asset value, end of period | $31.03 | $23.22 | $20.40 | $20.15 | $17.56 | |||||||||||||||
|
|
|
|
|
|
|
|
|
| |||||||||||
Total Return | ||||||||||||||||||||
Total investment return based on net asset value (b)* | 34.01 | % | 13.89 | % | 1.24 | % | 15.06 | % | 33.13 | % | ||||||||||
Ratios/Supplemental Data | ||||||||||||||||||||
Net assets, end of period (000’s omitted) | $28,650 | $25,220 | $30,833 | $37,198 | $37,948 | |||||||||||||||
Ratio to average net assets of: | ||||||||||||||||||||
Expenses | 1.06 | % | 1.06 | % | 1.00 | % | 1.00 | %+ | 1.06 | % | ||||||||||
Net investment income (loss) | (.10 | )% | .27 | % | .17 | % | .15 | %+ | .28 | % | ||||||||||
Portfolio turnover rate | 63 | % | 83 | % | 97 | % | 121 | % | 197 | % | ||||||||||
See footnote summary on page 19.
18
| AllianceBernstein Variable Products Series Fund |
Selected Data For A Share Of Capital Stock Outstanding Throughout Each Period
| CLASS B | ||||||||||||||||||||
| Year Ended December 31, | ||||||||||||||||||||
| 2013 | 2012 | 2011 | 2010 | 2009 | ||||||||||||||||
Net asset value, beginning of period | $22.50 | $19.81 | $19.62 | $17.10 | $12.88 | |||||||||||||||
|
|
|
|
|
|
|
|
|
| |||||||||||
Income From Investment Operations | ||||||||||||||||||||
Net investment income (loss) (a) | (.09 | ) | .01 | (.02 | ) | (.02 | ) | .01 | ||||||||||||
Net realized and unrealized gain on investment and foreign currency transactions | 7.68 | 2.68 | .21 | 2.55 | 4.21 | |||||||||||||||
|
|
|
|
|
|
|
|
|
| |||||||||||
Net increase in net asset value from operations | 7.59 | 2.69 | .19 | 2.53 | 4.22 | |||||||||||||||
|
|
|
|
|
|
|
|
|
| |||||||||||
Less: Dividends | ||||||||||||||||||||
Dividends from net investment income | (.01 | ) | –0 | – | –0 | – | (.01 | ) | –0 | – | ||||||||||
|
|
|
|
|
|
|
|
|
| |||||||||||
Net asset value, end of period | $30.08 | $22.50 | $19.81 | $19.62 | $17.10 | |||||||||||||||
|
|
|
|
|
|
|
|
|
| |||||||||||
Total Return | ||||||||||||||||||||
Total investment return based on net asset value (b)* | 33.72 | % | 13.58 | % | .97 | % | 14.80 | % | 32.76 | % | ||||||||||
Ratios/Supplemental Data | ||||||||||||||||||||
Net assets, end of period (000’s omitted) | $51,993 | $46,948 | $51,114 | $61,325 | $63,368 | |||||||||||||||
Ratio to average net assets of: | ||||||||||||||||||||
Expenses | 1.31 | % | 1.31 | % | 1.25 | % | 1.25 | %+ | 1.31 | % | ||||||||||
Net investment income (loss) | (.35 | )% | .03 | % | (.08 | )% | (.10 | )%+ | .04 | % | ||||||||||
Portfolio turnover rate | 63 | % | 83 | % | 97 | % | 121 | % | 197 | % | ||||||||||
| (a) | Based on average shares outstanding. |
| (b) | Total investment return is calculated assuming an initial investment made at the net asset value at the beginning of the period, reinvestment of all dividends and distributions at net asset value during the period, and redemption on the last day of the period. Total return does not reflect (i) insurance company’s separate account related expense charges and (ii) the deductions of taxes that a shareholder would pay on Portfolio distributions or the redemption of Portfolio shares. Total investment return calculated for a period of less than one year is not annualized. |
| * | Includes the impact of proceeds received and credited to the Portfolio resulting from class action settlements, which enhanced the Portfolio’s performance for the years ended December 31, 2013, December 31, 2012, December 31, 2011, December 31, 2010 and December 31, 2009 by 0.06%, 0.28%, 0.07%, 0.22% and 0.41%, respectively. |
| + | The ratio includes expenses attributable to costs of proxy solicitation. |
See notes to financial statements.
19
| REPORTOF INDEPENDENT REGISTERED | ||
| PUBLIC ACCOUNTING FIRM | AllianceBernstein Variable Products Series Fund | |
To the Board of Directors and Shareholders of AllianceBernstein Growth Portfolio:
We have audited the accompanying statement of assets and liabilities, including the portfolio of investments, of AllianceBernstein Growth Portfolio (one of the funds constituting AllianceBernstein Variable Products Series Fund, Inc. (the “Fund”)) as of December 31, 2013, and the related statement of operations for the year then ended, the statements of changes in net assets for each of the two years in the period then ended, and the financial highlights for each of the five years in the period then ended. These financial statements and financial highlights are the responsibility of the Fund’s management. Our responsibility is to express an opinion on these financial statements and financial highlights based on our audits.
We conducted our audits in accordance with the standards of the Public Company Accounting Oversight Board (United States). Those standards require that we plan and perform the audit to obtain reasonable assurance about whether the financial statements and financial highlights are free of material misstatement. We were not engaged to perform an audit of the Fund’s internal control over financial reporting. Our audits included consideration of internal control over financial reporting as a basis for designing audit procedures that are appropriate in the circumstances, but not for the purpose of expressing an opinion on the effectiveness of the Fund’s internal control over financial reporting. Accordingly, we express no such opinion. An audit also includes examining, on a test basis, evidence supporting the amounts and disclosures in the financial statements and financial highlights, assessing the accounting principles used and significant estimates made by management, and evaluating the overall financial statement presentation. Our procedures included confirmation of securities owned as of December 31, 2013, by correspondence with the custodian and others, or by other appropriate auditing procedures where replies from others were not received. We believe that our audits provide a reasonable basis for our opinion.
In our opinion, the financial statements and financial highlights referred to above present fairly, in all material respects, the financial position of AllianceBernstein Growth Portfolio (one of the funds constituting AllianceBernstein Variable Products Series Fund, Inc.) at December 31, 2013, the results of its operations for the year then ended, the changes in its net assets for each of the two years in the period then ended, and the financial highlights for each of the five years in the period then ended, in conformity with U.S. generally accepted accounting principles.

New York, New York
February 14, 2014
20
| 2013 FEDERAL | ||
| TAX INFORMATION (unaudited) | AllianceBernstein Variable Products Series Fund |
For Federal income tax purposes, the following information is furnished with respect to the distributions paid by the Portfolio during the taxable year ended December 31, 2013. For corporate shareholders, 100% of dividends paid qualify for the dividends received deduction.
21
| GROWTH PORTFOLIO | AllianceBernstein Variable Products Series Fund |
| BOARDOF DIRECTORS | ||
Marshall C. Turner, Jr.(1), Chairman John H. Dobkin(1) Michael J. Downey(1) | Nancy P. Jacklin(1) Robert M. Keith, President and | |
| William H. Foulk, Jr.(1) | Garry L. Moody(1) | |
| D. James Guzy(1) | Earl D. Weiner(1) | |
| OFFICERS | ||
Philip L. Kirstein, Senior Vice President and | Joseph J. Mantineo, Treasurer and Phyllis J. Clarke, Controller | |
Bruce K. Aronow(2), Vice President | ||
Frank V. Caruso(2), Vice President | Vincent S. Noto, Chief Compliance Officer | |
| John H. Fogarty, Vice President | ||
Emilie D. Wrapp, Secretary | ||
CUSTODIAN AND ACCOUNTING AGENT State Street Bank and Trust Company One Lincoln Street Boston, MA 02111 | LEGAL COUNSEL Seward & Kissel LLP One Battery Park Plaza | |
DISTRIBUTOR AllianceBernstein Investments, Inc. 1345 Avenue of the Americas New York, NY 10105 | TRANSFER AGENT AllianceBernstein Investor Services, Inc. P.O. Box 786003 San Antonio, TX 78278-6003 Toll-Free 1-(800) 221-5672 | |
INDEPENDENT REGISTERED PUBLIC ACCOUNTING FIRM Ernst & Young LLP 5 Times Square New York, NY 10036 |
| (1) | Member of the Audit Committee, the Governance and Nominating Committee and the Independent Directors Committee. Mr. Foulk is the sole member of the Fair Value Pricing Committee. |
| (2) | The management of, and investment decisions for, the Portfolio’s portfolio are made by the Adviser’s Growth Investment Team, with oversight by the Adviser’s Investment Advisory Members. Messrs. Bruce K. Aronow, Frank V. Caruso and John H. Fogarty are the investment professionals with the most significant responsibility for the day-to-day management of the Portfolio’s portfolio. |
22
| GROWTH PORTFOLIO | AllianceBernstein Variable Products Series Fund |
MANAGEMENTOFTHE FUND
Board of Directors Information
The business and affairs of the Fund are managed under the direction of the Board of Directors. Certain information concerning the Fund’s Directors is set forth below.
| NAME, ADDRESS*, AGE, (YEAR FIRST ELECTED**) | PRINCIPAL OCCUPATION(S) DURING PAST FIVE YEARS AND OTHER RELEVANT QUALIFICATIONS*** | PORTFOLIOS IN FUND COMPLEX OVERSEEN BY DIRECTOR | OTHER DIRECTORSHIP HELD BY DIRECTOR IN THE PAST FIVE YEARS | |||||
| INTERESTED DIRECTOR | ||||||||
Robert M. Keith, # 1345 Avenue of the Americas New York, NY 10105 53 (2010) | Senior Vice President of AllianceBernstein L.P. (the “Adviser”) and the head of AllianceBernstein Investments, Inc. (“ABI”) since July 2008; Director of ABI and President of the AllianceBernstein Mutual Funds. Previously, he served as Executive Managing Director of ABI from December 2006 to June 2008. Prior to joining ABI in 2006, Executive Managing Director of Bernstein Global Wealth Management, and prior thereto, Senior Managing Director and Global Head of Client Service and Sales of the Adviser’s institutional investment management business since 2004. Prior thereto, he was Managing Director and Head of North American Client Service and Sales in the Adviser’s institutional investment management business, with which he had been associated since prior to 2004. | 100 | None | |||||
| DISINTERESTED DIRECTORS | ||||||||
Marshall C. Turner, Jr., ## Chairman of the Board 72 (2005) | Private Investor since prior to 2009. Former CEO of Dupont Photomasks, Inc. (components of semi-conductor manufacturing), 2003-2006, and interim CEO 1999-2000. Interim CEO of MEMC Electronic Materials, Inc. (semi-conductor and solar cell substrates) from November 2008 until March 2009. He has extensive operating and early-stage investment experience, including prior service as general partner of three institutional venture capital partnerships, and serves on the boards of three education and science-related non-profit organizations. He has served as a director of one AllianceBernstein fund since 1992, and director or trustee of multiple AllianceBernstein funds since 2005. He is Chairman of the AllianceBernstein Funds since January 2014 | 100 | Xilinx, Inc. (programmable logic semi-conductors) and SunEdison, Inc. (semi-conductor substrates, solar materials and solar power plants) since prior to 2009 | |||||
John H. Dobkin, ## 72 (1992) | Independent Consultant since prior to 2009. Formerly, President of Save Venice, Inc. (preservation organization) from 2001–2002; Senior Advisor from June 1999-June 2000 and President of Historic Hudson Valley (historic preservation) from December 1989-May 1999. Previously, Director of the National Academy of Design. He has served as a director or trustee of various AllianceBernstein Funds since 1992, and as Chairman of the Audit Committees of a number of such Funds from 2001-2008. | 100 | None | |||||
23
| GROWTH PORTFOLIO | ||
| MANAGEMENTOFTHE FUND | ||
| (continued) | AllianceBernstein Variable Products Series Fund |
| NAME, ADDRESS*, AGE, (YEAR FIRST ELECTED**) | PRINCIPAL OCCUPATION(S) DURING PAST FIVE YEARS AND OTHER RELEVANT QUALIFICATIONS*** | PORTFOLIOS IN FUND COMPLEX OVERSEEN BY DIRECTOR | OTHER DIRECTORSHIP HELD BY DIRECTOR IN THE PAST FIVE YEARS | |||||
DISINTERESTED DIRECTORS (continued) | ||||||||
Michael J. Downey, ## 70 (2005) | Private Investor since prior to 2009. Formerly, managing partner of Lexington Capital, LLC (investment advisory firm) from December 1997 until December 2003. From 1987 until 1993, Chairman and CEO of Prudential Mutual Fund Management, director of the Prudential mutual funds, and member of the Executive Committee of Prudential Securities Inc. He has served as a director or trustee of the AllianceBernstein Funds since 2005 and is a director and Chairman of one other registered investment company. | 100 | Asia Pacific Fund, Inc. since prior to 2009, Prospect Acquisition Corp. (financial services) from 2007 until 2009, and The Merger Fund since prior to 2009 to 2013 | |||||
William H. Foulk, Jr., ##, ### 81 (1990) | Investment Adviser and an Independent Consultant since prior to 2009. Previously, he was Senior Manager of Barrett Associates, Inc., a registered investment adviser. He was formerly Deputy Comptroller and Chief Investment Officer of the State of New York and, prior thereto, Chief Investment Officer of the New York Bank for Savings. He has served as a director or trustee of various AllianceBernstein Funds since 1983, and has been Chairman of the Independent Directors Committee of the AllianceBernstein Funds since 2003. He served as Chairman of such Funds from 2003 through December 2013. He is also active in a number of mutual fund related organizations and committees. | 100 | None | |||||
D. James Guzy, ## 77 (2005) | Chairman of the Board of PLX Technology (semi-conductors) and of SRC Computers Inc., with which he has been associated since prior to 2009. He was a director of Intel Corporation (semi-conductors) from 1969 until 2008, and served as Chairman of the Finance Committee of such company for several years until May 2008. He was a Director of Cirrus Logic Corporation (semi-conductors) from 1984 until July 2011. He has served as a director or trustee of one or more of the AllianceBernstein Funds since 1982. | 100 | PLX Technology (semi-conductors) since prior to 2009, and Cirrus Logic Corporation (semi-conductors) since prior to 2009 until July 2011 | |||||
Nancy P. Jacklin, ## 65 (2006) | Professorial Lecturer at the Johns Hopkins School of Advanced International Studies since 2008. Formerly, U.S. Executive Director of the International Monetary Fund (December 2002-May 2006); Partner, Clifford Chance (1992-2002); Sector Counsel, International Banking and Finance, and Associate General Counsel, Citicorp (1985-1992); Assistant General Counsel (International), Federal Reserve Board of Governors (1982-1985); and Attorney Advisor, U.S. Department of the Treasury (1973-1982). Member of the Bar of the District of Columbia and of New York; and member of the Council on Foreign Relations. She has served as a director or trustee of the AllianceBernstein Funds since 2006. | 100 | None | |||||
24
| AllianceBernstein Variable Products Series Fund |
| NAME, ADDRESS*, AGE, (YEAR FIRST ELECTED**) | PRINCIPAL OCCUPATION(S) DURING PAST FIVE YEARS AND OTHER RELEVANT QUALIFICATIONS*** | PORTFOLIOS IN FUND COMPLEX OVERSEEN BY DIRECTOR | OTHER DIRECTORSHIP HELD BY DIRECTOR IN THE PAST FIVE YEARS | |||||
DISINTERESTED DIRECTORS (continued) | ||||||||
Garry L. Moody, ## 61 (2008) | Independent Consultant. Formerly, Partner, Deloitte & Touche LLP (1995-2008) where he held a number of senior positions, including Vice Chairman, and U.S. and Global Investment Management Practice Managing Partner; President, Fidelity Accounting and Custody Services Company (1993-1995); and Partner, Ernst & Young LLP (1975-1993), where he served as the National Director of Mutual Fund Tax Services and Managing Partner of its Chicago Office Tax department. He is a member of both the Governing Council of the Independent Directors Council (IDC), an organization of independent directors of mutual funds, and the Trustee Advisory Board of BoardIQ, a biweekly publication focused on issues and news affecting directors of mutual funds. He has served as a director or trustee, and as Chairman of the Audit Committee, of the AllianceBernstein Funds since 2008. | 100 | Greenbacker Renewable Energy Company LLC (renewable energy and energy efficiency projects) from August 2013 to January 2014 | |||||
Earl D. Weiner, ## 74 (2007) | Of Counsel, and Partner prior to January 2007, of the law firm Sullivan & Cromwell LLP and member of ABA Federal Regulation of Securities Committee Task Force to draft editions of the Fund Director’s Guidebook. He also serves as a director or trustee of various non-profit organizations and has served as Chairman or Vice Chairman of a number of them. He has served as a director or trustee of the AllianceBernstein Funds since 2007 and is Chairman of the Governance and Nominating Committees of the Funds. | 100 | None | |||||
| * | The address for each of the Fund’s disinterested Directors is c/o AllianceBernstein L.P., Attention: Philip L. Kirstein, 1345 Avenue of the Americas, New York, N.Y. 10105. |
| ** | There is no stated term of office for the Fund’s Directors. |
| *** | The information above includes each Director’s principal occupation during the last five years and other information relating to the experience, attributes, and skills relevant to each Director’s qualifications to serve as a Director, which led to the conclusion that each Director should serve as a Director for the Fund. |
| # | Mr. Keith is an “interested person” of the Fund as defined in Section 2(a)(19) of the Investment Company Act of 1940, of the Fund due to his position as a Senior Vice President of the Adviser. |
| ## | Member of the Audit Committee, the Governance and Nominating Committee and the Independent Directors Committee. |
| ### | Member of the Fair Value Pricing Committee. |
25
| GROWTH PORTFOLIO | ||
| MANAGEMENTOFTHE FUND | ||
| (continued) | AllianceBernstein Variable Products Series Fund |
Officer Information
Certain information concerning the Portfolio’s Officers is listed below.
| NAME, ADDRESS* AND AGE | PRINCIPAL POSITION(S) HELD WITH FUND | PRINCIPAL OCCUPATION DURING PAST FIVE YEARS | ||
| Robert M. Keith 53 | President and Chief Executive Officer | See biography above. | ||
| Philip L. Kirstein 68 | Senior Vice President and Independent Compliance Officer | Senior Vice President and Independent Compliance Officer of the AllianceBernstein Funds, with which he has been associated since October 2004. Prior thereto, he was Of Counsel to Kirkpatrick & Lockhart, LLP from October 2003 to October 2004, and General Counsel of Merrill Lynch Investment Managers, L.P. since prior to March 2003. | ||
| Bruce K. Aronow 47 | Vice President | Senior Vice President of the Adviser**, with which he has been associated since prior to 2009. | ||
Frank V. Caruso 57 | Vice President | Senior Vice President of the Adviser**, with which he has been associated since prior to 2009. | ||
John H. Fogarty 44 | Vice President | Senior Vice President of the Adviser**, with which he has been associated since prior to 2009. | ||
| Emilie D. Wrapp 58 | Secretary | Senior Vice President, Assistant General Counsel and Assistant Secretary of ABI**, with which she has been associated since prior to 2009. | ||
| Joseph J. Mantineo 54 | Treasurer and Chief Financial Officer | Senior Vice President of AllianceBernstein Investor Services, Inc. (“ABIS”)**, with which he has been associated since prior to 2009. | ||
| Phyllis J. Clarke 53 | Controller | Vice President of ABIS**, with which she has been associated since prior to 2009. | ||
Vincent S. Noto 49 | Chief Compliance Officer | Chief Compliance Officer of the AllianceBernstein Funds, and Vice President of ABIS**, with which he has been associated since prior to 2009. |
| * | The address for each of the Portfolio’s Officers is 1345 Avenue of the Americas, New York, NY 10105. |
| ** | The Adviser, ABI and ABIS are affiliates of the Fund. |
| The Fund’s Statement of Additional Information (“SAI”) has additional information about the Fund’s Directors and Officers and is available without charge upon request. Contact your financial representative or AllianceBernstein at (800) 227-4618, or visit www.alliancebernstein.com, for a free prospectus or SAI. |
26
| GROWTH PORTFOLIO | ||
| SENIOR OFFICER FEE EVALUATION | AllianceBernstein Variable Products Series Fund |
THE FOLLOWING IS NOT PART OF THE SHAREHOLDER REPORT OR THE FINANCIAL STATEMENTS
SUMMARY OF SENIOR OFFICER’S EVALUATION OF INVESTMENT ADVISORY AGREEMENT1
The following is a summary of the evaluation of the Investment Advisory Agreement between AllianceBernstein L.P. (the “Adviser”) and the AllianceBernstein Variable Products Series Fund (the “Fund”), in respect of AllianceBernstein Growth Portfolio (the “Portfolio”).2 The evaluation of the Investment Advisory Agreement was prepared by Philip L. Kirstein, the Senior Officer of the Fund, for the Directors of the Fund, as required by a September 2004 agreement between the Adviser and the New York State Attorney General (the “NYAG”). The Senior Officer’s evaluation of the Investment Advisory Agreement is not meant to diminish the responsibility or authority of the Board of Directors of the Fund to perform its duties pursuant to Section 15 of the Investment Company Act of 1940 (the “40 Act”) and applicable state law. The purpose of the summary is to provide shareholders with a synopsis of the independent evaluation of the reasonableness of the advisory fees proposed to be paid by the Portfolio which was provided to the Directors in connection with their review of the proposed approval of the continuance of the Investment Advisory Agreement. The Senior Officer’s evaluation considered the following factors:
| 1. | Advisory fees charged to institutional and other clients of the Adviser for like services; |
| 2. | Advisory fees charged by other mutual fund companies for like services; |
| 3. | Costs to the Adviser and its affiliates of supplying services pursuant to the advisory agreement, excluding any intra-corporate profit; |
| 4. | Profit margins of the Adviser and its affiliates from supplying such services; |
| 5. | Possible economies of scale as the Portfolio grows larger; and |
| 6. | Nature and quality of the Adviser’s services including the performance of the Portfolio. |
These factors, with the exception of the first factor, are generally referred to as the “Gartenberg factors,” which were articulated by the United States Court of Appeals for the Second Circuit in 1982. Gartenberg v. Merrill Lynch Asset Management, Inc., 694 F. 2d 923 (2d Cir. 1982). On March 30, 2010, the Supreme Court held the Gartenberg decision was correct in its basic formulation of what §36(b) requires: to face liability under §36(b), “an investment adviser must charge a fee that is so disproportionately large that it bears no reasonable relationship to the services rendered and could not have been the product of arm’s length bargaining.” Jones v. Harris Associates L.P., 130 S. Ct. 1418 (2010). In Jones, the Court stated the Gartenberg approach fully incorporates the correct understanding of fiduciary duty within the context of section 36(b) and noted with approval that “Gartenberg insists that all relevant circumstances be taken into account” and “uses the range of fees that might result from arm’s length bargaining as the benchmark for reviewing challenged fees.”3
PORTFOLIO ADVISORY FEES, NET ASSETS & EXPENSE RATIOS
The Adviser proposed that the Portfolio pays the advisory fee set forth in the table below for receiving the services to be provided pursuant to the Investment Advisory Agreement. The fee schedule below, implemented in January 2004 in consideration of the Adviser’s settlement with the NYAG in December 2003, is based on a master schedule that contemplates eight categories of funds with almost all funds in each category having the same advisory fee schedule.
| Category | Advisory Fee Based on % of Average Daily Net Assets | Net Assets 03/31/13 ($MIL) | Portfolio | |||||
Growth | 0.75% on 1st $2.5 billion 0.65% on next $2.5 billion 0.60% on the balance | $ | 74.8 | Growth Portfolio | ||||
| 1 | The information in the fee summary was completed on April 22, 2013 and discussed with the Board of Directors on April 30-May 2, 2013. |
| 2 | Future references to the Fund and the Portfolio do not include “AllianceBernstein.” References in the fee summary pertaining to performance and expense ratio rankings refer to the Class A shares of the Portfolio. |
| 3 | Jones v. Harris at 1427. |
27
| GROWTH PORTFOLIO | ||
| SENIOR OFFICER FEE EVALUATION | ||
| (continued) | AllianceBernstein Variable Products Series Fund |
The Adviser is reimbursed as specified in the Investment Advisory Agreement for certain clerical, legal, accounting, administrative and other services provided to the Portfolio. During the Portfolio’s most recently completed fiscal year, the Adviser received $44,841 (0.057% of the Portfolio’s average daily net assets) for such services.
Set forth below are the Portfolio’s total expense ratios for the most recently completed fiscal year:
| Portfolio | Total Expense Ratio | Fiscal Year | ||||
Growth Portfolio | Class A 1.06% | December 31 | ||||
| Class B 1.31% | ||||||
I. ADVISORY FEES CHARGED TO INSTITUTIONAL AND OTHER CLIENTS
The advisory fees charged to investment companies which the Adviser manages and sponsors are normally higher than those charged to similar sized institutional accounts, including pension plans and sub-advised investment companies. The fee differential reflects, among other things, different services provided to such clients, and different liabilities assumed. Services provided by the Adviser to the Portfolio that are not provided to non-investment company clients and sub-advised investment companies include providing office space and personnel to serve as Fund Officers, who among other responsibilities make the certifications required under the Sarbanes–Oxley Act of 2002, and coordinating with and monitoring the Portfolio’s third party service providers such as Fund counsel, auditors, custodians, transfer agents and pricing services. The accounting, administrative, legal and compliance requirements for the Portfolio are more costly than those for institutional assets due to the greater complexities and time required for investment companies, although as previously noted, the Adviser is reimbursed for providing such services. Also, retail mutual funds managed by the Adviser are widely held. Servicing the Portfolio’s investors is more time consuming and labor intensive compared to institutional clients since the Adviser needs to communicate with a more extensive network of financial intermediaries and shareholders. The Adviser also believes that it incurs substantial entrepreneurial risk when offering a new mutual fund, since establishing a new mutual fund requires a large upfront investment, and it may take a long time for the fund to achieve profitability since the fund must be priced to scale from inception in order to be competitive and assets are acquired one account at a time. In addition, managing the cash flow of an investment company may be more difficult than managing that of a stable pool of assets, such as an institutional account with little cash movement in either direction, particularly, if a fund is in net redemption and the Adviser is frequently forced to sell securities to raise cash for redemptions. However, managing a fund with positive cash flow may be easier at times than managing a stable pool of assets. In recent years, investment advisers have been sued by institutional clients and have suffered reputational damage both by the attendant publicity and outcomes other than complete victories. Accordingly, the legal and reputational risks associated with institutional accounts are greater than previously thought, although still not equal to those related to the mutual fund industry.
Notwithstanding the Adviser’s view that managing an investment company is not comparable to managing other institutional accounts because the services provided are different, the Supreme Court has indicated consideration should be given to the advisory fees charged to institutional accounts that have a substantially similar investment style as the Portfolio.4 In addition to the AllianceBernstein institutional fee schedule, set forth below is what would have been the effective advisory fee of the Portfolio had the AllianceBernstein institutional fee schedule been applicable to the Portfolio versus the Portfolio’s advisory fee based on March 31, 2013 net assets:5
| Portfolio | Net Assets 03/31/13 ($MIL) | AllianceBernstein Fee Schedule | Effective AB Inst. Adv. Fee | Portfolio Advisory Fee | ||||||||
Growth Portfolio | $74.8 | U.S. Growth Schedule 0.80% on 1st $25m 0.50% on next $25m 0.40% on next $50m 0.30% on next $100m 0.25% on the balance Minimum account size $25m | 0.567 | % | 0.750 | % | ||||||
| 4 | The Supreme Court stated that “courts may give such comparisons the weight that they merit in light of the similarities and differences between the services that the clients in question require, but the courts must be wary of inapt comparisons.” Among the significant differences the Supreme Court noted that may exist between services provided to mutual funds and institutional accounts are “higher marketing costs.” Jones v. Harris at 1428. |
| 5 | The Adviser has indicated that with respect to institutional accounts with assets greater than $300 million, it will negotiate a fee schedule. Discounts that are negotiated vary based upon each client relationship. |
28
| AllianceBernstein Variable Products Series Fund |
The Adviser also manages AllianceBernstein Growth Fund, Inc. (“Growth Fund, Inc.”), a retail mutual fund, which has a substantially similar investment style as the Portfolio. Set forth below is the fee schedule of Growth Fund, Inc. and what would have been the effective advisory fee of the Portfolio had the fee schedule of the retail mutual fund been applicable to the Portfolio:6
| Portfolio | AllianceBernstein Mutual Fund | Fee Schedule | ABMF Effective | Portfolio Advisory | ||||||||
Growth Portfolio | Growth Fund, Inc. | 0.75% on first $2.5 billion 0.65% on next $2.5 billion 0.60% on the balance | 0.750 | % | 0.750 | % | ||||||
The AllianceBernstein Investment Trust Management mutual funds (“ITM”), which are offered to investors in Japan, have an “all-in” fee to compensate the Adviser for investment advisory as well as fund accounting and administrative related services. The fee schedule of the ITM mutual fund that has a somewhat similar investment style as the Portfolio is as follows:
| Portfolio | ITM Mutual Fund | Fee | ||
Growth Portfolio | AllianceBernstein U.S. Growth Stock Fund A, B-Hedged/Unhedged | 0.75% |
The Adviser represented that it does not sub-advise any registered investment company with a substantially similar investment style as the Portfolio.
II. MANAGEMENT FEES CHARGED BY OTHER MUTUAL FUND COMPANIES FOR LIKE SERVICES.
Lipper Inc. (“Lipper”), an analytical service that is not affiliated with the Adviser, compared the fees charged to the Portfolio with fees charged to other investment companies for similar services offered by other investment advisers.7 Lipper’s analysis included the comparison of the Portfolio’s contractual management fee, estimated at the approximate current asset level of the Portfolio, to the median of the Portfolio’s Lipper Expense Group (“EG”) and the Portfolio’s contractual management fee ranking.8,9
Lipper describes an EG as a representative sample of comparable funds. Lipper’s standard methodology for screening funds to be included in an EG entails the consideration of several fund criteria, including fund type, investment classification/objective, load type and similar 12b-1/non-12b-1 service fees, asset (size) comparability, expense components and attributes. An EG will typically consist of seven to twenty funds.
| Portfolio | Contractual Management Fee (%)10 | Lipper EG Median (%) | Lipper EG Rank | Lipper EG Quintile | ||||||||||||
Growth Portfolio | 0.750 | 0.750 | 7/14 | 3 | ||||||||||||
Lipper also analyzed the Portfolio’s most recently completed fiscal year total expense ratio in comparison to the Portfolio’s EG and Lipper Expense Universe (“EU”).
| 6 | The retail mutual fund was also affected by the settlement between the Adviser and the NYAG. As a result, the Portfolio has the same breakpoints in its advisory fee schedule as the retail mutual fund. |
| 7 | The Supreme Court cautioned against accepting mutual fund fee comparisons without careful scrutiny since “these comparisons are problematic because these fees, like those challenged, may not be the product of negotiations conducted at arm’s length.” Jones v. Harris at 1429. |
| 8 | Lipper does not consider average account size when constructing EGs. Funds with relatively small average account sizes tend to have higher transfer agent expense ratio than comparable sized funds that have relatively large average account sizes. Note that there are limitations on Lipper expense category data because different funds categorize expenses differently. |
| 9 | The contractual management fee is calculated by Lipper using the Portfolio’s contractual management fee rate at a hypothetical asset level. The hypothetical asset level is based on the combined net assets of all classes of the Portfolio, rounded up to the next $25 million. Lipper’s total expense ratio information is based on the most recent annual report except as otherwise noted. A ranking of “1” would mean that the Portfolio had the lowest effective fee rate in the Lipper peer group. |
| 10 | The contractual management fee does not reflect any expense reimbursements made by the Portfolio to the Adviser for certain clerical, legal, accounting, administrative and other services. |
29
| GROWTH PORTFOLIO | ||
| SENIOR OFFICER FEE EVALUATION | ||
| (continued) | AllianceBernstein Variable Products Series Fund | |
The EU is a broader group compared to the EG, consisting of all funds that have the same investment classification/objective and load type as the subject Portfolio.11
| Portfolio | Expense Ratio | Lipper EG Median (%) | Lipper EG Rank | Lipper EU | Lipper Rank | |||||||||||||||
Growth Portfolio | 1.061 | 0.880 | 14/14 | 0.796 | 71/72 | |||||||||||||||
Based on this analysis, the Portfolio has a more favorable ranking on a management fee basis than it does on a total expense ratio basis.
III. COSTS TO THE ADVISER AND ITS AFFILIATES OF SUPPLYING SERVICES PURSUANT TO THE ADVISORY FEE ARRANGEMENT, EXCLUDING ANY INTRA-CORPORATE PROFIT.
The Adviser utilizes two profitability reporting systems, which operate independently but are aligned with each other, to estimate the Adviser’s profitability in connection with investment advisory services provided to the Portfolio. The Senior Officer has retained a consultant to provide independent advice regarding the alignment of the two profitability systems as well as the methodologies and allocations utilized by both profitability systems.
IV. PROFIT MARGINS OF THE ADVISER AND ITS AFFILIATES FOR SUPPLYING SUCH SERVICES.
The Portfolio’s profitability information, prepared by the Adviser for the Board of Directors, was reviewed by the Senior Officer and the consultant. The Adviser’s profitability from providing investment advisory services to the Portfolio increased during calendar year 2012, relative to 2011.
In addition to the Adviser’s direct profits from managing the Portfolio, certain of the Adviser’s affiliates have business relationships with the Portfolio and may earn a profit from providing other services to the Portfolio. The courts have referred to this type of business opportunity as “fall-out benefits” to the Adviser and indicated that such benefits should be factored into the evaluation of the total relationship between the Portfolio and the Adviser. Neither case law nor common business practice precludes the Adviser’s affiliates from earning a reasonable profit on this type of relationship provided the affiliates’ charges and services are competitive. These affiliates provide transfer agent, distribution and brokerage related services to the Portfolio and receive transfer agent fees, Rule 12b-1 payments, and brokerage commissions. In addition, the Adviser benefits from soft dollar arrangements which offset expenses the Adviser would otherwise incur.
The Portfolio has adopted a distribution plan for Class B shares pursuant to Rule 12b-1 under the 40 Act. Under the distribution plan, the Portfolio pays distribution and servicing fees to its principal underwriter, AllianceBernstein Investments, Inc. (“ABI”), the Portfolio’s distributor and an affiliate of the Adviser, at an annual rate of up to 0.50% of the Portfolio’s average daily net assets attributable to Class B shares. The current annual rate that the Portfolio pays to ABI for 12b-1 fees is 0.25%. During the fiscal year ended December 31, 2012, ABI received $126,305 in Rule 12b-1 fees.
During the fiscal year ended December 31, 2012, the Adviser incurred distribution expenses in the amount of $410,046 in connection with activities primarily intended to result in the sale of the Portfolio’s Class B shares. This amount includes the 12b-1 fees paid by the Portfolio to the Adviser.
Financial intermediaries, such as insurers, market and sell shares of the Portfolio and typically receive compensation from ABI, the Advisers and/or the Portfolio for selling shares of the Portfolio. These financial intermediaries receive compensation in any or all of the following forms: 12b-1 fees, defrayal of costs for educational seminars and training, additional distribution support, recordkeeping and/or administrative services. Payments related to providing contract-holder recordkeeping and/or administrative services will generally not exceed 0.35% of the average daily net assets of the Portfolio attributable to the relevant intermediary over the year. With respect to the Fund, which includes the Portfolio and other Portfolios of the Fund not discussed in this summary, ABI paid approximately $600,000 in 2012 and expects to pay approximately $600,000 in 2013 for educational support and distribution assistance (revenue sharing payments).
The transfer agent of the Portfolio is AllianceBernstein Investor Services, Inc. (“ABIS”). During the most recently completed fiscal year, ABIS received a fee of $1,385 from the Portfolio.13
| 11 | Except for asset (size) comparability, Lipper uses the same criteria for selecting an EG when selecting an EU. Unlike the EG, the EU allows for the same adviser to be represented by more than just one fund. |
| 12 | Most recently completed fiscal year end Class A total expense ratio. |
| 13 | The Fund, which includes the Portfolio and other Portfolios of the Fund paid ABIS a flat fee of $18,000 in 2012. |
30
| AllianceBernstein Variable Products Series Fund |
The Portfolio effected brokerage transactions through the Adviser’s affiliate, Sanford C. Bernstein & Co., LLC (“SCB & Co.”) and/or its U.K. affiliate, Sanford C. Bernstein Limited (“SCB Ltd.”), collectively “SCB,” and paid commissions during the Portfolio’s most recently completed fiscal year. The Adviser represented that SCB’s profitability from business conducted with the Portfolio is comparable to the profitability of SCB’s dealings with other similar third party clients. In the ordinary course of business, SCB receives and pays liquidity rebates from electronic communications networks (“ECNs”) derived from trading for its clients, including the Portfolio. These credits and charges are not being passed onto any SCB client. The Adviser also receives certain soft dollar benefits from brokers that execute agency trades for the Portfolio and other clients. These soft dollar benefits reduce the Adviser’s cost of doing business and increase its profitability.
V. POSSIBLE ECONOMIES OF SCALE
The Adviser has indicated that economies of scale are being shared with shareholders through pricing to scale, breakpoints, fee reductions/waivers and enhancement to services.
In May 2012, an independent consultant, retained by the Senior Officer, provided the Board of Directors information on the Adviser’s firm-wide average costs from 2005 through 2011 and the potential economies of scale. The independent consultant noted that from 2005 through 2007 the Adviser experienced significant growth in assets under management (“AUM”). During this period, operating expenses increased, in part to keep up with growth, and in part reflecting market returns. However, from 2008 through the first quarter of 2009, AUM rapidly and significantly decreased due to declines in market value and client withdrawals. When AUM rapidly decreased, some operating expenses categories, including base compensation and office space, adjusted more slowly during this period, resulting in an increase in average costs. Since 2009, AUM has experienced less significant changes. The independent consultant noted that changes in operating expenses reflect changes in business composition and business practices in response to changes in financial markets. Finally, the independent consultant concluded that the increase in average cost and the decline in net operating margin across the Adviser since late 2008 are inconsistent with the view that there are currently reductions in average costs due to economies of scale that can be shared with the AllianceBernstein Mutual Funds managed by the Adviser through lower fees.
Previously in February 2008, the independent consultant provided the Board of Directors an update of the Deli study on advisory fees and various fund characteristics.14,15 The independent consultant first reiterated the results of his previous two dimensional comparison analysis (fund size and family size) with the Board of Directors.16 The independent consultant then discussed the results of the regression model that was utilized to study the effects of various factors on advisory fees. The regression model output indicated that the bulk of the variation in fees predicted were explained by various factors, but substantially by fund AUM, family AUM, index fund indicator and investment style. The independent consultant also compared the advisory fees of the AllianceBernstein Mutual Funds to similar funds managed by 19 other large asset managers, regardless of the fund size and each Adviser’s proportion of mutual fund assets to non-mutual fund assets.
VI. NATURE AND QUALITY OF THE ADVISER’S SERVICES, INCLUDING THE PERFORMANCE OF THE PORTFOLIO
With assets under management of approximately $443 billion as of March 31, 2013, the Adviser has the investment experience to manage and provide non-investment services (described in Section I) to the Portfolio.
| 14 | The Deli study, originally published in 2002 based on 1997 data and updated for the February 2008 Presentation, may be of diminished value due to the age of the data used in the presentation and the changes experienced in the industry over the last four years. |
| 15 | As mentioned previously, the Supreme Court cautioned against accepting mutual fund fee comparisons without careful scrutiny since the fees may not be the product of negotiations conducted at arm’s length. See Jones V. Harris at 1429. |
| 16 | The two dimensional analysis showed patterns of lower advisory fees for funds with larger asset sizes and funds from larger family sizes compared to funds with smaller asset sizes and funds from smaller family sizes, which according to the independent consultant is indicative of a sharing of economies of scale and scope. However, in less liquid and active markets, such is not the case, as the empirical analysis showed potential for diseconomies of scale in those markets. The empirical analysis also showed diminishing economies of scale and scope as funds surpassed a certain high level of assets. |
31
| GROWTH PORTFOLIO | ||
| SENIOR OFFICER FEE EVALUATION | ||
| (continued) | AllianceBernstein Variable Products Series Fund | |
The information prepared by Lipper shows the 1, 3, 5 and 10 year performance returns and rankings of the Portfolio17 relative to its Lipper Performance Group (“PG”) and Lipper Performance Universe (“PU”)18 for the periods ended February 28, 2013.19
| Portfolio (%) | PG Median (%) | PU Median (%) | PG Rank | PU Rank | ||||||||||||||||
Growth Portfolio | ||||||||||||||||||||
1 year | 7.81 | 8.29 | 8.23 | 10/14 | 39/66 | |||||||||||||||
3 year | 12.37 | 12.74 | 11.95 | 8/14 | 26/62 | |||||||||||||||
5 year | 4.83 | 4.95 | 4.90 | 8/13 | 31/59 | |||||||||||||||
10 year | 7.84 | 7.91 | 7.95 | 8/12 | 31/52 | |||||||||||||||
Set forth below are the 1, 3, 5, 10 year and since inception performance returns of the Portfolio (in bold)20 versus its benchmarks.21 Portfolio and benchmark volatility and reward-to-variability ratio (“Sharpe Ratio”) information is also shown.22
Periods Ending February 28, 2013 Annualized Performance | ||||||||||||||||||||||||||||||||
| 1 Year (%) | 3 Year (%) | 5 Year (%) | 10 Year (%) | Since Inception (%) | Annualized | Risk Period (Year) | ||||||||||||||||||||||||||
| Volatility (%) | Sharpe (%) | |||||||||||||||||||||||||||||||
Growth Portfolio | 13.67 | 14.49 | 3.7 | 7.84 | 8.95 | 16.57 | 0.43 | 10 | ||||||||||||||||||||||||
Russell 1000 Growth Index | 17.63 | 13.66 | 3.88 | 8.77 | 10.46 | 15.00 | 0.50 | 10 | ||||||||||||||||||||||||
Inception Date: September 15, 1994 |
| |||||||||||||||||||||||||||||||
CONCLUSION:
Based on the factors discussed above the Senior Officer’s conclusion is that the proposed advisory fee for the Portfolio is reasonable and within the range of what would have been negotiated at arm’s-length in light of all the surrounding circumstances. This conclusion in respect of the Portfolio is based on an evaluation of all of these factors and no single factor was dispositive.
Dated: May 29, 2013
| 17 | The performance rankings are for the Class A shares of the Portfolio. The Portfolio’s performance returns shown were provided by Lipper. |
| 18 | The Portfolio’s PG is identical to the Portfolio’s respective EG. The Portfolio’s PU is not identical to the Portfolio’s EU as the criteria for including/excluding a fund from a PU is somewhat different from that of an EU. |
| 19 | The current Lipper investment classification/objective dictates the PG and PU throughout the life of the fund even if a fund had a different investment classification/objective at a different point in time. |
| 20 | The performance returns and risk measures shown in the table are for the Class A shares of the Portfolio. |
| 21 | The Adviser provided Portfolio and benchmark performance return information for periods through February 28, 2013. |
| 22 | Portfolio and benchmark volatility and Sharpe Ratio information was obtained through Lipper LANA, a database maintained by Lipper. Volatility is a statistical measure of the tendency of a market price or yield to vary over time. The Sharpe Ratio is a risk adjusted measure of return that divides a portfolio’s return in excess of the riskless return by the portfolio’s standard deviation. A portfolio with a greater volatility would be viewed as more risky than a portfolio with equivalent performance but lower volatility; for that reason, a greater return would be demanded for the more risky portfolio. A portfolio with a higher Sharpe Ratio would be viewed as better performing than a portfolio with a lower Sharpe Ratio. |
32
VPS-GTH-0151-1213
AllianceBernstein
Variable Products Series Fund, Inc.
 | AllianceBernstein Growth & Income Portfolio |
December 31, 2013
Annual Report

ANNUAL REPORT
Investment Products Offered
| Ø | Are Not FDIC Insured |
| Ø | May Lose Value |
| Ø | Are Not Bank Guaranteed |
AllianceBernstein Investments, Inc. (ABI) is the distributor of the AllianceBernstein family of mutual funds. ABI is a member of FINRA and is an affiliate of AllianceBernstein L.P., the manager of the funds.
You may obtain a description of the Fund’s proxy voting policies and procedures, and information regarding how the Fund voted proxies relating to portfolio securities during the most recent 12-month period ended June 30, without charge. Simply visit AllianceBernstein’s website at www.alliancebernstein.com or go to the Securities and Exchange Commission’s (the “Commission”) website at www.sec.gov, or call AllianceBernstein at (800) 227-4618.
The Fund files its complete schedule of portfolio holdings with the Commission for the first and third quarters of each fiscal year on Form N-Q. The Fund’s Forms N-Q are available on the Commission’s website at www.sec.gov. The Fund’s Forms N-Q may also be reviewed and copied at the Commission’s Public Reference Room in Washington, DC; information on the operation of the Public Reference Room may be obtained by calling (800) SEC-0330.
AllianceBernstein® and the AB Logo are registered trademarks and service marks used by permission of the owner, AllianceBernstein L.P.
| GROWTH & INCOME PORTFOLIO | AllianceBernstein Variable Products Series Fund |
LETTER TO INVESTORS
February 7, 2014
The following is an update of AllianceBernstein Variable Products Series Fund—AllianceBernstein Growth & Income Portfolio (the “Portfolio”) for the annual reporting period ended December 31, 2013.
INVESTMENT OBJECTIVE AND POLICIES
The Portfolio’s investment objective is long-term growth of capital. The Portfolio invests primarily in the equity securities of U.S. companies that AllianceBernstein L.P. (the “Adviser”) believes are undervalued, focusing on dividend-paying securities. The Adviser believes that, over time, a company’s stock price will come to reflect its intrinsic economic value. The Portfolio may invest in companies of any size and in any industry. The Portfolio also invests in high-quality securities of non-U.S. issuers.
The Portfolio may enter into derivatives transactions, such as options, futures, forwards and swaps. The Portfolio may use options strategies involving the purchase and/or writing of various combinations of call and/or put options, including on individual securities and stock indices, futures contracts (including futures contracts on individual securities and stock indices) or shares of exchange-traded funds, or ETFs. The Portfolio may, at times, invest in shares of ETFs in lieu of making direct investments in equity securities. ETFs may provide more efficient and economical exposure to the type of companies and geographic locations in which the Portfolio seeks to invest than direct investments.
INVESTMENT RESULTS
The table on page 3 shows the Portfolio’s performance compared to its benchmark, the Russell 1000 Value Index, for the one-, five- and 10-year periods ended December 31, 2013.
For the annual period, both share classes of the Portfolio outperformed the benchmark, as an emphasis on companies with strong fundamentals was rewarded. Strong stock selection, particularly in the industrials and financials sectors, benefited returns. Sector allocation was also positive, as an underweight to the utilities sector, contributed. Detracting from returns was stock selection in the technology sector and cash holdings in a rising market.
The Portfolio did not utilize derivatives during the annual period.
MARKET REVIEW AND INVESTMENT STRATEGY
Despite the solid gains made by U.S. equities in 2013, the Relative Value Investment Team (the “Team”) is taking a more conservative view going forward. While the Team remains constructive on the stock market, volatility is expected to increase.
The recent rally in the U.S. equity markets was underpinned by excess liquidity in the financial system that kept borrowing costs down and encouraged risk-taking. The Team believes that a transition has begun toward a phase where fundamentals are the primary determinant of valuations. Thus, companies will need to substantially grow their earnings to sustain their current valuations and continue their strong stock price performance.
Accordingly, the Team continued to identify companies meeting the Portfolio’s investment philosophy of relative-value discipline. Namely, to pursue attractively valued, well managed companies that deploy capital wisely, giving them capacity to generate free cash flow to pay dividends and enhance the value of company shares over the long term.
1
| GROWTH & INCOME PORTFOLIO | ||
| DISCLOSURESAND RISKS | AllianceBernstein Variable Products Series Fund |
Benchmark Disclosure
The unmanaged Russell 1000® Value Index does not reflect fees and expenses associated with the active management of a mutual fund portfolio. The Russell 1000 Value Index represents the performance of 1,000 large-cap value companies within the U.S. An investor cannot invest directly in an index, and its results are not indicative of the performance for any specific investment, including the Portfolio.
A Word About Risk
Market Risk: The value of the Portfolio’s assets will fluctuate as the stock or bond market fluctuates. The value of its investments may decline, sometimes rapidly and unpredictably, simply because of economic changes or other events that affect large portions of the market.
Foreign (Non-U.S.) Risk: Investments in securities of non-U.S. issuers may involve more risk than those of U.S. issuers. These securities may fluctuate more widely in price and may be less liquid due to adverse market, economic, political, regulatory or other factors.
Currency Risk: Fluctuations in currency exchange rates may negatively affect the value of the Portfolio’s investments or reduce its returns.
Derivatives Risk: Investments in derivatives may be illiquid, difficult to price, and leveraged so that small changes may produce disproportionate losses for the Portfolio, and may be subject to counterparty risk to a greater degree than more traditional investments.
Industry/Sector Risk: Investments in a particular industry or group of related industries may have more risk because market or economic factors affecting that industry could have a significant effect on the value of the Portfolio’s investments.
Management Risk: The Portfolio is subject to management risk because it is an actively managed investment fund. The Adviser will apply its investment techniques and risk analyses in making investment decisions for the Portfolio, but there is no guarantee that its techniques will produce the intended results.
These risks are fully discussed in the Variable Products prospectus.
An Important Note About Historical Performance
The investment return and principal value of an investment in the Portfolio will fluctuate, so that shares, when redeemed, may be worth more or less than their original cost. Performance shown on the following page represents past performance and does not guarantee future results. Current performance may be lower or higher than the performance information shown. Please contact your Financial Advisor or Insurance Agent Representative at your financial institution to obtain portfolio performance information current to the most recent month end.
Investors should consider the investment objectives, risks, charges and expenses of the Portfolio carefully before investing. For additional copies of the Portfolio’s prospectus or summary prospectus, which contains this and other information, call your financial advisor or 800.984.7654. Please read the prospectus and/or summary prospectus carefully before investing.
All fees and expenses related to the operation of the Portfolio have been deducted, but no adjustment has been made for insurance company separate account or annuity contract charges, which would reduce total return to a contract owner. Performance assumes reinvestment of distributions and does not account for taxes.
There are additional fees and expenses associated with all Variable Products. These fees can include mortality and expense risk charges, administrative charges, and other charges that can significantly reduce investment returns. Those fees and expenses are not reflected in this annual report. You should consult your Variable Products prospectus for a description of those fees and expenses and speak to your insurance agent or financial representative if you have any questions. You should read the prospectus before investing or sending money.
2
| GROWTH & INCOME PORTFOLIO | ||
| HISTORICAL PERFORMANCE | AllianceBernstein Variable Products Series Fund |
| THE PORTFOLIO VS. ITS BENCHMARK | NAV Returns | |||||||||||
| PERIODS ENDED DECEMBER 31, 2013 (unaudited) | 1 Year | 5 Years* | 10 Years* | |||||||||
AllianceBernstein Growth & Income Portfolio Class A** | 34.96% | 18.17% | 7.03% | |||||||||
AllianceBernstein Growth & Income Portfolio Class B** | 34.59% | 17.84% | 6.76% | |||||||||
Russell 1000 Value Index | 32.53% | 16.67% | 7.58% | |||||||||
* Average annual returns.
** Includes the impact of proceeds received and credited to the Portfolio resulting from class action settlements, which enhanced the performance of all share classes of the Portfolio for the annual period ended December 31, 2013, by 0.08%.
Please keep in mind that high, double-digit returns are highly unusual and cannot be sustained. Investors should also be aware that these returns were primarily achieved during favorable market conditions. |
| |||||||||||
The Portfolio’s current prospectus fee table shows the Portfolio’s total annual operating expense ratios as 0.60% and 0.85% for Class A and Class B, respectively. The Financial Highlights section of this report sets forth expense ratio data for the current reporting period; the expense ratios shown above may differ from the expense ratios in the Financial Highlights section since they are based on different time periods.
ALLIANCEBERNSTEIN GROWTH & INCOME PORTFOLIO CLASS A
GROWTH OF A $10,000 INVESTMENT
12/31/03 – 12/31/13 (unaudited)
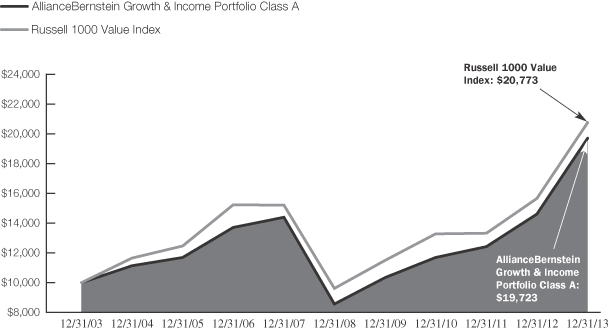
This chart illustrates the total value of an assumed $10,000 investment in AllianceBernstein Growth & Income Portfolio Class A shares (from 12/31/03 to 12/31/13) as compared to the performance of the Portfolio’s benchmark, the Russell 1000 Value Index. The chart assumes the reinvestment of dividends and capital gains distributions.
See Disclosures, Risks and Note about Historical Performance on page 2.
3
| GROWTH & INCOME PORTFOLIO | ||
| EXPENSE EXAMPLE (unaudited) | AllianceBernstein Variable Products Series Fund |
As a shareholder of the Fund, you incur two types of costs: (1) transaction costs, including sales charges (loads) on purchase payments, contingent deferred sales charges on redemptions and (2) ongoing costs, including management fees; distribution (12b-1) fees; and other Fund expenses. This example is intended to help you understand your ongoing costs (in dollars) of investing in the Fund and to compare these costs with the ongoing costs of investing in other mutual funds.
The Example is based on an investment of $1,000 invested at the beginning of the period and held for the entire period as indicated below.
Actual Expenses
The table below provides information about actual account values and actual expenses. You may use the information in this line, together with the amount you invested, to estimate the expenses that you paid over the period. Simply divide your account value by $1,000 (for example, an $8,600 account value divided by $1,000 = 8.6), then multiply the result by the number in the first line under the heading entitled “Expenses Paid During Period” to estimate the expenses you paid on your account during this period. The estimate of expenses does not include fees or other expenses of any variable insurance product. If such expenses were included, the estimate of expenses you paid during the period would be higher and your ending account value would be lower.
Hypothetical Example for Comparison Purposes
The table below provides information about hypothetical account values and hypothetical expenses based on the Fund’s actual expense ratio and an assumed annual rate of return of 5% before expenses, which is not the Fund’s actual return. The hypothetical account values and expenses may not be used to estimate the actual ending account balance or expenses you paid for the period. You may use this information to compare the ongoing costs of investing in the Fund and other funds by comparing this 5% hypothetical example with the 5% hypothetical examples that appear in the shareholder reports of other funds. The estimate of expenses does not include fees or other expenses of any variable insurance product. If such expenses were included, the estimate of expenses you paid during the period would be higher and your ending account value would be lower.
Please note that the expenses shown in the table are meant to highlight your ongoing costs only and do not reflect any transactional costs, such as sales charges (loads), or contingent deferred sales charges on redemptions. Therefore, the second line of each classes’ table is useful in comparing ongoing costs only, and will not help you determine the relative total costs of owning different funds. In addition, if these transactional costs were included, your costs would have been higher.
| Beginning Account Value July 1, 2013 | Ending Account Value December 31, 2013 | Expenses Paid During Period* | Annualized Expense Ratio* | |||||||||||||
Class A | ||||||||||||||||
Actual | $ | 1,000 | $ | 1,160.80 | $ | 3.27 | 0.60 | % | ||||||||
Hypothetical (5% annual return before expenses) | $ | 1,000 | $ | 1,022.18 | $ | 3.06 | 0.60 | % | ||||||||
Class B | ||||||||||||||||
Actual | $ | 1,000 | $ | 1,159.00 | $ | 4.63 | 0.85 | % | ||||||||
Hypothetical (5% annual return before expenses) | $ | 1,000 | $ | 1,020.92 | $ | 4.33 | 0.85 | % | ||||||||
| * | Expenses are equal to each classes’ annualized expense ratios, multiplied by the average account value over the period, multiplied by 184/365 (to reflect the one-half year period). |
4
| GROWTH & INCOME PORTFOLIO | ||
| TEN LARGEST HOLDINGS* | ||
| December 31, 2013 (unaudited) | AllianceBernstein Variable Products Series Fund | |
| COMPANY | U.S. $ VALUE | PERCENT OF NET ASSETS | ||||||
Berkshire Hathaway, Inc.—Class B | $ | 36,902,037 | 4.2 | % | ||||
Comcast Corp.—Class A | 29,671,495 | 3.4 | ||||||
UnitedHealth Group, Inc. | 29,531,907 | 3.4 | ||||||
Pfizer, Inc. | 28,297,526 | 3.3 | ||||||
Aon PLC | 26,978,185 | 3.1 | ||||||
Boeing Co. (The) | 25,477,224 | 2.9 | ||||||
Liberty Interactive Corp.—Class A | 24,633,396 | 2.8 | ||||||
Wells Fargo & Co. | 22,983,750 | 2.6 | ||||||
Apple, Inc. | 22,907,316 | 2.6 | ||||||
CVS Caremark Corp. | 22,246,604 | 2.6 | ||||||
|
|
|
| |||||
| $ | 269,629,440 | 30.9 | % | |||||
SECTOR BREAKDOWN**
December 31, 2013 (unaudited)
| SECTOR | U.S. $ VALUE | PERCENT OF TOTAL INVESTMENTS | ||||||
Financials | $ | 211,099,636 | 23.9 | % | ||||
Health Care | 146,857,063 | 16.7 | ||||||
Consumer Discretionary | 116,838,425 | 13.2 | ||||||
Energy | 99,740,598 | 11.3 | ||||||
Information Technology | 88,851,737 | 10.1 | ||||||
Industrials | 79,677,585 | 9.0 | ||||||
Consumer Staples | 33,164,773 | 3.8 | ||||||
Telecommunication Services | 30,122,528 | 3.4 | ||||||
Materials | 13,367,254 | 1.5 | ||||||
Utilities | 4,970,897 | 0.6 | ||||||
Short-Term Investments | 57,314,173 | 6.5 | ||||||
|
|
|
| |||||
Total Investments | $ | 882,004,669 | 100.0 | % | ||||
| * | Long-term investments. |
| ** | The Portfolio’s sector breakdown is expressed as a percentage of total investments and may vary over time. |
Please note: The sector classifications presented herein are based on the Global Industry Classification Standard (GICS) which was developed by Morgan Stanley Capital International and Standard & Poor’s. The components are divided into sector, industry group, and industry sub-indices as classified by the GICS for each of the market capitalization indices in the broad market. These sector classifications are broadly defined. The “Portfolio of Investments” section of the report reflects more specific industry information and is consistent with the investment restrictions discussed in the Portfolio’s prospectus.
5
| GROWTH & INCOME PORTFOLIO | ||
| PORTFOLIOOF INVESTMENTS | ||
| December 31, 2013 | AllianceBernstein Variable Products Series Fund | |
Company | Shares | U.S. $ Value | ||||||
COMMON STOCKS–94.4% | ||||||||
FINANCIALS–24.2% | ||||||||
CAPITAL MARKETS–4.9% | ||||||||
BlackRock, Inc.–Class A | 37,920 | $ | 12,000,542 | |||||
Goldman Sachs Group, Inc. (The) | 60,910 | 10,796,907 | ||||||
State Street Corp. | 267,620 | 19,640,632 | ||||||
|
| |||||||
| 42,438,081 | ||||||||
|
| |||||||
COMMERCIAL BANKS–2.6% | ||||||||
Wells Fargo & Co. | 506,250 | 22,983,750 | ||||||
|
| |||||||
CONSUMER FINANCE–0.6% | ||||||||
Capital One Financial Corp. | 68,150 | 5,220,971 | ||||||
|
| |||||||
DIVERSIFIED FINANCIAL SERVICES–8.2% | ||||||||
Berkshire Hathaway, Inc.–Class B(a) | 311,252 | 36,902,037 | ||||||
IntercontinentalExchange Group, Inc. | 58,783 | 13,221,473 | ||||||
JPMorgan Chase & Co. | 365,140 | 21,353,387 | ||||||
|
| |||||||
| 71,476,897 | ||||||||
|
| |||||||
INSURANCE–7.9% | ||||||||
ACE Ltd. | 103,170 | 10,681,190 | ||||||
Aflac, Inc. | 48,260 | 3,223,768 | ||||||
Allstate Corp. (The) | 125,390 | 6,838,771 | ||||||
Aon PLC | 321,590 | 26,978,185 | ||||||
Brown & Brown, Inc. | 164,360 | 5,159,261 | ||||||
Hartford Financial Services Group, Inc. | 214,410 | 7,768,074 | ||||||
MetLife, Inc. | 60,972 | 3,287,610 | ||||||
Travelers Cos., Inc. (The) | 55,700 | 5,043,078 | ||||||
|
| |||||||
| 68,979,937 | ||||||||
|
| |||||||
| 211,099,636 | ||||||||
|
| |||||||
HEALTH CARE–16.8% | ||||||||
BIOTECHNOLOGY–1.5% | ||||||||
Amgen, Inc. | 112,402 | 12,831,812 | ||||||
|
| |||||||
HEALTH CARE EQUIPMENT & SUPPLIES–2.0% | ||||||||
Abbott Laboratories | 362,560 | 13,896,925 | ||||||
Zimmer Holdings, Inc. | 36,760 | 3,425,664 | ||||||
|
| |||||||
| 17,322,589 | ||||||||
|
| |||||||
HEALTH CARE PROVIDERS & SERVICES–5.7% | ||||||||
CIGNA Corp. | 43,100 | 3,770,388 | ||||||
Express Scripts Holding Co.(a) | 48,030 | 3,373,627 | ||||||
Humana, Inc. | 51,990 | 5,366,408 | ||||||
McKesson Corp. | 49,020 | 7,911,828 | ||||||
UnitedHealth Group, Inc. | 392,190 | 29,531,907 | ||||||
|
| |||||||
| 49,954,158 | ||||||||
|
| |||||||
PHARMACEUTICALS–7.6% | ||||||||
Merck & Co., Inc. | 424,319 | 21,237,166 | ||||||
Pfizer, Inc. | 923,850 | 28,297,526 | ||||||
Roche Holding AG | 245,211 | 17,213,812 | ||||||
|
| |||||||
| 66,748,504 | ||||||||
|
| |||||||
| 146,857,063 | ||||||||
|
| |||||||
CONSUMER DISCRETIONARY–13.4% | ||||||||
AUTO COMPONENTS–0.4% | ||||||||
Gentex Corp./MI | 99,010 | $ | 3,266,340 | |||||
|
| |||||||
INTERNET & CATALOG RETAIL–2.8% | ||||||||
Liberty Interactive Corp.–Class A(a) | 839,298 | 24,633,396 | ||||||
|
| |||||||
LEISURE EQUIPMENT & | ||||||||
Mattel, Inc. | 70,460 | 3,352,487 | ||||||
|
| |||||||
MEDIA–9.0% | ||||||||
Comcast Corp.–Class A | 570,990 | 29,671,495 | ||||||
Scripps Networks Interactive, Inc.–Class A | 181,270 | 15,663,541 | ||||||
Time Warner Cable, Inc.–Class A | 40,810 | 5,529,755 | ||||||
Time Warner, Inc. | 219,960 | 15,335,611 | ||||||
Viacom, Inc.–Class B | 144,010 | 12,577,834 | ||||||
|
| |||||||
| 78,778,236 | ||||||||
|
| |||||||
MULTILINE RETAIL–0.8% | ||||||||
Macy’s, Inc. | 127,490 | 6,807,966 | ||||||
|
| |||||||
| 116,838,425 | ||||||||
|
| |||||||
ENERGY–11.4% | ||||||||
ENERGY EQUIPMENT & SERVICES–3.9% | ||||||||
Diamond Offshore Drilling, Inc. | 80,679 | 4,592,249 | ||||||
National Oilwell Varco, Inc. | 170,027 | 13,522,247 | ||||||
Schlumberger Ltd. | 134,110 | 12,084,652 | ||||||
Transocean Ltd. | 88,260 | 4,361,809 | ||||||
|
| |||||||
| 34,560,957 | ||||||||
|
| |||||||
OIL, GAS & CONSUMABLE FUELS–7.5% | ||||||||
Anadarko Petroleum Corp. | 68,490 | 5,432,627 | ||||||
Chevron Corp. | 110,160 | 13,760,086 | ||||||
ConocoPhillips | 96,750 | 6,835,387 | ||||||
Exxon Mobil Corp. | 214,420 | 21,699,304 | ||||||
HollyFrontier Corp. | 106,830 | 5,308,383 | ||||||
Marathon Oil Corp. | 141,830 | 5,006,599 | ||||||
Occidental Petroleum Corp. | 75,050 | 7,137,255 | ||||||
|
| |||||||
| 65,179,641 | ||||||||
|
| |||||||
| 99,740,598 | ||||||||
|
| |||||||
INFORMATION TECHNOLOGY–10.2% | ||||||||
COMMUNICATIONS EQUIPMENT–0.9% | ||||||||
Cisco Systems, Inc. | 329,000 | 7,386,050 | ||||||
|
| |||||||
COMPUTERS & PERIPHERALS–3.5% | ||||||||
Apple, Inc. | 40,825 | 22,907,316 | ||||||
NetApp, Inc. | 180,980 | 7,445,517 | ||||||
|
| |||||||
| 30,352,833 | ||||||||
|
| |||||||
6
| GROWTH & INCOME PORTFOLIO | ||
| PORTFOLIOOF INVESTMENTS | ||
| (continued) | AllianceBernstein Variable Products Series Fund |
Company | Shares | U.S. $ Value | ||||||
ELECTRONIC EQUIPMENT, INSTRUMENTS & COMPONENTS–2.4% | ||||||||
Avnet, Inc. | 151,950 | $ | 6,702,515 | |||||
TE Connectivity Ltd. | 262,590 | 14,471,335 | ||||||
|
| |||||||
| 21,173,850 | ||||||||
|
| |||||||
IT SERVICES–1.7% | ||||||||
Amdocs Ltd. | 148,604 | 6,128,429 | ||||||
International Business Machines Corp. | 27,130 | 5,088,774 | ||||||
NeuStar, Inc.–Class A(a) | 66,250 | 3,303,225 | ||||||
|
| |||||||
| 14,520,428 | ||||||||
|
| |||||||
SEMICONDUCTORS & SEMICONDUCTOR EQUIPMENT–0.9% | ||||||||
Maxim Integrated Products, Inc. | 115,100 | 3,212,441 | ||||||
NVIDIA Corp. | 304,500 | 4,878,090 | ||||||
|
| |||||||
| 8,090,531 | ||||||||
|
| |||||||
SOFTWARE–0.8% | ||||||||
Microsoft Corp. | 195,780 | 7,328,045 | ||||||
|
| |||||||
| 88,851,737 | ||||||||
|
| |||||||
INDUSTRIALS–9.1% | ||||||||
AEROSPACE & DEFENSE–4.1% | ||||||||
Boeing Co. (The) | 186,660 | 25,477,224 | ||||||
Raytheon Co. | 117,790 | 10,683,553 | ||||||
|
| |||||||
| 36,160,777 | ||||||||
|
| |||||||
AIRLINES–1.2% | ||||||||
Copa Holdings SA–Class A | 44,570 | 7,136,103 | ||||||
Delta Air Lines, Inc. | 122,380 | 3,361,778 | ||||||
|
| |||||||
| 10,497,881 | ||||||||
|
| |||||||
INDUSTRIAL | ||||||||
General Electric Co. | 513,310 | 14,388,079 | ||||||
|
| |||||||
MACHINERY–2.1% | ||||||||
Actuant Corp.–Class A | 261,220 | 9,571,101 | ||||||
Dover Corp. | 52,830 | 5,100,208 | ||||||
Parker Hannifin Corp. | 30,780 | 3,959,539 | ||||||
|
| |||||||
| 18,630,848 | ||||||||
|
| |||||||
| 79,677,585 | ||||||||
|
| |||||||
CONSUMER STAPLES–3.8% | ||||||||
FOOD & STAPLES | ||||||||
CVS Caremark Corp. | 310,837 | $ | 22,246,604 | |||||
|
| |||||||
HOUSEHOLD | ||||||||
Energizer Holdings, Inc. | 100,870 | 10,918,169 | ||||||
|
| |||||||
| 33,164,773 | ||||||||
|
| |||||||
TELECOMMUNICATION SERVICES–3.4% | ||||||||
DIVERSIFIED TELECOMMUNICATION SERVICES–3.4% | ||||||||
AT&T, Inc. | 490,050 | 17,230,158 | ||||||
Verizon Communications, Inc. | 262,360 | 12,892,370 | ||||||
|
| |||||||
| 30,122,528 | ||||||||
|
| |||||||
MATERIALS–1.5% | ||||||||
METALS & MINING–0.6% | ||||||||
Reliance Steel & Aluminum Co. | 67,250 | 5,100,240 | ||||||
|
| |||||||
PAPER & FOREST | ||||||||
Domtar Corp. | 87,630 | 8,267,014 | ||||||
|
| |||||||
| 13,367,254 | ||||||||
|
| |||||||
UTILITIES – 0.6% | ||||||||
ELECTRIC UTILITIES – 0.6% | ||||||||
Great Plains Energy, Inc. | 205,070 | 4,970,897 | ||||||
|
| |||||||
Total Common Stocks | 824,690,496 | |||||||
|
| |||||||
| Principal Amount (000) | ||||||||
SHORT-TERM | ||||||||
TIME DEPOSIT – 6.6% | ||||||||
State Street Time Deposit | $ | 57,314 | 57,314,173 | |||||
|
| |||||||
TOTAL | 882,004,669 | |||||||
Other assets less | (8,593,494 | ) | ||||||
|
| |||||||
NET ASSETS–100.0% | $ | 873,411,175 | ||||||
|
| |||||||
| (a) | Non-income producing security. |
Glossary:
ADR—American Depositary Receipt
See notes to financial statements.
7
| GROWTH & INCOME PORTFOLIO | ||
| STATEMENTOF ASSETS & LIABILITIES | ||
| December 31, 2013 | AllianceBernstein Variable Products Series Fund | |
ASSETS |
| |||
Investments in securities, at value (cost $671,194,860) | $ | 882,004,669 | ||
Cash | 99,851 | |||
Dividends and interest receivable | 826,926 | |||
Receivable for capital stock sold | 39,782 | |||
|
| |||
Total assets | 882,971,228 | |||
|
| |||
LIABILITIES | ||||
Payable for investment securities purchased | 8,135,007 | |||
Payable for capital stock redeemed | 722,287 | |||
Advisory fee payable | 387,570 | |||
Distribution fee payable | 143,109 | |||
Administrative fee payable | 13,886 | |||
Transfer Agent fee payable | 114 | |||
Accrued expenses | 158,080 | |||
|
| |||
Total liabilities | 9,560,053 | |||
|
| |||
NET ASSETS | $ | 873,411,175 | ||
|
| |||
COMPOSITION OF NET ASSETS | ||||
Capital stock, at par | $ | 31,703 | ||
Additional paid-in capital | 746,604,237 | |||
Undistributed net investment income | 9,928,588 | |||
Accumulated net realized loss on investment transactions | (93,963,162 | ) | ||
Net unrealized appreciation on investments | 210,809,809 | |||
|
| |||
| $ | 873,411,175 | |||
|
| |||
Net Asset Value Per Share—1 billion shares of capital stock authorized, $.001 par value
| Class | Net Assets | Shares Outstanding | Net Asset Value | |||||||||
A | $ | 164,153,656 | 5,905,237 | $ | 27.80 | |||||||
B | $ | 709,257,519 | 25,798,024 | $ | 27.49 | |||||||
See notes to financial statements.
8
| GROWTH & INCOME PORTFOLIO | ||
| STATEMENTOF OPERATIONS | ||
| Year Ended December 31, 2013 | AllianceBernstein Variable Products Series Fund | |
INVESTMENT INCOME | ||||
Dividends | ||||
Unaffiliated issuers | $ | 17,004,743 | ||
Affiliated issuers | 1,064 | |||
Interest | 5,878 | |||
Securities lending income | 3,424 | |||
|
| |||
| 17,015,109 | ||||
|
| |||
EXPENSES | ||||
Advisory fee (see Note B) | 4,768,536 | |||
Distribution fee—Class B | 1,799,452 | |||
Transfer agency—Class A | 2,048 | |||
Transfer agency—Class B | 9,934 | |||
Custodian | 154,154 | |||
Printing | 117,624 | |||
Legal | 54,171 | |||
Administrative | 54,103 | |||
Audit | 37,061 | |||
Directors’ fees | 4,531 | |||
Miscellaneous | 22,764 | |||
|
| |||
Total expenses | 7,024,378 | |||
|
| |||
Net investment income | 9,990,731 | |||
|
| |||
REALIZED AND UNREALIZED GAIN ON INVESTMENT TRANSACTIONS | ||||
Net realized gain on investment transactions | 175,745,634 | (a) | ||
Net change in unrealized appreciation/depreciation of investments | 80,022,635 | |||
|
| |||
Net gain on investment transactions | 255,768,269 | |||
|
| |||
NET INCREASE IN NET ASSETS FROM OPERATIONS | $ | 265,759,000 | ||
|
|
| (a) | On May 17, 2013, the Portfolio had a redemption-in-kind with total proceeds in the amount of $208,680,875. The gain on investments of $48,761,433 will not be realized for tax purposes. |
See notes to financial statements.
9
| GROWTH & INCOME PORTFOLIO | ||
| STATEMENT OF CHANGES IN NET ASSETS | AllianceBernstein Variable Products Series Fund |
| Year Ended December 31, 2013 | Year Ended December 31, 2012 | |||||||
INCREASE IN NET ASSETS FROM OPERATIONS | ||||||||
Net investment income | $ | 9,990,731 | $ | 11,486,585 | ||||
Net realized gain on investment transactions | 175,745,634 | 85,199,940 | ||||||
Net change in unrealized appreciation/depreciation of investments | 80,022,635 | 47,593,504 | ||||||
|
|
|
| |||||
Net increase in net assets from operations | 265,759,000 | 144,280,029 | ||||||
DIVIDENDS TO SHAREHOLDERS FROM | ||||||||
Net investment income | ||||||||
Class A | (1,985,126 | ) | (2,047,549 | ) | ||||
Class B | (9,529,113 | ) | (10,212,718 | ) | ||||
CAPITAL STOCK TRANSACTIONS | ||||||||
Net decrease | (276,433,549 | ) | (110,664,705 | ) | ||||
|
|
|
| |||||
Total increase (decrease) | (22,188,788 | ) | 21,355,057 | |||||
NET ASSETS | ||||||||
Beginning of period | 895,599,963 | 874,244,906 | ||||||
|
|
|
| |||||
End of period (including undistributed net investment income of $9,928,588 and $11,452,096, respectively) | $ | 873,411,175 | $ | 895,599,963 | ||||
|
|
|
| |||||
See notes to financial statements.
10
| GROWTH & INCOME PORTFOLIO | ||
| NOTES TO FINANCIAL STATEMENTS | ||
| December 31, 2013 | AllianceBernstein Variable Products Series Fund |
NOTE A: Significant Accounting Policies
The AllianceBernstein Growth & Income Portfolio (the “Portfolio”) is a series of AllianceBernstein Variable Products Series Fund, Inc. (the “Fund”). The Portfolio’s investment objective is long-term growth of capital. The Portfolio is diversified as defined under the Investment Company Act of 1940. The Fund was incorporated in the State of Maryland on November 17, 1987, as an open-end series investment company. The Fund offers thirteen separately managed pools of assets which have differing investment objectives and policies. The Portfolio offers Class A and Class B shares. Both classes of shares have identical voting, dividend, liquidating and other rights, except that Class B shares bear a distribution expense and have exclusive voting rights with respect to the Class B distribution plan.
The Portfolio offers and sells its shares only to separate accounts of certain life insurance companies for the purpose of funding variable annuity contracts and variable life insurance policies. Sales are made without a sales charge at the Portfolio’s net asset value per share.
The financial statements have been prepared in conformity with U.S. generally accepted accounting principles (“U.S. GAAP”) which require management to make certain estimates and assumptions that affect the reported amounts of assets and liabilities in the financial statements and amounts of income and expenses during the reporting period. Actual results could differ from those estimates. The following is a summary of significant accounting policies followed by the Portfolio.
1. Security Valuation
Portfolio securities are valued at their current market value determined on the basis of market quotations or, if market quotations are not readily available or are deemed unreliable, at “fair value” as determined in accordance with procedures established by and under the general supervision of the Fund’s Board of Directors (the “Board”).
In general, the market values of securities which are readily available and deemed reliable are determined as follows: securities listed on a national securities exchange (other than securities listed on the NASDAQ Stock Market, Inc. (“NASDAQ”)) or on a foreign securities exchange are valued at the last sale price at the close of the exchange or foreign securities exchange. If there has been no sale on such day, the securities are valued at the last traded price from the previous day. Securities listed on more than one exchange are valued by reference to the principal exchange on which the securities are traded; securities listed only on NASDAQ are valued in accordance with the NASDAQ Official Closing Price; listed or over the counter (“OTC”) market put or call options are valued at the mid level between the current bid and ask prices. If either a current bid or current ask price is unavailable, AllianceBernstein L.P. (the “Adviser”) will have discretion to determine the best valuation (e.g. last trade price in the case of listed options); open futures are valued using the closing settlement price or, in the absence of such a price, the most recent quoted bid price. If there are no quotations available for the day of valuation, the last available closing settlement price is used; U.S. government securities and other debt instruments having 60 days or less remaining until maturity are valued at amortized cost if their original maturity was 60 days or less; or by amortizing their fair value as of the 61st day prior to maturity if their original term to maturity exceeded 60 days; fixed-income securities, including mortgage-backed and asset-backed securities, may be valued on the basis of prices provided by a pricing service or at a price obtained from one or more of the major broker-dealers. In cases where broker-dealer quotes are obtained, the Adviser may establish procedures whereby changes in market yields or spreads are used to adjust, on a daily basis, a recently obtained quoted price on a security. Swaps and other derivatives are valued daily, primarily using independent pricing services, independent pricing models using market inputs, as well as third party broker-dealers or counterparties. Investment companies are valued at their net asset value each day.
Securities for which market quotations are not readily available (including restricted securities) or are deemed unreliable are valued at fair value. Factors considered in making this determination may include, but are not limited to, information obtained by contacting the issuer, analysts, analysis of the issuer’s financial statements or other available documents. In addition, the Portfolio may use fair value pricing for securities primarily traded in non-U.S. markets because most foreign markets close well before the Portfolio values its securities at 4:00 p.m., Eastern Time. The earlier close of these foreign markets gives rise to the possibility that significant events, including broad market moves, may have occurred in the interim and may materially affect the value of those securities. To account for this, the Portfolio may frequently value many of its foreign equity securities using fair value prices based on third party vendor modeling tools to the extent available.
2. Fair Value Measurements
In accordance with U.S. GAAP regarding fair value measurements, fair value is defined as the price that the Portfolio would receive to sell an asset or pay to transfer a liability in an orderly transaction between market participants at the measurement
11
| GROWTH & INCOME PORTFOLIO | ||
| NOTES TO FINANCIAL STATEMENTS | ||
| (continued) | AllianceBernstein Variable Products Series Fund |
date. U.S. GAAP establishes a framework for measuring fair value, and a three-level hierarchy for fair value measurements based upon the transparency of inputs to the valuation of an asset or liability (including those valued based on their market values as described in Note A.1 above). Inputs may be observable or unobservable and refer broadly to the assumptions that market participants would use in pricing the asset or liability. Observable inputs reflect the assumptions market participants would use in pricing the asset or liability based on market data obtained from sources independent of the Portfolio. Unobservable inputs reflect the Portfolio’s own assumptions about the assumptions that market participants would use in pricing the asset or liability based on the best information available in the circumstances. Each investment is assigned a level based upon the observability of the inputs which are significant to the overall valuation. The three-tier hierarchy of inputs is summarized below.
| • | Level 1—quoted prices in active markets for identical investments |
| • | Level 2—other significant observable inputs (including quoted prices for similar investments, interest rates, prepayment speeds, credit risk, etc.) |
| • | Level 3—significant unobservable inputs (including the Portfolio’s own assumptions in determining the fair value of investments) |
Where readily available market prices or relevant bid prices are not available for certain equity investments, such investments may be valued based on similar publicly traded investments, movements in relevant indices since last available prices or based upon underlying company fundamentals and comparable company data (such as multiples to earnings or other multiples to equity). Where an investment is valued using an observable input, such as another publicly traded security, the investment will be classified as Level 2. If management determines that an adjustment is appropriate based on restrictions on resale, illiquidity or uncertainty, and such adjustment is a significant component of the valuation, the investment will be classified as Level 3. An investment will also be classified as Level 3 where management uses company fundamentals and other significant inputs to determine the valuation.
The following table summarizes the valuation of the Portfolio’s investments by the above fair value hierarchy levels as of December 31, 2013:
| Level 1 | Level 2 | Level 3 | Total | |||||||||||||
Investments in Securities: | ||||||||||||||||
Assets: | ||||||||||||||||
Common Stocks* | $ | 824,690,496 | $ | –0 | – | $ | –0 | – | $ | 824,690,496 | ||||||
Short-Term Investments | –0 | – | 57,314,173 | –0 | – | 57,314,173 | ||||||||||
|
|
|
|
|
|
|
| |||||||||
Total Investments in Securities | 824,690,496 | 57,314,173 | –0 | – | 882,004,669 | |||||||||||
Other Financial Instruments** | –0 | – | –0 | – | –0 | – | –0 | – | ||||||||
|
|
|
|
|
|
|
| |||||||||
Total^ | $ | 824,690,496 | $ | 57,314,173 | $ | –0 | – | $ | 882,004,669 | |||||||
|
|
|
|
|
|
|
| |||||||||
| * | See Portfolio of Investments for sector classifications. |
| ** | Other financial instruments are derivative instruments, such as futures, forwards and swaps, which are valued at the unrealized appreciation/depreciation on the instrument. |
| ^ | There were no transfers between Level 1 and Level 2 during the reporting period. |
The Portfolio recognizes all transfers between levels of the fair value hierarchy assuming the financial instruments were transferred at the beginning of the reporting period.
The Adviser has established a Valuation Committee (the “Committee”) which is responsible for overseeing the pricing and valuation of all securities held in the Portfolio. The Committee operates under pricing and valuation policies and procedures established by the Adviser and approved by the Board, including pricing policies which set forth the mechanisms and processes to be employed on a daily basis to implement these policies and procedures. In particular, the pricing policies describe how to determine market quotations for securities and other instruments. The Committee’s responsibilities include: 1) fair value and liquidity determinations (and oversight of any third parties to whom any responsibility for fair value and liquidity determinations is delegated), and 2) regular monitoring of the Adviser’s pricing and valuation policies and procedures and modification or enhancement of these policies and procedures (or recommendation of the modification of these policies and procedures) as the Committee believes appropriate.
12
| AllianceBernstein Variable Products Series Fund |
The Committee is also responsible for monitoring the implementation of the pricing policies by the Adviser’s Pricing Group (the “Pricing Group”) and a third party which performs certain pricing functions in accordance with the pricing policies. The Pricing Group is responsible for the oversight of the third party on a day-to-day basis. The Committee and the Pricing Group perform a series of activities to provide reasonable assurance of the accuracy of prices including: 1) periodic vendor due diligence meetings, review of methodologies, new developments and processes at vendors, 2) daily comparison of security valuation versus prior day for all securities that exceeded established thresholds, and 3) daily review of unpriced, stale, and variance reports with exceptions reviewed by senior management and the Committee.
In addition, several processes outside of the pricing process are used to monitor valuation issues including: 1) performance and performance attribution reports are monitored for anomalous impacts based upon benchmark performance, and 2) portfolio managers review all portfolios for performance and analytics (which are generated using the Adviser’s prices).
3. Currency Translation
Assets and liabilities denominated in foreign currencies and commitments under forward currency exchange contracts are translated into U.S. dollars at the mean of the quoted bid and ask prices of such currencies against the U.S. dollar. Purchases and sales of portfolio securities are translated into U.S. dollars at the rates of exchange prevailing when such securities were acquired or sold. Income and expenses are translated into U.S. dollars at rates of exchange prevailing when accrued.
Net realized gain or loss on foreign currency transactions represents foreign exchange gains and losses from sales and maturities of foreign fixed income investments, foreign currency exchange contracts, holding of foreign currencies, currency gains or losses realized between the trade and settlement dates on foreign investment transactions, and the difference between the amounts of dividends, interest and foreign withholding taxes recorded on the Portfolio’s books and the U.S. dollar equivalent amounts actually received or paid. Net unrealized currency gains and losses from valuing foreign currency denominated assets and liabilities at period end exchange rates are reflected as a component of net unrealized appreciation or depreciation of foreign currency denominated assets and liabilities.
4. Taxes
It is the Portfolio’s policy to meet the requirements of the Internal Revenue Code applicable to regulated investment companies and to distribute all of its investment company taxable income and net realized gains, if any, to shareholders. Therefore, no provisions for federal income or excise taxes are required. The Portfolio may be subject to taxes imposed by countries in which it invests. Such taxes are generally based on income and/or capital gains earned or repatriated. Taxes are accrued and applied to net investment income, net realized gains and net unrealized appreciation/depreciation as such income and/or gains are earned.
In accordance with U.S. GAAP requirements regarding accounting for uncertainties in income taxes, management has analyzed the Portfolio’s tax positions taken or expected to be taken on federal and state income tax returns for all open tax years (the current and the prior three tax years) and has concluded that no provision for income tax is required in the Portfolio’s financial statements.
5. Investment Income and Investment Transactions
Dividend income is recorded on the ex-dividend date or as soon as the Portfolio is informed of the dividend. Interest income is accrued daily. Investment transactions are accounted for on the date the securities are purchased or sold. Investment gains or losses are determined on the identified cost basis. The Portfolio amortizes premiums and accretes discounts as adjustments to interest income.
6. Class Allocations
All income earned and expenses incurred by the Portfolio are borne on a pro-rata basis by each outstanding class of shares, based on the proportionate interest in the Portfolio represented by the net assets of such class, except for class specific expenses which are allocated to the respective class. Expenses of the Fund are charged proportionately to each Portfolio or based on other appropriate methods. Realized and unrealized gains and losses are allocated among the various share classes based on respective net assets.
7. Dividends and Distributions
Dividends and distributions to shareholders, if any, are recorded on the ex-dividend date. Income dividends and capital gains distributions are determined in accordance with federal tax regulations and may differ from those determined in accordance with U.S. GAAP. To the extent these differences are permanent, such amounts are reclassified within the capital accounts based on their federal tax basis treatment; temporary differences do not require such reclassification.
13
| GROWTH & INCOME PORTFOLIO | ||
| NOTES TO FINANCIAL STATEMENTS | ||
| (continued) | AllianceBernstein Variable Products Series Fund |
NOTE B: Advisory Fee and Other Transactions with Affiliates
Under the terms of the investment advisory agreement, the Portfolio pays the Adviser an advisory fee at an annual rate of .55% of the first $2.5 billion, .45% of the next $2.5 billion and .40% in excess of $5 billion, of the Portfolio’s average daily net assets. The fee is accrued daily and paid monthly.
Pursuant to the investment advisory agreement, the Portfolio may reimburse the Adviser for certain legal and accounting services provided to the Portfolio by the Adviser. For the year ended December 31, 2013, the reimbursement for such services amounted to $54,103.
Brokerage commissions paid on investment transactions for the year ended December 31, 2013 amounted to $778,196, of which $2,741 and $0, respectively, was paid to Sanford C. Bernstein & Co. LLC and Sanford C. Bernstein Limited, affiliates of the Adviser.
The Portfolio compensates AllianceBernstein Investor Services, Inc. (“ABIS”), a wholly-owned subsidiary of the Adviser, under a Transfer Agency Agreement for providing personnel and facilities to perform transfer agency services for the Portfolio. Such compensation retained by ABIS amounted to $1,385 for the year ended December 31, 2013.
NOTE C: Distribution Plan
The Portfolio has adopted a Distribution Plan (the “Plan”) for Class B shares pursuant to Rule 12b-1 under the Investment Company Act of 1940. Under the Plan, the Portfolio pays distribution and servicing fees to AllianceBernstein Investments, Inc. (the “Distributor”), a wholly-owned subsidiary of the Adviser, at an annual rate of up to .50% of the Portfolio’s average daily net assets attributable to Class B shares. The fees are accrued daily and paid monthly. The Board currently limits payments under the Plan to .25% of the Portfolio’s average daily net assets attributable to Class B shares. The Plan provides that the Distributor will use such payments in their entirety for distribution assistance and promotional activities.
The Portfolio is not obligated under the Plan to pay any distribution and servicing fees in excess of the amounts set forth above. The purpose of the payments to the Distributor under the Plan is to compensate the Distributor for its distribution services with respect to the sale of the Portfolio’s Class B shares. Since the Distributor’s compensation is not directly tied to its expenses, the amount of compensation received by it under the Plan during any year may be more or less than its actual expenses. For this reason, the Plan is characterized by the staff of the Securities and Exchange Commission as being of the “compensation” variety.
In the event that the Plan is terminated or not continued, no distribution or servicing fees (other than current amounts accrued but not yet paid) would be owed by the Portfolio to the Distributor.
The Plan also provides that the Adviser may use its own resources to finance the distribution of the Portfolio’s shares.
NOTE D: Investment Transactions
Purchases and sales of investment securities (excluding short-term investments) for the year ended December 31, 2013 were as follows:
| Purchases | Sales | |||||||
Investment securities (excluding U.S. government securities) | $ | 508,866,371 | $ | 622,960,248 | ||||
U.S. government securities | –0 | – | –0 | – | ||||
The cost of investments for federal income tax purposes, gross unrealized appreciation and unrealized depreciation are as follows:
Cost | $ | 672,519,323 | ||
|
| |||
Gross unrealized appreciation | 213,330,289 | |||
Gross unrealized depreciation | (3,844,943 | ) | ||
|
| |||
Net unrealized appreciation | $ | 209,485,346 | ||
|
|
1. Derivative Financial Instruments
The Portfolio may use derivatives in an effort to earn income and enhance returns, to replace more traditional direct investments, to obtain exposure to otherwise inaccessible markets (collectively, “investment purposes”), or to hedge or adjust the risk profile of its portfolio.
14
| AllianceBernstein Variable Products Series Fund |
The Portfolio did not engage in derivatives transactions for the year ended December 31, 2013.
2. Currency Transactions
The Portfolio may invest in non-U.S. dollar securities on a currency hedged or unhedged basis. The Portfolio may seek investment opportunities by taking long or short positions in currencies through the use of currency-related derivatives, including forward currency exchange contracts, futures and options on futures, swaps, and other options. The Portfolio may enter into transactions for investment opportunities when it anticipates that a foreign currency will appreciate or depreciate in value but securities denominated in that currency are not held by the Portfolio and do not present attractive investment opportunities. Such transactions may also be used when the Adviser believes that it may be more efficient than a direct investment in a foreign currency-denominated security. The Portfolio may also conduct currency exchange contracts on a spot basis (i.e., for cash at the spot rate prevailing in the currency exchange market for buying or selling currencies).
NOTE E: Securities Lending
The Portfolio may enter into securities lending transactions. Under the Portfolio’s securities lending program, all loans of securities will be collateralized continually by cash. The Portfolio will be compensated for the loan from a portion of the net return from the income earned on cash collateral after a rebate is paid to the borrower (in some cases, this rebate may be a “negative rebate” or fee paid by the borrower to the Portfolio in connection with the loan), and payments are made for fees of the securities lending agent and for certain other administrative expenses. It is the policy of the Portfolio to receive collateral consisting of cash in an amount exceeding the value of the securities loaned. The Portfolio will have the right to call a loan and obtain the securities loaned at any time on notice to the borrower within the normal and customary settlement time for the securities. While the securities are on loan, the borrower is obligated to pay the Portfolio amounts equal to any income or other distributions from the securities. The Portfolio will not have the right to vote any securities during the existence of a loan, but will have the right to regain ownership of loaned securities in order to exercise voting or other ownership rights. The lending agent has agreed to indemnify the Portfolio in the case of default of any securities borrower. Collateral received and securities loaned are marked to market daily to ensure that the securities loaned are secured by collateral. The lending agent will invest the cash collateral received in AllianceBernstein Exchange Reserves, an eligible money market vehicle, in accordance with the investment restrictions of the Portfolio, and as approved by the Board. The collateral received on securities loaned is recorded as an asset as well as a corresponding liability in the statement of assets and liabilities. When the Portfolio lends securities, its investment performance will continue to reflect changes in the value of the securities loaned. As of December 31, 2013, the Portfolio had no securities out on loan. The cash collateral will be adjusted on the next business day to maintain the required collateral amount. The Portfolio earned securities lending income of $3,424 and $1,064 from the borrowers and AllianceBernstein Exchange Reserves, respectively, for the year ended December 31, 2013; these amounts are reflected in the statement of operations. A principal risk of lending portfolio securities is that the borrower will fail to return the loaned securities upon termination of the loan and that the collateral will not be sufficient to replace the loaned securities. A summary of the Portfolio’s transactions in shares of AllianceBernstein Exchange Reserves for the year ended December 31, 2013 is as follows:
Market Value December 31, 2012 (000) | Purchases at Cost (000) | Sales Proceeds (000) | Market Value December 31, 2013 (000) | |||||||||||
| $ | 0 | $ | 74,510 | $ | 74,510 | $ | 0 | |||||||
NOTE F: Capital Stock
Each class consists of 500,000,000 authorized shares. Transactions in capital shares for each class were as follows:
| SHARES | AMOUNT | |||||||||||||||||
| Year Ended December 31, 2013 | Year Ended December 31, 2012 | Year Ended December 31, 2013 | Year Ended December 31, 2012 | |||||||||||||||
Class A | ||||||||||||||||||
Shares sold | 850,754 | 712,493 | $ | 20,712,220 | $ | 14,040,425 | ||||||||||||
Shares issued in reinvestment of dividends | 83,584 | 102,122 | 1,985,126 | 2,047,549 | ||||||||||||||
Shares redeemed | (1,322,227 | ) | (2,206,162 | ) | (31,796,790 | ) | (43,687,727 | ) | ||||||||||
|
|
|
|
|
|
|
| |||||||||||
Net decrease | (387,889 | ) | (1,391,547 | ) | $ | (9,099,444 | ) | $ | (27,599,753 | ) | ||||||||
|
|
|
|
|
|
|
| |||||||||||
15
| GROWTH & INCOME PORTFOLIO | ||
| NOTES TO FINANCIAL STATEMENTS | ||
| (continued) | AllianceBernstein Variable Products Series Fund |
| SHARES | AMOUNT | |||||||||||||||||
| Year Ended December 31, 2013 | Year Ended December 31, 2012 | Year Ended December 31, 2013 | Year Ended December 31, 2012 | |||||||||||||||
Class B | ||||||||||||||||||
Shares sold | 2,948,344 | 3,411,047 | $ | 71,020,261 | $ | 66,260,473 | ||||||||||||
Shares issued in reinvestment of dividends | 404,977 | 514,236 | 9,529,113 | 10,212,719 | ||||||||||||||
Shares redeemed | (14,546,299 | ) | (8,107,526 | ) | (347,883,479 | ) | (159,538,144 | ) | ||||||||||
|
|
|
|
|
|
|
| |||||||||||
Net decrease | (11,192,978 | ) | (4,182,243 | ) | $ | (267,334,105 | ) | $ | (83,064,952 | ) | ||||||||
|
|
|
|
|
|
|
| |||||||||||
NOTE G: Risks Involved in Investing in the Portfolio
Foreign Securities Risk—Investing in securities of foreign companies or foreign governments involves special risks which include changes in foreign currency exchange rates and the possibility of future political and economic developments which could adversely affect the value of such securities. Moreover, securities of many foreign companies or foreign governments and their markets may be less liquid and their prices more volatile than those of comparable U.S. companies or of the U.S. government.
Currency Risk—This is the risk that changes in foreign currency exchange rates may negatively affect the value of the Portfolio’s investments or reduce the returns of the Portfolio. For example, the value of the Portfolio’s investments in foreign currency-denominated securities or currencies may decrease if the U.S. dollar is strong (i.e., gaining value relative to other currencies) and other currencies are weak (i.e., losing value relative to the U.S. dollar). Currency markets are generally not as regulated as securities markets. Independent of the Portfolio’s investments denominated in foreign currencies, the Portfolio’s positions in various foreign currencies may cause the Portfolio to experience investment losses due to the changes in exchange rates and interest rates.
Derivatives Risk—The Portfolio may enter into derivative transactions such as forwards, options, futures and swaps. Derivatives may be illiquid, difficult to price, and leveraged so that small changes may produce disproportionate losses for the Portfolio, and subject to counterparty risk to a greater degree than more traditional investments. Derivatives may result in significant losses, including losses that are far greater than the value of the derivatives reflected in the statement of assets and liabilities.
Indemnification Risk—In the ordinary course of business, the Portfolio enters into contracts that contain a variety of indemnifications. The Portfolio’s maximum exposure under these arrangements is unknown. However, the Portfolio has not had prior claims or losses pursuant to these indemnification provisions and expects the risk of loss thereunder to be remote. Therefore, the Portfolio has not accrued any liability in connection with these indemnification provisions.
NOTE H: Joint Credit Facility
A number of open-end mutual funds managed by the Adviser, including the Portfolio, participate in a $140 million revolving credit facility (the “Facility”) intended to provide short-term financing, if necessary, subject to certain restrictions in connection with abnormal redemption activity. Commitment fees related to the Facility are paid by the participating funds and are included in miscellaneous expenses in the statement of operations. The Portfolio did not utilize the Facility during the year ended December 31, 2013.
NOTE I: Distributions to Shareholders
The tax character of distributions paid during the fiscal years ended December 31, 2013 and December 31, 2012 were as follows:
| 2013 | 2012 | |||||||
Distributions paid from: | ||||||||
Ordinary income | $ | 11,514,239 | $ | 12,260,267 | ||||
|
|
|
| |||||
Total taxable distributions paid | $ | 11,514,239 | $ | 12,260,267 | ||||
|
|
|
| |||||
16
| AllianceBernstein Variable Products Series Fund |
As of December 31, 2013, the components of accumulated earnings/(deficit) on a tax basis were as follows:
Undistributed ordinary income | $ | 9,928,588 | ||
Accumulated capital and other losses | (92,638,699 | )(a) | ||
Unrealized appreciation/(depreciation) | 209,485,346 | (b) | ||
|
| |||
Total accumulated earnings/(deficit) | $ | 126,775,235 | ||
|
|
| (a) | As of December 31, 2013, the Portfolio had a net capital loss carryforward of $92,638,699. During the fiscal year, the Portfolio utilized $123,800,828 of capital loss carryforwards to offset current year net realized gains. |
| (b) | The difference between book-basis and tax-basis unrealized appreciation/(depreciation) is attributable primarily to the tax deferral of losses on wash sales. |
For tax purposes, net capital losses may be carried over to offset future capital gains, if any. Funds are permitted to carry forward capital losses incurred in taxable years beginning after December 22, 2010 for an indefinite period. These post-enactment capital losses must be utilized prior to the pre-enactment capital losses, which are subject to expiration. Post-enactment capital loss carryforwards will retain their character as either short-term or long-term capital losses rather than being considered short-term as under previous regulation.
As of December 31, 2013, the Portfolio had a net capital loss carryforward of $92,638,699 which will expire as follows:
SHORT-TERM AMOUNT | LONG-TERM AMOUNT | EXPIRATION | ||
| $92,638,699 | n/a | 2017 |
During the current fiscal year, permanent differences primarily due to the tax treatment of gains from a redemption-in-kind resulted in a net increase in accumulated net realized loss on investment transactions and a net increase in additional paid-in capital. This reclassification had no effect on net assets.
NOTE J: Subsequent Events
Management has evaluated subsequent events for possible recognition or disclosure in the financial statements through the date the financial statements are issued. Management has determined that there are no material events that would require disclosure in the Portfolio’s financial statements through this date.
17
| GROWTH & INCOME PORTFOLIO | ||
| FINANCIAL HIGHLIGHTS | AllianceBernstein Variable Products Series Fund |
Selected Data For A Share Of Capital Stock Outstanding Throughout Each Period
| CLASS A | ||||||||||||||||||||
| Year Ended December 31, | ||||||||||||||||||||
| 2013 | 2012 | 2011 | 2010 | 2009 | ||||||||||||||||
Net asset value, beginning of period | $20.88 | $18.05 | $17.19 | $15.20 | $13.10 | |||||||||||||||
|
|
|
|
|
|
|
|
|
| |||||||||||
Income From Investment Operations | ||||||||||||||||||||
Net investment income (a) | .33 | .29 | .27 | .20 | .21 | |||||||||||||||
Net realized and unrealized gain on investment transactions | 6.92 | 2.86 | .83 | 1.79 | 2.47 | |||||||||||||||
|
|
|
|
|
|
|
|
|
| |||||||||||
Net increase in net asset value from operations | 7.25 | 3.15 | 1.10 | 1.99 | 2.68 | |||||||||||||||
|
|
|
|
|
|
|
|
|
| |||||||||||
Less: Dividends | ||||||||||||||||||||
Dividends from net investment income | (.33 | ) | (.32 | ) | (.24 | ) | –0 | – | (.58 | ) | ||||||||||
|
|
|
|
|
|
|
|
|
| |||||||||||
Net asset value, end of period | $27.80 | $20.88 | $18.05 | $17.19 | $15.20 | |||||||||||||||
|
|
|
|
|
|
|
|
|
| |||||||||||
Total Return | ||||||||||||||||||||
Total investment return based on net asset value (b)* | 34.96 | % | 17.53 | % | 6.32 | % | 13.09 | % | 20.82 | % | ||||||||||
Ratios/Supplemental Data | ||||||||||||||||||||
Net assets, end of period (000’s omitted) | $164,154 | $131,402 | $138,731 | $201,521 | $215,085 | |||||||||||||||
Ratio to average net assets of: | ||||||||||||||||||||
Expenses | .60 | % | .60 | % | .60 | % | .63 | %+ | .63 | % | ||||||||||
Net investment income | 1.35 | % | 1.48 | % | 1.52 | % | 1.30 | %+ | 1.58 | % | ||||||||||
Portfolio turnover rate | 63 | % | 80 | % | 76 | % | 66 | % | 125 | % | ||||||||||
See footnote summary on page 19.
18
| AllianceBernstein Variable Products Series Fund |
Selected Data For A Share Of Capital Stock Outstanding Throughout Each Period
| CLASS B | ||||||||||||||||||||
| Year Ended December 31, | ||||||||||||||||||||
| 2013 | 2012 | 2011 | 2010 | 2009 | ||||||||||||||||
Net asset value, beginning of period | $20.66 | $17.86 | $17.01 | $15.08 | $12.97 | |||||||||||||||
|
|
|
|
|
|
|
|
|
| |||||||||||
Income From Investment Operations | ||||||||||||||||||||
Net investment income (a) | .27 | .24 | .23 | .16 | .18 | |||||||||||||||
Net realized and unrealized gain on investment transactions | 6.83 | 2.83 | .81 | 1.77 | 2.42 | |||||||||||||||
|
|
|
|
|
|
|
|
|
| |||||||||||
Net increase in net asset value from operations | 7.10 | 3.07 | 1.04 | 1.93 | 2.60 | |||||||||||||||
|
|
|
|
|
|
|
|
|
| |||||||||||
Less: Dividends | ||||||||||||||||||||
Dividends from net investment income | (.27 | ) | (.27 | ) | (.19 | ) | –0 | – | (.49 | ) | ||||||||||
|
|
|
|
|
|
|
|
|
| |||||||||||
Net asset value, end of period | $27.49 | $20.66 | $17.86 | $17.01 | $15.08 | |||||||||||||||
|
|
|
|
|
|
|
|
|
| |||||||||||
Total Return | ||||||||||||||||||||
Total investment return based on net asset value (b)* | 34.59 | % | 17.24 | % | 6.07 | % | 12.80 | % | 20.35 | % | ||||||||||
Ratios/Supplemental Data | ||||||||||||||||||||
Net assets, end of period (000’s omitted) | $709,257 | $764,198 | $735,514 | $805,714 | $837,533 | |||||||||||||||
Ratio to average net assets of: | ||||||||||||||||||||
Expenses | .85 | % | .85 | % | .85 | % | .88 | %+ | .88 | % | ||||||||||
Net investment income | 1.11 | % | 1.23 | % | 1.28 | % | 1.05 | %+ | 1.33 | % | ||||||||||
Portfolio turnover rate | 63 | % | 80 | % | 76 | % | 66 | % | 125 | % | ||||||||||
| (a) | Based on average shares outstanding. |
| (b) | Total investment return is calculated assuming an initial investment made at the net asset value at the beginning of the period, reinvestment of all dividends and distributions at net asset value during the period, and redemption on the last day of the period. Total return does not reflect (i) insurance company’s separate account related expense charges and (ii) the deductions of taxes that a shareholder would pay on Portfolio distributions or the redemption of Portfolio shares. Total investment return calculated for a period of less than one year is not annualized. |
| * | Includes the impact of proceeds received and credited to the Portfolio resulting from class action settlements, which enhanced the Portfolio’s performance for the years ended December 31, 2013, December 31, 2012, December 31, 2011, December 31, 2010 and December 31, 2009 by 0.08%, 0.19%, 0.13%, 0.27% and 0.54%, respectively. |
| + | The ratio includes expenses attributable to costs of proxy solicitation. |
See notes to financial statements.
19
| REPORTOF INDEPENDENT REGISTERED | ||
| PUBLIC ACCOUNTING FIRM | AllianceBernstein Variable Products Series Fund | |
To the Board of Directors and Shareholders of AllianceBernstein Growth & Income Portfolio:
We have audited the accompanying statement of assets and liabilities, including the portfolio of investments, of AllianceBernstein Growth & Income Portfolio (one of the funds constituting AllianceBernstein Variable Products Series Fund, Inc. (the “Fund”)) as of December 31, 2013, and the related statement of operations for the year then ended, the statements of changes in net assets for each of the two years in the period then ended, and the financial highlights for each of the five years in the period then ended. These financial statements and financial highlights are the responsibility of the Fund’s management. Our responsibility is to express an opinion on these financial statements and financial highlights based on our audits.
We conducted our audits in accordance with the standards of the Public Company Accounting Oversight Board (United States). Those standards require that we plan and perform the audit to obtain reasonable assurance about whether the financial statements and financial highlights are free of material misstatement. We were not engaged to perform an audit of the Fund’s internal control over financial reporting. Our audits included consideration of internal control over financial reporting as a basis for designing audit procedures that are appropriate in the circumstances, but not for the purpose of expressing an opinion on the effectiveness of the Fund’s internal control over financial reporting. Accordingly, we express no such opinion. An audit also includes examining, on a test basis, evidence supporting the amounts and disclosures in the financial statements and financial highlights, assessing the accounting principles used and significant estimates made by management, and evaluating the overall financial statement presentation. Our procedures included confirmation of securities owned as of December 31, 2013, by correspondence with the custodian and others, or by other appropriate auditing procedures where replies from others were not received. We believe that our audits provide a reasonable basis for our opinion.
In our opinion, the financial statements and financial highlights referred to above present fairly, in all material respects, the financial position of AllianceBernstein Growth & Income Portfolio (one of the funds constituting AllianceBernstein Variable Products Series Fund, Inc.) at December 31, 2013, the results of its operations for the year then ended, the changes in its net assets for each of the two years in the period then ended, and the financial highlights for each of the five years in the period then ended, in conformity with U.S. generally accepted accounting principles.

New York, New York
February 14, 2014
20
| 2013 FEDERAL TAX INFORMATION | ||
| (unaudited) | AllianceBernstein Variable Products Series Fund |
For Federal income tax purposes, the following information is furnished with respect to the distributions paid by the Portfolio during the taxable year ended December 31, 2013. For corporate shareholders, 100% of dividends paid qualify for the dividends received deduction.
21
| GROWTH & INCOME PORTFOLIO | AllianceBernstein Variable Products Series Fund |
| BOARDOF DIRECTORS | ||
Marshall C. Turner, Jr.(1), Chairman John H. Dobkin(1) Michael J. Downey(1) William H. Foulk, Jr.(1) D. James Guzy(1) | Nancy P. Jacklin(1) Robert M. Keith, President and Garry L. Moody(1) Earl D. Weiner(1) | |
| OFFICERS | ||
Philip L. Kirstein, Senior Vice President and Independent Compliance Officer Frank V. Caruso(2), Vice President Emilie D. Wrapp, Secretary | Joseph J. Mantineo, Treasurer and Phyllis J. Clarke, Controller Vincent S. Noto, Chief Compliance Officer | |
CUSTODIANAND ACCOUNTING AGENT State Street Bank and Trust Company One Lincoln Street Boston, MA 02111 | LEGAL COUNSEL Seward & Kissel LLP One Battery Park Plaza New York, NY 10004 | |
DISTRIBUTOR AllianceBernstein Investments, Inc. 1345 Avenue of the Americas New York, NY 10105 | TRANSFER AGENT AllianceBernstein Investor Services, Inc. P.O. Box 786003 Toll-Free 1-(800) 221-5672 | |
INDEPENDENT REGISTERED PUBLIC ACCOUNTING FIRM Ernst & Young LLP 5 Times Square New York, NY 10036 |
| (1) | Member of the Audit Committee, the Governance and Nominating Committee and the Independent Directors Committee. Mr. Foulk is the sole member of the Fair Value Pricing Committee. |
| (2) | The day-to-day management of, and investment decisions for, the Portfolio’s portfolio are made by Mr. Frank V. Caruso, a member of the Adviser’s Relative Value Investment Team. |
22
| GROWTH & INCOME PORTFOLIO | AllianceBernstein Variable Products Series Fund |
MANAGEMENTOFTHE FUND
Board of Directors Information
The business and affairs of the Fund are managed under the direction of the Board of Directors. Certain information concerning the Fund’s Directors is set forth below.
NAME, ADDRESS,* AGE (YEAR FIRST ELECTED**) | PRINCIPAL OCCUPATION(S) DURING PAST FIVE YEARS AND OTHER RELEVANT QUALIFICATIONS*** | PORTFOLIOS IN FUND COMPLEX OVERSEEN BY DIRECTOR | OTHER DIRECTORSHIP HELD BY DIRECTOR IN THE PAST FIVE YEARS | |||||
| INTERESTED DIRECTOR | ||||||||
Robert M. Keith, # 1345 Avenue of the Americas New York, NY 10105 53 (2010) | Senior Vice President of AllianceBernstein L.P. (the “Adviser”) and the head of AllianceBernstein Investments, Inc. (“ABI”) since July 2008; Director of ABI and President of the AllianceBernstein Mutual Funds. Previously, he served as Executive Managing Director of ABI from December 2006 to June 2008. Prior to joining ABI in 2006, Executive Managing Director of Bernstein Global Wealth Management, and prior thereto, Senior Managing Director and Global Head of Client Service and Sales of the Adviser’s institutional investment management business since 2004. Prior thereto, he was Managing Director and Head of North American Client Service and Sales in the Adviser’s institutional investment management business, with which he had been associated since prior to 2004. | 100 | None | |||||
| DISINTERESTED DIRECTORS | ||||||||
Marshall C. Turner, Jr., ## Chairman of the Board 72 (2005) | Private Investor since prior to 2009. Former CEO of Dupont Photomasks, Inc. (components of semi-conductor manufacturing), 2003-2006, and interim CEO 1999–2000. Interim CEO of MEMC Electronic Materials, Inc. (semi-conductor and solar cell substrates) from November 2008 until March 2009. He has extensive operating and early-stage investment experience, including prior service as general partner of three institutional venture capital partnerships, and serves on the boards of three education and science-related non-profit organizations. He has served as a director of one AllianceBernstein fund since 1992, and director or trustee of multiple AllianceBernstein funds since 2005. He is Chairman of the AllianceBernstein Funds since January 2014. | 100 | Xilinx, Inc. (programmable logic semi-conductors) and SunEdison, Inc. (semi-conductor substrates, solar materials and solar power plants) since prior to 2009 | |||||
John H. Dobkin, ## 72 (1992) | Independent Consultant since prior to 2009. Formerly, President of Save Venice, Inc. (preservation organization) from 2001–2002; Senior Advisor from June 1999–June 2000 and President of Historic Hudson Valley (historic preservation) from December 1989–May 1999. Previously, Director of the National Academy of Design. He has served as a director or trustee of various AllianceBernstein Funds since 1992, and as Chairman of the Audit Committees of a number of such Funds from 2001–2008. | 100 | None | |||||
23
| GROWTH & INCOME PORTFOLIO | ||
| MANAGEMENTOFTHE FUND | ||
| (continued) | AllianceBernstein Variable Products Series Fund |
NAME, ADDRESS,* AGE (YEAR FIRST ELECTED**) | PRINCIPAL OCCUPATION(S) DURING PAST FIVE YEARS AND OTHER RELEVANT | PORTFOLIOS IN FUND COMPLEX OVERSEEN BY DIRECTOR | OTHER THE PAST FIVE YEARS | |||||
DISINTERESTED DIRECTORS (continued) | ||||||||
Michael J. Downey, ## 70 (2005) | Private Investor since prior to 2009. Formerly, managing partner of Lexington Capital, LLC (investment advisory firm) from December 1997 until December 2003. From 1987 until 1993, Chairman and CEO of Prudential Mutual Fund Management, director of the Prudential mutual funds, and member of the Executive Committee of Prudential Securities Inc. He has served as a director or trustee of the AllianceBernstein Funds since 2005 and is a director and Chairman of one other registered investment company. | 100 | Asia Pacific Fund, Inc. since prior to 2009, Prospect Acquisition Corp. (financial services) from 2007 until 2009, and The Merger Fund since prior to 2009 until 2013 | |||||
William H. Foulk, Jr., ##, ### 81 (1990) | Investment Adviser and an Independent Consultant since prior to 2009. Previously, he was Senior Manager of Barrett Associates, Inc., a registered investment adviser. He was formerly Deputy Comptroller and Chief Investment Officer of the State of New York and, prior thereto, Chief Investment Officer of the New York Bank for Savings. He has served as a director or trustee of various AllianceBernstein Funds since 1983, and has been Chairman of the Independent Directors Committee of the AllianceBernstein Funds since 2003. He served as Chairman of such Funds from 2003 through December 2013. He is also active in a number of mutual fund related organizations and committees. | 100 | None | |||||
D. James Guzy, ## 77 (2005) | Chairman of the Board of PLX Technology (semi-conductors) and of SRC Computers Inc., with which he has been associated since prior to 2009. He was a director of Intel Corporation (semi-conductors) from 1969 until 2008, and served as Chairman of the Finance Committee of such company for several years until May 2008. He was a Director of Cirrus Logic Corporation (semi-conductors) from 1984 until July 2011. He has served as a director or trustee of one or more of the AllianceBernstein Funds since 1982. | 100 | PLX Technology (semi-conductors) since prior to 2009, and Cirrus Logic Corporation (semi-conductors) since prior to 2009 until July 2011 | |||||
Nancy P. Jacklin, ## 65 (2006) | Professorial Lecturer at the Johns Hopkins School of Advanced International Studies since 2008. Formerly, U.S. Executive Director of the International Monetary Fund (December 2002–May 2006); Partner, Clifford Chance (1992–2002); Sector Counsel, International Banking and Finance, and Associate General Counsel, Citicorp (1985–1992); Assistant General Counsel (International), Federal Reserve Board of Governors (1982–1985); and Attorney Advisor, U.S. Department of the Treasury (1973–1982). Member of the Bar of the District of Columbia and of New York; and member of the Council on Foreign Relations. She has served as a director or trustee of the AllianceBernstein Funds since 2006. | 100 | None | |||||
24
| AllianceBernstein Variable Products Series Fund |
NAME, ADDRESS,* AGE (YEAR FIRST ELECTED**) | PRINCIPAL OCCUPATION(S) DURING PAST FIVE YEARS AND OTHER RELEVANT | PORTFOLIOS IN FUND COMPLEX OVERSEEN BY DIRECTOR | OTHER THE PAST FIVE YEARS | |||||
DISINTERESTED DIRECTORS (continued) | ||||||||
Garry L. Moody, ## 61 (2008) | Independent Consultant. Formerly, Partner, Deloitte & Touche LLP (1995–2008) where he held a number of senior positions, including Vice Chairman, and U.S. and Global Investment Management Practice Managing Partner; President, Fidelity Accounting and Custody Services Company (1993–1995); and Partner, Ernst & Young LLP (1975–1993), where he served as the National Director of Mutual Fund Tax Services and Managing Partner of its Chicago Office Tax department. He is a member of both the Governing Council of the Independent Directors Council (IDC), an organization of independent directors of mutual funds, and the Trustee Advisory Board of BoardIQ, a biweekly publication focused on issues and news affecting directors of mutual funds. He has served as a director or trustee, and as Chairman of the Audit Committee, of the AllianceBernstein Funds since 2008. | 100 | Greenbacker Renewable Energy Company LLC (renewable energy and energy efficiency projects) from August 2013 to January 2014 | |||||
Earl D. Weiner, ## 74 (2007) | Of Counsel, and Partner prior to January 2007, of the law firm Sullivan & Cromwell LLP and member of ABA Federal Regulation of Securities Committee Task Force to draft editions of the Fund Director’s Guidebook. He also serves as a director or trustee of various non-profit organizations and has served as Chairman or Vice Chairman of a number of them. He has served as a director or trustee of the AllianceBernstein Funds since 2007 and is Chairman of the Governance and Nominating Committees of the Funds. | 100 | None | |||||
| * | The address for each of the Fund’s disinterested Directors is c/o AllianceBernstein L.P., Attention: Philip L. Kirstein, 1345 Avenue of the Americas, New York, NY 10105. |
| ** | There is no stated term of office for the Fund’s Directors. |
| *** | The information above includes each Director’s principal occupation during the last five years and other information relating to the experience, attributes, and skills relevant to each Director’s qualifications to serve as a Director, which led to the conclusion that each Director should serve as a Director for the Fund. |
| # | Mr. Keith is an “interested person” of the Fund, as defined in the 1940 Act, due to his position as a Senior Vice President of the Adviser. |
| ## | Member of the Audit Committee, the Governance and Nominating Committee and the Independent Directors Committee. |
| ### | Member of the Fair Value Pricing Committee. |
25
| GROWTH & INCOME PORTFOLIO | ||
| MANAGEMENTOFTHE FUND | ||
| (continued) | AllianceBernstein Variable Products Series Fund |
Officer Information
Certain information concerning the Portfolio’s Officers is listed below.
NAME, ADDRESS,* AND AGE | PRINCIPAL POSITION(S) HELD WITH FUND | PRINCIPAL OCCUPATION DURING PAST FIVE YEARS | ||
Robert M. Keith | President and Chief Executive Officer | See biography above. | ||
| Philip L. Kirstein 68 | Senior Vice President and Independent Compliance Officer | Senior Vice President and Independent Compliance Officer of the AllianceBernstein Funds, with which he has been associated since October 2004. Prior thereto, he was Of Counsel to Kirkpatrick & Lockhart, LLP from October 2003 to October 2004, and General Counsel of Merrill Lynch Investment Managers, L.P. since prior to March 2003. | ||
| Frank V. Caruso 57 | Vice President | Senior Vice President of the Adviser**, with which he has been associated since prior to 2009. | ||
| Emilie D. Wrapp 58 | Secretary | Senior Vice President, Assistant General Counsel and Assistant Secretary of ABI**, with which she has been associated since prior to 2009. | ||
| Joseph J. Mantineo 54 | Treasurer and Chief Financial Officer | Senior Vice President of AllianceBernstein Investor Services, Inc. (“ABIS”)**, with which he has been associated since prior to 2009. | ||
| Phyllis J. Clarke 53 | Controller | Vice President of ABIS**, with which she has been associated since prior to 2009. | ||
| Vincent S. Noto 49 | Chief Compliance Officer | Chief Compliance Officer of the AllianceBernstein Funds, and Vice President of ABIS**, with which he has been associated since prior to 2009. |
| * | The address for each of the Portfolio’s Officers is 1345 Avenue of the Americas, New York, NY 10105. |
| ** | The Adviser, ABIS and ABI are affiliates of the Fund. |
| The Fund’s Statement of Additional Information (“SAI”) has additional information about the Fund’s Directors and Officers and is available without charge upon request. Contact your financial representative or AllianceBernstein at (800) 227-4618, or visit www.alliancebernstein.com, for a free prospectus or SAI. |
26
| GROWTH & INCOME PORTFOLIO | ||
| SENIOR OFFICER FEE EVALUATION | AllianceBernstein Variable Products Series Fund |
THE FOLLOWING IS NOT PART OF THE SHAREHOLDER REPORT OR THE FINANCIAL STATEMENTS
SUMMARY OF SENIOR OFFICER’S EVALUATION OF INVESTMENT ADVISORY AGREEMENT1
The following is a summary of the evaluation of the Investment Advisory Agreement between AllianceBernstein L.P. (the “Adviser”) and the AllianceBernstein Variable Products Series Fund (the “Fund”), in respect of AllianceBernstein Growth & Income Portfolio (the “Portfolio”)2 The evaluation of the Investment Advisory Agreement was prepared by Philip L. Kirstein, the Senior Officer of the Fund, for the Directors of the Fund, as required by a September 2004 agreement between the Adviser and the New York State Attorney General (the “NYAG”). The Senior Officer’s evaluation of the Investment Advisory Agreement is not meant to diminish the responsibility or authority of the Board of Directors of the Fund to perform its duties pursuant to Section 15 of the Investment Company Act of 1940 (the “40 Act”) and applicable state law. The purpose of the summary is to provide shareholders with a synopsis of the independent evaluation of the reasonableness of the advisory fees proposed to be paid by the Portfolio which was provided to the Directors in connection with their review of the proposed approval of the continuance of the Investment Advisory Agreement. The Senior Officer’s evaluation considered the following factors:
| 1. | Advisory fees charged to institutional and other clients of the Adviser for like services; |
| 2. | Advisory fees charged by other mutual fund companies for like services; |
| 3. | Costs to the Adviser and its affiliates of supplying services pursuant to the advisory agreement, excluding any intra-corporate profit; |
| 4. | Profit margins of the Adviser and its affiliates from supplying such services; |
| 5. | Possible economies of scale as the Portfolio grows larger; and |
| 6. | Nature and quality of the Adviser’s services including the performance of the Portfolio. |
These factors, with the exception of the first factor, are generally referred to as the “Gartenberg factors,” which were articulated by the United States Court of Appeals for the Second Circuit in 1982. Gartenberg v. Merrill Lynch Asset Management, Inc., 694 F. 2d 923 (2d Cir. 1982). The first factor is an additional factor required to be considered by the AoD. On March 30, 2010, the Supreme Court held the Gartenberg decision was correct in its basic formulation of what §36(b) requires: to face liability under §36(b), “an investment adviser must charge a fee that is so disproportionately large that it bears no reasonable relationship to the services rendered and could not have been the product of arm’s length bargaining.” Jones v. Harris Associates L.P., 130 S. Ct. 1418 (2010). In the Jones decision, the Court stated the Gartenberg approach fully incorporates the correct understanding of fiduciary duty within the context of section 36(b) and noted with approval that “Gartenberg insists that all relevant circumstances be taken into account” and “uses the range of fees that might result from arm’s-length bargaining as the benchmark for reviewing challenged fees.”3
PORTFOLIO ADVISORY FEES, NET ASSETS & EXPENSE RATIOS
The Adviser proposed that the Portfolio pays the advisory fee set forth in the table below for receiving the services to be provided pursuant to the Investment Advisory Agreement. The fee schedule below, implemented in January 2004 in consideration of the Adviser’s settlement with the NYAG in December 2003, is based on a master schedule that contemplates eight categories of funds with almost all funds in each category having the same advisory fee schedule.
| Category | Advisory Fee Based on % of Average Daily Net Assets | Net Assets 03/31/13 ($MIL) | Portfolio | |||||
Value | 0.55% on first $2.5 billion 0.45% on next $2.5 billion 0.40% on the balance | $ | 957.0 | Growth & Income Portfolio | ||||
| 1 | The information in the fee summary was completed on April 22, 2013 and discussed with the Board of Directors on April 30–May 2, 2013. |
| 2 | Future references to the Fund and the Portfolio do not include “AllianceBernstein.” References in the fee summary pertaining to performance and expense ratio rankings refer to the Class A shares of the Portfolio. |
| 3 | Jones v. Harris at 1427. |
27
| GROWTH & INCOME PORTFOLIO | ||
| SENIOR OFFICER FEE EVALUATION | ||
| (continued) | AllianceBernstein Variable Products Series Fund |
The Adviser is reimbursed as specified in the Investment Advisory Agreement for certain clerical, legal, accounting, administrative and other services provided to the Portfolio. During the Portfolio’s most recently completed fiscal year, the Adviser received $44,814 (0.005% of the Portfolio’s average daily net assets) for such services.
Set forth below are the Portfolio’s total expense ratios for the most recently completed fiscal year:
| Portfolio | Total Expense Ratio | Fiscal Year | ||||||
Growth & Income Portfolio | Class A 0.60% | December 31 | ||||||
| Class B 0.85% | ||||||||
I. ADVISORY FEES CHARGED TO INSTITUTIONAL AND OTHER CLIENTS
The advisory fees charged to investment companies which the Adviser manages and sponsors are normally higher than those charged to similar sized institutional accounts, including pension plans and sub-advised investment companies. The fee differential reflects, among other things, different services provided to such clients, and different liabilities assumed. Services provided by the Adviser to the Portfolio that are not provided to non-investment company clients and sub-advised investment companies include providing office space and personnel to serve as Fund Officers, who among other responsibilities make the certifications required under the Sarbanes–Oxley Act of 2002, and coordinating with and monitoring the Portfolio’s third party service providers such as Fund counsel, auditors, custodians, transfer agents and pricing services. The accounting, administrative, legal and compliance requirements for the Portfolio are more costly than those for institutional assets due to the greater complexities and time required for investment companies, although as previously noted, the Adviser is reimbursed for providing such services. Also, retail mutual funds managed by the Adviser are widely held. Servicing the Portfolio’s investors is more time consuming and labor intensive compared to institutional clients since the Adviser needs to communicate with a more extensive network of financial intermediaries and shareholders. The Adviser also believes that it incurs substantial entrepreneurial risk when offering a new mutual fund, since establishing a new mutual fund requires a large upfront investment, and it may take a long time for the fund to achieve profitability since the fund must be priced to scale from inception in order to be competitive and assets are acquired one account at a time. In addition, managing the cash flow of an investment company may be more difficult than managing that of a stable pool of assets, such as an institutional account with little cash movement in either direction, particularly, if a fund is in net redemption and the Adviser is frequently forced to sell securities to raise cash for redemptions. However, managing a fund with positive cash flow may be easier at times than managing a stable pool of assets. In recent years, investment advisers have been sued by institutional clients and have suffered reputational damage both by the attendant publicity and outcomes other than complete victories. Accordingly, the legal and reputational risks associated with institutional accounts are greater than previously thought, although still not equal to those related to the mutual fund industry.
Notwithstanding the Adviser’s view that managing an investment company is not comparable to managing other institutional accounts because the services provided are different, the Supreme Court has indicated consideration should be given to the advisory fees charged to institutional accounts that have a substantially similar investment style as the Portfolio.4 In addition to the AllianceBernstein institutional fee schedule, set forth below is what would have been the effective advisory fee of the Portfolio had the AllianceBernstein institutional fee schedule been applicable to the Portfolio versus the Portfolio’s advisory fee based on March 31, 2013 net assets:5
| Portfolio | Net Assets 03/31/13 ($MIL) | AllianceBernstein Institutional Fee Schedule | Effective AB Inst. Adv. Fee | Portfolio Advisory Fee | ||||||||
Growth & Income Portfolio | $957.0 | Relative Value Schedule 0.65% on first $25m 0.50% on next $25m 0.40% on next $50m 0.30% on next $100m 0.25% on the balance Minimum account size $25m | 0.280 | % | 0.550 | % | ||||||
| 4 | The Supreme Court stated that “courts may give such comparisons the weight that they merit in light of the similarities and differences between the services that the clients in question require, but the courts must be wary of inapt comparisons.” Among the significant differences the Supreme Court noted that may exist between services provided to mutual funds and institutional accounts are “higher marketing costs.” Jones v. Harris at 1428. |
| 5 | The Adviser has indicated that with respect to institutional accounts with assets greater than $300 million, it will negotiate a fee schedule. Discounts that are negotiated vary based upon each client relationship. |
28
| AllianceBernstein Variable Products Series Fund |
The Adviser also manages AllianceBernstein Growth & Income Fund, Inc. (“Growth & Income Fund, Inc.”), a retail mutual fund, which has a substantially similar investment style as the Portfolio. Set forth below is the fee schedule of Growth & Income Fund, Inc. and what would have been the effective advisory fee of the Portfolio had the fee schedule of the retail mutual fund been applicable to the Portfolio:6
| Portfolio | AllianceBernstein Mutual Fund | Fee Schedule | ABMF Effective Fee | Portfolio Advisory Fee | ||||||||
Growth & Income Portfolio | Growth & Income Fund, Inc. | 0.55% on first $2.5 billion 0.45% on next $2.5 billion 0.40% on the balance | 0.550 | % | 0.550 | % | ||||||
The Adviser represented that it does not sub-advise any registered investment company with a substantially similar investment style as the Portfolio.
II. MANAGEMENT FEES CHARGED BY OTHER MUTUAL FUND COMPANIES FOR LIKE SERVICES.
Lipper Inc. (“Lipper”), an analytical service that is not affiliated with the Adviser, compared the fees charged to the Portfolio with fees charged to other investment companies for similar services offered by other investment advisers.7 Lipper’s analysis included the comparison of the Portfolio’s contractual management fee, estimated at the approximate current asset level of the Portfolio, to the median of the Portfolio’s Lipper Expense Group (“EG”) and the Portfolio’s contractual management fee ranking.8,9
Lipper describes an EG as a representative sample of comparable funds. Lipper’s standard methodology for screening funds to be included in an EG entails the consideration of several fund criteria, including fund type, investment classification/objective, load type and similar 12b-1/non-12b-1 service fees, asset (size) comparability, expense components and attributes. An EG will typically consist of seven to twenty funds.
| Portfolio | Contractual Management Fee (%)10 | Lipper EG Median (%) | Lipper Rank | |||||||||
Growth & Income Portfolio | 0.550 | 0.611 | 4/10 | |||||||||
Lipper also analyzed the Portfolio’s most recently completed fiscal year total expense ratio in comparison to the Portfolio’s EG and Lipper Expense Universe (“EU”). The EU is a broader group compared to the EG, consisting of all funds that have the same investment classification/objective and load type as the subject Portfolio.11
| Portfolio | Expense Ratio | Lipper EG Median (%) | Lipper EG Rank | Lipper EU Median (%) | Lipper EU Rank | |||||||||||||||
Growth & Income Portfolio | 0.600 | 0.730 | 3/10 | 0.788 | 6/38 | |||||||||||||||
| 6 | The retail mutual fund was also affected by the settlement between the Adviser and the NYAG. As a result, the Portfolio has the same breakpoints in its advisory fee schedule as the retail mutual fund. |
| 7 | The Supreme Court cautioned against accepting mutual fund fee comparisons without careful scrutiny since “these comparisons are problematic because these fees, like those challenged, may not be the product of negotiations conducted at arm’s length.” Jones v. Harris at 1429. |
| 8 | Lipper does not consider average account size when constructing EGs. Funds with relatively small average account sizes tend to have higher transfer agent expense ratio than comparable sized funds that have relatively large average account sizes. Note that there are limitations on Lipper expense category data because different funds categorize expenses differently. |
| 9 | The contractual management fee is calculated by Lipper using the Portfolio’s contractual management fee rate at a hypothetical asset level. The hypothetical asset level is based on the combined net assets of all classes of the Portfolio, rounded up to the next $25 million. Lipper’s total expense ratio information is based on the most recent annual report except as otherwise noted. A ranking of “1” would mean that the Portfolio had the lowest effective fee rate in the Lipper peer group. |
| 10 | The contractual management fee does not reflect any expense reimbursements made by the Portfolio to the Adviser for certain clerical, legal, accounting, administrative and other services. |
| 11 | Except for asset (size) comparability, Lipper uses the same criteria for selecting an EG when selecting an EU. Unlike the EG, the EU allows for the same adviser to be represented by more than just one fund. |
| 12 | Most recently completed fiscal year end Class A total expense ratio. |
29
| GROWTH & INCOME PORTFOLIO | ||
| SENIOR OFFICER FEE EVALUATION | ||
| (continued) | AllianceBernstein Variable Products Series Fund |
Based on this analysis, the Portfolio has a more favorable ranking on a total expense ratio basis than on a management fee basis.
III. COSTS TO THE ADVISER AND ITS AFFILIATES OF SUPPLYING SERVICES PURSUANT TO THE ADVISORY FEE ARRANGEMENT, EXCLUDING ANY INTRA-CORPORATE PROFIT.
The Adviser utilizes two profitability reporting systems, which operate independently but are aligned with each other, to estimate the Adviser’s profitability in connection with investment advisory services provided to the Portfolio. The Senior Officer has retained a consultant to provide independent advice regarding the alignment of the two profitability systems as well as the methodologies and allocations utilized by both profitability systems.
IV. PROFIT MARGINS OF THE ADVISER AND ITS AFFILIATES FOR SUPPLYING SUCH SERVICES.
The Portfolio’s profitability information, prepared by the Adviser for the Board of Directors, was reviewed by the Senior Officer and the consultant. The Adviser’s profitability from providing investment advisory services to the Portfolio increased during calendar year 2012, relative to 2011.
In addition to the Adviser’s direct profits from managing the Portfolio, certain of the Adviser’s affiliates have business relationships with the Portfolio and may earn a profit from providing other services to the Portfolio. The courts have referred to this type of business opportunity as “fall-out benefits” to the Adviser and indicated that such benefits should be factored into the evaluation of the total relationship between the Portfolio and the Adviser. Neither case law nor common business practice precludes the Adviser’s affiliates from earning a reasonable profit on this type of relationship provided the affiliates’ charges and services are competitive. These affiliates provide transfer agent, distribution and brokerage related services to the Portfolio and receive transfer agent fees, Rule 12b-1 payments, and brokerage commissions. In addition, the Adviser benefits from soft dollar arrangements which offset expenses the Adviser would otherwise incur.
The Portfolio has adopted a distribution plan for Class B shares pursuant to Rule 12b-1 under the 40 Act. Under the distribution plan, the Portfolio pays distribution and servicing fees to its principal underwriter, AllianceBernstein Investments, Inc. (“ABI”), the Portfolio’s distributor and an affiliate of the Adviser, at an annual rate of up to 0.50% of the Portfolio’s average daily net assets attributable to Class B shares. The current annual rate that the Portfolio pays to ABI for 12b-1 fees is 0.25%. During the fiscal year ended December 31, 2012, ABI received $1,918,752 in Rule 12b-1 fees.
During the fiscal year ended December 31, 2012, the Adviser incurred distribution expenses in the amount of $4,508,423 in connection with activities primarily intended to result in the sale of the Portfolio’s Class B shares. This amount includes the 12b-1 fees paid by the Portfolio to the Adviser.
Financial intermediaries, such as insurers, market and sell shares of the Portfolio and typically receive compensation from ABI, the Advisers and/or the Portfolio for selling shares of the Portfolio. These financial intermediaries receive compensation in any or all of the following forms: 12b-1 fees, defrayal of costs for educational seminars and training, additional distribution support, recordkeeping and/or administrative services. Payments related to providing contract-holder recordkeeping and/or administrative services will generally not exceed 0.35% of the average daily net assets of the Portfolio attributable to the relevant intermediary over the year. With respect to the Fund, which includes the Portfolio and other Portfolios of the Fund not discussed in this summary, ABI paid approximately $600,000 in 2012 and expects to pay approximately $600,000 in 2013 for educational support and distribution assistance (revenue sharing payments).
The transfer agent of the Portfolio is AllianceBernstein Investor Services, Inc. (“ABIS”). During the most recently completed fiscal year, ABIS received a fee of $1,385 from the Portfolio.13
The Portfolio effected brokerage transactions through the Adviser’s affiliate, Sanford C. Bernstein & Co., LLC (“SCB & Co.”) and/or its U.K. affiliate, Sanford C. Bernstein Limited (“SCB Ltd.”), collectively “SCB,” and pay commissions during the Portfolio’s most recently completed fiscal year. The Adviser represented that SCB’s profitability from business conducted with the Portfolio is comparable to the profitability of SCB’s dealings with other similar third party clients. In the ordinary course of business, SCB receives and pays liquidity rebates from electronic communications networks (“ECNs”) derived from trading for its clients, including the Portfolio. These credits and charges are not being passed onto any SCB client. The Adviser also receives certain soft dollar benefits from brokers that execute agency trades for the Portfolio and other clients. These soft dollar benefits reduce the Adviser’s cost of doing business and increase its profitability.
| 13 | The Fund, which includes the Portfolio and other Portfolios of the Fund paid ABIS a flat fee of $18,000 in 2012. |
30
| AllianceBernstein Variable Products Series Fund |
V. POSSIBLE ECONOMIES OF SCALE
The Adviser has indicated that economies of scale are being shared with shareholders through pricing to scale, breakpoints, fee reductions/waivers and enhancement to services.
In May 2012, an independent consultant, retained by the Senior Officer, provided the Board of Directors information on the Adviser’s firm-wide average costs from 2005 through 2011 and the potential economies of scale. The independent consultant noted that from 2005 through 2007 the Adviser experienced significant growth in assets under management (“AUM”). During this period, operating expenses increased, in part to keep up with growth, and in part reflecting market returns. However, from 2008 through the first quarter of 2009, AUM rapidly and significantly decreased due to declines in market value and client withdrawals. When AUM rapidly decreased, some operating expenses categories, including base compensation and office space, adjusted more slowly during this period, resulting in an increase in average costs. Since 2009, AUM has experienced less significant changes. The independent consultant noted that changes in operating expenses reflect changes in business composition and business practices in response to changes in financial markets. Finally, the independent consultant concluded that the increase in average cost and the decline in net operating margin across the Adviser since late 2008 are inconsistent with the view that there are currently reductions in average costs due to economies of scale that can be shared with the AllianceBernstein Mutual Funds managed by the Adviser through lower fees.
Previously in February 2008, the independent consultant provided the Board of Directors an update of the Deli study on advisory fees and various fund characteristics.14,15 The independent consultant first reiterated the results of his previous two dimensional comparison analysis (fund size and family size) with the Board of Directors.16 The independent consultant then discussed the results of the regression model that was utilized to study the effects of various factors on advisory fees. The regression model output indicated that the bulk of the variation in fees predicted were explained by various factors, but substantially by fund AUM, family AUM, index fund indicator and investment style. The independent consultant also compared the advisory fees of the AllianceBernstein Mutual Funds to similar funds managed by 19 other large asset managers, regardless of the fund size and each Adviser’s proportion of mutual fund assets to non-mutual fund assets.
VI. NATURE AND QUALITY OF THE ADVISER’S SERVICES, INCLUDING THE PERFORMANCE OF THE PORTFOLIO
With assets under management of approximately $443 billion as of March 31, 2013, the Adviser has the investment experience to manage and provide non-investment services (described in Section I) to the Portfolio.
The information prepared by Lipper shows the 1, 3, 5 and 10 year performance returns and rankings of the Portfolio17 relative to its Lipper Performance Group (“PG”) and Lipper Performance Universe (“PU”)18 for the periods ended February 28, 2013.19
| Portfolio (%) | PG Median (%) | PU Median (%) | PG Rank | PU Rank | ||||||||||||
Growth & Income Portfolio | ||||||||||||||||
1 year | 13.67 | 11.77 | 12.24 | 5/10 | 17/38 | |||||||||||
3 year | 14.49 | 12.49 | 12.54 | 4/9 | 9/37 | |||||||||||
5 year | 3.70 | 4.67 | 4.50 | 5/8 | 27/36 | |||||||||||
10 year | 7.84 | 8.53 | 8.87 | 6/7 | 19/25 | |||||||||||
| 14 | The Deli study, originally published in 2002 based on 1997 data and updated for the February 2008 Presentation, may be of diminished value due to the age of the data used in the presentation and the changes experienced in the industry over the last four years. |
| 15 | As mentioned previously, the Supreme Court cautioned against accepting mutual fund fee comparisons without careful scrutiny since the fees may not be the product of negotiations conducted at arm’s length. See Jones v. Harris at 1429. |
| 16 | The two dimensional analysis showed patterns of lower advisory fees for funds with larger asset sizes and funds from larger family sizes compared to funds with smaller asset sizes and funds from smaller family sizes, which according to the independent consultant is indicative of a sharing of economies of scale and scope. However, in less liquid and active markets, such is not the case, as the empirical analysis showed potential for diseconomies of scale in those markets. The empirical analysis also showed diminishing economies of scale and scope as funds surpassed a certain high level of assets. |
| 17 | The performance rankings are for the Class A shares of the Portfolio. The Portfolio’s performance returns shown were provided by Lipper. |
| 18 | The Portfolio’s PG/PU is identical to the Portfolio’s EG/EU. |
| 19 | The current Lipper investment classification/objective dictates the PG and PU throughout the life of the fund even if a fund had a different investment classification/objective at a different point in time. |
31
| GROWTH & INCOME PORTFOLIO | ||
| SENIOR OFFICER FEE EVALUATION | ||
| (continued) | AllianceBernstein Variable Products Series Fund |
Set forth below are the 1, 3, 5, 10 year and since inception performance returns of the Portfolio (in bold)20 versus its benchmarks.21 Portfolio and benchmark volatility and reward-to-variability ratio (“Sharpe Ratio”) information is also shown.22
Periods Ending February 28, 2013 Annualized Performance | ||||||||||||||||||||||||||||||||
1 Year | 3 Year | 5 Year | 10 Year | Since | Annualized | Risk Period (Year) | ||||||||||||||||||||||||||
Volatility (%) | Sharpe (%) | |||||||||||||||||||||||||||||||
Growth & Income Portfolio | 7.81 | 12.37 | 4.83 | 7.84 | 7.64 | 15.26 | 0.46 | 10 | ||||||||||||||||||||||||
Russell 1000 Value Index | 9.60 | 13.80 | 6.38 | 8.42 | 7.62 | 15.68 | 0.50 | 10 | ||||||||||||||||||||||||
Inception Date: February 25, 1994 |
| |||||||||||||||||||||||||||||||
CONCLUSION:
Based on the factors discussed above the Senior Officer’s conclusion is that the proposed advisory fee for the Portfolio is reasonable and within the range of what would have been negotiated at arm’s-length in light of all the surrounding circumstances. This conclusion in respect of the Portfolio is based on an evaluation of all of these factors and no single factor was dispositive.
Dated: May 29, 2013
| 20 | The performance returns and risk measures shown in the table are for the Class A shares of the Portfolio. |
| 21 | The Adviser provided Portfolio and benchmark performance return information for periods through February 28, 2013. |
| 22 | Portfolio and benchmark volatility and Sharpe Ratio information was obtained through Lipper LANA, a database maintained by Lipper. Volatility is a statistical measure of the tendency of a market price or yield to vary over time. The Sharpe Ratio is a risk adjusted measure of return that divides a portfolio’s return in excess of the riskless return by the portfolio’s standard deviation. A portfolio with a greater volatility would be viewed as more risky than a portfolio with equivalent performance but lower volatility; for that reason, a greater return would be demanded for the more risky portfolio. A portfolio with a higher Sharpe Ratio would be viewed as better performing than a portfolio with a lower Sharpe Ratio. |
32
VPS-GI-0151-1213
AllianceBernstein
Variable Products Series Fund, Inc.
 | AllianceBernstein Intermediate Bond Portfolio |
December 31, 2013
Annual Report

ANNUAL REPORT
Investment Products Offered
| Ø | Are Not FDIC Insured |
| Ø | May Lose Value |
| Ø | Are Not Bank Guaranteed |
AllianceBernstein Investments, Inc. (ABI) is the distributor of the AllianceBernstein family of mutual funds. ABI is a member of FINRA and is an affiliate of AllianceBernstein L.P., the manager of the funds.
You may obtain a description of the Fund’s proxy voting policies and procedures, and information regarding how the Fund voted proxies relating to portfolio securities during the most recent 12-month period ended June 30, without charge. Simply visit AllianceBernstein’s website at www.alliancebernstein.com or go to the Securities and Exchange Commission’s (the “Commission”) website at www.sec.gov, or call AllianceBernstein at (800) 227-4618.
The Fund files its complete schedule of portfolio holdings with the Commission for the first and third quarters of each fiscal year on Form N-Q. The Fund’s Forms N-Q are available on the Commission’s website at www.sec.gov. The Fund’s Forms N-Q may also be reviewed and copied at the Commission’s Public Reference Room in Washington, DC; information on the operation of the Public Reference Room may be obtained by calling (800) SEC-0330.
AllianceBernstein® and the AB Logo are registered trademarks and service marks used by permission of the owner, AllianceBernstein L.P.
| INTERMEDIATE BOND PORTFOLIO | AllianceBernstein Variable Products Series Fund |
LETTERTO INVESTORS
February 7, 2014
The following is an update of AllianceBernstein Variable Products Series Fund—AllianceBernstein Intermediate Bond Portfolio (the “Portfolio”) for the annual reporting period ended December 31, 2013.
INVESTMENT OBJECTIVE AND POLICIES
The Portfolio’s investment objective is to generate income and price appreciation without assuming what AllianceBernstein L.P. (the “Adviser”) considers undue risk. The Portfolio invests, under normal circumstances, at least 80% of its net assets in fixed-income securities. The Portfolio expects to invest in readily marketable fixed-income securities with a range of maturities from short- to long-term and relatively attractive yields that do not involve undue risk of loss of capital. The Portfolio expects to invest in fixed-income securities with a dollar-weighted average maturity of between three to ten years and an average duration of three to six years. The Portfolio may invest up to 25% of its net assets in below investment grade bonds (commonly known as “junk bonds”). The Portfolio may use leverage for investment purposes.
The Portfolio may invest without limit in U.S. dollar-denominated foreign fixed-income securities and may invest up to 25% of its assets in non-U.S. dollar-denominated foreign fixed-income securities. These investments may include, in each case, developed and emerging market debt securities. The Portfolio may invest in mortgage-related and other asset-backed securities, loan participations, inflation-protected securities, structured securities, variable, floating and inverse floating-rate instruments, and preferred stock, and may use other investment techniques. The Portfolio intends, among other things, to enter into transactions such as reverse repurchase agreements and dollar rolls. The Portfolio may enter into, without limit, derivatives transactions, such as options, futures, forwards and swaps.
INVESTMENT RESULTS
The table on page 4 shows the Portfolio’s performance compared to its benchmark, the Barclays U.S. Aggregate Bond Index, for the one-, five- and 10-year periods ended December 31, 2013.
All share classes of the Portfolio underperformed the benchmark for the annual period ended December 31, 2013. Overall yield curve positioning detracted, while sector allocation, security selection and currency exposure were all positive. An underweight to U.S. Treasuries, which underperformed, contributed positively for the year; opportunistic exposure to corporate high yield also added to returns. Select exposure to hedged non-U.S. dollar bonds and non-agency collateralized mortgage obligations were modest contributors. Conversely, an overweight in asset-backed securities detracted. Investment-grade corporate security selection was positive for the annual period, although selection within agency mortgage and commercial mortgage-backed securities holdings dampened some of that gain.
The Portfolio utilized derivatives in the form of currency forwards to manage currency positioning; currency exposure, particularly a short position in the weakened Japanese yen, contributed positively during the annual period. Treasury futures and interest rate swaps were utilized in order to manage duration and yield curve positioning, which detracted for the annual period, as an overweight in the 10-year area of the curve, where yields rose most, had a negative impact on performance. Credit default swaps were utilized for hedging and investment purposes, which had an immaterial impact on annual performance.
MARKET REVIEW AND INVESTMENT STRATEGY
Overall, the annual period ended December 31, 2013 was marked by somewhat elevated market volatility, and beginning in May, sharply higher bond yields and a notable exodus from bond funds. Nevertheless, risk aversion continued to decline toward the end of the period, as the primary drivers of volatility were accelerating growth across the developed world and its corresponding implications.
After months of speculation that kept financial markets on edge, the U.S. Federal Reserve (the “Fed”) took its first modest steps toward ending a key component of its stimulus campaign in December. Policymakers decided to start tapering asset purchases of U.S. Treasuries and mortgages from $85 billion per month to $75 billion per month in January. At the same time, the Fed strengthened its commitment to keeping short-term interest rates near zero, well past the point when the civilian unemployment rate falls below the 6.5% threshold. Markets reacted positively to the news, as investors were accepting of the gradual pace of the changes and appeared relieved that a major source of uncertainty had been removed.
Most major fixed-income sectors fell into negative territory for 2013, as yields rose. Investment-grade corporates posted negative returns, but outperformed Treasuries and the broader fixed-income market on a duration-neutral basis helped by strong performance within financials. Financial fundamentals remained favorable as firms’ deleveraging continued. U.S. high yield debt outperformed investment-grade fixed-income sectors, as investors reached for yield.
1
| INTERMEDIATE BOND PORTFOLIO | ||
| DISCLOSURESAND RISKS | AllianceBernstein Variable Products Series Fund |
Benchmark Disclosure
The unmanaged Barclays U.S. Aggregate Bond Index does not reflect fees and expenses associated with the active management of a mutual fund portfolio. The Barclays U.S. Aggregate Bond Index represents the performance of securities within the U.S. investment-grade fixed rate bond market, with index components for government and corporate securities, mortgage pass-through securities, asset-backed securities, and commercial mortgage-backed securities. An investor cannot invest directly in an index, and its results are not indicative of the performance for any specific investment, including the Portfolio.
A Word About Risk
Market Risk: The value of the Portfolio’s assets will fluctuate as the stock or bond market fluctuates. The value of its investments may decline, sometimes rapidly and unpredictably, simply because of economic changes or other events that affect large portions of the market.
Interest Rate Risk: Changes in interest rates will affect the value of investments in fixed-income securities. When interest rates rise, the value of investments in fixed-income securities tends to fall and this decrease in value may not be offset by higher income from new investments. Interest rate risk is generally greater for fixed-income securities with longer maturities or durations.
Duration Risk: Duration is a measure that relates the expected price volatility of a fixed-income security to changes in interest rates. The duration of a fixed-income security may be shorter than or equal to full maturity of a fixed-income security. Fixed-income securities with longer durations have more risk and will decrease in price as interest rates rise. For example, a fixed-income security with a duration of three years will decrease in value by approximately 3% if interest rates increase by 1%.
Credit Risk: An issuer or guarantor of a fixed-income security, or the counterparty to a derivatives or other contract, may be unable or unwilling to make timely payments of interest or principal, or to otherwise honor its obligations. The issuer or guarantor may default, causing a loss of the full principal amount of a security. The degree of risk for a particular security may be reflected in its credit rating. There is the possibility that the credit rating of a fixed-income security may be downgraded after purchase, which may adversely affect the value of the security.
Below Investment Grade Security Risk: Investments in fixed-income securities with lower ratings (“junk bonds”) tend to have a higher probability that an issuer will default or fail to meet its payment obligations. These securities may be subject to greater price volatility due to such factors as specific corporate developments, interest rate sensitivity, negative perceptions of the junk bond market generally and less secondary market liquidity.
Inflation Risk: This is the risk that the value of assets or income from investments will be less in the future as inflation decreases the value of money. As inflation increases, the value of the Portfolio’s assets can decline as can the value of the Portfolio’s distributions. This risk is significantly greater if the Portfolio invests a significant portion of its assets in fixed-income securities with longer maturities.
Foreign (Non-U.S.) Risk: Investments in securities of non-U.S. issuers may involve more risk than those of U.S. issuers. These securities may fluctuate more widely in price and may be less liquid due to adverse market, economic, political, regulatory or other factors.
Emerging Market Risk: Investments in emerging market countries may have more risk because the markets are less developed and less liquid as well as being subject to increased economic, political, regulatory or other uncertainties.
Currency Risk: Fluctuations in currency exchange rates may negatively affect the value of the Portfolio’s investments or reduce its returns.
Prepayment Risk: The value of mortgage-related or other asset-backed securities may be particularly sensitive to changes in prevailing interest rates. Early payments of principal on some of these securities may occur during periods of falling mortgage interest rates and expose the Portfolio to a lower rate of return upon reinvestment of principal. Early payments associated with these securities cause these securities to experience significantly greater price and yield volatility than is experienced by traditional fixed-income securities. During periods of rising interest rates, a reduction in prepayments may
(Disclosures, Risks and Note about Historical Performance continued on next page)
2
| INTERMEDIATE BOND PORTFOLIO | ||
| DISCLOSURESAND RISKS | ||
| (continued) | AllianceBernstein Variable Products Series Fund |
increase the effective life of mortgage-related securities, subjecting them to greater risk of decline in market value in response to rising interest rates. If the life of a mortgage-related security is inaccurately predicted, the Portfolio may not be able to realize the rate of return it expected.
Leverage Risk: To the extent the Portfolio uses leveraging techniques, its net asset value (“NAV”) may be more volatile because leverage tends to exaggerate the effect of changes in interest rates and any increase or decrease in the value of the Portfolio’s investments.
Derivatives Risk: Derivatives may be illiquid, difficult to price, and leveraged so that small changes may produce disproportionate losses for the Portfolio, and may be subject to counterparty risk to a greater degree than more traditional investments.
Management Risk: The Portfolio is subject to management risk because it is an actively-managed investment fund. The Adviser will apply its investment techniques and risk analyses in making investment decisions, but there is no guarantee that its techniques will produce the intended results.
These risks are fully discussed in the Variable Products prospectus.
An Important Note About Historical Performance
The investment return and principal value of an investment in the Portfolio will fluctuate, so that shares, when redeemed, may be worth more or less than their original cost. Performance shown on the following page represents past performance and does not guarantee future results. Current performance may be lower or higher than the performance information shown. Please contact your Financial Advisor or Insurance Agent Representative at your financial institution to obtain portfolio performance information current to the most recent month end.
Investors should consider the investment objectives, risks, charges and expenses of the Portfolio carefully before investing. For additional copies of the Portfolio’s prospectus or summary prospectus, which contains this and other information, call your financial advisor or 800.984.7654. Please read the prospectus and/or summary prospectus carefully before investing.
All fees and expenses related to the operation of the Portfolio have been deducted, but no adjustment has been made for insurance company separate account or annuity contract charges, which would reduce total return to a contract owner. Performance assumes reinvestment of distributions and does not account for taxes.
There are additional fees and expenses associated with all Variable Products. These fees can include mortality and expense risk charges, administrative charges, and other charges that can significantly reduce investment returns. Those fees and expenses are not reflected in this annual report. You should consult your Variable Products prospectus for a description of those fees and expenses and speak to your insurance agent or financial representative if you have any questions. You should read the prospectus before investing or sending money.
3
| INTERMEDIATE BOND PORTFOLIO | ||
| HISTORICAL PERFORMANCE | AllianceBernstein Variable Products Series Fund |
| THE PORTFOLIO VS. ITS BENCHMARK | NAV Returns | |||||||||||
| PERIODS ENDED DECEMBER 31, 2013 (unaudited) | 1 Year | 5 Years* | 10 Years* | |||||||||
AllianceBernstein Intermediate Bond Portfolio Class A** | -2.16% | 7.44% | 4.45% | |||||||||
AllianceBernstein Intermediate Bond Portfolio Class B** | -2.34% | 7.19% | 4.20% | |||||||||
Barclays U.S. Aggregate Bond Index | -2.02% | 4.44% | 4.55% | |||||||||
* Average annual returns. | ||||||||||||
** Includes the impact of proceeds received and credited to the Portfolio resulting from class action settlements, which enhanced the performance of all share classes of the Portfolio for the annual period ended December 31, 2013 by 0.02%. |
| |||||||||||
The Portfolio’s current prospectus fee table shows the Portfolio’s total annual expense ratios as 0.70% and 0.96% for Class A and Class B, respectively. The Financial Highlights section of this report sets forth expense ratio data for the current reporting period; the expense ratios shown above may differ from the expense ratios in the Financial Highlights section since they are based on different time periods.
ALLIANCEBERNSTEIN INTERMEDIATE BOND PORTFOLIO CLASS A GROWTH OF A $10,000 INVESTMENT
12/31/03 – 12/31/13 (unaudited)
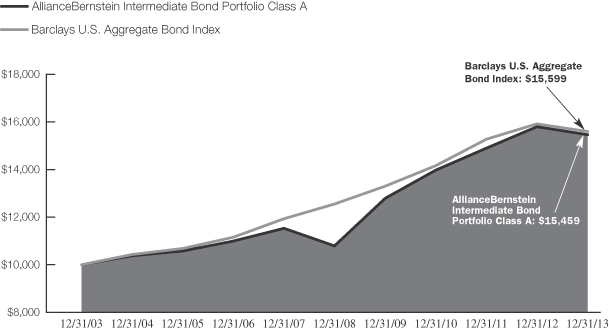
This chart illustrates the total value of an assumed $10,000 investment in AllianceBernstein Intermediate Bond Portfolio Class A shares (from 12/31/03 to 12/31/13) as compared to the performance of the Portfolio’s benchmark, the Barclays U.S. Aggregate Bond Index. The chart assumes the reinvestment of dividends and capital gains distributions.
See Disclosures, Risks and Note about Historical Performance on page 2-3.
4
| INTERMEDIATE BOND PORTFOLIO | ||
| EXPENSE EXAMPLE (unaudited) | AllianceBernstein Variable Products Series Fund |
As a shareholder of the Fund, you incur two types of costs: (1) transaction costs, including sales charges (loads) on purchase payments, contingent deferred sales charges on redemptions and (2) ongoing costs, including management fees; distribution (12b-1) fees; and other Fund expenses. This example is intended to help you understand your ongoing costs (in dollars) of investing in the Fund and to compare these costs with the ongoing costs of investing in other mutual funds.
The Example is based on an investment of $1,000 invested at the beginning of the period and held for the entire period as indicated below.
Actual Expenses
The table below provides information about actual account values and actual expenses. You may use the information in this line, together with the amount you invested, to estimate the expenses that you paid over the period. Simply divide your account value by $1,000 (for example, an $8,600 account value divided by $1,000 = 8.6), then multiply the result by the number in the first line under the heading entitled “Expenses Paid During Period” to estimate the expenses you paid on your account during this period. The estimate of expenses does not include fees of other expenses of any variable insurance product. If such expenses were included, the estimate of expenses you paid during the period would be higher and your ending account value would be lower.
Hypothetical Example for Comparison Purposes
The table below provides information about hypothetical account values and hypothetical expenses based on the Fund’s actual expense ratio and an assumed annual rate of return of 5% before expenses, which is not the Fund’s actual return. The hypothetical account values and expenses may not be used to estimate the actual ending account balance or expenses you paid for the period. You may use this information to compare the ongoing costs of investing in the Fund and other funds by comparing this 5% hypothetical example with the 5% hypothetical examples that appear in the shareholder reports of other funds. The estimate of expenses does not include fees of other expenses of any variable insurance product. If such expenses were included, the estimate of expenses you paid during the period would be higher and your ending account value would be lower.
Please note that the expenses shown in the table are meant to highlight your ongoing costs only and do not reflect any transactional costs, such as sales charges (loads), or contingent deferred sales charges on redemptions. Therefore, the second line of each class’ table is useful in comparing ongoing costs only, and will not help you determine the relative total costs of owning different funds. In addition, if these transactional costs were included, your costs would have been higher.
| Beginning Account Value July 1, 2013 | Ending Account Value December 31, 2013 | Expenses Paid During Period* | Annualized Expense Ratio* | |||||||||||||
Class A | ||||||||||||||||
Actual | $ | 1,000 | $ | 1,004.60 | $ | 4.04 | 0.80 | % | ||||||||
Hypothetical (5% annual return before expenses) | $ | 1,000 | $ | 1,021.17 | $ | 4.08 | 0.80 | % | ||||||||
Class B | ||||||||||||||||
Actual | $ | 1,000 | $ | 1,003.90 | $ | 5.30 | 1.05 | % | ||||||||
Hypothetical (5% annual return before expenses) | $ | 1,000 | $ | 1,019.91 | $ | 5.35 | 1.05 | % | ||||||||
| * | Expenses are equal to each classes’ annualized expense ratios, multiplied by the average account value over the period, multiplied by 184/365 (to reflect the one-half year period). |
5
| INTERMEDIATE BOND PORTFOLIO | ||
| SECURITY TYPE BREAKDOWN* | ||
| December 31, 2013 (unaudited) | AllianceBernstein Variable Products Series Fund | |
| SECURITY TYPE | U.S. $ VALUE | PERCENT OF TOTAL INVESTMENTS | ||||||
Mortgage Pass-Throughs | $ | 19,199,746 | 19.8 | % | ||||
Corporates—Investment Grades | 19,137,488 | 19.7 | ||||||
Asset-Backed Securities | 13,288,217 | 13.7 | ||||||
Commercial Mortgage-Backed Securities | 7,929,110 | 8.2 | ||||||
Governments—Treasuries | 7,593,857 | 7.8 | ||||||
Agencies | 4,110,499 | 4.2 | ||||||
Corporates—Non-Investment Grades | 2,722,878 | 2.8 | ||||||
Quasi-Sovereigns | 2,098,604 | 2.2 | ||||||
Inflation-Linked Securities | 1,830,761 | 1.9 | ||||||
Collateralized Mortgage Obligations | 1,677,914 | 1.7 | ||||||
Local Governments—Municipal Bonds | 1,498,126 | 1.6 | ||||||
Governments—Sovereign Bonds | 580,090 | 0.6 | ||||||
Preferred Stocks | 467,158 | 0.5 | ||||||
Other** | 175,444 | 0.2 | ||||||
Short-Term Investments | 14,678,222 | 15.1 | ||||||
|
|
|
| |||||
Total Investments | $ | 96,988,114 | 100.0 | % | ||||
| * | The Portfolio’s security type breakdown is expressed as a percentage of total investments and may vary over time. The Portfolio also enters into derivatives transactions, which may be used for hedging purposes (see “Portfolio of Investments” section of the report for additional details). |
| ** | “Other” represents less than 0.1% weightings in the following security types: Common Stocks, Emerging Markets—Corporate Bonds, Governments—Sovereign Agencies and Warrants. |
6
| INTERMEDIATE BOND PORTFOLIO | ||
| PORTFOLIOOF INVESTMENTS | ||
| December 31, 2013 | AllianceBernstein Variable Products Series Fund | |
| Principal Amount (000) | U.S. $ Value | |||||||||||
MORTGAGE PASS-THROUGHS–22.8% | ||||||||||||
AGENCY FIXED RATE | ||||||||||||
Federal Home Loan Mortgage Corp. Gold | ||||||||||||
4.00%, 1/01/44, TBA | U.S.$ | 340 | $ | 349,164 | ||||||||
4.50%, 10/01/39 | 1,557 | 1,649,616 | ||||||||||
Series 2005 | 234 | 256,536 | ||||||||||
Series 2007 | 66 | 72,585 | ||||||||||
Federal National Mortgage Association | ||||||||||||
3.00%, 6/01/43-7/01/43 | 1,484 | 1,410,926 | ||||||||||
3.50%, 7/01/43 | 942 | 937,765 | ||||||||||
3.50%, 1/01/44, TBA | 5,150 | 5,115,801 | ||||||||||
4.00%, 1/01/44, TBA | 2,333 | 2,401,017 | ||||||||||
4.50%, 1/25/44, TBA | 800 | 847,656 | ||||||||||
5.00%, 1/25/44, TBA | 800 | 868,813 | ||||||||||
Series 2003 | 212 | 233,603 | ||||||||||
Series 2004 | 195 | 214,712 | ||||||||||
Series 2005 | 171 | 181,546 | ||||||||||
5.50%, 2/01/35 | 242 | 266,757 | ||||||||||
Series 2007 | 237 | 251,897 | ||||||||||
Government National Mortgage Association | 2 | 1,554 | ||||||||||
|
| |||||||||||
| 15,059,948 | ||||||||||||
|
| |||||||||||
AGENCY FIXED RATE | ||||||||||||
Federal National Mortgage Association | ||||||||||||
2.50%, 1/01/29, TBA | 2,665 | 2,637,517 | ||||||||||
3.00%, 1/01/28, TBA | 280 | 285,742 | ||||||||||
3.50%, 2/01/29, TBA | 608 | 633,675 | ||||||||||
|
| |||||||||||
| 3,556,934 | ||||||||||||
|
| |||||||||||
AGENCY ARMS–0.7% | ||||||||||||
Federal Home Loan Mortgage Corp. | 183 | 194,529 | ||||||||||
Federal National Mortgage Association | ||||||||||||
Series 2003 | 131 | 139,968 | ||||||||||
Series 2007 | 234 | 248,367 | ||||||||||
|
| |||||||||||
| 582,864 | ||||||||||||
|
| |||||||||||
Total Mortgage Pass-Throughs | 19,199,746 | |||||||||||
|
| |||||||||||
CORPORATES–INVESTMENT GRADES–22.7% |
| |||||||||||
INDUSTRIAL–11.8% | ||||||||||||
BASIC–2.1% | ||||||||||||
Barrick North America Finance LLC | U.S.$ | 139 | $ | 133,836 | ||||||||
Basell Finance Co. BV | 85 | 107,329 | ||||||||||
Cia Minera Milpo SAA | 260 | 233,067 | ||||||||||
Dow Chemical Co. (The) | 94 | 82,535 | ||||||||||
Dow Chemical Co/The | 86 | 111,043 | ||||||||||
Gerdau Trade, Inc. | 260 | 243,454 | ||||||||||
Glencore Funding LLC | 155 | 144,850 | ||||||||||
International Paper Co. | ||||||||||||
4.75%, 2/15/22 | 65 | 68,147 | ||||||||||
7.95%, 6/15/18 | 56 | 68,023 | ||||||||||
LyondellBasell Industries NV | 200 | 224,135 | ||||||||||
Rio Tinto Finance USA PLC | ||||||||||||
2.875%, 8/21/22 | 117 | 109,047 | ||||||||||
3.50%, 3/22/22 | 41 | 40,234 | ||||||||||
Sociedad Quimica y Minera de Chile SA | 260 | 226,032 | ||||||||||
|
| |||||||||||
| 1,791,732 | ||||||||||||
|
| |||||||||||
CAPITAL GOODS–0.7% | ||||||||||||
Embraer SA | 82 | 82,000 | ||||||||||
Owens Corning | 160 | 177,550 | ||||||||||
Republic Services, Inc. | ||||||||||||
5.25%, 11/15/21 | 150 | 163,537 | ||||||||||
5.50%, 9/15/19 | 160 | 180,038 | ||||||||||
|
| |||||||||||
| 603,125 | ||||||||||||
|
| |||||||||||
COMMUNICATIONS– |
| |||||||||||
21st Century Fox America, Inc. | ||||||||||||
4.00%, 10/01/23(c) | 64 | 63,256 | ||||||||||
4.50%, 2/15/21 | 300 | 321,562 | ||||||||||
Comcast Cable Communications Holdings, Inc. | 280 | 387,821 | ||||||||||
DirecTV Holdings LLC/DirecTV Financing Co., Inc. | ||||||||||||
3.50%, 3/01/16 | 95 | 99,720 | ||||||||||
3.80%, 3/15/22 | 165 | 158,505 | ||||||||||
NBCUniversal Enterprise, Inc. 5.25%, 3/19/21(c) | 128 | 126,720 | ||||||||||
Omnicom Group, Inc. | 87 | 84,251 | ||||||||||
7
| INTERMEDIATE BOND PORTFOLIO | ||
| PORTFOLIOOF INVESTMENTS | ||
| (continued) | AllianceBernstein Variable Products Series Fund | |
| Principal Amount (000) | U.S. $ Value | |||||||||||
TCI Communications, Inc. | U.S.$ | 115 | $ | 148,980 | ||||||||
Time Warner Entertainment Co. LP | 101 | 116,168 | ||||||||||
|
| |||||||||||
| 1,506,983 | ||||||||||||
|
| |||||||||||
COMMUNICATIONS– |
| |||||||||||
American Tower Corp. | 260 | 274,943 | ||||||||||
AT&T, Inc. | 31 | 26,295 | ||||||||||
Deutsche Telekom International Finance BV | 320 | 305,374 | ||||||||||
Rogers Communications, Inc. | CAD | 27 | 24,813 | |||||||||
Telefonica Emisiones SAU | U.S.$ | 120 | 126,617 | |||||||||
United States Cellular Corp. | 17 | 16,115 | ||||||||||
Verizon Communications, Inc. | ||||||||||||
5.15%, 9/15/23 | 192 | 206,149 | ||||||||||
6.55%, 9/15/43 | 299 | 349,818 | ||||||||||
|
| |||||||||||
| 1,330,124 | ||||||||||||
|
| |||||||||||
CONSUMER CYCLICAL– |
| |||||||||||
Ford Motor Credit Co. LLC | 455 | 515,837 | ||||||||||
|
| |||||||||||
CONSUMER CYCLICAL–ENTERTAINMENT–0.2% |
| |||||||||||
Time Warner, Inc. | 105 | 132,885 | ||||||||||
Viacom, Inc. | 60 | 68,239 | ||||||||||
|
| |||||||||||
| 201,124 | ||||||||||||
|
| |||||||||||
CONSUMER CYCLICAL– |
| |||||||||||
Dollar General Corp. | 50 | 53,086 | ||||||||||
|
| |||||||||||
CONSUMER NON-CYCLICAL–1.0% |
| |||||||||||
Ahold Finance USA LLC | 290 | 343,409 | ||||||||||
Kroger Co. (The) | 194 | 188,175 | ||||||||||
Reynolds American, Inc. | 127 | 117,058 | ||||||||||
Thermo Fisher Scientific, Inc. | 78 | 77,259 | ||||||||||
Tyson Foods, Inc. | 143 | 145,598 | ||||||||||
|
| |||||||||||
| 871,499 | ||||||||||||
|
| |||||||||||
ENERGY–2.2% | ||||||||||||
Anadarko Petroleum Corp. | 124 | 139,244 | ||||||||||
Encana Corp. | U.S.$ | 45 | $ | 44,680 | ||||||||
Hess Corp. | 19 | 24,213 | ||||||||||
Nabors Industries, Inc. | 170 | 170,557 | ||||||||||
Noble Energy, Inc. | 238 | 295,821 | ||||||||||
Noble Holding International Ltd. | ||||||||||||
3.95%, 3/15/22 | 125 | 122,202 | ||||||||||
4.90%, 8/01/20 | 32 | 33,772 | ||||||||||
Phillips 66 | 232 | 235,762 | ||||||||||
Transocean, Inc. | ||||||||||||
3.80%, 10/15/22 | 75 | 71,087 | ||||||||||
6.375%, 12/15/21 | 1 | 1,124 | ||||||||||
6.50%, 11/15/20 | 120 | 137,033 | ||||||||||
Valero Energy Corp. | 177 | 202,174 | ||||||||||
Weatherford International Ltd./Bermuda | ||||||||||||
5.125%, 9/15/20 | 95 | 102,055 | ||||||||||
6.00%, 3/15/18 | 12 | 13,467 | ||||||||||
9.625%, 3/01/19 | 190 | 244,124 | ||||||||||
|
| |||||||||||
| 1,837,315 | ||||||||||||
|
| |||||||||||
TECHNOLOGY–1.1% | ||||||||||||
Baidu, Inc. | 220 | 218,482 | ||||||||||
Hewlett-Packard Co. | 107 | 110,175 | ||||||||||
Motorola Solutions, Inc. | ||||||||||||
3.50%, 3/01/23 | 165 | 152,649 | ||||||||||
7.50%, 5/15/25 | 25 | 29,659 | ||||||||||
Telefonaktiebolaget LM Ericsson | 300 | 291,591 | ||||||||||
Total System Services, Inc. | ||||||||||||
2.375%, 6/01/18 | 74 | 71,993 | ||||||||||
3.75%, 6/01/23 | 69 | 63,782 | ||||||||||
|
| |||||||||||
| 938,331 | ||||||||||||
|
| |||||||||||
TRANSPORTATION– | ||||||||||||
Southwest Airlines Co. | 75 | 83,555 | ||||||||||
|
| |||||||||||
TRANSPORTATION– | ||||||||||||
Ryder System, Inc. | ||||||||||||
5.85%, 11/01/16 | 116 | 128,504 | ||||||||||
7.20%, 9/01/15 | 108 | 118,560 | ||||||||||
|
| |||||||||||
| 247,064 | ||||||||||||
|
| |||||||||||
| 9,979,775 | ||||||||||||
|
| |||||||||||
FINANCIAL | ||||||||||||
BANKING–4.2% | ||||||||||||
ABN AMRO Bank NV | 225 | 223,919 | ||||||||||
8
| AllianceBernstein Variable Products Series Fund |
| Principal Amount (000) | U.S. $ Value | |||||||||||
Bank of America Corp. | U.S.$ | 113 | $ | 129,237 | ||||||||
BNP Paribas SA | 62 | 63,318 | ||||||||||
BPCE SA | 225 | 231,809 | ||||||||||
Compass Bank | 250 | 255,862 | ||||||||||
Credit Suisse AG | 240 | 251,206 | ||||||||||
Danske Bank A/S | GBP | 98 | 164,312 | |||||||||
Goldman Sachs Group, Inc. (The) | U.S.$ | 395 | 452,898 | |||||||||
LBG Capital No.2 PLC | EUR | 50 | 103,005 | |||||||||
Macquarie Group Ltd. | U.S.$ | 232 | 249,820 | |||||||||
Morgan Stanley | 140 | 156,576 | ||||||||||
Murray Street Investment | 27 | 29,076 | ||||||||||
Nationwide Building Society | 230 | 263,228 | ||||||||||
Rabobank Capital Funding Trust III | 90 | 93,825 | ||||||||||
Royal Bank of Scotland PLC (The) | 39 | 45,660 | ||||||||||
Skandinaviska Enskilda Banken AB | 100 | 102,000 | ||||||||||
Standard Chartered PLC | 265 | 268,445 | ||||||||||
UBS AG/Stamford CT | 250 | 286,329 | ||||||||||
Unicredit Luxembourg Finance SA | 190 | 202,155 | ||||||||||
|
| |||||||||||
| 3,572,680 | ||||||||||||
|
| |||||||||||
INSURANCE–2.2% | ||||||||||||
American International Group, Inc. | 75 | 80,612 | ||||||||||
6.40%, 12/15/20 | 215 | 254,100 | ||||||||||
Guardian Life Insurance Co. of America | 164 | 210,249 | ||||||||||
Hartford Financial Services Group, Inc. | 200 | 224,792 | ||||||||||
Humana, Inc. | U.S.$ | 50 | $ | 57,246 | ||||||||
7.20%, 6/15/18 | 85 | 100,559 | ||||||||||
Lincoln National Corp. | 113 | 145,449 | ||||||||||
Massachusetts Mutual Life Insurance Co. | 110 | 157,637 | ||||||||||
MetLife, Inc. | 109 | 135,106 | ||||||||||
10.75%, 8/01/39 | 85 | 125,375 | ||||||||||
Nationwide Mutual Insurance Co. | 100 | 140,233 | ||||||||||
Prudential Financial, Inc. | 185 | 181,300 | ||||||||||
|
| |||||||||||
| 1,812,658 | ||||||||||||
|
| |||||||||||
REITS–0.7% | ||||||||||||
HCP, Inc. | 278 | 302,625 | ||||||||||
Health Care REIT, Inc. | 275 | 293,049 | ||||||||||
|
| |||||||||||
| 595,674 | ||||||||||||
|
| |||||||||||
| 5,981,012 | ||||||||||||
|
| |||||||||||
UTILITY – 3.2% |
| |||||||||||
ELECTRIC–0.6% | ||||||||||||
CMS Energy Corp. | 37 | 39,944 | ||||||||||
Constellation Energy Group, Inc. | 64 | 68,102 | ||||||||||
MidAmerican Energy Holdings Co. | 170 | 193,131 | ||||||||||
TECO Finance, Inc. | 95 | 100,726 | ||||||||||
5.15%, 3/15/20 | 120 | 131,604 | ||||||||||
|
| |||||||||||
| 533,507 | ||||||||||||
|
| |||||||||||
NATURAL GAS–2.6% | ||||||||||||
DCP Midstream LLC | 108 | 112,877 | ||||||||||
Energy Transfer Partners LP | 336 | 394,223 | ||||||||||
Enterprise Products Operating LLC | 55 | 61,181 | ||||||||||
Kinder Morgan Energy Partners LP | 321 | 312,802 | ||||||||||
4.15%, 3/01/22 | 89 | 88,353 | ||||||||||
ONEOK, Inc. | 310 | 291,628 | ||||||||||
Talent Yield Investments Ltd. | 305 | 299,882 | ||||||||||
TransCanada PipeLines Ltd. | 235 | 241,395 | ||||||||||
Williams Cos., Inc. (The) | 209 | 182,417 | ||||||||||
9
| INTERMEDIATE BOND PORTFOLIO | ||
| PORTFOLIOOF INVESTMENTS | ||
| (continued) | AllianceBernstein Variable Products Series Fund | |
| Principal Amount (000) | U.S. $ Value | |||||||||||
Williams Partners LP | U.S.$ | 173 | $ | 189,171 | ||||||||
|
| |||||||||||
| 2,173,929 | ||||||||||||
|
| |||||||||||
| 2,707,436 | ||||||||||||
|
| |||||||||||
NON CORPORATE |
| |||||||||||
AGENCIES–NOT GOVERNMENT GUARANTEED–0.6% | ||||||||||||
CNOOC Finance 2013 Ltd. | 260 | 232,228 | ||||||||||
Gazprom OAO Via Gaz Capital SA | 215 | 237,037 | ||||||||||
|
| |||||||||||
| 469,265 | ||||||||||||
|
| |||||||||||
Total Corporates–Investment Grades (cost $18,208,527) | 19,137,488 | |||||||||||
|
| |||||||||||
ASSET-BACKED |
| |||||||||||
AUTOS–FIXED RATE–9.5% | ||||||||||||
Ally Auto Receivables Trust | 392 | 392,679 | ||||||||||
Ally Master Owner Trust | 260 | 260,269 | ||||||||||
AmeriCredit Automobile Receivables Trust | 355 | 356,254 | ||||||||||
Series 2013-1, Class A2 | 153 | 153,258 | ||||||||||
Series 2013-3, Class A3 | 335 | 334,981 | ||||||||||
Series 2013-4, Class A3 | 130 | 130,197 | ||||||||||
Series 2013-5, Class A2A | 85 | 84,996 | ||||||||||
Avis Budget Rental Car Funding AESOP LLC | 210 | 209,690 | ||||||||||
Series 2013-2A, Class A | 288 | 293,200 | ||||||||||
Bank of America Auto Trust | 245 | 246,872 | ||||||||||
Capital Auto Receivables Asset Trust | 275 | 275,885 | ||||||||||
Capital Auto Receivables Asset Trust/Ally | 202 | 201,855 | ||||||||||
CarMax Auto Owner Trust | 142 | 142,067 | ||||||||||
Exeter Automobile Receivables Trust | U.S.$ | 121 | $ | 121,290 | ||||||||
Series 2013-1A, Class A | 98 | 97,809 | ||||||||||
Fifth Third Auto Trust | 204 | 203,893 | ||||||||||
Flagship Credit Auto Trust | 85 | 85,340 | ||||||||||
Ford Auto Securitization Trust | CAD | 131 | 123,103 | |||||||||
Series 2013-R1A, Class A2 | 205 | 193,123 | ||||||||||
Series 2013-R4A, Class A1 | 88 | 83,332 | ||||||||||
Ford Credit Auto Lease Trust | U.S.$ | 110 | 110,367 | |||||||||
Ford Credit Auto Owner Trust | 100 | 98,893 | ||||||||||
Ford Credit Floorplan Master Owner Trust | 640 | 640,856 | ||||||||||
Series 2013-1, Class A1 | 136 | 135,978 | ||||||||||
Harley-Davidson Motorcycle Trust | 195 | 195,175 | ||||||||||
Hertz Vehicle Financing LLC | 175 | 174,663 | ||||||||||
Series 2013-1A, Class A2 | 485 | 476,090 | ||||||||||
Hyundai Auto Lease Securitization Trust | 264 | 264,263 | ||||||||||
M&T Bank Auto Receivables Trust | 160 | 160,405 | ||||||||||
Mercedes-Benz Auto Lease Trust | 173 | 173,097 | ||||||||||
Mercedes-Benz Master Owner Trust | 373 | 373,264 | ||||||||||
Navistar Financial Corp. Owner Trust | 63 | 63,402 | ||||||||||
10
| AllianceBernstein Variable Products Series Fund |
| Principal Amount (000) | U.S. $ Value | |||||||||||
Nissan Auto Lease Trust | U.S.$ | 84 | $ | 84,429 | ||||||||
Santander Drive Auto Receivables Trust | 280 | 280,847 | ||||||||||
Series 2012-6, Class A2 | 37 | 37,167 | ||||||||||
Series 2013-3, Class C | 249 | 245,900 | ||||||||||
Series 2013-4, Class A3 | 270 | 271,274 | ||||||||||
Series 2013-5, Class A2A | 131 | 130,969 | ||||||||||
SMART Trust/Australia | 98 | 98,022 | ||||||||||
|
| |||||||||||
| 8,005,154 | ||||||||||||
|
| |||||||||||
CREDIT CARDS–FIXED | ||||||||||||
American Express Credit Account Master Trust Series 2012-2, Class A | 620 | 621,051 | ||||||||||
Series 2012-5, Class A | 325 | 324,847 | ||||||||||
Cabela’s Master Credit Card Trust | 255 | 235,700 | ||||||||||
Chase Issuance Trust | 220 | 215,971 | ||||||||||
Discover Card Execution Note Trust | 224 | 224,784 | ||||||||||
Discover Card Master Trust | 300 | 301,214 | ||||||||||
Dryrock Issuance Trust | 320 | 319,907 | ||||||||||
World Financial Network Credit Card Master Trust | 190 | 189,665 | ||||||||||
|
| |||||||||||
| 2,433,139 | ||||||||||||
|
| |||||||||||
AUTOS–FLOATING RATE–1.1% | ||||||||||||
Ford Credit Floorplan Master Owner Trust | 430 | 436,708 | ||||||||||
GE Dealer Floorplan Master Note Trust | U.S.$ | 485 | $ | 486,300 | ||||||||
|
| |||||||||||
| 923,008 | ||||||||||||
|
| |||||||||||
OTHER ABS–FIXED RATE–1.0% | ||||||||||||
CIT Equipment Collateral | 213 | 213,032 | ||||||||||
CNH Equipment Trust | ||||||||||||
Series 2012-A, Class A3 | 173 | 173,382 | ||||||||||
Series 2013-C, Class A | 180 | 180,332 | ||||||||||
Series 2013-D, Class A2 | 211 | 210,754 | ||||||||||
GE Equipment Midticket LLC | 78 | 78,377 | ||||||||||
|
| |||||||||||
| 855,877 | ||||||||||||
|
| |||||||||||
CREDIT CARDS–FLOATING RATE–0.8% | ||||||||||||
Gracechurch Card Funding PLC | 320 | 321,624 | ||||||||||
Penarth Master Issuer PLC | 335 | 335,079 | ||||||||||
|
| |||||||||||
| 656,703 | ||||||||||||
|
| |||||||||||
HOME EQUITY LOANS–FLOATING RATE–0.3% | ||||||||||||
Asset Backed Funding Certificates | 57 | 54,789 | ||||||||||
GSAA Home Equity Trust | 208 | 141,222 | ||||||||||
HSBC Home Equity Loan Trust Series 2005-3, Class A1 | 63 | 62,747 | ||||||||||
|
| |||||||||||
| 258,758 | ||||||||||||
|
| |||||||||||
HOME EQUITY LOANS–FIXED RATE–0.2% | ||||||||||||
Citifinancial Mortgage Securities, Inc. | 49 | 50,074 | ||||||||||
Credit-Based Asset Servicing and Securitization LLC | 106 | 105,504 | ||||||||||
|
| |||||||||||
| 155,578 | ||||||||||||
|
| |||||||||||
Total Asset-Backed Securities | 13,288,217 | |||||||||||
|
| |||||||||||
11
| INTERMEDIATE BOND PORTFOLIO | ||
| PORTFOLIOOF INVESTMENTS | ||
| (continued) | AllianceBernstein Variable Products Series Fund | |
| Principal Amount (000) | U.S. $ Value | |||||||||||
COMMERCIAL MORTGAGE-BACKED SECURITIES–9.4% |
| |||||||||||
NON-AGENCY FIXED RATE | ||||||||||||
CGRBS Commercial Mortgage Trust | U.S.$ | 260 | $ | 246,959 | ||||||||
Citigroup Commercial Mortgage Trust | 131 | 142,444 | ||||||||||
COBALT CMBS Commercial Mortgage Trust | 191 | 210,801 | ||||||||||
Commercial Mortgage Pass-Through Certificates | 124 | 119,654 | ||||||||||
Credit Suisse Commercial Mortgage Trust | 105 | 103,783 | ||||||||||
Extended Stay America Trust | 180 | 177,071 | ||||||||||
Greenwich Capital Commercial Funding Corp. | 506 | 556,307 | ||||||||||
GS Mortgage Securities Corp. II | 232 | 234,763 | ||||||||||
Series 2013-KING, Class A | 277 | 272,236 | ||||||||||
JP Morgan Chase Commercial Mortgage Securities Trust | 476 | 522,043 | ||||||||||
Series 2007-CB20, Class A1A | 420 | 470,545 | ||||||||||
Series 2010-C2, Class A1 | 211 | 216,267 | ||||||||||
LB-UBS Commercial Mortgage Trust | 195 | 195,840 | ||||||||||
Merrill Lynch Mortgage Trust | 225 | 225,103 | ||||||||||
Series 2006-C2, Class A1A | 160 | 175,091 | ||||||||||
Merrill Lynch/Countrywide Commercial Mortgage Trust | U.S.$ | 1,105 | $ | 1,227,768 | ||||||||
ML-CFC Commercial Mortgage Trust | 606 | 660,588 | ||||||||||
Morgan Stanley Capital I Trust | 378 | 422,320 | ||||||||||
Motel 6 Trust | 280 | 277,184 | ||||||||||
UBS-Barclays Commercial Mortgage Trust | 60 | 56,847 | ||||||||||
Series 2012-C4, Class A5 | 112 | 104,471 | ||||||||||
Wachovia Bank Commercial Mortgage Trust | 424 | 463,822 | ||||||||||
WF-RBS Commercial Mortgage Trust | 233 | 223,634 | ||||||||||
|
| |||||||||||
| 7,305,541 | ||||||||||||
|
| |||||||||||
NON-AGENCY FLOATING RATE CMBS–0.7% | ||||||||||||
Banc of America Commercial Mortgage Trust | 78 | 82,893 | ||||||||||
Extended Stay America Trust | 140 | 139,258 | ||||||||||
GS Mortgage Securities Corp. II | 275 | 273,880 | ||||||||||
GS Mortgage Securities Trust | 136 | 127,538 | ||||||||||
|
| |||||||||||
| 623,569 | ||||||||||||
|
| |||||||||||
Total Commercial Mortgage-Backed Securities | 7,929,110 | |||||||||||
|
| |||||||||||
12
| AllianceBernstein Variable Products Series Fund |
| Principal Amount (000) | U.S. $ Value | |||||||||||
GOVERNMENTS– |
| |||||||||||
UNITED STATES–9.0% | ||||||||||||
U.S. Treasury Bonds | U.S.$ | 245 | $ | 231,372 | ||||||||
4.625%, 2/15/40 | 2,865 | 3,235,659 | ||||||||||
U.S. Treasury Notes | 1,800 | 1,797,890 | ||||||||||
1.375%, 9/30/18 | 925 | 913,726 | ||||||||||
1.50%, 8/31/18 | 935 | 930,252 | ||||||||||
2.50%, 8/15/23 | 505 | 484,958 | ||||||||||
|
| |||||||||||
Total Governments–Treasuries | 7,593,857 | |||||||||||
|
| |||||||||||
AGENCIES–4.9% |
| |||||||||||
AGENCY | ||||||||||||
Federal National Mortgage Association | 1,670 | 2,093,584 | ||||||||||
6.625%, 11/15/30 | 80 | 104,062 | ||||||||||
Residual Funding Corp. Principal Strip | 2,292 | 1,912,853 | ||||||||||
|
| |||||||||||
Total Agencies | 4,110,499 | |||||||||||
|
| |||||||||||
CORPORATES–NON-INVESTMENT GRADES–3.2% |
| |||||||||||
FINANCIAL INSTITUTIONS–1.7% | ||||||||||||
BANKING–1.2% | ||||||||||||
ABN Amro Bank NV | EUR | 60 | 82,088 | |||||||||
Bank of America Corp. | U.S.$ | 108 | 95,040 | |||||||||
Barclays Bank PLC | 280 | 298,200 | ||||||||||
Citigroup, Inc. | 161 | 148,981 | ||||||||||
HBOS Capital Funding LP | 95 | 94,644 | ||||||||||
LBG Capital No.1 PLC | 175 | 186,855 | ||||||||||
Societe Generale SA | EUR | 48 | 66,034 | |||||||||
|
| |||||||||||
| 971,842 | ||||||||||||
|
| |||||||||||
FINANCE–0.5% | ||||||||||||
Aviation Capital Group Corp. | U.S.$ | 155 | 173,661 | |||||||||
SLM Corp. | 5 | 5,288 | ||||||||||
Series A | 248 | 252,340 | ||||||||||
|
| |||||||||||
| 431,289 | ||||||||||||
|
| |||||||||||
| 1,403,131 | ||||||||||||
|
| |||||||||||
INDUSTRIAL–1.5% | ||||||||||||
BASIC–0.0% | ||||||||||||
Eagle Spinco, Inc. | U.S.$ | 22 | $ | 21,560 | ||||||||
|
| |||||||||||
CAPITAL GOODS–0.5% | ||||||||||||
B/E Aerospace, Inc. | 100 | 101,500 | ||||||||||
Ball Corp. | 195 | 193,050 | ||||||||||
Sealed Air Corp. | 81 | 78,772 | ||||||||||
|
| |||||||||||
| 373,322 | ||||||||||||
|
| |||||||||||
COMMUNICATIONS– |
| |||||||||||
DISH DBS Corp. | 100 | 93,250 | ||||||||||
Sirius XM Holdings, Inc. | 101 | 91,405 | ||||||||||
|
| |||||||||||
| 184,655 | ||||||||||||
|
| |||||||||||
COMMUNICATIONS– |
| |||||||||||
MetroPCS Wireless, Inc. | 90 | 92,925 | ||||||||||
Sprint Corp. | 100 | 107,500 | ||||||||||
|
| |||||||||||
| 200,425 | ||||||||||||
|
| |||||||||||
CONSUMER CYCLICAL– | ||||||||||||
Dana Holding Corp. | 37 | 37,093 | ||||||||||
|
| |||||||||||
CONSUMER CYCLICAL–ENTERTAINMENT–0.0% |
| |||||||||||
Greektown Holdings LLC | 55 | 0 | ||||||||||
|
| |||||||||||
CONSUMER CYCLICAL– |
| |||||||||||
Wynn Las Vegas LLC/Wynn Las Vegas Capital Corp. | 190 | 191,900 | ||||||||||
|
| |||||||||||
CONSUMER |
| |||||||||||
HCA, Inc. | 100 | 94,000 | ||||||||||
|
| |||||||||||
ENERGY–0.2% |
| |||||||||||
Cimarex Energy Co. | 93 | 98,347 | ||||||||||
Denbury Resources, Inc. | 102 | 92,055 | ||||||||||
|
| |||||||||||
| 190,402 | ||||||||||||
|
| |||||||||||
| 1,293,357 | ||||||||||||
|
| |||||||||||
13
| INTERMEDIATE BOND PORTFOLIO | ||
| PORTFOLIOOF INVESTMENTS | ||
| (continued) | AllianceBernstein Variable Products Series Fund | |
| Principal Amount (000) | U.S. $ Value | |||||||||||
UTILITY–0.0% | ||||||||||||
NATURAL GAS–0.0% |
| |||||||||||
Regency Energy Partners LP/Regency Energy Finance Corp. | U.S.$ | 29 | $ | 26,390 | ||||||||
|
| |||||||||||
Total Corporates–Non-Investment Grades | 2,722,878 | |||||||||||
|
| |||||||||||
QUASI-SOVEREIGNS–2.5% | ||||||||||||
QUASI-SOVEREIGN |
| |||||||||||
CHINA–0.3% | ||||||||||||
Sinopec Group Overseas Development 2013 Ltd. | 225 | 221,757 | ||||||||||
|
| |||||||||||
INDONESIA–0.4% | ||||||||||||
Perusahaan Listrik Negara PT | 360 | 346,500 | ||||||||||
|
| |||||||||||
KAZAKHSTAN–0.3% | ||||||||||||
KazMunayGas National Co. JSC | 212 | 237,970 | ||||||||||
|
| |||||||||||
MALAYSIA–0.5% | ||||||||||||
Petronas Capital Ltd. | 420 | 460,341 | ||||||||||
|
| |||||||||||
MEXICO–0.2% | ||||||||||||
Petroleos Mexicanos | 130 | 133,412 | ||||||||||
|
| |||||||||||
SOUTH KOREA–0.4% | ||||||||||||
Korea National Oil Corp. | 310 | 319,274 | ||||||||||
|
| |||||||||||
UNITED ARAB EMIRATES–0.4% |
| |||||||||||
IPIC GMTN Ltd. | 360 | 379,350 | ||||||||||
|
| |||||||||||
Total Quasi-Sovereigns | 2,098,604 | |||||||||||
|
| |||||||||||
INFLATION-LINKED SECURITIES–2.2% | ||||||||||||
UNITED STATES–2.2% | ||||||||||||
U.S. Treasury Inflation Index | 1,783 | 1,830,761 | ||||||||||
|
| |||||||||||
COLLATERALIZED MORTGAGE OBLIGATIONS–2.0% | ||||||||||||
NON-AGENCY FLOATING RATE–0.8% | ||||||||||||
Deutsche Alt-A Securities Mortgage Loan Trust | 219 | 125,475 | ||||||||||
HomeBanc Mortgage Trust | 117 | 97,061 | ||||||||||
IndyMac Index Mortgage Loan Trust | U.S.$ | 166 | $ | 123,657 | ||||||||
Series 2006-AR27, Class 2A2 | 177 | 149,444 | ||||||||||
Washington Mutual Mortgage Pass-Through Certificates | 224 | 177,049 | ||||||||||
|
| |||||||||||
| 672,686 | ||||||||||||
|
| |||||||||||
NON-AGENCY FIXED RATE–0.7% | ||||||||||||
Citigroup Mortgage Loan Trust, Inc. | 121 | 115,674 | ||||||||||
Countrywide Home Loan Mortgage Pass-Through Trust | 171 | 136,980 | ||||||||||
First Horizon Alternative Mortgage Securities Trust | 142 | 120,443 | ||||||||||
JP Morgan Alternative Loan Trust | 261 | 194,433 | ||||||||||
|
| |||||||||||
| 567,530 | ||||||||||||
|
| |||||||||||
AGENCY FIXED RATE–0.5% | ||||||||||||
Fannie Mae Grantor Trust | 50 | 44,591 | ||||||||||
Federal Home Loan Mortgage Corp. | 820 | 159,474 | ||||||||||
Series 4182, Class DI | 800 | 142,558 | ||||||||||
Freddie Mac Strips | 572 | 91,075 | ||||||||||
|
| |||||||||||
| 437,698 | ||||||||||||
|
| |||||||||||
Total Collateralized Mortgage Obligations | 1,677,914 | |||||||||||
|
| |||||||||||
14
| AllianceBernstein Variable Products Series Fund |
| Principal Amount (000) | U.S. $ Value | |||||||||||
LOCAL GOVERNMENTS-MUNICIPAL BONDS–1.8% |
| |||||||||||
UNITED STATES–1.8% | ||||||||||||
Broward Cnty FL Arpt System Revenue (Fort Lauderdale Hollywood Intl Arpt Fl) | U.S.$ | 240 | $ | 237,454 | ||||||||
California GO | 200 | 261,574 | ||||||||||
City Public Service Board of San Antonio | 240 | 244,195 | ||||||||||
Contra Costa CA Community College District | 240 | 248,302 | ||||||||||
Metropolitan Trnsp Auth NY | 255 | 257,073 | ||||||||||
University of Massachusetts Building Authority | 240 | 249,528 | ||||||||||
|
| |||||||||||
Total Local Governments-Municipal Bonds | 1,498,126 | |||||||||||
|
| |||||||||||
GOVERNMENTS-SOVEREIGN |
| |||||||||||
QATAR–0.5% | ||||||||||||
Qatar Government International Bond | 360 | 381,060 | ||||||||||
|
| |||||||||||
TURKEY–0.2% | ||||||||||||
Turkey Government International Bond | 260 | 199,030 | ||||||||||
|
| |||||||||||
Total Governments-Sovereign Bonds | 580,090 | |||||||||||
|
| |||||||||||
| Shares | ||||||||||||
PREFERRED | ||||||||||||
FINANCIAL |
| |||||||||||
BANKING–0.1% | ||||||||||||
Morgan Stanley | 5,000 | 130,700 | ||||||||||
|
| |||||||||||
INSURANCE–0.3% | ||||||||||||
Allstate Corp. (The) | 9,175 | 221,209 | ||||||||||
|
| |||||||||||
REITS–0.1% | ||||||||||||
Sovereign Real Estate Investment Trust 12.00%(c) | 93 | 115,249 | ||||||||||
|
| |||||||||||
Total Preferred Stocks | 467,158 | |||||||||||
|
| |||||||||||
EMERGING MARKETS–CORPORATE BONDS–0.1% |
| |||||||||||
INDUSTRIAL–0.1% | ||||||||||||
CONSUMER NON-CYCLICAL–0.1% | ||||||||||||
Marfrig Overseas Ltd. 9.50%, 5/04/20(c) (cost $99,765) | U.S.$ | 100 | $ | 93,000 | ||||||||
|
| |||||||||||
GOVERNMENTS–SOVEREIGN AGENCIES–0.1% |
| |||||||||||
GERMANY–0.1% | ||||||||||||
Landwirtschaftliche Rentenbank 5.125%, 2/01/17 | 70 | 78,754 | ||||||||||
|
| |||||||||||
| Shares | ||||||||||||
COMMON STOCKS–0.0% |
| |||||||||||
Greektown Superholdings, Inc.(d)(e)(f) | 41 | 3,690 | ||||||||||
|
| |||||||||||
WARRANTS–0.0% | ||||||||||||
Talon Equity Co. NV, expiring 11/24/15(d)(e)(f) | 47 | 0 | ||||||||||
|
| |||||||||||
| Principal Amount (000) | ||||||||||||
SHORT-TERM | ||||||||||||
TIME DEPOSIT–14.5% | ||||||||||||
State Street Time Deposit 0.01%, 1/02/14 (cost $12,209,376) | 12,209 | 12,209,376 | ||||||||||
|
| |||||||||||
GOVERNMENTS– | ||||||||||||
JAPAN–2.9% | ||||||||||||
Japan Treasury Discount Bill | JPY | 140,000 | 1,329,384 | |||||||||
Series 403 | 120,000 | 1,139,462 | ||||||||||
|
| |||||||||||
Total Governments-Treasuries | 2,468,846 | |||||||||||
|
| |||||||||||
Total Short-Term Investments | 14,678,222 | |||||||||||
|
| |||||||||||
TOTAL INVESTMENTS–115.1% | 96,988,114 | |||||||||||
Other assets less liabilities–(15.1)% | (12,690,345 | ) | ||||||||||
|
| |||||||||||
NET ASSETS–100.0% | $ | 84,297,769 | ||||||||||
|
| |||||||||||
15
| INTERMEDIATE BOND PORTFOLIO | ||
| PORTFOLIOOF INVESTMENTS | ||
| (continued) | AllianceBernstein Variable Products Series Fund | |
FUTURES (see Note D)
| Type | Number of Contracts | Expiration Month | Original Value | Value at December 31, 2013 | Unrealized Appreciation/ (Depreciation) | |||||||||||||
Purchased Contracts | ||||||||||||||||||
U.S. T-Note 5 Yr (CBT) Futures | 10 | March 2014 | $ | 1,208,803 | $ | 1,193,125 | $ | (15,678 | ) | |||||||||
U.S. T-Note 10 Yr (CBT) Futures | 11 | March 2014 | 1,378,367 | 1,353,516 | (24,851 | ) | ||||||||||||
Sold Contracts | ||||||||||||||||||
U.S. T-Note 2 Yr (CBT) Futures | 6 | March 2014 | 1,321,304 | 1,318,875 | 2,429 | |||||||||||||
|
| |||||||||||||||||
| $ | (38,100 | ) | ||||||||||||||||
|
| |||||||||||||||||
FORWARD CURRENCY EXCHANGE CONTRACTS (see Note D)
| Counterparty | Contracts to Deliver (000) | In Exchange For (000) | Settlement Date | Unrealized Appreciation/ (Depreciation) | ||||||||||||
Barclays Bank PLC Wholesale | JPY | 140,000 | USD | 1,381 | 1/14/14 | $ | 51,116 | |||||||||
Barclays Bank PLC Wholesale | JPY | 120,000 | USD | 1,183 | 1/21/14 | 43,817 | ||||||||||
Credit Suisse International | CAD | 696 | USD | 653 | 1/16/14 | (2,104 | ) | |||||||||
Goldman Sachs Bank USA | CAD | 483 | USD | 452 | 1/16/14 | (2,002) | ||||||||||
HSBC Bank USA | GBP | 98 | USD | 159 | 1/30/14 | (3,214 | ) | |||||||||
State Street Bank & Trust Co. | USD | 31 | CAD | 34 | 1/16/14 | 260 | ||||||||||
State Street Bank & Trust Co. | USD | 648 | NZD | 788 | 2/14/14 | (1,527 | ) | |||||||||
UBS AG | EUR | 188 | USD | 259 | 1/30/14 | (125 | ) | |||||||||
|
| |||||||||||||||
| $ | 86,221 | |||||||||||||||
|
| |||||||||||||||
CENTRALLY CLEARED CREDIT DEFAULT SWAPS (see Note D)
| Swap Counterparty & Referenced Obligation | Fixed Rate (Pay) Receive | Implied Credit Spread at December 31, 2013 | Notional Amount (000) | Market Value | Upfront Premiums Paid (Received) | Unrealized Appreciation/ (Depreciation) | ||||||||||||||||||
Buy Contracts | ||||||||||||||||||||||||
Morgan Stanley & Co., LLC/(INTRCONX): | ||||||||||||||||||||||||
CDX-NAHY Series 21, 5 Year Index, 12/20/18* | (5.00 | )% | 3.03 | % | $ | 1,350 | $ | (117,423) | $ | (54,029) | $ | (63,394) | ||||||||||||
| * | Termination date |
16
| AllianceBernstein Variable Products Series Fund |
CREDIT DEFAULT SWAPS (see Note D)
| Swap Counterparty & Referenced Obligation | Fixed Rate (Pay) Receive | Implied Credit Spread at December 31, 2013 | Notional Amount (000) | Market Value | Upfront Premiums Paid (Received) | Unrealized Appreciation/ (Depreciation) | ||||||||||||||||||
Sale Contracts | ||||||||||||||||||||||||
Credit Suisse International: | ||||||||||||||||||||||||
Anadarko Petroleum Corp., | 1.00 | % | 2.63 | % | $ | 270 | $ | 5,179 | $ | (7,067) | $ | 12,246 | ||||||||||||
| * | Termination date |
INTEREST RATE SWAPS (see Note D)
| Rate Type | ||||||||||||||||||||
| Swap Counterparty | Notional Amount (000) | Termination Date | Payments made by the Fund | Payments received by the Fund | Unrealized Appreciation/ (Depreciation) | |||||||||||||||
JPMorgan Chase Bank, NA | $ | 1,390 | 1/30/17 | 1.059 | % | 3 Month LIBOR | $ | (12,064 | ) | |||||||||||
JPMorgan Chase Bank, NA | 1,520 | 2/07/22 | 2.043 | % | 3 Month LIBOR | 68,403 | ||||||||||||||
|
| |||||||||||||||||||
| $ | 56,339 | |||||||||||||||||||
|
| |||||||||||||||||||
| (a) | Floating Rate Security. Stated interest rate was in effect at December 31, 2013. |
| (b) | Variable rate coupon, rate shown as of December 31, 2013. |
| (c) | Security is exempt from registration under Rule 144A of the Securities Act of 1933. These securities are considered liquid and may be resold in transactions exempt from registration, normally to qualified institutional buyers. At December 31, 2013, the aggregate market value of these securities amounted to $14,389,931 or 17.1% of net assets. |
| (d) | Non-income producing security. |
| (e) | Fair valued by the Adviser. |
| (f) | Illiquid security. |
| (g) | IO—Interest Only |
Currency Abbreviations:
CAD—Canadian Dollar
EUR—Euro
GBP—Great British Pound
JPY—Japanese Yen
NZD—New Zealand Dollar
USD—United States Dollar
Glossary:
ABS—Asset-Backed Securities
ARMs—Adjustable Rate Mortgages
CBT—Chicago Board of Trade
CDX-NAHY—North American High Yield Credit Default Swap Index
CFC—Customer Facility Charge
CMBS—Commercial Mortgage-Backed Securities
GO—General Obligation
INTRCONX—Inter-Continental Exchange
JSC—Joint Stock Company
LIBOR—London Interbank Offered Rates
REIT—Real Estate Investment Trust
TBA—To Be Announced
TIPS—Treasury Inflation Protected Security
See notes to financial statements.
17
| INTERMEDIATE BOND PORTFOLIO | ||
| STATEMENTOF ASSETS & LIABILITIES | ||
| December 31, 2013 | AllianceBernstein Variable Products Series Fund | |
ASSETS | ||||
Investments in securities, at value (cost $95,713,686) | $ | 96,988,114 | ||
Cash | 144,333 | (a)(b) | ||
Interest and dividends receivable | 510,518 | |||
Receivable for investment securities sold | 325,463 | |||
Unrealized appreciation of forward currency exchange contracts | 95,193 | |||
Unrealized appreciation on interest rate swaps | 68,403 | |||
Receivable for capital stock sold | 22,331 | |||
Unrealized appreciation on credit default swaps | 12,246 | |||
|
| |||
Total assets | 98,166,601 | |||
|
| |||
LIABILITIES | ||||
Payable for investment securities purchased | 13,505,905 | |||
Payable for capital stock redeemed | 137,656 | |||
Upfront premium received on centrally cleared credit default swaps | 54,029 | |||
Advisory fee payable | 31,598 | |||
Administrative fee payable | 13,886 | |||
Unrealized depreciation on interest rate swaps | 12,064 | |||
Unrealized depreciation of forward currency exchange contracts | 8,972 | |||
Upfront premium received on credit default swaps | 7,067 | |||
Distribution fee payable | 4,652 | |||
Payable for variation margin on centrally cleared credit default swaps | 3,888 | |||
Payable for variation margin on futures | 2,828 | |||
Transfer Agent fee payable | 112 | |||
Accrued expenses | 86,175 | |||
|
| |||
Total liabilities | 13,868,832 | |||
|
| |||
NET ASSETS | $ | 84,297,769 | ||
|
| |||
COMPOSITION OF NET ASSETS | ||||
Capital stock, at par | $ | 7,534 | ||
Additional paid-in capital | 79,090,868 | |||
Undistributed net investment income | 2,759,361 | |||
Accumulated net realized gain on investment and foreign currency transactions | 1,111,524 | |||
Net unrealized appreciation on investments and foreign currency denominated assets and liabilities | 1,328,482 | |||
|
| |||
| $ | 84,297,769 | |||
|
|
Net Asset Value Per Share—1 billion shares of capital stock authorized, $.001 par value
| Class | Net Assets | Shares Outstanding | Net Asset Value | |||||||||
A | $ | 61,847,572 | 5,512,625 | $ | 11.22 | |||||||
B | $ | 22,450,197 | 2,021,501 | $ | 11.11 | |||||||
| (a) | An amount of $24,550 has been segregated to collateralize margin requirements for open futures outstanding at December 31, 2013. |
| (b) | An amount of $43,461 has been segregated to collateralize margin requirements for open centrally cleared swaps outstanding at December 31, 2013. |
See notes to financial statements.
18
| INTERMEDIATE BOND PORTFOLIO | ||
| STATEMENTOF OPERATIONS | ||
| Year Ended December 31, 2013 | AllianceBernstein Variable Products Series Fund | |
INVESTMENT INCOME |
| |||
Interest | $ | 3,359,827 | ||
Dividends | 22,531 | |||
|
| |||
| 3,382,358 | ||||
|
| |||
EXPENSES | ||||
Advisory fee (see Note B) | 434,235 | |||
Distribution fee—Class B | 65,150 | |||
Transfer agency—Class A | 3,972 | |||
Transfer agency—Class B | 1,475 | |||
Custodian | 134,770 | |||
Administrative | 54,102 | |||
Audit | 48,767 | |||
Legal | 29,276 | |||
Printing | 23,321 | |||
Directors’ fees | 4,526 | |||
Miscellaneous | 6,747 | |||
|
| |||
Total expenses | 806,341 | |||
|
| |||
Net investment income | 2,576,017 | |||
|
| |||
REALIZED AND UNREALIZED GAIN (LOSS) ON INVESTMENT AND FOREIGN |
| |||
Net realized gain (loss) on: | ||||
Investment transactions | 1,194,794 | |||
Futures | 24,351 | |||
Swaps | (32,463 | ) | ||
Foreign currency transactions | 223,084 | |||
Net change in unrealized appreciation/depreciation of: | ||||
Investments | (6,155,832 | ) | ||
Futures | (37,339 | ) | ||
Swaps | 87,113 | |||
Foreign currency denominated assets and liabilities and other assets | (110,415 | ) | ||
|
| |||
Net loss on investment and foreign currency transactions | (4,806,707 | ) | ||
|
| |||
NET DECREASE IN NET ASSETS FROM OPERATIONS | $ | (2,230,690 | ) | |
|
| |||
See notes to financial statements.
19
| INTERMEDIATE BOND PORTFOLIO | ||
| STATEMENTOF CHANGESIN NET ASSETS | AllianceBernstein Variable Products Series Fund |
| Year Ended December 31, 2013 | Year Ended December 31, 2012 | |||||||
INCREASE (DECREASE) IN NET ASSETS FROM OPERATIONS | ||||||||
Net investment income | $ | 2,576,017 | $ | 3,114,481 | ||||
Net realized gain on investment and foreign currency transactions | 1,409,766 | 2,327,143 | * | |||||
Net change in unrealized appreciation/depreciation of investments and foreign currency denominated assets and liabilities and other assets | (6,216,473 | ) | 1,059,000 | |||||
Contributions from Adviser (see Note B) | –0 | – | 457,758 | * | ||||
|
|
|
| |||||
Net increase (decrease) in net assets from operations | (2,230,690 | ) | 6,958,382 | |||||
DIVIDENDS AND DISTRIBUTIONS TO SHAREHOLDERS FROM | ||||||||
Net investment income | ||||||||
Class A | (2,531,715 | ) | (3,744,770 | ) | ||||
Class B | (845,380 | ) | (1,288,079 | ) | ||||
Net realized gain on investment transactions | ||||||||
Class A | (2,053,818 | ) | (2,543,861 | ) | ||||
Class B | (749,834 | ) | (934,628 | ) | ||||
CAPITAL STOCK TRANSACTIONS | ||||||||
Net decrease | (15,758,067 | ) | (29,981,256 | ) | ||||
|
|
|
| |||||
Total decrease | (24,169,504 | ) | (31,534,212 | ) | ||||
NET ASSETS | ||||||||
Beginning of period | 108,467,273 | 140,001,485 | ||||||
|
|
|
| |||||
End of period (including undistributed net investment income of $2,759,361 and $3,196,442, respectively) | $ | 84,297,769 | $ | 108,467,273 | ||||
|
|
|
| |||||
| * | Amount reclassified from realized gain (loss) on investment transactions. |
See notes to financial statements.
20
| INTERMEDIATE BOND PORTFOLIO | ||
| NOTES TO FINANCIAL STATEMENTS | ||
| December 31, 2013 | AllianceBernstein Variable Products Series Fund | |
NOTE A: Significant Accounting Policies
The AllianceBernstein Intermediate Bond Portfolio (the “Portfolio”), is a series of AllianceBernstein Variable Products Series Fund, Inc. (the “Fund”). The Portfolio’s investment objective is to generate income and price appreciation without assuming what the Adviser considers undue risk. The Portfolio is diversified as defined under the Investment Company Act of 1940. The Fund was incorporated in the State of Maryland on November 17, 1987, as an open-end series investment company. The Fund offers thirteen separately managed pools of assets which have differing investment objectives and policies. The Portfolio offers Class A and Class B shares. Both classes of shares have identical voting, dividend, liquidating and other rights, except that Class B shares bear a distribution expense and have exclusive voting rights with respect to the Class B distribution plan.
The Portfolio offers and sells its shares only to separate accounts of certain life insurance companies for the purpose of funding variable annuity contracts and variable life insurance policies. Sales are made without a sales charge at the Portfolio’s net asset value per share.
The financial statements have been prepared in conformity with U.S. generally accepted accounting principles (“U.S. GAAP”) which require management to make certain estimates and assumptions that affect the reported amounts of assets and liabilities in the financial statements and amounts of income and expenses during the reporting period. Actual results could differ from those estimates. The following is a summary of significant accounting policies followed by the Portfolio.
1. Security Valuation
Portfolio securities are valued at their current market value determined on the basis of market quotations or, if market quotations are not readily available or are deemed unreliable, at “fair value” as determined in accordance with procedures established by and under the general supervision of the Fund’s Board of Directors (the “Board”).
In general, the market values of securities which are readily available and deemed reliable are determined as follows: securities listed on a national securities exchange (other than securities listed on the NASDAQ Stock Market, Inc. (“NASDAQ”)) or on a foreign securities exchange are valued at the last sale price at the close of the exchange or foreign securities exchange. If there has been no sale on such day, the securities are valued at the last traded price from the previous day. Securities listed on more than one exchange are valued by reference to the principal exchange on which the securities are traded; securities listed only on NASDAQ are valued in accordance with the NASDAQ Official Closing Price; listed or over the counter (“OTC”) market put or call options are valued at the mid level between the current bid and ask prices. If either a current bid or current ask price is unavailable, AllianceBernstein L.P. (the “Adviser”) will have discretion to determine the best valuation (e.g. last trade price in the case of listed options); open futures are valued using the closing settlement price or, in the absence of such a price, the most recent quoted bid price. If there are no quotations available for the day of valuation, the last available closing settlement price is used; U.S. government securities and other debt instruments having 60 days or less remaining until maturity are valued at amortized cost if their original maturity was 60 days or less; or by amortizing their fair value as of the 61st day prior to maturity if their original term to maturity exceeded 60 days; fixed-income securities, including mortgage-backed and asset-backed securities, may be valued on the basis of prices provided by a pricing service or at a price obtained from one or more of the major broker-dealers. In cases where broker-dealer quotes are obtained, the Adviser may establish procedures whereby changes in market yields or spreads are used to adjust, on a daily basis, a recently obtained quoted price on a security. Swaps and other derivatives are valued daily, primarily using independent pricing services, independent pricing models using market inputs, as well as third party broker-dealers or counterparties. Investment companies are valued at their net asset value each day.
Securities for which market quotations are not readily available (including restricted securities) or are deemed unreliable are valued at fair value. Factors considered in making this determination may include, but are not limited to, information obtained by contacting the issuer, analysts, analysis of the issuer’s financial statements or other available documents. In addition, the Portfolio may use fair value pricing for securities primarily traded in non-U.S. markets because most foreign markets close well before the Portfolio values its securities at 4:00 p.m., Eastern Time. The earlier close of these foreign markets gives rise to the possibility that significant events, including broad market moves, may have occurred in the interim and may materially affect the value of those securities.
2. Fair Value Measurements
In accordance with U.S. GAAP regarding fair value measurements, fair value is defined as the price that the Portfolio would receive to sell an asset or pay to transfer a liability in an orderly transaction between market participants at the measurement
21
| INTERMEDIATE BOND PORTFOLIO | ||
| NOTES TO FINANCIAL STATEMENTS | ||
| (continued) | AllianceBernstein Variable Products Series Fund | |
date. U.S. GAAP establishes a framework for measuring fair value, and a three-level hierarchy for fair value measurements based upon the transparency of inputs to the valuation of an asset or liability (including those valued based on their market values as described in Note A.1 above). Inputs may be observable or unobservable and refer broadly to the assumptions that market participants would use in pricing the asset or liability. Observable inputs reflect the assumptions market participants would use in pricing the asset or liability based on market data obtained from sources independent of the Portfolio. Unobservable inputs reflect the Portfolio’s own assumptions about the assumptions that market participants would use in pricing the asset or liability based on the best information available in the circumstances. Each investment is assigned a level based upon the observability of the inputs which are significant to the overall valuation. The three-tier hierarchy of inputs is summarized below.
| • | Level 1—quoted prices in active markets for identical investments |
| • | Level 2—other significant observable inputs (including quoted prices for similar investments, interest rates, prepayment speeds, credit risk, etc.) |
| • | Level 3—significant unobservable inputs (including the Portfolio’s own assumptions in determining the fair value of investments) |
The fair value of debt instruments, such as bonds, and over-the-counter derivatives is generally based on market price quotations, recently executed market transactions (where observable) or industry recognized modeling techniques and are generally classified as Level 2. Pricing vendor inputs to Level 2 valuations may include quoted prices for similar investments in active markets, interest rate curves, coupon rates, currency rates, yield curves, option adjusted spreads, default rates, credit spreads and other unique security features in order to estimate the relevant cash flows which are then discounted to calculate fair values. If these inputs are unobservable and significant to the fair value, these investments will be classified as Level 3. In addition, non-agency rated investments are classified as Level 3.
Where readily available market prices or relevant bid prices are not available for certain equity investments, such investments may be valued based on similar publicly traded investments, movements in relevant indices since last available prices or based upon underlying company fundamentals and comparable company data (such as multiples to earnings or other multiples to equity). Where an investment is valued using an observable input, such as another publicly traded security, the investment will be classified as Level 2. If management determines that an adjustment is appropriate based on restrictions on resale, illiquidity or uncertainty, and such adjustment is a significant component of the valuation, the investment will be classified as Level 3. An investment will also be classified as Level 3 where management uses company fundamentals and other significant inputs to determine the valuation.
Options and warrants are valued using market-based inputs to models, broker or dealer quotations, or alternative pricing sources with reasonable levels of price transparency, where such inputs and models are available. Alternatively the values may be obtained through unobservable management determined inputs and/or management’s proprietary models. Where models are used, the selection of a particular model to value an option or a warrant depends upon the contractual terms of, and specific risks inherent in, the option or warrant as well as the availability of pricing information in the market. Valuation models require a variety of inputs, including contractual terms, market prices, measures of volatility and correlations of such inputs. Exchange traded options will be classified as Level 2. For options or warrants that do not trade on exchange but trade in liquid markets, inputs can generally be verified and model selection does not involve significant management judgment. Options and warrants are classified within Level 2 on the fair value hierarchy when all of the significant inputs can be corroborated to market evidence. Otherwise such instruments are classified as Level 3.
Valuations of mortgage-backed or other asset-backed securities, by pricing vendors, are based on both proprietary and industry recognized models and discounted cash flow techniques. Significant inputs to the valuation of these instruments are value of the collateral, the rates and timing of delinquencies, the rates and timing of prepayments, and default and loss expectations, which are driven in part by housing prices for residential mortgages. Significant inputs are determined based on relative value analyses, which incorporate comparisons to instruments with similar collateral and risk profiles, including relevant indices. Mortgage and asset-backed securities for which management has collected current observable data through pricing services are generally categorized within Level 2. Those investments for which current observable data has not been provided are classified as Level 3.
Other fixed income investments, including non-U.S. government and corporate debt, are generally valued using quoted market prices, if available, which are typically impacted by current interest rates, maturity dates and any perceived credit risk
22
| AllianceBernstein Variable Products Series Fund |
of the issuer. Additionally, in the absence of quoted market prices, these inputs are used by pricing vendors to derive a valuation based upon industry or proprietary models which incorporate issuer specific data with relevant yield/spread comparisons with more widely quoted bonds with similar key characteristics. Those investments for which there are observable inputs are classified as Level 2. Where the inputs are not observable, the investments are classified as Level 3.
The following table summarizes the valuation of the Portfolio’s investments by the above fair value hierarchy levels as of December 31, 2013:
| Level 1 | Level 2 | Level 3 | Total | |||||||||||||
Investments in Securities: | ||||||||||||||||
Assets: | ||||||||||||||||
Mortgage Pass-Throughs | $ | –0 | – | $ | 19,199,746 | $ | –0 | – | $ | 19,199,746 | ||||||
Corporates–Investment Grades | –0 | – | 19,137,488 | –0 | – | 19,137,488 | ||||||||||
Asset-Backed Securities | –0 | – | 12,018,004 | 1,270,213 | 13,288,217 | |||||||||||
Commercial Mortgage-Backed Securities | –0 | – | 7,742,434 | 186,676 | 7,929,110 | |||||||||||
Governments–Treasuries | –0 | – | 7,593,857 | –0 | – | 7,593,857 | ||||||||||
Agencies | –0 | – | 4,110,499 | –0 | – | 4,110,499 | ||||||||||
Corporates–Non-Investment Grades | –0 | – | 2,722,878 | –0 | –^ | 2,722,878 | ||||||||||
Quasi-Sovereigns | –0 | – | 2,098,604 | –0 | – | 2,098,604 | ||||||||||
Inflation-Linked Securities | –0 | – | 1,830,761 | –0 | – | 1,830,761 | ||||||||||
Collateralized Mortgage Obligations | –0 | – | 437,698 | 1,240,216 | 1,677,914 | |||||||||||
Local Governments–Municipal Bonds | –0 | – | 1,498,126 | –0 | – | 1,498,126 | ||||||||||
Governments–Sovereign Bonds | –0 | – | 580,090 | –0 | – | 580,090 | ||||||||||
Preferred Stocks | 351,909 | 115,249 | –0 | – | 467,158 | |||||||||||
Emerging Markets–Corporate Bonds | –0 | – | 93,000 | –0 | – | 93,000 | ||||||||||
Governments–Sovereign Agencies | –0 | – | 78,754 | –0 | – | 78,754 | ||||||||||
Common Stocks | –0 | – | –0 | – | 3,690 | 3,690 | ||||||||||
Warrants | –0 | – | –0 | – | –0 | –^ | –0 | – | ||||||||
Short-Term Investments: | ||||||||||||||||
Time Deposit | –0 | – | 12,209,376 | –0 | – | 12,209,376 | ||||||||||
Governments–Treasuries | –0 | – | 2,468,846 | –0 | – | 2,468,846 | ||||||||||
|
|
|
|
|
|
|
| |||||||||
Total Investments in Securities | 351,909 | 93,935,410 | 2,700,795 | 96,988,114 | ||||||||||||
Other Financial Instruments*: | ||||||||||||||||
Assets: | ||||||||||||||||
Futures | 2,429 | –0 | – | –0 | – | 2,429 | # | |||||||||
Forward Currency Exchange Contracts | –0 | – | 95,193 | –0 | – | 95,193 | ||||||||||
Credit Default Swaps | –0 | – | 12,246 | –0 | – | 12,246 | ||||||||||
Interest Rate Swaps | –0 | – | 68,403 | –0 | – | 68,403 | ||||||||||
Liabilities: | ||||||||||||||||
Futures | (40,529 | ) | –0 | – | –0 | – | (40,529 | )# | ||||||||
Forward Currency Exchange Contracts | –0 | – | (8,972 | ) | –0 | – | (8,972 | ) | ||||||||
Centrally Cleared Credit Default Swaps | –0 | – | (63,394 | ) | –0 | – | (63,394 | )# | ||||||||
Interest Rate Swaps | –0 | – | (12,064 | ) | –0 | – | (12,064 | ) | ||||||||
|
|
|
|
|
|
|
| |||||||||
Total** | $ | 313,809 | $ | 94,026,822 | $ | 2,700,795 | $ | 97,041,426 | ||||||||
|
|
|
|
|
|
|
| |||||||||
| ^ | The Portfolio held securities with zero market value at period end. |
| * | Other financial instruments are derivative instruments, such as futures, forwards and swaps, which are valued at the unrealized appreciation/depreciation on the instrument. |
| # | Only variation margin receivable/payable at period end is reported within the statement of assets and liabilities. This amount reflects cumulative appreciation/(depreciation) of exchange traded derivatives reported in the portfolio of investments. |
| ** | There were no transfers between Level 1 and Level 2 during the reporting period. |
23
| INTERMEDIATE BOND PORTFOLIO | ||
| NOTES TO FINANCIAL STATEMENTS | ||
| (continued) | AllianceBernstein Variable Products Series Fund | |
The Portfolio recognizes all transfers between levels of the fair value hierarchy assuming the financial instruments were transferred at the beginning of the reporting period.
The following is a reconciliation of investments in which significant unobservable inputs (Level 3) were used in determining fair value.
| Asset-Backed Securities | Commercial Mortgage- Backed Securities | Corporates - Non-Investment Grades^ | ||||||||||
Balance as of 12/31/12 | $ | 981,790 | $ | 1,011,254 | $ | –0 | – | |||||
Accrued discounts/(premiums) | 1,896 | 8,156 | –0 | – | ||||||||
Realized gain (loss) | 4,331 | 60,854 | –0 | – | ||||||||
Change in unrealized appreciation/depreciation | (305 | ) | (46,625 | ) | –0 | – | ||||||
Purchases | 754,113 | 189,865 | –0 | – | ||||||||
Sales | (471,612 | ) | (1,036,828 | ) | –0 | – | ||||||
Transfers in to Level 3 | –0 | – | –0 | – | –0 | – | ||||||
Transfers out of Level 3 | –0 | – | –0 | – | –0 | – | ||||||
|
|
|
|
|
| |||||||
Balance as of 12/31/13 | $ | 1,270,213 | $ | 186,676 | $ | –0 | – | |||||
|
|
|
|
|
| |||||||
Net change in unrealized appreciation/depreciation | $ | 321 | $ | (3,052 | ) | $ | –0 | – | ||||
|
|
|
|
|
| |||||||
| Collateralized Mortgage Obligations | Common Stocks | Warrants^ | ||||||||||
Balance as of 12/31/12 | $ | 509,996 | $ | 2,460 | $ | –0 | – | |||||
Accrued discounts/(premiums) | 5,046 | –0 | – | –0 | – | |||||||
Realized gain (loss) | (5,557 | ) | –0 | – | –0 | – | ||||||
Change in unrealized appreciation/depreciation | 22,604 | 1,230 | –0 | – | ||||||||
Purchases | 839,091 | –0 | – | –0 | – | |||||||
Sales | (130,964 | ) | –0 | – | –0 | – | ||||||
Transfers in to Level 3 | –0 | – | –0 | – | –0 | – | ||||||
Transfers out of Level 3 | –0 | – | –0 | – | –0 | – | ||||||
|
|
|
|
|
| |||||||
Balance as of 12/31/13 | $ | 1,240,216 | $ | 3,690 | $ | –0 | – | |||||
|
|
|
|
|
| |||||||
Net change in unrealized appreciation/depreciation | $ | 22,604 | $ | 1,230 | $ | –0 | – | |||||
|
|
|
|
|
| |||||||
| Total | ||||||||||||
Balance as of 12/31/12 | $ | 2,505,500 | ||||||||||
Accrued discounts/(premiums) | 15,098 | |||||||||||
Realized gain (loss) | 59,628 | |||||||||||
Change in unrealized appreciation/depreciation | (23,096 | ) | ||||||||||
Purchases | 1,783,069 | |||||||||||
Sales | (1,639,404 | ) | ||||||||||
Transfers in to Level 3 | –0 | – | ||||||||||
Transfers out of Level 3 | –0 | – | ||||||||||
|
| |||||||||||
Balance as of 12/31/13 | $ | 2,700,795 | ||||||||||
|
| |||||||||||
Net change in unrealized appreciation/depreciation | $ | 21,103 | ||||||||||
|
| |||||||||||
| ^ | The Portfolio held securities with zero market value at period end. |
| * | The unrealized appreciation/depreciation is included in net change in unrealized appreciation/depreciation of investments in the accompanying statement of operations. |
24
| AllianceBernstein Variable Products Series Fund |
The following presents information about significant unobservable inputs related to the Portfolio with material categories of Level 3 investments at December 31, 2013:
| Quantitative Information about Level 3 Fair Value Measurements | ||||||||
| Fair Value at 12/31/13 | Valuation Technique | Unobservable Input | Range/Weighted Average | |||||
Asset-Backed Securities | $1,270,213 | Third Party Vendor | Evaluated Quotes | $67.83-$102.15/$96.27 | ||||
Commercial Mortgage-Backed Securities | $186,676 | Third Party Vendor | Evaluated Quotes | $98.84-$106.86/$102.40 | ||||
Corporates–Non-Investment Grades | $0 | Qualitative Assessment | $0.00/N/A | |||||
Collateralized Mortgage Obligations | $1,240,216 | Third Party Vendor | Evaluated Quotes | $57.26-$95.34/$78.85 | ||||
Common Stocks | $3,690 | Indicative Market Quotations | Broker Quote | $90.00/N/A | ||||
Warrants | $0 | Qualitative Assessment | $0.00/N/A | |||||
The Adviser has established a Valuation Committee (the “Committee”) which is responsible for overseeing the pricing and valuation of all securities held in the Portfolio. The Committee operates under pricing and valuation policies and procedures established by the Adviser and approved by the Board, including pricing policies which set forth the mechanisms and processes to be employed on a daily basis to implement these policies and procedures. In particular, the pricing policies describe how to determine market quotations for securities and other instruments. The Committee’s responsibilities include: 1) fair value and liquidity determinations (and oversight of any third parties to whom any responsibility for fair value and liquidity determinations is delegated), and 2) regular monitoring of the Adviser’s pricing and valuation policies and procedures and modification or enhancement of these policies and procedures (or recommendation of the modification of these policies and procedures) as the Committee believes appropriate.
The Committee is also responsible for monitoring the implementation of the pricing policies by the Adviser’s Pricing Group (the “Pricing Group”) and a third party which performs certain pricing functions in accordance with the pricing policies. The Pricing Group is responsible for the oversight of the third party on a day-to-day basis. The Committee and the Pricing Group perform a series of activities to provide reasonable assurance of the accuracy of prices including: 1) periodic vendor due diligence meetings, review of methodologies, new developments and processes at vendors, 2) daily comparison of security valuation versus prior day for all securities that exceeded established thresholds, and 3) daily review of unpriced, stale, and variance reports with exceptions reviewed by senior management and the Committee.
In addition, several processes outside of the pricing process are used to monitor valuation issues including: 1) performance and performance attribution reports are monitored for anomalous impacts based upon benchmark performance, and 2) portfolio managers review all portfolios for performance and analytics (which are generated using the Adviser’s prices).
3. Currency Translation
Assets and liabilities denominated in foreign currencies and commitments under forward currency exchange contracts are translated into U.S. dollars at the mean of the quoted bid and ask prices of such currencies against the U.S. dollar. Purchases and sales of portfolio securities are translated into U.S. dollars at the rates of exchange prevailing when such securities were acquired or sold. Income and expenses are translated into U.S. dollars at rates of exchange prevailing when accrued.
Net realized gain or loss on foreign currency transactions represents foreign exchange gains and losses from sales and maturities of foreign fixed income investments, foreign currency exchange contracts, holding of foreign currencies, currency gains or losses realized between the trade and settlement dates on foreign investment transactions, and the difference between the amounts of dividends, interest and foreign withholding taxes recorded on the Portfolio’s books and the U.S. dollar equivalent amounts actually received or paid. Net unrealized currency gains and losses from valuing foreign currency denominated assets and liabilities at period end exchange rates are reflected as a component of net unrealized appreciation or depreciation of foreign currency denominated assets and liabilities.
4. Taxes
It is the Portfolio’s policy to meet the requirements of the Internal Revenue Code applicable to regulated investment companies and to distribute all of its investment company taxable income and net realized gains, if any, to shareholders. Therefore,
25
| INTERMEDIATE BOND PORTFOLIO | ||
| NOTES TO FINANCIAL STATEMENTS | ||
| (continued) | AllianceBernstein Variable Products Series Fund | |
no provisions for federal income or excise taxes are required. The Portfolio may be subject to taxes imposed by countries in which it invests. Such taxes are generally based on income and/or capital gains earned or repatriated. Taxes are accrued and applied to net investment income, net realized gains and net unrealized appreciation/depreciation as such income and/or gains are earned.
In accordance with U.S. GAAP requirements regarding accounting for uncertainties in income taxes, management has analyzed the Portfolio’s tax positions taken or expected to be taken on federal and state income tax returns for all open tax years (the current and the prior three tax years) and has concluded that no provision for income tax is required in the Portfolio’s financial statements.
5. Investment Income and Investment Transactions
Dividend income is recorded on the ex-dividend date or as soon as the Portfolio is informed of the dividend. Interest income is accrued daily. Investment transactions are accounted for on the date the securities are purchased or sold. Investment gains or losses are determined on the identified cost basis. The Portfolio amortizes premiums and accretes discounts as adjustments to interest income.
6. Class Allocations
All income earned and expenses incurred by the Portfolio are borne on a pro-rata basis by each outstanding class of shares, based on the proportionate interest in the Portfolio represented by the net assets of such class, except for class specific expenses which are allocated to the respective class. Expenses of the Fund are charged proportionately to each Portfolio or based on other appropriate methods. Realized and unrealized gains and losses are allocated among the various share classes based on respective net assets.
7. Dividends and Distributions
Dividends and distributions to shareholders, if any, are recorded on the ex-dividend date. Income dividends and capital gains distributions are determined in accordance with federal tax regulations and may differ from those determined in accordance with U.S. GAAP. To the extent these differences are permanent, such amounts are reclassified within the capital accounts based on their federal tax basis treatment; temporary differences do not require such reclassification.
NOTE B: Advisory Fee and Other Transactions with Affiliates
Under the terms of the investment advisory agreement, the Portfolio pays the Adviser an advisory fee at an annual rate of .45% of the first $2.5 billion, ..40% of the next $2.5 billion and .35% in excess of $5 billion, of the Portfolio’s average daily net assets. The fee is accrued daily and paid monthly.
Pursuant to the investment advisory agreement, the Portfolio may reimburse the Adviser for certain legal and accounting services provided to the Portfolio by the Adviser. For the year ended December 31, 2013, the reimbursement for such services amounted to $54,102.
The Portfolio compensates AllianceBernstein Investor Services, Inc. (“ABIS”), a wholly-owned subsidiary of the Adviser, under a Transfer Agency Agreement for providing personnel and facilities to perform transfer agency services for the Portfolio. Such compensation retained by ABIS amounted to $1,385 for the year ended December 31, 2013.
Brokerage commissions paid on investment transactions for the year ended December 31, 2013 amounted to $247, of which $0 and $0, respectively, was paid to Sanford C. Bernstein & Co. LLC and Sanford C. Bernstein Limited, affiliates of the Adviser.
Prior to September 15, 2008, the Portfolio had swap counterparty exposure to Lehman Brothers Holdings Inc. (“Lehman Brothers”), as a guarantor for Lehman Brothers Special Financing Inc. (“LBSF”), which filed for bankruptcy on September 15, 2008. As a result, on September 15, 2008, the Portfolio terminated all outstanding swaps with LBSF prior to their scheduled maturity dates in accordance with the terms of the swaps. Upon the termination of the swaps, Lehman Brothers’ obligations to the Portfolio amounted to $920,116. The Portfolio’s claim to these obligations is subject to the pending bankruptcy proceeding against the Lehman Brothers estate (the “Bankruptcy Claim”). In accordance with its error correction policy, the Adviser has agreed to make the Portfolio whole in respect of the amount of the recovery that would be paid on the Bankruptcy Claim in the event the Bankruptcy Claim is not honored by the Lehman Brothers estate, or with respect to any diminution in value upon the sale of the Bankruptcy Claim, in either case resulting from the manner in which the Bankruptcy Claim was processed by the Adviser. On April 9, 2012, the portfolio management team determined to dispose of the position held by the Portfolio that reflects the Bankruptcy Claim (thereby realizing upon the corresponding
26
| AllianceBernstein Variable Products Series Fund |
undertaking of the Adviser to make payment in respect of said Claim to make the Portfolio whole). On that date, the Bankruptcy Claim was being valued at $457,758 (49.75% of the Bankruptcy Claim), based upon the estimated recovery value. Accordingly, on April 13, 2012, the Adviser reimbursed the Portfolio in an amount equal to $457,758.
NOTE C: Distribution Plan
The Portfolio has adopted a Distribution Plan (the “Plan”) for Class B shares pursuant to Rule 12b-1 under the Investment Company Act of 1940. Under the Plan, the Portfolio pays distribution and servicing fees to AllianceBernstein Investments, Inc. (the “Distributor”), a wholly-owned subsidiary of the Adviser, at an annual rate of up to .50% of the Portfolio’s average daily net assets attributable to Class B shares. The fees are accrued daily and paid monthly. The Board currently limits payments under the Plan to .25% of the Portfolio’s average daily net assets attributable to Class B shares. The Plan provides that the Distributor will use such payments in their entirety for distribution assistance and promotional activities.
The Portfolio is not obligated under the Plan to pay any distribution and servicing fees in excess of the amounts set forth above. The purpose of the payments to the Distributor under the Plan is to compensate the Distributor for its distribution services with respect to the sale of the Portfolio’s Class B shares. Since the Distributor’s compensation is not directly tied to its expenses, the amount of compensation received by it under the Plan during any year may be more or less than its actual expenses. For this reason, the Plan is characterized by the staff of the Securities and Exchange Commission as being of the “compensation” variety.
In the event that the Plan is terminated or not continued, no distribution or servicing fees (other than current amounts accrued but not yet paid) would be owed by the Portfolio to the Distributor.
The Plan also provides that the Adviser may use its own resources to finance the distribution of the Portfolio’s shares.
NOTE D: Investment Transactions
Purchases and sales of investment securities (excluding short-term investments) for the year ended December 31, 2013 were as follows:
| Purchases | Sales | |||||||
Investment securities (excluding U.S. government securities) | $ | 26,026,007 | $ | 28,639,901 | ||||
U.S. government securities | 182,713,723 | 191,736,110 | ||||||
The cost of investments for federal income tax purposes, gross unrealized appreciation and unrealized depreciation (excluding futures, swaps and foreign currency transactions) are as follows:
Cost | $ | 95,719,366 | ||
|
| |||
Gross unrealized appreciation | 2,364,380 | |||
Gross unrealized depreciation | (1,095,632 | ) | ||
|
| |||
Net unrealized appreciation | $ | 1,268,748 | ||
|
|
1. Derivative Financial Instruments
The Portfolio may use derivatives in an effort to earn income and enhance returns, to replace more traditional direct investments, to obtain exposure to otherwise inaccessible markets (collectively, “investment purposes”), or to hedge or adjust the risk profile of its portfolio.
The principal types of derivatives utilized by the Portfolio, as well as the methods in which they may be used are:
| • | Futures |
The Portfolio may buy or sell futures for investment purposes or for the purpose of hedging its portfolio against adverse effects of potential movements in the market. The Portfolio bears the market risk that arises from changes in the value of these instruments and the imperfect correlation between movements in the price of the futures and movements in the price of the assets, reference rates or indices which they are designed to track. Among other things, the Portfolio may purchase or sell futures for foreign currencies or options thereon for non-hedging purposes as a means of making direct investment in foreign currencies, as described below under “Currency Transactions”.
At the time the Portfolio enters into futures, the Portfolio deposits and maintains as collateral an initial margin with the broker, as required by the exchange on which the transaction is effected. Pursuant to the contract, the Portfolio
27
| INTERMEDIATE BOND PORTFOLIO | ||
| NOTES TO FINANCIAL STATEMENTS | ||
| (continued) | AllianceBernstein Variable Products Series Fund | |
agrees to receive from or pay to the broker an amount of cash equal to the daily fluctuation in the value of the contract. Such receipts or payments are known as variation margin and are recorded by the Portfolio as unrealized gains or losses. Risks may arise from the potential inability of a counterparty to meet the terms of the contract. The credit/counterparty risk for exchange-traded futures is generally less than privately negotiated futures, since the clearinghouse, which is the issuer or counterparty to each exchange-traded future, has robust risk mitigation standards, including the requirement to provide initial and variation margin. When the contract is closed, the Portfolio records a realized gain or loss equal to the difference between the value of the contract at the time it was opened and the time it was closed.
Use of long futures subjects the Portfolio to risk of loss in excess of the amounts shown on the statement of assets and liabilities, up to the notional value of the futures. Use of short futures subjects the Portfolio to unlimited risk of loss. Under some circumstances, futures exchanges may establish daily limits on the amount that the price of futures can vary from the previous day’s settlement price, which could effectively prevent liquidation of unfavorable positions.
During the year ended December 31, 2013, the Portfolio held futures for hedging purposes.
| • | Forward Currency Exchange Contracts |
The Portfolio may enter into forward currency exchange contracts in order to hedge its exposure to changes in foreign currency exchange rates on its foreign portfolio holdings, to hedge certain firm purchase and sale commitments denominated in foreign currencies and for non-hedging purposes as a means of making direct investments in foreign currencies, as described below under “Currency Transactions”.
A forward currency exchange contract is a commitment to purchase or sell a foreign currency at a future date at a negotiated forward rate. The gain or loss arising from the difference between the original contract and the closing of such contract would be included in net realized gain or loss on foreign currency transactions. Fluctuations in the value of open forward currency exchange contracts are recorded for financial reporting purposes as unrealized appreciation and/or depreciation by the Portfolio. Risks may arise from the potential inability of a counterparty to meet the terms of a contract and from unanticipated movements in the value of a foreign currency relative to the U.S. dollar.
During the year ended December 31, 2013, the Portfolio held forward currency exchange contracts for hedging and non-hedging purposes.
| • | Swaps |
The Portfolio may enter into swaps to hedge its exposure to interest rates, credit risk, or currencies. The Portfolio may also enter into swaps for non-hedging purposes as a means of gaining market exposures, including by making direct investments in foreign currencies, as described below under “Currency Transactions”. A swap is an agreement that obligates two parties to exchange a series of cash flows at specified intervals based upon or calculated by reference to changes in specified prices or rates for a specified amount of an underlying asset. The payment flows are usually netted against each other, with the difference being paid by one party to the other. In addition, collateral may be pledged or received by the Portfolio in accordance with the terms of the respective swaps to provide value and recourse to the Portfolio or its counterparties in the event of default, bankruptcy or insolvency by one of the parties to the swap.
Risks may arise as a result of the failure of the counterparty to the swap to comply with the terms of the swap. The loss incurred by the failure of a counterparty is generally limited to the net interim payment to be received by the Portfolio, and/or the termination value at the end of the contract. Therefore, the Portfolio considers the creditworthiness of each counterparty to a swap in evaluating potential counterparty risk. This risk is mitigated by having a netting arrangement between the Portfolio and the counterparty and by the posting of collateral by the counterparty to the Portfolio to cover the Portfolio’s exposure to the counterparty. Additionally, risks may arise from unanticipated movements in interest rates or in the value of the underlying securities. The Portfolio accrues for the interim payments on swaps on a daily basis, with the net amount recorded within unrealized appreciation/depreciation of swaps on the statement of assets and liabilities, where applicable. Once the interim payments are settled in cash, the net amount is recorded as realized gain/(loss) on swaps on the statement of operations, in addition to any realized gain/(loss) recorded upon the termination of swaps. Upfront premiums paid or received are
28
| AllianceBernstein Variable Products Series Fund |
recognized as cost or proceeds on the statement of assets and liabilities and are amortized on a straight line basis over the life of the contract. Amortized upfront premiums are included in net realized gain/(loss) from swaps on the statement of operations. Fluctuations in the value of swaps are recorded as a component of net change in unrealized appreciation/depreciation of swaps on the statement of operations.
Certain standardized swaps, including certain interest rate swaps and credit default swaps, are (or soon will be) subject to mandatory central clearing. Cleared swaps are transacted through futures commission merchants (“FCMs”) that are members of central clearinghouses, with the clearinghouse serving as central counterparty, similar to transactions in futures contracts. Centralized clearing will be required for additional categories of swaps on a phased-in basis based on requirements published by the Securities Exchange Commission and Commodity Futures Trading Commission.
At the time the Portfolio enters into a centrally cleared swap, the Portfolio deposits and maintains as collateral an initial margin with the broker, as required by the exchange on which the transaction is effected. Pursuant to the contract, the Portfolio agrees to receive from or pay to the broker an amount of cash equal to the daily fluctuation in the value of the contract. Such receipts or payments are known as variation margin and are recorded by the Portfolio as unrealized gains or losses. Risks may arise from the potential inability of a counterparty to meet the terms of the contract. The credit/counterparty risk for exchange-traded swaps is generally less than privately negotiated swaps, since the clearinghouse, which is the issuer or counterparty to each exchange-traded swap, has robust risk mitigation standards, including the requirement to provide initial and variation margin. When the contract is closed, the Portfolio records a realized gain or loss equal to the difference between the value of the contract at the time it was opened and the time it was closed.
Interest Rate Swaps:
The Portfolio is subject to interest rate risk exposure in the normal course of pursuing its investment objectives. Because the Portfolio holds fixed rate bonds, the value of these bonds may decrease if interest rates rise. To help hedge against this risk and to maintain its ability to generate income at prevailing market rates, the Portfolio may enter into interest rate swaps. Interest rate swaps are agreements between two parties to exchange cash flows based on a notional amount. The Portfolio may elect to pay a fixed rate and receive a floating rate, or, receive a fixed rate and pay a floating rate on a notional amount.
In addition, the Portfolio may also enter into interest rate swap transactions to preserve a return or spread on a particular investment or portion of its portfolio, or protecting against an increase in the price of securities the Portfolio anticipates purchasing at a later date. Interest rate swaps involve the exchange by a Portfolio with another party of their respective commitments to pay or receive interest (e.g., an exchange of floating rate payments for fixed rate payments) computed based on a contractually-based principal (or “notional”) amount. Interest rate swaps are entered into on a net basis (i.e., the two payment streams are netted out, with the Portfolio receiving or paying, as the case may be, only the net amount of the two payments).
During the year ended December 31, 2013, the Portfolio held interest rate swaps for hedging and non-hedging purposes.
Credit Default Swaps:
The Portfolio may enter into credit default swaps, including to manage its exposure to the market or certain sectors of the market, to reduce its risk exposure to defaults by corporate and sovereign issuers held by the Portfolio, or to create exposure to corporate or sovereign issuers to which it is not otherwise exposed. The Portfolio may purchase credit protection (“Buy Contract”) or provide credit protection (“Sale Contract”) on the referenced obligation of the credit default swap. During the term of the swap, the Portfolio receives/(pays) fixed payments from/(to) the respective counterparty, calculated at the agreed upon rate applied to the notional amount. If the Portfolio is a buyer/(seller) of protection and a credit event occurs, as defined under the terms of the swap, the Portfolio will either (i) receive from the seller/(pay to the buyer) of protection an amount equal to the notional amount of the swap (the “Maximum Payout Amount”) and deliver/(take delivery of) the referenced obligation or (ii) receive/(pay) a net settlement amount in the form of cash or securities equal to the notional amount of the swap less the recovery value of the referenced obligation.
29
| INTERMEDIATE BOND PORTFOLIO | ||
| NOTES TO FINANCIAL STATEMENTS | ||
| (continued) | AllianceBernstein Variable Products Series Fund | |
Credit default swaps may involve greater risks than if a Portfolio had invested in the referenced obligation directly. Credit default swaps are subject to general market risk, liquidity risk, counterparty risk and credit risk. If the Portfolio is a buyer of protection and no credit event occurs, it will lose the payments it made to its counterparty. If the Portfolio is a seller of protection and a credit event occurs, the value of the referenced obligation received by the Portfolio coupled with the periodic payments previously received, may be less than the Maximum Payout Amount it pays to the buyer, resulting in a net loss to the Portfolio.
During the year ended December 31, 2013, the Portfolio held credit default swaps for hedging and non-hedging purposes.
Implied credit spreads utilized in determining the market value of credit default swaps on issuers as of period end are disclosed in the portfolio of investments. The implied spreads serve as an indicator of the current status of the payment/performance risk and typically reflect the likelihood of default by the issuer of the referenced obligation. The implied credit spread of a particular reference obligation also reflects the cost of buying/selling protection and may reflect upfront payments required to be made to enter into the agreement. Widening credit spreads typically represent a deterioration of the referenced obligation’s credit soundness and greater likelihood of default or other credit event occurring as defined under the terms of the agreement. A credit spread identified as “Defaulted” indicates a credit event has occurred for the referenced obligation.
At December 31, 2013, the Portfolio had a Sale Contract outstanding with a Maximum Payout Amount of $270,000, with net unrealized appreciation of $12,246, and a term of less than 4 years, as reflected in the portfolio of investments.
In certain circumstances Maximum Payout Amounts may be partially offset by recovery values of the respective referenced obligations, upfront premium received upon entering into the agreement, or net amounts received from settlement of buy protection credit default swaps entered into by the Portfolio for the same reference obligation with the same counterparty. As of December 31, 2013, the Portfolio did not have Buy Contracts outstanding with respect to the same referenced obligation and same counterparty for its Sale Contracts outstanding.
The Portfolio typically enters into International Swaps and Derivatives Association, Inc. Master Agreements (“ISDA Master Agreement”) or similar master agreements (collectively, “Master Agreements”) with its OTC derivative contract counterparties in order to, among other things, reduce its credit risk to counterparties. ISDA Master Agreements include provisions for general obligations, representations, collateral and events of default or termination. Under an ISDA Master Agreement, the Portfolio typically may offset with the counterparty certain derivative financial instrument’s payables and/or receivables with collateral held and/or posted and create one single net payment (close-out netting) in the event of default or termination.
Various master agreements govern the terms of certain transactions with counterparties, including transactions such as exchange-traded derivative transactions, repurchase and reverse repurchase agreements. These master agreements typically attempt to reduce the counterparty risk associated with such transactions by specifying credit protection mechanisms and providing standardization that improves legal certainty. Cross-termination provisions under Master Agreements typically provide that a default in connection with one transaction between the Portfolio and a counterparty gives the non-defaulting party the right to terminate any other transactions in place with the defaulting party to create one single net payment due to/due from the defaulting party. In the event of a default by a Master Agreements counterparty, the return of collateral with market value in excess of the Portfolio’s net liability, held by the defaulting party, may be delayed or denied.
The Portfolio’s Master Agreements may contain provisions for early termination of OTC derivative transactions in the event the net assets of the Portfolio decline below specific levels (“net asset contingent features”). If these levels are triggered, the Portfolio’s counterparty has the right to terminate such transaction and require the Portfolio to pay or receive a settlement amount in connection with the terminated transaction. As of December 31, 2013, the Portfolio had OTC derivatives with contingent features in net liability positions in the amount of $6,608. If a trigger event had occurred at December 31, 2013, for those derivatives in a net liability position, an amount of $6,608 would be required to be posted by the Portfolio.
30
| AllianceBernstein Variable Products Series Fund |
At December 31, 2013, the Portfolio had entered into the following derivatives:
Asset Derivatives | Liability Derivatives | |||||||||||
Derivative Type | Statement of | Fair Value | Statement of | Fair Value | ||||||||
Interest rate contracts | Receivable/Payable for variation margin on futures | $ | 2,429 | * | Receivable/Payable for variation margin on futures | $ | 40,529 | * | ||||
Foreign exchange contracts | Unrealized appreciation of forward currency exchange contracts | 95,193 | Unrealized depreciation of forward currency exchange contracts | 8,972 | ||||||||
Interest rate contracts | Unrealized appreciation on interest rate swaps | 68,403 | Unrealized depreciation on interest rate swaps | 12,064 | ||||||||
Credit contracts | Unrealized appreciation on credit default swaps | 12,246 | ||||||||||
Credit contracts | Receivable/Payable for variation margin on centrally cleared credit default swaps | 63,394 | * | |||||||||
|
|
|
| |||||||||
Total | $ | 178,271 | $ | 124,959 | ||||||||
|
|
|
| |||||||||
| * | Only variation margin receivable/payable at period end is reported within the statement of assets and liabilities. This amount reflects cumulative appreciation/(depreciation) of exchange-traded derivatives as reported in the portfolio of investments. |
The effect of derivative instruments on the statement of operations for the year ended December 31, 2013:
Derivative Type | Location of Gain or (Loss) on Derivatives | Realized Gain or (Loss) on Derivatives | Change in Unrealized Appreciation or (Depreciation) | |||||||
Interest rate contracts | Net realized gain (loss) on futures; Net change in unrealized appreciation/depreciation of futures | $ | 24,351 | $ | (37,339 | ) | ||||
Foreign exchange contracts | Net realized gain (loss) on foreign currency transactions; Net change in unrealized appreciation/depreciation of foreign currency denominated assets and liabilities | (57,577 | ) | (110,438 | ) | |||||
Interest rate contracts | Net realized gain (loss) on swaps; Net change in unrealized appreciation/depreciation of swaps | (31,906 | ) | 145,278 | ||||||
Credit contracts | Net realized gain (loss) on swaps; Net change in unrealized appreciation/depreciation of swaps | (557 | ) | (58,165 | ) | |||||
|
|
|
| |||||||
Total | $ | (65,689 | ) | $ | (60,664 | ) | ||||
|
|
|
| |||||||
31
| INTERMEDIATE BOND PORTFOLIO | ||
| NOTES TO FINANCIAL STATEMENTS | ||
| (continued) | AllianceBernstein Variable Products Series Fund | |
The following table represents the volume of the Portfolio’s derivative transactions during the year ended December 31, 2013:
Futures: | ||||
Average original value of buy contracts | $ | 2,476,743 | (a) | |
Average original value of sale contracts | $ | 1,761,463 | ||
Forward Currency Exchange Contracts: | ||||
Average principal amount of buy contracts | $ | 1,120,064 | ||
Average principal amount of sale contracts | $ | 7,275,659 | ||
Interest Rate Swaps: | ||||
Average notional amount | $ | 3,228,859 | ||
Centrally Cleared Interest Rate Swaps: | ||||
Average notional amount | $ | 3,670,917 | (b) | |
Credit Default Swaps: | ||||
Average notional amount of sale contracts | $ | 282,308 | ||
Centrally Cleared Credit Default Swaps: | ||||
Average notional amount of buy contracts | $ | 1,112,500 | (c) | |
Average notional amount of sale contracts | $ | 400,000 | (d) | |
| (a) | Positions were open for six months during the year. |
| (b) | Positions were open for seven months during the year. |
| (c) | Positions were open for four months during the year. |
| (d) | Positions were open for one month during the year. |
For financial reporting purposes, the Portfolio does not offset derivative assets and derivative liabilities that are subject to netting arrangements in the statement of assets and liabilities.
All derivatives held during the reporting period are subject to netting arrangements. The following table presents the Portfolio’s derivative assets and liabilities by counterparty net of amounts available for offset under Master Agreements (“MA”) and net of the related collateral received/ pledged by the Portfolio as of December 31, 2013:
Counterparty | Derivative Assets Subject to MA | Derivative Available for Offset | Cash Collateral Received | Securities Collateral Received | Net Amount of Derivatives Assets | |||||||||||||||
Barclays Bank PLC Wholesale | $ | 94,933 | $ | –0 | – | $ | –0 | – | $ | –0 | – | $ | 94,933 | |||||||
Credit Suisse International | 5,179 | (2,104 | ) | –0 | – | –0 | – | 3,075 | ||||||||||||
JPMorgan Chase Bank, NA | 68,403 | (12,064 | ) | –0 | – | –0 | – | 56,339 | ||||||||||||
State Street Bank & Trust Co. | 260 | (260 | ) | –0 | – | –0 | – | –0 | – | |||||||||||
|
|
|
|
|
|
|
|
|
| |||||||||||
Total | $ | 168,775 | $ | (14,428 | ) | $ | –0 | – | $ | –0 | – | $ | 154,347 | |||||||
|
|
|
|
|
|
|
|
|
| |||||||||||
Counterparty | Derivative Liabilities Subject to MA | Derivative Available for Offset | Cash Collateral Pledged | Securities Collateral Pledged | Net Amount of Derivatives Liabilities | |||||||||||||||
Credit Suisse International | $ | 2,104 | $ | (2,104 | ) | $ | –0 | – | $ | –0 | – | $ | –0 | – | ||||||
Exchange-Traded Goldman Sachs Co* | 2,828 | –0 | – | (2,828 | ) | –0 | – | –0 | – | |||||||||||
Exchange-Traded Morgan Stanley & Co. LLC/(INTRCONX)* | 3,888 | –0 | – | (3,888 | ) | –0 | – | –0 | – | |||||||||||
Goldman Sachs Bank USA | 2,002 | –0 | – | –0 | – | –0 | – | 2,002 | ||||||||||||
HSBC Bank USA | 3,214 | –0 | – | –0 | – | –0 | – | 3,214 | ||||||||||||
JPMorgan Chase Bank, NA | 12,064 | (12,064 | ) | –0 | – | –0 | – | –0 | – | |||||||||||
State Street Bank & Trust Co. | 1,527 | (260 | ) | –0 | – | –0 | – | 1,267 | ||||||||||||
UBS AG | 125 | –0 | – | –0 | – | –0 | – | 125 | ||||||||||||
|
|
|
|
|
|
|
|
|
| |||||||||||
Total | $ | 27,752 | $ | (14,428 | ) | $ | (6,716 | ) | $ | –0 | – | $ | 6,608 | |||||||
|
|
|
|
|
|
|
|
|
| |||||||||||
| * | In addition to the amounts reflected above, cash collateral has been posted for initial margin requirements for open futures and centrally cleared swaps outstanding at December 31, 2013. |
32
| AllianceBernstein Variable Products Series Fund |
2. Currency Transactions
The Portfolio may invest in non-U.S. dollar securities on a currency hedged or unhedged basis. The Portfolio may seek investment opportunities by taking long or short positions in currencies through the use of currency-related derivatives, including forward currency exchange contracts, futures and options on futures, swaps, and other options. The Portfolio may enter into transactions for investment opportunities when it anticipates that a foreign currency will appreciate or depreciate in value but securities denominated in that currency are not held by the Portfolio and do not present attractive investment opportunities. Such transactions may also be used when the Adviser believes that it may be more efficient than a direct investment in a foreign currency-denominated security. The Portfolio may also conduct currency exchange contracts on a spot basis (i.e., for cash at the spot rate prevailing in the currency exchange market for buying or selling currencies).
3. Dollar Rolls
The Portfolio may enter into dollar rolls. Dollar rolls involve sales by the Portfolio of securities for delivery in the current month and the Portfolio’s simultaneously contracting to repurchase substantially similar (same type and coupon) securities on a specified future date. During the roll period, the Portfolio forgoes principal and interest paid on the securities. The Portfolio is compensated by the difference between the current sales price and the lower forward price for the future purchase (often referred to as the “drop”) as well as by the interest earned on the cash proceeds of the initial sale. Dollar rolls involve the risk that the market value of the securities the Portfolio is obligated to repurchase under the agreement may decline below the repurchase price. Dollar rolls are speculative techniques and may be considered to be borrowings by the Portfolio. For the year ended December 31, 2013, the Portfolio earned drop income of $317,648 which is included in interest income in the accompanying statement of operations.
4. Reverse Repurchase Agreements
Under a reverse repurchase agreement, the Portfolio sells securities and agrees to repurchase them at a mutually agreed upon date and price. At the time the Portfolio enters into a reverse repurchase agreement, it will establish a segregated account with the custodian containing liquid assets having a value at least equal to the repurchase price. For the year ended December 31, 2013, the Portfolio had no transactions in reverse repurchase agreements.
NOTE E: Capital Stock
Each class consists of 500,000,000 authorized shares. Transactions in capital shares for each class were as follows:
| SHARES | AMOUNT | |||||||||||||||||
| Year Ended December 31, 2013 | Year Ended December 31, 2012 | Year Ended December 31, 2013 | Year Ended December 31, 2012 | |||||||||||||||
Class A | ||||||||||||||||||
Shares sold | 74,962 | 218,065 | $ | 884,617 | $ | 2,741,087 | ||||||||||||
Shares issued in reinvestment of dividends and distributions | 413,111 | 524,053 | 4,585,533 | 6,288,631 | ||||||||||||||
Shares redeemed | (1,408,318 | ) | (2,767,258 | ) | (16,566,656 | ) | (34,849,164 | ) | ||||||||||
|
|
|
|
|
|
|
| |||||||||||
Net decrease | (920,245 | ) | (2,025,140 | ) | $ | (11,096,506 | ) | $ | (25,819,446 | ) | ||||||||
|
|
|
|
|
|
|
| |||||||||||
Class B | ||||||||||||||||||
Shares sold | 92,014 | 138,136 | $ | 1,077,143 | $ | 1,715,485 | ||||||||||||
Shares issued in reinvestment of dividends and distributions | 145,019 | 186,939 | 1,595,214 | 2,222,707 | ||||||||||||||
Shares redeemed | (628,054 | ) | (649,880 | ) | (7,333,918 | ) | (8,100,002 | ) | ||||||||||
|
|
|
|
|
|
|
| |||||||||||
Net decrease | (391,021 | ) | (324,805 | ) | $ | (4,661,561 | ) | $ | (4,161,810 | ) | ||||||||
|
|
|
|
|
|
|
| |||||||||||
NOTE F: Risks Involved in Investing in the Portfolio
Interest Rate Risk and Credit Risk—Interest rate risk is the risk that changes in interest rates will affect the value of the Portfolio’s investments in fixed-income debt securities such as bonds or notes. Increases in interest rates may cause the value of the Portfolio’s investments to decline. Credit risk is the risk that the issuer or guarantor of a debt security, or the counterparty to a derivative contract, will be unable or unwilling to make timely principal and/or interest payments, or to otherwise honor its obligations. The degree of risk for a particular security may be reflected in its credit risk rating. Credit risk is greater for medium quality and lower-rated securities. Lower-rated debt securities and similar unrated securities (commonly known as “junk bonds”) have speculative elements or are predominantly speculative risks.
33
| INTERMEDIATE BOND PORTFOLIO | ||
| NOTES TO FINANCIAL STATEMENTS | ||
| (continued) | AllianceBernstein Variable Products Series Fund | |
Duration Risk—Duration is the measure that relates the expected price volatility of a fixed-income security to changes in interest rates. The duration of a fixed-income security may be shorter than or equal to full maturity of a fixed-income security. Fixed-income securities with longer durations have more risk and will decrease in price as interest rates rise. For example, a fixed-income security with a duration of three years will decrease in value by approximately 3% if interest rates increase by 1%.
Foreign Securities Risk—Investing in securities of foreign companies or foreign governments involves special risks which include changes in foreign currency exchange rates and the possibility of future political and economic developments which could adversely affect the value of such securities. Moreover, securities of many foreign companies or foreign governments and their markets may be less liquid and their prices more volatile than those of comparable U.S. companies or of the U.S. government.
Emerging Market Risk—Investments in emerging market countries may have more risk because the markets are less developed and less liquid, and because these investments may be subject to increased economic, political, regulatory and other uncertainties.
Inflation Risk—This is the risk that the value of assets or income from investments will be less in the future as inflation decreases the value of money. As inflation increases, the real value of the Portfolio’s assets can decline as can the real value of the Portfolio’s distributions.
Currency Risk—This is the risk that changes in foreign currency exchange rates may negatively affect the value of the Portfolio’s investments or reduce the returns of the Portfolio. For example, the value of the Portfolio’s investments in foreign currency-denominated securities or currencies may decrease if the U.S. dollar is strong (i.e., gaining value relative to other currencies) and other currencies are weak (i.e., losing value relative to the U.S. dollar). Currency markets are generally not as regulated as securities markets. Independent of the Portfolio’s investments denominated in foreign currencies, the Portfolio’s positions in various foreign currencies may cause the Portfolio to experience investment losses due to the changes in exchange rates and interest rates.
Derivatives Risk—The Portfolio may enter into derivative transactions such as forwards, options, futures and swaps. Derivatives may be illiquid, difficult to price, and leveraged so that small changes may produce disproportionate losses for the Portfolio, and subject to counterparty risk to a greater degree than more traditional investments. Derivatives may result in significant losses, including losses that are far greater than the value of the derivatives reflected in the statement of assets and liabilities.
Leverage Risk—When the Portfolio borrows money or otherwise leverages its portfolio, it may be volatile because leverage tends to exaggerate the effect of any increase or decrease in the value of the Portfolio’s investments. The Portfolio may create leverage through the use of reverse repurchase arrangements, forward currency exchange contracts, forward commitments, dollar rolls or futures or by borrowing money. The use of derivative instruments by the Portfolio, such as forwards, futures, options and swaps, may also result in a form of leverage. Leverage may result in higher returns to the Portfolio than if the Portfolio were not leveraged, but may also adversely affect returns, particularly if the market is declining.
Indemnification Risk—In the ordinary course of business, the Portfolio enters into contracts that contain a variety of indemnifications. The Portfolio’s maximum exposure under these arrangements is unknown. However, the Portfolio has not had prior claims or losses pursuant to these indemnification provisions and expects the risk of loss thereunder to be remote. Therefore, the Portfolio has not accrued any liability in connection with these indemnification provisions.
NOTE G: Joint Credit Facility
A number of open-end mutual funds managed by the Adviser, including the Portfolio, participate in a $140 million revolving credit facility (the “Facility”) intended to provide short-term financing, if necessary, subject to certain restrictions in connection with abnormal redemption activity. Commitment fees related to the Facility are paid by the participating funds and are included in miscellaneous expenses in the statement of operations. The Portfolio did not utilize the Facility during the year ended December 31, 2013.
34
| AllianceBernstein Variable Products Series Fund |
NOTE H: Distributions to Shareholders
The tax character of distributions paid during the fiscal years ended December 31, 2013 and December 31, 2012 were as follows:
| 2013 | 2012 | |||||||
Distributions paid from: | ||||||||
Ordinary income | $ | 4,448,851 | $ | 5,421,309 | ||||
Net long-term capital gains | 1,731,896 | 3,090,029 | ||||||
|
|
|
| |||||
Total taxable distributions paid | $ | 6,180,747 | $ | 8,511,338 | ||||
|
|
|
| |||||
As of December 31, 2013, the components of accumulated earnings/(deficit) on a tax basis were as follows:
Undistributed ordinary income | $ | 2,728,367 | ||
Undistributed net capital gain | 1,075,148 | |||
Accumulated capital and other losses | (8,541 | )(a) | ||
Unrealized appreciation/(depreciation) | 1,404,393 | (b) | ||
|
| |||
Total accumulated earnings/(deficit) | $ | 5,199,367 | ||
|
|
| (a) | As of December 31, 2013, the Portfolio had cumulative deferred losses on straddles of $8,541. |
| (b) | The differences between book-basis and tax-basis unrealized appreciation/(depreciation) are attributable primarily to the tax deferral of losses on wash sales, the tax treatment of swaps and Treasury inflation-protected securities, and the realization for tax purposes of gains/losses on certain derivative instruments. |
For tax purposes, net capital losses may be carried over to offset future capital gains, if any. Funds are permitted to carry forward capital losses incurred in taxable years beginning after December 22, 2010 for an indefinite period, and such losses will retain their character as either short-term or long-term capital losses. As of December 31, 2013, the Portfolio did not have any capital loss carryforwards.
During the current fiscal year, permanent differences primarily due to the tax treatment of swaps, reclassifications of foreign currency and paydown gains/losses, and the redesignation of dividends resulted in a net increase in undistributed net investment income and a net decrease in accumulated net realized gain on investment and foreign currency transactions. These reclassifications had no effect on net assets.
NOTE I: Subsequent Events
Management has evaluated subsequent events for possible recognition or disclosure in the financial statements through the date the financial statements are issued. Management has determined that there are no material events that would require disclosure in the Portfolio’s financial statements through this date.
35
| INTERMEDIATE BOND PORTFOLIO | ||
| FINANCIAL HIGHLIGHTS | AllianceBernstein Variable Products Series Fund | |
Selected Data For A Share Of Capital Stock Outstanding Throughout Each Period
| CLASS A | ||||||||||||||||||||
| Year Ended December 31, | ||||||||||||||||||||
| 2013 | 2012 | 2011 | 2010 | 2009 | ||||||||||||||||
Net asset value, beginning of period | $12.30 | $12.54 | $12.39 | $11.98 | $10.50 | |||||||||||||||
|
|
|
|
|
|
|
|
|
| |||||||||||
Income From Investment Operations | ||||||||||||||||||||
Net investment income (a) | .32 | .33 | .42 | .48 | .52 | |||||||||||||||
Net realized and unrealized gain (loss) on investment and foreign currency transactions | (.59 | ) | .35 | # | .38 | .60 | 1.37 | |||||||||||||
Contributions from Adviser | –0 | – | .05 | # | –0 | – | –0 | – | –0 | – | ||||||||||
|
|
|
|
|
|
|
|
|
| |||||||||||
Net increase (decrease) in net asset value from operations | (.27 | ) | .73 | .80 | 1.08 | 1.89 | ||||||||||||||
|
|
|
|
|
|
|
|
|
| |||||||||||
Less: Dividends and Distributions | ||||||||||||||||||||
Dividends from net investment income | (.45 | ) | (.58 | ) | (.60 | ) | (.67 | ) | (.41 | ) | ||||||||||
Distributions from net realized gain on investment transactions | (.36 | ) | (.39 | ) | (.05 | ) | –0 | – | –0 | – | ||||||||||
|
|
|
|
|
|
|
|
|
| |||||||||||
Total dividends and distributions | (.81 | ) | (.97 | ) | (.65 | ) | (.67 | ) | (.41 | ) | ||||||||||
|
|
|
|
|
|
|
|
|
| |||||||||||
Net asset value, end of period | $11.22 | $12.30 | $12.54 | $12.39 | $11.98 | |||||||||||||||
|
|
|
|
|
|
|
|
|
| |||||||||||
Total Return | ||||||||||||||||||||
Total investment return based on net asset value (b) | (2.16 | )%* | 6.05 | %* | 6.64 | % | 9.20 | %* | 18.51 | %* | ||||||||||
Ratios/Supplemental Data | ||||||||||||||||||||
Net assets, end of period (000’s omitted) | $61,848 | $79,104 | $106,028 | $119,599 | $129,647 | |||||||||||||||
Ratio to average net assets of: | ||||||||||||||||||||
Expenses | .77 | % | .70 | % | .65 | % | .68 | %+ | .69 | % | ||||||||||
Net investment income | 2.74 | % | 2.67 | % | 3.42 | % | 3.90 | %+ | 4.69 | % | ||||||||||
Portfolio turnover rate** | 217 | % | 116 | % | 108 | % | 94 | % | 102 | % | ||||||||||
See footnote summary on page 37.
36
| AllianceBernstein Variable Products Series Fund |
Selected Data For A Share Of Capital Stock Outstanding Throughout Each Period
| CLASS B | ||||||||||||||||||||
| Year Ended December 31, | ||||||||||||||||||||
| 2013 | 2012 | 2011 | 2010 | 2009 | ||||||||||||||||
Net asset value, beginning of period | $12.17 | $12.41 | $12.26 | $11.86 | $10.40 | |||||||||||||||
|
|
|
|
|
|
|
|
|
| |||||||||||
Income From Investment Operations | ||||||||||||||||||||
Net investment income (a) | .29 | .30 | .39 | .44 | .49 | |||||||||||||||
Net realized and unrealized gain (loss) on investment and foreign currency transactions | (.58 | ) | .35 | # | .37 | .60 | 1.36 | |||||||||||||
Contributions from Adviser | –0 | – | .05 | # | –0 | – | –0 | – | –0 | – | ||||||||||
|
|
|
|
|
|
|
|
|
| |||||||||||
Net increase (decrease) in net asset value from operations | (.29 | ) | .70 | .76 | 1.04 | 1.85 | ||||||||||||||
|
|
|
|
|
|
|
|
|
| |||||||||||
Less: Dividends and Distributions | ||||||||||||||||||||
Dividends from net investment income | (.41 | ) | (.55 | ) | (.56 | ) | (.64 | ) | (.39 | ) | ||||||||||
Distributions from net realized gain on investment transactions | (.36 | ) | (.39 | ) | (.05 | ) | –0 | – | –0 | – | ||||||||||
|
|
|
|
|
|
|
|
|
| |||||||||||
Total dividends and distributions | (.77 | ) | (.94 | ) | (.61 | ) | (.64 | ) | (.39 | ) | ||||||||||
|
|
|
|
|
|
|
|
|
| |||||||||||
Net asset value, end of period | $11.11 | $12.17 | $12.41 | $12.26 | $11.86 | |||||||||||||||
|
|
|
|
|
|
|
|
|
| |||||||||||
Total Return | ||||||||||||||||||||
Total investment return based on net asset value (b) | (2.34 | )%* | 5.79 | %* | 6.38 | % | 8.93 | %* | 18.20 | %* | ||||||||||
Ratios/Supplemental Data | ||||||||||||||||||||
Net assets, end of period (000’s omitted) | $22,450 | $29,363 | $33,973 | $39,025 | $41,341 | |||||||||||||||
Ratio to average net assets of: | ||||||||||||||||||||
Expenses | 1.02 | % | .96 | % | .90 | % | .93 | %+ | .94 | % | ||||||||||
Net investment income | 2.49 | % | 2.43 | % | 3.17 | % | 3.64 | %+ | 4.44 | % | ||||||||||
Portfolio turnover rate** | 217 | % | 116 | % | 108 | % | 94 | % | 102 | % | ||||||||||
| (a) | Based on average shares outstanding. |
| (b) | Total investment return is calculated assuming an initial investment made at the net asset value at the beginning of the period, reinvestment of all dividends and distributions at net asset value during the period, and redemption on the last day of the period. Total return does not reflect (i) insurance company’s separate account related expense charges and (ii) the deductions of taxes that a shareholder would pay on Portfolio distributions or the redemption of Portfolio shares. Total investment return calculated for a period of less than one year is not annualized. |
| # | Amount reclassified from realized gain (loss) on investment transactions. |
| * | Includes the impact of proceeds received and credited to the Portfolio resulting from class action settlements, which enhanced the Portfolio’s performance for the years ended December 31, 2013, December 31, 2012, December 31, 2010 and December 31, 2009 by 0.02%%, 0.05%, 0.04% and 0.01%, respectively. |
| Includes the Adviser’s reimbursement in respect of the Lehman Bankruptcy Claim which contributed to the Portfolio’s performance by 0.38% for the year ended December 31, 2012. |
| + | The ratio includes expenses attributable to costs of proxy solicitation. |
| ** | The Portfolio accounts for dollar roll transactions as purchases and sales. |
See notes to financial statements.
37
| REPORTOF INDEPENDENT REGISTERED | ||
| PUBLIC ACCOUNTING FIRM | AllianceBernstein Variable Products Series Fund | |
To the Board of Directors and Shareholders of AllianceBernstein Intermediate Bond Portfolio:
We have audited the accompanying statement of assets and liabilities, including the portfolio of investments, of AllianceBernstein Intermediate Bond Portfolio (one of the funds constituting AllianceBernstein Variable Products Series Fund, Inc. (the “Fund”)) as of December 31, 2013, and the related statement of operations for the year then ended, the statements of changes in net assets for each of the two years in the period then ended, and the financial highlights for each of the five years in the period then ended. These financial statements and financial highlights are the responsibility of the Fund’s management. Our responsibility is to express an opinion on these financial statements and financial highlights based on our audits.
We conducted our audits in accordance with the standards of the Public Company Accounting Oversight Board (United States). Those standards require that we plan and perform the audit to obtain reasonable assurance about whether the financial statements and financial highlights are free of material misstatement. We were not engaged to perform an audit of the Fund’s internal control over financial reporting. Our audits included consideration of internal control over financial reporting as a basis for designing audit procedures that are appropriate in the circumstances, but not for the purpose of expressing an opinion on the effectiveness of the Fund’s internal control over financial reporting. Accordingly, we express no such opinion. An audit also includes examining, on a test basis, evidence supporting the amounts and disclosures in the financial statements and financial highlights, assessing the accounting principles used and significant estimates made by management, and evaluating the overall financial statement presentation. Our procedures included confirmation of securities owned as of December 31, 2013, by correspondence with the custodian and others, or by other appropriate auditing procedures where replies from others were not received. We believe that our audits provide a reasonable basis for our opinion.
In our opinion, the financial statements and financial highlights referred to above present fairly, in all material respects, the financial position of AllianceBernstein Intermediate Bond Portfolio (one of the funds constituting AllianceBernstein Variable Products Series Fund, Inc.) at December 31, 2013, the results of its operations for the year then ended, the changes in its net assets for each of the two years in the period then ended, and the financial highlights for each of the five years in the period then ended, in conformity with U.S. generally accepted accounting principles.

New York, New York
February 14, 2014
38
| 2013 FEDERAL TAX INFORMATION | ||
| (unaudited) | AllianceBernstein Variable Products Series Fund |
For Federal income tax purposes, the following information is furnished with respect to the distributions paid by the Portfolio during the taxable year ended December 31, 2013. For corporate shareholders, 0.18% of dividends paid qualify for the dividends received deduction.
39
| INTERMEDIATE BOND PORTFOLIO | AllianceBernstein Variable Products Series Fund |
| BOARDOF DIRECTORS | ||
| Marshall C. Turner, Jr.(1), Chairman | Nancy P. Jacklin(1) | |
John H. Dobkin(1) Michael J. Downey(1) | Robert M. Keith, President and Chief Executive Officer | |
| William H. Foulk, Jr.(1) | Garry L. Moody(1) | |
| D. James Guzy(1) | Earl D. Weiner(1) | |
| OFFICERS | ||
Philip L. Kirstein, Senior Vice President and Paul J. DeNoon(2), Vice President Shawn E. Keegan(2), Vice President Alison M. Martier(2), Vice President Douglas J. Peebles(2), Vice President | Greg J. Wilensky(2), Vice President Emilie D. Wrapp, Secretary Joseph J. Mantineo, Treasurer and Phyllis J. Clarke, Controller Vincent S. Noto, Chief Compliance Officer | |
CUSTODIANAND ACCOUNTING AGENT State Street Bank and Trust Company One Lincoln Street Boston, MA 02111 | LEGAL COUNSEL Seward & Kissel LLP One Battery Park Plaza New York, NY 10004 | |
DISTRIBUTOR AllianceBernstein Investments, Inc. 1345 Avenue of the Americas New York, NY 10105 | TRANSFER AGENT AllianceBernstein Investor Services, Inc. P.O. Box 786003 San Antonio, TX 78278-6003 Toll-Free 1-(800) 221-5672 | |
INDEPENDENT REGISTERED PUBLIC ACCOUNTING FIRM Ernst & Young LLP 5 Times Square New York, NY 10036 |
| (1) | Member of the Audit Committee, the Governance and Nominating Committee and the Independent Directors Committee. Mr. Foulk is the sole member of the Fair Value Pricing Committee. |
| (2) | The day-to-day management of, and investment decisions for, the Portfolio’s portfolio are made by the Adviser’s U.S. Core Fixed Income Investment Team. Mr. Paul J. DeNoon, Mr. Shawn E. Keegan, Mr. Douglas J. Peebles, Ms. Alison M. Martier and Mr. Greg J. Wilensky are the investment professionals with the most significant responsibility for the day-to-day management of the Portfolio’s portfolio. |
40
| INTERMEDIATE BOND PORTFOLIO | AllianceBernstein Variable Products Series Fund |
MANAGEMENTOFTHE FUND
Board of Directors Information
The business and affairs of the Fund are managed under the direction of the Board of Directors. Certain information concerning the Fund’s Directors is set forth below.
NAME, ADDRESS* AGE (YEAR FIRST | PRINCIPAL OCCUPATION(S) DURING PAST FIVE YEARS AND OTHER | PORTFOLIOS IN FUND COMPLEX OVERSEEN BY DIRECTOR | OTHER DIRECTORSHIPS HELD BY DIRECTOR IN THE PAST FIVE YEARS | |||||
| INTERESTED DIRECTOR | ||||||||
Robert M. Keith, # 1345 Avenue of the Americas New York, NY 10105 53 (2010) | Senior Vice President of AllianceBernstein L.P. (the “Adviser”) and the head of AllianceBernstein Investments, Inc. (“ABI”) since July 2008; Director of ABI and President of the AllianceBernstein Mutual Funds. Previously, he served as Executive Managing Director of ABI from December 2006 to June 2008. Prior to joining ABI in 2006, Executive Managing Director of Bernstein Global Wealth Management, and prior thereto, Senior Managing Director and Global Head of Client Service and Sales of the Adviser’s institutional investment management business since 2004. Prior thereto, he was Managing Director and Head of North American Client Service and Sales in the Adviser’s institutional investment management business, with which he had been associated since prior to 2004. | 100 | None | |||||
| DISINTERESTED DIRECTORS | ||||||||
Marshall C. Turner, Jr., ## Chairman of the Board 72 (2005) | Private Investor since prior to 2009. Former CEO of Dupont Photomasks, Inc. (components of semi-conductor manufacturing), 2003-2006, and interim CEO 1999-2000. Interim CEO of MEMC Electronic Materials, Inc. (semi-conductor and solar cell substrates) from November 2008 until March 2009. He has extensive operating and early-stage investment experience, including prior service as general partner of three institutional venture capital partnerships, and serves on the boards of three education and science-related non-profit organizations. He has served as a director of one AllianceBernstein fund since 1992, and director or trustee of multiple AllianceBernstein funds since 2005. He is Chairman of the AllianceBernstein Funds since January 2014. | 100 | Xilinx, Inc. (programmable logic semi-conductors) and SunEdison, Inc. (semi-conductor substrates, solar materials and solar power plants) since prior to 2009 | |||||
John H. Dobkin, ## 72 (1992) | Independent Consultant since prior to 2009. Formerly, President of Save Venice, Inc. (preservation organization) from 2001–2002; Senior Advisor from June 1999-June 2000 and President of Historic Hudson Valley (historic preservation) from December 1989-May 1999. Previously, Director of the National Academy of Design. He has served as a director or trustee of various AllianceBernstein Funds since 1992, and as Chairman of the Audit Committees of a number of such Funds from 2001-2008. | 100 | None | |||||
41
| INTERMEDIATE BOND PORTFOLIO | ||
| MANAGEMENTOFTHE FUND | ||
| (continued) | AllianceBernstein Variable Products Series Fund |
NAME, ADDRESS* AGE (YEAR FIRST | PRINCIPAL OCCUPATION(S) DURING PAST FIVE YEARS AND OTHER | PORTFOLIOS IN FUND COMPLEX OVERSEEN BY DIRECTOR | OTHER DIRECTORSHIPS HELD BY DIRECTOR IN THE PAST FIVE YEARS | |||||
| DISINTERESTED DIRECTORS (continued) | ||||||||
Michael J. Downey, ## 70 (2005) | Private Investor since prior to 2009. Formerly, managing partner of Lexington Capital, LLC (investment advisory firm) from December 1997 until December 2003. From 1987 until 1993, Chairman and CEO of Prudential Mutual Fund Management, director of the Prudential mutual funds, and member of the Executive Committee of Prudential Securities Inc. He has served as a director or trustee of the AllianceBernstein Funds since 2005 and is a director and Chairman of one other registered investment company. | 100 | Asia Pacific Fund, Inc. since prior to 2009, Prospect Acquisition Corp. (financial services) from 2007 until 2009, and The Merger Fund since prior to 2009 until 2013 | |||||
William H. Foulk, Jr., ##, ### 81 (1990) | Investment Adviser and an Independent Consultant since prior to 2009. Previously, he was Senior Manager of Barrett Associates, Inc., a registered investment adviser. He was formerly Deputy Comptroller and Chief Investment Officer of the State of New York and, prior thereto, Chief Investment Officer of the New York Bank for Savings. He has served as a director or trustee of various AllianceBernstein Funds since 1983, and has been Chairman of the Independent Directors Committee of the AllianceBernstein Funds since 2003. He served as Chairman of such Funds from 2003 through December 2013. He is also active in a number of mutual fund related organizations and committees. | 100 | None | |||||
D. James Guzy, ## 77 (2005) | Chairman of the Board of PLX Technology (semi-conductors) and of SRC Computers Inc., with which he has been associated since prior to 2009. He was a director of Intel Corporation (semi-conductors) from 1969 until 2008, and served as Chairman of the Finance Committee of such company for several years until May 2008. He was a Director of Cirrus Logic Corporation (semi-conductors) from 1984 until July 2011. He has served as a director or trustee of one or more of the AllianceBernstein Funds since 1982. | 100 | PLX Technology (semi-conductors) since prior to 2009, and Cirrus Logic Corporation (semi-conductors) since prior to 2009 until July 2011 | |||||
Nancy P. Jacklin, ## 65 (2006) | Professorial Lecturer at the Johns Hopkins School of Advanced International Studies since 2008. Formerly, U.S. Executive Director of the International Monetary Fund (December 2002–May 2006); Partner, Clifford Chance (1992–2002); Sector Counsel, International Banking and Finance, and Associate General Counsel, Citicorp (1985–1992); Assistant General Counsel (International), Federal Reserve Board of Governors (1982–1985); and Attorney Advisor, U.S. Department of the Treasury (1973–1982). Member of the Bar of the District of Columbia and of New York; and member of the Council on Foreign Relations. She has served as a director or trustee of the AllianceBernstein Funds since 2006. | 100 | None | |||||
42
| AllianceBernstein Variable Products Series Fund |
NAME, ADDRESS* AGE (YEAR FIRST | PRINCIPAL OCCUPATION(S) DURING PAST FIVE YEARS AND OTHER | PORTFOLIOS IN FUND COMPLEX OVERSEEN BY DIRECTOR | OTHER DIRECTORSHIPS HELD BY DIRECTOR IN THE PAST FIVE YEARS | |||||
| DISINTERESTED DIRECTORS (continued) | ||||||||
Garry L. Moody, ## 61 (2008) | Independent Consultant. Formerly, Partner, Deloitte & Touche LLP (1995–2008) where he held a number of senior positions, including Vice Chairman, and U.S. and Global Investment Management Practice Managing Partner; President, Fidelity Accounting and Custody Services Company (1993–1995); and Partner, Ernst & Young LLP (1975–1993), where he served as the National Director of Mutual Fund Tax Services and Managing Partner of its Chicago Office Tax department. He is a member of both the Governing Council of the Independent Directors Council (IDC), an organization of independent directors of mutual funds, and the Trustee Advisory Board of BoardIQ, a biweekly publication focused on issues and news affecting directors of mutual funds. He has served as a director or trustee, and as Chairman of the Audit Committee, of the AllianceBernstein Funds since 2008. | 100 | Greenbacker Renewable Energy Company LLC (renewable energy and energy efficiency projects) from August 2013 to January 2014 | |||||
Earl D. Weiner, ## 74 (2007) | Of Counsel, and Partner prior to January 2007, of the law firm Sullivan & Cromwell LLP and member of ABA Federal Regulation of Securities Committee Task Force to draft editions of the Fund Director’s Guidebook. He also serves as a director or trustee of various non-profit organizations and has served as Chairman or Vice Chairman of a number of them. He has served as a director or trustee of the AllianceBernstein Funds since 2007 and is Chairman of the Governance and Nominating Committees of the Funds. | 100 | None | |||||
| * | The address for the Fund’s disinterested Directors is c/o AllianceBernstein L.P., Attention: Philip L. Kirstein, 1345 Avenue of the Americas, New York, NY 10105. |
| ** | There is no stated term of office for the Fund’s Directors. |
| *** | The information above includes each Director’s principal occupation during the last five years and other information relating to the experience, attributes and skills relevant to each Director’s qualifications to serve as a Director, which led to the conclusion that each Director should serve as a Director for the Fund. |
| # | Mr. Keith is an “interested person” of the Fund as defined in the “1940 Act”, due to his position as a Senior Vice President of the Adviser. |
| ## | Member of the Audit Committee, the Governance and Nominating Committee and the Independent Directors Committee. |
| ### | Member of the Fair Value Pricing Committee. |
43
| INTERMEDIATE BOND PORTFOLIO | ||
| MANAGEMENTOFTHE FUND | ||
| (continued) | AllianceBernstein Variable Products Series Fund |
Officer Information
Certain information concerning the Portfolio’s Officers is listed below.
NAME, ADDRESS*, AGE | PRINCIPAL POSITION(S) HELD WITH FUND | PRINCIPAL OCCUPATION DURING PAST FIVE YEARS | ||
Robert M. Keith 53 | President and Chief Executive Officer | See biography above. | ||
Philip L. Kirstein 68 | Senior Vice President and Independent Compliance Officer | Senior Vice President and Independent Compliance Officer of the AllianceBernstein Funds, with which he has been associated since October 2004. Prior thereto, he was Of Counsel to Kirkpatrick & Lockhart, LLP from October 2003 to October 2004, and General Counsel of Merrill Lynch Investment Managers, L.P. since prior to March 2003. | ||
Paul J. DeNoon 51 | Vice President | Senior Vice President of the Adviser**, with which he has been associated since prior to 2009. | ||
Shawn E. Keegan 42 | Vice President | Vice President of the Adviser**, with which he has been associated since prior to 2009. | ||
Alison M. Martier 57 | Vice President | Senior Vice President of the Adviser**, with which she has been associated since prior to 2009. | ||
Douglas J. Peebles 48 | Vice President | Senior Vice President of the Adviser**, with which he has been associated since prior to 2009. | ||
Greg J. Wilensky 46 | Vice President | Senior Vice President of the Adviser**, with which he has been associated since prior to 2009. | ||
Emilie D. Wrapp 58 | Secretary | Senior Vice President, Assistant General Counsel and Assistant Secretary of ABI**, with which she has been associated since prior to 2009. | ||
Joseph J. Mantineo 54 | Treasurer and Chief Financial Officer | Senior Vice President of AllianceBernstein Investor Services, Inc. (“ABIS”)**, with which he has been associated since prior to 2009. | ||
Phyllis J. Clarke 53 | Controller | Vice President of ABIS**, with which she has been associated since prior to 2009. | ||
Vincent S. Noto 49 | Chief Compliance Officer | Chief Compliance Officer of the AllianceBernstein Funds, and Vice President of ABIS**, with which he has been associated since prior to 2009. |
| * | The address for each of the Portfolio’s Officers is 1345 Avenue of the Americas, New York, NY 10105. |
| ** | The Adviser, ABI and ABIS are affiliates of the Fund. |
| The Fund’s Statement of Additional Information (“SAI”) has additional information about the Directors and Officers and is available without charge upon request. Contact your financial representative or AllianceBernstein at (800) 227-4618, or visit www.alliancebernstein.com, for a free prospectus or SAI. |
44
INTERMEDIATE BOND PORTFOLIO | ||
| CONTINUANCE DISCLOSURE | AllianceBernstein Variable Products Series Fund | |
Information Regarding the Review and Approval of the Portfolio’s Advisory Agreement
The disinterested directors (the “directors”) of AllianceBernstein Variable Products Series Fund, Inc. (the “Fund”) approved the continuance of the Fund’s Advisory Agreement with the Adviser in respect of AllianceBernstein Intermediate Bond Portfolio (the “Portfolio”) at a meeting held on November 5-7, 2013.
Prior to approval of the continuance of the Advisory Agreement, the directors had requested from the Adviser, and received and evaluated, extensive materials. They reviewed the proposed continuance of the Advisory Agreement with the Adviser and with experienced counsel who are independent of the Adviser, who advised on the relevant legal standards. The directors also reviewed an independent evaluation prepared by the Fund’s Senior Officer (who is also the Fund’s Independent Compliance Officer) of the reasonableness of the advisory fee, in which the Senior Officer concluded that the contractual fee for the Portfolio was reasonable. The directors also discussed the proposed continuance in private sessions with counsel and the Fund’s Senior Officer.
The directors considered their knowledge of the nature and quality of the services provided by the Adviser to the Portfolio gained from their experience as directors or trustees of most of the registered investment companies advised by the Adviser, their overall confidence in the Adviser’s integrity and competence they have gained from that experience, the Adviser’s initiative in identifying and raising potential issues with the directors and its responsiveness, frankness and attention to concerns raised by the directors in the past, including the Adviser’s willingness to consider and implement organizational and operational changes designed to improve investment results and the services provided to the AllianceBernstein Funds. The directors noted that they have four regular meetings each year, at each of which they receive presentations from the Adviser on the investment results of the Portfolio and review extensive materials and information presented by the Adviser.
The directors also considered all other factors they believed relevant, including the specific matters discussed below. In their deliberations, the directors did not identify any particular information that was all-important or controlling, and different directors may have attributed different weights to the various factors. The directors determined that the selection of the Adviser to manage the Portfolio and the overall arrangements between the Portfolio and the Adviser, as provided in the Advisory Agreement, including the advisory fee, were fair and reasonable in light of the services performed, expenses incurred and such other matters as the directors considered relevant in the exercise of their business judgment. The material factors and conclusions that formed the basis for the directors’ determinations included the following:
Nature, Extent and Quality of Services Provided
The directors considered the scope and quality of services provided by the Adviser under the Advisory Agreement, including the quality of the investment research capabilities of the Adviser and the other resources it has dedicated to performing services for the Portfolio. They noted the professional experience and qualifications of the Portfolio’s portfolio management team and other senior personnel of the Adviser. The directors also considered that the Advisory Agreement provides that the Portfolio will reimburse the Adviser for the cost to it of providing certain clerical, accounting, administrative and other services to the Portfolio by employees of the Adviser or its affiliates. Requests for these reimbursements are made on a quarterly basis and subject to approval by the directors. Reimbursements, to the extent requested and paid, result in a higher rate of total compensation from the Portfolio to the Adviser than the fee rate stated in the Portfolio’s Advisory Agreement. The directors noted that the methodology used to determine the reimbursement amounts had been reviewed by an independent consultant retained by the Fund’s Senior Officer. The quality of administrative and other services, including the Adviser’s role in coordinating the activities of the Portfolio’s other service providers, also were considered. The directors concluded that, overall, they were satisfied with the nature, extent and quality of services provided to the Portfolio under the Advisory Agreement.
Costs of Services Provided and Profitability
The directors reviewed a schedule of the revenues, expenses and related notes indicating the profitability of the Portfolio to the Adviser for calendar years 2011 and 2012 that had been prepared with an expense allocation methodology arrived at in consultation with an independent consultant retained by the Fund’s Senior Officer. The directors noted the assumptions and methods of allocation used by the Adviser in preparing fund-specific profitability data and understood that there are a number of potentially acceptable allocation methodologies for information of this type. The directors noted that the profitability information reflected all revenues and expenses of the Adviser’s relationship with the Portfolio, including those relating to its subsidiaries which provide transfer agency, distribution and brokerage services to the Portfolio. The directors recognized that it is difficult to make comparisons of profitability of the Advisory Agreement with advisory contracts for unaffiliated funds
45
INTERMEDIATE BOND PORTFOLIO | ||
| CONTINUANCE DISCLOSURE | ||
| (continued) | AllianceBernstein Variable Products Series Fund | |
because comparative information is not generally publicly available and is affected by numerous factors. The directors focused on the profitability of the Adviser’s relationship with the Portfolio before taxes and distribution expenses. The directors concluded that they were satisfied that the Adviser’s level of profitability from its relationship with the Portfolio was not unreasonable.
Fall-Out Benefits
The directors considered the other benefits to the Adviser and its affiliates from their relationships with the Portfolio, including but not limited to benefits relating to 12b-1 fees and sales charges received by the Fund’s principal underwriter (which is a wholly owned subsidiary of the Adviser) in respect of the Portfolio’s Class B shares; and transfer agency fees paid by the Portfolio to a wholly owned subsidiary of the Adviser. The directors recognized that the Adviser’s profitability would be somewhat lower without these benefits. The directors also understood that the Adviser also might derive reputational and other benefits from its association with the Portfolio.
Investment Results
In addition to the information reviewed by the directors in connection with the meeting, the directors receive detailed performance information for the Portfolio at each regular Board meeting during the year. At the November 2013 meeting, the directors reviewed information prepared by Lipper showing the performance of the Class A Shares of the Portfolio as compared with that of a group of similar funds selected by Lipper (the “Performance Group”) and as compared with that of a broader array of funds selected by Lipper (the “Performance Universe”), and information prepared by the Adviser showing performance of the Class A Shares as compared with the Barclays Capital U.S. Government Bond Index (the “Index”), in each case for the 1-, 3-, 5- and 10-year periods ended July 31, 2013 and (in the case of comparisons with the Index) the since inception period (September 1992 inception). The directors noted that the Portfolio was in the 3rd quintile of the Performance Group and 4th quintile of the Performance Universe for the 1-year period, in the 5th quintile of the Performance Group and 4th quintile of the Performance Universe for the 3-year period, in the 2nd quintile of the Performance Group and the Performance Universe for the 5-year period, and in the 2nd quintile of the Performance Group and 3rd quintile of the Performance Universe for the 10-year period. The Portfolio lagged the Index in the period since inception and outperformed the Index in all other periods. The directors also noted the changes to the Portfolio’s investment policies and the acquisition of the following portfolios of the Fund: AllianceBernstein Americas Government Income Portfolio, AllianceBernstein Global Bond Portfolio, AllianceBernstein Global Dollar Government Portfolio and AllianceBernstein High Yield Portfolio, effective April 2008. Based on their review, the directors concluded that the Portfolio’s performance was acceptable.
Advisory Fees and Other Expenses
The directors considered the advisory fee rate paid by the Portfolio to the Adviser and information prepared by Lipper concerning advisory fee rates paid by other funds in the same Lipper category as the Portfolio at a common asset level. The directors recognized that it is difficult to make comparisons of advisory fees because there are variations in the services that are included in the fees paid by other funds.
The directors also considered the fees the Adviser charges non-fund clients pursuing a substantially similar investment style. For this purpose, they reviewed the relevant advisory fee information from the Adviser’s Form ADV and the evaluation from the Fund’s Senior Officer. The directors noted that the institutional fee schedule and the Portfolio’s fee schedule started at different rates and that the institutional fee schedule had breakpoints at lower asset levels. The application of the institutional fee schedule to the Portfolio’s net assets would result in a fee rate lower than the rate being paid by the Portfolio. The directors noted that the Adviser may, in some cases, agree to fee rates with large institutional clients that are lower than those reviewed by the directors and that they had previously discussed with the Adviser its policies in respect of such arrangements. The directors also reviewed information that indicated that the Portfolio’s fee rate is higher than the sub-advisory fee rate earned by the Adviser for sub-advising another registered investment company with a similar investment style. The directors noted that the Adviser advises a portfolio of another AllianceBernstein fund with a similar investment style for the same fee schedule as the Portfolio.
The Adviser reviewed with the directors the significantly greater scope of the services it provides to the Portfolio relative to institutional clients and sub-advised funds. The Adviser also noted that because mutual funds are constantly issuing and redeeming shares, they are more difficult to manage than an institutional account, where the assets tend to be relatively stable. In light of the substantial differences in services rendered by the Adviser to institutional clients as compared to funds such as the Portfolio, the directors considered these fee comparisons inapt and did not place significant weight on them in their deliberations.
46
| AllianceBernstein Variable Products Series Fund | ||
The directors also considered the total expense ratio of the Class A shares of the Portfolio in comparison to the fees and expenses of funds within two comparison groups created by Lipper: an Expense Group and an Expense Universe. Lipper described an Expense Group as a representative sample of funds comparable to the Portfolio and an Expense Universe as a broader group, consisting of all funds in the Portfolio’s investment classification/objective. The Class A expense ratio of the Portfolio was based on the Portfolio’s latest fiscal year. The directors noted that it was likely that the expense ratios of some of the other funds in the Portfolio’s Lipper category were lowered by waivers or reimbursements by those funds’ investment advisers, which in some cases might be voluntary or temporary. The directors view the expense ratio information as relevant to their evaluation of the Adviser’s services because the Adviser is responsible for coordinating services provided to the Portfolio by others.
The directors noted that, at the Portfolio’s current size, its contractual effective advisory fee rate of 45 basis points, plus the 4 basis points impact of the administrative expense reimbursement in the latest fiscal year, was lower than the Expense Group median. The directors also noted that the Portfolio’s total expense ratio was higher than the Expense Group and the Expense Universe medians. The directors noted that the Portfolio’s small asset base of approximately $91 million impacted the Portfolio’s expense ratio. The directors concluded that the Portfolio’s expense ratio was acceptable.
Economies of Scale
The directors noted that the advisory fee schedule for the Portfolio contains breakpoints that reduce the fee rates on assets above specified levels. The directors took into consideration prior presentations by an independent consultant on economies of scale in the mutual fund industry and for the AllianceBernstein Funds, and by the Adviser concerning certain of its views on economies of scale. The directors also had requested and received from the Adviser certain updates on economies of scale at the May 2013 meeting. The directors believe that economies of scale may be realized (if at all) by the Adviser across a variety of products and services, and not only in respect of a single fund. The directors noted that there is no established methodology for setting breakpoints that give effect to fund-specific services provided by a fund’s adviser and to the economies of scale that an adviser may realize in its overall mutual fund business or those components of it which directly or indirectly affect a fund’s operations. The directors observed that in the mutual fund industry as a whole, as well as among funds similar to the Portfolio, there is no uniformity or pattern in the fees and asset levels at which breakpoints (if any) apply. The directors also noted that the advisory agreements for many funds do not have breakpoints at all. Having taken these factors into account, the directors concluded that the Portfolio’s shareholders would benefit from a sharing of economies of scale in the event the Portfolio’s net assets exceed a breakpoint in the future.
47
| INTERMEDIATE BOND PORTFOLIO | ||
| SENIOR OFFICER FEE EVALUATION | AllianceBernstein Variable Products Series Fund |
THE FOLLOWING IS NOT PART OF THE SHAREHOLDER REPORT OR THE FINANCIAL STATEMENTS
SUMMARY OF SENIOR OFFICER’S EVALUATION OF INVESTMENT ADVISORY AGREEMENT1
The following is a summary of the evaluation of the Investment Advisory Agreement between AllianceBernstein L.P. (the “Adviser”) and the AllianceBernstein Variable Products Series Fund, Inc. (the “Fund”), in respect of AllianceBernstein Intermediate Bond Portfolio (the “Portfolio”),2,3 prepared by Philip L. Kirstein, the Senior Officer of the Fund for the Directors of the Fund, as required by the August 2004 agreement between the Adviser and the New York State Attorney General (the “NYAG”). The Senior Officer’s evaluation of the Investment Advisory Agreement is not meant to diminish the responsibility or authority of the Board of Directors to perform its duties pursuant to Section 15 of the Investment Company Act of 1940 (the “40 Act”) and applicable state law. The purpose of the summary is to provide shareholders with a synopsis of the independent evaluation of the reasonableness of the advisory fees proposed to be paid by the Portfolio which was provided to the Directors in connection with their review of the proposed approval of the continuance of the Investment Advisory Agreement.
The Senior Officer’s evaluation considered the following factors:
| 1. | Advisory fees charged to institutional and other clients of the Adviser for like services; |
| 2. | Advisory fees charged by other mutual fund companies for like services; |
| 3. | Costs to the Adviser and its affiliates of supplying services pursuant to the advisory agreement, excluding any intra-corporate profit; |
| 4. | Profit margins of the Adviser and its affiliates from supplying such services; |
| 5. | Possible economies of scale as the Portfolio grows larger; and |
| 6. | Nature and quality of the Adviser’s services including the performance of the Portfolio. |
These factors, with the exception of the first factor, are generally referred to as the “Gartenberg factors,” which were articulated by the United States Court of Appeals for the Second Circuit in 1982. Gartenberg v. Merrill Lynch Asset Management, Inc., 694 F. 2d 923 (2d Cir. 1982). On March 30, 2010, the Supreme Court held the Gartenberg decision was correct in its basic formulation of what Section 36(b) requires: to face liability under Section 36(b), “an investment adviser must charge a fee that is so disproportionately large that it bears no reasonable relationship to the services rendered and could not have been the product of arm’s length bargaining.” Jones v. Harris Associates L.P., 130 S. Ct. 1418 (2010). In Jones, the Court stated the Gartenberg approach fully incorporates the correct understanding of fiduciary duty within the context of Section 36(b) and noted with approval that “Gartenberg insists that all relevant circumstances be taken into account” and “uses the range of fees that might result from arm’s length bargaining as the benchmark for reviewing challenged fees.”4
INVESTMENT ADVISORY FEES, NET ASSETS & EXPENSE RATIOS
The Adviser proposed that the Portfolio pays the advisory fee set forth in the table below for receiving the services to be provided pursuant to the Investment Advisory Agreement. The fee schedule below, implemented in January 2004 in consideration of the Adviser’s settlement with the NYAG in December 2003, is based on a master schedule that contemplates eight categories of funds with almost all funds in each category having the same advisory fee schedule.5 Also shown are the Portfolio’s net assets on September 30, 2013.
| Portfolio | Category | Advisory Fee Based on % of Average Daily Net Assets | Net Assets ($MM) | |||
Intermediate Bond Portfolio | Low Risk Income | 0.45% on 1st $2.5 billion 0.40% on next $2.5 billion 0.35% on the balance | $90.2 |
| 1 | The information in the fee evaluation was completed on October 24, 2013 and discussed with the Board of Directors on November 5-7, 2013. |
| 2 | Future references to the Portfolio do not include “AllianceBernstein.” References in the fee summary pertaining to performance and expense ratios refer to Class A shares of the Portfolio. |
| 3 | It should be noted that on April 25, 2008, the Adviser’s variable fixed-income offerings were reorganized and U.S. Government/ High Grade Securities Portfolio acquired the assets of other fixed income series of the Fund, including Americas Government Income Portfolio, Global Bond Portfolio, Global Dollar Government Portfolio and High Yield Portfolio. On April 28, 2008 the investment guidelines of U.S. Government/ High Grade Securities Portfolio were broadened to match those of the Adviser’s U.S. Strategic Core Plus Strategy and the Portfolio’s name was changed to Intermediate Bond Portfolio. |
| 4 | Jones v. Harris at 1427. |
| 5 | Most of the AllianceBernstein Mutual Funds, which the Adviser manages, were affected by the Adviser’s settlement with the NYAG. |
48
| AllianceBernstein Variable Products Series Fund |
The Portfolio’s Investment Advisory Agreement provides for the Adviser to be reimbursed for certain clerical, legal, accounting, administrative and other services provided to the Portfolio. During the Portfolio’s the fiscal year ended December 31, 2012, the Adviser received $44,915 (0.038% of the Portfolio’s average daily net assets) for providing such services.
Set forth below are the Portfolio’s total expense ratios for the most recent semi-annual period:
| Portfolio | Total Expense Ratio6 | Fiscal Year | ||
Intermediate Bond Portfolio | Class A 0.74% Class B 0.99% | December 31 (ratio as of June 30, 2013) |
I. ADVISORY FEES CHARGED TO INSTITUTIONAL AND OTHER CLIENTS
The advisory fees charged to investment companies which the Adviser manages and sponsors are normally higher than those charged to similar sized institutional accounts, including pension plans and sub-advised investment companies. The fee differential reflects, among other things, different services provided to such clients, and different liabilities assumed. Services provided by the Adviser to the Portfolio that are not provided to non-investment company clients and sub-advised investment companies include providing office space and personnel to serve as Fund Officers, who among other responsibilities make the certifications required under the Sarbanes–Oxley Act of 2002, and coordinating with and monitoring the Portfolio’s third party service providers such as Fund counsel, auditors, custodians, transfer agents and pricing services. The accounting, administrative, legal and compliance requirements for the Portfolio are more costly than those for institutional assets due to the greater complexities and time required for investment companies, although as previously noted, the Adviser is reimbursed for providing such services. Servicing the Portfolio’s investors is more time consuming and labor intensive compared to institutional clients since the Adviser needs to communicate with a more extensive network of financial intermediaries and shareholders. The Adviser also believes that it incurs substantial entrepreneurial risk when offering a new mutual fund since establishing a new mutual fund requires a large upfront investment and it may take a long time for the fund to achieve profitability since the fund must be priced to scale from inception in order to be competitive and assets are acquired one account at a time. In addition, managing the cash flow of an investment company may be more difficult than managing that of a stable pool of assets, such as an institutional account with little cash movement in either direction, particularly, if a fund is in net redemption and the Adviser is frequently forced to sell securities to raise cash for redemptions. However, managing a fund with positive cash flow may be easier at times than managing a stable pool of assets. Finally, in recent years, investment advisers have been sued by institutional clients and have suffered reputational damage both by the attendant publicity and outcomes other than complete victories. Accordingly, the legal and reputational risks associated with institutional accounts are greater than previously thought, although still not equal to those related to the mutual fund industry.
Notwithstanding the Adviser’s view that managing an investment company is not comparable to managing other institutional accounts because the services provided are different, the Supreme Court has indicated consideration should be given to the advisory fees charged to institutional accounts with a similar investment style as the Portfolio.7 In addition to the AllianceBernstein Institutional fee schedule, set forth below is what would have been the effective advisory fee of the Portfolio had the AllianceBernstein Institutional fee schedule been applicable to the Portfolio versus the Portfolio’s advisory fee based on September 30, 2013 net assets.8
| Portfolio | Net Assets 9/30/13 ($MM) | AllianceBernstein Fee Schedule | Effective AB Inst. Adv. Fee (%) | Fund Advisory Fee (%) | ||||||||
Intermediate Bond Portfolio | $90.2 | U.S. Strategic Core Plus 0.50% on the first $30 million 0.20% on the balance Minimum Account Size: $25 million | 0.300 | 0.450 | ||||||||
| 6 | Annualized. |
| 7 | The Supreme Court stated that “courts may give such comparisons the weight that they merit in light of the similarities and differences between the services that the clients in question require, but the courts must be wary of inapt comparisons.” Among the significant differences the Supreme Court noted that may exist between services provided to mutual funds and institutional accounts are “higher marketing costs.” Jones v. Harris at 1428. |
| 8 | The Adviser has indicated that with respect to institutional accounts with assets greater than $300 million, it will negotiate a fee schedule. Discounts that are negotiated vary based upon each client relationship. |
49
| INTERMEDIATE BOND PORTFOLIO | ||
| SENIOR OFFICER FEE EVALUATION | ||
| (continued) | AllianceBernstein Variable Products Series Fund |
Certain of the AllianceBernstein Mutual Funds (“ABMF”), which the Adviser manages, have a similar investment style as the Portfolio and their fee schedules are set forth below. The AllianceBernstein Mutual Funds were also affected by the Adviser’s settlement with the NYAG. As a result, the Portfolio has the same breakpoints as AllianceBernstein Bond Fund, Inc.—Intermediate Bond Portfolio. Sanford C. Bernstein Fund II, Inc.—Intermediate Duration Institutional Portfolio, which is managed similarly as the Portfolio, was not affected by the settlement since the fund has lower breakpoints than the NYAG related fee schedule. Also shown are what would have been the effective advisory fees of the Portfolio had the ABMF fee schedules been applicable to the Portfolio based on September 30, 2013 net assets:
| Portfolio | ABMF Fund | Fee Schedule | ABMF Effective Fee (%) | Portfolio Advisory | ||||||||
Intermediate Bond Portfolio | Bond Fund, Inc.—Intermediate Bond Portfolio | 0.45% on first $2.5 billion 0.40% on next $2.5 billion 0.35% on the balance | 0.450 | 0.450 | ||||||||
Intermediate Bond Portfolio | Intermediate Duration Institutional Portfolio9 | 0.50% on first $1 billion 0.45% on the balance | 0.500 | 0.450 | ||||||||
The Adviser manages Intermediate Duration Portfolio of the Sanford C. Bernstein Fund, Inc. (“SCB Fund”), an open-end management investment company which has a similar investment style as the Portfolio. Set forth below is Intermediate Duration Portfolio’s advisory fee and what would have been the effective advisory fee of the Portfolio had the fee schedule of Intermediate Duration Portfolio been applicable to the Portfolio based on September 30, 2013 net assets:
| Portfolio | SCB Fund Portfolio | Fee Schedule | SCB Fund Effective Fee (%) | Portfolio Advisory Fee (%) | ||||||||
Intermediate Bond Portfolio | Intermediate Duration Portfolio | 0.50% on 1st $1 billion 0.45% on next $2 billion 0.40% on next $2 billion 0.35% on next $2 billion 0.30% the balance | 0.500 | 0.450 | ||||||||
The Adviser provides sub-advisory services to certain other investment companies managed by other fund families. The Adviser charges the fee set forth below for the sub-advisory relationship that has a somewhat similar investment style as the Portfolio. Also shown are the Portfolio’s advisory fee and what would have been the effective advisory fee of the Portfolio had the fee schedule of the sub-advisory relationship been applicable to the Portfolio based on September 30, 2013 net assets.
| Portfolio | Fee Schedule | Effective Sub-Adv. Fee (%) | Portfolio Advisory Fee (%) | |||||||||
Intermediate Bond Portfolio | Client # 1 | AB Sub-Advisory Fee Schedule: 0.29% on first $100 million 0.20% thereafter | 0.290 | 0.450 | ||||||||
It is fair to note that the services the Adviser provides pursuant to sub-advisory agreements are generally confined to the services related to the investment process; in other words, they are not as comprehensive as the services provided to the Portfolio by the Adviser. In addition, to the extent that this is the only sub-advisory relationship and it is with an affiliate of the Adviser, the fee schedule may not reflect arm’s-length bargaining or negotiations.
While it appears that the sub-advisory relationship is paying a lower fee than the Portfolio, it is difficult to evaluate the relevance of such a lower fee due to differences in terms of the services provided, risks involved and other competitive factors between the Portfolio and the sub-advisory relationship. There could be various business reasons why an investment adviser would be willing to provide a sub-advised relationship investment related services at a different fee level than an investment company it is sponsoring where the investment adviser is providing all the services, not just investment management service generally required by a registered investment company.
| 9 | Intermediate Duration Institutional Portfolio has an expense cap of 0.45%, which effectively reduces the advisory fee of the fund. |
50
| AllianceBernstein Variable Products Series Fund |
II. MANAGEMENT FEES CHARGED BY OTHER MUTUAL FUND COMPANIES FOR LIKE SERVICES.
Lipper, Inc. (“Lipper”), an analytical service that is not affiliated with the Adviser, compared the fees charged to the Portfolio with fees charged to other investment companies for similar services offered by other investment advisers.10 Lipper’s analysis included the comparison of the Portfolio’s contractual management fee, estimated at the approximate current asset level of the Portfolio, to the median of the Portfolio’s Lipper Expense Group (“EG”)11 and the Portfolio’s contractual management fee ranking.12
Lipper describes an EG as a representative sample of comparable funds. Lipper’s standard methodology for screening funds to be included in an EG entails the consideration of several fund criteria, including fund type, investment classification/objective, load type and similar 12b-1/non-12b-1 service fees, asset (size) comparability, expense components and attributes. An EG will typically consist of seven to twenty funds.
The Portfolio’s original EG had an insufficient number of peers. Consequently, Lipper expanded the Portfolio’s EG to include peers that have a similar but not the same Lipper classification/objective as the Portfolio. However, because Lipper had expanded the Portfolio’s EG, under Lipper’s standard guidelines, the Portfolio’s Lipper Expense Universe (“EU”) was also expanded to include universes of those peers that had a similar but not the same Lipper investment objective/classification. A “normal” EU will include funds that have the same investment objective/classification as the subject portfolio.13
| Portfolio | Contractual Fee (%)14 | Lipper Exp. Group Median (%) | Lipper Rank | |||
Intermediate Bond Portfolio | 0.450 | 0.500 | 2/12 |
Set forth below is a comparison of the Portfolio’s total expense ratio and the medians of the Portfolio’s EG and EU.
| Portfolio | Total Expense Ratio | Lipper Exp. Group Median (%) | Lipper Group Rank | Lipper Exp. Median (%) | Lipper Rank | |||||||||||||||
Intermediate Bond Portfolio | 0.705 | 0.652 | 11/12 | 0.604 | 25/28 | |||||||||||||||
Based on this analysis, the Portfolio has more favorable ranking on a contractual management fee basis than on a total expense basis.
III. COSTS TO THE ADVISER AND ITS AFFILIATES OF SUPPLYING SERVICES PURSUANT TO THE MANAGEMENT FEE ARRANGEMENT, EXCLUDING ANY INTRA-CORPORATE PROFIT.
The Adviser utilizes two profitability reporting systems, which operate independently but are aligned with each other, to estimate the Adviser’s profitability in connection with investment advisory services provided to the Portfolio. The Senior Officer has retained a consultant to provide independent advice regarding the alignment of the two profitability systems as well as the methodologies and allocations utilized by both profitability systems. See Section IV for additional discussion.
| 10 | The Supreme Court cautioned against accepting mutual fund fee comparisons without careful scrutiny since “these comparisons are problematic because these fees, like those challenged, may not be the product of negotiations conducted at arm’s length.” Jones v. Harris at 1429. |
| 11 | Lipper does not consider average account size when constructing EGs. Funds with relatively small average account sizes tend to have higher transfer agent expense ratio than comparable sized funds that have relatively large average account sizes. Note that there are limitations on Lipper expense category data because different funds categorize expenses differently. |
| 12 | The contractual management fee is calculated by Lipper using the Portfolio’s contractual management fee rate at a hypothetical asset level. The hypothetical asset level is based on the combined net assets of all classes of the Portfolio, rounded up to the next $25 million. Lipper’s total expense ratio information is based on the most recent annual report except as otherwise noted. A ranking of “1” would mean that the Portfolio had the lowest effective fee rate in the Lipper peer group. |
| 13 | Except for asset size comparability, Lipper uses the same criteria for selecting an EG peer when selecting an EU peer. Unlike the EG, the EU allows for the same adviser to be represented by more than just one fund. |
| 14 | The contractual management fee does not reflect any expense reimbursements made by the Portfolio to the Adviser for certain clerical, legal, accounting, administrative, and other services. |
| 15 | Most recently completed fiscal year Class A share total expense ratio. |
51
| INTERMEDIATE BOND PORTFOLIO | ||
| SENIOR OFFICER FEE EVALUATION | ||
| (continued) | AllianceBernstein Variable Products Series Fund |
IV. PROFIT MARGINS OF THE ADVISER AND ITS AFFILIATES FOR SUPPLYING SUCH SERVICES.
The Portfolio’s profitability information, prepared by the Adviser for the Board of Directors, was reviewed by the Senior Officer and the consultant. The Adviser’s profitability from providing investment advisory services to the Portfolio increased during calendar year 2012, relative to 2011.
In addition to the Adviser’s direct profits from managing the Portfolio, certain of the Adviser’s affiliates have business relationships with the Portfolio and may earn a profit from providing other services to the Portfolio. The courts have referred to this type of business opportunity as “fall-out benefits” to the Adviser and indicated that such benefits should be factored into the evaluation of the total relationship between the Portfolio and the Adviser. Neither case law nor common business practice precludes the Adviser’s affiliates from earning a reasonable profit on this type of relationship provided the affiliates’ charges and services are competitive and the relationship otherwise complies with the 40 Act restrictions. These affiliates provide transfer agent and distribution services to the Portfolio and receive transfer agent fees, Rule 12b-1 payments and front-end sales loads.
The Portfolio has adopted a distribution plan for Class B shares pursuant to Rule 12b-1 under the 40 Act. Under the distribution plan, the Portfolio pays distribution and servicing fees to its principal underwriter, AllianceBernstein Investments, Inc. (“ABI”), an affiliate of the Adviser, at an annual rate of up to 0.50% of the Portfolio’s average daily net assets attributable to Class B shares. The current annual rate that the Portfolio pays to ABI for 12b-1 fees is 0.25%. During the fiscal year ended December 31, 2012, ABI received $78,314 in Rule 12b-1 fees from the Portfolio.
During the fiscal year ended December 31, 2012, distribution expenses were incurred by ABI in the amount of $218,349 in connection with activities primarily intended to result in the sale of the Portfolio’s Class B shares. This expense amount incurred by ABI is partially offset by the 12b-1 fees paid by the Portfolio.
Financial intermediaries, such as insurers, market and sell shares of the Portfolio and typically receive compensation from ABI, the Adviser and/or the Portfolio for selling shares of the Portfolio. These financial intermediaries receive compensation in any or all of the following forms: 12b-1 fees, defrayal of costs for educational seminars and training, additional distribution support, and payments related to providing contract-holder record-keeping and/or administrative services. Payments related to providing contract-holder record keeping and/or administrative services will generally not exceed 0.35% of the average daily net assets of the Portfolio attributable to the firm over the year. With respect to the Fund,16 ABI paid approximately $600,000 in 2012 and expects to pay approximately $600,000 in 2013 for educational support and distribution assistance (revenue sharing payments).
The transfer agent of the Portfolio is AllianceBernstein Investor Services, Inc. (“ABIS”), an affiliate of the Adviser. During the most recently completed fiscal year, the Portfolio paid ABIS a fee of approximately $1,385.17
V. POSSIBLE ECONOMIES OF SCALE
The Adviser has indicated that economies of scale are being shared with shareholders through pricing to scale, breakpoints, fee reductions/waivers and enhancement to services.
In May 2012, an independent consultant, retained by the Senior Officer, provided the Board of Directors information on the Adviser’s firm-wide average costs from 2005 through 2011 and the potential economies of scale. The independent consultant noted that from 2005 through 2007 the Adviser experienced significant growth in assets under management (“AUM”). During this period, operating expenses increased, in part to keep up with growth, and in part reflecting market returns. However, from 2008 through the first quarter of 2009, AUM rapidly and significantly decreased due to declines in market value and client withdrawals. When AUM rapidly decreased, some operating expenses categories, including base compensation and office space, adjusted more slowly during this period, resulting in an increase in average costs. Since 2009, AUM has experienced less significant changes. The independent consultant noted that changes in operating expenses reflect changes in business composition and business practices in response to changes in financial markets. Finally, the independent consultant concluded that the increase in average cost and the decline in net operating margin across the Adviser since late 2008 are inconsistent with the view that there are currently reductions in average costs due to economies of scale that can be shared with the AllianceBernstein Mutual Funds managed by the Adviser through lower fees.
| 16 | The fee is inclusive of other Portfolios of the Fund (Equity and Blend), which are not discussed in this summary. |
| 17 | The Fund (which includes the Portfolio and other Portfolios of the Fund) paid ABIS a flat fee of $18,000 in 2012. |
52
| AllianceBernstein Variable Products Series Fund |
Previously, in February 2008, the independent consultant provided the Board of Directors an update of the Deli18 study on advisory fees and various fund characteristics.19 The independent consultant first reiterated the results of his previous two dimensional comparison analysis (fund size and family size) with the Board of Directors.20 The independent consultant then discussed the results of the regression model that was utilized to study the effects of various factors on advisory fees. The regression model output indicated that the bulk of the variation in fees predicted were explained by various factors, but substantially by fund AUM, family AUM, index fund indicator and investment style. The independent consultant also compared the advisory fees of the AllianceBernstein Mutual Funds to similar funds managed by 19 other large asset managers, regardless of the fund size and each Adviser’s proportion of mutual fund assets to non-mutual fund assets.
VI. NATURE AND QUALITY OF THE ADVISER’S SERVICES, INCLUDING THE PERFORMANCE OF THE FUND
With assets under management of approximately $445 billion as of September 30, 2013, the Adviser has the investment experience to manage and provide non-investment services (described in Section I) to the Portfolio.
The information prepared by Lipper shows the 1, 3, 5 and 10 year performance rankings21 of the Portfolio relative to its Lipper Performance Group (“PG”) and Lipper Performance Universe (“PU”)22 for the periods ended July 31, 2013.23
Fund Return (%) | PG Median (%) | PU Median (%) | PG Rank | PU Rank | ||||||||||||||||
Intermediate Bond Portfolio | ||||||||||||||||||||
1 year | –0.97 | –1.08 | –0.43 | 3/6 | 9/14 | |||||||||||||||
3 year | 3.75 | 3.82 | 3.99 | 5/6 | 11/14 | |||||||||||||||
5 year | 6.24 | 5.96 | 5.86 | 2/6 | 4/14 | |||||||||||||||
10 year | 4.80 | 4.48 | 4.71 | 2/6 | 6/12 | |||||||||||||||
| 18 | The Deli study, originally published in 2002 based on 1997 data and updated for the February 2008 Presentation, may be of diminished value due to the age of the data used in the presentation and the changes experienced in the industry over the last four years. |
| 19 | As mentioned previously, the Supreme Court cautioned against accepting mutual fund fee comparisons without careful scrutiny since the fees may not be the product of negotiations conducted at arm’s length. See Jones V. Harris at 1429. |
| 20 | The two dimensional analysis showed patterns of lower advisory fees for funds with larger asset sizes and funds from larger family sizes compared to funds with smaller asset sizes and funds from smaller family sizes, which according to the independent consultant is indicative of a sharing of economies of scale and scope. However, in less liquid and active markets, such is not the case, as the empirical analysis showed potential for diseconomies of scale in those markets. The empirical analysis also showed diminishing economies of scale and scope as funds surpassed a certain high level of assets. |
| 21 | The performance returns and rankings of the Portfolio are for the Portfolio’s Class A shares. The performance returns of the Portfolio were provided by Lipper. |
| 22 | The Portfolio’s PG/PU is not identical to its respective EG/EU as the criteria for including/excluding a fund to/from PG/PU is somewhat different than that of EG/EU. |
| 23 | The current Lipper investment classification/objective dictates the PG and PU throughout the life of the Portfolio even if a Portfolio had a different investment classification/objective at a different point in time. |
53
| INTERMEDIATE BOND PORTFOLIO | ||
| SENIOR OFFICER FEE EVALUATION | ||
| (continued) | AllianceBernstein Variable Products Series Fund |
Set forth below are the 1, 3, 5 and 10 year and since inception performance returns of the Portfolio (in bold)24 versus its benchmarks.25 Portfolio and benchmark volatility and reward-to-variability ratio (“Sharpe Ratio”) information is also shown.26
Periods Ending July 31, 2013 Annualized Performance | ||||||||||||||||||||||||||||||||
1 Year | 3 Year | 5 Year | 10 Year | Since Inception (%) | Annualized | Risk Period (Year) | ||||||||||||||||||||||||||
Volatility (%) | Sharpe (%) | |||||||||||||||||||||||||||||||
Intermediate Bond Portfolio | – | 0.97 | 3.75 | 6.24 | 4.80 | 5.41 | 4.39 | 0.69 | 10 | |||||||||||||||||||||||
Barclays Capital U.S. Government Bond Index | – | 2.54 | 2.68 | 4.26 | 4.50 | 5.72 | 4.01 | 0.70 | 10 | |||||||||||||||||||||||
Inception Date: September 17, 1992 |
| |||||||||||||||||||||||||||||||
CONCLUSION:
Based on the factors discussed above the Senior Officer’s conclusion is that the proposed advisory fee for the Portfolio is reasonable and within the range of what would have been negotiated at arm’s length in light of all the surrounding circumstances. This conclusion in respect of the Portfolio is based on an evaluation of all of these factors and no single factor was dispositive.
Dated: December 5, 2013
| 24 | The performance returns and risk measures shown in the table are for the Class A shares of the Portfolio. |
| 25 | The Adviser provided Portfolio and benchmark performance return information for periods through July 31, 2013. |
| 26 | Portfolio and benchmark volatility and Sharpe Ratio information was obtained through Lipper LANA, a database maintained by Lipper. Volatility is a statistical measure of the tendency of a market price or yield to vary over time. A Sharpe Ratio is a risk adjusted measure of return that divides a fund’s return in excess of the riskless return by the fund’s standard deviation. A fund with a greater volatility would be viewed as more risky than a fund with equivalent performance but lower volatility; for that reason, a greater return would be demanded for the more risky fund. A fund with a higher Sharpe Ratio would be viewed as better performing than a fund with a lower Sharpe Ratio. |
54
VPS-IB-0151-1213
AllianceBernstein
Variable Products Series Fund, Inc.
 | AllianceBernstein International Growth Portfolio |
December 31, 2013
Annual Report

ANNUAL REPORT
Investment Products Offered
| Ø | Are Not FDIC Insured |
| Ø | May Lose Value |
| Ø | Are Not Bank Guaranteed |
AllianceBernstein Investments, Inc. (ABI) is the distributor of the AllianceBernstein family of mutual funds. ABI is a member of FINRA and is an affiliate of AllianceBernstein L.P., the manager of the funds.
You may obtain a description of the Fund’s proxy voting policies and procedures, and information regarding how the Fund voted proxies relating to portfolio securities during the most recent 12-month period ended June 30, without charge. Simply visit AllianceBernstein’s website at www.alliancebernstein.com or go to the Securities and Exchange Commission’s (the “Commission”) website at www.sec.gov, or call AllianceBernstein at (800) 227-4618.
The Fund files its complete schedule of portfolio holdings with the Commission for the first and third quarters of each fiscal year on Form N-Q. The Fund’s Forms N-Q are available on the Commission’s website at www.sec.gov. The Fund’s Forms N-Q may also be reviewed and copied at the Commission’s Public Reference Room in Washington, DC; information on the operation of the Public Reference Room may be obtained by calling (800) SEC-0330.
AllianceBernstein® and the AB Logo are registered trademarks and service marks used by permission of the owner, AllianceBernstein L.P.
| INTERNATIONAL GROWTH | ||
| PORTFOLIO | AllianceBernstein Variable Products Series Fund |
LETTER TO INVESTORS
February 7, 2014
The following is an update of AllianceBernstein Variable Products Series Fund—AllianceBernstein International Growth Portfolio (the “Portfolio”) for the annual reporting period ended December 31, 2013.
INVESTMENT OBJECTIVE AND POLICIES
The Portfolio’s investment objective is long-term growth of capital. The Portfolio invests primarily in an international portfolio of equity securities of companies selected by AllianceBernstein L.P. (the “Adviser”) for their growth potential within various market sectors. Examples of the types of market sectors in which the Portfolio may invest include, but are not limited to, information technology (which includes telecommunications), health care, financial services, infrastructure, energy and natural resources, and consumer groups.
Under normal market conditions, the Portfolio invests significantly (at least 40%—unless market conditions are not deemed favorable by the Adviser) in securities of non-U.S. companies. In addition, the Portfolio invests, under normal circumstances, in the equity securities of companies located in at least three countries (and normally substantially more) other than the United States. The Portfolio invests in securities of companies in both developed and emerging market countries. Geographic distribution of the Portfolio’s investments among countries or regions also will be a product of the stock selection process rather than a pre-determined allocation. The Portfolio may also invest in synthetic foreign equity securities, which are various types of warrants used internationally that entitle a holder to buy or sell underlying securities. The Adviser expects that normally the Portfolio’s portfolio will tend to emphasize investments in larger capitalization companies, although the Portfolio may invest in smaller or medium capitalization companies.
The Portfolio may, at times, invest in shares of exchange-traded funds (“ETFs”) in lieu of making direct investments in equity securities. ETFs may provide more efficient and economical exposure to the type of companies and geographic locations in which the Portfolio seeks to invest than direct investments.
Currencies can have a dramatic impact on equity returns, significantly adding to returns in some years and greatly diminishing them in others. Currency and equity positions are evaluated separately. The Adviser may seek to hedge the currency exposure resulting from securities positions when it finds the currency exposure unattractive. To hedge all or a portion of its currency risk, the Portfolio may, from time to time, invest in currency-related derivatives, including forward currency exchange contracts, futures, options on futures, swaps and options. The Adviser may also seek investment opportunities by taking long or short positions in currencies through the use of currency-related derivatives.
The Portfolio may enter into other derivatives transactions, such as options, futures contracts, forwards and swaps. The Portfolio may use options strategies involving the purchase and/or writing of various combinations of call and/or put options, including on individual securities and stock indices, futures contracts (including futures contracts on individual securities and stock indices) or shares of ETFs. These transactions may be used, for example, in an effort to earn extra income, to adjust exposure to individual securities or markets, or to protect all or a portion of the Portfolio’s portfolio from a decline in value, sometimes within certain ranges.
INVESTMENT RESULTS
The table on page 5 shows the Portfolio’s performance compared to its benchmarks, the Morgan Stanley Capital International (“MSCI”) World (ex-U.S.) Index (net) and the MSCI All Country (“AC”) World (ex-U.S.) Index (net) for the one-, five- and 10-year periods ended December 31, 2013.
For the annual period ended December 31, 2013, all share classes of the Portfolio underperformed the benchmarks, with security selection driving the deficit. Stock selection in industrials and consumer-driven sectors undercut relative performance. Underweight exposure to the Japanese yen and an underweight to the materials sector, as well as stock selection within the technology sector, mitigated some of the losses. Currency exposure and sector allocation were both positive.
The Portfolio utilized derivatives in the form of currency forwards for hedging purposes, which detracted from performance during the annual period.
MARKET REVIEW AND INVESTMENT STRATEGY
International equity markets rose sharply in 2013, as a brightening macroeconomic outlook lifted risk assets. The U.S. Federal Reserve (the “Fed”) played a large role in the behavior of the financial markets during the year. The implementation of the Fed’s monetary policies in late 2012 fueled an extensive, liquidity-driven rally that boosted global stocks. Markets were volatile for most of the second half of 2013 as former Fed Chairman Ben Bernanke hinted that the U.S. may wind down its massive bond-buying program sooner than expected. After months of speculation, the Fed took its first steps toward
1
| AllianceBernstein Variable Products Series Fund |
ending a key component of its stimulus campaign in December. Amid a slew of data suggesting that the U.S. economy was gaining momentum, the Fed announced that it would gradually wind down its bond-purchasing program by late 2014. At the same time, it strengthened its commitment to keeping short-term interest rates near zero until late 2015. Markets reacted positively to news of this shift in monetary policy, as investors were enthusiastic about the gradual pace of the changes and relieved that a major source of uncertainty had been removed.
The Portfolio is tilted toward underappreciated growth opportunities in consumer and technology sectors. The Portfolio’s International Growth sector heads prefer market leaders with attractive earnings growth prospects and high returns on invested capital.
2
| INTERNATIONAL GROWTH PORTFOLIO | ||
| DISCLOSURESAND RISKS | AllianceBernstein Variable Products Series Fund | |
Benchmark Disclosure
Neither the unmanaged MSCI World (ex-U.S.) Index nor the unmanaged MSCI AC World (ex-U.S.) Index reflect fees and expenses associated with the active management of a mutual fund portfolio. The MSCI World (ex-U.S.) Index (free float-adjusted, market capitalization weighted) represents the equity market performance of developed markets, excluding the U.S. The MSCI AC World (ex-U.S.) Index (free float-adjusted, market capitalization weighted) represents the equity market performance of developed and emerging markets, excluding the U.S. MSCI makes no express or implied warranties or representations, and shall have no liability whatsoever with respect to any MSCI data contained herein. The MSCI data may not be further redistributed or used as a basis for other indices, any securities or financial products. This report is not approved, reviewed or produced by MSCI. An investor cannot invest directly in an index, and its results are not indicative of the performance for any specific investment, including the Portfolio.
A Word About Risk
Market Risk: The value of the Portfolio’s assets will fluctuate as the stock or bond market fluctuates. The value of its investments may decline, sometimes rapidly and unpredictably, simply because of economic changes or other events that affect large portions of the market. It includes the risk that a particular style of investing, such as growth, may underperform the market generally.
Foreign (Non-U.S.) Risk: Investments in securities of non-U.S. issuers may involve more risk than those of U.S. issuers. These securities may fluctuate more widely in price and may be less liquid due to adverse market, economic, political, regulatory or other factors.
Emerging Market Risk: Investments in emerging market countries may have more risk because the markets are less developed and less liquid as well as being subject to increased economic, political, regulatory or other uncertainties.
Currency Risk: Fluctuations in currency exchange rates may negatively affect the value of the Portfolio’s investments or reduce its returns.
Capitalization Risk: Investments in small- and mid-capitalization companies may be more volatile than investments in large-capitalization companies. Investments in small-capitalization companies may have additional risks because these companies have limited product lines, markets or financial resources.
Derivatives Risk: Derivatives may be illiquid, difficult to price, and leveraged so that small changes may produce disproportionate losses for the Portfolio, and may be subject to counterparty risk to a greater degree than more traditional investments.
Leverage Risk: To the extent the Portfolio uses leveraging techniques, its net asset value (“NAV”) may be more volatile because leverage tends to exaggerate the effect of changes in interest rates and any increase or decrease in the value of the Portfolio’s investments.
Management Risk: The Portfolio is subject to management risk because it is an actively-managed investment fund. The Adviser will apply its investment techniques and risk analyses in making investment decisions, but there is no guarantee that its techniques will produce the intended results.
These risks are fully discussed in the Variable Products prospectus.
An Important Note About Historical Performance
The investment return and principal value of an investment in the Portfolio will fluctuate, so that shares, when redeemed, may be worth more or less than their original cost. Performance shown on the following page represents past performance and does not guarantee future results. Current performance may be lower or higher than the performance information shown. Please contact your Financial Advisor or Insurance Agent Representative at your financial institution to obtain portfolio performance information current to the most recent month end.
Investors should consider the investment objectives, risks, charges and expenses of the Portfolio carefully before investing. For additional copies of the Portfolio’s prospectus or summary prospectus, which contains this and other information, call your financial advisor or 800.984.7654. Please read the prospectus and/or summary prospectus carefully before investing.
(Disclosures, Risks and Note about Historical Performance continued on next page)
3
| INTERNATIONAL GROWTH PORTFOLIO | ||
| DISCLOSURESAND RISKS | ||
| (continued) | AllianceBernstein Variable Products Series Fund | |
All fees and expenses related to the operation of the Portfolio have been deducted, but no adjustment has been made for insurance company separate account or annuity contract charges, which would reduce total return to a contract owner. Performance assumes reinvestment of distributions and does not account for taxes.
There are additional fees and expenses associated with all Variable Products. These fees can include mortality and expense risk charges, administrative charges, and other charges that can significantly reduce investment returns. Those fees and expenses are not reflected in this annual report. You should consult your Variable Products prospectus for a description of those fees and expenses and speak to your insurance agent or financial representative if you have any questions. You should read the prospectus before investing or sending money.
4
| INTERNATIONAL GROWTH PORTFOLIO | ||
| HISTORICAL PERFORMANCE | AllianceBernstein Variable Products Series Fund | |
| THE PORTFOLIO VS. ITS BENCHMARKS | NAV Returns | |||||||||||
| PERIODS ENDED DECEMBER 31, 2013 (unaudited) | 1 Year | 5 Years* | 10 Years* | |||||||||
AllianceBernstein International Growth Portfolio Class A | 13.60% | 11.72% | 7.21% | |||||||||
AllianceBernstein International Growth Portfolio Class B | 13.32% | 11.44% | 6.94% | |||||||||
MSCI World (ex-U.S.) Index (net) | 21.02% | 12.49% | 7.07% | |||||||||
MSCI AC World (ex-U.S.) Index (net) | 15.29% | 12.81% | 7.57% | |||||||||
* Average annual returns.
Please keep in mind that high, double-digit returns are highly unusual and cannot be sustained. Investors should also be aware that these returns were primarily achieved during favorable market conditions. |
| |||||||||||
The Portfolio’s current prospectus fee table shows the Portfolio’s total annual operating expense ratios as 0.97% and 1.22% for Class A and Class B shares, respectively. The Financial Highlights section of this report sets forth expense ratio data for the current reporting period; the expense ratios shown above may differ from the expense ratios in the Financial Highlights section since they are based on different time periods.
ALLIANCEBERNSTEIN INTERNATIONAL GROWTH PORTFOLIO CLASS A
GROWTH OF A $10,000 INVESTMENT
12/31/03 – 12/31/13 (unaudited)
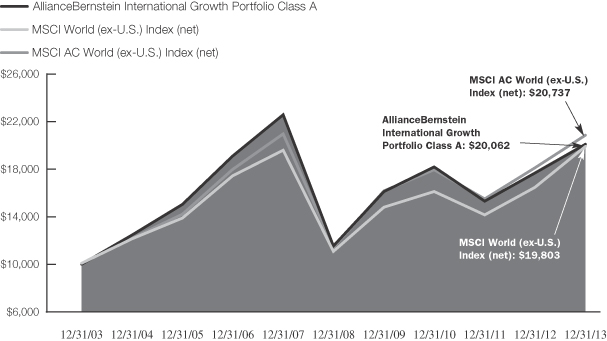
This chart illustrates the total value of an assumed $10,000 investment in AllianceBernstein International Growth Portfolio Class A shares (from 12/31/03 to 12/31/13) as compared to the performance of the Portfolio’s benchmarks, the MSCI World (ex-U.S.) Index (net) and the MSCI AC World (ex-U.S.) Index (net). The chart assumes the reinvestment of dividends and capital gains distributions.
See Disclosures, Risks and Note about Historical Performance on pages 3-4.
5
| INTERNATIONAL GROWTH PORTFOLIO | ||
| EXPENSE EXAMPLE (unaudited) | AllianceBernstein Variable Products Series Fund | |
As a shareholder of the Fund, you incur two types of costs: (1) transaction costs, including sales charges (loads) on purchase payments, contingent deferred sales charges on redemptions and (2) ongoing costs, including management fees; distribution (12b-1) fees; and other Fund expenses. This example is intended to help you understand your ongoing costs (in dollars) of investing in the Fund and to compare these costs with the ongoing costs of investing in other mutual funds.
The Example is based on an investment of $1,000 invested at the beginning of the period and held for the entire period as indicated below.
Actual Expenses
The table below provides information about actual account values and actual expenses. You may use the information in this line, together with the amount you invested, to estimate the expenses that you paid over the period. Simply divide your account value by $1,000 (for example, an $8,600 account value divided by $1,000 = 8.6), then multiply the result by the number in the first line under the heading entitled “Expenses Paid During Period” to estimate the expenses you paid on your account during this period. The estimate of expenses does not include fees or other expenses of any variable insurance product. If such expenses were included, the estimate of expenses you paid during the period would be higher and your ending account value would be lower.
Hypothetical Example for Comparison Purposes
The table below provides information about hypothetical account values and hypothetical expenses based on the Fund’s actual expense ratio and an assumed annual rate of return of 5% before expenses, which is not the Fund’s actual return. The hypothetical account values and expenses may not be used to estimate the actual ending account balance or expenses you paid for the period. You may use this information to compare the ongoing costs of investing in the Fund and other funds by comparing this 5% hypothetical example with the 5% hypothetical examples that appear in the shareholder reports of other funds. The estimate of expenses does not include fees or other expenses of any variable insurance product. If such expenses were included, the estimate of expenses you paid during the period would be higher and your ending account value would be lower.
Please note that the expenses shown in the table are meant to highlight your ongoing costs only and do not reflect any transactional costs, such as sales charges (loads), or contingent deferred sales charges on redemptions. Therefore, the second line of each class’ table is useful in comparing ongoing costs only, and will not help you determine the relative total costs of owning different funds. In addition, if these transactional costs were included, your costs would have been higher.
| Beginning Account Value July 1, 2013 | Ending Account Value December 31, 2013 | Expenses Paid During Period* | Annualized Expense Ratio* | |||||||||||||
Class A | ||||||||||||||||
Actual | $ | 1,000 | $ | 1,127.50 | $ | 4.99 | 0.93 | % | ||||||||
Hypothetical (5% annual return before expenses) | $ | 1,000 | $ | 1,020.52 | $ | 4.74 | 0.93 | % | ||||||||
Class B | ||||||||||||||||
Actual | $ | 1,000 | $ | 1,125.90 | $ | 6.32 | 1.18 | % | ||||||||
Hypothetical (5% annual return before expenses) | $ | 1,000 | $ | 1,019.26 | $ | 6.01 | 1.18 | % | ||||||||
| * | Expenses are equal to each classes’ annualized expense ratios, multiplied by the average account value over the period, multiplied by 184/365 (to reflect the one-half year period). |
6
| INTERNATIONAL GROWTH PORTFOLIO | ||
| TEN LARGEST HOLDINGS* | ||
| December 31, 2013 (unaudited) | AllianceBernstein Variable Products Series Fund | |
| COMPANY | U.S. $ VALUE | PERCENT OF NET ASSETS | ||||||
Roche Holding AG | $ | 5,787,407 | 3.7 | % | ||||
Prudential PLC | 5,547,566 | 3.5 | ||||||
Nestle SA | 5,452,924 | 3.5 | ||||||
British American Tobacco PLC | 5,155,234 | 3.3 | ||||||
Partners Group Holding AG | 4,915,880 | 3.1 | ||||||
AIA Group Ltd. | 4,803,960 | 3.1 | ||||||
Tencent Holdings Ltd. | 4,770,652 | 3.0 | ||||||
Anheuser-Busch InBev NV | 4,590,745 | 2.9 | ||||||
Aberdeen Asset Management PLC | 4,193,088 | 2.7 | ||||||
Diageo PLC | 3,816,238 | 2.4 | ||||||
|
|
|
| |||||
| $ | 49,033,694 | 31.2 | % | |||||
SECTOR BREAKDOWN**
December 31, 2013 (unaudited)
| SECTOR | U.S. $ VALUE | PERCENT OF TOTAL INVESTMENTS | ||||||
Financials | $ | 36,061,266 | 22.8 | % | ||||
Consumer Staples | 28,797,979 | 18.2 | ||||||
Consumer Discretionary | 23,141,027 | 14.6 | ||||||
Information Technology | 18,927,837 | 12.0 | ||||||
Health Care | 18,653,709 | 11.8 | ||||||
Industrials | 16,078,050 | 10.2 | ||||||
Energy | 7,399,211 | 4.7 | ||||||
Materials | 7,205,964 | 4.6 | ||||||
Short-Term Investments | 1,779,066 | 1.1 | ||||||
|
|
|
| |||||
Total Investments | $ | 158,044,109 | 100.0 | % | ||||
| * | Long-term investments. |
| ** | The Portfolio’s sector breakdown is expressed as a percentage of total investments (excluding security lending collateral) and may vary over time. The Portfolio also enters into derivatives transactions, which may be used for hedging or investment purpose (see “Portfolio of Investments” section of the report for additional details). |
Please note: The sector classifications presented herein are based on the Global Industry Classification Standard (GICS) which was developed by Morgan Stanley Capital International and Standard & Poor’s. The components are divided into sector, industry group, and industry sub-indices as classified by the GICS for each of the market capitalization indices in the broad market. These sector classifications are broadly defined. The “Portfolio of Investments” section of the report reflects more specific industry information and is consistent with the investment restrictions discussed in the Portfolio’s prospectus.
7
| INTERNATIONAL GROWTH PORTFOLIO | ||
| COUNTRY BREAKDOWN* | ||
| December 31, 2013 (unaudited) | AllianceBernstein Variable Products Series Fund | |
| COUNTRY | U.S. $ VALUE | PERCENT OF TOTAL INVESTMENTS | ||||||
United Kingdom | $ | 46,167,491 | 29.2 | % | ||||
Switzerland | 22,188,890 | 14.0 | ||||||
Japan | 11,646,308 | 7.4 | ||||||
China | 9,584,437 | 6.1 | ||||||
France | 9,309,658 | 5.9 | ||||||
Hong Kong | 9,156,220 | 5.8 | ||||||
Germany | 6,902,585 | 4.4 | ||||||
India | 5,010,973 | 3.2 | ||||||
Belgium | 4,590,745 | 2.9 | ||||||
Russia | 4,404,908 | 2.8 | ||||||
Italy | 4,332,449 | 2.7 | ||||||
Taiwan | 4,044,086 | 2.5 | ||||||
South Africa | 3,799,456 | 2.4 | ||||||
Other | 15,126,837 | 9.6 | ||||||
Short-Term Investments | 1,779,066 | 1.1 | ||||||
|
|
|
| |||||
Total Investments | $ | 158,044,109 | 100.0 | % | ||||
| * | All data are as of December 31, 2013. The Portfolio’s country breakdown is expressed as a percentage of total investments (excluding security lending collateral) and may vary over time. “Other” country weightings represent 1.8% or less in the following countries: Brazil, Denmark, Finland, Indonesia, Philippines, Singapore, South Korea, Sweden and United States. |
8
| INTERNATIONAL GROWTH PORTFOLIO | ||
| PORTFOLIOOF INVESTMENTS | ||
| December 31, 2013 | AllianceBernstein Variable Products Series Fund | |
| Company | Shares | U.S. $ Value | ||||||
COMMON STOCKS–99.5% | ||||||||
FINANCIALS–23.0% | ||||||||
CAPITAL MARKETS–8.4% | ||||||||
Aberdeen Asset Management PLC | 504,240 | $ | 4,193,088 | |||||
Azimut Holding SpA | 63,095 | 1,721,495 | ||||||
Partners Group Holding AG | 18,433 | 4,915,880 | ||||||
UBS AG(a) | 124,520 | 2,384,227 | ||||||
|
| |||||||
| 13,214,690 | ||||||||
|
| |||||||
COMMERCIAL BANKS–3.9% | ||||||||
HSBC Holdings PLC | 199,341 | 2,187,597 | ||||||
Sberbank of Russia (Sponsored ADR) | 96,437 | 1,212,213 | ||||||
Sumitomo Mitsui Financial Group, Inc. | 52,100 | 2,709,376 | ||||||
|
| |||||||
| 6,109,186 | ||||||||
|
| |||||||
DIVERSIFIED FINANCIAL SERVICES–1.3% | ||||||||
IG Group Holdings PLC | 196,298 | 2,005,437 | ||||||
|
| |||||||
INSURANCE–6.6% | ||||||||
AIA Group Ltd. | 954,400 | 4,803,960 | ||||||
Prudential PLC | 248,280 | 5,547,566 | ||||||
|
| |||||||
| 10,351,526 | ||||||||
|
| |||||||
REAL ESTATE MANAGEMENT & DEVELOPMENT–1.1% | ||||||||
BR Malls Participacoes SA | 84,800 | 611,625 | ||||||
Global Logistic Properties Ltd. | 514,000 | 1,179,083 | ||||||
|
| |||||||
| 1,790,708 | ||||||||
|
| |||||||
THRIFTS & MORTGAGE FINANCE–1.7% | ||||||||
Housing Development Finance Corp. | 200,290 | 2,589,719 | ||||||
|
| |||||||
| 36,061,266 | ||||||||
|
| |||||||
CONSUMER STAPLES–18.3% | ||||||||
BEVERAGES–5.3% | ||||||||
Anheuser-Busch InBev NV | 43,172 | 4,590,745 | ||||||
Diageo PLC | 115,160 | 3,816,238 | ||||||
|
| |||||||
| 8,406,983 | ||||||||
|
| |||||||
FOOD & STAPLES | ||||||||
Raia Drogasil SA | 76,200 | 477,371 | ||||||
Tsuruha Holdings, Inc. | 8,200 | 752,914 | ||||||
|
| |||||||
| 1,230,285 | ||||||||
|
| |||||||
FOOD PRODUCTS–6.0% | ||||||||
Danone | 39,036 | 2,816,129 | ||||||
Nestle SA | 74,402 | 5,452,924 | ||||||
Universal Robina Corp. | 442,900 | 1,131,391 | ||||||
|
| |||||||
| 9,400,444 | ||||||||
|
| |||||||
HOUSEHOLD | ||||||||
Reckitt Benckiser Group PLC | 35,920 | $ | 2,853,337 | |||||
Unicharm Corp. | 30,700 | 1,751,696 | ||||||
|
| |||||||
| 4,605,033 | ||||||||
|
| |||||||
TOBACCO–3.3% | ||||||||
British American Tobacco PLC | 96,047 | 5,155,234 | ||||||
|
| |||||||
| 28,797,979 | ||||||||
|
| |||||||
CONSUMER | ||||||||
AUTO COMPONENTS–0.8% | ||||||||
Nokian Renkaat Oyj | 27,230 | 1,305,798 | ||||||
|
| |||||||
AUTOMOBILES–2.8% | ||||||||
Nissan Motor Co., Ltd. | 271,100 | 2,271,819 | ||||||
Volkswagen AG (Preference Shares) | 7,409 | 2,085,030 | ||||||
|
| |||||||
| 4,356,849 | ||||||||
|
| |||||||
DIVERSIFIED CONSUMER SERVICES–0.6% | ||||||||
Kroton Educacional SA | 62,300 | 1,036,727 | ||||||
|
| |||||||
HOTELS, RESTAURANTS & LEISURE–1.6% | ||||||||
Melco Crown Entertainment Ltd. (ADR)(a) | 63,750 | 2,500,275 | ||||||
|
| |||||||
MEDIA–1.3% | ||||||||
Naspers Ltd.–Class N | 19,370 | 2,027,543 | ||||||
|
| |||||||
MULTILINE RETAIL–1.0% | ||||||||
Golden Eagle Retail Group Ltd.(b) | 631,000 | 835,343 | ||||||
Matahari Department Store Tbk PT(a) | 768,500 | 695,475 | ||||||
|
| |||||||
| 1,530,818 | ||||||||
|
| |||||||
SPECIALTY RETAIL–2.1% | ||||||||
Belle International Holdings Ltd. | 865,000 | 1,004,924 | ||||||
Fast Retailing Co., Ltd. | 5,500 | 2,271,626 | ||||||
|
| |||||||
| 3,276,550 | ||||||||
|
| |||||||
TEXTILES, APPAREL & LUXURY GOODS–4.5% | ||||||||
Brunello Cucinelli SpA | 31,383 | 1,115,689 | ||||||
Cie Financiere Richemont SA | 36,522 | 3,648,452 | ||||||
Li & Fung Ltd. | 654,000 | 847,061 | ||||||
Prada SpA | 168,000 | 1,495,265 | ||||||
|
| |||||||
| 7,106,467 | ||||||||
|
| |||||||
| 23,141,027 | ||||||||
|
| |||||||
INFORMATION | ||||||||
INTERNET SOFTWARE & SERVICES–6.9% | ||||||||
Baidu, Inc. (Sponsored ADR)(a) | 16,280 | 2,895,886 | ||||||
Mail.ru Group Ltd. (GDR)(c) | 33,050 | 1,474,030 | ||||||
Tencent Holdings Ltd. | 74,600 | 4,770,652 | ||||||
Yandex NV–Class A(a) | 39,830 | 1,718,665 | ||||||
|
| |||||||
| 10,859,233 | ||||||||
|
| |||||||
9
| INTERNATIONAL GROWTH PORTFOLIO | ||
| PORTFOLIOOF INVESTMENTS | ||
| (continued) | AllianceBernstein Variable Products Series Fund | |
| Company | Shares | U.S. $ Value | ||||||
IT SERVICES–0.8% | ||||||||
Tata Consultancy Services Ltd. | 33,280 | $ | 1,170,845 | |||||
|
| |||||||
SEMICONDUCTORS & SEMICONDUCTOR EQUIPMENT–4.4% | ||||||||
MediaTek, Inc. | 119,000 | 1,773,681 | ||||||
Samsung Electronics Co., Ltd. | 2,190 | 2,853,673 | ||||||
Taiwan Semiconductor Manufacturing Co., Ltd. | 643,000 | 2,270,405 | ||||||
|
| |||||||
| 6,897,759 | ||||||||
|
| |||||||
| 18,927,837 | ||||||||
|
| |||||||
HEALTH CARE–11.9% | ||||||||
HEALTH CARE EQUIPMENT & SUPPLIES–2.5% | ||||||||
Elekta AB–Class B | 65,150 | 996,999 | ||||||
Essilor International SA | 16,280 | 1,732,311 | ||||||
Shandong Weigao Group Medical Polymer Co., Ltd.–Class H | 800,000 | 1,082,556 | ||||||
|
| |||||||
| 3,811,866 | ||||||||
|
| |||||||
HEALTH CARE PROVIDERS & SERVICES–0.4% | ||||||||
Life Healthcare Group Holdings Ltd. | 166,170 | 663,675 | ||||||
|
| |||||||
PHARMACEUTICALS–9.0% | ||||||||
Aspen Pharmacare Holdings Ltd. | 43,211 | 1,108,238 | ||||||
Bayer AG | 14,477 | 2,032,722 | ||||||
Novo Nordisk A/S–Class B | 10,691 | 1,959,680 | ||||||
Roche Holding AG | 20,660 | 5,787,407 | ||||||
Shire PLC | 43,281 | 2,039,712 | ||||||
Sun Pharmaceutical Industries Ltd. | 136,110 | 1,250,409 | ||||||
|
| |||||||
| 14,178,168 | ||||||||
|
| |||||||
| 18,653,709 | ||||||||
|
| |||||||
INDUSTRIALS–10.2% | ||||||||
AEROSPACE & DEFENSE–2.1% | ||||||||
Safran SA | 48,030 | 3,339,449 | ||||||
|
| |||||||
COMMERCIAL SERVICES & SUPPLIES–1.1% | ||||||||
Aggreko PLC | 62,380 | 1,769,136 | ||||||
|
| |||||||
MACHINERY–2.4% | ||||||||
Komatsu Ltd. | 92,000 | 1,888,877 | ||||||
Melrose Industries PLC | 381,010 | 1,932,987 | ||||||
|
| |||||||
| 3,821,864 | ||||||||
|
| |||||||
PROFESSIONAL | ||||||||
Capita PLC | 150,480 | 2,590,243 | ||||||
Intertek Group PLC | 44,170 | 2,305,291 | ||||||
|
| |||||||
| 4,895,534 | ||||||||
|
| |||||||
TRADING COMPANIES & DISTRIBUTORS–1.5% | ||||||||
Wolseley PLC | 39,612 | 2,252,067 | ||||||
|
| |||||||
| 16,078,050 | ||||||||
|
| |||||||
ENERGY–4.7% | ||||||||
ENERGY EQUIPMENT & SERVICES–2.7% | ||||||||
Schlumberger Ltd. | 31,950 | $ | 2,879,015 | |||||
Technip SA | 14,770 | 1,421,769 | ||||||
|
| |||||||
| 4,300,784 | ||||||||
|
| |||||||
OIL, GAS & CONSUMABLE FUELS–2.0% | ||||||||
BG Group PLC | 143,990 | 3,098,427 | ||||||
|
| |||||||
| 7,399,211 | ||||||||
|
| |||||||
MATERIALS–4.6% | ||||||||
CHEMICALS–3.6% | ||||||||
Croda International PLC | 53,980 | 2,200,383 | ||||||
Essentra PLC | 48,440 | 690,043 | ||||||
Linde AG | 13,300 | 2,784,833 | ||||||
|
| |||||||
| 5,675,259 | ||||||||
|
| |||||||
METALS & MINING–1.0% | ||||||||
BHP Billiton PLC | 49,330 | 1,530,705 | ||||||
|
| |||||||
| 7,205,964 | ||||||||
|
| |||||||
Total Common Stocks | 156,265,043 | |||||||
|
| |||||||
| Principal Amount (000) | ||||||||
SHORT-TERM INVESTMENTS–1.1% | ||||||||
TIME DEPOSIT–1.1% | ||||||||
State Street Time Deposit 0.01%, 1/02/14 | U.S.$ | 1,779 | 1,779,066 | |||||
|
| |||||||
Total Investments Before Security Lending Collateral for Securities | 158,044,109 | |||||||
|
| |||||||
| Shares | ||||||||
INVESTMENTS OF CASH COLLATERAL FOR SECURITIES | ||||||||
INVESTMENT COMPANIES–0.1% | ||||||||
AllianceBernstein Exchange Reserves–Class I, | 176,680 | 176,680 | ||||||
|
| |||||||
TOTAL | 158,220,789 | |||||||
Other assets less | (1,110,601 | ) | ||||||
|
| |||||||
NET ASSETS–100.0% | $ | 157,110,188 | ||||||
|
| |||||||
10
| AllianceBernstein Variable Products Series Fund |
FORWARD CURRENCY EXCHANGE CONTRACTS (see Note D)
| Counterparty | Contracts to (000) | In Exchange For (000) | Settlement Date | Unrealized Appreciation/ (Depreciation) | ||||||||||||
Barclays Bank PLC Wholesale | USD | 1,689 | JPY | 164,083 | 2/18/14 | $ | (130,143 | ) | ||||||||
BNP Paribas SA | USD | 3,223 | CAD | 3,422 | 2/18/14 | (5,281 | ) | |||||||||
BNP Paribas SA | USD | 3,591 | JPY | 369,018 | 2/18/14 | (86,145 | ) | |||||||||
Credit Suisse International | CHF | 4,911 | USD | 5,532 | 2/18/14 | 24,393 | ||||||||||
Credit Suisse International | USD | 5,100 | JPY | 505,869 | 2/18/14 | (295,503 | ) | |||||||||
Goldman Sachs Bank USA | AUD | 457 | USD | 405 | 2/18/14 | (1,952 | ) | |||||||||
Goldman Sachs Bank USA | GBP | 9,802 | USD | 15,715 | 2/18/14 | (511,250 | ) | |||||||||
Goldman Sachs Bank USA | USD | 8,896 | AUD | 9,459 | 2/18/14 | (475,736 | ) | |||||||||
HSBC Bank USA | GBP | 1,767 | USD | 2,854 | 2/18/14 | (71,243 | ) | |||||||||
Standard Chartered Bank | HKD | 35,447 | USD | 4,574 | 2/18/14 | 2,206 | ||||||||||
State Street Bank & Trust Co. | CHF | 3,659 | USD | 3,982 | 2/18/14 | (121,652 | ) | |||||||||
State Street Bank & Trust Co. | USD | 5,686 | EUR | 4,243 | 2/18/14 | 150,969 | ||||||||||
State Street Bank & Trust Co. | USD | 1,905 | EUR | 1,380 | 2/18/14 | (6,094 | ) | |||||||||
State Street Bank & Trust Co. | USD | 933 | NOK | 5,652 | 2/18/14 | (2,597 | ) | |||||||||
State Street Bank & Trust Co. | USD | 2,197 | SEK | 14,411 | 2/18/14 | 41,953 | ||||||||||
|
| |||||||||||||||
| $ | (1,488,075 | ) | ||||||||||||||
|
| |||||||||||||||
| (a) | Non-income producing security. |
| (b) | Represents entire or partial securities out on loan. See Note E for securities lending information. |
| (c) | Security is exempt from registration under Rule 144A of the Securities Act of 1933. This security is considered liquid and may be resold in transactions exempt from registration, normally to qualified institutional buyers. At December 31, 2013, the market value of this security amounted to $1,474,030 or 0.9% of net assets. |
| (d) | Investment in affiliated money market mutual fund. The rate shown represents the 7-day yield as of period end. |
Currency Abbreviations:
AUD—Australian Dollar
CAD—Canadian Dollar
CHF—Swiss Franc
EUR—Euro
GBP—Great British Pound
HKD—Hong Kong Dollar
JPY—Japanese Yen
NOK—Norwegian Krone
SEK—Swedish Krona
USD—United States Dollar
Glossary:
ADR—American Depositary Receipt
GDR—Global Depositary Receipt
See notes to financial statements.
11
| INTERNATIONAL GROWTH PORTFOLIO | ||
| STATEMENTOF ASSETS & LIABILITIES | ||
| December 31, 2013 | AllianceBernstein Variable Products Series Fund | |
ASSETS | ||||
Investments in securities, at value | ||||
Unaffiliated issuers (cost $113,716,678) | $ | 158,044,109 | (a) | |
Affiliated issuers (cost $176,680—investment of cash collateral for securities loaned) | 176,680 | |||
Cash | 444 | |||
Foreign currencies, at value (cost $420,529) | 417,675 | |||
Dividends and interest receivable | 357,774 | |||
Unrealized appreciation of forward currency exchange contracts | 219,521 | |||
Receivable for capital stock sold | 9,138 | |||
|
| |||
Total assets | 159,225,341 | |||
|
| |||
LIABILITIES | ||||
Unrealized depreciation of forward currency exchange contracts | 1,707,596 | |||
Payable for collateral received on securities loaned | 176,680 | |||
Advisory fee payable | 94,327 | |||
Payable for capital stock redeemed | 34,281 | |||
Administrative fee payable | 13,886 | |||
Distribution fee payable | 10,895 | |||
Transfer Agent fee payable | 112 | |||
Accrued expenses | 77,376 | |||
|
| |||
Total liabilities | 2,115,153 | |||
|
| |||
NET ASSETS | $ | 157,110,188 | ||
|
| |||
COMPOSITION OF NET ASSETS | ||||
Capital stock, at par | $ | 8,180 | ||
Additional paid-in capital | 170,939,237 | |||
Undistributed net investment income | 861,057 | |||
Accumulated net realized loss on investment and foreign currency transactions | (57,543,181 | ) | ||
Net unrealized appreciation on investments and foreign currency denominated assets and liabilities | 42,844,895 | |||
|
| |||
| $ | 157,110,188 | |||
|
|
Net Asset Value Per Share—1 billion shares of capital stock authorized, $.001 par value
| Class | Net Assets | Shares Outstanding | Net Asset Value | |||||||||
A | $ | 102,466,795 | 5,316,368 | $ | 19.27 | |||||||
B | $ | 54,643,393 | 2,863,469 | $ | 19.08 | |||||||
| (a) | Includes securities on loan with a value of $167,069 (see Note E). |
See notes to financial statements.
12
| INTERNATIONAL GROWTH PORTFOLIO | ||
| STATEMENTOF OPERATIONS | ||
| Year Ended December 31, 2013 | AllianceBernstein Variable Products Series Fund | |
INVESTMENT INCOME | ||||
Dividends | ||||
Unaffiliated issuers (net of foreign taxes withheld of $259,220) | $ | 3,191,857 | ||
Affiliated issuers | 2,131 | |||
Interest | 392 | |||
Securities lending income | 68,171 | |||
|
| |||
| 3,262,551 | ||||
|
| |||
EXPENSES | ||||
Advisory fee (see Note B) | 1,169,423 | |||
Distribution fee—Class B | 141,206 | |||
Transfer agency—Class A | 3,652 | |||
Transfer agency—Class B | 2,088 | |||
Custodian | 112,374 | |||
Administrative | 54,097 | |||
Audit | 37,261 | |||
Legal | 32,489 | |||
Printing | 28,266 | |||
Directors’ fees | 4,522 | |||
Miscellaneous | 15,468 | |||
|
| |||
Total expenses | 1,600,846 | |||
|
| |||
Net investment income | 1,661,705 | |||
|
| |||
REALIZED AND UNREALIZED GAIN (LOSS) ON INVESTMENT AND FOREIGN CURRENCY TRANSACTIONS | ||||
Net realized gain (loss) on: | ||||
Investment transactions | 1,274,119 | (a) | ||
Foreign currency transactions | (744,278 | ) | ||
Net change in unrealized appreciation/depreciation of: | ||||
Investments | 19,083,426 | (b) | ||
Foreign currency denominated assets and liabilities | (1,500,640 | ) | ||
|
| |||
Net gain on investment and foreign currency transactions | 18,112,627 | |||
|
| |||
NET INCREASE IN NET ASSETS FROM OPERATIONS | $ | 19,774,332 | ||
|
| |||
| (a) | Net of foreign capital gains taxes of $35,625. |
| (b) | Net of decrease in accrued foreign capital gains taxes of $21,277. |
See notes to financial statements.
13
| INTERNATIONAL GROWTH PORTFOLIO | ||
| STATEMENTOF CHANGESIN NET ASSETS | AllianceBernstein Variable Products Series Fund | |
| Year Ended December 31, 2013 | Year Ended December 31, 2012 | |||||||
INCREASE (DECREASE) IN NET ASSETS FROM OPERATIONS | ||||||||
Net investment income | $ | 1,661,705 | $ | 1,875,627 | ||||
Net realized gain (loss) on investment and foreign currency transactions | 529,841 | (1,691,944 | ) | |||||
Net change in unrealized appreciation/depreciation of investments and foreign currency denominated assets and liabilities | 17,582,786 | 21,758,307 | ||||||
|
|
|
| |||||
Net increase in net assets from operations | 19,774,332 | 21,941,990 | ||||||
DIVIDENDS TO SHAREHOLDERS FROM | ||||||||
Net investment income | ||||||||
Class A | (969,189 | ) | (1,435,331 | ) | ||||
Class B | (406,590 | ) | (854,155 | ) | ||||
CAPITAL STOCK TRANSACTIONS | ||||||||
Net decrease | (17,593,374 | ) | (12,581,357 | ) | ||||
|
|
|
| |||||
Total increase | 805,179 | 7,071,147 | ||||||
NET ASSETS | ||||||||
Beginning of period | 156,305,009 | 149,233,862 | ||||||
|
|
|
| |||||
End of period (including undistributed net investment income of $861,057 and $1,159,976, respectively) | $ | 157,110,188 | $ | 156,305,009 | ||||
|
|
|
| |||||
See notes to financial statements.
14
| INTERNATIONAL GROWTH PORTFOLIO | ||
| NOTESTO FINANCIAL STATEMENTS | ||
| December 31, 2013 | AllianceBernstein Variable Products Series Fund | |
NOTE A: Significant Accounting Policies
The AllianceBernstein International Growth Portfolio (the “Portfolio”) is a series of AllianceBernstein Variable Products Series Fund, Inc. (the “Fund”). The Portfolio’s investment objective is long-term growth of capital. The Portfolio is diversified as defined under the Investment Company Act of 1940. The Fund was incorporated in the State of Maryland on November 17, 1987, as an open-end series investment company. The Fund offers thirteen separately managed pools of assets which have differing investment objectives and policies. The Portfolio offers Class A and Class B shares. Both classes of shares have identical voting, dividend, liquidating and other rights, except that Class B shares bear a distribution expense and have exclusive voting rights with respect to the Class B distribution plan.
The Portfolio offers and sells its shares only to separate accounts of certain life insurance companies for the purpose of funding variable annuity contracts and variable life insurance policies. Sales are made without a sales charge at the Portfolio’s net asset value per share.
The financial statements have been prepared in conformity with U.S. generally accepted accounting principles (“U.S. GAAP”) which require management to make certain estimates and assumptions that affect the reported amounts of assets and liabilities in the financial statements and amounts of income and expenses during the reporting period. Actual results could differ from those estimates. The following is a summary of significant accounting policies followed by the Portfolio.
1. Security Valuation
Portfolio securities are valued at their current market value determined on the basis of market quotations or, if market quotations are not readily available or are deemed unreliable, at “fair value” as determined in accordance with procedures established by and under the general supervision of the Fund’s Board of Directors (the “Board”).
In general, the market values of securities which are readily available and deemed reliable are determined as follows: securities listed on a national securities exchange (other than securities listed on the NASDAQ Stock Market, Inc. (“NASDAQ”)) or on a foreign securities exchange are valued at the last sale price at the close of the exchange or foreign securities exchange. If there has been no sale on such day, the securities are valued at the last traded price from the previous day. Securities listed on more than one exchange are valued by reference to the principal exchange on which the securities are traded; securities listed only on NASDAQ are valued in accordance with the NASDAQ Official Closing Price; listed or over the counter (“OTC”) market put or call options are valued at the mid level between the current bid and ask prices. If either a current bid or current ask price is unavailable, AllianceBernstein L.P. (the “Adviser”) will have discretion to determine the best valuation (e.g. last trade price in the case of listed options); open futures are valued using the closing settlement price or, in the absence of such a price, the most recent quoted bid price. If there are no quotations available for the day of valuation, the last available closing settlement price is used; U.S. government securities and other debt instruments having 60 days or less remaining until maturity are valued at amortized cost if their original maturity was 60 days or less; or by amortizing their fair value as of the 61st day prior to maturity if their original term to maturity exceeded 60 days; fixed-income securities, including mortgage-backed and asset-backed securities, may be valued on the basis of prices provided by a pricing service or at a price obtained from one or more of the major broker-dealers. In cases where broker-dealer quotes are obtained, the Adviser may establish procedures whereby changes in market yields or spreads are used to adjust, on a daily basis, a recently obtained quoted price on a security. Swaps and other derivatives are valued daily, primarily using independent pricing services, independent pricing models using market inputs, as well as third party broker-dealers or counterparties. Investment companies are valued at their net asset value each day.
Securities for which market quotations are not readily available (including restricted securities) or are deemed unreliable are valued at fair value. Factors considered in making this determination may include, but are not limited to, information obtained by contacting the issuer, analysts, analysis of the issuer’s financial statements or other available documents. In addition, the Portfolio may use fair value pricing for securities primarily traded in non-U.S. markets because most foreign markets close well before the Portfolio values its securities at 4:00 p.m., Eastern Time. The earlier close of these foreign markets gives rise to the possibility that significant events, including broad market moves, may have occurred in the interim and may materially affect the value of those securities. To account for this, the Portfolio may frequently value many of its foreign equity securities using fair value prices based on third party vendor modeling tools to the extent available.
2. Fair Value Measurements
In accordance with U.S. GAAP regarding fair value measurements, fair value is defined as the price that the Portfolio would receive to sell an asset or pay to transfer a liability in an orderly transaction between market participants at the measurement date. U.S. GAAP establishes a framework for measuring fair value, and a three-level hierarchy for fair value measurements based upon the transparency of inputs to the valuation of an asset or liability (including those valued based on their market
15
| INTERNATIONAL GROWTH PORTFOLIO | ||
| NOTESTO FINANCIAL STATEMENTS | ||
| (continued) | AllianceBernstein Variable Products Series Fund | |
values as described in Note A.1 above). Inputs may be observable or unobservable and refer broadly to the assumptions that market participants would use in pricing the asset or liability. Observable inputs reflect the assumptions market participants would use in pricing the asset or liability based on market data obtained from sources independent of the Portfolio. Unobservable inputs reflect the Portfolio’s own assumptions about the assumptions that market participants would use in pricing the asset or liability based on the best information available in the circumstances. Each investment is assigned a level based upon the observability of the inputs which are significant to the overall valuation. The three-tier hierarchy of inputs is summarized below.
| • | Level 1—quoted prices in active markets for identical investments |
| • | Level 2—other significant observable inputs (including quoted prices for similar investments, interest rates, prepayment speeds, credit risk, etc.) |
| • | Level 3—significant unobservable inputs (including the Portfolio’s own assumptions in determining the fair value of investments) |
Where readily available market prices or relevant bid prices are not available for certain equity investments, such investments may be valued based on similar publicly traded investments, movements in relevant indices since last available prices or based upon underlying company fundamentals and comparable company data (such as multiples to earnings or other multiples to equity). Where an investment is valued using an observable input, such as another publicly traded security, the investment will be classified as Level 2. If management determines that an adjustment is appropriate based on restrictions on resale, illiquidity or uncertainty, and such adjustment is a significant component of the valuation, the investment will be classified as Level 3. An investment will also be classified as Level 3 where management uses company fundamentals and other significant inputs to determine the valuation.
The following table summarizes the valuation of the Portfolio’s investments by the above fair value hierarchy levels as of December 31, 2013:
| Level 1 | Level 2 | Level 3 | Total | |||||||||||||
Investments in Securities: | ||||||||||||||||
Assets: | ||||||||||||||||
Common Stocks: | ||||||||||||||||
Financials | $ | 6,128,093 | $ | 29,933,173 | $ | –0 | – | $ | 36,061,266 | |||||||
Consumer Staples | 477,371 | 28,320,608 | –0 | – | 28,797,979 | |||||||||||
Consumer Discretionary | 3,537,002 | 19,604,025 | –0 | – | 23,141,027 | |||||||||||
Information Technology | 6,088,581 | 12,839,256 | –0 | – | 18,927,837 | |||||||||||
Health Care | 1,959,680 | 16,694,029 | –0 | – | 18,653,709 | |||||||||||
Industrials | –0 | – | 16,078,050 | –0 | – | 16,078,050 | ||||||||||
Energy | 2,879,015 | 4,520,196 | –0 | – | 7,399,211 | |||||||||||
Materials | –0 | – | 7,205,964 | –0 | – | 7,205,964 | ||||||||||
Short-Term Investments | –0 | – | 1,779,066 | –0 | – | 1,779,066 | ||||||||||
Investments of Cash Collateral for Securities Loaned in Affiliated Money Market Fund | 176,680 | –0 | – | –0 | – | 176,680 | ||||||||||
|
|
|
|
|
|
|
| |||||||||
Total Investments in Securities | 21,246,422 | 136,974,367 | + | –0 | – | 158,220,789 | ||||||||||
Other Financial Instruments* : | ||||||||||||||||
Assets: | ||||||||||||||||
Forward Currency Exchange Contracts | –0 | – | 219,521 | –0 | – | 219,521 | ||||||||||
Liabilities: | ||||||||||||||||
Forward Currency Exchange Contracts | –0 | – | (1,707,596 | ) | –0 | – | (1,707,596 | ) | ||||||||
|
|
|
|
|
|
|
| |||||||||
Total(a)(b) | $ | 21,246,422 | $ | 135,486,292 | $ | –0 | – | $ | 156,732,714 | |||||||
|
|
|
|
|
|
|
| |||||||||
| * | Other financial instruments are derivative instruments, such as futures, forwards and swaps, which are valued at the unrealized appreciation/depreciation on the instrument. |
| + | A significant portion of the Portfolio’s foreign equity investments are categorized as Level 2 investments since they are valued using fair value prices based on third party vendor modeling tools to the extent available, see Note A.1. |
| (a) | An amount of $3,404,776 was transferred from Level 1 to Level 2 due to the above mentioned foreign equity fair valuation using third party vendor modeling tools during the reporting period. |
| (b) | An amount of $7,064,224 was transferred from Level 2 to Level 1 as the above mentioned foreign equity fair valuation by the third party vendor was not applied during the reporting period. |
16
| AllianceBernstein Variable Products Series Fund |
The Portfolio recognizes all transfers between levels of the fair value hierarchy assuming the financial instruments were transferred at the beginning of the reporting period.
The following is a reconciliation of investments in which significant unobservable inputs (Level 3) were used in determining fair value.
| Warrants | Rights^ | Total | ||||||||||
Balance as of 12/31/12 | $ | 829,289 | $ | –0 | – | $ | 829,289 | |||||
Accrued discounts/(premiums) | –0 | – | –0 | – | –0 | – | ||||||
Realized gain (loss) | (78,691 | ) | 7,280 | (71,411 | ) | |||||||
Change in unrealized appreciation/depreciation | (4,977 | ) | –0 | – | (4,977 | ) | ||||||
Purchases | 914 | –0 | – | 914 | ||||||||
Sales | (746,535 | ) | (7,280 | ) | (753,815 | ) | ||||||
Transfers in to Level 3 | –0 | – | –0 | – | –0 | – | ||||||
Transfers out of Level 3 | –0 | – | –0 | – | –0 | – | ||||||
|
|
|
|
|
| |||||||
Balance as of 12/31/13 | $ | –0 | – | $ | –0 | – | $ | –0 | – | |||
|
|
|
|
|
| |||||||
Net change in unrealized appreciation/depreciation from Investments held as of 12/31/13* | $ | –0 | – | $ | –0 | – | $ | –0 | – | |||
|
|
|
|
|
| |||||||
| ^ | The Portfolio held securities with zero market value that were sold during the period. |
| * | The unrealized appreciation/depreciation is included in net change in unrealized appreciation/depreciation of investments in the accompanying statement of operations. |
The Adviser has established a Valuation Committee (the “Committee”) which is responsible for overseeing the pricing and valuation of all securities held in the Portfolio. The Committee operates under pricing and valuation policies and procedures established by the Adviser and approved by the Board, including pricing policies which set forth the mechanisms and processes to be employed on a daily basis to implement these policies and procedures. In particular, the pricing policies describe how to determine market quotations for securities and other instruments. The Committee’s responsibilities include: 1) fair value and liquidity determinations (and oversight of any third parties to whom any responsibility for fair value and liquidity determinations is delegated), and 2) regular monitoring of the Adviser’s pricing and valuation policies and procedures and modification or enhancement of these policies and procedures (or recommendation of the modification of these policies and procedures) as the Committee believes appropriate.
The Committee is also responsible for monitoring the implementation of the pricing policies by the Adviser’s Pricing Group (the “Pricing Group”) and a third party which performs certain pricing functions in accordance with the pricing policies. The Pricing Group is responsible for the oversight of the third party on a day-to-day basis. The Committee and the Pricing Group perform a series of activities to provide reasonable assurance of the accuracy of prices including: 1) periodic vendor due diligence meetings, review of methodologies, new developments and processes at vendors, 2) daily comparison of security valuation versus prior day for all securities that exceeded established thresholds, and 3) daily review of unpriced, stale, and variance reports with exceptions reviewed by senior management and the Committee.
In addition, several processes outside of the pricing process are used to monitor valuation issues including: 1) performance and performance attribution reports are monitored for anomalous impacts based upon benchmark performance, and 2) portfolio managers review all portfolios for performance and analytics (which are generated using the Adviser’s prices).
3. Currency Translation
Assets and liabilities denominated in foreign currencies and commitments under forward currency exchange contracts are translated into U.S. dollars at the mean of the quoted bid and ask prices of such currencies against the U.S. dollar. Purchases and sales of portfolio securities are translated into U.S. dollars at the rates of exchange prevailing when such securities were acquired or sold. Income and expenses are translated into U.S. dollars at rates of exchange prevailing when accrued.
Net realized gain or loss on foreign currency transactions represents foreign exchange gains and losses from sales and maturities of foreign fixed income investments, foreign currency exchange contracts, holding of foreign currencies, currency gains or losses realized between the trade and settlement dates on foreign investment transactions, and the difference between the amounts of dividends, interest and foreign withholding taxes recorded on the Portfolio’s books and the U.S. dollar equivalent
17
| INTERNATIONAL GROWTH PORTFOLIO | ||
| NOTESTO FINANCIAL STATEMENTS | ||
| (continued) | AllianceBernstein Variable Products Series Fund | |
amounts actually received or paid. Net unrealized currency gains and losses from valuing foreign currency denominated assets and liabilities at period end exchange rates are reflected as a component of net unrealized appreciation or depreciation of foreign currency denominated assets and liabilities.
4. Taxes
It is the Portfolio’s policy to meet the requirements of the Internal Revenue Code applicable to regulated investment companies and to distribute all of its investment company taxable income and net realized gains, if any, to shareholders. Therefore, no provisions for federal income or excise taxes are required. The Portfolio may be subject to taxes imposed by countries in which it invests. Such taxes are generally based on income and/or capital gains earned or repatriated. Taxes are accrued and applied to net investment income, net realized gains and net unrealized appreciation/depreciation as such income and/or gains are earned.
In accordance with U.S. GAAP requirements regarding accounting for uncertainties in income taxes, management has analyzed the Portfolio’s tax positions taken or expected to be taken on federal and state income tax returns for all open tax years (the current and the prior three tax years) and has concluded that no provision for income tax is required in the Portfolio’s financial statements.
5. Investment Income and Investment Transactions
Dividend income is recorded on the ex-dividend date or as soon as the Portfolio is informed of the dividend. Interest income is accrued daily. Investment transactions are accounted for on the date the securities are purchased or sold. Investment gains or losses are determined on the identified cost basis. The Portfolio amortizes premiums and accretes discounts as adjustments to interest income.
6. Class Allocations
All income earned and expenses incurred by the Portfolio are borne on a pro-rata basis by each outstanding class of shares, based on the proportionate interest in the Portfolio represented by the net assets of such class, except for class specific expenses which are allocated to the respective class. Expenses of the Fund are charged proportionately to each Portfolio or based on other appropriate methods. Realized and unrealized gains and losses are allocated among the various share classes based on respective net assets.
7. Dividends and Distributions
Dividends and distributions to shareholders, if any, are recorded on the ex-dividend date. Income dividends and capital gains distributions are determined in accordance with federal tax regulations and may differ from those determined in accordance with U.S. GAAP. To the extent these differences are permanent, such amounts are reclassified within the capital accounts based on their federal tax basis treatment; temporary differences do not require such reclassification.
NOTE B: Advisory Fee and Other Transactions with Affiliates
Under the terms of the investment advisory agreement, the Portfolio pays the Adviser an advisory fee at an annual rate of .75% of the first $2.5 billion, ..65% of the next $2.5 billion and .60% in excess of $5 billion, of the Portfolio’s average daily net assets. The fee is accrued daily and paid monthly.
Pursuant to the investment advisory agreement, the Portfolio may reimburse the Adviser for certain legal and accounting services provided to the Portfolio by the Adviser. For the year ended December 31, 2013, the reimbursement for such services amounted to $54,097.
Brokerage commissions paid on investment transactions for the year ended December 31, 2013 amounted to $151,936, of which $0 and $0, respectively, was paid to Sanford C. Bernstein & Co. LLC and Sanford C. Bernstein Limited, affiliates of the Adviser.
The Portfolio compensates AllianceBernstein Investor Services, Inc. (“ABIS”), a wholly-owned subsidiary of the Adviser, under a Transfer Agency Agreement for providing personnel and facilities to perform transfer agency services for the Portfolio. Such compensation retained by ABIS amounted to $1,385 for the year ended December 31, 2013.
NOTE C: Distribution Plan
The Portfolio has adopted a Distribution Plan (the “Plan”) for Class B shares pursuant to Rule 12b-1 under the Investment Company Act of 1940. Under the Plan, the Portfolio pays distribution and servicing fees to AllianceBernstein Investments,
18
| AllianceBernstein Variable Products Series Fund |
Inc. (the “Distributor”), a wholly-owned subsidiary of the Adviser, at an annual rate of up to .50% of the Portfolio’s average daily net assets attributable to Class B shares. The fees are accrued daily and paid monthly. The Board currently limits payments under the Plan to .25% of the Portfolio’s average daily net assets attributable to Class B shares. The Plan provides that the Distributor will use such payments in their entirety for distribution assistance and promotional activities.
The Portfolio is not obligated under the Plan to pay any distribution and servicing fees in excess of the amounts set forth above. The purpose of the payments to the Distributor under the Plan is to compensate the Distributor for its distribution services with respect to the sale of the Portfolio’s Class B shares. Since the Distributor’s compensation is not directly tied to its expenses, the amount of compensation received by it under the Plan during any year may be more or less than its actual expenses. For this reason, the Plan is characterized by the staff of the Securities and Exchange Commission as being of the “compensation” variety.
In the event that the Plan is terminated or not continued, no distribution or servicing fees (other than current amounts accrued but not yet paid) would be owed by the Portfolio to the Distributor.
The Plan also provides that the Adviser may use its own resources to finance the distribution of the Portfolio’s shares.
NOTE D: Investment Transactions
Purchases and sales of investment securities (excluding short-term investments) for the year ended December 31, 2013 were as follows:
| Purchases | Sales | |||||||
Investment securities (excluding U.S. government securities) | $ | 47,663,740 | $ | 60,146,512 | ||||
U.S. government securities | –0 | – | –0 | – | ||||
The cost of investments for federal income tax purposes, gross unrealized appreciation and unrealized depreciation (excluding foreign currency transactions) are as follows:
Cost | $ | 114,074,507 | ||
|
| |||
Gross unrealized appreciation | $ | 47,494,015 | ||
Gross unrealized depreciation | (3,347,733 | ) | ||
|
| |||
Net unrealized appreciation | $ | 44,146,282 | ||
|
|
1. Derivative Financial Instruments
The Portfolio may use derivatives in an effort to earn income and enhance returns, to replace more traditional direct investments, to obtain exposure to otherwise inaccessible markets (collectively, “investment purposes”), or to hedge or adjust the risk profile of its portfolio.
The principal type of derivatives utilized by the Portfolio, as well as the methods in which they may be used are:
| • | Forward Currency Exchange Contracts |
The Portfolio may enter into forward currency exchange contracts in order to hedge its exposure to changes in foreign currency exchange rates on its foreign portfolio holdings, to hedge certain firm purchase and sale commitments denominated in foreign currencies and for non-hedging purposes as a means of making direct investments in foreign currencies, as described below under “Currency Transactions”.
A forward currency exchange contract is a commitment to purchase or sell a foreign currency at a future date at a negotiated forward rate. The gain or loss arising from the difference between the original contract and the closing of such contract would be included in net realized gain or loss on foreign currency transactions. Fluctuations in the value of open forward currency exchange contracts are recorded for financial reporting purposes as unrealized appreciation and/or depreciation by the Portfolio. Risks may arise from the potential inability of a counterparty to meet the terms of a contract and from unanticipated movements in the value of a foreign currency relative to the U.S. dollar.
During the year ended December 31, 2013, the Portfolio held forward currency exchange contracts for hedging purposes.
19
| INTERNATIONAL GROWTH PORTFOLIO | ||
| NOTESTO FINANCIAL STATEMENTS | ||
| (continued) | AllianceBernstein Variable Products Series Fund | |
The Portfolio typically enters into International Swaps and Derivatives Association, Inc. Master Agreements (“ISDA Master Agreement”) or similar master agreements (collectively, “Master Agreements”) with its OTC derivative contract counterparties in order to, among other things, reduce its credit risk to counterparties. ISDA Master Agreements include provisions for general obligations, representations, collateral and events of default or termination. Under an ISDA Master Agreement, the Portfolio typically may offset with the counterparty certain derivative financial instrument’s payables and/or receivables with collateral held and/or posted and create one single net payment (close-out netting) in the event of default or termination.
Various master agreements govern the terms of certain transactions with counterparties, including transactions such as exchange-traded derivative transactions, repurchase and reverse repurchase agreements. These master agreements typically attempt to reduce the counterparty risk associated with such transactions by specifying credit protection mechanisms and providing standardization that improves legal certainty. Cross-termination provisions under Master Agreements typically provide that a default in connection with one transaction between the Portfolio and a counterparty gives the non-defaulting party the right to terminate any other transactions in place with the defaulting party to create one single net payment due to/due from the defaulting party. In the event of a default by a Master Agreements counterparty, the return of collateral with market value in excess of the Portfolio’s net liability, held by the defaulting party, may be delayed or denied.
The Portfolio’s Master Agreements may contain provisions for early termination of OTC derivative transactions in the event the net assets of the Portfolio decline below specific levels (“net asset contingent features”). If these levels are triggered, the Portfolio’s counterparty has the right to terminate such transaction and require the Portfolio to pay or receive a settlement amount in connection with the terminated transaction. As of December 31, 2013, the Portfolio had OTC derivatives with contingent features in net liability positions in the amount of $1,552,860. If a trigger event had occurred at December 31, 2013, for those derivatives in a net liability position, $1,552,860 would be required to be posted by the Portfolio.
At December 31, 2013, the Portfolio had entered into the following derivatives:
Asset Derivatives | Liability Derivatives | |||||||||||
Derivative Type | Statement of Assets and Liabilities Location | Fair Value | Statement of Assets and Liabilities Location | Fair Value | ||||||||
Foreign exchange contracts | Unrealized appreciation of forward currency exchange contracts | $ | 219,521 | Unrealized depreciation of forward currency exchange contracts | $ | 1,707,596 | ||||||
|
|
|
| |||||||||
Total | $ | 219,521 | $ | 1,707,596 | ||||||||
|
|
|
| |||||||||
The effect of derivative instruments on the statement of operations for the year ended December 31, 2013:
Derivative Type | Location of Gain or (Loss) on Derivatives | Realized Gain or (Loss) on Derivatives | Change in Unrealized Appreciation or (Depreciation) | |||||||
Foreign exchange contracts | Net realized gain (loss) on foreign currency transactions; Net change in unrealized appreciation/depreciation of foreign currency denominated assets and liabilities | $ | (619,711 | ) | $ | (1,490,401 | ) | |||
|
|
|
| |||||||
Total | $ | (619,711 | ) | $ | (1,490,401 | ) | ||||
|
|
|
| |||||||
The following table represents the volume of the Portfolio’s derivative transactions during the year ended December 31, 2013:
Forward Currency Exchange Contracts: | ||||
Average principal amount of buy contracts | $ | 54,180,203 | ||
Average principal amount of sale contracts | $ | 53,695,725 |
For financial reporting purposes, the Portfolio does not offset derivative assets and derivative liabilities that are subject to netting arrangements in the statement of assets and liabilities.
20
| AllianceBernstein Variable Products Series Fund |
All derivatives held during the reporting period were subject to netting arrangements. The following table presents the Portfolio’s derivative assets and liabilities by counterparty net of amounts available for offset under Master Agreements (“MA”) and net of the related collateral received/pledged by the Portfolio as of December 31, 2013:
Counterparty | Derivative Assets Subject to MA | Derivative Available for Offset | Collateral Received | Net Amount of Derivatives Assets | ||||||||||||
Credit Suisse International | $ | 24,393 | $ | (24,393 | ) | $ | –0 | – | $ | –0 | – | |||||
Standard Chartered Bank | 2,206 | –0 | – | –0 | – | 2,206 | ||||||||||
State Street Bank & Trust Co. | 192,922 | (130,343 | ) | –0 | – | 62,579 | ||||||||||
|
|
|
|
|
|
|
| |||||||||
Total | $ | 219,521 | $ | (154,736 | ) | $ | –0 | – | $ | 64,785 | ||||||
|
|
|
|
|
|
|
| |||||||||
Counterparty | Derivative Liabilities Subject to MA | Derivative Available for Offset | Collateral Pledged | Net Amount of Derivatives Liabilities | ||||||||||||
Barclays Bank PLC Wholesale | $ | 130,143 | $ | –0 | – | $ | –0 | – | $ | 130,143 | ||||||
BNP Paribas SA | 91,426 | –0 | – | –0 | – | 91,426 | ||||||||||
Credit Suisse International | 295,503 | (24,393 | ) | –0 | – | 271,110 | ||||||||||
Goldman Sachs Bank USA | 988,938 | –0 | – | –0 | – | 988,938 | ||||||||||
HSBC Bank USA | 71,243 | –0 | – | –0 | – | 71,243 | ||||||||||
State Street Bank & Trust Co. | 130,343 | (130,343 | ) | –0 | – | –0 | – | |||||||||
|
|
|
|
|
|
|
| |||||||||
Total | $ | 1,707,596 | $ | (154,736 | ) | $ | –0 | – | $ | 1,552,860 | ||||||
|
|
|
|
|
|
|
| |||||||||
2. Currency Transactions
The Portfolio may invest in non-U.S. dollar securities on a currency hedged or unhedged basis. The Portfolio may seek investment opportunities by taking long or short positions in currencies through the use of currency-related derivatives, including forward currency exchange contracts, futures and options on futures, swaps, and other options. The Portfolio may enter into transactions for investment opportunities when it anticipates that a foreign currency will appreciate or depreciate in value but securities denominated in that currency are not held by the Portfolio and do not present attractive investment opportunities. Such transactions may also be used when the Adviser believes that it may be more efficient than a direct investment in a foreign currency-denominated security. The Portfolio may also conduct currency exchange contracts on a spot basis (i.e., for cash at the spot rate prevailing in the currency exchange market for buying or selling currencies).
NOTE E: Securities Lending
The Portfolio may enter into securities lending transactions. Under the Portfolio’s securities lending program, all loans of securities will be collateralized continually by cash. The Portfolio will be compensated for the loan from a portion of the net return from the income earned on cash collateral after a rebate is paid to the borrower (in some cases, this rebate may be a “negative rebate” or fee paid by the borrower to the Portfolio in connection with the loan), and payments are made for fees of the securities lending agent and for certain other administrative expenses. It is the policy of the Portfolio to receive collateral consisting of cash in an amount exceeding the value of the securities loaned. The Portfolio will have the right to call a loan and obtain the securities loaned at any time on notice to the borrower within the normal and customary settlement time for the securities. While the securities are on loan, the borrower is obligated to pay the Portfolio amounts equal to any income or other distributions from the securities. The Portfolio will not have the right to vote any securities during the existence of a loan, but will have the right to regain ownership of loaned securities in order to exercise voting or other ownership rights. The lending agent has agreed to indemnify the Portfolio in the case of default of any securities borrower. Collateral received and securities loaned are marked to market daily to ensure that the securities loaned are secured by collateral. The lending agent will invest the cash collateral received in AllianceBernstein Exchange Reserves, an eligible money market vehicle, in accordance with the investment restrictions of the Portfolio, and as approved by the Board. The collateral received on securities loaned is recorded as an asset as well as a corresponding liability in the statement of assets and liabilities. When the Portfolio lends securities, its investment performance will continue to reflect changes in the value of the securities loaned. At December 31, 2013, the Portfolio had securities on loan with a value of $167,069 and had received cash collateral which has been invested into AllianceBernstein Exchange Reserves of $176,680. The cash collateral will be adjusted on the next business day to maintain the required collateral amount. The Portfolio earned securities lending income of $68,171 and $2,131 from the borrowers and AllianceBernstein Exchange Reserves, respectively, for the year ended
21
| INTERNATIONAL GROWTH PORTFOLIO | ||
| NOTESTO FINANCIAL STATEMENTS | ||
| (continued) | AllianceBernstein Variable Products Series Fund | |
December 31, 2013; these amounts are reflected in the statement of operations. A principal risk of lending portfolio securities is that the borrower will fail to return the loaned securities upon termination of the loan and that the collateral will not be sufficient to replace the loaned securities. A summary of the Portfolio’s transactions in shares of AllianceBernstein Exchange Reserves for the year ended December 31, 2013 is as follows:
Market Value December 31, 2012 (000) | Purchases at Cost (000) | Sales Proceeds (000) | Market Value December 31, 2013 (000) | |||||||||||
| $ | 2,331 | $ | 64,184 | $ | 66,338 | $ | 177 | |||||||
NOTE F: Capital Stock
Each class consists of 500,000,000 authorized shares. Transactions in capital shares for each class were as follows:
| SHARES | AMOUNT | |||||||||||||||||
| Year Ended December 31, 2013 | Year Ended December 31, 2012 | Year Ended December 31, 2013 | Year Ended December 31, 2012 | |||||||||||||||
Class A | ||||||||||||||||||
Shares sold | 168,679 | 727,229 | $ | 3,058,525 | $ | 11,579,918 | ||||||||||||
Shares issued in reinvestment of dividends | 53,487 | 89,262 | 969,189 | 1,435,331 | ||||||||||||||
Shares redeemed | (604,017 | ) | (1,145,926 | ) | (10,946,120 | ) | (18,320,349 | ) | ||||||||||
|
|
|
|
|
|
|
| |||||||||||
Net decrease | (381,851 | ) | (329,435 | ) | $ | (6,918,406 | ) | $ | (5,305,100 | ) | ||||||||
|
|
|
|
|
|
|
| |||||||||||
Class B | ||||||||||||||||||
Shares sold | 323,357 | 383,318 | $ | 5,795,702 | $ | 6,088,165 | ||||||||||||
Shares issued in reinvestment of dividends | 22,639 | 53,585 | 406,590 | 854,154 | ||||||||||||||
Shares redeemed | (943,420 | ) | (882,162 | ) | (16,877,260 | ) | (14,218,576 | ) | ||||||||||
|
|
|
|
|
|
|
| |||||||||||
Net decrease | (597,424 | ) | (445,259 | ) | $ | (10,674,968 | ) | $ | (7,276,257 | ) | ||||||||
|
|
|
|
|
|
|
| |||||||||||
NOTE G: Risks Involved in Investing in the Portfolio
Foreign Securities Risk—Investing in securities of foreign companies or foreign governments involves special risks which include changes in foreign currency exchange rates and the possibility of future political and economic developments which could adversely affect the value of such securities. Moreover, securities of many foreign companies or foreign governments and their markets may be less liquid and their prices more volatile than those of comparable U.S. companies or of the U.S. government.
Currency Risk—This is the risk that changes in foreign currency exchange rates may negatively affect the value of the Portfolio’s investments or reduce the returns of the Portfolio. For example, the value of the Portfolio’s investments in foreign currency-denominated securities or currencies may decrease if the U.S. dollar is strong (i.e., gaining value relative to other currencies) and other currencies are weak (i.e., losing value relative to the U.S. dollar). Currency markets are generally not as regulated as securities markets. Independent of the Portfolio’s investments denominated in foreign currencies, the Portfolio’s positions in various foreign currencies may cause the Portfolio to experience investment losses due to the changes in exchange rates and interest rates.
Emerging Market Risk—Investments in emerging market countries may have more risk because the markets are less developed and less liquid, and because these investments may be subject to increased economic, political, regulatory and other uncertainties.
Capitalization Risk—Investments in small- and mid-capitalization companies may be more volatile than investments in large-capitalization companies. Investments in small-capitalization companies may have additional risks because these companies have limited product lines, markets or financial resources.
Derivatives Risk—The Portfolio may enter into derivative transactions such as forwards, options, futures and swaps. Derivatives may be illiquid, difficult to price, and leveraged so that small changes may produce disproportionate losses for the Portfolio, and subject to counterparty risk to a greater degree than more traditional investments. Derivatives may result in significant losses, including losses that are far greater than the value of the derivatives reflected in the statement of assets and liabilities.
22
| AllianceBernstein Variable Products Series Fund |
Indemnification Risk—In the ordinary course of business, the Portfolio enters into contracts that contain a variety of indemnifications. The Portfolio’s maximum exposure under these arrangements is unknown. However, the Portfolio has not had prior claims or losses pursuant to these indemnification provisions and expects the risk of loss thereunder to be remote. Therefore, the Portfolio has not accrued any liability in connection with these indemnification provisions.
NOTE H: Joint Credit Facility
A number of open-end mutual funds managed by the Adviser, including the Portfolio, participate in a $140 million revolving credit facility (the “Facility”) intended to provide short-term financing, if necessary, subject to certain restrictions in connection with abnormal redemption activity. Commitment fees related to the Facility are paid by the participating funds and are included in miscellaneous expenses in the statement of operations. The Portfolio did not utilize the Facility during the year ended December 31, 2013.
NOTE I: Distributions to Shareholders
The tax character of distributions paid during the fiscal years ended December 31, 2013 and December 31, 2012 were as follows:
| 2013 | 2012 | |||||||
Distributions paid from: | ||||||||
Ordinary income | $ | 1,375,779 | $ | 2,289,486 | ||||
|
|
|
| |||||
Total taxable distributions paid | $ | 1,375,779 | $ | 2,289,486 | ||||
|
|
|
| |||||
As of December 31, 2013, the components of accumulated earnings/(deficit) on a tax basis were as follows:
Accumulated capital and other losses | $ | (57,991,255 | )(a) | |
Unrealized appreciation/(depreciation) | 44,154,027 | (b) | ||
|
| |||
Total accumulated earnings/(deficit) | $ | (13,837,228 | ) | |
|
|
| (a) | As of December 31, 2013, the Portfolio had a net capital loss carryforward of $57,362,032. During the fiscal year, the Portfolio utilized $1,061,986 of capital loss carryforwards to offset current year net realized gains. At December 31, 2013, the Portfolio had a qualified late-year ordinary loss deferral of $629,223 which is deemed to arise on January 1, 2014. |
| (b) | The differences between book-basis and tax-basis unrealized appreciation/(depreciation) are attributable primarily to the tax deferral of losses on wash sales and the realization for tax purposes of gain/losses on certain derivative instruments. |
For tax purposes, net capital losses may be carried over to offset future capital gains, if any. Funds are permitted to carry forward capital losses incurred in taxable years beginning after December 22, 2010 for an indefinite period. These post-enactment capital losses must be utilized prior to the pre-enactment capital losses, which are subject to expiration. Post-enactment capital loss carryforwards will retain their character as either short-term or long-term capital losses rather than being considered short-term as under previous regulation.
As of December 31, 2013, the Portfolio had a net capital loss carryforward of $57,362,032 which will expire as follows:
SHORT-TERM | LONG-TERM | EXPIRATION | ||
| $ 7,176,740 | n/a | 2016 | ||
| 42,501,075 | n/a | 2017 | ||
| 7,684,217 | –0– | no expiration |
During the current fiscal year, permanent differences primarily due to reclassifications of foreign currency and foreign capital gains tax, and the tax treatment of passive foreign investment companies (PFICs) resulted in a net decrease in undistributed net investment income and a net decrease in accumulated net realized loss on investment and foreign currency transactions. These reclassifications had no effect on net assets.
NOTE J: Subsequent Events
Management has evaluated subsequent events for possible recognition or disclosure in the financial statements through the date the financial statements are issued. Management has determined that there are no material events that would require disclosure in the Portfolio’s financial statements through this date.
23
| INTERNATIONAL GROWTH PORTFOLIO | ||
| FINANCIAL HIGHLIGHTS | AllianceBernstein Variable Products Series Fund | |
Selected Data For A Share Of Capital Stock Outstanding Throughout Each Period
| CLASS A | ||||||||||||||||||||
| Year Ended December 31, | ||||||||||||||||||||
| 2013 | 2012 | 2011 | 2010 | 2009 | ||||||||||||||||
Net asset value, beginning of period | $17.13 | $15.08 | $18.42 | $16.66 | $12.52 | |||||||||||||||
|
|
|
|
|
|
|
|
|
| |||||||||||
Income From Investment Operations | ||||||||||||||||||||
Net investment income (a) | .21 | .21 | .26 | .18 | .22 | |||||||||||||||
Net realized and unrealized gain (loss) on investment and foreign currency transactions | 2.11 | 2.12 | (3.08 | ) | 1.92 | 4.59 | ||||||||||||||
Contributions from Adviser | –0 | – | –0 | – | .00 | (b) | –0 | – | –0 | – | ||||||||||
|
|
|
|
|
|
|
|
|
| |||||||||||
Net increase (decrease) in net asset value from operations | 2.32 | 2.33 | (2.82 | ) | 2.10 | 4.81 | ||||||||||||||
|
|
|
|
|
|
|
|
|
| |||||||||||
Less: Dividends | ||||||||||||||||||||
Dividends from net investment income | (.18 | ) | (.28 | ) | (.52 | ) | (.34 | ) | (.67 | ) | ||||||||||
|
|
|
|
|
|
|
|
|
| |||||||||||
Net asset value, end of period | $19.27 | $17.13 | $15.08 | $18.42 | $16.66 | |||||||||||||||
|
|
|
|
|
|
|
|
|
| |||||||||||
Total Return | ||||||||||||||||||||
Total investment return based on net asset value (c) | 13.60 | % | 15.54 | % | (15.85 | )% | 12.89 | % | 39.58 | % | ||||||||||
Ratios/Supplemental Data | ||||||||||||||||||||
Net assets, end of period (000’s omitted) | $102,467 | $97,611 | $90,912 | $126,339 | $124,335 | |||||||||||||||
Ratio to average net assets of: | ||||||||||||||||||||
Expenses | .94 | % | .97 | % | .94 | % | .93 | %+ | .99 | % | ||||||||||
Net investment income | 1.15 | % | 1.33 | % | 1.53 | % | 1.08 | %+ | 1.55 | % | ||||||||||
Portfolio turnover rate | 31 | % | 52 | % | 66 | % | 104 | % | 118 | % | ||||||||||
See footnote summary on page 25.
24
| AllianceBernstein Variable Products Series Fund |
Selected Data For A Share Of Capital Stock Outstanding Throughout Each Period
| CLASS B | ||||||||||||||||||||
| Year Ended December 31, | ||||||||||||||||||||
| 2013 | 2012 | 2011 | 2010 | 2009 | ||||||||||||||||
Net asset value, beginning of period | $16.96 | $14.93 | $18.24 | $16.51 | $12.41 | |||||||||||||||
|
|
|
|
|
|
|
|
|
| |||||||||||
Income From Investment Operations | ||||||||||||||||||||
Net investment income (a) | .16 | .18 | .22 | .14 | .18 | |||||||||||||||
Net realized and unrealized gain (loss) on investment and foreign currency transactions | 2.09 | 2.08 | (3.06 | ) | 1.89 | 4.55 | ||||||||||||||
Contributions from Adviser | –0 | – | –0 | – | .00 | (b) | –0 | – | –0 | – | ||||||||||
|
|
|
|
|
|
|
|
|
| |||||||||||
Net increase (decrease) in net asset value from operations | 2.25 | 2.26 | (2.84 | ) | 2.03 | 4.73 | ||||||||||||||
|
|
|
|
|
|
|
|
|
| |||||||||||
Less: Dividends | ||||||||||||||||||||
Dividends from net investment income | (.13 | ) | (.23 | ) | (.47 | ) | (.30 | ) | (.63 | ) | ||||||||||
|
|
|
|
|
|
|
|
|
| |||||||||||
Net asset value, end of period | $19.08 | $16.96 | $14.93 | $18.24 | $16.51 | |||||||||||||||
|
|
|
|
|
|
|
|
|
| |||||||||||
Total Return | ||||||||||||||||||||
Total investment return based on net asset value (c) | 13.32 | % | 15.23 | % | (16.04 | )% | 12.61 | % | 39.24 | % | ||||||||||
Ratios/Supplemental Data | ||||||||||||||||||||
Net assets, end of period (000’s omitted) | $54,643 | $58,694 | $58,322 | $74,879 | $72,604 | |||||||||||||||
Ratio to average net assets of: | ||||||||||||||||||||
Expenses | 1.19 | % | 1.22 | % | 1.19 | % | 1.18 | %+ | 1.24 | % | ||||||||||
Net investment income | .92 | % | 1.11 | % | 1.27 | % | .83 | %+ | 1.28 | % | ||||||||||
Portfolio turnover rate | 31 | % | 52 | % | 66 | % | 104 | % | 118 | % | ||||||||||
| (a) | Based on average shares outstanding. |
| (b) | Amount is less than $.005. |
| (c) | Total investment return is calculated assuming an initial investment made at the net asset value at the beginning of the period, reinvestment of all dividends and distributions at net asset value during the period, and redemption on the last day of the period. Total return does not reflect (i) insurance company’s separate account related expense charges and (ii) the deductions of taxes that a shareholder would pay on Portfolio distributions or the redemption of Portfolio shares. Total investment return calculated for a period of less than one year is not annualized. |
| + | The ratio includes expenses attributable to costs of proxy solicitation. |
See notes to financial statements.
25
| REPORTOF INDEPENDENT REGISTERED | ||
| PUBLIC ACCOUNTING FIRM | AllianceBernstein Variable Products Series Fund | |
To the Board of Directors and Shareholders of AllianceBernstein International Growth Portfolio:
We have audited the accompanying statement of assets and liabilities, including the portfolio of investments, of AllianceBernstein International Growth Portfolio (one of the funds constituting AllianceBernstein Variable Products Series Fund, Inc. (the “Fund”)) as of December 31, 2013, and the related statement of operations for the year then ended, the statements of changes in net assets for each of the two years in the period then ended, and the financial highlights for each of the five years in the period then ended. These financial statements and financial highlights are the responsibility of the Fund’s management. Our responsibility is to express an opinion on these financial statements and financial highlights based on our audits.
We conducted our audits in accordance with the standards of the Public Company Accounting Oversight Board (United States). Those standards require that we plan and perform the audit to obtain reasonable assurance about whether the financial statements and financial highlights are free of material misstatement. We were not engaged to perform an audit of the Fund’s internal control over financial reporting. Our audits included consideration of internal control over financial reporting as a basis for designing audit procedures that are appropriate in the circumstances, but not for the purpose of expressing an opinion on the effectiveness of the Fund’s internal control over financial reporting. Accordingly, we express no such opinion. An audit also includes examining, on a test basis, evidence supporting the amounts and disclosures in the financial statements and financial highlights, assessing the accounting principles used and significant estimates made by management, and evaluating the overall financial statement presentation. Our procedures included confirmation of securities owned as of December 31, 2013, by correspondence with the custodian and others, or by other appropriate auditing procedures where replies from others were not received. We believe that our audits provide a reasonable basis for our opinion.
In our opinion, the financial statements and financial highlights referred to above present fairly, in all material respects, the financial position of AllianceBernstein International Growth Portfolio (one of the funds constituting AllianceBernstein Variable Products Series Fund, Inc.) at December 31, 2013, the results of its operations for the year then ended, the changes in its net assets for each of the two years in the period then ended, and the financial highlights for each of the five years in the period then ended, in conformity with U.S. generally accepted accounting principles.

New York, New York
February 14, 2014
26
| 2013 TAX INFORMATION (unaudited) | AllianceBernstein Variable Products Series Fund |
For Federal income tax purposes, the following information is furnished with respect to the earnings of the Portfolio for the taxable year ended December 31, 2013.
The Portfolio intends to make an election to pass through foreign taxes to its shareholders. For the taxable year ended December 31, 2013, $185,941 of foreign taxes may be passed through and the associated foreign source income for information reporting purposes is $2,476,815.
27
| INTERNATIONAL GROWTH | ||
| PORTFOLIO | AllianceBernstein Variable Products Series Fund |
| BOARDOF DIRECTORS | ||
Marshall C. Turner, Jr.(1), Chairman | Nancy P. Jacklin(1) Robert M. Keith, President and Garry L. Moody(1) Earl D. Weiner(1) | |
John H. Dobkin(1) Michael J. Downey(1) William H. Foulk, Jr.(1) D. James Guzy(1) | ||
| OFFICERS | ||
Philip L. Kirstein, Senior Vice President and Independent Compliance Officer Daniel C. Roarty(2), Vice President Tassos M. Stassopoulos(2), Vice President Emilie D. Wrapp, Secretary | Joseph J. Mantineo, Treasurer and Phyllis J. Clarke, Controller Vincent S. Noto, Chief Compliance Officer | |
CUSTODIAN AND ACCOUNTING AGENT State Street Bank and Trust Company One Lincoln Street Boston, MA 02111 | LEGAL COUNSEL Seward & Kissel LLP One Battery Park Plaza New York, NY 10004 | |
DISTRIBUTOR AllianceBernstein Investments, Inc. 1345 Avenue of the Americas New York, NY 10105 | TRANSFER AGENT AllianceBernstein Investor Services, Inc. P.O. Box 786003 San Antonio, TX 78278-6003 Toll-Free 1-(800) 221-5672 | |
INDEPENDENT REGISTERED PUBLIC ACCOUNTING FIRM Ernst & Young LLP 5 Times Square New York, NY 10036 |
| (1) | Member of the Audit Committee, the Governance and Nominating Committee and the Independent Directors Committee. Mr. Foulk is the sole member of the Fair Value Pricing Committee. |
| (2) | The day-to-day management of, and investment decisions for, the Portfolio’s portfolio are made by the Global Growth and Thematic Investment Team. Messrs. Daniel C. Roarty and Tassos M. Stassopoulos are the investment professionals with the most significant responsibility for the day-to-day management of the Portfolio’s portfolio. |
28
| INTERNATIONAL GROWTH PORTFOLIO | AllianceBernstein Variable Products Series Fund |
MANAGEMENTOFTHE FUND
Board of Directors Information
The business and affairs of the Fund are managed under the direction of the Board of Directors. Certain information concerning the Fund’s Directors is set forth below.
NAME, ADDRESS* (YEAR FIRST | PRINCIPAL DURING PAST FIVE YEARS | PORTFOLIOS IN FUND COMPLEX OVERSEEN BY DIRECTOR | OTHER DIRECTORSHIPS HELD BY DIRECTOR IN THE PAST FIVE YEARS | |||||
| INTERESTED DIRECTOR | ||||||||
Robert M. Keith, # 1345 Avenue of the Americas New York, NY 10105 53 (2010) | Senior Vice President of AllianceBernstein L.P. (the “Adviser”) and the head of AllianceBernstein Investments, Inc. (“ABI”) since July 2008; Director of ABI and President of the AllianceBernstein Mutual Funds. Previously, he served as Executive Managing Director of ABI from December 2006 to June 2008. Prior to joining ABI in 2006, Executive Managing Director of Bernstein Global Wealth Management, and prior thereto, Senior Managing Director and Global Head of Client Service and Sales of the Adviser’s institutional investment management business since 2004. Prior thereto, he was Managing Director and Head of North American Client Service and Sales in the Adviser’s institutional investment management business, with which he had been associated since prior to 2004. | 100 | None | |||||
| DISINTERESTED DIRECTORS | ||||||||
Marshall C. Turner, Jr., ## Chairman of the Board 72 (2005) | Private Investor since prior to 2009. Former CEO of Dupont Photomasks, Inc. (components of semi-conductor manufacturing), 2003-2006, and interim CEO 1999-2000. Interim CEO of MEMC Electronic Materials, Inc. (semi-conductor and solar cell substrates) from November 2008 until March 2009. He has extensive operating and early-stage investment experience, including prior service as general partner of three institutional venture capital partnerships, and serves on the boards of three education and science-related non-profit organizations. He has served as a director of one AllianceBernstein fund since 1992, and director or trustee of multiple AllianceBernstein funds since 2005. He is Chairman of the AllianceBernstein Funds since January 2014 | 100 | Xilinx, Inc. (programmable logic semi-conductors) and SunEdison, Inc. (semi-conductor substrates, solar materials and solar power plants) since prior to 2009 | |||||
John H. Dobkin, ## 72 (1992) | Independent Consultant since prior to 2009. Formerly, President of Save Venice, Inc. (preservation organization) from 2001–2002; Senior Advisor from June 1999-June 2000 and President of Historic Hudson Valley (historic preservation) from December 1989-May 1999. Previously, Director of the National Academy of Design. He has served as a director or trustee of various AllianceBernstein Funds since 1992, and as Chairman of the Audit Committees of a number of such Funds from 2001-2008. | 100 | None | |||||
29
| INTERNATIONAL GROWTH PORTFOLIO | ||
| MANAGEMENTOFTHE FUND | ||
| (continued) | AllianceBernstein Variable Products Series Fund | |
NAME, ADDRESS* (YEAR FIRST | PRINCIPAL DURING PAST FIVE YEARS | PORTFOLIOS IN FUND COMPLEX OVERSEEN BY DIRECTOR | OTHER DIRECTORSHIPS HELD BY DIRECTOR IN THE PAST FIVE YEARS | |||||
DISINTERESTED DIRECTORS (continued) | ||||||||
Michael J. Downey, ## 70 (2005) | Private Investor since prior to 2009. Formerly, managing partner of Lexington Capital, LLC (investment advisory firm) from December 1997 until December 2003. From 1987 until 1993, Chairman and CEO of Prudential Mutual Fund Management, director of the Prudential mutual funds, and member of the Executive Committee of Prudential Securities Inc. He has served as a director or trustee of the AllianceBernstein Funds since 2005 and is a director and Chairman of one other registered investment company. | 100 | Asia Pacific Fund, Inc. since prior to 2009, Prospect Acquisition Corp. (financial services) from 2007 until 2009, and The Merger Fund since prior to 2009 to 2013 | |||||
William H. Foulk, Jr., ##, ### 81 (1990) | Investment Adviser and an Independent Consultant since prior to 2009. Previously, he was Senior Manager of Barrett Associates, Inc., a registered investment adviser. He was formerly Deputy Comptroller and Chief Investment Officer of the State of New York and, prior thereto, Chief Investment Officer of the New York Bank for Savings. He has served as a director or trustee of various AllianceBernstein Funds since 1983, and has been Chairman of the Independent Directors Committee of the AllianceBernstein Funds since 2003. He served as Chairman of such Funds from 2003 through December 2013. He is also active in a number of mutual fund related organizations and committees. | 100 | None | |||||
D. James Guzy, ## 77 (2005) | Chairman of the Board of PLX Technology (semi-conductors) and of SRC Computers Inc., with which he has been associated since prior to 2009. He was a director of Intel Corporation (semi-conductors) from 1969 until 2008, and served as Chairman of the Finance Committee of such company for several years until May 2008. He was a Director of Cirrus Logic Corporation (semi-conductors) from 1984 until July 2011. He has served as a director or trustee of one or more of the AllianceBernstein Funds since 1982. | 100 | PLX Technology (semi-conductors) since prior to 2009, and Cirrus Logic Corporation (semi-conductors) since prior to 2009 until July 2011 | |||||
Nancy P. Jacklin, ## 65 (2006) | Professorial Lecturer at the Johns Hopkins School of Advanced International Studies since 2008. Formerly, U.S. Executive Director of the International Monetary Fund (December 2002-May 2006); Partner, Clifford Chance (1992-2002); Sector Counsel, International Banking and Finance, and Associate General Counsel, Citicorp (1985-1992); Assistant General Counsel (International), Federal Reserve Board of Governors (1982-1985); and Attorney Advisor, U.S. Department of the Treasury (1973-1982). Member of the Bar of the District of Columbia and of New York; and member of the Council on Foreign Relations. She has served as a director or trustee of the AllianceBernstein Funds since 2006. | 100 | None | |||||
30
| AllianceBernstein Variable Products Series Fund |
NAME, ADDRESS* (YEAR FIRST | PRINCIPAL DURING PAST FIVE YEARS | PORTFOLIOS IN FUND COMPLEX OVERSEEN BY DIRECTOR | OTHER DIRECTORSHIPS HELD BY DIRECTOR IN THE PAST FIVE YEARS | |||||
DISINTERESTED DIRECTORS (continued) | ||||||||
Garry L. Moody, ## 61 (2008) | Independent Consultant. Formerly, Partner, Deloitte & Touche LLP (1995-2008) where he held a number of senior positions, including Vice Chairman, and U.S. and Global Investment Management Practice Managing Partner; President, Fidelity Accounting and Custody Services Company (1993-1995); and Partner, Ernst & Young LLP (1975-1993), where he served as the National Director of Mutual Fund Tax Services and Managing Partner of its Chicago Office Tax department. He is a member of both the Governing Council of the Independent Directors Council (IDC), an organization of independent directors of mutual funds, and the Trustee Advisory Board of BoardIQ, a biweekly publication focused on issues and news affecting directors of mutual funds. He has served as a director or trustee, and as Chairman of the Audit Committee, of the AllianceBernstein Funds since 2008. | 100 | Greenbacker Renewable Energy Company LLC (renewable energy and energy efficiency projects) from August 2013 to January 2014 | |||||
Earl D. Weiner, ## 74 (2007) | Of Counsel, and Partner prior to January 2007, of the law firm Sullivan & Cromwell LLP and member of ABA Federal Regulation of Securities Committee Task Force to draft editions of the Fund Director’s Guidebook. He also serves as a director or trustee of various non-profit organizations and has served as Chairman or Vice Chairman of a number of them. He has served as a director or trustee of the AllianceBernstein Funds since 2007 and is Chairman of the Governance and Nominating Committees of the Funds. | 100 | None | |||||
| * | The address for the Portfolio’s disinterested Directors is c/o AllianceBernstein L.P., Attention: Philip L. Kirstein, 1345 Avenue of the Americas, New York, NY 10105. |
| ** | There is no stated term of office for the Fund’s Directors. |
| *** | The information above includes each Director’s principal occupation during the last five years and other information relating to the experience, attributes and skills relevant to each Director’s qualifications to serve as a Director, which led to the conclusion that each Director should serve as a Director for the Fund. |
| # | Mr. Keith is an “interested person” of the Fund, as defined in the “1940 Act”, due to his position as a Senior Vice President of the Adviser. |
| ## | Member of the Audit Committee, the Governance and Nominating Committee and the Independent Directors Committee. |
| ### | Member of the Fair Value Pricing Committee. |
31
| INTERNATIONAL GROWTH PORTFOLIO | ||
| MANAGEMENTOFTHE FUND | ||
| (continued) | AllianceBernstein Variable Products Series Fund | |
Officer Information
Certain information concerning the Portfolio’s Officers is listed below.
| NAME, ADDRESS* AND AGE | PRINCIPAL POSITION(S) HELD WITH FUND | PRINCIPAL OCCUPATION DURING PAST FIVE YEARS | ||
Robert M. Keith 53 | President and Chief Executive Officer | See biography above. | ||
| Philip L. Kirstein 68 | Senior Vice President and Independent Compliance Officer | Senior Vice President and Independent Compliance Officer of the AllianceBernstein Funds, with which he has been associated since October 2004. Prior thereto, he was Of Counsel to Kirkpatrick & Lockhart, LLP from October 2003 to October 2004, and General Counsel of Merrill Lynch Investment Managers, L.P. since prior to March 2003. | ||
Daniel C. Roarty 42 | Vice President | Senior Vice President of the Adviser** and Technology Sector Head, with which he has been associated since May 2011. Prior thereto, he was in research and portfolio management at Nuveen Investments since prior to 2009. | ||
Tassos M. Stassopoulos 45 | Vice President | Senior Vice President of the Adviser**, with which he has been associated since prior to 2009. | ||
| Emilie D. Wrapp 58 | Secretary | Senior Vice President, Assistant General Counsel and Assistant Secretary of ABI**, with which she has been associated since prior to 2009. | ||
| Joseph J. Mantineo 54 | Treasurer and Chief Financial Officer | Senior Vice President of AllianceBernstein Investor Services, Inc. (“ABIS”)**, with which he has been associated since prior to 2009. | ||
| Phyllis J. Clarke 53 | Controller | Vice President of ABIS**, with which she has been associated since prior to 2009. | ||
Vincent S. Noto 49 | Chief Compliance Officer | Chief Compliance Officer of the AllianceBernstein Funds, and Vice President of ABIS**, with which he has been associated since prior to 2009. |
| * | The address for each of the Portfolio’s Officers is 1345 Avenue of the Americas, New York, NY 10105. |
| ** | The Adviser, ABIS and ABI are affiliates of the Fund. |
| The Fund’s Statement of Additional Information (“SAI”) has additional information about the Fund’s Directors and Officers and is available without charge upon request. Contact your financial representative or AllianceBernstein at (800) 227-4618, or visit www.alliancebernstein.com, for a free prospectus or SAI. |
32
| INTERNATIONAL GROWTH PORTFOLIO | ||
| SENIOR OFFICER FEE EVALUATION | AllianceBernstein Variable Products Series Fund | |
THE FOLLOWING IS NOT PART OF THE SHAREHOLDER REPORT OR THE FINANCIAL STATEMENTS
SUMMARY OF SENIOR OFFICER’S EVALUATION OF INVESTMENT ADVISORY AGREEMENT1
The following is a summary of the evaluation of the Investment Advisory Agreement between AllianceBernstein L.P. (the “Adviser”) and the AllianceBernstein Variable Products Series Fund (the “Fund”), in respect of AllianceBernstein International Growth Portfolio (the “Portfolio”)2. The evaluation of the Investment Advisory Agreement was prepared by Philip L. Kirstein, the Senior Officer of the Fund, for the Directors of the Fund, as required by a September 2004 agreement between the Adviser and the New York State Attorney General (the “NYAG”). The Senior Officer’s evaluation of the Investment Advisory Agreement is not meant to diminish the responsibility or authority of the Board of Directors of the Fund to perform its duties pursuant to Section 15 of the Investment Company Act of 1940 (the “40 Act”) and applicable state law. The purpose of the summary is to provide shareholders with a synopsis of the independent evaluation of the reasonableness of the advisory fees proposed to be paid by the Portfolio which was provided to the Directors in connection with their review of the proposed approval of the continuance of the Investment Advisory Agreement. The Senior Officer’s evaluation considered the following factors:
| 1. | Advisory fees charged to institutional and other clients of the Adviser for like services; |
| 2. | Advisory fees charged by other mutual fund companies for like services; |
| 3. | Costs to the Adviser and its affiliates of supplying services pursuant to the advisory agreement, excluding any intra-corporate profit; |
| 4. | Profit margins of the Adviser and its affiliates from supplying such services; |
| 5. | Possible economies of scale as the Portfolio grows larger; and |
| 6. | Nature and quality of the Adviser’s services including the performance of the Portfolio. |
These factors, with the exception of the first factor, are generally referred to as the “Gartenberg factors,” which were articulated by the United States Court of Appeals for the Second Circuit in 1982. Gartenberg v. Merrill Lynch Asset Management, Inc., 694 F. 2d 923 (2d Cir. 1982). On March 30, 2010, the Supreme Court held the Gartenberg decision was correct in its basic formulation of what §36(b) requires: to face liability under §36(b), “an investment adviser must charge a fee that is so disproportionately large that it bears no reasonable relationship to the services rendered and could not have been the product of arm’s length bargaining.” Jones v. Harris Associates L.P., 130 S. Ct. 1418 (2010). In Jones, the Court stated the Gartenberg approach fully incorporates the correct understanding of fiduciary duty within the context of section 36(b) and noted with approval that “Gartenberg insists that all relevant circumstances be taken into account” and “uses the range of fees that might result from arm’s length bargaining as the benchmark for reviewing challenged fees.”3
PORTFOLIO ADVISORY FEES, NET ASSETS & EXPENSE RATIOS
The Adviser proposed that the Portfolio pays the advisory fee set forth in the table below for receiving the services to be provided pursuant to the Investment Advisory Agreement. The fee schedule below, implemented in January 2004 in consideration of the Adviser’s settlement with the NYAG in December 2003, is based on a master schedule that contemplates eight categories of funds with almost all funds in each category having the same advisory fee schedule.
| Category | Advisory Fee Based on % of Average Daily Net Assets | Net Assets 3/31/13 ($MIL) | Portfolio | |||||
International | 0.75% on 1st $2.5 billion 0.65% on next $2.5 billion 0.60% on the balance | $ | 158.6 | International Growth Portfolio | ||||
| 1 | The information in the fee summary was completed on April 22, 2013 and discussed with the Board of Directors on April 30-May 2, 2013. |
| 2 | Future references to the Fund and the Portfolio do not include “AllianceBernstein.” References in the fee summary pertaining to performance and expense ratio rankings refer to the Class A shares of the Portfolio. |
| 3 | Jones v. Harris at 1427. |
33
| INTERNATIONAL GROWTH PORTFOLIO | ||
| SENIOR OFFICER FEE EVALUATION | ||
| (continued) | AllianceBernstein Variable Products Series Fund | |
The Adviser is reimbursed as specified in the Investment Advisory Agreement for certain clerical, legal, accounting, administrative and other services provided to the Portfolio. During the Portfolio’s most recently completed fiscal year, the Adviser received $44,879 (0.028% of the Portfolio’s average daily net assets) for such services.
Set forth below are the Portfolio’s total expense ratios for the most recently completed fiscal year:
| Portfolio | Total Expense Ratio | Fiscal Year | ||||
International Growth Portfolio | Class A 0.97% Class B 1.22% | December 31 | ||||
I. ADVISORY FEES CHARGED TO INSTITUTIONAL AND OTHER CLIENTS
The advisory fees charged to investment companies which the Adviser manages and sponsors are normally higher than those charged to similar sized institutional accounts, including pension plans and sub-advised investment companies. The fee differential reflects, among other things, different services provided to such clients, and different liabilities assumed. Services provided by the Adviser to the Portfolio that are not provided to non-investment company clients and sub-advised investment companies include providing office space and personnel to serve as Fund Officers, who among other responsibilities make the certifications required under the Sarbanes–Oxley Act of 2002, and coordinating with and monitoring the Portfolio’s third party service providers such as Fund counsel, auditors, custodians, transfer agents and pricing services. The accounting, administrative, legal and compliance requirements for the Portfolio are more costly than those for institutional assets due to the greater complexities and time required for investment companies, although as previously noted, the Adviser is reimbursed for providing such services. Also, retail mutual funds managed by the Adviser are widely held. Servicing the Portfolio’s investors is more time consuming and labor intensive compared to institutional clients since the Adviser needs to communicate with a more extensive network of financial intermediaries and shareholders. The Adviser also believes that it incurs substantial entrepreneurial risk when offering a new mutual fund, since establishing a new mutual fund requires a large upfront investment, and it may take a long time for the fund to achieve profitability since the fund must be priced to scale from inception in order to be competitive and assets are acquired one account at a time. In addition, managing the cash flow of an investment company may be more difficult than managing that of a stable pool of assets, such as an institutional account with little cash movement in either direction, particularly, if a fund is in net redemption and the Adviser is frequently forced to sell securities to raise cash for redemptions. However, managing a fund with positive cash flow may be easier at times than managing a stable pool of assets. In recent years, investment advisers have been sued by institutional clients and have suffered reputational damage both by the attendant publicity and outcomes other than complete victories. Accordingly, the legal and reputational risks associated with institutional accounts are greater than previously thought, although still not equal to those related to the mutual fund industry.
Notwithstanding the Adviser’s view that managing an investment company is not comparable to managing other institutional accounts because the services provided are different, the Supreme Court has indicated consideration should be given to the advisory fees charged to institutional accounts that have a substantially similar investment style as the Portfolio4. In addition to the AllianceBernstein institutional fee schedule, set forth below is what would have been the effective advisory fee of the Portfolio had the AllianceBernstein institutional fee schedule been applicable to the Portfolio versus the Portfolio’s advisory fee based on March 31, 2013 net assets:5
| Portfolio | Net Assets 3/31/13 ($MIL) | AllianceBernstein Fee Schedule | Effective AB Inst. Adv. Fee | Portfolio Advisory Fee | ||||||||
International Growth Portfolio | $158.6 | International Research Growth AC Schedule 0.85% on first $25m 0.65% on next $25m 0.55% on next $50m 0.45% on the balance Minimum account size $25m | 0.576 | % | 0.750 | % | ||||||
| 4 | The Supreme Court stated that “courts may give such comparisons the weight that they merit in light of the similarities and differences between the services that the clients in question require, but the courts must be wary of inapt comparisons.” Among the significant differences the Supreme Court noted that may exist between services provided to mutual funds and institutional accounts are “higher marketing costs.” Jones v. Harris at 1428. |
| 5 | The Adviser has indicated that with respect to institutional accounts with assets greater than $300 million, it will negotiate a fee schedule. Discounts that are negotiated vary based upon each client relationship. |
34
| AllianceBernstein Variable Products Series Fund |
The Adviser also manages AllianceBernstein International Growth Fund, Inc. (“International Growth Fund, Inc.”), a retail mutual fund, which has a substantially similar investment style as the Portfolio. Set forth below is the fee schedule of International Growth Fund, Inc. and what would have been the effective advisory fee of the Portfolio had the fee schedule of the retail mutual fund been applicable to the Portfolio:6
| Portfolio | AllianceBernstein Mutual Fund | Fee Schedule | ABMF Effective | Portfolio Advisory | ||||||||
International Growth Portfolio | International Growth Fund, Inc. | 0.75% on first $2.5 billion 0.65% on next $2.5 billion 0.60% on the balance | 0.750% | 0.750% | ||||||||
The Adviser manages Sanford C. Bernstein Fund, Inc. (“SCB Fund”), an open-end management investment company. The International Portfolio of SCB Fund (“SCB International Portfolio”) has a somewhat similar investment style as the Portfolio. Set forth below is the fee schedule of SCB International Portfolio and what would have been the effective advisory fee of the Portfolio had the fee schedule of SCB International Portfolio been applicable to the Portfolio based on March 31, 2013 net assets:
| Portfolio | SCB Fund Portfolio | Fee Schedule | SCB Fund Effective Fee | Portfolio Advisory Fee | ||||||||
International Growth Portfolio7 | International Portfolio | 0.925% on 1st $1 billion 0.850% on next $3 billion 0.800% on next $2 billion 0.750% on next $2 billion 0.650% thereafter The Adviser is waving 5 basis points in advisory fees effective through October 31, 2013. | 0.875% | 0.750% | ||||||||
The Adviser represented that it does not sub-advise any registered investment company with a substantially similar investment style as the Portfolio.
II. MANAGEMENT FEES CHARGED BY OTHER MUTUAL FUND COMPANIES FOR LIKE SERVICES.
Lipper Inc. (“Lipper”), an analytical service that is not affiliated with the Adviser, compared the fees charged to the Portfolio with fees charged to other investment companies for similar services offered by other investment advisers.8 Lipper’s analysis included the comparison of the Portfolio’s contractual management fee, estimated at the approximate current asset level of the Portfolio, to the median of the Portfolio’s Lipper Expense Group (“EG”) and the Portfolio’s contractual management fee ranking.9,10
| 6 | The retail mutual fund was also affected by the settlement between the Adviser and the NYAG. As a result, the Portfolio has the same breakpoints in its advisory fee schedule as the retail mutual fund. |
| 7 | The investment guidelines of the Portfolio are more restrictive than the SCB Fund portfolio. The Portfolio invests primarily in either growth or value equity securities, in contrast to the SCB Fund portfolio, which invests in both growth and value equity securities. |
| 8 | The Supreme Court cautioned against accepting mutual fund fee comparisons without careful scrutiny since “these comparisons are problematic because these fees, like those challenged, may not be the product of negotiations conducted at arm’s length.” Jones v. Harris at 1429. |
| 9 | Lipper does not consider average account size when constructing EGs. Funds with relatively small average account sizes tend to have higher transfer agent expense ratio than comparable sized funds that have relatively large average account sizes. Note that there are limitations on Lipper expense category data because different funds categorize expenses differently. |
| 10 | The contractual management fee is calculated by Lipper using the Portfolio’s contractual management fee rate at a hypothetical asset level. The hypothetical asset level is based on the combined net assets of all classes of the Portfolio, rounded up to the next $25 million. Lipper’s total expense ratio information is based on the most recent annual report except as otherwise noted. A ranking of “1” would mean that the Portfolio had the lowest effective fee rate in the Lipper peer group. |
35
| INTERNATIONAL GROWTH PORTFOLIO | ||
| SENIOR OFFICER FEE EVALUATION | ||
| (continued) | AllianceBernstein Variable Products Series Fund | |
Lipper describes an EG as a representative sample of comparable funds. Lipper’s standard methodology for screening funds to be included in an EG entails the consideration of several fund criteria, including fund type, investment classification/objective, load type and similar 12b-1/non-12b-1 service fees, asset (size) comparability, expense components and attributes. An EG will typically consist of seven to twenty funds.
| Portfolio | Contractual Management Fee (%)11 | Lipper EG Median (%) | Lipper EG Rank | |||||||||
International Growth Portfolio | 0.750 | 0.817 | 4/13 | |||||||||
Lipper also analyzed the Portfolio’s most recently completed fiscal year total expense ratio in comparison to the Portfolio’s EG and Lipper Expense Universe (“EU”). The EU is a broader group compared to the EG, consisting of all funds that have the same investment classification/objective and load type as the subject Portfolio.12
| Portfolio | Expense Ratio | Lipper EG Median (%) | Lipper EG Rank | Lipper EU Median (%) | Lipper EU Rank | |||||||||||||||
International Growth Portfolio | 0.972 | 0.972 | 7/13 | 0.997 | 18/44 | |||||||||||||||
Based on this analysis, the Portfolio has a more favorable ranking on a management fee basis than on a total expense ratio basis.
III. COSTS TO THE ADVISER AND ITS AFFILIATES OF SUPPLYING SERVICES PURSUANT TO THE ADVISORY FEE ARRANGEMENT, EXCLUDING ANY INTRA-CORPORATE PROFIT.
The Adviser utilizes two profitability reporting systems, which operate independently but are aligned with each other, to estimate the Adviser’s profitability in connection with investment advisory services provided to the Portfolio. The Senior Officer has retained a consultant to provide independent advice regarding the alignment of the two profitability systems as well as the methodologies and allocations utilized by both profitability systems.
IV. PROFIT MARGINS OF THE ADVISER AND ITS AFFILIATES FOR SUPPLYING SUCH SERVICES.
The Portfolio’s profitability information, prepared by the Adviser for the Board of Directors, was reviewed by the Senior Officer and the consultant. The Adviser’s profitability from providing investment advisory services to the Portfolio decreased during calendar year 2012, relative to 2011.
In addition to the Adviser’s direct profits from managing the Portfolio, certain of the Adviser’s affiliates have business relationships with the Portfolio and may earn a profit from providing other services to the Portfolio. The courts have referred to this type of business opportunity as “fall-out benefits” to the Adviser and indicated that such benefits should be factored into the evaluation of the total relationship between the Portfolio and the Adviser. Neither case law nor common business practice precludes the Adviser’s affiliates from earning a reasonable profit on this type of relationship provided the affiliates’ charges and services are competitive. These affiliates provide transfer agent, distribution and brokerage related services to the Portfolio and receive transfer agent fees, Rule 12b-1 payments, and brokerage commissions. In addition, the Adviser benefits from soft dollar arrangements which offset expenses the Adviser would otherwise incur.
The Portfolio has adopted a distribution plan for Class B shares pursuant to Rule 12b-1 under the 40 Act. Under the distribution plan, the Portfolio pays distribution and servicing fees to its principal underwriter, AllianceBernstein Investments, Inc. (“ABI”), the Portfolio’s distributor and an affiliate of the Adviser, at an annual rate of up to 0.50% of the Portfolio’s average daily net assets attributable to Class B shares. The current annual rate that the Portfolio pays to ABI for 12b-1 fees is 0.25%. During the fiscal year ended December 31, 2012, ABI received $149,521 in Rule 12b-1 fees.
During the fiscal year ended December 31, 2012, the Adviser incurred distribution expenses in the amount of $469,646 in connection with activities primarily intended to result in the sale of the Portfolio’s Class B shares. This amount includes the 12b-1 fees paid by the Portfolio to the adviser.
| 11 | The contractual management fee does not reflect any expense reimbursements made by the Portfolio to the Adviser for certain clerical, legal, accounting, administrative and other services. |
| 12 | Except for asset (size) comparability, Lipper uses the same criteria for selecting an EG when selecting an EU. Unlike the EG, the EU allows for the same adviser to be represented by more than just one fund. |
| 13 | Most recently completed fiscal year end Class A total expense ratio. |
36
| AllianceBernstein Variable Products Series Fund |
Financial intermediaries, such as insurers, market and sell shares of the Portfolio and typically receive compensation from ABI, the Advisers and/or the Portfolio for selling shares of the Portfolio. These financial intermediaries receive compensation in any or all of the following forms: 12b-1 fees, defrayal of costs for educational seminars and training, additional distribution support, recordkeeping and/or administrative services. Payments related to providing contract-holder recordkeeping and/or administrative services will generally not exceed 0.35% of the average daily net assets of the Portfolio attributable to the relevant intermediary over the year. With respect to the Fund, which includes the Portfolio and other Portfolios of the Fund not discussed in this summary, ABI paid approximately $600,000 in 2012 and expects to pay approximately $600,000 in 2013 for educational support and distribution assistance (revenue sharing payments).
The transfer agent of the Portfolio is AllianceBernstein Investor Services, Inc. (“ABIS”). During the most recently completed fiscal year, ABIS received a fee of $1,385 from the Portfolio.14
The Portfolio effected brokerage transactions through and pais commissions to the Adviser’s affiliate, Sanford C. Bernstein & Co., LLC (“SCB & Co.”) nor its U.K. affiliate, Sanford C. Bernstein Limited (“SCB Ltd.”), collectively “SCB,” during the Portfolio’s most recently completed fiscal year. The Adviser represented that SCB’s profitability from business conducted with the Portfolio is comparable to the profitability of SCB’s dealings with other similar third party clients. In the ordinary course of business, SCB receives and pays liquidity rebates from electronic communications networks (“ECNs”) derived from trading for its clients, including the Portfolio. These credits and charges are not being passed onto any SCB client. The Adviser also receives certain soft dollar benefits from brokers that execute agency trades for the Portfolio and other clients. These soft dollar benefits reduce the Adviser’s cost of doing business and increase its profitability.
V. POSSIBLE ECONOMIES OF SCALE
The Adviser has indicated that economies of scale are being shared with shareholders through pricing to scale, breakpoints, fee reductions/waivers and enhancement to services.
In May 2012, an independent consultant, retained by the Senior Officer, provided the Board of Directors information on the Adviser’s firm-wide average costs from 2005 through 2011 and the potential economies of scale. The independent consultant noted that from 2005 through 2007 the Adviser experienced significant growth in assets under management (“AUM”). During this period, operating expenses increased, in part to keep up with growth, and in part reflecting market returns. However, from 2008 through the first quarter of 2009, AUM rapidly and significantly decreased due to declines in market value and client withdrawals. When AUM rapidly decreased, some operating expenses categories, including base compensation and office space, adjusted more slowly during this period, resulting in an increase in average costs. Since 2009, AUM has experienced less significant changes. The independent consultant noted that changes in operating expenses reflect changes in business composition and business practices in response to changes in financial markets. Finally, the independent consultant concluded that the increase in average cost and the decline in net operating margin across the Adviser since late 2008 are inconsistent with the view that there are currently reductions in average costs due to economies of scale that can be shared with the AllianceBernstein Mutual Funds managed by the Adviser through lower fees.
Previously in February 2008, the independent consultant provided the Board of Directors an update of the Deli study on advisory fees and various fund characteristics.15,16 The independent consultant first reiterated the results of his previous two dimensional comparison analysis (fund size and family size) with the Board of Directors.17 The independent consultant then discussed the results of the regression model that was utilized to study the effects of various factors on advisory fees. The regression model output indicated that the bulk of the variation in fees predicted were explained by various factors, but substantially by fund AUM, family AUM, index fund indicator and investment style. The independent consultant also compared the advisory fees of the AllianceBernstein Mutual Funds to similar funds managed by 19 other large asset managers, regardless of the fund size and each Adviser’s proportion of mutual fund assets to non-mutual fund assets.
| 14 | The Fund, which includes the Portfolio and other Portfolios of the Fund paid ABIS a flat fee of $18,000 in 2012. |
| 15 | The Deli study, originally published in 2002 based on 1997 data and updated for the February 2008 Presentation, may be of diminished value due to the age of the data used in the presentation and the changes experienced in the industry over the last four years. |
| 16 | As mentioned previously, the Supreme Court cautioned against accepting mutual fund fee comparisons without careful scrutiny since the fees may not be the product of negotiations conducted at arm’s length. See Jones V. Harris at 1429. |
| 17 | The two dimensional analysis showed patterns of lower advisory fees for funds with larger asset sizes and funds from larger family sizes compared to funds with smaller asset sizes and funds from smaller family sizes, which according to the independent consultant is indicative of a sharing of economies of scale and scope. However, in less liquid and active markets, such is not the case, as the empirical analysis showed potential for diseconomies of scale in those markets. The empirical analysis also showed diminishing economies of scale and scope as funds surpassed a certain high level of assets. |
37
| INTERNATIONAL GROWTH PORTFOLIO | ||
| SENIOR OFFICER FEE EVALUATION | ||
| (continued) | AllianceBernstein Variable Products Series Fund | |
VI. NATURE AND QUALITY OF THE ADVISER’S SERVICES, INCLUDING THE PERFORMANCE OF THE PORTFOLIO
With assets under management of approximately $443 billion as of March 31, 2013, the Adviser has the investment experience to manage and provide non-investment services (described in Section I) to the Portfolio.
The information prepared by Lipper shows the 1, 3, 5 and 10 year performance returns and rankings of the Portfolio18 relative to its Lipper Performance Group (“PG”) and Lipper Performance Universe (“PU”)19 for the periods ended February 28, 2013.20
| Portfolio (%) | PG Median (%) | PU Median (%) | PG Rank | PU Rank | ||||||||||||||||
International Growth Portfolio | ||||||||||||||||||||
1 year | 5.30 | 9.25 | 8.94 | 13/13 | 39/40 | |||||||||||||||
3 year | 6.03 | 8.83 | 8.79 | 12/12 | 32/35 | |||||||||||||||
5 year | -2.74 | -0.26 | 0.24 | 11/11 | 31/32 | |||||||||||||||
10 year | 10.58 | 10.06 | 10.06 | 4/10 | 12/26 | |||||||||||||||
Set forth below are the 1, 3, 5, 10 year and since inception performance returns of the Portfolio (in bold)21 versus its benchmarks.22 Portfolio and benchmark volatility and reward-to-variability ratio (“Sharpe Ratio”) information is also shown.23
Periods Ending February 28, 2013 Annualized Performance | ||||||||||||||||||||||||||||||||
1 Year | 3 Year | 5 Year | 10 Year (%) | Since Inception (%) | Annualized | Risk Period (Year) | ||||||||||||||||||||||||||
| Volatility (%) | Sharpe (%) | |||||||||||||||||||||||||||||||
International Growth Portfolio | 5.30 | 6.03 | -2.74 | 10.58 | 7.98 | 20.67 | 0.51 | 10 | ||||||||||||||||||||||||
MSCI AC World ex US Index (Net) | 6.66 | 6.65 | -0.87 | 10.68 | N/A | 19.01 | 0.54 | 10 | ||||||||||||||||||||||||
MSCI World ex US Index (Net)24 | 8.75 | 6.70 | -1.19 | 9.65 | 4.87 | N/A | N/A | N/A | ||||||||||||||||||||||||
Inception Date: September 23, 1994 | ||||||||||||||||||||||||||||||||
CONCLUSION:
Based on the factors discussed above the Senior Officer’s conclusion is that the proposed advisory fee for the Portfolio is reasonable and within the range of what would have been negotiated at arm’s-length in light of all the surrounding circumstances. This conclusion in respect of the Portfolio is based on an evaluation of all of these factors and no single factor was dispositive.
Dated: May 29, 2013
| 18 | The performance rankings are for the Class A shares of the Portfolio. The Portfolio’s performance returns shown were provided by Lipper. |
| 19 | The Portfolio’s PG is identical to the Portfolio’s respective EG. The Portfolio’s PU is not identical to the Portfolio’s EU as the criteria for including/excluding a fund from a PU is somewhat different from that of an EU. |
| 20 | The current Lipper investment classification/objective dictates the PG and PU throughout the life of the fund even if a fund had a different investment classification/objective at a different point in time. |
| 21 | The performance returns and risk measures shown in the table are for the Class A shares of the Portfolio. |
| 22 | The Adviser provided Portfolio and benchmark performance return information for periods through February 28, 2013. |
| 23 | Portfolio and benchmark volatility and Sharpe Ratio information was obtained through Lipper LANA, a database maintained by Lipper. Volatility is a statistical measure of the tendency of a market price or yield to vary over time. The Sharpe Ratio is a risk adjusted measure of return that divides a portfolio’s return in excess of the riskless return by the portfolio’s standard deviation. A portfolio with a greater volatility would be viewed as more risky than a portfolio with equivalent performance but lower volatility; for that reason, a greater return would be demanded for the more risky portfolio. A portfolio with a higher Sharpe Ratio would be viewed as better performing than a portfolio with a lower Sharpe Ratio. |
| 24 | Benchmark since inception date is the nearest month end after the Portfolio’s inception date. |
38
VPS-IG-0151-1213
AllianceBernstein
Variable Products Series Fund, Inc.
 | AllianceBernstein International Value Portfolio |
December 31, 2013
Annual Report

ANNUAL REPORT
Investment Products Offered
| Ø | Are Not FDIC Insured |
| Ø | May Lose Value |
| Ø | Are Not Bank Guaranteed |
AllianceBernstein Investments, Inc. (ABI) is the distributor of the AllianceBernstein family of mutual funds. ABI is a member of FINRA and is an affiliate of AllianceBernstein L.P., the manager of the funds.
You may obtain a description of the Fund’s proxy voting policies and procedures, and information regarding how the Fund voted proxies relating to portfolio securities during the most recent 12-month period ended June 30, without charge. Simply visit AllianceBernstein’s website at www.alliancebernstein.com or go to the Securities and Exchange Commission’s (the “Commission”) website at www.sec.gov, or call AllianceBernstein at (800) 227-4618.
The Fund files its complete schedule of portfolio holdings with the Commission for the first and third quarters of each fiscal year on Form N-Q. The Fund’s Forms N-Q are available on the Commission’s website at www.sec.gov. The Fund’s Forms N-Q may also be reviewed and copied at the Commission’s Public Reference Room in Washington, DC; information on the operation of the Public Reference Room may be obtained by calling (800) SEC-0330.
AllianceBernstein® and the AB Logo are registered trademarks and service marks used by permission of the owner, AllianceBernstein L.P.
| INTERNATIONAL VALUE PORTFOLIO | AllianceBernstein Variable Products Series Fund |
LETTER TO INVESTORS
February 7, 2014
The following is an update of AllianceBernstein Variable Products Series Fund AllianceBernstein International Value Portfolio (the “Portfolio”) for the annual reporting period ended December 31, 2013.
INVESTMENT OBJECTIVE AND POLICIES
The Portfolio’s investment objective is long-term growth of capital. The Portfolio will invest primarily in a diversified portfolio of equity securities of established companies selected from more than 40 industries and more than 40 developed and emerging-market countries. These countries currently include the developed nations in Europe and the Far East, Canada, Australia and emerging market countries worldwide. Under normal market conditions, the Portfolio invests significantly (at least 40%—unless market conditions are not deemed favorable by AllianceBernstein L.P., (the “Adviser”) in securities of non-U.S. companies. In addition, the Portfolio invests, under normal circumstances, in the equity securities of companies located in at least three countries.
The Portfolio invests in companies that are determined by the Adviser to be undervalued, using a fundamental value approach. In selecting securities for the Portfolio, the Adviser uses its fundamental and quantitative research to identify companies whose stocks are priced low in relation to their perceived long-term earnings power.
Currencies can have a dramatic impact on equity returns, significantly adding to returns in some years and greatly diminishing them in others. The Adviser evaluates currency and equity positions separately and may seek to hedge the currency exposure resulting from securities positions when it finds the currency exposure unattractive. To hedge a portion of its currency risk, the Portfolio may from time to time invest in currency-related derivatives, including forward currency exchange contracts, futures, options on futures, swaps and options. The Adviser may also seek investment opportunities by taking long or short positions in currencies through the use of currency-related derivatives.
The Portfolio may enter into other derivatives transactions, such as options, futures, forwards and swaps. The Portfolio may use options strategies involving the purchase and/or writing of various combinations of call and/or put options, including on individual securities and stock indices, futures contracts (including futures contracts on individual securities and stock indices) or shares of exchange-traded funds, or ETFs. The Portfolio may, at times, invest in shares of ETFs in lieu of making direct investments in equity securities. ETFs may provide more efficient and economical exposure to the type of companies and geographic locations in which the Portfolio seeks to invest than direct investments. The Portfolio may invest in depositary receipts, instruments of supranational entities denominated in the currency of any country, securities of multinational companies and “semi-governmental securities”, and enter into forward commitments.
INVESTMENT RESULTS
The table on page 4 shows the Portfolio’s performance compared to its benchmark, the Morgan Stanley Capital International Europe, Australasia and Far East (“MSCI EAFE”) Index (net), for the one-, five- and 10- year periods ended December 31, 2013.
For the annual period, class A shares of the Portfolio outperformed the benchmark, while B class shares underperformed. Security selection was positive for the period, particularly in the capital equipment, medical and finance sectors. Sector selection was also beneficial to returns, due to an underweight in consumer staples and overweights in capital equipment and telecommunications. Implicit currency selection was negative. Stock selection in the technology, industrial commodities and telecommunications sectors also detracted.
Derivatives used during the annual period included futures for investment purposes, which had an immaterial impact on performance; and forwards for hedging and investment purposes, which added to performance.
MARKET REVIEW AND INVESTMENT STRATEGY
International equities rallied strongly in the annual period on more encouraging growth data and expectations of continued U.S. monetary stimulus. While stocks retreated from mid-May peaks amid speculation that the U.S. Federal Reserve (the “Fed”) would end its asset purchase program, optimism prevailed. Stocks slipped again in August amid mounting Middle East tensions and fears that the Fed would start to taper its stimulus in September, which later proved premature. Positive developments in key regions of the world in November further boosted risk appetite, although a surprise interest rate cut by the European Central Bank to a record low, as a countermeasure to slowing growth in the euro zone, undermined some of the gains. Amid a slew of positive data in the U.S., the Fed took its first steps toward ending a key component of its stimulus campaign.
The Portfolio is focused on attractively valued opportunities, which currently are widespread across many industry sectors and regions. The International Value Investment Management Team prefers companies with robust cash flow generation and strong balance sheets, whose stocks are trading at deep valuation discounts.
1
| INTERNATIONAL VALUE PORTFOLIO | ||
| DISCLOSURESAND RISKS | AllianceBernstein Variable Products Series Fund |
Benchmark Disclosure
The unmanaged MSCI EAFE Index (net) does not reflect fees and expenses associated with the active management of a mutual fund portfolio. The MSCI EAFE Index (net; free float-adjusted, market capitalization weighted) represents the equity market performance of developed markets, excluding the U.S. and Canada. Net returns reflect the reinvestment of dividends after the deduction of non-U.S. withholding tax. MSCI makes no express or implied warranties or representations, and shall have no liability whatsoever with respect to any MSCI data contained herein. The MSCI data may not be further redistributed or used as a basis for other indices, any securities or financial products. This report is not approved, reviewed or produced by MSCI. An investor cannot invest directly in an index, and its results are not indicative of the performance for any specific investment, including the Portfolio.
A Word About Risk
Market Risk: The value of the Portfolio’s assets will fluctuate as the stock or bond market fluctuates. The value of its investments may decline, sometimes rapidly and unpredictably, simply because of economic changes or other events that affect large portions of the market. It includes the risk that a particular style of investing, such as value, may underperform the market generally.
Foreign (Non-U.S.) Risk: Investments in securities of non-U.S. issuers may involve more risk than those of U.S. issuers. These securities may fluctuate more widely in price and may be less liquid due to adverse market, economic, political, regulatory or other factors.
Emerging Market Risk: Investments in emerging market countries may have more risk because the markets are less developed and less liquid as well as being subject to increased economic, political, regulatory or other uncertainties.
Currency Risk: Fluctuations in currency exchange rates may negatively affect the value of the Portfolio’s investments or reduce its returns.
Derivatives Risk: Derivatives may be illiquid, difficult to price, and leveraged so that small changes may produce disproportionate losses for the Portfolio, and may be subject to counterparty risk to a greater degree than more traditional investments.
Leverage Risk: When the Portfolio borrows money or otherwise leverages its portfolio, it may be more volatile because leverage tends to exaggerate the effect of any increase or decrease in the value of the Portfolio’s investments. The Portfolio may create leverage through the use of reverse repurchase agreements, forward commitments, or by borrowing money.
Management Risk: The Portfolio is subject to management risk because it is an actively managed investment fund. The Adviser will apply its investment techniques and risk analyses in making investment decisions for the Portfolio, but there is no guarantee that its techniques will produce the intended results.
These risks are fully discussed in the Variable Products prospectus.
An Important Note About Historical Performance
The investment return and principal value of an investment in the Portfolio will fluctuate, so that shares, when redeemed, may be worth more or less than their original cost. Performance shown on the following page represents past performance and does not guarantee future results. Current performance may be lower or higher than the performance information shown. Please contact your Financial Advisor or Insurance Agent Representative at your financial institution to obtain portfolio performance information current to the most recent month end.
Investors should consider the investment objectives, risks, charges and expenses of the Portfolio carefully before investing. For additional copies of the Portfolio’s prospectus or summary prospectus, which contains this and other information, call your financial advisor or 800.984.7654. Please read the prospectus and/or summary prospectus carefully before investing.
(Disclosures, Risks and Note about Historical Performance continued on next page)
2
| AllianceBernstein Variable Products Series Fund | ||
All fees and expenses related to the operation of the Portfolio have been deducted, but no adjustment has been made for insurance company separate account or annuity contract charges, which would reduce total return to a contract owner. Performance assumes reinvestment of distributions and does not account for taxes.
There are additional fees and expenses associated with all Variable Products. These fees can include mortality and expense risk charges, administrative charges, and other charges that can significantly reduce investment returns. Those fees and expenses are not reflected in this annual report. You should consult your Variable Products prospectus for a description of those fees and expenses and speak to your insurance agent or financial representative if you have any questions. You should read the prospectus before investing or sending money.
3
| INTERNATIONAL VALUE PORTFOLIO | ||
| HISTORICAL PERFORMANCE | AllianceBernstein Variable Products Series Fund | |
| THE PORTFOLIO VS. ITS BENCHMARK | NAV Returns | |||||||||||
| PERIODS ENDED DECEMBER 31, 2013 (unaudited) | 1 Year | 5 Years* | 10 Years* | |||||||||
AllianceBernstein International Value Portfolio Class A | 23.00% | 9.89% | 4.63% | |||||||||
AllianceBernstein International Value Portfolio Class B | 22.73% | 9.61% | 4.38% | |||||||||
MSCI EAFE Index (net) | 22.78% | 12.44% | 6.91% | |||||||||
* Average annual returns.
Please keep in mind that high, double-digit returns are highly unusual and cannot be sustained. Investors should also be aware that these returns were primarily achieved during favorable market conditions. |
| |||||||||||
The Portfolio’s current prospectus fee table shows the Portfolio’s total annual expense ratios as 0.81% and 1.06% for Class A and Class B, respectively. The Financial Highlights section of this report sets forth expense ratio data for the current reporting period; the expense ratios shown above may differ from the expense ratios in the Financial Highlights section since they are based on different time periods.
ALLIANCEBERNSTEIN INTERNATIONAL VALUE PORTFOLIO CLASS A
GROWTH OF A $10,000 INVESTMENT
12/31/03 – 12/31/13 (unaudited)
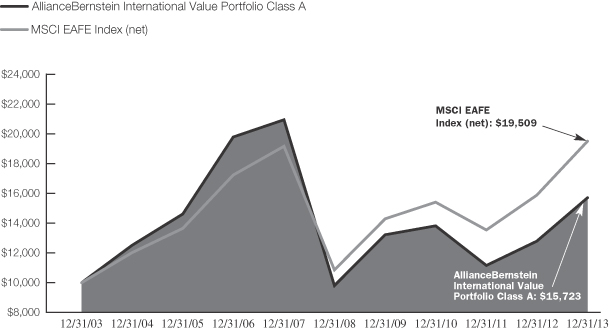
This chart illustrates the total value of an assumed $10,000 investment in AllianceBernstein International Value Portfolio Class A shares (from 12/31/03 to 12/31/13) as compared to the performance of the Portfolio’s benchmark, the MSCI EAFE Index. The chart assumes the reinvestment of dividends and capital gains distributions.
See Disclosures, Risks and Note about Historical Performance on pages 2-3.
4
| INTERNATIONAL VALUE PORTFOLIO | ||
| EXPENSE EXAMPLE (unaudited) | AllianceBernstein Variable Products Series Fund |
As a shareholder of the Fund, you incur two types of costs: (1) transaction costs, including sales charges (loads) on purchase payments, contingent deferred sales charges on redemptions and (2) ongoing costs, including management fees; distribution (12b-1) fees; and other Fund expenses. This example is intended to help you understand your ongoing costs (in dollars) of investing in the Fund and to compare these costs with the ongoing costs of investing in other mutual funds.
The Example is based on an investment of $1,000 invested at the beginning of the period and held for the entire period as indicated below.
Actual Expenses
The table below provides information about actual account values and actual expenses. You may use the information in this line, together with the amount you invested, to estimate the expenses that you paid over the period. Simply divide your account value by $1,000 (for example, an $8,600 account value divided by $1,000 = 8.6), then multiply the result by the number in the first line under the heading entitled “Expenses Paid During Period” to estimate the expenses you paid on your account during this period. The estimate of expenses does not include fees or other expenses of any variable insurance product. If such expenses were included, the estimate of expenses you paid during the period would be higher and your ending account value would be lower.
Hypothetical Example for Comparison Purposes
The table below provides information about hypothetical account values and hypothetical expenses based on the Fund’s actual expense ratio and an assumed annual rate of return of 5% before expenses, which is not the Fund’s actual return. The hypothetical account values and expenses may not be used to estimate the actual ending account balance or expenses you paid for the period. You may use this information to compare the ongoing costs of investing in the Fund and other funds by comparing this 5% hypothetical example with the 5% hypothetical examples that appear in the shareholder reports of other funds. The estimate of expenses does not include fees or other expenses of any variable insurance product. If such expenses were included, the estimate of expenses you paid during the period would be higher and your ending account value would be lower.
Please note that the expenses shown in the table are meant to highlight your ongoing costs only and do not reflect any transactional costs, such as sales charges (loads), or contingent deferred sales charges on redemptions. Therefore, the second line of each class’ table is useful in comparing ongoing costs only, and will not help you determine the relative total costs of owning different funds. In addition, if these transactional costs were included, your costs would have been higher.
| Beginning Account Value July 1, 2013 | Ending Account Value December 31, 2013 | Expenses Paid During Period* | Annualized Expense Ratio* | |||||||||||||
Class A | ||||||||||||||||
Actual | $ | 1,000 | $ | 1,191.40 | $ | 4.53 | 0.82 | % | ||||||||
Hypothetical (5% annual return before expenses) | $ | 1,000 | $ | 1,021.07 | $ | 4.18 | 0.82 | % | ||||||||
Class B | ||||||||||||||||
Actual | $ | 1,000 | $ | 1,189.50 | $ | 5.91 | 1.07 | % | ||||||||
Hypothetical (5% annual return before expenses) | $ | 1,000 | $ | 1,019.81 | $ | 5.45 | 1.07 | % | ||||||||
| * | Expenses are equal to each classes’ annualized expense ratios, multiplied by the average account value over the period, multiplied by 184/365 (to reflect the one-half year period). |
5
| INTERNATIONAL VALUE PORTFOLIO | ||
| TEN LARGEST HOLDINGS* | ||
| December 31, 2013 (unaudited) | AllianceBernstein Variable Products Series Fund |
| COMPANY | U.S. $ VALUE | PERCENT OF NET ASSETS | ||||||
GlaxoSmithKline PLC | $ | 22,347,826 | 2.8 | % | ||||
Vodafone Group PLC | 21,468,925 | 2.7 | ||||||
Roche Holding AG | 20,376,377 | 2.5 | ||||||
Novartis AG | 16,078,752 | 2.0 | ||||||
Vivendi SA | 14,826,366 | 1.9 | ||||||
HSBC Holdings PLC | 14,709,920 | 1.8 | ||||||
European Aeronautic Defence and Space Co. NV | 14,149,512 | 1.8 | ||||||
Valeo SA | 13,767,333 | 1.7 | ||||||
Actelion Ltd. | 13,590,830 | 1.7 | ||||||
Societe Generale SA | 12,388,488 | 1.5 | ||||||
|
|
|
| |||||
| $ | 163,704,329 | 20.4 | % | |||||
SECTOR BREAKDOWN**
December 31, 2013 (unaudited)
| SECTOR | U.S. $ VALUE | PERCENT OF TOTAL INVESTMENTS | ||||||
Financials | $ | 196,023,168 | 24.7 | % | ||||
Consumer Discretionary | 128,824,322 | 16.2 | ||||||
Industrials | 96,742,543 | 12.2 | ||||||
Health Care | 85,647,396 | 10.8 | ||||||
Consumer Staples | 57,464,274 | 7.3 | ||||||
Materials | 57,146,122 | 7.2 | ||||||
Telecommunication Services | 50,980,118 | 6.4 | ||||||
Energy | 47,375,929 | 6.0 | ||||||
Information Technology | 45,339,994 | 5.7 | ||||||
Utilities | 23,774,788 | 3.0 | ||||||
Short-Term Investments | 3,633,773 | 0.5 | ||||||
|
|
|
| |||||
Total Investments | $ | 792,952,427 | 100.0 | % | ||||
| * | Long-term investments. |
| ** | The Portfolio’s sector breakdown is expressed as a percentage of total investments (excluding security lending collateral) and may vary over time. The Portfolio also enters into derivatives transactions, which may be used for hedging or investment purpose (see “Portfolio of Investments” section of the report for additional details). |
Please note: The sector classifications presented herein are based on the Global Industry Classification Standard (GICS) which was developed by Morgan Stanley Capital International and Standard & Poor’s. The components are divided into sector, industry group, and industry sub-indices as classified by the GICS for each of the market capitalization indices in the broad market. These sector classifications are broadly defined. The “Portfolio of Investments” section of the report reflects more specific industry information and is consistent with the investment restrictions discussed in the Portfolio’s prospectus.
6
| INTERNATIONAL VALUE PORTFOLIO | ||
| COUNTRY BREAKDOWN* | ||
| December 31, 2013 (unaudited) | AllianceBernstein Variable Products Series Fund |
| COUNTRY | U.S. $ VALUE | PERCENT OF TOTAL INVESTMENTS | ||||||
United Kingdom | $ | 165,860,454 | 20.9 | % | ||||
Japan | 161,608,005 | 20.4 | ||||||
France | 105,101,436 | 13.3 | ||||||
Switzerland | 59,151,789 | 7.5 | ||||||
Germany | 48,614,150 | 6.1 | ||||||
Australia | 36,563,277 | 4.6 | ||||||
Italy | 30,913,616 | 3.9 | ||||||
Netherlands | 29,620,870 | 3.7 | ||||||
Hong Kong | 22,731,667 | 2.9 | ||||||
South Korea | 22,610,737 | 2.8 | ||||||
Russia | 15,316,503 | 1.9 | ||||||
Norway | 14,190,635 | 1.8 | ||||||
China | 12,573,409 | 1.6 | ||||||
Other | 64,462,106 | 8.1 | ||||||
Short-Term Investments | 3,633,773 | 0.5 | ||||||
|
|
|
| |||||
Total Investments | $ | 792,952,427 | 100.0 | % | ||||
| * | All data are as of December 31, 2013. The Portfolio’s country breakdown is expressed as a percentage of total investments (excluding security lending collateral) and may vary over time. “Other” country weightings represent 1.4% or less in the following countries: Belgium, Brazil, Denmark, India, Israel, Portugal, South Africa, Sweden, Taiwan, Turkey and United Arab Emirates. |
7
| INTERNATIONAL VALUE PORTFOLIO | ||
| PORTFOLIOOF INVESTMENTS | ||
| December 31, 2013 | AllianceBernstein Variable Products Series Fund | |
| Company | Shares | U.S. $ Value | ||||||
COMMON STOCKS–98.0% | ||||||||
FINANCIALS–24.0% | ||||||||
CAPITAL MARKETS–2.5% | ||||||||
Deutsche Bank AG (REG) | 214,941 | $ | 10,326,066 | |||||
Macquarie Group Ltd. | 200,427 | 9,837,515 | ||||||
|
| |||||||
| 20,163,581 | ||||||||
|
| |||||||
COMMERCIAL BANKS–13.3% | ||||||||
Banco do Brasil SA | 215,400 | 2,232,167 | ||||||
Bank Hapoalim BM | 570,745 | 3,197,936 | ||||||
Barclays PLC | 1,508,362 | 6,820,636 | ||||||
BNP Paribas SA | 74,760 | 5,831,822 | ||||||
China Construction Bank Corp.–Class H | 3,772,000 | 2,855,823 | ||||||
HSBC Holdings PLC | 1,340,416 | 14,709,920 | ||||||
Industrial & Commercial Bank of China Ltd.–Class H | 2,777,000 | 1,883,112 | ||||||
KBC Groep NV | 102,970 | 5,854,408 | ||||||
Lloyds Banking Group PLC(a) | 8,399,240 | 11,021,368 | ||||||
Mitsubishi UFJ Financial Group, Inc. | 1,530,000 | 10,158,273 | ||||||
National Australia Bank Ltd. | 313,360 | 9,780,606 | ||||||
Sberbank of Russia (Sponsored ADR) | 227,027 | 2,853,729 | ||||||
Societe Generale SA | 213,042 | 12,388,488 | ||||||
Sumitomo Mitsui Financial Group, Inc. | 153,800 | 7,998,121 | ||||||
UniCredit SpA | 1,246,370 | 9,194,030 | ||||||
|
| |||||||
| 106,780,439 | ||||||||
|
| |||||||
DIVERSIFIED FINANCIAL SERVICES–1.9% | ||||||||
ING Groep NV(a) | 489,090 | 6,831,866 | ||||||
ORIX Corp. | 483,700 | 8,499,509 | ||||||
|
| |||||||
| 15,331,375 | ||||||||
|
| |||||||
INSURANCE–3.2% | ||||||||
Aegon NV | 475,823 | 4,509,148 | ||||||
Ageas | 44,312 | 1,889,619 | ||||||
AIA Group Ltd. | 1,417,400 | 7,134,465 | ||||||
Aviva PLC | 595,600 | 4,455,951 | ||||||
Muenchener Rueckversicherungs AG | 34,910 | 7,700,094 | ||||||
|
| |||||||
| 25,689,277 | ||||||||
|
| |||||||
REAL ESTATE MANAGEMENT & DEVELOPMENT–3.1% | ||||||||
Aeon Mall Co., Ltd. | 160,800 | 4,504,545 | ||||||
China Overseas Land & Investment Ltd. | 948,000 | 2,675,867 | ||||||
Country Garden Holdings Co., Ltd. | 8,528,000 | 5,158,607 | ||||||
Lend Lease Group | 566,810 | 5,656,601 | ||||||
Mitsui Fudosan Co., Ltd. | 116,000 | 4,184,195 | ||||||
Wharf Holdings Ltd. | 311,000 | 2,378,289 | ||||||
|
| |||||||
| 24,558,104 | ||||||||
|
| |||||||
| 192,522,776 | ||||||||
|
| |||||||
CONSUMER DISCRETIONARY–16.1% | ||||||||
AUTO COMPONENTS–3.7% | ||||||||
Cie Generale des Etablissements Michelin–Class B | 92,962 | $ | 9,891,215 | |||||
GKN PLC | 967,350 | 5,994,402 | ||||||
Valeo SA | 124,230 | 13,767,333 | ||||||
|
| |||||||
| 29,652,950 | ||||||||
|
| |||||||
AUTOMOBILES–6.1% | ||||||||
Bayerische Motoren Werke AG | 53,150 | 6,241,545 | ||||||
Honda Motor Co., Ltd. | 225,600 | 9,312,114 | ||||||
Hyundai Motor Co. | 16,580 | 3,721,658 | ||||||
Mazda Motor Corp.(a) | 1,377,000 | 7,135,698 | ||||||
Nissan Motor Co., Ltd. | 693,800 | 5,814,046 | ||||||
Renault SA | 35,430 | 2,851,278 | ||||||
Tata Motors Ltd. | 428,010 | 2,618,468 | ||||||
Volkswagen AG (Preference Shares) | 39,110 | 11,006,281 | ||||||
|
| |||||||
| 48,701,088 | ||||||||
|
| |||||||
HOTELS, RESTAURANTS & LEISURE–1.2% | ||||||||
Ladbrokes PLC | 1,004,946 | 2,986,498 | ||||||
Melco Crown Entertainment Ltd. (ADR)(a) | 175,690 | 6,890,562 | ||||||
|
| |||||||
| 9,877,060 | ||||||||
|
| |||||||
HOUSEHOLD | ||||||||
Taylor Wimpey PLC | 2,432,240 | 4,504,499 | ||||||
|
| |||||||
MEDIA–1.3% | ||||||||
Liberty Global PLC–Series C(a) | 125,450 | 10,577,944 | ||||||
|
| |||||||
MULTILINE RETAIL–0.3% | ||||||||
Myer Holdings Ltd.(b) | 901,780 | 2,221,355 | ||||||
|
| |||||||
SPECIALTY RETAIL–2.3% | ||||||||
Kingfisher PLC | 644,960 | 4,117,450 | ||||||
Shimamura Co., Ltd. | 39,600 | 3,711,968 | ||||||
World Duty Free SpA(a) | 201,060 | 2,528,107 | ||||||
Yamada Denki Co., Ltd. | 2,465,900 | 8,065,899 | ||||||
|
| |||||||
| 18,423,424 | ||||||||
|
| |||||||
TEXTILES, APPAREL & LUXURY GOODS–0.6% | ||||||||
Cie Financiere Richemont SA | 48,710 | 4,866,002 | ||||||
|
| |||||||
| 128,824,322 | ||||||||
|
| |||||||
INDUSTRIALS–12.1% | ||||||||
AEROSPACE & | ||||||||
European Aeronautic Defence and Space Co. NV | 184,310 | 14,149,512 | ||||||
MTU Aero Engines AG | 45,650 | 4,486,066 | ||||||
Safran SA | 83,390 | 5,797,974 | ||||||
Thales SA | 47,740 | 3,076,533 | ||||||
Zodiac Aerospace | 24,920 | 4,416,074 | ||||||
|
| |||||||
| 31,926,159 | ||||||||
|
| |||||||
8
| AllianceBernstein Variable Products Series Fund |
| Company | Shares | U.S. $ Value | ||||||
AIRLINES–1.2% | ||||||||
Japan Airlines Co., Ltd. | 47,900 | $ | 2,362,968 | |||||
Qantas Airways Ltd.(a) | 3,952,513 | 3,877,076 | ||||||
Turk Hava Yollari | 1,083,248 | 3,247,676 | ||||||
|
| |||||||
| 9,487,720 | ||||||||
|
| |||||||
BUILDING PRODUCTS–0.5% | ||||||||
Asahi Glass Co., Ltd.(b) | 719,000 | 4,477,060 | ||||||
|
| |||||||
ELECTRICAL | ||||||||
Sumitomo Electric Industries Ltd. | 526,800 | 8,806,005 | ||||||
|
| |||||||
INDUSTRIAL CONGLOMERATES–2.6% | ||||||||
Bidvest Group Ltd. | 110,440 | 2,829,287 | ||||||
Hutchison Whampoa Ltd. | 464,000 | 6,328,351 | ||||||
Siemens AG | 43,470 | 5,960,543 | ||||||
Toshiba Corp. | 1,375,000 | 5,788,491 | ||||||
|
| |||||||
| 20,906,672 | ||||||||
|
| |||||||
MACHINERY–0.4% | ||||||||
IHI Corp. | 667,000 | 2,884,535 | ||||||
|
| |||||||
MARINE–1.4% | ||||||||
AP Moeller–Maersk | 485 | 5,248,648 | ||||||
Nippon Yusen KK | 1,892,000 | 6,049,532 | ||||||
|
| |||||||
| 11,298,180 | ||||||||
|
| |||||||
ROAD & RAIL–0.1% | ||||||||
Central Japan Railway Co. | 3,600 | 424,267 | ||||||
|
| |||||||
TRADING COMPANIES & DISTRIBUTORS–0.7% | ||||||||
Mitsubishi Corp. | 305,300 | 5,861,122 | ||||||
|
| |||||||
TRANSPORTATION INFRASTRUCTURE–0.1% | ||||||||
Sydney Airport | 197,380 | 670,823 | ||||||
|
| |||||||
| 96,742,543 | ||||||||
|
| |||||||
HEALTH CARE–10.7% | ||||||||
BIOTECHNOLOGY–1.7% | ||||||||
Actelion Ltd.(a) | 160,230 | 13,590,830 | ||||||
|
| |||||||
PHARMACEUTICALS–9.0% | ||||||||
Astellas Pharma, Inc. | 98,300 | 5,827,894 | ||||||
Daiichi Sankyo Co., Ltd. | 306,000 | 5,595,196 | ||||||
GlaxoSmithKline PLC | 836,450 | 22,347,826 | ||||||
Novartis AG | 200,610 | 16,078,752 | ||||||
Roche Holding AG | 72,740 | 20,376,377 | ||||||
Teva Pharmaceutical Industries Ltd. | 45,750 | 1,830,521 | ||||||
|
| |||||||
| 72,056,566 | ||||||||
|
| |||||||
| 85,647,396 | ||||||||
|
| |||||||
CONSUMER STAPLES–7.2% | ||||||||
BEVERAGES–1.6% | ||||||||
Anheuser-Busch InBev NV | 33,740 | 3,587,782 | ||||||
Asahi Group Holdings Ltd. | 112,600 | 3,177,535 | ||||||
Carlsberg A/S–Class B | 52,510 | 5,810,426 | ||||||
|
| |||||||
| 12,575,743 | ||||||||
|
| |||||||
FOOD & STAPLES | ||||||||
Koninklijke Ahold NV | 622,420 | 11,185,593 | ||||||
|
| |||||||
FOOD PRODUCTS–1.0% | ||||||||
Danone | 48,440 | $ | 3,494,551 | |||||
Nestle SA | 57,850 | 4,239,828 | ||||||
|
| |||||||
| 7,734,379 | ||||||||
|
| |||||||
HOUSEHOLD | ||||||||
Reckitt Benckiser Group PLC | 41,450 | 3,292,617 | ||||||
|
| |||||||
TOBACCO–2.8% | ||||||||
British American Tobacco PLC | 171,040 | 9,180,415 | ||||||
Imperial Tobacco Group PLC | 251,000 | 9,730,794 | ||||||
Japan Tobacco, Inc. | 115,700 | 3,764,733 | ||||||
|
| |||||||
| 22,675,942 | ||||||||
|
| |||||||
| 57,464,274 | ||||||||
|
| |||||||
MATERIALS–7.1% | ||||||||
CHEMICALS–3.9% | ||||||||
Arkema SA | 75,666 | 8,834,619 | ||||||
BASF SE | 27,110 | 2,893,555 | ||||||
Denki Kagaku Kogyo KK | 970,000 | 4,009,284 | ||||||
Incitec Pivot Ltd. | 1,883,880 | 4,519,301 | ||||||
Koninklijke DSM NV | 90,145 | 7,094,263 | ||||||
Nippon Shokubai Co., Ltd. | 367,000 | 4,054,682 | ||||||
|
| |||||||
| 31,405,704 | ||||||||
|
| |||||||
METALS & MINING–2.5% | ||||||||
Dowa Holdings Co., Ltd. | 302,000 | 2,954,756 | ||||||
Glencore Xstrata PLC(a) | 647,842 | 3,370,433 | ||||||
MMC Norilsk Nickel OJSC (ADR) | 368,230 | 6,119,983 | ||||||
Rio Tinto PLC | 129,700 | 7,329,300 | ||||||
|
| |||||||
| 19,774,472 | ||||||||
|
| |||||||
PAPER & FOREST PRODUCTS–0.7% | ||||||||
Mondi PLC | 343,690 | 5,965,946 | ||||||
|
| |||||||
| 57,146,122 | ||||||||
|
| |||||||
TELECOMMUNICATION SERVICES–6.3% | ||||||||
DIVERSIFIED TELECOMMUNICATION SERVICES–2.7% | ||||||||
Bezeq The Israeli Telecommunication Corp., Ltd. | 1,757,973 | 2,981,275 | ||||||
Telenor ASA | 168,030 | 4,014,839 | ||||||
Vivendi SA | 562,086 | 14,826,366 | ||||||
|
| |||||||
| 21,822,480 | ||||||||
|
| |||||||
WIRELESS TELECOMMUNICATION SERVICES–3.6% | ||||||||
NTT DoCoMo, Inc. | 291,000 | 4,791,685 | ||||||
Turkcell Iletisim Hizmetleri AS(a) | 546,640 | 2,897,028 | ||||||
Vodafone Group PLC | 5,452,855 | 21,468,925 | ||||||
|
| |||||||
| 29,157,638 | ||||||||
|
| |||||||
| 50,980,118 | ||||||||
|
| |||||||
9
| INTERNATIONAL VALUE PORTFOLIO | ||
| PORTFOLIOOF INVESTMENTS | ||
| (continued) | AllianceBernstein Variable Products Series Fund |
| Company | Shares | U.S. $ Value | ||||||
ENERGY–5.9% | ||||||||
ENERGY EQUIPMENT & SERVICES–1.8% | ||||||||
Aker Solutions ASA | 314,702 | $ | 5,634,309 | |||||
Saipem SpA | 196,210 | 4,207,847 | ||||||
Seadrill Ltd.(b) | 110,810 | 4,541,487 | ||||||
|
| |||||||
| 14,383,643 | ||||||||
|
| |||||||
OIL, GAS & CONSUMABLE FUELS–4.1% | ||||||||
ENI SpA | 401,460 | 9,700,739 | ||||||
Gazprom OAO (Sponsored ADR) | 318,430 | 2,754,419 | ||||||
JX Holdings, Inc. | 1,095,600 | 5,641,733 | ||||||
LUKOIL OAO (London) (Sponsored ADR) | 56,850 | 3,588,372 | ||||||
Royal Dutch Shell PLC (Euronext Amsterdam)–Class A | 316,699 | 11,307,023 | ||||||
|
| |||||||
| 32,992,286 | ||||||||
|
| |||||||
| 47,375,929 | ||||||||
|
| |||||||
INFORMATION TECHNOLOGY–5.6% | ||||||||
COMMUNICATIONS EQUIPMENT–0.4% | ||||||||
Telefonaktiebolaget LM Ericsson–Class B | 267,065 | 3,260,727 | ||||||
|
| |||||||
COMPUTERS & PERIPHERALS–0.6% | ||||||||
Catcher Technology Co., Ltd. | 709,000 | 4,616,794 | ||||||
|
| |||||||
ELECTRONIC EQUIPMENT, INSTRUMENTS & COMPONENTS–0.7% | ||||||||
LG Display Co., Ltd.(a) | 245,100 | 5,918,755 | ||||||
|
| |||||||
IT SERVICES–0.8% | ||||||||
Fujitsu Ltd.(a) | 1,333,000 | 6,908,507 | ||||||
|
| |||||||
SEMICONDUCTORS & SEMICONDUCTOR EQUIPMENT–3.1% | ||||||||
Samsung Electronics Co., Ltd. | 5,510 | 7,179,789 | ||||||
SK Hynix, Inc.(a) | 165,550 | 5,790,535 | ||||||
Sumco Corp. | 503,400 | 4,440,946 | ||||||
Taiwan Semiconductor Manufacturing Co., Ltd. | 799,000 | 2,821,235 | ||||||
Tokyo Electron Ltd. | 79,900 | 4,402,706 | ||||||
|
| |||||||
| 24,635,211 | ||||||||
|
| |||||||
| 45,339,994 | ||||||||
|
| |||||||
UTILITIES–3.0% | ||||||||
ELECTRIC UTILITIES–2.1% | ||||||||
EDP–Energias de Portugal SA | 1,643,770 | $ | 6,037,717 | |||||
Electricite de France | 163,260 | 5,775,671 | ||||||
Enel SpA | 1,210,730 | 5,282,893 | ||||||
|
| |||||||
| 17,096,281 | ||||||||
|
| |||||||
MULTI-UTILITIES–0.9% | ||||||||
National Grid PLC | 510,620 | 6,678,507 | ||||||
|
| |||||||
| 23,774,788 | ||||||||
|
| |||||||
Total Common Stocks | 785,818,262 | |||||||
|
| |||||||
WARRANTS–0.4% | ||||||||
FINANCIALS–0.4% | ||||||||
REAL ESTATE MANAGEMENT & DEVELOPMENT–0.4% | ||||||||
Emaar Properties PJSC, Merrill Lynch Intl & Co., | 1,682,800 | 3,500,392 | ||||||
|
| |||||||
| Principal Amount (000) | ||||||||
SHORT-TERM INVESTMENTS–0.4% | ||||||||
TIME DEPOSIT–0.4% | ||||||||
State Street Time Deposit | $ | 3,634 | 3,633,773 | |||||
|
| |||||||
| Shares | ||||||||
Total Investments Before Security Lending Collateral for Securities Loaned–98.8% | 792,952,427 | |||||||
|
| |||||||
INVESTMENTS OF CASH COLLATERAL FOR SECURITIES | ||||||||
INVESTMENT | ||||||||
AllianceBernstein Exchange Reserves–Class I, 0.07%(c) | 9,970,890 | 9,970,890 | ||||||
|
| |||||||
TOTAL | 802,923,317 | |||||||
Other assets less | (683,955 | ) | ||||||
|
| |||||||
NET ASSETS–100.0% | $ | 802,239,362 | ||||||
|
| |||||||
10
| AllianceBernstein Variable Products Series Fund |
FUTURES (see Note D)
| Type | Number of Contracts | Expiration Month | Original Value | Value at December 31, 2013 | Unrealized Appreciation/ (Depreciation) | |||||||||||||
Purchased Contracts | ||||||||||||||||||
Euro STOXX 50 Index Futures | 63 | March 2014 | $ | 2,570,701 | $ | 2,693,675 | $ | 122,974 | ||||||||||
FORWARD CURRENCY EXCHANGE CONTRACTS (see Note D)
| Counterparty | Contracts to Deliver (000) | In Exchange For (000) | Settlement Date | Unrealized (Depreciation) | ||||||||||||||||||||
Barclays Bank PLC Wholesale | KRW | 27,852,992 | USD | 25,799 | 1/15/14 | $ | (615,591 | ) | ||||||||||||||||
Barclays Bank PLC Wholesale | USD | 29,248 | EUR | 21,495 | 1/15/14 | 322,632 | ||||||||||||||||||
BNP Paribas SA | JPY | 5,193,914 | USD | 51,990 | 1/15/14 | 2,667,569 | ||||||||||||||||||
BNP Paribas SA | NOK | 41,461 | USD | 6,898 | 1/15/14 | 65,351 | ||||||||||||||||||
BNP Paribas SA | USD | 7,750 | AUD | 8,408 | 1/15/14 | (248,014 | ) | |||||||||||||||||
BNP Paribas SA | USD | 60,146 | JPY | 6,108,840 | 1/15/14 | (2,135,321 | ) | |||||||||||||||||
BNP Paribas SA | USD | 18,209 | NZD | 21,854 | 1/15/14 | (247,626 | ) | |||||||||||||||||
Citibank, NA | EUR | 17,956 | USD | 24,262 | 1/15/14 | (440,221 | ) | |||||||||||||||||
Citibank, NA | NOK | 35,795 | USD | 6,033 | 1/15/14 | 133,548 | ||||||||||||||||||
Citibank, NA | SEK | 16,264 | USD | 2,527 | 1/15/14 | (1,518 | ) | |||||||||||||||||
Citibank, NA | USD | 40,396 | SEK | 258,023 | 1/15/14 | (287,616 | ) | |||||||||||||||||
Credit Suisse International | CHF | 5,740 | USD | 6,464 | 1/15/14 | 28,501 | ||||||||||||||||||
Credit Suisse International | CHF | 33,181 | USD | 37,157 | 1/15/14 | (42,147 | ) | |||||||||||||||||
Credit Suisse International | EUR | 15,124 | USD | 20,346 | 1/15/14 | (460,248 | ) | |||||||||||||||||
Credit Suisse International | JPY | 1,013,652 | USD | 10,425 | 1/15/14 | 799,463 | ||||||||||||||||||
Credit Suisse International | USD | 2,200 | AUD | 2,430 | 1/15/14 | (31,462 | ) | |||||||||||||||||
Credit Suisse International | USD | 26,275 | CHF | 23,915 | 1/15/14 | 536,106 | ||||||||||||||||||
Credit Suisse International | USD | 5,489 | EUR | 4,067 | 1/15/14 | 106,395 | ||||||||||||||||||
Credit Suisse International | USD | 12,579 | NOK | 77,256 | 1/15/14 | 153,112 | ||||||||||||||||||
Credit Suisse International | CHF | 16,156 | USD | 18,207 | 4/16/14 | 80,317 | ||||||||||||||||||
Credit Suisse International | USD | 7,302 | NOK | 44,998 | 4/16/14 | 88,125 | ||||||||||||||||||
Deutsche Bank AG London | AUD | 6,396 | USD | 5,977 | 1/15/14 | 270,054 | ||||||||||||||||||
Deutsche Bank AG London | HKD | 15,660 | USD | 2,020 | 1/15/14 | 399 | ||||||||||||||||||
Deutsche Bank AG London | JPY | 4,236,728 | USD | 43,547 | 1/15/14 | 3,314,436 | ||||||||||||||||||
Deutsche Bank AG London | USD | 16,539 | GBP | 10,236 | 1/15/14 | 410,241 | ||||||||||||||||||
Deutsche Bank AG London | USD | 4,026 | NZD | 4,896 | 1/15/14 | (1,669 | ) | |||||||||||||||||
Goldman Sachs Bank USA | BRL | 4,506 | USD | 1,924 | 1/03/14 | 13,575 | ||||||||||||||||||
Goldman Sachs Bank USA | USD | 1,889 | BRL | 4,506 | 1/03/14 | 20,621 | ||||||||||||||||||
Goldman Sachs Bank USA | CNY | 28,855 | USD | 4,706 | 1/15/14 | (47,417 | ) | |||||||||||||||||
Goldman Sachs Bank USA | USD | 3,854 | AUD | 4,026 | 1/15/14 | (262,219 | ) | |||||||||||||||||
Goldman Sachs Bank USA | USD | 35,642 | EUR | 25,870 | 1/15/14 | (52,733 | ) | |||||||||||||||||
Goldman Sachs Bank USA | USD | 26,528 | JPY | 2,571,923 | 1/15/14 | (2,104,475 | ) | |||||||||||||||||
Goldman Sachs Bank USA | BRL | 4,506 | USD | 1,874 | 2/04/14 | (20,403 | ) | |||||||||||||||||
HSBC Bank USA | USD | 22,047 | GBP | 13,669 | 1/15/14 | 586,377 | ||||||||||||||||||
HSBC Bank USA | USD | 11,367 | GBP | 7,008 | 4/16/14 | 229,345 | ||||||||||||||||||
Royal Bank of Scotland PLC | USD | 15,507 | NZD | 18,962 | 1/15/14 | 77,916 | ||||||||||||||||||
Standard Chartered Bank | BRL | 4,506 | USD | 1,943 | 1/03/14 | 33,569 | ||||||||||||||||||
Standard Chartered Bank | USD | 1,924 | BRL | 4,506 | 1/03/14 | (13,575 | ) | |||||||||||||||||
Standard Chartered Bank | CNY | 57,736 | USD | 9,418 | 1/15/14 | (92,573 | ) | |||||||||||||||||
Standard Chartered Bank | EUR | 18,352 | USD | 25,222 | 1/15/14 | (24,695 | ) | |||||||||||||||||
Standard Chartered Bank | HKD | 125,440 | USD | 16,180 | 1/15/14 | 2,655 | ||||||||||||||||||
11
| INTERNATIONAL VALUE PORTFOLIO | ||
| PORTFOLIOOF INVESTMENTS | ||
| (continued) | AllianceBernstein Variable Products Series Fund |
| Counterparty | Contracts to Deliver (000) | In Exchange For (000) | Settlement Date | Unrealized (Depreciation) | ||||||||||||||||||||
Standard Chartered Bank | USD | 4,033 | CNY | 24,706 | 1/15/14 | $ | 36,653 | |||||||||||||||||
Standard Chartered Bank | USD | 5,940 | KRW | 6,342,407 | 1/15/14 | 75,256 | ||||||||||||||||||
Standard Chartered Bank | HKD | 21,286 | USD | 2,745 | 1/17/14 | 39 | ||||||||||||||||||
Standard Chartered Bank | EUR | 3,684 | USD | 5,063 | 4/16/14 | (5,166 | ) | |||||||||||||||||
State Street Bank & Trust Co. | USD | 16,733 | CHF | 15,006 | 1/15/14 | 90,545 | ||||||||||||||||||
UBS AG | GBP | 14,475 | USD | 23,254 | 1/15/14 | (713,564 | ) | |||||||||||||||||
UBS AG | NZD | 27,914 | USD | 22,983 | 1/15/14 | 41,283 | ||||||||||||||||||
|
| |||||||||||||||||||||||
| $ | 2,335,830 | |||||||||||||||||||||||
|
| |||||||||||||||||||||||
| (a) | Non-income producing security. |
| (b) | Represents entire or partial securities out on loan. See Note E for securities lending information. |
| (c) | Investment in affiliated money market mutual fund. The rate shown represents the 7-day yield as of period end. |
Currency Abbreviations:
AUD—Australian Dollar
BRL—Brazilian Real
CHF—Swiss Franc
CNY—Chinese Yuan Renminbi
EUR—Euro
GBP—Great British Pound
HKD—Hong Kong Dollar
JPY—Japanese Yen
KRW—South Korean Won
NOK—Norwegian Krone
NZD—New Zealand Dollar
SEK—Swedish Krona
USD—United States Dollar
Glossary:
ADR—American Depositary Receipt
OJSC—Open Joint Stock Company
PJSC—Public Joint Stock Company
REG—Registered Shares
See notes to financial statements.
12
| INTERNATIONAL VALUE PORTFOLIO | ||
| STATEMENTOF ASSETS & LIABILITIES | ||
| December 31, 2013 | AllianceBernstein Variable Products Series Fund | |
ASSETS | ||||
Investments in securities, at value | ||||
Unaffiliated issuers (cost $638,121,418) | $ | 792,952,427 | (a) | |
Affiliated issuers (cost $9,970,890—including investment of cash collateral for securities loaned) | 9,970,890 | |||
Cash | 445,900 | (b) | ||
Foreign currencies, at value (cost $2,574,219) | 2,584,652 | |||
Unrealized appreciation of forward currency exchange contracts | 10,184,083 | |||
Receivable for investment securities sold and foreign currency transactions | 4,713,844 | |||
Dividends and interest receivable | 2,723,961 | |||
Receivable for capital stock sold | 43,797 | |||
|
| |||
Total assets | 823,619,554 | |||
|
| |||
LIABILITIES | ||||
Payable for collateral received on securities loaned | 9,970,890 | |||
Unrealized depreciation of forward currency exchange contracts | 7,848,253 | |||
Payable for investment securities purchased and foreign currency transactions | 2,160,831 | |||
Payable for capital stock redeemed | 480,997 | |||
Advisory fee payable | 479,990 | |||
Distribution fee payable | 148,847 | |||
Administrative fee payable | 14,445 | |||
Payable for variation margin on futures | 380 | |||
Transfer Agent fee payable | 239 | |||
Accrued expenses | 275,320 | |||
|
| |||
Total liabilities | 21,380,192 | |||
|
| |||
NET ASSETS | $ | 802,239,362 | ||
|
| |||
COMPOSITION OF NET ASSETS | ||||
Capital stock, at par | $ | 53,970 | ||
Additional paid-in capital | 1,743,358,532 | |||
Undistributed net investment income | 1,508,872 | |||
Accumulated net realized loss on investment and foreign currency transactions | (1,100,097,441 | ) | ||
Net unrealized appreciation on investments and foreign currency denominated assets and liabilities | 157,415,429 | |||
|
| |||
| $ | 802,239,362 | |||
|
|
Net Asset Value Per Share—1 billion shares of capital stock authorized, $.001 par value
| Class | Net Assets | Shares Outstanding | Net Asset Value | |||||||||
A | $ | 58,722,721 | 3,918,698 | $ | 14.99 | |||||||
B | $ | 743,516,641 | 50,051,444 | $ | 14.86 | |||||||
| (a) | Includes securities on loan with a value of $9,501,886 (see Note E). |
| (b) | An amount of $202,870 has been segregated to collateralize margin requirements for open futures outstanding at December 31, 2013. |
See notes to financial statements.
13
| INTERNATIONAL VALUE PORTFOLIO | ||
| STATEMENTOF OPERATIONS | ||
| Year Ended December 31, 2013 | AllianceBernstein Variable Products Series Fund | |
INVESTMENT INCOME | ||||
Dividends | ||||
Unaffiliated issuers (net of foreign taxes withheld of $2,275,692) | $ | 29,306,347 | ||
Affiliated issuers | 20,016 | |||
Interest | 220 | |||
Securities lending income | 773,591 | |||
|
| |||
| 30,100,174 | ||||
|
| |||
EXPENSES | ||||
Advisory fee (see Note B) | 6,918,754 | |||
Distribution fee—Class B | 2,181,857 | |||
Transfer agency—Class A | 411 | |||
Transfer agency—Class B | 6,878 | |||
Custodian | 269,577 | |||
Printing | 197,131 | |||
Legal | 60,283 | |||
Administrative | 55,155 | |||
Audit | 28,275 | |||
Directors’ fees | 4,519 | |||
Miscellaneous | 55,152 | |||
|
| |||
Total expenses | 9,777,992 | |||
|
| |||
Net investment income | 20,322,182 | |||
|
| |||
REALIZED AND UNREALIZED GAIN (LOSS) ON INVESTMENT AND FOREIGN CURRENCY TRANSACTIONS | ||||
Net realized gain on: | ||||
Investment transactions | 76,276,889 | (a) | ||
Futures | 765,896 | |||
Foreign currency transactions | 27,814,464 | |||
Net change in unrealized appreciation/depreciation of: | ||||
Investments | 81,089,579 | |||
Futures | 120,184 | |||
Foreign currency denominated assets and liabilities | (14,028,985 | ) | ||
|
| |||
Net gain on investment and foreign currency transactions | 172,038,027 | |||
|
| |||
NET INCREASE IN NET ASSETS FROM OPERATIONS | $ | 192,360,209 | ||
|
|
| (a) | On May 17, 2013, the Portfolio had a redemption-in-kind with total proceeds in the amount of $210,077,559. The gain on investments of $13,721,399 will not be realized for tax purposes. |
See notes to financial statements.
14
| INTERNATIONAL VALUE PORTFOLIO | ||
| STATEMENTOF CHANGESIN NET ASSETS | AllianceBernstein Variable Products Series Fund | |
| Year Ended December 31, 2013 | Year Ended December 31, 2012 | |||||||
INCREASE (DECREASE) IN NET ASSETS FROM OPERATIONS | ||||||||
Net investment income | $ | 20,322,182 | $ | 30,051,082 | ||||
Net realized gain (loss) on investment and foreign currency transactions | 104,857,249 | (109,842,214 | ) | |||||
Net change in unrealized appreciation/depreciation of investments and foreign currency denominated assets and liabilities | 67,180,778 | 230,054,769 | ||||||
|
|
|
| |||||
Net increase in net assets from operations | 192,360,209 | 150,263,637 | ||||||
DIVIDENDS TO SHAREHOLDERS FROM | ||||||||
Net investment income | ||||||||
Class A | (3,119,249 | ) | (757,381 | ) | ||||
Class B | (48,329,623 | ) | (14,270,445 | ) | ||||
CAPITAL STOCK TRANSACTIONS | ||||||||
Net decrease | (444,999,837 | ) | (124,195,156 | ) | ||||
|
|
|
| |||||
Total increase (decrease) | (304,088,500 | ) | 11,040,655 | |||||
NET ASSETS | ||||||||
Beginning of period | 1,106,327,862 | 1,095,287,207 | ||||||
|
|
|
| |||||
End of period (including undistributed net investment income of $1,508,872 and $1,805,358, respectively) | $ | 802,239,362 | $ | 1,106,327,862 | ||||
|
|
|
| |||||
See notes to financial statements.
15
| INTERNATIONAL VALUE PORTFOLIO | ||
| NOTES TO FINANCIAL STATEMENTS | ||
| December 31, 2013 | AllianceBernstein Variable Products Series Fund |
NOTE A : Significant Accounting Policies
The AllianceBernstein International Value Portfolio (the “Portfolio”) is a series of AllianceBernstein Variable Products Series Fund, Inc. (the “Fund”). The Portfolio’s investment objective is long-term growth of capital. The Portfolio is diversified as defined under the Investment Company Act of 1940. The Fund was incorporated in the State of Maryland on November 17, 1987, as an open-end series investment company. The Fund offers thirteen separately managed pools of assets which have differing investment objectives and policies. The Portfolio offers Class A and Class B shares. Both classes of shares have identical voting, dividend, liquidating and other rights, except that Class B shares bear a distribution expense and have exclusive voting rights with respect to the Class B distribution plan.
The Portfolio offers and sells its shares only to separate accounts of certain life insurance companies for the purpose of funding variable annuity contracts and variable life insurance policies. Sales are made without a sales charge at the Portfolio’s net asset value per share.
The financial statements have been prepared in conformity with U.S. generally accepted accounting principles (“U.S. GAAP”) which require management to make certain estimates and assumptions that affect the reported amounts of assets and liabilities in the financial statements and amounts of income and expenses during the reporting period. Actual results could differ from those estimates. The following is a summary of significant accounting policies followed by the Portfolio.
1. Security Valuation
Portfolio securities are valued at their current market value determined on the basis of market quotations or, if market quotations are not readily available or are deemed unreliable, at “fair value” as determined in accordance with procedures established by and under the general supervision of the Fund’s Board of Directors (the “Board”).
In general, the market values of securities which are readily available and deemed reliable are determined as follows: securities listed on a national securities exchange (other than securities listed on the NASDAQ Stock Market, Inc. (“NASDAQ”)) or on a foreign securities exchange are valued at the last sale price at the close of the exchange or foreign securities exchange. If there has been no sale on such day, the securities are valued at the last traded price from the previous day. Securities listed on more than one exchange are valued by reference to the principal exchange on which the securities are traded; securities listed only on NASDAQ are valued in accordance with the NASDAQ Official Closing Price; listed or over the counter (“OTC”) market put or call options are valued at the mid level between the current bid and ask prices. If either a current bid or current ask price is unavailable, AllianceBernstein L.P. (the “Adviser”) will have discretion to determine the best valuation (e.g. last trade price in the case of listed options); open futures are valued using the closing settlement price or, in the absence of such a price, the most recent quoted bid price. If there are no quotations available for the day of valuation, the last available closing settlement price is used; U.S. government securities and other debt instruments having 60 days or less remaining until maturity are valued at amortized cost if their original maturity was 60 days or less; or by amortizing their fair value as of the 61st day prior to maturity if their original term to maturity exceeded 60 days; fixed-income securities, including mortgage-backed and asset-backed securities, may be valued on the basis of prices provided by a pricing service or at a price obtained from one or more of the major broker-dealers. In cases where broker-dealer quotes are obtained, the Adviser may establish procedures whereby changes in market yields or spreads are used to adjust, on a daily basis, a recently obtained quoted price on a security. Swaps and other derivatives are valued daily, primarily using independent pricing services, independent pricing models using market inputs, as well as third party broker-dealers or counterparties. Investment companies are valued at their net asset value each day.
Securities for which market quotations are not readily available (including restricted securities) or are deemed unreliable are valued at fair value. Factors considered in making this determination may include, but are not limited to, information obtained by contacting the issuer, analysts, analysis of the issuer’s financial statements or other available documents. In addition, the Portfolio may use fair value pricing for securities primarily traded in non-U.S. markets because most foreign markets close well before the Portfolio values its securities at 4:00 p.m., Eastern Time. The earlier close of these foreign markets gives rise to the possibility that significant events, including broad market moves, may have occurred in the interim and may materially affect the value of these securities. To account for this, the Portfolio may frequently value many of its foreign equity securities using fair value prices based on third party vendor modeling tools to the extent available.
2. Fair Value Measurements
In accordance with U.S. GAAP regarding fair value measurements, fair value is defined as the price that the Portfolio would receive to sell an asset or pay to transfer a liability in an orderly transaction between market participants at the measurement date. U.S. GAAP establishes a framework for measuring fair value, and a three-level hierarchy for fair value measurements
16
| AllianceBernstein Variable Products Series Fund |
based upon the transparency of inputs to the valuation of an asset or liability (including those valued based on their market values as described in Note A.1 above). Inputs may be observable or unobservable and refer broadly to the assumptions that market participants would use in pricing the asset or liability. Observable inputs reflect the assumptions market participants would use in pricing the asset or liability based on market data obtained from sources independent of the Portfolio. Unobservable inputs reflect the Portfolio’s own assumptions about the assumptions that market participants would use in pricing the asset or liability based on the best information available in the circumstances. Each investment is assigned a level based upon the observability of the inputs which are significant to the overall valuation. The three-tier hierarchy of inputs is summarized below.
| • | Level 1—quoted prices in active markets for identical investments |
| • | Level 2—other significant observable inputs (including quoted prices for similar investments, interest rates, prepayment speeds, credit risk, etc.) |
| • | Level 3—significant unobservable inputs (including the Portfolio’s own assumptions in determining the fair value of investments) |
Where readily available market prices or relevant bid prices are not available for certain equity investments, such investments may be valued based on similar publicly traded investments, movements in relevant indices since last available prices or based upon underlying company fundamentals and comparable company data (such as multiples to earnings or other multiples to equity). Where an investment is valued using an observable input, such as another publicly traded security, the investment will be classified as Level 2. If management determines that an adjustment is appropriate based on restrictions on resale, illiquidity or uncertainty, and such adjustment is a significant component of the valuation, the investment will be classified as Level 3. An investment will also be classified as Level 3 where management uses company fundamentals and other significant inputs to determine the valuation.
The following table summarizes the valuation of the Portfolio’s investments by the above fair value hierarchy levels as of December 31, 2013:
| Level 1 | Level 2 | Level 3 | Total | |||||||||||||
Investments in Securities: | ||||||||||||||||
Assets: | ||||||||||||||||
Common Stocks: | ||||||||||||||||
Financials | $ | 12,691,244 | $ | 179,831,532 | $ | –0 | – | $ | 192,522,776 | |||||||
Consumer Discretionary | 19,996,613 | 108,827,709 | –0 | – | 128,824,322 | |||||||||||
Industrials | –0 | – | 96,742,543 | –0 | – | 96,742,543 | ||||||||||
Health Care | –0 | – | 85,647,396 | –0 | – | 85,647,396 | ||||||||||
Consumer Staples | –0 | – | 57,464,274 | –0 | – | 57,464,274 | ||||||||||
Materials | –0 | – | 57,146,122 | –0 | – | 57,146,122 | ||||||||||
Telecommunication Services | –0 | – | 50,980,118 | –0 | – | 50,980,118 | ||||||||||
Energy | 6,342,791 | 41,033,138 | –0 | – | 47,375,929 | |||||||||||
Information Technology | –0 | – | 45,339,994 | –0 | – | 45,339,994 | ||||||||||
Utilities | –0 | – | 23,774,788 | –0 | – | 23,774,788 | ||||||||||
Warrants | –0 | – | 3,500,392 | –0 | – | 3,500,392 | ||||||||||
Short-Term Investments | –0 | – | 3,633,773 | –0 | – | 3,633,773 | ||||||||||
Investments of Cash Collateral for Securities Loaned in Affiliated Money Market Fund | 9,970,890 | –0 | – | –0 | – | 9,970,890 | ||||||||||
|
|
|
|
|
|
|
| |||||||||
Total Investments in Securities | 49,001,538 | 753,921,779 | + | –0 | – | 802,923,317 | ||||||||||
Other Financial Instruments* : | ||||||||||||||||
Assets: | ||||||||||||||||
Futures | –0 | – | 122,974 | –0 | – | 122,974 | # | |||||||||
Forward Currency Exchange Contracts | –0 | – | 10,184,083 | –0 | – | 10,184,083 | ||||||||||
Liabilities: | ||||||||||||||||
Forward Currency Exchange Contracts | –0 | – | (7,848,253 | ) | –0 | – | (7,848,253 | ) | ||||||||
|
|
|
|
|
|
|
| |||||||||
Total(a)(b) | $ | 49,001,538 | $ | 756,380,583 | $ | –0 | – | $ | 805,382,121 | |||||||
|
|
|
|
|
|
|
| |||||||||
| * | Other financial instruments are derivative instruments, such as futures, forwards and swaps, which are valued at the unrealized appreciation/depreciation on the instrument. |
17
| INTERNATIONAL VALUE PORTFOLIO | ||
| NOTES TO FINANCIAL STATEMENTS | ||
| (continued) | AllianceBernstein Variable Products Series Fund |
| + | A significant portion of the Portfolio’s foreign equity investments are categorized as Level 2 investments since they are valued using fair value prices based on third party vendor modeling tools to the extent available, see Note A.1. |
| # | Only variation margin receivable/payable at period end is reported within the statement of assets and liabilities. This amount reflects cumulative appreciation/(depreciation) of futures contracts as reported in the portfolio of investments. |
| (a) | An amount of $10,445,050 was transferred from Level 1 to Level 2 due to the above mentioned foreign equity fair valuation using third party vendor modeling tools during the reporting period. |
| (b) | An amount of $17,768,510 was transferred from Level 2 to Level 1 as the above mentioned foreign equity fair valuation by the third party vendor was not applied during the reporting period. |
The Portfolio recognizes all transfers between levels of the fair value hierarchy assuming the financial instruments were transferred at the beginning of the reporting period.
The Adviser has established a Valuation Committee (the “Committee”) which is responsible for overseeing the pricing and valuation of all securities held in the Portfolio. The Committee operates under pricing and valuation policies and procedures established by the Adviser and approved by the Board, including pricing policies which set forth the mechanisms and processes to be employed on a daily basis to implement these policies and procedures. In particular, the pricing policies describe how to determine market quotations for securities and other instruments. The Committee’s responsibilities include: 1) fair value and liquidity determinations (and oversight of any third parties to whom any responsibility for fair value and liquidity determinations is delegated), and 2) regular monitoring of the Adviser’s pricing and valuation policies and procedures and modification or enhancement of these policies and procedures (or recommendation of the modification of these policies and procedures) as the Committee believes appropriate.
The Committee is also responsible for monitoring the implementation of the pricing policies by the Adviser’s Pricing Group (the “Pricing Group”) and a third party which performs certain pricing functions in accordance with the pricing policies. The Pricing Group is responsible for the oversight of the third party on a day-to-day basis. The Committee and the Pricing Group perform a series of activities to provide reasonable assurance of the accuracy of prices including: 1) periodic vendor due diligence meetings, review of methodologies, new developments and processes at vendors, 2) daily comparison of security valuation versus prior day for all securities that exceeded established thresholds, and 3) daily review of unpriced, stale, and variance reports with exceptions reviewed by senior management and the Committee.
In addition, several processes outside of the pricing process are used to monitor valuation issues including: 1) performance and performance attribution reports are monitored for anomalous impacts based upon benchmark performance, and 2) portfolio managers review all portfolios for performance and analytics (which are generated using the Adviser’s prices).
3. Currency Translation
Assets and liabilities denominated in foreign currencies and commitments under forward currency exchange contracts are translated into U.S. dollars at the mean of the quoted bid and ask prices of such currencies against the U.S. dollar. Purchases and sales of portfolio securities are translated into U.S. dollars at the rates of exchange prevailing when such securities were acquired or sold. Income and expenses are translated into U.S. dollars at rates of exchange prevailing when accrued.
Net realized gain or loss on foreign currency transactions represents foreign exchange gains and losses from sales and maturities of foreign fixed income investments, foreign currency exchange contracts, holding of foreign currencies, currency gains or losses realized between the trade and settlement dates on foreign investment transactions, and the difference between the amounts of dividends, interest and foreign withholding taxes recorded on the Portfolio’s books and the U.S. dollar equivalent amounts actually received or paid. Net unrealized currency gains and losses from valuing foreign currency denominated assets and liabilities at period end exchange rates are reflected as a component of net unrealized appreciation or depreciation of foreign currency denominated assets and liabilities.
4. Taxes
It is the Portfolio’s policy to meet the requirements of the Internal Revenue Code applicable to regulated investment companies and to distribute all of its investment company taxable income and net realized gains, if any, to shareholders. Therefore, no provisions for federal income or excise taxes are required. The Portfolio may be subject to taxes imposed by countries in which it invests. Such taxes are generally based on income and/or capital gains earned or repatriated. Taxes are accrued and applied to net investment income, net realized gains and net unrealized appreciation/depreciation as such income and/or gains are earned.
In accordance with U.S. GAAP requirements regarding accounting for uncertainties in income taxes, management has analyzed the Portfolio’s tax positions taken or expected to be taken on federal and state income tax returns for all open tax years (the current and the prior three tax years) and has concluded that no provision for income tax is required in the Portfolio’s financial statements.
18
| AllianceBernstein Variable Products Series Fund |
5. Investment Income and Investment Transactions
Dividend income is recorded on the ex-dividend date or as soon as the Portfolio is informed of the dividend. Interest income is accrued daily. Investment transactions are accounted for on the date the securities are purchased or sold. Investment gains or losses are determined on the identified cost basis. The Portfolio amortizes premiums and accretes discounts as adjustments to interest income.
6. Class Allocations
All income earned and expenses incurred by the Portfolio are borne on a pro-rata basis by each outstanding class of shares, based on the proportionate interest in the Portfolio represented by the net assets of such class, except for class specific expenses which are allocated to the respective class. Expenses of the Fund are charged proportionately to each Portfolio or based on other appropriate methods. Realized and unrealized gains and losses are allocated among the various share classes based on respective net assets.
7. Dividends and Distributions
Dividends and distributions to shareholders, if any, are recorded on the ex-dividend date. Income dividends and capital gains distributions are determined in accordance with federal tax regulations and may differ from those determined in accordance with U.S. GAAP. To the extent these differences are permanent, such amounts are reclassified within the capital accounts based on their federal tax basis treatment; temporary differences do not require such reclassification.
NOTE B: Advisory Fee and Other Transactions with Affiliates
Under the terms of the investment advisory agreement, the Portfolio pays the Adviser an advisory fee at an annual rate of .75% of the first $2.5 billion, ..65% of the next $2.5 billion and .60% in excess of $5 billion, of the Portfolio’s average daily net assets. The fee is accrued daily and paid monthly. The Adviser has agreed to waive its fees and bear certain expenses to the extent necessary to limit total operating expenses on an annual basis to 1.20% and 1.45% of daily average net assets for Class A and Class B shares, respectively. For the year ended December 31, 2013, there were no expenses waived by the Adviser.
Pursuant to the investment advisory agreement, the Portfolio may reimburse the Adviser for certain legal and accounting services provided to the Portfolio by the Adviser. For the year ended December 31, 2013, the reimbursement for such services amounted to $55,155.
Brokerage commissions paid on investment transactions for the year ended December 31, 2013 amounted to $1,382,847, of which $212 and $337, respectively, was paid to Sanford C. Bernstein & Co. LLC and Sanford C. Bernstein Limited, affiliates of the Adviser.
The Portfolio compensates AllianceBernstein Investor Services, Inc. (“ABIS”), a wholly-owned subsidiary of the Adviser, under a Transfer Agency Agreement for providing personnel and facilities to perform transfer agency services for the Portfolio. Such compensation retained by ABIS amounted to $1,385 for the year ended December 31, 2013.
NOTE C: Distribution Plan
The Portfolio has adopted a Distribution Plan (the “Plan”) for Class B shares pursuant to Rule 12b-1 under the Investment Company Act of 1940. Under the Plan, the Portfolio pays distribution and servicing fees to AllianceBernstein Investments, Inc. (the “Distributor”), a wholly-owned subsidiary of the Adviser, at an annual rate of up to .50% of the Portfolio’s average daily net assets attributable to Class B shares. The fees are accrued daily and paid monthly. The Board currently limits payments under the Plan to .25% of the Portfolio’s average daily net assets attributable to Class B shares. The Plan provides that the Distributor will use such payments in their entirety for distribution assistance and promotional activities.
The Portfolio is not obligated under the Plan to pay any distribution and servicing fees in excess of the amounts set forth above. The purpose of the payments to the Distributor under the Plan is to compensate the Distributor for its distribution services with respect to the sale of the Portfolio’s Class B shares. Since the Distributor’s compensation is not directly tied to its expenses, the amount of compensation received by it under the Plan during any year may be more or less than its actual expenses. For this reason, the Plan is characterized by the staff of the Securities and Exchange Commission as being of the “compensation” variety.
In the event that the Plan is terminated or not continued, no distribution or servicing fees (other than current amounts accrued but not yet paid) would be owed by the Portfolio to the Distributor.
The Plan also provides that the Adviser may use its own resources to finance the distribution of the Portfolio’s shares.
19
| INTERNATIONAL VALUE PORTFOLIO | ||
| NOTES TO FINANCIAL STATEMENTS | ||
| (continued) | AllianceBernstein Variable Products Series Fund |
NOTE D : Investment Transactions
Purchases and sales of investment securities (excluding short-term investments) for the year ended December 31, 2013 were as follows:
| Purchases | Sales | |||||||
Investment securities (excluding U.S. government securities) | $ | 531,013,661 | $ | 785,243,274 | ||||
U.S. government securities | –0 | – | –0 | – | ||||
The cost of investments for federal income tax purposes, gross unrealized appreciation and unrealized depreciation (excluding futures and foreign currency transactions) are as follows:
Cost | $ | 655,142,410 | ||
|
| |||
Gross unrealized appreciation | $ | 168,868,373 | ||
Gross unrealized depreciation | (21,087,466 | ) | ||
|
| |||
Net unrealized appreciation | $ | 147,780,907 | ||
|
|
1. Derivative Financial Instruments
The Portfolio may use derivatives in an effort to earn income and enhance returns, to replace more traditional direct investments, to obtain exposure to otherwise inaccessible markets (collectively, “investment purposes”), or to hedge or adjust the risk profile of its portfolio.
The principal types of derivatives utilized by the Portfolio, as well as the methods in which they may be used are:
| • | Futures |
The Portfolio may buy or sell futures for investment purposes or for the purpose of hedging its portfolio against adverse effects of potential movements in the market. The Portfolio bears the market risk that arises from changes in the value of these instruments and the imperfect correlation between movements in the price of the futures and movements in the price of the assets, reference rates or indices which they are designed to track. Among other things, the Portfolio may purchase or sell futures for foreign currencies or options thereon for non-hedging purposes as a means of making direct investment in foreign currencies, as described below under “Currency Transactions”.
At the time the Portfolio enters into futures, the Portfolio deposits and maintains as collateral an initial margin with the broker, as required by the exchange on which the transaction is effected. Pursuant to the contract, the Portfolio agrees to receive from or pay to the broker an amount of cash equal to the daily fluctuation in the value of the contract. Such receipts or payments are known as variation margin and are recorded by the Portfolio as unrealized gains or losses. Risks may arise from the potential inability of a counterparty to meet the terms of the contract. The credit/counterparty risk for exchange-traded futures is generally less than privately negotiated futures, since the clearinghouse, which is the issuer or counterparty to each exchange-traded future, has robust risk mitigation standards, including the requirement to provide initial and variation margin. When the contract is closed, the Portfolio records a realized gain or loss equal to the difference between the value of the contract at the time it was opened and the time it was closed.
Use of long futures subjects the Portfolio to risk of loss in excess of the amounts shown on the statement of assets and liabilities, up to the notional value of the futures. Use of short futures subjects the Portfolio to unlimited risk of loss. Under some circumstances, futures exchanges may establish daily limits on the amount that the price of futures can vary from the previous day’s settlement price, which could effectively prevent liquidation of unfavorable positions.
During the year ended December 31, 2013, the Portfolio held futures for non-hedging purposes.
| • | Forward Currency Exchange Contracts |
The Portfolio may enter into forward currency exchange contracts in order to hedge its exposure to changes in foreign currency exchange rates on its foreign portfolio holdings, to hedge certain firm purchase and sale commitments denominated in foreign currencies and for non-hedging purposes as a means of making direct investments in foreign currencies, as described below under “Currency Transactions”.
A forward currency exchange contract is a commitment to purchase or sell a foreign currency at a future date at a negotiated forward rate. The gain or loss arising from the difference between the original contract and the closing of such contract would be included in net realized gain or loss on foreign currency transactions. Fluctuations in the
20
| AllianceBernstein Variable Products Series Fund |
value of open forward currency exchange contracts are recorded for financial reporting purposes as unrealized appreciation and/or depreciation by the Portfolio. Risks may arise from the potential inability of a counterparty to meet the terms of a contract and from unanticipated movements in the value of a foreign currency relative to the U.S. dollar.
During the year ended December 31, 2013, the Portfolio held forward currency exchange contracts for hedging and non-hedging purposes.
The Portfolio typically enters into International Swaps and Derivatives Association, Inc. Master Agreements (“ISDA Master Agreement”) or similar master agreements (collectively, “Master Agreements”) with its OTC derivative contract counterparties in order to, among other things, reduce its credit risk to counterparties. ISDA Master Agreements include provisions for general obligations, representations, collateral and events of default or termination. Under an ISDA Master Agreement, the Portfolio typically may offset with the counterparty certain derivative financial instrument’s payables and/or receivables with collateral held and/or posted and create one single net payment (close-out netting) in the event of default or termination.
Various master agreements govern the terms of certain transactions with counterparties, including transactions such as exchange-traded derivative transactions, repurchase and reverse repurchase agreements. These master agreements typically attempt to reduce the counterparty risk associated with such transactions by specifying credit protection mechanisms and providing standardization that improves legal certainty. Cross-termination provisions under Master Agreements typically provide that a default in connection with one transaction between the Portfolio and a counterparty gives the non-defaulting party the right to terminate any other transactions in place with the defaulting party to create one single net payment due to/due from the defaulting party. In the event of a default by a Master Agreements counterparty, the return of collateral with market value in excess of the Portfolio’s net liability, held by the defaulting party, may be delayed or denied.
The Portfolio’s Master Agreements may contain provisions for early termination of OTC derivative transactions in the event the net assets of the Portfolio decline below specific levels (“net asset contingent features”). If these levels are triggered, the Portfolio’s counterparty has the right to terminate such transaction and require the Portfolio to pay or receive a settlement amount in connection with the terminated transaction. As of December 31, 2013, the Portfolio had OTC derivatives with contingent features in net liability positions in the amount of $4,014,098. If a trigger event had occurred at December 31, 2013, for those derivatives in a net liability position, an amount of $4,014,098 would be required to be posted by the Portfolio.
At December 31, 2013, the Portfolio had entered into the following derivatives:
Asset Derivatives | Liability Derivatives | |||||||||||
Derivative Type | Statement of Location | Fair Value | Statement of Location | Fair Value | ||||||||
Equity contracts | Receivable/Payable for variation margin on futures | $ | 122,974 | * | ||||||||
Foreign exchange contracts | Unrealized appreciation of forward currency exchange contracts | 10,184,083 | Unrealized depreciation of forward currency exchange contracts | $ | 7,848,253 | |||||||
|
|
|
| |||||||||
Total | $10,307,057 | $ | 7,848,253 | |||||||||
|
|
|
| |||||||||
| * | Only variation margin receivable/payable at period end is reported within the statement of assets and liabilities. This amount reflects cumulative appreciation/(depreciation) as reported in the portfolio of investments. |
The effect of derivative instruments on the statement of operations for the year ended December 31, 2013:
Derivative Type | Location of Gain or (Loss) on Derivatives | Realized Gain or (Loss) on Derivatives | Change in Unrealized Appreciation or (Depreciation) | |||||||
Equity contracts | Net realized gain (loss) on futures; Net change in unrealized appreciation/depreciation of futures | $ | 765,896 | $ | 120,184 | |||||
Foreign exchange contracts | Net realized gain (loss) on foreign currency transactions; Net change in unrealized appreciation/depreciation of foreign currency denominated assets and liabilities | 29,331,482 | (14,141,354 | ) | ||||||
|
|
|
| |||||||
Total | $ | 30,097,378 | $ | (14,021,170 | ) | |||||
|
|
|
| |||||||
21
| INTERNATIONAL VALUE PORTFOLIO | ||
| NOTES TO FINANCIAL STATEMENTS | ||
| (continued) | AllianceBernstein Variable Products Series Fund |
The following table represents the volume of the Portfolio’s derivative transactions during the year ended December 31, 2013:
Futures: | ||||
Average original value of buy contracts | $ | 5,838,349 | ||
Forward Currency Exchange Contracts: | ||||
Average principal amount of buy contracts | $ | 350,882,501 | ||
Average principal amount of sale contracts | $ | 355,732,558 | ||
For financial reporting purposes, the Portfolio does not offset derivative assets and derivative liabilities that are subject to netting arrangements in the statement of assets and liabilities.
All derivatives held during the reporting period were subject to netting arrangements. The following table presents the Portfolio’s derivative assets and liabilities by counterparty net of amounts available for offset under Master Agreements (“MA”) and net of the related collateral received/ pledged by the Portfolio as of December 31, 2013:
Counterparty | Derivative Assets Subject to MA | Derivative Available for Offset | Collateral Received | Net Amount of Derivatives Assets | ||||||||||||
Barclays Bank PLC Wholesale | $ | 322,632 | $ | (322,632 | ) | $ | –0 | – | $ | –0 | – | |||||
BNP Paribas SA | 2,732,920 | (2,630,961 | ) | –0 | – | 101,959 | ||||||||||
Citibank, NA | 133,548 | (133,548 | ) | –0 | – | –0 | – | |||||||||
Credit Suisse International | 1,792,019 | (533,857 | ) | –0 | – | 1,258,162 | ||||||||||
Deutsche Bank AG London | 3,995,130 | (1,669 | ) | –0 | – | 3,993,461 | ||||||||||
Goldman Sachs Bank USA | 34,196 | (34,196 | ) | –0 | – | –0 | – | |||||||||
HSBC Bank USA | 815,722 | –0 | – | –0 | – | 815,722 | ||||||||||
Royal Bank of Scotland PLC | 77,916 | –0 | – | –0 | – | 77,916 | ||||||||||
Standard Chartered Bank | 148,172 | (136,009 | ) | –0 | – | 12,163 | ||||||||||
State Street Bank & Trust Co. | 90,545 | –0 | – | –0 | – | 90,545 | ||||||||||
UBS AG | 41,283 | (41,283 | ) | –0 | – | –0 | – | |||||||||
|
|
|
|
|
|
|
| |||||||||
Total | $ | 10,184,083 | $ | (3,834,155 | ) | $ | –0 | – | $ | 6,349,928 | ||||||
|
|
|
|
|
|
|
| |||||||||
Counterparty | Derivative Liabilities Subject to MA | Derivative Available for Offset | Collateral Pledged | Net Amount of Derivatives Liabilities | ||||||||||||
Barclays Bank PLC Wholesale | $ | 615,591 | $ | (322,632 | ) | $ | –0 | – | $ | 292,959 | ||||||
BNP Paribas SA | 2,630,961 | (2,630,961 | ) | –0 | – | –0 | – | |||||||||
Citibank, NA | 729,355 | (133,548 | ) | –0 | – | 595,807 | ||||||||||
Credit Suisse International | 533,857 | (533,857 | ) | –0 | – | –0 | – | |||||||||
Deutsche Bank AG London | 1,669 | (1,669 | ) | –0 | – | –0 | – | |||||||||
Exchange-Traded Goldman Sachs Co.* | 380 | –0 | – | (380 | ) | –0 | – | |||||||||
Goldman Sachs Bank USA | 2,487,247 | (34,196 | ) | –0 | – | 2,453,051 | ||||||||||
Standard Chartered Bank | 136,009 | (136,009 | ) | –0 | – | –0 | – | |||||||||
UBS AG | 713,564 | (41,283 | ) | –0 | – | 672,281 | ||||||||||
|
|
|
|
|
|
|
| |||||||||
Total | $ | 7,848,633 | $ | (3,834,155 | ) | $ | (380 | ) | $ | 4,014,098 | ||||||
|
|
|
|
|
|
|
| |||||||||
| * | In addition to the amounts reflected above, cash collateral has been posted for initial margin requirements for open futures outstanding at December 31, 2013. |
2. Currency Transactions
The Portfolio may invest in non-U.S. dollar securities on a currency hedged or unhedged basis. The Portfolio may seek investment opportunities by taking long or short positions in currencies through the use of currency-related derivatives, including forward currency exchange contracts, futures and options on futures, swaps, and other options. The Portfolio may enter into transactions for investment opportunities when it anticipates that a foreign currency will appreciate or depreciate in value but securities denominated in that currency are not held by the Portfolio and do not present attractive investment opportunities. Such transactions may also be used when the Adviser believes that it may be more efficient than a direct investment in a foreign currency-denominated security. The Portfolio may also conduct currency exchange contracts on a spot basis (i.e., for cash at the spot rate prevailing in the currency exchange market for buying or selling currencies).
22
| AllianceBernstein Variable Products Series Fund |
NOTE E: Securities Lending
The Portfolio may enter into securities lending transactions. Under the Portfolio’s securities lending program, all loans of securities will be collateralized continually by cash. The Portfolio will be compensated for the loan from a portion of the net return from the income earned on cash collateral after a rebate is paid to the borrower (in some cases, this rebate may be a “negative rebate” or fee paid by the borrower to the Portfolio in connection with the loan), and payments are made for fees of the securities lending agent and for certain other administrative expenses. It is the policy of the Portfolio to receive collateral consisting of cash in an amount exceeding the value of the securities loaned. The Portfolio will have the right to call a loan and obtain the securities loaned at any time on notice to the borrower within the normal and customary settlement time for the securities. While the securities are on loan, the borrower is obligated to pay the Portfolio amounts equal to any income or other distributions from the securities. The Portfolio will not have the right to vote any securities during the existence of a loan, but will have the right to regain ownership of loaned securities in order to exercise voting or other ownership rights. The lending agent has agreed to indemnify the Portfolio in the case of default of any securities borrower. Collateral received and securities loaned are marked to market daily to ensure that the securities loaned are secured by collateral. The lending agent will invest the cash collateral received in AllianceBernstein Exchange Reserves, an eligible money market vehicle, in accordance with the investment restrictions of the Portfolio, and as approved by the Board. The collateral received on securities loaned is recorded as an asset as well as a corresponding liability in the statement of assets and liabilities. When the Portfolio lends securities, its investment performance will continue to reflect changes in the value of the securities loaned. At December 31, 2013, the Portfolio had securities on loan with a value of $9,501,886 and had received cash collateral which has been invested into AllianceBernstein Exchange Reserves of $9,970,890. The cash collateral will be adjusted on the next business day to maintain the required collateral amount. The Portfolio earned securities lending income of $773,591 and $20,016 from the borrowers and AllianceBernstein Exchange Reserves, respectively, for the year ended December 31, 2013; these amounts are reflected in the statement of operations. A principal risk of lending portfolio securities is that the borrower will fail to return the loaned securities upon termination of the loan and that the collateral will not be sufficient to replace the loaned securities. A summary of the Portfolio’s transactions in shares of AllianceBernstein Exchange Reserves for the year ended December 31, 2013 is as follows:
Market Value December 31, 2012 (000) | Purchases at Cost (000) | Sales Proceeds (000) | Market Value December 31, 2013 (000) | |||||||||||
| $ | 38,373 | $ | 635,944 | $ | 664,346 | $ | 9,971 | |||||||
NOTE F: Capital Stock
Each class consists of 500,000,000 authorized shares. Transactions in capital shares for each class were as follows:
| SHARES | AMOUNT | |||||||||||||||||
| Year Ended December 31, 2013 | Year Ended December 31, 2012 | Year Ended December 31, 2013 | Year Ended December 31, 2012 | |||||||||||||||
Class A | ||||||||||||||||||
Shares sold | 704,487 | 524,576 | $ | 10,092,196 | $ | 6,413,101 | ||||||||||||
Shares issued in reinvestment of dividends | 219,705 | 60,205 | 3,119,249 | 757,381 | ||||||||||||||
Shares redeemed | (711,972 | ) | (2,270,141 | ) | (9,889,977 | ) | (27,369,031 | ) | ||||||||||
|
|
|
|
|
|
|
| |||||||||||
Net increase (decrease) | 212,220 | (1,685,360 | ) | $ | 3,321,468 | $ | (20,198,549 | ) | ||||||||||
|
|
|
|
|
|
|
| |||||||||||
Class B | ||||||||||||||||||
Shares sold | 1,604,342 | 7,681,424 | $ | 21,719,600 | $ | 89,127,074 | ||||||||||||
Shares issued in reinvestment of dividends | 3,444,995 | 1,144,382 | 48,329,623 | 14,270,445 | ||||||||||||||
Shares redeemed | (37,407,549 | ) | (17,078,721 | ) | (518,370,528 | ) | (207,394,126 | ) | ||||||||||
|
|
|
|
|
|
|
| |||||||||||
Net decrease | (32,358,212 | ) | (8,252,915 | ) | $ | (448,321,305 | ) | $ | (103,996,607 | ) | ||||||||
|
|
|
|
|
|
|
| |||||||||||
NOTE G: Risks Involved in Investing in the Portfolio
Foreign Securities Risk—Investing in securities of foreign companies or foreign governments involves special risks which include changes in foreign currency exchange rates and the possibility of future political and economic developments which could adversely affect the value of such securities. Moreover, securities of many foreign companies or foreign governments and their markets may be less liquid and their prices more volatile than those of comparable U.S. companies or of the U.S. government.
23
| INTERNATIONAL VALUE PORTFOLIO | ||
| NOTES TO FINANCIAL STATEMENTS | ||
| (continued) | AllianceBernstein Variable Products Series Fund |
Currency Risk—This is the risk that changes in foreign currency exchange rates may negatively affect the value of the Portfolio’s investments or reduce the returns of the Portfolio. For example, the value of the Portfolio’s investments in foreign currency-denominated securities or currencies may decrease if the U.S. dollar is strong (i.e., gaining value relative to other currencies) and other currencies are weak (i.e., losing value relative to the U.S. dollar). Currency markets are generally not as regulated as securities markets. Independent of the Portfolio’s investments denominated in foreign currencies, the Portfolio’s positions in various foreign currencies may cause the Portfolio to experience investment losses due to the changes in exchange rates and interest rates.
Derivatives Risk—The Portfolio may enter into derivative transactions such as forwards, options, futures and swaps. Derivatives may be illiquid, difficult to price, and leveraged so that small changes may produce disproportionate losses for the Portfolio, and subject to counterparty risk to a greater degree than more traditional investments. Derivatives may result in significant losses, including losses that are far greater than the value of the derivatives reflected in the statement of assets and liabilities.
Indemnification Risk—In the ordinary course of business, the Portfolio enters into contracts that contain a variety of indemnifications. The Portfolio’s maximum exposure under these arrangements is unknown. However, the Portfolio has not had prior claims or losses pursuant to these indemnification provisions and expects the risk of loss thereunder to be remote. Therefore, the Portfolio has not accrued any liability in connection with these indemnification provisions.
NOTE H: Joint Credit Facility
A number of open-end mutual funds managed by the Adviser, including the Portfolio, participate in a $140 million revolving credit facility (the “Facility”) intended to provide short-term financing, if necessary, subject to certain restrictions in connection with abnormal redemption activity. Commitment fees related to the Facility are paid by the participating funds and are included in miscellaneous expenses in the statement of operations. The Portfolio did not utilize the Facility during the year ended December 31, 2013.
NOTE I: Distributions to Shareholders
The tax character of distributions paid during the fiscal years ended December 31, 2013 and December 31, 2012 were as follows:
| 2013 | 2012 | |||||||
Distributions paid from: | ||||||||
Ordinary income | $ | 51,448,872 | $ | 15,027,826 | ||||
|
|
|
| |||||
Total distributions paid | $ | 51,448,872 | $ | 15,027,826 | ||||
|
|
|
| |||||
As of December 31, 2013, the components of accumulated earnings/(deficit) on a tax basis were as follows:
Undistributed ordinary income | $ | 9,570,737 | ||
Accumulated capital and other losses | (1,098,653,494 | )(a) | ||
Unrealized appreciation/(depreciation) | 147,909,617 | (b) | ||
|
| |||
Total accumulated earnings/(deficit) | $ | (941,173,140 | ) | |
|
|
| (a) | As of December 31, 2013, the Portfolio had a net capital loss carryforward of $1,098,653,494. During the fiscal year, the Portfolio utilized $55,640,708 of capital loss carryforwards to offset current year net realized gains. |
| (b) | The differences between book-basis and tax-basis unrealized appreciation/(depreciation) are attributable primarily to the tax deferral of losses on wash sales, the realization for tax purposes of gains/losses on certain derivative instruments, and the tax treatment of passive foreign investment companies (PFICs). |
For tax purposes, net capital losses may be carried over to offset future capital gains, if any. Funds are permitted to carry forward capital losses incurred in taxable years beginning after December 22, 2010 for an indefinite period. These post-enactment capital losses must be utilized prior to the pre-enactment capital losses, which are subject to expiration. Post-enactment capital loss carryforwards will retain their character as either short-term or long-term capital losses rather than being considered short-term as under previous regulation.
24
| AllianceBernstein Variable Products Series Fund |
As of December 31, 2013, the Portfolio had a net capital loss carryforward of $1,098,653,494 which will expire as follows:
SHORT-TERM AMOUNT | LONG-TERM AMOUNT | EXPIRATION | ||
| $ 41,335,504 | n/a | 2016 | ||
| 917,130,062 | n/a | 2017 | ||
| 50,169,345 | n/a | 2018 | ||
| 25,870,806 | $64,147,777 | no expiration |
During the current fiscal year, permanent differences primarily due to reclassifications of foreign currency, the tax treatment of gains from a redemption-in-kind, and the tax treatment of passive foreign investment companies (PFICs) resulted in a net decrease in distributions in excess of net investment income, a net increase in accumulated net realized loss on investment and foreign currency transactions, and a net increase in additional paid-in capital. These reclassifications had no effect on net assets.
NOTE J: Subsequent Events
Management has evaluated subsequent events for possible recognition or disclosure in the financial statements through the date the financial statements are issued. Management has determined that there are no material events that would require disclosure in the Portfolio’s financial statements through this date.
25
| INTERNATIONAL VALUE PORTFOLIO | ||
| FINANCIAL HIGHLIGHTS | AllianceBernstein Variable Products Series Fund |
Selected Data For A Share Of Capital Stock Outstanding Throughout Each Period
| CLASS A | ||||||||||||||||||||
| Year Ended December 31, | ||||||||||||||||||||
| 2013 | 2012 | 2011 | 2010 | 2009 | ||||||||||||||||
Net asset value, beginning of period | $12.96 | $11.50 | $14.90 | $14.70 | $11.05 | |||||||||||||||
|
|
|
|
|
|
|
|
|
| |||||||||||
Income From Investment Operations | ||||||||||||||||||||
Net investment income (a) | .33 | .36 | .36 | .27 | .29 | |||||||||||||||
Net realized and unrealized gain (loss) on investment and foreign currency transactions | 2.59 | 1.31 | (3.19 | ) | .39 | † | 3.54 | |||||||||||||
|
|
|
|
|
|
|
|
|
| |||||||||||
Net increase (decrease) in net asset value from operations | 2.92 | 1.67 | (2.83 | ) | .66 | 3.83 | ||||||||||||||
|
|
|
|
|
|
|
|
|
| |||||||||||
Less: Dividends and Distributions | ||||||||||||||||||||
Dividends from net investment income | (.89 | ) | (.21 | ) | (.56 | ) | (.46 | ) | (.18 | ) | ||||||||||
Tax return of capital | –0 | – | –0 | – | (.01 | ) | –0 | – | –0 | – | ||||||||||
|
|
|
|
|
|
|
|
|
| |||||||||||
Total dividends and distributions | (.89 | ) | (.21 | ) | (.57 | ) | (.46 | ) | (.18 | ) | ||||||||||
|
|
|
|
|
|
|
|
|
| |||||||||||
Net asset value, end of period | $14.99 | $12.96 | $11.50 | $14.90 | $14.70 | |||||||||||||||
|
|
|
|
|
|
|
|
|
| |||||||||||
Total Return | ||||||||||||||||||||
Total investment return based on net asset | 23.00 | % | 14.53 | % | (19.25 | )% | 4.59 | % | 34.68 | % | ||||||||||
Ratios/Supplemental Data | ||||||||||||||||||||
Net assets, end of period (000’s omitted) | $58,723 | $48,029 | $62,003 | $104,274 | $179,342 | |||||||||||||||
Ratio to average net assets of: | ||||||||||||||||||||
Expenses | .82 | % | .81 | % | .82 | % | .85 | %+ | .83 | % | ||||||||||
Net investment income | 2.33 | % | 2.97 | % | 2.55 | % | 1.94 | %+ | 2.40 | % | ||||||||||
Portfolio turnover rate | 59 | % | 41 | % | 62 | % | 52 | % | 52 | % | ||||||||||
See footnote summary on page 27.
26
| INTERNATIONAL VALUE PORTFOLIO | ||
| FINANCIAL HIGHLIGHTS | ||
| (continued) | AllianceBernstein Variable Products Series Fund |
Selected Data For A Share Of Capital Stock Outstanding Throughout Each Period
| CLASS B | ||||||||||||||||||||
| Year Ended December 31, | ||||||||||||||||||||
| 2013 | 2012 | 2011 | 2010 | 2009 | ||||||||||||||||
Net asset value, beginning of period | $12.84 | $11.40 | $14.77 | $14.54 | $10.93 | |||||||||||||||
|
|
|
|
|
|
|
|
|
| |||||||||||
Income From Investment Operations | ||||||||||||||||||||
Net investment income (a) | .30 | .32 | .31 | .24 | .28 | |||||||||||||||
Net realized and unrealized gain (loss) on investment and foreign currency transactions | 2.56 | 1.29 | (3.14 | ) | .38 | † | 3.47 | |||||||||||||
|
|
|
|
|
|
|
|
|
| |||||||||||
Net increase (decrease) in net asset value from operations | 2.86 | 1.61 | (2.83 | ) | .62 | 3.75 | ||||||||||||||
|
|
|
|
|
|
|
|
|
| |||||||||||
Less: Dividends and Distributions | ||||||||||||||||||||
Dividends from net investment income | (.84 | ) | (.17 | ) | (.53 | ) | (.39 | ) | (.14 | ) | ||||||||||
Tax return of capital | –0 | – | –0 | – | (.01 | ) | –0 | – | –0 | – | ||||||||||
|
|
|
|
|
|
|
|
|
| |||||||||||
Total dividends and distributions | (.84 | ) | (.17 | ) | (.54 | ) | (.39 | ) | (.14 | ) | ||||||||||
|
|
|
|
|
|
|
|
|
| |||||||||||
Net asset value, end of period | $14.86 | $12.84 | $11.40 | $14.77 | $14.54 | |||||||||||||||
|
|
|
|
|
|
|
|
|
| |||||||||||
Total Return | ||||||||||||||||||||
Total investment return based on net asset | 22.73 | % | 14.19 | % | (19.44 | )% | 4.30 | % | 34.36 | % | ||||||||||
Ratios/Supplemental Data | ||||||||||||||||||||
Net assets, end of period (000,000’s omitted) | $744 | $1,058 | $1,033 | $1,326 | $1,708 | |||||||||||||||
Ratio to average net assets of: | ||||||||||||||||||||
Expenses | 1.07 | % | 1.06 | % | 1.07 | % | 1.10 | %+ | 1.08 | % | ||||||||||
Net investment income | 2.20 | % | 2.70 | % | 2.23 | % | 1.73 | %+ | 2.38 | % | ||||||||||
Portfolio turnover rate | 59 | % | 41 | % | 62 | % | 52 | % | 52 | % | ||||||||||
| (a) | Based on average shares outstanding. |
| (b) | Total investment return is calculated assuming an initial investment made at the net asset value at the beginning of the period, reinvestment of all dividends and distributions at net asset value during the period, and redemption on the last day of the period. Total return does not reflect (i) insurance company’s separate account related expense charges and (ii) the deductions of taxes that a shareholder would pay on Portfolio distributions or the redemption of Portfolio shares. Total investment return calculated for a period of less than one year is not annualized. |
| † | Due to timing of sales and repurchase of capital shares, the net realized and unrealized gain (loss) per share is not in accord with the Portfolio’s change in net realized and unrealized gain (loss) on investment transactions for the period. |
| + | The ratio includes expenses attributable to costs of proxy solicitation. |
See notes to financial statements.
27
| REPORTOF INDEPENDENT REGISTERED | ||
| PUBLIC ACCOUNTING FIRM | AllianceBernstein Variable Products Series Fund | |
To the Board of Directors and Shareholders of AllianceBernstein International Value Portfolio:
We have audited the accompanying statement of assets and liabilities, including the portfolio of investments, of AllianceBernstein International Value Portfolio (one of the funds constituting AllianceBernstein Variable Products Series Fund, Inc. (the “Fund”)) as of December 31, 2013, and the related statement of operations for the year then ended, the statements of changes in net assets for each of the two years in the period then ended, and the financial highlights for each of the five years in the period then ended. These financial statements and financial highlights are the responsibility of the Fund’s management. Our responsibility is to express an opinion on these financial statements and financial highlights based on our audits.
We conducted our audits in accordance with the standards of the Public Company Accounting Oversight Board (United States). Those standards require that we plan and perform the audit to obtain reasonable assurance about whether the financial statements and financial highlights are free of material misstatement. We were not engaged to perform an audit of the Fund’s internal control over financial reporting. Our audits included consideration of internal control over financial reporting as a basis for designing audit procedures that are appropriate in the circumstances, but not for the purpose of expressing an opinion on the effectiveness of the Fund’s internal control over financial reporting. Accordingly, we express no such opinion. An audit also includes examining, on a test basis, evidence supporting the amounts and disclosures in the financial statements and financial highlights, assessing the accounting principles used and significant estimates made by management, and evaluating the overall financial statement presentation. Our procedures included confirmation of securities owned as of December 31, 2013, by correspondence with the custodian and others, or by other appropriate auditing procedures where replies from others were not received. We believe that our audits provide a reasonable basis for our opinion.
In our opinion, the financial statements and financial highlights referred to above present fairly, in all material respects, the financial position of AllianceBernstein International Value Portfolio (one of the funds constituting AllianceBernstein Variable Products Series Fund, Inc.) at December 31, 2013, the results of its operations for the year then ended, the changes in its net assets for each of the two years in the period then ended, and the financial highlights for each of the five years in the period then ended, in conformity with U.S. generally accepted accounting principles.

New York, New York
February 14, 2014
28
| 2013 TAX INFORMATION (unaudited) | AllianceBernstein Variable Products Series Fund |
For Federal income tax purposes, the following information is furnished with respect to the earnings of the Portfolio for the taxable year ended December 31, 2013.
The Portfolio intends to make an election to pass through foreign taxes to its shareholders. For the taxable year ended December 31, 2013, $1,139,375 of foreign taxes may be passed through and the associated foreign source income for information reporting purposes is $21,549,276.
29
| INTERNATIONAL VALUE PORTFOLIO | AllianceBernstein Variable Products Series Fund |
| BOARDOF DIRECTORS | ||
Marshall C. Turner, Jr.(1), Chairman | Nancy P. Jacklin(1) | |
| John H. Dobkin(1) | Robert M. Keith, President and Chief Executive Officer | |
| Michael J. Downey(1) | Garry L. Moody(1) | |
| William H. Foulk, Jr.(1) | Earl D. Weiner(1) | |
| D. James Guzy(1) | ||
| OFFICERS | ||
Philip L. Kirstein, Senior Vice President and Takeo Aso(2), Vice President Sharon E. Fay(2), Vice President Avi Lavi(2), Vice President Kevin F. Simms(2), Vice President | Emilie D. Wrapp, Secretary Joseph J. Mantineo, Treasurer and Phyllis J. Clarke, Controller Vincent S. Noto, Chief Compliance Officer | |
CUSTODIAN AND ACCOUNTING AGENT State Street Bank and Trust Company One Lincoln Street Boston, MA 20111 | LEGAL COUNSEL Seward & Kissel LLP One Battery Park Plaza New York, NY 10004 | |
DISTRIBUTOR AllianceBernstein Investments, Inc. 1345 Avenue of the Americas New York, NY 10105 | TRANSFER AGENT AllianceBernstein Investor Services, Inc. P.O. Box 786003 San Antonio, TX 78278-6003 Toll-Free 1-(800) 221-5672 | |
INDEPENDENT REGISTERED PUBLIC ACCOUNTING FIRM Ernst & Young LLP 5 Times Square New York, NY 10036 |
| (1) | Member of the Audit Committee, the Governance and Nominating Committee and the Independent Directors Committee. Mr. Foulk is the sole member of the Fair Value Pricing Committee. |
| (2) | The day-to-day management of, and investment decisions for, the Portfolio’s portfolio are made by the International Value Senior Investment Management Team. Ms. Sharon E. Fay, Mr. Takeo Aso, Mr. Avi Lavi and Mr. Kevin F. Simms are the investment professionals with the most significant responsibility for the day-to-day management of the Portfolio’s portfolio. |
30
| INTERNATIONAL VALUE PORTFOLIO | ||
| MANAGEMENTOFTHE FUND | AllianceBernstein Variable Products Series Fund |
Board of Directors Information
The business and affairs of the Fund are managed under the direction of the Board of Directors. Certain information concerning the Fund’s Directors is set forth below.
| NAME, ADDRESS*, AGE (YEAR FIRST ELECTED**) | PRINCIPAL OCCUPATION(S) DURING PAST FIVE YEARS AND OTHER RELEVANT QUALIFICATIONS*** | PORTFOLIOS IN FUND COMPLEX OVERSEEN BY DIRECTOR | OTHER DIRECTORSHIP HELD BY DIRECTOR IN PAST FIVE YEARS | |||||
| INTERESTED DIRECTOR | ||||||||
Robert M. Keith, # 1345 Avenue of the Americas New York, NY 10105 53 (2010) | Senior Vice President of AllianceBernstein L.P. (the “Adviser”) and the head of AllianceBernstein Investments, Inc. (“ABI”) since July 2008; Director of ABI and President of the AllianceBernstein Mutual Funds. Previously, he served as Executive Managing Director of ABI from December 2006 to June 2008. Prior to joining ABI in 2006, Executive Managing Director of Bernstein Global Wealth Management, and prior thereto, Senior Managing Director and Global Head of Client Service and Sales of the Adviser’s institutional investment management business since 2004. Prior thereto, he was Managing Director and Head of North American Client Service and Sales in the Adviser’s institutional investment management business, with which he had been associated since prior to 2004. | 100 | None | |||||
| DISINTERESTED DIRECTORS | ||||||||
Marshall C. Turner, Jr., ## Chairman of the Board 72 (2005) | Private Investor since prior to 2009. Former CEO of Dupont Photomasks, Inc. (components of semi-conductor manufacturing), 2003-2006, and interim CEO 1999-2000. Interim CEO of MEMC Electronic Materials, Inc. (semi-conductor and solar cell substrates) from November 2008 until March 2009. He has extensive operating and early-stage investment experience, including prior service as general partner of three institutional venture capital partnerships, and serves on the boards of three education and science-related non-profit organizations. He has served as a director of one AllianceBernstein fund since 1992, and director or trustee of multiple AllianceBernstein funds since 2005. He is Chairman of the AllianceBernstein Funds since January 2014. | 100 | Xilinx, Inc. (programmable logic semi-conductors) and SunEdison, Inc. (semi-conductor substrates, solar materials and solar power plants) since prior to 2009 | |||||
John H. Dobkin, ## 72 (1992) | Independent Consultant since prior to 2009. Formerly, President of Save Venice, Inc. (preservation organization) from 2001–2002; Senior Advisor from June 1999-June 2000 and President of Historic Hudson Valley (historic preservation) from December 1989-May 1999. Previously, Director of the National Academy of Design. He has served as a director or trustee of various AllianceBernstein Funds since 1992, and as Chairman of the Audit Committees of a number of such Funds from 2001-2008. | 100 | None | |||||
31
| INTERNATIONAL VALUE PORTFOLIO | ||
| MANAGEMENTOFTHE FUND | ||
| (continued) | AllianceBernstein Variable Products Series Fund |
| NAME, ADDRESS*, AGE (YEAR FIRST ELECTED**) | PRINCIPAL OCCUPATION(S) DURING PAST FIVE YEARS AND OTHER RELEVANT QUALIFICATIONS*** | PORTFOLIOS IN FUND COMPLEX OVERSEEN BY DIRECTOR | OTHER DIRECTORSHIP HELD BY DIRECTOR IN PAST FIVE YEARS | |||||
DISINTERESTED DIRECTORS (continued) | ||||||||
Michael J. Downey, ## 70 | Private Investor since prior to 2009. Formerly, managing partner of Lexington Capital, LLC (investment advisory firm) from December 1997 until December 2003. From 1987 until 1993, Chairman and CEO of Prudential Mutual Fund Management, director of the Prudential mutual funds, and member of the Executive Committee of Prudential Securities Inc. He has served as a director or trustee of the AllianceBernstein Funds since 2005 and is a director and Chairman of one other registered investment company. | 100 | Asia Pacific Fund, Inc. since prior to 2009, Prospect Acquisition Corp. (financial services) from 2007 until 2009, and The Merger Fund since prior to 2009 until 2013 | |||||
William H. Foulk, Jr., ##, ### 81 (1990) | Investment Adviser and an Independent Consultant since prior to 2009. Previously, he was Senior Manager of Barrett Associates, Inc., a registered investment adviser. He was formerly Deputy Comptroller and Chief Investment Officer of the State of New York and, prior thereto, Chief Investment Officer of the New York Bank for Savings. He has served as a director or trustee of various AllianceBernstein Funds since 1983, and has been Chairman of the Independent Directors Committee of the AllianceBernstein Funds since 2003. He served as Chairman of such Funds from 2003 through December 2013. He is also active in a number of mutual fund related organizations and committees. | 100 | None | |||||
D. James Guzy, ## 77 | Chairman of the Board of PLX Technology (semi-conductors) and of SRC Computers Inc., with which he has been associated since prior to 2009. He was a director of Intel Corporation (semi-conductors) from 1969 until 2008, and served as Chairman of the Finance Committee of such company for several years until May 2008. He was a Director of Cirrus Logic Corporation (semi-conductors) from 1984 until July 2011. He has served as a director or trustee of one or more of the AllianceBernstein Funds since 1982. | 100 | PLX Technology (semi-conductors) since prior to 2009, and Cirrus Logic Corporation (semi-conductors) since prior to 2009 until July 2011 | |||||
Nancy P. Jacklin, ## 65 (2006) | Professorial Lecturer at the Johns Hopkins School of Advanced International Studies since 2008. Formerly, U.S. Executive Director of the International Monetary Fund (December 2002-May 2006); Partner, Clifford Chance (1992-2002); Sector Counsel, International Banking and Finance, and Associate General Counsel, Citicorp (1985-1992); Assistant General Counsel (International), Federal Reserve Board of Governors (1982-1985); and Attorney Advisor, U.S. Department of the Treasury (1973-1982). Member of the Bar of the District of Columbia and of New York; and member of the Council on Foreign Relations. She has served as a director or trustee of the AllianceBernstein Funds since 2006.
| 100 | None | |||||
32
| AllianceBernstein Variable Products Series Fund |
| NAME, ADDRESS*, AGE (YEAR FIRST ELECTED**) | PRINCIPAL OCCUPATION(S) DURING PAST FIVE YEARS AND OTHER RELEVANT QUALIFICATIONS*** | PORTFOLIOS IN FUND COMPLEX OVERSEEN BY DIRECTOR | OTHER DIRECTORSHIP HELD BY DIRECTOR IN PAST FIVE YEARS | |||||
DISINTERESTED DIRECTORS (continued) | ||||||||
Garry L. Moody, ## 61 (2008) | Independent Consultant. Formerly, Partner, Deloitte & Touche LLP (1995-2008) where he held a number of senior positions, including Vice Chairman, and U.S. and Global Investment Management Practice Managing Partner; President, Fidelity Accounting and Custody Services Company (1993-1995); and Partner, Ernst & Young LLP (1975-1993), where he served as the National Director of Mutual Fund Tax Services and Managing Partner of its Chicago Office Tax department. He is a member of both the Governing Council of the Independent Directors Council (IDC), an organization of independent directors of mutual funds, and the Trustee Advisory Board of BoardIQ, a biweekly publication focused on issues and news affecting directors of mutual funds. He has served as a director or trustee, and as Chairman of the Audit Committee, of the AllianceBernstein Funds since 2008. | 100 | Greenbacker Renewable Energy Company LLC (renewable energy and energy efficiency projects) from August 2013 to January 2014 | |||||
Earl D. Weiner, ## 74 (2007) | Of Counsel, and Partner prior to January 2007, of the law firm Sullivan & Cromwell LLP and member of ABA Federal Regulation of Securities Committee Task Force to draft editions of the Fund Director’s Guidebook. He also serves as a director or trustee of various non-profit organizations and has served as Chairman or Vice Chairman of a number of them. He has served as a director or trustee of the AllianceBernstein Funds since 2007 and is Chairman of the Governance and Nominating Committees of the Funds. | 100 | None | |||||
| * | The address for each of the Fund’s disinterested Directors is c/o AllianceBernstein L.P., Attention: Philip L. Kirstein, 1345 Avenue of the Americas, New York, NY 10105. |
| ** | There is no stated term of office for the Fund’s Directors. |
| *** | The information above includes each Director’s principal occupation during the last five years and other information relating to the experience, attributes and skills relevant to each Director’s qualifications to serve as a Director, which led to the conclusion that each Director should serve as a Director for the Fund. |
| # | Mr. Keith is an “interested person” of the Fund, as defined in the 1940 Act, due to his position as a Senior Vice President of the Adviser. |
| ## | Member of the Audit Committee, the Governance and Nominating Committee and the Independent Directors Committee. |
| ### | Member of the Fair Value Pricing Committee. |
33
| INTERNATIONAL VALUE PORTFOLIO | AllianceBernstein Variable Products Series Fund |
Officer Information
Certain information concerning the Portfolio’s Officers is listed below.
| NAME, ADDRESS* AND AGE | PRINCIPAL POSITION(S) HELD WITH FUND | PRINCIPAL OCCUPATION DURING PAST FIVE YEARS | ||
| Robert M. Keith 53 | President and Chief Executive Officer | See biography above. | ||
| Philip L. Kirstein 68 | Senior Vice President and Independent Compliance Officer | Senior Vice President and Independent Compliance Officer of the AllianceBernstein Funds, with which he has been associated since October 2004. Prior thereto, he was Of Counsel to Kirkpatrick & Lockhart, LLP from October 2003 to October 2004, and General Counsel of Merrill Lynch Investment Managers, L.P. since prior to March 2003. | ||
| Takeo Aso 49 | Vice President | Senior Vice President of the Adviser**, with which he has been associated since prior to 2009. | ||
| Sharon E. Fay 53 | Vice President | Senior Vice President of the Adviser**, with which she has been associated since prior to 2009. | ||
| Avi Lavi 47 | Vice President | Senior Vice President of the Adviser**, with which he has been associated since prior to 2009. | ||
| Kevin F. Simms 47 | Vice President | Senior Vice President of the Adviser**, with which he has been associated since prior to 2009. | ||
| Emilie D. Wrapp 58 | Secretary | Senior Vice President, Assistant General Counsel and Assistant Secretary of ABI**, with which she has been associated since prior to 2009. | ||
| Joseph J. Mantineo 54 | Treasurer and Chief Financial Officer | Senior Vice President of AllianceBernstein Investor Services, Inc. (“ABIS”)**, with which he has been associated since prior to 2009. | ||
| Phyllis J. Clarke 53 | Controller | Vice President of ABIS**, with which she has been associated since prior to 2009. | ||
Vincent S. Noto 49 | Chief Compliance Officer | Chief Compliance Officer of the AllianceBernstein Funds, and Vice President of ABIS**, with which he has been associated since prior to 2009. |
| * | The address for each of the Portfolio Officers is 1345 Avenue of the Americas, New York, NY 10105. |
| ** | The Adviser, ABI and ABIS are affiliates of the Fund. |
| The Fund’s Statement of Additional Information (“SAI”) has additional information about the Fund’s Directors and Officers and is available without charge upon request. Contact your financial representative or AllianceBernstein at (800) 227-4618, or visit www.alliancebernstein.com, for a free prospectus or SAI. |
34
| INTERNATIONAL VALUE PORTFOLIO | ||
| SENIOR OFFICER FEE EVALUATION | AllianceBernstein Variable Products Series Fund |
THE FOLLOWING IS NOT PART OF THE SHAREHOLDER REPORT OR THE FINANCIAL STATEMENTS
SUMMARY OF SENIOR OFFICER’S EVALUATION OF INVESTMENT ADVISORY AGREEMENT1
The following is a summary of the evaluation of the Investment Advisory Agreement between AllianceBernstein L.P. (the “Adviser”) and the AllianceBernstein Variable Products Series Fund (the “Fund”), in respect of AllianceBernstein International Value Portfolio (the “Portfolio”).2 The evaluation of the Investment Advisory Agreement was prepared by Philip L. Kirstein, the Senior Officer of the Fund, for the Directors of the Fund, as required by a September 2004 agreement between the Adviser and the New York State Attorney General (the “NYAG”). The Senior Officer’s evaluation of the Investment Advisory Agreement is not meant to diminish the responsibility or authority of the Board of Directors of the Fund to perform its duties pursuant to Section 15 of the Investment Company Act of 1940 (the “40 Act”) and applicable state law. The purpose of the summary is to provide shareholders with a synopsis of the independent evaluation of the reasonableness of the advisory fees proposed to be paid by the Portfolio which was provided to the Directors in connection with their review of the proposed approval of the continuance of the Investment Advisory Agreement. The Senior Officer’s evaluation considered the following factors:
| 1. | Advisory fees charged to institutional and other clients of the Adviser for like services; |
| 2. | Advisory fees charged by other mutual fund companies for like services; |
| 3. | Costs to the Adviser and its affiliates of supplying services pursuant to the advisory agreement, excluding any intra-corporate profit; |
| 4. | Profit margins of the Adviser and its affiliates from supplying such services; |
| 5. | Possible economies of scale as the Portfolio grows larger; and |
| 6. | Nature and quality of the Adviser’s services including the performance of the Portfolio. |
These factors, with the exception of the first factor, are generally referred to as the “Gartenberg factors,” which were articulated by the United States Court of Appeals for the Second Circuit in 1982. Gartenberg v. Merrill Lynch Asset Management, Inc., 694 F. 2d 923 (2d Cir. 1982). The first factor is an additional factor required to be considered by the AoD. On March 30, 2010, the Supreme Court held the Gartenberg decision was correct in its basic formulation of what §36(b) requires: to face liability under §36(b), “an investment adviser must charge a fee that is so disproportionately large that it bears no reasonable relationship to the services rendered and could not have been the product of arm’s length bargaining.” Jones v. Harris Associates L.P., 130 S. Ct. 1418 (2010). In the Jones decision, the Court stated the Gartenberg approach fully incorporates the correct understanding of fiduciary duty within the context of section 36(b) and noted with approval that “Gartenberg insists that all relevant circumstances be taken into account” and “uses the range of fees that might result from arm’s-length bargaining as the benchmark for reviewing challenged fees.”3
PORTFOLIO ADVISORY FEES, NET ASSETS & EXPENSE RATIOS
The Adviser proposed that the Portfolio pays the advisory fee set forth in the table below for receiving the services to be provided pursuant to the Investment Advisory Agreement. The fee schedule below, implemented in January 2004 in consideration of the Adviser’s settlement with the NYAG in December 2003, is based on a master schedule that contemplates eight categories of funds with almost all funds in each category having the same advisory fee schedule.
| Category | Advisory Fee Based on % of Average Daily Net Assets | Net Assets 3/31/13 ($MIL) | Portfolio | |||||
International | 0.75% on first $2.5 billion 0.65% on next $2.5 billion 0.60% on the balance | $ | 1,063.0 | International Value Portfolio | ||||
| 1 | The information in the fee summary was completed on April 22, 2013 and discussed with the Board of Directors on April 30-May 2, 2013. |
| 2 | Future references to the Fund and the Portfolio do not include “AllianceBernstein.” References in the fee summary pertaining to performance and expense ratio rankings refer to the Class A shares of the Portfolio. |
| 3 | Jones v. Harris at 1427. |
35
| INTERNATIONAL VALUE PORTFOLIO | ||
| SENIOR OFFICER FEE EVALUATION | ||
| (continued) | AllianceBernstein Variable Products Series Fund |
The Adviser is reimbursed as specified in the Investment Advisory Agreement for certain clerical, legal, accounting, administrative and other services provided to the Portfolio. During the Portfolio’s most recently completed fiscal year, the Adviser received $44,851 (0.004% of the Portfolio’s average daily net assets) for such services.
The Adviser has agreed to waive that portion of its management fees and/or reimburse the Portfolio for that portion of its total operating expenses to the degree necessary to limit the Portfolio’s expense ratios to the amounts set forth below for the Portfolio’s fiscal year. The waiver is terminable by the Adviser upon at least 60 days’ notice prior to the Portfolio’s prospectus update or May 1st of each year. The Portfolio was operating below its expense caps for the most recent fiscal year; accordingly the expense limitation undertaking of the Portfolio was of no effect. In addition, set forth below are the gross expense ratios of the Portfolio for the most recently completed fiscal year:
| Portfolio | Expense Cap Pursuant to Expense Limitation Undertaking | Gross Expense Ratio | Fiscal Year End | |||||
International Value | Class A 1.20% | 0.81% | December 31 | |||||
Portfolio | Class B 1.45% | 1.06% | ||||||
I. ADVISORY FEES CHARGED TO INSTITUTIONAL AND OTHER CLIENTS
The advisory fees charged to investment companies which the Adviser manages and sponsors are normally higher than those charged to similar sized institutional accounts, including pension plans and sub-advised investment companies. The fee differential reflects, among other things, different services provided to such clients, and different liabilities assumed. Services provided by the Adviser to the Portfolio that are not provided to non-investment company clients and sub-advised investment companies include providing office space and personnel to serve as Fund Officers, who among other responsibilities make the certifications required under the Sarbanes–Oxley Act of 2002, and coordinating with and monitoring the Portfolio’s third party service providers such as Fund counsel, auditors, custodians, transfer agents and pricing services. The accounting, administrative, legal and compliance requirements for the Portfolio are more costly than those for institutional assets due to the greater complexities and time required for investment companies, although as previously noted, the Adviser is reimbursed for providing such services. Also, retail mutual funds managed by the Adviser are widely held. Servicing the Portfolio’s investors is more time consuming and labor intensive compared to institutional clients since the Adviser needs to communicate with a more extensive network of financial intermediaries and shareholders. The Adviser also believes that it incurs substantial entrepreneurial risk when offering a new mutual fund, since establishing a new mutual fund requires a large upfront investment, and it may take a long time for the fund to achieve profitability since the fund must be priced to scale from inception in order to be competitive and assets are acquired one account at a time. In addition, managing the cash flow of an investment company may be more difficult than managing that of a stable pool of assets, such as an institutional account with little cash movement in either direction, particularly, if a fund is in net redemption and the Adviser is frequently forced to sell securities to raise cash for redemptions. However, managing a fund with positive cash flow may be easier at times than managing a stable pool of assets. In recent years, investment advisers have been sued by institutional clients and have suffered reputational damage both by the attendant publicity and outcomes other than complete victories. Accordingly, the legal and reputational risks associated with institutional accounts are greater than previously thought, although still not equal to those related to the mutual fund industry.
Notwithstanding the Adviser’s view that managing an investment company is not comparable to managing other institutional accounts because the services provided are different, the Supreme Court has indicated consideration should be given to the advisory fees charged to institutional accounts that have a substantially similar investment style as the Portfolio.4 In
| 4 | The Supreme Court stated that “courts may give such comparisons the weight that they merit in light of the similarities and differences between the services that the clients in question require, but the courts must be wary of inapt comparisons.” Among the significant differences the Supreme Court noted that may exist between services provided to mutual funds and institutional accounts are “higher marketing costs.” Jones v. Harris at 1428. |
36
| AllianceBernstein Variable Products Series Fund |
addition to the AllianceBernstein institutional fee schedule, set forth below is what would have been the effective advisory fee of the Portfolio had the AllianceBernstein institutional fee schedule been applicable to the Portfolio versus the Portfolio’s advisory fee based on March 31, 2013 net assets:5
| Portfolio | Net Assets 3/31/13 ($MIL) | AllianceBernstein Institutional Fee Schedule | Effective AB Inst. Adv. Fee | Portfolio Advisory Fee | ||||||||||
International Value Portfolio | $ | 1,063.0 | International Value Schedule 0.80% on first $25m 0.60% on the next $25m 0.50% on the next $50m 0.40% on the balance | 0.419 | % | 0.750 | % | |||||||
The Adviser also manages AllianceBernstein International Value Fund, Inc. (“International Value Fund, Inc.”), a retail mutual fund, which has a substantially similar investment style as the Portfolio. Set forth below is the fee schedule of International Value Fund, Inc. and what would have been the effective advisory fee of the Portfolio had the fee schedule of the retail mutual fund been applicable to the Portfolio:6
| Portfolio | AllianceBernstein Mutual Fund | Fee Schedule | ABMF Effective | Portfolio Advisory | ||||||||
International Value Portfolio | International Value Fund, Inc. | 0.75% on first $2.5 billion 0.65% on next $2.5 billion 0.60% on the balance | 0.750% | 0.750% | ||||||||
The Adviser manages Sanford C. Bernstein Fund, Inc. (“SCB Fund”), an open-end management investment company. The International Portfolio of SCB Fund (“SCB International Portfolio”) has a somewhat similar investment style as the Portfolio. Set forth below is the fee schedule of SCB International Portfolio and what would have been the effective advisory fee of the Portfolio had the fee schedule of SCB International Portfolio been applicable to the Portfolio based on March 31, 2013 net assets:
| Portfolio | SCB Fund Portfolio | Fee Schedule | SCB Fund Effective Fee | Portfolio Advisory Fee | ||||||||
International Value Portfolio7 | International Portfolio | 0.925% on 1st $1 billion 0.850% on next $3 billion 0.800% on next $2 billion 0.750% on next $2 billion 0.650% thereafter The Adviser is waving 5 basis points in advisory fees effective through October 31, 2013. | 0.875 | % | 0.750 | % | ||||||
The Adviser provides sub-advisory services to certain other investment companies managed by other fund families that have an investment style similar to that of the Portfolio. The Adviser charges the fees set forth below for the sub-advisory relationships that have a somewhat similar investment style as the Portfolio. Also shown are the Portfolio’s advisory fee and what would have been the effective advisory fees of the Portfolio had the fee schedules of the sub-advisory relationships been applicable to the Portfolio based on March 31, 2013 net assets.
| 5 | The Adviser has indicated that with respect to institutional accounts with assets greater than $300 million, it will negotiate a fee schedule. Discounts that are negotiated vary based upon each client relationship. |
| 6 | The retail mutual fund was also affected by the settlement between the Adviser and the NYAG. As a result, the Portfolio has the same breakpoints in its advisory fee schedule as the retail mutual fund. |
| 7 | The investment guidelines of the Portfolio are more restrictive than the SCB Fund portfolio. The Portfolio invests primarily in either growth or value equity securities, in contrast to the SCB Fund portfolio, which invests in both growth and value equity securities. |
37
| INTERNATIONAL VALUE PORTFOLIO | ||
| SENIOR OFFICER FEE EVALUATION | ||
| (continued) | AllianceBernstein Variable Products Series Fund |
| Portfolio | Fee Schedule | Effective Sub-Adv. Fee | Portfolio Advisory Fee | |||||||||
International Value Portfolio | Client #18 | 0.60% on first $1 billion 0.55% on next $500 million 0.50% on next $500 million 0.45% on next $500 million 0.40% on the balance | 0.597% | 0.750% | ||||||||
It is fair to note that the services the Adviser provides pursuant to sub-advisory agreements are generally confined to the services related to the investment process; in other words, they are not as comprehensive as the services provided to the Portfolios by the Adviser. In addition, to the extent that certain of these sub-advisory relationships are with affiliates of the Adviser, the fee schedules may not reflect arm’s length bargaining or negotiations.
While it appears that the sub-advisory relationships are paying a lower fee than the Portfolios, it is difficult to evaluate the relevance of such lower fees due to differences in terms of the services provided, risks involved and other competitive factors between the Portfolios and the sub-advisory relationships. There could be various business reasons why an investment adviser would be willing to provide a sub-advisory relationship investment related services at a different fee level than an investment company it is sponsoring where the investment adviser is providing all the services, not just investment management, generally required by a registered investment company.
II. MANAGEMENT FEES CHARGED BY OTHER MUTUAL FUND COMPANIES FOR LIKE SERVICES.
Lipper, Inc. (“Lipper”), an analytical service that is not affiliated with the Adviser, compared the fees charged to the Portfolio with fees charged to other investment companies for similar services offered by other investment advisers.9 Lipper’s analysis included the comparison of the Portfolio’s contractual management fee, estimated at the approximate current asset level of the Portfolio, to the median of the Portfolio’s Lipper Expense Group (“EG”) and the Portfolio’s contractual management fee ranking.10,11
Lipper describes an EG as a representative sample of comparable funds. Lipper’s standard methodology for screening funds to be included in an EG entails the consideration of several fund criteria, including fund type, investment classification/objective, load type and similar 12b-1/non-12b-1 service fees, asset (size) comparability, expense components and attributes. An EG will typically consist of seven to twenty funds.
The Portfolio’s original EG had an insufficient number of peers. Consequently, Lipper expanded the Portfolio’s EG to include peers that have a similar but not the same Lipper classification/objective as the Portfolio. However, because Lipper had expanded the Portfolio’s EG, under Lipper’s standard guidelines, the Portfolio’s Lipper Expense Universe (“EU”) was also expanded to include universes of those peers that had a similar but not the same Lipper investment objective/classification. A “normal” EU will include funds that have the same investment objective/classification as the subject portfolio.12
| 8 | The client is an affiliate of the Adviser. |
| 9 | The Supreme Court cautioned against accepting mutual fund fee comparisons without careful scrutiny since “these comparisons are problematic because these fees, like those challenged, may not be the product of negotiations conducted at arm’s length.” Jones v. Harris at 1429. |
| 10 | Lipper does not consider average account size when constructing EGs. Funds with relatively small average account sizes tend to have higher transfer agent expense ratio than comparable sized funds that have relatively large average account sizes. Note that there are limitations on Lipper expense category data because different funds categorize expenses differently. |
| 11 | The contractual management fee is calculated by Lipper using the Portfolio’s contractual management fee rate at a hypothetical asset level. The hypothetical asset level is based on the combined net assets of all classes of the Portfolio, rounded up to the next $25 million. Lipper’s total expense ratio information is based on the most recent annual report except as otherwise noted. A ranking of “1” would mean that the Portfolio had the lowest effective fee rate in the Lipper peer group. |
| 12 | Portfolio’s EG includes the Portfolio, five other VIP International Value funds (“IFVE”), three VIP International Growth funds (“IFGE”) and two VIP International Core funds (“IFCE”). |
38
| AllianceBernstein Variable Products Series Fund |
| Portfolio | Contractual Management Fee13 | Lipper EG Median (%) | Lipper Rank | |||||||||
International Value Portfolio | 0.750 | 0.750 | 5/11 | |||||||||
Because Lipper had expanded the EG of the Portfolio, under Lipper’s standard guidelines, the Lipper Expense Universe (“EU”) was also expanded to include the universes of those peers that had a similar but not the same Lipper investment classification/objective.14 A “normal” EU will include funds that have the same investment classification/objective as the subject Portfolio.15
Set forth below is a comparison of the Portfolio’s total expense ratio and the medians of the Portfolio’s EG and EU. The Portfolio’s total expense ratio ranking is also shown in the table below.
| Portfolio | Expense Ratio (%)16 | Lipper EG Median (%) | Lipper EG Rank | Lipper EU Median (%) | Lipper EU Rank | |||||||||||||||
International Value Portfolio | 0.811 | 0.833 | 4/11 | 0.978 | 13/78 | |||||||||||||||
Based on this analysis, the Portfolio has a more favorable ranking on an expense ratio basis than on a management fee basis.
III. COSTS TO THE ADVISER AND ITS AFFILIATES OF SUPPLYING SERVICES PURSUANT TO THE ADVISORY FEE ARRANGEMENT, EXCLUDING ANY INTRA-CORPORATE PROFIT.
The Adviser utilizes two profitability reporting systems, which operate independently but are aligned with each other, to estimate the Adviser’s profitability in connection with investment advisory services provided to the Portfolio. The Senior Officer has retained a consultant to provide independent advice regarding the alignment of the two profitability systems as well as the methodologies and allocations utilized by both profitability systems.
IV. PROFIT MARGINS OF THE ADVISER AND ITS AFFILIATES FOR SUPPLYING SUCH SERVICES.
The Portfolio’s profitability information, prepared by the Adviser for the Board of Directors, was reviewed by the Senior Officer and the consultant. The Adviser’s profitability from providing investment advisory services to the Portfolio decreased during calendar year 2012, relative to 2011.
In addition to the Adviser’s direct profits from managing the Portfolio, certain of the Adviser’s affiliates have business relationships with the Portfolio and may earn a profit from providing other services to the Portfolio. The courts have referred to this type of business opportunity as “fall-out benefits” to the Adviser and indicated that such benefits should be factored into the evaluation of the total relationship between the Portfolio and the Adviser. Neither case law nor common business practice precludes the Adviser’s affiliates from earning a reasonable profit on this type of relationship provided the affiliates’ charges and services are competitive. These affiliates provide transfer agent, distribution and brokerage related services to the Portfolio and receive transfer agent fees, Rule 12b-1 payments, and brokerage commissions. In addition, the Adviser benefits from soft dollar arrangements which offset expenses the Adviser would otherwise incur.
The Portfolio has adopted a distribution plan for Class B shares pursuant to Rule 12b-1 under the 40 Act. Under the distribution plan, the Portfolio pays distribution and servicing fees to its principal underwriter, AllianceBernstein Investments, Inc. (“ABI”), the Portfolio’s distributor and an affiliate of the Adviser, at an annual rate of up to 0.50% of the Portfolio’s average daily net assets attributable to Class B shares. The current annual rate that the Portfolio pays to ABI for 12b-1 fees is 0.25%. During the fiscal year ended December 31, 2012, ABI received $2,642,116 in Rule 12b-1 fees.
During the fiscal year ended December 31, 2012, the Adviser incurred distribution expenses in the amount of $6,262,053 in connection with activities primarily intended to result in the sale of the Portfolio’s Class B shares. This amount includes the 12b-1 fees paid by the Portfolio to the Adviser.
| 13 | The contractual management fee does not reflect any expense reimbursements made by the Portfolio to the Adviser for certain clerical, legal, accounting, administrative and other services. In addition, the contractual management fee does not reflect any advisory fee waiver or expense cap that would effectively reduce the actual management fee. |
| 14 | for asset (size) comparability, Lipper uses the same criteria for selecting an EG peer when selecting an EU peer. Unlike the EG, the EU allows for the same adviser to be represented by more than just one fund. |
| 15 | The Portfolio’s EU includes the Portfolio, EG and all other VIP IFVE, IFGE and IFCE funds, excluding outliers. |
| 16 | Most recently completed fiscal year end Class A total expense ratio. |
39
| INTERNATIONAL VALUE PORTFOLIO | ||
| SENIOR OFFICER FEE EVALUATION | ||
| (continued) | AllianceBernstein Variable Products Series Fund |
Financial intermediaries, such as insurers, market and sell shares of the Portfolio and typically receive compensation from ABI, the Advisers and/or the Portfolio for selling shares of the Portfolio. These financial intermediaries receive compensation in any or all of the following forms: 12b-1 fees, defrayal of costs for educational seminars and training, additional distribution support, recordkeeping and/or administrative services. Payments related to providing contract-holder recordkeeping and/or administrative services will generally not exceed 0.35% of the average daily net assets of the Portfolio attributable to the relevant intermediary over the year. With respect to the Fund, which includes the Portfolio and other Portfolios of the Fund not discussed in this summary, ABI paid approximately $600,000 in 2012 and expects to pay approximately $600,000 in 2013 for educational support and distribution assistance (revenue sharing payments).
The transfer agent of the Portfolio is AllianceBernstein Investor Services, Inc. (“ABIS”). During the most recently completed fiscal year, ABIS received a fee of $1,385 from the Portfolio.17
The Portfolio effected brokerage transactions through the Adviser’s affiliate, Sanford C. Bernstein & Co., LLC (“SCB & Co.”) and/or its U.K. affiliate, Sanford C. Bernstein Limited (“SCB Ltd.”), collectively “SCB,” and paid commissions during the Portfolio’s most recently completed fiscal year. The Adviser represented that SCB’s profitability from business conducted with the Portfolio is comparable to the profitability of SCB’s dealings with other similar third party clients. In the ordinary course of business, SCB receives and pays liquidity rebates from electronic communications networks (“ECNs”) derived from trading for its clients, including the Portfolio. These credits and charges are not being passed onto any SCB client. The Adviser also receives certain soft dollar benefits from brokers that execute agency trades for the Portfolio and other clients. These soft dollar benefits reduce the Adviser’s cost of doing business and increase its profitability.
V. POSSIBLE ECONOMIES OF SCALE
The Adviser has indicated that economies of scale are being shared with shareholders through pricing to scale, breakpoints, fee reductions/waivers and enhancement to services.
In May 2012, an independent consultant, retained by the Senior Officer, provided the Board of Directors information on the Adviser’s firm-wide average costs from 2005 through 2011 and the potential economies of scale. The independent consultant noted that from 2005 through 2007 the Adviser experienced significant growth in assets under management (“AUM”). During this period, operating expenses increased, in part to keep up with growth, and in part reflecting market returns. However, from 2008 through the first quarter of 2009, AUM rapidly and significantly decreased due to declines in market value and client withdrawals. When AUM rapidly decreased, some operating expenses categories, including base compensation and office space, adjusted more slowly during this period, resulting in an increase in average costs. Since 2009, AUM has experienced less significant changes. The independent consultant noted that changes in operating expenses reflect changes in business composition and business practices in response to changes in financial markets. Finally, the independent consultant concluded that the increase in average cost and the decline in net operating margin across the Adviser since late 2008 are inconsistent with the view that there are currently reductions in average costs due to economies of scale that can be shared with the AllianceBernstein Mutual Funds managed by the Adviser through lower fees.
Previously in February 2008, the independent consultant provided the Board of Directors an update of the Deli study on advisory fees and various fund characteristics.18,19 The independent consultant first reiterated the results of his previous two dimensional comparison analysis (fund size and family size) with the Board of Directors.20 The independent consultant then discussed the results of the regression model that was utilized to study the effects of various factors on advisory fees. The regression model output indicated that the bulk of the variation in fees predicted were explained by various factors, but substantially by fund AUM, family AUM, index fund indicator and investment style. The independent consultant also compared the advisory fees of the AllianceBernstein Mutual Funds to similar funds managed by 19 other large asset managers, regardless of the fund size and each Adviser’s proportion of mutual fund assets to non-mutual fund assets.
| 17 | The Fund, which includes the Portfolio and other Portfolios of the Fund paid ABIS a flat fee of $18,000 in 2012. |
| 18 | The Deli study, originally published in 2002 based on 1997 data and updated for the February 2008 Presentation, may be of diminished value due to the age of the data used in the presentation and the changes experienced in the industry over the last four years. |
| 19 | As mentioned previously, the Supreme Court cautioned against accepting mutual fund fee comparisons without careful scrutiny since the fees may not be the product of negotiations conducted at arm’s length. See Jones V. Harris at 1429. |
| 20 | The two dimensional analysis showed patterns of lower advisory fees for funds with larger asset sizes and funds from larger family sizes compared to funds with smaller asset sizes and funds from smaller family sizes, which according to the independent consultant is indicative of a sharing of economies of scale and scope. However, in less liquid and active markets, such is not the case, as the empirical analysis showed potential for diseconomies of scale in those markets. The empirical analysis also showed diminishing economies of scale and scope as funds surpassed a certain high level of assets. |
40
| AllianceBernstein Variable Products Series Fund |
VI. NATURE AND QUALITY OF THE ADVISER’S SERVICES, INCLUDING THE PERFORMANCE OF THE PORTFOLIO
With assets under management of approximately $443 billion as of March 31, 2013, the Adviser has the investment experience to manage and provide non-investment services (described in Section I) to the Portfolio.
The information prepared by Lipper shows the 1, 3, 5 and 10 year performance returns and rankings of the Portfolio21 relative to its Lipper Performance Group (“PG”) and Lipper Performance Universe (“PU”)22 for the periods ended February 28, 2013.23
| Portfolio (%) | PG Median (%) | PU Median (%) | PG Rank | PU Rank | ||||||||||||||||
International Value Portfolio | ||||||||||||||||||||
1 year | 3.10 | 7.01 | 7.67 | 6/6 | 14/14 | |||||||||||||||
3 year | 1.86 | 6.20 | 6.07 | 5/5 | 12/13 | |||||||||||||||
5 year | – | 6.96 | – | 0.26 | – | 1.22 | 5/5 | 12/12 | ||||||||||||
10 year | 6.93 | 8.32 | 8.04 | 2/2 | 8/8 | |||||||||||||||
Set forth below are the 1, 3, 5 and 10 year and since inception performance returns of the Portfolio (in bold)24 versus its benchmark.25Portfolio and benchmark volatility and reward-to-variability ratio (“Sharpe Ratio”) information is also shown.26
Periods Ending February 28, 2013 Annualized Performance | ||||||||||||||||||||||||||||||||
1 Year | 3 Year | 5 Year | 10 Year (%) | Since Inception (%) | Annualized | Risk Period (Year) | ||||||||||||||||||||||||||
| Volatility (%) | Sharpe (%) | |||||||||||||||||||||||||||||||
International Value Portfolio | 3.10 | 1.86 | – | 6.96 | 6.93 | 4.99 | 21.79 | 0.34 | 10 | |||||||||||||||||||||||
MSCI EAFE Index (Net) | 9.84 | 6.85 | – | 1.26 | 9.39 | 4.27 | 18.30 | 0.49 | 10 | |||||||||||||||||||||||
Inception Date: May 10, 2001 |
| |||||||||||||||||||||||||||||||
CONCLUSION:
Based on the factors discussed above the Senior Officer’s conclusion is that the proposed advisory fee for the Portfolio is reasonable and within the range of what would have been negotiated at arm’s-length in light of all the surrounding circumstances. This conclusion in respect of the Portfolio is based on an evaluation of all of these factors and no single factor was dispositive.
Dated: May 29, 2013
| 21 | The performance rankings are for the Class A shares of the Portfolio. The Portfolio’s performance returns shown were provided by Lipper. |
| 22 | The Portfolio’s PG/PU are not identical to the Portfolio’s EG/EU as the criteria for including/excluding a fund in/from a PG/PU is somewhat different from that of an EG/EU. |
| 23 | Lipper investment classification/objective dictates the PG and PU throughout the life of the fund even if a fund had a different investment classification/objective at a different point in time. |
| 24 | The performance returns and risk measures shown in the table are for the Class A shares of the Portfolio. |
| 25 | The Adviser provided Portfolio and benchmark performance return information for periods through February 28, 2013. |
| 26 | Portfolio and benchmark volatility and Sharpe Ratio information was obtained through Lipper LANA, a database maintained by Lipper. Volatility is a statistical measure of the tendency of a market price or yield to vary over time. The Sharpe Ratio is a risk adjusted measure of return that divides a portfolio’s return in excess of the riskless return by the portfolio’s standard deviation. A portfolio with a greater volatility would be viewed as more risky than a portfolio with equivalent performance but lower volatility; for that reason, a greater return would be demanded for the more risky portfolio. A portfolio with a higher Sharpe Ratio would be viewed as better performing than a portfolio with a lower Sharpe Ratio. |
41
VPS-IV-0151-1213
AllianceBernstein
Variable Products Series Fund, Inc.
 | AllianceBernstein Large Cap Growth Portfolio |
December 31, 2013
Annual Report

ANNUAL REPORT
Investment Products Offered
| Ø | Are Not FDIC Insured |
| Ø | May Lose Value |
| Ø | Are Not Bank Guaranteed |
AllianceBernstein Investments, Inc. (ABI) is the distributor of the AllianceBernstein family of mutual funds. ABI is a member of FINRA and is an affiliate of AllianceBernstein L.P., the manager of the funds.
You may obtain a description of the Fund’s proxy voting policies and procedures, and information regarding how the Fund voted proxies relating to portfolio securities during the most recent 12-month period ended June 30, without charge. Simply visit AllianceBernstein’s website at www.alliancebernstein.com or go to the Securities and Exchange Commission’s (the “Commission”) website at www.sec.gov, or call AllianceBernstein at (800) 227-4618.
The Fund files its complete schedule of portfolio holdings with the Commission for the first and third quarters of each fiscal year on Form N-Q. The Fund’s Forms N-Q are available on the Commission’s website at www.sec.gov. The Fund’s Forms N-Q may also be reviewed and copied at the Commission’s Public Reference Room in Washington, DC; information on the operation of the Public Reference Room may be obtained by calling (800) SEC-0330.
AllianceBernstein® and the AB Logo are registered trademarks and service marks used by permission of the owner, AllianceBernstein L.P.
| LARGE CAP GROWTH PORTFOLIO | AllianceBernstein Variable Products Series Fund |
LETTER TO INVESTORS
February 7, 2014
The following is an update of AllianceBernstein Variable Products Series Fund—AllianceBernstein Large Cap Growth Portfolio (the “Portfolio”) for the annual reporting period ended December 31, 2013.
INVESTMENT OBJECTIVE AND POLICIES
The Portfolio’s investment objective is long-term growth of capital. The Portfolio invests primarily in the equity securities of a limited number of large, carefully selected, high-quality U.S. companies. The Portfolio invests primarily in the domestic equity securities of companies selected by AllianceBernstein L.P. (the “Adviser”) for their growth potential within various market sectors. The Portfolio emphasizes investments in large, seasoned companies and normally invests in approximately 50-70 companies. Under normal circumstances, the Portfolio will invest at least 80% of its net assets in common stocks of large-capitalization companies. The Adviser expects that normally the Portfolio’s portfolio will tend to emphasize investments in securities issued by U.S. companies, although it may invest in foreign securities. The Adviser’s research focus is on companies with high sustainable growth prospects, high or improving return on invested capital, transparent business models, and strong and lasting competitive advantages.
The Portfolio may, at times, invest in shares of exchange-traded funds, or ETFs, in lieu of making direct investments in securities. ETFs may provide more efficient and economical exposure to the types of companies and geographic locations in which the Portfolio seeks to invest than direct investments.
The Portfolio may enter into derivatives transactions, such as options, futures contracts, forwards and swaps. The Portfolio may use options strategies involving the purchase and/or writing of various combinations of call and/or put options, including on individual securities and stock indices, futures contracts (including futures contracts on individual securities and stock indices) or shares of ETFs. These transactions may be used, for example, in an effort to earn extra income, to adjust exposure to individual securities or markets, or to protect all or a portion of the Portfolio’s portfolio from a decline in value, sometimes within certain ranges.
INVESTMENT RESULTS
The table on page 3 shows the Portfolio’s performance compared to its benchmark, the Russell 1000 Growth Index, in addition to the broad market as measured by the Standard & Poor’s (“S&P”) 500 Index, for the one-, five- and 10-year periods ended December 31, 2013.
For the annual period, all share classes of the Portfolio outperformed the benchmark, as an emphasis on companies with strong fundamentals was rewarded. Stock selection, particularly in the financial and technology sectors benefitted returns. Sector selection detracted from performance, specifically by cash holdings in a rising market.
The Portfolio did not utilize derivatives during the reporting period.
MARKET REVIEW AND INVESTMENT STRATEGY
Despite the solid gains made by U.S. equities in 2013, the Large Cap Growth Investment Group (the “Team”) is taking a more conservative view going forward. While the Team remains constructive on the stock market, volatility is expected to increase.
The recent rally in the U.S. equity markets was underpinned by excess liquidity in the financial system that kept borrowing costs down and encouraged risk-taking. The Team believes that markets have begun to transition toward a phase where fundamentals are the primary determinant of valuations. Thus, in the Team’s view, companies will need to substantially grow their earnings to sustain their current valuations and continue their strong stock price performance.
Accordingly, the Team continues to identify companies that meet the Portfolio’s investment criteria of being strong businesses with high growth rates that produce healthy returns on equity and whose valuations do not adequately capture their upside potential.
1
| LARGE CAP GROWTH PORTFOLIO | ||
| DISCLOSURESAND RISKS | AllianceBernstein Variable Products Series Fund |
Benchmark Disclosure
Neither the unmanaged Russell 1000® Growth Index nor the unmanaged S&P 500® Index reflect fees and expenses associated with the active management of a mutual fund portfolio. Russell 1000 Growth Index represents the performance of 1,000 large-cap growth companies within the U.S. The S&P 500 Index includes 500 U.S. stocks and is a common representation of the performance of the overall U.S. stock market. An investor cannot invest directly in an index, and its results are not indicative of the performance for any specific investment, including the Portfolio.
A Word About Risk
Market Risk: The value of the Portfolio’s assets will fluctuate as the stock or bond market fluctuates. The value of its investments may decline, sometimes rapidly and unpredictably, simply because of economic changes or other events that affect large portions of the market. It includes the risk that a particular style of investing, such as growth, may underperform the market generally.
Focused Portfolio Risk: Investments in a limited number of companies may have more risk because changes in the value of a single security may have a more significant effect, either negative or positive, on the Portfolio’s, net asset value, or NAV.
Foreign (Non-U.S.) Risk: Investments in securities of non-U.S. issuers may involve more risk than those of U.S. issuers. These securities may fluctuate more widely in price and may be less liquid due to adverse market, economic, political, regulatory or other factors.
Derivatives Risk: Investments in derivatives may be illiquid, difficult to price, and leveraged so that small changes may produce disproportionate losses for the Portfolio, and may be subject to counterparty risk to a greater degree than more traditional investments.
Management Risk: The Portfolio is subject to management risk because it is an actively managed investment fund. The Adviser will apply its investment techniques and risk analyses in making investment decisions for the Portfolio, but there is no guarantee that its techniques will produce the intended results.
These risks are fully discussed in the Variable Products prospectus.
An Important Note About Historical Performance
The investment return and principal value of an investment in the Portfolio will fluctuate, so that shares, when redeemed, may be worth more or less than their original cost. Performance shown on the following page represents past performance and does not guarantee future results. Current performance may be lower or higher than the performance information shown. Please contact your Financial Advisor or Insurance Agent Representative at your financial institution to obtain portfolio performance information current to the most recent month end.
Investors should consider the investment objectives, risks, charges and expenses of the Portfolio carefully before investing. For additional copies of the Portfolio’s prospectus or summary prospectus, which contains this and other information, call your financial advisor or 800.984.7654. Please read the prospectus and/or summary prospectus carefully before investing.
All fees and expenses related to the operation of the Portfolio have been deducted, but no adjustment has been made for insurance company separate account or annuity contract charges, which would reduce total return to a contract owner. Performance assumes reinvestment of distributions and does not account for taxes.
There are additional fees and expenses associated with all Variable Products. These fees can include mortality and expense risk charges, administrative charges, and other charges that can significantly reduce investment returns. Those fees and expenses are not reflected in this annual report. You should consult your Variable Products prospectus for a description of those fees and expenses and speak to your insurance agent or financial representative if you have any questions. You should read the prospectus before investing or sending money.
2
| LARGE CAP GROWTH PORTFOLIO | ||
| HISTORICAL PERFORMANCE | AllianceBernstein Variable Products Series Fund |
| THE PORTFOLIO VS. ITS BENCHMARKS | NAV Returns | |||||||||||
| PERIODS ENDED DECEMBER 31, 2013 (unaudited) | 1 Year | 5 Years* | 10 Years * | |||||||||
AllianceBernstein Large Cap Growth Portfolio Class A** | 37.35% | 18.60% | 7.22% | |||||||||
AllianceBernstein Large Cap Growth Portfolio Class B** | 37.00% | 18.30% | 6.95% | |||||||||
Russell 1000 Growth Index | 33.48% | 20.39% | 7.83% | |||||||||
S&P 500 Index | 32.39% | 17.94% | 7.41% | |||||||||
* Average annual returns.
** Includes the impact of proceeds received and credited to the Portfolio resulting from class action settlements, which enhanced the performance of all share classes of the Portfolio for the annual period ended December 31, 2013, by 0.10%.
Please keep in mind that high, double-digit returns are highly unusual and cannot be sustained. Investors should also be aware that these returns were primarily achieved through favorable market conditions. |
| |||||||||||
The Portfolio’s current prospectus fee table shows the Portfolio’s total annual operating expense ratios as 0.86% and 1.11% for Class A and Class B, respectively. The Financial Highlights section of this report sets forth expense ratio data for the current reporting period; the expense ratios shown above may differ from the expense ratios in the Financial Highlights section since they are based on different time periods.
ALLIANCEBERNSTEIN LARGE CAP GROWTH PORTFOLIO CLASS A GROWTH OF A $10,000 INVESTMENT (unaudited)
12/31/03 – 12/31/13

This chart illustrates the total value of an assumed $10,000 investment in AllianceBernstein Large Cap Growth Portfolio Class A shares (from 12/31/03 to 12/31/13) as compared to the performance of the Portfolio’s benchmark, the Russell 1000 Growth Index, and the broad market, as represented by the S&P 500 Index. The chart assumes the reinvestment of dividends and capital gains distributions.
See Disclosures, Risks and Note about Historical Performance on page 2.
3
| LARGE CAP GROWTH PORTFOLIO | ||
| EXPENSE EXAMPLE (unaudited) | AllianceBernstein Variable Products Series Fund |
As a shareholder of the Fund, you incur two types of costs: (1) transaction costs, including sales charges (loads) on purchase payments, contingent deferred sales charges on redemptions and (2) ongoing costs, including management fees; distribution (12b-1) fees; and other Fund expenses. This example is intended to help you understand your ongoing costs (in dollars) of investing in the Fund and to compare these costs with the ongoing costs of investing in other mutual funds.
The Example is based on an investment of $1,000 invested at the beginning of the period and held for the entire period as indicated below.
Actual Expenses
The table below provides information about actual account values and actual expenses. You may use the information in this line, together with the amount you invested, to estimate the expenses that you paid over the period. Simply divide your account value by $1,000 (for example, an $8,600 account value divided by $1,000 = 8.6), then multiply the result by the number in the first line under the heading entitled “Expenses Paid During Period” to estimate the expenses you paid on your account during this period. The estimate of expenses does not include fees or other expenses of any variable insurance product. If such expenses were included, the estimate of expenses you paid during the period would be higher and your ending account value would be lower.
Hypothetical Example for Comparison Purposes
The table below provides information about hypothetical account values and hypothetical expenses based on the Fund’s actual expense ratio and an assumed annual rate of return of 5% before expenses, which is not the Fund’s actual return. The hypothetical account values and expenses may not be used to estimate the actual ending account balance or expenses you paid for the period. You may use this information to compare the ongoing costs of investing in the Fund and other funds by comparing this 5% hypothetical example with the 5% hypothetical examples that appear in the shareholder reports of other funds. The estimate of expenses does not include fees or other expenses of any variable insurance product. If such expenses were included, the estimate of expenses you paid during the period would be higher and your ending account value would be lower.
Please note that the expenses shown in the table are meant to highlight your ongoing costs only and do not reflect any transactional costs, such as sales charges (loads), or contingent deferred sales charges on redemptions. Therefore, the second line of each class’ table is useful in comparing ongoing costs only, and will not help you determine the relative total costs of owning different funds. In addition, if these transactional costs were included, your costs would have been higher.
| Beginning Account Value July 1, 2013 | Ending Account Value December 31, 2013 | Expenses Paid During Period* | Annualized Expense Ratio* | |||||||||||||
Class A | ||||||||||||||||
Actual | $ | 1,000 | $ | 1,241.30 | $ | 4.75 | 0.84 | % | ||||||||
Hypothetical (5% annual return before expenses) | $ | 1,000 | $ | 1,020.97 | $ | 4.28 | 0.84 | % | ||||||||
Class B | ||||||||||||||||
Actual | $ | 1,000 | $ | 1,239.80 | $ | 6.15 | 1.09 | % | ||||||||
Hypothetical (5% annual return before expenses) | $ | 1,000 | $ | 1,019.71 | $ | 5.55 | 1.09 | % | ||||||||
| * | Expenses are equal to each classes’ annualized expense ratios, multiplied by the average account value over the period, multiplied by 184/365 (to reflect the one-half year period). |
4
| LARGE CAP GROWTH PORTFOLIO | ||
| TEN LARGEST HOLDINGS* | ||
| December 31, 2013 (unaudited) | AllianceBernstein Variable Products Series Fund |
| COMPANY | U.S. $ VALUE | PERCENT OF NET ASSETS | ||||||
Google, Inc.—Class A | $ | 18,558,958 | 4.4 | % | ||||
Cognizant Technology Solutions Corp.—Class A | 17,477,618 | 4.2 | ||||||
Apple, Inc. | 15,624,108 | 3.7 | ||||||
Visa, Inc.—Class A | 14,500,922 | 3.5 | ||||||
IntercontinentalExchange Group, Inc. | 13,328,984 | 3.2 | ||||||
Boeing Co. (The) | 12,808,222 | 3.0 | ||||||
Biogen Idec, Inc. | 12,721,352 | 3.0 | ||||||
Danaher Corp. | 12,328,994 | 2.9 | ||||||
Schlumberger Ltd. | 12,249,103 | 2.9 | ||||||
priceline.com, Inc. | 10,287,240 | 2.4 | ||||||
|
|
|
| |||||
| $ | 139,885,501 | 33.2 | % | |||||
SECTOR BREAKDOWN**
December 31, 2013 (unaudited)
| SECTOR | U.S. $ VALUE | PERCENT OF TOTAL INVESTMENTS | ||||||
Consumer Discretionary | $ | 93,194,368 | 22.1 | % | ||||
Technology | 81,143,907 | 19.3 | ||||||
Health Care | 64,284,161 | 15.3 | ||||||
Producer Durables | 55,801,055 | 13.3 | ||||||
Financial Services | 37,224,893 | 8.8 | ||||||
Consumer Staples | 28,505,537 | 6.8 | ||||||
Energy | 20,202,459 | 4.8 | ||||||
Materials & Processing | 12,183,159 | 2.9 | ||||||
Short-Term Investments | 28,155,478 | 6.7 | ||||||
|
|
|
| |||||
Total Investments | $ | 420,695,017 | 100.0 | % | ||||
| * | Long-term investments. |
| ** | The Portfolio’s sector breakdown is expressed as a percentage of total investments (excluding security lending collateral) and may vary over time. |
Please note: The sector breakdown is classified in the above chart and throughout this report according to the Russell sector classification scheme. The Russell Sector scheme was developed by Russell Investments. Russell classifies index members into industries that most closely describe the nature of its business and its primary economic orientation. Multiple resources are used to obtain overall information about the company. Additional Russell sector scheme information can be found within Russell Index methodology documents available on Russell.com. The “Portfolio of Investments” section of the report reflects more specific industry information and is consistent with the investment restrictions discussed in the Portfolio’s prospectus.
5
| LARGE CAP GROWTH PORTFOLIO | ||
| PORTFOLIOOF INVESTMENTS | ||
| December 31, 2013 | AllianceBernstein Variable Products Series Fund |
| Shares | U.S. $ Value | ||||||
COMMON STOCKS–93.3% | ||||||||
CONSUMER DISCRETIONARY–22.1% | ||||||||
AUTO PARTS–0.7% | ||||||||
LKQ Corp.(a) | 95,490 | $ | 3,141,621 | |||||
|
| |||||||
CABLE TELEVISION SERVICES–2.0% | ||||||||
Comcast Corp.–Class A | 164,260 | 8,535,771 | ||||||
|
| |||||||
CONSUMER SERVICES: MISC.–1.6% | ||||||||
eBay, Inc.(a) | 122,160 | 6,705,362 | ||||||
|
| |||||||
DIVERSIFIED MEDIA–1.4% | ||||||||
Liberty Media Corp.(a) | 39,950 | 5,850,678 | ||||||
|
| |||||||
DIVERSIFIED RETAIL–3.8% | ||||||||
Amazon.com, Inc.(a) | 17,460 | 6,962,873 | ||||||
Costco Wholesale Corp. | 75,790 | 9,019,768 | ||||||
|
| |||||||
| 15,982,641 | ||||||||
|
| |||||||
ENTERTAINMENT–1.8% | ||||||||
Walt Disney Co. (The) | 97,170 | 7,423,788 | ||||||
|
| |||||||
LEISURE TIME–2.4% | ||||||||
priceline.com, Inc.(a) | 8,850 | 10,287,240 | ||||||
|
| |||||||
RECREATIONAL VEHICLES & BOATS–1.3% | ||||||||
Polaris Industries, Inc. | 36,220 | 5,275,081 | ||||||
|
| |||||||
RESTAURANTS–2.2% | ||||||||
Chipotle Mexican Grill, Inc.–Class A(a) | 4,350 | 2,317,593 | ||||||
Starbucks Corp. | 88,795 | 6,960,640 | ||||||
|
| |||||||
| 9,278,233 | ||||||||
|
| |||||||
SPECIALTY RETAIL–2.3% | ||||||||
Home Depot, Inc. (The) | 71,130 | 5,856,844 | ||||||
O’Reilly Automotive, Inc.(a) | 30,370 | 3,908,923 | ||||||
|
| |||||||
| 9,765,767 | ||||||||
|
| |||||||
TEXTILES, APPAREL & SHOES–2.6% | ||||||||
Michael Kors Holdings Ltd.(a) | 40,540 | 3,291,443 | ||||||
NIKE, Inc.–Class B | 46,630 | 3,666,983 | ||||||
VF Corp. | 64,000 | 3,989,760 | ||||||
|
| |||||||
| 10,948,186 | ||||||||
|
| |||||||
| 93,194,368 | ||||||||
|
| |||||||
TECHNOLOGY–19.3% | ||||||||
COMMUNICATIONS | ||||||||
QUALCOMM, Inc. | 44,830 | 3,328,628 | ||||||
|
| |||||||
COMPUTER SERVICES, SOFTWARE & SYSTEMS–13.3% | ||||||||
ANSYS, Inc.(a) | 83,522 | 7,283,118 | ||||||
Cognizant Technology Solutions Corp.–Class A(a) | 173,080 | 17,477,618 | ||||||
Facebook, Inc.–Class A(a) | 114,950 | 6,283,167 | ||||||
Google, Inc.–Class A(a) | 16,560 | 18,558,958 | ||||||
LinkedIn Corp.–Class A(a) | 16,630 | 3,605,883 | ||||||
Red Hat, Inc.(a) | 50,100 | 2,807,604 | ||||||
|
| |||||||
| 56,016,348 | ||||||||
|
| |||||||
COMPUTER | ||||||||
Apple, Inc. | 27,845 | $ | 15,624,108 | |||||
|
| |||||||
ELECTRONIC COMPONENTS–1.5% | ||||||||
Amphenol Corp.–Class A | 69,240 | 6,174,823 | ||||||
|
| |||||||
| 81,143,907 | ||||||||
|
| |||||||
HEALTH CARE–15.3% | ||||||||
BIOTECHNOLOGY–6.3% | ||||||||
Biogen Idec, Inc.(a) | 45,474 | 12,721,352 | ||||||
Celgene Corp.(a) | 47,050 | 7,949,568 | ||||||
Quintiles Transnational Holdings, Inc.(a) | 128,388 | 5,949,500 | ||||||
|
| |||||||
| 26,620,420 | ||||||||
|
| |||||||
HEALTH CARE MANAGEMENT SERVICES–2.2% | ||||||||
UnitedHealth Group, Inc. | 120,951 | 9,107,610 | ||||||
|
| |||||||
HEALTH CARE | ||||||||
McKesson Corp. | 23,750 | 3,833,250 | ||||||
|
| |||||||
MEDICAL EQUIPMENT–2.4% | ||||||||
Illumina, Inc.(a) | 37,535 | 4,152,122 | ||||||
Intuitive Surgical, Inc.(a) | 14,930 | 5,734,314 | ||||||
|
| |||||||
| 9,886,436 | ||||||||
|
| |||||||
PHARMACEUTICALS–3.5% | ||||||||
Allergan, Inc./United States | 67,136 | 7,457,467 | ||||||
Gilead Sciences, Inc.(a) | 98,190 | 7,378,978 | ||||||
|
| |||||||
| 14,836,445 | ||||||||
|
| |||||||
| 64,284,161 | ||||||||
|
| |||||||
PRODUCER | ||||||||
AEROSPACE–3.0% | ||||||||
Boeing Co. (The) | 93,840 | 12,808,222 | ||||||
|
| |||||||
AIR TRANSPORT–1.9% | ||||||||
Copa Holdings SA–Class A | 48,840 | 7,819,772 | ||||||
|
| |||||||
DIVERSIFIED MANUFACTURING OPERATIONS–2.9% | ||||||||
Danaher Corp. | 159,702 | 12,328,994 | ||||||
|
| |||||||
PRODUCER DURABLES: | ||||||||
WW Grainger, Inc. | 13,430 | 3,430,291 | ||||||
|
| |||||||
SCIENTIFIC INSTRUMENTS: CONTROL & FILTER–1.7% | ||||||||
Flowserve Corp. | 38,283 | 3,017,849 | ||||||
Parker Hannifin Corp. | 32,620 | 4,196,237 | ||||||
|
| |||||||
| 7,214,086 | ||||||||
|
| |||||||
SCIENTIFIC INSTRUMENTS: ELECTRICAL–1.4% | ||||||||
AMETEK, Inc. | 109,571 | 5,771,105 | ||||||
|
| |||||||
6
| AllianceBernstein Variable Products Series Fund |
| Shares | U.S. $ Value | ||||||
SCIENTIFIC INSTRUMENTS: GAUGES & METERS–0.8% | ||||||||
Mettler-Toledo International, Inc.(a) | 13,175 | $ | 3,196,123 | |||||
|
| |||||||
TRANSPORTATION MISCELLANEOUS–0.8% | ||||||||
Expeditors International of Washington, Inc. | 73,050 | 3,232,462 | ||||||
|
| |||||||
| 55,801,055 | ||||||||
|
| |||||||
FINANCIAL SERVICES–8.8% |
| |||||||
ASSET MANAGEMENT & CUSTODIAN–1.7% | ||||||||
Affiliated Managers Group, Inc.(a) | 19,070 | 4,135,901 | ||||||
BlackRock, Inc.–Class A | 10,280 | 3,253,312 | ||||||
|
| |||||||
| 7,389,213 | ||||||||
|
| |||||||
FINANCIAL DATA & SYSTEMS–3.4% | ||||||||
Visa, Inc.–Class A | 65,120 | 14,500,922 | ||||||
|
| |||||||
INSURANCE: PROPERTY-CASUALTY–0.5% | ||||||||
Verisk Analytics, | 30,520 | 2,005,774 | ||||||
|
| |||||||
SECURITIES BROKERAGE & SERVICES–3.2% | ||||||||
IntercontinentalExchange | 59,261 | 13,328,984 | ||||||
|
| |||||||
| 37,224,893 | ||||||||
|
| |||||||
CONSUMER STAPLES–6.8% | ||||||||
BEVERAGE: SOFT | ||||||||
Green Mountain Coffee Roasters, Inc.(a)(b) | 48,530 | 3,667,898 | ||||||
Monster Beverage Corp.(a) | 54,534 | 3,695,769 | ||||||
|
| |||||||
| 7,363,667 | ||||||||
|
| |||||||
DRUG & GROCERY STORE CHAINS–0.6% | ||||||||
CVS Caremark Corp. | 36,450 | 2,608,726 | ||||||
�� |
| |||||||
FOODS–2.9% | ||||||||
Hershey Co. (The) | 66,400 | 6,456,072 | ||||||
Mead Johnson Nutrition Co.–Class A | 69,580 | 5,828,021 | ||||||
|
| |||||||
| 12,284,093 | ||||||||
|
| |||||||
TOBACCO–1.5% | ||||||||
Philip Morris International, Inc. | 71,721 | 6,249,051 | ||||||
|
| |||||||
| 28,505,537 | ||||||||
|
| |||||||
ENERGY–4.8% | ||||||||
OIL WELL EQUIPMENT & SERVICES–3.8% | ||||||||
Oceaneering International, Inc. | 46,850 | 3,695,528 | ||||||
Schlumberger Ltd. | 135,935 | 12,249,103 | ||||||
|
| |||||||
| 15,944,631 | ||||||||
|
| |||||||
OIL: CRUDE | ||||||||
Noble Energy, Inc. | 62,514 | $ | 4,257,828 | |||||
|
| |||||||
| 20,202,459 | ||||||||
|
| |||||||
MATERIALS & PROCESSING–2.9% | ||||||||
FERTILIZERS–1.2% | ||||||||
Monsanto Co. | 43,213 | 5,036,475 | ||||||
|
| |||||||
METAL FABRICATING–1.7% | ||||||||
Precision Castparts Corp. | 26,538 | 7,146,684 | ||||||
|
| |||||||
| 12,183,159 | ||||||||
|
| |||||||
Total Common Stocks | 392,539,539 | |||||||
|
| |||||||
| Principal Amount (000) | ||||||||
SHORT-TERM INVESTMENTS–6.7% | ||||||||
TIME DEPOSIT–6.7% | ||||||||
State Street Time Deposit 0.01%, 1/02/14 | $ | 28,155 | 28,155,478 | |||||
|
| |||||||
TOTAL INVESTMENTS BEFORE SECURITY LENDING COLLATERAL FOR SECURITIES | 420,695,017 | |||||||
|
| |||||||
| Shares | ||||||||
INVESTMENTS OF CASH COLLATERAL FOR SECURITIES | ||||||||
INVESTMENT | ||||||||
AllianceBernstein Exchange Reserves–Class I, 0.07%(c) | 3,736,810 | 3,736,810 | ||||||
|
| |||||||
TOTAL | 424,431,827 | |||||||
Other assets less | (3,593,335 | ) | ||||||
|
| |||||||
NET ASSETS–100.0% | $ | 420,838,492 | ||||||
|
| |||||||
| (a) | Non-income producing security. |
| (b) | Represents entire or partial securities out on loan. See Note E for securities lending information. |
| (c) | Investment in affiliated money market mutual fund. The rate shown represents the 7-day yield as of period end. |
See notes to financial statements.
7
| LARGE CAP GROWTH PORTFOLIO | ||
| STATEMENTOF ASSETS & LIABILITIES | ||
| December 31, 2013 | AllianceBernstein Variable Products Series Fund | |
ASSETS | ||||
Investments in securities, at value | ||||
Unaffiliated issuers (cost $305,451,239) | $ | 420,695,017 | (a) | |
Affiliated issuers (cost $3,736,810—investment of cash collateral for securities loaned) | 3,736,810 | |||
Cash | 314,160 | |||
Receivable for investment securities sold | 467,831 | |||
Dividends and interest receivable | 378,818 | |||
Receivable for capital stock sold | 161,360 | |||
|
| |||
Total assets | 425,753,996 | |||
|
| |||
LIABILITIES | ||||
Payable for collateral received on securities loaned | 3,736,810 | |||
Payable for investment securities purchased | 510,625 | |||
Advisory fee payable | 254,448 | |||
Payable for capital stock redeemed | 219,701 | |||
Distribution fee payable | 46,412 | |||
Administrative fee payable | 13,886 | |||
Transfer Agent fee payable | 112 | |||
Accrued expenses | 133,510 | |||
|
| |||
Total liabilities | 4,915,504 | |||
|
| |||
NET ASSETS | $ | 420,838,492 | ||
|
| |||
COMPOSITION OF NET ASSETS | ||||
Capital stock, at par | $ | 9,987 | ||
Additional paid-in capital | 335,647,287 | |||
Accumulated net realized loss on investment transactions | (30,062,560 | ) | ||
Net unrealized appreciation on investments | 115,243,778 | |||
|
| |||
| $ | 420,838,492 | |||
|
|
Net Asset Value Per Share—1 billion shares of capital stock authorized, $.001 par value
| Class | Net Assets | Shares Outstanding | Net Asset Value | |||||||||
A | $ | 190,488,734 | 4,452,545 | $ | 42.78 | |||||||
B | $ | 230,349,758 | 5,534,545 | $ | 41.62 | |||||||
| (a) | Includes securities on loan with a value of $3,667,898 (see Note E). |
See notes to financial statements.
8
| LARGE CAP GROWTH PORTFOLIO | ||
| STATEMENTOF OPERATIONS | ||
| Year Ended December 31, 2013 | AllianceBernstein Variable Products Series Fund | |
INVESTMENT INCOME | ||||
Dividends | ||||
Unaffiliated issuers (net of foreign taxes withheld of $15,488) | $ | 2,764,229 | ||
Affiliated issuers | 1,094 | |||
Interest | 2,546 | |||
Securities lending income | 18,545 | |||
|
| |||
| 2,786,414 | ||||
|
| |||
EXPENSES | ||||
Advisory fee (see Note B) | 2,852,269 | |||
Distribution fee—Class B | 517,869 | |||
Transfer agency—Class A | 5,533 | |||
Transfer agency—Class B | 6,622 | |||
Custodian | 112,136 | |||
Printing | 101,398 | |||
Administrative | 54,101 | |||
Legal | 38,323 | |||
Audit | 35,606 | |||
Directors’ fees | 4,537 | |||
Miscellaneous | 9,039 | |||
|
| |||
Total expenses | 3,737,433 | |||
|
| |||
Net investment loss | (951,019 | ) | ||
|
| |||
REALIZED AND UNREALIZED GAIN ON INVESTMENT TRANSACTIONS | ||||
Net realized gain on investment transactions | 40,515,361 | |||
Net change in unrealized appreciation/depreciation of investments | 81,506,094 | |||
|
| |||
Net gain on investment transactions | 122,021,455 | |||
|
| |||
NET INCREASE IN NET ASSETS FROM OPERATIONS | $ | 121,070,436 | ||
|
|
See notes to financial statements.
9
| LARGE CAP GROWTH PORTFOLIO | ||
| STATEMENTOF CHANGESIN NET ASSETS | AllianceBernstein Variable Products Series Fund | |
| Year Ended December 31, 2013 | Year Ended December 31, 2012 | |||||||
INCREASE (DECREASE) IN NET ASSETS FROM OPERATIONS | ||||||||
Net investment income (loss) | $ | (951,019 | ) | $ | 164,364 | |||
Net realized gain on investment transactions | 40,515,361 | 13,850,502 | ||||||
Net change in unrealized appreciation/depreciation of investments | 81,506,094 | 42,216,262 | ||||||
|
|
|
| |||||
Net increase in net assets from operations | 121,070,436 | 56,231,128 | ||||||
DIVIDENDS TO SHAREHOLDERS FROM | ||||||||
Net investment income | ||||||||
Class A | (127,070 | ) | (490,716 | ) | ||||
Class B | –0 | – | (59,787 | ) | ||||
CAPITAL STOCK TRANSACTIONS | ||||||||
Net decrease | (51,226,644 | ) | (65,941,709 | ) | ||||
|
|
|
| |||||
Total increase (decrease) | 69,716,722 | (10,261,084 | ) | |||||
NET ASSETS | ||||||||
Beginning of period | 351,121,770 | 361,382,854 | ||||||
|
|
|
| |||||
End of period (including distributions in excess of net investment income of $–0– and ($90,377), respectively) | $ | 420,838,492 | $ | 351,121,770 | ||||
|
|
|
| |||||
See notes to financial statements.
10
| LARGE CAP GROWTH PORTFOLIO | ||
| NOTES TO FINANCIAL STATEMENTS | ||
| December 31, 2013 | AllianceBernstein Variable Products Series Fund | |
NOTE A : Significant Accounting Policies
The AllianceBernstein Large Cap Growth Portfolio (the “Portfolio”) is a series of AllianceBernstein Variable Products Series Fund, Inc. (the “Fund”). The Portfolio’s investment objective is long-term growth of capital. The Portfolio is diversified as defined under the Investment Company Act of 1940. The Fund was incorporated in the State of Maryland on November 17, 1987, as an open-end series investment company. The Fund offers thirteen separately managed pools of assets which have differing investment objectives and policies. The Portfolio offers Class A and Class B shares. Both classes of shares have identical voting, dividend, liquidating and other rights, except that Class B shares bear a distribution expense and have exclusive voting rights with respect to the Class B distribution plan.
The Portfolio offers and sells its shares only to separate accounts of certain life insurance companies for the purpose of funding variable annuity contracts and variable life insurance policies. Sales are made without a sales charge at the Portfolio’s net asset value per share.
The financial statements have been prepared in conformity with U.S. generally accepted accounting principles (“U.S. GAAP”) which require management to make certain estimates and assumptions that affect the reported amounts of assets and liabilities in the financial statements and amounts of income and expenses during the reporting period. Actual results could differ from those estimates. The following is a summary of significant accounting policies followed by the Portfolio.
1. Security Valuation
Portfolio securities are valued at their current market value determined on the basis of market quotations or, if market quotations are not readily available or are deemed unreliable, at “fair value” as determined in accordance with procedures established by and under the general supervision of the Fund’s Board of Directors (the “Board”).
In general, the market values of securities which are readily available and deemed reliable are determined as follows: securities listed on a national securities exchange (other than securities listed on the NASDAQ Stock Market, Inc. (“NASDAQ”)) or on a foreign securities exchange are valued at the last sale price at the close of the exchange or foreign securities exchange. If there has been no sale on such day, the securities are valued at the last traded price from the previous day. Securities listed on more than one exchange are valued by reference to the principal exchange on which the securities are traded; securities listed only on NASDAQ are valued in accordance with the NASDAQ Official Closing Price; listed or over the counter (“OTC”) market put or call options are valued at the mid level between the current bid and ask prices. If either a current bid or current ask price is unavailable, AllianceBernstein L.P. (the “Adviser”) will have discretion to determine the best valuation (e.g. last trade price in the case of listed options); open futures are valued using the closing settlement price or, in the absence of such a price, the most recent quoted bid price. If there are no quotations available for the day of valuation, the last available closing settlement price is used; U.S. government securities and other debt instruments having 60 days or less remaining until maturity are valued at amortized cost if their original maturity was 60 days or less; or by amortizing their fair value as of the 61st day prior to maturity if their original term to maturity exceeded 60 days; fixed-income securities, including mortgage-backed and asset-backed securities, may be valued on the basis of prices provided by a pricing service or at a price obtained from one or more of the major broker-dealers. In cases where broker-dealer quotes are obtained, the Adviser may establish procedures whereby changes in market yields or spreads are used to adjust, on a daily basis, a recently obtained quoted price on a security. Swaps and other derivatives are valued daily, primarily using independent pricing services, independent pricing models using market inputs, as well as third party broker-dealers or counterparties. Investment companies are valued at their net asset value each day.
Securities for which market quotations are not readily available (including restricted securities) or are deemed unreliable are valued at fair value. Factors considered in making this determination may include, but are not limited to, information obtained by contacting the issuer, analysts, analysis of the issuer’s financial statements or other available documents. In addition, the Portfolio may use fair value pricing for securities primarily traded in non-U.S. markets because most foreign markets close well before the Portfolio values its securities at 4:00 p.m., Eastern Time. The earlier close of these foreign markets gives rise to the possibility that significant events, including broad market moves, may have occurred in the interim and may materially affect the value of those securities. To account for this, the Portfolio may frequently value many of its foreign equity securities using fair value prices based on third party vendor modeling tools to the extent available.
2. Fair Value Measurements
In accordance with U.S. GAAP regarding fair value measurements, fair value is defined as the price that the Portfolio would receive to sell an asset or pay to transfer a liability in an orderly transaction between market participants at the measurement
11
| LARGE CAP GROWTH PORTFOLIO | ||
| NOTES TO FINANCIAL STATEMENTS | ||
| (continued) | AllianceBernstein Variable Products Series Fund | |
date. U.S. GAAP establishes a framework for measuring fair value, and a three-level hierarchy for fair value measurements based upon the transparency of inputs to the valuation of an asset or liability (including those valued based on their market values as described in Note A.1 above). Inputs may be observable or unobservable and refer broadly to the assumptions that market participants would use in pricing the asset or liability. Observable inputs reflect the assumptions market participants would use in pricing the asset or liability based on market data obtained from sources independent of the Portfolio. Unobservable inputs reflect the Portfolio’s own assumptions about the assumptions that market participants would use in pricing the asset or liability based on the best information available in the circumstances. Each investment is assigned a level based upon the observability of the inputs which are significant to the overall valuation. The three-tier hierarchy of inputs is summarized below.
| • | Level 1—quoted prices in active markets for identical investments |
| • | Level 2—other significant observable inputs (including quoted prices for similar investments, interest rates, prepayment speeds, credit risk, etc.) |
| • | Level 3—significant unobservable inputs (including the Portfolio’s own assumptions in determining the fair value of investments) |
Where readily available market prices or relevant bid prices are not available for certain equity investments, such investments may be valued based on similar publicly traded investments, movements in relevant indices since last available prices or based upon underlying company fundamentals and comparable company data (such as multiples to earnings or other multiples to equity). Where an investment is valued using an observable input, such as another publicly traded security, the investment will be classified as Level 2. If management determines that an adjustment is appropriate based on restrictions on resale, illiquidity or uncertainty, and such adjustment is a significant component of the valuation, the investment will be classified as Level 3. An investment will also be classified as Level 3 where management uses company fundamentals and other significant inputs to determine the valuation.
The following table summarizes the valuation of the Portfolio’s investments by the above fair value hierarchy levels as of December 31, 2013:
| Level 1 | Level 2 | Level 3 | Total | |||||||||||||
Investments in Securities: | ||||||||||||||||
Assets: | ||||||||||||||||
Common Stocks* | $ | 392,539,539 | $ | – 0 | – | $ | – 0 | – | $ | 392,539,539 | ||||||
Short-Term Investments | – 0 | – | 28,155,478 | – 0 | – | 28,155,478 | ||||||||||
Investments of Cash Collateral for Securities | 3,736,810 | – 0 | – | – 0 | – | 3,736,810 | ||||||||||
|
|
|
|
|
|
|
| |||||||||
Total Investments in Securities | 396,276,349 | 28,155,478 | – 0 | – | 424,431,827 | |||||||||||
Other Financial Instruments** | – 0 | – | – 0 | – | – 0 | – | – 0 | – | ||||||||
|
|
|
|
|
|
|
| |||||||||
Total^ | $ | 396,276,349 | $ | 28,155,478 | $ | – 0 | – | $ | 424,431,827 | |||||||
|
|
|
|
|
|
|
| |||||||||
| * | See Portfolio of Investments for sector classifications. |
| ** | Other financial instruments are derivative instruments, such as futures, forwards and swaps, which are valued at the unrealized appreciation/depreciation on the instrument. |
| ^ | There were no transfers between Level 1 and Level 2 during the reporting period. |
The Portfolio recognizes all transfers between levels of the fair value hierarchy assuming the financial instruments were transferred at the beginning of the reporting period.
The Adviser has established a Valuation Committee (the “Committee”) which is responsible for overseeing the pricing and valuation of all securities held in the Portfolio. The Committee operates under pricing and valuation policies and procedures established by the Adviser and approved by the Board, including pricing policies which set forth the mechanisms and processes to be employed on a daily basis to implement these policies and procedures. In particular, the pricing policies describe how to determine market quotations for securities and other instruments. The Committee’s responsibilities include: 1) fair value and liquidity determinations (and oversight of any third parties to whom any responsibility for fair value and liquidity determinations is delegated), and 2) regular monitoring of the Adviser’s pricing and valuation policies and procedures and modification or enhancement of these policies and procedures (or recommendation of the modification of these policies and procedures) as the Committee believes appropriate.
12
| AllianceBernstein Variable Products Series Fund |
The Committee is also responsible for monitoring the implementation of the pricing policies by the Adviser’s Pricing Group (the “Pricing Group”) and a third party which performs certain pricing functions in accordance with the pricing policies. The Pricing Group is responsible for the oversight of the third party on a day-to-day basis. The Committee and the Pricing Group perform a series of activities to provide reasonable assurance of the accuracy of prices including: 1) periodic vendor due diligence meetings, review of methodologies, new developments and processes at vendors, 2) daily comparison of security valuation versus prior day for all securities that exceeded established thresholds, and 3) daily review of unpriced, stale, and variance reports with exceptions reviewed by senior management and the Committee.
In addition, several processes outside of the pricing process are used to monitor valuation issues including: 1) performance and performance attribution reports are monitored for anomalous impacts based upon benchmark performance, and 2) portfolio managers review all portfolios for performance and analytics (which are generated using the Adviser’s prices).
3. Currency Translation
Assets and liabilities denominated in foreign currencies and commitments under forward currency exchange contracts are translated into U.S. dollars at the mean of the quoted bid and ask prices of such currencies against the U.S. dollar. Purchases and sales of portfolio securities are translated into U.S. dollars at the rates of exchange prevailing when such securities were acquired or sold. Income and expenses are translated into U.S. dollars at rates of exchange prevailing when accrued.
Net realized gain or loss on foreign currency transactions represents foreign exchange gains and losses from sales and maturities of foreign fixed income investments, foreign currency exchange contracts, holding of foreign currencies, currency gains or losses realized between the trade and settlement dates on foreign investment transactions, and the difference between the amounts of dividends, interest and foreign withholding taxes recorded on the Portfolio’s books and the U.S. dollar equivalent amounts actually received or paid. Net unrealized currency gains and losses from valuing foreign currency denominated assets and liabilities at period end exchange rates are reflected as a component of net unrealized appreciation or depreciation of foreign currency denominated assets and liabilities.
4. Taxes
It is the Portfolio’s policy to meet the requirements of the Internal Revenue Code applicable to regulated investment companies and to distribute all of its investment company taxable income and net realized gains, if any, to shareholders. Therefore, no provisions for federal income or excise taxes are required. The Portfolio may be subject to taxes imposed by countries in which it invests. Such taxes are generally based on income and/or capital gains earned or repatriated. Taxes are accrued and applied to net investment income, net realized gains and net unrealized appreciation/depreciation as such income and/or gains are earned.
In accordance with U.S. GAAP requirements regarding accounting for uncertainties in income taxes, management has analyzed the Portfolio’s tax positions taken or expected to be taken on federal and state income tax returns for all open tax years (the current and the prior three tax years) and has concluded that no provision for income tax is required in the Portfolio’s financial statements.
5. Investment Income and Investment Transactions
Dividend income is recorded on the ex-dividend date or as soon as the Portfolio is informed of the dividend. Interest income is accrued daily. Investment transactions are accounted for on the date the securities are purchased or sold. Investment gains or losses are determined on the identified cost basis. The Portfolio amortizes premiums and accretes discounts as adjustments to interest income.
6. Class Allocations
All income earned and expenses incurred by the Portfolio are borne on a pro-rata basis by each outstanding class of shares, based on the proportionate interest in the Portfolio represented by the net assets of such class, except for class specific expenses which are allocated to the respective class. Expenses of the Fund are charged proportionately to each Portfolio or based on other appropriate methods. Realized and unrealized gains and losses are allocated among the various share classes based on respective net assets.
7. Dividends and Distributions
Dividends and distributions to shareholders, if any, are recorded on the ex-dividend date. Income dividends and capital gains distributions are determined in accordance with federal tax regulations and may differ from those determined in accordance with U.S. GAAP. To the extent these differences are permanent, such amounts are reclassified within the capital accounts based on their federal tax basis treatment; temporary differences do not require such reclassification.
13
| LARGE CAP GROWTH PORTFOLIO | ||
| NOTES TO FINANCIAL STATEMENTS | ||
| (continued) | AllianceBernstein Variable Products Series Fund | |
NOTE B : Advisory Fee and Other Transactions with Affiliates
Under the terms of the investment advisory agreement, the Portfolio pays the Adviser an advisory fee at an annual rate of .75% of the first $2.5 billion, .65% of the next $2.5 billion and .60% in excess of $5 billion, of the Portfolio’s average daily net assets. The fee is accrued daily and paid monthly.
Pursuant to the investment advisory agreement, the Portfolio may reimburse the Adviser for certain legal and accounting services provided to the Portfolio by the Adviser. For the year ended December 31, 2013, the reimbursement for such services amounted to $54,101.
Brokerage commissions paid on investment transactions for the year ended December 31, 2013 amounted to $223,215, of which $0 and $0, respectively, was paid to Sanford C. Bernstein & Co. LLC and Sanford C. Bernstein Limited, affiliates of the Adviser.
The Portfolio compensates AllianceBernstein Investor Services, Inc. (“ABIS”), a wholly-owned subsidiary of the Adviser, under a Transfer Agency Agreement for providing personnel and facilities to perform transfer agency services for the Portfolio. Such compensation retained by ABIS amounted to $1,385 for the year ended December 31, 2013.
NOTE C : Distribution Plan
The Portfolio has adopted a Distribution Plan (the “Plan”) for Class B shares pursuant to Rule 12b-1 under the Investment Company Act of 1940. Under the Plan, the Portfolio pays distribution and servicing fees to AllianceBernstein Investments, Inc. (the “Distributor”), a wholly-owned subsidiary of the Adviser, at an annual rate of up to .50% of the Portfolio’s average daily net assets attributable to Class B shares. The fees are accrued daily and paid monthly. The Board currently limits payments under the Plan to .25% of the Portfolio’s average daily net assets attributable to Class B shares. The Plan provides that the Distributor will use such payments in their entirety for distribution assistance and promotional activities.
The Portfolio is not obligated under the Plan to pay any distribution and servicing fees in excess of the amounts set forth above. The purpose of the payments to the Distributor under the Plan is to compensate the Distributor for its distribution services with respect to the sale of the Portfolio’s Class B shares. Since the Distributor’s compensation is not directly tied to its expenses, the amount of compensation received by it under the Plan during any year may be more or less than its actual expenses. For this reason, the Plan is characterized by the staff of the Securities and Exchange Commission as being of the “compensation” variety.
In the event that the Plan is terminated or not continued, no distribution or servicing fees (other than current amounts accrued but not yet paid) would be owed by the Portfolio to the Distributor.
The Plan also provides that the Adviser may use its own resources to finance the distribution of the Portfolio’s shares.
NOTE D : Investment Transactions
Purchases and sales of investment securities (excluding short-term investments) for the year ended December 31, 2013 were as follows:
| Purchases | Sales | |||||||
Investment securities (excluding U.S. government securities) | $ | 212,668,130 | $ | 283,514,814 | ||||
U.S. government securities | – 0 | – | – 0 | – | ||||
The cost of investments for federal income tax purposes, gross unrealized appreciation and unrealized depreciation are as follows:
Cost | $ | 309,781,572 | ||
|
| |||
Gross unrealized appreciation | $ | 117,082,106 | ||
Gross unrealized depreciation | (2,431,851 | ) | ||
|
| |||
Net unrealized appreciation | $ | 114,650,255 | ||
|
|
1. Derivative Financial Instruments
The Portfolio may use derivatives in an effort to earn income and enhance returns, to replace more traditional direct investments, to obtain exposure to otherwise inaccessible markets (collectively, “investment purposes”), or to hedge or adjust the risk profile of its portfolio.
14
| AllianceBernstein Variable Products Series Fund |
The Portfolio did not engage in derivatives transactions for the year ended December 31, 2013.
2. Currency Transactions
The Portfolio may invest in non-U.S. dollar securities on a currency hedged or unhedged basis. The Portfolio may seek investment opportunities by taking long or short positions in currencies through the use of currency-related derivatives, including forward currency exchange contracts, futures and options on futures, swaps, and other options. The Portfolio may enter into transactions for investment opportunities when it anticipates that a foreign currency will appreciate or depreciate in value but securities denominated in that currency are not held by the Portfolio and do not present attractive investment opportunities. Such transactions may also be used when the Adviser believes that it may be more efficient than a direct investment in a foreign currency-denominated security. The Portfolio may also conduct currency exchange contracts on a spot basis (i.e., for cash at the spot rate prevailing in the currency exchange market for buying or selling currencies).
NOTE E : Securities Lending
The Portfolio may enter into securities lending transactions. Under the Portfolio’s securities lending program, all loans of securities will be collateralized continually by cash. The Portfolio will be compensated for the loan from a portion of the net return from the income earned on cash collateral after a rebate is paid to the borrower (in some cases, this rebate may be a “negative rebate” or fee paid by the borrower to the Portfolio in connection with the loan), and payments are made for fees of the securities lending agent and for certain other administrative expenses. It is the policy of the Portfolio to receive collateral consisting of cash in an amount exceeding the value of the securities loaned. The Portfolio will have the right to call a loan and obtain the securities loaned at any time on notice to the borrower within the normal and customary settlement time for the securities. While the securities are on loan, the borrower is obligated to pay the Portfolio amounts equal to any income or other distributions from the securities. The Portfolio will not have the right to vote any securities during the existence of a loan, but will have the right to regain ownership of loaned securities in order to exercise voting or other ownership rights. The lending agent has agreed to indemnify the Portfolio in the case of default of any securities borrower. Collateral received and securities loaned are marked to market daily to ensure that the securities loaned are secured by collateral. The lending agent will invest the cash collateral received in AllianceBernstein Exchange Reserves, an eligible money market vehicle, in accordance with the investment restrictions of the Portfolio, and as approved by the Board. The collateral received on securities loaned is recorded as an asset as well as a corresponding liability in the statement of assets and liabilities. When the Portfolio lends securities, its investment performance will continue to reflect changes in the value of the securities loaned. At December 31, 2013, the Portfolio had securities on loan with a value of $3,667,898 and had received cash collateral which has been invested into AllianceBernstein Exchange Reserves of $3,736,810. The cash collateral will be adjusted on the next business day to maintain the required collateral amount. The Portfolio earned securities lending income of $18,545 and $1,094 from the borrowers and AllianceBernstein Exchange Reserves, respectively, for the year ended December 31, 2013; these amounts are reflected in the statement of operations. A principal risk of lending portfolio securities is that the borrower will fail to return the loaned securities upon termination of the loan and that the collateral will not be sufficient to replace the loaned securities. A summary of the Portfolio’s transactions in shares of AllianceBernstein Exchange Reserves for the year ended December 31, 2013 is as follows:
Market Value December 31, 2012 (000) | Purchases at Cost (000) | Sales Proceeds (000) | Market Value December 31, 2013 (000) | |||||||||||
| $ | 1,880 | $ | 22,320 | $ | 20,463 | $ | 3,737 | |||||||
NOTE F : Capital Stock
Each class consists of 500,000,000 authorized shares. Transactions in capital shares for each class were as follows:
| SHARES | AMOUNT | |||||||||||||||||
| Year Ended December 31, 2013 | Year Ended December 31, 2012 | Year Ended December 31, 2013 | Year Ended December 31, 2012 | |||||||||||||||
Class A | ||||||||||||||||||
Shares sold | 99,625 | 84,976 | $ | 3,596,763 | $ | 2,557,847 | ||||||||||||
Shares issued in reinvestment of dividends | 3,499 | 16,100 | 127,070 | 490,716 | ||||||||||||||
Shares redeemed | (791,125 | ) | (1,164,566 | ) | (28,666,154 | ) | (35,040,903 | ) | ||||||||||
|
|
|
|
|
|
|
| |||||||||||
Net decrease | (688,001 | ) | (1,063,490 | ) | $ | (24,942,321 | ) | $ | (31,992,340 | ) | ||||||||
|
|
|
|
|
|
|
| |||||||||||
15
| LARGE CAP GROWTH PORTFOLIO | ||
| NOTES TO FINANCIAL STATEMENTS | ||
| (continued) | AllianceBernstein Variable Products Series Fund | |
| SHARES | AMOUNT | |||||||||||||||||
| Year Ended December 31, 2013 | Year Ended December 31, 2012 | Year Ended December 31, 2013 | Year Ended December 31, 2012 | |||||||||||||||
Class B | ||||||||||||||||||
Shares sold | 257,016 | 366,059 | $ | 9,095,751 | $ | 10,679,970 | ||||||||||||
Shares issued in reinvestment of dividends | – 0 | – | 2,011 | – 0 | – | 59,787 | ||||||||||||
Shares redeemed | (1,007,058 | ) | (1,523,390 | ) | (35,380,074 | ) | (44,689,126 | ) | ||||||||||
|
|
|
|
|
|
|
| |||||||||||
Net decrease | (750,042 | ) | (1,155,320 | ) | $ | (26,284,323 | ) | $ | (33,949,369 | ) | ||||||||
|
|
|
|
|
|
|
| |||||||||||
NOTE G : Risks Involved in Investing in the Portfolio
Foreign Securities Risk—Investing in securities of foreign companies or foreign governments involves special risks which include changes in foreign currency exchange rates and the possibility of future political and economic developments which could adversely affect the value of such securities. Moreover, securities of many foreign companies or foreign governments and their markets may be less liquid and their prices more volatile than those of comparable U.S. companies or of the U.S. government.
Currency Risk—This is the risk that changes in foreign currency exchange rates may negatively affect the value of the Portfolio’s investments or reduce the returns of the Portfolio. For example, the value of the Portfolio’s investments in foreign currency-denominated securities or currencies may decrease if the U.S. dollar is strong (i.e., gaining value relative to other currencies) and other currencies are weak (i.e., losing value relative to the U.S. dollar). Currency markets are generally not as regulated as securities markets. Independent of the Portfolio’s investments denominated in foreign currencies, the Portfolio’s positions in various foreign currencies may cause the Portfolio to experience investment losses due to the changes in exchange rates and interest rates.
Focused Portfolio Risk—Investments in a limited number of companies may have more risk because changes in the value of a single security may have a more significant effect, either negative or positive, on the Portfolio’s NAV.
Derivatives Risk—The Portfolio may enter into derivative transactions such as forwards, options, futures and swaps. Derivatives may be illiquid, difficult to price, and leveraged so that small changes may produce disproportionate losses for the Portfolio, and subject to counterparty risk to a greater degree than more traditional investments. Derivatives may result in significant losses, including losses that are far greater than the value of the derivatives reflected in the statement of assets and liabilities.
Indemnification Risk—In the ordinary course of business, the Portfolio enters into contracts that contain a variety of indemnifications. The Portfolio’s maximum exposure under these arrangements is unknown. However, the Portfolio has not had prior claims or losses pursuant to these indemnification provisions and expects the risk of loss thereunder to be remote. Therefore, the Portfolio has not accrued any liability in connection with these indemnification provisions.
NOTE H : Joint Credit Facility
A number of open-end mutual funds managed by the Adviser, including the Portfolio, participate in a $140 million revolving credit facility (the “Facility”) intended to provide short-term financing, if necessary, subject to certain restrictions in connection with abnormal redemption activity. Commitment fees related to the Facility are paid by the participating funds and are included in miscellaneous expenses in the statement of operations. The Portfolio did not utilize the Facility during the year ended December 31, 2013.
NOTE I: Distributions to Shareholders
The tax character of distributions paid during the fiscal years ended December 31, 2013 and December 31, 2012 were as follows:
| 2013 | 2012 | |||||||
Distributions paid from: | ||||||||
Ordinary income | $ | 127,070 | $ | 550,503 | ||||
|
|
|
| |||||
Total taxable distributions paid | $ | 127,070 | $ | 550,503 | ||||
|
|
|
| |||||
16
| AllianceBernstein Variable Products Series Fund |
As of December 31, 2013, the components of accumulated earnings/(deficit) on a tax basis were as follows:
Accumulated capital and other losses | $ | (29,469,037 | )(a) | |
Unrealized appreciation/(depreciation) | 114,650,255 | (b) | ||
|
| |||
Total accumulated earnings/(deficit) | $ | 85,181,218 | ||
|
|
| (a) | As of December 31, 2013, the Portfolio had a net capital loss carryforward of $29,469,037. During the fiscal year, the Portfolio utilized $39,104,906 of capital loss carryforwards to offset current year net realized gains. |
| (b) | The difference between book-basis and tax-basis unrealized appreciation/(depreciation) is attributable primarily to the tax deferral of losses on wash sales. |
For tax purposes, net capital losses may be carried over to offset future capital gains, if any. Funds are permitted to carry forward capital losses incurred in taxable years beginning after December 22, 2010 for an indefinite period. These post-enactment capital losses must be utilized prior to the pre-enactment capital losses, which are subject to expiration. Post-enactment capital loss carryforwards will retain their character as either short-term or long-term capital losses rather than being considered short-term as under previous regulation.
As of December 31, 2013, the Portfolio had a net capital loss carryforward of $29,469,037 which will expire as follows:
SHORT-TERM AMOUNT | LONG-TERM AMOUNT | EXPIRATION | ||
| $ 519,354 | n/a | 2016 | ||
| 28,949,683 | n/a | 2017 |
During the current fiscal year, permanent differences primarily due to the tax treatment of partnership investments, return of capital distributions received from underlying securities, a dividend overdistribution and the disallowance of a net operating loss resulted in a net decrease in distributions in excess of net investment income, a net increase in accumulated net realized loss on investment transactions, and a net decrease in additional paid-in capital. These reclassifications had no effect on net assets.
NOTE J : Subsequent Events
Management has evaluated subsequent events for possible recognition or disclosure in the financial statements through the date the financial statements are issued. Management has determined that there are no material events that would require disclosure in the Portfolio’s financial statements through this date.
17
| LARGE CAP GROWTH PORTFOLIO | ||
| FINANCIAL HIGHLIGHTS | AllianceBernstein Variable Products Series Fund |
Selected Data For A Share Of Capital Stock Outstanding Throughout Each Period
| CLASS A | ||||||||||||||||||||
| Year Ended December 31, | ||||||||||||||||||||
| 2013 | 2012 | 2011 | 2010 | 2009 | ||||||||||||||||
Net asset value, beginning of period | $31.17 | $26.86 | $27.79 | $25.36 | $18.47 | |||||||||||||||
|
|
|
|
|
|
|
|
|
| |||||||||||
Income From Investment Operations | ||||||||||||||||||||
Net investment income (loss) (a) | (.04 | ) | .05 | .09 | .07 | .10 | ||||||||||||||
Net realized and unrealized gain (loss) on investment transactions | 11.68 | 4.35 | (.93 | ) | 2.48 | 6.82 | ||||||||||||||
|
|
|
|
|
|
|
|
|
| |||||||||||
Net increase (decrease) in net asset value from operations | 11.64 | 4.40 | (.84 | ) | 2.55 | 6.92 | ||||||||||||||
|
|
|
|
|
|
|
|
|
| |||||||||||
Less: Dividends | ||||||||||||||||||||
Dividends from net investment income | (.03 | ) | (.09 | ) | (.09 | ) | (.12 | ) | (.03 | ) | ||||||||||
|
|
|
|
|
|
|
|
|
| |||||||||||
Net asset value, end of period | $42.78 | $31.17 | $26.86 | $27.79 | $25.36 | |||||||||||||||
|
|
|
|
|
|
|
|
|
| |||||||||||
Total Return | ||||||||||||||||||||
Total investment return based on net | 37.35 | % | 16.39 | % | (3.04 | )% | 10.10 | % | 37.52 | % | ||||||||||
Ratios/Supplemental Data | ||||||||||||||||||||
Net assets, end of period (000’s omitted) | $190,488 | $160,226 | $166,654 | $200,977 | $211,940 | |||||||||||||||
Ratio to average net assets of: | ||||||||||||||||||||
Expenses | .85 | % | .86 | % | .84 | % | .85 | %+ | .88 | % | ||||||||||
Net investment income (loss) | (.11 | )% | .18 | % | .33 | % | .29 | %+ | .47 | % | ||||||||||
Portfolio turnover rate | 60 | % | 94 | % | 89 | % | 105 | % | 97 | % | ||||||||||
See footnote summary on page 19.
18
| LARGE CAP GROWTH PORTFOLIO | ||
| FINANCIAL HIGHLIGHTS | AllianceBernstein Variable Products Series Fund |
Selected Data For A Share Of Capital Stock Outstanding Throughout Each Period
| CLASS B | ||||||||||||||||||||
| Year Ended December 31, | ||||||||||||||||||||
| 2013 | 2012 | 2011 | 2010 | 2009 | ||||||||||||||||
Net asset value, beginning of period | $30.38 | $26.17 | $27.08 | $24.72 | $18.03 | |||||||||||||||
|
|
|
|
|
|
|
|
|
| |||||||||||
Income From Investment Operations | ||||||||||||||||||||
Net investment income (loss) (a) | (.13 | ) | (.02 | ) | .02 | .01 | .04 | |||||||||||||
Net realized and unrealized gain (loss) on investment transactions | 11.37 | 4.24 | (.91 | ) | 2.42 | 6.65 | ||||||||||||||
|
|
|
|
|
|
|
|
|
| |||||||||||
Net increase (decrease) in net asset value from operations | 11.24 | 4.22 | (.89 | ) | 2.43 | 6.69 | ||||||||||||||
|
|
|
|
|
|
|
|
|
| |||||||||||
Less: Dividends | ||||||||||||||||||||
Dividends from net investment income | – 0 | – | (.01 | ) | (.02 | ) | (.07 | ) | – 0 | – | ||||||||||
|
|
|
|
|
|
|
|
|
| |||||||||||
Net asset value, end of period | $41.62 | $30.38 | $26.17 | $27.08 | $24.72 | |||||||||||||||
|
|
|
|
|
|
|
|
|
| |||||||||||
Total Return | ||||||||||||||||||||
Total investment return based on net | 37.00 | % | 16.12 | % | (3.27 | )% | 9.83 | % | 37.10 | % | ||||||||||
Ratios/Supplemental Data | ||||||||||||||||||||
Net assets, end of period (000’s omitted) | $230,350 | $190,896 | $194,729 | $223,520 | $233,460 | |||||||||||||||
Ratio to average net assets of: | ||||||||||||||||||||
Expenses | 1.10 | % | 1.11 | % | 1.09 | % | 1.10 | %+ | 1.13 | % | ||||||||||
Net investment income (loss) | (.36 | )% | (.07 | )% | .08 | % | .04 | %+ | .22 | % | ||||||||||
Portfolio turnover rate | 60 | % | 94 | % | 89 | % | 105 | % | 97 | % | ||||||||||
| (a) | Based on average shares outstanding. |
| (b) | Total investment return is calculated assuming an initial investment made at the net asset value at the beginning of the period, reinvestment of all dividends and distributions at net asset value during the period, and redemption on the last day of the period. Total return does not reflect (i) insurance company’s separate account related expense charges and (ii) the deductions of taxes that a shareholder would pay on Portfolio distributions or the redemption of Portfolio shares. Total investment return calculated for a period of less than one year is not annualized. |
| * | Includes the impact of proceeds received and credited to the Portfolio resulting from class action settlements, which enhanced the Portfolio’s performance for the years ended December 31, 2013, December 31, 2012, December 31, 2011, December 31, 2010 and December 31, 2009 by 0.10%, 0.95%, 0.46%, 0.58% and 1.96%, respectively. |
| + | The ratio includes expenses attributable to costs of proxy solicitation. |
See notes to financial statements.
19
| REPORTOF INDEPENDENT REGISTERED | ||
| PUBLIC ACCOUNTING FIRM | AllianceBernstein Variable Products Series Fund | |
To the Board of Directors and Shareholders of AllianceBernstein Large Cap Growth Portfolio:
We have audited the accompanying statement of assets and liabilities, including the portfolio of investments, of AllianceBernstein Large Cap Growth Portfolio (one of the funds constituting AllianceBernstein Variable Products Series Fund, Inc. (the “Fund”)) as of December 31, 2013, and the related statement of operations for the year then ended, the statements of changes in net assets for each of the two years in the period then ended, and the financial highlights for each of the five years in the period then ended. These financial statements and financial highlights are the responsibility of the Fund’s management. Our responsibility is to express an opinion on these financial statements and financial highlights based on our audits.
We conducted our audits in accordance with the standards of the Public Company Accounting Oversight Board (United States). Those standards require that we plan and perform the audit to obtain reasonable assurance about whether the financial statements and financial highlights are free of material misstatement. We were not engaged to perform an audit of the Fund’s internal control over financial reporting. Our audits included consideration of internal control over financial reporting as a basis for designing audit procedures that are appropriate in the circumstances, but not for the purpose of expressing an opinion on the effectiveness of the Fund’s internal control over financial reporting. Accordingly, we express no such opinion. An audit also includes examining, on a test basis, evidence supporting the amounts and disclosures in the financial statements and financial highlights, assessing the accounting principles used and significant estimates made by management, and evaluating the overall financial statement presentation. Our procedures included confirmation of securities owned as of December 31, 2013, by correspondence with the custodian and others, or by other appropriate auditing procedures where replies from others were not received. We believe that our audits provide a reasonable basis for our opinion.
In our opinion, the financial statements and financial highlights referred to above present fairly, in all material respects, the financial position of AllianceBernstein Large Cap Growth Portfolio (one of the funds constituting AllianceBernstein Variable Products Series Fund, Inc.) at December 31, 2013, the results of its operations for the year then ended, the changes in its net assets for each of the two years in the period then ended, and the financial highlights for each of the five years in the period then ended, in conformity with U.S. generally accepted accounting principles.

New York, New York
February 14, 2014
20
| 2013 TAX INFORMATION (unaudited) | AllianceBernstein Variable Products Series Fund |
For Federal income tax purposes, the following information is furnished with respect to the distributions paid by the Portfolio during the taxable year ended December 31, 2013. For corporate shareholders, 97.31% of dividends paid qualify for the dividends received deduction.
21
| LARGE CAP GROWTH PORTFOLIO | AllianceBernstein Variable Products Series Fund |
| BOARDOF DIRECTORS | ||
Marshall C. Turner, Jr.(1), Chairman John H. Dobkin(1) Michael J. Downey(1) William H. Foulk, Jr.(1) D. James Guzy(1) Nancy P. Jacklin(1) | Robert M. Keith, President and Garry L. Moody(1) | |
Earl D. Weiner(1) | ||
| OFFICERS | ||
Philip L. Kirstein, Senior Vice President and Frank V. Caruso(2), Vice President Vincent C. DuPont(2) , Vice President John H. Fogarty(2), Vice President | Emilie D. Wrapp, Secretary Joseph J. Mantineo, Treasurer and Phyllis J. Clarke, Controller Vincent S. Noto, Chief Compliance Officer | |
CUSTODIAN AND ACCOUNTING AGENT State Street Bank and Trust Company One Lincoln Street Boston, MA 02111 | LEGAL COUNSEL Seward & Kissel LLP One Battery Park Plaza New York, NY 10004 | |
DISTRIBUTOR AllianceBernstein Investments, Inc. 1345 Avenue of the Americas New York, NY 10105 | TRANSFER AGENT AllianceBernstein Investor Services, Inc. P.O. Box 786003 San Antonio, TX 78278-6003 Toll-Free 1-(800) 221-5672 | |
INDEPENDENT REGISTERED PUBLIC ACCOUNTING FIRM Ernst & Young LLP 5 Times Square New York, NY 10036 |
| (1) | Member of the Audit Committee, the Governance and Nominating Committee and the Independent Directors Committee. Mr. Foulk is the sole member of the Fair Value Pricing Committee. |
| (2) | The day-to-day management of, and investment decisions for, the Portfolio’s portfolio are made by the U.S. Large Cap Growth Investment Team. Mr. Frank V. Caruso, Mr. Vincent C. DuPont and Mr. John H. Fogarty are the investment professionals with the most significant responsibility for the day-to-day management of the Portfolio’s portfolio. |
22
| LARGE CAP GROWTH PORTFOLIO | ||
| MANAGEMENTOFTHE FUND | AllianceBernstein Variable Products Series Fund |
Board of Directors Information
The business and affairs of the Fund are managed under the direction of the Board of Directors. Certain information concerning the Fund’s Directors is set forth below.
| NAME, ADDRESS*, AGE AND (YEAR FIRST ELECTED**) | PRINCIPAL OCCUPATION(S) DURING PAST FIVE YEARS AND OTHER RELEVANT QUALIFICATIONS*** | PORTFOLIOS IN FUND COMPLEX OVERSEEN BY DIRECTOR | OTHER DIRECTORSHIP HELD BY DIRECTOR IN THE PAST FIVE YEARS | |||||
| INTERESTED DIRECTOR | ||||||||
Robert M. Keith, # 1345 Avenue of the Americas New York, NY 10105 53 (2010) | Senior Vice President of AllianceBernstein L.P. (the “Adviser”) and the head of AllianceBernstein Investments, Inc. (“ABI”) since July 2008; Director of ABI and President of the AllianceBernstein Mutual Funds. Previously, he served as Executive Managing Director of ABI from December 2006 to June 2008. Prior to joining ABI in 2006, Executive Managing Director of Bernstein Global Wealth Management, and prior thereto, Senior Managing Director and Global Head of Client Service and Sales of the Adviser’s institutional investment management business since 2004. Prior thereto, he was Managing Director and Head of North American Client Service and Sales in the Adviser’s institutional investment management business, with which he had been associated since prior to 2004. | 100 | None | |||||
| DISINTERESTED DIRECTORS | ||||||||
Marshall C. Turner, Jr., ## Chairman of the Board 72 (2005) | Private Investor since prior to 2009. Former CEO of Dupont Photomasks, Inc. (components of semi-conductor manufacturing), 2003-2006, and interim CEO 1999-2000. Interim CEO of MEMC Electronic Materials, Inc. (semi-conductor and solar cell substrates) from November 2008 until March 2009. He has extensive operating and early-stage investment experience, including prior service as general partner of three institutional venture capital partnerships, and serves on the boards of three education and science-related non-profit organizations. He has served as a director of one AllianceBernstein fund since 1992, and director or trustee of multiple AllianceBernstein funds since 2005. He is Chairman of the AllianceBernstein Funds since January 2014. | 100 | Xilinx, Inc. (programmable logic semi-conductors) and SunEdison, Inc. (semi-conductor substrates, solar materials and solar power plants) since prior to 2009 | |||||
John H. Dobkin, ## 72 (1992) | Independent Consultant since prior to 2009. Formerly, President of Save Venice, Inc. (preservation organization) from 2001–2002; Senior Advisor from June 1999-June 2000 and President of Historic Hudson Valley (historic preservation) from December 1989-May 1999. Previously, Director of the National Academy of Design. He has served as a director or trustee of various AllianceBernstein Funds since 1992, and as Chairman of the Audit Committees of a number of such Funds from 2001-2008. | 100 | None | |||||
23
| LARGE CAP GROWTH PORTFOLIO | ||
| MANAGEMENTOFTHE FUND | ||
| (continued) | AllianceBernstein Variable Products Series Fund |
| NAME, ADDRESS*, AGE AND (YEAR FIRST ELECTED**) | PRINCIPAL OCCUPATION(S) DURING PAST FIVE YEARS AND OTHER RELEVANT QUALIFICATIONS*** | PORTFOLIOS IN FUND COMPLEX OVERSEEN BY DIRECTOR | OTHER DIRECTORSHIP HELD BY DIRECTOR IN THE PAST FIVE YEARS | |||||
| DISINTERESTED DIRECTORS (continued) | ||||||||
Michael J. Downey, ## 70 | Private Investor since prior to 2009. Formerly, managing partner of Lexington Capital, LLC (investment advisory firm) from December 1997 until December 2003. From 1987 until 1993, Chairman and CEO of Prudential Mutual Fund Management, director of the Prudential mutual funds, and member of the Executive Committee of Prudential Securities Inc. He has served as a director or trustee of the AllianceBernstein Funds since 2005 and is a director and Chairman of one other registered investment company. | 100 | Asia Pacific Fund, Inc. since prior to 2009, Prospect Acquisition Corp. (financial services) from 2007 until 2009, and The Merger Fund since prior to 2009 until 2013 | |||||
William H. Foulk, Jr., ##, ### 81 | Investment Adviser and an Independent Consultant since prior to 2009. Previously, he was Senior Manager of Barrett Associates, Inc., a registered investment adviser. He was formerly Deputy Comptroller and Chief Investment Officer of the State of New York and, prior thereto, Chief Investment Officer of the New York Bank for Savings. He has served as a director or trustee of various AllianceBernstein Funds since 1983, and has been Chairman of the Independent Directors Committee of the AllianceBernstein Funds since 2003. He served as Chairman of such Funds from 2003 through December 2013. He is also active in a number of mutual fund related organizations and committees. | 100 | None | |||||
D. James Guzy, ## 77 | Chairman of the Board of PLX Technology (semi-conductors) and of SRC Computers Inc., with which he has been associated since prior to 2009. He was a director of Intel Corporation (semi-conductors) from 1969 until 2008, and served as Chairman of the Finance Committee of such company for several years until May 2008. He was a Director of Cirrus Logic Corporation (semi-conductors) from 1984 until July 2011. He has served as a director or trustee of one or more of the AllianceBernstein Funds since 1982. | 100 | PLX Technology (semi-conductors) since prior to 2009, and Cirrus Logic Corporation (semi-conductors) since prior to 2009 until July 2011 | |||||
Nancy P. Jacklin, ## 65 | Professorial Lecturer at the Johns Hopkins School of Advanced International Studies since 2008. Formerly, U.S. Executive Director of the International Monetary Fund (December 2002-May 2006); Partner, Clifford Chance (1992-2002); Sector Counsel, International Banking and Finance, and Associate General Counsel, Citicorp (1985-1992); Assistant General Counsel (International), Federal Reserve Board of Governors (1982-1985); and Attorney Advisor, U.S. Department of the Treasury (1973-1982). Member of the Bar of the District of Columbia and of New York; and member of the Council on Foreign Relations. She has served as a director or trustee of the AllianceBernstein Funds since 2006. | 100 | None | |||||
24
| AllianceBernstein Variable Products Series Fund |
| NAME, ADDRESS*, AGE AND (YEAR FIRST ELECTED**) | PRINCIPAL OCCUPATION(S) DURING PAST FIVE YEARS AND OTHER RELEVANT QUALIFICATIONS*** | PORTFOLIOS IN FUND COMPLEX OVERSEEN BY DIRECTOR | OTHER DIRECTORSHIP HELD BY DIRECTOR IN THE PAST FIVE YEARS | |||||
| DISINTERESTED DIRECTORS (continued) | ||||||||
Garry L. Moody, ## 61 (2008) | Independent Consultant. Formerly, Partner, Deloitte & Touche LLP (1995-2008) where he held a number of senior positions, including Vice Chairman, and U.S. and Global Investment Management Practice Managing Partner; President, Fidelity Accounting and Custody Services Company (1993-1995); and Partner, Ernst & Young LLP (1975-1993), where he served as the National Director of Mutual Fund Tax Services and Managing Partner of its Chicago Office Tax department. He is a member of both the Governing Council of the Independent Directors Council (IDC), an organization of independent directors of mutual funds, and the Trustee Advisory Board of BoardIQ, a biweekly publication focused on issues and news affecting directors of mutual funds. He has served as a director or trustee, and as Chairman of the Audit Committee, of the AllianceBernstein Funds since 2008. | 100 | Greenbacker Renewable Energy Company LLC (renewable energy and energy efficiency projects) from August 2013 to January 2014 | |||||
Earl D. Weiner, ## 74 | Of Counsel, and Partner prior to January 2007, of the law firm Sullivan & Cromwell LLP and member of ABA Federal Regulation of Securities Committee Task Force to draft editions of the Fund Director’s Guidebook. He also serves as a director or trustee of various non-profit organizations and has served as Chairman or Vice Chairman of a number of them. He has served as a director or trustee of the AllianceBernstein Funds since 2007 and is Chairman of the Governance and Nominating Committees of the Funds. | 100 | None | |||||
| * | The address for each of the Fund’s disinterested Directors is c/o AllianceBernstein L.P., Attention: Philip L. Kirstein, 1345 Avenue of the Americas, New York, NY 10105. |
| ** | There is no stated term of office for the Fund’s Directors. |
| *** | The information above includes each Director’s principal occupation during the last five years and other information relating to the experience, attributes, and skills relevant to each Director’s qualifications to serve as a Director, which led to the conclusion that each Director should serve as a Director for the Fund. |
| # | Mr. Keith is an “interested person” of the Fund, as defined in Section 2(a)(19) of the Investment Company Act of 1940, due to his position as a Senior Vice President of the Adviser. |
| ## | Member of the Audit Committee, the Governance and Nominating Committee and the Independent Directors Committee. |
| ### | Member of the Fair Value Pricing Committee. |
25
| LARGE CAP GROWTH PORTFOLIO | ||
| MANAGEMENTOFTHE FUND | ||
| (continued) | AllianceBernstein Variable Products Series Fund |
Officer Information
Certain information concerning the Portfolio Officers is listed below.
| NAME, ADDRESS* AND AGE | PRINCIPAL POSITION(S) HELD WITH FUND | PRINCIPAL OCCUPATION DURING PAST FIVE YEARS | ||
Robert M. Keith 53 | President and Chief Executive Officer | See biography above. | ||
| Philip L. Kirstein 68 | Senior Vice President and Independent Compliance Officer | Senior Vice President and Independent Compliance Officer of the AllianceBernstein Funds, with which he has been associated since October 2004. Prior thereto, he was Of Counsel to Kirkpatrick & Lockhart, LLP from October 2003 to October 2004, and General Counsel of Merrill Lynch Investment Managers, L.P. since prior to March 2003. | ||
Frank V. Caruso 57 | Vice President | Senior Vice President of the Adviser**, with which he has been associated since prior to 2009. | ||
Vincent C. DuPont 51 | Vice President | Senior Vice President of the Adviser**, with which he was associated since prior to 2009. | ||
| John H. Fogarty 44 | Vice President | Senior Vice President of the Adviser**, with which he has been associated since prior to 2009. | ||
| Emilie D. Wrapp 58 | Secretary | Senior Vice President, Assistant General Counsel and Assistant Secretary of ABI**, with which she has been associated since prior to 2009. | ||
| Joseph J. Mantineo 54 | Treasurer and Chief Financial Officer | Senior Vice President of AllianceBernstein Investor Services, Inc. (“ABIS”)**, with which he has been associated since prior to 2009. | ||
| Phyllis J. Clarke 53 | Controller | Vice President of ABIS**, with which she has been associated since prior to 2009. | ||
Vincent S. Noto 49 | Chief Compliance Officer | Chief Compliance Officer of the AllianceBernstein Funds, and Vice President of ABIS**, with which he has been associated since prior to 2009. | ||
| * | The address for each of the Portfolio’s Officers is 1345 Avenue of the Americas, New York, NY 10105. |
| ** | The Adviser, ABI and ABIS are affiliates of the Fund. |
| The Fund’s Statement of Additional Information (“SAI”) has additional information about the Fund’s Directors and Officers and is available without charge upon request. Contact your financial representative or AllianceBernstein at (800) 227-4618, or visit www.alliancebernstein.com, for a free prospectus or SAI. |
26
| LARGE CAP GROWTH PORTFOLIO | ||
| SENIOR OFFICER FEE EVALUATION | AllianceBernstein Variable Products Series Fund |
THE FOLLOWING IS NOT PART OF THE SHAREHOLDER REPORT OR THE FINANCIAL STATEMENTS
SUMMARY OF SENIOR OFFICER’S EVALUATION OF INVESTMENT ADVISORY AGREEMENT1
The following is a summary of the evaluation of the Investment Advisory Agreement between AllianceBernstein L.P. (the “Adviser”) and the AllianceBernstein Variable Products Series Fund (the “Fund”), in respect of AllianceBernstein Large Cap Growth Portfolio (the “Portfolio”).2 The evaluation of the Investment Advisory Agreement was prepared by Philip L. Kirstein, the Senior Officer of the Fund, for the Directors of the Fund, as required by a September 2004 agreement between the Adviser and the New York State Attorney General (the “NYAG”). The Senior Officer’s evaluation of the Investment Advisory Agreement is not meant to diminish the responsibility or authority of the Board of Directors of the Fund to perform its duties pursuant to Section 15 of the Investment Company Act of 1940 (the “40 Act”) and applicable state law. The purpose of the summary is to provide shareholders with a synopsis of the independent evaluation of the reasonableness of the advisory fees proposed to be paid by the Portfolio which was provided to the Directors in connection with their review of the proposed approval of the continuance of the Investment Advisory Agreement. The Senior Officer’s evaluation considered the following factors:
| 1. | Advisory fees charged to institutional and other clients of the Adviser for like services; |
| 2. | Advisory fees charged by other mutual fund companies for like services; |
| 3. | Costs to the Adviser and its affiliates of supplying services pursuant to the advisory agreement, excluding any intra-corporate profit; |
| 4. | Profit margins of the Adviser and its affiliates from supplying such services; |
| 5. | Possible economies of scale as the Portfolio grows larger; and |
| 6. | Nature and quality of the Adviser’s services including the performance of the Portfolio. |
These factors, with the exception of the first factor, are generally referred to as the “Gartenberg factors,” which were articulated by the United States Court of Appeals for the Second Circuit in 1982. Gartenberg v. Merrill Lynch Asset Management, Inc., 694 F. 2d 923 (2d Cir. 1982). The first factor is an additional factor required to be considered by the AoD. On March 30, 2010, the Supreme Court held the Gartenberg decision was correct in its basic formulation of what §36(b) requires: to face liability under §36(b), “an investment adviser must charge a fee that is so disproportionately large that it bears no reasonable relationship to the services rendered and could not have been the product of arm’s length bargaining.” Jones v. Harris Associates L.P., 130 S. Ct. 1418 (2010). In the Jones decision, the Court stated the Gartenberg approach fully incorporates the correct understanding of fiduciary duty within the context of section 36(b) and noted with approval that “Gartenberg insists that all relevant circumstances be taken into account” and “uses the range of fees that might result from arm’s-length bargaining as the benchmark for reviewing challenged fees.”3
PORTFOLIO ADVISORY FEES, NET ASSETS & EXPENSE RATIOS
The Adviser proposed that the Portfolio pays the advisory fee set forth in the table below for receiving the services to be provided pursuant to the Investment Advisory Agreement. The fee schedule below, implemented in January 2004 in consideration of the Adviser’s settlement with the NYAG in December 2003, is based on a master schedule that contemplates eight categories of funds with almost all funds in each category having the same advisory fee schedule.
| Category | Advisory Fee Based on % of Average Daily Net Assets | Net Assets 3/31/13 ($MIL) | Portfolio | |||||
Growth | 0.75% on first $2.5 billion 0.65% on next $2.5 billion 0.60% on the balance | $ | 372.2 | Large Cap Growth Portfolio | ||||
The Adviser is reimbursed as specified in the Investment Advisory Agreement for certain clerical, legal, accounting, administrative and other services provided to the Portfolio. During the Portfolio’s most recently completed fiscal year, the Adviser received $45,150 (0.012% of the Portfolio’s average daily net assets) for such services.
| 1 | The information in the fee summary was completed on April 22, 2013 and discussed with the Board of Directors on April 30-May 2, 2013. |
| 2 | Future references to the Fund and the Portfolio do not include “AllianceBernstein.” References in the fee summary pertaining to performance and expense ratio rankings refer to the Class A shares of the Portfolio. |
| 3 | Jones v. Harris at 1427. |
27
| LARGE CAP GROWTH PORTFOLIO | ||
| SENIOR OFFICER FEE EVALUATION | ||
| (continued) | AllianceBernstein Variable Products Series Fund |
Set forth below are the Portfolio’s gross expense ratios for the most recently completed fiscal year:
| Portfolio | Total Expense Ratio | Fiscal Year | ||
Large Cap Growth Portfolio | Class A 0.86% Class B 1.11% | December 31 |
I. ADVISORY FEES CHARGED TO INSTITUTIONAL AND OTHER CLIENTS
The advisory fees charged to investment companies which the Adviser manages and sponsors are normally higher than those charged to similar sized institutional accounts, including pension plans and sub-advised investment companies. The fee differential reflects, among other things, different services provided to such clients, and different liabilities assumed. Services provided by the Adviser to the Portfolio that are not provided to non-investment company clients and sub-advised investment companies include providing office space and personnel to serve as Fund Officers, who among other responsibilities make the certifications required under the Sarbanes–Oxley Act of 2002, and coordinating with and monitoring the Portfolio’s third party service providers such as Fund counsel, auditors, custodians, transfer agents and pricing services. The accounting, administrative, legal and compliance requirements for the Portfolio are more costly than those for institutional assets due to the greater complexities and time required for investment companies, although as previously noted, the Adviser is reimbursed for providing such services. Also, retail mutual funds managed by the Adviser are widely held. Servicing the Portfolio’s investors is more time consuming and labor intensive compared to institutional clients since the Adviser needs to communicate with a more extensive network of financial intermediaries and shareholders. The Adviser also believes that it incurs substantial entrepreneurial risk when offering a new mutual fund, since establishing a new mutual fund requires a large upfront investment, and it may take a long time for the fund to achieve profitability since the fund must be priced to scale from inception in order to be competitive and assets are acquired one account at a time. In addition, managing the cash flow of an investment company may be more difficult than managing that of a stable pool of assets, such as an institutional account with little cash movement in either direction, particularly, if a fund is in net redemption and the Adviser is frequently forced to sell securities to raise cash for redemptions. However, managing a fund with positive cash flow may be easier at times than managing a stable pool of assets. In recent years, investment advisers have been sued by institutional clients and have suffered reputational damage both by the attendant publicity and outcomes other than complete victories. Accordingly, the legal and reputational risks associated with institutional accounts are greater than previously thought, although still not equal to those related to the mutual fund industry.
Notwithstanding the Adviser’s view that managing an investment company is not comparable to managing other institutional accounts because the services provided are different, the Supreme Court has indicated consideration should be given to the advisory fees charged to institutional accounts that have a substantially similar investment style as the Portfolio.4 In addition to the AllianceBernstein institutional fee schedule, set forth below is what would have been the effective advisory fee of the Portfolio had the AllianceBernstein institutional fee schedule been applicable to the Portfolio versus the Portfolio’s advisory fee based on March 31, 2013 net assets:5
| Portfolio | Net Assets 3/31/12 ($MIL) | AllianceBernstein Institutional Fee Schedule | Effective AB Inst. Adv. Fee | Portfolio Advisory Fee | ||||||||
Large Cap Growth Portfolio | $372.2 | Large Cap Growth Schedule 0.80% on first $25m 0.50% on the next $25m 0.40% on the next $50m 0.30% on the next $100m 0.25% on the balance Minimum account size $25m | 0.337 | % | 0.750 | % | ||||||
| 4 | The Supreme Court stated that “courts may give such comparisons the weight that they merit in light of the similarities and differences between the services that the clients in question require, but the courts must be wary of inapt comparisons.” Among the significant differences the Supreme Court noted that may exist between services provided to mutual funds and institutional accounts are “higher marketing costs.” Jones v. Harris at 1428. |
| 5 | The Adviser has indicated that with respect to institutional accounts with assets greater than $300 million, it will negotiate a fee schedule. Discounts that are negotiated vary based upon each client relationship. |
28
| AllianceBernstein Variable Products Series Fund |
The Adviser also manages AllianceBernstein Large Cap Growth Fund, Inc. (“Large Cap Growth Fund, Inc.), retail mutual fund, which has a substantially similar investment style as the Portfolio. Set forth below is the fee schedule of Large Cap Growth Fund, Inc. and what would have been the effective advisory fee of the Portfolio had the fee schedule of the retail mutual fund been applicable to the Portfolio:6
| Portfolio | AllianceBernstein Mutual Fund | Fee Schedule | ABMF Effective Fee | Portfolio Advisory Fee | ||||||||
Large Cap Growth Portfolio | Large Cap Growth Fund, Inc. | 0.75% on first $2.5 billion 0.65% on next $2.5 billion 0.60% on the balance | 0.750% | 0.750% | ||||||||
The Adviser also manages and sponsors retail mutual funds, which are organized in jurisdictions outside the United States, generally Luxembourg and Japan, and sold to non-United States resident investors. The Adviser charges the fees set forth for American Growth Portfolio, which is a Luxembourg fund that has a somewhat similar investment style as the Portfolio.
| Fund | Fee7 | |
American Growth Portfolio | ||
Class A | 1.50% | |
Class I (Institutional) | 0.70% |
The Adviser provides sub-advisory services to certain other investment companies managed by other fund families that have an investment style similar to that of the Portfolio. The Adviser charges the fees set forth below for the sub-advisory relationship that has a somewhat similar investment style as the Portfolio. Also shown is the Portfolio’s advisory fee and what would have been the effective advisory fee of the Portfolio had the fee schedules of the sub-advisory relationship been applicable to the Portfolio based on March 31, 2013 net assets.
| Portfolio | Fee Schedule | Effective Fee(%) | Portfolio Advisory Fee(%) | |||||||||
Large Cap Growth Portfolio | Client # 1 | 0.35% on the first $50 million 0.30% on the next $100 million 0.25% on the balance | 0.277 | 0.750 | ||||||||
It is fair to note that the services the Adviser provides pursuant to sub-advisory agreements are generally confined to the services related to the investment process; in other words, they are not as comprehensive as the services provided to the Portfolio by the Adviser.
While it appears that the sub-advisory relationship is paying a lower fee than the Portfolio, it is difficult to evaluate the relevance of such a lower fee due to differences in terms of the services provided, risks involved and other competitive factors between the Portfolio and the sub-advisory relationship. There could be various business reasons why an investment adviser would be willing to provide a sub-advisory relationship investment related services at a different fee level than an investment company it is sponsoring where the investment adviser is providing all the services, not just investment management, generally required by a registered investment company.
II. MANAGEMENT FEES CHARGED BY OTHER MUTUAL FUND COMPANIES FOR LIKE SERVICES.
Lipper Inc. (“Lipper”), an analytical service that is not affiliated with the Adviser, compared the fees charged to the Portfolio with fees charged to other investment companies for similar services offered by other investment advisers.8 Lipper’s analysis
| 6 | The retail mutual fund was also affected by the settlement between the Adviser and the NYAG. As a result, the Portfolio has the same breakpoints in its advisory fee schedule as the retail mutual fund. |
| 7 | It should be noted that Class A shares of the fund are charged an “all-in” fee, which includes investment advisory services and distribution related services, unlike Class I shares, whose fee is for only investment advisory services. |
| 8 | The Supreme Court cautioned against accepting mutual fund fee comparisons without careful scrutiny since “these comparisons are problematic because these fees, like those challenged, may not be the product of negotiations conducted at arm’s length.” Jones v. Harris at 1429. |
29
| LARGE CAP GROWTH PORTFOLIO | ||
| SENIOR OFFICER FEE EVALUATION | ||
| (continued) | AllianceBernstein Variable Products Series Fund |
included the comparison of the Portfolio’s contractual management fee, estimated at the approximate current asset level of the Portfolio, to the median of the Portfolio’s Lipper Expense Group (“EG”) and the Portfolio’s contractual management fee ranking.9,10
Lipper describes an EG as a representative sample of comparable funds. Lipper’s standard methodology for screening funds to be included in an EG entails the consideration of several fund criteria, including fund type, investment classification/objective, load type and similar 12b-1/non-12b-1 service fees, asset (size) comparability, expense components and attributes. An EG will typically consist of seven to twenty funds.
| Portfolio | Contractual Management Fee (%)11 | Lipper EG Median (%) | Lipper EG Rank | |||||||||
Large Cap Growth Portfolio | 0.750 | 0.750 | 7/13 | |||||||||
Lipper also analyzed the Portfolio’s most recently completed fiscal year total expense ratio in comparison to the Portfolio’s EG and Lipper Expense Universe (“EU”). The EU is a broader group compared to the EG, consisting of all funds that have the same investment classification/objective and load type as the subject Portfolio.12
| Portfolio | Expense Ratio (%)13 | Lipper EG Median (%) | Lipper EG Rank | Lipper EU Median (%) | Lipper EU Rank | |||||||||||||||
Large Cap Growth Portfolio | 0.862 | 0.800 | 12/13 | 0.796 | 54/72 | |||||||||||||||
Based on this analysis, the Portfolio has a more favorable ranking on a management fee basis than on a total expense ratio basis.
III. COSTS TO THE ADVISER AND ITS AFFILIATES OF SUPPLYING SERVICES PURSUANT TO THE ADVISORY FEE ARRANGEMENT, EXCLUDING ANY INTRA-CORPORATE PROFIT.
The Adviser utilizes two profitability reporting systems, which operate independently but are aligned with each other, to estimate the Adviser’s profitability in connection with investment advisory services provided to the Portfolio. The Senior Officer has retained a consultant to provide independent advice regarding the alignment of the two profitability systems as well as the methodologies and allocations utilized by both profitability systems.
IV. PROFIT MARGINS OF THE ADVISER AND ITS AFFILIATES FOR SUPPLYING SUCH SERVICES.
The Portfolio’s profitability information, prepared by the Adviser for the Board of Directors, was reviewed by the Senior Officer and the consultant. The Adviser’s profitability from providing investment advisory services to the Portfolio decreased during calendar year 2012, relative to 2011.
In addition to the Adviser’s direct profits from managing the Portfolio, certain of the Adviser’s affiliates have business relationships with the Portfolio and may earn a profit from providing other services to the Portfolio. The courts have referred to this type of business opportunity as “fall-out benefits” to the Adviser and indicated that such benefits should be factored into the evaluation of the total relationship between the Portfolio and the Adviser. Neither case law nor common business practice precludes the Adviser’s affiliates from earning a reasonable profit on this type of relationship provided the affiliates’ charges and services are competitive. These affiliates provide transfer agent, distribution and brokerage related services to the Portfolio and receive transfer agent fees, Rule 12b-1 payments, and brokerage commissions. In addition, the Adviser benefits from soft dollar arrangements which offset expenses the Adviser would otherwise incur.
| 9 | Lipper does not consider average account size when constructing EGs. Funds with relatively small average account sizes tend to have higher transfer agent expense ratio than comparable sized funds that have relatively large average account sizes. Note that there are limitations on Lipper expense category data because different funds categorize expenses differently. |
| 10 | The contractual management fee is calculated by Lipper using the Portfolio’s contractual management fee rate at a hypothetical asset level. The hypothetical asset level is based on the combined net assets of all classes of the Portfolio, rounded up to the next $25 million. Lipper’s total expense ratio information is based on the most recent annual report except as otherwise noted. A ranking of “1” would mean that the Portfolio had the lowest effective fee rate in the Lipper peer group. |
| 11 | The contractual management fee does not reflect any expense reimbursements made by the Portfolio to the Adviser for certain clerical, legal, accounting, administrative and other services. In addition, the contractual management fee does not reflect any advisory fee waiver or expense cap that would effectively reduce the actual management fee. |
| 12 | Except for asset (size) comparability, Lipper uses the same criteria for selecting an EG when selecting an EU. Unlike the EG, the EU allows for the same adviser to be represented by more than just one fund. |
| 13 | Most recently completed fiscal year end Class A total expense ratio. |
30
| AllianceBernstein Variable Products Series Fund |
The Portfolio has adopted a distribution plan for Class B shares pursuant to Rule 12b-1 under the 40 Act. Under the distribution plan, the Portfolio pays distribution and servicing fees to its principal underwriter, AllianceBernstein Investments, Inc. (“ABI”), the Portfolio’s distributor and an affiliate of the Adviser, at an annual rate of up to 0.50% of the Portfolio’s average daily net assets attributable to Class B shares. The current annual rate that the Portfolio pays to ABI for 12b-1 fees is 0.25%. During the fiscal year ended December 31, 2012, ABI, an affiliate of the Adviser, received $498,774 in Rule 12b-1 fees.
During the fiscal year ended December 31, 2012, the Adviser incurred distribution expenses in the amount of $1,328,082 in connection with activities primarily intended to result in the sale of the Portfolio’s Class B shares. This amount includes the 12b-1 fees paid by the Portfolio to the Adviser.
Financial intermediaries, such as insurers, market and sell shares of the Portfolio and typically receive compensation from ABI, the Advisers and/or the Portfolio for selling shares of the Portfolio. These financial intermediaries receive compensation in any or all of the following forms: 12b-1 fees, defrayal of costs for educational seminars and training, additional distribution support, recordkeeping and/or administrative services. Payments related to providing contract-holder recordkeeping and/or administrative services will generally not exceed 0.35% of the average daily net assets of the Portfolio attributable to the relevant intermediary over the year. With respect to the Fund, which includes the Portfolio and other Portfolios of the Fund not discussed in this summary, ABI paid approximately $600,000 in 2012 and expects to pay approximately $600,000 in 2013 for educational support and distribution assistance (revenue sharing payments).
The transfer agent of the Portfolio is AllianceBernstein Investor Services, Inc. (“ABIS”). During the most recently completed fiscal year, ABIS received a fee of $1,385 from the Portfolio.14
The Portfolio did not effect brokerage transactions through the Adviser’s affiliate, Sanford C. Bernstein & Co., LLC (“SCB & Co.”) nor its U.K. affiliate, Sanford C. Bernstein Limited (“SCB Ltd.”), collectively “SCB,” and pay commissions during the Portfolio’s most recently completed fiscal year. The Adviser represented that SCB’s profitability from business conducted in the future with the Portfolio would be comparable to the profitability of SCB’s dealings with other similar third party clients. In the ordinary course of business, SCB receives and pays liquidity rebates from electronic communications networks (“ECNs”) derived from trading for its clients, including the Portfolio. These credits and charges are not being passed onto any SCB client. The Adviser also receives certain soft dollar benefits from brokers that execute agency trades for the Portfolio and other clients. These soft dollar benefits reduce the Adviser’s cost of doing business and increase its profitability.
V. POSSIBLE ECONOMIES OF SCALE
The Adviser has indicated that economies of scale are being shared with shareholders through pricing to scale, breakpoints, fee reductions/waivers and enhancement to services.
In May 2012, an independent consultant, retained by the Senior Officer, provided the Board of Directors information on the Adviser’s firm-wide average costs from 2005 through 2011 and the potential economies of scale. The independent consultant noted that from 2005 through 2007 the Adviser experienced significant growth in assets under management (“AUM”). During this period, operating expenses increased, in part to keep up with growth, and in part reflecting market returns. However, from 2008 through the first quarter of 2009, AUM rapidly and significantly decreased due to declines in market value and client withdrawals. When AUM rapidly decreased, some operating expenses categories, including base compensation and office space, adjusted more slowly during this period, resulting in an increase in average costs. Since 2009, AUM has experienced less significant changes. The independent consultant noted that changes in operating expenses reflect changes in business composition and business practices in response to changes in financial markets. Finally, the independent consultant concluded that the increase in average cost and the decline in net operating margin across the Adviser since late 2008 are inconsistent with the view that there are currently reductions in average costs due to economies of scale that can be shared with the AllianceBernstein Mutual Funds managed by the Adviser through lower fees.
Previously in February 2008, the independent consultant provided the Board of Directors an update of the Deli study on advisory fees and various fund characteristics.15,16 The independent consultant first reiterated the results of his previous two
| 14 | The Fund, which includes the Portfolio and other Portfolios of the Fund paid ABIS a flat fee of $18,000 in 2012. |
| 15 | The Deli study, originally published in 2002 based on 1997 data and updated for the February 2008 Presentation, may be of diminished value due to the age of the data used in the presentation and the changes experienced in the industry over the last four years. |
| 16 | As mentioned previously, the Supreme Court cautioned against accepting mutual fund fee comparisons without careful scrutiny since the fees may not be the product of negotiations conducted at arm’s length. See Jones V. Harris at 1429. |
31
| LARGE CAP GROWTH PORTFOLIO | ||
| SENIOR OFFICER FEE EVALUATION | ||
| (continued) | AllianceBernstein Variable Products Series Fund |
dimensional comparison analysis (fund size and family size) with the Board of Directors.17 The independent consultant then discussed the results of the regression model that was utilized to study the effects of various factors on advisory fees. The regression model output indicated that the bulk of the variation in fees predicted were explained by various factors, but substantially by fund AUM, family AUM, index fund indicator and investment style. The independent consultant also compared the advisory fees of the AllianceBernstein Mutual Funds to similar funds managed by 19 other large asset managers, regardless of the fund size and each Adviser’s proportion of mutual fund assets to non-mutual fund assets.
VI. NATURE AND QUALITY OF THE ADVISER’S SERVICES, INCLUDING THE PERFORMANCE OF THE PORTFOLIO
With assets under management of approximately $443 billion as of March 31, 2013, the Adviser has the investment experience to manage and provide non-investment services (described in Section I) to the Portfolio.
The information prepared by Lipper shows the 1, 3, 5 and 10 year performance returns and rankings of the Portfolio18 relative to its Lipper Performance Group (“PG”) and Lipper Performance Universe (“PU”)19 for the periods ended February 28, 2013.20
| Portfolio (%) | PG Median (%) | PU Median (%) | PG Rank | PU Rank | ||||||||||||||||
Large Cap Growth Portfolio | ||||||||||||||||||||
1 year | 9.81 | 9.15 | 8.23 | 5/13 | 18/66 | |||||||||||||||
3 year | 10.74 | 11.53 | 11.95 | 9/13 | 44/62 | |||||||||||||||
5 year | 4.77 | 5.07 | 4.90 | 8/12 | 32/59 | |||||||||||||||
10 year | 7.27 | 7.84 | 7.95 | 10/11 | 44/52 | |||||||||||||||
Set forth below are the 1, 3, 5, 10 year and since inception performance returns of the Portfolio (in bold)21 versus its benchmarks.22 Portfolio and benchmark volatility and reward-to-variability ratio (“Sharpe Ratio”) information is also shown.23
Periods Ending February 28, 2013 Annualized Performance | ||||||||||||||||||||||||||||||||
1 Year | 3 Year | 5 Year | 10 Year | Since Inception (%) | Annualized | Risk Period (Year) | ||||||||||||||||||||||||||
| Volatility (%) | Sharpe (%) | |||||||||||||||||||||||||||||||
Large Cap Growth Portfolio | 9.81 | 10.74 | 4.77 | 7.27 | 8.43 | 16.44 | 0.40 | 10 | ||||||||||||||||||||||||
Russell 1000 Growth Index | 9.60 | 13.80 | 6.38 | 8.42 | 7.77 | 15.00 | 0.50 | 10 | ||||||||||||||||||||||||
Inception Date: June 26, 1992 | ||||||||||||||||||||||||||||||||
| 17 | The two dimensional analysis showed patterns of lower advisory fees for funds with larger asset sizes and funds from larger family sizes compared to funds with smaller asset sizes and funds from smaller family sizes, which according to the independent consultant is indicative of a sharing of economies of scale and scope. However, in less liquid and active markets, such is not the case, as the empirical analysis showed potential for diseconomies of scale in those markets. The empirical analysis also showed diminishing economies of scale and scope as funds surpassed a certain high level of assets. |
| 18 | The performance rankings are for the Class A shares of the Portfolio. The Portfolio’s performance returns shown were provided by Lipper. |
| 19 | The Portfolio’s PG is identical to the Portfolio’s respective EG. The Portfolio’s PU is not identical to the Portfolio’s EU as the criteria for including/excluding a fund from a PU is somewhat different from that of an EU. |
| 20 | Lipper investment classification/objective dictates the PG and PU throughout the life of the fund even if a fund had a different investment classification/objective at a different point in time. |
| 21 | The performance returns and risk measures shown in the table are for the Class A shares of the Portfolio. |
| 22 | The Adviser provided Portfolio and benchmark performance return information for periods through February 28, 2013. |
| 23 | Portfolio and benchmark volatility and Sharpe Ratio information was obtained through Lipper LANA, a database maintained by Lipper. Volatility is a statistical measure of the tendency of a market price or yield to vary over time. The Sharpe Ratio is a risk adjusted measure of return that divides a portfolio’s return in excess of the riskless return by the portfolio’s standard deviation. A portfolio with a greater volatility would be viewed as more risky than a portfolio with equivalent performance but lower volatility; for that reason, a greater return would be demanded for the more risky portfolio. A portfolio with a higher Sharpe Ratio would be viewed as better performing than a portfolio with a lower Sharpe Ratio. |
32
| AllianceBernstein Variable Products Series Fund |
CONCLUSION:
Based on the factors discussed above the Senior Officer’s conclusion is that the proposed advisory fee for the Portfolio is reasonable and within the range of what would have been negotiated at arm’s-length in light of all the surrounding circumstances. This conclusion in respect of the Portfolio is based on an evaluation of all of these factors and no single factor was dispositive.
Dated: May 29, 2013
33
VPS-LCG-0151-1213
AllianceBernstein
Variable Products Series Fund, Inc.
 | AllianceBernstein Real Estate Investment Portfolio |
December 31, 2013
Annual Report

ANNUAL REPORT
Investment Products Offered
| Ø | Are Not FDIC Insured |
| Ø | May Lose Value |
| Ø | Are Not Bank Guaranteed |
AllianceBernstein Investments, Inc. (ABI) is the distributor of the AllianceBernstein family of mutual funds. ABI is a member of FINRA and is an affiliate of AllianceBernstein L.P., the manager of the funds.
You may obtain a description of the Fund’s proxy voting policies and procedures, and information regarding how the Fund voted proxies relating to portfolio securities during the most recent 12-month period ended June 30, without charge. Simply visit AllianceBernstein’s website at www.alliancebernstein.com or go to the Securities and Exchange Commission’s (the “Commission”) website at www.sec.gov, or call AllianceBernstein at (800) 227-4618.
The Fund files its complete schedule of portfolio holdings with the Commission for the first and third quarters of each fiscal year on Form N-Q. The Fund’s Forms N-Q are available on the Commission’s website at www.sec.gov. The Fund’s Forms N-Q may also be reviewed and copied at the Commission’s Public Reference Room in Washington, DC; information on the operation of the Public Reference Room may be obtained by calling (800) SEC-0330.
AllianceBernstein® and the AB Logo are registered trademarks and service marks used by permission of the owner, AllianceBernstein L.P.
| REAL ESTATE INVESTMENT | ||
| PORTFOLIO | AllianceBernstein Variable Products Series Fund |
LETTER TO INVESTORS
February 7, 2014
The following is an update of AllianceBernstein Variable Products Series Fund—AllianceBernstein Real Estate Investment Portfolio (the “Portfolio”) for the annual reporting period ended December 31, 2013.
INVESTMENT OBJECTIVE AND POLICIES
The Portfolio’s investment objective is total return from long-term growth of capital and income. Under normal circumstances, the Portfolio invests at least 80% of its net assets in the equity securities of real estate investment trusts (“REITs”), and other real estate industry companies, such as real estate operating companies (“REOCs”). The Portfolio seeks to invest in real estate companies whose underlying portfolios are diversified geographically and by property type.
The Portfolio may invest in mortgage-backed securities, which are securities that directly or indirectly represent participations in, or are collateralized by and payable from, mortgage loans secured by real property. These securities include mortgage pass-through certificates, real estate mortgage investment conduit certificates (“REMICs”), and collateralized mortgage obligations, (“CMOs”). The Portfolio may also invest in short-term investment grade debt securities and other fixed-income securities.
The Portfolio invests in equity securities that include common stock, shares of beneficial interests of REITs and securities with common stock characteristics, such as preferred stock or convertible securities (“real estate equity securities”). The Portfolio may invest in foreign securities and enter into forward commitments and standby commitment agreements.
Currencies can have a dramatic impact on equity returns, significantly adding to returns in some years and greatly diminishing them in others. Currency and equity positions are evaluated separately. AllianceBernstein L.P. (the “Adviser”) may seek to hedge the currency exposure resulting from securities positions when it finds the currency exposure unattractive. To hedge all or a portion of its currency risk, the Portfolio may, from time to time, invest in currency-related derivatives, including forward currency exchange contracts, futures, options on futures, swaps and options. The Adviser may also seek investment opportunities by taking long or short positions in currencies through the use of currency-related derivatives.
The Portfolio may enter into other derivatives transactions, such as options, futures, forwards and swaps. The Portfolio may use options strategies involving the purchase and/or writing of various combinations of call and/or put options, including on individual securities and stock indices, futures contracts (including futures contracts on individual securities and stock indices) or shares of exchange-traded funds (“ETFs”). These transactions may be used, for example, to earn extra income, to adjust exposure to individual securities or markets, or to protect all or a portion of the Portfolio’s portfolio from a decline in value, sometimes within certain ranges.
The Portfolio may, at times, invest in shares of ETFs in lieu of making direct investments in equity securities. ETFs may provide more efficient and economical exposure to the type of companies and geographic locations in which the Portfolio seeks to invest than direct investments.
INVESTMENT RESULTS
The table on page 4 shows the Portfolio’s performance compared to its benchmark, the Financial Times Stock Exchange National Association of Real Estate Investment Trusts (“FTSE NAREIT”) Equity REIT Index, in addition to the broad market as measured by the Standard & Poor’s (“S&P”) 500 Index, for the one-, five- and 10-year periods ended December 31, 2013.
For the annual period ended December 31, 2013, all share classes of the Portfolio outperformed the benchmark. Sector selection was positive, helped primarily by an overweight to the outperforming lodging sector. Stock selection was positive in the specialty, health care and retail sectors, which was partially offset by negative stock selection in the lodging sector. The Portfolio did not hold derivatives, nor was performance affected by leverage during the annual period.
MARKET REVIEW AND INVESTMENT STRATEGY
Policy announcements by several of the world’s central banks and hopes for better global economic growth helped the U.S. real estate markets post a gain during the annual period. Most segments of the U.S. property market have been performing well. Many retail shopping centers have benefited from improving rents and occupancy. Occupancy levels at malls are now comparable to the levels reached during the peak of 2012. In the more economically-sensitive lodging sector, occupancy in many markets has also recovered to near the levels seen at the prior peak, which has resulted in increases in revenue per available room. In the office sector, conditions have begun to improve in urban central business districts and have stabilized in suburban markets. In the residential sector, the increase in new supply of multifamily apartments has resulted in slowing rent growth. The Portfolio’s Senior Investment Management Team has been finding opportunities across a wide group of sectors, focusing on attractively priced companies with improving fundamentals and strong balance sheets to withstand periods of renewed volatility.
1
| REAL ESTATE INVESTMENT PORTFOLIO | ||
| DISCLOSURESAND RISKS | AllianceBernstein Variable Products Series Fund | |
Benchmark Disclosure
Neither the unmanaged FTSE® NAREIT Equity REIT Index nor the unmanaged S&P® 500 Index reflect fees and expenses associated with the active management of a mutual fund portfolio. The FTSE NAREIT Equity REIT Index (market-value-weighted index based upon the last closing price of the month) represents the performance of tax-qualified REITs listed on the NYSE, AMEX and the NASDAQ. The S&P 500 Index includes 500 U.S. stocks and is a common representation of the performance of the overall U.S. stock market. An investor cannot invest directly in an index, and its results are not indicative of the performance for any specific investment, including the Portfolio.
A Word About Risk
Market Risk: The value of the Portfolio’s assets will fluctuate as the stock or bond market fluctuates. The value of its investments may decline, sometimes rapidly and unpredictably, simply because of economic changes or other events that affect large portions of the market.
Interest Rate Risk: Changes in interest rates will affect the value of investments in fixed-income securities. When interest rates rise, the value of investments in fixed-income securities tends to fall and this decrease in value may not be offset by higher income from new investments. Interest rate risk is generally greater for fixed-income securities with longer maturities or durations.
Credit Risk: An issuer or guarantor of a fixed-income security, or the counterparty to a derivatives or other contract, may be unable or unwilling to make timely payments of interest or principal, or to otherwise honor its obligations. The issuer or guarantor may default, causing a loss of the full principal amount of a security. The degree of risk for a particular security may be reflected in its credit rating. There is the possibility that the credit rating of a fixed-income security may be downgraded after purchase, which may adversely affect the value of the security. Investments in fixed-income securities with lower ratings tend to have a higher probability that an issuer will default or fail to meet its payment obligations.
Real Estate Risk: The Portfolio’s investments in the real estate market have many of the same risks as direct ownership of real estate, including the risk that the value of real estate could decline due to a variety of factors that affect the real estate market generally. Investments in REITs may have additional risks. REITs are dependent on the capability of their managers, may have limited diversification, and could be significantly affected by changes in tax laws.
Prepayment Risk: The value of mortgage-related or other asset-backed securities may be particularly sensitive to changes in prevailing interest rates. Early payments of principal on some of these securities may occur during periods of falling mortgage interest rates and expose the Portfolio to a lower rate of return upon reinvestment of principal. Early payments associated with these securities cause these securities to experience significantly greater price and yield volatility than is experienced by traditional fixed-income securities. During periods of rising interest rates, a reduction in prepayments may increase the effective life of mortgage-related securities, subjecting them to greater risk of decline in market value in response to rising interest rates. If the life of a mortgage-related security is inaccurately predicted, the Portfolio may not be able to realize the rate of return it expected.
Derivatives Risk: Derivatives may be illiquid, difficult to price, and leveraged so that small changes may produce disproportionate losses for the Portfolio, and may be subject to counterparty risk to a greater degree than more traditional investments.
Leverage Risk: To the extent the Portfolio uses leveraging techniques, its net asset value (“NAV”), may be more volatile because leverage tends to exaggerate the effect of changes in interest rates and any increase or decrease in the value of the Portfolio’s investments.
Foreign (Non-U.S.) Risk: Investments in securities of non-U.S. issuers may involve more risk than those of U.S. issuers. These securities may fluctuate more widely in price and may be less liquid due to adverse market, economic, political, regulatory or other factors.
Currency Risk: Fluctuations in currency exchange rates may negatively affect the value of the Portfolio’s investments or reduce its returns.
(Disclosures, Risks and Note about Historical Performance continued on next page)
2
| REAL ESTATE INVESTMENT PORTFOLIO | ||
| DISCLOSURESAND RISKS | ||
| (continued) | AllianceBernstein Variable Products Series Fund | |
Management Risk: The Portfolio is subject to management risk because it is an actively-managed investment fund. The Adviser will apply its investment techniques and risk analyses in making investment decisions for the Portfolio, but there is no guarantee that its techniques will produce the intended results.
These risks are fully discussed in the Variable Products prospectus.
An Important Note About Historical Performance
The investment return and principal value of an investment in the Portfolio will fluctuate, so that shares, when redeemed, may be worth more or less than their original cost. Performance shown on the following page represents past performance and does not guarantee future results. Current performance may be lower or higher than the performance information shown. Please contact your Financial Advisor or Insurance Agent Representative at your financial institution to obtain portfolio performance information current to the most recent month end.
Investors should consider the investment objectives, risks, charges and expenses of the Portfolio carefully before investing. For additional copies of the Portfolio’s prospectus or summary prospectus, which contains this and other information, call your financial advisor or 800.984.7654. Please read the prospectus and/or summary prospectus carefully before investing.
All fees and expenses related to the operation of the Portfolio have been deducted, but no adjustment has been made for insurance company separate account or annuity contract charges, which would reduce total return to a contract owner. Performance assumes reinvestment of distributions and does not account for taxes.
There are additional fees and expenses associated with all Variable Products. These fees can include mortality and expense risk charges, administrative charges, and other charges that can significantly reduce investment returns. Those fees and expenses are not reflected in this annual report. You should consult your Variable Products prospectus for a description of those fees and expenses and speak to your insurance agent or financial representative if you have any questions. You should read the prospectus before investing or sending money.
3
| REAL ESTATE INVESTMENT PORTFOLIO | ||
| HISTORICAL PERFORMANCE | AllianceBernstein Variable Products Series Fund | |
| THE PORTFOLIO VS. ITS BENCHMARK | NAV Returns | |||||||||||
| PERIODS ENDED DECEMBER 31, 2013 (unaudited) | 1 Year | 5 Years* | 10 Years* | |||||||||
AllianceBernstein Real Estate Investment Portfolio Class A | 4.20% | 17.63% | 9.75% | |||||||||
AllianceBernstein Real Estate Investment Portfolio Class B | 3.97% | 17.35% | 9.48% | |||||||||
FTSE NAREIT Equity REIT Index | 2.86% | 16.90% | 8.61% | |||||||||
S&P 500 Index | 32.39% | 17.94% | 7.41% | |||||||||
* Average annual returns.
Please keep in mind that high, double-digit returns are highly unusual and cannot be sustained. Investors should also be aware that these returns were primarily achieved during favorable market conditions.
|
| |||||||||||
The Portfolio’s current prospectus fee table shows the Portfolio’s total annual operating expense ratios as 0.84% and 1.10% for Class A and Class B, respectively. The Financial Highlights section of this report sets forth expense ratio data for the current reporting period; the expense ratios shown above may differ from the expense ratios in the Financial Highlights section since they are based on different time periods.
ALLIANCEBERNSTEIN REAL ESTATE INVESTMENT PORTFOLIO CLASS A
GROWTH OF A $10,000 INVESTMENT
12/31/03 – 12/31/13 (unaudited)

This chart illustrates the total value of an assumed $10,000 investment in AllianceBernstein Real Estate Investment Portfolio Class A shares (from 12/31/03 to 12/31/13) as compared to the performance of the Portfolio’s benchmark, the FTSE NAREIT Equity REIT Index and the broad market, as measured by the S&P 500 Index. The chart assumes the reinvestment of dividends and capital gains distributions.
See Disclosures, Risks and Note about Historical Performance on pages 2-3.
4
| REAL ESTATE INVESTMENT PORTFOLIO | ||
| EXPENSE EXAMPLE (unaudited) | AllianceBernstein Variable Products Series Fund | |
As a shareholder of the Fund, you incur two types of costs: (1) transaction costs, including sales charges (loads) on purchase payments, contingent deferred sales charges on redemptions and (2) ongoing costs, including management fees; distribution (12b-1) fees; and other Fund expenses. This example is intended to help you understand your ongoing costs (in dollars) of investing in the Fund and to compare these costs with the ongoing costs of investing in other mutual funds.
The Example is based on an investment of $1,000 invested at the beginning of the period and held for the entire period as indicated below.
Actual Expenses
The table below provides information about actual account values and actual expenses. You may use the information in this line, together with the amount you invested, to estimate the expenses that you paid over the period. Simply divide your account value by $1,000 (for example, an $8,600 account value divided by $1,000 = 8.6), then multiply the result by the number in the first line under the heading entitled “Expenses Paid During Period” to estimate the expenses you paid on your account during this period. The estimate of expenses does not include fees or other expenses of any variable insurance product. If such expenses were included, the estimate of expenses you paid during the period would be higher and your ending account value would be lower.
Hypothetical Example for Comparison Purposes
The table below provides information about hypothetical account values and hypothetical expenses based on the Fund’s actual expense ratio and an assumed annual rate of return of 5% before expenses, which is not the Fund’s actual return. The hypothetical account values and expenses may not be used to estimate the actual ending account balance or expenses you paid for the period. You may use this information to compare the ongoing costs of investing in the Fund and other funds by comparing this 5% hypothetical example with the 5% hypothetical examples that appear in the shareholder reports of other funds. The estimate of expenses does not include fees or other expenses of any variable insurance product. If such expenses were included, the estimate of expenses you paid during the period would be higher and your ending account value would be lower.
Please note that the expenses shown in the table are meant to highlight your ongoing costs only and do not reflect any transactional costs, such as sales charges (loads), or contingent deferred sales charges on redemptions. Therefore, the second line of each classes’ table is useful in comparing ongoing costs only, and will not help you determine the relative total costs of owning different funds. In addition, if these transactional costs were included, your costs would have been higher.
| Beginning Account Value July 1, 2013 | Ending Account Value December 31, 2013 | Expenses Paid During Period* | Annualized Expense Ratio* | |||||||||||||
Class A | ||||||||||||||||
Actual | $ | 1,000 | $ | 981.10 | $ | 4.69 | 0.94 | % | ||||||||
Hypothetical (5% annual return before expenses) | $ | 1,000 | $ | 1,020.47 | $ | 4.79 | 0.94 | % | ||||||||
Class B | ||||||||||||||||
Actual | $ | 1,000 | $ | 979.90 | $ | 6.24 | 1.25 | % | ||||||||
Hypothetical (5% annual return before expenses) | $ | 1,000 | $ | 1,018.90 | $ | 6.36 | 1.25 | % | ||||||||
| * | Expenses are equal to each classes’ annualized expense ratios, multiplied by the average account value over the period, multiplied by 184/365 (to reflect the one-half year period). |
5
| REAL ESTATE INVESTMENT PORTFOLIO | ||
| TEN LARGEST HOLDINGS* | ||
| December 31, 2013 (unaudited) | AllianceBernstein Variable Products Series Fund | |
| COMPANY | U.S. $ VALUE | PERCENT OF NET ASSETS | ||||||
Simon Property Group, Inc. | $ | 4,076,366 | 9.3 | % | ||||
American Tower Corp. | 1,506,203 | 3.4 | ||||||
SL Green Realty Corp. | 1,313,274 | 3.0 | ||||||
Public Storage | 1,297,482 | 3.0 | ||||||
ProLogis, Inc. | 1,234,943 | 2.8 | ||||||
Equity Residential | 1,228,281 | 2.8 | ||||||
Weyerhaeuser Co. | 1,160,829 | 2.6 | ||||||
General Growth Properties, Inc. | 1,083,981 | 2.5 | ||||||
AvalonBay Communities, Inc. | 974,215 | 2.2 | ||||||
Boston Properties, Inc. | 967,466 | 2.2 | ||||||
|
|
|
| |||||
| $ | 14,843,040 | 33.8 | % | |||||
INDUSTRY BREAKDOWN**
December 31, 2013 (unaudited)
| INDUSTRY | U.S. $ VALUE | PERCENT OF TOTAL INVESTMENTS | ||||||
Diversified/Specialty | $ | 10,900,308 | 24.9 | % | ||||
Multi-Family | 5,641,144 | 12.9 | ||||||
Regional Mall | 5,160,347 | 11.8 | ||||||
Health Care | 5,027,537 | 11.5 | ||||||
Office | 4,057,475 | 9.3 | ||||||
Lodging | 3,783,626 | 8.7 | ||||||
Shopping Center/Other Retail | 3,189,185 | 7.3 | ||||||
Industrial Warehouse Distribution | 2,713,388 | 6.2 | ||||||
Self Storage | 1,862,344 | 4.3 | ||||||
Mortgage | 817,954 | 1.9 | ||||||
Triple Net | 500,285 | 1.1 | ||||||
Short-Term Investments | 46,866 | 0.1 | ||||||
|
|
|
| |||||
Total Investments | $ | 43,700,459 | 100.0 | % | ||||
| * | Long-term investments. |
| ** | The Portfolio’s industry breakdown is expressed as a percentage of total investments (excluding security lending) and may vary over time. |
Please note: The industry classifications presented herein are based on the industry categorization methodology of the Adviser.
6
| REAL ESTATE INVESTMENT PORTFOLIO | ||
| PORTFOLIOOF INVESTMENTS | ||
| December 31, 2013 | AllianceBernstein Variable Products Series Fund | |
| Company | Shares | U.S. $ Value | ||||||
COMMON STOCKS–99.3% | ||||||||
EQUITY:OTHER–37.4% | ||||||||
DIVERSIFIED/SPECIALTY–24.8% | ||||||||
Altisource Residential Corp. | 10,570 | $ | 318,263 | |||||
American Tower Corp. | 18,870 | 1,506,203 | ||||||
Armada Hoffler Properties, Inc. | 28,300 | 262,624 | ||||||
BioMed Realty Trust, Inc. | 16,300 | 295,356 | ||||||
Chambers Street Properties(a) | 99,270 | 759,415 | ||||||
Corrections Corp. of America | 17,922 | 574,759 | ||||||
Digital Realty Trust, Inc.(a) | 9,280 | 455,834 | ||||||
Geo Group, Inc. (The) | 19,260 | 620,557 | ||||||
Gramercy Property Trust, Inc.(b) | 76,970 | 442,578 | ||||||
Kennedy-Wilson Holdings, Inc. | 30,530 | 679,292 | ||||||
Lexington Realty Trust(a) | 59,210 | 604,534 | ||||||
Plum Creek Timber Co., Inc. | 8,220 | 382,312 | ||||||
Rayonier, Inc. | 12,650 | 532,565 | ||||||
Regal Entertainment Group–Class A | 34,110 | 663,439 | ||||||
Spirit Realty Capital, Inc. | 93,760 | 921,661 | ||||||
Vornado Realty Trust | 8,110 | 720,087 | ||||||
Weyerhaeuser Co. | 36,770 | 1,160,829 | ||||||
|
| |||||||
| 10,900,308 | ||||||||
|
| |||||||
HEALTH CARE–11.4% | ||||||||
HCP, Inc. | 25,760 | 935,603 | ||||||
Health Care REIT, Inc. | 16,071 | 860,924 | ||||||
LTC Properties, Inc. | 20,600 | 729,034 | ||||||
Medical Properties Trust, Inc. | 62,395 | 762,467 | ||||||
Omega Healthcare Investors, Inc. | 15,960 | 475,608 | ||||||
Senior Housing Properties Trust | 15,680 | 348,566 | ||||||
Ventas, Inc. | 15,980 | 915,335 | ||||||
|
| |||||||
| 5,027,537 | ||||||||
|
| |||||||
TRIPLE NET–1.2% | ||||||||
EPR Properties | 3,970 | 195,165 | ||||||
National Retail Properties, Inc.(a) | 10,060 | 305,120 | ||||||
|
| |||||||
| 500,285 | ||||||||
|
| |||||||
| 16,428,130 | ||||||||
|
| |||||||
RETAIL–19.0% | ||||||||
REGIONAL MALL–11.7% | ||||||||
General Growth Properties, Inc. | 54,010 | 1,083,981 | ||||||
Simon Property Group, Inc. | 26,790 | 4,076,366 | ||||||
|
| |||||||
| 5,160,347 | ||||||||
|
| |||||||
SHOPPING CENTER/OTHER RETAIL–7.3% | ||||||||
DDR Corp. | 50,123 | 770,391 | ||||||
Inland Real Estate Corp. | 29,170 | 306,868 | ||||||
Kimco Realty Corp. | 23,780 | 469,655 | ||||||
Kite Realty Group Trust | 106,959 | 702,721 | ||||||
Ramco-Gershenson Properties Trust | 47,481 | 747,351 | ||||||
Retail Properties of America, Inc.–Class A | 15,110 | 192,199 | ||||||
|
| |||||||
| 3,189,185 | ||||||||
|
| |||||||
| 8,349,532 | ||||||||
|
| |||||||
RESIDENTIAL–17.1% | ||||||||
MULTI-FAMILY–12.8% | ||||||||
Apartment Investment & Management Co.–Class A | 9,960 | $ | 258,064 | |||||
Associated Estates Realty Corp. | 45,560 | 731,238 | ||||||
AvalonBay Communities, Inc. | 8,240 | 974,215 | ||||||
Brookfield Residential Properties, Inc.(b) | 19,653 | 475,406 | ||||||
Camden Property Trust | 2,010 | 114,329 | ||||||
Equity Residential | 23,680 | 1,228,281 | ||||||
Home Properties, Inc. | 4,400 | 235,928 | ||||||
Mid-America Apartment Communities, Inc. | 14,310 | 869,189 | ||||||
Post Properties, Inc. | 4,190 | 189,514 | ||||||
Sun Communities, Inc. | 13,250 | 564,980 | ||||||
|
| |||||||
| 5,641,144 | ||||||||
|
| |||||||
SELF STORAGE–4.3% | ||||||||
CubeSmart | 25,420 | 405,195 | ||||||
Public Storage | 8,620 | 1,297,482 | ||||||
Sovran Self Storage, Inc. | 2,450 | 159,667 | ||||||
|
| |||||||
| 1,862,344 | ||||||||
|
| |||||||
| 7,503,488 | ||||||||
|
| |||||||
OFFICE–9.2% | ||||||||
OFFICE–9.2% | ||||||||
Boston Properties, Inc. | 9,639 | 967,466 | ||||||
Corporate Office Properties Trust | 6,870 | 162,750 | ||||||
Cousins Properties, Inc. | 65,919 | 678,966 | ||||||
Franklin Street Properties Corp. | 8,890 | 106,236 | ||||||
Government Properties Income Trust | 4,470 | 111,079 | ||||||
Parkway Properties, Inc./MD | 37,206 | 717,704 | ||||||
SL Green Realty Corp. | 14,216 | 1,313,274 | ||||||
|
| |||||||
| 4,057,475 | ||||||||
|
| |||||||
LODGING–8.6% | ||||||||
LODGING–8.6% | ||||||||
Ashford Hospitality Prime, Inc. | 17,442 | 317,444 | ||||||
Ashford Hospitality Trust, Inc. | 87,009 | 720,435 | ||||||
Chesapeake Lodging Trust | 13,470 | 340,656 | ||||||
DiamondRock Hospitality Co. | 72,170 | 833,563 | ||||||
Hersha Hospitality Trust | 132,810 | 739,752 | ||||||
Host Hotels & Resorts, Inc. | 36,200 | 703,728 | ||||||
Strategic Hotels & Resorts, Inc.(b) | 13,550 | 128,048 | ||||||
|
| |||||||
| 3,783,626 | ||||||||
|
| |||||||
INDUSTRIALS–6.2% | ||||||||
INDUSTRIAL WAREHOUSE DISTRIBUTION–6.2% | ||||||||
Granite Real Estate Investment Trust | 19,780 | 721,772 | ||||||
ProLogis, Inc. | 33,422 | 1,234,943 | ||||||
STAG Industrial, Inc. | 37,110 | 756,673 | ||||||
|
| |||||||
| 2,713,388 | ||||||||
|
| |||||||
MORTGAGE–1.8% | ||||||||
MORTGAGE–1.8% | ||||||||
NorthStar Realty Finance Corp. | 28,460 | 382,787 | ||||||
Starwood Property Trust, Inc. | 15,710 | 435,167 | ||||||
|
| |||||||
| 817,954 | ||||||||
|
| |||||||
Total Common Stocks | 43,653,593 | |||||||
|
| |||||||
7
| REAL ESTATE INVESTMENT PORTFOLIO | ||
| PORTFOLIOOF INVESTMENTS | ||
| (continued) | AllianceBernstein Variable Products Series Fund | |
| Principal Amount (000) | U.S. $ Value | |||||||
SHORT-TERM INVESTMENTS–0.1% | ||||||||
TIME DEPOSIT–0.1% | ||||||||
State Street Time Deposit | $ | 47 | $ | 46,866 | ||||
|
| |||||||
Total Investments Before Security Lending Collateral for Securities Loaned – 99.4% (cost $39,717,607) | 43,700,459 | |||||||
|
| |||||||
| Shares | ||||||||
INVESTMENTS OF CASH COLLATERAL FOR SECURITIES | ||||||||
INVESTMENT | ||||||||
AllianceBernstein Exchange Reserves–Class I, 0.07%(c) (cost $2,191,725) | 2,191,725 | $ | 2,191,725 | |||||
|
| |||||||
TOTAL | 45,892,184 | |||||||
Other assets less | (1,922,143 | ) | ||||||
|
| |||||||
NET ASSETS–100.0% | $ | 43,970,041 | ||||||
|
| |||||||
8
| (a) | Represents entire or partial securities out on loan. See Note E for securities lending information. |
| (b) | Non-income producing security. |
| (c) | Investment in affiliated money market mutual fund. The rate shown represents the 7-day yield as of period end. |
Glossary:
REIT—Real Estate Investment Trust
See notes to financial statements.
| REAL ESTATE INVESTMENT PORTFOLIO | ||
| STATEMENT OF ASSETS & LIABILITIES | ||
| December 31, 2013 | AllianceBernstein Variable Products Series Fund | |
ASSETS | ||||
Investments in securities, at value | ||||
Unaffiliated issuers (cost $39,717,607) | $ | 43,700,459 | (a) | |
Affiliated issuers (cost $2,191,725–investment of cash collateral for securities loaned) | 2,191,725 | |||
Foreign currencies, at value (cost $9,320) | 9,440 | |||
Dividends and interest receivable | 227,169 | |||
Receivable for investment securities sold | 152,653 | |||
Receivable for capital stock sold | 116,099 | |||
|
| |||
Total assets | 46,397,545 | |||
|
| |||
LIABILITIES | ||||
Payable for collateral received on securities loaned | 2,191,725 | |||
Payable for capital stock redeemed | 128,901 | |||
Advisory fee payable | 19,804 | |||
Administrative fee payable | 14,445 | |||
Distribution fee payable | 2,527 | |||
Transfer Agent fee payable | 112 | |||
Accrued expenses | 69,990 | |||
|
| |||
Total liabilities | 2,427,504 | |||
|
| |||
NET ASSETS | $ | 43,970,041 | ||
|
| |||
COMPOSITION OF NET ASSETS | ||||
Capital stock, at par | $ | 3,930 | ||
Additional paid-in capital | 26,274,738 | |||
Undistributed net investment income | 1,633,063 | |||
Accumulated net realized gain on investment and foreign currency transactions | 12,075,319 | |||
Net unrealized appreciation on investments and foreign currency denominated assets and liabilities | 3,982,991 | |||
|
| |||
| $ | 43,970,041 | |||
|
|
Net Asset Value Per Share—1 billion shares of capital stock authorized, $.001 par value
| Class | Net Assets | Shares Outstanding | Net Asset Value | |||||||||
A | $ | 31,575,861 | 2,825,236 | $ | 11.18 | |||||||
B | $ | 12,394,180 | 1,104,993 | $ | 11.22 | |||||||
| (a) | Includes securities on loan with a value of $2,124,903 (see Note E). |
See notes to financial statements.
9
| REAL ESTATE INVESTMENT PORTFOLIO | ||
| STATEMENT OF OPERATIONS | ||
| Year Ended December 31, 2013 | AllianceBernstein Variable Products Series Fund | |
INVESTMENT INCOME | ||||
Dividends | ||||
Unaffiliated issuers (net of foreign taxes withheld of $8,084) | $ | 2,230,986 | ||
Affiliated issuers | 1,401 | |||
Interest | 97 | |||
Securities lending income | 14,275 | |||
|
| |||
| 2,246,759 | ||||
|
| |||
EXPENSES | ||||
Advisory fee (see Note B) | 431,175 | |||
Distribution fee—Class B | 34,520 | |||
Transfer agency—Class A | 4,621 | |||
Transfer agency—Class B | 1,079 | |||
Custodian | 82,004 | |||
Administrative | 55,158 | |||
Audit | 47,438 | |||
Legal | 30,562 | |||
Printing | 16,199 | |||
Directors’ fees | 4,541 | |||
Miscellaneous | 6,404 | |||
|
| |||
Total expenses | 713,701 | |||
|
| |||
Net investment income | 1,533,058 | |||
|
| |||
REALIZED AND UNREALIZED GAIN (LOSS) ON INVESTMENT AND FOREIGN CURRENCY TRANSACTIONS | ||||
Net realized gain (loss) on: | ||||
Investment transactions | 12,207,213 | |||
Foreign currency transactions | (7,623 | ) | ||
Net change in unrealized appreciation/depreciation of: | ||||
Investments | (9,677,379 | ) | ||
Foreign currency denominated assets and liabilities | (345 | ) | ||
|
| |||
Net gain on investment and foreign currency transactions | 2,521,866 | |||
|
| |||
NET INCREASE IN NET ASSETS FROM OPERATIONS | $ | 4,054,924 | ||
|
|
See notes to financial statements.
10
| REAL ESTATE INVESTMENT PORTFOLIO | ||
| STATEMENTOF CHANGESIN NET ASSETS | AllianceBernstein Variable Products Series Fund | |
| Year Ended December 31, 2013 | Year Ended December 31, 2012 | |||||||
INCREASE (DECREASE) IN NET ASSETS FROM OPERATIONS | ||||||||
Net investment income | $ | 1,533,058 | $ | 1,163,918 | ||||
Net realized gain on investment and foreign currency transactions | 12,199,590 | 9,114,364 | ||||||
Net change in unrealized appreciation/depreciation of investments and foreign currency denominated assets and liabilities | (9,677,724 | ) | 4,992,332 | |||||
|
|
|
| |||||
Net increase in net assets from operations | 4,054,924 | 15,270,614 | ||||||
DIVIDENDS AND DISTRIBUTIONS TO SHAREHOLDERS FROM | ||||||||
Net investment income | ||||||||
Class A | (1,092,258 | ) | (725,260 | ) | ||||
Class B | (167,764 | ) | (124,087 | ) | ||||
Net realized gain on investment transactions | ||||||||
Class A | (7,572,992 | ) | (7,794,055 | ) | ||||
Class B | (1,408,799 | ) | (1,707,830 | ) | ||||
CAPITAL STOCK TRANSACTIONS | ||||||||
Net increase (decrease) | (33,459,009 | ) | 2,067,707 | |||||
|
|
|
| |||||
Total increase (decrease) | (39,645,898 | ) | 6,987,089 | |||||
NET ASSETS | ||||||||
Beginning of period | 83,615,939 | 76,628,850 | ||||||
|
|
|
| |||||
End of period (including undistributed net investment income of $1,633,063 and $1,367,650, respectively) | $ | 43,970,041 | $ | 83,615,939 | ||||
|
|
|
| |||||
See notes to financial statements.
11
| REAL ESTATE INVESTMENT PORTFOLIO | ||
| NOTESTO FINANCIAL STATEMENTS | ||
| December 31, 2013 | AllianceBernstein Variable Products Series Fund | |
NOTE A: Significant Accounting Policies
The AllianceBernstein Real Estate Investment Portfolio (the “Portfolio”) is a series of AllianceBernstein Variable Products Series Fund, Inc. (the “Fund”). The Portfolio’s investment objective is total return from long-term growth of capital and income. The Portfolio is diversified as defined under the Investment Company Act of 1940. The Fund was incorporated in the State of Maryland on November 17, 1987, as an open-end series investment company. The Fund offers thirteen separately managed pools of assets which have differing investment objectives and policies. The Portfolio offers Class A and Class B shares. Both classes of shares have identical voting, dividend, liquidating and other rights, except that Class B shares bear a distribution expense and have exclusive voting rights with respect to the Class B distribution plan.
The Portfolio offers and sells its shares only to separate accounts of certain life insurance companies for the purpose of funding variable annuity contracts and variable life insurance policies. Sales are made without a sales charge at the Portfolio’s net asset value per share.
The financial statements have been prepared in conformity with U.S. generally accepted accounting principles (“U.S. GAAP”) which require management to make certain estimates and assumptions that affect the reported amounts of assets and liabilities in the financial statements and amounts of income and expenses during the reporting period. Actual results could differ from those estimates. The following is a summary of significant accounting policies followed by the Portfolio.
1. Security Valuation
Portfolio securities are valued at their current market value determined on the basis of market quotations or, if market quotations are not readily available or are deemed unreliable, at “fair value” as determined in accordance with procedures established by and under the general supervision of the Fund’s Board of Directors (the “Board”).
In general, the market values of securities which are readily available and deemed reliable are determined as follows: securities listed on a national securities exchange (other than securities listed on the NASDAQ Stock Market, Inc. (“NASDAQ”)) or on a foreign securities exchange are valued at the last sale price at the close of the exchange or foreign securities exchange. If there has been no sale on such day, the securities are valued at the last traded price from the previous day. Securities listed on more than one exchange are valued by reference to the principal exchange on which the securities are traded; securities listed only on NASDAQ are valued in accordance with the NASDAQ Official Closing Price; listed or over the counter (“OTC”) market put or call options are valued at the mid level between the current bid and ask prices. If either a current bid or current ask price is unavailable, AllianceBernstein L.P. (the “Adviser”) will have discretion to determine the best valuation (e.g. last trade price in the case of listed options); open futures are valued using the closing settlement price or, in the absence of such a price, the most recent quoted bid price. If there are no quotations available for the day of valuation, the last available closing settlement price is used; U.S. government securities and other debt instruments having 60 days or less remaining until maturity are valued at amortized cost if their original maturity was 60 days or less; or by amortizing their fair value as of the 61st day prior to maturity if their original term to maturity exceeded 60 days; fixed-income securities, including mortgage-backed and asset-backed securities, may be valued on the basis of prices provided by a pricing service or at a price obtained from one or more of the major broker-dealers. In cases where broker-dealer quotes are obtained, the Adviser may establish procedures whereby changes in market yields or spreads are used to adjust, on a daily basis, a recently obtained quoted price on a security. Swaps and other derivatives are valued daily, primarily using independent pricing services, independent pricing models using market inputs, as well as third party broker-dealers or counterparties. Investment companies are valued at their net asset value each day.
Securities for which market quotations are not readily available (including restricted securities) or are deemed unreliable are valued at fair value. Factors considered in making this determination may include, but are not limited to, information obtained by contacting the issuer, analysts, analysis of the issuer’s financial statements or other available documents. In addition, the Portfolio may use fair value pricing for securities primarily traded in non-U.S. markets because most foreign markets close well before the Portfolio values its securities at 4:00 p.m., Eastern Time. The earlier close of these foreign markets gives rise to the possibility that significant events, including broad market moves, may have occurred in the interim and may materially affect the value of those securities. To account for this, the Portfolio may frequently value many of its foreign equity securities using fair value prices based on third party vendor modeling tools to the extent available.
2. Fair Value Measurements
In accordance with U.S. GAAP regarding fair value measurements, fair value is defined as the price that the Portfolio would receive to sell an asset or pay to transfer a liability in an orderly transaction between market participants at the measurement
12
| AllianceBernstein Variable Products Series Fund |
date. U.S. GAAP establishes a framework for measuring fair value, and a three-level hierarchy for fair value measurements based upon the transparency of inputs to the valuation of an asset or liability (including those valued based on their market values as described in Note A.1 above). Inputs may be observable or unobservable and refer broadly to the assumptions that market participants would use in pricing the asset or liability. Observable inputs reflect the assumptions market participants would use in pricing the asset or liability based on market data obtained from sources independent of the Portfolio. Unobservable inputs reflect the Portfolio’s own assumptions about the assumptions that market participants would use in pricing the asset or liability based on the best information available in the circumstances. Each investment is assigned a level based upon the observability of the inputs which are significant to the overall valuation. The three-tier hierarchy of inputs is summarized below.
| • | Level 1—quoted prices in active markets for identical investments |
| • | Level 2—other significant observable inputs (including quoted prices for similar investments, interest rates, prepayment speeds, credit risk, etc.) |
| • | Level 3—significant unobservable inputs (including the Portfolio’s own assumptions in determining the fair value of investments) |
Where readily available market prices or relevant bid prices are not available for certain equity investments, such investments may be valued based on similar publicly traded investments, movements in relevant indices since last available prices or based upon underlying company fundamentals and comparable company data (such as multiples to earnings or other multiples to equity). Where an investment is valued using an observable input, such as another publicly traded security, the investment will be classified as Level 2. If management determines that an adjustment is appropriate based on restrictions on resale, illiquidity or uncertainty, and such adjustment is a significant component of the valuation, the investment will be classified as Level 3. An investment will also be classified as Level 3 where management uses company fundamentals and other significant inputs to determine the valuation.
The following table summarizes the valuation of the Portfolio’s investments by the above fair value hierarchy levels as of December 31, 2013:
| Level 1 | Level 2 | Level 3 | Total | |||||||||||||
Investments in Securities: | ||||||||||||||||
Assets: | ||||||||||||||||
Common Stocks* | $ | 43,653,593 | $ | –0 | – | $ | –0 | – | $ | 43,653,593 | ||||||
Short-Term Investments | –0 | – | 46,866 | –0 | – | 46,866 | ||||||||||
Investments of Cash Collateral for Securities Loaned in Affiliated Money Market Fund | 2,191,725 | –0 | – | –0 | – | 2,191,725 | ||||||||||
|
|
|
|
|
|
|
| |||||||||
Total Investments in Securities | 45,845,318 | 46,866 | –0 | – | 45,892,184 | |||||||||||
Other Financial Instruments** | –0 | – | –0 | – | –0 | – | –0 | – | ||||||||
|
|
|
|
|
|
|
| |||||||||
Total^ | $ | 45,845,318 | $ | 46,866 | $ | –0 | – | $ | 45,892,184 | |||||||
|
|
|
|
|
|
|
| |||||||||
| * | See Portfolio of Investments for sector classifications. |
| ** | Other financial instruments are derivative instruments, such as futures, forwards and swap contracts, which are valued at the unrealized appreciation/depreciation on the instrument. |
| ^ | There were no transfers between Level 1 and Level 2 during the reporting period. |
The Portfolio recognizes all transfers between levels of the fair value hierarchy assuming the financial instruments were transferred at the beginning of the reporting period.
The Adviser has established a Valuation Committee (the “Committee”) which is responsible for overseeing the pricing and valuation of all securities held in the Portfolio. The Committee operates under pricing and valuation policies and procedures established by the Adviser and approved by the Board, including pricing policies which set forth the mechanisms and processes to be employed on a daily basis to implement these policies and procedures. In particular, the pricing policies describe how to determine market quotations for securities and other instruments. The Committee’s responsibilities include: 1) fair value and liquidity determinations (and oversight of any third parties to whom any responsibility for fair value and liquidity determinations is delegated), and 2) regular monitoring of the Adviser’s pricing and valuation policies and procedures and modification or enhancement of these policies and procedures (or recommendation of the modification of these policies and procedures) as the Committee believes appropriate.
13
| REAL ESTATE INVESTMENT PORTFOLIO | ||
| NOTESTO FINANCIAL STATEMENTS | ||
| (continued) | AllianceBernstein Variable Products Series Fund | |
The Committee is also responsible for monitoring the implementation of the pricing policies by the Adviser’s Pricing Group (the “Pricing Group”) and a third party which performs certain pricing functions in accordance with the pricing policies. The Pricing Group is responsible for the oversight of the third party on a day-to-day basis. The Committee and the Pricing Group perform a series of activities to provide reasonable assurance of the accuracy of prices including: 1) periodic vendor due diligence meetings, review of methodologies, new developments and processes at vendors, 2) daily comparison of security valuation versus prior day for all securities that exceeded established thresholds, and 3) daily review of unpriced, stale, and variance reports with exceptions reviewed by senior management and the Committee.
In addition, several processes outside of the pricing process are used to monitor valuation issues including: 1) performance and performance attribution reports are monitored for anomalous impacts based upon benchmark performance, and 2) portfolio managers review all portfolios for performance and analytics (which are generated using the Adviser’s prices).
3. Currency Translation
Assets and liabilities denominated in foreign currencies and commitments under forward currency exchange contracts are translated into U.S. dollars at the mean of the quoted bid and ask prices of such currencies against the U.S. dollar. Purchases and sales of portfolio securities are translated into U.S. dollars at the rates of exchange prevailing when such securities were acquired or sold. Income and expenses are translated into U.S. dollars at rates of exchange prevailing when accrued.
Net realized gain or loss on foreign currency transactions represents foreign exchange gains and losses from sales and maturities of foreign fixed income investments, foreign currency exchange contracts, holding of foreign currencies, currency gains or losses realized between the trade and settlement dates on foreign investment transactions, and the difference between the amounts of dividends, interest and foreign withholding taxes recorded on the Portfolio’s books and the U.S. dollar equivalent amounts actually received or paid. Net unrealized currency gains and losses from valuing foreign currency denominated assets and liabilities at period end exchange rates are reflected as a component of net unrealized appreciation or depreciation of foreign currency denominated assets and liabilities.
4. Taxes
It is the Portfolio’s policy to meet the requirements of the Internal Revenue Code applicable to regulated investment companies and to distribute all of its investment company taxable income and net realized gains, if any, to shareholders. Therefore, no provisions for federal income or excise taxes are required. The Portfolio may be subject to taxes imposed by countries in which it invests. Such taxes are generally based on income and/or capital gains earned or repatriated. Taxes are accrued and applied to net investment income, net realized gains and net unrealized appreciation/depreciation as such income and/or gains are earned.
In accordance with U.S. GAAP requirements regarding accounting for uncertainties in income taxes, management has analyzed the Portfolio’s tax positions taken or expected to be taken on federal and state income tax returns for all open tax years (the current and the prior three tax years) and has concluded that no provision for income tax is required in the Portfolio’s financial statements.
5. Investment Income and Investment Transactions
Dividend income is recorded on the ex-dividend date or as soon as the Portfolio is informed of the dividend. Interest income is accrued daily. Investment transactions are accounted for on the date the securities are purchased or sold. Investment gains or losses are determined on the identified cost basis. The Portfolio amortizes premiums and accretes discounts as adjustments to interest income.
6. Class Allocations
All income earned and expenses incurred by the Portfolio are borne on a pro-rata basis by each outstanding class of shares, based on the proportionate interest in the Portfolio represented by the net assets of such class, except for class specific expenses which are allocated to the respective class. Expenses of the Fund are charged proportionately to each Portfolio or based on other appropriate methods. Realized and unrealized gains and losses are allocated among the various share classes based on respective net assets.
7. Dividends and Distributions
Dividends and distributions to shareholders, if any, are recorded on the ex-dividend date. Income dividends and capital gains distributions are determined in accordance with federal tax regulations and may differ from those determined in accordance with U.S. GAAP. To the extent these differences are permanent, such amounts are reclassified within the capital accounts based on their federal tax basis treatment; temporary differences do not require such reclassification.
14
| AllianceBernstein Variable Products Series Fund |
NOTE B : Advisory Fee and Other Transactions with Affiliates
Under the terms of the investment advisory agreement, the Portfolio pays the Adviser an advisory fee at an annual rate of .55% of the first $2.5 billion, .45% of the next $2.5 billion and .40% in excess of $5 billion, of the Portfolio’s average daily net assets. The fee is accrued daily and paid monthly.
Pursuant to the investment advisory agreement, the Portfolio may reimburse the Adviser for certain legal and accounting services provided to the Portfolio by the Adviser. For the year ended December 31, 2013, the reimbursement for such services amounted to $55,158.
Brokerage commissions paid on investment transactions for the year ended December 31, 2013 amounted to $251,843, of which $979 and $0, respectively, was paid to Sanford C. Bernstein & Co. LLC and Sanford C. Bernstein Limited, affiliates of the Adviser.
The Portfolio compensates AllianceBernstein Investor Services, Inc. (“ABIS”), a wholly-owned subsidiary of the Adviser, under a Transfer Agency Agreement for providing personnel and facilities to perform transfer agency services for the Portfolio. Such compensation retained by ABIS amounted to $1,385 for the year ended December 31, 2013.
NOTE C: Distribution Plan
The Portfolio has adopted a Distribution Plan (the “Plan”) for Class B shares pursuant to Rule 12b-1 under the Investment Company Act of 1940. Under the Plan, the Portfolio pays distribution and servicing fees to AllianceBernstein Investments, Inc. (the “Distributor”), a wholly-owned subsidiary of the Adviser, at an annual rate of up to .50% of the Portfolio’s average daily net assets attributable to Class B shares. The fees are accrued daily and paid monthly. The Board currently limits payments under the Plan to .25% of the Portfolio’s average daily net assets attributable to Class B shares. The Plan provides that the Distributor will use such payments in their entirety for distribution assistance and promotional activities.
The Portfolio is not obligated under the Plan to pay any distribution and servicing fees in excess of the amounts set forth above. The purpose of the payments to the Distributor under the Plan is to compensate the Distributor for its distribution services with respect to the sale of the Portfolio’s Class B shares. Since the Distributor’s compensation is not directly tied to its expenses, the amount of compensation received by it under the Plan during any year may be more or less than its actual expenses. For this reason, the Plan is characterized by the staff of the Securities and Exchange Commission as being of the “compensation” variety.
In the event that the Plan is terminated or not continued, no distribution or servicing fees (other than current amounts accrued but not yet paid) would be owed by the Portfolio to the Distributor.
The Plan also provides that the Adviser may use its own resources to finance the distribution of the Portfolio’s shares.
NOTE D: Investment Transactions
Purchases and sales of investment securities (excluding short-term investments) for the year ended December 31, 2013 were as follows:
| Purchases | Sales | |||||||
Investment securities (excluding U.S. government securities) | $ | 75,802,365 | $ | 115,984,591 | ||||
U.S. government securities | –0 | – | –0 | – | ||||
The cost of investments for federal income tax purposes, gross unrealized appreciation and unrealized depreciation (excluding foreign currency transactions) are as follows:
Cost | $ | 42,080,591 | ||
|
| |||
Gross unrealized appreciation | $ | 5,565,802 | ||
Gross unrealized depreciation | (1,754,209 | ) | ||
|
| |||
Net unrealized appreciation | $ | 3,811,593 | ||
|
|
1. Derivative Financial Instruments
The Portfolio may use derivatives in an effort to earn income and enhance returns, to replace more traditional direct investments, to obtain exposure to otherwise inaccessible markets (collectively, “investment purposes”), or to hedge or adjust the risk profile of its portfolio.
The Portfolio did not engage in derivatives transactions for the year ended December 31, 2013.
15
| REAL ESTATE INVESTMENT PORTFOLIO | ||
| NOTESTO FINANCIAL STATEMENTS | ||
| (continued) | AllianceBernstein Variable Products Series Fund | |
2. Currency Transactions
The Portfolio may invest in non-U.S. dollar securities on a currency hedged or unhedged basis. The Portfolio may seek investment opportunities by taking long or short positions in currencies through the use of currency-related derivatives, including forward currency exchange contracts, futures and options on futures, swaps, and other options. The Portfolio may enter into transactions for investment opportunities when it anticipates that a foreign currency will appreciate or depreciate in value but securities denominated in that currency are not held by the Portfolio and do not present attractive investment opportunities. Such transactions may also be used when the Adviser believes that it may be more efficient than a direct investment in a foreign currency-denominated security. The Portfolio may also conduct currency exchange contracts on a spot basis (i.e., for cash at the spot rate prevailing in the currency exchange market for buying or selling currencies).
NOTE E: Securities Lending
The Portfolio may enter into securities lending transactions. Under the Portfolio’s securities lending program, all loans of securities will be collateralized continually by cash. The Portfolio will be compensated for the loan from a portion of the net return from the income earned on cash collateral after a rebate is paid to the borrower (in some cases, this rebate may be a “negative rebate” or fee paid by the borrower to the Portfolio in connection with the loan), and payments are made for fees of the securities lending agent and for certain other administrative expenses. It is the policy of the Portfolio to receive collateral consisting of cash in an amount exceeding the value of the securities loaned. The Portfolio will have the right to call a loan and obtain the securities loaned at any time on notice to the borrower within the normal and customary settlement time for the securities. While the securities are on loan, the borrower is obligated to pay the Portfolio amounts equal to any income or other distributions from the securities. The Portfolio will not have the right to vote any securities during the existence of a loan, but will have the right to regain ownership of loaned securities in order to exercise voting or other ownership rights. The lending agent has agreed to indemnify the Portfolio in the case of default of any securities borrower. Collateral received and securities loaned are marked to market daily to ensure that the securities loaned are secured by collateral. The lending agent will invest the cash collateral received in AllianceBernstein Exchange Reserves, an eligible money market vehicle, in accordance with the investment restrictions of the Portfolio, and as approved by the Board. The collateral received on securities loaned is recorded as an asset as well as a corresponding liability in the statement of assets and liabilities. When the Portfolio lends securities, its investment performance will continue to reflect changes in the value of the securities loaned. At December 31, 2013, the Portfolio had securities on loan with a value of $2,124,903 and had received cash collateral which has been invested into AllianceBernstein Exchange Reserves of $2,191,725. The cash collateral will be adjusted on the next business day to maintain the required collateral amount. The Portfolio earned securities lending income of $14,275 and $1,401 from the borrowers and AllianceBernstein Exchange Reserves, respectively, for the year ended December 31, 2013; these amounts are reflected in the statement of operations. A principal risk of lending portfolio securities is that the borrower will fail to return the loaned securities upon termination of the loan and that the collateral will not be sufficient to replace the loaned securities. A summary of the Portfolio’s transactions in shares of AllianceBernstein Exchange Reserves for the year ended December 31, 2013 is as follows:
Market Value December 31, 2012 (000) | Purchases at Cost (000) | Sales Proceeds (000) | Market Value December 31, 2013 (000) | |||||||||||
| $ | 3,627 | $ | 68,605 | $ | 70,040 | $ | 2,192 | |||||||
16
| AllianceBernstein Variable Products Series Fund |
NOTE F : Capital Stock
Each class consists of 500,000,000 authorized shares. Transactions in capital shares for each class were as follows:
| SHARES | AMOUNT | |||||||||||||||||
| Year Ended December 31, 2013 | Year Ended December 31, 2012 | Year Ended December 31, 2013 | Year Ended December 31, 2012 | |||||||||||||||
Class A | ||||||||||||||||||
Shares sold | 524,528 | 526,781 | $ | 6,706,724 | $ | 6,564,576 | ||||||||||||
Shares issued in reinvestment of dividends and distributions | 793,521 | 723,201 | 8,665,250 | 8,519,314 | ||||||||||||||
Shares redeemed | (4,211,856 | ) | (981,046 | ) | (48,665,290 | ) | (12,236,787 | ) | ||||||||||
|
|
|
|
|
|
|
| |||||||||||
Net increase (decrease) | (2,893,807 | ) | 268,936 | $ | (33,293,316 | ) | $ | 2,847,103 | ||||||||||
|
|
|
|
|
|
|
| |||||||||||
Class B | ||||||||||||||||||
Shares sold | 173,655 | 159,102 | $ | 2,176,681 | $ | 2,021,568 | ||||||||||||
Shares issued in reinvestment of dividends and distributions | 143,716 | 154,985 | 1,576,563 | 1,831,918 | ||||||||||||||
Shares redeemed | (317,045 | ) | (375,770 | ) | (3,918,937 | ) | (4,632,882 | ) | ||||||||||
|
|
|
|
|
|
|
| |||||||||||
Net increase (decrease) | 326 | (61,683 | ) | $ | (165,693 | ) | $ | (779,396 | ) | |||||||||
|
|
|
|
|
|
|
| |||||||||||
NOTE G: Risks Involved in Investing in the Portfolio
Concentration of Risk—Although the Portfolio does not invest directly in real estate, it invests primarily in real estate equity securities and has a policy of concentration of its investments in the real estate industry. Therefore, an investment in the Portfolio is subject to certain risks associated with the direct ownership of real estate and with the real estate industry in general. To the extent that assets underlying the Portfolio’s investments are concentrated geographically, by property type or in certain other respects, the Portfolio may be subject to additional risks.
In addition, investing in Real Estate Investment Trusts (“REITs”) involves certain unique risks in addition to those risks associated with investing in the real estate industry in general. REITs are dependent upon management skills, are not diversified, and are subject to heavy cash flow dependency, default by borrowers and self-liquidation. REITs are also subject to the possibilities of failing to qualify for tax-free pass-through of income under the Internal Revenue Code and failing to maintain their exemptions from registration under the 1940 Act. REITs (especially mortgage REITs) also are subject to interest rate risks.
Currency Risk—This is the risk that changes in foreign currency exchange rates may negatively affect the value of the Portfolio’s investments or reduce the returns of the Portfolio. For example, the value of the Portfolio’s investments in foreign currency-denominated securities or currencies may decrease if the U.S. dollar is strong (i.e., gaining value relative to other currencies) and other currencies are weak (i.e., losing value relative to the U.S. dollar). Currency markets are generally not as regulated as securities markets. Independent of the Portfolio’s investments denominated in foreign currencies, the Portfolio’s positions in various foreign currencies may cause the Portfolio to experience investment losses due to the changes in exchange rates and interest rates.
Derivatives Risk—The Portfolio may enter into derivative transactions such as forwards, options, futures and swaps. Derivatives may be illiquid, difficult to price, and leveraged so that small changes may produce disproportionate losses for the Portfolio, and subject to counterparty risk to a greater degree than more traditional investments. Derivatives may result in significant losses, including losses that are far greater than the value of the derivatives reflected in the statement of assets and liabilities.
Indemnification Risk—In the ordinary course of business, the Portfolio enters into contracts that contain a variety of indemnifications. The Portfolio’s maximum exposure under these arrangements is unknown. However, the Portfolio has not had prior claims or losses pursuant to these indemnification provisions and expects the risk of loss thereunder to be remote. Therefore, the Portfolio has not accrued any liability in connection with these indemnification provisions.
17
| REAL ESTATE INVESTMENT PORTFOLIO | ||
| NOTES TO FINANCIAL STATEMENTS | ||
| (continued) | AllianceBernstein Variable Products Series Fund | |
NOTE H: Joint Credit Facility
A number of open-end mutual funds managed by the Adviser, including the Portfolio, participate in a $140 million revolving credit facility (the “Facility”) intended to provide short-term financing, if necessary, subject to certain restrictions in connection with abnormal redemption activity. Commitment fees related to the Facility are paid by the participating funds and are included in miscellaneous expenses in the statement of operations. The Portfolio did not utilize the Facility during the year ended December 31, 2013.
NOTE I: Distributions to Shareholders
The tax character of distributions paid during the fiscal years ended December 31, 2013 and December 31, 2012 were as follows:
| 2013 | 2012 | |||||||
Distributions paid from: | ||||||||
Ordinary income | $ | 3,797,777 | $ | 1,915,205 | ||||
Net long-term capital gains | 6,444,036 | 8,436,027 | ||||||
|
|
|
| |||||
Total taxable distributions paid | $ | 10,241,813 | $ | 10,351,232 | ||||
|
|
|
| |||||
As of December 31, 2013, the components of accumulated earnings/(deficit) on a tax basis were as follows:
Undistributed ordinary income | $ | 4,095,200 | ||
Undistributed net capital gain | 9,784,440 | |||
Unrealized appreciation/(depreciation) | 3,811,732 | (a) | ||
|
| |||
Total accumulated earnings/(deficit) | $ | 17,691,372 | ||
|
|
| (a) | The difference between book-basis and tax-basis unrealized appreciation/(depreciation) is attributable primarily to the tax deferral of losses on wash sales. |
For tax purposes, net capital losses may be carried over to offset future capital gains, if any. Funds are permitted to carry forward capital losses incurred in taxable years beginning after December 22, 2010 for an indefinite period, and such losses will retain their character as either short-term or long-term capital losses. As of December 31, 2013, the Portfolio did not have any capital loss carryforwards.
During the current fiscal year, permanent differences primarily due to foreign currency reclassifications resulted in a net decrease in undistributed net investment income and a net increase in accumulated net realized gain on investment and foreign currency transactions. These reclassifications had no effect on net assets.
NOTE J: Subsequent Events
Management has evaluated subsequent events for possible recognition or disclosure in the financial statements through the date the financial statements are issued. Management has determined that there are no material events that would require disclosure in the Portfolio’s financial statements through this date.
18
| REAL ESTATE INVESTMENT PORTFOLIO | ||
| FINANCIAL HIGHLIGHTS | AllianceBernstein Variable Products Series Fund | |
Selected Data For A Share Of Capital Stock Outstanding Throughout Each Period
| CLASS A | ||||||||||||||||||||
| Year Ended December 31, | ||||||||||||||||||||
| 2013 | 2012 | 2011 | 2010 | 2009 | ||||||||||||||||
Net asset value, beginning of period | $ | 12.25 | $ | 11.58 | $ | 12.02 | $ | 9.64 | $ | 7.86 | ||||||||||
|
|
|
|
|
|
|
|
|
| |||||||||||
Income From Investment Operations | ||||||||||||||||||||
Net investment income (a) | .24 | .18 | .11 | .23 | .19 | |||||||||||||||
Net realized and unrealized gain on investment and foreign currency transactions | .24 | 2.21 | 1.02 | 2.30 | 1.98 | |||||||||||||||
|
|
|
|
|
|
|
|
|
| |||||||||||
Net increase in net asset value from operations | .48 | 2.39 | 1.13 | 2.53 | 2.17 | |||||||||||||||
|
|
|
|
|
|
|
|
|
| |||||||||||
Less: Dividends and Distributions | ||||||||||||||||||||
Dividends from net investment income | (.20 | ) | (.15 | ) | (.18 | ) | (.15 | ) | (.23 | ) | ||||||||||
Distributions from net realized gain on investment transactions | (1.35 | ) | (1.57 | ) | (1.39 | ) | –0 | – | (.16 | ) | ||||||||||
|
|
|
|
|
|
|
|
|
| |||||||||||
Total dividends and distributions | (1.55 | ) | (1.72 | ) | (1.57 | ) | (.15 | ) | (.39 | ) | ||||||||||
|
|
|
|
|
|
|
|
|
| |||||||||||
Net asset value, end of period | $ | 11.18 | $ | 12.25 | $ | 11.58 | $ | 12.02 | $ | 9.64 | ||||||||||
|
|
|
|
|
|
|
|
|
| |||||||||||
Total Return | ||||||||||||||||||||
Total investment return based on net asset value (b) | 4.20 | % | 21.19 | % | 9.03 | %* | 26.34 | % | 29.46 | % | ||||||||||
Ratios/Supplemental Data | ||||||||||||||||||||
Net assets, end of period (000’s omitted) | $ | 31,576 | $ | 70,048 | $ | 63,093 | $ | 66,493 | $ | 38,317 | ||||||||||
Ratio to average net assets of: | ||||||||||||||||||||
Expenses | .86 | % | .84 | % | .88 | % | .87 | %+ | 1.25 | % | ||||||||||
Net investment income | 1.92 | % | 1.49 | % | .91 | % | 2.15 | %+ | 2.50 | % | ||||||||||
Portfolio turnover rate | 98 | % | 110 | % | 114 | % | 132 | % | 94 | % | ||||||||||
See footnote summary on page 20.
19
| REAL ESTATE INVESTMENT PORTFOLIO | ||
| FINANCIAL HIGHLIGHTS | ||
| (continued) | AllianceBernstein Variable Products Series Fund | |
Selected Data For A Share Of Capital Stock Outstanding Throughout Each Period
| CLASS B | ||||||||||||||||||||
| Year Ended December 31, | ||||||||||||||||||||
| 2013 | 2012 | 2011 | 2010 | 2009 | ||||||||||||||||
Net asset value, beginning of period | $ | 12.28 | $ | 11.61 | $ | 12.05 | $ | 9.67 | $ | 7.86 | ||||||||||
|
|
|
|
|
|
|
|
|
| |||||||||||
Income From Investment Operations | ||||||||||||||||||||
Net investment income (a) | .27 | .15 | .08 | .20 | .20 | |||||||||||||||
Net realized and unrealized gain on investment and | .18 | 2.20 | 1.02 | 2.31 | 1.97 | |||||||||||||||
|
|
|
|
|
|
|
|
|
| |||||||||||
Net increase in net asset value from operations | .45 | 2.35 | 1.10 | 2.51 | 2.17 | |||||||||||||||
|
|
|
|
|
|
|
|
|
| |||||||||||
Less: Dividends and Distributions | ||||||||||||||||||||
Dividends from net investment income | (.16 | ) | (.11 | ) | (.15 | ) | (.13 | ) | (.20 | ) | ||||||||||
Distributions from net realized gain on investment transactions | (1.35 | ) | (1.57 | ) | (1.39 | ) | –0 | – | (.16 | ) | ||||||||||
|
|
|
|
|
|
|
|
|
| |||||||||||
Total dividends and distributions | (1.51 | ) | (1.68 | ) | (1.54 | ) | (.13 | ) | (.36 | ) | ||||||||||
|
|
|
|
|
|
|
|
|
| |||||||||||
Net asset value, end of period | $ | 11.22 | $ | 12.28 | $ | 11.61 | �� | $ | 12.05 | $ | 9.67 | |||||||||
|
|
|
|
|
|
|
|
|
| |||||||||||
Total Return | ||||||||||||||||||||
Total investment return based on net asset value (b) | 3.97 | % | 20.83 | % | 8.75 | %* | 26.05 | % | 29.22 | % | ||||||||||
Ratios/Supplemental Data | ||||||||||||||||||||
Net assets, end of period (000’s omitted) | $ | 12,394 | $ | 13,568 | $ | 13,536 | $ | 14,479 | $ | 12,517 | ||||||||||
Ratio to average net assets of: | ||||||||||||||||||||
Expenses | 1.15 | % | 1.10 | % | 1.13 | % | 1.13 | %+ | 1.53 | % | ||||||||||
Net investment income | 2.13 | % | 1.19 | % | .64 | % | 1.89 | %+ | 2.67 | % | ||||||||||
Portfolio turnover rate | 98 | % | 110 | % | 114 | % | 132 | % | 94 | % | ||||||||||
| (a) | Based on average shares outstanding. |
| (b) | Total investment return is calculated assuming an initial investment made at the net asset value at the beginning of the period, reinvestment of all dividends and distributions at net asset value during the period, and redemption on the last day of the period. Total return does not reflect (i) insurance company’s separate account related expense charges and (ii) the deductions of taxes that a shareholder would pay on Portfolio distributions or the redemption of Portfolio shares. Total investment return calculated for a period of less than one year is not annualized. |
| * | Includes the impact of proceeds received and credited to the Portfolio resulting from class action settlements, which enhanced the Portfolio’s performance for the year ended December 31, 2011 by 0.06%. |
| + | The ratio includes expenses attributable to costs of proxy solicitation. |
See notes to financial statements.
20
| REPORTOF INDEPENDENT REGISTERED | ||
| PUBLIC ACCOUNTING FIRM | AllianceBernstein Variable Products Series Fund | |
To the Board of Directors and Shareholders of AllianceBernstein Real Estate Investment Portfolio:
We have audited the accompanying statement of assets and liabilities, including the portfolio of investments, of AllianceBernstein Real Estate Investment Portfolio (one of the funds constituting AllianceBernstein Variable Products Series Fund, Inc. (the “Fund”)) as of December 31, 2013, and the related statement of operations for the year then ended, the statements of changes in net assets for each of the two years in the period then ended, and the financial highlights for each of the five years in the period then ended. These financial statements and financial highlights are the responsibility of the Fund’s management. Our responsibility is to express an opinion on these financial statements and financial highlights based on our audits.
We conducted our audits in accordance with the standards of the Public Company Accounting Oversight Board (United States). Those standards require that we plan and perform the audit to obtain reasonable assurance about whether the financial statements and financial highlights are free of material misstatement. We were not engaged to perform an audit of the Fund’s internal control over financial reporting. Our audits included consideration of internal control over financial reporting as a basis for designing audit procedures that are appropriate in the circumstances, but not for the purpose of expressing an opinion on the effectiveness of the Fund’s internal control over financial reporting. Accordingly, we express no such opinion. An audit also includes examining, on a test basis, evidence supporting the amounts and disclosures in the financial statements and financial highlights, assessing the accounting principles used and significant estimates made by management, and evaluating the overall financial statement presentation. Our procedures included confirmation of securities owned as of December 31, 2013, by correspondence with the custodian and others, or by other appropriate auditing procedures where replies from others were not received. We believe that our audits provide a reasonable basis for our opinion.
In our opinion, the financial statements and financial highlights referred to above present fairly, in all material respects, the financial position of AllianceBernstein Real Estate Investment Portfolio (one of the funds constituting AllianceBernstein Variable Products Series Fund, Inc.) at December 31, 2013, the results of its operations for the year then ended, the changes in its net assets for each of the two years in the period then ended, and the financial highlights for each of the five years in the period then ended, in conformity with U.S. generally accepted accounting principles.

New York, New York
February 14, 2014
21
| 2013 TAX INFORMATION (unaudited) | AllianceBernstein Variable Products Series Fund |
For Federal income tax purposes, the following information is furnished with respect to the distributions paid by the Portfolio during the taxable year ended December 31, 2013. For corporate shareholders, 0.20% of dividends paid qualify for the dividends received deduction.
22
| REAL ESTATE INVESTMENT | ||
| PORTFOLIO | AllianceBernstein Variable Products Series Fund |
| BOARDOF DIRECTORS | ||
Marshall C. Turner, Jr.(1), Chairman John H. Dobkin(1) Michael J. Downey(1) William H. Foulk, Jr.(1) D. James Guzy(1) | Nancy P. Jacklin(1) Robert M. Keith, President and Garry L. Moody(1) Earl D. Weiner(1) | |
| OFFICERS | ||
Philip L. Kirstein, Senior Vice President and Eric J. Franco(2), Vice President Emilie D. Wrapp, Secretary | Joseph J. Mantineo, Treasurer and Phyllis J. Clarke, Controller Vincent S. Noto, Chief Compliance Officer | |
| CUSTODIANAND ACCOUNTING AGENT | LEGAL COUNSEL | |
| State Street Bank and Trust Company | Seward & Kissel LLP | |
| One Lincoln Street | One Battery Park Plaza | |
| Boston, MA 02111 | New York, NY 10004 | |
| DISTRIBUTOR | TRANSFER AGENT | |
| AllianceBernstein Investments, Inc. | AllianceBernstein Investor Services, Inc. | |
| 1345 Avenue of the Americas | P.O. Box 786003 | |
| New York, NY 10105 | San Antonio, TX 78278-6003 | |
| Toll-Free 1-(800) 221-5672 | ||
| INDEPENDENT REGISTERED PUBLIC ACCOUNTING FIRM | ||
| Ernst & Young LLP | ||
| 5 Times Square | ||
| New York, NY 10036 |
| (1) | Member of the Audit Committee, the Governance and Nominating Committee and the Independent Directors Committee. Mr. Foulk is the sole member of the Fair Value Pricing Committee. |
| (2) | The day-to-day management of, and investment decisions for, the Portfolio’s portfolio are made by the REIT Senior Investment Management Team. Mr. Eric J. Franco is the investment professional with the most significant responsibility for the day-to-day management of the Portfolio’s portfolio. |
23
| REAL ESTATE INVESTMENT | ||
| PORTFOLIO | AllianceBernstein Variable Products Series Fund |
MANAGEMENTOFTHE FUND
Board of Directors Information
The business and affairs of the Fund are managed under the direction of the Board of Directors. Certain information concerning the Fund’s Directors is set forth below.
NAME, ADDRESS* (YEAR FIRST | PRINCIPAL OCCUPATION(S) DURING PAST FIVE YEARS AND OTHER | PORTFOLIOS IN FUND COMPLEX OVERSEEN BY DIRECTOR | OTHER DIRECTORSHIPS HELD BY DIRECTOR IN THE PAST FIVE YEARS | |||||
| INTERESTED DIRECTOR | ||||||||
Robert M. Keith, # New York, NY 10105 53 (2010) | Senior Vice President of AllianceBernstein L.P. (the “Adviser”) and the head of AllianceBernstein Investments, Inc. (“ABI”) since July 2008; Director of ABI and President of the AllianceBernstein Mutual Funds. Previously, he served as Executive Managing Director of ABI from December 2006 to June 2008. Prior to joining ABI in 2006, Executive Managing Director of Bernstein Global Wealth Management, and prior thereto, Senior Managing Director and Global Head of Client Service and Sales of the Adviser’s institutional investment management business since 2004. Prior thereto, he was Managing Director and Head of North American Client Service and Sales in the Adviser’s institutional investment management business, with which he had been associated since prior to 2004. | 100 | None | |||||
| DISINTERESTED DIRECTORS | ||||||||
Marshall C. Turner, Jr., ## Chairman of the Board 72 | Private Investor since prior to 2009. Former CEO of Dupont Photomasks, Inc. (components of semi-conductor manufacturing), 2003-2006, and interim CEO 1999-2000. Interim CEO of MEMC Electronic Materials, Inc. (semi-conductor and solar cell substrates) from November 2008 until March 2009. He has extensive operating and early-stage investment experience, including prior service as general partner of three institutional venture capital partnerships, and serves on the boards of three education and science-related non-profit organizations. He has served as a director of one AllianceBernstein fund since 1992, and director or trustee of multiple AllianceBernstein funds since 2005. He is Chairman of the AllianceBernstein Funds since January 2014. | 100 | Xilinx, Inc. (programmable logic semi-conductors) and SunEdison, Inc. (semi-conductor substrates, solar materials and solar power plants) since prior to 2009 | |||||
John H. Dobkin, ## 72 (1992) | Independent Consultant since prior to 2009. Formerly, President of Save Venice, Inc. (preservation organization) from 2001–2002; Senior Advisor from June 1999-June 2000 and President of Historic Hudson Valley (historic preservation) from December 1989-May 1999. Previously, Director of the National Academy of Design. He has served as a director or trustee of various AllianceBernstein Funds since 1992, and as Chairman of the Audit Committees of a number of such Funds from 2001-2008. | 100 | None | |||||
24
| AllianceBernstein Variable Products Series Fund |
NAME, ADDRESS* (YEAR FIRST | PRINCIPAL OCCUPATION(S) DURING PAST FIVE YEARS AND OTHER | PORTFOLIOS IN FUND COMPLEX OVERSEEN BY DIRECTOR | OTHER DIRECTORSHIPS HELD BY DIRECTOR IN THE PAST FIVE YEARS | |||||
| DISINTERESTED DIRECTORS (continued) | ||||||||
Michael J. Downey, ## 70 (2005) | Private Investor since prior to 2009. Formerly, managing partner of Lexington Capital, LLC (investment advisory firm) from December 1997 until December 2003. From 1987 until 1993, Chairman and CEO of Prudential Mutual Fund Management, director of the Prudential mutual funds, and member of the Executive Committee of Prudential Securities Inc. He has served as a director or trustee of the AllianceBernstein Funds since 2005 and is a director and Chairman of one other registered investment company. | 100 | Asia Pacific Fund, Inc. since prior to 2009, Prospect Acquisition Corp. (financial services) from 2007 until 2009, and The Merger Fund since prior to 2009 to 2013 | |||||
William H. Foulk, Jr., ##, 81 (1990) | Investment Adviser and an Independent Consultant since prior to 2009. Previously, he was Senior Manager of Barrett Associates, Inc., a registered investment adviser. He was formerly Deputy Comptroller and Chief Investment Officer of the State of New York and, prior thereto, Chief Investment Officer of the New York Bank for Savings. He has served as a director or trustee of various AllianceBernstein Funds since 1983, and has been Chairman of the Independent Directors Committee of the AllianceBernstein Funds since 2003. He served as Chairman of such Funds from 2003 through December 2013. He is also active in a number of mutual fund related organizations and committees. | 100 | None | |||||
D. James Guzy, ## 77 (2005) | Chairman of the Board of PLX Technology (semi-conductors) and of SRC Computers Inc., with which he has been associated since prior to 2009. He was a director of Intel Corporation (semi-conductors) from 1969 until 2008, and served as Chairman of the Finance Committee of such company for several years until May 2008. He was a Director of Cirrus Logic Corporation (semi-conductors) from 1984 until July 2011. He has served as a director or trustee of one or more of the AllianceBernstein Funds since 1982. | 100 | PLX Technology (semi-conductors) since prior to 2009, and Cirrus Logic Corporation (semi-conductors) since prior to 2009 until July 2011 | |||||
Nancy P. Jacklin, ## 65 (2006) | Professorial Lecturer at the Johns Hopkins School of Advanced International Studies since 2008. Formerly, U.S. Executive Director of the International Monetary Fund (December 2002-May 2006); Partner, Clifford Chance (1992-2002); Sector Counsel, International Banking and Finance, and Associate General Counsel, Citicorp (1985-1992); Assistant General Counsel (International), Federal Reserve Board of Governors (1982-1985); and Attorney Advisor, U.S. Department of the Treasury (1973-1982). Member of the Bar of the District of Columbia and of New York; and member of the Council on Foreign Relations. She has served as a director or trustee of the AllianceBernstein Funds since 2006. | 100 | None | |||||
25
| REAL ESTATE INVESTMENT PORTFOLIO | ||
| MANAGEMENTOFTHE FUND | ||
| (continued) | AllianceBernstein Variable Products Series Fund | |
NAME, ADDRESS* (YEAR FIRST | PRINCIPAL OCCUPATION(S) DURING PAST FIVE YEARS AND OTHER | PORTFOLIOS IN FUND COMPLEX OVERSEEN BY DIRECTOR | OTHER DIRECTORSHIPS HELD BY DIRECTOR IN THE PAST FIVE YEARS | |||||
| DISINTERESTED DIRECTORS (continued) | ||||||||
Garry L. Moody, ## 61 (2008) | Independent Consultant. Formerly, Partner, Deloitte & Touche LLP (1995-2008) where he held a number of senior positions, including Vice Chairman, and U.S. and Global Investment Management Practice Managing Partner; President, Fidelity Accounting and Custody Services Company (1993-1995); and Partner, Ernst & Young LLP (1975-1993), where he served as the National Director of Mutual Fund Tax Services and Managing Partner of its Chicago Office Tax department. He is a member of both the Governing Council of the Independent Directors Council (IDC), an organization of independent directors of mutual funds, and the Trustee Advisory Board of BoardIQ, a biweekly publication focused on issues and news affecting directors of mutual funds. He has served as a director or trustee, and as Chairman of the Audit Committee, of the AllianceBernstein Funds since 2008. | 100 | Greenbacker Renewable Energy Company LLC (renewable energy and energy efficiency projects) from August 2013 to January 2014 | |||||
Earl D. Weiner, ## 74 (2007) | Of Counsel, and Partner prior to January 2007, of the law firm Sullivan & Cromwell LLP and member of ABA Federal Regulation of Securities Committee Task Force to draft editions of the Fund Director’s Guidebook. He also serves as a director or trustee of various non-profit organizations and has served as Chairman or Vice Chairman of a number of them. He has served as a director or trustee of the AllianceBernstein Funds since 2007 and is Chairman of the Governance and Nominating Committees of the Funds. | 100 | None | |||||
| * | The address for the Fund’s disinterested Directors is c/o AllianceBernstein L.P., Attention: Philip L. Kirstein, 1345 Avenue of the Americas, New York, NY 10105. |
| ** | There is no stated term of office for the Fund’s Directors. |
| *** | The information above includes each Director’s principal occupation during the last five years and other information relating to the experience, attributes and skills relevant to each Director’s qualifications to serve as a Director, which led to the conclusion that each Director should serve as a Director for the Fund. |
| # | Mr. Keith is an “interested person” of the Fund as defined in the “1940 Act”, due to his position as a Senior Vice President of the Adviser. |
| ## | Member of the Audit Committee, the Governance and Nominating Committee and the Independent Directors Committee. |
| ### | Member of the Fair Value Pricing Committee. |
26
| AllianceBernstein Variable Products Series Fund |
Officer Information
Certain information concerning the Portfolio’s Officers is listed below.
NAME, ADDRESS* AND AGE | PRINCIPAL POSITION(S) HELD WITH FUND | PRINCIPAL OCCUPATION DURING PAST FIVE YEARS | ||
Robert M. Keith 53 | President and Chief Executive Officer | See biography above. | ||
Philip L. Kirstein 68 | Senior Vice President and Independent Compliance Officer | Senior Vice President and Independent Compliance Officer of the AllianceBernstein Funds, with which he has been associated since October 2004. Prior thereto, he was Of Counsel to Kirkpatrick & Lockhart, LLP from October 2003 to October 2004, and General Counsel of Merrill Lynch Investment Managers, L.P. since prior to March 2003. | ||
Eric J. Franco 53 | Vice President | Senior Vice President of the Adviser**, with which he has been associated since prior to 2009. | ||
Emilie D. Wrapp 58 | Secretary | Senior Vice President, Assistant General Counsel and Assistant Secretary of ABI**, with which she has been associated since prior to 2009. | ||
Joseph J. Mantineo 54 | Treasurer and Chief Financial Officer | Senior Vice President of AllianceBernstein Investor Services, Inc. (“ABIS”)**, with which he has been associated since prior to 2009. | ||
Phyllis J. Clarke 53 | Controller | Vice President of ABIS**, with which she has been associated since prior to 2009. | ||
Vincent S. Noto 49 | Chief Compliance Officer | Chief Compliance Officer of the AllianceBernstein Funds, and Vice President of ABIS**, with which he has been associated since prior to 2009. |
| * | The address for each of the Portfolio’s Officers is 1345 Avenue of the Americas, New York, NY 10105. |
| ** | The Adviser, ABI and ABIS are affiliates of the Fund. |
| The Fund’s Statement of Additional Information (“SAI”) has additional information about the Fund’s Directors and Officers and is available without charge upon request. Contact your financial representative or AllianceBernstein at (800) 227-4618, or visit www.alliancebernstein.com, for a free prospectus or SAI. |
27
| REAL ESTATE INVESTMENT PORTFOLIO | ||
| SENIOR OFFICER FEE EVALUATION | AllianceBernstein Variable Products Series Fund | |
THE FOLLOWING IS NOT PART OF THE SHAREHOLDER REPORT OR THE FINANCIAL STATEMENTS
SUMMARY OF SENIOR OFFICER’S EVALUATION OF INVESTMENT ADVISORY AGREEMENT1
The following is a summary of the evaluation of the Investment Advisory Agreement between AllianceBernstein L.P. (the “Adviser”) and the AllianceBernstein Variable Products Series Fund (the “Fund”), in respect of AllianceBernstein Real Estate Investment Portfolio (the “Portfolio”).2 The evaluation of the Investment Advisory Agreement was prepared by Philip L. Kirstein, the Senior Officer of the Fund, for the Directors of the Fund, as required by a September 2004 agreement between the Adviser and the New York State Attorney General (the “NYAG”). The Senior Officer’s evaluation of the Investment Advisory Agreement is not meant to diminish the responsibility or authority of the Board of Directors of the Fund to perform its duties pursuant to Section 15 of the Investment Company Act of 1940 (the “40 Act”) and applicable state law. The purpose of the summary is to provide shareholders with a synopsis of the independent evaluation of the reasonableness of the advisory fees proposed to be paid by the Portfolio which was provided to the Directors in connection with their review of the proposed approval of the continuance of the Investment Advisory Agreement. The Senior Officer’s evaluation considered the following factors:
| 1. | Advisory fees charged to institutional and other clients of the Adviser for like services; |
| 2. | Advisory fees charged by other mutual fund companies for like services; |
| 3. | Costs to the Adviser and its affiliates of supplying services pursuant to the advisory agreement, excluding any intra-corporate profit; |
| 4. | Profit margins of the Adviser and its affiliates from supplying such services; |
| 5. | Possible economies of scale as the Portfolio grows larger; and |
| 6. | Nature and quality of the Adviser’s services including the performance of the Portfolio. |
These factors, with the exception of the first factor, are generally referred to as the “Gartenberg factors,” which were articulated by the United States Court of Appeals for the Second Circuit in 1982. Gartenberg v. Merrill Lynch Asset Management, Inc., 694 F. 2d 923 (2d Cir. 1982). The first factor is an additional factor required to be considered by the AoD. On March 30, 2010, the Supreme Court held the Gartenberg decision was correct in its basic formulation of what §36(b) requires: to face liability under §36(b), “an investment adviser must charge a fee that is so disproportionately large that it bears no reasonable relationship to the services rendered and could not have been the product of arm’s length bargaining.” Jones v. Harris Associates L.P., 130 S. Ct. 1418 (2010). In the Jones decision, the Court stated the Gartenberg approach fully incorporates the correct understanding of fiduciary duty within the context of section 36(b) and noted with approval that “Gartenberg insists that all relevant circumstances be taken into account” and “uses the range of fees that might result from arm’s-length bargaining as the benchmark for reviewing challenged fees.”3
PORTFOLIO ADVISORY FEES, NET ASSETS & EXPENSE RATIOS
The Adviser proposed that the Portfolio pays the advisory fee set forth in the table below for receiving the services to be provided pursuant to the Investment Advisory Agreement. The fee schedule below, implemented in January 2004 in consideration of the Adviser’s settlement with the NYAG in December 2003, is based on a master schedule that contemplates eight categories of funds with almost all funds in each category having the same advisory fee schedule.
| Category | Advisory Fee Based on % of Average Daily Net Assets | Net Assets 3/31/13 ($MIL) | Portfolio | |||||
Value | 0.55% on first $2.5 billion 0.45% on next $2.5 billion 0.40% on the balance | $ | 92.1 | Real Estate Investment Portfolio | ||||
| 1 | The information in the fee summary was completed on April 22, 2013 and discussed with the Board of Directors on April 30-May 2, 2013. |
| 2 | Future references to the Fund and the Portfolio do not include “AllianceBernstein.” References in the fee summary pertaining to performance and expense ratio rankings refer to the Class A shares of the Portfolio. |
| 3 | Jones v. Harris at 1427. |
28
| AllianceBernstein Variable Products Series Fund |
The Adviser is reimbursed as specified in the Investment Advisory Agreement for certain clerical, legal, accounting, administrative and other services provided to the Portfolio. During the Portfolio’s most recently completed fiscal year, the Adviser received $45,659 (0.056% of the Portfolio’s average daily net assets) for such services.
Set forth below are the Portfolio’s total expense ratios for the most recently completed fiscal year:
| Portfolio | Total Expense Ratio | Fiscal Year | ||
Real Estate Investment Portfolio | Class A 0.84% | December 31 | ||
| Class B 1.10% |
I. ADVISORY FEES CHARGED TO INSTITUTIONAL AND OTHER CLIENTS
The advisory fees charged to investment companies which the Adviser manages and sponsors are normally higher than those charged to similar sized institutional accounts, including pension plans and sub-advised investment companies. The fee differential reflects, among other things, different services provided to such clients, and different liabilities assumed. Services provided by the Adviser to the Portfolio that are not provided to non-investment company clients and sub-advised investment companies include providing office space and personnel to serve as Fund Officers, who among other responsibilities make the certifications required under the Sarbanes—Oxley Act of 2002, and coordinating with and monitoring the Portfolio’s third party service providers such as Fund counsel, auditors, custodians, transfer agents and pricing services. The accounting, administrative, legal and compliance requirements for the Portfolio are more costly than those for institutional assets due to the greater complexities and time required for investment companies, although as previously noted, the Adviser is reimbursed for providing such services. Also, retail mutual funds managed by the Adviser are widely held. Servicing the Portfolio’s investors is more time consuming and labor intensive compared to institutional clients since the Adviser needs to communicate with a more extensive network of financial intermediaries and shareholders. The Adviser also believes that it incurs substantial entrepreneurial risk when offering a new mutual fund, since establishing a new mutual fund requires a large upfront investment, and it may take a long time for the fund to achieve profitability since the fund must be priced to scale from inception in order to be competitive and assets are acquired one account at a time.
In addition, managing the cash flow of an investment company may be more difficult than managing that of a stable pool of assets, such as an institutional account with little cash movement in either direction, particularly, if a fund is in net redemption and the Adviser is frequently forced to sell securities to raise cash for redemptions. However, managing a fund with positive cash flow may be easier at times than managing a stable pool of assets. In recent years, investment advisers have been sued by institutional clients and have suffered reputational damage both by the attendant publicity and outcomes other than complete victories. Accordingly, the legal and reputational risks associated with institutional accounts are greater than previously thought, although still not equal to those related to the mutual fund industry.
Notwithstanding the Adviser’s view that managing an investment company is not comparable to managing other institutional accounts because the services provided are different, the Supreme Court has indicated consideration should be given to the advisory fees charged to institutional accounts that have a substantially similar investment style as the Portfolio.4 In addition to the AllianceBernstein institutional fee schedule, set forth below is what would have been the effective advisory fee of the Portfolio had the AllianceBernstein institutional fee schedule been applicable to the Portfolio versus the Portfolio’s advisory fee based on March 31, 2013 net assets:5
| Portfolio | Net Assets 3/31/13 ($MIL) | AllianceBernstein Fee Schedule | Effective AB Inst. Adv. Fee | Portfolio Advisory Fee | ||||||||||
Real Estate Investment Portfolio | $ | 92.1 | U.S. REIT Schedule 0.55% on first $25m 0.45% on next $25m 0.40% the balance Minimum account size $25m | 0.454 | % | 0.550 | % | |||||||
| 4 | The Supreme Court stated that “courts may give such comparisons the weight that they merit in light of the similarities and differences between the services that the clients in question require, but the courts must be wary of inapt comparisons.” Among the significant differences the Supreme Court noted that may exist between services provided to mutual funds and institutional accounts are “higher marketing costs.” Jones v. Harris at 1428. |
| 5 | The Adviser has indicated that with respect to institutional accounts with assets greater than $300 million, it will negotiate a fee schedule. Discounts that are negotiated vary based upon each client relationship. |
29
| REAL ESTATE INVESTMENT PORTFOLIO | ||
| SENIOR OFFICER FEE EVALUATION | ||
| (continued) | AllianceBernstein Variable Products Series Fund | |
The Adviser also manages AllianceBernstein Global Real Estate Investment Fund, Inc. (“Global Real Estate Investment Fund, Inc.), a retail mutual fund, which has a substantially somewhat investment style as the Portfolio. Set forth below is the fee schedule of Global Real Estate Investment Fund, Inc. and what would have been the effective advisory fee of the Portfolio had the fee schedule of the retail mutual fund been applicable to the Portfolio:6,7
| Portfolio | AllianceBernstein Mutual Fund | Fee Schedule | ABMF Effective | Portfolio Advisory | ||||||||
Real Estate Investment Portfolio | Global Real Estate Investment Fund, Inc. | 0.55% on first $2.5 billion 0.45% on next $2.5 billion 0.40% on the balance | 0.550% | 0.550% | ||||||||
The Adviser also manages and sponsors retail mutual funds, which are organized in jurisdictions outside the United States, generally Luxembourg and Japan, and sold to non-United States resident investors. The Adviser charges the following fees for the Luxembourg fund that has a somewhat similar investment style as the Portfolio.8
| Fund | Fee9 | |
Global Real Estate Securities Portfolio | 1.75% 0.95% |
The Adviser represented that it does not sub-advise any registered investment company with a substantially similar investment style as the Portfolio.
II. MANAGEMENT FEES CHARGED BY OTHER MUTUAL FUND COMPANIES FOR LIKE SERVICES.
Lipper Inc. (“Lipper”), an analytical service that is not affiliated with the Adviser, compared the fees charged to the Portfolio with fees charged to other investment companies for similar services offered by other investment advisers.10 Lipper’s analysis included the comparison of the Portfolio’s contractual management fee, estimated at the approximate current asset level of the Portfolio, to the median of the Portfolio’s Lipper Expense Group (“EG”) and the Portfolio’s contractual management fee ranking11,12
Lipper describes an EG as a representative sample of comparable funds. Lipper’s standard methodology for screening funds to be included in an EG entails the consideration of several fund criteria, including fund type, investment classification/objective, load type and similar 12b-1/non-12b-1 service fees, asset (size) comparability, expense components and attributes. An EG will typically consist of seven to twenty funds.
| 6 | The Portfolio’s investment guidelines are more restrictive than that of AllianceBernstein Global Real Estate Investment Fund, Inc. The Portfolio primarily invests in equity securities of U.S. real estate investment trusts (“REITS”) and other U.S. real estate industry companies, in contrast to the AllianceBernstein Global Real Estate Investment Fund, Inc., which may invest in equities of non-U.S. REITS and other non-U.S. real estate industry companies. |
| 7 | The retail mutual fund was also affected by the settlement between the Adviser and the NYAG. As a result, the Portfolio has the same breakpoints in its advisory fee schedule as the retail mutual fund. |
| 8 | The Portfolio’s investment guidelines are more restrictive than that of the Luxembourg fund. The Portfolio primarily invests in equity securities of U.S. real estate investment trusts (“REITS”) and other U.S. real estate industry companies, in contrast to the Luxembourg fund, which may invest in equities of non-U.S. REITS and other non-U.S. real estate industry companies. |
| 9 | Class A shares of the funds are charged an “all-in” fee, which includes investment advisory services and distribution related services, unlike Class I shares, whose fee is for only investment advisory services. |
| 10 | The Supreme Court cautioned against accepting mutual fund fee comparisons without careful scrutiny since “these comparisons are problematic because these fees, like those challenged, may not be the product of negotiations conducted at arm’s length.” Jones v. Harris at 1429. |
| 11 | Lipper does not consider average account size when constructing EGs. Funds with relatively small average account sizes tend to have higher transfer agent expense ratio than comparable sized funds that have relatively large average account sizes. Note that there are limitations on Lipper expense category data because different funds categorize expenses differently. |
| 12 | The contractual management fee is calculated by Lipper using the Portfolio’s contractual management fee rate at a hypothetical asset level. The hypothetical asset level is based on the combined net assets of all classes of the Portfolio, rounded up to the next $25 million. Lipper’s total expense ratio information is based on the most recent annual report except as otherwise noted. A ranking of “1” would mean that the Portfolio had the lowest effective fee rate in the Lipper peer group. |
30
| AllianceBernstein Variable Products Series Fund |
| Portfolio | Contractual Management Fee (%)13 | Lipper EG Median (%) | Lipper Rank | |||||||||
Real Estate Investment Portfolio | 0.550 | 0.750 | 3/11 | |||||||||
Lipper also analyzed the Portfolio’s most recently completed fiscal year total expense ratio in comparison to the Portfolio’s EG and Lipper Expense Universe (“EU”). The EU14 is a broader group compared to the EG, consisting of all funds that have the same investment classification/objective and load type as the subject Portfolio.
| Portfolio | Expense Ratio | Lipper EG Median (%) | Lipper EG Rank | Lipper EU Median (%) | Lipper EU Rank | |||||||||||||||
Real Estate Investment Portfolio | 0.844 | 0.884 | 6/11 | 0.842 | 9/15 | |||||||||||||||
Based on this analysis, the Portfolio has a more favorable ranking on a management fee basis than it does on a total expense ratio basis.
III. COSTS TO THE ADVISER AND ITS AFFILIATES OF SUPPLYING SERVICES PURSUANT TO THE ADVISORY FEE ARRANGEMENT, EXCLUDING ANY INTRA-CORPORATE PROFIT.
The Adviser utilizes two profitability reporting systems, which operate independently but are aligned with each other, to estimate the Adviser’s profitability in connection with investment advisory services provided to the Portfolio. The Senior Officer has retained a consultant to provide independent advice regarding the alignment of the two profitability systems as well as the methodologies and allocations utilized by both profitability systems.
IV. PROFIT MARGINS OF THE ADVISER AND ITS AFFILIATES FOR SUPPLYING SUCH SERVICES.
The Portfolio’s profitability information, prepared by the Adviser for the Board of Directors, was reviewed by the Senior Officer and the consultant. The Adviser’s profitability from providing investment advisory services to the Portfolio increased during calendar year 2012, relative to 2011.
In addition to the Adviser’s direct profits from managing the Portfolio, certain of the Adviser’s affiliates have business relationships with the Portfolio and may earn a profit from providing other services to the Portfolio. The courts have referred to this type of business opportunity as “fall-out benefits” to the Adviser and indicated that such benefits should be factored into the evaluation of the total relationship between the Portfolio and the Adviser. Neither case law nor common business practice precludes the Adviser’s affiliates from earning a reasonable profit on this type of relationship provided the affiliates’ charges and services are competitive. These affiliates provide transfer agent, distribution and brokerage related services to the Portfolio and receive transfer agent fees, Rule 12b-1 payments, and brokerage commissions. In addition, the Adviser benefits from soft dollar arrangements which offset expenses the Adviser would otherwise incur.
The Portfolio has adopted a distribution plan for Class B shares pursuant to Rule 12b-1 under the 40 Act. Under the distribution plan, the Portfolio pays distribution and servicing fees to its principal underwriter, AllianceBernstein Investments, Inc. (“ABI”), the Portfolio’s distributor and an affiliate of the Adviser, at an annual rate of up to 0.50% of the Portfolio’s average daily net assets attributable to Class B shares. The current annual rate that the Portfolio pays to ABI for 12b-1 fees is 0.25%. During the fiscal year ended December 31, 2012, ABI received $353,666 in Rule 12b-1 fees.
During the fiscal year ended December 31, 2012, the Adviser incurred distribution expenses in the amount of $117,813 in connection with activities primarily intended to result in the sale of the Portfolio’s Class B shares. This amount includes the 12b-1 fees paid by the Portfolio to the Adviser.
| 13 | The contractual management fee does not reflect any expense reimbursements made by the Portfolio to the Adviser for certain clerical, legal, accounting, administrative and other services. |
| 14 | Except for asset (size) comparability, Lipper uses the same criteria for selecting an EG when selecting an EU. Unlike the EG, the EU allows for the same adviser to be represented by more than just one fund. |
| 15 | Most recently completed fiscal year end Class A total expense ratio. |
31
| REAL ESTATE INVESTMENT PORTFOLIO | ||
| SENIOR OFFICER FEE EVALUATION | ||
| (continued) | AllianceBernstein Variable Products Series Fund | |
Financial intermediaries, such as insurers, market and sell shares of the Portfolio and typically receive compensation from ABI, the Advisers and/or the Portfolio for selling shares of the Portfolio. These financial intermediaries receive compensation in any or all of the following forms: 12b-1 fees, defrayal of costs for educational seminars and training, additional distribution support, recordkeeping and/or administrative services. Payments related to providing contract-holder recordkeeping and/or administrative services will generally not exceed 0.35% of the average daily net assets of the Portfolio attributable to the relevant intermediary over the year. With respect to the Fund, which includes the Portfolio and other Portfolios of the Fund not discussed in this summary, ABI paid approximately $600,000 in 2012 and expects to pay approximately $600,000 in 2013 for educational support and distribution assistance (revenue sharing payments).
The transfer agent of the Portfolio is AllianceBernstein Investor Services, Inc. (“ABIS”). During the most recently completed fiscal year, ABIS received a fee of $1,385 from the Portfolio.16
The Portfolio effected brokerage transactions through the Adviser’s affiliate, Sanford C. Bernstein & Co., LLC (“SCB & Co.”) and/or its U.K. affiliate, Sanford C. Bernstein Limited (“SCB Ltd.”), collectively “SCB,” and paid commissions during the Portfolio’s most recently completed fiscal year. The Adviser represented that SCB’s profitability from business conducted with the Portfolio is comparable to the profitability of SCB’s dealings with other similar third party clients. In the ordinary course of business, SCB receives and pays liquidity rebates from electronic communications networks (“ECNs”) derived from trading for its clients, including the Portfolio. These credits and charges are not being passed onto any SCB client. The Adviser also receives certain soft dollar benefits from brokers that execute agency trades for the Portfolio and other clients. These soft dollar benefits reduce the Adviser’s cost of doing business and increase its profitability.
V. POSSIBLE ECONOMIES OF SCALE
The Adviser has indicated that economies of scale are being shared with shareholders through pricing to scale, breakpoints, fee reductions/waivers and enhancement to services.
In May 2012, an independent consultant, retained by the Senior Officer, provided the Board of Directors information on the Adviser’s firm-wide average costs from 2005 through 2011 and the potential economies of scale. The independent consultant noted that from 2005 through 2007 the Adviser experienced significant growth in assets under management (“AUM”). During this period, operating expenses increased, in part to keep up with growth, and in part reflecting market returns. However, from 2008 through the first quarter of 2009, AUM rapidly and significantly decreased due to declines in market value and client withdrawals. When AUM rapidly decreased, some operating expenses categories, including base compensation and office space, adjusted more slowly during this period, resulting in an increase in average costs. Since 2009, AUM has experienced less significant changes. The independent consultant noted that changes in operating expenses reflect changes in business composition and business practices in response to changes in financial markets. Finally, the independent consultant concluded that the increase in average cost and the decline in net operating margin across the Adviser since late 2008 are inconsistent with the view that there are currently reductions in average costs due to economies of scale that can be shared with the AllianceBernstein Mutual Funds managed by the Adviser through lower fees.
Previously in February 2008, the independent consultant provided the Board of Directors an update of the Deli study on advisory fees and various fund characteristics.17,18 The independent consultant first reiterated the results of his previous two
| 16 | The Fund, which includes the Portfolio and other Portfolios of the Fund paid ABIS a flat fee of $18,000 in 2012. |
| 17 | The Deli study, originally published in 2002 based on 1997 data and updated for the February 2008 Presentation, may be of diminished value due to the age of the data used in the presentation and the changes experienced in the industry over the last four years. |
| 18 | As mentioned previously, the Supreme Court cautioned against accepting mutual fund fee comparisons without careful scrutiny since the fees may not be the product of negotiations conducted at arm’s length. See Jones V. Harris at 1429. |
32
| AllianceBernstein Variable Products Series Fund |
dimensional comparison analysis (fund size and family size) with the Board of Directors.19 The independent consultant then discussed the results of the regression model that was utilized to study the effects of various factors on advisory fees. The regression model output indicated that the bulk of the variation in fees predicted were explained by various factors, but substantially by fund AUM, family AUM, index fund indicator and investment style. The independent consultant also compared the advisory fees of the AllianceBernstein Mutual Funds to similar funds managed by 19 other large asset managers, regardless of the fund size and each Adviser’s proportion of mutual fund assets to non-mutual fund assets.
VI. NATURE AND QUALITY OF THE ADVISER’S SERVICES, INCLUDING THE PERFORMANCE OF THE PORTFOLIO
With assets under management of approximately $443 billion as of March 31, 2013, the Adviser has the investment experience to manage and provide non-investment services (described in Section I) to the Portfolio.
The information prepared by Lipper shows the 1, 3, 5 and 10 year performance returns and rankings of the Portfolio20 relative to its Lipper Performance Group (“PG”) and Lipper Performance Universe (“PU”)21 for the periods ended February 28, 2013.22
| Portfolio (%) | PG Median (%) | PU Median (%) | PG Rank | PU Rank | ||||||||||||||||
Real Estate Investment Portfolio | ||||||||||||||||||||
1 year | 20.23 | 15.56 | 15.56 | 1/11 | 1/15 | |||||||||||||||
3 year | 20.58 | 19.41 | 19.41 | 1/11 | 1/15 | |||||||||||||||
5 year | 9.15 | 7.53 | 7.53 | 2/11 | 2/15 | |||||||||||||||
10 year | 13.68 | 11.54 | 12.17 | 1/8 | 1/10 | |||||||||||||||
Set forth below are the 1, 3, 5, 10 year and since inception performance returns of the Portfolio (in bold)23 versus its benchmarks.24 Portfolio and benchmark volatility and reward-to-variability ratio (“Sharpe Ratio”) information is also shown.25
| Periods Ending February 28, 2013 Annualized Performance | ||||||||||||||||||||||||||||||||
1 Year | 3 Year | 5 Year | 10 Year (%) | Since Inception (%) | Annualized | Risk Period (Year) | ||||||||||||||||||||||||||
| Volatility (%) | Sharpe (%) | |||||||||||||||||||||||||||||||
Real Estate Investment Portfolio | 20.23 | 20.58 | 9.15 | 13.68 | 10.33 | 24.72 | 0.58 | 10 | ||||||||||||||||||||||||
FTSE NAREIT Equity REIT Index26 | 19.19 | 20.35 | 7.76 | 12.47 | 9.76 | 25.53 | 0.53 | 10 | ||||||||||||||||||||||||
S&P 500 Stock Index | 13.46 | 13.50 | 4.94 | 8.24 | 6.30 | N/A | N/A | 10 | ||||||||||||||||||||||||
Inception Date: January 9, 1997 | ||||||||||||||||||||||||||||||||
| 19 | The two dimensional analysis showed patterns of lower advisory fees for funds with larger asset sizes and funds from larger family sizes compared to funds with smaller asset sizes and funds from smaller family sizes, which according to the independent consultant is indicative of a sharing of economies of scale and scope. However, in less liquid and active markets, such is not the case, as the empirical analysis showed potential for diseconomies of scale in those markets. The empirical analysis also showed diminishing economies of scale and scope as funds surpassed a certain high level of assets. |
| 20 | The performance rankings are for the Class A shares of the Portfolio. The Portfolio’s performance returns shown were provided by Lipper. |
| 21 | The Portfolio’s PG/PU are identical to the Portfolio’s respective EG/EU. |
| 22 | Lipper investment classification/objective dictates the PG and PU throughout the life of the fund even if a fund had a different investment classification/objective at a different point in time. |
| 23 | The performance returns and risk measures shown in the table are for the Class A shares of the Portfolio. |
| 24 | The Adviser provided Portfolio and benchmark performance return information for periods through February 28, 2013. |
| 25 | Portfolio and benchmark volatility and Sharpe Ratio information was obtained through Lipper LANA, a database maintained by Lipper. Volatility is a statistical measure of the tendency of a market price or yield to vary over time. The Sharpe Ratio is a risk adjusted measure of return that divides a portfolio’s return in excess of the riskless return by the portfolio’s standard deviation. A portfolio with a greater volatility would be viewed as more risky than a portfolio with equivalent performance but lower volatility; for that reason, a greater return would be demanded for the more risky portfolio. A portfolio with a higher Sharpe Ratio would be viewed as better performing than a portfolio with a lower Sharpe Ratio. |
| 26 | Benchmark since inception date is the nearest month end after the Portfolio’s inception date. |
33
| REAL ESTATE INVESTMENT PORTFOLIO | ||
| SENIOR OFFICER FEE EVALUATION | ||
| (continued) | AllianceBernstein Variable Products Series Fund | |
CONCLUSION:
Based on the factors discussed above the Senior Officer’s conclusion is that the proposed advisory fee for the Portfolio is reasonable and within the range of what would have been negotiated at arm’s-length in light of all the surrounding circumstances. This conclusion in respect of the Portfolio is based on an evaluation of all of these factors and no single factor was dispositive.
Dated: May 29, 2013
34
VPS-REI-0151-1213
AllianceBernstein
Variable Products Series Fund, Inc.
 | AllianceBernstein Small Cap Growth Portfolio |
December 31, 2013
Annual Report

ANNUAL REPORT
Investment Products Offered
| Ø | Are Not FDIC Insured |
| Ø | May Lose Value |
| Ø | Are Not Bank Guaranteed |
AllianceBernstein Investments, Inc. (ABI) is the distributor of the AllianceBernstein family of mutual funds. ABI is a member of FINRA and is an affiliate of AllianceBernstein L.P., the manager of the funds.
You may obtain a description of the Fund’s proxy voting policies and procedures, and information regarding how the Fund voted proxies relating to portfolio securities during the most recent 12-month period ended June 30, without charge. Simply visit AllianceBernstein’s website at www.alliancebernstein.com or go to the Securities and Exchange Commission’s (the “Commission”) website at www.sec.gov, or call AllianceBernstein at (800) 227-4618.
The Fund files its complete schedule of portfolio holdings with the Commission for the first and third quarters of each fiscal year on Form N-Q. The Fund’s Forms N-Q are available on the Commission’s website at www.sec.gov. The Fund’s Forms N-Q may also be reviewed and copied at the Commission’s Public Reference Room in Washington, DC; information on the operation of the Public Reference Room may be obtained by calling (800) SEC-0330.
AllianceBernstein® and the AB Logo are registered trademarks and service marks used by permission of the owner, AllianceBernstein L.P.
| SMALL CAP GROWTH | ||
| PORTFOLIO | AllianceBernstein Variable Products Series Fund |
LETTER TO INVESTORS
February 7, 2014
The following is an update of AllianceBernstein Variable Products Series Fund—AllianceBernstein Small Cap Growth Portfolio (the “Portfolio”) for the annual reporting period ended December 31, 2013.
INVESTMENT OBJECTIVES AND POLICIES
The Portfolio’s investment objective is long-term growth of capital. The Portfolio invests primarily in a diversified portfolio of equity securities with relatively smaller capitalizations as compared to the overall U.S. market. Under normal circumstances, the Portfolio invests at least 80% of its net assets in equity securities of smaller companies. For these purposes, “smaller companies” are those that, at the time of investment, fall within the lowest 20% of the total U.S. equity market (excluding companies with market caps of less than $10 million). Because the Portfolio’s definition of smaller companies is dynamic, the limits on market capitalization will change with the markets.
The Portfolio may invest in any company and industry and in any type of equity security with potential for capital appreciation. It invests in well-known and established companies and in new and less-seasoned companies. The Portfolio’s investment policies emphasize investments in companies that are demonstrating improving financial results and a favorable earnings outlook. The Portfolio may invest in foreign securities. Normally, the Portfolio invests in about 95-125 companies broadly diversified by sector.
The Portfolio invests primarily in equity securities but may also invest in other types of securities, such as preferred stocks. The Portfolio may, at times, invest in shares of exchange-traded fund (“ETFs”) in lieu of making direct investments in securities. ETFs may provide more efficient and economical exposure to the types of companies and geographic locations in which the Portfolio seeks to invest than direct investments. The Portfolio may also invest up to 20% of its total assets in rights or warrants.
Effective February 1, 2013, the Portfolio was closed to new investments except that Contractholders of variable products with investment options that included the Portfolio as of January 31, 2013, may continue to purchase shares of the Portfolio in accordance with the procedures for the purchase of shares in the prospectus of the separate account in which they invest, including through reinvestment of dividends and capital gains distributions. The Portfolio may (i) make additional exceptions that, in the Adviser’s judgment, do not adversely affect the Adviser’s ability to manage the
Portfolio; (ii) reject any investment or refuse any exception, including those detailed above, that the Adviser believes will adversely affect its ability to manage the Portfolio; and (iii) close and/or reopen the Portfolio to new or existing Contractholders at any time.
INVESTMENT RESULTS
The table on page 3 shows the Portfolio’s performance compared to its benchmark, the Russell 2000 Growth Index, for the one-, five- and 10-year periods ended December 31, 2013.
All share classes of the Portfolio outperformed the benchmark for the annual period ended December 31, 2013, with stock selection in every sector except technology contributing to performance. Modest cash exposures detracted from performance in a rising market. Sector allocations, which result from the Portfolio’s “bottom-up” stock selection process, remained muted compared to the benchmark and did not have a meaningful impact on relative returns. As of December 31, 2013, the largest overweight was to the consumer/commercial services sector, while the largest underweight was to the financial sector. The Portfolio did not utilize leverage or derivatives during the annual period.
MARKET REVIEW AND INVESTMENT STRATEGY
U.S. and global equity markets rallied in 2013, driven by macroeconomic improvements and the accommodative monetary policies of major central banks. U.S. small-cap growth stocks, as measured by the benchmark, rose significantly and outperformed the S&P 500 Index and small-cap value stocks. The U.S. economic expansion, although still relatively modest by historical standards, appears to be broadening and evidence is building that the recovery is becoming self-sustaining. Improving data on jobs, consumer spending and housing continues to bolster investor confidence. Although investors worried about the impact of the Federal Reserve’s reduction in its asset purchase program and how it would affect interest rates, the announcement in December that it would begin to taper the program reassured the markets. It would appear that investors have begun to recognize that the reduction in liquidity and a gradual increase in interest rates signal a healthier economy.
While corporate managements continue to keep a tight rein on expenses and capital spending, macroeconomic fears no longer dominate investor sentiment. The Small Cap Growth Investment Team (the “Team”) anticipates global economic growth to improve in 2014, which should support company revenue and earnings growth. Against this backdrop, the Team has balanced the Portfolio between strong secular growers and companies that it believes are positioned to disproportionately benefit from an expected acceleration in economic activity.
1
| SMALL CAP GROWTH PORTFOLIO | ||
| DISCLOSURESAND RISKS | AllianceBernstein Variable Products Series Fund |
Benchmark Disclosure
The unmanaged Russell 2000® Growth Index does not reflect fees and expenses associated with the active management of a mutual fund portfolio. The Russell 2000 Growth Index represents the performance of 2,000 small-cap growth companies within the U.S. An investor cannot invest directly in an index, and its results are not indicative of the performance for any specific investment, including the Portfolio.
A Word About Risk
Market Risk: The value of the Portfolio’s assets will fluctuate as the stock or bond market fluctuates. The value of its investments may decline, sometimes rapidly and unpredictably, simply because of economic changes or other events that affect large portions of the market. It includes the risk that a particular style of investing, such as growth, may underperform the market generally.
Capitalization Risk: Investments in small- and mid-capitalization companies may be more volatile than investments in large-capitalization companies. Investments in small-capitalization companies may have additional risks because these companies have limited product lines, markets or financial resources.
Foreign (Non-U.S.) Risk: Investments in securities of non-U.S. issuers may involve more risk than those of U.S. issuers. These securities may fluctuate more widely in price and may be less liquid due to adverse market, economic, political, regulatory or other factors.
Derivatives Risk: Derivatives may be illiquid, difficult to price, and leveraged so that small changes may produce disproportionate losses for the Portfolio, and may be subject to counterparty risk to a greater degree than more traditional investments.
Management Risk: The Portfolio is subject to management risk because it is an actively-managed investment fund. The Adviser will apply its investment techniques and risk analyses in making investment decisions for the Portfolio, but there is no guarantee that its techniques will produce the intended results.
These risks are fully discussed in the Variable Products prospectus.
An Important Note About Historical Performance
The investment return and principal value of an investment in the Portfolio will fluctuate, so that shares, when redeemed, may be worth more or less than their original cost. Performance shown on the following page represents past performance and does not guarantee future results. Current performance may be lower or higher than the performance information shown. Please contact your Financial Advisor or Insurance Agent Representative at your financial institution to obtain portfolio performance information current to the most recent month end.
Investors should consider the investment objectives, risks, charges and expenses of the Portfolio carefully before investing. For additional copies of the Portfolio’s prospectus or summary prospectus, which contains this and other information, call your financial advisor or 800.984.7654. Please read the prospectus and/or summary prospectus carefully before investing.
All fees and expenses related to the operation of the Portfolio have been deducted, but no adjustment has been made for insurance company separate account or annuity contract charges, which would reduce total return to a contract owner. Performance assumes reinvestment of distributions and does not account for taxes.
There are additional fees and expenses associated with all Variable Products. These fees can include mortality and expense risk charges, administrative charges, and other charges that can significantly reduce investment returns. Those fees and expenses are not reflected in this annual report. You should consult your Variable Products prospectus for a description of those fees and expenses and speak to your insurance agent or financial representative if you have any questions. You should read the prospectus before investing or sending money.
2
| SMALL CAP GROWTH PORTFOLIO | ||
| HISTORICAL PERFORMANCE | AllianceBernstein Variable Products Series Fund |
| THE PORTFOLIO VS. ITS BENCHMARK | NAV Returns | |||||||||||
| PERIODS ENDED DECEMBER 31, 2013 (unaudited) | 1 Year | 5 Years* | 10 Years* | |||||||||
AllianceBernstein Small Cap Growth Portfolio Class A** | 45.66% | 27.71% | 10.91% | |||||||||
AllianceBernstein Small Cap Growth Portfolio Class B** | 45.33% | 27.38% | 10.64% | |||||||||
Russell 2000 Growth Index | 43.30% | 22.58% | 9.41% | |||||||||
* Average annual returns.
** Includes the impact of proceeds received and credited to the Portfolio resulting from class action settlements, which enhanced the performance of all share classes of the Portfolio for the annual period ended December 31, 2013 by 0.23%.
Please keep in mind that high, double-digit returns are highly unusual and cannot be sustained. Investors should also be aware that these returns were primarily achieved during favorable market conditions. |
| |||||||||||
The Portfolio’s current prospectus fee table shows the Portfolio’s total annual operating expense ratios as 1.18% and 1.43% for Class A and Class B, respectively. The Financial Highlights section of this report sets forth expense ratio data for the current reporting period; the expense ratios shown above may differ from the expense ratios in the Financial Highlights section since they are based on different time periods.
ALLIANCEBERNSTEIN SMALL CAP GROWTH PORTFOLIO CLASS A
GROWTH OF A $10,000 INVESTMENT
12/31/03 – 12/31/13 (unaudited)

This chart illustrates the total value of an assumed $10,000 investment in AllianceBernstein Small Cap Growth Portfolio Class A shares (from 12/31/03 to 12/31/13) as compared to the performance of the Portfolio’s benchmark, the Russell 2000 Growth Index. The chart assumes the reinvestment of dividends and capital gains distributions.
See Disclosures, Risks and Note about Historical Performance on page 2.
3
| SMALL CAP GROWTH PORTFOLIO | ||
| EXPENSE EXAMPLE (unaudited) | AllianceBernstein Variable Products Series Fund |
As a shareholder of the Fund, you incur two types of costs: (1) transaction costs, including sales charges (loads) on purchase payments, contingent deferred sales charges on redemptions and (2) ongoing costs, including management fees; distribution (12b-1) fees; and other Fund expenses. This example is intended to help you understand your ongoing costs (in dollars) of investing in the Fund and to compare these costs with the ongoing costs of investing in other mutual funds.
The Example is based on an investment of $1,000 invested at the beginning of the period and held for the entire period as indicated below.
Actual Expenses
The table below provides information about actual account values and actual expenses. You may use the information in this line, together with the amount you invested, to estimate the expenses that you paid over the period. Simply divide your account value by $1,000 (for example, an $8,600 account value divided by $1,000 = 8.6), then multiply the result by the number in the first line under the heading entitled “Expenses Paid During Period” to estimate the expenses you paid on your account during this period. The estimate of expenses does not include fees or other expenses of any variable insurance product. If such expenses were included, the estimate of expenses you paid during the period would be higher and your ending account value would be lower.
Hypothetical Example for Comparison Purposes
The table below provides information about hypothetical account values and hypothetical expenses based on the Fund’s actual expense ratio and an assumed annual rate of return of 5% before expenses, which is not the Fund’s actual return. The hypothetical account values and expenses may not be used to estimate the actual ending account balance or expenses you paid for the period. You may use this information to compare the ongoing costs of investing in the Fund and other funds by comparing this 5% hypothetical example with the 5% hypothetical examples that appear in the shareholder reports of other funds. The estimate of expenses does not include fees or other expenses of any variable insurance product. If such expenses were included, the estimate of expenses you paid during the period would be higher and your ending account value would be lower.
Please note that the expenses shown in the table are meant to highlight your ongoing costs only and do not reflect any transactional costs, such as sales charges (loads), or contingent deferred sales charges on redemptions. Therefore, the second line of each classes’ table is useful in comparing ongoing costs only, and will not help you determine the relative total costs of owning different funds. In addition, if these transactional costs were included, your costs would have been higher.
| Beginning Account Value July 1, 2013 | Ending Account Value December 31, 2013 | Expenses Paid During Period* | Annualized Expense Ratio* | |||||||||||||
Class A | ||||||||||||||||
Actual | $ | 1,000 | $ | 1,248.60 | $ | 6.69 | 1.18 | % | ||||||||
Hypothetical (5% annual return before expenses) | $ | 1,000 | $ | 1,019.26 | $ | 6.01 | 1.18 | % | ||||||||
Class B | ||||||||||||||||
Actual | $ | 1,000 | $ | 1,247.50 | $ | 8.10 | 1.43 | % | ||||||||
Hypothetical (5% annual return before expenses) | $ | 1,000 | $ | 1,018.00 | $ | 7.27 | 1.43 | % | ||||||||
| * | Expenses are equal to each classes’ annualized expense ratios, multiplied by the average account value over the period, multiplied by 184/365 (to reflect the one-half year period). |
4
| SMALL CAP GROWTH PORTFOLIO | ||
| TEN LARGEST HOLDINGS* | ||
| December 31, 2013 (unaudited) | AllianceBernstein Variable Products Series Fund |
| COMPANY | U.S. $ VALUE | PERCENT OF NET ASSETS | ||||||
Conn’s, Inc. | $ | 1,414,123 | 2.0 | % | ||||
CoStar Group, Inc. | 1,372,537 | 1.9 | ||||||
PolyOne Corp. | 1,337,644 | 1.9 | ||||||
Kirby Corp. | 1,168,470 | 1.6 | ||||||
Dealertrack Technologies, Inc. | 1,149,208 | 1.6 | ||||||
Ultimate Software Group, Inc. (The) | 1,132,602 | 1.6 | ||||||
Pacira Pharmaceuticals, Inc./DE | 1,115,881 | 1.6 | ||||||
Acadia Healthcare Co., Inc. | 1,104,540 | 1.5 | ||||||
Lumber Liquidators Holdings, Inc. | 1,104,010 | 1.5 | ||||||
Hexcel Corp. | 1,097,855 | 1.5 | ||||||
|
|
|
| |||||
| $ | 11,996,870 | 16.7 | % | |||||
SECTOR BREAKDOWN**
December 31, 2013 (unaudited)
| SECTOR | U.S. $ VALUE | PERCENT OF TOTAL INVESTMENTS | ||||||
Information Technology | $ | 18,365,989 | 25.6 | % | ||||
Health Care | 15,669,638 | 21.8 | ||||||
Industrials | 15,016,581 | 20.9 | ||||||
Consumer Discretionary | 11,920,160 | 16.6 | ||||||
Financials | 3,521,397 | 4.9 | ||||||
Energy | 3,225,404 | 4.5 | ||||||
Materials | 1,337,644 | 1.8 | ||||||
Consumer Staples | 1,281,323 | 1.8 | ||||||
Telecommunication Services | 263,959 | 0.4 | ||||||
Short-Term Investments | 1,200,586 | 1.7 | ||||||
|
|
|
| |||||
Total Investments | $ | 71,802,681 | 100.0 | % | ||||
| * | Long-term investments. |
| ** | The Portfolio’s sector breakdown is expressed as a percentage of total investments (excluding security lending collateral) and may vary over time. |
Please note: The sector classifications presented herein are based on the Global Industry Classification Standard (GICS) which was developed by Morgan Stanley Capital International and Standard & Poor’s. The components are divided into sector, industry group, and industry sub-indices as classified by the GICS for each of the market capitalization indices in the broad market. These sector classifications are broadly defined. The “Portfolio of Investments” section of the report reflects more specific industry information and is consistent with the investment restrictions discussed in the Portfolio’s prospectus.
5
| SMALL CAP GROWTH PORTFOLIO | ||
| PORTFOLIOOF INVESTMENTS | ||
| December 31, 2013 | AllianceBernstein Variable Products Series Fund | |
| Company | Shares | U.S. $ Value | ||||||
COMMON STOCKS–98.5% | ||||||||
INFORMATION | ||||||||
COMMUNICATIONS | ||||||||
Ciena Corp.(a) | 28,422 | $ | 680,138 | |||||
Infinera Corp.(a) | 40,410 | 395,210 | ||||||
|
| |||||||
| 1,075,348 | ||||||||
|
| |||||||
INTERNET SOFTWARE & | ||||||||
Cornerstone OnDemand, Inc.(a) | 10,880 | 580,339 | ||||||
CoStar Group, Inc.(a) | 7,436 | 1,372,537 | ||||||
Criteo SA (Sponsored ADR)(a) | 8,005 | 273,771 | ||||||
Dealertrack Technologies, Inc.(a) | 23,902 | 1,149,208 | ||||||
Demandware, Inc.(a) | 12,774 | 819,069 | ||||||
Envestnet, Inc.(a) | 13,810 | 556,543 | ||||||
LogMeIn, Inc.(a) | 15,360 | 515,328 | ||||||
Pandora Media, Inc.(a) | 24,220 | 644,252 | ||||||
Shutterstock, Inc.(a) | 8,278 | 692,289 | ||||||
Yelp, Inc.(a) | 11,433 | 788,305 | ||||||
Zillow, Inc.(a)(b) | 4,580 | 374,324 | ||||||
|
| |||||||
| 7,765,965 | ||||||||
|
| |||||||
SEMICONDUCTORS & SEMICONDUCTOR | ||||||||
Cavium, Inc.(a) | 18,570 | 640,851 | ||||||
Power Integrations, Inc. | 12,652 | 706,235 | ||||||
Synaptics, Inc.(a) | 9,840 | 509,810 | ||||||
Teradyne, Inc.(a) | 34,270 | 603,837 | ||||||
|
| |||||||
| 2,460,733 | ||||||||
|
| |||||||
SOFTWARE–9.9% | ||||||||
Aspen Technology, Inc.(a) | 20,852 | 871,614 | ||||||
FireEye, Inc.(a) | 6,407 | 279,409 | ||||||
FleetMatics Group PLC(a) | 10,407 | 450,103 | ||||||
Guidewire Software, Inc.(a) | 20,739 | 1,017,663 | ||||||
Interactive Intelligence Group, Inc.(a) | 7,150 | 481,624 | ||||||
PTC, Inc.(a) | 25,790 | 912,708 | ||||||
SS&C Technologies Holdings, Inc.(a) | 22,069 | 976,774 | ||||||
Tableau Software, Inc.–Class A(a) | 13,658 | 941,446 | ||||||
Ultimate Software Group, Inc. (The)(a) | 7,392 | 1,132,602 | ||||||
|
| |||||||
| 7,063,943 | ||||||||
|
| |||||||
| 18,365,989 | ||||||||
|
| |||||||
HEALTH CARE–21.9% | ||||||||
BIOTECHNOLOGY–5.5% | ||||||||
Aegerion Pharmaceuticals, Inc.(a) | 4,271 | 303,070 | ||||||
Celldex Therapeutics, Inc.(a) | 10,617 | 257,038 | ||||||
Cubist Pharmaceuticals, Inc.(a) | 7,551 | 520,037 | ||||||
Hyperion Therapeutics, Inc.(a) | 1,608 | 32,514 | ||||||
Intercept Pharmaceuticals, Inc.(a) | 4,207 | 287,254 | ||||||
Isis Pharmaceuticals, Inc.(a) | 9,171 | 365,373 | ||||||
Karyopharm Therapeutics, Inc.(a) | 7,025 | 161,013 | ||||||
KYTHERA Biopharmaceuticals, Inc.(a) | 6,846 | $ | 255,014 | |||||
Momenta Pharmaceuticals, Inc.(a) | 15,970 | 282,350 | ||||||
NPS Pharmaceuticals, Inc.(a) | 16,490 | 500,636 | ||||||
Puma Biotechnology, Inc.(a) | 4,876 | 504,812 | ||||||
Synageva BioPharma Corp.(a) | 4,335 | 280,561 | ||||||
TESARO, Inc.(a) | 6,293 | 177,714 | ||||||
|
| |||||||
| 3,927,386 | ||||||||
|
| |||||||
HEALTH CARE EQUIPMENT & | ||||||||
Align Technology, Inc.(a) | 16,360 | 934,974 | ||||||
Cardiovascular Systems, Inc.(a) | 7,164 | 245,653 | ||||||
HeartWare International, Inc.(a) | 8,901 | 836,338 | ||||||
LDR Holding Corp.(a) | 11,956 | 282,162 | ||||||
Sirona Dental Systems, Inc.(a) | 7,474 | 524,675 | ||||||
Tandem Diabetes Care, Inc.(a) | 14,878 | 383,406 | ||||||
TearLab Corp.(a)(b) | 20,821 | 194,468 | ||||||
|
| |||||||
| 3,401,676 | ||||||||
|
| |||||||
HEALTH CARE PROVIDERS & | ||||||||
Acadia Healthcare Co., Inc.(a) | 23,337 | 1,104,540 | ||||||
IPC The Hospitalist Co., Inc.(a) | 3,411 | 202,579 | ||||||
Mednax, Inc.(a) | 12,704 | 678,140 | ||||||
Premier, Inc.–Class A(a) | 11,832 | 434,944 | ||||||
Team Health Holdings, Inc.(a) | 19,149 | 872,237 | ||||||
WellCare Health Plans, Inc.(a) | 7,523 | 529,770 | ||||||
|
| |||||||
| 3,822,210 | ||||||||
|
| |||||||
LIFE SCIENCES TOOLS & | ||||||||
ICON PLC(a) | 20,015 | 808,806 | ||||||
PAREXEL International Corp.(a) | 14,620 | 660,532 | ||||||
|
| |||||||
| 1,469,338 | ||||||||
|
| |||||||
PHARMACEUTICALS–4.3% | ||||||||
Akorn, Inc.(a) | 31,848 | 784,416 | ||||||
Aratana Therapeutics, Inc.(a) | 8,260 | 157,766 | ||||||
Jazz Pharmaceuticals PLC(a) | 7,830 | 990,965 | ||||||
Pacira Pharmaceuticals, Inc./DE(a) | 19,410 | 1,115,881 | ||||||
|
| |||||||
| 3,049,028 | ||||||||
|
| |||||||
| 15,669,638 | ||||||||
|
| |||||||
INDUSTRIALS–20.9% | ||||||||
AEROSPACE & DEFENSE–2.1% | ||||||||
Hexcel Corp.(a) | 24,566 | 1,097,855 | ||||||
KEYW Holding Corp. (The)(a) | 29,635 | 398,294 | ||||||
|
| |||||||
| 1,496,149 | ||||||||
|
| |||||||
COMMERCIAL SERVICES & | ||||||||
Interface, Inc. | 34,210 | 751,252 | ||||||
|
| |||||||
CONSTRUCTION & ENGINEERING–1.3% | ||||||||
Dycom Industries, Inc.(a) | 32,574 | 905,231 | ||||||
|
| |||||||
INDUSTRIAL | ||||||||
Carlisle Cos., Inc. | 12,930 | 1,026,642 | ||||||
|
| |||||||
6
| AllianceBernstein Variable Products Series Fund |
| Company | Shares | U.S. $ Value | ||||||
MACHINERY–8.7% | ||||||||
Actuant Corp.–Class A | 22,390 | $ | 820,370 | |||||
Chart Industries, Inc.(a) | 10,247 | 980,023 | ||||||
IDEX Corp. | 13,345 | 985,528 | ||||||
Lincoln Electric Holdings, Inc. | 10,960 | 781,886 | ||||||
Middleby Corp. (The)(a) | 4,510 | 1,082,265 | ||||||
RBC Bearings, Inc.(a) | 9,216 | 652,032 | ||||||
Valmont Industries, Inc. | 6,352 | 947,210 | ||||||
|
| |||||||
| 6,249,314 | ||||||||
|
| |||||||
MARINE–1.6% | ||||||||
Kirby Corp.(a) | 11,773 | 1,168,470 | ||||||
|
| |||||||
PROFESSIONAL | ||||||||
TrueBlue, Inc.(a) | 35,268 | 909,209 | ||||||
WageWorks, Inc.(a) | 9,320 | 553,981 | ||||||
|
| |||||||
| 1,463,190 | ||||||||
|
| |||||||
ROAD & RAIL–1.2% | ||||||||
Genesee & Wyoming, | 9,282 | 891,536 | ||||||
|
| |||||||
TRADING COMPANIES & DISTRIBUTORS–1.5% | ||||||||
United Rentals, Inc.(a) | 13,660 | 1,064,797 | ||||||
|
| |||||||
| 15,016,581 | ||||||||
|
| |||||||
CONSUMER | ||||||||
DISTRIBUTORS–0.8% | ||||||||
LKQ Corp.(a) | 16,313 | 536,698 | ||||||
|
| |||||||
DIVERSIFIED CONSUMER SERVICES–2.2% | ||||||||
Bright Horizons Family Solutions, Inc.(a) | 21,860 | 803,137 | ||||||
Capella Education Co. | 11,760 | 781,334 | ||||||
|
| |||||||
| 1,584,471 | ||||||||
|
| |||||||
INTERNET & CATALOG RETAIL–3.1% | ||||||||
HomeAway, Inc.(a) | 21,500 | 878,920 | ||||||
Shutterfly, Inc.(a) | 18,027 | 918,115 | ||||||
zulily, Inc.–Class A(a)(b) | 10,851 | 449,557 | ||||||
|
| |||||||
| 2,246,592 | ||||||||
|
| |||||||
MEDIA–0.9% | ||||||||
National CineMedia, Inc. | 32,210 | 642,911 | ||||||
|
| |||||||
SPECIALTY RETAIL–9.6% | ||||||||
Cabela’s, Inc.(a) | 9,915 | 660,934 | ||||||
Conn’s, Inc.(a) | 17,948 | 1,414,123 | ||||||
Container Store Group, Inc. (The)(a) | 13,722 | 639,582 | ||||||
Dick’s Sporting Goods, Inc. | 13,100 | 761,110 | ||||||
Five Below, Inc.(a) | 18,669 | 806,501 | ||||||
Hibbett Sports, Inc.(a)(b) | 12,405 | 833,740 | ||||||
Lumber Liquidators Holdings, Inc.(a) | 10,730 | 1,104,010 | ||||||
Restoration Hardware Holdings, Inc.(a) | 10,245 | 689,488 | ||||||
|
| |||||||
| 6,909,488 | ||||||||
|
| |||||||
| 11,920,160 | ||||||||
|
| |||||||
FINANCIALS–4.9% | ||||||||
CAPITAL MARKETS–1.1% | ||||||||
Stifel Financial Corp.(a) | 16,186 | $ | 775,633 | |||||
|
| |||||||
COMMERCIAL BANKS–3.8% | ||||||||
City National Corp./CA | 4,740 | 375,503 | ||||||
Iberiabank Corp. | 11,188 | 703,166 | ||||||
Signature Bank/New York NY(a) | 7,426 | 797,701 | ||||||
SVB Financial Group(a) | 8,291 | 869,394 | ||||||
|
| |||||||
| 2,745,764 | ||||||||
|
| |||||||
| 3,521,397 | ||||||||
|
| |||||||
ENERGY–4.5% | ||||||||
ENERGY EQUIPMENT & | ||||||||
Dril-Quip, Inc.(a) | 5,740 | 630,998 | ||||||
Forum Energy Technologies, Inc.(a) | 10,000 | 282,600 | ||||||
Oil States International, Inc.(a) | 4,391 | 446,653 | ||||||
|
| |||||||
| 1,360,251 | ||||||||
|
| |||||||
OIL, GAS & CONSUMABLE | ||||||||
Emerald Oil, Inc.(a) | 26,550 | 203,373 | ||||||
Laredo Petroleum Holdings, Inc.(a) | 22,744 | 629,781 | ||||||
Matador Resources Co.(a) | 24,106 | 449,336 | ||||||
Oasis Petroleum, Inc.(a) | 12,405 | 582,663 | ||||||
|
| |||||||
| 1,865,153 | ||||||||
|
| |||||||
| 3,225,404 | ||||||||
|
| |||||||
MATERIALS–1.9% | ||||||||
CHEMICALS–1.9% | ||||||||
PolyOne Corp. | 37,840 | 1,337,644 | ||||||
|
| |||||||
CONSUMER STAPLES–1.8% | ||||||||
FOOD & STAPLES | ||||||||
Chefs’ Warehouse, Inc. (The)(a) | 24,253 | 707,217 | ||||||
Sprouts Farmers Market, Inc.(a) | 14,939 | 574,106 | ||||||
|
| |||||||
| 1,281,323 | ||||||||
|
| |||||||
TELECOMMUNICATION | ||||||||
WIRELESS TELECOMMUNICATION | ||||||||
RingCentral, Inc.–Class A(a) | 14,369 | 263,959 | ||||||
|
| |||||||
Total Common Stocks | 70,602,095 | |||||||
|
| |||||||
7
| SMALL CAP GROWTH PORTFOLIO | ||
| PORTFOLIOOF INVESTMENTS | ||
| (continued) | AllianceBernstein Variable Products Series Fund |
| Company | Principal Amount (000) | U.S. $ Value | ||||||
SHORT-TERM | ||||||||
TIME DEPOSIT–1.7% | ||||||||
State Street Time Deposit | $ | 1,201 | $ | 1,200,586 | ||||
|
| |||||||
Total Investments Before Security Lending Collateral for Securities Loaned–100.2% | 71,802,681 | |||||||
|
| |||||||
| Company | Shares | U.S. $ Value | ||||||
INVESTMENTS OF CASH COLLATERAL FOR SECURITIES | ||||||||
INVESTMENT | ||||||||
AllianceBernstein Exchange Reserves–Class I, 0.07%(c) | 1,764,096 | $ | 1,764,096 | |||||
|
| |||||||
TOTAL | 73,566,777 | |||||||
Other assets less | (1,928,789 | ) | ||||||
|
| |||||||
NET ASSETS–100.0% | $ | 71,637,988 | ||||||
|
| |||||||
| (a) | Non-income producing security. |
| (b) | Represents entire or partial securities out on loan. See Note E for securities lending information. |
| (c) | Investment in affiliated money market mutual fund. The rate shown represents the 7-day yield as of period end. |
Glossary:
ADR—American Depositary Receipt
See notes to financial statements.
8
| SMALL CAP GROWTH PORTFOLIO | ||
| STATEMENTOF ASSETS & LIABILITIES | ||
| December 31, 2013 | AllianceBernstein Variable Products Series Fund | |
ASSETS | ||||
Investments in securities, at value | ||||
Unaffiliated issuers (cost $49,502,042) | $ | 71,802,681 | (a) | |
Affiliated issuers (cost $1,764,096—investment of cash collateral for securities loaned) | 1,764,096 | |||
Receivable for investment securities sold | 200,651 | |||
Dividends and interest receivable | 15,987 | |||
Receivable for capital stock sold | 12,764 | |||
|
| |||
Total assets | 73,796,179 | |||
|
| |||
LIABILITIES | ||||
Payable for collateral received on securities loaned | 1,764,096 | |||
Payable for investment securities purchased | 151,739 | |||
Payable for capital stock redeemed | 110,786 | |||
Advisory fee payable | 42,826 | |||
Audit fee payable | 33,273 | |||
Administrative fee payable | 14,445 | |||
Distribution fee payable | 7,606 | |||
Transfer Agent fee payable | 239 | |||
Accrued expenses | 33,181 | |||
|
| |||
Total liabilities | 2,158,191 | |||
|
| |||
NET ASSETS | $ | 71,637,988 | ||
|
| |||
COMPOSITION OF NET ASSETS | ||||
Capital stock, at par | $ | 3,119 | ||
Additional paid-in capital | 41,116,218 | |||
Accumulated net realized gain on investment transactions | 8,218,012 | |||
Net unrealized appreciation on investments | 22,300,639 | |||
|
| |||
| $ | 71,637,988 | |||
|
|
Net Asset Value Per Share—1 billion shares of capital stock authorized, $.001 par value
| Class | Net Assets | Shares Outstanding | Net Asset Value | |||||||||
A | $ | 33,510,293 | 1,427,682 | $ | 23.47 | |||||||
B | $ | 38,127,695 | 1,691,685 | $ | 22.54 | |||||||
| (a) | Includes securities on loan with a value of $1,733,840 (see Note E). |
See notes to financial statements.
9
| SMALL CAP GROWTH PORTFOLIO | ||
| STATEMENTOF OPERATIONS | ||
| Year Ended December 31, 2013 | AllianceBernstein Variable Products Series Fund | |
INVESTMENT INCOME | ||||
Dividends | ||||
Unaffiliated issuers | $ | 118,730 | ||
Affiliated issuers | 1,715 | |||
Interest | 134 | |||
Securities lending income | 16,513 | |||
|
| |||
| 137,092 | ||||
|
| |||
EXPENSES | ||||
Advisory fee (see Note B) | 472,772 | |||
Distribution fee—Class B | 79,463 | |||
Transfer agency—Class A | 3,273 | |||
Transfer agency—Class B | 3,377 | |||
Custodian | 98,567 | |||
Administrative | 57,354 | |||
Audit | 35,525 | |||
Legal | 34,592 | |||
Printing | 26,966 | |||
Directors’ fees | 4,541 | |||
Miscellaneous | 3,702 | |||
|
| |||
Total expenses | 820,132 | |||
|
| |||
Net investment loss | (683,040 | ) | ||
|
| |||
REALIZED AND UNREALIZED GAIN ON INVESTMENT TRANSACTIONS | ||||
Net realized gain on investment transactions | 9,317,581 | |||
Net change in unrealized appreciation/depreciation of investments | 14,956,858 | |||
|
| |||
Net gain on investment transactions | 24,274,439 | |||
|
| |||
NET INCREASE IN NET ASSETS FROM OPERATIONS | $ | 23,591,399 | ||
|
|
See notes to financial statements.
10
| SMALL CAP GROWTH PORTFOLIO | ||
| STATEMENTOF CHANGESIN NET ASSETS | AllianceBernstein Variable Products Series Fund |
| Year Ended December 31, 2013 | Year Ended December 31, 2012 | |||||||
INCREASE (DECREASE) IN NET ASSETS FROM OPERATIONS | ||||||||
Net investment loss | $ | (683,040 | ) | $ | (455,562 | ) | ||
Net realized gain on investment transactions | 9,317,581 | 10,564,871 | ||||||
Net change in unrealized appreciation/depreciation of investments | 14,956,858 | (674,563 | ) | |||||
|
|
|
| |||||
Net increase in net assets from operations | 23,591,399 | 9,434,746 | ||||||
DISTRIBUTIONS TO SHAREHOLDERS FROM | ||||||||
Net realized gain on investment transactions | ||||||||
Class A | (4,909,967 | ) | (1,011,897 | ) | ||||
Class B | (5,425,603 | ) | (1,178,017 | ) | ||||
CAPITAL STOCK TRANSACTIONS | ||||||||
Net increase (decrease) | 4,452,720 | (12,349,425 | ) | |||||
|
|
|
| |||||
Total increase (decrease) | 17,708,549 | (5,104,593 | ) | |||||
NET ASSETS | ||||||||
Beginning of period | 53,929,439 | 59,034,032 | ||||||
|
|
|
| |||||
End of period (including accumulated net investment loss of $-0- and $-0-, respectively) | $ | 71,637,988 | $ | 53,929,439 | ||||
|
|
|
| |||||
See notes to financial statements.
11
| SMALL CAP GROWTH PORTFOLIO | ||
| NOTES TO FINANCIAL STATEMENTS | ||
| December 31, 2013 | AllianceBernstein Variable Products Series Fund |
NOTE A: Significant Accounting Policies
The AllianceBernstein Small Cap Growth Portfolio (the “Portfolio”) is a series of AllianceBernstein Variable Products Series Fund, Inc. (the “Fund”). The Portfolio’s investment objective is long-term growth of capital. The Portfolio is diversified as defined under the Investment Company Act of 1940. The Fund was incorporated in the State of Maryland on November 17, 1987, as an open-end series investment company. The Fund offers thirteen separately managed pools of assets which have differing investment objectives and policies. The Portfolio offers Class A and Class B shares. Both classes of shares have identical voting, dividend, liquidating and other rights, except that Class B shares bear a distribution expense and have exclusive voting rights with respect to the Class B distribution plan.
The Portfolio offers and sells its shares only to separate accounts of certain life insurance companies for the purpose of funding variable annuity contracts and variable life insurance policies. Sales are made without a sales charge at the Portfolio’s net asset value per share.
Effective February 1, 2013, the Portfolio was closed to new investments except that Contractholders of variable products with investment options that included the Portfolio as of January 31, 2013, may continue to purchase shares of the Portfolio in accordance with the procedures for the purchase of shares in the prospectus of the separate account in which they invest, including through reinvestment of dividends and capital gains distributions.
The Portfolio may (i) make additional exceptions that, in the Adviser’s judgment, do not adversely affect the Adviser’s ability to manage the Portfolio; (ii) reject any investment or refuse any exception, including those detailed above, that the Adviser believes will adversely affect its ability to manage the Portfolio; and (iii) close and/or reopen the Portfolio to new or existing Contractholders at any time.
The financial statements have been prepared in conformity with U.S. generally accepted accounting principles (“U.S. GAAP”) which require management to make certain estimates and assumptions that affect the reported amounts of assets and liabilities in the financial statements and amounts of income and expenses during the reporting period. Actual results could differ from those estimates. The following is a summary of significant accounting policies followed by the Portfolio.
1. Security Valuation
Portfolio securities are valued at their current market value determined on the basis of market quotations or, if market quotations are not readily available or are deemed unreliable, at “fair value” as determined in accordance with procedures established by and under the general supervision of the Fund’s Board of Directors (the “Board”).
In general, the market values of securities which are readily available and deemed reliable are determined as follows: securities listed on a national securities exchange (other than securities listed on the NASDAQ Stock Market, Inc. (“NASDAQ”)) or on a foreign securities exchange are valued at the last sale price at the close of the exchange or foreign securities exchange. If there has been no sale on such day, the securities are valued at the last traded price from the previous day. Securities listed on more than one exchange are valued by reference to the principal exchange on which the securities are traded; securities listed only on NASDAQ are valued in accordance with the NASDAQ Official Closing Price; listed or over the counter (“OTC”) market put or call options are valued at the mid level between the current bid and ask prices. If either a current bid or current ask price is unavailable, AllianceBernstein L.P. (the “Adviser”) will have discretion to determine the best valuation (e.g. last trade price in the case of listed options); open futures are valued using the closing settlement price or, in the absence of such a price, the most recent quoted bid price. If there are no quotations available for the day of valuation, the last available closing settlement price is used; U.S. government securities and other debt instruments having 60 days or less remaining until maturity are valued at amortized cost if their original maturity was 60 days or less; or by amortizing their fair value as of the 61st day prior to maturity if their original term to maturity exceeded 60 days; fixed-income securities, including mortgage-backed and asset-backed securities, may be valued on the basis of prices provided by a pricing service or at a price obtained from one or more of the major broker-dealers. In cases where broker-dealer quotes are obtained, the Adviser may establish procedures whereby changes in market yields or spreads are used to adjust, on a daily basis, a recently obtained quoted price on a security. Swaps and other derivatives are valued daily, primarily using independent pricing services, independent pricing models using market inputs, as well as third party broker-dealers or counterparties. Investment companies are valued at their net asset value each day.
Securities for which market quotations are not readily available (including restricted securities) or are deemed unreliable are valued at fair value. Factors considered in making this determination may include, but are not limited to, information obtained by contacting the issuer, analysts, analysis of the issuer’s financial statements or other available documents. In
12
| AllianceBernstein Variable Products Series Fund |
addition, the Portfolio may use fair value pricing for securities primarily traded in non-U.S. markets because most foreign markets close well before the Portfolio values its securities at 4:00 p.m., Eastern Time. The earlier close of these foreign markets gives rise to the possibility that significant events, including broad market moves, may have occurred in the interim and may materially affect the value of those securities. To account for this, the Portfolio may frequently value many of its foreign equity securities using fair value prices based on third party vendor modeling tools to the extent available.
2. Fair Value Measurements
In accordance with U.S. GAAP regarding fair value measurements, fair value is defined as the price that the Portfolio would receive to sell an asset or pay to transfer a liability in an orderly transaction between market participants at the measurement date. U.S. GAAP establishes a framework for measuring fair value, and a three-level hierarchy for fair value measurements based upon the transparency of inputs to the valuation of an asset or liability (including those valued based on their market values as described in Note A.1 above). Inputs may be observable or unobservable and refer broadly to the assumptions that market participants would use in pricing the asset or liability. Observable inputs reflect the assumptions market participants would use in pricing the asset or liability based on market data obtained from sources independent of the Portfolio. Unobservable inputs reflect the Portfolio’s own assumptions about the assumptions that market participants would use in pricing the asset or liability based on the best information available in the circumstances. Each investment is assigned a level based upon the observability of the inputs which are significant to the overall valuation. The three-tier hierarchy of inputs is summarized below.
| • | Level 1—quoted prices in active markets for identical investments |
| • | Level 2—other significant observable inputs (including quoted prices for similar investments, interest rates, prepayment speeds, credit risk, etc.) |
| • | Level 3—significant unobservable inputs (including the Portfolio’s own assumptions in determining the fair value of investments) |
Where readily available market prices or relevant bid prices are not available for certain equity investments, such investments may be valued based on similar publicly traded investments, movements in relevant indices since last available prices or based upon underlying company fundamentals and comparable company data (such as multiples to earnings or other multiples to equity). Where an investment is valued using an observable input, such as another publicly traded security, the investment will be classified as Level 2. If management determines that an adjustment is appropriate based on restrictions on resale, illiquidity or uncertainty, and such adjustment is a significant component of the valuation, the investment will be classified as Level 3. An investment will also be classified as Level 3 where management uses company fundamentals and other significant inputs to determine the valuation.
The following table summarizes the valuation of the Portfolio’s investments by the above fair value hierarchy levels as of December 31, 2013:
| Level 1 | Level 2 | Level 3 | Total | |||||||||||||
Investments in Securities: | ||||||||||||||||
Assets: | ||||||||||||||||
Common Stocks* | $ | 70,602,095 | $ | –0 | – | $ | –0 | – | $ | 70,602,095 | ||||||
Short-Term Investments | –0 | – | 1,200,586 | –0 | – | 1,200,586 | ||||||||||
Investments of Cash Collateral for Securities Loaned in Affiliated Money Market Fund | 1,764,096 | –0 | – | –0 | – | 1,764,096 | ||||||||||
|
|
|
|
|
|
|
| |||||||||
Total Investments in Securities | 72,366,191 | 1,200,586 | –0 | – | 73,566,777 | |||||||||||
Other Financial Instruments** | –0 | – | –0 | – | –0 | – | –0 | – | ||||||||
|
|
|
|
|
|
|
| |||||||||
Total^ | $ | 72,366,191 | $ | 1,200,586 | $ | –0 | – | $ | 73,566,777 | |||||||
|
|
|
|
|
|
|
| |||||||||
| * | See Portfolio of Investments for sector classifications. |
| ** | Other financial instruments are derivative instruments, such as futures, forwards and swaps, which are valued at the unrealized appreciation/depreciation on the instrument. |
| ^ | There were no transfers between Level 1 and Level 2 during the reporting period. |
The Portfolio recognizes all transfers between levels of the fair value hierarchy assuming the financial instruments were transferred at the beginning of the reporting period.
13
| SMALL CAP GROWTH PORTFOLIO | ||
| NOTES TO FINANCIAL STATEMENTS | ||
| (continued) | AllianceBernstein Variable Products Series Fund |
The Adviser has established a Valuation Committee (the “Committee”) which is responsible for overseeing the pricing and valuation of all securities held in the Portfolio. The Committee operates under pricing and valuation policies and procedures established by the Adviser and approved by the Board, including pricing policies which set forth the mechanisms and processes to be employed on a daily basis to implement these policies and procedures. In particular, the pricing policies describe how to determine market quotations for securities and other instruments. The Committee’s responsibilities include: 1) fair value and liquidity determinations (and oversight of any third parties to whom any responsibility for fair value and liquidity determinations is delegated), and 2) regular monitoring of the Adviser’s pricing and valuation policies and procedures and modification or enhancement of these policies and procedures (or recommendation of the modification of these policies and procedures) as the Committee believes appropriate.
The Committee is also responsible for monitoring the implementation of the pricing policies by the Adviser’s Pricing Group (the “Pricing Group”) and a third party which performs certain pricing functions in accordance with the pricing policies. The Pricing Group is responsible for the oversight of the third party on a day-to-day basis. The Committee and the Pricing Group perform a series of activities to provide reasonable assurance of the accuracy of prices including: 1) periodic vendor due diligence meetings, review of methodologies, new developments and processes at vendors, 2) daily comparison of security valuation versus prior day for all securities that exceeded established thresholds, and 3) daily review of unpriced, stale, and variance reports with exceptions reviewed by senior management and the Committee.
In addition, several processes outside of the pricing process are used to monitor valuation issues including: 1) performance and performance attribution reports are monitored for anomalous impacts based upon benchmark performance, and 2) portfolio managers review all portfolios for performance and analytics (which are generated using the Adviser’s prices).
3. Currency Translation
Assets and liabilities denominated in foreign currencies and commitments under forward currency exchange contracts are translated into U.S. dollars at the mean of the quoted bid and ask prices of such currencies against the U.S. dollar. Purchases and sales of portfolio securities are translated into U.S. dollars at the rates of exchange prevailing when such securities were acquired or sold. Income and expenses are translated into U.S. dollars at rates of exchange prevailing when accrued.
Net realized gain or loss on foreign currency transactions represents foreign exchange gains and losses from sales and maturities of foreign fixed income investments, foreign currency exchange contracts, holding of foreign currencies, currency gains or losses realized between the trade and settlement dates on foreign investment transactions, and the difference between the amounts of dividends, interest and foreign withholding taxes recorded on the Portfolio’s books and the U.S. dollar equivalent amounts actually received or paid. Net unrealized currency gains and losses from valuing foreign currency denominated assets and liabilities at period end exchange rates are reflected as a component of net unrealized appreciation or depreciation of foreign currency denominated assets and liabilities.
4. Taxes
It is the Portfolio’s policy to meet the requirements of the Internal Revenue Code applicable to regulated investment companies and to distribute all of its investment company taxable income and net realized gains, if any, to shareholders. Therefore, no provisions for federal income or excise taxes are required. The Portfolio may be subject to taxes imposed by countries in which it invests. Such taxes are generally based on income and/or capital gains earned or repatriated. Taxes are accrued and applied to net investment income, net realized gains and net unrealized appreciation/depreciation as such income and/or gains are earned.
In accordance with U.S. GAAP requirements regarding accounting for uncertainties in income taxes, management has analyzed the Portfolio’s tax positions taken or expected to be taken on federal and state income tax returns for all open tax years (the current and the prior three tax years) and has concluded that no provision for income tax is required in the Portfolio’s financial statements.
5. Investment Income and Investment Transactions
Dividend income is recorded on the ex-dividend date or as soon as the Portfolio is informed of the dividend. Interest income is accrued daily. Investment transactions are accounted for on the date the securities are purchased or sold. Investment gains or losses are determined on the identified cost basis. The Portfolio amortizes premiums and accretes discounts as adjustments to interest income.
14
| AllianceBernstein Variable Products Series Fund |
6. Class Allocations
All income earned and expenses incurred by the Portfolio are borne on a pro-rata basis by each outstanding class of shares, based on the proportionate interest in the Portfolio represented by the net assets of such class, except for class specific expenses which are allocated to the respective class. Expenses of the Fund are charged proportionately to each Portfolio or based on other appropriate methods. Realized and unrealized gains and losses are allocated among the various share classes based on respective net assets.
7. Dividends and Distributions
Dividends and distributions to shareholders, if any, are recorded on the ex-dividend date. Income dividends and capital gains distributions are determined in accordance with federal tax regulations and may differ from those determined in accordance with U.S. GAAP. To the extent these differences are permanent, such amounts are reclassified within the capital accounts based on their federal tax basis treatment; temporary differences do not require such reclassification.
NOTE B: Advisory Fee and Other Transactions with Affiliates
Under the terms of the investment advisory agreement, the Portfolio pays the Adviser an advisory fee at an annual rate of .75% of the first $2.5 billion, .65% of the next $2.5 billion and .60% in excess of $5 billion, of the Portfolio’s average daily net assets. The fee is accrued daily and paid monthly.
Pursuant to the investment advisory agreement, the Portfolio may reimburse the Adviser for certain legal and accounting services provided to the Portfolio by the Adviser. For the year ended December 31, 2013, the reimbursement for such services amounted to $57,354.
Brokerage commissions paid on investment transactions for the year ended December 31, 2013 amounted to $91,885, of which $52 and $0, respectively, was paid to Sanford C. Bernstein & Co. LLC and Sanford C. Bernstein Limited, affiliates of the Adviser.
The Portfolio compensates AllianceBernstein Investor Services, Inc. (“ABIS”), a wholly-owned subsidiary of the Adviser, under a Transfer Agency Agreement for providing personnel and facilities to perform transfer agency services for the Portfolio. Such compensation retained by ABIS amounted to $1,385 for the year ended December 31, 2013.
NOTE C: Distribution Plan
The Portfolio has adopted a Distribution Plan (the “Plan”) for Class B shares pursuant to Rule 12b-1 under the Investment Company Act of 1940. Under the Plan, the Portfolio pays distribution and servicing fees to AllianceBernstein Investments, Inc. (the “Distributor”), a wholly-owned subsidiary of the Adviser, at an annual rate of up to .50% of the Portfolio’s average daily net assets attributable to Class B shares. The fees are accrued daily and paid monthly. The Board currently limits payments under the Plan to .25% of the Portfolio’s average daily net assets attributable to Class B shares. The Plan provides that the Distributor will use such payments in their entirety for distribution assistance and promotional activities.
The Portfolio is not obligated under the Plan to pay any distribution and servicing fees in excess of the amounts set forth above. The purpose of the payments to the Distributor under the Plan is to compensate the Distributor for its distribution services with respect to the sale of the Portfolio’s Class B shares. Since the Distributor’s compensation is not directly tied to its expenses, the amount of compensation received by it under the Plan during any year may be more or less than its actual expenses. For this reason, the Plan is characterized by the staff of the Securities and Exchange Commission as being of the “compensation” variety.
In the event that the Plan is terminated or not continued, no distribution or servicing fees (other than current amounts accrued but not yet paid) would be owed by the Portfolio to the Distributor.
The Plan also provides that the Adviser may use its own resources to finance the distribution of the Portfolio’s shares.
NOTE D: Investment Transactions
Purchases and sales of investment securities (excluding short-term investments) for the year ended December 31, 2013 were as follows:
| Purchases | Sales | |||||||
Investment securities (excluding U.S. government securities) | $ | 49,598,865 | $ | 56,078,262 | ||||
U.S. government securities | –0 | – | –0 | – | ||||
15
| SMALL CAP GROWTH PORTFOLIO | ||
| NOTES TO FINANCIAL STATEMENTS | ||
| (continued) | AllianceBernstein Variable Products Series Fund |
The cost of investments for federal income tax purposes, gross unrealized appreciation and unrealized depreciation are as follows:
Cost | $ | 51,888,166 | ||
|
| |||
Gross unrealized appreciation | $ | 22,572,613 | ||
Gross unrealized depreciation | (894,002 | ) | ||
|
| |||
Net unrealized appreciation | $ | 21,678,611 | ||
|
|
1. Derivative Financial Instruments
The Portfolio may use derivatives in an effort to earn income and enhance returns, to replace more traditional direct investments, to obtain exposure to otherwise inaccessible markets (collectively, “investment purposes”), or to hedge or adjust the risk profile of its portfolio.
The Portfolio did not engage in derivatives transactions for the year ended December 31, 2013.
2. Currency Transactions
The Portfolio may invest in non-U.S. dollar securities on a currency hedged or unhedged basis. The Portfolio may seek investment opportunities by taking long or short positions in currencies through the use of currency-related derivatives, including forward currency exchange contracts, futures and options on futures, swaps, and other options. The Portfolio may enter into transactions for investment opportunities when it anticipates that a foreign currency will appreciate or depreciate in value but securities denominated in that currency are not held by the Portfolio and do not present attractive investment opportunities. Such transactions may also be used when the Adviser believes that it may be more efficient than a direct investment in a foreign currency-denominated security. The Portfolio may also conduct currency exchange contracts on a spot basis (i.e., for cash at the spot rate prevailing in the currency exchange market for buying or selling currencies).
NOTE E: Securities Lending
The Portfolio may enter into securities lending transactions. Under the Portfolio’s securities lending program, all loans of securities will be collateralized continually by cash. The Portfolio will be compensated for the loan from a portion of the net return from the income earned on cash collateral after a rebate is paid to the borrower (in some cases, this rebate may be a “negative rebate” or fee paid by the borrower to the Portfolio in connection with the loan), and payments are made for fees of the securities lending agent and for certain other administrative expenses. It is the policy of the Portfolio to receive collateral consisting of cash in an amount exceeding the value of the securities loaned. The Portfolio will have the right to call a loan and obtain the securities loaned at any time on notice to the borrower within the normal and customary settlement time for the securities. While the securities are on loan, the borrower is obligated to pay the Portfolio amounts equal to any income or other distributions from the securities. The Portfolio will not have the right to vote any securities during the existence of a loan, but will have the right to regain ownership of loaned securities in order to exercise voting or other ownership rights. The lending agent has agreed to indemnify the Portfolio in the case of default of any securities borrower. Collateral received and securities loaned are marked to market daily to ensure that the securities loaned are secured by collateral. The lending agent will invest the cash collateral received in AllianceBernstein Exchange Reserves, an eligible money market vehicle, in accordance with the investment restrictions of the Portfolio, and as approved by the Board. The collateral received on securities loaned is recorded as an asset as well as a corresponding liability in the statement of assets and liabilities. When the Portfolio lends securities, its investment performance will continue to reflect changes in the value of the securities loaned. At December 31, 2013, the Portfolio had securities on loan with a value of $1,733,840 and had received cash collateral which has been invested into AllianceBernstein Exchange Reserves of $1,764,096. The cash collateral will be adjusted on the next business day to maintain the required collateral amount. The Portfolio earned securities lending income of $16,513 and $1,715 from the borrowers and AllianceBernstein Exchange Reserves, respectively, for the year ended December 31, 2013; these amounts are reflected in the statement of operations. A principal risk of lending portfolio securities is that the borrower will fail to return the loaned securities upon termination of the loan and that the collateral will not be sufficient to replace the loaned securities. A summary of the Portfolio’s transactions in shares of AllianceBernstein Exchange Reserves for the year ended December 31, 2013 is as follows:
Market Value December 31, 2012 (000) | Purchases at Cost (000) | Sales Proceeds (000) | Market Value December 31, 2013 (000) | |||||||||||
| $ | 3,204 | $ | 37,025 | $ | 38,465 | $ | 1,764 | |||||||
16
| AllianceBernstein Variable Products Series Fund |
NOTE F: Capital Stock
Each class consists of 500,000,000 authorized shares. Transactions in capital shares for each class were as follows:
| SHARES | AMOUNT | |||||||||||||||||
| Year Ended December 31, 2013 | Year Ended December 31, 2012 | Year Ended December 31, 2013 | Year Ended December 31, 2012 | |||||||||||||||
Class A | ||||||||||||||||||
Shares sold | 175,197 | 969,895 | $ | 3,755,689 | $ | 18,413,926 | ||||||||||||
Shares issued in reinvestment of distributions | 242,587 | 53,483 | 4,909,967 | 1,011,897 | ||||||||||||||
Shares redeemed | (439,402 | ) | (1,293,042 | ) | (9,575,673 | ) | (25,002,041 | ) | ||||||||||
|
|
|
|
|
|
|
| |||||||||||
Net decrease | (21,618 | ) | (269,664 | ) | $ | (910,017 | ) | $ | (5,576,218 | ) | ||||||||
|
|
|
|
|
|
|
| |||||||||||
Class B | ||||||||||||||||||
Shares sold | 425,918 | 678,372 | $ | 9,109,480 | $ | 12,428,150 | ||||||||||||
Shares issued in reinvestment of distributions | 278,808 | 64,232 | 5,425,603 | 1,178,017 | ||||||||||||||
Shares redeemed | (453,555 | ) | (1,088,427 | ) | (9,172,346 | ) | (20,379,374 | ) | ||||||||||
|
|
|
|
|
|
|
| |||||||||||
Net increase (decrease) | 251,171 | (345,823 | ) | $ | 5,362,737 | $ | (6,773,207 | ) | ||||||||||
|
|
|
|
|
|
|
| |||||||||||
NOTE G: Risks Involved in Investing in the Portfolio
Foreign Securities Risk—Investing in securities of foreign companies or foreign governments involves special risks which include changes in foreign currency exchange rates and the possibility of future political and economic developments which could adversely affect the value of such securities. Moreover, securities of many foreign companies or foreign governments and their markets may be less liquid and their prices more volatile than those of comparable U.S. companies or of the U.S. government.
Currency Risk—This is the risk that changes in foreign currency exchange rates may negatively affect the value of the Portfolio’s investments or reduce the returns of the Portfolio. For example, the value of the Portfolio’s investments in foreign currency-denominated securities or currencies may decrease if the U.S. dollar is strong (i.e., gaining value relative to other currencies) and other currencies are weak (i.e., losing value relative to the U.S. dollar). Currency markets are generally not as regulated as securities markets. Independent of the Portfolio’s investments denominated in foreign currencies, the Portfolio’s positions in various foreign currencies may cause the Portfolio to experience investment losses due to the changes in exchange rates and interest rates.
Derivatives Risk—The Portfolio may enter into derivative transactions such as forwards, options, futures and swaps. Derivatives may be illiquid, difficult to price, and leveraged so that small changes may produce disproportionate losses for the Portfolio, and subject to counterparty risk to a greater degree than more traditional investments. Derivatives may result in significant losses, including losses that are far greater than the value of the derivatives reflected in the statement of assets and liabilities.
Indemnification Risk—In the ordinary course of business, the Portfolio enters into contracts that contain a variety of indemnifications. The Portfolio’s maximum exposure under these arrangements is unknown. However, the Portfolio has not had prior claims or losses pursuant to these indemnification provisions and expects the risk of loss thereunder to be remote. Therefore, the Portfolio has not accrued any liability in connection with these indemnification provisions.
NOTE H: Joint Credit Facility
A number of open-end mutual funds managed by the Adviser, including the Portfolio, participate in a $140 million revolving credit facility (the “Facility”) intended to provide short-term financing, if necessary, subject to certain restrictions in connection with abnormal redemption activity. Commitment fees related to the Facility are paid by the participating funds and are included in miscellaneous expenses in the statement of operations. The Portfolio did not utilize the Facility during the year ended December 31, 2013.
17
| SMALL CAP GROWTH PORTFOLIO | ||
| NOTES TO FINANCIAL STATEMENTS | ||
| (continued) | AllianceBernstein Variable Products Series Fund |
NOTE I: Distributions to Shareholders
The tax character of distributions paid during the fiscal years ended December 31, 2013 and December 31, 2012 were as follows:
| 2013 | 2012 | |||||||
Distributions paid from: | ||||||||
Net long-term capital gains | $ | 10,335,570 | $ | 2,189,914 | ||||
|
|
|
| |||||
Total taxable distributions paid | $ | 10,335,570 | $ | 2,189,914 | ||||
|
|
|
| |||||
As of December 31, 2013, the components of accumulated earnings/(deficit) on a tax basis were as follows:
Undistributed net capital gain | $ | 8,840,040 | ||
Unrealized appreciation/(depreciation) | 21,678,611 | (a) | ||
|
| |||
Total accumulated earnings/(deficit) | $ | 30,518,651 | ||
|
|
| (a) | The difference between book-basis and tax-basis unrealized appreciation/(depreciation) is attributable primarily to the tax deferral of losses on wash sales. |
For tax purposes, net capital losses may be carried over to offset future capital gains, if any. Funds are permitted to carry forward capital losses incurred in taxable years beginning after December 22, 2010 for an indefinite period, and such losses will retain their character as either short-term or long-term capital losses. As of December 31, 2013, the Portfolio did not have any capital loss carryforwards.
During the current fiscal year, permanent differences primarily due to the disallowance of a net operating loss resulted in a net decrease in accumulated net investment loss and a net decrease in additional paid-in capital. These reclassifications had no effect on net assets.
NOTE J: Subsequent Events
Management has evaluated subsequent events for possible recognition or disclosure in the financial statements through the date the financial statements are issued. Management has determined that there are no material events that would require disclosure in the Portfolio’s financial statements through this date.
18
| SMALL CAP GROWTH PORTFOLIO | ||
| FINANCIAL HIGHLIGHTS | AllianceBernstein Variable Products Series Fund | |
Selected Data For A Share Of Capital Stock Outstanding Throughout Each Period
| CLASS A | ||||||||||||||||||||
| Year Ended December 31, | ||||||||||||||||||||
| 2013 | 2012 | 2011 | 2010 | 2009 | ||||||||||||||||
Net asset value, beginning of period | $18.96 | $17.09 | $16.36 | $11.95 | $8.43 | |||||||||||||||
|
|
|
|
|
|
|
|
|
| |||||||||||
Income From Investment Operations | ||||||||||||||||||||
Net investment loss (a) | (.21 | ) | (.12 | ) | (.15 | ) | (.13 | ) | (.13 | ) | ||||||||||
Net realized and unrealized gain on investment transactions | 8.30 | 2.69 | .88 | 4.54 | 3.65 | |||||||||||||||
|
|
|
|
|
|
|
|
|
| |||||||||||
Net increase in net asset value from operations | 8.09 | 2.57 | .73 | 4.41 | 3.52 | |||||||||||||||
|
|
|
|
|
|
|
|
|
| |||||||||||
Less: Distributions | ||||||||||||||||||||
Distributions from net realized gain on investment transactions | (3.58 | ) | (.70 | ) | –0 | – | –0 | – | –0 | – | ||||||||||
|
|
|
|
|
|
|
|
|
| |||||||||||
Net asset value, end of period | $23.47 | $18.96 | $17.09 | $16.36 | $11.95 | |||||||||||||||
|
|
|
|
|
|
|
|
|
| |||||||||||
Total Return | ||||||||||||||||||||
Total investment return based on net asset value (b) | 45.66 | %* | 15.02 | % | 4.46 | %* | 36.90 | %* | 41.76 | %* | ||||||||||
Ratios/Supplemental Data | ||||||||||||||||||||
Net assets, end of period (000’s omitted) | $33,510 | $27,479 | $29,369 | $29,018 | $22,876 | |||||||||||||||
Ratio to average net assets of: | ||||||||||||||||||||
Expenses | 1.17 | % | 1.18 | % | 1.18 | % | 1.37 | %+ | 1.62 | % | ||||||||||
Net investment loss | (.96 | )% | (.64 | )% | (.85 | )% | (1.00 | )%+ | (1.33 | )% | ||||||||||
Portfolio turnover rate | 81 | % | 105 | % | 92 | % | 95 | % | 106 | % | ||||||||||
See footnote summary on page 20.
19
| SMALL CAP GROWTH PORTFOLIO | ||
| FINANCIAL HIGHLIGHTS | ||
| (continued) | AllianceBernstein Variable Products Series Fund |
Selected Data For A Share Of Capital Stock Outstanding Throughout Each Period
| CLASS B | ||||||||||||||||||||
| Year Ended December 31, | ||||||||||||||||||||
| 2013 | 2012 | 2011 | 2010 | 2009 | ||||||||||||||||
Net asset value, beginning of period | $18.36 | $16.61 | $15.94 | $11.67 | $8.26 | |||||||||||||||
|
|
|
|
|
|
|
|
|
| |||||||||||
Income From Investment Operations | ||||||||||||||||||||
Net investment loss (a) | (.25 | ) | (.16 | ) | (.19 | ) | (.16 | ) | (.15 | ) | ||||||||||
Net realized and unrealized gain on investment transactions | 8.01 | 2.61 | .86 | 4.43 | 3.56 | |||||||||||||||
|
|
|
|
|
|
|
|
|
| |||||||||||
Net increase in net asset value from operations | 7.76 | 2.45 | .67 | 4.27 | 3.41 | |||||||||||||||
|
|
|
|
|
|
|
|
|
| |||||||||||
Less: Distributions | ||||||||||||||||||||
Distributions from net realized gain on investment transactions | (3.58 | ) | (.70 | ) | –0 | – | –0 | – | –0 | – | ||||||||||
|
|
|
|
|
|
|
|
|
| |||||||||||
Net asset value, end of period | $22.54 | $18.36 | $16.61 | $15.94 | $11.67 | |||||||||||||||
|
|
|
|
|
|
|
|
|
| |||||||||||
Total Return | ||||||||||||||||||||
Total investment return based on net asset value (b) | 45.33 | %* | 14.73 | % | 4.20 | %* | 36.59 | %* | 41.28 | %* | ||||||||||
Ratios/Supplemental Data | ||||||||||||||||||||
Net assets, end of period (000’s omitted) | $38,128 | $26,450 | $29,665 | $29,128 | $14,796 | |||||||||||||||
Ratio to average net assets of: | ||||||||||||||||||||
Expenses | 1.43 | % | 1.43 | % | 1.43 | % | 1.62 | %+ | 1.87 | % | ||||||||||
Net investment loss | (1.21 | )% | (.89 | )% | (1.11 | )% | (1.23 | )%+ | (1.58 | )% | ||||||||||
Portfolio turnover rate | 81 | % | 105 | % | 92 | % | 95 | % | 106 | % | ||||||||||
| (a) | Based on average shares outstanding. |
| (b) | Total investment return is calculated assuming an initial investment made at the net asset value at the beginning of the period, reinvestment of all dividends and distributions at net asset value during the period, and redemption on the last day of the period. Total return does not reflect (i) insurance company’s separate account related expense charges and (ii) the deductions of taxes that a shareholder would pay on Portfolio distributions or the redemption of Portfolio shares. Total investment return calculated for a period of less than one year is not annualized. |
| * | Includes the impact of proceeds received and credited to the Portfolio resulting from class action settlements, which enhanced the Portfolio’s performance for the years ended December 31, 2013, December 31, 2011, December 31, 2010 and December 31, 2009 by 0.23%, 0.09%, 0.05% and 0.28%, respectively. |
| + | The ratio includes expenses attributable to costs of proxy solicitation. |
See notes to financial statements.
20
| REPORTOF INDEPENDENT REGISTERED | ||
| PUBLIC ACCOUNTING FIRM | AllianceBernstein Variable Products Series Fund | |
To the Board of Directors and Shareholders of AllianceBernstein Small Cap Growth Portfolio:
We have audited the accompanying statement of assets and liabilities, including the portfolio of investments, of AllianceBernstein Small Cap Growth Portfolio (one of the funds constituting AllianceBernstein Variable Products Series Fund, Inc. (the “Fund”)) as of December 31, 2013, and the related statement of operations for the year then ended, the statements of changes in net assets for each of the two years in the period then ended, and the financial highlights for each of the five years in the period then ended. These financial statements and financial highlights are the responsibility of the Fund’s management. Our responsibility is to express an opinion on these financial statements and financial highlights based on our audits.
We conducted our audits in accordance with the standards of the Public Company Accounting Oversight Board (United States). Those standards require that we plan and perform the audit to obtain reasonable assurance about whether the financial statements and financial highlights are free of material misstatement. We were not engaged to perform an audit of the Fund’s internal control over financial reporting. Our audits included consideration of internal control over financial reporting as a basis for designing audit procedures that are appropriate in the circumstances, but not for the purpose of expressing an opinion on the effectiveness of the Fund’s internal control over financial reporting. Accordingly, we express no such opinion. An audit also includes examining, on a test basis, evidence supporting the amounts and disclosures in the financial statements and financial highlights, assessing the accounting principles used and significant estimates made by management, and evaluating the overall financial statement presentation. Our procedures included confirmation of securities owned as of December 31, 2013, by correspondence with the custodian and others, or by other appropriate auditing procedures where replies from others were not received. We believe that our audits provide a reasonable basis for our opinion.
In our opinion, the financial statements and financial highlights referred to above present fairly, in all material respects, the financial position of AllianceBernstein Small Cap Growth Portfolio (one of the funds constituting AllianceBernstein Variable Products Series Fund, Inc.) at December 31, 2013, the results of its operations for the year then ended, the changes in its net assets for each of the two years in the period then ended, and the financial highlights for each of the five years in the period then ended, in conformity with U.S. generally accepted accounting principles.

New York, New York
February 14, 2014
21
| SMALL CAP GROWTH PORTFOLIO | AllianceBernstein Variable Products Series Fund |
| BOARDOF DIRECTORS | ||
Marshall C. Turner, Jr.(1), Chairman John H. Dobkin(1) Michael J. Downey(1) William H. Foulk, Jr.(1) D. James Guzy(1) | Nancy P. Jacklin(1) Robert M. Keith, President and Garry L. Moody(1) Earl D. Weiner(1) | |
| OFFICERS | ||
Philip L. Kirstein, Senior Vice President and Bruce K. Aronow(2), Vice President N. Kumar Kirpalani(2), Vice President Samantha S. Lau(2), Vice President | Wen-Tse Tseng(2), Vice President Emilie D. Wrapp, Secretary Joseph J. Mantineo, Treasurer and Phyllis J. Clarke, Controller Vincent S. Noto, Chief Compliance Officer | |
| CUSTODIANAND ACCOUNTING AGENT | LEGAL COUNSEL | |
State Street Bank and Trust Company One Lincoln Street Boston, MA 02111 | Seward & Kissel LLP One Battery Park Plaza New York, NY 10004 | |
| DISTRIBUTOR | TRANSFER AGENT | |
AllianceBernstein Investments, Inc. 1345 Avenue of the Americas New York, NY 10105 | AllianceBernstein Investor Services, Inc. P.O. Box 786003 San Antonio, TX 78278-6003 Toll-Free 1-(800) 221-5672 | |
| INDEPENDENT REGISTERED PUBLIC | ||
| ACCOUNTING FIRM | ||
Ernst & Young LLP 5 Times Square New York, NY 10036 |
| (1) | Member of the Audit Committee, the Governance and Nominating Committee and the Independent Directors Committee. Mr. Foulk is the sole member of the Fair Value Pricing Committee. |
| (2) | The management of, and investment decisions for, the Portfolio’s portfolio are made by the Adviser’s Small Cap Growth Investment Team. Mr. Bruce K. Aronow, Mr. N. Kumar Kirpalani, Ms. Samantha S. Lau and Mr. Wen-Tse Tseng, members of the Adviser’s Small Cap Growth Investment Team, are primarily responsible for the day-to-day management of the Portfolio’s portfolio. |
22
| SMALL CAP GROWTH PORTFOLIO | AllianceBernstein Variable Products Series Fund |
MANAGEMENTOFTHE FUND
Board of Directors Information
The business and affairs of the Fund are managed under the direction of the Board of Directors. Certain information concerning the Fund’s Directors is set forth below.
NAME, ADDRESS*, AGE, (YEAR FIRST ELECTED**) | PRINCIPAL OCCUPATION(S) DURING PAST FIVE YEARS AND OTHER RELEVANT QUALIFICATIONS*** | PORTFOLIOS IN FUND COMPLEX OVERSEEN BY DIRECTOR | OTHER DIRECTORSHIP HELD BY DIRECTOR IN THE PAST FIVE YEARS | |||||
| INTERESTED DIRECTOR | ||||||||
Robert M. Keith, # 1345 Avenue of the Americas New York, NY 10105 53 (2010) | Senior Vice President of AllianceBernstein L.P. (the “Adviser”) and the head of AllianceBernstein Investments, Inc. (“ABI”) since July 2008; Director of ABI and President of the AllianceBernstein Mutual Funds. Previously, he served as Executive Managing Director of ABI from December 2006 to June 2008. Prior to joining ABI in 2006, Executive Managing Director of Bernstein Global Wealth Management, and prior thereto, Senior Managing Director and Global Head of Client Service and Sales of the Adviser’s institutional investment management business since 2004. Prior thereto, he was Managing Director and Head of North American Client Service and Sales in the Adviser’s institutional investment management business, with which he had been associated since prior to 2004. | 100 | None | |||||
| DISINTERESTED DIRECTORS | ||||||||
Marshall C. Turner, Jr., ## Chairman of the Board 72 (2005) | Private Investor since prior to 2009. Former CEO of Dupont Photomasks, Inc. (components of semi-conductor manufacturing), 2003-2006, and interim CEO 1999-2000. Interim CEO of MEMC Electronic Materials, Inc. (semi-conductor and solar cell substrates) from November 2008 until March 2009. He has extensive operating and early-stage investment experience, including prior service as general partner of three institutional venture capital partnerships, and serves on the boards of three education and science-related non-profit organizations. He has served as a director of one AllianceBernstein fund since 1992, and director or trustee of multiple AllianceBernstein funds since 2005. He is Chairman of the AllianceBernstein Funds since January 2014. | 100 | Xilinx, Inc. (programmable logic semi-conductors) and SunEdison, Inc. (semi-conductor substrates, solar materials and solar power plants) since prior to 2009 | |||||
John H. Dobkin, ## 72 (1992) | Independent Consultant since prior to 2009. Formerly, President of Save Venice, Inc. (preservation organization) from 2001–2002; Senior Advisor from June 1999-June 2000 and President of Historic Hudson Valley (historic preservation) from December 1989-May 1999. Previously, Director of the National Academy of Design. He has served as a director or trustee of various AllianceBernstein Funds since 1992, and as Chairman of the Audit Committees of a number of such Funds from 2001-2008. | 100 | None | |||||
23
| SMALL CAP GROWTH PORTFOLIO | ||
| MANAGEMENTOFTHE FUND | ||
| (CONTINUED) | AllianceBernstein Variable Products Series Fund |
NAME, ADDRESS*, AGE, (YEAR FIRST ELECTED**) | PRINCIPAL OCCUPATION(S) DURING PAST FIVE YEARS AND OTHER RELEVANT QUALIFICATIONS*** | PORTFOLIOS IN FUND COMPLEX OVERSEEN BY DIRECTOR | OTHER DIRECTORSHIP HELD BY DIRECTOR IN THE PAST FIVE YEARS | |||||
| DISINTERESTED DIRECTORS (continued) | ||||||||
Michael J. Downey, ## 70 (2005) | Private Investor since prior to 2009. Formerly, managing partner of Lexington Capital, LLC (investment advisory firm) from December 1997 until December 2003. From 1987 until 1993, Chairman and CEO of Prudential Mutual Fund Management, director of the Prudential mutual funds, and member of the Executive Committee of Prudential Securities Inc. He has served as a director or trustee of the AllianceBernstein Funds since 2005 and is a director and Chairman of one other registered investment company. | 100 | Asia Pacific Fund, Inc. since prior to 2009, Prospect Acquisition Corp. (financial services) from 2007 until 2009, and The Merger Fund since prior to 2009 to 2013 | |||||
William H. Foulk, Jr., ##, ### 81 (1990) | Investment Adviser and an Independent Consultant since prior to 2009. Previously, he was Senior Manager of Barrett Associates, Inc., a registered investment adviser. He was formerly Deputy Comptroller and Chief Investment Officer of the State of New York and, prior thereto, Chief Investment Officer of the New York Bank for Savings. He has served as a director or trustee of various AllianceBernstein Funds since 1983, and has been Chairman of the Independent Directors Committee of the AllianceBernstein Funds since 2003. He served as Chairman of such Funds from 2003 through December 2013. He is also active in a number of mutual fund related organizations and committees. | 100 | None | |||||
D. James Guzy, ## 77 (2005) | Chairman of the Board of PLX Technology (semi-conductors) and of SRC Computers Inc., with which he has been associated since prior to 2009. He was a director of Intel Corporation (semi-conductors) from 1969 until 2008, and served as Chairman of the Finance Committee of such company for several years until May 2008. He was a Director of Cirrus Logic Corporation (semi-conductors) from 1984 until July 2011. He has served as a director or trustee of one or more of the AllianceBernstein Funds since 1982. | 100 | PLX Technology (semi-conductors) since prior to 2009, and Cirrus Logic Corporation (semi-conductors) since prior to 2009 until July 2011 | |||||
Nancy P. Jacklin, ## 65 (2006) | Professorial Lecturer at the Johns Hopkins School of Advanced International Studies since 2008. Formerly, U.S. Executive Director of the International Monetary Fund (December 2002-May 2006); Partner, Clifford Chance (1992-2002); Sector Counsel, International Banking and Finance, and Associate General Counsel, Citicorp (1985-1992); Assistant General Counsel (International), Federal Reserve Board of Governors (1982-1985); and Attorney Advisor, U.S. Department of the Treasury (1973-1982). Member of the Bar of the District of Columbia and of New York; and member of the Council on Foreign Relations. She has served as a director or trustee of the AllianceBernstein Funds since 2006. | 100 | None | |||||
24
| AllianceBernstein Variable Products Series Fund |
NAME, ADDRESS*, AGE, (YEAR FIRST ELECTED**) | PRINCIPAL OCCUPATION(S) DURING PAST FIVE YEARS AND OTHER RELEVANT QUALIFICATIONS*** | PORTFOLIOS IN FUND COMPLEX OVERSEEN BY DIRECTOR | OTHER DIRECTORSHIP HELD BY DIRECTOR IN THE PAST FIVE YEARS | |||||
| DISINTERESTED DIRECTORS (continued) | ||||||||
Garry L. Moody, ## 61 (2008) | Independent Consultant. Formerly, Partner, Deloitte & Touche LLP (1995-2008) where he held a number of senior positions, including Vice Chairman, and U.S. and Global Investment Management Practice Managing Partner; President, Fidelity Accounting and Custody Services Company (1993-1995); and Partner, Ernst & Young LLP (1975-1993), where he served as the National Director of Mutual Fund Tax Services and Managing Partner of its Chicago Office Tax department. He is a member of both the Governing Council of the Independent Directors Council (IDC), an organization of independent directors of mutual funds, and the Trustee Advisory Board of BoardIQ, a biweekly publication focused on issues and news affecting directors of mutual funds. He has served as a director or trustee, and as Chairman of the Audit Committee, of the AllianceBernstein Funds since 2008. | 100 | Greenbacker Renewable Energy Company LLC (renewable energy and energy efficiency projects) from August 2013 until January 2014 | |||||
Earl D. Weiner, ## 74 (2007) | Of Counsel, and Partner prior to January 2007, of the law firm Sullivan & Cromwell LLP and member of ABA Federal Regulation of Securities Committee Task Force to draft editions of the Fund Director’s Guidebook. He also serves as a director or trustee of various non-profit organizations and has served as Chairman or Vice Chairman of a number of them. He has served as a director or trustee of the AllianceBernstein Funds since 2007 and is Chairman of the Governance and Nominating Committees of the Funds. | 100 | None | |||||
| * | The address for each of the Fund’s disinterested Directors is c/o AllianceBernstein L.P., Attention: Philip L. Kirstein, 1345 Avenue of the Americas, New York, NY 10105. |
| ** | There is no stated term of office for the Fund’s Directors. |
| *** | The information above includes each Director’s principal occupation during the last five years and other information relating to the experience, attributes, and skills relevant to each Director’s qualifications to serve as a Director, which led to the conclusion that each Director should serve as a Director for the Fund. |
| # | Mr. Keith is an “interested person” of the Fund, as defined in the 1940 Act, due to his position as a Senior Vice President of the Adviser. |
| ## | Member of the Audit Committee, the Governance and Nominating Committee and the Independent Directors Committee. |
| ### | Member of the Fair Value Pricing Committee. |
25
| SMALL CAP GROWTH PORTFOLIO | ||
| MANAGEMENTOFTHE FUND | ||
| (CONTINUED) | AllianceBernstein Variable Products Series Fund |
Officer Information
Certain information concerning the Portfolio’s Officers is listed below.
| NAME, ADDRESS* AND AGE | PRINCIPAL POSITION(S) HELD WITH FUND | PRINCIPAL OCCUPATION DURING PAST FIVE YEARS | ||
Robert M. Keith 53 | President and Chief Executive Officer | See biography above. | ||
Philip L. Kirstein 68 | Senior Vice President and Independent Compliance Officer | Senior Vice President and Independent Compliance Officer of the AllianceBernstein Funds, with which he has been associated since October 2004. Prior thereto, he was Of Counsel to Kirkpatrick & Lockhart, LLP from October 2003 to October 2004, and General Counsel of Merrill Lynch Investment Managers, L.P. since prior to March 2003. | ||
Bruce K. Aronow 47 | Vice President | Senior Vice President of the Adviser**, with which he has been associated since prior to 2009. | ||
N. Kumar Kirpalani 60 | Vice President | Senior Vice President of the Adviser**, with which he has been associated since prior to 2009. | ||
Samantha S. Lau 41 | Vice President | Senior Vice President of the Adviser**, with which she has been associated since prior to 2009. | ||
Wen-Tse Tseng 48 | Vice President | Senior Vice President of the Adviser**, with which he has been associated since prior to 2009. | ||
Emilie D. Wrapp 58 | Secretary | Senior Vice President, Assistant General Counsel and Assistant Secretary of ABI**, with which she has been associated since prior to 2009. | ||
Joseph J. Mantineo 54 | Treasurer and Chief Financial Officer | Senior Vice President of AllianceBernstein Investor Services, Inc. (“ABIS”)**, with which he has been associated since prior to 2009. | ||
Phyllis J. Clarke 53 | Controller | Vice President of ABIS**, with which she has been associated since prior to 2009. | ||
Vincent S. Noto 49 | Chief Compliance Officer | Chief Compliance Officer of the AllianceBernstein Funds, and Vice President of ABIS**, with which he has been associated since prior to 2009. |
| * | The address for each of the Portfolio’s Officers is 1345 Avenue of the Americas, New York, NY 10105. |
| ** | The Adviser, ABI and ABIS are affiliates of the Fund. |
| The Fund’s Statement of Additional Information (SAI) has additional information about the Fund’s Directors and Officers and is available without charge upon request. Contact your financial representative or AllianceBernstein at (800) 227-4618, or visit www. alliancebernstein.com, for a free prospectus or SAI. |
26
| SMALL CAP GROWTH PORTFOLIO | ||
| SENIOR OFFICER FEE EVALUATION | AllianceBernstein Variable Products Series Fund |
THE FOLLOWING IS NOT PART OF THE SHAREHOLDER REPORT OR THE FINANCIAL STATEMENTS
SUMMARY OF SENIOR OFFICER’S EVALUATION OF INVESTMENT ADVISORY AGREEMENT1
The following is a summary of the evaluation of the Investment Advisory Agreement between AllianceBernstein L.P. (the “Adviser”) and the AllianceBernstein Variable Products Series Fund (the “Fund”), in respect of AllianceBernstein Small Cap Growth Portfolio (the “Portfolio”).2 The evaluation of the Investment Advisory Agreement was prepared by Philip L. Kirstein, the Senior Officer of the Fund, for the Directors of the Fund, as required by a September 2004 agreement between the Adviser and the New York State Attorney General (the “NYAG”). The Senior Officer’s evaluation of the Investment Advisory Agreement is not meant to diminish the responsibility or authority of the Board of Directors of the Fund to perform its duties pursuant to Section 15 of the Investment Company Act of 1940 (the “40 Act”) and applicable state law. The purpose of the summary is to provide shareholders with a synopsis of the independent evaluation of the reasonableness of the advisory fees proposed to be paid by the Portfolio which was provided to the Directors in connection with their review of the proposed approval of the continuance of the Investment Advisory Agreement. The Senior Officer’s evaluation considered the following factors:
| 1. | Advisory fees charged to institutional and other clients of the Adviser for like services; |
| 2. | Advisory fees charged by other mutual fund companies for like services; |
| 3. | Costs to the Adviser and its affiliates of supplying services pursuant to the advisory agreement, excluding any intra-corporate profit; |
| 4. | Profit margins of the Adviser and its affiliates from supplying such services; |
| 5. | Possible economies of scale as the Portfolio grows larger; and |
| 6. | Nature and quality of the Adviser’s services including the performance of the Portfolio. |
These factors, with the exception of the first factor, are generally referred to as the “Gartenberg factors,” which were articulated by the United States Court of Appeals for the Second Circuit in 1982. Gartenberg v. Merrill Lynch Asset Management, Inc., 694 F. 2d 923 (2d Cir. 1982). The first factor is an additional factor required to be considered by the AoD. On March 30, 2010, the Supreme Court held the Gartenberg decision was correct in its basic formulation of what §36(b) requires: to face liability under §36(b), “an investment adviser must charge a fee that is so disproportionately large that it bears no reasonable relationship to the services rendered and could not have been the product of arm’s length bargaining.” Jones v. Harris Associates L.P., 130 S. Ct. 1418 (2010). In the Jones decision, the Court stated the Gartenberg approach fully incorporates the correct understanding of fiduciary duty within the context of section 36(b) and noted with approval that “Gartenberg insists that all relevant circumstances be taken into account” and “uses the range of fees that might result from arm’s-length bargaining as the benchmark for reviewing challenged fees.”3
PORTFOLIO ADVISORY FEES, NET ASSETS & EXPENSE RATIOS
The Adviser proposed that the Portfolio pays the advisory fee set forth in the table below for receiving the services to be provided pursuant to the Investment Advisory Agreement. The fee schedule below, implemented in January 2004 in consideration of the Adviser’s settlement with the NYAG in December 2003, is based on a master schedule that contemplates eight categories of funds with almost all funds in each category having the same advisory fee schedule.
| Category | Advisory Fee Based on % of Average Daily Net Assets | Net Assets 3/31/13 ($MIL) | Portfolio | |||||
Growth | 0.75% on first $2.5 billion 0.65% on next $2.5 billion 0.60% on the balance | $ | 58.9 | Small Cap Growth Portfolio | ||||
| 1 | The information in the fee summary was completed on April 22, 2013 and discussed with the Board of Directors on April 30-May 2, 2013. |
| 2 | Future references to the Fund and the Portfolio do not include “AllianceBernstein.” References in the fee summary pertaining to performance and expense ratio rankings refer to the Class A shares of the Portfolio. |
| 3 | Jones v. Harris at 1427. |
27
| SMALL CAP GROWTH PORTFOLIO | ||
| SENIOR OFFICER FEE EVALUATION | ||
| (continued) | AllianceBernstein Variable Products Series Fund |
The Adviser is reimbursed as specified in the Investment Advisory Agreement for certain clerical, legal, accounting, administrative and other services provided to the Portfolio. During the Portfolio’s most recently completed fiscal year, the Adviser received $44,986 (0.075% of the Portfolio’s average daily net assets) for such services.
Set forth below are the Portfolio’s total expense ratios for the most recently completed fiscal year:
| Portfolio | Total Expense Ratio | Fiscal Year | ||||
Small Cap Growth Portfolio | Class A 1.18% Class B 1.43% | December 31 | ||||
I. ADVISORY FEES CHARGED TO INSTITUTIONAL AND OTHER CLIENTS
The advisory fees charged to investment companies which the Adviser manages and sponsors are normally higher than those charged to similar sized institutional accounts, including pension plans and sub-advised investment companies. The fee differential reflects, among other things, different services provided to such clients, and different liabilities assumed. Services provided by the Adviser to the Portfolio that are not provided to non-investment company clients and sub-advised investment companies include providing office space and personnel to serve as Fund Officers, who among other responsibilities make the certifications required under the Sarbanes–Oxley Act of 2002, and coordinating with and monitoring the Portfolio’s third party service providers such as Fund counsel, auditors, custodians, transfer agents and pricing services. The accounting, administrative, legal and compliance requirements for the Portfolio are more costly than those for institutional assets due to the greater complexities and time required for investment companies, although as previously noted, the Adviser is reimbursed for providing such services. Also, retail mutual funds managed by the Adviser are widely held. Servicing the Portfolio’s investors is more time consuming and labor intensive compared to institutional clients since the Adviser needs to communicate with a more extensive network of financial intermediaries and shareholders. The Adviser also believes that it incurs substantial entrepreneurial risk when offering a new mutual fund, since establishing a new mutual fund requires a large upfront investment, and it may take a long time for the fund to achieve profitability since the fund must be priced to scale from inception in order to be competitive and assets are acquired one account at a time.
In addition, managing the cash flow of an investment company may be more difficult than managing that of a stable pool of assets, such as an institutional account with little cash movement in either direction, particularly, if a fund is in net redemption and the Adviser is frequently forced to sell securities to raise cash for redemptions. However, managing a fund with positive cash flow may be easier at times than managing a stable pool of assets. In recent years, investment advisers have been sued by institutional clients and have suffered reputational damage both by the attendant publicity and outcomes other than complete victories. Accordingly, the legal and reputational risks associated with institutional accounts are greater than previously thought, although still not equal to those related to the mutual fund industry.
Notwithstanding the Adviser’s view that managing an investment company is not comparable to managing other institutional accounts because the services provided are different, the Supreme Court has indicated consideration should be given to the advisory fees charged to institutional accounts that have a substantially similar investment style as the Portfolio.4 In addition to the AllianceBernstein institutional fee schedule, set forth below is what would have been the effective advisory fee of the Portfolio had the AllianceBernstein institutional fee schedule been applicable to the Portfolio versus the Portfolio’s advisory fee based on March 31, 2013 net assets:5
| Portfolio | Net Assets 3/31/13 ($MIL) | AllianceBernstein Institutional Fee Schedule | Effective AB Inst. Adv. Fee | Portfolio Advisory Fee | ||||||||
Small Cap Growth Portfolio | $58.9 | Small Cap Growth Schedule | 0.977 | % | 0.750 | % | ||||||
| 1.00% on first $50m | ||||||||||||
| 0.85% on the next $50m | ||||||||||||
| 0.75% on the balance | ||||||||||||
| Minimum account size $25m | ||||||||||||
| 4 | The Supreme Court stated that “courts may give such comparisons the weight that they merit in light of the similarities and differences between the services that the clients in question require, but the courts must be wary of inapt comparisons.” Among the significant differences the Supreme Court noted that may exist between services provided to mutual funds and institutional accounts are “higher marketing costs.” Jones v. Harris at 1428. |
| 5 | The Adviser has indicated that with respect to institutional accounts with assets greater than $300 million, it will negotiate a fee schedule. Discounts that are negotiated vary based upon each client relationship. |
28
| AllianceBernstein Variable Products Series Fund |
The Adviser also manages AllianceBernstein Cap Fund, Inc.—Small Cap Growth Portfolio (“Cap Fund, Inc.—Small Cap Growth Portfolio”), a retail mutual fund, which has a substantially similar investment style as the Portfolio. Set forth below is the fee schedule of Cap Fund, Inc.—Small Cap Growth Portfolio and what would have been the effective advisory fee of the Portfolio had the fee schedule of the retail mutual fund been applicable to the Portfolio:6
| Portfolio | AllianceBernstein Mutual Fund | Fee Schedule | ABMF Effective | Portfolio Advisory | ||||||||
Small-Cap Growth Portfolio7 | Cap Fund, Inc.—Small Cap Growth Portfolio | 0.75% on first $2.5 billion 0.65% on next $2.5 billion 0.60% on the balance | 0.750 | % | 0.750 | % | ||||||
The Adviser provides sub-advisory services to certain other investment companies managed by other fund families that have an investment style similar to that of the Portfolio. The Adviser charges the fees set forth below for the sub-advisory relationships that have a somewhat similar investment style as the Portfolio. Also shown are the Portfolio’s advisory fee and what would have been the effective advisory fees of the Portfolio had the fee schedules of the sub-advisory relationships been applicable to the Portfolio based on March 31, 2013 net assets.
| Portfolio | Sub-Advised Fund Fee Schedule | Effective Sub-Adv. Fee | Portfolio Adv. Fee | |||||||||
Small Cap Growth Portfolio | Client #18,9 | 0.60% on first $1 billion 0.55% on next $500 million 0.50% on next $500 million 0.45% on next $500 million 0.40% on the balance | 0.600 | % | 0.750 | % | ||||||
| Client #2 | 0.55% of average daily net assets | 0.550 | % | 0.750 | % | |||||||
| Client #3 | 0.65% on 1st $25 million 0.60% on next $75 million 0.55% on the balance | 0.621 | % | 0.750 | % | |||||||
| Client #4 | 0.45% of average daily net assets | 0.450 | % | 0.750 | % | |||||||
It is fair to note that the services the Adviser provides pursuant to sub-advisory agreements are generally confined to the services related to the investment process; in other words, they are not as comprehensive as the services provided to the Portfolio by the Adviser. In addition, to the extent that certain of these sub-advisory relationships are with affiliates of the Adviser, the fee schedules may not reflect arm’s length bargaining or negotiations.
While it appears that the sub-advisory relationships are paying a lower fee than the Portfolio, it is difficult to evaluate the relevance of such lower fees due to differences in terms of the services provided, risks involved and other competitive factors between the Portfolio and the sub-advisory relationships. There could be various business reasons why an investment adviser would be willing to provide a sub-advisory relationship investment related services at a different fee level than an investment company it is sponsoring where the investment adviser is providing all the services, not just investment management, generally required by a registered investment company.
| 6 | The retail mutual fund was also affected by the settlement between the Adviser and the NYAG. As a result, the Portfolio has the same breakpoints in its advisory fee schedule as the retail mutual fund. |
| 7 | The advisory fee of AllianceBernstein Cap Fund, Inc.—Small Cap Growth Portfolio is based on the mutual fund’s net assets at the end of each quarter and is paid to the Adviser quarterly, in contrast to the Portfolio, whose advisory fee is based on the Portfolio’s average daily net assets and is paid on a monthly basis. |
| 8 | The client is an affiliate of the Adviser. |
| 9 | Assets are aggregated with other accounts of the client for purposes of calculating the investment advisory fee. |
29
| SMALL CAP GROWTH PORTFOLIO | ||
| SENIOR OFFICER FEE EVALUATION | ||
| (continued) | AllianceBernstein Variable Products Series Fund |
II. MANAGEMENT FEES CHARGED BY OTHER MUTUAL FUND COMPANIES FOR LIKE SERVICES.
Lipper Inc. (“Lipper”), an analytical service that is not affiliated with the Adviser, compared the fees charged to the Portfolio with fees charged to other investment companies for similar services offered by other investment advisers.10 Lipper’s analysis included the comparison of the Portfolio’s contractual management fee, estimated at the approximate current asset level of the Portfolio, to the median of the Portfolio’s Lipper Expense Group (“EG”) and the Portfolio’s contractual management fee ranking.11,12
Lipper describes an EG as a representative sample of comparable funds. Lipper’s standard methodology for screening funds to be included in an EG entails the consideration of several fund criteria, including fund type, investment classification/objective, load type and similar 12b-1/non-12b-1 service fees, asset (size) comparability, expense components and attributes. An EG will typically consist of seven to twenty funds.
| Portfolio | Contractual Management Fee (%)13 | Lipper EG Median (%) | Lipper Rank | |||||||||
Small Cap Growth Portfolio | 0.750 | 0.885 | 2/14 | |||||||||
Lipper also analyzed the Portfolio’s most recently completed fiscal year total expense ratio in comparison to the Portfolio’s EG and Lipper Expense Universe (“EU”). The EU is a broader group compared to the EG, consisting of all funds that have the same investment classification/objective and load type as the subject Portfolio.14
| Portfolio | Expense Ratio | Lipper EG Median (%) | Lipper Rank | Lipper EU Median (%) | Lipper EU Rank | |||||||||||||||
Small Cap Growth Portfolio | 1.180 | 0.998 | 14/14 | 0.957 | 40/40 | |||||||||||||||
Based on this analysis, the Portfolio has a more favorable ranking on a management fee basis than on a total expense ratio basis.
III. COSTS TO THE ADVISER AND ITS AFFILIATES OF SUPPLYING SERVICES PURSUANT TO THE ADVISORY FEE ARRANGEMENT, EXCLUDING ANY INTRA-CORPORATE PROFIT.
The Adviser utilizes two profitability reporting systems, which operate independently but are aligned with each other, to estimate the Adviser’s profitability in connection with investment advisory services provided to the Portfolio. The Senior Officer has retained a consultant to provide independent advice regarding the alignment of the two profitability systems as well as the methodologies and allocations utilized by both profitability systems.
IV. PROFIT MARGINS OF THE ADVISER AND ITS AFFILIATES FOR SUPPLYING SUCH SERVICES.
The Portfolio’s profitability information, prepared by the Adviser for the Board of Directors, was reviewed by the Senior Officer and the consultant. The Adviser’s profitability from providing investment advisory services to the Portfolio increased during calendar year 2012, relative to 2011.
| 10 | The Supreme Court cautioned against accepting mutual fund fee comparisons without careful scrutiny since “these comparisons are problematic because these fees, like those challenged, may not be the product of negotiations conducted at arm’s length.” Jones v. Harris at 1429. |
| 11 | Lipper does not consider average account size when constructing EGs. Funds with relatively small average account sizes tend to have higher transfer agent expense ratio than comparable sized funds that have relatively large average account sizes. Note that there are limitations on Lipper expense category data because different funds categorize expenses differently. |
| 12 | The contractual management fee is calculated by Lipper using the Portfolio’s contractual management fee rate at a hypothetical asset level. The hypothetical asset level is based on the combined net assets of all classes of the Portfolio, rounded up to the next $25 million. Lipper’s total expense ratio information is based on the most recent annual report except as otherwise noted. A ranking of “1” would mean that the Portfolio had the lowest effective fee rate in the Lipper peer group. |
| 13 | The contractual management fee does not reflect any expense reimbursements made by the Portfolio to the Adviser for certain clerical, legal, accounting, administrative and other services. |
| 14 | Except for asset (size) comparability, Lipper uses the same criteria for selecting an EG when selecting an EU. Unlike the EG, the EU allows for the same adviser to be represented by more than just one fund. |
| 15 | Most recently completed fiscal year end Class A total expense ratio. |
30
| AllianceBernstein Variable Products Series Fund |
In addition to the Adviser’s direct profits from managing the Portfolio, certain of the Adviser’s affiliates have business relationships with the Portfolio and may earn a profit from providing other services to the Portfolio. The courts have referred to this type of business opportunity as “fall-out benefits” to the Adviser and indicated that such benefits should be factored into the evaluation of the total relationship between the Portfolio and the Adviser. Neither case law nor common business practice precludes the Adviser’s affiliates from earning a reasonable profit on this type of relationship provided the affiliates’ charges and services are competitive. These affiliates provide transfer agent, distribution and brokerage related services to the Portfolio and receive transfer agent fees, Rule 12b-1 payments, and brokerage commissions. In addition, the Adviser benefits from soft dollar arrangements which offset expenses the Adviser would otherwise incur.
The Portfolio has adopted a distribution plan for Class B shares pursuant to Rule 12b-1 under the 40 Act. Under the distribution plan, the Portfolio pays distribution and servicing fees to its principal underwriter, AllianceBernstein Investments, Inc. (“ABI”), the Portfolio’s distributor and an affiliate of the Adviser, at an annual rate of up to 0.50% of the Portfolio’s average daily net assets attributable to Class B shares. The current annual rate that the Portfolio pays to ABI for 12b-1 fees is 0.25%. During the fiscal year ended December 31, 2012, ABI received $74,116 in Rule 12b-1 fees.
During the fiscal year ended December 31, 2012, the Adviser incurred distribution expenses in the amount of $225,253 in connection with activities primarily intended to result in the sale of the Portfolio’s Class B shares. This amount includes the 12b-1 fees paid by the Portfolio to the Adviser.
Financial intermediaries, such as insurers, market and sell shares of the Portfolio and typically receive compensation from ABI, the Advisers and/or the Portfolio for selling shares of the Portfolio. These financial intermediaries receive compensation in any or all of the following forms: 12b-1 fees, defrayal of costs for educational seminars and training, additional distribution support, recordkeeping and/or administrative services. Payments related to providing contract-holder recordkeeping and/or administrative services will generally not exceed 0.35% of the average daily net assets of the Portfolio attributable to the relevant intermediary over the year. With respect to the Fund, which includes the Portfolio and other Portfolios of the Fund not discussed in this summary, ABI paid approximately $600,000 in 2012 and expects to pay approximately $600,000 in 2013 for educational support and distribution assistance (revenue sharing payments).
The transfer agent of the Portfolio is AllianceBernstein Investor Services, Inc. (“ABIS”). During the most recently completed fiscal year, ABIS received a fee of $1,385 from the Portfolio.16
The Portfolio effected brokerage transactions through the Adviser’s affiliate, Sanford C. Bernstein & Co., LLC (“SCB & Co.”) and/or its U.K. affiliate, Sanford C. Bernstein Limited (“SCB Ltd.”), collectively “SCB,” and paid commissions during the Portfolio’s most recently completed fiscal year. The Adviser represented that SCB’s profitability from business conducted with the Portfolio is comparable to the profitability of SCB’s dealings with other similar third party clients. In the ordinary course of business, SCB receives and pays liquidity rebates from electronic communications networks (“ECNs”) derived from trading for its clients, including the Portfolio. These credits and charges are not being passed onto any SCB client. The Adviser also receives certain soft dollar benefits from brokers that execute agency trades for the Portfolio and other clients. These soft dollar benefits reduce the Adviser’s cost of doing business and increase its profitability.
V. POSSIBLE ECONOMIES OF SCALE
The Adviser has indicated that economies of scale are being shared with shareholders through pricing to scale, breakpoints, fee reductions/waivers and enhancement to services.
In May 2012, an independent consultant, retained by the Senior Officer, provided the Board of Directors information on the Adviser’s firm-wide average costs from 2005 through 2011 and the potential economies of scale. The independent consultant noted that from 2005 through 2007 the Adviser experienced significant growth in assets under management (“AUM”). During this period, operating expenses increased, in part to keep up with growth, and in part reflecting market returns. However, from 2008 through the first quarter of 2009, AUM rapidly and significantly decreased due to declines in market value and client withdrawals. When AUM rapidly decreased, some operating expenses categories, including base compensation and office space, adjusted more slowly during this period, resulting in an increase in average costs. Since 2009, AUM has experienced less significant changes. The independent consultant noted that changes in operating expenses reflect changes in business composition and business practices in response to changes in financial markets. Finally, the
| 16 | The Fund, which includes the Portfolio and other Portfolios of the Fund paid ABIS a flat fee of $18,000 in 2012. |
31
| SMALL CAP GROWTH PORTFOLIO | ||
| SENIOR OFFICER FEE EVALUATION | ||
| (continued) | AllianceBernstein Variable Products Series Fund |
independent consultant concluded that the increase in average cost and the decline in net operating margin across the Adviser since late 2008 are inconsistent with the view that there are currently reductions in average costs due to economies of scale that can be shared with the AllianceBernstein Mutual Funds managed by the Adviser through lower fees.
Previously in February 2008, the independent consultant provided the Board of Directors an update of the Deli study on advisory fees and various fund characteristics.17,18 The independent consultant first reiterated the results of his previous two dimensional comparison analysis (fund size and family size) with the Board of Directors.19 The independent consultant then discussed the results of the regression model that was utilized to study the effects of various factors on advisory fees. The regression model output indicated that the bulk of the variation in fees predicted were explained by various factors, but substantially by fund AUM, family AUM, index fund indicator and investment style. The independent consultant also compared the advisory fees of the AllianceBernstein Mutual Funds to similar funds managed by 19 other large asset managers, regardless of the fund size and each Adviser’s proportion of mutual fund assets to non-mutual fund assets.
VI. NATURE AND QUALITY OF THE ADVISER’S SERVICES, INCLUDING THE PERFORMANCE OF THE PORTFOLIO
With assets under management of approximately $443 billion as of March 31, 2013, the Adviser has the investment experience to manage and provide non-investment services (described in Section I) to the Portfolio.
The information prepared by Lipper shows the 1, 3, 5 and 10 year performance returns and rankings of the Portfolio20 relative to its Lipper Performance Group (“PG”) and Lipper Performance Universe (“PU”)21 for the periods ended February 28, 2013.22
| Portfolio (%) | PG Median (%) | PU Median (%) | PG Rank | PU Rank | ||||||||||||||||
Small Cap Growth Portfolio | ||||||||||||||||||||
1 year | 7.47 | 9.34 | 9.35 | 10/14 | 27/37 | |||||||||||||||
3 year | 20.19 | 16.11 | 15.12 | 1/14 | 1/34 | |||||||||||||||
5 year | 10.03 | 8.30 | 7.66 | 2/13 | 5/32 | |||||||||||||||
10 year | 12.32 | 11.37 | 11.37 | 3/11 | 7/28 | |||||||||||||||
Set forth below are the 1, 3, 5, 10 year and since inception performance returns of the Portfolio (in bold)23 versus its benchmark.24 Portfolio and benchmark volatility and reward-to-variability ratio (“Sharpe Ratio”) information is also shown.25
| 17 | The Deli study, originally published in 2002 based on 1997 data and updated for the February 2008 Presentation, may be of diminished value due to the age of the data used in the presentation and the changes experienced in the industry over the last four years. |
| 18 | As mentioned previously, the Supreme Court cautioned against accepting mutual fund fee comparisons without careful scrutiny since the fees may not be the product of negotiations conducted at arm’s length. See Jones V. Harris at 1429. |
| 19 | The two dimensional analysis showed patterns of lower advisory fees for funds with larger asset sizes and funds from larger family sizes compared to funds with smaller asset sizes and funds from smaller family sizes, which according to the independent consultant is indicative of a sharing of economies of scale and scope. However, in less liquid and active markets, such is not the case, as the empirical analysis showed potential for diseconomies of scale in those markets. The empirical analysis also showed diminishing economies of scale and scope as funds surpassed a certain high level of assets. |
| 20 | The performance rankings are for the Class A shares of the Portfolio. The Portfolio’s performance returns shown were provided by Lipper. |
| 21 | The Portfolio’s PG is identical to the Portfolio’s respective EG. The Portfolio’s PU is not identical to the Portfolio’s EU as the criteria for including/excluding a fund from a PU is somewhat different from that of an EU. |
| 22 | The current Lipper investment classification/objective dictates the PG and PU throughout the life of the fund even if a fund had a different investment classification/objective at a different point in time. |
| 23 | The performance returns and risk measures shown in the table are for the Class A shares of the Portfolio. |
| 24 | The Adviser provided Portfolio and benchmark performance return information for periods through February 28, 2013. |
| 25 | Portfolio and benchmark volatility and Sharpe Ratio information was obtained through Lipper LANA, a database maintained by Lipper. Volatility is a statistical measure of the tendency of a market price or yield to vary over time. The Sharpe Ratio is a risk adjusted measure of return that divides a portfolio’s return in excess of the riskless return by the portfolio’s standard deviation. A portfolio with a greater volatility would be viewed as more risky than a portfolio with equivalent performance but lower volatility; for that reason, a greater return would be demanded for the more risky portfolio. A portfolio with a higher Sharpe Ratio would be viewed as better performing than a portfolio with a lower Sharpe Ratio. |
32
| AllianceBernstein Variable Products Series Fund |
Periods Ending February 28, 2013 Annualized Performance | ||||||||||||||||||||||||||||||||
1 Year | 3 Year | 5 Year | 10 Year (%) | Since Inception (%) | Annualized | Risk | ||||||||||||||||||||||||||
| Volatility (%) | Sharpe (%) | |||||||||||||||||||||||||||||||
Small Cap Growth Portfolio | 7.47 | 20.19 | 10.03 | 12.32 | 5.45 | 21.10 | 0.57 | 10 | ||||||||||||||||||||||||
Russell 2000 Growth Index | 11.17 | 15.77 | 7.83 | 11.22 | 5.42 | 19.67 | 0.58 | 10 | ||||||||||||||||||||||||
Inception Date: August 5, 1996 |
| |||||||||||||||||||||||||||||||
CONCLUSION:
Based on the factors discussed above the Senior Officer’s conclusion is that the proposed advisory fee for the Portfolio is reasonable and within the range of what would have been negotiated at arm’s-length in light of all the surrounding circumstances. This conclusion in respect of the Portfolio is based on an evaluation of all of these factors and no single factor was dispositive.
Dated: May 29, 2013
33
VPS-SCG-0151-1213
AllianceBernstein
Variable Products Series Fund, Inc.
 | AllianceBernstein Small/Mid Cap Value Portfolio |
December 31, 2013
Annual Report

ANNUAL REPORT
Investment Products Offered
| Ø | Are Not FDIC Insured |
| Ø | May Lose Value |
| Ø | Are Not Bank Guaranteed |
AllianceBernstein Investments, Inc. (ABI) is the distributor of the AllianceBernstein family of mutual funds. ABI is a member of FINRA and is an affiliate of AllianceBernstein L.P., the manager of the funds.
You may obtain a description of the Fund’s proxy voting policies and procedures, and information regarding how the Fund voted proxies relating to portfolio securities during the most recent 12-month period ended June 30, without charge. Simply visit AllianceBernstein’s website at www.alliancebernstein.com or go to the Securities and Exchange Commission’s (the “Commission”) website at www.sec.gov, or call AllianceBernstein at (800) 227-4618.
The Fund files its complete schedule of portfolio holdings with the Commission for the first and third quarters of each fiscal year on Form N-Q. The Fund’s Forms N-Q are available on the Commission’s website at www.sec.gov. The Fund’s Forms N-Q may also be reviewed and copied at the Commission’s Public Reference Room in Washington, DC; information on the operation of the Public Reference Room may be obtained by calling (800) SEC-0330.
AllianceBernstein® and the AB Logo are registered trademarks and service marks used by permission of the owner, AllianceBernstein L.P.
| SMALL/MID CAP VALUE PORTFOLIO | AllianceBernstein Variable Products Series Fund |
LETTERTO INVESTORS
February 7, 2014
The following is an update of AllianceBernstein Variable Products Series Fund—AllianceBernstein Small/Mid Cap Value Portfolio (the “Portfolio”) for the annual reporting period ended December 31, 2013.
INVESTMENT OBJECTIVE AND POLICIES
The Portfolio’s investment objective is long-term growth of capital. The Portfolio invests primarily in a diversified portfolio of equity securities of small- to mid-capitalization U.S. companies, generally representing 60 to 125 companies. Under normal circumstances, the Portfolio invests at least 80% of its net assets in securities of small- to mid-capitalization companies. Because the Portfolio’s definition of small- to mid-capitalization companies is dynamic, the lower and upper limits on market capitalization will change with the markets. The Portfolio invests in companies that are determined by AllianceBernstein L.P. (the “Adviser”) to be undervalued, using the Adviser’s fundamental value approach. In selecting securities for the Portfolio’s portfolio, the Adviser uses its fundamental and quantitative research to identify companies whose long-term earnings power is not reflected in the current market price of their securities.
The Portfolio may enter into derivatives transactions, such as options, futures, forwards and swaps. The Portfolio may use options strategies involving the purchase and/or writing of various combinations of call and/or put options, including on individual securities and stock indices, futures contracts (including futures contracts on individual securities and stock indices) or shares of exchange-traded funds (“ETFs”). These transactions may be used, for example, to earn extra income, to adjust exposure to individual securities or markets, or to protect all or a portion of the Portfolio’s portfolio from a decline in value, sometimes within certain ranges.
The Portfolio may invest in securities issued by non-U.S. companies.
The Portfolio may, at times, invest in shares of ETFs in lieu of making direct investments in equity securities. ETFs may provide more efficient and economical exposure to the type of companies and geographic locations in which the Portfolio seeks to invest than direct investments.
INVESTMENT RESULTS
The table on page 3 shows the Portfolio’s performance compared to its benchmark, the Russell 2500 Value Index, in addition to the broad small/mid-cap universe, as measured by the Russell 2500 Index, for the one-, five- and 10-year periods ended December 31, 2013.
All share classes of the Portfolio outperformed the benchmark and the Russell 2500 Index for the annual period ended December 31, 2013. Holdings within the financials, energy and technology sectors contributed most to the gain. An underweight and stock selection in consumer growth and holdings in consumer staples slightly offset relative performance. The Portfolio did not employ derivatives or leverage during the annual period.
MARKET REVIEW AND INVESTMENT STRATEGY
U.S. and global equity markets surged in 2013, as investors gained confidence that challenges to economic growth and market stability would be contained, and the actions of the U.S. Federal Reserve (the “Fed”) drove market actions. Small- and mid-cap value stocks achieved solid double-digit returns for the annual period ended December 31, 2013, as measured by the benchmark, and beat the broad market, as represented by the S&P 500 Index.
Former Fed Chairman Ben Bernanke first hinted in May that the Fed might begin tempering its monetary support, which had kept U.S. interest rates at a 50-year low and had fueled a liquidity-driven rally that bolstered risk assets. Positive sentiment about the continuation of the Fed’s stimulus campaign faded somewhat, however, as investors eventually refocused on the mixed economic conditions that had brought about the decision. Adding to investor anxiety were growing worries about a deadlocked budget and debt-ceiling negotiations in the U.S.; news that such a scenario would be avoided with a deal by U.S. policymakers to raise the country’s borrowing limit sparked a relief rally in November. After months of speculation, the Fed took its first modest steps toward ending a key component of its stimulus campaign in December. Amid a slew of data suggesting that the U.S. economy was gaining momentum, the Fed announced that it would gradually wind down its massive bond-purchasing program by late 2014. At the same time, it strengthened its commitment to keeping short-term interest rates near zero until late 2015. Markets reacted positively to news of this shift in monetary policy, as investors were enthusiastic about the gradual pace of the changes and relieved that a major source of uncertainty had been removed.
The current economic climate has allowed the Portfolio to invest opportunistically in undervalued companies with solid fundamentals, without sacrificing the Portfolio’s deep-value discipline. As the economy continues its pace of growth, the Portfolio’s emphasis continues to be at the stock-specific level, where the trend is focused on attractively-valued companies with solid balance sheets and strong free cash flow.
1
| SMALL/MID CAP VALUE PORTFOLIO | ||
| DISCLOSURESAND RISKS | AllianceBernstein Variable Products Series Fund |
Benchmark Disclosure
Neither the unmanaged Russell 2500® Value Index nor the Russell 2500 Index reflect fees and expenses associated with the active management of a mutual fund portfolio. The Russell 2500 Value Index represents the performance of 2,500 small- to mid-cap value companies within the U.S. The Russell 2500 Index represents the performance of 2,500 small- to mid-cap cap companies within the U.S. An investor cannot invest directly in an index, and its results are not indicative of the performance for any specific investment, including the Portfolio.
A Word About Risk
Market Risk: The value of the Portfolio’s assets will fluctuate as the stock or bond market fluctuates. The value of its investments may decline, sometimes rapidly and unpredictably, simply because of economic changes or other events that affect large portions of the market. It includes the risk that a particular style of investing, such as value, may underperform the market generally.
Capitalization Risk: Investments in small- and mid-capitalization companies may be more volatile than investments in large-capitalization companies. Investments in small-capitalization companies may have additional risks because these companies have limited product lines, markets or financial resources.
Foreign (Non-U.S.) Risk: Investments in securities of non-U.S. issuers may involve more risk than those of U.S. issuers. These securities may fluctuate more widely in price and may be less liquid due to adverse market, economic, political, regulatory or other factors.
Currency Risk: Fluctuations in currency exchange rates may negatively affect the value of the Portfolio’s investments or reduce its returns.
Derivatives Risk: Derivatives may be illiquid, difficult to price, and leveraged so that small changes may produce disproportionate losses for the Portfolio, and may be subject to counterparty risk to a greater degree than more traditional investments.
Management Risk: The Portfolio is subject to management risk because it is an actively-managed investment fund. The Adviser will apply its investment techniques and risk analyses in making investment decisions for the Portfolio, but there is no guarantee that its techniques will produce the intended results.
These risks are fully discussed in the Variable Products prospectus.
An Important Note About Historical Performance
The investment return and principal value of an investment in the Portfolio will fluctuate, so that shares, when redeemed, may be worth more or less than their original cost. Performance shown on the following page represents past performance and does not guarantee future results. Current performance may be lower or higher than the performance information shown. Please contact your Financial Advisor or Insurance Agent Representative at your financial institution to obtain portfolio performance information current to the most recent month end.
Investors should consider the investment objectives, risks, charges and expenses of the Portfolio carefully before investing. For additional copies of the Portfolio’s prospectus or summary prospectus, which contains this and other information, call your financial advisor or 800.984.7654. Please read the prospectus and/or summary prospectus carefully before investing.
All fees and expenses related to the operation of the Portfolio have been deducted, but no adjustment has been made for insurance company separate account or annuity contract charges, which would reduce total return to a contract owner. Performance assumes reinvestment of distributions and does not account for taxes.
There are additional fees and expenses associated with all Variable Products. These fees can include mortality and expense risk charges, administrative charges, and other charges that can significantly reduce investment returns. Those fees and expenses are not reflected in this annual report. You should consult your Variable Products prospectus for a description of those fees and expenses and speak to your insurance agent or financial representative if you have any questions. You should read the prospectus before investing or sending money.
2
| SMALL/MID CAP VALUE PORTFOLIO | ||
| HISTORICAL PERFORMANCE | AllianceBernstein Variable Products Series Fund | |
| THE PORTFOLIO VS. ITS BENCHMARK | NAV Returns | |||||||||||
| PERIODS ENDED DECEMBER 31, 2013 (unaudited) | 1 Year | 5 Years* | 10 Years* | |||||||||
AllianceBernstein Small/Mid Cap Value Portfolio Class A** | 38.06% | 22.18% | 10.04% | |||||||||
AllianceBernstein Small/Mid Cap Value Portfolio Class B** | 37.63% | 21.89% | 9.79% | |||||||||
Russell 2500 Value Index | 33.32% | 19.61% | 9.29% | |||||||||
Russell 2500 Index | 36.80% | 21.77% | 9.81% | |||||||||
* Average annual returns.
| ||||||||||||
** Includes the impact of proceeds received and credited to the Portfolio resulting from class action settlements, which enhanced the performance of all share classes of the Portfolio for the annual period ended December 31, 2013 by 0.01%. |
| |||||||||||
Please keep in mind that high, double-digit returns are highly unusual and cannot be sustained. Investors should also be aware that these returns were primarily achieved during favorable market conditions. |
| |||||||||||
The Portfolio’s current prospectus fee table shows the Portfolio’s total annual operating expense ratios as 0.82% and 1.07% for Class A and Class B, respectively. The Financial Highlights section of this report sets forth expense ratio data for the current reporting period; the expense ratios shown above may differ from the expense ratios in the Financial Highlights section since they are based on different time periods.
ALLIANCEBERNSTEIN SMALL/MID CAP VALUE PORTFOLIO CLASS A
GROWTH OF A $10,000 INVESTMENT
12/31/03 – 12/31/13 (unaudited)
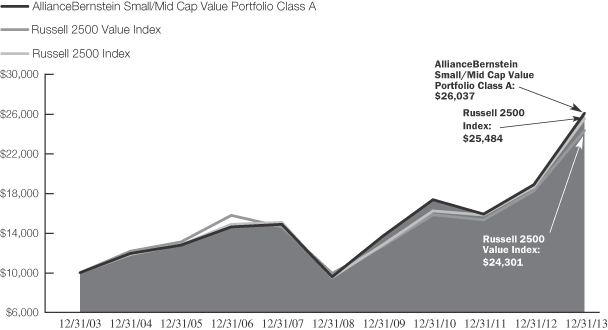
This chart illustrates the total value of an assumed $10,000 investment in AllianceBernstein Small/Mid Cap Value Portfolio Class A shares (from 12/31/03 to 12/31/13) as compared to the performance of the Portfolio’s benchmark, the Russell 2500 Value Index and the broad small/mid-cap universe, as represented by the Russell 2500 Index. The chart assumes the reinvestment of dividends and capital gains distributions.
See Disclosures, Risks and Note about Historical Performance on page 2.
3
| SMALL/MID CAP VALUE PORTFOLIO | ||
| EXPENSE EXAMPLE (unaudited) | AllianceBernstein Variable Products Series Fund | |
As a shareholder of the Fund, you incur two types of costs: (1) transaction costs, including sales charges (loads) on purchase payments, contingent deferred sales charges on redemptions and (2) ongoing costs, including management fees; distribution (12b-1) fees; and other Fund expenses. This example is intended to help you understand your ongoing costs (in dollars) of investing in the Fund and to compare these costs with the ongoing costs of investing in other mutual funds.
The Example is based on an investment of $1,000 invested at the beginning of the period and held for the entire period as indicated below.
Actual Expenses
The table below provides information about actual account values and actual expenses. You may use the information in this line, together with the amount you invested, to estimate the expenses that you paid over the period. Simply divide your account value by $1,000 (for example, an $8,600 account value divided by $1,000 = 8.6), then multiply the result by the number in the first line under the heading entitled “Expenses Paid During Period” to estimate the expenses you paid on your account during this period. The estimate of expenses does not include fees or other expenses of any variable insurance product. If such expenses were included, the estimate of expenses you paid during the period would be higher and your ending account value would be lower.
Hypothetical Example for Comparison Purposes
The table below provides information about hypothetical account values and hypothetical expenses based on the Fund’s actual expense ratio and an assumed annual rate of return of 5% before expenses, which is not the Fund’s actual return. The hypothetical account values and expenses may not be used to estimate the actual ending account balance or expenses you paid for the period. You may use this information to compare the ongoing costs of investing in the Fund and other funds by comparing this 5% hypothetical example with the 5% hypothetical examples that appear in the shareholder reports of other funds. The estimate of expenses does not include fees or other expenses of any variable insurance product. If such expenses were included, the estimate of expenses you paid during the period would be higher and your ending account value would be lower.
Please note that the expenses shown in the table are meant to highlight your ongoing costs only and do not reflect any transactional costs, such as sales charges (loads), or contingent deferred sales charges on redemptions. Therefore, the second line of each class’ table is useful in comparing ongoing costs only, and will not help you determine the relative total costs of owning different funds. In addition, if these transactional costs were included, your costs would have been higher.
| Beginning Account Value July 1, 2013 | Ending Account Value December 31, 2013 | Expenses Paid During Period* | Annualized Expense Ratio* | |||||||||||||
Class A | ||||||||||||||||
Actual | $ | 1,000 | $ | 1,174.50 | $ | 4.49 | 0.82 | % | ||||||||
Hypothetical (5% annual return before expenses) | $ | 1,000 | $ | 1,021.07 | $ | 4.18 | 0.82 | % | ||||||||
Class B | ||||||||||||||||
Actual | $ | 1,000 | $ | 1,172.90 | $ | 5.86 | 1.07 | % | ||||||||
Hypothetical (5% annual return before expenses) | $ | 1,000 | $ | 1,019.81 | $ | 5.45 | 1.07 | % | ||||||||
| * | Expenses are equal to each classes’ annualized expense ratios, multiplied by the average account value over the period, multiplied by 184/365 (to reflect the one-half year period). |
4
| SMALL/MID CAP VALUE PORTFOLIO | ||
| TEN LARGEST HOLDINGS* | ||
| December 31, 2013 (unaudited) | AllianceBernstein Variable Products Series Fund | |
| COMPANY | U.S. $ VALUE | PERCENT OF NET ASSETS | ||||||
Gannett Co., Inc. | $ | 11,094,571 | 1.6 | % | ||||
Terex Corp. | 10,797,728 | 1.6 | ||||||
Avnet, Inc. | 10,563,022 | 1.5 | ||||||
Genworth Financial, Inc.—Class A | 10,462,095 | 1.5 | ||||||
PulteGroup, Inc. | 10,356,108 | 1.5 | ||||||
E*Trade Financial Corp. | 10,214,175 | 1.5 | ||||||
Tutor Perini Corp. | 10,154,167 | 1.5 | ||||||
Zions Bancorporation | 10,132,472 | 1.5 | ||||||
American Financial Group, Inc./OH | 10,023,655 | 1.4 | ||||||
Lear Corp. | 9,980,362 | 1.4 | ||||||
|
|
|
| |||||
| $ | 103,778,355 | 15.0 | % | |||||
SECTOR BREAKDOWN**
December 31, 2013 (unaudited)
| SECTOR | U.S. $ VALUE | PERCENT OF TOTAL INVESTMENTS | ||||||
Financials | $ | 197,583,665 | 28.6 | % | ||||
Consumer Discretionary | 132,615,944 | 19.2 | ||||||
Information Technology | 120,404,966 | 17.4 | ||||||
Industrials | 67,376,336 | 9.7 | ||||||
Materials | 58,817,818 | 8.5 | ||||||
Energy | 37,397,472 | 5.4 | ||||||
Utilities | 34,559,124 | 5.0 | ||||||
Health Care | 27,877,560 | 4.0 | ||||||
Consumer Staples | 7,469,914 | 1.1 | ||||||
Short-Term Investments | 7,548,709 | 1.1 | ||||||
|
|
|
| |||||
Total Investments | $ | 691,651,508 | 100.0 | % | ||||
| * | Long-term investments. |
| ** | The Portfolio’s sector breakdown is expressed as a percentage of total investments (excluding security lending collateral) and may vary over time. |
Please note: The sector classifications presented herein are based on the Global Industry Classification Standard (GICS) which was developed by Morgan Stanley Capital International and Standard & Poor’s. The components are divided into sector, industry group, and industry sub-indices as classified by the GICS for each of the market capitalization indices in the broad market. These sector classifications are broadly defined. The “Portfolio of Investments” section of the report reflects more specific industry information and is consistent with the investment restrictions discussed in the Portfolio’s prospectus.
5
| SMALL/MID CAP VALUE PORTFOLIO | ||
| PORTFOLIOOF INVESTMENTS | ||
| December 31, 2013 | AllianceBernstein Variable Products Series Fund | |
| Company | Shares | U.S. $ Value | ||||||
COMMON STOCKS–99.2% |
| |||||||
FINANCIALS–28.7% |
| |||||||
CAPITAL MARKETS–1.5% |
| |||||||
E*Trade Financial Corp.(a) | 520,070 | $ | 10,214,175 | |||||
|
| |||||||
COMMERCIAL BANKS–10.3% | ||||||||
Associated Banc-Corp | 372,310 | 6,478,194 | ||||||
CapitalSource, Inc. | 463,580 | 6,661,645 | ||||||
Comerica, Inc. | 200,310 | 9,522,737 | ||||||
First Niagara Financial Group, Inc. | 852,580 | 9,054,400 | ||||||
Huntington Bancshares, Inc./OH | 982,410 | 9,480,256 | ||||||
Popular, Inc.(a) | 265,970 | 7,641,318 | ||||||
Susquehanna Bancshares, Inc. | 481,294 | 6,179,815 | ||||||
Webster Financial Corp. | 184,980 | 5,767,676 | ||||||
Zions Bancorporation | 338,200 | 10,132,472 | ||||||
|
| |||||||
| 70,918,513 | ||||||||
|
| |||||||
INSURANCE–8.8% | ||||||||
American Financial Group, Inc./OH | 173,660 | 10,023,655 | ||||||
Aspen Insurance Holdings Ltd. | 240,270 | 9,925,554 | ||||||
Genworth Financial, Inc.– | 673,670 | 10,462,095 | ||||||
PartnerRe Ltd. | 63,190 | 6,662,122 | ||||||
Reinsurance Group of America, Inc.–Class A | 85,420 | 6,612,362 | ||||||
Unum Group | 236,200 | 8,285,896 | ||||||
Validus Holdings Ltd. | 211,900 | 8,537,451 | ||||||
|
| |||||||
| 60,509,135 | ||||||||
|
| |||||||
REAL ESTATE INVESTMENT TRUSTS (REITs)–7.9% | ||||||||
BioMed Realty Trust, Inc. | 268,500 | 4,865,220 | ||||||
Camden Property Trust | 87,110 | 4,954,817 | ||||||
DDR Corp. | 359,020 | 5,518,137 | ||||||
DiamondRock Hospitality Co. | 668,670 | 7,723,139 | ||||||
LTC Properties, Inc. | 189,380 | 6,702,158 | ||||||
Medical Properties Trust, Inc. | 505,700 | 6,179,654 | ||||||
Mid-America Apartment Communities, Inc. | 107,120 | 6,506,469 | ||||||
Parkway Properties, Inc./MD | 420,480 | 8,111,059 | ||||||
STAG Industrial, Inc. | 210,200 | 4,285,978 | ||||||
|
| |||||||
| 54,846,631 | ||||||||
|
| |||||||
THRIFTS & MORTGAGE FINANCE–0.2% | ||||||||
Essent Group Ltd.(a) | 45,520 | 1,095,211 | ||||||
|
| |||||||
| 197,583,665 | ||||||||
|
| |||||||
CONSUMER DISCRETIONARY–19.2% | ||||||||
AUTO COMPONENTS–5.1% | ||||||||
Dana Holding Corp. | 385,480 | 7,563,118 | ||||||
Lear Corp. | 123,260 | 9,980,362 | ||||||
Tenneco, Inc.(a) | 163,010 | 9,221,476 | ||||||
TRW Automotive Holdings Corp.(a) | 115,160 | 8,566,752 | ||||||
|
| |||||||
| 35,331,708 | ||||||||
|
| |||||||
AUTOMOBILES–1.2% | ||||||||
Thor Industries, Inc. | 153,470 | $ | 8,476,148 | |||||
|
| |||||||
HOTELS, RESTAURANTS & LEISURE–0.8% | ||||||||
DineEquity, Inc. | 68,030 | 5,683,907 | ||||||
|
| |||||||
HOUSEHOLD DURABLES–3.7% |
| |||||||
Meritage Homes Corp.(a) | 169,820 | 8,149,662 | ||||||
NVR, Inc.(a) | 6,808 | 6,985,076 | ||||||
PulteGroup, Inc. | 508,400 | 10,356,108 | ||||||
|
| |||||||
| 25,490,846 | ||||||||
|
| |||||||
MEDIA–3.0% | ||||||||
Gannett Co., Inc. | 375,070 | 11,094,571 | ||||||
Regal Entertainment Group–Class A | 478,110 | 9,299,239 | ||||||
|
| |||||||
| 20,393,810 | ||||||||
|
| |||||||
SPECIALTY RETAIL–4.4% | ||||||||
Children’s Place Retail Stores, Inc. (The)(a) | 147,870 | 8,424,154 | ||||||
GameStop Corp.–Class A | 93,170 | 4,589,554 | ||||||
Men’s Wearhouse, Inc. (The) | 163,520 | 8,352,602 | ||||||
Office Depot, Inc.(a) | 1,669,790 | 8,833,189 | ||||||
|
| |||||||
| 30,199,499 | ||||||||
|
| |||||||
TEXTILES, APPAREL & LUXURY GOODS–1.0% | ||||||||
Jones Group, Inc. (The) | 470,590 | 7,040,026 | ||||||
|
| |||||||
| 132,615,944 | ||||||||
|
| |||||||
INFORMATION TECHNOLOGY–17.5% | ||||||||
COMMUNICATIONS EQUIPMENT–1.2% | ||||||||
Harris Corp. | 116,760 | 8,151,016 | ||||||
|
| |||||||
ELECTRONIC EQUIPMENT, INSTRUMENTS & COMPONENTS–8.9% | ||||||||
Anixter International, Inc. | 66,720 | 5,994,125 | ||||||
Arrow Electronics, Inc.(a) | 179,690 | 9,748,182 | ||||||
Avnet, Inc. | 239,470 | 10,563,022 | ||||||
CDW Corp./DE | 265,740 | 6,207,686 | ||||||
Flextronics International Ltd.(a) | 402,540 | 3,127,736 | ||||||
Insight Enterprises, Inc.(a) | 229,931 | 5,221,733 | ||||||
Jabil Circuit, Inc. | 327,820 | 5,717,181 | ||||||
TTM Technologies, Inc.(a) | 594,562 | 5,101,342 | ||||||
Vishay Intertechnology, Inc.(a) | 721,770 | 9,570,670 | ||||||
|
| |||||||
| 61,251,677 | ||||||||
|
| |||||||
IT SERVICES–2.9% | ||||||||
Amdocs Ltd. | 223,630 | 9,222,501 | ||||||
Convergys Corp. | 359,400 | 7,565,370 | ||||||
Genpact Ltd.(a) | 188,390 | 3,460,725 | ||||||
|
| |||||||
| 20,248,596 | ||||||||
|
| |||||||
SEMICONDUCTORS & SEMICONDUCTOR EQUIPMENT–3.7% | ||||||||
Entegris, Inc.(a) | 681,500 | 7,905,400 | ||||||
6
| AllianceBernstein Variable Products Series Fund | ||
| Company | Shares | U.S. $ Value | ||||||
Lam Research Corp.(a) | 159,480 | $ | 8,683,686 | |||||
Micron Technology, Inc.(a) | 176,060 | 3,831,065 | ||||||
MKS Instruments, Inc. | 156,388 | 4,682,257 | ||||||
|
| |||||||
| 25,102,408 | ||||||||
|
| |||||||
SOFTWARE–0.8% | ||||||||
Electronic Arts, Inc.(a) | 246,350 | 5,651,269 | ||||||
|
| |||||||
| 120,404,966 | ||||||||
INDUSTRIALS–9.8% |
| |||||||
COMMERCIAL SERVICES & | ||||||||
Steelcase, Inc.–Class A | 360,270 | 5,713,882 | ||||||
|
| |||||||
CONSTRUCTION & ENGINEERING–2.4% | ||||||||
Granite Construction, Inc. | 172,900 | 6,048,042 | ||||||
Tutor Perini Corp.(a) | 386,090 | 10,154,167 | ||||||
|
| |||||||
| 16,202,209 | ||||||||
|
| |||||||
ELECTRICAL EQUIPMENT–0.9% |
| |||||||
General Cable Corp. | 213,350 | 6,274,624 | ||||||
|
| |||||||
MACHINERY–2.7% | ||||||||
Kennametal, Inc. | 155,440 | 8,093,761 | ||||||
Terex Corp. | 257,150 | 10,797,728 | ||||||
|
| |||||||
| 18,891,489 | ||||||||
|
| |||||||
ROAD & RAIL–2.3% | ||||||||
Con-way, Inc. | 196,340 | 7,796,661 | ||||||
Ryder System, Inc. | 105,120 | 7,755,754 | ||||||
|
| |||||||
| 15,552,415 | ||||||||
|
| |||||||
TRADING COMPANIES & DISTRIBUTORS–0.7% | ||||||||
Aircastle Ltd. | 247,480 | 4,741,717 | ||||||
|
| |||||||
| 67,376,336 | ||||||||
|
| |||||||
MATERIALS–8.5% | ||||||||
CHEMICALS–2.3% | ||||||||
Chemtura Corp.(a) | 224,880 | 6,278,650 | ||||||
Huntsman Corp. | 400,100 | 9,842,460 | ||||||
|
| |||||||
| 16,121,110 | ||||||||
|
| |||||||
CONTAINERS & |
| |||||||
Avery Dennison Corp. | 155,940 | 7,826,628 | ||||||
Graphic Packaging Holding Co.(a) | 983,200 | 9,438,720 | ||||||
|
| |||||||
| 17,265,348 | ||||||||
|
| |||||||
METALS & MINING–3.7% | ||||||||
Commercial Metals Co. | 450,020 | 9,148,907 | ||||||
Reliance Steel & Aluminum Co. | 94,935 | 7,199,870 | ||||||
Steel Dynamics, Inc. | 464,820 | 9,082,583 | ||||||
|
| |||||||
| 25,431,360 | ||||||||
|
| |||||||
| 58,817,818 | ||||||||
|
| |||||||
ENERGY–5.4% | ||||||||
ENERGY EQUIPMENT & SERVICES–0.7% | ||||||||
Helix Energy Solutions Group, Inc.(a) | 216,920 | 5,028,206 | ||||||
|
| |||||||
OIL, GAS & CONSUMABLE FUELS–4.7% | ||||||||
Bill Barrett Corp.(a) | 283,190 | $ | 7,583,828 | |||||
Cimarex Energy Co. | 75,930 | 7,965,816 | ||||||
Stone Energy Corp.(a) | 199,600 | 6,904,164 | ||||||
Western Refining, Inc.(b) | 233,800 | 9,915,458 | ||||||
|
| |||||||
| 32,369,266 | ||||||||
|
| |||||||
| 37,397,472 | ||||||||
|
| |||||||
UTILITIES–5.0% | ||||||||
ELECTRIC UTILITIES–1.3% | ||||||||
PNM Resources, Inc. | 342,560 | 8,262,547 | ||||||
Westar Energy, Inc. | 27,100 | 871,807 | ||||||
|
| |||||||
| 9,134,354 | ||||||||
|
| |||||||
GAS UTILITIES–3.7% | ||||||||
Atmos Energy Corp. | 192,100 | 8,725,182 | ||||||
Southwest Gas Corp. | 149,910 | 8,381,468 | ||||||
UGI Corp. | 200,630 | 8,318,120 | ||||||
|
| |||||||
| 25,424,770 | ||||||||
|
| |||||||
| 34,559,124 | ||||||||
|
| |||||||
HEALTH CARE–4.0% | ||||||||
HEALTH CARE PROVIDERS & | ||||||||
Health Net, Inc./CA(a) | 276,310 | 8,198,118 | ||||||
LifePoint Hospitals, Inc.(a) | 171,825 | 9,079,233 | ||||||
Molina Healthcare, Inc.(a) | 158,470 | 5,506,832 | ||||||
Universal Health Services, Inc.–Class B | 62,680 | 5,093,377 | ||||||
|
| |||||||
| 27,877,560 | ||||||||
|
| |||||||
CONSUMER STAPLES–1.1% | ||||||||
FOOD PRODUCTS–1.1% | ||||||||
Dean Foods Co.(a) | 434,550 | 7,469,914 | ||||||
|
| |||||||
Total Common Stocks | 684,102,799 | |||||||
|
| |||||||
| Principal Amount (000) | ||||||||
SHORT-TERM INVESTMENTS–1.1% | ||||||||
TIME DEPOSIT–1.1% | ||||||||
State Street Time Deposit | $ | 7,549 | 7,548,709 | |||||
|
| |||||||
TOTAL INVESTMENTS BEFORE SECURITY LENDING COLLATERAL FOR SECURITIES LOANED–100.3% | 691,651,508 | |||||||
|
| |||||||
7
| SMALL/MID CAP VALUE PORTFOLIO | ||
| PORTFOLIOOF INVESTMENTS | ||
| (continued) | AllianceBernstein Variable Products Series Fund | |
| Company | Shares | U.S. $ Value | ||||||
INVESTMENTS OF CASH COLLATERAL FOR SECURITIES | ||||||||
INVESTMENT | ||||||||
AllianceBernstein Exchange Reserves–Class I, 0.07%(c) | 9,819,600 | $ | 9,819,600 | |||||
|
| |||||||
TOTAL INVESTMENTS–101.7% | $ | 701,471,108 | ||||||
Other assets less liabilities–(1.7)% | (11,647,712 | ) | ||||||
|
| |||||||
NET ASSETS–100.0% | $ | 689,823,396 | ||||||
|
| |||||||
| (a) | Non-income producing security. |
| (b) | Represents entire or partial securities out on loan. See Note E for securities lending information. |
| (c) | Investment in affiliated money market mutual fund. The rate shown represents the 7-day yield as of period end. |
See notes to financial statements.
8
| SMALL/MID CAP VALUE PORTFOLIO | ||
| STATEMENTOF ASSETS & LIABILITIES | ||
| December 31, 2013 | AllianceBernstein Variable Products Series Fund | |
ASSETS |
| |||
Investments in securities, at value | ||||
Unaffiliated issuers (cost $530,091,978) | $ | 691,651,508 | (a) | |
Affiliated issuers (cost $9,819,600—investment of cash collateral for securities loaned) | 9,819,600 | |||
Dividends and interest receivable | 1,157,753 | |||
Receivable for capital stock sold | 680,620 | |||
Receivable for investment securities sold | 136,903 | |||
|
| |||
Total assets | 703,446,384 | |||
|
| |||
LIABILITIES | ||||
Payable for collateral received on securities loaned | 9,819,600 | |||
Payable for investment securities purchased | 2,447,838 | |||
Payable for capital stock redeemed | 710,966 | |||
Advisory fee payable | 415,021 | |||
Distribution fee payable | 94,789 | |||
Administrative fee payable | 14,445 | |||
Transfer Agent fee payable | 112 | |||
Accrued expenses | 120,217 | |||
|
| |||
Total liabilities | 13,622,988 | |||
|
| |||
NET ASSETS | $ | 689,823,396 | ||
|
| |||
COMPOSITION OF NET ASSETS | ||||
Capital stock, at par | $ | 30,271 | ||
Additional paid-in capital | 451,160,710 | |||
Undistributed net investment income | 3,816,816 | |||
Accumulated net realized gain on investment transactions | 73,256,069 | |||
Net unrealized appreciation on investments | 161,559,530 | |||
|
| |||
| $ | 689,823,396 | |||
|
| |||
Net Asset Value Per Share—1 billion shares of capital stock authorized, $.001 par value
| Class | Net Assets | Shares Outstanding | Net Asset Value | |||||||||
A | $ | 217,145,785 | 9,487,615 | $ | 22.89 | |||||||
B | $ | 472,677,611 | 20,783,729 | $ | 22.74 | |||||||
| (a) | Includes securities on loan with a value of $9,915,458 (see Note E). |
See notes to financial statements.
9
| SMALL/MID CAP VALUE PORTFOLIO | ||
| STATEMENTOF OPERATIONS | ||
| Year Ended December 31, 2013 | AllianceBernstein Variable Products Series Fund | |
INVESTMENT INCOME | ||||||
Dividends | ||||||
Unaffiliated issuers | $ | 9,392,736 | ||||
Affiliated issuers | 9,420 | |||||
Interest | 1,091 | |||||
Securities lending income | | 119,305 | | |||
|
|
| ||||
| 9,522,552 | ||||||
|
|
| ||||
EXPENSES | ||||||
Advisory fee (see Note B) | 4,524,964 | |||||
Distribution fee—Class B | 1,036,624 | |||||
Transfer agency—Class A | 2,580 | |||||
Transfer agency—Class B | 5,667 | |||||
Custodian | 132,713 | |||||
Printing | 92,190 | |||||
Administrative | 55,161 | |||||
Legal | 44,183 | |||||
Audit | 37,023 | |||||
Directors’ fees | 4,540 | |||||
Miscellaneous | 14,527 | |||||
|
|
| ||||
Total expenses | 5,950,172 | |||||
|
| |||||
Net investment income | 3,572,380 | |||||
|
| |||||
REALIZED AND UNREALIZED GAIN ON INVESTMENT TRANSACTIONS | ||||||
Net realized gain on investment transactions | 76,474,917 | |||||
Net change in unrealized appreciation/depreciation of investments | 108,998,800 | |||||
|
| |||||
Net gain on investment transactions | 185,473,717 | |||||
|
| |||||
NET INCREASE IN NET ASSETS FROM OPERATIONS | $ | 189,046,097 | ||||
|
|
|
See notes to financial statements
10
| SMALL/MID CAP VALUE PORTFOLIO | ||
| STATEMENT OF CHANGES IN NET ASSETS | AllianceBernstein Variable Products Series Fund | |
| Year Ended December 31, 2013 | Year Ended December 31, 2012 | |||||||
INCREASE IN NET ASSETS FROM OPERATIONS | ||||||||
Net investment income | $ | 3,572,380 | $ | 2,906,031 | ||||
Net realized gain on investment transactions | 76,474,917 | 34,604,067 | ||||||
Net change in unrealized appreciation/depreciation of investments | 108,998,800 | 45,967,479 | ||||||
|
|
|
| |||||
Net increase in net assets from operations | 189,046,097 | 83,477,577 | ||||||
DIVIDENDS AND DISTRIBUTIONS TO SHAREHOLDERS FROM | ||||||||
Net investment income | ||||||||
Class A | (1,173,072 | ) | (851,210 | ) | ||||
Class B | (1,768,157 | ) | (968,496 | ) | ||||
Net realized gain on investment transactions | ||||||||
Class A | (10,888,972 | ) | (4,960,815 | ) | ||||
Class B | (24,158,193 | ) | (10,712,748 | ) | ||||
CAPITAL STOCK TRANSACTIONS | ||||||||
Net increase (decrease) | 34,149,805 | (37,267,033 | ) | |||||
|
|
|
| |||||
Total increase | 185,207,508 | 28,717,275 | ||||||
NET ASSETS | ||||||||
Beginning of period | 504,615,888 | 475,898,613 | ||||||
|
|
|
| |||||
End of period (including undistributed net investment income of $3,816,816 and $3,189,159, respectively) | $ | 689,823,396 | $ | 504,615,888 | ||||
|
|
|
| |||||
See notes to financial statements.
11
| SMALL/MID CAP VALUE PORTFOLIO | ||
| NOTES TO FINANCIAL STATEMENTS | ||
| December 31, 2013 | AllianceBernstein Variable Products Series Fund | |
NOTE A: Significant Accounting Policies
The AllianceBernstein Small/Mid Cap Value Portfolio (the “Portfolio”) is a series of AllianceBernstein Variable Products Series Fund, Inc. (the “Fund”). The Portfolio’s investment objective is long-term growth of capital. The Portfolio is diversified as defined under the Investment Company Act of 1940. The Fund was incorporated in the State of Maryland on November 17, 1987, as an open-end series investment company. The Fund offers thirteen separately managed pools of assets which have differing investment objectives and policies. The Portfolio offers Class A and Class B shares. Both classes of shares have identical voting, dividend, liquidating and other rights, except that Class B shares bear a distribution expense and have exclusive voting rights with respect to the Class B distribution plan.
The Portfolio offers and sells its shares only to separate accounts of certain life insurance companies for the purpose of funding variable annuity contracts and variable life insurance policies. Sales are made without a sales charge at the Portfolio’s net asset value per share.
The financial statements have been prepared in conformity with U.S. generally accepted accounting principles (“U.S. GAAP”) which require management to make certain estimates and assumptions that affect the reported amounts of assets and liabilities in the financial statements and amounts of income and expenses during the reporting period. Actual results could differ from those estimates. The following is a summary of significant accounting policies followed by the Portfolio.
1. Security Valuation
Portfolio securities are valued at their current market value determined on the basis of market quotations or, if market quotations are not readily available or are deemed unreliable, at “fair value” as determined in accordance with procedures established by and under the general supervision of the Fund’s Board of Directors (the “Board”).
In general, the market values of securities which are readily available and deemed reliable are determined as follows: securities listed on a national securities exchange (other than securities listed on the NASDAQ Stock Market, Inc. (“NASDAQ”)) or on a foreign securities exchange are valued at the last sale price at the close of the exchange or foreign securities exchange. If there has been no sale on such day, the securities are valued at the last traded price from the previous day. Securities listed on more than one exchange are valued by reference to the principal exchange on which the securities are traded; securities listed only on NASDAQ are valued in accordance with the NASDAQ Official Closing Price; listed or over the counter (“OTC”) market put or call options are valued at the mid level between the current bid and ask prices. If either a current bid or current ask price is unavailable, AllianceBernstein L.P. (the “Adviser”) will have discretion to determine the best valuation (e.g. last trade price in the case of listed options); open futures are valued using the closing settlement price or, in the absence of such a price, the most recent quoted bid price. If there are no quotations available for the day of valuation, the last available closing settlement price is used; U.S. government securities and other debt instruments having 60 days or less remaining until maturity are valued at amortized cost if their original maturity was 60 days or less; or by amortizing their fair value as of the 61st day prior to maturity if their original term to maturity exceeded 60 days; fixed-income securities, including mortgage-backed and asset-backed securities, may be valued on the basis of prices provided by a pricing service or at a price obtained from one or more of the major broker-dealers. In cases where broker-dealer quotes are obtained, the Adviser may establish procedures whereby changes in market yields or spreads are used to adjust, on a daily basis, a recently obtained quoted price on a security. Swaps and other derivatives are valued daily, primarily using independent pricing services, independent pricing models using market inputs, as well as third party broker-dealers or counterparties. Investment companies are valued at their net asset value each day.
Securities for which market quotations are not readily available (including restricted securities) or are deemed unreliable are valued at fair value. Factors considered in making this determination may include, but are not limited to, information obtained by contacting the issuer, analysts, analysis of the issuer’s financial statements or other available documents. In addition, the Portfolio may use fair value pricing for securities primarily traded in non-U.S. markets because most foreign markets close well before the Portfolio values its securities at 4:00 p.m., Eastern Time. The earlier close of these foreign markets gives rise to the possibility that significant events, including broad market moves, may have occurred in the interim and may materially affect the value of those securities. To account for this, the Portfolio may frequently value many of its foreign equity securities using fair value prices based on third party vendor modeling tools to the extent available.
2. Fair Value Measurements
In accordance with U.S. GAAP regarding fair value measurements, fair value is defined as the price that the Portfolio would receive to sell an asset or pay to transfer a liability in an orderly transaction between market participants at the measurement date. U.S. GAAP establishes a framework for measuring fair value, and a three-level hierarchy for fair value measurements
12
| AllianceBernstein Variable Products Series Fund | ||
based upon the transparency of inputs to the valuation of an asset or liability (including those valued based on their market values as described in Note A.1 above). Inputs may be observable or unobservable and refer broadly to the assumptions that market participants would use in pricing the asset or liability. Observable inputs reflect the assumptions market participants would use in pricing the asset or liability based on market data obtained from sources independent of the Portfolio. Unobservable inputs reflect the Portfolio’s own assumptions about the assumptions that market participants would use in pricing the asset or liability based on the best information available in the circumstances. Each investment is assigned a level based upon the observability of the inputs which are significant to the overall valuation. The three-tier hierarchy of inputs is summarized below.
| • | Level 1—quoted prices in active markets for identical investments |
| • | Level 2—other significant observable inputs (including quoted prices for similar investments, interest rates, prepayment speeds, credit risk, etc.) |
| • | Level 3—significant unobservable inputs (including the Portfolio’s own assumptions in determining the fair value of investments) |
Where readily available market prices or relevant bid prices are not available for certain equity investments, such investments may be valued based on similar publicly traded investments, movements in relevant indices since last available prices or based upon underlying company fundamentals and comparable company data (such as multiples to earnings or other multiples to equity). Where an investment is valued using an observable input, such as another publicly traded security, the investment will be classified as Level 2. If management determines that an adjustment is appropriate based on restrictions on resale, illiquidity or uncertainty, and such adjustment is a significant component of the valuation, the investment will be classified as Level 3. An investment will also be classified as Level 3 where management uses company fundamentals and other significant inputs to determine the valuation.
The following table summarizes the valuation of the Portfolio’s investments by the above fair value hierarchy levels as of December 31, 2013:
| Level 1 | Level 2 | Level 3 | Total | |||||||||||||
Investments in Securities: | ||||||||||||||||
Assets: |
| |||||||||||||||
Common Stocks* | $ | 684,102,799 | $ | –0 | – | $ | –0 | – | $ | 684,102,799 | ||||||
Short-Term Investments | –0 | – | 7,548,709 | –0 | – | 7,548,709 | ||||||||||
Investments of Cash Collateral for Securities Loaned in Affiliated Money Market Fund | 9,819,600 | –0 | – | –0 | – | 9,819,600 | ||||||||||
|
|
|
|
|
|
|
| |||||||||
Total Investments in Securities | 693,922,399 | 7,548,709 | –0 | – | 701,471,108 | |||||||||||
Other Financial Instruments** | –0 | – | –0 | – | –0 | – | –0 | – | ||||||||
|
|
|
|
|
|
|
| |||||||||
Total^ | $ | 693,922,399 | $ | 7,548,709 | $ | –0 | – | $ | 701,471,108 | |||||||
|
|
|
|
|
|
|
| |||||||||
| * | See Portfolio of Investments for sector classifications. |
| ** | Other financial instruments are derivative instruments, such as futures, forwards and swaps, which are valued at the unrealized appreciation/depreciation on the instrument. |
| ^ | There were no transfers between Level 1 and Level 2 during the reporting period. |
The Portfolio recognizes all transfers between levels of the fair value hierarchy assuming the financial instruments were transferred at the beginning of the reporting period.
The Adviser has established a Valuation Committee (the “Committee”) which is responsible for overseeing the pricing and valuation of all securities held in the Portfolio. The Committee operates under pricing and valuation policies and procedures established by the Adviser and approved by the Board, including pricing policies which set forth the mechanisms and processes to be employed on a daily basis to implement these policies and procedures. In particular, the pricing policies describe how to determine market quotations for securities and other instruments. The Committee’s responsibilities include: 1) fair value and liquidity determinations (and oversight of any third parties to whom any responsibility for fair value and liquidity determinations is delegated), and 2) regular monitoring of the Adviser’s pricing and valuation policies and procedures and modification or enhancement of these policies and procedures (or recommendation of the modification of these policies and procedures) as the Committee believes appropriate.
13
| SMALL/MID CAP VALUE PORTFOLIO | ||
| NOTES TO FINANCIAL STATEMENTS | ||
| (continued) | AllianceBernstein Variable Products Series Fund | |
The Committee is also responsible for monitoring the implementation of the pricing policies by the Adviser’s Pricing Group (the “Pricing Group”) and a third party which performs certain pricing functions in accordance with the pricing policies. The Pricing Group is responsible for the oversight of the third party on a day-to-day basis. The Committee and the Pricing Group perform a series of activities to provide reasonable assurance of the accuracy of prices including: 1) periodic vendor due diligence meetings, review of methodologies, new developments and processes at vendors, 2) daily comparison of security valuation versus prior day for all securities that exceeded established thresholds, and 3) daily review of unpriced, stale, and variance reports with exceptions reviewed by senior management and the Committee.
In addition, several processes outside of the pricing process are used to monitor valuation issues including: 1) performance and performance attribution reports are monitored for anomalous impacts based upon benchmark performance, and 2) portfolio managers review all portfolios for performance and analytics (which are generated using the Adviser’s prices).
3. Currency Translation
Assets and liabilities denominated in foreign currencies and commitments under forward currency exchange contracts are translated into U.S. dollars at the mean of the quoted bid and ask prices of such currencies against the U.S. dollar. Purchases and sales of portfolio securities are translated into U.S. dollars at the rates of exchange prevailing when such securities were acquired or sold. Income and expenses are translated into U.S. dollars at rates of exchange prevailing when accrued.
Net realized gain or loss on foreign currency transactions represents foreign exchange gains and losses from sales and maturities of foreign fixed income investments, foreign currency exchange contracts, holding of foreign currencies, currency gains or losses realized between the trade and settlement dates on foreign investment transactions, and the difference between the amounts of dividends, interest and foreign withholding taxes recorded on the Portfolio’s books and the U.S. dollar equivalent amounts actually received or paid. Net unrealized currency gains and losses from valuing foreign currency denominated assets and liabilities at period end exchange rates are reflected as a component of net unrealized appreciation or depreciation of foreign currency denominated assets and liabilities.
4. Taxes
It is the Portfolio’s policy to meet the requirements of the Internal Revenue Code applicable to regulated investment companies and to distribute all of its investment company taxable income and net realized gains, if any, to shareholders. Therefore, no provisions for federal income or excise taxes are required. The Portfolio may be subject to taxes imposed by countries in which it invests. Such taxes are generally based on income and/or capital gains earned or repatriated. Taxes are accrued and applied to net investment income, net realized gains and net unrealized appreciation/depreciation as such income and/or gains are earned.
In accordance with U.S. GAAP requirements regarding accounting for uncertainties in income taxes, management has analyzed the Portfolio’s tax positions taken or expected to be taken on federal and state income tax returns for all open tax years (the current and the prior three tax years) and has concluded that no provision for income tax is required in the Portfolio’s financial statements.
5. Investment Income and Investment Transactions
Dividend income is recorded on the ex-dividend date or as soon as the Portfolio is informed of the dividend. Interest income is accrued daily. Investment transactions are accounted for on the date the securities are purchased or sold. Investment gains or losses are determined on the identified cost basis. The Portfolio amortizes premiums and accretes discounts as adjustments to interest income.
6. Class Allocations
All income earned and expenses incurred by the Portfolio are borne on a pro-rata basis by each outstanding class of shares, based on the proportionate interest in the Portfolio represented by the net assets of such class, except for class specific expenses which are allocated to the respective class. Expenses of the Fund are charged proportionately to each Portfolio or based on other appropriate methods. Realized and unrealized gains and losses are allocated among the various share classes based on respective net assets.
7. Dividends and Distributions
Dividends and distributions to shareholders, if any, are recorded on the ex-dividend date. Income dividends and capital gains distributions are determined in accordance with federal tax regulations and may differ from those determined in accordance with U.S. GAAP. To the extent these differences are permanent, such amounts are reclassified within the capital accounts based on their federal tax basis treatment; temporary differences do not require such reclassification.
14
| AllianceBernstein Variable Products Series Fund | ||
NOTE B: Advisory Fee and Other Transactions with Affiliates
Under the terms of the investment advisory agreement, the Portfolio pays the Adviser an advisory fee at an annual rate of .75% of the first $2.5 billion, .65% of the next $2.5 billion and .60% in excess of $5 billion, of the Portfolio’s average daily net assets. The fee is accrued daily and paid monthly. The Adviser has agreed to waive its fees and bear certain expenses to the extent necessary to limit total operating expenses on an annual basis to 1.20% and 1.45% of daily average net assets for Class A and Class B shares, respectively. For the year ended December 31, 2013, there were no expenses waived by the Adviser.
Pursuant to the investment advisory agreement, the Portfolio may reimburse the Adviser for certain legal and accounting services provided to the Portfolio by the Adviser. For the year ended December 31, 2013, the reimbursement for such services amounted to $55,161.
Brokerage commissions paid on investment transactions for the year ended December 31, 2013 amounted to $935,929, of which $0 and $0, respectively, was paid to Sanford C. Bernstein & Co. LLC and Sanford C. Bernstein Limited, affiliates of the Adviser.
The Portfolio compensates AllianceBernstein Investor Services, Inc. (“ABIS”), a wholly-owned subsidiary of the Adviser, under a Transfer Agency Agreement for providing personnel and facilities to perform transfer agency services for the Portfolio. Such compensation retained by ABIS amounted to $1,385 for the year ended December 31, 2013.
NOTE C: Distribution Plan
The Portfolio has adopted a Distribution Plan (the “Plan”) for Class B shares pursuant to Rule 12b-1 under the Investment Company Act of 1940. Under the Plan, the Portfolio pays distribution and servicing fees to AllianceBernstein Investments, Inc. (the “Distributor”), a wholly-owned subsidiary of the Adviser, at an annual rate of up to .50% of the Portfolio’s average daily net assets attributable to Class B shares. The fees are accrued daily and paid monthly. The Board currently limits payments under the Plan to .25% of the Portfolio’s average daily net assets attributable to Class B shares. The Plan provides that the Distributor will use such payments in their entirety for distribution assistance and promotional activities.
The Portfolio is not obligated under the Plan to pay any distribution and servicing fees in excess of the amounts set forth above. The purpose of the payments to the Distributor under the Plan is to compensate the Distributor for its distribution services with respect to the sale of the Portfolio’s Class B shares. Since the Distributor’s compensation is not directly tied to its expenses, the amount of compensation received by it under the Plan during any year may be more or less than its actual expenses. For this reason, the Plan is characterized by the staff of the Securities and Exchange Commission as being of the “compensation” variety.
In the event that the Plan is terminated or not continued, no distribution or servicing fees (other than current amounts accrued but not yet paid) would be owed by the Portfolio to the Distributor.
The Plan also provides that the Adviser may use its own resources to finance the distribution of the Portfolio’s shares.
NOTE D : Investment Transactions
Purchases and sales of investment securities (excluding short-term investments) for the year ended December 31, 2013 were as follows:
| Purchases | Sales | |||||||
Investment securities (excluding U.S. government securities) | $ | 334,767,489 | $ | 334,664,702 | ||||
U.S. government securities | –0 | – | –0 | – | ||||
The cost of investments for federal income tax purposes, gross unrealized appreciation and unrealized depreciation are as follows:
Cost | $ | 542,150,620 | ||
|
| |||
Gross unrealized appreciation | $ | 169,285,602 | ||
Gross unrealized depreciation | (9,965,114 | ) | ||
|
| |||
Net unrealized appreciation | $ | 159,320,488 | ||
|
|
15
| SMALL/MID CAP VALUE PORTFOLIO | ||
| NOTES TO FINANCIAL STATEMENTS | ||
| (continued) | AllianceBernstein Variable Products Series Fund | |
1. Derivative Financial Instruments
The Portfolio may use derivatives in an effort to earn income and enhance returns, to replace more traditional direct investments, to obtain exposure to otherwise inaccessible markets (collectively, “investment purposes”), or to hedge or adjust the risk profile of its portfolio.
The Portfolio did not engage in derivatives transactions for the year ended December 31, 2013.
2. Currency Transactions
The Portfolio may invest in non-U.S. dollar securities on a currency hedged or unhedged basis. The Portfolio may seek investment opportunities by taking long or short positions in currencies through the use of currency-related derivatives, including forward currency exchange contracts, futures and options on futures, swaps, and other options. The Portfolio may enter into transactions for investment opportunities when it anticipates that a foreign currency will appreciate or depreciate in value but securities denominated in that currency are not held by the Portfolio and do not present attractive investment opportunities. Such transactions may also be used when the Adviser believes that it may be more efficient than a direct investment in a foreign currency-denominated security. The Portfolio may also conduct currency exchange contracts on a spot basis (i.e., for cash at the spot rate prevailing in the currency exchange market for buying or selling currencies).
NOTE E: Securities Lending
The Portfolio may enter into securities lending transactions. Under the Portfolio’s securities lending program, all loans of securities will be collateralized continually by cash. The Portfolio will be compensated for the loan from a portion of the net return from the income earned on cash collateral after a rebate is paid to the borrower (in some cases, this rebate may be a “negative rebate” or fee paid by the borrower to the Portfolio in connection with the loan), and payments are made for fees of the securities lending agent and for certain other administrative expenses. It is the policy of the Portfolio to receive collateral consisting of cash in an amount exceeding the value of the securities loaned. The Portfolio will have the right to call a loan and obtain the securities loaned at any time on notice to the borrower within the normal and customary settlement time for the securities. While the securities are on loan, the borrower is obligated to pay the Portfolio amounts equal to any income or other distributions from the securities. The Portfolio will not have the right to vote any securities during the existence of a loan, but will have the right to regain ownership of loaned securities in order to exercise voting or other ownership rights. The lending agent has agreed to indemnify the Portfolio in the case of default of any securities borrower. Collateral received and securities loaned are marked to market daily to ensure that the securities loaned are secured by collateral. The lending agent will invest the cash collateral received in AllianceBernstein Exchange Reserves, an eligible money market vehicle, in accordance with the investment restrictions of the Portfolio, and as approved by the Board. The collateral received on securities loaned is recorded as an asset as well as a corresponding liability in the statement of assets and liabilities. When the Portfolio lends securities, its investment performance will continue to reflect changes in the value of the securities loaned. At December 31, 2013, the Portfolio had securities on loan with a value of $9,915,458 and had received cash collateral which has been invested into AllianceBernstein Exchange Reserves of $9,819,600. The cash collateral will be adjusted on the next business day to maintain the required collateral amount. The Portfolio earned securities lending income of $119,305 and $9,420 from the borrowers and AllianceBernstein Exchange Reserves, respectively, for the year ended December 31, 2013; these amounts are reflected in the statement of operations. A principal risk of lending portfolio securities is that the borrower will fail to return the loaned securities upon termination of the loan and that the collateral will not be sufficient to replace the loaned securities. A summary of the Portfolio’s transactions in shares of AllianceBernstein Exchange Reserves for the year ended December 31, 2013 is as follows:
Market Value (000) | Purchases at Cost (000) | Sales Proceeds (000) | Market Value December 31, 2013 (000) | |||||||||||
| $ | 6,422 | $ | 144,216 | $ | 140,818 | $ | 9,820 | |||||||
16
| AllianceBernstein Variable Products Series Fund | ||
NOTE F: Capital Stock
Each class consists of 500,000,000 authorized shares. Transactions in capital shares for each class were as follows:
| Shares | Amount | |||||||||||||||||
| Year Ended December 31, 2013 | Year Ended December 31, 2012 | Year Ended December 31, 2013 | Year Ended December 31, 2012 | |||||||||||||||
Class A | ||||||||||||||||||
Shares sold | 2,218,096 | 1,122,960 | $ | 45,752,106 | $ | 18,970,347 | ||||||||||||
Shares issued in reinvestment of dividends and distributions | 588,680 | 356,566 | 12,062,044 | 5,812,025 | ||||||||||||||
Shares redeemed | (2,193,629 | ) | (2,421,507 | ) | (44,891,426 | ) | (40,598,442 | ) | ||||||||||
|
|
|
|
|
|
|
| |||||||||||
Net increase (decrease) | 613,147 | (941,981 | ) | $ | 12,922,724 | $ | (15,816,070 | ) | ||||||||||
|
|
|
|
|
|
|
| |||||||||||
Class B | ||||||||||||||||||
Shares sold | 4,088,375 | 2,003,207 | $ | 85,041,955 | $ | 33,615,199 | ||||||||||||
Shares issued in reinvestment of dividends and distributions | 1,272,146 | 720,176 | 25,926,350 | 11,681,244 | ||||||||||||||
Shares redeemed | (4,364,028 | ) | (4,017,175 | ) | (89,741,224 | ) | (66,747,406 | ) | ||||||||||
|
|
|
|
|
|
|
| |||||||||||
Net increase (decrease) | 996,493 | (1,293,792 | ) | $ | 21,227,081 | $ | (21,450,963 | ) | ||||||||||
|
|
|
|
|
|
|
| |||||||||||
17
| SMALL/MID CAP VALUE PORTFOLIO | ||
| NOTES TO FINANCIAL STATEMENTS | ||
| (continued) | AllianceBernstein Variable Products Series Fund | |
NOTE G: Risks Involved in Investing in the Portfolio
Foreign Securities Risk—Investing in securities of foreign companies or foreign governments involves special risks which include changes in foreign currency exchange rates and the possibility of future political and economic developments which could adversely affect the value of such securities. Moreover, securities of many foreign companies or foreign governments and their markets may be less liquid and their prices more volatile than those of comparable U.S. companies or of the U.S. government.
Currency Risk—This is the risk that changes in foreign currency exchange rates may negatively affect the value of the Portfolio’s investments or reduce the returns of the Portfolio. For example, the value of the Portfolio’s investments in foreign currency-denominated securities or currencies may decrease if the U.S. dollar is strong (i.e., gaining value relative to other currencies) and other currencies are weak (i.e., losing value relative to the U.S. dollar). Currency markets are generally not as regulated as securities markets. Independent of the Portfolio’s investments denominated in foreign currencies, the Portfolio’s positions in various foreign currencies may cause the Portfolio to experience investment losses due to the changes in exchange rates and interest rates.
Derivatives Risk—The Portfolio may enter into derivative transactions such as forwards, options, futures and swaps. Derivatives may be illiquid, difficult to price, and leveraged so that small changes may produce disproportionate losses for the Portfolio, and subject to counterparty risk to a greater degree than more traditional investments. Derivatives may result in significant losses, including losses that are far greater than the value of the derivatives reflected in the statement of assets and liabilities.
Indemnification Risk—In the ordinary course of business, the Portfolio enters into contracts that contain a variety of indemnifications. The Portfolio’s maximum exposure under these arrangements is unknown. However, the Portfolio has not had prior claims or losses pursuant to these indemnification provisions and expects the risk of loss thereunder to be remote. Therefore, the Portfolio has not accrued any liability in connection with these indemnification provisions.
NOTE H: Joint Credit Facility
A number of open-end mutual funds managed by the Adviser, including the Portfolio, participate in a $140 million revolving credit facility (the “Facility”) intended to provide short-term financing, if necessary, subject to certain restrictions in connection with abnormal redemption activity. Commitment fees related to the Facility are paid by the participating funds and are included in miscellaneous expenses in the statement of operations. The Portfolio did not utilize the Facility during the year ended December 31, 2013.
NOTE I: Distributions to Shareholders
The tax character of distributions paid during the fiscal years ended December 31, 2013 and December 31, 2012 were as follows:
| 2013 | 2012 | |||||||
Distributions paid from: | ||||||||
Ordinary income | $ | 15,132,800 | $ | 1,817,886 | ||||
Net long-term capital gains | 22,855,594 | 15,675,383 | ||||||
|
|
|
| |||||
Total taxable distributions paid | $ | 37,988,394 | $ | 17,493,269 | ||||
|
|
|
| |||||
As of December 31, 2013, the components of accumulated earnings/(deficit) on a tax basis were as follows:
Undistributed ordinary income | $ | 15,162,841 | ||
Undistributed net capital gain | 64,149,087 | |||
Unrealized appreciation/(depreciation) | 159,320,488 | (a) | ||
|
| |||
Total accumulated earnings/(deficit) | $ | 238,632,416 | ||
|
|
| (a) | The differences between book-basis and tax-basis unrealized appreciation/(depreciation) are attributable primarily to the tax deferral of losses on wash sales and return of capital distributions received from underlying securities. |
18
| AllianceBernstein Variable Products Series Fund | ||
For tax purposes, net capital losses may be carried over to offset future capital gains, if any. Funds are permitted to carry forward capital losses incurred in taxable years beginning after December 22, 2010 for an indefinite period, and such losses will retain their character as either short-term or long-term capital losses. As of December 31, 2013, the Portfolio did not have any capital loss carryforwards.
During the current fiscal year, permanent differences primarily due to return of capital distributions received from underlying securities resulted in a net decrease in undistributed net investment income and a net increase in accumulated net realized gain on investment transactions. These reclassifications had no effect on net assets.
NOTE J: Subsequent Events
Management has evaluated subsequent events for possible recognition or disclosure in the financial statements through the date the financial statements are issued. Management has determined that there are no material events that would require disclosure in the Portfolio’s financial statements through this date.
19
| SMALL/MID CAP VALUE PORTFOLIO | ||
| FINANCIAL HIGHLIGHTS | AllianceBernstein Variable Products Series Fund |
Selected Data For A Share Of Capital Stock Outstanding Throughout Each Period
| CLASS A | ||||||||||||||||||||
| Year Ended December 31, | ||||||||||||||||||||
| 2013 | 2012 | 2011 | 2010 | 2009 | ||||||||||||||||
Net asset value, beginning of period | $17.67 | $15.46 | $16.95 | $13.41 | $9.92 | |||||||||||||||
|
|
|
|
|
|
|
|
|
| |||||||||||
Income From Investment Operations | ||||||||||||||||||||
Net investment income (a) | .16 | .13 | .09 | .08 | .08 | |||||||||||||||
Net realized and unrealized gain (loss) on investment transactions | 6.41 | 2.72 | (1.50 | ) | 3.52 | 4.01 | ||||||||||||||
|
|
|
|
|
|
|
|
|
| |||||||||||
Net increase (decrease) in net asset value from operations | 6.57 | 2.85 | (1.41 | ) | 3.60 | 4.09 | ||||||||||||||
|
|
|
|
|
|
|
|
|
| |||||||||||
Less: Dividends and Distributions | ||||||||||||||||||||
Dividends from net investment income | (.13 | ) | (.10 | ) | (.08 | ) | (.06 | ) | (.12 | ) | ||||||||||
Distributions from net realized gain on investment transactions | (1.22 | ) | (.54 | ) | –0 | – | –0 | – | (.48 | ) | ||||||||||
|
|
|
|
|
|
|
|
|
| |||||||||||
Total dividends and distributions | (1.35 | ) | (.64 | ) | (.08 | ) | (.06 | ) | (.60 | ) | ||||||||||
|
|
|
|
|
|
|
|
|
| |||||||||||
Net asset value, end of period | $22.89 | $17.67 | $15.46 | $16.95 | $13.41 | |||||||||||||||
|
|
|
|
|
|
|
|
|
| |||||||||||
Total Return | ||||||||||||||||||||
Total investment return based on net asset value (b) | 38.06 | %* | 18.75 | % | (8.39 | )% | 26.91 | % | 42.86 | % | ||||||||||
Ratios/Supplemental Data | ||||||||||||||||||||
Net assets, end of period (000’s omitted) | $217,146 | $156,832 | $151,754 | $174,068 | $134,291 | |||||||||||||||
Ratio to average net assets of: | ||||||||||||||||||||
Expenses | .81 | % | .82 | % | .83 | % | .84 | %+ | .87 | % | ||||||||||
Net investment income | .77 | % | .75 | % | .56 | % | .56 | %+ | .70 | % | ||||||||||
Portfolio turnover rate | 56 | % | 50 | % | 70 | % | 54 | % | 58 | % | ||||||||||
See footnote summary on page 21.
20
| AllianceBernstein Variable Products Series Fund | ||
Selected Data For A Share Of Capital Stock Outstanding Throughout Each Period
| CLASS B | ||||||||||||||||||||
| Year Ended December 31, | ||||||||||||||||||||
| 2013 | 2012 | 2011 | 2010 | 2009 | ||||||||||||||||
Net asset value, beginning of period | $17.58 | $15.38 | $16.87 | $13.36 | $9.87 | |||||||||||||||
|
|
|
|
|
|
|
|
|
| |||||||||||
Income From Investment Operations | ||||||||||||||||||||
Net investment income (a) | .11 | .08 | .05 | .05 | .05 | |||||||||||||||
Net realized and unrealized gain (loss) on investment transactions | 6.36 | 2.71 | (1.50 | ) | 3.50 | 4.01 | ||||||||||||||
|
|
|
|
|
|
|
|
|
| |||||||||||
Net increase (decrease) in net asset value from operations | 6.47 | 2.79 | (1.45 | ) | 3.55 | 4.06 | ||||||||||||||
|
|
|
|
|
|
|
|
|
| |||||||||||
Less: Dividends and Distributions | ||||||||||||||||||||
Dividends from net investment income | (.09 | ) | (.05 | ) | (.04 | ) | (.04 | ) | (.09 | ) | ||||||||||
Distributions from net realized gain on investment transactions | (1.22 | ) | (.54 | ) | –0 | – | –0 | – | (.48 | ) | ||||||||||
|
|
|
|
|
|
|
|
|
| |||||||||||
Total dividends and distributions | (1.31 | ) | (.59 | ) | (.04 | ) | (.04 | ) | (.57 | ) | ||||||||||
|
|
|
|
|
|
|
|
|
| |||||||||||
Net asset value, end of period | $22.74 | $17.58 | $15.38 | $16.87 | $13.36 | |||||||||||||||
|
|
|
|
|
|
|
|
|
| |||||||||||
Total Return | ||||||||||||||||||||
Total investment return based on net asset value (b) | 37.63 | %* | 18.47 | % | (8.62 | )% | 26.59 | % | 42.66 | % | ||||||||||
Ratios/Supplemental Data | ||||||||||||||||||||
Net assets, end of period (000’s omitted) | $472,677 | $347,784 | $324,145 | $378,436 | $264,635 | |||||||||||||||
Ratio to average net assets of: | ||||||||||||||||||||
Expenses | 1.06 | % | 1.07 | % | 1.08 | % | 1.09 | %+ | 1.12 | % | ||||||||||
Net investment income | .51 | % | .51 | % | .31 | % | .31 | %+ | .42 | % | ||||||||||
Portfolio turnover rate | 56 | % | 50 | % | 70 | % | 54 | % | 58 | % | ||||||||||
| (a) | Based on average shares outstanding. |
| (b) | Total investment return is calculated assuming an initial investment made at the net asset value at the beginning of the period, reinvestment of all dividends and distributions at net asset value during the period, and redemption on the last day of the period. Total return does not reflect (i) insurance company’s separate account related expense charges and (ii) the deductions of taxes that a shareholder would pay on Portfolio distributions or the redemption of Portfolio shares. Total investment return calculated for a period of less than one year is not annualized. |
| * | Includes the impact of proceeds received and credited to the Portfolio resulting from the class action settlements, which enhanced the Portfolio’s performance for the year ended December 31, 2013 by 0.01%. |
| + | The ratio includes expenses attributable to costs of proxy solicitation. |
| See | notes to financial statements. |
21
| REPORTOF INDEPENDENT REGISTERED | ||
| PUBLIC ACCOUNTING FIRM | AllianceBernstein Variable Products Series Fund | |
To the Board of Directors and Shareholders of AllianceBernstein Small/Mid Cap Value Portfolio:
We have audited the accompanying statement of assets and liabilities, including the portfolio of investments, of AllianceBernstein Small/Mid Cap Value Portfolio (one of the funds constituting AllianceBernstein Variable Products Series Fund, Inc. (the “Fund”)) as of December 31, 2013, and the related statement of operations for the year then ended, the statements of changes in net assets for each of the two years in the period then ended, and the financial highlights for each of the five years in the period then ended. These financial statements and financial highlights are the responsibility of the Fund’s management. Our responsibility is to express an opinion on these financial statements and financial highlights based on our audits.
We conducted our audits in accordance with the standards of the Public Company Accounting Oversight Board (United States). Those standards require that we plan and perform the audit to obtain reasonable assurance about whether the financial statements and financial highlights are free of material misstatement. We were not engaged to perform an audit of the Fund’s internal control over financial reporting. Our audits included consideration of internal control over financial reporting as a basis for designing audit procedures that are appropriate in the circumstances, but not for the purpose of expressing an opinion on the effectiveness of the Fund’s internal control over financial reporting. Accordingly, we express no such opinion. An audit also includes examining, on a test basis, evidence supporting the amounts and disclosures in the financial statements and financial highlights, assessing the accounting principles used and significant estimates made by management, and evaluating the overall financial statement presentation. Our procedures included confirmation of securities owned as of December 31, 2013, by correspondence with the custodian and others, or by other appropriate auditing procedures where replies from others were not received. We believe that our audits provide a reasonable basis for our opinion.
In our opinion, the financial statements and financial highlights referred to above present fairly, in all material respects, the financial position of AllianceBernstein Small/Mid Cap Value Portfolio (one of the funds constituting AllianceBernstein Variable Products Series Fund, Inc.) at December 31, 2013, the results of its operations for the year then ended, the changes in its net assets for each of the two years in the period then ended, and the financial highlights for each of the five years in the period then ended, in conformity with U.S. generally accepted accounting principles.

New York, New York
February 14, 2014
22
| 2013 TAX INFORMATION (unaudited) | AllianceBernstein Variable Products Series Fund |
For Federal income tax purposes, the following information is furnished with respect to the distributions paid by the Portfolio during the taxable year ended December 31, 2013. For corporate shareholders, 33.05% of dividends paid qualify for the dividends received deduction.
23
| SMALL/MID CAP VALUE PORTFOLIO | AllianceBernstein Variable Products Series Fund |
| BOARDOF DIRECTORS | ||
Marshall C. Turner, Jr.(1), Chairman John H. Dobkin(1) Michael J. Downey(1) William H. Foulk, Jr.(1) D. James Guzy(1) | Nancy P. Jacklin(1) Robert M. Keith, President and Garry L. Moody(1) Earl D. Weiner(1) | |
| OFFICERS | ||
Philip L. Kirstein, Senior Vice President and Joseph G. Paul(2), Vice President James W. MacGregor(2), Vice President Andrew J. Weiner(2), Vice President | Emilie D. Wrapp, Secretary Joseph J. Mantineo, Treasurer and Phyllis J. Clarke, Controller Vincent S. Noto, Chief Compliance Officer | |
CUSTODIAN AND ACCOUNTING AGENT State Street Bank and Trust Company One Lincoln Street Boston, MA 02111 | LEGAL COUNSEL Seward & Kissel LLP One Battery Park Plaza New York, NY 10004 | |
DISTRIBUTOR AllianceBernstein Investments, Inc. 1345 Avenue of the Americas New York, NY 10105 | TRANSFER AGENT AllianceBernstein Investor Services, Inc. P.O. Box 786003 San Antonio, TX 78278-6003 Toll-Free 1-(800) 221-5672 | |
INDEPENDENT REGISTERED PUBLIC ACCOUNTING FIRM Ernst & Young LLP 5 Times Square New York, NY 10036 |
| (1) | Member of the Audit Committee, the Governance and Nominating Committee and the Independent Directors Committee. Mr. Foulk is the sole member of the Fair Value Pricing Committee. |
| (2) | The day-to-day management of, and investment decisions for, the Portfolio’s portfolio are made by the Small/Mid-Cap Value Senior Investment Management Team. Mr. Joseph G. Paul, Mr. James W. MacGregor and Mr. Andrew J. Weiner are the investment professionals with the most significant responsibility for the day-to-day management of the Portfolio’s portfolio. |
24
| SMALL/MID CAP VALUE PORTFOLIO | AllianceBernstein Variable Products Series Fund |
MANAGEMENTOFTHE FUND
Board of Directors Information
The business and affairs of the Fund are managed under the direction of the Board of Directors. Certain information concerning the Fund’s Directors is set forth below.
| NAME, ADDRESS*, AGE, (YEAR FIRST ELECTED**) | PRINCIPAL OCCUPATION(S) DURING PAST FIVE YEARS AND OTHER RELEVANT QUALIFICATIONS*** | PORTFOLIOS IN FUND COMPLEX OVERSEEN BY DIRECTOR | OTHER DIRECTORSHIP HELD Y DIRECTOR IN THE PAST FIVE YEARS | |||||
| INTERESTED DIRECTOR | ||||||||
Robert M. Keith, # 1345 Avenue of the Americas New York, NY 10105 53 (2010) | Senior Vice President of AllianceBernstein L.P. (the “Adviser”) and the head of AllianceBernstein Investments, Inc. (“ABI”) since July 2008; Director of ABI and President of the AllianceBernstein Mutual Funds. Previously, he served as Executive Managing Director of ABI from December 2006 to June 2008. Prior to joining ABI in 2006, Executive Managing Director of Bernstein Global Wealth Management, and prior thereto, Senior Managing Director and Global Head of Client Service and Sales of the Adviser’s institutional investment management business since 2004. Prior thereto, he was Managing Director and Head of North American Client Service and Sales in the Adviser’s institutional investment management business, with which he had been associated since prior to 2004. | 100 | None | |||||
| DISINTERESTED DIRECTORS | ||||||||
Marshall C. Turner, Jr., ## Chairman of the Board 72 (2005) | Private Investor since prior to 2009. Former CEO of Dupont Photomasks, Inc. (components of semi-conductor manufacturing), 2003-2006, and interim CEO 1999-2000. Interim CEO of MEMC Electronic Materials, Inc. (semi-conductor and solar cell substrates) from November 2008 until March 2009. He has extensive operating and early-stage investment experience, including prior service as general partner of three institutional venture capital partnerships, and serves on the boards of three education and science-related non-profit organizations. He has served as a director of one AllianceBernstein fund since 1992, and director or trustee of multiple AllianceBernstein funds since 2005. He is Chairman of the AllianceBernstein Funds since January 2014. | 100 | Xilinx, Inc. (programmable logic semi-conductors) and SunEdison, Inc. (semi-conductor substrates, solar materials and solar power plants) since prior to 2009 | |||||
John H. Dobkin, ## 72 (1992) | Independent Consultant since prior to 2009. Formerly, President of Save Venice, Inc. (preservation organization) from 2001–2002; Senior Advisor from June 1999-June 2000 and President of Historic Hudson Valley (historic preservation) from December 1989-May 1999. Previously, Director of the National Academy of Design. He has served as a director or trustee of various AllianceBernstein Funds since 1992, and as Chairman of the Audit Committees of a number of such Funds from 2001-2008. | 100 | None | |||||
25
| AllianceBernstein Variable Products Series Fund |
| NAME, ADDRESS*, AGE, (YEAR FIRST ELECTED**) | PRINCIPAL OCCUPATION(S) DURING PAST FIVE YEARS AND OTHER RELEVANT QUALIFICATIONS*** | PORTFOLIOS IN FUND COMPLEX OVERSEEN BY DIRECTOR | OTHER DIRECTORSHIP HELD Y DIRECTOR IN THE PAST FIVE YEARS | |||||
Michael J. Downey, ## 70 (2005) | Private Investor since prior to 2009. Formerly, managing partner of Lexington Capital, LLC (investment advisory firm) from December 1997 until December 2003. From 1987 until 1993, Chairman and CEO of Prudential Mutual Fund Management, director of the Prudential mutual funds, and member of the Executive Committee of Prudential Securities Inc. He has served as a director or trustee of the AllianceBernstein Funds since 2005 and is a director and Chairman of one other registered investment company. | 100 | Asia Pacific Fund, Inc. since prior to 2009, Prospect Acquisition Corp. (financial services) from 2007 until 2009, and The Merger Fund since prior to 2009 until 2013 | |||||
William H. Foulk, Jr., ##, ### 81 (1990) | Investment Adviser and an Independent Consultant since prior to 2009. Previously, he was Senior Manager of Barrett Associates, Inc., a registered investment adviser. He was formerly Deputy Comptroller and Chief Investment Officer of the State of New York and, prior thereto, Chief Investment Officer of the New York Bank for Savings. He has served as a director or trustee of various AllianceBernstein Funds since 1983, and has been Chairman of the Independent Directors Committee of the AllianceBernstein Funds since 2003. He served as Chairman of such Funds from 2003 through December 2013. He is also active in a number of mutual fund related organizations and committees. | 100 | None | |||||
D. James Guzy, ## 77 (2005) | Chairman of the Board of PLX Technology (semi-conductors) and of SRC Computers Inc., with which he has been associated since prior to 2009. He was a director of Intel Corporation (semi-conductors) from 1969 until 2008, and served as Chairman of the Finance Committee of such company for several years until May 2008. He was a Director of Cirrus Logic Corporation (semi-conductors) from 1984 until July 2011. He has served as a director or trustee of one or more of the AllianceBernstein Funds since 1982. | 100 | PLX Technology (semi-conductors) since prior to 2009, and Cirrus Logic Corporation (semi-conductors) since prior to 2009 until July 2011 | |||||
Nancy P. Jacklin, ## 65 (2006) | Professorial Lecturer at the Johns Hopkins School of Advanced International Studies since 2008. Formerly, U.S. Executive Director of the International Monetary Fund (December 2002-May 2006); Partner, Clifford Chance (1992-2002); Sector Counsel, International Banking and Finance, and Associate General Counsel, Citicorp (1985-1992); Assistant General Counsel (International), Federal Reserve Board of Governors (1982-1985); and Attorney Advisor, U.S. Department of the Treasury (1973-1982). Member of the Bar of the District of Columbia and of New York; and member of the Council on Foreign Relations. She has served as a director or trustee of the AllianceBernstein Funds since 2006. | 100 | None | |||||
26
| SMALL/MID CAP VALUE PORTFOLIO | ||
| MANAGEMENTOFTHE FUND | ||
| (continued) | AllianceBernstein Variable Products Series Fund | |
| NAME, ADDRESS*, AGE, (YEAR FIRST ELECTED**) | PRINCIPAL OCCUPATION(S) DURING PAST FIVE YEARS AND OTHER RELEVANT QUALIFICATIONS*** | PORTFOLIOS IN FUND COMPLEX OVERSEEN BY DIRECTOR | OTHER DIRECTORSHIP HELD Y DIRECTOR IN THE PAST FIVE YEARS | |||||
Garry L. Moody, ## 61 (2008) | Independent Consultant. Formerly, Partner, Deloitte & Touche LLP (1995-2008) where he held a number of senior positions, including Vice Chairman, and U.S. and Global Investment Management Practice Managing Partner; President, Fidelity Accounting and Custody Services Company (1993-1995); and Partner, Ernst & Young LLP (1975-1993), where he served as the National Director of Mutual Fund Tax Services and Managing Partner of its Chicago Office Tax department. He is a member of both the Governing Council of the Independent Directors Council (IDC), an organization of independent directors of mutual funds, and the Trustee Advisory Board of BoardIQ, a biweekly publication focused on issues and news affecting directors of mutual funds. He has served as a director or trustee, and as Chairman of the Audit Committee, of the AllianceBernstein Funds since 2008. | 100 | Greenbacker Renewable Energy Company LLC (renewable energy and energy efficiency projects) from August 2013 to January 2014 | |||||
Earl D. Weiner, ## 74 (2007) | Of Counsel, and Partner prior to January 2007, of the law firm Sullivan & Cromwell LLP and member of ABA Federal Regulation of Securities Committee Task Force to draft editions of the Fund Director’s Guidebook. He also serves as a director or trustee of various non-profit organizations and has served as Chairman or Vice Chairman of a number of them. He has served as a director or trustee of the AllianceBernstein Funds since 2007 and is Chairman of the Governance and Nominating Committees of the Funds. | 100 | None | |||||
| * | The address for each of the Fund’s disinterested Directors is c/o AllianceBernstein L.P., Attention: Philip L. Kirstein, 1345 Avenue of the Americas, New York, NY 10105. |
| ** | There is no stated term of office for the Fund’s Directors. |
| *** | The information above includes each Director’s principal occupation during the last five years and other information relating to the experience, attributes and skills relevant to each Director’s qualifications to serve as a Director, which led to the conclusion that each Director should serve as a Director for the Fund. |
| # | Mr. Keith is an “interested person” of the Fund, as defined in the 1940 Act, due to his position as a Senior Vice President of the Adviser. |
| ## | Member of the Audit Committee, the Governance and Nominating Committee and the Independent Directors Committee. |
| ### | Member of the Fair Value Pricing Committee. |
27
| SMALL/MID CAP VALUE PORTFOLIO | ||
| MANAGEMENTOFTHE FUND | ||
| (continued) | AllianceBernstein Variable Products Series Fund | |
Officer Information
Certain information concerning the Portfolio’s Officers is listed below.
| NAME, ADDRESS* AND AGE | PRINCIPAL POSITION(S) HELD WITH FUND | PRINCIPAL OCCUPATION DURING PAST FIVE YEARS | ||
| Robert M. Keith 53 | President and Chief Executive Officer | See biography above. | ||
| Philip L. Kirstein 68 | Senior Vice President and Independent Compliance Officer | Senior Vice President and Independent Compliance Officer of the AllianceBernstein Funds, with which he has been associated since October 2004. Prior thereto, he was Of Counsel to Kirkpatrick & Lockhart, LLP from October 2003 to October 2004, and General Counsel of Merrill Lynch Investment Managers, L.P. since prior to March 2003. | ||
| Joseph G. Paul 54 | Vice President | Senior Vice President of the Adviser**, with which he has been associated since prior to 2009. | ||
| James W. MacGregor 46 | Vice President | Senior Vice President of the Adviser**, with which he has been associated since prior to 2009. | ||
| Andrew J. Weiner 45 | Vice President | Senior Vice President of the Adviser**, with which he has been associated since prior to 2009. | ||
| Emilie D. Wrapp 58 | Secretary | Senior Vice President, Assistant General Counsel and Assistant Secretary of ABI **, with which she has been associated since prior to 2009. | ||
| Joseph J. Mantineo 54 | Treasurer and Chief Financial Officer | Senior Vice President of AllianceBernstein Investor Services, Inc. (“ABIS”)**, with which he has been associated since prior to 2009. | ||
| Phyllis J. Clarke 53 | Controller | Vice President of ABIS**, with which she has been associated since prior to 2009. | ||
Vincent S. Noto 49 | Chief Compliance Officer | Chief Compliance Officer of the AllianceBernstein Funds, and Vice President of ABIS**, with which he has been associated since prior to 2009. |
| * | The address for each of the Portfolio’s Officers is 1345 Avenue of the Americas, New York, NY 10105. |
| ** | The Adviser, ABIS and ABI are affiliates of the Fund. |
| The Fund’s Statement of Additional Information (“SAI”) has additional information about the Fund’s Directors and Officers and is available without charge upon request. Contact your financial representative or AllianceBernstein at (800) 227-4618 or visit www.alliancebernstein.com for a free prospectus or SAI. |
28
| SMALL/MID CAP VALUE PORTFOLIO | ||
| SENIOR OFFICER FEE EVALUATION | AllianceBernstein Variable Products Series Fund |
THE FOLLOWING IS NOT PART OF THE SHAREHOLDER REPORT OR THE FINANCIAL STATEMENTS
SUMMARY OF SENIOR OFFICER’S EVALUATION OF INVESTMENT ADVISORY AGREEMENT1
The following is a summary of the evaluation of the Investment Advisory Agreement between AllianceBernstein L.P. (the “Adviser”) and the AllianceBernstein Variable Products Series Fund (the “Fund”), in respect of AllianceBernstein Small/Mid Cap Value Portfolio (the “Portfolio”).2 The evaluation of the Investment Advisory Agreement was prepared by Philip L. Kirstein, the Senior Officer of the Fund, for the Directors of the Fund, as required by a September 2004 agreement between the Adviser and the New York State Attorney General (the “NYAG”). The Senior Officer’s evaluation of the Investment Advisory Agreement is not meant to diminish the responsibility or authority of the Board of Directors of the Fund to perform its duties pursuant to Section 15 of the Investment Company Act of 1940 (the “40 Act”) and applicable state law. The purpose of the summary is to provide shareholders with a synopsis of the independent evaluation of the reasonableness of the advisory fees proposed to be paid by the Portfolio which was provided to the Directors in connection with their review of the proposed approval of the continuance of the Investment Advisory Agreement. The Senior Officer’s evaluation considered the following factors:
| 1. | Advisory fees charged to institutional and other clients of the Adviser for like services; |
| 2. | Advisory fees charged by other mutual fund companies for like services; |
| 3. | Costs to the Adviser and its affiliates of supplying services pursuant to the advisory agreement, excluding any intra-corporate profit; |
| 4. | Profit margins of the Adviser and its affiliates from supplying such services; |
| 5. | Possible economies of scale as the Portfolio grows larger; and |
| 6. | Nature and quality of the Adviser’s services including the performance of the Portfolio. |
These factors, with the exception of the first factor, are generally referred to as the “Gartenberg factors,” which were articulated by the United States Court of Appeals for the Second Circuit in 1982. Gartenberg v. Merrill Lynch Asset Management, Inc., 694 F. 2d 923 (2d Cir. 1982). The first factor is an additional factor required to be considered by the AoD. On March 30, 2010, the Supreme Court held the Gartenberg decision was correct in its basic formulation of what §36(b) requires: to face liability under §36(b), “an investment adviser must charge a fee that is so disproportionately large that it bears no reasonable relationship to the services rendered and could not have been the product of arm’s length bargaining.” Jones v. Harris Associates L.P., 130 S. Ct. 1418 (2010). In the Jones decision, the Court stated the Gartenberg approach fully incorporates the correct understanding of fiduciary duty within the context of section 36(b) and noted with approval that “Gartenberg insists that all relevant circumstances be taken into account” and “uses the range of fees that might result from arm’s-length bargaining as the benchmark for reviewing challenged fees.”3
PORTFOLIO ADVISORY FEES, NET ASSETS & EXPENSE RATIOS
The Adviser proposed that the Portfolio pays the advisory fee set forth in the table below for receiving the services to be provided pursuant to the Investment Advisory Agreement. The fee schedule below, implemented in January 2004 in consideration of the Adviser’s settlement with the NYAG in December 2003, is based on a master schedule that contemplates eight categories of funds with almost all funds in each category having the same advisory fee schedule.
| Category | Advisory Fee Based on % of Average Daily Net Assets | Net Assets 3/31/13 ($MIL) | Portfolio | |||||
Specialty | 0.75% on first $2.5 billion 0.65% on next $2.5 billion 0.60% on the balance | $ | 576.2 | Small/Mid Cap Value Portfolio | ||||
| 1 | The information in the fee summary was completed on April 22, 2013 and discussed with the Board of Directors on April 30-May 2, 2013. |
| 2 | Future references to the Fund and the Portfolio do not include “AllianceBernstein.” References in the fee summary pertaining to performance and expense ratio rankings refer to the Class A shares of the Portfolio. |
| 3 | Jones v. Harris at 1427. |
29
| SMALL/MID CAP VALUE PORTFOLIO | ||
| SENIOR OFFICER FEE EVALUATION | ||
| (continued) | AllianceBernstein Variable Products Series Fund | |
The Adviser is reimbursed as specified in the Investment Advisory Agreement for certain clerical, legal, accounting, administrative and other services provided to the Portfolio. During the Portfolio’s most recently completed fiscal year, the Adviser received $45,506 (0.009% of the Portfolio’s average daily net assets) for such services.
The Adviser has agreed to waive that portion of its management fees and/or reimburse the Portfolio for that portion of its total operating expenses to the degree necessary to limit the Portfolio’s expense ratios to the amounts set forth below for the Portfolio’s fiscal year. The waiver is terminable by the Adviser upon at least 60 days’ notice prior to the Portfolio’s prospectus update or May 1st of each year. The Portfolio was operating below its expense caps for the most recent fiscal year; accordingly the expense limitation undertaking of the Portfolio was of no effect. In addition, set forth below are the gross expense ratios of the Portfolio for the most recently completed fiscal year:
| Portfolio | Expense Cap Pursuant Undertaking | Gross Expense Ratio | Fiscal Year End | |||
Small/Mid Cap Value Portfolio | Class A 1.20% Class B 1.45% | 0.83% 1.08% | December 31 |
I. ADVISORY FEES CHARGED TO INSTITUTIONAL AND OTHER CLIENTS
The advisory fees charged to investment companies which the Adviser manages and sponsors are normally higher than those charged to similar sized institutional accounts, including pension plans and sub-advised investment companies. The fee differential reflects, among other things, different services provided to such clients, and different liabilities assumed. Services provided by the Adviser to the Portfolio that are not provided to non-investment company clients and sub-advised investment companies include providing office space and personnel to serve as Fund Officers, who among other responsibilities make the certifications required under the Sarbanes–Oxley Act of 2002, and coordinating with and monitoring the Portfolio’s third party service providers such as Fund counsel, auditors, custodians, transfer agents and pricing services. The accounting, administrative, legal and compliance requirements for the Portfolio are more costly than those for institutional assets due to the greater complexities and time required for investment companies, although as previously noted, the Adviser is reimbursed for providing such services. Also, retail mutual funds managed by the Adviser are widely held. Servicing the Portfolio’s investors is more time consuming and labor intensive compared to institutional clients since the Adviser needs to communicate with a more extensive network of financial intermediaries and shareholders. The Adviser also believes that it incurs substantial entrepreneurial risk when offering a new mutual fund, since establishing a new mutual fund requires a large upfront investment, and it may take a long time for the fund to achieve profitability since the fund must be priced to scale from inception in order to be competitive and assets are acquired one account at a time. In addition, managing the cash flow of an investment company may be more difficult than managing that of a stable pool of assets, such as an institutional account with little cash movement in either direction, particularly, if a fund is in net redemption and the Adviser is frequently forced to sell securities to raise cash for redemptions. However, managing a fund with positive cash flow may be easier at times than managing a stable pool of assets. In recent years, investment advisers have been sued by institutional clients and have suffered reputational damage both by the attendant publicity and outcomes other than complete victories. Accordingly, the legal and reputational risks associated with institutional accounts are greater than previously thought, although still not equal to those related to the mutual fund industry.
Notwithstanding the Adviser’s view that managing an investment company is not comparable to managing other institutional accounts because the services provided are different, the Supreme Court has indicated consideration should be given to the advisory fees charged to institutional accounts that have a substantially similar investment style as the Portfolio.4 In addition to the AllianceBernstein institutional fee schedule, set forth below is what would have been the effective advisory fee of the Portfolio had the AllianceBernstein institutional fee schedule been applicable to the Portfolio versus the Portfolio’s advisory fee based on March 31, 2013 net assets:5
| 4 | The Supreme Court stated that “courts may give such comparisons the weight that they merit in light of the similarities and differences between the services that the clients in question require, but the courts must be wary of inapt comparisons.” Among the significant differences the Supreme Court noted that may exist between services provided to mutual funds and institutional accounts are “higher marketing costs.” Jones v. Harris at 1428. |
| 5 | The Adviser has indicated that with respect to institutional accounts with assets greater than $300 million, it will negotiate a fee schedule. Discounts that are negotiated vary based upon each client relationship. |
30
| AllianceBernstein Variable Products Series Fund | ||
| Portfolio | Net Assets 3/31/13 ($MIL) | AllianceBernstein Institutional Fee Schedule | Effective AB Inst. Adv. Fee | Portfolio Advisory Fee | ||||||||||
Small/Mid Cap Value Portfolio | $ | 576.2 | Small & Mid Cap Value Schedule 0.95% on first $25m 0.75% on the next $25m 0.65% on the next $50m 0.55% on the balance Minimum account size $25m | 0.585 | % | 0.750 | % | |||||||
The Adviser also manages AllianceBernstein Discovery Value Fund, Inc. (“Discovery Value Fund, Inc.”), a retail mutual fund, which has a substantially similar investment style as the Portfolio. Set forth below is the fee schedule of Discovery Value Fund, Inc., and what would have been the effective advisory fee of the Portfolio had the fee schedule of the retail mutual fund been applicable to the Portfolio:6
| Portfolio | AllianceBernstein Mutual Fund | Fee Schedule | ABMF Effective | Portfolio Advisory | ||||||||
Small/Mid Cap Value Portfolio | Discovery Value Fund, Inc. | 0.75% on first $2.5 billion 0.65% on next $2.5 billion 0.60% on the balance | 0.750 | % | 0.750 | % | ||||||
The Adviser provides sub-advisory services to certain other investment companies managed by other fund families that have an investment style similar to that of the Portfolio. The Adviser charges the fees set forth below for the sub-advisory relationships that have a somewhat similar investment style as the Portfolio. Also shown are the Portfolio’s advisory fee and what would have been the effective advisory fees of the Portfolio had the fee schedules of the sub-advisory relationships been applicable to the Portfolio based on March 31, 2013 net assets.
| Portfolio | Fee Schedule | Effective Sub-Adv. Fee | Portfolio Advisory Fee | |||||||||
Small/Mid Cap Value Portfolio | Client # 1 | 0.50% on the first $250 million 0.40% on the balance | 0.472% | 0.750% | ||||||||
| Client #2 | 0.95% on the first $10 million 0.75% on the next $40 million 0.65% on the next $50 million 0.55% on the balance | 0.580% | 0.750% | |||||||||
| Client #3 | 0.61% on the first $150 million 0.50% on the balance | 0.529% | 0.750% | |||||||||
It is fair to note that the services the Adviser provides pursuant to sub-advisory agreements are generally confined to the services related to the investment process; in other words, they are not as comprehensive as the services provided to the Portfolio by the Adviser.
While it appears that the sub-advisory relationships are paying a lower fee than the Portfolio, it is difficult to evaluate the relevance of such lower fees due to differences in terms of the services provided, risks involved and other competitive factors between the Portfolio and the sub-advisory relationships. There could be various business reasons why an investment adviser would be willing to provide a sub-advisory relationship investment related services at a different feel level than an investment company it is sponsoring where the investment adviser is providing all the services, not just investment management generally required by a registered investment company.
| 6 | The retail mutual fund was also affected by the settlement between the Adviser and the NYAG. As a result, the Portfolio has the same breakpoints in its advisory fee schedule as the retail mutual fund. |
31
| SMALL/MID CAP VALUE PORTFOLIO | ||
| SENIOR OFFICER FEE EVALUATION | ||
| (continued) | AllianceBernstein Variable Products Series Fund | |
II. MANAGEMENT FEES CHARGED BY OTHER MUTUAL FUND COMPANIES FOR LIKE SERVICES.
Lipper, Lipper, Inc. (“Lipper”), an analytical service that is not affiliated with the Adviser, compared the fees charged to the Portfolio with fees charged to other investment companies for similar services offered by other investment advisers.7 Lipper’s analysis included the comparison of the Portfolio’s contractual management fee, estimated at the approximate current asset level of the Portfolio, to the median of the Portfolio’s Lipper Expense Group (“EG”) and the Portfolio’s contractual management fee ranking. 8,9
Lipper describes an EG as a representative sample of comparable funds. Lipper’s standard methodology for screening funds to be included in an EG entails the consideration of several fund criteria, including fund type, investment classification/objective, load type and similar 12b-1/non-12b-1 service fees, asset (size) comparability, expense components and attributes. An EG will typically consist of seven to twenty funds.
The Portfolio’s original EG had an insufficient number of peers. Consequently, Lipper expanded the Portfolio’s EG to include peers that have a similar but not the same Lipper classification/objective as the Portfolio. However, because Lipper had expanded the Portfolio’s EG, under Lipper’s standard guidelines, the Portfolio’s Lipper Expense Universe (“EU”) was also expanded to include universes of those peers that had a similar but not the same Lipper investment objective/classification. A “normal” EU will include funds that have the same investment objective/classification as the subject portfolio.10,11
| Portfolio | Contractual Management Fee (%)12 | Lipper EG Median (%) | Lipper Rank | |||||||||
Small/Mid Cap Value Portfolio | 0.750 | 0.804 | 4/12 | |||||||||
Set forth below is a comparison of the Portfolio’s total expense ratio and the medians of the Portfolio’s EG and EU.13 The Portfolio’s total expense ratio ranking is also shown in the table below.
| Portfolio | Expense Ratio | Lipper EG Median (%) | Lipper EG Rank | Lipper EU Median (%) | Lipper EU Rank | |||||||||||||||
Small/Mid Cap Value Portfolio | 0.824 | 0.874 | 4/12 | 0.879 | 8/30 | |||||||||||||||
Based on this analysis, the Portfolio has a more favorable ranking on a management fee basis than on a total expense ratio basis.
| 7 | The Supreme Court cautioned against accepting mutual fund fee comparisons without careful scrutiny since “these comparisons are problematic because these fees, like those challenged, may not be the product of negotiations conducted at arm’s length.” Jones v. Harris at 1429. |
| 8 | Lipper does not consider average account size when constructing EGs. Funds with relatively small average account sizes tend to have higher transfer agent expense ratio than comparable sized funds that have relatively large average account sizes. Note that there are limitations on Lipper expense category data because different funds categorize expenses differently. |
| 9 | The contractual management fee is calculated by Lipper using the Portfolio’s contractual management fee rate at a hypothetical asset level. The hypothetical asset level is based on the combined net assets of all classes of the Portfolio, rounded up to the next $25 million. Lipper’s total expense ratio information is based on the most recent annual report except as otherwise noted. A ranking of “1” would mean that the Portfolio had the lowest effective fee rate in the Lipper peer group. |
| 10 | Except for asset size comparability, Lipper uses the same criteria for selecting an EG peer when selecting an EU peer. Unlike the EG, the EU allows for the same adviser to be represented by more than just one fund. |
| 11 | The Portfolio’s EG includes the Portfolio, five other VIP Small-Cap Value funds (“SCVE”) and six VIP Mid-Cap Value funds (“MCVE”). |
| 12 | The contractual management fee does not reflect any expense reimbursements made by the Portfolio to the Adviser for certain clerical, legal, accounting, administrative and other services. In addition, the contractual management fee does not reflect any advisory fee waiver or expense cap that would effectively reduce the actual management fee. |
| 13 | The Portfolio’s EU includes the Portfolio, EG and all other VIP SCVE and VIP MCVE funds, excluding outliers. |
| 14 | Most recently completed fiscal year end Class A total expense ratio. |
32
| AllianceBernstein Variable Products Series Fund | ||
III. COSTS TO THE ADVISER AND ITS AFFILIATES OF SUPPLYING SERVICES PURSUANT TO THE ADVISORY FEE ARRANGEMENT, EXCLUDING ANY INTRA-CORPORATE PROFIT.
The Adviser utilizes two profitability reporting systems, which operate independently but are aligned with each other, to estimate the Adviser’s profitability in connection with investment advisory services provided to the Portfolio. The Senior Officer has retained a consultant to provide independent advice regarding the alignment of the two profitability systems as well as the methodologies and allocations utilized by both profitability systems.
IV. PROFIT MARGINS OF THE ADVISER AND ITS AFFILIATES FOR SUPPLYING SUCH SERVICES.
The Portfolio’s profitability information, prepared by the Adviser for the Board of Directors, was reviewed by the Senior Officer and the consultant. The Adviser’s profitability from providing investment advisory services to the Portfolio decreased slightly during calendar year 2012, relative to 2011.
In addition to the Adviser’s direct profits from managing the Portfolio, certain of the Adviser’s affiliates have business relationships with the Portfolio and may earn a profit from providing other services to the Portfolio. The courts have referred to this type of business opportunity as “fall-out benefits” to the Adviser and indicated that such benefits should be factored into the evaluation of the total relationship between the Portfolio and the Adviser. Neither case law nor common business practice precludes the Adviser’s affiliates from earning a reasonable profit on this type of relationship provided the affiliates’ charges and services are competitive. These affiliates provide transfer agent, distribution and brokerage related services to the Portfolio and receive transfer agent fees, Rule 12b-1 payments, and brokerage commissions. In addition, the Adviser benefits from soft dollar arrangements which offset expenses the Adviser would otherwise incur.
The Portfolio has adopted a distribution plan for Class B shares pursuant to Rule 12b-1 under the 40 Act. Under the distribution plan, the Portfolio pays distribution and servicing fees to its principal underwriter, AllianceBernstein Investments, Inc. (“ABI”), the Portfolio’s distributor and an affiliate of the Adviser, at an annual rate of up to 0.50% of the Portfolio’s average daily net assets attributable to Class B shares. The current annual rate that the Portfolio pays to ABI for 12b-1 fees is 0.25%. During the fiscal year ended December 31, 2012, ABI received $846,302 in Rule 12b-1 fees.
During the fiscal year ended December 31, 2012, the Adviser incurred distribution expenses in the amount of $2,025,374 in connection with activities primarily intended to result in the sale of the Portfolio’s Class B shares. This amount includes the 12b-1 fees paid by the Portfolio to the Adviser.
Financial intermediaries, such as insurers, market and sell shares of the Portfolio and typically receive compensation from ABI, the Advisers and/or the Portfolio for selling shares of the Portfolio. These financial intermediaries receive compensation in any or all of the following forms: 12b-1 fees, defrayal of costs for educational seminars and training, additional distribution support, recordkeeping and/or administrative services. Payments related to providing contract-holder recordkeeping and/or administrative services will generally not exceed 0.35% of the average daily net assets of the Portfolio attributable to the relevant intermediary over the year. With respect to the Fund, which includes the Portfolio and other Portfolios of the Fund not discussed in this summary, ABI paid approximately $600,000 in 2012 and expects to pay approximately $600,000 in 2013 for educational support and distribution assistance (revenue sharing payments).
The transfer agent of the Portfolio is AllianceBernstein Investor Services, Inc. (“ABIS”). During the most recently completed fiscal year, ABIS received a fee of $1,385 from the Portfolio.15
The Portfolio did not effect brokerage transactions and pay commissions through the Adviser’s affiliate, Sanford C. Bernstein & Co., LLC (“SCB & Co.”) nor its U.K. affiliate, Sanford C. Bernstein Limited (“SCB Ltd.”), collectively “SCB,” during the Portfolio’s most recently completed fiscal year. The Adviser represented that SCB’s profitability from business conducted in the future with the Portfolio would be comparable to the profitability of SCB’s dealings with other similar third party clients. In the ordinary course of business, SCB receives and pays liquidity rebates from electronic communications networks (“ECNs”) derived from trading for its clients, including the Portfolio. These credits and charges are not being passed onto any SCB client. The Adviser also receives certain soft dollar benefits from brokers that execute agency trades for the Portfolio and other clients. These soft dollar benefits reduce the Adviser’s cost of doing business and increase its profitability.
V. POSSIBLE ECONOMIES OF SCALE
The Adviser has indicated that economies of scale are being shared with shareholders through pricing to scale, breakpoints, fee reductions/waivers and enhancement to services.
| 15 | The Fund, which includes the Portfolio and other Portfolios of the Fund paid ABIS a flat fee of $18,000 in 2012. |
33
| SMALL/MID CAP VALUE PORTFOLIO | ||
| SENIOR OFFICER FEE EVALUATION | ||
| (continued) | AllianceBernstein Variable Products Series Fund | |
In May 2012, an independent consultant, retained by the Senior Officer, provided the Board of Directors information on the Adviser’s firm-wide average costs from 2005 through 2011 and the potential economies of scale. The independent consultant noted that from 2005 through 2007 the Adviser experienced significant growth in assets under management (“AUM”). During this period, operating expenses increased, in part to keep up with growth, and in part reflecting market returns. However, from 2008 through the first quarter of 2009, AUM rapidly and significantly decreased due to declines in market value and client withdrawals. When AUM rapidly decreased, some operating expenses categories, including base compensation and office space, adjusted more slowly during this period, resulting in an increase in average costs. Since 2009, AUM has experienced less significant changes. The independent consultant noted that changes in operating expenses reflect changes in business composition and business practices in response to changes in financial markets. Finally, the independent consultant concluded that the increase in average cost and the decline in net operating margin across the Adviser since late 2008 are inconsistent with the view that there are currently reductions in average costs due to economies of scale that can be shared with the AllianceBernstein Mutual Funds managed by the Adviser through lower fees.
Previously in February 2008, the independent consultant provided the Board of Directors an update of the Deli study on advisory fees and various fund characteristics.16,17 The independent consultant first reiterated the results of his previous two dimensional comparison analysis (fund size and family size) with the Board of Directors.18 The independent consultant then discussed the results of the regression model that was utilized to study the effects of various factors on advisory fees. The regression model output indicated that the bulk of the variation in fees predicted were explained by various factors, but substantially by fund AUM, family AUM, index fund indicator and investment style. The independent consultant also compared the advisory fees of the AllianceBernstein Mutual Funds to similar funds managed by 19 other large asset managers, regardless of the fund size and each Adviser’s proportion of mutual fund assets to non-mutual fund assets.
VI. NATURE AND QUALITY OF THE ADVISER’S SERVICES, INCLUDING THE PERFORMANCE OF THE PORTFOLIO
With assets under management of approximately $443 billion as of March 31, 2013, the Adviser has the investment experience to manage and provide non-investment services (described in Section I) to the Portfolio.
The information prepared by Lipper shows the 1, 3, 5 and 10 year performance returns and rankings of the Portfolio19 relative to its Lipper Performance Group (“PG”) and Lipper Performance Universe (“PU”)20 for the periods ended February 28, 2013.21
Set forth below are the 1, 3, 5, 10 year and since inception performance returns of the Portfolio (in bold)22 versus its benchmarks.23 Portfolio and benchmark volatility and reward-to-variability ratio (“Sharpe Ratio”) information is also shown.24
| 16 | The Deli study, originally published in 2002 based on 1997 data and updated for the February 2008 Presentation, may be of diminished value due to the age of the data used in the presentation and the changes experienced in the industry over the last four years. |
| 17 | As mentioned previously, the Supreme Court cautioned against accepting mutual fund fee comparisons without careful scrutiny since the fees may not be the product of negotiations conducted at arm’s length. See Jones V. Harris at 1429. |
| 18 | The two dimensional analysis showed patterns of lower advisory fees for funds with larger asset sizes and funds from larger family sizes compared to funds with smaller asset sizes and funds from smaller family sizes, which according to the independent consultant is indicative of a sharing of economies of scale and scope. However, in less liquid and active markets, such is not the case, as the empirical analysis showed potential for diseconomies of scale in those markets. The empirical analysis also showed diminishing economies of scale and scope as funds surpassed a certain high level of assets. |
| 19 | The performance rankings are for the Class A shares of the Portfolio. The Portfolio’s performance returns shown were provided by Lipper. |
| 20 | The Portfolio’s PG/PU are not identical to the Portfolio’s respective EG/EU as the criteria for including/excluding a fund in/from a PG/PU is somewhat different from that of an EG/EU. |
| 21 | Lipper investment classification/objective dictates the PG and PU throughout the life of the fund even if a fund had a different investment classification/objective at a different point in time. |
| 22 | The performance returns and risk measures shown in the table are for the Class A shares of the Portfolio. |
| 23 | The Adviser provided Portfolio and benchmark performance return information for periods through February 22, 2013. |
| 24 | Portfolio and benchmark volatility and Sharpe Ratio information was obtained through Lipper LANA, a database maintained by Lipper. Volatility is a statistical measure of the tendency of a market price or yield to vary over time. The Sharpe Ratio is a risk adjusted measure of return that divides a portfolio’s return in excess of the riskless return by the portfolio’s standard deviation. A portfolio with a greater volatility would be viewed as more risky than a portfolio with equivalent performance but lower volatility; for that reason, a greater return would be demanded for the more risky portfolio. A portfolio with a higher Sharpe Ratio would be viewed as better performing than a portfolio with a lower Sharpe Ratio. |
34
| AllianceBernstein Variable Products Series Fund | ||
| Portfolio (%) | PG Median (%) | PU Median (%) | PG Rank | PU Rank | ||||||||||||||||
Small/Mid Cap Value Portfolio | ||||||||||||||||||||
1 year | 17.00 | 14.87 | 14.40 | 1/6 | 2/15 | |||||||||||||||
3 year | 13.16 | 12.97 | 12.97 | 3/6 | 7/14 | |||||||||||||||
5 year | 7.86 | 7.14 | 7.38 | 3/6 | 4/13 | |||||||||||||||
10 year | 11.84 | 12.29 | 11.84 | 3/4 | 5/9 | |||||||||||||||
Periods Ending February 28, 2013 Annualized Performance | ||||||||||||||||||||||||||||||||
1 Year | 3 Year | 5 Year | 5 Year | Since Inception (%) | Annualized | Risk Period (Year) | ||||||||||||||||||||||||||
| Volatility (%) | Sharpe (%) | |||||||||||||||||||||||||||||||
Small/Mid Cap Value Portfolio | 17.00 | 13.16 | 7.86 | 11.84 | 9.88 | 20.30 | 0.57 | 10 | ||||||||||||||||||||||||
Russell 2500 Value Index | 18.92 | 15.19 | 7.82 | 11.72 | 8.81 | 18.73 | 0.59 | 10 | ||||||||||||||||||||||||
Russell 2500 Index | 15.17 | 15.75 | 7.92 | 11.92 | 7.75 | N/A | N/A | N/A | ||||||||||||||||||||||||
Inception Date: May 2, 2001 | ||||||||||||||||||||||||||||||||
CONCLUSION:
Based on the factors discussed above the Senior Officer’s conclusion is that the proposed advisory fee for the Portfolio is reasonable and within the range of what would have been negotiated at arm’s-length in light of all the surrounding circumstances. This conclusion in respect of the Portfolio is based on an evaluation of all of these factors and no single factor was dispositive.
Dated: May 29, 2013
35
VPS-SMCV-0151-1213
AllianceBernstein
Variable Products Series Fund, Inc.
 | AllianceBernstein Value Portfolio |
December 31, 2013
Annual Report

ANNUAL REPORT
Investment Products Offered
| Ø | Are Not FDIC Insured |
| Ø | May Lose Value |
| Ø | Are Not Bank Guaranteed |
AllianceBernstein Investments, Inc. (ABI) is the distributor of the AllianceBernstein family of mutual funds. ABI is a member of FINRA and is an affiliate of AllianceBernstein L.P., the manager of the funds.
You may obtain a description of the Fund’s proxy voting policies and procedures, and information regarding how the Fund voted proxies relating to portfolio securities during the most recent 12-month period ended June 30, without charge. Simply visit AllianceBernstein’s website at www.alliancebernstein.com or go to the Securities and Exchange Commission’s (the “Commission”) website at www.sec.gov, or call AllianceBernstein at (800) 227-4618.
The Fund files its complete schedule of portfolio holdings with the Commission for the first and third quarters of each fiscal year on Form N-Q. The Fund’s Forms N-Q are available on the Commission’s website at www.sec.gov. The Fund’s Forms N-Q may also be reviewed and copied at the Commission’s Public Reference Room in Washington, DC; information on the operation of the Public Reference Room may be obtained by calling (800) SEC-0330.
AllianceBernstein® and the AB Logo are registered trademarks and service marks used by permission of the owner, AllianceBernstein L.P.
| VALUE PORTFOLIO | AllianceBernstein Variable Products Series Fund |
LETTER TO INVESTORS
February 7, 2014
The following is an update of AllianceBernstein Variable Products Series Fund—AllianceBernstein Value Portfolio (the “Portfolio”) for the annual reporting period ended December 31, 2013.
INVESTMENT OBJECTIVE AND POLICIES
The Portfolio’s investment objective is long-term growth of capital. The Portfolio invests primarily in a diversified portfolio of equity securities of U.S. companies, generally representing approximately 90-150 companies, with relatively large market capitalizations that AllianceBernstein L.P. (the “Adviser”) believes are undervalued. The Portfolio invests in companies that are determined by the Adviser to be undervalued using the fundamental value approach of the Adviser. The fundamental value approach seeks to identify a universe of securities that are considered to be undervalued because they are attractively priced relative to their future earnings power and dividend-paying capability.
The Portfolio may enter into derivatives transactions, such as options, futures, forwards and swaps. The Portfolio may use options strategies involving the purchase and/or writing of various combinations of call and/or put options, including on individual securities and stock indices, futures contracts (including futures contracts on individual securities and stock indices) or shares of exchange-traded funds (“ETFs”). These transactions may be used, for example, to earn extra income, to adjust exposure to individual securities or markets, or to protect all or a portion of the Portfolio’s portfolio from a decline in value, sometimes within certain ranges.
The Portfolio may invest in securities of non-U.S. issuers.
The Portfolio may, at times, invest in shares of ETFs in lieu of making direct investments in equity securities. ETFs may provide more efficient and economical exposure to the type of companies and geographic locations in which the Portfolio seeks to invest than direct investments.
INVESTMENT RESULTS
The table on page 3 shows the Portfolio’s performance compared to its benchmark, the Russell 1000 Value Index, and the broad U.S. stock market, as represented by the Standard and Poor’s (“S&P”) 500 Index, for the one-, five- and 10-year periods ended December 31, 2013.
All share classes of the Portfolio outperformed the benchmark and the S&P 500 Index for the annual period ended December 31, 2013. Security selection was the main source of outperformance, particularly in the technology, financial and consumer cyclicals sectors. Sector selection also contributed to returns, owing to underweights in the utilities and industrial resource sectors, as well as an overweight in the consumer cyclicals sector. Negative security selection in the consumer growth, consumer staples and energy sectors offset some of these gains. The Portfolio did not utilize derivatives during the annual period.
MARKET REVIEW AND INVESTMENT STRATEGY
Global equities rallied strongly in the annual period, on encouraging growth data and expectations of continued U.S. monetary stimulus. While stocks retreated from mid-May peaks amid speculation that the U.S. Federal Reserve (the “Fed”) would end its asset purchase program, optimism prevailed. Stocks slipped again in August amid mounting Middle East tensions and fears that the Fed would start to taper its stimulus in September which later proved premature. Positive developments in key regions of the world in November further boosted risk appetite, although a surprise interest rate cut by the European Central Bank to a record low, as a countermeasure to slowing growth in the euro zone, undermined some of the gains. Amid a slew of positive data in the U.S., the Fed took its first steps toward ending a key component of its stimulus campaign.
The Portfolio has remained focused on attractively-valued opportunities, which are widespread across most industry sectors and regions. The U.S. Value Senior Investment Management Team prefers companies with robust cash flow generation and strong balance sheets, whose stocks are trading at deep valuation discounts.
1
| VALUE PORTFOLIO | ||
| DISCLOSURESAND RISKS | AllianceBernstein Variable Products Series Fund |
Benchmark Disclosure
Neither the unmanaged Russell 1000® Value Index nor the unmanaged S&P 500® Index reflect fees and expenses associated with the active management of a mutual fund portfolio. The Russell 1000 Value Index represents the performance of 1,000 large-cap companies within the U.S. The S&P 500 Index includes 500 U.S. stocks and is a common representation of the performance of the overall U.S. stock market. An investor cannot invest directly in an index, and its results are not indicative of the performance for any specific investment, including the Portfolio.
A Word About Risk
Market Risk: The value of the Portfolio’s assets will fluctuate as the stock or bond market fluctuates. The value of its investments may decline, sometimes rapidly and unpredictably, simply because of economic changes or other events that affect large portions of the market. It includes the risk that a particular style of investing, such as value, may underperform the market generally.
Foreign (Non-U.S.) Risk: Investments in securities of non-U.S. issuers may involve more risk than those of U.S. issuers. These securities may fluctuate more widely in price and may be less liquid due to adverse market, economic, political, regulatory or other factors.
Currency Risk: Fluctuations in currency exchange rates may negatively affect the value of the Portfolio’s investments or reduce its returns.
Derivatives Risk: Derivatives may be illiquid, difficult to price, and leveraged so that small changes may produce disproportionate losses for the Portfolio, and may be subject to counterparty risk to a greater degree than more traditional investments.
Management Risk: The Portfolio is subject to management risk because it is an actively-managed investment fund. The Adviser will apply its investment techniques and risk analyses in making investment decisions for the Portfolio, but there is no guarantee that its techniques will produce the intended results.
These risks are fully discussed in the Variable Products prospectus.
An Important Note About Historical Performance
The investment return and principal value of an investment in the Portfolio will fluctuate, so that shares, when redeemed, may be worth more or less than their original cost. Performance shown on the following page represents past performance and does not guarantee future results. Current performance may be lower or higher than the performance information shown. Please contact your Financial Advisor or Insurance Agent Representative at your financial institution to obtain portfolio performance information current to the most recent month end.
Investors should consider the investment objectives, risks, charges and expenses of the Portfolio carefully before investing. For additional copies of the Portfolio’s prospectus or summary prospectus, which contains this and other information, call your financial advisor or 800.984.7654. Please read the prospectus and/or summary prospectus carefully before investing.
All fees and expenses related to the operation of the Portfolio have been deducted, but no adjustment has been made for insurance company separate account or annuity contract charges, which would reduce total return to a contract owner. Performance assumes reinvestment of distributions and does not account for taxes.
There are additional fees and expenses associated with all Variable Products. These fees can include mortality and expense risk charges, administrative charges, and other charges that can significantly reduce investment returns. Those fees and expenses are not reflected in this annual report. You should consult your Variable Products prospectus for a description of those fees and expenses and speak to your insurance agent or financial representative if you have any questions. You should read the prospectus before investing or sending money.
2
| VALUE PORTFOLIO | ||
| HISTORICAL PERFORMANCE | AllianceBernstein Variable Products Series Fund |
| THE PORTFOLIO VS. ITS BENCHMARK | NAV Returns | |||||||||||
| PERIODS ENDED DECEMBER 31, 2013 (unaudited) | 1 Year | 5 Years* | 10 Years* | |||||||||
AllianceBernstein Value Portfolio Class A** | 36.85% | 15.66% | 5.46% | |||||||||
AllianceBernstein Value Portfolio Class B** | 36.49% | 15.40% | 5.29% | |||||||||
Russell 1000 Value Index | 32.53% | 16.67% | 7.58% | |||||||||
S&P 500 Index | 32.39% | 17.94% | 7.41% | |||||||||
* Average annual returns.
** Includes the impact of proceeds received and credited to the Portfolio resulting from class action settlements, which enhanced the performance of all share classes of the Portfolio for the annual period ended December 31, 2013 by 0.07%.
Please keep in mind that high, double-digit returns are highly unusual and cannot be sustained. Investors should also be aware that these returns were primarily achieved during favorable market conditions. |
| |||||||||||
The Portfolio’s current prospectus fee table shows the Portfolio’s total annual expense ratios as 0.72% and 0.97% for Class A and Class B, respectively. The Financial Highlights section of this report sets forth expense ratio data for the current reporting period; the expense ratios shown above may differ from the expense ratios in the Financial Highlights section since they are based on different time periods.
ALLIANCEBERNSTEIN VALUE PORTFOLIO CLASS A
GROWTH OF A $10,000 INVESTMENT
12/31/03 – 12/31/13 (unaudited)

This chart illustrates the total value of an assumed $10,000 investment in AllianceBernstein Value Portfolio Class A shares (from 12/31/03 to 12/31/13) as compared to the performance of the Portfolio’s benchmark, the Russell 1000 Value Index, and the broad U.S. market, as represented by the S&P 500 Index. The chart assumes the reinvestment of dividends and capital gains distributions.
See Disclosures, Risks and Note about Historical Performance on page 2.
3
| VALUE PORTFOLIO | ||
| EXPENSE EXAMPLE (unaudited) | AllianceBernstein Variable Products Series Fund |
As a shareholder of the Fund, you incur two types of costs: (1) transaction costs, including sales charges (loads) on purchase payments, contingent deferred sales charges on redemptions and (2) ongoing costs, including management fees; distribution (12b-1) fees; and other Fund expenses. This example is intended to help you understand your ongoing costs (in dollars) of investing in the Fund and to compare these costs with the ongoing costs of investing in other mutual funds.
The Example is based on an investment of $1,000 invested at the beginning of the period and held for the entire period as indicated below.
Actual Expenses
The table below provides information about actual account values and actual expenses. You may use the information in this line, together with the amount you invested, to estimate the expenses that you paid over the period. Simply divide your account value by $1,000 (for example, an $8,600 account value divided by $1,000 = 8.6), then multiply the result by the number in the first line under the heading entitled “Expenses Paid During Period” to estimate the expenses you paid on your account during this period. The estimate of expenses does not include fees or other expenses of any variable insurance product. If such expenses were included, the estimate of expenses you paid during the period would be higher and your ending account value would be lower.
Hypothetical Example for Comparison Purposes
The table below provides information about hypothetical account values and hypothetical expenses based on the Fund’s actual expense ratio and an assumed annual rate of return of 5% before expenses, which is not the Fund’s actual return. The hypothetical account values and expenses may not be used to estimate the actual ending account balance or expenses you paid for the period. You may use this information to compare the ongoing costs of investing in the Fund and other funds by comparing this 5% hypothetical example with the 5% hypothetical examples that appear in the shareholder reports of other funds. The estimate of expenses does not include fees or other expenses of any variable insurance product. If such expenses were included, the estimate of expenses you paid during the period would be higher and your ending account value would be lower.
Please note that the expenses shown in the table are meant to highlight your ongoing costs only and do not reflect any transactional costs, such as sales charges (loads), or contingent deferred sales charges on redemptions. Therefore, the second line of each classes’ table is useful in comparing ongoing costs only, and will not help you determine the relative total costs of owning different funds. In addition, if these transactional costs were included, your costs would have been higher.
| Beginning Account Value July 1, 2013 | Ending Account Value December 31, 2013 | Expenses Paid During Period* | Annualized Expense Ratio* | |||||||||||||
Class A | ||||||||||||||||
Actual | $ | 1,000 | $ | 1,152.70 | $ | 4.07 | 0.75 | % | ||||||||
Hypothetical (5% annual return before expenses)* | $ | 1,000 | $ | 1,021.42 | $ | 3.82 | 0.75 | % | ||||||||
Class B | ||||||||||||||||
Actual | $ | 1,000 | $ | 1,151.80 | $ | 5.42 | 1.00 | % | ||||||||
Hypothetical (5% annual return before expenses)* | $ | 1,000 | $ | 1,020.16 | $ | 5.09 | 1.00 | % | ||||||||
| * | Expenses are equal to each classes’ annualized expense ratios, multiplied by the average account value over the period, multiplied by 184/365 (to reflect the one-half year period). |
4
| VALUE PORTFOLIO | ||
| TEN LARGEST HOLDINGS* | ||
| December 31, 2013 (unaudited) | AllianceBernstein Variable Products Series Fund |
| COMPANY | U.S. $ VALUE | PERCENT OF NET ASSETS | ||||||
Pfizer, Inc. | $ | 4,934,493 | 3.7 | % | ||||
Wells Fargo & Co. | 4,757,920 | 3.5 | ||||||
Exxon Mobil Corp. | 4,503,400 | 3.4 | ||||||
General Electric Co. | 4,358,665 | 3.2 | ||||||
Bank of America Corp. | 3,792,852 | 2.8 | ||||||
Citigroup, Inc. | 3,684,177 | 2.7 | ||||||
Chevron Corp. | 3,634,881 | 2.7 | ||||||
Johnson & Johnson | 3,159,855 | 2.4 | ||||||
AT&T, Inc. | 3,044,856 | 2.3 | ||||||
Hewlett-Packard Co. | 2,853,960 | 2.1 | ||||||
|
|
|
| |||||
| $ | 38,725,059 | 28.8 | % | |||||
SECTOR BREAKDOWN**
December 31, 2013 (unaudited)
| SECTOR | U.S. $ VALUE | PERCENT OF TOTAL INVESTMENTS | ||||||
Financials | $ | 39,691,137 | 29.5 | % | ||||
Energy | 21,205,329 | 15.7 | ||||||
Consumer Discretionary | 19,871,198 | 14.8 | ||||||
Health Care | 17,804,097 | 13.2 | ||||||
Information Technology | 12,750,204 | 9.5 | ||||||
Industrials | 7,696,165 | 5.7 | ||||||
Consumer Staples | 4,518,629 | 3.4 | ||||||
Telecommunication Services | 4,460,016 | 3.3 | ||||||
Utilities | 4,122,948 | 3.1 | ||||||
Materials | 2,183,616 | 1.6 | ||||||
Short-Term Investments | 270,996 | 0.2 | ||||||
|
|
|
| |||||
Total Investments | $ | 134,574,335 | 100.0 | % | ||||
| * | Long-term investments. |
| ** | The Portfolio’s sector breakdown is expressed as a percentage of total investments and may vary over time. |
Please note: The sector classifications presented herein are based on the Global Industry Classification Standard (GICS) which was developed by Morgan Stanley Capital International and Standard & Poor’s. The components are divided into sector, industry group, and industry sub-indices as classified by the GICS for each of the market capitalization indices in the broad market. These sector classifications are broadly defined. The “Portfolio of Investments” section of the report reflects more specific industry information and is consistent with the investment restrictions discussed in the Portfolio’s prospectus.
5
| VALUE PORTFOLIO | ||
| PORTFOLIOOF INVESTMENTS | ||
| December 31, 2013 | AllianceBernstein Variable Products Series Fund |
Company | Shares | U.S. $ Value | ||||||
COMMON STOCKS–99.9% | ||||||||
FINANCIALS–29.5% | ||||||||
CAPITAL MARKETS–1.8% | ||||||||
E*Trade Financial Corp.(a) | 31,300 | $ | 614,732 | |||||
Goldman Sachs Group, Inc. (The) | 7,400 | 1,311,724 | ||||||
State Street Corp. | 7,300 | 535,747 | ||||||
|
| |||||||
| 2,462,203 | ||||||||
|
| |||||||
COMMERCIAL BANKS–5.5% | ||||||||
CIT Group, Inc. | 30,500 | 1,589,965 | ||||||
Fifth Third Bancorp | 19,800 | 416,394 | ||||||
KeyCorp | 24,700 | 331,474 | ||||||
Regions Financial Corp. | 36,700 | 362,963 | ||||||
Wells Fargo & Co. | 104,800 | 4,757,920 | ||||||
|
| |||||||
| 7,458,716 | ||||||||
|
| |||||||
CONSUMER FINANCE–2.7% | ||||||||
Capital One Financial Corp. | 27,500 | 2,106,775 | ||||||
Discover Financial Services | 27,300 | 1,527,435 | ||||||
|
| |||||||
| 3,634,210 | ||||||||
|
| |||||||
DIVERSIFIED FINANCIAL SERVICES–8.3% | ||||||||
Bank of America Corp. | 243,600 | 3,792,852 | ||||||
Berkshire Hathaway, Inc.– | 9,300 | 1,102,608 | ||||||
Citigroup, Inc. | 70,700 | 3,684,177 | ||||||
ING US, Inc. | 10,500 | 369,075 | ||||||
JPMorgan Chase & Co. | 37,200 | 2,175,456 | ||||||
|
| |||||||
| 11,124,168 | ||||||||
|
| |||||||
INSURANCE–11.2% | ||||||||
American Financial Group, Inc./OH | 21,900 | 1,264,068 | ||||||
American International Group, Inc. | 49,700 | 2,537,185 | ||||||
Aon PLC | 17,700 | 1,484,853 | ||||||
Assurant, Inc. | 10,700 | 710,159 | ||||||
Chubb Corp. (The) | 17,100 | 1,652,373 | ||||||
Everest Re Group Ltd. | 2,900 | 452,023 | ||||||
Genworth Financial, Inc.– | 85,500 | 1,327,815 | ||||||
Lincoln National Corp. | 29,600 | 1,527,952 | ||||||
PartnerRe Ltd. | 15,400 | 1,623,622 | ||||||
Reinsurance Group of America, Inc.–Class A | 17,600 | 1,362,416 | ||||||
Travelers Cos., Inc. (The) | 10,300 | 932,562 | ||||||
Unum Group | 3,900 | 136,812 | ||||||
|
| |||||||
| 15,011,840 | ||||||||
|
| |||||||
| 39,691,137 | ||||||||
|
| |||||||
ENERGY–15.8% | ||||||||
ENERGY EQUIPMENT & SERVICES–1.6% | ||||||||
Halliburton Co. | 27,500 | 1,395,625 | ||||||
Nabors Industries Ltd. | 42,000 | 713,580 | ||||||
|
| |||||||
| 2,109,205 | ||||||||
|
| |||||||
OIL, GAS & CONSUMABLE FUELS–14.2% | ||||||||
Chesapeake Energy Corp. | 8,500 | 230,690 | ||||||
Chevron Corp. | 29,100 | 3,634,881 | ||||||
Company | Shares | U.S. $ Value | ||||||
Exxon Mobil Corp. | 44,500 | $ | 4,503,400 | |||||
Hess Corp. | 29,000 | 2,407,000 | ||||||
HollyFrontier Corp. | 4,300 | 213,667 | ||||||
Marathon Petroleum Corp. | 24,300 | 2,229,039 | ||||||
Occidental Petroleum Corp. | 25,600 | 2,434,560 | ||||||
Phillips 66 | 11,900 | 917,847 | ||||||
Valero Energy Corp. | 50,100 | 2,525,040 | ||||||
|
| |||||||
| 19,096,124 | ||||||||
|
| |||||||
| 21,205,329 | ||||||||
|
| |||||||
CONSUMER | ||||||||
AUTO COMPONENTS–2.2% | ||||||||
Lear Corp. | 7,300 | 591,081 | ||||||
Magna International, Inc.–Class A | 15,700 | 1,288,342 | ||||||
TRW Automotive Holdings Corp.(a) | 14,000 | 1,041,460 | ||||||
|
| |||||||
| 2,920,883 | ||||||||
|
| |||||||
AUTOMOBILES–2.5% | ||||||||
Ford Motor Co. | 114,100 | 1,760,563 | ||||||
General Motors Co.(a) | 40,200 | 1,642,974 | ||||||
|
| |||||||
| 3,403,537 | ||||||||
|
| |||||||
HOUSEHOLD DURABLES–1.1% | ||||||||
PulteGroup, Inc. | 71,100 | 1,448,307 | ||||||
|
| |||||||
MEDIA–5.5% | ||||||||
Gannett Co., Inc. | 50,600 | 1,496,748 | ||||||
Liberty Global PLC–Class A(a) | 8,133 | 723,756 | ||||||
Liberty Global PLC–Series C(a) | 15,000 | 1,264,800 | ||||||
Regal Entertainment Group–Class A | 23,000 | 447,350 | ||||||
Time Warner, Inc. | 15,100 | 1,052,772 | ||||||
Twenty-First Century Fox, Inc.–Class A | 37,700 | 1,326,286 | ||||||
Viacom, Inc.–Class B | 12,500 | 1,091,750 | ||||||
|
| |||||||
| 7,403,462 | ||||||||
|
| |||||||
MULTILINE RETAIL–0.9% | ||||||||
Macy’s, Inc. | 23,800 | 1,270,920 | ||||||
|
| |||||||
SPECIALTY RETAIL–2.6% | ||||||||
GameStop Corp.–Class A | 23,400 | 1,152,684 | ||||||
Staples, Inc. | 13,400 | 212,926 | ||||||
TJX Cos., Inc. | 32,300 | 2,058,479 | ||||||
|
| |||||||
| 3,424,089 | ||||||||
|
| |||||||
| 19,871,198 | ||||||||
|
| |||||||
HEALTH CARE–13.2% | ||||||||
BIOTECHNOLOGY–0.5% | ||||||||
Vertex Pharmaceuticals, Inc.(a) | 9,000 | 668,700 | ||||||
|
| |||||||
HEALTH CARE EQUIPMENT & SUPPLIES–1.7% | ||||||||
Medtronic, Inc. | 40,300 | 2,312,817 | ||||||
|
| |||||||
HEALTH CARE PROVIDERS & SERVICES–2.3% | ||||||||
Aetna, Inc. | 26,200 | 1,797,058 | ||||||
Health Net, Inc./CA(a) | 28,800 | 854,496 | ||||||
WellPoint, Inc. | 4,400 | 406,516 | ||||||
|
| |||||||
| 3,058,070 | ||||||||
|
| |||||||
6
| AllianceBernstein Variable Products Series Fund |
Company | Shares | U.S. $ Value | ||||||
PHARMACEUTICALS–8.7% | ||||||||
GlaxoSmithKline PLC (Sponsored ADR) | 25,300 | $ | 1,350,767 | |||||
Johnson & Johnson | 34,500 | 3,159,855 | ||||||
Merck & Co., Inc. | 23,900 | 1,196,195 | ||||||
Pfizer, Inc. | 161,100 | 4,934,493 | ||||||
Roche Holding AG (Sponsored ADR) | 16,000 | 1,123,200 | ||||||
|
| |||||||
| 11,764,510 | ||||||||
|
| |||||||
| 17,804,097 | ||||||||
|
| |||||||
INFORMATION TECHNOLOGY–9.5% | ||||||||
COMMUNICATIONS EQUIPMENT–1.3% | ||||||||
Cisco Systems, Inc. | 22,000 | 493,900 | ||||||
Harris Corp. | 18,300 | 1,277,523 | ||||||
|
| |||||||
| 1,771,423 | ||||||||
|
| |||||||
COMPUTERS & PERIPHERALS–3.0% | ||||||||
Apple, Inc. | 2,000 | 1,122,220 | ||||||
Hewlett-Packard Co. | 102,000 | 2,853,960 | ||||||
|
| |||||||
| 3,976,180 | ||||||||
|
| |||||||
ELECTRONIC EQUIPMENT, INSTRUMENTS & COMPONENTS–0.6% | ||||||||
Arrow Electronics, Inc.(a) | 14,900 | 808,325 | ||||||
|
| |||||||
OFFICE ELECTRONICS–1.3% | ||||||||
Xerox Corp. | 146,200 | 1,779,254 | ||||||
|
| |||||||
SEMICONDUCTORS & SEMICONDUCTOR EQUIPMENT–1.9% | ||||||||
Applied Materials, Inc. | 65,900 | 1,165,771 | ||||||
Lam Research Corp.(a) | 14,300 | 778,635 | ||||||
Micron Technology, Inc.(a) | 28,600 | 622,336 | ||||||
|
| |||||||
| 2,566,742 | ||||||||
|
| |||||||
SOFTWARE–1.4% | ||||||||
CA, Inc. | 4,800 | 161,520 | ||||||
Electronic Arts, Inc.(a) | 61,400 | 1,408,516 | ||||||
Symantec Corp. | 11,800 | 278,244 | ||||||
|
| |||||||
| 1,848,280 | ||||||||
|
| |||||||
| 12,750,204 | ||||||||
|
| |||||||
INDUSTRIALS–5.7% | ||||||||
AEROSPACE & DEFENSE–0.6% | ||||||||
Northrop Grumman Corp. | 6,700 | 767,887 | ||||||
|
| |||||||
AIRLINES–0.4% | ||||||||
Delta Air Lines, Inc. | 19,900 | 546,653 | ||||||
|
| |||||||
INDUSTRIAL CONGLOMERATES–3.2% | ||||||||
General Electric Co. | 155,500 | 4,358,665 | ||||||
|
| |||||||
Company | Shares | U.S. $ Value | ||||||
MACHINERY–1.5% | ||||||||
Illinois Tool Works, Inc. | 21,000 | $ | 1,765,680 | |||||
Parker Hannifin Corp. | 2,000 | 257,280 | ||||||
|
| |||||||
| 2,022,960 | ||||||||
|
| |||||||
| 7,696,165 | ||||||||
|
| |||||||
CONSUMER STAPLES–3.4% | ||||||||
FOOD & STAPLES | ||||||||
CVS Caremark Corp. | 4,700 | 336,379 | ||||||
Kroger Co. (The) | 49,000 | 1,936,970 | ||||||
|
| |||||||
| 2,273,349 | ||||||||
|
| |||||||
HOUSEHOLD PRODUCTS–1.0% | ||||||||
Procter & Gamble Co. (The) | 15,700 | 1,278,137 | ||||||
|
| |||||||
TOBACCO–0.7% | ||||||||
Philip Morris International, Inc. | 11,100 | 967,143 | ||||||
|
| |||||||
| 4,518,629 | ||||||||
|
| |||||||
TELECOMMUNICATION SERVICES–3.3% | ||||||||
DIVERSIFIED TELECOMMUNICATION SERVICES–2.3% | ||||||||
AT&T, Inc. | 86,600 | 3,044,856 | ||||||
|
| |||||||
WIRELESS TELECOMMUNICATION SERVICES–1.0% | ||||||||
Vodafone Group PLC | 36,000 | 1,415,160 | ||||||
|
| |||||||
| 4,460,016 | ||||||||
|
| |||||||
UTILITIES–3.1% | ||||||||
ELECTRIC UTILITIES–1.2% | ||||||||
Edison International | 35,600 | 1,648,280 | ||||||
|
| |||||||
GAS UTILITIES–1.1% | ||||||||
Atmos Energy Corp. | 32,000 | 1,453,440 | ||||||
|
| |||||||
MULTI-UTILITIES–0.8% | ||||||||
CenterPoint Energy, Inc. | 32,600 | 755,668 | ||||||
DTE Energy Co. | 4,000 | 265,560 | ||||||
|
| |||||||
| 1,021,228 | ||||||||
|
| |||||||
| 4,122,948 | ||||||||
|
| |||||||
MATERIALS–1.6% | ||||||||
CHEMICALS–1.6% | ||||||||
LyondellBasell Industries NV–Class A | 27,200 | 2,183,616 | ||||||
|
| |||||||
Total Common Stocks | 134,303,339 | |||||||
|
| |||||||
7
| VALUE PORTFOLIO | ||
| PORTFOLIOOF INVESTMENTS | ||
| (continued) | AllianceBernstein Variable Products Series Fund |
Company | Principal Amount (000) | U.S. $ Value | ||||||
SHORT-TERM INVESTMENTS–0.2% | ||||||||
TIME DEPOSIT–0.2% | ||||||||
State Street Time Deposit | $ | 271 | $ | 270,996 | ||||
|
| |||||||
TOTAL | 134,574,335 | |||||||
Other assets less | (97,975 | ) | ||||||
|
| |||||||
NET ASSETS–100.0% | $ | 134,476,360 | ||||||
|
| |||||||
| (a) | Non-income producing security. |
Glossary:
ADR—American Depositary Receipt
See notes to financial statements.
8
| VALUE PORTFOLIO | ||
| STATEMENTOF ASSETS & LIABILITIES | ||
| December 31, 2013 | AllianceBernstein Variable Products Series Fund | |
ASSETS | ||||
Investments in securities, at value (cost $98,518,866) | $ | 134,574,335 | ||
Dividends and interest receivable | 192,773 | |||
Receivable for capital stock sold | 3,396 | |||
|
| |||
Total assets | 134,770,504 | |||
|
| |||
LIABILITIES | ||||
Payable for capital stock redeemed | 106,387 | |||
Advisory fee payable | 59,902 | |||
Printing fee payable | 34,482 | |||
Audit fee payable | 33,273 | |||
Distribution fee payable | 26,785 | |||
Administrative fee payable | 14,445 | |||
Transfer Agent fee payable | 112 | |||
Accrued expenses | 18,758 | |||
|
| |||
Total liabilities | 294,144 | |||
|
| |||
NET ASSETS | $ | 134,476,360 | ||
|
| |||
COMPOSITION OF NET ASSETS | ||||
Capital stock, at par | $ | 9,539 | ||
Additional paid-in capital | 141,060,759 | |||
Undistributed net investment income | 1,936,168 | |||
Accumulated net realized loss on investment and foreign currency transactions | (44,585,575 | ) | ||
Net unrealized appreciation on investments | 36,055,469 | |||
|
| |||
| $ | 134,476,360 | |||
|
|
Net Asset Value Per Share—1 billion shares of capital stock authorized, $.001 par value
| Class | Net Assets | Shares Outstanding | Net Asset Value | |||||||||
A | $ | 2,204,948 | 155,066 | $ | 14.22 | |||||||
B | $ | 132,271,412 | 9,383,548 | $ | 14.10 | |||||||
See notes to financial statements.
9
| VALUE PORTFOLIO | ||
| STATEMENTOF OPERATIONS | ||
| Year Ended December 31, 2013 | AllianceBernstein Variable Products Series Fund |
INVESTMENT INCOME | ||||
Dividends | ||||
Unaffiliated issuers (net of foreign taxes withheld of $21,804) | $ | 3,414,591 | ||
Affiliated issuers | 813 | |||
Interest | 85 | |||
Securities lending income | 12,469 | |||
|
| |||
| 3,427,958 | ||||
|
| |||
EXPENSES | ||||
Advisory fee (see Note B) | 835,428 | |||
Distribution fee—Class B | 374,964 | |||
Transfer agency—Class A | 81 | |||
Transfer agency—Class B | 6,101 | |||
Custodian | 84,032 | |||
Administrative | 55,163 | |||
Printing | 42,613 | |||
Audit | 39,043 | |||
Legal | 32,767 | |||
Directors’ fees | 4,542 | |||
Miscellaneous | 8,855 | |||
|
| |||
Total expenses | 1,483,589 | |||
|
| |||
Net investment income | 1,944,369 | |||
|
| |||
REALIZED AND UNREALIZED GAIN ON INVESTMENT TRANSACTIONS | ||||
Net realized gain on investment transactions | 26,346,896 | |||
Net change in unrealized appreciation/depreciation of investments | 19,276,766 | |||
|
| |||
Net gain on investment transactions | 45,623,662 | |||
|
| |||
NET INCREASE IN NET ASSETS FROM OPERATIONS | $ | 47,568,031 | ||
|
|
See notes to financial statements.
10
| VALUE PORTFOLIO | ||
| STATEMENT OF CHANGES IN NET ASSETS | AllianceBernstein Variable Products Series Fund |
| Year Ended December 31, 2013 | Year Ended December 31, 2012 | |||||||
INCREASE IN NET ASSETS FROM OPERATIONS | ||||||||
Net investment income | $ | 1,944,369 | $ | 2,903,480 | ||||
Net realized gain on investment and foreign currency transactions | 26,346,896 | 9,812,887 | ||||||
Net change in unrealized appreciation/depreciation of investments | 19,276,766 | 12,001,916 | ||||||
|
|
|
| |||||
Net increase in net assets from operations | 47,568,031 | 24,718,283 | ||||||
DIVIDENDS TO SHAREHOLDERS FROM | ||||||||
Net investment income | ||||||||
Class A | (44,293 | ) | (29,034 | ) | ||||
Class B | (2,863,346 | ) | (2,792,590 | ) | ||||
CAPITAL STOCK TRANSACTIONS | ||||||||
Net decrease | (69,636,711 | ) | (39,143,747 | ) | ||||
|
|
|
| |||||
Total decrease | (24,976,319 | ) | (17,247,088 | ) | ||||
NET ASSETS | ||||||||
Beginning of period | 159,452,679 | 176,699,767 | ||||||
|
|
|
| |||||
End of period (including undistributed net investment income of $1,936,168 and $2,899,438, respectively) | $ | 134,476,360 | $ | 159,452,679 | ||||
|
|
|
| |||||
See notes to financial statements.
11
| VALUE PORTFOLIO | ||
| NOTES TO FINANCIAL STATEMENTS | ||
| December 31, 2013 | AllianceBernstein Variable Products Series Fund | |
NOTE A: Significant Accounting Policies
The AllianceBernstein Value Portfolio (the “Portfolio”) is a series of AllianceBernstein Variable Products Series Fund, Inc. (the “Fund”). The Portfolio’s investment objective is long-term growth of capital. The Portfolio is diversified as defined under the Investment Company Act of 1940. The Fund was incorporated in the State of Maryland on November 17, 1987, as an open-end series investment company. The Fund offers thirteen separately managed pools of assets which have differing investment objectives and policies. The Portfolio offers Class A and Class B shares. Both classes of shares have identical voting, dividend, liquidating and other rights, except that Class B shares bear a distribution expense and have exclusive voting rights with respect to the Class B distribution plan.
The Portfolio offers and sells its shares only to separate accounts of certain life insurance companies for the purpose of funding variable annuity contracts and variable life insurance policies. Sales are made without a sales charge at the Portfolio’s net asset value per share.
The financial statements have been prepared in conformity with U.S. generally accepted accounting principles (“U.S. GAAP”) which require management to make certain estimates and assumptions that affect the reported amounts of assets and liabilities in the financial statements and amounts of income and expenses during the reporting period. Actual results could differ from those estimates. The following is a summary of significant accounting policies followed by the Portfolio.
1. Security Valuation
Portfolio securities are valued at their current market value determined on the basis of market quotations or, if market quotations are not readily available or are deemed unreliable, at “fair value” as determined in accordance with procedures established by and under the general supervision of the Fund’s Board of Directors (the “Board”).
In general, the market values of securities which are readily available and deemed reliable are determined as follows: securities listed on a national securities exchange (other than securities listed on the NASDAQ Stock Market, Inc. (“NASDAQ”)) or on a foreign securities exchange are valued at the last sale price at the close of the exchange or foreign securities exchange. If there has been no sale on such day, the securities are valued at the last traded price from the previous day. Securities listed on more than one exchange are valued by reference to the principal exchange on which the securities are traded; securities listed only on NASDAQ are valued in accordance with the NASDAQ Official Closing Price; listed or over the counter (“OTC”) market put or call options are valued at the mid level between the current bid and ask prices. If either a current bid or current ask price is unavailable, AllianceBernstein L.P. (the “Adviser”) will have discretion to determine the best valuation (e.g. last trade price in the case of listed options); open futures are valued using the closing settlement price or, in the absence of such a price, the most recent quoted bid price. If there are no quotations available for the day of valuation, the last available closing settlement price is used; U.S. government securities and other debt instruments having 60 days or less remaining until maturity are valued at amortized cost if their original maturity was 60 days or less; or by amortizing their fair value as of the 61st day prior to maturity if their original term to maturity exceeded 60 days; fixed-income securities, including mortgage-backed and asset-backed securities, may be valued on the basis of prices provided by a pricing service or at a price obtained from one or more of the major broker-dealers. In cases where broker-dealer quotes are obtained, the Adviser may establish procedures whereby changes in market yields or spreads are used to adjust, on a daily basis, a recently obtained quoted price on a security. Swaps and other derivatives are valued daily, primarily using independent pricing services, independent pricing models using market inputs, as well as third party broker-dealers or counterparties. Investment companies are valued at their net asset value each day.
Securities for which market quotations are not readily available (including restricted securities) or are deemed unreliable are valued at fair value. Factors considered in making this determination may include, but are not limited to, information obtained by contacting the issuer, analysts, analysis of the issuer’s financial statements or other available documents. In addition, the Portfolio may use fair value pricing for securities primarily traded in non-U.S. markets because most foreign markets close well before the Portfolio values its securities at 4:00 p.m., Eastern Time. The earlier close of these foreign markets gives rise to the possibility that significant events, including broad market moves, may have occurred in the interim and may materially affect the value of those securities. To account for this, the Portfolio may frequently value many of its foreign equity securities using fair value prices based on third party vendor modeling tools to the extent available.
2. Fair Value Measurements
In accordance with U.S. GAAP regarding fair value measurements, fair value is defined as the price that the Portfolio would receive to sell an asset or pay to transfer a liability in an orderly transaction between market participants at the measurement
12
| AllianceBernstein Variable Products Series Fund |
date. U.S. GAAP establishes a framework for measuring fair value, and a three-level hierarchy for fair value measurements based upon the transparency of inputs to the valuation of an asset or liability (including those valued based on their market values as described in Note A.1 above). Inputs may be observable or unobservable and refer broadly to the assumptions that market participants would use in pricing the asset or liability. Observable inputs reflect the assumptions market participants would use in pricing the asset or liability based on market data obtained from sources independent of the Portfolio. Unobservable inputs reflect the Portfolio’s own assumptions about the assumptions that market participants would use in pricing the asset or liability based on the best information available in the circumstances. Each investment is assigned a level based upon the observability of the inputs which are significant to the overall valuation. The three-tier hierarchy of inputs is summarized below.
| • | Level 1—quoted prices in active markets for identical investments |
| • | Level 2—other significant observable inputs (including quoted prices for similar investments, interest rates, prepayment speeds, credit risk, etc.) |
| • | Level 3—significant unobservable inputs (including the Portfolio’s own assumptions in determining the fair value of investments) |
Where readily available market prices or relevant bid prices are not available for certain equity investments, such investments may be valued based on similar publicly traded investments, movements in relevant indices since last available prices or based upon underlying company fundamentals and comparable company data (such as multiples to earnings or other multiples to equity). Where an investment is valued using an observable input, such as another publicly traded security, the investment will be classified as Level 2. If management determines that an adjustment is appropriate based on restrictions on resale, illiquidity or uncertainty, and such adjustment is a significant component of the valuation, the investment will be classified as Level 3. An investment will also be classified as Level 3 where management uses company fundamentals and other significant inputs to determine the valuation.
The following table summarizes the valuation of the Portfolio’s investments by the above fair value hierarchy levels as of December 31, 2013:
| Level 1 | Level 2 | Level 3 | Total | |||||||||||||
Investments in Securities: | ||||||||||||||||
Assets: | ||||||||||||||||
Common Stocks* | $ | 134,303,339 | $ | –0 | – | $ | –0 | – | $ | 134,303,339 | ||||||
Short-Term Investments | –0 | – | 270,996 | –0 | – | 270,996 | ||||||||||
|
|
|
|
|
|
|
| |||||||||
Total Investments in Securities | 134,303,339 | 270,996 | –0 | – | 134,574,335 | |||||||||||
Other Financial Instruments** | –0 | – | –0 | – | –0 | – | –0 | – | ||||||||
|
|
|
|
|
|
|
| |||||||||
Total^ | $ | 134,303,339 | $ | 270,996 | $ | –0 | – | $ | 134,574,335 | |||||||
|
|
|
|
|
|
|
| |||||||||
| * | See Portfolio of Investments for sector classifications. |
| ** | Other financial instruments are derivative instruments, such as futures, forwards and swaps, which are valued at the unrealized appreciation/depreciation on the instrument. |
| ^ | There were no transfers between Level 1 and Level 2 during the reporting period. |
The Portfolio recognizes all transfers between levels of the fair value hierarchy assuming the financial instruments were transferred at the beginning of the reporting period.
The Adviser has established a Valuation Committee (the “Committee”) which is responsible for overseeing the pricing and valuation of all securities held in the Portfolio. The Committee operates under pricing and valuation policies and procedures established by the Adviser and approved by the Board, including pricing policies which set forth the mechanisms and processes to be employed on a daily basis to implement these policies and procedures. In particular, the pricing policies describe how to determine market quotations for securities and other instruments. The Committee’s responsibilities include: 1) fair value and liquidity determinations (and oversight of any third parties to whom any responsibility for fair value and liquidity determinations is delegated), and 2) regular monitoring of the Adviser’s pricing and valuation policies and procedures and modification or enhancement of these policies and procedures (or recommendation of the modification of these policies and procedures) as the Committee believes appropriate.
13
| VALUE PORTFOLIO | ||
| NOTES TO FINANCIAL STATEMENTS | ||
| (continued) | AllianceBernstein Variable Products Series Fund | |
The Committee is also responsible for monitoring the implementation of the pricing policies by the Adviser’s Pricing Group (the “Pricing Group”) and a third party which performs certain pricing functions in accordance with the pricing policies. The Pricing Group is responsible for the oversight of the third party on a day-to-day basis. The Committee and the Pricing Group perform a series of activities to provide reasonable assurance of the accuracy of prices including: 1) periodic vendor due diligence meetings, review of methodologies, new developments and processes at vendors, 2) daily comparison of security valuation versus prior day for all securities that exceeded established thresholds, and 3) daily review of unpriced, stale, and variance reports with exceptions reviewed by senior management and the Committee.
In addition, several processes outside of the pricing process are used to monitor valuation issues including: 1) performance and performance attribution reports are monitored for anomalous impacts based upon benchmark performance, and 2) portfolio managers review all portfolios for performance and analytics (which are generated using the Adviser’s prices).
3. Currency Translation
Assets and liabilities denominated in foreign currencies and commitments under forward currency exchange contracts are translated into U.S. dollars at the mean of the quoted bid and ask prices of such currencies against the U.S. dollar. Purchases and sales of portfolio securities are translated into U.S. dollars at the rates of exchange prevailing when such securities were acquired or sold. Income and expenses are translated into U.S. dollars at rates of exchange prevailing when accrued.
Net realized gain or loss on foreign currency transactions represents foreign exchange gains and losses from sales and maturities of foreign fixed income investments, foreign currency exchange contracts, holding of foreign currencies, currency gains or losses realized between the trade and settlement dates on foreign investment transactions, and the difference between the amounts of dividends, interest and foreign withholding taxes recorded on the Portfolio’s books and the U.S. dollar equivalent amounts actually received or paid. Net unrealized currency gains and losses from valuing foreign currency denominated assets and liabilities at period end exchange rates are reflected as a component of net unrealized appreciation or depreciation of foreign currency denominated assets and liabilities.
4. Taxes
It is the Portfolio’s policy to meet the requirements of the Internal Revenue Code applicable to regulated investment companies and to distribute all of its investment company taxable income and net realized gains, if any, to shareholders. Therefore, no provisions for federal income or excise taxes are required. The Portfolio may be subject to taxes imposed by countries in which it invests. Such taxes are generally based on income and/or capital gains earned or repatriated. Taxes are accrued and applied to net investment income, net realized gains and net unrealized appreciation/depreciation as such income and/or gains are earned.
In accordance with U.S. GAAP requirements regarding accounting for uncertainties in income taxes, management has analyzed the Portfolio’s tax positions taken or expected to be taken on federal and state income tax returns for all open tax years (the current and the prior three tax years) and has concluded that no provision for income tax is required in the Portfolio’s financial statements.
5. Investment Income and Investment Transactions
Dividend income is recorded on the ex-dividend date or as soon as the Portfolio is informed of the dividend. Interest income is accrued daily. Investment transactions are accounted for on the date the securities are purchased or sold. Investment gains or losses are determined on the identified cost basis. The Portfolio amortizes premiums and accretes discounts as adjustments to interest income.
6. Class Allocations
All income earned and expenses incurred by the Portfolio are borne on a pro-rata basis by each outstanding class of shares, based on the proportionate interest in the Portfolio represented by the net assets of such class, except for class specific expenses which are allocated to the respective class. Expenses of the Fund are charged proportionately to each Portfolio or based on other appropriate methods. Realized and unrealized gains and losses are allocated among the various share classes based on respective net assets.
7. Dividends and Distributions
Dividends and distributions to shareholders, if any, are recorded on the ex-dividend date. Income dividends and capital gains distributions are determined in accordance with federal tax regulations and may differ from those determined in accordance with U.S. GAAP. To the extent these differences are permanent, such amounts are reclassified within the capital accounts based on their federal tax basis treatment; temporary differences do not require such reclassification.
14
| AllianceBernstein Variable Products Series Fund |
NOTE B: Advisory Fee and Other Transactions with Affiliates
Under the terms of the investment advisory agreement, the Portfolio pays the Adviser an advisory fee at an annual rate of .55% of the first $2.5 billion, .45% of the next $2.5 billion and .40% in excess of $5 billion, of the Portfolio’s average daily net assets. The fee is accrued daily and paid monthly. The Adviser has agreed to waive its fees and bear certain expenses to the extent necessary to limit total operating expenses on an annual basis to 1.20% and 1.45% of daily average net assets for Class A and Class B shares, respectively. For the year ended December 31, 2013, there were no expenses waived by the Adviser.
Pursuant to the investment advisory agreement, the Portfolio may reimburse the Adviser for certain legal and accounting services provided to the Portfolio by the Adviser. For the year ended December 31, 2013, the reimbursement for such services amounted to $55,163.
Brokerage commissions paid on investment transactions for the year ended December 31, 2013 amounted to $160,176, of which $0 and $0, respectively, was paid to Sanford C. Bernstein & Co. LLC and Sanford C. Bernstein Limited, affiliates of the Adviser.
The Portfolio compensates AllianceBernstein Investor Services, Inc. (“ABIS”), a wholly-owned subsidiary of the Adviser, under a Transfer Agency Agreement for providing personnel and facilities to perform transfer agency services for the Portfolio. Such compensation retained by ABIS amounted to $1,385 for the year ended December 31, 2013.
NOTE C: Distribution Plan
The Portfolio has adopted a Distribution Plan (the “Plan”) for Class B shares pursuant to Rule 12b-1 under the Investment Company Act of 1940. Under the Plan, the Portfolio pays distribution and servicing fees to AllianceBernstein Investments, Inc. (the “Distributor”), a wholly-owned subsidiary of the Adviser, at an annual rate of up to .50% of the Portfolio’s average daily net assets attributable to Class B shares. The fees are accrued daily and paid monthly. The Board currently limits payments under the Plan to .25% of the Portfolio’s average daily net assets attributable to Class B shares. The Plan provides that the Distributor will use such payments in their entirety for distribution assistance and promotional activities.
The Portfolio is not obligated under the Plan to pay any distribution and servicing fees in excess of the amounts set forth above. The purpose of the payments to the Distributor under the Plan is to compensate the Distributor for its distribution services with respect to the sale of the Portfolio’s Class B shares. Since the Distributor’s compensation is not directly tied to its expenses, the amount of compensation received by it under the Plan during any year may be more or less than its actual expenses. For this reason, the Plan is characterized by the staff of the Securities and Exchange Commission as being of the “compensation” variety.
In the event that the Plan is terminated or not continued, no distribution or servicing fees (other than current amounts accrued but not yet paid) would be owed by the Portfolio to the Distributor.
The Plan also provides that the Adviser may use its own resources to finance the distribution of the Portfolio’s shares.
NOTE D: Investment Transactions
Purchases and sales of investment securities (excluding short-term investments) for the year ended December 31, 2013 were as follows:
| Purchases | Sales | |||||||
Investment securities (excluding U.S. government securities) | $ | 65,216,124 | $ | 135,257,883 | ||||
U.S. government securities | –0 | – | –0 | – | ||||
The cost of investments for federal income tax purposes, gross unrealized appreciation and unrealized depreciation are as follows:
Cost | $ | 98,862,817 | ||
|
| |||
Gross unrealized appreciation | $ | 36,195,838 | ||
Gross unrealized depreciation | (484,320 | ) | ||
|
| |||
Net unrealized appreciation | $ | 35,711,518 | ||
|
|
15
| VALUE PORTFOLIO | ||
| NOTES TO FINANCIAL STATEMENTS | ||
| (continued) | AllianceBernstein Variable Products Series Fund | |
1. Derivative Financial Instruments
The Portfolio may use derivatives in an effort to earn income and enhance returns, to replace more traditional direct investments, to obtain exposure to otherwise inaccessible markets (collectively, “investment purposes”), or to hedge or adjust the risk profile of its portfolio.
The Portfolio did not engage in derivatives transactions for the year ended December 31, 2013.
2. Currency Transactions
The Portfolio may invest in non-U.S. dollar securities on a currency hedged or unhedged basis. The Portfolio may seek investment opportunities by taking long or short positions in currencies through the use of currency-related derivatives, including forward currency exchange contracts, futures and options on futures, swaps, and other options. The Portfolio may enter into transactions for investment opportunities when it anticipates that a foreign currency will appreciate or depreciate in value but securities denominated in that currency are not held by the Portfolio and do not present attractive investment opportunities. Such transactions may also be used when the Adviser believes that it may be more efficient than a direct investment in a foreign currency-denominated security. The Portfolio may also conduct currency exchange contracts on a spot basis (i.e., for cash at the spot rate prevailing in the currency exchange market for buying or selling currencies).
NOTE E: Securities Lending
The Portfolio may enter into securities lending transactions. Under the Portfolio’s securities lending program, all loans of securities will be collateralized continually by cash. The Portfolio will be compensated for the loan from a portion of the net return from the income earned on cash collateral after a rebate is paid to the borrower (in some cases, this rebate may be a “negative rebate” or fee paid by the borrower to the Portfolio in connection with the loan), and payments are made for fees of the securities lending agent and for certain other administrative expenses. It is the policy of the Portfolio to receive collateral consisting of cash in an amount exceeding the value of the securities loaned. The Portfolio will have the right to call a loan and obtain the securities loaned at any time on notice to the borrower within the normal and customary settlement time for the securities. While the securities are on loan, the borrower is obligated to pay the Portfolio amounts equal to any income or other distributions from the securities. The Portfolio will not have the right to vote any securities during the existence of a loan, but will have the right to regain ownership of loaned securities in order to exercise voting or other ownership rights. The lending agent has agreed to indemnify the Portfolio in the case of default of any securities borrower. Collateral received and securities loaned are marked to market daily to ensure that the securities loaned are secured by collateral. The lending agent will invest the cash collateral received in AllianceBernstein Exchange Reserves, an eligible money market vehicle, in accordance with the investment restrictions of the Portfolio, and as approved by the Board. The collateral received on securities loaned is recorded as an asset as well as a corresponding liability in the statement of assets and liabilities. When the Portfolio lends securities, its investment performance will continue to reflect changes in the value of the securities loaned. As of December 31, 2013, the Portfolio had no securities out on loan. The cash collateral will be adjusted on the next business day to maintain the required collateral amount. The Portfolio earned securities lending income of $12,469 and $813 from the borrowers and AllianceBernstein Exchange Reserves, respectively, for the year ended December 31, 2013; these amounts are reflected in the statement of operations. A principal risk of lending portfolio securities is that the borrower will fail to return the loaned securities upon termination of the loan and that the collateral will not be sufficient to replace the loaned securities. A summary of the Portfolio’s transactions in shares of AllianceBernstein Exchange Reserves for the year ended December 31, 2013 is as follows:
Market Value December 31, 2012 (000) | Purchases at Cost (000) | Sales Proceeds (000) | Market Value December 31, 2013 (000) | |||||||||||
| $ | 816 | $ | 24,660 | $ | 25,476 | $ | 0 | |||||||
16
| AllianceBernstein Variable Products Series Fund |
NOTE F: Capital Stock
Each class consists of 500,000,000 authorized shares. Transactions in capital shares for each class were as follows:
| SHARES | AMOUNT | |||||||||||||||||
| Year Ended December 31, 2013 | Year Ended December 31, 2012 | Year Ended December 31, 2013 | Year Ended December 31, 2012 | |||||||||||||||
Class A | ||||||||||||||||||
Shares sold | 23,224 | 3,550 | $ | 286,557 | $ | 36,002 | ||||||||||||
Shares issued in reinvestment of dividends | 3,455 | 2,895 | 44,293 | 29,034 | ||||||||||||||
Shares redeemed | (15,732 | ) | (24,236 | ) | (196,764 | ) | (248,107 | ) | ||||||||||
|
|
|
|
|
|
|
| |||||||||||
Net increase (decrease) | 10,947 | (17,791 | ) | $ | 134,086 | $ | (183,071 | ) | ||||||||||
|
|
|
|
|
|
|
| |||||||||||
Class B | ||||||||||||||||||
Shares sold | 405,430 | 316,889 | $ | 5,020,795 | $ | 3,142,785 | ||||||||||||
Shares issued in reinvestment of dividends | 225,106 | 280,662 | 2,863,346 | 2,792,591 | ||||||||||||||
Shares redeemed | (6,229,165 | ) | (4,484,363 | ) | (77,654,938 | ) | (44,896,052 | ) | ||||||||||
|
|
|
|
|
|
|
| |||||||||||
Net decrease | (5,598,629 | ) | (3,886,812 | ) | $ | (69,770,797 | ) | $ | (38,960,676 | ) | ||||||||
|
|
|
|
|
|
|
| |||||||||||
NOTE G: Risks Involved in Investing in the Portfolio
Foreign Securities Risk—Investing in securities of foreign companies or foreign governments involves special risks which include changes in foreign currency exchange rates and the possibility of future political and economic developments which could adversely affect the value of such securities. Moreover, securities of many foreign companies or foreign governments and their markets may be less liquid and their prices more volatile than those of comparable U.S. companies or of the U.S. government.
Currency Risk—This is the risk that changes in foreign currency exchange rates may negatively affect the value of the Portfolio’s investments or reduce the returns of the Portfolio. For example, the value of the Portfolio’s investments in foreign currency-denominated securities or currencies may decrease if the U.S. dollar is strong (i.e., gaining value relative to other currencies) and other currencies are weak (i.e., losing value relative to the U.S. dollar). Currency markets are generally not as regulated as securities markets. Independent of the Portfolio’s investments denominated in foreign currencies, the Portfolio’s positions in various foreign currencies may cause the Portfolio to experience investment losses due to the changes in exchange rates and interest rates.
Derivatives Risk—The Portfolio may enter into derivative transactions such as forwards, options, futures and swaps. Derivatives may be illiquid, difficult to price, and leveraged so that small changes may produce disproportionate losses for the Portfolio, and subject to counterparty risk to a greater degree than more traditional investments. Derivatives may result in significant losses, including losses that are far greater than the value of the derivatives reflected in the statement of assets and liabilities.
Indemnification Risk—In the ordinary course of business, the Portfolio enters into contracts that contain a variety of indemnifications. The Portfolio’s maximum exposure under these arrangements is unknown. However, the Portfolio has not had prior claims or losses pursuant to these indemnification provisions and expects the risk of loss thereunder to be remote. Therefore, the Portfolio has not accrued any liability in connection with these indemnification provisions.
NOTE H: Joint Credit Facility
A number of open-end mutual funds managed by the Adviser, including the Portfolio, participate in a $140 million revolving credit facility (the “Facility”) intended to provide short-term financing, if necessary, subject to certain restrictions in connection with abnormal redemption activity. Commitment fees related to the Facility are paid by the participating funds and are included in miscellaneous expenses in the statement of operations. The Portfolio did not utilize the Facility during the year ended December 31, 2013.
17
| VALUE PORTFOLIO | ||
| NOTES TO FINANCIAL STATEMENTS | ||
| (continued) | AllianceBernstein Variable Products Series Fund | |
NOTE I: Distributions to Shareholders
The tax character of distributions paid during the fiscal years ended December 31, 2013 and December 31, 2012 were as follows:
| 2013 | 2012 | |||||||
Distributions paid from: | ||||||||
Ordinary income | $ | 2,907,639 | $ | 2,821,624 | ||||
|
|
|
| |||||
Total taxable distributions paid | $ | 2,907,639 | $ | 2,821,624 | ||||
|
|
|
| |||||
As of December 31, 2013, the components of accumulated earnings/(deficit) on a tax basis were as follows:
Undistributed ordinary income | $ | 1,936,168 | ||
Accumulated capital and other losses | (44,241,624 | )(a) | ||
Unrealized appreciation/(depreciation) | 35,711,518 | (b) | ||
|
| |||
Total accumulated earnings/(deficit) | $ | (6,593,938 | ) | |
|
|
| (a) | On December 31, 2013, the Portfolio had a net capital loss carryforward of $44,241,624. During the fiscal year, the Portfolio utilized $26,246,267 of capital loss carryforwards to offset current year net realized gains. |
| (b) | The difference between book-basis and tax-basis unrealized appreciation/(depreciation) is attributable primarily to the tax deferral of losses on wash sales. |
For tax purposes, net capital losses may be carried over to offset future capital gains, if any. Funds are permitted to carry forward capital losses incurred in taxable years beginning after December 22, 2010 for an indefinite period. These post-enactment capital losses must be utilized prior to the pre-enactment capital losses, which are subject to expiration. Post-enactment capital loss carryforwards will retain their character as either short-term or long-term capital losses rather than being considered short-term as under previous regulation.
As of December 31, 2013, the Portfolio had a net capital loss carryforward of $44,241,624 which will expire as follows:
SHORT-TERM AMOUNT | LONG-TERM AMOUNT | EXPIRATION | ||
| $44,241,624 | n/a | 2017 |
During the current fiscal year, there were no permanent differences that resulted in adjustments to undistributed net investment income, accumulated net realized loss on investment and foreign currency transactions, or additional paid-in capital.
NOTE J: Subsequent Events
Management has evaluated subsequent events for possible recognition or disclosure in the financial statements through the date the financial statements are issued. Management has determined that there are no material events that would require disclosure in the Portfolio’s financial statements through this date.
18
| VALUE PORTFOLIO | ||
| FINANCIAL HIGHLIGHTS | AllianceBernstein Variable Products Series Fund |
Selected Data For A Share Of Capital Stock Outstanding Throughout Each Period
| CLASS A | ||||||||||||||||||||
| Year Ended December 31, | ||||||||||||||||||||
| 2013 | 2012 | 2011 | 2010 | 2009 | ||||||||||||||||
Net asset value, beginning of period | $10.63 | $9.37 | $9.84 | $8.97 | $7.67 | |||||||||||||||
|
|
|
|
|
|
|
|
|
| |||||||||||
Income From Investment Operations | ||||||||||||||||||||
Net investment income (a) | .19 | .20 | .17 | .12 | .16 | |||||||||||||||
Net realized and unrealized gain (loss) on investment and foreign currency transactions | 3.70 | 1.26 | (.50 | ) | .93 | 1.41 | ||||||||||||||
|
|
|
|
|
|
|
|
|
| |||||||||||
Net increase (decrease) in net asset value from operations | 3.89 | 1.46 | (.33 | ) | 1.05 | 1.57 | ||||||||||||||
|
|
|
|
|
|
|
|
|
| |||||||||||
Less: Dividends | ||||||||||||||||||||
Dividends from net investment income | (.30 | ) | (.20 | ) | (.14 | ) | (.18 | ) | (.27 | ) | ||||||||||
|
|
|
|
|
|
|
|
|
| |||||||||||
Net asset value, end of period | $14.22 | $10.63 | $9.37 | $9.84 | $8.97 | |||||||||||||||
|
|
|
|
|
|
|
|
|
| |||||||||||
Total Return | ||||||||||||||||||||
Total investment return based on net asset | 36.85 | %* | 15.73 | % | (3.50 | )% | 11.81 | %* | 21.12 | %* | ||||||||||
Ratios/Supplemental Data | ||||||||||||||||||||
Net assets, end of period (000’s omitted) | $2,205 | $1,533 | $1,517 | $1,707 | $1,594 | |||||||||||||||
Ratio to average net assets of: | ||||||||||||||||||||
Expenses | .73 | % | .72 | % | .71 | % | .71 | %+ | .70 | % | ||||||||||
Net investment income | 1.51 | % | 1.98 | % | 1.78 | % | 1.37 | %+ | 2.09 | % | ||||||||||
Portfolio turnover rate | 44 | % | 40 | % | 62 | % | 73 | % | 64 | % | ||||||||||
See footnote summary on page 20.
19
| VALUE PORTFOLIO | ||
| FINANCIAL HIGHLIGHTS | ||
| (continued) | AllianceBernstein Variable Products Series Fund |
Selected Data For A Share Of Capital Stock Outstanding Throughout Each Period
| CLASS B | ||||||||||||||||||||
| Year Ended December 31, | ||||||||||||||||||||
| 2013 | 2012 | 2011 | 2010 | 2009 | ||||||||||||||||
Net asset value, beginning of period | $10.54 | $9.28 | $9.75 | $8.90 | $7.59 | |||||||||||||||
|
|
|
|
|
|
|
|
|
| |||||||||||
Income From Investment Operations | ||||||||||||||||||||
Net investment income (a) | .16 | .17 | .15 | .10 | .14 | |||||||||||||||
Net realized and unrealized gain (loss) on investment and foreign currency transactions | 3.66 | 1.26 | (.50 | ) | .91 | 1.41 | ||||||||||||||
|
|
|
|
|
|
|
|
|
| |||||||||||
Net increase (decrease) in net asset value from operations | 3.82 | 1.43 | (.35 | ) | 1.01 | 1.55 | ||||||||||||||
|
|
|
|
|
|
|
|
|
| |||||||||||
Less: Dividends | ||||||||||||||||||||
Dividends from net investment income | (.26 | ) | (.17 | ) | (.12 | ) | (.16 | ) | (.24 | ) | ||||||||||
|
|
|
|
|
|
|
|
|
| |||||||||||
Net asset value, end of period | $14.10 | $10.54 | $9.28 | $9.75 | $8.90 | |||||||||||||||
|
|
|
|
|
|
|
|
|
| |||||||||||
Total Return | ||||||||||||||||||||
Total investment return based on net asset | 36.49 | %* | 15.54 | % | (3.78 | )% | 11.42 | %* | 21.04 | %* | ||||||||||
Ratios/Supplemental Data | ||||||||||||||||||||
Net assets, end of period (000’s omitted) | $132,271 | $157,920 | $175,183 | $212,522 | $213,827 | |||||||||||||||
Ratio to average net assets of: | ||||||||||||||||||||
Expenses | .98 | % | .97 | % | .96 | % | .96 | %+ | .95 | % | ||||||||||
Net investment income | 1.28 | % | 1.72 | % | 1.51 | % | 1.12 | %+ | 1.84 | % | ||||||||||
Portfolio turnover rate | 44 | % | 40 | % | 62 | % | 73 | % | 64 | % | ||||||||||
| (a) | Based on average shares outstanding. |
| (b) | Total investment return is calculated assuming an initial investment made at the net asset value at the beginning of the period, reinvestment of all dividends and distributions at net asset value during the period, and redemption on the last day of the period. Total return does not reflect (i) insurance company’s separate account related expense charges and (ii) the deductions of taxes that a shareholder would pay on Portfolio distributions or the redemption of Portfolio shares. Total investment return calculated for a period of less than one year is not annualized. |
| * | Includes the impact of proceeds received and credited to the Portfolio resulting from class action settlements, which enhanced the Portfolio’s performance for the years ended December 31, 2013, December 31, 2010 and December 31, 2009 by 0.07%, 0.01% and 0.02%, respectively. |
| + | The ratio includes expenses attributable to costs of proxy solicitation. |
See notes to financial statements.
20
| REPORTOF INDEPENDENT REGISTERED | ||
| PUBLIC ACCOUNTING FIRM | AllianceBernstein Variable Products Series Fund | |
To the Board of Directors and Shareholders of AllianceBernstein Value Portfolio:
We have audited the accompanying statement of assets and liabilities, including the portfolio of investments, of AllianceBernstein Value Portfolio (one of the funds constituting AllianceBernstein Variable Products Series Fund, Inc. (the “Fund”)) as of December 31, 2013, and the related statement of operations for the year then ended, the statements of changes in net assets for each of the two years in the period then ended, and the financial highlights for each of the five years in the period then ended. These financial statements and financial highlights are the responsibility of the Fund’s management. Our responsibility is to express an opinion on these financial statements and financial highlights based on our audits.
We conducted our audits in accordance with the standards of the Public Company Accounting Oversight Board (United States). Those standards require that we plan and perform the audit to obtain reasonable assurance about whether the financial statements and financial highlights are free of material misstatement. We were not engaged to perform an audit of the Fund’s internal control over financial reporting. Our audits included consideration of internal control over financial reporting as a basis for designing audit procedures that are appropriate in the circumstances, but not for the purpose of expressing an opinion on the effectiveness of the Fund’s internal control over financial reporting. Accordingly, we express no such opinion. An audit also includes examining, on a test basis, evidence supporting the amounts and disclosures in the financial statements and financial highlights, assessing the accounting principles used and significant estimates made by management, and evaluating the overall financial statement presentation. Our procedures included confirmation of securities owned as of December 31, 2013, by correspondence with the custodian and others, or by other appropriate auditing procedures where replies from others were not received. We believe that our audits provide a reasonable basis for our opinion.
In our opinion, the financial statements and financial highlights referred to above present fairly, in all material respects, the financial position of AllianceBernstein Value Portfolio (one of the funds constituting AllianceBernstein Variable Products Series Fund, Inc.) at December 31, 2013, the results of its operations for the year then ended, the changes in its net assets for each of the two years in the period then ended, and the financial highlights for each of the five years in the period then ended, in conformity with U.S. generally accepted accounting principles.

New York, New York
February 14, 2014
21
| 2013 TAX INFORMATION (unaudited) | AllianceBernstein Variable Products Series Fund |
For Federal income tax purposes, the following information is furnished with respect to the distributions paid by the Portfolio during the taxable year ended December 31, 2013. For corporate shareholders, 100% of dividends paid qualify for the dividends received deduction.
22
| VALUE PORTFOLIO | AllianceBernstein Variable Products Series Fund |
| BOARDOF DIRECTORS | ||
Marshall C. Turner, Jr.(1), Chairman John H. Dobkin(1) Michael J. Downey(1) William H. Foulk, Jr.(1) D. James Guzy(1) | Nancy P. Jacklin(1) Robert M. Keith, President and Garry L. Moody(1) Earl D. Weiner(1) | |
| OFFICERS | ||
Philip L. Kirstein, Senior Vice President and Christopher W. Marx(2), Vice President Joseph G. Paul(2), Vice President Gregory L. Powell(2), Vice President | Emilie D. Wrapp, Secretary Joseph J. Mantineo, Treasurer and Phyllis J. Clarke, Controller Vincent S. Noto, Chief Compliance Officer | |
| CUSTODIANAND ACCOUNTING AGENT | LEGAL COUNSEL | |
| State Street Bank and Trust Company | Seward & Kissel LLP | |
| One Lincoln Street | One Battery Park Plaza | |
| Boston, MA 02111 | New York, NY 10004 | |
| DISTRIBUTOR | TRANSFER AGENT | |
| AllianceBernstein Investments, Inc. | AllianceBernstein Investor Services, Inc. | |
| 1345 Avenue of the Americas | P.O. Box 786003 | |
| New York, NY 10105 | San Antonio, TX 78278-6003 | |
| Toll-free 1-(800) 221-5672 | ||
| INDEPENDENT REGISTERED PUBLIC | ||
| ACCOUNTING FIRM | ||
| Ernst & Young LLP | ||
| 5 Times Square | ||
| New York, NY 10036 |
| (1) | Member of the Audit Committee, the Governance and Nominating Committee and the Independent Directors Committee. Mr. Foulk is the sole member of the Fair Value Pricing Committee. |
| (2) | The day-to-day management of, and investment decisions for, the Portfolio’s portfolio are made by the U.S. Value Senior Investment Management Team. Mr. Joseph G. Paul, Mr. Christopher W. Marx and Mr. Gregory L. Powell are the investment professionals with the most significant responsibility for the day-to-day management of the Portfolio’s portfolio. |
23
| VALUE PORTFOLIO | AllianceBernstein Variable Products Series Fund |
MANAGEMENTOFTHE FUND
Board of Directors Information
The business and affairs of the Fund are managed under the direction of the Board of Directors. Certain information concerning the Fund’s Directors is set forth below.
| NAME, ADDRESS*, AGE, (YEAR FIRST ELECTED**) | PRINCIPAL OCCUPATION(S) DURING PAST FIVE YEARS AND OTHER RELEVANT QUALIFICATIONS*** | PORTFOLIOS IN FUND COMPLEX OVERSEEN BY DIRECTOR | OTHER DIRECTORSHIP HELD BY DIRECTOR IN THE PAST FIVE YEARS | |||||
| INTERESTED DIRECTOR | ||||||||
Robert M. Keith, # 1345 Avenue of the Americas New York, NY 10105 53 (2010) | �� | Senior Vice President of AllianceBernstein L.P. (the “Adviser”) and the head of AllianceBernstein Investments, Inc. (“ABI”) since July 2008; Director of ABI and President of the AllianceBernstein Mutual Funds. Previously, he served as Executive Managing Director of ABI from December 2006 to June 2008. Prior to joining ABI in 2006, Executive Managing Director of Bernstein Global Wealth Management, and prior thereto, Senior Managing Director and Global Head of Client Service and Sales of the Adviser’s institutional investment management business since 2004. Prior thereto, he was Managing Director and Head of North American Client Service and Sales in the Adviser’s institutional investment management business, with which he had been associated since prior to 2004. | 100 | None | ||||
| DISINTERESTED DIRECTORS | ||||||||
Marshall C. Turner, Jr., ## Chairman of the Board 72 (2005) | Private Investor since prior to 2009. Former CEO of Dupont Photomasks, Inc. (components of semi-conductor manufacturing), 2003-2006, and interim CEO 1999-2000. Interim CEO of MEMC Electronic Materials, Inc. (semi-conductor and solar cell substrates) from November 2008 until March 2009. He has extensive operating and early-stage investment experience, including prior service as general partner of three institutional venture capital partnerships, and serves on the boards of three education and science-related non-profit organizations. He has served as a director of one AllianceBernstein fund since 1992, and director or trustee of multiple AllianceBernstein funds since 2005. He is Chairman of the AllianceBernstein Funds since January 2014. | 100 | Xilinx, Inc. (programmable logic semi-conductors) and SunEdison, Inc. (semi-conductor substrates, solar materials and solar power plants) since prior to 2009 | |||||
24
| AllianceBernstein Variable Products Series Fund |
| NAME, ADDRESS*, AGE, (YEAR FIRST ELECTED**) | PRINCIPAL OCCUPATION(S) DURING PAST FIVE YEARS AND OTHER RELEVANT QUALIFICATIONS*** | PORTFOLIOS IN FUND COMPLEX OVERSEEN BY DIRECTOR | OTHER DIRECTORSHIP HELD BY DIRECTOR IN THE PAST FIVE YEARS | |||||
| DISINTERESTED DIRECTORS (continued) | ||||||||
John H. Dobkin, ## 72 (1992) | Independent Consultant since prior to 2009. Formerly, President of Save Venice, Inc. (preservation organization) from 2001–2002; Senior Advisor from June 1999-June 2000 and President of Historic Hudson Valley (historic preservation) from December 1989-May 1999. Previously, Director of the National Academy of Design. He has served as a director or trustee of various AllianceBernstein Funds since 1992, and as Chairman of the Audit Committees of a number of such Funds from 2001-2008. | 100 | None | |||||
Michael J. Downey, ## 70 (2005) | Private Investor since prior to 2009. Formerly, managing partner of Lexington Capital, LLC (investment advisory firm) from December 1997 until December 2003. From 1987 until 1993, Chairman and CEO of Prudential Mutual Fund Management, director of the Prudential mutual funds, and member of the Executive Committee of Prudential Securities Inc. He has served as a director or trustee of the AllianceBernstein Funds since 2005 and is a director and Chairman of one other registered investment company. | 100 | Asia Pacific Fund, Inc. since prior to 2009, Prospect Acquisition Corp. (financial services) from 2007 until 2009, and The Merger Fund since prior to 2009 until 2013 | |||||
William H. Foulk, Jr., ##, ### 81 (1990) | Investment Adviser and an Independent Consultant since prior to 2009. Previously, he was Senior Manager of Barrett Associates, Inc., a registered investment adviser. He was formerly Deputy Comptroller and Chief Investment Officer of the State of New York and, prior thereto, Chief Investment Officer of the New York Bank for Savings. He has served as a director or trustee of various AllianceBernstein Funds since 1983, and has been Chairman of the Independent Directors Committee of the AllianceBernstein Funds since 2003. He served as Chairman of such Funds from 2003 through December 2013. He is also active in a number of mutual fund related organizations and committees. | 100 | None | |||||
25
| VALUE PORTFOLIO | ||
| MANAGEMENTOFTHE FUND | ||
| (continued) | AllianceBernstein Variable Products Series Fund |
| NAME, ADDRESS*, AGE, (YEAR FIRST ELECTED**) | PRINCIPAL OCCUPATION(S) DURING PAST FIVE YEARS AND OTHER RELEVANT QUALIFICATIONS*** | PORTFOLIOS IN FUND COMPLEX OVERSEEN BY DIRECTOR | OTHER DIRECTORSHIP HELD BY DIRECTOR IN THE PAST FIVE YEARS | |||||
| DISINTERESTED DIRECTORS (continued) | ||||||||
D. James Guzy, ## 77 (2005) | Chairman of the Board of PLX Technology (semi-conductors) and of SRC Computers Inc., with which he has been associated since prior to 2009. He was a director of Intel Corporation (semi-conductors) from 1969 until 2008, and served as Chairman of the Finance Committee of such company for several years until May 2008. He was a Director of Cirrus Logic Corporation (semi-conductors) from 1984 until July 2011. He has served as a director or trustee of one or more of the AllianceBernstein Funds since 1982. | 100 | PLX Technology (semi-conductors) since prior to 2009, and Cirrus Logic Corporation (semi-conductors) since prior to 2009 until July 2011 | |||||
Nancy P. Jacklin, ## 65 (2006) | Professorial Lecturer at the Johns Hopkins School of Advanced International Studies since 2008. Formerly, U.S. Executive Director of the International Monetary Fund (December 2002-May 2006); Partner, Clifford Chance (1992-2002); Sector Counsel, International Banking and Finance, and Associate General Counsel, Citicorp (1985-1992); Assistant General Counsel (International), Federal Reserve Board of Governors (1982-1985); and Attorney Advisor, U.S. Department of the Treasury (1973-1982). Member of the Bar of the District of Columbia and of New York; and member of the Council on Foreign Relations. She has served as a director or trustee of the AllianceBernstein Funds since 2006. | 100 | None | |||||
Garry L. Moody, ## 61 (2008) | Independent Consultant. Formerly, Partner, Deloitte & Touche LLP (1995-2008) where he held a number of senior positions, including Vice Chairman, and U.S. and Global Investment Management Practice Managing Partner; President, Fidelity Accounting and Custody Services Company (1993-1995); and Partner, Ernst & Young LLP (1975-1993), where he served as the National Director of Mutual Fund Tax Services and Managing Partner of its Chicago Office Tax department. He is a member of both the Governing Council of the Independent Directors Council (IDC), an organization of independent directors of mutual funds, and the Trustee Advisory Board of BoardIQ, a biweekly publication focused on issues and news affecting directors of mutual funds. He has served as a director or trustee, and as Chairman of the Audit Committee, of the AllianceBernstein Funds since 2008. | 100 | Greenbacker Renewable Energy Company LLC (renewable energy and energy efficiency projects) from August 2013 to January 2014 | |||||
26
| AllianceBernstein Variable Products Series Fund |
| NAME, ADDRESS*, AGE, (YEAR FIRST ELECTED**) | PRINCIPAL OCCUPATION(S) DURING PAST FIVE YEARS AND OTHER RELEVANT QUALIFICATIONS*** | PORTFOLIOS IN FUND COMPLEX OVERSEEN BY DIRECTOR | OTHER DIRECTORSHIP HELD BY DIRECTOR IN THE PAST FIVE YEARS | |||||
| DISINTERESTED DIRECTORS (continued) | ||||||||
Earl D. Weiner, ## 74 (2007) | Of Counsel, and Partner prior to January 2007, of the law firm Sullivan & Cromwell LLP and member of ABA Federal Regulation of Securities Committee Task Force to draft editions of the Fund Director’s Guidebook. He also serves as a director or trustee of various non-profit organizations and has served as Chairman or Vice Chairman of a number of them. He has served as a director or trustee of the AllianceBernstein Funds since 2007 and is Chairman of the Governance and Nominating Committees of the Funds. | 100 | None | |||||
| * | The address for each of the Portfolio’s disinterested Directors is c/o AllianceBernstein L.P., Attention: Philip L. Kirstein, 1345 Avenue of the Americas, New York, NY 10105. |
| ** | There is no stated term of office for the Fund’s Directors. |
| *** | The information above includes each Director’s principal occupation during the last five years and other information relating to the experience, attributes and skills relevant to each Director’s qualifications to serve as a Director, which led to the conclusion that each Director should serve as a Director for the Fund. |
| # | Mr. Keith is an “interested person” of the Fund, as defined in the 1940 Act, due to his position as a Senior Vice President of the Adviser. |
| ## | Member of the Audit Committee, the Governance and Nominating Committee and the Independent Directors Committee. |
| ### | Member of the Fair Value Pricing Committee. |
27
| VALUE PORTFOLIO | ||
| MANAGEMENTOFTHE FUND | ||
| (continued) | AllianceBernstein Variable Products Series Fund |
Officer Information
Certain information concerning the Portfolio’s Officers is listed below.
| NAME, ADDRESS* AND AGE | PRINCIPAL POSITION(S) HELD WITH FUND | PRINCIPAL OCCUPATION DURING PAST FIVE YEARS | ||
Robert M. Keith 53 | President and Chief Executive Officer | See biography above. | ||
Philip L. Kirstein 68 | Senior Vice President and Independent Compliance Officer | Senior Vice President and Independent Compliance Officer of the AllianceBernstein Funds, with which he has been associated since October 2004. Prior thereto, he was Of Counsel to Kirkpatrick & Lockhart, LLP from October 2003 to October 2004, and General Counsel of Merrill Lynch Investment Managers, L.P. since prior to March 2003. | ||
Christopher W. Marx 46 | Vice President | Senior Vice President of the Adviser**, with which he has been associated since prior to 2009. | ||
Joseph G. Paul 54 | Vice President | Senior Vice President of the Adviser**, with which he has been associated since prior to 2009. | ||
Gregory L. Powell 55 | Vice President | Senior Vice President of the Adviser**, with which he has been associated since prior to 2009. | ||
Emilie D. Wrapp 58 | Secretary | Senior Vice President, Assistant General Counsel and Assistant Secretary of ABI**, with which she has been associated since prior to 2009. | ||
Joseph J. Mantineo 54 | Treasurer and Chief Financial Officer | Senior Vice President of AllianceBernstein Investor Services, Inc. (“ABIS”)**, with which he has been associated since prior to 2009. | ||
Phyllis J. Clarke 53 | Controller | Vice President of ABIS**, with which she has been associated since prior to 2009. | ||
Vincent S. Noto 49 | Chief Compliance Officer | Chief Compliance Officer of the AllianceBernstein Funds, and Vice President of ABIS**, with which he has been associated since prior to 2009. |
| * | The address for each of the Portfolio’s Officers is 1345 Avenue of the Americas, New York, NY 10105. |
| ** | The Adviser, ABIS and ABI are affiliates of the Fund. |
| The Fund’s Statement of Additional Information (“SAI”) has additional information about the Fund’s Directors and Officers and is available without charge upon request. Contact your financial representative or AllianceBernstein at (800) 227-4618, or visit www.alliancebernstein.com, for a free prospectus or SAI. |
28
| VALUE PORTFOLIO | ||
| SENIOR OFFICER FEE EVALUATION | AllianceBernstein Variable Products Series Fund |
THE FOLLOWING IS NOT PART OF THE SHAREHOLDER REPORT OR THE FINANCIAL STATEMENTS
SUMMARY OF SENIOR OFFICER’S EVALUATION OF INVESTMENT ADVISORY AGREEMENT1
The following is a summary of the evaluation of the Investment Advisory Agreement between AllianceBernstein L.P. (the “Adviser”) and the AllianceBernstein Variable Products Series Fund (the “Fund”), in respect of AllianceBernstein Value Portfolio (the “Portfolio”).2 The evaluation of the Investment Advisory Agreement was prepared by Philip L. Kirstein, the Senior Officer of the Fund, for the Directors of the Fund, as required by a September 2004 agreement between the Adviser and the New York State Attorney General (the “NYAG”). The Senior Officer’s evaluation of the Investment Advisory Agreement is not meant to diminish the responsibility or authority of the Board of Directors of the Fund to perform its duties pursuant to Section 15 of the Investment Company Act of 1940 (the “40 Act”) and applicable state law. The purpose of the summary is to provide shareholders with a synopsis of the independent evaluation of the reasonableness of the advisory fees proposed to be paid by the Portfolio which was provided to the Directors in connection with their review of the proposed approval of the continuance of the Investment Advisory Agreement. The Senior Officer’s evaluation considered the following factors:
| 1. | Advisory fees charged to institutional and other clients of the Adviser for like services; |
| 2. | Advisory fees charged by other mutual fund companies for like services; |
| 3. | Costs to the Adviser and its affiliates of supplying services pursuant to the advisory agreement, excluding any intra-corporate profit; |
| 4. | Profit margins of the Adviser and its affiliates from supplying such services; |
| 5. | Possible economies of scale as the Portfolio grows larger; and |
| 6. | Nature and quality of the Adviser’s services including the performance of the Portfolio. |
These factors, with the exception of the first factor, are generally referred to as the “Gartenberg factors,” which were articulated by the United States Court of Appeals for the Second Circuit in 1982. Gartenberg v. Merrill Lynch Asset Management, Inc., 694 F. 2d 923 (2d Cir. 1982). The first factor is an additional factor required to be considered by the AoD. On March 30, 2010, the Supreme Court held the Gartenberg decision was correct in its basic formulation of what §36(b) requires: to face liability under §36(b), “an investment adviser must charge a fee that is so disproportionately large that it bears no reasonable relationship to the services rendered and could not have been the product of arm’s length bargaining.” Jones v. Harris Associates L.P., 130 S. Ct. 1418 (2010). In the Jones decision, the Court stated the Gartenberg approach fully incorporates the correct understanding of fiduciary duty within the context of section 36(b) and noted with approval that “Gartenberg insists that all relevant circumstances be taken into account” and “uses the range of fees that might result from arm’s-length bargaining as the benchmark for reviewing challenged fees.”3
PORTFOLIO ADVISORY FEES, NET ASSETS & EXPENSE RATIOS
The Adviser proposed that the Portfolio pays the advisory fee set forth in the table below for receiving the services to be provided pursuant to the Investment Advisory Agreement. The fee schedule below, implemented in January 2004 in consideration of the Adviser’s settlement with the NYAG in December 2003, is based on a master schedule that contemplates eight categories of funds with almost all funds in each category having the same advisory fee schedule.
| Category | Advisory Fee Based on % of Average Daily Net Assets | Net Assets 03/31/13 ($MIL) | Portfolio | |||||
Value | 0.55% on first $2.5 billion 0.45% on next $2.5 billion 0.40% on the balance | $ | 167.8 | Value Portfolio | ||||
| 1 | The information in the fee summary was completed on April 22, 2013 and discussed with the Board of Directors on April 30-May 2, 2013. |
| 2 | Future references to the Fund and the Portfolio do not include “AllianceBernstein.” References in the fee summary pertaining to performance and expense ratio rankings refer to the Class A shares of the Portfolio. |
| 3 | Jones v. Harris at 1427. |
29
| VALUE PORTFOLIO | ||
| SENIOR OFFICER FEE EVALUATION | ||
| (continued) | AllianceBernstein Variable Products Series Fund |
The Adviser is reimbursed as specified in the Investment Advisory Agreement for certain clerical, legal, accounting, administrative and other services provided to the Portfolio. During the Portfolio’s most recently completed fiscal year, the Adviser received $45,169(0.027% of the Portfolio’s average daily net assets) for such services.
The Adviser has agreed to waive that portion of its management fees and/or reimburse the Portfolio for that portion of its total operating expenses to the degree necessary to limit the Portfolio’s expense ratios to the amounts set forth below for the Portfolio’s fiscal year. The waiver is terminable by the Adviser upon at least 60 days’ notice prior to the Portfolio’s prospectus update or May 1st of each year. The Portfolio was operating below its expense caps for the most recent fiscal year; accordingly the expense limitation undertaking of the Portfolio was of no effect. In addition, set forth below are the gross expense ratios of the Portfolio for the most recently completed fiscal year:
| Portfolio | Expense Cap Pursuant to Expense Limitation Undertaking | Gross Expense Ratio | Fiscal Year End | |||||
Value Portfolio | Class A 1.20% Class B 1.45% |
| 0.72% 0.97% |
| December 31 | |||
I. ADVISORY FEES CHARGED TO INSTITUTIONAL AND OTHER CLIENTS
The advisory fees charged to investment companies which the Adviser manages and sponsors are normally higher than those charged to similar sized institutional accounts, including pension plans and sub-advised investment companies. The fee differential reflects, among other things, different services provided to such clients, and different liabilities assumed. Services provided by the Adviser to the Portfolio that are not provided to non-investment company clients and sub-advised investment companies include providing office space and personnel to serve as Fund Officers, who among other responsibilities make the certifications required under the Sarbanes–Oxley Act of 2002, and coordinating with and monitoring the Portfolio’s third party service providers such as Fund counsel, auditors, custodians, transfer agents and pricing services. The accounting, administrative, legal and compliance requirements for the Portfolio are more costly than those for institutional assets due to the greater complexities and time required for investment companies, although as previously noted, the Adviser is reimbursed for providing such services. Also, retail mutual funds managed by the Adviser are widely held. Servicing the Portfolio’s investors is more time consuming and labor intensive compared to institutional clients since the Adviser needs to communicate with a more extensive network of financial intermediaries and shareholders. The Adviser also believes that it incurs substantial entrepreneurial risk when offering a new mutual fund, since establishing a new mutual fund requires a large upfront investment, and it may take a long time for the fund to achieve profitability since the fund must be priced to scale from inception in order to be competitive and assets are acquired one account at a time. In addition, managing the cash flow of an investment company may be more difficult than managing that of a stable pool of assets, such as an institutional account with little cash movement in either direction, particularly, if a fund is in net redemption and the Adviser is frequently forced to sell securities to raise cash for redemptions. However, managing a fund with positive cash flow may be easier at times than managing a stable pool of assets. In recent years, investment advisers have been sued by institutional clients and have suffered reputational damage both by the attendant publicity and outcomes other than complete victories. Accordingly, the legal and reputational risks associated with institutional accounts are greater than previously thought, although still not equal to those related to the mutual fund industry.
Notwithstanding the Adviser’s view that managing an investment company is not comparable to managing other institutional accounts because the services provided are different, the Supreme Court has indicated consideration should be given to the advisory fees charged to institutional accounts that have a substantially similar investment style as the Portfolio.4 In addition to the AllianceBernstein institutional fee schedule, set forth below is what would have been the effective advisory fee of the Portfolio had the AllianceBernstein institutional fee schedule been applicable to the Portfolio versus the Portfolio’s advisory fee based on March 31, 2013 net assets:5
| 4 | The Supreme Court stated that “courts may give such comparisons the weight that they merit in light of the similarities and differences between the services that the clients in question require, but the courts must be wary of inapt comparisons.” Among the significant differences the Supreme Court noted that may exist between services provided to mutual funds and institutional accounts are “higher marketing costs.” Jones v. Harris at 1428. |
| 5 | The Adviser has indicated that with respect to institutional accounts with assets greater than $300 million, it will negotiate a fee schedule. Discounts that are negotiated vary based upon each client relationship. |
30
| AllianceBernstein Variable Products Series Fund |
| Portfolio | Net Assets 03/31/13 ($MIL) | AllianceBernstein Institutional Fee Schedule | Effective AB Inst. Adv. Fee | Portfolio Advisory Fee | ||||||||
Value Portfolio | $167.8 | U.S. Diversified Value Schedule | 0.412 | % | 0.550 | % | ||||||
| 0.65% on first $25m | ||||||||||||
| 0.50% on the next $25m | ||||||||||||
| 0.40% on the next $50m | ||||||||||||
| 0.30% on the next $100m | ||||||||||||
| 0.25% on the balance | ||||||||||||
| Minimum account size $25m | ||||||||||||
The Adviser also manages AllianceBernstein Value Fund, Inc. (“Value Fund, Inc.”), a retail mutual fund, which has a substantially similar investment style as the Portfolio. Set forth below is the fee schedule of Value Fund, Inc. and what would have been the effective advisory fee of the Portfolio had the fee schedule of the retail mutual fund been applicable to the Portfolio:6
| Portfolio | AllianceBernstein Mutual Fund | Fee Schedule | ABMF Effective | Portfolio Advisory | ||||||||
Value Portfolio | Value Fund, Inc. | 0.55% on first $2.5 billion | 0.550 | % | 0.550 | % | ||||||
| 0.45% on next $2.5 billion | ||||||||||||
| 0.40% on the balance | ||||||||||||
The Adviser provides sub-advisory services to certain other investment companies managed by other fund families that have an investment style similar to that of the Portfolio. The Adviser charges the fees set forth below for the sub-advisory relationships that have a somewhat similar investment style as the Portfolio. Also shown are the Portfolio’s advisory fees and what would have been the effective advisory fees of the Portfolio had the fee schedules of the sub-advisory relationships been applicable to the Portfolio based on March 31, 2013 net assets.
| Portfolio | Fee Schedule | Effective Sub-Adv. Fee | Portfolio Advisory Fee | |||||||||
Value Portfolio | Client #17 | 0.49% on the first $100 million 0.30% on the next $100 million 0.25% on the balance | 0.413% | 0.550% | ||||||||
| Client #27 | 0.30% of the average daily net assets | 0.300% | 0.550% | |||||||||
It is fair to note that the services the Adviser provides pursuant to sub-advisory agreements are generally confined to the services related to the investment process; in other words, they are not as comprehensive as the services provided to the Portfolio by the Adviser. In addition, to the extent that certain of these sub-advisory relationships are with affiliates of the Adviser, the fee schedules may not reflect arm’s length bargaining or negotiations.
While it appears that the sub-advisory relationships are paying a lower fee than the Portfolios, it is difficult to evaluate the relevance of such lower fees due to differences in terms of the services provided, risks involved and other competitive factors between the Portfolio and the sub-advisory relationship. There could be various business reasons why an investment adviser would be willing to provide a sub-advisory relationship investment related services at a different fee level than an investment company it is sponsoring where the investment adviser is providing all the services, not just investment management, generally required by a registered investment company.
| 6 | The retail mutual fund was also affected by the settlement between the Adviser and the NYAG. As a result, the Portfolio has the same breakpoints in its advisory fee schedule as the retail mutual fund. |
| 7 | The client is an affiliate of the Adviser. |
31
| VALUE PORTFOLIO | ||
| SENIOR OFFICER FEE EVALUATION | ||
| (continued) | AllianceBernstein Variable Products Series Fund |
II. MANAGEMENT FEES CHARGED BY OTHER MUTUAL FUND COMPANIES FOR LIKE SERVICES.
Lipper Inc. (“Lipper”), an analytical service that is not affiliated with the Adviser, compared the fees charged to the Portfolio with fees charged to other investment companies for similar services offered by other investment advisers.8 Lipper’s analysis included the comparison of the Portfolio’s contractual management fee, estimated at the approximate current asset level of the Portfolio, to the median of the Portfolio’s Lipper Expense Group (“EG”) and the Portfolio’s contractual management fee ranking.9,10
Lipper describes an EG as a representative sample of comparable funds. Lipper’s standard methodology for screening funds to be included in an EG entails the consideration of several fund criteria, including fund type, investment classification/objective, load type and similar 12b-1/non-12b-1 service fees, asset (size) comparability, expense components and attributes. An EG will typically consist of seven to twenty funds.
| Portfolio | Contractual Management Fee(%)11 | Lipper EG Median (%) | Lipper Rank | |||||||||
Value Portfolio | 0.550 | % | 0.745 | % | 1/13 | |||||||
Lipper also analyzed the Portfolio’s most recently completed fiscal year total expense ratio in comparison to the Portfolio’s EG and Lipper Expense Universe (“EU”). The EU12 is a broader group compared to the EG, consisting of all funds that have the same investment classification/objective and load type as the subject Portfolio.
| Portfolio | Expense Ratio | Lipper EG Median(%) | Lipper EG Rank | Lipper EU Median (%) | Lipper EU Rank | |||||||||||||||
Value Portfolio | 0.722 | % | 0.775 | % | 3/13 | 0.763 | % | 12/32 | ||||||||||||
Based on this analysis, the Portfolio hasa more favorable ranking on a management fee basis than on a total expense ratio basis.
III. COSTS TO THE ADVISER AND ITS AFFILIATES OF SUPPLYING SERVICES
PURSUANT TO THE ADVISORY FEE ARRANGEMENT, EXCLUDING ANY INTRA-CORPORATE PROFIT.
The Adviser utilizes two profitability reporting systems, which operate independently but are aligned with each other, to estimate the Adviser’s profitability in connection with investment advisory services provided to the Portfolio. The Senior Officer has retained a consultant to provide independent advice regarding the alignment of the two profitability systems as well as the methodologies and allocations utilized by both profitability systems.
IV. PROFIT MARGINS OF THE ADVISER AND ITS AFFILIATES FOR SUPPLYING SUCH SERVICES.
The Portfolio’s profitability information, prepared by the Adviser for the Board of Directors, was reviewed by the Senior Officer and the consultant. The Adviser’s profitability from providing investment advisory services to thePortfoliodecreased duringcalendar year 2012, relative to 2011.
| 8 | The Supreme Court cautioned against accepting mutual fund fee comparisons without careful scrutiny since “these comparisons are problematic because these fees, like those challenged, may not be the product of negotiations conducted at arm’s length.” Jones v. Harris at 1429. |
| 9 | Lipper does not consider average account size when constructing EGs. Funds with relatively small average account sizes tend to have higher transfer agent expense ratio than comparable sized funds that have relatively large average account sizes. Note that there are limitations on Lipper expense category data because different funds categorize expenses differently. |
| 10 | The contractual management fee is calculated by Lipper using the Portfolio’s contractual management fee rate at a hypothetical asset level. The hypothetical asset level is based on the combined net assets of all classes of the Portfolio, rounded up to the next $25 million. Lipper’s total expense ratio information is based on the most recent annual report except as otherwise noted. A ranking of “1” would mean that the Portfolio had the lowest effective fee rate in the Lipper peer group. |
| 11 | The contractual management fee does not reflect any expense reimbursements made by the Portfolio to the Adviser for certain clerical, legal, accounting, administrative and other services. In addition, the contractual management fee does not reflect any advisory fee waiver or expense cap that would effectively reduce the actual management fee. |
| 12 | Except for asset (size) comparability, Lipper uses the same criteria for selecting an EG when selecting an EU. Unlike the EG, the EU allows for the same adviser to be represented by more than just one fund. |
| 13 | Most recently completed fiscal year end Class A total expense ratio. |
32
| AllianceBernstein Variable Products Series Fund |
In addition to the Adviser’s direct profits from managing the Portfolio, certain of the Adviser’s affiliates have business relationships with the Portfolio and may earn a profit from providing other services to the Portfolio. The courts have referred to this type of business opportunity as “fall-out benefits” to the Adviser and indicated that such benefits should be factored into the evaluation of the total relationship between the Portfolio and the Adviser. Neither case law nor common business practice precludes the Adviser’s affiliates from earning a reasonable profit on this type of relationship provided the affiliates’ charges and services are competitive. These affiliates provide transfer agent, distribution and brokerage related services to the Portfolio and receive transfer agent fees, Rule 12b-1 payments, and brokerage commissions. In addition, the Adviser benefits from soft dollar arrangements which offset expenses the Adviser would otherwise incur.
The Portfolio has adopted a distribution plan for Class B shares pursuant to Rule 12b-1 under the 40 Act. Under the distribution plan, the Portfolio pays distribution and servicing fees to its principal underwriter, AllianceBernstein Investments, Inc. (“ABI”), the Portfolio’s distributor and an affiliate of the Adviser, at an annual rate of up to 0.50% of the Portfolio’s average daily net assets attributable to Class B shares. The current annual rate that the Portfolio pays to ABI for 12b-1 fees is 0.25%. During the fiscal year ended December 31, 2012, ABI received $418,618 in Rule 12b-1 fees.
During the fiscal year ended December 31, 2012, the Adviser incurred distribution expenses in the amount of $1,117,197 in connection with activities primarily intended to result in the sale of the Portfolio’s Class B shares. This amount includes the 12b-1 fees paid by the Portfolio to the Adviser.
Financial intermediaries, such as insurers, market and sell shares of the Portfolio and typically receive compensation from ABI, the Advisers and/or the Portfolio for selling shares of the Portfolio. These financial intermediaries receive compensation in any or all of the following forms: 12b-1 fees, defrayal of costs for educational seminars and training, additional distribution support, recordkeeping and/or administrative services. Payments related to providing contract-holder recordkeeping and/or administrative services will generally not exceed 0.35% of the average daily net assets of the Portfolio attributable to the relevant intermediary over the year. With respect to the Fund, which includes the Portfolio and other Portfolios of the Fund not discussed in this summary, ABI paid approximately $600,000 in 2012 and expects to pay approximately $600,000 in 2013 for educational support and distribution assistance (revenue sharing payments).
The transfer agent of the Portfolio is AllianceBernstein Investor Services, Inc. (“ABIS”). During the most recently completed fiscal year, ABIS received a fee of $1,385 from the Portfolio.14
The Portfolio did not effect brokerage transactions and pay commissions through the Adviser’s affiliate, Sanford C. Bernstein & Co., LLC (“SCB & Co.”) nor its U.K. affiliate, Sanford C. Bernstein Limited (“SCB Ltd.”), collectively “SCB,” during the Portfolio’s most recently completed fiscal year. The Adviser represented that SCB’s profitability from business conducted in the future with the Portfolio would be comparable to the profitability of SCB’s dealings with other similar third party clients. In the ordinary course of business, SCB receives and pays liquidity rebates from electronic communications networks (“ECNs”) derived from trading for its clients, including the Portfolio. These credits and charges are not being passed onto any SCB client. The Adviser also receives certain soft dollar benefits from brokers that execute agency trades for the Portfolio and other clients. These soft dollar benefits reduce the Adviser’s cost of doing business and increase its profitability.
V. POSSIBLE ECONOMIES OF SCALE
The Adviser has indicated that economies of scale are being shared with shareholders through pricing to scale, breakpoints, fee reductions/waivers and enhancement to services.
In May 2012, an independent consultant, retained by the Senior Officer, provided the Board of Directors information on the Adviser’s firm-wide average costs from 2005 through 2011 and the potential economies of scale. The independent consultant noted that from 2005 through 2007 the Adviser experienced significant growth in assets under management (“AUM”). During this period, operating expenses increased, in part to keep up with growth, and in part reflecting market returns. However, from 2008 through the first quarter of 2009, AUM rapidly and significantly decreased due to declines in market value and client withdrawals. When AUM rapidly decreased, some operating expenses categories, including base compensation and office space, adjusted more slowly during this period, resulting in an increase in average costs. Since 2009, AUM has experienced less significant changes. The independent consultant noted that changes in operating expenses reflect changes in business composition and business practices in response to changes in financial markets. Finally, the
| 14 | The Fund (which includes the Portfolio and other Portfolios of the Fund) paid ABIS a flat fee of $18,000 in 2012. |
33
| VALUE PORTFOLIO | ||
| SENIOR OFFICER FEE EVALUATION | ||
| (continued) | AllianceBernstein Variable Products Series Fund |
independent consultant concluded that the increase in average cost and the decline in net operating margin across the Adviser since late 2008 are inconsistent with the view that there are currently reductions in average costs due to economies of scale that can be shared with the AllianceBernstein Mutual Funds managed by the Adviser through lower fees.
Previously in February 2008, the independent consultant provided the Board of Directors an update of the Deli study on advisory fees and various fund characteristics.15,16 The independent consultant first reiterated the results of his previous two dimensional comparison analysis (fund size and family size) with the Board of Directors.17 The independent consultant then discussed the results of the regression model that was utilized to study the effects of various factors on advisory fees. The regression model output indicated that the bulk of the variation in fees predicted were explained by various factors, but substantially by fund AUM, family AUM, index fund indicator and investment style. The independent consultant also compared the advisory fees of the AllianceBernstein Mutual Funds to similar funds managed by 19 other large asset managers, regardless of the fund size and each Adviser’s proportion of mutual fund assets to non-mutual fund assets.
VI. NATURE AND QUALITY OF THE ADVISER’S SERVICES, INCLUDING THE PERFORMANCE OF THE PORTFOLIO
With assets under management of approximately $443 billion as of March 31, 2013, the Adviser has the investment experience to manage and provide non-investment services (described in Section I) to the Portfolio.
The information prepared by Lipper shows the 1, 3, 5 and 10 year performance returns and rankings of the Portfolio18 relative to its Lipper Performance Group (“PG”) and Lipper Performance Universe (“PU”)19 for the periods ended February 28, 2013.20
| Portfolio (%) | PG Median (%) | PU Median (%) | PG Rank | PU Rank | ||||||||||||||||
Value Portfolio | ||||||||||||||||||||
1 year | 14.28 | 14.28 | 14.66 | 7/13 | 17/28 | |||||||||||||||
3 year | 10.25 | 11.19 | 11.18 | 9/13 | 22/27 | |||||||||||||||
5 year | 1.15 | 2.93 | 3.33 | 12/13 | 24/25 | |||||||||||||||
10 year | 6.18 | 8.41 | 8.09 | 11/11 | 22/22 | |||||||||||||||
| 15 | The Deli study, originally published in 2002 based on 1997 data and updated for the February 2008 Presentation, may be of diminished value due to the age of the data used in the presentation and the changes experienced in the industry over the last four years. |
| 16 | As mentioned previously, the Supreme Court cautioned against accepting mutual fund fee comparisons without careful scrutiny since the fees may not be the product of negotiations conducted at arm’s length. See Jones V. Harris at 1429. |
| 17 | The two dimensional analysis showed patterns of lower advisory fees for funds with larger asset sizes and funds from larger family sizes compared to funds with smaller asset sizes and funds from smaller family sizes, which according to the independent consultant is indicative of a sharing of economies of scale and scope. However, in less liquid and active markets, such is not the case, as the empirical analysis showed potential for diseconomies of scale in those markets. The empirical analysis also showed diminishing economies of scale and scope as funds surpassed a certain high level of assets. |
| 18 | The performance rankings are for the Class A shares of the Portfolio. The Portfolio’s performance returns shown were provided by Lipper. |
| 19 | The Portfolio’s PG is identical to the Portfolio’s respective EG. The Portfolio’s PU is not identical to the Portfolio’s EU as the criteria for including/excluding a fund from a PU is somewhat different from that of an EU. |
| 20 | Lipper investment classification/objective dictates the PG and PU throughout the life of the fund even if a fund had a different investment classification/objective at a different point in time. |
34
| AllianceBernstein Variable Products Series Fund |
Set forth below are the 1, 3, 5 and 10 year and since inception performance returns of the Portfolio (in bold)21 versus its benchmarks.22Portfolio and benchmark volatility and reward-to-variability ratio (“Sharpe Ratio”) information is also shown.23
Periods Ending February 28, 2013 Annualized Performance | ||||||||||||||||||||||||||||||||
1 Year | 3 Year | 5 Year | 10 Year (%) | Since Inception (%) | Annualized | Risk Period (Year) | ||||||||||||||||||||||||||
| Volatility (%) | Sharpe (%) | |||||||||||||||||||||||||||||||
Value Portfolio | 14.28 | 10.25 | 1.15 | 6.18 | 6.20 | 16.39 | 0.34 | 10 | ||||||||||||||||||||||||
Russell 1000 Value Index | 17.63 | 13.66 | 3.88 | 8.77 | 8.50 | 15.68 | 0.50 | 10 | ||||||||||||||||||||||||
Inception Date: July 22, 2002 | ||||||||||||||||||||||||||||||||
CONCLUSION:
Based on the factors discussed above the Senior Officer’s conclusion is that the proposed advisory fee for the Portfolio is reasonable and within the range of what would have been negotiated at arm’s-length in light of all the surrounding circumstances. This conclusion in respect of the Portfolio is based on an evaluation of all of these factors and no single factor was dispositive.
Dated: May 29, 2013
| 21 | The performance returns and risk measures shown in the table are for the Class A shares of the Portfolio. |
| 22 | The Adviser provided Portfolio and benchmark performance return information for periods through February 28, 2013. |
| 23 | Portfolio and benchmark volatility and Sharpe Ratio information was obtained through Lipper LANA, a database maintained by Lipper. Volatility is a statistical measure of the tendency of a market price or yield to vary over time. The Sharpe Ratio is a risk adjusted measure of return that divides a portfolio’s return in excess of the riskless return by the portfolio’s standard deviation. A portfolio with a greater volatility would be viewed as more risky than a portfolio with equivalent performance but lower volatility; for that reason, a greater return would be demanded for the more risky portfolio. A portfolio with a higher Sharpe Ratio would be viewed as better performing than a portfolio with a lower Sharpe Ratio. |
35
VPS-VAL-0151-1213
ITEM 2. CODE OF ETHICS.
(a) The registrant has adopted a code of ethics that applies to its principal executive officer, principal financial officer and principal accounting officer. A copy of the registrant’s code of ethics is filed herewith as Exhibit 12(a)(1).
(b) During the period covered by this report, no material amendments were made to the provisions of the code of ethics adopted in 2(a) above.
(c) During the period covered by this report, no implicit or explicit waivers to the provisions of the code of ethics adopted in 2(a) above were granted.
ITEM 3. AUDIT COMMITTEE FINANCIAL EXPERT.
The registrant’s Board of Directors has determined that independent directors William H. Foulk, Jr and Garry L. Moody. qualify as audit committee financial experts.
ITEM 4. PRINCIPAL ACCOUNTANT FEES AND SERVICES.
(a) - (c) The following table sets forth the aggregate fees billed by the independent auditor Ernst & Young LLP, for the Fund’s last two fiscal years for professional services rendered for: (i) the audit of the Fund’s annual financial statements included in the Fund’s annual report to stockholders; (ii) assurance and related services that are reasonably related to the performance of the audit of the Fund’s financial statements and are not reported under (i), which include multi-class distribution testing, advice and education on accounting and auditing issues, and consent letters; and (iii) tax compliance, tax advice and tax return preparation.
| Audit Fees | Audit-Related Fees | Tax Fees | ||||||||||||||
AllianceBernstein Balanced Wealth Strategy Portfolio | 2012 | 45,500 | 326 | 14,746 | ||||||||||||
| 2013 | 45,500 | — | 25,662 | |||||||||||||
AllianceBernstein Global Thematic Growth Portfolio | 2012 | 27,500 | 326 | 12,886 | ||||||||||||
| 2013 | 27,500 | — | 18,348 | |||||||||||||
AllianceBernstein Growth Portfolio | 2012 | 26,000 | 326 | 8,717 | ||||||||||||
| 2013 | 26,000 | — | 10,563 | |||||||||||||
AllianceBernstein Growth and Income Portfolio | 2012 | 26,000 | 326 | 9,302 | ||||||||||||
| 2013 | 26,000 | — | 11,148 | |||||||||||||
AllianceBernstein Intermediate Bond Portfolio | 2012 | 40,000 | 326 | 9,716 | ||||||||||||
| 2013 | 40,000 | — | 9,725 | |||||||||||||
AllianceBernstein International Growth Portfolio | 2012 | 27,500 | 326 | 13,918 | ||||||||||||
| 2013 | 27,500 | — | 19,405 | |||||||||||||
AllianceBernstein International Value Portfolio | 2012 | 27,500 | 326 | 34,018 | ||||||||||||
| 2013 | 27,500 | — | 17,180 | |||||||||||||
AllianceBernstein Large Cap Growth Portfolio | 2012 | 26,000 | 326 | 8,717 | ||||||||||||
| 2013 | 26,000 | — | 10,563 | |||||||||||||
AllianceBernstein Real Estate Investment Portfolio | 2012 | 27,500 | 326 | 15,099 | ||||||||||||
| 2013 | 27,500 | — | 18,445 | |||||||||||||
AllianceBernstein Small Cap Growth Portfolio | 2012 | 26,000 | 326 | 8,633 | ||||||||||||
| 2013 | 26,000 | — | 10,479 | |||||||||||||
AllianceBernstein Small-Mid Cap Value Portfolio | 2012 | 26,000 | 326 | 13,398 | ||||||||||||
| 2013 | 26,000 | — | 16,744 | |||||||||||||
AllianceBernstein Value Portfolio | 2012 | 26,000 | 326 | 8,633 | ||||||||||||
| 2013 | 26,000 | — | 10,479 | |||||||||||||
AllianceBernstein Dynamic Asset Allocation Portfolio | 2012 | 45,500 | 326 | 14,202 | ||||||||||||
| 2013 | 45,500 | — | 18,445 | |||||||||||||
(d) Not applicable.
(e) (1) Beginning with audit and non-audit service contracts entered into on or after May 6, 2003, the Fund’s Audit Committee policies and procedures require the pre-approval of all audit and non-audit services provided to the Fund by the Fund’s independent registered public accounting firm. The Fund’s Audit Committee policies and procedures also require pre-approval of all audit and non-audit services provided to the Adviser and Service Affiliates to the extent that these services are directly related to the operations or financial reporting of the Fund.
(e) (2) All of the amounts for Audit Fees, Audit-Related Fees and Tax Fees in the table under Item 4 (a) – (c) are for services pre-approved by the Fund’s Audit Committee.
(f) Not applicable.
(g) The following table sets forth the aggregate non-audit services provided to the Fund, the Fund’s Adviser and entities that control, are controlled by or under common control with the Adviser that provide ongoing services to the Fund:
| All Fees for Non-Audit Services Provided to the Portfolio, the Adviser and Service Affiliates | Total Amount of Foregoing Column Pre- approved by the Audit Committee (Portion Comprised of Audit Related Fees) (Portion Comprised of Tax Fees) | |||||||||||
AllianceBernstein Balanced Wealth Strategy Portfolio | 2012 | $ | 712,117 | 15,072 | ||||||||
| (326 | ) | |||||||||||
| (14,746 | ) | |||||||||||
| 2013 | $ | 275,464 | 25,662 | |||||||||
| — | ||||||||||||
| (25,662 | ) | |||||||||||
AllianceBernstein Global Thematic Growth Portfolio | 2012 | $ | 710,257 | 13,212 | ||||||||
| (326 | ) | |||||||||||
| (12,886 | ) | |||||||||||
| 2013 | $ | 281,353 | 18,348 | |||||||||
| — | ||||||||||||
| (18,348 | ) | |||||||||||
AllianceBernstein Growth Portfolio | 2012 | $ | 706,088 | 9,043 | ||||||||
| (326 | ) | |||||||||||
| (8,717 | ) | |||||||||||
| 2013 | $ | 283,708 | 10,563 | |||||||||
| — | ||||||||||||
| (10,563 | ) | |||||||||||
AllianceBernstein Growth and Income Portfolio | 2012 | $ | 706,673 | 9,628 | ||||||||
| (326 | ) | |||||||||||
| (9,302 | ) | |||||||||||
| 2013 | $ | 283,123 | 11,148 | |||||||||
| — | ||||||||||||
| (11,148 | ) | |||||||||||
AllianceBernstein Intermediate Bond Portfolio | 2012 | $ | 707,087 | 10,042 | ||||||||
| (326 | ) | |||||||||||
| (9,716 | ) | |||||||||||
| 2013 | $ | 284,546 | 9,725 | |||||||||
| — | ||||||||||||
| (9,725 | ) | |||||||||||
AllianceBernstein International Growth Portfolio | 2012 | $ | 711,289 | 14,244 | ||||||||
| (326 | ) | |||||||||||
| (13,918 | ) | |||||||||||
| 2013 | $ | 280,601 | 19,405 | |||||||||
| — | ||||||||||||
| (19,405 | ) | |||||||||||
AllianceBernstein International Value Portfolio | 2012 | $ | 731,389 | 34,344 | ||||||||
| (326 | ) | |||||||||||
| (34,018 | ) | |||||||||||
| 2013 | $ | 281,491 | 17,180 | |||||||||
| — | ||||||||||||
| (17,180 | ) | |||||||||||
AllianceBernstein Large Cap Growth Portfolio | 2012 | $ | 706,088 | 9,043 | ||||||||
| (326 | ) | |||||||||||
| (8,717 | ) | |||||||||||
| 2013 | $ | 283,708 | 10,563 | |||||||||
| — | ||||||||||||
| (10,563 | ) | |||||||||||
AllianceBernstein Real Estate Investment Portfolio | 2012 | $ | 712,470 | 15,425 | ||||||||
| (326 | ) | |||||||||||
| (15,099 | ) | |||||||||||
| 2013 | $ | 275,826 | 18,445 | |||||||||
| — | ||||||||||||
| (18,445 | ) | |||||||||||
AllianceBernstein Small Cap Growth Portfolio | 2012 | $ | 706,004 | 8,959 | ||||||||
| (326 | ) | |||||||||||
| (8,633 | ) | |||||||||||
| 2013 | $ | 283,792 | 10,479 | |||||||||
| — | ||||||||||||
| (10,479 | ) | |||||||||||
AllianceBernstein Small-Mid Cap Value Portfolio | 2012 | $ | 710,769 | 13,724 | ||||||||
| (326 | ) | |||||||||||
| (13,398 | ) | |||||||||||
| 2013 | $ | 277,527 | 16,744 | |||||||||
| — | ||||||||||||
| (16,744 | ) | |||||||||||
AllianceBernstein Value Portfolio | 2012 | $ | 706,004 | 8,959 | ||||||||
| (326 | ) | |||||||||||
| (8,633 | ) | |||||||||||
| 2013 | $ | 283,792 | 10,479 | |||||||||
| — | ||||||||||||
| (10,479 | ) | |||||||||||
AllianceBernstein Dynamic Asset Allocation Portfolio | 2012 | $ | 711,573 | 14,528 | ||||||||
| (326 | ) | |||||||||||
| (14,202 | ) | |||||||||||
| 2013 | $ | 275,826 | 18,445 | |||||||||
| — | ||||||||||||
| (18,445 | ) |
(h) The Audit Committee of the Fund has considered whether the provision of any non-audit services not pre-approved by the Audit Committee provided by the Fund’s independent registered public accounting firm to the Adviser and Service Affiliates is compatible with maintaining the auditor’s independence.
ITEM 5. AUDIT COMMITTEE OF LISTED REGISTRANTS.
Not applicable to the registrant.
ITEM 6. SCHEDULE OF INVESTMENTS.
Please see Schedule of Investments contained in the Report to Shareholders included under Item 1 of this Form N-CSR.
ITEM 7. DISCLOSURE OF PROXY VOTING POLICIES AND PROCEDURES FOR CLOSED-END MANAGEMENT INVESTMENT COMPANIES.
Not applicable to the registrant.
ITEM 8. PORTFOLIO MANAGERS OF CLOSED-END MANAGEMENT INVESTMENT COMPANIES.
Not applicable to the registrant.
ITEM 9. PURCHASES OF EQUITY SECURITIES BY CLOSED-END MANAGEMENT INVESTMENT COMPANY AND AFFILIATED PURCHASERS.
Not applicable to the registrant.
ITEM 10. SUBMISSION OF MATTERS TO A VOTE OF SECURITY HOLDERS.
There have been no material changes to the procedures by which shareholders may recommend nominees to the Fund’s Board of Directors since the Fund last provided disclosure in response to this item.
ITEM 11. CONTROLS AND PROCEDURES.
(a) The registrant’s principal executive officer and principal financial officer have concluded that the registrant’s disclosure controls and procedures (as defined in Rule 30a-3(c) under the Investment Company Act of 1940, as amended) are effective at the reasonable assurance level based on their evaluation of these controls and procedures as of a date within 90 days of the filing date of this document.
(b) There were no significant changes in the registrant’s internal controls over financial reporting that could significantly affect these controls subsequent to the date of their evaluation, including any corrective actions with regard to significant deficiencies and material weaknesses.
ITEM 12. EXHIBITS.
The following exhibits are attached to this Form N-CSR:
EXHIBIT NO. | DESCRIPTION OF EXHIBIT | |
| 12 (a) (1) | Code of ethics that is subject to the disclosure of Item 2 hereof | |
| 12 (b) (1) | Certification of Principal Executive Officer Pursuant to Section 302 of the Sarbanes-Oxley Act of 2002 | |
| 12 (b) (2) | Certification of Principal Financial Officer Pursuant to Section 302 of the Sarbanes-Oxley Act of 2002 | |
| 12 (c) | Certification of Principal Executive Officer and Principal Financial Officer Pursuant to Section 906 of the Sarbanes-Oxley Act of 2002 | |
SIGNATURES
Pursuant to the requirements of the Securities Exchange Act of 1934 and the Investment Company Act of 1940, the registrant has duly caused this report to be signed on its behalf by the undersigned, thereunto duly authorized.
(Registrant): AllianceBernstein Variable Products Series Fund, Inc.
| By: | /s/ Robert M. Keith | |
| Robert M. Keith | ||
| President | ||
| Date: | February 12, 2014 | |
Pursuant to the requirements of the Securities Exchange Act of 1934 and the Investment Company Act of 1940, this report has been signed below by the following persons on behalf of the registrant and in the capacities and on the dates indicated.
| By: | /s/ Robert M. Keith | |
| Robert M. Keith | ||
| President | ||
| Date: | February 12, 2014 | |
| By: | /s/ Joseph J. Mantineo | |
| Joseph J. Mantineo | ||
| Treasurer and Chief Financial Officer | ||
| Date: | February 12, 2014 | |