UNITED STATES
SECURITIES AND EXCHANGE COMMISSION
Washington, D.C. 20549
FORM N-CSR
CERTIFIED SHAREHOLDER REPORT OF
REGISTERED MANAGEMENT INVESTMENT COMPANIES
Investment Company Act file number: 811-05445
Name of Registrant: Vanguard Fenway Funds
Address of Registrant:
P.O. Box 2600
Valley Forge, PA 19482
Name and address of agent for service:
Heidi Stam, Esquire
P.O. Box 876
Valley Forge, PA 19482
Registrant’s telephone number, including area code: (610) 669-1000
Date of fiscal year end: September 30
Date of reporting period: October 1, 2013 – March 31, 2014
Item 1: Reports to Shareholders
![]()
Semiannual Report | March 31, 2014
Vanguard Equity Income Fund

Vanguard’s Principles for Investing Success
We want to give you the best chance of investment success. These principles, grounded in Vanguard’s research and experience, can put you on the right path.
Goals. Create clear, appropriate investment goals.
Balance. Develop a suitable asset allocation using broadly diversified funds. Cost. Minimize cost.
Discipline. Maintain perspective and long-term discipline.
A single theme unites these principles: Focus on the things you can control.
We believe there is no wiser course for any investor.
| Contents | |
| Your Fund’s Total Returns. | 1 |
| Chairman’s Letter. | 2 |
| Advisors’ Report. | 7 |
| Fund Profile. | 10 |
| Performance Summary. | 12 |
| Financial Statements. | 13 |
| About Your Fund’s Expenses. | 26 |
| Trustees Approve Advisory Arrangements. | 28 |
| Glossary. | 30 |
Please note: The opinions expressed in this report are just that—informed opinions. They should not be considered promises or advice.
Also, please keep in mind that the information and opinions cover the period through the date on the front of this report. Of course, the risks of investing in your fund are spelled out in the prospectus.
See the Glossary for definitions of investment terms used in this report.
About the cover: The ship’s wheel represents leadership and guidance, essential qualities in navigating difficult seas.
This one is a replica based on an 18th-century British vessel. The HMSVanguard, another ship of that era, served as the flagship for British Admiral Horatio Nelson when he defeated a French fleet at the Battle of the Nile.
| Your Fund’s Total Returns | ||||
| Six Months Ended March 31, 2014 | ||||
| Total | ||||
| Returns | ||||
| Vanguard Equity Income Fund | ||||
| Investor Shares | 11.53% | |||
| Admiral™ Shares | 11.55 | |||
| FTSE High Dividend Yield Index | 11.60 | |||
| Equity Income Funds Average | 10.83 | |||
| Equity Income Funds Average: Derived from data provided by Lipper, a Thomson Reuters Company. | ||||
| Admiral Shares carry lower expenses and are available to investors who meet certain account-balance requirements. | ||||
| Your Fund’s Performance at a Glance | ||||
| September 30, 2013, Through March 31, 2014 | ||||
| Distributions Per Share | ||||
| Starting | Ending | Income | Capital | |
| Share Price | Share Price | Dividends | Gains | |
| Vanguard Equity Income Fund | ||||
| Investor Shares | $28.26 | $30.23 | $0.426 | $0.799 |
| Admiral Shares | 59.24 | 63.35 | 0.922 | 1.675 |
1

Chairman’s Letter
Dear Shareholder,
Vanguard Equity Income Fund returned 11.53% for Investor Shares for the six months ended March 31, 2014, in line with the return of its benchmark, the FTSE High Dividend Yield Index, and ahead of the average return of peer funds.
The recent half year was a tale of two quarters. U.S. stock markets kept climbing from October through December, helping to make 2013 an exceptional year; in January, however, markets retreated before advancing in February and wobbling in March. Higher-yielding, slower-growing companies—which had less appeal to investors in 2013—began to look more attractive. Still, dividend-oriented stocks lagged the broad U.S. market’s six-month return.
At the end of March, the fund’s 30-day SEC yield stood at 2.69%, down slightly from 2.77% in September 2013 and almost unchanged from a year ago. (All returns and yields discussed here and elsewhere in this letter are for Investor Shares.) Your fund’s yield was about 1 percentage point higher than that of the broad U.S. stock market, as measured by the yield of Vanguard Total Stock Market Index Fund.
Despite recent choppiness, U.S. stocks were productive
The half year got off to a rocky start, with the partial federal government shutdown in October. In December, however, two developments helped reduce the uncertainty that is so often
2
a scourge of capital markets. Congress passed a two-year budget agreement, which will provide more predictability when it comes to federal spending. And the Federal Reserve ended a long guessing game when it announced that the first scaling back, or “tapering,” of its stimulative bond-buying program would begin in January.
The broad U.S. stock market returned about 12% for the six months ended March 31. Corporate earnings, for the most part, continued to rise as the U.S. economy showed modest growth.
Although the Fed’s bond-buying has helped support the market for several years, the monthly reduction of its purchases, as well as a few of its public statements, has created some apprehension among investors. Slow economic growth in China and the conflict in Ukraine have also caused market turbulence.
International stocks returned about 5%. The developed markets of Europe, where there’s been some improvement in the economy, posted a strong advance, while the developed markets of the Pacific region and emerging markets had weaker results.
Bonds reclaimed some ground after a difficult stretch
Over the six months, the broad U.S. taxable bond market returned 1.70%, a welcome result in view of the market’s struggles for much of calendar-year 2013. The yield of the 10-year Treasury note
| Market Barometer | |||
| Total Returns | |||
| Periods Ended March 31, 2014 | |||
| Six | One | Five Years | |
| Months | Year | (Annualized) | |
| Stocks | |||
| Russell 1000 Index (Large-caps) | 12.48% | 22.41% | 21.73% |
| Russell 2000 Index (Small-caps) | 9.94 | 24.90 | 24.31 |
| Russell 3000 Index (Broad U.S. market) | 12.28 | 22.61 | 21.93 |
| FTSE All-World ex US Index (International) | 5.25 | 12.50 | 15.93 |
| Bonds | |||
| Barclays U.S. Aggregate Bond Index (Broad taxable market) | 1.70% | -0.10% | 4.80% |
| Barclays Municipal Bond Index (Broad tax-exempt market) | 3.65 | 0.39 | 5.71 |
| Citigroup Three-Month U.S. Treasury Bill Index | 0.00 | 0.05 | 0.08 |
| CPI | |||
| Consumer Price Index | 0.92% | 1.51% | 2.13% |
3
finished the half year at 2.72%, up from 2.63% at September’s end, but down from nearly 3% on December 31. (Bond prices and yields move in opposite directions.)
Many bond investors have been focusing on the possibility of interest rates moving higher and the negative effect that would have on bond prices. However, there’s a flip side to rising rates. As Greg Davis, the new head of our Fixed Income Group, recently noted, long-term investors can benefit over time because “you’re going to be reinvesting those coupon payments and principal payments at higher rates.”
Municipal bonds returned 3.65% for the six months, another major improvement over calendar-year 2013, as investors waded back into the muni market; many had fled last year when challenges surfaced for some issuers. For money market and savings accounts, returns remained meager because of the Fed’s target of 0%–0.25% for short-term interest rates.
International bond markets (as measured by the Barclays Global Aggregate Index ex USD) returned 2.05%.
Some of the largest sectors gave the fund a boost
Your fund’s advisors, Wellington Management Company and Vanguard Equity Investment Group, seek to generate superior returns by investing in high-quality, mostly large companies with above-average yields in out-of-favor industries. Their strategy was rewarded in the half year.
| Expense Ratios | |||
| Your Fund Compared With Its Peer Group | |||
| Investor | Admiral | Peer Group | |
| Shares | Shares | Average | |
| Equity Income Fund | 0.30% | 0.21% | 1.22% |
The fund expense ratios shown are from the prospectus dated January 27, 2014, and represent estimated costs for the current fiscal year. For the six months ended March 31, 2014, the fund’s annualized expense ratios were 0.29% for Investor Shares and 0.20% for Admiral Shares. The peer-group expense ratio is derived from data provided by Lipper, a Thomson Reuters Company, and captures information through year-end 2013.
Peer group: Equity Income Funds.
4
Strength was broad and deep, especially in four of the fund’s largest sectors: financials, health care, industrials, and information technology. Together, these four industry
groups—led by financials and health care—contributed about two-thirds of the fund’s total return.
| The appeal of low-cost investing is growing |
| Minimizing investment costs is a critical part of every investor’s toolkit. Why? Because every |
| dollar paid for fund management expenses is simply a dollar less that can work on your behalf. |
| Put another way, the lower your mutual fund’s costs, the greater your share of the fund’s return. |
| Not surprisingly, research indicates that lower-cost investments have tended to outperform |
| their higher-cost counterparts. |
| Investors are catching on to the value of lower-cost mutual funds. Funds with lower expense |
| ratios dominated in attracting investment dollars over the decade ended December 31, 2012, |
| according to a Vanguard research paper titled Costs Matter: Are Fund Investors Voting With |
| Their Feet? (You can read the paper at vanguard.com/matter.) And, as the chart below shows, |
| Vanguard’s leadership in keeping down costs for investors seems to have encouraged the |
| industry to reduce its average costs—at least over the past decade. |
| Even so, Vanguard’s average expenses continue to be less than one-fifth the industry average: |
| 0.19% versus 1.08% (as of December 31, 2013). That cost difference remains a powerful tool |
| in the hands of Vanguard clients. |
| Vanguard fund costs remain far below industry average |

Industry average expense ratio
Vanguard average expense ratio
Sources: Vanguard and Lipper, a Thomson Reuters Company.
5
Banks performed especially well, as they had in fiscal year 2013, and continued to put distance between the 2008–2009 financial crisis and their current, stronger balance sheets. And major pharmaceutical companies, which make up most of the fund’s health care holdings, have been buoyed in part by advances in genetically targeted treatments for diseases.
Overall, the advisors’ selections outperformed their counterparts in the benchmark in six of the ten sectors. The relatively small utilities sector gave your fund a helpful assist, but this contribution was partly offset by disappointing results from the fund’s industrial machinery holdings.
Divining the future is tricky, but preparing for it is prudent
Predictions are often made but rarely come true. In an interview with our newsletter In The Vanguard, University of Pennsylvania professor Philip Tetlock noted: “As a whole, experts [are] slightly more accurate than the proverbial dart-throwing chimpanzee.”
Dr. Tetlock’s extensive research on the accuracy of predictions found that it’s best to think in terms of probabilities and to avoid bold, specific declarations about what the future holds. At Vanguard, we agree that forecasting the economy and capital markets should be leavened with modesty. Joe Davis, our chief economist, is fond of saying that we “treat the future with the humility it deserves.”
That’s why our economists don’t make the pinpoint projections that you’ll see elsewhere. Instead, using sophisticated statistical models, we provide a range and probability of potential outcomes—for the return of U.S. stocks, for example. And we explain our rationale for such outcomes, allowing you to make better-informed decisions about risk and return.
In January, as they do each year, our economists issued Vanguard’s Economic and Investment Outlook. They also update their perspectives periodically and address significant developments, such as changes in Federal Reserve policy. (You can read our most recent outlook at vanguard.com/ research.)
Our forecasts acknowledge that no one can envision every scenario. And that reality underlines one of Vanguard’s core investment principles: Develop a suitable asset allocation using broadly diversified funds. Having a balanced portfolio can help you get through unforeseen events and achieve your goals—even without a crystal ball.
As always, thank you for investing with Vanguard.
Sincerely,

F. William McNabb III
Chairman and Chief Executive Officer
April 17, 2014
6
Advisors’ Report
For the six months ended March 31, 2014, Vanguard Equity Income Fund returned more than 11%, in line with the return of the FTSE High Dividend Yield Index and ahead of the average return of its peer group. Your fund is managed by two independent investment advisors, a strategy that enhances the fund’s diversification by providing exposure to distinct yet complementary investment approaches. It is not uncommon for different advisors to have different views about individual securities or the broader investment environment.
The advisors, the percentage of fund assets each manages, and brief descriptions of their investment strategies are presented in the table below. Each advisor has also prepared a discussion of the investment environment that existed during the fiscal half year and of how their portfolio positioning reflects this assessment. These comments were prepared on April 10, 2014.
Wellington Management Company, LLP
Portfolio Manager:
W. Michael Reckmeyer, III, CFA,
Senior Vice President and Equity Portfolio Manager
Following strong returns in 2013, equity markets consolidated some of their gains in the first few months of 2014 because of weaker-than-expected global economic growth as well as concerns caused by Russia’s annexation of Crimea. The Federal Reserve continues to taper its quantitative
| Vanguard Equity Income Fund Investment Advisors | |||
| Fund Assets Managed | |||
| Investment Advisor | % | $ Million | Investment Strategy |
| Wellington Management | 64 | 10,341 | A fundamental approach to seeking desirable stocks. |
| Company, LLP | Our selections typically offer above-average dividend | ||
| yields, below-average valuations, and the potential for | |||
| dividend increases in the future. | |||
| Vanguard Equity Investment | 34 | 5,547 | Employs a quantitative fundamental management |
| Group | approach, using models that assess valuation, growth | ||
| prospects, management decisions, market sentiment, | |||
| and earnings and balance-sheet quality of companies | |||
| as compared with their peers. | |||
| Cash Investments | 2 | 290 | These short-term reserves are invested by Vanguard in |
| equity index products to simulate investment in stocks. | |||
| Each advisor may also maintain a modest cash | |||
| position. | |||
7
easing program, and this adds further uncertainty to the picture, as the consequences of this tapering remain unknown.
In the United States, recent economic indicators make us optimistic that growth can accelerate in 2014, mainly because of the diminishing effects of the tax increase and government sequestration seen in 2013. However, the impact of severe weather on the consumer has held back economic activity and raised doubts about the underlying economic strength.
In other developed markets, Europe remains on a gradually improving trend, with more economies showing signs of bottoming or experiencing improving economic activity. One risk to continued expansion is deflationary forces; the European Central Bank has indicated that it is closely watching these, and it may take additional measures to ensure that deflation does not become reality. Japan’s growth has been solid, but the recently enacted value-added tax increase is expected to temporarily decelerate the economy.
The emerging markets have also been weaker than expected. China’s economic growth has slowed as its government is starting to address the country’s banking and real estate problems. The government has indicated that it will boost stimulus measures to reduce the chance of a significant dislocation. Emerging markets dependent upon China have seen their economies slow as a result of lower demand from China; the pressures of weaker currencies and higher interest rates resulting from the Fed’s tapering have also slowed these economies.
Significant purchases during the past six months included new positions in Home Depot, Enbridge, and Symantec. We also added to our positions in Verizon and Wal-Mart. We eliminated our positions in Lowe’s, AT&T, and Time Warner Cable because of valuations, as well as Stanley Black & Decker and BP because of eroding fundamentals.
Vanguard Equity Investment Group
Portfolio Managers: James P. Stetler, Principal
James D. Troyer, CFA, Principal
Michael R. Roach, CFA
Equities continued to produce robust returns, as the broad U.S. equity market rose more than 12% (as measured by the Russell 3000 Index) over the six months. Stocks of both large and small companies performed in a similar manner. Globally, the U.S. equity market outpaced other developed countries, while emerging markets continued to underperform. Performance within the FTSE High Dividend Yield Index benchmark, which returned 11.60%, was broad-based, with all ten sector groups generating positive returns. Results in the benchmark were best in financials, health care, and information technology; telecommunication and consumer discretionary companies were the laggards.
8
Over the last six months, the Federal Reserve announced multiple reductions to its stimulative bond-buying program, effective beginning in January. Chairwoman Janet Yellen’s testimony to Congress in February suggested that tapering would likely continue despite severe weather–related softness in recent economic data. There were no major fiscal surprises during the period, and without new policy stimulus (and even with the reductions), the economy seems to be improving: The Institute for Supply Management Manufacturing Index has consistently been above 50 (the dividing line between expansion and contraction in manufacturing), and annualized GDP growth has been in range of 2% to 4%, in line with historical averages.
Globally, market participants have kept an eye on the tensions in Ukraine. China has seen its growth rate decelerate as it goes through economic rebalancing toward increased consumption and correspondingly less reliance on investment. Latin America, in turn, has struggled because of weaker demand from China. The uncertainty triggered by these developments has pushed up equity market volatility.
Although it’s important to understand how these macroeconomic factors affect overall portfolio performance, our approach to investing focuses on specific stock fundamentals. Our process compares stocks within industry groups to identify those with characteristics that we believe will enable them to outperform over the long run. We use a strict quantitative process that concentrates on a combination of valuation and other factors focused on fundamental growth. We then construct our portfolio, aiming to maximize return and minimize exposure to risks relative to our benchmark, such as market-cap risk, that our research indicates do not improve returns.
Our model was effective over the six months across sectors, as we were able to produce positive stock selection results in seven of the ten industry sectors, with the strongest results in industrials, utilities, and information technology.
In industrials, Northrop Grumman, Raytheon, and Lockheed Martin were the largest contributors to relative performance. In utilities, Exelon and Ameren drove results; Lexmark International and Seagate Technology did the same in technology. Unfortunately, we were not able to avoid all poor performers. Our selections in the consumer discretionary group were disappointing, as GameStop and Wynn Resorts did not perform as expected.
9
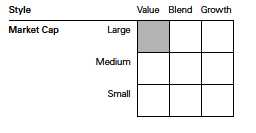
| Equity Income Fund | |||
| Fund Profile | |||
| As of March 31, 2014 | |||
| Share-Class Characteristics | |||
| Investor | Admiral | ||
| Shares | Shares | ||
| Ticker Symbol | VEIPX | VEIRX | |
| Expense Ratio1 | 0.30% | 0.21% | |
| 30-Day SEC Yield | 2.69% | 2.78% | |
| Portfolio Characteristics | |||
| DJ | |||
| U.S. | |||
| FTSE High | Total | ||
| Dividend | Market | ||
| Yield | FA | ||
| Fund | Index | Index | |
| Number of Stocks | 155 | 390 | 3,674 |
| Median Market Cap | $98.3B | $128.3B | $43.7B |
| Price/Earnings Ratio | 15.8x | 16.1x | 20.1x |
| Price/Book Ratio | 2.6x | 2.5x | 2.6x |
| Return on Equity | 19.5% | 20.8% | 17.2% |
| Earnings Growth | |||
| Rate | 11.4% | 10.5% | 12.4% |
| Dividend Yield | 3.0% | 3.1% | 1.9% |
| Foreign Holdings | 9.9% | 0.0% | 0.0% |
| Turnover Rate | |||
| (Annualized) | 43% | — | — |
| Short-Term Reserves | 1.3% | — | — |
| Volatility Measures | ||
| FTSE High | DJ | |
| Dividend | U.S. Total | |
| Yield | Market | |
| Index | FA Index | |
| R-Squared | 0.99 | 0.89 |
| Beta | 1.03 | 0.78 |
| These measures show the degree and timing of the fund’s fluctuations compared with the indexes over 36 months. | ||
| Ten Largest Holdings (% of total net assets) | ||
| Johnson & Johnson | Pharmaceuticals | 4.0% |
| Wells Fargo & Co. | Diversified Banks | 3.9 |
| Microsoft Corp. | Systems Software | 3.6 |
| Exxon Mobil Corp. | Integrated Oil & Gas | 3.4 |
| Verizon Communications Integrated | ||
| Inc. | Telecommunication | |
| Services | 3.0 | |
| JPMorgan Chase & Co. | Diversified Banks | 3.0 |
| Chevron Corp. | Integrated Oil & Gas | 2.9 |
| Merck & Co. Inc. | Pharmaceuticals | 2.8 |
| General Electric Co. | Industrial | |
| Conglomerates | 2.2 | |
| Marsh & McLennan Cos. | ||
| Inc. | Insurance Brokers | 2.0 |
| Top Ten | 30.8% | |
| The holdings listed exclude any temporary cash investments and equity index products. | ||
Investment Focus
1 The expense ratios shown are from the prospectus dated January 27, 2014, and represent estimated costs for the current fiscal year. For the six months ended March 31, 2014, the annualized expense ratios were 0.29% for Investor Shares and 0.20% for Admiral Shares.
10
Equity Income Fund
Sector Diversification (% of equity exposure)
| DJ | |||
| U.S. | |||
| FTSE High | Total | ||
| Dividend | Market | ||
| Yield | FA | ||
| Fund | Index | Index | |
| Consumer Discretionary | 5.9% | 5.9% | 12.8% |
| Consumer Staples | 12.7 | 13.5 | 8.4 |
| Energy | 11.7 | 11.8 | 9.4 |
| Financials | 16.6 | 12.8 | 17.6 |
| Health Care | 12.9 | 11.4 | 13.0 |
| Industrials | 12.5 | 11.5 | 11.5 |
| Information Technology | 13.1 | 16.6 | 18.1 |
| Materials | 3.9 | 4.1 | 3.9 |
| Telecommunication | |||
| Services | 4.1 | 5.1 | 2.2 |
| Utilities | 6.6 | 7.3 | 3.1 |
11
Equity Income Fund
Performance Summary
All of the returns in this report represent past performance, which is not a guarantee of future results that may be achieved by the fund. (Current performance may be lower or higher than the performance data cited. For performance data current to the most recent month-end, visit our website at vanguard.com/performance.) Note, too, that both investment returns and principal value can fluctuate widely, so an investor’s shares, when sold, could be worth more or less than their original cost. The returns shown do not reflect taxes that a shareholder would pay on fund distributions or on the sale of fund shares.
Fiscal-Year Total Returns (%): September 30, 2003, Through March 31, 2014
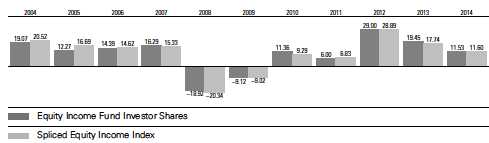
For a benchmark description, see the Glossary.
Note: For 2014, performance data reflect the six months ended March 31, 2014.
| Average Annual Total Returns: Periods Ended March 31, 2014 | ||||
| Inception | One | Five | Ten | |
| Date | Year | Years | Years | |
| Investor Shares | 3/21/1988 | 19.65% | 21.69% | 8.67% |
| Admiral Shares | 8/13/2001 | 19.74 | 21.79 | 8.78 |
See Financial Highlights for dividend and capital gains information.
12
Equity Income Fund
Financial Statements (unaudited)
Statement of Net Assets
As of March 31, 2014
The fund reports a complete list of its holdings in regulatory filings four times in each fiscal year, at the quarter-ends. For the second and fourth fiscal quarters, the lists appear in the fund’s semiannual and annual reports to shareholders. For the first and third fiscal quarters, the fund files the lists with the Securities and Exchange Commission on Form N-Q. Shareholders can look up the fund’s Forms N-Q on the SEC’s website at sec.gov. Forms N-Q may also be reviewed and copied at the SEC’s Public Reference Room (see the back cover of this report for further information).
| Market | ||
| Value | ||
| Shares | ($000) | |
| Common Stocks (97.0%)1 | ||
| Consumer Discretionary (5.6%) | ||
| Home Depot Inc. | 2,784,800 | 220,361 |
| McDonald’s Corp. | 1,748,505 | 171,406 |
| WPP plc | 5,743,458 | 118,673 |
| Thomson Reuters Corp. | 2,369,470 | 81,036 |
| Mattel Inc. | 2,019,460 | 81,001 |
| Las Vegas Sands Corp. | 653,800 | 52,814 |
| Wynn Resorts Ltd. | 176,000 | 39,098 |
| Best Buy Co. Inc. | 1,239,700 | 32,740 |
| GameStop Corp. Class A | 795,000 | 32,675 |
| Cablevision Systems | ||
| Corp. Class A | 1,767,000 | 29,809 |
| Time Warner Cable Inc. | 159,400 | 21,867 |
| Ford Motor Co. | 884,300 | 13,795 |
| Autoliv Inc. | 68,100 | 6,834 |
| Garmin Ltd. | 76,200 | 4,211 |
| 906,320 | ||
| Consumer Staples (12.2%) | ||
| Kraft Foods Group Inc. | 4,841,199 | 271,591 |
| Wal-Mart Stores Inc. | 3,170,692 | 242,336 |
| Philip Morris | ||
| International Inc. | 2,891,745 | 236,747 |
| Procter & Gamble Co. | 2,418,540 | 194,934 |
| Unilever NV | 3,925,120 | 161,401 |
| PepsiCo Inc. | 1,614,690 | 134,827 |
| Altria Group Inc. | 3,112,975 | 116,519 |
| Diageo plc ADR | 849,900 | 105,889 |
| Anheuser-Busch InBev | ||
| NV ADR | 852,160 | 89,733 |
| Kimberly-Clark Corp. | 766,588 | 84,516 |
| Coca-Cola Co. | 2,183,464 | 84,413 |
| British American | ||
| Tobacco plc | 999,175 | 55,740 |
| Sysco Corp. | 1,502,360 | 54,280 |
| General Mills Inc. | 753,900 | 39,067 |
| Walgreen Co. | 465,400 | 30,730 |
| Nu Skin Enterprises Inc. | ||
| Class A | 348,800 | 28,898 |
| Kellogg Co. | 346,100 | 21,704 |
| Market | ||
| Value | ||
| Shares | ($000) | |
| Imperial Tobacco | ||
| Group plc | 441,628 | 17,859 |
| Dr Pepper Snapple | ||
| Group Inc. | 240,300 | 13,087 |
| Herbalife Ltd. | 30,000 | 1,718 |
| 1,985,989 | ||
| Energy (11.3%) | ||
| Exxon Mobil Corp. | 5,611,210 | 548,103 |
| Chevron Corp. | 3,941,570 | 468,692 |
| Occidental Petroleum | ||
| Corp. | 2,143,030 | 204,209 |
| ConocoPhillips | 2,888,920 | 203,236 |
| Suncor Energy Inc. | 4,712,010 | 164,732 |
| Enbridge Inc. | 2,259,800 | 102,844 |
| Royal Dutch Shell plc | ||
| Class B | 2,089,005 | 81,556 |
| Helmerich & Payne Inc. | 288,800 | 31,063 |
| Ensco plc Class A | 494,800 | 26,116 |
| 1,830,551 | ||
| Financials (16.1%) | ||
| Wells Fargo & Co. | 12,659,940 | 629,705 |
| JPMorgan Chase & Co. | 7,945,530 | 482,373 |
| Marsh & McLennan Cos. | ||
| Inc. | 6,542,970 | 322,568 |
| PNC Financial Services | ||
| Group Inc. | 2,487,392 | 216,403 |
| BlackRock Inc. | 596,030 | 187,440 |
| ACE Ltd. | 1,376,440 | 136,350 |
| M&T Bank Corp. | 904,890 | 109,763 |
| Chubb Corp. | 1,195,880 | 106,792 |
| US Bancorp | 2,243,840 | 96,171 |
| Plum Creek Timber Co. | ||
| Inc. | 1,540,200 | 64,750 |
| Travelers Cos. Inc. | 546,600 | 46,516 |
| Fifth Third Bancorp | 1,877,500 | 43,089 |
| Axis Capital Holdings Ltd. | 683,800 | 31,352 |
| PartnerRe Ltd. | 301,300 | 31,185 |
| Waddell & Reed Financial | ||
| Inc. Class A | 294,000 | 21,644 |
13
| Equity Income Fund | ||
| Market | ||
| Value | ||
| Shares | ($000) | |
| StanCorp Financial Group | ||
| Inc. | 228,500 | 15,264 |
| Huntington Bancshares | ||
| Inc. | 1,494,400 | 14,899 |
| Validus Holdings Ltd. | 313,800 | 11,833 |
| Invesco Ltd. | 311,200 | 11,514 |
| Protective Life Corp. | 134,200 | 7,058 |
| Old Republic International | ||
| Corp. | 345,000 | 5,658 |
| Hanover Insurance Group | ||
| Inc. | 45,600 | 2,802 |
| Lazard Ltd. Class A | 48,700 | 2,293 |
| First Commonwealth | ||
| Financial Corp. | 143,700 | 1,299 |
| Aflac Inc. | 17,800 | 1,122 |
| Prudential Financial Inc. | 12,400 | 1,050 |
| 2,600,893 | ||
| Health Care (12.5%) | ||
| Johnson & Johnson | 6,628,145 | 651,083 |
| Merck & Co. Inc. | 8,102,324 | 459,969 |
| Pfizer Inc. | 9,855,444 | 316,557 |
| Roche Holding AG | 719,078 | 216,272 |
| Baxter International Inc. | 1,250,150 | 91,986 |
| AstraZeneca plc ADR | 1,386,449 | 89,953 |
| AbbVie Inc. | 1,598,600 | 82,168 |
| Eli Lilly & Co. | 1,204,649 | 70,906 |
| Bristol-Myers Squibb Co. | 622,532 | 32,340 |
| Medtronic Inc. | 129,100 | 7,945 |
| 2,019,179 | ||
| Industrials (12.1%) | ||
| General Electric Co. | 13,879,452 | 359,339 |
| United Technologies | ||
| Corp. | 2,495,680 | 291,595 |
| Eaton Corp. plc | 2,803,110 | 210,570 |
| 3M Co. | 1,500,330 | 203,535 |
| United Parcel Service Inc. | ||
| Class B | 1,644,830 | 160,174 |
| Lockheed Martin Corp. | 623,120 | 101,718 |
| Illinois Tool Works Inc. | 1,154,870 | 93,926 |
| Schneider Electric SA | 1,015,076 | 89,963 |
| Waste Management Inc. | 1,914,490 | 80,543 |
| Boeing Co. | 501,500 | 62,933 |
| General Dynamics Corp. | 510,600 | 55,615 |
| Raytheon Co. | 528,800 | 52,240 |
| Caterpillar Inc. | 321,700 | 31,967 |
| L-3 Communications | ||
| Holdings Inc. | 266,700 | 31,511 |
| Northrop Grumman Corp. | 253,013 | 31,217 |
| RR Donnelley & Sons Co. | 1,628,900 | 29,157 |
| Pitney Bowes Inc. | 1,121,600 | 29,150 |
| Copa Holdings SA | ||
| Class A | 186,600 | 27,092 |
| Exelis Inc. | 467,200 | 8,881 |
| Emerson Electric Co. | 53,800 | 3,594 |
| Harsco Corp. | 97,500 | 2,284 |
| 1,957,004 | ||
| Market | ||
| Value | ||
| Shares | ($000) | |
| Information Technology (12.6%) | ||
| Microsoft Corp. | 14,041,319 | 575,554 |
| Apple Inc. | 550,600 | 295,529 |
| Intel Corp. | 10,710,750 | 276,444 |
| Cisco Systems Inc. | 9,685,680 | 217,056 |
| Analog Devices Inc. | 3,786,860 | 201,234 |
| Symantec Corp. | 4,199,600 | 83,866 |
| Maxim Integrated | ||
| Products Inc. | 2,281,616 | 75,567 |
| Texas Instruments Inc. | 1,187,100 | 55,972 |
| Applied Materials Inc. | 2,274,800 | 46,451 |
| Seagate Technology plc | 656,300 | 36,858 |
| Lexmark International Inc. | ||
| Class A | 722,700 | 33,454 |
| Harris Corp. | 456,800 | 33,419 |
| Broadridge Financial | ||
| Solutions Inc. | 826,000 | 30,678 |
| Computer Sciences Corp. | 443,900 | 26,998 |
| Linear Technology Corp. | 460,200 | 22,407 |
| Western Union Co. | 702,800 | 11,498 |
| Xilinx Inc. | 127,340 | 6,911 |
| Xerox Corp. | 166,900 | 1,886 |
| Intersil Corp. Class A | 131,300 | 1,696 |
| Leidos Holdings Inc. | 43,100 | 1,524 |
| 2,035,002 | ||
| Materials (3.8%) | ||
| Dow Chemical Co. | 3,851,920 | 187,165 |
| EI du Pont de Nemours | ||
| & Co. | 2,040,817 | 136,939 |
| Nucor Corp. | 1,621,610 | 81,956 |
| Akzo Nobel NV | 873,335 | 71,230 |
| LyondellBasell Industries | ||
| NV Class A | 656,400 | 58,380 |
| Packaging Corp. of | ||
| America | 489,100 | 34,418 |
| Avery Dennison Corp. | 600,900 | 30,448 |
| Scotts Miracle-Gro Co. | ||
| Class A | 176,700 | 10,828 |
| International Paper Co. | 37,773 | 1,733 |
| 613,097 | ||
| Other (0.4%) | ||
| ^,2 Vanguard High Dividend | ||
| Yield ETF | 1,047,950 | 66,147 |
| Telecommunication Services (4.0%) | ||
| Verizon Communications | ||
| Inc. | 10,267,586 | 488,429 |
| AT&T Inc. | 4,469,797 | 156,756 |
| 645,185 | ||
| Utilities (6.4%) | ||
| National Grid plc | 11,361,349 | 156,125 |
| UGI Corp. | 2,628,660 | 119,893 |
| Northeast Utilities | 2,620,790 | 119,246 |
| Xcel Energy Inc. | 3,747,090 | 113,762 |
| NextEra Energy Inc. | 955,316 | 91,347 |
| Dominion Resources Inc. | 828,900 | 58,844 |
14
| Equity Income Fund | ||
| Market | ||
| Value | ||
| Shares | ($000) | |
| Exelon Corp. | 1,471,300 | 49,377 |
| Edison International | 813,300 | 46,041 |
| Public Service Enterprise | ||
| Group Inc. | 1,187,700 | 45,299 |
| American Electric Power | ||
| Co. Inc. | 889,400 | 45,057 |
| Ameren Corp. | 896,000 | 36,915 |
| AGL Resources Inc. | 655,700 | 32,103 |
| Entergy Corp. | 329,800 | 22,047 |
| Wisconsin Energy Corp. | 435,200 | 20,258 |
| Vectren Corp. | 446,300 | 17,580 |
| OGE Energy Corp. | 381,500 | 14,024 |
| MDU Resources Group | ||
| Inc. | 392,500 | 13,467 |
| Duke Energy Corp. | 172,100 | 12,257 |
| Great Plains Energy Inc. | 293,200 | 7,928 |
| IDACORP Inc. | 70,200 | 3,894 |
| Portland General Electric | ||
| Co. | 106,200 | 3,434 |
| Avista Corp. | 93,100 | 2,853 |
| Otter Tail Corp. | 58,000 | 1,786 |
| Empire District Electric | ||
| Co. | 58,400 | 1,420 |
| 1,034,957 | ||
| Total Common Stocks | ||
| (Cost $12,132,820) | 15,694,324 | |
| Temporary Cash Investments (2.8%)1 | ||
| Money Market Fund (1.4%) | ||
| 3,4 Vanguard Market | ||
| Liquidity Fund, | ||
| 0.122% | 217,937,308 | 217,937 |
| Face | ||
| Amount | ||
| ($000) | ||
| Repurchase Agreement (1.3%) | ||
| Goldman Sachs & Co. | ||
| 0.100%, 4/1/14 | ||
| (Dated 3/31/14, | ||
| Repurchase Value | ||
| $ 210,701,000, | ||
| collateralized by | ||
| Federal National | ||
| Mortgage Assn. | ||
| 3.500%–4.500%, | ||
| 5/1/43–1/1/44, | ||
| with a value | ||
| of $214,914,000) | 210,700 | 210,700 |
| Face | Market | ||
| Amount | Value | ||
| ($000) | ($000) | ||
| U.S. Government and Agency Obligations (0.1%) | |||
| 5 | Fannie Mae | ||
| Discount Notes, | |||
| 0.080%, 5/14/14 | 2,400 | 2,399 | |
| 6 | Federal Home Loan | ||
| Bank Discount Notes, | |||
| 0.079%, 4/30/14 | 1,000 | 1,000 | |
| 6,7 | Federal Home Loan | ||
| Bank Discount Notes, | |||
| 0.060%, 5/7/14 | 400 | 400 | |
| 6,7 | Federal Home Loan | ||
| Bank Discount Notes, | |||
| 0.110%, 5/9/14 | 2,000 | 2,000 | |
| 6 | Federal Home Loan | ||
| Bank Discount Notes, | |||
| 0.075%, 5/21/14 | 300 | 300 | |
| 6 | Federal Home Loan | ||
| Bank Discount Notes, | |||
| 0.125%, 5/30/14 | 200 | 200 | |
| 6,7 | Federal Home Loan | ||
| Bank Discount Notes, | |||
| 0.070%, 6/4/14 | 1,200 | 1,200 | |
| 6,7 | Federal Home Loan | ||
| Bank Discount Notes, | |||
| 0.075%–0.080%, 6/6/14 | 900 | 900 | |
| 6,7 | Federal Home Loan | ||
| Bank Discount Notes, | |||
| 0.077%, 6/13/14 | 500 | 500 | |
| 6 | Federal Home Loan | ||
| Bank Discount Notes, | |||
| 0.074%, 6/18/14 | 900 | 900 | |
| 6,7 | Federal Home Loan | ||
| Bank Discount Notes, | |||
| 0.093%, 7/18/14 | 7,800 | 7,798 | |
| 17,597 | |||
| Total Temporary Cash Investments | |||
| (Cost $446,234) | 446,234 | ||
| Total Investments (99.8%) | |||
| (Cost $12,579,054) | 16,140,558 | ||
| Other Assets and Liabilities (0.2%) | |||
| Other Assets | 99,341 | ||
| Liabilities4 | (61,369) | ||
| 37,972 | |||
| Net Assets (100%) | 16,178,530 | ||
15
Equity Income Fund
| At March 31, 2014, net assets consisted of: | |
| Amount | |
| ($000) | |
| Paid-in Capital | 12,204,007 |
| Overdistributed Net Investment Income | (9,580) |
| Accumulated Net Realized Gains | 421,026 |
| Unrealized Appreciation (Depreciation) | |
| Investment Securities | 3,561,504 |
| Futures Contracts | 1,506 |
| Foreign Currencies | 67 |
| Net Assets | 16,178,530 |
| Investor Shares—Net Assets | |
| Applicable to 178,228,095 outstanding | |
| $.001 par value shares of beneficial | |
| interest (unlimited authorization) | 5,387,341 |
| Net Asset Value Per Share— | |
| Investor Shares | $30.23 |
| Admiral Shares—Net Assets | |
| Applicable to 170,331,661 outstanding | |
| $.001 par value shares of beneficial | |
| interest (unlimited authorization) | 10,791,189 |
| Net Asset Value Per Share— | |
| Admiral Shares | $63.35 |
See Note A in Notes to Financial Statements.
^ Includes partial security positions on loan to broker-dealers. The total value of securities on loan is $884,000.
1 The fund invests a portion of its cash reserves in equity markets through the use of index futures contracts. After giving effect to futures investments, the fund’s effective common stock and temporary cash investment positions represent 98.5% and 1.3%, respectively, of net assets.
2 Considered an affiliated company of the fund as the issuer is another member of The Vanguard Group.
3 Affiliated money market fund available only to Vanguard funds and certain trusts and accounts managed by Vanguard. Rate shown is the 7-day yield.
4 Includes $896,000 of collateral received for securities on loan.
5 The issuer was placed under federal conservatorship in September 2008; since that time, its daily operations have been managed by the Federal Housing Finance Agency and it receives capital from the U.S. Treasury, as needed to maintain a positive net worth, in exchange for senior preferred stock.
6 The issuer operates under a congressional charter; its securities are generally neither guaranteed by the U.S. Treasury nor backed by the full faith and credit of the U.S. government.
7 Securities with a value of $11,898,000 have been segregated as initial margin for open futures contracts.
ADR—American Depositary Receipt.
See accompanying Notes, which are an integral part of the Financial Statements.
16
| Equity Income Fund | |
| Statement of Operations | |
| Six Months Ended | |
| March 31, 2014 | |
| ($000) | |
| Investment Income | |
| Income | |
| Dividends1,2 | 238,346 |
| Interest2 | 190 |
| Securities Lending | 337 |
| Total Income | 238,873 |
| Expenses | |
| Investment Advisory Fees—Note B | |
| Basic Fee | 5,516 |
| Performance Adjustment | (51) |
| The Vanguard Group—Note C | |
| Management and Administrative—Investor Shares | 4,868 |
| Management and Administrative—Admiral Shares | 5,238 |
| Marketing and Distribution—Investor Shares | 632 |
| Marketing and Distribution—Admiral Shares | 1,123 |
| Custodian Fees | 95 |
| Shareholders’ Reports—Investor Shares | 53 |
| Shareholders’ Reports—Admiral Shares | 35 |
| Trustees’ Fees and Expenses | 11 |
| Total Expenses | 17,520 |
| Net Investment Income | 221,353 |
| Realized Net Gain (Loss) | |
| Investment Securities Sold2 | 538,692 |
| Futures Contracts | 21,876 |
| Foreign Currencies | (16) |
| Realized Net Gain (Loss) | 560,552 |
| Change in Unrealized Appreciation (Depreciation) | |
| Investment Securities | 852,439 |
| Futures Contracts | 5,307 |
| Foreign Currencies | 6 |
| Change in Unrealized Appreciation (Depreciation) | 857,752 |
| Net Increase (Decrease) in Net Assets Resulting from Operations | 1,639,657 |
1 Dividends are net of foreign withholding taxes of $1,933,000.
2 Dividend income, interest income, and realized net gain (loss) from affiliated companies of the fund were $978,000, $163,000, and $34,257,000, respectively.
See accompanying Notes, which are an integral part of the Financial Statements.
17
| Equity Income Fund | ||
| Statement of Changes in Net Assets | ||
| Six Months Ended | Year Ended | |
| March 31, | September 30, | |
| 2014 | 2013 | |
| ($000) | ($000) | |
| Increase (Decrease) in Net Assets | ||
| Operations | ||
| Net Investment Income | 221,353 | 330,626 |
| Realized Net Gain (Loss) | 560,552 | 565,543 |
| Change in Unrealized Appreciation (Depreciation) | 857,752 | 1,113,922 |
| Net Increase (Decrease) in Net Assets Resulting from Operations | 1,639,657 | 2,010,091 |
| Distributions | ||
| Net Investment Income | ||
| Investor Shares | (74,060) | (122,346) |
| Admiral Shares | (151,282) | (208,254) |
| Realized Capital Gain1 | ||
| Investor Shares | (136,041) | — |
| Admiral Shares | (265,749) | — |
| Total Distributions | (627,132) | (330,600) |
| Capital Share Transactions | ||
| Investor Shares | 202,723 | 65,329 |
| Admiral Shares | 990,675 | 2,886,791 |
| Net Increase (Decrease) from Capital Share Transactions | 1,193,398 | 2,952,120 |
| Total Increase (Decrease) | 2,205,923 | 4,631,611 |
| Net Assets | ||
| Beginning of Period | 13,972,607 | 9,340,996 |
| End of Period2 | 16,178,530 | 13,972,607 |
1 Includes fiscal 2014 short-term gain distributions totaling $18,677,000. Short-term gain distributions are treated as ordinary income dividends for tax purposes.
2 Net Assets—End of Period includes undistributed (overdistributed) net investment income of ($9,580,000) and ($5,575,000).
See accompanying Notes, which are an integral part of the Financial Statements.
18
| Equity Income Fund | ||||||
| Financial Highlights | ||||||
| Investor Shares | ||||||
| Six Months | ||||||
| Ended | ||||||
| For a Share Outstanding | March 31, | Year Ended September 30, | ||||
| Throughout Each Period | 2014 | 2013 | 2012 | 2011 | 2010 | 2009 |
| Net Asset Value, Beginning of Period | $28.26 | $24.31 | $19.40 | $18.83 | $17.40 | $20.02 |
| Investment Operations | ||||||
| Net Investment Income | .420 | .732 | .667 | .596 | .526 | .585 |
| Net Realized and Unrealized Gain (Loss) | ||||||
| on Investments | 2.775 | 3.946 | 4.908 | .567 | 1.432 | (2.506) |
| Total from Investment Operations | 3.195 | 4.678 | 5.575 | 1.163 | 1.958 | (1.921) |
| Distributions | ||||||
| Dividends from Net Investment Income | (. 426) | (.728) | (. 665) | (. 593) | (. 528) | (. 587) |
| Distributions from Realized Capital Gains | (.799) | — | — | — | — | (.112) |
| Total Distributions | (1.225) | (.728) | (. 665) | (. 593) | (. 528) | (. 699) |
| Net Asset Value, End of Period | $30.23 | $28.26 | $24.31 | $19.40 | $18.83 | $17.40 |
| Total Return1 | 11.53% | 19.45% | 29.00% | 6.00% | 11.36% | -9.12% |
| Ratios/Supplemental Data | ||||||
| Net Assets, End of Period (Millions) | $5,387 | $4,839 | $4,107 | $2,835 | $2,651 | $2,423 |
| Ratio of Total Expenses to | ||||||
| Average Net Assets2 | 0.29% | 0.30% | 0.30% | 0.31% | 0.31% | 0.36% |
| Ratio of Net Investment Income to | ||||||
| Average Net Assets | 2.80% | 2.81% | 3.00% | 2.89% | 2.88% | 3.76% |
| Portfolio Turnover Rate | 43% | 34% | 26% | 29% | 45% | 51% |
The expense ratio, net income ratio, and turnover rate for the current period have been annualized.
1 Total returns do not include account service fees that may have applied in the periods shown. Fund prospectuses provide information about any applicable account service fees.
2 Includes performance-based investment advisory fee increases (decreases) of 0.00%, 0.00%, 0.00%, 0.01%, 0.01%, and 0.02%.
See accompanying Notes, which are an integral part of the Financial Statements.
19
| Equity Income Fund | ||||||
| Financial Highlights | ||||||
| Admiral Shares | ||||||
| Six Months | ||||||
| Ended | ||||||
| For a Share Outstanding | March 31, | Year Ended September 30, | ||||
| Throughout Each Period | 2014 | 2013 | 2012 | 2011 | 2010 | 2009 |
| Net Asset Value, Beginning of Period | $59.24 | $50.94 | $40.67 | $39.47 | $36.46 | $41.97 |
| Investment Operations | ||||||
| Net Investment Income | .908 | 1.585 | 1.445 | 1.286 | 1.138 | 1.264 |
| Net Realized and Unrealized Gain (Loss) | ||||||
| on Investments | 5.799 | 8.293 | 10.265 | 1.194 | 3.013 | (5.269) |
| Total from Investment Operations | 6.707 | 9.878 | 11.710 | 2.480 | 4.151 | (4.005) |
| Distributions | ||||||
| Dividends from Net Investment Income | (.922) | (1.578) | (1.440) | (1.280) | (1.141) | (1.270) |
| Distributions from Realized Capital Gains | (1.675) | — | — | — | — | (.235) |
| Total Distributions | (2.597) | (1.578) | (1.440) | (1.280) | (1.141) | (1.505) |
| Net Asset Value, End of Period | $63.35 | $59.24 | $50.94 | $40.67 | $39.47 | $36.46 |
| Total Return | 11.55% | 19.61% | 29.06% | 6.10% | 11.50% | -9.05% |
| Ratios/Supplemental Data | ||||||
| Net Assets, End of Period (Millions) | $10,791 | $9,134 | $5,234 | $2,614 | $1,667 | $1,475 |
| Ratio of Total Expenses to | ||||||
| Average Net Assets1 | 0.20% | 0.21% | 0.21% | 0.22% | 0.22% | 0.24% |
| Ratio of Net Investment Income to | ||||||
| Average Net Assets | 2.89% | 2.90% | 3.09% | 2.98% | 2.97% | 3.89% |
| Portfolio Turnover Rate | 43% | 34% | 26% | 29% | 45% | 51% |
The expense ratio, net income ratio, and turnover rate for the current period have been annualized.
1 Includes performance-based investment advisory fee increases (decreases) of 0.00%, 0.00%, 0.00%, 0.01%, 0.01%, and 0.02%.
See accompanying Notes, which are an integral part of the Financial Statements.
20
Equity Income Fund
Notes to Financial Statements
Vanguard Equity Income Fund is registered under the Investment Company Act of 1940 as an open-end investment company, or mutual fund. The fund offers two classes of shares: Investor Shares and Admiral Shares. Investor Shares are available to any investor who meets the fund’s minimum purchase requirements. Admiral Shares are designed for investors who meet certain administrative, service, and account-size criteria.
A. The following significant accounting policies conform to generally accepted accounting principles for U.S. mutual funds. The fund consistently follows such policies in preparing its financial statements.
1. Security Valuation: Securities are valued as of the close of trading on the New York Stock Exchange (generally 4 p.m., Eastern time) on the valuation date. Equity securities are valued at the latest quoted sales prices or official closing prices taken from the primary market in which each security trades; such securities not traded on the valuation date are valued at the mean of the latest quoted bid and asked prices. Securities for which market quotations are not readily available, or whose values have been affected by events occurring before the fund’s pricing time but after the close of the securities’ primary markets, are valued at their fair values calculated according to procedures adopted by the board of trustees. These procedures include obtaining quotations from an independent pricing service, monitoring news to identify significant market- or security-specific events, and evaluating changes in the values of foreign market proxies (for example, ADRs, futures contracts, or exchange-traded funds), between the time the foreign markets close and the fund’s pricing time. When fair-value pricing is employed, the prices of securities used by a fund to calculate its net asset value may differ from quoted or published prices for the same securities. Investments in Vanguard Market Liquidity Fund are valued at that fund’s net asset value. Temporary cash investments acquired over 60 days to maturity are valued using the latest bid prices or using valuations based on a matrix system (which considers such factors as security prices, yields, maturities, and ratings), both as furnished by independent pricing services. Other temporary cash investments are valued at amortized cost, which approximates market value.
2. Foreign Currency: Securities and other assets and liabilities denominated in foreign currencies are translated into U.S. dollars using exchange rates obtained from an independent third party as of the fund’s pricing time on the valuation date. Realized gains (losses) and unrealized appreciation (depreciation) on investment securities include the effects of changes in exchange rates since the securities were purchased, combined with the effects of changes in security prices. Fluctuations in the value of other assets and liabilities resulting from changes in exchange rates are recorded as unrealized foreign currency gains (losses) until the assets or liabilities are settled in cash, at which time they are recorded as realized foreign currency gains (losses).
3. Futures Contracts: The fund uses index futures contracts to a limited extent, with the objective of maintaining full exposure to the stock market while maintaining liquidity. The fund may purchase or sell futures contracts to achieve a desired level of investment, whether to accommodate portfolio turnover or cash flows from capital share transactions. The primary risks associated with the use of futures contracts are imperfect correlation between changes in market values of stocks held by the fund and the prices of futures contracts, and the possibility of an illiquid market. Counterparty risk involving futures is mitigated because a regulated clearinghouse is the counterparty instead of the clearing broker. To further mitigate counterparty risk, the fund trades futures contracts on an exchange, monitors the financial strength of its clearing brokers and clearinghouse, and has entered into clearing agreements with its clearing brokers. The clearinghouse imposes initial margin requirements to secure the fund’s performance and requires daily settlement of variation margin representing changes in the market value of each contract.
21
Equity Income Fund
Futures contracts are valued at their quoted daily settlement prices. The aggregate notional amounts of the contracts are not recorded in the Statement of Net Assets. Fluctuations in the value of the contracts are recorded in the Statement of Net Assets as an asset (liability) and in the Statement of Operations as unrealized appreciation (depreciation) until the contracts are closed, when they are recorded as realized futures gains (losses).
During the six months ended March 31, 2014, the fund’s average investments in long and short futures contracts represented 2% and 0% of net assets, respectively, based on quarterly average aggregate settlement values.
4. Repurchase Agreements: The fund enters into repurchase agreements with institutional counterparties. Securities pledged as collateral to the fund under repurchase agreements are held by a custodian bank until the agreements mature. Each agreement requires that the market value of the collateral be sufficient to cover payments of interest and principal. The fund further mitigates its counterparty risk by entering into repurchase agreements only with a diverse group of prequalified counterparties, monitoring their financial strength, and entering into master repurchase agreements with its counterparties. The master repurchase agreements provide that, in the event of a counterparty’s default (including bankruptcy), the fund may terminate any repurchase agreements with that counterparty, determine the net amount owed, and sell or retain the collateral up to the net amount owed to the fund. Such action may be subject to legal proceedings, which may delay or limit the disposition of collateral.
5. Federal Income Taxes: The fund intends to continue to qualify as a regulated investment company and distribute all of its taxable income. Management has analyzed the fund’s tax positions taken for all open federal income tax years (September 30, 2010–2013), and for the period ended March 31, 2014, and has concluded that no provision for federal income tax is required in the fund’s financial statements.
6. Distributions: Distributions to shareholders are recorded on the ex-dividend date.
7. Securities Lending: To earn additional income, the fund lends its securities to qualified institutional borrowers. Security loans are required to be secured at all times by collateral in an amount at least equal to the market value of securities loaned. Daily market fluctuations could cause the value of loaned securities to be more or less than the value of the collateral received. When this occurs, the collateral is adjusted and settled on the next business day. The fund further mitigates its counterparty risk by entering into securities lending transactions only with a diverse group of prequalified counterparties, monitoring their financial strength, and entering into master securities lending agreements with its counterparties. The master securities lending agreements provide that, in the event of a counterparty’s default (including bankruptcy), the fund may terminate any loans with that borrower, determine the net amount owed, and sell or retain the collateral up to the net amount owed to the fund; however, such actions may be subject to legal proceedings. While collateral mitigates counterparty risk, in the absence of a default the fund may experience delays and costs in recovering the securities loaned. The fund invests cash collateral received in Vanguard Market Liquidity Fund, and records a liability in the Statement of Net Assets for the return of the collateral, during the period the securities are on loan. Securities lending income represents fees charged to borrowers plus income earned on invested cash collateral, less expenses associated with the loan.
22
Equity Income Fund
8. Credit Facility: The fund and certain other funds managed by The Vanguard Group participate in a $2.89 billion committed credit facility provided by a syndicate of lenders pursuant to a credit agreement which may be renewed annually; each fund is individually liable for its borrowings, if any, under the credit facility. Borrowings may be utilized for temporary and emergency purposes, and are subject to the fund’s regulatory and contractual borrowing restrictions. The participating funds are charged administrative fees and an annual commitment fee of 0.06% of the undrawn amount of the facility, which are allocated to the funds in accordance with a methodology approved by the board of trustees and included in Management and Administrative expenses on the fund’s Statement of Operations. Any borrowings under this facility bear interest at a rate equal to the higher of the Federal Funds Rate or LIBOR Reference Rate plus an agreed-upon spread.
The fund had no borrowings outstanding at March 31, 2014, or at any time during the period then ended.
9. Other: Dividend income is recorded on the ex-dividend date. Interest income includes income distributions received from Vanguard Market Liquidity Fund and is accrued daily. Premiums and discounts on debt securities purchased are amortized and accreted, respectively, to interest income over the lives of the respective securities. Security transactions are accounted for on the date securities are bought or sold. Costs used to determine realized gains (losses) on the sale of investment securities are those of the specific securities sold.
Each class of shares has equal rights as to assets and earnings, except that each class separately bears certain class-specific expenses related to maintenance of shareholder accounts (included in Management and Administrative expenses) and shareholder reporting. Marketing and distribution expenses are allocated to each class of shares based on a method approved by the board of trustees. Income, other non-class-specific expenses, and gains and losses on investments are allocated to each class of shares based on its relative net assets.
B. Wellington Management Company, LLP, provides investment advisory services to a portion of the fund for a fee calculated at an annual percentage rate of average net assets managed by the advisor. The basic fee of Wellington Management Company, LLP, is subject to quarterly adjustments based on performance for the preceding three years relative to the FTSE High Dividend Yield Index.
The Vanguard Group provides investment advisory services to a portion of the fund on an at-cost basis; the fund paid Vanguard advisory fees of $590,000 for the six months ended March 31, 2014.
For the six months ended March 31, 2014, the aggregate investment advisory fee represented an effective annual basic rate of 0.07% of the fund’s average net assets, before a decrease of $51,000 (0.00%) based on performance.
C. The Vanguard Group furnishes at cost corporate management, administrative, marketing, and distribution services. The costs of such services are allocated to the fund under methods approved by the board of trustees. The fund has committed to provide up to 0.40% of its net assets in capital contributions to Vanguard. At March 31, 2014, the fund had contributed capital of $1,689,000 to Vanguard (included in Other Assets), representing 0.01% of the fund’s net assets and 0.68% of Vanguard’s capitalization. The fund’s trustees and officers are also directors and officers of Vanguard.
23
Equity Income Fund
D. Various inputs may be used to determine the value of the fund’s investments. These inputs are summarized in three broad levels for financial statement purposes. The inputs or methodologies used to value securities are not necessarily an indication of the risk associated with investing in those securities.
Level 1—Quoted prices in active markets for identical securities.
Level 2—Other significant observable inputs (including quoted prices for similar securities, interest rates, prepayment speeds, credit risk, etc.).
Level 3—Significant unobservable inputs (including the fund’s own assumptions used to determine the fair value of investments).
The following table summarizes the market value of the fund’s investments as of March 31, 2014, based on the inputs used to value them:
| Level 1 | Level 2 | Level 3 | |
| Investments | ($000) | ($000) | ($000) |
| Common Stocks | 14,886,905 | 807,419 | — |
| Temporary Cash Investments | 217,937 | 228,297 | — |
| Futures Contracts—Assets1 | 1,803 | — | — |
| Total | 15,106,645 | 1,035,716 | — |
| 1 Represents variation margin on the last day of the reporting period. |
E. At March 31, 2014, the aggregate settlement value of open futures contracts and the related unrealized appreciation (depreciation) were:
| ($000) | ||||
| Aggregate | ||||
| Number of | Settlement | Unrealized | ||
| Long (Short) | Value | Appreciation | ||
| Futures Contracts | Expiration | Contracts | Long (Short) | (Depreciation) |
| S&P 500 Index | June 2014 | 359 | 167,348 | 1,143 |
| E-mini S&P 500 Index | June 2014 | 747 | 69,643 | 363 |
| 1,506 |
Unrealized appreciation (depreciation) on open futures contracts is required to be treated as realized gain (loss) for tax purposes.
F. Distributions are determined on a tax basis and may differ from net investment income and realized capital gains for financial reporting purposes. Differences may be permanent or temporary. Permanent differences are reclassified among capital accounts in the financial statements to reflect their tax character. Temporary differences arise when certain items of income, expense, gain, or loss are recognized in different periods for financial statement and tax purposes. These differences will reverse at some time in the future. Differences in classification may also result from the treatment of short-term gains as ordinary income for tax purposes. The fund’s tax-basis capital gains and losses are determined only at the end of each fiscal year.
24
Equity Income Fund
During the six months ended March 31, 2014, the fund realized net foreign currency losses of $16,000, which decreased distributable net income for tax purposes; accordingly, such losses have been reclassified from accumulated net realized gains to overdistributed net investment income.
At March 31, 2014, the cost of investment securities for tax purposes was $12,579,054,000. Net unrealized appreciation of investment securities for tax purposes was $3,561,504,000, consisting of unrealized gains of $3,605,668,000 on securities that had risen in value since their purchase and $44,164,000 in unrealized losses on securities that had fallen in value since their purchase.
G. During the six months ended March 31, 2014, the fund purchased $3,854,156,000 of investment securities and sold $3,210,777,000 of investment securities, other than temporary cash investments.
H. Capital share transactions for each class of shares were:
| Six Months Ended | Year Ended | |||
| March 31, 2014 | September 30, 2013 | |||
| Amount | Shares | Amount | Shares | |
| ($000) | (000) | ($000) | (000) | |
| Investor Shares | ||||
| Issued | 720,822 | 24,554 | 1,660,385 | 62,876 |
| Issued in Lieu of Cash Distributions | 197,731 | 6,840 | 113,805 | 4,261 |
| Redeemed | (715,830) | (24,358) | (1,708,861) | (64,935) |
| Net Increase (Decrease)—Investor Shares | 202,723 | 7,036 | 65,329 | 2,202 |
| Admiral Shares | ||||
| Issued | 1,544,549 | 25,060 | 3,878,687 | 69,335 |
| Issued in Lieu of Cash Distributions | 360,894 | 5,954 | 175,891 | 3,123 |
| Redeemed | (914,768) | (14,861) | (1,167,787) | (21,012) |
| Net Increase (Decrease)—Admiral Shares | 990,675 | 16,153 | 2,886,791 | 51,446 |
I. Management has determined that no material events or transactions occurred subsequent to March 31, 2014, that would require recognition or disclosure in these financial statements.
25
About Your Fund’s Expenses
As a shareholder of the fund, you incur ongoing costs, which include costs for portfolio management, administrative services, and shareholder reports (like this one), among others. Operating expenses, which are deducted from a fund’s gross income, directly reduce the investment return of the fund.
A fund’s expenses are expressed as a percentage of its average net assets. This figure is known as the expense ratio. The following examples are intended to help you understand the ongoing costs (in dollars) of investing in your fund and to compare these costs with those of other mutual funds. The examples are based on an investment of $1,000 made at the beginning of the period shown and held for the entire period.
The accompanying table illustrates your fund’s costs in two ways:
• Based on actual fund return. This section helps you to estimate the actual expenses that you paid over the period. The ”Ending Account Value“ shown is derived from the fund‘s actual return, and the third column shows the dollar amount that would have been paid by an investor who started with $1,000 in the fund. You may use the information here, together with the amount you invested, to estimate the expenses that you paid over the period.
To do so, simply divide your account value by $1,000 (for example, an $8,600 account value divided by $1,000 = 8.6), then multiply the result by the number given for your fund under the heading ”Expenses Paid During Period.“
• Based on hypothetical 5% yearly return. This section is intended to help you compare your fund‘s costs with those of other mutual funds. It assumes that the fund had a yearly return of 5% before expenses, but that the expense ratio is unchanged. In this case—because the return used is not the fund’s actual return—the results do not apply to your investment. The example is useful in making comparisons because the Securities and Exchange Commission requires all mutual funds to calculate expenses based on a 5% return. You can assess your fund’s costs by comparing this hypothetical example with the hypothetical examples that appear in shareholder reports of other funds.
Note that the expenses shown in the table are meant to highlight and help you compare ongoing costs only and do not reflect transaction costs incurred by the fund for buying and selling securities. Further, the expenses do not include any purchase, redemption, or account service fees described in the fund prospectus. If such fees were applied to your account, your costs would be higher. Your fund does not carry a “sales load.”
The calculations assume no shares were bought or sold during the period. Your actual costs may have been higher or lower, depending on the amount of your investment and the timing of any purchases or redemptions.
You can find more information about the fund’s expenses, including annual expense ratios, in the Financial Statements section of this report. For additional information on operating expenses and other shareholder costs, please refer to your fund’s current prospectus.
26
| Six Months Ended March 31, 2014 | |||
| Beginning | Ending | Expenses | |
| Account Value | Account Value | Paid During | |
| Equity Income Fund | 9/30/2013 | 3/31/2014 | Period |
| Based on Actual Fund Return | |||
| Investor Shares | $1,000.00 | $1,115.33 | $1.53 |
| Admiral Shares | 1,000.00 | 1,115.50 | 1.05 |
| Based on Hypothetical 5% Yearly Return | |||
| Investor Shares | $1,000.00 | $1,023.49 | $1.46 |
| Admiral Shares | 1,000.00 | 1,023.93 | 1.01 |
The calculations are based on expenses incurred in the most recent six-month period. The fund’s annualized six-month expense ratios for that period are 0.29% for Investor Shares and 0.20% for Admiral Shares. The dollar amounts shown as “Expenses Paid” are equal to the annualized expense ratio multiplied by the average account value over the period, multiplied by the number of days in the most recent six-month period, then divided by the number of days in the most recent 12-month period.
27
Trustees Approve Advisory Arrangements
The board of trustees of Vanguard Equity Income Fund has renewed the fund’s investment advisory arrangement with The Vanguard Group, Inc. (Vanguard) (through its Equity Investment Group). The board also renewed the fund’s investment advisory arrangement and approved an amended investment advisory agreement with Wellington Management Company, LLP (Wellington Management), effective April 1, 2014. The amended agreement contains a new base fee schedule; however, other terms of the existing agreement have not changed. The board determined that renewing the fund’s advisory arrangements and amending the fee schedule for Wellington Management was in the best interests of the fund and its shareholders.
The board based its decisions upon an evaluation of each advisor’s investment staff, portfolio management process, and performance. The trustees considered the factors discussed below, among others. However, no single factor determined whether the board approved the arrangements. Rather, it was the totality of the circumstances that drove the board’s decisions.
Nature, extent, and quality of services
The board considered the quality of the fund’s investment management services over both the short and long term, and took into account the organizational depth and stability of each advisor. The board noted the following:
Wellington Management. Wellington Management, founded in 1928, is among the nation’s oldest and most respected institutional investment managers. The firm has advised the fund since 2000. The board also noted that the portfolio manager to the fund has over two decades of investment industry experience. The firm and the fund’s management team have depth and stability. The portfolio manager is backed by a well-tenured team of research analysts who conduct detailed fundamental analysis of their respective industries and companies. The board noted that the new fee arrangement would help Wellington Management to continue to attract and retain top investment talent, and thereby support enhanced organizational depth and stability, which would benefit the fund and its shareholders.
Vanguard. Vanguard has been managing investments for more than three decades. The Equity Investment Group adheres to a sound, disciplined investment management process; the team has considerable experience, stability, and depth. Vanguard has managed a portion of the fund since 2003.
The board concluded that each advisor’s experience, stability, depth, and performance, among other factors, warranted approval and continuation of the advisory arrangements.
Investment performance
The board considered the short- and long-term performance of the fund and each advisor, including any periods of outperformance or underperformance relative to a benchmark index and peer group. The board concluded that the performance was such that each advisory arrangement should continue. Information about the fund’s most recent performance can be found in the Performance Summary section of this report.
Cost
The board concluded that the fund’s expense ratio was well below the average expense ratio charged by funds in its peer group and that the fund’s advisory fee rate was also well below its peer-group average. Information about the fund’s expenses appears in the About Your Fund’s Expense section of this report as well as in the Financial Statements section, which also includes information about the fund’s advisory fee rate.
28
The board did not consider profitability of Wellington Management in determining whether to approve the advisory fee, because Wellington Management is independent of Vanguard, and the advisory fee is the result of arm’s-length negotiations. The board does not conduct a profitability analysis of Vanguard, because of Vanguard’s unique “at-cost” structure. Unlike most other mutual fund management companies, Vanguard is owned by the funds it oversees, and produces “profits” only in the form of reduced expenses for fund shareholders.
The benefit of economies of scale
The board concluded that the fund’s shareholders benefit from economies of scale because of breakpoints in the fund’s advisory fee schedule for Wellington Management. The breakpoints reduce the effective rate of the fee as the fund’s assets managed by Wellington Management increase. The board also concluded that the fund’s at-cost arrangement with Vanguard ensures that the fund will realize economies of scale as it grows, with the cost to shareholders declining as the fund’s assets managed by Vanguard increase.
The board will consider whether to renew the advisory arrangements again after a one-year period.
29
Glossary
30-Day SEC Yield. A fund’s 30-day SEC yield is derived using a formula specified by the U.S. Securities and Exchange Commission. Under the formula, data related to the fund’s security holdings in the previous 30 days are used to calculate the fund’s hypothetical net income for that period, which is then annualized and divided by the fund’s estimated average net assets over the calculation period. For the purposes of this calculation, a security’s income is based on its current market yield to maturity (for bonds), its actual income (for asset-backed securities), or its projected dividend yield (for stocks). Because the SEC yield represents hypothetical annualized income, it will differ—at times significantly—from the fund’s actual experience. As a result, the fund’s income distributions may be higher or lower than implied by the SEC yield.
Beta. A measure of the magnitude of a fund’s past share-price fluctuations in relation to the ups and downs of a given market index. The index is assigned a beta of 1.00. Compared with a given index, a fund with a beta of 1.20 typically would have seen its share price rise or fall by 12% when the index rose or fell by 10%. For this report, beta is based on returns over the past 36 months for both the fund and the index. Note that a fund’s beta should be reviewed in conjunction with its R-squared (see definition). The lower the R-squared, the less correlation there is between the fund and the index, and the less reliable beta is as an indicator of volatility.
Dividend Yield. Dividend income earned by stocks, expressed as a percentage of the aggregate market value (or of net asset value, for a fund). The yield is determined by dividing the amount of the annual dividends by the aggregate value (or net asset value) at the end of the period. For a fund, the dividend yield is based solely on stock holdings and does not include any income produced by other investments.
Earnings Growth Rate. The average annual rate of growth in earnings over the past five years for the stocks now in a fund.
Equity Exposure. A measure that reflects a fund’s investments in stocks and stock futures. Any holdings in short-term reserves are excluded.
Expense Ratio. A fund’s total annual operating expenses expressed as a percentage of the fund’s average net assets. The expense ratio includes management and administrative expenses, but does not include the transaction costs of buying and selling portfolio securities.
Foreign Holdings. The percentage of a fund represented by securities or depositary receipts of companies based outside the United States.
Inception Date. The date on which the assets of a fund (or one of its share classes) are first invested in accordance with the fund’s investment objective. For funds with a subscription period, the inception date is the day after that period ends. Investment performance is measured from the inception date.
Median Market Cap. An indicator of the size of companies in which a fund invests; the midpoint of market capitalization (market price x shares outstanding) of a fund’s stocks, weighted by the proportion of the fund’s assets invested in each stock. Stocks representing half of the fund’s assets have market capitalizations above the median, and the rest are below it.
Price/Book Ratio. The share price of a stock divided by its net worth, or book value, per share. For a fund, the weighted average price/book ratio of the stocks it holds.
30
Price/Earnings Ratio. The ratio of a stock’s current price to its per-share earnings over the past year. For a fund, the weighted average P/E of the stocks it holds. P/E is an indicator of market expectations about corporate prospects; the higher the P/E, the greater the expectations for a company’s future growth.
R-Squared. A measure of how much of a fund’s past returns can be explained by the returns from the market in general, as measured by a given index. If a fund’s total returns were precisely synchronized with an index’s returns, its R-squared would be 1.00. If the fund’s returns bore no relationship to the index’s returns, its R-squared would be 0. For this report, R-squared is based on returns over the past 36 months for both the fund and the index.
Return on Equity. The annual average rate of return generated by a company during the past five years for each dollar of shareholder’s equity (net income divided by shareholder’s equity). For a fund, the weighted average return on equity for the companies whose stocks it holds.
Short-Term Reserves. The percentage of a fund invested in highly liquid, short-term securities that can be readily converted to cash.
Turnover Rate. An indication of the fund’s trading activity. Funds with high turnover rates incur higher transaction costs and may be more likely to distribute capital gains (which may be taxable to investors). The turnover rate excludes in-kind transactions, which have minimal impact on costs.
Benchmark Information
Spliced Equity Income Index: Russell 1000 Value Index through July 31, 2007; FTSE High Dividend Yield Index thereafter.
31
The People Who Govern Your Fund
The trustees of your mutual fund are there to see that the fund is operated and managed in your best interests since, as a shareholder, you are a part owner of the fund. Your fund’s trustees also serve on the board of directors of The Vanguard Group, Inc., which is owned by the Vanguard funds and provides services to them on an at-cost basis.
A majority of Vanguard’s board members are independent, meaning that they have no affiliation with Vanguard or the funds they oversee, apart from the sizable personal investments they have made as private individuals. The independent board members have distinguished backgrounds in business, academia, and public service. Each of the trustees and executive officers oversees 179 Vanguard funds.
The following table provides information for each trustee and executive officer of the fund. More information about the trustees is in the Statement of Additional Information, which can be obtained, without charge, by contacting Vanguard at 800-662-7447, or online at vanguard.com.
| InterestedTrustee1 | and Delphi Automotive LLP (automotive components); |
| Senior Advisor at New Mountain Capital. | |
| F. William McNabb III | |
| Born 1957. Trustee Since July 2009. Chairman of the | Amy Gutmann |
| Board. Principal Occupation(s) During the Past Five | Born 1949. Trustee Since June 2006. Principal |
| Years: Chairman of the Board of The Vanguard Group, | Occupation(s) During the Past Five Years: President of |
| Inc., and of each of the investment companies served | the University of Pennsylvania; Christopher H. Browne |
| by The Vanguard Group, since January 2010; Director | Distinguished Professor of Political Science, School of |
| of The Vanguard Group since 2008; Chief Executive | Arts and Sciences, and Professor of Communication, |
| Officer and President of The Vanguard Group, and of | Annenberg School for Communication, with secondary |
| each of the investment companies served by The | faculty appointments in the Department of Philosophy, |
| Vanguard Group, since 2008; Director of Vanguard | School of Arts and Sciences, and at the Graduate |
| Marketing Corporation; Managing Director of The | School of Education, University of Pennsylvania; |
| Vanguard Group (1995–2008). | Trustee of the National Constitution Center; Chair |
| of the Presidential Commission for the Study of | |
| Bioethical Issues. | |
| IndependentTrustees | |
| JoAnn Heffernan Heisen | |
| Emerson U. Fullwood | Born 1950. Trustee Since July 1998. Principal |
| Born 1948. Trustee Since January 2008. Principal | Occupation(s) During the Past Five Years: Corporate |
| Occupation(s) During the Past Five Years: Executive | Vice President and Chief Global Diversity Officer |
| Chief Staff and Marketing Officer for North America | (retired 2008) and Member of the Executive |
| and Corporate Vice President (retired 2008) of Xerox | Committee (1997–2008) of Johnson & Johnson |
| Corporation (document management products and | (pharmaceuticals/medical devices/consumer |
| services); Executive in Residence and 2009–2010 | products); Director of Skytop Lodge Corporation |
| Distinguished Minett Professor at the Rochester | (hotels), the University Medical Center at Princeton, |
| Institute of Technology; Director of SPX Corporation | the Robert Wood Johnson Foundation, and the Center |
| (multi-industry manufacturing), the United Way of | for Talent Innovation; Member of the Advisory Board |
| Rochester, Amerigroup Corporation (managed health | of the Maxwell School of Citizenship and Public Affairs |
| care), the University of Rochester Medical Center, | at Syracuse University. |
| Monroe Community College Foundation, and North | |
| Carolina A&T University. | F. Joseph Loughrey |
| Born 1949. Trustee Since October 2009. Principal | |
| Rajiv L. Gupta | Occupation(s) During the Past Five Years: President |
| Born 1945. Trustee Since December 2001.2 | and Chief Operating Officer (retired 2009) of Cummins |
| Principal Occupation(s) During the Past Five Years: | Inc. (industrial machinery); Chairman of the Board |
| Chairman and Chief Executive Officer (retired 2009) | of Hillenbrand, Inc. (specialized consumer services), |
| and President (2006–2008) of Rohm and Haas Co. | and of Oxfam America; Director of SKF AB (industrial |
| (chemicals); Director of Tyco International, Ltd. | machinery), Hyster-Yale Materials Handling, Inc. |
| (diversified manufacturing and services), Hewlett- | (forklift trucks), the Lumina Foundation for Education, |
| Packard Co. (electronic computer manufacturing), |
| and the V Foundation for Cancer Research; Member | Executive Officers | |
| of the Advisory Council for the College of Arts and | ||
| Letters and of the Advisory Board to the Kellogg | Glenn Booraem | |
| Institute for International Studies, both at the | Born 1967. Controller Since July 2010. Principal | |
| University of Notre Dame. | Occupation(s) During the Past Five Years: Principal | |
| of The Vanguard Group, Inc.; Controller of each of | ||
| Mark Loughridge | the investment companies served by The Vanguard | |
| Born 1953. Trustee Since March 2012. Principal | Group; Assistant Controller of each of the investment | |
| Occupation(s) During the Past Five Years: Senior Vice | companies served by The Vanguard Group (2001–2010). | |
| President and Chief Financial Officer (retired 2013) | ||
| at IBM (information technology services); Fiduciary | Thomas J. Higgins | |
| Member of IBM’s Retirement Plan Committee (2004– | Born 1957. Chief Financial Officer Since September | |
| 2013); Member of the Council on Chicago Booth. | 2008. Principal Occupation(s) During the Past Five | |
| Years: Principal of The Vanguard Group, Inc.; Chief | ||
| Scott C. Malpass | Financial Officer of each of the investment companies | |
| Born 1962. Trustee Since March 2012. Principal | served by The Vanguard Group; Treasurer of each of | |
| Occupation(s) During the Past Five Years: Chief | the investment companies served by The Vanguard | |
| Investment Officer and Vice President at the University | Group (1998–2008). | |
| of Notre Dame; Assistant Professor of Finance at the | ||
| Mendoza College of Business at Notre Dame; Member | Kathryn J. Hyatt | |
| of the Notre Dame 403(b) Investment Committee; | Born 1955. Treasurer Since November 2008. Principal | |
| Board Member of TIFF Advisory Services, Inc. | Occupation(s) During the Past Five Years: Principal of | |
| (investment advisor); Member of the Investment | The Vanguard Group, Inc.; Treasurer of each of the | |
| Advisory Committees of the Financial Industry | investment companies served by The Vanguard | |
| Regulatory Authority (FINRA) and of Major League | Group; Assistant Treasurer of each of the investment | |
| Baseball. | companies served by The Vanguard Group (1988–2008). | |
| André F. Perold | Heidi Stam | |
| Born 1952. Trustee Since December 2004. Principal | Born 1956. Secretary Since July 2005. Principal | |
| Occupation(s) During the Past Five Years: George | Occupation(s) During the Past Five Years: Managing | |
| Gund Professor of Finance and Banking, Emeritus | Director of The Vanguard Group, Inc.; General Counsel | |
| at the Harvard Business School (retired 2011); | of The Vanguard Group; Secretary of The Vanguard | |
| Chief Investment Officer and Managing Partner of | Group and of each of the investment companies | |
| HighVista Strategies LLC (private investment firm); | served by The Vanguard Group; Director and Senior | |
| Director of Rand Merchant Bank; Overseer of the | Vice President of Vanguard Marketing Corporation. | |
| Museum of Fine Arts Boston. | ||
| Vanguard Senior ManagementTeam | ||
| Alfred M. Rankin, Jr. | ||
| Born 1941. Trustee Since January 1993. Principal | Mortimer J. Buckley | Chris D. McIsaac |
| Occupation(s) During the Past Five Years: Chairman, | Kathleen C. Gubanich | Michael S. Miller |
| President, and Chief Executive Officer of NACCO | Paul A. Heller | James M. Norris |
| Industries, Inc. (housewares/lignite), and of Hyster- | Martha G. King | Glenn W. Reed |
| Yale Materials Handling, Inc. (forklift trucks); Chairman | John T. Marcante | |
| of the Board of University Hospitals of Cleveland. | ||
| Peter F. Volanakis | Chairman Emeritus and Senior Advisor | |
| Born 1955. Trustee Since July 2009. Principal | ||
| Occupation(s) During the Past Five Years: President | John J. Brennan | |
| and Chief Operating Officer (retired 2010) of Corning | Chairman, 1996–2009 | |
| Incorporated (communications equipment); Trustee of | Chief Executive Officer and President, 1996–2008 | |
| Colby-Sawyer College; Member of the Advisory Board | ||
| of the Norris Cotton Cancer Center and of the Advisory | Founder | |
| Board of the Parthenon Group (strategy consulting). | ||
| John C. Bogle | ||
| Chairman and Chief Executive Officer, 1974–1996 | ||
1 Mr. McNabb is considered an “interested person,” as defined in the Investment Company Act of 1940, because he is an officer of the Vanguard funds.
2 December 2002 for Vanguard Equity Income Fund, the Vanguard Municipal Bond Funds, and the Vanguard State Tax-Exempt Funds.
 | |
| P.O. Box 2600 | |
| Valley Forge, PA 19482-2600 |
Connect with Vanguard® > vanguard.com
| Fund Information > 800-662-7447 | CFA® is a trademark owned by CFA Institute. |
| Direct Investor Account Services > 800-662-2739 | |
| Institutional Investor Services > 800-523-1036 | |
| Text Telephone for People | |
| With Hearing Impairment > 800-749-7273 | |
| This material may be used in conjunction | |
| with the offering of shares of any Vanguard | |
| fund only if preceded or accompanied by | |
| the fund’s current prospectus. | |
| All comparative mutual fund data are from Lipper, a | |
| Thomson Reuters Company, or Morningstar, Inc., unless | |
| otherwise noted. | |
| You can obtain a free copy of Vanguard’s proxy voting | |
| guidelines by visiting vanguard.com/proxyreporting or by | |
| calling Vanguard at 800-662-2739. The guidelines are | |
| also available from the SEC’s website, sec.gov. In | |
| addition, you may obtain a free report on how your fund | |
| voted the proxies for securities it owned during the 12 | |
| months ended June 30. To get the report, visit either | |
| vanguard.com/proxyreporting or sec.gov. | |
| You can review and copy information about your fund at | |
| the SEC’s Public Reference Room in Washington, D.C. To | |
| find out more about this public service, call the SEC at | |
| 202-551-8090. Information about your fund is also | |
| available on the SEC’s website, and you can receive | |
| copies of this information, for a fee, by sending a | |
| request in either of two ways: via e-mail addressed to | |
| publicinfo@sec.gov or via regular mail addressed to the | |
| Public Reference Section, Securities and Exchange | |
| Commission, Washington, DC 20549-1520. | |
| © 2014 The Vanguard Group, Inc. | |
| All rights reserved. | |
| Vanguard Marketing Corporation, Distributor. | |
| Q652 052014 | |
![]()
Semiannual Report | March 31, 2014
Vanguard PRIMECAP Core Fund

Vanguard’s Principles for Investing Success
We want to give you the best chance of investment success. These principles, grounded in Vanguard’s research and experience, can put you on the right path.
Goals. Create clear, appropriate investment goals.
Balance. Develop a suitable asset allocation using broadly diversified funds. Cost. Minimize cost.
Discipline. Maintain perspective and long-term discipline.
A single theme unites these principles: Focus on the things you can control.
We believe there is no wiser course for any investor.
| Contents | |
| Your Fund’s Total Returns. | 1 |
| Chairman’s Letter. | 2 |
| Advisor’s Report. | 8 |
| Fund Profile. | 11 |
| Performance Summary. | 12 |
| Financial Statements. | 13 |
| About Your Fund’s Expenses. | 22 |
| Trustees Approve Advisory Arrangement. | 24 |
| Glossary. | 25 |
Please note: The opinions expressed in this report are just that—informed opinions. They should not be considered promises or advice.
Also, please keep in mind that the information and opinions cover the period through the date on the front of this report. Of course, the risks of investing in your fund are spelled out in the prospectus.
See the Glossary for definitions of investment terms used in this report.
About the cover: The ship’s wheel represents leadership and guidance, essential qualities in navigating difficult seas.
This one is a replica based on an 18th-century British vessel. The HMSVanguard, another ship of that era, served as the flagship for British Admiral Horatio Nelson when he defeated a French fleet at the Battle of the Nile.
| Your Fund’s Total Returns | ||||
| Six Months Ended March 31, 2014 | ||||
| Total | ||||
| Returns | ||||
| Vanguard PRIMECAP Core Fund | 14.64% | |||
| MSCI US Prime Market 750 Index | 12.42 | |||
| Multi-Cap Core Funds Average | 11.19 | |||
| Multi-Cap Core Funds Average: Derived from data provided by Lipper, a Thomson Reuters Company. | ||||
| Your Fund’s Performance at a Glance | ||||
| September 30, 2013, Through March 31, 2014 | ||||
| Distributions Per Share | ||||
| Starting | Ending | Income | Capital | |
| Share Price | Share Price | Dividends | Gains | |
| Vanguard PRIMECAP Core Fund | $18.65 | $20.45 | $0.178 | $0.677 |
1

Chairman’s Letter
Dear Shareholder,
Vanguard PRIMECAP Core Fund delivered strong returns over the six months ended March 31, 2014, with skilled fund management, ample investment opportunities, and accommodative monetary policy all playing roles in the performance.
The fund returned 14.64%, ahead of its comparative standards: the MSCI US PRIME Market 750 Index (+12.42%) and the average return of peer funds (+11.19%).
Health care and technology stocks, a traditional focus for PRIMECAP Core, were once again the fund’s largest contributors. These two areas make up more than half of the portfolio and also delivered more than half of the return. But the fund’s performance was more than a two-sector show; industrial stocks also strongly influenced the outcome.
To a lesser degree, the financial, consumer discretionary, and materials groups contributed as well. None of the sectors represented in the fund posted a decline, although lightly held energy, consumer staples, and utilities stocks barely registered on the overall result.
Despite some recent choppiness, U.S. stocks were productive
The broad U.S. stock market recorded a solid gain of about 12% for the six months ended March 31, although the market became increasingly rocky over the period’s
2
second half. Corporate earnings, for the most part, continued to rise as the U.S. economy showed modest growth.
While the Federal Reserve’s stimulative bond-buying program has helped support the market for several years, since January the Fed has been making monthly cuts in its purchases, creating some apprehension among investors. Slow economic growth in China and the conflict in Ukraine have also caused market turbulence.
International stocks returned about 5%. The developed markets of Europe, where there’s been some improvement in the economy, posted a strong advance, while the developed markets of the Pacific region and emerging markets had weaker results.
Bonds reclaimed some lost ground following a difficult stretch
Over the six months, the broad U.S. taxable bond market returned 1.70%, a welcome result in view of the market’s struggles for much of calendar-year 2013. The yield of the 10-year Treasury note finished the semiannual period at 2.72%, up from 2.63% at September’s end, but down from nearly 3% on December 31. (Bond prices and yields move in opposite directions.)
Many bond investors have been focusing on the possibility of interest rates moving higher and the negative effect that would have on bond prices. However, there’s a flip side to rising rates. As noted recently by Greg Davis, the new head of our Fixed Income Group, long-term investors can
| Market Barometer | |||
| Total Returns | |||
| Periods Ended March 31, 2014 | |||
| Six | One | Five Years | |
| Months | Year | (Annualized) | |
| Stocks | |||
| Russell 1000 Index (Large-caps) | 12.48% | 22.41% | 21.73% |
| Russell 2000 Index (Small-caps) | 9.94 | 24.90 | 24.31 |
| Russell 3000 Index (Broad U.S. market) | 12.28 | 22.61 | 21.93 |
| FTSE All-World ex US Index (International) | 5.25 | 12.50 | 15.93 |
| Bonds | |||
| Barclays U.S. Aggregate Bond Index (Broad taxable market) | 1.70% | -0.10% | 4.80% |
| Barclays Municipal Bond Index (Broad tax-exempt market) | 3.65 | 0.39 | 5.71 |
| Citigroup Three-Month U.S. Treasury Bill Index | 0.00 | 0.05 | 0.08 |
| CPI | |||
| Consumer Price Index | 0.92% | 1.51% | 2.13% |
3
benefit over time because “you’re going to be reinvesting those coupon payments and principal payments at higher rates.”
Municipal bonds returned 3.65% for the six months, another major improvement over calendar-year 2013, as investors waded back into the muni market; many had fled last year when challenges surfaced for some issuers. For money market and savings accounts, returns remained meager because of the Fed’s target of 0%–0.25% for short-term interest rates.
International bond markets (as measured by the Barclays Global Aggregate Index ex USD) returned 2.05%.
Two sectors set the pace as the fund chugged forward
PRIMECAP Management Company, the fund’s advisor, builds and maintains a portfolio of companies with long-term growth potential that is not reflected in their share prices. Because the advisor’s investments aren’t often in alignment with the overall market, the fund’s performance often diverges from that of the broad market.
Since its founding in 2004, the PRIMECAP Core Fund has registered an average annual return of 10%, more than 2 percentage points better than that of its benchmark. En route to that impressive record, however, the fund’s long-term investors had to persevere through some lengthy periods of underperformance.
| Expense Ratios | ||
| Your Fund Compared With Its Peer Group | ||
| Peer Group | ||
| Fund | Average | |
| PRIMECAP Core Fund | 0.50% | 1.17% |
The fund expense ratio shown is from the prospectus dated January 27, 2014, and represents estimated costs for the current fiscal year. For the six months ended March 31, 2014, the fund’s annualized expense ratio was 0.50%. The peer-group expense ratio is derived from data provided by Lipper, a Thomson Reuters Company, and captures information through year-end 2013.
Peer group: Multi-Cap Core Funds.
4
For example, PRIMECAP Core trailed one or both of its comparative standards in fiscal years 2010, 2011, and 2012. However, the advisor waited rather than wavered, and the fund has delivered notable results for the past 18 months, outpacing its benchmark and the average return of peer funds. The successful outcome wouldn’t have been possible if the advisor hadn’t displayed conviction in its meticulous research and
The appeal of low-cost investing is growing
Minimizing investment costs is a critical part of every investor’s toolkit. Why? Because every dollar paid for fund management expenses is simply a dollar less that can work on your behalf.
Put another way, the lower your mutual fund’s costs, the greater your share of the fund’s return. Not surprisingly, research indicates that lower-cost investments have tended to outperform their higher-cost counterparts.
Investors are catching on to the value of lower-cost mutual funds. Funds with lower expense ratios dominated in attracting investment dollars over the decade ended December 31, 2012, according to a Vanguard research paper titled Costs Matter: Are Fund Investors Voting With Their Feet? (You can read the paper at vanguard.com/matter.) And, as the chart below shows, Vanguard’s leadership in keeping down costs for investors seems to have encouraged the industry to reduce its average costs—at least over the past decade.
Even so, Vanguard’s average expenses continue to be less than one-fifth the industry average: 0.19% versus 1.08% (as of December 31, 2013). That cost difference remains a powerful tool in the hands of Vanguard clients.
Vanguard fund costs remain far below industry average

Industry average expense ratio
Vanguard average expense ratio
Sources: Vanguard and Lipper, a Thomson Reuters Company.
5
stock selection process. (You can review the fund’s returns compared with its benchmark on the Performance Summary page in this report.)
In the six months through March, PRIMECAP Management had various hits and misses within the health care sector, but its heavy allocation to a few top firms in the biotechnology and pharmaceutical industries ultimately provided an advantage. The fund’s health care holdings have benefited from the aging of the U.S. population, because older people require much more health care than others do, and from the Federal Drug Administration’s more favorable stance toward approval of new medicines. PRIMECAP Management is focused on identifying companies with promising medicines that are at early stages in the pipeline.
Within technology, careful stock choices and a large sector allocation were important to the fund’s climb. Most of the strength came from companies involved with the internet, computer storage, or software. A common theme was the advisor’s commitment to firms that emerged in fine shape after enduring challenging stretches. Central to that conviction is the advisor’s view that internet and smartphone growth across the globe will have particular benefit for certain areas within the technology universe.
The industrial sector, the fund’s third-largest, led the rest with a return of about 21%. PRIMECAP Core’s airline stocks rose nearly 60%; consolidation within this industry has led to a favorable pricing environment and increased profitability. At the other end of the sector spectrum, a small number of the fund’s financial, consumer discretionary, and materials holdings also spurred results.
For more about the advisor’s strategy and the fund’s positioning during the six months, please see the Advisor’s Report that follows this letter.
Divining the future is tricky, but preparing for it is prudent
Predictions are often made but rarely come true. In an interview with our newsletter In The Vanguard, University of Pennsylvania professor Philip Tetlock noted: “As a whole, experts [are] slightly more accurate than the proverbial dart-throwing chimpanzee.”
Dr. Tetlock’s extensive research on the accuracy of predictions found that it’s best to think in terms of probabilities and to avoid bold, specific declarations about what the future holds. At Vanguard, we agree that forecasting the economy and capital markets should be leavened with modesty. Joe Davis, our chief economist, is fond of saying that we “treat the future with the humility it deserves.”
That’s why our economists don’t make the pinpoint projections that you’ll see elsewhere. Instead, using sophisticated statistical models, we provide a range and probability of potential outcomes—for example, the return of U.S. stocks. And we explain our rationale for such outcomes, allowing you to make better-informed decisions about risk and return.
6
In January, as they do each year, our economists issued Vanguard’s Economic and Investment Outlook. They also update their perspectives periodically and address significant developments, such as changes in Federal Reserve policy. (You can read the Outlook paper at vanguard.com/research.)
Our forecasts acknowledge that no one can envision every scenario. And that underlines one of Vanguard’s core investment principles: Develop a suitable asset allocation using broadly diversified funds. Having a balanced portfolio can help you get through unforeseen events and achieve your goals—even without a crystal ball.
As always, thank you for entrusting your assets to Vanguard.
Sincerely,
F. William McNabb III
Chairman and Chief Executive Officer April 17, 2014
7
Advisor’s Report
For the six months ended March 31, 2014, Vanguard PRIMECAP Core Fund returned 14.64%, exceeding both the 12.42% return of its benchmark, the unmanaged MSCI US Prime Market 750 Index, and the 11.19% average return of its multi-capitalization core fund competitors. Favorable stock selection in the information technology, health care, and industrial sectors was the main reason for the positive performance.
Investment environment
Over the past six months, U.S. equities continued to appreciate, with the Standard & Poor’s 500 Index reaching a new all-time high during the first calendar quarter of 2014. However, almost all of the positive returns during the period were generated during the fourth calendar quarter of 2013. Trends during the fourth quarter were generally consistent with those witnessed earlier in the calendar year, as cyclical sectors such as consumer discretionary and industrials continued to lead the market. “Momentum” stocks, particularly in the information technology sector, outperformed during this period and into early 2014.
More recently, U.S. equities have been led by defensive sectors such as utilities, the best-performing sector over the first three months of 2014. Stocks with low price/earnings multiples and high dividend yields, including a number of the fund’s holdings in the health care and information technology sectors, generally outperformed the broader market, while many momentum stocks experienced sudden and severe price declines.
During the period, the Federal Reserve continued to tighten U.S. monetary policy by “tapering” the amount of its monthly bond purchases by $10 billion per month. On March 19, Janet Yellen, the new Federal Reserve chair, stated that the Fed would likely continue the tapering so long as economic data continued to improve, and also that the Fed was likely to keep its federal funds rate target at the current level (between 0% and 0.25%) for a considerable time after the asset-purchase program ends. Long-term interest rates, which had risen in calendar 2013, dropped over the past three months, with the 10-year Treasury note yielding 2.72% on March 31, down from 2.97% on December 31.
On the geopolitical front, Russia invaded Ukraine and annexed the strategically important province of Crimea. As this letter was being written, tensions remained high, stirring investor concerns.
Outlook for U.S. equities
Looking ahead, we are cautious about the prospects for U.S. equities, though we continue to believe they represent a more attractive investment than bonds at current prices. As of late March, the S&P 500 Index in aggregate was trading at approximately 17 times calendar-2013 estimated earnings per share of $110, a reasonable valuation by historical standards. However, we are skeptical that the S&P 500 can sustain its recent growth rate in earnings per share.
8
Over the past two years, revenues per share for the S&P 500 grew at a 2.2% compounded average rate, while earnings per share grew at 6.2%. Looking at the next two years, consensus S&P 500 estimates assume that growth in revenue per share will accelerate to 3.6% annually while growth in earnings per share rises to 9.9% per year. We are concerned that these estimates may prove overly optimistic and may need to be revised downward.
Consumer debt levels in the United States remain high and wage growth has been tepid, suggesting that the scope for growth based on additional consumer credit expansion is limited. In addition, we are concerned by the U.S. government’s persistent fiscal deficits and high debt levels relative to GDP (gross domestic product), particularly in light of the aging population.
Portfolio update and outlook
The portfolio remains significantly overweighted in health care and information technology stocks. As of March 31, these two sectors accounted for about 58% of the fund’s assets (versus 31% for the MSCI US Prime Market 750 Index), including nine of the ten largest holdings in the fund.
The fund’s outperformance over the past six months was driven by favorable stock selection in the industrial and information technology sectors, overweight positions in the health care and information technology sectors, and underweight positions in the consumer staples, energy, telecommunication services, and consumer discretionary sectors. In the industrial sector, the fund’s position in Southwest Airlines (+63%) added to relative returns. In the information technology sector, gains from the fund’s investments in SanDisk (+37%) and Google (+27%) more than offset losses from its investments in Symantec (–18%) and ASML (–5%).
We believe that many of our holdings, particularly in the information technology and health care sectors, are attractively valued. A significant number of these holdings are characterized by high dividend yields, strong balance sheets, and low price/earnings multiples.
Information technology
In the information technology area, exploitation of the internet continues to proliferate through the adoption of smart-phones, internet-connected machines, and other innovations. We believe we have positioned the fund to benefit from the ongoing growth of the internet by investing in companies that provide enabling technologies as well as companies that provide internet-based services directly to end users. We also remain optimistic that advances in health care technologies will continue, as we discuss below.
Health care
The fund’s substantial investments in health care reflect our belief that innovation in this area will continue, as well as our expectation that the consumption of health care services will grow more rapidly than the overall economy for the foreseeable future. In terms of innovation, the
9
precipitous decline in the cost of genetic sequencing is allowing researchers to identify links to diseases and rapidly develop therapies that improve the standard of care. Increasingly, drugs developed on the basis of a better understanding of the genetic causes of a disease are providing higher cure rates with fewer side effects than conventional treatments.
Furthermore, global demographic trends should support growth in demand for health care services given the aging of populations in most developed countries as well as in China. As the proportion of elderly people in the population increases, health care spending grows, because older people consume substantially more health care resources than the general population. We are also optimistic that the expected rise in living standards in many developing countries will open up new markets for health care products and services over time.
Conclusion
We remain committed to our investment philosophy, which is based on individual stock selection. Although this “bottom-up” approach can lead to periods of under-performance when the stocks in our portfolio fall out of favor, we believe it can generate superior results for investors over the long term.
PRIMECAP Management Company April 9, 2014
10
PRIMECAP Core Fund
Fund Profile
As of March 31, 2014
| Portfolio Characteristics | |||
| DJ | |||
| U.S. | |||
| MSCI US | Total | ||
| Prime | Market | ||
| Market | FA | ||
| Fund | 750 Index | Index | |
| Number of Stocks | 139 | 762 | 3,674 |
| Median Market Cap | $60.7B | $60.0B | $43.7B |
| Price/Earnings Ratio | 20.5x | 19.2x | 20.1x |
| Price/Book Ratio | 3.3x | 2.7x | 2.6x |
| Return on Equity | 19.7% | 18.2% | 17.2% |
| Earnings Growth | |||
| Rate | 15.8% | 12.4% | 12.4% |
| Dividend Yield | 1.7% | 2.0% | 1.9% |
| Foreign Holdings | 12.5% | 0.0% | 0.0% |
| Turnover Rate | |||
| (Annualized) | 19% | — | — |
| Ticker Symbol | VPCCX | — | — |
| Expense Ratio1 | 0.50% | — | — |
| 30-Day SEC Yield | 1.07% | — | — |
| Short-Term Reserves | 4.1% | — | — |
Sector Diversification (% of equity exposure)
| DJ | |||
| U.S. | |||
| MSCI US | Total | ||
| Prime | Market | ||
| Market | FA | ||
| Fund | 750 Index | Index | |
| Consumer Discretionary | 10.0% | 12.7% | 12.8% |
| Consumer Staples | 1.2 | 9.1 | 8.4 |
| Energy | 3.8 | 10.0 | 9.4 |
| Financials | 6.4 | 16.5 | 17.6 |
| Health Care | 30.7 | 13.0 | 13.0 |
| Industrials | 16.3 | 10.9 | 11.5 |
| Information Technology | 27.1 | 18.5 | 18.1 |
| Materials | 4.4 | 3.7 | 3.9 |
| Telecommunication | |||
| Services | 0.0 | 2.5 | 2.2 |
| Utilities | 0.1 | 3.1 | 3.1 |
| Volatility Measures | ||
| DJ | ||
| MSCI US | U.S. Total | |
| Prime Market | Market | |
| 750 Index | FA Index | |
| R-Squared | 0.95 | 0.95 |
| Beta | 0.95 | 0.93 |
| These measures show the degree and timing of the fund’s fluctuations compared with the indexes over 36 months. | ||
| Ten Largest Holdings (% of total net assets) | ||
| Roche Holding AG | Pharmaceuticals | 5.0% |
| Amgen Inc. | Biotechnology | 4.7 |
| Biogen Idec Inc. | Biotechnology | 4.1 |
| Eli Lilly & Co. | Pharmaceuticals | 3.5 |
| Southwest Airlines Co. | Airlines | 3.3 |
| Google Inc. | Internet Software & | |
| Services | 3.2 | |
| Texas Instruments Inc. | Semiconductors | 2.8 |
| Johnson & Johnson | Pharmaceuticals | 2.5 |
| Medtronic Inc. | Health Care | |
| Equipment | 2.4 | |
| Novartis AG | Pharmaceuticals | 2.3 |
| Top Ten | 33.8% | |
| The holdings listed exclude any temporary cash investments and equity index products. | ||
Investment Focus
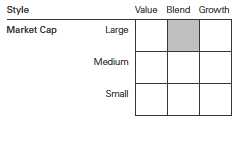
1 The expense ratio shown is from the prospectus dated January 27, 2014, and represents estimated costs for the current fiscal year. For the six months ended March 31, 2014, the annualized expense ratio was 0.50%.
11
PRIMECAP Core Fund
Performance Summary
All of the returns in this report represent past performance, which is not a guarantee of future results that may be achieved by the fund. (Current performance may be lower or higher than the performance data cited. For performance data current to the most recent month-end, visit our website at vanguard.com/performance.) Note, too, that both investment returns and principal value can fluctuate widely, so an investor’s shares, when sold, could be worth more or less than their original cost. The returns shown do not reflect taxes that a shareholder would pay on fund distributions or on the sale of fund shares.
Fiscal-Year Total Returns (%): December 9, 2004, Through March 31, 2014

| Average Annual Total Returns: Periods Ended March 31, 2014 | ||||
| Inception | One | Five | Since | |
| Date | Year | Years | Inception | |
| PRIMECAP Core Fund | 12/9/2004 | 26.51% | 21.54% | 10.00% |
See Financial Highlights for dividend and capital gains information.
12
PRIMECAP Core Fund
Financial Statements (unaudited)
Statement of Net Assets
As of March 31, 2014
The fund reports a complete list of its holdings in regulatory filings four times in each fiscal year, at the quarter-ends. For the second and fourth fiscal quarters, the lists appear in the fund’s semiannual and annual reports to shareholders. For the first and third fiscal quarters, the fund files the lists with the Securities and Exchange Commission on Form N-Q. Shareholders can look up the fund’s Forms N-Q on the SEC’s website at sec.gov. Forms N-Q may also be reviewed and copied at the SEC’s Public Reference Room (see the back cover of this report for further information).
| Market | |||
| Value | |||
| Shares | ($000) | ||
| Common Stocks (96.0%) | |||
| Consumer Discretionary (9.6%) | |||
| L Brands Inc. | 1,588,520 | 90,180 | |
| TJX Cos. Inc. | 1,450,000 | 87,942 | |
| Walt Disney Co. | 1,034,200 | 82,808 | |
| * | CarMax Inc. | 1,764,900 | 82,597 |
| * | DIRECTV | 734,488 | 56,130 |
| Carnival Corp. | 1,437,200 | 54,412 | |
| ^ | Sony Corp. ADR | 2,400,000 | 45,888 |
| Ross Stores Inc. | 466,550 | 33,382 | |
| Whirlpool Corp. | 205,000 | 30,639 | |
| * | Bed Bath & Beyond Inc. | 337,491 | 23,219 |
| VF Corp. | 223,380 | 13,823 | |
| Macy’s Inc. | 116,100 | 6,884 | |
| Time Warner Cable Inc. | 49,756 | 6,826 | |
| Dillard’s Inc. Class A | 56,800 | 5,248 | |
| Las Vegas Sands Corp. | 25,000 | 2,020 | |
| * | Amazon.com Inc. | 600 | 202 |
| 622,200 | |||
| Consumer Staples (1.1%) | |||
| PepsiCo Inc. | 425,000 | 35,488 | |
| CVS Caremark Corp. | 327,377 | 24,507 | |
| Kellogg Co. | 190,000 | 11,915 | |
| 71,910 | |||
| Energy (3.7%) | |||
| Transocean Ltd. | 2,010,000 | 83,093 | |
| Schlumberger Ltd. | 507,100 | 49,442 | |
| Noble Energy Inc. | 398,411 | 28,303 | |
| EOG Resources Inc. | 124,600 | 24,443 | |
| * | Cameron International Corp. | 255,988 | 15,812 |
| National Oilwell Varco Inc. | 191,800 | 14,936 | |
| Cabot Oil & Gas Corp. | 241,000 | 8,165 | |
| * | Southwestern Energy Co. | 149,300 | 6,869 |
| Exxon Mobil Corp. | 46,012 | 4,494 | |
| Encana Corp. | 70,000 | 1,497 | |
| Petroleo Brasileiro SA ADR | |||
| Type A | 75,000 | 1,040 | |
| Petroleo Brasileiro SA ADR | 30,000 | 395 | |
| Frank’s International NV | 10,000 | 248 | |
| 238,737 | |||
| Market | |||
| Value | |||
| Shares | ($000) | ||
| Financials (6.1%) | |||
| Marsh & McLennan | |||
| Cos. Inc. | 2,829,375 | 139,488 | |
| Charles Schwab Corp. | 3,920,511 | 107,148 | |
| Wells Fargo & Co. | 1,142,000 | 56,803 | |
| Chubb Corp. | 348,200 | 31,094 | |
| Willis Group Holdings plc | 592,900 | 26,165 | |
| CME Group Inc. | 159,700 | 11,819 | |
| American Express Co. | 108,300 | 9,750 | |
| Comerica Inc. | 166,000 | 8,599 | |
| US Bancorp | 109,000 | 4,672 | |
| Discover Financial Services | 21,000 | 1,222 | |
| 396,760 | |||
| Health Care (29.5%) | |||
| Roche Holding AG | 1,075,440 | 323,453 | |
| Amgen Inc. | 2,450,419 | 302,235 | |
| * | Biogen Idec Inc. | 872,497 | 266,871 |
| Eli Lilly & Co. | 3,828,200 | 225,328 | |
| Johnson & Johnson | 1,661,150 | 163,175 | |
| Medtronic Inc. | 2,475,200 | 152,324 | |
| Novartis AG ADR | 1,740,305 | 147,961 | |
| Abbott Laboratories | 1,628,700 | 62,721 | |
| * | Boston Scientific Corp. | 3,632,200 | 49,107 |
| GlaxoSmithKline plc ADR | 726,000 | 38,790 | |
| AbbVie Inc. | 744,800 | 38,283 | |
| Sanofi ADR | 728,300 | 38,076 | |
| Thermo Fisher | |||
| Scientific Inc. | 268,600 | 32,296 | |
| * | Waters Corp. | 290,654 | 31,510 |
| * | Illumina Inc. | 169,863 | 25,252 |
| Agilent Technologies Inc. | 70,000 | 3,914 | |
| Stryker Corp. | 45,500 | 3,707 | |
| * | Cerner Corp. | 10,000 | 562 |
| 1,905,565 | |||
| Industrials (15.6%) | |||
| Southwest Airlines Co. | 8,926,525 | 210,755 | |
| Honeywell | |||
| International Inc. | 1,190,100 | 110,394 | |
| United Parcel Service Inc. | |||
| Class B | 827,500 | 80,582 | |
13
| PRIMECAP Core Fund | |||
| Market | |||
| Value | |||
| Shares | ($000) | ||
| FedEx Corp. | 597,475 | 79,201 | |
| Airbus Group NV | 897,350 | 64,269 | |
| Boeing Co. | 509,600 | 63,950 | |
| Union Pacific Corp. | 224,450 | 42,120 | |
| Rockwell Automation Inc. | 294,200 | 36,643 | |
| Delta Air Lines Inc. | 952,000 | 32,987 | |
| Caterpillar Inc. | 315,900 | 31,391 | |
| Pentair Ltd. | 391,000 | 31,022 | |
| Norfolk Southern Corp. | 297,650 | 28,923 | |
| * | United Continental | ||
| Holdings Inc. | 600,600 | 26,805 | |
| CH Robinson | |||
| Worldwide Inc. | 482,744 | 25,291 | |
| ^ | Ritchie Bros | ||
| Auctioneers Inc. | 893,300 | 21,555 | |
| * | AECOM Technology Corp. | 495,000 | 15,924 |
| Expeditors International | |||
| of Washington Inc. | 379,000 | 15,020 | |
| United Technologies Corp. | 115,000 | 13,437 | |
| * | Hertz Global Holdings Inc. | 470,000 | 12,521 |
| Cummins Inc. | 71,000 | 10,578 | |
| Safran SA | 145,000 | 10,046 | |
| IDEX Corp. | 137,000 | 9,986 | |
| Republic Services Inc. | |||
| Class A | 266,935 | 9,118 | |
| CSX Corp. | 250,000 | 7,242 | |
| * | Jacobs Engineering | ||
| Group Inc. | 100,000 | 6,350 | |
| TransDigm Group Inc. | 25,000 | 4,630 | |
| Canadian Pacific | |||
| Railway Ltd. | 24,030 | 3,615 | |
| Chicago Bridge & Iron | |||
| Co. NV | 24,500 | 2,135 | |
| * | Kirby Corp. | 16,000 | 1,620 |
| PACCAR Inc. | 23,000 | 1,551 | |
| * | American Airlines Group Inc. | 40,000 | 1,464 |
| Babcock & Wilcox Co. | 25,000 | 830 | |
| * | Avis Budget Group Inc. | 5,400 | 263 |
| 1,012,218 | |||
| Information Technology (26.0%) | |||
| * | Google Inc. Class A | 183,972 | 205,039 |
| Texas Instruments Inc. | 3,863,300 | 182,155 | |
| SanDisk Corp. | 1,521,216 | 123,508 | |
| Microsoft Corp. | 2,859,200 | 117,199 | |
| QUALCOMM Inc. | 1,342,930 | 105,903 | |
| EMC Corp. | 3,025,100 | 82,918 | |
| Hewlett-Packard Co. | 2,536,500 | 82,081 | |
| * | Flextronics | ||
| International Ltd. | 8,841,200 | 81,693 | |
| Intuit Inc. | 921,500 | 71,628 | |
| Intel Corp. | 2,716,700 | 70,118 | |
| * | Electronic Arts Inc. | 2,081,600 | 60,387 |
| KLA-Tencor Corp. | 694,900 | 48,045 | |
| ASML Holding NV | 485,000 | 45,280 | |
| Market | |||
| Value | |||
| Shares | ($000) | ||
| Cisco Systems Inc. | 1,931,500 | 43,285 | |
| Symantec Corp. | 1,797,800 | 35,902 | |
| Applied Materials Inc. | 1,605,000 | 32,774 | |
| * | Adobe Systems Inc. | 498,000 | 32,738 |
| Corning Inc. | 1,425,000 | 29,668 | |
| Oracle Corp. | 680,800 | 27,852 | |
| NVIDIA Corp. | 1,519,600 | 27,216 | |
| Visa Inc. Class A | 121,113 | 26,143 | |
| * | eBay Inc. | 449,200 | 24,814 |
| Accenture plc Class A | 306,900 | 24,466 | |
| Altera Corp. | 547,200 | 19,831 | |
| Analog Devices Inc. | 347,400 | 18,461 | |
| Telefonaktiebolaget LM | |||
| Ericsson ADR | 1,354,800 | 18,059 | |
| *,^ | BlackBerry Ltd. | 1,527,100 | 12,339 |
| Activision Blizzard Inc. | 580,000 | 11,855 | |
| Apple Inc. | 19,650 | 10,547 | |
| MasterCard Inc. Class A | 86,000 | 6,424 | |
| Xilinx Inc. | 27,300 | 1,482 | |
| * | VMware Inc. Class A | 3,000 | 324 |
| * | Micron Technology Inc. | 12,000 | 284 |
| Motorola Solutions Inc. | 2,750 | 177 | |
| 1,680,595 | |||
| Materials (4.3%) | |||
| Monsanto Co. | 893,350 | 101,636 | |
| Cabot Corp. | 616,478 | 36,409 | |
| Potash Corp. of | |||
| Saskatchewan Inc. | 938,500 | 33,993 | |
| Praxair Inc. | 229,700 | 30,084 | |
| EI du Pont de | |||
| Nemours & Co. | 300,000 | 20,130 | |
| Dow Chemical Co. | 350,000 | 17,007 | |
| Celanese Corp. Class A | 265,000 | 14,710 | |
| LyondellBasell Industries | |||
| NV Class A | 102,400 | 9,107 | |
| Greif Inc. Class A | 130,000 | 6,824 | |
| * | Crown Holdings Inc. | 100,000 | 4,474 |
| Greif Inc. Class B | 37,000 | 2,148 | |
| 276,522 | |||
| Utilities (0.1%) | |||
| Exelon Corp. | 140,000 | 4,698 | |
| Total Common Stocks | |||
| (Cost $3,475,370) | 6,209,205 | ||
14
| PRIMECAP Core Fund | ||
| Market | ||
| Value | ||
| Shares | ($000) | |
| Temporary Cash Investment (4.2%) | ||
| Money Market Fund (4.2%) | ||
| 1,2 Vanguard Market Liquidity | ||
| Fund, 0.122% | ||
| (Cost $273,677) | 273,676,930 | 273,677 |
| Total Investments (100.2%) | ||
| (Cost $3,749,047) | 6,482,882 | |
| Other Assets and Liabilities (-0.2%) | ||
| Other Assets | 21,064 | |
| Liabilities2 | (33,638) | |
| (12,574) | ||
| Net Assets (100%) | ||
| Applicable to 316,335,869 outstanding | ||
| $.001 par value shares of beneficial | ||
| interest (unlimited authorization) | 6,470,308 | |
| Net Asset Value Per Share | $20.45 | |
| At March 31, 2014, net assets consisted of: | |
| Amount | |
| ($000) | |
| Paid-in Capital | 3,479,664 |
| Undistributed Net Investment Income | 21,325 |
| Accumulated Net Realized Gains | 235,282 |
| Unrealized Appreciation (Depreciation) | |
| Investment Securities | 2,733,835 |
| Foreign Currencies | 202 |
| Net Assets | 6,470,308 |
See Note A in Notes to Financial Statements.
* Non-income-producing security.
^ Includes partial security positions on loan to broker-dealers. The total value of securities on loan is $7,761,000.
1 Affiliated money market fund available only to Vanguard funds and certain trusts and accounts managed by Vanguard. Rate shown is the 7-day yield.
2 Includes $8,261,000 of collateral received for securities on loan.
ADR—American Depositary Receipt.
See accompanying Notes, which are an integral part of the Financial Statements.
15
| PRIMECAP Core Fund | |
| Statement of Operations | |
| Six Months Ended | |
| March 31, 2014 | |
| ($000) | |
| Investment Income | |
| Income | |
| Dividends1 | 59,235 |
| Interest2 | 157 |
| Securities Lending | 108 |
| Total Income | 59,500 |
| Expenses | |
| Investment Advisory Fees—Note B | 9,517 |
| The Vanguard Group—Note C | |
| Management and Administrative | 5,314 |
| Marketing and Distribution | 418 |
| Custodian Fees | 66 |
| Shareholders’ Reports | 20 |
| Trustees’ Fees and Expenses | 4 |
| Total Expenses | 15,339 |
| Net Investment Income | 44,161 |
| Realized Net Gain (Loss) | |
| Investment Securities Sold | 249,967 |
| Foreign Currencies | 204 |
| Realized Net Gain (Loss) | 250,171 |
| Change in Unrealized Appreciation (Depreciation) | |
| Investment Securities | 540,917 |
| Foreign Currencies | (89) |
| Change in Unrealized Appreciation (Depreciation) | 540,828 |
| Net Increase (Decrease) in Net Assets Resulting from Operations | 835,160 |
| 1 Dividends are net of foreign withholding taxes of $2,327,000. | |
| 2 Interest income from an affiliated company of the fund was $157,000. | |
See accompanying Notes, which are an integral part of the Financial Statements.
16
| PRIMECAP Core Fund | ||
| Statement of Changes in Net Assets | ||
| Six Months Ended | Year Ended | |
| March 31, | September 30, | |
| 2014 | 2013 | |
| ($000) | ($000) | |
| Increase (Decrease) in Net Assets | ||
| Operations | ||
| Net Investment Income | 44,161 | 73,595 |
| Realized Net Gain (Loss) | 250,171 | 204,410 |
| Change in Unrealized Appreciation (Depreciation) | 540,828 | 1,024,463 |
| Net Increase (Decrease) in Net Assets Resulting from Operations | 835,160 | 1,302,468 |
| Distributions | ||
| Net Investment Income | (54,577) | (79,568) |
| Realized Capital Gain | (207,572) | (81,710) |
| Total Distributions | (262,149) | (161,278) |
| Capital Share Transactions | ||
| Issued | 244,869 | 402,141 |
| Issued in Lieu of Cash Distributions | 235,932 | 144,815 |
| Redeemed | (357,523) | (616,525) |
| Net Increase (Decrease) from Capital Share Transactions | 123,278 | (69,569) |
| Total Increase (Decrease) | 696,289 | 1,071,621 |
| Net Assets | ||
| Beginning of Period | 5,774,019 | 4,702,398 |
| End of Period1 | 6,470,308 | 5,774,019 |
1 Net Assets—End of Period includes undistributed net investment income of $21,325,000 and $31,537,000.
See accompanying Notes, which are an integral part of the Financial Statements.
17
| PRIMECAP Core Fund | ||||||
| Financial Highlights | ||||||
| Six Months | ||||||
| Ended | ||||||
| For a Share Outstanding | March 31, | Year Ended September 30, | ||||
| Throughout Each Period | 2014 | 2013 | 2012 | 2011 | 2010 | 2009 |
| Net Asset Value, Beginning of Period | $18.65 | $14.98 | $12.37 | $12.51 | $11.42 | $11.41 |
| Investment Operations | ||||||
| Net Investment Income | .143 | .242 | .206 | .145 | .1331 | .097 |
| Net Realized and Unrealized Gain (Loss) | ||||||
| on Investments | 2.512 | 3.955 | 2.567 | (.143) | 1.051 | .030 |
| Total from Investment Operations | 2.655 | 4.197 | 2.773 | .002 | 1.184 | .127 |
| Distributions | ||||||
| Dividends from Net Investment Income | (.178) | (. 260) | (.163) | (.142) | (. 094) | (.117) |
| Distributions from Realized Capital Gains | (.677) | (.267) | — | — | — | — |
| Total Distributions | (. 855) | (. 527) | (.163) | (.142) | (. 094) | (.117) |
| Net Asset Value, End of Period | $20.45 | $18.65 | $14.98 | $12.37 | $12.51 | $11.42 |
| Total Return2 | 14.64% | 28.88% | 22.55% | -0.10% | 10.39% | 1.45% |
| Ratios/Supplemental Data | ||||||
| Net Assets, End of Period (Millions) | $6,470 | $5,774 | $4,702 | $4,345 | $4,569 | $4,245 |
| Ratio of Total Expenses to | ||||||
| Average Net Assets | 0.50% | 0.50% | 0.50% | 0.51% | 0.51% | 0.54% |
| Ratio of Net Investment Income to | ||||||
| Average Net Assets | 1.44% | 1.42% | 1.39% | 1.01% | 1.09%1 | 1.10% |
| Portfolio Turnover Rate | 19% | 7% | 10% | 9% | 8% | 5% |
The expense ratio, net income ratio, and turnover rate for the current period have been annualized.
1 Net investment income per share and the ratio of net investment income to average net assets include $.019 and 0.15%, respectively, resulting from a special dividend from Weyerhaeuser Co. in July 2010.
2 Total returns do not include transaction or account service fees that may have applied in the periods shown. Fund prospectuses provide information about any applicable transaction and account service fees.
See accompanying Notes, which are an integral part of the Financial Statements.
18
PRIMECAP Core Fund
Notes to Financial Statements
Vanguard PRIMECAP Core Fund is registered under the Investment Company Act of 1940 as an open-end investment company, or mutual fund.
A. The following significant accounting policies conform to generally accepted accounting principles for U.S. mutual funds. The fund consistently follows such policies in preparing its financial statements.
1. Security Valuation: Securities are valued as of the close of trading on the New York Stock Exchange (generally 4 p.m., Eastern time) on the valuation date. Equity securities are valued at the latest quoted sales prices or official closing prices taken from the primary market in which each security trades; such securities not traded on the valuation date are valued at the mean of the latest quoted bid and asked prices. Securities for which market quotations are not readily available, or whose values have been affected by events occurring before the fund’s pricing time but after the close of the securities’ primary markets, are valued at their fair values calculated according to procedures adopted by the board of trustees. These procedures include obtaining quotations from an independent pricing service, monitoring news to identify significant market- or security-specific events, and evaluating changes in the values of foreign market proxies (for example, ADRs, futures contracts, or exchange-traded funds), between the time the foreign markets close and the fund’s pricing time. When fair-value pricing is employed, the prices of securities used by a fund to calculate its net asset value may differ from quoted or published prices for the same securities. Investments in Vanguard Market Liquidity Fund are valued at that fund’s net asset value.
2. Foreign Currency: Securities and other assets and liabilities denominated in foreign currencies are translated into U.S. dollars using exchange rates obtained from an independent third party as of the fund’s pricing time on the valuation date. Realized gains (losses) and unrealized appreciation (depreciation) on investment securities include the effects of changes in exchange rates since the securities were purchased, combined with the effects of changes in security prices. Fluctuations in the value of other assets and liabilities resulting from changes in exchange rates are recorded as unrealized foreign currency gains (losses) until the assets or liabilities are settled in cash, at which time they are recorded as realized foreign currency gains (losses).
3. Federal Income Taxes: The fund intends to continue to qualify as a regulated investment company and distribute all of its taxable income. Management has analyzed the fund’s tax positions taken for all open federal income tax years (September 30, 2010–2013), and for the period ended March 31, 2014, and has concluded that no provision for federal income tax is required in the fund’s financial statements.
4. Distributions: Distributions to shareholders are recorded on the ex-dividend date.
5. Securities Lending: To earn additional income, the fund lends its securities to qualified institutional borrowers. Security loans are required to be secured at all times by collateral in an amount at least equal to the market value of securities loaned. Daily market fluctuations could cause the value of loaned securities to be more or less than the value of the collateral received. When this occurs, the collateral is adjusted and settled on the next business day. The fund further mitigates its counterparty risk by entering into securities lending transactions only with a diverse group of prequalified counter-parties, monitoring their financial strength, and entering into master securities lending agreements with its counterparties. The master securities lending agreements provide that, in the event of a counterparty’s default (including bankruptcy), the fund may terminate any loans with that borrower, determine the net amount owed, and sell or retain the collateral up to the net amount owed to the fund; however, such actions may be subject to legal proceedings. While collateral mitigates
19
PRIMECAP Core Fund
counterparty risk, in the absence of a default the fund may experience delays and costs in recovering the securities loaned. The fund invests cash collateral received in Vanguard Market Liquidity Fund, and records a liability in the Statement of Net Assets for the return of the collateral, during the period the securities are on loan. Securities lending income represents fees charged to borrowers plus income earned on invested cash collateral, less expenses associated with the loan.
6. Credit Facility: The fund and certain other funds managed by The Vanguard Group participate in a $2.89 billion committed credit facility provided by a syndicate of lenders pursuant to a credit agreement which may be renewed annually; each fund is individually liable for its borrowings, if any, under the credit facility. Borrowings may be utilized for temporary and emergency purposes, and are subject to the fund’s regulatory and contractual borrowing restrictions. The participating funds are charged administrative fees and an annual commitment fee of 0.06% of the undrawn amount of the facility, which are allocated to the funds in accordance with a methodology approved by the board of trustees and included in Management and Administrative expenses on the fund’s Statement of Operations. Any borrowings under this facility bear interest at a rate equal to the higher of the Federal Funds Rate or LIBOR Reference Rate plus an agreed-upon spread.
The fund had no borrowings outstanding at March 31, 2014, or at any time during the period then ended.
7. Other: Dividend income is recorded on the ex-dividend date. Interest income includes income distributions received from Vanguard Market Liquidity Fund and is accrued daily. Security transactions are accounted for on the date securities are bought or sold. Costs used to determine realized gains (losses) on the sale of investment securities are those of the specific securities sold.
B. PRIMECAP Management Company provides investment advisory services to the fund for a fee calculated at an annual percentage rate of average net assets. For the six months ended March 31, 2014, the investment advisory fee represented an effective annual rate of 0.31% of the fund’s average net assets.
C. The Vanguard Group furnishes at cost corporate management, administrative, marketing, and distribution services. The costs of such services are allocated to the fund under methods approved by the board of trustees. The fund has committed to provide up to 0.40% of its net assets in capital contributions to Vanguard. At March 31, 2014, the fund had contributed capital of $692,000 to Vanguard (included in Other Assets), representing 0.01% of the fund’s net assets and 0.28% of Vanguard’s capitalization. The fund’s trustees and officers are also directors and officers of Vanguard.
D. Various inputs may be used to determine the value of the fund’s investments. These inputs are summarized in three broad levels for financial statement purposes. The inputs or methodologies used to value securities are not necessarily an indication of the risk associated with investing in those securities.
Level 1—Quoted prices in active markets for identical securities.
Level 2—Other significant observable inputs (including quoted prices for similar securities, interest rates, prepayment speeds, credit risk, etc.).
Level 3—Significant unobservable inputs (including the fund’s own assumptions used to determine the fair value of investments).
20
PRIMECAP Core Fund
The following table summarizes the market value of the fund’s investments as of March 31, 2014, based on the inputs used to value them:
| Level 1 | Level 2 | Level 3 | |
| Investments | ($000) | ($000) | ($000) |
| Common Stocks | 5,811,437 | 397,768 | — |
| Temporary Cash Investments | 273,677 | — | — |
| Total | 6,085,114 | 397,768 | — |
E. Distributions are determined on a tax basis and may differ from net investment income and realized capital gains for financial reporting purposes. Differences may be permanent or temporary. Permanent differences are reclassified among capital accounts in the financial statements to reflect their tax character. Temporary differences arise when certain items of income, expense, gain, or loss are recognized in different periods for financial statement and tax purposes. These differences will reverse at some time in the future. Differences in classification may also result from the treatment of short-term gains as ordinary income for tax purposes. The fund’s tax-basis capital gains and losses are determined only at the end of each fiscal year.
During the six months ended March 31, 2014, the fund realized net foreign currency gains of $204,000, which increased distributable net income for tax purposes; accordingly, such gains have been reclassified from accumulated net realized gains to undistributed net investment income.
At March 31, 2014, the cost of investment securities for tax purposes was $3,749,047,000. Net unrealized appreciation of investment securities for tax purposes was $2,733,835,000, consisting of unrealized gains of $2,808,280,000 on securities that had risen in value since their purchase and $74,445,000 in unrealized losses on securities that had fallen in value since their purchase.
F. During the six months ended March 31, 2014, the fund purchased $548,813,000 of investment securities and sold $641,235,000 of investment securities, other than temporary cash investments.
G. Capital shares issued and redeemed were:
| Six Months Ended | Year Ended | |
| March 31, 2014 | September 30, 2013 | |
| Shares | Shares | |
| (000) | (000) | |
| Issued | 12,532 | 23,662 |
| Issued in Lieu of Cash Distributions | 12,563 | 9,674 |
| Redeemed | (18,288) | (37,714) |
| Net Increase (Decrease) in Shares Outstanding | 6,807 | (4,378) |
H. Management has determined that no material events or transactions occurred subsequent to March 31, 2014, that would require recognition or disclosure in these financial statements.
21
About Your Fund’s Expenses
As a shareholder of the fund, you incur ongoing costs, which include costs for portfolio management, administrative services, and shareholder reports (like this one), among others. Operating expenses, which are deducted from a fund’s gross income, directly reduce the investment return of the fund.
A fund’s expenses are expressed as a percentage of its average net assets. This figure is known as the expense ratio. The following examples are intended to help you understand the ongoing costs (in dollars) of investing in your fund and to compare these costs with those of other mutual funds. The examples are based on an investment of $1,000 made at the beginning of the period shown and held for the entire period.
The accompanying table illustrates your fund’s costs in two ways:
• Based on actual fund return. This section helps you to estimate the actual expenses that you paid over the period. The ”Ending Account Value“ shown is derived from the fund‘s actual return, and the third column shows the dollar amount that would have been paid by an investor who started with $1,000 in the fund. You may use the information here, together with the amount you invested, to estimate the expenses that you paid over the period.
To do so, simply divide your account value by $1,000 (for example, an $8,600 account value divided by $1,000 = 8.6), then multiply the result by the number given for your fund under the heading ”Expenses Paid During Period.“
• Based on hypothetical 5% yearly return. This section is intended to help you compare your fund‘s costs with those of other mutual funds. It assumes that the fund had a yearly return of 5% before expenses, but that the expense ratio is unchanged. In this case—because the return used is not the fund’s actual return—the results do not apply to your investment. The example is useful in making comparisons because the Securities and Exchange Commission requires all mutual funds to calculate expenses based on a 5% return. You can assess your fund’s costs by comparing this hypothetical example with the hypothetical examples that appear in shareholder reports of other funds.
Note that the expenses shown in the table are meant to highlight and help you compare ongoing costs only and do not reflect transaction costs incurred by the fund for buying and selling securities. Further, the expenses do not include any purchase, redemption, or account service fees described in the fund prospectus. If such fees were applied to your account, your costs would be higher. Your fund does not carry a “sales load.”
The calculations assume no shares were bought or sold during the period. Your actual costs may have been higher or lower, depending on the amount of your investment and the timing of any purchases or redemptions.
You can find more information about the fund’s expenses, including annual expense ratios, in the Financial Statements section of this report. For additional information on operating expenses and other shareholder costs, please refer to your fund’s current prospectus.
22
| Six Months Ended March 31, 2014 | |||
| Beginning | Ending | Expenses | |
| Account Value | Account Value | Paid During | |
| PRIMECAP Core Fund | 9/30/2013 | 3/31/2014 | Period |
| Based on Actual Fund Return | $1,000.00 | $1,146.44 | $2.68 |
| Based on Hypothetical 5% Yearly Return | 1,000.00 | 1,022.44 | 2.52 |
The calculations are based on expenses incurred in the most recent six-month period. The fund’s annualized six-month expense ratio for that period is 0.50%. The dollar amounts shown as “Expenses Paid” are equal to the annualized expense ratio multiplied by the average account value over the period, multiplied by the number of days in the most recent six-month period, then divided by the number of days in the most recent 12-month period.
23
Trustees Approve Advisory Arrangement
The board of trustees of Vanguard PRIMECAP Core Fund has renewed the fund’s investment advisory arrangement with PRIMECAP Management Company (PRIMECAP Management). The board determined that renewing the fund’s advisory arrangement was in the best interests of the fund and its shareholders.
The board based its decision upon an evaluation of the advisor’s investment staff, portfolio management process, and performance. The trustees considered the factors discussed below, among others. However, no single factor determined whether the board approved the arrangement. Rather, it was the totality of the circumstances that drove the board’s decision.
Nature, extent, and quality of services
The board considered the quality of the fund’s investment management services over both the short and long term, and took into account the organizational depth and stability of the advisor. The board noted that PRIMECAP Management, founded in 1983, is recognized for its long-term approach to equity investing. Five experienced portfolio managers are responsible for separate sub-portfolios, and each portfolio manager employs a fundamental, research-driven approach in seeking to identify companies whose long-term potential has been overlooked by the market and whose stock is trading at attractive valuation levels. The firm has managed the fund since the fund’s inception in 2004.
The board concluded that the advisor’s experience, stability, depth, and performance, among other factors, warranted continuation of the advisory arrangement.
Investment performance
The board considered the short- and long-term performance of the fund, including any periods of outperformance or underperformance relative to a benchmark index and peer group. The board concluded that the performance was such that the advisory arrangement should continue. Information about the fund’s most recent performance can be found in the Performance Summary section of this report.
Cost
The board concluded that the fund’s expense ratio was well below the average expense ratio charged by funds in its peer group and that the fund’s advisory fee rate was also well below its peer-group average. Information about the fund’s expenses appears in the About Your Fund’s Expenses section of this report as well as in the Financial Statements section, which also includes information about the fund’s advisory fee rate.
The board did not consider profitability of PRIMECAP Management in determining whether to approve the advisory fee, because PRIMECAP Management is independent of Vanguard, and the advisory fee is the result of arm’s-length negotiations.
The benefit of economies of scale
The board concluded that the fund’s shareholders benefit from economies of scale because of the breakpoints in the fund’s advisory fee schedule. The breakpoints reduce the effective rate of the fee as the fund’s assets increase.
The board will consider whether to renew the advisory arrangement again after a one-year period.
24
Glossary
30-Day SEC Yield. A fund’s 30-day SEC yield is derived using a formula specified by the U.S. Securities and Exchange Commission. Under the formula, data related to the fund’s security holdings in the previous 30 days are used to calculate the fund’s hypothetical net income for that period, which is then annualized and divided by the fund’s estimated average net assets over the calculation period. For the purposes of this calculation, a security’s income is based on its current market yield to maturity (for bonds), its actual income (for asset-backed securities), or its projected dividend yield (for stocks). Because the SEC yield represents hypothetical annualized income, it will differ—at times significantly—from the fund’s actual experience. As a result, the fund’s income distributions may be higher or lower than implied by the SEC yield.
Beta. A measure of the magnitude of a fund’s past share-price fluctuations in relation to the ups and downs of a given market index. The index is assigned a beta of 1.00. Compared with a given index, a fund with a beta of 1.20 typically would have seen its share price rise or fall by 12% when the index rose or fell by 10%. For this report, beta is based on returns over the past 36 months for both the fund and the index. Note that a fund’s beta should be reviewed in conjunction with its R-squared (see definition). The lower the R-squared, the less correlation there is between the fund and the index, and the less reliable beta is as an indicator of volatility.
Dividend Yield. Dividend income earned by stocks, expressed as a percentage of the aggregate market value (or of net asset value, for a fund). The yield is determined by dividing the amount of the annual dividends by the aggregate value (or net asset value) at the end of the period. For a fund, the dividend yield is based solely on stock holdings and does not include any income produced by other investments.
Earnings Growth Rate. The average annual rate of growth in earnings over the past five years for the stocks now in a fund.
Equity Exposure. A measure that reflects a fund’s investments in stocks and stock futures. Any holdings in short-term reserves are excluded.
Expense Ratio. A fund’s total annual operating expenses expressed as a percentage of the fund’s average net assets. The expense ratio includes management and administrative expenses, but does not include the transaction costs of buying and selling portfolio securities.
Foreign Holdings. The percentage of a fund represented by securities or depositary receipts of companies based outside the United States.
Inception Date. The date on which the assets of a fund (or one of its share classes) are first invested in accordance with the fund’s investment objective. For funds with a subscription period, the inception date is the day after that period ends. Investment performance is measured from the inception date.
Median Market Cap. An indicator of the size of companies in which a fund invests; the midpoint of market capitalization (market price x shares outstanding) of a fund’s stocks, weighted by the proportion of the fund’s assets invested in each stock. Stocks representing half of the fund’s assets have market capitalizations above the median, and the rest are below it.
Price/Book Ratio. The share price of a stock divided by its net worth, or book value, per share. For a fund, the weighted average price/book ratio of the stocks it holds.
25
Price/Earnings Ratio. The ratio of a stock’s current price to its per-share earnings over the past year. For a fund, the weighted average P/E of the stocks it holds. P/E is an indicator of market expectations about corporate prospects; the higher the P/E, the greater the expectations for a company’s future growth.
R-Squared. A measure of how much of a fund’s past returns can be explained by the returns from the market in general, as measured by a given index. If a fund’s total returns were precisely synchronized with an index’s returns, its R-squared would be 1.00. If the fund’s returns bore no relationship to the index’s returns, its R-squared would be 0. For this report, R-squared is based on returns over the past 36 months for both the fund and the index.
Return on Equity. The annual average rate of return generated by a company during the past five years for each dollar of shareholder’s equity (net income divided by shareholder’s equity). For a fund, the weighted average return on equity for the companies whose stocks it holds.
Short-Term Reserves. The percentage of a fund invested in highly liquid, short-term securities that can be readily converted to cash.
Turnover Rate. An indication of the fund’s trading activity. Funds with high turnover rates incur higher transaction costs and may be more likely to distribute capital gains (which may be taxable to investors). The turnover rate excludes in-kind transactions, which have minimal impact on costs.
26
This page intentionally left blank.
The People Who Govern Your Fund
The trustees of your mutual fund are there to see that the fund is operated and managed in your best interests since, as a shareholder, you are a part owner of the fund. Your fund’s trustees also serve on the board of directors of The Vanguard Group, Inc., which is owned by the Vanguard funds and provides services to them on an at-cost basis.
A majority of Vanguard’s board members are independent, meaning that they have no affiliation with Vanguard or the funds they oversee, apart from the sizable personal investments they have made as private individuals. The independent board members have distinguished backgrounds in business, academia, and public service. Each of the trustees and executive officers oversees 179 Vanguard funds.
The following table provides information for each trustee and executive officer of the fund. More information about the trustees is in the Statement of Additional Information, which can be obtained, without charge, by contacting Vanguard at 800-662-7447, or online at vanguard.com.
| InterestedTrustee1 | and Delphi Automotive LLP (automotive components); |
| Senior Advisor at New Mountain Capital. | |
| F. William McNabb III | |
| Born 1957. Trustee Since July 2009. Chairman of the | Amy Gutmann |
| Board. Principal Occupation(s) During the Past Five | Born 1949. Trustee Since June 2006. Principal |
| Years: Chairman of the Board of The Vanguard Group, | Occupation(s) During the Past Five Years: President of |
| Inc., and of each of the investment companies served | the University of Pennsylvania; Christopher H. Browne |
| by The Vanguard Group, since January 2010; Director | Distinguished Professor of Political Science, School of |
| of The Vanguard Group since 2008; Chief Executive | Arts and Sciences, and Professor of Communication, |
| Officer and President of The Vanguard Group, and of | Annenberg School for Communication, with secondary |
| each of the investment companies served by The | faculty appointments in the Department of Philosophy, |
| Vanguard Group, since 2008; Director of Vanguard | School of Arts and Sciences, and at the Graduate |
| Marketing Corporation; Managing Director of The | School of Education, University of Pennsylvania; |
| Vanguard Group (1995–2008). | Trustee of the National Constitution Center; Chair |
| of the Presidential Commission for the Study of | |
| Bioethical Issues. | |
| IndependentTrustees | |
| JoAnn Heffernan Heisen | |
| Emerson U. Fullwood | Born 1950. Trustee Since July 1998. Principal |
| Born 1948. Trustee Since January 2008. Principal | Occupation(s) During the Past Five Years: Corporate |
| Occupation(s) During the Past Five Years: Executive | Vice President and Chief Global Diversity Officer |
| Chief Staff and Marketing Officer for North America | (retired 2008) and Member of the Executive |
| and Corporate Vice President (retired 2008) of Xerox | Committee (1997–2008) of Johnson & Johnson |
| Corporation (document management products and | (pharmaceuticals/medical devices/consumer |
| services); Executive in Residence and 2009–2010 | products); Director of Skytop Lodge Corporation |
| Distinguished Minett Professor at the Rochester | (hotels), the University Medical Center at Princeton, |
| Institute of Technology; Director of SPX Corporation | the Robert Wood Johnson Foundation, and the Center |
| (multi-industry manufacturing), the United Way of | for Talent Innovation; Member of the Advisory Board |
| Rochester, Amerigroup Corporation (managed health | of the Maxwell School of Citizenship and Public Affairs |
| care), the University of Rochester Medical Center, | at Syracuse University. |
| Monroe Community College Foundation, and North | |
| Carolina A&T University. | F. Joseph Loughrey |
| Born 1949. Trustee Since October 2009. Principal | |
| Rajiv L. Gupta | Occupation(s) During the Past Five Years: President |
| Born 1945. Trustee Since December 2001.2 | and Chief Operating Officer (retired 2009) of Cummins |
| Principal Occupation(s) During the Past Five Years: | Inc. (industrial machinery); Chairman of the Board |
| Chairman and Chief Executive Officer (retired 2009) | of Hillenbrand, Inc. (specialized consumer services), |
| and President (2006–2008) of Rohm and Haas Co. | and of Oxfam America; Director of SKF AB (industrial |
| (chemicals); Director of Tyco International, Ltd. | machinery), Hyster-Yale Materials Handling, Inc. |
| (diversified manufacturing and services), Hewlett- | (forklift trucks), the Lumina Foundation for Education, |
| Packard Co. (electronic computer manufacturing), |
| and the V Foundation for Cancer Research; Member | Executive Officers | |
| of the Advisory Council for the College of Arts and | ||
| Letters and of the Advisory Board to the Kellogg | Glenn Booraem | |
| Institute for International Studies, both at the | Born 1967. Controller Since July 2010. Principal | |
| University of Notre Dame. | Occupation(s) During the Past Five Years: Principal | |
| of The Vanguard Group, Inc.; Controller of each of | ||
| Mark Loughridge | the investment companies served by The Vanguard | |
| Born 1953. Trustee Since March 2012. Principal | Group; Assistant Controller of each of the investment | |
| Occupation(s) During the Past Five Years: Senior Vice | companies served by The Vanguard Group (2001–2010). | |
| President and Chief Financial Officer (retired 2013) | ||
| at IBM (information technology services); Fiduciary | Thomas J. Higgins | |
| Member of IBM’s Retirement Plan Committee (2004– | Born 1957. Chief Financial Officer Since September | |
| 2013); Member of the Council on Chicago Booth. | 2008. Principal Occupation(s) During the Past Five | |
| Years: Principal of The Vanguard Group, Inc.; Chief | ||
| Scott C. Malpass | Financial Officer of each of the investment companies | |
| Born 1962. Trustee Since March 2012. Principal | served by The Vanguard Group; Treasurer of each of | |
| Occupation(s) During the Past Five Years: Chief | the investment companies served by The Vanguard | |
| Investment Officer and Vice President at the University | Group (1998–2008). | |
| of Notre Dame; Assistant Professor of Finance at the | ||
| Mendoza College of Business at Notre Dame; Member | Kathryn J. Hyatt | |
| of the Notre Dame 403(b) Investment Committee; | Born 1955. Treasurer Since November 2008. Principal | |
| Board Member of TIFF Advisory Services, Inc. | Occupation(s) During the Past Five Years: Principal of | |
| (investment advisor); Member of the Investment | The Vanguard Group, Inc.; Treasurer of each of the | |
| Advisory Committees of the Financial Industry | investment companies served by The Vanguard | |
| Regulatory Authority (FINRA) and of Major League | Group; Assistant Treasurer of each of the investment | |
| Baseball. | companies served by The Vanguard Group (1988–2008). | |
| André F. Perold | Heidi Stam | |
| Born 1952. Trustee Since December 2004. Principal | Born 1956. Secretary Since July 2005. Principal | |
| Occupation(s) During the Past Five Years: George | Occupation(s) During the Past Five Years: Managing | |
| Gund Professor of Finance and Banking, Emeritus | Director of The Vanguard Group, Inc.; General Counsel | |
| at the Harvard Business School (retired 2011); | of The Vanguard Group; Secretary of The Vanguard | |
| Chief Investment Officer and Managing Partner of | Group and of each of the investment companies | |
| HighVista Strategies LLC (private investment firm); | served by The Vanguard Group; Director and Senior | |
| Director of Rand Merchant Bank; Overseer of the | Vice President of Vanguard Marketing Corporation. | |
| Museum of Fine Arts Boston. | ||
| Vanguard Senior ManagementTeam | ||
| Alfred M. Rankin, Jr. | ||
| Born 1941. Trustee Since January 1993. Principal | Mortimer J. Buckley | Chris D. McIsaac |
| Occupation(s) During the Past Five Years: Chairman, | Kathleen C. Gubanich | Michael S. Miller |
| President, and Chief Executive Officer of NACCO | Paul A. Heller | James M. Norris |
| Industries, Inc. (housewares/lignite), and of Hyster- | Martha G. King | Glenn W. Reed |
| Yale Materials Handling, Inc. (forklift trucks); Chairman | John T. Marcante | |
| of the Board of University Hospitals of Cleveland. | ||
| Peter F. Volanakis | Chairman Emeritus and Senior Advisor | |
| Born 1955. Trustee Since July 2009. Principal | ||
| Occupation(s) During the Past Five Years: President | John J. Brennan | |
| and Chief Operating Officer (retired 2010) of Corning | Chairman, 1996–2009 | |
| Incorporated (communications equipment); Trustee of | Chief Executive Officer and President, 1996–2008 | |
| Colby-Sawyer College; Member of the Advisory Board | ||
| of the Norris Cotton Cancer Center and of the Advisory | Founder | |
| Board of the Parthenon Group (strategy consulting). | ||
| John C. Bogle | ||
| Chairman and Chief Executive Officer, 1974–1996 | ||
1 Mr. McNabb is considered an “interested person,” as defined in the Investment Company Act of 1940, because he is an officer of the Vanguard funds.
2 December 2002 for Vanguard Equity Income Fund, the Vanguard Municipal Bond Funds, and the Vanguard State Tax-Exempt Funds.
 | |
| P.O. Box 2600 | |
| Valley Forge, PA 19482-2600 |
Connect with Vanguard® > vanguard.com
| Fund Information > 800-662-7447 | |
| Direct Investor Account Services > 800-662-2739 | |
| Institutional Investor Services > 800-523-1036 | |
| Text Telephone for People | |
| With Hearing Impairment > 800-749-7273 | |
| This material may be used in conjunction | |
| with the offering of shares of any Vanguard | |
| fund only if preceded or accompanied by | |
| the fund’s current prospectus. | |
| All comparative mutual fund data are from Lipper, a | |
| Thomson Reuters Company, or Morningstar, Inc., unless | |
| otherwise noted. | |
| You can obtain a free copy of Vanguard’s proxy voting | |
| guidelines by visiting vanguard.com/proxyreporting or by | |
| calling Vanguard at 800-662-2739. The guidelines are | |
| also available from the SEC’s website, sec.gov. In | |
| addition, you may obtain a free report on how your fund | |
| voted the proxies for securities it owned during the 12 | |
| months ended June 30. To get the report, visit either | |
| vanguard.com/proxyreporting or sec.gov. | |
| You can review and copy information about your fund at | |
| the SEC’s Public Reference Room in Washington, D.C. To | |
| find out more about this public service, call the SEC at | |
| 202-551-8090. Information about your fund is also | |
| available on the SEC’s website, and you can receive | |
| copies of this information, for a fee, by sending a | |
| request in either of two ways: via e-mail addressed to | |
| publicinfo@sec.gov or via regular mail addressed to the | |
| Public Reference Section, Securities and Exchange | |
| Commission, Washington, DC 20549-1520. | |
| © 2014 The Vanguard Group, Inc. | |
| All rights reserved. | |
| Vanguard Marketing Corporation, Distributor. | |
| Q12202 052014 | |
Item 2: Code of Ethics.
Not Applicable.
Item 3:
Not Applicable.
Item 4: Principal Accountant Fees and Services.
Not. Applicable.
Item 5: Audit Committee of Listed Registrants.
Not Applicable.
Item 6: Investments.
Not Applicable.
Item 7: Disclosure of Proxy Voting Policies and Procedures for Closed-End Management Investment Companies.
Not Applicable.
Item 8: Portfolio Managers of Closed-End Management Investment Companies.
Not Applicable.
Item 9: Purchase of Equity Securities by Closed-End Management Investment Company and Affiliated Purchasers.
Not Applicable.
Item 10: Submission of Matters to a Vote of Security Holders.
Not Applicable.
Item 11: Controls and Procedures.
(a) Disclosure Controls and Procedures. The Principal Executive and Financial Officers concluded that the Registrant’s Disclosure Controls and Procedures are effective based on their evaluation of the Disclosure Controls and Procedures as of a date within 90 days of the filing date of this report.
(b) Internal Control Over Financial Reporting. There were no significant changes in Registrant’s Internal Control Over Financial Reporting or in other factors that could significantly affect this control subsequent to the date of the evaluation, including any corrective actions with regard to significant deficiencies and material weaknesses.
Item 12: Exhibits.
(a) Certifications.
Pursuant to the requirements of the Securities Exchange Act of 1934 and the Investment Company Act of 1940, the registrant has duly caused this report to be signed on its behalf by the undersigned, thereunto duly authorized.
| VANGUARD FENWAY FUNDS | |
| By: | /s/ F. WILLIAM MCNABB III* |
| F. WILLIAM MCNABB III | |
| CHIEF EXECUTIVE OFFICER | |
| Date: May 19, 2014 | |
Pursuant to the requirements of the Securities Exchange Act of 1934 and the Investment Company Act of 1940, this report has been signed below by the following persons on behalf of the registrant and in the capacities and on the dates indicated.
| VANGUARD FENWAY FUNDS | |
| By: | /s/ F. WILLIAM MCNABB III* |
| F. WILLIAM MCNABB III | |
| CHIEF EXECUTIVE OFFICER | |
| Date: May 19, 2014 | |
| VANGUARD FENWAY FUNDS | |
| By: | /s/ THOMAS J. HIGGINS* |
| THOMAS J. HIGGINS | |
| CHIEF FINANCIAL OFFICER | |
| Date: May 19, 2014 | |
* By: /s/ Heidi Stam
Heidi Stam, pursuant to a Power of Attorney filed on April 22, 2014 see file Number 2-17620, Incorporated by Reference.