UNITED STATES
SECURITIES AND EXCHANGE COMMISSION
Washington, D.C. 20549
FORM N-CSR
CERTIFIED SHAREHOLDER REPORT
OF
REGISTERED MANAGEMENT INVESTMENT COMPANIES
Investment Company Act file number: | 811-05445 | |
Name of Registrant: | Vanguard Fenway Funds | |
Address of Registrant: | P.O. Box 2600 | |
| Valley Forge, PA 19482 | ||
Name and address of agent for service: | Heidi Stam, Esquire | |
| P.O. Box 876 | ||
| Valley Forge, PA 19482 | ||
Registrant’s telephone number, including area code: (610) 669-1000 | ||
Date of fiscal year end: September 30 | ||
Date of reporting period: October 1, 2015 – March 31, 2016 | ||
Item 1: Reports to Shareholders | ||
Semiannual Report | March 31, 2016
Vanguard Equity Income Fund
Vanguard’s Principles for Investing Success
We want to give you the best chance of investment success. These principles, grounded in Vanguard’s research and experience, can put you on the right path.
Goals. Create clear, appropriate investment goals.
Balance. Develop a suitable asset allocation using broadly diversified funds. Cost. Minimize cost.
Discipline. Maintain perspective and long-term discipline.
A single theme unites these principles: Focus on the things you can control.
We believe there is no wiser course for any investor.
| Contents | |
| Your Fund’s Total Returns. | 1 |
| Chairman’s Letter. | 2 |
| Advisors’ Report. | 7 |
| Fund Profile. | 11 |
| Performance Summary. | 12 |
| Financial Statements. | 13 |
| About Your Fund’s Expenses. | 27 |
| Trustees Approve Advisory Arrangements. | 29 |
| Glossary. | 31 |
Please note: The opinions expressed in this report are just that—informed opinions. They should not be considered promises or advice.
Also, please keep in mind that the information and opinions cover the period through the date on the front of this report. Of course, the
risks of investing in your fund are spelled out in the prospectus.
See the Glossary for definitions of investment terms used in this report.
About the cover: Pictured is a sailing block on the Brilliant, a 1932 schooner docked in Mystic, Connecticut. A type of pulley, the
sailing block helps coordinate the setting of the sails. At Vanguard, the intricate coordination of technology and people allows
us to help millions of clients around the world reach their financial goals.
Your Fund’s Total Returns
| Six Months Ended March 31, 2016 | |
| Total | |
| Returns | |
| Vanguard Equity Income Fund | |
| Investor Shares | 10.84% |
| Admiral™ Shares | 10.89 |
| FTSE High Dividend Yield Index | 12.02 |
| Equity Income Funds Average | 7.44 |
Equity Income Funds Average: Derived from data provided by Lipper, a Thomson Reuters Company.
Admiral Shares carry lower expenses and are available to investors who meet certain account-balance requirements.
| Your Fund’s Performance at a Glance | ||||
| September 30, 2015, Through March 31, 2016 | ||||
| Distributions Per Share | ||||
| Starting | Ending | Income | Capital | |
| Share Price | Share Price | Dividends | Gains | |
| Vanguard Equity Income Fund | ||||
| Investor Shares | $28.78 | $30.39 | $0.460 | $1.016 |
| Admiral Shares | 60.31 | 63.69 | 0.988 | 2.130 |
1

Chairman’s Letter
Dear Shareholder,
Despite a brief resurgence of volatility, U.S. stocks produced solid gains for the six months ended March 31, 2016. Stocks of larger-capitalization companies generally outpaced those of smaller firms, while growth stocks finished slightly ahead of their value counterparts.
Vanguard Equity Income Fund, which tends to favor large-cap value stocks, returned nearly 11% for the period. It trailed its benchmark, the FTSE High Dividend Yield Index, but finished more than three percentage points ahead of its peer group average and the broad U.S. stock market.
The fund notched gains in all ten industry sectors, with more than half posting double-digit results. In several sectors, however, the fund’s holdings failed to keep pace with those in the index, leading to its relative underperformance.
As of March 31, the fund’s 30-day SEC yield was 2.86% for Investor Shares, compared with 3.12% at the start of the period. The SEC yield for Admiral Shares stood at 2.95%, compared with 3.21% six months earlier.
Stocks charted an uneven course en route to a favorable outcome
The broad U.S. stock market returned about 7% over the six months. The period began and ended strongly, with
2
fluctuations in the middle as China’s economic slowdown and falling oil and commodity prices worried investors.
Stocks rallied in March as investors again seemed encouraged by news about monetary policy. The Federal Reserve indicated, after a mid-March meeting, that it would raise interest rates fewer times in 2016 than previously anticipated. And central bankers in Europe and Asia kept up stimulus measures to combat weak growth and low inflation.
International stocks returned about 3% for the period after surging more than 8% in March. Stocks from emerging markets and from developed markets of the Pacific region outperformed European stocks, which were nearly flat.
Bonds produced gains following a subpar start
After posting weak results for the first three months of the period, bonds managed solid gains. The broad U.S. taxable bond market returned 2.44% for the fiscal half year.
With stocks volatile and the Fed proceeding cautiously with rate hikes, bonds proved attractive. The yield of the 10-year U.S. Treasury note closed at 1.77% at the end of March, down from 2.05% six months earlier. (Bond prices and yields move in opposite directions.)
Returns for money market funds and savings accounts remained limited by the Fed’s target rate of 0.25%–0.5%—still low despite rising a quarter percentage point in December.
| Market Barometer | |||
| Total Returns | |||
| Periods Ended March 31, 2016 | |||
| Six | One | Five Years | |
| Months | Year | (Annualized) | |
| Stocks | |||
| Russell 1000 Index (Large-caps) | 7.75% | 0.50% | 11.35% |
| Russell 2000 Index (Small-caps) | 2.02 | -9.76 | 7.20 |
| Russell 3000 Index (Broad U.S. market) | 7.30 | -0.34 | 11.01 |
| FTSE All-World ex US Index (International) | 3.09 | -8.53 | 0.70 |
| Bonds | |||
| Barclays U.S. Aggregate Bond Index (Broad taxable market) | 2.44% | 1.96% | 3.78% |
| Barclays Municipal Bond Index (Broad tax-exempt market) | 3.20 | 3.98 | 5.59 |
| Citigroup Three-Month U.S. Treasury Bill Index | 0.06 | 0.08 | 0.04 |
| CPI | |||
| Consumer Price Index | 0.08% | 0.85% | 1.28% |
3
International bond markets (as measured by the Barclays Global Aggregate Index ex USD) returned 6.90%. International bonds got a boost as foreign currencies strengthened against the dollar, a turnabout from the trend of recent years. Even without this currency benefit, however, international bond returns were solidly positive.
The fund posted sizable gains despite trailing its benchmark
Vanguard Equity Income Fund focuses on high-quality, well-established companies with above-average current dividend yields and potential for long-term capital appreciation. This approach often leads the fund’s advisors, Wellington Management Company and Vanguard Quantitative Equity Group, to invest in out-of-favor industries, where companies trade at a discount to the overall market’s valuation.
As I mentioned, the fund produced positive results in all ten sectors for the period. Stocks of industrial, information technology, and consumer staples companies contributed most to performance, together adding nearly 6 percentage points to the fund’s total return.
Despite its strong overall result, the fund trailed its benchmark. This underper-formance can be attributed to smaller returns in a number of sectors. The most notable of these was health care, where the fund’s pharmaceutical stocks failed
| Expense Ratios | |||
| Your Fund Compared With Its Peer Group | |||
| Investor | Admiral | Peer Group | |
| Shares | Shares | Average | |
| Equity Income Fund | 0.26% | 0.17% | 1.20% |
The fund expense ratios shown are from the prospectus dated January 27, 2016, and represent estimated costs for the current fiscal year. For
the six months ended March 31, 2016, the fund’s annualized expense ratios were 0.24% for Investor Shares and 0.16% for Admiral Shares.
The peer-group expense ratio is derived from data provided by Lipper, a Thomson Reuters Company, and captures information through
year-end 2015.
Peer group: Equity Income Funds.
4
to keep pace with those in the index. Weaker selection in consumer staples and telecommunication services also hurt the fund in comparison to the benchmark. The fund’s overweight allocation to financials detracted as the sector was one of the worst performers in the benchmark.
Energy was a relative bright spot, as the fund’s holdings outpaced those in the index.
For more about the advisors’ strategy and the fund’s positioning during the six months, please see the Advisors’ Report that follows this letter.
| Vanguard’s growth translates into lower costs for you |
| Research indicates that lower-cost investments have tended to outperform higher-cost ones. |
| So it’s little wonder that funds with lower expense ratios—including those at Vanguard—have |
| dominated the industry’s cash inflows in recent years. |
| Vanguard has long been a low-cost leader, with expenses well below those of many other |
| investment management companies. That cost difference remains a powerful advantage for |
| Vanguard clients. Why? Because a lower expense ratio allows a fund to pass along a greater |
| share of its returns to its investors. |
| What’s more, as you can see in the chart below, we’ve been able to lower our costs continually |
| as our assets under management have grown. Our steady growth has not been an explicit |
| business objective. Rather, we focus on putting our clients’ interests first at all times, and |
| giving them the best chance for investment success. But economies of scale—the cost |
| efficiencies that come with our growth—have allowed us to keep lowering our fund costs, |
| even as we invest in our people and technology. |
| The benefit of economies of scale |

| Note: Data are for U.S.-based Vanguard funds only. |
| Source: Vanguard. |
Consider rebalancing to manage your risk
Let’s say you’ve taken the time to carefully create an appropriate asset allocation for your investment portfolio. Your efforts have produced a diversified mix of stock, bond, and money market funds tailored to your goals, time horizon, and risk tolerance.
But what should you do when your portfolio drifts from its original asset allocation as the financial markets rise or fall? Consider rebalancing to bring it back to the proper mix.
Just one year of outsized returns can throw your allocation out of whack. Take 2013 as an example. That year, the broad stock market (as measured by the Russell 3000 Index) returned 33.55% and the broad taxable bond market (as measured by the Barclays U.S. Aggregate Bond Index) returned –2.02%. A hypothetical portfolio that tracked the broad domestic market indexes and started the year with 60% stocks and 40% bonds would have ended with a more aggressive mix of 67% stocks and 33% bonds.
Rebalancing to bring your portfolio back to its original targets would require you to shift assets away from areas that have been performing well toward those that have been falling behind. That isn’t easy or intuitive. It’s a way to minimize risk rather than maximize returns and to stick with your investment plan through different types of markets. (You can read more about our approach in Best Practices for Portfolio Rebalancing at vanguard.com/research.)
It’s not necessary to check your portfolio every day or every month, much less rebalance it that frequently. It may be more appropriate to monitor it annually or semiannually and rebalance when your allocation swings 5 percentage points or more from its target.
It’s important, of course, to be aware of the tax implications. You’ll want to consult with your tax advisor, but generally speaking, it may be a good idea to make any asset changes within a tax-advantaged retirement account or to direct new cash flows into the underweighted asset class.
However you go about it, keeping your asset allocation from drifting too far off target can help you stay on track with the investment plan you’ve crafted to meet your financial goals.
As always, thank you for investing with Vanguard.
Sincerely,

F. William McNabb III
Chairman and Chief Executive Officer
April 14, 2016
6
Advisors’ Report
For the six months ended March 31, 2016, Vanguard Equity Income Fund returned almost 11%. It trailed its benchmark, the FTSE High Dividend Yield Index, but finished ahead of its peer group average and the broad U.S. stock market.
This performance reflects the combined results of your fund’s two independent investment advisors, Wellington Management Company and Vanguard Quantitative Equity Group. The use of two advisors provides exposure to distinct yet complementary investment approaches, enhancing the diversification of your fund. It is not uncommon for different advisors to have different views about individual securities or the broader investment environment.
The advisors, the percentage and amount of the fund’s assets each manages, and brief descriptions of their investment strategies are presented in the table below. The advisors have also prepared a discussion of the investment environment that existed during the six months and its effect on portfolio positioning. These comments were prepared on April 19, 2016.
Wellington Management Company llp
Portfolio Manager:
W. Michael Reckmeyer, III, CFA,
Senior Managing Director
and Equity Portfolio Manager
The investment environment remained somewhat precarious during the period, with divergent trends between developed and emerging markets and uncertainty over central bank policies.
China continues to transition from a rapidly growing economy to more moderate growth and has employed a variety of actions to stimulate economic
| Vanguard Equity Income Fund Investment Advisors | |||
| Fund Assets Managed | |||
| Investment Advisor | % | $ Million | Investment Strategy |
| Wellington Management | 64 | 12,885 | A fundamental approach to seeking desirable stocks. |
| Company LLP | Our selections typically offer above-average dividend | ||
| yields, below-average valuations, and the potential for | |||
| dividend increases in the future. | |||
| Vanguard Quantitative Equity | 34 | 6,939 | Employs a quantitative fundamental management |
| Group | approach, using models that assess valuation, growth | ||
| prospects, management decisions, market sentiment, | |||
| and earnings and balance-sheet quality of companies | |||
| as compared with their peers. | |||
| Cash Investments | 2 | 373 | These short-term reserves are invested by Vanguard in |
| equity index products to simulate investment in stocks. | |||
| Each advisor may also maintain a modest cash | |||
| position. | |||
7
activity. Although data out of China have been more positive recently, the extent of the country’s slowdown is still uncertain. Other emerging economies are also slowing, with Brazil and Russia in severe recessions.
Europe struggled at the beginning of 2016, and the European Central Bank (ECB) continued to take action, expanding monetary policies and moving interest rates further into negative territory. Markets had mixed reactions, and the ECB’s tactics have prompted some volatility in recent months. Japan also experienced a rocky start to 2016, as the Bank of Japan surprised investors with its decision to implement negative interest rates.
The United States is in its seventh year of expansion and one of the largest economic recoveries in history. Core inflation is starting to tick up, unemployment continues to fall, and wages have been accelerating. It also remains to be seen how the Federal Reserve’s experiment with quantitative easing will play out, particularly with the global uncertainties and other central banks’ actions. With this backdrop, the consumer remains resilient. However, the strong dollar will likely weigh on U.S. exports, and energy and industrial inventories remain elevated.
Our underperformance was driven by sector allocation, a residual of our bottom-up stock selection process. An overweight allocation to financials, the worst performing sector in the benchmark, and a cash position in a strong equity market detracted most from relative performance. Stock selection in health care, utilities, and consumer staples also hurt performance. On an individual name basis, our positions in Marathon Oil and Union Pacific, as well as our decision not to own benchmark constituent AT&T, detracted most. We eliminated our position in Marathon Oil as eroding oil fundamentals caused management to cut its dividend.
Selection in the energy, financial, and information technology sectors helped performance. Overweight allocations to utilities and industrials, as well as our underweight position in Eli Lilly and decisions not to own energy companies Kinder Morgan or Williams, also aided performance. We eliminated our position in Eli Lilly early in the period.
At the end of the period, we were most overweighted in financials, health care, and energy. Consumer staples, consumer discretionary, and telecommunication services were our largest underweights relative to the benchmark.
Significant purchases in the past six months included new positions in Sempra Energy, Canadian Natural Resources, TransCanada, and Amgen. We trimmed our positions in Home Depot because of valuation and in Analog Devices as the stock neared our target price. We also eliminated Symantec over concerns about business fundamentals and our uncertainty about how management would allocate excess cash.
As always, we remain focused on finding investment opportunities in quality dividend-paying companies with superior total return potential at discounted valuations.
8
Vanguard Quantitative Equity Group
Portfolio Managers:
Michael R. Roach, CFA
James P. Stetler, Principal
Binbin Guo, Principal, Head of Equity
Research and Portfolio Strategies
For the six months, the Equity Income Fund returned nearly 11%, trailing its benchmark. The broad U.S. equity market was up 7.30%. Large- and mid-capitalization stocks drove performance, returning 7.75%, while small-caps lagged the broad market with a 2.02% return. Growth stocks took a slight lead over value stocks, with returns of 7.45% and 7.15%, respectively. Globally, the U.S. equity market continued to outperform international markets, with emerging markets turning in a strong performance and developed markets advancing modestly.
Performance within the FTSE benchmark was broad-based as all ten sector groups generated positive returns, with the strongest results in telecommunication services, materials, and utility companies. Although the energy sector improved over the prior period, energy and financials were the index’s weakest performers.
Heading into 2016, the U.S. economy continued to grow but at a slower pace. Fourth quarter 2015 real GDP grew 1.4%, compared with 2.0% in the third quarter, with the deceleration primarily attributed to downturns in nonresidential fixed investment, exports, and state and local government spending. Corporate profits decreased 8.1% in the same quarter, reflecting the largest quarterly decline since the first quarter of 2011. However, the U.S. job market further improved. Total nonfarm payroll employment rose by 215,000 in March, and the unemployment rate was slightly changed at 5.0%.
After declining significantly in the first quarter of 2016, oil prices recovered, increasing over 40% after bottoming out in mid-February. This volatility spilled into the global stock markets, which saw similar price action in the same quarter. The Federal Reserve raised interest rates in December after having kept them near zero since 2008. Further gradual hikes are expected later this year but are dependent on global economic data. Although the U.S. interest rates are increasing, several central banks, including the European Central Bank and the Bank of Japan, are experimenting with negative interest rates in an attempt to spur economic growth.
Although it’s important to understand how overall portfolio performance is affected by the macro factors we’ve described, our approach to investing focuses on specific stock fundamentals. We compare all stocks in our investment universe within the same industry groups in order to identify those with characteristics that we believe will enable them to outperform over the long run. To do this, we use a strict quantitative process involving valuation and other factors that are focused on fundamental growth. The interaction of these factors generates a daily opinion that seeks to capitalize on
9
investor biases across the market. Using the results of our model, we construct our portfolio with the goal of maximizing expected return while minimizing exposure to risks relative to the benchmark, such as industry selection, that our research indicates do not improve returns.
For the fiscal half year, our quality, valuation, and management decision models contributed positively to performance. However, our growth and sentiment models did not perform as expected.
Our stock selection results across sectors were mixed. We produced strong positive selections in four sectors, with the best results in utilities and the least favorable in consumer discretionary.
Within utilities, Atmos Energy (+29%), Exelon (+23%), and PPL (+18%) contributed most to relative performance. In consumer discretionary, an overweight in GameStop (–21%) and an underweight in McDonald’s (+30%) detracted.
10
Equity Income Fund
Fund Profile
As of March 31, 2016
| Share-Class Characteristics | ||
| Investor | Admiral | |
| Shares | Shares | |
| Ticker Symbol | VEIPX | VEIRX |
| Expense Ratio1 | 0.26% | 0.17% |
| 30-Day SEC Yield | 2.86% | 2.95% |
| Portfolio Characteristics | |||
| FTSE High | DJ | ||
| Dividend | U.S. Total | ||
| Yield | Market | ||
| Fund | Index | FA Index | |
| Number of Stocks | 205 | 425 | 3,900 |
| Median Market Cap | $105.7B | $120.5B | $52.5B |
| Price/Earnings Ratio | 19.0x | 18.8x | 21.8x |
| Price/Book Ratio | 2.5x | 2.6x | 2.7x |
| Return on Equity | 18.4% | 18.4% | 17.5% |
| Earnings Growth | |||
| Rate | 4.6% | 2.7% | 8.0% |
| Dividend Yield | 3.2% | 3.3% | 2.1% |
| Foreign Holdings | 7.9% | 0.0% | 0.0% |
| Turnover Rate | |||
| (Annualized) | 25% | — | — |
| Short-Term Reserves | 1.9% | — | — |
| Sector Diversification (% of equity exposure) | |||
| FTSE High | DJ | ||
| Dividend | U.S. Total | ||
| Yield | Market | ||
| Fund | Index | FA Index | |
| Consumer | |||
| Discretionary | 5.9% | 6.8% | 13.6% |
| Consumer Staples | 11.9 | 14.9 | 9.2 |
| Energy | 11.2 | 10.2 | 6.1 |
| Financials | 15.5 | 13.1 | 17.4 |
| Health Care | 12.0 | 10.8 | 13.7 |
| Industrials | 12.8 | 11.8 | 10.7 |
| Information | |||
| Technology | 14.1 | 14.6 | 20.1 |
| Materials | 2.5 | 3.4 | 3.2 |
| Telecommunication | |||
| Services | 4.8 | 5.8 | 2.5 |
| Utilities | 9.3 | 8.6 | 3.5 |
| Volatility Measures | ||
| FTSE High | DJ | |
| Dividend | U.S. Total | |
| Yield | Market | |
| Index | FA Index | |
| R-Squared | 0.98 | 0.92 |
| Beta | 0.99 | 0.89 |
These measures show the degree and timing of the fund’s fluctuations compared with the indexes over 36 months.
| Ten Largest Holdings (% of total net assets) | ||
| Microsoft Corp. | Systems Software | 4.7% |
| Johnson & Johnson | Pharmaceuticals | 3.3 |
| General Electric Co. | Industrial | |
| Conglomerates | 3.1 | |
| Wells Fargo & Co. | Diversified Banks | 3.0 |
| JPMorgan Chase & Co. | Diversified Banks | 2.9 |
| Verizon Communications Integrated | ||
| Inc. | Telecommunication | |
| Services | 2.8 | |
| Cisco Systems Inc. | Communications | |
| Equipment | 2.5 | |
| Exxon Mobil Corp. | Integrated Oil & Gas | 2.5 |
| Intel Corp. | Semiconductors | 2.3 |
| Merck & Co. Inc. | Pharmaceuticals | 2.2 |
| Top Ten | 29.3% | |
The holdings listed exclude any temporary cash investments and equity index products.
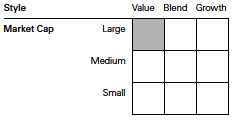
Investment Focus
1 The expense ratios shown are from the prospectus dated January 27, 2016, and represent estimated costs for the current fiscal year. For the six
months ended March 31, 2016, the annualized expense ratios were 0.24% for Investor Shares and 0.16% for Admiral Shares.
11
Equity Income Fund
Performance Summary
All of the returns in this report represent past performance, which is not a guarantee of future results that may be achieved by the fund. (Current performance may be lower or higher than the performance data cited. For performance data current to the most recent month-end, visit our website at vanguard.com/performance.) Note, too, that both investment returns and principal value can fluctuate widely, so an investor’s shares, when sold, could be worth more or less than their original cost. The returns shown do not reflect taxes that a shareholder would pay on fund distributions or on the sale of fund shares.
Fiscal-Year Total Returns (%): September 30, 2005, Through March 31, 2016

Note: For 2016, performance data reflect the six months ended March 31, 2016.
| Average Annual Total Returns: Periods Ended March 31, 2016 | ||||
| Inception | One | Five | Ten | |
| Date | Year | Years | Years | |
| Investor Shares | 3/21/1988 | 4.39% | 12.20% | 7.81% |
| Admiral Shares | 8/13/2001 | 4.48 | 12.30 | 7.92 |
See Financial Highlights for dividend and capital gains information.
12
Equity Income Fund
Financial Statements (unaudited)
Statement of Net Assets
As of March 31, 2016
The fund reports a complete list of its holdings in regulatory filings four times in each fiscal year, at the quarter-ends. For the second and fourth fiscal quarters, the lists appear in the fund���s semiannual and annual reports to shareholders. For the first and third fiscal quarters, the fund files the lists with the Securities and Exchange Commission on Form N-Q. Shareholders can look up the fund’s Forms N-Q on the SEC’s website at sec.gov. Forms N-Q may also be reviewed and copied at the SEC’s Public Reference Room (see the back cover of this report for further information).
| Market | |||
| Value• | |||
| Shares | ($000) | ||
| Common Stocks (96.7%)1 | |||
| Consumer Discretionary (5.6%) | |||
| Home Depot Inc. | 2,668,400 | 356,045 | |
| McDonald’s Corp. | 1,901,999 | 239,043 | |
| Thomson Reuters Corp. | 2,537,270 | 102,709 | |
| Target Corp. | 910,704 | 74,933 | |
| General Motors Co. | 1,798,408 | 56,524 | |
| Carnival Corp. | 1,057,256 | 55,791 | |
| Ford Motor Co. | 3,663,201 | 49,453 | |
| Darden Restaurants Inc. | 644,783 | 42,749 | |
| Leggett & Platt Inc. | 822,472 | 39,808 | |
| Omnicom Group Inc. | 475,587 | 39,583 | |
| ^ | American Eagle Outfitters | ||
| Inc. | 2,149,133 | 35,826 | |
| ^ | Nordstrom Inc. | 160,820 | 9,200 |
| Gannett Co. Inc. | 507,439 | 7,683 | |
| Abercrombie & Fitch Co. | 230,671 | 7,275 | |
| ^ | Cracker Barrel Old | ||
| Country Store Inc. | 36,538 | 5,578 | |
| VF Corp. | 82,400 | 5,336 | |
| Time Inc. | 135,597 | 2,094 | |
| 1,129,630 | |||
| Consumer Staples (11.5%) | |||
| Coca-Cola Co. | 7,210,180 | 334,480 | |
| Kraft Heinz Co. | 3,509,670 | 275,720 | |
| Philip Morris International | |||
| Inc. | 2,806,359 | 275,332 | |
| Procter & Gamble Co. | 2,667,494 | 219,561 | |
| British American Tobacco | |||
| plc | 3,461,559 | 202,420 | |
| Altria Group Inc. | 3,166,508 | 198,413 | |
| Wal-Mart Stores Inc. | 2,164,204 | 148,226 | |
| PepsiCo Inc. | 1,151,290 | 117,984 | |
| Diageo plc ADR | 910,100 | 98,173 | |
| Kimberly-Clark Corp. | 497,620 | 66,935 | |
| General Mills Inc. | 962,705 | 60,987 | |
| ConAgra Foods Inc. | 1,144,000 | 51,045 | |
| Clorox Co. | 363,970 | 45,882 | |
| Coca-Cola Enterprises Inc. | 849,722 | 43,115 | |
| Sysco Corp. | 897,192 | 41,926 | |
| Campbell Soup Co. | 581,694 | 37,106 | |
| Ingredion Inc. | 345,791 | 36,927 | |
| Dr Pepper Snapple Group | |||
| Inc. | 380,525 | 34,027 | |
| ^ | Nu Skin Enterprises Inc. | ||
| Class A | 372,380 | 14,244 | |
| Universal Corp. | 150,034 | 8,524 | |
| ^ | Cal-Maine Foods Inc. | 100,807 | 5,233 |
| Bunge Ltd. | 67,465 | 3,823 | |
| 2,320,083 | |||
| Energy (10.8%) | |||
| Exxon Mobil Corp. | 5,989,365 | 500,651 | |
| Chevron Corp. | 4,298,537 | 410,080 | |
| Suncor Energy Inc. | 9,724,010 | 270,425 | |
| Occidental Petroleum | |||
| Corp. | 3,006,635 | 205,744 | |
| Phillips 66 | 2,266,477 | 196,254 | |
| Enbridge Inc. | 2,979,500 | 115,932 | |
| Canadian Natural | |||
| Resources Ltd. | 3,953,300 | 106,739 | |
| ^ | TransCanada Corp. | 1,524,800 | 59,947 |
| Valero Energy Corp. | 926,458 | 59,423 | |
| PBF Energy Inc. Class A | 1,122,971 | 37,283 | |
| ^ | Nordic American Tankers | ||
| Ltd. | 2,574,029 | 36,268 | |
| Noble Corp. plc | 3,421,359 | 35,411 | |
| Ensco plc Class A | 3,249,180 | 33,694 | |
| TransCanada Corp. | |||
| Subscription Receipts | 911,400 | 32,105 | |
| Western Refining Inc. | 1,058,001 | 30,777 | |
| HollyFrontier Corp. | 724,314 | 25,583 | |
| Scorpio Tankers Inc. | 2,777,715 | 16,194 | |
| ^ | Ship Finance International | ||
| Ltd. | 369,875 | 5,138 | |
| Teekay Corp. | 383,572 | 3,322 | |
| ConocoPhillips | 72,212 | 2,908 | |
| ^ | CVR Energy Inc. | 100,600 | 2,626 |
| 2,186,504 | |||
13
Equity Income Fund
| Market | ||
| Value• | ||
| Shares | ($000) | |
| Financials (14.9%) | ||
| Wells Fargo & Co. | 12,412,107 | 600,250 |
| JPMorgan Chase & Co. | 9,759,536 | 577,960 |
| Marsh & McLennan Cos. | ||
| Inc. | 5,490,070 | 333,741 |
| PNC Financial Services | ||
| Group Inc. | 2,714,448 | 229,561 |
| Chubb Ltd. | 1,752,299 | 208,786 |
| BlackRock Inc. | 606,730 | 206,634 |
| MetLife Inc. | 3,085,700 | 135,586 |
| M&T Bank Corp. | 1,075,190 | 119,346 |
| US Bancorp | 2,402,740 | 97,527 |
| Prudential Financial Inc. | 881,031 | 63,628 |
| Travelers Cos. Inc. | 536,203 | 62,580 |
| Principal Financial Group | ||
| Inc. | 1,396,500 | 55,092 |
| Fifth Third Bancorp | 2,800,236 | 46,736 |
| Aflac Inc. | 729,393 | 46,054 |
| Regions Financial Corp. | 5,308,287 | 41,670 |
| Lazard Ltd. Class A | 1,052,449 | 40,835 |
| Navient Corp. | 3,328,079 | 39,837 |
| SunTrust Banks Inc. | 548,071 | 19,774 |
| First American Financial | ||
| Corp. | 422,211 | 16,090 |
| Ameriprise Financial Inc. | 169,720 | 15,955 |
| Hanover Insurance Group | ||
| Inc. | 163,863 | 14,784 |
| Federated Investors Inc. | ||
| Class B | 326,543 | 9,421 |
| CME Group Inc. | 96,142 | 9,234 |
| Old Republic International | ||
| Corp. | 250,588 | 4,581 |
| Washington Federal Inc. | 201,500 | 4,564 |
| Old National Bancorp | 324,892 | 3,960 |
| KeyCorp | 300,491 | 3,317 |
| BGC Partners Inc. | ||
| Class A | 302,924 | 2,742 |
| First Commonwealth | ||
| Financial Corp. | 267,000 | 2,366 |
| BBCN Bancorp Inc. | 141,772 | 2,154 |
| T. Rowe Price Group Inc. | 26,668 | 1,959 |
| 3,016,724 | ||
| Health Care (11.6%) | ||
| Johnson & Johnson | 6,147,472 | 665,157 |
| Merck & Co. Inc. | 8,280,390 | 438,115 |
| Pfizer Inc. | 14,066,244 | 416,924 |
| Bristol-Myers Squibb Co. | 3,610,854 | 230,661 |
| Roche Holding AG | 526,858 | 129,365 |
| ^ AstraZeneca plc ADR | 3,674,098 | 103,463 |
| Novartis AG | 1,310,211 | 94,796 |
| Eli Lilly & Co. | 1,168,754 | 84,162 |
| Amgen Inc. | 538,900 | 80,797 |
| AbbVie Inc. | 1,297,438 | 74,110 |
| Owens & Minor Inc. | 271,733 | 10,983 |
| Baxter International Inc. | 92,282 | 3,791 |
| Computer Programs | ||
| & Systems Inc. | 29,179 | 1,521 |
| 2,333,845 | ||
| Industrials (12.4%) | ||
| General Electric Co. | 19,953,816 | 634,332 |
| Eaton Corp. plc | 4,101,056 | 256,562 |
| 3M Co. | 1,391,500 | 231,866 |
| United Technologies | ||
| Corp. | 2,032,780 | 203,481 |
| United Parcel Service Inc. | ||
| Class B | 1,593,204 | 168,035 |
| Honeywell International | ||
| Inc. | 1,388,900 | 155,626 |
| Raytheon Co. | 1,253,743 | 153,747 |
| Union Pacific Corp. | 1,648,500 | 131,138 |
| Waste Management Inc. | 1,542,590 | 91,013 |
| Boeing Co. | 692,640 | 87,924 |
| Caterpillar Inc. | 1,097,810 | 84,026 |
| PACCAR Inc. | 891,700 | 48,767 |
| Stanley Black & Decker | ||
| Inc. | 461,239 | 48,527 |
| GATX Corp. | 768,596 | 36,508 |
| Pitney Bowes Inc. | 1,679,063 | 36,167 |
| General Dynamics Corp. | 231,500 | 30,412 |
| Lockheed Martin Corp. | 94,273 | 20,881 |
| Emerson Electric Co. | 281,075 | 15,285 |
| Briggs & Stratton Corp. | 452,781 | 10,831 |
| RR Donnelley & Sons Co. | 553,387 | 9,076 |
| CH Robinson Worldwide | ||
| Inc. | 116,299 | 8,633 |
| CSX Corp. | 256,078 | 6,594 |
| Steelcase Inc. Class A | 407,509 | 6,080 |
| General Cable Corp. | 493,141 | 6,021 |
| Aircastle Ltd. | 222,069 | 4,939 |
| West Corp. | 161,600 | 3,688 |
| Greenbrier Cos. Inc. | 110,295 | 3,049 |
| Ryder System Inc. | 43,240 | 2,801 |
| ADT Corp. | 67,750 | 2,795 |
| MSC Industrial Direct Co. | ||
| Inc. Class A | 18,591 | 1,419 |
| Kennametal Inc. | 60,758 | 1,366 |
| ^ American Railcar | ||
| Industries Inc. | 29,416 | 1,198 |
| 2,502,787 | ||
| Information Technology (13.5%) | ||
| Microsoft Corp. | 17,312,086 | 956,147 |
| Cisco Systems Inc. | 17,647,440 | 502,423 |
| Intel Corp. | 14,076,250 | 455,367 |
| International Business | ||
| Machines Corp. | 896,471 | 135,771 |
| Analog Devices Inc. | 2,063,075 | 122,113 |
| Maxim Integrated | ||
| Products Inc. | 3,231,889 | 118,869 |
14
Equity Income Fund
| Market | ||
| Value• | ||
| Shares | ($000) | |
| Texas Instruments Inc. | 2,005,508 | 115,156 |
| QUALCOMM Inc. | 970,471 | 49,630 |
| Leidos Holdings Inc. | 780,686 | 39,284 |
| Western Union Co. | 1,975,079 | 38,099 |
| Lexmark International Inc. | ||
| Class A | 956,900 | 31,989 |
| Broadridge Financial | ||
| Solutions Inc. | 492,348 | 29,201 |
| HP Inc. | 1,542,383 | 19,002 |
| Computer Sciences Corp. | 466,700 | 16,050 |
| KLA-Tencor Corp. | 213,427 | 15,540 |
| Diebold Inc. | 531,722 | 15,372 |
| CSRA Inc. | 521,600 | 14,031 |
| Xilinx Inc. | 194,368 | 9,219 |
| Seagate Technology plc | 231,586 | 7,978 |
| Xerox Corp. | 693,568 | 7,740 |
| Linear Technology Corp. | 169,280 | 7,543 |
| EarthLink Holdings Corp. | 973,578 | 5,520 |
| Science Applications | ||
| International Corp. | 99,540 | 5,309 |
| 2,717,353 | ||
| Materials (2.4%) | ||
| Dow Chemical Co. | 4,182,571 | 212,726 |
| International Paper Co. | 1,476,520 | 60,596 |
| Nucor Corp. | 1,279,610 | 60,526 |
| LyondellBasell Industries | ||
| Class A | 665,179 | 56,926 |
| Bemis Co. Inc. | 665,663 | 34,468 |
| Avery Dennison Corp. | 474,010 | 34,181 |
| EI du Pont de Nemours | ||
| & Co. | 147,060 | 9,312 |
| Domtar Corp. | 210,021 | 8,506 |
| Commercial Metals Co. | 313,776 | 5,325 |
| Reliance Steel | ||
| & Aluminum Co. | 45,693 | 3,161 |
| Huntsman Corp. | 112,146 | 1,491 |
| Schweitzer-Mauduit | ||
| International Inc. | 44,761 | 1,409 |
| 488,627 | ||
| Other (0.4%) | ||
| ^,2 Vanguard High Dividend | ||
| Yield ETF | 1,047,950 | 72,351 |
| Telecommunication Services (4.6%) | ||
| Verizon Communications | ||
| Inc. | 10,406,073 | 562,760 |
| BCE Inc. | 3,850,600 | 175,490 |
| AT&T Inc. | 4,048,057 | 158,562 |
| CenturyLink Inc. | 1,291,301 | 41,270 |
| 938,082 | ||
| Utilities (9.0%) | ||
| Dominion Resources Inc. | 3,527,800 | 265,008 |
| Xcel Energy Inc. | 4,743,590 | 198,377 |
| UGI Corp. | 4,406,249 | 177,528 |
| Eversource Energy | 2,806,390 | 163,725 |
| NextEra Energy Inc. | 1,230,530 | 145,621 |
| Sempra Energy | 1,095,700 | 114,008 |
| Duke Energy Corp. | 1,379,122 | 111,268 |
| National Grid plc | 7,441,192 | 105,289 |
| Exelon Corp. | 1,799,400 | 64,526 |
| American Electric Power | ||
| Co. Inc. | 911,173 | 60,502 |
| Public Service Enterprise | ||
| Group Inc. | 1,197,896 | 56,469 |
| PPL Corp. | 1,462,202 | 55,666 |
| FirstEnergy Corp. | 1,347,888 | 48,484 |
| Consolidated Edison Inc. | 588,180 | 45,066 |
| WGL Holdings Inc. | 505,891 | 36,611 |
| Atmos Energy Corp. | 363,667 | 27,006 |
| CMS Energy Corp. | 591,761 | 25,114 |
| SCANA Corp. | 305,367 | 21,421 |
| NiSource Inc. | 689,676 | 16,249 |
| ONE Gas Inc. | 207,537 | 12,681 |
| Entergy Corp. | 158,321 | 12,552 |
| Ameren Corp. | 215,498 | 10,796 |
| TECO Energy Inc. | 303,142 | 8,346 |
| Vectren Corp. | 161,849 | 8,183 |
| pinnacle west capital | ||
| corp. | 105,917 | 7,951 |
| cleco corp. | 140,145 | 7,737 |
| agl resources inc. | 72,222 | 4,705 |
| southern co. | 83,585 | 4,324 |
| avista corp. | 86,720 | 3,536 |
| Great Plains Energy Inc. | 74,694 | 2,409 |
| 1,821,158 | ||
| Total Common Stocks | ||
| (Cost $15,573,403) | 19,527,144 |
15
Equity Income Fund
| Market | |||
| Value• | |||
| Shares | ($000) | ||
| Temporary Cash Investments (4.1%)1 | |||
| Money Market Fund (2.1%) | |||
| 3,4 | Vanguard Market | ||
| Liquidity Fund, | |||
| 0.495% | 429,354,469 | 429,354 | |
| Face | |||
| Amount | |||
| ($000) | |||
| Repurchase Agreements (1.7%) | |||
| Goldman Sachs & Co. | |||
| 0.300%, 4/1/16 (Dated | |||
| 3/31/16, Repurchase | |||
| Value $155,101,000, | |||
| collateralized by Federal | |||
| Home Loan Mortgage | |||
| Corp. 3.50%, 7/1/42, | |||
| Federal National Mortgage | |||
| Assn. 2.470%–4.000%, | |||
| 6/1/22–7/1/44, with a | |||
| value of $158,202,000) | 155,100 | 155,100 | |
| RBS Securities, Inc. | |||
| 0.290%, 4/1/16 (Dated | |||
| 3/31/16, Repurchase Value | |||
| $143,301,000, collateralized | |||
| by U.S. Treasury Note | |||
| 1.375%–2.000%, 9/30/18– | |||
| 2/15/23, with a value of | |||
| $146,170,000) | 143,300 | 143,300 | |
| Societe Generale | |||
| 0.320%, 4/1/16 (Dated | |||
| 3/31/16, Repurchase Value | |||
| $39,400,000, collateralized | |||
| by Federal Home Loan | |||
| Bank 1.250%, 3/30/21, | |||
| U.S. Treasury Note/ | |||
| Bond, 0.625%–3.875%, | |||
| 8/31/16–2/15/46, with a | |||
| value of $40,188,000) | 39,400 | 39,400 | |
| 337,800 | |||
| U.S. Government and Agency Obligations (0.3%) | |||
| 5 | Federal Home Loan | ||
| Bank Discount Notes, | |||
| 0.331%, 4/13/16 | 500 | 500 | |
| 5,6 | Federal Home Loan | ||
| Bank Discount Notes, | |||
| 0.245%, 4/20/16 | 9,000 | 8,999 | |
| 5,6 | Federal Home Loan | ||
| Bank Discount Notes, | |||
| 0.294%, 4/29/16 | 7,000 | 6,999 | |
| Face | Market | |||
| Amount | Value• | |||
| ($000) | ($000) | |||
| 5 | Federal Home Loan | |||
| Bank Discount Notes, | ||||
| 0.371%, 5/4/16 | 100 | 100 | ||
| 5 | Federal Home Loan | |||
| Bank Discount Notes, | ||||
| 0.380%–0.387%, 6/8/16 | 50,000 | 49,966 | ||
| 5,6 | Federal Home Loan | |||
| Bank Discount Notes, | ||||
| 0.471%, 8/10/16 | 5,000 | 4,992 | ||
| 6 | United States Treasury Bill, | |||
| 0.370%–0.386%, 5/26/16 | 500 | 500 | ||
| 6 | United States Treasury Note, | |||
| 0.375%, 5/31/16 | 1,000 | 1,000 | ||
| 73,056 | ||||
| Total Temporary Cash Investments | ||||
| (Cost $840,206) | 840,210 | |||
| Total Investments (100.8%) | ||||
| (Cost $16,413,609) | 20,367,354 | |||
| Amount | ||||
| ($000 | ||||
| Other Assets and Liabilities (-0.8%) | ||||
| Other Assets | ||||
| Investment in Vanguard | 1,672 | |||
| Receivables for Investment Securities Sold | 267 | |||
| Receivables for Accrued Income | 45,848 | |||
| Receivables for Capital Shares Issued | 34,850 | |||
| Other Assets | 888 | |||
| Total Other Assets | 83,525 | |||
| Liabilities | ||||
| Payables for Investment Securities | ||||
| Purchased | (69,520) | |||
| Collateral for Securities on Loan | (125,112) | |||
| Payables for Capital Shares Redeemed | (36,484) | |||
| Payables to Investment Advisor | (3,149) | |||
| Payables to Vanguard | (18,523) | |||
| Other Liabilities | (605) | |||
| Total Liabilities | (253,393) | |||
| Net Assets (100%) | 20,197,486 | |||
16
Equity Income Fund
| At March 31, 2016, net assets consisted of: | |
| Amount | |
| ($000) | |
| Paid-in Capital | 16,297,348 |
| Overdistributed Net Investment Income | (195) |
| Accumulated Net Realized Losses | (58,691) |
| Unrealized Appreciation (Depreciation) | |
| Investment Securities | 3,953,745 |
| Futures Contracts | 5,214 |
| Foreign Currencies | 65 |
| Net Assets | 20,197,486 |
| Investor Shares—Net Assets | |
| Applicable to 171,028,603 outstanding | |
| $.001 par value shares of beneficial | |
| interest (unlimited authorization) | 5,197,102 |
| Net Asset Value Per Share— | |
| Investor Shares | $30.39 |
| Admiral Shares—Net Assets | |
| Applicable to 235,524,153 outstanding | |
| $.001 par value shares of beneficial | |
| interest (unlimited authorization) | 15,000,384 |
| Net Asset Value Per Share— | |
| Admiral Shares | $63.69 |
• See Note A in Notes to Financial Statements.
^ Includes partial security positions on loan to broker-dealers. The total value of securities on loan is $119,850,000.
1 The fund invests a portion of its cash reserves in equity markets through the use of index futures contracts. After giving effect to futures
investments, the fund’s effective common stock and temporary cash investment positions represent 98.3% and 2.5%, respectively, of
net assets.
2 Considered an affiliated company of the fund as the issuer is another member of The Vanguard Group.
3 Affiliated money market fund available only to Vanguard funds and certain trusts and accounts managed by Vanguard. Rate shown is the
7-day yield.
4 Includes $125,112,000 of collateral received for securities on loan.
5 The issuer operates under a congressional charter; its securities are generally neither guaranteed by the U.S. Treasury nor backed by the
full faith and credit of the U.S. government.
6 Securities with a value of $15,091,000 have been segregated as initial margin for open futures contracts.
ADR—American Depositary Receipt.
See accompanying Notes, which are an integral part of the Financial Statements.
17
Equity Income Fund
Statement of Operations
| Six Months Ended | |
| March 31, 2016 | |
| ($000) | |
| Investment Income | |
| Income | |
| Dividends1,2 | 315,040 |
| Interest2 | 779 |
| Securities Lending | 1,450 |
| Total Income | 317,269 |
| Expenses | |
| Investment Advisory Fees—Note B | |
| Basic Fee | 8,364 |
| Performance Adjustment | (862) |
| The Vanguard Group—Note C | |
| Management and Administrative—Investor Shares | 3,304 |
| Management and Administrative—Admiral Shares | 4,877 |
| Marketing and Distribution—Investor Shares | 645 |
| Marketing and Distribution—Admiral Shares | 824 |
| Custodian Fees | 80 |
| Shareholders’ Reports—Investor Shares | 51 |
| Shareholders’ Reports—Admiral Shares | 52 |
| Trustees’ Fees and Expenses | 10 |
| Total Expenses | 17,345 |
| Net Investment Income | 299,924 |
| Realized Net Gain (Loss) | |
| Investment Securities Sold2 | (48,150) |
| Futures Contracts | 21,750 |
| Foreign Currencies | (321) |
| Realized Net Gain (Loss) | (26,721) |
| Change in Unrealized Appreciation (Depreciation) | |
| Investment Securities | 1,678,041 |
| Futures Contracts | 7,236 |
| Foreign Currencies | 190 |
| Change in Unrealized Appreciation (Depreciation) | 1,685,467 |
| Net Increase (Decrease) in Net Assets Resulting from Operations | 1,958,670 |
| 1 Dividends are net of foreign withholding taxes of $2,976,000. | |
| 2 Dividend income, interest income, and realized net gain (loss) from affiliated companies of the fund were $1,129,000, $410,000, and $0, respectively. | |
See accompanying Notes, which are an integral part of the Financial Statements.
18
Equity Income Fund
Statement of Changes in Net Assets
| Six Months Ended | Year Ended | |
| March 31, | September 30, | |
| 2016 | 2015 | |
| ($000) | ($000) | |
| Increase (Decrease) in Net Assets | ||
| Operations | ||
| Net Investment Income | 299,924 | 522,834 |
| Realized Net Gain (Loss) | (26,721) | 709,638 |
| Change in Unrealized Appreciation (Depreciation) | 1,685,467 | (1,607,265) |
| Net Increase (Decrease) in Net Assets Resulting from Operations | 1,958,670 | (374,793) |
| Distributions | ||
| Net Investment Income | ||
| Investor Shares | (77,134) | (148,834) |
| Admiral Shares | (221,224) | (377,108) |
| Realized Capital Gain1 | ||
| Investor Shares | (168,698) | (178,446) |
| Admiral Shares | (461,701) | (410,635) |
| Total Distributions | (928,757) | (1,115,023) |
| Capital Share Transactions | ||
| Investor Shares | 117,285 | (307,678) |
| Admiral Shares | 1,275,515 | 1,725,388 |
| Net Increase (Decrease) from Capital Share Transactions | 1,392,800 | 1,417,710 |
| Total Increase (Decrease) | 2,422,713 | (72,106) |
| Net Assets | ||
| Beginning of Period | 17,774,773 | 17,846,879 |
| End of Period2 | 20,197,486 | 17,774,773 |
1 Includes fiscal 2016 and 2015 short-term gain distributions totaling $134,022,000 and $129,551,000, respectively. Short-term gain
distributions are treated as ordinary income dividends for tax purposes.
2 Net Assets—End of Period includes undistributed (overdistributed) net investment income of ($195,000) and ($1,440,000).
See accompanying Notes, which are an integral part of the Financial Statements.
19
Equity Income Fund
Financial Highlights
| Investor Shares | |||||||
| Six Months | |||||||
| Ended | |||||||
| For a Share Outstanding | March 31, | Year Ended September 30, | |||||
| Throughout Each Period | 2016 | 2015 | 2014 | 2013 | 2012 | 2011 | |
| Net Asset Value, Beginning of Period | $28.78 | $31.23 | $28.26 | $24.31 | $19.40 | $18.83 | |
| Investment Operations | |||||||
| Net Investment Income | . 463 | . 847 | . 826 | .732 | . 667 | . 596 | |
| Net Realized and Unrealized Gain (Loss) | |||||||
| on Investments | 2.623 | (1.431) | 3.754 | 3.946 | 4.908 | .567 | |
| Total from Investment Operations | 3.086 | (.584) | 4.580 | 4.678 | 5.575 | 1.163 | |
| Distributions | |||||||
| Dividends from Net Investment Income | (. 460) | (. 852) | (. 811) | (.728) | (. 665) | (. 593) | |
| Distributions from Realized Capital Gains | (1.016) | (1.014) | (.799) | — | — | — | |
| Total Distributions | (1.476) | (1.866) | (1.610) | (.728) | (.665) | (.593) | |
| Net Asset Value, End of Period | $30.39 | $28.78 | $31.23 | $28.26 | $24.31 | $19.40 | |
| Total Return1 | 10.84% | -2.11% | 16.62% | 19.45% | 29.00% | 6.00% | |
| Ratios/Supplemental Data | |||||||
| Net Assets, End of Period (Millions) | $5,197 | $4,812 | $5,528 | $4,839 | $4,107 | $2,835 | |
| Ratio of Total Expenses to | |||||||
| Average Net Assets2 | 0.24% | 0.26% | 0.29% | 0.30% | 0.30% | 0.31% | |
| Ratio of Net Investment Income to | |||||||
| Average Net Assets | 3.11% | 2.72% | 2.74% | 2.81% | 3.00% | 2.89% | |
| Portfolio Turnover Rate | 25% | 32% | 33% | 34% | 26% | 29% | |
The expense ratio, net income ratio, and turnover rate for the current period have been annualized.
1 Total returns do not include account service fees that may have applied in the periods shown. Fund prospectuses provide information about
any applicable account service fees.
2 Includes performance-based investment advisory fee increases (decreases) of (0.01%), (0.01%), 0.00%, 0.00%, 0.00%, and 0.01%.
See accompanying Notes, which are an integral part of the Financial Statements.
20
Equity Income Fund
Financial Highlights
| Admiral Shares | |||||||
| Six Months | |||||||
| Ended | |||||||
| For a Share Outstanding | March 31, | Year Ended September 30, | |||||
| Throughout Each Period | 2016 | 2015 | 2014 | 2013 | 2012 | 2011 | |
| Net Asset Value, Beginning of Period | $60.31 | $65.45 | $59.24 | $50.94 | $40.67 | $39.47 | |
| Investment Operations | |||||||
| Net Investment Income | .994 | 1.834 | 1.790 | 1.585 | 1.445 | 1.286 | |
| Net Realized and Unrealized Gain (Loss) | |||||||
| on Investments | 5.504 | (3.003) | 7.853 | 8.293 | 10.265 | 1.194 | |
| Total from Investment Operations | 6.498 | (1.169) | 9.643 | 9.878 | 11.710 | 2.480 | |
| Distributions | |||||||
| Dividends from Net Investment Income | (.988) | (1.846) | (1.758) | (1.578) | (1.440) | (1.280) | |
| Distributions from Realized Capital Gains | (2.130) | (2.125) | (1.675) | — | — | — | |
| Total Distributions | (3.118) | (3.971) | (3.433) | (1.578) | (1.440) | (1.280) | |
| Net Asset Value, End of Period | $63.69 | $60.31 | $65.45 | $59.24 | $50.94 | $40.67 | |
| Total Return1 | 10.89% | -2.03% | 16.70% | 19.61% | 29.06% | 6.10% | |
| Ratios/Supplemental Data | |||||||
| Net Assets, End of Period (Millions) | $15,000 | $12,962 | $12,319 | $9,134 | $5,234 | $2,614 | |
| Ratio of Total Expenses to | |||||||
| Average Net Assets2 | 0.16% | 0.17% | 0.20% | 0.21% | 0.21% | 0.22% | |
| Ratio of Net Investment Income to | |||||||
| Average Net Assets | 3.19% | 2.81% | 2.83% | 2.90% | 3.09% | 2.98% | |
| Portfolio Turnover Rate | 25% | 32% | 33% | 34% | 26% | 29% | |
The expense ratio, net income ratio, and turnover rate for the current period have been annualized.
1 Total returns do not include account service fees that may have applied in the periods shown. Fund prospectuses provide information about
any applicable account service fees.
2 Includes performance-based investment advisory fee increases (decreases) of (0.01%), (0.01%), 0.00%, 0.00%, 0.00%, and 0.01%.
See accompanying Notes, which are an integral part of the Financial Statements.
21
Equity Income Fund
Notes to Financial Statements
Vanguard Equity Income Fund is registered under the Investment Company Act of 1940 as an open-end investment company, or mutual fund. The fund offers two classes of shares: Investor Shares and Admiral Shares. Investor Shares are available to any investor who meets the fund’s minimum purchase requirements. Admiral Shares are designed for investors who meet certain administrative, service, and account-size criteria.
A. The following significant accounting policies conform to generally accepted accounting principles for U.S. investment companies. The fund consistently follows such policies in preparing its financial statements.
1. Security Valuation: Securities are valued as of the close of trading on the New York Stock Exchange (generally 4 p.m., Eastern time) on the valuation date. Equity securities are valued at the latest quoted sales prices or official closing prices taken from the primary market in which each security trades; such securities not traded on the valuation date are valued at the mean of the latest quoted bid and asked prices. Securities for which market quotations are not readily available, or whose values have been affected by events occurring before the fund’s pricing time but after the close of the securities’ primary markets, are valued at their fair values calculated according to procedures adopted by the board of trustees. These procedures include obtaining quotations from an independent pricing service, monitoring news to identify significant market- or security-specific events, and evaluating changes in the values of foreign market proxies (for example, ADRs, futures contracts, or exchange-traded funds), between the time the foreign markets close and the fund’s pricing time. When fair-value pricing is employed, the prices of securities used by a fund to calculate its net asset value may differ from quoted or published prices for the same securities. Investments in Vanguard Market Liquidity Fund are valued at that fund’s net asset value. Temporary cash investments acquired over 60 days to maturity are valued using the latest bid prices or using valuations based on a matrix system (which considers such factors as security prices, yields, maturities, and ratings), both as furnished by independent pricing services. Other temporary cash investments are valued at amortized cost, which approximates market value.
2. Foreign Currency: Securities and other assets and liabilities denominated in foreign currencies are translated into U.S. dollars using exchange rates obtained from an independent third party as of the fund’s pricing time on the valuation date. Realized gains (losses) and unrealized appreciation (depreciation) on investment securities include the effects of changes in exchange rates since the securities were purchased, combined with the effects of changes in security prices. Fluctuations in the value of other assets and liabilities resulting from changes in exchange rates are recorded as unrealized foreign currency gains (losses) until the assets or liabilities are settled in cash, at which time they are recorded as realized foreign currency gains (losses).
3. Futures Contracts: The fund uses index futures contracts to a limited extent, with the objective of maintaining full exposure to the stock market while maintaining liquidity. The fund may purchase or sell futures contracts to achieve a desired level of investment, whether to accommodate portfolio turnover or cash flows from capital share transactions. The primary risks associated with the use of futures contracts are imperfect correlation between changes in market values of stocks held by the fund and the prices of futures contracts, and the possibility of an illiquid market. Counterparty risk involving futures is mitigated because a regulated clearinghouse is the counterparty instead of the clearing broker. To further mitigate counterparty risk, the fund trades futures contracts on an exchange, monitors the financial strength of its clearing brokers and clearinghouse, and has entered into clearing agreements with its clearing brokers. The clearinghouse imposes initial margin requirements to secure the fund’s performance and requires daily settlement of variation margin representing changes in the market value of each contract.
22
Equity Income Fund
Futures contracts are valued at their quoted daily settlement prices. The aggregate settlement values of the contracts are not recorded in the Statement of Net Assets. Fluctuations in the value of the contracts are recorded in the Statement of Net Assets as an asset (liability) and in the Statement of Operations as unrealized appreciation (depreciation) until the contracts are closed, when they are recorded as realized futures gains (losses).
During the six months ended March 31, 2016, the fund’s average investments in long and short futures contracts represented 1% and 0% of net assets, respectively, based on the average of aggregate settlement values at each quarter-end during the period.
4. Repurchase Agreements: The fund enters into repurchase agreements with institutional counterparties. Securities pledged as collateral to the fund under repurchase agreements are held by a custodian bank until the agreements mature. Each agreement requires that the market value of the collateral be sufficient to cover payments of interest and principal. The fund further mitigates its counterparty risk by entering into repurchase agreements only with a diverse group of prequalified counterparties, monitoring their financial strength, and entering into master repurchase agreements with its counterparties. The master repurchase agreements provide that, in the event of a counterparty’s default (including bankruptcy), the fund may terminate any repurchase agreements with that counterparty, determine the net amount owed, and sell or retain the collateral up to the net amount owed to the fund. Such action may be subject to legal proceedings, which may delay or limit the disposition of collateral.
5. Federal Income Taxes: The fund intends to continue to qualify as a regulated investment company and distribute all of its taxable income. Management has analyzed the fund’s tax positions taken for all open federal income tax years (September 30, 2012–2015), and for the period ended March 31, 2016, and has concluded that no provision for federal income tax is required in the fund’s financial statements.
6. Distributions: Distributions to shareholders are recorded on the ex-dividend date.
7. Securities Lending: To earn additional income, the fund lends its securities to qualified institutional borrowers. Security loans are subject to termination by the fund at any time, and are required to be secured at all times by collateral in an amount at least equal to the market value of securities loaned. Daily market fluctuations could cause the value of loaned securities to be more or less than the value of the collateral received. When this occurs, the collateral is adjusted and settled on the next business day. The fund further mitigates its counterparty risk by entering into securities lending transactions only with a diverse group of prequalified counterparties, monitoring their financial strength, and entering into master securities lending agreements with its counterparties. The master securities lending agreements provide that, in the event of a counterparty’s default (including bankruptcy), the fund may terminate any loans with that borrower, determine the net amount owed, and sell or retain the collateral up to the net amount owed to the fund; however, such actions may be subject to legal proceedings. While collateral mitigates counterparty risk, in the absence of a default the fund may experience delays and costs in recovering the securities loaned. The fund invests cash collateral received in Vanguard Market Liquidity Fund, and records a liability in the Statement of Net Assets for the return of the collateral, during the period the securities are on loan. Securities lending income represents fees charged to borrowers plus income earned on invested cash collateral, less expenses associated with the loan.
8. Credit Facility: The fund and certain other funds managed by The Vanguard Group (“Vanguard”) participate in a $3.1 billion committed credit facility provided by a syndicate of lenders pursuant to a credit agreement that may be renewed annually; each fund is individually liable for its borrowings,
23
Equity Income Fund
if any, under the credit facility. Borrowings may be utilized for temporary and emergency purposes, and are subject to the fund’s regulatory and contractual borrowing restrictions. The participating funds are charged administrative fees and an annual commitment fee of 0.10% of the undrawn amount of the facility; these fees are allocated to the funds based on a method approved by the fund’s board of trustees and included in Management and Administrative expenses on the fund’s Statement of Operations. Any borrowings under this facility bear interest at a rate based upon the higher of the one-month London Interbank Offered Rate, federal funds effective rate, or overnight bank funding rate plus an agreed-upon spread.
The fund had no borrowings outstanding at March 31, 2016, or at any time during the period then ended.
9. Other: Dividend income is recorded on the ex-dividend date. Interest income includes income distributions received from Vanguard Market Liquidity Fund and is accrued daily. Premiums and discounts on debt securities purchased are amortized and accreted, respectively, to interest income over the lives of the respective securities. Security transactions are accounted for on the date securities are bought or sold. Costs used to determine realized gains (losses) on the sale of investment securities are those of the specific securities sold.
Each class of shares has equal rights as to assets and earnings, except that each class separately bears certain class-specific expenses related to maintenance of shareholder accounts (included in Management and Administrative expenses) and shareholder reporting. Marketing and distribution expenses are allocated to each class of shares based on a method approved by the board of trustees. Income, other non-class-specific expenses, and gains and losses on investments are allocated to each class of shares based on its relative net assets.
B. Wellington Management Company LLP provides investment advisory services to a portion of the fund for a fee calculated at an annual percentage rate of average net assets managed by the advisor. The basic fee of Wellington Management Company LLP is subject to quarterly adjustments based on performance relative to the FTSE High Dividend Yield Index for the preceding three years.
Vanguard provides investment advisory services to a portion of the fund as described below; the fund paid Vanguard advisory fees of $1,208,000 for the six months ended March 31, 2016.
For the six months ended March 31, 2016, the aggregate investment advisory fee paid to all advisors represented an effective annual basic rate of 0.09% of the fund’s average net assets, before a decrease of $862,000 (0.01%) based on performance.
C. In accordance with the terms of a Funds’ Service Agreement (the “FSA”) between Vanguard and the fund, Vanguard furnishes to the fund investment advisory, corporate management, administrative, marketing, distribution, and cash management services at Vanguard’s cost of operations (as defined by the FSA). These costs of operations are allocated to the fund based on methods and guidelines approved by the board of trustees. Vanguard does not require reimbursement in the current period for certain costs of operations (such as deferred compensation/benefits and risk/insurance costs); the fund’s liability for these costs of operations is included in Payables to Vanguard on the Statement of Net Assets.
Upon the request of Vanguard, the fund may invest up to 0.40% of its net assets as capital in Vanguard. At March 31, 2016, the fund had contributed to Vanguard capital in the amount of $1,672,000, representing 0.01% of the fund’s net assets and 0.67% of Vanguard’s capitalization. The fund’s trustees and officers are also directors and employees, respectively, of Vanguard.
24
Equity Income Fund
D. Various inputs may be used to determine the value of the fund’s investments. These inputs are summarized in three broad levels for financial statement purposes. The inputs or methodologies used to value securities are not necessarily an indication of the risk associated with investing in those securities.
Level 1—Quoted prices in active markets for identical securities.
Level 2—Other significant observable inputs (including quoted prices for similar securities, interest rates, prepayment speeds, credit risk, etc.).
Level 3—Significant unobservable inputs (including the fund’s own assumptions used to determine the fair value of investments).
The following table summarizes the market value of the fund’s investments as of March 31, 2016, based on the inputs used to value them:
| Level 1 | Level 2 | Level 3 | |
| Investments | ($000) | ($000) | ($000) |
| Common Stocks | 18,995,274 | 531,870 | — |
| Temporary Cash Investments | 429,354 | 410,856 | — |
| Futures Contracts—Assets1 | 11 | — | — |
| Futures Contracts—Liabilities1 | (594) | — | — |
| Total | 19,424,045 | 942,726 | — |
| 1 Represents variation margin on the last day of the reporting period. | |||
E. At March 31, 2016, the aggregate settlement value of open futures contracts and the related unrealized appreciation (depreciation) were:
| ($000) | ||||
| Aggregate | ||||
| Number of | Settlement | Unrealized | ||
| Long (Short) | Value | Appreciation | ||
| Futures Contracts | Expiration | Contracts | Long (Short) | (Depreciation) |
| E-mini S&P 500 Index | June 2016 | 3,209 | 329,163 | 5,214 |
Unrealized appreciation (depreciation) on open futures contracts is required to be treated as realized gain (loss) for tax purposes.
F. Distributions are determined on a tax basis and may differ from net investment income and realized capital gains for financial reporting purposes. Differences may be permanent or temporary. Permanent differences are reclassified among capital accounts in the financial statements to reflect their tax character. Temporary differences arise when certain items of income, expense, gain, or loss are recognized in different periods for financial statement and tax purposes. These differences will reverse at some time in the future. Differences in classification may also result from the treatment of short-term gains as ordinary income for tax purposes. The fund’s tax-basis capital gains and losses are determined only at the end of each fiscal year.
During the six months ended March 31, 2016, the fund realized net foreign currency losses of $321,000, which decreased distributable net income for tax purposes; accordingly, such losses have been reclassified from accumulated net realized losses to overdistributed net investment income.
25
Equity Income Fund
At March 31, 2016, the cost of investment securities for tax purposes was $16,413,734,000. Net unrealized appreciation of investment securities for tax purposes was $3,953,620,000, consisting of unrealized gains of $4,272,775,000 on securities that had risen in value since their purchase and $319,155,000 in unrealized losses on securities that had fallen in value since their purchase.
G. During the six months ended March 31, 2016, the fund purchased $2,918,431,000 of investment securities and sold $2,318,423,000 of investment securities, other than temporary cash investments.
H. Capital share transactions for each class of shares were:
| Six Months Ended | Year Ended | |||
| March 31, 2016 | September 30, 2015 | |||
| Amount | Shares | Amount | Shares | |
| ($000) | (000) | ($000) | (000) | |
| Investor Shares | ||||
| Issued | 499,301 | 16,931 | 1,014,630 | 32,639 |
| Issued in Lieu of Cash Distributions | 229,754 | 7,687 | 306,263 | 10,045 |
| Redeemed | (611,770) | (20,831) | (1,628,571) | (52,449) |
| Net Increase (Decrease)—Investor Shares | 117,285 | 3,787 | (307,678) | (9,765) |
| Admiral Shares | ||||
| Issued | 1,968,765 | 31,919 | 3,559,820 | 54,765 |
| Issued in Lieu of Cash Distributions | 579,327 | 9,247 | 672,092 | 10,525 |
| Redeemed | (1,272,577) | (20,567) | (2,506,524) | (38,575) |
| Net Increase (Decrease) —Admiral Shares | 1,275,515 | 20,599 | 1,725,388 | 26,715 |
I. Management has determined that no material events or transactions occurred subsequent to March 31, 2016, that would require recognition or disclosure in these financial statements.
26
About Your Fund’s Expenses
As a shareholder of the fund, you incur ongoing costs, which include costs for portfolio management, administrative services, and shareholder reports (like this one), among others. Operating expenses, which are deducted from a fund’s gross income, directly reduce the investment return of the fund.
A fund’s expenses are expressed as a percentage of its average net assets. This figure is known as the expense ratio. The following examples are intended to help you understand the ongoing costs (in dollars) of investing in your fund and to compare these costs with those of other mutual funds. The examples are based on an investment of $1,000 made at the beginning of the period shown and held for the entire period.
The accompanying table illustrates your fund’s costs in two ways:
• Based on actual fund return. This section helps you to estimate the actual expenses that you paid over the period. The ”Ending Account Value“ shown is derived from the fund‘s actual return, and the third column shows the dollar amount that would have been paid by an investor who started with $1,000 in the fund. You may use the information here, together with the amount you invested, to estimate the expenses that you paid over the period.
To do so, simply divide your account value by $1,000 (for example, an $8,600 account value divided by $1,000 = 8.6), then multiply the result by the number given for your fund under the heading ”Expenses Paid During Period.“
• Based on hypothetical 5% yearly return. This section is intended to help you compare your fund‘s costs with those of other mutual funds. It assumes that the fund had a yearly return of 5% before expenses, but that the expense ratio is unchanged. In this case—because the return used is not the fund’s actual return—the results do not apply to your investment. The example is useful in making comparisons because the Securities and Exchange Commission requires all mutual funds to calculate expenses based on a 5% return. You can assess your fund’s costs by comparing this hypothetical example with the hypothetical examples that appear in shareholder reports of other funds.
Note that the expenses shown in the table are meant to highlight and help you compare ongoing costs only and do not reflect transaction costs incurred by the fund for buying and selling securities. Further, the expenses do not include any purchase, redemption, or account service fees described in the fund prospectus. If such fees were applied to your account, your costs would be higher. Your fund does not carry a “sales load.”
The calculations assume no shares were bought or sold during the period. Your actual costs may have been higher or lower, depending on the amount of your investment and the timing of any purchases or redemptions.
You can find more information about the fund’s expenses, including annual expense ratios, in the Financial Statements section of this report. For additional information on operating expenses and other shareholder costs, please refer to your fund’s current prospectus.
27
| Six Months Ended March 31, 2016 | |||
| Beginning | Ending | Expenses | |
| Account Value | Account Value | Paid During | |
| Equity Income Fund | 9/30/2015 | 3/31/2016 | Period |
| Based on Actual Fund Return | |||
| Investor Shares | $1,000.00 | $1,108.40 | $1.27 |
| Admiral Shares | 1,000.00 | 1,108.92 | 0.84 |
| Based on Hypothetical 5% Yearly Return | |||
| Investor Shares | $1,000.00 | $1,023.80 | $1.21 |
| Admiral Shares | 1,000.00 | 1,024.20 | 0.81 |
The calculations are based on expenses incurred in the most recent six-month period. The fund’s annualized six-month expense ratios for that
period are 0.24% for Investor Shares and 0.16% for Admiral Shares. The dollar amounts shown as “Expenses Paid” are equal to the
annualized expense ratio multiplied by the average account value over the period, multiplied by the number of days in the most recent
six-month period, then divided by the number of days in the most recent 12-month period (183/366).
28
Trustees Approve Advisory Arrangements
The board of trustees of Vanguard Equity Income Fund has renewed the fund’s investment advisory arrangements with Wellington Management Company LLP (Wellington Management) and The Vanguard Group, Inc. (Vanguard)��through its Quantitative Equity Group. The board determined that renewing the fund’s advisory arrangements was in the best interests of the fund and its shareholders.
The board based its decisions upon an evaluation of each advisor’s investment staff, portfolio management process, and performance. The trustees considered the factors discussed below, among others. However, no single factor determined whether the board approved the arrangements. Rather, it was the totality of the circumstances that drove the board’s decisions.
Nature, extent, and quality of services
The board reviewed the quality of the fund’s investment management services over both the short and long term, and took into account the organizational depth and stability of each advisor. The board considered the following:
Wellington Management. Wellington Management, founded in 1928, is among the nation’s oldest and most respected institutional investment managers. The firm has advised the fund since 2000. The board also noted that the portfolio manager to the fund has over two decades of investment industry experience. Utilizing fundamental research, Wellington Management seeks to build a portfolio with an above-market yield, superior growth rate, and more attractive valuation. While every company purchased for the portfolio will pay a dividend, the goal is to build a portfolio with an above-market yield in aggregate, allowing for individual companies with below-market yields. Normalized earnings, normalized price-to-earnings ratios, and improving returns on capital are key to the research process.
Vanguard. Vanguard has been managing investments for more than three decades. The Quantitative Equity Group adheres to a sound, disciplined investment management process; the team has considerable experience, stability, and depth. Vanguard has managed a portion of the fund since 2003.
The board concluded that each advisor’s experience, stability, depth, and performance, among other factors, warranted continuation of the advisory arrangements.
Investment performance
The board considered the short- and long-term performance of the fund and each advisor, including any periods of outperformance or underperformance relative to a benchmark index and peer group. The board concluded that the performance was such that each advisory arrangement should continue. Information about the fund’s most recent performance can be found in the Performance Summary section of this report.
Cost
The board concluded that the fund’s expense ratio was well below the average expense ratio charged by funds in its peer group and that the fund’s advisory fee rate was also well below its peer-group average. Information about the fund’s expenses appears in the About Your Fund’s Expenses section of this report as well as in the Financial Statements section, which also includes information about the fund’s advisory fee rate.
The board did not consider profitability of Wellington Management in determining whether to approve the advisory fee, because Wellington Management is independent of Vanguard, and the advisory fee is the result of arm’s-length negotiations. The board does not conduct a profitability analysis of Vanguard, because of Vanguard’s unique “at-cost” structure. Unlike most other mutual fund management companies, Vanguard is owned by the funds it oversees, and produces “profits” only in the form of reduced expenses for fund shareholders.
29
The benefit of economies of scale
The board concluded that the fund’s shareholders benefit from economies of scale because of breakpoints in the fund’s advisory fee schedule for Wellington Management. The breakpoints reduce the effective rate of the fee as the fund’s assets managed by Wellington Management increase. The board also concluded that the fund’s at-cost arrangement with Vanguard ensures that the fund will realize economies of scale as it grows, with the cost to shareholders declining as the fund’s assets managed by Vanguard increase.
The board will consider whether to renew the advisory arrangements again after a one-year period.
30
Glossary
30-Day SEC Yield. A fund’s 30-day SEC yield is derived using a formula specified by the U.S. Securities and Exchange Commission. Under the formula, data related to the fund’s security holdings in the previous 30 days are used to calculate the fund’s hypothetical net income for that period, which is then annualized and divided by the fund’s estimated average net assets over the calculation period. For the purposes of this calculation, a security’s income is based on its current market yield to maturity (for bonds), its actual income (for asset-backed securities), or its projected dividend yield (for stocks). Because the SEC yield represents hypothetical annualized income, it will differ—at times significantly—from the fund’s actual experience. As a result, the fund’s income distributions may be higher or lower than implied by the SEC yield.
Beta. A measure of the magnitude of a fund’s past share-price fluctuations in relation to the ups and downs of a given market index. The index is assigned a beta of 1.00. Compared with a given index, a fund with a beta of 1.20 typically would have seen its share price rise or fall by 12% when the index rose or fell by 10%. For this report, beta is based on returns over the past 36 months for both the fund and the index. Note that a fund’s beta should be reviewed in conjunction with its R-squared (see definition). The lower the R-squared, the less correlation there is between the fund and the index, and the less reliable beta is as an indicator of volatility.
Dividend Yield. Dividend income earned by stocks, expressed as a percentage of the aggregate market value (or of net asset value, for a fund). The yield is determined by dividing the amount of the annual dividends by the aggregate value (or net asset value) at the end of the period. For a fund, the dividend yield is based solely on stock holdings and does not include any income produced by other investments.
Earnings Growth Rate. The average annual rate of growth in earnings over the past five years for the stocks now in a fund.
Equity Exposure. A measure that reflects a fund’s investments in stocks and stock futures. Any holdings in short-term reserves are excluded.
Expense Ratio. A fund’s total annual operating expenses expressed as a percentage of the fund’s average net assets. The expense ratio includes management and administrative expenses, but does not include the transaction costs of buying and selling portfolio securities.
Foreign Holdings. The percentage of a fund represented by securities or depositary receipts of companies based outside the United States.
Inception Date. The date on which the assets of a fund (or one of its share classes) are first invested in accordance with the fund’s investment objective. For funds with a subscription period, the inception date is the day after that period ends. Investment performance is measured from the inception date.
Median Market Cap. An indicator of the size of companies in which a fund invests; the midpoint of market capitalization (market price x shares outstanding) of a fund’s stocks, weighted by the proportion of the fund’s assets invested in each stock. Stocks representing half of the fund’s assets have market capitalizations above the median, and the rest are below it.
Price/Book Ratio. The share price of a stock divided by its net worth, or book value, per share. For a fund, the weighted average price/book ratio of the stocks it holds.
31
Price/Earnings Ratio. The ratio of a stock’s current price to its per-share earnings over the past year. For a fund, the weighted average P/E of the stocks it holds. P/E is an indicator of market expectations about corporate prospects; the higher the P/E, the greater the expectations for a company’s future growth.
R-Squared. A measure of how much of a fund’s past returns can be explained by the returns from the market in general, as measured by a given index. If a fund’s total returns were precisely synchronized with an index’s returns, its R-squared would be 1.00. If the fund’s returns bore no relationship to the index’s returns, its R-squared would be 0. For this report, R-squared is based on returns over the past 36 months for both the fund and the index.
Return on Equity. The annual average rate of return generated by a company during the past five years for each dollar of shareholder’s equity (net income divided by shareholder’s equity). For a fund, the weighted average return on equity for the companies whose stocks it holds.
Short-Term Reserves. The percentage of a fund invested in highly liquid, short-term securities that can be readily converted to cash.
Turnover Rate. An indication of the fund’s trading activity. Funds with high turnover rates incur higher transaction costs and may be more likely to distribute capital gains (which may be taxable to investors). The turnover rate excludes in-kind transactions, which have minimal impact on costs.
Benchmark Information
Spliced Equity Income Index: Russell 1000 Value Index through July 31, 2007; FTSE High Dividend Yield Index thereafter.
32
This page intentionally left blank.
This page intentionally left blank.
This page intentionally left blank.
The People Who Govern Your Fund
The trustees of your mutual fund are there to see that the fund is operated and managed in your best interests since, as a shareholder, you are a part owner of the fund. Your fund’s trustees also serve on the board of directors of The Vanguard Group, Inc., which is owned by the Vanguard funds and provides services to them on an at-cost basis.
A majority of Vanguard’s board members are independent, meaning that they have no affiliation with Vanguard or the funds they oversee, apart from the sizable personal investments they have made as private individuals. The independent board members have distinguished backgrounds in business, academia, and public service. Each of the trustees and executive officers oversees 198 Vanguard funds.
The following table provides information for each trustee and executive officer of the fund. More information about the trustees is in the Statement of Additional Information, which can be obtained, without charge, by contacting Vanguard at 800-662-7447, or online at vanguard.com.
| InterestedTrustee1 | Rajiv L. Gupta |
| Born 1945. Trustee Since December 2001.2 Principal | |
| F. William McNabb III | Occupation(s) During the Past Five Years and Other |
| Born 1957. Trustee Since July 2009. Chairman of | Experience: Chairman and Chief Executive Officer |
| the Board. Principal Occupation(s) During the Past | (retired 2009) and President (2006–2008) of |
| Five Years and Other Experience: Chairman of the | Rohm and Haas Co. (chemicals); Director of Tyco |
| Board of The Vanguard Group, Inc., and of each of | International PLC (diversified manufacturing and |
| the investment companies served by The Vanguard | services), HP Inc. (printer and personal computer |
| Group, since January 2010; Director of The Vanguard | manufacturing), and Delphi Automotive PLC |
| Group since 2008; Chief Executive Officer and | (automotive components); Senior Advisor at |
| President of The Vanguard Group, and of each of | New Mountain Capital. |
| the investment companies served by The Vanguard | |
| Group, since 2008; Director of Vanguard Marketing | Amy Gutmann |
| Corporation; Managing Director of The Vanguard | Born 1949. Trustee Since June 2006. Principal |
| Group (1995–2008). | Occupation(s) During the Past Five Years and |
| Other Experience: President of the University of | |
| IndependentTrustees | Pennsylvania; Christopher H. Browne Distinguished |
| Professor of Political Science, School of Arts and | |
| Emerson U. Fullwood | Sciences, and Professor of Communication, Annenberg |
| Born 1948. Trustee Since January 2008. Principal | School for Communication, with secondary faculty |
| Occupation(s) During the Past Five Years and Other | appointments in the Department of Philosophy, School |
| Experience: Executive Chief Staff and Marketing | of Arts and Sciences, and at the Graduate School of |
| Officer for North America and Corporate Vice President | Education, University of Pennsylvania; Trustee of the |
| (retired 2008) of Xerox Corporation (document manage- | National Constitution Center; Chair of the Presidential |
| ment products and services); Executive in Residence | Commission for the Study of Bioethical Issues. |
| and 2009–2010 Distinguished Minett Professor at | |
| the Rochester Institute of Technology; Lead Director | JoAnn Heffernan Heisen |
| of SPX FLOW, Inc. (multi-industry manufacturing); | Born 1950. Trustee Since July 1998. Principal |
| Director of the United Way of Rochester, the University | Occupation(s) During the Past Five Years and |
| of Rochester Medical Center, Monroe Community | Other Experience: Corporate Vice President and |
| College Foundation, North Carolina A&T University, | Chief Global Diversity Officer (retired 2008) and |
| and Roberts Wesleyan College. | Member of the Executive Committee (1997–2008) |
| of Johnson & Johnson (pharmaceuticals/medical | |
| devices/consumer products); Director of Skytop | |
| Lodge Corporation (hotels) and the Robert Wood | |
| Johnson Foundation; Member of the Advisory | |
| Board of the Institute for Women’s Leadership | |
| at Rutgers University. |
| F. Joseph Loughrey | Executive Officers | |
| Born 1949. Trustee Since October 2009. Principal | ||
| Occupation(s) During the Past Five Years and Other | Glenn Booraem | |
| Experience: President and Chief Operating Officer | Born 1967. Treasurer Since May 2015. Principal | |
| (retired 2009) of Cummins Inc. (industrial machinery); | Occupation(s) During the Past Five Years and | |
| Chairman of the Board of Hillenbrand, Inc. (specialized | Other Experience: Principal of The Vanguard Group, | |
| consumer services), and of Oxfam America; Director | Inc.; Treasurer of each of the investment companies | |
| of SKF AB (industrial machinery), Hyster-Yale Materials | served by The Vanguard Group; Controller of each of | |
| Handling, Inc. (forklift trucks), the Lumina Foundation | the investment companies served by The Vanguard | |
| for Education, and the V Foundation for Cancer | Group (2010–2015); Assistant Controller of each of | |
| Research; Member of the Advisory Council for the | the investment companies served by The Vanguard | |
| College of Arts and Letters and of the Advisory Board | Group (2001–2010). | |
| to the Kellogg Institute for International Studies, both | ||
| at the University of Notre Dame. | Thomas J. Higgins | |
| Born 1957. Chief Financial Officer Since September | ||
| Mark Loughridge | 2008. Principal Occupation(s) During the Past Five | |
| Born 1953. Trustee Since March 2012. Principal | Years and Other Experience: Principal of The Vanguard | |
| Occupation(s) During the Past Five Years and Other | Group, Inc.; Chief Financial Officer of each of the | |
| Experience: Senior Vice President and Chief Financial | investment companies served by The Vanguard Group; | |
| Officer (retired 2013) at IBM (information technology | Treasurer of each of the investment companies served | |
| services); Fiduciary Member of IBM’s Retirement Plan | by The Vanguard Group (1998–2008). | |
| Committee (2004–2013); Director of the Dow Chemical | ||
| Company; Member of the Council on Chicago Booth. | Peter Mahoney | |
| Born 1974. Controller Since May 2015. Principal | ||
| Scott C. Malpass | Occupation(s) During the Past Five Years and | |
| Born 1962. Trustee Since March 2012. Principal | Other Experience: Head of Global Fund Accounting | |
| Occupation(s) During the Past Five Years and Other | at The Vanguard Group, Inc.; Controller of each of the | |
| Experience: Chief Investment Officer and Vice | investment companies served by The Vanguard Group; | |
| President at the University of Notre Dame; Assistant | Head of International Fund Services at The Vanguard | |
| Professor of Finance at the Mendoza College of | Group (2008–2014). | |
| Business at Notre Dame; Member of the Notre Dame | ||
| 403(b) Investment Committee, the Board of Advisors | Heidi Stam | |
| for Spruceview Capital Partners, and the Investment | Born 1956. Secretary Since July 2005. Principal | |
| Advisory Committee of Major League Baseball; Board | Occupation(s) During the Past Five Years and Other | |
| Member of TIFF Advisory Services, Inc., and Catholic | Experience: Managing Director of The Vanguard | |
| Investment Services, Inc. (investment advisors). | Group, Inc.; General Counsel of The Vanguard Group; | |
| Secretary of The Vanguard Group and of each of the | ||
| André F. Perold | investment companies served by The Vanguard Group; | |
| Born 1952. Trustee Since December 2004. Principal | Director and Senior Vice President of Vanguard | |
| Occupation(s) During the Past Five Years and Other | Marketing Corporation. | |
| Experience: George Gund Professor of Finance and | ||
| Banking, Emeritus at the Harvard Business School | Vanguard Senior ManagementTeam | |
| (retired 2011); Chief Investment Officer and Managing | Mortimer J. Buckley | James M. Norris |
| Partner of HighVista Strategies LLC (private investment | Kathleen C. Gubanich | Thomas M. Rampulla |
| firm); Director of Rand Merchant Bank; Overseer of | Martha G. King | Glenn W. Reed |
| the Museum of Fine Arts Boston. | John T. Marcante | Karin A. Risi |
| Chris D. McIsaac | ||
| Peter F. Volanakis | ||
| Born 1955. Trustee Since July 2009. Principal | ||
| Occupation(s) During the Past Five Years and Other | Chairman Emeritus and Senior Advisor | |
| Experience: President and Chief Operating Officer | ||
| (retired 2010) of Corning Incorporated (communications | John J. Brennan | |
| equipment); Trustee of Colby-Sawyer College and | Chairman, 1996–2009 | |
| Chairman of its Finance and Enrollment Committee; | Chief Executive Officer and President, 1996–2008 | |
| Member of the Advisory Board of the Norris Cotton | ||
| Cancer Center. | Founder | |
| John C. Bogle | ||
| Chairman and Chief Executive Officer, 1974–1996 | ||
1 Mr. McNabb is considered an “interested person,” as defined in the Investment Company Act of 1940, because he is an officer of the Vanguard funds.
2 December 2002 for Vanguard Equity Income Fund, the Vanguard Municipal Bond Funds, and the Vanguard State Tax-Exempt Funds.
 | ||
| P.O. Box 2600 | ||
| Valley Forge, PA 19482-2600 | ||
| Connect with Vanguard® > vanguard.com | ||
| Fund Information > 800-662-7447 | CFA® is a registered trademark owned by CFA Institute. | |
| Direct Investor Account Services > 800-662-2739 | ||
| Institutional Investor Services > 800-523-1036 | ||
| Text Telephone for People | ||
| Who Are Deaf or Hard of Hearing> 800-749-7273 | ||
| This material may be used in conjunction | ||
| with the offering of shares of any Vanguard | ||
| fund only if preceded or accompanied by | ||
| the fund’s current prospectus. | ||
| All comparative mutual fund data are from Lipper, a | ||
| Thomson Reuters Company, or Morningstar, Inc., unless | ||
| otherwise noted. | ||
| You can obtain a free copy of Vanguard’s proxy voting | ||
| guidelines by visiting vanguard.com/proxyreporting or by | ||
| calling Vanguard at 800-662-2739. The guidelines are | ||
| also available from the SEC’s website, sec.gov. In | ||
| addition, you may obtain a free report on how your fund | ||
| voted the proxies for securities it owned during the 12 | ||
| months ended June 30. To get the report, visit either | ||
| vanguard.com/proxyreporting or sec.gov. | ||
| You can review and copy information about your fund at | ||
| the SEC’s Public Reference Room in Washington, D.C. To | ||
| find out more about this public service, call the SEC at | ||
| 202-551-8090. Information about your fund is also | ||
| available on the SEC’s website, and you can receive | ||
| copies of this information, for a fee, by sending a | ||
| request in either of two ways: via email addressed to | ||
| publicinfo@sec.gov or via regular mail addressed to the | ||
| Public Reference Section, Securities and Exchange | ||
| Commission, Washington, DC 20549-1520. | ||
| © 2016 The Vanguard Group, Inc. | ||
| All rights reserved. | ||
| Vanguard Marketing Corporation, Distributor. | ||
| Q652 052016 | ||
Semiannual Report | March 31, 2016
Vanguard PRIMECAP Core Fund
Vanguard’s Principles for Investing Success
We want to give you the best chance of investment success. These principles, grounded in Vanguard’s research and experience, can put you on the right path.
Goals. Create clear, appropriate investment goals.
Balance. Develop a suitable asset allocation using broadly diversified funds. Cost. Minimize cost.
Discipline. Maintain perspective and long-term discipline.
A single theme unites these principles: Focus on the things you can control.
We believe there is no wiser course for any investor.
| Contents | |
| Your Fund’s Total Returns. | 1 |
| Chairman’s Letter. | 2 |
| Advisor’s Report. | 8 |
| Fund Profile. | 12 |
| Performance Summary. | 13 |
| Financial Statements. | 14 |
| About Your Fund’s Expenses. | 24 |
| Trustees Approve Advisory Arrangement. | 26 |
| Glossary. | 27 |
Please note: The opinions expressed in this report are just that—informed opinions. They should not be considered promises or advice.
Also, please keep in mind that the information and opinions cover the period through the date on the front of this report. Of course, the
risks of investing in your fund are spelled out in the prospectus.
See the Glossary for definitions of investment terms used in this report.
About the cover: Pictured is a sailing block on the Brilliant, a 1932 schooner docked in Mystic, Connecticut. A type of pulley, the
sailing block helps coordinate the setting of the sails. At Vanguard, the intricate coordination of technology and people allows
us to help millions of clients around the world reach their financial goals.
Your Fund’s Total Returns
| Six Months Ended March 31, 2016 | |
| Total | |
| Returns | |
| Vanguard PRIMECAP Core Fund | 7.35% |
| MSCI US Prime Market 750 Index | 7.75 |
| Multi-Cap Core Funds Average | 4.90 |
| Multi-Cap Core Funds Average: Derived from data provided by Lipper, a Thomson Reuters Company. | |
| Your Fund’s Performance at a Glance | ||||
| September 30, 2015, Through March 31, 2016 | ||||
| Distributions Per Share | ||||
| Starting | Ending | Income | Capital | |
| Share Price | Share Price | Dividends | Gains | |
| Vanguard PRIMECAP Core Fund | $20.26 | $20.73 | $0.243 | $0.789 |
1

Chairman’s Letter
Dear Shareholder,
While markets could be volatile and its holdings weren’t completely in sync with market sector trends, Vanguard PRIMECAP Core Fund ultimately delivered a solid performance over the six months ended March 31, 2016.
The fund returned about 7%, a fraction behind the benchmark MSCI US Prime Market 750 Index and more than 2 percentage points ahead of the average return of its multi-capitalization core fund peers.
Stocks charted an uneven course en route to a favorable outcome
The broad U.S. stock market returned about 7% over the six months. The period began and ended strongly, with fluctuations in the middle as China’s economic slowdown and falling oil and commodity prices worried investors.
Stocks rallied in March as investors again seemed encouraged by news about monetary policy. The Federal Reserve indicated, after a mid-March meeting, that it would raise interest rates fewer times in 2016 than previously anticipated. And central bankers in Europe and Asia kept up stimulus measures to combat weak growth and low inflation.
International stocks returned about 3% for the period after surging more than 8% in March. Stocks from emerging markets and from developed markets of the Pacific region outperformed European stocks, which were nearly flat.
2
Bonds produced gains following a subpar start
After posting weak results for the first three months of the period, bonds managed solid gains in the final three. The broad U.S. taxable bond market returned 2.44% for the fiscal half year.
With stocks volatile and the Fed proceeding cautiously with rate hikes, bonds proved attractive. The yield of the 10-year U.S. Treasury note closed at 1.77% at the end of March, down from 2.05% six months earlier. (Bond prices and yields move in opposite directions.)
Returns for money market funds and savings accounts remained limited by the Fed’s target rate of 0.25%–0.5%—still low despite rising a quarter percentage point in December.
International bond markets (as measured by the Barclays Global Aggregate Index ex USD) returned 6.90%. International bonds benefited as foreign currencies strengthened against the dollar, a turnabout from the trend of recent years. Even in local currencies, however, international bond returns were solidly positive, boosted in part by the additional stimulus measures in Europe and Asia.
| Market Barometer | |||
| Total Returns | |||
| Periods Ended March 31, 2016 | |||
| Six | One | Five Years | |
| Months | Year | (Annualized) | |
| Stocks | |||
| Russell 1000 Index (Large-caps) | 7.75% | 0.50% | 11.35% |
| Russell 2000 Index (Small-caps) | 2.02 | -9.76 | 7.20 |
| Russell 3000 Index (Broad U.S. market) | 7.30 | -0.34 | 11.01 |
| FTSE All-World ex US Index (International) | 3.09 | -8.53 | 0.70 |
| Bonds | |||
| Barclays U.S. Aggregate Bond Index (Broad taxable market) | 2.44% | 1.96% | 3.78% |
| Barclays Municipal Bond Index (Broad tax-exempt market) | 3.20 | 3.98 | 5.59 |
| Citigroup Three-Month U.S. Treasury Bill Index | 0.06 | 0.08 | 0.04 |
| CPI | |||
| Consumer Price Index | 0.08% | 0.85% | 1.28% |
3
The technology sector surged while health care stocks lagged
Vanguard PRIMECAP Core Fund has had a commendable record since its December 2004 launch. From its inception through March 31, 2016, the fund has generated an average annual return of nearly 9.5%. By comparison, annual returns for both the broad U.S. market and the benchmark MSCI US Prime Market 750 Index averaged around 7.5%, and the average annual return of the fund’s multi-cap core fund peers was almost 6%.
A decade-plus of significant outperformance is uncommon in the mutual fund industry. Credit for this accomplishment belongs to the fund’s advisor, PRIMECAP Management Company. The advisor has demonstrated conviction, patience, and skill in constructing a portfolio that bears little resemblance to its benchmark index even as it aims to surpass it.
A portfolio that looks different from the benchmark index is likely to behave differently, too; hopefully for the better, but possibly for the worse. The road to long-term outperformance sometimes travels through short-term underperfor-mance as the advisor maintains stock holdings through difficult stretches with the belief that there eventually will be a rebound.
The information technology and health care sectors continue to be the cornerstones of the PRIMECAP Core Fund, but their results diverged over the six months
| Expense Ratios | ||
| Your Fund Compared With Its Peer Group | ||
| Peer Group | ||
| Fund | Average | |
| PRIMECAP Core Fund | 0.47% | 1.17% |
The fund expense ratio shown is from the prospectus dated January 27, 2016, and represents estimated costs for the current fiscal year. For
the six months ended March 31, 2016, the fund’s annualized expense ratio was 0.45%. The peer-group expense ratio is derived from data
provided by Lipper, a Thomson Reuters Company, and captures information through year-end 2015.
Peer group: Multi-Cap Core Funds.
4
under review. Technology stocks were the fund’s best performers, while health care stocks were its worst.
PRIMECAP Core’s technology stocks accounted for close to 30% of the portfolio, on average, over the period. Their return of more than 17% was well ahead of the 11% for those in the benchmark. Gains were evident across the board, with semiconductors, hardware, software, and internet companies all making sizable contributions. Competition is fierce within the industry as corporations gravitate toward cloud computing and consumers opt for new products and
| Vanguard’s growth translates into lower costs for you |
| Research indicates that lower-cost investments have tended to outperform higher-cost ones. |
| So it’s little wonder that funds with lower expense ratios—including those at Vanguard—have |
| dominated the industry’s cash inflows in recent years. |
| Vanguard has long been a low-cost leader, with expenses well below those of many other |
| investment management companies. That cost difference remains a powerful advantage for |
| Vanguard clients. Why? Because a lower expense ratio allows a fund to pass along a greater |
| share of its returns to its investors. |
| What’s more, as you can see in the chart below, we’ve been able to lower our costs continually |
| as our assets under management have grown. Our steady growth has not been an explicit |
| business objective. Rather, we focus on putting our clients’ interests first at all times, and |
| giving them the best chance for investment success. But economies of scale—the cost |
| efficiencies that come with our growth—have allowed us to keep lowering our fund costs, |
| even as we invest in our people and technology. |
| The benefit of economies of scale |

| Note: Data are for U.S.-based Vanguard funds only. |
| Source: Vanguard. |
5
services. PRIMECAP Management’s research and insight into this sector are invaluable.
The health care sector also made up nearly 30% of the fund’s portfolio, on average, over the period. PRIMECAP Core’s health care stocks returned about –1%, compared with a rise of about 2% for those of the benchmark. Pharmaceutical stocks were the primary culprit as the possibility of increased government regulation loomed over future profits. A slowdown in merger and acquisition activity hurt, too. However, the fund’s health care equipment stocks performed well and its biotechnology stocks managed a slight gain even as the biotech industry as a whole struggled with high valuations.
PRIMECAP Core’s exposure to the industrial sector approached 20%, on average, over the period and also boosted returns. Airline and air freight and logistics firms were responsible for most of the performance as lower fuel prices reduced costs. The fund had 10% or more exposure to only one other sector: consumer discretionary, which returned about 4%.
For more about the advisor’s strategy and the fund’s positioning during the six months, please see the Advisor’s Report that follows this letter.
Consider rebalancing to manage your risk
Let’s say you’ve taken the time to carefully create an appropriate asset allocation for your investment portfolio. Your efforts have produced a diversified mix of stock, bond, and money market funds tailored to your goals, time horizon, and risk tolerance.
But what should you do when your portfolio drifts from its original asset allocation as the financial markets rise or fall? Consider rebalancing to bring it back to the proper mix.
Just one year of outsized returns can throw your allocation out of whack. Take 2013 as an example. That year, the broad stock market (as measured by the Russell 3000 Index) returned 33.55% and the broad taxable bond market (as measured by the Barclays U.S. Aggregate Bond Index) returned –2.02%. A hypothetical portfolio that tracked the broad domestic market indexes and started the year with 60% stocks and 40% bonds would have ended with a more aggressive mix of 67% stocks and 33% bonds.
Rebalancing to bring your portfolio back to its original targets would require you to shift assets away from areas that have been performing well toward those that have been falling behind. That isn’t easy or intuitive. It’s a way to minimize risk rather than maximize returns and to stick with your investment plan through different types of markets. (You can read more about our approach in Best Practices for Portfolio Rebalancing at vanguard.com/research.)
6
It’s not necessary to check your portfolio every day or every month, much less rebalance it that frequently. It may be more appropriate to monitor it annually or semiannually and rebalance when your allocation swings 5 percentage points or more from its target.
It’s important, of course, to be aware of the tax implications. You’ll want to consult with your tax advisor, but generally speaking, it may be a good idea to make any asset changes within a tax-advantaged retirement account or to direct new cash flows into the underweighted asset class.
However you go about it, keeping your asset allocation from drifting too far off target can help you stay on track with the investment plan you’ve crafted to meet your financial goals.
As always, thank you for investing with Vanguard.
Sincerely,

F. William McNabb III
Chairman and Chief Executive Officer
April 19, 2016
7
Advisor’s Report
For the six months ended March 31, 2016, Vanguard PRIMECAP Core Fund returned 7.35%, trailing the 7.75% return of its benchmark, the unmanaged MSCI US Prime Market 750 Index, and the 8.49% return of the unmanaged Standard & Poor’s 500 Index. But the fund surpassed the 4.90% return of its multi-capitalization core fund competitors.
There were several reasons for the underperformance relative to the unmanaged S&P 500. Primary among them were unfavorable stock selection and an overweight position in health care, the second-worst-performing sector over the period, as well as the fund’s underweight positions in consumer staples, utilities, and telecommunication services. These negatives were partially offset by favorable stock selection and an overweight position in information technology, as well as an underweight position in financials, the worst-performing sector.
The investment environment
The six months ended March 31 were characterized by significant volatility in financial markets worldwide, including the U.S. equity markets. Stocks rallied from the beginning of October through December 2015, then sold off sharply in January and early February before rallying into the end of March. The February stock market trough roughly coincided with the bottom in West Texas Intermediate crude oil, which fell to $26 per barrel before rebounding to end March at $38. Contrary to the expectations of many investors, Treasury bond yields fell as the Federal
Reserve signaled it would raise interest rates more gradually than it had planned. Faced with lower net interest margins, financials underperformed the S&P 500 by nearly 8%, with some of the largest banks and brokerages faring far worse. Sluggish economic growth and below-target inflation have led central banks in Europe and Japan to introduce negative short-term interest rates and ramp up government bond purchases, further pressuring already low long-term rates. Ten-year German and Japanese bonds currently yield within 15 basis points of 0%, an unprecedented situation.
Relative to other developed economies, the U.S. economy was a bright spot as real GDP (gross domestic product) continued to expand at a modest pace (+2.4% in 2015). Supported by rising incomes, healthy household balance sheets, low inflation (in part because of falling energy prices), and improving access to historically inexpensive credit, U.S. consumer spending appears to be on solid footing. We are concerned, however, by the unfolding U.S. presidential election. Candidates on both sides have vilified U.S. corporations and espoused trade policies that could harm global companies, including many of the fund’s holdings.
Outlook for U.S. equities
S&P 500 earnings per share are expected to decline 7% in the first quarter of 2016, the worst performance since the third quarter of 2009. Even excluding the troubled energy sector, S&P 500 earnings per share are expected to decline. Trading at approximately 16.5 times the estimated
8
earnings per share for the next 12 months, the S&P 500 Index appears fully valued by historical standards. However, with the 10-year Treasury bond yielding 1.8%, well below the S&P 500 Index dividend yield of 2.2%, we continue to believe that stocks represent a more attractive investment than bonds at current prices. We find certain stocks to be attractively valued, notably the fund’s biotechnology holdings, which, after a period of significant underperformance, trade at a discount to the S&P 500 price-to-earnings multiple in spite of their far superior long-term growth prospects.
Portfolio update and outlook
While the fund’s total return exceeded that of the S&P 500 during the fourth quarter because of favorable sector allocations and strong selection in information technology, this was more than offset by relative underperformance during the first quarter of 2016. Sector allocations (overweight health care and underweight consumer staples, utilities, and telecom) posed challenges, and several of the fund’s largest pharmaceutical and biotechnology holdings declined.
After several consecutive years of outperformance, the health care sector lagged the S&P 500 Index over the six months. Biotechnology stocks were hit especially hard. The decline was precipitated by high-profile generic-drug price increases and the subsequent broader scrutiny of the entire biotechnology and pharmaceutical industry. Among the fund’s biotechnology and pharmaceutical holdings, Novartis (–19%), Eli Lilly (–13%), Biogen (–11%),
and Roche (–3%) were the most significant detractors. The fund’s biotechnology and pharmaceutical holdings made up over 18% of assets as of March 31, more than double the S&P 500 Index weighting of 9%. In spite of the near-term uncertainty and political rhetoric over drug pricing, we believe that the industry’s fundamentals remain intact. Demand for health care products is expected to continue to grow, driven by demographic trends as well as by the industry’s ability to develop new, safer, more effective therapies. We believe that companies that develop novel therapies that extend lives and represent real advancements will ultimately receive favorable pricing and reimbursement for their products.
The fund also remains overweight information technology stocks, which made up 30% of assets as of March 31, compared with a 21% weighting in the S&P 500 Index. The fund’s internet and software holdings modestly underperformed the S&P 500 Index, while its hardware and semiconductor holdings significantly outperformed. The fund’s hardware holdings outperformed due primarily to strong gains in SanDisk (+40%), which agreed to be acquired by Western Digital, and Hewlett Packard Enterprise (+21%), as well as the fund’s minimal position in Apple (flat). Losses in NetApp (–7%) partially offset these gains. While Gartner, a research and advisory firm, expects global IT spending to fall 0.5% in 2016, we remain confident in the long-term outlook for the fund’s information technology holdings.
9
Microsoft, the fund’s largest software holding, is successfully transforming its products and business model to adapt to the new cloud computing paradigm, where resources are consumed on demand over the internet. Alphabet and Alibaba, the fund’s largest internet holdings, are growing rapidly as consumers worldwide spend more time and money on internet-based services. Texas Instruments, the fund’s largest semiconductor holding, stands to benefit from the proliferation of electronics in automobiles and other devices and the incorporation of connectivity. While the fund’s hardware holdings, including Hewlett Packard Enterprise and NetApp, face more challenging transitions to the cloud, they trade at extremely low valuations that more than compensate investors for the associated risks.
Approximately 8% of the fund’s assets were invested in airline stocks as of March 31. Industry fundamentals remain strong. Robust traffic leads to high load factors, and lower fuel costs boost earnings. Nevertheless, investors remain leery of the airline industry. We recognize that terrorism is a significant risk, and are especially concerned given the recent terrorist attacks in Paris and Brussels. But we believe that structural changes in the industry over the last several years—most importantly industry consolidation—have enabled airlines to prosper under normal conditions.
Furthermore, the industry benefits from secular trends, as demonstrated by the fact that the 6% growth in global passenger traffic far exceeds real global GDP growth. In spite of these positives, several of our airline holdings trade at among the lowest price-to-earnings multiples in the S&P 500.
The fund remains significantly underweighted in energy stocks. We have found few compelling investments in the sector, as we believe current valuations (over 60 times forward earnings per share) assume a significant increase in oil prices. We view declining production costs and slower demand from China and other emerging markets as secular, not cyclical, trends. Furthermore, new technologies such as vehicle electrification may reduce oil demand over the long term.
After rallying strongly during the six months as investors flocked to perceived safe haven investments, telecommunication services, utilities, and consumer staples stocks appear stretched relative to their growth prospects, in our opinion. For example, consumer staples stocks trade for 21 times forward earnings per share—the most expensive sector on a price-to-earnings basis except for the reeling energy sector—in spite of minimal expected revenue growth.
The fund held approximately 8% of its assets in cash as of March 31.
10
Conclusion
We remain committed to our investment philosophy, which is to invest in attractively priced stocks for the long term. This bottom-up approach often results in portfolios that bear little resemblance to market indexes; therefore, our results often deviate substantially from those indexes. Furthermore, our long-term investment horizon results in low portfolio turnover, which can mean extended periods of underperformance when the stocks in our portfolio fall out of favor. We nonetheless believe that this approach can generate superior results for shareholders over the long term.
PRIMECAP Management Company
April 21, 2016
11
PRIMECAP Core Fund
Fund Profile
As of March 31, 2016
| Portfolio Characteristics | |||
| MSCI US | DJ | ||
| Prime | U.S. Total | ||
| Market | Market | ||
| Fund | 750 Index | FA Index | |
| Number of Stocks | 148 | 732 | 3,900 |
| Median Market Cap | $52.1B | $65.3B | $52.5B |
| Price/Earnings Ratio | 18.9x | 21.0x | 21.8x |
| Price/Book Ratio | 3.2x | 2.8x | 2.7x |
| Return on Equity | 18.2% | 18.3% | 17.5% |
| Earnings Growth | |||
| Rate | 9.1% | 7.8% | 8.0% |
| Dividend Yield | 1.8% | 2.1% | 2.1% |
| Foreign Holdings | 10.7% | 0.0% | 0.0% |
| Turnover Rate | |||
| (Annualized) | 10% | — | — |
| Ticker Symbol | VPCCX | — | — |
| Expense Ratio1 | 0.47% | — | — |
| 30-Day SEC Yield | 1.26% | — | — |
| Short-Term Reserves | 7.9% | — | — |
| Sector Diversification (% of equity exposure) | |||
| DJ | |||
| U.S. | |||
| MSCI US | Total | ||
| Prime | Market | ||
| Market | FA | ||
| Fund 750 Index | Index | ||
| Consumer | |||
| Discretionary | 12.4% | 13.6% | 13.6% |
| Consumer Staples | 0.9 | 10.0 | 9.2 |
| Energy | 1.1 | 6.5 | 6.1 |
| Financials | 8.3 | 15.7 | 17.4 |
| Health Care | 24.4 | 14.0 | 13.7 |
| Industrials | 19.3 | 10.5 | 10.7 |
| Information | |||
| Technology | 30.3 | 20.6 | 20.1 |
| Materials | 2.6 | 3.0 | 3.2 |
| Telecommunication | |||
| Services | 0.7 | 2.7 | 2.5 |
| Utilities | 0.0 | 3.4 | 3.5 |
| Volatility Measures | ||
| DJ | ||
| MSCI US | U.S. Total | |
| Prime Market | Market | |
| 750 Index | FA Index | |
| R-Squared | 0.94 | 0.93 |
| Beta | 0.96 | 0.95 |
These measures show the degree and timing of the fund’s fluctuations compared with the indexes over 36 months.
| Ten Largest Holdings (% of total net assets) | ||
| Southwest Airlines Co. | Airlines | 5.0% |
| Amgen Inc. | Biotechnology | 4.4 |
| Eli Lilly & Co. | Pharmaceuticals | 3.8 |
| Alphabet Inc. | Internet Software & | |
| Services | 3.6 | |
| Roche Holding AG | Pharmaceuticals | 3.3 |
| Biogen Inc. | Biotechnology | 2.8 |
| Texas Instruments Inc. | Semiconductors | 2.8 |
| JPMorgan Chase & Co. | Diversified Banks | 2.1 |
| Microsoft Corp. | Systems Software | 2.0 |
| FedEx Corp. | Air Freight & | |
| Logistics | 2.0 | |
| Top Ten | 31.8% | |
The holdings listed exclude any temporary cash investments and equity index products.
Investment Focus

1 The expense ratio shown is from the prospectus dated January 27, 2016, and represents estimated costs for the current fiscal year. For the six
months ended March 31, 2016, the annualized expense ratio was 0.45%.
12
PRIMECAP Core Fund
Performance Summary
All of the returns in this report represent past performance, which is not a guarantee of future results that may be achieved by the fund. (Current performance may be lower or higher than the performance data cited. For performance data current to the most recent month-end, visit our website at vanguard.com/performance.) Note, too, that both investment returns and principal value can fluctuate widely, so an investor’s shares, when sold, could be worth more or less than their original cost. The returns shown do not reflect taxes that a shareholder would pay on fund distributions or on the sale of fund shares.
Fiscal-Year Total Returns (%): September 30, 2005, Through March 31, 2016

| Average Annual Total Returns: Periods Ended March 31, 2016 | ||||
| Inception | One | Five | Ten | |
| Date | Year | Years | Years | |
| PRIMECAP Core Fund | 12/9/2004 | -1.32% | 12.01% | 8.59% |
See Financial Highlights for dividend and capital gains information.
13
PRIMECAP Core Fund
Financial Statements (unaudited)
Statement of Net Assets
As of March 31, 2016
The fund reports a complete list of its holdings in regulatory filings four times in each fiscal year, at the quarter-ends. For the second and fourth fiscal quarters, the lists appear in the fund’s semiannual and annual reports to shareholders. For the first and third fiscal quarters, the fund files the lists with the Securities and Exchange Commission on Form N-Q. Shareholders can look up the fund’s Forms N-Q on the SEC’s website at sec.gov. Forms N-Q may also be reviewed and copied at the SEC’s Public Reference Room (see the back cover of this report for further information).
| Market | |||
| Value• | |||
| Shares | ($000) | ||
| Common Stocks (92.1%) | |||
| Consumer Discretionary (11.5%) | |||
| * | CarMax Inc. | 2,901,700 | 148,277 |
| TJX Cos. Inc. | 1,524,700 | 119,460 | |
| L Brands Inc. | 1,288,325 | 113,128 | |
| Sony Corp. ADR | 3,765,000 | 96,836 | |
| Carnival Corp. | 1,629,300 | 85,978 | |
| Walt Disney Co. | 745,000 | 73,986 | |
| Ross Stores Inc. | 1,010,900 | 58,531 | |
| Las Vegas Sands Corp. | 610,000 | 31,525 | |
| Tribune Media Co. | |||
| Class A | 803,500 | 30,814 | |
| Royal Caribbean Cruises | |||
| Ltd. | 329,000 | 27,027 | |
| Gildan Activewear Inc. | |||
| Class A | 605,300 | 18,468 | |
| * | Amazon.com Inc. | 30,593 | 18,161 |
| VF Corp. | 278,000 | 18,003 | |
| Garmin Ltd. | 425,000 | 16,983 | |
| * | Bed Bath & Beyond Inc. | 337,491 | 16,753 |
| Time Warner Cable Inc. | 50,000 | 10,231 | |
| * | AutoZone Inc. | 7,800 | 6,214 |
| McDonald’s Corp. | 42,900 | 5,392 | |
| * | Norwegian Cruise Line | ||
| Holdings Ltd. | 91,700 | 5,070 | |
| Newell Rubbermaid Inc. | 110,000 | 4,872 | |
| Lowe’s Cos. Inc. | 41,500 | 3,144 | |
| Marriott International Inc. | |||
| Class A | 40,000 | 2,847 | |
| Comcast Corp. Class A | 45,100 | 2,755 | |
| 914,455 | |||
| Consumer Staples (0.8%) | |||
| CVS Health Corp. | 322,377 | 33,440 | |
| PepsiCo Inc. | 300,000 | 30,744 | |
| 64,184 | |||
| Energy (1.0%) | |||
| Schlumberger Ltd. | 444,300 | 32,767 | |
| ^ | Transocean Ltd. | 1,408,300 | 12,872 |
| Cabot Oil & Gas Corp. | 425,000 | 9,652 | |
| National Oilwell Varco Inc. | 243,200 | 7,563 | |
| *,^ | Southwestern Energy Co. | 785,000 | 6,335 |
| EOG Resources Inc. | 63,000 | 4,573 | |
| Exxon Mobil Corp. | 46,012 | 3,846 | |
| * | Cameron International | ||
| Corp. | 25,300 | 1,696 | |
| * | Petroleo Brasileiro SA | ||
| ADR Preference Shares | 75,000 | 340 | |
| * | Petroleo Brasileiro SA ADR | 30,000 | 175 |
| Frank’s International NV | 10,000 | 165 | |
| 79,984 | |||
| Financials (7.6%) | |||
| JPMorgan Chase & Co. | 2,780,066 | 164,636 | |
| Marsh & McLennan Cos. | |||
| Inc. | 1,976,475 | 120,150 | |
| Charles Schwab Corp. | 3,662,100 | 102,612 | |
| Wells Fargo & Co. | 1,702,000 | 82,309 | |
| Progressive Corp. | 1,194,800 | 41,985 | |
| Northern Trust Corp. | 551,400 | 35,935 | |
| US Bancorp | 718,300 | 29,156 | |
| Chubb Ltd. | 79,330 | 9,452 | |
| Discover Financial | |||
| Services | 170,700 | 8,692 | |
| CME Group Inc. | 79,850 | 7,670 | |
| American Express Co. | 51,000 | 3,131 | |
| Comerica Inc. | 35,000 | 1,325 | |
| 607,053 | |||
| Health Care (22.4%) | |||
| Amgen Inc. | 2,350,324 | 352,384 | |
| Eli Lilly & Co. | 4,199,800 | 302,427 | |
| Roche Holding AG | 1,066,806 | 261,944 | |
| * | Biogen Inc. | 865,400 | 225,281 |
| Novartis AG ADR | 1,610,605 | 116,672 | |
| Medtronic plc | 1,107,700 | 83,077 | |
| Thermo Fisher Scientific | |||
| Inc. | 562,700 | 79,673 | |
| Abbott Laboratories | 1,712,700 | 71,642 | |
| * | Boston Scientific Corp. | 3,327,200 | 62,585 |
| Johnson & Johnson | 558,800 | 60,462 | |
| AstraZeneca plc ADR | 1,921,800 | 54,118 | |
| * | Waters Corp. | 225,000 | 29,682 |
14
PRIMECAP Core Fund
| Market | |||
| Value• | |||
| Shares | ($000) | ||
| * | Illumina Inc. | 155,900 | 25,273 |
| Sanofi ADR | 540,000 | 21,686 | |
| Merck & Co. Inc. | 365,000 | 19,312 | |
| Agilent Technologies Inc. | 382,600 | 15,247 | |
| Stryker Corp. | 45,500 | 4,882 | |
| AbbVie Inc. | 73,000 | 4,170 | |
| * | Cerner Corp. | 10,000 | 530 |
| 1,791,047 | |||
| Industrials (17.8%) | |||
| Southwest Airlines Co. | 8,926,525 | 399,908 | |
| FedEx Corp. | 983,775 | 160,080 | |
| Airbus Group SE | 1,556,850 | 103,153 | |
| United Parcel Service Inc. | |||
| Class B | 827,500 | 87,276 | |
| Honeywell International | |||
| Inc. | 690,000 | 77,315 | |
| American Airlines Group | |||
| Inc. | 1,708,000 | 70,045 | |
| * | United Continental | ||
| Holdings Inc. | 1,108,000 | 66,325 | |
| Delta Air Lines Inc. | 1,328,000 | 64,647 | |
| Deere & Co. | 512,600 | 39,465 | |
| Boeing Co. | 299,800 | 38,057 | |
| Caterpillar Inc. | 445,000 | 34,060 | |
| * | Jacobs Engineering Group | ||
| Inc. | 746,655 | 32,517 | |
| * | AECOM | 833,203 | 25,654 |
| Safran SA | 337,600 | 23,565 | |
| CSX Corp. | 915,000 | 23,561 | |
| Union Pacific Corp. | 266,400 | 21,192 | |
| Rockwell Automation Inc. | 168,700 | 19,190 | |
| Pentair plc | 350,000 | 18,991 | |
| Ritchie Bros Auctioneers | |||
| Inc. | 618,300 | 16,744 | |
| * | Hertz Global Holdings Inc. | 1,410,000 | 14,847 |
| Republic Services Inc. | |||
| Class A | 268,935 | 12,815 | |
| CH Robinson Worldwide | |||
| Inc. | 165,000 | 12,248 | |
| United Technologies Corp. | 120,000 | 12,012 | |
| * | TransDigm Group Inc. | 52,500 | 11,568 |
| IDEX Corp. | 139,000 | 11,520 | |
| Expeditors International | |||
| of Washington Inc. | 230,000 | 11,226 | |
| Alaska Air Group Inc. | 50,000 | 4,101 | |
| Norfolk Southern Corp. | 41,237 | 3,433 | |
| Tyco International plc | 75,000 | 2,753 | |
| * | Kirby Corp. | 16,000 | 965 |
| Chicago Bridge & Iron Co. | |||
| NV | 20,000 | 732 | |
| 1,419,965 | |||
| Information Technology (27.9%) | |||
| Texas Instruments Inc. | 3,845,800 | 220,826 | |
| Microsoft Corp. | 2,939,200 | 162,332 | |
| * | Alphabet Inc. Class A | 189,177 | 144,323 |
| * | Alphabet Inc. Class C | 189,226 | 140,964 |
| SanDisk Corp. | 1,572,516 | 119,637 | |
| Hewlett Packard | |||
| Enterprise Co. | 6,727,567 | 119,280 | |
| Intel Corp. | 3,316,700 | 107,295 | |
| * | Flextronics International | ||
| Ltd. | 8,881,200 | 107,107 | |
| NetApp Inc. | 3,020,400 | 82,427 | |
| HP Inc. | 6,689,367 | 82,413 | |
| EMC Corp. | 3,080,300 | 82,090 | |
| Cisco Systems Inc. | 2,707,500 | 77,083 | |
| KLA-Tencor Corp. | 982,600 | 71,543 | |
| Telefonaktiebolaget LM | |||
| Ericsson ADR | 6,563,300 | 65,830 | |
| QUALCOMM Inc. | 1,239,830 | 63,405 | |
| Intuit Inc. | 541,500 | 56,321 | |
| NVIDIA Corp. | 1,530,000 | 54,514 | |
| ^ | ASML Holding NV | 480,000 | 48,187 |
| * | Alibaba Group Holding | ||
| Ltd. ADR | 542,430 | 42,868 | |
| * | PayPal Holdings Inc. | 1,064,900 | 41,105 |
| * | Adobe Systems Inc. | 435,000 | 40,803 |
| Activision Blizzard Inc. | 905,000 | 30,625 | |
| * | eBay Inc. | 1,257,900 | 30,013 |
| Corning Inc. | 1,425,000 | 29,768 | |
| Applied Materials Inc. | 1,259,000 | 26,666 | |
| * | Keysight Technologies | ||
| Inc. | 895,589 | 24,844 | |
| * | Yahoo! Inc. | 619,600 | 22,807 |
| Analog Devices Inc. | 365,000 | 21,604 | |
| Visa Inc. Class A | 277,000 | 21,185 | |
| Oracle Corp. | 500,000 | 20,455 | |
| * | Electronic Arts Inc. | 300,000 | 19,833 |
| * | Micron Technology Inc. | 1,850,000 | 19,370 |
| Apple Inc. | 132,000 | 14,387 | |
| * | BlackBerry Ltd. | 1,547,500 | 12,519 |
| Teradyne Inc. | 150,000 | 3,239 | |
| * | VMware Inc. Class A | 3,000 | 157 |
| 2,227,825 | |||
| Materials (2.4%) | |||
| Monsanto Co. | 773,350 | 67,854 | |
| Praxair Inc. | 229,700 | 26,289 | |
| Dow Chemical Co. | 418,000 | 21,259 | |
| Celanese Corp. Class A | 320,000 | 20,960 | |
| EI du Pont de Nemours | |||
| & Co. | 275,000 | 17,413 | |
| Potash Corp. of | |||
| Saskatchewan Inc. | 758,500 | 12,910 | |
| Cabot Corp. | 150,000 | 7,249 | |
| * | Crown Holdings Inc. | 100,000 | 4,959 |
| Greif Inc. Class A | 125,400 | 4,107 | |
| LyondellBasell Industries | |||
| NV Class A | 46,200 | 3,954 | |
| Greif Inc. Class B | 37,000 | 1,732 | |
| Chemours Co. | 55,000 | 385 | |
| 189,071 | |||
15
PRIMECAP Core Fund
| Market | ||
| Value• | ||
| Shares | ($000) | |
| Telecommunication Services (0.7%) | ||
| AT&T Inc. | 905,492 | 35,468 |
| *,^ Sprint Corp. | 5,680,000 | 19,766 |
| 55,234 | ||
| Total Common Stocks | ||
| (Cost $4,508,166) | 7,348,818 | |
| Temporary Cash Investment (8.4%) | ||
| Money Market Fund (8.4%) | ||
| 1,2 Vanguard Market Liquidity | ||
| Fund, 0.495% | ||
| (Cost $665,876) | 665,875,828 | 665,876 |
| Total Investments (100.5%) | ||
| (Cost $5,174,042) | 8,014,694 | |
| Amount | ||
| ($000) | ||
| Other Assets and Liabilities (-0.5%) | ||
| Other Assets | ||
| Investment in Vanguard | 672 | |
| Receivables for Accrued Income | 11,761 | |
| Receivables for Capital Shares Issued | 1,987 | |
| Other Assets | 2,890 | |
| Total Other Assets | 17,310 | |
| Liabilities | ||
| Payables for Investment Securities | ||
| Purchased | (6,639) | |
| Collateral for Securities on Loan | (31,473) | |
| Payables to Investment Advisor | (5,840) | |
| Payables for Capital Shares Redeemed | (3,288) | |
| Payables to Vanguard | (9,097) | |
| Other Liabilities | (113) | |
| Total Liabilities | (56,450) | |
| Net Assets (100%) | ||
| Applicable to 384,781,536 outstanding | ||
| $.001 par value shares of beneficial | ||
| interest (unlimited authorization) | 7,975,554 | |
| Net Asset Value Per Share | $20.73 | |
| At March 31, 2016, net assets consisted of: | |
| Amount | |
| ($000) | |
| Paid-in Capital | 4,985,826 |
| Undistributed Net Investment Income | 27,267 |
| Accumulated Net Realized Gains | 121,846 |
| Unrealized Appreciation (Depreciation) | |
| Investment Securities | 2,840,652 |
| Foreign Currencies | (37) |
| Net Assets | 7,975,554 |
• See Note A in Notes to Financial Statements.
* Non-income-producing security.
^ Includes partial security positions on loan to broker-dealers. The total value of securities on loan is $28,696,000.
1 Affiliated money market fund available only to Vanguard funds and certain trusts and accounts managed by Vanguard. Rate shown
is the 7-day yield.
2 Includes $31,473,000 of collateral received for securities on loan.
ADR—American Depositary Receipt.
See accompanying Notes, which are an integral part of the Financial Statements.
16
PRIMECAP Core Fund
Statement of Operations
| Six Months Ended | |
| March 31, 2016 | |
| ($000) | |
| Investment Income | |
| Income | |
| Dividends1 | 69,846 |
| Interest2 | 1,046 |
| Securities Lending | 496 |
| Total Income | 71,388 |
| Expenses | |
| Investment Advisory Fees—Note B | 11,556 |
| The Vanguard Group—Note C | |
| Management and Administrative | 4,626 |
| Marketing and Distribution | 718 |
| Custodian Fees | 58 |
| Shareholders’ Reports | 28 |
| Trustees’ Fees and Expenses | 4 |
| Total Expenses | 16,990 |
| Net Investment Income | 54,398 |
| Realized Net Gain (Loss) | |
| Investment Securities Sold | 134,009 |
| Foreign Currencies | (20) |
| Realized Net Gain (Loss) | 133,989 |
| Change in Unrealized Appreciation (Depreciation) | |
| Investment Securities | 323,439 |
| Foreign Currencies | 109 |
| Change in Unrealized Appreciation (Depreciation) | 323,548 |
| Net Increase (Decrease) in Net Assets Resulting from Operations | 511,935 |
| 1 Dividends are net of foreign withholding taxes of $2,213,000. | |
| 2 Interest income from an affiliated company of the fund was $1,046,000. | |
See accompanying Notes, which are an integral part of the Financial Statements.
17
PRIMECAP Core Fund
Statement of Changes in Net Assets
| Six Months Ended | Year Ended | |
| March 31, | September 30, | |
| 2016 | 2015 | |
| ($000) | ($000) | |
| Increase (Decrease) in Net Assets | ||
| Operations | ||
| Net Investment Income | 54,398 | 95,603 |
| Realized Net Gain (Loss) | 133,989 | 323,785 |
| Change in Unrealized Appreciation (Depreciation) | 323,548 | (477,795) |
| Net Increase (Decrease) in Net Assets Resulting from Operations | 511,935 | (58,407) |
| Distributions | ||
| Net Investment Income | (84,999) | (85,623) |
| Realized Capital Gain1 | (275,983) | (411,308) |
| Total Distributions | (360,982) | (496,931) |
| Capital Share Transactions | ||
| Issued | 946,604 | 800,640 |
| Issued in Lieu of Cash Distributions | 323,163 | 445,777 |
| Redeemed | (362,466) | (601,660) |
| Net Increase (Decrease) from Capital Share Transactions | 907,301 | 644,757 |
| Total Increase (Decrease) | 1,058,254 | 89,419 |
| Net Assets | ||
| Beginning of Period | 6,917,300 | 6,827,881 |
| End of Period2 | 7,975,554 | 6,917,300 |
1 Includes fiscal 2016 and 2015 short-term gain distributions totaling $0 and $11,734,000 respectively. Short-term gain distributions are
treated as ordinary income dividends for tax purposes.
2 Net Assets—End of Period includes undistributed (overdistributed) net investment income of $27,267,000 and $57,888,000.
See accompanying Notes, which are an integral part of the Financial Statements.
18
PRIMECAP Core Fund
Financial Highlights
| Six Months | |||||||
| Ended | |||||||
| For a Share Outstanding | March 31, | Year Ended September 30, | |||||
| Throughout Each Period | 2016 | 2015 | 2014 | 2013 | 2012 | 2011 | |
| Net Asset Value, Beginning of Period | $20.26 | $21.87 | $18.65 | $14.98 | $12.37 | $12.51 | |
| Investment Operations | |||||||
| Net Investment Income | .144 | .285 | .255 | .242 | .206 | .145 | |
| Net Realized and Unrealized Gain (Loss) | |||||||
| on Investments | 1.358 | (.328) | 3.820 | 3.955 | 2.567 | (.143) | |
| Total from Investment Operations | 1.502 | (.043) | 4.075 | 4.197 | 2.773 | .002 | |
| Distributions | |||||||
| Dividends from Net Investment Income | (.243) | (.270) | (.178) | (.260) | (.163) | (.142) | |
| Distributions from Realized Capital Gains | (.789) | (1.297) | (.677) | (.267) | — | — | |
| Total Distributions | (1.032) | (1.567) | (.855) | (.527) | (.163) | (.142) | |
| Net Asset Value, End of Period | $20.73 | $20.26 | $21.87 | $18.65 | $14.98 | $12.37 | |
| Total Return1 | 7.35% | -0.73% | 22.60% | 28.88% | 22.55% | -0.10% | |
| Ratios/Supplemental Data | |||||||
| Net Assets, End of Period (Millions) | $7,976 | $6,917 | $6,828 | $5,774 | $4,702 | $4,345 | |
| Ratio of Total Expenses to | |||||||
| Average Net Assets | 0.45% | 0.47% | 0.50% | 0.50% | 0.50% | 0.51% | |
| Ratio of Net Investment Income to | |||||||
| Average Net Assets | 1.41% | 1.29% | 1.23% | 1.42% | 1.39% | 1.01% | |
| Portfolio Turnover Rate | 10% | 10% | 13% | 7% | 10% | 9% | |
The expense ratio, net income ratio, and turnover rate for the current period have been annualized.
1 Total returns do not include transaction or account service fees that may have applied in the periods shown. Fund prospectuses provide
information about any applicable transaction and account service fees.
See accompanying Notes, which are an integral part of the Financial Statements.
19
PRIMECAP Core Fund
Notes to Financial Statements
Vanguard PRIMECAP Core Fund is registered under the Investment Company Act of 1940 as an open-end investment company, or mutual fund.
The following significant accounting policies conform to generally accepted accounting principles for U.S. investment companies. The fund consistently follows such policies in preparing its financial statements.
1. Security Valuation: Securities are valued as of the close of trading on the New York Stock Exchange (generally 4 p.m., Eastern time) on the valuation date. Equity securities are valued at the latest quoted sales prices or official closing prices taken from the primary market in which each security trades; such securities not traded on the valuation date are valued at the mean of the latest quoted bid and asked prices. Securities for which market quotations are not readily available, or whose values have been affected by events occurring before the fund’s pricing time but after the close of the securities’ primary markets, are valued at their fair values calculated according to procedures adopted by the board of trustees. These procedures include obtaining quotations from an independent pricing service, monitoring news to identify significant market- or security-specific events, and evaluating changes in the values of foreign market proxies (for example, ADRs, futures contracts, or exchange-traded funds), between the time the foreign markets close and the fund’s pricing time. When fair-value pricing is employed, the prices of securities used by a fund to calculate its net asset value may differ from quoted or published prices for the same securities. Investments in Vanguard Market Liquidity Fund are valued at that fund’s net asset value.
2. Foreign Currency: Securities and other assets and liabilities denominated in foreign currencies are translated into U.S. dollars using exchange rates obtained from an independent third party as of the fund’s pricing time on the valuation date. Realized gains (losses) and unrealized appreciation (depreciation) on investment securities include the effects of changes in exchange rates since the securities were purchased, combined with the effects of changes in security prices. Fluctuations in the value of other assets and liabilities resulting from changes in exchange rates are recorded as unrealized foreign currency gains (losses) until the assets or liabilities are settled in cash, at which time they are recorded as realized foreign currency gains (losses).
3. Federal Income Taxes: The fund intends to continue to qualify as a regulated investment company and distribute all of its taxable income. Management has analyzed the fund’s tax positions taken for all open federal income tax years (September 30, 2012–2015), and for the period ended March 31, 2016, and has concluded that no provision for federal income tax is required in the fund’s financial statements.
4. Distributions: Distributions to shareholders are recorded on the ex-dividend date.
5. Securities Lending: To earn additional income, the fund lends its securities to qualified institutional borrowers. Security loans are subject to termination by the fund at any time, and are required to be secured at all times by collateral in an amount at least equal to the market value of securities loaned. Daily market fluctuations could cause the value of loaned securities to be more or less than the value of the collateral received. When this occurs, the collateral is adjusted and settled on the next business day. The fund further mitigates its counterparty risk by entering into securities lending transactions only with a diverse group of prequalified counterparties, monitoring their financial strength, and entering into master securities lending agreements with its counterparties. The master securities lending agreements provide that, in the event of a counterparty’s default (including bankruptcy), the
20
PRIMECAP Core Fund
fund may terminate any loans with that borrower, determine the net amount owed, and sell or retain the collateral up to the net amount owed to the fund; however, such actions may be subject to legal proceedings. While collateral mitigates counterparty risk, in the absence of a default the fund may experience delays and costs in recovering the securities loaned. The fund invests cash collateral received in Vanguard Market Liquidity Fund, and records a liability in the Statement of Net Assets for the return of the collateral, during the period the securities are on loan. Securities lending income represents fees charged to borrowers plus income earned on invested cash collateral, less expenses associated with the loan.
6. Credit Facility: The fund and certain other funds managed by The Vanguard Group (“Vanguard”) participate in a $3.1 billion committed credit facility provided by a syndicate of lenders pursuant to a credit agreement that may be renewed annually; each fund is individually liable for its borrowings, if any, under the credit facility. Borrowings may be utilized for temporary and emergency purposes, and are subject to the fund’s regulatory and contractual borrowing restrictions. The participating funds are charged administrative fees and an annual commitment fee of 0.10% of the undrawn amount of the facility; these fees are allocated to the funds based on a method approved by the fund’s board of trustees and included in Management and Administrative expenses on the fund’s Statement of Operations. Any borrowings under this facility bear interest at a rate based upon the higher of the one-month London Interbank Offered Rate, federal funds effective rate, or overnight bank funding rate plus an agreed-upon spread.
The fund had no borrowings outstanding at March 31, 2016, or at any time during the period then ended.
7. Other: Dividend income is recorded on the ex-dividend date. Interest income includes income distributions received from Vanguard Market Liquidity Fund and is accrued daily. Security transactions are accounted for on the date securities are bought or sold. Costs used to determine realized gains (losses) on the sale of investment securities are those of the specific securities sold.
B. PRIMECAP Management Company provides investment advisory services to the fund for a fee calculated at an annual percentage rate of average net assets. For the six months ended March 31, 2016, the investment advisory fee represented an effective annual rate of 0.31% of the fund’s average net assets.
C. In accordance with the terms of a Funds’ Service Agreement (the “FSA”) between Vanguard and the fund, Vanguard furnishes to the fund corporate management, administrative, marketing, and distribution services at Vanguard’s cost of operations (as defined by the FSA). These costs of operations are allocated to the fund based on methods and guidelines approved by the board of trustees. Vanguard does not require reimbursement in the current period for certain costs of operations (such as deferred compensation/benefits and risk/insurance costs); the fund’s liability for these costs of operations is included in Payables to Vanguard on the Statement of Net Assets.
Upon the request of Vanguard, the fund may invest up to 0.40% of its net assets as capital in Vanguard. At March 31, 2016, the fund had contributed to Vanguard capital in the amount of $672,000, representing 0.01% of the fund’s net assets and 0.27% of Vanguard’s capitalization. The fund’s trustees and officers are also directors and employees, respectively, of Vanguard.
21
PRIMECAP Core Fund
D. Various inputs may be used to determine the value of the fund’s investments. These inputs are summarized in three broad levels for financial statement purposes. The inputs or methodologies used to value securities are not necessarily an indication of the risk associated with investing in those securities.
Level 1—Quoted prices in active markets for identical securities.
Level 2—Other significant observable inputs (including quoted prices for similar securities, interest rates, prepayment speeds, credit risk, etc.).
Level 3—Significant unobservable inputs (including the fund’s own assumptions used to determine the fair value of investments).
The following table summarizes the market value of the fund’s investments as of March 31, 2016, based on the inputs used to value them:
| Level 1 | Level 2 | Level 3 | |
| Investments | ($000) | ($000) | ($000) |
| Common Stocks | 6,960,156 | 388,662 | — |
| Temporary Cash Investments | 665,876 | — | — |
| Total | 7,626,032 | 388,662 | — |
E. Distributions are determined on a tax basis and may differ from net investment income and realized capital gains for financial reporting purposes. Differences may be permanent or temporary. Permanent differences are reclassified among capital accounts in the financial statements to reflect their tax character. Temporary differences arise when certain items of income, expense, gain, or loss are recognized in different periods for financial statement and tax purposes. These differences will reverse at some time in the future. Differences in classification may also result from the treatment of short-term gains as ordinary income for tax purposes. The fund’s tax-basis capital gains and losses are determined only at the end of each fiscal year.
During the six months ended March 31, 2016, the fund realized net foreign currency losses of $20,000, which decreased distributable net income for tax purposes; accordingly, such losses have been reclassified from accumulated net realized gains to undistributed net investment income.
At March 31, 2016, the cost of investment securities for tax purposes was $5,174,042,000. Net unrealized appreciation of investment securities for tax purposes was $2,840,652,000, consisting of unrealized gains of $3,047,061,000 on securities that had risen in value since their purchase and $206,409,000 in unrealized losses on securities that had fallen in value since their purchase.
F. During the six months ended March 31, 2016, the fund purchased $670,235,000 of investment securities and sold $348,151,000 of investment securities, other than temporary cash investments.
22
PRIMECAP Core Fund
G. Capital shares issued and redeemed were:
| Six Months Ended | Year Ended | |
| March 31, 2016 | September 30, 2015 | |
| Shares | Shares | |
| (000) | (000) | |
| Issued | 45,616 | 36,473 |
| Issued in Lieu of Cash Distributions | 15,403 | 20,364 |
| Redeemed | (17,709) | (27,555) |
| Net Increase (Decrease) in Shares Outstanding | 43,310 | 29,282 |
H. Management has determined that no material events or transactions occurred subsequent to March 31, 2016, that would require recognition or disclosure in these financial statements.
23
About Your Fund’s Expenses
As a shareholder of the fund, you incur ongoing costs, which include costs for portfolio management, administrative services, and shareholder reports (like this one), among others. Operating expenses, which are deducted from a fund’s gross income, directly reduce the investment return of the fund.
A fund’s expenses are expressed as a percentage of its average net assets. This figure is known as the expense ratio. The following examples are intended to help you understand the ongoing costs (in dollars) of investing in your fund and to compare these costs with those of other mutual funds. The examples are based on an investment of $1,000 made at the beginning of the period shown and held for the entire period.
The accompanying table illustrates your fund’s costs in two ways:
• Based on actual fund return. This section helps you to estimate the actual expenses that you paid over the period. The ”Ending Account Value“ shown is derived from the fund‘s actual return, and the third column shows the dollar amount that would have been paid by an investor who started with $1,000 in the fund. You may use the information here, together with the amount you invested, to estimate the expenses that you paid over the period.
To do so, simply divide your account value by $1,000 (for example, an $8,600 account value divided by $1,000 = 8.6), then multiply the result by the number given for your fund under the heading ”Expenses Paid During Period.“
• Based on hypothetical 5% yearly return. This section is intended to help you compare your fund‘s costs with those of other mutual funds. It assumes that the fund had a yearly return of 5% before expenses, but that the expense ratio is unchanged. In this case—because the return used is not the fund’s actual return—the results do not apply to your investment. The example is useful in making comparisons because the Securities and Exchange Commission requires all mutual funds to calculate expenses based on a 5% return. You can assess your fund’s costs by comparing this hypothetical example with the hypothetical examples that appear in shareholder reports of other funds.
Note that the expenses shown in the table are meant to highlight and help you compare ongoing costs only and do not reflect transaction costs incurred by the fund for buying and selling securities. Further, the expenses do not include any purchase, redemption, or account service fees described in the fund prospectus. If such fees were applied to your account, your costs would be higher. Your fund does not carry a “sales load.”
The calculations assume no shares were bought or sold during the period. Your actual costs may have been higher or lower, depending on the amount of your investment and the timing of any purchases or redemptions.
You can find more information about the fund’s expenses, including annual expense ratios, in the Financial Statements section of this report. For additional information on operating expenses and other shareholder costs, please refer to your fund’s current prospectus.
24
| Six Months Ended March 31, 2016 | |||
| Beginning | Ending | Expenses | |
| Account Value | Account Value | Paid During | |
| PRIMECAP Core Fund | 9/30/2015 | 3/31/2016 | Period |
| Based on Actual Fund Return | $1,000.00 | $1,073.53 | $2.33 |
| Based on Hypothetical 5% Yearly Return | 1,000.00 | 1,022.75 | 2.28 |
The calculations are based on expenses incurred in the most recent six-month period. The fund’s annualized six-month expense ratio for that
period is 0.45%. The dollar amounts shown as “Expenses Paid” are equal to the annualized expense ratio multiplied by the average account
value over the period, multiplied by the number of days in the most recent six-month period, then divided by the number of days in the most
recent 12-month period (183/366).
25
Trustees Approve Advisory Arrangement
The board of trustees of Vanguard PRIMECAP Core Fund has renewed the fund’s investment advisory arrangement with PRIMECAP Management Company (PRIMECAP Management). The board determined that renewing the fund’s advisory arrangement was in the best interests of the fund and its shareholders.
The board based its decision upon an evaluation of the advisor’s investment staff, portfolio management process, and performance. The trustees considered the factors discussed below, among others. However, no single factor determined whether the board approved the arrangement. Rather, it was the totality of the circumstances that drove the board’s decision.
Nature, extent, and quality of services
The board reviewed the quality of the fund’s investment management services over both the short and long term, and took into account the organizational depth and stability of the advisor. The board considered that PRIMECAP Management, founded in 1983, is recognized for its long-term approach to equity investing. The portfolio managers are responsible for separate sub-portfolios, and each portfolio manager employs a fundamental, research-driven approach in seeking to identify companies with long-term potential that the market has yet to appreciate. The multi-counselor approach that the advisor employs is designed to emphasize individual decision-making and enable each portfolio manager to invest only in his highest-conviction ideas. PRIMECAP’s fundamental research focuses on developing opinions independent from Wall Street’s consensus and maintaining a long-term time horizon. PRIMECAP Management has managed the fund since the fund’s inception in 2004.
The board concluded that the advisor’s experience, stability, depth, and performance, among other factors, warranted continuation of the advisory arrangement.
Investment performance
The board considered the short- and long-term performance of the fund, including any periods of outperformance or underperformance relative to a benchmark index and peer group. The board concluded that the performance was such that the advisory arrangement should continue. Information about the fund’s most recent performance can be found in the Performance Summary section of this report.
Cost
The board concluded that the fund’s expense ratio was well below the average expense ratio charged by funds in its peer group and that the fund’s advisory fee rate was also well below its peer-group average. Information about the fund’s expenses appears in the About Your Fund’s Expenses section of this report as well as in the Financial Statements section, which also includes information about the fund’s advisory fee rate.
The board did not consider profitability of PRIMECAP Management in determining whether to approve the advisory fee, because PRIMECAP Management is independent of Vanguard, and the advisory fee is the result of arm’s-length negotiations.
The benefit of economies of scale
The board concluded that the fund’s shareholders benefit from economies of scale because of the breakpoints in the fund’s advisory fee schedule. The breakpoints reduce the effective rate of the fee as the fund’s assets increase.
The board will consider whether to renew the advisory arrangement again after a one-year period.
26
Glossary
30-Day SEC Yield. A fund’s 30-day SEC yield is derived using a formula specified by the U.S. Securities and Exchange Commission. Under the formula, data related to the fund’s security holdings in the previous 30 days are used to calculate the fund’s hypothetical net income for that period, which is then annualized and divided by the fund’s estimated average net assets over the calculation period. For the purposes of this calculation, a security’s income is based on its current market yield to maturity (for bonds), its actual income (for asset-backed securities), or its projected dividend yield (for stocks). Because the SEC yield represents hypothetical annualized income, it will differ—at times significantly—from the fund’s actual experience. As a result, the fund’s income distributions may be higher or lower than implied by the SEC yield.
Beta. A measure of the magnitude of a fund’s past share-price fluctuations in relation to the ups and downs of a given market index. The index is assigned a beta of 1.00. Compared with a given index, a fund with a beta of 1.20 typically would have seen its share price rise or fall by 12% when the index rose or fell by 10%. For this report, beta is based on returns over the past 36 months for both the fund and the index. Note that a fund’s beta should be reviewed in conjunction with its R-squared (see definition). The lower the R-squared, the less correlation there is between the fund and the index, and the less reliable beta is as an indicator of volatility.
Dividend Yield. Dividend income earned by stocks, expressed as a percentage of the aggregate market value (or of net asset value, for a fund). The yield is determined by dividing the amount of the annual dividends by the aggregate value (or net asset value) at the end of the period. For a fund, the dividend yield is based solely on stock holdings and does not include any income produced by other investments.
Earnings Growth Rate. The average annual rate of growth in earnings over the past five years for the stocks now in a fund.
Equity Exposure. A measure that reflects a fund’s investments in stocks and stock futures. Any holdings in short-term reserves are excluded.
Expense Ratio. A fund’s total annual operating expenses expressed as a percentage of the fund’s average net assets. The expense ratio includes management and administrative expenses, but does not include the transaction costs of buying and selling portfolio securities.
Foreign Holdings. The percentage of a fund represented by securities or depositary receipts of companies based outside the United States.
Inception Date. The date on which the assets of a fund (or one of its share classes) are first invested in accordance with the fund’s investment objective. For funds with a subscription period, the inception date is the day after that period ends. Investment performance is measured from the inception date.
Median Market Cap. An indicator of the size of companies in which a fund invests; the midpoint of market capitalization (market price x shares outstanding) of a fund’s stocks, weighted by the proportion of the fund’s assets invested in each stock. Stocks representing half of the fund’s assets have market capitalizations above the median, and the rest are below it.
Price/Book Ratio. The share price of a stock divided by its net worth, or book value, per share. For a fund, the weighted average price/book ratio of the stocks it holds.
27
Price/Earnings Ratio. The ratio of a stock’s current price to its per-share earnings over the past year. For a fund, the weighted average P/E of the stocks it holds. P/E is an indicator of market expectations about corporate prospects; the higher the P/E, the greater the expectations for a company’s future growth.
R-Squared. A measure of how much of a fund’s past returns can be explained by the returns from the market in general, as measured by a given index. If a fund’s total returns were precisely synchronized with an index’s returns, its R-squared would be 1.00. If the fund’s returns bore no relationship to the index’s returns, its R-squared would be 0. For this report, R-squared is based on returns over the past 36 months for both the fund and the index.
Return on Equity. The annual average rate of return generated by a company during the past five years for each dollar of shareholder’s equity (net income divided by shareholder’s equity). For a fund, the weighted average return on equity for the companies whose stocks it holds.
Short-Term Reserves. The percentage of a fund invested in highly liquid, short-term securities that can be readily converted to cash.
Turnover Rate. An indication of the fund’s trading activity. Funds with high turnover rates incur higher transaction costs and may be more likely to distribute capital gains (which may be taxable to investors). The turnover rate excludes in-kind transactions, which have minimal impact on costs.
28
This page intentionally left blank.
This page intentionally left blank.
This page intentionally left blank.
The People Who Govern Your Fund
The trustees of your mutual fund are there to see that the fund is operated and managed in your best interests since, as a shareholder, you are a part owner of the fund. Your fund’s trustees also serve on the board of directors of The Vanguard Group, Inc., which is owned by the Vanguard funds and provides services to them on an at-cost basis.
A majority of Vanguard’s board members are independent, meaning that they have no affiliation with Vanguard or the funds they oversee, apart from the sizable personal investments they have made as private individuals. The independent board members have distinguished backgrounds in business, academia, and public service. Each of the trustees and executive officers oversees 198 Vanguard funds.
The following table provides information for each trustee and executive officer of the fund. More information about the trustees is in the Statement of Additional Information, which can be obtained, without charge, by contacting Vanguard at 800-662-7447, or online at vanguard.com.
| InterestedTrustee1 | Rajiv L. Gupta |
| Born 1945. Trustee Since December 2001.2 Principal | |
| F. William McNabb III | Occupation(s) During the Past Five Years and Other |
| Born 1957. Trustee Since July 2009. Chairman of | Experience: Chairman and Chief Executive Officer |
| the Board. Principal Occupation(s) During the Past | (retired 2009) and President (2006–2008) of |
| Five Years and Other Experience: Chairman of the | Rohm and Haas Co. (chemicals); Director of Tyco |
| Board of The Vanguard Group, Inc., and of each of | International PLC (diversified manufacturing and |
| the investment companies served by The Vanguard | services), HP Inc. (printer and personal computer |
| Group, since January 2010; Director of The Vanguard | manufacturing), and Delphi Automotive PLC |
| Group since 2008; Chief Executive Officer and | (automotive components); Senior Advisor at |
| President of The Vanguard Group, and of each of | New Mountain Capital. |
| the investment companies served by The Vanguard | |
| Group, since 2008; Director of Vanguard Marketing | Amy Gutmann |
| Corporation; Managing Director of The Vanguard | Born 1949. Trustee Since June 2006. Principal |
| Group (1995–2008). | Occupation(s) During the Past Five Years and |
| Other Experience: President of the University of | |
| IndependentTrustees | Pennsylvania; Christopher H. Browne Distinguished |
| Professor of Political Science, School of Arts and | |
| Emerson U. Fullwood | Sciences, and Professor of Communication, Annenberg |
| Born 1948. Trustee Since January 2008. Principal | School for Communication, with secondary faculty |
| Occupation(s) During the Past Five Years and Other | appointments in the Department of Philosophy, School |
| Experience: Executive Chief Staff and Marketing | of Arts and Sciences, and at the Graduate School of |
| Officer for North America and Corporate Vice President | Education, University of Pennsylvania; Trustee of the |
| (retired 2008) of Xerox Corporation (document manage- | National Constitution Center; Chair of the Presidential |
| ment products and services); Executive in Residence | Commission for the Study of Bioethical Issues. |
| and 2009–2010 Distinguished Minett Professor at | |
| the Rochester Institute of Technology; Lead Director | JoAnn Heffernan Heisen |
| of SPX FLOW, Inc. (multi-industry manufacturing); | Born 1950. Trustee Since July 1998. Principal |
| Director of the United Way of Rochester, the University | Occupation(s) During the Past Five Years and |
| of Rochester Medical Center, Monroe Community | Other Experience: Corporate Vice President and |
| College Foundation, North Carolina A&T University, | Chief Global Diversity Officer (retired 2008) and |
| and Roberts Wesleyan College. | Member of the Executive Committee (1997–2008) |
| of Johnson & Johnson (pharmaceuticals/medical | |
| devices/consumer products); Director of Skytop | |
| Lodge Corporation (hotels) and the Robert Wood | |
| Johnson Foundation; Member of the Advisory | |
| Board of the Institute for Women’s Leadership | |
| at Rutgers University. |
| F. Joseph Loughrey | Executive Officers | |
| Born 1949. Trustee Since October 2009. Principal | ||
| Occupation(s) During the Past Five Years and Other | Glenn Booraem | |
| Experience: President and Chief Operating Officer | Born 1967. Treasurer Since May 2015. Principal | |
| (retired 2009) of Cummins Inc. (industrial machinery); | Occupation(s) During the Past Five Years and | |
| Chairman of the Board of Hillenbrand, Inc. (specialized | Other Experience: Principal of The Vanguard Group, | |
| consumer services), and of Oxfam America; Director | Inc.; Treasurer of each of the investment companies | |
| of SKF AB (industrial machinery), Hyster-Yale Materials | served by The Vanguard Group; Controller of each of | |
| Handling, Inc. (forklift trucks), the Lumina Foundation | the investment companies served by The Vanguard | |
| for Education, and the V Foundation for Cancer | Group (2010–2015); Assistant Controller of each of | |
| Research; Member of the Advisory Council for the | the investment companies served by The Vanguard | |
| College of Arts and Letters and of the Advisory Board | Group (2001–2010). | |
| to the Kellogg Institute for International Studies, both | ||
| at the University of Notre Dame. | Thomas J. Higgins | |
| Born 1957. Chief Financial Officer Since September | ||
| Mark Loughridge | 2008. Principal Occupation(s) During the Past Five | |
| Born 1953. Trustee Since March 2012. Principal | Years and Other Experience: Principal of The Vanguard | |
| Occupation(s) During the Past Five Years and Other | Group, Inc.; Chief Financial Officer of each of the | |
| Experience: Senior Vice President and Chief Financial | investment companies served by The Vanguard Group; | |
| Officer (retired 2013) at IBM (information technology | Treasurer of each of the investment companies served | |
| services); Fiduciary Member of IBM’s Retirement Plan | by The Vanguard Group (1998–2008). | |
| Committee (2004–2013); Director of the Dow Chemical | ||
| Company; Member of the Council on Chicago Booth. | Peter Mahoney | |
| Born 1974. Controller Since May 2015. Principal | ||
| Scott C. Malpass | Occupation(s) During the Past Five Years and | |
| Born 1962. Trustee Since March 2012. Principal | Other Experience: Head of Global Fund Accounting | |
| Occupation(s) During the Past Five Years and Other | at The Vanguard Group, Inc.; Controller of each of the | |
| Experience: Chief Investment Officer and Vice | investment companies served by The Vanguard Group; | |
| President at the University of Notre Dame; Assistant | Head of International Fund Services at The Vanguard | |
| Professor of Finance at the Mendoza College of | Group (2008–2014). | |
| Business at Notre Dame; Member of the Notre Dame | ||
| 403(b) Investment Committee, the Board of Advisors | Heidi Stam | |
| for Spruceview Capital Partners, and the Investment | Born 1956. Secretary Since July 2005. Principal | |
| Advisory Committee of Major League Baseball; Board | Occupation(s) During the Past Five Years and Other | |
| Member of TIFF Advisory Services, Inc., and Catholic | Experience: Managing Director of The Vanguard | |
| Investment Services, Inc. (investment advisors). | Group, Inc.; General Counsel of The Vanguard Group; | |
| Secretary of The Vanguard Group and of each of the | ||
| investment companies served by The Vanguard Group; | ||
| André F. Perold | Director and Senior Vice President of Vanguard | |
| Born 1952. Trustee Since December 2004. Principal | Marketing Corporation. | |
| Occupation(s) During the Past Five Years and Other | ||
| Experience: George Gund Professor of Finance and | ||
| Banking, Emeritus at the Harvard Business School | Vanguard Senior ManagementTeam | |
| (retired 2011); Chief Investment Officer and Managing | Mortimer J. Buckley | James M. Norris |
| Partner of HighVista Strategies LLC (private investment | Kathleen C. Gubanich | Thomas M. Rampulla |
| firm); Director of Rand Merchant Bank; Overseer of | Martha G. King | Glenn W. Reed |
| the Museum of Fine Arts Boston. | John T. Marcante | Karin A. Risi |
| Chris D. McIsaac | ||
| Peter F. Volanakis | ||
| Born 1955. Trustee Since July 2009. Principal | ||
| Occupation(s) During the Past Five Years and Other | Chairman Emeritus and Senior Advisor | |
| Experience: President and Chief Operating Officer | John J. Brennan | |
| (retired 2010) of Corning Incorporated (communications | Chairman, 1996–2009 | |
| equipment); Trustee of Colby-Sawyer College and | Chief Executive Officer and President, 1996–2008 | |
| Chairman of its Finance and Enrollment Committee; | ||
| Member of the Advisory Board of the Norris Cotton | ||
| Cancer Center. | Founder | |
| John C. Bogle | ||
| Chairman and Chief Executive Officer, 1974–1996 | ||
1 Mr. McNabb is considered an “interested person,” as defined in the Investment Company Act of 1940, because he is an officer of the Vanguard funds.
2 December 2002 for Vanguard Equity Income Fund, the Vanguard Municipal Bond Funds, and the Vanguard State Tax-Exempt Funds.
 | |
| P.O. Box 2600 | |
| Valley Forge, PA 19482-2600 | |
| Connect with Vanguard® > vanguard.com | |
| Fund Information > 800-662-7447 | |
| Direct Investor Account Services > 800-662-2739 | |
| Institutional Investor Services > 800-523-1036 | |
| Text Telephone for People | |
| Who Are Deaf or Hard of Hearing> 800-749-7273 | |
| This material may be used in conjunction | |
| with the offering of shares of any Vanguard | |
| fund only if preceded or accompanied by | |
| the fund’s current prospectus. | |
| All comparative mutual fund data are from Lipper, a | |
| Thomson Reuters Company, or Morningstar, Inc., unless | |
| otherwise noted. | |
| You can obtain a free copy of Vanguard’s proxy voting | |
| guidelines by visiting vanguard.com/proxyreporting or by | |
| calling Vanguard at 800-662-2739. The guidelines are | |
| also available from the SEC’s website, sec.gov. In | |
| addition, you may obtain a free report on how your fund | |
| voted the proxies for securities it owned during the 12 | |
| months ended June 30. To get the report, visit either | |
| vanguard.com/proxyreporting or sec.gov. | |
| You can review and copy information about your fund at | |
| the SEC’s Public Reference Room in Washington, D.C. To | |
| find out more about this public service, call the SEC at | |
| 202-551-8090. Information about your fund is also | |
| available on the SEC’s website, and you can receive | |
| copies of this information, for a fee, by sending a | |
| request in either of two ways: via email addressed to | |
| publicinfo@sec.gov or via regular mail addressed to the | |
| Public Reference Section, Securities and Exchange | |
| Commission, Washington, DC 20549-1520. | |
| © 2016 The Vanguard Group, Inc. | |
| All rights reserved. | |
| Vanguard Marketing Corporation, Distributor. | |
| Q12202 052016 | |
Item 2: Code of Ethics.
Not Applicable.
Item 3: Audit Committee Financial Expert.
Not Applicable.
Item 4: Principal Accountant Fees and Services.
(a) Audit Fees.
Not Applicable.
Item 5: Audit Committee of Listed Registrants.
Not Applicable.
Item 6: Investments.
Not Applicable.
Item 7: Disclosure of Proxy Voting Policies and Procedures for Closed-End Management
Investment Companies.
Not Applicable.
Item 8: Portfolio Managers of Closed-End Management Investment Companies.
Not Applicable.
Item 9: Purchase of Equity Securities by Closed-End Management Investment Company and
Affiliated Purchasers.
Not Applicable.
Item 10: Submission of Matters to a Vote of Security Holders.
Not Applicable.
Item 11: Controls and Procedures.
(a) Disclosure Controls and Procedures. The Principal Executive and Financial Officers concluded that the Registrant’s Disclosure Controls and Procedures are effective based on their evaluation of the Disclosure Controls and Procedures as of a date within 90 days of the filing date of this report.
(b) Internal Control Over Financial Reporting. There were no significant changes in Registrant’s Internal Control Over Financial Reporting or in other factors that could significantly affect this control subsequent to the date of the evaluation, including any corrective actions with regard to significant deficiencies and material weaknesses.
Item 12: Exhibits.
(a) Certifications.
Pursuant to the requirements of the Securities Exchange Act of 1934 and the Investment Company Act of 1940, the registrant has duly caused this report to be signed on its behalf by the undersigned, thereunto duly authorized.
| VANGUARD FENWAY FUNDS | |
| BY: | /s/ F. WILLIAM MCNABB III* |
| F. WILLIAM MCNABB III | |
| CHIEF EXECUTIVE OFFICER | |
| Date: May 18, 2016 | |
Pursuant to the requirements of the Securities Exchange Act of 1934 and the Investment Company Act of 1940, this report has been signed below by the following persons on behalf of the registrant and in the capacities and on the dates indicated.
| VANGUARD FENWAY FUNDS | |
| BY: | /s/ F. WILLIAM MCNABB III* |
| F. WILLIAM MCNABB III | |
| CHIEF EXECUTIVE OFFICER | |
| Date: May 18, 2016 | |
| VANGUARD FENWAY FUNDS | |
| BY: | /s/ THOMAS J. HIGGINS* |
| THOMAS J. HIGGINS | |
| CHIEF FINANCIAL OFFICER | |
| Date: May 18, 2016 | |
* By: /s/ Heidi Stam
Heidi Stam, pursuant to a Power of Attorney filed on April 22, 2014 see file Number 2-17620, Incorporated by Reference.