UNITED STATES
SECURITIES AND EXCHANGE COMMISSION
Washington, D.C. 20549
FORM N-CSR
CERTIFIED SHAREHOLDER REPORT
OF
REGISTERED MANAGEMENT INVESTMENT COMPANIES
| Investment Company Act file number: | 811-05445 | |
Name of Registrant: | Vanguard Fenway Funds | |
Address of Registrant: | P.O. Box 2600 | |
| Valley Forge, PA 19482 | ||
Name and address of agent for service: | Heidi Stam, Esquire | |
| P.O. Box 876 | ||
| Valley Forge, PA 19482 | ||
Registrant’s telephone number, including area code: | (610) 669-1000 | |
Date of fiscal year end: September 30 | ||
Date of reporting period: October 1, 2014 – March 31, 2015 | ||
| Item 1: Reports to Shareholders | ||
Semiannual Report | March 31, 2015
Vanguard Equity Income Fund
The mission continues
On May 1, 1975, Vanguard began operations, a fledgling company based on the simple but revolutionary idea that a mutual fund company should be managed solely in the interest of its investors.
Four decades later, that revolutionary spirit continues to animate the enterprise. Vanguard remains on a mission to give investors the best chance of investment success.
As we mark our 40th anniversary, we thank you for entrusting your assets to Vanguard and giving us the opportunity to help you reach your financial goals in the decades to come.
| Contents | |
| Your Fund’s Total Returns. | 1 |
| Chairman’s Letter. | 2 |
| Advisors’ Report. | 7 |
| Fund Profile. | 10 |
| Performance Summary. | 12 |
| Financial Statements. | 13 |
| About Your Fund’s Expenses. | 26 |
| Trustees Approve Advisory Arrangements. | 28 |
| Glossary. | 30 |
Please note: The opinions expressed in this report are just that—informed opinions. They should not be considered promises or advice.
Also, please keep in mind that the information and opinions cover the period through the date on the front of this report. Of course, the risks of investing in your fund are spelled out in the prospectus.
See the Glossary for definitions of investment terms used in this report.
About the cover: Since our founding, Vanguard has drawn inspiration from the enterprise and valor demonstrated by British naval hero Horatio Nelson and his command at the Battle of the Nile in 1798. The photograph displays a replica of a merchant ship from the same era as Nelson’s flagship, the HMS Vanguard.
Your Fund’s Total Returns
| Six Months Ended March 31, 2015 | |
| Total | |
| Returns | |
| Vanguard Equity Income Fund | |
| Investor Shares | 3.93% |
| Admiral™ Shares | 3.98 |
| FTSE High Dividend Yield Index | 4.16 |
| Equity Income Funds Average | 3.90 |
| Equity Income Funds Average: Derived from data provided by Lipper, a Thomson Reuters Company. | |
| Admiral Shares carry lower expenses and are available to investors who meet certain account-balance requirements. |
| Your Fund’s Performance at a Glance | ||||
| September 30, 2014, Through March 31, 2015 | ||||
| Distributions Per Share | ||||
| Starting | Ending | Income | Capital | |
| Share Price | Share Price | Dividends | Gains | |
| Vanguard Equity Income Fund | ||||
| Investor Shares | $31.23 | $30.99 | $0.427 | $1.014 |
| Admiral Shares | 65.45 | 64.95 | 0.926 | 2.125 |
1

Chairman’s Letter
Dear Shareholder,
U.S. stock markets were punctuated by periods of volatility during the six months ended March 31, 2015, and ended on a downbeat. Still, amid returns that were more muted than a year ago, an important milestone was reached: the sixth anniversary of the bull market (see the box on page 5).
Vanguard Equity Income Fund returned almost 4% for the period, in line with its peer-group average. The fund’s result was a bit behind that of its high-dividend-yield benchmark, which in turn trailed the broad U.S. market by about 3 percentage points. In contrast, high-dividend-yield stocks outperformed the broad U.S. market for the fiscal year ended September 2014.
The fund’s 30-day SEC yield for Investor Shares stood at 2.74% as of March 31, up modestly from the start of the period and still about 1 percentage point higher than that of the broad U.S. stock market (as measured by the yield of Vanguard Total Stock Market Index Fund).
The Fed’s cautious approach has helped the U.S. stock market
The broad U.S. stock market returned about 7% for the six months ended March 31, 2015. Stocks were resilient after declining markedly at the start of the period and enduring subsequent bouts of turmoil. Investors’ concerns included the strength of the dollar and how it would affect the profits of U.S.-based multinational corporations.
2
Overall, stocks responded favorably to both the Federal Reserve’s cautious approach to raising short-term interest rates and the monetary stimulus efforts of other nations’ central banks. A strong rebound in February, when the broad market notched its largest monthly gain since October 2011, helped lift returns for the period.
International stocks had a slightly negative return as the dollar’s strength against many foreign currencies hurt results. Without this currency effect, stocks outside of the United States generally advanced. The developed markets of the Pacific, particularly Japan, were especially strong in both dollars and local currencies.
Bond prices received a boost from central bank stimulus
Bond prices also were supported by central banks’ accommodative policies and by investors who sought safe-haven assets amid turbulence in the stock market. The broad U.S. taxable bond market returned 3.43%. The yield of the 10-year Treasury note ended March at 1.95%, down from 2.48% six months earlier. (Bond prices and yields move in opposite directions.)
Municipal bonds returned 2.40%, although results faded later in the period as more bonds were issued. The Fed’s target of 0%–0.25% for short-term interest rates continued to cap returns for money market funds and savings accounts.
| Market Barometer | |||
| Total Returns | |||
| Periods Ended March 31, 2015 | |||
| Six | One | Five Years | |
| Months | Year | (Annualized) | |
| Stocks | |||
| Russell 1000 Index (Large-caps) | 6.55% | 12.73% | 14.73% |
| Russell 2000 Index (Small-caps) | 14.46 | 8.21 | 14.57 |
| Russell 3000 Index (Broad U.S. market) | 7.13 | 12.37 | 14.71 |
| FTSE All-World ex US Index (International) | -0.08 | -0.21 | 5.19 |
| Bonds | |||
| Barclays U.S. Aggregate Bond Index (Broad taxable market) | 3.43% | 5.72% | 4.41% |
| Barclays Municipal Bond Index (Broad tax-exempt market) | 2.40 | 6.62 | 5.11 |
| Citigroup Three-Month U.S. Treasury Bill Index | 0.00 | 0.03 | 0.06 |
| CPI | |||
| Consumer Price Index | -0.80% | -0.07% | 1.64% |
3
International bond markets (as measured by the Barclays Global Aggregate Index ex USD) returned –7.49%, a reflection of foreign currencies’ weakness relative to the dollar. International bonds hedged to eliminate the effect of currency exchange rates produced positive returns.
Consumer-related stocks bolstered the fund’s result
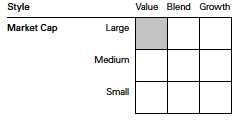
Wellington Management Company and Vanguard Equity Investment Group, through its Quantitative Equity Group, seek to invest in high-quality, well-established companies with above-average current dividend yields and the potential for capital appreciation over the long term. These companies, which tend to be larger and oriented more toward value than growth, weren’t the market’s sweet spot during the half year—when smaller companies and growth stocks generally outperformed.
Even in this more challenging environment, your advisors’ selections earned positive returns in seven of the ten industry groups. The two best-performing sectors were consumer discretionary and consumer staples, which together contributed about half of the fund’s total return for the period. Merger and acquisition activity helped, as did consumers’ looser grip on their wallets.
As global oil prices continued falling, the energy sector was the worst performer, posting a double-digit decline in both the fund and its benchmark. Softness in some commodity prices also weighed on
| Expense Ratios | |||
| Your Fund Compared With Its Peer Group | |||
| Investor | Admiral | Peer Group | |
| Shares | Shares | Average | |
| Equity Income Fund | 0.29% | 0.20% | 1.22% |
| The fund expense ratios shown are from the prospectus dated January 27, 2015, and represent estimated costs for the current fiscal year. For the six months ended March 31, 2015, the fund’s annualized expense ratios were 0.28% for Investor Shares and 0.19% for Admiral Shares. The peer-group expense ratio is derived from data provided by Lipper, a Thomson Reuters Company, and captures information through year-end 2014. | |||
Peer group: Equity Income Funds.
4
returns in materials, and several telecommunication services companies struggled as well.
The advisors added the most value compared with the benchmark in the two consumer-related sectors and in industrials. In information technology, however, the fund fell behind. The advisors’ somewhat lighter stake in IT was a factor, as was the index’s stronger returns.
The Advisors’ Report that follows this letter provides additional details about the management of the fund during the fiscal half year.
| Marking the sixth anniversary of the bull market |
| There’s been a long and steep climb in the U.S. stock market in the six years since the worst |
| of the financial crisis. |
| The dark line in the chart below traces the rise in the Russell 3000 Index from a low of 390 |
| on March 9, 2009, to 1,241 on March 9, 2015—an increase of roughly 220% in 72 months. |
| The robustness and duration of the advance defied the predictions of some market pundits. |
| Of course, the financial crisis caught many of them off guard as well. The lighter line below |
| charts the drop of about 60% in the index in 17 months, from its pre-crisis peak of 908 on |
| October 9, 2007. |
| These sharp and unexpected movements illustrate the challenge of trying to time the markets. |
| Instead of trying to guess which way the wind will blow (and for how long), investors are |
| generally better off staying committed to their investment plan through market ups and downs. |
| Rebalancing your portfolio from time to time will help keep market movements from pushing |
| your allocation to stocks and bonds off target. |
| The performance of the U.S. stock market since the start of the financial crisis |

5
Our commitment to balanced investing has roots reaching back many decades
On May 1, Vanguard will celebrate its 40th anniversary. Although many things have changed since 1975, our investment philosophy has not. From the start, we’ve focused on four timeless, straightforward principles that we believe help give clients the best chance for investment success:
• Goals. Create clear, appropriate investment goals.
• Balance. Develop a suitable asset allocation using broadly diversified funds.
• Cost. Minimize cost.
• Discipline. Maintain perspective and long-term discipline.
Vanguard has followed all of these principles since its founding, and one of them—the focus on balanced investing—is in the company’s DNA. That’s because our predecessor company, Wellington Management, was a pioneer in this respect, launching a fund in 1929 that included both stocks and bonds.
The Wellington™ Fund got its start on the eve of the Great Depression but it thrived over the long term, thanks in large part to its balancing of stocks and bonds. And this strategy continues to define the fund, now one of the nation’s largest balanced funds.
As we embark on our fifth decade, we’ll continue to emphasize the importance of balanced, diversified investing. How investors allocate assets between stocks and bonds has an enormous effect on their portfolio’s risks and returns. And broad diversification reduces exposure to specific risks, while providing opportunities to benefit from the market’s current leaders. (You can read more in Vanguard’s Principles for Investing Success, available at vanguard.com/research.)
As always, thank you for investing with Vanguard.
Sincerely,

F. William McNabb III
Chairman and Chief Executive Officer
April 20, 2015
6
Advisors’ Report
For the six months ended March 31, 2015, Vanguard Equity Income Fund returned almost 4%. It modestly trailed the 4.16% return of its benchmark, the FTSE High Dividend Yield Index, and was just ahead of its peer-group average. This performance reflects the combined results of your fund’s two independent investment advisors, Wellington Management Company and Vanguard Equity Investment Group (through its Quantitative Equity Group). The use of two advisors provides exposure to distinct yet complementary investment approaches, enhancing the diversification of your fund. It is not uncommon for different advisors to have different views about individual securities or the broader investment environment.
The advisors, the percentage and amount of the fund’s assets each manages, and brief descriptions of their investment strategies are presented in the table below. The advisors have also prepared a discussion of the investment environment that existed during the six months and its effect on portfolio positioning. These comments were prepared on April 13, 2015.
Wellington Management Company llp
Portfolio Manager:
W. Michael Reckmeyer, III, CFA,
Senior Managing Director
and Equity Portfolio Manager
The investment environment remained precarious, with divergent economic and monetary policies across the globe, geopolitical risks such as heightened tensions in the Middle East and Russia, and ongoing risks from terrorism and cyber threats.
| Vanguard Equity Income Fund Investment Advisors | ||||
| Fund Assets Managed | ||||
| Investment Advisor | % | $ Million | Investment Strategy | |
| Wellington Management | 64 | 12,171 | A fundamental approach to seeking desirable stocks. | |
| Company LLP | Our selections typically offer above-average dividend | |||
| yields, below-average valuations, and the potential for | ||||
| dividend increases in the future. | ||||
| Vanguard Equity Investment | 34 | 6,502 | Employs a quantitative fundamental management | |
| Group | approach, using models that assess valuation, growth | |||
| prospects, management decisions, market sentiment, | ||||
| and earnings and balance-sheet quality of companies | ||||
| as compared with their peers. | ||||
| Cash Investments | 2 | 339 | These short-term reserves are invested by Vanguard in | |
| equity index products to simulate investment in stocks. | ||||
| Each advisor may also maintain a modest cash | ||||
| position. | ||||
7
Economic growth slowed in the developing countries as Brazil and Russia fell into recession and China navigated its structural problems. China is trying to mitigate the severity of the downturn with fiscal and monetary stimulus, and although we expect to see ongoing modest growth, a more severe correction is a risk.
In developed economies, Europe appeared to be improving. The European Central Bank’s implementation of aggressive quantitative easing seemed to be helping the economy regain its footing. The United States maintained its solid economic growth, which we think will stay in the 2.5%-to-3% range. Employment remained strong, and improving wages should enable the economic momentum to continue. Risks include unintended consequences as the Federal Reserve normalizes monetary policy, as well as the stronger U.S. dollar.
Our performance was driven by security selection, particularly in the consumer staples, industrial, and consumer discretionary sectors. This success was partially offset by weak selection in information technology, as our decision not to own Apple was our top relative detractor. Choices in health care and utilities also disappointed, as did sector allocation, which is a residual of our bottom-up stock selection process. Our underweight allocation to information technology hurt most.
At the end of the period, we remained most overweighted in the financial, health care, and industrial sectors. Consumer staples, energy, and utilities were the largest underweights relative to the benchmark.
Significant purchases in the past six months included new positions in Coca-Cola, Raytheon, Honeywell, and IBM. We eliminated DuPont and trimmed our Unilever holdings because of valuation. We sold out of ConocoPhillips and reduced our stake in Roche Holding because of eroding fundamentals.
Vanguard Equity Investment Group
Portfolio Managers:
James P. Stetler, Principal
James D. Troyer, CFA, Principal
Michael R. Roach, CFA
The broad U.S. equity market returned more than 7% for the six months. Large- and mid-capitalization stocks were easily outpaced by small-caps, and growth outperformed value. U.S. equities continued to deliver better results than international developed and emerging markets. Performance in the FTSE High Dividend Yield Index benchmark was solid as seven of ten sector groups generated positive returns. Results were best in consumer discretionary, technology, and utilities. Energy companies followed the price drop of oil and declined more than –10%.
Moving into 2015, the U.S. economy built on its momentum. Fourth-quarter GDP growth came in at an annual rate
8
of 2.2%. This was down from the 5% increase in the third quarter but still encouraging. Job growth slowed in March, but the unemployment level declined to 5.5% and approached full employment. However, the past six months have not been without challenges. The harsh winter experienced by many parts of the country affected first-quarter 2015 growth, and wholesale inventory levels increased when tepid sales left little motivation to restock warehouses.
Uncertainty remained as to when the Federal Reserve would begin raising interest rates and to what extent. Additionally, the strength of the U.S. dollar increased the price of exports by as much as 20%, challenging the revenues and profits of multinationals.
Although it’s important to understand how our overall performance is affected by the macroeconomic factors we’ve described, our approach to investing focuses on specific fundamentals—not on technical analysis of stock price movements. We compare all the stocks in our investment universe within the same industry groups in order to identify those with characteristics that we believe will enable them to outperform over the long run.
To do this, we use a strict quantitative process that systematically focuses on five key traits: (1) high quality—healthy balance sheets and consistent cash flow generation; (2) effective use of capital—sound investment policies that prefer internal to external funding; (3) consistent earnings growth—a demonstrated ability to increase earnings year after year; (4) strong market sentiment—market confirmation of our view; and (5) reasonable valuation—avoidance of overpriced stocks.
Using these criteria, we generate a composite expected return for all the stocks we follow each day, seeking to capitalize on investor biases across the market. We then monitor our portfolio, based on those scores, and make adjustments when appropriate to maximize expected return while minimizing exposure to risks relative to the benchmark (such as industry selection) that our research indicates do not improve returns.
For the fiscal half year, our quality model contributed to performance but our growth and sentiment models were neutral. Our management decisions and valuation models did not perform as expected.
Our stock selection over the six months had mixed results. It produced gains in six of the ten sectors in the benchmark, with the strongest returns in technology and the most disappointing in energy.
In technology, Apple Inc. (+25%), Cypress Semiconductor (+45%), and Broadridge Financial Solutions (+34%) were the largest contributors to relative performance. Detractors in energy included ONEOK (–25%), Ensco plc (–35%), and Targa Resources (–29%).
9
Equity Income Fund
Fund Profile
As of March 31, 2015
| Share-Class Characteristics | ||
| Investor | Admiral | |
| Shares | Shares | |
| Ticker Symbol | VEIPX | VEIRX |
| Expense Ratio1 | 0.29% | 0.20% |
| 30-Day SEC Yield | 2.74% | 2.83% |
| Portfolio Characteristics | |||
| FTSE High | DJ | ||
| Dividend | U.S. Total | ||
| Yield | Market | ||
| Fund | Index | FA Index | |
| Number of Stocks | 174 | 432 | 3,757 |
| Median Market Cap $106.9B | $106.9B | $46.5B | |
| Price/Earnings Ratio | 17.1x | 17.4x | 21.4x |
| Price/Book Ratio | 2.7x | 2.6x | 2.8x |
| Return on Equity | 18.4% | 18.6% | 17.5% |
| Earnings Growth | |||
| Rate | 9.7% | 7.9% | 13.5% |
| Dividend Yield | 3.0% | 3.2% | 1.9% |
| Foreign Holdings | 8.6% | 0.0% | 0.0% |
| Turnover Rate | |||
| (Annualized) | 36% | — | — |
| Short-Term Reserves | 0.7% | — | — |
| Volatility Measures | ||
| FTSE High | DJ | |
| Dividend | U.S. Total | |
| Yield | Market | |
| Index | FA Index | |
| R-Squared | 0.98 | 0.92 |
| Beta | 0.98 | 0.90 |
| These measures show the degree and timing of the fund’s fluctuations compared with the indexes over 36 months. | ||
| Ten Largest Holdings (% of total net assets) | ||
| Wells Fargo & Co. | Diversified Banks | 3.9% |
| Microsoft Corp. | Systems Software | 3.6 |
| Johnson & Johnson | Pharmaceuticals | 3.1 |
| JPMorgan Chase & Co. | Diversified Banks | 3.1 |
| Merck & Co. Inc. | Pharmaceuticals | 2.9 |
| Exxon Mobil Corp. | Integrated Oil & Gas | 2.8 |
| Verizon Communications | Integrated | |
| Inc. | Telecommunication | |
| Services | 2.6 | |
| Chevron Corp. | Integrated Oil & Gas | 2.4 |
| Home Depot Inc. | Home Improvement | |
| Retail | 2.3 | |
| Pfizer Inc. | Pharmaceuticals | 2.3 |
| Top Ten | 29.0% | |
| The holdings listed exclude any temporary cash investments and equity index products. | ||
Investment Focus
1 The expense ratios shown are from the prospectus dated January 27, 2015, and represent estimated costs for the current fiscal year. For the six months ended March 31, 2015, the annualized expense ratios were 0.28% for Investor Shares and 0.19% for Admiral Shares.
10
Equity Income Fund
| Sector Diversification (% of equity exposure) | |||
| FTSE High | DJ | ||
| Dividend | U.S. Total | ||
| Yield | Market | ||
| Fund | Index | FA Index | |
| Consumer | |||
| Discretionary | 6.5% | 6.7% | 13.4% |
| Consumer Staples | 12.2 | 14.2 | 8.4 |
| Energy | 10.9 | 12.1 | 7.3 |
| Financials | 16.4 | 14.0 | 17.6 |
| Health Care | 13.3 | 11.7 | 14.6 |
| Industrials | 12.8 | 11.3 | 11.1 |
| Information | |||
| Technology | 13.9 | 13.7 | 19.0 |
| Materials | 3.0 | 3.6 | 3.5 |
| Telecommunication | |||
| Services | 4.1 | 4.8 | 2.0 |
| Utilities | 6.9 | 7.9 | 3.1 |
11
Equity Income Fund
Performance Summary
All of the returns in this report represent past performance, which is not a guarantee of future results that may be achieved by the fund. (Current performance may be lower or higher than the performance data cited. For performance data current to the most recent month-end, visit our website at vanguard.com/performance.) Note, too, that both investment returns and principal value can fluctuate widely, so an investor’s shares, when sold, could be worth more or less than their original cost. The returns shown do not reflect taxes that a shareholder would pay on fund distributions or on the sale of fund shares.
Fiscal-Year Total Returns (%): September 30, 2004, Through March 31, 2015

For a benchmark description, see the Glossary.
Note: For 2015, performance data reflect the six months ended March 31, 2015.
| Average Annual Total Returns: Periods Ended March 31, 2015 | ||||
| Inception | One | Five | Ten | |
| Date | Year | Years | Years | |
| Investor Shares | 3/21/1988 | 8.67% | 14.81% | 8.46% |
| Admiral Shares | 8/13/2001 | 8.78 | 14.91 | 8.58 |
See Financial Highlights for dividend and capital gains information.
12
Equity Income Fund
Financial Statements (unaudited)
Statement of Net Assets
As of March 31, 2015
The fund reports a complete list of its holdings in regulatory filings four times in each fiscal year, at the quarter-ends. For the second and fourth fiscal quarters, the lists appear in the fund’s semiannual and annual reports to shareholders. For the first and third fiscal quarters, the fund files the lists with the Securities and Exchange Commission on Form N-Q. Shareholders can look up the fund’s Forms N-Q on the SEC’s website at sec.gov. Forms N-Q may also be reviewed and copied at the SEC’s Public Reference Room (see the back cover of this report for further information).
| Market | ||
| Value | ||
| Shares | ($000) | |
| Common Stocks (98.0%)1 | ||
| Consumer Discretionary (6.3%) | ||
| Home Depot Inc. | 3,883,200 | 441,170 |
| McDonald’s Corp. | 1,828,605 | 178,179 |
| Thomson Reuters Corp. | 2,537,270 | 102,912 |
| General Motors Co. | 1,747,200 | 65,520 |
| WPP plc | 2,376,928 | 53,982 |
| Carnival Corp. | 1,062,900 | 50,849 |
| Target Corp. | 541,500 | 44,441 |
| Omnicom Group Inc. | 553,100 | 43,131 |
| H&R Block Inc. | 1,233,700 | 39,565 |
| Cablevision Systems Corp. | ||
| Class A | 1,953,500 | 35,749 |
| Best Buy Co. Inc. | 897,200 | 33,905 |
| Leggett & Platt Inc. | 440,000 | 20,280 |
| Autoliv Inc. | 118,400 | 13,944 |
| Garmin Ltd. | 293,200 | 13,933 |
| American Eagle Outfitters | ||
| Inc. | 726,300 | 12,405 |
| Ford Motor Co. | 739,800 | 11,940 |
| Darden Restaurants Inc. | 157,200 | 10,900 |
| Cracker Barrel Old Country | ||
| Store Inc. | 54,900 | 8,353 |
| Bob Evans Farms Inc. | 109,800 | 5,079 |
| Cinemark Holdings Inc. | 87,500 | 3,944 |
| Cato Corp. Class A | 19,900 | 788 |
| 1,190,969 | ||
| Consumer Staples (12.0%) | ||
| Kraft Foods Group Inc. | 3,964,870 | 345,400 |
| Wal-Mart Stores Inc. | 3,047,692 | 250,673 |
| Procter & Gamble Co. | 3,043,640 | 249,396 |
| Coca-Cola Co. | 5,813,764 | 235,748 |
| Philip Morris International | ||
| Inc. | 2,774,145 | 208,976 |
| Altria Group Inc. | 3,558,675 | 178,005 |
| PepsiCo Inc. | 1,703,090 | 162,849 |
| Diageo plc ADR | 910,100 | 100,630 |
| British American Tobacco | ||
| plc | 1,875,012 | 97,097 |
| Market | ||
| Value | ||
| Shares | ($000) | |
| Anheuser-Busch InBev | ||
| NV ADR | 794,260 | 96,828 |
| Unilever NV | 1,811,120 | 75,632 |
| Reynolds American Inc. | 706,900 | 48,713 |
| Dr Pepper Snapple Group | ||
| Inc. | 610,400 | 47,904 |
| ConAgra Foods Inc. | 1,199,800 | 43,829 |
| Kimberly-Clark Corp. | 359,088 | 38,462 |
| Sysco Corp. | 1,006,160 | 37,962 |
| Clorox Co. | 338,800 | 37,400 |
| Ingredion Inc. | 192,400 | 14,973 |
| Campbell Soup Co. | 140,800 | 6,554 |
| 2,277,031 | ||
| Energy (10.6%) | ||
| Exxon Mobil Corp. | 6,305,110 | 535,934 |
| Chevron Corp. | 4,282,670 | 449,595 |
| Suncor Energy Inc. | 6,124,810 | 179,151 |
| Phillips 66 | 1,888,700 | 148,452 |
| Occidental Petroleum | ||
| Corp. | 2,007,330 | 146,535 |
| Enbridge Inc. | 2,419,900 | 117,365 |
| Marathon Oil Corp. | 3,503,700 | 91,482 |
| Valero Energy Corp. | 933,200 | 59,370 |
| Royal Dutch Shell plc | ||
| Class B | 1,506,716 | 46,935 |
| ONEOK Inc. | 853,700 | 41,182 |
| Targa Resources Corp. | 394,100 | 37,751 |
| Western Refining Inc. | 684,400 | 33,802 |
| ConocoPhillips | 437,500 | 27,239 |
| Spectra Energy Corp. | 691,800 | 25,022 |
| Kinder Morgan Inc. | 518,600 | 21,812 |
| Noble Corp. plc | 1,413,800 | 20,189 |
| PBF Energy Inc. Class A | 490,700 | 16,645 |
| Delek US Holdings Inc. | 322,500 | 12,819 |
| Murphy Oil Corp. | 216,700 | 10,098 |
| Teekay Corp. | 59,200 | 2,757 |
| ^ Paragon Offshore plc | 1,203,620 | 1,565 |
| SemGroup Corp. Class A | 7,900 | 643 |
| 2,026,343 |
13
Equity Income Fund
| Market | ||
| Value | ||
| Shares | ($000) | |
| Financials (16.0%) | ||
| Wells Fargo & Co. | 13,591,440 | 739,374 |
| JPMorgan Chase & Co. | 9,614,630 | 582,454 |
| Marsh & McLennan | ||
| Cos. Inc. | 6,130,270 | 343,847 |
| PNC Financial Services | ||
| Group Inc. | 2,679,492 | 249,836 |
| BlackRock Inc. | 606,730 | 221,966 |
| ACE Ltd. | 1,473,940 | 164,330 |
| MetLife Inc. | 3,145,700 | 159,015 |
| M&T Bank Corp. | 1,075,190 | 136,549 |
| US Bancorp | 2,402,740 | 104,928 |
| Travelers Cos. Inc. | 582,000 | 62,932 |
| Navient Corp. | 1,994,700 | 40,552 |
| Axis Capital Holdings Ltd. | 736,000 | 37,963 |
| Lazard Ltd. Class A | 718,000 | 37,760 |
| PartnerRe Ltd. | 328,400 | 37,546 |
| Validus Holdings Ltd. | 809,000 | 34,059 |
| Janus Capital Group Inc. | 1,270,500 | 21,840 |
| CME Group Inc. | 188,900 | 17,891 |
| Huntington Bancshares | ||
| Inc. | 1,255,300 | 13,871 |
| Iron Mountain Inc. | 375,276 | 13,690 |
| Invesco Ltd. | 269,800 | 10,708 |
| Capitol Federal Financial | ||
| Inc. | 206,800 | 2,585 |
| First Commonwealth | ||
| Financial Corp. | 267,000 | 2,403 |
| Endurance Specialty | ||
| Holdings Ltd. | 31,200 | 1,907 |
| Hanover Insurance Group | ||
| Inc. | 22,000 | 1,597 |
| 3,039,603 | ||
| Health Care (13.0%) | ||
| Johnson & Johnson | 5,939,445 | 597,508 |
| Merck & Co. Inc. | 9,429,124 | 541,986 |
| Pfizer Inc. | 12,335,444 | 429,150 |
| Bristol-Myers Squibb Co. | 2,847,432 | 183,659 |
| Eli Lilly & Co. | 2,260,449 | 164,222 |
| AstraZeneca plc ADR | 1,837,049 | 125,709 |
| Roche Holding AG | 438,348 | 120,455 |
| AbbVie Inc. | 1,767,100 | 103,446 |
| Baxter International Inc. | 1,338,750 | 91,704 |
| Novartis AG | 735,221 | 72,567 |
| Quest Diagnostics Inc. | 500,000 | 38,425 |
| 2,468,831 | ||
| Industrials (12.5%) | ||
| General Electric Co. | 16,605,252 | 411,976 |
| 3M Co. | 1,813,230 | 299,092 |
| Eaton Corp. plc | 4,050,410 | 275,185 |
| United Technologies | ||
| Corp. | 2,154,580 | 252,517 |
| United Parcel Service Inc. | ||
| Class B | 1,678,130 | 162,678 |
| Market | ||
| Value | ||
| Shares | ($000) | |
| Waste Management Inc. | 2,747,290 | 148,986 |
| Raytheon Co. | 1,232,300 | 134,629 |
| Honeywell International | ||
| Inc. | 1,158,400 | 120,833 |
| Boeing Co. | 705,700 | 105,911 |
| Schneider Electric SE | 1,086,970 | 84,587 |
| Lockheed Martin Corp. | 408,500 | 82,909 |
| Illinois Tool Works Inc. | 735,570 | 71,453 |
| Caterpillar Inc. | 582,800 | 46,642 |
| PACCAR Inc. | 707,700 | 44,684 |
| Stanley Black & Decker | ||
| Inc. | 455,200 | 43,408 |
| General Dynamics Corp. | 275,300 | 37,366 |
| Pitney Bowes Inc. | 1,260,200 | 29,388 |
| GATX Corp. | 129,600 | 7,514 |
| RR Donnelley & Sons Co. | 348,500 | 6,688 |
| Timken Co. | 141,900 | 5,980 |
| Matson Inc. | 43,200 | 1,821 |
| Aircastle Ltd. | 39,600 | 889 |
| 2,375,136 | ||
| Information Technology (13.4%) | ||
| Microsoft Corp. | 16,617,019 | 675,565 |
| Intel Corp. | 12,337,950 | 385,808 |
| Cisco Systems Inc. | 13,106,080 | 360,745 |
| Analog Devices Inc. | 4,054,960 | 255,462 |
| International Business | ||
| Machines Corp. | 1,348,400 | 216,418 |
| Texas Instruments Inc. | 2,096,800 | 119,905 |
| Maxim Integrated | ||
| Products Inc. | 3,021,717 | 105,186 |
| Symantec Corp. | 4,497,100 | 105,075 |
| QUALCOMM Inc. | 750,500 | 52,040 |
| Western Union Co. | 2,186,100 | 45,493 |
| Seagate Technology plc | 836,300 | 43,513 |
| Broadridge Financial | ||
| Solutions Inc. | 693,800 | 38,166 |
| Apple Inc. | 291,700 | 36,296 |
| Lexmark International Inc. | ||
| Class A | 809,700 | 34,283 |
| Cypress Semiconductor | ||
| Corp. | 2,335,600 | 32,955 |
| Computer Sciences Corp. | 466,700 | 30,466 |
| Diebold Inc. | 247,600 | 8,780 |
| Leidos Holdings Inc. | 147,300 | 6,181 |
| Science Applications | ||
| International Corp. | 54,900 | 2,819 |
| EarthLink Holdings Corp. | 120,300 | 534 |
| 2,555,690 | ||
| Materials (2.9%) | ||
| Dow Chemical Co. | 3,761,820 | 180,492 |
| Akzo Nobel NV | 1,189,358 | 89,927 |
| Nucor Corp. | 1,736,410 | 82,532 |
| LyondellBasell Industries | ||
| NV Class A | 639,700 | 56,166 |
14
Equity Income Fund
| Market | ||
| Value | ||
| Shares | ($000) | |
| International Paper Co. | 927,200 | 51,450 |
| Avery Dennison Corp. | 763,000 | 40,370 |
| EI du Pont de Nemours | ||
| & Co. | 520,170 | 37,177 |
| Bemis Co. Inc. | 240,400 | 11,133 |
| 549,247 | ||
| Other (0.4%) | ||
| 2 Vanguard High Dividend | ||
| Yield ETF | 1,047,950 | 71,575 |
| Telecommunication Services (4.1%) | ||
| Verizon Communications | ||
| Inc. | 10,199,086 | 495,982 |
| BCE Inc. | 2,751,400 | 116,482 |
| AT&T Inc. | 2,981,097 | 97,333 |
| CenturyLink Inc. | 1,376,500 | 47,558 |
| Frontier Communications | ||
| Corp. | 2,051,000 | 14,459 |
| 771,814 | ||
| Utilities (6.8%) | ||
| UGI Corp. | 4,926,090 | 160,541 |
| Xcel Energy Inc. | 4,513,590 | 157,118 |
| National Grid plc | 12,166,064 | 156,409 |
| Eversource Energy | 2,806,390 | 141,779 |
| NextEra Energy Inc. | 1,222,316 | 127,182 |
| Duke Energy Corp. | 1,403,500 | 107,761 |
| American Electric Power | ||
| Co. Inc. | 947,200 | 53,280 |
| PG&E Corp. | 974,000 | 51,690 |
| Public Service Enterprise | ||
| Group Inc. | 1,182,300 | 49,562 |
| Edison International | 764,300 | 47,746 |
| Entergy Corp. | 546,200 | 42,325 |
| PPL Corp. | 1,197,100 | 40,294 |
| Vectren Corp. | 792,200 | 34,968 |
| Atmos Energy Corp. | 512,700 | 28,352 |
| Pinnacle West Capital | ||
| Corp. | 377,000 | 24,034 |
| CMS Energy Corp. | 416,700 | 14,547 |
| AES Corp. | 1,052,700 | 13,527 |
| WGL Holdings Inc. | 231,500 | 13,057 |
| DTE Energy Co. | 156,700 | 12,644 |
| New Jersey Resources | ||
| Corp. | 400,000 | 12,424 |
| American Water Works | ||
| Co. Inc. | 136,900 | 7,421 |
| PNM Resources Inc. | 61,500 | 1,796 |
| 1,298,457 | ||
| Total Common Stocks | ||
| (Cost $14,764,582) | 18,624,696 | |
| Market | |||
| Value | |||
| Shares | ($000) | ||
| Temporary Cash Investments (2.1%)1 | |||
| Money Market Fund (1.4%) | |||
| 3,4 | Vanguard Market | ||
| Liquidity Fund, | |||
| 0.128% | 260,048,652 | 260,049 | |
| Face | |||
| Amount | |||
| ($000) | |||
| Repurchase Agreement (0.4%) | |||
| Goldman Sachs & Co. | |||
| 0.150%, 4/1/15 (Dated | |||
| 3/31/15, Repurchase | |||
| Value $80,700,000, | |||
| collateralized by Federal | |||
| Home Loan Mortgage | |||
| Corp. 2.882%–4.000%, | |||
| 10/1/34–3/1/45, Federal | |||
| National Mortgage Assn. | |||
| 2.770%–5.000%, | |||
| 1/1/20–2/1/45, and | |||
| Government National | |||
| Mortgage Assn. | |||
| 3.000%–6.500%, | |||
| 8/15/38–10/20/44, with | |||
| a value of $82,314,000) | 80,700 | 80,700 | |
| U.S. Government and Agency Obligations (0.3%) | |||
| 5 | Fannie Mae Discount | ||
| Notes, 0.130%, 4/27/15 | 200 | 200 | |
| 5,6 | Fannie Mae Discount | ||
| Notes, 0.140%, 7/8/15 | 4,000 | 3,998 | |
| 7 | Federal Home Loan | ||
| Bank Discount Notes, | |||
| 0.068%, 4/6/15 | 1,000 | 1,000 | |
| 7 | Federal Home Loan | ||
| Bank Discount Notes, | |||
| 0.064%, 4/15/15 | 1,000 | 1,000 | |
| 6,7 | Federal Home Loan | ||
| Bank Discount Notes, | |||
| 0.100%, 4/24/15 | 3,600 | 3,600 | |
| 6,7 | Federal Home Loan | ||
| Bank Discount Notes, | |||
| 0.063%, 4/29/15 | 1,500 | 1,500 | |
| 6,7 | Federal Home Loan | ||
| Bank Discount Notes, | |||
| 0.060%, 5/1/15 | 1,000 | 1,000 | |
| 6,7 | Federal Home Loan | ||
| Bank Discount Notes, | |||
| 0.077%, 5/20/15 | 300 | 300 | |
15
Equity Income Fund
| Face | Market | ||
| Amount | Value | ||
| ($000) | ($000) | ||
| 7 | Federal Home Loan | ||
| Bank Discount Notes, | |||
| 0.060%, 5/27/15 | 50,000 | 49,993 | |
| 6,7 | Federal Home Loan | ||
| Bank Discount Notes, | |||
| 0.067%, 6/3/15 | 1,000 | 1,000 | |
| 5,6 | Freddie Mac Discount | ||
| Notes, 0.118%, 7/31/15 | 4,800 | 4,798 | |
| 68,389 | |||
| Total Temporary Cash Investments | |||
| (Cost $409,140) | 409,138 | ||
| Total Investments (100.1%) | |||
| (Cost $15,173,722) | 19,033,834 | ||
| Other Assets and Liabilities (-0.1%) | |||
| Other Assets | 139,882 | ||
| Liabilities4 | (161,430) | ||
| (21,548) | |||
| Net Assets (100%) | 19,012,286 | ||
| At March 31, 2015, net assets consisted of: | |
| Amount | |
| ($000) | |
| Paid-in Capital | 14,695,743 |
| Overdistributed Net Investment Income | (6,281) |
| Accumulated Net Realized Gains | 463,991 |
| Unrealized Appreciation (Depreciation) | |
| Investment Securities | 3,860,112 |
| Futures Contracts | (1,165) |
| Foreign Currencies | (114) |
| Net Assets | 19,012,286 |
| Investor Shares—Net Assets | |
| Applicable to 181,663,334 outstanding | |
| $.001 par value shares of beneficial | |
| interest (unlimited authorization) | 5,629,617 |
| Net Asset Value Per Share— | |
| Investor Shares | $30.99 |
| Admiral Shares—Net Assets | |
| Applicable to 206,040,647 outstanding | |
| $.001 par value shares of beneficial | |
| interest (unlimited authorization) | 13,382,669 |
| Net Asset Value Per Share— | |
| Admiral Shares | $64.95 |
See Note A in Notes to Financial Statements.
^ Includes partial security positions on loan to broker-dealers. The total value of securities on loan is $195,000.
1 The fund invests a portion of its cash reserves in equity markets through the use of index futures contracts. After giving effect to futures investments, the fund’s effective common stock and temporary cash investment positions represent 99.5% and 0.6%, respectively, of net assets.
2 Considered an affiliated company of the fund as the issuer is another member of The Vanguard Group.
3 Affiliated money market fund available only to Vanguard funds and certain trusts and accounts managed by Vanguard. Rate shown is the 7-day yield.
4 Includes $300,000 of collateral received for securities on loan.
5 The issuer was placed under federal conservatorship in September 2008; since that time, its daily operations have been managed by the Federal Housing Finance Agency and it receives capital from the U.S. Treasury, as needed to maintain a positive net worth, in exchange for senior preferred stock.
6 Securities with a value of $12,796,000 have been segregated as initial margin for open futures contracts.
7 The issuer operates under a congressional charter; its securities are generally neither guaranteed by the U.S. Treasury nor backed by the full faith and credit of the U.S. government.
ADR—American Depositary Receipt.
See accompanying Notes, which are an integral part of the Financial Statements.
16
Equity Income Fund
Statement of Operations
| Six Months Ended | |
| March 31, 2015 | |
| ($000) | |
| Investment Income | |
| Income | |
| Dividends1,2 | 271,083 |
| Interest2 | 254 |
| Securities Lending | 851 |
| Total Income | 272,188 |
| Expenses | |
| Investment Advisory Fees—Note B | |
| Basic Fee | 7,470 |
| Performance Adjustment | (691) |
| The Vanguard Group—Note C | |
| Management and Administrative—Investor Shares | 5,042 |
| Management and Administrative—Admiral Shares | 6,131 |
| Marketing and Distribution—Investor Shares | 656 |
| Marketing and Distribution—Admiral Shares | 1,405 |
| Custodian Fees | 85 |
| Shareholders’ Reports—Investor Shares | 49 |
| Shareholders’ Reports—Admiral Shares | 48 |
| Trustees’ Fees and Expenses | 16 |
| Total Expenses | 20,211 |
| Net Investment Income | 251,977 |
| Realized Net Gain (Loss) | |
| Investment Securities Sold2 | 478,517 |
| Futures Contracts | 11,295 |
| Foreign Currencies | (428) |
| Realized Net Gain (Loss) | 489,384 |
| Change in Unrealized Appreciation (Depreciation) | |
| Investment Securities | (22,559) |
| Futures Contracts | 562 |
| Foreign Currencies | 8 |
| Change in Unrealized Appreciation (Depreciation) | (21,989) |
| Net Increase (Decrease) in Net Assets Resulting from Operations | 719,372 |
| 1 Dividends are net of foreign withholding taxes of $2,790,000. | |
| 2 Dividend income, interest income, and realized net gain (loss) from affiliated companies of the fund were $1,073,000, $177,000, and $0, | |
| respectively. | |
See accompanying Notes, which are an integral part of the Financial Statements.
17
Equity Income Fund
Statement of Changes in Net Assets
| Six Months Ended | Year Ended | |
| March 31, | September 30, | |
| 2015 | 2014 | |
| ($000) | ($000) | |
| Increase (Decrease) in Net Assets | ||
| Operations | ||
| Net Investment Income | 251,977 | 454,786 |
| Realized Net Gain (Loss) | 489,384 | 770,697 |
| Change in Unrealized Appreciation (Depreciation) | (21,989) | 1,175,497 |
| Net Increase (Decrease) in Net Assets Resulting from Operations | 719,372 | 2,400,980 |
| Distributions | ||
| Net Investment Income | ||
| Investor Shares | (76,066) | (142,170) |
| Admiral Shares | (183,909) | (304,850) |
| Realized Capital Gain1 | ||
| Investor Shares | (178,447) | (136,041) |
| Admiral Shares | (410,635) | (265,749) |
| Total Distributions | (849,057) | (848,810) |
| Capital Share Transactions | ||
| Investor Shares | 140,823 | 165,292 |
| Admiral Shares | 1,154,269 | 2,156,810 |
| Net Increase (Decrease) from Capital Share Transactions | 1,295,092 | 2,322,102 |
| Total Increase (Decrease) | 1,165,407 | 3,874,272 |
| Net Assets | ||
| Beginning of Period | 17,846,879 | 13,972,607 |
| End of Period2 | 19,012,286 | 17,846,879 |
| 1 Includes fiscal 2015 and 2014 short-term gain distributions totaling $129,552,000 and $18,677,000, respectively. Short-term gain distributions are treated as ordinary income dividends for tax purposes. 2 Net Assets—End of Period includes undistributed (overdistributed) net investment income of ($6,281,000) and $2,145,000. | ||
See accompanying Notes, which are an integral part of the Financial Statements.
18
Equity Income Fund
Financial Highlights
| Investor Shares | ||||||
| Six Months | ||||||
| Ended | ||||||
| For a Share Outstanding | March 31, | Year Ended September 30, | ||||
| Throughout Each Period | 2015 | 2014 | 2013 | 2012 | 2011 | 2010 |
| Net Asset Value, Beginning of Period | $31.23 | $28.26 | $24.31 | $19.40 | $18.83 | $17.40 |
| Investment Operations | ||||||
| Net Investment Income | . 414 | . 826 | .732 | . 667 | . 596 | . 526 |
| Net Realized and Unrealized Gain (Loss) | ||||||
| on Investments | .787 | 3.754 | 3.946 | 4.908 | .567 | 1.432 |
| Total from Investment Operations | 1.201 | 4.580 | 4.678 | 5.575 | 1.163 | 1.958 |
| Distributions | ||||||
| Dividends from Net Investment Income | (. 427) | (. 811) | (.728) | (. 665) | (. 593) | (. 528) |
| Distributions from Realized Capital Gains | (1.014) | (.799) | — | — | — | — |
| Total Distributions | (1.441) | (1.610) | (.728) | (.665) | (.593) | (.528) |
| Net Asset Value, End of Period | $30.99 | $31.23 | $28.26 | $24.31 | $19.40 | $18.83 |
| Total Return1 | 3.93% | 16.62% | 19.45% | 29.00% | 6.00% | 11.36% |
| Ratios/Supplemental Data | ||||||
| Net Assets, End of Period (Millions) | $5,630 | $5,528 | $4,839 | $4,107 | $2,835 | $2,651 |
| Ratio of Total Expenses to | ||||||
| Average Net Assets2 | 0.28% | 0.29% | 0.30% | 0.30% | 0.31% | 0.31% |
| Ratio of Net Investment Income to | ||||||
| Average Net Assets | 2.65% | 2.74% | 2.81% | 3.00% | 2.89% | 2.88% |
| Portfolio Turnover Rate | 36% | 33% | 34% | 26% | 29% | 45% |
| The expense ratio, net income ratio, and turnover rate for the current period have been annualized. 1 Total returns do not include account service fees that may have applied in the periods shown. Fund prospectuses provide information about any applicable account service fees. 2 Includes performance-based investment advisory fee increases (decreases) of (0.01%), 0.00%, 0.00%, 0.00%, 0.01%, and 0.01%. | ||||||
See accompanying Notes, which are an integral part of the Financial Statements.
19
Equity Income Fund
Financial Highlights
| Admiral Shares | ||||||
| Six Months | ||||||
| Ended | ||||||
| For a Share Outstanding | March 31, | Year Ended September 30, | ||||
| Throughout Each Period | 2015 | 2014 | 2013 | 2012 | 2011 | 2010 |
| Net Asset Value, Beginning of Period | $65.45 | $59.24 | $50.94 | $40.67 | $39.47 | $36.46 |
| Investment Operations | ||||||
| Net Investment Income | .896 | 1.790 | 1.585 | 1.445 | 1.286 | 1.138 |
| Net Realized and Unrealized Gain (Loss) | ||||||
| on Investments | 1.655 | 7.853 | 8.293 | 10.265 | 1.194 | 3.013 |
| Total from Investment Operations | 2.551 | 9.643 | 9.878 | 11.710 | 2.480 | 4.151 |
| Distributions | ||||||
| Dividends from Net Investment Income | (.926) | (1.758) | (1.578) | (1.440) | (1.280) | (1.141) |
| Distributions from Realized Capital Gains (2.125) | (1.675) | — | — | — | — | |
| Total Distributions | (3.051) | (3.433) | (1.578) | (1.440) | (1.280) | (1.141) |
| Net Asset Value, End of Period | $64.95 | $65.45 | $59.24 | $50.94 | $40.67 | $39.47 |
| Total Return1 | 3.98% | 16.70% | 19.61% | 29.06% | 6.10% | 11.50% |
| Ratios/Supplemental Data | ||||||
| Net Assets, End of Period (Millions) | $13,383 | $12,319 | $9,134 | $5,234 | $2,614 | $1,667 |
| Ratio of Total Expenses to | ||||||
| Average Net Assets2 | 0.19% | 0.20% | 0.21% | 0.21% | 0.22% | 0.22% |
| Ratio of Net Investment Income to | ||||||
| Average Net Assets | 2.74% | 2.83% | 2.90% | 3.09% | 2.98% | 2.97% |
| Portfolio Turnover Rate | 36% | 33% | 34% | 26% | 29% | 45% |
| The expense ratio, net income ratio, and turnover rate for the current period have been annualized. 1 Total returns do not include account service fees that may have applied in the periods shown. Fund prospectuses provide information about any applicable account service fees. 2 Includes performance-based investment advisory fee increases (decreases) of (0.01%), 0.00%, 0.00%, 0.00%, 0.01%, and 0.01%. | ||||||
See accompanying Notes, which are an integral part of the Financial Statements.
20
Equity Income Fund
Notes to Financial Statements
Vanguard Equity Income Fund is registered under the Investment Company Act of 1940 as an open-end investment company, or mutual fund. The fund offers two classes of shares: Investor Shares and Admiral Shares. Investor Shares are available to any investor who meets the fund’s minimum purchase requirements. Admiral Shares are designed for investors who meet certain administrative, service, and account-size criteria.
A. The following significant accounting policies conform to generally accepted accounting principles for U.S. investment companies. The fund consistently follows such policies in preparing its financial statements.
1. Security Valuation: Securities are valued as of the close of trading on the New York Stock Exchange (generally 4 p.m., Eastern time) on the valuation date. Equity securities are valued at the latest quoted sales prices or official closing prices taken from the primary market in which each security trades; such securities not traded on the valuation date are valued at the mean of the latest quoted bid and asked prices. Securities for which market quotations are not readily available, or whose values have been affected by events occurring before the fund’s pricing time but after the close of the securities’ primary markets, are valued at their fair values calculated according to procedures adopted by the board of trustees. These procedures include obtaining quotations from an independent pricing service, monitoring news to identify significant market- or security-specific events, and evaluating changes in the values of foreign market proxies (for example, ADRs, futures contracts, or exchange-traded funds), between the time the foreign markets close and the fund’s pricing time. When fair-value pricing is employed, the prices of securities used by a fund to calculate its net asset value may differ from quoted or published prices for the same securities. Investments in Vanguard Market Liquidity Fund are valued at that fund’s net asset value. Temporary cash investments acquired over 60 days to maturity are valued using the latest bid prices or using valuations based on a matrix system (which considers such factors as security prices, yields, maturities, and ratings), both as furnished by independent pricing services. Other temporary cash investments are valued at amortized cost, which approximates market value.
2. Foreign Currency: Securities and other assets and liabilities denominated in foreign currencies are translated into U.S. dollars using exchange rates obtained from an independent third party as of the fund’s pricing time on the valuation date. Realized gains (losses) and unrealized appreciation (depreciation) on investment securities include the effects of changes in exchange rates since the securities were purchased, combined with the effects of changes in security prices. Fluctuations in the value of other assets and liabilities resulting from changes in exchange rates are recorded as unrealized foreign currency gains (losses) until the assets or liabilities are settled in cash, at which time they are recorded as realized foreign currency gains (losses).
3. Futures Contracts: The fund uses index futures contracts to a limited extent, with the objective of maintaining full exposure to the stock market while maintaining liquidity. The fund may purchase or sell futures contracts to achieve a desired level of investment, whether to accommodate portfolio turnover or cash flows from capital share transactions. The primary risks associated with the use of futures contracts are imperfect correlation between changes in market values of stocks held by the fund and the prices of futures contracts, and the possibility of an illiquid market. Counterparty risk involving futures is mitigated because a regulated clearinghouse is the counterparty instead of the clearing broker. To further mitigate counterparty risk, the fund trades futures contracts on an exchange, monitors the financial strength of its clearing brokers and clearinghouse, and has entered into clearing
21
Equity Income Fund
agreements with its clearing brokers. The clearinghouse imposes initial margin requirements to secure the fund’s performance and requires daily settlement of variation margin representing changes in the market value of each contract.
Futures contracts are valued at their quoted daily settlement prices. The aggregate settlement values of the contracts are not recorded in the Statement of Net Assets. Fluctuations in the value of the contracts are recorded in the Statement of Net Assets as an asset (liability) and in the Statement of Operations as unrealized appreciation (depreciation) until the contracts are closed, when they are recorded as realized futures gains (losses).
During the six months ended March 31, 2015, the fund’s average investments in long and short futures contracts represented 2% and 0% of net assets, respectively, based on the average of aggregate settlement values at each quarter-end during the period.
4. Repurchase Agreements: The fund enters into repurchase agreements with institutional counterparties. Securities pledged as collateral to the fund under repurchase agreements are held by a custodian bank until the agreements mature. Each agreement requires that the market value of the collateral be sufficient to cover payments of interest and principal. The fund further mitigates its counterparty risk by entering into repurchase agreements only with a diverse group of prequalified counterparties, monitoring their financial strength, and entering into master repurchase agreements with its counterparties. The master repurchase agreements provide that, in the event of a counterparty’s default (including bankruptcy), the fund may terminate any repurchase agreements with that counterparty, determine the net amount owed, and sell or retain the collateral up to the net amount owed to the fund. Such action may be subject to legal proceedings, which may delay or limit the disposition of collateral.
5. Federal Income Taxes: The fund intends to continue to qualify as a regulated investment company and distribute all of its taxable income. Management has analyzed the fund’s tax positions taken for all open federal income tax years (September 30, 2011–2014), and for the period ended March 31, 2015, and has concluded that no provision for federal income tax is required in the fund’s financial statements.
6. Distributions: Distributions to shareholders are recorded on the ex-dividend date.
7. Securities Lending: To earn additional income, the fund lends its securities to qualified institutional borrowers. Security loans are required to be secured at all times by collateral in an amount at least equal to the market value of securities loaned. Daily market fluctuations could cause the value of loaned securities to be more or less than the value of the collateral received. When this occurs, the collateral is adjusted and settled on the next business day. The fund further mitigates its counterparty risk by entering into securities lending transactions only with a diverse group of prequalified counterparties, monitoring their financial strength, and entering into master securities lending agreements with its counterparties. The master securities lending agreements provide that, in the event of a counterparty’s default (including bankruptcy), the fund may terminate any loans with that borrower, determine the net amount owed, and sell or retain the collateral up to the net amount owed to the fund; however, such actions may be subject to legal proceedings. While collateral mitigates counterparty risk, in the absence of a default the fund may experience delays and costs in recovering the securities loaned. The fund invests cash collateral received in Vanguard Market Liquidity Fund, and records a liability in the Statement of Net Assets for the return of the collateral, during the period the securities are on loan. Securities lending income represents fees charged to borrowers plus income earned on invested cash collateral, less expenses associated with the loan.
22
Equity Income Fund
8. Credit Facility: The fund and certain other funds managed by The Vanguard Group participate in a $3 billion committed credit facility provided by a syndicate of lenders pursuant to a credit agreement that may be renewed annually; each fund is individually liable for its borrowings, if any, under the credit facility. Borrowings may be utilized for temporary and emergency purposes, and are subject to the fund’s regulatory and contractual borrowing restrictions. The participating funds are charged administrative fees and an annual commitment fee of 0.06% of the undrawn amount of the facility; these fees are allocated to the funds based on a method approved by the fund’s board of trustees and included in Management and Administrative expenses on the fund’s Statement of Operations. Any borrowings under this facility bear interest at a rate equal to the higher of the federal funds rate or LIBOR reference rate plus an agreed-upon spread.
The fund had no borrowings outstanding at March 31, 2015, or at any time during the period then ended.
9. Other: Dividend income is recorded on the ex-dividend date. Interest income includes income distributions received from Vanguard Market Liquidity Fund and is accrued daily. Premiums and discounts on debt securities purchased are amortized and accreted, respectively, to interest income over the lives of the respective securities. Security transactions are accounted for on the date securities are bought or sold. Costs used to determine realized gains (losses) on the sale of investment securities are those of the specific securities sold.
Each class of shares has equal rights as to assets and earnings, except that each class separately bears certain class-specific expenses related to maintenance of shareholder accounts (included in Management and Administrative expenses) and shareholder reporting. Marketing and distribution expenses are allocated to each class of shares based on a method approved by the board of trustees. Income, other non-class-specific expenses, and gains and losses on investments are allocated to each class of shares based on its relative net assets.
B. Wellington Management Company LLP provides investment advisory services to a portion of the fund for a fee calculated at an annual percentage rate of average net assets managed by the advisor. The basic fee of Wellington Management Company LLP is subject to quarterly adjustments based on performance for the preceding three years relative to the FTSE High Dividend Yield Index.
The Vanguard Group provides investment advisory services to a portion of the fund on an at-cost basis; the fund paid Vanguard advisory fees of $796,000 for the six months ended March 31, 2015.
For the six months ended March 31, 2015, the aggregate investment advisory fee represented an effective annual basic rate of 0.08% of the fund’s average net assets, before a decrease of $691,000 (0.01%) based on performance.
C. The Vanguard Group furnishes at cost corporate management, administrative, marketing, and distribution services. The costs of such services are allocated to the fund based on methods approved by the board of trustees. The fund has committed to invest up to 0.40% of its net assets in Vanguard. At March 31, 2015, the fund had contributed capital of $1,751,000 to Vanguard (included in Other Assets), representing 0.01% of the fund’s net assets and 0.70% of Vanguard’s capitalization. The fund’s trustees and officers are also directors and officers of Vanguard.
23
Equity Income Fund
D. Various inputs may be used to determine the value of the fund’s investments. These inputs are summarized in three broad levels for financial statement purposes. The inputs or methodologies used to value securities are not necessarily an indication of the risk associated with investing in those securities.
Level 1—Quoted prices in active markets for identical securities.
Level 2—Other significant observable inputs (including quoted prices for similar securities, interest rates, prepayment speeds, credit risk, etc.).
Level 3—Significant unobservable inputs (including the fund’s own assumptions used to determine the fair value of investments).
The following table summarizes the market value of the fund’s investments as of March 31, 2015, based on the inputs used to value them:
| Level 1 | Level 2 | Level 3 | |
| Investments | ($000) | ($000) | ($000) |
| Common Stocks | 17,902,737 | 721,959 | — |
| Temporary Cash Investments | 260,049 | 149,089 | — |
| Futures Contracts—Liabilities1 | (1,993) | — | — |
| Total | 18,160,793 | 871,048 | — |
| 1 Represents variation margin on the last day of the reporting period. |
E. At March 31, 2015, the aggregate settlement value of open futures contracts and the related unrealized appreciation (depreciation) were:
| ($000) | ||||
| Aggregate | ||||
| Number of | Settlement | Unrealized | ||
| Long (Short) | Value | Appreciation | ||
| Futures Contracts | Expiration | Contracts | Long (Short) | (Depreciation) |
| S&P 500 Index | June 2015 | 448 | 230,810 | (786) |
| E-mini S&P 500 Index | June 2015 | 518 | 53,375 | (379) |
| (1,165) |
Unrealized appreciation (depreciation) on open futures contracts is required to be treated as realized gain (loss) for tax purposes.
F. Distributions are determined on a tax basis and may differ from net investment income and realized capital gains for financial reporting purposes. Differences may be permanent or temporary. Permanent differences are reclassified among capital accounts in the financial statements to reflect their tax character. Temporary differences arise when certain items of income, expense, gain, or loss are recognized in different periods for financial statement and tax purposes. These differences will reverse at some time in the future. Differences in classification may also result from the treatment of short-term gains as ordinary income for tax purposes. The fund’s tax-basis capital gains and losses are determined only at the end of each fiscal year.
24
Equity Income Fund
At March 31, 2015, the cost of investment securities for tax purposes was $15,173,722,000. Net unrealized appreciation of investment securities for tax purposes was $3,860,112,000, consisting of unrealized gains of $4,010,301,000 on securities that had risen in value since their purchase and $150,189,000 in unrealized losses on securities that had fallen in value since their purchase.
G. During the six months ended March 31, 2015, the fund purchased $4,016,513,000 of investment securities and sold $3,249,011,000 of investment securities, other than temporary cash investments.
H. Capital share transactions for each class of shares were:
| Six Months Ended | Year Ended | |||
| March 31, 2015 | September 30, 2014 | |||
| Amount | Shares | Amount | Shares | |
| ($000) | (000) | ($000) | (000) | |
| Investor Shares | ||||
| Issued | 605,106 | 19,343 | 1,351,608 | 44,836 |
| Issued in Lieu of Cash Distributions | 238,643 | 7,800 | 261,200 | 8,834 |
| Redeemed | (702,926) | (22,487) | (1,447,516) | (47,855) |
| Net Increase (Decrease)—Investor Shares | 140,823 | 4,656 | 165,292 | 5,815 |
| Admiral Shares | ||||
| Issued | 1,828,694 | 27,948 | 3,402,387 | 53,571 |
| Issued in Lieu of Cash Distributions | 512,370 | 7,989 | 490,387 | 7,895 |
| Redeemed | (1,186,795) | (18,106) | (1,735,964) | (27,436) |
| Net Increase (Decrease)—Admiral Shares | 1,154,269 | 17,831 | 2,156,810 | 34,030 |
I. Management has determined that no material events or transactions occurred subsequent to March 31, 2015, that would require recognition or disclosure in these financial statements.
25
About Your Fund’s Expenses
As a shareholder of the fund, you incur ongoing costs, which include costs for portfolio management, administrative services, and shareholder reports (like this one), among others. Operating expenses, which are deducted from a fund’s gross income, directly reduce the investment return of the fund.
A fund’s expenses are expressed as a percentage of its average net assets. This figure is known as the expense ratio. The following examples are intended to help you understand the ongoing costs (in dollars) of investing in your fund and to compare these costs with those of other mutual funds. The examples are based on an investment of $1,000 made at the beginning of the period shown and held for the entire period.
The accompanying table illustrates your fund’s costs in two ways:
• Based on actual fund return. This section helps you to estimate the actual expenses that you paid over the period. The ”Ending Account Value“ shown is derived from the fund‘s actual return, and the third column shows the dollar amount that would have been paid by an investor who started with $1,000 in the fund. You may use the information here, together with the amount you invested, to estimate the expenses that you paid over the period.
To do so, simply divide your account value by $1,000 (for example, an $8,600 account value divided by $1,000 = 8.6), then multiply the result by the number given for your fund under the heading ”Expenses Paid During Period.“
• Based on hypothetical 5% yearly return. This section is intended to help you compare your fund‘s costs with those of other mutual funds. It assumes that the fund had a yearly return of 5% before expenses, but that the expense ratio is unchanged. In this case—because the return used is not the fund’s actual return—the results do not apply to your investment. The example is useful in making comparisons because the Securities and Exchange Commission requires all mutual funds to calculate expenses based on a 5% return. You can assess your fund’s costs by comparing this hypothetical example with the hypothetical examples that appear in shareholder reports of other funds.
Note that the expenses shown in the table are meant to highlight and help you compare ongoing costs only and do not reflect transaction costs incurred by the fund for buying and selling securities. Further, the expenses do not include any purchase, redemption, or account service fees described in the fund prospectus. If such fees were applied to your account, your costs would be higher. Your fund does not carry a “sales load.”
The calculations assume no shares were bought or sold during the period. Your actual costs may have been higher or lower, depending on the amount of your investment and the timing of any purchases or redemptions.
You can find more information about the fund’s expenses, including annual expense ratios, in the Financial Statements section of this report. For additional information on operating expenses and other shareholder costs, please refer to your fund’s current prospectus.
26
| Six Months Ended March 31, 2015 | |||
| Beginning | Ending | Expenses | |
| Account Value | Account Value | Paid During | |
| Equity Income Fund | 9/30/2014 | 3/31/2015 | Period |
| Based on Actual Fund Return | |||
| Investor Shares | $1,000.00 | $1,039.31 | $1.42 |
| Admiral Shares | 1,000.00 | 1,039.84 | 0.97 |
| Based on Hypothetical 5% Yearly Return | |||
| Investor Shares | $1,000.00 | $1,023.54 | $1.41 |
| Admiral Shares | 1,000.00 | 1,023.98 | 0.96 |
| The calculations are based on expenses incurred in the most recent six-month period. The fund’s annualized six-month expense ratios for that period are 0.28% for Investor Shares and 0.19% for Admiral Shares. The dollar amounts shown as “Expenses Paid” are equal to the annualized expense ratio multiplied by the average account value over the period, multiplied by the number of days in the most recent six-month period, then divided by the number of days in the most recent 12-month period. | |||
27
Trustees Approve Advisory Arrangements
The board of trustees of Vanguard Equity Income Fund has renewed the fund’s investment advisory arrangement with The Vanguard Group, Inc. (Vanguard) (Vanguard’s Equity Investment Group through its Quantitative Equity Group). The board also renewed the fund’s investment advisory arrangement and approved an amended investment advisory agreement with Wellington Management Company LLP (Wellington Management), effective April 1, 2015. The amended agreement contains a new base fee schedule; however, other terms of the existing agreement have not changed. The board determined that renewing the fund’s advisory arrangements and amending the fee schedule for Wellington Management was in the best interests of the fund and its shareholders.
The board based its decisions upon an evaluation of each advisor’s investment staff, portfolio management process, and performance. The trustees considered the factors discussed below, among others. However, no single factor determined whether the board approved the arrangements. Rather, it was the totality of the circumstances that drove the board’s decisions.
Nature, extent, and quality of services
The board considered the quality of the fund’s investment management services over both the short and long term, and took into account the organizational depth and stability of each advisor.
The board noted the following:
Wellington Management. Wellington Management, founded in 1928, is among the nation’s oldest and most respected institutional investment managers. The firm has advised the fund since 2000. The board also noted that the portfolio manager to the fund has over two decades of investment industry experience. Utilizing fundamental research, Wellington Management seeks to build a portfolio with an above-market yield, superior growth rate, and more attractive valuation. While every company purchased for the portfolio will pay a dividend, the goal is to build a portfolio with an above-market yield in aggregate, allowing for individual companies with below-market yields. Normalized earnings, normalized price-to-earnings ratios, and improving returns on capital are key to the research process. The board noted that the new fee arrangement would help Wellington Management to continue to attract and retain top investment talent, and thereby support enhanced organizational depth and stability, which would benefit the fund and its shareholders.
Vanguard. Vanguard has been managing investments for more than three decades. The Quantitative Equity Group adheres to a sound, disciplined investment management process; the team has considerable experience, stability, and depth. Vanguard has managed a portion of the fund since 2003.
The board concluded that each advisor’s experience, stability, depth, and performance, among other factors, warranted approval and continuation of the advisory arrangements.
Investment performance
The board considered the short- and long-term performance of the fund and each advisor, including any periods of outperformance or underperformance relative to a benchmark index and peer group. The board concluded that the performance was such that each advisory arrangement should continue. Information about the fund’s most recent performance can be found in the Performance Summary section of this report.
28
Cost
The board concluded that the fund’s expense ratio was well below the average expense ratio charged by funds in its peer group and that the fund’s advisory fee rate was also well below its peer-group average. Information about the fund’s expenses appears in the About Your Fund’s Expenses section of this report as well as in the Financial Statements section, which also includes information about the fund’s advisory fee rate.
The board did not consider profitability of Wellington Management in determining whether to approve the advisory fee, because Wellington Management is independent of Vanguard, and the advisory fee is the result of arm’s-length negotiations. The board does not conduct a profitability analysis of Vanguard, because of Vanguard’s unique “at-cost” structure. Unlike most other mutual fund management companies, Vanguard is owned by the funds it oversees, and produces “profits” only in the form of reduced expenses for fund shareholders.
The benefit of economies of scale
The board concluded that the fund’s shareholders benefit from economies of scale because of breakpoints in the fund’s advisory fee schedule for Wellington Management. The breakpoints reduce the effective rate of the fee as the fund’s assets managed by Wellington Management increase. The board also concluded that the fund’s at-cost arrangement with Vanguard ensures that the fund will realize economies of scale as it grows, with the cost to shareholders declining as the fund’s assets managed by Vanguard increase.
The board will consider whether to renew the advisory arrangements again after a one-year period.
29
Glossary
30-Day SEC Yield. A fund’s 30-day SEC yield is derived using a formula specified by the U.S. Securities and Exchange Commission. Under the formula, data related to the fund’s security holdings in the previous 30 days are used to calculate the fund’s hypothetical net income for that period, which is then annualized and divided by the fund’s estimated average net assets over the calculation period. For the purposes of this calculation, a security’s income is based on its current market yield to maturity (for bonds), its actual income (for asset-backed securities), or its projected dividend yield (for stocks). Because the SEC yield represents hypothetical annualized income, it will differ—at times significantly—from the fund’s actual experience. As a result, the fund’s income distributions may be higher or lower than implied by the SEC yield.
Beta. A measure of the magnitude of a fund’s past share-price fluctuations in relation to the ups and downs of a given market index. The index is assigned a beta of 1.00. Compared with a given index, a fund with a beta of 1.20 typically would have seen its share price rise or fall by 12% when the index rose or fell by 10%. For this report, beta is based on returns over the past 36 months for both the fund and the index. Note that a fund’s beta should be reviewed in conjunction with its R-squared (see definition). The lower the R-squared, the less correlation there is between the fund and the index, and the less reliable beta is as an indicator of volatility.
Dividend Yield. Dividend income earned by stocks, expressed as a percentage of the aggregate market value (or of net asset value, for a fund). The yield is determined by dividing the amount of the annual dividends by the aggregate value (or net asset value) at the end of the period. For a fund, the dividend yield is based solely on stock holdings and does not include any income produced by other investments.
Earnings Growth Rate. The average annual rate of growth in earnings over the past five years for the stocks now in a fund.
Equity Exposure. A measure that reflects a fund’s investments in stocks and stock futures. Any holdings in short-term reserves are excluded.
Expense Ratio. A fund’s total annual operating expenses expressed as a percentage of the fund’s average net assets. The expense ratio includes management and administrative expenses, but does not include the transaction costs of buying and selling portfolio securities.
Foreign Holdings. The percentage of a fund represented by securities or depositary receipts of companies based outside the United States.
Inception Date. The date on which the assets of a fund (or one of its share classes) are first invested in accordance with the fund’s investment objective. For funds with a subscription period, the inception date is the day after that period ends. Investment performance is measured from the inception date.
Median Market Cap. An indicator of the size of companies in which a fund invests; the midpoint of market capitalization (market price x shares outstanding) of a fund’s stocks, weighted by the proportion of the fund’s assets invested in each stock. Stocks representing half of the fund’s assets have market capitalizations above the median, and the rest are below it.
Price/Book Ratio. The share price of a stock divided by its net worth, or book value, per share. For a fund, the weighted average price/book ratio of the stocks it holds.
30
Price/Earnings Ratio. The ratio of a stock’s current price to its per-share earnings over the past year. For a fund, the weighted average P/E of the stocks it holds. P/E is an indicator of market expectations about corporate prospects; the higher the P/E, the greater the expectations for a company’s future growth.
R-Squared. A measure of how much of a fund’s past returns can be explained by the returns from the market in general, as measured by a given index. If a fund’s total returns were precisely synchronized with an index’s returns, its R-squared would be 1.00. If the fund’s returns bore no relationship to the index’s returns, its R-squared would be 0. For this report, R-squared is based on returns over the past 36 months for both the fund and the index.
Return on Equity. The annual average rate of return generated by a company during the past five years for each dollar of shareholder’s equity (net income divided by shareholder’s equity). For a fund, the weighted average return on equity for the companies whose stocks it holds.
Short-Term Reserves. The percentage of a fund invested in highly liquid, short-term securities that can be readily converted to cash.
Turnover Rate. An indication of the fund’s trading activity. Funds with high turnover rates incur higher transaction costs and may be more likely to distribute capital gains (which may be taxable to investors). The turnover rate excludes in-kind transactions, which have minimal impact on costs.
Benchmark Information
Spliced Equity Income Index: Russell 1000 Value Index through July 31, 2007; FTSE High Dividend Yield Index thereafter.
31
The People Who Govern Your Fund
The trustees of your mutual fund are there to see that the fund is operated and managed in your best interests since, as a shareholder, you are a part owner of the fund. Your fund’s trustees also serve on the board of directors of The Vanguard Group, Inc., which is owned by the Vanguard funds and provides services to them on an at-cost basis.
A majority of Vanguard’s board members are independent, meaning that they have no affiliation with Vanguard or the funds they oversee, apart from the sizable personal investments they have made as private individuals. The independent board members have distinguished backgrounds in business, academia, and public service. Each of the trustees and executive officers oversees 178 Vanguard funds
The following table provides information for each trustee and executive officer of the fund. More information about the trustees is in the Statement of Additional Information, which can be obtained, without charge, by contacting Vanguard at 800-662-7447, or online at vanguard.com.
| InterestedTrustee1 | Rajiv L. Gupta |
| Born 1945. Trustee Since December 2001.2 Principal | |
| F. William McNabb III | Occupation(s) During the Past Five Years and Other |
| Born 1957. Trustee Since July 2009. Chairman of | Experience: Chairman and Chief Executive Officer |
| the Board. Principal Occupation(s) During the Past | (retired 2009) and President (2006–2008) of |
| Five Years and Other Experience: Chairman of the | Rohm and Haas Co. (chemicals); Director of Tyco |
| Board of The Vanguard Group, Inc., and of each of | International PLC (diversified manufacturing and |
| the investment companies served by The Vanguard | services), Hewlett-Packard Co. (electronic computer |
| Group, since January 2010; Director of The Vanguard | manufacturing), and Delphi Automotive PLC |
| Group since 2008; Chief Executive Officer and | (automotive components); Senior Advisor at New |
| President of The Vanguard Group, and of each of | Mountain Capital. |
| the investment companies served by The Vanguard | |
| Group, since 2008; Director of Vanguard Marketing | Amy Gutmann |
| Corporation; Managing Director of The Vanguard | Born 1949. Trustee Since June 2006. Principal |
| Group (1995–2008). | Occupation(s) During the Past Five Years and |
| Other Experience: President of the University of | |
| IndependentTrustees | Pennsylvania; Christopher H. Browne Distinguished |
| Professor of Political Science, School of Arts and | |
| Emerson U. Fullwood | Sciences, and Professor of Communication, Annenberg |
| Born 1948. Trustee Since January 2008. Principal | School for Communication, with secondary faculty |
| Occupation(s) During the Past Five Years and | appointments in the Department of Philosophy, School |
| Other Experience: Executive Chief Staff and | of Arts and Sciences, and at the Graduate School of |
| Marketing Officer for North America and Corporate | Education, University of Pennsylvania; Trustee of the |
| Vice President (retired 2008) of Xerox Corporation | National Constitution Center; Chair of the Presidential |
| (document management products and services); | Commission for the Study of Bioethical Issues. |
| Executive in Residence and 2009–2010 Distinguished | |
| Minett Professor at the Rochester Institute of | JoAnn Heffernan Heisen |
| Technology; Director of SPX Corporation (multi-industry | Born 1950. Trustee Since July 1998. Principal |
| manufacturing), the United Way of Rochester, | Occupation(s) During the Past Five Years and Other |
| Amerigroup Corporation (managed health care), the | Experience: Corporate Vice President and Chief |
| University of Rochester Medical Center, Monroe | Global Diversity Officer (retired 2008) and Member |
| Community College Foundation, and North Carolina | of the Executive Committee (1997–2008) of Johnson |
| A&T University. | & Johnson (pharmaceuticals/medical devices/ |
| consumer products); Director of Skytop Lodge | |
| Corporation (hotels), the University Medical Center | |
| at Princeton, the Robert Wood Johnson Foundation, | |
| and the Center for Talent Innovation; Member of | |
| the Advisory Board of the Institute for Women’s | |
| Leadership at Rutgers University. |
| F. Joseph Loughrey | Executive Officers | |
| Born 1949. Trustee Since October 2009. Principal | ||
| Occupation(s) During the Past Five Years and Other | Glenn Booraem | |
| Experience: President and Chief Operating Officer | Born 1967. Controller Since July 2010. Principal | |
| (retired 2009) of Cummins Inc. (industrial machinery); | Occupation(s) During the Past Five Years and Other | |
| Chairman of the Board of Hillenbrand, Inc. (specialized | Experience: Principal of The Vanguard Group, Inc.; | |
| consumer services), and of Oxfam America; Director | Controller of each of the investment companies served | |
| of SKF AB (industrial machinery), Hyster-Yale Materials | by The Vanguard Group; Assistant Controller of each of | |
| Handling, Inc. (forklift trucks), the Lumina Foundation | the investment companies served by The Vanguard | |
| for Education, and the V Foundation for Cancer | Group (2001–2010). | |
| Research; Member of the Advisory Council for the | ||
| College of Arts and Letters and of the Advisory Board | Thomas J. Higgins | |
| to the Kellogg Institute for International Studies, both | Born 1957. Chief Financial Officer Since September | |
| at the University of Notre Dame. | 2008. Principal Occupation(s) During the Past Five | |
| Years and Other Experience: Principal of The Vanguard | ||
| Mark Loughridge | Group, Inc.; Chief Financial Officer of each of the | |
| Born 1953. Trustee Since March 2012. Principal | investment companies served by The Vanguard Group; | |
| Occupation(s) During the Past Five Years and Other | Treasurer of each of the investment companies served | |
| Experience: Senior Vice President and Chief Financial | by The Vanguard Group (1998–2008). | |
| Officer (retired 2013) at IBM (information technology | ||
| services); Fiduciary Member of IBM’s Retirement Plan | Kathryn J. Hyatt | |
| Committee (2004–2013); Director of the Dow Chemical | Born 1955. Treasurer Since November 2008. Principal | |
| Company; Member of the Council on Chicago Booth. | Occupation(s) During the Past Five Years and Other | |
| Experience: Principal of The Vanguard Group, Inc.; | ||
| Scott C. Malpass | Treasurer of each of the investment companies served | |
| Born 1962. Trustee Since March 2012. Principal | by The Vanguard Group; Assistant Treasurer of each of | |
| Occupation(s) During the Past Five Years and Other | the investment companies served by The Vanguard | |
| Experience: Chief Investment Officer and Vice | Group (1988–2008). | |
| President at the University of Notre Dame; Assistant | ||
| Professor of Finance at the Mendoza College of | Heidi Stam | |
| Business at Notre Dame; Member of the Notre Dame | Born 1956. Secretary Since July 2005. Principal | |
| 403(b) Investment Committee; Board Member of | Occupation(s) During the Past Five Years and Other | |
| TIFF Advisory Services, Inc., and Catholic Investment | Experience: Managing Director of The Vanguard | |
| Services, Inc. (investment advisors); Member of | Group, Inc.; General Counsel of The Vanguard Group; | |
| the Investment Advisory Committee of Major | Secretary of The Vanguard Group and of each of the | |
| League Baseball. | investment companies served by The Vanguard Group; | |
| Director and Senior Vice President of Vanguard | ||
| André F. Perold | Marketing Corporation. | |
| Born 1952. Trustee Since December 2004. Principal | ||
| Occupation(s) During the Past Five Years and Other | Vanguard Senior ManagementTeam | |
| Experience: George Gund Professor of Finance and | ||
| Banking, Emeritus at the Harvard Business School | Mortimer J. Buckley | Chris D. McIsaac |
| (retired 2011); Chief Investment Officer and Managing | Kathleen C. Gubanich | Michael S. Miller |
| Partner of HighVista Strategies LLC (private investment | Paul A. Heller | James M. Norris |
| firm); Director of Rand Merchant Bank; Overseer of | Martha G. King | Glenn W. Reed |
| the Museum of Fine Arts Boston. | John T. Marcante | |
| Peter F. Volanakis | Chairman Emeritus and Senior Advisor | |
| Born 1955. Trustee Since July 2009. Principal | ||
| Occupation(s) During the Past Five Years and Other | John J. Brennan | |
| Experience: President and Chief Operating Officer | Chairman, 1996–2009 | |
| (retired 2010) of Corning Incorporated (communications | Chief Executive Officer and President, 1996–2008 | |
| equipment); Trustee of Colby-Sawyer College; | ||
| Member of the Advisory Board of the Norris Cotton | Founder | |
| Cancer Center and of the Advisory Board of the | ||
| Parthenon Group (strategy consulting). | John C. Bogle | |
| Chairman and Chief Executive Officer, 1974–1996 | ||
1 Mr. McNabb is considered an “interested person,” as defined in the Investment Company Act of 1940, because he is an officer of the Vanguard funds.
2 December 2002 for Vanguard Equity Income Fund, the Vanguard Municipal Bond Funds, and the Vanguard State Tax-Exempt Funds.
 | ||
| P.O. Box 2600 | ||
| Valley Forge, PA 19482-2600 | ||
| Connect with Vanguard® > vanguard.com | ||
| Fund Information > 800-662-7447 | CFA® is a registered trademark owned by CFA Institute. | |
| Direct Investor Account Services > 800-662-2739 | ||
| Institutional Investor Services > 800-523-1036 | ||
| Text Telephone for People | ||
| Who Are Deaf or Hard of Hearing> 800-749-7273 | ||
| This material may be used in conjunction | ||
| with the offering of shares of any Vanguard | ||
| fund only if preceded or accompanied by | ||
| the fund’s current prospectus. | ||
| All comparative mutual fund data are from Lipper, a | ||
| Thomson Reuters Company, or Morningstar, Inc., unless | ||
| otherwise noted. | ||
| You can obtain a free copy of Vanguard’s proxy voting | ||
| guidelines by visiting vanguard.com/proxyreporting or by | ||
| calling Vanguard at 800-662-2739. The guidelines are | ||
| also available from the SEC’s website, sec.gov. In | ||
| addition, you may obtain a free report on how your fund | ||
| voted the proxies for securities it owned during the 12 | ||
| months ended June 30. To get the report, visit either | ||
| vanguard.com/proxyreporting or sec.gov. | ||
| You can review and copy information about your fund at | ||
| the SEC’s Public Reference Room in Washington, D.C. To | ||
| find out more about this public service, call the SEC at | ||
| 202-551-8090. Information about your fund is also | ||
| available on the SEC’s website, and you can receive | ||
| copies of this information, for a fee, by sending a | ||
| request in either of two ways: via e-mail addressed to | ||
| publicinfo@sec.gov or via regular mail addressed to the | ||
| Public Reference Section, Securities and Exchange | ||
| Commission, Washington, DC 20549-1520. | ||
| © 2015 The Vanguard Group, Inc. | ||
| All rights reserved. | ||
| Vanguard Marketing Corporation, Distributor. | ||
| Q652 052015 | ||
Semiannual Report | March 31, 2015
Vanguard PRIMECAP Core Fund
The mission continues
On May 1, 1975, Vanguard began operations, a fledgling company based on the simple but revolutionary idea that a mutual fund company should be managed solely in the interest of its investors.
Four decades later, that revolutionary spirit continues to animate the enterprise. Vanguard remains on a mission to give investors the best chance of investment success.
As we mark our 40th anniversary, we thank you for entrusting your assets to Vanguard and giving us the opportunity to help you reach your financial goals in the decades to come.
| Contents | |
| Your Fund’s Total Returns. | 1 |
| Chairman’s Letter. | 2 |
| Advisor’s Report. | 8 |
| Fund Profile. | 12 |
| Performance Summary. | 13 |
| Financial Statements. | 14 |
| About Your Fund’s Expenses. | 23 |
| Trustees Approve Advisory Arrangement. | 25 |
| Glossary. | 26 |
Please note: The opinions expressed in this report are just that—informed opinions. They should not be considered promises or advice. Also, please keep in mind that the information and opinions cover the period through the date on the front of this report. Of course, the risks of investing in your fund are spelled out in the prospectus.
See the Glossary for definitions of investment terms used in this report.
About the cover: Since our founding, Vanguard has drawn inspiration from the enterprise and valor demonstrated by British naval hero Horatio Nelson and his command at the Battle of the Nile in 1798. The photograph displays a replica of a merchant ship from the same era as Nelson’s flagship, the HMS Vanguard.
Your Fund’s Total Returns
| Six Months Ended March 31, 2015 | |
| Total | |
| Returns | |
| Vanguard PRIMECAP Core Fund | 7.99% |
| MSCI US Prime Market 750 Index | 6.62 |
| Multi-Cap Core Funds Average | 6.45 |
| Multi-Cap Core Funds Average: Derived from data provided by Lipper, a Thomson Reuters Company. |
| Your Fund’s Performance at a Glance | ||||
| September 30, 2014, Through March 31, 2015 | ||||
| Distributions Per Share | ||||
| Starting | Ending | Income | Capital | |
| Share Price | Share Price | Dividends | Gains | |
| Vanguard PRIMECAP Core Fund | $21.87 | $22.04 | $0.270 | $1.297 |
1

Chairman’s Letter
Dear Shareholder,
Investors received an array of returns from the U.S. stock market’s various segments over the six months ended March 31, 2015. From a style standpoint, growth stocks stood the tallest. When it came to size, small-capitalization stocks ruled over large- and mid-caps.
In this environment, Vanguard PRIMECAP Core Fund, which contains a mix of both growth and value stocks and large- and mid-caps, notched impressive results. The fund returned about 8%, more than 1 percentage point better than the return of its benchmark, the MSCI US Prime Market 750 Index, and the average return of its multi-cap core fund peers.
Health care and information technology are PRIMECAP Core’s two largest holdings and have been most identified with the fund’s success. Although health care stocks contributed significantly to the fund’s overall return, they didn’t overwhelm. Meanwhile, technology stocks struggled. Most of the fund’s outperformance came from the consumer discretionary and industrial sectors.
The Fed’s cautious approach has helped the U.S. stock market
The broad U.S. stock market returned about 7% for the six months. Stocks were resilient after declining markedly at the start of the period and enduring bouts of turmoil in subsequent months. Investors’ concerns included the strength of the dollar and how it would affect the profits of U.S.-based multinational corporations.
Overall, stocks responded favorably to both the Federal Reserve’s cautious approach to raising short-term interest rates and the monetary stimulus efforts of other nations’ central banks. A strong rebound in February, when the broad market notched its largest monthly gain since October 2011, helped lift returns for the period.
International stocks had a slightly negative return as the dollar’s strength against many foreign currencies hurt results. Without this currency effect, stocks outside of the United States generally advanced. The developed markets of the Pacific, particularly Japan, were especially strong.
Bond prices received a boost from central bank stimulus
Bond prices also were supported by accommodative monetary policies from the world’s central banks and investors who sought safe-haven assets amid turbulence in the stock market. The broad U.S. taxable bond market returned 3.43%. The yield of the 10-year Treasury note ended March at 1.95%, down from 2.48% six months earlier. (Bond prices and yields move in opposite directions.)
Municipal bonds returned 2.40%, although results faded later in the period as more bonds were issued.
| Market Barometer | |||
| Total Returns | |||
| Periods Ended March 31, 2015 | |||
| Six | One | Five Years | |
| Months | Year | (Annualized) | |
| Stocks | |||
| Russell 1000 Index (Large-caps) | 6.55% | 12.73% | 14.73% |
| Russell 2000 Index (Small-caps) | 14.46 | 8.21 | 14.57 |
| Russell 3000 Index (Broad U.S. market) | 7.13 | 12.37 | 14.71 |
| FTSE All-World ex US Index (International) | -0.08 | -0.21 | 5.19 |
| Bonds | |||
| Barclays U.S. Aggregate Bond Index (Broad taxable market) | 3.43% | 5.72% | 4.41% |
| Barclays Municipal Bond Index (Broad tax-exempt market) | 2.40 | 6.62 | 5.11 |
| Citigroup Three-Month U.S. Treasury Bill Index | 0.00 | 0.03 | 0.06 |
| CPI | |||
| Consumer Price Index | -0.80% | -0.07% | 1.64% |
3
International bond markets (as measured by the Barclays Global Aggregate Index ex USD) returned –7.49%, a reflection of foreign currencies’ weakness relative to the dollar. International bonds hedged to eliminate the effect of currency exchange rates produced positive returns.
The Fed’s target of 0%–0.25% for short-term interest rates continued to cap returns for money market funds and savings accounts.
A mix of sectors brought about the fund’s outperformance
Your fund’s advisor, PRIMECAP Management Company, is known for its talent and experience, a detailed investment process, and great patience. These factors have helped the fund surpass its comparative standards over its more than ten years of existence, including in the recent half year. That’s a tribute to PRIMECAP Management, which recently added James Marchetti to its roster of distinguished portfolio managers.
When PRIMECAP Management invests in stocks of companies that meet its strict criteria, it generally does so for years, rather than months, at a time. If it believes a company is sound, its prospects bright, and its management team sharp, the advisor tends to hold on, even amid occasional detours through short-term underperformance.
PRIMECAP Management has long favored health care and technology stocks. These sectors, where innovation and patience are
| Expense Ratios | ||
| Your Fund Compared With Its Peer Group | ||
| Peer Group | ||
| Fund | Average | |
| PRIMECAP Core Fund | 0.50% | 1.21% |
| The fund expense ratio shown is from the prospectus dated January 27, 2015, and represents estimated costs for the current fiscal year. For the six months ended March 31, 2015, the fund’s annualized expense ratio was 0.49%. The peer-group expense ratio is derived from data provided by Lipper, a Thomson Reuters Company, and captures information through year-end 2014. | ||
| Peer group: Multi-Cap Core Funds. | ||
4
crucial to success, match up nicely with the advisor’s careful research methods and long-term investment strategy. Over the recent six months, however, health care shined less than usual, and technology didn’t shine at all.
Still, health care stocks contributed more than 3 percentage points to PRIMECAP Core’s returns. That was largely a result of the advisor’s allocation to the sector, which averaged 30% of assets over the period, and its specific biotechnology holdings.
| Marking the sixth anniversary of the bull market |
| There’s been a long and steep climb in the U.S. stock market in the six years since the worst |
| of the financial crisis. |
| The dark line in the chart below traces the rise in the Russell 3000 Index from a low of 390 |
| on March 9, 2009, to 1,241 on March 9, 2015—an increase of roughly 220% in 72 months. |
| The robustness and duration of the advance defied the predictions of some market pundits. |
| Of course, the financial crisis caught many of them off guard as well. The lighter line below |
| charts the drop of about 60% in the index in 17 months, from its pre-crisis peak of 908 on |
| October 9, 2007. |
| These sharp and unexpected movements illustrate the challenge of trying to time the markets. |
| Instead of trying to guess which way the wind will blow (and for how long), investors are |
| generally better off staying committed to their investment plan through market ups and downs. |
| Rebalancing your portfolio from time to time will help keep market movements from pushing |
| your allocation to stocks and bonds off target. |
| The performance of the U.S. stock market since the start of the financial crisis |
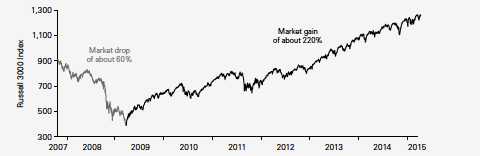
| Sources: Vanguard, based on data for the Russell 3000 Index. |
5
The biotechnology firms the advisor focused on cultivate rich drug pipelines that are quite productive now or are expected to be in the years ahead. The fund’s pharmaceutical companies generated spottier results, however, and the fund had no exposure to the robust managed health care area.
Technology holdings encompassed about one-quarter of the portfolio’s assets and posted tepid returns of about 1%. By comparison, the technology stocks held by the benchmark gained almost 7%.
With its two workhouse sectors carrying less than their usual loads, PRIMECAP Core relied on consumer discretionary and industrial stocks for superior performance. Consumer discretionary holdings returned about 29%, more than twice the return of their counterparts in the benchmark. Household appliance firms and apparel and automotive retailers stood out.
PRIMECAP Core’s industrial stocks returned about 14%, also about twice as high as the comparable result for the benchmark. Most of the difference came from airlines, where pricing advantages have benefited some larger firms and lower fuel prices have generally improved profitability in the industry.
None of the six other industry sectors accounted for more than 7% of the portfolio While PRIMECAP Core’s energy stocks declined more steeply than those of the benchmark, the advisor’s small exposure to the sector worked in its favor.
For more about the advisor’s strategy and the fund’s positioning during the six months, please see the Advisor’s Report that follows this letter.
Our commitment to balanced investing has roots reaching back many decades
On May 1, Vanguard will celebrate its 40th anniversary. Although many things have changed since 1975, our investment philosophy has not. From the start, we’ve focused on four timeless, straightforward principles that we believe help give clients the best chance for investment success:
• Goals. Create clear, appropriate investment goals.
• Balance. Develop a suitable asset allocation using broadly diversified funds.
• Cost. Minimize cost.
• Discipline. Maintain perspective and long-term discipline.
Although Vanguard has followed all of these principles since its founding, one of them—the focus on balanced investing—is in the company’s DNA. That’s because our predecessor company, Wellington Management, was a pioneer in this respect, launching a fund in 1929 that included both stocks and bonds.
Vanguard Wellington™ Fund got its start on the eve of the Great Depression, but it thrived over the long term, thanks in large part to its balancing of stocks and bonds. And this strategy continues to define the fund, now one of the nation’s largest balanced funds.
6
As we embark on our fifth decade, we’ll continue to emphasize the importance of balanced, diversified investing. How investors allocate assets between stocks and bonds has an enormous effect on their portfolio’s risks and returns. And broad diversification reduces exposure to specific risks, while providing opportunities to benefit from the market’s current leaders. (You can read more in Vanguard’s Principles for Investing Success, available at vanguard.com/research.)
As always, thank you for investing with Vanguard.
Sincerely,

F. William McNabb III
Chairman and Chief Executive Officer
April 20, 2015
Advisor’s Report
For the six months ended March 31, 2015, Vanguard PRIMECAP Core Fund returned 7.99%, exceeding the 6.62% return of its benchmark, the unmanaged MSCI US Prime Market 750 Index, the 6.45% average return of its multi-capitalization core fund competitors, and the 5.93% return of the unmanaged S&P 500 Index. Relative to the S&P 500, the fund’s outperformance was attributable primarily to its overweight position in health care, the top-contributing sector over the period, and its underweight position in energy, the worst-performing sector. Stock selection had a modestly positive impact on the fund’s relative results, with strong selection in consumer discretionary and industrials partially offset by unfavorable selection in information technology, health care, and energy.
Investment environment
Over the six months, U.S. equities continued to appreciate, and the S&P 500 reached a new high during the first calendar quarter of 2015. Small-capitalization stocks, as measured by the Russell 2000 Index, widely outperformed large-capitalization stocks, as measured by the Russell 1000 Index. Within each index, stocks with higher price/earnings ratios and higher forecasted growth rates outperformed stocks with lower P/E ratios and lower forecasted growth rates.
The U.S. economy continued to expand, as real gross domestic product (GDP) grew 5.0% in the third quarter of 2014 and 2.2% in the fourth quarter. The labor market improved further, with the unemployment rate declining over the period to 5.5%, the lowest level since May 2008. Inflation remained low, in part because of falling energy prices; the gasoline component of the Consumer Price Index declined 33% from February 2014 to February 2015. Lower gasoline prices contributed to improving consumer confidence and a higher savings rate over the past several months. The U.S. dollar strengthened, notably against the euro, which declined from $1.26 on September 30 to $1.08 on March 31 as the European Central Bank began buying sovereign bonds. The strong dollar hurt U.S. exporters, including many of the fund’s information technology companies, by increasing the cost of their dollar-denominated products and services sold in countries whose currencies have depreciated against the dollar or by reducing the dollar value of their products and services sold in foreign currencies.
The Federal Reserve concluded its asset purchase program in October. In March, 15 of 17 participants in the Fed’s Federal Open Market Committee indicated that it would be appropriate to begin increasing the target range for the federal funds rate, currently at 0–0.25%, at some point in 2015.
On the geopolitical front, in early April the United States and five other world powers reached a controversial, preliminary deal with Iran to limit its nuclear program in exchange for lifting economic sanctions. The Middle East remained mired in conflict, with civil wars in Yemen, Syria, and Iraq. In Africa, one terrorist group, Boko Haram, massacred civilians in Nigeria, and another, Al-Shabaab, did the same in Kenya.
8
Outlook for U.S. equities
We are less constructive on the outlook for U.S. equities than we have been in recent years, though we continue to find individual stocks that are attractively valued. We also believe that stocks are a more attractive investment than bonds at current prices. As of March 31, the S&P 500 was trading for approximately 17.3 times 2015 consensus estimated earnings per share of $120, a higher level than the average of the past 15 years. The index also appears more expensive on a price-to-sales multiple basis, because profit margins are near record highs.
Portfolio update and outlook
For the six-month period, the portfolio was overweighted in health care, information technology, and industrials. These sectors constituted about 74% of the fund’s holdings on average (compared to a 45% combined average weighting in the S&P 500), including nine of the fund’s ten largest holdings at the end of the period.
The fund’s outperformance over the period was largely the result of favorable sector allocations, notably in health care (overweight) and energy (underweight). Positive stock selection in consumer discretionary and industrials was offset by unfavorable stock selection in information technology, health care, and energy. In consumer discretionary, CarMax (+49%), Sony (+48%), L Brands (+45%), Ross Stores (+40%), Whirlpool (+40%), Carnival (+20%), and TJX (+19%) accounted for most of the outperformance. The largest positive contributors in industrials were United Continental Holdings (+44%) and Southwest Airlines (+32%).
These positives were partially offset by unfavorable stock selection in information technology, including SanDisk (–35%), EMC (–12%), Hewlett Packard (–11%), Google (–5%), and an underweight position in Apple (+25%). In health care, Roche (–4%) detracted from the fund’s relative results, while in energy, unfavorable selection was led by Transocean (–51%).
Health care
We remain confident in the fundamental long-term outlook for the health care industry. Increasing worldwide demand for its products will be driven by demographic trends and by the industry’s ability to develop more effective therapies for a range of diseases and conditions. For example, Biogen, one of the fund’s largest holdings, recently reported positive data in an early stage trial studying its Alzheimer’s disease treatment, rekindling both researcher and investor enthusiasm in the potential of this class of drug. Eli Lilly, another top-ten holding, has a similar promising drug in late-stage clinical trials.
Another area of tremendous progress is the treatment of hepatitis C virus liver infections. Five years ago, the standard treatment for this deadly disease consisted of a year-long regimen, including hard-to-tolerate weekly injections; the resulting cure rate was about 50%. Recently, Gilead (which the fund did not hold during the period) and Abbvie received FDA approval for their oral therapies, which can achieve cure rates of about 95% in as little as 8 to 12 weeks, and further improvements are on the horizon.
9
Although our long-term outlook for health care is positive, it is tempered by increasing concerns about reimbursement and pricing for approved drugs and biologics. Payers recently have been able to extract higher-than-expected pricing concessions from Abbvie and Gilead as they competed for market share with their new hepatitis C drugs. This made investors concerned that pricing pressure may similarly make its way into other therapeutic areas, such as diabetes, rheumatoid arthritis, and multiple sclerosis.
Ultimately, we feel that high-value therapies that are unique in the market and substantially improve patient outcomes will continue to garner favorable pricing from reimbursement authorities. As we think ahead to our stock positioning in health care, we will focus to an even greater extent on the more innovative bio/pharma companies with the most distinctive pipelines. Given the uncertain pricing outlook, we feel that it might be harder for the large biotech and pharmaceutical groups to continue their relative outperformance. Increasingly, we see more attractive opportunities in other health care areas, such as life science research tools and diagnostics.
Information technology
We continue to believe that many of the funds’ holdings in information technology are attractively valued. The P/E multiple of the sector relative to that of the broader S&P 500 is near a multidecade low. The tech companies in the index are also far better capitalized than companies in other sectors. Many of the fund’s holdings have considerable percentages of their market capitalization in net cash on their balance sheets. Valuations for these holdings, which are already at reasonable multiples, are even more attractive when their net cash balances are considered.
A fundamental technology shift occurring today is the transition from client-server to internet-based, or cloud, architectures, which allow users to rent software applications and computing resources and use them as services over the internet. This model is more flexible than the traditional one of buying perpetual or term-based licenses to software and running these applications on local servers. We believe that Microsoft and Intel, which are nearly synonymous with the client-server era of computing, are good examples of companies that are evolving to remain relevant. Microsoft has reengineered and repriced many of its software applications to be delivered as cloud services, while the servers that power the cloud’s data centers overwhelmingly use Intel processors.
Industrials
Within industrials, we continue to find the airline industry attractive for equity investment in spite of its recent outperformance. The industry has consolidated significantly over the past decade, and today the four largest airlines constitute roughly 85% of industry capacity. Capacity has been reduced by 9% since 2007, and utilization is at historically high levels, giving the airlines the opportunity to raise ticket prices. Furthermore, the industry has established new, high-margin ancillary revenue streams, which are becoming
10
significant drivers of profitability. Finally, the recent drop in crude oil prices has been a major boost to the airlines, as jet fuel averages roughly 25% of an airline’s costs.
Conclusion
In conclusion, we remain committed to our investment philosophy, which is to invest in attractively priced individual stocks for the long term. This “bottom-up” approach often results in portfolios that bear little resemblance to market indexes; therefore, our results often deviate substantially. Furthermore, our long-term investment horizon results in low portfolio turnover, which creates the possibility for extended periods of underperformance when the stocks in our portfolio fall out of favor. We nonetheless believe that this approach can generate superior results for investors over the long term.
PRIMECAP Management Company
April 13, 2015
PRIMECAP Core Fund
Fund Profile
As of March 31, 2015
| Portfolio Characteristics | |||
| MSCI US | DJ | ||
| Prime | U.S. Total | ||
| Market | Market | ||
| Fund | 750 Index | FA Index | |
| Number of Stocks | 143 | 748 | 3,757 |
| Median Market Cap | $57.8B | $63.7B | $46.5B |
| Price/Earnings Ratio | 22.3x | 20.5x | 21.4x |
| Price/Book Ratio | 3.8x | 2.9x | 2.8x |
| Return on Equity | 19.5% | 18.3% | 17.5% |
| Earnings Growth | |||
| Rate | 14.7% | 13.7% | 13.5% |
| Dividend Yield | 1.7% | 2.0% | 1.9% |
| Foreign Holdings | 12.3% | 0.0% | 0.0% |
| Turnover Rate | |||
| (Annualized) | 10% | — | — |
| Ticker Symbol | VPCCX | — | — |
| Expense Ratio1 | 0.50% | — | — |
| 30-Day SEC Yield | 1.07% | — | — |
| Short-Term Reserves | 7.7% | — | — |
| Sector Diversification (% of equity exposure) | |||
| DJ | |||
| U.S. | |||
| MSCI US | Total | ||
| Prime | Market | ||
| Market | FA | ||
| Fund | 750 Index | Index | |
| Consumer | |||
| Discretionary | 12.5% | 13.2% | 13.4% |
| Consumer Staples | 0.9 | 9.2 | 8.4 |
| Energy | 1.9 | 7.9 | 7.3 |
| Financials | 6.5 | 16.4 | 17.6 |
| Health Care | 30.3 | 14.7 | 14.6 |
| Industrials | 18.3 | 10.5 | 11.1 |
| Information | |||
| Technology | 26.3 | 19.6 | 19.0 |
| Materials | 3.3 | 3.3 | 3.5 |
| Telecommunication | |||
| Services | 0.0 | 2.2 | 2.0 |
| Utilities | 0.0 | 3.0 | 3.1 |
| Volatility Measures | ||
| DJ | ||
| MSCI US | U.S. Total | |
| Prime Market | Market | |
| 750 Index | FA Index | |
| R-Squared | 0.90 | 0.90 |
| Beta | 0.91 | 0.89 |
| These measures show the degree and timing of the fund’s fluctuations compared with the indexes over 36 months. | ||
| Ten Largest Holdings (% of total net assets) | ||
| Southwest Airlines Co. | Airlines | 5. |
| Amgen Inc. | Biotechnology | 5.1 |
| Biogen Inc. | Biotechnology | 4.7 |
| Eli Lilly & Co. | Pharmaceuticals | 3.9 |
| Roche Holding AG | Pharmaceuticals | 3.8 |
| Texas Instruments Inc. | Semiconductors | 2.9 |
| Google Inc. | Internet Software & | |
| Services | 2.7 | |
| Johnson & Johnson | Pharmaceuticals | 2.2 |
| L Brands Inc. | Apparel Retail | 2.1 |
| Novartis AG | Pharmaceuticals | 2.1 |
| Top Ten | 34.7 | |
| The holdings listed exclude any temporary cash investments and equity index products. | ||
Investment Focus
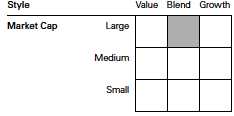
1 The expense ratio shown is from the prospectus dated January 27, 2015, and represents estimated costs for the current fiscal year. For the six months ended March 31, 2015, the annualized expense ratio was 0.49%.
12
PRIMECAP Core Fund
Performance Summary
All of the returns in this report represent past performance, which is not a guarantee of future results that may be achieved by the fund. (Current performance may be lower or higher than the performance data cited. For performance data current to the most recent month-end, visit our website at vanguard.com/performance.) Note, too, that both investment returns and principal value can fluctuate widely, so an investor’s shares, when sold, could be worth more or less than their original cost. The returns shown do not reflect taxes that a shareholder would pay on fund distributions or on the sale of fund shares.
Fiscal-Year Total Returns (%): December 9, 2004, Through March 31, 2015

| Average Annual Total Returns: Periods Ended March 31, 2015 | ||||
| Inception | One | Five | Ten | |
| Date | Year | Years | Years | |
| PRIMECAP Core Fund | 12/9/2004 | 15.49% | 15.55% | 10.68% |
See Financial Highlights for dividend and capital gains information.
13
PRIMECAP Core Fund
Financial Statements (unaudited)
Statement of Net Assets
As of March 31, 2015
The fund reports a complete list of its holdings in regulatory filings four times in each fiscal year, at the quarter-ends. For the second and fourth fiscal quarters, the lists appear in the fund’s semiannual and annual reports to shareholders. For the first and third fiscal quarters, the fund files the lists with the Securities and Exchange Commission on Form N-Q. Shareholders can look up the fund’s Forms N-Q on the SEC’s website at sec.gov. Forms N-Q may also be reviewed and copied at the SEC’s Public Reference Room (see the back cover of this report for further information).
| Market | |||
| Value• | |||
| Shares | ($000) | ||
| Common Stocks (92.5%) | |||
| Consumer Discretionary (11.6%) | |||
| L Brands Inc. | 1,705,620 | 160,823 | |
| * | CarMax Inc. | 1,811,400 | 125,005 |
| TJX Cos. Inc. | 1,425,000 | 99,821 | |
| * | Sony Corp. ADR | 3,450,000 | 92,391 |
| Walt Disney Co. | 780,000 | 81,814 | |
| Carnival Corp. | 1,614,300 | 77,228 | |
| * | DIRECTV | 734,488 | 62,505 |
| Ross Stores Inc. | 507,950 | 53,517 | |
| Gildan Activewear Inc. | |||
| Class A | 953,900 | 28,159 | |
| Whirlpool Corp. | 130,000 | 26,268 | |
| * | Bed Bath & Beyond Inc. | 337,491 | 25,911 |
| * | Urban Outfitters Inc. | 401,900 | 18,347 |
| VF Corp. | 223,380 | 16,823 | |
| Time Warner Cable Inc. | 53,000 | 7,944 | |
| * | Amazon.com Inc. | 13,000 | 4,837 |
| * | Norwegian Cruise Line | ||
| Holdings Ltd. | 81,700 | 4,413 | |
| Las Vegas Sands Corp. | 10,000 | 550 | |
| Royal Caribbean Cruises Ltd. | 5,000 | 409 | |
| 886,765 | |||
| Consumer Staples (0.8%) | |||
| CVS Health Corp. | 327,377 | 33,789 | |
| PepsiCo Inc. | 300,000 | 28,686 | |
| 62,475 | |||
| Energy (1.7%) | |||
| Schlumberger Ltd. | 507,100 | 42,313 | |
| ^ | Transocean Ltd. | 1,880,500 | 27,587 |
| EOG Resources Inc. | 203,000 | 18,613 | |
| National Oilwell Varco Inc. | 263,200 | 13,157 | |
| Cabot Oil & Gas Corp. | 391,000 | 11,546 | |
| Noble Energy Inc. | 150,000 | 7,335 | |
| Exxon Mobil Corp. | 46,012 | 3,911 | |
| * | Southwestern Energy Co. | 159,300 | 3,694 |
| * | Cameron International Corp. | 25,300 | 1,142 |
| Encana Corp. | 60,000 | 669 | |
| Petroleo Brasileiro SA ADR | |||
| Type A | 75,000 | 457 | |
| Market | |||
| Value• | |||
| Shares | ($000) | ||
| Frank’s International NV | 10,000 | 187 | |
| Petroleo Brasileiro SA ADR | 30,000 | 180 | |
| 130,791 | |||
| Financials (6.0%) | |||
| Marsh & McLennan | |||
| Cos. Inc. | 2,713,875 | 152,221 | |
| Charles Schwab Corp. | 3,799,511 | 115,657 | |
| Wells Fargo & Co. | 1,112,000 | 60,493 | |
| Chubb Corp. | 376,500 | 38,064 | |
| Progressive Corp. | 1,024,800 | 27,875 | |
| US Bancorp | 509,000 | 22,228 | |
| CME Group Inc. | 159,700 | 15,125 | |
| JPMorgan Chase & Co. | 241,973 | 14,659 | |
| Discover Financial Services | 104,000 | 5,860 | |
| American Express Co. | 51,000 | 3,984 | |
| Comerica Inc. | 35,000 | 1,580 | |
| 457,746 | |||
| Health Care (28.0%) | |||
| Amgen Inc. | 2,424,836 | 387,610 | |
| * | Biogen Inc. | 860,400 | 363,295 |
| Eli Lilly & Co. | 4,154,800 | 301,846 | |
| Roche Holding AG | 1,071,606 | 294,469 | |
| Johnson & Johnson | 1,646,650 | 165,653 | |
| Novartis AG ADR | 1,612,605 | 159,019 | |
| Medtronic plc | 1,312,700 | 102,378 | |
| Abbott Laboratories | 1,701,800 | 78,844 | |
| Thermo Fisher | |||
| Scientific Inc. | 499,600 | 67,116 | |
| * | Boston Scientific Corp. | 3,402,200 | 60,389 |
| * | Illumina Inc. | 163,900 | 30,427 |
| * | Waters Corp. | 240,654 | 29,918 |
| AbbVie Inc. | 473,500 | 27,719 | |
| GlaxoSmithKline plc ADR | 600,000 | 27,690 | |
| Sanofi ADR | 541,000 | 26,747 | |
| Agilent Technologies Inc. | 382,600 | 15,897 | |
| Stryker Corp. | 45,500 | 4,197 | |
| * | Cerner Corp. | 10,000 | 733 |
| 2,143,947 | |||
14
PRIMECAP Core Fund
| Market | |||
| Value• | |||
| Shares | ($000) | ||
| Industrials (17.0%) | |||
| Southwest Airlines Co. | 8,926,525 | 395,445 | |
| Airbus Group NV | 1,465,913 | 95,301 | |
| Honeywell | |||
| International Inc. | 872,200 | 90,979 | |
| FedEx Corp. | 488,175 | 80,769 | |
| United Parcel Service Inc. | |||
| Class B | 827,500 | 80,218 | |
| * | United Continental | ||
| Holdings Inc. | 1,088,000 | 73,168 | |
| Boeing Co. | 349,800 | 52,498 | |
| Delta Air Lines Inc. | 1,140,000 | 51,254 | |
| Rockwell Automation Inc. | 260,200 | 30,181 | |
| Union Pacific Corp. | 276,300 | 29,926 | |
| Pentair plc | 455,981 | 28,677 | |
| Caterpillar Inc. | 350,000 | 28,010 | |
| * | Jacobs Engineering | ||
| Group Inc. | 571,700 | 25,818 | |
| Safran SA | 337,600 | 23,589 | |
| CSX Corp. | 705,000 | 23,350 | |
| Norfolk Southern Corp. | 218,400 | 22,478 | |
| CH Robinson | |||
| Worldwide Inc. | 300,000 | 21,966 | |
| * | Hertz Global Holdings Inc. | 965,000 | 20,921 |
| American Airlines | |||
| Group Inc. | 377,300 | 19,914 | |
| ^ | Ritchie Bros | ||
| Auctioneers Inc. | 618,300 | 15,420 | |
| * | AECOM | 495,000 | 15,256 |
| United Technologies Corp. | 120,000 | 14,064 | |
| Expeditors International of | |||
| Washington Inc. | 230,000 | 11,081 | |
| Republic Services Inc. | |||
| Class A | 266,935 | 10,827 | |
| IDEX Corp. | 139,000 | 10,540 | |
| TransDigm Group Inc. | 37,500 | 8,202 | |
| Alaska Air Group Inc. | 100,000 | 6,618 | |
| Deere & Co. | 68,400 | 5,998 | |
| ^ | Canadian Pacific Railway Ltd. | 12,530 | 2,289 |
| * | Kirby Corp. | 16,000 | 1,201 |
| ^ | Chicago Bridge & Iron | ||
| Co. NV | 20,000 | 985 | |
| 1,296,943 | |||
| Information Technology (24.3%) | |||
| Texas Instruments Inc. | 3,845,800 | 219,922 | |
| Microsoft Corp. | 2,939,200 | 119,493 | |
| * | Flextronics | ||
| International Ltd. | 8,861,200 | 112,316 | |
| * | Google Inc. Class A | 188,372 | 104,490 |
| * | Google Inc. Class C | 184,972 | 101,365 |
| Hewlett-Packard Co. | 2,749,100 | 85,662 | |
| Intel Corp. | 2,716,700 | 84,951 | |
| EMC Corp. | 3,080,100 | 78,727 | |
| SanDisk Corp. | 1,226,216 | 78,012 | |
| Market | |||
| Value• | |||
| Shares | ($000) | ||
| QUALCOMM Inc. | 1,083,530 | 75,132 | |
| Intuit Inc. | 718,500 | 69,666 | |
| NetApp Inc. | 1,955,900 | 69,356 | |
| Telefonaktiebolaget LM | |||
| Ericsson ADR | 5,517,600 | 69,246 | |
| Cisco Systems Inc. | 2,252,600 | 62,003 | |
| * | eBay Inc. | 1,014,900 | 58,539 |
| ASML Holding NV | 485,000 | 49,000 | |
| KLA-Tencor Corp. | 780,000 | 45,466 | |
| * | Adobe Systems Inc. | 498,000 | 36,822 |
| Corning Inc. | 1,425,000 | 32,319 | |
| NVIDIA Corp. | 1,520,000 | 31,806 | |
| Visa Inc. Class A | 454,340 | 29,718 | |
| Oracle Corp. | 666,000 | 28,738 | |
| Applied Materials Inc. | 1,240,000 | 27,974 | |
| Altera Corp. | 643,200 | 27,600 | |
| * | Electronic Arts Inc. | 375,000 | 22,056 |
| Analog Devices Inc. | 350,000 | 22,050 | |
| Symantec Corp. | 895,300 | 20,919 | |
| Activision Blizzard Inc. | 800,000 | 18,180 | |
| Apple Inc. | 131,000 | 16,300 | |
| * | Keysight Technologies Inc. | 420,300 | 15,614 |
| * | BlackBerry Ltd. | 1,527,100 | 13,637 |
| * | Alibaba Group Holding | ||
| Ltd. ADR | 113,530 | 9,450 | |
| MasterCard Inc. Class A | 108,000 | 9,330 | |
| * | Yahoo! Inc. | 125,600 | 5,581 |
| Broadcom Corp. Class A | 72,500 | 3,139 | |
| * | Micron Technology Inc. | 37,000 | 1,004 |
| * | VMware Inc. Class A | 3,000 | 246 |
| Motorola Solutions Inc. | 2,750 | 183 | |
| 1,856,012 | |||
| Materials (3.1%) | |||
| Monsanto Co. | 861,350 | 96,936 | |
| Potash Corp. of | |||
| Saskatchewan Inc. | 929,976 | 29,992 | |
| Praxair Inc. | 229,700 | 27,734 | |
| EI du Pont de Nemours | |||
| & Co. | 275,000 | 19,654 | |
| Dow Chemical Co. | 400,000 | 19,192 | |
| Celanese Corp. Class A | 292,000 | 16,311 | |
| Cabot Corp. | 175,000 | 7,875 | |
| * | Crown Holdings Inc. | 100,000 | 5,402 |
| Greif Inc. Class A | 125,400 | 4,925 | |
| LyondellBasell Industries | |||
| NV Class A | 46,200 | 4,056 | |
| Greif Inc. Class B | 37,000 | 1,702 | |
| 233,779 | |||
| Telecommunication Services (0.0%) | |||
| * | Sprint Corp. | 650,000 | 3,081 |
| Total Common Stocks | |||
| (Cost $3,745,195) | 7,071,539 | ||
15
PRIMECAP Core Fund
| Market | ||
| Value• | ||
| Shares | ($000) | |
| Temporary Cash Investment (7.9%) | ||
| Money Market Fund (7.9%) | ||
| 1,2 Vanguard Market Liquidity | ||
| Fund, 0.128% | ||
| (Cost $607,307) | 607,306,880 | 607,307 |
| Total Investments (100.4%) | ||
| (Cost $4,352,502) | 7,678,846 | |
| Other Assets and Liabilities (-0.4%) | ||
| Other Assets | 26,859 | |
| Liabilities2 | (56,009) | |
| (29,150) | ||
| Net Assets (100%) | ||
| Applicable to 347,034,411 outstanding | ||
| $.001 par value shares of beneficial | ||
| interest (unlimited authorization) | 7,649,696 | |
| Net Asset Value Per Share | $22.04 | |
| At March 31, 2015, net assets consisted of: | |
| Amount | |
| ($000) | |
| Paid-in Capital | 4,180,158 |
| Undistributed Net Investment Income | 24,117 |
| Accumulated Net Realized Gains | 119,062 |
| Unrealized Appreciation (Depreciation) | |
| Investment Securities | 3,326,344 |
| Foreign Currencies | 15 |
| Net Assets | 7,649,696 |
• See Note A in Notes to Financial Statements.
* Non-income-producing security.
^ Includes partial security positions on loan to broker-dealers. The total value of securities on loan is $19,060,000.
1 Affiliated money market fund available only to Vanguard funds and certain trusts and accounts managed by Vanguard. Rate shown is the 7-day yield.
2 Includes $19,567,000 of collateral received for securities on loan.
ADR—American Depositary Receipt.
See accompanying Notes, which are an integral part of the Financial Statements.
16
PRIMECAP Core Fund
Statement of Operations
| Six Months Ended | |
| March 31, 2015 | |
| ($000) | |
| Investment Income | |
| Income | |
| Dividends1 | 74,328 |
| Interest2 | 323 |
| Securities Lending | 893 |
| Total Income | 75,544 |
| Expenses | |
| Investment Advisory Fees—Note B | 11,228 |
| The Vanguard Group—Note C | |
| Management and Administrative | 6,006 |
| Marketing and Distribution | 485 |
| Custodian Fees | 59 |
| Shareholders’ Reports | 21 |
| Trustees’ Fees and Expenses | 6 |
| Total Expenses | 17,805 |
| Net Investment Income | 57,739 |
| Realized Net Gain (Loss) | |
| Investment Securities Sold | 164,362 |
| Foreign Currencies | (209) |
| Realized Net Gain (Loss) | 164,153 |
| Change in Unrealized Appreciation (Depreciation) | |
| Investment Securities | 331,329 |
| Foreign Currencies | 168 |
| Change in Unrealized Appreciation (Depreciation) | 331,497 |
| Net Increase (Decrease) in Net Assets Resulting from Operations | 553,389 |
| 1 Dividends are net of foreign withholding taxes of $2,178,000. | |
| 2 Interest income from an affiliated company of the fund was $323,000. |
See accompanying Notes, which are an integral part of the Financial Statements.
17
PRIMECAP Core Fund
Statement of Changes in Net Assets
| Six Months Ended | Year Ended | |
| March 31, | September 30, | |
| 2015 | 2014 | |
| ($000) | ($000) | |
| Increase (Decrease) in Net Assets | ||
| Operations | ||
| Net Investment Income | 57,739 | 78,963 |
| Realized Net Gain (Loss) | 164,153 | 401,489 |
| Change in Unrealized Appreciation (Depreciation) | 331,497 | 801,653 |
| Net Increase (Decrease) in Net Assets Resulting from Operations | 553,389 | 1,282,105 |
| Distributions | ||
| Net Investment Income | (85,623) | (54,577) |
| Realized Capital Gain1 | (411,308) | (207,572) |
| Total Distributions | (496,931) | (262,149) |
| Capital Share Transactions | ||
| Issued | 578,014 | 478,435 |
| Issued in Lieu of Cash Distributions | 445,777 | 235,932 |
| Redeemed | (258,434) | (680,461) |
| Net Increase (Decrease) from Capital Share Transactions | 765,357 | 33,906 |
| Total Increase (Decrease) | 821,815 | 1,053,862 |
| Net Assets | ||
| Beginning of Period | 6,827,881 | 5,774,019 |
| End of Period2 | 7,649,696 | 6,827,881 |
| 1 Includes fiscal 2015 and 2014 short-term gain distributions totaling $11,734,000 and $0, respectively. Short-term gain distributions are treated as ordinary income dividends for tax purposes. | ||
| 2 Net Assets—End of Period includes undistributed (overdistributed) net investment income of $24,117,000 and $52,210,000. | ||
See accompanying Notes, which are an integral part of the Financial Statements.
18
PRIMECAP Core Fund
Financial Highlights
| Six Months | ||||||
| Ended | ||||||
| For a Share Outstanding | March 31, | Year Ended September 30, | ||||
| Throughout Each Period | 2015 | 2014 | 2013 | 2012 | 2011 | 2010 |
| Net Asset Value, Beginning of Period | $21.87 | $18.65 | $14.98 | $12.37 | $12.51 | $11.42 |
| Investment Operations | ||||||
| Net Investment Income | .173 | .255 | .242 | .206 | .145 | .1331 |
| Net Realized and Unrealized Gain (Loss) | ||||||
| on Investments | 1.564 | 3.820 | 3.955 | 2.567 | (.143) | 1.051 |
| Total from Investment Operations | 1.737 | 4.075 | 4.197 | 2.773 | .002 | 1.184 |
| Distributions | ||||||
| Dividends from Net Investment Income | (. 270) | (.178) | (. 260) | (.163) | (.142) | (. 094) |
| Distributions from Realized Capital Gains | (1.297) | (.677) | (.267) | — | — | — |
| Total Distributions | (1.567) | (. 855) | (. 527) | (.163) | (.142) | (. 094) |
| Net Asset Value, End of Period | $22.04 | $21.87 | $18.65 | $14.98 | $12.37 | $12.51 |
| Total Return2 | 7.99% | 22.60% | 28.88% | 22.55% | -0.10% | 10.39% |
| Ratios/Supplemental Data | ||||||
| Net Assets, End of Period (Millions) | $7,650 | $6,828 | $5,774 | $4,702 | $4,345 | $4,569 |
| Ratio of Total Expenses to | ||||||
| Average Net Assets | 0.49% | 0.50% | 0.50% | 0.50% | 0.51% | 0.51% |
| Ratio of Net Investment Income to | ||||||
| Average Net Assets | 1.47% | 1.23% | 1.42% | 1.39% | 1.01% | 1.09%1 |
| Portfolio Turnover Rate | 10% | 13% | 7% | 10% | 9% | 8% |
| The expense ratio, net income ratio, and turnover rate for the current period have been annualized. | ||||||
| 1 Net investment income per share and the ratio of net investment income to average net assets include $0.019 and 0.15%, respectively, resulting from a special dividend from Weyerhaeuser Co. in July 2010. 2 Total returns do not include transaction or account service fees that may have applied in the periods shown. Fund prospectuses provide information about any applicable transaction and account service fees. | ||||||
See accompanying Notes, which are an integral part of the Financial Statements.
19
PRIMECAP Core Fund
Notes to Financial Statements
Vanguard PRIMECAP Core Fund is registered under the Investment Company Act of 1940 as an open-end investment company, or mutual fund.
A. The following significant accounting policies conform to generally accepted accounting principles for U.S. investment companies. The fund consistently follows such policies in preparing its financial statements.
1. Security Valuation: Securities are valued as of the close of trading on the New York Stock Exchange (generally 4 p.m., Eastern time) on the valuation date. Equity securities are valued at the latest quoted sales prices or official closing prices taken from the primary market in which each security trades; such securities not traded on the valuation date are valued at the mean of the latest quoted bid and asked prices. Securities for which market quotations are not readily available, or whose values have been affected by events occurring before the fund’s pricing time but after the close of the securities’ primary markets, are valued at their fair values calculated according to procedures adopted by the board of trustees. These procedures include obtaining quotations from an independent pricing service, monitoring news to identify significant market- or security-specific events, and evaluating changes in the values of foreign market proxies (for example, ADRs, futures contracts, or exchange-traded funds), between the time the foreign markets close and the fund’s pricing time. When fair-value pricing is employed, the prices of securities used by a fund to calculate its net asset value may differ from quoted or published prices for the same securities. Investments in Vanguard Market Liquidity Fund are valued at that fund’s net asset value.
2. Foreign Currency: Securities and other assets and liabilities denominated in foreign currencies are translated into U.S. dollars using exchange rates obtained from an independent third party as of the fund’s pricing time on the valuation date. Realized gains (losses) and unrealized appreciation (depreciation) on investment securities include the effects of changes in exchange rates since the securities were purchased, combined with the effects of changes in security prices. Fluctuations in the value of other assets and liabilities resulting from changes in exchange rates are recorded as unrealized foreign currency gains (losses) until the assets or liabilities are settled in cash, at which time they are recorded as realized foreign currency gains (losses).
3. Federal Income Taxes: The fund intends to continue to qualify as a regulated investment company and distribute all of its taxable income. Management has analyzed the fund’s tax positions taken for all open federal income tax years (September 30, 2011–2014), and for the period ended March 31, 2015, and has concluded that no provision for federal income tax is required in the fund’s financial statements.
4. Distributions: Distributions to shareholders are recorded on the ex-dividend date.
5. Securities Lending: To earn additional income, the fund lends its securities to qualified institutional borrowers. Security loans are required to be secured at all times by collateral in an amount at least equal to the market value of securities loaned. Daily market fluctuations could cause the value of loaned securities to be more or less than the value of the collateral received. When this occurs, the collateral is adjusted and settled on the next business day. The fund further mitigates its counterparty risk by entering into securities lending transactions only with a diverse group of prequalified counterparties, monitoring their financial strength, and entering into master securities lending agreements with its counterparties. The master securities lending agreements provide that, in the event of a counterparty’s default (including bankruptcy), the fund may terminate any loans with that borrower, determine the net amount owed, and sell or retain the collateral up to the net amount
20
PRIMECAP Core Fund
owed to the fund; however, such actions may be subject to legal proceedings. While collateral mitigates counterparty risk, in the absence of a default the fund may experience delays and costs in recovering the securities loaned. The fund invests cash collateral received in Vanguard Market Liquidity Fund, and records a liability in the Statement of Net Assets for the return of the collateral, during the period the securities are on loan. Securities lending income represents fees charged to borrowers plus income earned on invested cash collateral, less expenses associated with the loan.
6. Credit Facility: The fund and certain other funds managed by The Vanguard Group participate in a $3 billion committed credit facility provided by a syndicate of lenders pursuant to a credit agreement that may be renewed annually; each fund is individually liable for its borrowings, if any, under the credit facility. Borrowings may be utilized for temporary and emergency purposes, and are subject to the fund’s regulatory and contractual borrowing restrictions. The participating funds are charged administrative fees and an annual commitment fee of 0.06% of the undrawn amount of the facility; these fees are allocated to the funds based on a method approved by the fund’s board of trustees and included in Management and Administrative expenses on the fund’s Statement of Operations. Any borrowings under this facility bear interest at a rate equal to the higher of the federal funds rate or LIBOR reference rate plus an agreed-upon spread.
The fund had no borrowings outstanding at March 31, 2015, or at any time during the period then ended.
7. Other: Dividend income is recorded on the ex-dividend date. Interest income includes income distributions received from Vanguard Market Liquidity Fund and is accrued daily. Security transactions are accounted for on the date securities are bought or sold. Costs used to determine realized gains (losses) on the sale of investment securities are those of the specific securities sold.
B. PRIMECAP Management Company provides investment advisory services to the fund for a fee calculated at an annual percentage rate of average net assets. For the six months ended March 31, 2015, the investment advisory fee represented an effective annual rate of 0.31% of the fund’s average net assets.
C. The Vanguard Group furnishes at cost corporate management, administrative, marketing, and distribution services. The costs of such services are allocated to the fund based on methods approved by the board of trustees. The fund has committed to invest up to 0.40% of its net assets in Vanguard At March 31, 2015, the fund had contributed capital of $696,000 to Vanguard (included in Other Assets), representing 0.01% of the fund’s net assets and 0.28% of Vanguard’s capitalization. The fund’s trustees and officers are also directors and officers of Vanguard.
D. Various inputs may be used to determine the value of the fund’s investments. These inputs are summarized in three broad levels for financial statement purposes. The inputs or methodologies used to value securities are not necessarily an indication of the risk associated with investing in those securities.
Level 1—Quoted prices in active markets for identical securities.
Level 2—Other significant observable inputs (including quoted prices for similar securities, interest rates, prepayment speeds, credit risk, etc.).
Level 3—Significant unobservable inputs (including the fund’s own assumptions used to determine the fair value of investments).
21
PRIMECAP Core Fund
The following table summarizes the market value of the fund’s investments as of March 31, 2015, based on the inputs used to value them:
| Level 1 | Level 2 | Level 3 | |
| Investments | ($000) | ($000) | ($000) |
| Common Stocks | 6,658,180 | 413,359 | — |
| Temporary Cash Investments | 607,307 | — | — |
| Total | 7,265,487 | 413,359 | — |
E. Distributions are determined on a tax basis and may differ from net investment income and realized capital gains for financial reporting purposes. Differences may be permanent or temporary. Permanent differences are reclassified among capital accounts in the financial statements to reflect their tax character. Temporary differences arise when certain items of income, expense, gain, or loss are recognized in different periods for financial statement and tax purposes. These differences will reverse at some time in the future. Differences in classification may also result from the treatment of short-term gains as ordinary income for tax purposes. The fund’s tax-basis capital gains and losses are determined only at the end of each fiscal year.
During the six months ended March 31, 2015, the fund realized net foreign currency losses of $209,000, which decreased distributable net income for tax purposes; accordingly, such losses have been reclassified from accumulated net realized gains to undistributed net investment income.
At March 31, 2015, the cost of investment securities for tax purposes was $4,352,502,000. Net unrealized appreciation of investment securities for tax purposes was $3,326,344,000, consisting of unrealized gains of $3,437,098,000 on securities that had risen in value since their purchase and $110,754,000 in unrealized losses on securities that had fallen in value since their purchase.
F. During the six months ended March 31, 2015, the fund purchased $407,479,000 of investment securities and sold $350,659,000 of investment securities, other than temporary cash investments.
G. Capital shares issued and redeemed were:
| Six Months Ended | Year Ended | |
| March 31, 2015 | September 30, 2014 | |
| Shares | Shares | |
| (000) | (000) | |
| Issued | 26,231 | 23,520 |
| Issued in Lieu of Cash Distributions | 20,364 | 12,563 |
| Redeemed | (11,751) | (33,422) |
| Net Increase (Decrease) in Shares Outstanding | 34,844 | 2,661 |
H. Management has determined that no material events or transactions occurred subsequent to March 31, 2015, that would require recognition or disclosure in these financial statements.
22
About Your Fund’s Expenses
As a shareholder of the fund, you incur ongoing costs, which include costs for portfolio management, administrative services, and shareholder reports (like this one), among others. Operating expenses, which are deducted from a fund’s gross income, directly reduce the investment return of the fund.
A fund’s expenses are expressed as a percentage of its average net assets. This figure is known as the expense ratio. The following examples are intended to help you understand the ongoing costs (in dollars) of investing in your fund and to compare these costs with those of other mutual funds. The examples are based on an investment of $1,000 made at the beginning of the period shown and held for the entire period.
The accompanying table illustrates your fund’s costs in two ways:
• Based on actual fund return. This section helps you to estimate the actual expenses that you paid over the period. The ”Ending Account Value“ shown is derived from the fund‘s actual return, and the third column shows the dollar amount that would have been paid by an investor who started with $1,000 in the fund. You may use the information here, together with the amount you invested, to estimate the expenses that you paid over the period.
To do so, simply divide your account value by $1,000 (for example, an $8,600 account value divided by $1,000 = 8.6), then multiply the result by the number given for your fund under the heading ”Expenses Paid During Period.“
• Based on hypothetical 5% yearly return. This section is intended to help you compare your fund‘s costs with those of other mutual funds. It assumes that the fund had a yearly return of 5% before expenses, but that the expense ratio is unchanged. In this case—because the return used is not the fund’s actual return—the results do not apply to your investment. The example is useful in making comparisons because the Securities and Exchange Commission requires all mutual funds to calculate expenses based on a 5% return. You can assess your fund’s costs by comparing this hypothetical example with the hypothetical examples that appear in shareholder reports of other funds.
Note that the expenses shown in the table are meant to highlight and help you compare ongoing costs only and do not reflect transaction costs incurred by the fund for buying and selling securities. Further, the expenses do not include any purchase, redemption, or account service fees described in the fund prospectus. If such fees were applied to your account, your costs would be higher. Your fund does not carry a “sales load.”
The calculations assume no shares were bought or sold during the period. Your actual costs may have been higher or lower, depending on the amount of your investment and the timing of any purchases or redemptions.
You can find more information about the fund’s expenses, including annual expense ratios, in the Financial Statements section of this report. For additional information on operating expenses and other shareholder costs, please refer to your fund’s current prospectus.
23
| Six Months Ended March 31, 2015 | |||
| Beginning | Ending | Expenses | |
| Account Value | Account Value | Paid During | |
| PRIMECAP Core Fund | 9/30/2014 | 3/31/2015 | Period |
| Based on Actual Fund Return | $1,000.00 | $1,079.91 | $2.54 |
| Based on Hypothetical 5% Yearly Return | 1,000.00 | 1,022.49 | 2.47 |
| The calculations are based on expenses incurred in the most recent six-month period. The fund’s annualized six-month expense ratio for that period is 0.49%. The dollar amounts shown as “Expenses Paid” are equal to the annualized expense ratio multiplied by the average account value over the period, multiplied by the number of days in the most recent six-month period, then divided by the number of days in the most recent 12-month period. | |||
24
Trustees Approve Advisory Arrangement
The board of trustees of Vanguard PRIMECAP Core Fund has renewed the fund’s investment advisory arrangement with PRIMECAP Management Company (PRIMECAP Management). The board determined that renewing the fund’s advisory arrangement was in the best interests of the fund and its shareholders.
The board based its decision upon an evaluation of the advisor’s investment staff, portfolio management process, and performance. The trustees considered the factors discussed below, among others. However, no single factor determined whether the board approved the arrangement Rather, it was the totality of the circumstances that drove the board’s decision.
Nature, extent, and quality of services
The board considered the quality of the fund’s investment management services over both the short and long term, and took into account the organizational depth and stability of the advisor. The board noted that PRIMECAP Management, founded in 1983, is recognized for its long-term approach to equity investing. Five experienced portfolio managers are responsible for separate sub-portfolios, and each portfolio manager employs a fundamental, research-driven approach in seeking to identify companies with long-term potential that the market has yet to appreciate. The multi-counselor approach that the advisor employs is designed to emphasize individual decision-making and enable each portfolio manager to invest only in his highest-conviction ideas. PRIMECAP Management has managed the fund since the fund’s inception in 2004.
The board concluded that the advisor’s experience, stability, depth, and performance, among other factors, warranted continuation of the advisory arrangement.
Investment performance
The board considered the short- and long-term performance of the fund, including any periods of outperformance or underperformance relative to a benchmark index and peer group. The board concluded that the performance was such that the advisory arrangement should continue. Information about the fund’s most recent performance can be found in the Performance Summary section of this report.
Cost
The board concluded that the fund’s expense ratio was well below the average expense ratio charged by funds in its peer group and that the fund’s advisory fee rate was also well below its peer-group average. Information about the fund’s expenses appears in the About Your Fund’s Expenses section of this report as well as in the Financial Statements section, which also includes information about the fund’s advisory fee rate.
The board did not consider profitability of PRIMECAP Management in determining whether to approve the advisory fee, because PRIMECAP Management is independent of Vanguard, and the advisory fee is the result of arm’s-length negotiations.
The benefit of economies of scale
The board concluded that the fund’s shareholders benefit from economies of scale because of the breakpoints in the fund’s advisory fee schedule. The breakpoints reduce the effective rate of the fee as the fund’s assets increase.
The board will consider whether to renew the advisory arrangement again after a one-year period.
25
Glossary
30-Day SEC Yield. A fund’s 30-day SEC yield is derived using a formula specified by the U.S. Securities and Exchange Commission. Under the formula, data related to the fund’s security holdings in the previous 30 days are used to calculate the fund’s hypothetical net income for that period, which is then annualized and divided by the fund’s estimated average net assets over the calculation period. For the purposes of this calculation, a security’s income is based on its current market yield to maturity (for bonds), its actual income (for asset-backed securities), or its projected dividend yield (for stocks). Because the SEC yield represents hypothetical annualized income, it will differ—at times significantly—from the fund’s actual experience. As a result, the fund’s income distributions may be higher or lower than implied by the SEC yield.
Beta. A measure of the magnitude of a fund’s past share-price fluctuations in relation to the ups and downs of a given market index. The index is assigned a beta of 1.00. Compared with a given index, a fund with a beta of 1.20 typically would have seen its share price rise or fall by 12% when the index rose or fell by 10%. For this report, beta is based on returns over the past 36 months for both the fund and the index. Note that a fund’s beta should be reviewed in conjunction with its R-squared (see definition). The lower the R-squared, the less correlation there is between the fund and the index, and the less reliable beta is as an indicator of volatility.
Dividend Yield. Dividend income earned by stocks, expressed as a percentage of the aggregate market value (or of net asset value, for a fund). The yield is determined by dividing the amount of the annual dividends by the aggregate value (or net asset value) at the end of the period. For a fund, the dividend yield is based solely on stock holdings and does not include any income produced by other investments.
Earnings Growth Rate. The average annual rate of growth in earnings over the past five years for the stocks now in a fund.
Equity Exposure. A measure that reflects a fund’s investments in stocks and stock futures. Any holdings in short-term reserves are excluded.
Expense Ratio. A fund’s total annual operating expenses expressed as a percentage of the fund’s average net assets. The expense ratio includes management and administrative expenses, but does not include the transaction costs of buying and selling portfolio securities.
Foreign Holdings. The percentage of a fund represented by securities or depositary receipts of companies based outside the United States.
Inception Date. The date on which the assets of a fund (or one of its share classes) are first invested in accordance with the fund’s investment objective. For funds with a subscription period, the inception date is the day after that period ends. Investment performance is measured from the inception date.
Median Market Cap. An indicator of the size of companies in which a fund invests; the midpoint of market capitalization (market price x shares outstanding) of a fund’s stocks, weighted by the proportion of the fund’s assets invested in each stock. Stocks representing half of the fund’s assets have market capitalizations above the median, and the rest are below it.
Price/Book Ratio. The share price of a stock divided by its net worth, or book value, per share. For a fund, the weighted average price/book ratio of the stocks it holds.
26
Price/Earnings Ratio. The ratio of a stock’s current price to its per-share earnings over the past year. For a fund, the weighted average P/E of the stocks it holds. P/E is an indicator of market expectations about corporate prospects; the higher the P/E, the greater the expectations for a company’s future growth.
R-Squared. A measure of how much of a fund’s past returns can be explained by the returns from the market in general, as measured by a given index. If a fund’s total returns were precisely synchronized with an index’s returns, its R-squared would be 1.00. If the fund’s returns bore no relationship to the index’s returns, its R-squared would be 0. For this report, R-squared is based on returns over the past 36 months for both the fund and the index.
Return on Equity. The annual average rate of return generated by a company during the past five years for each dollar of shareholder’s equity (net income divided by shareholder’s equity). For a fund, the weighted average return on equity for the companies whose stocks it holds.
Short-Term Reserves. The percentage of a fund invested in highly liquid, short-term securities that can be readily converted to cash.
Turnover Rate. An indication of the fund’s trading activity. Funds with high turnover rates incur higher transaction costs and may be more likely to distribute capital gains (which may be taxable to investors). The turnover rate excludes in-kind transactions, which have minimal impact on costs.
27
The People Who Govern Your Fund
The trustees of your mutual fund are there to see that the fund is operated and managed in your best interests since, as a shareholder, you are a part owner of the fund. Your fund’s trustees also serve on the board of directors of The Vanguard Group, Inc., which is owned by the Vanguard funds and provides services to them on an at-cost basis.
A majority of Vanguard’s board members are independent, meaning that they have no affiliation with Vanguard or the funds they oversee, apart from the sizable personal investments they have made as private individuals. The independent board members have distinguished backgrounds in business, academia, and public service. Each of the trustees and executive officers oversees 178 Vanguard funds.
The following table provides information for each trustee and executive officer of the fund. More information about the trustees is in the Statement of Additional Information, which can be obtained, without charge, by contacting Vanguard at 800-662-7447, or online at vanguard.com.
| InterestedTrustee1 | Rajiv L. Gupta |
| Born 1945. Trustee Since December 2001.2 Principal | |
| F. William McNabb III | Occupation(s) During the Past Five Years and Other |
| Born 1957. Trustee Since July 2009. Chairman of | Experience: Chairman and Chief Executive Officer |
| the Board. Principal Occupation(s) During the Past | (retired 2009) and President (2006–2008) of |
| Five Years and Other Experience: Chairman of the | Rohm and Haas Co. (chemicals); Director of Tyco |
| Board of The Vanguard Group, Inc., and of each of | International PLC (diversified manufacturing and |
| the investment companies served by The Vanguard | services), Hewlett-Packard Co. (electronic computer |
| Group, since January 2010; Director of The Vanguard | manufacturing), and Delphi Automotive PLC |
| Group since 2008; Chief Executive Officer and | (automotive components); Senior Advisor at New |
| President of The Vanguard Group, and of each of | Mountain Capital. |
| the investment companies served by The Vanguard | |
| Group, since 2008; Director of Vanguard Marketing | Amy Gutmann |
| Corporation; Managing Director of The Vanguard | Born 1949. Trustee Since June 2006. Principal |
| Group (1995–2008). | Occupation(s) During the Past Five Years and |
| Other Experience: President of the University of | |
| IndependentTrustees | Pennsylvania; Christopher H. Browne Distinguished |
| Professor of Political Science, School of Arts and | |
| Emerson U. Fullwood | Sciences, and Professor of Communication, Annenberg |
| Born 1948. Trustee Since January 2008. Principal | School for Communication, with secondary faculty |
| Occupation(s) During the Past Five Years and | appointments in the Department of Philosophy, School |
| Other Experience: Executive Chief Staff and | of Arts and Sciences, and at the Graduate School of |
| Marketing Officer for North America and Corporate | Education, University of Pennsylvania; Trustee of the |
| Vice President (retired 2008) of Xerox Corporation | National Constitution Center; Chair of the Presidential |
| (document management products and services); | Commission for the Study of Bioethical Issues. |
| Executive in Residence and 2009–2010 Distinguished | |
| Minett Professor at the Rochester Institute of | JoAnn Heffernan Heisen |
| Technology; Director of SPX Corporation (multi-industry | Born 1950. Trustee Since July 1998. Principal |
| manufacturing), the United Way of Rochester, | Occupation(s) During the Past Five Years and Other |
| Amerigroup Corporation (managed health care), the | Experience: Corporate Vice President and Chief |
| University of Rochester Medical Center, Monroe | Global Diversity Officer (retired 2008) and Member |
| Community College Foundation, and North Carolina | of the Executive Committee (1997–2008) of Johnson |
| A&T University. | & Johnson (pharmaceuticals/medical devices/ |
| consumer products); Director of Skytop Lodge | |
| Corporation (hotels), the University Medical Center | |
| at Princeton, the Robert Wood Johnson Foundation, | |
| and the Center for Talent Innovation; Member of | |
| the Advisory Board of the Institute for Women’s | |
| Leadership at Rutgers University. |
| F. Joseph Loughrey | Executive Officers | |
| Born 1949. Trustee Since October 2009. Principal | ||
| Occupation(s) During the Past Five Years and Other | Glenn Booraem | |
| Experience: President and Chief Operating Officer | Born 1967. Controller Since July 2010. Principal | |
| (retired 2009) of Cummins Inc. (industrial machinery); | Occupation(s) During the Past Five Years and Other | |
| Chairman of the Board of Hillenbrand, Inc. (specialized | Experience: Principal of The Vanguard Group, Inc.; | |
| consumer services), and of Oxfam America; Director | Controller of each of the investment companies served | |
| of SKF AB (industrial machinery), Hyster-Yale Materials | by The Vanguard Group; Assistant Controller of each of | |
| Handling, Inc. (forklift trucks), the Lumina Foundation | the investment companies served by The Vanguard | |
| for Education, and the V Foundation for Cancer | Group (2001–2010). | |
| Research; Member of the Advisory Council for the | ||
| College of Arts and Letters and of the Advisory Board | Thomas J. Higgins | |
| to the Kellogg Institute for International Studies, both | Born 1957. Chief Financial Officer Since September | |
| at the University of Notre Dame. | 2008. Principal Occupation(s) During the Past Five | |
| Years and Other Experience: Principal of The Vanguard | ||
| Mark Loughridge | Group, Inc.; Chief Financial Officer of each of the | |
| Born 1953. Trustee Since March 2012. Principal | investment companies served by The Vanguard Group; | |
| Occupation(s) During the Past Five Years and Other | Treasurer of each of the investment companies served | |
| Experience: Senior Vice President and Chief Financial | by The Vanguard Group (1998–2008). | |
| Officer (retired 2013) at IBM (information technology | ||
| services); Fiduciary Member of IBM’s Retirement Plan | Kathryn J. Hyatt | |
| Committee (2004–2013); Director of the Dow Chemical | Born 1955. Treasurer Since November 2008. Principal | |
| Company; Member of the Council on Chicago Booth. | Occupation(s) During the Past Five Years and Other | |
| Experience: Principal of The Vanguard Group, Inc.; | ||
| Scott C. Malpass | Treasurer of each of the investment companies served | |
| Born 1962. Trustee Since March 2012. Principal | by The Vanguard Group; Assistant Treasurer of each of | |
| Occupation(s) During the Past Five Years and Other | the investment companies served by The Vanguard | |
| Experience: Chief Investment Officer and Vice | Group (1988–2008). | |
| President at the University of Notre Dame; Assistant | ||
| Professor of Finance at the Mendoza College of | Heidi Stam | |
| Business at Notre Dame; Member of the Notre Dame | Born 1956. Secretary Since July 2005. Principal | |
| 403(b) Investment Committee; Board Member of | Occupation(s) During the Past Five Years and Other | |
| TIFF Advisory Services, Inc., and Catholic Investment | Experience: Managing Director of The Vanguard | |
| Services, Inc. (investment advisors); Member of | Group, Inc.; General Counsel of The Vanguard Group; | |
| the Investment Advisory Committee of Major | Secretary of The Vanguard Group and of each of the | |
| League Baseball. | investment companies served by The Vanguard Group; | |
| Director and Senior Vice President of Vanguard | ||
| André F. Perold | Marketing Corporation. | |
| Born 1952. Trustee Since December 2004. Principal | ||
| Occupation(s) During the Past Five Years and Other | Vanguard Senior ManagementTeam | |
| Experience: George Gund Professor of Finance and | ||
| Banking, Emeritus at the Harvard Business School | Mortimer J. Buckley | Chris D. McIsaac |
| (retired 2011); Chief Investment Officer and Managing | Kathleen C. Gubanich | Michael S. Miller |
| Partner of HighVista Strategies LLC (private investment | Paul A. Heller | James M. Norris |
| firm); Director of Rand Merchant Bank; Overseer of | Martha G. King | Glenn W. Reed |
| the Museum of Fine Arts Boston. | John T. Marcante | |
| Peter F. Volanakis | Chairman Emeritus and Senior Advisor | |
| Born 1955. Trustee Since July 2009. Principal | ||
| Occupation(s) During the Past Five Years and Other | John J. Brennan | |
| Experience: President and Chief Operating Officer | Chairman, 1996–2009 | |
| (retired 2010) of Corning Incorporated (communications | Chief Executive Officer and President, 1996–2008 | |
| equipment); Trustee of Colby-Sawyer College; | ||
| Member of the Advisory Board of the Norris Cotton | Founder | |
| Cancer Center and of the Advisory Board of the | ||
| Parthenon Group (strategy consulting). | John C. Bogle | |
| Chairman and Chief Executive Officer, 1974–1996 | ||
1 Mr. McNabb is considered an “interested person,” as defined in the Investment Company Act of 1940, because he is an officer of the Vanguard funds.
2 December 2002 for Vanguard Equity Income Fund, the Vanguard Municipal Bond Funds, and the Vanguard State Tax-Exempt Funds.
 | |
| P.O. Box 2600 | |
| Valley Forge, PA 19482-2600 | |
| Connect with Vanguard® > vanguard.com | |
| Fund Information > 800-662-7447 | |
| Direct Investor Account Services > 800-662-2739 | |
| Institutional Investor Services > 800-523-1036 | |
| Text Telephone for People | |
| Who Are Deaf or Hard of Hearing> 800-749-7273 | |
| This material may be used in conjunction | |
| with the offering of shares of any Vanguard | |
| fund only if preceded or accompanied by | |
| the fund’s current prospectus. | |
| All comparative mutual fund data are from Lipper, a | |
| Thomson Reuters Company, or Morningstar, Inc., unless | |
| otherwise noted. | |
| You can obtain a free copy of Vanguard’s proxy voting | |
| guidelines by visiting vanguard.com/proxyreporting or by | |
| calling Vanguard at 800-662-2739. The guidelines are | |
| also available from the SEC’s website, sec.gov. In | |
| addition, you may obtain a free report on how your fund | |
| voted the proxies for securities it owned during the 12 | |
| months ended June 30. To get the report, visit either | |
| vanguard.com/proxyreporting or sec.gov. | |
| You can review and copy information about your fund at | |
| the SEC’s Public Reference Room in Washington, D.C. To | |
| find out more about this public service, call the SEC at | |
| 202-551-8090. Information about your fund is also | |
| available on the SEC’s website, and you can receive | |
| copies of this information, for a fee, by sending a | |
| request in either of two ways: via e-mail addressed to | |
| publicinfo@sec.gov or via regular mail addressed to the | |
| Public Reference Section, Securities and Exchange | |
| Commission, Washington, DC 20549-1520. | |
| © 2015 The Vanguard Group, Inc. | |
| All rights reserved. | |
| Vanguard Marketing Corporation, Distributor. | |
| Q12202 052015 | |
Item 2: Code of Ethics.
Not Applicable.
Item 3: Audit Committee Financial Expert.
Not Applicable.
Item 4: Principal Accountant Fees and Services.
(a) Audit Fees.
Not Applicable.
Item 5: Audit Committee of Listed Registrants.
Not Applicable.
Item 6: Investments.
Not Applicable.
Item 7: Disclosure of Proxy Voting Policies and Procedures for Closed-End Management
Investment Companies.
Not Applicable.
Item 8: Portfolio Managers of Closed-End Management Investment Companies.
Not Applicable.
Item 9: Purchase of Equity Securities by Closed-End Management Investment Company and
Affiliated Purchasers.
Not Applicable.
Item 10: Submission of Matters to a Vote of Security Holders.
Not Applicable.
Item 11: Controls and Procedures.
(a) Disclosure Controls and Procedures. The Principal Executive and Financial
Officers concluded that the Registrant’s Disclosure Controls and Procedures are effective
based on their evaluation of the Disclosure Controls and Procedures as of a date within 90
days of the filing date of this report.
(b) Internal Control Over Financial Reporting. There were no significant changes in Registrant’s Internal Control Over Financial Reporting or in other factors that could significantly affect this control subsequent to the date of the evaluation, including any corrective actions with regard to significant deficiencies and material weaknesses.
Item 12: Exhibits.
(a) Certifications.
Pursuant to the requirements of the Securities Exchange Act of 1934 and the Investment Company Act of 1940, the registrant has duly caused this report to be signed on its behalf by the undersigned, thereunto duly authorized.
| VANGUARD FENWAY FUNDS | |
| BY: | /s/ F. WILLIAM MCNABB III* |
| F. WILLIAM MCNABB III | |
| CHIEF EXECUTIVE OFFICER | |
| Date: May 21, 2015 | |
Pursuant to the requirements of the Securities Exchange Act of 1934 and the Investment Company Act of 1940, this report has been signed below by the following persons on behalf of the registrant and in the capacities and on the dates indicated.
| VANGUARD FENWAY FUNDS | |
| BY: | /s/ F. WILLIAM MCNABB III* |
| F. WILLIAM MCNABB III | |
| CHIEF EXECUTIVE OFFICER | |
Date: May 21, 2015 | |
| VANGUARD FENWAY FUNDS |
BY: | /s/ THOMAS J. HIGGINS* |
| THOMAS J. HIGGINS | |
| CHIEF FINANCIAL OFFICER | |
Date: May 21, 2015 | |
* By: /s/ Heidi Stam
Heidi Stam, pursuant to a Power of Attorney filed on April 22, 2014 see file Number 2-17620, Incorporated by Reference.