UNITED STATES
SECURITIES AND EXCHANGE COMMISSION
Washington, D.C. 20549
FORM N-CSR
CERTIFIED SHAREHOLDER REPORT
OF
REGISTERED MANAGEMENT INVESTMENT COMPANIES
Investment Company Act file number: 811-05445
| Name of Registrant: | Vanguard Fenway Funds | |
| Address of Registrant: | P.O. Box 2600 | |
| Valley Forge, PA 19482 | ||
| Name and address of agent for service: | Anne E. Robinson, Esquire | |
| P.O. Box 876 | ||
| Valley Forge, PA 19482 | ||
Registrant’s telephone number, including area code: (610) 669-1000
Date of fiscal year end: September 30
Date of reporting period: October 1, 2016 – March 31, 2017
Item 1: Reports to Shareholders
Semiannual Report | March 31, 2017
Vanguard Equity Income Fund
A new format, unwavering commitment
As you begin reading this report, you’ll notice that we’ve made some improvements to the opening sections—based on feedback from you, our clients.
Page 1 starts with a new ”Your Fund’s Performance at a Glance,” a concise, handy summary of how your fund performed during the period.
In the renamed ”Chairman’s Perspective,” Bill McNabb will focus on enduring principles and investment insights.
We’ve modified some tables, and eliminated some redundancy, but we haven’t removed any information.
At Vanguard, we’re always looking for better ways to communicate and to help you make sound investment decisions. Thank you for entrusting your assets to us.
| Contents | |
| Your Fund’s Performance at a Glance. | 1 |
| Chairman’s Perspective. | 2 |
| Advisors’ Report. | 6 |
| Fund Profile. | 10 |
| Performance Summary. | 11 |
| Financial Statements. | 12 |
| About Your Fund’s Expenses. | 26 |
| Trustees Approve Advisory Arrangements. | 28 |
| Glossary. | 30 |
Please note: The opinions expressed in this report are just that—informed opinions. They should not be considered promises or advice. Also, please keep in mind that the information and opinions cover the period through the date on the front of this report. Of course, the risks of investing in your fund are spelled out in the prospectus.
See the Glossary for definitions of investment terms used in this report.
About the cover: No matter what language you speak, Vanguard has one consistent message and set of principles. Our primary focus is on you, our clients. We conduct our business with integrity as a faithful steward of your assets. This message is shown translated into seven languages, reflecting our expanding global presence.
Your Fund’s Performance at a Glance
• Vanguard Equity Income Fund returned well over 9% for the six months ended March 31, 2017. It slightly exceeded the 9.38% return of its benchmark index and the 8.46% average return of its peers.
• The Equity Income Fund seeks an above-average level of dividend income and reasonable long-term capital appreciation. Its two subadvisors perform extensive research to identify dividend-paying, undervalued companies with catalysts for share-price appreciation.
• Nine of the fund’s ten industry sectors recorded positive results. Only its telecommunication services stocks had a negative outcome, returning about –3%.
• The financial sector, the fund’s largest, was the top performer and contributed close to 4 percentage points to returns.
• Information technology and industrial stocks each added more than 1 percentage point to results, although the latter trailed the benchmark’s corresponding sector.
• The advisors’ selection in the consumer discretionary sector also helped returns relative to the benchmark.
| Total Returns: Six Months Ended March 31, 2017 | |||
| Total | |||
| Returns | |||
| Vanguard Equity Income Fund | |||
| Investor Shares | 9.51% | ||
| Admiral™ Shares | 9.57 | ||
| FTSE High Dividend Yield Index | 9.38 | ||
| Equity Income Funds Average | 8.46 | ||
| Equity Income Funds Average: Derived from data provided by Lipper, a Thomson Reuters Company. | |||
| Admiral Shares carry lower expenses and are available to investors who meet certain account-balance requirements. | |||
| Expense Ratios | |||
| Your Fund Compared With Its Peer Group | |||
| Investor | Admiral | Peer Group | |
| Shares | Shares | Average | |
| Equity Income Fund | 0.26% | 0.17% | 1.20% |
The fund expense ratios shown are from the prospectus dated January 26, 2017, and represent estimated costs for the current fiscal year. For the six months ended March 31, 2017, the fund’s annualized expense ratios were 0.26% for Investor Shares and 0.17% for Admiral Shares. The peer-group expense ratio is derived from data provided by Lipper, a Thomson Reuters Company, and captures information through year-end 2016.
Peer group: Equity Income Funds.
1
Chairman’s Perspective

Bill McNabb
Chairman and Chief Executive Officer
Dear Shareholder,
For many people, including me, falling interest rates have been the general trend in the bond market throughout our working lives. At the beginning of 1983, the year I graduated from business school, the yield of the benchmark 10-year U.S. Treasury note stood at more than 10%. It was less than 2.5% at the beginning of 2017.
Because bond prices move in the opposite direction from rates, my career happens to have overlapped with the greatest bull market for bonds in history.
It appears that may be changing. And, of course, there’s no shortage of advice about how to prepare for the shift.
Rates may be headed higher (really)
This bond bull market has reminded us time and again just how hard it is to predict when rates will rise or fall and by how much. If you follow bonds, you might recall the markets bracing for a sustained rate increase back in 2010 as the economy pulled out of recession, or again in 2013 when the Federal Reserve said it would start tapering its bond purchases, or again at the end of 2015 when the Fed raised short-term rates for the first time in almost a decade. And yet, prognostications notwithstanding, interest rates remained anchored near historical lows.
That said, rates seem to be on an upswing. With economic activity picking up, wages starting to move higher, and inflation coming
2
off recent lows, the Fed has nudged short-term rates higher twice in recent months and has signaled that further gradual increases are likely through 2018. The perceived pro-growth stance of the new U.S. administration also has played a role in framing a case for higher rates.
Short-term pain, longer-term gain
Bond investors are understandably concerned. If interest rates shoot up, the market value of bonds will drop sharply, with prices falling to bring yields in line with the new, prevailing higher rates. That’s the potential short-term pain. But long-term investors should actually want rates to go up. If you like bonds that pay 2%, you should love bonds that pay 4%, right?
There’s a simple—though imperfect—rule of thumb that helps make clear this point. If the time frame of your investing goal exceeds the time frame of your bond portfolio (a medium-term goal matched with short-term bonds, or a long-term goal paired with bonds not quite as long-term), rising rates will work out in your favor, maybe decidedly so.
Think of it this way: If you have a big cash need in the near future—say, a tuition bill coming due in a few years—and you own bonds that are long-term in nature, this time-frame mismatch could spell trouble if rates rise sharply; you’d be selling bonds that would be worth less. But if you’re saving to retire ten or 15 years down the road and rates are steadily rising, over time you’ll be earning higher and higher yields.
| Market Barometer | |||
| Total Returns | |||
| Periods Ended March 31, 2017 | |||
| Six | One | Five Years | |
| Months | Year | (Annualized) | |
| Stocks | |||
| Russell 1000 Index (Large-caps) | 10.09% | 17.43% | 13.26% |
| Russell 2000 Index (Small-caps) | 11.52 | 26.22 | 12.35 |
| Russell 3000 Index (Broad U.S. market) | 10.19 | 18.07 | 13.18 |
| FTSE All-World ex US Index (International) | 6.74 | 13.50 | 4.82 |
| Bonds | |||
| Bloomberg Barclays U.S. Aggregate Bond Index | |||
| (Broad taxable market) | -2.18% | 0.44% | 2.34% |
| Bloomberg Barclays Municipal Bond Index | |||
| (Broad tax-exempt market) | -2.10 | 0.15 | 3.24 |
| Citigroup Three-Month U.S. Treasury Bill Index | 0.21 | 0.34 | 0.10 |
| CPI | |||
| Consumer Price Index | 0.98% | 2.38% | 1.23% |
3
Josh Barrickman, our head of fixed income indexing for the Americas, calls it “the virtuous cycle of compounding interest at a higher rate.”
The bottom line is, you can end up better off than if rates haven’t risen because you’re earning more income, which over time more than washes away any price hit.
Beware of short-sighted, short-term moves
This logic can be difficult to grasp, tempting anxious bond investors to make drastic shifts to lessen the immediate pain of rising rates. Unfortunately, such moves can backfire.
Taking shelter in short-term bonds, for example, might seem like a good idea. Their prices generally hold up better than those of longer-term bonds in a rising-rate environment. But they also offer less income.
For example, when the market started worrying about rising rates in 2010, moving into short-term securities—and staying there—would have proved costly. Through 2016, those securities returned roughly half of what the broad U.S. bond market did.
Favoring high-yield bonds is another tack some investors take, expecting higher income to help cushion price declines.
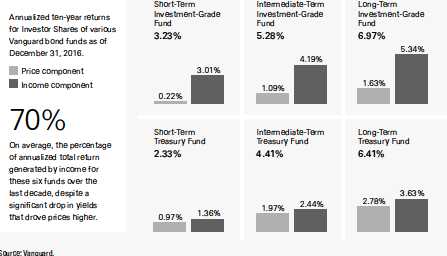
What has driven long-term returns for Vanguard bond funds?
4
High-yield securities, however, typically perform best when stocks are rising, making them unlikely to zig when stocks zag.
We saw clear evidence of the correlation between stocks and high-yield bonds in the frantic markets following the United Kingdom’s vote to leave the European Union last year. From June 23 to June 27, both U.S. stocks and U.S. high-yield bonds lost ground. The broad U.S. bond market, meanwhile, climbed 1.2% as investors sought a safe haven.
Your portfolio is more than the sum of its parts
Different assets have different roles to play in a balanced and diversified portfolio. Stocks are valuable because they can produce higher returns over time, while bonds can provide a crucial counterweight to the volatility of stocks.
Perhaps the most important thing to keep in mind about bonds is that although their prices can fluctuate, they remain “fixed income” securities. Barring default, you can be certain of getting income until the bonds mature. It’s that income that drives returns for patient bond investors who resist the urge to jump in and out of the market, as you can see in the accompanying box.
A lot has changed since I first started following the bond market, but the important role that bonds can play in a balanced and diversified portfolio hasn’t.
As always, thank you for investing with Vanguard.

F. William McNabb III
Chairman and Chief Executive Officer
April 14, 2017
5
Advisors’ Report
Vanguard Equity Income Fund returned 9.51% for Investor Shares and 9.57% for Admiral Shares for the six months ended March 31, 2017. It slightly outpaced its benchmark, the FTSE High Dividend Yield Index, but lagged the broad U.S. market. It surpassed the average return of its equity income peers by about 1 percentage point.
This performance reflects the combined results of your fund’s two independent investment advisors, Wellington Management Company and Vanguard Quantitative Equity Group. The use of two advisors provides exposure to distinct yet complementary investment approaches,
enhancing the diversification of your fund. It is not uncommon for different advisors to have different views about individual securities or the broader investment environment.
The advisors, the percentage and amount of the fund’s assets each manages, and brief descriptions of their investment strategies are presented in the table below. The advisors have also prepared a discussion of the investment environment that existed during the six months and its effect on portfolio positioning. These comments were prepared on April 21, 2017.
| Vanguard Equity Income Fund Investment Advisors | |||
| Fund Assets Managed | |||
| Investment Advisor | % | $ Million | Investment Strategy |
| Wellington Management | 64 | 17,636 | A fundamental approach to seeking desirable stocks. |
| Company LLP | Our selections typically offer above-average dividend | ||
| yields, below-average valuations, and the potential for | |||
| dividend increases in the future. | |||
| Vanguard Quantitative Equity | 34 | 9,394 | Employs a quantitative fundamental management |
| Group | approach, using models that assess valuation, growth | ||
| prospects, management decisions, market sentiment, | |||
| and earnings and balance-sheet quality of companies | |||
| as compared with their peers. | |||
| Cash Investments | 2 | 490 | These short-term reserves are invested by Vanguard in |
| equity index products to simulate investment in stocks. | |||
| Each advisor may also maintain a modest cash | |||
| position. | |||
6
Wellington Management Company llp
Portfolio Manager:
W. Michael Reckmeyer, III, CFA,
Senior Managing Director
and Equity Portfolio Manager
Investors experienced a historic six months, punctuated by Donald Trump’s presidential victory. U.S. equities, as measured by the S&P 500 Index, hit a series of record highs during November and December. Expectations rose that President Trump would reduce regulatory restrictions and increase fiscal stimulus through measures such as cutting corporate and individual taxes and boosting infrastructure spending. Although global merger and acquisition volume declined –16.6% from 2015’s record, 2016’s $3.6 trillion in announced deals was still the third-highest ever (after 2015 and 2007).
Equities continued their climb into 2017 despite escalating European political risk and uncertainty surrounding President Trump’s protectionist trade agenda. Investors bid up risk assets amid increasing optimism about global economic growth. The upcoming French presidential election was a primary source of anxiety as anti-euro candidate Marine Le Pen gained in polling during February. The political rhetoric in France grew raucous with anti-establishment and anti-globalization
themes. However, solid fourth-quarter European GDP growth and strengthening global manufacturing data helped to boost risk appetites.
On the monetary policy front, the U.S. Federal Reserve raised rates twice during the period, in December and March. The market was unfazed by each 25-basis-point increase because the moves, only the second and third rate increases in the past decade, were well-telegraphed. Although risks stemming from President Trump’s ambitious U.S. legislative agenda and European elections were top of mind, economic data releases from most major economies remained robust, helping the rally to roll on.
The portfolio was hurt by security selection but aided by sector allocation, a residual effect of our bottom-up stock selection process. Selection in financials, industrials, and telecommunication services were the primary detractors from relative performance. A cash position in a strong equity market and an underweighted allocation to materials also weighed on results. Among individual stocks, our positions in AstraZeneca and Occidental Petroleum, as well as our decision not to own benchmark constituent Boeing, detracted most. We eliminated our position in AstraZeneca to fund more attractive opportunities.
7
Sector allocation boosted relative returns, largely driven by an overweighted allocation to financials, the best-performing sector in the index. An underweighted allocation to telecommunication services and stock selection in consumer staples and consumer discretionary were also positive. The top individual contributors to relative performance included Analog Devices and Eli Lilly, a new purchase. Our underweighted position in Exxon Mobil helped as well.
At the end of the period, we were overweighted in financials, health care, and energy. Relative to the benchmark, we were most underweighted in telecommunication services, consumer staples, and consumer discretionary.
Significant purchases in the past six months included new positions in Cardinal Health, Qualcomm, and Eli Lilly. We also added to our position in Unilever, which we believe is well-diversified by geography and product segment, with a higher organic growth revenue rate than the average consumer staples stock. Our largest sale was the elimination of AstraZeneca. We also trimmed our positions in Enbridge and UGI as they hit our price targets, and Verizon Communications because of eroding fundamentals.
As always, we remain focused on finding investment opportunities in quality dividend-paying companies with attractive total return potential at discounted valuations.
Vanguard Quantitative Equity Group
Portfolio Managers:
Michael R. Roach, CFA
James P. Stetler
Binbin Guo, Principal, Head of Equity
Research and Portfolio Strategies
The investment environment
The period opened on an optimistic note as the U.S. economy appeared to pick up steam. The manufacturing and housing sectors reported solid activity and the employment rate continued to improve even as wages rose. Personal consumption, private investment, and residential and nonresidential fixed investment also added to growth. Commodities, especially oil, regained some ground after price declines earlier in the year.
That optimism carried over into the first quarter of 2017. Consumer confidence rose in March to its highest level in nearly two decades. Unemployment dropped to 4.5% though the country added only 98,000 jobs, and the labor force participation rate held steady at 63%.
Against this backdrop, stocks surged as investors anticipated stronger growth and higher inflation. The earlier economic improvement and the prospect of more infrastructure spending, greater deregulation, and possible tax-code changes under the new administration helped fuel a shift toward riskier assets, propelling stocks to record highs in early 2017.
8
The broad U.S. equity market (as measured by the Russell 3000 Index) returned 10.19% for the period. Value stocks outperformed their growth counterparts, small-capitalization stocks beat large-caps, and U.S. stocks outpaced their developed and emerging-market peers.
These developments most likely played a large part in the Federal Reserve’s decision to raise the federal funds target interest rate by a quarter of a percentage point in March, to 0.75%–1%. It was the Fed’s second rate increase in three months but only the third in the past decade.
Investment objective and strategy
Although our overall performance is affected by the macroeconomic factors we’ve described, our approach to investing focuses on specific stock fundamentals that we believe are more likely to produce outperformance over the long run. Those fundamentals are: high quality—healthy balance sheets and consistent cash-flow generation; effective use of capital—sound investment policies that favor internal over external funding; consistent earnings growth—a demonstrated ability to grow earnings year after year; strong market sentiment––market confirmation of our view; and reasonable valuation—avoidance of overpriced stocks.
Using these five themes, we generate a daily composite stock ranking, seeking to capitalize on investor biases. We then monitor our portfolio based on those rankings and adjust when appropriate to
maximize expected return while minimizing exposure to risks that our research indicates do not improve returns (such as industry selection and other risks relative to our benchmark).
Our successes and shortfalls
Over the six months, the results from our combined model were positive. Our valuation and quality models and, to a lesser extent, our management decisions model lifted relative returns. However, our growth and sentiment models did not perform as expected.
Results exceeded those of the benchmark in eight sectors and were strongest in financials, information technology, and consumer discretionary. Our consumer staples holdings lagged the most, followed to a lesser degree by telecommunication services and health care.
In financials, Regions Financial was the largest relative contributor, as were Darden Restaurants in consumer discretionary and Steel Dynamics and Huntsman in materials. Our underweighting of Qualcomm boosted relative performance in information technology. Disappointments in consumer staples included underweighted allocations to Kimberly-Clark and Reynolds American. Energy holding Noble and Pitney Bowes in industrials also fell short on a relative basis.
9
Equity Income Fund
Fund Profile
As of March 31, 2017
| Share-Class Characteristics | ||
| Investor | Admiral | |
| Shares | Shares | |
| Ticker Symbol | VEIPX | VEIRX |
| Expense Ratio1 | 0.26% | 0.17% |
| 30-Day SEC Yield | 2.71% | 2.79% |
| Portfolio Characteristics | |||
| FTSE High | DJ | ||
| Dividend | U.S. Total | ||
| Yield | Market | ||
| Fund | Index | FA Index | |
| Number of Stocks | 211 | 410 | 3,813 |
| Median Market Cap $107.6B | $116.0B | $58.2B | |
| Price/Earnings Ratio | 22.1x | 21.7x | 25.4x |
| Price/Book Ratio | 2.9x | 2.9x | 3.0x |
| Return on Equity | 16.7% | 16.8% | 16.3% |
| Earnings Growth | |||
| Rate | 2.2% | 1.7% | 7.3% |
| Dividend Yield | 3.0% | 3.1% | 1.9% |
| Foreign Holdings | 8.2% | 0.0% | 0.0% |
| Turnover Rate | |||
| (Annualized) | 27% | — | — |
| Short-Term | |||
| Reserves | 2.2% | — | — |
Sector Diversification (% of equity exposure)
| FTSE High | DJ | ||
| Dividend | U.S. Total | ||
| Yield | Market | ||
| Fund | Index | FA Index | |
| Consumer | |||
| Discretionary | 5.3% | 5.6% | 12.7% |
| Consumer Staples | 12.8 | 14.4 | 8.3 |
| Energy | 10.1 | 9.8 | 6.2 |
| Financials | 17.6 | 14.9 | 14.8 |
| Health Care | 13.8 | 10.9 | 13.3 |
| Industrials | 11.7 | 11.9 | 10.7 |
| Information | |||
| Technology | 14.5 | 15.7 | 21.2 |
| Materials | 3.2 | 3.7 | 3.4 |
| Real Estate | 0.0 | 0.0 | 4.1 |
| Telecommunication | |||
| Services | 3.6 | 5.1 | 2.1 |
| Utilities | 7.4 | 8.0 | 3.2 |
| Volatility Measures | ||
| FTSE High | DJ | |
| Dividend | U.S. Total | |
| Yield | Market | |
| Index | FA Index | |
| R-Squared | 0.98 | 0.91 |
| Beta | 0.98 | 0.86 |
These measures show the degree and timing of the fund’s fluctuations compared with the indexes over 36 months.
| Ten Largest Holdings (% of total net assets) | ||
| Microsoft Corp. | Systems Software | 4.6% |
| JPMorgan Chase & Co. | Diversified Banks | 3.6 |
| Wells Fargo & Co. | Diversified Banks | 3.2 |
| Johnson & Johnson | Pharmaceuticals | 3.1 |
| Philip Morris | ||
| International Inc. | Tobacco | 3.1 |
| Cisco Systems Inc. | Communications | |
| Equipment | 2.5 | |
| General Electric Co. | Industrial | |
| Conglomerates | 2.4 | |
| Merck & Co. Inc. | Pharmaceuticals | 2.2 |
| Pfizer Inc. | Pharmaceuticals | 2.0 |
| Exxon Mobil Corp. | Integrated Oil & Gas | 1.9 |
| Top Ten | 28.6% | |
The holdings listed exclude any temporary cash investments and
equity index products.
Investment Focus
1 The expense ratios shown are from the prospectus dated January 26, 2017, and represent estimated costs for the current fiscal year. For the six months ended March 31, 2017, the annualized expense ratios were 0.26% for Investor Shares and 0.17% for Admiral Shares.
10
Equity Income Fund
Performance Summary
All of the returns in this report represent past performance, which is not a guarantee of future results that may be achieved by the fund. (Current performance may be lower or higher than the performance data cited. For performance data current to the most recent month-end, visit our website at vanguard.com/performance.) Note, too, that both investment returns and principal value can fluctuate widely, so an investor’s shares, when sold, could be worth more or less than their original cost. The returns shown do not reflect taxes that a shareholder would pay on fund distributions or on the sale of fund shares.
Fiscal-Year Total Returns (%): September 30, 2006, Through March 31, 2017
For a benchmark description, see the Glossary.
Note: For 2017, performance data reflect the six months ended March 31, 2017.
| Average Annual Total Returns: Periods Ended March 31, 2017 | ||||
| Inception | One | Five | Ten | |
| Date | Year | Years | Years | |
| Investor Shares | 3/21/1988 | 15.80% | 12.86% | 7.74% |
| Admiral Shares | 8/13/2001 | 15.94 | 12.97 | 7.85 |
See Financial Highlights for dividend and capital gains information.
11
Equity Income Fund
Financial Statements (unaudited)
Statement of Net Assets
As of March 31, 2017
The fund reports a complete list of its holdings in regulatory filings four times in each fiscal year, at the quarter-ends. For the second and fourth fiscal quarters, the lists appear in the fund’s semiannual and annual reports to shareholders. For the first and third fiscal quarters, the fund files the lists with the Securities and Exchange Commission on Form N-Q. Shareholders can look up the fund’s Forms N-Q on the SEC’s website at sec.gov. Forms N-Q may also be reviewed and copied at the SEC’s Public Reference Room (see the back cover of this report for further information).
| Market | |||
| Value• | |||
| Shares | ($000) | ||
| Common Stocks (96.0%)1 | |||
| Consumer Discretionary (5.0%) | |||
| Home Depot Inc. | 2,381,882 | 349,732 | |
| McDonald’s Corp. | 1,924,544 | 249,440 | |
| VF Corp. | 3,482,781 | 191,448 | |
| Best Buy Co. Inc. | 1,299,481 | 63,869 | |
| Darden Restaurants Inc. | 746,858 | 62,490 | |
| Carnival Corp. | 1,020,886 | 60,140 | |
| L Brands Inc. | 1,162,200 | 54,740 | |
| Ford Motor Co. | 4,451,048 | 51,810 | |
| General Motors Co. | 1,463,054 | 51,734 | |
| Kohl’s Corp. | 760,489 | 30,275 | |
| ^ | Regal Entertainment | ||
| Group Class A | 1,332,828 | 30,095 | |
| International Game | |||
| Technology plc | 1,192,049 | 28,251 | |
| Tupperware Brands Corp. | 416,995 | 26,154 | |
| Coach Inc. | 332,397 | 13,738 | |
| Tailored Brands Inc. | 887,970 | 13,266 | |
| Garmin Ltd. | 255,850 | 13,076 | |
| Time Inc. | 553,010 | 10,701 | |
| Hasbro Inc. | 94,455 | 9,428 | |
| Omnicom Group Inc. | 107,398 | 9,259 | |
| Ralph Lauren Corp. | |||
| Class A | 111,404 | 9,093 | |
| Leggett & Platt Inc. | 164,762 | 8,291 | |
| ^ | Rent-A-Center Inc. | 850,957 | 7,548 |
| Meredith Corp. | 90,232 | 5,829 | |
| Staples Inc. | 527,239 | 4,624 | |
| Bob Evans Farms Inc. | 59,035 | 3,830 | |
| Chico’s FAS Inc. | 255,332 | 3,626 | |
| Sturm Ruger & Co. Inc. | 38,744 | 2,075 | |
| MDC Holdings Inc. | 62,896 | 1,890 | |
| 1,366,452 | |||
| Consumer Staples (12.3%) | |||
| Philip Morris | |||
| International Inc. | 7,455,422 | 841,717 | |
| PepsiCo Inc. | 2,908,644 | 325,361 | |
| ^ | Unilever NV | 6,107,592 | 303,425 |
| Coca-Cola Co. | 6,957,028 | 295,256 | |
| Procter & Gamble Co. | 3,285,590 | 295,210 | |
| British American | |||
| Tobacco plc | 4,072,177 | 270,176 | |
| Kraft Heinz Co. | 2,760,423 | 250,674 | |
| Wal-Mart Stores Inc. | 3,217,420 | 231,912 | |
| Altria Group Inc. | 2,823,366 | 201,645 | |
| ^ | Diageo plc ADR | 1,011,019 | 116,854 |
| Conagra Brands Inc. | 1,582,880 | 63,853 | |
| Nu Skin Enterprises Inc. | |||
| Class A | 902,731 | 50,138 | |
| Reynolds American Inc. | 676,023 | 42,603 | |
| Kellogg Co. | 455,063 | 33,042 | |
| Universal Corp. | 385,585 | 27,280 | |
| Ingredion Inc. | 213,290 | 25,686 | |
| Bunge Ltd. | 174,212 | 13,808 | |
| General Mills Inc. | 107,032 | 6,316 | |
| 3,394,956 | |||
| Energy (9.7%) | |||
| Exxon Mobil Corp. | 6,511,831 | 534,035 | |
| Chevron Corp. | 4,950,743 | 531,561 | |
| Suncor Energy Inc. | 10,803,639 | 332,212 | |
| ^ | TransCanada Corp. | 4,486,270 | 207,033 |
| Occidental Petroleum | |||
| Corp. | 3,206,715 | 203,177 | |
| Canadian Natural | |||
| Resources Ltd. | 6,153,744 | 201,781 | |
| Phillips 66 | 2,248,870 | 178,156 | |
| Valero Energy Corp. | 1,141,841 | 75,693 | |
| Kinder Morgan Inc. | 2,814,293 | 61,183 | |
| ONEOK Inc. | 1,101,298 | 61,056 | |
| ConocoPhillips | 1,034,654 | 51,598 | |
| Williams Cos. Inc. | 1,620,554 | 47,952 | |
| Enbridge Inc. | 1,021,566 | 42,742 | |
| ^ | Ship Finance | ||
| International Ltd. | 2,086,913 | 30,678 | |
| ^ | PBF Energy Inc. Class A | 1,106,062 | 24,521 |
| Marathon Petroleum Corp. 442,218 | 22,350 | ||
| Cosan Ltd. | 2,436,602 | 20,809 | |
12
Equity Income Fund
| Market | ||
| Value• | ||
| Shares | ($000) | |
| Murphy Oil Corp. | 690,137 | 19,731 |
| Delek US Holdings Inc. | 373,449 | 9,064 |
| Archrock Inc. | 718,247 | 8,906 |
| SemGroup Corp. Class A | 77,974 | 2,807 |
| 2,667,045 | ||
| Financials (16.9%) | ||
| JPMorgan Chase & Co. | 11,405,854 | 1,001,890 |
| Wells Fargo & Co. | 15,771,154 | 877,822 |
| Marsh & McLennan | ||
| Cos. Inc. | 5,974,448 | 441,452 |
| PNC Financial Services | ||
| Group Inc. | 2,511,740 | 302,012 |
| MetLife Inc. | 5,181,681 | 273,696 |
| Chubb Ltd. | 1,927,905 | 262,677 |
| BlackRock Inc. | 674,178 | 258,554 |
| Principal Financial | ||
| Group Inc. | 3,292,228 | 207,773 |
| M&T Bank Corp. | 1,194,658 | 184,849 |
| Thomson Reuters Corp. | 3,559,877 | 153,894 |
| US Bancorp | 2,669,665 | 137,488 |
| Prudential Financial Inc. | 863,876 | 92,158 |
| Aflac Inc. | 1,029,039 | 74,523 |
| Ameriprise Financial Inc. | 540,565 | 70,101 |
| Regions Financial Corp. | 4,501,401 | 65,405 |
| Fifth Third Bancorp | 2,219,680 | 56,380 |
| Navient Corp. | 3,404,751 | 50,254 |
| Travelers Cos. Inc. | 345,600 | 41,659 |
| SunTrust Banks Inc. | 548,984 | 30,359 |
| LPL Financial Holdings Inc. | 684,619 | 27,268 |
| Axis Capital Holdings Ltd. | 173,809 | 11,650 |
| Federated Investors Inc. | ||
| Class B | 366,770 | 9,661 |
| Washington Federal Inc. | 183,332 | 6,068 |
| FNF Group | 97,563 | 3,799 |
| Eaton Vance Corp. | 81,970 | 3,685 |
| LegacyTexas Financial | ||
| Group Inc. | 64,297 | 2,566 |
| AmTrust Financial | ||
| Services Inc. | 137,631 | 2,541 |
| 4,650,184 | ||
| Health Care (13.2%) | ||
| Johnson & Johnson | 6,794,514 | 846,257 |
| Merck & Co. Inc. | 9,614,337 | 610,895 |
| Pfizer Inc. | 15,877,709 | 543,176 |
| Eli Lilly & Co. | 3,925,193 | 330,148 |
| Bristol-Myers Squibb Co. | 5,520,571 | 300,209 |
| Cardinal Health Inc. | 2,552,500 | 208,156 |
| Novartis AG | 2,737,950 | 203,314 |
| Roche Holding AG | 717,018 | 183,366 |
| Amgen Inc. | 993,212 | 162,956 |
| AbbVie Inc. | 1,674,984 | 109,142 |
| Abbott Laboratories | 1,965,700 | 87,297 |
| Gilead Sciences Inc. | 545,845 | 37,074 |
| Baxter International Inc. | 99,211 | 5,145 |
| Owens & Minor Inc. | 52,581 | 1,819 | |
| 3,628,954 | |||
| Industrials (11.2%) | |||
| General Electric Co. | 22,430,052 | 668,416 | |
| Eaton Corp. plc | 4,720,076 | 349,994 | |
| Union Pacific Corp. | 2,929,082 | 310,248 | |
| 3M Co. | 1,565,210 | 299,472 | |
| Honeywell | |||
| International Inc. | 1,957,910 | 244,484 | |
| United Technologies | |||
| Corp. | 1,487,422 | 166,904 | |
| Raytheon Co. | 1,048,426 | 159,885 | |
| Boeing Co. | 822,483 | 145,464 | |
| Caterpillar Inc. | 1,274,081 | 118,184 | |
| United Parcel Service | |||
| Inc. Class B | 870,177 | 93,370 | |
| Cummins Inc. | 475,907 | 71,957 | |
| Copa Holdings SA Class A | 475,558 | 53,381 | |
| Lockheed Martin Corp. | 193,671 | 51,826 | |
| Ryder System Inc. | 558,850 | 42,160 | |
| ^ | GATX Corp. | 688,301 | 41,959 |
| ^ | Greenbrier Cos. Inc. | 895,535 | 38,598 |
| MSC Industrial Direct | |||
| Co. Inc. Class A | 350,060 | 35,972 | |
| Emerson Electric Co. | 408,926 | 24,478 | |
| General Cable Corp. | 1,137,559 | 20,419 | |
| Deere & Co. | 179,717 | 19,564 | |
| Timken Co. | 346,038 | 15,641 | |
| Waste Management Inc. | 196,624 | 14,338 | |
| Pitney Bowes Inc. | 1,056,230 | 13,847 | |
| Briggs & Stratton Corp. | 587,077 | 13,180 | |
| West Corp. | 512,848 | 12,524 | |
| CSX Corp. | 261,768 | 12,185 | |
| Knoll Inc. | 422,097 | 10,050 | |
| Aircastle Ltd. | 385,149 | 9,294 | |
| Brady Corp. Class A | 227,047 | 8,775 | |
| Republic Services Inc. | |||
| Class A | 111,814 | 7,023 | |
| Kennametal Inc. | 129,527 | 5,081 | |
| RR Donnelley & Sons Co. | 367,492 | 4,450 | |
| ^ | American Railcar | ||
| Industries Inc. | 94,446 | 3,882 | |
| LSC Communications Inc. | 133,400 | 3,356 | |
| Norfolk Southern Corp. | 24,432 | 2,736 | |
| HNI Corp. | 58,236 | 2,684 | |
| Steelcase Inc. Class A | 158,497 | 2,655 | |
| 3,098,436 | |||
| Information Technology (13.8%) | |||
| Microsoft Corp. | 19,168,463 | 1,262,435 | |
| Cisco Systems Inc. | 20,007,684 | 676,260 | |
| Intel Corp. | 13,645,083 | 492,178 | |
| Analog Devices Inc. | 3,979,252 | 326,100 | |
| QUALCOMM Inc. | 3,316,961 | 190,195 | |
13
Equity Income Fund
| Market | ||
| Value• | ||
| Shares | ($000) | |
| Maxim Integrated | ||
| Products Inc. | 4,067,812 | 182,889 |
| International Business | ||
| Machines Corp. | 971,905 | 169,247 |
| Texas Instruments Inc. | 1,526,862 | 123,004 |
| HP Inc. | 3,937,537 | 70,403 |
| KLA-Tencor Corp. | 705,428 | 67,065 |
| Seagate Technology plc | 1,336,645 | 61,392 |
| Western Union Co. | 2,736,357 | 55,685 |
| Science Applications | ||
| International Corp. | 540,767 | 40,233 |
| Cypress Semiconductor | ||
| Corp. | 2,636,251 | 36,275 |
| Computer Sciences Corp. | 488,700 | 33,725 |
| 3,787,086 | ||
| Materials (3.1%) | ||
| Dow Chemical Co. | 5,270,039 | 334,858 |
| International Paper Co. | 3,797,439 | 192,834 |
| LyondellBasell Industries | ||
| NV Class A | 865,084 | 78,887 |
| Huntsman Corp. | 2,373,243 | 58,239 |
| Steel Dynamics Inc. | 1,480,681 | 51,468 |
| Commercial Metals Co. | 2,280,202 | 43,620 |
| Greif Inc. Class A | 412,755 | 22,739 |
| EI du Pont de | ||
| Nemours & Co. | 217,051 | 17,436 |
| Nucor Corp. | 226,352 | 13,518 |
| WestRock Co. | 169,445 | 8,816 |
| Packaging Corp. | ||
| of America | 81,560 | 7,473 |
| Rayonier Advanced | ||
| Materials Inc. | 544,150 | 7,319 |
| Olin Corp. | 169,643 | 5,576 |
| Schnitzer Steel | ||
| Industries Inc. | 140,666 | 2,905 |
| Sonoco Products Co. | 46,294 | 2,450 |
| 848,138 | ||
| Other (0.3%) | ||
| 2 Vanguard High Dividend | �� | |
| Yield ETF | 1,047,950 | 81,373 |
| Telecommunication Services (3.4%) | ||
| Verizon | ||
| Communications Inc. | 8,839,031 | 430,903 |
| AT&T Inc. | 7,223,104 | 300,120 |
| BCE Inc. | 4,278,210 | 189,420 |
| ^ Windstream Holdings Inc. | 2,346,030 | 12,786 |
| Cogent Communications | ||
| Holdings Inc. | 171,990 | 7,404 |
| 940,633 | ||
| Utilities (7.1%) | ||
| Dominion Resources Inc. | 4,126,950 | 320,128 |
| NextEra Energy Inc. | 1,614,434 | 207,245 |
| Eversource Energy | 3,405,223 | 200,159 |
| Sempra Energy | 1,584,549 | 175,093 |
| Xcel Energy Inc. | 3,732,287 | 165,900 |
| Duke Energy Corp. | 1,393,177 | 114,254 |
| UGI Corp. | 1,883,456 | 93,043 |
| Edison International | 925,186 | 73,654 |
| FirstEnergy Corp. | 1,922,349 | 61,169 |
| CenterPoint Energy Inc. | 2,179,538 | 60,090 |
| PPL Corp. | 1,599,386 | 59,801 |
| Entergy Corp. | 771,755 | 58,622 |
| AES Corp. | 4,891,853 | 54,691 |
| MDU Resources | ||
| Group Inc. | 1,950,337 | 53,381 |
| Ameren Corp. | 939,455 | 51,285 |
| DTE Energy Co. | 396,085 | 40,444 |
| NRG Energy Inc. | 2,005,225 | 37,498 |
| Southwest Gas | ||
| Holdings Inc. | 433,009 | 35,901 |
| National Fuel Gas Co. | 394,652 | 23,529 |
| Great Plains Energy Inc. | 730,506 | 21,345 |
| ONE Gas Inc. | 305,329 | 20,640 |
| PG&E Corp. | 205,947 | 13,667 |
| Hawaiian Electric | ||
| Industries Inc. | 128,583 | 4,283 |
| OGE Energy Corp. | 107,198 | 3,750 |
| Exelon Corp. | 78,964 | 2,841 |
| Pinnacle West Capital Corp. | 26,506 | 2,210 |
| South Jersey Industries Inc. | 56,884 | 2,028 |
| NRG Yield Inc. | 113,070 | 2,001 |
| PNM Resources Inc. | 51,599 | 1,909 |
| Southern Co. | 37,403 | 1,862 |
| 1,962,423 | ||
| Total Common Stocks | ||
| (Cost $20,103,387) | 26,425,680 | |
| Temporary Cash Investments (4.7%)1 | ||
| Money Market Fund (2.2%) | ||
| 3,4 Vanguard Market | ||
| Liquidity Fund, 0.965% | 5,969,168 | 597,036 |
14
Equity Income Fund
| Face | Market | ||
| Amount | Value• | ||
| ($000) | ($000) | ||
| Repurchase Agreements (2.2%) | |||
| Goldman Sachs & Co. | |||
| 0.790%, 4/3/17 (Dated | |||
| 3/31/17, Repurchase | |||
| Value $228,615,000 | |||
| collateralized by Federal | |||
| Home Loan Mortgage | |||
| Corp. 3.500%, 1/1/47, | |||
| and Federal National | |||
| Mortgage Assn. 2.380%– | |||
| 4.000%, 3/1/23–1/1/47, | |||
| with a value of | |||
| $233,172,000) | 228,600 | 228,600 | |
| RBS Securities, Inc. | |||
| 0.780%, 4/3/17 (Dated | |||
| 3/31/17, Repurchase | |||
| Value $267,217,000 | |||
| collateralized by U.S. | |||
| Treasury Note/Bond | |||
| 0.875%, 5/15/17, with | |||
| a value of $272,546,000) | 267,200 | 267,200 | |
| Societe Generale | |||
| 0.780%, 4/3/17 (Dated | |||
| 3/31/17, Repurchase | |||
| Value $112,207,000 | |||
| collateralized by Federal | |||
| Home Loan Mortgage | |||
| Corp. 1.000%, 8/28/19, | |||
| Federal National Mortgage | |||
| Assn. 1.125%, 9/6/19, | |||
| Government National | |||
| Mortgage Assn. 3.500%, | |||
| 4/20/46, and U.S. | |||
| Treasury Note/Bond | |||
| 2.250%–4.625%, | |||
| 12/31/23–2/15/40, with | |||
| a value of $114,444,000) | 112,200 | 112,200 | |
| 608,000 | |||
| U.S. Government and Agency Obligations (0.3%) | |||
| 5 | Federal Home Loan Bank | ||
| Discount Notes, 0.771%, | |||
| 5/31/17 | 50,000 | 49,940 | |
| 6 | United States Treasury Bill, | ||
| 0.491%–0.571%, 5/4/17 | 4,000 | 3,998 | |
| United States Treasury Bill, | |||
| 0.623%–0.646%, 5/18/17 | 1,100 | 1,099 | |
| United States Treasury Bill, | |||
| 0.557%, 5/25/17 | 2,000 | 1,998 | |
| United States Treasury Bill, | |||
| 0.516%–0.713%, 6/1/17 | 6,900 | 6,892 | |
| 6 | United States Treasury Bill, | ||
| 0.598%–0.741%, 6/8/17 | 3,100 | 3,096 | |
| 6 | United States Treasury Bill, | ||
| 0.729%–0.759%, 6/15/17 | 6,100 | 6,091 | |
| 6 | United States Treasury Bill, | ||
| 0.592%, 7/13/17 | 10,000 | 9,979 | |
| 6 | United States Treasury Bill, | ||
| 0.638%, 8/24/17 | 4,100 | 4,087 | |
| 87,180 | |||
| Total Temporary Cash Investments | |||
| (Cost $1,292,148) | 1,292,216 | ||
| Total Investments (100.7%) | |||
| (Cost $21,395,535) | 27,717,896 | ||
| Amount | |||
| ($000) | |||
| Other Assets and Liabilities (-0.7%) | |||
| Other Assets | |||
| Investment in Vanguard | 1,881 | ||
| Receivables for Investment Securities Sold 8,824 | |||
| Receivables for Accrued Income | 60,383 | ||
| Receivables for Capital Shares Issued | 72,563 | ||
| Other Assets | 171 | ||
| Total Other Assets | 143,822 | ||
| Liabilities | |||
| Payables for Investment Securities | |||
| Purchased | (40,484) | ||
| Collateral for Securities on Loan | (255,590) | ||
| Payables to Investment Advisor | (4,461) | ||
| Payables for Capital Shares Redeemed | (19,229) | ||
| Payables to Vanguard | (20,735) | ||
| Other Liabilities | (867) | ||
| Total Liabilities | (341,366) | ||
| Net Assets (100%) | 27,520,352 | ||
15
Equity Income Fund
At March 31, 2017, net assets consisted of:
| Amount | |
| ($000) | |
| Paid-in Capital | 21,069,401 |
| Overdistributed Net Investment Income | (10,569) |
| Accumulated Net Realized Gains | 140,492 |
| Unrealized Appreciation (Depreciation) | |
| Investment Securities | 6,322,361 |
| Futures Contracts | (1,277) |
| Foreign Currencies | (56) |
| Net Assets | 27,520,352 |
| Investor Shares—Net Assets | |
| Applicable to 177,757,244 outstanding | |
| $.001 par value shares of beneficial | |
| interest (unlimited authorization) | 6,021,387 |
| Net Asset Value Per Share— | |
| Investor Shares | $33.87 |
| Admiral Shares—Net Assets | |
| Applicable to 302,816,826 outstanding | |
| $.001 par value shares of beneficial | |
| interest (unlimited authorization) | 21,498,965 |
| Net Asset Value Per Share— | |
| Admiral Shares | $71.00 |
• See Note A in Notes to Financial Statements.
^ Includes partial security positions on loan to broker-dealers. The total value of securities on loan is $241,974,000.
1 The fund invests a portion of its cash reserves in equity markets through the use of index futures contracts. After giving effect to futures
investments, the fund’s effective common stock and temporary cash investment positions represent 97.6% and 3.1%, respectively,
of net assets.
2 Considered an affiliated company of the fund as the issuer is another member of The Vanguard Group.
3 Affiliated money market fund available only to Vanguard funds and certain trusts and accounts managed by Vanguard. Rate shown is
the 7-day yield.
4 Includes $255,590,000 of collateral received for securities on loan.
5 The issuer operates under a congressional charter; its securities are generally neither guaranteed by the U.S. Treasury nor backed by
the full faith and credit of the U.S. government.
6 Securities with a value of $16,445,000 have been segregated as initial margin for open futures contracts.
ADR—American Depositary Receipt.
See accompanying Notes, which are an integral part of the Financial Statements.
16
Equity Income Fund
| Statement of Operations | |
| Six Months Ended | |
| March 31, 2017 | |
| ($000) | |
| Investment Income | |
| Income | |
| Dividends1,2 | 381,172 |
| Interest2 | 2,681 |
| Securities Lending—Net | 2,852 |
| Total Income | 386,705 |
| Expenses | |
| Investment Advisory Fees—Note B | |
| Basic Fee | 11,115 |
| Performance Adjustment | (1,217) |
| The Vanguard Group—Note C | |
| Management and Administrative—Investor Shares | 4,457 |
| Management and Administrative—Admiral Shares | 7,558 |
| Marketing and Distribution—Investor Shares | 610 |
| Marketing and Distribution—Admiral Shares | 1,018 |
| Custodian Fees | 111 |
| Shareholders’ Reports—Investor Shares | 97 |
| Shareholders’ Reports—Admiral Shares | 100 |
| Trustees’ Fees and Expenses | 23 |
| Total Expenses | 23,872 |
| Net Investment Income | 362,833 |
| Realized Net Gain (Loss) | |
| Investment Securities Sold2 | 130,250 |
| Futures Contracts | 54,059 |
| Foreign Currencies | 117 |
| Realized Net Gain (Loss) | 184,426 |
| Change in Unrealized Appreciation (Depreciation) | |
| Investment Securities | 1,770,475 |
| Futures Contracts | (3,239) |
| Foreign Currencies | 7 |
| Change in Unrealized Appreciation (Depreciation) | 1,767,243 |
| Net Increase (Decrease) in Net Assets Resulting from Operations | 2,314,502 |
1 Dividends are net of foreign withholding taxes of $5,257,000.
2 Dividend income, interest income, and realized net gain (loss) from affiliated companies of the fund were $1,286,000, $1,699,000, and $0,
respectively.
See accompanying Notes, which are an integral part of the Financial Statements.
17
Equity Income Fund
| Statement of Changes in Net Assets | ||
| Six Months Ended | Year Ended | |
| March 31, | September 30, | |
| 2017 | 2016 | |
| ($000) | ($000) | |
| Increase (Decrease) in Net Assets | ||
| Operations | ||
| Net Investment Income | 362,833 | 628,706 |
| Realized Net Gain (Loss) | 184,426 | 273,175 |
| Change in Unrealized Appreciation (Depreciation) | 1,767,243 | 2,280,228 |
| Net Increase (Decrease) in Net Assets Resulting from Operations | 2,314,502 | 3,182,109 |
| Distributions | ||
| Net Investment Income | ||
| Investor Shares | (83,633) | (151,777) |
| Admiral Shares | (298,291) | (466,535) |
| Realized Capital Gain1 | ||
| Investor Shares | (59,063) | (168,698) |
| Admiral Shares | (197,567) | (461,700) |
| Total Distributions | (638,554) | (1,248,710) |
| Capital Share Transactions | ||
| Investor Shares | 153,259 | 179,932 |
| Admiral Shares | 2,088,878 | 3,714,163 |
| Net Increase (Decrease) from Capital Share Transactions | 2,242,137 | 3,894,095 |
| Total Increase (Decrease) | 3,918,085 | 5,827,494 |
| Net Assets | ||
| Beginning of Period | 23,602,267 | 17,774,773 |
| End of Period2 | 27,520,352 | 23,602,267 |
1 Includes fiscal 2017 and 2016 short-term gain distributions totaling $0 and $134,022,000, respectively. Short-term gain distributions are
treated as ordinary income dividends for tax purposes.
2 Net Assets—End of Period includes undistributed (overdistributed) net investment income of ($10,569,000) and $8,405,000.
See accompanying Notes, which are an integral part of the Financial Statements.
18
Equity Income Fund
| Financial Highlights | |||||||
| Investor Shares | |||||||
| Six Months | |||||||
| Ended | |||||||
| For a Share Outstanding | March 31, | Year Ended September 30, | |||||
| Throughout Each Period | 2017 | 2016 | 2015 | 2014 | 2013 | 2012 | |
| Net Asset Value, Beginning of Period | $31.69 | $28.78 | $31.23 | $28.26 | $24.31 | $19.40 | |
| Investment Operations | |||||||
| Net Investment Income | . 453 | . 909 | . 847 | . 826 | .732 | . 667 | |
| Net Realized and Unrealized Gain (Loss) | |||||||
| on Investments | 2.541 | 3.912 | (1.431) | 3.754 | 3.946 | 4.908 | |
| Total from Investment Operations | 2.994 | 4.821 | (.584) | 4.580 | 4.678 | 5.575 | |
| Distributions | |||||||
| Dividends from Net Investment Income | (. 476) | (. 895) | (. 852) | (. 811) | (.728) | (. 665) | |
| Distributions from Realized Capital Gains | (.338) | (1.016) | (1.014) | (.799) | — | — | |
| Total Distributions | (.814) | (1.911) | (1.866) | (1.610) | (.728) | (.665) | |
| Net Asset Value, End of Period | $33.87 | $31.69 | $28.78 | $31.23 | $28.26 | $24.31 | |
| Total Return1 | 9.51% | 17.21% | -2.11% | 16.62% | 19.45% | 29.00% | |
| Ratios/Supplemental Data | |||||||
| Net Assets, End of Period (Millions) | $6,021 | $5,487 | $4,812 | $5,528 | $4,839 | $4,107 | |
| Ratio of Total Expenses to | |||||||
| Average Net Assets2 | 0.26% | 0.26% | 0.26% | 0.29% | 0.30% | 0.30% | |
| Ratio of Net Investment Income to | |||||||
| Average Net Assets | 2.80% | 3.00% | 2.72% | 2.74% | 2.81% | 3.00% | |
| Portfolio Turnover Rate | 27% | 26% | 32% | 33% | 34% | 26% | |
The expense ratio, net investment income ratio, and turnover rate for the current period have been annualized.
1 Total returns do not include account service fees that may have applied in the periods shown. Fund prospectuses provide information about
any applicable account service fees.
2 Includes performance-based investment advisory fee increases (decreases) of (0.01%), (0.01%), (0.01%), 0.00%, 0.00%, and 0.00%.
See accompanying Notes, which are an integral part of the Financial Statements.
19
Equity Income Fund
| Financial Highlights | |||||||
| Admiral Shares | |||||||
| Six Months | |||||||
| Ended | |||||||
| For a Share Outstanding | March 31, | Year Ended September 30, | |||||
| Throughout Each Period | 2017 | 2016 | 2015 | 2014 | 2013 | 2012 | |
| Net Asset Value, Beginning of Period | $66.43 | $60.31 | $65.45 | $59.24 | $50.94 | $40.67 | |
| Investment Operations | |||||||
| Net Investment Income | .981 | 1.963 | 1.834 | 1.790 | 1.585 | 1.445 | |
| Net Realized and Unrealized Gain (Loss) | |||||||
| on Investments | 5.329 | 8.219 | (3.003) | 7.853 | 8.293 | 10.265 | |
| Total from Investment Operations | 6.310 | 10.182 | (1.169) | 9.643 | 9.878 | 11.710 | |
| Distributions | |||||||
| Dividends from Net Investment Income | (1.032) | (1.932) | (1.846) | (1.758) | (1.578) | (1.440) | |
| Distributions from Realized Capital Gains | (0.708) | (2.130) | (2.125) | (1.675) | — | — | |
| Total Distributions | (1.740) | (4.062) | (3.971) | (3.433) | (1.578) | (1.440) | |
| Net Asset Value, End of Period | $71.00 | $66.43 | $60.31 | $65.45 | $59.24 | $50.94 | |
| Total Return1 | 9.57% | 17.35% | -2.03% | 16.70% | 19.61% | 29.06% | |
| Ratios/Supplemental Data | |||||||
| Net Assets, End of Period (Millions) | $21,499 | $18,115 | $12,962 | $12,319 | $9,134 | $5,234 | |
| Ratio of Total Expenses to | |||||||
| Average Net Assets2 | 0.17% | 0.17% | 0.17% | 0.20% | 0.21% | 0.21% | |
| Ratio of Net Investment Income to | |||||||
| Average Net Assets | 2.89% | 3.09% | 2.81% | 2.83% | 2.90% | 3.09% | |
| Portfolio Turnover Rate | 27% | 26% | 32% | 33% | 34% | 26% | |
The expense ratio, net investment income ratio, and turnover rate for the current period have been annualized.
1 Total returns do not include account service fees that may have applied in the periods shown. Fund prospectuses provide information about
any applicable account service fees.
2 Includes performance-based investment advisory fee increases (decreases) of (0.01%), (0.01%), (0.01%), 0.00% 0.00%, and 0.00%.
See accompanying Notes, which are an integral part of the Financial Statements.
20
Equity Income Fund
Notes to Financial Statements
Vanguard Equity Income Fund is registered under the Investment Company Act of 1940 as an open-end investment company, or mutual fund. The fund offers two classes of shares: Investor Shares and Admiral Shares. Investor Shares are available to any investor who meets the fund’s minimum purchase requirements. Admiral Shares are designed for investors who meet certain administrative, service, and account-size criteria.
A. The following significant accounting policies conform to generally accepted accounting principles for U.S. investment companies. The fund consistently follows such policies in preparing its financial statements.
1. Security Valuation: Securities are valued as of the close of trading on the New York Stock Exchange (generally 4 p.m., Eastern time) on the valuation date. Equity securities are valued at the latest quoted sales prices or official closing prices taken from the primary market in which each security trades; such securities not traded on the valuation date are valued at the mean of the latest quoted bid and asked prices. Securities for which market quotations are not readily available, or whose values have been affected by events occurring before the fund’s pricing time but after the close of the securities’ primary markets, are valued at their fair values calculated according to procedures adopted by the board of trustees. These procedures include obtaining quotations from an independent pricing service, monitoring news to identify significant market- or security-specific events, and evaluating changes in the values of foreign market proxies (for example, ADRs, futures contracts, or exchange-traded funds), between the time the foreign markets close and the fund’s pricing time. When fair-value pricing is employed, the prices of securities used by a fund to calculate its net asset value may differ from quoted or published prices for the same securities. Investments in Vanguard Market Liquidity Fund are valued at that fund’s net asset value. Temporary cash investments are valued using the latest bid prices or using valuations based on a matrix system (which considers such factors as security prices, yields, maturities, and ratings), both as furnished by independent pricing services.
2. Foreign Currency: Securities and other assets and liabilities denominated in foreign currencies are translated into U.S. dollars using exchange rates obtained from an independent third party as of the fund’s pricing time on the valuation date. Realized gains (losses) and unrealized appreciation (depreciation) on investment securities include the effects of changes in exchange rates since the securities were purchased, combined with the effects of changes in security prices. Fluctuations in the value of other assets and liabilities resulting from changes in exchange rates are recorded as unrealized foreign currency gains (losses) until the assets or liabilities are settled in cash, at which time they are recorded as realized foreign currency gains (losses).
3. Futures Contracts: The fund uses index futures contracts to a limited extent, with the objective of maintaining full exposure to the stock market while maintaining liquidity. The fund may purchase or sell futures contracts to achieve a desired level of investment, whether to accommodate portfolio turnover or cash flows from capital share transactions. The primary risks associated with the use of futures contracts are imperfect correlation between changes in market values of stocks held by the fund and the prices of futures contracts, and the possibility of an illiquid market. Counterparty risk involving futures is mitigated because a regulated clearinghouse is the counterparty instead of the clearing broker. To further mitigate counterparty risk, the fund trades futures contracts on an exchange, monitors the financial strength of its clearing brokers and clearinghouse, and has entered into clearing agreements with its clearing brokers. The clearinghouse imposes initial margin requirements to secure the fund’s performance and requires daily settlement of variation margin representing changes in the market value of each contract.
21
Equity Income Fund
Futures contracts are valued at their quoted daily settlement prices. The aggregate settlement values of the contracts are not recorded in the Statement of Net Assets. Fluctuations in the value of the contracts are recorded in the Statement of Net Assets as an asset (liability) and in the Statement of Operations as unrealized appreciation (depreciation) until the contracts are closed, when they are recorded as realized futures gains (losses).
During the six months ended March 31, 2017, the fund’s average investments in long and short futures contracts represented 2% and 0% of net assets, respectively, based on the average of aggregate settlement values at each quarter-end during the period.
4. Repurchase Agreements: The fund enters into repurchase agreements with institutional counterparties. Securities pledged as collateral to the fund under repurchase agreements are held by a custodian bank until the agreements mature, and in the absence of a default, such collateral cannot be repledged, resold, or rehypothecated. Each agreement requires that the market value of the collateral be sufficient to cover payments of interest and principal. The fund further mitigates its counterparty risk by entering into repurchase agreements only with a diverse group of prequalified counterparties, monitoring their financial strength, and entering into master repurchase agreements with its counterparties. The master repurchase agreements provide that, in the event of a counter-party’s default (including bankruptcy), the fund may terminate any repurchase agreements with that counterparty, determine the net amount owed, and sell or retain the collateral up to the net amount owed to the fund. Such action may be subject to legal proceedings, which may delay or limit the disposition of collateral.
5. Federal Income Taxes: The fund intends to continue to qualify as a regulated investment company and distribute all of its taxable income. Management has analyzed the fund’s tax positions taken for all open federal income tax years (September, 2013–2016), and for the period ended March 31, 2017, and has concluded that no provision for federal income tax is required in the fund’s financial statements.
6. Distributions: Distributions to shareholders are recorded on the ex-dividend date.
7. Securities Lending: To earn additional income, the fund lends its securities to qualified institutional borrowers. Security loans are subject to termination by the fund at any time, and are required to be secured at all times by collateral in an amount at least equal to the market value of securities loaned. Daily market fluctuations could cause the value of loaned securities to be more or less than the value of the collateral received. When this occurs, the collateral is adjusted and settled on the next business day. The fund further mitigates its counterparty risk by entering into securities lending transactions only with a diverse group of prequalified counterparties, monitoring their financial strength, and entering into master securities lending agreements with its counterparties. The master securities lending agreements provide that, in the event of a counterparty’s default (including bankruptcy), the fund may terminate any loans with that borrower, determine the net amount owed, and sell or retain the collateral up to the net amount owed to the fund; however, such actions may be subject to legal proceedings. While collateral mitigates counterparty risk, in the event of a default the fund may experience delays and costs in recovering the securities loaned. The fund invests cash collateral received in Vanguard Market Liquidity Fund, and records a liability in the Statement of Net Assets for the return of the collateral, during the period the securities are on loan. Securities lending income represents fees charged to borrowers plus income earned on invested cash collateral, less expenses associated with the loan. During the term of the loan, the fund is entitled to all distributions made on or in respect of the loaned securities.
22
Equity Income Fund
8. Credit Facility: The fund and certain other funds managed by The Vanguard Group (“Vanguard”) participate in a $3.1 billion committed credit facility provided by a syndicate of lenders pursuant to a credit agreement that may be renewed annually; each fund is individually liable for its borrowings, if any, under the credit facility. Borrowings may be utilized for temporary and emergency purposes, and are subject to the fund’s regulatory and contractual borrowing restrictions. The participating funds are charged administrative fees and an annual commitment fee of 0.10% of the undrawn amount of the facility; these fees are allocated to the funds based on a method approved by the fund’s board of trustees and included in Management and Administrative expenses on the fund’s Statement of Operations. Any borrowings under this facility bear interest at a rate based upon the higher of the one-month London Interbank Offered Rate, federal funds effective rate, or overnight bank funding rate plus an agreed-upon spread.
The fund had no borrowings outstanding at March 31, 2017, or at any time during the period then ended.
9. Other: Dividend income is recorded on the ex-dividend date. Interest income includes income distributions received from Vanguard Market Liquidity Fund and is accrued daily. Premiums and discounts on debt securities purchased are amortized and accreted, respectively, to interest income over the lives of the respective securities. Security transactions are accounted for on the date securities are bought or sold. Costs used to determine realized gains (losses) on the sale of investment securities are those of the specific securities sold.
Each class of shares has equal rights as to assets and earnings, except that each class separately bears certain class-specific expenses related to maintenance of shareholder accounts (included in Management and Administrative expenses) and shareholder reporting. Marketing and distribution expenses are allocated to each class of shares based on a method approved by the board of trustees. Income, other non-class-specific expenses, and gains and losses on investments are allocated to each class of shares based on its relative net assets.
B. The investment advisory firm Wellington Management Company LLP provides investment advisory services to a portion of the fund for a fee calculated at an annual percentage rate of average net assets managed by the advisor. The basic fee of Wellington Management Company LLP is subject to quarterly adjustments based on performance relative to the FTSE High Dividend Yield Index for the preceding three years.
Vanguard provides investment advisory services to a portion of the fund as described below; the fund paid Vanguard advisory fees of $1,589,000 for the six months ended March 31, 2017.
For the six months ended March 31, 2017, the aggregate investment advisory fee paid to all advisors represented an effective annual basic rate of 0.09% of the fund’s average net assets, before a decrease of $1,217,000 (0.01%) based on performance.
C. In accordance with the terms of a Funds’ Service Agreement (the “FSA”) between Vanguard and the fund, Vanguard furnishes to the fund investment advisory, corporate management, administrative, marketing, and distribution services at Vanguard’s cost of operations (as defined by the FSA). These costs of operations are allocated to the fund based on methods and guidelines approved by the board of trustees. Vanguard does not require reimbursement in the current period for certain costs of operations (such as deferred compensation/benefits and risk/insurance costs); the fund’s liability for these costs of operations is included in Payables to Vanguard on the Statement of Net Assets.
23
Equity Income Fund
Upon the request of Vanguard, the fund may invest up to 0.40% of its net assets as capital in Vanguard. At March 31, 2017, the fund had contributed to Vanguard capital in the amount of $1,881,000 representing 0.01% of the fund’s net assets and 0.75% of Vanguard’s capitalization. The fund’s trustees and officers are also directors and employees, respectively, of Vanguard.
D. Various inputs may be used to determine the value of the fund’s investments. These inputs are summarized in three broad levels for financial statement purposes. The inputs or methodologies used to value securities are not necessarily an indication of the risk associated with investing in those securities.
Level 1—Quoted prices in active markets for identical securities.
Level 2—Other significant observable inputs (including quoted prices for similar securities, interest
rates, prepayment speeds, credit risk, etc.).
Level 3—Significant unobservable inputs (including the fund’s own assumptions used to determine
the fair value of investments).
The following table summarizes the market value of the fund’s investments as of March 31, 2017, based on the inputs used to value them:
| Level 1 | Level 2 | Level 3 | |
| Investments | ($000) | ($000) | ($000) |
| Common Stocks | 25,768,824 | 656,856 | — |
| Temporary Cash Investments | 597,036 | 695,180 | — |
| Futures Contracts—Liabilities1 | (857) | — | — |
| Total | 26,365,003 | 1,352,036 | — |
| 1 Represents variation margin on the last day of the reporting period. |
E. At March 31, 2017, the aggregate settlement value of open futures contracts and the related unrealized appreciation (depreciation) were:
| ($000) | ||||
| Aggregate | ||||
| Number of | Settlement | Unrealized | ||
| Long (Short) | Value | Appreciation | ||
| Futures Contracts | Expiration | Contracts | Long (Short) | (Depreciation) |
| E-mini S&P 500 Index | June 2017 | 3,663 | 432,087 | (1,277) |
Unrealized appreciation (depreciation) on open futures contracts is required to be treated as realized gain (loss) for tax purposes.
F. Distributions are determined on a tax basis and may differ from net investment income and realized capital gains for financial reporting purposes. Differences may be permanent or temporary. Permanent differences are reclassified among capital accounts in the financial statements to reflect their tax character. Temporary differences arise when certain items of income, expense, gain, or loss are recognized in different periods for financial statement and tax purposes. These differences will reverse at some time in the future. Differences in classification may also result from the treatment of short-term gains as ordinary income for tax purposes. The fund’s tax-basis capital gains and losses are determined only at the end of each fiscal year.
24
Equity Income Fund
During the six months ended March 31, 2017, the fund realized net foreign currency gains of $117,000, which increased distributable net income for tax purposes; accordingly, such gains have been reclassified from accumulated net realized gains to overdistributed net investment income.
At March 31, 2017, the cost of investment securities for tax purposes was $21,395,779,000. Net unrealized appreciation of investment securities for tax purposes was $6,322,117,000, consisting of unrealized gains of $6,518,349,000 on securities that had risen in value since their purchase and $196,232,000 in unrealized losses on securities that had fallen in value since their purchase.
G. During the six months ended March 31, 2017, the fund purchased $5,030,400,000 of investment securities and sold $3,347,150,000 of investment securities, other than temporary cash investments.
H. Capital share transactions for each class of shares were:
| Six Months Ended | Year Ended | |||
| March 31, 2017 | September 30, 2016 | |||
| Amount | Shares | Amount | Shares | |
| ($000) | (000) | ($000) | (000) | |
| Investor Shares | ||||
| Issued | 819,102 | 25,034 | 1,251,751 | 40,977 |
| Issued in Lieu of Cash Distributions | 132,416 | 3,990 | 298,827 | 9,913 |
| Redeemed | (798,259) | (24,384) | (1,370,646) | (45,014) |
| Net Increase (Decrease)—Investor Shares | 153,259 | 4,640 | 179,932 | 5,876 |
| Admiral Shares | ||||
| Issued | 3,511,606 | 50,885 | 5,274,178 | 82,254 |
| Issued in Lieu of Cash Distributions | 421,116 | 6,052 | 784,001 | 12,393 |
| Redeemed | (1,843,844) | (26,822) | (2,344,016) | (36,870) |
| Net Increase (Decrease)—Admiral Shares | 2,088,878 | 30,115 | 3,714,163 | 57,777 |
I. Management has determined that no material events or transactions occurred subsequent to March 31, 2017, that would require recognition or disclosure in these financial statements.
25
About Your Fund’s Expenses
As a shareholder of the fund, you incur ongoing costs, which include costs for portfolio management, administrative services, and shareholder reports (like this one), among others. Operating expenses, which are deducted from a fund’s gross income, directly reduce the investment return of the fund.
A fund’s expenses are expressed as a percentage of its average net assets. This figure is known as the expense ratio. The following examples are intended to help you understand the ongoing costs (in dollars) of investing in your fund and to compare these costs with those of other mutual funds. The examples are based on an investment of $1,000 made at the beginning of the period shown and held for the entire period.
The accompanying table illustrates your fund’s costs in two ways:
• Based on actual fund return. This section helps you to estimate the actual expenses that you paid over the period. The ”Ending Account Value“ shown is derived from the fund‘s actual return, and the third column shows the dollar amount that would have been paid by an investor who started with $1,000 in the fund. You may use the information here, together with the amount you invested, to estimate the expenses that you paid over the period.
To do so, simply divide your account value by $1,000 (for example, an $8,600 account value divided by $1,000 = 8.6), then multiply the result by the number given for your fund under the heading ”Expenses Paid During Period.“
• Based on hypothetical 5% yearly return. This section is intended to help you compare your fund‘s costs with those of other mutual funds. It assumes that the fund had a yearly return of 5% before expenses, but that the expense ratio is unchanged. In this case—because the return used is not the fund’s actual return—the results do not apply to your investment. The example is useful in making comparisons because the Securities and Exchange Commission requires all mutual funds to calculate expenses based on a 5% return. You can assess your fund’s costs by comparing this hypothetical example with the hypothetical examples that appear in shareholder reports of other funds.
Note that the expenses shown in the table are meant to highlight and help you compare ongoing costs only and do not reflect transaction costs incurred by the fund for buying and selling securities. Further, the expenses do not include any purchase, redemption, or account service fees described in the fund prospectus. If such fees were applied to your account, your costs would be higher. Your fund does not carry a “sales load.”
The calculations assume no shares were bought or sold during the period. Your actual costs may have been higher or lower, depending on the amount of your investment and the timing of any purchases or redemptions.
You can find more information about the fund’s expenses, including annual expense ratios, in the Financial Statements section of this report. For additional information on operating expenses and other shareholder costs, please refer to your fund’s current prospectus.
26
| Six Months Ended March 31, 2017 | |||
| Beginning | Ending | Expenses | |
| Account Value | Account Value | Paid During | |
| Equity Income Fund | 9/30/2016 | 3/31/2017 | Period |
| Based on Actual Fund Return | |||
| Investor Shares | $1,000.00 | $1,095.12 | $1.36 |
| Admiral Shares | 1,000.00 | 1,095.66 | 0.89 |
| Based on Hypothetical 5% Yearly Return | |||
| Investor Shares | $1,000.00 | $1,023.64 | $1.31 |
| Admiral Shares | 1,000.00 | 1,024.08 | 0.86 |
The calculations are based on expenses incurred in the most recent six-month period. The fund’s annualized six-month expense ratios for that period are 0.26% for Investor Shares and 0.17% for Admiral Shares. The dollar amounts shown as “Expenses Paid” are equal to the annualized expense ratio multiplied by the average account value over the period, multiplied by the number of days in the most recent six-month period, then divided by the number of days in the most recent 12-month period (182/365).
27
Trustees Approve Advisory Arrangements
The board of trustees of Vanguard Equity Income Fund has renewed the fund’s investment advisory arrangements with Wellington Management Company LLP and The Vanguard Group, Inc. (Vanguard)—through its Quantitative Equity Group. The board determined that renewing the fund’s advisory arrangements was in the best interests of the fund and its shareholders.
The board based its decisions upon an evaluation of each advisor’s investment staff, portfolio management process, and performance. This evaluation included information provided to the board by Vanguard’s Portfolio Review Department, which is responsible for advisor oversight and product management. The Portfolio Review Department met regularly with the advisors and made monthly presentations to the board during the fiscal year that directed the board’s focus to relevant information and topics.
The board, or an investment committee made up of board members, also received information throughout the year during advisor presentations. For each advisor presentation, the board was provided with letters and reports that included information about, among other things, the advisory firm and the advisor’s assessment of the investment environment, portfolio performance, and portfolio characteristics.
In addition, the board received monthly reports, which included a Market and Economic Report, a Fund Dashboard Monthly Summary, and a Fund Performance Report.
Prior to their meeting, the trustees were provided with a memo and materials that summarized the information they received over the course of the year. They also considered the factors discussed below, among others. However, no single factor determined whether the board approved the arrangements. Rather, it was the totality of the circumstances that drove the board’s decisions.
Nature, extent, and quality of services
The board reviewed the quality of the fund’s investment management services over both the short and long term and took into account the organizational depth and stability of each advisor. The board considered the following:
Wellington Management. Wellington Management, founded in 1928, is among the nation’s oldest and most respected institutional investment managers. Using fundamental research, Wellington Management seeks to build a portfolio with an above-market yield, superior growth rate, and attractive valuation. Although every company purchased for the portfolio will pay a dividend, the goal is to build a portfolio with an above-market yield in aggregate, allowing for individual companies with below-market yields. Normalized earnings, normalized price-to-earnings ratios, and improving returns on capital are key to the research process. The board also noted that the portfolio manager of the fund has more than two decades of investment industry experience. The firm has advised the fund since 2000.
Vanguard. Vanguard has been managing investments for more than three decades. The Quantitative Equity Group adheres to a sound, disciplined investment management process; the team has considerable experience, stability, and depth. Vanguard has managed a portion of the fund since 2003.
The board concluded that each advisor’s experience, stability, depth, and performance, among other factors, warranted continuation of the advisory arrangements.
28
Investment performance
The board considered the short- and long-term performance of the fund and each advisor, including any periods of outperformance or underperformance compared with a relevant benchmark index and peer group. The board concluded that the performance was such that each advisory arrangement should continue. Information about the fund’s most recent performance can be found in the Performance Summary section of this report.
Cost
The board concluded that the fund’s expense ratio was well below the average expense ratio charged by funds in its peer group and that the fund’s advisory expenses were also well below the peer-group average. Information about the fund’s expenses appears in the About Your Fund’s Expenses section of this report as well as in the Financial Statements section, which also includes information about the fund’s advisory expenses.
The board did not consider the profitability of Wellington Management in determining whether to approve the advisory fee, because Wellington Management is independent of Vanguard and the advisory fee is the result of arm’s-length negotiations. The board does not conduct a profitability analysis of Vanguard because of Vanguard’s unique “at-cost” structure. Unlike most other mutual fund management companies, Vanguard is owned by the funds it oversees and produces “profits” only in the form of reduced expenses for fund shareholders.
The benefit of economies of scale
The board concluded that the fund’s shareholders benefit from economies of scale because of breakpoints in the fund’s advisory fee schedule for Wellington Management. The breakpoints reduce the effective rate of the fee as the fund’s assets managed by Wellington Management increase. The board also concluded that the fund’s at-cost arrangement with Vanguard ensures that the fund will realize economies of scale as it grows, with the cost to shareholders declining as the fund’s assets managed by Vanguard increase.
The board will consider whether to renew the advisory arrangements again after a one-year period.
29
Glossary
30-Day SEC Yield. A fund’s 30-day SEC yield is derived using a formula specified by the U.S. Securities and Exchange Commission. Under the formula, data related to the fund’s security holdings in the previous 30 days are used to calculate the fund’s hypothetical net income for that period, which is then annualized and divided by the fund’s estimated average net assets over the calculation period. For the purposes of this calculation, a security’s income is based on its current market yield to maturity (for bonds), its actual income (for asset-backed securities), or its projected dividend yield (for stocks). Because the SEC yield represents hypothetical annualized income, it will differ—at times significantly—from the fund’s actual experience. As a result, the fund’s income distributions may be higher or lower than implied by the SEC yield.
Beta. A measure of the magnitude of a fund’s past share-price fluctuations in relation to the ups and downs of a given market index. The index is assigned a beta of 1.00. Compared with a given index, a fund with a beta of 1.20 typically would have seen its share price rise or fall by 12% when the index rose or fell by 10%. For this report, beta is based on returns over the past 36 months for both the fund and the index. Note that a fund’s beta should be reviewed in conjunction with its R-squared (see definition). The lower the R-squared, the less correlation there is between the fund and the index, and the less reliable beta is as an indicator of volatility.
Dividend Yield. Dividend income earned by stocks, expressed as a percentage of the aggregate market value (or of net asset value, for a fund). The yield is determined by dividing the amount of the annual dividends by the aggregate value (or net asset value) at the end of the period. For a fund, the dividend yield is based solely on stock holdings and does not include any income produced by other investments.
Earnings Growth Rate. The average annual rate of growth in earnings over the past five years for the stocks now in a fund.
Equity Exposure. A measure that reflects a fund’s investments in stocks and stock futures. Any holdings in short-term reserves are excluded.
Expense Ratio. A fund’s total annual operating expenses expressed as a percentage of the fund’s average net assets. The expense ratio includes management and administrative expenses, but does not include the transaction costs of buying and selling portfolio securities.
Foreign Holdings. The percentage of a fund represented by securities or depositary receipts of companies based outside the United States.
Inception Date. The date on which the assets of a fund (or one of its share classes) are first invested in accordance with the fund’s investment objective. For funds with a subscription period, the inception date is the day after that period ends. Investment performance is measured from the inception date.
Median Market Cap. An indicator of the size of companies in which a fund invests; the midpoint of market capitalization (market price x shares outstanding) of a fund’s stocks, weighted by the proportion of the fund’s assets invested in each stock. Stocks representing half of the fund’s assets have market capitalizations above the median, and the rest are below it.
Price/Book Ratio. The share price of a stock divided by its net worth, or book value, per share. For a fund, the weighted average price/book ratio of the stocks it holds.
30
Price/Earnings Ratio. The ratio of a stock’s current price to its per-share earnings over the past year. For a fund, the weighted average P/E of the stocks it holds. P/E is an indicator of market expectations about corporate prospects; the higher the P/E, the greater the expectations for a company’s future growth.
R-Squared. A measure of how much of a fund’s past returns can be explained by the returns from the market in general, as measured by a given index. If a fund’s total returns were precisely synchronized with an index’s returns, its R-squared would be 1.00. If the fund’s returns bore no relationship to the index’s returns, its R-squared would be 0. For this report, R-squared is based on returns over the past 36 months for both the fund and the index.
Return on Equity. The annual average rate of return generated by a company during the past five years for each dollar of shareholder’s equity (net income divided by shareholder’s equity). For a fund, the weighted average return on equity for the companies whose stocks it holds.
Short-Term Reserves. The percentage of a fund invested in highly liquid, short-term securities that can be readily converted to cash.
Turnover Rate. An indication of the fund’s trading activity. Funds with high turnover rates incur higher transaction costs and may be more likely to distribute capital gains (which may be taxable to investors). The turnover rate excludes in-kind transactions, which have minimal impact on costs.
Benchmark Information
Spliced Equity Income Index: Russell 1000 Value Index through July 31, 2007; FTSE High Dividend Yield Index thereafter.
31
The People Who Govern Your Fund
The trustees of your mutual fund are there to see that the fund is operated and managed in your best interests since, as a shareholder, you are a part owner of the fund. Your fund’s trustees also serve on the board of directors of The Vanguard Group, Inc., which is owned by the Vanguard funds and provides services to them on an at-cost basis.
A majority of Vanguard’s board members are independent, meaning that they have no affiliation with Vanguard or the funds they oversee, apart from the sizable personal investments they have made as private individuals. The independent board members have distinguished backgrounds in business, academia, and public service. Each of the trustees and executive officers oversees 195 Vanguard funds.
The following table provides information for each trustee and executive officer of the fund. The mailing address of the trustees and officers is P.O. Box 876, Valley Forge, PA 19482. More information about the trustees is in the Statement of Additional Information, which can be obtained, without charge, by contacting Vanguard at 800-662-7447, or online at vanguard.com.
Interested Trustee1
F. William McNabb III
Born 1957. Trustee Since July 2009. Chairman of the Board. Principal Occupation(s) During the Past Five Years and Other Experience: Chairman of the Board of The Vanguard Group, Inc., and of each of the investment companies served by The Vanguard Group, since January 2010; Director of The Vanguard Group since 2008; Chief Executive Officer and President of The Vanguard Group, and of each of the investment companies served by The Vanguard Group, since 2008; Director of Vanguard Marketing Corporation; Managing Director of The Vanguard Group (1995–2008).
Independent Trustees
Emerson U. Fullwood
Born 1948. Trustee Since January 2008. Principal Occupation(s) During the Past Five Years and Other Experience: Executive Chief Staff and Marketing Officer for North America and Corporate Vice President (retired 2008) of Xerox Corporation (document management products and services); Executive in Residence and 2009–2010 Distinguished Minett Professor at the Rochester Institute of Technology; Lead Director of SPX FLOW, Inc. (multi-industry manufacturing); Director of the United Way of Rochester, the University of Rochester Medical Center, Monroe Community College Foundation, North Carolina A&T University, and Roberts Wesleyan College.
Rajiv L. Gupta
Born 1945. Trustee Since December 2001.2 Principal Occupation(s) During the Past Five Years and Other Experience: Chairman and Chief Executive Officer (retired 2009) and President (2006–2008) of Rohm and Haas Co. (chemicals); Director of Arconic Inc.
(diversified manufacturer), HP Inc. (printer and personal computer manufacturing), and Delphi Automotive plc (automotive components); Senior Advisor at New Mountain Capital.
Amy Gutmann
Born 1949. Trustee Since June 2006. Principal Occupation(s) During the Past Five Years and Other Experience: President of the University of Pennsylvania; Christopher H. Browne Distinguished Professor of Political Science, School of Arts and Sciences, and Professor of Communication, Annenberg School for Communication, with secondary faculty appointments in the Department of Philosophy, School of Arts and Sciences, and at the Graduate School of Education, University of Pennsylvania; Trustee of the National Constitution Center; Chair of the Presidential Commission for the Study of Bioethical Issues.
JoAnn Heffernan Heisen
Born 1950. Trustee Since July 1998. Principal Occupation(s) During the Past Five Years and Other Experience: Corporate Vice President and Chief Global Diversity Officer (retired 2008) and Member of the Executive Committee (1997–2008) of Johnson & Johnson (pharmaceuticals/medical devices/consumer products); Director of Skytop Lodge Corporation (hotels) and the Robert Wood Johnson Foundation; Member of the Advisory Board of the Institute for Women’s Leadership at Rutgers University.
F. Joseph Loughrey
Born 1949. Trustee Since October 2009. Principal Occupation(s) During the Past Five Years and Other Experience: President and Chief Operating Officer (retired 2009) of Cummins Inc. (industrial machinery); Chairman of the Board of Hillenbrand, Inc. (specialized consumer services), Oxfam America, and the Lumina
Foundation for Education; Director of SKF AB (industrial machinery), Hyster-Yale Materials Handling, Inc. (forklift trucks), and the V Foundation for Cancer Research; Member of the Advisory Council for the College of Arts and Letters and Chair of the Advisory Board to the Kellogg Institute for International Studies, both at the University of Notre Dame.
Mark Loughridge
Born 1953. Trustee Since March 2012. Principal Occupation(s) During the Past Five Years and Other Experience: Senior Vice President and Chief Financial Officer (retired 2013) at IBM (information technology services); Fiduciary Member of IBM’s Retirement Plan Committee (2004–2013); Director of the Dow Chemical Company; Member of the Council on Chicago Booth.
Scott C. Malpass
Born 1962. Trustee Since March 2012. Principal Occupation(s) During the Past Five Years and Other Experience: Chief Investment Officer and Vice President at the University of Notre Dame; Assistant Professor of Finance at the Mendoza College of Business at Notre Dame; Member of the Notre Dame 403(b) Investment Committee, the Board of Advisors for Spruceview Capital Partners, and the Investment Advisory Committee of Major League Baseball; Board Member of TIFF Advisory Services, Inc., and Catholic Investment Services, Inc. (investment advisors); Member of the Board of Superintendence of the Institute for the Works of Religion.
André F. Perold
Born 1952. Trustee Since December 2004. Principal Occupation(s) During the Past Five Years and Other Experience: George Gund Professor of Finance and Banking, Emeritus at the Harvard Business School (retired 2011); Chief Investment Officer and Co-Managing Partner of HighVista Strategies LLC (private investment firm); Overseer of the Museum of Fine Arts Boston.
Peter F. Volanakis
Born 1955. Trustee Since July 2009. Principal Occupation(s) During the Past Five Years and Other Experience: President and Chief Operating Officer (retired 2010) of Corning Incorporated (communications equipment); Chairman of the Board of Trustees of Colby-Sawyer College; Member of the Board of Hypertherm, Inc. (industrial cutting systems, software, and consumables).
Executive Officers
Glenn Booraem
Born 1967. Investment Stewardship Officer Since February 2017. Principal Occupation(s) During the Past Five Years and Other Experience: Principal of The Vanguard Group, Inc.; Treasurer (2015–2017),
Controller (2010–2015), and Assistant Controller (2001–2010) of each of the investment companies served by The Vanguard Group.
Thomas J. Higgins
Born 1957. Chief Financial Officer Since September 2008. Principal Occupation(s) During the Past Five Years and Other Experience: Principal of The Vanguard Group, Inc.; Chief Financial Officer of each of the investment companies served by The Vanguard Group; Treasurer of each of the investment companies served by The Vanguard Group (1998–2008).
Peter Mahoney
Born 1974. Controller Since May 2015. Principal Occupation(s) During the Past Five Years and Other Experience: Principal of The Vanguard Group, Inc.; Controller of each of the investment companies served by The Vanguard Group; Head of International Fund Services at The Vanguard Group (2008–2014).
Anne E. Robinson
Born 1970. Secretary Since September 2016. Principal Occupation(s) During the Past Five Years and Other Experience: Managing Director of The Vanguard Group, Inc.; General Counsel of The Vanguard Group; Secretary of The Vanguard Group and of each of the investment companies served by The Vanguard Group; Director and Senior Vice President of Vanguard Marketing Corporation; Managing Director and General Counsel of Global Cards and Consumer Services at Citigroup (2014–2016); Counsel at American Express (2003–2014).
Michael Rollings
Born 1963. Treasurer Since February 2017. Principal Occupation(s) During the Past Five Years and Other Experience: Managing Director of The Vanguard Group, Inc.; Treasurer of each of the investment companies served by The Vanguard Group; Executive Vice President and Chief Financial Officer of MassMutual Financial Group (2006–2016).
| Vanguard Senior ManagementTeam | |
| Mortimer J. Buckley | James M. Norris |
| John James | Thomas M. Rampulla |
| Martha G. King | Glenn W. Reed |
| John T. Marcante | Karin A. Risi |
| Chris D. McIsaac | |
Chairman Emeritus and Senior Advisor
John J. Brennan
Chairman, 1996–2009
Chief Executive Officer and President, 1996–2008
Founder
John C. Bogle
Chairman and Chief Executive Officer, 1974–1996
1 Mr. McNabb is considered an “interested person,” as defined in the Investment Company Act of 1940, because he is an officer of the Vanguard funds.
2 December 2002 for Vanguard Equity Income Fund, the Vanguard Municipal Bond Funds, and the Vanguard State Tax-Exempt Funds.
 | |
| P.O. Box 2600 | |
| Valley Forge, PA 19482-2600 | |
| Connect with Vanguard® > vanguard.com | |
| Fund Information > 800-662-7447 | CFA® is a registered trademark owned by CFA Institute. |
| Direct Investor Account Services > 800-662-2739 | |
| Institutional Investor Services > 800-523-1036 | |
| Text Telephone for People | |
| Who Are Deaf or Hard of Hearing> 800-749-7273 | |
| This material may be used in conjunction | |
| with the offering of shares of any Vanguard | |
| fund only if preceded or accompanied by | |
| the fund’s current prospectus. | |
| All comparative mutual fund data are from Lipper, a | |
| Thomson Reuters Company, or Morningstar, Inc., unless | |
| otherwise noted. | |
| You can obtain a free copy of Vanguard’s proxy voting | |
| guidelines by visiting vanguard.com/proxyreporting or by | |
| calling Vanguard at 800-662-2739. The guidelines are | |
| also available from the SEC’s website, sec.gov. In | |
| addition, you may obtain a free report on how your fund | |
| voted the proxies for securities it owned during the 12 | |
| months ended June 30. To get the report, visit either | |
| vanguard.com/proxyreporting or sec.gov. | |
| You can review and copy information about your fund at | |
| the SEC’s Public Reference Room in Washington, D.C. To | |
| find out more about this public service, call the SEC at | |
| 202-551-8090. Information about your fund is also | |
| available on the SEC’s website, and you can receive | |
| copies of this information, for a fee, by sending a | |
| request in either of two ways: via email addressed to | |
| publicinfo@sec.gov or via regular mail addressed to the | |
| Public Reference Section, Securities and Exchange | |
| Commission, Washington, DC 20549-1520. | |
| © 2017 The Vanguard Group, Inc. | |
| All rights reserved. | |
| Vanguard Marketing Corporation, Distributor. | |
| Q652 052017 | |
Semiannual Report | March 31, 2017
Vanguard PRIMECAP Core Fund
A new format, unwavering commitment
As you begin reading this report, you’ll notice that we’ve made some improvements to the opening sections—based on feedback from you, our clients.
Page 1 starts with a new ”Your Fund’s Performance at a Glance,” a concise, handy summary of how your fund performed during the period.
In the renamed ”Chairman’s Perspective,” Bill McNabb will focus on enduring principles and investment insights.
We’ve modified some tables, and eliminated some redundancy, but we haven’t removed any information.
At Vanguard, we’re always looking for better ways to communicate and to help you make sound investment decisions. Thank you for entrusting your assets to us.
| Contents | |
| Your Fund’s Performance at a Glance. | 1 |
| Chairman’s Perspective. | 2 |
| Advisor’s Report. | 6 |
| Fund Profile. | 8 |
| Performance Summary. | 9 |
| Financial Statements. | 10 |
| About Your Fund’s Expenses. | 20 |
| Trustees Approve Advisory Arrangement. | 22 |
| Glossary. | 24 |
Please note: The opinions expressed in this report are just that—informed opinions. They should not be considered promises or advice. Also, please keep in mind that the information and opinions cover the period through the date on the front of this report. Of course, the risks of investing in your fund are spelled out in the prospectus.
See the Glossary for definitions of investment terms used in this report.
About the cover: No matter what language you speak, Vanguard has one consistent message and set of principles. Our primary focus is on you, our clients. We conduct our business with integrity as a faithful steward of your assets. This message is shown translated into seven languages, reflecting our expanding global presence.
Your Fund’s Performance at a Glance
• Vanguard PRIMECAP Core Fund returned more than 11% for the six months ended March 31, 2017, exceeding the 10% return of its benchmark, the MSCI US Prime Market 750 Index, and the more than 9% average return of its multi-capitalization core fund peers.
• Value stocks outpaced their growth counterparts during the period, and small-caps outperformed large-caps. Six of the fund’s sectors contributed positively to performance.
• PRIMECAP Management Company, the fund’s advisor, traditionally invests most heavily in the information technology and health care sectors. The fund’s technology stocks advanced almost 15%, ahead of those in the benchmark, and contributed more than four percentage points to results. However, health care stocks were among the biggest detractors.
| Total Returns: Six Months Ended March 31, 2017 | ||
| Total | ||
| Returns | ||
| Vanguard PRIMECAP Core Fund | 11.44% | |
| MSCI US Prime Market 750 Index | 10.08 | |
| Multi-Cap Core Funds Average | 9.39 | |
| Multi-Cap Core Funds Average: Derived from data provided by Lipper, a Thomson Reuters Company. | ||
| Expense Ratios | ||
| Your Fund Compared With Its Peer Group | ||
| Peer Group | ||
| Fund | Average | |
| PRIMECAP Core Fund | 0.46% | 1.12% |
The fund expense ratio shown is from the prospectus dated January 26, 2017, and represents estimated costs for the current fiscal year. For the six months ended March 31, 2017, the fund’s annualized expense ratio was 0.46%. The peer-group expense ratio is derived from data provided by Lipper, a Thomson Reuters Company, and captures information through year-end 2016.
Peer group: Multi-Cap Core Funds.
1
Chairman’s Perspective

Bill McNabb
Chairman and Chief Executive Officer
Dear Shareholder,
For many people, including me, falling interest rates have been the general trend in the bond market throughout our working lives. At the beginning of 1983, the year I graduated from business school, the yield of the benchmark 10-year U.S. Treasury note stood at more than 10%. It was less than 2.5% at the beginning of 2017.
Because bond prices move in the opposite direction from rates, my career happens to have overlapped with the greatest bull market for bonds in history.
It appears that may be changing. And, of course, there’s no shortage of advice about how to prepare for the shift.
Rates may be headed higher (really)
This bond bull market has reminded us time and again just how hard it is to predict when rates will rise or fall and by how much. If you follow bonds, you might recall the markets bracing for a sustained rate increase back in 2010 as the economy pulled out of recession, or again in 2013 when the Federal Reserve said it would start tapering its bond purchases, or again at the end of 2015 when the Fed raised short-term rates for the first time in almost a decade. And yet, prognostications notwithstanding, interest rates remained anchored near historical lows.
That said, rates seem to be on an upswing. With economic activity picking up, wages starting to move higher, and inflation coming
2
off recent lows, the Fed has nudged short-term rates higher twice in recent months and has signaled that further gradual increases are likely through 2018. The perceived pro-growth stance of the new U.S. administration also has played a role in framing a case for higher rates.
Short-term pain, longer-term gain
Bond investors are understandably concerned. If interest rates shoot up, the market value of bonds will drop sharply, with prices falling to bring yields in line with the new, prevailing higher rates. That’s the potential short-term pain. But long-term investors should actually want rates to go up. If you like bonds that pay 2%, you should love bonds that pay 4%, right?
There’s a simple—though imperfect—rule of thumb that helps make clear this point. If the time frame of your investing goal exceeds the time frame of your bond portfolio (a medium-term goal matched with short-term bonds, or a long-term goal paired with bonds not quite as long-term), rising rates will work out in your favor, maybe decidedly so.
Think of it this way: If you have a big cash need in the near future—say, a tuition bill coming due in a few years—and you own bonds that are long-term in nature, this time-frame mismatch could spell trouble if rates rise sharply; you’d be selling bonds that would be worth less. But if you’re saving to retire ten or 15 years down the road and rates are steadily rising, over time you’ll be earning higher and higher yields.
| Market Barometer | |||
| Total Returns | |||
| Periods Ended March 31, 2017 | |||
| Six | One | Five Years | |
| Months | Year | (Annualized) | |
| Stocks | |||
| Russell 1000 Index (Large-caps) | 10.09% | 17.43% | 13.26% |
| Russell 2000 Index (Small-caps) | 11.52 | 26.22 | 12.35 |
| Russell 3000 Index (Broad U.S. market) | 10.19 | 18.07 | 13.18 |
| FTSE All-World ex US Index (International) | 6.74 | 13.50 | 4.82 |
| Bonds | |||
| Bloomberg Barclays U.S. Aggregate Bond Index | |||
| (Broad taxable market) | -2.18% | 0.44% | 2.34% |
| Bloomberg Barclays Municipal Bond Index | |||
| (Broad tax-exempt market) | -2.10 | 0.15 | 3.24 |
| Citigroup Three-Month U.S. Treasury Bill Index | 0.21 | 0.34 | 0.10 |
| CPI | |||
| Consumer Price Index | 0.98% | 2.38% | 1.23% |
3
Josh Barrickman, our head of fixed income indexing for the Americas, calls it “the virtuous cycle of compounding interest at a higher rate.”
The bottom line is, you can end up better off than if rates haven’t risen because you’re earning more income, which over time more than washes away any price hit.
Beware of short-sighted, short-term moves
This logic can be difficult to grasp, tempting anxious bond investors to make drastic shifts to lessen the immediate pain of rising rates. Unfortunately, such moves can backfire.
Taking shelter in short-term bonds, for example, might seem like a good idea. Their prices generally hold up better than those of longer-term bonds in a rising-rate environment. But they also offer less income.
For example, when the market started worrying about rising rates in 2010, moving into short-term securities—and staying there—would have proved costly. Through 2016, those securities returned roughly half of what the broad U.S. bond market did.
Favoring high-yield bonds is another tack some investors take, expecting higher income to help cushion price declines.
What has driven long-term returns for Vanguard bond funds?
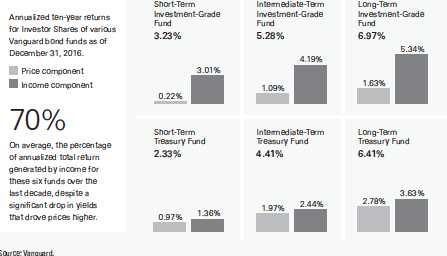
4
High-yield securities, however, typically perform best when stocks are rising, making them unlikely to zig when stocks zag.
We saw clear evidence of the correlation between stocks and high-yield bonds in the frantic markets following the United Kingdom’s vote to leave the European Union last year. From June 23 to June 27, both U.S. stocks and U.S. high-yield bonds lost ground. The broad U.S. bond market, meanwhile, climbed 1.2% as investors sought a safe haven.
Your portfolio is more than the sum of its parts
Different assets have different roles to play in a balanced and diversified portfolio. Stocks are valuable because they can produce higher returns over time, while bonds can provide a crucial counterweight to the volatility of stocks.
Perhaps the most important thing to keep in mind about bonds is that although their prices can fluctuate, they remain “fixed income” securities. Barring default, you can be certain of getting income until the bonds mature. It’s that income that drives returns for patient bond investors who resist the urge to jump in and out of the market, as you can see in the accompanying box.
A lot has changed since I first started following the bond market, but the important role that bonds can play in a balanced and diversified portfolio hasn’t.
As always, thank you for investing with Vanguard.
Sincerely,
F. William McNabb III
Chairman and Chief Executive Officer
April 14, 2017
5
Advisor’s Report
For the six months ended March 31, 2017, Vanguard PRIMECAP Core Fund returned 11.44%, exceeding the 10.08% return of the fund’s benchmark, the unmanaged MSCI US Prime Market 750 Index; the 9.39% average return of the fund’s multi-capitalization core fund competitors; and the 10.12% return of the Standard & Poor’s 500 Index, which serves as a proxy for the broad market in the attribution discussion that follows.
The investment environment
Donald Trump’s unexpected victory in the U.S. presidential election resulted in significant market shifts, including higher U.S. stock prices and bond yields. Financials was the best-performing sector in the S&P 500 Index during the period as investors bid up the prices of bank stocks in anticipation of higher interest rates and a reduced regulatory burden. Defensive sectors such as consumer staples, telecommunication services, and utilities underperformed. Health care stocks were volatile as investors considered the impact of a potential repeal of the Affordable Care Act and politicians continued to criticize drug companies for their pricing practices. Cyclical sectors such as industrials, information technology, and consumer discretionary outperformed.
Portfolio update
The portfolio remains heavily overweighted in information technology, health care, and industrial stocks, with these sectors making up 70% of ending assets, compared with 46% in the S&P 500 Index. The portfolio’s most significant underweights are in
consumer staples, energy, real estate, and utilities, which collectively accounted for 2% of ending assets, compared with 22% in the S&P 500 Index. The portfolio is also significantly underweighted in financials, materials, and telecommunication services, which represented 12% of ending assets, compared with 20% in the index.
In information technology, the fund is significantly overweighted in semiconductor and semiconductor equipment stocks (10% versus 3% for the S&P 500 Index). During the period, the fund’s semiconductor and semiconductor equipment holdings returned 21%, led by NVIDIA (+59%), Texas Instruments (+16%), KLA-Tencor (+38%), and Micron Technology (+63%).
Within health care, the fund is most overweighted in biotechnology and pharmaceutical stocks, whose 18% combined weighting was more than double the 8% weighting in the S&P 500 Index. The health care sector underper-formed during the period with a return of 4%, and our health care holdings returned 1%. Drug stocks were hurt by pricing concerns, a lull in industry productivity, and the failure of a couple of high-profile drug candidates in clinical trials.
The fund is also significantly overweighted in industrial stocks (18% versus 10% for the S&P 500 Index) because of its investments in airlines (8% versus 1% for the index) and air freight and logistics (3% versus 1%). The fund’s airline holdings returned 32%.
6
As of March 31, 2017, the fund’s top ten holdings represented 33% of assets.
Advisor perspectives
The fund is most heavily weighted in information technology stocks, which accounted for 29% of holdings as of the end of the period, compared with 22% in the S&P 500 Index. We expect the semiconductor industry to continue to grow as declining costs for information processing, storage, and transmission drive increased consumption. For example, the number of internet-connected endpoints is expected to grow rapidly, as previously unconnected objects such as industrial equipment, cars, consumer electronics, and appliances are brought online and as low-cost sensors enable new applications for businesses and consumers.
This so-called “internet of things” is expected to transform the manufacturing and health care industries as the availability of real-time information will allow for dramatic cost and quality improvements. Meanwhile, software algorithms are becoming increasingly capable of “learning” and solving complex problems by ingesting and processing enormous quantities of data. Semiconductors are the physical devices that enable the internet of things, self-learning algorithms, and the vast majority of other information processing, storage, and transmission-based products and services that businesses and consumers increasingly rely on. Barriers to entry in the semiconductor and semiconductor equipment industries are significant, and the industry
has consolidated over the past couple of decades. However, China-based companies are expected to play an increasing role in the global industry, a trend we are watching closely.
Outside of information technology, we remain enthusiastic about the fund’s airline holdings, whose extraordinarily low valuation multiples reflect a high degree of skepticism about their ability to sustain current profits. We are excited by the prospects for our health care holdings, many of which currently trade at below-average valuations in spite of superior secular growth prospects.
Conclusion
As bottom-up stock pickers, we spend our time searching for opportunities to invest in stocks with long-term prospects we find to be materially better than market prices would seem to imply. Our approach often results in portfolios that bear little resemblance to market indexes, creating the possibility for substantial deviations in relative performance. For example, our relative returns were significantly negative during the first half of calendar 2016 when the fund’s overweighted sectors and industries underperformed, and we expect to experience similar conditions in the future. We nonetheless believe that this approach can generate superior results for shareholders over the long term.
PRIMECAP Management Company
April 14, 2017
7
PRIMECAP Core Fund
Fund Profile
As of March 31, 2017
| Portfolio Characteristics | |||
| MSCI US | DJ | ||
| Prime | U.S. Total | ||
| Market | Market | ||
| Fund | 750 Index | FA Index | |
| Number of Stocks | 152 | 753 | 3,813 |
| Median Market Cap $54.2B | $77.5B | $58.2B | |
| Price/Earnings Ratio | 20.8x | 24.3x | 25.4x |
| Price/Book Ratio | 3.6x | 3.1x | 3.0x |
| Return on Equity | 18.1% | 17.0% | 16.3% |
| Earnings Growth | |||
| Rate | 11.1% | 7.2% | 7.3% |
| Dividend Yield | 1.7% | 2.0% | 1.9% |
| Foreign Holdings | 11.4% | 0.0% | 0.0% |
| Turnover Rate | |||
| (Annualized) | 9% | — | — |
| Ticker Symbol | VPCCX | — | — |
| Expense Ratio1 | 0.46% | — | — |
| 30-Day SEC Yield | 1.22% | — | — |
| Short-Term Reserves | 4.5% | — | — |
Sector Diversification (% of equity exposure)
| MSCI US | DJ | ||
| Prime | U.S. Total | ||
| Market | Market | ||
| Fund | 750 Index | FA Index | |
| Consumer | |||
| Discretionary | 12.6% | 12.8% | 12.7% |
| Consumer Staples | 0.8 | 9.0 | 8.3 |
| Energy | 1.0 | 6.4 | 6.2 |
| Financials | 9.6 | 14.0 | 14.8 |
| Health Care | 22.7 | 13.6 | 13.3 |
| Industrials | 19.2 | 10.3 | 10.7 |
| Information | |||
| Technology | 30.6 | 21.9 | 21.2 |
| Materials | 2.3 | 3.0 | 3.4 |
| Real Estate | 0.0 | 3.4 | 4.1 |
| Telecommunication | |||
| Services | 1.2 | 2.4 | 2.1 |
| Utilities | 0.0 | 3.2 | 3.2 |
| Volatility Measures | ||
| DJ | ||
| MSCI US | U.S. Total | |
| Prime Market | Market | |
| 750 Index | FA Index | |
| R-Squared | 0.91 | 0.91 |
| Beta | 1.04 | 1.02 |
These measures show the degree and timing of the fund’s fluctuations compared with the indexes over 36 months.
Ten Largest Holdings (% of total net assets)
| Southwest Airlines Co. | Airlines | 5.2% |
| Eli Lilly & Co. | Pharmaceuticals | 4.0 |
| Amgen Inc. | Biotechnology | 3.9 |
| Alphabet Inc. | Internet Software & | |
| Services | 3.5 | |
| JPMorgan Chase & Co. | Diversified Banks | 3.2 |
| Texas Instruments Inc. | Semiconductors | 3.0 |
| Roche Holding AG | Pharmaceuticals | 2.9 |
| Biogen Inc. | Biotechnology | 2.5 |
| Microsoft Corp. | Systems Software | 2.1 |
| FedEx Corp. | Air Freight & | |
| Logistics | 2.0 | |
| Top Ten | 32.3% |
The holdings listed exclude any temporary cash investments and equity index products.
Investment Focus
1 The expense ratio shown is from the prospectus dated January 26, 2017, and represents estimated costs for the current fiscal year. For the six months ended March 31, 2017, the annualized expense ratio was 0.46%.
8
PRIMECAP Core Fund
Performance Summary
All of the returns in this report represent past performance, which is not a guarantee of future results that may be achieved by the fund. (Current performance may be lower or higher than the performance data cited. For performance data current to the most recent month-end, visit our website at vanguard.com/performance.) Note, too, that both investment returns and principal value can fluctuate widely, so an investor’s shares, when sold, could be worth more or less than their original cost. The returns shown do not reflect taxes that a shareholder would pay on fund distributions or on the sale of fund shares.
Fiscal-Year Total Returns (%): September 30, 2006, Through March 31, 2017
Note: For 2017, performance data reflect the six months ended March 31, 2017.
Average Annual Total Returns: Periods Ended March 31, 2017
| Inception | One | Five | Ten | |
| Date | Year | Years | Years | |
| PRIMECAP Core Fund | 12/9/2004 | 21.23% | 15.71% | 9.92% |
See Financial Highlights for dividend and capital gains information.
9
PRIMECAP Core Fund
Financial Statements (unaudited)
Statement of Net Assets
As of March 31, 2017
The fund reports a complete list of its holdings in regulatory filings four times in each fiscal year, at the quarter-ends. For the second and fourth fiscal quarters, the lists appear in the fund’s semiannual and annual reports to shareholders. For the first and third fiscal quarters, the fund files the lists with the Securities and Exchange Commission on Form N-Q. Shareholders can look up the fund’s Forms N-Q on the SEC’s website at sec.gov. Forms N-Q may also be reviewed and copied at the SEC’s Public Reference Room (see the back cover of this report for further information).
| Market | |||
| Value• | |||
| Shares | ($000) | ||
| Common Stocks (95.5%) | |||
| Consumer Discretionary (12.0%) | |||
| * | CarMax Inc. | 2,658,000 | 157,407 |
| Royal Caribbean | |||
| Cruises Ltd. | 1,335,000 | 130,977 | |
| Sony Corp. ADR | 3,800,000 | 128,174 | |
| TJX Cos. Inc. | 1,529,700 | 120,969 | |
| Carnival Corp. | 1,885,900 | 111,098 | |
| Ross Stores Inc. | 1,227,000 | 80,822 | |
| L Brands Inc. | 1,474,100 | 69,430 | |
| Walt Disney Co. | 600,000 | 68,034 | |
| Las Vegas Sands Corp. | 610,000 | 34,813 | |
| * | Amazon.com Inc. | 31,493 | 27,920 |
| Tribune Media Co. Class A | 685,700 | 25,556 | |
| VF Corp. | 434,000 | 23,857 | |
| Lowe’s Cos. Inc. | 247,700 | 20,363 | |
| Newell Brands Inc. | 410,000 | 19,340 | |
| Whirlpool Corp. | 94,731 | 16,230 | |
| Comcast Corp. Class A | 309,000 | 11,615 | |
| Gildan Activewear Inc. | |||
| Class A | 340,000 | 9,194 | |
| CBS Corp. Class B | 132,000 | 9,155 | |
| Bed Bath & Beyond Inc. | 216,791 | 8,555 | |
| Hilton Worldwide | |||
| Holdings Inc. | 144,999 | 8,477 | |
| * | Charter Communications | ||
| Inc. Class A | 24,400 | 7,987 | |
| * | AutoZone Inc. | 7,800 | 5,640 |
| * | Norwegian Cruise Line | ||
| Holdings Ltd. | 91,700 | 4,652 | |
| Marriott International Inc. | |||
| Class A | 46,000 | 4,332 | |
| Signet Jewelers Ltd. | 46,000 | 3,186 | |
| MGM Resorts International | 90,000 | 2,466 | |
| Adient plc | 27,050 | 1,966 | |
| * | Tempur Sealy | ||
| International Inc. | 1,000 | 46 | |
| 1,112,261 | |||
| Consumer Staples (0.8%) | |||
| CVS Health Corp. | 432,377 | 33,941 | |
| PepsiCo Inc. | 300,000 | 33,558 | |
| Tyson Foods Inc. Class A | 70,000 | 4,320 | |
| 71,819 | |||
| Energy (0.9%) | |||
| Schlumberger Ltd. | 394,300 | 30,795 | |
| * | Transocean Ltd. | 1,321,800 | 16,456 |
| * | Southwestern Energy Co. | 1,675,000 | 13,685 |
| Cabot Oil & Gas Corp. | 435,000 | 10,401 | |
| National Oilwell Varco Inc. | 230,200 | 9,229 | |
| EOG Resources Inc. | 60,000 | 5,853 | |
| 86,419 | |||
| Financials (9.2%) | |||
| JPMorgan Chase & Co. | 3,363,866 | 295,482 | |
| Charles Schwab Corp. | 2,998,300 | 122,361 | |
| Wells Fargo & Co. | 1,733,000 | 96,459 | |
| Discover Financial | |||
| Services | 1,364,900 | 93,346 | |
| Marsh & McLennan | |||
| Cos. Inc. | 1,190,412 | 87,960 | |
| Northern Trust Corp. | 784,400 | 67,913 | |
| US Bancorp | 758,300 | 39,052 | |
| Progressive Corp. | 721,500 | 28,268 | |
| CME Group Inc. | 79,850 | 9,486 | |
| Travelers Cos. Inc. | 49,000 | 5,906 | |
| American Express Co. | 51,000 | 4,035 | |
| Comerica Inc. | 35,000 | 2,400 | |
| Chubb Ltd. | 9,630 | 1,312 | |
| 853,980 | |||
10
PRIMECAP Core Fund
| Market | |||
| Value• | |||
| Shares | ($000) | ||
| Health Care (21.7%) | |||
| Eli Lilly & Co. | 4,370,800 | 367,628 | |
| Amgen Inc. | 2,202,136 | 361,304 | |
| Roche Holding AG | 1,061,806 | 271,540 | |
| * | Biogen Inc. | 861,300 | 235,497 |
| ^ | AstraZeneca plc ADR | 4,829,100 | 150,378 |
| Novartis AG ADR | 1,754,100 | 130,277 | |
| Thermo Fisher | |||
| Scientific Inc. | 562,700 | 86,431 | |
| * | Boston Scientific Corp. | 3,356,200 | 83,469 |
| Medtronic plc | 868,000 | 69,926 | |
| Abbott Laboratories | 1,552,400 | 68,942 | |
| Merck & Co. Inc. | 582,500 | 37,012 | |
| * | Illumina Inc. | 155,900 | 26,603 |
| Sanofi ADR | 540,000 | 24,435 | |
| * | Bioverativ Inc. | 430,650 | 23,453 |
| Bristol-Myers Squibb Co. | 399,000 | 21,698 | |
| Agilent Technologies Inc. | 382,600 | 20,228 | |
| * | Waters Corp. | 125,000 | 19,539 |
| Stryker Corp. | 45,500 | 5,990 | |
| Zimmer Biomet Holdings Inc. | 42,900 | 5,238 | |
| AbbVie Inc. | 60,000 | 3,910 | |
| * | Cerner Corp. | 10,000 | 588 |
| 2,014,086 | |||
| Industrials (18.3%) | |||
| Southwest Airlines Co. | 9,006,525 | 484,191 | |
| FedEx Corp. | 963,500 | 188,027 | |
| American Airlines | |||
| Group Inc. | 3,297,800 | 139,497 | |
| Airbus SE | 1,586,850 | 121,016 | |
| * | United Continental | ||
| Holdings Inc. | 1,158,000 | 81,801 | |
| United Parcel Service | |||
| Inc. Class B | 742,700 | 79,692 | |
| Delta Air Lines Inc. | 1,433,000 | 65,861 | |
| Deere & Co. | 548,600 | 59,721 | |
| Caterpillar Inc. | 592,000 | 54,914 | |
| Jacobs Engineering | |||
| Group Inc. | 881,655 | 48,738 | |
| * | AECOM | 1,275,000 | 45,377 |
| Honeywell | |||
| International Inc. | 315,000 | 39,334 | |
| Siemens AG | 280,000 | 38,352 | |
| CSX Corp. | 735,000 | 34,214 | |
| Rockwell Automation Inc. | 168,700 | 26,268 | |
| Safran SA | 340,000 | 25,376 | |
| Union Pacific Corp. | 237,000 | 25,103 | |
| Pentair plc | 310,000 | 19,462 | |
| Ritchie Bros | |||
| Auctioneers Inc. | 533,300 | 17,546 | |
| United Technologies Corp. | 150,000 | 16,831 | |
| General Dynamics Corp. | 82,500 | 15,444 | |
| Boeing Co. | 80,000 | 14,149 | |
| Johnson Controls | |||
| International plc | 310,500 | 13,078 | |
| IDEX Corp. | 139,000 | 12,998 | |
| Rockwell Collins Inc. | 117,000 | 11,368 | |
| Textron Inc. | 211,000 | 10,041 | |
| TransDigm Group Inc. | 30,500 | 6,715 | |
| * | Herc Holdings Inc. | 104,000 | 5,084 |
| * | Hertz Global Holdings Inc. | 200,000 | 3,508 |
| 1,703,706 | |||
| Information Technology (29.2%) | |||
| Texas Instruments Inc. | 3,468,300 | 279,406 | |
| Microsoft Corp. | 2,959,200 | 194,893 | |
| Hewlett Packard | |||
| Enterprise Co. | 7,197,567 | 170,582 | |
| * | Alphabet Inc. Class A | 189,677 | 160,808 |
| * | Alphabet Inc. Class C | 193,163 | 160,240 |
| * | Flex Ltd. | 9,264,300 | 155,640 |
| NVIDIA Corp. | 1,405,000 | 153,047 | |
| NetApp Inc. | 3,020,400 | 126,404 | |
| HP Inc. | 6,739,367 | 120,500 | |
| KLA-Tencor Corp. | 1,193,600 | 113,476 | |
| Intel Corp. | 2,600,000 | 93,782 | |
| Cisco Systems Inc. | 2,547,500 | 86,105 | |
| QUALCOMM Inc. | 1,303,430 | 74,739 | |
| Intuit Inc. | 550,000 | 63,795 | |
| ASML Holding NV | 480,000 | 63,744 | |
| * | Alibaba Group | ||
| Holding Ltd. ADR | 542,430 | 58,490 | |
| * | Adobe Systems Inc. | 440,000 | 57,257 |
| * | Micron Technology Inc. | 1,970,000 | 56,933 |
| Applied Materials Inc. | 1,399,000 | 54,421 | |
| ^ | Telefonaktiebolaget LM | ||
| Ericsson ADR | 7,793,157 | 51,747 | |
| Activision Blizzard Inc. | 905,000 | 45,123 | |
| * | eBay Inc. | 1,335,900 | 44,846 |
| Corning Inc. | 1,425,000 | 38,475 | |
| * | Keysight Technologies Inc. | 919,300 | 33,224 |
| * | PayPal Holdings Inc. | 768,300 | 33,052 |
| * | Yahoo! Inc. | 692,600 | 32,144 |
| Analog Devices Inc. | 389,100 | 31,887 | |
| * | Dell Technologies Inc. | ||
| Class V | 404,264 | 25,905 | |
| Western Digital Corp. | 302,743 | 24,985 | |
| * | Electronic Arts Inc. | 275,000 | 24,618 |
| Visa Inc. Class A | 275,000 | 24,439 | |
| Oracle Corp. | 450,000 | 20,075 | |
| Apple Inc. | 132,000 | 18,963 | |
11
PRIMECAP Core Fund
| Market | |||
| Value• | |||
| Shares | ($000) | ||
| * | BlackBerry Ltd. | 1,547,500 | 11,993 |
| Teradyne Inc. | 250,000 | 7,775 | |
| Mastercard Inc. Class A | 10,000 | 1,125 | |
| *,^ | VMware Inc. Class A | 3,000 | 276 |
| 2,714,914 | |||
| Materials (2.2%) | |||
| Monsanto Co. | 773,350 | 87,543 | |
| Dow Chemical Co. | 478,000 | 30,372 | |
| Praxair Inc. | 229,700 | 27,242 | |
| EI du Pont de | |||
| Nemours & Co. | 275,000 | 22,091 | |
| Celanese Corp. Class A | 150,000 | 13,477 | |
| Cabot Corp. | 125,000 | 7,489 | |
| Greif Inc. Class A | 100,000 | 5,509 | |
| * | Crown Holdings Inc. | 100,000 | 5,295 |
| LyondellBasell Industries | |||
| NV Class A | 40,000 | 3,648 | |
| Greif Inc. Class B | 36,000 | 2,351 | |
| * | AdvanSix Inc. | 15,000 | 410 |
| 205,427 | |||
| Real Estate (0.0%) | |||
| Park Hotels & Resorts Inc. | 75,741 | 1,944 | |
| Telecommunication Services (1.2%) | |||
| * | Sprint Corp. | 8,290,000 | 71,957 |
| AT&T Inc. | 805,492 | 33,468 | |
| * | T-Mobile US Inc. | 21,000 | 1,357 |
| 106,782 | |||
| Total Common Stocks | |||
| (Cost $4,878,809) | 8,871,338 | ||
| Temporary Cash Investment (5.1%) | |||
| Money Market Fund (5.1%) | |||
| 1,2 | Vanguard Market | ||
| Liquidity Fund, 0.965% | |||
| (Cost $476,001) | 4,759,916 | 476,087 | |
| Total Investments (100.6%) | |||
| (Cost $5,354,810) | 9,347,425 | ||
| Other Assets and Liabilities (-0.6%) | |||
| Other Assets | 27,770 | ||
| Liabilities 2 | (85,387) | ||
| (57,617) | |||
| Net Assets (100%) | |||
| Applicable to 389,909,230 outstanding | |||
| $.001 par value shares of beneficial | |||
| interest (unlimited authorization) | 9,289,808 | ||
| Net Asset Value Per Share | $23.83 | ||
| Amount | |
| ($000) | |
| Statement of Assets and Liabilities | |
| Assets | |
| Investments in Securities, at Value | |
| Unaffiliated Issuers | 8,871,338 |
| Affiliated Vanguard Funds | 476,087 |
| Total Investments in Securities | 9,347,425 |
| Investment in Vanguard | 646 |
| Receivables for Investment | |
| Securities Sold | 4,144 |
| Receivables for Accrued Income | 17,818 |
| Receivables for Capital Shares Issued | 5,115 |
| Other Assets | 47 |
| Total Assets | 9,375,195 |
| Liabilities | |
| Payables for Investment Securities | |
| Purchased | 9,361 |
| Collateral for Securities on Loan | 57,396 |
| Payables to Investment Advisor | 6,980 |
| Payables for Capital Shares Redeemed | 2,254 |
| Payables to Vanguard | 9,396 |
| Total Liabilities | 85,387 |
| Net Assets | 9,289,808 |
12
PRIMECAP Core Fund
At March 31, 2017, net assets consisted of:
| Amount | |
| ($000) | |
| Paid-in Capital | 5,132,584 |
| Undistributed Net Investment Income | 35,512 |
| Accumulated Net Realized Gains | 129,354 |
| Unrealized Appreciation (Depreciation) | |
| Investment Securities | 3,992,615 |
| Foreign Currencies | (257) |
| Net Assets | 9,289,808 |
• See Note A in Notes to Financial Statements.
* Non-income-producing security.
^ Includes partial security positions on loan to broker-dealers. The total value of securities on loan is $55,510,000.
1 Affiliated money market fund available only to Vanguard funds and certain trusts and accounts managed by Vanguard. Rate shown is the
7-day yield.
2 Includes $57,396,000 of collateral received for securities on loan.
ADR—American Depositary Receipt.
See accompanying Notes, which are an integral part of the Financial Statements.
13
PRIMECAP Core Fund
| Statement of Operations | |
| Six Months Ended | |
| March 31, 2017 | |
| ($000) | |
| Investment Income | |
| Income | |
| Dividends1 | 85,806 |
| Interest2 | 1,622 |
| Securities Lending—Net | 153 |
| Total Income | 87,581 |
| Expenses | |
| Investment Advisory Fees—Note B | 13,454 |
| The Vanguard Group—Note C | |
| Management and Administrative | 5,696 |
| Marketing and Distribution | 734 |
| Custodian Fees | 52 |
| Shareholders’ Reports | 48 |
| Trustees’ Fees and Expenses | 8 |
| Total Expenses | 19,992 |
| Net Investment Income | 67,589 |
| Realized Net Gain (Loss) | |
| Investment Securities Sold2 | 143,611 |
| Foreign Currencies | 19 |
| Realized Net Gain (Loss) | 143,630 |
| Change in Unrealized Appreciation (Depreciation) | |
| Investment Securities | 743,856 |
| Foreign Currencies | (130) |
| Change in Unrealized Appreciation (Depreciation) | 743,726 |
| Net Increase (Decrease) in Net Assets Resulting from Operations | 954,945 |
1 Dividends are net of foreign withholding taxes of $2,446,000.
2 Interest income and realized net gain (loss) from an affiliated company of the fund were $1,622,000 and ($1,000), respectively.
See accompanying Notes, which are an integral part of the Financial Statements.
14
PRIMECAP Core Fund
| Statement of Changes in Net Assets | ||
| Six Months Ended | Year Ended | |
| March 31, | September 30, | |
| 2017 | 2016 | |
| ($000) | ($000) | |
| Increase (Decrease) in Net Assets | ||
| Operations | ||
| Net Investment Income | 67,589 | 102,631 |
| Realized Net Gain (Loss) | 143,630 | 365,165 |
| Change in Unrealized Appreciation (Depreciation) | 743,726 | 731,565 |
| Net Increase (Decrease) in Net Assets Resulting from Operations | 954,945 | 1,199,361 |
| Distributions | ||
| Net Investment Income | (103,025) | (84,999) |
| Realized Capital Gain1 | (350,990) | (275,983) |
| Total Distributions | (454,015) | (360,982) |
| Capital Share Transactions | ||
| Issued | 431,500 | 1,115,657 |
| Issued in Lieu of Cash Distributions | 388,936 | 323,163 |
| Redeemed | (451,547) | (774,510) |
| Net Increase (Decrease) from Capital Share Transactions | 368,889 | 664,310 |
| Total Increase (Decrease) | 869,819 | 1,502,689 |
| Net Assets | ||
| Beginning of Period | 8,419,989 | 6,917,300 |
| End of Period2 | 9,289,808 | 8,419,989 |
1 Includes fiscal 2017 and 2016 short-term gain distributions totaling $12,674,000 and $0, respectively. Short-term gain distributions are
treated as ordinary income dividends for tax purposes.
2 Net Assets—End of Period includes undistributed (overdistributed) net investment income of $35,512,000 and $70,929,000.
See accompanying Notes, which are an integral part of the Financial Statements.
15
PRIMECAP Core Fund
| Financial Highlights | |||||||
| Six Months | |||||||
| Ended | |||||||
| For a Share Outstanding | March 31, | Year Ended September 30, | |||||
| Throughout Each Period | 2017 | 2016 | 2015 | 2014 | 2013 | 2012 | |
| Net Asset Value, Beginning of Period | $22.55 | $20.26 | $21.87 | $18.65 | $14.98 | $12.37 | |
| Investment Operations | |||||||
| Net Investment Income | .179 | .275 | .285 | .255 | .242 | .206 | |
| Net Realized and Unrealized Gain (Loss) | |||||||
| on Investments | 2.326 | 3.047 | (.328) | 3.820 | 3.955 | 2.567 | |
| Total from Investment Operations | 2.505 | 3.322 | (.043) | 4.075 | 4.197 | 2.773 | |
| Distributions | |||||||
| Dividends from Net Investment Income | (. 278) | (. 243) | (. 270) | (.178) | (. 260) | (.163) | |
| Distributions from Realized Capital Gains | (. 947) | (.789) | (1.297) | (. 677) | (. 267) | — | |
| Total Distributions | (1.225) | (1.032) | (1.567) | (.855) | (.527) | (.163) | |
| Net Asset Value, End of Period | $23.83 | $22.55 | $20.26 | $21.87 | $18.65 | $14.98 | |
| Total Return1 | 11.44% | 16.78% | -0.73% | 22.60% | 28.88% | 22.55% | |
| Ratios/Supplemental Data | |||||||
| Net Assets, End of Period (Millions) | $9,290 | $8,420 | $6,917 | $6,828 | $5,774 | $4,702 | |
| Ratio of Total Expenses to | |||||||
| Average Net Assets | 0.46% | 0.46% | 0.47% | 0.50% | 0.50% | 0.50% | |
| Ratio of Net Investment Income to | |||||||
| Average Net Assets | 1.48% | 1.31% | 1.29% | 1.23% | 1.42% | 1.39% | |
| Portfolio Turnover Rate | 9% | 11% | 10% | 13% | 7% | 10% | |
The expense ratio, net investment income ratio, and turnover rate for the current period have been annualized.
1 Total returns do not include transaction or account service fees that may have applied in the periods shown. Fund prospectuses provide
information about any applicable transaction and account service fees.
See accompanying Notes, which are an integral part of the Financial Statements.
16
PRIMECAP Core Fund
Notes to Financial Statements
Vanguard PRIMECAP Core Fund is registered under the Investment Company Act of 1940 as an open-end investment company, or mutual fund.
A. The following significant accounting policies conform to generally accepted accounting principles for U.S. investment companies. The fund consistently follows such policies in preparing its financial statements.
1. Security Valuation: Securities are valued as of the close of trading on the New York Stock Exchange (generally 4 p.m., Eastern time) on the valuation date. Equity securities are valued at the latest quoted sales prices or official closing prices taken from the primary market in which each security trades; such securities not traded on the valuation date are valued at the mean of the latest quoted bid and asked prices. Securities for which market quotations are not readily available, or whose values have been affected by events occurring before the fund’s pricing time but after the close of the securities’ primary markets, are valued at their fair values calculated according to procedures adopted by the board of trustees. These procedures include obtaining quotations from an independent pricing service, monitoring news to identify significant market- or security-specific events, and evaluating changes in the values of foreign market proxies (for example, ADRs, futures contracts, or exchange-traded funds), between the time the foreign markets close and the fund’s pricing time. When fair-value pricing is employed, the prices of securities used by a fund to calculate its net asset value may differ from quoted or published prices for the same securities. Investments in Vanguard Market Liquidity Fund are valued at that fund’s net asset value.
2. Foreign Currency: Securities and other assets and liabilities denominated in foreign currencies are translated into U.S. dollars using exchange rates obtained from an independent third party as of the fund’s pricing time on the valuation date. Realized gains (losses) and unrealized appreciation (depreciation) on investment securities include the effects of changes in exchange rates since the securities were purchased, combined with the effects of changes in security prices. Fluctuations in the value of other assets and liabilities resulting from changes in exchange rates are recorded as unrealized foreign currency gains (losses) until the assets or liabilities are settled in cash, at which time they are recorded as realized foreign currency gains (losses).
3. Federal Income Taxes: The fund intends to continue to qualify as a regulated investment company and distribute all of its taxable income. Management has analyzed the fund’s tax positions taken for all open federal income tax years (September 30, 2013–2016), and for the period ended March 31, 2017, and has concluded that no provision for federal income tax is required in the fund’s financial statements.
4. Distributions: Distributions to shareholders are recorded on the ex-dividend date.
5. Securities Lending: To earn additional income, the fund lends its securities to qualified institutional borrowers. Security loans are subject to termination by the fund at any time, and are required to be secured at all times by collateral in an amount at least equal to the market value of securities loaned. Daily market fluctuations could cause the value of loaned securities to be more or less than the value of the collateral received. When this occurs, the collateral is adjusted and settled on the next business day. The fund further mitigates its counterparty risk by entering into securities lending transactions only with a diverse group of prequalified counterparties, monitoring their financial strength, and entering into master securities lending agreements with its counterparties. The master securities lending agreements provide that, in the event of a counterparty’s default (including bankruptcy), the fund may terminate any loans with that borrower, determine the net amount owed, and sell or retain
17
PRIMECAP Core Fund
the collateral up to the net amount owed to the fund; however, such actions may be subject to legal proceedings. While collateral mitigates counterparty risk, in the event of a default the fund may experience delays and costs in recovering the securities loaned. The fund invests cash collateral received in Vanguard Market Liquidity Fund, and records a liability in the Statement of Assets and Liabilities for the return of the collateral, during the period the securities are on loan. Securities lending income represents fees charged to borrowers plus income earned on invested cash collateral, less expenses associated with the loan. During the term of the loan, the fund is entitled to all distributions made on or in respect of the loaned securities.
6. Credit Facility: The fund and certain other funds managed by The Vanguard Group (“Vanguard”) participate in a $3.1 billion committed credit facility provided by a syndicate of lenders pursuant to a credit agreement that may be renewed annually; each fund is individually liable for its borrowings, if any, under the credit facility. Borrowings may be utilized for temporary and emergency purposes, and are subject to the fund’s regulatory and contractual borrowing restrictions. The participating funds are charged administrative fees and an annual commitment fee of 0.10% of the undrawn amount of the facility; these fees are allocated to the funds based on a method approved by the fund’s board of trustees and included in Management and Administrative expenses on the fund’s Statement of Operations. Any borrowings under this facility bear interest at a rate based upon the higher of the one-month London Interbank Offered Rate, federal funds effective rate, or overnight bank funding rate plus an agreed-upon spread.
The fund had no borrowings outstanding at March 31, 2017, or at any time during the period then ended.
7. Other: Dividend income is recorded on the ex-dividend date. Interest income includes income distributions received from Vanguard Market Liquidity Fund and is accrued daily. Premiums and discounts on debt securities purchased are amortized and accreted, respectively, to interest income over the lives of the respective securities. Security transactions are accounted for on the date securities are bought or sold. Costs used to determine realized gains (losses) on the sale of investment securities are those of the specific securities sold.
B. PRIMECAP Management Company provides investment advisory services to the fund for a fee calculated at an annual percentage rate of average net assets. For the six months ended March 31, 2017, the investment advisory fee represented an effective annual rate of 0.31% of the fund’s average net assets.
C. In accordance with the terms of a Funds’ Service Agreement (the “FSA”) between Vanguard and the fund, Vanguard furnishes to the fund corporate management, administrative, marketing, and distribution services at Vanguard’s cost of operations (as defined by the FSA). These costs of operations are allocated to the fund based on methods and guidelines approved by the board of trustees. Vanguard does not require reimbursement in the current period for certain costs of operations (such as deferred compensation/benefits and risk/insurance costs); the fund’s liability for these costs of operations is included in Payables to Vanguard on the Statement of Assets and Liabilities.
Upon the request of Vanguard, the fund may invest up to 0.40% of its net assets as capital in Vanguard. At March 31, 2017, the fund had contributed to Vanguard capital in the amount of $646,000, representing 0.01% of the fund’s net assets and 0.26% of Vanguard’s capitalization. The fund’s trustees and officers are also directors and employees, respectively, of Vanguard.
18
PRIMECAP Core Fund
D. Various inputs may be used to determine the value of the fund’s investments. These inputs are summarized in three broad levels for financial statement purposes. The inputs or methodologies used to value securities are not necessarily an indication of the risk associated with investing in those securities.
Level 1—Quoted prices in active markets for identical securities.
Level 2—Other significant observable inputs (including quoted prices for similar securities, interest rates, prepayment speeds, credit risk, etc.).
Level 3—Significant unobservable inputs (including the fund’s own assumptions used to determine the fair value of investments).
The following table summarizes the market value of the fund’s investments as of March 31, 2017, based on the inputs used to value them:
| Level 1 | Level 2 | Level 3 | |
| Investments | ($000) | ($000) | ($000) |
| Common Stocks | 8,415,054 | 456,284 | — |
| Temporary Cash Investments | 476,087 | — | — |
| Total | 8,891,141 | 456,284 | — |
E. Distributions are determined on a tax basis and may differ from net investment income and realized capital gains for financial reporting purposes. Differences may be permanent or temporary. Permanent differences are reclassified among capital accounts in the financial statements to reflect their tax character. Temporary differences arise when certain items of income, expense, gain, or loss are recognized in different periods for financial statement and tax purposes. These differences will reverse at some time in the future. Differences in classification may also result from the treatment of short-term gains as ordinary income for tax purposes. The fund’s tax-basis capital gains and losses are determined only at the end of each fiscal year.
At March 31, 2017, the cost of investment securities for tax purposes was $5,354,810,000. Net unrealized appreciation of investment securities for tax purposes was $3,992,615,000, consisting of unrealized gains of $4,137,985,000 on securities that had risen in value since their purchase and $145,370,000 in unrealized losses on securities that had fallen in value since their purchase.
F. During the six months ended March 31, 2017, the fund purchased $428,343,000 of investment securities and sold $394,681,000 of investment securities, other than temporary cash investments.
| G. Capital shares issued and redeemed were: | ||
| Six Months Ended | Year Ended | |
| March 31, 2017 | September 30, 2016 | |
| Shares | Shares | |
| (000) | (000) | |
| Issued | 18,734 | 53,545 |
| Issued in Lieu of Cash Distributions | 17,325 | 15,403 |
| Redeemed | (19,588) | (36,981) |
| Net Increase (Decrease) in Shares Outstanding | 16,471 | 31,967 |
H. Management has determined that no material events or transactions occurred subsequent to March 31, 2017, that would require recognition or disclosure in these financial statements.
19
About Your Fund’s Expenses
As a shareholder of the fund, you incur ongoing costs, which include costs for portfolio management, administrative services, and shareholder reports (like this one), among others. Operating expenses, which are deducted from a fund’s gross income, directly reduce the investment return of the fund.
A fund’s expenses are expressed as a percentage of its average net assets. This figure is known as the expense ratio. The following examples are intended to help you understand the ongoing costs (in dollars) of investing in your fund and to compare these costs with those of other mutual funds. The examples are based on an investment of $1,000 made at the beginning of the period shown and held for the entire period.
The accompanying table illustrates your fund’s costs in two ways:
• Based on actual fund return. This section helps you to estimate the actual expenses that you paid over the period. The ”Ending Account Value“ shown is derived from the fund‘s actual return, and the third column shows the dollar amount that would have been paid by an investor who started with $1,000 in the fund. You may use the information here, together with the amount you invested, to estimate the expenses that you paid over the period.
To do so, simply divide your account value by $1,000 (for example, an $8,600 account value divided by $1,000 = 8.6), then multiply the result by the number given for your fund under the heading ”Expenses Paid During Period.“
• Based on hypothetical 5% yearly return. This section is intended to help you compare your fund‘s costs with those of other mutual funds. It assumes that the fund had a yearly return of 5% before expenses, but that the expense ratio is unchanged. In this case—because the return used is not the fund’s actual return—the results do not apply to your investment. The example is useful in making comparisons because the Securities and Exchange Commission requires all mutual funds to calculate expenses based on a 5% return. You can assess your fund’s costs by comparing this hypothetical example with the hypothetical examples that appear in shareholder reports of other funds.
Note that the expenses shown in the table are meant to highlight and help you compare ongoing costs only and do not reflect transaction costs incurred by the fund for buying and selling securities. Further, the expenses do not include any purchase, redemption, or account service fees described in the fund prospectus. If such fees were applied to your account, your costs would be higher. Your fund does not carry a “sales load.”
The calculations assume no shares were bought or sold during the period. Your actual costs may have been higher or lower, depending on the amount of your investment and the timing of any purchases or redemptions.
You can find more information about the fund’s expenses, including annual expense ratios, in the Financial Statements section of this report. For additional information on operating expenses and other shareholder costs, please refer to your fund’s current prospectus.
20
| Six Months Ended March 31, 2017 | |||
| Beginning | Ending | Expenses | |
| Account Value | Account Value | Paid During | |
| PRIMECAP Core Fund | 9/30/2016 | 3/31/2017 | Period |
| Based on Actual Fund Return | $1,000.00 | $1,114.43 | $2.42 |
| Based on Hypothetical 5% Yearly Return | 1,000.00 | 1,022.64 | 2.32 |
The calculations are based on expenses incurred in the most recent six-month period. The fund’s annualized six-month expense ratio for that period is 0.46%. The dollar amounts shown as “Expenses Paid” are equal to the annualized expense ratio multiplied by the average account value over the period, multiplied by the number of days in the most recent six-month period, then divided by the number of days in the most recent 12-month period (182/365).
21
Trustees Approve Advisory Arrangement
The board of trustees of Vanguard PRIMECAP Core Fund has renewed the fund’s investment advisory arrangement with PRIMECAP Management Company (PRIMECAP Management). The board determined that renewing the fund’s advisory arrangement was in the best interests of the fund and its shareholders.
The board based its decision upon an evaluation of the advisor’s investment staff, portfolio management process, and performance. This evaluation included information provided to the board by Vanguard’s Portfolio Review Department, which is responsible for fund and advisor oversight and product management. The Portfolio Review Department met regularly with the advisor and made monthly presentations to the board during the fiscal year that directed the board’s focus to relevant information and topics.
The board, or an investment committee made up of board members, also received information throughout the year during advisor presentations. For each advisor presentation, the board was provided with letters and reports that included information about, among other things, the advisory firm and the advisor’s assessment of the investment environment, portfolio performance, and portfolio characteristics.
In addition, the board received monthly reports, which included a Market and Economic Report, a Fund Dashboard Monthly Summary, and a Fund Performance Report.
Prior to their meeting, the trustees were provided with a memo and materials that summarized the information they received over the course of the year. They also considered the factors discussed below, among others. However, no single factor determined whether the board approved the arrangement. Rather, it was the totality of the circumstances that drove the board’s decision.
Nature, extent, and quality of services
The board reviewed the quality of the fund’s investment management services over both the short and long term, and took into account the organizational depth and stability of the advisor. The board considered that PRIMECAP Management, founded in 1983, is recognized for its long-term approach to equity investing. The portfolio managers are responsible for separate sub-portfolios, and each portfolio manager employs a fundamental, research-driven approach in seeking to identify companies with long-term potential that the market has yet to appreciate. The multi-counselor approach that the advisor employs is designed to emphasize individual decision-making and enable each portfolio manager to invest only in his or her highest-conviction ideas. PRIMECAP’s fundamental research focuses on developing opinions independent from Wall Street’s consensus and maintaining a long-term time horizon. PRIMECAP Management has managed the fund since the fund’s inception in 2004.
The board concluded that the advisor’s experience, stability, depth, and performance, among other factors, warranted continuation of the advisory arrangement.
Investment performance
The board considered the short- and long-term performance of the fund, including any periods of outperformance or underperformance compared with a relevant benchmark index and peer group. The board concluded that the performance was such that the advisory arrangement should continue. Information about the fund’s most recent performance can be found in the Performance Summary section of this report.
22
Cost
The board concluded that the fund’s expense ratio was well below the average expense ratio charged by funds in its peer group and that the fund’s advisory fee rate was also well below its peer-group average. Information about the fund’s expenses appears in the About Your Fund’s Expenses section of this report as well as in the Financial Statements section, which also includes information about the fund’s advisory fee rate.
The board did not consider the profitability of PRIMECAP Management in determining whether to approve the advisory fee, because PRIMECAP Management is independent of Vanguard and the advisory fee is the result of arm’s-length negotiations.
The benefit of economies of scale
The board concluded that the fund’s shareholders benefit from economies of scale because of the breakpoints in the fund’s advisory fee schedule. The breakpoints reduce the effective rate of the fee as the fund’s assets increase.
The board will consider whether to renew the advisory arrangement again after a one-year period.
23
Glossary
30-Day SEC Yield. A fund’s 30-day SEC yield is derived using a formula specified by the U.S. Securities and Exchange Commission. Under the formula, data related to the fund’s security holdings in the previous 30 days are used to calculate the fund’s hypothetical net income for that period, which is then annualized and divided by the fund’s estimated average net assets over the calculation period. For the purposes of this calculation, a security’s income is based on its current market yield to maturity (for bonds), its actual income (for asset-backed securities), or its projected dividend yield (for stocks). Because the SEC yield represents hypothetical annualized income, it will differ—at times significantly—from the fund’s actual experience. As a result, the fund’s income distributions may be higher or lower than implied by the SEC yield.
Beta. A measure of the magnitude of a fund’s past share-price fluctuations in relation to the ups and downs of a given market index. The index is assigned a beta of 1.00. Compared with a given index, a fund with a beta of 1.20 typically would have seen its share price rise or fall by 12% when the index rose or fell by 10%. For this report, beta is based on returns over the past 36 months for both the fund and the index. Note that a fund’s beta should be reviewed in conjunction with its R-squared (see definition). The lower the R-squared, the less correlation there is between the fund and the index, and the less reliable beta is as an indicator of volatility.
Dividend Yield. Dividend income earned by stocks, expressed as a percentage of the aggregate market value (or of net asset value, for a fund). The yield is determined by dividing the amount of the annual dividends by the aggregate value (or net asset value) at the end of the period. For a fund, the dividend yield is based solely on stock holdings and does not include any income produced by other investments.
Earnings Growth Rate. The average annual rate of growth in earnings over the past five years for the stocks now in a fund.
Equity Exposure. A measure that reflects a fund’s investments in stocks and stock futures. Any holdings in short-term reserves are excluded.
Expense Ratio. A fund’s total annual operating expenses expressed as a percentage of the fund’s average net assets. The expense ratio includes management and administrative expenses, but does not include the transaction costs of buying and selling portfolio securities.
Foreign Holdings. The percentage of a fund represented by securities or depositary receipts of companies based outside the United States.
Inception Date. The date on which the assets of a fund (or one of its share classes) are first invested in accordance with the fund’s investment objective. For funds with a subscription period, the inception date is the day after that period ends. Investment performance is measured from the inception date.
Median Market Cap. An indicator of the size of companies in which a fund invests; the midpoint of market capitalization (market price x shares outstanding) of a fund’s stocks, weighted by the proportion of the fund’s assets invested in each stock. Stocks representing half of the fund’s assets have market capitalizations above the median, and the rest are below it.
Price/Book Ratio. The share price of a stock divided by its net worth, or book value, per share. For a fund, the weighted average price/book ratio of the stocks it holds.
24
Price/Earnings Ratio. The ratio of a stock’s current price to its per-share earnings over the past year. For a fund, the weighted average P/E of the stocks it holds. P/E is an indicator of market expectations about corporate prospects; the higher the P/E, the greater the expectations for a company’s future growth.
R-Squared. A measure of how much of a fund’s past returns can be explained by the returns from the market in general, as measured by a given index. If a fund’s total returns were precisely synchronized with an index’s returns, its R-squared would be 1.00. If the fund’s returns bore no relationship to the index’s returns, its R-squared would be 0. For this report, R-squared is based on returns over the past 36 months for both the fund and the index.
Return on Equity. The annual average rate of return generated by a company during the past five years for each dollar of shareholder’s equity (net income divided by shareholder’s equity). For a fund, the weighted average return on equity for the companies whose stocks it holds.
Short-Term Reserves. The percentage of a fund invested in highly liquid, short-term securities that can be readily converted to cash.
Turnover Rate. An indication of the fund’s trading activity. Funds with high turnover rates incur higher transaction costs and may be more likely to distribute capital gains (which may be taxable to investors). The turnover rate excludes in-kind transactions, which have minimal impact on costs.
25
This page intentionally left blank.
This page intentionally left blank.
The People Who Govern Your Fund
The trustees of your mutual fund are there to see that the fund is operated and managed in your best interests since, as a shareholder, you are a part owner of the fund. Your fund’s trustees also serve on the board of directors of The Vanguard Group, Inc., which is owned by the Vanguard funds and provides services to them on an at-cost basis.
A majority of Vanguard’s board members are independent, meaning that they have no affiliation with Vanguard or the funds they oversee, apart from the sizable personal investments they have made as private individuals. The independent board members have distinguished backgrounds in business, academia, and public service. Each of the trustees and executive officers oversees 195 Vanguard funds.
The following table provides information for each trustee and executive officer of the fund. The mailing address of the trustees and officers is P.O. Box 876, Valley Forge, PA 19482. More information about the trustees is in the Statement of Additional Information, which can be obtained, without charge, by contacting Vanguard at 800-662-7447, or online at vanguard.com.
Interested Trustee1
F. William McNabb III
Born 1957. Trustee Since July 2009. Chairman of the Board. Principal Occupation(s) During the Past Five Years and Other Experience: Chairman of the Board of The Vanguard Group, Inc., and of each of the investment companies served by The Vanguard Group, since January 2010; Director of The Vanguard Group since 2008; Chief Executive Officer and President of The Vanguard Group, and of each of the investment companies served by The Vanguard Group, since 2008; Director of Vanguard Marketing Corporation; Managing Director of The Vanguard Group (1995–2008).
Independent Trustees
Emerson U. Fullwood
Born 1948. Trustee Since January 2008. Principal Occupation(s) During the Past Five Years and Other Experience: Executive Chief Staff and Marketing Officer for North America and Corporate Vice President (retired 2008) of Xerox Corporation (document management products and services); Executive in Residence and 2009–2010 Distinguished Minett Professor at the Rochester Institute of Technology; Lead Director of SPX FLOW, Inc. (multi-industry manufacturing); Director of the United Way of Rochester, the University of Rochester Medical Center, Monroe Community College Foundation, North Carolina A&T University, and Roberts Wesleyan College.
Rajiv L. Gupta
Born 1945. Trustee Since December 2001.2 Principal Occupation(s) During the Past Five Years and Other Experience: Chairman and Chief Executive Officer (retired 2009) and President (2006–2008) of Rohm and Haas Co. (chemicals); Director of Arconic Inc.
(diversified manufacturer), HP Inc. (printer and personal computer manufacturing), and Delphi Automotive plc (automotive components); Senior Advisor at New Mountain Capital.
Amy Gutmann
Born 1949. Trustee Since June 2006. Principal Occupation(s) During the Past Five Years and Other Experience: President of the University of Pennsylvania; Christopher H. Browne Distinguished Professor of Political Science, School of Arts and Sciences, and Professor of Communication, Annenberg School for Communication, with secondary faculty appointments in the Department of Philosophy, School of Arts and Sciences, and at the Graduate School of Education, University of Pennsylvania; Trustee of the National Constitution Center; Chair of the Presidential Commission for the Study of Bioethical Issues.
JoAnn Heffernan Heisen
Born 1950. Trustee Since July 1998. Principal Occupation(s) During the Past Five Years and Other Experience: Corporate Vice President and Chief Global Diversity Officer (retired 2008) and Member of the Executive Committee (1997–2008) of Johnson & Johnson (pharmaceuticals/medical devices/consumer products); Director of Skytop Lodge Corporation (hotels) and the Robert Wood Johnson Foundation; Member of the Advisory Board of the Institute for Women’s Leadership at Rutgers University.
F. Joseph Loughrey
Born 1949. Trustee Since October 2009. Principal Occupation(s) During the Past Five Years and Other Experience: President and Chief Operating Officer (retired 2009) of Cummins Inc. (industrial machinery); Chairman of the Board of Hillenbrand, Inc. (specialized consumer services), Oxfam America, and the Lumina
Foundation for Education; Director of SKF AB (industrial machinery), Hyster-Yale Materials Handling, Inc. (forklift trucks), and the V Foundation for Cancer Research; Member of the Advisory Council for the College of Arts and Letters and Chair of the Advisory Board to the Kellogg Institute for International Studies, both at the University of Notre Dame.
Mark Loughridge
Born 1953. Trustee Since March 2012. Principal Occupation(s) During the Past Five Years and Other Experience: Senior Vice President and Chief Financial Officer (retired 2013) at IBM (information technology services); Fiduciary Member of IBM’s Retirement Plan Committee (2004–2013); Director of the Dow Chemical Company; Member of the Council on Chicago Booth.
Scott C. Malpass
Born 1962. Trustee Since March 2012. Principal Occupation(s) During the Past Five Years and Other Experience: Chief Investment Officer and Vice President at the University of Notre Dame; Assistant Professor of Finance at the Mendoza College of Business at Notre Dame; Member of the Notre Dame 403(b) Investment Committee, the Board of Advisors for Spruceview Capital Partners, and the Investment Advisory Committee of Major League Baseball; Board Member of TIFF Advisory Services, Inc., and Catholic Investment Services, Inc. (investment advisors); Member of the Board of Superintendence of the Institute for the Works of Religion.
André F. Perold
Born 1952. Trustee Since December 2004. Principal Occupation(s) During the Past Five Years and Other Experience: George Gund Professor of Finance and Banking, Emeritus at the Harvard Business School (retired 2011); Chief Investment Officer and Co-Managing Partner of HighVista Strategies LLC (private investment firm); Overseer of the Museum of Fine Arts Boston.
Peter F. Volanakis
Born 1955. Trustee Since July 2009. Principal Occupation(s) During the Past Five Years and Other Experience: President and Chief Operating Officer (retired 2010) of Corning Incorporated (communications equipment); Chairman of the Board of Trustees of Colby-Sawyer College; Member of the Board of Hypertherm, Inc. (industrial cutting systems, software, and consumables).
Executive Officers
Glenn Booraem
Born 1967. Investment Stewardship Officer Since February 2017. Principal Occupation(s) During the Past Five Years and Other Experience: Principal of The Vanguard Group, Inc.; Treasurer (2015–2017),
Controller (2010–2015), and Assistant Controller (2001–2010) of each of the investment companies served by The Vanguard Group.
Thomas J. Higgins
Born 1957. Chief Financial Officer Since September 2008. Principal Occupation(s) During the Past Five Years and Other Experience: Principal of The Vanguard Group, Inc.; Chief Financial Officer of each of the investment companies served by The Vanguard Group; Treasurer of each of the investment companies served by The Vanguard Group (1998–2008).
Peter Mahoney
Born 1974. Controller Since May 2015. Principal Occupation(s) During the Past Five Years and Other Experience: Principal of The Vanguard Group, Inc.; Controller of each of the investment companies served by The Vanguard Group; Head of International Fund Services at The Vanguard Group (2008–2014).
Anne E. Robinson
Born 1970. Secretary Since September 2016. Principal Occupation(s) During the Past Five Years and Other Experience: Managing Director of The Vanguard Group, Inc.; General Counsel of The Vanguard Group; Secretary of The Vanguard Group and of each of the investment companies served by The Vanguard Group; Director and Senior Vice President of Vanguard Marketing Corporation; Managing Director and General Counsel of Global Cards and Consumer Services at Citigroup (2014–2016); Counsel at American Express (2003–2014).
Michael Rollings
Born 1963. Treasurer Since February 2017. Principal Occupation(s) During the Past Five Years and Other Experience: Managing Director of The Vanguard Group, Inc.; Treasurer of each of the investment companies served by The Vanguard Group; Executive Vice President and Chief Financial Officer of MassMutual Financial Group (2006–2016).
| Vanguard Senior ManagementTeam | |
| Mortimer J. Buckley | James M. Norris |
| John James | Thomas M. Rampulla |
| Martha G. King | Glenn W. Reed |
| John T. Marcante | Karin A. Risi |
| Chris D. McIsaac | |
Chairman Emeritus and Senior Advisor John J. Brennan
Chairman, 1996–2009
Chief Executive Officer and President, 1996–2008
Founder John C. Bogle
Chairman and Chief Executive Officer, 1974–1996
1 Mr. McNabb is considered an “interested person,” as defined in the Investment Company Act of 1940, because he is an officer of the
Vanguard funds.
2 December 2002 for Vanguard Equity Income Fund, the Vanguard Municipal Bond Funds, and the Vanguard State Tax-Exempt Funds.
 | |
| P.O. Box 2600 | |
| Valley Forge, PA 19482-2600 | |
| Connect with Vanguard® > vanguard.com | |
| Fund Information > 800-662-7447 | |
| Direct Investor Account Services > 800-662-2739 | |
| Institutional Investor Services > 800-523-1036 | |
| Text Telephone for People | |
| Who Are Deaf or Hard of Hearing> 800-749-7273 | |
| This material may be used in conjunction | |
| with the offering of shares of any Vanguard | |
| fund only if preceded or accompanied by | |
| the fund’s current prospectus. | |
| All comparative mutual fund data are from Lipper, a | |
| Thomson Reuters Company, or Morningstar, Inc., unless | |
| otherwise noted. | |
| You can obtain a free copy of Vanguard’s proxy voting | |
| guidelines by visiting vanguard.com/proxyreporting or by | |
| calling Vanguard at 800-662-2739. The guidelines are | |
| also available from the SEC’s website, sec.gov. In | |
| addition, you may obtain a free report on how your fund | |
| voted the proxies for securities it owned during the 12 | |
| months ended June 30. To get the report, visit either | |
| vanguard.com/proxyreporting or sec.gov. | |
| You can review and copy information about your fund at | |
| the SEC’s Public Reference Room in Washington, D.C. To | |
| find out more about this public service, call the SEC at | |
| 202-551-8090. Information about your fund is also | |
| available on the SEC’s website, and you can receive | |
| copies of this information, for a fee, by sending a | |
| request in either of two ways: via email addressed to | |
| publicinfo@sec.gov or via regular mail addressed to the | |
| Public Reference Section, Securities and Exchange | |
| Commission, Washington, DC 20549-1520. | |
| © 2017 The Vanguard Group, Inc. | |
| All rights reserved. | |
| Vanguard Marketing Corporation, Distributor. | |
| Q12202 052017 | |
Item 2: Code of Ethics. The Registrant has adopted a code of ethics that applies to the Registrant’s principal executive officer, principal financial officer, principal accounting officer or controller or persons performing similar functions. The Code of Ethics was amended during the reporting period covered by this report to make certain technical, non-material changes.
Item 3: Audit Committee Financial Expert.
Not Applicable.
Item 4: Principal Accountant Fees and Services.
(a) Audit Fees.
Not Applicable.
Item 5: Audit Committee of Listed Registrants.
Not Applicable.
Item 6: Investments.
Not Applicable.
Item 7: Disclosure of Proxy Voting Policies and Procedures for Closed-End Management Investment Companies.
Not Applicable.
Item 8: Portfolio Managers of Closed-End Management Investment Companies.
Not Applicable.
Item 9: Purchase of Equity Securities by Closed-End Management Investment Company and Affiliated Purchasers.
Not Applicable.
Item 10: Submission of Matters to a Vote of Security Holders.
Not Applicable.
Item 11: Controls and Procedures.
(a) Disclosure Controls and Procedures. The Principal Executive and Financial Officers concluded that the Registrant’s Disclosure Controls and Procedures are effective
based on their evaluation of the Disclosure Controls and Procedures as of a date within 90 days of the filing date of this report.
(b) Internal Control Over Financial Reporting. There were no significant changes in Registrant’s Internal Control Over Financial Reporting or in other factors that could significantly affect this control subsequent to the date of the evaluation, including any corrective actions with regard to significant deficiencies and material weaknesses.
Item 12: Exhibits.
(a) Certifications.
Pursuant to the requirements of the Securities Exchange Act of 1934 and the Investment Company Act of 1940, the registrant has duly caused this report to be signed on its behalf by the undersigned, thereunto duly authorized.
VANGUARD FENWAY FUNDS | |
BY: | /s/ F. WILLIAM MCNABB III* F. WILLIAM MCNABB III CHIEF EXECUTIVE OFFICER |
Date: May 18, 2017
Pursuant to the requirements of the Securities Exchange Act of 1934 and the Investment Company Act of 1940, this report has been signed below by the following persons on behalf of the registrant and in the capacities and on the dates indicated.
VANGUARD FENWAY FUNDS | |
BY: | /s/ F. WILLIAM MCNABB III* F. WILLIAM MCNABB III CHIEF EXECUTIVE OFFICER |
| Date: May 18, 2017 | |
| VANGUARD FENWAY FUNDS | |
BY: | /s/ THOMAS J. HIGGINS* THOMAS J. HIGGINS CHIEF FINANCIAL OFFICER |
Date: May 18, 2017
* By: /s/ Anne E. Robinson
Anne E. Robinson, pursuant to a Power of Attorney filed on October 4, 2016 see file Number 33-32548, Incorporated by Reference.
0448435, v0.47