UNITED STATES
SECURITIES AND EXCHANGE COMMISSION
Washington, D.C. 20549
FORM N-CSR
CERTIFIED SHAREHOLDER REPORT OF REGISTERED MANAGEMENT
INVESTMENT COMPANIES
Investment Company Act file number 811-05601
SEI Institutional International Trust
(Exact name of registrant as specified in charter)
SEI Investments
One Freedom Valley Drive
Oaks, PA 19456
(Address of principal executive offices) (Zip code)
CT Corporation
155 Federal Street
Boston, MA 02110
(Name and address of agent for service)
Registrant’s telephone number, including area code: 1-800-342-5734
Date of fiscal year end: September 30, 2014
Date of reporting period: September 30, 2014
| Item 1. | Reports to Stockholders. |

September 30, 2014
ANNUAL REPORT
SEI Institutional International Trust
† International Equity Fund
† Emerging Markets Equity Fund
† International Fixed Income Fund
† Emerging Markets Debt Fund

Letter to Shareholders | 1 | |||
| 3 | ||||
| 8 | ||||
| 55 | ||||
| 56 | ||||
| 57 | ||||
| 59 | ||||
| 60 | ||||
| 71 | ||||
| 72 | ||||
| 75 | ||||
Board of Trustees Considerations in Approving | 76 | |||
| 79 | ||||
The Trust files its complete schedule of portfolio holdings with the Securities and Exchange Commission for the first and third quarters of each fiscal year on Form N-Q within sixty days after the end of the period. The Trust’s Form N-Q is available on the Commission’s website at http://www.sec.gov, and may be reviewed and copied at the Commission’s Public Reference Room in Washington, DC. Information on the operation of the Public Reference Room may be obtained by calling 1-800-SEC-0330.
A description of the policies and procedures that the Trust uses to determine how to vote proxies relating to portfolio securities, as well as information relating to how a Fund voted proxies relating to portfolio securities during the most recent 12-month period ended June 30, is available (i) without charge, upon request, by calling 1-800-DIAL-SEI; and (ii) on the Commission’s website at http://www.sec.gov.
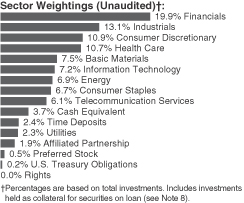
SEI INSTITUTIONAL INTERNATIONAL TRUST — SEPTEMBER 30, 2014 (Unaudited)
To Our Shareholders:
This annual report covers the year ended September 30, 2014. Most markets stumbled out of the gate in the fourth quarter of 2013 before rebounding strongly through the middle of 2014. However, fear and uncertainty returned in the third quarter, causing many asset classes to give back some or all of their gains by the end of September.
Geopolitical events
There were several important geopolitical developments during the Funds’ fiscal year. One of the most relevant occurred in Eastern Europe, where Russia’s annexation of the Crimean Peninsula and subsequent tensions with Ukraine had a negative impact on certain areas of the market. Worries about an outbreak of Ebola in Western Africa and the subsequent spread of the virus to Europe and the U.S. played a prominent role in news headlines from the summer of 2014 through the end of the Funds’ reporting period. At present, Ebola seems unlikely to have a significant impact on the global economy. However, there was an interesting correlation between Ebola-related headlines and market volatility during the third quarter of 2014 which, while quite possibly coincidental, might also reflect heightened anxiety among investors given the somewhat uncertain state of global economic policies and growth. There has also been severe unrest in certain areas of the Middle East; while conflicts in Iraq and Syria have taken a terrible human toll, they have not had a significant impact on global markets or the global economy. Several important national elections took place during the period, and others are scheduled to occur during the fourth quarter of 2014.
Economic and market performance
For the period, global economic growth was sustained but still frustratingly slow, and near-term growth estimates have been revised downward. Growth, inflation and interest rate expectations fluctuated quite a bit over the period, leading to higher volatility in several asset classes, as discussed below.
Encouraging signs were seen in Europe for most of the period. The U.K. remained on the solid economic trajectory it has enjoyed since the end of 2012, and the country has enjoyed notable labor-market improvements as a result. Layoffs and unemployment both declined nicely during the reporting period. Wage increases remained subdued, however. This should help keep a lid on inflation and allow the Bank of England (“BOE”) to take a measured approach to tightening monetary policy. Gilt yields rose toward the end of 2013 on rising optimism but gradually declined over the rest of the period on faltering expectations for both growth (especially in the euro area) and central bank-tightening (most notably in the U.K. and the U.S.). U.K. stocks were largely flat and exhibited increasing volatility toward the end of the period. In late 2013 and early 2014, the euro area’s economy finally appeared to be rebounding from the stubborn recession that began in 2011. Inflation remained quite tame despite the rebound — so tame, in fact, that concerns over the risk of deflation were reignited in recent months. Euro-area government bonds performed well during the period, with falling interest rates and narrower spreads between the yields on core and periphery issuers (such as Greece and Germany, respectively). Unfortunately, some worrying signs surfaced again toward the end of the Funds’ fiscal year, as Italy, France and some smaller national economies appeared to be at risk of reentering recession. Even Germany, the currency union’s stalwart in recent years, showed some signs of sputtering toward the end of the third quarter. While leaders of the European Central Bank (“ECB”) and International Monetary Fund have observed in recent months that the eurozone appears to be in need of further fiscal and/or monetary easing, the European Commission and Germany have thus far been resistant to such calls. The resulting uncertainty led to some spread widening in September, reflecting renewed risk aversion among investors. German government bonds were especially strong performers over the reporting period. European stocks performed well from October 2013 until July 2014, but from that point through the end of September, they gave up much of those gains.
In the U.S., the steady but still largely uninspiring economic growth of recent years was interrupted by a sharp acceleration in the fourth quarter of 2013, which stoked fears of tighter monetary policy from the Federal Reserve (“Fed”), followed by a sudden and unexpected contraction in the first quarter of 2014. The first-quarter decline raised concerns over the durability of the current economic expansion. However, a solid rebound in economic activity during the second quarter of 2014 indicated that the slowdown was largely caused by harsh winter conditions in certain regions of the country. Like the U.K., the U.S. finally began to see solid labor-market improvements during 2014. Layoffs continued to decline, and in
| SEI Institutional International Trust / Annual Report / September 30, 2014 | 1 |
September 2014, the U.S. unemployment rate fell below 6% for the first time since 2008. At the same time, wage gains — and, as a result, inflation expectations — remained fairly muted; thus, like the BOE, the Fed should be able to take a slow and measured approach to tightening monetary policy. That said, the Fed spent 2014 reducing its monthly bond purchases in order to wind down its quantitative-easing programs. And as labor-market and other economic data continued to improve, markets began to price in the beginning of Fed interest rate hikes. This, along with growing weakness in the eurozone and rising expectations that the ECB would be forced to ease policy and weaken the euro, helped put a strong bid under the dollar. The greenback appreciated sharply against most other currencies during the third quarter of 2014, an event which had negative effects on some global asset classes, including commodities and local-currency emerging-markets debt, for example.
In the Asia-Pacific region, Japan’s long-moribund economic growth showed signs of revival following implementation of the new prime minister’s economic policies in 2013. However, a sharp hike in the national consumption tax in April 2014 appeared to undermine the country’s momentum for the rest of the reporting period. Another hike in the tax, along with comprehensive economic reforms, are still under consideration. As a result, Japan’s economic performance could rely heavily on government-policy decisions in coming quarters and years. Like parts of the eurozone, China gave investors cause for concern over the reporting period. The government is attempting to rebalance the country’s economy by lessening its dependence on export and low-value added manufacturing activities in favor of domestic consumption. The government has also been taking a strong stand against corrupt business and financial practices. While these efforts should prove positive in the long term, they — along with rising overall debt levels within the country — added to the general uncertainty surrounding China’s economy over the past year. This uncertainty had a notable impact on commodity prices during the period. After falling during the last quarter of 2013, commodity prices (as measured by the Reuters/Jefferies CRB Index, for example) rose during the first quarter of 2014 before falling sharply between June and the end of September on slower growth in China, recession fears in the eurozone, and a sharply stronger U.S. dollar. Commodity-reliant economies such as Australia endured a bit of a roller coaster ride toward the end of the period as a result.
Outside China, results were mixed in other emerging markets (“EM”). After selling off in the fourth quarter of 2013, EM equities rebounded strongly through August 2014 before a sharp September decline gave back most of those gains. In EM debt, external-currency issues (with the notable exception of Venezuela) outperformed local currency thanks to the U.S. dollar’s strength against many EM currencies. Brazil, which successfully hosted the 2014 World Cup, saw its equity markets struggle while its local-currency debt bucked that asset class’ overall trend by performing well; Mexico’s equity and local-currency debt experienced similar dynamics. Argentina was a notable outperformer in both emerging-market debt and equities, as it worked toward resolving its longstanding debt issues. Russian and Ukrainian debt and Russian equities were notable underperformers due to their deepening conflict and growing fears of recession in both countries. (Sanctions against Russia by the U.S. and Europe, and the threat of Russian retaliation in energy markets once winter arrives, added to the uncertainty surrounding Eastern Europe.) Elsewhere, markets responded positively to the elections of pro-business and reform-minded candidates in India and Indonesia.
Our view
We believe the global economic recovery remains a work in progress. Economic expansions in North America and the U.K. seem to be well established, and we expect the Fed and the BOE to take very cautious approaches toward policy normalization as long as inflation pressures remain subdued. On behalf of SEI Investments, I want to thank you for your confidence in the SEI Institutional International Trust. We are dedicated to helping our investors reach their long-term objectives, and we look forward to serving your investment needs in the future.
Sincerely,

William Lawrence, CFA
Managing Director, Portfolio Management Team
| 2 | SEI Institutional International Trust / Annual Report / September 30, 2014 |
MANAGEMENT’S DISCUSSION AND ANALYSIS OF FUND PERFORMANCE
SEI INSTITUTIONAL INTERNATIONAL TRUST — SEPTEMBER 30, 2014 (Unaudited)
International Equity Fund
I. Objective
The International Equity Fund (the “Fund”) seeks to provide long-term capital appreciation.
II. Multi-Manager Approach Statement
The Fund uses a multi-manager approach, relying on a number of sub-advisers with differing investment approaches to manage portions of the Fund’s portfolio, under the general supervision of SEI Investments Management Corporation (“SIMC”). The Fund utilized the following sub-advisers as of September 30, 2014: Acadian Asset Management LLC, Causeway Capital Management LLC, Henderson Global Investors (North America) Inc., INTECH Investment Management LLC, Neuberger Berman Management LLC, Schroder Investment Management North America, Inc. and Tradewinds Global Investors LLC. For the year ended September 30, 2014, Henderson Global Investors (North America) Inc. was added to and del Rey Global Investors LLC was terminated from the Fund.
III. Return vs. Benchmark
For the year ended September 30, 2014, the Fund’s Class A shares underperformed the MSCI EAFE Index (the “Index”), returning 3.66% versus the Index return of 4.25%.
IV. Fund Attribution
At the sector level, Fund underperformance came mainly from a combination of stock selection and sector allocation. Selection in energy was weak, as the Fund was underweight a number of large integrated oil firms that performed especially well during the period. Overweight exposure to the weak performing industrials sector also weighed on returns. In contrast, selection in the consumer discretionary sector contributed positively to performance, mainly through holdings in the auto industry.
Regionally, the Fund’s positioning was beneficial, but weak stock selection in Europe detracted. In terms of portfolio positioning, there were two significant contributors — underweights to Australia and to Japan. Australia has been going through a roller coaster ride of performance swings, driven in large part by its economy’s dependence on natural-resource prices; with the pressure on commodity prices, Australia was outshined by many of its developed
neighbors. In Japan, the implementation of “Abenomics” has caused some stumbles, in large part due to the implementation of a national sales tax increase. However, going forward, we believe a weaker yen may benefit the country’s exporters. Stock selection in Europe, particularly in French industrials, was a weak point. Although performance in emerging markets strengthened dramatically during the period until September’s selloff, the Fund’s opportunistic positioning had a neutral impact.
At the manager level, Acadian Asset Management LLC and Causeway Capital Management LLC performed best against the benchmark, followed by INTECH Investment Management LLC, Schroder Investment Management North America, Inc. and Tradewinds Global Investors LLC. Henderson Global Investors Investors (North America) Inc. and Neuberger Berman Management LLC underperformed.
International Equity Fund:
AVERAGE ANNUAL TOTAL RETURN1
| One Year Return | Annualized 3 Year Return | Annualized 5 Year Return | Annualized 10 Year Return | Annualized Inception to Date | ||||||||||||||||
| Class A | 3.66% | 12.75% | 6.11% | 3.65% | 3.53% | |||||||||||||||
| Class I | 3.33% | 12.41% | 5.81% | 3.38% | 3.28% | |||||||||||||||
| MSCI EAFE Index | 4.25% | 13.65% | 6.56% | 6.32% | 4.60% | |||||||||||||||
Comparison of Change in the Value of a $100,000 Investment in the International Equity Fund, Class A and Class I, versus the MSCI EAFE Index
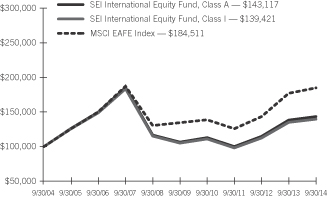
| 1 | For the year ended September 30, 2014. Past performance is no indication of future performance. Class I Shares were offered beginning on January 4, 2002. Class A Shares were offered beginning December 20, 1989. The performance of Class I Shares may be lower than the performance of Class A Shares because of different distribution fees paid by Class I shareholders. Returns shown do not reflect the deduction of taxes that a shareholder would pay on fund distributions or the redemption of fund shares. The returns for certain periods reflect fee waivers and/or reimbursements in effect for that period; absent fee waivers and reimbursements, performance would have been lower. |
| SEI Institutional International Trust / Annual Report / September 30, 2014 | 3 |
MANAGEMENT’S DISCUSSION AND ANALYSIS OF FUND PERFORMANCE
SEI INSTITUTIONAL INTERNATIONAL TRUST — SEPTEMBER 30, 2014 (Unaudited)
Emerging Markets Equity Fund
I. Objective
The Emerging Markets Equity Fund (the “Fund”) seeks capital appreciation.
II. Multi-Manager Approach Statement
The Fund uses a multi-manager approach, relying on a number of sub-advisers with differing investment approaches to manage portions of the Fund’s portfolio, under the general supervision of SEI Investments Management Corp. (“SIMC”). The Fund utilized the following sub-advisers as of September 30, 2014: Delaware Investment Fund Advisers, JO Hambro Capital Management Limited, Kleinwort Benson Investors International Ltd., Lazard Asset Management LLC, Neuberger Berman Management LLC and PanAgora Asset Management, Inc. For the year ended September 30, 2014, no manager changes were made.
III. Return vs. Benchmark
For the year ended September 30, 2014, the Fund’s Class A Shares underperformed the MSCI Emerging Markets Index (Gross) (the “Index”), returning 2.68% versus the Index return of 4.66%.
IV. Fund Attribution
During the period, the top-performing sector within emerging markets was health care, and the Fund benefitted from both an overweight to and strong stock selection in this sector. In contrast, stock selection was challenged in information technology and industrials (particularly in the software and transportation industries, respectively).
As mentioned in the enclosed shareholder letter, markets responded positively to the election of business-friendly candidates in certain countries. India was a standout performer for this reason, as strong investor sentiment followed elections of new leadership. The Fund benefitted from an overweight to the country as well as strong stock selection, particularly in the financials and health care sectors. The Fund’s holdings in Russia stood in stark contrast to India, as Russia’s equity market was among the weakest-performing due in large part to the events relating to Crimea and Ukraine that were noted in the shareholder letter. The Fund was marginally overweight to Russia over the course of the period, and holdings in Russian industrials,
financials and energy stocks detracted the most from results. The Fund’s holdings in Brazilian equities which, as noted in the shareholder letter, lagged, also weighed on results; stock selection in the industrial and financial sectors was particularly weak.
At the manager level, JO Hambro Capital Management Limited, Delaware Investment Fund Advisers and Neuberger Berman Management LLC were the best-performing sub-advisers. PanAgora Asset Management, Inc. also slightly outperformed the benchmark. Kleinwort Benson Investors International Ltd. lagged the benchmark slightly, while Lazard Asset Management LLC underperformed by a wider margin.
Emerging Markets Equity Fund:
AVERAGE ANNUAL TOTAL RETURN1
| One Year Return | Annualized 3 Year Return | Annualized 5 Year Return | Annualized 10 Year Return | Annualized Inception to Date | ||||||||||||||||
| Class A | 2.68% | 6.60% | 2.78% | 8.32% | 4.79% | |||||||||||||||
MSCI Emerging Markets Index (Gross) | 4.66% | 7.56% | 4.76% | 11.03% | 6.65% | |||||||||||||||
Comparison of Change in the Value of a $100,000 Investment in the
Emerging Markets Equity Fund, Class A, versus the MSCI Emerging Markets Index (Gross)
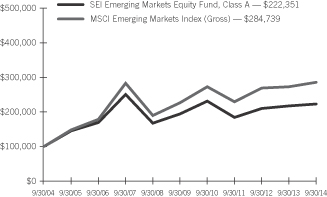
| 1 | For the year ended September 30, 2014. Past performance is no indication of future performance. Class A Shares were offered beginning January 17, 1995. Returns shown do not reflect the deduction of taxes that a shareholder would pay on fund distributions or the redemption of fund shares. The returns for certain periods reflect fee waivers and/or reimbursements in effect for that period; absent fee waivers and reimbursements, performance would have been lower. |
| 4 | SEI Institutional International Trust / Annual Report / September 30, 2014 |
MANAGEMENT’S DISCUSSION AND ANALYSIS OF FUND PERFORMANCE
SEI INSTITUTIONAL INTERNATIONAL TRUST — SEPTEMBER 30, 2014 (Unaudited)
International Fixed Income Fund
I. Objective
The SIT International Fixed Income Fund (the “Fund”) seeks to provide capital appreciation and current income.
II. Multi-Manager Approach Statement
The Fund uses a multi-manager approach, relying on a number of sub-advisers with differing investment approaches to manage portions of the Fund’s portfolio, under the general supervision of SEI Investments Management Corporation (“SIMC”). The Fund utilized the following sub-advisers as of September 30, 2014: AllianceBernstein L.P., FIL Investment Advisors and Wellington Management Company, LLP. For the year ended September 30, 2014, no manager changes were made.
III. Return vs. Benchmark
For the year ended September 30, 2014, the Fund’s Class A shares underperformed the Barclays Global Aggregate ex-US Index, Hedged (the “Index”) returning 5.96% versus a return of 6.47% for the Index.
IV. Fund Attribution
As noted in the enclosed shareholder letter, more interest rate-sensitive areas of the fixed-income market performed well over the period, as longer-term rates declined. As a result, the Fund’s shorter-than-benchmark duration position detracted. (Duration measures the sensitivity of a fixed-income security’s price to changes in interest rates.) As also noted in the shareholder letter, corporate and securitized debt outperformed most government sectiors. Within the Fund, the main contributors to outperformance were overweights to the corporate bond sector (especially financial issuers) and securitized debt and underweights to government-related sectors. Security selection within the corporate and securitized sub-sectors also helped. Country positioning within the government bond sector significantly detracted from benchmark-relative performance. This was especially true for a long-duration position in the U.S. and short-duration position in Germany during the third quarter of 2013 when longer-dated German government bonds outperformed. Underweights to the peripheral countries of the euro-currency area during most of the Fund’s fiscal year detracted; as noted in the shareholder letter, all periphery government bonds rallied over most of the period.
Manager performance was mixed. Wellington Management Company and FIL Investment Advisors detracted, while AllianceBernstein outperformed.
U.S. Treasury futures and interest rate swaps were used to efficiently assist in managing the Fund’s duration and yield-curve exposures. They did not have a material impact on Fund performance. Currency forwards were used to efficiently assist in managing the Fund’s foreign-currency risk. This activity had a material and positive impact on Fund performance, as currency forwards are the primary financial instrument used by the Fund to hedge against movements in foreign currencies, and foreign currencies declined in value relative to the U.S. dollar in the last two months of the Fund’s fiscal year.
International Fixed Income Fund:
AVERAGE ANNUAL TOTAL RETURN1
| One Year Return | Annualized 3 Year Return | Annualized 5 Year Return | Annualized 10 Year Return | Annualized Inception to Date | ||||||||||||||||
| Class A | 5.96% | 4.33% | 4.24% | 3.04% | 4.51% | |||||||||||||||
| Barclays Global Aggregate ex-US Index, Hedged | 6.47% | 4.78% | 4.23% | 4.61% | 5.98% | |||||||||||||||
Comparison of Change in the Value of a $100,000 Investment in the International Fixed Income Fund, Class A, versus the Barclays Global Aggregate ex-US Index, Hedged
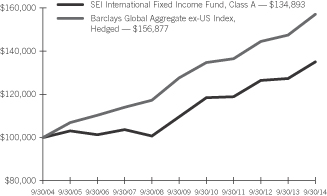
| 1 | For the year ended September 30, 2014. Past performance is no indication of future performance. Class A Shares were offered beginning September 1, 1993. Returns shown do not reflect the deduction of taxes that a shareholder would pay on fund distributions or the redemption of fund shares. The returns for certain periods reflect fee waivers and/or reimbursements in effect for that period; absent fee waivers and reimbursements, performance would have been lower. |
| SEI Institutional International Trust / Annual Report / September 30, 2014 | 5 |
MANAGEMENT’S DISCUSSION AND ANALYSIS OF FUND PERFORMANCE
SEI INSTITUTIONAL INTERNATIONAL TRUST — SEPTEMBER 30, 2014 (Unaudited)
Emerging Markets Debt Fund
I. Objective
The Emerging Markets Debt Fund (the “Fund”) seeks to maximize total return.
II. Multi-Manager Approach
The Fund uses a multi-manager approach, relying on a number of sub-advisers with differing investment approaches to manage portions of the Fund’s portfolio, under the general supervision of SEI Investments Management Corp. (“SIMC”). The Fund utilized the following sub-advisers as of September 30, 2014: Investec Asset Management Ltd., Neuberger Berman Management LLC and Stone Harbor Investment Partners LP. In December 2013, Ashmore Investment Management Limited was removed and Neuberger Berman Management LLC was added to the Fund.
III. Return vs. Benchmark
For the year ended September 30, 2014, the Fund’s Class A shares underperformed a Hybrid of 50% J.P. Morgan EMBI Global Diversified Index and 50% J.P. Morgan GBI-EM Global Diversified Index (the “Index”), returning 1.90% versus the Index return of 3.97%.
IV. Fund Attribution
For the year ended September 30, 2014, emerging-markets debt (“EMD”), as proxied by a blend of 50% J.P. Morgan EMBI Global Diversified Index and 50% J.P. Morgan GBI-EM Global Diversified Index, returned 3.97%, which almost exactly offset the 3.87% loss experienced over the prior 12 months (U.S. dollar returns). The market was weak from the last three months of 2013 until January 2014 due to a combination of strong U.S. economic data (which stoked fears of rising interest rates and tighter U.S. Federal Reserve (Fed) policy) and investor outflows from EMD funds. As investors gained more clarity on the pace and impact of the Fed’s removal of monetary stimulus in the U.S., EMD embarked on a five-month recovery that came to a halt in July amid escalation of the conflict between Russia and Ukraine. The market posted negative returns over the final three months of the reporting period as the U.S. and EU imposed sanctions on Russia in light of its conflict with Ukraine, global growth expectations were lowered, and a full calendar of political elections in several emerging-market countries approached.
External-currency EMD, as represented by the J.P. Morgan EMBI Global Diversified Index, posted a strong 10% return. This performance can be attributed to a 42 basis point decline in spreads between EMD and U.S. Treasury yields (from 341 basis points at the start of the reporting period to 299 basis points at the end) as well as a 12 basis point decline in the U.S. 10-year Treasury yields from 2.61% to 2.49%. (Bond yields and prices typically move inversely.) The external-debt benchmark has a relatively long interest-rate duration (a high sensitivity to interest-rate changes), and at times, this can have a large impact on returns. Local-currency debt, as represented by the J.P. Morgan GBI-EM Global Diversified Index, dramatically underperformed external debt, posting a -1.54% return. The Fund’s overweight to local debt throughout the course of the period was one of the primary drivers of underperformance against the blended benchmark.
Within external debt, Venezuela was the only country to post a negative return as it continues to struggle with poor growth, high inflation, goods shortages, turnover of key government officials and lower oil prices. The Fund’s overweight position in Venezuela — justified, in our view, by the country’s low debt load, the government’s commitment to servicing debt, and high bond yields — was the largest detractor from relative performance. The second largest detractor in external debt was an overweight to Russia, as that country’s bonds underperformed the Index by approximately 9%. Russia’s conflict with Ukraine has resulted in a sharp economic slowdown, wider credit spreads and currency depreciation. The Fund maintained its Russian external-debt holdings on the basis of the country’s significant dollar reserves and modest external debt load. Offsetting the negative impacts of Russia and Venezuela was the positive impact of being overweight Argentina, the best performer in the Index. During the early part of the Fund’s fiscal year, the country’s bonds rallied when the government took steps to potentially repay old debt, improve the accuracy of economic statistics and come to a settlement with holdouts from its 2001 bond default. Other positive contributors included an underweight to Ukraine, whose economy has been decimated by the conflict with Russia, and an overweight to Indonesia where bonds rose solidly following a favorable presidential-election outcome.
| 6 | SEI Institutional International Trust / Annual Report / September 30, 2014 |
Emerging-markets (“EM”) currencies broadly depreciated versus the U.S. dollar, and this accounted for most of the local-currency market’s underperformance versus external debt (much of the external-EMD market is denominated in dollars). As was the case in external debt, Russia was a poor performer, and the ruble is now hovering near all-time lows. The Chilean peso also depreciated as copper prices were pulled down in the broader commodities selloff. (Copper is a critically important resource and export for the Chilean economy.) The Fund had a neutral position in the Russian ruble but benefitted from an underweight to the Chilean peso. An overweight position in Brazilian local-currency bonds was a positive contributor as the currency rallied and local bonds rose leading up to the World Cup and October’s 2014 presidential elections. Exposure to Mexican local bonds, one of the market’s best performers, added to performance following that country’s decision to cut interest rates in order to stimulate growth.
Off-benchmark positioning in EM corporate debt contributed positively to returns, as those securities performed well. (The Fund’s blended benchmark includes only sovereign and quasi-sovereign debt; quasi-sovereigns are issuers where the national government is the majority owner.) Exposure ranged from 5% to 10% during the period, with positions concentrated in high-yielding Brazilian, Colombian, Chinese and Mexican credits.
Sub-adviser performance was mixed over the reporting period. Stone Harbor Investment Partners LP underperformed, hurt mainly by its overweights to Russia and Venezuela. Neuberger Berman Management LLC performed in line with the benchmark, while Investec Asset Management Ltd. slightly outperformed.
Currency forwards and swap contracts were used by the Fund as a way to either hedge particular positions or gain exposure to additional areas of the market. Interest-rate futures were used primarily for managing interest-rate risk. Foreign-currency hedges on local-currency bonds were generally positive contributors to performance, particularly against European currencies that suffered as a result of European economic weakness and fallout from the conflict between Russia and Ukraine.
Emerging Markets Debt Fund
AVERAGE ANNUAL TOTAL RETURN1
| One Year Return | Annualized 3 Year Return | Annualized 5 Year Return | Annualized 10 Year Return | Annualized Inception to Date | ||||||||||||||||
| Class A | 1.90% | 4.61% | 6.19% | 7.98% | 9.25% | |||||||||||||||
| J.P. Morgan EMBI Global Diversified Index | 9.67% | 7.95% | 8.03% | 8.32% | 9.15% | |||||||||||||||
| J.P. Morgan GBI-EM Global Diversified Index | (1.54)% | 2.21% | 4.43% | 8.80% | N/A | |||||||||||||||
50/50 Hybrid consisting of the J.P. Morgan EMBI Global Diversified Index and the J.P. Morgan GBI-EM Global Diversified Index | 3.97% | 5.11% | 6.29% | 8.64% | N/A | |||||||||||||||
Comparison of Change in the Value of a $100,000 Investment in the Emerging Markets Debt Fund, Class A, versus a 50/50 Hybrid of the Following Indexes: the J.P. Morgan EMBI Global Diversified Index, and the J.P. Morgan GBI-EM Global Diversified Index
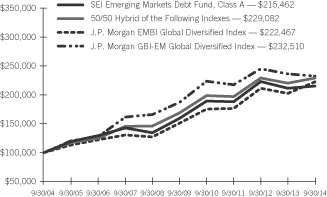
| 1 | For the year ended September 30, 2014. Past performance is no indication of future performance. Class A Shares were offered beginning June 26, 1997. Returns shown do not reflect the deduction of taxes that a shareholder would pay on fund distributions or the redemption of fund shares. The returns for certain periods reflect fee waivers and/or reimbursements in effect for that period; absent fee waivers and reimbursements, performance would have been lower. |
| N/A — Not Available. |
| SEI Institutional International Trust / Annual Report / September 30, 2014 | 7 |
International Equity Fund
September 30, 2014
| Description | Shares | Market Value ($ Thousands) | ||||||
COMMON STOCK — 92.7% | ||||||||
Australia — 1.7% | ||||||||
Amcor | 48,567 | $ | 481 | |||||
APA Group | 59,544 | 388 | ||||||
Australia & New Zealand Banking Group | 189,238 | 5,120 | ||||||
Bank of Queensland | 68,141 | 694 | ||||||
BC Iron (A) | 117,343 | 166 | ||||||
Brambles | 1,094,277 | 9,116 | ||||||
Caltex Australia | 24,820 | 608 | ||||||
Centamin | 126,960 | 126 | ||||||
Challenger | 88,503 | 551 | ||||||
Commonwealth Bank of Australia | 174,848 | 11,519 | ||||||
CSL | 75,814 | 4,921 | ||||||
CSR | 633,976 | 1,847 | ||||||
Downer EDI | 168,919 | 652 | ||||||
Flight Centre Travel Group | 8,600 | 322 | ||||||
Lend Lease | 127,221 | 1,596 | ||||||
Macquarie Group | 49,551 | 2,497 | ||||||
Mount Gibson Iron | 339,726 | 162 | ||||||
Ramsay Health Care | 13,363 | 586 | ||||||
REA Group | 7,422 | 281 | ||||||
Seek | 15,556 | 221 | ||||||
Sonic Healthcare | 12,138 | 186 | ||||||
Suncorp Group | 5,264 | 65 | ||||||
Telstra | 265,264 | 1,230 | ||||||
Western Areas | 30,257 | 114 | ||||||
Westpac Banking | 24,557 | 691 | ||||||
Woolworths | 47,826 | 1,433 | ||||||
|
| |||||||
| 45,573 | ||||||||
|
| |||||||
Austria — 0.3% | ||||||||
Andritz | 115,245 | 6,147 | ||||||
OMV | 61,847 | 2,082 | ||||||
Porr Ag | 908 | 58 | ||||||
Telekom Austria | 9,480 | 85 | ||||||
Voestalpine | 3,157 | 125 | ||||||
|
| |||||||
| 8,497 | ||||||||
|
| |||||||
| Description | Shares | Market Value ($ Thousands) | ||||||
Belgium — 1.8% | ||||||||
Ageas | 264,488 | $ | 8,782 | |||||
AGFA-Gevaert* | 70,231 | 185 | ||||||
Anheuser-Busch InBev | 22,206 | 2,472 | ||||||
Belgacom (A) | 183,879 | 6,402 | ||||||
bpost | 21,272 | 508 | ||||||
Colruyt (A) | 94,781 | 4,177 | ||||||
Delhaize Group | 13,495 | 939 | ||||||
Groupe Bruxelles Lambert | 49,988 | 4,582 | ||||||
KBC Groep | 272,639 | 14,522 | ||||||
Telenet Group Holding* | 8,172 | 469 | ||||||
Tessenderlo Chemie | 11,552 | 319 | ||||||
UCB | 57,764 | 5,245 | ||||||
|
| |||||||
| 48,602 | ||||||||
|
| |||||||
Brazil — 0.3% | ||||||||
Centrais Eletricas Brasileiras | 355,800 | 954 | ||||||
Centrais Eletricas Brasileiras ADR (A) | 1,065,969 | 2,878 | ||||||
Cia Energetica de Minas Gerais ADR (A) | 393,389 | 2,451 | ||||||
Cia Paranaense de Energia ADR (A) | 79,993 | 1,094 | ||||||
Light | 20,500 | 176 | ||||||
Marfrig Global Foods* | 19,300 | 53 | ||||||
|
| |||||||
| 7,606 | ||||||||
|
| |||||||
Canada — 3.7% | ||||||||
Agrium | 136,827 | 12,178 | ||||||
Alimentation Couche-Tard, Cl B | 253,000 | 8,107 | ||||||
Bank of Nova Scotia | 118,371 | 7,337 | ||||||
Bankers Petroleum* | 18,400 | 89 | ||||||
Barrick Gold | 487,984 | 7,154 | ||||||
Cameco | 261,896 | 4,625 | ||||||
Canadian Imperial Bank of Commerce (A) | 20,600 | 1,854 | ||||||
Cenovus Energy | 148,822 | 4,012 | ||||||
Cogeco Cable | 27,200 | 1,393 | ||||||
EnerCare | 11,200 | 138 | ||||||
Enerplus (A) | 16,800 | 320 | ||||||
Entertainment One | 45,396 | 233 | ||||||
Finning International | 10,900 | 308 | ||||||
Gildan Activewear | 127,137 | 6,970 | ||||||
Imperial Oil | 116,900 | 5,535 | ||||||
Jean Coutu Group PJC, Cl A | 54,900 | 1,153 | ||||||
Kinross Gold* | 2,024,033 | 6,679 | ||||||
Laurentian Bank of Canada | 7,100 | 308 | ||||||
Linamar | 21,100 | 1,091 | ||||||
Magellan Aerospace | 5,200 | 54 | ||||||
Magna International, Cl A | 48,000 | 4,566 | ||||||
OceanaGold* | 21,400 | 44 | ||||||
Open Text | 72,500 | 4,019 | ||||||
Quebecor, Cl B | 20,000 | 504 | ||||||
Shaw Communications, Cl B (A) | 19,400 | 476 | ||||||
ShawCor | 130,000 | 6,572 | ||||||
| 8 | SEI Institutional International Trust / Annual Report / September 30, 2014 |
| Description | Shares | Market Value ($ Thousands) | ||||||
Suncor Energy | 147,600 | $ | 5,353 | |||||
Talisman Energy | 615,306 | 5,322 | ||||||
Toronto-Dominion Bank | 63,567 | 3,144 | ||||||
Transcontinental, Cl A | 17,100 | 224 | ||||||
|
| |||||||
| 99,762 | ||||||||
|
| |||||||
China — 0.4% | ||||||||
Alibaba Group Holding ADR* | 21,900 | 1,946 | ||||||
PICC Property & Casualty | 4,336,900 | 7,685 | ||||||
|
| |||||||
| 9,631 | ||||||||
|
| |||||||
Denmark — 1.2% | ||||||||
AP Moeller - Maersk, Cl A | 487 | 1,126 | ||||||
AP Moeller - Maersk, Cl B | 2,628 | 6,244 | ||||||
Coloplast, Cl B | 12,609 | 1,057 | ||||||
Danske Bank | 79,095 | 2,150 | ||||||
DSV | 26,069 | 734 | ||||||
H Lundbeck | 4,986 | 111 | ||||||
Jyske Bank* | 130,001 | 7,027 | ||||||
Novo Nordisk, Cl B | 147,559 | 7,062 | ||||||
Pandora | 39,058 | 3,063 | ||||||
Rockwool International, Cl B | 597 | 86 | ||||||
TDC | 144,918 | 1,101 | ||||||
Vestas Wind Systems* | 69,495 | 2,717 | ||||||
|
| |||||||
| 32,478 | ||||||||
|
| |||||||
Finland — 0.6% | ||||||||
Elisa, Cl A | 19,921 | 529 | ||||||
Fortum | 18,038 | 440 | ||||||
Metso | 8,230 | 293 | ||||||
Neste Oil | 10,395 | 214 | ||||||
Nokia | 672,641 | 5,740 | ||||||
Orion, Cl B | 46,736 | 1,830 | ||||||
Sampo, Cl A | 63,784 | 3,094 | ||||||
Stora Enso, Cl R | 326,874 | 2,728 | ||||||
Tieto | 15,404 | 389 | ||||||
UPM-Kymmene | 109,024 | 1,558 | ||||||
|
| |||||||
| 16,815 | ||||||||
|
| |||||||
France — 10.9% | ||||||||
Accor | 14,933 | 662 | ||||||
Aeroports de Paris | 4,954 | 593 | ||||||
Alcatel-Lucent* | 2,016,643 | 6,259 | ||||||
Arkema | 61,222 | 4,108 | ||||||
AtoS | 21,377 | 1,549 | ||||||
AXA | 246,451 | 6,074 | ||||||
BNP Paribas | 365,386 | 24,242 | ||||||
Boiron | 1,900 | 159 | ||||||
Cap Gemini | 6,768 | 486 | ||||||
Carrefour | 320,879 | 9,915 | ||||||
Cie de St.-Gobain | 24,217 | 1,108 | ||||||
Cie Generale des Etablissements-Michelin, Cl B | 73,484 | 6,932 | ||||||
| Description | Shares | Market Value ($ Thousands) | ||||||
CNP Assurances (A) | 20,896 | $ | 394 | |||||
Credit Agricole | 145,469 | 2,195 | ||||||
Dassault Systemes (A) | 7,092 | 456 | ||||||
Electricite de France | 241,203 | 7,913 | ||||||
Essilor International | 46,968 | 5,158 | ||||||
Etablissements Maurel et Prom | 15,912 | 224 | ||||||
Eurazeo | 5,874 | 423 | ||||||
Eutelsat Communications | 27,227 | 879 | ||||||
GDF Suez | 413,055 | 10,363 | ||||||
Groupe Eurotunnel | 33,212 | 406 | ||||||
Groupe Fnac* | 1,286 | 48 | ||||||
Iliad | 2,853 | 604 | ||||||
Imerys (A) | 498 | 37 | ||||||
Ipsen | 11,571 | 569 | ||||||
JC Decaux (A) | 12,538 | 396 | ||||||
Kering | 14,953 | 3,016 | ||||||
Lagardere | 56,694 | 1,518 | ||||||
Legrand (A) | 222,542 | 11,581 | ||||||
Metropole Television (A) | 10,297 | 166 | ||||||
Natixis | 133,741 | 920 | ||||||
Nexity | 7,174 | 265 | ||||||
Orange | 133,400 | 2,006 | ||||||
Pernod Ricard | 48,285 | 5,468 | ||||||
Publicis Groupe* | 115,174 | 7,910 | ||||||
Rallye | 18,165 | 794 | ||||||
Rexel | 781,726 | 14,590 | ||||||
Safran | 119,463 | 7,754 | ||||||
Sanofi | 404,105 | 45,719 | ||||||
Schneider Electric | 281,567 | 21,626 | ||||||
SCOR | 26,866 | 839 | ||||||
SES (A) | 53,554 | 1,852 | ||||||
Societe Generale | 9,237 | 472 | ||||||
Sodexo | 107,447 | 10,517 | ||||||
Suez Environnement | 261,133 | 4,419 | ||||||
Technicolor* | 124,177 | 811 | ||||||
Technip (A) | 173,877 | 14,631 | ||||||
Teleperformance | 4,248 | 263 | ||||||
Thales | 123,198 | 6,564 | ||||||
Total | 288,561 | 18,755 | ||||||
Valeo | 34,262 | 3,813 | ||||||
Vallourec | 188,088 | 8,651 | ||||||
Veolia Environnement* | 48,555 | 857 | ||||||
Vetoquinol | 1,345 | 61 | ||||||
Vinci | 50,598 | 2,941 | ||||||
Vivendi | 9,907 | 239 | ||||||
Wendel | 5,451 | 618 | ||||||
Zodiac Aerospace | 29,079 | 928 | ||||||
|
| |||||||
| 292,716 | ||||||||
|
| |||||||
Germany — 6.9% | ||||||||
Adidas | 28,728 | 2,150 | ||||||
Bayer | 155,512 | 21,786 | ||||||
Bayerische Motoren Werke | 25,520 | 2,741 | ||||||
Borussia Dortmund GmbH & KGaA | 22,765 | 128 | ||||||
| SEI Institutional International Trust / Annual Report / September 30, 2014 | 9 |
SCHEDULE OF INVESTMENTS
International Equity Fund (Continued)
September 30, 2014
| Description | Shares | Market Value ($ Thousands) | ||||||
Brenntag | 151,515 | $ | 7,447 | |||||
Commerzbank* | 155,131 | 2,320 | ||||||
Continental | 94,749 | 18,031 | ||||||
Daimler | 152,613 | 11,708 | ||||||
Deutsche Annington Immobilien | 15,181 | 441 | ||||||
Deutsche Boerse | 120,924 | 8,147 | ||||||
Deutsche Lufthansa | 178,440 | 2,819 | ||||||
Deutsche Post | 142,980 | 4,586 | ||||||
Deutsche Telekom | 107,199 | 1,625 | ||||||
Deutsche Wohnen | 65,828 | 1,407 | ||||||
Duerr | 7,405 | 541 | ||||||
E.ON | 205,212 | 3,758 | ||||||
Fresenius | 18,120 | 897 | ||||||
GEA Group | 87,291 | 3,809 | ||||||
Gerresheimer | 20,399 | 1,325 | ||||||
Grammer | 6,818 | 264 | ||||||
HeidelbergCement | 53,540 | 3,539 | ||||||
Henkel | 18,922 | 1,769 | ||||||
Hochtief | 51,963 | 3,578 | ||||||
Hugo Boss | 5,356 | 670 | ||||||
Indus Holding | 2,704 | 131 | ||||||
Infineon Technologies | 224,826 | 2,327 | ||||||
Kabel Deutschland Holding | 4,327 | 588 | ||||||
KION Group | 2,542 | 94 | ||||||
Krones | 1,165 | 101 | ||||||
KUKA | 6,300 | 382 | ||||||
Linde | 89,773 | 17,255 | ||||||
MAN | 1,530 | 172 | ||||||
Merck | 51,484 | 4,750 | ||||||
Muenchener Rueckversicherungs | 24,460 | 4,837 | ||||||
Nordex* | 47,206 | 871 | ||||||
OSRAM Licht* | 28,111 | 1,047 | ||||||
Rhoen Klinikum | 32,981 | 1,001 | ||||||
RTL Group | 7,154 | 614 | ||||||
RWE | 185,000 | 7,211 | ||||||
SAP | 159,925 | 11,536 | ||||||
SAP ADR | 79,100 | 5,708 | ||||||
Siemens | 122,394 | 14,591 | ||||||
Suedzucker (A) | 40,762 | 641 | ||||||
Talanx | 2,562 | 85 | ||||||
ThyssenKrupp | 91,504 | 2,401 | ||||||
TUI | 156,224 | 2,338 | ||||||
United Internet | 19,038 | 810 | ||||||
Wacker Neuson | 2,833 | 54 | ||||||
|
| |||||||
| 185,031 | ||||||||
|
| |||||||
Greece — 0.1% | ||||||||
Alpha Bank AE* | 3,045,494 | 2,362 | ||||||
|
| |||||||
Guernsey — 0.0% | ||||||||
Friends Life Group | 69,569 | 347 | ||||||
|
| |||||||
Hong Kong — 2.1% | ||||||||
AIA Group | 2,237,200 | 11,568 | ||||||
Chaoda Modern Agriculture* (B) (C) | 2,440,000 | — | ||||||
| Description | Shares | Market Value ($ Thousands) | ||||||
Cheung Kong Holdings | 124,000 | $ | 2,042 | |||||
China Merchants Holdings International | 1,300,000 | 4,018 | ||||||
China Mobile | 1,022,240 | 11,815 | ||||||
CNOOC | 2,751,000 | 4,719 | ||||||
Digital China Holdings | 4,431,000 | 3,966 | ||||||
Galaxy Entertainment Group | 139,000 | 807 | ||||||
Hongkong Land Holdings | 412,000 | 2,802 | ||||||
Hutchison Whampoa | 76,500 | 926 | ||||||
Jardine Matheson Holdings | 97,442 | 5,808 | ||||||
Jardine Strategic Holdings | 121,110 | 4,221 | ||||||
Link (D) | 506,000 | 2,916 | ||||||
Sands China | 67,200 | 350 | ||||||
|
| |||||||
| 55,958 | ||||||||
|
| |||||||
India — 0.3% | ||||||||
Idea Cellular | 1,565,645 | 4,211 | ||||||
Tata Motors ADR | 63,880 | 2,792 | ||||||
|
| |||||||
| 7,003 | ||||||||
|
| |||||||
Indonesia — 0.1% | ||||||||
APERAM* (A) | 77,101 | 2,407 | ||||||
|
| |||||||
Ireland — 0.2% | ||||||||
Bank of Ireland* | 568,744 | 223 | ||||||
ICON* | 22,474 | 1,286 | ||||||
Kerry Group, Cl A | 28,826 | 2,033 | ||||||
Ryanair Holdings ADR* | 33,800 | 1,907 | ||||||
|
| |||||||
| 5,449 | ||||||||
|
| |||||||
Israel — 1.8% | ||||||||
Bank Hapoalim | 153,463 | 865 | ||||||
Bezeq Israeli Telecommunication | 5,270,279 | 9,099 | ||||||
Check Point Software Technologies* | 231,156 | 16,005 | ||||||
NICE Systems | 4,227 | 171 | ||||||
Teva Pharmaceutical Industries | 55,183 | 2,976 | ||||||
Teva Pharmaceutical Industries ADR | 371,212 | 19,953 | ||||||
|
| |||||||
| 49,069 | ||||||||
|
| |||||||
Italy — 2.3% | ||||||||
Ascopiave | 56,391 | 128 | ||||||
Assicurazioni Generali | 178 | 4 | ||||||
Atlantia | 60,770 | 1,501 | ||||||
Azimut Holding | 217,075 | 5,493 | ||||||
Enel | 981,817 | 5,212 | ||||||
Exor | 103,913 | 4,035 | ||||||
Fiat (A) | 120,462 | 1,163 | ||||||
Finmeccanica | 12,390 | 121 | ||||||
Intesa Sanpaolo | 2,842,787 | 8,640 | ||||||
Luxottica Group | 10,278 | 535 | ||||||
Mediaset* | 1,783,451 | 6,849 | ||||||
| 10 | SEI Institutional International Trust / Annual Report / September 30, 2014 |
| Description | Shares | Market Value ($ Thousands) | ||||||
Mediobanca | 66,955 | $ | 576 | |||||
Pirelli & C | 42,418 | 587 | ||||||
Recordati | 20,281 | 333 | ||||||
Snam Rete Gas | 232,836 | 1,288 | ||||||
Societa Cattolica di Assicurazioni SCRL (A) | 2,663 | 46 | ||||||
Telecom Italia | 5,059,630 | 5,800 | ||||||
Telecom Italia RNC | 10,431,066 | 9,270 | ||||||
Terna Rete Elettrica Nazionale | 160,035 | 805 | ||||||
UniCredit | 1,138,572 | 9,004 | ||||||
Unione di Banche Italiane | 125,417 | 1,055 | ||||||
UnipolSai | 127,991 | 362 | ||||||
|
| |||||||
| 62,807 | ||||||||
|
| |||||||
Japan — 15.8% | ||||||||
Alfresa Holdings | 99,200 | 1,430 | ||||||
Arcland Sakamoto | 16,700 | 391 | ||||||
Astellas Pharma | 265,500 | 3,952 | ||||||
Bandai Namco Holdings | 20,200 | 518 | ||||||
Bridgestone | 164,900 | 5,445 | ||||||
Calsonic Kansei | 104,000 | 566 | ||||||
Canon Marketing Japan | 64,500 | 1,242 | ||||||
Casio Computer (A) | 4,600 | 77 | ||||||
Central Japan Railway | 32,600 | 4,403 | ||||||
Chiyoda | 6,000 | 66 | ||||||
Coca-Cola West | 43,600 | 634 | ||||||
Dai Nippon Printing | 651,000 | 6,525 | ||||||
Daikin Industries | 10,100 | 626 | ||||||
Daikyo | 86,000 | 161 | ||||||
Daito Trust Construction | 39,700 | 4,689 | ||||||
Daiwa House Industry | 174,000 | 3,121 | ||||||
Denso | 4,800 | 221 | ||||||
Doutor Nichires Holdings | 3,200 | 51 | ||||||
Dydo Drinco | 9,800 | 387 | ||||||
East Japan Railway | 10,300 | 772 | ||||||
Ebara | 1,234,000 | 7,391 | ||||||
Fanuc | 56,200 | 10,149 | ||||||
Fuji Film Holdings | 494,643 | 15,196 | ||||||
Fuji Heavy Industries | 7,600 | 251 | ||||||
Fuji Soft | 6,100 | 149 | ||||||
Fujitsu | 818,000 | 5,034 | ||||||
Geo Holdings | 20,000 | 172 | ||||||
Hitachi | 1,913,000 | 14,605 | ||||||
Hoya | 69,700 | 2,341 | ||||||
Inpex | 121,800 | 1,720 | ||||||
IT Holdings | 61,000 | 1,067 | ||||||
Japan Airlines | 107,400 | 2,937 | ||||||
Japan Prime Realty Investment, Cl A (D) | 38 | 137 | ||||||
Japan Tobacco | 216,342 | 7,035 | ||||||
JGC | 188,000 | 5,131 | ||||||
Kaken Pharmaceutical | 14,000 | 316 | ||||||
Kanematsu | 158,000 | 254 | ||||||
Kansai Paint | 727,600 | 10,865 | ||||||
| Description | Shares | Market Value ($ Thousands) | ||||||
Kao | 22,900 | $ | 893 | |||||
KDDI | 303,600 | 18,247 | ||||||
Keyence | 19,300 | 8,386 | ||||||
Komatsu | 253,700 | 5,866 | ||||||
Kubota | 297,000 | 4,691 | ||||||
Lawson | 82,600 | 5,775 | ||||||
LIXIL Group | 24,100 | 515 | ||||||
Mabuchi Motor | 102,000 | 8,889 | ||||||
Medipal Holdings | 24,700 | 300 | ||||||
MEIJI Holdings | 10,300 | 814 | ||||||
Miraca Holdings | 130,000 | 5,374 | ||||||
Misawa Homes | 24,600 | 250 | ||||||
Mitsubishi Tanabe Pharma | 360,400 | 5,286 | ||||||
Morinaga Milk Industry | 122,000 | 393 | ||||||
MS&AD Insurance Group Holdings | 437,400 | 9,540 | ||||||
Murata Manufacturing | 10,500 | 1,194 | ||||||
Nabtesco | 169,100 | 4,053 | ||||||
NGK Insulators | 34,000 | 810 | ||||||
NGK Spark Plug | 2,900 | 85 | ||||||
NH Foods | 31,000 | 657 | ||||||
Nidec | 32,700 | 2,212 | ||||||
Nikon (A) | 640,600 | 9,256 | ||||||
Nippo | 16,000 | 293 | ||||||
Nippon Flour Mills | 28,000 | 136 | ||||||
Nippon Paint Holdings | 29,000 | 652 | ||||||
Nippon Telegraph & Telephone | 81,100 | 5,043 | ||||||
Nippon Telegraph & Telephone ADR | 388,907 | 12,099 | ||||||
Nissan Motor | 459,100 | 4,474 | ||||||
Nissan Tokyo Sales Holdings | 8,100 | 22 | ||||||
Nisshin Fudosan | 10,600 | 45 | ||||||
Nitori Holdings | 12,700 | 786 | ||||||
Nomura Real Estate Holdings | 63,000 | 1,082 | ||||||
North Pacific Bank | 140,000 | 551 | ||||||
NTT DOCOMO | 207,360 | 3,460 | ||||||
Ono Pharmaceutical | 11,300 | 1,003 | ||||||
Otsuka Holdings | 82,300 | 2,836 | ||||||
Panasonic | 343,400 | 4,084 | ||||||
Rohm | 121,800 | 7,661 | ||||||
Ryohin Keikaku | 40,130 | 4,781 | ||||||
Santen Pharmaceutical | 126,500 | 7,081 | ||||||
Seiko Epson | 3,200 | 154 | ||||||
Seino Holdings | 120,000 | 962 | ||||||
Sekisui Chemical | 373,000 | 4,278 | ||||||
Sekisui House | 468,300 | 5,516 | ||||||
Seven & I Holdings | 154,000 | 5,972 | ||||||
Shimizu | 91,000 | 718 | ||||||
Shin-Etsu Chemical | 154,300 | 10,083 | ||||||
Shinko Electric Industries | 23,900 | 175 | ||||||
Shiseido | 446,900 | 7,372 | ||||||
Showa | 17,300 | 189 | ||||||
SKY Perfect JSAT Holdings | 30,100 | 177 | ||||||
SMC | 68,600 | 18,917 | ||||||
SoftBank | 232,880 | 16,324 | ||||||
Sugi Holdings | 101,900 | 4,278 | ||||||
| SEI Institutional International Trust / Annual Report / September 30, 2014 | 11 |
SCHEDULE OF INVESTMENTS
International Equity Fund (Continued)
September 30, 2014
| Description | Shares | Market Value ($ Thousands) | ||||||
Sumitomo Forestry | 15,700 | $ | 169 | |||||
Sumitomo Heavy Industries | 52,000 | 292 | ||||||
Sumitomo Mitsui Financial Group | 552,700 | 22,527 | ||||||
Sumitomo Mitsui Trust Holdings | 1,944,220 | 8,091 | ||||||
Suzuken | 12,400 | 357 | ||||||
Taisei | 23,000 | 130 | ||||||
Takata | 265,500 | 6,022 | ||||||
Tosoh | 47,000 | 190 | ||||||
Toyota Motor | 357,700 | 21,075 | ||||||
Toyota Motor ADR | 52,058 | 6,118 | ||||||
Tsuruha Holdings | 136,600 | 7,596 | ||||||
Ulvac* | 14,800 | 186 | ||||||
United Urban Investment (D) | 81 | 124 | ||||||
Wacoal Holdings | 599,704 | 5,839 | ||||||
Warabeya Nichiyo | 13,300 | 239 | ||||||
Watabe Wedding | 6,395 | 34 | ||||||
West Japan Railway | 4,900 | 219 | ||||||
Yamazaki Baking | 80,000 | 1,031 | ||||||
Yellow Hat | 12,500 | 275 | ||||||
|
| |||||||
| 425,231 | ||||||||
|
| |||||||
Malta — 0.0% | ||||||||
BGP Holdings* (C) | 198,683 | — | ||||||
|
| |||||||
Mexico — 0.1% | ||||||||
Gruma, Cl B* | 27,044 | 290 | ||||||
Grupo Financiero Banorte, Cl O | 266,416 | 1,706 | ||||||
|
| |||||||
| 1,996 | ||||||||
|
| |||||||
Netherlands — 6.0% | ||||||||
Aegon | 660,778 | 5,452 | ||||||
Airbus Group | 38,119 | 2,399 | ||||||
Akzo Nobel | 354,140 | 24,270 | ||||||
ASML Holding | 180,770 | 17,999 | ||||||
BinckBank | 21,382 | 213 | ||||||
Boskalis Westminster | 22,283 | 1,255 | ||||||
Delta Lloyd | 20,943 | 505 | ||||||
Heineken Holding (A) | 5,558 | 368 | ||||||
ING Groep* | 598,928 | 8,557 | ||||||
James Hardie Industries | 83,667 | 876 | ||||||
Koninklijke Ahold | 370,914 | 6,007 | ||||||
Koninklijke DSM | 87,365 | 5,392 | ||||||
Koninklijke KPN* | 380,329 | 1,219 | ||||||
Nielsen | 161,600 | 7,164 | ||||||
OCI* (A) | 15,026 | 464 | ||||||
PostNL | 954,622 | 4,126 | ||||||
Reed Elsevier | 914,927 | 20,769 | ||||||
Royal Dutch Shell, Cl A | 518,762 | 19,862 | ||||||
Royal Dutch Shell, Cl B | 66,628 | 2,632 | ||||||
Royal Dutch Shell ADR, Cl B | 120,744 | 9,553 | ||||||
TNT Express (A) | 814,791 | 5,161 | ||||||
Unilever | 212,443 | 8,462 | ||||||
Wolters Kluwer (A) | 250,418 | 6,681 | ||||||
|
| |||||||
| 159,386 | ||||||||
|
| |||||||
| Description | Shares | Market Value ($ Thousands) | ||||||
New Zealand — 0.1% | ||||||||
Air New Zealand | 139,644 | $ | 211 | |||||
Fletcher Building | 19,930 | 137 | ||||||
Ryman Healthcare | 55,085 | 335 | ||||||
Spark New Zealand | 294,596 | 682 | ||||||
|
| |||||||
| 1,365 | ||||||||
|
| |||||||
Norway — 1.6% | ||||||||
Akastor | 371,893 | 1,497 | ||||||
Aker Solutions* | 371,893 | 3,784 | ||||||
Archer* | 68,195 | 96 | ||||||
Bonheur | 5,117 | 82 | ||||||
DnB | 789,476 | 14,787 | ||||||
Kvaerner | 80,275 | 132 | ||||||
Norsk Hydro | 396,281 | 2,217 | ||||||
Orkla | 171,094 | 1,548 | ||||||
Salmar | 7,125 | 126 | ||||||
Seadrill | 89,087 | 2,390 | ||||||
Statoil | 465,787 | 12,706 | ||||||
Telenor | 170,760 | 3,749 | ||||||
Veidekke | 8,294 | 83 | ||||||
|
| |||||||
| 43,197 | ||||||||
|
| |||||||
Poland — 0.0% | ||||||||
Tauron Polska Energia | 59,269 | 96 | ||||||
|
| |||||||
Portugal — 0.3% | ||||||||
CTT Correios de Portugal | 766,831 | 7,454 | ||||||
Energias de Portugal | 239,844 | 1,047 | ||||||
Sonae | 211,509 | 307 | ||||||
|
| |||||||
| 8,808 | ||||||||
|
| |||||||
Puerto Rico — 0.0% | ||||||||
Triple-S Management, Cl B* | 23,165 | 461 | ||||||
|
| |||||||
Russia — 0.4% | ||||||||
Eurasia Drilling GDR | 137,351 | 3,901 | ||||||
Gazprom ADR | 854,460 | 6,015 | ||||||
Surgutneftegas ADR | 8,414 | 56 | ||||||
|
| |||||||
| 9,972 | ||||||||
|
| |||||||
Singapore — 1.1% | ||||||||
City Developments | 771,000 | 5,816 | ||||||
DBS Group Holdings | 637,816 | 9,212 | ||||||
Flextronics International* | 247,798 | 2,557 | ||||||
Sembcorp Industries | 969,000 | 3,936 | ||||||
Sembcorp Marine (A) | 1,240,000 | 3,637 | ||||||
United Overseas Bank | 228,600 | 4,015 | ||||||
|
| |||||||
| 29,173 | ||||||||
|
| |||||||
| 12 | SEI Institutional International Trust / Annual Report / September 30, 2014 |
| Description | Shares | Market Value ($ Thousands) | ||||||
South Africa — 0.2% | ||||||||
ArcelorMittal | 63,922 | $ | 880 | |||||
Impala Platinum Holdings | 489,531 | 3,770 | ||||||
Net 1 UEPS Technologies* | 5,340 | 64 | ||||||
|
| |||||||
| 4,714 | ||||||||
|
| |||||||
South Korea — 2.4% |
| |||||||
Hyundai Motor | 43,291 | 7,815 | ||||||
KB Financial Group ADR | 152,945 | 5,540 | ||||||
KT&G | 114,702 | 10,272 | ||||||
LG Display ADR | 215,154 | 3,389 | ||||||
Meritz Financial Group | 22,180 | 177 | ||||||
POSCO | 12,654 | 3,939 | ||||||
Samsung Electronics | 10,566 | 11,855 | ||||||
SK Telecom | 48,496 | 13,327 | ||||||
SK Telecom ADR | 293,466 | 8,904 | ||||||
|
| |||||||
| 65,218 | ||||||||
|
| |||||||
Spain — 1.5% |
| |||||||
Abertis Infraestructuras | 67,144 | 1,327 | ||||||
Acerinox | 19,057 | 293 | ||||||
ACS Actividades de Construccion y Servicios | 129,720 | 4,985 | ||||||
Amadeus IT Holding, Cl A | 69,455 | 2,599 | ||||||
Banco Popular Espanol | 97,587 | 597 | ||||||
Banco Santander | 367,561 | 3,534 | ||||||
CaixaBank | 319,664 | 1,947 | ||||||
Enagas | 33,212 | 1,071 | ||||||
Endesa | 8,158 | 322 | ||||||
Ferrovial | 44,015 | 854 | ||||||
Gamesa Tecnologica* | 10,518 | 116 | ||||||
Gas Natural | 57,565 | 1,695 | ||||||
Grifols | 25,031 | 1,026 | ||||||
Iberdrola | 236,371 | 1,693 | ||||||
International Consolidated Airlines Group* | 1,957,408 | 11,649 | ||||||
Red Electrica | 13,640 | 1,181 | ||||||
Tecnicas Reunidas (A) | 99,789 | 5,293 | ||||||
Zardoya Otis | 28,710 | 356 | ||||||
|
| |||||||
| 40,538 | ||||||||
|
| |||||||
Sweden — 2.0% |
| |||||||
Assa Abloy, Cl B | 5,859 | 303 | ||||||
Electrolux, Cl B | 174,769 | 4,628 | ||||||
Elekta, Cl B (A) | 232,162 | 2,292 | ||||||
Hufvudstaden, Cl A | 4,930 | 61 | ||||||
Husqvarna, Cl B | 105,104 | 745 | ||||||
Industrivarden, Cl C | 72,362 | 1,266 | ||||||
Intrum Justitia | 19,757 | 558 | ||||||
Investor, Cl B | 12,887 | 456 | ||||||
JM | 25,049 | 802 | ||||||
Loomis, Cl B | 6,766 | 194 | ||||||
Meda, Cl A | 14,812 | 208 | ||||||
| Description | Shares | Market Value ($ Thousands) | ||||||
NCC, Cl B | 18,704 | $ | 622 | |||||
Nordea Bank | 746,349 | 9,722 | ||||||
Peab | 11,408 | 79 | ||||||
Securitas, Cl B | 19,256 | 214 | ||||||
Skandinaviska Enskilda Banken, Cl A | 627,339 | 8,390 | ||||||
Skanska, Cl B | 81,989 | 1,698 | ||||||
Svenska Cellulosa, Cl B | 130,799 | 3,123 | ||||||
Svenska Handelsbanken, Cl A | 20,559 | 968 | ||||||
Swedbank, Cl A | 52,900 | 1,333 | ||||||
Telefonaktiebolaget LM Ericsson, Cl B | 712,643 | 9,056 | ||||||
Telefonaktiebolaget LM Ericsson ADR | 614,218 | 7,733 | ||||||
|
| |||||||
| 54,451 | ||||||||
|
| |||||||
Switzerland — 9.5% | ||||||||
Actelion | 29,385 | 3,454 | ||||||
Adecco | 26,797 | 1,819 | ||||||
Aryzta | 13,921 | 1,200 | ||||||
Baloise Holding | 9,033 | 1,158 | ||||||
Barry Callebaut | 30 | 33 | ||||||
Chocoladefabriken Lindt & Spruengli | 83 | 1,121 | ||||||
Cie Financiere Richemont | 31,400 | 2,575 | ||||||
Clariant | 689,608 | 11,807 | ||||||
Credit Suisse Group | 545,033 | 15,099 | ||||||
Emmi | 824 | 282 | ||||||
Galenica | 892 | 785 | ||||||
Geberit | 3,465 | 1,120 | ||||||
Georg Fischer | 1,802 | 1,061 | ||||||
Givaudan | 13,175 | 21,069 | ||||||
Holcim | 12,233 | 892 | ||||||
Julius Baer Group | 122,275 | 5,483 | ||||||
Lonza Group | 58,239 | 7,034 | ||||||
Nestle | 112,186 | 8,248 | ||||||
Novartis | 400,639 | 37,800 | ||||||
OC Oerlikon | 87,314 | 1,087 | ||||||
Pargesa Holding | 2,541 | 202 | ||||||
Partners Group Holding | 21,610 | 5,688 | ||||||
Roche Holding | 132,371 | 39,219 | ||||||
SGS | 5,079 | 10,530 | ||||||
Siegfried Holding | 717 | 106 | ||||||
Sika | 2,866 | 9,934 | ||||||
Sonova Holding | 41,161 | 6,574 | ||||||
Sulzer | 44,269 | 5,444 | ||||||
Swiss Life Holding | 22,635 | 5,406 | ||||||
Swiss Re | 30,400 | 2,423 | ||||||
Swisscom | 5,359 | 3,043 | ||||||
Syngenta | 5,169 | 1,646 | ||||||
UBS | 566,431 | 9,839 | ||||||
UBS Registered | 1,081,301 | 18,853 | ||||||
Zurich Insurance Group | 44,988 | 13,409 | ||||||
|
| |||||||
| 255,443 | ||||||||
|
| |||||||
| SEI Institutional International Trust / Annual Report / September 30, 2014 | 13 |
SCHEDULE OF INVESTMENTS
International Equity Fund (Continued)
September 30, 2014
| Description | Shares | Market Value ($ Thousands) | ||||||
Taiwan — 0.2% |
| |||||||
Hon Hai Precision Industry | 1,532,160 | $ | 4,835 | |||||
Radium Life Tech | 265,200 | 155 | ||||||
United Microelectronics ADR | 340,869 | 678 | ||||||
|
| |||||||
| 5,668 | ||||||||
|
| |||||||
United Kingdom — 15.9% |
| |||||||
3i Group | 85,609 | 532 | ||||||
Admiral Group | 2,478 | 52 | ||||||
Afren* | 132,019 | 221 | ||||||
Amlin | 1,229,229 | 8,649 | ||||||
Aon | 100,100 | 8,776 | ||||||
ARM Holdings | 205,000 | 3,011 | ||||||
Associated British Foods | 183,636 | 7,975 | ||||||
AstraZeneca | 171,226 | 12,329 | ||||||
Aviva | 1,486,997 | 12,620 | ||||||
Babcock International Group | 60,000 | 1,062 | ||||||
BAE Systems | 203,420 | 1,555 | ||||||
Balfour Beatty | 773,027 | 2,363 | ||||||
Barclays | 4,880,810 | 17,997 | ||||||
Berendsen | 54,241 | 862 | ||||||
BG Group | 1,059,199 | 19,575 | ||||||
BHP Billiton | 109,491 | 3,044 | ||||||
BP | 557,445 | 4,098 | ||||||
BP ADR | 72,369 | 3,181 | ||||||
British American Tobacco | 296,193 | 16,720 | ||||||
British Land (D) | 222,872 | 2,538 | ||||||
British Sky Broadcasting Group | 7,736 | 111 | ||||||
BT Group, Cl A | 249,327 | 1,534 | ||||||
Bunzl | 452,454 | 11,809 | ||||||
Capita | 245,307 | 4,629 | ||||||
Carnival | 178,627 | 7,135 | ||||||
Catlin Group | 686,353 | 5,808 | ||||||
Cobham | 61,708 | 291 | ||||||
Compass Group | 291,348 | 4,707 | ||||||
Diageo | 267,131 | 7,730 | ||||||
EnQuest* | 47,528 | 84 | ||||||
GKN | 283,346 | 1,466 | ||||||
GlaxoSmithKline | 292,933 | 6,710 | ||||||
Hammerson | 152,652 | 1,422 | ||||||
Hargreaves Lansdown | 33,878 | 519 | ||||||
Hikma Pharmaceuticals | 43,058 | 1,210 | ||||||
Home Retail Group | 2,606,352 | 7,052 | ||||||
Howden Joinery Group | 1,032,470 | 5,676 | ||||||
HSBC Holdings | 2,467,390 | 25,148 | ||||||
IMI | 17,950 | 358 | ||||||
Imperial Tobacco Group | 20,360 | 879 | ||||||
InterContinental Hotels Group | 26,439 | 1,020 | ||||||
Investec | 346,802 | 2,922 | ||||||
ITV | 1,977,069 | 6,660 | ||||||
John Wood Group | 18,089 | 223 | ||||||
Johnson Matthey | 29,298 | 1,386 | ||||||
Kingfisher | 648,158 | 3,403 | ||||||
| Description | Shares | Market Value ($ Thousands) | ||||||
Land Securities Group (D) | 39,877 | $ | 672 | |||||
Legal��& General Group | 764,713 | 2,838 | ||||||
Lloyds Banking Group* | 20,379,390 | 25,396 | ||||||
London Stock Exchange Group | 16,756 | 507 | ||||||
Man Group | 329,461 | 634 | ||||||
Michael Page International | 699,531 | 4,747 | ||||||
Mondi | 107,590 | 1,763 | ||||||
National Grid | 228,928 | 3,296 | ||||||
Next | 27,003 | 2,891 | ||||||
Pace | 17,386 | 84 | ||||||
Prudential | 548,461 | 12,234 | ||||||
QinetiQ Group | 192,599 | 701 | ||||||
Reckitt Benckiser Group | 50,865 | 4,412 | ||||||
Reed Elsevier | 880,801 | 14,108 | ||||||
Rentokil Initial | 3,744,268 | 7,150 | ||||||
Rexam | 612,914 | 4,887 | ||||||
Rio Tinto | 202,986 | 9,976 | ||||||
SABMiller | 120,745 | 6,710 | ||||||
Sage Group | 106,918 | 633 | ||||||
Segro (D) | 116,190 | 684 | ||||||
Shire | 85,063 | 7,364 | ||||||
Smith & Nephew | 182,783 | 3,082 | ||||||
SSE | 92,420 | 2,318 | ||||||
St. James’s Place | 473,240 | 5,600 | ||||||
Synthomer | 21,503 | 74 | ||||||
TalkTalk Telecom Group | 1,467,890 | 7,115 | ||||||
Tate & Lyle | 27,024 | 259 | ||||||
Tesco | 1,614,390 | 4,873 | ||||||
Thomas Cook Group* | 1,830,603 | 3,532 | ||||||
Travis Perkins | 220,562 | 5,950 | ||||||
TSB Banking Group* (A) (E) | 1,708,148 | 7,698 | ||||||
TUI Travel | 196,122 | 1,237 | ||||||
Unilever | 34,406 | 1,442 | ||||||
United Utilities Group | 65,495 | 858 | ||||||
Vodafone Group | 6,143,620 | 20,358 | ||||||
Weir Group | 34,117 | 1,384 | ||||||
Whitbread | 29,617 | 1,994 | ||||||
WPP | 552,772 | 11,112 | ||||||
Xchanging | 57,394 | 175 | ||||||
|
| |||||||
| 427,800 | ||||||||
|
| |||||||
United States — 0.9% | ||||||||
Affymetrix* | 6,280 | 50 | ||||||
Alliance HealthCare Services* | 7,648 | 173 | ||||||
Argan | 12,894 | 430 | ||||||
Axis Capital Holdings | 176,543 | 8,356 | ||||||
Bassett Furniture Industries | 5,007 | 68 | ||||||
Central Garden and Pet, Cl A* | 6,077 | 49 | ||||||
Central Pacific Financial | 4,978 | 89 | ||||||
Computer Sciences | 53,826 | 3,291 | ||||||
Constellium, Cl A* | 41,612 | 1,024 | ||||||
Ducommun * | 1,905 | 52 | ||||||
| 14 | SEI Institutional International Trust / Annual Report / September 30, 2014 |
| Description | Shares/Face Amount | Market Value ($ Thousands) | ||||||
Global Cash Access Holdings* | 11,939 | $ | 81 | |||||
Harvard Bioscience* | 14,767 | 60 | ||||||
Manpowergroup | 60,399 | 4,234 | ||||||
Medifast* | 20,734 | 681 | ||||||
Midcoast Energy Partners | 5,899 | 132 | ||||||
Nautilus* | 4,579 | 55 | ||||||
NN | 8,361 | 223 | ||||||
Pantry* | 8,932 | 181 | ||||||
Pilgrim’s Pride* | 15,264 | 466 | ||||||
Provident Financial Holdings | 5,496 | 80 | ||||||
RadNet* | 30,354 | 201 | ||||||
Reading International, Cl A* | 6,849 | 58 | ||||||
Renewable Energy Group* | 28,868 | 293 | ||||||
Repligen* | 5,809 | 116 | ||||||
REX American Resources* | 11,831 | 862 | ||||||
SciClone Pharmaceuticals* | 7,716 | 53 | ||||||
Skilled Healthcare Group, Cl A* | 9,096 | 60 | ||||||
Skullcandy* | 44,212 | 344 | ||||||
Sykes Enterprises* | 2,630 | 53 | ||||||
Take-Two Interactive Software* | 84,728 | 1,955 | ||||||
Taro Pharmaceutical Industries* | 6,130 | 942 | ||||||
Warren Resources* | 61,957 | 328 | ||||||
ZAGG* | 12,637 | 71 | ||||||
|
| |||||||
| 25,111 | ||||||||
|
| |||||||
Total Common Stock | 2,490,741 | |||||||
|
| |||||||
PREFERRED STOCK — 0.8% |
| |||||||
Germany — 0.8% | ||||||||
Bayerische Motoren Werke | 8,215 | 669 | ||||||
Draegerwerk | 2,624 | 232 | ||||||
Henkel | 88,502 | 8,839 | ||||||
Volkswagen | 59,834 | 12,426 | ||||||
|
| |||||||
Total Preferred Stock (Cost $24,493) ($ Thousands) | 22,166 | |||||||
|
| |||||||
U.S. TREASURY OBLIGATIONS (F) (G) — 0.2% |
| |||||||
U.S. Treasury Bills | ||||||||
0.041%, 05/28/2015 | $ | 297 | 297 | |||||
0.038%, 03/05/2015 | 5,419 | 5,418 | ||||||
|
| |||||||
Total U.S. Treasury Obligations (Cost $5,715) ($ Thousands) | 5,715 | |||||||
|
| |||||||
RIGHTS — 0.0% | ||||||||
Italy — 0.0% | ||||||||
Fiat, Expires 10/08/2014* | 120 | — | ||||||
|
| |||||||
| Description | Number of Rights/ Shares/Face Amount (1) | Market Value ($ Thousands) | ||||||||||
Spain — 0.0% | ||||||||||||
Banco Popular Espanol, Expires 10/01/2014* | 98 | $ | 2 | |||||||||
|
| |||||||||||
Total Rights | 2 | |||||||||||
|
| |||||||||||
AFFILIATED PARTNERSHIP — 1.9% |
| |||||||||||
SEI Liquidity Fund, L.P. | 51,797,689 | 51,798 | ||||||||||
|
| |||||||||||
Total Affiliated Partnership |
| 51,798 | ||||||||||
|
| |||||||||||
CASH EQUIVALENT — 3.8% |
| |||||||||||
SEI Daily Income Trust, Prime Obligation Fund, Cl A | 101,506,987 | 101,507 | ||||||||||
|
| |||||||||||
Total Cash Equivalent |
| 101,507 | ||||||||||
|
| |||||||||||
TIME DEPOSITS — 2.4% |
| |||||||||||
Brown Brothers Harriman | ||||||||||||
4.500%, 10/01/2014 | ZAR | 15 | 1 | |||||||||
2.750%, 10/01/2014 | NZD | 22 | 17 | |||||||||
1.578%, 10/01/2014 | AUD | 172 | 151 | |||||||||
0.350%, 10/01/2014 | NOK | 43 | 7 | |||||||||
0.299%, 10/01/2014 | CAD | 2 | 1 | |||||||||
0.060%, 10/01/2014 | GBP | 266 | 432 | |||||||||
0.050%, 10/01/2014 | SEK | 1 | — | |||||||||
0.030%, 10/01/2014 | 63,189 | 63,189 | ||||||||||
0.005%, 10/01/2014 | SGD | 92 | 72 | |||||||||
0.005%, 10/01/2014 | HKD | 1,430 | 184 | |||||||||
0.005%, 10/01/2014 | JPY | 11,215 | 102 | |||||||||
0.001%, 10/01/2014 | CHF | 209 | 219 | |||||||||
0.000%, 10/01/2014 | EUR | 876 | 1,107 | |||||||||
0.000%, 10/01/2014 | DKK | — | — | |||||||||
|
| |||||||||||
Total Time Deposits |
| 65,482 | ||||||||||
|
| |||||||||||
Total Investments — 101.8% |
| $ | 2,737,411 | |||||||||
|
| |||||||||||
A list of the open futures contracts held by the Fund at September 30, 2014, is as follows:
| Type of Contract | Number of Contracts Long | Expiration Date | Unrealized Appreciation (Depreciation) ($ Thousands) | |||||||||
DJ Euro Stoxx 50 Index | 924 | Dec-2014 | $ | (324 | ) | |||||||
FTSE 100 Index | 280 | Dec-2014 | (799 | ) | ||||||||
Hang Seng Index | 36 | Oct-2014 | (267 | ) | ||||||||
SPI 200 Index | 92 | Dec-2014 | (352 | ) | ||||||||
Topix Index | 191 | Dec-2014 | 517 | |||||||||
|
| |||||||||||
| $ | (1,225 | ) | ||||||||||
|
| |||||||||||
| SEI Institutional International Trust / Annual Report / September 30, 2014 | 15 |
SCHEDULE OF INVESTMENTS
International Equity Fund (Concluded)
September 30, 2014
For the year ended September 30, 2014, the total amount of all open futures contracts, as presented in the table above, are representative of the volume of activity for this derivative type during the year.
Percentages are based on a Net Assets of $2,687,824 ($ Thousands).
| * | Non-income producing security. |
| ** | Rate shown is the 7-day effective yield as of September 30, 2014. |
| † | Investment in Affiliated Security. |
| (1) | In U.S. dollars unless otherwise indicated. |
| (A) | This security or a partial position of this security is on loan at September 30, 2014. The total market value of securities on loan at September 30, 2014 was $49,273 ($ Thousands) (See Note 8). |
| (B) | Security fair valued using methods determined in good faith by the Valuation Committee of the Board of Trustees. The total market value of such securities as of September 30, 2014 was $0 ($ Thousands) and represented 0.0% of Net Assets. |
| (C) | Securities considered illiquid. The total market value of such securities as of September 30, 2014 was $0 ($ Thousands) and represented 0.0% of Net Assets. |
| (D) | Real Estate Investment Trust. |
| (E) | Securities sold within terms of a private placement memorandum, exempt from registration under Section 144A of the Securities Act of 1933, as amended, and may be sold only to dealers in that program or other “accredited investors.” These securities have been determined to be liquid under guidelines established by the Board of Trustees. |
| (F) | Security, or portion thereof, has been pledged as collateral on open futures contracts. |
| (G) | The rate reported on the Schedule of Investments is the effective yield at time of purchase. |
| (H) | This security was purchased with cash collateral held from securities on loan (see Note 8). The total value of such securities as of September 30, 2014 was $51,798 ($ Thousands). |
ADR — American Depositary Receipt
AUD — Australian Dollar
CAD — Canadian Dollar
CHF — Swiss Franc
Cl — Class
DJ — Dow Jones
DKK — Danish Krone
EUR — Euro
FTSE — Financial Times and the London Stock Exchange
GBP — British Pound Sterling
GDR — Global Depositary Receipt
HKD — Hong Kong Dollar
JPY — Japanese Yen
L.P. — Limited Partnership
NOK — Norwegian Krone
NZD — New Zealand Dollar
SEK — Swedish Krone
SGD — Singapore Dollar
SPI — Share Price Index
ZAR — South African Rand
The following is a list of the level of inputs used as of September 30, 2014, in valuing the Fund’s investments and other financial instruments carried at value ($ Thousands):
| Investments in Securities | Level 1 | Level 2 | Level 3 | Total | ||||||||||||
Common Stock | $ | 2,490,741 | $ | — | $ | — | $ | 2,490,741 | ||||||||
Preferred Stock | 22,166 | — | — | 22,166 | ||||||||||||
U.S. Treasury Obligations | — | 5,715 | — | 5,715 | ||||||||||||
Rights | 2 | — | — | 2 | ||||||||||||
Affiliated Partnership | — | 51,798 | — | 51,798 | ||||||||||||
Cash Equivalent | 101,507 | — | — | 101,507 | ||||||||||||
Time Deposits | — | 65,482 | — | 65,482 | ||||||||||||
|
|
|
|
|
|
|
| |||||||||
Total Investments in Securities | $ | 2,614,416 | $ | 122,995 | $ | — | $ | 2,737,411 | ||||||||
|
|
|
|
|
|
|
| |||||||||
| Other Financial Instruments | Level 1 | Level 2 | Level 3 | Total | ||||||||||||
Futures Contracts* | ||||||||||||||||
Unrealized Appreciation | $ | 517 | $ | — | $ | — | $ | 517 | ||||||||
Unrealized Depreciation | (1,742 | ) | — | — | (1,742 | ) | ||||||||||
|
|
|
|
|
|
|
| |||||||||
Total Other Financial Instruments | $ | (1,225 | ) | $ | — | $ | — | $ | (1,225 | ) | ||||||
|
|
|
|
|
|
|
| |||||||||
| * | Futures contracts are valued at the unrealized appreciation (depreciation) on the instrument. |
For the year ended September 30, 2014, there were no transfers between Level 1 and Level 2 assets and liabilities.
For the year ended September 30, 2014, there were no transfers from Level 2 into Level 3 assets and liabilities.
Amounts designated as “—” are $0 or have been rounded to $0.
The accompanying notes are an integral part of the financial statements.
| 16 | SEI Institutional International Trust / Annual Report / September 30, 2014 |
SCHEDULE OF INVESTMENTS
Emerging Markets Equity Fund
September 30, 2014
| Description | Shares | Market Value ($ Thousands) | ||||||||
COMMON STOCK — 89.5% | ||||||||||
Argentina — 0.5% | ||||||||||
Arcos Dorados Holdings, Cl A (A) | 333,300 | $ | 1,993 | |||||||
MercadoLibre (A) | 21,300 | 2,314 | ||||||||
Tenaris ADR (A) | 67,648 | 3,082 | ||||||||
YPF ADR (A) | 50,800 | 1,879 | ||||||||
|
| |||||||||
| 9,268 | ||||||||||
|
| |||||||||
Brazil — 8.4% | ||||||||||
ALL - America Latina Logistica | 403,261 | 1,045 | ||||||||
AMBEV | 541,000 | 3,558 | ||||||||
AMBEV ADR | 1,088,692 | 7,131 | ||||||||
B2W Cia Digital* | 621,653 | 8,278 | ||||||||
Banco Bradesco | 566,082 | 8,067 | ||||||||
Banco do Brasil | 265,580 | 2,760 | ||||||||
Banco Santander Brasil | 527,815 | 3,452 | ||||||||
BB Seguridade Participacoes | 339,100 | 4,470 | ||||||||
BM&FBovespa | 958,817 | 4,396 | ||||||||
BR Malls Participacoes | 697,700 | 5,480 | ||||||||
Brasil Insurance Participacoes e Administracao | 405,200 | 1,335 | ||||||||
Braskem ADR (A) | 231,110 | 3,044 | ||||||||
BRF ADR (A) | 238,454 | 5,673 | ||||||||
CCR | 364,200 | 2,513 | ||||||||
CETIP - Mercados Organizados | 89,900 | 1,116 | ||||||||
Cia Paranaense de Energia ADR (A) | 24,910 | 341 | ||||||||
Cielo | 250,440 | 4,072 | ||||||||
Cosan Industria e Comercio | 83,900 | 1,336 | ||||||||
Cyrela Brazil Realty Empreendimentos e Participacoes | 1,105,667 | 5,574 | ||||||||
EcoRodovias Infraestrutura e Logistica | 503,200 | 2,453 | ||||||||
EDP - Energias do Brasil | 738,600 | 2,994 | ||||||||
Estacio Participacoes | 621,400 | 6,461 | ||||||||
Fibria Celulose ADR* (A) | 299,285 | 3,292 | ||||||||
Gerdau ADR (A) | 1,114,026 | 5,347 | ||||||||
| Description | Shares | Market Value ($ Thousands) | ||||||||
Gol Linhas Aereas Inteligentes ADR | 681,538 | $ | 3,278 | |||||||
Hypermarcas* | 680,660 | 4,902 | ||||||||
JBS | 435,100 | 1,638 | ||||||||
Klabin | 269,300 | 1,304 | ||||||||
Kroton Educacional | 835,848 | 5,248 | ||||||||
Localiza Rent a Car | 174,932 | 2,512 | ||||||||
Lojas Renner | 40,400 | 1,167 | ||||||||
Mahle-Metal Leve Industria e Comercio | 22,600 | 200 | ||||||||
MRV Engenharia e Participacoes | 248,700 | 826 | ||||||||
Multiplus | 101,500 | 1,216 | ||||||||
Petroleo Brasileiro | 82,822 | 588 | ||||||||
Petroleo Brasileiro ADR | 659,265 | 9,355 | ||||||||
Porto Seguro | 139,700 | 1,625 | ||||||||
Qualicorp* | 321,600 | 3,180 | ||||||||
Santos Brasil Participacoes | 75,820 | 520 | ||||||||
Sao Martinho | 36,800 | 592 | ||||||||
Sul America | 109,682 | 676 | ||||||||
Telefonica Brasil ADR (A) | 136,000 | 2,676 | ||||||||
Tim Participacoes | 141,100 | 739 | ||||||||
Tim Participacoes ADR | 473,100 | 12,395 | ||||||||
Totvs | 220,520 | 3,344 | ||||||||
Vale | 56,186 | 618 | ||||||||
Vale ADR, Cl B (A) | 631,561 | 6,954 | ||||||||
Valid Solucoes e Servicos de Seguranca em Meios de Pagamento e Identificacao S.A | 131,800 | 2,042 | ||||||||
Via Varejo* | 259,900 | 2,577 | ||||||||
|
| |||||||||
| 164,360 | ||||||||||
|
| |||||||||
Canada — 0.4% | ||||||||||
Africa Oil* (A) | 155,700 | 685 | ||||||||
Pacific Rubiales Energy | 351,676 | 5,910 | ||||||||
SEMAFO | 273,720 | 965 | ||||||||
|
| |||||||||
| 7,560 | ||||||||||
|
| |||||||||
Chile — 0.8% | ||||||||||
Banco de Chile | 21,399,622 | 2,642 | ||||||||
Banco Santander Chile | 99,800,700 | 5,575 | ||||||||
Cia Cervecerias Unidas ADR (A) | 167,691 | 3,694 | ||||||||
SACI Falabella | 221,990 | 1,678 | ||||||||
Sociedad Quimica y Minera de Chile ADR (A) | 104,900 | 2,742 | ||||||||
|
| |||||||||
| 16,331 | ||||||||||
|
| |||||||||
China — 14.1% | ||||||||||
AAC Technologies Holdings (A) | 957,280 | 5,560 | ||||||||
Agricultural Bank of China | 31,564,432 | 13,983 | ||||||||
Alibaba Group Holding ADR* | 40,400 | 3,590 | ||||||||
Anhui Conch Cement (A) | 1,542,500 | 4,926 | ||||||||
ANTA Sports Products | 2,281,000 | 4,647 | ||||||||
Anton Oilfield Services Group (A) | 3,106,000 | 920 | ||||||||
Baidu ADR* | 139,276 | 30,394 | ||||||||
| SEI Institutional International Trust / Annual Report / September 30, 2014 | 17 |
SCHEDULE OF INVESTMENTS
Emerging Markets Equity Fund (Continued)
September 30, 2014
| Description | Shares | Market Value ($ Thousands) | ||||||||
Bank of China | 25,358,105 | $ | 11,364 | |||||||
Byd (A) | 169,500 | 1,125 | ||||||||
Byd Electronic International | 695,000 | 805 | ||||||||
Changyou.com ADR* (A) | 121,000 | 2,895 | ||||||||
China BlueChemical | 2,500,000 | 1,085 | ||||||||
China Child Care (A) | 4,708,100 | 1,043 | ||||||||
China CITIC Bank | 1,486,000 | 901 | ||||||||
China Coal Energy (A) | 1,526,000 | 892 | ||||||||
China Construction Bank | 27,770,993 | 19,456 | ||||||||
China Lesso Group Holdings | 739,600 | 369 | ||||||||
China Life Insurance | 1,170,000 | 3,247 | ||||||||
China Merchants Bank | 2,365,076 | 4,045 | ||||||||
China National Materials (A) | 9,819,438 | 2,264 | ||||||||
China Oilfield Services | 2,030,000 | 5,359 | ||||||||
China Petroleum & Chemical | 9,785,839 | 8,570 | ||||||||
China Petroleum & Chemical ADR (A) | 24,900 | 2,175 | ||||||||
China Shenhua Energy | 892,000 | 2,487 | ||||||||
China Telecom | 3,726,000 | 2,284 | ||||||||
China Vanke* (A) | 2,988,124 | 5,280 | ||||||||
Chongqing Rural Commercial Bank | 2,726,612 | 1,236 | ||||||||
CITIC Securities | 953,500 | 2,198 | ||||||||
Coolpad Group | 7,480,000 | 1,329 | ||||||||
Datang International Power Generation | 1,510,000 | 788 | ||||||||
Dongfeng Motor Group | 2,046,000 | 3,362 | ||||||||
Evergrande Real Estate Group (A) | 2,193,000 | 825 | ||||||||
Great Wall Motor | 328,000 | 1,274 | ||||||||
Guangzhou R&F Properties (A) | 2,174,800 | 2,199 | ||||||||
Huaneng Power International | 4,120,000 | 4,499 | ||||||||
Industrial & Commercial Bank of China | 34,900,768 | 21,754 | ||||||||
Jiangsu Expressway | 3,066,000 | 3,234 | ||||||||
Jiangxi Copper | 1,525,000 | 2,510 | ||||||||
KWG Property Holding | 1,737,370 | 1,219 | ||||||||
New Oriental Education & Technology Group* | 302,300 | 7,013 | ||||||||
PetroChina | 2,596,000 | 3,326 | ||||||||
PetroChina ADR (A) | 57,809 | 7,429 | ||||||||
PICC Property & Casualty | 2,095,800 | 3,714 | ||||||||
Ping An Insurance Group of China | 1,091,500 | 8,195 | ||||||||
Shanghai Electric Group | 1,382,000 | 735 | ||||||||
Shimao Property Holdings | 460,000 | 931 | ||||||||
SINA* | 69,200 | 2,847 | ||||||||
Sinopec Engineering Group | 3,406,500 | 3,672 | ||||||||
SOHO China | 2,051,028 | 1,484 | ||||||||
Sohu.com* | 103,600 | 5,204 | ||||||||
Tencent Holdings | 1,080,535 | 16,072 | ||||||||
Tingyi Cayman Islands Holding | 1,288,000 | 3,384 | ||||||||
Tsingtao Brewery | 458,000 | 3,262 | ||||||||
Uni-President China Holdings (A) | 5,582,400 | 5,579 | ||||||||
Vipshop Holdings ADR* (A) | 2,466 | 466 | ||||||||
| Description | Shares | Market Value ($ Thousands) | ||||||||
WuXi PharmaTech Cayman* | 31,674 | $ | 1,109 | |||||||
Youku Tudou ADR* (A) | 57,800 | 1,036 | ||||||||
Zhejiang Expressway | 3,558,000 | 3,615 | ||||||||
Zhuzhou CSR Times Electric | 2,275,600 | 8,792 | ||||||||
ZTE | 529,600 | 1,174 | ||||||||
|
| |||||||||
| 275,132 | ||||||||||
|
| |||||||||
Colombia — 0.6% | ||||||||||
Bancolombia ADR, Cl R (A) | 102,200 | 5,797 | ||||||||
Ecopetrol | 3,249,243 | 5,094 | ||||||||
Grupo Argos | 81,692 | 919 | ||||||||
|
| |||||||||
| 11,810 | ||||||||||
|
| |||||||||
Czech Republic — 0.7% | ||||||||||
CEZ | 161,731 | 4,917 | ||||||||
Komercni Banka | 38,094 | 9,060 | ||||||||
|
| |||||||||
| 13,977 | ||||||||||
|
| |||||||||
Egypt — 0.0% | ||||||||||
Commercial International Bank Egypt GDR | 134,788 | 927 | ||||||||
|
| |||||||||
Greece — 0.4% | ||||||||||
Alpha Bank AE* | 2,865,766 | 2,223 | ||||||||
OPAP | 37,618 | 492 | ||||||||
Piraeus Bank* | 2,813,026 | 4,761 | ||||||||
|
| |||||||||
| 7,476 | ||||||||||
|
| |||||||||
Hong Kong — 6.1% | ||||||||||
Bolina Holding (A) | 4,005,700 | 1,578 | ||||||||
Chaoda Modern Agriculture* (B) (C) | 2,056,181 | — | ||||||||
China Everbright | 328,000 | 615 | ||||||||
China Everbright International | 5,531,600 | 7,323 | ||||||||
China High Precision Automation | 1,385,624 | 221 | ||||||||
China Medical System Holdings (A) | 2,712,500 | 4,639 | ||||||||
China Mengniu Dairy | 1,789,915 | 7,376 | ||||||||
China Minsheng Banking | 1,185,100 | 1,084 | ||||||||
China Mobile (A) | 2,031,181 | 27,485 | ||||||||
China Modern Dairy Holdings* (A) | 4,037,000 | 1,872 | ||||||||
China Power International | 2,861,000 | 1,326 | ||||||||
China State Construction International Holdings | 7,652,184 | 11,372 | ||||||||
China Taiping Insurance Holdings* | 1,258,200 | 2,729 | ||||||||
China Unicom Hong Kong ADR (A) | 137,890 | 2,072 | ||||||||
CNOOC | 7,185,607 | 12,326 | ||||||||
CNOOC ADR (A) | 16,710 | 2,883 | ||||||||
Far East Horizon | 1,431,000 | 1,281 | ||||||||
GOME Electrical Appliances Holding | 9,371,000 | 1,521 | ||||||||
Guangzhou Automobile Group | 988,000 | 956 | ||||||||
Haier Electronics Group | 2,555,000 | 6,696 | ||||||||
| 18 | SEI Institutional International Trust / Annual Report / September 30, 2014 |
| Description | Shares | Market Value ($ Thousands) | ||||||||
Lenovo Group | 1,010,000 | $ | 1,504 | |||||||
Nine Dragons Paper Holdings | 2,083,500 | 1,500 | ||||||||
Samsonite International | 602,752 | 1,941 | ||||||||
Sands China | 439,300 | 2,291 | ||||||||
Shanghai Industrial Holdings | 107,000 | 317 | ||||||||
Sunny Optical Technology Group | 5,348,107 | 7,934 | ||||||||
Techtronic Industries | 2,326,500 | 6,726 | ||||||||
Zoomlion Heavy Industry Science and Technology (A) | 3,912,060 | 2,282 | ||||||||
|
| |||||||||
| 119,850 | ||||||||||
|
| |||||||||
Hungary — 0.0% | ||||||||||
Richter Gedeon Nyrt | 59,370 | 930 | ||||||||
|
| |||||||||
India — 7.7% | ||||||||||
Adani Ports and Special Economic Zone | 905,380 | 4,069 | ||||||||
Aurobindo Pharma | 719,611 | 11,282 | ||||||||
Axis Bank | 638,270 | 3,903 | ||||||||
Bank of Baroda | 395,950 | 5,785 | ||||||||
Cairn India | 853,961 | 4,312 | ||||||||
Crompton Greaves | 554,442 | 1,805 | ||||||||
Cummins India | 457,035 | 4,966 | ||||||||
Dabur India | 1,070,867 | 3,852 | ||||||||
Glenmark Pharmaceuticals | 658,447 | 7,695 | ||||||||
HCL Technologies | 86,460 | 2,401 | ||||||||
HDFC Bank | 121,100 | 5,641 | ||||||||
Housing Development Finance | 44,756 | 765 | ||||||||
ICICI Bank ADR | 260,954 | 12,813 | ||||||||
Idea Cellular | 834,627 | 2,245 | ||||||||
Indiabulls Housing Finance | 215,603 | 1,406 | ||||||||
Infosys ADR (A) | 14,636 | 885 | ||||||||
ITC | 451,610 | 2,707 | ||||||||
Jubilant Foodworks* | 134,207 | 2,674 | ||||||||
Mahindra & Mahindra GDR | 138,078 | 3,042 | ||||||||
Oil & Natural Gas | 276,855 | 1,831 | ||||||||
Oil India | 59,070 | 582 | ||||||||
Oriental Bank of Commerce | 234,465 | 872 | ||||||||
Power Finance | 253,630 | 963 | ||||||||
Power Grid Corp of India | 1,977,814 | 4,331 | ||||||||
Prestige Estates Projects* | 746,500 | 2,658 | ||||||||
Reliance Communications* | 820,362 | 1,315 | ||||||||
Reliance Industries | 295,715 | 4,528 | ||||||||
Reliance Industries GDR (D) | 572,823 | 17,471 | ||||||||
Rural Electrification | 225,164 | 911 | ||||||||
Sesa Sterlite | 535,207 | 2,362 | ||||||||
Shriram Transport Finance | 371,597 | 5,609 | ||||||||
Syndicate Bank | 165,516 | 293 | ||||||||
Tata Consultancy Services | 8,433 | 374 | ||||||||
Tata Global Beverages | 1,283,110 | 3,311 | ||||||||
Tata Motors, Cl A | 492,200 | 2,750 | ||||||||
Tata Motors ADR (A) | 142,700 | 6,237 | ||||||||
Tata Steel* | 258,149 | 1,919 | ||||||||
UCO Bank | 543,854 | 702 | ||||||||
| Description | Shares | Market Value ($ Thousands) | ||||||||
UPL | 566,809 | $ | 3,121 | |||||||
Wipro ADR (A) | 142,168 | 1,729 | ||||||||
WNS Holdings ADR* | 11,629 | 262 | ||||||||
Yes Bank | 510,520 | 4,620 | ||||||||
Zee Entertainment Enterprises | 118,800 | 604 | ||||||||
|
| |||||||||
| 151,603 | ||||||||||
|
| |||||||||
Indonesia — 2.3% | ||||||||||
Adaro Energy | 23,196,300 | 2,237 | ||||||||
AKR Corporindo | 8,990,900 | 4,021 | ||||||||
Bank Negara Indonesia Persero | 2,982,200 | 1,352 | ||||||||
Bank Rakyat Indonesia Persero | 8,328,151 | 7,125 | ||||||||
Gudang Garam | 684,300 | 3,183 | ||||||||
Indo Tambangraya Megah | 366,900 | 782 | ||||||||
Indocement Tunggal Prakarsa | 486,900 | 861 | ||||||||
Matahari Department Store | 2,459,100 | 3,274 | ||||||||
Matahari Putra Prima | 2,831,900 | 732 | ||||||||
Perusahaan Gas Negara Persero | 4,666,500 | 2,298 | ||||||||
Perusahaan Perkebunan London Sumatra Indonesia | 2,177,800 | 340 | ||||||||
Semen Indonesia Persero | 4,068,300 | 5,150 | ||||||||
Surya Citra Media | 2,019,000 | 634 | ||||||||
Tambang Batubara Bukit Asam | 2,278,100 | 2,468 | ||||||||
Telekomunikasi Indonesia Persero | 31,231,680 | 7,472 | ||||||||
United Tractors | 1,687,181 | 2,755 | ||||||||
|
| |||||||||
| 44,684 | ||||||||||
|
| |||||||||
Israel — 0.5% | ||||||||||
Teva Pharmaceutical Industries ADR | 195,400 | 10,503 | ||||||||
|
| |||||||||
Malaysia — 1.5% | ||||||||||
Alliance Financial Group | 1,324,100 | 2,014 | ||||||||
AMMB Holdings | 832,500 | 1,744 | ||||||||
Axiata Group | 2,464,536 | 5,259 | ||||||||
British American Tobacco Malaysia | 41,451 | 891 | ||||||||
Hong Leong Financial Group | 56,400 | 303 | ||||||||
IOI | 513,100 | 752 | ||||||||
IOI Properties Group | 542,049 | 433 | ||||||||
Malayan Banking | 1,853,800 | 5,628 | ||||||||
Petronas Chemicals Group | 829,700 | 1,578 | ||||||||
Telekom Malaysia | 979,976 | 1,972 | ||||||||
Top Glove | 2,097,528 | 3,165 | ||||||||
UEM Sunrise | 3,565,395 | 1,978 | ||||||||
UMW Holdings | 751,700 | 2,809 | ||||||||
|
| |||||||||
| 28,526 | ||||||||||
|
| |||||||||
Mexico — 5.3% | ||||||||||
Alfa, Cl A | 382,500 | 1,316 | ||||||||
America Movil, Ser L (A) | 4,253,309 | 15,674 | ||||||||
Arca Continental | 566,000 | 3,886 | ||||||||
Cemex ADR* (A) | 661,674 | 8,628 | ||||||||
| SEI Institutional International Trust / Annual Report / September 30, 2014 | 19 |
SCHEDULE OF INVESTMENTS
Emerging Markets Equity Fund (Continued)
September 30, 2014
| Description | Shares | Market Value ($ Thousands) | ||||||||
Coca-Cola Femsa ADR (A) | 8,092 | $ | 815 | |||||||
Compartamos* | 1,812,300 | 3,880 | ||||||||
Controladora Comercial Mexicana | 181,900 | 681 | ||||||||
Empresas ICA ADR* (A) | 237,380 | 1,643 | ||||||||
Fibra Uno Administracion (E) | 1,091,000 | 3,589 | ||||||||
Fomento Economico Mexicano | 166,600 | 1,532 | ||||||||
Fomento Economico Mexicano ADR | 73,639 | 6,778 | ||||||||
Genomma Lab Internacional, Cl B* (A) | 2,603,600 | 6,242 | ||||||||
Gruma, Cl B* | 154,532 | 1,655 | ||||||||
Grupo Financiero Banorte, Cl O | 2,202,686 | 14,106 | ||||||||
Grupo Financiero Santander Mexico ADR (A) | 226,478 | 3,064 | ||||||||
Grupo Lala, Cl B | 500,920 | 1,227 | ||||||||
Grupo Mexico, Ser B | 1,687,000 | 5,669 | ||||||||
Grupo Televisa | 104,500 | 709 | ||||||||
Grupo Televisa ADR | 373,628 | 12,659 | ||||||||
Inmobiliaria Vesta (A) | 1,647,100 | 3,544 | ||||||||
Kimberly-Clark de Mexico, Cl A | 1,149,700 | 2,713 | ||||||||
Wal-Mart de Mexico, Ser V | 1,274,798 | 3,208 | ||||||||
|
| |||||||||
| 103,218 | ||||||||||
|
| |||||||||
Netherlands — 0.5% | ||||||||||
Yandex, Cl A* | 356,900 | 9,920 | ||||||||
|
| |||||||||
Norway — 0.0% | ||||||||||
Opera Software | 66,480 | 931 | ||||||||
|
| |||||||||
Peru — 0.7% | ||||||||||
Credicorp | 85,300 | 13,084 | ||||||||
|
| |||||||||
Philippines — 0.9% | ||||||||||
Aboitiz Equity Ventures | 1,015,700 | 1,220 | ||||||||
Alliance Global Group | 1,204,488 | 698 | ||||||||
Ayala | 200,310 | 3,303 | ||||||||
BDO Unibank | 1,363,753 | 2,980 | ||||||||
DMCI Holdings | 217,110 | 382 | ||||||||
International Container Terminal Services | 1,577,324 | 3,880 | ||||||||
RFM | 11,003,900 | 1,300 | ||||||||
SM Investments | 165,070 | 2,955 | ||||||||
SM Prime Holdings | 2,126,100 | 828 | ||||||||
|
| |||||||||
| 17,546 | ||||||||||
|
| |||||||||
Poland — 0.7% | ||||||||||
Asseco Poland | 33,224 | 468 | ||||||||
Energa | 167,390 | 1,215 | ||||||||
Eurocash (A) | 274,436 | 2,682 | ||||||||
KGHM Polska Miedz (A) | 34,120 | 1,306 | ||||||||
PGE | 281,646 | 1,787 | ||||||||
Polski Koncern Naftowy Orlen | 95,739 | 1,195 | ||||||||
Powszechna Kasa Oszczednosci Bank Polski | 87,384 | 1,048 | ||||||||
| Description | Shares | Market Value ($ Thousands) | ||||||||
Powszechny Zaklad Ubezpieczen | 21,104 | $ | 3,074 | |||||||
Tauron Polska Energia | 772,294 | 1,254 | ||||||||
|
| |||||||||
| 14,029 | ||||||||||
|
| |||||||||
Qatar — 0.1% | ||||||||||
Barwa Real Estate | 150,129 | 1,651 | ||||||||
|
| |||||||||
Russia — 4.6% | ||||||||||
Etalon Group GDR | 56,800 | 207 | ||||||||
Eurasia Drilling GDR | 81,314 | 2,309 | ||||||||
Gazprom ADR (A) | 1,114,665 | 7,769 | ||||||||
Globaltrans Investment GDR | 343,809 | 2,888 | ||||||||
Lukoil ADR | 252,220 | 12,838 | ||||||||
Magnit GDR | 126,335 | 7,297 | ||||||||
Mail.ru Group GDR* | 14,310 | 402 | ||||||||
MegaFon GDR | 139,534 | 3,542 | ||||||||
MMC Norilsk Nickel ADR | 200,785 | 3,745 | ||||||||
Mobile Telesystems ADR (A) | 183,087 | 2,735 | ||||||||
NovaTek GDR | 54,339 | 5,662 | ||||||||
Phosagro GDR | 30,133 | 336 | ||||||||
QIWI ADR (A) | 81,000 | 2,559 | ||||||||
Rosneft GDR | 577,186 | 3,363 | ||||||||
Sberbank of Russia ADR | 1,747,090 | 13,746 | ||||||||
Severstal GDR | 174,931 | 1,746 | ||||||||
Sistema GDR | 55,343 | 382 | ||||||||
Surgutneftegas ADR | 146,322 | 968 | ||||||||
Tatneft ADR | 81,126 | 2,865 | ||||||||
TMK GDR | 479,835 | 4,367 | ||||||||
X5 Retail Group GDR* | 569,328 | 10,504 | ||||||||
|
| |||||||||
| 90,230 | ||||||||||
|
| |||||||||
Singapore — 0.2% | ||||||||||
Asian Pay Television Trust | 5,762,500 | 3,728 | ||||||||
China Yuchai International | 27,469 | 509 | ||||||||
|
| |||||||||
| 4,237 | ||||||||||
|
| |||||||||
South Africa — 5.5% | ||||||||||
Alexander Forbes Group Holdings* | 5,265,194 | 3,821 | ||||||||
Anglo American Platinum* (A) | 26,473 | 858 | ||||||||
AngloGold Ashanti | 60,300 | 724 | ||||||||
ArcelorMittal South Africa* (A) | 159,732 | 526 | ||||||||
Barclays Africa Group (A) | 192,852 | 2,631 | ||||||||
Barloworld (A) | 59,893 | 490 | ||||||||
Bidvest Group (A) | 214,598 | 5,428 | ||||||||
Coronation Fund Managers (A) | 85,274 | 730 | ||||||||
Exxaro Resources (A) | 250,870 | 2,849 | ||||||||
FirstRand (A) | 1,235,666 | 4,705 | ||||||||
Foschini Group (A) | 71,484 | 742 | ||||||||
Impala Platinum Holdings (A) | 51,336 | 395 | ||||||||
Imperial Holdings | 49,885 | 768 | ||||||||
Investec (A) | 202,421 | 1,700 | ||||||||
Kumba Iron Ore (A) | 58,157 | 1,372 | ||||||||
Liberty Holdings (A) | 84,209 | 918 | ||||||||
| 20 | SEI Institutional International Trust / Annual Report / September 30, 2014 |
| Description | Shares | Market Value ($ Thousands) | ||||||||
Life Healthcare Group Holdings | 1,208,956 | $ | 4,766 | |||||||
Mediclinic International | 110,069 | 896 | ||||||||
Mondi (A) | 91,891 | 1,505 | ||||||||
MTN Group | 625,918 | 13,203 | ||||||||
Murray & Roberts Holdings* (A) | 239,957 | 535 | ||||||||
Nampak | 410,379 | 1,494 | ||||||||
Naspers, Cl N | 50,161 | 5,527 | ||||||||
Nedbank Group (A) | 99,081 | 1,920 | ||||||||
Netcare | 608,312 | 1,702 | ||||||||
Redefine Properties (A) (E) | 2,202,900 | 1,895 | ||||||||
Remgro (A) | 163,147 | 3,293 | ||||||||
RMB Holdings | 329,328 | 1,653 | ||||||||
Sasol | 197,541 | 10,724 | ||||||||
Sasol ADR | 59,375 | 3,235 | ||||||||
Shoprite Holdings (A) | 250,290 | 3,101 | ||||||||
SPAR Group (A) | 213,713 | 2,375 | ||||||||
Standard Bank Group (A) | 821,798 | 9,503 | ||||||||
Steinhoff International Holdings (A) | 584,022 | 2,796 | ||||||||
Telkom | 107,522 | 520 | ||||||||
Tongaat Hulett (A) | 19,087 | 264 | ||||||||
Truworths International (A) | 130,667 | 786 | ||||||||
Vodacom Group | 190,186 | 2,188 | ||||||||
Woolworths Holdings (A) | 737,947 | 4,566 | ||||||||
|
| |||||||||
| 107,104 | ||||||||||
|
| |||||||||
South Korea — 12.1% | ||||||||||
Chongkundang Holdings | 1,449 | 81 | ||||||||
Coway | 157,350 | 12,570 | ||||||||
Dongbu Insurance | 67,581 | 3,811 | ||||||||
Doosan Heavy Industries & Construction | 83,602 | 2,064 | ||||||||
Grand Korea Leisure | 38,594 | 1,534 | ||||||||
GS Home Shopping | 1,349 | 325 | ||||||||
Halla Visteon Climate Control | 162,890 | 7,903 | ||||||||
Hanil Cement | 1,745 | 226 | ||||||||
Hanwha Life Insurance | 196,551 | 1,322 | ||||||||
Hite Jinro | 62,170 | 1,364 | ||||||||
Hyosung | 11,642 | 834 | ||||||||
Hyundai Development* | 52,963 | 2,143 | ||||||||
Hyundai Glovis | 5,434 | 1,658 | ||||||||
Hyundai Marine & Fire Insurance | 64,647 | 1,783 | ||||||||
Hyundai Mobis | 1,295 | 315 | ||||||||
Hyundai Motor | 50,008 | 9,028 | ||||||||
Industrial Bank of Korea | 200,247 | 3,027 | ||||||||
Kangwon Land | 82,120 | 2,790 | ||||||||
KB Financial Group ADR (A) | 147,725 | 5,351 | ||||||||
KCC | 13,323 | 9,078 | ||||||||
KH Vatec | 30,371 | 842 | ||||||||
Kia Motors | 116,088 | 5,908 | ||||||||
Korea Aerospace Industries | 160,821 | 6,210 | ||||||||
KT | 26,140 | 850 | ||||||||
KT ADR | 214,890 | 3,483 | ||||||||
KT&G | 64,587 | 5,784 | ||||||||
LG | 45,416 | 3,305 | ||||||||
| Description | Shares | Market Value ($ Thousands) | ||||||||
LG Display* | 47,280 | $ | 1,523 | |||||||
LG Display ADR | 212,640 | 3,349 | ||||||||
LG Electronics | 51,847 | 3,228 | ||||||||
Lock & Lock | 12,800 | 146 | ||||||||
Lotte Chilsung Beverage | 3,034 | 6,248 | ||||||||
Lotte Confectionery | 2,514 | 5,191 | ||||||||
LS Industrial Systems* | 31,479 | 1,751 | ||||||||
Mirae Asset Securities | 11,960 | 504 | ||||||||
NAVER | 3,118 | 2,384 | ||||||||
NCSoft | 29,597 | 3,772 | ||||||||
Nong Shim | 918 | 237 | ||||||||
POSCO | 1,355 | 422 | ||||||||
S-1, Cl 1 | 16,455 | 1,271 | ||||||||
Samsung Electronics | 45,910 | 51,511 | ||||||||
Samsung Engineering | 69,833 | 3,984 | ||||||||
Samsung Fire & Marine Insurance | 3,289 | 881 | ||||||||
Samsung Heavy Industries | 72,608 | 1,737 | ||||||||
Samsung Life Insurance | 32,804 | 3,295 | ||||||||
SFA Engineering | 87,083 | 3,582 | ||||||||
Shinhan Financial Group | 212,301 | 9,778 | ||||||||
SK C&C | 12,084 | 2,777 | ||||||||
SK Hynix | 78,797 | 3,491 | ||||||||
SK Innovation | 11,250 | 865 | ||||||||
SK Networks | 185,265 | 1,861 | ||||||||
SK Telecom | 10,747 | 2,953 | ||||||||
SK Telecom ADR (A) | 643,571 | 19,526 | ||||||||
Sung Kwang Bend | 130,005 | 2,248 | ||||||||
Sungwoo Hitech | 128,440 | 2,081 | ||||||||
Vieworks | 53,314 | 1,781 | ||||||||
Wonik IPS* | 152,277 | 1,811 | ||||||||
|
| |||||||||
| 237,777 | ||||||||||
|
| |||||||||
Spain — 0.4% | ||||||||||
Cemex Latam Holdings* | 885,667 | 7,897 | ||||||||
|
| |||||||||
Taiwan — 8.8% | ||||||||||
Advanced Semiconductor Engineering | 985,000 | 1,146 | ||||||||
Asustek Computer | 430,000 | 4,099 | ||||||||
AU Optronics | 3,945,000 | 1,667 | ||||||||
Catcher Technology | 445,000 | 4,125 | ||||||||
Cathay Financial Holding | 3,679,337 | 5,993 | ||||||||
Chailease Holding | 307,120 | 746 | ||||||||
Chicony Electronics | 187,926 | 562 | ||||||||
China Motor | 1,405,000 | 1,252 | ||||||||
China Steel Chemical | 406,800 | 2,387 | ||||||||
Compal Electronics | 1,784,000 | 1,334 | ||||||||
CTCI | 800,000 | 1,362 | ||||||||
Delta Electronics | 370,000 | 2,335 | ||||||||
eMemory Technology | 299,000 | 3,347 | ||||||||
Farglory Land Development | 1,082,043 | 1,275 | ||||||||
Fubon Financial Holding | 1,872,000 | 2,874 | ||||||||
Hermes Microvision | 96,200 | 4,016 | ||||||||
Hiwin Technologies | 639,078 | 5,714 | ||||||||
| SEI Institutional International Trust / Annual Report / September 30, 2014 | 21 |
SCHEDULE OF INVESTMENTS
Emerging Markets Equity Fund (Continued)
September 30, 2014
| Description | Shares | Market Value ($ Thousands) | ||||||||
Hon Hai Precision Industry | 3,415,807 | $ | 10,780 | |||||||
Inventec | 3,292,000 | 2,143 | ||||||||
King Yuan Electronics | 616,000 | 525 | ||||||||
King’s Town Bank | 692,000 | 766 | ||||||||
Kinsus Interconnect Technology | 211,000 | 784 | ||||||||
Lite-On Technology | 2,692,917 | 3,882 | ||||||||
MediaTek | 1,540,500 | 22,814 | ||||||||
Merida Industry | 106,050 | 739 | ||||||||
Merry Electronics | 266,062 | 1,238 | ||||||||
Mitac Holdings | 2,795,000 | 2,306 | ||||||||
PChome Online | 141,504 | 1,377 | ||||||||
Pegatron | 1,488,000 | 2,739 | ||||||||
Pou Chen | 1,431,000 | 1,590 | ||||||||
Powertech Technology | 353,000 | 638 | ||||||||
President Chain Store | 318,652 | 2,284 | ||||||||
Quanta Computer | 1,816,000 | 4,609 | ||||||||
Radiant Opto-Electronics | 522,050 | 2,068 | ||||||||
Realtek Semiconductor | 1,075,173 | 3,817 | ||||||||
Taishin Financial Holding | 5,146,481 | 2,411 | ||||||||
Taiwan Cement | 2,376,000 | 3,538 | ||||||||
Taiwan Semiconductor Manufacturing | 8,476,390 | 33,438 | ||||||||
Taiwan Semiconductor Manufacturing ADR (A) | 463,453 | 9,353 | ||||||||
Teco Electric and Machinery | 1,660,000 | 1,705 | ||||||||
Transcend Information | 543,000 | 1,803 | ||||||||
Uni-President Enterprises | 64,002 | 111 | ||||||||
United Microelectronics | 1,488,000 | 616 | ||||||||
United Microelectronics ADR (A) | 1,462,000 | 2,909 | ||||||||
Vanguard International Semiconductor | 1,181,000 | 1,732 | ||||||||
Wistron | 1,769,000 | 1,806 | ||||||||
Wistron NeWeb | 198,900 | 467 | ||||||||
WPG Holdings | 1,858,000 | 2,272 | ||||||||
|
| |||||||||
| 171,494 | ||||||||||
|
| |||||||||
Thailand — 1.8% | ||||||||||
Advanced Info Service | 203,300 | 1,411 | ||||||||
Bangkok Bank | 390,954 | 2,460 | ||||||||
Bangkok Bank Foreign | 904,400 | 5,857 | ||||||||
Bangkok Dusit Medical Services | 2,282,000 | 1,302 | ||||||||
Bangkok Dusit Medical Services, Cl F (A) | 2,558,500 | 1,460 | ||||||||
Bangkok Expressway | 148,400 | 174 | ||||||||
CP ALL | 1,809,400 | 2,497 | ||||||||
CP Seven Eleven | 531,900 | 734 | ||||||||
Delta Electronics Thailand | 183,700 | 351 | ||||||||
Kiatnakin Bank | 503,744 | 656 | ||||||||
Krung Thai Bank NVDR | 3,373,300 | 2,466 | ||||||||
Land & Houses | 5,440,900 | 1,745 | ||||||||
PTT | 451,250 | 5,010 | ||||||||
PTT Global Chemical | 1,326,700 | 2,496 | ||||||||
Ratchaburi Electricity Generating Holding | 269,800 | 493 | ||||||||
| Description | Shares | Market Value ($ Thousands) | ||||||||
Siam Commercial Bank | 325,900 | $ | 1,829 | |||||||
Thanachart Capital | 1,825,200 | 2,097 | ||||||||
VGI Global Media | 4,243,524 | 1,819 | ||||||||
|
| |||||||||
| 34,857 | ||||||||||
|
| |||||||||
Turkey — 2.4% | ||||||||||
Anadolu Efes Biracilik Ve Malt Sanayii* | 368,421 | 4,248 | ||||||||
Arcelik | 654,047 | 3,484 | ||||||||
Aselsan Elektronik Sanayi Ve Ticaret | 917,693 | 3,702 | ||||||||
EIS Eczacibasi Ilac ve Sinai ve Finansal Yatirimlar Sanayi ve Ticaret | 158,566 | 149 | ||||||||
Emlak Konut Gayrimenkul Yatirim Ortakligi (E) | 6,609,989 | 6,898 | ||||||||
Eregli Demir ve Celik Fabrikalari | 1,665,174 | 3,088 | ||||||||
Ford Otomotiv Sanayi | 263,263 | 3,018 | ||||||||
TAV Havalimanlari Holding | 1,139,579 | 9,144 | ||||||||
Tofas Turk Otomobil Fabrikasi | 542,973 | 3,047 | ||||||||
Turk Hava Yollari* | 227,992 | 647 | ||||||||
Turk Telekomunikasyon | 564,761 | 1,488 | ||||||||
Turkcell Iletisim Hizmetleri* (A) | 177,535 | 2,333 | ||||||||
Turkiye Garanti Bankasi | 479,905 | 1,683 | ||||||||
Turkiye Halk Bankasi | 337,475 | 2,027 | ||||||||
Turkiye Is Bankasi, Cl C | 613,119 | 1,360 | ||||||||
Turkiye Sise ve Cam Fabrikalari | 967,349 | 1,226 | ||||||||
|
| |||||||||
| 47,542 | ||||||||||
|
| |||||||||
United Arab Emirates — 0.4% | ||||||||||
Abu Dhabi Commercial Bank | 560,791 | 1,293 | ||||||||
Dragon Oil | 440,028 | 4,255 | ||||||||
Dubai Islamic Bank | 727,218 | 1,644 | ||||||||
Emaar Malls Group* | 367,553 | 290 | ||||||||
|
| |||||||||
| 7,482 | ||||||||||
|
| |||||||||
United Kingdom — 0.6% | ||||||||||
Afren* | 1,251,653 | 2,100 | ||||||||
Anglo American ADR | 83,740 | 935 | ||||||||
Hikma Pharmaceuticals | 145,080 | 4,076 | ||||||||
SABMiller | 87,065 | 4,832 | ||||||||
|
| |||||||||
| 11,943 | ||||||||||
|
| |||||||||
United States — 0.5% | ||||||||||
Avon Products | 133,700 | 1,684 | ||||||||
First Cash Financial Services* | 75,700 | 4,238 | ||||||||
Freeport-McMoRan | 119,600 | 3,905 | ||||||||
|
| |||||||||
| 9,827 | ||||||||||
|
| |||||||||
Total Common Stock (Cost $1,710,191) ($ Thousands) | 1,753,706 | |||||||||
|
| |||||||||
| 22 | SEI Institutional International Trust / Annual Report / September 30, 2014 |
| Description | Shares/ Number of Rights | Market Value ($ Thousands) | ||||||||
EXCHANGE TRADED FUNDS — 5.0% |
| |||||||||
United States — 5.0% |
| |||||||||
iPath MSCI India Index ETN* | 138,897 | $ | 9,750 | |||||||
iShares MSCI Emerging Markets ETF | 1,870,980 | 77,758 | ||||||||
iShares MSCI India ETF | 321,400 | 9,758 | ||||||||
|
| |||||||||
Total Exchange Traded Funds (Cost $98,469) ($ Thousands) | 97,266 | |||||||||
|
| |||||||||
PREFERRED STOCK — 2.8% | ||||||||||
Brazil — 2.6% | ||||||||||
Banco do Estado do Rio Grande do Sul | 312,700 | 1,870 | ||||||||
Bradespar | 238,100 | 1,740 | ||||||||
Centrais Eletricas Brasileiras | 174,500 | 727 | ||||||||
Cia Brasileira de Distribuicao | 29,916 | 1,305 | ||||||||
Cia Energetica de Sao Paulo, Cl B | 315,900 | 3,419 | ||||||||
Cia Paranaense de Energia | 109,900 | 1,502 | ||||||||
Itau Unibanco Holding | 736,737 | 10,244 | ||||||||
Itausa - Investimentos Itau | 40,889 | 155 | ||||||||
Klabin | 1,556,700 | 1,493 | ||||||||
Marcopolo | 2,383,100 | 3,882 | ||||||||
Metalurgica Gerdau, Cl A | 332,560 | 1,933 | ||||||||
Petroleo Brasileiro | 177,516 | 1,319 | ||||||||
Petroleo Brasileiro ADR, Cl A | 543,471 | 8,092 | ||||||||
Suzano Papel e Celulose, Cl A | 257,100 | 1,032 | ||||||||
Vale, Cl A | 612,785 | 5,949 | ||||||||
Vale ADR, Cl B | 683,926 | 6,641 | ||||||||
|
| |||||||||
| 51,303 | ||||||||||
|
| |||||||||
Colombia — 0.1% | ||||||||||
Banco Davivienda | 91,460 | 1,321 | ||||||||
Bancolombia | 97,762 | 1,389 | ||||||||
|
| |||||||||
| 2,710 | ||||||||||
|
| |||||||||
South Korea — 0.1% | ||||||||||
Samsung Electronics | 929 | 791 | ||||||||
|
| |||||||||
Total Preferred Stock | 54,804 | |||||||||
|
| |||||||||
RIGHTS — 0.0% | ||||||||||
South Africa — 0.0% | ||||||||||
Woolworths Holdings, Expires 10/13/2014* (A) | 7 | 5 | ||||||||
|
| |||||||||
Total Rights | 5 | |||||||||
|
| |||||||||
| Description | Face Amount (1) | Market Value ($ Thousands) | ||||||||||
DEBENTURE BOND — 0.0% |
| |||||||||||
Brazil — 0.0% | ||||||||||||
Vale, Ser 1997 | BRL | 8 | $ | — | ||||||||
|
| |||||||||||
Total Debenture Bond | — | |||||||||||
|
| |||||||||||
AFFILIATED PARTNERSHIP — 8.9% |
| |||||||||||
SEI Liquidity Fund, L.P. | 173,970,704 | 173,971 | ||||||||||
|
| |||||||||||
Total Affiliated Partnership |
| 173,971 | ||||||||||
|
| |||||||||||
CASH EQUIVALENT — 0.9% |
| |||||||||||
SEI Daily Income Trust, |
| 18,210,628 | 18,211 | |||||||||
|
| |||||||||||
Total Cash Equivalent |
| 18,211 | ||||||||||
|
| |||||||||||
TIME DEPOSITS — 1.7% |
| |||||||||||
Brown Brothers Harriman | ||||||||||||
4.500%, 10/01/2014 | ZAR | 475 | 42 | |||||||||
0.350%, 10/01/2014 | NOK | — | — | |||||||||
0.299%, 10/01/2014 | CAD | 22 | 20 | |||||||||
0.060%, 10/01/2014 | GBP | — | — | |||||||||
0.050%, 10/01/2014 | SEK | 1 | — | |||||||||
0.030%, 10/01/2014 | 32,305 | 32,305 | ||||||||||
0.005%, 10/01/2014 | SGD | — | — | |||||||||
0.005%, 10/01/2014 | HKD | 7,691 | 991 | |||||||||
0.000%, 10/01/2014 | EUR | 28 | 35 | |||||||||
|
| |||||||||||
Total Time Deposits |
| 33,393 | ||||||||||
|
| |||||||||||
Total Investments — 108.8% |
| $ | 2,131,356 | |||||||||
|
| |||||||||||
Percentages are based on a Net Assets of $1,958,078 ($ Thousands).
| * | Non-income producing security. |
| ** | Rate shown is the 7-day effective yield as of September 30, 2014. |
| † | Investment in Affiliated Security. |
| (1) | In U.S. dollars unless otherwise indicated. |
| (A) | This security or a partial position of this security is on loan at September 30, 2014. The total market value of securities on loan at September 30, 2014 was $167,813 ($ Thousands) (See Note 8). |
| (B) | Security fair valued using methods determined in good faith by the Valuation Committee of the Board of Trustees. The total market value of such securities as of September 30, 2014 was $221 ($ Thousands) and represented 0.0% of Net Assets. |
| (C) | Securities considered illiquid. The total market value of such securities as of September 30, 2014 was $221 ($ Thousands) and represented 0.0% of Net Assets. |
| SEI Institutional International Trust / Annual Report / September 30, 2014 | 23 |
SCHEDULE OF INVESTMENTS
Emerging Markets Equity Fund (Concluded)
September 30, 2014
| (D) | Securities sold within terms of a private placement memorandum, exempt from registration under Section 144A of the Securities Act of 1933, as amended, and may be sold only to dealers in that program or other “accredited investors.” These securities have been determined to be liquid under guidelines established by the Board of Trustees. |
| (E) | Real Estate Investment Trust. |
| (F) | Variable Rate Security — The rate reported on the Schedule of Investments is the rate in effect as of September 30, 2014. |
| (G) | This security was purchased with cash collateral held from securities on loan (see Note 8). The total value of such securities as of September 30, 2014 was $173,971 ($ Thousands). |
ADR — American Depositary Receipt
BRL — Brazilian Real
CAD — Canadian Dollar
Cl — Class
ETF — Exchange Traded Fund
ETN — Exchange Traded Note
EUR — Euro
GBP — British Pound Sterling
GDR — Global Depositary Receipt
HKD — Hong Kong Dollar
L.P. — Limited Partnership
MSCI — Morgan Stanley Capital International
NOK — Norwegian Krone
NVDR — Non-Voting Depositary Receipt
SEK — Swedish Krona
Ser — Series
SGD — Singapore Dollar
ZAR — South African Rand
The following is a list of the level of inputs used as of September 30, 2014, in valuing the Fund’s investments carried at value ($ Thousands):
| Investments in Securities | Level 1 | Level 2 | Level 3(1) | Total | ||||||||||||
Common Stock | $ | 1,753,485 | $ | — | $ | 221 | $ | 1,753,706 | ||||||||
Exchange Traded Funds | 97,266 | — | — | 97,266 | ||||||||||||
Preferred Stock | 54,804 | — | — | 54,804 | ||||||||||||
Rights | — | — | 5 | 5 | ||||||||||||
Debenture Bond | — | — | — | — | ||||||||||||
Affiliated Partnership | — | 173,971 | — | 173,971 | ||||||||||||
Cash Equivalent | 18,211 | — | — | 18,211 | ||||||||||||
Time Deposits | — | 33,393 | — | 33,393 | ||||||||||||
|
|
|
|
|
|
|
| |||||||||
Total Investments in Securities | $ | 1,923,766 | $ | 207,364 | $ | 226 | $ | 2,131,356 | ||||||||
|
|
|
|
|
|
|
| |||||||||
| (1) | A reconciliation of Level 3 investments is presented when the Fund has a significant amount of Level 3 investments at the beginning and/or end of the period in relation to net assets. |
For the year ended September 30, 2014, there were no transfers between Level 1 and Level 2 assets and liabilities.
For the year ended September 30, 2014, there were no transfers between Level 2 and Level 3 assets and liabilities.
Amounts designated as “—” are $0 or have been rounded to $0.
The accompanying notes are an integral part of the financial statements.
| 24 | SEI Institutional International Trust / Annual Report / September 30, 2014 |
SCHEDULE OF INVESTMENTS
International Fixed Income Fund
September 30, 2014
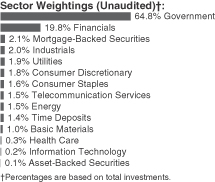
| Description | Face Amount (1) (Thousands) | Market Value ($ Thousands) | ||||||||||
GLOBAL BONDS — 93.7% |
| |||||||||||
Australia — 2.2% | ||||||||||||
Aurizon Network MTN | ||||||||||||
2.000%, 09/18/2024 | EUR | 300 | $ | 375 | ||||||||
Australia & New Zealand Banking Group MTN | ||||||||||||
3.625%, 07/18/2022 | EUR | 300 | 456 | |||||||||
Commonwealth Bank of Australia | ||||||||||||
1.375%, 01/22/2019 | EUR | 560 | 739 | |||||||||
Glencore Australia Holdings | ||||||||||||
4.500%, 09/19/2019 | 900 | 784 | ||||||||||
Government of Australia | ||||||||||||
6.000%, 02/15/2017 | 2,060 | 1,941 | ||||||||||
2.750%, 04/21/2024 | 2,710 | 2,230 | ||||||||||
Government of Australia, Ser 122 | ||||||||||||
5.250%, 03/15/2019 | 2,400 | 2,305 | ||||||||||
Government of Australia, Ser 124 | ||||||||||||
5.750%, 05/15/2021 | 1,300 | 1,310 | ||||||||||
Queensland Treasury, Ser 17 | ||||||||||||
6.000%, 09/14/2017 | 780 | 743 | ||||||||||
Suncorp-Metway | ||||||||||||
5.125%, 10/27/2014 | GBP | 235 | 382 | |||||||||
Westpac Banking MTN | ||||||||||||
1.500%, 03/24/2021 | EUR | 220 | 292 | |||||||||
1.375%, 04/17/2020 | EUR | 230 | 304 | |||||||||
|
| |||||||||||
| 11,861 | ||||||||||||
|
| |||||||||||
Austria — 0.4% | ||||||||||||
Republic of Austria | ||||||||||||
3.650%, 04/20/2022 | 290 | 445 | ||||||||||
3.200%, 02/20/2017 | 600 | 816 | ||||||||||
3.150%, 06/20/2044 | 150 | 239 | ||||||||||
1.950%, 06/18/2019 | 280 | 382 | ||||||||||
1.650%, 10/21/2024 | 225 | 298 | ||||||||||
|
| |||||||||||
| 2,180 | ||||||||||||
|
| |||||||||||
| Description | Face Amount (1) (Thousands) | Market Value ($ Thousands) | ||||||||||
Belgium — 0.7% | ||||||||||||
Kingdom of Belgium | ||||||||||||
3.750%, 06/22/2045 | 338 | $ | 556 | |||||||||
3.000%, 06/22/2034 | 350 | 506 | ||||||||||
2.600%, 06/22/2024 | 490 | 697 | ||||||||||
Kingdom of Belgium, Ser 44 | ||||||||||||
5.000%, 03/28/2035 | 150 | 279 | ||||||||||
Kingdom of Belgium, Ser 47 | ||||||||||||
3.250%, 09/28/2016 | 270 | 363 | ||||||||||
Kingdom of Belgium, Ser 58 | ||||||||||||
3.750%, 09/28/2020 | 231 | 348 | ||||||||||
Kingdom of Belgium, Ser 69 | ||||||||||||
1.250%, 06/22/2018 | 545 | 718 | ||||||||||
|
| |||||||||||
| 3,467 | ||||||||||||
|
| |||||||||||
Brazil — 0.4% | ||||||||||||
Braskem Finance | ||||||||||||
6.450%, 02/03/2024 | USD | 300 | 312 | |||||||||
BRF | ||||||||||||
3.950%, 05/22/2023 (A) | USD | 410 | 386 | |||||||||
Cosan | ||||||||||||
5.000%, 03/14/2023 (A) | USD | 240 | 230 | |||||||||
Petrobras International Finance MTN | ||||||||||||
6.250%, 12/14/2026 | GBP | 260 | 436 | |||||||||
Raizen Energy Finance | ||||||||||||
7.000%, 02/01/2017 (A) | USD | 270 | 296 | |||||||||
Rio Oil Finance Trust, Ser 2014-1 | ||||||||||||
6.250%, 07/06/2024 | USD | 320 | 330 | |||||||||
Vale | ||||||||||||
5.625%, 09/11/2042 | USD | 133 | 130 | |||||||||
|
| |||||||||||
| 2,120 | ||||||||||||
|
| |||||||||||
Canada — 4.4% | ||||||||||||
Bell Canada MTN | ||||||||||||
5.000%, 02/15/2017 | 270 | 258 | ||||||||||
4.700%, 09/11/2023 | 80 | 77 | ||||||||||
3.350%, 06/18/2019 | 29 | 27 | ||||||||||
3.250%, 06/17/2020 | 95 | 86 | ||||||||||
Bombardier | ||||||||||||
6.000%, 10/15/2022 (A) | USD | 310 | 309 | |||||||||
Canada Housing Trust No. 1 | ||||||||||||
4.100%, 12/15/2018 | 1,390 | 1,362 | ||||||||||
2.050%, 06/15/2017 | 2,470 | 2,247 | ||||||||||
CDP Financial | ||||||||||||
4.400%, 11/25/2019 (A) | USD | 850 | 934 | |||||||||
Government of Canada | ||||||||||||
5.750%, 06/01/2033 | 485 | 640 | ||||||||||
5.000%, 06/01/2037 | 1,300 | 1,633 | ||||||||||
4.250%, 12/01/2021 | 605 | 702 | ||||||||||
4.000%, 06/01/2041 | 910 | 1,021 | ||||||||||
2.500%, 06/01/2024 | 2,210 | 2,038 | ||||||||||
| SEI Institutional International Trust / Annual Report / September 30, 2014 | 25 |
SCHEDULE OF INVESTMENTS
International Fixed Income Fund (Continued)
September 30, 2014
| Description | Face Amount (1) (Thousands) | Market Value ($ Thousands) | ||||||||||
2.000%, 06/01/2016 | 1,250 | $ | 1,135 | |||||||||
1.750%, 09/01/2019 | 1,980 | 1,782 | ||||||||||
1.250%, 02/01/2016 | 895 | 803 | ||||||||||
Muskrat Falls | ||||||||||||
3.630%, 06/01/2029 | 340 | 330 | ||||||||||
National Bank of Canada | ||||||||||||
1.500%, 03/25/2021 | EUR | 257 | 341 | |||||||||
NOVA Chemicals | ||||||||||||
5.250%, 08/01/2023 (A) | USD | 150 | 156 | |||||||||
Province of British Columbia | ||||||||||||
3.250%, 12/18/2021 | 1,150 | 1,085 | ||||||||||
2.250%, 03/01/2019 | 575 | 524 | ||||||||||
Province of Manitoba Canada | ||||||||||||
3.850%, 12/01/2021 | 710 | 691 | ||||||||||
Province of Ontario Canada | ||||||||||||
8.100%, 09/08/2023 | 700 | 884 | ||||||||||
3.500%, 06/02/2024 | 125 | 117 | ||||||||||
3.450%, 06/02/2045 | 245 | 213 | ||||||||||
3.150%, 06/02/2022 | 2,000 | 1,846 | ||||||||||
Province of Quebec Canada | ||||||||||||
3.500%, 12/01/2045 | 145 | 126 | ||||||||||
3.000%, 09/01/2023 | 500 | 450 | ||||||||||
Quebecor Media | ||||||||||||
5.750%, 01/15/2023 | USD | 128 | 127 | |||||||||
Rogers Communications | ||||||||||||
4.000%, 06/06/2022 | 165 | 153 | ||||||||||
TransCanada PipeLines | ||||||||||||
2.500%, 08/01/2022 | USD | 300 | 284 | |||||||||
Yamana | ||||||||||||
4.950%, 07/15/2024 (A) | USD | 324 | 323 | |||||||||
|
| |||||||||||
| 22,704 | ||||||||||||
|
| |||||||||||
Chile — 0.2% | ||||||||||||
Empresa de Transporte de Pasajeros Metro | ||||||||||||
4.750%, 02/04/2024 (A) | USD | 390 | 404 | |||||||||
ENTEL Chile | ||||||||||||
4.875%, 10/30/2024 | USD | 380 | 388 | |||||||||
|
| |||||||||||
| 792 | ||||||||||||
|
| |||||||||||
China — 0.3% | ||||||||||||
Baidu | ||||||||||||
2.750%, 06/09/2019 | USD | 200 | 199 | |||||||||
CNOOC Nexen Finance | ||||||||||||
4.250%, 04/30/2024 | USD | 390 | 396 | |||||||||
State Grid Overseas Investment | ||||||||||||
4.125%, 05/07/2024 (A) | USD | 390 | 400 | |||||||||
Talent Yield Investments | ||||||||||||
4.500%, 04/25/2022 (A) | USD | 310 | 320 | |||||||||
Tencent Holdings MTN | ||||||||||||
3.375%, 05/02/2019 (A) | USD | 390 | 394 | |||||||||
|
| |||||||||||
| 1,709 | ||||||||||||
|
| |||||||||||
| Description | Face Amount (1) (Thousands) | Market Value ($ Thousands) | ||||||||||
Colombia — 0.1% | ||||||||||||
Ecopetrol | ||||||||||||
5.875%, 05/28/2045 | USD | 109 | $ | 110 | ||||||||
Oleoducto Central | ||||||||||||
4.000%, 05/07/2021 | USD | 390 | 388 | |||||||||
|
| |||||||||||
| 498 | ||||||||||||
|
| |||||||||||
Czech Republic — 0.1% | ||||||||||||
Government of Czech Republic | ||||||||||||
4.700%, 09/12/2022 | 1,500 | 88 | ||||||||||
3.875%, 05/24/2022 | EUR | 50 | 75 | |||||||||
Government of Czech Republic, Ser 51 | ||||||||||||
4.000%, 04/11/2017 | 8,050 | 406 | ||||||||||
|
| |||||||||||
| 569 | ||||||||||||
|
| |||||||||||
Denmark — 1.2% | ||||||||||||
Danske Bank | ||||||||||||
5.375%, 09/29/2021 (B) | GBP | 170 | 290 | |||||||||
3.875%, 10/04/2023 (B) | EUR | 150 | 204 | |||||||||
3.500%, 04/16/2018 | EUR | 155 | 218 | |||||||||
DONG Energy MTN | ||||||||||||
5.750%, 04/09/2040 | GBP | 200 | 395 | |||||||||
Kingdom of Denmark | ||||||||||||
4.500%, 11/15/2039 | 1,300 | 337 | ||||||||||
4.000%, 11/15/2017 | 1,600 | 305 | ||||||||||
3.000%, 11/15/2021 | 21,800 | 4,328 | ||||||||||
1.500%, 11/15/2023 | 670 | 120 | ||||||||||
|
| |||||||||||
| 6,197 | ||||||||||||
|
| |||||||||||
Finland — 0.3% | ||||||||||||
Elisa MTN | �� | |||||||||||
2.250%, 10/04/2019 | 300 | 400 | ||||||||||
Government of Finland | ||||||||||||
1.500%, 04/15/2023 | 340 | 451 | ||||||||||
Nordea Bank Finland MTN | ||||||||||||
2.375%, 07/17/2017 | 190 | 255 | ||||||||||
2.250%, 05/03/2019 | 170 | 233 | ||||||||||
|
| |||||||||||
| 1,339 | ||||||||||||
|
| |||||||||||
France — 8.5% | ||||||||||||
ALD International MTN | ||||||||||||
2.000%, 05/26/2017 | 500 | 650 | ||||||||||
Arkema | ||||||||||||
3.850%, 04/30/2020 | 200 | 287 | ||||||||||
AXA MTN | ||||||||||||
5.625%, 01/16/2054 (B) | GBP | 302 | 514 | |||||||||
Banque Federative du Credit Mutuel MTN | ||||||||||||
2.000%, 09/19/2019 | 400 | 535 | ||||||||||
Banque PSA Finance MTN | ||||||||||||
4.875%, 09/25/2015 | 450 | 590 | ||||||||||
4.000%, 06/24/2015 | 450 | 581 | ||||||||||
| 26 | SEI Institutional International Trust / Annual Report / September 30, 2014 |
| Description | Face Amount (1) (Thousands) | Market Value ($ Thousands) | ||||||||||
BNP Paribas | ||||||||||||
4.730%, 04/12/2049 (B) | 300 | $ | 389 | |||||||||
BNP Paribas Home Loan SFH MTN | ||||||||||||
3.125%, 03/22/2022 | 200 | 295 | ||||||||||
BPCE MTN | ||||||||||||
5.250%, 04/16/2029 | GBP | 100 | 168 | |||||||||
4.500%, 03/15/2025 (A) | USD | 430 | 417 | |||||||||
1.375%, 05/22/2019 | 200 | 259 | ||||||||||
BPCE SFH MTN | ||||||||||||
1.750%, 11/29/2019 | 600 | 809 | ||||||||||
1.500%, 01/30/2020 | 400 | 532 | ||||||||||
Caisse Centrale du Credit Immobilier de France MTN | ||||||||||||
1.125%, 04/22/2019 | 100 | 131 | ||||||||||
Caisse de Refinancement de |
| |||||||||||
3.750%, 12/12/2016 | 400 | 546 | ||||||||||
3.500%, 04/25/2017 | 350 | 480 | ||||||||||
Caisse Francaise de Financement Local MTN | ||||||||||||
4.875%, 07/03/2017 | 220 | 314 | ||||||||||
3.750%, 05/18/2016 | 225 | 301 | ||||||||||
3.625%, 02/26/2018 | 63 | 89 | ||||||||||
Casino Guichard Perracho MTN | ||||||||||||
4.726%, 05/26/2021 | 300 | 455 | ||||||||||
Christian Dior | ||||||||||||
1.375%, 06/19/2019 | 300 | 383 | ||||||||||
Cie de Financement Foncier MTN | ||||||||||||
4.625%, 09/23/2017 | 575 | 823 | ||||||||||
Cie de St.-Gobain MTN | ||||||||||||
4.625%, 10/09/2029 | GBP | 120 | 205 | |||||||||
3.500%, 09/30/2015 | 550 | 716 | ||||||||||
Coface | ||||||||||||
4.125%, 03/27/2024 | 200 | 271 | ||||||||||
Credit Agricole MTN | ||||||||||||
2.375%, 11/27/2020 | 600 | 818 | ||||||||||
Credit Agricole Home Loan SFH MTN | ||||||||||||
3.250%, 03/23/2017 | 100 | 136 | ||||||||||
2.875%, 09/09/2016 | 300 | 399 | ||||||||||
Dexia Credit Local MTN | ||||||||||||
2.000%, 01/22/2021 | 200 | 272 | ||||||||||
1.625%, 10/29/2018 | 565 | 750 | ||||||||||
1.375%, 09/18/2019 | 500 | 658 | ||||||||||
Electricite de France MTN | ||||||||||||
6.500%, 01/26/2019 (A) | USD | 250 | 293 | |||||||||
5.375%, 12/12/2049 (B) | 200 | 285 | ||||||||||
French Treasury Note | ||||||||||||
1.000%, 07/25/2017 | 235 | 305 | ||||||||||
| Description | Face Amount (1) (Thousands) | Market Value ($ Thousands) | ||||||||||
Government of France | ||||||||||||
5.000%, 10/25/2016 | 1,240 | $ | 1,729 | |||||||||
4.500%, 04/25/2041 | 220 | 402 | ||||||||||
3.750%, 10/25/2019 | 1,225 | 1,816 | ||||||||||
3.250%, 05/25/2045 | 4,785 | 7,216 | ||||||||||
2.500%, 05/25/2030 | 860 | 1,174 | ||||||||||
2.250%, 05/25/2024 | 1,515 | 2,100 | ||||||||||
1.750%, 11/25/2024 | 865 | 1,141 | ||||||||||
1.000%, 11/25/2018 | 1,390 | 1,815 | ||||||||||
1.000%, 05/25/2019 | 3,835 | 5,012 | ||||||||||
0.500%, 11/25/2019 | 535 | 681 | ||||||||||
HSBC SFH France MTN | ||||||||||||
2.000%, 10/16/2023 | 700 | 955 | ||||||||||
Iliand | ||||||||||||
4.875%, 06/01/2016 | 300 | 400 | ||||||||||
Numericable Group | ||||||||||||
5.375%, 05/15/2022 | 225 | 294 | ||||||||||
RCI Banque MTN | ||||||||||||
5.625%, 10/05/2015 | 500 | 663 | ||||||||||
Renault MTN | ||||||||||||
3.625%, 09/19/2018 | 450 | 612 | ||||||||||
Sanofi MTN | ||||||||||||
2.500%, 11/14/2023 | 200 | 277 | ||||||||||
Societe Generale MTN | ||||||||||||
5.750%, 04/20/2016 (A) | USD | 111 | 118 | |||||||||
5.200%, 04/15/2021 (A) | USD | 225 | 251 | |||||||||
3.875%, 12/17/2015 | GBP | 100 | 167 | |||||||||
Societe Generale SFH MTN | ||||||||||||
3.250%, 06/06/2016 | 400 | 532 | ||||||||||
UNEDIC | ||||||||||||
0.875%, 10/25/2022 | 600 | 751 | ||||||||||
Unibail-Rodamco MTN | ||||||||||||
2.375%, 02/25/2021 (C) | 500 | 679 | ||||||||||
Veolia Environnement MTN | ||||||||||||
4.625%, 03/30/2027 | 200 | 317 | ||||||||||
Wendel | ||||||||||||
5.875%, 09/17/2019 | 800 | 1,210 | ||||||||||
|
| |||||||||||
| 44,968 | ||||||||||||
|
| |||||||||||
Germany — 7.7% | ||||||||||||
Allianz Finance II MTN | ||||||||||||
3.500%, 02/14/2022 | 100 | 147 | ||||||||||
Bundesobligation | ||||||||||||
0.500%, 02/23/2018 | 1,700 | 2,186 | ||||||||||
Bundesrepublik Deutschland | ||||||||||||
6.500%, 07/04/2027 | 125 | 257 | ||||||||||
4.750%, 09/20/2033 | 490 | 884 | ||||||||||
3.000%, 07/04/2020 | 300 | 439 | ||||||||||
2.500%, 07/04/2044 | 1,055 | 1,531 | ||||||||||
2.250%, 09/04/2021 | 320 | 454 | ||||||||||
1.750%, 02/15/2024 | 50 | 68 | ||||||||||
1.500%, 05/15/2023 | 1,465 | 1,970 | ||||||||||
1.500%, 05/15/2024 | 3,220 | 4,292 | ||||||||||
| SEI Institutional International Trust / Annual Report / September 30, 2014 | 27 |
SCHEDULE OF INVESTMENTS
International Fixed Income Fund (Continued)
September 30, 2014
| Description | Face Amount (1) (Thousands) | Market Value ($ Thousands) | ||||||||||
Bundesrepublik Deutschland, Ser 00 | ||||||||||||
5.500%, 01/04/2031 | 550 | $ | 1,090 | |||||||||
Bundesrepublik Deutschland, Ser 03 | ||||||||||||
4.750%, 07/04/2034 | 150 | 287 | ||||||||||
Bundesschatzanweisungen | ||||||||||||
0.000%, 12/12/2014 (D) | 7,050 | 8,906 | ||||||||||
0.000%, 06/12/2015 (D) | 4,700 | 5,940 | ||||||||||
Continental MTN | ||||||||||||
3.125%, 09/09/2020 | 600 | 842 | ||||||||||
Deutsche Bank | ||||||||||||
1.250%, 09/08/2021 | 1,000 | 1,265 | ||||||||||
Deutsche Bundesrepublik | ||||||||||||
4.000%, 01/04/2037 | 110 | 196 | ||||||||||
Deutsche Telekom International Finance MTN | ||||||||||||
7.375%, 12/04/2019 | GBP | 200 | 397 | |||||||||
Deutschland Inflation Linked Bond | ||||||||||||
0.100%, 04/15/2023 | 3,094 | 4,115 | ||||||||||
E.ON International Finance MTN | ||||||||||||
6.000%, 10/30/2019 | GBP | 300 | 563 | |||||||||
KFW | ||||||||||||
3.875%, 01/21/2019 | 575 | 842 | ||||||||||
3.375%, 08/30/2017 | CHF | 370 | 425 | |||||||||
Linde Finance MTN | ||||||||||||
3.875%, 06/01/2021 | 450 | 677 | ||||||||||
Muenchener Rueckversicherungs MTN | ||||||||||||
6.250%, 05/26/2042 (B) | 200 | 309 | ||||||||||
ProSiebenSat.1 Media | ||||||||||||
2.625%, 04/15/2021 | 300 | 389 | ||||||||||
Robert Bosch GmbH MTN | ||||||||||||
1.750%, 07/08/2024 | 600 | 784 | ||||||||||
RWE | ||||||||||||
7.000%, 10/12/2072 (B) | USD | 224 | 243 | |||||||||
Vier Gas Transport GmbH MTN | ||||||||||||
3.125%, 07/10/2023 | 250 | 357 | ||||||||||
2.875%, 06/12/2025 | 200 | 279 | ||||||||||
|
| |||||||||||
| 40,134 | ||||||||||||
|
| |||||||||||
Guatemala — 0.0% | ||||||||||||
Comcel Trust | ||||||||||||
6.875%, 02/06/2024 | USD | 230 | 243 | |||||||||
|
| |||||||||||
Indonesia — 0.0% | ||||||||||||
Republic of Indonesia MTN | ||||||||||||
2.875%, 07/08/2021 (A) | EUR | 181 | 231 | |||||||||
|
| |||||||||||
Ireland — 1.3% | ||||||||||||
AIB Mortgage Bank MTN | ||||||||||||
2.625%, 07/29/2016 | 400 | 526 | ||||||||||
| Description | Face Amount (1) (Thousands) | Market Value ($ Thousands) | ||||||||||
Allied Irish Banks MTN | ||||||||||||
2.875%, 11/28/2016 | 400 | $ | 517 | |||||||||
Aquarius and Investments for Zurich Insurance MTN | ||||||||||||
4.250%, 10/02/2043 (B) | 100 | 137 | ||||||||||
Bank of Ireland MTN | ||||||||||||
2.750%, 06/05/2016 | 250 | 323 | ||||||||||
2.063%, 09/22/2015 (A) (B) | CAD | 205 | 177 | |||||||||
Bank of Ireland Mortgage Bank | ||||||||||||
1.750%, 03/19/2019 | 450 | 598 | ||||||||||
CRH Finland Services MTN | ||||||||||||
2.750%, 10/15/2020 | 350 | 476 | ||||||||||
FGA Capital Ireland MTN | ||||||||||||
2.875%, 01/26/2018 | 210 | 274 | ||||||||||
2.625%, 04/17/2019 | 350 | 453 | ||||||||||
GE Capital UK Funding MTN | ||||||||||||
4.375%, 07/31/2019 | GBP | 600 | 1,054 | |||||||||
Ireland Government Bond | ||||||||||||
5.400%, 03/13/2025 | 790 | 1,329 | ||||||||||
4.500%, 10/18/2018 | 345 | 509 | ||||||||||
|
| |||||||||||
| 6,373 | ||||||||||||
|
| |||||||||||
Israel — 0.0% | ||||||||||||
Israel Government Bond | ||||||||||||
4.250%, 03/31/2023 | 750 | 240 | ||||||||||
|
| |||||||||||
Italy — 9.9% | ||||||||||||
Banca Monte dei Paschi di Siena | ||||||||||||
5.000%, 02/09/2018 | 230 | 331 | ||||||||||
4.875%, 09/15/2016 | 700 | 958 | ||||||||||
Banco Popolare SC MTN | ||||||||||||
3.500%, 03/14/2019 | 350 | 459 | ||||||||||
Buoni Poliennali Del Tesoro | ||||||||||||
4.000%, 02/01/2037 | 120 | 167 | ||||||||||
Edison MTN | ||||||||||||
3.875%, 11/10/2017 | 600 | 832 | ||||||||||
Enel Finance International | ||||||||||||
3.875%, 10/07/2014 (A) | USD | 350 | 350 | |||||||||
Eni MTN | ||||||||||||
3.625%, 01/29/2029 | 600 | 881 | ||||||||||
GTECH | ||||||||||||
8.250%, 03/31/2066 (B) | 650 | 878 | ||||||||||
Intesa Sanpaolo MTN | ||||||||||||
5.250%, 01/12/2024 | USD | 375 | 400 | |||||||||
5.017%, 06/26/2024 (A) | USD | 200 | 195 | |||||||||
4.875%, 07/10/2015 | 300 | 392 | ||||||||||
4.000%, 11/09/2017 | 368 | 511 | ||||||||||
3.928%, 09/15/2026 | 550 | 691 | ||||||||||
Italy Buoni Poliennali Del Tesoro | ||||||||||||
6.500%, 11/01/2027 | 305 | 542 | ||||||||||
5.500%, 11/01/2022 | 890 | 1,415 | ||||||||||
5.000%, 03/01/2022 | 890 | 1,370 | ||||||||||
| 28 | SEI Institutional International Trust / Annual Report / September 30, 2014 |
| Description | Face Amount (1) (Thousands) | Market Value ($ Thousands) | ||||||||
5.000%, 03/01/2025 | 960 | $ | 1,495 | |||||||
5.000%, 09/01/2040 | 370 | 580 | ||||||||
4.750%, 09/01/2021 | 3,250 | 4,928 | ||||||||
4.750%, 09/01/2044 | 355 | 539 | ||||||||
4.500%, 02/01/2020 | 570 | 844 | ||||||||
4.500%, 03/01/2024 | 5,674 | 8,532 | ||||||||
4.000%, 09/01/2020 | 1,205 | 1,753 | ||||||||
3.750%, 05/01/2021 | 880 | 1,261 | ||||||||
3.750%, 09/01/2024 | 1,425 | 2,021 | ||||||||
3.500%, 11/01/2017 | 2,161 | 2,967 | ||||||||
3.500%, 06/01/2018 | 300 | 416 | ||||||||
3.500%, 03/01/2030 | 1,390 | 1,868 | ||||||||
2.750%, 11/15/2016 | 1,100 | 1,455 | ||||||||
2.500%, 05/01/2019 | 1,950 | 2,628 | ||||||||
2.250%, 04/22/2017 | 4,374 | 5,752 | ||||||||
1.500%, 08/01/2019 | 770 | 993 | ||||||||
1.150%, 05/15/2017 | 1,490 | 1,911 | ||||||||
Telecom Italia MTN | ||||||||||
4.500%, 01/25/2021 | 400 | 545 | ||||||||
Unione di Banche Italiane MTN | ||||||||||
4.500%, 02/22/2016 | 200 | 267 | ||||||||
|
| |||||||||
| 51,127 | ||||||||||
|
| |||||||||
Japan — 15.7% | ||||||||||
Government of Japan 5 Year Bond | ||||||||||
0.300%, 09/20/2015 | 724,100 | 6,616 | ||||||||
0.300%, 09/20/2018 | 830,600 | 7,623 | ||||||||
Government of Japan 5 Year Bond, | ||||||||||
0.300%, 03/20/2017 | 443,900 | 4,068 | ||||||||
Government of Japan 5 Year Bond, | ||||||||||
0.200%, 09/20/2017 | 850,000 | 7,772 | ||||||||
Government of Japan 5 Year Bond, | ||||||||||
0.100%, 03/20/2018 | 37,900 | 345 | ||||||||
Government of Japan 10 Year Bond | ||||||||||
0.800%, 09/20/2023 | 351,050 | 3,301 | ||||||||
Government of Japan 10 Year Bond, Ser 301 | ||||||||||
1.500%, 06/20/2019 | 85,300 | 826 | ||||||||
Government of Japan 10 Year Bond, Ser 303 | ||||||||||
1.400%, 09/20/2019 | 209,800 | 2,028 | ||||||||
Government of Japan 10 Year Bond, Ser 308 | ||||||||||
1.300%, 06/20/2020 | 155,000 | 1,501 | ||||||||
Government of Japan 10 Year Bond, Ser 313 | ||||||||||
1.300%, 03/20/2021 | 750,000 | 7,300 | ||||||||
Government of Japan 20 Year Bond | ||||||||||
1.700%, 06/20/2033 | 280,450 | 2,746 | ||||||||
Government of Japan 20 Year Bond, | ||||||||||
2.000%, 03/21/2022 | 257,000 | 2,634 | ||||||||
| Description | Face Amount (1) (Thousands) | Market Value ($ Thousands) | ||||||||||
Government of Japan 20 Year Bond, | ||||||||||||
2.100%, 09/20/2024 | 434,000 | $ | 4,561 | |||||||||
Government of Japan 20 Year Bond, | ||||||||||||
2.100%, 12/20/2027 | 459,650 | 4,881 | ||||||||||
Government of Japan 20 Year Bond, Ser 106 | ||||||||||||
2.200%, 09/20/2028 | 110,900 | 1,191 | ||||||||||
Government of Japan 20 Year Bond, Ser 112 | ||||||||||||
2.100%, 06/20/2029 | 325,000 | 3,448 | ||||||||||
Government of Japan 20 Year Bond, Ser 128 | ||||||||||||
1.900%, 06/20/2031 | 55,000 | 564 | ||||||||||
Government of Japan 20 Year Bond, Ser 140 | ||||||||||||
1.700%, 09/20/2032 | 34,850 | 344 | ||||||||||
Government of Japan 20 Year Bond, Ser 143 | ||||||||||||
1.600%, 03/20/2033 | 337,000 | 3,258 | ||||||||||
Government of Japan 20 Year Bond, | ||||||||||||
1.500%, 03/20/2033 | 116,050 | 1,104 | ||||||||||
Government of Japan 30 Year Bond, | ||||||||||||
2.300%, 03/20/2039 | 322,500 | 3,412 | ||||||||||
Government of Japan 30 Year Bond, | ||||||||||||
2.000%, 09/20/2040 | 717,000 | 7,173 | ||||||||||
Government of Japan 30 Year Bond, | ||||||||||||
2.200%, 03/20/2041 | 30,000 | 312 | ||||||||||
Government of Japan 30 Year Bond, | ||||||||||||
2.000%, 03/20/2042 | 72,450 | 723 | ||||||||||
Government of Japan 30 Year Bond, | ||||||||||||
1.800%, 03/20/2043 | 154,300 | 1,472 | ||||||||||
Government of Japan 40 Year Bond | ||||||||||||
1.700%, 03/20/2054 | 56,400 | 508 | ||||||||||
Government of Japan 40 Year Bond, | ||||||||||||
1.900%, 03/20/2053 | 20,000 | 191 | ||||||||||
Mizuho Financial Group Cayman 3 | ||||||||||||
4.600%, 03/27/2024 | USD | 306 | 318 | |||||||||
ORIX | ||||||||||||
4.710%, 04/27/2015 | USD | 135 | 138 | |||||||||
SMFG Preferred Capital | ||||||||||||
10.231%, 01/25/2029 (B) | GBP | 575 | 1,356 | |||||||||
|
| |||||||||||
| 81,714 | ||||||||||||
|
| |||||||||||
| SEI Institutional International Trust / Annual Report / September 30, 2014 | 29 |
SCHEDULE OF INVESTMENTS
International Fixed Income Fund (Continued)
September 30, 2014
| Description | Face Amount (1) (Thousands) | Market Value ($ Thousands) | ||||||||||
Malaysia — 0.2% | ||||||||||||
Bank Negara Malaysia Monetary Notes | ||||||||||||
2.825%, 10/02/2014 (D) | 1,275 | $ | 389 | |||||||||
Malaysia Government Bond | ||||||||||||
5.734%, 07/30/2019 | 1,500 | 497 | ||||||||||
3.418%, 08/15/2022 | 445 | 131 | ||||||||||
|
| |||||||||||
| 1,017 | ||||||||||||
|
| |||||||||||
Mexico — 1.5% | ||||||||||||
Grupo KUO De | ||||||||||||
6.250%, 12/04/2022 (A) | USD | 300 | 308 | |||||||||
Mexican Bonos | ||||||||||||
8.000%, 06/11/2020 | 12,606 | 1,055 | ||||||||||
7.750%, 11/13/2042 | 9,050 | 738 | ||||||||||
4.750%, 06/14/2018 | 33,725 | 2,494 | ||||||||||
Mexican Bonos, Ser M10 | ||||||||||||
8.500%, 12/13/2018 | 23,860 | 2,005 | ||||||||||
Mexican Bonos, Ser M20 | ||||||||||||
10.000%, 12/05/2024 | 1,941 | 187 | ||||||||||
Mexican Udibonos | ||||||||||||
5.000%, 06/16/2016 | 1,810 | 757 | ||||||||||
Petroleos Mexicanos | ||||||||||||
3.500%, 01/30/2023 | USD | 425 | 407 | |||||||||
|
| |||||||||||
| 7,951 | ||||||||||||
|
| |||||||||||
Morocco — 0.1% | ||||||||||||
OCP | ||||||||||||
5.625%, 04/25/2024 | USD | 390 | 406 | |||||||||
|
| |||||||||||
Netherlands — 5.3% | ||||||||||||
ABN AMRO Bank MTN | ||||||||||||
6.375%, 04/27/2021 | 245 | 383 | ||||||||||
Achmea BV MTN | ||||||||||||
2.500%, 11/19/2020 | 625 | 847 | ||||||||||
Achmea Hypotheekbank MTN | ||||||||||||
2.750%, 02/18/2021 | 150 | 205 | ||||||||||
2.375%, 02/08/2016 | 275 | 356 | ||||||||||
Aegon MTN | ||||||||||||
4.000%, 04/25/2044 (B) | 108 | 139 | ||||||||||
Akzo Nobel MTN | ||||||||||||
8.000%, 04/06/2016 | GBP | 205 | 364 | |||||||||
ASML Holding | ||||||||||||
3.375%, 09/19/2023 | 450 | 639 | ||||||||||
Bharti Airtel International | ||||||||||||
4.000%, 12/10/2018 | 270 | 372 | ||||||||||
Coco-Cola HBC Finance | ||||||||||||
2.375%, 06/18/2020 | 750 | 998 | ||||||||||
Cooperatieve Centrale Raiffeisen-Boerenleenbank BA | ||||||||||||
2.500%, 05/26/2026 (B) | 260 | 331 | ||||||||||
EDP Finance MTN | ||||||||||||
2.625%, 01/18/2022 | 440 | 548 | ||||||||||
| Description | Face Amount (1) (Thousands) | Market Value ($ Thousands) | ||||||||||
Heineken MTN | ||||||||||||
2.125%, 08/04/2020 | 300 | $ | 403 | |||||||||
ING Bank MTN | ||||||||||||
6.125%, 05/29/2023 (B) | 145 | 210 | ||||||||||
5.800%, 09/25/2023 (A) | USD | 375 | 413 | |||||||||
3.625%, 02/25/2026 (B) | 180 | 241 | ||||||||||
3.375%, 03/23/2017 | 125 | 171 | ||||||||||
Kingdom of Netherlands | ||||||||||||
4.000%, 01/15/2037 | 300 | 533 | ||||||||||
3.500%, 07/15/2020 | 3,235 | 4,811 | ||||||||||
3.250%, 07/15/2021 | 705 | 1,048 | ||||||||||
2.250%, 07/15/2022 | 1,255 | 1,763 | ||||||||||
2.000%, 07/15/2024 | 625 | 856 | ||||||||||
1.750%, 07/15/2023 | 1,015 | 1,370 | ||||||||||
1.750%, 07/15/2023 (F) | 4,250 | 5,736 | ||||||||||
1.250%, 01/15/2019 | 770 | 1,018 | ||||||||||
Koninklijke KPN | ||||||||||||
3.250%, 02/01/2021 | 200 | 278 | ||||||||||
NN Group | ||||||||||||
4.625%, 04/08/2044 (B) | 850 | 1,098 | ||||||||||
Robert Bosch Investment Nederland MTN | ||||||||||||
1.625%, 05/24/2021 | 500 | 661 | ||||||||||
Shell International Finance | ||||||||||||
2.250%, 01/06/2023 | USD | 825 | 778 | |||||||||
TenneT Holding | ||||||||||||
2.125%, 11/01/2020 | 350 | 470 | ||||||||||
UPCB Finance | ||||||||||||
7.625%, 01/15/2020 | 250 | 331 | ||||||||||
Wuerth Finance International MTN | ||||||||||||
1.750%, 05/21/2020 | 150 | 199 | ||||||||||
|
| |||||||||||
| 27,570 | ||||||||||||
|
| |||||||||||
New Zealand — 0.9% | ||||||||||||
Government of New Zealand | ||||||||||||
5.500%, 04/15/2023 | 320 | 273 | ||||||||||
5.000%, 03/15/2019 | 5,340 | 4,333 | ||||||||||
Westpac Securities MTN | ||||||||||||
0.875%, 06/24/2019 | EUR | 100 | 129 | |||||||||
|
| |||||||||||
| 4,735 | ||||||||||||
|
| |||||||||||
Norway — 0.5% | ||||||||||||
DnB Bank MTN | ||||||||||||
4.750%, 03/08/2022 (B) | EUR | 120 | 164 | |||||||||
3.000%, 09/26/2023 (B) | EUR | 170 | 227 | |||||||||
Eksportfinans | ||||||||||||
2.375%, 05/25/2016 | USD | 200 | 200 | |||||||||
2.000%, 09/15/2015 | USD | 20 | 20 | |||||||||
Government of Norway | ||||||||||||
4.500%, 05/22/2019 | 2,325 | 407 | ||||||||||
2.000%, 05/24/2023 | 645 | 99 | ||||||||||
Kommunalbanken MTN | ||||||||||||
1.000%, 03/15/2018 (A) | USD | 800 | 787 | |||||||||
| 30 | SEI Institutional International Trust / Annual Report / September 30, 2014 |
| Description | Face Amount (1) (Thousands) | Market Value ($ Thousands) | ||||||||||
Sparebank 1 Boligkreditt MTN | ||||||||||||
2.375%, 11/22/2016 | EUR | 170 | $ | 225 | ||||||||
Yara International | ||||||||||||
7.875%, 06/11/2019 (A) | USD | 185 | 223 | |||||||||
|
| |||||||||||
| 2,352 | ||||||||||||
|
| |||||||||||
Peru — 0.0% | ||||||||||||
Minsur | ||||||||||||
6.250%, 02/07/2024 | USD | 230 | 253 | |||||||||
|
| |||||||||||
Poland — 0.4% | ||||||||||||
Republic of Poland | ||||||||||||
5.125%, 04/21/2021 | USD | 135 | 150 | |||||||||
4.000%, 10/25/2023 | 300 | 98 | ||||||||||
2.500%, 07/25/2018 | 710 | 217 | ||||||||||
Republic of Poland, Ser 1019 | ||||||||||||
5.500%, 10/25/2019 | 1,475 | 512 | ||||||||||
Republic of Poland, Ser 1021 | ||||||||||||
5.750%, 10/25/2021 | 3,490 | 1,256 | ||||||||||
|
| |||||||||||
| 2,233 | ||||||||||||
|
| |||||||||||
Portugal — 0.4% | ||||||||||||
Caixa Geral de Depositos MTN | ||||||||||||
3.000%, 01/15/2019 | 300 | 411 | ||||||||||
Portugal Obrigacoes do Tesouro OT | ||||||||||||
4.750%, 06/14/2019 | 290 | 416 | ||||||||||
3.875%, 02/15/2030 | 215 | 275 | ||||||||||
3.850%, 04/15/2021 | 240 | 331 | ||||||||||
|
| |||||||||||
| 1,433 | ||||||||||||
|
| |||||||||||
Romania — 0.0% | ||||||||||||
Romanian Government International Bond MTN | ||||||||||||
4.625%, 09/18/2020 | EUR | 40 | 57 | |||||||||
3.625%, 04/24/2024 | EUR | 20 | 27 | |||||||||
|
| |||||||||||
| 84 | ||||||||||||
|
| |||||||||||
Singapore — 0.3% | ||||||||||||
Government of Singapore | ||||||||||||
4.000%, 09/01/2018 | 495 | 429 | ||||||||||
3.375%, 09/01/2033 | 900 | 748 | ||||||||||
3.125%, 09/01/2022 | 275 | 229 | ||||||||||
Temasek Financial I MTN | ||||||||||||
2.375%, 01/23/2023 (A) | USD | 495 | 474 | |||||||||
|
| |||||||||||
| 1,880 | ||||||||||||
|
| |||||||||||
Slovak Republic — 0.0% | ||||||||||||
Slovakia Government Bond | ||||||||||||
3.375%, 11/15/2024 | 110 | 163 | ||||||||||
|
| |||||||||||
South Africa — 0.4% | ||||||||||||
Gold Fields Orogen Holding | ||||||||||||
4.875%, 10/07/2020 | USD | 400 | 356 | |||||||||
Republic of South Africa | ||||||||||||
8.250%, 09/15/2017 | 15,605 | 1,419 | ||||||||||
| Description | Face Amount (1) (Thousands) | Market Value ($ Thousands) | ||||||||
8.000%, 01/31/2030 | 2,820 | $ | 234 | |||||||
7.000%, 02/28/2031 | 5,005 | 376 | ||||||||
|
| |||||||||
| 2,385 | ||||||||||
|
| |||||||||
South Korea — 0.8% | ||||||||||
Korea Treasury Bond | ||||||||||
4.250%, 06/10/2021 | 1,270,230 | 1,321 | ||||||||
4.000%, 12/10/2031 | 510,000 | 546 | ||||||||
3.500%, 09/10/2016 | 973,960 | 944 | ||||||||
3.500%, 03/10/2024 | 1,047,890 | 1,045 | ||||||||
2.750%, 03/10/2018 | 511,230 | 490 | ||||||||
|
| |||||||||
| 4,346 | ||||||||||
|
| |||||||||
Spain — 4.9% | ||||||||||
Ayt Cedulas Cajas Global | ||||||||||
3.750%, 12/14/2022 | 200 | 287 | ||||||||
AyT Cedulas Cajas X Fondo de Titulizacion | ||||||||||
0.152%, 06/30/2015 (B) | 200 | 252 | ||||||||
Banco de Sabadell | ||||||||||
3.375%, 01/23/2018 | 100 | 138 | ||||||||
Banco Popular Espanol | ||||||||||
4.000%, 10/18/2016 | 100 | 135 | ||||||||
3.750%, 01/22/2019 | 100 | 140 | ||||||||
2.125%, 10/08/2019 | 100 | 133 | ||||||||
Bankia | ||||||||||
4.000%, 02/03/2025 | 300 | 445 | ||||||||
CaixaBank | ||||||||||
3.000%, 03/22/2018 | 200 | 275 | ||||||||
Caja de Ahorros y Pensiones de Barcelona | ||||||||||
2.375%, 05/09/2019 | 700 | 912 | ||||||||
Ferrovial Emisiones MTN | ||||||||||
3.375%, 06/07/2021 | 475 | 671 | ||||||||
Fondo de Amortizacion del Deficit Electrico | ||||||||||
4.125%, 03/17/2017 | 200 | 274 | ||||||||
2.250%, 12/17/2016 | 700 | 917 | ||||||||
Government of Spain | ||||||||||
6.000%, 01/31/2029 | 465 | 808 | ||||||||
5.850%, 01/31/2022 | 660 | 1,084 | ||||||||
5.500%, 07/30/2017 | 545 | 785 | ||||||||
5.500%, 04/30/2021 | 1,980 | 3,163 | ||||||||
5.150%, 10/31/2044 | 680 | 1,120 | ||||||||
4.850%, 10/31/2020 | 1,430 | 2,193 | ||||||||
4.700%, 07/30/2041 | 230 | 357 | ||||||||
4.500%, 01/31/2018 | 1,020 | 1,453 | ||||||||
3.800%, 04/30/2024 | 1,000 | 1,452 | ||||||||
3.300%, 07/30/2016 | 3,400 | 4,528 | ||||||||
3.150%, 01/31/2016 | 1,350 | 1,771 | ||||||||
2.750%, 10/31/2024 | 585 | 776 | ||||||||
Santander Consumer Finance | ||||||||||
3.875%, 03/23/2016 | 200 | 266 | ||||||||
| SEI Institutional International Trust / Annual Report / September 30, 2014 | 31 |
SCHEDULE OF INVESTMENTS
International Fixed Income Fund (Continued)
September 30, 2014
| Description | Face Amount (1) (Thousands) | Market Value ($ Thousands) | ||||||||||
Santander International Debt MTN | ||||||||||||
4.625%, 03/21/2016 | 700 | $ | 938 | |||||||||
|
| |||||||||||
| 25,273 | ||||||||||||
|
| |||||||||||
Supra-National — 0.8% | ||||||||||||
European Financial Stability Facility | ||||||||||||
1.625%, 07/17/2020 | EUR | 1,700 | 2,291 | |||||||||
European Investment Bank MTN | ||||||||||||
2.750%, 09/15/2021 | EUR | 1,000 | 1,448 | |||||||||
1.375%, 09/15/2021 | EUR | 575 | 764 | |||||||||
|
| |||||||||||
| 4,503 | ||||||||||||
|
| |||||||||||
Sweden — 0.8% | ||||||||||||
Akzo Nobel Sweden Finance MTN | ||||||||||||
2.625%, 07/27/2022 | EUR | 150 | 205 | |||||||||
Kingdom of Sweden | ||||||||||||
3.500%, 03/30/2039 | 260 | 46 | ||||||||||
1.500%, 11/13/2023 | 2,200 | 309 | ||||||||||
Kingdom of Sweden, Ser 1047 | ||||||||||||
5.000%, 12/01/2020 | 3,700 | 638 | ||||||||||
Kingdom of Sweden, Ser 1052 | ||||||||||||
4.250%, 03/12/2019 | 4,485 | 722 | ||||||||||
Kingdom of Sweden, Ser 1054 | ||||||||||||
3.500%, 06/01/2022 | 3,535 | 574 | ||||||||||
Nordea Bank MTN | ||||||||||||
4.500%, 03/26/2020 | EUR | 225 | 327 | |||||||||
4.000%, 03/29/2021 | EUR | 255 | 365 | |||||||||
Skandinaviska Enskilda Banken MTN | ||||||||||||
1.875%, 11/14/2019 | EUR | 175 | 233 | |||||||||
Svenska Handelsbanken | ||||||||||||
2.656%, 01/15/2024 (B) | EUR | 651 | 857 | |||||||||
|
| |||||||||||
| 4,276 | ||||||||||||
|
| |||||||||||
Switzerland — 0.7% | ||||||||||||
Credit Suisse MTN | ||||||||||||
5.750%, 09/18/2025 (B) | EUR | 250 | 346 | |||||||||
4.750%, 08/05/2019 | EUR | 400 | 600 | |||||||||
Government of Switzerland | ||||||||||||
3.000%, 05/12/2019 | 160 | 190 | ||||||||||
2.000%, 04/28/2021 | 1,070 | 1,249 | ||||||||||
2.000%, 05/25/2022 | 110 | 130 | ||||||||||
1.500%, 04/30/2042 | 120 | 135 | ||||||||||
1.250%, 06/11/2024 | 100 | 112 | ||||||||||
UBS MTN | ||||||||||||
6.625%, 04/11/2018 | GBP | 150 | 280 | |||||||||
6.375%, 07/20/2016 | GBP | 160 | 282 | |||||||||
4.750%, 02/12/2026 (B) | EUR | 500 | 662 | |||||||||
4.280%, 04/29/2049 (B) | EUR | 200 | 254 | |||||||||
|
| |||||||||||
| 4,240 | ||||||||||||
|
| |||||||||||
| Description | Face Amount (1) (Thousands) | Market Value ($ Thousands) | ||||||||||
Thailand — 0.1% | ||||||||||||
Thailand Government Bond | ||||||||||||
3.650%, 12/17/2021 | THB | 16,020 | $ | 507 | ||||||||
|
| |||||||||||
Turkey — 0.2% | ||||||||||||
Akbank | ||||||||||||
3.875%, 10/24/2017 (A) | USD | 380 | 382 | |||||||||
Republic of Turkey | ||||||||||||
5.875%, 04/02/2019 | EUR | 225 | 325 | |||||||||
5.500%, 02/16/2017 | EUR | 50 | 68 | |||||||||
Turkiye Garanti Bankasi MTN | ||||||||||||
4.750%, 10/17/2019 (A) | USD | 390 | 387 | |||||||||
|
| |||||||||||
| 1,162 | ||||||||||||
|
| |||||||||||
United Arab Emirates — 0.1% | ||||||||||||
Emirates Telecommunications MTN | ||||||||||||
2.750%, 06/18/2026 | EUR | 275 | 360 | |||||||||
IPIC GMTN MTN | ||||||||||||
6.875%, 03/14/2026 | GBP | 100 | 203 | |||||||||
5.875%, 03/14/2021 | EUR | 125 | 200 | |||||||||
|
| |||||||||||
| 763 | ||||||||||||
|
| |||||||||||
United Kingdom — 16.2% | ||||||||||||
AA Bond | ||||||||||||
4.720%, 07/02/2043 | 500 | 858 | ||||||||||
Abbey National Treasury Services MTN | ||||||||||||
5.250%, 02/16/2029 | 450 | 891 | ||||||||||
5.125%, 04/14/2021 | 300 | 562 | ||||||||||
4.250%, 04/12/2021 | EUR | 350 | 541 | |||||||||
3.625%, 09/08/2016 | EUR | 300 | 404 | |||||||||
2.000%, 01/14/2019 | EUR | 400 | 531 | |||||||||
1.750%, 01/15/2018 | EUR | 525 | 686 | |||||||||
Aviva | ||||||||||||
6.875%, 05/22/2038 (B) | EUR | 195 | 284 | |||||||||
6.125%, 11/14/2036 (B) | 200 | 353 | ||||||||||
AWG Parent | ||||||||||||
6.875%, 08/21/2023 | 230 | 473 | ||||||||||
Bank of Scotland MTN | ||||||||||||
4.750%, 06/08/2022 | EUR | 290 | 471 | |||||||||
4.625%, 06/08/2017 | EUR | 275 | 389 | |||||||||
Barclays Bank MTN | ||||||||||||
6.750%, 01/16/2023 (B) | 350 | 622 | ||||||||||
6.625%, 03/30/2022 | EUR | 340 | 538 | |||||||||
4.250%, 01/12/2022 | 250 | 448 | ||||||||||
BAT International Finance MTN | ||||||||||||
7.250%, 03/12/2024 | 250 | 527 | ||||||||||
5.375%, 06/29/2017 | EUR | 425 | 607 | |||||||||
Bishopsgate Asset Finance | ||||||||||||
4.808%, 08/14/2044 | 180 | 290 | ||||||||||
Boparan Finance | ||||||||||||
5.250%, 07/15/2019 | 140 | 204 | ||||||||||
| 32 | SEI Institutional International Trust / Annual Report / September 30, 2014 |
| Description | Face Amount (1) (Thousands) | Market Value ($ Thousands) | ||||||||||
BP Capital Markets MTN | ||||||||||||
2.994%, 02/18/2019 | EUR | 162 | $ | 224 | ||||||||
2.500%, 11/06/2022 | USD | 400 | 377 | |||||||||
2.177%, 09/28/2021 | EUR | 245 | 327 | |||||||||
British American Tobacco Holdings MTN | ||||||||||||
4.000%, 07/07/2020 | 100 | 147 | ||||||||||
British Sky Broadcasting Group MTN | ||||||||||||
3.750%, 09/16/2024 (A) | USD | 211 | 210 | |||||||||
2.500%, 09/15/2026 | EUR | 500 | 637 | |||||||||
1.500%, 09/15/2021 | EUR | 250 | 315 | |||||||||
Channel Link Enterprises Finance | ||||||||||||
3.559%, 06/30/2050 (B) | EUR | 700 | 878 | |||||||||
Co-Operative Bank | ||||||||||||
4.750%, 11/11/2021 | 250 | 442 | ||||||||||
Coventry Building Society MTN | ||||||||||||
4.625%, 04/19/2018 | 230 | 407 | ||||||||||
Direct Line Insurance Group | ||||||||||||
9.250%, 04/27/2042 (B) | 100 | 205 | ||||||||||
Eastern Power Networks MTN | ||||||||||||
6.250%, 11/12/2036 | 160 | 331 | ||||||||||
ENW Finance MTN | ||||||||||||
6.125%, 07/21/2021 | 350 | 665 | ||||||||||
Eversholt Funding MTN | ||||||||||||
5.831%, 12/02/2020 | 100 | 184 | ||||||||||
Experian Finance MTN | ||||||||||||
4.750%, 02/04/2020 | EUR | 425 | 634 | |||||||||
FCE Bank MTN | ||||||||||||
5.125%, 11/16/2015 | 200 | 337 | ||||||||||
4.825%, 02/15/2017 | 200 | 345 | ||||||||||
1.875%, 05/12/2016 | EUR | 250 | 322 | |||||||||
1.625%, 09/09/2016 | EUR | 100 | 129 | |||||||||
First Hydro Finance | ||||||||||||
9.000%, 07/31/2021 | 220 | 474 | ||||||||||
Great Rolling Stock MTN | ||||||||||||
6.250%, 07/27/2020 | 300 | 559 | ||||||||||
HBOS Capital Funding | ||||||||||||
6.461%, 11/30/2049 (B) | 115 | 196 | ||||||||||
Heathrow Funding MTN | ||||||||||||
1.875%, 05/23/2022 | 175 | 228 | ||||||||||
HJ Heinz Finance UK | ||||||||||||
6.250%, 02/18/2030 | 115 | 201 | ||||||||||
HSBC Bank MTN | ||||||||||||
4.750%, 09/29/2020 (B) | 225 | 374 | ||||||||||
4.125%, 08/12/2020 | USD | 375 | 403 | |||||||||
HSBC Holdings MTN | ||||||||||||
6.500%, 05/20/2024 | 250 | 506 | ||||||||||
Imperial Tobacco Finance MTN | ||||||||||||
8.375%, 02/17/2016 | EUR | 575 | 804 | |||||||||
5.500%, 09/28/2026 | 350 | 645 | ||||||||||
3.375%, 02/26/2026 | EUR | 400 | 553 | |||||||||
2.250%, 02/26/2021 | EUR | 400 | 527 | |||||||||
| Description | Face Amount (1) (Thousands) | Market Value ($ Thousands) | ||||||||||
Intu SGS Finance MTN | ||||||||||||
3.875%, 03/17/2023 (C) | 250 | $ | 411 | |||||||||
Lloyds Banking Group | ||||||||||||
7.000%, 12/29/2049 (B) | 750 | 1,200 | ||||||||||
Lloyds TSB Bank MTN | ||||||||||||
6.500%, 03/24/2020 | EUR | 275 | 426 | |||||||||
4.625%, 02/02/2017 | EUR | 150 | 208 | |||||||||
Mondi Finance MTN | ||||||||||||
3.375%, 09/28/2020 | EUR | 400 | 556 | |||||||||
Motability Operations Group MTN | ||||||||||||
3.750%, 11/29/2017 | EUR | 300 | 416 | |||||||||
National Grid North America | ||||||||||||
1.750%, 07/22/2019 | 300 | 393 | ||||||||||
National Westminster Bank | ||||||||||||
6.500%, 09/07/2021 | 220 | 396 | ||||||||||
6.500%, 09/07/2021 | 550 | 991 | ||||||||||
Nationwide Building Society MTN | ||||||||||||
4.625%, 02/08/2021 | EUR | 550 | 866 | |||||||||
4.125%, 03/20/2023 (B) | EUR | 1,200 | 1,620 | |||||||||
Network Rail Infrastructure Finance MTN | ||||||||||||
4.400%, 03/06/2016 | CAD | 690 | 644 | |||||||||
Northern Rock | ||||||||||||
5.625%, 06/22/2017 (A) | USD | 1,750 | 1,936 | |||||||||
Northumbrian Water Finance | ||||||||||||
6.875%, 02/06/2023 | 190 | 383 | ||||||||||
6.000%, 10/11/2017 | 500 | 904 | ||||||||||
Paragon Offshore | ||||||||||||
7.250%, 08/15/2024 (A) | USD | 214 | 181 | |||||||||
6.750%, 07/15/2022 (A) | USD | 30 | 25 | |||||||||
PGH Capital | ||||||||||||
5.750%, 07/07/2021 | 250 | 418 | ||||||||||
RL Finance Bonds No. 2 | ||||||||||||
6.125%, 11/30/2043 (B) | 100 | 169 | ||||||||||
Rolls-Royce | ||||||||||||
6.750%, 04/30/2019 | 100 | 193 | ||||||||||
Royal Bank of Scotland | ||||||||||||
9.500%, 03/16/2022 (B) | USD | 200 | 228 | |||||||||
6.934%, 04/09/2018 | EUR | 300 | 435 | |||||||||
5.125%, 01/13/2024 | 400 | 762 | ||||||||||
Severn Trent Utilities Finance | ||||||||||||
6.125%, 02/26/2024 | 195 | 382 | ||||||||||
Southern Gas Networks MTN | ||||||||||||
4.875%, 10/05/2023 | 215 | 387 | ||||||||||
Standard Chartered MTN | ||||||||||||
4.000%, 07/12/2022 (B) | USD | 390 | 400 | |||||||||
Standard Life MTN | ||||||||||||
5.500%, 12/04/2042 (B) | 250 | 428 | ||||||||||
5.314%, 01/06/2049 (B) | EUR | 230 | 291 | |||||||||
Tesco MTN | ||||||||||||
6.125%, 02/24/2022 | 300 | 533 | ||||||||||
Thames Water Utilities Cayman Finance | ||||||||||||
4.000%, 06/19/2025 | 335 | 558 | ||||||||||
| SEI Institutional International Trust / Annual Report / September 30, 2014 | 33 |
SCHEDULE OF INVESTMENTS
International Fixed Income Fund (Continued)
September 30, 2014
| Description | Face Amount (1) (Thousands) | Market Value ($ Thousands) | ||||||||
United Kingdom Gilt | ||||||||||
5.000%, 03/07/2018 | 2,545 | $ | 4,624 | |||||||
4.500%, 09/07/2034 | 250 | 502 | ||||||||
4.500%, 12/07/2042 | 1,675 | 3,475 | ||||||||
4.250%, 06/07/2032 | 110 | 213 | ||||||||
3.750%, 09/07/2020 | 215 | 384 | ||||||||
3.750%, 07/22/2052 | 315 | 592 | ||||||||
3.500%, 01/22/2045 | 585 | 1,028 | ||||||||
3.250%, 01/22/2044 | 680 | 1,142 | ||||||||
2.750%, 09/07/2024 | 345 | 575 | ||||||||
2.250%, 09/07/2023 | 2,805 | 4,524 | ||||||||
1.750%, 07/22/2019 | 5,865 | 9,496 | ||||||||
1.250%, 07/22/2018 | 555 | 890 | ||||||||
United Kingdom Gilt - Inflation Linked | ||||||||||
2.500%, 07/26/2016 | 550 | 2,979 | ||||||||
United Kingdom Treasury | ||||||||||
4.750%, 12/07/2030 | 1,380 | 2,809 | ||||||||
4.250%, 03/07/2036 | 770 | 1,503 | ||||||||
4.250%, 09/07/2039 | 1,170 | 2,310 | ||||||||
4.000%, 03/07/2022 | 2,050 | 3,757 | ||||||||
1.750%, 01/22/2017 | 1,670 | 2,753 | ||||||||
Wales & West Utilities Finance | ||||||||||
6.750%, 12/17/2036 (B) | 200 | 370 | ||||||||
6.250%, 11/30/2021 | 240 | 466 | ||||||||
Western Power Distribution South West | ||||||||||
5.750%, 03/23/2040 | 200 | 397 | ||||||||
Western Power Distribution West Midlands | ||||||||||
3.875%, 10/17/2024 | 230 | 381 | ||||||||
Yorkshire Power Finance | ||||||||||
7.250%, 08/04/2028 | 208 | 442 | ||||||||
Yorkshire Water Services Bradford Finance | ||||||||||
6.375%, 08/19/2039 | 100 | 215 | ||||||||
|
| |||||||||
| 84,832 | ||||||||||
|
| |||||||||
United States — 5.7% | ||||||||||
21st Century Fox America | ||||||||||
4.500%, 02/15/2021 | 75 | 82 | ||||||||
AbbVie | ||||||||||
2.900%, 11/06/2022 | 255 | 244 | ||||||||
Aetna | ||||||||||
2.750%, 11/15/2022 | 165 | 158 | ||||||||
Altria Group | ||||||||||
4.750%, 05/05/2021 | 180 | 196 | ||||||||
4.250%, 08/09/2042 | 265 | 240 | ||||||||
American Equity Investment Life Holding | ||||||||||
6.625%, 07/15/2021 | 144 | 151 | ||||||||
| Description | Face Amount (1) (Thousands) | Market Value ($ Thousands) | ||||||||||
American International Group | ||||||||||||
8.175%, 05/15/2058 (B) | 240 | $ | 323 | |||||||||
6.797%, 11/15/2017 | EUR | 170 | 253 | |||||||||
AT&T | ||||||||||||
5.875%, 04/28/2017 | GBP | 200 | 356 | |||||||||
4.875%, 06/01/2044 | GBP | 130 | 224 | |||||||||
Bank of America MTN | ||||||||||||
4.200%, 08/26/2024 | 214 | 212 | ||||||||||
4.000%, 04/01/2024 | 148 | 150 | ||||||||||
0.922%, 03/28/2018 (B) | EUR | 300 | 375 | |||||||||
Bristol-Myers Squibb | ||||||||||||
2.000%, 08/01/2022 | 670 | 622 | ||||||||||
Chevron | ||||||||||||
2.355%, 12/05/2022 | 810 | 771 | ||||||||||
Citigroup | ||||||||||||
5.000%, 08/02/2019 | EUR | 230 | 347 | |||||||||
4.450%, 01/10/2017 | 250 | 266 | ||||||||||
2.375%, 05/22/2024 | EUR | 700 | 928 | |||||||||
2.125%, 09/10/2026 | EUR | 650 | 820 | |||||||||
Coca-Cola | ||||||||||||
2.750%, 05/06/2026 | EUR | 160 | 214 | |||||||||
1.125%, 09/22/2022 | EUR | 750 | 946 | |||||||||
Diamond Offshore Drilling | ||||||||||||
4.875%, 11/01/2043 | 130 | 121 | ||||||||||
Discovery Communications | ||||||||||||
2.375%, 03/07/2022 | EUR | 350 | 465 | |||||||||
Dover MTN | ||||||||||||
2.125%, 12/01/2020 | EUR | 250 | 335 | |||||||||
General Electric | ||||||||||||
2.700%, 10/09/2022 | 320 | 311 | ||||||||||
General Electric Capital MTN | ||||||||||||
5.500%, 01/08/2020 | 305 | 350 | ||||||||||
5.300%, 02/11/2021 | 205 | 231 | ||||||||||
4.625%, 01/07/2021 | 750 | 827 | ||||||||||
Glencore Funding | ||||||||||||
4.125%, 05/30/2023 (A) | 94 | 93 | ||||||||||
Goldman Sachs Group MTN | ||||||||||||
4.250%, 01/29/2026 | GBP | 190 | 319 | |||||||||
2.625%, 08/19/2020 | EUR | 350 | 478 | |||||||||
Healthcare Trust of America Holdings | ||||||||||||
3.375%, 07/15/2021 (C) | 86 | 86 | ||||||||||
Illinois Tool Works MTN | ||||||||||||
3.000%, 05/19/2034 | EUR | 400 | 539 | |||||||||
INEOS Group Holdings | ||||||||||||
5.750%, 02/15/2019 | 350 | 443 | ||||||||||
Intelsat Jackson Holdings | ||||||||||||
5.500%, 08/01/2023 | 240 | 229 | ||||||||||
International Business Machines MTN | ||||||||||||
1.375%, 11/19/2019 | EUR | 250 | 327 | |||||||||
| 34 | SEI Institutional International Trust / Annual Report / September 30, 2014 |
| Description | Face Amount (1) (Thousands) | Market Value ($ Thousands) | ||||||||||
Jefferies Group MTN | ||||||||||||
2.375%, 05/20/2020 | EUR | 700 | $ | 904 | ||||||||
John Deere Bank MTN | ||||||||||||
1.500%, 07/16/2018 | 250 | 327 | ||||||||||
JPMorgan Chase Bank | ||||||||||||
0.767%, 05/31/2017 (B) | EUR | 1,250 | 1,575 | |||||||||
JPMorgan Chase MTN | ||||||||||||
0.602%, 10/12/2015 (B) | EUR | 350 | 441 | |||||||||
Merrill Lynch MTN | ||||||||||||
0.634%, 09/14/2018 (B) | EUR | 375 | 465 | |||||||||
Metropolitan Life Global Funding I MTN | ||||||||||||
4.625%, 05/16/2017 | EUR | 200 | 280 | |||||||||
Morgan Stanley MTN | ||||||||||||
5.375%, 08/10/2020 | EUR | 150 | 233 | |||||||||
3.750%, 09/21/2017 | EUR | 350 | 483 | |||||||||
2.375%, 03/31/2021 | EUR | 1,250 | 1,673 | |||||||||
Nabors Industries | ||||||||||||
5.100%, 09/15/2023 (A) | EUR | 280 | 304 | |||||||||
Nissan Motor Acceptance | ||||||||||||
2.350%, 03/04/2019 (A) | 540 | 541 | ||||||||||
Offshore Group Investment | ||||||||||||
7.125%, 04/01/2023 | 218 | 192 | ||||||||||
Owens Corning | ||||||||||||
6.500%, 12/01/2016 | 145 | 160 | ||||||||||
Philip Morris International | ||||||||||||
2.900%, 11/15/2021 | 325 | 325 | ||||||||||
2.875%, 05/30/2024 | EUR | 100 | 139 | |||||||||
2.875%, 03/03/2026 | EUR | 435 | 598 | |||||||||
2.125%, 05/30/2019 | EUR | 100 | 134 | |||||||||
PNC Funding | ||||||||||||
5.125%, 02/08/2020 | 300 | 338 | ||||||||||
3.300%, 03/08/2022 | 150 | 151 | ||||||||||
Priceline Group | ||||||||||||
2.375%, 09/23/2024 | EUR | 250 | 318 | |||||||||
Principal Financial Group | ||||||||||||
1.850%, 11/15/2017 | 175 | 175 | ||||||||||
Procter & Gamble | ||||||||||||
2.000%, 11/05/2021 | EUR | 150 | 202 | |||||||||
Prologis | ||||||||||||
3.375%, 02/20/2024 | EUR | 300 | 421 | |||||||||
3.000%, 01/18/2022 | EUR | 250 | 345 | |||||||||
3.000%, 06/02/2026 | EUR | 200 | 269 | |||||||||
Prologis International Funding II MTN | ||||||||||||
2.875%, 04/04/2022 | 220 | 297 | ||||||||||
Prudential Financial | ||||||||||||
5.625%, 06/15/2043 (B) | 545 | 568 | ||||||||||
Rabobank Capital Funding | ||||||||||||
5.556%, 12/31/2019 (B) | GBP | 153 | 260 | |||||||||
Regency Energy Partners | ||||||||||||
4.500%, 11/01/2023 | 72 | 70 | ||||||||||
Republic Services | ||||||||||||
4.750%, 05/15/2023 | 155 | 170 | ||||||||||
| Description | Face Amount (1) (Thousands) | Market Value ($ Thousands) | ||||||||||
Reynolds American | ||||||||||||
3.250%, 11/01/2022 | 180 | $ | 174 | |||||||||
Ryder System MTN | ||||||||||||
5.850%, 11/01/2016 | 116 | 127 | ||||||||||
Sabine Pass Liquefaction | ||||||||||||
5.750%, 05/15/2024 (A) | 230 | 234 | ||||||||||
Seagate HDD | ||||||||||||
4.750%, 01/01/2025 (A) | 123 | 122 | ||||||||||
Sirius XM Radio | ||||||||||||
4.625%, 05/15/2023 (A) | 254 | 236 | ||||||||||
SM Energy | ||||||||||||
6.500%, 01/01/2023 | 16 | 17 | ||||||||||
Societe Generale | ||||||||||||
5.922%, 04/05/2017 (A) (B) | 180 | 190 | ||||||||||
Sprint | ||||||||||||
7.875%, 09/15/2023 (A) | 187 | 198 | ||||||||||
Time Warner Cable | ||||||||||||
5.750%, 06/02/2031 | GBP | 250 | 475 | |||||||||
5.250%, 07/15/2042 | GBP | 400 | 726 | |||||||||
UBS MTN | ||||||||||||
5.875%, 12/20/2017 | USD | 247 | 278 | |||||||||
United Technologies | ||||||||||||
1.800%, 06/01/2017 | 201 | 204 | ||||||||||
UnitedHealth Group | ||||||||||||
2.750%, 02/15/2023 | 120 | 116 | ||||||||||
Verizon Communications | ||||||||||||
6.550%, 09/15/2043 | 165 | 206 | ||||||||||
Viacom | ||||||||||||
3.875%, 04/01/2024 | 148 | 147 | ||||||||||
WellPoint | ||||||||||||
4.650%, 01/15/2043 | 110 | 108 | ||||||||||
2.300%, 07/15/2018 | 150 | 150 | ||||||||||
Wells Fargo MTN | ||||||||||||
4.600%, 04/01/2021 | 75 | 82 | ||||||||||
Williams Partners | ||||||||||||
5.250%, 03/15/2020 | 89 | 99 | ||||||||||
3.900%, 01/15/2025 | 228 | 226 | ||||||||||
Windstream | ||||||||||||
7.500%, 04/01/2023 | 255 | 261 | ||||||||||
|
| |||||||||||
| 29,766 | ||||||||||||
|
| |||||||||||
Total Global Bonds | 490,596 | |||||||||||
|
| |||||||||||
MORTGAGE-BACKED SECURITIES — 2.0% |
| |||||||||||
Agency Mortgage-Backed Obligations — 0.1% |
| |||||||||||
FHLMC Structured Agency Credit Risk Debt Notes, Ser 2014-HQ2, Cl M1 | ||||||||||||
1.604%, 09/25/2024 (A) (B) | 430 | 429 | ||||||||||
FHLMC, Ser K501, Cl X1A, IO | ||||||||||||
1.849%, 08/25/2016 (B) (E) | 299 | 7 | ||||||||||
|
| |||||||||||
| 436 | ||||||||||||
|
| |||||||||||
| SEI Institutional International Trust / Annual Report / September 30, 2014 | 35 |
SCHEDULE OF INVESTMENTS
International Fixed Income Fund (Continued)
September 30, 2014
| Description | Face Amount (1) (Thousands) | Market Value ($ Thousands) | ||||||||
Non-Agency Mortgage-Backed Obligations — 1.9% |
| |||||||||
BB-UBS Trust, | ||||||||||
3.430%, 11/05/2036 (A) | 100 | $ | 99 | |||||||
Bear Stearns Adjustable Rate Mortgage Trust, Ser 2004-6, Cl 3A | ||||||||||
2.665%, 09/25/2034 (A) (B) | 94 | 93 | ||||||||
Bear Stearns Commercial Mortgage Securities, Ser 2005-PW10, Cl A4 | ||||||||||
5.405%, 12/11/2040 (B) | 178 | 184 | ||||||||
Bear Stearns Commercial Mortgage Securities, | ||||||||||
4.871%, 09/11/2042 | 20 | 21 | ||||||||
Bear Stearns Commercial Mortgage Securities, Ser 2005-T20, Cl A4A | ||||||||||
5.289%, 10/12/2042 (B) | 40 | 41 | ||||||||
Bear Stearns Commercial Mortgage Securities, Ser 2006-T24, Cl A4 | ||||||||||
5.537%, 10/12/2041 | 192 | 205 | ||||||||
Bear Stearns Commercial Mortgage Securities, Ser 2007-PW15, Cl A4 | ||||||||||
5.331%, 02/11/2044 | 54 | 57 | ||||||||
Bear Stearns Commercial Mortgage Securities, Ser 2007-PW16, Cl A4 | ||||||||||
5.897%, 06/11/2040 (B) | 241 | 265 | ||||||||
Bear Stearns Commercial Mortgage Securities, Ser 2007-PW17, Cl A4 | ||||||||||
5.694%, 06/11/2050 (B) | 110 | 120 | ||||||||
Bear Stearns Commercial Mortgage Securities, Ser 2007-T26, Cl A4 | ||||||||||
5.471%, 01/12/2045 (B) | 66 | 71 | ||||||||
CD Mortgage Trust, | ||||||||||
5.886%, 11/15/2044 (B) | 107 | 118 | ||||||||
Citigroup Commercial Mortgage Trust, Ser 2006-C4, Cl A3 | ||||||||||
5.975%, 03/15/2049 (B) | 150 | 158 | ||||||||
Citigroup Commercial Mortgage Trust, Ser 2008-C7, Cl A4 | ||||||||||
6.339%, 12/10/2049 (B) | 570 | 628 | ||||||||
Citigroup Mortgage Loan Trust, | ||||||||||
2.612%, 05/25/2035 (A) (B) | 605 | 599 | ||||||||
COMM Mortgage Trust, | ||||||||||
5.948%, 06/10/2046 (B) | 126 | 134 | ||||||||
COMM Mortgage Trust, | ||||||||||
4.238%, 07/10/2045 (B) | 35 | 38 | ||||||||
COMM Mortgage Trust, | ||||||||||
3.213%, 03/10/2046 | 105 | 105 | ||||||||
| Description | Face Amount (1) (Thousands) | Market Value ($ Thousands) | ||||||||||
COMM Mortgage Trust, | ||||||||||||
3.334%, 06/10/2046 | 130 | $ | 131 | |||||||||
COMM Mortgage Trust, | ||||||||||||
4.022%, 07/10/2045 | 50 | 53 | ||||||||||
COMM Mortgage Trust, | ||||||||||||
3.955%, 02/10/2047 | 70 | 73 | ||||||||||
COMM Mortgage Trust, | ||||||||||||
1.304%, 06/15/2034 (A) (B) | 230 | 230 | ||||||||||
COMM Mortgage Trust, | ||||||||||||
3.694%, 08/10/2047 | 65 | 66 | ||||||||||
Commercial Mortgage Loan Trust, | ||||||||||||
6.212%, 12/10/2049 (B) | 276 | 299 | ||||||||||
Credit Suisse First Boston Mortgage Securities, Ser 2005-C2, Cl AMFX | ||||||||||||
4.877%, 04/15/2037 | 85 | 86 | ||||||||||
CW Capital Cobalt, | ||||||||||||
5.223%, 08/15/2048 | 45 | 48 | ||||||||||
Eddystone Finance, | ||||||||||||
1.081%, 04/19/2021 (B) (E) | 124 | 199 | ||||||||||
FNMA Connecticut Avenue Securities, Ser 2013-C01, Cl M1 | ||||||||||||
2.155%, 10/25/2023 (A) (B) | 130 | 131 | ||||||||||
FNMA Connecticut Avenue Securities, Ser 2014-C01, Cl M1 | ||||||||||||
1.755%, 01/25/2024 (A) (B) | 334 | 334 | ||||||||||
GE Capital Commercial Mortgage, | ||||||||||||
5.490%, 11/10/2045 (B) | 55 | 57 | ||||||||||
GMAC Commercial Mortgage Securities Trust, | ||||||||||||
5.238%, 11/10/2045 (B) | 109 | 113 | ||||||||||
Goldman Sachs Mortgage Securities Trust, Ser 2014-GC20, Cl D | ||||||||||||
5.029%, 04/10/2047 (A) (B) | 80 | 74 | ||||||||||
Granite Master Issuer, | ||||||||||||
0.187%, 12/20/2054 (A) (B) (E) | EUR | 100 | 126 | |||||||||
Granite Master Issuer, | ||||||||||||
0.207%, 12/20/2054 (A) (B) (E) | EUR | 197 | 248 | |||||||||
Greenwich Capital Commercial Funding, Ser 2006-GG7, Cl A4 | ||||||||||||
6.014%, 07/10/2038 (B) | 141 | 150 | ||||||||||
| 36 | SEI Institutional International Trust / Annual Report / September 30, 2014 |
| Description | Face Amount (1) (Thousands) | Market Value ($ Thousands) | ||||||||
Greenwich Capital Commercial Funding, Ser 2007-GG11, Cl A4 | ||||||||||
5.736%, 12/10/2049 | 240 | $ | 263 | |||||||
Greenwich Capital Commercial Funding, Ser 2007-GG9, Cl AM | ||||||||||
5.475%, 03/10/2039 | 370 | 391 | ||||||||
GS Mortgage Securities II, | ||||||||||
5.366%, 05/03/2032 (A) | 50 | 58 | ||||||||
GS Mortgage Securities Trust, | ||||||||||
1.865%, 08/10/2044 (A) (B) | 303 | 19 | ||||||||
GS Mortgage Securities Trust, | ||||||||||
0.366%, 07/10/2046 (B) | 1,660 | 20 | ||||||||
GSR Mortgage Loan Trust, | ||||||||||
4.506%, 01/25/2035 (A) (B) | 155 | 152 | ||||||||
Hilton USA Trust, Ser 2013-HLT, | ||||||||||
2.662%, 11/05/2030 (A) | 100 | 100 | ||||||||
JPMBB Commercial Mortgage Securities Trust, | ||||||||||
0.890%, 09/15/2047 (B) | 1,000 | 54 | ||||||||
JPMorgan Chase Commercial Mortgage Securities, | ||||||||||
5.420%, 01/12/2043 (B) | 85 | 88 | ||||||||
JPMorgan Chase Commercial Mortgage Securities, | ||||||||||
6.058%, 04/15/2045 (B) | 90 | 96 | ||||||||
JPMorgan Chase Commercial Mortgage Securities, | ||||||||||
5.399%, 05/15/2045 | 74 | 79 | ||||||||
JPMorgan Chase Commercial Mortgage Securities, | ||||||||||
5.716%, 02/15/2051 | 85 | 92 | ||||||||
JPMorgan Chase Commercial Mortgage Securities, | ||||||||||
5.892%, 02/12/2049 (B) | 235 | 256 | ||||||||
JPMorgan Chase Commercial Mortgage Securities, | ||||||||||
1.654%, 02/12/2051 (B) | 207 | 199 | ||||||||
JPMorgan Chase Commercial Mortgage Securities, | ||||||||||
6.068%, 02/12/2051 | 19 | 20 | ||||||||
JPMorgan Chase Commercial Mortgage Securities, | ||||||||||
2.829%, 10/15/2045 | 90 | 88 | ||||||||
| Description | Face Amount (1) (Thousands) | Market Value ($ Thousands) | ||||||||
JPMorgan Chase Commercial Mortgage Securities, | ||||||||||
4.822%, 10/15/2045 (A) (B) | 100 | $ | 99 | |||||||
JPMorgan Chase Commercial Mortgage Securities, | ||||||||||
2.840%, 12/15/2047 | 50 | 49 | ||||||||
JPMorgan Chase Commercial Mortgage Securities, | ||||||||||
3.905%, 05/05/2030 (A) | 100 | 103 | ||||||||
JPMorgan Mortgage Trust, | ||||||||||
2.246%, 12/25/2034 (A) (B) | 109 | 109 | ||||||||
LB-UBS Commercial Mortgage Trust, Ser 2007-C2, Cl A3 | ||||||||||
5.430%, 02/15/2040 | 70 | 75 | ||||||||
LB-UBS Commercial Mortgage Trust, Ser 2007-C6, Cl A4 | ||||||||||
5.858%, 07/15/2040 (B) | 169 | 179 | ||||||||
LB-UBS Commercial Mortgage Trust, Ser 2007-C7, Cl A3 | ||||||||||
5.866%, 09/15/2045 (B) | 64 | 71 | ||||||||
LB-UBS Commercial Mortgage Trust, Ser 2008-C1, Cl A2 | ||||||||||
6.320%, 04/15/2041 (B) | 51 | 57 | ||||||||
Merrill Lynch Mortgage Trust, | ||||||||||
5.137%, 07/12/2038 (B) | 55 | 57 | ||||||||
ML-CFC Commercial Mortgage Trust, Ser 2007-5, Cl AM | ||||||||||
5.419%, 08/12/2048 | 40 | 42 | ||||||||
ML-CFC Commercial Mortgage Trust, Ser 2007-5, Cl A4 | ||||||||||
5.378%, 08/12/2048 | 136 | 145 | ||||||||
Morgan Stanley Bank of America Merrill Lynch Trust, | ||||||||||
3.741%, 08/15/2047 | 65 | 67 | ||||||||
Morgan Stanley Capital I Trust, | ||||||||||
4.989%, 08/13/2042 | 166 | 167 | ||||||||
Morgan Stanley Capital I Trust, | ||||||||||
5.548%, 10/12/2052 (A) (B) | 10 | 10 | ||||||||
Morgan Stanley Capital I Trust, | ||||||||||
5.548%, 10/12/2052 (A) (B) | 15 | 15 | ||||||||
Morgan Stanley Capital I Trust, | ||||||||||
5.692%, 04/15/2049 (B) | 160 | 174 | ||||||||
Morgan Stanley Capital I, | ||||||||||
5.809%, 12/12/2049 | 75 | 82 | ||||||||
| SEI Institutional International Trust / Annual Report / September 30, 2014 | 37 |
SCHEDULE OF INVESTMENTS
International Fixed Income Fund (Continued)
September 30, 2014
| Description | Face Amount (1) (Thousands) | Market Value ($ Thousands) | ||||||||
Morgan Stanley Re-REMIC Trust, Ser 2010-GG10, Cl A4A | ||||||||||
5.991%, 08/15/2045 (A) (B) | 174 | $ | 189 | |||||||
Silverstone Master Issuer, | ||||||||||
2.006%, 01/21/2055 (A) (B) | 300 | 487 | ||||||||
UBS-Barclays Commercial Mortgage Trust, Ser 2013-C5, Cl A4 | ||||||||||
3.185%, 03/10/2046 | 130 | 129 | ||||||||
UBS-Barclays Commercial Mortgage Trust, Ser 2013-C6, Cl A3 | ||||||||||
2.971%, 04/10/2046 | 70 | 68 | ||||||||
Wachovia Bank Commercial Mortgage Trust, | ||||||||||
5.418%, 01/15/2045 (B) | 24 | 25 | ||||||||
Wells Fargo Commercial Mortgage Trust, Ser 2012-LC5, Cl D | ||||||||||
4.938%, 10/15/2045 (A) (B) | 10 | 10 | ||||||||
WFRBS Commercial Mortgage Trust, Ser 2011-C4, Cl A4 | ||||||||||
4.902%, 06/15/2044 (A) (B) | 175 | 195 | ||||||||
WFRBS Commercial Mortgage Trust, Ser 2014-C20, Cl A5 | ||||||||||
3.995%, 05/15/2047 | 125 | 131 | ||||||||
WFRBS Commerical Mortgage Trust, Ser 2013-C15, Cl A3 | ||||||||||
3.881%, 08/15/2046 | 70 | 73 | ||||||||
|
| |||||||||
| 10,137 | ||||||||||
|
| |||||||||
Total Mortgage-Backed Securities | 10,573 | |||||||||
|
| |||||||||
CORPORATE OBLIGATIONS — 0.9% |
| |||||||||
United States — 0.9% | ||||||||||
Access Midstream Partners | ||||||||||
4.875%, 03/15/2024 | 200 | 205 | ||||||||
Anadarko Petroleum | ||||||||||
6.375%, 09/15/2017 | 330 | 374 | ||||||||
California Resources | ||||||||||
5.500%, 09/15/2021 (A) | 168 | 171 | ||||||||
CNA Financial | ||||||||||
7.250%, 11/15/2023 | 110 | 136 | ||||||||
6.500%, 08/15/2016 | 40 | 44 | ||||||||
Credit Suisse NY MTN | ||||||||||
3.625%, 09/09/2024 | 260 | 257 | ||||||||
Crown Castle International | ||||||||||
4.875%, 04/15/2022 (C) | 120 | 117 | ||||||||
Duke Realty | ||||||||||
6.750%, 03/15/2020 (C) | 140 | 165 | ||||||||
Enterprise Products Operating | ||||||||||
5.950%, 02/01/2041 | 100 | 119 | ||||||||
General Electric Capital MTN | ||||||||||
5.550%, 05/04/2020 | 45 | 51 | ||||||||
2.375%, 06/30/2015 | 150 | 152 | ||||||||
| Description | Face Amount (1) (Thousands) | Market Value ($ Thousands) | ||||||||||
Kinder Morgan Energy Partners | ||||||||||||
6.850%, 02/15/2020 | 150 | $ | 176 | |||||||||
3.500%, 09/01/2023 | 171 | 162 | ||||||||||
2.650%, 02/01/2019 | 39 | 39 | ||||||||||
McGraw Hill Financial | ||||||||||||
5.900%, 11/15/2017 | 325 | 357 | ||||||||||
Morgan Stanley | ||||||||||||
3.450%, 11/02/2015 | 125 | 129 | ||||||||||
Noble Holding International | ||||||||||||
4.900%, 08/01/2020 | 25 | 26 | ||||||||||
PNC Bank | ||||||||||||
2.700%, 11/01/2022 | 445 | 424 | ||||||||||
Prudential Financial MTN | ||||||||||||
6.100%, 06/15/2017 | 125 | 140 | ||||||||||
Ryder System MTN | ||||||||||||
7.200%, 09/01/2015 | 108 | 114 | ||||||||||
SLM MTN | ||||||||||||
5.500%, 01/15/2019 | 433 | 442 | ||||||||||
Time Warner | ||||||||||||
4.875%, 03/15/2020 | 150 | 166 | ||||||||||
Total System Services | ||||||||||||
2.375%, 06/01/2018 | 236 | 234 | ||||||||||
Verizon Communications | ||||||||||||
4.862%, 08/21/2046 (A) | 44 | 44 | ||||||||||
Viacom | ||||||||||||
6.125%, 10/05/2017 | 325 | 367 | ||||||||||
Williams Partners | ||||||||||||
4.000%, 11/15/2021 | 150 | 155 | ||||||||||
|
| |||||||||||
Total Corporate Obligations |
| 4,766 | ||||||||||
|
| |||||||||||
ASSET-BACKED SECURITIES — 0.1% |
| |||||||||||
Automotive — 0.1% | ||||||||||||
Bavarian Sky, | ||||||||||||
0.329%, 06/20/2020 (B) | 329 | 416 | ||||||||||
|
| |||||||||||
Other Asset-Backed Securities — 0.0% |
| |||||||||||
Volta Electricity Receivables, | ||||||||||||
4.172%, 02/16/2017 | 203 | 258 | ||||||||||
|
| |||||||||||
Total Asset-Backed Securities |
| 674 | ||||||||||
|
| |||||||||||
TIME DEPOSITS (2) — 1.4% | ||||||||||||
Brown Brothers Harriman | ||||||||||||
4.500%, 10/01/2014 | ZAR | 1 | — | |||||||||
2.750%, 10/01/2014 | NZD | 21 | 16 | |||||||||
1.578%, 10/01/2014 | AUD | 19 | 17 | |||||||||
0.350%, 10/01/2014 | NOK | 138 | 21 | |||||||||
0.299%, 10/01/2014 | CAD | 101 | 91 | |||||||||
0.060%, 10/01/2014 | GBP | 76 | 123 | |||||||||
0.050%, 10/01/2014 | SEK | 121 | 17 | |||||||||
| 38 | SEI Institutional International Trust / Annual Report / September 30, 2014 |
| Description | Face Amount (2) (Thousands) | Market Value ($ Thousands) | ||||||||||
0.030%, 10/01/2014 | 6,617 | $ | 6,617 | |||||||||
0.005%, 10/01/2014 | SGD | 22 | 17 | |||||||||
0.005%, 10/01/2014 | HKD | 2 | — | |||||||||
0.005%, 10/01/2014 | JPY | 14,219 | 130 | |||||||||
0.001%, 10/01/2014 | CHF | — | — | |||||||||
0.000%, 10/01/2014 | EUR | 168 | 212 | |||||||||
0.000%, 10/01/2014 | DKK | 12 | 2 | |||||||||
|
| |||||||||||
Total Time Deposits |
| 7,263 | ||||||||||
|
| |||||||||||
Total Investments — 98.1% |
| $ | 513,872 | |||||||||
|
| |||||||||||
A list of the open futures contracts held by the Fund at September 30, 2014, is as follows:
| Type of Contract | Number of Contracts Long (Short) | Expiration Date | Unrealized Appreciation (Depreciation) ($ Thosands) | |||||||||
10-YR MINI JGB | 33 | Dec-2014 | $ | 5 | ||||||||
90-Day Euro$ | (5 | ) | Dec-2014 | — | ||||||||
Australian 10-Year Bond | 12 | Dec-2014 | 14 | |||||||||
Australian 3-Year Bond | 11 | Dec-2014 | 3 | |||||||||
Canadian 10-Year Bond | 18 | Dec-2014 | (6 | ) | ||||||||
Euro-Bobl | (7 | ) | Dec-2014 | (4 | ) | |||||||
Euro-Bobl | 87 | Dec-2014 | 33 | |||||||||
Euro-Bund | (15 | ) | Dec-2014 | (4 | ) | |||||||
Euro-Bund | 84 | Dec-2014 | 20 | |||||||||
Euro-Buxl 30 Year Bond | 16 | Dec-2014 | 16 | |||||||||
Euro-Schatz | 27 | Dec-2014 | — | |||||||||
Japanese 10-Year Bond | 7 | Dec-2014 | 11 | |||||||||
Long Gilt 10-Year Bond | (13 | ) | Dec-2014 | (17 | ) | |||||||
Long Gilt 10-Year Bond | 2 | Dec-2014 | — | |||||||||
U.S. 2-Year Treasury Note | (69 | ) | Dec-2014 | — | ||||||||
U.S. 5-Year Treasury Note | (111 | ) | Dec-2014 | (10 | ) | |||||||
U.S. 5-Year Treasury Note | 48 | Dec-2014 | (11 | ) | ||||||||
U.S. Long Treasury Bond | (147 | ) | Dec-2014 | 15 | ||||||||
U.S. Long Treasury Bond | 50 | Dec-2014 | (7 | ) | ||||||||
U.S. Ultra Long Treasury Bond | (8 | ) | Dec-2014 | 5 | ||||||||
|
| |||||||||||
| $ | 63 | |||||||||||
|
| |||||||||||
For the year ended September 30, 2014, the total amount of all open futures contracts, as presented in the table above, are representative of the volume of activity for this derivative type during the year.
A list of the open forward foreign currency contracts held by the Fund at September 30, 2014, is as follows:
| Settlement Date | Currency to Deliver (Thousands) | Currency to Receive (Thousands) | Unrealized Appreciation (Depreciation) | |||||||||||||||||
10/03/2014 | USD | 1,798 | AUD | 2,061 | $ | 6 | ||||||||||||||
10/03/2014 | USD | 4,021 | CAD | 4,496 | 2 | |||||||||||||||
10/03/2014 | USD | 4,057 | DKK | 23,974 | 11 | |||||||||||||||
10/03/2014 | USD | 687 | MXN | 9,282 | 4 | |||||||||||||||
10/03/2014 | USD | 474 | SEK | 3,434 | 3 | |||||||||||||||
| Settlement Date | Currency to Deliver (Thousands) | Currency to Receive (Thousands) | Unrealized Appreciation (Depreciation) | |||||||||||||||||
10/03/2014-10/31/2014 | MXN | 108,860 | USD | 8,238 | $ | 141 | ||||||||||||||
10/03/2014-10/31/2014 | USD | 122,266 | EUR | 96,902 | 145 | |||||||||||||||
10/03/2014-10/31/2014 | USD | 24,816 | GBP | 15,305 | (4 | ) | ||||||||||||||
10/03/2014-10/31/2014 | USD | 35,820 | JPY | 3,921,327 | (70 | ) | ||||||||||||||
10/03/2014-11/05/2014 | AUD | 20,618 | USD | 18,488 | 482 | |||||||||||||||
10/03/2014-11/05/2014 | CAD | 30,831 | USD | 27,937 | 359 | |||||||||||||||
10/03/2014-11/05/2014 | DKK | 52,286 | USD | 9,040 | 166 | |||||||||||||||
10/03/2014-11/05/2014 | EUR | 290,964 | USD | 375,923 | 8,344 | |||||||||||||||
10/03/2014-11/05/2014 | GBP | 61,712 | USD | 101,624 | 1,604 | |||||||||||||||
10/03/2014-11/05/2014 | NZD | 15,761 | USD | 12,760 | 508 | |||||||||||||||
10/03/2014-11/05/2014 | SEK | 19,974 | USD | 2,810 | 38 | |||||||||||||||
10/03/2014-11/05/2014 | USD | 5,321 | NZD | 6,858 | 15 | |||||||||||||||
10/03/2014-08/21/2015 | JPY | 12,654,103 | USD | 118,479 | 3,082 | |||||||||||||||
10/14/2014-10/31/2014 | MYR | 3,395 | USD | 1,042 | 9 | |||||||||||||||
10/15/2014-10/31/2014 | ZAR | 24,062 | USD | 2,145 | 22 | |||||||||||||||
10/17/2014-10/31/2014 | SGD | 2,881 | USD | 2,273 | 14 | |||||||||||||||
10/22/2014-10/31/2014 | NOK | 12,774 | USD | 2,004 | 17 | |||||||||||||||
10/22/2014-10/31/2014 | USD | 2,965 | NOK | 18,681 | (58 | ) | ||||||||||||||
10/31/2014 | CHF | 3,163 | USD | 3,376 | 64 | |||||||||||||||
10/31/2014 | CZK | 10,333 | USD | 482 | 7 | |||||||||||||||
10/31/2014 | ILS | 777 | USD | 212 | 1 | |||||||||||||||
10/31/2014 | KRW | 5,155,592 | USD | 4,947 | 63 | |||||||||||||||
10/31/2014 | THB | 16,305 | USD | 505 | 3 | |||||||||||||||
10/31/2014 | USD | 1,045 | CHF | 990 | (9 | ) | ||||||||||||||
10/31/2014-11/07/2014 | PLN | 6,835 | USD | 2,102 | 38 | |||||||||||||||
|
| |||||||||||||||||||
| $ | 15,007 | |||||||||||||||||||
|
| |||||||||||||||||||
A list of the counterparties for the open forward foreign currency contracts held by the Fund at September 30, 2014, is as follows:
| Counterparty | Currency to Deliver ($ Thousands) | Currency to Receive ($ Thousands) | Unrealized Appreciation (Depreciation) ($ Thousands) | |||||||||
Bank of America | $ | (2,006 | ) | $ | 2,024 | $ | 18 | |||||
Barclays PLC | (388 | ) | 386 | (2 | ) | |||||||
BMOC | (522 | ) | 535 | 13 | ||||||||
BNP Paribas | (36,675 | ) | 37,115 | 440 | ||||||||
Brown Brothers Harriman | (540,525 | ) | 548,308 | 7,783 | ||||||||
Citigroup | (81,050 | ) | 83,823 | 2,773 | ||||||||
Credit Suisse First Boston | (3,188 | ) | 3,252 | 64 | ||||||||
Deutsche Bank | (34,445 | ) | 35,260 | 815 | ||||||||
Goldman Sachs | (31,216 | ) | 31,661 | 445 | ||||||||
HSBC | (12,781 | ) | 12,786 | 5 | ||||||||
JPMorgan Chase Bank | (77,360 | ) | 78,338 | 978 | ||||||||
Morgan Stanley | (6,459 | ) | 6,491 | 32 | ||||||||
RBC | (7,908 | ) | 7,958 | 50 | ||||||||
Royal Bank of Scotland | (41,933 | ) | 43,487 | 1,554 | ||||||||
Standard Bank | (749 | ) | 755 | 6 | ||||||||
UBS | (5,133 | ) | 5,154 | 21 | ||||||||
Westpac Banking | (357 | ) | 369 | 12 | ||||||||
|
| |||||||||||
| $ | 15,007 | |||||||||||
|
| |||||||||||
For the year ended September 30, 2014, the total amount of all open forward foreign currency contracts, as presented in the table above are representative of the volume of activity for this derivative type during the year.
A list of the open OTC swap agreements held by the Fund at September 30, 2014, is as follows:
| Credit Default Swaps | ||||||||||||||||||
| Counterparty | Reference Entity/Obligation | Buy/Sell Protection | (Pays)/ Receives Rate | Termination Date | Notional Amount ($ Thousands) | Net Unrealized Depreciation ($ Thousands) | ||||||||||||
Citibank | Government of UK 4.25% STK 07/06/2032 GBP 100 | BUY | (1.00) | 09/20/2019 | $ | 4,200 | $ | (13 | ) | |||||||||
Deutsche Bank | Government of UK 4.25% STK 07/06/2032 GBP 100 | BUY | (1.00) | 09/20/2019 | 174 | — | ||||||||||||
JPMorgan Chase Bank | Government of UK 4.25% STK 07/06/2032 GBP 100 | BUY | (1.00) | 09/20/2019 | 450 | — | ||||||||||||
JPMorgan Chase Bank | Government of UK 4.25% STK 07/06/2032 GBP 100 | BUY | (1.00) | 09/20/2019 | 230 | (1 | ) | |||||||||||
JPMorgan Chase Bank | Government of UK 4.25% STK 07/06/2032 GBP 100 | BUY | (1.00) | 09/20/2019 | 66 | — | ||||||||||||
|
| |||||||||||||||||
| $ | (14 | ) | ||||||||||||||||
|
| |||||||||||||||||
| SEI Institutional International Trust / Annual Report / September 30, 2014 | 39 |
SCHEDULE OF INVESTMENTS
International Fixed Income Fund (Concluded)
September 30, 2014
| Interest Rate Swaps | ||||||||||||||||||
| Counterparty | Fund Pays | Fund Receives | Termination Date | Currency | Notional Amount (Thousands) | Net Unrealized Depreciation ($ Thousands) | ||||||||||||
| Citigroup | 3.79% | 6-Month GBP - LIBOR | 05/19/2019 | GBP | 2,500 | $ | (392 | ) | ||||||||||
| Citibank | 2.83% | 3 MonthUSD - LIBOR | 08/08/2023 | USD | 6,000 | (166 | ) | |||||||||||
| Citibank | EU CPI Overall Excluding Tobacco | 1.22% | 04/03/2019 | EUR | 2,450 | (18 | ) | |||||||||||
|
| |||||||||||||||||
| $ | (576 | ) | ||||||||||||||||
|
| |||||||||||||||||
A list of the open centrally cleared swap agreements held by the Fund at September 30, 2014, is as follows:
| Interest Rate Swaps | ||||||||||||||||||
| Counterparty | Fund Pays | Fund Receives | Termination Date | Currency | Notional Amount (Thousands) | Net Unrealized Appreciation (Depreciation) ($ Thousands) | ||||||||||||
| JPMorgan Chase Bank | 1.49% | 6-Month EUR - EURIBOR | 09/12/2018 | EUR | 7,000 | $ | (425 | ) | ||||||||||
| JPMorgan Chase Bank | 1.988% | 6-Month EUR - EURIBOR | 11/21/2023 | EUR | 5,500 | (596 | ) | |||||||||||
| JPMorgan Chase Bank | 1.90% | 6-Month EUR - EURIBOR | 03/24/2024 | EUR | 2,200 | (213 | ) | |||||||||||
| Citibank | 3.34% | 6-Month GBP - LIBOR | 01/17/2044 | GBP | 1,000 | (157 | ) | |||||||||||
| JPMorgan Chase Bank | 2.87% | 6-Month GBP - LIBOR | 02/14/2024 | GBP | 250 | (15 | ) | |||||||||||
| JPMorgan Chase Bank | 6-Month JPY - LIBOR | 1.56% | 11/28/2033 | JPY | 600,000 | 188 | ||||||||||||
|
| |||||||||||||||||
| $ | (1,218 | ) | ||||||||||||||||
|
| |||||||||||||||||
For the year ended September 30, 2014, the total amount of all swap agreements, as presented in the table above, are representative of the volume of activity for this derivative type during the year.
Percentages are based on a Net Assets of $523,784 ($ Thousands).
| (1) | In local currency unless otherwise indicated. |
| (2) | In U.S. Dollars unless otherwise indicated. |
| (A) | Securities sold within terms of a private placement memorandum, exempt from registration under Section 144A of the Securities Act of 1933, as amended, and may be sold only to dealers in that program or other “accredited investors.” These securities have been determined to be liquid under guidelines established by the Board of Trustees. |
| (B) | Variable Rate Security — The rate reported on the Schedule of Investments is the rate in effect as of September 30, 2014. |
| (C) | Real Estate Investment Trust. |
| (D) | The rate reported on the Schedule of Investments is the effective yield at time of purchase. |
| (E) | Securities considered illiquid. The total market value of such securities as of September 30, 2014 was $580 ($ Thousands) and represented 0.1% of Net Assets. |
| (F) | Security, or portion thereof, has been pledged as collateral on open swap agreements. |
AUD — Australian Dollar
CAD — Canadian Dollar
CHF — Swiss Franc
CZK — Czech Koruna
Cl — Class
| CPI | — Consumer Price Index |
DKK — Danish Krone
EUR — Euro
EURIBOR — Euro London Interbank Offered Rate
FHLMC — Federal Home Loan Mortgage Corporation
| FNMA | — Federal National Mortgage Association |
GBP — British Pound Sterling
HKD — Hong Kong Dollar
ILS — Israeli Shekel
IO — Interest Only
JPY — Japanese Yen
KRW — Korean Won
LIBOR — London Interbank Offered Rate
MTN — Medium Term Note
MXN — Mexican Peso
MYR — Malaysian Ringgit
NOK — Norwegian Krone
OTC — Over the Counter
NZD — New Zealand Dollar
PLC — Public Limited Company
PLN — Polish Zlotty
| Re-REMIC | — Resecuritization of Real Estate Mortgage Investment Conduit |
SEK — Swedish Krone
Ser — Series
| SFH | — Societes de Financement de l’Habitat |
SGD — Singapore Dollar
THB — Thai Baht
USD — U.S. Dollar
ZAR — South African Rand
The following is a list of the level of inputs used as of September 30, 2014, in valuing the Fund’s investments and other financial instruments carried at value ($ Thousands):
| Investments in Securities | Level 1 | Level 2 | Level 3 | Total | ||||||||||||
Global Bonds | $ | — | $ | 490,596 | $ | — | $ | 490,596 | ||||||||
Mortgage-Backed Securities | — | 10,573 | — | 10,573 | ||||||||||||
Corporate Obligations | — | 4,766 | — | 4,766 | ||||||||||||
Asset-Backed Securities | — | 674 | — | 674 | ||||||||||||
Time Deposits | — | 7,263 | — | 7,263 | ||||||||||||
|
|
|
|
|
|
|
| |||||||||
Total Investments in Securities | $ | — | $ | 513,872 | $ | — | $ | 513,872 | ||||||||
|
|
|
|
|
|
|
| |||||||||
| Other Financial Instruments | Level 1 | Level 2 | Level 3 | Total | ||||||||||||
Futures Contracts* | ||||||||||||||||
Unrealized Appreciation | $ | 122 | $ | — | $ | — | $ | 122 | ||||||||
Unrealized Depreciation | (59 | ) | — | — | (59 | ) | ||||||||||
Forwards Contracts* | ||||||||||||||||
Unrealized Appreciation | — | 15,148 | — | 15,148 | ||||||||||||
Unrealized Depreciation | — | (141 | ) | — | (141 | ) | ||||||||||
OTC Swaps* | ||||||||||||||||
Credit Default Swaps* | ||||||||||||||||
Unrealized Depreciation | — | (14 | ) | — | (14 | ) | ||||||||||
Interest Rate Swaps* | ||||||||||||||||
Unrealized Depreciation | — | (576 | ) | — | (576 | ) | ||||||||||
Centrally Cleared Swaps* | ||||||||||||||||
Interest Rate Swaps* | �� | |||||||||||||||
Unrealized Appreciation | — | 188 | — | 188 | ||||||||||||
Unrealized Depreciation | — | (1,406 | ) | — | (1,406 | ) | ||||||||||
|
|
|
|
|
|
|
| |||||||||
Total Other Financial Instruments | $ | 63 | $ | 13,199 | $ | — | $ | 13,262 | ||||||||
|
|
|
|
|
|
|
| |||||||||
| * | Futures contracts, forwards contracts and swaps are valued at the net unrealized appreciation (depreciation) on the instrument. |
For the year ended September 30, 2014, there were no transfers between Level 1 and Level 2 assets and liabilities.
For the year ended September 30, 2014, there were no transfers between Level 2 and Level 3 assets and liabilities.
Amounts designated as “—” are $0 or have been rounded to $0.
The accompanying notes are an integral part of the financial statements.
| 40 | SEI Institutional International Trust / Annual Report / September 30, 2014 |
SCHEDULE OF INVESTMENTS
Emerging Markets Debt Fund
September 30, 2014
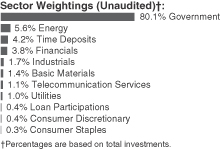
| Description | Face Amount (1) (Thousands) | Market Value ($ Thousands) | ||||||||
GLOBAL BONDS — 93.5% |
| |||||||||
Angola — 0.2% | ||||||||||
Republic of Angola Via Northern Lights III | ||||||||||
7.000%, 08/16/2019 | 2,536 | $ | 2,735 | |||||||
|
| |||||||||
Argentina — 1.5% | ||||||||||
City of Buenos Aires Argentina | ||||||||||
9.950%, 03/01/2017 (A) (B) | 1,150 | 1,151 | ||||||||
9.950%, 03/01/2017 | 1,060 | 1,061 | ||||||||
Republic of Argentina | ||||||||||
7.000%, 10/03/2015 | 7,582 | 7,023 | ||||||||
7.000%, 04/17/2017 | 10,723 | 9,298 | ||||||||
6.000%, 03/31/2023 (A) (C) | 815 | 888 | ||||||||
YPF | ||||||||||
8.750%, 04/04/2024 (B) | 556 | 562 | ||||||||
|
| |||||||||
| 19,983 | ||||||||||
|
| |||||||||
Azerbaijan — 0.8% | ||||||||||
International Bank of Azerbaijan | ||||||||||
5.625%, 06/11/2019 | 1,700 | 1,678 | ||||||||
Republic of Azerbaijan International Bond | ||||||||||
4.750%, 03/18/2024 | 700 | 714 | ||||||||
4.750%, 03/18/2024 (B) | 2,829 | 2,886 | ||||||||
State Oil of the Azerbaijan Republic | ||||||||||
5.450%, 02/09/2017 | 1,312 | 1,368 | ||||||||
4.750%, 03/13/2023 | 3,694 | 3,635 | ||||||||
|
| |||||||||
| 10,281 | ||||||||||
|
| |||||||||
Bahrain — 0.1% | ||||||||||
Kingdom of Bahrain | ||||||||||
6.000%, 09/19/2044 (B) | 855 | 862 | ||||||||
|
| |||||||||
Barbados — 0.1% | ||||||||||
Columbus International | ||||||||||
7.375%, 03/30/2021 (B) | 1,515 | 1,576 | ||||||||
|
| |||||||||
Belize — 0.2% | ||||||||||
Belize Government International Bond | ||||||||||
5.000%, 02/20/2038 (D) | 4,500 | 3,319 | ||||||||
|
| |||||||||
| Description | Face Amount (1) (Thousands) | Market Value ($ Thousands) | ||||||||||
Bermuda — 0.2% | ||||||||||||
Government of Bermuda | ||||||||||||
4.854%, 02/06/2024 | 1,680 | $ | 1,735 | |||||||||
4.138%, 01/03/2023 (B) | 820 | 808 | ||||||||||
|
| |||||||||||
| 2,543 | ||||||||||||
|
| |||||||||||
Bolivia — 0.4% | ||||||||||||
Government of Bolivia | ||||||||||||
5.950%, 08/22/2023 | 4,802 | 5,138 | ||||||||||
4.875%, 10/29/2022 (B) | 250 | 255 | ||||||||||
|
| |||||||||||
| 5,393 | ||||||||||||
|
| |||||||||||
Bosnia and Herzegovina — 0.0% |
| |||||||||||
Republic of Bosnia & Herzegovina | ||||||||||||
2.063%, 12/11/2017 (A) (E) | DEM | 1,125 | 611 | |||||||||
|
| |||||||||||
Brazil — 8.9% | ||||||||||||
Banco Nacional de Desenvolvimento Economico e Social | ||||||||||||
6.500%, 06/10/2019 (B) | 660 | 742 | ||||||||||
5.750%, 09/26/2023 | 280 | 298 | ||||||||||
5.500%, 07/12/2020 (B) | 400 | 425 | ||||||||||
4.000%, 04/14/2019 (B) | 730 | 732 | ||||||||||
Brazil Letras do Tesouro Nacional | ||||||||||||
12.390%, 01/01/2016 (F) | BRL | 20,010 | 7,077 | |||||||||
11.885%, 01/01/2018 (F) | BRL | 74,919 | 20,829 | |||||||||
11.237%, 07/01/2018 (F) | BRL | 21,385 | 5,608 | |||||||||
10.590%, 01/01/2017 (F) | BRL | 36,215 | 11,352 | |||||||||
Brazil Loan Trust 1 | ||||||||||||
5.477%, 07/24/2023 (B) | 2,344 | 2,437 | ||||||||||
5.477%, 07/24/2023 | 351 | 360 | ||||||||||
Brazil Notas do Tesouro Nacional | ||||||||||||
10.000%, 01/01/2017 | BRL | 24,900 | 9,699 | |||||||||
Brazil Notas do Tesouro Nacional, Ser B | ||||||||||||
6.000%, 08/15/2020 | BRL | 4,385 | 4,418 | |||||||||
Brazil Notas do Tesouro Nacional, Serie F | ||||||||||||
10.000%, 01/01/2018 | BRL | 15,414 | 5,900 | |||||||||
10.000%, 01/01/2021 | BRL | 10,876 | 3,991 | |||||||||
10.000%, 01/01/2023 | BRL | 17,650 | 6,345 | |||||||||
10.000%, 01/01/2025 | BRL | 13,756 | 4,860 | |||||||||
BRF | ||||||||||||
4.750%, 05/22/2024 (B) | 1,723 | 1,697 | ||||||||||
Caixa Economica Federal | ||||||||||||
4.250%, 05/13/2019 | 200 | 199 | ||||||||||
CIMPOR Financial Operations | ||||||||||||
5.750%, 07/17/2024 (B) | 501 | 485 | ||||||||||
Cosan | ||||||||||||
5.000%, 03/14/2023 (B) | 533 | 512 | ||||||||||
| SEI Institutional International Trust / Annual Report / September 30, 2014 | 41 |
SCHEDULE OF INVESTMENTS
Emerging Markets Debt Fund (Continued)
September 30, 2014
| Description | Face Amount (1) (Thousands) | Market Value ($ Thousands) | ||||||||||
ESAL GmbH | ||||||||||||
6.250%, 02/05/2023 (B) | 350 | $ | 339 | |||||||||
Federal Republic of Brazil | ||||||||||||
10.125%, 05/15/2027 | 850 | 1,317 | ||||||||||
10.125%, 05/15/2027 | 1,378 | 2,136 | ||||||||||
8.875%, 04/15/2024 | 400 | 545 | ||||||||||
8.250%, 01/20/2034 | 2,540 | 3,410 | ||||||||||
7.125%, 01/20/2037 | 6,983 | 8,572 | ||||||||||
5.875%, 01/15/2019 | 369 | 415 | ||||||||||
4.875%, 01/22/2021 | 420 | 446 | ||||||||||
4.250%, 01/07/2025 | 1,196 | 1,184 | ||||||||||
2.625%, 01/05/2023 | 7,606 | 6,845 | ||||||||||
Itau Unibanco Holding | ||||||||||||
5.650%, 03/19/2022 (B) | 200 | 201 | ||||||||||
JBS Finance II | ||||||||||||
8.250%, 01/29/2018 | 370 | 386 | ||||||||||
8.250%, 01/29/2018 (B) | 350 | 365 | ||||||||||
Marfrig Holding Europe | ||||||||||||
6.875%, 06/24/2019 (B) | 355 | 345 | ||||||||||
Marfrig Overseas | ||||||||||||
9.500%, 05/04/2020 (B) | 835 | 881 | ||||||||||
9.500%, 05/04/2020 | 650 | 686 | ||||||||||
Minerva Luxembourg | ||||||||||||
12.250%, 02/10/2022 (B) | 650 | 748 | ||||||||||
7.750%, 01/31/2023 | 1,400 | 1,425 | ||||||||||
Odebrecht Drilling Norbe VIII/IX | ||||||||||||
6.350%, 06/30/2021 | 109 | 112 | ||||||||||
6.350%, 06/30/2021 (B) | 18 | 18 | ||||||||||
Odebrecht Offshore Drilling Finance | ||||||||||||
6.750%, 10/01/2022 (B) | 191 | 198 | ||||||||||
Rio Oil Finance Trust, | ||||||||||||
6.250%, 07/06/2024 (B) | 1,265 | 1,305 | ||||||||||
Samarco Mineracao | ||||||||||||
4.125%, 11/01/2022 (B) | 238 | 222 | ||||||||||
Schahin II Finance | ||||||||||||
5.875%, 09/25/2022 (B) | 81 | 77 | ||||||||||
|
| |||||||||||
| 120,144 | ||||||||||||
|
| |||||||||||
Chile — 1.7% | ||||||||||||
Banco del Estado de Chile | ||||||||||||
4.125%, 10/07/2020 | 30 | 31 | ||||||||||
3.875%, 02/08/2022 (B) | 230 | 233 | ||||||||||
BancoEstado | ||||||||||||
4.125%, 10/07/2020 (B) | 270 | 282 | ||||||||||
Bonos de la Tesoreria de la Republica en pesos | ||||||||||||
6.000%, 01/01/2020 | CLP | 80,000 | 146 | |||||||||
6.000%, 01/01/2022 | CLP | 90,000 | 165 | |||||||||
Empresa Nacional del Petroleo | ||||||||||||
6.250%, 07/08/2019 (B) | 100 | 113 | ||||||||||
6.250%, 07/08/2019 | 50 | 56 | ||||||||||
| Description | Face Amount (1) (Thousands) | Market Value ($ Thousands) | ||||||||||
5.250%, 08/10/2020 | 100 | $ | 107 | |||||||||
5.250%, 08/10/2020 (B) | 240 | 257 | ||||||||||
ENTEL Chile | ||||||||||||
4.875%, 10/30/2024 (B) | 200 | 205 | ||||||||||
GNL Quintero | ||||||||||||
4.634%, 07/31/2029 (B) | 918 | 917 | ||||||||||
Nacional del Cobre de Chile | ||||||||||||
6.150%, 10/24/2036 | 1,748 | 2,039 | ||||||||||
5.625%, 09/21/2035 | 880 | 963 | ||||||||||
5.625%, 10/18/2043 | 250 | 274 | ||||||||||
4.500%, 08/13/2023 | 1,041 | 1,096 | ||||||||||
4.500%, 08/13/2023 (B) | 3,266 | 3,440 | ||||||||||
3.875%, 11/03/2021 | 646 | 662 | ||||||||||
3.875%, 11/03/2021 (B) | 403 | 413 | ||||||||||
3.000%, 07/17/2022 (B) | 1,923 | 1,843 | ||||||||||
Republic of Chile | ||||||||||||
5.500%, 08/05/2020 | CLP | 323,000 | 571 | |||||||||
3.875%, 08/05/2020 | 4,117 | 4,393 | ||||||||||
2.250%, 10/30/2022 | 3,981 | 3,762 | ||||||||||
VTR Finance | ||||||||||||
6.875%, 01/15/2024 (B) | 486 | 503 | ||||||||||
|
| |||||||||||
| 22,471 | ||||||||||||
|
| |||||||||||
China — 1.2% | ||||||||||||
Amber Circle Funding | ||||||||||||
3.250%, 12/04/2022 | 850 | 816 | ||||||||||
CITIC | ||||||||||||
7.875%, 04/15/2049 (E) | 183 | 192 | ||||||||||
6.800%, 01/17/2023 | 2,100 | 2,421 | ||||||||||
6.375%, 04/10/2020 | 400 | 451 | ||||||||||
CNOOC Curtis Funding No. 1 Pty | ||||||||||||
4.500%, 10/03/2023 | 1,100 | 1,140 | ||||||||||
CNOOC Nexen Finance | ||||||||||||
4.250%, 04/30/2024 | 1,118 | 1,136 | ||||||||||
Country Garden Holdings | ||||||||||||
11.125%, 02/23/2018 | 275 | 297 | ||||||||||
Kaisa Group Holdings | ||||||||||||
8.875%, 03/19/2018 (B) | 150 | 152 | ||||||||||
Sinochem Offshore Capital MTN | ||||||||||||
3.250%, 04/29/2019 (B) | 1,432 | 1,438 | ||||||||||
Sinochem Overseas Capital | ||||||||||||
4.500%, 11/12/2020 | 1,480 | 1,565 | ||||||||||
4.500%, 11/12/2020 (B) | 2,803 | 2,965 | ||||||||||
Sinopec Capital | ||||||||||||
3.125%, 04/24/2023 (B) | 1,219 | 1,148 | ||||||||||
Sinopec Group Overseas Development | ||||||||||||
4.875%, 05/17/2042 (B) | 300 | 313 | ||||||||||
4.375%, 04/10/2024 (B) | 1,273 | 1,307 | ||||||||||
State Grid Overseas Investment | ||||||||||||
4.125%, 05/07/2024 (B) | 1,216 | 1,247 | ||||||||||
|
| |||||||||||
| 16,588 | ||||||||||||
|
| |||||||||||
| 42 | SEI Institutional International Trust / Annual Report / September 30, 2014 |
| Description | Face Amount (1) (Thousands) | Market Value ($ Thousands) | ||||||||||
Colombia — 5.3% | ||||||||||||
Bancolombia | ||||||||||||
5.125%, 09/11/2022 | 150 | $ | 151 | |||||||||
Bogota Distrito Capital | ||||||||||||
9.750%, 07/26/2028 (B) | COP | 8,820,000 | 5,454 | |||||||||
9.750%, 07/26/2028 | COP | 370,000 | 229 | |||||||||
Citigroup Funding, CLN (Republic of Colombia) | ||||||||||||
11.000%, 07/27/2020 | COP | 7,940,000 | 4,804 | |||||||||
Colombian TES | ||||||||||||
11.250%, 10/24/2018 | COP | 69,800 | 41 | |||||||||
10.000%, 07/24/2024 | COP | 4,633,700 | 2,800 | |||||||||
7.500%, 08/26/2026 | COP | 4,030,200 | 2,046 | |||||||||
7.000%, 09/11/2019 | COP | 9,034,800 | 4,643 | |||||||||
7.000%, 09/11/2019 | COP | 3,275,300 | 1,686 | |||||||||
7.000%, 05/04/2022 | COP | 580,000 | 291 | |||||||||
7.000%, 05/04/2022 | COP | 864,000 | 434 | |||||||||
7.000%, 05/04/2022 | COP | 8,736,900 | 4,387 | |||||||||
6.000%, 04/28/2028 | COP | 8,156,800 | 3,599 | |||||||||
5.000%, 11/21/2018 | COP | 4,884,800 | 2,353 | |||||||||
Ecopetrol | ||||||||||||
5.875%, 05/28/2045 | 1,051 | 1,064 | ||||||||||
Emgesa ESP | ||||||||||||
8.750%, 01/25/2021 | COP | 1,450,000 | 777 | |||||||||
Empresas Publicas de Medellin ESP | ||||||||||||
8.375%, 02/01/2021 | COP | 4,482,000 | 2,338 | |||||||||
7.625%, 09/10/2024 (B) | COP | 3,971,000 | 1,976 | |||||||||
Financiera de Desarrollo Territorial Findeter | ||||||||||||
7.875%, 08/12/2024 (B) | COP | 1,645,000 | 830 | |||||||||
7.875%, 08/12/2024 | COP | 884,000 | 446 | |||||||||
JPMorgan, CLN (Republic of Columbia) | ||||||||||||
7.000%, 05/04/2022 | COP | 2,087,000 | 1,048 | |||||||||
Pacific Rubiales Energy | ||||||||||||
7.250%, 12/12/2021 | 2,171 | 2,361 | ||||||||||
5.125%, 03/28/2023 (B) | 107 | 102 | ||||||||||
Republic of Colombia | ||||||||||||
12.000%, 10/22/2015 | COP | 1,009,000 | 534 | |||||||||
12.000%, 10/22/2015 | COP | 1,626,000 | 861 | |||||||||
11.750%, 02/25/2020 | 1,587 | 2,253 | ||||||||||
10.375%, 01/28/2033 | 360 | 560 | ||||||||||
9.850%, 06/28/2027 | COP | 3,422,000 | 2,139 | |||||||||
8.125%, 05/21/2024 | 1,190 | 1,577 | ||||||||||
7.750%, 04/14/2021 | COP | 1,942,000 | 1,042 | |||||||||
7.375%, 03/18/2019 | 2,046 | 2,440 | ||||||||||
7.375%, 09/18/2037 | 6,052 | 8,079 | ||||||||||
6.125%, 01/18/2041 | 1,485 | 1,736 | ||||||||||
5.625%, 02/26/2044 | 1,170 | 1,287 | ||||||||||
4.375%, 07/12/2021 | 4,915 | 5,198 | ||||||||||
4.375%, 03/21/2023 | COP | 1,017,000 | 434 | |||||||||
|
| |||||||||||
| 72,000 | ||||||||||||
|
| |||||||||||
| Description | Face Amount (1) (Thousands) | Market Value ($ Thousands) | ||||||||||
Costa Rica — 0.5% | ||||||||||||
Banco Nacional de Costa Rica | ||||||||||||
6.250%, 11/01/2023 (B) | 240 | $ | 241 | |||||||||
Costa Rica Government International Bond | ||||||||||||
7.000%, 04/04/2044 (B) | 988 | 993 | ||||||||||
4.375%, 04/30/2025 (B) | 781 | 707 | ||||||||||
4.375%, 04/30/2025 | 702 | 635 | ||||||||||
4.250%, 01/26/2023 | 2,349 | 2,167 | ||||||||||
Instituto Costarricense de Electricidad | ||||||||||||
6.950%, 11/10/2021 | 400 | 424 | ||||||||||
6.375%, 05/15/2043 | 250 | 214 | ||||||||||
|
| |||||||||||
| 5,381 | ||||||||||||
|
| |||||||||||
Croatia — 0.8% | ||||||||||||
Government of Croatia | ||||||||||||
6.750%, 11/05/2019 | 790 | 871 | ||||||||||
6.625%, 07/14/2020 | 1,437 | 1,581 | ||||||||||
6.375%, 03/24/2021 (B) | 1,636 | 1,775 | ||||||||||
6.250%, 04/27/2017 (B) | 630 | 669 | ||||||||||
6.000%, 01/26/2024 | 1,500 | 1,599 | ||||||||||
6.000%, 01/26/2024 (B) | 3,805 | 4,057 | ||||||||||
5.875%, 07/09/2018 | EUR | 150 | 211 | |||||||||
|
| |||||||||||
| 10,763 | ||||||||||||
|
| |||||||||||
Dominican Republic — 1.1% | ||||||||||||
Dominican Republic | ||||||||||||
15.950%, 06/04/2021 | DOP | 3,800 | 111 | |||||||||
11.500%, 05/10/2024 | DOP | 55,000 | 1,344 | |||||||||
11.000%, 01/05/2018 | DOP | 6,320 | 148 | |||||||||
11.000%, 07/30/2021 (B) | DOP | 53,760 | 1,235 | |||||||||
9.040%, 01/23/2018 | 1,390 | 1,508 | ||||||||||
7.500%, 05/06/2021 (B) | 1,830 | 2,059 | ||||||||||
7.500%, 05/06/2021 | 3,049 | 3,430 | ||||||||||
7.450%, 04/30/2044 (B) | 2,850 | 3,049 | ||||||||||
6.600%, 01/28/2024 (B) | 230 | 247 | ||||||||||
5.875%, 04/18/2024 (B) | 770 | 793 | ||||||||||
5.875%, 04/18/2024 | 710 | 721 | ||||||||||
|
| |||||||||||
| 14,645 | ||||||||||||
|
| |||||||||||
Ecuador — 0.1% | ||||||||||||
Republic of Ecuador | ||||||||||||
9.375%, 12/15/2015 | 1,554 | 1,632 | ||||||||||
|
| |||||||||||
Egypt — 0.2% | ||||||||||||
Government of Egypt | ||||||||||||
6.875%, 04/30/2040 | 1,434 | 1,427 | ||||||||||
5.750%, 04/29/2020 | 450 | 471 | ||||||||||
5.750%, 04/29/2020 (B) | 100 | 105 | ||||||||||
|
| |||||||||||
| 2,003 | ||||||||||||
|
| |||||||||||
| SEI Institutional International Trust / Annual Report / September 30, 2014 | 43 |
SCHEDULE OF INVESTMENTS
Emerging Markets Debt Fund (Continued)
September 30, 2014
| Description | Face Amount (1) (Thousands) | Market Value ($ Thousands) | ||||||||||
El Salvador — 0.5% | ||||||||||||
Republic of El Salvador | ||||||||||||
8.250%, 04/10/2032 | 267 | $ | 308 | |||||||||
8.250%, 04/10/2032 | 480 | 553 | ||||||||||
7.750%, 01/24/2023 | 708 | 793 | ||||||||||
7.750%, 01/24/2023 | 680 | 762 | ||||||||||
7.375%, 12/01/2019 | 400 | 444 | ||||||||||
6.375%, 01/18/2027 (B) | 1,482 | 1,482 | ||||||||||
5.875%, 01/30/2025 (A) (B) | 638 | 626 | ||||||||||
5.875%, 01/30/2025 | 1,743 | 1,713 | ||||||||||
Telemovil Finance | ||||||||||||
8.000%, 10/01/2017 | 476 | 488 | ||||||||||
|
| |||||||||||
| 7,169 | ||||||||||||
|
| |||||||||||
Gabon — 0.0% | ||||||||||||
Gabonese Republic | ||||||||||||
8.200%, 12/12/2017 | 490 | 552 | ||||||||||
|
| |||||||||||
Georgia — 0.1% | ||||||||||||
Georgian Railway JSC | ||||||||||||
7.750%, 07/11/2022 | 1,362 | 1,529 | ||||||||||
|
| |||||||||||
Ghana — 0.3% | ||||||||||||
Republic of Ghana | ||||||||||||
8.500%, 10/04/2017 (B) | 300 | 322 | ||||||||||
8.125%, 01/18/2026 (B) | 1,567 | 1,571 | ||||||||||
8.125%, 01/18/2026 | 1,604 | 1,608 | ||||||||||
7.875%, 08/07/2023 | 900 | 902 | ||||||||||
|
| |||||||||||
| 4,403 | ||||||||||||
|
| |||||||||||
Guatemala — 0.1% | ||||||||||||
Comcel Trust | ||||||||||||
6.875%, 02/06/2024 (B) | 1,090 | 1,150 | ||||||||||
Guatemala Government Bond | ||||||||||||
4.875%, 02/13/2028 | 509 | 518 | ||||||||||
|
| |||||||||||
| 1,668 | ||||||||||||
|
| |||||||||||
Honduras — 0.2% | ||||||||||||
Republic of Honduras | ||||||||||||
8.750%, 12/16/2020 | 1,851 | 2,096 | ||||||||||
|
| |||||||||||
Hungary — 5.1% | ||||||||||||
Magyar Export-Import Bank | ||||||||||||
4.000%, 01/30/2020 (B) | 925 | 916 | ||||||||||
Republic of Hungary | ||||||||||||
8.000%, 02/12/2015 | HUF | 230,000 | 956 | |||||||||
7.750%, 08/24/2015 | HUF | 230,690 | 987 | |||||||||
7.625%, 03/29/2041 | 4,390 | 5,597 | ||||||||||
7.500%, 11/12/2020 | HUF | 83,900 | 406 | |||||||||
7.000%, 06/24/2022 | HUF | 851,570 | 4,048 | |||||||||
6.750%, 02/24/2017 | HUF | 302,710 | 1,349 | |||||||||
6.750%, 11/24/2017 | HUF | 1,047,530 | 4,767 | |||||||||
6.750%, 10/22/2028 | HUF | 1,286,870 | 6,235 | |||||||||
| Description | Face Amount (1) (Thousands) | Market Value ($ Thousands) | ||||||||||
6.500%, 06/24/2019 | HUF | 3,699,640 | $ | 16,869 | ||||||||
6.375%, 03/29/2021 | 920 | 1,033 | ||||||||||
6.250%, 01/29/2020 | 770 | 856 | ||||||||||
6.000%, 01/11/2019 | EUR | 982 | 1,437 | |||||||||
6.000%, 11/24/2023 | HUF | 261,390 | 1,176 | |||||||||
5.750%, 11/22/2023 | 3,716 | 4,027 | ||||||||||
5.500%, 12/22/2016 | HUF | 510,620 | 2,227 | |||||||||
5.500%, 12/20/2018 | HUF | 531,290 | 2,338 | |||||||||
5.500%, 06/24/2025 | HUF | 275,990 | 1,199 | |||||||||
5.375%, 02/21/2023 | 3,388 | 3,574 | ||||||||||
5.375%, 03/25/2024 | 536 | 565 | ||||||||||
5.000%, 03/30/2016 | GBP | 227 | 381 | |||||||||
4.125%, 02/19/2018 | 3,724 | 3,847 | ||||||||||
4.000%, 04/25/2018 | HUF | 465,170 | 1,941 | |||||||||
4.000%, 03/25/2019 | 1,856 | 1,893 | ||||||||||
|
| |||||||||||
| 68,624 | ||||||||||||
|
| |||||||||||
India — 0.2% | ||||||||||||
Bharti Airtel International Netherlands | ||||||||||||
5.350%, 05/20/2024 (B) | 927 | 988 | ||||||||||
5.125%, 03/11/2023 (B) | 639 | 672 | ||||||||||
Export-Import Bank of India MTN | ||||||||||||
4.000%, 08/07/2017 | 200 | 209 | ||||||||||
Vedanta Resources | ||||||||||||
7.125%, 05/31/2023 (B) | 160 | 164 | ||||||||||
6.750%, 06/07/2016 | 125 | 130 | ||||||||||
6.000%, 01/31/2019 (B) | 324 | 327 | ||||||||||
|
| |||||||||||
| 2,490 | ||||||||||||
|
| |||||||||||
Indonesia — 8.0% | ||||||||||||
Adaro Indonesia | ||||||||||||
7.625%, 10/22/2019 | 300 | 312 | ||||||||||
Deutsche Bank, CLN (Republic of Indonesia) | ||||||||||||
7.000%, 05/15/2022 | IDR | 2,300,000 | 176 | |||||||||
7.000%, 05/15/2027 | IDR | 2,300,000 | 163 | |||||||||
6.625%, 05/15/2033 | IDR | 2,300,000 | 149 | |||||||||
Deutsche Bank MTN | ||||||||||||
7.000%, 05/17/2022 | IDR | 9,000,000 | 677 | |||||||||
Genel Energy Finance | ||||||||||||
7.500%, 05/14/2019 | 1,800 | 1,777 | ||||||||||
Indosat Palapa | ||||||||||||
7.375%, 07/29/2020 (B) |
| 200 | 212 | |||||||||
JPMorgan, CLN (Republic of Indonesia) | ||||||||||||
7.000%, 05/15/2022 | IDR | 105,300,000 | 8,037 | |||||||||
6.625%, 05/15/2033 | IDR | 3,100,000 | 200 | |||||||||
Listrindo Capital | ||||||||||||
6.950%, 02/21/2019 (B) |
| 200 | 211 | |||||||||
Majapahit Holding | ||||||||||||
8.000%, 08/07/2019 | 470 | 549 | ||||||||||
7.875%, 06/29/2037 (B) |
| 205 | 241 | |||||||||
7.750%, 01/20/2020 | 894 | 1,035 | ||||||||||
| 44 | SEI Institutional International Trust / Annual Report / September 30, 2014 |
| Description | Face Amount (1) (Thousands) | Market Value ($ Thousands) | ||||||||||
Pelabuhan Indonesia III | ||||||||||||
4.875%, 10/01/2024 | 1,659 | $ | 1,640 | |||||||||
4.875%, 10/01/2024 (B) |
| 200 | 198 | |||||||||
Pertamina Persero MTN | ||||||||||||
6.500%, 05/27/2041 (B) |
| 380 | 389 | |||||||||
6.450%, 05/30/2044 (B) |
| 1,432 | 1,446 | |||||||||
6.000%, 05/03/2042 (B) |
| 935 | 895 | |||||||||
6.000%, 05/03/2042 | 340 | 326 | ||||||||||
5.625%, 05/20/2043 | 3,882 | 3,533 | ||||||||||
5.250%, 05/23/2021 (B) |
| 500 | 518 | |||||||||
4.875%, 05/03/2022 (B) |
| 220 | 220 | |||||||||
Perusahaan Gas Negara Persero | ||||||||||||
5.125%, 05/16/2024 (B) |
| 63 | 63 | |||||||||
Republic of Indonesia | ||||||||||||
12.800%, 06/15/2021 | IDR | 1,965,000 | 197 | |||||||||
11.625%, 03/04/2019 | 3,403 | 4,526 | ||||||||||
11.625%, 03/04/2019 | 1,674 | 2,226 | ||||||||||
11.625%, 03/04/2019 (B) |
| 975 | 1,297 | |||||||||
11.000%, 09/15/2025 | IDR | 3,200,000 | 311 | |||||||||
9.000%, 03/15/2029 | IDR | 107,985,000 | 9,007 | |||||||||
8.500%, 10/12/2035 | 1,000 | 1,350 | ||||||||||
8.500%, 10/12/2035 | 2,632 | 3,553 | ||||||||||
8.375%, 03/15/2024 | IDR | 178,374,000 | 14,544 | |||||||||
8.375%, 09/15/2026 | IDR | 580,000 | 47 | |||||||||
8.375%, 03/15/2034 | IDR | 55,920,000 | 4,328 | |||||||||
8.375%, 03/15/2034 | IDR | 62,460,000 | 4,834 | |||||||||
8.250%, 06/15/2032 | IDR | 17,369,000 | 1,354 | |||||||||
7.875%, 04/15/2019 | IDR | 38,025,000 | 3,074 | |||||||||
7.750%, 01/17/2038 | 7,418 | 9,421 | ||||||||||
7.750%, 01/17/2038 | 1,478 | 1,877 | ||||||||||
7.000%, 05/15/2022 | IDR | 59,080,000 | 4,509 | |||||||||
6.875%, 01/17/2018 | 2,394 | 2,696 | ||||||||||
6.750%, 01/15/2044 (B) |
| 1,650 | 1,930 | |||||||||
6.625%, 05/15/2033 | IDR | 30,376,000 | 1,963 | |||||||||
6.625%, 02/17/2037 | 676 | 764 | ||||||||||
6.125%, 05/15/2028 | IDR | 26,020,000 | 1,714 | |||||||||
5.875%, 03/13/2020 (B) |
| 224 | 246 | |||||||||
5.625%, 05/15/2023 | IDR | 44,408,000 | 3,025 | |||||||||
5.250%, 01/17/2042 | 1,029 | 992 | ||||||||||
4.875%, 05/05/2021 (B) |
| 200 | 208 | |||||||||
4.875%, 05/05/2021 | 2,600 | 2,704 | ||||||||||
3.375%, 04/15/2023 (B) |
| 1,939 | 1,803 | |||||||||
2.875%, 07/08/2021 (B) | EUR | 594 | 758 | |||||||||
|
| |||||||||||
| 108,225 | ||||||||||||
|
| |||||||||||
Iraq — 0.6% | ||||||||||||
Republic of Iraq | ||||||||||||
5.800%, 01/15/2028 | 9,324 | 8,345 | ||||||||||
|
| |||||||||||
Israel — 0.1% | ||||||||||||
Altice Financing | ||||||||||||
8.000%, 12/15/2019 | EUR | 400 | 550 | |||||||||
7.875%, 12/15/2019 (A) | 400 | 426 | ||||||||||
| Description | Face Amount (1) (Thousands) | Market Value ($ Thousands) | ||||||||||
Altice Finco | ||||||||||||
9.875%, 12/15/2020 (A) | 300 | $ | 336 | |||||||||
|
| |||||||||||
| 1,312 | ||||||||||||
|
| |||||||||||
Italy — 0.0% | ||||||||||||
Wind Acquisition Finance | ||||||||||||
4.750%, 07/15/2020 (B) | 49 | 47 | ||||||||||
4.000%, 07/15/2020 (B) | EUR | 200 | 249 | |||||||||
|
| |||||||||||
| 296 | ||||||||||||
|
| |||||||||||
Ivory Coast — 0.8% | ||||||||||||
Ivory Coast Government Bond | ||||||||||||
5.750%, 12/31/2032 | 3,413 | 3,255 | ||||||||||
5.750%, 12/31/2032 (A) (C) | 6,465 | 6,166 | ||||||||||
5.375%, 07/23/2024 (B) | 1,713 | 1,634 | ||||||||||
|
| |||||||||||
| 11,055 | ||||||||||||
|
| |||||||||||
Jamaica — 0.4% | ||||||||||||
Digicel Group | ||||||||||||
8.250%, 09/30/2020 | 2,200 | 2,266 | ||||||||||
Jamaica Government International Bond | ||||||||||||
7.625%, 07/09/2025 | 2,524 | 2,692 | ||||||||||
|
| |||||||||||
| 4,958 | ||||||||||||
|
| |||||||||||
Kazakhstan — 1.9% | ||||||||||||
Development Bank of Kazakhstan | ||||||||||||
4.125%, 12/10/2022 | 770 | 728 | ||||||||||
Halyk Savings Bank of Kazakhstan | ||||||||||||
7.250%, 01/28/2021 (B) | 400 | 432 | ||||||||||
7.250%, 01/28/2021 | 200 | 216 | ||||||||||
KazAgro National Management Holding | ||||||||||||
4.625%, 05/24/2023 | 3,830 | 3,630 | ||||||||||
Kazakhstan Temir Zholy Finance | ||||||||||||
6.950%, 07/10/2042 (B) | 250 | 271 | ||||||||||
Kazatomprom Natsionalnaya Atomnaya Kompaniya | ||||||||||||
6.250%, 05/20/2015 (B) | 450 | 460 | ||||||||||
6.250%, 05/20/2015 | 100 | 102 | ||||||||||
KazMunayGas National MTN | ||||||||||||
11.750%, 01/23/2015 | 1,611 | 1,658 | ||||||||||
9.125%, 07/02/2018 | 1,248 | 1,460 | ||||||||||
9.125%, 07/02/2018 (B) | 2,342 | 2,740 | ||||||||||
7.000%, 05/05/2020 (B) | 676 | 752 | ||||||||||
6.375%, 04/09/2021 (B) | 4,301 | 4,635 | ||||||||||
6.375%, 04/09/2021 | 1,234 | 1,330 | ||||||||||
5.750%, 04/30/2043 (B) | 781 | 735 | ||||||||||
5.750%, 04/30/2043 | 3,240 | 3,033 | ||||||||||
4.400%, 04/30/2023 | 1,022 | 982 | ||||||||||
4.400%, 04/30/2023 (B) | 523 | 503 | ||||||||||
| SEI Institutional International Trust / Annual Report / September 30, 2014 | 45 |
SCHEDULE OF INVESTMENTS
Emerging Markets Debt Fund (Continued)
September 30, 2014
| Description | Face Amount (1) (Thousands) | Market Value ($ Thousands) | ||||||||||
Republic of Kazakhstan | ||||||||||||
6.375%, 10/06/2020 (B) | 600 | $ | 647 | |||||||||
Samruk-Energy JSC MTN | ||||||||||||
3.750%, 12/20/2017 | 500 | 501 | ||||||||||
Zhaikmunai Via Zhaikmunai International | ||||||||||||
7.125%, 11/13/2019 (A) (B) | 425 | 445 | ||||||||||
|
| |||||||||||
| 25,260 | ||||||||||||
|
| |||||||||||
Kenya — 0.4% | ||||||||||||
Kenya Government International Bond | ||||||||||||
6.875%, 06/24/2024 (B) | 2,216 | 2,332 | ||||||||||
Kenya Infrastructure Bond | ||||||||||||
11.000%, 09/15/2025 | KES | 230,000 | 2,608 | |||||||||
|
| |||||||||||
| 4,940 | ||||||||||||
|
| |||||||||||
Latvia — 0.1% | ||||||||||||
Republic of Latvia | ||||||||||||
2.750%, 01/12/2020 | 670 | 657 | ||||||||||
|
| |||||||||||
Lithuania — 0.3% | ||||||||||||
Republic of Lithuania | ||||||||||||
7.375%, 02/11/2020 | 462 | 556 | ||||||||||
6.625%, 02/01/2022 | 1,358 | 1,616 | ||||||||||
6.125%, 03/09/2021 (B) | 1,424 | 1,643 | ||||||||||
5.125%, 09/14/2017 (B) | 310 | 339 | ||||||||||
5.125%, 09/14/2017 | 200 | 219 | ||||||||||
|
| |||||||||||
| 4,373 | ||||||||||||
|
| |||||||||||
Malaysia — 5.0% | ||||||||||||
Malaysia Government Bond | ||||||||||||
5.248%, 09/15/2028 (B) | MYR | 1,050 | 353 | |||||||||
4.392%, 04/15/2026 | MYR | 10,601 | 3,309 | |||||||||
4.378%, 11/29/2019 | MYR | 1,353 | 425 | |||||||||
4.262%, 09/15/2016 | MYR | 12,380 | 3,838 | |||||||||
4.181%, 07/15/2024 | MYR | 25,751 | 8,006 | |||||||||
4.160%, 07/15/2021 | MYR | 3,879 | 1,204 | |||||||||
4.048%, 09/30/2021 | MYR | 4,020 | 1,243 | |||||||||
4.012%, 09/15/2017 | MYR | 13,780 | 4,253 | |||||||||
3.892%, 03/15/2027 | MYR | 1,369 | 407 | |||||||||
3.889%, 07/31/2020 | MYR | 6,983 | 2,138 | |||||||||
3.844%, 04/15/2033 | MYR | 1,770 | 506 | |||||||||
3.835%, 08/12/2015 | MYR | 4,097 | 1,254 | |||||||||
3.741%, 02/27/2015 | MYR | 2,000 | 611 | |||||||||
3.654%, 10/31/2019 | MYR | 13,220 | 4,024 | |||||||||
3.580%, 09/28/2018 | MYR | 4,747 | 1,447 | |||||||||
3.502%, 05/31/2027 | MYR | 1,050 | 298 | |||||||||
3.492%, 03/31/2020 | MYR | 26,179 | 7,876 | |||||||||
3.480%, 03/15/2023 | MYR | 14,448 | 4,279 | |||||||||
3.418%, 08/15/2022 | MYR | 8,999 | 2,659 | |||||||||
3.394%, 03/15/2017 | MYR | 2,460 | 748 | |||||||||
3.314%, 10/31/2017 | MYR | 21,610 | 6,538 | |||||||||
| Description | Face Amount (1) (Thousands) | Market Value ($ Thousands) | ||||||||||
3.260%, 03/01/2018 | MYR | 18,650 | $ | 5,632 | ||||||||
3.197%, 10/15/2015 | MYR | 9,213 | 2,803 | |||||||||
3.172%, 07/15/2016 | MYR | 6,780 | 2,061 | |||||||||
|
| |||||||||||
| 65,912 | ||||||||||||
|
| |||||||||||
Mexico — 6.2% | ||||||||||||
Alfa | ||||||||||||
6.875%, 03/25/2044 (B) | 1,395 | 1,550 | ||||||||||
America Movil | ||||||||||||
6.000%, 06/09/2019 | MXN | 12,420 | 931 | |||||||||
BBVA Bancomer | ||||||||||||
6.750%, 09/30/2022 (B) | 500 | 560 | ||||||||||
4.375%, 04/10/2024 (B) | 1,855 | 1,874 | ||||||||||
Cemex | ||||||||||||
6.500%, 12/10/2019 | 550 | 568 | ||||||||||
Cemex Espana Luxembourg | ||||||||||||
9.875%, 04/30/2019 | 950 | 1,055 | ||||||||||
Cemex Finance | ||||||||||||
9.375%, 10/12/2022 (B) | 350 | 395 | ||||||||||
Comision Federal de Electricidad | ||||||||||||
5.750%, 02/14/2042 (B) | 500 | 529 | ||||||||||
4.875%, 05/26/2021 (B) | 400 | 424 | ||||||||||
4.875%, 01/15/2024 (B) | 637 | 670 | ||||||||||
El Puerto de Liverpool | ||||||||||||
3.950%, 10/02/2024 | 348 | 345 | ||||||||||
Fermaca Enterprises S de RL | ||||||||||||
6.375%, 03/30/2038 (B) | 361 | 378 | ||||||||||
Mexican Bonos | ||||||||||||
7.500%, 06/03/2027 | MXN | 36,854 | 3,001 | |||||||||
6.500%, 06/09/2022 | MXN | 7,036 | 542 | |||||||||
6.250%, 06/16/2016 | MXN | 13,381 | 1,039 | |||||||||
6.000%, 06/18/2015 | MXN | 5,099 | 387 | |||||||||
5.000%, 06/15/2017 | MXN | 39,491 | 2,985 | |||||||||
Mexican Bonos, Ser M | ||||||||||||
6.500%, 06/10/2021 | MXN | 96,230 | 7,471 | |||||||||
Mexican Bonos, Ser M10 | ||||||||||||
8.500%, 12/13/2018 | MXN | 12,020 | 1,010 | |||||||||
7.750%, 12/14/2017 | MXN | 32,714 | 2,653 | |||||||||
7.250%, 12/15/2016 | MXN | 31,357 | 2,488 | |||||||||
Mexican Bonos, Ser M20 | ||||||||||||
10.000%, 12/05/2024 | MXN | 34,930 | 3,358 | |||||||||
8.500%, 05/31/2029 | MXN | 5,093 | 447 | |||||||||
8.000%, 12/07/2023 | MXN | 66,576 | 5,614 | |||||||||
7.750%, 05/29/2031 | MXN | 101,574 | 8,352 | |||||||||
Mexican Bonos, Ser M30 | ||||||||||||
10.000%, 11/20/2036 | MXN | 8,900 | 896 | |||||||||
8.500%, 11/18/2038 | MXN | 38,121 | 3,353 | |||||||||
Mexican Bonos, Ser MI10 | ||||||||||||
9.500%, 12/18/2014 | MXN | 31,235 | 2,356 | |||||||||
Mexican Udibonos | ||||||||||||
4.500%, 11/22/2035 | MXN | 5,716 | 2,551 | |||||||||
2.500%, 12/10/2020 | MXN | 6,273 | 2,469 | |||||||||
2.000%, 06/09/2022 | MXN | 1,471 | 552 | |||||||||
| 46 | SEI Institutional International Trust / Annual Report / September 30, 2014 |
| Description | Face Amount (1) (Thousands) | Market Value ($ Thousands) | ||||||||||
Offshore Drilling Holding | ||||||||||||
8.375%, 09/20/2020 | 1,700 | $ | 1,798 | |||||||||
Petroleos Mexicanos | ||||||||||||
7.190%, 09/12/2024 | MXN | 44,250 | 3,327 | |||||||||
6.625%, 06/15/2035 | 2,800 | 3,249 | ||||||||||
6.500%, 06/02/2041 | 572 | 662 | ||||||||||
6.375%, 01/23/2045 (B) | 806 | 911 | ||||||||||
3.500%, 01/30/2023 (B) | 185 | 178 | ||||||||||
Trust F | ||||||||||||
5.250%, 12/15/2024 (B) (G) | 1,080 | 1,123 | ||||||||||
United Mexican States MTN | ||||||||||||
6.050%, 01/11/2040 | 796 | 943 | ||||||||||
5.750%, 10/12/2110 | 468 | 483 | ||||||||||
5.550%, 01/21/2045 | 3,197 | 3,552 | ||||||||||
4.750%, 03/08/2044 | 660 | 655 | ||||||||||
4.000%, 10/02/2023 | 3,880 | 4,010 | ||||||||||
3.500%, 01/21/2021 | 175 | 177 | ||||||||||
United Mexican States, Ser A MTN | ||||||||||||
6.750%, 09/27/2034 | 1,040 | 1,321 | ||||||||||
|
| |||||||||||
| 83,192 | ||||||||||||
|
| |||||||||||
Mongolia — 0.5% | ||||||||||||
Development Bank of Mongolia MTN | ||||||||||||
5.750%, 03/21/2017 | 902 | 884 | ||||||||||
5.125%, 12/05/2022 | 2,713 | 2,401 | ||||||||||
4.125%, 01/05/2018 | 2,556 | 2,403 | ||||||||||
|
| |||||||||||
| 5,688 | ||||||||||||
|
| |||||||||||
Montenegro — 0.0% | ||||||||||||
Republic of Montenegro | ||||||||||||
7.875%, 09/14/2015 | EUR | 120 | 159 | |||||||||
5.375%, 05/20/2019 | EUR | 399 | 536 | |||||||||
|
| |||||||||||
| 695 | ||||||||||||
|
| |||||||||||
Morocco — 0.5% | ||||||||||||
Kingdom of Morocco | ||||||||||||
5.500%, 12/11/2042 (B) | 200 | 199 | ||||||||||
5.500%, 12/11/2042 | 1,000 | 995 | ||||||||||
4.250%, 12/11/2022 | 1,180 | 1,171 | ||||||||||
4.250%, 12/11/2022 (A) (B) | 1,348 | 1,338 | ||||||||||
OCP | ||||||||||||
5.625%, 04/25/2024 (B) | 3,128 | 3,254 | ||||||||||
|
| |||||||||||
| 6,957 | ||||||||||||
|
| |||||||||||
Mozambique — 0.1% | ||||||||||||
EMATUM Via Mozambique EMATUM Finance 2020 | ||||||||||||
6.305%, 09/11/2020 | 845 | 848 | ||||||||||
|
| |||||||||||
| Description | Face Amount (1) (Thousands) | Market Value ($ Thousands) | ||||||||||
Nigeria — 0.6% | ||||||||||||
Nigeria Treasury Bill | ||||||||||||
11.492%, 02/05/2015 (F) | NGN | 37,000 | $ | 218 | ||||||||
11.200%, 05/07/2015 (F) | NGN | 12,900 | 74 | |||||||||
11.154%, 04/23/2015 (F) | NGN | 25,200 | 145 | |||||||||
11.131%, 03/05/2015 (F) | NGN | 24,553 | 144 | |||||||||
Republic of Nigeria | ||||||||||||
16.390%, 01/27/2022 | NGN | 210,000 | 1,528 | |||||||||
15.100%, 04/27/2017 | NGN | 23,192 | 151 | |||||||||
14.200%, 03/14/2024 | NGN | 616,856 | 4,125 | |||||||||
6.750%, 01/28/2021 (B) | 550 | 598 | ||||||||||
6.750%, 01/28/2021 | 1,372 | 1,492 | ||||||||||
6.375%, 07/12/2023 | 596 | 638 | ||||||||||
6.375%, 07/12/2023 (B) | 551 | 590 | ||||||||||
|
| |||||||||||
| 9,703 | ||||||||||||
|
| |||||||||||
Pakistan — 0.4% | ||||||||||||
Republic of Pakistan | ||||||||||||
8.250%, 04/15/2024 | 3,400 | 3,400 | ||||||||||
7.250%, 04/15/2019 (B) | 500 | 501 | ||||||||||
7.125%, 03/31/2016 | 500 | 506 | ||||||||||
6.875%, 06/01/2017 | 430 | 438 | ||||||||||
6.875%, 06/01/2017 | 100 | �� | 102 | |||||||||
|
| |||||||||||
| 4,947 | ||||||||||||
|
| |||||||||||
Panama — 0.8% | ||||||||||||
Panama Notas del Tesoro | ||||||||||||
4.875%, 02/05/2021 | 704 | 742 | ||||||||||
Republic of Panama | ||||||||||||
9.375%, 01/16/2023 | 560 | 767 | ||||||||||
9.375%, 04/01/2029 | 2,614 | 3,875 | ||||||||||
8.875%, 09/30/2027 | 270 | 385 | ||||||||||
8.125%, 04/28/2034 | 2,128 | 2,841 | ||||||||||
7.125%, 01/29/2026 | 100 | 126 | ||||||||||
6.700%, 01/26/2036 | 1,350 | 1,657 | ||||||||||
4.300%, 04/29/2053 | 130 | 112 | ||||||||||
4.000%, 09/22/2024 | 380 | 379 | ||||||||||
|
| |||||||||||
| 10,884 | ||||||||||||
|
| |||||||||||
Paraguay — 0.3% | ||||||||||||
Republic of Paraguay | ||||||||||||
6.100%, 08/11/2044 (B) | 1,406 | 1,483 | ||||||||||
6.100%, 08/11/2044 | 400 | 422 | ||||||||||
4.625%, 01/25/2023 | 1,960 | 1,986 | ||||||||||
Telefonica Celular del Paraguay | ||||||||||||
6.750%, 12/13/2022 | 200 | 208 | ||||||||||
6.750%, 12/13/2022 (A) | 200 | 208 | ||||||||||
|
| |||||||||||
| 4,307 | ||||||||||||
|
| |||||||||||
Peru — 1.8% | ||||||||||||
Abengoa Transmision Sur | ||||||||||||
6.875%, 04/30/2043 (B) | 273 | 302 | ||||||||||
| SEI Institutional International Trust / Annual Report / September 30, 2014 | 47 |
SCHEDULE OF INVESTMENTS
Emerging Markets Debt Fund (Continued)
September 30, 2014
| Description | Face Amount (1) (Thousands) | Market Value ($ Thousands) | ||||||||||
BBVA Banco Continental | ||||||||||||
5.250%, 09/22/2029 (B) (E) |
| 651 | $ | 654 | ||||||||
Cementos Pacasmayo SAA | ||||||||||||
4.500%, 02/08/2023 (B) | 200 | 191 | ||||||||||
Cia Minera Ares SAC | ||||||||||||
7.750%, 01/23/2021 (B) | 209 | 221 | ||||||||||
Inkia Energy | ||||||||||||
8.375%, 04/04/2021 (B) | 200 | 219 | ||||||||||
Peru Enhanced Pass-Through Finance | ||||||||||||
4.600%, 06/02/2025 (A) (B) (F) |
| 1,000 | 702 | |||||||||
2.272%, 05/31/2018 (A) (B) (F) |
| 290 | 272 | |||||||||
2.265%, 05/31/2018 (F) | 108 | 101 | ||||||||||
Republic of Peru | ||||||||||||
9.910%, 05/05/2015 | PEI | 675 | 242 | |||||||||
8.750%, 11/21/2033 | 4,077 | 6,197 | ||||||||||
8.200%, 08/12/2026 | PEI | 4,268 | 1,755 | |||||||||
7.840%, 08/12/2020 | PEI | 9,806 | 3,859 | |||||||||
7.350%, 07/21/2025 | 1,980 | 2,579 | ||||||||||
7.125%, 03/30/2019 | 2,566 | 3,053 | ||||||||||
6.950%, 08/12/2031 | PEI | 770 | 276 | |||||||||
6.900%, 08/12/2037 | PEI | 4,630 | 1,615 | |||||||||
6.850%, 02/12/2042 | PEI | 613 | 213 | |||||||||
6.550%, 03/14/2037 | 372 | 469 | ||||||||||
5.200%, 09/12/2023 | PEI | 5,668 | 1,898 | |||||||||
|
| |||||||||||
| 24,818 | ||||||||||||
|
| |||||||||||
Philippines — 0.6% | ||||||||||||
Development Bank of Philippines | ||||||||||||
5.500%, 03/25/2021 | 330 | 362 | ||||||||||
National Power | ||||||||||||
9.625%, 05/15/2028 (A) | 1,100 | 1,623 | ||||||||||
Republic of Philippines | ||||||||||||
9.500%, 02/02/2030 | 371 | 579 | ||||||||||
7.750%, 01/14/2031 | 198 | 275 | ||||||||||
6.375%, 10/23/2034 | 2,733 | 3,444 | ||||||||||
5.500%, 03/30/2026 | 500 | 574 | ||||||||||
3.900%, 11/26/2022 | PHP | 45,000 | 986 | |||||||||
|
| |||||||||||
| 7,843 | ||||||||||||
|
| |||||||||||
Poland — 2.8% | ||||||||||||
Republic of Poland | ||||||||||||
5.750%, 04/25/2029 | PLN | 20,546 | 7,977 | |||||||||
5.000%, 04/25/2016 | PLN | 7,503 | 2,373 | |||||||||
5.000%, 03/23/2022 | 357 | 392 | ||||||||||
4.750%, 04/25/2017 | PLN | 1,120 | 361 | |||||||||
4.000%, 10/25/2023 | PLN | 10,803 | 3,527 | |||||||||
4.000%, 01/22/2024 | 682 | 701 | ||||||||||
3.250%, 07/25/2025 | PLN | 22,332 | 6,872 | |||||||||
3.000%, 08/24/2016 | PLN | 9,226 | 2,884 | |||||||||
2.750%, 08/25/2023 | PLN | 5,514 | 1,830 | |||||||||
2.500%, 07/25/2018 | PLN | 4,970 | 1,517 | |||||||||
| Description | Face Amount (1) (Thousands) | Market Value ($ Thousands) | ||||||||||
Republic of Poland, Ser 0922 | ||||||||||||
5.750%, 09/23/2022 | PLN | 17,878 | $ | 6,503 | ||||||||
Republic of Poland, Ser 1017 | ||||||||||||
5.250%, 10/25/2017 | PLN | 7,800 | 2,577 | |||||||||
Republic of Poland, Ser 1021 | ||||||||||||
5.750%, 10/25/2021 | PLN | 2,152 | 775 | |||||||||
|
| |||||||||||
| 38,289 | ||||||||||||
|
| |||||||||||
Qatar — 0.1% | ||||||||||||
Qtel International Finance | ||||||||||||
7.875%, 06/10/2019 | 665 | 814 | ||||||||||
|
| |||||||||||
Romania — 1.7% | ||||||||||||
Government of Romania MTN | ||||||||||||
6.750%, 02/07/2022 (B) | 350 | 414 | ||||||||||
6.750%, 02/07/2022 | 4,848 | 5,733 | ||||||||||
6.125%, 01/22/2044 | 390 | 445 | ||||||||||
5.950%, 06/11/2021 | RON | 6,670 | 2,134 | |||||||||
5.850%, 04/26/2023 | RON | 10,310 | 3,288 | |||||||||
5.800%, 07/26/2027 | RON | 2,900 | 927 | |||||||||
4.875%, 01/22/2024 (B) | 3,136 | 3,312 | ||||||||||
4.875%, 01/22/2024 (B) | 1,616 | 1,707 | ||||||||||
4.750%, 08/29/2016 | RON | 8,980 | 2,663 | |||||||||
4.750%, 06/24/2019 | RON | 1,940 | 585 | |||||||||
4.750%, 02/24/2025 | RON | 1,590 | 468 | |||||||||
4.750%, 02/24/2025 | RON | 5,400 | 1,603 | |||||||||
4.375%, 08/22/2023 | 2,050 | 2,097 | ||||||||||
|
| |||||||||||
| 25,376 | ||||||||||||
|
| |||||||||||
Russia — 6.6% | ||||||||||||
Alfa Bank Via Alfa Bond Issuance | ||||||||||||
7.750%, 04/28/2021 | 500 | 501 | ||||||||||
7.500%, 09/26/2019 | 750 | 735 | ||||||||||
7.500%, 09/26/2019 (B) | 71 | 70 | ||||||||||
Credit Bank of Moscow Via CBOM Finance | ||||||||||||
7.700%, 02/01/2018 | 1,000 | 971 | ||||||||||
EuroChem Mineral & Chemical Via EuroChem GI | ||||||||||||
5.125%, 12/12/2017 (B) | 175 | 171 | ||||||||||
Gazprom Neft OAO Via GPN Capital | ||||||||||||
6.000%, 11/27/2023 (B) | 480 | 454 | ||||||||||
Ritekro | ||||||||||||
13.317%, 11/07/2022 (A) (F) (H) | 914 | 457 | ||||||||||
Russian Federal Bond - OFZ | ||||||||||||
8.150%, 02/03/2027 | RUB | 181,146 | 4,243 | |||||||||
7.600%, 04/14/2021 | RUB | 447,914 | 10,463 | |||||||||
7.600%, 07/20/2022 | RUB | 216,166 | 4,990 | |||||||||
7.500%, 03/15/2018 | RUB | 34,823 | 836 | |||||||||
7.500%, 02/27/2019 | RUB | 72,220 | 1,713 | |||||||||
7.400%, 04/19/2017 | RUB | 70,000 | 1,697 | |||||||||
7.350%, 01/20/2016 | RUB | 80,000 | 1,991 | |||||||||
7.050%, 01/19/2028 | RUB | 370,855 | 7,833 | |||||||||
| 48 | SEI Institutional International Trust / Annual Report / September 30, 2014 |
| Description | Face Amount (1) (Thousands) | Market Value ($ Thousands) | ||||||||||
7.000%, 12/03/2014 (D) | RUB | 22,770 | $ | 498 | ||||||||
7.000%, 01/25/2023 | RUB | 202,968 | 4,482 | |||||||||
7.000%, 08/16/2023 | RUB | 232,494 | 5,073 | |||||||||
6.900%, 08/03/2016 | RUB | 48,434 | 1,184 | |||||||||
6.800%, 12/11/2019 | RUB | 83,764 | 1,918 | |||||||||
6.700%, 05/15/2019 | RUB | 3,728 | 85 | |||||||||
6.400%, 05/27/2020 | RUB | 13,460 | 304 | |||||||||
6.200%, 01/31/2018 | RUB | 116,910 | 2,701 | |||||||||
Russian Foreign Bond - Eurobond | ||||||||||||
7.850%, 03/10/2018 | RUB | 105,000 | 2,535 | |||||||||
7.500%, 03/31/2030 | 19,430 | 21,766 | ||||||||||
5.625%, 04/04/2042 | 600 | 597 | ||||||||||
4.875%, 09/16/2023 (B) | 1,200 | 1,183 | ||||||||||
3.250%, 04/04/2017 | 1,200 | 1,204 | ||||||||||
Russian Railways Via RZD Capital | ||||||||||||
5.700%, 04/05/2022 | 1,200 | 1,188 | ||||||||||
Sistema Via Sistema International Funding | ||||||||||||
6.950%, 05/17/2019 | 1,000 | 795 | ||||||||||
6.950%, 05/17/2019 | 500 | 398 | ||||||||||
TMK OAO Via TMK Capital | ||||||||||||
6.750%, 04/03/2020 | 1,300 | 1,164 | ||||||||||
VEB-Leasing Via VEB Leasing Investment | ||||||||||||
5.125%, 05/27/2016 | 320 | 317 | ||||||||||
Vimpel Communications Via VIP Finance Ireland | ||||||||||||
7.748%, 02/02/2021 (B) | 19 | 19 | ||||||||||
VimpelCom Holdings | ||||||||||||
7.504%, 03/01/2022 | 870 | 886 | ||||||||||
7.504%, 03/01/2022 (B) | 300 | 306 | ||||||||||
5.950%, 02/13/2023 (B) | 200 | 183 | ||||||||||
5.200%, 02/13/2019 (B) | 500 | 482 | ||||||||||
Vnesheconombank Via VEB Finance | ||||||||||||
6.902%, 07/09/2020 | 1,310 | 1,323 | ||||||||||
6.800%, 11/22/2025 | 580 | 566 | ||||||||||
6.800%, 11/22/2025 (B) | 150 | 146 | ||||||||||
5.450%, 11/22/2017 (B) | 400 | 398 | ||||||||||
|
| |||||||||||
| 88,826 | ||||||||||||
|
| |||||||||||
Senegal — 0.1% | ||||||||||||
Republic of Senegal | ||||||||||||
8.750%, 05/13/2021 (B) | 540 | 629 | ||||||||||
8.750%, 05/13/2021 | 200 | 233 | ||||||||||
6.250%, 07/30/2024 (B) | 426 | 425 | ||||||||||
|
| |||||||||||
| 1,287 | ||||||||||||
|
| |||||||||||
Serbia — 0.3% | ||||||||||||
Republic of Serbia | ||||||||||||
7.250%, 09/28/2021 (B) | 200 | 223 | ||||||||||
7.250%, 09/28/2021 | 2,370 | 2,644 | ||||||||||
5.875%, 12/03/2018 | 1,297 | 1,352 | ||||||||||
| Description | Face Amount (1) (Thousands) | Market Value ($ Thousands) | ||||||||||
5.875%, 12/03/2018 (B) | 530 | $ | 553 | |||||||||
4.875%, 02/25/2020 | 200 | 199 | ||||||||||
|
| |||||||||||
| 4,971 | ||||||||||||
|
| |||||||||||
Singapore — 0.5% | ||||||||||||
Singapore Government Bond | ||||||||||||
3.375%, 09/01/2033 | SGD | 1,530 | 1,272 | |||||||||
3.000%, 09/01/2024 | SGD | 7,156 | 5,867 | |||||||||
|
| |||||||||||
| 7,139 | ||||||||||||
|
| |||||||||||
Slovak Republic — 0.1% | ||||||||||||
Slovakia Government International Bond | ||||||||||||
4.375%, 05/21/2022 | 617 | 658 | ||||||||||
|
| |||||||||||
Slovenia — 0.5% | ||||||||||||
Slovenia Government International Bond | ||||||||||||
5.850%, 05/10/2023 | 691 | 769 | ||||||||||
5.850%, 05/10/2023 | 444 | 494 | ||||||||||
5.250%, 02/18/2024 (B) | 1,844 | 1,964 | ||||||||||
5.250%, 02/18/2024 | 2,400 | 2,556 | ||||||||||
4.125%, 02/18/2019 | 900 | 937 | ||||||||||
|
| |||||||||||
| 6,720 | ||||||||||||
|
| |||||||||||
South Africa — 4.5% | ||||||||||||
Eskom Holdings | ||||||||||||
6.750%, 08/06/2023 (B) | 1,289 | 1,352 | ||||||||||
Republic of South Africa | ||||||||||||
8.750%, 01/31/2044 | ZAR | 22,860 | 1,950 | |||||||||
8.750%, 02/28/2048 | ZAR | 85,630 | 7,388 | |||||||||
8.500%, 01/31/2037 | ZAR | 49,827 | 4,216 | |||||||||
8.250%, 09/15/2017 | ZAR | 29,822 | 2,712 | |||||||||
8.250%, 03/31/2032 | ZAR | 7,200 | 598 | |||||||||
8.000%, 12/21/2018 | ZAR | 36,857 | 3,316 | |||||||||
8.000%, 01/31/2030 | ZAR | 48,083 | 3,994 | |||||||||
7.750%, 02/28/2023 | ZAR | 27,100 | 2,343 | |||||||||
7.250%, 01/15/2020 | ZAR | 115,827 | 10,026 | |||||||||
7.000%, 02/28/2031 | ZAR | 50,909 | 3,826 | |||||||||
6.875%, 05/27/2019 | 580 | 658 | ||||||||||
6.500%, 02/28/2041 | ZAR | 21,595 | 1,437 | |||||||||
6.250%, 03/31/2036 | ZAR | 49,380 | 3,278 | |||||||||
5.875%, 09/16/2025 | 9,521 | 10,473 | ||||||||||
4.665%, 01/17/2024 | 545 | 549 | ||||||||||
Transnet SOC | ||||||||||||
9.500%, 05/13/2021 (B) | ZAR | 13,360 | 1,169 | |||||||||
4.000%, 07/26/2022 (B) | 1,119 | 1,053 | ||||||||||
ZAR Sovereign Capital Fund Propriety | ||||||||||||
3.903%, 06/24/2020 (B) | 1,046 | 1,041 | ||||||||||
|
| |||||||||||
| 61,379 | ||||||||||||
|
| |||||||||||
| SEI Institutional International Trust / Annual Report / September 30, 2014 | 49 |
SCHEDULE OF INVESTMENTS
Emerging Markets Debt Fund (Continued)
September 30, 2014
| Description | Face Amount (1) (Thousands) | Market Value ($ Thousands) | ||||||||||
Sri Lanka — 0.1% | ||||||||||||
Bank of Ceylon | ||||||||||||
6.875%, 05/03/2017 (B) | 320 | $ | 338 | |||||||||
Republic of Sri Lanka | ||||||||||||
6.250%, 07/27/2021 (B) | 200 | 210 | ||||||||||
5.125%, 04/11/2019 (B) | 673 | 683 | ||||||||||
|
| |||||||||||
| 1,231 | ||||||||||||
|
| |||||||||||
Supra-National — 0.2% | ||||||||||||
European Investment Bank MTN | ||||||||||||
8.500%, 09/17/2024 | ZAR | 9,200 | 799 | |||||||||
Inter-American Development Bank MTN | ||||||||||||
7.350%, 09/12/2018 | IDR | 20,140,000 | 1,647 | |||||||||
|
| |||||||||||
| 2,446 | ||||||||||||
|
| |||||||||||
Thailand — 3.1% | ||||||||||||
PTT Exploration & Production | ||||||||||||
4.875%, 06/18/2019 (B) (E) |
| 1,728 | 1,745 | |||||||||
Thailand Government Bond | ||||||||||||
5.670%, 03/13/2028 | THB | 3,000 | 112 | |||||||||
4.875%, 06/22/2029 | THB | 4,979 | 173 | |||||||||
3.875%, 06/13/2019 | THB | 423,880 | 13,618 | |||||||||
3.650%, 12/17/2021 | THB | 127,040 | 4,023 | |||||||||
3.625%, 05/22/2015 | THB | 8,630 | 269 | |||||||||
3.625%, 06/16/2023 | THB | 445,100 | 13,982 | |||||||||
3.580%, 12/17/2027 | THB | 68,200 | 2,090 | |||||||||
3.250%, 06/16/2017 | THB | 60,460 | 1,900 | |||||||||
1.250%, 03/12/2028 | THB | 23,640 | 672 | |||||||||
1.200%, 07/14/2021 | THB | 67,300 | 2,169 | |||||||||
|
| |||||||||||
| 40,753 | ||||||||||||
|
| |||||||||||
Trinidad & Tobago — 0.1% | ||||||||||||
Republic of Trinidad & Tobago | ||||||||||||
4.375%, 01/16/2024 (B) | 1,305 | 1,413 | ||||||||||
|
| |||||||||||
Turkey — 7.6% | ||||||||||||
Export Credit Bank of Turkey | ||||||||||||
5.875%, 04/24/2019 (B) | 200 | 212 | ||||||||||
Finansbank | ||||||||||||
6.250%, 04/30/2019 (B) | 1,342 | 1,396 | ||||||||||
Republic of Turkey | ||||||||||||
11.875%, 01/15/2030 | 900 | 1,514 | ||||||||||
10.700%, 02/24/2016 | TRY | 3,230 | 1,435 | |||||||||
10.500%, 01/15/2020 | TRY | 10,634 | 4,863 | |||||||||
10.400%, 03/27/2019 | TRY | 6,430 | 2,897 | |||||||||
10.400%, 03/20/2024 | TRY | 2,250 | 1,026 | |||||||||
9.500%, 01/12/2022 | TRY | 9,887 | 4,287 | |||||||||
9.000%, 01/27/2016 | TRY | 10,200 | 4,431 | |||||||||
9.000%, 03/08/2017 | TRY | 14,234 | 6,178 | |||||||||
8.800%, 11/14/2018 | TRY | 4,935 | 2,107 | |||||||||
8.800%, 09/27/2023 | TRY | 8,256 | 3,410 | |||||||||
| Description | Face Amount (1) (Thousands) | Market Value ($ Thousands) | ||||||||||
8.500%, 07/10/2019 | TRY | 1,770 | $ | 742 | ||||||||
8.500%, 09/14/2022 | TRY | 21,342 | 8,684 | |||||||||
8.300%, 10/07/2015 | TRY | 5,088 | 2,207 | |||||||||
8.300%, 06/20/2018 | TRY | 2,500 | 1,050 | |||||||||
8.300%, 06/20/2018 | TRY | 12,721 | 5,343 | |||||||||
8.000%, 02/14/2034 | 1,350 | 1,731 | ||||||||||
7.500%, 07/14/2017 | 2,463 | 2,759 | ||||||||||
7.500%, 11/07/2019 | 3,579 | 4,112 | ||||||||||
7.375%, 02/05/2025 | 6,070 | 7,208 | ||||||||||
7.250%, 03/05/2038 | 200 | 240 | ||||||||||
7.100%, 03/08/2023 | TRY | 16,324 | 6,084 | |||||||||
7.100%, 03/08/2023 | TRY | 1,120 | 417 | |||||||||
7.000%, 09/26/2016 | 378 | 413 | ||||||||||
7.000%, 06/05/2020 | 4,852 | 5,501 | ||||||||||
6.875%, 03/17/2036 | 1,360 | 1,559 | ||||||||||
6.750%, 04/03/2018 | 1,656 | 1,834 | ||||||||||
6.750%, 05/30/2040 | 375 | 425 | ||||||||||
6.625%, 02/17/2045 | 600 | 671 | ||||||||||
6.500%, 01/07/2015 | TRY | 5,864 | 2,553 | |||||||||
6.300%, 02/14/2018 | TRY | 7,359 | 2,931 | |||||||||
6.250%, 09/26/2022 | 1,602 | 1,762 | ||||||||||
6.000%, 01/14/2041 | 1,380 | 1,428 | ||||||||||
5.750%, 03/22/2024 | 201 | 213 | ||||||||||
5.625%, 03/30/2021 | 2,370 | 2,518 | ||||||||||
5.125%, 03/25/2022 | 573 | 590 | ||||||||||
4.500%, 02/11/2015 | TRY | 3,690 | 1,632 | |||||||||
3.250%, 03/23/2023 | 539 | 485 | ||||||||||
TC Ziraat Bankasi | ||||||||||||
4.250%, 07/03/2019 (B) | 1,440 | 1,410 | ||||||||||
Turk Telekomunikasyon | ||||||||||||
4.875%, 06/19/2024 (B) | 645 | 620 | ||||||||||
|
| |||||||||||
| 100,878 | ||||||||||||
|
| |||||||||||
Ukraine — 1.2% | ||||||||||||
Government of Ukraine | ||||||||||||
9.250%, 07/24/2017 | 10,206 | 8,956 | ||||||||||
9.250%, 07/24/2017 (B) | 403 | 354 | ||||||||||
7.950%, 02/23/2021 | 650 | 552 | ||||||||||
7.950%, 02/23/2021 (B) | 250 | 212 | ||||||||||
7.800%, 11/28/2022 (B) | 300 | 257 | ||||||||||
7.500%, 04/17/2023 (B) | 1,049 | 879 | ||||||||||
6.875%, 09/23/2015 | 674 | 600 | ||||||||||
6.750%, 11/14/2017 | 2,881 | 2,449 | ||||||||||
6.580%, 11/21/2016 | 403 | 343 | ||||||||||
6.250%, 06/17/2016 | 637 | 548 | ||||||||||
Ukraine Railways Via Shortline | ||||||||||||
9.500%, 05/21/2018 | 200 | 148 | ||||||||||
Ukreximbank Via Biz Finance | ||||||||||||
8.750%, 01/22/2018 | 670 | 506 | ||||||||||
|
| |||||||||||
| 15,804 | ||||||||||||
|
| |||||||||||
| 50 | SEI Institutional International Trust / Annual Report / September 30, 2014 |
| Description | Face Amount (1) (Thousands) | Market Value ($ Thousands) | ||||||||
United Arab Emirates — 0.1% | ||||||||||
MAF Global Securities | ||||||||||
7.125%, 10/29/2049 (E) | 600 | $ | 652 | |||||||
|
| |||||||||
Uruguay — 0.5% | ||||||||||
Republic of Uruguay | ||||||||||
7.625%, 03/21/2036 | 484 | 642 | ||||||||
5.100%, 06/18/2050 | 3,826 | 3,711 | ||||||||
4.500%, 08/14/2024 | 829 | 869 | ||||||||
Republic of Uruguay PIK | ||||||||||
7.875%, 01/15/2033 | 671 | 899 | ||||||||
|
| |||||||||
| 6,121 | ||||||||||
|
| |||||||||
Venezuela — 3.7% | ||||||||||
Petroleos de Venezuela | ||||||||||
9.750%, 05/17/2035 | 1,595 | 1,013 | ||||||||
9.000%, 11/17/2021 | 3,539 | 2,362 | ||||||||
8.500%, 11/02/2017 | 10,309 | 8,118 | ||||||||
8.500%, 11/02/2017 | 1,002 | 789 | ||||||||
6.000%, 05/16/2024 | 3,657 | 1,890 | ||||||||
6.000%, 05/16/2024 | 3,900 | 1,999 | ||||||||
6.000%, 11/15/2026 | 1,729 | 899 | ||||||||
5.500%, 04/12/2037 | 250 | 121 | ||||||||
5.375%, 04/12/2027 | 390 | 193 | ||||||||
5.250%, 04/12/2017 | 6,883 | 4,784 | ||||||||
5.000%, 10/28/2015 | 1,300 | 1,115 | ||||||||
Republic of Venezuela | ||||||||||
13.625%, 08/15/2018 | 1,716 | 1,568 | ||||||||
13.625%, 08/15/2018 | 144 | 127 | ||||||||
12.750%, 08/23/2022 | 6,987 | 5,817 | ||||||||
11.950%, 08/05/2031 | 1,678 | 1,288 | ||||||||
11.750%, 10/21/2026 | 2,515 | 1,944 | ||||||||
9.375%, 01/13/2034 | 2,561 | 1,690 | ||||||||
9.250%, 09/15/2027 | 1,313 | 903 | ||||||||
9.250%, 05/07/2028 | 2,445 | 1,608 | ||||||||
9.000%, 05/07/2023 | 1,915 | 1,292 | ||||||||
9.000%, 05/07/2023 | 20 | 14 | ||||||||
8.500%, 10/08/2014 | 780 | 770 | ||||||||
8.250%, 10/13/2024 | 1,252 | 798 | ||||||||
7.750%, 10/13/2019 | 3,225 | 2,233 | ||||||||
7.650%, 04/21/2025 | 290 | 178 | ||||||||
6.000%, 12/09/2020 | 587 | 362 | ||||||||
5.750%, 02/26/2016 | 6,477 | 5,522 | ||||||||
|
| |||||||||
| 49,397 | ||||||||||
|
| |||||||||
Vietnam — 0.1% | ||||||||||
Republic of Vietnam | ||||||||||
6.875%, 01/15/2016 | 360 | 381 | ||||||||
6.750%, 01/29/2020 | 830 | 935 | ||||||||
|
| |||||||||
| 1,316 | ||||||||||
|
| |||||||||
| Description | Face Amount (1) (Thousands) | Market Value ($ Thousands) | ||||||||||
Zambia — 0.4% | ||||||||||||
Republic of Zambia | ||||||||||||
8.500%, 04/14/2024 | 600 | $ | 682 | |||||||||
5.375%, 09/20/2022 | 2,360 | 2,242 | ||||||||||
Republic of Zambia Treasury Bills | ||||||||||||
19.970%, 08/24/2015 (F) | ZMW | 1,755 | 239 | |||||||||
19.225%, 02/09/2015 (F) | ZMW | 3,440 | 515 | |||||||||
17.231%, 09/21/2015 (F) | ZMW | 12,000 | 1,614 | |||||||||
|
| |||||||||||
| 5,292 | ||||||||||||
|
| |||||||||||
Total Global Bonds |
| 1,257,438 | ||||||||||
|
| |||||||||||
LOAN PARTICIPATIONS — 0.4% |
| |||||||||||
Singapore — 0.4% | ||||||||||||
Ashmore Cayman SPC, No. 1 | ||||||||||||
0.000%, 08/31/2011 (A) (C) (H) |
| 9,161 | 5,177 | |||||||||
Morton Bay | ||||||||||||
6.220%, 12/31/2013 (A) (H) |
| 3,158 | 600 | |||||||||
|
| |||||||||||
Total Loan Participations |
| 5,777 | ||||||||||
|
| |||||||||||
TIME DEPOSITS — 4.1% |
| |||||||||||
Brown Brothers Harriman | ||||||||||||
4.500%, 10/01/2014 | ZAR | 2,091 | 185 | |||||||||
0.060%, 10/01/2014 | GBP | — | — | |||||||||
0.030%, 10/01/2014 | 55,236 | 55,236 | ||||||||||
0.005%, 10/01/2014 | SGD | 7 | 6 | |||||||||
0.000%, 10/01/2014 | EUR | 17 | 22 | |||||||||
|
| |||||||||||
Total Time Deposits |
| 55,449 | ||||||||||
|
| |||||||||||
Total Investments — 98.0% |
| $ | 1,318,664 | |||||||||
|
| |||||||||||
| SEI Institutional International Trust / Annual Report / September 30, 2014 | 51 |
SCHEDULE OF INVESTMENTS
Emerging Markets Debt Fund (Continued)
September 30, 2014
A list of the open futures contracts held by the Fund at September 30, 2014, is as follows:
| Type of Contract | Number of Contracts Long (Short) | Expiration Date | Unrealized Appreciation (Depreciation) ($ Thousands) | |||||||||
Euro-Bund | (11 | ) | Dec-2014 | $ | (20 | ) | ||||||
Korea 10-Year Bond | (67 | ) | Dec-2014 | (117 | ) | |||||||
Korea 3-Year Bond | (63 | ) | Dec-2014 | (26 | ) | |||||||
R208 Bond | 670 | Nov-2014 | (66 | ) | ||||||||
U.S. 10-Year Treasury Note | (68 | ) | Dec-2014 | 54 | ||||||||
U.S. 10-Year Treasury Note | 23 | Dec-2014 | (21 | ) | ||||||||
U.S. 2-Year Treasury Note | (8 | ) | Sep-2014 | — | ||||||||
U.S. 5-Year Treasury Note | (187 | ) | Dec-2014 | 81 | ||||||||
U.S. 5-Year Treasury Note | 29 | Dec-2014 | — | |||||||||
U.S. Long Treasury Bond | 103 | Dec-2014 | (120 | ) | ||||||||
|
| |||||||||||
| $ | (235 | ) | ||||||||||
|
| |||||||||||
For the year ended September 30, 2014, the total amount of all open future contracts, as presented in the table above, are representative of the volume of activity for this derivative type during the year.
A list of the open forward foreign currency contracts held by the Fund at September 30, 2014, is as follows:
Settlement Date | Currency to Deliver (Thousands) | Currency to Receive (Thousands) | Unrealized (Depreciation) | |||||||||||||||||
10/01/2014-12/03/2014 | USD | 21,034 | BRL | 50,224 | $ | (741 | ) | |||||||||||||
10/01/2014-12/04/2014 | BRL | 84,411 | USD | 36,002 | 1,921 | |||||||||||||||
10/01/2014-12/17/2014 | MXN | 364,991 | USD | 27,444 | 357 | |||||||||||||||
10/01/2014-12/17/2014 | TRY | 57,808 | USD | 25,891 | 789 | |||||||||||||||
10/01/2014-12/17/2014 | USD | 7,669 | HUF | 1,842,081 | (180 | ) | ||||||||||||||
10/01/2014-12/17/2014 | USD | 20,343 | TRY | 45,065 | (748 | ) | ||||||||||||||
10/01/2014-01/15/2015 | USD | 52,225 | MXN | 691,552 | (899 | ) | ||||||||||||||
10/01/2014-02/18/2015 | HUF | 2,882,821 | USD | 12,299 | 585 | |||||||||||||||
10/02/2014-12/17/2014 | EUR | 52,093 | USD | 67,559 | 1,742 | |||||||||||||||
10/02/2014-12/17/2014 | USD | 35,899 | EUR | 27,908 | (643 | ) | ||||||||||||||
10/02/2014-12/17/2014 | ZAR | 179,525 | USD | 16,471 | 729 | |||||||||||||||
10/06/2014-11/03/2014 | EUR | 4,441 | RON | 19,691 | 26 | |||||||||||||||
10/06/2014-11/03/2014 | RON | 36,710 | EUR | 8,280 | (39 | ) | ||||||||||||||
10/06/2014-11/28/2014 | CLP | 5,084,886 | USD | 8,506 | 21 | |||||||||||||||
10/06/2014-12/18/2014 | USD | 27,620 | CLP | 16,322,166 | (417 | ) | ||||||||||||||
10/08/2014-10/15/2014 | USD | 16,144 | RUB | 604,340 | (892 | ) | ||||||||||||||
10/08/2014-11/19/2014 | USD | 6,565 | PHP | 286,732 | (177 | ) | ||||||||||||||
10/08/2014-11/28/2014 | PHP | 487,565 | USD | 10,956 | 99 | |||||||||||||||
10/08/2014-12/17/2014 | RUB | 496,295 | USD | 13,515 | 1,009 | |||||||||||||||
10/10/2014 | AUD | 9,191 | USD | 8,297 | 259 | |||||||||||||||
10/10/2014 | USD | 2,733 | AUD | 3,127 | 1 | |||||||||||||||
10/10/2014-11/26/2014 | USD | 16,695 | COP | 32,859,000 | (467 | ) | ||||||||||||||
10/14/2014-11/06/2014 | USD | 20,313 | ZAR | 222,031 | (736 | ) | ||||||||||||||
10/14/2014-11/10/2014 | USD | 9,908 | THB | 318,713 | (84 | ) | ||||||||||||||
10/14/2014-12/15/2014 | USD | 27,269 | MYR | 87,479 | (659 | ) | ||||||||||||||
10/14/2014-12/17/2014 | MYR | 42,903 | USD | 13,298 | 260 | |||||||||||||||
10/14/2014-12/17/2014 | THB | 449,195 | USD | 13,884 | 44 | |||||||||||||||
10/15/2014-12/08/2014 | IDR | 85,281,303 | USD | 7,086 | 157 | |||||||||||||||
10/15/2014-12/08/2014 | USD | 9,108 | IDR | 111,601,082 | (21 | ) | ||||||||||||||
10/15/2014-12/17/2014 | COP | 28,072,256 | USD | 14,420 | 567 | |||||||||||||||
10/21/2014-12/17/2014 | SGD | 37,886 | USD | 30,245 | 532 | |||||||||||||||
10/22/2014 | EUR | 4,485 | HUF | 1,414,184 | 86 | |||||||||||||||
10/22/2014-01/21/2015 | USD | 13,085 | INR | 803,802 | (248 | ) | ||||||||||||||
10/22/2014-03/25/2015 | HUF | 5,844,666 | EUR | 18,680 | (113 | ) | ||||||||||||||
10/23/2014-11/03/2014 | EUR | 17,376 | PLN | 73,057 | 121 | |||||||||||||||
10/23/2014-01/15/2015 | PLN | 39,086 | EUR | 9,277 | (60 | ) | ||||||||||||||
10/31/2014 | USD | 392 | GBP | 242 | – | |||||||||||||||
10/31/2014-11/28/2014 | GBP | 483 | USD | 789 | 7 | |||||||||||||||
11/03/2014-12/17/2014 | PEI | 73,840 | USD | 25,448 | 182 | |||||||||||||||
11/03/2014-12/17/2014 | USD | 16,870 | PEI | 49,010 | (104 | ) | ||||||||||||||
11/06/2014-11/19/2014 | USD | 9,525 | NGN | 1,592,702 | 89 | |||||||||||||||
11/19/2014 | NGN | 178,500 | USD | 1,073 | (4 | ) | ||||||||||||||
11/19/2014 | USD | 4,596 | KRW | 4,753,874 | (93 | ) | ||||||||||||||
Settlement Date | Currency to Deliver (Thousands) | Currency to Receive (Thousands) | Unrealized (Depreciation) | |||||||||||||||||
11/19/2014 | USD | 3,377 | KZT | 627,060 | $ | 41 | ||||||||||||||
11/19/2014-12/17/2014 | KRW | 10,088,780 | USD | 9,710 | 156 | |||||||||||||||
12/03/2014 | ILS | 39,959 | USD | 11,192 | 336 | |||||||||||||||
12/17/2014 | PLN | 12,285 | USD | 3,754 | 51 | |||||||||||||||
12/17/2014 | RON | 8,535 | USD | 2,507 | 75 | |||||||||||||||
12/17/2014 | USD | 10,557 | PLN | 34,245 | (232 | ) | ||||||||||||||
12/17/2014 | USD | 5,429 | TWD | 161,610 | (111 | ) | ||||||||||||||
12/17/2014-01/21/2015 | TWD | 338,702 | USD | 11,316 | 166 | |||||||||||||||
01/21/2015 | USD | 5,921 | CNY | 36,579 | (14 | ) | ||||||||||||||
07/10/2015-09/15/2015 | USD | 16,591 | CNH | 104,463 | 101 | |||||||||||||||
|
| |||||||||||||||||||
| $ | 2,827 | |||||||||||||||||||
|
| |||||||||||||||||||
A list of the counterparties for the open forward foreign currency contracts held by the Fund at September 30, 2014, is as follows:
| Counterparty | Currency to ($ Thousands) | Currency to Receive ($ Thousands) | Unrealized ($ Thousands) | |||||||||
Citigroup | $ | (140,564 | ) | $ | 141,043 | $ | 479 | |||||
Goldman Sachs | (311,628 | ) | 313,453 | 1,825 | ||||||||
HSBC | (4,825 | ) | 4,851 | 26 | ||||||||
JPMorgan Chase Bank | (343,710 | ) | 344,207 | 497 | ||||||||
|
| |||||||||||
| $ | 2,827 | |||||||||||
|
| |||||||||||
For the year ended September 30, 2014, the total amount of all open forward foreign currency contracts, as presented in the table above, are representative of the volume of activity for this derivative type during the year.
| 52 | SEI Institutional International Trust / Annual Report / September 30, 2014 |
A list of the open OTC swap agreements held by the fund at September 30, 2014, is as follows:
| Interest Rate Swaps | ||||||||||||||||||||
| Counterparty | Fund Pays | Fund Receives | Termination Date | Currency | Notional Amount (Thousands) | Net Unrealized Appreciation (Depreciation) ($ Thousands) | ||||||||||||||
| JPMorgan Chase Bank | 0.64% | 3-Month ILS - TELBOR | 07/31/2016 | ILS | 15,000 | $ | (22 | ) | ||||||||||||
| Goldman Sachs | 3-Month ZAR - JIBAR | 8.76% | 01/16/2029 | ZAR | 52,000 | 126 | ||||||||||||||
| Goldman Sachs | 28-Day MXN - TIIE | 6.26% | 07/25/2024 | MXN | 15,428 | (10 | ) | |||||||||||||
| Goldman Sachs | 28-Day MXN - TIIE | 6.31% | 05/20/2024 | MXN | 13,503 | (4 | ) | |||||||||||||
| Goldman Sachs | 3-Month ZAR - JIBAR | 8.30% | 01/16/2024 | ZAR | 23,000 | 28 | ||||||||||||||
| Goldman Sachs | 3-Month ZAR - JIBAR | 8.19% | 12/20/2023 | ZAR | 10,000 | 3 | ||||||||||||||
| Goldman Sachs | 1-Year BRL - CDI | 10.89% | 01/03/2023 | BRL | 5,012 | (189 | ) | |||||||||||||
| Goldman Sachs | 4.26% | 7-Day CNY - CNRR007 | 08/05/2019 | CNY | 76,000 | (527 | ) | |||||||||||||
| Goldman Sachs | 4.10% | 3-Month MYR - KLIBOR | 08/01/2019 | MYR | 20,000 | (41 | ) | |||||||||||||
| Goldman Sachs | 28-Day MXN - TIIE | 6.82% | 06/27/2019 | MXN | 218,869 | (31 | ) | |||||||||||||
| Goldman Sachs | 28-Day MXN - TIIE | 7.45% | 04/01/2019 | MXN | 194,784 | 71 | ||||||||||||||
| Goldman Sachs | 3-Month ILS - TELBOR | 2.29% | 12/24/2018 | ILS | 14,000 | 254 | ||||||||||||||
| Goldman Sachs | 1-Year BRL - CDI | 11.81% | 01/02/2018 | BRL | 9,833 | (51 | ) | |||||||||||||
| Goldman Sachs | 2.45% | 6-Month HUF - BUBOR | 07/11/2016 | HUF | 3,073,496 | 1 | ||||||||||||||
| Goldman Sachs | 0.76% | 3-Month ILS - TELBOR | 05/22/2016 | ILS | 11,000 | (28 | ) | |||||||||||||
| Goldman Sachs | 0.95% | 3-Month ILS - TELBOR | 04/02/2016 | ILS | 6,000 | (21 | ) | |||||||||||||
| Goldman Sachs | 1.21% | 3-Month ILS - TELBOR | 02/14/2016 | ILS | 8,000 | (43 | ) | |||||||||||||
| Goldman Sachs | 3.31% | 6-Month PLN - WIBOR | 02/03/2016 | PLN | 30,000 | (306 | ) | |||||||||||||
| Goldman Sachs | 1.20% | 3-Month ILS - TELBOR | 01/16/2016 | ILS | 34,383 | (179 | ) | |||||||||||||
| Goldman Sachs | 1-Year BRL - CDI | 11.59% | 01/04/2016 | BRL | 5,024 | 4 | ||||||||||||||
| Goldman Sachs | 1-Year BRL - CDI | 11.00% | 01/04/2016 | BRL | 45,820 | (196 | ) | |||||||||||||
| Goldman Sachs | 1.18% | 3-Month ILS - TELBOR | 12/24/2015 | ILS | 33,000 | (185 | ) | |||||||||||||
| JPMorgan Chase Bank | 4.29% | 6-Month HUF - BUBOR | 08/04/2024 | HUF | 800,000 | (131 | ) | |||||||||||||
|
| |||||||||||||||||||
| $ | (1,477 | ) | ||||||||||||||||||
|
| |||||||||||||||||||
For the year ended September 30, 2014, the total number of all open swap agreements, as presented in the table above, are representative of the volume of activity for this derivative type during the year.
Percentages are based on a Net Assets of $1,345,731 ($ Thousands).
| (1) | In U.S. dollars unless otherwise indicated. |
| (A) | Securities considered illiquid. The total market value of such securities as of September 30, 2014 was $21,026 ($ Thousands) and represented 1.6% of Net Assets. |
| (B) | Securities sold within terms of a private placement memorandum, exempt from registration under Section 144A of the Securities Act of 1933, as amended, and may be sold only to dealers in that program or other “accredited investors.” These securities have been determined to be liquid under guidelines established by the board of Trustees. |
| (C) | Security in default on interest payments. |
| (D) | Step Bonds — The rate reflected on the Schedule of Investments is the effective yield on September 30, 2014. The coupon on a step bond changes on a specified date. |
| (E) | Variable Rate Security — The rate reported on the Schedule of Investments is the rate in effect as of September 30, 2014. |
| (F) | The rate reported on the Schedule of Investments is the effective yield at time of purchase. |
| (G) | Real Estate Investment Trust. |
| (H) | Security fair valued using methods determined in good faith by the Valuation Committee of the Board of Trustees. The total market value of such securities as of September 30, 2014 was $6,234 ($ Thousands) and represented 0.5% of Net Assets. |
BRL — Brazilian Real
BUBOR — Budapest Interbank Offered Rate
CDI — Average One-Day Interbank Deposit Rate
CLN — Credit Linked Note
CLP — Chilean Peso
CNH — Chinese Yuen (Offshore)
CNY — Chinese Renminbi
COP — Colombian Peso
DEM — German Mark
DOP — Dominican Peso
EUR — Euro
GBP — British Pound Sterling
HUF — Hungarian Forint
IDR — Indonesia Rupiah
ILS — Israeli Shekel
INR — India Rupee
JIBAR — Johannesburg Interbank Agreed Rate
KES — Kenyan Shilling
KLIBOR — Kuala Lumpur Interbank Offered Rate
KRW — Korean Won
KZT — Kazakhstani Tenge
MTN — Medium Term Note
MXN — Mexican Peso
MYR — Malaysian Ringgit
NGN — Nigerian Naira
OTC — Over the Counter
PEI — Peruvian Inca
PHP — Philippine Peso
PIK — Payment-in-Kind
PLN — Polish Zlotty
RON — Romanian Leu
RUB — Russian Ruble
Ser — Series
SGD — Singapore Dollar
SPC — Segregated Portfolio Company
| TELBOR | — Tel Aviv Interbank Offered Rate |
| THB | — Thai Baht |
| TIIE | — Equilibrium Interbank Offered Rate |
TRY — Turkish Lira
USD — U.S. Dollar
WIBOR — Warsaw Interbank Offered Rate
ZAR — South African Rand
ZMW — Zambian Kwacha
| SEI Institutional International Trust / Annual Report / September 30, 2014 | 53 |
SCHEDULE OF INVESTMENTS
Emerging Markets Debt Fund (Concluded)
September 30, 2014
The following is a list of the level of inputs used as of September 30, 2014, in valuing the
Fund’s investments and other financial instruments carried at value ($ Thousands):
| Investments in Securities | Level 1 | Level 2 | Level 3(1) | Total | ||||||||||||
Global Bonds | $— | $ | 1,256,981 | $ | 457 | $ | 1,257,438 | |||||||||
Loan Participations | — | — | 5,777 | 5,777 | ||||||||||||
Time Deposits | — | 55,449 | — | 55,449 | ||||||||||||
|
|
|
|
|
|
|
| |||||||||
Total Investments in Securities | $— | $ | 1,312,430 | $ | 6,234 | $ | 1,318,664 | |||||||||
|
|
|
|
|
|
|
| |||||||||
| Other Financial Instruments | Level 1 | Level 2 | Level 3 | Total | ||||||||||||
Futures Contracts* | ||||||||||||||||
Unrealized Appreciation | $ | 135 | $ | — | $— | $ | 135 | |||||||||
Unrealized Depreciation | (370 | ) | — | — | (370 | ) | ||||||||||
Forwards Contracts* | ||||||||||||||||
Unrealized Appreciation | — | 10,509 | — | 10,509 | ||||||||||||
Unrealized Depreciation | — | (7,682 | ) | — | (7,682 | ) | ||||||||||
OTC Swaps | ||||||||||||||||
Interest Rate Swaps* | ||||||||||||||||
Unrealized Appreciation | — | 487 | — | 487 | ||||||||||||
Unrealized Depreciation | — | (1,964 | ) | — | (1,964 | ) | ||||||||||
|
|
|
|
|
|
|
| |||||||||
Total Other Financial Instruments | $ | (235 | ) | $ | 1,350 | $— | $ | 1,115 | ||||||||
|
|
|
|
|
|
|
| |||||||||
| (1) | Of the $6,234 ($ Thousands) in Level 3 securities as of September 30, 2014, $6,234 ($ Thousands) or 0.5% are not valued via third party pricing vendors and broker quotes. If significant, the disclosure of the unobservable inputs and the interrelationships and sensitivity between these inputs are required for those Level 3 securities that are not valued by third party pricing vendors or broker quotes. |
| * | Futures contracts, forwards contracts and swaps are valued at the unrealized appreciation (depreciation) on the instrument. |
For the year ended September 30, 2014, there were no transfers between Level 1 and Level 2 assets and liabilities.
For the year ended September 30, 2014, there were no transfers between Level 2 and Level 3 assets and liabilities.
Amounts designated as “—” are $0 or have been rounded to $0.
The accompanying notes are an integral part of the financial statements.
| 54 | SEI Institutional International Trust / Annual Report / September 30, 2014 |
Statements of Assets and Liabilities ($ Thousands)
September 30, 2014
International Equity Fund | Emerging Markets Equity Fund | International Fixed Income Fund | Emerging Markets Debt Fund | |||||||||||||
ASSETS: | ||||||||||||||||
Investments, at value (Cost $2,443,413, $1,910,737, $522,116 and $1,371,967, respectively)(1) | $ | 2,584,106 | $ | 1,939,174 | $ | 513,872 | $ | 1,318,664 | ||||||||
Affiliated investments, at value (Cost $153,305, $192,182, $0 and $0, respectively) | 153,305 | 192,182 | — | — | ||||||||||||
Cash | 895 | 266 | — | 1,200 | ||||||||||||
Foreign currency, at value (Cost $0, $6,631, $0 and $2,140, respectively) | — | 6,486 | — | 2,067 | ||||||||||||
Cash pledged as collateral for futures contracts | — | — | 917 | 931 | ||||||||||||
Receivable for investment securities sold | 7,592 | 4,474 | 8,421 | 19,106 | ||||||||||||
Unrealized gain on forward foreign currency contracts | — | — | 15,621 | 10,882 | ||||||||||||
Receivable for fund shares sold | 2,764 | 40,441 | 305 | 2,055 | ||||||||||||
Dividends and interest receivable | 5,301 | 2,621 | 4,655 | 19,483 | ||||||||||||
Variation margin receivable | 560 | — | 70 | 18 | ||||||||||||
Foreign tax reclaim receivable | 2,181 | 38 | — | — | ||||||||||||
Unrealized gain on foreign spot currency contracts | 6 | 2 | 2 | — | ||||||||||||
Total Assets | 2,756,710 | 2,185,684 | 543,863 | 1,374,406 | ||||||||||||
LIABILITIES: | ||||||||||||||||
Payable for investment securities purchased | 11,141 | 46,058 | 6,973 | 15,838 | ||||||||||||
Payable upon return of securities loaned | 51,798 | 173,971 | — | — | ||||||||||||
Payable to custodian | — | — | 9 | — | ||||||||||||
Foreign currency payable, at value (Cost $1,109, $0, $681 and $0, respectively) | 1,110 | — | 684 | — | ||||||||||||
Unrealized loss on forward foreign currency contracts | — | — | 614 | 8,055 | ||||||||||||
Swap contracts, at value (Premiums received $0, $0, $189 and $0, respectively) | — | — | 779 | 1,477 | ||||||||||||
Payable for fund shares redeemed | 1,486 | 2,078 | 10,469 | 1,516 | ||||||||||||
Variation margin payable | 359 | — | 65 | 105 | ||||||||||||
Unrealized loss on foreign spot currency contracts | 12 | 3 | 23 | 1 | ||||||||||||
Investment advisory fees payable | 1,145 | 1,610 | 131 | 476 | ||||||||||||
Administration fees payable | 1,019 | 1,080 | 263 | 731 | ||||||||||||
Shareholder servicing fees payable | 569 | 415 | 5 | 281 | ||||||||||||
Trustees’ fees | 2 | 2 | — | 1 | ||||||||||||
Chief compliance officer fees payable | 3 | 2 | 1 | 2 | ||||||||||||
Administration servicing fees payable | 4 | — | — | — | ||||||||||||
Other accrued expenses | 233 | 364 | 63 | 192 | ||||||||||||
Accrued foreign capital gains tax on appreciated securities | 5 | 2,023 | — | — | ||||||||||||
Total Liabilities | 68,886 | 227,606 | 20,079 | 28,675 | ||||||||||||
Net Assets | $ | 2,687,824 | $ | 1,958,078 | $ | 523,784 | $ | 1,345,731 | ||||||||
NET ASSETS: | ||||||||||||||||
Paid in Capital (unlimited authorization — no par value) | $ | 3,298,956 | $ | 1,960,127 | $ | 507,076 | $ | 1,416,446 | ||||||||
Undistributed (distributions in excess of) net investment income | 46,723 | 10,174 | 13,152 | (11,629 | ) | |||||||||||
Accumulated net realized loss on investments, futures contracts, option contracts, foreign currency contracts and swap contracts | (797,125 | ) | (38,581 | ) | (332 | ) | (6,386 | ) | ||||||||
Net unrealized appreciation (depreciation) on investments and option contracts | 140,693 | 28,437 | (8,244 | ) | (53,303 | ) | ||||||||||
Net unrealized appreciation (depreciation) on futures contracts | (1,225 | ) | — | 63 | (235 | ) | ||||||||||
Net unrealized deprecation on swap contracts | — | — | (1,808 | ) | (1,477 | ) | ||||||||||
Net unrealized appreciation (depreciation) on forward foreign currency contracts, foreign currencies and translation of other assets and liabilities denominated in foreign currencies | (193 | ) | (56 | ) | 13,877 | 2,315 | ||||||||||
Accumulated foreign capital gains tax on appreciated securities | (5 | ) | (2,023 | ) | — | — | ||||||||||
Net Assets | $ | 2,687,824 | $ | 1,958,078 | $ | 523,784 | $ | 1,345,731 | ||||||||
Net Asset Value, Offering and Redemption Price Per Share — Class ($2,682,481,552 ÷ 269,874,615 shares, $1,958,077,901 ÷ 181,934,554 shares, $523,784,060 ÷ 47,685,097 shares, $1,345,730,855 ÷ 131,881,883 shares, respectively.) | $9.94 | $10.76 | $10.98 | $10.20 | ||||||||||||
Net Asset Value, Offering and Redemption Price Per Share — Class I ($5,342,205 ÷ 538,314 shares) | $9.92 | N/A | N/A | N/A | ||||||||||||
| (1) | Included in “Investments, at value” is the market value of securities on loan in the amounts of $49,273, $167,813, $0 and $0, ($ Thousands), respectively. |
N/A — Not applicable. Share classes currently not offered.
Amounts designated as “—” are $0 or have been rounded to $0.
The accompanying notes are an integral part of the financial statements.
| SEI Institutional International Trust / Annual Report / September 30, 2014 | 55 |
Statements of Operations ($ Thousands)
For the year ended September 30, 2014
International Equity Fund | Emerging Markets Equity Fund | International Fixed Income Fund | Emerging Markets Debt Fund | |||||||||||||
Investment Income: | ||||||||||||||||
Dividends | $ | 85,033 | $ | 48,959 | $ | — | $ | — | ||||||||
Dividends from Affiliated Security (1)(2) | 8 | 2 | — | — | ||||||||||||
Interest | 22 | 30 | 11,521 | 77,586 | ||||||||||||
Security Lending Income — Net(1) | 1,625 | 1,458 | — | 33 | ||||||||||||
Less: Foreign Taxes Withheld | (7,743 | ) | (5,322 | ) | (26 | ) | (539 | ) | ||||||||
Total Investment Income | 78,945 | 45,127 | 11,495 | 77,080 | ||||||||||||
Expenses: | ||||||||||||||||
Investment Advisory Fees | 13,214 | 18,663 | 1,472 | 10,755 | ||||||||||||
Administration Fees | 11,775 | 11,553 | 2,944 | 8,224 | ||||||||||||
Shareholder Servicing Fees — Class A | 6,527 | 4,444 | 1,227 | 3,163 | ||||||||||||
Shareholder Servicing Fees — Class I | 15 | — | — | — | ||||||||||||
Administrative Servicing Fees — Class I | 15 | — | — | — | ||||||||||||
Custodian/Wire Agent Fees | 324 | 779 | 68 | 290 | ||||||||||||
Printing Fees | 251 | 179 | 45 | 118 | ||||||||||||
Professional Fees | 153 | 194 | 27 | 78 | ||||||||||||
Registration Fees | 59 | 36 | 12 | 30 | ||||||||||||
Trustees’ Fees | 32 | 22 | 6 | 16 | ||||||||||||
Chief Compliance Officer Fees | 13 | 10 | 2 | 7 | ||||||||||||
Overdraft Fees | 5 | 14 | 7 | 24 | ||||||||||||
Other Expenses | 93 | 64 | 86 | 97 | ||||||||||||
Total Expenses | 32,476 | 35,958 | 5,896 | 22,802 | ||||||||||||
Less: | ||||||||||||||||
Waiver of Investment Advisory Fees | — | (1,076 | ) | — | (5,555 | ) | ||||||||||
Waiver of Shareholder Servicing Fees — Class A | — | — | (879 | ) | — | |||||||||||
Fees Paid Indirectly | — | (7 | ) | — | — | |||||||||||
Net Expenses | 32,476 | 34,875 | 5,017 | 17,247 | ||||||||||||
Net Investment Income | 46,469 | 10,252 | 6,478 | 59,833 | ||||||||||||
Net Realized and Unrealized Gain (Loss) on Investments, Purchased Options, Futures Contracts, Swap Contracts and Foreign Currency Transactions: | ||||||||||||||||
Net Realized Gain (Loss) from: | ||||||||||||||||
Investments | 177,660 | 70,904 | 7,833 | 1,861 | ||||||||||||
Futures Contracts | 10,139 | — | 303 | (583 | ) | |||||||||||
Purchased Options | — | — | — | (365 | ) | |||||||||||
Swap Contracts | — | — | 1,124 | (3,964 | ) | |||||||||||
Foreign Currency Transactions | (1,027 | ) | (688 | ) | 7,088 | (31,240 | ) | |||||||||
Net Change in Unrealized Appreciation (Depreciation) on: | ||||||||||||||||
Investments | (151,780 | ) | (35,842 | ) | (12,876 | ) | (10,131 | ) | ||||||||
Futures Contracts | (853 | ) | — | 444 | (205 | ) | ||||||||||
Purchased Options | — | — | — | 361 | ||||||||||||
Swap Contracts | — | — | (2,728 | ) | 3,660 | |||||||||||
Foreign Capital Gains Tax on Appreciated Securities | (5 | ) | (1,875 | ) | — | — | ||||||||||
Foreign Currency Transactions | (317 | ) | (72 | ) | 21,099 | 4,303 | ||||||||||
Net Realized and Unrealized Gain (Loss) on Investments, Purchased Options, Futures Contracts, Swap Contracts and Foreign Currency Transactions | 33,817 | 32,427 | 22,287 | (36,303 | ) | |||||||||||
Net Increase in Net Assets Resulting from Operations | $ | 80,286 | $ | 42,679 | $ | 28,765 | $ | 23,530 | ||||||||
| (1) | Income is from the investment of collateral in an affiliated security. |
| (2) | See Note 4 in Notes to Financial Statements. |
Amounts designated as “—” are $0 or have been rounded to $0.
The accompanying notes are an integral part of the financial statements.
| 56 | SEI Institutional International Trust / Annual Report / September 30, 2014 |
Statements of Changes in Net Assets ($ Thousands)
For the years ended September 30,
| International Equity Fund | Emerging Markets Equity Fund | |||||||||||||||
| 2014 | 2013 | 2014 | 2013 | |||||||||||||
Operations: | ||||||||||||||||
Net Investment Income | $ | 46,469 | $ | 30,536 | $ | 10,252 | $ | 5,287 | ||||||||
Net Realized Gain from Investments and Futures Contracts | 187,799 | 81,432 | 70,904 | 9,079 | ||||||||||||
Net Realized Loss on Forward Foreign Currency Contracts and Foreign Currency Transactions | (1,027 | ) | (2,172 | ) | (688 | ) | (1,531 | ) | ||||||||
Net Change in Unrealized Appreciation (Depreciation) on Investments and Futures Contracts | (152,633 | ) | 273,430 | (35,842 | ) | 28,776 | ||||||||||
Net Change in Unrealized Appreciation (Depreciation) on Foreign Capital Tax Gains on Appreciated Securities | (5 | ) | — | (1,875 | ) | 147 | ||||||||||
Net Change in Unrealized Appreciation (Depreciation) on Forward Foreign Currency Contracts, Foreign Currencies, and Translation of Other Assets and Liabilities Denominated in Foreign Currencies | (317 | ) | 441 | (72 | ) | (30 | ) | |||||||||
Net Increase in Net Assets Resulting from Operations | 80,286 | 383,667 | 42,679 | 41,728 | ||||||||||||
Dividends From: | ||||||||||||||||
Net Investment Income: | ||||||||||||||||
Class A | (31,558 | ) | (29,890 | ) | (7,645 | ) | (4,998 | ) | ||||||||
Class I | (64 | ) | (72 | ) | N/A | N/A | ||||||||||
Total Dividends | (31,622 | ) | (29,962 | ) | (7,645 | ) | (4,998 | ) | ||||||||
Capital Share Transactions: | ||||||||||||||||
Class A: | ||||||||||||||||
Proceeds from Shares Issued | 655,997 | 563,306 | 848,194 | 724,981 | ||||||||||||
Reinvestment of Dividends & Distributions | 28,743 | 27,440 | 7,072 | 4,533 | ||||||||||||
Cost of Shares Redeemed | (400,975 | ) | (436,142 | ) | (345,905 | ) | (252,291 | ) | ||||||||
Increase in Net Assets Derived from Class A Transactions | 283,765 | 154,604 | 509,361 | 477,223 | ||||||||||||
Class I: | ||||||||||||||||
Proceeds from Shares Issued | 1,352 | 1,323 | N/A | N/A | ||||||||||||
Reinvestment of Dividends & Distributions | 45 | 47 | N/A | N/A | ||||||||||||
Cost of Shares Redeemed | (2,156 | ) | (1,647 | ) | N/A | N/A | ||||||||||
Decrease in Net Assets Derived from Class I Transactions | (759 | ) | (277 | ) | N/A | N/A | ||||||||||
Increase in Net Assets Derived from Capital Share Transactions | 283,006 | 154,327 | 509,361 | 477,223 | ||||||||||||
Net Increase in Net Assets | 331,670 | 508,032 | 544,395 | 513,953 | ||||||||||||
Net Assets: | ||||||||||||||||
Beginning of Year | 2,356,154 | 1,848,122 | 1,413,683 | 899,730 | ||||||||||||
End of Year | $ | 2,687,824 | $ | 2,356,154 | $ | 1,958,078 | $ | 1,413,683 | ||||||||
Undistributed Net Investment Income Included in Net Assets at End of Year | $ | 46,723 | $ | 29,494 | $ | 10,174 | $ | 3,516 | ||||||||
Share Transactions: | ||||||||||||||||
Class A: | ||||||||||||||||
Shares Issued | 64,705 | 63,540 | 78,929 | 70,166 | ||||||||||||
Reinvestment of Distributions | 2,851 | 3,244 | 667 | 426 | ||||||||||||
Shares Redeemed | (39,602 | ) | (49,907 | ) | (31,919 | ) | (24,132 | ) | ||||||||
Total Class A Transactions | 27,954 | 16,877 | 47,677 | 46,460 | ||||||||||||
Class I: | ||||||||||||||||
Shares Issued | 133 | 148 | N/A | N/A | ||||||||||||
Reinvestment of Distributions | 4 | 6 | N/A | N/A | ||||||||||||
Shares Redeemed | (212 | ) | (185 | ) | N/A | N/A | ||||||||||
Total Class I Transactions | (75 | ) | (31 | ) | N/A | N/A | ||||||||||
Net Increase in Shares Outstanding from Share Transactions | 27,879 | 16,846 | 47,677 | 46,460 | ||||||||||||
N/A — Not applicable. Share classes currently not offered.
Amounts designated as “—” are $0 or have been rounded to $0.
The accompanying notes are an integral part of the financial statements.
| SEI Institutional International Trust / Annual Report / September 30, 2014 | 57 |
Statements of Changes in Net Assets ($ Thousands) (Concluded)
For the years ended September 30,
| International Fixed Income Fund | Emerging Markets Debt Fund | |||||||||||||||
| 2014 | 2013 | 2014 | 2013 | |||||||||||||
Operations: | ||||||||||||||||
Net Investment Income | $ | 6,478 | $ | 6,789 | $ | 59,833 | $ | 50,806 | ||||||||
Net Realized Gain (Loss) from Investments, Futures Contracts, Option Contracts and Swap Contracts | 9,260 | 6,287 | (3,051 | ) | 11,840 | |||||||||||
Net Realized Gain (Loss) on Forward Foreign Currency Contracts and Foreign Currency Transactions | 7,088 | 17,142 | (31,240 | ) | 2,913 | |||||||||||
Net Change in Unrealized Depreciation on Investments, Futures Contracts, Option Contracts and Swap Contracts | (15,160 | ) | (21,948 | ) | (6,315 | ) | (124,707 | ) | ||||||||
Net Change in Unrealized Appreciation (Depreciation) on Forward Foreign Currency Contracts, Foreign Currencies, and Translation of Other Assets and Liabilities Denominated in Foreign Currencies | 21,099 | (4,510 | ) | 4,303 | (4,978 | ) | ||||||||||
Net Increase (Decrease) in Net Assets Resulting from Operations | 28,765 | 3,760 | 23,530 | (64,126 | ) | |||||||||||
Dividends and Distributions from: | ||||||||||||||||
Net Investment Income: | ||||||||||||||||
Class A | (2,598 | ) | (17,902 | ) | (37,069 | ) | (70,620 | ) | ||||||||
Net Realized Gains: | ||||||||||||||||
Class A | — | — | (7,466 | ) | (45,779 | ) | ||||||||||
Return of Capital: | ||||||||||||||||
Class A | — | (4,024 | ) | — | — | |||||||||||
Total Dividends and Distributions | (2,598 | ) | (21,926 | ) | (44,535 | ) | (116,399 | ) | ||||||||
Capital Share Transactions: | ||||||||||||||||
Class A: | ||||||||||||||||
Proceeds from Shares Issued | 132,549 | 119,934 | 460,776 | 470,901 | ||||||||||||
Reinvestment of Dividends & Distributions | 2,293 | 19,825 | 39,056 | 101,418 | ||||||||||||
Cost of Shares Redeemed | (110,607 | ) | (140,004 | ) | (315,392 | ) | (374,600 | ) | ||||||||
Increase (Decrease) in Net Assets Derived from Capital Share Transactions | 24,235 | (245 | ) | 184,440 | 197,719 | |||||||||||
Net Increase (Decrease) in Net Assets | 50,402 | (18,411 | ) | 163,435 | 17,194 | |||||||||||
Net Assets: | ||||||||||||||||
Beginning of Year | 473,382 | 491,793 | 1,182,296 | 1,165,102 | ||||||||||||
End of Year | $ | 523,784 | $ | 473,382 | $ | 1,345,731 | $ | 1,182,296 | ||||||||
Undistributed (Distributions in excess of) Net Investment Income Included in Net Assets at End of Year | $ | 13,152 | $ | 2,722 | $ | (11,629 | ) | $ | (2,072 | ) | ||||||
Share Transactions: | ||||||||||||||||
Class A: | ||||||||||||||||
Shares Issued | 12,407 | 11,333 | 44,744 | 41,939 | ||||||||||||
Reinvestment of Distributions | 220 | 1,897 | 3,784 | 8,776 | ||||||||||||
Shares Redeemed | (10,379 | ) | (13,265 | ) | (30,598 | ) | (33,284 | ) | ||||||||
Total Class A Transactions | 2,248 | (35 | ) | 17,930 | 17,431 | |||||||||||
Amounts designated as “—” are either $0 or have been rounded to $0.
The accompanying notes are an integral part of the financial statements.
| 58 | SEI Institutional International Trust / Annual Report / September 30, 2014 |
For the years ended September 30,
For a Share Outstanding Throughout Each Year
| Net Asset Value, Beginning of Year | Net Investment Income(1) | Net Realized and Unrealized Gains (Losses) on Securities(1) | Total from Operations | Dividends from Net Investment Income | Distributions from Realized Capital Gains | Total Dividends and Distributions and Return of Capital | Net Asset Value, End of Year | Total Return† | Net Assets End of Year (Thousands) | Ratio of Expenses to Average Net Assets* | Ratio of Expenses to Average Net Assets (Excluding Fees Paid Indirectly)** | Ratio of Expenses to Average Net Assets (Excluding Waivers and Fees Paid Indirectly)** | Ratio of Net Investment Income to Average Net Assets | Portfolio Turnover Rate | ||||||||||||||||||||||||||||||||||||||||||||||
International Equity Fund |
| |||||||||||||||||||||||||||||||||||||||||||||||||||||||||||
Class A |
| |||||||||||||||||||||||||||||||||||||||||||||||||||||||||||
2014 | $ | 9.71 | $ | 0.18 | $ | 0.18 | $ | 0.36 | $ | (0.13 | ) | $ | — | $ | (0.13 | ) | $ | 9.94 | 3.66 | % | $ | 2,682,482 | 1.24 | %(2) | 1.24 | %(2) | 1.24 | %(2) | 1.78 | % | 60 | % | ||||||||||||||||||||||||||||
2013 | 8.19 | 0.13 | 1.53 | 1.66 | (0.14 | ) | — | (0.14 | ) | 9.71 | 20.47 | 2,350,201 | 1.25 | (2) | 1.25 | (2) | 1.25 | (2) | 1.50 | 47 | ||||||||||||||||||||||||||||||||||||||||
2012 | 7.29 | 0.14 | 0.92 | 1.06 | (0.16 | ) | — | (0.16 | ) | 8.19 | 14.76 | 1,842,851 | 1.26 | (2) | 1.26 | (2) | 1.26 | (2) | 1.75 | 56 | ||||||||||||||||||||||||||||||||||||||||
2011 | 8.34 | 0.16 | (1.08 | ) | (0.92 | ) | (0.13 | ) | — | (0.13 | ) | 7.29 | (11.34 | ) | 1,566,893 | 1.27 | (2) | 1.27 | (2) | 1.27 | (2) | 1.88 | 98 | |||||||||||||||||||||||||||||||||||||
2010 | 7.88 | 0.10 | 0.36 | 0.46 | — | — | — | 8.34 | 5.84 | 1,898,206 | 1.27 | (2) | 1.27 | (2) | 1.28 | (10) | 1.26 | 144 | ||||||||||||||||||||||||||||||||||||||||||
Class I |
| |||||||||||||||||||||||||||||||||||||||||||||||||||||||||||
2014 | $ | 9.70 | $ | 0.15 | $ | 0.17 | $ | 0.32 | $ | (0.10 | ) | $ | — | $ | (0.10 | ) | $ | 9.92 | 3.33 | % | $ | 5,342 | 1.49 | %(2) | 1.49 | %(2) | 1.49 | %(2) | 1.48 | % | 60 | % | ||||||||||||||||||||||||||||
2013 | 8.18 | 0.11 | 1.52 | 1.63 | (0.11 | ) | — | (0.11 | ) | 9.70 | 20.19 | 5,953 | 1.50 | (2) | 1.50 | (2) | 1.50 | (2) | 1.21 | 47 | ||||||||||||||||||||||||||||||||||||||||
2012 | 7.28 | 0.12 | 0.91 | 1.03 | (0.13 | ) | — | (0.13 | ) | 8.18 | 14.37 | 5,271 | 1.51 | (2) | 1.51 | (2) | 1.51 | (2) | 1.48 | 56 | ||||||||||||||||||||||||||||||||||||||||
2011 | 8.32 | 0.13 | (1.06 | ) | (0.93 | ) | (0.11 | ) | — | (0.11 | ) | 7.28 | (11.44 | ) | 5,265 | 1.52 | (2) | 1.52 | (2) | 1.52 | (2) | 1.54 | 98 | |||||||||||||||||||||||||||||||||||||
2010 | 7.89 | 0.08 | 0.35 | 0.43 | — | — | — | 8.32 | 5.45 | 8,455 | 1.52 | (2) | 1.52 | (2) | 1.53 | (10) | 1.00 | 144 | ||||||||||||||||||||||||||||||||||||||||||
Emerging Markets Equity Fund |
| |||||||||||||||||||||||||||||||||||||||||||||||||||||||||||
Class A |
| |||||||||||||||||||||||||||||||||||||||||||||||||||||||||||
2014 | $ | 10.53 | $ | 0.06 | $ | 0.22 | $ | 0.28 | $ | (0.05 | ) | $ | — | $ | (0.05 | ) | $ | 10.76 | 2.68 | % | $ | 1,958,078 | 1.96 | %(3) | 1.96 | %(3) | 2.02 | %(11) | 0.58 | % | 59 | % | ||||||||||||||||||||||||||||
2013 | 10.25 | 0.06 | 0.28 | 0.34 | (0.06 | ) | — | (0.06 | ) | 10.53 | 3.29 | 1,413,683 | 1.96 | (3) | 1.96 | (3) | 2.04 | (11) | 0.52 | 78 | ||||||||||||||||||||||||||||||||||||||||
2012 | 9.00 | 0.05 | 1.23 | 1.28 | (0.03 | ) | — | (0.03 | ) | 10.25 | 14.21 | 899,730 | 1.97 | (3) | 1.97 | (3) | 2.07 | (11) | 0.49 | 93 | ||||||||||||||||||||||||||||||||||||||||
2011 | 11.40 | 0.05 | (2.35 | ) | (2.30 | ) | (0.10 | ) | — | (0.10 | ) | 9.00 | (20.38 | ) | 695,498 | 1.96 | (3) | 1.96 | (3) | 2.09 | (11) | 0.44 | 98 | |||||||||||||||||||||||||||||||||||||
2010 | 9.64 | 0.04 | 1.78 | 1.82 | (0.06 | ) | — | (0.06 | ) | 11.40 | 18.93 | 935,583 | 1.96 | (3) | 1.96 | (3) | 2.09 | (11) | 0.38 | 81 | ||||||||||||||||||||||||||||||||||||||||
International Fixed Income Fund |
| |||||||||||||||||||||||||||||||||||||||||||||||||||||||||||
Class A |
| |||||||||||||||||||||||||||||||||||||||||||||||||||||||||||
2014 | $ | 10.42 | $ | 0.14 | $ | 0.48 | $ | 0.62 | $ | (0.06 | ) | $ | — | $ | (0.06 | ) | $ | 10.98 | 5.96 | % | $ | 523,784 | 1.02 | %(4) | 1.02 | %(4) | 1.20 | %(12) | 1.32 | % | 104 | % | ||||||||||||||||||||||||||||
2013 | 10.82 | 0.14 | (0.06 | ) | 0.08 | (0.48 | )(9) | — | (0.48 | ) | 10.42 | 0.77 | 473,382 | 1.02 | (4) | 1.02 | (4) | 1.20 | (12) | 1.37 | 86 | |||||||||||||||||||||||||||||||||||||||
2012 | 10.44 | 0.17 | 0.48 | 0.65 | (0.27 | ) | — | (0.27 | ) | 10.82 | 6.34 | 491,793 | 1.02 | (4) | 1.02 | (4) | 1.21 | (12) | 1.60 | 103 | ||||||||||||||||||||||||||||||||||||||||
2011 | 10.92 | 0.25 | (0.22 | ) | 0.03 | (0.51 | )(8) | — | (0.51 | ) | 10.44 | 0.41 | 488,929 | 1.02 | (4) | 1.02 | (4) | 1.21 | (12) | 2.40 | 119 | |||||||||||||||||||||||||||||||||||||||
2010 | 10.21 | 0.24 | 0.57 | 0.81 | (0.10 | )(7) | — | (0.10 | ) | 10.92 | 7.97 | 505,081 | 1.07 | (6) | 1.07 | (6) | 1.21 | (12) | 2.33 | 135 | ||||||||||||||||||||||||||||||||||||||||
Emerging Markets Debt Fund |
| |||||||||||||||||||||||||||||||||||||||||||||||||||||||||||
Class A |
| |||||||||||||||||||||||||||||||||||||||||||||||||||||||||||
2014 | $ | 10.38 | $ | 0.49 | $ | (0.29 | ) | $ | 0.20 | $ | (0.31 | ) | $ | (0.07 | ) | $ | (0.38 | ) | $ | 10.20 | 1.90 | % | $ | 1,345,731 | 1.36 | %(5) | 1.36 | %(5) | 1.80 | %(13) | 4.73 | % | 92 | % | ||||||||||||||||||||||||||
2013 | 12.07 | 0.47 | (1.02 | ) | (0.55 | ) | (0.68 | ) | (0.46 | ) | (1.14 | ) | 10.38 | (5.19 | ) | 1,182,296 | 1.36 | (5) | 1.36 | (5) | 1.81 | (13) | 4.20 | 90 | ||||||||||||||||||||||||||||||||||||
2012 | 10.81 | 0.55 | 1.36 | 1.91 | (0.63 | ) | (0.02 | ) | (0.65 | ) | 12.07 | 18.48 | 1,165,102 | 1.36 | (5) | 1.36 | (5) | 1.80 | (13) | 4.85 | 102 | |||||||||||||||||||||||||||||||||||||||
2011 | 11.19 | 0.63 | (0.70 | ) | (0.07 | ) | (0.31 | ) | — | (0.31 | ) | 10.81 | (0.71 | ) | 876,396 | 1.36 | (5) | 1.36 | (5) | 1.80 | (13) | 5.58 | 59 | |||||||||||||||||||||||||||||||||||||
2010 | 10.24 | 0.67 | 1.14 | 1.81 | (0.86 | ) | — | (0.86 | ) | 11.19 | 18.78 | 931,865 | 1.36 | (5) | 1.36 | (5) | 1.79 | (13) | 6.41 | 70 | ||||||||||||||||||||||||||||||||||||||||
| * | Includes Fees Paid Indirectly, if applicable. See Note 4 in Notes to Financial Statements. |
| ** | See Note 4 in Notes to Financial Statements. |
| † | Returns do not reflect the deduction of taxes that a shareholder would pay on fund distributions or the redemption of fund shares. |
| (1) | Per share net investment income/(loss) and net realized and unrealized gains/(losses) calculated using average shares. |
| (2) | The expense ratio includes overdraft fees. Had this expense been excluded, the ratios for Class A and I shares would have been 1.24% and 1.49%, respectively for 2014, 1.25% and 1.50%, respectively for 2013, 1.26% and 1.51%, respectively for 2012, 1.27% and 1.52%, respectively for 2011 and 2010. |
| (3) | The expense ratio includes overdraft fees. Had this expense been excluded, the ratios would have been 1.96% for 2014, 2013, 2012, 2011 and 2010. |
| (4) | The expense ratio includes overdraft fees. Had this expense been excluded, the ratios would have been 1.02%, 1.02%, 1.02%, 1.02% and 1.01% for 2014, 2013, 2012 and 2011 respectively. |
| (5) | The expense ratio includes overdraft fees. Had this expense been excluded, the ratios would have been 1.36% for 2014, 2013, 2012, 2011 and 2010. |
| (6) | The expense ratio includes proxy and overdraft fees. Had these expenses been excluded, the ratio would have been 1.01% for 2010. |
| (7) | Includes a return of capital of less than $0.01. |
| (8) | Includes a return of capital of $0.01 per share. |
| (9) | Includes a return of capital of $0.09 per share. |
| (10) | The expense ratio includes overdraft fees. Had this expense been excluded, the ratios for Class A and I shares would have been 1.28% and 1.53%, respectively for 2010. |
| (11) | The expense ratio includes overdraft fees. Had this expense been excluded the ratios would have been 2.02%, 2.04%, 2.06%, 2.09% and 2.09% for 2014, 2013, 2012, 2011 and 2010. |
| (12) | The expense ratio includes overdraft fees. Had this expense been excluded the ratios would have been 1.20%, 1.20%, 1.21%, 1.21% and 1.15% for 2014, 2013, 2012, 2011 and 2010. |
| (13) | The expense ratio includes overdraft fees. Had this expense been excluded the ratios would have been 1.80%, 1.81%, 1.80%, 1.80% and 1.79% for 2014, 2013, 2012, 2011 and 2010. |
Amounts designated as “—” are either $0 or have been rounded to $0.
The accompanying notes are an integral part of the financial statements.
| SEI Institutional International Trust / Annual Report / September 30, 2014 | 59 |
September 30, 2014
1. ORGANIZATION
SEI Institutional International Trust (the “Trust”) was organized as a Massachusetts business trust under a Declaration of Trust dated June 30, 1988. The operations of the Trust commenced on December 20, 1989.
The Trust is registered under the Investment Company Act of 1940, as amended, as an open-end investment company with four funds: International Equity Fund, Emerging Markets Equity Fund, International Fixed Income Fund and Emerging Markets Debt Fund (together the “Funds”) each of which are diversified Funds with the exception of the International Fixed Income Fund and the Emerging Markets Debt Fund. The Trust’s prospectuses provide a description of each Fund’s investment goal, principal strategies and risks. The Trust is registered to offer Class A and Class Y shares of each of the Funds and Class I shares of the International Equity Fund. As of September 30, 2014, the Class Y shares had not yet commenced operations.
2. SIGNIFICANT ACCOUNTING POLICIES
The following is a summary of significant accounting policies consistently followed by the Funds.
Use of Estimates — The preparation of financial statements, in conformity with U.S. generally accepted accounting principles (“U.S. GAAP”), requires management to make estimates and assumptions that affect the reported amounts of assets and liabilities and disclosure of contingent assets and liabilities as of the date of the financial statements, and the reported amounts of increases and decreases in net assets from operations during the reporting period. Actual results could differ from those estimates.
Security Valuation — Securities listed on a securities exchange, market or automated quotation system for which quotations are readily available are valued at the last quoted sale price on the primary exchange or market (foreign or domestic) on which they are traded, or, if there is no such reported sale, at the most recent quoted bid price. Debt securities are priced based upon valuations provided by independent, third-party pricing agents, if available. Such values generally reflect the last reported sales price if the security is actively traded. The third-party pricing agents may also value debt securities at an evaluated bid price by employing methodologies that utilize actual market transactions, broker-supplied valuations, or other methodologies designed to identify the market value for such securities. Debt obligations with remaining maturities of sixty days or less may be valued at their amortized cost, which approximates market value. The prices for foreign securities are reported in local currency and converted to U.S. dollars using currency exchange rates. Prices for most securities held in the Funds are provided daily by recognized independent pricing agents. SEI Investments Management Corporation (“SIMC”) or a sub-adviser, as applicable, reasonably believes that prices provided by independent pricing agents are reliable. However, there can be no assurance that such pricing service’s prices will be reliable. SIMC or a sub-adviser, as applicable, continuously
monitors the reliability of prices obtained from any pricing service and will notify the Funds’ administrator if it believes that a particular pricing service is no longer a reliable source of prices. The Funds’ administrator, in turn, will notify the Trust’s Fair Value Committee if it receives such notification from SIMC or a sub-adviser, as applicable, or if the Funds’ administrator reasonably believes that a particular pricing service is no longer a reliable source for prices. If a security price cannot be obtained from an independent, third-party pricing agent, the Funds seek to obtain a bid price from at least one independent broker.
Securities for which market prices are not “readily available” are determined to be unreliable or can not be valued using methodologies described above are valued in accordance with Fair Value Procedures established by the Trust’s Board of Trustees (the “Board”). The Trust’s Fair Value Procedures are implemented through a Fair Value Committee (the “Committee”) designated by the Board. The Committee is currently composed of two members of the Board of Trustees, as well as representatives from SIMC and its affiliates. The Committee provides regular reports to the Board concerning investments for which market prices are not readily available or may be unreliable. Some of the more common reasons that may necessitate that a security be valued using Fair Value Procedures include: the security’s trading has been halted or suspended; the security has been de-listed from a national exchange; the security’s primary trading market is temporarily closed at a time when, under normal conditions, it would be open; or the security’s primary pricing source is not able or willing to provide a price. When a security is valued in accordance with the Fair Value Procedures, the Committee will determine the value after taking into consideration relevant information reasonably available to the Committee. Examples of factors the Committee may consider are: (i) the facts giving rise to the need to fair value; (ii) the last trade price; (iii) the performance of the market or the issuer’s industry; (iv) the liquidity of the security; (v) the size of the holding in a Fund; or (vi) any other appropriate information. The determination of a security’s fair value price often involves the consideration of a number of subjective factors and is therefore subject to the unavoidable risk that the value assigned to a security may be higher or lower than the security’s value would be if a reliable market quotation for the security was readily available.
For securities that principally trade on a foreign market or exchange, a significant gap in time can exist between the time of a particular security’s last trade and the time at which a Fund calculates its net asset value. The closing prices of such securities may no longer reflect their market value at the time the Fund calculates net asset value if an event that could materially affect the value of those securities (a “Significant Event”) has occurred between the time of the security’s last close and the time that the Fund calculates net asset value. A Significant Event may relate to a single issuer or to an entire market sector. If the adviser or sub-adviser of a Fund becomes aware of a Significant Event that has occurred with respect to a security or group of securities after the closing of the exchange or market on which the
| 60 | SEI Institutional International Trust / Annual Report / September 30, 2014 |
security or securities principally trade, but before the time at which the Fund calculates net asset value, it may request that a Committee meeting be called. In addition, the Fund’s administrator monitors price movements among certain selected indices, securities and/or baskets of securities that may be an indicator that the closing prices received earlier from foreign exchanges or markets may not reflect market value at the time the Fund calculates net asset value. If price movements in a monitored index or security exceed levels established by the administrator, the administrator notifies the adviser or sub-adviser for any Fund holding the relevant securities that such limits have been exceeded. In such event, the adviser or sub-adviser makes the determination whether a Committee Meeting should be called based on the information provided.
The International Equity Fund and Emerging Markets Equity Fund also use a third-party fair valuation vendor. The vendor provides a fair value for foreign securities held by these Funds based on certain factors and methodologies (involving, generally, tracking valuation correlations between the U.S. market and each non-U.S. security). Values from the fair value vendor are applied in the event that there is a movement in the U.S. market that exceeds a specific threshold that has been established by the Committee. The Committee has also established a “confidence interval” which is used to determine the level of historical correlation between the value of a specific foreign security and movements in the U.S. market before a particular security will be fair valued when the threshold is exceeded. In the event that the threshold established by the Committee is exceeded on a specific day, the International Equity Fund and Emerging Markets Equity Fund will value the non-U.S. securities in their portfolios that exceed the applicable “confidence interval” based upon the adjusted prices provided by the fair valuation vendor.
In accordance with U.S. GAAP, fair value is defined as the price that the Fund would receive upon selling an investment in an orderly transaction to an independent buyer in the principal or most advantageous market of the investment. A three-tier hierarchy has been established to maximize the use of the observable market data and minimize the use of unobservable inputs and to establish classification of the fair value measurements for disclosure purposes. Inputs refer broadly to the assumptions that market participants would use in pricing an asset. Inputs may be observable or unobservable. Observable inputs are inputs that reflect the assumptions market participants would use in pricing the asset or liability developed based on market data obtained from sources independent of the reporting entity. Unobservable inputs are inputs that reflect the reporting entity’s own assumptions about the assumptions market participants would use in pricing the asset or liability developed based on the best information available in the circumstances.
The three-tier hierarchy of inputs is summarized in the three broad Levels listed below:
Level 1 — quoted prices in active markets for identical investments
Level 2 — other significant observable inputs (including quoted prices for similar investments, interest rates, prepayment speeds, credit risks, etc.)
Level 3 — significant unobservable inputs (including the Fund’s own assumptions in determining the fair value of investments)
Investments are classified within the level of the lowest significant input considered in determining fair value. Investments classified within Level 3 whose fair value measurement considers several inputs may include Level 1 or Level 2 inputs as components of the overall fair value measurement.
The valuation techniques used by the Funds to measure fair value during the year ended September 30, 2014 maximized the use of observable inputs and minimized the use of unobservable inputs.
For the year ended September 30, 2014, there have been no significant changes to the inputs or the Trust’s fair valuation methodologies.
Security Transactions and Investment Income — Security transactions are recorded on the trade date. Cost used in determining net realized capital gains and losses on the sale of securities is determined on the basis of specific identification. Dividend income and expense is recognized on the ex-dividend date, and interest income or expense is recognized using the accrual basis of accounting.
Distributions received on securities that represent a return of capital or capital gain are recorded as a reduction of cost of investments and/ or as a realized gain. The Trust estimates the components of distributions received that may be considered nontaxable distributions or capital gain distributions.
Amortization and accretion is calculated using the scientific interest method, which approximates the effective interest method over the holding period of the security, which is not materially different from the effective interest method. Amortization of premiums and discounts is included in interest income.
Expenses — Expenses that are directly related to one of the Funds are charged directly to that Fund. Other operating expenses of the Trust are prorated to the Funds on the basis of relative daily net assets.
Classes — Class-specific expenses are borne by that class. Income, non-class specific expenses, and realized and unrealized gains/losses are allocated to the respective classes on the basis of relative daily net assets.
Foreign Currency Translation — The books and records of the Funds investing in international securities are maintained in U.S. dollars on the following basis:
(i) market value of investment securities, assets and liabilities at the current rate of exchange; and
(ii) purchases and sales of investment securities, income and expenses at the relevant rates of exchange prevailing on the respective dates of such transactions.
| SEI Institutional International Trust / Annual Report / September 30, 2014 | 61 |
Notes to Financial Statements (Continued)
September 30, 2014
The Funds do not isolate that portion of gains and losses on investments in equity securities that is due to changes in the foreign exchange rates from that which is due to changes in market prices of equity securities.
The Funds report certain foreign-currency-related transactions as components of realized gains for financial reporting purposes, whereas such components are treated as ordinary income for Federal income tax purposes.
Forward Foreign Currency Contracts — To the extent consistent with its investment objective and strategies, a Fund may enter into forward foreign currency contracts as hedges against either specific transactions, fund positions, speculative purposes or anticipated fund positions. All commitments are “marked-to-market” daily at the applicable foreign exchange rate, and any resulting unrealized gains or losses are recorded currently. The Fund realizes gains and losses at the time forward contracts are extinguished. Unrealized gains or losses on outstanding positions in forward foreign currency contracts held at the close of the year are recognized as ordinary income or loss for federal income tax purposes. The Fund could be exposed to risk if the counterparties to the contracts are unable to meet the terms of the contract and from unanticipated movements in the value of a foreign currency relative to the U.S. dollar.
Finally, the risk exists that losses could exceed amounts disclosed on the Statement of Assets and Liabilities. Refer to each Fund’s Schedule of Investments for details regarding open forward foreign currency contracts as of September 30, 2014, if applicable.
Futures Contracts — To the extent consistent with its investment objective and strategies, the Funds may purchase futures contracts to gain exposure to market changes, which may be more efficient or cost effective than actually buying the securities. To the extent consistent with its investment objective and strategies, a Fund may utilize futures contracts for tactical hedging purposes as well as to enhance the Funds’ returns and may also utilize futures contracts to efficiently assist in managing the Funds’ duration and yield curve exposure. Upon entering into such a contract, a Fund is required to deposit and maintain as collateral such initial margin as required by the exchange on which the contract is held. The contracts are marked to market daily and the resulting changes in value are accounted for as unrealized gains and losses. Variation margin payments are paid or received, depending upon whether unrealized losses or gains are incurred. When the contract is closed, the Funds record a realized gain or loss equal to the difference between the proceeds from (or cost of) the closing transaction and the amount invested in the contract.
Risks of entering into futures contracts include the possibility that there will be an imperfect price correlation between the futures and the underlying securities. Second, it is possible that a lack of liquidity for futures contracts could exist in the secondary market, resulting in an inability to close a position prior to its maturity date. Third, the
futures contract involves the risk that a Fund could lose more than the original margin deposit required to initiate a futures transaction.
Finally, the risk exists that losses could exceed amounts disclosed on the Statement of Assets and Liabilities. Refer to each Fund’s Schedule of Investments for details regarding open futures contracts as of September 30, 2014, if applicable.
Options/Swaptions Writing/Purchasing — To the extent consistent with its investment objective and strategies, a Fund may invest in financial options/swaptions contracts for the purpose of hedging its existing portfolio securities, or securities that a Fund intends to purchase, against fluctuations in fair market value caused by changes in prevailing market interest rates. A Fund may also invest in financial option/swaption contracts to enhance its returns. When the Fund writes or purchases an option/swaption, an amount equal to the premium received or paid by the Fund is recorded as a liability or an asset and is subsequently adjusted to the current market value of the option/swaption written or purchased. Premiums received or paid from writing or purchasing options/ swaptions which expire unexercised are treated by the Fund on the expiration date as realized gains or losses. The difference between the premium and the amount paid or received on effecting a closing purchase or sale transaction, including brokerage commissions, is also treated as a realized gain or loss. If an option/swaption is exercised, the premium paid or received is added to the cost of the purchase or proceeds from the sale in determining whether the Fund has realized a gain or a loss.
The risk in writing a call option/swaption is a Fund may give up the opportunity for profit if the market price of the security increases. The risk in writing a put option/swaption is a Fund may incur a loss if the market price of the security decreases and the option/swaption is exercised. The risk in purchasing an option/swaption is a Fund may pay a premium whether or not the option/swaption is exercised. The Funds also have the additional risk of being unable to enter into a closing transaction at an acceptable price if a liquid secondary market does not exist. Option/swaption contracts also involve the risk that they may not work as intended due to unanticipated developments in market conditions or other causes.
Finally, the risk exists that losses on written options could exceed amounts disclosed on the Statements of Assets and Liabilities. Refer to each Fund’s Schedule of Investments for details regarding open option/swaption contracts as of September 30, 2014, if applicable.
Swap Agreements — To the extent consistent with its investment objective and strategies, a Fund may invest in swap contracts as an efficient means to take and manage risk in the portfolio, including interest rate risk, credit risk and overall yield sensitivity. A swap agreement is a two-party contract under which an agreement is made to exchange returns from predetermined investments or instruments, including a particular interest rate, foreign currency, or “basket” of
| 62 | SEI Institutional International Trust / Annual Report / September 30, 2014 |
securities representing a particular index. Swap agreements are privately negotiated in the over-the-counter market (“OTC swaps”) or may be executed in a multilateral or other trade facility platform, such as a registered commodities exchange (“Centrally Cleared swaps”). Interest rate swaps involve the exchange by a Fund with another party of their respective commitments to pay or receive interest (e.g., an exchange of floating rate payments for fixed rate payments) with respect to a notional amount of principal. Credit default swaps involve the periodic payment by a Fund or counterparty of interest based on a specified rate multiplied by a notional amount assigned to an underlying debt instrument or group of debt instruments in exchange for the assumption of credit risk on the same instruments. In the event of a credit event, usually in the form of a credit rating downgrade, the party receiving periodic payments (i.e. floating rate payer) must pay the other party (i.e. fixed rate payer) an amount equal to the outstanding principal of the downgraded debt instrument. Total return swaps allow an investor to benefit from the cash flow without ever actually owning the underlying security. The receiver must pay any decline in value to the payer at the end of the total return swap. However, the investor does not need to make a payment if there is no decline in price. Payments can be made on various indices, bonds (i.e. mortgage backed securities, bank debt and corporate), loans or commodities. The value of a total return swap is equal to the change in value of the underlying asset versus the accrued income payment based on LIBOR (London Interbank Offered Rate) or some other form of index on the notional amount. Interest rate swaps involve the exchange by a Fund with another party of their respective commitments to pay or receive interest (e.g., an exchange of floating rate payments for fixed rate payments) with respect to a notional amount of principal to manage a Fund’s exposure to interest rates. Payments received or made are recorded as realized gains or losses. A Fund could be exposed to credit or market risk due to unfavorable changes in the fluctuation of interest rates or if the counterparty defaults on its obligation to perform. Risk of loss may exceed amounts recognized on the statement of assets and liabilities. In connection with swap agreements, securities/cash may be set aside as collateral by the Fund’s custodian. A Fund may enter into swap agreements in order to, among other things, change the maturity or duration of the investment portfolio; protect a Fund’s value from changes in interest rates; or expose a Fund to a different security or market.
Swaps are marked-to-market daily based upon quotations from market makers and the resulting changes in market values, if any, are recorded as unrealized gains or losses in the Statement of Operations. Net payments of interest are recorded as realized gains or losses. Daily changes in valuation of Centrally Cleared swaps, if any, are recorded as a receivable or payable for the change in value as appropriate (“variation margin”) on the Statements of Assets and Liabilities.
Entering into swap agreements involves, to varying degrees, elements of credit and market risk in excess of the amounts recognized on the Schedule of Investments or the Statement of Assets and Liabilities.
Such risks involve the possibility that there will be no liquid market for these agreements, that the counterparty to the agreement may default on its obligation to perform and that there may be unfavorable changes in the fluctuation of interest rates. Risks also arise from potential losses from adverse market movements.
Counterparty risk may be mitigated by having a master netting arrangement between a Fund and the counterparty and by having the counterparty post collateral to cover a Fund’s exposure to the counterparty. Refer to each Fund’s Schedule of Investments for details regarding open swap contracts as of September 30, 2014, if applicable.
Delayed Delivery Transactions — A Fund may purchase or sell securities on a when-issued or delayed delivery basis. These transactions involve a commitment by the Fund to purchase or sell securities for a predetermined price or yield, with payment and delivery taking place beyond the customary settlement period. When delayed delivery purchases are outstanding, the Fund will set aside liquid assets in an amount sufficient to meet the purchase price. When purchasing a security on a delayed delivery basis, the Fund assumes the rights and risks of ownership of the security, including the risk of price and yield fluctuations, and takes such fluctuations into account when determining its net asset value. The Fund may dispose of or renegotiate a delayed delivery transaction after it is entered into, and may sell when-issued securities before they are delivered, which may result in a capital gain or loss. When the Fund has sold a security on a delayed delivery basis, the Fund does not participate in future gains and losses with respect to the security.
Loan Participations and Brady Bonds — To the extent consistent with its investment objective and strategies, a Fund may invest in U.S. dollar-denominated fixed- and floating-rate loans (“Loans”) arranged through private negotiations between a foreign sovereign entity and one or more financial institutions (“Lenders”). The Fund invests in such Loans in the form of participations in Loans (“Participations”) or assignments of all or a portion of Loans from third parties. Participations typically result in a Fund having a contractual relationship only with the Lenders, not with the sovereign borrowers. This Fund has the right to receive payments of principal, interest and any fees to which it is entitled from the Lender selling the Participation and only upon receipt by the Lender of the payments from the borrower. In connection with purchasing Participations, the Fund generally has no right to enforce compliance by the borrower with the terms of the loan agreement relating to the Loan, nor any rights of set-off against the borrower, and the Fund will not benefit directly from any collateral supporting the Loan in which it has purchased the Participation. As a result, the Fund assumes the credit risk of both the borrower and the Lender that is selling the Participation.
Certain debt obligations, customarily referred to as “Brady Bonds,” are created through the exchange of existing commercial bank loans to foreign entities for new obligations in connection with debt
| SEI Institutional International Trust / Annual Report / September 30, 2014 | 63 |
Notes to Financial Statements (Continued)
September 30, 2014
restructuring under a plan introduced by former U.S. Secretary of the Treasury Nicholas F. Brady. Brady Bonds have only been issued since 1989, and, accordingly, do not have a long payment history. They are issued by governments that may have previously defaulted on the loans being restructured by the Brady Bonds, so they are subject to the risk of default by the issuer. They may be fully or partially collateralized or uncollateralized and issued in various currencies.
Illiquid Securities — A security is considered illiquid if it cannot be sold or disposed of in the ordinary course of business within seven days or less for its approximate carrying value on the books of the Funds. Valuations of illiquid securities may differ significantly from the values that would have been used had an active market value for these securities existed.
Dividends and Distributions to Shareholders — The International Equity, Emerging Markets Equity and International Fixed Income Funds will distribute substantially all of their net investment income and all net realized capital gains, if any, at least annually. The Emerging Markets Debt Fund will distribute substantially all of its net investment income, if any, at least quarterly and all net realized gains, if any, at least annually. All dividends and distributions are recorded on ex-dividend date.
Investments in Real Estate Investment Trusts (“REITs”) — Dividend income is recorded based on the income included in distributions received from the REIT investments using published REIT reclassifications including management estimates when actual amounts are not available. Distributions received in excess of this estimated amount are recorded as a reduction of the cost of investments or reclassified to capital gains. The actual amounts of income, return of capital, and capital gains are only determined by each REIT after its fiscal year-end, and may differ from the estimated amounts.
Redemption Fees — The Funds charge a redemption fee based on a redemption, or a series of redemptions from a single identifiable source that in the aggregate exceed a specific dollar threshold within any thirty day period, as presented below:
| Dollar Threshold ($ Thousands) | Redemption Fee | |||||||
| International Equity Fund | $ | 50,000 | 0.75 | % | ||||
| Emerging Markets Equity Fund | 25,000 | 1.25 | ||||||
| International Fixed Income Fund | 25,000 | 1.00 | ||||||
| Emerging Markets Debt Fund | 25,000 | 1.00 | ||||||
For the year ended September 30, 2014, the Funds did not charge any redemption fees. Such fees, if any, are retained by the Funds for the benefit of the remaining shareholders.
3. DERIVATIVE TRANSACTIONS
The following tables include only Funds that had exposure to more than one type of risk on derivatives held throughout the year. For Funds that held derivatives throughout the year with only one type of risk exposure, additional information can be found on the Schedules of Investments and the Statements of Operations. The fair value of derivative instruments as of September 30, 2014 was as follows:
| Asset Derivatives | Liability Derivatives | |||||||||||
| Year ended September 30, 2014 ($ Thousands) | Year ended September 30, 2014 ($ Thousands) | |||||||||||
| Statement of Assets and Liabilities Location | Fair Value | Statement of Assets and Liabilities Location | Fair Value | |||||||||
| International Fixed Income Fund | ||||||||||||
Interest rate contracts | Net Assets — Unrealized appreciation on futures contracts | $ | 122 | * | Net Assets — Unrealized depreciation on futures contracts | $ | 59 | |||||
Net Assets — Unrealized appreciation on swap contracts | 188 | † | Net Assets — Unrealized depreciation on swap contracts | 1,982 | † | |||||||
Credit contracts | Net Assets — Unrealized appreciation on swap contracts | — | † | Net Assets — Unrealized depreciation on swap contracts | 14 | † | ||||||
Foreign exchange contracts | Unrealized gain on forward foreign currency contracts | 15,621 | Unrealized loss on forward foreign currency contracts | 614 | ||||||||
|
|
|
| |||||||||
Total Derivatives not accounted for as hedging instruments | $ | 15,931 | $ | 2,669 | ||||||||
|
|
|
| |||||||||
| Emerging Markets Debt Fund | ||||||||||||
Interest rate contracts | Net Assets — Unrealized appreciation on futures contracts | $ | 135 | * | Net Assets — Unrealized depreciation on futures contracts | $ | 370 | * | ||||
Net Assets — Unrealized appreciation on swap contracts | 487 | † | Net Assets — Unrealized depreciation on swap contracts | 1,964 | † | |||||||
Foreign exchange contracts | Unrealized gain on forward foreign currency contracts | 10,882 | Unrealized loss on forward foreign currency contracts | 8,055 | ||||||||
|
|
|
| |||||||||
Total Derivatives not accounted for as hedging instruments | $ | 11,504 | $ | 10,389 | ||||||||
|
|
|
| |||||||||
| * | Includes cumulative appreciation/depreciation of futures contracts as reported in the Schedules of Investments. Only current day’s variation margin is reported within the Statements of Assets & Liabilities. |
| † | Includes cumulative appreciation/depreciation of swap contracts as reported in the Schedules of Investments. Market Value is reported within the Statements of Assets & Liabilities for OTC swap contracts that have paid premiums. For centrally cleared swap contracts current days variation margin is reported within the Statements of Assets & Liabilities. |
| 64 | SEI Institutional International Trust / Annual Report / September 30, 2014 |
The effect of derivative instruments on the Statements of Operations for the year ended September 30, 2014.
Amount of realized gain or (loss) on derivatives recognized in income ($ Thousands):
| Derivatives Not Accounted for as Hedging Instruments | Options | Futures | Forward Currency Contracts | Swaps | Total | |||||||||||||||
| International Fixed Income Fund | ||||||||||||||||||||
Interest rate contracts | $ | — | $ | 303 | $ | — | $ | 1,099 | $ | 1,402 | ||||||||||
Foreign exchange contracts | — | — | 11,033 | — | 11,033 | |||||||||||||||
Credit contracts | — | — | — | (26 | ) | (26 | ) | |||||||||||||
Equity contracts | — | — | — | 51 | 51 | |||||||||||||||
Total | $ | — | $ | 303 | $ | 11,033 | $ | 1,124 | $ | 12,460 | ||||||||||
| Emerging Markets Debt Fund | ||||||||||||||||||||
Interest rate contracts | $ | — | $ | (583 | ) | $ | — | $ | 1,453 | $ | 870 | |||||||||
Foreign exchange contracts | (365 | ) | — | (2,207 | ) | — | (2,572 | ) | ||||||||||||
Equity contracts | — | — | — | (5,417 | ) | (5,417 | ) | |||||||||||||
Total | $ | (365 | ) | $ | (583 | ) | $ | (2,207 | ) | $ | (3,964 | ) | $ | (7,119 | ) | |||||
Change in unrealized appreciation or (depreciation) on derivatives recognized in income ($ Thousands):
| Derivatives Not Accounted for as Hedging Instruments | Options | Futures | Forward Currency Contracts | Swaps | Total | |||||||||||||||
| International Fixed Income Fund | ||||||||||||||||||||
Interest rate contracts | $ | — | $ | 444 | $ | — | $ | (2,714 | ) | $ | (2,270 | ) | ||||||||
Credit contracts | — | — | — | (14 | ) | (14 | ) | |||||||||||||
Foreign exchange contracts | — | — | 21,507 | — | 21,507 | |||||||||||||||
Total | $ | — | $ | 444 | $ | 21,507 | $ | (2,728 | ) | $ | 19,223 | |||||||||
| Emerging Markets Debt Fund | ||||||||||||||||||||
Interest rate contracts | $ | — | $ | (205 | ) | $ | — | $ | (1,381 | ) | $ | (1,586 | ) | |||||||
Foreign exchange contracts | 361 | — | 5,150 | — | 5,511 | |||||||||||||||
Equity contracts | — | — | — | 5,041 | 5,041 | |||||||||||||||
Total | $ | 361 | $ | (205 | ) | $ | 5,150 | $ | 3,660 | $ | 8,966 | |||||||||
A Fund is subject to various netting arrangements with select counterparties (“Master Agreements”). Master Agreements govern the terms of certain transactions, and reduce the counterparty risk associated with relevant transactions by specifying credit protection mechanisms and providing standardization that improves legal certainty. Since different types of transactions have different mechanics and are sometimes traded out of different legal entities of a particular counterparty organization, each type of transaction may be covered by a different Master Agreement, resulting in the need for multiple agreements with a single counterparty. As the Master Agreements are specific to unique operations of different asset types, they allow a Fund to close out and net its total exposure to a specific counterparty entity in the event of a default with respect to all the transactions governed under a single agreement with a specific counterparty entity.
Master Agreements can also help limit counterparty risk by specifying collateral posting arrangements at pre-arranged exposure levels. Under the Master Agreements, collateral is routinely transferred if the total net exposure to certain transactions (net of existing collateral already in place) governed under the relevant Master Agreement with a counterparty in a given account exceeds a specified threshold, which typically ranges from zero to $250,000 depending on the counterparty and the type of Master Agreement. United States Treasury Securities and U.S. dollar cash are generally the preferred forms of
collateral. Securities and cash pledged as collateral are reflected as assets in the Statements of Assets and Liabilities as either a component of investments at value (securities) or deposits due from counterparties (cash). Cash collateral received is not typically held in a segregated account and as such is reflected as a liability in the Statement of Assets and Liabilities as deposits due to counterparties. The market value of any securities received as collateral is not reflected as a component of net asset value. A Fund’s overall exposure to counterparty risk can change substantially within a short period, as it is affected by each transaction subject to the relevant Master Agreement.
Customer Account Agreements and related addendums govern exchange traded derivatives transactions such as futures, options on futures, and centrally cleared swaps. Exchange traded derivative transactions require posting of initial margin as determined by each relevant clearing agency which is segregated at a broker account registered with the Commodities Futures Trading Commission (CFTC), or the applicable regulator. In the US, counterparty risk is significantly reduced as creditors of the futures broker do not have claim to Fund assets in the segregated account. Additionally, portability of exposure in the event of default further reduces risk to the Funds. Variation margin, or changes in market value, are exchanged daily, but may not be netted between futures and cleared OTC derivatives.
| SEI Institutional International Trust / Annual Report / September 30, 2014 | 65 |
Notes to Financial Statements (Continued)
September 30, 2014
The following is a summary of the market value and variation margin of exchange-traded or centrally cleared financial derivative instruments of the Funds as of September 30, 2014 ($ Thousands):
| Financial Derivative Assets | Financial Derivative Liabilities | |||||||||||||||||||||||||
| Variation Margin Asset | Variation Margin Liability | |||||||||||||||||||||||||
| Fund | Futures | Swap Agreements | Total | Futures | Swap Agreements | Total | ||||||||||||||||||||
International Equity Fund | $ | 560 | $ | — | $ | 560 | $ | 359 | $ | — | $ | 359 | ||||||||||||||
International Fixed Income Fund | 70 | — | 70 | 29 | 36 | 65 | ||||||||||||||||||||
Emerging Markets Debt Fund | 18 | — | 18 | 105 | — | 105 | ||||||||||||||||||||
Total Exchange-Traded or Centrally Cleared | $ | 648 | $ | — | $ | 648 | $ | 493 | $ | 36 | $ | 529 | ||||||||||||||
Securities with an aggregate market value of $8,621,082 have been pledged as collateral for exchange-traded and centrally cleared derivative instruments as of September 30, 2014.
International Swaps and Derivatives Association, Inc. Master Agreements and Credit Support Annexes (“ISDA Master Agreements”) govern OTC financial derivative transactions entered into by a Fund and select counterparties. ISDA Master Agreements maintain provisions for general obligations, representations, agreements, collateral and events
of default or termination. Events of termination include conditions that may entitle counterparties to elect to terminate early and cause settlement of all outstanding transactions under the applicable ISDA Master Agreement. Any election to terminate early could be material to the financial statements. In limited circumstances, the ISDA Master Agreement may contain additional provisions that add additional counterparty protection beyond coverage of existing daily exposure if the counterparty has a decline in credit quality below a predefined level. These amounts, if any, may be segregated with a third party custodian.
The following is a summary by derivative type of the market value of OTC financial derivative instruments and collateral (received)/pledged as of September 30, 2014 ($ Thousands):
| Financial Derivative Assets | Financial Derivative Liabilities | |||||||||||||||||||||||||||||||||||||||
| Fund | Forward Foreign Currency Contracts | Swap Agreements | Total Over the Counter | Forward Foreign Currency Contracts | Swap Agreements | Total Over the Counter | Net Market Value of OTC Derivatives | Collateral (Received)/ Pledged(1) | Net Exposures(2) | |||||||||||||||||||||||||||||||
International Fixed Income Fund | $ | 15,621 | $ | — | $ | 15,621 | $ | 614 | $ | 779 | $ | 1,393 | $ | 14,228 | $ | — | $ | 14,228 | ||||||||||||||||||||||
Emerging Markets Debt Fund | 10,882 | 487 | 11,369 | 8,055 | 1,964 | 10,019 | 1,350 | — | 1,350 | |||||||||||||||||||||||||||||||
Total Over the Counter | $ | 26,503 | $ | 487 | $ | 26,990 | $ | 8,669 | $ | 2,743 | $ | 11,412 | ||||||||||||||||||||||||||||
| (1) | Excess collateral is not shown for financial reporting purposes. |
| (2) | Net Exposures represents the net receivable/(payable) that would be due from /to the counterparty in the event of default. Exposure from OTC financial derivative instruments can only be netted across transactions governed under the same master agreement with the same legal entity. |
Securities with an aggregate market value of $0 have been pledged and $0 have been received as collateral for financial derivative instruments as governed by ISDA Master Agreements as of September 30, 2014.
4. INVESTMENT ADVISORY, ADMINISTRATION AND DISTRIBUTION AGREEMENTS, INVESTMENT SUB-ADVISORY AGREEMENTS AND OTHER TRANSACTIONS WITH AFFILIATES
Investment Advisory, Administration and Distribution Agreements — SIMC serves as investment adviser (the “Adviser”) to each Fund. In connection with serving as Adviser, SIMC is entitled to a fee, which is calculated daily and paid monthly, based on the average daily net assets of each fund.
SEI Investments Global Funds Services (the “Administrator”) provides administrative and transfer agency services to the Funds for annual fees, based on the average daily net assets of each fund.
SEI Investments Distribution Co. (the “Distributor”), a wholly owned subsidiary of SEI Investments Company (“SEI”), serves as each Fund’s Distributor. The Trust has adopted plans under which firms,
including the Distributor, that provide shareholder and administrative services may receive compensation therefrom.
Such plans provide fees payable to the Distributor, calculated as a percentage of the average daily net assets attributable to each particular class of each respective fund. Under both the Shareholder Servicing Plan and Administrative Service Plan, the Distributor may retain as profit any difference between the fee it receives and the amount it pays to third parties.
The Adviser, Administrator and/or Distributor have voluntarily agreed to waive a portion of their fees in order to keep total direct operating expenses (exclusive of interest from borrowings, brokerage commissions, taxes, Trustees fees and extraordinary expenses not incurred in the ordinary course of the Funds’ business) at a specified level. The voluntary waivers by the Funds’ Adviser, Administrator and/or Distributor are limited to the Funds’ direct operating expenses and, therefore, do not apply to indirect expenses incurred by the Funds, such as acquired fund fees and expenses (AFFE). The waivers are voluntary and the Funds’ Adviser, Administrator and/or Distributor may discontinue all or part of any of these waivers at any time.
| 66 | SEI Institutional International Trust / Annual Report / September 30, 2014 |
The following is a summary of annual fees payable to the Adviser, Administrator and/or Distributor and the voluntary expense limitations for each Fund prior to October 1, 2014:
| Advisory Fee | Administration Fee | Shareholder Servicing Fee | Administrative Servicing Fee | Voluntary Expense Limitations | ||||||||||||||||
International Equity Fund | ||||||||||||||||||||
Class A | 0.505 | % | 0.45 | % | 0.25 | % | — | 1.25 | % | |||||||||||
Class I | 0.505 | % | 0.45 | % | 0.25 | % | 0.25 | % | 1.50 | % | ||||||||||
Emerging Markets Equity Fund | ||||||||||||||||||||
Class A | 1.05 | % | 0.65 | % | 0.25 | % | — | 1.96 | % | |||||||||||
International Fixed Income Fund | ||||||||||||||||||||
Class A | 0.30 | % | 0.60 | % | 0.25 | % | — | 1.02 | % | |||||||||||
Emerging Markets Debt Fund | ||||||||||||||||||||
Class A | 0.85 | % | 0.65 | % | 0.25 | % | — | 1.36 | % | |||||||||||
Effective October 1, 2014, the annual fees payable to the Adviser, Administrator and Distributor and the voluntary expense limitation for each Fund will be as follows:
| Advisory Fee | Administration Fee | Shareholder Servicing Fee | Administrative Servicing Fee | Voluntary Expense Limitations | ||||||||||||||||
International Equity Fund | ||||||||||||||||||||
Class A | 0.505 | % | 0.45 | % | 0.25 | % | — | 1.25 | % | |||||||||||
Class I | 0.505 | % | 0.45 | % | 0.25 | % | 0.25 | % | 1.50 | % | ||||||||||
Emerging Markets Equity Fund | ||||||||||||||||||||
Class A | 1.05 | %(1) | 0.45 | % | 0.25 | % | — | 1.73 | % | |||||||||||
International Fixed Income Fund | ||||||||||||||||||||
Class A | 0.30 | % | 0.45 | % | 0.25 | % | — | 1.02 | % | |||||||||||
Emerging Markets Debt Fund | ||||||||||||||||||||
Class A | 0.85 | % | 0.45 | % | 0.25 | % | — | 1.36 | % | |||||||||||
| (1) | SIMC has contractually agreed to waive its management fee as necessary to keep the management fee paid by the Fund during its fiscal year from exceeding 0.95%. This fee waiver agreement shall remain in effect until January 31, 2016 and, unless earlier terminated, shall be automatically renewed for successive one-year periods thereafter. The agreement may be amended or terminated only with the consent of the Board of Trustees. |
Investment Sub-Advisory Agreements — As of September 30, 2014, SIMC has entered into Investment Sub-Advisory Agreements with the following parties:
| Investment Sub-Adviser |
| International Equity Fund |
| Acadian Asset Management LLC |
Causeway Capital Management LLC |
Henderson Global Investors (North America) Inc. |
| INTECH Investment Management LLC |
| Neuberger Berman Management LLC |
| Schroder Investment Management North America, Inc. |
| Tradewinds Global Investors LLC |
| Emerging Markets Equity Fund |
| Delaware Investment Fund Advisers |
| JO Hambro Capital Management Limited |
| Kleinwort Benson Investors International Ltd. |
| Lazard Asset Management LLC |
| Neuberger Berman Management LLC |
| PanAgora Asset Management, Inc. |
| International Fixed Income Fund |
| AllianceBernstein L.P. |
| FIL Investment Advisors |
| Wellington Management Company, LLP |
| Emerging Markets Debt Fund |
| Investec Asset Management Ltd. |
| Neuberger Berman Management LLC |
| Stone Harbor Investment Partners LP |
Under the investment sub-advisory agreements, each sub-adviser receives an annual fee, paid by SIMC.
Brokerage Commissions Paid to Affiliates — The Distribution Agreement between the Distributor and the Trust provides that the Distributor may receive compensation on fund transactions effected for the Trust in accordance with the rules of the Securities and Exchange Commission (“SEC”). Accordingly, it is expected that fund transactions may result in brokerage commissions being paid to the Distributor. The SEC rules require that such commissions not exceed usual and customary commissions. There were no such commissions for the year ended September 30, 2014.
Fees Paid Indirectly — The Funds may direct certain fund trades to the Distributor who pays a portion of the Fund’s expenses. Accordingly, the expenses reduced, which were used to pay third party expenses, and the effect on the Fund’s expense ratio, as a percentage of the Fund’s average daily net assets for the year ended September 30, 2014, can be found on the Statement of Operations and Financial Highlights, if applicable.
| SEI Institutional International Trust / Annual Report / September 30, 2014 | 67 |
Notes to Financial Statements (Continued)
September 30, 2014
Investment in Affiliated Securities — The Funds may invest in the SEI Daily Income Trust Prime Obligation Fund, an affiliated money market fund to manage excess cash or to serve as margin or collateral
for derivative positions. Additionally, the Funds may invest cash collateral from the securities lending program in the SEI Liquidity Fund L.P., also an affiliated fund.
The following is summary of the transactions with affiliates for the year ended September 30, 2014 ($ Thousands):
| SEI Liquidity Fund, L.P. | Purchases at Cost | Proceeds from Sales | Value 9/30/2014 | Dividend Income | ||||||||||||
International Equity Fund | $ | 1,000,751 | $ | (1,045,686 | ) | $ | 51,798 | $ | 1,625 | |||||||
Emerging Markets Equity Fund | 555,222 | (459,158 | ) | 173,971 | 1,458 | |||||||||||
Emerging Markets Debt Fund | 59,981 | (64,905 | ) | — | 33 | |||||||||||
| SEI Daily Income Trust, Prime Obligation | ||||||||||||||||
International Equity Fund | $ | 279,982 | $ | (251,116 | ) | $ | 101,507 | $ | 8 | |||||||
Emerging Markets Equity Fund | 368,987 | (358,597 | ) | 18,211 | 2 | |||||||||||
Payment to Affiliates — Certain Officers and Trustees of the Trust are also Officers and/or Directors of the Administrator, Adviser and/or the Distributor.
The Trust pays each unaffiliated Trustee an annual fee for attendance at quarterly, interim, and committee meetings. The Administrator or the Distributor pays compensation of Officers and affiliated Trustees.
A portion of the services provided by the Chief Compliance Officer (“CCO”) and his staff, whom are employees of the Administrator, are paid for by the Trust as incurred. The services include regulatory oversight of the Trust’s Adviser, sub-advisers and service providers as required by SEC regulations.
Interfund Lending — The SEC has granted an exemption that permits the Trust to participate in an interfund lending program (“the Program”) with existing or future investment companies registered under the 1940 Act that are advised by SIMC (the “SEI Funds”). The Program allows the SEI Funds to lend money to and borrow money from each other for temporary or emergency purposes. Participation in the Program is voluntary for both borrowing and lending funds. Interfund loans may be made only when the rate of interest to be charged is more favorable to the lending fund than an investment in overnight repurchase agreements (“Repo Rate”), and more favorable to the borrowing fund than the rate of interest that would be charged by a bank for short-term borrowings (“Bank Loan Rate”). The Bank Loan Rate will be determined using a formula reviewed annually by the SEI Funds’ Board of Trustees. The interest rate imposed on interfund loans is the average of the Repo Rate and the Bank Loan Rate. For the year ended September 30, 2014, the Trust had not participated in the Program.
5. INVESTMENT TRANSACTIONS
The cost of security purchases and the proceeds from the sale of securities, other than temporary cash investments and futures, during the year ended September 30, 2014, were as follows:
| Purchases ($ Thousands) | Sales and Maturities ($ Thousands) | |||||||
International Equity Fund | ||||||||
US Government | $ | — | $ | — | ||||
Other | 1,741,546 | 1,479,380 | ||||||
Emerging Markets Equity Fund | ||||||||
US Government | $ | — | $ | — | ||||
Other | 1,501,910 | 1,013,110 | ||||||
| Purchases ($ Thousands) | Sales and Maturities ($ Thousands) | |||||||
International Fixed Income Fund | ||||||||
US Government | 9,912 | 12,943 | ||||||
Other | 502,593 | 466,625 | ||||||
Emerging Markets Debt Fund | ||||||||
US Government | — | — | ||||||
Other | 1,233,883 | 1,050,274 | ||||||
6. FEDERAL TAX INFORMATION:
It is each Fund’s intention to continue to qualify as a regulated investment company under Subchapter M of the Internal Revenue Code and distribute all of its taxable income (including net capital gains). Accordingly, no provision for Federal income taxes is required.
The Funds may be subject to taxes imposed by countries in which they invest with respect to their investments in issuers existing or operating in such countries. Such taxes are generally based on income earned. The Funds accrue such taxes when the related income is earned.
Dividends from net investment income and distributions from net realized capital gains are determined in accordance with U.S. Federal income tax regulations, which may differ from those amounts determined under U.S. GAAP. These book/tax differences are either temporary or permanent in nature. To the extent these differences are permanent, they are charged or credited to paid-in capital, undistributed net investment income or accumulated net realized gain, as appropriate, in the period that the differences arise.
Accordingly, the following permanent differences, primarily attributable to different treatment for gains and losses on paydowns of mortgage and asset-backed securities for tax purposes, investments in swaps, investments in passive foreign investment companies, investments in partnerships, distribution reclassification, REIT income reclassification and foreign currency transactions have been reclassified to/from the following accounts as of September 30, 2014:
| Paid-in- Capital ($ Thousands) | Undistributed Net Investment Income/(Loss) ($ Thousands) | Accumulated Realized Gain/(Loss) ($ Thousands) | ||||||||||
International Equity Fund | $ | — | $ | 2,382 | $ | (2,382 | ) | |||||
Emerging Markets Equity Fund | — | 4,051 | (4,051 | ) | ||||||||
International Fixed Income Fund | — | 6,550 | (6,550 | ) | ||||||||
Emerging Markets Debt Fund | — | (32,321 | ) | 32,321 | ||||||||
| 68 | SEI Institutional International Trust / Annual Report / September 30, 2014 |
The tax character of dividends and distributions declared during the last two years were as follows:
| Ordinary Income ($ Thousands) | Long-Term Capital Gain ($ Thousands) | Return of Capital ($ Thousands) | Totals ($ Thousands) | |||||||||||||||||
International Equity Fund | 2014 | $ | 31,622 | $ | — | $ | — | $ | 31,622 | |||||||||||
| 2013 | 29,962 | — | — | 29,962 | ||||||||||||||||
Emerging Markets Equity Fund | 2014 | 7,645 | — | — | 7,645 | |||||||||||||||
| 2013 | 4,998 | — | — | 4,998 | ||||||||||||||||
International Fixed Income Fund | 2014 | 2,598 | — | — | 2,598 | |||||||||||||||
| 2013 | 17,902 | — | 4,024 | 21,926 | ||||||||||||||||
Emerging Markets Debt Fund | 2014 | 33,867 | 10,668 | — | 44,535 | |||||||||||||||
| 2013 | 79,157 | 37,242 | — | 116,399 | ||||||||||||||||
As of September 30, 2014, the components of Distributable Earnings/(Accumulated Losses) were as follows:
| Undistributed Ordinary Income ($ Thousands) | Undistributed Long Term ($ Thousands) | Capital Loss Carryforwards ($ Thousands) | ||||||||||
International Equity Fund | $ | 52,572 | $ | — | $ | (785,728 | ) | |||||
Emerging Markets Equity Fund | 18,637 | — | (17,532 | ) | ||||||||
International Fixed Income Fund | 31,012 | — | (280 | ) | ||||||||
Emerging Markets Debt Fund | — | 32 | — | |||||||||
| Unrealized Appreciation ($ Thousands) | Other Temporary Differences ($ Thousands) | Total Accumulated Gains (Losses) ($ Thousands) | ||||||||||
International Equity Fund | $ | 120,900 | $ | 1,124 | $ | (611,132 | ) | |||||
Emerging Markets Equity Fund | (3,152 | ) | (2 | ) | (2,049 | ) | ||||||
International Fixed Income Fund | 3,970 | (17,994 | ) | 16,708 | ||||||||
Emerging Markets Debt Fund | (58,918 | ) | (11,829 | ) | (70,715 | ) | ||||||
For Federal income tax purposes, capital carryforwards may be carried forward and applied against future capital gains as follows:
| Expires 2017 ($ Thousands) | Expires 2018 ($ Thousands) | Total Capital Loss Carryforward 09/30/14 ($ Thousands) | ||||||||||
International Equity Fund | $ | 95,371 | $ | 690,357 | $ | 785,728 | ||||||
Emerging Markets Equity Fund | — | 17,532 | 17,532 | |||||||||
International Fixed Income Fund | — | 280 | 280 | |||||||||
Under the Regulated Investment Company Modernization Act of 2010, Funds will be permitted to carry forward capital losses incurred in taxable years beginning after December 22, 2010 for an unlimited period. However, any losses incurred during those future taxable years will be required to be utilized prior to the losses incurred in pre-enactment taxable years. As a result of this ordering rule, pre-enactment capital loss carryforwards may be more likely to expire unused. Additionally, post-enactment capital losses that are carried forward will retain their character as either short-term or long-term capital losses rather than being considered all short-term as under previous law.
During the year ended September 30, 2014, the following Funds utilized capital loss carryforwards to offset capital gains:
| Amount utilized ($ Thousands) | ||||
International Equity Fund | $ | 181,227 | ||
Emerging Markets Equity Fund | 65,351 | |||
International Fixed Income Fund | 10,258 | |||
For Federal income tax purposes, the cost of securities owned at September 30, 2014, and the net realized gains or losses on securities sold for the period were not materially different from amounts reported for financial reporting purposes. These differences are primarily due to investments in partnerships, passive foreign investment companies and wash sales which cannot be used for Federal income tax purposes in the current year and have been deferred for use in future years. The aggregate gross unrealized appreciation and depreciation on total investments, excluding options purchased, held by the Funds at September 30, 2014, was as follows:
| Federal Tax Cost ($ Thousands) | Aggregate Gross Unrealized Appreciation ($ Thousands) | Aggregate Gross Unrealized Depreciation ($ Thousands) | Net Unrealized Appreciation ($ Thousands) | |||||||||||||
International Equity Fund | $ | 2,615,088 | $ | 277,325 | $ | (155,002 | ) | $ | 122,323 | |||||||
Emerging Markets Equity Fund | 2,132,429 | 175,921 | (176,994 | ) | (1,073 | ) | ||||||||||
International Fixed Income Fund | 522,132 | 10,762 | (19,022 | ) | (8,260 | ) | ||||||||||
Emerging Markets Debt Fund | 1,378,406 | 26,298 | (86,040 | ) | (59,742 | ) | ||||||||||
Management has analyzed the Funds’ tax positions taken on federal income tax returns for all open tax years and has concluded that as of September 30, 2014, no provision for income tax would be required in the Funds’ financial statements. The Funds’ federal and state income and federal excise tax returns for tax years for which the applicable statutes of limitations have not expired are subject to examination by the Internal Revenue Service and state departments of revenue.
7. CONCENTRATION/RISKS
In the normal course of business, the Trust enters into contracts that provide general indemnifications by the Trust to the counterparty to the contract. The Trust’s maximum exposure under these arrangements is dependent on future claims that may be made against the Trust and, therefore, cannot be estimated; however, management believes that, based on experience, the risk of loss from such claims is considered remote.
The following descriptions provide additional information about some of the risks of investing in the Funds:
Asset-Backed Securities Risk — Payment of principal and interest on asset-backed securities is dependent largely on the cash flows generated by the assets backing the securities, and asset-backed securities may not have the benefit of any security interest in the related assets.
| SEI Institutional International Trust / Annual Report / September 30, 2014 | 69 |
Notes to Financial Statements (Concluded)
September 30, 2014
Credit Risk — The risk that the issuer of a security or the counterparty to a contract will default or otherwise become unable to honor a financial obligation.
Currency Risk — To the extent a Fund takes positions in currencies, it will be subject to the risk that currency exchange rates may fluctuate in response to, among other things, changes in interest rates, intervention (or failure to intervene) by U.S. or foreign governments, central banks or supranational entities, or by the imposition of currency controls or other political developments in the United States or abroad.
Fixed Income Market Risk — The prices of a Fund’s fixed income securities respond to economic developments, particularly interest rate changes, as well as to perceptions about the creditworthiness of individual issuers, including governments and their agencies. Generally, the Fund’s fixed income securities will decrease in value if interest rates rise and vice versa. In the case of foreign securities, price fluctuations will reflect international economic and political events, as well as changes in currency valuations relative to the U.S. dollar.
Foreign Investment/Emerging Markets Risk — The risk that non-U.S. securities may be subject to additional risks due to, among other things, political, social and economic developments abroad, currency movements, and different legal, regulatory and tax environments. These additional risks may be heightened with respect to emerging market countries since political turmoil and rapid changes in economic conditions are more likely to occur in these countries.
Interest Rate Risk — The risk that a rise in interest rates will cause a fall in the value of fixed income securities, including U.S. Government Securities, in which the Fund invests. Although U.S. Government securities are considered to be among the safest investments, they are not guaranteed against price movements due to changing interest rates. A low interest rate environment may present greater interest rate risk, because there may be a greater likelihood of rates increasing and rates may increase more rapidly.
Mortgage-Backed Securities Risk — Mortgage-backed securities are affected by, among other things, interest rate changes and the possibility of prepayment of the underlying mortgage loans. Mortgage-backed securities are also subject to the risk that underlying borrowers will be unable to meet their obligations.
Please refer to each Fund’s current prospectus for additional disclosure regarding the risks associated with investing in the Funds. The foregoing is not intended to be a complete discussion of the risks associated with the investment strategies of the Funds.
8. SECURITIES LENDING
A Fund may lend portfolio securities to brokers, dealers and other financial organizations that meet capital and other credit requirements or other criteria established by the Trust’s Board of Trustees. These
loans may not exceed 33 1/3% of the total asset value of a Fund (including the loan collateral). No Fund will lend portfolio securities to its Adviser, sub-adviser or their affiliates unless it has applied for and received specific authority to do so from the SEC. Loans of portfolio securities will be fully collateralized by cash. Collateral will be maintained in an amount equal to at least 100% of the current market value of the loaned securities by marking to market daily, although the borrower will be required to deliver collateral between 102% and 105% of the market value of borrowed securities for domestic and foreign securities, respectively. However, due to market fluctuations during the day, the value of securities loaned on a particular day may, during the course of the day, exceed the value of collateral. On each business day, the amount of collateral is adjusted based on the prior day’s market fluctuations and the current day’s lending activity. Income from lending activity is determined by the amount of interest earned on collateral, less any amounts payable to the borrowers of the securities and the lending agent. Lending securities involves certain
risks, including the risk that a Fund may be delayed or prevented from recovering the collateral if the borrower fails to return the securities.
Cash collateral received in connection with securities lending is invested in short-term investments by the lending agent. These investments may include the SEI Liquidity Fund L.P., and the Fund bears all of the gains and losses on such investment. There is no guarantee that these investments will not lose value.
The following is a summary of securities lending agreements held by certain Funds which would be subject to offset as of September 30, 2014 ($ Thousands):
| Fund | Securities Loaned at Value | Cash Collateral Received(1) | Net Amount | |||||||||
International Equity Fund | $ | 49,273 | $ | 49,273 | $ | — | ||||||
Emerging Markets Equity Fund | 167,813 | 167,813 | — | |||||||||
| (1) | Excess collateral received in connection with the above securities lending transactions is not shown for financial reporting purposes. See each Fund’s Schedule of Investments for the total collateral received. |
9. SUBSEQUENT EVENTS
Management has evaluated the need for disclosures and/or adjustments resulting from subsequent events through the date the financial statements were issued. Based on this evaluation, no disclosure and/or adjustments were required to the financial statements as of
November 26, 2014 except for the disclosure included in Note 4 relating to a change in Fund expenses effective October 1, 2014.
| 70 | SEI Institutional International Trust / Annual Report / September 30, 2014 |
Report of Independent Registered Public Accounting Firm
The Board of Trustees and Shareholders
SEI Institutional International Trust:
We have audited the accompanying statements of assets and liabilities of SEI Institutional International Trust comprised of the International Equity Fund, Emerging Markets Equity Fund, International Fixed Income Fund and Emerging Markets Debt Fund (collectively, the “Funds”), including the schedules of investments, as of September 30, 2014, and the related statements of operations for the year then ended, the statements of changes in net assets for each of the years in the two-year period then ended, and the financial highlights for each of the years in the five-year period then ended. These financial statements and financial highlights are the responsibility of the Funds’ management. Our responsibility is to express an opinion on these financial statements and financial highlights based on our audits.
We conducted our audits in accordance with the standards of the Public Company Accounting Oversight Board (United States). Those standards require that we plan and perform the audit to obtain reasonable assurance about whether the financial statements and financial highlights are free of material misstatement. An audit includes examining, on a test basis, evidence supporting the amounts and disclosures in the financial statements. Our procedures included confirmation of securities owned as of September 30, 2014, by correspondence with the custodian and brokers, or other appropriate auditing procedures. An audit also includes assessing the accounting principles used and significant estimates made by management, as well as evaluating the overall financial statement presentation. We believe that our audits provide a reasonable basis for our opinion.
In our opinion, the financial statements and financial highlights referred to above present fairly, in all material respects, the financial position of each of the funds comprising SEI Institutional International Trust as of September 30, 2014, the results of their operations for the year then ended, the changes in their net assets for each of the years in the two-year period then ended, and the financial highlights for each of the years in the five-year period then ended, in conformity with U.S. generally accepted accounting principles.
Philadelphia, Pennsylvania
November 26, 2014
| SEI Institutional International Trust / Annual Report / September 30, 2014 | 71 |
Trustees and Officers of the Trust (Unaudited)
The following chart lists Trustees and Officers as of September 30, 2014.
Set forth below are the names, ages, addresses, position with the Trust, Term of Office and Length of Time Served, the principal occupations for the last five years, number of portfolios in fund complex overseen by the trustees, and other directorships outside the fund complex of each of the persons currently serving as Trustees and Officers of the Trust. The Trust’s Statement of Additional Information (“SAI”) includes additional information about the Trustees and Officers. The SAI may be obtained without charge by calling 1-800-342-5734.
| Name, Age and Address | Position(s) Held with Trusts | Term of Office and Length of Time Served1 | Principal Occupation(s) During Past Five Years | Number of Portfolios in Fund Complex Overseen by Trustee2 | Other Directorships Held by Trustee | |||||
| INTERESTED DIRECTORS | ||||||||||
| Robert A. Nesher One Freedom Valley Drive, Oaks, PA 19456 68 yrs. old | Chairman of the Board of Trustees* | since 1982 | Currently performs various services on behalf of SEI for which Mr. Nesher is compensated. | 99 | Trustee of The Advisors’ Inner Circle Fund, The Advisors’ Inner Circle Fund II, The KP Funds, Bishop Street Funds, Director of SEI Global Master Fund, plc, SEI Global Assets Fund, plc, SEI Global Investments Fund, plc, SEI Investments Global, Limited, SEI Investments — Global Fund Services, Limited, SEI Investments (Europe), Limited, SEI Global Nominee Ltd., and SEI Structured Credit Fund, L.P. | |||||
| William M. Doran One Freedom Valley Drive Oaks, PA 19456 74 yrs. old | Trustee* | since 1982 | Self-employed Consultant since 2003. Partner, Morgan, Lewis & Bockius LLP (law firm) from 1976 to 2003, counsel to the Trust, SEI, SIMC, the Administrator and the Distributor. Secretary of SEI since 1978. | 99 | Trustee of The Advisors’ Inner Circle Fund, The Advisors’ Inner Circle Fund II, The Advisors’ Inner Circle III, The KP Funds, O’Connor EQUUS, Bishop Street Funds, Director of SEI since 1974. Director of the Distributor since 2003. Director of SEI Investments — Global Fund Services, Limited, SEI Investments Global, Limited, SEI Investments (Europe), Limited, SEI Global Nominee, Ltd, SEI Investments (Asia), Limited, and SEI Asset Korea Co., Ltd. | |||||
| TRUSTEES | ||||||||||
| George J. Sullivan Jr. One Freedom Valley Drive, Oaks, PA 19456 71 yrs. old | Trustee | since 1996 | Retired since January 2012. Self-employed Consultant, Newfound Consultants, Inc. since April 1997-December 2011. | 99 | Trustee of The Advisors’ Inner Circle Fund, The Advisors’ Inner Circle Fund II, The KP Funds, Bishop Street Funds, State Street Navigator Securities Lending Trust, Director of SEI Structured Credit Fund L.P. and member of the independent review committee for SEI’s Canadian-registered mutual funds. | |||||
| *Messrs. | Nesher and Doran are Trustees who may be deemed as “interested” persons of the Trust as that term is defined in the 1940 Act by virtue of their affiliation with SIMC and the Trust’s Distributor. |
| 1There | is no stated term of office for the Trustees of the Trust. However, a Trustee must retire from the Board by the end of the calendar year in which the Trustee turns 75 provided that, although there shall be a presumption that each Trustee attaining such age shall retire, the Board may, if it deems doing so to be consistent with the best interest of the Trust, and with the consent of any Trustee that is eligible for retirement, by unanimous vote, extend the term of such Trustee for successive periods of one year. |
| 2The | Fund Complex includes the following Trusts: SEI Asset Allocation Trust, SEI Daily Income Trust, SEI Institutional Investments Trust, Adviser Managed Trust, SEI Institutional International Trust, SEI Institutional Managed Trust, SEI Liquid Asset Trust, SEI Tax Exempt Trust, SEI Insurance Products Trust and New Covenant Funds. |
| 72 | SEI Institutional International Trust / Annual Report / September 30, 2014 |
| Name, Age and Address | Position(s) Held with Trusts | Term of Office and Length of Time Served1 | Principal Occupation(s) During Past Five Years | Number of Portfolios in Fund Complex Overseen by Trustee2 | Other Directorships Held by Trustee | |||||
| TRUSTEES (continued) | ||||||||||
| Nina Lesavoy One Freedom Valley Drive, Oaks, PA 19456 57 yrs. old | Trustee | since 2003 | Founder and Managing Director, Avec Capital, since 2008. Managing Director, Cue Capital from March 2002 to March 2008 | 99 | Director of SEI Structured Credit Fund, L.P. | |||||
| James M. Williams One Freedom Valley Drive, Oaks, PA 19456 66 yrs. old | Trustee | since 2004 | Vice President and Chief Investment Officer, J. Paul Getty Trust, Non-Profit Foundation for Visual Arts, since December 2002. | 99 | Trustee/Director of Ariel Mutual Funds and SEI Structured Credit Fund, L.P. | |||||
| Mitchell A. Johnson One Freedom Valley Drive, Oaks, PA 19456 72 yrs. old | Trustee | since 2007 | Private Investor since 1994. | 99 | Trustee of The Advisors’ Inner Circle Fund, The Advisors’ Inner Circle Fund II, The KP Funds and Bishop Street Funds. | |||||
| Hubert L. Harris, Jr. One Freedom Valley Drive, Oaks, PA 19456 71 yrs. old | Trustee | since 2008 | Retired since December 2005. Chief Executive Officer and Chair of the Board of Directors, AMVESCAP Retirement, Inc., 1997-December 2005. Chief Executive Officer, INVESCO North America, September 2003-December 2005. | 99 | Director of Colonial BancGroup, Inc. and St. Joseph’s Translational Research Institute, Chair of the Board of Trustees, Georgia Tech Foundation, Inc. (nonprofit corporation); Board of Councilors of the Carter Center. | |||||
| OFFICERS | ||||||||||
| Robert A. Nesher One Freedom Valley Drive, Oaks, PA 19456 68 yrs. Old | President and CEO | since 2005 | Currently performs various services on behalf of SEI for which Mr. Nesher is compensated. | N/A | N/A | |||||
| Peter A. Rodriguez One Freedom Valley Drive, Oaks, PA 19456 52 yrs. old | Controller and Chief Financial Officer | since 2011 | Director, Fund Accounting, SEI Investments Global Funds Services (March 2011, September 2002 to March 2005 and 1997- 2002); Director, Mutual Fund Trading, SEI Private Trust Company (May 2009 to February 2011); Director, Asset Data Services, Global Wealth Services (June 2006 to April 2009); Director, Portfolio Accounting, SEI Investments Global Funds Services (March 2005 to June 2006) | N/A | N/A | |||||
| Russell Emery One Freedom Valley Drive, Oaks, PA 19456 51 yrs. old | Chief Compliance Officer | since 2006 | Chief Compliance Officer of SEI Institutional Managed Trust, SEI Daily Income Trust, SEI Institutional International Trust, SEI Asset Allocation Trust, SEI Liquid Asset Trust, SEI Tax Exempt Trust, SEI Institutional Investments Trust, The Advisors’ Inner Circle Fund, The Advisors’ Inner Circle Fund II, and Bishop Street Funds, since March 2006. Chief Compliance Officer of SEI Structured Credit Fund, LP since June 2007. Chief Compliance Officer of Adviser Managed Trust since December 2010. Chief Compliance Officer of New Covenant Funds since February 2012. Chief Compliance Officer of SEI Insurance Products Trust since 2013. | N/A | N/A | |||||
| SEI Institutional International Trust / Annual Report / September 30, 2014 | 73 |
Trustees and Officers of the Trust (Unaudited) (Concluded)
| Name, Age and Address | Position(s) Held with Trusts | Term of Office and Length of Time Served1 | Principal Occupation(s) During Past Five Years | Number of Portfolios in Fund Complex Overseen by Trustee2 | Other Directorships Held by Trustee | |||||
| OFFICERS (continued) | ||||||||||
| Timothy D. Barto One Freedom Valley Drive, Oaks, PA 19456 46 yrs. old | Vice President and Secretary | since 2002 | General Counsel, Vice President and Secretary of SIMC and the Administrator since 2004. Vice President and Assistant Secretary of SEI since 2001. Vice President of SIMC and the Administrator since 1999. | N/A | N/A | |||||
| Aaron Buser One Freedom Valley Drive, Oaks, PA 19456 43 yrs. old | Vice President and Assistant Secretary | since 2008 | Vice President and Assistant Secretary of SIMC since 2007. Associate at Stark & Stark (2004-2007). | N/A | N/A | |||||
| David F. McCann One Freedom Valley Drive, Oaks, PA 19456 38 yrs. old | Vice President and Assistant Secretary | since 2009 | Vice President and Assistant Secretary of SIMC since 2008. Attorney, Drinker, Bidder & Reath LLP (law firm), May 2005-October 2008. | N/A | N/A | |||||
| Stephen G. MacRae One Freedom Valley Drive, Oaks, PA 19456 46 yrs. old | Vice President | since 2012 | Director of Global Investment Product Management since 2004. | N/A | N/A | |||||
| Edward McCusker One Freedom Valley Drive Oaks, PA 19456 30 yrs. old | Anti-Money Laundering Compliance Officer and Privacy Officer | since 2013 | Compliance Manager of SEI Investments Company, May 2011-April 2013. Project Manager and AML Operations Lead of SEI Private Trust Company, September 2010- May 2011. Private Banking Client Service Professional of SEI Private Banking and Trust, September 2008-September 2010. | N/A | N/A | |||||
| 1Each | trustee shall hold office during the lifetime of this Trust until the election and qualification of his or her successor, or until he or she sooner dies, resigns or is removed in accordance with the Trust’s Declaration of Trust. |
| 2The | Fund Complex includes the following Trusts: SEI Asset Allocation Trust, SEI Daily Income Trust, SEI Institutional Investments Trust, Adviser Managed Trust, SEI Institutional International Trust, SEI Institutional Managed Trust, SEI Liquid Asset Trust, SEI Tax Exempt Trust, SEI Insurance Products Trust and New Covenant Funds. |
| 74 | SEI Institutional International Trust / Annual Report / September 30, 2014 |
Disclosure of Fund Expenses (Unaudited)
All mutual funds have operating expenses. As a shareholder of a fund, your investment is affected by these ongoing costs, which include (among others) costs for portfolio management, administrative services, and shareholder reports like this one. It is important for you to understand the impact of these costs on your investment returns.
Operating expenses such as these are deducted from the fund’s gross income and directly reduce your final investment return. These expenses are expressed as a percentage of the fund’s average net assets; this percentage is known as the fund’s expense ratio.
The following examples use the expense ratio and are intended to help you understand the ongoing costs (in dollars) of investing in your fund and to compare these costs with those of other mutual funds. The examples are based on an investment of $1,000 made at the beginning of the period shown and held for the entire period.
The table on this page illustrates your fund’s costs in two ways:
Actual Fund return. This section helps you to estimate the actual expenses after fee waivers that your Fund incurred over the period. The “Expenses Paid During Period” column shows the actual dollar expense cost incurred by a $1,000 investment in the Fund, and the “Ending Account Value” number is derived from deducting that expense cost from the Fund’s gross investment return.
You can use this information, together with the actual amount you invested in the Fund, to estimate the expenses you paid over that period. Simply divide your actual account value by $1,000 to arrive at a ratio (for example, an $8,600 account value divided by $1,000 = 8.6), then multiply that ratio by the number shown for your Fund under “Expenses Paid During Period.”
Hypothetical 5% return. This section helps you compare your Fund’s costs with those of other mutual funds. It assumes that the fund had an annual 5% return before expenses during the year, but that the expense ratio (Column 3) for the period is unchanged. This example is useful in making comparisons because the Securities and Exchange Commission requires all mutual funds to make this 5% calculation. You can assess your Fund’s comparative cost by comparing the hypothetical result for your Fund in the “Expense Paid During Period” column with those that appear in the same charts in the shareholder reports for other funds.
NOTE: Because the return is set at 5% for comparison purposes — NOT your Fund’s actual return — the account values shown may not apply to your specific investment.
Beginning 4/1/14 | Ending Account Value 9/30/14 | Annualized Expense Ratios | Expenses Paid During Period* | |||||||||||||
International Equity Fund |
| |||||||||||||||
Actual Fund Return |
| |||||||||||||||
Class A | $ | 1,000.00 | $ | 972.60 | 1.24 | % | $ | 6.12 | ||||||||
Class I | $ | 1,000.00 | 970.60 | 1.49 | 7.35 | |||||||||||
Hypothetical 5% Return |
| |||||||||||||||
Class A | $ | 1,000.00 | $ | 1,018.86 | 1.24 | % | $ | 6.27 | ||||||||
Class I | $ | 1,000.00 | 1,017.61 | 1.49 | 7.53 | |||||||||||
Emerging Markets Equity Fund |
| |||||||||||||||
Actual Fund Return | ||||||||||||||||
Class A | $ | 1,000.00 | $ | 1,018.90 | 1.96 | % | $ | 9.93 | ||||||||
Hypothetical 5% Return |
| |||||||||||||||
Class A | $ | 1,000.00 | $ | 1,015.23 | 1.96 | % | $ | 9.92 | ||||||||
| Beginning Account Value 4/1/14 | Ending Account Value 9/30/14 | Annualized Expense Ratios | Expenses Paid During Period* | |||||||||||||
International Fixed Income Fund |
| |||||||||||||||
Actual Fund Return | ||||||||||||||||
Class A | $ | 1,000.00 | $ | 1,034.90 | 1.02 | % | $ | 5.22 | ||||||||
Hypothetical 5% Return |
| |||||||||||||||
Class A | $ | 1,000.00 | $ | 1,019.94 | 1.02 | % | $ | 5.18 | ||||||||
Emerging Markets Debt Fund |
| |||||||||||||||
Actual Fund Return | ||||||||||||||||
Class A | $ | 1,000.00 | $ | 1,005.20 | 1.36 | % | $ | 6.86 | ||||||||
Hypothetical 5% Return |
| |||||||||||||||
Class A | $ | 1,000.00 | $ | 1,018.23 | 1.36 | % | $ | 6.90 | ||||||||
| * | Expenses are equal to the Fund’s annualized expense ratio multiplied by the average account value over the period, multiplied by 183/365 (to reflect the one-half year period shown). |
| SEI Institutional International Trust / Annual Report / September 30, 2014 | 75 |
Board of Trustees Considerations in Approving the Funds’ Investment Advisory and Sub-Advisory Agreements (Unaudited)
SEI Institutional International Trust (the “Trust”) and SEI Investments Management Corporation (“SIMC”) have entered into an investment advisory agreement (the “Advisory Agreement”). Pursuant to the Advisory Agreement, SIMC oversees the investment advisory services provided to the series of the Trust (the “Funds”) and may manage all or a portion of a Funds’ assets. Pursuant to separate sub-advisory agreements (the “Sub-Advisory Agreements” and, together with the Advisory Agreement, the “Investment Advisory Agreements”) with SIMC, and under the supervision of SIMC and the Trust’s Board of Trustees (the “Board”), the sub-advisers (each, a “Sub-Adviser” and collectively, the “Sub-Advisers”) are responsible for the day-to-day investment management of all or a discrete portion of the assets of the Funds. The Sub-Advisers are also responsible for managing their employees who provide services to these Funds. The Sub-Advisers are selected based primarily upon the research and recommendations of SIMC, which evaluates quantitatively and qualitatively the Sub-Advisers’ skills and investment results in managing assets for specific asset classes, investment styles and strategies.
The Investment Company Act of 1940, as amended (the “1940 Act”) requires that the initial approval of, as well as the continuation of, the Funds’ Investment Advisory Agreements must be specifically approved: (i) by the vote of the Board or by a vote of the shareholders of the Funds; and (ii) by the vote of a majority of the Trustees who are not parties to the Investment Advisory Agreements or “interested persons” of any party (the “Independent Trustees”), cast in person at a meeting called for the purpose of voting on such approval(s). In connection with their consideration of such approval(s), the Funds’ Trustees must request and evaluate, and SIMC and the Sub-Advisers are required to furnish, such information as may be reasonably necessary to evaluate the terms of the Investment Advisory Agreements. In addition, the Securities and Exchange Commission takes the position that, as part of their fiduciary duties with respect to a mutual fund’s fees, mutual fund boards are required to evaluate the material factors applicable to a decision to approve an Investment Advisory Agreement.
Consistent with these responsibilities, the Board calls and holds meetings each year that are dedicated to considering whether to approve new and terminate or renew existing Investment Advisory Agreements between the Trust and SIMC and SIMC and the Sub-Advisers with respect to the Funds of the Trust. In preparation for these meetings, the Board requests and reviews a wide variety of materials provided by SIMC and the Sub-Advisers, including information about SIMC’s and the Sub-Advisers’ affiliates, personnel and operations. The Board also receives data from third parties. This information is provided in addition to the detailed information about the Funds that the Board reviews during the course of each year, including information that relates to Fund operations and Fund performance. The Trustees also receive a memorandum from counsel regarding the responsibilities of Trustees in connection with their consideration of whether to approve the Trust’s Investment Advisory Agreements. Finally, the Independent Trustees receive advice from independent counsel to the Independent Trustees, meet in executive sessions outside the presence of Fund management and participate in question and answer sessions with representatives of SIMC and the Sub-Advisers.
Specifically, during the course of the Trust’s fiscal year, the Board requested and received written materials from SIMC and the Sub-Advisers regarding: (i) the quality of SIMC’s and the Sub-Advisers’ investment management and other services; (ii) SIMC’s and the Sub-Advisers’ investment management personnel; (iii) SIMC’s and the Sub-Advisers’ operations and financial condition; (iv) SIMC’s and the Sub-Advisers’ brokerage practices (including any soft dollar arrangements) and investment strategies; (v) the level of the advisory fees that SIMC charges the Funds and the level of the sub-advisory fees that SIMC pays the Sub-Advisers, compared with fees each charge to comparable accounts; (vi) the advisory fees charged by SIMC and the Funds’ overall fees and operating expenses compared with peer groups of mutual funds generally as classified by Lipper (unless otherwise adjusted), an independent provider of investment company data; (vii) the level of SIMC’s and the Sub-Advisers’ profitability from their Fund-related operations; (viii) SIMC’s and the Sub-Advisers’ compliance systems; (ix) the Adviser’s and Sub-Advisers’ potential economies of scale; (x) SIMC’s and the Sub-Advisers’ policies on and compliance procedures for personal securities transactions; (xi) SIMC’s and the Sub-Advisers’ expertise and resources in domestic and/or international financial markets; and (xii) the Funds’ performance compared with peer groups of mutual funds as classified by Lipper (unless otherwise adjusted) and the Funds’ benchmark indices.
| 76 | SEI Institutional International Trust / Annual Report / September 30, 2014 |
At the December 10-11, 2013, March 25-26, 2014, June 24-25, 2014 and September 15-16, 2014 meetings of the Board of Trustees, the Trustees, including a majority of the Independent Trustees, approved the Advisory Agreement and approved the selection of SIMC and certain Sub-Advisers to act in their respective capacities for the Funds. The Board’s approval was based on its consideration and evaluation of a variety of specific factors discussed at the meetings and at prior meetings, including but not necessarily limited to:
| • | the nature, extent and quality of the services provided to the Funds under the Investment Advisory Agreements, including the resources of SIMC and the Sub-Advisers dedicated to the Funds; |
| • | the Funds’ investment performance and how it compared to that of other comparable mutual funds and the applicable benchmarks; |
| • | the Funds’ expenses under each Investment Advisory Agreement and how those expenses compared to those of other comparable mutual funds; |
| • | the profitability of SIMC and, in most cases, the Sub-Advisers and their affiliates with respect to the Funds, including both direct and indirect benefits accruing to SIMC and the Sub-Advisers and their affiliates; and |
| • | the extent to which economies of scale would be realized as the Funds grow and whether fee levels in the Investment Advisory Agreements reflect those economies of scale for the benefit of Fund investors. |
Nature, Extent and Quality of Services. The Board considered the nature, extent and quality of the services provided by SIMC and the Sub-Advisers to the Funds and the resources of SIMC and the Sub-Advisers and their affiliates dedicated to the Funds. In this regard, the Trustees evaluated, among other things, SIMC’s and each Sub-Adviser’s personnel, experience, track record and compliance program. Following evaluation, the Board concluded that, within the context of its full deliberations, the nature, extent and quality of services provided by SIMC and the Sub-Advisers to the Funds and the resources of SIMC and the Sub-Advisers and their affiliates dedicated to the Funds were sufficient to support renewal of the Investment Advisory Agreements.
Fund Performance. The Board considered Fund performance in determining whether to approve new and terminate or renew existing Investment Advisory Agreements. Specifically, the Trustees considered the Funds’ performance relative to their peer groups and appropriate indices/benchmarks in light of total return, yield and market trends. As part of this review, the Trustees considered the composition of each peer group and selection criteria. In evaluating performance, the Trustees considered both market risk and shareholder risk expectations for the Funds. The Trustees found Fund performance satisfactory, or, where performance was materially below the benchmark and/or peer group, the Trustees were satisfied that appropriate steps were being taken, but agreed that they would continue to closely monitor the Fund performance. Following evaluation, the Board concluded that, within the context of its full deliberations, the performance of the Funds was sufficient to support renewal of the Investment Advisory Agreements.
Fund Expenses. With respect to the Funds’ expenses under the Investment Advisory Agreements, the Trustees considered the rate of compensation called for by the Investment Advisory Agreements and the Funds’ net operating expense ratio in comparison to those of the Funds’ respective peer groups. The Trustees further considered the fact that the comparative fee analysis either showed that the various fees were below average or that there was a reasonable basis for the fee level. The Trustees also considered the effects of SIMC’s voluntary waiver of management and other fees to prevent total Fund expenses from exceeding a specified cap and concluded that SIMC, through waivers, has maintained the Funds’ net operating expenses at competitive levels for its distribution channels. Following evaluation, the Board concluded that, within the context of its full deliberations, the expenses of the Funds are reasonable and supported renewal of the Investment Advisory Agreements.
| SEI Institutional International Trust / Annual Report / September 30, 2014 | 77 |
Board of Trustees Considerations in Approving the Funds’ Investment Advisory and Sub-Advisory Agreements (Unaudited) (Concluded)
Profitability. With regard to profitability, the Trustees considered compensation flowing to SIMC and the Sub-Advisers and their affiliates, directly or indirectly. The Trustees considered whether the levels of compensation and profitability were reasonable. The Trustees found that profitability was reasonable. When considering the profitability of the Sub-Advisers, the Board took into account the fact that the Sub-Advisers are compensated by SIMC and not by the Funds directly, and such compensation with respect to any unaffiliated Sub-Adviser reflects an arms-length negotiation between the Sub-Adviser and SIMC. Based on this evaluation, the Board concluded that, within the context of its full deliberations, the profitability of each of SIMC and the Sub-Advisers is reasonable and supported renewal of the Investment Advisory Agreements.
Economies of Scale. The Trustees considered the existence of any economies of scale and whether those were passed along to the Funds’ shareholders through a graduated investment advisory fee schedule or other means, including any fee waivers by SIMC and its affiliates. The Trustees recognized that economies of scale are difficult to identify and quantify and are rarely identifiable on a fund-by-fund basis. Based on this evaluation, the Board was unable to conclude that economies of scale, if any, were not appropriately shared with the Funds.
Based on the Trustees’ deliberation and their evaluation of the information described above, the Board, including all of the Independent Trustees, unanimously approved the continuation of the Investment Advisory Agreements and concluded that the compensation under the Investment Advisory Agreements is fair and reasonable in light of such services and expenses and such other matters as the Trustees considered to be relevant in the exercise of their reasonable judgment. In the course of their deliberations, different factors may have been given varied weight by different Trustees, and the Trustees did not identify any particular information that was all-important or controlling.
| 78 | SEI Institutional International Trust / Annual Report / September 30, 2014 |
Notice to Shareholders (Unaudited)
For shareholders who do not have a September 30, 2014, taxable year end, this notice is for informational purposes only. For shareholders with
a September 30, 2014, taxable year end, please consult your tax adviser as to the pertinence of this notice.
For the fiscal year ended September 30, 2014, the Funds are designating long term and qualifying dividend income with regard to distributions paid during the year as follows:
| (A) Return of Capital | (B) Long Term Capital Gains Distributions (Tax Basis) | (C) Ordinary Income Distributions (Tax Basis) | (D) Total Distributions (Tax Basis) | (E) Dividends Qualifying for Corporate Dividends Rec. Deduction (1) | (F) | (G) U.S. Government Interest (3) | (H) Interest Related Dividends (4) | (I) Short-Term Capital Gain Dividends (5) | ||||||||||||||||||||||||||
International Equity Fund | 0.00% | 0.00 | % | 100.00 | % | 100.00 | % | 0.00 | % | 100.00 | % | 0.00 | % | 100.00 | % | 0.00 | % | |||||||||||||||||
Emerging Markets Equity Fund | 0.00% | 0.00 | % | 100.00 | % | 100.00 | % | 0.00 | % | 100.00 | % | 0.00 | % | 0.00 | % | 0.00 | % | |||||||||||||||||
International Fixed Income Fund | 0.00% | 0.00 | % | 100.00 | % | 100.00 | % | 0.00 | % | 0.00 | % | 1.03 | % | 5.96 | % | 0.00 | % | |||||||||||||||||
Emerging Markets Debt Fund | 0.00% | 16.76 | % | 83.24 | % | 100.00 | % | 0.00 | % | 0.00 | % | 0.00 | % | 0.02 | % | 100.00 | % | |||||||||||||||||
The Funds intend to pass through foreign tax credit to shareholders. For the fiscal year ended September 30, 2014, the amount of foreign source income and foreign tax credit are as follows:
| Fund | Foreign Source Income | Foreign Tax Credit Pass Through | ||||||
International Equity | $ | 50,924,810 | $ | 2,913,421 | ||||
Emerging Markets Equity | 19,202,844 | 4,046,184 | ||||||
| (1) | “Dividends Received Deduction” represent dividends which qualify for the corporate dividends received deduction. |
| (2) | “Qualifying Dividend Income” represent qualifying dividends as created by the Jobs and Growth Tax Relief Reconciliation Act of 2003. It is the intention of the Fund to designate the max amount permitted by law. |
| (3) | “U.S. Government Interest” represent the amount of interest that was derived from direct U.S. Government obligations and distributed during the fiscal year. Generally, interest from direct U.S. Government obligations is exempt from state income tax. However, for shareholders who are residents of California, Connecticut or New York, the statutory threshold requirements were not satisfied to permit exemption of these amounts from state income. |
| (4) | The percentage in this column represents the amount of “Interest Related Dividend” is reflected as a percentage of ordinary income distribution for calendar year ended 2013. Interest related dividends is exempted from U.S. withholding tax when paid to foreign investors. The provision that allows RICs to pass through “Interest Related Dividend” expired after 12/31/13. |
| (5) | The percentage of this column represents the amount of “Short Term Capital Gain Dividend” is reflected as a percentage of short term capital gain distribution for calendar year ended 2013 that is exempted from U.S. withholding tax when paid to foreign investors. The provision that allows RICs to pass through “Short Term Capital Gain Dividend” expired after 12/31/13. |
Items (A), (B), (C) and (D) are based on the percentage of each fund’s total distribution.
Items (E) and (F) are based on the percentage of “Ordinary Income Distributions.”
Item (G) is based on the percentage of gross income of each Fund.
Item (H) is based on the percentage of net investment income distributions.
Item (I) is based on the percentage of short-term capital gains distributions.
Please consult your tax adviser for proper treatment of this information. This notification should be kept with your permanent tax records.
| SEI Institutional International Trust / Annual Report / September 30, 2014 | 79 |
SEI INSTITUTIONAL INTERNATIONAL TRUST ANNUAL REPORT SEPTEMBER 30, 2014
Robert A. Nesher, Chairman
Trustees
William M. Doran
George J. Sullivan, Jr.
Nina Lesavoy
James M. Williams
Mitchell A. Johnson
Hubert L. Harris, Jr.
Officers
Robert A. Nesher
President and Chief Executive Officer
Peter A. Rodriguez
Controller and Chief Financial Officer
Russell Emery
Chief Compliance Officer
Timothy D. Barto
Vice President, Secretary
Aaron Buser
Vice President, Assistant Secretary
David F. McCann
Vice President, Assistant Secretary
Stephen G. MacRae
Vice President
Edward McCusker
Anti-Money Laundering Compliance Officer
Privacy Officer
Investment Adviser
SEI Investments Management Corporation
Administrator
SEI Investments Global Funds Services
Distributor
SEI Investments Distribution Co.
Legal Counsel
Morgan, Lewis & Bockius LLP
Independent Registered Public Accounting Firm
KPMG LLP
This report and the financial statements contained herein are submitted for the general information of the shareholders of the Trust and must be preceded or accompanied by a current prospectus. Shares of the SEI Funds are not deposits or obligations of, or guaranteed or endorsed by, any bank. The shares are not federally insured by the Federal Deposit Insurance Corporation (FDIC), the Federal Reserve Board, or any other government agency. Investment in the shares involves risk, including the possible loss of principal.
For more information call
1 800 DIAL SEI
(1 800 342 5734)

1 Freedom Valley Drive, P.O. Box 1100, Oaks, PA 19456
SEI-F-018 (9/14)
| Item 2. | Code of Ethics. |
The Registrant has adopted a code of ethics that applies to the Registrant’s principal executive officer, principal financial officer, comptroller or principal accounting officer, and any person who performs a similar function.
| Item 3. | Audit Committee Financial Expert. |
(a)(1) The Registrant’s Board of Trustees has determined that the Registrant has at least two audit committee financial experts serving on the audit committee.
(a) (2) The audit committee financial experts are George J. Sullivan, Jr. and Hubert L. Harris, Jr. Messrs. Sullivan and Harris are independent as defined in Form N-CSR Item 3 (a) (2).
| Item 4. | Principal Accountant Fees and Services. |
Fees billed by KPMG LLP (“KPMG”) related to the Registrant.
KPMG billed the Registrant aggregate fees for services rendered to the Registrant for the fiscal years 2014 and 2013 as follows:
| Fiscal 2014 | Fiscal 2013 | |||||||||||||||||||||||||
| All fees and services to the Registrant that were pre- approved | All fees and services to service affiliates that were pre- approved | All other fees and services to service affiliates that did not require pre- approval | All fees and services to the Registrant that were pre- approved | All fees and services to service affiliates that were pre- approved | All other fees and services to service affiliates that did not require pre- approval | |||||||||||||||||||||
(a) | Audit Fees(1) | $ | 200,500 | $ | 0 | N/A | $ | 213,500 | $ | 0 | N/A | |||||||||||||||
(b) | Audit-Related Fees | $ | 0 | $ | 0 | $ | 0 | $ | 0 | $ | 0 | $ | 0 | |||||||||||||
(c) | Tax Fees(3) | $ | 0 | $ | 0 | $ | 0 | $ | 0 | $ | 28,000 | $ | 0 | |||||||||||||
(d) | All Other Fees(2) | $ | 240,350 | $ | 0 | $ | 0 | $ | 0 | $ | 237,000 | $ | 0 | |||||||||||||
Notes:
| (1) | Audit fees include amounts related to the audit of the Registrant’s annual financial statements and services normally provided by the accountant in connection with statutory and regulatory filings. |
| (2) | See Item 4(g) for a description of the services comprising the fees disclosed under this category. |
| (3) | Tax fees include amounts related to tax compliance and consulting services for various service affiliates of the Registrant. |
(e)(1) The Registrant’s Audit Committee has adopted and the Board of Trustees has ratified an Audit and Non-Audit Services Pre-Approval Policy (the “Policy”), which sets forth the procedures and the conditions pursuant to which services proposed to be performed by the independent auditor of the Registrant may be pre-approved.
The Policy provides that all requests or applications for proposed services to be provided by the independent auditor must be submitted to the Registrant’s Chief Financial Officer (“CFO”) and must include a detailed description of the services proposed to be rendered. The CFO will determine whether such services: (1) require specific pre-approval; (2) are included within the list of services that have received the general pre-approval of the Audit Committee pursuant to the Policy; or (3) have been previously pre-approved in connection with the independent auditor’s annual engagement letter for the applicable year or otherwise. In any instance where services require pre-approval, the Audit Committee will consider whether such services are consistent with SEC’s rules and whether the provision of such services would impair the auditor’s independence.
Requests or applications to provide services that require specific pre-approval by the Audit Committee will be submitted to the Audit Committee by the CFO. The Audit Committee will be informed by the CFO on a quarterly basis of all services rendered by the independent auditor. The Audit Committee has delegated specific pre-approval authority to either the Audit Committee Chair or financial experts, provided that the estimated fee for any such proposed pre-approved service does not exceed $50,000 and any pre-approval decisions are reported to the Audit Committee at its next regularly scheduled meeting.
Services that have received the general pre-approval of the Audit Committee are identified and described in the Policy. In addition, the Policy sets forth a maximum fee per engagement with respect to each identified service that has received general pre-approval.
All services to be provided by the independent auditor shall be provided pursuant to a signed written engagement letter with the Registrant, the investment advisor or applicable control affiliate (except that matters as to which an engagement letter would be impractical because of timing issues or because the matter is small may not be the subject of an engagement letter) that sets forth both the services to be provided by the independent auditor and the total fees to be paid to the independent auditor for those services.
In addition, the Audit Committee has determined to take additional measures on an annual basis to meet its responsibility to oversee the work of the independent auditor and to assure the auditor’s independence from the Registrant, such as reviewing a formal written statement from the independent auditor delineating all relationships between the independent auditor and the Registrant, and discussing with the independent auditor its methods and procedures for ensuring independence.
(e)(2) Percentage of fees billed applicable to non-audit services pursuant to waiver of pre-approval requirement were as follows:
| Fiscal 2014 | Fiscal 2013 | |||||||
Audit-Related Fees | 0 | % | 0 | % | ||||
Tax Fees | 0 | % | 0 | % | ||||
All Other Fees | 0 | % | 0 | % | ||||
(f) Not Applicable.
(g)(1) The aggregate non-audit fees and services billed by KPMG for the fiscal years 2014 and 2013 were $240,350 and $237,000, respectively. Non-audit fees consist of SSAE No.16 review of fund accounting and administration operations, attestation report in accordance with Rule 17Ad-13, agreed upon procedures report over certain internal controls related to compliance with federal securities laws and regulations.
(h) During the past fiscal year, Registrant’s principal accountant provided certain non-audit services to Registrant’s investment adviser or to entities controlling, controlled by, or under common control with Registrant’s investment adviser that provide ongoing services to Registrant that were not subject to pre-approval pursuant to paragraph (c)(7)(ii) of Rule 2-01 of Regulation S-X. The Audit Committee of Registrant’s Board of Trustees reviewed and considered these non-audit services provided by Registrant’s principal accountant to Registrant’s affiliates, including whether the provision of these non-audit services is compatible with maintaining the principal accountant’s independence.
| Item 5. | Audit Committee of Listed Registrants. |
Not applicable.
| Item 6. | Schedule of Investments |
The Schedules of Investments in securities of unaffiliated issuers as of the close of the reporting period for the International Equity Fund, Emerging Markets Equity Fund, International Fixed Income Fund, and Emerging Markets Debt Fund are included as part of the report to shareholders filed under Item 1 of this form.
| Item 7. | Disclosure of Proxy Voting Policies and Procedures for Closed-End Management Investment Companies. |
Not applicable.
| Item 8. | Portfolio Managers of Closed-End Management Investment Companies |
Not applicable.
| Item 9. | Purchases of Equity Securities by Closed-End Management Company and Affiliated Purchasers. |
Not applicable.
| Item 10. | Submission of Matters to a Vote of Security Holders. |
The Registrant has a standing Governance Committee (the “Committee”) currently consisting of the Independent Trustees. The Committee is responsible for evaluating and recommending nominees for election to the Registrant’s Board of Trustees (the “Board”). Pursuant to the Committee’s Charter, adopted on June 18, 2004, as amended, the Committee will review all shareholder recommendations for nominations to fill vacancies on the Board if such recommendations are submitted in writing and addressed to the Committee at the Registrant’s office.
| Item 11. | Controls and Procedures. |
(a) The Registrant’s principal executive and principal financial officers, or persons performing similar functions, have concluded that the Registrant’s disclosure controls and procedures (as defined in Rule 30a-3(c) under the Investment Company Act of 1940 (the “1940 Act”)) are effective, based on the evaluation of these controls and procedures required by Rule 30a-3(b) under the 1940 Act and Rules
13a-15(b) or 15d-15(b) under the Securities Exchange Act of 1934 as of a date within 90 days of the filing date of this report.
(b) There were no changes in the Registrant’s internal control over financial reporting (as defined in Rule 30a-3(d) under the 1940 Act) that occurred during the second fiscal quarter of the period covered by this report that have materially affected, or are reasonably likely to materially affect, the Registrants internal control over financial reporting.
| Items 12. | Exhibits. |
(a)(1) Code of Ethics attached hereto.
(a)(2) A separate certification for the principal executive officer and the principal financial officer of the Registrant as required by Rule 30a-2(a) under the Investment Company Act of 1940, as amended (17 CFR 270.30a-2(a)), are filed herewith.
(b) Officer certifications as required by Rule 30a-2(b) under the Investment Company Act of 1940, as amended (17 CFR 270.30a-2(b)) also accompany this filing as exhibits.
SIGNATURES
Pursuant to the requirements of the Securities Exchange Act of 1934 and the Investment Company Act of 1940, the Registrant has duly caused this report to be signed on its behalf by the undersigned, thereunto duly authorized.
| SEI Institutional International Trust | ||||||
| By: | /s/ Robert A. Nesher | |||||
| Robert A. Nesher | ||||||
| President & CEO | ||||||
Date: December 8, 2014
Pursuant to the requirements of the Securities Exchange Act of 1934 and the Investment Company Act of 1940, this report has been signed below by the following persons on behalf of the Registrant and in the capacities and on the dates indicated.
| By: | /s/ Robert A. Nesher | |||||
| Robert A. Nesher | ||||||
| President & CEO |
Date: December 8, 2014
| By: | /s/ Peter A. Rodriguez | |||||
Peter A. Rodriguez | ||||||
Controller & CFO |
Date: December 8, 2014