UNITED STATES
SECURITIES AND EXCHANGE COMMISSION
Washington, D.C. 20549
FORM N-CSR
CERTIFIED SHAREHOLDER REPORT OF REGISTERED
MANAGEMENT INVESTMENT COMPANIES
Investment Company Act file number 811-05601
SEI Institutional International Trust
(Exact name of registrant as specified in charter)
SEI Investments
One Freedom Valley Drive
Oaks, PA 19456
(Address of principal executive offices) (Zip code)
CT Corporation
155 Federal Street
Boston, MA 02110
(Name and address of agent for service)
Registrant’s telephone number, including area code: 1-800-342-5734
Date of fiscal year end: September 30, 2015
Date of reporting period: September 30, 2015
| Item 1. | Reports to Stockholders. |

September 30, 2015
ANNUAL REPORT
SEI Institutional International Trust
➤ International Equity Fund
➤ Emerging Markets Equity Fund
➤ International Fixed Income Fund
➤ Emerging Markets Debt Fund

| 1 | ||||
| 5 | ||||
| 12 | ||||
| 61 | ||||
| 62 | ||||
| 63 | ||||
| 65 | ||||
| 66 | ||||
| 79 | ||||
| 80 | ||||
| 83 | ||||
Board of Trustees Considerations in Approving the Advisory and Sub-Advisory Agreements | 84 | |||
| 87 | ||||
The Trust files its complete schedule of portfolio holdings with the Securities and Exchange Commission for the first and third quarters of each fiscal year on Form N-Q within sixty days after the end of the period. The Trust’s Form N-Q is available on the Commission’s website at http://www.sec.gov, and may be reviewed and copied at the Commission’s Public Reference Room in Washington, DC. Information on the operation of the Public Reference Room may be obtained by calling 1-800-SEC-0330.
A description of the policies and procedures that the Trust uses to determine how to vote proxies relating to portfolio securities, as well as information relating to how a Fund voted proxies relating to portfolio securities during the most recent 12-month period ended June 30, is available (i) without charge, upon request, by calling 1-800-DIAL-SEI; and (ii) on the Commission’s website at http://www.sec.gov.
SEI INSTITUTIONAL INTERNATIONAL TRUST — SEPTEMBER 30, 2015 (Unaudited)
This annual report covers the year ended September 30, 2015. Performance varied significantly across asset classes over the course of the Funds’ fiscal year. A declining global economic outlook and heightened volatility marked the fourth quarter of 2014, followed by a round of global central-bank easing measures to start the New Year and nearly two full quarters of relative calm that proved hospitable to risk assets. The period concluded with indiscriminate volatility during the third quarter of 2015, which put downward pressure on a majority of global assets (aside from “safe-haven” developed-market government securities).
Geopolitical events
There were several important geopolitical developments during the Funds’ fiscal year. Worries about an outbreak of Ebola in Africa and the subsequent spread of the virus played a prominent role in news headlines at the beginning of the Funds’ reporting period; although it did not have a significant impact on the global economy. Severe unrest continued in certain areas of the Middle East, driven by the opposing and overlapping interests of ISIS, the Syrian regime, Syrian nationalists, Kurdish forces, the Iraqi military, Iranian-backed Shiite militias and, at the end of period, the Russian military. While the conflict that originated in Syria and Iraq appears to have influenced destablizing events elsewhere in the Middle East and Northern Africa, and taken a terrible human toll, it has not had a significant impact on global markets or the economy. Iran’s agreement with the U.S., U.K., Russia, France, China and Germany regarding the scope of its nuclear program was completed late in the Funds’ fiscal year, paving the way for the removal of sanctions against Iran.
Economic performance — Global
Global economic growth continued at a diminishing pace for the period, while near-term growth estimates were revised downward, stemming mostly from weakness in emerging economies. Inflation trends diverged, with an accelerating decline among developed nations as prices reversed higher in developing regions. Continued U.S. dollar strength and a general reliance by emerging economies on commodity exports amid declining prices were primarily responsible for the desynchronization.
Economic performance — U.S.
In the U.S., economic growth dropped off at the beginning of the period; the fourth quarter of 2014 registered less than half of the preceding quarter’s admittedly stellar expansion, and was followed by a modest contraction in the first quarter of 2015 that can be attributed partially to seasonal slowdown effects. Second-quarter growth bordered on impressive, due in large part to strong consumer activity; both retail sales and consumer spending measures registered significant spikes in May. Revolving consumer credit retreated during the first half of the period, before reversing into a string of expansions during the second half, indicating renewed consumer appetite. Personal income growth was solid and relatively consistent throughout the period, outpacing spending in most months. Consumer prices declined early in the period against the backdrop of a strengthening U.S. dollar, and price increases were muted when measured on a core basis (with volatile food and energy components removed); negative price pressures were more pronounced at the producer level. The trend subsided through much of the first and second quarters of 2015, before prices began to slide again amid third-quarter volatility. Home prices joined in the late-period decline, according to Case-Shiller, but actually delivered notable growth in the majority of the Funds’ fiscal year; year-over-year price growth was fairly consistent throughout the period. Existing-home sales were mixed early in the period, then steadily increased, hitting an eight-year high in the summer of 2015. New-home sales did not follow a clear trend but were strong, reaching a seven-year peak in the first quarter of 2015 and then again in the summer. The labor market benefited from consistent improvement — jobless claims and the unemployment rate both declined over the Funds’ fiscal year — although the percentage of Americans participating in the labor force edged down. Industrial production was volatile from month to month, and year-over-year growth trended downward over the period in concert with capacity utilization. Durable goods orders were also unimpressive, with the value of new orders (excluding volatile transportation-sector components) declining over the period. Motor vehicle sales increased with limited consistency, but registered their highest level in a decade at the end of the Funds’ fiscal year.
| SEI Institutional International Trust / Annual Report / September 30, 2015 | 1 |
The Federal Reserve (Fed) concluded monthly bond purchases at the beginning of the period as it wound down its quantitative-easing program. Expectations for an eventual increase in the federal funds rate progressed further along the calendar, remaining to be seen at the end of the Funds’ fiscal year. While the U.S. economy has neared full employment, the Fed must also consider inflation and price stability when determining the timing of its first rate hike.
Economic performance — Europe
Europe succeeded in cultivating steady, albeit low, economic growth over the course of the Funds’ fiscal year. The fourth quarter of 2014 improved modestly on the prior quarter, which lifted off from flatlining conditions. The first quarter of 2015 also exhibited marginal acceleration before the growth rate held firm during the second quarter. The European Central Bank’s (ECB) commencement of an asset-purchase program at the start of the Funds’ fiscal year, and sizeable subsequent expansion in the New Year to include sovereign debt, served as the impetus for a chain reaction of central-bank loosening measures around the globe. An assurance was given by the ECB during the second quarter of 2015 that it would not prematurely conclude its program even if economic conditions improved substantially; third-quarter volatility may have prompted the ECB to go a step further in suggesting that the program could be expanded if deteriorating conditions warranted. The eurozone also contended with a restructuring of Greece’s public-debt obligations following elections in January 2015 that brought the leftist Syriza party and prime minister Alexis Tsipras to power. Much of the preoccupation with Europe during the first and second quarters of 2015 centered on the negotiations between Greece, other euro-member states, the ECB and the International Monetary Fund. The euro’s viability as a common currency among member states with limited fiscal policy coordination came into question, which, along with the ECB’s asset-purchase program, likely contributed to the euro’s slide during the first half of the Funds’ fiscal year. Despite the euro’s apparent weakness, consumer price pressures were low-to-negative (generally negative at the producer level), with both measures bottoming in the first quarter of 2015. In labor-market terms, unemployment remained unchanged for the first several months of the Funds’ fiscal year before trending modestly lower through most of the remaining period. The dichotomy between Europe’s core and periphery was stark throughout the period, with Greece’s unemployment rate remaining more than five times that of Germany.
U.K. economic growth softened, but then recovered during the period. The fourth quarter of 2014 and first quarter of 2015 each registered slower growth than the preceding quarters, while improvement during the second quarter of 2015 offset the deceleration. The Bank of England (BoE) made no changes to monetary policy in the Funds’ fiscal year; its latest quarterly inflation report released in August 2015 indicated that consumer-price inflation was not projected to reach levels consistent with an increase in the Bank Rate for at least several quarters following the fiscal year end. Consumer-price changes oscillated monthly between positive and negative, with the year-ago trend declining steadily in the first half of the period and remaining essentially unchanged thereafter. Producer-price trends followed a similar first-half/second-half pattern, but were decidedly more negative (especially among input prices). Price trends were due primarily to commodity-price weakness and sterling strength, which both intensified from late 2014 through the first quarter of 2015, picked up again during the summer, and tapered at the end of the period. The labor trend remained promising throughout most of the period, with both the claimant count and the unemployment rate declining in most months. Year-over-year average weekly earnings growth doubled over the period as well.
Economic performance — Asia Pacific
In the Asia-Pacific region, Japan began the period in recession but recovered during the fourth quarter of 2014 and first quarter of the New Year, following an expansion of the Bank of Japan’s asset-purchase program and a postponed national sales tax increase. The economy fell back into contraction territory during the second quarter. While the yen weakened early in the Funds’ fiscal year, it remained in a relatively tight range (with the exception of temporary further weakening during the summer of 2015). China’s economy, meanwhile, experienced steadily declining growth throughout the period, albeit from levels considerably higher than most other economies. The People’s Bank of China loosened its monetary policy stance, reducing benchmark interest rates and bank-reserve requirement ratios at multiple points during the Funds’ fiscal year. However, the government’s decision to let the renminbi float and decline in value against the U.S. dollar during the third quarter of 2015 had more significant global repercussions — especially given its implications for a potential rebalancing of global trade and the uncertainty about potential future actions.
| 2 | SEI Institutional International Trust / Annual Report / September 30, 2015 |
Market developments — equities
Global equity markets, as reflected by the MSCI All-Country World Index (ACWI), endured a swoon at the beginning of the Funds’ reporting period. Prior to recovering, markets navigated a choppy first quarter of 2015, trended higher in the second quarter, and fell back to their lows near the end of the period. U.S. large-cap stocks (Russell 1000 Index) followed essentially the same path, while U.S. small-cap stocks (Russell 2000 Index) delivered stronger performance when equities were in favor (registering a small gain for the full period) over the course of the Funds’ fiscal year.
A majority of sectors were negative, with a similar order of performance between U.S. (S&P 500 Index) and global (MSCI ACWI Index) sectors; although the U.S. delivered better overall performance. Consumer discretionary, followed by consumer staples and healthcare, were the top-performing sectors — with positive returns in the U.S. and globally. Information technology and utilities each delivered modestly positive performance in the U.S., while information technology was negative globally. Financials and industrials were negative everywhere, but by considerably more on a global basis than in the U.S. Telecommunications was the only sector that declined by more in the U.S. than globally. Energy was universally the worst performer, followed at a significant distance by materials, which also delivered a deeply negative performance.
Although normally sensitive to the threat of rising interest rates, real estate investment trusts (as measured by the Wilshire Real Estate Securities Index), performed well for the period, outpacing all U.S. sectors despite succumbing to the summer swoon.
Regionally, Europe was well-represented among countries with strong relative performance; although Greece and Russia delivered some of the most severe overall losses. The U.S. and Japan also performed relatively well, while returns across the broader Asia and Pacific regions ranged from slightly to deeply negative. Latin America, particularly Brazil and Colombia, also struggled with sharp declines.
Market developments — fixed income
Developed-market government bonds performed well during the Funds’ fiscal year, as yields declined on U.S. Treasuries, U.K. gilts, German bunds and Japanese government bonds (yields and prices move inversely). The appetite for these high-quality securities led to a relatively consistent decline in yields for much of the first half of the reporting period. However, an uneven reversal followed through the spring, with the market falling again in the summer as investors sought out the safety of developed-market government securities.
Notably, despite a great deal of central-bank monetary policy actions during the period, there were no benchmark interest-rate increases, as most adjustments served to loosen central bank postures. Inflation-linked bonds struggled for the most part. U.S. Treasury inflation-protected securities, which are impacted negatively by both rising interest rates and falling inflation, continued to underperform during the period. They performed well over the first four months of the New Year before selling off — sharply at first, and then steadily through the Funds’ fiscal year end.
Spread sectors — areas of the market that offer a higher yield than government debt in return for assuming more credit risk (including corporate, mortgage-backed securities and asset-backed securities) — performed well during the fiscal year, despite varying degrees of volatility among sectors during periods of stress, especially during the third quarter of 2015.
Investment-grade U.S. corporate debt was positive over the full period, despite early-2015 gains having mostly eroded by the end of the second quarter. High-yield corporates (which are below investment grade and carry greater credit risk) had a volatile, ultimately unproductive fourth-quarter 2014 before climbing through late-May 2015 — and finally sharply declining to finish the Funds’ fiscal year with losses.
Globally, emerging-market bonds generally lagged developed markets; but performance varied within the segment. Local-currency emerging-market bonds had steep losses, while external-currency (foreign-currency denominated) bonds were only slightly negative.
Market developments — commodities
Commodity prices (as measured by the Reuters/Jefferies CRB Index) began the Funds’ fiscal year with a continuation of declines that began in mid-2014 and proceeded until late January 2015. The slide recommenced in earnest during May, continuing through the end of the period aside from a slight rebound in late August. Energy prices — especially oil — were clear laggards within the commodity complex, followed at a distance by industrial metals and then by precious metals. Agricultural commodities were mixed, with corn and wheat in positive territory at the fiscal year end.
| SEI Institutional International Trust / Annual Report / September 30, 2015 | 3 |
Our view
Economic and market cycles in recent years have been disjointed and out of sync from region to region and country to country. Volatility notwithstanding, it is our expectation that monetary policies will remain far more expansionary and for longer in Japan, Europe and the rest of the world compared to the U.S. It’s our strong conviction that developed economies will not only avoid recession but will actually step up the pace of growth in the year ahead. If demand flags in those regions, deflationary pressures will probably intensify.
On behalf of SEI, I want to thank you for your confidence in the SEI Institutional International Trust. We are dedicated to helping our investors reach their long-term objectives, and we look forward to serving your investment needs in the future.
Sincerely,

William Lawrence, CFA
Managing Director, Portfolio Management Team
| 4 | SEI Institutional International Trust / Annual Report / September 30, 2015 |
MANAGEMENT’S DISCUSSION AND ANALYSIS OF FUND PERFORMANCE
SEI INSTITUTIONAL INTERNATIONAL TRUST — SEPTEMBER 30, 2015 (Unaudited)
International Equity Fund
I. Objective:
The International Equity Fund (the “Fund”) seeks long-term capital appreciation.
II. Investment Approach
The Fund uses a multi-manager approach, relying on a number of sub-advisers with differing investment approaches to manage portions of the Fund’s portfolio, under the general supervision of SEI Investments Management Corporation (“SIMC”). The Fund utilized the following sub-advisers as of September 30, 2015: Acadian Asset Management LLC, Blackcrane Capital, LLC, Causeway Capital Management LLC, Henderson Global Investors (North America) Inc., INTECH Investment Management LLC, Neuberger Berman Management LLC, Tradewinds Global Investors LLC and WCM Investment Management. For the year ended September 30, 2015, sub-adviser Schroders Investment Management North America, Inc. was terminated and sub-advisers Blackcrane Capital, LLC and WCM Investment Management were added to the Fund.
III. Returns
For the year ended September 30, 2015, the Fund’s Class A shares outperformed the MSCI EAFE Index (the “Index”), returning -5.98% versus the Index return of -8.66%.
IV. Performance Discussion
At the sector level, the Fund’s outperformance came mainly from stock selection, while sector selection was also slightly additive. Selection was relatively strong in financials, followed by materials, consumer staples, industrials and consumer discretionary. In financials and materials, the Fund benefited from having an underweight to some of the troubled banks or materials companies that experienced strong negative performance during the period. Stock selection was poor in energy and utilities, the former due to the oil and gas industry, which was hit heavily during the reporting period given the decline in commodity prices addressed in the enclosed shareholder letter. The Fund slightly benefited from an overweight to the consumer discretionary, information technology and
telecommunication services sectors. Meanwhile, an underweight to consumer staples detracted as the sector once again performed
relatively well in the risk-averse environment despite rather rich valuations.
Regionally, the Fund’s outperformance came mainly from stock selection, while sector selection was also slightly additive. Stock selection was positive in most developed regions and countries, led by the U.K., where the Fund benefited from good stock selection in many sectors, and also by underweighting several of the troubled energy and commodity names. Stock selection in continental Europe was also a positive in both peripheral countries such as Italy and Portugal and in core countries such as Germany and Belgium. Stock selection was a negative in France while an overweight to Norway, a country with heavy exposure to the beleaguered oil industry, also detracted from performance. Stock selection in Japan was beneficial, but an underweight to the country, which was a top performer given the ongoing economic reforms by Prime Minister Shinzo Abe, detracted slightly. The Fund was also negatively impacted by exposure to commodity and natural-resources heavy Canada, yet benefited from an underweight to Australia for the same reason. Emerging markets as an asset class performed very poorly during the reporting period, underperforming its developed-markets peers. As a result, exposure to emerging markets in aggregate was a negative. The contribution by emerging Asia was more than offset by poor performance in Latin America, as noted in the shareholder letter, given its high correlation to the commodity sector but also some political and economic troubles in Brazil, its largest economy.
For the year ended September 30, 2015, Fund-manager performance was mixed but mostly positive. Neuberger Berman Management LLC had strong stock selection in Europe and the U.K. with the strongest contribution from Germany, while France and Sweden detracted. Henderson Global Investors (North America) Inc. also had good stock selection in the U.K., while also benefitting from an underweight to the Pacific ex-Japan region and good stock selection within the region. Blackcrane Capital, LLC, a manager that was added in October 2014, demonstrated solid stock selection in Japan while also benefitting from exposure to Korea. Acadian Asset Management LLC’s quantitative model and INTECH Investment Management LLC’s mathematical model produced solid results; the former was helped by stock selection in Europe and Japan, while the latter achieved good results in Europe, the U.K. and the Pacific ex-Japan region. Causeway
| SEI Institutional International Trust / Annual Report / September 30, 2015 | 5 |
MANAGEMENT’S DISCUSSION AND ANALYSIS OF FUND PERFORMANCE
SEI INSTITUTIONAL INTERNATIONAL TRUST — SEPTEMBER 30, 2015 (Unaudited)
Capital Management LLC’s value strategy lagged during the year with poor stock selection broadly spread across regions, but most pronounced in Europe and Japan.
International Equity Fund:
AVERAGE ANNUAL TOTAL RETURN1
| One Year Return | Annualized 3 Year Return | Annualized 5 Year Return | Annualized 10 Year Return | Annualized to Date | ||||||||||||||||
| Class A† | -5.98% | 5.50% | 3.62% | 0.63% | 3.15% | |||||||||||||||
| Class I† | -6.18% | 5.23% | 3.37% | 0.39% | 2.72% | |||||||||||||||
| Class Y | N/A | N/A | N/A | N/A | -2.24% | * | ||||||||||||||
| MSCI EAFE Index | -8.66% | 5.63% | 3.98% | 2.97% | 4.06% | |||||||||||||||
Comparison of Change in the Value of a $100,000 Investment in the International Equity Fund, Class A and Class I, versus the MSCI EAFE Index
| 1 | For the year ended September 30, 2015. Past performance is no indication of future performance. Class I Shares were offered beginning on January 4, 2002. Class A Shares were offered beginning December 20, 1989. The performance of Class I Shares may be lower than the performance of Class A Shares because of different distribution fees paid by Class I shareholders. Returns shown do not reflect the deduction of taxes that a shareholder would pay on fund distributions or the redemption of fund shares. The returns for certain periods reflect fee waivers and/or reimbursements in effect for that period; absent fee waivers and reimbursements, performance would have been lower. |
| † | The graph is based on only Class A and Class I Shares; performance for Class Y Shares would be different due to differences in fee structures. |
| * | Cumulative inception to date as of December 31, 2014. |
| N/A — Not Available. |
| 6 | SEI Institutional International Trust / Annual Report / September 30, 2015 |
MANAGEMENT’S DISCUSSION AND ANALYSIS OF FUND PERFORMANCE
SEI INSTITUTIONAL INTERNATIONAL TRUST — SEPTEMBER 30, 2015 (Unaudited)
Emerging Markets Equity Fund
I. Objective:
The Emerging Markets Equity Fund (the “Fund”) seeks capital appreciation.
II. Investment Approach
The Fund uses a multi-manager approach, relying on a number of sub-advisers with differing investment approaches to manage portions of the Fund’s portfolio, under the general supervision of SEI Investments Management Corp. (“SIMC”). The Fund utilized the following sub-advisers as of September 30, 2015: Delaware Investment Fund Advisers, a series of Delaware Management Business Trust, JO Hambro Capital Management Limited, Kleinwort Benson Investors International Ltd., Lazard Asset Management LLC, Neuberger Berman Management LLC, PanAgora Asset Management, Inc. and RWC Asset Advisors (US) LLC. During the year, Everest Capital was added to and then removed from the Fund. The Everest investment team migrated to RWC Asset Advisors (US) LLC, which was then added to the Fund during the year.
III. Returns
For the year ended September 30, 2015, the Fund’s Class A shares underperformed the MSCI Emerging Markets Index (Gross) (the “Index”), returning -20.78% versus the Index return of -18.98%.
IV. Performance Discussion
While all equities sectors reported negative absolute performance during the Fund’s fiscal year, the Fund’s underperformance was primarily due to stock selection, as sector selection provided some benefit.
Stock selection was negative in information technology (IT), consumer discretionary and energy and materials. While selection in financials and consumer staples was beneficial, it could not offset the poor performance elsewhere. Within IT, the Fund was primarily and adversely impacted by several of its Chinese software and services holdings, which experienced strong sell offs. The Fund’s IT holdings detracted due to underweights to particular companies (e.g. an Indian IT consulting & services firm as well as a Chinese Internet firm) that performed well. In absolute terms, the healthcare sector
underperformed the least, and the Fund benefited from an overweight as well as selection within the sector. As addressed in the enclosed shareholder letter, energy and materials performed very poorly in absolute terms, as markets experienced a sharp sell off in commodities given the slowdown of the Chinese economy. In both energy and materials, the Fund’s holdings underperformed their respective benchmark holdings and hence detracted from overall results. However underweights to both sectors were positive.
Regionally, the Fund’s underperformance came mainly from allocation, while stock selection had a minor negative impact. Latin America was the worst performing region given the adverse impact of the sharp sell off in commodities. As the shareholder letter noted, Brazil and Colombia were hit harder than other Latin American countries. Stock selection in Brazil detracted from overall results. EMEA was a tale of two stories; Greece, a small country within the region, saw deeply negative absolute performance as the country defaulted on its International Monetary Fund debt after a month of negotiations with its Eurozone creditors. The Fund’s underweight to Greece, however, contributed. Beneficial regions for the Fund included some of the smaller Eastern European countries. Emerging Asia was a contributor to overall results. Despite the negative news about a Chinese economic-growth slowdown, as well as the volatility of the Chinese stock market, it was one of the better performing countries within the equities asset class, followed by India and the Philippines. The Fund benefited from an overweight and stock selection in India, as well as good stock selection in Korea and an underweight to Malaysia.
Fund manager results were mixed during the year. Delaware Investment Fund Advisers detracted most, attributable to poor stock selection in emerging Asia as well as selection in and overweight to Latin America. In Emerging Asia, the Fund’s holdings in China and India underperformed the respective benchmark components. Within Latin America the biggest detractor was Brazil, while holdings in Mexico did not perform well. Both JO Hambro Capital Management Limited and Neuberger Berman Management LLC outperformed the respective benchmark with positive performance bolstered by their exposure in Emerging Asia. JO Hambro Capital Management Limited also benefited from good stock selection in China and Taiwan, while
| SEI Institutional International Trust / Annual Report / September 30, 2015 | 7 |
MANAGEMENT’S DISCUSSION AND ANALYSIS OF FUND PERFORMANCE
SEI INSTITUTIONAL INTERNATIONAL TRUST — SEPTEMBER 30, 2015 (Unaudited)
Neuberger Berman Management LLC produced solid results in China, Indonesia and India. Meanwhile PanAgora Asset Management Inc.’s model added value in EMEA and the manager’s underweight to Latin America was also beneficial. Lazard Asset Management LLC’s strategy slightly lagged the benchmark and while stock selection in emerging Asia was strong; the strategy was negatively impacted by stock selection in Latin America, primarily Brazil, as well as through emerging-markets holdings that are listed on exchanges in North America. Kleinwort Benson Investors International Ltd. performed slightly ahead of the benchmark, with results in EMEA slightly ahead of emerging Asia.
Emerging Markets Equity Fund:
AVERAGE ANNUAL TOTAL RETURN1
| One Year Return | Annualized 3 Year Return | Annualized 5 Year Return | Annualized 10 Year Return | Annualized to Date | ||||||||||||||||
| Class A† | -20.78% | -5.64% | -5.24% | 1.99% | 3.38% | |||||||||||||||
| Class Y | N/A | N/A | N/A | N/A | -16.17% | * | ||||||||||||||
MSCI Emerging Markets Index (Gross) | -18.98% | -4.93% | -3.25% | 4.60% | 5.25% | |||||||||||||||
Comparison of Change in the Value of a $100,000 Investment in the
Emerging Markets Equity Fund, Class A, versus the MSCI Emerging Markets Index (Gross)
| 1 | For the year ended September 30, 2015. Past performance is no indication of future performance. Class A Shares were offered beginning January 17, 1995. Returns shown do not reflect the deduction of taxes that a shareholder would pay on fund distributions or the redemption of fund shares. The returns for certain periods reflect fee waivers and/or reimbursements in effect for that period; absent fee waivers and reimbursements, performance would have been lower. |
| † | The graph is based on only Class A Shares; performance for Class Y Shares would be different due to differences in fee structures. |
| * | Cumulative inception to date as of December 31, 2014. |
| N/A — Not Available. |
| 8 | SEI Institutional International Trust / Annual Report / September 30, 2015 |
MANAGEMENT’S DISCUSSION AND ANALYSIS OF FUND PERFORMANCE
SEI INSTITUTIONAL INTERNATIONAL TRUST — SEPTEMBER 30, 2015 (Unaudited)
International Fixed Income Fund
I. Objective:
The International Fixed-Income Fund (the “Fund”) seeks capital appreciation and current income.
II. Investment Approach
The Fund uses a multi-manager approach, relying on a number of sub-advisers with differing investment approaches to manage portions of the Fund’s portfolio, under the general supervision of SEI Investments Management Corporation (“SIMC”). The Fund utilized the following sub-advisers as of September 30, 2015: AllianceBernstein, L.P., FIL Investment Advisors and Wellington Management Company, LLP. For the year ended September 30, 2015, no manager changes were made.
III. Returns
For the year ended September 30, 2015, the Fund’s Class A shares underperformed the Barclays Global Aggregate ex-US Index, Hedged (the “Index”), returning 2.02% versus the Index return of 3.37%.
Performance Discussion
During the Fund’s fiscal year, persistent worries over the global economic outlook, anxiety over an economic slowdown in China, declining commodity prices, the end of U.S. quantitative easing (QE), expectations about the U.S. Federal Reserve raising interest rates, and the beginning of the European Central Bank’s QE program, were dominant market themes. As noted in the enclosed shareholder letter, both European and Japanese bonds rallied, supported by QE and investor panic during this risk-off period.
From a performance perspective, the Fund’s short-duration stance in the European and Japanese markets was detrimental. However, overweight exposures to Europe partially mitigated the negative impact. Performance also suffered from exposure to credit risk, predominantly in the investment-grade and high-yield subsectors across the U.S., U.K. and Europe. As the shareholder letter addressed, widening spreads, especially during the third quarter of 2015, were the result of shaken sentiment due to the correction in emerging markets and downgraded global-growth outlook. As a result, the Fund’s overweight to credit detracted.
From the sub-adviser (manager) perspective, all of the Fund’s managers underperformed. In the case of FIL Investment Advisors, exposure to credit risk severely impaired performance, alongside an underweight to U.S., U.K. and Canadian and Japanese interest-rate risk. However, exposure to German Bunds slightly mitigated underperformance. Additionally, FIL Investment Advisors overweight to securitized bonds was a negative. AllianceBernstein’s performance was also detrimental due to its high exposure to credit risk amid widening spreads, as well as its short-duration stance. Wellington underperformed for the same reasons, and due to its exposure to the securitized sector.
International Fixed Income Fund:
AVERAGE ANNUAL TOTAL RETURN1
| One Year Return | Annualized 3 Year Return | Annualized 5 Year Return | Annualized 10 Year Return | Annualized Inception to Date | ||||||||||||||||
| Class A | 2.02% | 2.90% | 3.07% | 2.94% | 4.39% | |||||||||||||||
| Barclays Global Aggregate ex-US Index, Hedged | 3.37% | 3.95% | 3.80% | 4.26% | 5.86% | |||||||||||||||
Comparison of Change in the Value of a $100,000 Investment in the International Fixed Income Fund, Class A, versus the Barclays Global Aggregate ex-US Index, Hedged
| 1 | For the year ended September 30, 2015. Past performance is no indication of future performance. Class A Shares were offered beginning September 1, 1993. Returns shown do not reflect the deduction of taxes that a shareholder would pay on fund distributions or the redemption of fund shares. The returns for certain periods reflect fee waivers and/or reimbursements in effect for that period; absent fee waivers and reimbursements, performance would have been lower. |
| SEI Institutional International Trust / Annual Report / September 30, 2015 | 9 |
MANAGEMENT’S DISCUSSION AND ANALYSIS OF FUND PERFORMANCE
SEI INSTITUTIONAL INTERNATIONAL TRUST — SEPTEMBER 30, 2015 (Unaudited)
Emerging Markets Debt Fund
I. Objective:
The Emerging Markets Debt Fund (the “Fund”) seeks to maximize total return.
II. Investment Approach
The Fund uses a multi-manager approach, relying on a number of sub-advisers with differing investment approaches to manage portions of the Fund’s portfolio, under the general supervision of SEI Investments Management Corp. (“SIMC”). The Fund utilized the following sub-advisers as of September 30, 2015: Investec Asset Management Ltd., Neuberger Berman Fixed Income LLC and Stone Harbor Investment Partners LP. For the year ended September 30, 2015, no manager changes were made.
III. Returns
For the year ended September 30, 2015, the Fund’s Class A shares underperformed a hybrid of 50% J.P. Morgan EMBI Global Diversified Index and 50% J.P. Morgan GBI-EM Global Diversified (the “Index”), returning -13.35% versus the Index return of -10.62%.
IV. Performance Discussion
For the year ended September 30, 2015, emerging markets were adversely affected by several broad factors: low commodity prices — most significantly the drop in oil prices noted in the enclosed shareholder letter — as large index constituents Russia, Mexico, Brazil, Malaysia and Venezuela are all oil exporters; the slowing Chinese economy, which has hurt emerging markets overall, but Asian countries like Malaysia, Indonesia and Philippines even more so; and the U.S. economy, which performed relatively well, serving as a flight to safety for many investors while also causing the U.S. dollar to strengthen relative to every emerging country’s local currency. Along with these broader themes, there were some non-financial market risks that affected countries with large weights in the index. The conflict between Russia and the Ukraine seems more benign now than it did a year ago; as a consequence of this improving landscape, Ukraine’s external debt returned over 50% in the third quarter of 2015, making it the market’s top performer. The other country gaining investor attention is Brazil, where a corruption probe into state-run oil company Petrobras has affected the oil giant as well as Brazil’s
government. Brazil’s credit rating was cut twice in the third quarter of 2015, ending the Fund’s fiscal year with a junk-status rating by Standard & Poor.
The majority of the blended-index underperformance comes from the local currency (GBI-EM Global Diversified) portion, which declined 19.77% over the last twelve months. The poor performance of local currencies stemmed from the appreciation of the U.S. dollar, as addressed in the shareholder letter, versus every local-EM currency in the index: the Mexican peso, the Malaysian ringgit, the Russian rouble, the Brazilian real, and the Colombian peso, each of which has weakened more than 20% to the U.S. dollar. The best performing currency — and only currency in the GBI-EM index that hasn’t weakened more than 10% to the U.S. dollar — was the Philippine peso, which weakened only 3.8% to the U.S. dollar. Therefore, while the Fund benefited from a consistent underweight to local debt over the period, it was unfortunately more than offset by local-debt selection, which was one of the primary drivers of underperformance for the year.
The external index (EMBI Global Diversified) was down 0.62% over the past twelve months, which, when compared to the local-index performance addressed in the paragraph above, is relatively flat. The external index spread increased significantly over the year, reflecting uncertainty over low commodity prices, a weak Chinese economy and expectations that the U.S. Federal Reserve will raise interest rates in the near future. The Fund was hurt by an average underweight to external debt during the Fund’s fiscal year, but the primary driver of underperformance came from selection in external debt.
Within local debt, selection in Brazil was the strongest driver of underperformance. A combination of overweights and selection in Mexico, Russia and Indonesia were the other main detractors in local debt. These four countries have all been affected by low energy prices and a strong U.S. dollar. An underweight combined with good security selection led to Polish local debt being the largest contributor in the Fund.
Within external debt, an underweight to Ukraine was the strongest detractor over the period. The Fund increased its Ukraine underweight in the beginning of 2015 only to see the country’s external debt rally during the third quarter of 2015. Another major
| 10 | SEI Institutional International Trust / Annual Report / September 30, 2015 |
detractor was an underweight to the Philippines. The position is justified by the country’s tight valuations and relatively low spread compared to most others in the index, but an investment-grade market rally and a lack of headline news from the Philippines led to solid performance. Off-benchmark holdings in Slovenia were the largest contributor in external debt, as the country generated strong positive returns over the period.
Positioning in pure emerging-market corporate debt also contributed to returns. The Fund’s benchmark includes only sovereign and quasi-sovereign (majority owned by the government) debt, so the Fund’s exposure is off-benchmark, with positions concentrated in high-yielding Brazilian, Russian, Chinese and Mexican credits.
Use of Derivatives
Currency forwards and swap contracts were used in the Fund for the one-year period ending September 30, 2015 as a way to either hedge particular positions or gain exposure to additional areas of the market. Foreign-exchange (FX) hedges on local currency bonds generally contributed to performance, particularly those used to reduce FX exposure in countries like Brazil, Russia and Malaysia.
Emerging Markets Debt Fund
AVERAGE ANNUAL TOTAL RETURN1
| One Year Return | Annualized 3 Year Return | Annualized 5 Year Return | Annualized 10 Year Return | Annualized Inception to Date | ||||||||||||||||
| Class A† | -13.35% | -5.75% | -0.30% | 4.58% | 7.87% | |||||||||||||||
| Class Y | N/A | N/A | N/A | N/A | -9.48% | * | ||||||||||||||
| J.P. Morgan EMBI Global Diversified Index | 0.62% | 1.50% | 4.73% | 6.89% | 8.59% | |||||||||||||||
| J.P. Morgan GBI-EM Global Diversified Index | -19.77% | -8.72% | -3.56% | 4.45% | N/A | |||||||||||||||
| 50/50 Hybrid consisting of the J.P. Morgan EMBI Global Diversified Index and the J.P. Morgan GBI-EM Global Diversified Index | -10.62% | -3.69% | 0.58% | 5.74% | N/A | |||||||||||||||
Comparison of Change in the Value of a $100,000 Investment in the Emerging Markets Debt Fund, Class A, versus a 50/50 Hybrid of the Following Indexes: the J.P. Morgan EMBI Global Diversified Index, and the J.P. Morgan GBI-EM Global Diversified Index
| 1 | For the year ended September 30, 2015. Past performance is no indication of future performance. Class A Shares were offered beginning June 26, 1997. Returns shown do not reflect the deduction of taxes that a shareholder would pay on fund distributions or the redemption of fund shares. The returns for certain periods reflect fee waivers and/or reimbursements in effect for that period; absent fee waivers and reimbursements, performance would have been lower. |
| † | The graph is based on only Class A Shares; performance for Class Y Shares would be different due to differences in fee structures. |
| * | Cumulative inception to date as of December 31, 2014. |
| N/A — Not Available. |
| SEI Institutional International Trust / Annual Report / September 30, 2015 | 11 |
International Equity Fund
September 30, 2015
| Description | Shares | Market Value ($ Thousands) | ||||||||
COMMON STOCK — 92.0% | ||||||||||
Australia — 1.9% | ||||||||||
Amcor | 488,828 | $ | 4,555 | |||||||
AMP | 98,120 | 385 | ||||||||
APA Group | 49,445 | 299 | ||||||||
Australia & New Zealand Banking Group | 165,280 | 3,160 | ||||||||
Australian Stock Exchange | 43,316 | 1,156 | ||||||||
Brambles | 411,955 | 2,833 | ||||||||
Caltex Australia | 216,849 | 4,800 | ||||||||
Cochlear | 10,440 | 615 | ||||||||
Commonwealth Bank of Australia | 113,672 | 5,837 | ||||||||
CSL | 140,523 | 8,853 | ||||||||
CSR | 633,976 | 1,297 | ||||||||
Downer EDI | 121,970 | 288 | ||||||||
Echo Entertainment Group | 154,008 | 527 | ||||||||
Insurance Australia Group | 1,219,170 | 4,180 | ||||||||
Lend Lease | 42,894 | 381 | ||||||||
Macquarie Group | 20,809 | 1,130 | ||||||||
Newcrest Mining* | 140,488 | 1,266 | ||||||||
Qantas Airways* | 1,363,154 | 3,572 | ||||||||
Ramsay Health Care | 13,363 | 553 | ||||||||
Scentre Group (A) | 183,993 | 506 | ||||||||
Sirtex Medical | 15,474 | 359 | ||||||||
SMS Management & Technology | 42,238 | 155 | ||||||||
Stockland (A) | 199,487 | 542 | ||||||||
Tatts Group | 98 | — | ||||||||
Telstra | 265,264 | 1,050 | ||||||||
Transurban Group | 182,287 | 1,283 | ||||||||
Westfield (A) | 147,434 | 1,037 | ||||||||
|
| |||||||||
| 50,619 | ||||||||||
|
| |||||||||
Austria — 0.1% | ||||||||||
ANDRITZ | 67,795 | 3,049 | ||||||||
OMV | 33,055 | 803 | ||||||||
Wienerberger | 7,964 | 140 | ||||||||
|
| |||||||||
| 3,992 | ||||||||||
|
| |||||||||
| Description | Shares | Market Value ($ Thousands) | ||||||||
Belgium — 1.7% | ||||||||||
Ageas | 279,056 | $ | 11,452 | |||||||
AGFA-Gevaert* | 70,231 | 252 | ||||||||
Anheuser-Busch InBev | 22,206 | 2,354 | ||||||||
Colruyt (B) | 79,486 | 3,814 | ||||||||
Delhaize Group | 65,551 | 5,792 | ||||||||
Groupe Bruxelles Lambert | 83,482 | 6,285 | ||||||||
KBC Groep | 252,939 | 15,951 | ||||||||
Proximus | 1,679 | 58 | ||||||||
|
| |||||||||
| 45,958 | ||||||||||
|
| |||||||||
Brazil — 0.0% | ||||||||||
Cia Energetica de Minas Gerais ADR | 237,782 | 423 | ||||||||
JBS | 42,700 | 180 | ||||||||
|
| |||||||||
| 603 | ||||||||||
|
| |||||||||
Canada — 2.9% | ||||||||||
Agrium (B) | 68,477 | 6,129 | ||||||||
Alimentation Couche-Tard, Cl B | 148,800 | 6,811 | ||||||||
Baytex Energy (B) | 470,869 | 1,500 | ||||||||
Cameco (B) | 434,899 | 5,293 | ||||||||
Canadian Imperial Bank of Commerce (B) | 61,100 | 4,370 | ||||||||
Canadian Natural Resources | 152,800 | 2,972 | ||||||||
Canadian Pacific Railway | 49,480 | 7,104 | ||||||||
CGI Group, Cl A* | 29,700 | 1,071 | ||||||||
Cogeco Cable | 27,200 | 1,309 | ||||||||
Constellation Software | 17,800 | 7,426 | ||||||||
Dominion Diamond | 50,500 | 537 | ||||||||
Entertainment One | 106,941 | 402 | ||||||||
George Weston | 4,200 | 338 | ||||||||
Gildan Activewear (B) | 363,346 | 10,916 | ||||||||
Home Capital Group, Cl B (B) | 119,900 | 2,864 | ||||||||
Imperial Oil | 238,920 | 7,534 | ||||||||
Linamar | 21,100 | 1,101 | ||||||||
Magna International, Cl A | 81,500 | 3,891 | ||||||||
Power Corp of Canada | 38,900 | 803 | ||||||||
Quebecor, Cl B | 16,000 | 349 | ||||||||
Royal Bank of Canada | 37,400 | 2,058 | ||||||||
Sun Life Financial | 31,700 | 1,018 | ||||||||
Suncor Energy | 60,300 | 1,605 | ||||||||
|
| |||||||||
| 77,401 | ||||||||||
|
| |||||||||
China — 0.4% | ||||||||||
Alibaba Group Holding ADR* | 29,800 | 1,757 | ||||||||
STMicroelectronics (B) | 111,352 | 755 | ||||||||
Tencent Holdings | 416,900 | 7,040 | ||||||||
|
| |||||||||
| 9,552 | ||||||||||
|
| |||||||||
Denmark — 2.4% | ||||||||||
Bavarian Nordic* | 11,467 | 455 | ||||||||
Carlsberg, Cl B | 5,937 | 455 | ||||||||
Chr Hansen Holding | 175,592 | 9,823 | ||||||||
Coloplast, Cl B | 101,405 | 7,183 | ||||||||
| 12 | SEI Institutional International Trust / Annual Report / September 30, 2015 |
| Description | Shares | Market Value ($ Thousands) | ||||||||
Danske Bank | 9,265 | $ | 279 | |||||||
H Lundbeck | 222,080 | 5,915 | ||||||||
ISS | 351,633 | 11,664 | ||||||||
Jyske Bank* | 76,481 | 4,212 | ||||||||
Novo Nordisk, Cl B | 50,889 | 2,745 | ||||||||
Novo Nordisk ADR | 210,318 | 11,408 | ||||||||
Novozymes, Cl B | 157,252 | 6,852 | ||||||||
Pandora | 38,213 | 4,443 | ||||||||
|
| |||||||||
| 65,434 | ||||||||||
|
| |||||||||
Finland — 0.5% | ||||||||||
Aktia Bank | 5,931 | 72 | ||||||||
Amer Sports, Cl A | 27,087 | 685 | ||||||||
Elisa, Cl A | 29,937 | 1,008 | ||||||||
Kone, Cl B | 15,350 | 584 | ||||||||
Neste | 114,696 | 2,635 | ||||||||
Nokia | 88,505 | 606 | ||||||||
Orion, Cl B | 61,183 | 2,310 | ||||||||
Sampo, Cl A | 15,811 | 763 | ||||||||
Stora Enso, Cl R | 359,778 | 2,713 | ||||||||
Tieto | 15,404 | 388 | ||||||||
UPM-Kymmene | 189,206 | 2,825 | ||||||||
Valmet | 24,475 | 237 | ||||||||
|
| |||||||||
| 14,826 | ||||||||||
|
| |||||||||
France — 8.6% | ||||||||||
Accor | 13,075 | 609 | ||||||||
Alcatel-Lucent* | 3,275,460 | 11,980 | ||||||||
Arkema | 43,236 | 2,794 | ||||||||
Atos | 29,616 | 2,269 | ||||||||
AXA | 118,335 | 2,860 | ||||||||
BNP Paribas | 331,339 | 19,406 | ||||||||
Boiron | 1,900 | 183 | ||||||||
Bonduelle S.C.A. | 2,303 | 59 | ||||||||
Cap Gemini | 6,275 | 558 | ||||||||
Carrefour | 358,155 | 10,567 | ||||||||
Christian Dior | 12,412 | 2,310 | ||||||||
Cie des Alpes | 3,261 | 64 | ||||||||
CNP Assurances | 19,539 | 271 | ||||||||
Dassault Systemes | 1,948 | 144 | ||||||||
Electricite de France | 277,248 | 4,891 | ||||||||
Engie | 762,129 | 12,315 | ||||||||
Essilor International | 7,247 | 881 | ||||||||
Eurofins Scientific | 3,986 | 1,222 | ||||||||
Eutelsat Communications | 5,952 | 182 | ||||||||
Groupe Eurotunnel | 33,212 | 451 | ||||||||
Ipsen | 30,854 | 1,910 | ||||||||
Legrand | 191,515 | 10,144 | ||||||||
L’Oreal | 5,483 | 949 | ||||||||
LVMH Moet Hennessy Louis Vuitton | 43,066 | 7,320 | ||||||||
Metropole Television | 37,494 | 715 | ||||||||
Natixis | 12,049 | 66 | ||||||||
Numericable-SFR SAS* | 16,776 | 773 | ||||||||
| Description | Shares | Market Value ($ Thousands) | ||||||||
Orange | 912,632 | $ | 13,767 | |||||||
Pernod Ricard | 28,450 | 2,867 | ||||||||
Peugeot* | 72,859 | 1,095 | ||||||||
Publicis Groupe | 53,826 | 3,670 | ||||||||
Renault | 12,643 | 903 | ||||||||
Rexel | 1,013,170 | 12,432 | ||||||||
Safran | 12,181 | 915 | ||||||||
Sanofi | 344,287 | 32,585 | ||||||||
Schneider Electric | 239,031 | 13,358 | ||||||||
SCOR | 17,328 | 620 | ||||||||
SEB | 5,886 | 541 | ||||||||
SES | 16,793 | 528 | ||||||||
Societe BIC | 4,474 | 693 | ||||||||
Sodexo | 57,919 | 4,783 | ||||||||
SPIE* | 129,920 | 2,156 | ||||||||
Technicolor | 209,719 | 1,444 | ||||||||
Technip | 160,392 | 7,566 | ||||||||
Teleperformance | 4,248 | 321 | ||||||||
Thales | 93,116 | 6,465 | ||||||||
Total | 524,313 | 23,536 | ||||||||
Unibail-Rodamco (A) | 2,525 | 653 | ||||||||
Valeo | 37,408 | 5,047 | ||||||||
Vetoquinol | 569 | 25 | ||||||||
|
| |||||||||
| 231,863 | ||||||||||
|
| |||||||||
Germany — 5.9% | ||||||||||
Bayer | 209,349 | 26,783 | ||||||||
Bayerische Motoren Werke | 121,082 | 10,731 | ||||||||
Brenntag | 93,083 | 5,016 | ||||||||
Continental | 25,793 | 5,481 | ||||||||
Daimler | 102,292 | 7,421 | ||||||||
Daimler ADR | 4,915 | 358 | ||||||||
DCC | 46,740 | 3,535 | ||||||||
Deutsche Bank* (B) | 151,693 | 4,096 | ||||||||
Deutsche Boerse | 103,694 | 8,920 | ||||||||
Deutsche EuroShop | 29,331 | 1,319 | ||||||||
Deutsche Lufthansa | 303,231 | 4,221 | ||||||||
Deutsche Post | 7,442 | 206 | ||||||||
Deutsche Telekom | 86,682 | 1,537 | ||||||||
Deutsche Wohnen | 24,203 | 646 | ||||||||
Duerr | 8,895 | 625 | ||||||||
Evonik Industries | 68,616 | 2,293 | ||||||||
Fresenius | 49,420 | 3,313 | ||||||||
Fresenius Medical Care | 11,933 | 930 | ||||||||
Gerresheimer | 20,399 | 1,486 | ||||||||
Hannover Rueck | 31,057 | 3,174 | ||||||||
Henkel | 912 | 80 | ||||||||
Hochtief | 60,368 | 5,020 | ||||||||
Infineon Technologies | 62,293 | 701 | ||||||||
Krones | 6,828 | 717 | ||||||||
KUKA (B) | 3,781 | 290 | ||||||||
Linde | 90,024 | 14,576 | ||||||||
Merck | 67,121 | 5,935 | ||||||||
Muenchener Rueckversicherungs | 1,900 | 354 | ||||||||
| SEI Institutional International Trust / Annual Report / September 30, 2015 | 13 |
SCHEDULE OF INVESTMENTS
International Equity Fund (Continued)
September 30, 2015
| Description | Shares | Market Value ($ Thousands) | ||||||||
Nordex* | 68,932 | $ | 1,881 | |||||||
Pfeiffer Vacuum Technology | 17,950 | 2,072 | ||||||||
ProSiebenSat.1 Media | 54,569 | 2,674 | ||||||||
QIAGEN* | 5,099 | 131 | ||||||||
Rhoen Klinikum (B) | 41,757 | 1,180 | ||||||||
SAP | 213,498 | 13,811 | ||||||||
SAP ADR (B) | 63,400 | 4,108 | ||||||||
Siemens | 82,175 | 7,335 | ||||||||
STADA Arzneimittel | 7,027 | 251 | ||||||||
Symrise | 14,365 | 864 | ||||||||
Talanx | 13,993 | 419 | ||||||||
ThyssenKrupp | 5,661 | 99 | ||||||||
TUI | 156,224 | 2,851 | ||||||||
Volkswagen | 3,131 | 369 | ||||||||
Vonovia | 27,335 | 879 | ||||||||
|
| |||||||||
| 158,688 | ||||||||||
|
| |||||||||
Hong Kong — 2.6% | ||||||||||
AIA Group | 2,280,669 | 11,927 | ||||||||
BOC Hong Kong Holdings | 432,000 | 1,278 | ||||||||
Chaoda Modern Agriculture | 2,440,000 | 75 | ||||||||
Cheung Kong Infrastructure Holdings (B) | 107,000 | 960 | ||||||||
Cheung Kong Property Holdings | 69,326 | 504 | ||||||||
China Merchants Holdings International | 1,389,779 | 4,103 | ||||||||
China Mobile | 1,268,740 | 15,124 | ||||||||
CK Hutchison Holdings | 59,326 | 772 | ||||||||
CLP Holdings | 131,000 | 1,122 | ||||||||
CNOOC | 8,166,000 | 8,496 | ||||||||
Cosmo Lady China Holdings (B) (C) | 5,832,919 | 6,190 | ||||||||
Digital China Holdings | 3,997,000 | 3,722 | ||||||||
Hang Seng Bank | 25,300 | 457 | ||||||||
Henderson Land Development | 774,198 | 4,624 | ||||||||
Hong Kong & China Gas | 294,400 | 553 | ||||||||
Hong Kong Exchanges and Clearing | 38,500 | 884 | ||||||||
Link (A) | 158,500 | 872 | ||||||||
MTR | 144,500 | 627 | ||||||||
New World Development | 717,000 | 699 | ||||||||
Power Assets Holdings | 135,000 | 1,277 | ||||||||
Samsonite International | 780,400 | 2,585 | ||||||||
Stella International Holdings | 274,214 | 674 | ||||||||
Sun Hung Kai Properties | 166,000 | 2,168 | ||||||||
Swire Pacific, Cl A | 38,000 | 427 | ||||||||
Techtronic Industries | 107,500 | 401 | ||||||||
Wheelock | 154,000 | 671 | ||||||||
|
| |||||||||
| 71,192 | ||||||||||
|
| |||||||||
India — 0.4% | ||||||||||
HDFC Bank ADR | 75,590 | 4,618 | ||||||||
ICICI Bank ADR | 684,874 | 5,739 | ||||||||
WNS Holdings ADR* | 13,053 | 365 | ||||||||
|
| |||||||||
| 10,722 | ||||||||||
|
| |||||||||
| Description | Shares | Market Value ($ Thousands) | ||||||||
Indonesia — 0.0% | ||||||||||
Telekomunikasi Indonesia Persero | 4,560,300 | $ | 826 | |||||||
|
| |||||||||
Ireland — 0.4% | ||||||||||
Bank of Ireland* | 849,847 | 330 | ||||||||
CRH | 70,504 | 1,850 | ||||||||
Experian | 387,393 | 6,212 | ||||||||
Ryanair Holdings ADR | 42,800 | 3,351 | ||||||||
|
| |||||||||
| 11,743 | ||||||||||
|
| |||||||||
Israel — 1.5% | ||||||||||
Bezeq Israeli Telecommunication | 2,903,570 | 5,550 | ||||||||
Check Point Software Technologies* | 107,600 | 8,536 | ||||||||
Teva Pharmaceutical Industries | 15,786 | 902 | ||||||||
Teva Pharmaceutical Industries ADR | 438,893 | 24,780 | ||||||||
|
| |||||||||
| 39,768 | ||||||||||
|
| |||||||||
Italy — 1.8% | ||||||||||
Amplifon | 45,605 | 345 | ||||||||
Atlantia | 23,758 | 663 | ||||||||
Azimut Holding | 119,385 | 2,559 | ||||||||
Brembo | 68,726 | 2,655 | ||||||||
DiaSorin | 11,692 | 511 | ||||||||
Enel | 88,909 | 396 | ||||||||
Exor | 76,979 | 3,342 | ||||||||
Fiat Chrysler Automobiles* | 173,048 | 2,245 | ||||||||
Finmeccanica* | 74,777 | 933 | ||||||||
Intesa Sanpaolo | 645,786 | 2,277 | ||||||||
Luxottica Group | 20,108 | 1,390 | ||||||||
Mediaset | 832,990 | 3,813 | ||||||||
Recordati | 92,755 | 2,135 | ||||||||
Salini Impregilo | 180,297 | 687 | ||||||||
Saras* | 455,886 | 966 | ||||||||
Telecom Italia RNC | 6,056,572 | 6,185 | ||||||||
Tenaris | 485,562 | 5,824 | ||||||||
UniCredit | 1,859,322 | 11,547 | ||||||||
|
| |||||||||
| 48,473 | ||||||||||
|
| |||||||||
Japan — 18.0% | ||||||||||
Adastria | 22,700 | 1,361 | ||||||||
Aeon | 40,600 | 631 | ||||||||
Ain Pharmaciez | 20,300 | 1,039 | ||||||||
Ajinomoto | 72,000 | 1,520 | ||||||||
Alps Electric | 89,900 | 2,547 | ||||||||
ANA Holdings | 346,000 | 971 | ||||||||
Arcland Sakamoto | 16,700 | 361 | ||||||||
| 14 | SEI Institutional International Trust / Annual Report / September 30, 2015 |
| Description | Shares | Market Value ($ Thousands) | ||||||||
Asahi Glass | 61,000 | $ | 357 | |||||||
Asahi Kasei | 245,000 | 1,728 | ||||||||
ASKUL (B) | 258,409 | 9,827 | ||||||||
Astellas Pharma | 74,700 | 969 | ||||||||
Calbee | 14,500 | 469 | ||||||||
Calsonic Kansei | 32,000 | 241 | ||||||||
Canon Marketing Japan | 67,400 | 999 | ||||||||
Central Japan Railway | 46,500 | 7,503 | ||||||||
Chiba Bank | 102,000 | 726 | ||||||||
Coca-Cola West | 12,800 | 249 | ||||||||
Dai Nippon Printing | 729,000 | 7,056 | ||||||||
Daiichi Sankyo | 89,400 | 1,557 | ||||||||
Daiichikosho | 10,500 | 374 | ||||||||
Daikin Industries | 31,300 | 1,757 | ||||||||
Daikyo | 607,000 | 1,029 | ||||||||
Daito Trust Construction | 36,800 | 3,740 | ||||||||
Daiwa House Industry | 174,000 | 4,310 | ||||||||
Daiwa Securities Group | 179,000 | 1,159 | ||||||||
Don Quijote Holdings | 197,066 | 7,431 | ||||||||
Dydo Drinco | 8,000 | 341 | ||||||||
East Japan Railway | 164,200 | 13,884 | ||||||||
Ebara | 2,685,170 | 9,935 | ||||||||
Eisai | 9,700 | 572 | ||||||||
Fanuc | 30,500 | 4,695 | ||||||||
Fast Retailing | 2,100 | 853 | ||||||||
Fuji Film Holdings | 532,271 | 19,927 | ||||||||
Fuji Heavy Industries | 181,012 | 6,530 | ||||||||
Fujitsu | 242,000 | 1,052 | ||||||||
Fujitsu General | 55,000 | 599 | ||||||||
Fukuoka Financial Group | 91,000 | 434 | ||||||||
Geo Holdings | 20,000 | 320 | ||||||||
Haseko | 155,100 | 1,759 | ||||||||
Hitachi | 2,380,000 | 12,016 | ||||||||
Hokuetsu Kishu Paper | 91,800 | 499 | ||||||||
Hoya | 60,802 | 1,995 | ||||||||
Iida Group Holdings | 111,000 | 1,741 | ||||||||
Isetan Mitsukoshi Holdings | 60,900 | 915 | ||||||||
IT Holdings | 53,000 | 1,204 | ||||||||
Izumi | 21,100 | 856 | ||||||||
Japan Airlines | 121,500 | 4,300 | ||||||||
Japan Tobacco | 483,344 | 15,024 | ||||||||
kabu.com Securities | 92,000 | 299 | ||||||||
Kaken Pharmaceutical | 11,500 | 1,067 | ||||||||
Kandenko | 33,000 | 213 | ||||||||
Kanematsu | 158,000 | 222 | ||||||||
Kansai Paint | 428,600 | 5,830 | ||||||||
Kao | 41,296 | 1,875 | ||||||||
Kawasaki Heavy Industries | 204,000 | 705 | ||||||||
KDDI | 805,000 | 18,016 | ||||||||
Keyence | 23,000 | 10,292 | ||||||||
Kikkoman | 23,000 | 633 | ||||||||
Kobe Steel | 389,000 | 422 | ||||||||
Koito Manufacturing | 203,888 | 6,666 | ||||||||
Konami Holdings | 19,800 | 428 | ||||||||
Kose | 22,084 | 2,010 | ||||||||
| Description | Shares | Market Value ($ Thousands) | ||||||||
Kyudenko | 47,000 | $ | 785 | |||||||
Mabuchi Motor | 169,700 | 7,369 | ||||||||
Maeda Road Construction | 43,000 | 756 | ||||||||
Mazda Motor | 77,798 | 1,231 | ||||||||
Medipal Holdings | 31,900 | 508 | ||||||||
MEIJI Holdings | 17,600 | 1,291 | ||||||||
Minebea | 59,000 | 628 | ||||||||
Miraca Holdings | 76,500 | 3,249 | ||||||||
Mitsubishi Chemical Holdings | 169,200 | 886 | ||||||||
Mitsubishi UFJ Financial Group | 157,500 | 951 | ||||||||
Mitsui Chemicals | 152,000 | 488 | ||||||||
Mizuho Financial Group | 2,830,700 | 5,297 | ||||||||
Morinaga Milk Industry | 155,000 | 646 | ||||||||
MS&AD Insurance Group Holdings | 362,100 | 9,725 | ||||||||
Murata Manufacturing | 10,100 | 1,311 | ||||||||
Nexon | 25,000 | 334 | ||||||||
NH Foods | 30,000 | 613 | ||||||||
Nichi-iko Pharmaceutical | 58,200 | 1,542 | ||||||||
Nidec | 9,400 | 648 | ||||||||
Nihon Kohden | 87,100 | 1,445 | ||||||||
Nikon (B) | 724,600 | 8,762 | ||||||||
Nintendo | 3,100 | 524 | ||||||||
Nippo | 28,000 | 477 | ||||||||
Nippon Express | 185,000 | 885 | ||||||||
Nippon Paint Holdings | 29,000 | 508 | ||||||||
Nippon Paper Industries | 64,300 | 981 | ||||||||
Nippon Signal | 57,900 | 559 | ||||||||
Nippon Suisan Kaisha | 192,600 | 575 | ||||||||
Nippon Telegraph & Telephone | 113,800 | 4,000 | ||||||||
Nippon Telegraph & Telephone ADR | 328,689 | 11,606 | ||||||||
Nissha Printing (B) | 41,900 | 799 | ||||||||
Nitori Holdings | 7,500 | 590 | ||||||||
Nitto Denko | 16,000 | 958 | ||||||||
NOK | 16,300 | 353 | ||||||||
Nomura Holdings | 232,200 | 1,345 | ||||||||
NSK | 46,100 | 447 | ||||||||
NTT Data | 27,800 | 1,405 | ||||||||
NTT DOCOMO | 230,124 | 3,846 | ||||||||
Obayashi | 50,000 | 427 | ||||||||
OKUMA | 58,000 | 363 | ||||||||
Omron | 191,900 | 5,782 | ||||||||
Oriental Land | 34,000 | 1,901 | ||||||||
Otsuka Holdings | 128,400 | 4,107 | ||||||||
Panasonic | 375,500 | 3,804 | ||||||||
Pigeon | 145,744 | 3,408 | ||||||||
Rakuten | 121,800 | 1,561 | ||||||||
Relo Holdings | 4,300 | 422 | ||||||||
Rohm | 135,600 | 6,036 | ||||||||
Saizeriya | 28,900 | 656 | ||||||||
Santen Pharmaceutical | 303,900 | 4,078 | ||||||||
SBI Holdings | 154,100 | 1,742 | ||||||||
Secom | 8,600 | 517 | ||||||||
Seino Holdings | 78,700 | 824 | ||||||||
Sekisui House | 440,200 | 6,885 | ||||||||
| SEI Institutional International Trust / Annual Report / September 30, 2015 | 15 |
SCHEDULE OF INVESTMENTS
International Equity Fund (Continued)
September 30, 2015
| Description | Shares | Market Value ($ Thousands) | ||||||||
Seven & I Holdings | 172,100 | $ | 7,867 | |||||||
Shimano | 9,700 | 1,361 | ||||||||
Shimizu | 39,000 | 335 | ||||||||
Shin-Etsu Chemical | 120,700 | 6,193 | ||||||||
Shionogi | 33,300 | 1,199 | ||||||||
Shiseido | 202,400 | 4,412 | ||||||||
SMC | 20,800 | 4,564 | ||||||||
SoftBank Group | 271,900 | 12,483 | ||||||||
Sompo Japan Nipponkoa Holdings | 34,200 | 995 | ||||||||
Sony | 129,300 | 3,163 | ||||||||
Sumitomo Chemical | 470,000 | 2,380 | ||||||||
Sumitomo Metal Mining | 11,000 | 125 | ||||||||
Sumitomo Mitsui Financial Group | 516,700 | 19,630 | ||||||||
Sumitomo Mitsui Trust Holdings | 2,283,220 | 8,406 | ||||||||
Sumitomo Osaka Cement | 332,000 | 1,180 | ||||||||
Sundrug | 68,900 | 3,638 | ||||||||
Suruga Bank | 23,000 | 428 | ||||||||
Sysmex | 175,400 | 9,293 | ||||||||
Taisei | 91,000 | 594 | ||||||||
Takeda Pharmaceutical | 11,700 | 514 | ||||||||
TDK | 14,200 | 805 | ||||||||
Teijin | 43,000 | 131 | ||||||||
Terumo | 8,900 | 252 | ||||||||
Tochigi Bank | 65,000 | 358 | ||||||||
Tokyo Electric Power* | 556,500 | 3,721 | ||||||||
Tokyo Electron | 2,900 | 137 | ||||||||
Tokyo Gas | 1,000 | 5 | ||||||||
Toppan Forms | 28,400 | 337 | ||||||||
Toray Industries | 105,000 | 909 | ||||||||
Tosoh | 242,000 | 1,165 | ||||||||
Toyota Industries | 11,600 | 552 | ||||||||
Toyota Motor | 333,000 | 19,494 | ||||||||
Toyota Motor ADR | 78,023 | 9,151 | ||||||||
Tsuruha Holdings | 135,452 | 11,702 | ||||||||
Ube Industries | 473,000 | 826 | ||||||||
Unicharm | 240,700 | 4,280 | ||||||||
Wacoal Holdings | 658,704 | 7,889 | ||||||||
Warabeya Nichiyo | 13,300 | 231 | ||||||||
West Japan Railway | 55,900 | 3,511 | ||||||||
Yamaguchi Financial Group (B) | 57,000 | 700 | ||||||||
Yamaha Motor | 37,300 | 752 | ||||||||
Yamazaki Baking | 123,000 | 1,897 | ||||||||
Zenkoku Hosho | 13,100 | 434 | ||||||||
|
| |||||||||
| 486,875 | ||||||||||
|
| |||||||||
Jordan — 0.1% | ||||||||||
Hikma Pharmaceuticals | 51,075 | 1,775 | ||||||||
|
| |||||||||
Luxembourg — 0.1% |
| |||||||||
APERAM* | 70,785 | 1,912 | ||||||||
|
| |||||||||
Malaysia — 0.0% | ||||||||||
Public Bank | 284,100 | 1,135 | ||||||||
|
| |||||||||
Malta — 0.0% | ||||||||||
BGP Holdings* | 198,683 | — | ||||||||
|
| |||||||||
| Description | Shares | Market Value ($ Thousands) | ||||||||
Mexico — 0.4% | ||||||||||
America Movil, Ser L | 4,577,257 | $ | 3,795 | |||||||
America Movil ADR, Ser L | 58,792 | 973 | ||||||||
Arca Continental | 91,033 | 511 | ||||||||
Gruma, Cl B | 27,044 | 371 | ||||||||
Wal-Mart de Mexico | 2,245,856 | 5,528 | ||||||||
|
| |||||||||
| 11,178 | ||||||||||
|
| |||||||||
Netherlands — 5.8% | ||||||||||
Aegon | 1,406,544 | 8,077 | ||||||||
AerCap Holdings* | 38,900 | 1,488 | ||||||||
Akzo Nobel | 352,991 | 22,868 | ||||||||
Altice* | 24,772 | 526 | ||||||||
ASML Holding | 189,383 | 16,538 | ||||||||
BinckBank | 34,364 | 283 | ||||||||
Boskalis Westminster | 44,415 | 1,940 | ||||||||
Heineken Holding | 22,175 | 1,578 | ||||||||
ING Groep | 828,577 | 11,701 | ||||||||
Koninklijke Ahold | 207,190 | 4,033 | ||||||||
Koninklijke DSM | 202,512 | 9,327 | ||||||||
Koninklijke KPN | 150,408 | 563 | ||||||||
Koninklijke Philips | 92,054 | 2,161 | ||||||||
NXP Semiconductors* | 62,619 | 5,452 | ||||||||
PostNL* | 946,783 | 3,448 | ||||||||
Randstad Holding | 85,985 | 5,115 | ||||||||
Refresco Gerber* (C) | 290,799 | 4,544 | ||||||||
RELX | 1,325,680 | 21,671 | ||||||||
Royal Dutch Shell, Cl A | 390,019 | 9,223 | ||||||||
Royal Dutch Shell ADR, Cl B (B) | 199,442 | 9,470 | ||||||||
Unilever | 199,465 | 7,997 | ||||||||
Wolters Kluwer | 306,751 | 9,450 | ||||||||
|
| |||||||||
| 157,453 | ||||||||||
|
| |||||||||
New Zealand — 0.0% | ||||||||||
Air New Zealand | 193,571 | 304 | ||||||||
|
| |||||||||
Norway — 0.8% | ||||||||||
Aker Solutions | 767,074 | 2,648 | ||||||||
DnB | 206,201 | 2,676 | ||||||||
Gjensidige Forsikring | 88,290 | 1,188 | ||||||||
Statoil | 309,486 | 4,536 | ||||||||
Statoil ADR (B) | 50,197 | 731 | ||||||||
Telenor | 463,901 | 8,644 | ||||||||
Yara International | 17,690 | 704 | ||||||||
|
| |||||||||
| 21,127 | ||||||||||
|
| |||||||||
Peru — 0.0% | ||||||||||
Credicorp | 6,961 | 740 | ||||||||
|
| |||||||||
Poland — 0.0% | ||||||||||
Emperia Holding | 4,811 | 81 | ||||||||
Eurocash | 16,085 | 189 | ||||||||
| 16 | SEI Institutional International Trust / Annual Report / September 30, 2015 |
| Description | Shares | Market Value ($ Thousands) | ||||||||
Polski Koncern Naftowy Orlen | 13,890 | $ | 242 | |||||||
|
| |||||||||
| 512 | ||||||||||
|
| |||||||||
Portugal — 0.4% | ||||||||||
CTT Correios de Portugal | 804,731 | 8,968 | ||||||||
NOS SGPS | 57,143 | 470 | ||||||||
|
| |||||||||
| 9,438 | ||||||||||
|
| |||||||||
Russia — 0.1% | ||||||||||
Surgutneftegas ADR | 8,414 | 43 | ||||||||
Yandex, Cl A* | 176,520 | 1,894 | ||||||||
|
| |||||||||
| 1,937 | ||||||||||
|
| |||||||||
Singapore — 0.8% | ||||||||||
CapitaLand | 267,000 | 506 | ||||||||
City Developments | 1,230,900 | 6,684 | ||||||||
ComfortDelgro | 353,000 | 714 | ||||||||
DBS Group Holdings | 453,200 | 5,187 | ||||||||
Oversea-Chinese Banking | 912,900 | 5,668 | ||||||||
Singapore Airlines | 186,900 | 1,407 | ||||||||
Singapore Exchange | 67,400 | 334 | ||||||||
Singapore Telecommunications | 255,000 | 647 | ||||||||
United Overseas Bank | 45,000 | 590 | ||||||||
|
| |||||||||
| 21,737 | ||||||||||
|
| |||||||||
South Africa — 0.3% | ||||||||||
FirstRand | 321,798 | 1,144 | ||||||||
Investec (B) | 596,650 | 4,578 | ||||||||
Liberty Holdings | 35,960 | 328 | ||||||||
Shoprite Holdings | 257,923 | 2,944 | ||||||||
|
| |||||||||
| 8,994 | ||||||||||
|
| |||||||||
South Korea — 3.0% | ||||||||||
Cosmax (B) | 71,285 | 12,985 | ||||||||
Hyundai Motor | 41,749 | 5,830 | ||||||||
Korea Electric Power | 9,971 | 416 | ||||||||
KT&G | 82,439 | 7,757 | ||||||||
LG Display ADR | 215,154 | 2,044 | ||||||||
Samsung Electronics | 13,787 | 13,301 | ||||||||
Shinhan Financial Group | 315,781 | 11,087 | ||||||||
SK Hynix | 7,965 | 229 | ||||||||
SK Telecom | 74,994 | 16,653 | ||||||||
SK Telecom ADR | 446,179 | 10,887 | ||||||||
|
| |||||||||
| 81,189 | ||||||||||
|
| |||||||||
Spain — 1.4% | ||||||||||
ACS Actividades de Construccion y Servicios | 61,973 | 1,779 | ||||||||
Banco Bilbao Vizcaya Argentaria | 340,886 | 2,883 | ||||||||
Banco Santander | 37,412 | 199 | ||||||||
CaixaBank | 2,077,388 | 8,000 | ||||||||
Ferrovial | 44,015 | 1,048 | ||||||||
| Description | Shares | Market Value ($ Thousands) | ||||||||
Grifols | 34,437 | $ | 1,419 | |||||||
Grifols ADR | 366,484 | 11,141 | ||||||||
Iberdrola | 175,673 | 1,166 | ||||||||
Industria de Diseno Textil | 171,545 | 5,738 | ||||||||
International Consolidated Airlines Group* | 123,502 | 1,098 | ||||||||
Red Electrica | 5,753 | 477 | ||||||||
Tecnicas Reunidas | 63,547 | 2,808 | ||||||||
|
| |||||||||
| 37,756 | ||||||||||
|
| |||||||||
Sweden — 1.7% | ||||||||||
Assa Abloy, Cl B | 75,304 | 1,348 | ||||||||
Atlas Copco, Cl A | 23,795 | 571 | ||||||||
BillerudKorsnas | 79,733 | 1,147 | �� | |||||||
Boliden | 159,211 | 2,494 | ||||||||
Electrolux, Cl B | 135,588 | 3,826 | ||||||||
Hennes & Mauritz, Cl B | 9,675 | 353 | ||||||||
Husqvarna, Cl B | 148,854 | 972 | ||||||||
Industrivarden, Cl C | 50,642 | 888 | ||||||||
Intrum Justitia | 11,105 | 383 | ||||||||
Investor, Cl B | 37,219 | 1,277 | ||||||||
JM | 16,958 | 456 | ||||||||
L E Lundbergforetagen, Cl B | 10,706 | 517 | ||||||||
Nordea Bank | 352,758 | 3,925 | ||||||||
Peab | 67,542 | 468 | ||||||||
Skandinaviska Enskilda Banken, Cl A | 272,171 | 2,903 | ||||||||
Svenska Cellulosa, Cl B | 374,579 | 10,462 | ||||||||
Telefonaktiebolaget LM Ericsson, Cl B | 419,243 | 4,115 | ||||||||
Telefonaktiebolaget LM Ericsson ADR | 871,841 | 8,527 | ||||||||
|
| |||||||||
| 44,632 | ||||||||||
|
| |||||||||
Switzerland — 7.7% | ||||||||||
Actelion | 19,717 | 2,505 | ||||||||
Adecco | 46,740 | 3,410 | ||||||||
ams (B) | 16,748 | 623 | ||||||||
Aryzta* (B) | 148,012 | 6,264 | ||||||||
Baloise Holding (B) | 474 | 54 | ||||||||
Chocoladefabriken Lindt & Sprungli (B) | 72 | 422 | ||||||||
Cie Financiere Richemont (B) | 135,478 | 10,504 | ||||||||
Clariant | 636,225 | 10,687 | ||||||||
Credit Suisse Group | 214,962 | 5,156 | ||||||||
Dufry* | 45,140 | 5,280 | ||||||||
Emmi | 1,144 | 477 | ||||||||
Galenica (B) | 892 | 1,132 | ||||||||
Geberit (B) | 1,767 | 540 | ||||||||
Givaudan | 5,525 | 8,980 | ||||||||
Julius Baer Group | 90,160 | 4,080 | ||||||||
Lonza Group | 49,431 | 6,473 | ||||||||
Nestle (B) | 135,149 | 10,128 | ||||||||
Novartis | 359,066 | 32,920 | ||||||||
Partners Group Holding (B) | 15,985 | 5,403 | ||||||||
Roche Holding | 104,595 | 27,600 | ||||||||
| SEI Institutional International Trust / Annual Report / September 30, 2015 | 17 |
SCHEDULE OF INVESTMENTS
International Equity Fund (Continued)
September 30, 2015
| Description | Shares | Market Value ($ Thousands) | ||||||||
Schindler Holding | 4,430 | $ | 635 | |||||||
SGS (B) | 6,324 | 11,012 | ||||||||
Sonova Holding (B) | 18,700 | 2,400 | ||||||||
Swatch Group (B) | 8,637 | 3,195 | ||||||||
Swiss Life Holding (B) | 18,242 | 4,065 | ||||||||
Swiss Re | 10,039 | 860 | ||||||||
TE Connectivity | 41,400 | 2,479 | ||||||||
UBS Group | 1,602,286 | 29,590 | ||||||||
Wolseley | 14,833 | 869 | ||||||||
Zurich Insurance Group | 39,091 | 9,584 | ||||||||
|
| |||||||||
| 207,327 | ||||||||||
|
| |||||||||
Taiwan — 0.6% | ||||||||||
Chunghwa Telecom | 200,000 | 601 | ||||||||
Hon Hai Precision Industry | 1,927,968 | 5,043 | ||||||||
Taiwan Semiconductor Manufacturing ADR | 543,800 | 11,284 | ||||||||
United Microelectronics ADR | 257,109 | 417 | ||||||||
|
| |||||||||
| 17,345 | ||||||||||
|
| |||||||||
Turkey — 0.0% | ||||||||||
Tupras Turkiye Petrol Rafinerileri | 19,466 | 477 | ||||||||
|
| |||||||||
United Kingdom — 16.2% | ||||||||||
3i Group | 176,588 | 1,246 | ||||||||
Aon | 59,000 | 5,228 | ||||||||
ARM Holdings (B) | 104,439 | 1,508 | ||||||||
ARM Holdings ADR | 157,205 | 6,799 | ||||||||
Ashtead Group (B) | 140,696 | 1,990 | ||||||||
Associated British Foods | 95,455 | 4,830 | ||||||||
AstraZeneca | 74,751 | 4,757 | ||||||||
Aviva | 2,108,709 | 14,424 | ||||||||
BAE Systems | 243,637 | 1,657 | ||||||||
Balfour Beatty (B) | 1,359,129 | 5,184 | ||||||||
Barclays | 4,518,461 | 16,759 | ||||||||
Barratt Developments | 114,876 | 1,120 | ||||||||
Berendsen (B) | 83,679 | 1,275 | ||||||||
Berkeley Group Holdings | 17,882 | 905 | ||||||||
BG Group | 742,380 | 10,719 | ||||||||
BP | 265,106 | 1,347 | ||||||||
BP ADR | 72,369 | 2,212 | ||||||||
British American Tobacco (B) | 335,887 | 18,578 | ||||||||
British Land (A) | 78,684 | 999 | ||||||||
BT Group, Cl A | 80,484 | 512 | ||||||||
Bunzl (B) | 279,792 | 7,512 | ||||||||
Burberry Group (B) | 69,367 | 1,438 | ||||||||
Carnival | 261,725 | 13,564 | ||||||||
Compass Group (B) | 594,902 | 9,508 | ||||||||
Dialog Semiconductor* | 161,940 | 6,483 | ||||||||
Diageo | 333,220 | 8,966 | ||||||||
Dixons Carphone | 29,961 | 193 | ||||||||
DS Smith | 1,864,924 | 11,119 | ||||||||
Genus (B) | 21,832 | 470 | ||||||||
GlaxoSmithKline | 1,046,849 | 20,147 | ||||||||
| Description | Shares | Market Value ($ Thousands) | ||||||||
Glencore (B) | 2,044,613 | $ | 2,835 | |||||||
Greggs | 21,949 | 361 | ||||||||
Hammerson (A) | 120,152 | 1,135 | ||||||||
Hargreaves Lansdown (B) | 28,761 | 526 | ||||||||
Home Retail Group (B) | 3,781,672 | 7,798 | ||||||||
Howden Joinery Group | 607,400 | 4,477 | ||||||||
HSBC Holdings | 2,927,726 | 22,078 | ||||||||
ICAP (B) | 114,784 | 795 | ||||||||
Imperial Tobacco Group | 57,847 | 2,997 | ||||||||
Inchcape | 57,618 | 628 | ||||||||
Indivior | 114,855 | 394 | ||||||||
Inmarsat | 75,931 | 1,131 | ||||||||
InterContinental Hotels Group | 35,584 | 1,233 | ||||||||
International Consolidated Airlines Group* (B) | 920,152 | 8,211 | ||||||||
ITV | 2,944,379 | 10,987 | ||||||||
JD Sports Fashion | 13,514 | 195 | ||||||||
John Wood Group | 60,945 | 570 | ||||||||
Land Securities Group (A) | 44,078 | 842 | ||||||||
Legal & General Group | 995,626 | 3,598 | ||||||||
Lloyds Banking Group | 24,559,961 | 27,995 | ||||||||
London Stock Exchange Group | 40,070 | 1,473 | ||||||||
Lonmin | 13 | — | ||||||||
Michael Page International | 699,531 | 5,022 | ||||||||
Mitie Group | 77,657 | 360 | ||||||||
Mondi | 222,342 | 4,655 | ||||||||
National Grid | 113,122 | 1,578 | ||||||||
Next | 5,609 | 647 | ||||||||
Pentair | 39,000 | 1,991 | ||||||||
Pearson (B) | 83,136 | 1,426 | ||||||||
Persimmon | 60,543 | 1,845 | ||||||||
Premier Oil | 253,724 | 259 | ||||||||
Prudential (B) | 293,060 | 6,204 | ||||||||
QinetiQ Group | 186,098 | 636 | ||||||||
Reckitt Benckiser Group | 113,116 | 10,277 | ||||||||
Regus | 177,425 | 826 | ||||||||
RELX (B) | 443,797 | 7,600 | ||||||||
Rentokil Initial | 5,213,592 | 11,510 | ||||||||
Rightmove | 11,198 | 619 | ||||||||
Royal Bank of Scotland Group* | 2,229,091 | 10,672 | ||||||||
Royal Mail (B) | 50,995 | 354 | ||||||||
SABMiller | 61,135 | 3,474 | ||||||||
Sage Group (B) | 136,151 | 1,030 | ||||||||
Savills | 24,794 | 342 | ||||||||
Schroders (B) | 81,813 | 3,481 | ||||||||
Segro (A) | 116,190 | 756 | ||||||||
Shire | 50,372 | 3,440 | ||||||||
Smith & Nephew | 25,161 | 440 | ||||||||
Spectris | 78,062 | 2,005 | ||||||||
SSE (B) | 681,690 | 15,423 | ||||||||
ST Modwen Properties | 65,629 | 414 | ||||||||
St. James’s Place (B) | 281,576 | 3,627 | ||||||||
TalkTalk Telecom Group (B) | 1,203,585 | 5,737 | ||||||||
Taylor Wimpey | 514,105 | 1,521 | ||||||||
| 18 | SEI Institutional International Trust / Annual Report / September 30, 2015 |
| Description | Shares/ Face Amount (Thousands) | Market Value ($ Thousands) | ||||||||||
Tesco (B) | 3,070,292 | $ | 8,541 | |||||||||
Travis Perkins | 160,348 | 4,779 | ||||||||||
Unilever | 26,696 | 1,090 | ||||||||||
United Utilities Group | 35,735 | 501 | ||||||||||
Vodafone Group | 6,325,077 | 20,014 | ||||||||||
Whitbread | 10,323 | 731 | ||||||||||
WPP | 613,872 | 12,806 | ||||||||||
|
| |||||||||||
| 438,341 | ||||||||||||
|
| |||||||||||
United States — 3.5% | ||||||||||||
ACE | 85,960 | 8,888 | ||||||||||
Axis Capital Holdings | 193,443 | 10,392 | ||||||||||
Carnival | 7,025 | 349 | ||||||||||
Cognizant Technology Solutions, Cl A* | 190,095 | 11,902 | ||||||||||
Core Laboratories (B) | 49,610 | 4,951 | ||||||||||
Dave & Buster’s Entertainment* | 212,941 | 8,056 | ||||||||||
Flextronics International* | 512,911 | 5,406 | ||||||||||
Gilead Sciences | 56,659 | 5,563 | ||||||||||
ICON* | 164,512 | 11,675 | ||||||||||
Lazard, Cl A | 178,400 | 7,725 | ||||||||||
ManpowerGroup | 74,667 | 6,114 | ||||||||||
Nielsen Holdings | 113,000 | 5,025 | ||||||||||
Sensata Technologies Holding* | 160,780 | 7,129 | ||||||||||
Taro Pharmaceutical Industries* | 10,047 | 1,436 | ||||||||||
|
| |||||||||||
| 94,611 | ||||||||||||
|
| |||||||||||
Total Common Stock |
| 2,488,455 | ||||||||||
|
| |||||||||||
PREFERRED STOCK — 1.0% |
| |||||||||||
Germany — 0.6% | ||||||||||||
Draegerwerk | 2,624 | 221 | ||||||||||
Henkel | 44,135 | 4,530 | ||||||||||
Volkswagen | 97,526 | 10,676 | ||||||||||
|
| |||||||||||
| 15,427 | ||||||||||||
|
| |||||||||||
South Korea — 0.4% |
| |||||||||||
Hyundai Motor | 64,682 | 6,049 | ||||||||||
Samsung Electronics | 7,654 | 5,950 | ||||||||||
|
| |||||||||||
| 11,999 | ||||||||||||
|
| |||||||||||
Total Preferred Stock |
| 27,426 | ||||||||||
|
| |||||||||||
U.S. TREASURY OBLIGATIONS — 0.3% |
| |||||||||||
U.S. Treasury Bills | ||||||||||||
0.115%, 03/03/2016 (D) (E) | $ | 700 | 700 | |||||||||
0.103%, 02/04/2016 (D) (E) | 7,993 | 7,992 | ||||||||||
|
| |||||||||||
Total U.S. Treasury Obligations |
| 8,692 | ||||||||||
|
| |||||||||||
| Description | Shares/ Face Amount (1) (Thousands) | Market Value ($ Thousands) | ||||||||||
AFFILIATED PARTNERSHIP — 8.7% |
| |||||||||||
SEI Liquidity Fund, L.P. | ||||||||||||
0.050%†** (F) | 233,929,359 | $ | 233,929 | |||||||||
|
| |||||||||||
Total Affiliated Partnership |
| 233,929 | ||||||||||
|
| |||||||||||
CASH EQUIVALENT — 3.4% |
| |||||||||||
SEI Daily Income Trust, Prime Obligation Fund, Cl A | ||||||||||||
0.030%†** | 91,924,487 | 91,924 | ||||||||||
|
| |||||||||||
Total Cash Equivalent |
| 91,924 | ||||||||||
|
| |||||||||||
TIME DEPOSITS — 3.0% |
| |||||||||||
Brown Brothers Harriman | ||||||||||||
5.750%, 10/01/2015 | ZAR | 204 | 15 | |||||||||
1.550%, 10/01/2015 | NZD | 159 | 102 | |||||||||
1.168%, 10/01/2015 | AUD | 568 | 399 | |||||||||
0.154%, 10/01/2015 | NOK | 291 | 34 | |||||||||
0.100%, 10/01/2015 | SGD | 104 | 73 | |||||||||
0.100%, 10/01/2015 | DKK | 115 | 17 | |||||||||
0.058%, 10/01/2015 | CAD | 250 | 187 | |||||||||
0.057%, 10/01/2015 | GBP | 855 | 1,294 | |||||||||
0.030%, 10/01/2015 | 77,829 | 77,829 | ||||||||||
0.005%, 10/01/2015 | HKD | 1,861 | 240 | |||||||||
0.005%, 10/01/2015 | JPY | 12,417 | 104 | |||||||||
(0.238)%, 10/01/2015 | EUR | 609 | 680 | |||||||||
(0.733)%, 10/01/2015 | SEK | 1 | — | |||||||||
(1.000)%, 10/01/2015 | CHF | 212 | 217 | |||||||||
|
| |||||||||||
Total Time Deposits |
| 81,191 | ||||||||||
|
| |||||||||||
Total Investments — 108.4% |
| $ | 2,931,617 | |||||||||
|
| |||||||||||
A list of the open futures contracts held by the Fund at September 30, 2015, is as follows:
| Type of Contract | Number of Contracts Long | Expiration Date | Unrealized Appreciation (Depreciation) ($ Thousands) | |||||||||
DJ Euro Stoxx 50 Index | 1,082 | Dec-2015 | $ | (900 | ) | |||||||
FTSE 100 Index | 293 | Dec-2015 | (104 | ) | ||||||||
Hang Seng Index | 32 | Oct-2015 | 49 | |||||||||
SPI 200 Index | 92 | Dec-2015 | (103 | ) | ||||||||
Topix Index | 205 | Dec-2015 | (798 | ) | ||||||||
|
| |||||||||||
| $ | (1,856 | ) | ||||||||||
|
| |||||||||||
For the year ended September 30, 2015, the total amount of all open futures contracts, as presented in the table above, are representative of the volume of activity for this derivative type during the year.
| SEI Institutional International Trust / Annual Report / September 30, 2015 | 19 |
SCHEDULE OF INVESTMENTS
International Equity Fund (Concluded)
September 30, 2015
Percentages are based on a Net Assets of $2,703,969 ($ Thousands).
| * | Non-income producing security. |
| ** | Rate shown is the 7-day effective yield as of September 30, 2015. |
| † | Investment in Affiliated Security. |
| (1) | In U.S. dollars unless otherwise indicated. |
| (A) | Real Estate Investment Trust. |
| (B) | This security or a partial position of this security is on loan at September 30, 2015. The total market value of securities on loan at September 30, 2015 was $229,050 ($ Thousands). |
| (C) | Securities sold within terms of a private placement memorandum, exempt from registration under Section 144A of the Securities Act of 1933, as amended, and may be sold only to dealers in that program or other “accredited investors.” These securities have been determined to be liquid under guidelines established by the Board of Trustees. |
| (D) | Security, or portion thereof, has been pledged as collateral on open futures contracts. |
| (E) | Zero coupon security. The rate reported on the Schedule of Investments is the effective yield at time of purchase. |
| (F) | This security was purchased with cash collateral held from securities on loan. The total value of such securities as of September 30, 2015 was $233,929 ($ Thousands). |
ADR — American Depositary Receipt
AUD — Australian Dollar
CAD — Canadian Dollar
CHF — Swiss Franc
Cl — Class
DJ — Dow Jones
DKK — Danish Krone
EUR — Euro
FTSE — Financial Times and the London Stock Exchange
GBP — British Pound Sterling
HKD — Hong Kong Dollar
JPY — Japanese Yen
L.P. — Limited Partnership
NOK — Norwegian Krone
NZD — New Zealand Dollar
SEK — Swedish Krone
SGD — Singapore Dollar
SPI — Share Price Index
ZAR — South African Rand
The following is a list of the level of inputs used as of September 30, 2015, in valuing the Fund’s investments and other financial instruments carried at value ($ Thousands):
| Investments in Securities | Level 1 | Level 2 | Level 3 | Total | ||||||||||||
Common Stock | $ | 2,488,455 | $ | — | $ | — | $ | 2,488,455 | ||||||||
Preferred Stock | 27,426 | — | — | 27,426 | ||||||||||||
U.S. Treasury Obligations | — | 8,692 | — | 8,692 | ||||||||||||
Affiliated Partnership | — | 233,929 | — | 233,929 | ||||||||||||
Cash Equivalent | 91,924 | — | — | 91,924 | ||||||||||||
Time Deposits | — | 81,191 | — | 81,191 | ||||||||||||
|
|
|
|
|
|
|
| |||||||||
Total Investments in Securities | $ | 2,607,805 | $ | 323,812 | $ | — | $ | 2,931,617 | ||||||||
|
|
|
|
|
|
|
| |||||||||
| Other Financial Instruments | Level 1 | Level 2 | Level 3 | Total | ||||||||||||
Futures Contracts* | ||||||||||||||||
Unrealized Appreciation | $ | 49 | $ | — | $ | — | $ | 49 | ||||||||
Unrealized Depreciation | (1,905 | ) | — | — | (1,905 | ) | ||||||||||
|
|
|
|
|
|
|
| |||||||||
Total Other Financial Instruments | $ | (1,856 | ) | $ | — | $ | — | $ | (1,856 | ) | ||||||
|
|
|
|
|
|
|
| |||||||||
| * | Futures contracts are valued at the unrealized appreciation (depreciation) on the instrument. |
For the year ended September 30, 2015, there were no transfers between Level 1 and Level 2 assets and liabilities.
For the year ended September 30, 2015, there were no transfers from Level 2 into Level 3 assets and liabilities.
Amounts designated as “—” are $0 or have been rounded to $0.
The accompanying notes are an integral part of the financial statements.
| 20 | SEI Institutional International Trust / Annual Report / September 30, 2015 |
SCHEDULE OF INVESTMENTS
Emerging Markets Equity Fund
September 30, 2015
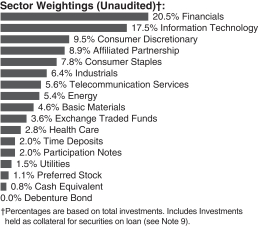
| Description | Shares | Market Value ($ Thousands) | ||||||||
COMMON STOCK — 89.6% |
| |||||||||
Argentina — 0.4% | ||||||||||
Arcos Dorados Holdings, Cl A | 320,900 | $ | 873 | |||||||
Banco Macro ADR* | 21,300 | 818 | ||||||||
Grupo Financiero Galicia ADR* | 56,300 | 1,003 | ||||||||
YPF* | 23,942 | 365 | ||||||||
YPF ADR | 167,836 | 2,556 | ||||||||
|
| |||||||||
| 5,615 | ||||||||||
|
| |||||||||
Austria — 0.2% | ||||||||||
Erste Group Bank | 114,810 | 3,333 | ||||||||
|
| |||||||||
Brazil — 4.8% | ||||||||||
AMBEV | 617,200 | 3,019 | ||||||||
AMBEV ADR | 853,992 | 4,185 | ||||||||
B2W Cia Digital* | 598,553 | 2,223 | ||||||||
Banco Bradesco ADR (A) | 424,705 | 2,276 | ||||||||
Banco do Brasil | 439,080 | 1,657 | ||||||||
Banco Santander Brasil ADR (A) | 508,215 | 1,601 | ||||||||
BB Seguridade Participacoes | 823,400 | 5,106 | ||||||||
Braskem ADR | 222,510 | 1,876 | ||||||||
BRF ADR | 6,134 | 109 | ||||||||
CETIP - Mercados Organizados | 53,900 | 445 | ||||||||
Cielo | 299,128 | 2,769 | ||||||||
Cosan Industria e Comercio | 214,500 | 1,075 | ||||||||
Cyrela Brazil Realty Empreendimentos e Participacoes | 727,300 | 1,523 | ||||||||
EDP - Energias do Brasil | 115,900 | 339 | ||||||||
Embraer | 141,900 | 903 | ||||||||
Embraer ADR (A) | 93,600 | 2,394 | ||||||||
Estacio Participacoes | 658,000 | 2,304 | ||||||||
FPC Par Corretora de Seguros | 442,800 | 1,028 | ||||||||
Gerdau ADR | 691,726 | 948 | ||||||||
Gol Linhas Aereas Inteligentes ADR (A) | 517,245 | 504 | ||||||||
Hypermarcas* | 908,160 | 3,462 | ||||||||
JBS | 649,600 | 2,739 | ||||||||
Klabin | 389,700 | 2,151 | ||||||||
| Description | Shares | Market Value ($ Thousands) | ||||||||
Lojas Americanas | 198,300 | $ | 582 | |||||||
Lojas Renner | 681,400 | 3,173 | ||||||||
Mahle-Metal Leve | 49,500 | 287 | ||||||||
MRV Engenharia e Participacoes | 248,700 | 387 | ||||||||
Multiplus | 38,400 | 311 | ||||||||
Petroleo Brasileiro ADR* | 1,128,224 | 4,908 | ||||||||
Raia Drogasil | 88,500 | 869 | ||||||||
Rumo Logistica Operadora Multimodal* | 116,111 | 173 | ||||||||
Santos Brasil Participacoes | 73,020 | 238 | ||||||||
Telefonica Brasil ADR (A) | 251,338 | 2,295 | ||||||||
Tim Participacoes ADR | 377,700 | 3,569 | ||||||||
Ultrapar Participacoes | 66,300 | 1,109 | ||||||||
Vale ADR, Cl B (A) | 439,261 | 1,845 | ||||||||
Valid Solucoes e Servicos de Seguranca em Meios de Pagamento e Identificacao | 210,800 | 2,435 | ||||||||
|
| |||||||||
| 66,817 | ||||||||||
|
| |||||||||
Canada — 0.3% | ||||||||||
First Quantum Minerals | 450,239 | 1,642 | ||||||||
Parex Resources* | 100,612 | 694 | ||||||||
SEMAFO* | 528,874 | 1,140 | ||||||||
|
| |||||||||
| 3,476 | ||||||||||
|
| |||||||||
Chile — 0.8% | ||||||||||
Banco de Chile | 15,948,451 | 1,658 | ||||||||
Banco Santander Chile | 30,099,760 | 1,361 | ||||||||
Cia Cervecerias Unidas ADR | 113,291 | 2,509 | ||||||||
Corpbanca ADR | 16,690 | 222 | ||||||||
Empresas CMPC | 327,032 | 840 | ||||||||
Empresas COPEC | 60,239 | 545 | ||||||||
Enersis | 1,349,577 | 339 | ||||||||
SACI Falabella | 344,490 | 2,130 | ||||||||
Sociedad Quimica y Minera de Chile ADR (A) | 101,000 | 1,469 | ||||||||
|
| |||||||||
| 11,073 | ||||||||||
|
| |||||||||
China — 16.6% | ||||||||||
AAC Technologies Holdings (A) | 1,079,280 | 6,807 | ||||||||
Agricultural Bank of China | 18,073,932 | 6,885 | ||||||||
Alibaba Group Holding ADR* (A) | 55,100 | 3,249 | ||||||||
Anhui Conch Cement | 1,561,700 | 4,633 | ||||||||
ANTA Sports Products | 2,415,000 | 6,268 | ||||||||
Baidu ADR* | 131,301 | 18,042 | ||||||||
Bank of China | 18,778,105 | 8,154 | ||||||||
Beijing Capital International Airport | 772,000 | 720 | ||||||||
BYD Electronic International | 695,000 | 434 | ||||||||
Changyou.com ADR* | 146,700 | 2,611 | ||||||||
China BlueChemical | 878,000 | 236 | ||||||||
China Child Care (A) | 4,291,800 | 382 | ||||||||
China Communications Services | 2,626,000 | 1,017 | ||||||||
| SEI Institutional International Trust / Annual Report / September 30, 2015 | 21 |
SCHEDULE OF INVESTMENTS
Emerging Markets Equity Fund (Continued)
September 30, 2015
| Description | Shares | Market Value ($ Thousands) | ||||||||
China Construction Bank | 20,729,993 | $ | 13,929 | |||||||
China Life Insurance | 1,545,000 | 5,399 | ||||||||
China Merchants Bank | 910,076 | 2,215 | ||||||||
China Petroleum & Chemical | 9,945,839 | 6,131 | ||||||||
China Petroleum & Chemical ADR | 8,400 | 517 | ||||||||
China Shenhua Energy | 905,000 | 1,390 | ||||||||
China Telecom | 3,634,000 | 1,766 | ||||||||
China Vanke (A) | 3,154,224 | 6,790 | ||||||||
Chongqing Rural Commercial Bank | 2,726,612 | 1,556 | ||||||||
CITIC Securities | 858,900 | 1,552 | ||||||||
Country Garden Holdings | 5,604,000 | 2,044 | ||||||||
Ctrip.com International ADR* | 23,896 | 1,510 | ||||||||
Datang International Power Generation | 3,704,000 | 1,412 | ||||||||
Dongfeng Motor Group | 378,000 | 475 | ||||||||
Evergrande Real Estate Group (A) | 7,494,000 | 4,306 | ||||||||
Great Wall Motor | 763,500 | 855 | ||||||||
Guangzhou R&F Properties | 932,800 | 849 | ||||||||
Huaneng Power International | 4,928,000 | 5,316 | ||||||||
Industrial & Commercial Bank of China | 34,736,768 | 20,170 | ||||||||
Jiangsu Expressway | 2,748,000 | 3,513 | ||||||||
Jiangxi Copper | 1,189,000 | 1,461 | ||||||||
KWG Property Holding | 1,737,370 | 1,148 | ||||||||
New Oriental Education & Technology Group ADR (A) | 282,300 | 5,705 | ||||||||
PetroChina | 2,036,000 | 1,430 | ||||||||
PetroChina ADR | 60,635 | 4,226 | ||||||||
PICC Property & Casualty | 1,977,800 | 3,893 | ||||||||
Ping An Insurance Group of China | 2,102,000 | 10,540 | ||||||||
Qunar Cayman Islands ADR* (A) | 36,000 | 1,082 | ||||||||
Shanghai Electric Group (A) | 2,844,000 | 1,564 | ||||||||
SINA* | 66,700 | 2,676 | ||||||||
Sinopec Engineering Group | 2,995,000 | 2,616 | ||||||||
Sinopharm Group | 326,400 | 1,158 | ||||||||
Sinotrans | 2,685,000 | 1,268 | ||||||||
SOHO China | 1,400,528 | 548 | ||||||||
Sohu.com* | 107,600 | 4,444 | ||||||||
Tencent Holdings | 1,557,735 | 26,305 | ||||||||
Tingyi Cayman Islands Holding | 1,432,000 | 2,293 | ||||||||
TravelSky Technology | 233,000 | 295 | ||||||||
Uni-President China Holdings (A) | 5,375,400 | 5,238 | ||||||||
Vipshop Holdings ADR* | 163,359 | 2,744 | ||||||||
Want Want China Holdings (A) | 976,000 | 804 | ||||||||
Weibo ADR* (A) | 42,200 | 493 | ||||||||
Youku Tudou ADR* | 55,700 | 982 | ||||||||
Zhejiang Expressway | 1,630,000 | 1,785 | ||||||||
Zhuzhou CSR Times Electric | 452,800 | 3,372 | ||||||||
ZTE | 348,374 | 801 | ||||||||
|
| |||||||||
| 230,004 | ||||||||||
|
| |||||||||
Colombia — 0.3% | ||||||||||
Bancolombia ADR, Cl R (A) | 77,000 | 2,479 | ||||||||
Cementos Argos | 175,869 | 538 | ||||||||
| Description | Shares | Market Value ($ Thousands) | ||||||||
Cemex Latam Holdings* | 339,212 | $ | 1,352 | |||||||
|
| |||||||||
| 4,369 | ||||||||||
|
| |||||||||
Czech Republic — 0.5% | ||||||||||
CEZ (A) | 70,777 | 1,478 | ||||||||
Komercni Banka | 26,046 | 5,641 | ||||||||
|
| |||||||||
| 7,119 | ||||||||||
|
| |||||||||
Egypt — 0.1% | ||||||||||
Commercial International Bank Egypt GDR | 134,788 | 828 | ||||||||
|
| |||||||||
Greece — 0.1% | ||||||||||
FF Group | 44,400 | 906 | ||||||||
National Bank of Greece* | 1,239,500 | 531 | ||||||||
|
| |||||||||
| 1,437 | ||||||||||
|
| |||||||||
Hong Kong — 8.3% | ||||||||||
AIA Group | 589,300 | 3,082 | ||||||||
Belle International Holdings | 936,000 | 814 | ||||||||
Bolina Holding | 531,300 | 155 | ||||||||
Brilliance China Automotive Holdings | 784,700 | 934 | ||||||||
CAR* (A) | 847,000 | 1,231 | ||||||||
Chaoda Modern Agriculture | 2,056,181 | 63 | ||||||||
China Everbright | 324,000 | 747 | ||||||||
China Everbright Bank | 1,308,000 | 569 | ||||||||
China Everbright International | 4,213,500 | 5,933 | ||||||||
China High Precision Automation Group (B) | 1,385,624 | 222 | ||||||||
China Medical System Holdings | 3,308,200 | 3,821 | ||||||||
China Mengniu Dairy | 1,465,615 | 5,155 | ||||||||
China Minsheng Banking | 1,716,600 | 1,601 | ||||||||
China Mobile | 2,000,641 | 23,849 | ||||||||
China Mobile ADR | 97,840 | 5,821 | ||||||||
China Overseas Land & Investment | 168,000 | 511 | ||||||||
China Power International Development | 2,861,000 | 1,876 | ||||||||
China Resources Land | 98,000 | 232 | ||||||||
China Resources Power Holdings | 576,000 | 1,322 | ||||||||
China State Construction International Holdings | 5,325,984 | 7,663 | ||||||||
China Taiping Insurance Holdings* | 1,022,782 | 3,215 | ||||||||
CNOOC | 7,577,107 | 7,883 | ||||||||
Far East Horizon | 1,161,000 | 906 | ||||||||
Galaxy Entertainment Group | 756,000 | 1,941 | ||||||||
Geely Automobile Holdings | 4,691,700 | 2,271 | ||||||||
Haier Electronics Group | 2,410,000 | 4,046 | ||||||||
Hua Hong Semiconductor* (C) | 2,236,000 | 2,277 | ||||||||
Huadian Fuxin Energy | 2,245,385 | 782 | ||||||||
Lee & Man Paper Manufacturing | 3,373,000 | 1,713 | ||||||||
Lenovo Group | 2,610,000 | 2,234 | ||||||||
Melco Crown Entertainment ADR (A) | 53,000 | 729 | ||||||||
| 22 | SEI Institutional International Trust / Annual Report / September 30, 2015 |
| Description | Shares | Market Value ($ Thousands) | ||||||||
PAX Global Technology | 1,489,999 | $ | 1,565 | |||||||
Samsonite International | 621,652 | 2,059 | ||||||||
Shanghai Fosun Pharmaceutical Group | 470,000 | 1,475 | ||||||||
Shanghai Industrial Holdings | 674,000 | 1,496 | ||||||||
Skyworth Digital Holdings | 502,000 | 341 | ||||||||
Sunac China Holdings | 1,386,000 | 728 | ||||||||
Sunny Optical Technology Group (A) | 4,323,507 | 8,739 | ||||||||
Techtronic Industries | 1,013,500 | 3,777 | ||||||||
Xinyi Solar Holdings | 4,056,000 | 1,401 | ||||||||
|
| |||||||||
| 115,179 | ||||||||||
|
| |||||||||
Hungary — 0.3% | ||||||||||
MOL Hungarian Oil & Gas | 9,904 | 432 | ||||||||
OTP Bank (A) | 94,710 | 1,822 | ||||||||
Richter Gedeon Nyrt | 122,894 | 1,951 | ||||||||
|
| |||||||||
| 4,205 | ||||||||||
|
| |||||||||
India — 7.3% | ||||||||||
Adani Ports & Special Economic Zone | 612,027 | 2,805 | ||||||||
Aurobindo Pharma | 534,481 | 6,284 | ||||||||
Axis Bank | 484,569 | 3,675 | ||||||||
Bharat Petroleum | 155,021 | 2,020 | ||||||||
Cairn India | 1,032,727 | 2,431 | ||||||||
Canara Bank | 253,991 | 1,092 | ||||||||
Cummins India | 369,150 | 6,187 | ||||||||
Dabur India | 1,010,452 | 4,258 | ||||||||
Dewan Housing Finance | 521,600 | 1,753 | ||||||||
Dish TV India* | 1,183,788 | 1,920 | ||||||||
Dr Reddy’s Laboratories | 28,326 | 1,802 | ||||||||
Glenmark Pharmaceuticals | 392,699 | 6,303 | ||||||||
HCL Technologies | 116,519 | 1,747 | ||||||||
HDFC Bank ADR | 96,145 | 5,873 | ||||||||
Hero MotoCorp | 78,300 | 2,872 | ||||||||
Hindustan Zinc | 144,735 | 309 | ||||||||
Housing Development Finance | 58,601 | 1,086 | ||||||||
ICICI Bank | 577,200 | 2,387 | ||||||||
ICICI Bank ADR | 678,520 | 5,686 | ||||||||
Idea Cellular | 672,998 | 1,537 | ||||||||
IFCI* | 737,425 | 244 | ||||||||
Indiabulls Housing Finance | 107,556 | 1,305 | ||||||||
Infosys ADR (A) | 73,506 | 1,403 | ||||||||
Larsen & Toubro | 70,100 | 1,571 | ||||||||
Motherson Sumi Systems | 164,800 | 580 | ||||||||
Oriental Bank of Commerce | 234,465 | 470 | ||||||||
Power Finance | 278,814 | 982 | ||||||||
Power Grid Corp of India | 1,598,934 | 3,238 | ||||||||
Prestige Estates Projects | 710,100 | 2,343 | ||||||||
Reliance Capital | 226,221 | 1,301 | ||||||||
Reliance Industries | 261,551 | 3,445 | ||||||||
Reliance Industries GDR (C) | 451,203 | 11,715 | ||||||||
Rural Electrification | 248,373 | 1,042 | ||||||||
| Description | Shares | Market Value ($ Thousands) | ||||||||
Shriram Transport Finance | 75,529 | $ | 1,069 | |||||||
SKS Microfinance* | 225,455 | 1,399 | ||||||||
SRF | 18,546 | 320 | ||||||||
Syndicate Bank | 165,516 | 209 | ||||||||
Tata Chemicals | 104,241 | 611 | ||||||||
Tata Consultancy Services | 8,433 | 333 | ||||||||
Tata Motors, Cl A | 466,295 | 1,538 | ||||||||
UCO Bank | 740,322 | 525 | ||||||||
UPL | 119,331 | 840 | ||||||||
Vedanta | 405,523 | 530 | ||||||||
WNS Holdings ADR* | 11,629 | 325 | ||||||||
Zee Entertainment Enterprises | 269,226 | 1,619 | ||||||||
|
| |||||||||
| 100,984 | ||||||||||
|
| |||||||||
Indonesia — 2.0% | ||||||||||
AKR Corporindo | 4,595,700 | 1,842 | ||||||||
Astra International | 2,213,000 | 792 | ||||||||
Bank Negara Indonesia Persero | 2,982,200 | 847 | ||||||||
Bank Pembangunan Daerah Jawa Barat Dan Banten | 4,107,500 | 173 | ||||||||
Bank Rakyat Indonesia Persero | 4,892,251 | 2,905 | ||||||||
Gudang Garam | 590,300 | 1,704 | ||||||||
Indofood CBP Sukses Makmur | 325,600 | 277 | ||||||||
Kalbe Farma | 11,452,000 | 1,083 | ||||||||
Link Net* | 4,468,200 | 1,369 | ||||||||
Matahari Department Store | 2,618,900 | 2,893 | ||||||||
Matahari Putra Prima | 2,831,900 | 375 | ||||||||
Perusahaan Gas Negara Persero | 6,305,400 | 1,095 | ||||||||
Perusahaan Perkebunan London Sumatra Indonesia | 2,177,800 | 207 | ||||||||
Semen Indonesia Persero | 2,436,600 | 1,508 | ||||||||
Sumber Alfaria Trijaya | 44,779,300 | 1,741 | ||||||||
Tambang Batubara Bukit Asam | 3,801,600 | 1,466 | ||||||||
Telekomunikasi Indonesia Persero | 26,635,180 | 4,825 | ||||||||
United Tractors | 1,609,781 | 1,944 | ||||||||
Vale Indonesia | 1,143,500 | 171 | ||||||||
|
| |||||||||
| 27,217 | ||||||||||
|
| |||||||||
Jordan — 0.3% | ||||||||||
Hikma Pharmaceuticals | 133,282 | 4,633 | ||||||||
|
| |||||||||
Malaysia — 0.5% | ||||||||||
AMMB Holdings | 813,100 | 846 | ||||||||
Axiata Group | 475,500 | 628 | ||||||||
British American Tobacco Malaysia | 53,251 | 732 | ||||||||
IOI Properties Group | 542,049 | 246 | ||||||||
Malayan Banking | 979,400 | 1,911 | ||||||||
Sunway | 274,900 | 198 | ||||||||
Sunway Construction Group* | 16,510 | 4 | ||||||||
Telekom Malaysia | 547,776 | 833 | ||||||||
Top Glove | 203,600 | 374 | ||||||||
| SEI Institutional International Trust / Annual Report / September 30, 2015 | 23 |
SCHEDULE OF INVESTMENTS
Emerging Markets Equity Fund (Continued)
September 30, 2015
| Description | Shares | Market Value ($ Thousands) | ||||||||
UEM Sunrise | 3,433,195 | $ | 963 | |||||||
YTL | 1,081,400 | 394 | ||||||||
|
| |||||||||
| 7,129 | ||||||||||
|
| |||||||||
Mexico — 5.3% | ||||||||||
Alfa, Cl A (A) | 192,800 | 374 | ||||||||
Alsea | 225,300 | 663 | ||||||||
America Movil, Ser L | 4,209,674 | 3,490 | ||||||||
America Movil ADR, Ser L (A) | 164,675 | 2,725 | ||||||||
Arca Continental | 471,100 | 2,646 | ||||||||
Cemex ADR* (A) | 832,821 | 5,821 | ||||||||
Coca-Cola Femsa ADR (A) | 8,092 | 561 | ||||||||
Controladora Comercial Mexicana | 243,600 | 705 | ||||||||
Empresas ICA ADR* (A) | 228,580 | 382 | ||||||||
Fomento Economico Mexicano | 199,400 | 1,778 | ||||||||
Fomento Economico Mexicano ADR (A) | 78,679 | 7,022 | ||||||||
Gentera (A) | 1,072,400 | 1,748 | ||||||||
Gruma, Cl B | 154,532 | 2,120 | ||||||||
Grupo Financiero Banorte, Cl O | 2,677,913 | 13,103 | ||||||||
Grupo Financiero Santander Mexico ADR (A) | 218,078 | 1,601 | ||||||||
Grupo GICSA* | 2,263,200 | 1,908 | ||||||||
Grupo Mexico, Ser B | 1,414,900 | 3,414 | ||||||||
Grupo Televisa | 75,600 | 393 | ||||||||
Grupo Televisa ADR | 347,837 | 9,051 | ||||||||
Infraestructura Energetica Nova | 544,900 | 2,225 | ||||||||
Inmobiliaria Vesta | 1,973,700 | 3,082 | ||||||||
Promotora y Operadora de Infraestructura* | 38,400 | 420 | ||||||||
Unifin Financiera* | 1,044,200 | 2,321 | ||||||||
Wal-Mart de Mexico | 2,454,698 | 6,042 | ||||||||
|
| |||||||||
| 73,595 | ||||||||||
|
| |||||||||
Pakistan — 0.1% | ||||||||||
United Bank | 764,200 | 1,073 | ||||||||
|
| |||||||||
Peru — 0.8% | ||||||||||
Cia de Minas Buenaventura SAA ADR (A) | 89,037 | 531 | ||||||||
Credicorp | 99,063 | 10,536 | ||||||||
|
| |||||||||
| 11,067 | ||||||||||
|
| |||||||||
Philippines — 1.5% | ||||||||||
Aboitiz Equity Ventures | 706,340 | 873 | ||||||||
Alliance Global Group | 1,204,488 | 397 | ||||||||
Ayala | 215,340 | 3,543 | ||||||||
BDO Unibank | 1,060,923 | 2,354 | ||||||||
Cebu Air | 201,950 | 375 | ||||||||
DMCI Holdings | 1,085,550 | 298 | ||||||||
Globe Telecom | 8,695 | 438 | ||||||||
International Container Terminal Services | 1,488,334 | 2,393 | ||||||||
JG Summit Holdings | 273,400 | 414 | ||||||||
Megaworld | 4,165,800 | 390 | ||||||||
| Description | Shares | Market Value ($ Thousands) | ||||||||
RFM | 4,539,600 | $ | 389 | |||||||
SM Investments | 104,210 | 1,989 | ||||||||
SM Prime Holdings | 4,845,800 | 2,149 | ||||||||
Universal Robina | 1,062,100 | 4,376 | ||||||||
Vista Land & Lifescapes | 2,371,200 | 255 | ||||||||
|
| |||||||||
| 20,633 | ||||||||||
|
| |||||||||
Poland — 0.8% | ||||||||||
Asseco Poland | 40,041 | 568 | ||||||||
Energa | 184,429 | 818 | ||||||||
Eurocash (A) | 324,534 | 3,814 | ||||||||
KGHM Polska Miedz (A) | 102,672 | 2,219 | ||||||||
PGE Polska Grupa Energetyczna (A) | 332,055 | 1,178 | ||||||||
Polish Oil & Gas | 457,542 | 782 | ||||||||
Powszechna Kasa Oszczednosci Bank Polski (A) | 84,143 | 652 | ||||||||
Powszechny Zaklad Ubezpieczen (A) | 8,017 | 823 | ||||||||
Tauron Polska Energia (A) | 857,976 | 742 | ||||||||
|
| |||||||||
| 11,596 | ||||||||||
|
| |||||||||
Portugal — 0.2% | ||||||||||
Jeronimo Martins (A) | 160,590 | 2,165 | ||||||||
|
| |||||||||
Qatar — 0.1% | ||||||||||
Barwa Real Estate | 129,771 | 1,521 | ||||||||
United Development | 64,728 | 416 | ||||||||
|
| |||||||||
| 1,937 | ||||||||||
|
| |||||||||
Russia — 4.4% | ||||||||||
Etalon Group GDR | 56,800 | 94 | ||||||||
Gazprom ADR | 1,523,883 | 6,177 | ||||||||
Lukoil ADR | 170,334 | 5,802 | ||||||||
Magnit GDR (A) | 175,725 | 8,457 | ||||||||
Mail.Ru Group GDR* | 14,310 | 248 | ||||||||
MegaFon GDR | 91,234 | 1,111 | ||||||||
MMC Norilsk Nickel PJSC ADR | 135,381 | 1,946 | ||||||||
Mobile TeleSystems ADR | 209,266 | 1,511 | ||||||||
NovaTek GDR | 20,699 | 1,906 | ||||||||
Novolipetsk Steel GDR | 111,200 | 1,275 | ||||||||
Phosagro GDR | 30,133 | 427 | ||||||||
QIWI ADR | 129,656 | 2,090 | ||||||||
Rosneft GDR | 689,710 | 2,556 | ||||||||
Rostelecom ADR | 51,116 | 401 | ||||||||
Sberbank of Russia ADR (A) | 2,196,713 | 10,811 | ||||||||
Severstal GDR | 217,854 | 2,310 | ||||||||
Sistema GDR | 55,343 | 381 | ||||||||
Surgutneftegas ADR | 224,162 | 1,143 | ||||||||
Tatneft ADR (A) | 74,860 | 2,106 | ||||||||
TMK GDR | 229,180 | 710 | ||||||||
X5 Retail Group GDR* (A) | 290,694 | 5,069 | ||||||||
Yandex, Cl A* | 402,080 | 4,314 | ||||||||
|
| |||||||||
| 60,845 | ||||||||||
|
| |||||||||
| 24 | SEI Institutional International Trust / Annual Report / September 30, 2015 |
| Description | Shares | Market Value ($ Thousands) | ||||||||
Singapore — 0.2% | ||||||||||
Asian Pay Television Trust | 4,913,800 | $ | 2,713 | |||||||
China Yuchai International | 22,250 | 275 | ||||||||
|
| |||||||||
| 2,988 | ||||||||||
|
| |||||||||
South Africa — 5.4% | ||||||||||
Alexander Forbes Group Holdings | 5,052,249 | 2,790 | ||||||||
AngloGold Ashanti ADR* (A) | 58,100 | 476 | ||||||||
Aspen Pharmacare Holdings | 80,600 | 1,716 | ||||||||
AVI | 96,691 | 613 | ||||||||
Barclays Africa Group | 168,166 | 2,073 | ||||||||
Barloworld | 73,229 | 398 | ||||||||
Bidvest Group (A) | 210,367 | 4,981 | ||||||||
Clicks Group | 55,416 | 361 | ||||||||
Coronation Fund Managers | 85,274 | 402 | ||||||||
DataTec | 74,779 | 336 | ||||||||
FirstRand | 1,097,673 | 3,902 | ||||||||
Foschini Group | 108,602 | 1,103 | ||||||||
Gold Fields | 341,186 | 916 | ||||||||
Investec (A) | 539,808 | 4,131 | ||||||||
Liberty Holdings | 118,836 | 1,085 | ||||||||
Life Healthcare Group Holdings | 1,298,546 | 3,351 | ||||||||
Mediclinic International | 110,069 | 880 | ||||||||
MMI Holdings | 495,569 | 853 | ||||||||
Mondi | 89,456 | 1,882 | ||||||||
MTN Group | 535,509 | 6,903 | ||||||||
Murray & Roberts Holdings | 336,265 | 284 | ||||||||
Naspers, Cl N | 48,893 | 6,135 | ||||||||
Netcare | 885,330 | 2,326 | ||||||||
Old Mutual | 470,011 | 1,350 | ||||||||
Petra Diamonds* (A) | 409,702 | 524 | ||||||||
Redefine Properties (D) | 1,881,852 | 1,593 | ||||||||
RMB Holdings | 382,795 | 1,826 | ||||||||
Sappi* | 180,100 | 553 | ||||||||
Sasol (A) | 143,998 | 4,029 | ||||||||
Shoprite Holdings | 81,478 | 930 | ||||||||
Sibanye Gold ADR | 104,839 | 486 | ||||||||
SPAR Group | 133,414 | 1,787 | ||||||||
Standard Bank Group | 713,763 | 6,979 | ||||||||
Steinhoff International Holdings (A) | 304,305 | 1,872 | ||||||||
Telkom | 107,522 | 519 | ||||||||
Tongaat Hulett | 19,087 | 149 | ||||||||
Truworths International | 140,869 | 867 | ||||||||
Tsogo Sun Holdings | 616,169 | 1,078 | ||||||||
Vodacom Group | 183,132 | 1,827 | ||||||||
|
| |||||||||
| 74,266 | ||||||||||
|
| |||||||||
South Korea — 12.7% | ||||||||||
BGF retail | 6,710 | 1,143 | ||||||||
Chongkundang Holdings (A) | 1,449 | 112 | ||||||||
CJ CGV (A) | 21,551 | 1,926 | ||||||||
Coway | 120,779 | 8,534 | ||||||||
Daewoo International (A) | 83,659 | 1,475 | ||||||||
Dongbu Insurance (A) | 30,025 | 1,555 | ||||||||
E-Mart | 9,061 | 1,761 | ||||||||
| Description | Shares | Market Value ($ Thousands) | ||||||||
GS Engineering & Construction (A) | 47,523 | $ | 995 | |||||||
GS Home Shopping | 7,836 | 1,273 | ||||||||
GS Retail | 39,074 | 2,013 | ||||||||
Hanil Cement | 1,745 | 196 | ||||||||
Hanon Systems (A) | 33,545 | 1,112 | ||||||||
Hanwha | 42,418 | 1,400 | ||||||||
Hanwha Life Insurance | 204,958 | 1,410 | ||||||||
Hanwha Techwin (A) | 41,856 | 1,104 | ||||||||
Hite Jinro (A) | 28,341 | 547 | ||||||||
Hotel Shilla (A) | 15,771 | 1,538 | ||||||||
Hyosung | 29,507 | 2,822 | ||||||||
Hyundai Marine & Fire Insurance | 79,784 | 2,049 | ||||||||
Hyundai Motor (A) | 46,010 | 6,425 | ||||||||
Kangwon Land | 91,847 | 3,283 | ||||||||
KB Financial Group ADR (A) | 115,597 | 3,397 | ||||||||
KCC | 11,089 | 3,900 | ||||||||
Kia Motors | 25,604 | 1,160 | ||||||||
KONA I | 25,923 | 967 | ||||||||
Korea Aerospace Industries | 15,557 | 898 | ||||||||
KT | 18,069 | 470 | ||||||||
KT ADR | 145,000 | 1,895 | ||||||||
KT&G | 47,669 | 4,486 | ||||||||
LF | 16,119 | 446 | ||||||||
LG (A) | 61,430 | 3,163 | ||||||||
LG Chem | 15,000 | 3,654 | ||||||||
LG Display | 64,675 | 1,250 | ||||||||
LG Display ADR | 134,540 | 1,278 | ||||||||
LG International | 32,893 | 755 | ||||||||
LG Uplus | 188,781 | 1,933 | ||||||||
Lotte Chemical | 16,974 | 3,917 | ||||||||
Lotte Chilsung Beverage (A) | 2,083 | 4,244 | ||||||||
Lotte Confectionery (A) | 2,421 | 4,487 | ||||||||
LS Industrial Systems | 20,289 | 779 | ||||||||
NAVER | 11,176 | 4,852 | ||||||||
NCSoft | 33,150 | 5,322 | ||||||||
S-1, Cl 1 (A) | 19,573 | 1,541 | ||||||||
Samsung Electronics | 43,927 | 42,378 | ||||||||
Samsung Engineering (A) | 67,293 | 1,762 | ||||||||
Samsung Life Insurance | 63,342 | 5,292 | ||||||||
Seah Besteel | 12,579 | 320 | ||||||||
SFA Engineering (A) | 75,193 | 2,869 | ||||||||
Shinhan Financial Group | 81,061 | 2,846 | ||||||||
SK Holdings | 8,231 | 1,699 | ||||||||
SK Hynix | 126,658 | 3,640 | ||||||||
SK Telecom | 8,294 | 1,842 | ||||||||
SK Telecom ADR | 471,929 | 11,515 | ||||||||
Sung Kwang Bend (A) | 63,500 | 550 | ||||||||
Tongyang Life Insurance | 38,651 | 464 | ||||||||
Vieworks (A) | 45,697 | 1,298 | ||||||||
Yuhan | 12,015 | 2,471 | ||||||||
|
| |||||||||
| 176,413 | ||||||||||
|
| |||||||||
Switzerland — 0.0% | ||||||||||
Wizz Air Holdings* (C) | 10,922 | 339 | ||||||||
|
| |||||||||
| SEI Institutional International Trust / Annual Report / September 30, 2015 | 25 |
SCHEDULE OF INVESTMENTS
Emerging Markets Equity Fund (Continued)
September 30, 2015
| Description | Shares | Market Value ($ Thousands) | ||||||||
Taiwan — 10.2% | ||||||||||
Advanced Semiconductor Engineering | 3,653,000 | $ | 3,953 | |||||||
Asustek Computer | 482,000 | 4,157 | ||||||||
Catcher Technology | 228,000 | 2,447 | ||||||||
Cathay Financial Holding | 1,969,987 | 2,704 | ||||||||
Chailease Holding | 319,404 | 502 | ||||||||
Cheng Shin Rubber Industry | 454,000 | 748 | ||||||||
Cheng Uei Precision Industry | 225,000 | 316 | ||||||||
Chicony Electronics | 622,075 | 1,436 | ||||||||
China Motor | 1,567,000 | 1,101 | ||||||||
China Steel Chemical | 381,800 | 1,184 | ||||||||
Compal Electronics | 1,372,000 | 782 | ||||||||
CTBC Financial Holding | 3,406,088 | 1,763 | ||||||||
CTCI | 1,148,000 | 1,374 | ||||||||
Eclat Textile | 180,546 | 2,864 | ||||||||
Elite Advanced Laser | 218,400 | 882 | ||||||||
eMemory Technology | 259,800 | 2,574 | ||||||||
Far Eastern New Century | 832,653 | 742 | ||||||||
Farglory Land Development | 297,043 | 314 | ||||||||
Fubon Financial Holding | 1,625,000 | 2,550 | ||||||||
Hermes Microvision | 73,600 | 2,783 | ||||||||
Highwealth Construction | 633,100 | 897 | ||||||||
Hiwin Technologies | 178,630 | 958 | ||||||||
Hon Hai Precision Industry | 4,736,367 | 12,390 | ||||||||
Hota Industrial Manufacturing | 595,000 | 1,912 | ||||||||
Hu Lane Associate | 460,600 | 1,776 | ||||||||
Kenda Rubber Industrial | 224,702 | 321 | ||||||||
King Yuan Electronics | 616,000 | 393 | ||||||||
King’s Town Bank | 802,000 | 569 | ||||||||
Largan Precision | 54,200 | 4,250 | ||||||||
Lite-On Technology | 1,263,296 | 1,164 | ||||||||
Makalot Industrial | 241,094 | 1,997 | ||||||||
MediaTek | 1,012,100 | 7,528 | ||||||||
Mega Financial Holding | 786,000 | 546 | ||||||||
Mitac Holdings | 2,795,000 | 1,746 | ||||||||
PChome Online | 97,868 | 1,124 | ||||||||
Pegatron | 1,466,000 | 3,608 | ||||||||
Pou Chen | 1,221,000 | 1,840 | ||||||||
Powertech Technology | 1,016,000 | 1,845 | ||||||||
Quanta Computer | 1,734,000 | 3,026 | ||||||||
Radiant Opto-Electronics | 955,050 | 2,964 | ||||||||
Realtek Semiconductor | 1,110,173 | 1,892 | ||||||||
Sercomm | 635,411 | 1,568 | ||||||||
Simplo Technology | 196,000 | 631 | ||||||||
Taishin Financial Holding | 5,146,481 | 1,827 | ||||||||
Taiwan Cement | 2,958,000 | 3,007 | ||||||||
Taiwan Semiconductor Manufacturing (A) | 7,295,222 | 36,405 | ||||||||
Teco Electric and Machinery | 951,000 | 752 | ||||||||
Transcend Information | 260,000 | 658 | ||||||||
Tung Thih Electronic | 529,500 | 3,631 | ||||||||
United Microelectronics | 5,008,000 | 1,649 | ||||||||
Vanguard International Semiconductor | 1,248,000 | 1,414 | ||||||||
| Description | Shares | Market Value ($ Thousands) | ||||||||
WPG Holdings | 1,716,000 | $ | 1,658 | |||||||
Yuanta Financial Holding | 1,943,678 | 725 | ||||||||
|
| |||||||||
| 141,847 | ||||||||||
|
| |||||||||
Thailand — 2.0% | ||||||||||
AP Thailand | 2,502,800 | 373 | ||||||||
Bangkok Bank Foreign | 654,100 | 2,871 | ||||||||
Bangkok Dusit Medical Services, Cl F (A) | 1,208,600 | 616 | ||||||||
Bangkok Dusit Medical Services | 2,282,000 | 1,163 | ||||||||
Bangkok Expressway | 148,400 | 149 | ||||||||
Central Pattana | 788,800 | 974 | ||||||||
CP ALL | 3,221,100 | 4,243 | ||||||||
CP Seven Eleven PCL (A) | 1,166,900 | 1,537 | ||||||||
Delta Electronics Thailand | 290,900 | 706 | ||||||||
Hana Microelectronics | 292,900 | 229 | ||||||||
Kasikornbank NVDR | 468,700 | 2,204 | ||||||||
Krung Thai Bank NVDR (A) | 1,633,900 | 768 | ||||||||
Major Cineplex Group (A) | 280,100 | 247 | ||||||||
Minor International | 1,700,100 | 1,350 | ||||||||
PTT (A) | 568,950 | 3,792 | ||||||||
PTT Global Chemical | 1,384,100 | 2,056 | ||||||||
Ratchaburi Electricity Generating Holding | 275,700 | 406 | ||||||||
Siam Cement | 68,650 | 877 | ||||||||
Siam Commercial Bank | 180,200 | 667 | ||||||||
Sino-Thai Engineering & Construction | 1,220,000 | 816 | ||||||||
Thai Union Group | 1,770,300 | 897 | ||||||||
Thanachart Capital (A) | 1,188,700 | 1,041 | ||||||||
Tisco Financial Group* | 276,600 | 271 | ||||||||
|
| |||||||||
| 28,253 | ||||||||||
|
| |||||||||
Turkey — 2.0% | ||||||||||
Akbank (A) | 1,099,975 | 2,467 | ||||||||
Anadolu Efes Biracilik Ve Malt Sanayii (A) | 229,485 | 1,618 | ||||||||
Arcelik | 483,500 | 2,359 | ||||||||
Aselsan Elektronik Sanayi Ve Ticaret (A) | 495,064 | 2,256 | ||||||||
Brisa Bridgestone Sabanci Sanayi ve Ticaret (A) | 31,208 | 87 | ||||||||
Emlak Konut Gayrimenkul Yatirim Ortakligi (A) (D) | 1,987,052 | 1,651 | ||||||||
Eregli Demir ve Celik Fabrikalari | 804,169 | 993 | ||||||||
Ford Otomotiv Sanayi | 83,429 | 891 | ||||||||
KOC Holding | 162,377 | 634 | ||||||||
Koza Altin Isletmeleri (A) | 23,343 | 170 | ||||||||
TAV Havalimanlari Holding | 261,111 | 2,051 | ||||||||
Tofas Turk Otomobil Fabrikasi | 263,220 | 1,563 | ||||||||
Trakya Cam Sanayii (A) | 119,156 | 74 | ||||||||
Tupras Turkiye Petrol Rafinerileri | 79,004 | 1,936 | ||||||||
Turk Hava Yollari* | 185,970 | 491 | ||||||||
Turkcell Iletisim Hizmetleri ADR | 120,935 | 1,050 | ||||||||
Turkiye Garanti Bankasi | 1,810,967 | 4,217 | ||||||||
| 26 | SEI Institutional International Trust / Annual Report / September 30, 2015 |
| Description | Shares/Number Of Participation Notes | Market Value ($ Thousands) | ||||||||
Turkiye Halk Bankasi (A) | 229,405 | $ | 767 | |||||||
Turkiye Is Bankasi, Cl C | 255,036 | 398 | ||||||||
Ulker Biskuvi Sanayi | 237,100 | 1,502 | ||||||||
|
| |||||||||
| 27,175 | ||||||||||
|
| |||||||||
United Arab Emirates — 0.5% | ||||||||||
Abu Dhabi Commercial Bank | 560,791 | 1,168 | ||||||||
Air Arabia | 4,346,616 | 1,659 | ||||||||
Emaar Properties | 2,127,100 | 3,752 | ||||||||
Union National Bank | 145,237 | 243 | ||||||||
|
| |||||||||
| 6,822 | ||||||||||
|
| |||||||||
United Kingdom — 0.4% | ||||||||||
Anglo American ADR | 80,640 | 332 | ||||||||
SABMiller | 83,755 | 4,733 | ||||||||
|
| |||||||||
| 5,065 | ||||||||||
|
| |||||||||
United States — 0.2% | ||||||||||
Bizlink Holding | 251,596 | 1,100 | ||||||||
Freeport-McMoRan (A) | 122,190 | 1,184 | ||||||||
PriceSmart | 9,313 | 720 | ||||||||
|
| |||||||||
| 3,004 | ||||||||||
|
| |||||||||
Total Common Stock |
| 1,242,501 | ||||||||
|
| |||||||||
EXCHANGE TRADED FUNDS — 3.9% |
| |||||||||
United States — 3.9% |
| |||||||||
iPath MSCI India Index ETN | 127,879 | 8,463 | ||||||||
iShares MSCI Emerging Markets ETF | 1,153,591 | 37,815 | ||||||||
iShares MSCI India ETF | 295,900 | 8,454 | ||||||||
|
| |||||||||
Total Exchange Traded Funds (Cost $55,368) ($ Thousands) | 54,732 | |||||||||
|
| |||||||||
PARTICIPATION NOTES — 2.2% |
| |||||||||
India — 1.0% | ||||||||||
Axis Bank, Expires 06/13/18 | 333,372 | 2,521 | ||||||||
Dr Reddy’s Laboratories, Expires 11/02/18 | 33,600 | 2,134 | ||||||||
IRB Infrastructure Developers, Expires 06/25/20 | 701,669 | 2,541 | ||||||||
State Bank of India, Expires 05/31/18 | 545,966 | 1,976 | ||||||||
Tata Motors, Expires 06/25/20 | 516,839 | 2,355 | ||||||||
UPL, Expires 03/18/19 | 193,100 | 1,351 | ||||||||
Zee Entertainment Enterprises, Expires 09/03/19* | 124,429 | 745 | ||||||||
|
| |||||||||
| 13,623 | ||||||||||
|
| |||||||||
China — 0.7% | ||||||||||
China Vanke, Expires 06/29/20* | 2,194,200 | 4,390 | ||||||||
Fuyao Glass Industry Group, Expires 11/25/15 | 612,428 | 1,138 | ||||||||
| Description | Number Of Participation Notes/Shares | Market Value ($ Thousands) | ||||||||
Hangzhou Hikvision Digital Technology, Expires 06/29/20 | 443,800 | $ | 2,273 | |||||||
Huangshan Tourism Development, Expires 12/09/19 | 221,034 | 661 | ||||||||
Wuliangye Yibin, Expires 06/29/20* | 125,600 | 508 | ||||||||
|
| |||||||||
| 8,970 | ||||||||||
|
| |||||||||
Switzerland — 0.2% | ||||||||||
CITIC Securities, Expires 10/22/19* | 499,527 | 1,066 | ||||||||
Qingdao Haier, Expires 10/22/19* | 1,545,758 | 2,202 | ||||||||
|
| |||||||||
| 3,268 | ||||||||||
|
| |||||||||
United Kingdom — 0.1% | ||||||||||
Mouswat Medical, Expires 03/05/18* | 33,231 | 1,079 | ||||||||
|
| |||||||||
Kuwait — 0.1% | ||||||||||
National Bank of Kuwait, Expires 03/24/16 | 366,010 | 979 | ||||||||
|
| |||||||||
Saudi Arabia — 0.1% | ||||||||||
Al Tayyar, Expires 03/05/18 | 43,600 | 878 | ||||||||
Bupa Arabia, Expires 10/10/16* | 8,114 | 535 | ||||||||
Bupa Arabia, Expires 04/05/17 | 5,386 | 359 | ||||||||
|
| |||||||||
| 1,772 | ||||||||||
|
| |||||||||
Vietnam — 0.0% | ||||||||||
Hoa Phat Group JSC, Expires 07/24/18* | 377,200 | 505 | ||||||||
|
| |||||||||
Total Participation Notes (Cost $37,770) ($ Thousands) | 30,196 | |||||||||
|
| |||||||||
PREFERRED STOCK — 1.2% |
| |||||||||
Brazil — 1.0% | ||||||||||
Banco Bradesco | 356,400 | 1,907 | ||||||||
Banco do Estado do Rio Grande do Sul | 183,500 | 260 | ||||||||
Braskem | 90,300 | 380 | ||||||||
Cia Energetica de Sao Paulo, Cl B | 103,700 | 396 | ||||||||
Cia Paranaense de Energia | 77,500 | 637 | ||||||||
Itau Unibanco Holding | 621,006 | 4,106 | ||||||||
Itau Unibanco Holding ADR | 440,104 | 2,914 | ||||||||
Itausa - Investimentos Itau | 44,977 | 81 | ||||||||
Metalurgica Gerdau, Cl A | 369,960 | 272 | ||||||||
Petroleo Brasileiro ADR, Cl A* | 235,300 | 866 | ||||||||
Suzano Papel e Celulose, Cl A | 208,800 | 1,006 | ||||||||
Vale, Cl A | 244,900 | 818 | ||||||||
|
| |||||||||
| 13,643 | ||||||||||
|
| |||||||||
Colombia — 0.0% | ||||||||||
Banco Davivienda | 67,371 | 523 | ||||||||
|
| |||||||||
| SEI Institutional International Trust / Annual Report / September 30, 2015 | 27 |
SCHEDULE OF INVESTMENTS
Emerging Markets Equity Fund (Concluded)
September 30, 2015
| Description | Shares/Number Of (Thousands) | Market Value ($ Thousands) | ||||||||||
South Korea — 0.2% | ||||||||||||
Samsung Electronics | 2,503 | $ | 1,946 | |||||||||
|
| |||||||||||
Total Preferred Stock (Cost $35,480) ($ Thousands) | 16,112 | |||||||||||
|
| |||||||||||
RIGHTS — 0.0% | ||||||||||||
Taiwan — 0.0% | ||||||||||||
Pchome Online, | 6 | 3 | ||||||||||
|
| |||||||||||
Total Rights | 3 | |||||||||||
|
| |||||||||||
DEBENTURE BOND — 0.0% |
| |||||||||||
Brazil — 0.0% | ||||||||||||
Vale, Ser 1997 | ||||||||||||
0.000%, 09/30/2049 (E) | BRL | 8 | — | |||||||||
|
| |||||||||||
Total Debenture Bond | — | |||||||||||
|
| |||||||||||
AFFILIATED PARTNERSHIP — 9.8% |
| |||||||||||
SEI Liquidity Fund, L.P. | ||||||||||||
0.050%†** (F) | 135,644,659 | 135,645 | ||||||||||
|
| |||||||||||
Total Affiliated Partnership |
| 135,645 | ||||||||||
|
| |||||||||||
CASH EQUIVALENT — 0.9% |
| |||||||||||
SEI Daily Income Trust, Prime Obligation Fund, Cl A |
| |||||||||||
0.030%†** |
| 12,202,592 | 12,203 | |||||||||
|
| |||||||||||
Total Cash Equivalent |
| 12,203 | ||||||||||
|
| |||||||||||
TIME DEPOSITS — 2.2% |
| |||||||||||
Brown Brothers Harriman | ||||||||||||
5.750%, 10/01/2015 | ZAR | 560 | 40 | |||||||||
0.154%, 10/01/2015 | NOK | — | — | |||||||||
0.100%, 10/01/2015 | SGD | — | — | |||||||||
0.058%, 10/01/2015 | CAD | 22 | 17 | |||||||||
0.057%, 10/01/2015 | GBP | — | — | |||||||||
0.030%, 10/01/2015 | 29,756 | 29,756 | ||||||||||
0.005%, 10/01/2015 | HKD | 5,352 | 691 | |||||||||
(0.238)%, 10/01/2015 | EUR | 49 | 54 | |||||||||
(0.733)%, 10/01/2015 | SEK | — | — | |||||||||
|
| |||||||||||
Total Time Deposits |
| 30,558 | ||||||||||
|
| |||||||||||
Total Investments — 109.8% |
| $ | 1,521,950 | |||||||||
|
| |||||||||||
Percentages are based on a Net Assets of $1,386,630 ($ Thousands).
| * | Non-income producing security. |
| ** | Rate shown is the 7-day effective yield as of September 30, 2015. |
| † | Investment in Affiliated Security. |
| (1) | In U.S. dollars unless otherwise indicated. |
| (A) | This security or a partial position of this security is on loan at September 30, 2015. The total market value of securities on loan at September 30, 2015 was $131,380 ($ Thousands). |
| (B) | Security fair valued using methods determined in good faith by the Valuation Committee of the Board of Trustees. The total market value of such securities as of September 30, 2015 was $222 ($ Thousands) and represented 0.0% of Net Assets. |
| (C) | Securities sold within terms of a private placement memorandum, exempt from registration under Section 144A of the Securities Act of 1933, as amended, and may be sold only to dealers in that program or other “accredited investors.” These securities have been determined to be liquid under guidelines established by the Board of Trustees. |
| (D) | Real Estate Investment Trust. |
| (E) | Variable Rate Security — The rate reported on the Schedule of Investments is the rate in effect as of September 30, 2015. |
| (F) | This security was purchased with cash collateral held from securities on loan. The total value of such securities as of September 30, 2015 was $135,645 ($ Thousands). |
ADR — American Depositary Receipt
BRL — Brazilian Real
CAD — Canadian Dollar
Cl — Class
ETF — Exchange Traded Fund
ETN — Exchange Traded Note
EUR — Euro
GBP — British Pound Sterling
GDR — Global Depositary Receipt
HKD — Hong Kong Dollar
L.P. — Limited Partnership
MSCI — Morgan Stanley Capital International
NOK — Norwegian Krone
NVDR — Non-Voting Depositary Receipt
SEK — Swedish Krona
Ser — Series
SGD — Singapore Dollar
ZAR — South African Rand
The following is a list of the level of inputs used as of September 30, 2015, in valuing the Fund’s investments carried at value ($ Thousands):
| Investments in Securities | Level 1 | Level 2 | Level 3(1) | Total | ||||||||||||
Common Stock | $ | 1,242,279 | $ | — | $ | 222 | $ | 1,242,501 | ||||||||
Exchange Traded Funds | 54,732 | — | — | 54,732 | ||||||||||||
Participation Notes | — | 30,196 | — | 30,196 | ||||||||||||
Preferred Stock | 16,112 | — | — | 16,112 | ||||||||||||
Rights | 3 | — | — | 3 | ||||||||||||
Affiliated Partnership | — | 135,645 | — | 135,645 | ||||||||||||
Cash Equivalent | 12,203 | — | — | 12,203 | ||||||||||||
Time Deposits | — | 30,558 | — | 30,558 | ||||||||||||
|
|
|
|
|
|
|
| |||||||||
Total Investments in Securities | $ | 1,325,329 | $ | 196,399 | $ | 222 | $ | 1,521,950 | ||||||||
|
|
|
|
|
|
|
| |||||||||
| (1) | A reconciliation of Level 3 investments is presented when the Fund has a significant amount of Level 3 investments at the beginning and/or end of the period in relation to net assets. |
For the year ended September 30, 2015, there were no transfers between Level 1 and Level 2 assets and liabilities.
For the year ended September 30, 2015, there were no transfers between Level 2 and Level 3 assets and liabilities.
For the year ended September 30, 2015, there were no transfers into Level 3 assets and liabilities.
Amounts designated as “—” are $0 or have been rounded to $0.
The accompanying notes are an integral part of the financial statements.
| 28 | SEI Institutional International Trust / Annual Report / September 30, 2015 |
SCHEDULE OF INVESTMENTS
International Fixed Income Fund
September 30, 2015
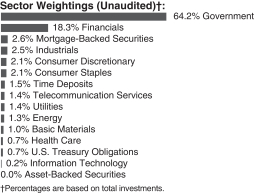
| Description | Face Amount (Thousands) (1) | Market Value ($ Thousands) | ||||||||||
GLOBAL BONDS — 92.8% | ||||||||||||
Australia — 3.2% | ||||||||||||
Aurizon Network MTN | ||||||||||||
2.000%, 09/18/2024 | EUR | 300 | $ | 315 | ||||||||
Australia & New Zealand Banking Group MTN | ||||||||||||
3.625%, 07/18/2022 | EUR | 300 | 397 | |||||||||
Commonwealth Bank of Australia | ||||||||||||
1.375%, 01/22/2019 | EUR | 560 | 647 | |||||||||
Government of Australia | ||||||||||||
4.500%, 04/21/2033 | 135 | 113 | ||||||||||
3.750%, 04/21/2037 | 845 | 641 | ||||||||||
3.250%, 04/21/2025 | 4,590 | 3,394 | ||||||||||
2.750%, 04/21/2024 | 1,785 | 1,272 | ||||||||||
Government of Australia, Ser 122 | ||||||||||||
5.250%, 03/15/2019 | 4,825 | 3,772 | ||||||||||
Government of Australia, Ser 124 | ||||||||||||
5.750%, 05/15/2021 | 5,300 | 4,422 | ||||||||||
Queensland Treasury, Ser 17 | ||||||||||||
6.000%, 09/14/2017 | 780 | 590 | ||||||||||
Westpac Banking MTN | ||||||||||||
1.500%, 03/24/2021 | EUR | 220 | 257 | |||||||||
1.375%, 04/17/2020 | EUR | 230 | 266 | |||||||||
|
| |||||||||||
| 16,086 | ||||||||||||
|
| |||||||||||
Austria — 0.4% | ||||||||||||
Republic of Austria | ||||||||||||
4.150%, 03/15/2037 | 55 | 92 | ||||||||||
3.650%, 04/20/2022 | 290 | 394 | ||||||||||
3.200%, 02/20/2017 | 600 | 701 | ||||||||||
3.150%, 06/20/2044 | 150 | 227 | ||||||||||
1.950%, 06/18/2019 | 280 | 336 | ||||||||||
1.650%, 10/21/2024 | 225 | 271 | ||||||||||
|
| |||||||||||
| 2,021 | ||||||||||||
|
| |||||||||||
Belgium — 0.8% | ||||||||||||
Kingdom of Belgium | ||||||||||||
3.750%, 06/22/2045 | 338 | 541 | ||||||||||
3.000%, 06/22/2034 | 350 | 479 | ||||||||||
| Description | | Face Amount (Thousands) (1) | | | Market Value ($ Thousands) | | ||||||
1.000%, 06/22/2031 | 710 | $ | 738 | |||||||||
0.800%, 06/22/2025 | 715 | 790 | ||||||||||
Kingdom of Belgium, Ser 44 | ||||||||||||
5.000%, 03/28/2035 | 150 | 262 | ||||||||||
Kingdom of Belgium, Ser 58 | ||||||||||||
3.750%, 09/28/2020 | 496 | 654 | ||||||||||
Kingdom of Belgium, Ser 69 | ||||||||||||
1.250%, 06/22/2018 | 545 | 631 | ||||||||||
|
| |||||||||||
| 4,095 | ||||||||||||
|
| |||||||||||
Brazil — 0.8% | ||||||||||||
Brazil Letras do Tesouro Nacional | ||||||||||||
13.871%, 01/01/2016 (A) | 8,020 | 1,946 | ||||||||||
Brazil Notas do Tesouro Nacional | ||||||||||||
10.000%, 01/01/2017 | 2,800 | 660 | ||||||||||
Brazil Notas do Tesouro Nacional, Serie B | ||||||||||||
6.000%, 08/15/2050 | BRL | 150 | 84 | |||||||||
6.000%, 05/15/2055 | 153 | 89 | ||||||||||
Brazil Notas do Tesouro Nacional, Serie F | ||||||||||||
10.000%, 01/01/2025 | 5,136 | 931 | ||||||||||
Raizen Energy Finance | ||||||||||||
7.000%, 02/01/2017 (B) | USD | 270 | 274 | |||||||||
|
| |||||||||||
| 3,984 | ||||||||||||
|
| |||||||||||
Canada — 4.0% | ||||||||||||
Bank of Nova Scotia MTN | ||||||||||||
0.750%, 09/17/2021 | 570 | 641 | ||||||||||
Bell Canada MTN | ||||||||||||
5.000%, 02/15/2017 | 270 | 211 | ||||||||||
4.700%, 09/11/2023 | 80 | 66 | ||||||||||
3.350%, 06/18/2019 | 29 | 23 | ||||||||||
3.250%, 06/17/2020 | 95 | 73 | ||||||||||
Bombardier | ||||||||||||
6.000%, 10/15/2022 (B) | USD | 210 | 156 | |||||||||
Canada Housing Trust No. 1 | ||||||||||||
4.100%, 12/15/2018 | 1,390 | 1,138 | ||||||||||
1.700%, 12/15/2017 | 1,065 | 810 | ||||||||||
CDP Financial | ||||||||||||
4.400%, 11/25/2019 (B) | USD | 850 | 934 | |||||||||
Government of Canada | ||||||||||||
5.750%, 06/01/2033 | 900 | 1,038 | ||||||||||
5.000%, 06/01/2037 | 1,300 | 1,440 | ||||||||||
4.250%, 12/01/2021 | 612 | 588 | ||||||||||
4.000%, 06/01/2041 | 1,035 | 1,039 | ||||||||||
3.500%, 12/01/2045 | 85 | 81 | ||||||||||
2.500%, 06/01/2024 | 1,425 | 1,164 | ||||||||||
2.000%, 06/01/2016 | 1,595 | 1,201 | ||||||||||
1.750%, 09/01/2019 | 1,000 | 777 | ||||||||||
1.500%, 09/01/2017 | 1,945 | 1,477 | ||||||||||
Muskrat Falls | ||||||||||||
3.630%, 06/01/2029 | 340 | 291 | ||||||||||
National Bank of Canada | ||||||||||||
1.500%, 03/25/2021 | EUR | 567 | 665 | |||||||||
| SEI Institutional International Trust / Annual Report / September 30, 2015 | 29 |
SCHEDULE OF INVESTMENTS
International Fixed Income Fund (Continued)
September 30, 2015
| Description | | Face Amount (Thousands) (1) | | | Market Value ($ Thousands) | | ||||||
NOVA Chemicals | ||||||||||||
5.250%, 08/01/2023 (B) | USD | 150 | $ | 145 | ||||||||
Province of British Columbia | ||||||||||||
3.250%, 12/18/2021 | 1,150 | 933 | ||||||||||
2.250%, 03/01/2019 | 575 | 445 | ||||||||||
Province of Manitoba Canada | ||||||||||||
3.850%, 12/01/2021 | 710 | 591 | ||||||||||
Province of Ontario Canada | ||||||||||||
3.500%, 06/02/2024 | 1,200 | 979 | ||||||||||
3.450%, 06/02/2045 | 245 | 187 | ||||||||||
3.150%, 06/02/2022 | 2,000 | 1,605 | ||||||||||
Province of Quebec Canada | ||||||||||||
3.500%, 12/01/2045 | 145 | 110 | ||||||||||
3.000%, 09/01/2023 | 500 | 395 | ||||||||||
Quebecor Media | ||||||||||||
5.750%, 01/15/2023 | USD | 128 | 126 | |||||||||
Rogers Communications | ||||||||||||
4.000%, 06/06/2022 | 165 | 130 | ||||||||||
Teck Resources | ||||||||||||
4.500%, 01/15/2021 | 305 | 206 | ||||||||||
Yamana Gold | ||||||||||||
4.950%, 07/15/2024 | USD | 324 | 289 | |||||||||
|
| |||||||||||
| 19,954 | ||||||||||||
|
| |||||||||||
China — 0.1% | ||||||||||||
Tencent Holdings MTN | ||||||||||||
3.375%, 05/02/2019 (B) | USD | 390 | 397 | |||||||||
|
| |||||||||||
Colombia — 0.0% | ||||||||||||
Ecopetrol | ||||||||||||
7.375%, 09/18/2043 | 121 | 111 | ||||||||||
5.875%, 05/28/2045 | USD | 109 | 83 | |||||||||
|
| |||||||||||
| 194 | ||||||||||||
|
| |||||||||||
Czech Republic — 0.1% | ||||||||||||
Government of Czech Republic | ||||||||||||
4.700%, 09/12/2022 | 1,500 | 81 | ||||||||||
3.875%, 05/24/2022 | EUR | 50 | 67 | |||||||||
Government of Czech Republic, Ser 51 | ||||||||||||
4.000%, 04/11/2017 | 8,050 | 352 | ||||||||||
|
| |||||||||||
| 500 | ||||||||||||
|
| |||||||||||
Denmark — 1.3% | ||||||||||||
Danske Bank | ||||||||||||
5.375%, 09/29/2021 (C) | GBP | 170 | 270 | |||||||||
3.875%, 10/04/2023 (C) | EUR | 150 | 177 | |||||||||
3.500%, 04/16/2018 | EUR | 155 | 188 | |||||||||
DONG Energy MTN | ||||||||||||
5.750%, 04/09/2040 | GBP | 200 | 361 | |||||||||
Kingdom of Denmark | ||||||||||||
4.500%, 11/15/2039 | 1,300 | 319 | ||||||||||
4.000%, 11/15/2017 | 1,600 | 260 | ||||||||||
3.000%, 11/15/2021 | 21,800 | 3,778 | ||||||||||
1.500%, 11/15/2023 | 670 | 108 | ||||||||||
| Description | Face Amount (Thousands) (1) | Market Value ($ Thousands) | ||||||||||
0.100%, 11/15/2023 | 5,840 | $ | 899 | |||||||||
|
| |||||||||||
| 6,360 | ||||||||||||
|
| |||||||||||
Finland — 0.3% | ||||||||||||
Elisa MTN | ||||||||||||
2.250%, 10/04/2019 | 300 | 352 | ||||||||||
Government of Finland | ||||||||||||
2.625%, 07/04/2042 | 55 | 78 | ||||||||||
1.500%, 04/15/2023 | 340 | 407 | ||||||||||
Nordea Bank Finland MTN | ||||||||||||
2.375%, 07/17/2017 | 190 | 221 | ||||||||||
2.250%, 05/03/2019 | 170 | 204 | ||||||||||
|
| |||||||||||
| 1,262 | ||||||||||||
|
| |||||||||||
France — 7.5% | ||||||||||||
ALD International MTN | ||||||||||||
2.000%, 05/26/2017 | 500 | 570 | ||||||||||
Arkema MTN | ||||||||||||
3.850%, 04/30/2020 | 200 | 251 | ||||||||||
1.500%, 01/20/2025 | 300 | 318 | ||||||||||
AXA MTN | ||||||||||||
5.625%, 01/16/2054 (C) | GBP | 302 | 451 | |||||||||
BNP Paribas | ||||||||||||
5.019%, 12/31/2049 (C) | 100 | 115 | ||||||||||
4.730%, 04/12/2049 (C) | 200 | 225 | ||||||||||
BNP Paribas Home Loan SFH MTN | ||||||||||||
3.125%, 03/22/2022 | 200 | 261 | ||||||||||
BPCE MTN | ||||||||||||
6.117%, 10/29/2049 (C) | 150 | 180 | ||||||||||
5.250%, 04/16/2029 | GBP | 100 | 157 | |||||||||
4.500%, 03/15/2025 (B) | USD | 215 | 207 | |||||||||
1.375%, 05/22/2019 | 200 | 228 | ||||||||||
BPCE SFH | ||||||||||||
1.750%, 11/29/2019 | 600 | 713 | ||||||||||
Bureau Veritas | ||||||||||||
3.125%, 01/21/2021 | 100 | 119 | ||||||||||
Caisse Centrale du Credit Immobilier de France MTN | ||||||||||||
1.125%, 04/22/2019 | 100 | 115 | ||||||||||
Caisse de Refinancement de l’Habitat | ||||||||||||
3.750%, 12/12/2016 | 400 | 467 | ||||||||||
3.500%, 04/25/2017 | 350 | 412 | ||||||||||
Caisse Francaise de Financement Local MTN | ||||||||||||
4.875%, 07/03/2017 | 220 | 267 | ||||||||||
3.750%, 05/18/2016 | 225 | 257 | ||||||||||
3.625%, 02/26/2018 | 63 | 76 | ||||||||||
Christian Dior | ||||||||||||
1.375%, 06/19/2019 | 300 | 340 | ||||||||||
Credit Agricole MTN | ||||||||||||
6.637%, 05/29/2049 (C) | 335 | 343 | ||||||||||
0.875%, 01/19/2022 | 600 | 646 | ||||||||||
| 30 | SEI Institutional International Trust / Annual Report / September 30, 2015 |
| Description | Face Amount (Thousands) (1) | Market Value ($ Thousands) | ||||||||||
Credit Agricole Home Loan SFH MTN | ||||||||||||
3.250%, 03/23/2017 | 100 | $ | 117 | |||||||||
2.875%, 09/09/2016 | 300 | 344 | ||||||||||
Dexia Credit Local MTN | ||||||||||||
2.000%, 01/22/2021 | 200 | 241 | ||||||||||
1.625%, 10/29/2018 | 565 | 658 | ||||||||||
1.375%, 09/18/2019 | 500 | 581 | ||||||||||
0.625%, 01/21/2022 | 1,550 | 1,727 | ||||||||||
Electricite de France MTN | ||||||||||||
6.500%, 01/26/2019 (B) | USD | 250 | 287 | |||||||||
5.375%, 12/12/2049 (C) | 100 | 115 | ||||||||||
4.500%, 11/12/2040 | 250 | 344 | ||||||||||
Ephios Bondco | ||||||||||||
6.250%, 07/01/2022 (B) | 160 | 178 | ||||||||||
France Government Bond OAT | ||||||||||||
0.500%, 05/25/2025 (E) | 5,605 | 6,027 | ||||||||||
French Treasury Note | ||||||||||||
1.000%, 07/25/2017 | 850 | 969 | ||||||||||
Government of France | ||||||||||||
4.750%, 04/25/2035 | 85 | 144 | ||||||||||
4.500%, 04/25/2041 | 220 | 383 | ||||||||||
4.000%, 10/25/2038 | 285 | 454 | ||||||||||
3.250%, 05/25/2045 | 1,205 | 1,759 | ||||||||||
2.500%, 05/25/2030 | 1,875 | 2,394 | ||||||||||
2.250%, 05/25/2024 | 1,515 | 1,909 | ||||||||||
1.000%, 05/25/2019 | 1,280 | 1,481 | ||||||||||
0.500%, 11/25/2019 | 2,040 | 2,319 | ||||||||||
HSBC SFH France MTN | ||||||||||||
2.000%, 10/16/2023 | 700 | 858 | ||||||||||
Iliand | ||||||||||||
4.875%, 06/01/2016 | 300 | 343 | ||||||||||
Infra Foch | ||||||||||||
2.125%, 04/16/2025 | 1,000 | 1,103 | ||||||||||
Klepierre MTN | ||||||||||||
1.000%, 04/17/2023 (D) | 100 | 106 | ||||||||||
Lafarge MTN | ||||||||||||
4.750%, 03/23/2020 | 195 | 248 | ||||||||||
Orange MTN | ||||||||||||
5.000%, 10/20/2049 (C) | 130 | 142 | ||||||||||
Publicis Groupe | ||||||||||||
1.125%, 12/16/2021 | 600 | 662 | ||||||||||
RCI Banque MTN | ||||||||||||
5.625%, 10/05/2015 | 500 | 558 | ||||||||||
Renault MTN | ||||||||||||
3.625%, 09/19/2018 | 450 | 533 | ||||||||||
Sanofi MTN | ||||||||||||
2.500%, 11/14/2023 | 200 | 243 | ||||||||||
Societe Generale | ||||||||||||
5.922%, 04/05/2017 (B) (C) | 180 | 182 | ||||||||||
5.750%, 04/20/2016 (B) | USD | 111 | 114 | |||||||||
3.875%, 12/17/2015 | GBP | 100 | 152 | |||||||||
Societe Generale SFH MTN | ||||||||||||
3.250%, 06/06/2016 | 400 | 456 | ||||||||||
Unibail-Rodamco MTN | ||||||||||||
2.375%, 02/25/2021 (D) | 500 | 595 | ||||||||||
| Description | Face Amount (Thousands) (1) | Market Value ($ Thousands) | ||||||||||
Veolia Environnement MTN | ||||||||||||
4.625%, 03/30/2027 | 200 | $ | 282 | |||||||||
Wendel | ||||||||||||
5.875%, 09/17/2019 | 800 | 1,047 | ||||||||||
2.500%, 02/09/2027 | 300 | 308 | ||||||||||
|
| |||||||||||
| 37,081 | ||||||||||||
|
| |||||||||||
Germany — 7.6% | ||||||||||||
Allianz | ||||||||||||
2.241%, 07/07/2045 (C) | 500 | 504 | ||||||||||
Bundesobligation | ||||||||||||
0.500%, 02/23/2018 | 850 | 966 | ||||||||||
0.000%, 04/17/2020 | 2,230 | 2,497 | ||||||||||
Bundesrepublik Deutschland | ||||||||||||
6.250%, 01/04/2030 | 770 | 1,479 | ||||||||||
4.750%, 09/20/2033 | 300 | 496 | ||||||||||
4.000%, 01/04/2037 | 210 | 357 | ||||||||||
2.500%, 07/04/2044 | 390 | 561 | ||||||||||
2.500%, 08/15/2046 | 200 | 289 | ||||||||||
2.250%, 09/04/2021 | 100 | 126 | ||||||||||
1.500%, 09/04/2022 | 720 | 875 | ||||||||||
1.500%, 05/15/2024 | 800 | 976 | ||||||||||
1.000%, 08/15/2025 | 310 | 360 | ||||||||||
0.500%, 02/15/2025 | 2,059 | 2,292 | ||||||||||
Bundesrepublik Deutschland, Ser 03 | ||||||||||||
4.750%, 07/04/2034 | 630 | 1,137 | ||||||||||
Bundesrepublik Deutschland, Ser 08 | ||||||||||||
4.250%, 07/04/2018 | 835 | 1,047 | ||||||||||
Bundesschatzanweisungen | ||||||||||||
0.000%, 12/11/2015 | 11,000 | 12,284 | ||||||||||
Continental MTN | ||||||||||||
3.125%, 09/09/2020 | 600 | 725 | ||||||||||
Deutsche Annington Finance MTN | ||||||||||||
2.125%, 07/09/2022 | 177 | 199 | ||||||||||
Deutsche Bank | ||||||||||||
1.250%, 09/08/2021 | 1,000 | 1,102 | ||||||||||
Deutsche Bundesrepublik Inflation Linked Bond | ||||||||||||
0.100%, 04/15/2023 | 1,239 | 1,449 | ||||||||||
Deutsche Telekom International Finance MTN | ||||||||||||
7.375%, 12/04/2019 | GBP | 200 | 366 | |||||||||
E.ON International Finance MTN | ||||||||||||
6.000%, 10/30/2019 | GBP | 300 | 511 | |||||||||
FMS Wertmanagement | ||||||||||||
1.125%, 12/07/2016 | 600 | 911 | ||||||||||
Grand City Properties | ||||||||||||
1.500%, 04/17/2025 | 1,400 | 1,393 | ||||||||||
Infineon Technologies | ||||||||||||
1.000%, 09/10/2018 | 100 | 111 | ||||||||||
KFW | ||||||||||||
3.875%, 01/21/2019 | 575 | 725 | ||||||||||
3.375%, 08/30/2017 | CHF | 370 | 408 | |||||||||
| SEI Institutional International Trust / Annual Report / September 30, 2015 | 31 |
SCHEDULE OF INVESTMENTS
International Fixed Income Fund (Continued)
September 30, 2015
| Description | Face Amount (Thousands) (1) | Market Value ($ Thousands) | ||||||||||
Linde Finance MTN | ||||||||||||
3.875%, 06/01/2021 | 450 | $ | 589 | |||||||||
Muenchener Rueckversicherungs MTN | ||||||||||||
6.250%, 05/26/2042 (C) | 200 | 267 | ||||||||||
ProSiebenSat.1 Media | ||||||||||||
2.625%, 04/15/2021 | 300 | 343 | ||||||||||
RWE Finance MTN | ||||||||||||
6.500%, 08/10/2021 | 120 | 167 | ||||||||||
Vier Gas Transport GmbH MTN | ||||||||||||
2.875%, 06/12/2025 | 200 | 244 | ||||||||||
Volkswagen Financial Services MTN | ||||||||||||
1.750%, 08/21/2017 | 230 | 339 | ||||||||||
Wuerth Finance International MTN | ||||||||||||
1.750%, 05/21/2020 | 150 | 175 | ||||||||||
1.000%, 05/19/2022 | 500 | 556 | ||||||||||
ZF North America Capital | ||||||||||||
4.000%, 04/29/2020 (B) | 180 | 171 | ||||||||||
|
| |||||||||||
| 36,997 | ||||||||||||
|
| |||||||||||
Hong Kong — 0.2% | ||||||||||||
Hutchison Whampoa Finance 14 | ||||||||||||
1.375%, 10/31/2021 | EUR | 935 | 1,027 | |||||||||
|
| |||||||||||
Indonesia — 0.2% | ||||||||||||
Indonesia Government International Bond MTN | ||||||||||||
2.875%, 07/08/2021 | 730 | 780 | ||||||||||
|
| |||||||||||
Ireland — 1.7% | ||||||||||||
AIB Mortgage Bank MTN | ||||||||||||
2.625%, 07/29/2016 | 400 | 455 | ||||||||||
Bank of Ireland MTN | ||||||||||||
4.250%, 06/11/2024 (C) | 800 | 903 | ||||||||||
Bank of Ireland Mortgage Bank | ||||||||||||
1.750%, 03/19/2019 | 450 | 526 | ||||||||||
Ireland Government Bond | ||||||||||||
5.400%, 03/13/2025 | 1,008 | 1,539 | ||||||||||
4.500%, 10/18/2018 | 345 | 438 | ||||||||||
4.500%, 04/18/2020 | 450 | 598 | ||||||||||
3.400%, 03/18/2024 | 1,035 | 1,373 | ||||||||||
2.400%, 05/15/2030 | 680 | 822 | ||||||||||
2.000%, 02/18/2045 | 950 | 1,010 | ||||||||||
0.800%, 03/15/2022 | 300 | 338 | ||||||||||
|
| |||||||||||
| 8,002 | ||||||||||||
|
| |||||||||||
Israel — 0.0% | ||||||||||||
Israel Government Bond | ||||||||||||
4.250%, 03/31/2023 | 750 | 229 | ||||||||||
|
| |||||||||||
Italy — 7.0% | ||||||||||||
Assicurazioni Generali MTN | ||||||||||||
7.750%, 12/12/2042 (C) | 300 | 393 | ||||||||||
| Description | Face Amount (Thousands) (1) | Market Value ($ Thousands) | ||||||||||
Banca Monte dei Paschi di Siena | ||||||||||||
5.000%, 02/09/2018 | 230 | $ | 284 | |||||||||
4.875%, 09/15/2016 | 700 | 813 | ||||||||||
Banco Popolare SC MTN | ||||||||||||
3.500%, 03/14/2019 | 350 | 398 | ||||||||||
Buoni Poliennali Del Tesoro | ||||||||||||
4.000%, 02/01/2037 | 450 | 617 | ||||||||||
Edison MTN | ||||||||||||
3.875%, 11/10/2017 | 600 | 716 | ||||||||||
Eni MTN | ||||||||||||
3.625%, 01/29/2029 | 600 | 755 | ||||||||||
FCA Capital Ireland MTN | ||||||||||||
2.875%, 01/26/2018 | 210 | 241 | ||||||||||
2.625%, 04/17/2019 | 350 | 400 | ||||||||||
Intesa Sanpaolo MTN | ||||||||||||
5.250%, 01/12/2024 | USD | 375 | 400 | |||||||||
5.017%, 06/26/2024 (B) | USD | 200 | 197 | |||||||||
4.000%, 11/09/2017 | 368 | 438 | ||||||||||
3.928%, 09/15/2026 | 550 | 616 | ||||||||||
1.125%, 03/04/2022 | 200 | 211 | ||||||||||
Italy Buoni Poliennali Del Tesoro | ||||||||||||
5.500%, 09/01/2022 | 400 | 570 | ||||||||||
5.500%, 11/01/2022 | 1,325 | 1,891 | ||||||||||
5.000%, 08/01/2034 | 1,575 | 2,421 | ||||||||||
4.750%, 09/01/2021 | 3,250 | 4,388 | ||||||||||
4.750%, 08/01/2023 | 542 | 751 | ||||||||||
4.750%, 09/01/2044 | 300 | 465 | ||||||||||
4.500%, 05/01/2023 | 1,130 | 1,538 | ||||||||||
4.500%, 03/01/2024 | 1,750 | 2,398 | ||||||||||
4.000%, 09/01/2020 | 1,555 | 2,003 | ||||||||||
3.750%, 05/01/2021 | 561 | 720 | ||||||||||
3.750%, 09/01/2024 | 1,265 | 1,655 | ||||||||||
3.500%, 03/01/2030 | 1,290 | 1,669 | ||||||||||
2.600%, 09/15/2023 | 968 | 1,244 | ||||||||||
2.500%, 12/01/2024 | 200 | 239 | ||||||||||
1.500%, 08/01/2019 | 1,955 | 2,259 | ||||||||||
1.350%, 04/15/2022 | 1,707 | 1,921 | ||||||||||
1.150%, 05/15/2017 | 2,135 | 2,423 | ||||||||||
|
| |||||||||||
| 35,034 | ||||||||||||
|
| |||||||||||
Japan — 20.1% | ||||||||||||
Government of Japan | ||||||||||||
0.100%, 09/10/2024 | 330,000 | 2,927 | ||||||||||
Government of Japan 10 Year Bond | ||||||||||||
0.800%, 09/20/2023 | 820,350 | 7,181 | ||||||||||
0.600%, 03/20/2024 | 684,000 | 5,889 | ||||||||||
0.400%, 06/20/2025 | 300,000 | 2,522 | ||||||||||
0.300%, 12/20/2024 | 83,700 | 700 | ||||||||||
Government of Japan 10 Year Bond, Ser 301 | ||||||||||||
1.500%, 06/20/2019 | 85,300 | 751 | ||||||||||
Government of Japan 10 Year Bond, Ser 308 | ||||||||||||
1.300%, 06/20/2020 | 295,600 | 2,612 | ||||||||||
| 32 | SEI Institutional International Trust / Annual Report / September 30, 2015 |
| Description | Face Amount (Thousands) (1) | Market Value ($ Thousands) | ||||||||
Government of Japan 10 Year Bond, Ser 313 | ||||||||||
1.300%, 03/20/2021 | 750,000 | $ | 6,681 | |||||||
Government of Japan 10 Year Bond, Ser 314 | ||||||||||
1.100%, 03/20/2021 | 157,700 | 1,390 | ||||||||
Government of Japan 20 Year Bond | ||||||||||
1.700%, 06/20/2033 | 444,850 | 4,166 | ||||||||
1.400%, 09/20/2034 | 525,000 | 4,648 | ||||||||
Government of Japan 20 Year Bond, Ser 106 | ||||||||||
2.200%, 09/20/2028 | 110,900 | 1,114 | ||||||||
Government of Japan 20 Year Bond, Ser 112 | ||||||||||
2.100%, 06/20/2029 | 249,200 | 2,482 | ||||||||
Government of Japan 20 Year Bond, Ser 128 | ||||||||||
1.900%, 06/20/2031 | 55,000 | 535 | ||||||||
Government of Japan 20 Year Bond, Ser 140 | ||||||||||
1.700%, 09/20/2032 | 34,850 | 328 | ||||||||
Government of Japan 20 Year Bond, Ser 143 | ||||||||||
1.600%, 03/20/2033 | 298,400 | 2,761 | ||||||||
Government of Japan 20 Year Bond, Ser 144 | ||||||||||
1.500%, 03/20/2033 | 146,650 | 1,337 | ||||||||
Government of Japan 20 Year Bond, Ser 55 | ||||||||||
2.000%, 03/21/2022 | 107,000 | 1,004 | ||||||||
Government of Japan 20 Year Bond, Ser 99 | ||||||||||
2.100%, 12/20/2027 | 395,100 | 3,916 | ||||||||
Government of Japan 30 Year Bond, Ser 30 | ||||||||||
2.300%, 03/20/2039 | 322,500 | 3,255 | ||||||||
Government of Japan 30 Year Bond, Ser 33 | ||||||||||
2.000%, 09/20/2040 | 827,000 | 7,933 | ||||||||
Government of Japan 30 Year Bond, Ser 34 | ||||||||||
2.200%, 03/20/2041 | 55,700 | 554 | ||||||||
Government of Japan 30 Year Bond, Ser 36 | ||||||||||
2.000%, 03/20/2042 | 94,450 | 906 | ||||||||
Government of Japan 30 Year Bond, Ser 38 | ||||||||||
1.800%, 03/20/2043 | 271,650 | 2,503 | ||||||||
Government of Japan 30 Year Bond, Ser 44 | ||||||||||
1.700%, 09/20/2044 | 141,000 | 1,269 | ||||||||
Government of Japan 40 Year Bond, Ser 6 | ||||||||||
1.900%, 03/20/2053 | 20,000 | 187 | ||||||||
| Description | Face Amount (Thousands) (1) | Market Value ($ Thousands) | ||||||||||
Government of Japan 5 Year Bond | ||||||||||||
0.300%, 09/20/2018 | 1,063,600 | $ | 8,954 | |||||||||
Government of Japan 5 Year Bond, Ser 106 | ||||||||||||
0.200%, 09/20/2017 | 850,000 | 7,122 | ||||||||||
Japan Treasury Discount Bill | ||||||||||||
0.000%, 10/13/2015 (A) | 220,000 | 1,837 | ||||||||||
0.000%, 10/26/2015 (A) | 220,000 | 1,837 | ||||||||||
0.000%, 11/16/2015 (A) | 200,000 | 1,670 | ||||||||||
0.000%, 12/21/2015 (A) | 680,000 | 5,678 | ||||||||||
0.000%, 12/28/2015 (A) | 210,000 | 1,754 | ||||||||||
Mizuho Financial Group Cayman 3 | ||||||||||||
4.600%, 03/27/2024 | USD | 306 | 318 | |||||||||
SMFG Preferred Capital | ||||||||||||
10.231%, 01/25/2029 (C) | GBP | 475 | 1,085 | |||||||||
|
| |||||||||||
| 99,806 | ||||||||||||
|
| |||||||||||
Luxembourg — 0.1% | ||||||||||||
Eurofins Scientific | ||||||||||||
3.375%, 01/30/2023 | 300 | 332 | ||||||||||
2.250%, 01/27/2022 | 200 | 210 | ||||||||||
|
| |||||||||||
| 542 | ||||||||||||
|
| |||||||||||
Malaysia — 0.2% | ||||||||||||
Malaysia Government Bond | ||||||||||||
5.734%, 07/30/2019 | 1,500 | 360 | ||||||||||
3.955%, 09/15/2025 | 1,135 | 254 | ||||||||||
3.418%, 08/15/2022 | 445 | 97 | ||||||||||
|
| |||||||||||
| 711 | ||||||||||||
|
| |||||||||||
Mexico — 0.5% | ||||||||||||
Mexican Bonos | ||||||||||||
8.000%, 06/11/2020 | 12,606 | 830 | ||||||||||
7.750%, 11/13/2042 | 11,690 | 760 | ||||||||||
Mexican Bonos, Ser M | ||||||||||||
6.500%, 06/10/2021 | 5,356 | 331 | ||||||||||
Mexican Bonos, Ser M20 | ||||||||||||
10.000%, 12/05/2024 | 1,941 | 146 | ||||||||||
United Mexican States MTN | ||||||||||||
1.625%, 03/06/2024 | 416 | 431 | ||||||||||
|
| |||||||||||
| 2,498 | ||||||||||||
|
| |||||||||||
Netherlands — 4.4% | ||||||||||||
ABN AMRO Bank MTN | ||||||||||||
6.375%, 04/27/2021 | 245 | 323 | ||||||||||
4.310%, 03/29/2049 (C) | 155 | 173 | ||||||||||
2.875%, 06/30/2025 (C) | 550 | 619 | ||||||||||
Achmea MTN | ||||||||||||
2.500%, 11/19/2020 | 625 | 734 | ||||||||||
Achmea Bank MTN | ||||||||||||
2.750%, 02/18/2021 | 150 | 177 | ||||||||||
Akzo Nobel Sweden Finance MTN | ||||||||||||
2.625%, 07/27/2022 | EUR | 150 | 181 | |||||||||
| SEI Institutional International Trust / Annual Report / September 30, 2015 | 33 |
SCHEDULE OF INVESTMENTS
International Fixed Income Fund (Continued)
September 30, 2015
| Description | Face Amount (Thousands) (1) | Market Value ($ Thousands) | ||||||||||
Akzo Nobel MTN | ||||||||||||
8.000%, 04/06/2016 | GBP | 205 | $ | 321 | ||||||||
ASML Holding | ||||||||||||
3.375%, 09/19/2023 | 450 | 557 | ||||||||||
Bharti Airtel International | ||||||||||||
4.000%, 12/10/2018 | 270 | 320 | ||||||||||
Coco-Cola HBC Finance | ||||||||||||
2.375%, 06/18/2020 | 750 | 876 | ||||||||||
Cooperatieve Centrale Raiffeisen-Boerenleenbank BA | ||||||||||||
6.875%, 03/19/2020 | 300 | 393 | ||||||||||
5.500%, 01/22/2049 (C) | 600 | 666 | ||||||||||
2.500%, 05/26/2026 (C) | 260 | 287 | ||||||||||
Delta Lloyd MTN | ||||||||||||
4.375%, 06/29/2049 (C) | 100 | 94 | ||||||||||
Geberit International | ||||||||||||
0.688%, 03/30/2021 | 1,100 | 1,213 | ||||||||||
Generali Finance MTN | ||||||||||||
4.596%, 11/30/2049 (C) | 550 | 567 | ||||||||||
ING Bank MTN | ||||||||||||
5.800%, 09/25/2023 (B) | USD | 375 | 407 | |||||||||
3.375%, 03/23/2017 | 125 | 147 | ||||||||||
Kingdom of Netherlands | ||||||||||||
5.500%, 01/15/2028 | 295 | 502 | ||||||||||
4.000%, 01/15/2037 | 300 | 503 | ||||||||||
3.750%, 01/15/2042 | 60 | 102 | ||||||||||
2.750%, 01/15/2047 | 2,350 | 3,452 | ||||||||||
2.250%, 07/15/2022 | 610 | 768 | ||||||||||
2.000%, 07/15/2024 | 625 | 780 | ||||||||||
1.750%, 07/15/2023 | 1,890 | 2,312 | ||||||||||
1.250%, 01/15/2019 | 485 | 565 | ||||||||||
0.250%, 01/15/2020 | 340 | 384 | ||||||||||
0.250%, 07/15/2025 | 1,430 | 1,517 | ||||||||||
0.250%, 07/15/2025 | 110 | 117 | ||||||||||
NN Group | ||||||||||||
4.625%, 04/08/2044 (C) | 675 | 748 | ||||||||||
Shell International Finance | ||||||||||||
2.250%, 01/06/2023 | USD | 825 | 788 | |||||||||
2.000%, 11/15/2018 | USD | 560 | 566 | |||||||||
TenneT Holding | ||||||||||||
2.125%, 11/01/2020 | 350 | 416 | ||||||||||
|
| |||||||||||
| 21,575 | ||||||||||||
|
| |||||||||||
New Zealand — 0.2% | ||||||||||||
Government of New Zealand | ||||||||||||
5.500%, 04/15/2023 | 320 | 239 | ||||||||||
3.000%, 04/15/2020 | 590 | 382 | ||||||||||
Westpac Securities MTN | ||||||||||||
0.875%, 06/24/2019 | EUR | 100 | 114 | |||||||||
|
| |||||||||||
| 735 | ||||||||||||
|
| |||||||||||
Norway — 0.4% | ||||||||||||
DNB Bank | ||||||||||||
6.012%, 01/29/2049 (C) | GBP | 150 | 233 | |||||||||
| Description | Face Amount (Thousands) (1) | Market Value ($ Thousands) | ||||||||||
Eksportfinans | ||||||||||||
2.375%, 05/25/2016 | USD | 200 | $ | 200 | ||||||||
Government of Norway | ||||||||||||
4.500%, 05/22/2019 | 2,325 | 310 | ||||||||||
2.000%, 05/24/2023 | 645 | 79 | ||||||||||
Kommunalbanken MTN | ||||||||||||
1.000%, 03/15/2018 (B) | USD | 800 | 799 | |||||||||
SpareBank 1 Boligkreditt MTN | ||||||||||||
2.375%, 11/22/2016 | EUR | 170 | 195 | |||||||||
|
| |||||||||||
| 1,816 | ||||||||||||
|
| |||||||||||
Poland — 0.3% | ||||||||||||
Republic of Poland | ||||||||||||
5.250%, 01/20/2025 | 85 | 126 | ||||||||||
5.125%, 04/21/2021 | USD | 135 | 152 | |||||||||
3.250%, 07/25/2025 | 575 | 156 | ||||||||||
2.500%, 07/25/2018 | 710 | 189 | ||||||||||
Republic of Poland, Ser 1019 | ||||||||||||
5.500%, 10/25/2019 | 670 | 199 | ||||||||||
Republic of Poland, Ser 1021 | ||||||||||||
5.750%, 10/25/2021 | 3,490 | 1,081 | ||||||||||
|
| |||||||||||
| 1,903 | ||||||||||||
|
| |||||||||||
Portugal — 0.3% | ||||||||||||
Caixa Geral de Depositos MTN | ||||||||||||
3.000%, 01/15/2019 | 300 | 363 | ||||||||||
EDP Finance MTN | ||||||||||||
2.625%, 01/18/2022 | 440 | 490 | ||||||||||
Portugal Obrigacoes do Tesouro OT | ||||||||||||
3.875%, 02/15/2030 | 215 | 267 | ||||||||||
|
| |||||||||||
| 1,120 | ||||||||||||
|
| |||||||||||
Romania — 0.0% | ||||||||||||
Romanian Government International Bond MTN | ||||||||||||
4.625%, 09/18/2020 | EUR | 40 | 51 | |||||||||
3.625%, 04/24/2024 | EUR | 20 | 24 | |||||||||
|
| |||||||||||
| 75 | ||||||||||||
|
| |||||||||||
Singapore — 0.2% | ||||||||||||
Government of Singapore | ||||||||||||
4.000%, 09/01/2018 | 495 | 373 | ||||||||||
3.125%, 09/01/2022 | 275 | 203 | ||||||||||
Temasek Financial I MTN | ||||||||||||
2.375%, 01/23/2023 (B) | USD | 495 | 489 | |||||||||
|
| |||||||||||
| 1,065 | ||||||||||||
|
| |||||||||||
Slovak Republic — 0.0% | ||||||||||||
Slovakia Government Bond | ||||||||||||
3.375%, 11/15/2024 | 110 | 151 | ||||||||||
|
| |||||||||||
| 34 | SEI Institutional International Trust / Annual Report / September 30, 2015 |
| Description | Face Amount (Thousands) (1) | Market Value ($ Thousands) | ||||||||
South Africa — 0.3% | ||||||||||
Republic of South Africa | ||||||||||
8.250%, 09/15/2017 | 6,600 | $ | 486 | |||||||
8.000%, 01/31/2030 | 2,820 | 190 | ||||||||
7.750%, 02/28/2023 | 4,095 | 287 | ||||||||
7.000%, 02/28/2031 | 5,005 | 304 | ||||||||
|
| |||||||||
| 1,267 | ||||||||||
|
| |||||||||
South Korea — 0.6% | ||||||||||
Korea Treasury Bond | ||||||||||
4.250%, 06/10/2021 | 1,270,230 | 1,213 | ||||||||
4.000%, 12/10/2031 | 574,090 | 603 | ||||||||
3.750%, 12/10/2033 | 133,450 | 138 | ||||||||
3.500%, 03/10/2024 | 194,510 | 183 | ||||||||
3.250%, 09/10/2018 | 520,990 | 460 | ||||||||
3.000%, 09/10/2024 | 186,630 | 170 | ||||||||
2.750%, 03/10/2018 | 511,230 | 443 | ||||||||
|
| |||||||||
| 3,210 | ||||||||||
|
| |||||||||
Spain — 4.6% | ||||||||||
Banco Popular Espanol | ||||||||||
8.250%, 04/29/2049 (C) | 200 | 214 | ||||||||
4.000%, 10/18/2016 | 100 | 116 | ||||||||
3.750%, 01/22/2019 | 100 | 124 | ||||||||
2.125%, 10/08/2019 | 100 | 118 | ||||||||
Bankia | ||||||||||
4.125%, 03/24/2036 | 350 | 492 | ||||||||
CaixaBank | ||||||||||
0.057%, 01/09/2018 (B) (C) | 200 | 221 | ||||||||
Criteria CaixaHolding MTN | ||||||||||
1.625%, 04/21/2022 | 800 | 830 | ||||||||
Ferrovial Emisiones MTN | ||||||||||
3.375%, 06/07/2021 | 475 | 582 | ||||||||
Fondo de Amortizacion del Deficit Electrico MTN | ||||||||||
4.125%, 03/17/2017 | 200 | 236 | ||||||||
2.250%, 12/17/2016 | 700 | 800 | ||||||||
Government of Spain | ||||||||||
6.000%, 01/31/2029 | 465 | 738 | ||||||||
5.900%, 07/30/2026 | 125 | 192 | ||||||||
5.500%, 07/30/2017 | 315 | 386 | ||||||||
5.500%, 04/30/2021 | 1,980 | 2,738 | ||||||||
4.700%, 07/30/2041 | 1,229 | 1,798 | ||||||||
4.400%, 10/31/2023 | 680 | 916 | ||||||||
4.200%, 01/31/2037 | 475 | 648 | ||||||||
3.800%, 04/30/2024 | 1,000 | 1,297 | ||||||||
3.300%, 07/30/2016 | 2,400 | 2,751 | ||||||||
2.750%, 10/31/2024 | 790 | 951 | ||||||||
1.950%, 07/30/2030 | 1,510 | 1,592 | ||||||||
1.800%, 11/30/2024 | 999 | 1,196 | ||||||||
1.400%, 01/31/2020 | 885 | 1,015 | ||||||||
0.500%, 10/31/2017 | 1,285 | 1,443 | ||||||||
| Description | Face Amount (Thousands) (1) | Market Value ($ Thousands) | ||||||||||
Santander Consumer Finance | ||||||||||||
3.875%, 03/23/2016 | 200 | $ | 227 | |||||||||
Santander International Debt MTN | ||||||||||||
4.625%, 03/21/2016 | 700 | 797 | ||||||||||
Telefonica Emisiones SAU MTN | ||||||||||||
5.375%, 02/02/2018 | 185 | 300 | ||||||||||
5.289%, 12/09/2022 | GBP | 250 | 418 | |||||||||
|
| |||||||||||
| 23,136 | ||||||||||||
|
| |||||||||||
Supra-National — 1.0% | ||||||||||||
European Financial Stability Facility | ||||||||||||
1.625%, 07/17/2020 | EUR | 1,700 | 2,033 | |||||||||
European Investment Bank MTN | ||||||||||||
2.750%, 09/15/2021 | EUR | 1,000 | 1,278 | |||||||||
1.375%, 09/15/2021 | EUR | 575 | 683 | |||||||||
International Bank for Reconstruction & Development MTN | ||||||||||||
1.000%, 12/28/2016 | 600 | 911 | ||||||||||
|
| |||||||||||
| 4,905 | ||||||||||||
|
| |||||||||||
Sweden — 1.0% | ||||||||||||
Kingdom of Sweden | ||||||||||||
3.500%, 03/30/2039 | 260 | 41 | ||||||||||
1.500%, 11/13/2023 | 1,020 | 131 | ||||||||||
Kingdom of Sweden, Ser 1047 | ||||||||||||
5.000%, 12/01/2020 | 3,700 | 554 | ||||||||||
Kingdom of Sweden, Ser 1052 | ||||||||||||
4.250%, 03/12/2019 | 5,275 | 726 | ||||||||||
Kingdom of Sweden, Ser 1054 | ||||||||||||
3.500%, 06/01/2022 | 3,535 | 510 | ||||||||||
Nordea Bank MTN | ||||||||||||
4.500%, 03/26/2020 | EUR | 225 | 283 | |||||||||
4.000%, 03/29/2021 | EUR | 255 | 318 | |||||||||
Skandinaviska Enskilda Banken MTN | ||||||||||||
1.875%, 11/14/2019 | EUR | 175 | 204 | |||||||||
Stadshypotek MTN | ||||||||||||
4.250%, 10/10/2017 | 600 | 434 | ||||||||||
Svenska Handelsbanken | ||||||||||||
2.656%, 01/15/2024 (C) | EUR | 651 | 745 | |||||||||
Swedbank Hypotek MTN | ||||||||||||
1.125%, 05/21/2021 | 600 | 692 | ||||||||||
Sweden Government Bond | ||||||||||||
2.500%, 05/12/2025 | 1,345 | 187 | ||||||||||
Vattenfall | ||||||||||||
3.000%, 03/19/2077 (C) | 175 | 146 | ||||||||||
|
| |||||||||||
| 4,971 | ||||||||||||
|
| |||||||||||
Switzerland — 1.2% | ||||||||||||
Aquarius and Investments for Zurich Insurance MTN | ||||||||||||
4.250%, 10/02/2043 (C) | 100 | 119 | ||||||||||
| SEI Institutional International Trust / Annual Report / September 30, 2015 | 35 |
SCHEDULE OF INVESTMENTS
International Fixed Income Fund (Continued)
September 30, 2015
| Description | Face Amount (Thousands) (1) | Market Value ($ Thousands) | ||||||||||
Credit Suisse NY MTN | ||||||||||||
3.625%, 09/09/2024 | 260 | $ | 260 | |||||||||
Credit Suisse MTN | ||||||||||||
5.750%, 09/18/2025 (C) | EUR | 250 | 308 | |||||||||
4.750%, 08/05/2019 | EUR | 400 | 512 | |||||||||
Dufry Finance | ||||||||||||
4.500%, 07/15/2022 | 235 | 268 | ||||||||||
4.500%, 08/01/2023 | 100 | 114 | ||||||||||
Glencore Australia Holdings MTN | ||||||||||||
4.500%, 09/19/2019 | 900 | 590 | ||||||||||
Glencore Finance Europe MTN | ||||||||||||
3.375%, 09/30/2020 | 290 | 275 | ||||||||||
Glencore Funding | ||||||||||||
4.125%, 05/30/2023 (B) | 94 | 74 | ||||||||||
2.125%, 04/16/2018 (B) | 242 | 208 | ||||||||||
Government of Switzerland | ||||||||||||
3.000%, 05/12/2019 | 160 | 187 | ||||||||||
2.000%, 04/28/2021 | 1,070 | 1,254 | ||||||||||
2.000%, 05/25/2022 | 110 | 131 | ||||||||||
1.500%, 04/30/2042 | 120 | 148 | ||||||||||
1.250%, 06/11/2024 | 100 | 116 | ||||||||||
Switzerland Government Bond | ||||||||||||
3.500%, 04/08/2033 | 100 | 157 | ||||||||||
UBS Group Funding Jersey | ||||||||||||
4.125%, 09/24/2025 (B) | 220 | 219 | ||||||||||
UBS MTN | ||||||||||||
6.625%, 04/11/2018 | GBP | 150 | 254 | |||||||||
6.375%, 07/20/2016 | GBP | 160 | 252 | |||||||||
4.750%, 02/12/2026 (C) | EUR | 500 | 586 | |||||||||
Zurich Finance USA MTN | ||||||||||||
6.500%, 10/14/2015 | 500 | 559 | ||||||||||
|
| |||||||||||
| 6,591 | ||||||||||||
|
| |||||||||||
Thailand — 0.1% | ||||||||||||
Thailand Government Bond | ||||||||||||
4.675%, 06/29/2044 | 1,800 | 58 | ||||||||||
3.650%, 12/17/2021 | 16,020 | 469 | ||||||||||
3.625%, 06/16/2023 | 7,815 | 229 | ||||||||||
|
| |||||||||||
| 756 | ||||||||||||
|
| |||||||||||
Turkey — 0.0% | ||||||||||||
Republic of Turkey | ||||||||||||
5.500%, 02/16/2017 | EUR | 50 | 59 | |||||||||
|
| |||||||||||
United Arab Emirates — 0.1% |
| |||||||||||
Emirates Telecommunications MTN | ||||||||||||
2.750%, 06/18/2026 | EUR | 275 | 325 | |||||||||
|
| |||||||||||
United Kingdom — 15.3% |
| |||||||||||
AA Bond | ||||||||||||
4.720%, 07/02/2043 | 500 | 796 | ||||||||||
| Description | Face Amount (Thousands) (1) | Market Value ($ Thousands) | ||||||||||
Abbey National Treasury Services MTN | ||||||||||||
5.250%, 02/16/2029 | 450 | $ | 867 | |||||||||
5.125%, 04/14/2021 | 300 | 525 | ||||||||||
4.250%, 04/12/2021 | EUR | 350 | 470 | |||||||||
1.750%, 01/15/2018 | EUR | 525 | 601 | |||||||||
1.125%, 01/14/2022 | 330 | 356 | ||||||||||
Anglian Water Services Financing | ||||||||||||
6.875%, 08/21/2023 | 230 | 445 | ||||||||||
Aviva MTN | ||||||||||||
6.875%, 05/22/2038 (C) | EUR | 195 | 241 | |||||||||
6.125%, 11/14/2036 (C) | 200 | 321 | ||||||||||
3.375%, 12/04/2045 (C) | 500 | 511 | ||||||||||
Bank of Scotland | ||||||||||||
7.281%, 05/29/2049 (C) | 950 | 1,683 | ||||||||||
4.750%, 06/08/2022 | EUR | 290 | 410 | |||||||||
Barclays Bank MTN | ||||||||||||
6.750%, 01/16/2023 (C) | 350 | 569 | ||||||||||
6.625%, 03/30/2022 | EUR | 272 | 372 | |||||||||
4.250%, 01/12/2022 | 250 | 425 | ||||||||||
BAT International Finance MTN | ||||||||||||
7.250%, 03/12/2024 | 250 | 494 | ||||||||||
5.375%, 06/29/2017 | EUR | 425 | 516 | |||||||||
Bishopsgate Asset Finance | ||||||||||||
4.808%, 08/14/2044 | 178 | 277 | ||||||||||
BP Capital Markets MTN | ||||||||||||
2.177%, 09/28/2021 | EUR | 245 | 286 | |||||||||
British American Tobacco Holdings MTN | ||||||||||||
4.000%, 07/07/2020 | 100 | 128 | ||||||||||
Canary Wharf Finance II | ||||||||||||
6.455%, 04/22/2030 | 15 | 31 | ||||||||||
5.952%, 01/22/2035 | 15 | 28 | ||||||||||
Channel Link Enterprises Finance | ||||||||||||
3.299%, 06/30/2050 (C) | EUR | 700 | 780 | |||||||||
Co-Operative Bank | ||||||||||||
4.750%, 11/11/2021 | 250 | 419 | ||||||||||
Coventry Building Society MTN | ||||||||||||
4.625%, 04/19/2018 | 230 | 377 | ||||||||||
CPUK Finance | ||||||||||||
3.588%, 02/28/2042 | 400 | 599 | ||||||||||
2.666%, 02/28/2042 | 700 | 1,048 | ||||||||||
Delphi Automotive | ||||||||||||
1.500%, 03/10/2025 | 300 | 306 | ||||||||||
Direct Line Insurance Group | ||||||||||||
9.250%, 04/27/2042 (C) | 100 | 185 | ||||||||||
Eastern Power Networks MTN | ||||||||||||
6.250%, 11/12/2036 | 160 | 322 | ||||||||||
ENW Finance MTN | ||||||||||||
6.125%, 07/21/2021 | 350 | 624 | ||||||||||
Eversholt Funding MTN | ||||||||||||
6.697%, 02/22/2035 | 100 | 196 | ||||||||||
FCE Bank MTN | ||||||||||||
5.125%, 11/16/2015 | 350 | 532 | ||||||||||
| 36 | SEI Institutional International Trust / Annual Report / September 30, 2015 |
| Description | Face Amount (Thousands) (1) | Market Value ($ Thousands) | ||||||||||
4.825%, 02/15/2017 | 200 | $ | 314 | |||||||||
1.875%, 05/12/2016 | EUR | 250 | 281 | |||||||||
1.625%, 09/09/2016 | EUR | 100 | 113 | |||||||||
First Hydro Finance | ||||||||||||
9.000%, 07/31/2021 | 220 | 440 | ||||||||||
Firstgroup | ||||||||||||
5.250%, 11/29/2022 | 200 | 327 | ||||||||||
Great Rolling Stock MTN | ||||||||||||
6.250%, 07/27/2020 | 300 | 522 | ||||||||||
HBOS Capital Funding | ||||||||||||
6.461%, 11/30/2049 (C) | 115 | 184 | ||||||||||
Heathrow Funding MTN | ||||||||||||
1.875%, 05/23/2022 | 175 | 202 | ||||||||||
HSBC Bank | ||||||||||||
4.125%, 08/12/2020 | USD | 375 | 406 | |||||||||
HSBC Capital Funding | ||||||||||||
5.130%, 03/29/2049 (C) | 150 | 169 | ||||||||||
HSBC Holdings MTN | ||||||||||||
6.500%, 05/20/2024 | 250 | 468 | ||||||||||
Imperial Tobacco Finance MTN | ||||||||||||
8.375%, 02/17/2016 | EUR | 575 | 661 | |||||||||
5.500%, 09/28/2026 | 350 | 612 | ||||||||||
2.250%, 02/26/2021 | EUR | 400 | 463 | |||||||||
Intu SGS Finance MTN | ||||||||||||
3.875%, 03/17/2023 (D) | 250 | 389 | ||||||||||
Jaguar Land Rover Automotive | ||||||||||||
5.000%, 02/15/2022 | 100 | 150 | ||||||||||
Lloyds Banking Group | ||||||||||||
7.000%, 12/29/2049 (C) | 750 | 1,122 | ||||||||||
Lloyds TSB Bank MTN | ||||||||||||
4.625%, 02/02/2017 | EUR | 150 | 177 | |||||||||
Merlin Entertainment | ||||||||||||
2.750%, 03/15/2022 | 300 | 313 | ||||||||||
Mondi Finance MTN | ||||||||||||
5.750%, 04/03/2017 | 1,100 | 1,320 | ||||||||||
3.375%, 09/28/2020 | EUR | 400 | 489 | |||||||||
National Westminster Bank | ||||||||||||
6.500%, 09/07/2021 | 220 | 372 | ||||||||||
6.500%, 09/07/2021 | 550 | 929 | ||||||||||
Nationwide Building Society MTN | ||||||||||||
4.625%, 02/08/2021 | EUR | 550 | 748 | |||||||||
4.125%, 03/20/2023 (C) | EUR | 1,495 | 1,764 | |||||||||
0.750%, 06/25/2019 | 266 | 302 | ||||||||||
Network Rail Infrastructure Finance MTN | ||||||||||||
4.400%, 03/06/2016 | CAD | 690 | 522 | |||||||||
Northumbrian Water Finance | ||||||||||||
6.875%, 02/06/2023 | 190 | 361 | ||||||||||
6.000%, 10/11/2017 | 500 | 821 | ||||||||||
Rio Tinto Finance MTN | ||||||||||||
4.000%, 12/11/2029 | 165 | 246 | ||||||||||
RL Finance Bonds No. 2 | ||||||||||||
6.125%, 11/30/2043 (C) | 100 | 155 | ||||||||||
| Description | Face Amount (Thousands) (1) | Market Value ($ Thousands) | ||||||||||
Rolls-Royce | ||||||||||||
6.750%, 04/30/2019 | 100 | $ | 175 | |||||||||
Royal Bank of Scotland | ||||||||||||
9.500%, 03/16/2022 (C) | USD | 200 | 218 | |||||||||
6.934%, 04/09/2018 | EUR | 300 | 373 | |||||||||
5.125%, 01/13/2024 | 400 | 724 | ||||||||||
3.875%, 10/19/2020 | 123 | 161 | ||||||||||
Santander UK | ||||||||||||
6.222%, 05/29/2049 (C) | 170 | 265 | ||||||||||
Santander UK Group Holdings | ||||||||||||
7.375%, 06/24/2022 (C) | 250 | 377 | ||||||||||
Sky | ||||||||||||
3.750%, 09/16/2024 (B) | USD | 211 | 208 | |||||||||
Standard Chartered MTN | ||||||||||||
4.000%, 07/12/2022 (C) | USD | 390 | 391 | |||||||||
Standard Life MTN | ||||||||||||
5.500%, 12/04/2042 (C) | 250 | 396 | ||||||||||
Tesco | ||||||||||||
6.052%, 10/13/2039 | 645 | 953 | ||||||||||
United Kingdom Gilt | ||||||||||||
6.000%, 12/07/2028 | 100 | 224 | ||||||||||
4.500%, 09/07/2034 | 250 | 505 | ||||||||||
4.500%, 12/07/2042 | 1,675 | 3,562 | ||||||||||
4.250%, 12/07/2027 | 125 | 238 | ||||||||||
4.250%, 06/07/2032 | 110 | 214 | ||||||||||
3.750%, 07/22/2052 | 375 | 752 | ||||||||||
3.500%, 01/22/2045 | 775 | 1,420 | ||||||||||
3.250%, 01/22/2044 | 860 | 1,507 | ||||||||||
2.750%, 09/07/2024 | 850 | 1,403 | ||||||||||
2.250%, 09/07/2023 | 2,325 | 3,700 | ||||||||||
2.000%, 07/22/2020 | 2,075 | 3,260 | ||||||||||
2.000%, 09/07/2025 | 925 | 1,430 | ||||||||||
1.750%, 07/22/2019 | 520 | 809 | ||||||||||
United Kingdom Treasury | ||||||||||||
5.000%, 03/07/2025 | 1,430 | 2,801 | ||||||||||
4.750%, 12/07/2030 | 1,380 | 2,803 | ||||||||||
4.750%, 12/07/2038 | 350 | 750 | ||||||||||
4.250%, 03/07/2036 | 745 | 1,468 | ||||||||||
4.250%, 09/07/2039 | 1,170 | 2,353 | ||||||||||
4.250%, 12/07/2040 | 370 | 750 | ||||||||||
4.000%, 03/07/2022 | 1,565 | 2,757 | ||||||||||
1.750%, 01/22/2017 | 800 | 1,232 | ||||||||||
United Kingdom Treasury Bill | ||||||||||||
0.473%, 10/19/2015 (A) | 3,000 | 4,543 | ||||||||||
Wales & West Utilities Finance | ||||||||||||
6.750%, 12/17/2036 (C) | 200 | 335 | ||||||||||
6.250%, 11/30/2021 | 240 | 437 | ||||||||||
Western Power Distribution West Midlands | ||||||||||||
3.875%, 10/17/2024 | 230 | 370 | ||||||||||
Yorkshire Power Finance | ||||||||||||
7.250%, 08/04/2028 | 208 | 427 | ||||||||||
| SEI Institutional International Trust / Annual Report / September 30, 2015 | 37 |
SCHEDULE OF INVESTMENTS
International Fixed Income Fund (Continued)
September 30, 2015
| Description | Face Amount (Thousands) (1) | Market Value ($ Thousands) | ||||||||||
Yorkshire Water Services Bradford Finance | ||||||||||||
6.375%, 08/19/2039 | 100 | $ | 205 | |||||||||
|
| |||||||||||
| 75,578 | ||||||||||||
|
| |||||||||||
United States — 6.7% | ||||||||||||
21st Century Fox America | ||||||||||||
4.500%, 02/15/2021 | 75 | 81 | ||||||||||
AbbVie | ||||||||||||
3.600%, 05/14/2025 | 359 | 354 | ||||||||||
2.500%, 05/14/2020 | 49 | 49 | ||||||||||
Aetna | ||||||||||||
2.750%, 11/15/2022 | 40 | 39 | ||||||||||
Altria Group | ||||||||||||
4.750%, 05/05/2021 | 180 | 196 | ||||||||||
4.250%, 08/09/2042 | 265 | 245 | ||||||||||
American International Group | ||||||||||||
8.175%, 05/15/2058 (C) | 240 | 317 | ||||||||||
5.750%, 03/15/2067 | 150 | 232 | ||||||||||
Anthem | ||||||||||||
4.650%, 01/15/2043 | 110 | 108 | ||||||||||
2.300%, 07/15/2018 | 150 | 151 | ||||||||||
AT&T | ||||||||||||
5.875%, 04/28/2017 | GBP | 200 | 321 | |||||||||
4.875%, 06/01/2044 | GBP | 130 | 196 | |||||||||
Bank of America MTN | ||||||||||||
2.375%, 06/19/2024 | 410 | 469 | ||||||||||
0.800%, 03/28/2018 (C) | EUR | 300 | 331 | |||||||||
0.514%, 09/14/2018 (C) | EUR | 375 | 409 | |||||||||
Berkshire Hathaway | ||||||||||||
1.125%, 03/16/2027 | 297 | 293 | ||||||||||
Biogen | ||||||||||||
2.900%, 09/15/2020 | 167 | 169 | ||||||||||
CBS | ||||||||||||
4.000%, 01/15/2026 | 450 | 443 | ||||||||||
Chevron | ||||||||||||
2.355%, 12/05/2022 | 535 | 517 | ||||||||||
Citigroup | ||||||||||||
4.450%, 01/10/2017 | 250 | 260 | ||||||||||
2.375%, 05/22/2024 | EUR | 700 | 802 | |||||||||
Coca-Cola | ||||||||||||
2.750%, 05/06/2026 | EUR | 160 | 187 | |||||||||
1.125%, 09/22/2022 | EUR | 400 | 446 | |||||||||
CVS Health | ||||||||||||
5.125%, 07/20/2045 | 350 | 376 | ||||||||||
Devon Energy | ||||||||||||
5.000%, 06/15/2045 | 270 | 245 | ||||||||||
DH Europe Finance | ||||||||||||
1.700%, 01/04/2022 | 1,440 | 1,629 | ||||||||||
Diamond Offshore Drilling | ||||||||||||
4.875%, 11/01/2043 | 130 | 85 | ||||||||||
Discovery Communications | ||||||||||||
1.900%, 03/19/2027 | 360 | 344 | ||||||||||
| Description | Face Amount (Thousands) (1) | Market Value ($ Thousands) | ||||||||||
Dover MTN | ||||||||||||
2.125%, 12/01/2020 | EUR | 250 | $ | 291 | ||||||||
Eli Lilly | ||||||||||||
1.000%, 06/02/2022 | 405 | 448 | ||||||||||
Entergy | ||||||||||||
4.000%, 07/15/2022 | 314 | 324 | ||||||||||
Enterprise Products Operating | ||||||||||||
3.700%, 02/15/2026 | 123 | 116 | ||||||||||
Exelon | ||||||||||||
3.950%, 06/15/2025 | 356 | 359 | ||||||||||
GE Capital UK Funding MTN | ||||||||||||
4.375%, 07/31/2019 | GBP | 400 | 653 | |||||||||
General Electric | ||||||||||||
2.700%, 10/09/2022 | 320 | 321 | ||||||||||
1.875%, 05/28/2027 | 800 | 895 | ||||||||||
1.250%, 05/26/2023 | 200 | 221 | ||||||||||
General Electric Capital MTN | ||||||||||||
5.500%, 01/08/2020 | 305 | 349 | ||||||||||
5.300%, 02/11/2021 | 205 | 236 | ||||||||||
4.625%, 01/07/2021 | 750 | 837 | ||||||||||
Goldman Sachs Group | ||||||||||||
3.750%, 05/22/2025 | 400 | 401 | ||||||||||
2.625%, 08/19/2020 | EUR | 350 | 416 | |||||||||
Illinois Tool Works MTN | ||||||||||||
3.000%, 05/19/2034 | EUR | 200 | 231 | |||||||||
INEOS Group Holdings | ||||||||||||
5.750%, 02/15/2019 | 350 | 375 | ||||||||||
International Business Machines MTN | ||||||||||||
1.375%, 11/19/2019 | EUR | 250 | 288 | |||||||||
International Paper | ||||||||||||
5.150%, 05/15/2046 | 38 | 37 | ||||||||||
3.800%, 01/15/2026 | 374 | 368 | ||||||||||
Jefferies Group MTN | ||||||||||||
2.375%, 05/20/2020 | EUR | 700 | 760 | |||||||||
John Deere Bank MTN | ||||||||||||
1.500%, 07/16/2018 | 250 | 287 | ||||||||||
JPMorgan Chase MTN | ||||||||||||
1.068%, 05/30/2017 (C) | 100 | 149 | ||||||||||
0.382%, 10/12/2015 (C) | EUR | 350 | 390 | |||||||||
Kinder Morgan | ||||||||||||
2.250%, 03/16/2027 | 519 | 459 | ||||||||||
1.500%, 03/16/2022 | 600 | 578 | ||||||||||
McDonald’s | ||||||||||||
1.125%, 05/26/2022 | 400 | 439 | ||||||||||
Mellon Capital III | ||||||||||||
6.369%, 09/05/2066 (C) | 150 | 229 | ||||||||||
Merck | ||||||||||||
2.500%, 10/15/2034 | 500 | 579 | ||||||||||
1.875%, 10/15/2026 | 300 | 341 | ||||||||||
1.125%, 10/15/2021 | 400 | 448 | ||||||||||
MetLife | ||||||||||||
5.250%, 12/29/2049 (C) | 349 | 346 | ||||||||||
| 38 | SEI Institutional International Trust / Annual Report / September 30, 2015 |
| Description | Face Amount (Thousands) (1) | Market Value ($ Thousands) | ||||||||||
Mondelez International | ||||||||||||
2.375%, 03/06/2035 | 250 | $ | 244 | |||||||||
1.625%, 03/08/2027 | 300 | 304 | ||||||||||
1.000%, 03/07/2022 | 200 | 215 | ||||||||||
Morgan Stanley | ||||||||||||
3.750%, 09/21/2017 | EUR | 350 | 416 | |||||||||
2.375%, 03/31/2021 | EUR | 1,250 | 1,466 | |||||||||
1.875%, 03/30/2023 | 490 | 547 | ||||||||||
1.750%, 01/30/2025 | 205 | 221 | ||||||||||
Nabors Industries | ||||||||||||
5.100%, 09/15/2023 | 93 | 82 | ||||||||||
ONEOK Partners | ||||||||||||
3.800%, 03/15/2020 | 128 | 129 | ||||||||||
Owens Corning | ||||||||||||
6.500%, 12/01/2016 | 9 | 10 | ||||||||||
Philip Morris International | ||||||||||||
2.900%, 11/15/2021 | 325 | 327 | ||||||||||
2.875%, 05/30/2024 | EUR | 100 | 123 | |||||||||
2.875%, 03/03/2026 | EUR | 435 | 528 | |||||||||
Plains All American Pipeline | ||||||||||||
3.600%, 11/01/2024 | 330 | 309 | ||||||||||
PNC Funding | ||||||||||||
5.125%, 02/08/2020 | 300 | 336 | ||||||||||
3.300%, 03/08/2022 | 150 | 154 | ||||||||||
Priceline Group | ||||||||||||
2.375%, 09/23/2024 | EUR | 250 | 274 | |||||||||
1.800%, 03/03/2027 | 400 | 384 | ||||||||||
Principal Financial Group | ||||||||||||
1.850%, 11/15/2017 | 175 | 176 | ||||||||||
Prologis International Funding II MTN | ||||||||||||
2.875%, 04/04/2022 | 220 | 255 | ||||||||||
Prologis | ||||||||||||
3.375%, 02/20/2024 | EUR | 300 | 352 | |||||||||
3.000%, 01/18/2022 | EUR | 250 | 292 | |||||||||
3.000%, 06/02/2026 | EUR | 200 | 226 | |||||||||
Prudential Financial | ||||||||||||
5.625%, 06/15/2043 (C) | 545 | 562 | ||||||||||
Rabobank Capital Funding Trust IV | ||||||||||||
5.556%, 12/31/2019 (C) | GBP | 153 | 240 | |||||||||
Republic Services | ||||||||||||
4.750%, 05/15/2023 | 155 | 171 | ||||||||||
Reynolds American | ||||||||||||
5.850%, 08/15/2045 | 146 | 162 | ||||||||||
4.450%, 06/12/2025 | 360 | 377 | ||||||||||
3.250%, 11/01/2022 | 180 | 179 | ||||||||||
Ryder System MTN | ||||||||||||
5.850%, 11/01/2016 | 116 | 122 | ||||||||||
Seagate HDD Cayman | ||||||||||||
4.750%, 01/01/2025 | 123 | 118 | ||||||||||
Sprint | ||||||||||||
7.875%, 09/15/2023 | 187 | 151 | ||||||||||
Thermo Fisher Scientific | ||||||||||||
2.150%, 07/21/2022 | 157 | 177 | ||||||||||
2.000%, 04/15/2025 | 164 | 177 | ||||||||||
| Description | Face Amount (Thousands) (1) | Market Value ($ Thousands) | ||||||||
UBS MTN | ||||||||||
5.875%, 12/20/2017 | 247 | $ | 269 | |||||||
United Technologies | ||||||||||
1.800%, 06/01/2017 | 201 | 203 | ||||||||
Verizon Communications | ||||||||||
5.012%, 08/21/2054 | 44 | 40 | ||||||||
4.672%, 03/15/2055 | 193 | 166 | ||||||||
2.625%, 12/01/2031 | 100 | 109 | ||||||||
1.625%, 03/01/2024 | 700 | 759 | ||||||||
Viacom | ||||||||||
3.875%, 04/01/2024 | 148 | 139 | ||||||||
Wells Fargo MTN | ||||||||||
4.600%, 04/01/2021 | 75 | 82 | ||||||||
Williams Partners | ||||||||||
3.900%, 01/15/2025 | 228 | 196 | ||||||||
|
| |||||||||
| 33,234 | ||||||||||
|
| |||||||||
Total Global Bonds |
| 460,032 | ||||||||
|
| |||||||||
MORTGAGE-BACKED SECURITIES — 2.6% |
| |||||||||
Agency Mortgage-Backed Obligation — 0.5% |
| |||||||||
FHLMC Structured Agency Credit Risk Debt Notes, Ser 2014-DN1, Cl M1 | ||||||||||
1.194%, 02/25/2024 (B) (C) | 367 | 366 | ||||||||
FHLMC Structured Agency Credit Risk Debt Notes, Ser 2014-HQ2, Cl M1 | ||||||||||
1.644%, 09/25/2024 (B) (C) | 364 | 365 | ||||||||
FHLMC Structured Agency Credit Risk Debt Notes, Ser 2015-DNA1, Cl M2 | ||||||||||
2.044%, 10/25/2027 (B) (C) | 490 | 483 | ||||||||
FHLMC Structured Agency Credit Risk Debt Notes, Ser 2015-DNA2, Cl M2 | ||||||||||
2.794%, 12/25/2027 (B) (C) | 250 | 251 | ||||||||
FHLMC Structured Agency Credit Risk Debt Notes, Ser 2015-DNA2, Cl M1 | ||||||||||
1.344%, 12/25/2027 (B) (C) | 440 | 440 | ||||||||
FHLMC Structured Agency Credit Risk Debt Notes, Ser 2015-HQ1, Cl M1 | ||||||||||
1.244%, 03/25/2025 (B) (C) | 233 | 232 | ||||||||
FHLMC Structured Agency Credit Risk Debt Notes, Ser 2015-HQ2, Cl M1 | ||||||||||
1.294%, 05/25/2025 (B) (C) | 341 | 340 | ||||||||
FHLMC, Ser K501, Cl X1A, IO | ||||||||||
1.726%, 08/25/2016 (C) | 247 | 2 | ||||||||
|
| |||||||||
| 2,479 | ||||||||||
|
| |||||||||
| SEI Institutional International Trust / Annual Report / September 30, 2015 | 39 |
SCHEDULE OF INVESTMENTS
International Fixed Income Fund (Continued)
September 30, 2015
| Description | Face Amount (Thousands) (1) | Market Value ($ Thousands) | ||||||||
Non-Agency Mortgage-Backed Obligation — 2.1% |
| |||||||||
Banc of America Commercial Mortgage, Ser 2007-5, Cl A4 | ||||||||||
5.492%, 02/10/2051 | 111 | $ | 116 | |||||||
Banc of America Commercial Mortgage, Ser 2015-UBS7, Cl A4 | ||||||||||
3.705%, 09/15/2048 | 20 | 21 | ||||||||
Bear Stearns Adjustable Rate Mortgage | ||||||||||
2.897%, 09/25/2034 (B) (C) | 80 | 79 | ||||||||
Bear Stearns Commercial Mortgage | ||||||||||
5.405%, 12/11/2040 (C) | 73 | 73 | ||||||||
Bear Stearns Commercial Mortgage | ||||||||||
5.611%, 09/11/2041 (C) | 241 | 243 | ||||||||
Bear Stearns Commercial Mortgage | ||||||||||
5.537%, 10/12/2041 | 66 | 68 | ||||||||
Bear Stearns Commercial Mortgage | ||||||||||
5.778%, 04/12/2038 (C) | 25 | 25 | ||||||||
Bear Stearns Commercial Mortgage | ||||||||||
5.331%, 02/11/2044 | 51 | 53 | ||||||||
Bear Stearns Commercial Mortgage | ||||||||||
5.895%, 06/11/2040 (C) | 31 | 33 | ||||||||
Bear Stearns Commercial Mortgage | ||||||||||
5.694%, 06/11/2050 (C) | 175 | 185 | ||||||||
Bear Stearns Commercial Mortgage | ||||||||||
5.471%, 01/12/2045 (C) | 63 | 66 | ||||||||
Citigroup Commercial Mortgage Trust, | ||||||||||
5.968%, 03/15/2049 (C) | 126 | 127 | ||||||||
Citigroup Commercial Mortgage Trust, | ||||||||||
6.349%, 12/10/2049 (C) | 425 | 453 | ||||||||
Citigroup Commercial Mortgage Trust, | ||||||||||
5.063%, 03/10/2047 (B) (C) | 20 | 18 | ||||||||
Citigroup Commercial Mortgage Trust, | ||||||||||
3.192%, 04/10/2048 | 15 | 15 | ||||||||
Citigroup Commercial Mortgage Trust, | ||||||||||
2.935%, 04/10/2048 | 30 | 30 | ||||||||
Citigroup Mortgage Loan Trust, | ||||||||||
2.662%, 05/25/2035 (B) (C) | 506 | 492 | ||||||||
| Description | Face Amount (Thousands) (1) | Market Value ($ Thousands) | ||||||||
COBALT Commercial Mortgage Trust, | ||||||||||
5.254%, 08/15/2048 | 35 | $ | 36 | |||||||
COMM 2015-PC1 Mortgage Trust, | ||||||||||
3.620%, 07/10/2050 | 50 | 52 | ||||||||
COMM Mortgage Trust, | ||||||||||
5.292%, 12/10/2046 | 115 | 119 | ||||||||
COMM Mortgage Trust, | ||||||||||
2.540%, 12/10/2045 | 125 | 124 | ||||||||
COMM Mortgage Trust, | ||||||||||
2.098%, 10/15/2045 (C) | 172 | 16 | ||||||||
COMM Mortgage Trust, | ||||||||||
4.238%, 07/10/2045 (C) | 35 | 39 | ||||||||
COMM Mortgage Trust, | ||||||||||
3.334%, 06/10/2046 | 130 | 136 | ||||||||
COMM Mortgage Trust, | ||||||||||
4.022%, 07/10/2045 | 50 | 54 | ||||||||
COMM Mortgage Trust, | ||||||||||
3.955%, 02/10/2047 | 70 | 76 | ||||||||
COMM Mortgage Trust, | ||||||||||
4.051%, 04/10/2047 | 25 | 27 | ||||||||
COMM Mortgage Trust, | ||||||||||
3.796%, 08/10/2047 | 65 | 69 | ||||||||
COMM Mortgage Trust, | ||||||||||
3.528%, 12/10/2047 | 30 | 31 | ||||||||
COMM Mortgage Trust, | ||||||||||
1.348%, 06/15/2034 (B) (C) | 187 | 187 | ||||||||
COMM Mortgage Trust, | ||||||||||
3.694%, 08/10/2047 | 65 | 68 | ||||||||
COMM Mortgage Trust, | ||||||||||
3.178%, 02/10/2035 | 100 | 100 | ||||||||
Commercial Mortgage Loan Trust, | ||||||||||
6.230%, 12/10/2049 (C) | 249 | 259 | ||||||||
Commercial Mortgage Pass Through Certificates, Ser CR14, Cl XA, IO | ||||||||||
1.023%, 02/10/2047 (C) | 692 | 30 | ||||||||
Commercial Mortgage Pass-Through Certificates, Ser 2008-C1, Cl A3 | ||||||||||
6.172%, 02/15/2041 (C) | 55 | 59 | ||||||||
| 40 | SEI Institutional International Trust / Annual Report / September 30, 2015 |
| Description | Face Amount (Thousands) (1) | Market Value ($ Thousands) | ||||||||
Commerical Mortgage Trust, | ||||||||||
6.014%, 07/10/2038 (C) | 136 | $ | 137 | |||||||
Commerical Mortgage Trust, | ||||||||||
5.736%, 12/10/2049 | 264 | 277 | ||||||||
Commerical Mortgage Trust, | ||||||||||
5.475%, 03/10/2039 | 370 | 383 | ||||||||
Credit Suisse Commercial Mortgage Trust, | ||||||||||
5.889%, 06/15/2039 (C) | 132 | 138 | ||||||||
Credit Suisse First Boston Mortgage | ||||||||||
4.877%, 04/15/2037 | 30 | 30 | ||||||||
CSAIL Commercial Mortgage Trust, | ||||||||||
1.055%, 06/15/2057 | 543 | 34 | ||||||||
CSAIL Commercial Mortgage Trust, | ||||||||||
3.718%, 08/15/2048 | 45 | 47 | ||||||||
CSAIL Commercial Mortgage Trust, | ||||||||||
3.508%, 08/15/2048 | 75 | 59 | ||||||||
Eddystone Finance, Ser 2006-1, Cl A2 | ||||||||||
1.109%, 04/19/2021 (C) | 105 | 152 | ||||||||
FNMA Connecticut Avenue Securities, | ||||||||||
2.199%, 10/25/2023 (B) (C) | 96 | 97 | ||||||||
FNMA Connecticut Avenue Securities, | ||||||||||
1.799%, 01/25/2024 (B) (C) | 260 | 261 | ||||||||
FNMA Connecticut Avenue Securities, | ||||||||||
1.144%, 05/25/2024 (B) (C) | 16 | 16 | ||||||||
FNMA Connecticut Avenue Securities, | ||||||||||
2.299%, 11/25/2024 (B) (C) | 278 | 279 | ||||||||
FNMA Connecticut Avenue Securities, | ||||||||||
1.394%, 05/25/2025 (B) (C) | 84 | 83 | ||||||||
GE Capital Commercial Mortgage, | ||||||||||
5.543%, 11/10/2045 (C) | 18 | 18 | ||||||||
GE Commercial Mortgage Trust, | ||||||||||
5.606%, 12/10/2049 (C) | 35 | 36 | ||||||||
GMAC Commercial Mortgage Securities Trust, | ||||||||||
5.238%, 11/10/2045 (C) | 40 | 40 | ||||||||
| Description | Face Amount (Thousands) (1) | Market Value ($ Thousands) | ||||||||
Granite Master Issuer, | ||||||||||
0.077%, 12/20/2054 (B) (C) | 56 | $ | 62 | |||||||
Granite Master Issuer, | ||||||||||
0.097%, 12/20/2054 (B) (C) | 110 | 123 | ||||||||
GS Mortgage Securities II, | ||||||||||
5.989%, 08/10/2045 (C) | 138 | 146 | ||||||||
GS Mortgage Securities II, | ||||||||||
3.551%, 04/10/2034 (B) | 100 | 105 | ||||||||
GS Mortgage Securities Trust, | ||||||||||
1.815%, 08/10/2044 (B) (C) | 524 | 25 | ||||||||
GS Mortgage Securities Trust, | ||||||||||
0.338%, 07/10/2046 (C) | 2,867 | 27 | ||||||||
GS Mortgage Securities Trust, | ||||||||||
5.029%, 04/10/2047 (B) (C) | 80 | 72 | ||||||||
GSR Mortgage Loan Trust, | ||||||||||
2.257%, 01/25/2035 (B) (C) | 130 | 126 | ||||||||
JPMBB Commercial Mortgage Securities, | ||||||||||
1.029%, 09/15/2047 (C) | 994 | 46 | ||||||||
JPMBB Commercial Mortgage Securities, | ||||||||||
3.494%, 01/15/2048 | 15 | 16 | ||||||||
JPMBB Commercial Mortgage Securities, | ||||||||||
3.179%, 02/15/2048 | 25 | 25 | ||||||||
JPMorgan Chase Commercial Mortgage Securities, | ||||||||||
5.427%, 01/12/2043 (C) | 15 | 15 | ||||||||
JPMorgan Chase Commercial Mortgage Securities, | ||||||||||
6.095%, 04/15/2045 (C) | 64 | 65 | ||||||||
JPMorgan Chase Commercial Mortgage Securities, | ||||||||||
5.399%, 05/15/2045 | 72 | 74 | ||||||||
JPMorgan Chase Commercial Mortgage Securities, | ||||||||||
5.336%, 05/15/2047 | 124 | 128 | ||||||||
JPMorgan Chase Commercial Mortgage Securities, | ||||||||||
5.716%, 02/15/2051 | 45 | 47 | ||||||||
| SEI Institutional International Trust / Annual Report / September 30, 2015 | 41 |
SCHEDULE OF INVESTMENTS
International Fixed Income Fund (Continued)
September 30, 2015
| Description | Face Amount (Thousands) (1) | Market Value ($ Thousands) | ||||||||
JPMorgan Chase Commercial Mortgage Securities, | ||||||||||
5.884%, 02/12/2049 (C) | 189 | $ | 198 | |||||||
JPMorgan Chase Commercial Mortgage Securities, | ||||||||||
6.068%, 02/12/2051 | 28 | 30 | ||||||||
JPMorgan Chase Commercial Mortgage Securities, | ||||||||||
1.706%, 02/12/2051 (C) | 320 | 315 | ||||||||
JPMorgan Chase Commercial Mortgage Securities, | ||||||||||
4.821%, 10/15/2045 (B) (C) | 100 | 97 | ||||||||
JPMorgan Chase Commercial Mortgage Securities, | ||||||||||
2.829%, 10/15/2045 | 135 | 137 | ||||||||
JPMorgan Chase Commercial Mortgage Securities, | ||||||||||
2.840%, 12/15/2047 | 135 | 136 | ||||||||
JPMorgan Chase Commercial Mortgage Securities, | ||||||||||
1.127%, 06/15/2029 (B) (C) | 130 | 129 | ||||||||
JPMorgan Mortgage Trust, | ||||||||||
2.244%, 12/25/2034 (B) (C) | 89 | 88 | ||||||||
LB-UBS Commercial Mortgage Trust, | ||||||||||
5.858%, 07/15/2040 (C) | 141 | 148 | ||||||||
LB-UBS Commercial Mortgage Trust, | ||||||||||
6.269%, 04/15/2041 (C) | 47 | 51 | ||||||||
Merrill Lynch Mortgage Trust, | ||||||||||
5.137%, 07/12/2038 (C) | 8 | 8 | ||||||||
Merrill Lynch Mortgage Trust, | ||||||||||
5.782%, 08/12/2043 (C) | 120 | 124 | ||||||||
ML-CFC Commercial Mortgage Trust, | ||||||||||
5.419%, 08/12/2048 | 40 | 42 | ||||||||
ML-CFC Commercial Mortgage Trust, Ser 2007-5, Cl A4 | ||||||||||
5.378%, 08/12/2048 | 127 | 132 | ||||||||
Morgan Stanley Bank of America Merrill Lynch Trust, | ||||||||||
3.176%, 08/15/2045 | 40 | 41 | ||||||||
| Description | Face Amount (Thousands) (1) | Market Value ($ Thousands) | ||||||||
Morgan Stanley Bank of America Merrill Lynch Trust, | ||||||||||
4.218%, 07/15/2046 (C) | 60 | $ | 65 | |||||||
Morgan Stanley Bank of America Merrill Lynch Trust, | ||||||||||
3.741%, 08/15/2047 | 65 | 68 | ||||||||
Morgan Stanley Bank of America Merrill Lynch Trust, | ||||||||||
3.249%, 02/15/2048 | 65 | 66 | ||||||||
Morgan Stanley Bank of America Merrill Lynch Trust, | ||||||||||
3.306%, 04/15/2048 | 60 | 61 | ||||||||
Morgan Stanley Capital I Trust, | ||||||||||
5.566%, 10/12/2052 (B) (C) | 15 | 15 | ||||||||
Morgan Stanley Capital I Trust, | ||||||||||
5.566%, 10/12/2052 (B) (C) | 10 | 10 | ||||||||
Morgan Stanley Capital I Trust, | ||||||||||
5.569%, 12/15/2044 | 97 | 102 | ||||||||
Morgan Stanley Capital I Trust, | ||||||||||
5.692%, 04/15/2049 (C) | 160 | 167 | ||||||||
Morgan Stanley Capital I Trust, | ||||||||||
6.461%, 01/11/2043 (B) (C) | 35 | 36 | ||||||||
Morgan Stanley Re-REMIC Trust, | ||||||||||
5.989%, 08/15/2045 (B) (C) | 257 | 269 | ||||||||
SFAVE Commercial Mortgage Securities Trust, | ||||||||||
3.872%, 01/05/2035 (B) (C) | 135 | 134 | ||||||||
UBS-Barclays Commercial Mortgage Trust, | ||||||||||
3.091%, 08/10/2049 | 30 | 31 | ||||||||
UBS-Barclays Commercial Mortgage Trust, | ||||||||||
3.185%, 03/10/2046 | 130 | 133 | ||||||||
UBS-Barclays Commercial Mortgage Trust, | ||||||||||
2.971%, 04/10/2046 | 70 | 71 | ||||||||
Wachovia Bank Commercial Mortgage Trust, | ||||||||||
5.418%, 01/15/2045 (C) | 33 | 33 | ||||||||
| 42 | SEI Institutional International Trust / Annual Report / September 30, 2015 |
| Description | Face Amount (Thousands) (1) | Market Value ($ Thousands) | ||||||||
Wells Fargo Commercial Mortgage Trust, | ||||||||||
4.936%, 10/15/2045 (B) (C) | 35 | $ | 34 | |||||||
Wells Fargo Commercial Mortgage Trust, | ||||||||||
3.839%, 09/15/2058 | 35 | 37 | ||||||||
Wells Fargo Commercial Mortgage Trust, | ||||||||||
4.242%, 05/15/2048 (C) | 65 | 55 | ||||||||
WFRBS Commercial Mortgage Trust, | ||||||||||
4.902%, 06/15/2044 (B) (C) | 120 | 135 | ||||||||
WFRBS Commercial Mortgage Trust, | ||||||||||
2.870%, 11/15/2045 | 75 | 76 | ||||||||
WFRBS Commercial Mortgage Trust, | ||||||||||
3.995%, 05/15/2047 | 65 | 70 | ||||||||
WFRBS Commercial Mortgage Trust, | ||||||||||
3.678%, 08/15/2047 | 60 | 63 | ||||||||
WFRBS Commercial Mortgage Trust, | ||||||||||
3.881%, 08/15/2046 | 70 | 75 | ||||||||
|
| |||||||||
| 10,250 | ||||||||||
|
| |||||||||
Total Mortgage-Backed Securities (Cost $12,872) ($ Thousands) | 12,729 | |||||||||
|
| |||||||||
CORPORATE OBLIGATIONS — 1.2% |
| |||||||||
United States — 1.2% | ||||||||||
Anadarko Petroleum | ||||||||||
6.375%, 09/15/2017 | 330 | 356 | ||||||||
CCO Safari II | ||||||||||
4.908%, 07/23/2025 (B) | 180 | 179 | ||||||||
3.579%, 07/23/2020 (B) | 180 | 179 | ||||||||
CNA Financial | ||||||||||
7.250%, 11/15/2023 | 110 | 131 | ||||||||
6.500%, 08/15/2016 | 40 | 42 | ||||||||
Cox Communications | ||||||||||
2.950%, 06/30/2023 (B) | 127 | 116 | ||||||||
EnLink Midstream Partners | ||||||||||
4.150%, 06/01/2025 | 460 | 422 | ||||||||
Enterprise Products Operating | ||||||||||
5.950%, 02/01/2041 | 100 | 103 | ||||||||
HP Enterprises | ||||||||||
4.900%, 10/15/2025 (B) | 350 | 349 | ||||||||
Kinder Morgan | ||||||||||
5.000%, 02/15/2021 (B) | 161 | 165 | ||||||||
Kinder Morgan Energy Partners | ||||||||||
2.650%, 02/01/2019 | 39 | 38 | ||||||||
| Description | Face Amount (Thousands) (1) | Market Value ($ Thousands) | ||||||||
Kraft Heinz Foods | ||||||||||
3.500%, 07/15/2022 (B) | 230 | $ | 235 | |||||||
2.800%, 07/02/2020 (B) | 270 | 272 | ||||||||
McGraw Hill Financial | ||||||||||
5.900%, 11/15/2017 | 325 | 349 | ||||||||
4.400%, 02/15/2026 (B) | 313 | 318 | ||||||||
Morgan Stanley | ||||||||||
3.450%, 11/02/2015 | 125 | 125 | ||||||||
Mosaic | ||||||||||
5.625%, 11/15/2043 | 135 | 142 | ||||||||
Navient MTN | ||||||||||
5.500%, 01/15/2019 | 248 | 230 | ||||||||
PNC Bank | ||||||||||
2.700%, 11/01/2022 | 445 | 429 | ||||||||
Prudential Financial MTN | ||||||||||
6.100%, 06/15/2017 | 125 | 134 | ||||||||
Reynolds American | ||||||||||
3.750%, 05/20/2023 (B) | 180 | 181 | ||||||||
Time Warner | ||||||||||
4.875%, 03/15/2020 | 150 | 166 | ||||||||
Total System Services | ||||||||||
2.375%, 06/01/2018 | 236 | 237 | ||||||||
Transocean | ||||||||||
6.800%, 03/15/2038 | 210 | 130 | ||||||||
Viacom | ||||||||||
6.125%, 10/05/2017 | 325 | 351 | ||||||||
Williams Partners | ||||||||||
4.125%, 11/15/2020 | 95 | 97 | ||||||||
4.000%, 11/15/2021 | 150 | 144 | ||||||||
|
| |||||||||
Total Corporate Obligations |
| 5,620 | ||||||||
|
| |||||||||
U.S. TREASURY OBLIGATION — 0.6% |
| |||||||||
U.S. Treasury Note | ||||||||||
1.250%, 01/31/2020 | 3,220 | 3,217 | ||||||||
|
| |||||||||
Total U.S. Treasury Obligation | 3,217 | |||||||||
|
| |||||||||
ASSET-BACKED SECURITIES — 0.0% |
| |||||||||
Automotive — 0.0% | ||||||||||
Bavarian Sky, | ||||||||||
0.137%, 06/20/2020 (C) | 33 | 37 | ||||||||
|
| |||||||||
Other Asset-Backed Securities — 0.0% |
| |||||||||
Volta Electricity Receivables, | ||||||||||
4.172%, 02/16/2017 | 121 | 137 | ||||||||
|
| |||||||||
Total Asset-Backed Securities |
| 174 | ||||||||
|
| |||||||||
| SEI Institutional International Trust / Annual Report / September 30, 2015 | 43 |
SCHEDULE OF INVESTMENTS
International Fixed Income Fund (Continued)
September 30, 2015
| Description | Face Amount (Thousands) (2) | Market Value ($ Thousands) | ||||||||||
TIME DEPOSITS — 1.5% |
| |||||||||||
Brown Brothers Harriman | ||||||||||||
5.750%, 10/01/2015 | ZAR | 54 | $ | 4 | ||||||||
1.550%, 10/01/2015 | NZD | 31 | 20 | |||||||||
1.168%, 10/01/2015 | AUD | 61 | 43 | |||||||||
0.154%, 10/01/2015 | NOK | 46 | 5 | |||||||||
0.100%, 10/01/2015 | SGD | 25 | 18 | |||||||||
0.100%, 10/01/2015 | DKK | 2 | – | |||||||||
0.058%, 10/01/2015 | CAD | 31 | 23 | |||||||||
0.057%, 10/01/2015 | GBP | 788 | 1,193 | |||||||||
0.030%, 10/01/2015 | 5,245 | 5,245 | ||||||||||
0.005%, 10/01/2015 | HKD | 2 | – | |||||||||
0.005%, 10/01/2015 | JPY | 21,335 | 178 | |||||||||
(0.238)%, 10/01/2015 | EUR | 647 | 723 | |||||||||
(0.733)%, 10/01/2015 | SEK | 145 | 17 | |||||||||
(1.000)%, 10/01/2015 | CHF | 2 | 2 | |||||||||
|
| |||||||||||
Total Time Deposits |
| 7,471 | ||||||||||
|
| |||||||||||
Total Investments — 98.7% |
| $ | 489,243 | |||||||||
|
| |||||||||||
A list of the open futures contracts held by the Fund at September 30, 2015, is as follows:
| Type of Contract | Number of Contracts Long (Short) | Expiration Date | Unrealized Appreciation (Depreciation) ($ Thousands) | |||||||||
10-YR MINI JGB | 6 | Dec-2015 | $ | 2 | ||||||||
Australian 10-Year Bond | (11 | ) | Dec-2015 | (4 | ) | |||||||
Australian 3-Year Bond | 4 | Dec-2015 | 1 | |||||||||
Canadian 10-Year Bond | (45 | ) | Dec-2015 | 32 | ||||||||
Euro-Buxl 30 Year Bond | 8 | Dec-2015 | 45 | |||||||||
Euro | (180 | ) | Dec-2015 | 54 | ||||||||
Euro-Bobl | (20 | ) | Dec-2015 | (12 | ) | |||||||
Euro-Bobl | 41 | Dec-2015 | 33 | |||||||||
Euro-Schatz | 38 | Dec-2015 | 4 | |||||||||
Euro-Bund | (8 | ) | Dec-2015 | (28 | ) | |||||||
Euro-Bund | 92 | Dec-2015 | 204 | |||||||||
Japanese 10-Year Bond | 5 | Dec-2015 | 14 | |||||||||
Long Gilt 10-Year Bond | (5 | ) | Dec-2015 | (2 | ) | |||||||
Long Gilt 10-Year Bond | 31 | Dec-2015 | 49 | |||||||||
Short Gilt 2-Year Bond | (6 | ) | Dec-2015 | (2 | ) | |||||||
U.S. 2-Year Treasury Note | (30 | ) | Dec-2015 | (9 | ) | |||||||
U.S. 2-Year Treasury Note | (75 | ) | Dec-2015 | (19 | ) | |||||||
U.S. 5-Year Treasury Note | 50 | Jan-2016 | 14 | |||||||||
U.S. 5-Year Treasury Note | (31 | ) | Jan-2016 | (24 | ) | |||||||
U.S. 10-Year Treasury Note | (35 | ) | Dec-2015 | (43 | ) | |||||||
U.S. 10-Year Treasury Note | (114 | ) | Dec-2015 | (122 | ) | |||||||
U.S. Long Treasury Bond | (2 | ) | Dec-2015 | (4 | ) | |||||||
U.S. Long Treasury Bond | 5 | Dec-2015 | 6 | |||||||||
U.S. Ultra Long Treasury Bond | (19 | ) | Dec-2015 | 71 | ||||||||
U.S. Ultra Long Treasury Bond | 7 | Dec-2015 | 3 | |||||||||
|
| |||||||||||
| $ | 263 | |||||||||||
|
| |||||||||||
For the year ended September 30, 2015, the total amount of all open futures contracts, as presented in the table above, are representative of the volume of activity for this derivative type during the year.
A list of the forward foreign currency contracts held by the Fund at September 30, 2015, is as follows:
| Settlement Date | Currency to Deliver (Thousands) | Currency to Receive (Thousands) | Unrealized Appreciation (Depreciation) ($ Thousands) | |||||||||||||||||
10/1/15-11/4/15 | EUR | 289,497 | USD | 325,759 | $ | 2,545 | ||||||||||||||
10/1/15-11/4/15 | USD | 98,450 | EUR | 87,702 | (548 | ) | ||||||||||||||
10/2/15-10/30/15 | USD | 4,649 | CAD | 6,220 | (10 | ) | ||||||||||||||
10/2/15-11/19/15 | CAD | 36,914 | USD | 27,694 | 161 | |||||||||||||||
10/2/15-1/6/16 | BRL | 25,178 | USD | 6,900 | 697 | |||||||||||||||
10/2/15-1/6/16 | USD | 2,118 | BRL | 8,261 | (58 | ) | ||||||||||||||
10/6/15 | USD | 4,017 | DKK | 26,702 | (21 | ) | ||||||||||||||
10/6/15-10/30/15 | USD | 5,292 | AUD | 7,525 | (10 | ) | ||||||||||||||
10/6/15-10/30/15 | USD | 34,120 | JPY | 4,103,493 | 147 | |||||||||||||||
10/6/15-11/4/15 | AUD | 29,461 | USD | 20,696 | 38 | |||||||||||||||
10/6/15-11/4/15 | DKK | 53,404 | USD | 8,058 | 63 | |||||||||||||||
10/6/15-11/4/15 | JPY | 15,291,567 | USD | 127,149 | (577 | ) | ||||||||||||||
10/6/15-11/4/15 | SEK | 15,436 | USD | 1,838 | (4 | ) | ||||||||||||||
10/6/15-11/5/15 | USD | 1,502 | SEK | 12,550 | (4 | ) | ||||||||||||||
10/6/15-11/10/15 | GBP | 65,777 | USD | 100,589 | 979 | |||||||||||||||
10/6/15-11/10/15 | USD | 27,835 | GBP | 18,304 | (110 | ) | ||||||||||||||
10/9/15 | IDR | 25,636,505 | USD | 1,737 | (8 | ) | ||||||||||||||
10/9/15 | USD | 1,647 | IDR | 23,295,138 | (61 | ) | ||||||||||||||
10/9/15 | USD | 1,569 | MYR | 6,641 | (58 | ) | ||||||||||||||
10/9/15-10/30/15 | MYR | 9,896 | USD | 2,357 | 104 | |||||||||||||||
10/9/15-10/30/15 | NZD | 998 | USD | 640 | 3 | |||||||||||||||
10/13/15 | USD | 521 | ZAR | 7,020 | (15 | ) | ||||||||||||||
10/13/15-10/30/15 | ZAR | 25,492 | USD | 1,863 | 25 | |||||||||||||||
10/16/15 | TWD | 28,244 | USD | 871 | 15 | |||||||||||||||
10/30/15 | CHF | 2,333 | USD | 2,397 | 6 | |||||||||||||||
10/30/15 | CZK | 10,333 | USD | 428 | 3 | |||||||||||||||
10/30/15 | ILS | 777 | USD | 197 | (1 | ) | ||||||||||||||
10/30/15 | KRW | 4,462,698 | USD | 3,730 | (29 | ) | ||||||||||||||
10/30/15 | NOK | 3,225 | USD | 389 | 11 | |||||||||||||||
10/30/15 | PLN | 6,357 | USD | 1,683 | 12 | |||||||||||||||
10/30/15 | THB | 24,826 | USD | 680 | (3 | ) | ||||||||||||||
10/30/15 | USD | 363 | KRW | 433,630 | 2 | |||||||||||||||
10/30/15 | USD | 80 | MXN | 1,380 | 1 | |||||||||||||||
10/30/15 | USD | 165 | NOK | 1,370 | (5 | ) | ||||||||||||||
10/30/15 | USD | 135 | NZD | 215 | 2 | |||||||||||||||
10/30/15 | USD | 56 | SGD | 80 | — | |||||||||||||||
10/30/15-11/6/15 | SGD | 6,455 | USD | 4,586 | 50 | |||||||||||||||
10/30/15-11/20/15 | MXN | 35,605 | USD | 2,067 | (28 | ) | ||||||||||||||
11/5/15 | SEK | 7,381 | EUR | 790 | 1 | |||||||||||||||
|
| |||||||||||||||||||
| $ | 3,315 | |||||||||||||||||||
|
| |||||||||||||||||||
A list of the counterparties for the open forward foreign currency contracts held by the Fund at September 30, 2015, is as follows:
| Counterparty | Currency to Deliver ($ Thousands) | Currency to Receive ($ Thousands) | Unrealized Appreciation (Depreciation) ($ Thousands) | |||||||||
Bank of America | $ | (327 | ) | $ | 326 | $ | (1 | ) | ||||
Barclays PLC | (856 | ) | 871 | 15 | ||||||||
BNP Paribas | (346 | ) | 354 | 8 | ||||||||
Brown Brothers Harriman | (731,495 | ) | 733,777 | 2,282 | ||||||||
Citigroup | (35,900 | ) | 36,154 | 254 | ||||||||
Deutsche Bank | (332 | ) | 332 | — | ||||||||
Goldman Sachs | (4,136 | ) | 4,486 | 350 | ||||||||
HSBC | (4,454 | ) | 4,428 | (26 | ) | |||||||
JPMorgan Chase Bank | (6,708 | ) | 6,682 | (26 | ) | |||||||
Morgan Stanley | (254 | ) | 282 | 28 | ||||||||
National Bank of Australia | (41 | ) | 41 | — | ||||||||
RBC | (41 | ) | 41 | — | ||||||||
Royal Bank of Scotland | (20,620 | ) | 20,624 | 4 | ||||||||
Standard Bank | (4,113 | ) | 4,235 | 122 | ||||||||
State Street | (543 | ) | 549 | 6 | ||||||||
UBS | (11,482 | ) | 11,781 | 299 | ||||||||
|
| |||||||||||
| $ | 3,315 | |||||||||||
|
| |||||||||||
| 44 | SEI Institutional International Trust / Annual Report / September 30, 2015 |
For the year ended September 30, 2015, the total amount of all open forward foreign currency contracts, as presented in the table above are representative of the volume of activity for this derivative type during the year.
A list of open OTC swap agreements held by the Fund at September 30, 2015, are as follows:
| Credit Default Swaps | ||||||||||||||||
| Counterparty | Reference/Entity Obligation | Buy/Sell Protection | (Pays)/Receives Rate | Termination Date | Notional Amount ($ Thousands) | Net Unrealized Depreciation ($ Thousands) | ||||||||||
| JPMorgan Chase Bank | JPSW CDS 12/20 VOLKSWAGEN | Sell | 1.00 | 12/20/2020 | (1,500 | ) | $ | (36 | ) | |||||||
|
| |||||||||||||||
| Interest Rate Swaps | ||||||||||||||||
| Counterparty | Fund Pays | Fund Receives | Termination Date | Currency | Notional Amount (Thousands) | Net Unrealized Depreciation ($ Thousands) | ||||||||||
| Citigroup | 2.83% | 3-Month USD LIBOR | 08/08/2023 | USD | 6,000 | $ | (483 | ) | ||||||||
| Citigroup | Euro CPI Overall Excluding Tobacco | 1.22 % | 04/03/2019 | EUR | 2,450 | (44 | ) | |||||||||
| Citigroup | 3.79% | 6-Month GBP EURIBOR | 05/19/2019 | GBP | 2,500 | (390 | ) | |||||||||
|
| |||||||||||||||
| $ | (917 | ) | ||||||||||||||
|
| |||||||||||||||
A list of open centrally cleared swap agreements held by the Fund at September 30, 2015, are as follows:
| Credit Default Swaps | ||||||||||||||||
| Counterparty | Reference/Entity Obligation | Buy/Sell Protection | (Pays)/Receives Rate | Termination Date | Notional Amount ($ Thousands) | Net Unrealized Depreciation ($ Thousands) | ||||||||||
| Citigroup | ITRAXX-XOVERS23V1-5Y | Sell | 5.00% | 06/20/2020 | $ | (1,490 | ) | $ | (64 | ) | ||||||
|
| |||||||||||||||
| Interest Rate Swaps | ||||||||||||||||
| Counterparty | Fund Pays | Fund Receives | Termination Date | Currency | Notional Amount (Thousands) | Net Unrealized Appreciation (Depreciation) ($ Thousands) | ||||||||||
| Citigroup | 3.34% | 6-Month GBP EURIBOR | 01/17/2044 | GBP | 1,000 | $ | (428 | ) | ||||||||
| JPMorgan Chase Bank | 6-Month JPY LIBOR | 1.56 % | 11/28/2033 | JPY | 600,000 | 432 | ||||||||||
| JPMorgan Chase Bank | 1.90% | 6-Month EUR EURIBOR | 03/24/2024 | EUR | 2,200 | (227 | ) | |||||||||
| JPMorgan Chase Bank | 2.87% | 6-Month GBP EURIBOR | 02/14/2024 | GBP | 250 | (35 | ) | |||||||||
| JPMorgan Chase Bank | 1.49% | 6-Month EUR EURIBOR | 11/21/2023 | EUR | 5,500 | (616 | ) | |||||||||
| JPMorgan Chase Bank | 1.49% | 6-Month EUR EURIBOR | 09/12/2018 | EUR | 7,000 | (318 | ) | |||||||||
|
| |||||||||||||||
| $ | (1,192 | ) | ||||||||||||||
|
| |||||||||||||||
For the year ended September 30, 2015, the total amount of all swap agreements, as presented in the table above, are representative of the volume of activity for this derivative type during the year.
Percentages are based on a Net Assets of $495,957 ($ Thousands).
| (1) | In local currency unless otherwise indicated. |
| (2) | In U.S. Dollars unless otherwise indicated. |
| (A) | Zero coupon security. The rate reported on the Schedule of Investments is the effective yield at time of purchase. |
| (B) | Securities sold within terms of a private placement memorandum, exempt from registration under Section 144A of the Securities Act of 1933, as amended, and may be sold only to dealers in that program or other “accredited investors.” These securities have been determined to be liquid under guidelines established by the Board of Trustees. |
| (C) | Variable Rate Security — The rate reported on the Schedule of Investments is the rate in effect as of September 30, 2015. |
| (D) | Real Estate Investment Trust. |
| (E) | Security, or portion therof, has been pledged as collateral on open swap agreements. |
AUD — Australian Dollar
BRL — Brazilian Real
CAD — Canadian Dollar
CHF — Swiss Franc
Cl — Class
CPI — Consumer Price Index
CZK — Czech Koruna
DKK — Danish Krone
EUR — Euro
EURIBOR — Euro London Interbank Offered Rate
FHLMC — Federal Home Loan Mortgage Corporation
FNMA — Federal National Mortgage Association
GBP — British Pound Sterling
HKD — Hong Kong Dollar
IDR — Indonesian Rupiah
ILS — Isreali Shekel
IO — Interest Only
JPY — Japanese Yen
KRW — Korean Won
LIBOR — London Interbank Offered Rate
MTN — Medium Term Note
MXN — Mexican Peso
MYR — Malaysian Ringgit
NOK — Norweigan Krone
NZD — New Zealand Dollar
OTC — Over the Counter
PLC — Public Limited Company
PLN — Polish Zlotty
SEK — Swedish Krona
Ser — Series
SGD — Singapore Dollar
THB — Thai Bhat
TWD — Taiwan Dollar
USD — U.S. Dollar
ZAR — South African Rand
| SEI Institutional International Trust / Annual Report / September 30, 2015 | 45 |
SCHEDULE OF INVESTMENTS
International Fixed Income Fund (concluded)
September 30, 2015
The following is a list of the level of inputs used as of September 30, 2015, in valuing the Fund’s investments and other financial instruments carried at value ($ Thousands):
| Investments in Securities | Level 1 | Level 2 | Level 3 | Total | ||||||||||||
Global Bonds | $ | — | $ | 460,032 | $ | — | $ | 460,032 | ||||||||
Mortgage-Backed Securities | — | 12,729 | — | 12,729 | ||||||||||||
Corporate Obligations | — | 5,620 | — | 5,620 | ||||||||||||
U.S. Treasury Obligation | — | 3,217 | — | 3,217 | ||||||||||||
Asset-Backed Securities | — | 174 | — | 174 | ||||||||||||
Time Deposits | — | 7,471 | — | 7,471 | ||||||||||||
|
|
|
|
|
|
|
| |||||||||
Total Investments in Securities | $ | — | $ | 489,243 | $ | — | $ | 489,243 | ||||||||
|
|
|
|
|
|
|
| |||||||||
| Other Financial Instruments | Level 1 | Level 2 | Level 3 | Total | ||||||||||||
Futures Contracts* | ||||||||||||||||
Unrealized Appreciation | $ | 532 | $ | — | $ | — | $ | 532 | ||||||||
Unrealized Depreciation | (269 | ) | — | — | (269 | ) | ||||||||||
Forwards Contracts* | ||||||||||||||||
Unrealized Appreciation | — | 4,865 | — | 4,865 | ||||||||||||
Unrealized Depreciation | — | (1,550 | ) | — | (1,550 | ) | ||||||||||
OTC Swaps | ||||||||||||||||
Credit Default Swaps* | ||||||||||||||||
Unrealized Depreciation | — | (36 | ) | — | (36 | ) | ||||||||||
Interest Rate Swaps* | ||||||||||||||||
Unrealized Depreciation | — | (917 | ) | — | (917 | ) | ||||||||||
Centrally Cleared Swaps | ||||||||||||||||
Credit Default Swaps* | ||||||||||||||||
Unrealized Depreciation | — | (64 | ) | — | (64 | ) | ||||||||||
Interest Rate Swaps* | ||||||||||||||||
Unrealized Appreciation | — | 432 | — | 432 | ||||||||||||
Unrealized Depreciation | — | (1,624 | ) | — | (1,624 | ) | ||||||||||
|
|
|
|
|
|
|
| |||||||||
Total Other Financial Instruments | $ | 263 | $ | 1,106 | $ | — | $ | 1,369 | ||||||||
|
|
|
|
|
|
|
| |||||||||
| * | Futures contracts, forwards contracts, and swap contracts are valued at the net unrealized appreciation (depreciation) on the instrument. |
For the year ended September 30, 2015, there were no transfers between Level 1 and Level 2 assets and liabilities.
For the year ended September 30, 2015, there were no transfers between Level 2 and Level 3 assets and liabilities.
Amounts designated as “—” are $0 or have been rounded to $0.
The accompanying notes are an integral part of the financial statements.
| 46 | SEI Institutional International Trust / Annual Report / September 30, 2015 |
SCHEDULE OF INVESTMENTS
Emerging Markets Debt Fund
September 30, 2015
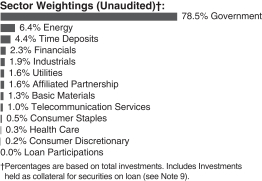
| Description | Face Amount (Thousands) (1) | Market Value ($ Thousands) | ||||||||||
GLOBAL BONDS — 94.7% |
| |||||||||||
Angola — 0.1% | ||||||||||||
Republic of Angola Via Northern Lights III | ||||||||||||
7.000%, 08/16/2019 | 749 | $ | 707 | |||||||||
|
| |||||||||||
Argentina — 1.2% | ||||||||||||
City of Buenos Aires Argentina MTN | ||||||||||||
8.950%, 02/19/2021 | 925 | 953 | ||||||||||
Provincia de Buenos Aires | ||||||||||||
9.375%, 09/14/2018 | 1,175 | 1,154 | ||||||||||
Republic of Argentina | ||||||||||||
7.000%, 04/17/2017 | 6,146 | 5,985 | ||||||||||
6.000%, 03/31/2023 (A) | 815 | 888 | ||||||||||
5.870%, 03/31/2023 (A) | DEM | 590 | 313 | |||||||||
3.043%, 12/15/2035 (B) | 1,203 | 95 | ||||||||||
0.044%, 12/15/2035 (B) | 23,021 | 1,835 | ||||||||||
YPF | ||||||||||||
8.875%, 12/19/2018 | 727 | 702 | ||||||||||
8.750%, 04/04/2024 (C) | 800 | 707 | ||||||||||
8.750%, 04/04/2024 | 194 | 171 | ||||||||||
8.500%, 07/28/2025 (C) | 2,563 | 2,236 | ||||||||||
|
| |||||||||||
| 15,039 | ||||||||||||
|
| |||||||||||
Armenia — 0.3% | ||||||||||||
Republic of Armenia | ||||||||||||
7.150%, 03/26/2025 (C) | 4,476 | 4,222 | ||||||||||
|
| |||||||||||
Azerbaijan — 0.8% | ||||||||||||
International Bank of Azerbaijan | ||||||||||||
5.625%, 06/11/2019 | 1,700 | 1,517 | ||||||||||
Republic of Azerbaijan | ||||||||||||
4.750%, 03/18/2024 | 1,900 | 1,776 | ||||||||||
4.750%, 03/18/2024 (C) | 1,820 | 1,702 | ||||||||||
State Oil of the Azerbaijan Republic | ||||||||||||
6.950%, 03/18/2030 | 830 | 776 | ||||||||||
5.450%, 02/09/2017 | 1,312 | 1,332 | ||||||||||
| Description | Face Amount (Thousands) (1) | Market Value ($ Thousands) | ||||||||||
4.750%, 03/13/2023 | 3,694 | $ | 3,223 | |||||||||
4.750%, 03/13/2023 | 500 | 436 | ||||||||||
|
| |||||||||||
| 10,762 | ||||||||||||
|
| |||||||||||
Belize — 0.1% | ||||||||||||
Belize Government International Bond | ||||||||||||
5.000%, 08/20/2017 (D) | 2,637 | 1,940 | ||||||||||
|
| |||||||||||
Bermuda — 0.1% | ||||||||||||
Government of Bermuda | ||||||||||||
4.854%, 02/06/2024 | 1,680 | 1,756 | ||||||||||
|
| |||||||||||
Brazil — 8.4% | ||||||||||||
Banco Nacional de Desenvolvimento Economico e Social | ||||||||||||
6.500%, 06/10/2019 (C) | 660 | 633 | ||||||||||
5.500%, 07/12/2020 (C) | 400 | 362 | ||||||||||
Braskem Finance | ||||||||||||
5.750%, 04/15/2021 | 3,715 | 3,046 | ||||||||||
Brazil Letras do Tesouro Nacional | ||||||||||||
16.485%, 07/01/2019 (E) | 6,580 | 944 | ||||||||||
13.871%, 01/01/2016 (E) | BRL | 20,010 | 4,855 | |||||||||
12.592%, 07/01/2018 (E) | BRL | 23,825 | 3,968 | |||||||||
12.372%, 01/01/2019 (E) | BRL | 37,253 | 5,744 | |||||||||
11.939%, 01/01/2018 (E) | BRL | 54,052 | 9,689 | |||||||||
8.457%, 01/01/2019 (E) | 83,150 | 12,840 | ||||||||||
Brazil Loan Trust 1 | ||||||||||||
5.477%, 07/24/2023 (C) | 2,183 | 1,899 | ||||||||||
5.477%, 07/24/2023 | 351 | 304 | ||||||||||
Brazil Minas SPE via State of Minas Gerais | ||||||||||||
5.333%, 02/15/2028 | 1,944 | 1,536 | ||||||||||
Brazil Notas do Tesouro Nacional | ||||||||||||
10.000%, 01/01/2017 | BRL | 16,650 | 3,922 | |||||||||
Brazil Notas do Tesouro Nacional, Serie F | ||||||||||||
10.000%, 01/01/2018 | BRL | 10,986 | 2,460 | |||||||||
10.000%, 01/01/2021 | BRL | 27,352 | 5,499 | |||||||||
10.000%, 01/01/2023 | BRL | 16,198 | 3,076 | |||||||||
10.000%, 01/01/2025 | BRL | 73,586 | 13,336 | |||||||||
BRF | ||||||||||||
4.750%, 05/22/2024 | 3,410 | 3,222 | ||||||||||
Caixa Economica Federal | ||||||||||||
4.250%, 05/13/2019 | 200 | 176 | ||||||||||
CIMPOR Financial Operations | ||||||||||||
5.750%, 07/17/2024 (C) | 299 | 201 | ||||||||||
Cosan | ||||||||||||
5.000%, 03/14/2023 (C) | 699 | 524 | ||||||||||
ESAL GmbH | ||||||||||||
6.250%, 02/05/2023 (C) | 647 | 595 | ||||||||||
| SEI Institutional International Trust / Annual Report / September 30, 2015 | 47 |
SCHEDULE OF INVESTMENTS
Emerging Markets Debt Fund (Continued)
September 30, 2015
| Description | Face Amount (Thousands) (1) | Market Value ($ Thousands) | ||||||||||
Federal Republic of Brazil | ||||||||||||
10.125%, 05/15/2027 | 1,378 | $ | 1,778 | |||||||||
10.125%, 05/15/2027 | 850 | 1,096 | ||||||||||
8.250%, 01/20/2034 | 3,280 | 3,395 | ||||||||||
7.125%, 01/20/2037 | 5,504 | 5,146 | ||||||||||
5.000%, 01/27/2045 | 3,080 | 2,302 | ||||||||||
4.875%, 01/22/2021 | 3,260 | 3,170 | ||||||||||
4.250%, 01/07/2025 (F) | 6,467 | 5,659 | ||||||||||
2.625%, 01/05/2023 (F) | 1,154 | 935 | ||||||||||
Gerdau Trade | ||||||||||||
5.750%, 01/30/2021 (C) | USD | 53 | 46 | |||||||||
GTL Trade Finance | ||||||||||||
5.893%, 04/29/2024 (C) (F) | 716 | 594 | ||||||||||
Marfrig Overseas | ||||||||||||
9.500%, 05/04/2020 (C) | 835 | 810 | ||||||||||
9.500%, 05/04/2020 | 650 | 630 | ||||||||||
Minerva Luxembourg | ||||||||||||
7.750%, 01/31/2023 | 1,400 | 1,225 | ||||||||||
Petrobras Global Finance | ||||||||||||
6.250%, 03/17/2024 | 332 | 242 | ||||||||||
4.875%, 03/17/2020 | 549 | 398 | ||||||||||
Petrobras International Finance | ||||||||||||
5.750%, 01/20/2020 | 1,517 | 1,132 | ||||||||||
5.375%, 01/27/2021 | 2,723 | 1,981 | ||||||||||
|
| |||||||||||
| 109,370 | ||||||||||||
|
| |||||||||||
Chile — 1.7% | ||||||||||||
Banco del Estado de Chile MTN | ||||||||||||
4.125%, 10/07/2020 | 30 | 31 | ||||||||||
3.875%, 02/08/2022 (C) | 230 | 234 | ||||||||||
BancoEstado | ||||||||||||
4.125%, 10/07/2020 (C) | 270 | 283 | ||||||||||
Bonos de la Tesoreria de la Republica en pesos | ||||||||||||
6.000%, 01/01/2020 | CLP | 80,000 | 125 | |||||||||
6.000%, 01/01/2022 | CLP | 90,000 | 143 | |||||||||
Empresa Electrica Angamos | ||||||||||||
4.875%, 05/25/2029 (C) | 523 | 493 | ||||||||||
Empresa Nacional del Petroleo | ||||||||||||
6.250%, 07/08/2019 (C) | 100 | 109 | ||||||||||
6.250%, 07/08/2019 | 50 | 55 | ||||||||||
5.250%, 08/10/2020 (C) | 240 | 251 | ||||||||||
5.250%, 08/10/2020 | 100 | 104 | ||||||||||
4.375%, 10/30/2024 (C) | 564 | 546 | ||||||||||
Nacional del Cobre de Chile | ||||||||||||
6.150%, 10/24/2036 | 1,748 | 1,790 | ||||||||||
5.625%, 09/21/2035 | 880 | 863 | ||||||||||
5.625%, 10/18/2043 | 250 | 235 | ||||||||||
4.875%, 11/04/2044 (C) (F) | 4,284 | 3,617 | ||||||||||
4.500%, 08/13/2023 (C) | 1,152 | 1,151 | ||||||||||
4.500%, 09/16/2025 (C) | 1,875 | 1,801 | ||||||||||
4.250%, 07/17/2042 | 265 | 205 | ||||||||||
3.875%, 11/03/2021 (C) | 403 | 400 | ||||||||||
| Description | Face Amount (Thousands) (1) | Market Value ($ Thousands) | ||||||||||
3.000%, 07/17/2022 (C) (F) | 1,950 | $ | 1,784 | |||||||||
Republic of Chile | ||||||||||||
5.500%, 08/05/2020 | CLP | 323,000 | 479 | |||||||||
3.875%, 08/05/2020 | 1,207 | 1,288 | ||||||||||
3.125%, 03/27/2025 | 750 | 742 | ||||||||||
2.250%, 10/30/2022 | 3,981 | 3,822 | ||||||||||
VTR Finance | ||||||||||||
6.875%, 01/15/2024 (C) | 1,026 | 931 | ||||||||||
|
| |||||||||||
| 21,482 | ||||||||||||
|
| |||||||||||
China — 1.2% | ||||||||||||
Amber Circle Funding | ||||||||||||
3.250%, 12/04/2022 | 850 | 842 | ||||||||||
CITIC | ||||||||||||
6.800%, 01/17/2023 | 2,100 | 2,379 | ||||||||||
CNOOC Curtis Funding No. 1 Pty | ||||||||||||
4.500%, 10/03/2023 | 650 | 673 | ||||||||||
CNOOC Finance | ||||||||||||
3.500%, 05/05/2025 | 234 | 223 | ||||||||||
Country Garden Holdings | ||||||||||||
7.875%, 05/27/2019 | 674 | 706 | ||||||||||
7.500%, 03/09/2020 | 200 | 205 | ||||||||||
7.250%, 04/04/2021 | 319 | 321 | ||||||||||
Longfor Properties | ||||||||||||
6.750%, 01/29/2023 | 200 | 199 | ||||||||||
Sinochem Offshore Capital MTN | ||||||||||||
3.250%, 04/29/2019 (C) | 1,432 | 1,450 | ||||||||||
Sinochem Overseas Capital | ||||||||||||
4.500%, 11/12/2020 | 2,361 | 2,475 | ||||||||||
4.500%, 11/12/2020 (C) | 429 | 450 | ||||||||||
Sinopec Capital | ||||||||||||
3.125%, 04/24/2023 (C) | 1,019 | 970 | ||||||||||
Sinopec Group Overseas Development | ||||||||||||
4.375%, 10/17/2023 | 921 | 958 | ||||||||||
4.375%, 04/10/2024 (C) | 800 | 832 | ||||||||||
3.250%, 04/28/2025 (C) | 1,094 | 1,045 | ||||||||||
State Grid Overseas Investment | ||||||||||||
4.125%, 05/07/2024 (C) | 1,216 | 1,281 | ||||||||||
Three Gorges Finance I Cayman Islands | ||||||||||||
3.700%, 06/10/2025 (C) | 341 | 348 | ||||||||||
|
| |||||||||||
| 15,357 | ||||||||||||
|
| |||||||||||
Colombia — 5.4% | ||||||||||||
Bogota Distrito Capital | ||||||||||||
9.750%, 07/26/2028 (C) | COP | 8,820,000 | 3,126 | |||||||||
9.750%, 07/26/2028 | COP | 370,000 | 131 | |||||||||
Citigroup Funding, CLN (Republic of Colombia) | ||||||||||||
11.000%, 07/27/2020 | COP | 7,940,000 | 2,944 | |||||||||
Colombian TES | ||||||||||||
11.250%, 10/24/2018 | COP | 69,800 | 25 | |||||||||
| 48 | SEI Institutional International Trust / Annual Report / September 30, 2015 |
| Description | Face Amount (Thousands) (1) | Market Value ($ Thousands) | ||||||||||
11.000%, 07/24/2020 | COP | 227,500 | $ | 84 | ||||||||
10.000%, 07/24/2024 | COP | 7,966,900 | 2,887 | |||||||||
7.750%, 09/18/2030 | COP | 37,959,700 | 11,094 | |||||||||
7.500%, 08/26/2026 | COP | 9,663,400 | 2,914 | |||||||||
7.000%, 09/11/2019 | COP | 1,593,400 | 516 | |||||||||
7.000%, 05/04/2022 | COP | 864,000 | 270 | |||||||||
7.000%, 05/04/2022 | COP | 580,000 | 181 | |||||||||
7.000%, 05/04/2022 | COP | 22,627,000 | 7,078 | |||||||||
6.000%, 04/28/2028 | COP | 17,713,200 | 4,641 | |||||||||
Ecopetrol | ||||||||||||
5.375%, 06/26/2026 | 717 | 626 | ||||||||||
Emgesa ESP | ||||||||||||
8.750%, 01/25/2021 | COP | 1,450,000 | 474 | |||||||||
Empresas Publicas de Medellin ESP | ||||||||||||
8.375%, 02/01/2021 | COP | 4,272,000 | 1,386 | |||||||||
7.625%, 09/10/2024 (C) | COP | 3,971,000 | 1,145 | |||||||||
Financiera de Desarrollo Territorial Findeter | ||||||||||||
7.875%, 08/12/2024 (C) | COP | 1,645,000 | 474 | |||||||||
7.875%, 08/12/2024 | COP | 884,000 | 255 | |||||||||
JPMorgan, CLN (Republic of Columbia) | ||||||||||||
7.000%, 05/04/2022 | COP | 2,087,000 | 653 | |||||||||
Pacific Exploration and Production | ||||||||||||
5.625%, 01/19/2025 (C) | 2,298 | 804 | ||||||||||
Pacific Rubiales Energy | ||||||||||||
5.375%, 01/26/2019 | 900 | 333 | ||||||||||
5.125%, 03/28/2023 (C) | 101 | 35 | ||||||||||
Republic of Colombia | ||||||||||||
11.750%, 02/25/2020 | 1,422 | 1,881 | ||||||||||
10.375%, 01/28/2033 | 360 | 510 | ||||||||||
9.850%, 06/28/2027 | COP | 5,078,000 | 1,870 | |||||||||
9.850%, 06/28/2027 | COP | 1,257,000 | 463 | |||||||||
8.125%, 05/21/2024 | 550 | 673 | ||||||||||
7.750%, 04/14/2021 | COP | 3,875,000 | 1,268 | |||||||||
7.375%, 03/18/2019 | 2,046 | 2,317 | ||||||||||
7.375%, 09/18/2037 | 5,189 | 5,825 | ||||||||||
6.125%, 01/18/2041 | 2,110 | 2,089 | ||||||||||
5.625%, 02/26/2044 | 870 | 813 | ||||||||||
5.000%, 06/15/2045 | 2,309 | 1,980 | ||||||||||
4.500%, 01/28/2026 | 1,466 | 1,426 | ||||||||||
4.375%, 07/12/2021 | 4,457 | 4,539 | ||||||||||
4.375%, 03/21/2023 | COP | 1,917,000 | 508 | |||||||||
4.375%, 03/21/2023 | COP | 1,184,000 | 314 | |||||||||
4.000%, 02/26/2024 | 2,040 | 1,977 | ||||||||||
|
| |||||||||||
| 70,529 | ||||||||||||
|
| |||||||||||
Costa Rica — 0.9% | ||||||||||||
Banco Nacional de Costa Rica | ||||||||||||
6.250%, 11/01/2023 (C) | 240 | 236 | ||||||||||
| Description | Face Amount (Thousands) (1) | Market Value ($ Thousands) | ||||||||||
Instituto Costarricense de Electricidad | ||||||||||||
6.950%, 11/10/2021 | 400 | $ | 405 | |||||||||
6.375%, 05/15/2043 | 250 | 191 | ||||||||||
Republic of Costa Rica | ||||||||||||
7.158%, 03/12/2045 (C) | 1,237 | 1,104 | ||||||||||
7.158%, 03/12/2045 | 1,290 | 1,142 | ||||||||||
7.000%, 04/04/2044 | 1,400 | 1,237 | ||||||||||
7.000%, 04/04/2044 (C) | 4,412 | 3,899 | ||||||||||
4.375%, 04/30/2025 (C) | 781 | 650 | ||||||||||
4.375%, 04/30/2025 | 702 | 584 | ||||||||||
4.250%, 01/26/2023 | 1,424 | 1,232 | ||||||||||
|
| |||||||||||
| 10,680 | ||||||||||||
|
| |||||||||||
Croatia — 0.9% | ||||||||||||
Government of Croatia | ||||||||||||
6.750%, 11/05/2019 | 790 | 859 | ||||||||||
6.625%, 07/14/2020 | 2,103 | 2,280 | ||||||||||
6.375%, 03/24/2021 (C) | 1,941 | 2,087 | ||||||||||
6.250%, 04/27/2017 (C) | 630 | 660 | ||||||||||
6.000%, 01/26/2024 | 1,100 | 1,159 | ||||||||||
6.000%, 01/26/2024 (C) | 1,948 | 2,053 | ||||||||||
5.875%, 07/09/2018 | EUR | 150 | 184 | |||||||||
5.500%, 04/04/2023 (C) | 654 | 670 | ||||||||||
|
| |||||||||||
| 9,952 | ||||||||||||
|
| |||||||||||
Dominican Republic — 1.5% | ||||||||||||
Dominican Republic | ||||||||||||
15.950%, 06/04/2021 | DOP | 3,800 | 106 | |||||||||
11.500%, 05/10/2024 | DOP | 55,000 | 1,304 | |||||||||
11.000%, 01/05/2018 | DOP | 6,320 | 143 | |||||||||
11.000%, 07/30/2021 (C) | DOP | 53,760 | 1,193 | |||||||||
9.040%, 01/23/2018 | 993 | 1,048 | ||||||||||
8.625%, 04/20/2027 | 1,407 | 1,629 | ||||||||||
7.500%, 05/06/2021 (C) | 1,830 | 1,958 | ||||||||||
7.500%, 05/06/2021 | 3,304 | 3,535 | ||||||||||
7.450%, 04/30/2044 (C) | 2,850 | 2,911 | ||||||||||
7.450%, 04/30/2044 | 1,015 | 1,038 | ||||||||||
6.850%, 01/27/2045 | 400 | 385 | ||||||||||
6.850%, 01/27/2045 (C) | 1,699 | 1,635 | ||||||||||
6.600%, 01/28/2024 | 882 | 913 | ||||||||||
5.875%, 04/18/2024 (C) | 1,259 | 1,240 | ||||||||||
5.875%, 04/18/2024 | 210 | 208 | ||||||||||
|
| |||||||||||
| 19,246 | ||||||||||||
|
| |||||||||||
Ecuador — 0.8% | ||||||||||||
EP PetroEcuador via Noble Sovereign Funding I | ||||||||||||
5.957%, 09/24/2019 (B) | 3,262 | 2,471 | ||||||||||
Republic of Ecuador | ||||||||||||
10.500%, 03/24/2020 (C) | 3,770 | 2,827 | ||||||||||
9.375%, 12/15/2015 | 1,554 | 1,515 | ||||||||||
7.950%, 06/20/2024 | 5,350 | 3,772 | ||||||||||
|
| |||||||||||
| 10,585 | ||||||||||||
|
| |||||||||||
| SEI Institutional International Trust / Annual Report / September 30, 2015 | 49 |
SCHEDULE OF INVESTMENTS
Emerging Markets Debt Fund (Continued)
September 30, 2015
| Description | Face Amount (Thousands) (1) | Market Value ($ Thousands) | ||||||||
Egypt — 0.4% | ||||||||||
Government of Egypt | ||||||||||
6.875%, 04/30/2040 | 734 | $ | 690 | |||||||
5.875%, 06/11/2025 (C) | 4,765 | 4,503 | ||||||||
|
| |||||||||
| 5,193 | ||||||||||
|
| |||||||||
El Salvador — 0.8% | ||||||||||
Republic of El Salvador | ||||||||||
8.250%, 04/10/2032 | 267 | 262 | ||||||||
8.250%, 04/10/2032 | 513 | 503 | ||||||||
7.750%, 01/24/2023 | 802 | 796 | ||||||||
7.750%, 01/24/2023 | 708 | 703 | ||||||||
7.650%, 06/15/2035 | 3,161 | 2,817 | ||||||||
7.375%, 12/01/2019 | 400 | 414 | ||||||||
6.375%, 01/18/2027 | 2,530 | 2,220 | ||||||||
6.375%, 01/18/2027 (C) | 1,755 | 1,540 | ||||||||
5.875%, 01/30/2025 (C) | 638 | 554 | ||||||||
5.875%, 01/30/2025 | 210 | 181 | ||||||||
|
| |||||||||
| 9,990 | ||||||||||
|
| |||||||||
Ethiopia — 0.1% | ||||||||||
Federal Democratic Republic of Ethiopia | ||||||||||
6.625%, 12/11/2024 (C) | 669 | 611 | ||||||||
6.625%, 12/11/2024 | 600 | 548 | ||||||||
|
| |||||||||
| 1,159 | ||||||||||
|
| |||||||||
Gabon — 0.1% | ||||||||||
Gabonese Republic | ||||||||||
8.200%, 12/12/2017 | 490 | 494 | ||||||||
6.950%, 06/16/2025 (C) | 893 | 750 | ||||||||
6.375%, 12/12/2024 (C) | 261 | 215 | ||||||||
6.375%, 12/12/2024 | 255 | 210 | ||||||||
|
| |||||||||
| 1,669 | ||||||||||
|
| |||||||||
Georgia — 0.3% | ||||||||||
Georgian Railway JSC | ||||||||||
7.750%, 07/11/2022 | 3,377 | 3,398 | ||||||||
|
| |||||||||
Ghana — 0.3% | ||||||||||
Republic of Ghana | ||||||||||
8.500%, 10/04/2017 (C) | 300 | 297 | ||||||||
8.125%, 01/18/2026 (C) | 2,604 | 2,162 | ||||||||
8.125%, 01/18/2026 | 290 | 241 | ||||||||
7.875%, 08/07/2023 | 1,400 | 1,162 | ||||||||
|
| |||||||||
| 3,862 | ||||||||||
|
| |||||||||
Guatemala — 0.1% | ||||||||||
Comcel Trust | ||||||||||
6.875%, 02/06/2024 (C) | 1,090 | 1,077 | ||||||||
Guatemala Government Bond | ||||||||||
4.875%, 02/13/2028 | 509 | 495 | ||||||||
|
| |||||||||
| 1,572 | ||||||||||
|
| |||||||||
| Description | Face Amount (Thousands) (1) | Market Value ($ Thousands) | ||||||||||
Honduras — 0.0% | ||||||||||||
Republic of Honduras | ||||||||||||
8.750%, 12/16/2020 | 560 | $ | 620 | |||||||||
|
| |||||||||||
Hungary — 4.9% | ||||||||||||
Magyar Export-Import Bank | ||||||||||||
4.000%, 01/30/2020 (C) | 925 | 929 | ||||||||||
Republic of Hungary | ||||||||||||
7.625%, 03/29/2041 | 8,128 | 10,790 | ||||||||||
7.500%, 11/12/2020 | HUF | 262,990 | 1,164 | |||||||||
7.000%, 06/24/2022 | HUF | 2,727,700 | 11,986 | |||||||||
6.500%, 06/24/2019 | HUF | 1,100,810 | 4,543 | |||||||||
6.375%, 03/29/2021 | 1,254 | 1,431 | ||||||||||
6.250%, 01/29/2020 | 770 | 865 | ||||||||||
6.000%, 11/24/2023 | HUF | 200,030 | 853 | |||||||||
5.750%, 11/22/2023 | 3,960 | 4,405 | ||||||||||
5.500%, 12/22/2016 | HUF | 555,220 | 2,106 | |||||||||
5.500%, 12/20/2018 | HUF | 404,600 | 1,609 | |||||||||
5.500%, 06/24/2025 | HUF | 2,807,750 | 11,770 | |||||||||
5.375%, 02/21/2023 | 2,700 | 2,936 | ||||||||||
5.375%, 03/25/2024 | 536 | 582 | ||||||||||
4.125%, 02/19/2018 | 3,504 | 3,640 | ||||||||||
4.000%, 04/25/2018 | HUF | 209,060 | 791 | |||||||||
4.000%, 03/25/2019 | 1,856 | 1,926 | ||||||||||
3.500%, 06/24/2020 | HUF | 121,180 | 454 | |||||||||
3.500%, 06/24/2020 | HUF | 125,550 | 471 | |||||||||
2.500%, 06/22/2018 | HUF | 239,220 | 873 | |||||||||
|
| |||||||||||
| 64,124 | ||||||||||||
|
| |||||||||||
India — 0.3% | ||||||||||||
ABJA Investment Pte | ||||||||||||
5.950%, 07/31/2024 | 472 | 416 | ||||||||||
5.950%, 07/31/2024 | 200 | 176 | ||||||||||
Bharti Airtel International Netherlands BV | ||||||||||||
5.125%, 03/11/2023 | 3,155 | 3,327 | ||||||||||
Export-Import Bank of India MTN | ||||||||||||
4.000%, 08/07/2017 | 200 | 207 | ||||||||||
Vedanta Resources | ||||||||||||
8.250%, 06/07/2021 (C) | 27 | 19 | ||||||||||
6.000%, 01/31/2019 (C) | 131 | 95 | ||||||||||
|
| |||||||||||
| 4,240 | ||||||||||||
|
| |||||||||||
Indonesia — 8.2% | ||||||||||||
Deutsche Bank, CLN (Republic of Indonesia) | ||||||||||||
7.000%, 05/15/2022 | IDR | 2,300,000 | 137 | |||||||||
Indonesia Treasury Bond | ||||||||||||
8.750%, 05/15/2031 | 31,451,000 | 1,956 | ||||||||||
8.250%, 05/15/2036 | 12,322,000 | 721 | ||||||||||
7.000%, 05/15/2027 | 2,300,000 | 128 | ||||||||||
Majapahit Holding | ||||||||||||
8.000%, 08/07/2019 | 470 | 518 | ||||||||||
| 50 | SEI Institutional International Trust / Annual Report / September 30, 2015 |
| Description | Face Amount (Thousands) (1) | Market Value ($ Thousands) | ||||||||||
7.875%, 06/29/2037 (C) | 205 | $ | 220 | |||||||||
7.875%, 06/29/2037 | 300 | 322 | ||||||||||
7.750%, 01/20/2020 | 894 | 995 | ||||||||||
Pelabuhan Indonesia III | ||||||||||||
4.875%, 10/01/2024 | 1,659 | 1,543 | ||||||||||
Pertamina Persero | ||||||||||||
6.500%, 05/27/2041 (C) | 380 | 333 | ||||||||||
6.450%, 05/30/2044 (C) | 885 | 768 | ||||||||||
6.450%, 05/30/2044 | 439 | 382 | ||||||||||
6.000%, 05/03/2042 (C) | 935 | 774 | ||||||||||
6.000%, 05/03/2042 | 340 | 281 | ||||||||||
5.625%, 05/20/2043 | 3,882 | 3,018 | ||||||||||
5.250%, 05/23/2021 (C) | 500 | 494 | ||||||||||
4.875%, 05/03/2022 (C) | 220 | 209 | ||||||||||
Perusahaan Listrik Negara MTN | ||||||||||||
5.250%, 10/24/2042 | 580 | 458 | ||||||||||
Republic of Indonesia MTN | ||||||||||||
12.800%, 06/15/2021 | IDR | 210,000 | 16 | |||||||||
11.625%, 03/04/2019 | 80 | 102 | ||||||||||
11.625%, 03/04/2019 | 1,674 | 2,128 | ||||||||||
11.625%, 03/04/2019 (C) | 975 | 1,239 | ||||||||||
11.000%, 09/15/2025 | IDR | 3,200,000 | 234 | |||||||||
9.000%, 03/15/2029 | IDR | 220,937,000 | 14,162 | |||||||||
8.500%, 10/12/2035 | 925 | 1,161 | ||||||||||
8.375%, 03/15/2024 | IDR | 255,396,000 | 16,361 | |||||||||
8.375%, 09/15/2026 | IDR | 580,000 | 37 | |||||||||
8.375%, 03/15/2034 | IDR | 192,246,000 | 11,379 | |||||||||
8.250%, 06/15/2032 | IDR | 17,369,000 | 1,019 | |||||||||
7.875%, 04/15/2019 | IDR | 47,746,000 | 3,095 | |||||||||
7.750%, 01/17/2038 | 1,478 | 1,735 | ||||||||||
7.750%, 01/17/2038 | 7,418 | 8,706 | ||||||||||
7.000%, 05/15/2022 | IDR | 156,380,000 | 9,283 | |||||||||
6.875%, 01/17/2018 | 2,004 | 2,199 | ||||||||||
6.750%, 01/15/2044 (C) | 1,650 | 1,751 | ||||||||||
6.625%, 05/15/2033 | IDR | 35,776,000 | 1,768 | |||||||||
6.625%, 02/17/2037 | 1,426 | 1,500 | ||||||||||
6.125%, 05/15/2028 | IDR | 26,020,000 | 1,299 | |||||||||
5.875%, 01/15/2024 (C) | 1,163 | 1,231 | ||||||||||
5.875%, 01/15/2024 | 2,876 | 3,045 | ||||||||||
5.625%, 05/15/2023 | IDR | 44,408,000 | 2,369 | |||||||||
5.250%, 01/17/2042 | 692 | 620 | ||||||||||
5.125%, 01/15/2045 (C) | 1,084 | 951 | ||||||||||
4.875%, 05/05/2021 | 1,051 | 1,085 | ||||||||||
4.875%, 05/05/2021 (C) | 200 | 206 | ||||||||||
4.125%, 01/15/2025 | 2,381 | 2,206 | ||||||||||
3.375%, 04/15/2023 (C) | 1,939 | 1,767 | ||||||||||
2.875%, 07/08/2021 (C) | EUR | 594 | 637 | |||||||||
|
| |||||||||||
| 106,548 | ||||||||||||
|
| |||||||||||
Iraq — 0.2% | ||||||||||||
Republic of Iraq | ||||||||||||
5.800%, 01/15/2028 | 3,280 | 2,258 | ||||||||||
|
| |||||||||||
| Description | Face Amount (Thousands) (1) | Market Value ($ Thousands) | ||||||||
Italy — 0.0% | ||||||||||
Wind Acquisition Finance | ||||||||||
4.750%, 07/15/2020 (C) | 49 | $ | 49 | |||||||
|
| |||||||||
Ivory Coast — 1.2% | ||||||||||
Ivory Coast Government Bond | ||||||||||
6.375%, 03/03/2028 (C) | 2,946 | 2,614 | ||||||||
5.750%, 12/31/2032 | 7,869 | 6,813 | ||||||||
5.750%, 12/31/2032 | 3,413 | 2,955 | ||||||||
5.750%, 12/31/2032 | 1,100 | 952 | ||||||||
5.375%, 07/23/2024 (C) | 2,769 | 2,412 | ||||||||
|
| |||||||||
| 15,746 | ||||||||||
|
| |||||||||
Jamaica — 0.9% | ||||||||||
Digicel Group | ||||||||||
8.250%, 09/30/2020 | 2,200 | 2,035 | ||||||||
7.125%, 04/01/2022 (C) | 1,040 | 897 | ||||||||
Government of Jamaica | ||||||||||
7.875%, 07/28/2045 | 1,192 | 1,192 | ||||||||
7.625%, 07/09/2025 | 2,911 | 3,158 | ||||||||
6.750%, 04/28/2028 | 4,885 | 4,909 | ||||||||
|
| |||||||||
| 12,191 | ||||||||||
|
| |||||||||
Kazakhstan — 2.5% | ||||||||||
Development Bank of Kazakhstan | ||||||||||
4.125%, 12/10/2022 | 770 | 657 | ||||||||
KazAgro National Management Holding | ||||||||||
4.625%, 05/24/2023 | 3,830 | 3,060 | ||||||||
Kazakhstan Temir Zholy Finance | ||||||||||
6.950%, 07/10/2042 (C) | 250 | 195 | ||||||||
KazMunayGas National MTN | ||||||||||
9.125%, 07/02/2018 | 1,507 | 1,634 | ||||||||
9.125%, 07/02/2018 (C) | 1,336 | 1,448 | ||||||||
7.000%, 05/05/2020 (C) | 1,565 | 1,583 | ||||||||
6.375%, 04/09/2021 | 1,099 | 1,076 | ||||||||
6.375%, 04/09/2021 (C) | 6,341 | 6,206 | ||||||||
6.000%, 11/07/2044 (C) | 605 | 446 | ||||||||
5.750%, 04/30/2043 (C) | 3,133 | 2,273 | ||||||||
5.750%, 04/30/2043 | 10,694 | 7,726 | ||||||||
4.875%, 05/07/2025 (C) | 390 | 328 | ||||||||
4.400%, 04/30/2023 (C) | 1,032 | 875 | ||||||||
4.400%, 04/30/2023 | 1,022 | 859 | ||||||||
Republic of Kazakhstan MTN | ||||||||||
6.500%, 07/21/2045 (C) | 360 | 338 | ||||||||
6.375%, 10/06/2020 (C) | 600 | 565 | ||||||||
5.125%, 07/21/2025 | 1,931 | 1,875 | ||||||||
Samruk-Energy JSC MTN | ||||||||||
3.750%, 12/20/2017 | 500 | 472 | ||||||||
Zhaikmunai | ||||||||||
6.375%, 02/14/2019 (C) | 362 | 290 | ||||||||
| SEI Institutional International Trust / Annual Report / September 30, 2015 | 51 |
SCHEDULE OF INVESTMENTS
Emerging Markets Debt Fund (Continued)
September 30, 2015
| Description | Face Amount (Thousands) (1) | Market Value ($ Thousands) | ||||||||||
Zhaikmunai Via Zhaikmunai International | ||||||||||||
7.125%, 11/13/2019 (C) | 282 | $ | 226 | |||||||||
|
| |||||||||||
| 32,132 | ||||||||||||
|
| |||||||||||
Kenya — 0.6% | ||||||||||||
Kenya Government International Bond | ||||||||||||
6.875%, 06/24/2024 (C) | 4,883 | 4,424 | ||||||||||
6.875%, 06/24/2024 | 673 | 610 | ||||||||||
5.875%, 06/24/2019 (C) | 1,295 | 1,242 | ||||||||||
Kenya Infrastructure Bond | ||||||||||||
11.000%, 09/15/2025 | KES | 230,000 | 1,952 | |||||||||
11.000%, 10/12/2026 | 20,000 | 160 | ||||||||||
|
| |||||||||||
| 8,388 | ||||||||||||
|
| |||||||||||
Lithuania — 0.2% | ||||||||||||
Republic of Lithuania | ||||||||||||
7.375%, 02/11/2020 | 462 | 554 | ||||||||||
7.375%, 02/11/2020 (C) | 195 | 234 | ||||||||||
6.625%, 02/01/2022 | 200 | 242 | ||||||||||
6.125%, 03/09/2021 (C) | 1,424 | 1,661 | ||||||||||
|
| |||||||||||
| 2,691 | ||||||||||||
|
| |||||||||||
Luxembourg — 0.0% | ||||||||||||
Altice Financing | ||||||||||||
8.000%, 12/15/2019 | EUR | 400 | 465 | |||||||||
|
| |||||||||||
Malaysia — 4.0% | ||||||||||||
1MDB Global Investments | ||||||||||||
4.400%, 03/09/2023 | MYR | 3,100 | 2,325 | |||||||||
Malaysia Government Bond | ||||||||||||
5.248%, 09/15/2028 (C) | MYR | 1,050 | 255 | |||||||||
4.935%, 09/30/2043 | MYR | 4,200 | 973 | |||||||||
4.498%, 04/15/2030 | MYR | 1,240 | 278 | |||||||||
4.392%, 04/15/2026 | MYR | 10,601 | 2,433 | |||||||||
4.262%, 09/15/2016 | MYR | 20,610 | 4,736 | |||||||||
4.181%, 07/15/2024 | MYR | 11,316 | 2,531 | |||||||||
4.160%, 07/15/2021 | MYR | 4,260 | 976 | |||||||||
4.048%, 09/30/2021 | MYR | 4,330 | 975 | |||||||||
4.012%, 09/15/2017 | MYR | 900 | 207 | |||||||||
3.955%, 09/15/2025 | MYR | 4,697 | 1,051 | |||||||||
3.892%, 03/15/2027 | MYR | 1,369 | 296 | |||||||||
3.889%, 07/31/2020 | MYR | 2,330 | 528 | |||||||||
3.844%, 04/15/2033 | MYR | 1,770 | 355 | |||||||||
3.654%, 10/31/2019 | MYR | 13,430 | 3,022 | |||||||||
3.580%, 09/28/2018 | MYR | 4,747 | 1,079 | |||||||||
3.502%, 05/31/2027 | MYR | 1,050 | 216 | |||||||||
3.492%, 03/31/2020 | MYR | 12,824 | 2,882 | |||||||||
3.480%, 03/15/2023 | MYR | 14,448 | 3,117 | |||||||||
3.418%, 08/15/2022 | MYR | 15,169 | 3,293 | |||||||||
3.314%, 10/31/2017 | MYR | 39,479 | 8,968 | |||||||||
3.260%, 03/01/2018 | MYR | 18,210 | 4,111 | |||||||||
| Description | Face Amount (Thousands) (1) | Market Value ($ Thousands) | ||||||||||
3.197%, 10/15/2015 | MYR | 8,823 | $ | 2,007 | ||||||||
3.172%, 07/15/2016 | MYR | 5,310 | 1,208 | |||||||||
Petronas Capital MTN | ||||||||||||
4.500%, 03/18/2045 (C) | 1,010 | 934 | ||||||||||
3.500%, 03/18/2025 (C) | 3,859 | 3,674 | ||||||||||
|
| |||||||||||
| 52,430 | ||||||||||||
|
| |||||||||||
Mexico — 8.2% | ||||||||||||
America Movil | ||||||||||||
7.125%, 12/09/2024 | MXN | 18,110 | 1,039 | |||||||||
6.000%, 06/09/2019 | MXN | 12,420 | 729 | |||||||||
BBVA Bancomer | ||||||||||||
6.750%, 09/30/2022 (C) | 500 | 541 | ||||||||||
Cemex | ||||||||||||
6.125%, 05/05/2025 (C) | 1,241 | 1,129 | ||||||||||
5.700%, 01/11/2025 (C) | 213 | 191 | ||||||||||
Cemex Finance | ||||||||||||
9.375%, 10/12/2022 | 1,500 | 1,596 | ||||||||||
9.375%, 10/12/2022 (C) | 618 | 657 | ||||||||||
6.000%, 04/01/2024 (C) | 77 | 70 | ||||||||||
Comision Federal de Electricidad | ||||||||||||
7.350%, 11/25/2025 | 21,225 | 1,226 | ||||||||||
5.750%, 02/14/2042 (C) | 500 | 453 | ||||||||||
4.875%, 01/15/2024 (C) | 237 | 240 | ||||||||||
Fermaca Enterprises S de RL | ||||||||||||
6.375%, 03/30/2038 (C) | 358 | 339 | ||||||||||
Mexican Bonos, Ser M10 | ||||||||||||
8.500%, 12/13/2018 | MXN | 16,050 | 1,050 | |||||||||
8.000%, 12/17/2015 | MXN | 37,960 | 2,260 | |||||||||
7.750%, 12/14/2017 | MXN | 48,511 | 3,078 | |||||||||
7.250%, 12/15/2016 | MXN | 86,159 | 5,291 | |||||||||
Mexican Bonos, Ser M20 | ||||||||||||
10.000%, 12/05/2024 | MXN | 233,662 | 17,564 | |||||||||
8.500%, 05/31/2029 | MXN | 15,768 | 1,098 | |||||||||
8.000%, 12/07/2023 | MXN | 11,575 | 770 | |||||||||
7.750%, 05/29/2031 | MXN | 73,086 | 4,792 | |||||||||
Mexican Bonos, Ser M30 | ||||||||||||
10.000%, 11/20/2036 | MXN | 8,900 | 714 | |||||||||
8.500%, 11/18/2038 | MXN | 67,335 | 4,713 | |||||||||
Mexican Bonos | ||||||||||||
7.750%, 11/23/2034 | MXN | 1,846 | 121 | |||||||||
7.750%, 11/13/2042 | MXN | 3,280 | 213 | |||||||||
7.500%, 06/03/2027 | MXN | 39,023 | 2,512 | |||||||||
6.500%, 06/09/2022 | MXN | 60,549 | 3,705 | |||||||||
5.000%, 06/15/2017 | MXN | 34,891 | 2,092 | |||||||||
5.000%, 12/11/2019 | MXN | 52,380 | 3,071 | |||||||||
Mexican Udibonos | ||||||||||||
2.500%, 12/10/2020 | MXN | 6,273 | 1,996 | |||||||||
2.000%, 06/09/2022 | MXN | 1,471 | 445 | |||||||||
Mexico Cetes | ||||||||||||
0.000%, 03/03/2016 (E) | MXN | 615,590 | 3,582 | |||||||||
Petroleos Mexicanos MTN | ||||||||||||
7.190%, 09/12/2024 | MXN | 55,630 | 3,119 | |||||||||
| 52 | SEI Institutional International Trust / Annual Report / September 30, 2015 |
| Description | Face Amount (Thousands) (1) | Market Value ($ Thousands) | ||||||||||
6.625%, 06/15/2035 | 3,450 | $ | 3,234 | |||||||||
6.500%, 06/02/2041 | 572 | 526 | ||||||||||
6.375%, 01/23/2045 (C) | 806 | 724 | ||||||||||
4.250%, 01/15/2025 (C) | 560 | 512 | ||||||||||
4.250%, 01/15/2025 | 3,625 | 3,317 | ||||||||||
3.500%, 01/30/2023 (C) | 185 | 167 | ||||||||||
Petroloes Mexicanos MTN | ||||||||||||
5.625%, 01/23/2046 (C) | 1,193 | 971 | ||||||||||
Sixsigma Networks Mexico | ||||||||||||
8.250%, 11/07/2021 (C) | 606 | 569 | ||||||||||
United Mexican States MTN | ||||||||||||
7.500%, 04/08/2033 | 336 | 434 | ||||||||||
6.050%, 01/11/2040 | 1,548 | 1,701 | ||||||||||
5.750%, 10/12/2110 | 468 | 438 | ||||||||||
5.550%, 01/21/2045 | 5,876 | 6,016 | ||||||||||
4.750%, 03/08/2044 | 2,218 | 2,024 | ||||||||||
4.600%, 01/23/2046 | 2,301 | 2,048 | ||||||||||
4.000%, 10/02/2023 | 5,284 | 5,382 | ||||||||||
3.600%, 01/30/2025 | 6,392 | 6,256 | ||||||||||
3.500%, 01/21/2021 | 507 | 516 | ||||||||||
United Mexican States, Ser A MTN | ||||||||||||
6.750%, 09/27/2034 | 1,924 | 2,299 | ||||||||||
|
| |||||||||||
| 107,530 | ||||||||||||
|
| |||||||||||
Mongolia — 0.8% | ||||||||||||
Development Bank of Mongolia MTN | ||||||||||||
5.750%, 03/21/2017 | 902 | 852 | ||||||||||
Mongolia Government Bond MTN | ||||||||||||
5.125%, 12/05/2022 | 7,907 | 6,494 | ||||||||||
5.125%, 12/05/2022 | 481 | 395 | ||||||||||
4.125%, 01/05/2018 | 2,556 | 2,358 | ||||||||||
Trade & Development Bank of Mongolia MTN | ||||||||||||
9.375%, 05/19/2020 (C) | 355 | 346 | ||||||||||
|
| |||||||||||
| 10,445 | ||||||||||||
|
| |||||||||||
Montenegro — 0.0% | ||||||||||||
Republic of Montenegro | ||||||||||||
5.375%, 05/20/2019 | EUR | 399 | 454 | |||||||||
|
| |||||||||||
Morocco — 0.2% | ||||||||||||
Kingdom of Morocco | ||||||||||||
5.500%, 12/11/2042 | 900 | 892 | ||||||||||
5.500%, 12/11/2042 (C) | 200 | 198 | ||||||||||
4.250%, 12/11/2022 (C) | 287 | 290 | ||||||||||
OCP | ||||||||||||
5.625%, 04/25/2024 (C) | 305 | 311 | ||||||||||
4.500%, 10/22/2025 (C) | 1,056 | 987 | ||||||||||
|
| |||||||||||
| 2,678 | ||||||||||||
|
| |||||||||||
| Description | Face Amount (Thousands) (1) | Market Value ($ Thousands) | ||||||||
Mozambique — 0.0% | ||||||||||
EMATUM Via Mozambique EMATUM Finance 2020 | ||||||||||
6.305%, 09/11/2020 | 591 | $ | 505 | |||||||
|
| |||||||||
Nigeria — 0.3% | ||||||||||
Republic of Nigeria | ||||||||||
6.750%, 01/28/2021 | 2,902 | 2,750 | ||||||||
6.750%, 01/28/2021 (C) | 550 | 521 | ||||||||
6.375%, 07/12/2023 | 1,163 | 1,029 | ||||||||
|
| |||||||||
| 4,300 | ||||||||||
|
| |||||||||
Pakistan — 0.3% | ||||||||||
Republic of Pakistan | ||||||||||
8.250%, 04/15/2024 | 3,400 | 3,554 | ||||||||
7.250%, 04/15/2019 (C) | 500 | 513 | ||||||||
7.125%, 03/31/2016 | 500 | 506 | ||||||||
6.875%, 06/01/2017 | 430 | 446 | ||||||||
6.875%, 06/01/2017 | 100 | 104 | ||||||||
|
| |||||||||
| 5,123 | ||||||||||
|
| |||||||||
Panama — 1.2% | ||||||||||
Panama Notas del Tesoro | ||||||||||
4.875%, 02/05/2021 | 704 | 742 | ||||||||
Republic of Panama | ||||||||||
9.375%, 01/16/2023 | 560 | 758 | ||||||||
9.375%, 04/01/2029 | 3,456 | 4,972 | ||||||||
8.875%, 09/30/2027 | 1,345 | 1,849 | ||||||||
8.125%, 04/28/2034 | 2,128 | 2,761 | ||||||||
6.700%, 01/26/2036 | 1,350 | 1,606 | ||||||||
4.300%, 04/29/2053 | 130 | 110 | ||||||||
4.000%, 09/22/2024 | 901 | 889 | ||||||||
3.750%, 03/16/2025 | 862 | 834 | ||||||||
|
| |||||||||
| 14,521 | ||||||||||
|
| |||||||||
Paraguay — 0.6% | ||||||||||
Republic of Paraguay | ||||||||||
6.100%, 08/11/2044 (C) | 1,536 | 1,501 | ||||||||
6.100%, 08/11/2044 | 861 | 842 | ||||||||
4.625%, 01/25/2023 (C) | 737 | 724 | ||||||||
4.625%, 01/25/2023 | 3,216 | 3,160 | ||||||||
Telefonica Celular del Paraguay | ||||||||||
6.750%, 12/13/2022 | 200 | 193 | ||||||||
6.750%, 12/13/2022 | 200 | 193 | ||||||||
|
| |||||||||
| 6,613 | ||||||||||
|
| |||||||||
Peru — 1.8% | ||||||||||
Abengoa Transmision Sur | ||||||||||
6.875%, 04/30/2043 (C) | 273 | 285 | ||||||||
Peru Enhanced Pass-Through Finance | ||||||||||
4.648%, 06/02/2025 (C) (E) | 1,000 | 761 | ||||||||
2.265%, 05/31/2018 (E) | 81 | 78 | ||||||||
| SEI Institutional International Trust / Annual Report / September 30, 2015 | 53 |
SCHEDULE OF INVESTMENTS
Emerging Markets Debt Fund (Continued)
September 30, 2015
| Description | Face Amount (Thousands) (1) | Market Value ($ Thousands) | ||||||||||
2.007%, 05/31/2018 (C) (E) | 218 | $ | 209 | |||||||||
Republic of Peru | ||||||||||||
8.750%, 11/21/2033 | 3,637 | 5,128 | ||||||||||
8.200%, 08/12/2026 | PEI | 4,268 | 1,371 | |||||||||
7.350%, 07/21/2025 | 1,344 | 1,677 | ||||||||||
6.950%, 08/12/2031 | PEI | 6,696 | 1,916 | |||||||||
6.950%, 08/12/2031 | PEI | 9,861 | 2,821 | |||||||||
6.850%, 02/12/2042 | PEI | 613 | 165 | |||||||||
6.550%, 03/14/2037 | 1,794 | 2,059 | ||||||||||
5.700%, 08/12/2024 | PEI | 3,584 | 993 | |||||||||
5.700%, 08/12/2024 (C) | PEI | 10,512 | 2,929 | |||||||||
4.125%, 08/25/2027 | 3,300 | 3,234 | ||||||||||
Southern Copper | ||||||||||||
3.875%, 04/23/2025 | 680 | 615 | ||||||||||
|
| |||||||||||
| 24,241 | ||||||||||||
|
| |||||||||||
Philippines — 0.3% | ||||||||||||
Development Bank of Philippines | ||||||||||||
5.500%, 03/25/2021 | 330 | 367 | ||||||||||
National Power | ||||||||||||
9.625%, 05/15/2028 | 1,100 | 1,653 | ||||||||||
Republic of Philippines | ||||||||||||
6.375%, 01/15/2032 | 887 | 1,135 | ||||||||||
3.900%, 11/26/2022 | PHP | 45,000 | 934 | |||||||||
|
| |||||||||||
| 4,089 | ||||||||||||
|
| |||||||||||
Poland — 4.0% | ||||||||||||
Republic of Poland | ||||||||||||
4.000%, 10/25/2023 | PLN | 17,459 | 4,999 | |||||||||
3.750%, 04/25/2018 | PLN | 4,860 | 1,336 | |||||||||
3.250%, 07/25/2025 | PLN | 70,563 | 19,201 | |||||||||
3.000%, 08/24/2016 | PLN | 9,162 | 2,446 | |||||||||
3.000%, 03/17/2023 | 290 | 289 | ||||||||||
2.750%, 08/25/2023 | PLN | 16,981 | 4,876 | |||||||||
1.552%, 01/25/2016 (E) | PLN | 11,378 | 2,977 | |||||||||
1.500%, 04/25/2020 | PLN | 41,600 | 10,534 | |||||||||
0.000%, 07/25/2017 (E) | 800 | 204 | ||||||||||
Republic of Poland, Ser 0922 | ||||||||||||
5.750%, 09/23/2022 | PLN | 11,501 | 3,613 | |||||||||
Republic of Poland, Ser 1017 | ||||||||||||
5.250%, 10/25/2017 | PLN | 7,330 | 2,062 | |||||||||
|
| |||||||||||
| 52,537 | ||||||||||||
|
| |||||||||||
Qatar — 0.3% | ||||||||||||
Ooredoo International Finance | ||||||||||||
7.875%, 06/10/2019 | 665 | 796 | ||||||||||
State of Qatar | ||||||||||||
6.400%, 01/20/2040 | 2,150 | 2,818 | ||||||||||
|
| |||||||||||
| 3,614 | ||||||||||||
|
| |||||||||||
Romania — 2.1% | ||||||||||||
Government of Romania MTN | ||||||||||||
6.750%, 02/07/2022 | 3,367 | 3,973 | ||||||||||
6.750%, 02/07/2022 (C) | 350 | 413 | ||||||||||
6.125%, 01/22/2044 | 690 | 799 | ||||||||||
| Description | Face Amount (Thousands) (1) | Market Value ($ Thousands) | ||||||||||
5.950%, 06/11/2021 | RON | 2,630 | $ | 765 | ||||||||
5.850%, 04/26/2023 | RON | 9,250 | 2,703 | |||||||||
5.750%, 04/29/2020 | RON | 19,090 | 5,461 | |||||||||
5.750%, 04/29/2020 | RON | 810 | 232 | |||||||||
4.875%, 01/22/2024 | 126 | 136 | ||||||||||
4.875%, 01/22/2024 (C) | 1,424 | 1,535 | ||||||||||
4.750%, 08/29/2016 | RON | 8,980 | 2,336 | |||||||||
4.750%, 06/24/2019 | RON | 23,060 | 6,332 | |||||||||
4.750%, 02/24/2025 | RON | 4,900 | 1,344 | |||||||||
4.375%, 08/22/2023 (C) | 539 | 562 | ||||||||||
4.375%, 08/22/2023 | 1,462 | 1,523 | ||||||||||
|
| |||||||||||
| 28,114 | ||||||||||||
|
| |||||||||||
Russia — 5.2% | ||||||||||||
Alfa Bank Via Alfa Bond Issuance | ||||||||||||
7.750%, 04/28/2021 | 1,500 | 1,533 | ||||||||||
EDC Finance | ||||||||||||
4.875%, 04/17/2020 | 650 | 552 | ||||||||||
Gaz Capital | ||||||||||||
6.510%, 03/07/2022 (C) | 224 | 221 | ||||||||||
Gazprom Neft OAO Via GPN Capital | ||||||||||||
4.375%, 09/19/2022 (C) | 230 | 198 | ||||||||||
Gazprom OAO Via Gaz Capital | ||||||||||||
9.250%, 04/23/2019 | 3,575 | 3,946 | ||||||||||
9.250%, 04/23/2019 (C) | 381 | 421 | ||||||||||
4.950%, 07/19/2022 (C) | 157 | 143 | ||||||||||
4.300%, 11/12/2015 (C) | 408 | 409 | ||||||||||
Ritekro | ||||||||||||
13.277%, 11/07/2022 (E) (G) (H) | 914 | 457 | ||||||||||
Rosneft Oil via Rosneft International Finance | ||||||||||||
3.149%, 03/06/2017 (C) | 7 | 7 | ||||||||||
Russian Federal Bond - OFZ | ||||||||||||
8.150%, 02/03/2027 | RUB | 34,254 | 436 | |||||||||
7.600%, 04/14/2021 | RUB | 580,174 | 7,626 | |||||||||
7.600%, 07/20/2022 | RUB | 415,187 | 5,326 | |||||||||
7.500%, 03/15/2018 | RUB | 185,392 | 2,616 | |||||||||
7.500%, 02/27/2019 | RUB | 214,314 | 2,949 | |||||||||
7.400%, 04/19/2017 | RUB | 70,000 | 1,016 | |||||||||
7.400%, 06/14/2017 | RUB | 46,878 | 676 | |||||||||
7.350%, 01/20/2016 | RUB | 80,000 | 1,211 | |||||||||
7.050%, 01/19/2028 | RUB | 165,852 | 1,903 | |||||||||
7.000%, 01/25/2023 | RUB | 233,026 | 2,856 | |||||||||
7.000%, 08/16/2023 | RUB | 193,574 | 2,350 | |||||||||
6.900%, 08/03/2016 | RUB | 48,434 | 716 | |||||||||
6.800%, 12/11/2019 | RUB | 85,636 | 1,123 | |||||||||
6.700%, 05/15/2019 | RUB | 355,381 | 4,726 | |||||||||
6.500%, 12/03/2014 (D) | RUB | 22,770 | 287 | |||||||||
6.400%, 05/27/2020 | RUB | 30,800 | 392 | |||||||||
6.200%, 01/31/2018 | RUB | 296,103 | 4,073 | |||||||||
Russian Foreign Bond - Eurobond | ||||||||||||
7.850%, 03/10/2018 | RUB | 120,000 | 1,705 | |||||||||
| 54 | SEI Institutional International Trust / Annual Report / September 30, 2015 |
| Description | Face Amount (Thousands) (1) | Market Value ($ Thousands) | ||||||||||
5.625%, 04/04/2042 | 2,000 | $ | 1,870 | |||||||||
5.000%, 04/29/2020 | 5,900 | 6,099 | ||||||||||
4.875%, 09/16/2023 (F) | 2,200 | 2,218 | ||||||||||
4.875%, 09/16/2023 (C) | 1,200 | 1,210 | ||||||||||
3.625%, 09/16/2020 | 1,000 | 1,120 | ||||||||||
3.250%, 04/04/2017 | 600 | 602 | ||||||||||
Vimpel Communications Via VIP Finance Ireland | ||||||||||||
7.748%, 02/02/2021 (C) | 429 | 438 | ||||||||||
VimpelCom Holdings | ||||||||||||
7.504%, 03/01/2022 (C) | 1,061 | 1,064 | ||||||||||
Vnesheconombank Via VEB Finance | ||||||||||||
6.902%, 07/09/2020 | 1,310 | 1,317 | ||||||||||
6.800%, 11/22/2025 | 1,344 | 1,272 | ||||||||||
6.800%, 11/22/2025 (C) | 150 | 142 | ||||||||||
5.450%, 11/22/2017 (C) | 400 | 402 | ||||||||||
|
| |||||||||||
| 67,628 | ||||||||||||
|
| |||||||||||
Senegal — 0.3% | ||||||||||||
Republic of Senegal | ||||||||||||
8.750%, 05/13/2021 | 790 | 824 | ||||||||||
8.750%, 05/13/2021 (C) | 540 | 563 | ||||||||||
6.250%, 07/30/2024 | 3,530 | 3,161 | ||||||||||
6.250%, 07/30/2024 (C) | 426 | 381 | ||||||||||
|
| |||||||||||
| 4,929 | ||||||||||||
|
| |||||||||||
Serbia — 0.5% | ||||||||||||
Republic of Serbia | ||||||||||||
7.250%, 09/28/2021 | 3,255 | 3,646 | ||||||||||
7.250%, 09/28/2021 (C) | 200 | 224 | ||||||||||
5.875%, 12/03/2018 | 815 | 851 | ||||||||||
5.875%, 12/03/2018 (C) | 530 | 553 | ||||||||||
4.875%, 02/25/2020 (C) | 246 | 248 | ||||||||||
4.875%, 02/25/2020 | 1,214 | 1,226 | ||||||||||
|
| |||||||||||
| 6,748 | ||||||||||||
|
| |||||||||||
Slovenia — 0.7% | ||||||||||||
Slovenia Government International Bond | ||||||||||||
5.850%, 05/10/2023 | 1,800 | 2,057 | ||||||||||
5.250%, 02/18/2024 | 5,980 | 6,578 | ||||||||||
|
| |||||||||||
| 8,635 | ||||||||||||
|
| |||||||||||
South Africa — 5.4% | ||||||||||||
Eskom Holdings | ||||||||||||
7.125%, 02/11/2025 | 372 | 350 | ||||||||||
7.125%, 02/11/2025 (C) (F) | 5,756 | 5,416 | ||||||||||
6.750%, 08/06/2023 (C) | 1,289 | 1,205 | ||||||||||
6.750%, 08/06/2023 | 1,100 | 1,028 | ||||||||||
5.750%, 01/26/2021 | 1,389 | 1,305 | ||||||||||
Republic of South Africa | ||||||||||||
10.500%, 12/21/2026 | ZAR | 104,627 | 8,675 | |||||||||
| Description | Face Amount (Thousands) (1) | Market Value ($ Thousands) | ||||||||||
8.750%, 01/31/2044 | ZAR | 20,346 | $ | 1,419 | ||||||||
8.750%, 02/28/2048 | ZAR | 61,485 | 4,287 | |||||||||
8.500%, 01/31/2037 | ZAR | 35,403 | 2,425 | |||||||||
8.250%, 09/15/2017 | ZAR | 29,822 | 2,195 | |||||||||
8.250%, 03/31/2032 | ZAR | 8,270 | 559 | |||||||||
8.000%, 12/21/2018 | ZAR | 5,380 | 393 | |||||||||
8.000%, 01/31/2030 | ZAR | 167,076 | 11,253 | |||||||||
7.750%, 02/28/2023 | ZAR | 108,686 | 7,621 | |||||||||
7.250%, 01/15/2020 | ZAR | 55,842 | 3,948 | |||||||||
7.000%, 02/28/2031 | ZAR | 42,150 | 2,564 | |||||||||
6.875%, 05/27/2019 | 580 | 647 | ||||||||||
6.750%, 03/31/2021 | ZAR | 31,200 | 2,123 | |||||||||
6.500%, 02/28/2041 | ZAR | 21,130 | 1,144 | |||||||||
6.250%, 03/31/2036 | ZAR | 53,179 | 2,866 | |||||||||
5.875%, 09/16/2025 | 5,925 | 6,310 | ||||||||||
Transnet SOC MTN | ||||||||||||
9.500%, 05/13/2021 (C) | ZAR | 13,360 | 925 | |||||||||
ZAR Sovereign Capital Fund Propriety | ||||||||||||
3.903%, 06/24/2020 (C) | 1,046 | 1,038 | ||||||||||
|
| |||||||||||
| 69,696 | ||||||||||||
|
| |||||||||||
Sri Lanka — 0.4% | ||||||||||||
Republic of Sri Lanka | ||||||||||||
6.250%, 10/04/2020 (C) | 694 | 701 | ||||||||||
6.125%, 06/03/2025 (C) | 905 | 873 | ||||||||||
5.875%, 07/25/2022 | 1,020 | 984 | ||||||||||
5.875%, 07/25/2022 (C) | 724 | 699 | ||||||||||
|
| |||||||||||
| 3,257 | ||||||||||||
|
| |||||||||||
Supra-National — 0.1% | ||||||||||||
European Investment Bank MTN | ||||||||||||
8.500%, 09/17/2024 | ZAR | 9,200 | 652 | |||||||||
Inter-American Development Bank MTN | ||||||||||||
7.350%, 09/12/2018 | IDR | 20,140,000 | 1,252 | |||||||||
|
| |||||||||||
| 1,904 | ||||||||||||
|
| |||||||||||
Thailand — 2.4% | ||||||||||||
Thailand Government Bond | ||||||||||||
5.670%, 03/13/2028 | THB | 3,000 | 105 | |||||||||
4.875%, 06/22/2029 | THB | 47,582 | 1,581 | |||||||||
3.875%, 06/13/2019 | THB | 118,000 | 3,469 | |||||||||
3.850%, 12/12/2025 | THB | 119,963 | 3,606 | |||||||||
3.650%, 12/17/2021 | THB | 386,356 | 11,310 | |||||||||
3.625%, 06/16/2023 | THB | 294,110 | 8,604 | |||||||||
3.580%, 12/17/2027 | THB | 69,970 | 2,033 | |||||||||
2.550%, 06/26/2020 | THB | 15,000 | 420 | |||||||||
1.250%, 03/12/2028 | THB | 23,392 | 534 | |||||||||
1.200%, 07/14/2021 | THB | 63,249 | 1,617 | |||||||||
|
| |||||||||||
| 33,279 | ||||||||||||
|
| |||||||||||
| SEI Institutional International Trust / Annual Report / September 30, 2015 | 55 |
SCHEDULE OF INVESTMENTS
Emerging Markets Debt Fund (Continued)
September 30, 2015
| Description | Face Amount (Thousands) (1) | Market Value ($ Thousands) | ||||||||||
Trinidad & Tobago — 0.1% | ||||||||||||
Republic of Trinidad & Tobago | ||||||||||||
4.375%, 01/16/2024 (C) | 1,316 | $ | 1,421 | |||||||||
|
| |||||||||||
Tunisia — 0.1% | ||||||||||||
Banque Centrale de Tunisie | ||||||||||||
5.750%, 01/30/2025 (C) | 1,298 | 1,236 | ||||||||||
|
| |||||||||||
Turkey — 6.5% | ||||||||||||
Export Credit Bank of Turkey | ||||||||||||
5.875%, 04/24/2019 (C) | 200 | 203 | ||||||||||
5.000%, 09/23/2021 (C) | 538 | 514 | ||||||||||
Republic of Turkey | ||||||||||||
11.875%, 01/15/2030 | 900 | 1,436 | ||||||||||
10.500%, 01/15/2020 | TRY | 9,158 | 2,985 | |||||||||
10.400%, 03/27/2019 | TRY | 3,560 | 1,153 | |||||||||
10.400%, 03/20/2024 | TRY | 2,250 | 723 | |||||||||
9.500%, 01/12/2022 | TRY | 8,610 | 2,659 | |||||||||
9.400%, 07/08/2020 | 5,772 | 1,792 | ||||||||||
9.000%, 03/08/2017 | TRY | 10,845 | 3,489 | |||||||||
9.000%, 07/24/2024 | TRY | 21,228 | 6,261 | |||||||||
8.800%, 11/14/2018 | TRY | 9,824 | 3,052 | |||||||||
8.500%, 07/10/2019 | TRY | 18,266 | 5,565 | |||||||||
8.500%, 09/14/2022 | TRY | 13,148 | 3,835 | |||||||||
8.300%, 10/07/2015 | TRY | 1,708 | 564 | |||||||||
8.300%, 06/20/2018 | TRY | 14,151 | 4,370 | |||||||||
8.200%, 07/13/2016 | TRY | 6,947 | 2,242 | |||||||||
8.000%, 03/12/2025 | TRY | 11,669 | 3,236 | |||||||||
8.000%, 02/14/2034 | 1,350 | 1,630 | ||||||||||
7.500%, 11/07/2019 | 2,260 | 2,539 | ||||||||||
7.400%, 02/05/2020 | TRY | 44,087 | 12,785 | |||||||||
7.375%, 02/05/2025 | 1,151 | 1,316 | ||||||||||
7.100%, 03/08/2023 | TRY | 6,560 | 1,751 | |||||||||
7.000%, 06/05/2020 | 3,187 | 3,522 | ||||||||||
6.875%, 03/17/2036 | 1,787 | 1,933 | ||||||||||
6.750%, 04/03/2018 | 1,374 | 1,483 | ||||||||||
6.750%, 05/30/2040 | 2,513 | 2,676 | ||||||||||
6.300%, 02/14/2018 | TRY | 1,090 | 324 | |||||||||
6.250%, 09/26/2022 | 2,414 | 2,580 | ||||||||||
6.000%, 01/14/2041 | 1,086 | 1,057 | ||||||||||
5.750%, 03/22/2024 | 1,161 | 1,203 | ||||||||||
5.625%, 03/30/2021 | 1,912 | 1,996 | ||||||||||
5.125%, 03/25/2022 (F) | 2,063 | 2,086 | ||||||||||
4.250%, 04/14/2026 | 1,278 | 1,161 | ||||||||||
TC Ziraat Bankasi | ||||||||||||
4.250%, 07/03/2019 (C) | 1,440 | 1,394 | ||||||||||
|
| |||||||||||
| 85,515 | ||||||||||||
|
| |||||||||||
Ukraine — 0.8% | ||||||||||||
Government of Ukraine | ||||||||||||
9.250%, 07/24/2017 | 3,434 | 2,716 | ||||||||||
7.800%, 11/28/2022 | 4,941 | 3,917 | ||||||||||
7.500%, 04/17/2023 | 725 | 578 | ||||||||||
6.750%, 11/14/2017 | 1,898 | 1,499 | ||||||||||
| Description | Face Amount (Thousands) (1) | Market Value ($ Thousands) | ||||||||
6.250%, 06/17/2016 | 808 | $ | 633 | |||||||
Ukreximbank Via Biz Finance | ||||||||||
9.625%, 04/27/2022 (C) | 1,711 | 1,499 | ||||||||
|
| |||||||||
| 10,842 | ||||||||||
|
| |||||||||
Uruguay — 0.7% | ||||||||||
Republic of Uruguay PIK | ||||||||||
7.875%, 01/15/2033 | 1,809 | 2,261 | ||||||||
Republic of Uruguay | ||||||||||
7.625%, 03/21/2036 | 786 | 972 | ||||||||
5.100%, 06/18/2050 | 4,249 | 3,729 | ||||||||
4.500%, 08/14/2024 | 632 | 638 | ||||||||
4.125%, 11/20/2045 | 458 | 362 | ||||||||
|
| |||||||||
| 7,962 | ||||||||||
|
| |||||||||
Venezuela — 2.4% | ||||||||||
Petroleos de Venezuela | ||||||||||
9.000%, 11/17/2021 | 150 | 54 | ||||||||
8.500%, 11/02/2017 | 7,016 | 4,683 | ||||||||
8.500%, 11/02/2017 | 12,575 | 8,394 | ||||||||
6.000%, 05/16/2024 | 7,010 | 2,278 | ||||||||
5.250%, 04/12/2017 | 156 | 70 | ||||||||
5.250%, 04/12/2017 | 8,076 | 3,629 | ||||||||
Republic of Venezuela | ||||||||||
13.625%, 08/15/2018 | 1,716 | 978 | ||||||||
13.625%, 08/15/2018 | 144 | 73 | ||||||||
12.750%, 08/23/2022 | 2,237 | 956 | ||||||||
11.950%, 08/05/2031 | 1,420 | 558 | ||||||||
11.750%, 10/21/2026 | 2,515 | 975 | ||||||||
9.375%, 01/13/2034 | 5,886 | 2,031 | ||||||||
9.250%, 09/15/2027 | 1,313 | 512 | ||||||||
9.250%, 05/07/2028 | 445 | 150 | ||||||||
8.250%, 10/13/2024 | 500 | 168 | ||||||||
8.250%, 10/13/2024 | 7,020 | 2,352 | ||||||||
5.750%, 02/26/2016 | 5,011 | 4,221 | ||||||||
|
| |||||||||
| 32,082 | ||||||||||
|
| |||||||||
Vietnam — 0.1% | ||||||||||
Republic of Vietnam | ||||||||||
6.750%, 01/29/2020 | 439 | 477 | ||||||||
4.800%, 11/19/2024 (C) | 1,026 | 970 | ||||||||
|
| |||||||||
| 1,447 | ||||||||||
|
| |||||||||
Zambia — 0.4% | ||||||||||
Republic of Zambia | ||||||||||
8.970%, 07/30/2027 | 1,105 | 887 | ||||||||
8.970%, 07/30/2027 (C) | 1,439 | 1,137 | ||||||||
8.500%, 04/14/2024 (C) | 524 | 419 | ||||||||
8.500%, 04/14/2024 | 975 | 780 | ||||||||
5.375%, 09/20/2022 | 2,360 | 1,672 | ||||||||
|
| |||||||||
| 4,895 | ||||||||||
|
| |||||||||
Total Global Bonds (Cost $1,457,475) ($ Thousands) | 1,236,592 | |||||||||
|
| |||||||||
| 56 | SEI Institutional International Trust / Annual Report / September 30, 2015 |
| Description | Face Amount (Thousands) (1)/Shares | Market Value ($ Thousands) | ||||||||||
LOAN PARTICIPATIONS — 0.0% |
| |||||||||||
Singapore — 0.0% | ||||||||||||
Ashmore Cayman SPC, No. 1 |
| |||||||||||
0.000%, |
| 262 | $ | 131 | ||||||||
Morton Bay | ||||||||||||
6.220%, 12/31/2013 (G) (H) |
| 3,158 | — | |||||||||
|
| |||||||||||
Total Loan Participations (Cost $3,396) ($ Thousands) |
| 131 | ||||||||||
|
| |||||||||||
AFFILIATED PARTNERSHIP — 1.6% |
| |||||||||||
SEI Liquidity Fund, L.P. | ||||||||||||
0.050%†* (I) | 20,810,230 | 20,810 | ||||||||||
|
| |||||||||||
Total Affiliated Partnership (Cost $20,810) ($ Thousands) |
| 20,810 | ||||||||||
|
| |||||||||||
TIME DEPOSITS — 4.4% |
| |||||||||||
Brown Brothers Harriman | ||||||||||||
5.750%, 10/01/2015 | ZAR | 3,893 | 281 | |||||||||
0.100%, 10/01/2015 | SGD | 1 | — | |||||||||
0.057%, 10/01/2015 | GBP | — | — | |||||||||
0.030%, 10/01/2015 | 56,965 | 56,965 | ||||||||||
(0.238)%, 10/01/2015 | EUR | 27 | 30 | |||||||||
|
| |||||||||||
Total Time Deposits (Cost $57,276) ($ Thousands) |
| 57,276 | ||||||||||
|
| |||||||||||
Total Investments — 100.7% (Cost $1,538,957) ($ Thousands) |
| $ | 1,314,809 | |||||||||
|
| |||||||||||
A list of the open futures contracts held by the Fund at September 30, 2015, is as follows:
| Type of Contract | Number of Contracts Long (Short) | Expiration Date | Unrealized Appreciation (Depreciation) ($ Thousands) | |||||||||
JSE Bond Future R2037 | 166 | Nov-2015 | $ | (26 | ) | |||||||
JSE Bond Future R208 | 670 | Nov-2015 | (37 | ) | ||||||||
U.S. 2-Year Treasury Note | 12 | Dec-2015 | 3 | |||||||||
U.S. 5-Year Treasury Note | (95 | ) | Jan-2016 | (86 | ) | |||||||
U.S. 5-Year Treasury Note | (128 | ) | Jan-2016 | (83 | ) | |||||||
U.S. 10-Year Treasury Note | (75 | ) | Dec-2015 | (105 | ) | |||||||
U.S. 10-Year Treasury Note | 14 | Dec-2015 | 19 | |||||||||
U.S. Long Treasury Bond | 21 | Dec-2015 | 59 | |||||||||
|
| |||||||||||
| $ | (256 | ) | ||||||||||
|
| |||||||||||
For the year ended September 30, 2015, the total amount of all open futures contracts, as presented in the table above, are representative of the volume of activity for this derivative type during the year.
A list of the open forward foreign currency contracts held by the Fund at September 30, 2015, is as follows:
| Settlement Date | Currency to Deliver (Thousands) | Currency to Receive (Thousands) | Unrealized Appreciation (Depreciation) ($ Thousands) | |||||||||||||||||
10/1/15-12/16/15 | MXN | 310,335 | USD | 18,364 | $ | 135 | ||||||||||||||
10/1/15-3/17/16 | USD | 19,864 | IDR | 281,578,962 | (954 | ) | ||||||||||||||
10/2/15-12/2/15 | BRL | 180,656 | USD | 47,132 | 2,417 | |||||||||||||||
10/2/15-12/2/15 | USD | 33,852 | BRL | 131,613 | (1,153 | ) | ||||||||||||||
10/5/15-10/27/15 | USD | 8,019 | THB | 286,332 | (134 | ) | ||||||||||||||
10/5/15-12/16/15 | COP | 97,543,688 | USD | 31,727 | 223 | |||||||||||||||
10/5/15-12/16/15 | THB | 390,949 | USD | 10,846 | 86 | |||||||||||||||
10/5/15-12/16/15 | USD | 24,618 | COP | 74,808,375 | (462 | ) | ||||||||||||||
10/5/15-12/16/15 | USD | 54,929 | EUR | 48,596 | (676 | ) | ||||||||||||||
10/5/15-12/17/15 | USD | 15,648 | ZAR | 212,252 | (416 | ) | ||||||||||||||
10/5/15-12/18/15 | EUR | 43,824 | USD | 49,323 | 391 | |||||||||||||||
10/8/15 | GBP | 236 | USD | 362 | 4 | |||||||||||||||
10/8/15 | USD | 361 | GBP | 236 | (4 | ) | ||||||||||||||
10/8/15-11/30/15 | INR | 500,584 | USD | 7,468 | (136 | ) | ||||||||||||||
10/8/15-12/16/15 | USD | 24,881 | INR | 1,655,727 | 200 | |||||||||||||||
10/8/15-12/17/15 | ZAR | 169,584 | USD | 12,336 | 158 | |||||||||||||||
10/13/15-12/16/15 | IDR | 271,405,459 | USD | 18,883 | 588 | |||||||||||||||
10/13/15-12/16/15 | MYR | 65,873 | USD | 15,355 | 364 | |||||||||||||||
10/14/15-11/30/15 | USD | 21,954 | RUB | 1,383,827 | (1,002 | ) | ||||||||||||||
10/14/15-12/10/15 | EUR | 17,311 | PLN | 72,955 | (175 | ) | ||||||||||||||
10/14/15-12/10/15 | PLN | 62,740 | EUR | 14,896 | 153 | |||||||||||||||
10/14/15-12/16/15 | RUB | 1,991,266 | USD | 31,347 | 1,312 | |||||||||||||||
10/15/15-12/16/15 | TRY | 90,463 | USD | 30,991 | 1,449 | |||||||||||||||
10/15/15-12/16/15 | USD | 28,709 | TRY | 82,943 | (1,560 | ) | ||||||||||||||
10/19/15-11/18/15 | USD | 5,012 | CZK | 121,537 | (12 | ) | ||||||||||||||
10/19/15-12/16/15 | PEI | 74,309 | USD | 22,265 | (466 | ) | ||||||||||||||
10/20/15 | EUR | 836 | RON | 3,707 | 4 | |||||||||||||||
10/20/15 | RON | 32,710 | EUR | 7,382 | (22 | ) | ||||||||||||||
10/21/15-1/20/16 | KRW | 22,289,605 | USD | 18,932 | 165 | |||||||||||||||
10/21/15-6/2/16 | NGN | 2,481,088 | USD | 10,932 | (699 | ) | ||||||||||||||
10/21/15-8/10/16 | USD | 12,511 | NGN | 3,028,320 | 1,357 | |||||||||||||||
10/26/15-7/29/16 | KES | 247,000 | USD | 2,264 | (19 | ) | ||||||||||||||
10/28/15 | USD | 7,649 | RON | 30,167 | (29 | ) | ||||||||||||||
10/28/15-12/16/15 | PLN | 24,758 | USD | 6,539 | 38 | |||||||||||||||
10/28/15-12/16/15 | USD | 10,093 | CLP | 7,029,497 | (58 | ) | ||||||||||||||
10/28/15-12/16/15 | USD | 20,776 | PLN | 78,723 | (108 | ) | ||||||||||||||
10/29/15-11/19/15 | USD | 4,903 | SGD | 6,887 | (65 | ) | ||||||||||||||
10/29/15-12/16/15 | SGD | 19,914 | USD | 14,151 | 166 | |||||||||||||||
11/2/15 | CLP | 5,153,675 | USD | 7,436 | 68 | |||||||||||||||
11/3/15 | USD | 2,473 | KRW | 2,956,980 | 17 | |||||||||||||||
11/16/15-12/16/15 | USD | 4,356 | PHP | 205,287 | 17 | |||||||||||||||
11/17/15-12/16/15 | USD | 31,593 | MXN | 524,727 | (763 | ) | ||||||||||||||
11/18/15-12/16/15 | CZK | 155,776 | USD | 6,504 | 88 | |||||||||||||||
11/19/15 | USD | 9,991 | PEI | 33,493 | 264 | |||||||||||||||
11/25/15 | AUD | 3,572 | USD | 2,494 | (7 | ) | ||||||||||||||
11/27/15-12/16/15 | USD | 11,227 | MYR | 47,775 | (351 | ) | ||||||||||||||
12/1/15 | EUR | 221 | HUF | 69,430 | — | |||||||||||||||
12/1/15 | HUF | 1,394,146 | EUR | 4,452 | 3 | |||||||||||||||
12/1/15-12/16/15 | ILS | 50,744 | USD | 13,048 | 103 | |||||||||||||||
12/3/15-12/16/15 | TWD | 447,426 | USD | 13,945 | 413 | |||||||||||||||
12/3/15-12/16/15 | USD | 7,456 | TWD | 244,442 | (63 | ) | ||||||||||||||
12/16/15 | HUF | 2,111,472 | USD | 7,496 | (34 | ) | ||||||||||||||
12/16/15 | RON | 24,972 | USD | 6,271 | (33 | ) | ||||||||||||||
12/16/15 | USD | 2,738 | HUF | 768,586 | 4 | |||||||||||||||
12/16/15-3/16/16 | CNY | 31,825 | USD | 4,882 | (38 | ) | ||||||||||||||
|
| |||||||||||||||||||
| $ | 748 | |||||||||||||||||||
|
| |||||||||||||||||||
| SEI Institutional International Trust / Annual Report / September 30, 2015 | 57 |
SCHEDULE OF INVESTMENTS
Emerging Markets Debt Fund (Continued)
September 30, 2015
A list of the counterparties for the open forward foreign currency contracts held by the Fund at September 30, 2015, is as follows:
| Counterparty | Currency to Deliver ($ Thousands) | Currency to Receive ($ Thousands) | Unrealized Appreciation (Depreciation) ($ Thousands) | |||||||||
Barclays PLC | $ | (7,534 | ) | $ | 7,343 | $ | (191 | ) | ||||
Brown Brothers Harriman | (6,336 | ) | 6,322 | (14 | ) | |||||||
Citigroup | (128,467 | ) | 129,220 | 753 | ||||||||
Goldman Sachs | (288,594 | ) | 289,369 | 775 | ||||||||
HSBC | (4,869 | ) | 4,832 | (37 | ) | |||||||
JPMorgan Chase Bank | (377,391 | ) | 376,890 | (501 | ) | |||||||
Merrill Lynch | (5,215 | ) | 5,178 | (37 | ) | |||||||
|
| |||||||||||
| $ | 748 | |||||||||||
|
| |||||||||||
For the year ended September 30, 2015, the total amount of all open forward foreign currency contracts, as presented in the table above, are representative of the volume of activity for this derivative type during the year.
A list of open OTC swap agreements held by the Fund at September 30, 2015, are as follows:
| Interest Rate Swaps | ||||||||||||||||||||
| Counterparty | Fund Pays | Fund Receives | Termination Date | Currency | Notional Amount (Thousands) | Net Unrealized Appreciation (Depreciation) ($ Thousands) | ||||||||||||||
Goldman Sachs | 3-Month ZAR - JIBAR | 8.76% | 01/16/2029 | ZAR | 52,000 | $ | 64 | |||||||||||||
Goldman Sachs | 2.46% | 6-Month PLN - WIBOR | 09/22/2025 | PLN | 5,500 | 3 | ||||||||||||||
Goldman Sachs | 28-Day MXN - TIIE | 6.36% | 09/05/2025 | MXN | 59,917 | (3 | ) | |||||||||||||
Goldman Sachs | 4.63% | 1-Day CLP - CLICP | 08/21/2025 | CLP | 205,000 | 27 | ||||||||||||||
Goldman Sachs | 28-Day MXN - TIIE | 6.36% | 05/21/2025 | MXN | 23,145 | 2 | ||||||||||||||
Goldman Sachs | 3.45% | 6-Month HUF - BUBOR | 05/11/2025 | HUF | 800,000 | (169 | ) | |||||||||||||
Goldman Sachs | 4.53% | 1-Day CLP - CLICP | 03/11/2025 | CLP | 791,933 | 104 | ||||||||||||||
Goldman Sachs | 3-Month ZAR - JIBAR | 8.30% | 01/16/2024 | ZAR | 23,000 | 10 | ||||||||||||||
Goldman Sachs | 3-Month ZAR - JIBAR | 8.19% | 12/20/2023 | ZAR | 10,000 | (3 | ) | |||||||||||||
Goldman Sachs | 1-Year BRL - CDI | 10.89% | 01/03/2023 | BRL | 5,012 | (379 | ) | |||||||||||||
Goldman Sachs | 1-Day BRL - CDI | 11.99% | 01/02/2023 | BRL | 3,000 | (162 | ) | |||||||||||||
Goldman Sachs | 28-Day MXN - TIIE | 5.90% | 09/12/2022 | MXN | 75,956 | (4 | )�� | |||||||||||||
Goldman Sachs | 1-Day BRL - CDI | 12.73% | 01/01/2021 | BRL | 10,608 | (354 | ) | |||||||||||||
Goldman Sachs | 6-Month THB - BIBOR | 2.01% | 08/05/2020 | THB | 35,000 | (9 | ) | |||||||||||||
Goldman Sachs | 0.59% | 6-Month CZK - PRIBOR | 03/13/2020 | CZK | 25,000 | (12 | ) | |||||||||||||
Goldman Sachs | 5.12% | 28-Day MXN - TIIE | 11/28/2019 | MXN | 12,000 | 1 | ||||||||||||||
Goldman Sachs | 28-Day MXN - TIIE | 6.82% | 06/27/2019 | MXN | 218,869 | 75 | ||||||||||||||
Goldman Sachs | 1-Day BRL - CDI | 13.39% | 01/02/2019 | BRL | 14,395 | (243 | ) | |||||||||||||
Goldman Sachs | 1-Day BRL - CDI | 13.42% | 01/02/2019 | BRL | 19,336 | (322 | ) | |||||||||||||
Goldman Sachs | 1-Year BRL - CDI | 11.81% | 01/02/2018 | BRL | 9,833 | (227 | ) | |||||||||||||
Goldman Sachs | 1-Year BRL - CDI | 11.98% | 01/02/2018 | BRL | 3,338 | (73 | ) | |||||||||||||
Goldman Sachs | 1-Day BRL - CDI | 12.86% | 01/02/2018 | BRL | 35,816 | (535 | ) | |||||||||||||
Goldman Sachs | 1-Day BRL - CDI | 13.27% | 01/02/2017 | BRL | 27,961 | (197 | ) | |||||||||||||
Goldman Sachs | 2.45% | 6-Month HUF - BUBOR | 07/11/2016 | HUF | 3,073,496 | (197 | ) | |||||||||||||
Goldman Sachs | 0.76% | 3-Month ILS - TELBOR | 05/22/2016 | ILS | 11,000 | (20 | ) | |||||||||||||
Goldman Sachs | 0.95% | 3-Month ILS - TELBOR | 04/02/2016 | ILS | 6,000 | (14 | ) | |||||||||||||
Goldman Sachs | 1.21% | 3-Month ILS - TELBOR | 02/14/2016 | ILS | 8,000 | (24 | ) | |||||||||||||
Goldman Sachs | 3.31% | 6-Month PLN - WIBOR | 02/03/2016 | PLN | 30,000 | (189 | ) | |||||||||||||
Goldman Sachs | 1.20% | 3-Month ILS - TELBOR | 01/16/2016 | ILS | 34,383 | (101 | ) | |||||||||||||
Goldman Sachs | 1-Year BRL - CDI | 11.59% | 01/04/2016 | BRL | 5,024 | (14 | ) | |||||||||||||
Goldman Sachs | 1-Year BRL - CDI | 11.00% | 01/04/2016 | BRL | 45,820 | (280 | ) | |||||||||||||
Goldman Sachs | 1-Year BRL - CDI | 11.92% | 01/04/2016 | BRL | 20,309 | (67 | ) | |||||||||||||
JPMorgan Chase Bank | 4.72% | 1-Day CLP - CLICP | 06/05/2025 | CLP | 1,293,489 | 155 | ||||||||||||||
JPMorgan Chase Bank | 4.29% | 6-Month HUF - BUBOR | 08/04/2024 | HUF | 800,000 | (372 | ) | |||||||||||||
JPMorgan Chase Bank | 6-Month THB - BIBOR | 2.13% | 05/18/2020 | THB | 185,000 | (21 | ) | |||||||||||||
JPMorgan Chase Bank | 0.50% | 6-Month CZK - PRIBOR | 05/05/2020 | CZK | 140,000 | (26 | ) | |||||||||||||
JPMorgan Chase Bank | 5.33% | Columbia IBR Overnight Interbank | 03/11/2020 | COP | 6,515,340 | 143 | ||||||||||||||
JPMorgan Chase Bank | 0.54% | 6-Month CZK - PRIBOR | 02/16/2020 | CZK | 250,000 | (94 | ) | |||||||||||||
JPMorgan Chase Bank | 3-Month ILS - TELBOR | 1.14% | 03/24/2019 | ILS | 100,000 | 8 | ||||||||||||||
JPMorgan Chase Bank | 5.41% | Columbia IBR Overnight Interbank | 09/21/2017 | COP | 20,651,242 | 45 | ||||||||||||||
JPMorgan Chase Bank | 1.77% | 3-Month HUF - BUBOR | 07/17/2017 | HUF | 5,732,291 | (74 | ) | |||||||||||||
JPMorgan Chase Bank | 0.64% | 3-Month ILS - TELBOR | 07/31/2016 | ILS | 15,000 | (22 | ) | |||||||||||||
|
| |||||||||||||||||||
| $ | (3,570 | ) | ||||||||||||||||||
|
| |||||||||||||||||||
| Cross Currency Swaps | ||||||||||||||||||||
| Counterparty | Fund Pays | Fund Receives | Termination Date | Currency | Notional Amount (Thousands) | Notional Amount of Currency Delivered (Thousands) | Net Unrealized Depreciation ($ Thousands) | |||||||||||||
| JPMorgan Chase Bank | 3-Month USD - LIBOR | 8.57% | 10/28/2016 | TRY | 80,000 | (35,826 | ) | $ | (758 | ) | ||||||||||
|
| |||||||||||||||||||
| 58 | SEI Institutional International Trust / Annual Report / September 30, 2015 |
A list of open centrally cleared swap agreements held by the Fund at September 30, 2015, are as follows:
| Interest Rate Swaps | ||||||||||||||||
| Counterparty | Fund Pays | Fund Receives | Termination Date | Currency | Notional Amount (Thousands) | Net Unrealized (Depreciation) | ||||||||||
| Bank of America | 2.34% | 3-Month USD - LIBOR | 02/06/2045 | USD | 1,930 | $ | 78 | |||||||||
| Bank of America | 2.14% | 3-Month USD - LIBOR | 01/12/2025 | USD | 3,534 | (69 | ) | |||||||||
| JPMorgan Chase Bank | 2.08% | 3-Month USD - LIBOR | 01/13/2025 | USD | 4,680 | (64 | ) | |||||||||
|
| |||||||||||||||
| $ | (55 | ) | ||||||||||||||
|
| |||||||||||||||
For the year ended September 30, 2015, the total amount of all open swap agreements, as presented in the table above, are representative of the volume of activity for this derivative type during the year.
Percentages are based on a Net Assets of $1,305,950 ($ Thousands).
| * | Rate shown is the 7-day effective yield as of September 30, 2015. |
| † | Investment in Affiliated Security. |
| (1) | In U.S. dollars unless otherwise indicated. |
| (A) | Security in default on interest payments. |
| (B) | Variable Rate Security — The rate reported on the Schedule of Investments is the rate in effect as of September 30, 2015. |
| (C) | Securities sold within terms of a private placement memorandum, exempt from registration under Section 144A of the Securities Act of 1933, as amended, and may be sold only to dealers in that program or other “accredited investors.” These securities have been determined to be liquid under guidelines established by the Board of Trustees. |
| (D) | Step Bonds — The rate reflected on the Schedule of Investments is the effective yield on September 30, 2015. The coupon on a step bond changes on a specified date. |
| (E) | Zero coupon security. The rate reported on the Schedule of Investments is the effective yield at time of purchase. |
| (F) | This security or a partial position of this security is on loan at September 30, 2015. The total market value of securities on loan at September 30, 2015 was $20,564 ($ Thousands). |
| (G) | Security fair valued using methods determined in good faith by the Valuation Committee of the Board of Trustees. The total market value of such securities as of September 30, 2015 was $588 ($ Thousands) and represented 0.0% of Net Assets. |
| (H) | Securities considered illiquid. The total market value of such securities as of September 30, 2015 was $588 ($ Thousands) and represented 0.0% of Net Assets. |
| (I) | This security was purchased with cash collateral held from securities on loan. The total value of such securities as of September 30, 2015 was $20,810 ($ Thousands). |
AUD — Australian Dollar
BRL — Brazilian Real
BIBOR — Bangkok Interbank Offered Rate
BUBOR — Budapest Interbank Offered Rate
CDI — Average One-Day Interbank Deposit Rate
CLN — Credit Linked Note
CLICP — Colombia IBR Overnight Interbank Reference Rate
CLP — Chilean Peso
CNY — Chinese Renminbi
COP — Colombian Peso
CZK — Czech Koruna
DEM — German Mark
DOP — Dominican Peso
EUR — Euro
GBP — British Pound Sterling
HUF — Hungarian Forint
IBR — Interbank Rate
IDR — Indonesian Rupiah
ILS — Israeli Shekel
INR — India Rupee
JIBAR — Johannesburg Interbank Agreed Rate
KES — Kenyan Shilling
KRW — Korean Won
L.P. — Limited Partnership
LIBOR — London Interbank Offered Rate
MTN — Medium Term Note
MXN — Mexican Peso
MYR — Malaysian Ringgit
NGN — Nigerian Naira
PEI — Peruvian Inca
PHP — Philippine Peso
PIK — Payment-in-Kind
PLC — Public Limited Company
PLN — Polish Zloty
PRIBOR — Prague Interbank Offered Rate
RON — Romanian Leu
RUB — Russian Ruble
Ser — Series
SGD — Singapore Dollar
SPC — Segregated Portfolio Company
TELBOR — Tel Aviv Interbank Offered Rate
THB — Thai Baht
TIIE — Equilibrium Interbank Offered Rate
TRY — New Turkish Lira
TWD — Taiwan Dollar
USD — U.S. Dollar
WIBOR — Warsaw Interbank Offered Rate
ZAR — South African Rand
The following is a list of the level of inputs used as of September 30, 2015, in valuing the Fund’s investments and other financial instruments carried at value ($ Thousands):
| Investments in Securities | Level 1 | Level 2 | Level 3(1) | Total | ||||||||||||
Global Bonds | $ | — | $ | 1,236,135 | $ | 457 | $ | 1,236,592 | ||||||||
Loan Participations | — | — | 131 | 131 | ||||||||||||
Affiliated Partnership | — | 20,810 | — | 20,810 | ||||||||||||
Time Deposits | — | 57,276 | — | 57,276 | ||||||||||||
|
|
|
|
|
|
|
| |||||||||
Total Investments in Securities | $ | — | $ | 1,314,221 | $ | 588 | $ | 1,314,809 | ||||||||
|
|
|
|
|
|
|
| |||||||||
| Other Financial Instruments | Level 1 | Level 2 | Level 3 | Total | ||||||||||||
Futures Contracts* | ||||||||||||||||
Unrealized Appreciation | $ | 81 | $ | — | $ | — | $ | 81 | ||||||||
Unrealized Depreciation | (337 | ) | — | — | (337 | ) | ||||||||||
Forwards Contracts* | ||||||||||||||||
Unrealized Appreciation | — | 10,187 | — | 10,187 | ||||||||||||
Unrealized Depreciation | — | (9,439 | ) | — | (9,439 | ) | ||||||||||
OTC Swaps | ||||||||||||||||
Interest Rate Swaps* | ||||||||||||||||
Unrealized Appreciation | — | 638 | — | 638 | ||||||||||||
Unrealized Depreciation | — | (4,208 | ) | — | (4,208 | ) | ||||||||||
Cross Currency Swaps* | ||||||||||||||||
Unrealized Depreciation | — | (758 | ) | — | (758 | ) | ||||||||||
| SEI Institutional International Trust / Annual Report / September 30, 2015 | 59 |
SCHEDULE OF INVESTMENTS
Emerging Markets Debt Fund (Concluded)
September 30, 2015
| Other Financial Instruments | Level 1 | Level 2 | Level 3 | Total | ||||||||||||
Centrally Cleared Swaps | ||||||||||||||||
Interest Rate Swaps* | ||||||||||||||||
Unrealized Appreciation | $ | — | $ | 78 | $ | — | $ | 78 | ||||||||
Unrealized Depreciation | — | (133 | ) | — | (133 | ) | ||||||||||
|
|
|
|
|
|
|
| |||||||||
Total Other Financial Instruments | $ | (256 | ) | $ | (3,635 | ) | $ | — | $ | (3,891 | ) | |||||
|
|
|
|
|
|
|
| |||||||||
| (1) | Of the $588 ($ Thousands) in Level 3 securities as of September 30, 2015, $588 ($ Thousands) or 0.05% as a percent of net assets are not valued via third party pricing vendors and broker quotes. If significant, the disclosure of the unobservable inputs and the interrelationships and sensitivity between these inputs are required for those Level 3 securities that are no valued by third party pricing vendors or broker quotes. A reconciliation of Level 3 investments is presented when the Fund has a significant amount of Level 3 investments at the beginning and/or end of the period in relation to net assets. |
| * | Futures contracts, forwards contracts and swaps are valued at the unrealized appreciation (depreciation) on the instrument. |
For the year ended September 30, 2015, there were no transfers between Level 1 and Level 2 assets and liabilities.
For the year ended September 30, 2015, there were no transfers between Level 2 and Level 3 assets and liabilities.
Amounts designated as “—” are $0 or have been rounded to $0.
The accompanying notes are an integral part of the financial statements.
| 60 | SEI Institutional International Trust / Annual Report / September 30, 2015 |
Statements of Assets and Liabilities ($ Thousands)
September 30, 2015
| International Equity Fund | Emerging Markets Equity Fund | International Fixed Income Fund | Emerging Markets Debt Fund | |||||||||||||
ASSETS: | ||||||||||||||||
Investments, at value (Cost $2,731,461, $1,677,951, $520,516 and $1,518,147, respectively)(1) | $ | 2,605,764 | $ | 1,374,102 | $ | 489,243 | $ | 1,293,999 | ||||||||
Affiliated investments, at value (Cost $325,853, $147,848, $0 and $20,810, respectively) | 325,853 | 147,848 | — | 20,810 | ||||||||||||
Cash | 1 | — | — | 5,073 | ||||||||||||
Foreign currency, at value (Cost $284, $2,783, $78 and $1,015, respectively) | 265 | 2,773 | 80 | 1,183 | ||||||||||||
Cash pledged as collateral for futures and swap contracts | — | — | 1,759 | 947 | ||||||||||||
Receivable for investment securities sold | 9,989 | 3,174 | 3,493 | 9,197 | ||||||||||||
Unrealized gain on forward foreign currency contracts | — | — | 4,865 | 10,187 | ||||||||||||
Receivable for fund shares sold | 3,893 | 19,701 | 226 | 2,293 | ||||||||||||
Dividends and interest receivable | 6,220 | 2,351 | 4,030 | 19,651 | ||||||||||||
Variation margin receivable | 2,174 | — | 270 | 70 | ||||||||||||
Foreign tax reclaim receivable | 4,051 | 45 | — | — | ||||||||||||
Unrealized gain on foreign spot currency contracts | — | — | — | 11 | ||||||||||||
Swap contracts, at value (Premiums paid $0, $0, $0 and $0, respectively) | — | — | — | 637 | ||||||||||||
Prepaid Expense | — | 14 | — | 11 | ||||||||||||
Total Assets | 2,958,210 | 1,550,008 | 503,966 | 1,364,069 | ||||||||||||
LIABILITIES: | ||||||||||||||||
Payable for investment securities purchased | 14,985 | 16,970 | 3,544 | 19,500 | ||||||||||||
Payable upon return of securities loaned | 233,929 | 135,645 | — | 20,810 | ||||||||||||
Payable to custodian | — | — | 8 | 769 | ||||||||||||
Unrealized loss on forward foreign currency contracts | — | — | 1,550 | 9,439 | ||||||||||||
Swap contracts, at value (Premiums received $0, $0, $96 and $0, respectively) | — | — | 1,049 | 4,965 | ||||||||||||
Payable for fund shares redeemed | 2,448 | 8,309 | 1,174 | 1,113 | ||||||||||||
Variation margin payable | — | — | 41 | 14 | ||||||||||||
Unrealized loss on foreign spot currency contracts | 2 | 3 | 193 | — | ||||||||||||
Investment advisory fees payable | 1,072 | 1,078 | 80 | 572 | ||||||||||||
Administration fees payable | 1,014 | 511 | 185 | 492 | ||||||||||||
Shareholder servicing fees payable | 537 | 274 | 102 | 256 | ||||||||||||
Trustees’ fees | 1 | 1 | — | 1 | ||||||||||||
Chief compliance officer fees payable | 4 | 2 | 1 | 2 | ||||||||||||
Administration servicing fees payable | 4 | — | — | — | ||||||||||||
Other accrued expenses | 240 | 415 | 82 | 186 | ||||||||||||
Accrued foreign capital gains tax on appreciated securities | 5 | 170 | — | — | ||||||||||||
Total Liabilities | 254,241 | 163,378 | 8,009 | 58,119 | ||||||||||||
Net Assets | $ | 2,703,969 | $ | 1,386,630 | $ | 495,957 | $ | 1,305,950 | ||||||||
NET ASSETS: | ||||||||||||||||
Paid in Capital (unlimited authorization — no par value) | $ | 3,536,703 | $ | 1,770,419 | $ | 507,770 | $ | 1,598,145 | ||||||||
Undistributed (distributions in excess of) net investment income | 25,838 | 6,484 | 19,687 | (26,663 | ) | |||||||||||
Accumulated net realized loss on investments, futures contracts, foreign currency contracts and swap contracts | (730,718 | ) | (86,216 | ) | (314 | ) | (36,981 | ) | ||||||||
Net unrealized depreciation on investments | (125,697 | ) | (303,849 | ) | (31,273 | ) | (224,148 | ) | ||||||||
Net unrealized appreciation (depreciation) on futures contracts | (1,856 | ) | — | 263 | (256 | ) | ||||||||||
Net unrealized deprecation on swap contracts | — | — | (2,209 | ) | (4,383 | ) | ||||||||||
Net unrealized appreciation (depreciation) on forward foreign currency contracts, foreign currencies and translation of other assets and liabilities denominated in foreign currencies | (296 | ) | (38 | ) | 2,033 | 236 | ||||||||||
Accumulated foreign capital gains tax on appreciated securities | (5 | ) | (170 | ) | — | — | ||||||||||
Net Assets | $ | 2,703,969 | $ | 1,386,630 | $ | 495,957 | $ | 1,305,950 | ||||||||
Net Asset Value, Offering and Redemption Price Per Share — Class A ($2,568,634,566 ÷ 280,373,678 shares, $1,342,617,896 ÷ 159,263,166 shares, $495,957,081 ÷ 47,763,537 shares, $1,227,566,761 ÷ 141,677,417 shares, respectively.) | $9.16 | $8.43 | $10.38 | $8.66 | ||||||||||||
Net Asset Value, Offering and Redemption Price Per Share — Class I ($4,955,802 ÷ 541,536 shares) | $9.15 | N/A | N/A | N/A | ||||||||||||
Net Asset Value, Offering and Redemption Price Per Share — Class Y ($130,378,756 ÷ 14,209,033 shares, $44,012,488 ÷ 5,208,459 shares, N/A, $78,383,342 ÷ 9,036,686 shares, respectively.) | $9.18 | $8.45 | N/A | $8.67 | ||||||||||||
| (1) | Included in “Investments, at value” is the market value of securities on loan in the amounts of $229,050, $131,380, $0 and $20,564, ($ Thousands), respectively. |
N/A — Not applicable. Share classes currently not offered.
Amounts designated as “—” are $0 or have been rounded to $0.
The accompanying notes are an integral part of the financial statements.
| SEI Institutional International Trust / Annual Report / September 30, 2015 | 61 |
Statements of Operations ($ Thousands)
For the year ended September 30, 2015
| International Equity Fund | Emerging Markets Equity Fund | International Fixed Income Fund | Emerging Markets Debt Fund | |||||||||||||
Investment Income: | ||||||||||||||||
Dividends | $ | 68,437 | $ | 44,770 | $ | — | $ | — | ||||||||
Dividends from Affiliated Investments(1) | 11 | 2 | — | — | ||||||||||||
Interest | 92 | 11 | 10,587 | 87,111 | ||||||||||||
Security Lending Income — Net(1)(2) | 1,543 | 1,120 | — | 25 | ||||||||||||
Less: Foreign Taxes Withheld | (5,710 | ) | (4,903 | ) | (47 | ) | (941 | ) | ||||||||
Total Investment Income | 64,373 | 41,000 | 10,540 | 86,195 | ||||||||||||
Expenses: | ||||||||||||||||
Investment Advisory Fees | 14,121 | 18,015 | 1,562 | 11,679 | ||||||||||||
Administration Fees | 12,583 | 7,713 | 2,342 | 6,183 | ||||||||||||
Shareholder Servicing Fees — Class A | 6,713 | 4,197 | 1,302 | 3,284 | ||||||||||||
Shareholder Servicing Fees — Class I | 12 | — | — | — | ||||||||||||
Admin Servicing Fees — Class I | 12 | — | — | — | ||||||||||||
Trustees’ Fees | 36 | 23 | 7 | 18 | ||||||||||||
Chief Compliance Officer Fees | 14 | 8 | 3 | 7 | ||||||||||||
Custodian/Wire Agent Fees | 317 | 557 | 82 | 338 | ||||||||||||
Printing Fees | 373 | 231 | 73 | 181 | ||||||||||||
Overdraft Fees | 2 | 5 | 1 | 11 | ||||||||||||
Professional Fees | 183 | 181 | 33 | 74 | ||||||||||||
Registration Fees | 73 | 52 | 10 | 34 | ||||||||||||
Other Expenses | 93 | 64 | 143 | 115 | ||||||||||||
Total Expenses | 34,532 | 31,046 | 5,558 | 21,924 | ||||||||||||
Less: | ||||||||||||||||
Waiver of Investment Advisory Fees | (66 | ) | (1,726 | ) | (240 | ) | (3,362 | ) | ||||||||
Fees Paid Indirectly | — | (15 | ) | — | — | |||||||||||
Net Expenses | 34,466 | 29,305 | 5,318 | 18,562 | ||||||||||||
Net Investment Income | 29,907 | 11,695 | 5,222 | 67,633 | ||||||||||||
Net Realized and Unrealized Gain (Loss) on Investments, Futures Contracts, Swap Contracts and Foreign Currency Transactions: | ||||||||||||||||
Net Realized Gain (Loss) from: | ||||||||||||||||
Investments | 79,804 | (42,913 | ) | 843 | (27,964 | ) | ||||||||||
Futures Contracts | (10,010 | ) | — | (676 | ) | (1,280 | ) | |||||||||
Swap Contracts | — | — | (570 | ) | (52 | ) | ||||||||||
Foreign Currency Transactions | (1,670 | ) | (1,467 | ) | 40,448 | (56,413 | ) | |||||||||
Net Change in Unrealized Appreciation (Depreciation) on: | ||||||||||||||||
Investments | (266,390 | ) | (332,286 | ) | (23,029 | ) | (170,845 | ) | ||||||||
Futures Contracts | (631 | ) | — | 200 | (21 | ) | ||||||||||
Swap Contracts | — | — | (401 | ) | (2,906 | ) | ||||||||||
Foreign Capital Gains Tax on Appreciated Securities | — | 1,853 | — | — | ||||||||||||
Foreign Currency Transactions | (103 | ) | 18 | (11,844 | ) | (2,079 | ) | |||||||||
Net Realized and Unrealized Gain (Loss) on Investments, Futures Contracts, Swap Contracts and Foreign Currency Transactions | (199,000 | ) | (374,795 | ) | 4,971 | (261,560 | ) | |||||||||
Net Increase (Decrease) in Net Assets Resulting from Operations | $ | (169,093 | ) | $ | (363,100 | ) | $ | 10,193 | $ | (193,927 | ) | |||||
| (1) | See Note 5 in Notes to Financial Statements. |
| (2) | Income is from the investment of collateral in an affiliated security. |
Amounts designated as “—” are $0 or have been rounded to $0.
The accompanying notes are an integral part of the financial statements.
| 62 | SEI Institutional International Trust / Annual Report / September 30, 2015 |
Statements of Changes in Net Assets ($ Thousands)
For the years ended September 30,
| International Equity Fund* | Emerging Markets Equity Fund* | |||||||||||||||
| 2015 | 2014 | 2015 | 2014 | |||||||||||||
Operations: | ||||||||||||||||
Net Investment Income | $ | 29,907 | $ | 46,469 | $ | 11,695 | $ | 10,252 | ||||||||
Net Realized Gain (Loss) from Investments and Futures Contracts | 69,794 | 187,799 | (42,913 | ) | 70,904 | |||||||||||
Net Realized Loss on Forward Foreign Currency Contracts and Foreign Currency Transactions | (1,670 | ) | (1,027 | ) | (1,467 | ) | (688 | ) | ||||||||
Net Change in Unrealized Depreciation on Investments, Affiliated Investments and Futures Contracts | (267,021 | ) | (152,633 | ) | (332,286 | ) | (35,842 | ) | ||||||||
Net Change in Unrealized Appreciation (Depreciation) on Foreign Capital Tax Gains on Appreciated Securities | — | (5 | ) | 1,853 | (1,875 | ) | ||||||||||
Net Change in Unrealized Appreciation (Depreciation) on Forward Foreign Currency Contracts, Foreign Currencies, and Translation of Other Assets and Liabilities Denominated in Foreign Currencies | (103 | ) | (317 | ) | 18 | (72 | ) | |||||||||
Net Increase (Decrease) in Net Assets Resulting from Operations | (169,093 | ) | 80,286 | (363,100 | ) | 42,679 | ||||||||||
Dividends from: | ||||||||||||||||
Net Investment Income: | ||||||||||||||||
Class A | (52,424 | ) | (31,558 | ) | (18,640 | ) | (7,645 | ) | ||||||||
Class I | (85 | ) | (64 | ) | N/A | N/A | ||||||||||
Class Y | — | — | — | — | ||||||||||||
Total Dividends | (52,509 | ) | (31,622 | ) | (18,640 | ) | (7,645 | ) | ||||||||
Capital Share Transactions: | ||||||||||||||||
Class A: | ||||||||||||||||
Proceeds from Shares Issued | 691,524 | 655,997 | 494,958 | 848,194 | ||||||||||||
Reinvestment of Dividends & Distributions | 48,485 | 28,743 | 17,391 | 7,072 | ||||||||||||
Cost of Shares Redeemed | (634,524 | ) | (400,975 | ) | (753,872 | ) | (345,905 | ) | ||||||||
Increase (Decrease) in Net Assets Derived from Class A Transactions | 105,485 | 283,765 | (241,523 | ) | 509,361 | |||||||||||
Class I: | ||||||||||||||||
Proceeds from Shares Issued | 1,300 | 1,352 | N/A | N/A | ||||||||||||
Reinvestment of Dividends & Distributions | 53 | 45 | N/A | N/A | ||||||||||||
Cost of Shares Redeemed | (1,323 | ) | (2,156 | ) | N/A | N/A | ||||||||||
Increase (Decrease) in Net Assets Derived from Class I Transactions | 30 | (759 | ) | N/A | N/A | |||||||||||
Class Y: | ||||||||||||||||
Proceeds from Shares Issued | 154,735 | — | 57,875 | — | ||||||||||||
Reinvestment of Dividends & Distributions | — | — | — | — | ||||||||||||
Cost of Shares Redeemed | (22,503 | ) | — | (6,060 | ) | — | ||||||||||
Increase in Net Assets Derived from Class Y Transactions | 132,232 | — | 51,815 | — | ||||||||||||
Increase (Decrease) in Net Assets Derived from Capital Share Transactions | 237,747 | 283,006 | (189,708 | ) | 509,361 | |||||||||||
Net Increase (Decrease) in Net Assets | 16,145 | 331,670 | (571,448 | ) | 544,395 | |||||||||||
Net Assets: | ||||||||||||||||
Beginning of Year | 2,687,824 | 2,356,154 | 1,958,078 | 1,413,683 | ||||||||||||
End of Year | $ | 2,703,969 | $ | 2,687,824 | $ | 1,386,630 | $ | 1,958,078 | ||||||||
Undistributed Net Investment Income Included in Net Assets at End of Year | $ | 25,838 | $ | 46,723 | $ | 6,484 | $ | 10,174 | ||||||||
Share Transactions: | ||||||||||||||||
Class A: | ||||||||||||||||
Shares Issued | 70,760 | 64,705 | 49,684 | 78,929 | ||||||||||||
Reinvestment of Distributions | 5,082 | 2,851 | 1,729 | 667 | ||||||||||||
Shares Redeemed | (65,342 | ) | (39,602 | ) | (74,085 | ) | (31,919 | ) | ||||||||
Total Class A Transactions | 10,500 | 27,954 | (22,672 | ) | 47,677 | |||||||||||
Class I: | ||||||||||||||||
Shares Issued | 134 | 133 | N/A | N/A | ||||||||||||
Reinvestment of Distributions | 5 | 4 | N/A | N/A | ||||||||||||
Shares Redeemed | (136 | ) | (212 | ) | N/A | N/A | ||||||||||
Total Class I Transactions | 3 | (75 | ) | N/A | N/A | |||||||||||
Class Y: | ||||||||||||||||
Shares Issued | 16,463 | — | 5,824 | — | ||||||||||||
Shares Redeemed | (2,254 | ) | — | (616 | ) | — | ||||||||||
Total Class Y Transactions | 14,209 | — | 5,208 | — | ||||||||||||
Net Increase (Decrease) in Shares Outstanding from Share Transactions | 24,712 | 27,879 | (17,464 | ) | 47,677 | |||||||||||
| * | Class Y shares of the Fund commenced operations on December 31, 2014. |
N/A — Not applicable. Share classes currently not offered.
Amounts designated as “—” are $0 or have been rounded to $0.
The accompanying notes are an integral part of the financial statements.
| SEI Institutional International Trust / Annual Report / September 30, 2015 | 63 |
Statements of Changes in Net Assets ($ Thousands) (Concluded)
For the years ended September 30,
| International Fixed Income Fund | Emerging Markets Debt Fund* | |||||||||||||||
| 2015 | 2014 | 2015 | 2014 | |||||||||||||
Operations: | ||||||||||||||||
Net Investment Income | $ | 5,222 | $ | 6,478 | $ | 67,633 | $ | 59,833 | ||||||||
Net Realized Gain (Loss) from Investments, Futures Contracts and Swap Contracts | (403 | ) | 9,260 | (29,296 | ) | (3,051 | ) | |||||||||
Net Realized Gain (Loss) on Forward Foreign Currency Contracts and Foreign Currency Transactions | 40,448 | 7,088 | (56,413 | ) | (31,240 | ) | ||||||||||
Net Change in Unrealized Depreciation on Investments, Futures Contracts and Swap Contracts | (23,230 | ) | (15,160 | ) | (173,772 | ) | (6,315 | ) | ||||||||
Net Change in Unrealized Appreciation (Depreciation) on Forward Foreign Currency Contracts, Foreign Currencies, and Translation of Other Assets and Liabilities Denominated in Foreign Currencies | (11,844 | ) | 21,099 | (2,079 | ) | 4,303 | ||||||||||
Net Increase (Decrease) in Net Assets Resulting from Operations | 10,193 | 28,765 | (193,927 | ) | 23,530 | |||||||||||
Dividends and Distributions from: | ||||||||||||||||
Net Investment Income: | ||||||||||||||||
Class A | (38,714 | ) | (2,598 | ) | (25,714 | ) | (37,069 | ) | ||||||||
Class Y | N/A | N/A | (441 | ) | — | |||||||||||
Net Realized Gains: | ||||||||||||||||
Class A | — | — | (1,398 | ) | (7,466 | ) | ||||||||||
Class Y | N/A | N/A | — | — | ||||||||||||
Total Dividends and Distributions | (38,714 | ) | (2,598 | ) | (27,553 | ) | (44,535 | ) | ||||||||
Capital Share Transactions: | ||||||||||||||||
Class A: | ||||||||||||||||
Proceeds from Shares Issued | 116,276 | 132,549 | 466,451 | 460,776 | ||||||||||||
Reinvestment of Dividends & Distributions | 34,693 | 2,293 | 24,076 | 39,056 | ||||||||||||
Cost of Shares Redeemed | (150,275 | ) | (110,607 | ) | (395,413 | ) | (315,392 | ) | ||||||||
Increase in Net Assets Derived from Class A Transactions | 694 | 24,235 | 95,114 | 184,440 | ||||||||||||
Class Y: | ||||||||||||||||
Proceeds from Shares Issued | N/A | N/A | 94,421 | — | ||||||||||||
Reinvestment of Dividends & Distributions | N/A | N/A | 441 | — | ||||||||||||
Cost of Shares Redeemed | N/A | N/A | (8,277 | ) | — | |||||||||||
Increase in Net Assets Derived from Class Y Transactions | N/A | N/A | 86,585 | — | ||||||||||||
Increase in Net Assets Derived from Capital Share Transactions | 694 | 24,235 | 181,699 | 184,440 | ||||||||||||
Net Increase (Decrease) in Net Assets | (27,827 | ) | 50,402 | (39,781 | ) | 163,435 | ||||||||||
Net Assets: | ||||||||||||||||
Beginning of Year | 523,784 | 473,382 | 1,345,731 | 1,182,296 | ||||||||||||
End of Year | $ | 495,957 | $ | 523,784 | $ | 1,305,950 | $ | 1,345,731 | ||||||||
Undistributed (Distributions in Excess of) Net Investment Income Included in Net Assets at End of Year | $ | 19,687 | $ | 13,152 | $ | (26,663 | ) | $ | (11,629 | ) | ||||||
Share Transactions: | ||||||||||||||||
Class A: | ||||||||||||||||
Shares Issued | 10,971 | 12,407 | 48,643 | 44,744 | ||||||||||||
Reinvestment of Distributions | 3,346 | 220 | 2,455 | 3,784 | ||||||||||||
Shares Redeemed | (14,238 | ) | (10,379 | ) | (41,303 | ) | (30,598 | ) | ||||||||
Total Class A Transactions | 79 | 2,248 | 9,795 | 17,930 | ||||||||||||
Class Y: | ||||||||||||||||
Shares Issued | N/A | N/A | 9,882 | — | ||||||||||||
Reinvestment of Distributions | N/A | N/A | 47 | — | ||||||||||||
Shares Redeemed | N/A | N/A | (892 | ) | — | |||||||||||
Total Class Y Transactions | N/A | N/A | 9,037 | — | ||||||||||||
Net Increase in Shares Outstanding from Share Transactions | 79 | 2,248 | 18,832 | 17,930 | ||||||||||||
| * | Class Y shares of the Fund commenced operations on December 31, 2014. |
N/A — Not applicable. Share classes currently not offered.
Amounts designated as “—” are either $0 or have been rounded to $0.
The accompanying notes are an integral part of the financial statements.
| 64 | SEI Institutional International Trust / Annual Report / September 30, 2015 |
For the years or period ended September 30,
For a Share Outstanding Throughout Each Year or Period
| Net Asset Value, Beginning of Period | Net Investment Income(1) | Net Realized and Unrealized Gains (Losses) on Securities(1) | Total from Operations | Dividends from Net Investment Income | Distributions from Realized Capital Gains | Total Dividends and Distributions and Return of Capital | Net Asset Value, End of Period | Total Return† | Net Assets End of Period (Thousands) | Ratio of Expenses to Average Net Assets* | Ratio of Expenses to Average Net Assets (Excluding Fees Paid Indirectly)** | Ratio of Expenses to Average Net Assets (Excluding Waivers and Fees Paid Indirectly)** | Ratio of Net Investment Income to Average Net Assets | Portfolio Turnover Rate | ||||||||||||||||||||||||||||||||||||||||||||||
International Equity Fund |
| |||||||||||||||||||||||||||||||||||||||||||||||||||||||||||
Class A |
| |||||||||||||||||||||||||||||||||||||||||||||||||||||||||||
2015 | $ | 9.94 | $ | 0.10 | $ | (0.69 | ) | $ | (0.59 | ) | $ | (0.19 | ) | $ | — | $ | (0.19 | ) | $ | 9.16 | (5.98 | )% | $ | 2,568,634 | 1.24 | %(2) | 1.24 | %(2) | 1.24 | %(2) | 1.04 | % | 68 | % | ||||||||||||||||||||||||||
2014 | 9.71 | 0.18 | 0.18 | 0.36 | (0.13 | ) | — | (0.13 | ) | 9.94 | 3.66 | 2,682,482 | 1.24 | (2) | 1.24 | (2) | 1.24 | (2) | 1.78 | 60 | ||||||||||||||||||||||||||||||||||||||||
2013 | 8.19 | 0.13 | 1.53 | 1.66 | (0.14 | ) | — | (0.14 | ) | 9.71 | 20.47 | 2,350,201 | 1.25 | (2) | 1.25 | (2) | 1.25 | (2) | 1.50 | 47 | ||||||||||||||||||||||||||||||||||||||||
2012 | 7.29 | 0.14 | 0.92 | 1.06 | (0.16 | ) | — | (0.16 | ) | 8.19 | 14.76 | 1,842,851 | 1.26 | (2) | 1.26 | (2) | 1.26 | (2) | 1.75 | 56 | ||||||||||||||||||||||||||||||||||||||||
2011 | 8.34 | 0.16 | (1.08 | ) | (0.92 | ) | (0.13 | ) | — | (0.13 | ) | 7.29 | (11.34 | ) | 1,566,893 | 1.27 | (2) | 1.27 | (2) | 1.27 | (2) | 1.88 | 98 | |||||||||||||||||||||||||||||||||||||
Class I |
| |||||||||||||||||||||||||||||||||||||||||||||||||||||||||||
2015 | $ | 9.92 | $ | 0.08 | $ | (0.69 | ) | $ | (0.61 | ) | $ | (0.16 | ) | $ | — | $ | (0.16 | ) | $ | 9.15 | (6.18 | )% | $ | 4,956 | 1.49 | %(2) | 1.49 | %(2) | 1.49 | %(2) | 0.76 | % | 68 | % | ||||||||||||||||||||||||||
2014 | 9.70 | 0.15 | 0.17 | 0.32 | (0.10 | ) | — | (0.10 | ) | 9.92 | 3.33 | 5,342 | 1.49 | (2) | 1.49 | (2) | 1.49 | (2) | 1.48 | 60 | ||||||||||||||||||||||||||||||||||||||||
2013 | 8.18 | 0.11 | 1.52 | 1.63 | (0.11 | ) | — | (0.11 | ) | 9.70 | 20.19 | 5,953 | 1.50 | (2) | 1.50 | (2) | 1.50 | (2) | 1.21 | 47 | ||||||||||||||||||||||||||||||||||||||||
2012 | 7.28 | 0.12 | 0.91 | 1.03 | (0.13 | ) | — | (0.13 | ) | 8.18 | 14.37 | 5,271 | 1.51 | (2) | 1.51 | (2) | 1.51 | (2) | 1.48 | 56 | ||||||||||||||||||||||||||||||||||||||||
2011 | 8.32 | 0.13 | (1.06 | ) | (0.93 | ) | (0.11 | ) | — | (0.11 | ) | 7.28 | (11.44 | ) | 5,265 | 1.52 | (2) | 1.52 | (2) | 1.52 | (2) | 1.54 | 98 | |||||||||||||||||||||||||||||||||||||
Class Y |
| |||||||||||||||||||||||||||||||||||||||||||||||||||||||||||
2015(15) | $ | 9.39 | $ | 0.13 | $ | (0.34 | ) | $ | (0.21 | ) | $ | — | $ | — | $ | — | $ | 9.18 | (2.24 | )% | $ | 130,379 | 1.00 | %(11) | 1.00 | %(11) | 1.00 | %(11) | 1.72 | % | 68 | % | ||||||||||||||||||||||||||||
Emerging Markets Equity Fund |
| |||||||||||||||||||||||||||||||||||||||||||||||||||||||||||
Class A |
| |||||||||||||||||||||||||||||||||||||||||||||||||||||||||||
2015 | $ | 10.76 | $ | 0.07 | $ | (2.29 | ) | $ | (2.22 | ) | $ | (0.11 | ) | $ | — | $ | (0.11 | ) | $ | 8.43 | (20.78 | )% | $ | 1,342,618 | 1.72 | %(3) | 1.72 | %(3) | 1.72 | %(8) | 0.67 | % | 67 | % | ||||||||||||||||||||||||||
2014 | 10.53 | 0.06 | 0.22 | 0.28 | (0.05 | ) | — | (0.05 | ) | 10.76 | 2.68 | 1,958,078 | 1.96 | (3) | 1.96 | (3) | 2.02 | (8) | 0.58 | 59 | ||||||||||||||||||||||||||||||||||||||||
2013 | 10.25 | 0.06 | 0.28 | 0.34 | (0.06 | ) | — | (0.06 | ) | 10.53 | 3.29 | 1,413,683 | 1.96 | (3) | 1.96 | (3) | 2.04 | (8) | 0.52 | 78 | ||||||||||||||||||||||||||||||||||||||||
2012 | 9.00 | 0.05 | 1.23 | 1.28 | (0.03 | ) | — | (0.03 | ) | 10.25 | 14.21 | 899,730 | 1.97 | (3) | 1.97 | (3) | 2.07 | (8) | 0.49 | 93 | ||||||||||||||||||||||||||||||||||||||||
2011 | 11.40 | 0.05 | (2.35 | ) | (2.30 | ) | (0.10 | ) | — | (0.10 | ) | 9.00 | (20.38 | ) | 695,498 | 1.96 | (3) | 1.96 | (3) | 2.09 | (8) | 0.44 | 98 | |||||||||||||||||||||||||||||||||||||
Class Y |
| |||||||||||||||||||||||||||||||||||||||||||||||||||||||||||
2015(15) | $ | 10.08 | $ | 0.10 | $ | (1.73 | ) | $ | (1.63 | ) | $ | — | $ | — | $ | — | $ | 8.45 | (16.17 | )% | $ | 44,012 | 1.47 | %(12) | 1.47 | %(12) | 1.47 | %(12) | 1.33 | % | 67 | % | ||||||||||||||||||||||||||||
International Fixed Income Fund |
| |||||||||||||||||||||||||||||||||||||||||||||||||||||||||||
Class A |
| |||||||||||||||||||||||||||||||||||||||||||||||||||||||||||
2015 | $ | 10.98 | $ | 0.11 | $ | 0.11 | $ | 0.22 | $ | (0.82 | ) | $ | — | $ | (0.82 | ) | $ | 10.38 | 2.02 | % | $ | 495,957 | 1.02 | %(4) | 1.02 | %(4) | 1.07 | %(9) | 1.00 | % | 78 | % | ||||||||||||||||||||||||||||
2014 | 10.42 | 0.14 | 0.48 | 0.62 | (0.06 | ) | — | (0.06 | ) | 10.98 | 5.96 | 523,784 | 1.02 | (4) | 1.02 | (4) | 1.20 | (9) | 1.32 | 104 | ||||||||||||||||||||||||||||||||||||||||
2013 | 10.82 | 0.14 | (0.06 | ) | 0.08 | (0.48 | )(7) | — | (0.48 | ) | 10.42 | 0.77 | 473,382 | 1.02 | (4) | 1.02 | (4) | 1.20 | (9) | 1.37 | 86 | |||||||||||||||||||||||||||||||||||||||
2012 | 10.44 | 0.17 | 0.48 | 0.65 | (0.27 | ) | — | (0.27 | ) | 10.82 | 6.34 | 491,793 | 1.02 | (4) | 1.02 | (4) | 1.21 | (9) | 1.60 | 103 | ||||||||||||||||||||||||||||||||||||||||
2011 | 10.92 | 0.25 | (0.22 | ) | 0.03 | (0.51 | )(6) | — | (0.51 | ) | 10.44 | 0.41 | 488,929 | 1.02 | (4) | 1.02 | (4) | 1.21 | (9) | 2.40 | 119 | |||||||||||||||||||||||||||||||||||||||
Emerging Markets Debt Fund |
| |||||||||||||||||||||||||||||||||||||||||||||||||||||||||||
Class A |
| |||||||||||||||||||||||||||||||||||||||||||||||||||||||||||
2015 | $ | 10.20 | $ | 0.47 | $ | (1.81 | ) | $ | (1.34 | ) | $ | (0.19 | ) | $ | (0.01 | ) | $ | (0.20 | ) | $ | 8.66 | (13.35 | )% | $ | 1,227,567 | 1.36 | %(5) | 1.36 | %(5) | 1.61 | %(10) | 4.91 | % | 71 | % | |||||||||||||||||||||||||
2014 | 10.38 | 0.49 | (0.29 | ) | 0.20 | (0.31 | ) | (0.07 | ) | (0.38 | ) | 10.20 | 1.90 | 1,345,731 | 1.36 | (5) | 1.36 | (5) | 1.80 | (10) | 4.73 | 92 | ||||||||||||||||||||||||||||||||||||||
2013 | 12.07 | 0.47 | (1.02 | ) | (0.55 | ) | (0.68 | ) | (0.46 | ) | (1.14 | ) | 10.38 | (5.19 | ) | 1,182,296 | 1.36 | (5) | 1.36 | (5) | 1.81 | (10) | 4.20 | 90 | ||||||||||||||||||||||||||||||||||||
2012 | 10.81 | 0.55 | 1.36 | 1.91 | (0.63 | ) | (0.02 | ) | (0.65 | ) | 12.07 | 18.48 | 1,165,102 | 1.36 | (5) | 1.36 | (5) | 1.80 | (10) | 4.85 | 102 | |||||||||||||||||||||||||||||||||||||||
2011 | 11.19 | 0.63 | (0.70 | ) | (0.07 | ) | (0.31 | ) | — | (0.31 | ) | 10.81 | (0.71 | ) | 876,396 | 1.36 | (5) | 1.36 | (5) | 1.80 | (10) | 5.58 | 59 | |||||||||||||||||||||||||||||||||||||
Class Y |
| |||||||||||||||||||||||||||||||||||||||||||||||||||||||||||
2015(15) | $ | 9.63 | $ | 0.37 | $ | (1.28 | ) | $ | (0.91 | ) | $ | (0.05 | ) | $ | — | $ | (0.05 | ) | $ | 8.67 | (9.48 | )% | $ | 78,383 | 1.11 | %(13) | 1.11 | %(13) | 1.36 | %(14) | 5.24 | % | 71 | % | ||||||||||||||||||||||||||
| * | Includes Fees Paid Indirectly, if applicable. See Note 5 in Notes to Financial Statements. |
| ** | See Note 5 in Notes to Financial Statements. |
| † | Returns do not reflect the deduction of taxes that a shareholder would pay on fund distributions or the redemption of fund shares. |
| (1) | Per share net investment income/(loss) and net realized and unrealized gains/(losses) calculated using average shares. |
| (2) | The expense ratio includes overdraft fees. Had this expense been excluded, the ratios for Class A and I shares would have been 1.24% and 1.49%, respectively for 2015 and 2014, 1.25% and 1.50%, respectively for 2013, 1.26% and 1.51%, respectively for 2012, 1.27% and 1.52%, respectively for 2011. |
| (3) | The expense ratio includes overdraft fees. Had this expense been excluded, the ratios would have been 1.71% for 2015, 1.96% for 2014, 2013, 2012 and 2011. |
| (4) | The expense ratio includes overdraft fees. Had this expense been excluded, the ratios would have been 1.02%, 1.02%, 1.02%, 1.02% and 1.01% for 2015, 2014, 2013, 2012 and 2011 respectively. |
| (5) | The expense ratio includes overdraft fees. Had this expense been excluded, the ratios would have been 1.36% for 2015, 2014, 2013, 2012 and 2011. |
| (6) | Includes a return of capital of $0.01 per share. |
| (7) | Includes a return of capital of $0.09 per share. |
| (8) | The expense ratio includes overdraft fees. Had this expense been excluded the ratios would have been 1.71%, 2.02%, 2.04%, 2.06% and 2.09% for 2015, 2014, 2013, 2012 and 2011. |
| (9) | The expense ratio includes overdraft fees. Had this expense been excluded the ratios would have been 1.07%, 1.20%, 1.20%, 1.21% and 1.21% for 2015, 2014, 2013, 2012 and 2011. |
| (10) | The expense ratio includes overdraft fees. Had this expense been excluded the ratios would have been 1.61%, 1.80%, 1.81%, 1.80% and 1.80% for 2015, 2014, 2013, 2012 and 2011. |
| (11) | The expense ratio includes overdraft fees. Had this expense been excluded the ratio would have been 0.99% for 2015. |
| (12) | The expense ratio includes overdraft fees. Had this expense been excluded the ratio would have been 1.46% for 2015. |
| (13) | The expense ratio includes overdraft fees. Had this expense been excluded the ratio would have been 1.11% for 2015. |
| (14) | The expense ratio includes overdraft fees. Had this expense been excluded the ratio would have been 1.36% for 2015. |
| (15) | Commenced operations on December 31, 2014. All ratios for the period have been annualized except total return and portfolio turnover which are for the period indicated and have not been annualized. |
The accompanying notes are an integral part of the financial statements.
| SEI Institutional International Trust / Annual Report / September 30, 2015 | 65 |
September 30, 2015
1. ORGANIZATION
SEI Institutional International Trust (the “Trust”) was organized as a Massachusetts business trust under a Declaration of Trust dated June 30, 1988. The operations of the Trust commenced on December 20, 1989.
The Trust is registered under the Investment Company Act of 1940, as amended, as an open-end investment company with four funds: International Equity Fund, Emerging Markets Equity Fund, International Fixed Income Fund and Emerging Markets Debt Fund (together the “Funds”) each of which are diversified Funds with the exception of the International Fixed Income Fund and the Emerging Markets Debt Fund. The Trust’s prospectuses provide a description of each Fund’s investment goal, principal strategies and risks. The Trust is registered to offer Class A and Class Y shares of each of the Funds and Class I shares of the International Equity Fund. As of September 30, 2015, the Class Y shares had not yet commenced operations for the International Fixed Income Fund.
2. SIGNIFICANT ACCOUNTING POLICIES
The following is a summary of significant accounting policies consistently followed by the Funds.
Use of Estimates — The preparation of financial statements, in conformity with U.S. generally accepted accounting principles (“U.S. GAAP”), requires management to make estimates and assumptions that affect the reported amounts of assets and liabilities and disclosure of contingent assets and liabilities as of the date of the financial statements, and the reported amounts of increases and decreases in net assets from operations during the reporting period. Actual results could differ from those estimates.
Security Valuation — Securities listed on a securities exchange, market or automated quotation system for which quotations are readily available are valued at the last quoted sale price on an exchange or market (foreign or domestic) on which they are traded, or, if there is no such reported sale, at the most recent quoted bid price. Debt securities are priced based upon valuations provided by independent, third-party pricing agents, if available. Such values generally reflect the last reported sales price if the security is actively traded. The third-party pricing agents may also value debt securities at an evaluated bid price by employing methodologies that utilize actual market transactions, broker-supplied valuations, or other methodologies designed to identify the market value for such securities. Debt obligations with remaining maturities of sixty days or less may be valued at their amortized cost, which approximates market value. The prices for foreign securities are reported in local currency and converted to U.S. dollars using currency exchange rates. Prices for most securities held in the Funds are provided daily by recognized independent pricing agents. SEI Investments Management Corporation (“SIMC”) or a sub-adviser, as applicable, reasonably believes that prices provided by independent pricing agents are reliable.
However, there can be no assurance that such pricing service’s prices will be reliable. SIMC or a sub-adviser, as applicable, continuously monitors the reliability of prices obtained from any pricing service and will notify the Funds’ administrator if it believes that a particular pricing service is no longer a reliable source of prices. The Funds’ administrator, in turn, will notify the Trust’s Fair Value Committee if it receives such notification from SIMC or a sub-adviser, as applicable, or if the Funds’ administrator reasonably believes that a particular pricing service is no longer a reliable source for prices. If a security price cannot be obtained from an independent, third-party pricing agent, the Funds seek to obtain a bid price from at least one independent broker.
Securities for which market prices are not “readily available” are determined to be unreliable or can not be valued using methodologies described above are valued in accordance with Fair Value Procedures established by the Trust’s Board of Trustees (the “Board”). The Trust’s Fair Value Procedures are implemented through a Fair Value Committee (the “Committee”) designated by the Board. The Committee is currently composed of two members of the Board of Trustees, as well as representatives from SIMC and its affiliates. The Committee provides regular reports to the Board concerning investments for which market prices are not readily available or may be unreliable. Some of the more common reasons that may necessitate that a security be valued using Fair Value Procedures include: the security’s trading has been halted or suspended; the security has been de-listed from a national exchange; the security’s primary trading market is temporarily closed at a time when, under normal conditions, it would be open; or the security’s primary pricing source is not able or willing to provide a price. When a security is valued in accordance with the Fair Value Procedures, the Committee will determine the value after taking into consideration relevant information reasonably available to the Committee. Examples of factors the Committee may consider are: (i) the facts giving rise to the need to fair value; (ii) the last trade price; (iii) the performance of the market or the issuer’s industry; (iv) the liquidity of the security; (v) the size of the holding in a Fund; or (vi) any other appropriate information. The determination of a security’s fair value price often involves the consideration of a number of subjective factors and is therefore subject to the unavoidable risk that the value assigned to a security may be higher or lower than the security’s value would be if a reliable market quotation for the security was readily available.
For securities that principally trade on a foreign market or exchange, a significant gap in time can exist between the time of a particular security’s last trade and the time at which a Fund calculates its net asset value. The closing prices of such securities may no longer reflect their market value at the time the Fund calculates net asset value if an event that could materially affect the value of those securities (a “Significant Event”) has occurred between the time of the security’s last close and the time that the Fund calculates net asset value. A Significant Event may relate to a single issuer or to an entire market
| 66 | SEI Institutional International Trust / Annual Report / September 30, 2015 |
sector. If the adviser or sub-adviser of a Fund becomes aware of a Significant Event that has occurred with respect to a security or group of securities after the closing of the exchange or market on which the security or securities principally trade, but before the time at which the Fund calculates net asset value, it may request that a Committee meeting be called.
The International Equity Fund and Emerging Markets Equity Fund also use a third-party fair valuation vendor. The vendor provides a fair value for foreign securities held by these Funds based on certain factors and methodologies (involving, generally, tracking valuation correlations between the U.S. market and each non-U.S. security). Values from the fair value vendor are applied in the event that there is a movement in the U.S. market that exceeds a specific threshold that has been established by the Committee. The Committee has also established a “confidence interval” which is used to determine the level of historical correlation between the value of a specific foreign security and movements in the U.S. market before a particular security will be fair valued when the threshold is exceeded. In the event that the threshold established by the Committee is exceeded on a specific day, the International Equity Fund and Emerging Markets Equity Fund will value the non-U.S. securities in their portfolios that exceed the applicable “confidence interval” based upon the adjusted prices provided by the fair valuation vendor.
In accordance with U.S. GAAP, fair value is defined as the price that the Fund would receive upon selling an investment in an orderly transaction to an independent buyer in the principal or most advantageous market of the investment. A three-tier hierarchy has been established to maximize the use of the observable market data and minimize the use of unobservable inputs and to establish classification of the fair value measurements for disclosure purposes. Inputs refer broadly to the assumptions that market participants would use in pricing an asset. Inputs may be observable or unobservable. Observable inputs are inputs that reflect the assumptions market participants would use in pricing the asset or liability developed based on market data obtained from sources independent of the reporting entity. Unobservable inputs are inputs that reflect the reporting entity’s own assumptions about the assumptions market participants would use in pricing the asset or liability developed based on the best information available in the circumstances.
The three-tier hierarchy of inputs is summarized in the three broad Levels listed below:
Level 1 — quoted prices in active markets for identical investments
Level 2 — other significant observable inputs (including quoted prices for similar investments, interest rates, prepayment speeds, credit risks, etc.)
Level 3 — significant unobservable inputs (including the Fund’s own assumptions in determining the fair value of investments)
Investments are classified within the level of the lowest significant input considered in determining fair value. Investments classified within Level 3 whose fair value measurement considers several inputs may include Level 1 or Level 2 inputs as components of the overall fair value measurement.
The valuation techniques used by the Funds to measure fair value during the year ended September 30, 2015 maximized the use of observable inputs and minimized the use of unobservable inputs.
For the year ended September 30, 2015, there have been no significant changes to the inputs or the Trust’s fair valuation methodologies.
Security Transactions and Investment Income — Security transactions are recorded on the trade date. Cost used in determining net realized capital gains and losses on the sale of securities is determined on the basis of specific identification. Dividend income and expense is recognized on the ex-dividend date, and interest income or expense is recognized using the accrual basis of accounting.
Distributions received on securities that represent a return of capital or capital gain are recorded as a reduction of cost of investments and/ or as a realized gain. The Trust estimates the components of distributions received that may be considered nontaxable distributions or capital gain distributions.
Amortization and accretion is calculated using the scientific interest method, which is not materially different from the effective interest method. Amortization of premiums and discounts is included in interest income.
Expenses — Expenses that are directly related to one of the Funds are charged directly to that Fund. Other operating expenses of the Trust are prorated to the Funds on the basis of relative daily net assets.
Classes — Class-specific expenses are borne by that class. Income, non-class specific expenses, and realized and unrealized gains/losses are allocated to the respective classes on the basis of relative daily net assets.
Foreign Currency Translation — The books and records of the Funds investing in international securities are maintained in U.S. dollars on the following basis:
(i) market value of investment securities, assets and liabilities at the current rate of exchange; and
(ii) purchases and sales of investment securities, income and expenses at the relevant rates of exchange prevailing on the respective dates of such transactions.
The Funds do not isolate that portion of gains and losses on investments in equity securities that is due to changes in the foreign exchange rates from that which is due to changes in market prices of equity securities.
| SEI Institutional International Trust / Annual Report / September 30, 2015 | 67 |
Notes to Financial Statements (Continued)
September 30, 2015
The Funds report certain foreign-currency-related transactions as components of realized gains for financial reporting purposes, whereas such components are treated as ordinary income for Federal income tax purposes.
Forward Foreign Currency Contracts — To the extent consistent with its investment objective and strategies, a Fund may enter into forward foreign currency contracts as hedges against either specific transactions, fund positions, speculative purposes or anticipated fund positions. All commitments are “marked-to-market” daily at the applicable foreign exchange rate, and any resulting unrealized gains or losses are recorded currently. The Fund realizes gains and losses at the time forward contracts are extinguished. Unrealized gains or losses on outstanding positions in forward foreign currency contracts held at the close of the year are recognized as ordinary income or loss for federal income tax purposes. The Fund could be exposed to risk if the counterparties to the contracts are unable to meet the terms of the contract and from unanticipated movements in the value of a foreign currency relative to the U.S. dollar.
Finally, the risk exists that losses could exceed amounts disclosed on the Statement of Assets and Liabilities. Refer to each Fund’s Schedule of Investments for details regarding open forward foreign currency contracts as of September 30, 2015, if applicable.
Futures Contracts — To the extent consistent with its investment objective and strategies, the Funds may purchase futures contracts to gain exposure to market changes, which may be more efficient or cost effective than actually buying the securities. To the extent consistent with its investment objective and strategies, a Fund may utilize futures contracts for tactical hedging purposes as well as to enhance the Funds’ returns and may also utilize futures contracts to efficiently assist in managing the Funds’ duration and yield curve exposure. Upon entering into such a contract, a Fund is required to deposit and maintain as collateral such initial margin as required by the exchange on which the contract is held. The contracts are marked to market daily and the resulting changes in value are accounted for as unrealized gains and losses. Variation margin payments are paid or received, depending upon whether unrealized losses or gains are incurred. When the contract is closed, the Funds record a realized gain or loss equal to the difference between the proceeds from (or cost of) the closing transaction and the amount invested in the contract.
Risks of entering into futures contracts include the possibility that there will be an imperfect price correlation between the futures and the underlying securities. Second, it is possible that a lack of liquidity for futures contracts could exist in the secondary market, resulting in an inability to close a position prior to its maturity date. Third, the futures contract involves the risk that a Fund could lose more than the original margin deposit required to initiate a futures transaction.
Finally, the risk exists that losses could exceed amounts disclosed on the Statement of Assets and Liabilities. Refer to each Fund’s
Schedule of Investments for details regarding open futures contracts as of September 30, 2015, if applicable.
Swap Agreements — To the extent consistent with its investment objective and strategies, a Fund may invest in swap contracts as an efficient means to take and manage risk in the portfolio, including interest rate risk, credit risk and overall yield sensitivity. A swap agreement is a two-party contract under which an agreement is made to exchange returns from predetermined investments or instruments, including a particular interest rate, foreign currency, or “basket” of securities representing a particular index. Swap agreements are privately negotiated in the over-the-counter market (“OTC swaps”) or may be executed in a multilateral or other trade facility platform, such as a registered commodities exchange (“Centrally Cleared swaps”). Interest rate swaps involve the exchange by a Fund with another party of their respective commitments to pay or receive interest (e.g., an exchange of floating rate payments for fixed rate payments) with respect to a notional amount of principal. Credit default swaps involve the periodic payment by a Fund or counterparty of interest based on a specified rate multiplied by a notional amount assigned to an underlying debt instrument or group of debt instruments in exchange for the assumption of credit risk on the same instruments. In the event of a credit event, usually in the form of a credit rating downgrade, the party receiving periodic payments (i.e. floating rate payer) must pay the other party (i.e. fixed rate payer) an amount equal to the outstanding principal of the downgraded debt instrument. Total return swaps allow an investor to benefit from the cash flow without ever actually owning the underlying security. The receiver must pay any decline in value to the payer at the end of the total return swap. However, the investor does not need to make a payment if there is no decline in price. Payments can be made on various indices, bonds (i.e. mortgage backed securities, bank debt and corporate), loans or commodities. The value of a total return swap is equal to the change in value of the underlying asset versus the accrued income payment based on LIBOR (London Interbank Offered Rate) or some other form of index on the notional amount. Interest rate swaps involve the exchange by a Fund with another party of their respective commitments to pay or receive interest (e.g., an exchange of floating rate payments for fixed rate payments) with respect to a notional amount of principal to manage a Fund’s exposure to interest rates. Payments received or made are recorded as realized gains or losses. A Fund could be exposed to credit or market risk due to unfavorable changes in the fluctuation of interest rates or if the counterparty defaults on its obligation to perform. Risk of loss may exceed amounts recognized on the statement of assets and liabilities. In connection with swap agreements, securities/cash may be set aside as collateral by the Fund’s custodian. A Fund may enter into swap agreements in order to, among other things, change the maturity or duration of the investment portfolio; protect a Fund’s value from changes in interest rates; or expose a Fund to a different security or market.
| 68 | SEI Institutional International Trust / Annual Report / September 30, 2015 |
Swaps are marked-to-market daily based upon quotations from market makers and the resulting changes in market values, if any, are recorded as unrealized gains or losses in the Statement of Operations. Centrally cleared swaps are valued at the settlement price established each day by the board of exchange on which they are traded. The daily settlement prices for centrally cleared swaps are provided by an independent source. Net payments of interest are recorded as realized gains or losses. Daily changes in valuation of Centrally Cleared swaps, if any, are recorded as a receivable or payable for the change in value as appropriate (“variation margin”) on the Statements of Assets and Liabilities.
Entering into swap agreements involves, to varying degrees, elements of credit and market risk in excess of the amounts recognized on the Schedule of Investments or the Statement of Assets and Liabilities. Such risks involve the possibility that there will be no liquid market for these agreements, that the counterparty to the agreement may default on its obligation to perform and that there may be unfavorable changes in the fluctuation of interest rates. Risks also arise from potential losses from adverse market movements.
Counterparty risk may be mitigated by having a master netting arrangement between a Fund and the counterparty and by having the counterparty post collateral to cover a Fund’s exposure to the counterparty. Refer to each Fund’s Schedule of Investments for details regarding open swap contracts as of September 30, 2015, if applicable.
Delayed Delivery Transactions — A Fund may purchase or sell securities on a when-issued or delayed delivery basis. These transactions involve a commitment by the Fund to purchase or sell securities for a predetermined price or yield, with payment and delivery taking place beyond the customary settlement period. When delayed delivery purchases are outstanding, the Fund will set aside liquid assets in an amount sufficient to meet the purchase price. When purchasing a security on a delayed delivery basis, the Fund assumes the rights and risks of ownership of the security, including the risk of price and yield fluctuations, and takes such fluctuations into account when determining its net asset value. The Fund may dispose of or renegotiate a delayed delivery transaction after it is entered into, and may sell when-issued securities before they are delivered, which may result in a capital gain or loss. When the Fund has sold a security on a delayed delivery basis, the Fund does not participate in future gains and losses with respect to the security.
Loan Participations and Brady Bonds — To the extent consistent with its investment objective and strategies, a Fund may invest in U.S. dollar-denominated fixed- and floating-rate loans (“Loans”) arranged through private negotiations between a foreign sovereign entity and one or more financial institutions (“Lenders”). The Fund invests in such Loans in the form of participations in Loans (“Participations”) or assignments of all or a portion of Loans from third parties. Participations typically result in a Fund having a contractual relationship
only with the Lenders, not with the sovereign borrowers. This Fund has the right to receive payments of principal, interest and any fees to which it is entitled from the Lender selling the Participation and only upon receipt by the Lender of the payments from the borrower. In connection with purchasing Participations, the Fund generally has no right to enforce compliance by the borrower with the terms of the loan agreement relating to the Loan, nor any rights of set-off against the borrower, and the Fund will not benefit directly from any collateral supporting the Loan in which it has purchased the Participation. As a result, the Fund assumes the credit risk of both the borrower and the Lender that is selling the Participation.
Certain debt obligations, customarily referred to as “Brady Bonds,” are created through the exchange of existing commercial bank loans to foreign entities for new obligations in connection with debt restructuring under a plan introduced by former U.S. Secretary of the Treasury Nicholas F. Brady. Brady Bonds have only been issued since 1989, and, accordingly, do not have a long payment history. They are issued by governments that may have previously defaulted on the loans being restructured by the Brady Bonds, so they are subject to the risk of default by the issuer. They may be fully or partially collateralized or uncollateralized and issued in various currencies.
Illiquid Securities — A security is considered illiquid if it cannot be sold or disposed of in the ordinary course of business within seven days or less for its approximate carrying value on the books of the Funds. Valuations of illiquid securities may differ significantly from the values that would have been used had an active market value for these securities existed.
Dividends and Distributions to Shareholders — The International Equity, Emerging Markets Equity and International Fixed Income Funds will distribute substantially all of their net investment income and all net realized capital gains, if any, at least annually. The Emerging Markets Debt Fund will distribute substantially all of its net investment income, if any, at least quarterly and all net realized gains, if any, at least annually. All dividends and distributions are recorded on ex-dividend date.
Investments in Real Estate Investment Trusts (“REITs”) — Dividend income is recorded based on the income included in distributions received from the REIT investments using published REIT reclassifications including management estimates when actual amounts are not available. Distributions received in excess of this estimated amount are recorded as a reduction of the cost of investments or reclassified to capital gains. The actual amounts of income, return of capital, and capital gains are only determined by each REIT after its fiscal year-end, and may differ from the estimated amounts.
Participation Notes (P-Notes) — To the extent consistent with its Investment Objective and Strategies, a Fund may acquire P-Notes issued by participating banks or broker-dealers. P-Notes are participation interest notes that are designed to offer a return linked to a particular underlying equity, debt, currency or market. The
| SEI Institutional International Trust / Annual Report / September 30, 2015 | 69 |
Notes to Financial Statements (Continued)
September 30, 2015
P-Notes in which the Fund may invest will typically have a maturity of one year. When purchasing a P-Note, the posting of margin is not required because the full cost of the P-Note (plus commission) is paid at the time of purchase. When the P-Note matures, the issuer will pay to, or receive from, the purchaser the difference between the minimal value of the underlying instrument at the time of purchase and that instrument’s value at maturity. Investments in P-Notes involve the same risks associated with a direct investment in the underlying foreign companies of foreign securities markets that they seek to replicate. In addition, there can be no assurance that the trading price of P-Notes will equal the underlying value of the foreign companies or foreign securities markets that they seek to replicate. The holder of a participation note that is linked to a particular underlying security is entitled to receive any dividends paid in connection with an underlying security or instrument. However, the holder of a participation note does not receive voting rights as it would if it directly owned the underlying security or instrument. P-Notes are generally traded over-the-counter. P-Notes constitute general unsecured contractual obligations of the banks or broker-dealers that issue them and the counterparty. There is also counterparty risk associated with these investments because the Fund is relying on the creditworthiness of such counterparty and has no rights under a participation note against the issuer of the underlying security. In addition, the Fund
Redemption Fees — As of July 17, 2015, the Funds no longer charge redemption fees. The Funds charged a redemption fee based on a redemption, or a series of redemptions from a single identifiable source that in the aggregate exceeded a specific dollar threshold within any thirty day period, as presented below:
| Dollar Threshold ($ Thousands) | Redemption Fee | |||||||
| International Equity Fund | $ | 50,000 | 0.75 | % | ||||
| Emerging Markets Equity Fund | 25,000 | 1.25 | ||||||
| International Fixed Income Fund | 25,000 | 1.00 | ||||||
| Emerging Markets Debt Fund | 25,000 | 1.00 | ||||||
For the year ended September 30, 2015, the Funds did not charge any redemption fees. Such fees, if any, were retained by the Funds for the benefit of the remaining shareholders.
3. CREDIT DERIVATIVES
A Fund may use credit default swaps to reduce risk where a Fund has exposure to the issuer, or to take an active long or short position with respect to the likelihood of an event of default. The reference obligation of the swap can be a single issuer, a “basket” of issuers, or an index. The underlying referenced assets are corporate debt, sovereign debt and asset backed securities.
The buyer of a credit default swap is generally obligated to pay the seller a periodic stream of payments over the term of the contract in return for a contingent payment upon the occurrence of a credit event with respect to an underlying reference obligation. Generally, a credit event for corporate or sovereign reference obligations means bankruptcy, failure to pay, obligation acceleration, repudiation/moratorium or restructuring. For credit default swaps on asset-backed securities, a credit event may be triggered by events such as failure to pay principal, maturity extension, rating downgrade or write-down.
If a Fund is a seller of protection, and a credit event occurs, as defined under the terms of that particular swap agreement, a Fund will generally either (i) pay to the buyer an amount equal to the notional amount of the swap and take delivery of the referenced obligation, other deliverable obligations, or underlying securities comprising a referenced index or (ii) pay a net settlement amount in the form of cash or securities equal to the notional amount of the swap less the recovery value of the referenced obligation or underlying securities comprising a referenced index.
If a Fund is a buyer of protection and a credit event occurs, as defined under the terms of that particular swap agreement, a Fund will either (i) receive from the seller of protection an amount equal to the notional amount of the swap and deliver the referenced obligation, other deliverable obligations or underlying securities comprising the referenced index or (ii) receive a net settlement amount in the form of cash or securities equal to the notional amount of the swap less the recovery value of the referenced obligation or underlying securities comprising the referenced index. Recovery values are assumed by market makers considering either industry standard recovery rates or entity specific factors and considerations until a credit event occurs. If a credit event has occurred, the recovery value is determined by a facilitated auction whereby a minimum number of allowable broker bids, together with a specified valuation method, are used to calculate the settlement value.
| 70 | SEI Institutional International Trust / Annual Report / September 30, 2015 |
As of September 30, 2015, the International Fixed Income Fund is the seller (“providing protection”) on a total notional amount of $3.0 million. The notional amounts of the swaps are not recorded in the financial statements; however the notional amounts approximate the maximum potential amount of future payments that the Fund could be required to make if the Fund was the seller of protection and a credit event were to occur. Those credit default swaps (“CDS”) for which the Fund is providing protection at balance sheet date are summarized as follows:
| INTERNATIONAL FIXED INCOME FUND WRITTEN CREDIT DERIVATIVE CONTRACTS | SINGLE NAME CDS | CDS INDEX | ||||||||||||||||||
| REFERENCE ASSET | CORP US$ | SOVEREIGN US$ | ABS US$ | CORP US$ | Total | |||||||||||||||
Fair value of written credit derivatives | $ | (131,232 | ) | — | — | $ | 79,263 | $ | (51,970 | ) | ||||||||||
Maximum potential amount of future payments | 1,674,369 | 1,663,206 | 3,337,575 | |||||||||||||||||
Recourse provisions with third parties to recover any amounts paid under the credit derivative (including any purchased credit protection)1 | — | — | — | — | — | |||||||||||||||
Collateral held by the Partnership or other third parties which the Partnership can obtain upon occurrence of triggering event | — | — | — | — | — | |||||||||||||||
| 1 | Potential recoveries would include purchased credit derivatives to the extent they offset written credit derivatives which have an identical underlying, or a netting arrangement or credit support annex with the counterparty. There may be other potential recoveries from recourse provisions where agreements cover multiple derivative arrangements but those amounts have not been included. |
| MAXIMUM POTENTIAL AMOUNT OF FUTURE PAYMENTS BY CONTRACT TERM | ||||||||||||||||||||||||
| 0-6 MONTHS | 6-12 MONTHS | 1-5 YEARS | 5-10 YEARS | > 10 YEARS | Total | |||||||||||||||||||
Current credit spread* on underlying (in basis points) [1] | ||||||||||||||||||||||||
0-100 | — | — | $ | 1,663,206 | $ | 1,674,369 | — | $ | 3,337,575 | |||||||||||||||
>101 | — | — | — | — | — | — | ||||||||||||||||||
Total | — | — | $ | 1,663,206 | $ | 1,674,369 | — | $ | 3,337,575 | |||||||||||||||
| * | The credit spread on the underlying asset is generally indicative of the current status of the underlying risk of the Fund having to perform. The spread also reflects the cost of buying/selling protection and may include upfront payments required to be made to enter into a contract. Higher credit spreads with a shorter contract term is indicative of a higher likelihood of performance by the Fund. |
The credit spread disclosed above for each reference obligation where the Fund is the seller of protection is a representation of the current payment/performance risk of the swap.
4. DERIVATIVE TRANSACTIONS
The following tables include only Funds that had exposure to more than one type of risk on derivatives held throughout the year. For Funds that held derivatives throughout the year with only one type of risk exposure, additional information can be found on the Schedules of Investments and the Statements of Operations. The fair value of derivative instruments as of September 30, 2015 was as follows:
| Asset Derivatives | Liability Derivatives | |||||||||||
| Year ended September 30, 2015 ($ Thousands) | Year ended September 30, 2015 ($ Thousands) | |||||||||||
| Statement of Assets and Liabilities Location | Fair Value | Statement of Assets and Liabilities Location | Fair Value | |||||||||
| International Fixed Income Fund | ||||||||||||
Interest rate contracts | Net Assets — Unrealized appreciation on futures contracts | $ | 532 | * | Net Assets — Unrealized depreciation on futures contracts | $ | 269 | * | ||||
Net Assets — Unrealized appreciation on swap contracts | 432 | † | Net Assets — Unrealized depreciation on swap contracts | 2,541 | † | |||||||
Credit contracts | Net Assets — Unrealized appreciation on swap contracts | — | † | Net Assets — Unrealized depreciation on swap contracts | 100 | † | ||||||
Foreign exchange contracts | Unrealized gain on forward foreign currency contracts | 4,865 | Unrealized loss on forward foreign currency contracts | 1,550 | ||||||||
|
|
|
| |||||||||
Total Derivatives not accounted for as hedging instruments | $ | 5,829 | $ | 4,460 | ||||||||
|
|
|
| |||||||||
| SEI Institutional International Trust / Annual Report / September 30, 2015 | 71 |
Notes to Financial Statements (Continued)
September 30, 2015
| Asset Derivatives | Liability Derivatives | |||||||||||
| Year ended September 30, 2015 ($ Thousands) | Year ended September 30, 2015 ($ Thousands) | |||||||||||
| Statement of Assets and Liabilities Location | Fair Value | Statement of Assets and Liabilities Location | Fair Value | |||||||||
| Emerging Markets Debt Fund | ||||||||||||
Interest rate contracts | Net Assets — Unrealized appreciation on futures contracts | $ | 81 | * | Net Assets — Unrealized depreciation on futures contracts | $ | 337 | * | ||||
Net Assets — Unrealized appreciation on swap contracts | 716 | † | Net Assets — Unrealized depreciation on swap contracts | 4,341 | † | |||||||
Foreign exchange contracts | Unrealized gain on forward foreign currency contracts | 10,185 | Unrealized loss on forward foreign currency contracts | 9,437 | ||||||||
Net Assets — Unrealized appreciation on swap contracts | — | † | Net Assets — Unrealized depreciation on swap contracts | 758 | † | |||||||
|
|
|
| |||||||||
Total Derivatives not accounted for as hedging instruments | $ | 10,982 | $ | 14,873 | ||||||||
|
|
|
| |||||||||
| * | Includes cumulative appreciation/depreciation of futures contracts as reported in the Schedules of Investments. Only current day’s variation margin is reported within the Statements of Assets & Liabilities. |
| † | Includes cumulative appreciation/depreciation of swap contracts as reported in the Schedules of Investments. Market Value is reported within the Statements of Assets & Liabilities for OTC swap contracts that have paid premiums. For centrally cleared swap contracts current days variation margin is reported within the Statements of Assets & Liabilities. |
The effect of derivative instruments on the Statements of Operations for the year ended September 30, 2015.
Amount of realized gain or (loss) on derivatives recognized in income ($ Thousands):
| Derivatives Not Accounted for as Hedging Instruments | Futures | Forward Currency Contracts | Swaps | Total | ||||||||||||
| International Fixed Income Fund | ||||||||||||||||
Interest rate contracts | $ | (676 | ) | $ | — | $ | (554 | ) | $ | (1,230 | ) | |||||
Foreign exchange contracts | — | 65,979 | — | 65,979 | ||||||||||||
Credit contracts | — | — | (16 | ) | (16 | ) | ||||||||||
Total | $ | (676 | ) | $ | 65,979 | $ | (570 | ) | $ | 64,733 | ||||||
| Emerging Markets Debt Fund | ||||||||||||||||
Interest rate contracts | $ | (1,280 | ) | $ | — | $ | (52 | ) | $ | (1,332 | ) | |||||
Foreign exchange contracts | — | 9,844 | — | 9,844 | ||||||||||||
Total | $ | (1,280 | ) | $ | 9,844 | $ | (52 | ) | $ | 8,512 | ||||||
Change in unrealized appreciation or (depreciation) on derivatives recognized in income ($ Thousands):
| Derivatives Not Accounted for as Hedging Instruments | Futures | Forward Currency Contracts | Swaps | Total | ||||||||||||
| International Fixed Income Fund | ||||||||||||||||
Interest rate contracts | $ | 200 | $ | — | $ | (315 | ) | $ | (115 | ) | ||||||
Credit contracts | — | — | (86 | ) | (86 | ) | ||||||||||
Foreign exchange contracts | — | (11,692 | ) | — | (11,692 | ) | ||||||||||
Total | $ | 200 | $ | (11,692 | ) | $ | (401 | ) | $ | (11,893 | ) | |||||
| Emerging Markets Debt Fund | ||||||||||||||||
Interest rate contracts | $ | (21 | ) | $ | — | $ | (2,148 | ) | $ | (2,169 | ) | |||||
Foreign exchange contracts | — | (2,079 | ) | (758 | ) | (2,837 | ) | |||||||||
Total | $ | (21 | ) | $ | (2,079 | ) | $ | (2,906 | ) | $ | (5,006 | ) | ||||
A Fund is subject to various netting arrangements with select counterparties (“Master Agreements”). Master Agreements govern the terms of certain transactions, and reduce the counterparty risk associated with relevant transactions by specifying credit protection mechanisms and providing standardization that improves legal certainty. Since different types of transactions have different mechanics and are sometimes traded out of different legal entities of a particular counterparty organization, each type of transaction may be covered by a different Master Agreement, resulting in the need for multiple agreements with a single counterparty. As the Master Agreements are specific to
unique operations of different asset types, they allow a Fund to close out and net its total exposure to a specific counterparty entity in the event of a default with respect to all the transactions governed under a single agreement with a specific counterparty entity.
Master Agreements can also help limit counterparty risk by specifying collateral posting arrangements at pre-arranged exposure levels. Under the Master Agreements, collateral is routinely transferred if the total net exposure to certain transactions (net of existing collateral already in place) governed under the relevant Master Agreement with
| 72 | SEI Institutional International Trust / Annual Report / September 30, 2015 |
a counterparty in a given account exceeds a specified threshold, which typically ranges from zero to $250,000 depending on the counterparty and the type of Master Agreement. United States Treasury Securities and U.S. dollar cash are generally the preferred forms of collateral. Securities and cash pledged as collateral are reflected as assets in the Statements of Assets and Liabilities as either a component of investments at value (securities) or deposits due from counterparties (cash). Cash collateral received is not typically held in a segregated account and as such is reflected as a liability in the Statement of Assets and Liabilities as deposits due to counterparties. The market value of any securities received as collateral is not reflected as a component of net asset value. A Fund’s overall exposure to counterparty risk can change substantially within a short period, as it is affected by each transaction subject to the relevant Master Agreement.
Customer Account Agreements and related addendums govern exchange traded derivatives transactions such as futures, options on futures, and centrally cleared swaps. Exchange traded derivative transactions require posting of initial margin as determined by each relevant clearing agency which is segregated at a broker account registered with the Commodities Futures Trading Commission (CFTC), or the applicable regulator. In the US, counterparty risk is significantly reduced as creditors of the futures broker do not have claim to Fund assets in the segregated account. Additionally, portability of exposure in the event of default further reduces risk to the Funds. Variation margin, or changes in market value, are exchanged daily, but may not be netted between futures and cleared OTC derivatives.
The following is a summary of the market value and variation margin of exchange-traded or centrally cleared financial derivative instruments of the Funds as of September 30, 2015 ($ Thousands):
| Financial Derivative Assets | Financial Derivative Liabilities | |||||||||||||||||||||||||
| Variation Margin Asset | Variation Margin Liability | |||||||||||||||||||||||||
| Fund | Futures | Swap Agreements | Total | Futures | Swap Agreements | Total | ||||||||||||||||||||
International Equity Fund | $ | 2,174 | $ | — | $ | 2,174 | $ | — | $ | — | $ | — | ||||||||||||||
International Fixed Income Fund | 253 | 17 | 270 | 24 | 17 | 41 | ||||||||||||||||||||
Emerging Markets Debt Fund | 57 | 13 | 70 | 14 | — | 14 | ||||||||||||||||||||
Securities with an aggregate market value of $539,770 have been pledged as collateral for exchange-traded and centrally cleared derivative instruments as of September 30, 2015.
International Swaps and Derivatives Association, Inc. Master Agreements and Credit Support Annexes (“ISDA Master Agreements”) govern OTC financial derivative transactions entered into by a Fund and select counterparties. ISDA Master Agreements maintain provisions for general obligations, representations, agreements, collateral and events
of default or termination. Events of termination include conditions that may entitle counterparties to elect to terminate early and cause settlement of all outstanding transactions under the applicable ISDA Master Agreement. Any election to terminate early could be material to the financial statements. In limited circumstances, the ISDA Master Agreement may contain additional provisions that add additional counterparty protection beyond coverage of existing daily exposure if the counterparty has a decline in credit quality below a predefined level. These amounts, if any, may be segregated with a third party custodian.
The following is a summary by derivative type of the market value of OTC financial derivative instruments and collateral (received)/pledged as of September 30, 2015 ($ Thousands):
| Financial Derivative Assets | Financial Derivative Liabilities | |||||||||||||||||||||||||||||||||||||||
| Fund | Forward Foreign Currency Contracts | Swap Agreements | Total Over the Counter | Forward Foreign Currency Contracts | Swap Agreements | Total Over the Counter | Net Market Value of OTC Derivatives | Collateral (Received)/ Pledged | Net Exposures(1) | |||||||||||||||||||||||||||||||
International Fixed Income Fund | $ | 4,865 | $ | — | $ | 4,865 | $ | 1,550 | $ | 953 | $ | 2,503 | $ | 2,362 | $ | — | $ | 2,362 | ||||||||||||||||||||||
Emerging Markets Debt Fund | 10,187 | 637 | 10,824 | 9,439 | 4,965 | 14,404 | (3,580 | ) | — | (3,580 | ) | |||||||||||||||||||||||||||||
| (1) | Excess collateral is not shown for financial reporting purposes. |
| (2) | Net Exposures represents the net receivable/(payable) that would be due from /to the counterparty in the event of default. Exposure from OTC financial derivative instruments can only be netted across transactions governed under the same master agreement with the same legal entity. |
| SEI Institutional International Trust / Annual Report / September 30, 2015 | 73 |
Notes to Financial Statements (Continued)
September 30, 2015
No securities have been pledged or have been received as collateral for financial derivative instruments as governed by ISDA Master Agreements as of September 30, 2015.
5. INVESTMENT ADVISORY, ADMINISTRATION AND DISTRIBUTION AGREEMENTS, INVESTMENT SUB-ADVISORY AGREEMENTS AND OTHER TRANSACTIONS WITH AFFILIATES
Investment Advisory, Administration and Distribution Agreements — SIMC serves as investment adviser (the “Adviser”) to each Fund. In connection with serving as Adviser, SIMC is entitled to a fee, which is calculated daily and paid monthly, based on the average daily net assets of each fund.
SEI Investments Global Funds Services (the “Administrator”) provides administrative and transfer agency services to the Funds for annual fees, based on the average daily net assets of each fund.
SEI Investments Distribution Co. (the “Distributor”), a wholly owned subsidiary of SEI Investments Company (“SEI”), serves as each Fund’s Distributor. The Trust has adopted plans under which firms,
including the Distributor, that provide shareholder and administrative services may receive compensation therefrom.
Such plans provide fees payable to the Distributor, calculated as a percentage of the average daily net assets attributable to each particular class of each respective fund. Under both the Shareholder Servicing Plan and Administrative Service Plan, the Distributor may retain as profit any difference between the fee it receives and the amount it pays to third parties.
The Adviser, Administrator and/or Distributor have voluntarily agreed to waive a portion of their fees in order to keep total direct operating expenses (exclusive of interest from borrowings, brokerage commissions, taxes, Trustees fees and extraordinary expenses not incurred in the ordinary course of the Funds’ business) at a specified level. The voluntary waivers by the Funds’ Adviser, Administrator and/or Distributor are limited to the Funds’ direct operating expenses and, therefore, do not apply to indirect expenses incurred by the Funds, such as acquired fund fees and expenses (AFFE). The waivers are voluntary and the Funds’ Adviser, Administrator and/or Distributor may discontinue all or part of any of these waivers at any time.
The following is a summary of annual fees payable to the Adviser, Administrator and Distributor and the contractual and voluntary expense limitation for each Fund will be as follows:
| Advisory Fee | Administration Fee | Shareholder Servicing Fee | Administrative Servicing Fee | Voluntary Expense Limitations | ||||||||||||||||
International Equity Fund | ||||||||||||||||||||
Class A | 0.505 | % | 0.45 | % | 0.25 | % | — | 1.25 | % | |||||||||||
Class I | 0.505 | % | 0.45 | % | 0.25 | % | 0.25 | % | 1.50 | % | ||||||||||
Class Y | 0.505 | % | 0.45 | % | — | — | 1.00 | % | ||||||||||||
Emerging Markets Equity Fund | ||||||||||||||||||||
Class A | 1.05 | %(1) | 0.45 | % | 0.25 | % | — | N/A | ||||||||||||
Class Y | 1.05 | %(1) | 0.45 | % | — | — | N/A | |||||||||||||
International Fixed Income Fund | ||||||||||||||||||||
Class A | 0.30 | % | 0.45 | % | 0.25 | % | — | 1.02 | % | |||||||||||
Emerging Markets Debt Fund | ||||||||||||||||||||
Class A | 0.85 | % | 0.45 | % | 0.25 | % | — | 1.36 | % | |||||||||||
Class Y | 0.85 | % | 0.45 | % | — | — | 1.11 | % | ||||||||||||
| (1) | Effective October 1, 2014, SIMC has contractually agreed to waive its management fee as necessary to keep the management fee paid by the Fund during its fiscal year from exceeding 0.95%. This fee waiver agreement shall remain in effect until January 31, 2016 and, unless earlier terminated, shall be automatically renewed for successive one-year periods thereafter. The agreement may be amended or terminated only with the consent of the Board of Trustees. |
N/A — Not applicable
| 74 | SEI Institutional International Trust / Annual Report / September 30, 2015 |
Investment Sub-Advisory Agreements — As of September 30, 2015, SIMC has entered into Investment Sub-Advisory Agreements with the following parties:
| Investment Sub-Adviser |
| International Equity Fund |
| Acadian Asset Management LLC |
| Blackcrane Capital, LLC |
Causeway Capital Management LLC |
Henderson Global Investors (North America) Inc. |
| INTECH Investment Management LLC |
| Neuberger Berman Management LLC |
| Tradewinds Global Investors LLC |
| WCM Investment Management |
| Emerging Markets Equity Fund |
| Delaware Investment Fund Advisers, a series of Delaware Management Business Trust |
| JO Hambro Capital Management Limited |
| Kleinwort Benson Investors International Ltd. |
| Lazard Asset Management LLC |
| Neuberger Berman Management LLC |
| PanAgora Asset Management, Inc. |
| RWC Asset Advisors (US) LLC |
| International Fixed Income Fund |
| AllianceBernstein L.P. |
| FIL Investment Advisors |
| Wellington Management Company, LLP |
| Emerging Markets Debt Fund |
| Investec Asset Management Ltd. |
| Neuberger Berman Fixed Income LLC |
| Stone Harbor Investment Partners LP |
Under the investment sub-advisory agreements, each sub-adviser receives an annual fee, paid by SIMC.
Brokerage Commissions Paid to Affiliates — The Distribution Agreement between the Distributor and the Trust provides that the Distributor may receive compensation on fund transactions effected for the Trust in accordance with the rules of the Securities and Exchange Commission (“SEC”). Accordingly, it is expected that fund transactions may result in brokerage commissions being paid to the Distributor. The SEC rules require that such commissions not exceed usual and customary commissions. There were no such commissions for the year ended September 30, 2015.
Fees Paid Indirectly — The Funds may direct certain fund trades to the Distributor who pays a portion of the Fund’s expenses. Accordingly, the expenses reduced, which were used to pay third party expenses, and the effect on the Fund’s expense ratio, as a percentage of the Fund’s average daily net assets for the year ended September 30, 2015, can be found on the Statement of Operations and Financial Highlights, if applicable.
Investment in Affiliated Securities — The Funds may invest in the SEI Daily Income Trust Prime Obligation Fund, an affiliated money market fund to manage excess cash or to serve as margin or collateral for derivative positions. Additionally, the Funds may invest cash collateral from the securities lending program in the SEI Liquidity Fund, L.P., also an affiliated fund.
The following is summary of the transactions with affiliates for the year ended September 30, 2015 ($ Thousands):
| SEI Liquidity Fund, L.P. | Purchases at Cost | Proceeds from Sales | Value 9/30/2015 | Dividend Income | ||||||||||||
International Equity Fund | $ | 1,302,684 | $ | (1,120,553 | ) | $ | 233,929 | $ | 1,543 | |||||||
Emerging Markets Equity Fund | 585,583 | (623,909 | ) | 135,645 | 1,120 | |||||||||||
Emerging Markets Debt Fund | 25,584 | (4,774 | ) | 20,810 | 25 | |||||||||||
| SEI Daily Income Trust Prime Obligation Fund | ||||||||||||||||
International Equity Fund | 327,628 | (337,211 | ) | 91,924 | 11 | |||||||||||
Emerging Markets Equity Fund | 268,277 | (274,285 | ) | 12,203 | 2 | |||||||||||
Payment to Affiliates — Certain Officers and Trustees of the Trust are also Officers and/or Directors of the Administrator, Adviser and/or the Distributor.
The Trust pays each unaffiliated Trustee an annual fee for attendance at quarterly, interim, and committee meetings. The Administrator or the Distributor pays compensation of Officers and affiliated Trustees.
A portion of the services provided by the Chief Compliance Officer (“CCO”) and his staff, whom are employees of the Administrator, are paid for by the Trust as incurred. The services include regulatory oversight of the Trust’s Adviser, sub-advisers and service providers as required by SEC regulations.
Interfund Lending — The SEC has granted an exemption that permits the Trust to participate in an interfund lending program (“the Program”) with existing or future investment companies registered under the 1940 Act that are advised by SIMC (the “SEI Funds”). The Program allows the SEI Funds to lend money to and borrow money from each other for temporary or emergency purposes. Participation in the Program is voluntary for both borrowing and lending funds. Interfund loans may be made only when the rate of interest to be charged is more favorable to the lending fund than an investment in overnight repurchase agreements (“Repo Rate”), and more favorable to the borrowing fund than the rate of interest that would be charged by a bank for short-term borrowings (“Bank Loan Rate”). The Bank Loan Rate will be determined using a formula reviewed annually by
| SEI Institutional International Trust / Annual Report / September 30, 2015 | 75 |
Notes to Financial Statements (Continued)
September 30, 2015
the SEI Funds’ Board of Trustees. The interest rate imposed on interfund loans is the average of the Repo Rate and the Bank Loan Rate. For the year ended September 30, 2015, the Trust had not participated in the Program.
6. INVESTMENT TRANSACTIONS
The cost of security purchases and the proceeds from the sale of securities, other than temporary cash investments and futures, during the year ended September 30, 2015, were as follows:
| Purchases ($ Thousands) | Sales and Maturities ($ Thousands) | |||||||
International Equity Fund | ||||||||
US Government | $ | — | $ | — | ||||
Other | 1,977,535 | 1,787,936 | ||||||
Emerging Markets Equity Fund | ||||||||
US Government | — | — | ||||||
Other | 1,131,388 | 1,318,800 | ||||||
International Fixed Income Fund | ||||||||
US Government | 18,913 | 13,197 | ||||||
Other | 346,118 | 347,096 | ||||||
Emerging Markets Debt Fund | ||||||||
US Government | 29,410 | 2,634 | ||||||
Other | 1,078,243 | 879,921 | ||||||
7. FEDERAL TAX INFORMATION:
It is each Fund’s intention to continue to qualify as a regulated investment company under Subchapter M of the Internal Revenue Code and distribute all of its taxable income (including net capital gains). Accordingly, no provision for Federal income taxes is required.
The Funds may be subject to taxes imposed by countries in which they invest with respect to their investments in issuers existing or operating in such countries. Such taxes are generally based on income earned. The Funds accrue such taxes when the related income is earned.
Dividends from net investment income and distributions from net realized capital gains are determined in accordance with U.S. Federal income tax regulations, which may differ from those amounts
determined under U.S. GAAP. These book/tax differences are either temporary or permanent in nature. To the extent these differences are permanent, they are charged or credited to paid-in capital, undistributed net investment income or accumulated net realized gain, as appropriate, in the period that the differences arise.
Accordingly, the following permanent differences, primarily attributable to different treatment for gains and losses on paydowns of mortgage and asset-backed securities for tax purposes, investments in swaps, investments in passive foreign investment companies, investments in partnerships, distribution reclassification, REIT income reclassification and foreign currency transactions have been reclassified to/from the following accounts as of September 30, 2015:
| Paid-in- Capital ($ Thousands) | Undistributed Net Investment Income/(Loss) ($ Thousands) | Accumulated Realized Gain/(Loss) ($ Thousands) | ||||||||||
International Equity Fund | $ | — | $ | 1,717 | $ | (1,717 | ) | |||||
Emerging Markets Equity Fund | — | 3,255 | (3,255 | ) | ||||||||
International Fixed Income Fund | — | 40,027 | (40,027 | ) | ||||||||
Emerging Markets Debt Fund | — | (56,512 | ) | 56,512 | ||||||||
The tax character of dividends and distributions declared during the last two years were as follows:
| Ordinary Income ($ Thousands) | Long-Term Capital Gain ($ Thousands) | Return of Capital ($ Thousands) | Totals ($ Thousands) | |||||||||||||||||
International Equity Fund | 2015 | $ | 52,509 | $ | — | $ | — | $ | 52,509 | |||||||||||
| 2014 | 31,622 | — | — | 31,622 | ||||||||||||||||
Emerging Markets Equity Fund | 2015 | 18,640 | — | — | 18,640 | |||||||||||||||
| 2014 | 7,645 | — | — | 7,645 | ||||||||||||||||
International Fixed Income Fund | 2015 | 38,714 | — | — | 38,714 | |||||||||||||||
| 2014 | 2,598 | — | — | 2,598 | ||||||||||||||||
Emerging Markets Debt Fund | 2015 | 27,003 | 550 | — | 27,553 | |||||||||||||||
| 2014 | 33,867 | 10,668 | — | 44,535 | ||||||||||||||||
As of September 30, 2015, the components of Distributable Earnings/(Accumulated Losses) were as follows:
| Undistributed Ordinary Income ($ Thousands) | Undistributed Long Term ($ Thousands) | Capital Loss Carryforwards ($ Thousands) | Post October ($ Thousands) | Late Year ($ Thousands) | Unrealized ($ Thousands) | Other ($ Thousands) | Total Accumulated Losses ($ Thousands) | |||||||||||||||||||||||||
International Equity Fund | $ | 29,250 | $ | — | $ | (709,632 | ) | $ | — | $ | — | $ | (153,360 | ) | $ | 1,008 | $ | (832,734 | ) | |||||||||||||
Emerging Markets Equity Fund | 10,980 | — | (11,026 | ) | (46,481 | ) | — | (337,262 | ) | — | (383,789 | ) | ||||||||||||||||||||
International Fixed Income Fund | 25,197 | 41 | — | — | — | (31,332 | ) | (5,719 | ) | (11,813 | ) | |||||||||||||||||||||
Emerging Markets Debt Fund | — | — | — | (29,930 | ) | (21,428 | ) | (235,719 | ) | (5,046 | ) | (292,195 | ) | |||||||||||||||||||
| 76 | SEI Institutional International Trust / Annual Report / September 30, 2015 |
For Federal income tax purposes, capital loss carryforwards may be carried forward and applied against future capital gains as follows:
| Expires 2017 ($ Thousands) | Expires 2018 ($ Thousands) | Total Capital Loss Carryforward 09/30/15 ($ Thousands) | ||||||||||
International Equity Fund | $ | 19,275 | $ | 690,357 | $ | 709,632 | ||||||
Emerging Markets Equity Fund | — | 11,026 | 11,026 | |||||||||
Under the Regulated Investment Company Modernization Act of 2010, Funds will be permitted to carry forward capital losses incurred in taxable years beginning after December 22, 2010 for an unlimited period. However, any losses incurred during those future taxable years will be required to be utilized prior to the losses incurred in pre-enactment taxable years. As a result of this ordering rule, pre-enactment capital loss carryforwards may be more likely to expire unused. Additionally, post-enactment capital losses that are carried forward will retain their character as either short-term or long-term capital losses rather than being considered all short-term as under previous law.
During the year ended September 30, 2015, the following Funds utilized capital loss carryforwards to offset capital gains:
| Amount utilized ($ Thousands) | ||||
International Equity Fund | $ | 76,023 | ||
Emerging Markets Equity Fund | 6,508 | |||
International Fixed Income Fund | 280 | |||
For Federal income tax purposes, the cost of securities owned at September 30, 2015, and the net realized gains or losses on securities sold for the period were not materially different from amounts reported for financial reporting purposes. These differences are primarily due to investments in partnerships, passive foreign investment companies and wash sales which cannot be used for Federal income tax purposes in the current year and have been deferred for use in future years. The aggregate gross unrealized appreciation and depreciation on total investments held by the Funds at September 30, 2015, was as follows:
| Federal Tax Cost ($ Thousands) | Aggregate Gross Unrealized Appreciation ($ Thousands) | Aggregate Gross Unrealized Depreciation ($ Thousands) | Net ($ Thousands) | |||||||||||||
International Equity Fund | $ | 3,082,820 | $ | 161,398 | $ | (312,601 | ) | $(151,203 | ) | |||||||
Emerging Markets Equity Fund | 1,859,004 | 66,359 | (403,413 | ) | (337,054 | ) | ||||||||||
International Fixed Income Fund | 520,662 | 5,067 | (36,486 | ) | (31,419 | ) | ||||||||||
Emerging Markets Debt Fund | 1,546,197 | 8,716 | (240,104 | ) | (231,388 | ) | ||||||||||
Management has analyzed the Funds’ tax positions taken on federal income tax returns for all open tax years and has concluded that as of September 30, 2015, no provision for income tax would be required in the Funds’ financial statements. The Funds’ federal and state income and federal excise tax returns for tax years for which the applicable
statutes of limitations have not expired are subject to examination by the Internal Revenue Service and state departments of revenue.
8. CONCENTRATION/RISKS
In the normal course of business, the Trust enters into contracts that provide general indemnifications by the Trust to the counterparty to the contract. The Trust’s maximum exposure under these arrangements is dependent on future claims that may be made against the Trust and, therefore, cannot be estimated; however, management believes that, based on experience, the risk of loss from such claims is considered remote.
The following descriptions provide additional information about some of the risks of investing in the Funds:
Asset-Backed Securities Risk — Payment of principal and interest on asset-backed securities is dependent largely on the cash flows generated by the assets backing the securities, and asset-backed securities may not have the benefit of any security interest in the related assets.
Credit Risk — The risk that the issuer of a security or the counterparty to a contract will default or otherwise become unable to honor a financial obligation.
Currency Risk — To the extent a Fund takes positions in currencies, it will be subject to the risk that currency exchange rates may fluctuate in response to, among other things, changes in interest rates, intervention (or failure to intervene) by U.S. or foreign governments, central banks or supranational entities, or by the imposition of currency controls or other political developments in the United States or abroad.
Fixed Income Market Risk — The prices of a Fund’s fixed income securities respond to economic developments, particularly interest rate changes, as well as to perceptions about the creditworthiness of individual issuers, including governments and their agencies. Generally, the Fund’s fixed income securities will decrease in value if interest rates rise and vice versa. In the case of foreign securities, price fluctuations will reflect international economic and political events, as well as changes in currency valuations relative to the U.S. dollar.
Foreign Investment/Emerging Markets Risk — The risk that non-U.S. securities may be subject to additional risks due to, among other things, political, social and economic developments abroad, currency movements, and different legal, regulatory and tax environments. These additional risks may be heightened with respect to emerging market countries since political turmoil and rapid changes in economic conditions are more likely to occur in these countries.
Interest Rate Risk — The risk that a rise in interest rates will cause a fall in the value of fixed income securities, including U.S. Government Securities, in which the Fund invests. Although U.S. Government securities are considered to be among the safest investments, they are not guaranteed against price movements due to changing interest rates. A low interest rate environment may present greater interest rate
| SEI Institutional International Trust / Annual Report / September 30, 2015 | 77 |
Notes to Financial Statements (Concluded)
September 30, 2015
risk, because there may be a greater likelihood of rates increasing and rates may increase more rapidly.
Mortgage-Backed Securities Risk — Mortgage-backed securities are affected by, among other things, interest rate changes and the possibility of prepayment of the underlying mortgage loans. Mortgage-backed securities are also subject to the risk that underlying borrowers will be unable to meet their obligations.
Please refer to each Fund’s current prospectus for additional disclosure regarding the risks associated with investing in the Funds. The foregoing is not intended to be a complete discussion of the risks associated with the investment strategies of the Funds.
9. SECURITIES LENDING
A Fund may lend portfolio securities to brokers, dealers and other financial organizations that meet capital and other credit requirements or other criteria established by the Trust’s Board of Trustees. These loans may not exceed 33 1/3% of the total asset value of a Fund (including the loan collateral). No Fund will lend portfolio securities to its Adviser, sub-adviser or their affiliates unless it has applied for and received specific authority to do so from the SEC. Loans of portfolio securities will be fully collateralized by cash. Collateral will be maintained in an amount equal to at least 100% of the current market value of the loaned securities by marking to market daily, although the borrower will be required to deliver collateral between 102% and 105% of the market value of borrowed securities for domestic and foreign securities, respectively. However, due to market fluctuations during the day, the value of securities loaned on a particular day may, during the course of the day, exceed the value of collateral. On each business day, the amount of collateral is adjusted based on the prior day’s market fluctuations and the current day’s lending activity. Income from lending activity is determined by the amount of interest earned on collateral, less any amounts payable to the borrowers of the securities and the lending agent. Lending securities involves certain risks, including the risk that a Fund may be delayed or prevented from recovering the collateral if the borrower fails to return the securities.
Cash collateral received in connection with securities lending is invested in short-term investments by the lending agent. These investments may include the SEI Liquidity Fund, L.P., and the Fund bears all of the gains and losses on such investment. There is no guarantee that these investments will not lose value.
The following is a summary of securities lending agreements held by certain Funds which would be subject to offset as of September 30, 2015 ($ Thousands):
| Fund | Securities Loaned at Value | Cash Collateral Received(1) | Net Amount | |||||||||
International Equity Fund | $ | 229,050 | $ | 229,050 | $ | — | ||||||
Emerging Markets Equity Fund | 131,380 | 131,380 | — | |||||||||
Emerging Markets Debt Fund | 20,564 | 20,564 | — | |||||||||
| (1) | Excess collateral received in connection with the above securities lending transactions is not shown for financial reporting purposes. See each Fund’s Schedule of Investments for the total collateral received. |
10. NEW ACCOUNTING PRONOUNCEMENT
In May 2015, the Financial Accounting Standards Board (FASB) issued Accounting Standards Update (ASU) No. 2015-07 regarding “Disclosures for Investments in Certain Entities That Calculate Net Asset Value per Share”. The amendments in this update are effective for the Fund for fiscal years beginning after December 15, 2015, and interim periods within those fiscal years. ASU No. 2015-07 will eliminate the requirement to categorize investments in the fair value hierarchy if their fair value is measured at net asset value (NAV) per share (or its equivalent) using the practical expedient in the FASB’s fair value measurement guidance. Management has evaluated the implications of ASU No. 2015-07 and determined there is no impact to the financial statements.
11. SUBSEQUENT EVENTS
Management has evaluated the need for disclosures and/or adjustments resulting from subsequent events through the date the financial statements were issued. Based on this evaluation, no disclosure and/or adjustments were required to the financial statements as of September 30, 2015.
| 78 | SEI Institutional International Trust / Annual Report / September 30, 2015 |
Report of Independent Registered Public Accounting Firm
The Board of Trustees and Shareholders
SEI Institutional International Trust:
We have audited the accompanying statements of assets and liabilities, including the schedules of investments, of SEI Institutional International Trust, comprised of the International Equity Fund, Emerging Markets Equity Fund, Emerging Markets Debt Fund, and the International Fixed Income Fund (collectively, the “Funds”), as of September 30, 2015, and the related statements of operations for the year then ended, the statements of changes in net assets for each of the years in the two-year period then ended, and the financial highlights for each of the years or periods in the five-year period then ended. These financial statements and financial highlights are the responsibility of the Funds’ management. Our responsibility is to express an opinion on these financial statements and financial highlights based on our audits.
We conducted our audits in accordance with the standards of the Public Company Accounting Oversight Board (United States). Those standards require that we plan and perform the audit to obtain reasonable assurance about whether the financial statements and financial highlights are free of material misstatement. An audit includes examining, on a test basis, evidence supporting the amounts and disclosures in the financial statements. Our procedures included confirmation of securities owned as of September 30, 2015, by correspondence with the custodian, transfer agent and brokers or other appropriate auditing procedures. An audit also includes assessing the accounting principles used and significant estimates made by management, as well as evaluating the overall financial statement presentation. We believe that our audits provide a reasonable basis for our opinion.
In our opinion, the financial statements and financial highlights referred to above present fairly, in all material respects, the financial position of each of the Funds comprising the SEI Institutional International Trust as of September 30, 2015, the results of their operations for the year then ended, the changes in their net assets for each of the years in the two-year period then ended, and the financial highlights for each of the years or periods in the five-year period then ended, in conformity with U.S. generally accepted accounting principles.

Philadelphia, Pennsylvania
November 30, 2015
| SEI Institutional International Trust / Annual Report / September 30, 2015 | 79 |
Trustees and Officers of the Trust (Unaudited)
The following chart lists Trustees and Officers as of September 30, 2015.
Set forth below are the names, ages, addresses, position with the Trust, Term of Office and Length of Time Served, the principal occupations for the last five years, number of portfolios in fund complex overseen by the trustees, and other directorships outside the fund complex of each of the persons currently serving as Trustees and Officers of the Trust. The Trust’s Statement of Additional Information (“SAI”) includes additional information about the Trustees and Officers. The SAI may be obtained without charge by calling 1-800-342-5734.
| Name, Age and Address | Position(s) Held with Trusts | Term of Office and Length of Time Served1 | Principal Occupation(s) During Past Five Years | Number of Portfolios in Fund Complex Overseen by Trustee2 | Other Directorships Held by Trustee | |||||
| INTERESTED DIRECTORS | ||||||||||
| Robert A. Nesher One Freedom Valley Drive, Oaks, PA 19456 69 yrs. old | Chairman of the Board of Trustees* | since 1982 | Currently performs various services on behalf of SEI for which Mr. Nesher is compensated. | 99 | Trustee of The Advisors’ Inner Circle Fund, The Advisors’ Inner Circle Fund II, The KP Funds, Bishop Street Funds, Director of SEI Global Master Fund, plc, SEI Global Assets Fund, plc, SEI Global Investments Fund, plc, SEI Investments Global, Limited, SEI Investments — Global Fund Services, Limited, SEI Investments (Europe), Limited, SEI Global Nominee Ltd., and SEI Structured Credit Fund, L.P. | |||||
| William M. Doran One Freedom Valley Drive Oaks, PA 19456 75 yrs. old | Trustee* | since 1982 | Self-employed Consultant since 2003. Partner, Morgan, Lewis & Bockius LLP (law firm) from 1976 to 2003, counsel to the Trust, SEI, SIMC, the Administrator and the Distributor. Secretary of SEI since 1978. | 99 | Trustee of The Advisors’ Inner Circle Fund, The Advisors’ Inner Circle Fund II, The Advisors’ Inner Circle III, The KP Funds, O’Connor EQUUS, Bishop Street Funds, Director of SEI since 1974. Director of the Distributor since 2003. Director of SEI Investments — Global Fund Services, Limited, SEI Investments Global, Limited, SEI Investments (Europe), Limited, SEI Global Nominee, Ltd, SEI Investments (Asia), Limited, and SEI Asset Korea Co., Ltd. | |||||
| TRUSTEES | ||||||||||
| George J. Sullivan Jr. One Freedom Valley Drive, Oaks, PA 19456 72 yrs. old | Trustee | since 1996 | Retired since January 2012. Self-employed Consultant, Newfound Consultants, Inc. since April 1997-December 2011. | 99 | Trustee of The Advisors’ Inner Circle Fund, The Advisors’ Inner Circle Fund II, The KP Funds, Bishop Street Funds, State Street Navigator Securities Lending Trust, Director of SEI Structured Credit Fund L.P. and member of the independent review committee for SEI’s Canadian-registered mutual funds. | |||||
| *Messrs. | Nesher and Doran are Trustees who may be deemed as “interested” persons of the Trust as that term is defined in the 1940 Act by virtue of their affiliation with SIMC and the Trust’s Distributor. |
| 1There | is no stated term of office for the Trustees of the Trust. However, a Trustee must retire from the Board by the end of the calendar year in which the Trustee turns 75 provided that, although there shall be a presumption that each Trustee attaining such age shall retire, the Board may, if it deems doing so to be consistent with the best interest of the Trust, and with the consent of any Trustee that is eligible for retirement, by unanimous vote, extend the term of such Trustee for successive periods of one year. |
| 2The | Fund Complex includes the following Trusts: SEI Asset Allocation Trust, SEI Daily Income Trust, SEI Institutional Investments Trust, Adviser Managed Trust, SEI Institutional International Trust, SEI Institutional Managed Trust, SEI Liquid Asset Trust, SEI Tax Exempt Trust, SEI Insurance Products Trust, SEI Catholic Values Trust and New Covenant Funds. |
| 80 | SEI Institutional International Trust / Annual Report / September 30, 2015 |
| Name, Age and Address | Position(s) Held with Trusts | Term of Office and Length of Time Served1 | Principal Occupation(s) During Past Five Years | Number of Portfolios in Fund Complex Overseen by Trustee2 | Other Directorships Held by Trustee | |||||
| TRUSTEES (continued) | ||||||||||
| Nina Lesavoy One Freedom Valley Drive, Oaks, PA 19456 58 yrs. old | Trustee | since 2003 | Founder and Managing Director, Avec Capital, since 2008. Managing Director, Cue Capital from March 2002 to March 2008 | 99 | Director of SEI Structured Credit Fund, L.P. | |||||
| James M. Williams One Freedom Valley Drive, Oaks, PA 19456 67 yrs. old | Trustee | since 2004 | Vice President and Chief Investment Officer, J. Paul Getty Trust, Non-Profit Foundation for Visual Arts, since December 2002. | 99 | Trustee/Director of Ariel Mutual Funds and SEI Structured Credit Fund, L.P. | |||||
| Mitchell A. Johnson One Freedom Valley Drive, Oaks, PA 19456 73 yrs. old | Trustee | since 2007 | Private Investor since 1994. | 99 | Trustee of The Advisors’ Inner Circle Fund, The Advisors’ Inner Circle Fund II, The KP Funds and Bishop Street Funds. | |||||
| Hubert L. Harris, Jr. One Freedom Valley Drive, Oaks, PA 19456 72 yrs. old | Trustee | since 2008 | Retired since December 2005. Chief Executive Officer and Chair of the Board of Directors, AMVESCAP Retirement, Inc., 1997-December 2005. Chief Executive Officer, INVESCO North America, September 2003-December 2005. | 99 | Director of Colonial BancGroup, Inc. and St. Joseph’s Translational Research Institute, Chair of the Board of Trustees, Georgia Tech Foundation, Inc. (nonprofit corporation); Board of Councilors of the Carter Center. | |||||
| OFFICERS | ||||||||||
| Robert A. Nesher One Freedom Valley Drive, Oaks, PA 19456 69 yrs. Old | President and CEO | since 2005 | Currently performs various services on behalf of SEI for which Mr. Nesher is compensated. | N/A | N/A | |||||
Arthur Ramanjulu One Freedom Oaks, PA 19456 51 yrs. old | Controller and Chief Financial Officer | since 2015 | Director, Funds Accounting, SEI Investments Global Funds Services (March 2015); Senior Manager, Funds Accounting, SEI Global Fund Services (March 2007 to February 2015). | N/A | N/A | |||||
| Russell Emery One Freedom Valley Drive, Oaks, PA 19456 52 yrs. old | Chief Compliance Officer | since 2006 | Chief Compliance Officer of SEI Institutional Managed Trust, SEI Daily Income Trust, SEI Institutional International Trust, SEI Asset Allocation Trust, SEI Liquid Asset Trust, SEI Tax Exempt Trust, SEI Institutional Investments Trust, The Advisors’ Inner Circle Fund, The Advisors’ Inner Circle Fund II, and Bishop Street Funds, since March 2006. Chief Compliance Officer of SEI Structured Credit Fund, LP since June 2007. Chief Compliance Officer of Adviser Managed Trust since December 2010. Chief Compliance Officer of New Covenant Funds since February 2012. Chief Compliance Officer of SEI Insurance Products Trust since 2013. Chief Compliance Officer of SEI Catholic Values Trust since 2015. | N/A | N/A | |||||
| SEI Institutional International Trust / Annual Report / September 30, 2015 | 81 |
Trustees and Officers of the Trust (Unaudited) (Concluded)
| Name, Age and Address | Position(s) Held with Trusts | Term of Office and Length of Time Served1 | Principal Occupation(s) During Past Five Years | Number of Portfolios in Fund Complex Overseen by Trustee2 | Other Directorships Held by Trustee | |||||
| OFFICERS (continued) | ||||||||||
| Timothy D. Barto One Freedom Valley Drive, Oaks, PA 19456 47 yrs. old | Vice President and Secretary | since 2002 | General Counsel, Vice President and Secretary of SIMC and the Administrator since 2004. Vice President and Assistant Secretary of SEI since 2001. Vice President of SIMC and the Administrator since 1999. | N/A | N/A | |||||
| Aaron Buser One Freedom Valley Drive, Oaks, PA 19456 44 yrs. old | Vice President and Assistant Secretary | since 2008 | Vice President and Assistant Secretary of SIMC since 2007. Associate at Stark & Stark (2004-2007). | N/A | N/A | |||||
| David F. McCann One Freedom Valley Drive, Oaks, PA 19456 39 yrs. old | Vice President and Assistant Secretary | since 2009 | Vice President and Assistant Secretary of SIMC since 2008. Attorney, Drinker, Bidder & Reath LLP (law firm), May 2005-October 2008. | N/A | N/A | |||||
| Stephen G. MacRae One Freedom Valley Drive, Oaks, PA 19456 47 yrs. old | Vice President | since 2012 | Director of Global Investment Product Management since 2004. | N/A | N/A | |||||
| Bridget E. Sudall One Freedom Valley Drive Oaks, PA 19456 35 yrs. old | Anti-Money Laundering Compliance Officer and Privacy Officer | since 2015 | Anti-Money Laundering Compliance Officer and Privacy Officer since 2015. Senior Associate and AML Officer, Morgan Stanley Alternative Investment Partners, April 2011 to March 2015. Investor Services Team Lead, Morgan Stanley Alternative Investment Partners, July 2007 to April 2011. | N/A | N/A | |||||
| 1Each | trustee shall hold office during the lifetime of this Trust until the election and qualification of his or her successor, or until he or she sooner dies, resigns or is removed in accordance with the Trust’s Declaration of Trust. |
| 2The | Fund Complex includes the following Trusts: SEI Asset Allocation Trust, SEI Daily Income Trust, SEI Institutional Investments Trust, Adviser Managed Trust, SEI Institutional International Trust, SEI Institutional Managed Trust, SEI Liquid Asset Trust, SEI Tax Exempt Trust, SEI Insurance Products Trust, SEI Catholic Values Trust and New Covenant Funds. |
| 82 | SEI Institutional International Trust / Annual Report / September 30, 2015 |
Disclosure of Fund Expenses (Unaudited)
All mutual funds have operating expenses. As a shareholder of a fund, your investment is affected by these ongoing costs, which include (among others) costs for portfolio management, administrative services, and shareholder reports like this one. It is important for you to understand the impact of these costs on your investment returns.
Operating expenses such as these are deducted from the fund’s gross income and directly reduce your final investment return. These expenses are expressed as a percentage of the fund’s average net assets; this percentage is known as the fund’s expense ratio.
The following examples use the expense ratio and are intended to help you understand the ongoing costs (in dollars) of investing in your fund and to compare these costs with those of other mutual funds. The examples are based on an investment of $1,000 made at the beginning of the period shown and held for the entire period.
The table on this page illustrates your fund’s costs in two ways:
Actual Fund return. This section helps you to estimate the actual expenses after fee waivers that your Fund incurred over the period. The “Expenses Paid During Period” column shows the actual dollar expense cost incurred by a $1,000 investment in the Fund, and the “Ending Account Value” number is derived from deducting that expense cost from the Fund’s gross investment return.
You can use this information, together with the actual amount you invested in the Fund, to estimate the expenses you paid over that period. Simply divide your actual account value by $1,000 to arrive at a ratio (for example, an $8,600 account value divided by $1,000 = 8.6), then multiply that ratio by the number shown for your Fund under “Expenses Paid During Period.”
Hypothetical 5% return. This section helps you compare your Fund’s costs with those of other mutual funds. It assumes that the fund had an annual 5% return before expenses during the year, but that the expense ratio (Column 3) for the period is unchanged. This example is useful in making comparisons because the Securities and Exchange Commission requires all mutual funds to make this 5% calculation. You can assess your Fund’s comparative cost by comparing the hypothetical result for your Fund in the “Expense Paid During Period” column with those that appear in the same charts in the shareholder reports for other funds.
NOTE: Because the return is set at 5% for comparison purposes — NOT your Fund’s actual return — the account values shown may not apply to your specific investment.
| Beginning Account Value 4/1/2015 | Ending Account Value 9/30/2015 | Annualized Expense Ratios | Expenses Paid During Period* | |||||||||||||
International Equity Fund |
| |||||||||||||||
Actual Fund Return |
| |||||||||||||||
Class A | $ | 1,000.00 | $ | 924.30 | 1.25 | % | $ | 6.03 | ||||||||
Class I | $ | 1,000.00 | 923.30 | 1.50 | 7.23 | |||||||||||
Class Y | $ | 1,000.00 | 926.30 | 1.00 | 4.83 | |||||||||||
Hypothetical 5% Return |
| |||||||||||||||
Class A | $ | 1,000.00 | $ | 1,018.80 | 1.25 | % | $ | 6.33 | ||||||||
Class I | $ | 1,000.00 | 1,017.55 | 1.50 | 7.59 | |||||||||||
Class Y | $ | 1,000.00 | 1,020.05 | 1.00 | 5.06 | |||||||||||
Emerging Markets Equity Fund |
| |||||||||||||||
Actual Fund Return |
| |||||||||||||||
Class A | $ | 1,000.00 | $ | 839.60 | 1.71 | % | $ | 7.89 | ||||||||
Class Y | $ | 1,000.00 | 840.80 | 1.46 | 6.74 | |||||||||||
Hypothetical 5% Return |
| |||||||||||||||
Class A | $ | 1,000.00 | $ | 1,016.50 | 1.71 | % | $ | 8.64 | ||||||||
Class Y | $ | 1,000.00 | 1,017.75 | 1.46 | 7.38 | |||||||||||
| Beginning Account Value 4/1/2015 | Ending Account Value 9/30/2015 | Annualized Expense Ratios | Expenses Paid During Period* | |||||||||||||
International Fixed Income Fund |
| |||||||||||||||
Actual Fund Return |
| |||||||||||||||
Class A | $ | 1,000.00 | $ | 980.20 | 1.02 | % | $ | 5.06 | ||||||||
Hypothetical 5% Return |
| |||||||||||||||
Class A | $ | 1,000.00 | $ | 1,019.95 | 1.02 | % | $ | 5.16 | ||||||||
Emerging Markets Debt Fund |
| |||||||||||||||
Actual Fund Return |
| |||||||||||||||
Class A | $ | 1,000.00 | $ | 910.20 | 1.36 | % | $ | 6.51 | ||||||||
Class Y | $ | 1,000.00 | 910.90 | 1.11 | 5.32 | |||||||||||
Hypothetical 5% Return |
| |||||||||||||||
Class A | $ | 1,000.00 | $ | 1,018.25 | 1.36 | % | $ | 6.88 | ||||||||
Class Y | $ | 1,000.00 | 1,019.50 | 1.11 | 5.62 | |||||||||||
| * | Expenses are equal to the Fund’s annualized expense ratio multiplied by the average account value over the period, multiplied by 183/365 (to reflect the one-half year period shown). |
| SEI Institutional International Trust / Annual Report / September 30, 2015 | 83 |
Board of Trustees Considerations in Approving the Funds’ Investment Advisory and Sub-Advisory Agreements (Unaudited)
SEI Institutional International Trust (the “Trust”) and SEI Investments Management Corporation (“SIMC”) have entered into an investment advisory agreement (the “Advisory Agreement”). Pursuant to the Advisory Agreement, SIMC is responsible for the investment advisory services provided to the series of the Trust (the “Funds”). Pursuant to separate sub-advisory agreements with SIMC (the “Sub-Advisory Agreements” and, together with the Advisory Agreement, the “Investment Advisory Agreements”), and under the supervision of SIMC and the Trust’s Board of Trustees (the “Board”), the sub-advisers (each, a “Sub-Adviser” and collectively, the “Sub-Advisers”) provide security selection and certain other advisory services with respect to all or a discrete portion of the assets of the Funds. The Sub-Advisers are also responsible for managing their employees who provide services to these Funds. The Sub-Advisers are selected based primarily upon the research and recommendations of SIMC, which evaluates quantitatively and qualitatively the Sub-Advisers’ skills and investment results in managing assets for specific asset classes, investment styles and strategies.
The Investment Company Act of 1940, as amended (the “1940 Act”), requires that the initial approval of, as well as the continuation of, the Funds’ Investment Advisory Agreements must be specifically approved: (i) by the vote of the Board or by a vote of the shareholders of the Funds; and (ii) by the vote of a majority of the Trustees who are not parties to the Investment Advisory Agreements or “interested persons” of any party (the “Independent Trustees”), cast in person at a meeting called for the purpose of voting on such approval(s). In connection with their consideration of such approval(s), the Funds’ Trustees must request and evaluate, and SIMC and the Sub-Advisers are required to furnish, such information as may be reasonably necessary to evaluate the terms of the Investment Advisory Agreements. In addition, the Securities and Exchange Commission takes the position that, as part of their fiduciary duties with respect to a mutual fund’s fees, mutual fund boards are required to evaluate the material factors applicable to a decision to approve an Investment Advisory Agreement.
Consistent with these responsibilities, the Board calls and holds meetings each year to consider whether to approve new and/or renew existing Investment Advisory Agreements between the Trust and SIMC and SIMC and the Sub-Advisers with respect to the Funds of the Trust. In preparation for these meetings, the Board requests and reviews a wide variety of materials provided by SIMC and the Sub-Advisers, including information about SIMC’s and the Sub-Advisers’ affiliates, personnel and operations and the services provided pursuant to the Investment Advisory Agreements. The Board also receives data from third parties. This information is provided in addition to the detailed information about the Funds that the Board reviews during the course of each year, including information that relates to Fund operations and Fund performance. The Trustees also receive a memorandum from counsel regarding the responsibilities of Trustees in connection with their consideration of whether to approve the Trust’s Investment Advisory Agreements. Finally, the Independent Trustees receive advice from independent counsel to the Independent Trustees, meet in executive sessions outside the presence of Fund management and participate in question and answer sessions with representatives of SIMC and the Sub-Advisers.
Specifically, during the course of the Trust’s fiscal year, the Board requested and received written materials from SIMC and the Sub-Advisers regarding: (i) the quality of SIMC’s and the Sub-Advisers’ investment management and other services; (ii) SIMC’s and the Sub-Advisers’ investment management personnel; (iii) SIMC’s and the Sub-Advisers’ operations and financial condition; (iv) SIMC’s and the Sub-Advisers’ brokerage practices (including any soft dollar arrangements) and investment strategies; (v) the level of the advisory fees that SIMC charges the Funds and the level of the sub-advisory fees that SIMC pays the Sub-Advisers, compared with fees each charge to any comparable accounts; (vi) the advisory fees charged by SIMC, and the Funds’ overall fees and operating expenses compared with peer groups of mutual funds prepared by Lipper, an independent provider of investment company data; (vii) the level of SIMC’s and the Sub-Advisers’ profitability from their Fund-related operations; (viii) SIMC’s and the Sub-Advisers’ compliance program, including a description of material compliance matters and material compliance violations; (ix) SIMC’s potential economies of scale; (x) SIMC’s and the Sub-Advisers’ policies on and compliance procedures for personal securities transactions; (xi) SIMC’s and the Sub-Advisers’ expertise and resources in domestic and/or international financial markets; and (xii) the Funds’ performance over various periods of time compared with peer groups of mutual funds prepared by Lipper and the Funds’ benchmark indices.
| 84 | SEI Institutional International Trust / Annual Report / September 30, 2015 |
At the March 24-25, 2015 meeting of the Board of Trustees, the Trustees, including a majority of the Independent Trustees, approved the renewal of the Advisory Agreement. Also, certain Sub-Advisory Agreements (other than certain of those operating under an initial two-year term) were either initially approved or, if the Sub-Advisory Agreement was already in effect, renewed at meetings of the Board of Trustees held during the course of the Trust’s fiscal year on December 9-10, 2014, March 24-25, 2015, June 22-23, 2015 and September 15-16, 2015. In each case, the Board’s approval (or renewal) was based on its consideration and evaluation of the factors described above, as discussed at the meetings and at prior meetings. The following discusses some, but not all, of the factors that were considered by the Board in connection with its assessment of the Investment Advisory Agreements.
Nature, Extent and Quality of Services. The Board considered the nature, extent and quality of the services provided by SIMC and the Sub-Advisers to the Funds and the resources of SIMC and the Sub-Advisers and their affiliates dedicated to the Funds. In this regard, the Trustees evaluated, among other things, SIMC’s and each Sub-Adviser’s personnel, experience, track record and compliance program. Following evaluation, the Board concluded that, within the context of its full deliberations, the nature, extent and quality of services provided by SIMC and the Sub-Advisers to the Funds and the resources of SIMC and the Sub-Advisers and their affiliates dedicated to the Funds were sufficient to support renewal of the Investment Advisory Agreements. In addition to advisory services, the Board considered the nature and quality of certain administrative, transfer agency and other non-investment advisory services provided to the Funds by SIMC and/or its affiliates.
Performance. In determining whether to renew SIMC’s Advisory Agreement, the Trustees considered the Funds’ performance relative to their peer groups and appropriate indices/benchmarks. The Trustees reviewed performance information for each Fund, noting that they receive performance reports that permit them to monitor each Fund’s performance at board meetings throughout the year. As part of this review, the Trustees considered the composition of each peer group and selection criteria. In assessing Fund performance, the Trustees considered a report compiled by Lipper, an independent third-party, which was engaged to prepare an assessment of the Funds in connection with the renewal of the Advisory Agreement (the “Lipper Report”). The Lipper Report included metrics on risk analysis, volatility versus total return, net total return and performance consistency for the Funds and a universe of comparable funds. Based on the materials considered and discussed at the meetings, the Trustees found Fund performance satisfactory, or, where performance was materially below the benchmark and/or peer group, the Trustees were satisfied by the reasons provided to explain such performance. In connection with the approval or renewal of Sub-Advisory Agreements, the Board considered the performance of the Sub-Adviser relative to appropriate indices/benchmarks. Following evaluation, the Board concluded that, within the context of its full deliberations, the performance of the Funds was sufficient to support renewal of SIMC’s Advisory Agreement, and the performance of each Sub-Adviser was sufficient to support approval or renewal of the Sub-Advisory Agreement.
Fees. With respect to the Funds’ expenses under the Investment Advisory Agreements, the Trustees considered the rate of compensation called for by the Investment Advisory Agreements and the Funds’ net operating expense ratio in comparison to those of the Funds’ respective peer groups. In assessing Fund expenses, the Trustees considered the information in the Lipper Report, which included various metrics related to fund expenses, including, but not limited to, contractual management fees at various fee levels, actual management fees, and actual total expenses (including underlying fund expenses) for the Funds and a universe of comparable funds. Based on the materials considered and discussion at the meetings, the Trustees further determined that fees were either shown to be below the peer average in the comparative fee analysis, or that there was a reasonable basis for the fee level. The Trustees also considered the effects of SIMC’s voluntary waiver of management and other fees to prevent total Fund expenses from exceeding a specified cap and concluded that SIMC, through waivers, has maintained the Funds’ net operating expenses at competitive levels for its distribution channels. In determining the appropriateness of fees, the Board also took into consideration the impact of fees incurred indirectly by the Funds as a result of investments into underlying funds, including funds from which SIMC or its affiliates earn fees. The Board also took into consideration compensation earned from the Funds by SIMC or its affiliates for non-advisory services, such as administration, transfer agency, shareholder services or brokerage, and considered whether SIMC and its affiliates may have realized other benefits from their
| SEI Institutional International Trust / Annual Report / September 30, 2015 | 85 |
Board of Trustees Considerations in Approving the Funds’ Investment Advisory and Sub-Advisory Agreements (Unaudited) (Concluded)
relationship with the Funds, such as any research and brokerage services received under soft dollar arrangements. When considering fees paid to Sub-Advisers, the Board took into account the fact that the Sub-Advisers are compensated by SIMC and not by the Funds directly, and that such compensation with respect to any unaffiliated Sub-Adviser reflects an arms-length negotiation between the Sub-Adviser and SIMC. Following evaluation, the Board concluded that, within the context of its full deliberations, the expenses of the Funds are reasonable and supported renewal of the Investment Advisory Agreements. The Board also considered whether the Sub-Advisers and their affiliates may have realized other benefits from their relationship with the Funds, such as any research and brokerage services received under soft dollar arrangements.
Profitability. With regard to profitability, the Trustees considered compensation flowing to SIMC and the Sub-Advisers and their affiliates, directly or indirectly. The Trustees considered whether the levels of compensation and profitability were reasonable. As with the fee levels, when considering the profitability of the Sub-Advisers, the Board took into account the fact that compensation with respect to any unaffiliated Sub-Adviser reflects an arms-length negotiation between the Sub-Adviser and SIMC. In connection with the approval or renewal of each Sub-Advisory Agreement, the Board also took into consideration the impact that the fees paid to the Sub-Adviser have on SIMC’s advisory fee margin and profitability. Based on this evaluation, the Board concluded that, within the context of its full deliberations, the profitability of each of SIMC and the Sub-Advisers is reasonable and supported renewal of the Investment Advisory Agreements.
Economies of Scale. With respect to the Advisory Agreement, the Trustees considered whether any economies of scale were being realized by SIMC and their affiliates and, if so, whether the benefits of such economies of scale were passed along to the Funds’ shareholders through a graduated investment advisory fee schedule or other means, including any fee waivers by SIMC and its affiliates. The Trustees recognized that economies of scale are difficult to identify and quantify and are rarely identifiable on a fund-by-fund basis. Based on this evaluation, the Board determined that the fees were reasonable in light of the information that was provided by SIMC with respect to economies of scale.
Based on the Trustees’ deliberation and their evaluation of the information described above, the Board, including all of the Independent Trustees, with the assistance of Fund counsel and Independent Trustees’ counsel, unanimously approved the approval or renewal, as applicable, of the Investment Advisory Agreements and concluded that the compensation under the Investment Advisory Agreements is fair and reasonable in light of such services and expenses and such other matters as the Trustees considered to be relevant in the exercise of their reasonable judgment. In the course of its deliberations, the Board did not identify any particular factor (or conclusion with respect thereto) or single piece of information that was all-important, controlling or determinative of its decision, but considered all of the factors together, and each Trustee may have attributed different weights to the various factors (and conclusions with respect thereto) and information.
| 86 | SEI Institutional International Trust / Annual Report / September 30, 2015 |
Notice to Shareholders (Unaudited)
For shareholders who do not have a September 30, 2015, taxable year end, this notice is for informational purposes only. For shareholders with
a September 30, 2015, taxable year end, please consult your tax adviser as to the pertinence of this notice.
For the fiscal year ended September 30, 2015, the Funds are designating long term and qualifying dividend income with regard to distributions paid during the year as follows:
| (A) Return of Capital | (B) Long Term Capital Gains Distributions (Tax Basis) | (C) Ordinary Income Distributions (Tax Basis) | (D) Total Distributions (Tax Basis) | (E) Dividends Qualifying for Corporate Dividends Rec. Deduction (1) | ||||||||||||||||
| International Equity Fund | 0.00 | % | 0.00 | % | 100.00 | % | 100.00 | % | 0.00 | % | ||||||||||
| Emerging Markets Equity Fund | 0.00 | % | 0.00 | % | 100.00 | % | 100.00 | % | 0.00 | % | ||||||||||
| International Fixed Income Fund | 0.00 | % | 0.00 | % | 100.00 | % | 100.00 | % | 0.00 | % | ||||||||||
| Emerging Markets Debt Fund | 0.00 | % | 1.99 | % | 98.01 | % | 100.00 | % | 0.00 | % | ||||||||||
| (F) Qualifying Dividend Income (15% Tax Rate for QDI) (2) | (G) U.S. Government Interest (3) | (H) Interest Related Dividends (4) | (I) Short-Term Capital Gain Dividends (5) | |||||||||||||
| International Equity Fund | 100.00 | % | 0.00 | % | 0.00 | % | 0.00 | % | ||||||||
| Emerging Markets Equity Fund | 100.00 | % | 0.00 | % | 0.00 | % | 0.00 | % | ||||||||
| International Fixed Income Fund | 0.00 | % | 0.00 | % | 0.00 | % | 0.00 | % | ||||||||
| Emerging Markets Debt Fund | 0.00 | % | 0.00 | % | 0.00 | % | 100.00 | % | ||||||||
The Funds intend to pass through foreign tax credit to shareholders. For the fiscal year ended September 30, 2015, the amount of foreign source income and foreign tax credit are as follows:
| Fund | Foreign Source Income | Foreign Tax Credit Pass Through | ||||||
International Equity | $ | 30,809,548 | $ | 1,925,730 | ||||
Emerging Markets Equity | 15,095,949 | 4,441,905 | ||||||
| (1) | “Dividends Received Deduction” represent dividends which qualify for the corporate dividends received deduction. |
| (2) | “Qualifying Dividend Income” represent qualifying dividends as created by the Jobs and Growth Tax Relief Reconciliation Act of 2003. It is the intention of the Fund to designate the max amount permitted by law. |
| (3) | “U.S. Government Interest” represent the amount of interest that was derived from direct U.S. Government obligations and distributed during the fiscal year. Generally, interest from direct U.S. Government obligations is exempt from state income tax. However, for shareholders who are residents of California, Connecticut or New York, the statutory threshold requirements were not satisfied to permit exemption of these amounts from state income. |
| (4) | The percentage in this column represents the amount of “Interest Related Dividend” is reflected as a percentage of ordinary income distribution. Interest related dividends is exempted from U.S. withholding tax when paid to foreign investors. |
| (5) | The percentage of this column represents the amount of “Short Term Capital Gain Dividend” is reflected as a percentage of short term capital gain distribution that is exempted from U.S. withholding tax when paid to foreign investors. |
Items (A), (B), (C) and (D) are based on the percentage of each fund’s total distribution.
Items (E) and (F) are based on the percentage of “Ordinary Income Distributions.”
Item (G) is based on the percentage of gross income of each Fund.
Item (H) is based on the percentage of net investment income distributions.
Item (I) is based on the percentage of short-term capital gains distributions.
Please consult your tax adviser for proper treatment of this information. This notification should be kept with your permanent tax records.
| SEI Institutional International Trust / Annual Report / September 30, 2015 | 87 |
SEI INSTITUTIONAL INTERNATIONAL TRUST ANNUAL REPORT SEPTEMBER 30, 2015
Robert A. Nesher, Chairman
Trustees
William M. Doran
George J. Sullivan, Jr.
Nina Lesavoy
James M. Williams
Mitchell A. Johnson
Hubert L. Harris, Jr.
Officers
Robert A. Nesher
President and Chief Executive Officer
Arthur Ramanjulu
Controller and Chief Financial Officer
Russell Emery
Chief Compliance Officer
Timothy D. Barto
Vice President, Secretary
Aaron Buser
Vice President, Assistant Secretary
David F. McCann
Vice President, Assistant Secretary
Stephen G. MacRae
Vice President
Bridget E. Sudall
Anti-Money Laundering Compliance Officer
Privacy Officer
Investment Adviser
SEI Investments Management Corporation
Administrator
SEI Investments Global Funds Services
Distributor
SEI Investments Distribution Co.
Legal Counsel
Morgan, Lewis & Bockius LLP
Independent Registered Public Accounting Firm
KPMG LLP
This report and the financial statements contained herein are submitted for the general information of the shareholders of the Trust and must be preceded or accompanied by a current prospectus. Shares of the SEI Funds are not deposits or obligations of, or guaranteed or endorsed by, any bank. The shares are not federally insured by the Federal Deposit Insurance Corporation (FDIC), the Federal Reserve Board, or any other government agency. Investment in the shares involves risk, including the possible loss of principal.
For more information call
1 800 DIAL SEI
(1 800 342 5734)

1 Freedom Valley Drive, P.O. Box 1100, Oaks, PA 19456
SEI-F-018 (9/15)
| Item 2. | Code of Ethics. |
The Registrant has adopted a code of ethics that applies to the Registrant’s principal executive officer, principal financial officer, principal accounting officer or controller, or persons performing similar functions.
| Item 3. | Audit Committee Financial Expert. |
(a)(1) The Registrant’s Board of Trustees has determined that the Registrant has at least two audit committee financial experts serving on the audit committee.
(a) (2) The audit committee financial experts are George J. Sullivan, Jr. and Hubert L. Harris, Jr. Messrs. Sullivan and Harris are independent as defined in Form N-CSR Item 3 (a) (2).
| Item 4. | Principal Accountant Fees and Services. |
Fees billed by KPMG LLP (“KPMG”) related to the Registrant.
KPMG billed the Registrant aggregate fees for services rendered to the Registrant for the fiscal years 2015 and 2014 as follows:
| Fiscal 2015 | Fiscal 2014 | ||||||||||||||||||||||||||||||||
| All fees and services to the Registrant that were pre- approved | All fees and services to service affiliates that were pre- approved | All other fees approval | All fees and that were pre- | All fees and affiliates that | All other fees and services to service affiliates that did not require pre- approval | ||||||||||||||||||||||||||||
(a) | Audit Fees (1) | $ | 200,500 | $ | 0 | N/A | $ | 200,500 | $ | 0 | N/A | ||||||||||||||||||||||
(b) | Audit-Related Fees | $ | 0 | $ | 0 | $ | 0 | $ | 0 | $ | 0 | $ | 0 | ||||||||||||||||||||
(c) | Tax Fees | $ | 0 | $ | 0 | $ | 0 | $ | 0 | $ | 0 | $ | 0 | ||||||||||||||||||||
(d) | All Other Fees (2) | $ | 0 | $ | 240,350 | $ | 0 | $ | 0 | $ | 240,350 | $ | 0 | ||||||||||||||||||||
Notes:
| (1) | Audit fees include amounts related to the audit of the Registrant’s annual financial statements and services normally provided by the accountant in connection with statutory and regulatory filings. |
| (2) | See Item 4(g) for a description of the services comprising the fees disclosed under this category. |
(e)(1) The Registrant’s Audit Committee has adopted and the Board of Trustees has ratified an Audit and Non-Audit Services Pre-Approval Policy (the “Policy”), which sets forth the procedures and the conditions pursuant to which services proposed to be performed by the independent auditor of the Registrant may be pre-approved.
The Policy provides that all requests or applications for proposed services to be provided by the independent auditor must be submitted to the Registrant’s Chief Financial Officer (“CFO”) and must include a detailed description of the services proposed to be rendered. The CFO will determine whether such services: (1) require specific pre-approval; (2) are included within the list of services that have received the general pre-approval of the Audit Committee pursuant to the Policy; or (3) have been previously pre-approved in connection with the independent auditor’s annual engagement letter for the applicable year or otherwise. In any instance where services require pre-approval, the Audit Committee will consider whether such services are consistent with SEC’s rules and whether the provision of such services would impair the auditor’s independence.
Requests or applications to provide services that require specific pre-approval by the Audit Committee will be submitted to the Audit Committee by the CFO. The Audit Committee will be informed by the CFO on a quarterly basis of all services rendered by the independent auditor. The Audit Committee has delegated specific pre-approval authority to either the Audit Committee Chair or financial experts, provided that the estimated fee for any such proposed pre-approved service does not exceed $100,000 and any pre-approval decisions are reported to the Audit Committee at its next regularly scheduled meeting.
Services that have received the general pre-approval of the Audit Committee are identified and described in the Policy. In addition, the Policy sets forth a maximum fee per engagement with respect to each identified service that has received general pre-approval.
All services to be provided by the independent auditor shall be provided pursuant to a signed written engagement letter with the Registrant, the investment advisor or applicable control affiliate (except that matters as to which an engagement letter would be impractical because of timing issues or because the matter is small may not be the subject of an engagement letter) that sets forth both the services to be provided by the independent auditor and the total fees to be paid to the independent auditor for those services.
In addition, the Audit Committee has determined to take additional measures on an annual basis to meet its responsibility to oversee the work of the independent auditor and to assure the auditor’s independence from the Registrant, such as reviewing a formal written statement from the independent auditor delineating all relationships between the independent auditor and the Registrant, and discussing with the independent auditor its methods and procedures for ensuring independence.
(e)(2) Percentage of fees billed applicable to non-audit services pursuant to waiver of pre-approval requirement were as follows:
| Fiscal 2015 | Fiscal 2014 | |||||||||
Audit-Related Fees | 0 | % | 0 | % | ||||||
Tax Fees | 0 | % | 0 | % | ||||||
All Other Fees | 0 | % | 0 | % | ||||||
(f) Not Applicable.
(g)(1) The aggregate non-audit fees and services billed by KPMG for the fiscal years 2015 and 2014 were $240,350 and $240,350, respectively. Non-audit fees consist of SSAE No.16 review of fund accounting and administration operations, attestation report in accordance with Rule 17Ad-13, agreed upon procedures report over certain internal controls related to compliance with federal securities laws and regulations.
(h) During the past fiscal year, Registrant’s principal accountant provided certain non-audit services to Registrant’s investment adviser or to entities controlling, controlled by, or under common control with Registrant’s investment adviser that provide ongoing services to Registrant that were not subject to pre-approval pursuant to paragraph (c)(7)(ii) of Rule 2-01 of Regulation S-X. The Audit Committee of Registrant’s Board of Trustees reviewed and considered these non-audit services provided by Registrant’s principal accountant to Registrant’s affiliates, including whether the provision of these non-audit services is compatible with maintaining the principal accountant’s independence.
| Item 5. | Audit Committee of Listed Registrants. |
Not applicable.
| Item 6. | Schedule of Investments |
The Schedules of Investments in securities of unaffiliated issuers as of the close of the reporting period for the International Equity Fund, Emerging Markets Equity Fund, International Fixed Income Fund, and Emerging Markets Debt Fund are included as part of the report to shareholders filed under Item 1 of this form.
| Item 7. | Disclosure of Proxy Voting Policies and Procedures for Closed-End Management Investment Companies. |
Not applicable.
| Item 8. | Portfolio Managers of Closed-End Management Investment Companies |
Not applicable.
| Item 9. | Purchases of Equity Securities by Closed-End Management Company and Affiliated Purchasers. |
Not applicable.
| Item 10. | Submission of Matters to a Vote of Security Holders. |
The Registrant has a standing Governance Committee (the “Committee”) currently consisting of the Independent Trustees. The Committee is responsible for evaluating and recommending nominees for election to the Registrant’s Board of Trustees (the “Board”). Pursuant to the Committee’s Charter, adopted on June 18, 2004, as amended, the Committee will review all shareholder recommendations for nominations to fill vacancies on the Board if such recommendations are submitted in writing and addressed to the Committee at the Registrant’s office.
| Item 11. | Controls and Procedures. |
(a) The Registrant’s principal executive and principal financial officers, or persons performing similar functions, have concluded that the Registrant’s disclosure controls and procedures (as defined in Rule 30a-3(c) under the Investment Company Act of 1940 (the “1940 Act”)) are effective, based on the evaluation of these controls and procedures required by Rule 30a-3(b) under the 1940 Act and Rules 13a-15(b) or 15d-15(b) under the Securities Exchange Act of 1934 as of a date within 90 days of the filing date of this report.
(b) There were no changes in the Registrant’s internal control over financial reporting (as defined in Rule 30a-3(d) under the 1940 Act) that occurred during the second fiscal quarter of the period covered by this report that have materially affected, or are reasonably likely to materially affect, the Registrants internal control over financial reporting.
| Items 12. | Exhibits. |
(a)(1) Code of Ethics attached hereto.
(a)(2) A separate certification for the principal executive officer and the principal financial officer of the Registrant as required by Rule 30a-2(a) under the Investment Company Act of 1940, as amended (17 CFR 270.30a-2(a)), are filed herewith.
(b) Officer certifications as required by Rule 30a-2(b) under the Investment Company Act of 1940, as amended (17 CFR 270.30a-2(b)) also accompany this filing as exhibits.
SIGNATURES
Pursuant to the requirements of the Securities Exchange Act of 1934 and the Investment Company Act of 1940, the Registrant has duly caused this report to be signed on its behalf by the undersigned, thereunto duly authorized.
| SEI Institutional International Trust | ||||||
| By: | /s/ Robert A. Nesher | |||||
| Robert A. Nesher | ||||||
| President & CEO | ||||||
Date: December 8, 2015
Pursuant to the requirements of the Securities Exchange Act of 1934 and the Investment Company Act of 1940, this report has been signed below by the following persons on behalf of the Registrant and in the capacities and on the dates indicated.
| By: | /s/ Robert A. Nesher | |||||
| Robert A. Nesher | ||||||
| President & CEO |
Date: December 8, 2015
| By: | /s/ Arthur Ramanjulu | |||||
| Arthur Ramanjulu | ||||||
| Controller & CFO |
Date: December 8, 2015