UNITED STATES
SECURITIES AND EXCHANGE COMMISSION
Washington, D.C. 20549
FORM N-CSR
CERTIFIED SHAREHOLDER REPORT OF REGISTERED
MANAGEMENT INVESTMENT COMPANIES
Investment Company Act file number 811-05601
SEI Institutional International Trust
(Exact name of registrant as specified in charter)
SEI Investments
One Freedom Valley Drive
Oaks, PA 19456
(Address of principal executive offices) (Zip code)
CT Corporation
155 Federal Street
Boston, MA 02110
(Name and address of agent for service)
Registrant’s telephone number, including area code: 1-800-342-5734
Date of fiscal year end: September 30, 2017
Date of reporting period: September 30, 2017
| Item 1. | Reports to Stockholders. |

September 30, 2017
ANNUAL REPORT
SEI Institutional International Trust
 | International Equity Fund | |
| Emerging Markets Equity Fund | |
| International Fixed Income Fund | |
| Emerging Markets Debt Fund | |

The Trust files its complete schedule of portfolio holdings with the Securities and Exchange Commission for the first and third quarter of each fiscal year on Form N-Q within sixty days after the end of the period. The Trust’s Forms N-Q are available on the Commission’s website at http://www.sec.gov, and may be reviewed and copied at the Commission’s Public Reference Room in Washington, DC. Information on the operation of the Public Reference Room may be obtained by calling 1-800-SEC-0330.
A description of the policies and procedures that the Trust uses to determine how to vote proxies relating to portfolio securities, as well as information relating to how a Fund voted proxies relating to portfolio securities during the most recent 12-month period ended June 30, is available (i) without charge, upon request, by calling 1-800-DIAL-SEI; and (ii) on the Commission’s website at http://www.sec.gov.
September 30, 2017 (Unaudited)
To Our Shareholders:
Looking back, the expectations we shared for the Funds’ most recently completed fiscal year, from the start of October 2016 through the end of September 2017, largely came to pass. The pace of interest-rate increases by the Federal Reserve (“Fed”) followed the market’s more modest expectations rather than those projected by Federal Open Market Committee members. The European Central Bank’s (“ECB”) commitment to stimulus efforts entrenched euro weakness relative to the U.S. dollar for part of the period; the same can be said for the Bank of Japan (“BOJ”) and the yen. China continued to guide its currency lower, hitting a low near the end of the fiscal period. The global oil supply-demand imbalance persisted throughout the year; the Organization of Petroleum Exporting Countries’ (“OPEC”) agreement to curb production in January temporarily bolstered markets, but prices retraced due to record U.S. inventories and rising U.S. production before rebounding during the final quarter of the period.
Geopolitical events
Geopolitical threats and an assortment of other noneconomic influences continued in various regions: civil war and domestic struggle in parts of the Middle East and Africa, the suffering of refugees and migrants in bordering countries and Europe, and acts of global terror.
Severe unrest continued in certain areas of the Middle East, driven by the opposing and overlapping regional interests of extremist groups, nationalist fighters and state actors. Syrian government forces appeared to consolidate military gains in and around Aleppo, with assistance from Russia, while Iraqi forces, supported by U.S. military resources, made notable progress in reversing Islamic State gains. The U.S. military increased its air support during the period, targeting both Syrian government and extremist positions, while also raising the profile of its involvement in Afghanistan by targeting Islamic State strongholds.
Despite the considerable aforementioned instability in the Middle East, the price of oil remained mostly insulated from regional developments. Oil-price weakness, which began to moderate in 2016, remained primarily attributable to oversupply. Energy-export-dependent Venezuela succumbed to the economically depressive effects of low oil prices during the period, as food shortages and a breakdown of the rule of law appeared to worsen, despite an eventual rebound in the price of oil. Brazil’s prospects also paled, then recovered partially, as a corruption investigation centering on its lead state-run oil company enveloped a cross-section of political leaders. The OPEC reached an agreement in late 2016 with the cooperation of non-OPEC producers to enact production cuts in pursuit of a balanced market.
The lasting effect of the Syrian migrant crisis on the European Union (“EU”) remains unknown. Immigration served as one of the key points of contention leading up to Great Britain’s Brexit vote to leave the European Union prior to the reporting year. Prime Minister May triggered Article 50 during the fiscal period and began the formal withdrawal process.
Immigration-driven uncertainty also took center stage in the months leading up to the U.S. presidential election, which Donald Trump ultimately won in November with a tough stance on immigration. President Trump’s early actions following his inauguration in January demonstrated a commitment to follow through on tighter U.S. immigration policy.
A raft of political surprises unfolded late in the fiscal period. The U.K. Conservative party relinquished its parliamentary majority and was forced to seek a partner to form a minority government. Emmanuel Macron’s early-May victory in the French presidential election amounted to a significant win for the establishment. In the U.S., a high-profile special prosecutor was appointed to investigate the possibility of collusion between Donald Trump’s presidential campaign and Russia. In Brazil, an ongoing top-level corruption scandal was blown wide open in mid-May as potential evidence emerged of a taped conversation featuring President Michel Temer approving a large hush-money bribe.
Toward the end of the fiscal year, political tensions weighed heavily on investor attitudes. President Trump stated that aggression from North Korea would be met with “fire and fury” while controversy over Trump’s response to violent clashes between protesters in Charlottesville, Virginia drove sentiment after the president dissolved two advisory councils. Setbacks in the Trump administration’s efforts to repeal and replace Obamacare sparked volatility, as investors assumed that tax and budget resolutions would have to wait until health care legislation was resolved.
SEI Institutional International Trust / Annual Report / September 30, 2017 |
1 |
LETTER TO SHAREHOLDERS (Continued)
September 30, 2017 (Unaudited)
Economic performance
U.S. economic growth accelerated in the fourth quarter of 2016, slumped early in 2017, and then rebounded solidly in the second quarter as both consumer and government spending boosted the economy. The labor market remained historically strong throughout the year: the unemployment rate fell, finishing the period at 4.2%, while the labor-force participation rate ended at 63.1%, marginally higher than a year ago. Average hourly earnings gained, bouncing around a mean of about 0.2% growth per month over the year; although a modest increase in price pressures weighed on real personal income growth as the period progressed. The Fed raised its target interest rate in mid-December 2016, and again in both March and June 2017, representing two of three projected rate increases in 2017. The Fed also announced that it would start to reduce the size of its balance sheet and reverse some of the quantitative easing that has been so supportive of bond prices in recent years.
The ECB held its benchmark interest rate unchanged at a historic low through the fiscal period, while the Bank of England did the same with the hope of stimulating the U.K. economy following the Brexit vote. Quarterly growth in the eurozone expanded at its quickest pace since 2015, emphasizing the area’s notable economic performance at a time that many thought would be plagued by political uncertainty. Year-on-year growth was 2.3% at the end of the second quarter of 2017, with France, Italy and Greece all beating expectations. The U.K. economy grew at 1.5% year-on-year through the second quarter of 2017, but slowed significantly toward the end of the fiscal period as a weakened pound dampened consumer spending to its lowest level in three years.
Japanese GDP grew 1.4% year-on-year at the end of the second quarter of 2017, while the BOJ maintained stimulus to try to rejuvenate the economy. Meanwhile, economic growth in China expanded by 6.9% year-on-year in the second quarter of 2017 after China’s government provided substantial fiscal stimulus early in the period to support the government’s growth targets.
Market developments
For the fiscal period ending September 30, 2017, geopolitical events dominated global equity markets. Market movements were driven by periods of risk-on and risk-off rallies. The early part of the fiscal period was marked by continued, but uninspiring, economic expansion and populist movements surprisingly sweeping political elections in the U.K. and the U.S. The second half saw a synchronized global economic recovery.
Investors positioned defensively into the U.S. presidential elections. Though candidate Trump presented a source of uncertainty to markets, promises of deregulation, corporate-tax reform and fiscally expansionary policies sparked a sharp rally in cyclical assets, and defensive assets that were bid up during prior years sold off. OPEC’s decision to curb output and the Fed’s rate hike also contributed to the sharp rally for traditional value sectors (financials, industrials and energy).
The turn of the calendar year marked the beginning of the reversal of the cyclical rally (dubbed the Trump reflation trade). The first few months saw setbacks for the Trump administration after Washington failed to pass a replacement for the Affordable Care Act and controversies involving Russian election meddling plagued the new administration. There was a realization that the growth expected from promised regulatory changes would take a while to play out, and markets began to unwind the reflation trade. At the same time, assets such as defensive sectors and technology stocks that sold off during the reflation trade rallied during this period. The risk-on sentiment that pushed equities higher over the quarter was also visible in fixed income markets, with credit outperforming government bonds. U.S. Treasury yields rose across the curve with short-term yields rising more than long-term yields. Yields for 10-year government bonds began the fiscal period around 1.6% and ended around 2.3%, reflecting increased optimism around economic growth, but remained below their late-2016 peak.
Stocks rallied toward the end of the fiscal period amid signs of global economic synchronization, strong earnings and continued central-bank stimulus.
The U.K. stunned investors prior to the start of the fiscal year with the British vote to leave the EU and joined the list of frustrations for European equities that included Italian banks with oversized debt. The result was a lack of enthusiasm for stocks in the region despite continued stimulus from the ECB. European stocks experienced a small rally after the Brexit vote as investors looked past the results, and saw an even greater rally after Donald Trump’s surprising victory in the U.S. elections. President Trump’s promises of deregulation and fiscal stimulus, along with
2 |
SEI Institutional International Trust / Annual Report / September 30, 2017 |
the Fed’s three rate increases during the period, sparked a cyclical rally in European stocks, with banks leading the way. At the turn of the year, despite political volatility from French and Dutch elections and the possibility of further fragmentation in the EU, signs of economic recovery emerged in the region, and European equities rallied on the back of recovering economic growth and victories for pro-EU parties in elections nearer the end of the fiscal period.
Looking back on market performance for the full period, the MSCI ACWI Index, a proxy for global equities in both developed and emerging markets, rose 18.65% in U.S. dollar terms. U.S. markets marginally lagged, as the S&P 500 Index returned 18.61%.
The U.S. equity market began the fiscal year with investors focused on the presidential election campaign. Value stocks in general and the financial sector, in particular, rose sharply after the election, while high-dividend-yield segments of the market, such as utilities and real-estate investment trusts (“REITs”), lagged as they were seen as less attractive in a rising interest-rate environment. One trend that reversed as the fiscal year progressed was the underperformance of growth stocks. Many growth managers outperformed value managers, as internet-commerce and information-technology stocks were market leaders for the final three quarters of the fiscal year, and information technology became the second best-performing sector (after financials) for the full fiscal year. The latter group’s rally in the final fiscal quarter provided a boost to growth stocks, propelling the Russell 1000 Growth Index to 21.94% for the period, while the Russell 1000 Value Index returned 15.12%.
Small-cap stocks outperformed as well. U.S. small caps (Russell 2000 Index) outpaced large caps (Russell 1000 Index), delivering 20.74% and 18.54%, respectively.
After hitting lows early in the fiscal period on the heels of deflationary fears caused by low commodity prices and Brexit-related concerns, rates began to rise. Economic growth exceeded expectations, and Trump’s victory sparked expectations of reflationary fiscal policy. The market began to price in a December 2016 Fed rate hike, causing Treasury yields to rise, particularly those at the front end of the yield curve. The Fed voted to increase the federal-funds rate target range to 1.00 -1.25% after a third rate hike during the period in June 2017, and increased its projection for the pace of rate hikes in 2017 from two to three, citing strengthening labor-market conditions and firming inflation as the rationale.
Inflation-sensitive assets, such as commodities and Treasury inflation-protected securities, were mixed. The Bloomberg Commodity Total Return Index (which represents the broad commodity market) eased 0.29% lower during the period, as the energy and agriculture sectors dragged down the index, while the Bloomberg Barclays 1-10 Year US TIPS Index (USD) ebbed 0.14%.
Global fixed income, as measured by the Bloomberg Barclays Global Aggregate Index, fell 1.26% in U.S. dollar terms during the reporting period, while the high-yield market was strong, with the BofA Merrill Lynch US High Yield Constrained Index delivering 9.05%.
U.S. investment-grade corporate debt was positive, as the Bloomberg Barclays Investment Grade US Corporate Index returned 2.21%. U.S. asset-backed and mortgage-backed securities were both marginally positive during the fiscal year, although both faced headwinds late in the period from rising interest-rate expectations.
Emerging-market debt delivered positive performance. The J.P. Morgan GBI Emerging Markets Global Diversified Index, which tracks local-currency-denominated emerging-market bonds, gained 7.32% in U.S. dollar terms during the reporting period thanks to an impressive rally in the second half of the period. The J.P. Morgan EMBI Global Diversified Index, which tracks emerging-market debt denominated in external currencies (such as the U.S. dollar), advanced by 4.61%.
Our view
Neither devastating hurricanes nor all-around political dysfunction have done much to halt the U.S. equity market’s rise. Even the game of nuclear chess being played between North Korea’s Kim Jong-un and President Donald Trump has failed to elicit much of a response. To be sure, all good things eventually come to an end. Yet when we consider valuations, the upward momentum of the U.S. economy and earnings, and the likely path of Fed policy and inflation, we reason that the U.S. equity bull market isn’t dead yet.
On the issue of valuations, there is no denying that U.S. equities are trading at elevated levels. But the exceedingly low level of prevailing interest rates is an important mitigating factor. There has been a strong inverse relationship
SEI Institutional International Trust / Annual Report / September 30, 2017 |
3 |
LETTER TO SHAREHOLDERS (Concluded)
September 30, 2017 (Unaudited)
between bond yields and valuations over the past four decades, which we believe justifies structurally elevated valuations.
The overriding question among investors is a simple one: is a recession on the horizon? We contend that the answer is “no.” Financial stress, a harbinger of recession, is virtually non-existent. Recent economic data also point to the continuation of slow-but-steady economic growth.
A large portion of the world appears to be growing at a slightly better-than-trend pace. The breadth of the improvement is particularly impressive; as of July 2017, 72% of the countries that make up the Organization for Economic Cooperation and Development’s (“OECD”) Composite Leading Indicator index have posted improvement over the past year—and 75% of countries in the index came in above 100. This means above-trend growth will likely continue in the months ahead on a global basis.
According to the OECD’s calculations, Brazil’s economic situation is improving at the fastest rate. The eurozone as a whole looks set to grow above trend, as does Japan. China’s momentum remains toward the upside, even though recent economic data suggest some deceleration. The U.S. economy, by contrast, is growing somewhat below trend. India also is signaling below-trend growth, but has begun to rebound. On balance, things are looking up in much of the world.
One of the big surprises of 2017 is the extensive weakness of the U.S. dollar, which has fallen by about 8% against a trade-weighted basket of foreign currencies since the end of last year. The U.S. dollar can appreciate and depreciate in long cycles. If the peak at the end of 2016 proves to be the top of the current cycle, the most recent upswing would be shorter in duration than previously experienced—but the magnitude of the trough-to-peak rise would be similar to that of the up-cycle that occurred from April 1995 to March 2002 (about 41%).
The drop in the greenback coincides with the improved global macroeconomic outlook. Economic growth of developed economies around the world is converging with that of the U.S. While U.S. monetary policy is further along the path toward tightening, other central banks have already begun to raise rates (Canada) or may do so soon (the U.K.). Even the ECB is expected to announce its first steps away from unconventional monetary stimulus by the end of this year.
Political considerations are coming into play as well. Participants in the currency markets have adopted a far more sanguine view regarding the political stability of the eurozone following a series of national elections this year that enhanced the position of parties favoring further European integration. While confidence in the eurozone has increased, international confidence in the U.S. has ebbed. The Trump administration’s decision to pull out of the Trans-Pacific Partnership and Paris climate accord was controversial in the U.S.; it was especially confounding to those outside the U.S., and raised questions of whether it is relinquishing its role as leader of the free world. Confidence in the existing international economic order was also hurt by the threat of additional U.S. trade discord with Canada, Mexico, South Korea and China. Trump was voted into office partially owing to his populist stance on trade; but we think a trade war could be as dangerous an economic blunder today as it was during the Great Depression.
We continue to expect a U.S. business-friendly tax package to be enacted and signed by the Trump administration before the end of the year. However, the absence of such legislation could further dampen investors’ expectations for U.S. economic growth—thereby causing a serious correction in the overall U.S. equity market, especially hurting economically sensitive small-company and value stocks.
As noted above, the upturn in global economic activity has spurred the world’s major central banks to reassess their policy stance. The danger is that they could make a policy mistake, either by acting too quickly or not fast enough. The BOE faces the greatest policy challenge, with an accelerating inflation rate at a time when its overall economic growth has been somewhat below that of the U.S. and eurozone. Although the BOE has signaled its intention to reverse the easing implemented in the aftermath of the Brexit vote, it is unclear whether the correct policy course calls for further tightening moves.
In the run-up to this October’s all-important National Congress of the Communist Party of China, the country’s economic policy has been geared toward growth. President Xi Jinping’s government has been focused on restraining rampant speculation in the property markets and curtailing growth of the shadow-banking system—with
4 |
SEI Institutional International Trust / Annual Report / September 30, 2017 |
mixed success. As soon as China’s economy begins to weaken and financial markets exhibit signs of stress, its economic planners tend to reengage the accelerator.
It may be time to step on the brake again following the National Congress and the likely strengthening of President Xi’s political power coming out of that meeting. The current inflation rate for Chinese manufacturing producer prices is near the peak levels recorded in 2004, 2008 and 2011. A cyclical slowdown in China’s economy would likely be bad news for commodity prices and other emerging economies. Since the overall consumer price index remains at less than a 2% rate, we expect the People’s Bank of China to try a gentle tap on the brake.
While we would not rule out a correction in asset values more notable than others that occurred in the past 18 months, our investment mantra of buying on the dip still holds.
Our equity strategies remain positioned for further cyclical improvement around the world. They generally have a smaller-company and value bias versus their benchmarks. We tend to favor momentum-oriented opportunities, and view equity markets outside the U.S. as more attractive than U.S. equity markets. Indeed, our caution toward equities is most pronounced in the U.S., where the outlook for earnings growth is more modest than elsewhere in the world.
On the fixed-income side, we expect yields will slowly move higher as global growth becomes more entrenched and central banks begin to remove the extraordinary stimulative measures of quantitative easing and zero (or negative) interest rates. Our underlying managers are generally short duration versus their benchmarks, favor credit-spread strategies and are positioned for a further narrowing of the yield curve, especially in the U.S.
On behalf of SEI Investments, I thank you for your continued confidence. We are working every day to maintain that confidence, and look forward to serving your investment needs in the future.
Sincerely,

William T. Lawrence, CFA
Managing Director, Portfolio Management Team
SEI Institutional International Trust / Annual Report / September 30, 2017 |
5 |
MANAGEMENT’S DISCUSSION AND ANALYSIS OF FUND PERFORMANCE
September 30, 2017 (Unaudited)
International Equity Fund
I. Objective
The International Equity Fund (the “Fund”) seeks to provide long-term capital appreciation.
II. Multi-Manager Approach Statement
The Fund uses a multi-manager approach, relying on a number of sub-advisers with differing investment approaches to manage portions of the Fund’s portfolio, under the general supervision of SEI Investments Management Corporation (“SIMC”). The Fund utilized the following sub-advisers during the year ending September 30, 2017: Acadian Asset Management LLC, Blackcrane Capital, LLC, Causeway Capital Management LLC, Henderson Global Investors (North America) Inc., INTECH Investment Management LLC, Neuberger Berman Investment Advisers LLC, NWQ Investment Management Company, LLC and WCM Investment Management. For the year ended September 30, 2017, sub-adviser Henderson Global Investors (North America) Inc. was terminated from the Fund.
III. Return vs. Benchmark
For the year ended September 30, 2017, the Fund’s Class F shares outperformed the MSCI EAFE Index (the “Index”), returning 19.23% versus the Index return of 19.10%.
IV. Fund Attribution
International developed stocks continued their upward march during the fiscal year, leading U.S. equities but trailing their emerging-market peers. The financial sector was the top-performing sector, reflecting the emergence of synchronized global growth early in 2017, as noted in the shareholder letter. While technology was the second-best performing sector on the back of strong growth in semiconductors, the materials and energy sectors trailed close behind, indicating the better position the global economy was in compared to a year earlier. Within the Fund, the technology and healthcare sectors added the most to performance. Strong security selection within technology and exposure to ex-benchmark names in emerging markets helped. Technology stocks in both emerging markets and the U.S. appreciated on strong fundamentals and market preference for growth stocks. An underweight to healthcare, as well as strong stock selection in pharmaceuticals and biotechnology stocks, also benefited performance. Auto stocks drove selection within the consumer-discretionary sector, which contributed to performance. The biggest detractors to performance came from the consumer-staples and industrials sectors. For staples, an overweight and
selection within the lagging sector provided a headwind to performance. Poor stock selection within industrials also drove the underperformance.
Regionally, Europe was the best-performing region due to a strong rally and passive flows after presidential elections across the continent resulted in ¬friendly outcomes. An underweight to the Pacific ex-Japan region provided a substantial tailwind to the Fund, as the region lagged thanks to macroeconomic headwinds in the area’s largest country, Australia. The next best-performing country in the Fund was the U.K. The portfolio added value by avoiding the weak healthcare and utilities sectors, while selection was positive across multiple sectors. The portfolio also benefited from an underweight to Japan, which faced economic headwinds as well. The economic issues were a drag on Japanese equity performance, and being underweight during the fiscal year helped. Most managers in the Fund were underweight to Japan. Within Europe, stock selection within the biggest countries lagged but was strong in countries near the periphery and northern Europe.
Manager performance was mixed. Acadian Asset Management LLC was the best-performing manager due to strong stock selection in European airlines and pharmaceutical companies. Ex-benchmark positions in emerging markets also helped. Causeway Capital Management LLC was the next best-performing manager due to strong stock selection in European banks and U.K. stocks in general. Blackcrane Capital, LLC was slightly positive due to strong stock selection in auto sectors. Neuberger Berman also outperformed due to its tilt towards Europe. The manager also benefited from ex-benchmark positions. WCM Investment Management nearly matched the benchmark, as an underweight to cyclical parts of the benchmark detracted from the strong stock selection in consumer and technology sectors. INTECH Investment Management LLC’s mathematical model produced benchmark-like results as well, with poor stock selection in Europe. Henderson Global Investors (North America) Inc. detracted from performance with poor stock selection. NWQ Investment Management Company, LLC was the worst-performing manager due to poor stock selection in the consumer sectors and French and Israeli stocks.
6 |
SEI Institutional International Trust / Annual Report / September 30, 2017 |
| AVERAGE ANNUAL TOTAL RETURN1 |
| 1 Year Return | Annualized 3 Year Return | Annualized 5 Year Return | Annualized 10 Year Return | Annualized Inception to Date | ||||||||||||||||
International Equity Fund, Class F | 19.23% | 5.80% | 8.14% | -0.87% | 3.78% | |||||||||||||||
International Equity Fund, Class I | 19.00% | 5.53% | 7.86% | -1.12% | 3.84% | |||||||||||||||
International Equity Fund, Class Y | 19.59% | 6.02% | 8.28% | -0.81% | 3.80% | |||||||||||||||
| MSCI EAFE Index | 19.10% | 5.04% | 8.38% | 1.34% | 4.65% | |||||||||||||||
Comparison of Change in the Value of a $100,000
Investment in the International Equity Fund, Class F,
Class I and Class Y, versus the MSCI EAFE Index
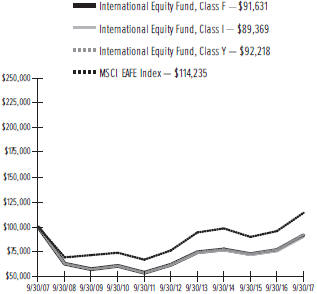
| 1 | For the year ended September 30, 2017. Past performance is no indication of future performance. Class F shares (formerly Class A shares) were offered beginning December 20, 1989. Class I shares were offered beginning January 4, 2002. The performance of Class I shares prior to January 4, 2002 is calculated using the performance of Class F shares adjusted for the higher expenses of the Class I shares. Returns for Class I shares are substantially similar to those of Class F shares and differ only to the extent that Class I shares have higher total annual fund operating expenses than Class F shares. Class Y shares were offered beginning December 31, 2014. Class Y shares performance for the period prior to December 31, 2014 derived from the performance of Class F shares. Returns for Class Y shares are substantially similar to those of Class F shares and differ only to the extent that Class Y shares have lower total annual fund operating expenses than Class F shares. Returns shown do not reflect the deduction of taxes that a shareholder would pay on fund distributions or the redemption of fund shares. The returns for the period reflect fee waivers and/or reimbursements in effect for the period; absent fee waivers and reimbursements, performance would have been lower. |
SEI Institutional International Trust / Annual Report / September 30, 2017 |
7 |
MANAGEMENT’S DISCUSSION AND ANALYSIS OF FUND PERFORMANCE
September 30, 2017 (Unaudited)
Emerging Market Equity Fund
I. Objective
The Emerging Markets Equity Fund (the “Fund”) seeks to provide capital appreciation.
II. Multi-Manager Approach Statement
The Fund uses a multi-manager approach, relying on a number of sub-advisers with differing investment approaches to manage portions of the Fund’s portfolio, under the general supervision of SEI Investments Management Corp. (“SIMC”). The Fund utilized the following sub-advisers during the year ending September 30, 2017: J O Hambro Capital Management Limited, KBI Global Investors (North America) Ltd., Lazard Asset Management LLC, Macquarie Investment Management (formerly Delaware Investment Fund Advisers, a series of Delaware Management Business Trust), Neuberger Berman Investment Advisers LLC, PanAgora Asset Management Inc. and RWC Asset Advisors (US) LLC. For the year ended September 30, 2017, no manager changes were made.
III. Return vs. Benchmark
For the year ended September 30, 2017, the Fund’s Class F shares outperformed the MSCI Emerging Markets Index (the “Index”), returning 23.10% versus the Index return of 22.91%.
IV. Fund Attribution
Emerging markets outpaced both the U.S. and developed international markets, as measured by the S&P 500 Index and the MSCI EAFE Index, during the fiscal year. All sectors had positive absolute returns during the period. Information technology delivered the strongest performance, followed by the real-estate sector and cyclicals, particularly energy and materials, while defensive sectors such as consumer staples and healthcare lagged. The technology sector was one of the strongest-performing sectors due to strong fundamental data. The concentration of technology stocks at the top of the benchmark also benefited from healthy passive inflows throughout the fiscal year. Cyclical sectors fared well due to strong synchronized global growth that served as a tailwind, as noted in the shareholder letter. The financials sector also benefited Fund performance. A recovering Russian economy helped Russian bank stocks outperform, and bank holdings in other countries rallied, driven by macroeconomic improvements. Within technology, the Fund benefited from an overweight to the strong-performing sector, and stock selection in Russian technology stocks helped. Healthy passive inflows, which benefit technology stocks the most,
rewarded an overweight position in technology. Stock selection and a slight overweight in materials also helped.
Regionally, the best-performing countries were China, Taiwan and India. With strong passive inflows, the biggest countries in the benchmark (East Asian countries due to the large technology companies in those countries) were rewarded the most. The inclusion of Chinese ‘A’ shares in the benchmark also boosted Chinese equities. Stock selection was especially strong in China. Solid fundamental data in technology and consumer stocks were rewarded during the fiscal year and contributed to positive portfolio results. Indian banks were a boost to performance as investors favored private banks with strong management and competitive models over the inefficient state-run banks in India. An underweight to Malaysia helped, as Malaysia experienced a headwind from falling oil prices. Within the Europe, Middle East and Africa region, the overweight to Russia paid off due to a recovering economy. The improving economy was a boost to Russian cyclicals, and the Fund’s exposure to Russian cyclicals, as well as Russian retailing and technology companies, helped. Fund holdings in Latin America contributed to performance as well, although not by as much as holdings in other regions. Brazilian holdings helped, as the Fund owned stocks with the smallest exposure to the political scandal that plagued Brazil during the first half of 2017.
Fund manager results were generally positive. All managers except KBI Global Investors (North America) Ltd outperformed the benchmark. Macquarie Investment Management had the best performance, driven by strong stock selection within Asia. The manager’s selection in technology stocks was especially helpful. The same can be said for Neuberger Berman Investment Advisers LLC, which had strong selection in the technology sector as well. Both managers also had strong stock selection in banks. For Neuberger Berman Investment Advisers LLC, the manager’s focus on quality companies at reasonable prices was in favor during the period. RWC Asset Advisors (US) LLC and Lazard Asset Management LLC also outperformed through strong stock selection. RWC Asset Advisors (US) LLC benefited from materials stocks in South Africa that had strong results which provided a tailwind, while Lazard Asset Management LLC’s investments in Chinese educational stocks were rewarded by strong market growth and demand. PanAgora Asset Management Inc. outperformed through strong stock selection in financials and the consumer-discretionary sector despite areas of weakness in
8 |
SEI Institutional International Trust / Annual Report / September 30, 2017 |
technology stocks. J O Hambro Capital Management Limited added value and outperformed partially due to a momentum-style tailwind. KBI Global Investors (North America) Ltd suffered a style headwind, as dividend stocks moved out of favor with the rise in global interest rates, which detracted.
AVERAGE ANNUAL TOTAL RETURN1
| 1 Year Return | Annualized 3 Year | Annualized 5 Year | Annualized 10 Year | Annualized Inception to Date | ||||||||||||||||
Emerging Markets Equity Fund, Class F | 23.10% | 5.57% | 4.53% | 0.46% | 4.89% | |||||||||||||||
Emerging Markets Equity Fund, Class Y | 23.46% | 5.84% | 4.69% | 0.54% | 4.93% | |||||||||||||||
MSCI Emerging Markets Index (Gross) | 22.91% | 5.28% | 4.36% | 1.65% | 6.47% | |||||||||||||||
Comparison of Change in the Value of a $100,000 Investment in the Emerging Markets Equity Fund, Class F and Class Y, versus the S&P 500 Index and the MSCI Emerging Markets Index (Gross)
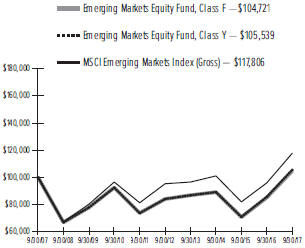
| 1 | For the year ended September 30, 2017. Past performance is no indication of future performance. Class F shares (formerly Class A shares) were offered beginning January 17, 1995. Class Y shares were offered beginning December 31, 2014. Class Y shares performance for the period prior to December 31, 2014 derived from the performance of Class F shares. Returns for Class Y shares are substantially similar to those of Class F shares and differ only to the extent that Class Y shares have lower total annual fund operating expenses than Class F shares. Returns shown do not reflect the deduction of taxes that a shareholder would pay on fund distributions or the redemption of fund shares. The returns for the period reflect fee waivers and/or reimbursements in effect for the period; absent fee waivers and reimbursements, performance would have been lower. |
SEI Institutional International Trust / Annual Report / September 30, 2017 |
9 |
MANAGEMENT’S DISCUSSION AND ANALYSIS OF FUND PERFORMANCE
September 30, 2017 (Unaudited)
International Fixed Income Fund
I. Objective
The International Fixed Income Fund (the “Fund”) seeks to provide capital appreciation and current income.
II. Multi-Manager Approach Statement
The Fund uses a multi-manager approach, relying on a number of sub-advisers with differing investment approaches to manage portions of the Fund’s portfolio, under the general supervision of SEI Investments Management Corporation (“SIMC”). The Fund utilized the following sub-advisers during the year ending September 30, 2017: AllianceBernstein, L.P., FIL Investment Advisors and Wellington Management Company LLP. For the year ended September 30, 2017, sub-adviser FIL Investment Advisors was terminated from the Fund.
III. Return vs. Benchmark
For the year ended September 30, 2017, the Fund’s Class F shares outperformed the Bloomberg Barclays Global Aggregate ex-USD Index (the “Index”), returning -1.03% versus the Index return of -0.55%.
IV. Fund Attribution
Investor appetite for risk was generally strong through the fiscal year, as credit-sensitive sectors outperformed interest rate-sensitive assets, as noted in the shareholder letter. Government-bond yields rose sharply early in the reporting period in response to Trump’s election victory, although 2017 saw a degree of desynchronization across the core markets. Bond yields drifted higher as the eurozone economy surprised to the upside, while the U.S. reflation trade stalled after the Trump administration’s economic agenda struggled to gain traction. U.K. gilt yields also tracked slightly lower through much of 2017 on fears over Brexit. Japanese government-bond yields, meanwhile, remained tightly range-bound, consistent with the Bank of Japan’s yield-curve control policy. Overall, government yields finished the period higher.
Spread sectors outperformed duration-matched sovereigns, as lower-quality fared particularly well. Investors’ risk appetites extended to emerging markets, with U.S. dollar weakness in 2017 providing an additional boost to local-currency debt. Risk assets, in general, benefited from a combination of synchronized global growth, benign inflation and continued accommodative central-bank policy.
The benchmark Bloomberg Barclays Global Aggregate ex-USD Index returned -0.55% during the period. Some
of the capital loss attributable to rising government yields was offset by coupon income as well as spread compression in the credit sectors.
The Fund’s outperformance was driven primarily by its pro-cyclical positioning; the overweight to corporate credit was beneficial in the spread-tightening environment, as was the underweight duration stance in G3 markets (Colombia, Mexico and Venezuela) as yields rose across core sovereign markets. Our overweight to local-currency emerging-market debt also added to excess performance thanks to yield convergence across developed markets and appreciating currencies against the U.S. dollar. Finally, our off-index exposure to Treasury inflation-protected securities added alpha as implied inflation rose during the period.
At the sub-adviser level, AllianceBernstein LP. was the best-performing manager, thanks to its relatively aggressive credit-beta stance. FIL Investment Advisors was terminated in March and posted flat performance against the benchmark up until termination. Wellington Management Company LLP’s performance was also relatively flat to benchmark. Its credit strategies contributed, although its macro and quant strategies both detracted.
AVERAGE ANNUAL TOTAL RETURN1
| 1 Year Return | Annualized 3 Year Return | Annualized 5 Year Return | Annualized 10 Year Return | Annualized Inception to Date | ||||||||||||||||
International Fixed Income Fund, Class F† | -1.03% | 2.71% | 2.96% | 3.49% | 4.28% | |||||||||||||||
International Fixed Income Fund, Class Y† | -0.76% | N/A | N/A | N/A | 3.07%* | |||||||||||||||
Bloomberg Barclays Global Aggregate ex-USD Index | -0.55% | 3.40% | 3.74% | 4.29% | 5.66% | |||||||||||||||
10 |
SEI Institutional International Trust / Annual Report / September 30, 2017 |
Comparison of Change in the Value of a $100,000 Investment in the International Fixed Income Fund, Class F versus the Bloomberg Barclays Global Aggregate ex-USD Index
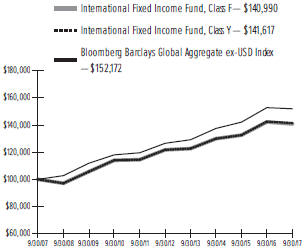
| 1 | For the year ended September 30, 2017. Past performance is no indication of future performance. Class F shares (formerly Class A shares) were offered beginning September 1, 1993. Class Y shares were offered beginning October 30, 2015. Returns shown do not reflect the deduction of taxes that a shareholder would pay on fund distributions or the redemption of fund shares. The returns for the period reflect fee waivers and/or reimbursements in effect for the period; absent fee waivers and reimbursements, performance would have been lower. |
| † | Returns for Class Y shares are substantially similar to those of Class F shares and differ only to the extent that Class Y shares have lower total annual fund operating expenses than Class F shares. |
| * | Cumulative inception to date as of October 30, 2015. |
N/A — Not Available
SEI Institutional International Trust / Annual Report / September 30, 2017 |
11 |
MANAGEMENT’S DISCUSSION AND ANALYSIS OF FUND PERFORMANCE
September 30, 2017 (Unaudited)
Emerging Markets Debt Fund
I. Objective
The Emerging Markets Debt Fund (the “Fund”) seeks to maximize total return.
II. Multi-Manager Approach
The Fund uses a multi-manager approach, relying on a number of sub-advisers with differing investment approaches to manage portions of the Fund’s portfolio, under the general supervision of SEI Investments Management Corp. (“SIMC”). The Fund utilized the following sub-advisers during the year ending September 30, 2017: Investec Asset Management Ltd., Neuberger Berman Investment Advisers LLC and Stone Harbor Investment Partners LP. For the year ended September 30, 2017, no manager changes were made.
III. Return vs. Benchmark
For the year ended September 30, 2017, the Fund’s Class F shares outperformed a hybrid of 50% J.P. Morgan EMBI Global Diversified Index and 50% J.P. Morgan GBI-EM Global Diversified (the “Index”), returning 6.93% versus the Index return of 5.98%.
IV. Fund Attribution
The fiscal year ended September 30, 2017 began with a surprise outcome in the U.S. presidential election and a subsequent selloff across emerging-markets debt, followed by the recovery and outperformance of those assets through the remainder of the reporting period in 2017.
The beginning of the period saw a Hillary Clinton victory in the U.S. presidential election priced into the markets. A Clinton victory was seen as potentially beneficial for emerging markets, especially for local-currency debt. Donald Trump ran a campaign based on isolationist policies that could be detrimental for many emerging-market countries, with the promise to put “America First” by, among other things, killing trade deals like the North American Free Trade Agreement (“NAFTA”) and the threat to impose new tariffs on imports through a Border Adjustment Tax (“BAT”). In addition, Trump campaigned on tax reform, a commitment to infrastructure spending and replacing the healthcare system. After the surprise victory, markets that had anticipated a Clinton presidency priced in Donald Trump and his policies, which were expected to increase inflation and strengthen the U.S. dollar. This occurred in conjunction with markets anticipating what would be the first of three U.S. Federal Reserve interest-rate hikes during the fiscal
year, as noted in the shareholder letter, which put further pressure on emerging-market rates.
However, the fear was short-lived. Emerging-market assets sold off in the fourth quarter of 2016 and began their recovery by the first quarter of 2017. This happened, in part, because the Trump trade—a reaction to inflation and U.S. dollar expectations linked to Trump’s campaign promises—quickly began to fade. By the time Donald Trump took office in January 2017, the tough trade rhetoric he had pushed for the entire election had softened, while he backed away from the threat of BAT implementation and talking about a “renegotiation” of NAFTA rather than simply “killing” the trade deal. It also became clear that his agenda to repeal healthcare and reform the tax code would be much more difficult to push through Congress than originally anticipated. This unwinding of expectations helped spur a rally in emerging-market rates and currencies.
Another important driver to the strong performance of emerging-market debt since Trump’s election was the improved fundamentals across the emerging-markets debt asset class. Helped in part by the stabilization of commodity prices, emerging markets saw their current-account balances improve in 2017. Additionally, inflation in many emerging-market economies fell, allowing certain central banks to cut rates at a time when developed markets were either raising rates or keeping them on hold. While the surprise U.S. election result and subsequent rally drove emerging-market performance for the first part of the year, continued fundamental improvement throughout the period drove strong performance of the asset class over the fiscal year.
While emerging-market debt is an asset class that can be affected by macro events like the U.S. election, it is also driven by idiosyncratic happenings in each of the emerging-market debt universe countries. Argentina experienced a large rally after the market-friendly Mauricio Macri was elected and began to implement economic reform. Implementation of reforms has gone smoothly and the country’s economic indicators have improved. However, sentiment was hurt early in the summer by polls showing increased support for former president Cristina Fernandez de Kirchner; a good performance by the former president’s party in October’s mid-term legislative election could constrict Macri’s ability to continue implementing economic reform. However, a surprisingly strong showing by Macri’s party in the August primary led to a rally.
Mexico was affected more than most other countries during the first months after Trump’s surprise win. The
12 |
SEI Institutional International Trust / Annual Report / September 30, 2017 |
peso, seen as a proxy for emerging-market sentiment, sold off to an all-time low against the U.S. dollar in January 2017. Around the same time the peso was hitting its historic low, several key members of the Trump administration began to take a softer tone when discussing the future of U.S.-Mexico trade relations, which helped stop the currency from sliding further and led to modest recovery. Mexico’s central bank took the additional step of issuing foreign-exchange hedges, a move that would support Mexico’s currency. Eventually the peso began to trade more in line with its underlying fundamentals and passed through its pre-U.S. election level.
Turkey experienced a failed coup d’état attempt in the summer of 2016. The failed attempt to overthrow President Erdogan strengthened his seemingly authoritarian control over the country. In the months following the attempt, Erdogan jailed thousands of opponents and declared martial law. Turkey’s political strife coincided with an already-weak economy, which drove the weak performance of the Turkish lira against the U.S. dollar during the 12-month period.
A relatively low-yielding currency with seemingly little upside benefited from the outcome of France’s presidential election. Markets feared that a victory by Marine Le Pen could have led to France’s exit from the European Union. Emmanuel Macron’s victory was received positively by markets and led to a rally in emerging-European economies like Hungary.
Finally, Venezuela, long reliant on income from oil sales, was crippled by low energy prices. The weak fundamentals underlying Venezuela’s economy were exacerbated when the U.S. implemented sanctions in August to restrict U.S. institutions from buying new debt issued by the Venezuelan government and the state-owned oil company PDVSA. Although the sanctions had no immediate economic impact, they essentially choked off Venezuelan president Nicolas Maduro’s access to new cash, an important source of funding for the government to provide services and service existing debt in a time of persistently-low oil prices. Although the sanctions did not directly affect most bonds that were already issued and, more importantly, do not directly affect any bonds that the Fund holds, the sanctions have the potential to affect liquidity for both sovereign and PDVSA bonds going forward.
The top contributors to Fund performance over the fiscal year were hard-currency securities within Argentina, an overweight to, and security selection within, Mexico and an underweight to the Turkish lira.
The top detractors to the Fund during the reporting period were cash positioning (cash holdings in the Fund are U.S. dollar-denominated, while emerging-market currencies strengthened meaningfully against the U.S. dollar over the period), an underweight to local-currency debt in Hungary and a small overweight to Venezuelan debt.
All managers contributed to relative performance during the fiscal year. Neuberger Berman Investment Advisers LLC was the top-performing manager, due primarily to positioning within Mexico and external Argentinian and Indonesian debt, as well as underweights to Hungary and South Korea. Cash positioning was a detractor. Investec Asset Management Ltd. also contributed on the merits of positioning in Mexico and Turkey, an overweight to local Russian debt and underweights to local Brazil debt, as well as external Malaysian debt. Holdings in cash detracted. Stone Harbor Investment Partners LP benefited due to strong selection within Argentina and overweights to Brazil and Ukraine, while an underweight to local Hungary debt, an overweight to Venezuela and cash positioning detracted.
Currency forwards and swap contracts were used in the Fund for the one-year period ending September 30, 2017 as a way to either hedge particular positions or gain exposure to additional areas of the market. Foreign-exchange hedges on local-currency bonds generally contributed to performance.
AVERAGE ANNUAL TOTAL RETURN1
| 1 Year Return | Annualized 3 Year Return | Annualized 5 Year Return | Annualized 10 Year Return | Annualized Inception to Date | ||||||||||||||||
Emerging Markets Debt Fund, Class F | 6.93% | 2.55% | 0.83% | 5.00% | 8.23% | |||||||||||||||
Emerging Markets Debt Fund, Class Y | 7.18% | 2.79% | 0.97% | 5.07% | 8.27% | |||||||||||||||
J.P. Morgan EMBI Global Diversified Index | 4.61% | 6.50% | 4.91% | 7.46% | 8.75% | |||||||||||||||
J.P. Morgan GBI-EM Global Diversified Index | 7.32% | 0.26% | -0.91% | 3.80% | N/A | |||||||||||||||
50/50 Hybrid of the J.P. Morgan EMBI Global Diversified Index and the J.P. Morgan GBI-EM Global Diversified Index | 5.98% | 3.41% | 2.02% | 5.70% | N/A | |||||||||||||||
SEI Institutional International Trust / Annual Report / September 30, 2017 |
13 |
MANAGEMENT’S DISCUSSION AND ANALYSIS OF FUND PERFORMANCE
September 30, 2017 (Unaudited)
Emerging Markets Debt Fund (Concluded)
Comparison of Change in the Value of a $100,000 Investment in the Emerging Markets Debt Fund, Class F and Class Y, versus a 50/50 Hybrid of the Following Indexes: the J.P. Morgan EMBI Global Diversified Index and the J.P. Morgan GBI-EM Global Diversified Index

| 1 | For the year ended September 30, 2017. Past performance is no indication of future performance. Class F shares (formerly Class A shares) were offered beginning June 26, 1997. Class Y shares were offered beginning December 31, 2014. Class Y shares performance for the period prior to December 31, 2014 derived from the performance of Class F shares. Returns for Class Y shares are substantially similar to those of Class F shares and differ only to the extent that Class Y shares have lower total annual fund operating expenses than Class F shares. Returns shown do not reflect the deduction of taxes that a shareholder would pay on fund distributions or the redemption of fund shares. The returns for the period reflect fee waivers and/or reimbursements in effect for the period; absent fee waivers and reimbursements, performance would have been lower. |
N/A — Not Available.
14 |
SEI Institutional International Trust / Annual Report / September 30, 2017 |
September 30, 2017
International Equity Fund
†Percentages based on total investments. Includes investments held as collateral for securities on loan (see Note 9).
| Description | Shares | Market Value ($ Thousands) | ||||||
COMMON STOCK — 93.2% | ||||||||
Argentina — 0.0% | ||||||||
Ternium ADR | 27,562 | $ | 853 | |||||
Australia — 2.1% | ||||||||
AGL Energy | 114,498 | 2,100 | ||||||
Aristocrat Leisure | 764,014 | 12,589 | ||||||
Australia & New Zealand Banking Group | 14,066 | 327 | ||||||
Australian Stock Exchange | 31,909 | 1,313 | ||||||
Bank of Queensland | 63,761 | 649 | ||||||
Bendigo & Adelaide Bank | 66,422 | 605 | ||||||
BlueScope Steel | 359,284 | 3,093 | ||||||
Brambles | 268,377 | 1,895 | ||||||
Challenger | 94,687 | 925 | ||||||
CIMIC Group | 20,454 | 709 | ||||||
Cochlear | 47,663 | 5,954 | ||||||
Computershare | 85,319 | 969 | ||||||
CSL | 162,152 | 17,044 | ||||||
CSR | 178,014 | 661 | ||||||
Dexus ‡ | 155,424 | 1,159 | ||||||
Downer EDI | 147,742 | 785 | ||||||
Fortescue Metals Group | 433,449 | 1,748 | ||||||
Goodman Group ‡ | 40,040 | 259 | ||||||
Insurance Australia Group | 1,857,176 | 9,283 | ||||||
LendLease Group | 97,759 | 1,375 | ||||||
Mineral Resources | 61,149 | 780 | ||||||
National Australia Bank | 22,476 | 555 | ||||||
Orica | 40,754 | 632 | ||||||
OZ Minerals | 504,373 | 2,936 | ||||||
Qantas Airways | 2,343,806 | 10,722 | ||||||
Rio Tinto | 7,207 | 376 | ||||||
Seek | 13,392 | 174 | ||||||
South32 | 3,048,099 | 7,821 | ||||||
Treasury Wine Estates | 58,461 | 628 | ||||||
|
|
| ||||||
| 88,066 | ||||||||
|
|
| ||||||
Austria — 0.6% | ||||||||
ANDRITZ | 117,300 | 6,782 | ||||||
| Description | Shares | Market Value ($ Thousands) | ||||||
COMMON STOCK (continued) | ||||||||
Erste Group Bank * | 14,715 | $ | 636 | |||||
Immobilien Anlagen | 32,000 | 919 | ||||||
Lenzing | 20,778 | 3,014 | ||||||
OMV | 170,296 | 9,923 | ||||||
Raiffeisen International Bank Holding * | 28,151 | 944 | ||||||
S IMMO | 10,145 | 179 | ||||||
Vienna Insurance Group | 5,476 | 162 | ||||||
voestalpine | 18,117 | 924 | ||||||
Wienerberger | 19,669 | 481 | ||||||
|
|
| ||||||
| 23,964 | ||||||||
|
|
| ||||||
Belgium — 1.1% | ||||||||
Ageas | 424,064 | 19,933 | ||||||
AGFA-Gevaert * | 70,231 | 335 | ||||||
Groupe Bruxelles Lambert | 123,200 | 12,963 | ||||||
KBC Group | 50,068 | 4,244 | ||||||
Solvay (A) | 7,302 | 1,091 | ||||||
Telenet Group Holding * | 9,700 | 642 | ||||||
UCB | 51,333 | 3,655 | ||||||
Umicore | 1,468 | 121 | ||||||
|
|
| ||||||
| 42,984 | ||||||||
|
|
| ||||||
Brazil — 0.4% | ||||||||
Embraer | 2,148,200 | 12,177 | ||||||
Raia Drogasil * | 238,200 | 5,645 | ||||||
|
|
| ||||||
| 17,822 | ||||||||
|
|
| ||||||
Canada — 3.2% | ||||||||
Alimentation Couche-Tard, Cl B | 205,725 | 9,360 | ||||||
Bank of Montreal | 61,400 | 4,636 | ||||||
Canadian Imperial Bank of Commerce (A) | 131,834 | 11,508 | ||||||
Canadian Natural Resources | 322,116 | 10,788 | ||||||
Canadian Pacific Railway (A) | 105,325 | 17,650 | ||||||
Cogeco Communications | 10,970 | 807 | ||||||
Encana | 1,919,849 | 22,550 | ||||||
Entertainment One | 106,941 | 370 | ||||||
Gildan Activewear | 363,528 | 11,333 | ||||||
High Liner Foods | 9,000 | 101 | ||||||
Manulife Financial | 671,300 | 13,586 | ||||||
Royal Bank of Canada | 141,893 | 10,953 | ||||||
Suncor Energy | 221,650 | 7,750 | ||||||
Toronto-Dominion Bank | 173,386 | 9,739 | ||||||
|
|
| ||||||
| 131,131 | ||||||||
|
|
| ||||||
China — 1.9% | ||||||||
Alibaba Group Holding ADR * | 96,900 | 16,736 | ||||||
Baidu ADR * | 127,300 | 31,531 | ||||||
Ctrip.com International ADR * | 148,413 | 7,827 | ||||||
STMicroelectronics | 520,327 | 10,070 | ||||||
Tencent Holdings | 269,200 | 11,587 | ||||||
|
|
| ||||||
| 77,751 | ||||||||
|
|
| ||||||
Denmark — 2.1% | ||||||||
AP Moller – Maersk, Cl A | 456 | 838 | ||||||
AP Moller – Maersk, Cl B | 180 | 342 | ||||||
SEI Institutional International Trust / Annual Report / September 30, 2017 |
15 |
SCHEDULE OF INVESTMENTS
September 30, 2017
International Equity Fund (Continued)
| Description | Shares | Market Value ($ Thousands) | ||||||
COMMON STOCK (continued) | ||||||||
Bavarian Nordic *(A) | 35,887 | $ | 1,605 | |||||
Chr Hansen Holding | 120,221 | 10,313 | ||||||
Coloplast, Cl B | 119,218 | 9,678 | ||||||
Danske Bank | 42,246 | 1,690 | ||||||
Dfds | 24,291 | 1,388 | ||||||
H Lundbeck | 173,189 | 9,996 | ||||||
ISS | 507,538 | 20,415 | ||||||
Novozymes, Cl B | 184,593 | 9,475 | ||||||
Scandinavian Tobacco Group (B) | 783,114 | 13,896 | ||||||
Schouw | 5,421 | 589 | ||||||
Vestas Wind Systems | 42,843 | 3,845 | ||||||
|
|
| ||||||
| 84,070 | ||||||||
|
|
| ||||||
Finland — 0.7% | ||||||||
Cargotec, Cl B | 31,119 | 1,955 | ||||||
Neste | 178,680 | 7,805 | ||||||
Orion, Cl B | 100,058 | 4,644 | ||||||
Stora Enso, Cl R | 484,560 | 6,846 | ||||||
UPM-Kymmene | 247,924 | 6,721 | ||||||
Wartsila, Cl B | 13,603 | 963 | ||||||
|
|
| ||||||
| 28,934 | ||||||||
|
|
| ||||||
France — 7.8% | ||||||||
Aeroports de Paris | 4,735 | 766 | ||||||
Air France-KLM * | 493,305 | 7,780 | ||||||
Air Liquide | 48,302 | 6,444 | ||||||
Airbus | 18,966 | 1,803 | ||||||
Arkema | 99,014 | 12,144 | ||||||
Aroundtown | 52,528 | 376 | ||||||
Atos | 55,766 | 8,653 | ||||||
BNP Paribas | 137,217 | 11,071 | ||||||
Boiron | 1,900 | 170 | ||||||
Bouygues | 11,160 | 530 | ||||||
Carrefour | 692,722 | 14,000 | ||||||
Cie Generale des Etablissements Michelin, Cl B | 6,812 | 995 | ||||||
CNP Assurances | 106,230 | 2,490 | ||||||
Credit Agricole | 166,975 | 3,036 | ||||||
Dassault Systemes | 3,978 | 402 | ||||||
Derichebourg | 85,621 | 898 | ||||||
Elior Group (A)(B) | 185,190 | 4,904 | ||||||
Engie | 968,080 | 16,446 | ||||||
Essilor International | 64,582 | 7,998 | ||||||
Eurazeo | 6,620 | 592 | ||||||
Erofins Scientific | 15,427 | 9,750 | ||||||
Eutelsat Communications | 18,184 | 539 | ||||||
Gaztransport Et Technigaz | 3,902 | 212 | ||||||
Hermes International | 22,424 | 11,308 | ||||||
Ipsen | 59,104 | 7,857 | ||||||
IPSOS | 18,645 | 645 | ||||||
Kering | 10,505 | 4,186 | ||||||
Lagardere | 6,748 | 226 | ||||||
Les Nouveaux Constructeurs | 1,043 | 66 | ||||||
| Description | Shares | Market Value ($ Thousands) | ||||||
COMMON STOCK (continued) | ||||||||
L’Oreal | 34,312 | $ | 7,297 | |||||
LVMH Moet Hennessy Louis Vuitton | 45,288 | 12,499 | ||||||
Natixis | 131,149 | 1,050 | ||||||
Nexity | 18,692 | 1,142 | ||||||
Pernod Ricard | 57,615 | 7,973 | ||||||
Peugeot | 488,541 | 11,638 | ||||||
Publicis Groupe | 187,879 | 13,125 | ||||||
Remy Cointreau | 486 | 58 | ||||||
Safran | 30,650 | 3,132 | ||||||
Sanofi | 167,842 | 16,669 | ||||||
Schneider Electric * | 436,592 | 38,003 | ||||||
SCOR | 28,161 | 1,181 | ||||||
SEB | 117 | 21 | ||||||
Societe Generale | 275,171 | 16,114 | ||||||
Sodexo | 61,583 | 7,681 | ||||||
SPIE | 261,185 | 7,188 | ||||||
Television Francaise 1 | 18,686 | 273 | ||||||
Thales | 122,867 | 13,912 | ||||||
Total | 148,479 | 7,977 | ||||||
UBISOFT Entertainment * | 6,237 | 429 | ||||||
Valeo | 192,338 | 14,275 | ||||||
Vetoquinol | 352 | 23 | ||||||
Wendel | 3,496 | 566 | ||||||
Zodiac Aerospace | 15,004 | 434 | ||||||
|
|
| ||||||
| 318,947 | ||||||||
|
|
| ||||||
Germany — 6.3% | ||||||||
Adidas | 70,330 | 15,914 | ||||||
Allianz | 80,728 | 18,128 | ||||||
AURELIUS Equity Opportunities & KGaA (A) | 198,164 | 13,035 | ||||||
BASF | 258,094 | 27,473 | ||||||
Beiersdorf | 120,566 | 12,975 | ||||||
Borussia Dortmund GmbH & KGaA | 42,113 | 408 | ||||||
Brenntag | 91,547 | 5,099 | ||||||
Commerzbank * | 31,311 | 426 | ||||||
Continental | 31,340 | 7,957 | ||||||
Covestro (B) | 21,740 | 1,870 | ||||||
CTS Eventim & KGaA | 138,095 | 6,029 | ||||||
Deutsche Boerse | 150,098 | 16,274 | ||||||
Deutsche Lufthansa | 413,508 | 11,493 | ||||||
Deutsche Post | 21,314 | 949 | ||||||
Evotec * | 25,996 | 617 | ||||||
Fraport Frankfurt Airport Services Worldwide | 6,879 | 653 | ||||||
Gerresheimer | 6,047 | 468 | ||||||
Hamburger Hafen und Logistik | 7,969 | 251 | ||||||
Hannover Rueck | 34,105 | 4,111 | ||||||
HeidelbergCement | 2,883 | 296 | ||||||
Heidelberger Druckmaschinen * | 275,287 | 1,123 | ||||||
Hella KGaA Hueck | 165,202 | 9,741 | ||||||
Hochtief | 52,812 | 8,912 | ||||||
HUGO BOSS | 1,958 | 173 | ||||||
Indus Holding | 60,562 | 4,480 | ||||||
Infineon Technologies | 100,884 | 2,537 | ||||||
16 |
SEI Institutional International Trust / Annual Report / September 30, 2017 |
| Description | Shares | Market Value ($ Thousands) | ||||||
COMMON STOCK (continued) | ||||||||
Kloeckner | 96,437 | $ | 1,237 | |||||
Koenig & Bauer | 17,940 | 1,479 | ||||||
LANXESS | 4,328 | 342 | ||||||
Linde | 76,114 | 15,877 | ||||||
Merck | 7,329 | 815 | ||||||
Muenchener Rueckversicherungs | 845 | 181 | ||||||
OSRAM Licht | 26,452 | 2,111 | ||||||
Puma | 2,210 | 860 | ||||||
Rheinmetall | 2,554 | 288 | ||||||
RWE * | 15,769 | 358 | ||||||
SAP | 251,583 | 27,568 | ||||||
SAP ADR (A) | 121,800 | 13,355 | ||||||
Siemens | 112,747 | 15,888 | ||||||
Siltronic * | 2,621 | 325 | ||||||
Suedzucker | 26,401 | 567 | ||||||
Talanx | 15,921 | 644 | ||||||
TUI | 293,862 | 4,994 | ||||||
Uniper (A) | 91,866 | 2,520 | ||||||
|
|
| ||||||
| 260,801 | ||||||||
|
|
| ||||||
Hong Kong — 2.8% | ||||||||
AIA Group | 2,073,800 | 15,293 | ||||||
ASM Pacific Technology | 374,800 | 5,398 | ||||||
BOC Hong Kong Holdings | 572,000 | 2,779 | ||||||
Chaoda Modern Agriculture * | 2,440,000 | 58 | ||||||
China Merchants Holdings International | 1,977,338 | 6,101 | ||||||
China Mobile | 2,238,240 | 22,681 | ||||||
CLP Holdings | 19,500 | 200 | ||||||
CNOOC | 13,537,000 | 17,470 | ||||||
Galaxy Entertainment Group * | 2,378,000 | 16,745 | ||||||
Hang Lung Group | 50,000 | 180 | ||||||
Hang Seng Bank | 37,500 | 914 | ||||||
Henderson Land Development | 1,076,831 | 7,135 | ||||||
Hongkong & Shanghai Hotels | 212,500 | 355 | ||||||
I-CABLE Communications * | 57,541 | 2 | ||||||
Jardine Strategic Holdings | 13,000 | 562 | ||||||
Melco Resorts & Entertainment ADR | 39,200 | 945 | ||||||
MTR | 40,000 | 234 | ||||||
New World Development | 182,000 | 261 | ||||||
Samsonite International | 1,654,200 | 7,095 | ||||||
Sands China | 333,600 | 1,736 | ||||||
SITC International Holdings | 1,274,220 | 1,155 | ||||||
Swire Properties | 177,800 | 603 | ||||||
Techtronic Industries | 1,272,000 | 6,791 | ||||||
Wheelock | 43,000 | 303 | ||||||
|
|
| ||||||
| 114,996 | ||||||||
|
|
| ||||||
India — 0.2% | ||||||||
HDFC Bank ADR | 99,237 | 9,563 | ||||||
|
|
| ||||||
Indonesia — 0.0% | ||||||||
Telekomunikasi Indonesia Persero | 1,858,000 | 646 | ||||||
|
|
| ||||||
| Description | Shares | Market Value ($ Thousands) | ||||||
COMMON STOCK (continued) | ||||||||
Ireland — 0.8% | ||||||||
Allied Irish Banks | 2,949,069 | $ | 17,728 | |||||
CRH | 36,830 | 1,405 | ||||||
Experian | 715,895 | 14,398 | ||||||
|
|
| ||||||
| 33,531 | ||||||||
|
|
| ||||||
Israel — 1.1% | ||||||||
Azrieli Group | 3,231 | 179 | ||||||
Bank Hapoalim | 921,884 | 6,457 | ||||||
Bank Leumi Le-Israel | 2,477,985 | 13,177 | ||||||
Check Point Software Technologies * | 141,144 | 16,093 | ||||||
Elbit Systems | 5,507 | 809 | ||||||
Frutarom Industries | 6,781 | 523 | ||||||
Israel Discount Bank, Cl A * | 324,589 | 820 | ||||||
Mizrahi Tefahot Bank | 101,887 | 1,828 | ||||||
Teva Pharmaceutical Industries ADR (A) | 252,452 | 4,443 | ||||||
|
|
| ||||||
| 44,329 | ||||||||
|
|
| ||||||
Italy — 3.4% | ||||||||
Autogrill | 121,385 | 1,579 | ||||||
Azimut Holding | 273,670 | 5,921 | ||||||
Buzzi Unicem | 429,126 | 11,587 | ||||||
CNH Industrial | 190,870 | 2,293 | ||||||
Enel | 985,553 | 5,936 | ||||||
EXOR | 98,885 | 6,272 | ||||||
Ferrari | 88,346 | 9,765 | ||||||
Fiat Chrysler Automobiles * | 1,282,258 | 22,981 | ||||||
GEDI Gruppo Editoriale * | 69,934 | 62 | ||||||
Hera | 156,915 | 493 | ||||||
Juventus Football Club * | 195,403 | 183 | ||||||
Leonardo | 6,270 | 117 | ||||||
Luxottica Group | 114,558 | 6,405 | ||||||
Maire Tecnimont (A) | 114,992 | 636 | ||||||
Prysmian | 16,018 | 541 | ||||||
Recordati | 234,942 | 10,832 | ||||||
Saras | 692,920 | 1,858 | ||||||
Societa Iniziative Autostradali e Servizi | 74,009 | 1,182 | ||||||
Tenaris (A) | 1,160,933 | 16,469 | ||||||
UniCredit * | 1,705,649 | 36,336 | ||||||
|
|
| ||||||
| 141,448 | ||||||||
|
|
| ||||||
Japan — 17.0% | ||||||||
77 Bank | 53,800 | 1,329 | ||||||
Aeon Mall | 82,000 | 1,459 | ||||||
Amada Holdings | 34,700 | 381 | ||||||
ANA Holdings | 82,800 | 3,133 | ||||||
Arcland Sakamoto | 33,400 | 503 | ||||||
Asahi Breweries | 22,800 | 923 | ||||||
Asahi Glass | 210,200 | 7,796 | ||||||
Asahi Kasei | 217,000 | 2,670 | ||||||
Bandai Namco Holdings | 4,800 | 165 | ||||||
Benesse | 108,400 | 3,910 | ||||||
Bridgestone | 138,700 | 6,291 | ||||||
Brother Industries | 38,800 | 902 | ||||||
SEI Institutional International Trust / Annual Report / September 30, 2017 |
17 |
SCHEDULE OF INVESTMENTS
September 30, 2017
International Equity Fund (Continued)
| Description | Shares | Market Value ($ Thousands) | ||||||
COMMON STOCK (continued) | ||||||||
Canon Marketing Japan | 144,800 | $ | 3,459 | |||||
Central Japan Railway | 3,400 | 596 | ||||||
Dai Nippon Printing | 486,500 | 11,639 | ||||||
Daikin Industries | 125,000 | 12,654 | ||||||
Daikyo | 100,100 | 1,965 | ||||||
Daito Trust Construction | 67,600 | 12,311 | ||||||
Daiwa House Industry | 232,200 | 8,014 | ||||||
Disco | 6,700 | 1,362 | ||||||
East Japan Railway | 222,200 | 20,500 | ||||||
en-japan | 19,700 | 722 | ||||||
Fanuc * | 2,100 | 425 | ||||||
Fuji Film Holdings | 262,900 | 10,199 | ||||||
Fujitsu | 1,564,000 | 11,614 | ||||||
Fujitsu General | 19,600 | 396 | ||||||
Furukawa Electric | 116,400 | 6,391 | ||||||
Goldcrest | 21,700 | 514 | ||||||
Gree | 71,100 | 486 | ||||||
GungHo Online Entertainment *(A) | 191,400 | 517 | ||||||
Hakudo | 5,300 | 100 | ||||||
Haseko | 248,700 | 3,314 | ||||||
Hikari Tsushin | 1,700 | 213 | ||||||
Hitachi * | 2,151,000 | 15,151 | ||||||
Hitachi Chemical | 7,800 | 214 | ||||||
Hitachi Construction Machinery * | 17,700 | 524 | ||||||
Hitachi High-Technologies | 4,900 | 178 | ||||||
Hitachi Metals | 16,800 | 234 | ||||||
Hoya * | 123,400 | 6,660 | ||||||
Itochu (A) | 91,600 | 1,500 | ||||||
Japan Airlines | 679,700 | 22,994 | ||||||
Japan Tobacco | 307,400 | 10,071 | ||||||
Kajima | 82,000 | 814 | ||||||
Kansai Electric Power | 130,400 | 1,668 | ||||||
Kansai Paint | 384,600 | 9,676 | ||||||
Kao | 116,500 | 6,851 | ||||||
KDDI | 948,000 | 24,987 | ||||||
Keikyu | 27,000 | 547 | ||||||
Keyence | 93,300 | 49,524 | ||||||
Kirin Brewery | 71,200 | 1,675 | ||||||
Koito Manufacturing * | 202,110 | 12,676 | ||||||
Kokuyo | 61,200 | 1,036 | ||||||
Komatsu | 609,300 | 17,327 | ||||||
Konami Holdings | 127,200 | 6,113 | ||||||
Kose | 54,400 | 6,229 | ||||||
K’s Holdings | 62,200 | 1,378 | ||||||
Kuraray | 55,200 | 1,032 | ||||||
Kyocera * | 18,500 | 1,147 | ||||||
Kyushu Electric Power | 15,600 | 166 | ||||||
Lion | 31,200 | 569 | ||||||
Mabuchi Motor | 284,600 | 14,234 | ||||||
Makita | 24,700 | 995 | ||||||
Marubeni | 25,600 | 175 | ||||||
McDonald’s Holdings Japan | 10,600 | 469 | ||||||
| Description | Shares | Market Value ($ Thousands) | ||||||
COMMON STOCK (continued) | ||||||||
Mebuki Financial Group | 15,200 | $ | 59 | |||||
MISUMI Group | 13,900 | 366 | ||||||
Mitsubishi Chemical Holdings * | 650,200 | 6,192 | ||||||
Mitsubishi Electric | 44,300 | 692 | ||||||
Mitsubishi Gas Chemical | 211,200 | 4,948 | ||||||
Mitsubishi Tanabe Pharma | 52,600 | 1,206 | ||||||
Mitsui OSK Lines | 7,200 | 218 | ||||||
Mixi * | 84,900 | 4,095 | ||||||
Mochida Pharmaceutical | 6,000 | 441 | ||||||
Morinaga Milk Industry | 29,000 | 1,108 | ||||||
MS&AD Insurance Group Holdings | 532,000 | 17,123 | ||||||
Nabtesco | 123,200 | 4,575 | ||||||
NH Foods | 43,000 | 1,182 | ||||||
Nidec | 18,000 | 2,210 | ||||||
Nikon * | 213,700 | 3,704 | ||||||
Nippon Express | 12,900 | 840 | ||||||
Nippon Light Metal Holdings | 214,000 | 608 | ||||||
Nippon Paint Holdings | 10,100 | 343 | ||||||
Nippon Soda | 166,000 | 1,009 | ||||||
Nippon Telegraph & Telephone | 94,300 | 4,320 | ||||||
Nippon Telegraph & Telephone ADR | 439,238 | 20,082 | ||||||
Nippon Valqua Industries | 11,600 | 283 | ||||||
Nisshin Oillio Group | 4,800 | 157 | ||||||
Nitori Holdings | 8,700 | 1,244 | ||||||
Nitto Kogyo | 13,600 | 240 | ||||||
North Pacific Bank | 232,900 | 737 | ||||||
NSK | 28,200 | 380 | ||||||
Oenon Holdings | 24,200 | 67 | ||||||
Oji Holdings | 39,000 | 210 | ||||||
Okasan Securities Group * | 117,000 | 671 | ||||||
Omron * | 311,000 | 15,831 | ||||||
Oracle Japan * | 3,800 | 298 | ||||||
Otsuka | 8,100 | 519 | ||||||
Panasonic | 629,800 | 9,123 | ||||||
Persol Holdings (A) | 520,722 | 12,134 | ||||||
Pigeon | 354,464 | 12,108 | ||||||
Plenus | 37,900 | 837 | ||||||
Pola Orbis Holdings | 6,100 | 185 | ||||||
Prima Meat Packers | 137,000 | 926 | ||||||
Recruit Holdings | 199,600 | 4,321 | ||||||
Rohm | 161,200 | 13,805 | ||||||
Ryohin Keikaku | 2,500 | 736 | ||||||
Saizeriya | 74,900 | 2,059 | ||||||
Santen Pharmaceutical | 446,200 | 7,028 | ||||||
Sawada Holdings * | 3,700 | 33 | ||||||
SBI Holdings * | 55,700 | 838 | ||||||
Seiko Epson | 6,600 | 160 | ||||||
Sekisui Chemical | 98,400 | 1,935 | ||||||
Sekisui House | 1,018,800 | 17,165 | ||||||
Seven & I Holdings | 244,700 | 9,445 | ||||||
Sharp *(A) | 25,100 | 757 | ||||||
Shimamura | 1,400 | 168 | ||||||
18 |
SEI Institutional International Trust / Annual Report / September 30, 2017 |
| Description | Shares | Market Value ($ Thousands) | ||||||
COMMON STOCK (continued) | ||||||||
Shin-Etsu Chemical | 5,200 | $ | 465 | |||||
Shionogi | 150,000 | 8,197 | ||||||
Shiseido | 8,800 | 352 | ||||||
Showa | 20,500 | 252 | ||||||
SMC | 27,900 | 9,837 | ||||||
Stanley Electric | 24,700 | 846 | ||||||
Start Today | 26,100 | 827 | ||||||
Sumitomo (A) | 151,800 | 2,183 | ||||||
Sumitomo Chemical | 31,000 | 194 | ||||||
Sumitomo Heavy Industries | 17,600 | 705 | ||||||
Sumitomo Mitsui Financial Group | 248,900 | 9,552 | ||||||
Sumitomo Mitsui Trust Holdings | 380,822 | 13,739 | ||||||
Sumitomo Rubber Industries | 33,800 | 619 | ||||||
Suzuken | 11,400 | 405 | ||||||
Suzuki Motor | 33,800 | 1,772 | ||||||
Sysmex | 102,200 | 6,519 | ||||||
T&D Holdings | 23,500 | 341 | ||||||
Taisei | 17,000 | 891 | ||||||
Takeda Pharmaceutical | 206,500 | 11,400 | ||||||
THK * | 19,000 | 646 | ||||||
TIS | 53,400 | 1,575 | ||||||
Tochigi Bank | 65,000 | 277 | ||||||
Toho | 11,200 | 391 | ||||||
Tokyo Electric Power Holdings * | 845,200 | 3,409 | ||||||
Tokyo Electron | 51,100 | 7,844 | ||||||
Tomy | 19,300 | 267 | ||||||
Toppan Printing | 8,000 | 79 | ||||||
Topre | 188,800 | 5,795 | ||||||
Tosoh | 162,500 | 3,661 | ||||||
TOTO | 260,200 | 10,957 | ||||||
Toyota Motor | 107,600 | 6,414 | ||||||
Toyota Motor ADR (A) | 148,433 | 17,689 | ||||||
Trend Micro * | 6,600 | 325 | ||||||
Ube Industries | 215,300 | 6,216 | ||||||
Ulvac | 36,500 | 2,293 | ||||||
USS | 42,800 | 863 | ||||||
Wacoal Holdings | 418,852 | 11,944 | ||||||
Warabeya Nichiyo | 13,300 | 339 | ||||||
West Japan Railway | 8,800 | 612 | ||||||
Yakult Honsha | 15,500 | 1,117 | ||||||
Yamaha Motor | 35,700 | 1,069 | ||||||
Yaskawa Electric | 49,600 | 1,571 | ||||||
Yokogawa Electric | 11,000 | 187 | ||||||
Yokohama Rubber | 7,700 | 159 | ||||||
|
|
| ||||||
| 698,183 | ||||||||
|
|
| ||||||
Malaysia — 0.1% | ||||||||
Malaysian Pacific Industries | 63,100 | 200 | ||||||
Tenaga Nasional | 522,600 | 1,772 | ||||||
|
|
| ||||||
| 1,972 | ||||||||
|
|
| ||||||
Malta — 0.0% | ||||||||
BGP Holdings * | 198,683 | – | ||||||
|
|
| ||||||
| Description | Shares | Market Value ($ Thousands) | ||||||
COMMON STOCK (continued) | ||||||||
Mexico — 0.3% | ||||||||
Alfa, Cl A | 4,914,400 | $ | 6,211 | |||||
Wal-Mart de Mexico | 2,761,800 | 6,342 | ||||||
|
|
| ||||||
| 12,553 | ||||||||
|
|
| ||||||
Netherlands — 5.6% | ||||||||
ABN AMRO Group (B) | 50,461 | 1,512 | ||||||
AerCap Holdings * | 179,600 | 9,179 | ||||||
Akzo Nobel | 208,377 | 19,244 | ||||||
Arcadis | 18,155 | 391 | ||||||
ArcelorMittal * | 116,981 | 3,018 | ||||||
ASML Holding | 118,129 | 20,117 | ||||||
ASR Nederland | 71,120 | 2,846 | ||||||
Coca-Cola European Partners | 7,500 | 315 | ||||||
Heineken | 85,048 | 8,411 | ||||||
Heineken Holding | 36,000 | 3,383 | ||||||
ING Groep | 1,514,909 | 27,938 | ||||||
Koninklijke DSM | 255,757 | 20,941 | ||||||
NN Group | 4,956 | 207 | ||||||
Randstad Holding | 18,078 | 1,119 | ||||||
Refresco Group (B) | 348,609 | 7,023 | ||||||
RELX (AEX) | 60,725 | 1,293 | ||||||
Royal Dutch Shell, Cl A | 701,781 | 21,214 | ||||||
Royal Dutch Shell, Cl B | 1,040,427 | 32,029 | ||||||
Royal Dutch Shell ADR, Cl B (A) | 278,352 | 17,408 | ||||||
Unilever | 329,530 | 19,494 | ||||||
Wolters Kluwer | 304,927 | 14,093 | ||||||
|
|
| ||||||
| 231,175 | ||||||||
|
|
| ||||||
New Zealand — 0.1% | ||||||||
Air New Zealand | 896,722 | 2,184 | ||||||
Fisher & Paykel Healthcare | 43,051 | 398 | ||||||
Meridian Energy | 103,207 | 212 | ||||||
Spark New Zealand | 189,082 | 499 | ||||||
|
|
| ||||||
| 3,293 | ||||||||
|
|
| ||||||
Norway — 1.2% | ||||||||
Aker Solutions * | 1,623,185 | 8,593 | ||||||
DNB | 15,546 | 313 | ||||||
Marine Harvest * | 859,245 | 17,001 | ||||||
Norsk Hydro | 1,442,752 | 10,494 | ||||||
Statoil | 6,479 | 130 | ||||||
Telenor | 650,214 | 13,755 | ||||||
|
|
| ||||||
| 50,286 | ||||||||
|
|
| ||||||
Poland — 0.0% | ||||||||
Emperia Holding * | 3,171 | 82 | ||||||
|
|
| ||||||
Portugal — 0.0% | ||||||||
CTT Correios de Portugal | 61,914 | 373 | ||||||
Jeronimo Martins | 52,423 | 1,035 | ||||||
Navigator | 50,665 | 247 | ||||||
|
|
| ||||||
| 1,655 | ||||||||
|
|
| ||||||
SEI Institutional International Trust / Annual Report / September 30, 2017 |
19 |
SCHEDULE OF INVESTMENTS
September 30, 2017
International Equity Fund (Continued)
| Description | Shares | Market Value ($ Thousands) | ||||||
COMMON STOCK (continued) | ||||||||
Russia — 0.2% | ||||||||
Yandex, Cl A * | 230,338 | $ | 7,590 | |||||
|
|
| ||||||
Singapore — 1.0% | ||||||||
CapitaLand Commercial Trust ‡ | 129,700 | 158 | ||||||
City Developments | 1,516,300 | 12,651 | ||||||
DBS Group Holdings | 687,700 | 10,544 | ||||||
Hong Leong Finance | 56,400 | 107 | ||||||
Oversea-Chinese Banking | 1,349,500 | 11,091 | ||||||
Singapore Airlines | 133,700 | 989 | ||||||
Singapore Technologies Engineering | 1,934,200 | 4,900 | ||||||
Sunningdale Tech | 120,900 | 175 | ||||||
United Overseas Bank | 48,500 | 839 | ||||||
UOL Group | 103,100 | 616 | ||||||
|
|
| ||||||
| 42,070 | ||||||||
|
|
| ||||||
South Africa — 0.1% | ||||||||
Investec | 416,323 | 3,022 | ||||||
|
|
| ||||||
South Korea — 2.2% | ||||||||
Amorepacific | 7,278 | 1,649 | ||||||
KT ADR | 490,614 | 6,805 | ||||||
LG Display ADR | 309,560 | 4,154 | ||||||
Samsung Electronics | 18,310 | 40,989 | ||||||
SK Hynix | 12,263 | 888 | ||||||
SK Telecom | 85,516 | 19,039 | ||||||
SK Telecom ADR | 675,621 | 16,614 | ||||||
|
|
| ||||||
| 90,138 | ||||||||
|
|
| ||||||
Spain — 1.7% | ||||||||
ACS Actividades de Construccion y Servicios | 295,899 | 10,968 | ||||||
Aena (B) | 13,208 | 2,385 | ||||||
Amadeus IT Holding, Cl A | 31,887 | 2,073 | ||||||
Banco Bilbao Vizcaya Argentaria | 1,555,556 | 13,905 | ||||||
Banco de Sabadell | 131,452 | 274 | ||||||
Bankinter | 131,920 | 1,248 | ||||||
CaixaBank | 1,896,787 | 9,508 | ||||||
Ence Energia y Celulosa | 75,481 | 393 | ||||||
Endesa | 405,987 | 9,155 | ||||||
Iberdrola | 261,042 | 2,028 | ||||||
Industria de Diseno Textil | 126,549 | 4,770 | ||||||
International Consolidated Airlines Group * | 97,940 | 780 | ||||||
Mapfre | 177,058 | 577 | ||||||
Melia Hotels International | 71,989 | 1,041 | ||||||
Repsol | 242,281 | 4,465 | ||||||
Unicaja Banco *(B) | 4,092,000 | 6,289 | ||||||
|
|
| ||||||
| 69,859 | ||||||||
|
|
| ||||||
Sweden — 2.3% | ||||||||
Alfa Laval | 384,287 | 9,364 | ||||||
Atlas Copco, Cl A | 480,459 | 20,302 | ||||||
Atlas Copco, Cl B | 16,696 | 646 | ||||||
Boliden | 44,645 | 1,508 | ||||||
Electrolux, Cl B | 319,001 | 10,810 | ||||||
Granges (A) | 56,966 | 651 | ||||||
| Description | Shares | Market Value ($ Thousands) | ||||||
COMMON STOCK (continued) | ||||||||
Industrivarden, Cl C | 6,979 | $ | 176 | |||||
Investor, Cl B | 51,365 | 2,532 | ||||||
Kinnevik | 11,904 | 387 | ||||||
Millicom International Cellular | 192,479 | 12,675 | ||||||
NCC, Cl B | 29,859 | 707 | ||||||
Nordea Bank | 670,248 | 9,065 | ||||||
Oriflame Holding | 64,368 | 2,189 | ||||||
Sandvik | 510,602 | 8,789 | ||||||
Skanska, Cl B | 7,503 | 174 | ||||||
Ssab Svenskt Stal, Cl A * | 80,829 | 389 | ||||||
Telefonaktiebolaget LM Ericsson ADR | 1,643,012 | 9,447 | ||||||
Volvo, Cl B | 334,816 | 6,440 | ||||||
|
|
| ||||||
| 96,251 | ||||||||
|
|
| ||||||
Switzerland — 7.1% | ||||||||
ABB | 1,015,347 | 25,121 | ||||||
Adecco Group | 208,369 | 16,237 | ||||||
Aryzta | 242,744 | 7,461 | ||||||
Baloise Holding | 8,304 | 1,315 | ||||||
Barry Callebaut * | 141 | 216 | ||||||
Cie Financiere Richemont | 301,410 | 27,568 | ||||||
Coca-Cola HBC | 35,493 | 1,202 | ||||||
Emmi | 1,041 | 683 | ||||||
EMS-Chemie Holding | 1,356 | 902 | ||||||
Geberit | 4,156 | 1,968 | ||||||
Givaudan | 4,895 | 10,659 | ||||||
Idorsia * | 16,929 | 303 | ||||||
Julius Baer Group | 147,452 | 8,732 | ||||||
Kuehne & Nagel International | 1,633 | 303 | ||||||
LafargeHolcim | 9,516 | 557 | ||||||
Lonza Group | 40,802 | 10,711 | ||||||
Nestle | 327,622 | 27,460 | ||||||
Novartis | 342,167 | 29,315 | ||||||
Pargesa Holding | 1,843 | 153 | ||||||
Partners Group Holding | 15,782 | 10,716 | ||||||
Roche Holding | 169,059 | 43,191 | ||||||
Schindler Holding | 5,494 | 1,207 | ||||||
SGS | 4,389 | 10,537 | ||||||
Siegfried Holding | 422 | 139 | ||||||
Sika | 356 | 2,651 | ||||||
Sonova Holding | 41,612 | 7,066 | ||||||
Straumann Holding | 6,797 | 4,369 | ||||||
Swiss Life Holding | 36,212 | 12,765 | ||||||
Swiss Re | 57,488 | 5,210 | ||||||
Tecan Group | 3,617 | 749 | ||||||
UBS Group | 393,725 | 6,734 | ||||||
Zurich Insurance Group | 49,820 | 15,210 | ||||||
|
|
| ||||||
| 291,410 | ||||||||
|
|
| ||||||
Taiwan — 0.6% | ||||||||
General Interface Solution Holding | 214,000 | 2,128 | ||||||
HannStar Display | 7,204,000 | 2,791 | ||||||
Hon Hai Precision Industry | 2,968,764 | 10,280 | ||||||
20 |
SEI Institutional International Trust / Annual Report / September 30, 2017 |
| Description | Shares | Market Value ($ Thousands) | ||||||
COMMON STOCK (continued) | ||||||||
Primax Electronics | 164,000 | $ | 406 | |||||
Taiwan Semiconductor Manufacturing ADR | 250,840 | 9,419 | ||||||
UPC Technology | 733,000 | 389 | ||||||
|
|
| ||||||
| 25,413 | ||||||||
|
|
| ||||||
Thailand — 0.0% | ||||||||
Bangchak | 818,300 | 982 | ||||||
Banpu | 834,200 | 440 | ||||||
|
|
| ||||||
| 1,422 | ||||||||
|
|
| ||||||
Turkey — 0.1% | ||||||||
Tupras Turkiye Petrol Rafinerileri | 82,890 | 2,834 | ||||||
Turkiye Is Bankasi, Cl C | 92,120 | 176 | ||||||
Turkiye Vakiflar Bankasi Tao, Cl D | 758,569 | 1,338 | ||||||
|
|
| ||||||
| 4,348 | ||||||||
|
|
| ||||||
United Kingdom — 14.1% | ||||||||
3i Group | 360,582 | 4,417 | ||||||
Abcam | 27,895 | 382 | ||||||
Anglo American | 125,572 | 2,257 | ||||||
Aon | 86,500 | 12,638 | ||||||
Ashtead Group | 510,521 | 12,322 | ||||||
Associated British Foods | 95,811 | 4,104 | ||||||
AstraZeneca | 386,556 | 25,698 | ||||||
AstraZeneca ADR (A) | 19,065 | 646 | ||||||
Aviva | 2,520,581 | 17,399 | ||||||
BAE Systems | 111,988 | 949 | ||||||
Balfour Beatty | 2,312,426 | 8,352 | ||||||
Bank of Ireland Group * | 1,366,167 | 11,184 | ||||||
Barclays | 12,622,922 | 32,745 | ||||||
Barratt Developments | 168,267 | 1,387 | ||||||
Berkeley Group Holdings | 66,360 | 3,309 | ||||||
BHP Billiton (LSE) | 419,207 | 7,393 | ||||||
BP | 4,206,244 | 26,936 | ||||||
BP ADR | 175,984 | 6,763 | ||||||
British American Tobacco | 518,259 | 32,485 | ||||||
Bunzl | 293,630 | 8,931 | ||||||
Burberry Group | 61,541 | 1,453 | ||||||
Carnival | 258,631 | 16,458 | ||||||
Cobham * | 5,763,786 | 11,267 | ||||||
Compass Group | 1,085,963 | 23,064 | ||||||
DCC | 63,735 | 6,195 | ||||||
Diageo | 305,358 | 10,050 | ||||||
easyJet | 34,938 | 570 | ||||||
Evraz | 38,582 | 162 | ||||||
Ferrexpo | 80,631 | 316 | ||||||
G4S | 93,470 | 349 | ||||||
Genus | 13,935 | 392 | ||||||
GlaxoSmithKline | 1,394,407 | 27,847 | ||||||
Glencore | 1,117,483 | 5,127 | ||||||
Hays | 1,246,426 | 3,167 | ||||||
Howden Joinery Group | 1,103,780 | 6,383 | ||||||
HSBC Holdings | 902,498 | 8,925 | ||||||
Imperial Brands ADR | 12,508 | 541 | ||||||
| Description | Shares | Market Value ($ Thousands) | ||||||
COMMON STOCK (continued) | ||||||||
Inchcape | 57,618 | $ | 667 | |||||
Indivior * | 326,107 | 1,486 | ||||||
InterContinental Hotels Group | 33,314 | 1,765 | ||||||
Intertek Group | 6,862 | 459 | ||||||
Investec (LSE) | 455,248 | 3,329 | ||||||
JD Sports Fashion | 95,690 | 481 | ||||||
Legal & General Group | 683,357 | 2,383 | ||||||
Lloyds Banking Group | 23,508,682 | 21,362 | ||||||
London Stock Exchange Group | 17,141 | 881 | ||||||
Micro Focus International | 136,197 | 4,362 | ||||||
Mondi | 205,971 | 5,541 | ||||||
NEX Group | 75,308 | 669 | ||||||
Pagegroup | 34,532 | 231 | ||||||
Persimmon | 106,231 | 3,680 | ||||||
Provident Financial | 3,051 | 34 | ||||||
Prudential | 952,903 | 22,840 | ||||||
QinetiQ Group | 319,745 | 1,059 | ||||||
Reckitt Benckiser Group | 158,330 | 14,472 | ||||||
Redrow | 61,682 | 490 | ||||||
RELX | 662,261 | 14,545 | ||||||
Rio Tinto (LSE) | 10,290 | 479 | ||||||
Royal Bank of Scotland Group * | 5,800,199 | 20,879 | ||||||
RSA Insurance Group | 197,746 | 1,653 | ||||||
Schroders | 105,802 | 4,762 | ||||||
Segro ‡ | 98,617 | 709 | ||||||
Smith & Nephew | 47,772 | 864 | ||||||
Smiths Group | 455,874 | 9,645 | ||||||
Spectris | 196,504 | 6,354 | ||||||
SSE | 634,804 | 11,898 | ||||||
SSP Group | 45,002 | 325 | ||||||
St. James’s Place | 545,080 | 8,381 | ||||||
Standard Life Aberdeen | 121,375 | 706 | ||||||
Subsea 7 * | 476,602 | 7,825 | ||||||
Tate & Lyle | 97,498 | 848 | ||||||
Taylor Wimpey | 564,507 | 1,481 | ||||||
Tesco * | 6,658,381 | 16,719 | ||||||
Travis Perkins | 508,433 | 9,877 | ||||||
Unilever | 11,890 | 689 | ||||||
Vodafone Group | 5,365,472 | 15,031 | ||||||
Weir Group | 473,423 | 12,481 | ||||||
Wm Morrison Supermarkets | 60,144 | 189 | ||||||
Worldpay Group (B) | 898,037 | 4,904 | ||||||
|
|
| ||||||
| 579,998 | ||||||||
|
|
| ||||||
United States — 5.0% | ||||||||
Accenture, Cl A | 99,226 | 13,402 | ||||||
Agilent Technologies | 87,266 | 5,602 | ||||||
Alphabet, Cl C * | 8,086 | 7,755 | ||||||
Axis Capital Holdings | 298,339 | 17,098 | ||||||
Barracuda Networks * | 373,776 | 9,057 | ||||||
Canadian Pacific Railway (NYSE) | 79,234 | 13,314 | ||||||
Chubb | 100,906 | 14,384 | ||||||
Constellium, Cl A * | 23,630 | 242 | ||||||
SEI Institutional International Trust / Annual Report / September 30, 2017 |
21 |
SCHEDULE OF INVESTMENTS
September 30, 2017
International Equity Fund (Concluded)
| Description | Shares | Market Value ($ Thousands) | ||||||
COMMON STOCK (continued) |
| |||||||
Core Laboratories (A) | 101,951 | $ | 10,063 | |||||
Delphi Automotive | 49,400 | 4,861 | ||||||
Facebook, Cl A * | 50,641 | 8,653 | ||||||
Flextronics International * | 671,017 | 11,119 | ||||||
ICON * | 218,119 | 24,839 | ||||||
International Game Technology | 92,063 | 2,260 | ||||||
Luxoft Holding, Cl A * | 222,618 | 10,641 | ||||||
Masonite International * | 117,839 | 8,154 | ||||||
Nielsen Holdings | 145,200 | 6,019 | ||||||
ProPetro Holding * | 507,495 | 7,283 | ||||||
Sensata Technologies Holding * | 157,900 | 7,590 | ||||||
STMicroelectronics (NYSE), Cl Y | 59,255 | 1,151 | ||||||
TE Connectivity | 71,934 | 5,975 | ||||||
UBS Group (NYSE) | 1,038,014 | 17,802 | ||||||
|
| |||||||
| 207,264 | ||||||||
|
| |||||||
Total Common Stock |
| 3,837,820 | ||||||
|
| |||||||
PREFERRED STOCK — 1.7% | ||||||||
Germany — 1.2% | ||||||||
Fuchs Petrolub | 12,778 | 757 | ||||||
Henkel | 76,061 | 10,354 | ||||||
Volkswagen | 251,595 | 41,046 | ||||||
|
| |||||||
| 52,157 | ||||||||
|
| |||||||
South Korea — 0.5% | ||||||||
Hyundai Motor | 99,732 | 8,151 | ||||||
Samsung Electronics | 6,339 | 11,412 | ||||||
|
| |||||||
| 19,563 | ||||||||
|
| |||||||
Total Preferred Stock |
| 71,720 | ||||||
|
| |||||||
| | Number of Rights | | ||||||
|
| |||||||
RIGHTS — 0.0% | ||||||||
Singapore — 0.0% | ||||||||
CapitaLand Commercial Trust, Expires 10/24/2017 * | 21,530 | 5 | ||||||
|
| |||||||
Total Rights | 5 | |||||||
|
| |||||||
| Description | Shares | Market Value ($ Thousands) | ||||||
AFFILIATED PARTNERSHIP — 3.2% |
| |||||||
SEI Liquidity Fund, L.P. | 131,088,732 | $ | 131,091 | |||||
|
| |||||||
Total Affiliated Partnership | 131,091 | |||||||
|
| |||||||
CASH EQUIVALENT — 2.6% | ||||||||
SEI Daily Income Trust, Government Fund, Cl F | ||||||||
0.840%**† | 106,620,178 | 106,620 | ||||||
Total Cash Equivalent | 106,620 | |||||||
|
| |||||||
Total Investments in Securities— 100.7% |
| $ | 4,147,256 | |||||
|
| |||||||
|
| |||||||
22 |
SEI Institutional International Trust / Annual Report / September 30, 2017 |
A list of the open futures contracts held by the Fund at September 30, 2017, is as follows:
| Type of Contract | Number of Contracts Long | Expiration Date | Notional Amount ($ Thousands) | Value ($ Thousands) | Unrealized Appreciation (Depreciation) ($ Thousands) | |||||||||||||||
| DJ Euro Stoxx 50 Index | 1,048 | Dec-2017 | 43,788 | 44,305 | 1,087 | |||||||||||||||
| FTSE 100 Index | 245 | Dec-2017 | 23,846 | 24,092 | (154 | ) | ||||||||||||||
| Hang Seng Index | 34 | Oct-2017 | 5,953 | 5,989 | 36 | |||||||||||||||
| SPI 200 Index | 90 | Dec-2017 | 10,229 | 10,007 | (69 | ) | ||||||||||||||
| Topix Index | 196 | Dec-2017 | 28,350 | 29,165 | 1,745 | |||||||||||||||
|
| |||||||||||||||||||
| 112,166 | 113,558 | 2,645 | ||||||||||||||||||
|
| |||||||||||||||||||
| Percentages are based on Net Assets of $4,118,501 ($ Thousands). |
| * | Non-income producing security. |
| ** | Rate shown is the 7-day effective yield as of September 30, 2017. |
| † | Investment in Affiliated Security (See Note 5). |
| ‡ | Real Estate Investment Trust. |
| (A) | Certain securities or partial positions of certain securities are on loan at September 30, 2017 (see Note 9). The total market value of securities on loan at September 30, 2017 was $130,618 ($ Thousands). |
| (B) | Security exempt from registration under Rule 144A of the Securities Act of 1933. These securities may be resold in transactions exempt from registration normally to qualified institutions. On September 30, 2017, the value of these securities amounted to $42,783 ($ Thousands), representing 1.0% of the Net Assets of the Fund. |
| (C) | This security was purchased with cash collateral held from securities on loan (see Note 9). The total market value of such securities as of September 30, 2017 was $131,091 ($ Thousands). |
ADR — American Depositary Receipt
AEX — Amsterdam Stock Exchange
Cl — Class
DJ — Dow Jones
FTSE — Financial Times and Stock Exchange
L.P. — Limited Partnership
LSE — London Stock Exchange
NYSE — New York Stock Exchange
SPI — Share Price Index
The following is a list of the level of inputs used as of September 30, 2017, in valuing the Fund’s investments and other financial instruments carried at value ($ Thousands):
| Investments in Securities | Level 1 | Level 2 | Level 3 | Total | ||||||||||||
Common Stock | $ | 3,814,027 | $ | 23,793 | $ | – | $ | 3,837,820 | ||||||||
Preferred Stock | 71,720 | – | – | 71,720 | ||||||||||||
Rights | 5 | – | – | 5 | ||||||||||||
Affiliated Partnership | – | 131,091 | – | 131,091 | ||||||||||||
Cash Equivalent | 106,620 | – | – | 106,620 | ||||||||||||
|
|
|
|
|
|
|
| |||||||||
Total Investments in Securities | $ | 3,992,372 | $ | 154,884 | $ | — | $ | 4,147,256 | ||||||||
|
|
|
|
|
|
|
| |||||||||
| Other Financial Instruments | Level 1 | Level 2 | Level 3 | Total | ||||||||||||
Futures Contracts * | ||||||||||||||||
Unrealized Appreciation | $ | 2,868 | $ | – | $ | – | $ | 2,868 | ||||||||
Unrealized Depreciation | (223 | ) | – | – | (223 | ) | ||||||||||
|
|
|
|
|
|
|
| |||||||||
Total Other Financial Instruments | $ | 2,645 | $ | – | $ | – | $ | 2,645 | ||||||||
|
|
|
|
|
|
|
| |||||||||
*Futures contracts are valued at the unrealized appreciation (depreciation) on the instrument.
For the year ended September 30, 2017, there were transfers between Level 1 and Level 2 assets and liabilities. The primary reason for changes in the classifications between Levels 1 and 2 occurs when foreign equity securities are fair valued using other observable market-based inputs in place of the closing exchange price due to events occurring after the close of the exchange or market on which the investment is principally traded.
For the year ended September 30, 2017, there were no transfers between Level 2 and Level 3 assets and liabilities.
For more information on valuation inputs, see Note 2 - Significant Accounting Policies in Notes to Financial Statements.
Amounts designated as “–” are $0 or have been rounded to $0.
The following in a summary of the transactions with affiliates for the year ended September 30, 2017 ($ Thousands):
| Security Description | Value at 9/30/2016 | Purchases at Cost | Proceeds from Sales | Realized Gain (Loss) | Change in Unrealized Appreciation (Depreciation) | Value 9/30/2017 | Dividend Income | |||||||||||||||||||||
SEI Liquidity Fund, L.P. | $ | 284,416 | $ | 1,464,028 | $ | (1,617,354 | ) | $ | (3 | ) | $ | 4 | $ | 131,091 | $ | 1,925 | ||||||||||||
SEI Daily Income Trust, Government Fund, Cl F | 34,929 | 636,119 | (564,428 | ) | — | — | 106,620 | 589 | ||||||||||||||||||||
|
|
|
|
|
|
|
|
|
|
|
|
|
| |||||||||||||||
Totals | $ | 319,345 | $ | 2,100,147 | $ | (2,181,782 | ) | $ | (3 | ) | $ | 4 | $ | 237,711 | $ | 2,514 | ||||||||||||
|
|
|
|
|
|
|
|
|
|
|
|
|
| |||||||||||||||
The accompanying notes are an integral part of the financial statements.
SEI Institutional International Trust / Annual Report / September 30, 2017 |
23 |
SCHEDULE OF INVESTMENTS
September 30, 2017
Emerging Market Equity Fund

†Percentages based on total investments. Includes investments held as collateral for securities on loan (see Note 9).
| Description | Shares | Market Value ($ Thousands) | ||||||
COMMON STOCK — 92.9% | ||||||||
Argentina — 0.5% | ||||||||
Arcos Dorados Holdings, | 240,500 | $ | 2,417 | |||||
Cresud SACIF y A ADR * | 84,609 | 1,580 | ||||||
Grupo Supervielle ADR | 56,116 | 1,386 | ||||||
IRSA Inversiones y Representaciones ADR * | 75,700 | 1,858 | ||||||
YPF ADR | 141,126 | 3,144 | ||||||
|
| |||||||
| 10,385 | ||||||||
|
| |||||||
Austria — 0.2% | ||||||||
Erste Group Bank | 107,171 | 4,630 | ||||||
|
| |||||||
Brazil — 6.4% | ||||||||
Ambev | 352,400 | 2,344 | ||||||
Ambev ADR | 154,570 | 1,019 | ||||||
Arezzo Industria e Comercio | 69,300 | 1,102 | ||||||
Atacadao Distribuicao Comercio e Industria * | 965,900 | 4,733 | ||||||
B2W Cia Digital * | 1,495,884 | 9,907 | ||||||
B3 - Brasil Bolsa Balcao * | 668,200 | 5,042 | ||||||
Banco Bradesco ADR * | 1,144,864 | 12,674 | ||||||
Banco do Brasil * | 330,100 | 3,647 | ||||||
Banco Santander Brasil ADR | 117,500 | 1,027 | ||||||
BB Seguridade Participacoes | 48,200 | 434 | ||||||
Braskem ADR | 25,510 | 682 | ||||||
BRF ADR *(A) | 182,300 | 2,627 | ||||||
CCR | 174,013 | 979 | ||||||
Cia de Saneamento Basico do Estado de Sao Paulo * | 73,400 | 771 | ||||||
Cielo | 253,931 | 1,761 | ||||||
Cosan Industria e Comercio | 404,237 | 4,616 | ||||||
Cyrela Brazil Realty Empreendimentos e Participacoes | 173,700 | 754 | ||||||
EDP - Energias do Brasil * | 398,900 | 1,914 | ||||||
Energisa | 488,038 | 3,919 | ||||||
Engie Brasil Energia | 31,600 | 365 | ||||||
| Description | Shares | Market Value ($ Thousands) | ||||||
COMMON STOCK (continued) |
| |||||||
Estacio Participacoes | 54,400 | $ | 533 | |||||
Fleury | 99,800 | 929 | ||||||
Gerdau ADR | 86,032 | 295 | ||||||
Hypermarcas | 502,660 | 5,099 | ||||||
JBS | 214,000 | 576 | ||||||
Kroton Educacional | 1,026,500 | 6,481 | ||||||
Lojas Renner | 258,590 | 2,943 | ||||||
Magazine Luiza | 8,000 | 187 | ||||||
MRV Engenharia e Participacoes | 269,500 | 1,166 | ||||||
Petroleo Brasileiro ADR *(A) | 1,410,203 | 14,158 | ||||||
Porto Seguro * | 93,000 | 1,108 | ||||||
Qualicorp | 288,207 | 3,419 | ||||||
Rumo * | 2,215,686 | 8,462 | ||||||
Smiles | 54,900 | 1,388 | ||||||
Telefonica Brasil ADR | 374,481 | 5,932 | ||||||
TIM Participacoes ADR | 247,200 | 4,519 | ||||||
Vale * | 264,400 | 2,680 | ||||||
Vale ADR, Cl B *(A) | 433,567 | 4,366 | ||||||
|
| |||||||
| 124,558 | ||||||||
|
| |||||||
Canada — 0.7% | ||||||||
First Quantum Minerals | 1,099,951 | 12,322 | ||||||
Parex Resources * | 115,671 | 1,392 | ||||||
|
| |||||||
| 13,714 | ||||||||
|
| |||||||
Chile — 0.6% | ||||||||
Banco Santander Chile | 19,521,854 | 1,453 | ||||||
Centros Comerciales Sudamericanos | 709,481 | 2,172 | ||||||
Cia Cervecerias Unidas ADR | 74,377 | 2,003 | ||||||
Embotelladora Andina ADR, Cl B | 10,559 | 291 | ||||||
Enel Generacion Chile | 557,757 | 488 | ||||||
SACI Falabella | 376,290 | 3,675 | ||||||
Sociedad Quimica y Minera de Chile ADR | 26,800 | 1,492 | ||||||
|
| |||||||
| 11,574 | ||||||||
|
| |||||||
China — 21.3% | ||||||||
51job ADR * | 8,838 | 536 | ||||||
AAC Technologies Holdings | 87,633 | 1,472 | ||||||
Agricultural Bank of China | 15,534,932 | 6,961 | ||||||
Air China | 1,294,000 | 1,075 | ||||||
Alibaba Group Holding | 308,171 | 53,224 | ||||||
Angang Steel (A) | 8,952,768 | 7,897 | ||||||
Anhui Conch Cement (A) | 826,000 | 3,294 | ||||||
ANTA Sports Products (A) | 1,074,069 | 4,517 | ||||||
Baidu ADR * | 133,249 | 33,004 | ||||||
Bank of China | 12,244,105 | 6,035 | ||||||
Beijing Capital International Airport | 1,216,000 | 1,812 | ||||||
Bitauto Holdings ADR * | 24,416 | 1,091 | ||||||
Changyou.com ADR * | 98,500 | 3,902 | ||||||
China Communications Services | 2,440,000 | 1,256 | ||||||
China Construction Bank | 17,490,379 | 14,511 | ||||||
China Life Insurance | 1,033,000 | 3,075 | ||||||
China Merchants Bank | 925,076 | 3,251 | ||||||
China National Building Material (A) | 8,041,000 | 5,570 | ||||||
24 |
SEI Institutional International Trust / Annual Report / September 30, 2017 |
| Description | Shares | Market Value ($ Thousands) | ||||||
COMMON STOCK (continued) |
| |||||||
China Petroleum & Chemical | 7,072,839 | $ | 5,297 | |||||
China Railway Construction (A) | 938,500 | 1,190 | ||||||
China Shenhua Energy | 2,003,000 | 4,708 | ||||||
China Telecom | 3,486,000 | 1,785 | ||||||
China Vanke | 411,700 | 1,355 | ||||||
Chongqing Rural Commercial Bank | 1,772,612 | 1,123 | ||||||
CITIC Securities | 3,165,900 | 6,964 | ||||||
COSCO SHIPPING Holdings *(A) | 1,202,538 | 645 | ||||||
Ctrip.com International ADR * | 206,230 | 10,877 | ||||||
Dongfeng Motor Group (A) | 2,722,000 | 3,596 | ||||||
ENN Energy Holdings (A) | 303,000 | 2,196 | ||||||
Fosun International (A) | 169,000 | 356 | ||||||
Great Wall Motor | 463,500 | 570 | ||||||
Guangzhou R&F Properties | 2,208,000 | 5,117 | ||||||
Huaneng Power International | 1,120,000 | 693 | ||||||
Industrial & Commercial Bank of China | 35,423,868 | 26,305 | ||||||
JD.com ADR * | 193,642 | 7,397 | ||||||
Jiangsu Expressway | 742,000 | 1,136 | ||||||
KWG Property Holding | 441,370 | 472 | ||||||
Longfor Properties | 373,500 | 942 | ||||||
NetEase ADR | 23,974 | 6,325 | ||||||
New Oriental Education & Technology Group ADR | 29,779 | 2,628 | ||||||
PICC Property & Casualty | 2,773,700 | 4,894 | ||||||
Ping An Insurance Group of China | 2,256,357 | 17,318 | ||||||
SINA * | 177,159 | 25,877 | ||||||
Sino-Ocean Group Holding | 3,069,500 | 2,047 | ||||||
Sinopec Engineering Group | 1,606,000 | 1,417 | ||||||
Sinopec Shanghai Petrochemical | 9,304,000 | 5,539 | ||||||
Sinotrans | 1,006,000 | 511 | ||||||
Sinotrans Shipping | 465,500 | 134 | ||||||
Sinotruk Hong Kong | 266,500 | 369 | ||||||
Sohu.com * | 171,500 | 9,338 | ||||||
TAL Education Group ADR *(A) | 48,780 | 1,644 | ||||||
Tencent Holdings | 1,476,425 | 63,551 | ||||||
Tingyi Cayman Islands Holding (A) | 2,254,000 | 3,394 | ||||||
TravelSky Technology | 735,000 | 1,915 | ||||||
Tsingtao Brewery (A) | 288,000 | 1,102 | ||||||
Uni-President China Holdings | 3,953,400 | 3,892 | ||||||
Vipshop Holdings ADR * | 278,771 | 2,450 | ||||||
Want Want China Holdings (A) | 2,982,000 | 2,096 | ||||||
Weibo ADR *(A) | 46,760 | 4,626 | ||||||
Weichai Power (A) | 1,476,000 | 1,618 | ||||||
Zhejiang Expressway | 2,292,000 | 2,849 | ||||||
Zhuzhou CRRC Times Electric (A) | 1,044,200 | 5,849 | ||||||
ZTE * | 1,030,200 | 3,370 | ||||||
ZTO Express Cayman ADR *(A) | 252,700 | 3,548 | ||||||
|
|
| ||||||
| 413,508 | ||||||||
|
|
| ||||||
Colombia — 0.2% | ||||||||
Bancolombia ADR, Cl R | 89,055 | 4,078 | ||||||
|
|
| ||||||
| Description | Shares | Market Value ($ Thousands) | ||||||
COMMON STOCK (continued) | ||||||||
Czech Republic — 0.2% | ||||||||
CEZ | 28,956 | $ | 581 | |||||
Komercni Banka | 68,250 | 2,980 | ||||||
|
| |||||||
| 3,561 | ||||||||
|
| |||||||
Egypt — 0.2% | ||||||||
Commercial International Bank Egypt SAE GDR | 911,421 | 4,142 | ||||||
|
| |||||||
Greece — 0.4% | ||||||||
Eurobank Ergasias * | 4,031,961 | 3,565 | ||||||
Hellenic Telecommunications Organization | 103,411 | 1,251 | ||||||
JUMBO | 18,292 | 303 | ||||||
National Bank of Greece * | 8,609,353 | 2,921 | ||||||
OPAP | 14,030 | 148 | ||||||
Titan Cement | 5,429 | 138 | ||||||
|
| |||||||
| 8,326 | ||||||||
|
| |||||||
Hong Kong — 7.8% | ||||||||
ASM Pacific Technology | 290,000 | 4,177 | ||||||
Beijing Enterprises Holdings | 474,200 | 2,550 | ||||||
Beijing Enterprises Water Group | 3,460,000 | 2,786 | ||||||
Brilliance China Automotive Holdings (A) | 4,989,808 | 13,288 | ||||||
Chaoda Modern Agriculture * | 2,056,181 | 49 | ||||||
China Conch Venture Holdings | 766,500 | 1,492 | ||||||
China Everbright International (A) | 5,056,100 | 6,344 | ||||||
China Gas Holdings (A) | 818,000 | 2,451 | ||||||
China High Precision Automation Group * | 1,385,624 | — | ||||||
China Medical System Holdings | 4,895,200 | 8,549 | ||||||
China Mengniu Dairy *(A) | 1,358,000 | 3,799 | ||||||
China Mobile | 1,235,541 | 12,520 | ||||||
China Mobile ADR | 111,540 | 5,640 | ||||||
China Overseas Land & Investment | 1,112,549 | 3,618 | ||||||
China Resources Power Holdings | 1,772,000 | 3,199 | ||||||
China State Construction International | ||||||||
Holdings | 5,177,923 | 7,544 | ||||||
China Taiping Insurance Holdings | 678,791 | 1,816 | ||||||
China Travel International Investment Hong Kong | 786,000 | 288 | ||||||
CITIC | 3,032,000 | 4,480 | ||||||
CNOOC | 4,940,607 | 6,376 | ||||||
CSPC Pharmaceutical Group | 564,000 | 944 | ||||||
Fuyao Glass Industry Group (B) | 30,400 | 110 | ||||||
Galaxy Entertainment Group * | 944,548 | 6,651 | ||||||
Geely Automobile Holdings | 569,000 | 1,603 | ||||||
Guangzhou Automobile Group | 1,704,000 | 3,944 | ||||||
Haier Electronics Group | 1,319,100 | 3,215 | ||||||
Hengan International Group (A) | 149,500 | 1,384 | ||||||
Li Ning * | 2,994,500 | 2,668 | ||||||
Minth Group | 668,350 | 3,500 | ||||||
People’s Insurance Group of China | 4,215,000 | 1,883 | ||||||
Semiconductor Manufacturing International *(A) | 1,994,000 | 2,252 | ||||||
Shandong Weigao Group Medical Polymer | 1,132,000 | 801 | ||||||
SEI Institutional International Trust / Annual Report / September 30, 2017 |
25 |
SCHEDULE OF INVESTMENTS
September 30, 2017
Emerging Market Equity Fund (Continued)
| Description | Shares | Market Value ($ Thousands) | ||||||
COMMON STOCK (continued) | ||||||||
Shanghai Industrial Holdings | 295,000 | $ | 893 | |||||
Shimao Property Holdings | 1,201,500 | 2,606 | ||||||
Sihuan Pharmaceutical Holdings Group | 1,520,000 | 553 | ||||||
Sino Biopharmaceutical | 3,574,200 | 3,780 | ||||||
SMI Holdings Group (A) | 1,911,200 | 1,006 | ||||||
Sun Art Retail Group (A) | 2,367,000 | 2,197 | ||||||
Sunny Optical Technology Group | 835,394 | 13,284 | ||||||
Techtronic Industries | 782,000 | 4,175 | ||||||
United RUSAL | 2,253,000 | 1,699 | ||||||
Yuexiu Property | 6,198,000 | 1,262 | ||||||
|
|
| ||||||
| 151,376 | ||||||||
|
|
| ||||||
Hungary — 0.2% | ||||||||
MOL Hungarian Oil & Gas | 161,408 | 1,843 | ||||||
Richter Gedeon Nyrt | 85,263 | 2,125 | ||||||
|
|
| ||||||
| 3,968 | ||||||||
|
|
| ||||||
India — 8.6% | ||||||||
Adani Ports & Special Economic Zone | 1,111,515 | 6,411 | ||||||
Apollo Tyres | 171,448 | 645 | ||||||
APS Holdings * | 1 | – | ||||||
Aurobindo Pharma | 146,689 | 1,553 | ||||||
Axis Bank | 350,513 | 2,732 | ||||||
Bajaj Auto | 111,081 | 5,288 | ||||||
Bharat Forge | 323,712 | 2,919 | ||||||
Bharat Petroleum | 92,280 | 666 | ||||||
Bharti Infratel | 1,027,078 | 6,264 | ||||||
Cummins India | 231,979 | 3,283 | ||||||
Dabur India | 591,637 | 2,763 | ||||||
Dewan Housing Finance | 387,915 | 3,264 | ||||||
Glenmark Pharmaceuticals | 174,650 | 1,600 | ||||||
HCL Technologies | 579,172 | 7,757 | ||||||
HDFC Bank ADR | 76,559 | 7,378 | ||||||
Hero MotoCorp | 52,111 | 3,011 | ||||||
Hexaware Technologies | 83,114 | 343 | ||||||
Hindalco Industries | 577,782 | 2,128 | ||||||
Hindustan Petroleum | 169,941 | 1,110 | ||||||
Hindustan Unilever | 136,726 | 2,457 | ||||||
Housing Development Finance | 201,845 | 5,383 | ||||||
ICICI Bank | 1,095,787 | 4,640 | ||||||
ICICI Bank ADR | 1,173,866 | 10,048 | ||||||
Indiabulls Housing Finance | 141,972 | 2,623 | ||||||
Indian Oil | 135,150 | 829 | ||||||
Infosys | 439,661 | 6,057 | ||||||
Infosys ADR (A) | 56,388 | 823 | ||||||
ITC | 362,200 | 1,432 | ||||||
Mahindra & Mahindra | 24,117 | 463 | ||||||
Mahindra & Mahindra Financial Services | 387,071 | 2,444 | ||||||
Maruti Udyog | 3,375 | 412 | ||||||
Muthoot Finance | 126,454 | 919 | ||||||
National Aluminium | 154,450 | 185 | ||||||
NHPC | 1,617,096 | 670 | ||||||
NMDC | 219,795 | 396 | ||||||
| Description | Shares | Market Value ($ Thousands) | ||||||
COMMON STOCK (continued) | ||||||||
Oil & Natural Gas | 429,502 | $ | 1,124 | |||||
Oil India | 87,864 | 476 | ||||||
Parag Milk Foods (B) | 276,910 | 1,042 | ||||||
PC Jeweller | 85,641 | 434 | ||||||
Petronet LNG | 599,012 | 2,120 | ||||||
Power Finance | 3,184,180 | 5,942 | ||||||
Power Grid Corp of India | 1,069,379 | 3,454 | ||||||
Prestige Estates Projects | 456,135 | 1,908 | ||||||
Reliance Capital | 149,206 | 1,339 | ||||||
Reliance Home Finance * | 88,684 | 135 | ||||||
Reliance Industries | 405,282 | 4,845 | ||||||
Reliance Industries GDR (B) | 762,422 | 18,184 | ||||||
Rural Electrification | 337,479 | 790 | ||||||
SH Kelkar (B) | 384,504 | 1,481 | ||||||
Shriram Transport Finance | 202,782 | 3,273 | ||||||
Tata Chemicals | 191,289 | 1,884 | ||||||
Tata Consultancy Services | 165,890 | 6,187 | ||||||
Tata Global Beverages | 398,744 | 1,256 | ||||||
Tata Motors ADR * | 83,348 | 2,606 | ||||||
Tata Steel | 55,651 | 556 | ||||||
Tech Mahindra | 358,583 | 2,513 | ||||||
Vedanta | 1,346,407 | 6,478 | ||||||
Zee Entertainment Enterprises | 130,355 | 1,038 | ||||||
|
|
| ||||||
| 167,961 | ||||||||
|
|
| ||||||
Indonesia — 1.8% | ||||||||
Adaro Energy | 6,555,500 | 888 | ||||||
Astra International | 5,383,800 | 3,158 | ||||||
Bank Central Asia | 1,594,573 | 2,403 | ||||||
Bank Negara Indonesia Persero | 3,751,300 | 2,061 | ||||||
Bank Rakyat Indonesia Persero | 7,207,361 | 8,174 | ||||||
Matahari Department Store | 4,500,300 | 3,099 | ||||||
Perusahaan Gas Negara Persero | 2,115,700 | 247 | ||||||
Sumber Alfaria Trijaya | 33,071,700 | 1,706 | ||||||
Surya Citra Media | 5,994,700 | 975 | ||||||
Tambang Batubara Bukit Asam | 1,035,800 | 804 | ||||||
Telekomunikasi Indonesia Persero | 15,821,315 | 5,497 | ||||||
United Tractors | 2,170,130 | 5,156 | ||||||
|
|
| ||||||
| 34,168 | ||||||||
|
|
| ||||||
Jordan — 0.1% | ||||||||
Hikma Pharmaceuticals (A) | 49,350 | 802 | ||||||
|
|
| ||||||
Malaysia — 0.3% | ||||||||
AirAsia | 354,700 | 290 | ||||||
AMMB Holdings | 356,900 | 369 | ||||||
Bursa Malaysia | 53,300 | 126 | ||||||
Genting | 281,400 | 636 | ||||||
Inari Amertron | 4,324,350 | 2,601 | ||||||
Kuala Lumpur Kepong | 97,500 | 567 | ||||||
Petronas Dagangan | 73,700 | 425 | ||||||
Top Glove | 255,600 | 336 | ||||||
UEM Sunrise * | 2,512,095 | 678 | ||||||
26 |
SEI Institutional International Trust / Annual Report / September 30, 2017 |
| Description | Shares | Market Value ($ Thousands) | ||||||
COMMON STOCK (continued) | ||||||||
Westports Holdings | 469,900 | $ | 424 | |||||
|
|
| ||||||
| 6,452 | ||||||||
|
|
| ||||||
Mexico — 3.5% | ||||||||
America Movil, Ser L | 1,068,474 | 951 | ||||||
America Movil ADR, Cl L | 199,935 | 3,549 | ||||||
Cemex ADR * | 306,518 | 2,783 | ||||||
Coca-Cola Femsa ADR | 105,272 | 8,120 | ||||||
El Puerto de Liverpool (A) | 53,700 | 435 | ||||||
Fomento Economico Mexicano | 425,700 | 4,076 | ||||||
Fomento Economico Mexicano ADR | 45,873 | 4,382 | ||||||
Genomma Lab Internacional, Cl B * | 158,600 | 202 | ||||||
Gentera | 1,192,800 | 1,938 | ||||||
Gruma, Cl B | 79,885 | 1,176 | ||||||
Grupo Aeroportuario del Sureste, Cl B | 19,620 | 375 | ||||||
Grupo Financiero Banorte, Cl O | 2,122,322 | 14,652 | ||||||
Grupo Financiero Santander Mexico, | 276,900 | 564 | ||||||
Grupo Financiero Santander Mexico ADR | 368,965 | 3,723 | ||||||
Grupo GICSA * | 2,047,600 | 1,350 | ||||||
Grupo Mexico, Ser B | 1,614,200 | 4,958 | ||||||
Grupo Televisa ADR | 154,225 | 3,805 | ||||||
Industrias Bachoco ADR | 5,760 | 383 | ||||||
Infraestructura Energetica Nova | 533,700 | 2,997 | ||||||
Kimberly-Clark de Mexico, Cl A | 319,100 | 652 | ||||||
Megacable Holdings | 164,200 | 686 | ||||||
Unifin Financiera | 564,300 | 1,897 | ||||||
Wal-Mart de Mexico | 2,249,234 | 5,165 | ||||||
|
|
| ||||||
| 68,819 | ||||||||
|
|
| ||||||
Netherlands — 0.1% | ||||||||
VEON ADR | 221,060 | 924 | ||||||
|
|
| ||||||
Norway — 0.0% | ||||||||
Yara International | 17,095 | 766 | ||||||
|
|
| ||||||
Peru — 0.9% | ||||||||
Cia de Minas Buenaventura ADR | 420,887 | 5,383 | ||||||
Credicorp | 55,399 | 11,358 | ||||||
|
|
| ||||||
| 16,741 | ||||||||
|
|
| ||||||
Philippines — 0.8% | ||||||||
Ayala | 122,380 | 2,337 | ||||||
BDO Unibank | 1,897,736 | 4,883 | ||||||
Cebu Air | 201,950 | 436 | ||||||
DMCI Holdings | 1,652,700 | 507 | ||||||
Globe Telecom | 10,370 | 418 | ||||||
GT Capital Holdings | 59,375 | 1,357 | ||||||
International Container Terminal Services | 166,080 | 340 | ||||||
Metropolitan Bank & Trust | 1,261,910 | 2,149 | ||||||
Pilipinas Shell Petroleum | 941,740 | 1,261 | ||||||
PLDT | 40,600 | 1,333 | ||||||
Semirara Mining & Power, Cl A | 263,280 | 242 | ||||||
Vista Land & Lifescapes | 2,371,200 | 297 | ||||||
|
|
| ||||||
| 15,560 | ||||||||
|
|
| ||||||
| Description | Shares | Market Value ($ Thousands) | ||||||
COMMON STOCK (continued) | ||||||||
Poland — 0.9% | ||||||||
Dino Polska *(B) | 222,000 | $ | 4,042 | |||||
Energa | 267,913 | 985 | ||||||
Eurocash | 29,662 | 315 | ||||||
KGHM Polska Miedz | 62,071 | 2,000 | ||||||
Orange Polska * | 228,925 | 332 | ||||||
PLAY Communications *(B) | 375,904 | 3,825 | ||||||
Polski Koncern Naftowy Orlen | 33,209 | 1,109 | ||||||
Powszechna Kasa Oszczednosci Bank | ||||||||
Polski * | 215,822 | 2,093 | ||||||
Powszechny Zaklad Ubezpieczen (A) | 198,615 | 2,507 | ||||||
|
| |||||||
| 17,208 | ||||||||
|
| |||||||
Portugal — 0.2% | ||||||||
Galp Energia, Cl B | 237,080 | 4,203 | ||||||
|
| |||||||
Qatar — 0.1% | ||||||||
Industries Qatar QSC | 5,690 | 143 | ||||||
Ooredoo QSC | 33,024 | 752 | ||||||
Qatar National Bank | 20,129 | 676 | ||||||
|
| |||||||
| 1,571 | ||||||||
|
| |||||||
Russia — 5.0% | ||||||||
Detsky Mir | 952,100 | 1,699 | ||||||
Etalon Group GDR | 56,800 | 235 | ||||||
Gazprom ADR | 1,721,417 | 7,213 | ||||||
LUKOIL ADR | 254,406 | 13,483 | ||||||
Magnit GDR | 181,447 | 7,430 | ||||||
Mail.Ru Group GDR * | 147,545 | 4,847 | ||||||
Mobile TeleSystems ADR | 167,132 | 1,745 | ||||||
Novatek GDR | 241 | 28 | ||||||
Novolipetsk Steel GDR | 147,532 | 3,356 | ||||||
Rosneft Oil GDR | 686,493 | 3,813 | ||||||
Sberbank of Russia ADR | 1,870,354 | 26,677 | ||||||
Surgutneftegas ADR | 123,038 | 624 | ||||||
X5 Retail Group GDR * | 392,967 | 17,640 | ||||||
Yandex, Cl A * | 247,258 | 8,147 | ||||||
|
| |||||||
| 96,937 | ||||||||
|
| |||||||
South Africa — 3.7% | ||||||||
AngloGold Ashanti ADR | 58,100 | 540 | ||||||
Aspen Pharmacare Holdings | 133,112 | 2,993 | ||||||
AVI | 102,853 | 746 | ||||||
Barclays Africa Group | 165,855 | 1,707 | ||||||
Barloworld | 130,437 | 1,203 | ||||||
Bid (A) | 141,785 | 3,191 | ||||||
Bidvest Group | 25,142 | 322 | ||||||
Capitec Bank Holdings | 38,116 | 2,425 | ||||||
Discovery | 105,952 | 1,104 | ||||||
Exxaro Resources | 191,178 | 1,739 | ||||||
FirstRand | 1,770,420 | 6,822 | ||||||
Foschini Group | 44,056 | 443 | ||||||
Gold Fields ADR | 449,277 | 1,936 | ||||||
Imperial Holdings | 94,580 | 1,339 | ||||||
SEI Institutional International Trust / Annual Report / September 30, 2017 |
27 |
SCHEDULE OF INVESTMENTS
September 30, 2017
Emerging Market Equity Fund (Continued)
| Description | Shares | Market Value ($ Thousands) | ||||||
COMMON STOCK (continued) | ||||||||
Investec | 80,288 | $ | 583 | |||||
JSE | 243,200 | 2,231 | ||||||
Liberty Holdings | 190,704 | 1,486 | ||||||
Life Healthcare Group Holdings | 1,582,254 | 2,777 | ||||||
MMI Holdings | 543,731 | 699 | ||||||
Mondi | 87,546 | 2,344 | ||||||
MTN Group | 86,193 | 794 | ||||||
Murray & Roberts Holdings | 269,889 | 320 | ||||||
Naspers, Cl N | 75,295 | 16,283 | ||||||
NEPI Rockcastle | 21,753 | 296 | ||||||
Novus Holdings | 26,043 | 13 | ||||||
Petra Diamonds * | 832,419 | 938 | ||||||
Pick n Pay Stores | 160,306 | 684 | ||||||
Sappi | 171,159 | 1,167 | ||||||
Sasol | 107,285 | 2,948 | ||||||
SPAR Group | 110,108 | 1,362 | ||||||
Standard Bank Group | 406,550 | 4,752 | ||||||
Telkom | 402,637 | 1,768 | ||||||
Truworths International | 247,748 | 1,417 | ||||||
Vodacom Group | 135,676 | 1,619 | ||||||
Wilson Bayly Holmes-Ovcon | 45,758 | 499 | ||||||
Woolworths Holdings | 241,346 | 1,070 | ||||||
|
|
| ||||||
| 72,560 | ||||||||
|
|
| ||||||
South Korea — 12.6% | ||||||||
Amorepacific (A) | 3,000 | 680 | ||||||
BGF retail (A) | 55,294 | 4,007 | ||||||
Cheil Worldwide | 22,184 | 353 | ||||||
CJ CGV (A) | 31,048 | 1,746 | ||||||
CJ O Shopping | 3,621 | 626 | ||||||
Com2uSCorp (A) | 23,510 | 2,566 | ||||||
Coway | 86,852 | 7,128 | ||||||
DGB Financial Group | 75,445 | 692 | ||||||
Dongbu Insurance | 19,852 | 1,265 | ||||||
Doosan Bobcat (A) | 93,943 | 2,998 | ||||||
GS Home Shopping | 4,031 | 764 | ||||||
Hana Financial Group | 51,446 | 2,127 | ||||||
Hanon Systems | 85,481 | 940 | ||||||
Hyosung | 20,667 | 2,625 | ||||||
Hyundai Engineering & Construction | 10,079 | 338 | ||||||
Hyundai Marine & Fire Insurance (A) | 131,488 | 5,201 | ||||||
Hyundai Motor | 42,788 | 5,622 | ||||||
Hyundai Robotics * | 15,490 | 5,761 | ||||||
Industrial Bank of Korea | 88,400 | 1,111 | ||||||
ING Life Insurance Korea (A)(B) | 168,533 | 6,982 | ||||||
Kangwon Land | 123,447 | 3,772 | ||||||
KB Financial Group | 38,347 | 1,878 | ||||||
KB Financial Group ADR | 60,897 | 2,986 | ||||||
KCC | 8,106 | 2,650 | ||||||
Kia Motors | 52,720 | 1,457 | ||||||
Korea Aerospace Industries (A) | 122,013 | 4,655 | ||||||
Korea Electric Power | 71,634 | 2,439 | ||||||
KT ADR | 39,817 | 552 | ||||||
| Description | Shares | Market Value ($ Thousands) | ||||||
COMMON STOCK (continued) | ||||||||
KT&G | 42,527 | $ | 3,917 | |||||
LG | 19,200 | 1,351 | ||||||
LG Chem | 17,130 | 5,863 | ||||||
LG Electronics (A) | 21,509 | 1,547 | ||||||
LG Household & Health Care (A) | 1,567 | 1,281 | ||||||
LG Uplus | 302,138 | 3,522 | ||||||
Lotte Chilsung Beverage | 1,985 | 2,390 | ||||||
Lotte Confectionery (A) | 16,137 | 2,382 | ||||||
LS Cable | 17,261 | 1,188 | ||||||
Mando (A) | 23,192 | 5,153 | ||||||
Meritz Fire & Marine Insurance (A) | 44,892 | 966 | ||||||
Meritz Securities (A) | 181,440 | 697 | ||||||
NAVER (A) | 6,333 | 4,119 | ||||||
NCSoft (A) | 16,145 | 6,548 | ||||||
Netmarble Games *(B) | 2,921 | 386 | ||||||
NH Investment & Securities | 157,898 | 1,875 | ||||||
Orion *(A) | 31,938 | 2,705 | ||||||
Partron (A) | 196,020 | 1,588 | ||||||
POSCO | 15,858 | 4,389 | ||||||
Posco Daewoo | 26,679 | 450 | ||||||
Samsung Electronics | 30,127 | 67,443 | ||||||
Samsung Engineering *(A) | 288,340 | 2,769 | ||||||
Samsung Life Insurance | 25,835 | 2,549 | ||||||
Seoul Semiconductor (A) | 101,019 | 2,214 | ||||||
SFA Engineering (A) | 86,576 | 3,126 | ||||||
Shinhan Financial Group | 67,056 | 2,945 | ||||||
SK Holdings | 3,958 | 995 | ||||||
SK Hynix | 241,976 | 17,514 | ||||||
SK Innovation | 11,952 | 2,077 | ||||||
SK Telecom | 27,311 | 6,081 | ||||||
SK Telecom ADR | 345,820 | 8,504 | ||||||
SPC Samlip (A) | 10,606 | 1,199 | ||||||
Woori Bank (A) | 111,519 | 1,738 | ||||||
|
|
| ||||||
| 245,392 | ||||||||
|
|
| ||||||
Switzerland — 0.2% | ||||||||
Wizz Air Holdings *(B) | 93,725 | 3,598 | ||||||
|
|
| ||||||
Taiwan — 10.0% | ||||||||
Accton Technology | 1,066,200 | 3,428 | ||||||
Acer | 1,411,000 | 705 | ||||||
Advanced Ceramic X | 118,900 | 1,655 | ||||||
Advanced Semiconductor Engineering | 2,415,745 | 2,956 | ||||||
Airtac International Group | 241,681 | 3,331 | ||||||
Asustek Computer | 363,000 | 2,987 | ||||||
Catcher Technology | 252,040 | 2,348 | ||||||
Cathay Financial Holding | 738,885 | 1,175 | ||||||
Chailease Holding | 1,141,404 | 2,752 | ||||||
China Development Financial Holding | 1,803,000 | 541 | ||||||
Chipbond Technology | 574,000 | 958 | ||||||
Compal Electronics | 2,646,000 | 1,880 | ||||||
CTBC Financial Holding | 4,391,000 | 2,751 | ||||||
Cub Elecparts | 155,500 | 1,828 | ||||||
28 |
SEI Institutional International Trust / Annual Report / September 30, 2017 |
| Description | Shares | Market Value ($ Thousands) | ||||||
COMMON STOCK (continued) | ||||||||
Delta Electronics | 948,100 | $ | 4,877 | |||||
Eclat Textile | 219,040 | 2,662 | ||||||
Elite Advanced Laser | 554,160 | 2,056 | ||||||
Elite Material | 683,400 | 3,245 | ||||||
eMemory Technology | 163,200 | 2,091 | ||||||
Epistar * | 1,152,000 | 1,466 | ||||||
Evergreen Marine Taiwan * | 1,585,000 | 915 | ||||||
Farglory Land Development | 364,043 | 411 | ||||||
First Financial Holding | 2,409,480 | 1,545 | ||||||
FLEXium Interconnect | 500,462 | 1,914 | ||||||
Formosa Chemicals & Fibre | 355,000 | 1,079 | ||||||
Formosa Plastics | 272,000 | 823 | ||||||
Foxconn Technology | 671,570 | 1,938 | ||||||
Hiwin Technologies | 347,312 | 3,064 | ||||||
Hon Hai Precision Industry | 5,230,303 | 18,111 | ||||||
Hota Industrial Manufacturing | 1,375,251 | 6,485 | ||||||
Hu Lane Associate | 207,700 | 1,164 | ||||||
Inventec | 3,631,000 | 2,682 | ||||||
Kingpak Technology | 283,110 | 2,542 | ||||||
King’s Town Bank | 424,000 | 447 | ||||||
Largan Precision | 15,446 | 2,715 | ||||||
Lite-On Technology | 1,347,936 | 1,925 | ||||||
MediaTek | 999,100 | 9,374 | ||||||
Merry Electronics | 213,000 | 1,342 | ||||||
Micro-Star International | 1,125,000 | 2,419 | ||||||
Nan Ya Plastics | 201,000 | 495 | ||||||
Nanya Technology | 1,392,000 | 3,939 | ||||||
Parade Technologies | 282,600 | 4,492 | ||||||
Pegatron | 1,496,000 | 3,883 | ||||||
Phison Electronics | 315,000 | 3,740 | ||||||
President Chain Store | 212,000 | 1,786 | ||||||
Quanta Computer | 293,000 | 674 | ||||||
Radiant Opto-Electronics | 461,000 | 1,079 | ||||||
Silicon Motion Technology ADR (A) | 43,940 | 2,110 | ||||||
Taiwan Semiconductor Manufacturing | 6,633,717 | 47,362 | ||||||
Taiwan Semiconductor Manufacturing ADR | 278,066 | 10,441 | ||||||
Win Semiconductors | 461,200 | 2,951 | ||||||
Wistron | 2,611,315 | 2,088 | ||||||
WPG Holdings | 1,239,000 | 1,649 | ||||||
Yuanta Financial Holding | 4,869,000 | 2,095 | ||||||
|
|
| ||||||
| 195,371 | ||||||||
|
|
| ||||||
Thailand — 1.5% | ||||||||
Bangkok Bank Foreign (A) | 376,600 | 2,202 | ||||||
Beauty Community | 4,425,900 | 2,123 | ||||||
Carabao Group | 335,300 | 877 | ||||||
CP Seven Eleven PCL (A) | 1,328,500 | 2,659 | ||||||
Kasikornbank | 340,800 | 2,115 | ||||||
Kiatnakin Bank NVDR (A) | 445,500 | 932 | ||||||
Krung Thai Bank NVDR (A) | 2,721,500 | 1,534 | ||||||
Land and Houses PCL NVDR (A) | 3,276,900 | 973 | ||||||
PTT | 237,150 | 2,901 | ||||||
PTT NVDR | 74,900 | 916 | ||||||
| Description | Shares | Market Value ($ Thousands) | ||||||
COMMON STOCK (continued) | ||||||||
PTT Global Chemical | 1,080,700 | $ | 2,495 | |||||
PTT Global Chemical NVDR | 304,400 | 703 | ||||||
Star Petroleum Refining NVDR | 312,800 | 166 | ||||||
Thai Oil | 2,099,700 | 5,824 | ||||||
Thai Oil NVDR | 386,200 | 1,071 | ||||||
Thanachart Capital NVDR | 662,100 | 968 | ||||||
Tisco Financial Group | 276,600 | 639 | ||||||
Tisco Financial Group NVDR | 240,200 | 555 | ||||||
|
|
| ||||||
| 29,653 | ||||||||
|
|
| ||||||
Turkey — 1.8% | ||||||||
Akbank Turk | 2,007,428 | 5,306 | ||||||
Anadolu Efes Biracilik Ve Malt Sanayii | 192,588 | 1,133 | ||||||
Arcelik | 300,086 | 1,917 | ||||||
Aselsan Elektronik Sanayi Ve Ticaret | 189,025 | 1,398 | ||||||
Coca-Cola Icecek | 97,197 | 1,018 | ||||||
Emlak Konut Gayrimenkul Yatirim Ortakligi *‡ | 2,669,427 | 2,012 | ||||||
Eregli Demir ve Celik Fabrikalari | 1,178,808 | 2,562 | ||||||
Ford Otomotiv Sanayi | 125,073 | 1,604 | ||||||
KOC Holding | 107,066 | 492 | ||||||
Mavi Giyim Sanayi Ve Ticaret, Cl B *(B) | 133,500 | 1,915 | ||||||
TAV Havalimanlari Holding | 270,328 | 1,342 | ||||||
Tofas Turk Otomobil Fabrikasi | 265,385 | 2,305 | ||||||
Turkcell Iletisim Hizmetleri | 1,022,102 | 3,647 | ||||||
Turkcell Iletisim Hizmetleri ADR | 114,135 | 1,007 | ||||||
Turkiye Garanti Bankasi | 1,384,085 | 3,768 | ||||||
Turkiye Is Bankasi, Cl C | 685,689 | 1,307 | ||||||
Ulker Biskuvi Sanayi | 373,314 | 2,031 | ||||||
|
|
| ||||||
| 34,764 | ||||||||
|
|
| ||||||
United Arab Emirates — 0.7% | ||||||||
Abu Dhabi Commercial Bank | �� | 435,745 | 843 | |||||
Aldar Properties | 3,419,100 | 2,171 | ||||||
Dubai Investments | 1,903,333 | 1,202 | ||||||
Dubai Islamic Bank | 2,012,356 | 3,318 | ||||||
Emaar Properties | 2,611,962 | 6,041 | ||||||
First Abu Dhabi Bank | 231,914 | 644 | ||||||
|
|
| ||||||
| 14,219 | ||||||||
|
|
| ||||||
United Kingdom — 1.3% | ||||||||
Anglo American | 122,768 | 2,204 | ||||||
KAZ Minerals * | 882,525 | 9,158 | ||||||
Mail.Ru Group (LSE) GDR *(A) | 21,577 | 711 | ||||||
Novatek (LSE) GDR | 19,315 | 2,266 | ||||||
RusHydro ADR | 692,509 | 994 | ||||||
Tullow Oil *(A) | 3,597,778 | 8,983 | ||||||
|
|
| ||||||
| 24,316 | ||||||||
|
|
| ||||||
United States — 0.1% | ||||||||
Globant * | 36,080 | 1,446 | ||||||
SEI Institutional International Trust / Annual Report / September 30, 2017 |
29 |
SCHEDULE OF INVESTMENTS
September 30, 2017
Emerging Market Equity Fund (Concluded)
| Description | Shares | Market Value ($ Thousands) | ||||||
COMMON STOCK (continued) | ||||||||
PriceSmart | 6,400 | $ | 571 | |||||
|
| |||||||
| 2,017 | ||||||||
|
| |||||||
Total Common Stock (Cost $1,529,001) ($ Thousands) | 1,807,822 | |||||||
|
| |||||||
PREFERRED STOCK — 2.8% | ||||||||
Brazil — 2.2% | ||||||||
Banco Bradesco * | 233,972 | 2,602 | ||||||
Banco do Estado do Rio Grande do Sul | 250,700 | 1,386 | ||||||
Braskem | 36,000 | 482 | ||||||
Cia Brasileira de Distribuicao Grupo Pao de Acucar ADR * | 267,450 | 6,331 | ||||||
Cia Energetica de Minas Gerais | 355,500 | 899 | ||||||
Cia Energetica de Sao Paulo, Cl B | 66,100 | 301 | ||||||
Cia Paranaense de Energia | 67,600 | 599 | ||||||
Itau Unibanco Holding | 602,996 | 8,293 | ||||||
Itau Unibanco Holding ADR | 392,354 | 5,375 | ||||||
Itausa - Investimentos Itau | 737,210 | 2,575 | ||||||
Metalurgica Gerdau, Cl A * | 674,600 | 1,120 | ||||||
Petroleo Brasileiro ADR, Cl A * | 497,355 | 4,804 | ||||||
Randon Implementos e Participacoes | 746,600 | 1,633 | ||||||
Suzano Papel e Celulose, Cl A | 572,800 | 3,332 | ||||||
Telefonica Brasil | 182,000 | 2,898 | ||||||
|
| |||||||
| 42,630 | ||||||||
|
| |||||||
Colombia — 0.1% | ||||||||
Banco Davivienda | 193,315 | 2,189 | ||||||
Bancolombia | 40,841 | 470 | ||||||
|
| |||||||
| 2,659 | ||||||||
|
| |||||||
South Korea — 0.5% | ||||||||
Samsung Electronics | 5,148 | 9,268 | ||||||
|
| |||||||
Total Preferred Stock | 54,557 | |||||||
|
| |||||||
Number of Participation Notes | ||||||||
PARTICIPATION NOTES — 2.0% | ||||||||
China — 0.2% | ||||||||
Wuliangye Yibin, Expires 06/29/2020 * | 525,700 | 4,530 | ||||||
India — 0.1% | ||||||||
Zee Entertainment Enterprises, Expires 09/03/2019 * | 194,847 | 1,554 | ||||||
Luxembourg — 0.6% | ||||||||
Hoa Phat Group JSC, Expires 11/20/2020 * | 786,731 | 1,333 | ||||||
Mahindra & Mahindra Financial Services, Expires 11/26/2018 * | 780,015 | 4,934 | ||||||
| Description | Number of Participation Notes | Market Value ($ Thousands) | ||||||
PARTICIPATION NOTES (continued) |
| |||||||
National Commercial Bank, | 228,475 | $ | 3,117 | |||||
Savola Group, Expires 12/20/2020 * | 186,361 | 2,257 | ||||||
|
| |||||||
| 11,641 | ||||||||
|
| |||||||
Saudi Arabia — 0.3% | ||||||||
Al Tayyar Travel Group, Expires 03/05/2018 * | 236,863 | 2,166 | ||||||
HBSC Bank Savola Group, Expires 01/24/2020 * | 284,680 | 3,431 | ||||||
|
| |||||||
| 5,597 | ||||||||
|
| |||||||
Switzerland — 0.5% | ||||||||
Hangzhou Hikvision, Expires 08/22/2018 * | 1,788,489 | 8,616 | ||||||
|
| |||||||
United States — 0.2% | ||||||||
Motherson Sumi Systems, | 726,846 | 3,742 | ||||||
|
| |||||||
Vietnam — 0.1% | ||||||||
Hoa Phat Group, Expires 07/24/2018 * | 1,444,409 | 2,448 | ||||||
Total Participation Notes | 38,128 | |||||||
|
| |||||||
| Shares | ||||||||
EXCHANGE TRADED FUND — 0.1% |
| |||||||
United States — 0.1% | ||||||||
iShares MSCI Emerging Markets ETF (A) | 50,335 | 2,256 | ||||||
|
| |||||||
Total Exchange Traded Fund | 2,256 | |||||||
|
| |||||||
Face Amount (Thousands) | ||||||||
DEBENTURE BOND — 0.0% | ||||||||
Brazil — 0.0% | ||||||||
Vale, Ser 1997 | ||||||||
0.000%, 09/30/2049 (C) | BRL | 8 | – | |||||
|
| |||||||
Total Debenture Bond | – | |||||||
|
| |||||||
30 |
SEI Institutional International Trust / Annual Report / September 30, 2017 |
| Description | Shares | Market Value ($ Thousands) | ||||||
AFFILIATED PARTNERSHIP — 7.9% |
| |||||||
SEI Liquidity Fund, L.P. | 154,587,294 | $ | 154,588 | |||||
|
| |||||||
Total Affiliated Partnership |
| 154,588 | ||||||
|
| |||||||
CASH EQUIVALENT — 0.4% |
| |||||||
SEI Daily Income Trust, Government Fund, Cl F |
| |||||||
0.840%**† | 7,827,213 | 7,827 | ||||||
|
| |||||||
Total Cash Equivalent |
| 7,827 | ||||||
|
| |||||||
Total Investments in Securities— 106.1% |
| $ | 2,065,178 | |||||
|
| |||||||
Percentages are based on Net Assets of $1,946,409 ($ Thousands).
| * | Non-income producing security. |
| ** | Rate shown is the 7-day effective yield as of September 30, 2017. |
| † | Investment in Affiliated Security (see Note 5). |
| ‡ | Real Estate Investment Trust. |
| (A) | Certain securities or partial positions of certain securities are on loan at September 30, 2017 (see Note 9). The total market value of securities on loan at September 30, 2017 was $146,754 ($ Thousands). |
| (B) | Security exempt from registration under Rule 144A of the Securities Act of 1933. These securities may be resold in transactions exempt from registration normally to qualified institutions.On September 30, 2017, the value of these securities amounted to $41,565 ($ Thousands), representing 2.1% of the Net Assets of the Fund. |
| (C) | Variable or floating rate security, the interest rate of which adjusts periodically based on changes in current interest rates and prepayments on the underlying pool of assets. |
| (D) | This security was purchased with cash collateral held from securities on loan (see Note 9). The total market value of such securities as of September 30, 2017 was $154,588 ($ Thousands). |
ADR — American Depositary Receipt
BRL — Brazilian Real
Cl — Class
ETF — Exchange Traded Fund
GDR — Global Depositary Receipt
JSC — Joint-Stock Company
L.P. — Limited Partnership
LSE — London Stock Exchange
MSCI — Morgan Stanley Capital International
NVDR — Non-Voting Depositary Receipt
PCL — Public Company Limited
QSC — Qatari Shareholding Company
Ser — Series
USD —United States Dollar
The following is a list of the level of inputs used as of September 30, 2017, in valuing the Fund’s investments carried at value ($ Thousands):
| Investments in Securities | Level 1 | Level 2 | Level 3 | Total | ||||||||||||
Common Stock | $ | 1,793,233 | $ | 14,589 | $ | – | $ | 1,807,822 | ||||||||
Preferred Stock | 54,557 | – | – | 54,557 | ||||||||||||
Participation Notes | – | 38,128 | – | 38,128 | ||||||||||||
Exchange Traded Fund | 2,256 | – | – | 2,256 | ||||||||||||
Debenture Bond | – | – | – | – | ||||||||||||
Affiliated Partnership | – | 154,588 | – | 154,588 | ||||||||||||
Cash Equivalent | 7,827 | – | – | 7,827 | ||||||||||||
|
|
|
|
|
|
|
| |||||||||
Total Investments in Securities | $ | 1,857,873 | $ | 207,305 | $ | – | $ | 2,065,178 | ||||||||
|
|
|
|
|
|
|
| |||||||||
For the year ended September 30, 2017, there were transfers between Level 1 and Level 2 assets and liabilities. The primary reason for changes in the classifications between Levels 1 and 2 occurs when foreign equity securities are fair valued using other observable market-based inputs in place of the closing exchange price due to events occurring after the close of the exchange or market on which the investment is principally traded.
For the year ended September 30, 2017, there were no transfers between Level 2 and Level 3 assets and liabilities.
For more information on valuation inputs, see Note 2 - Significant Accounting Policies in Notes to Financial Statements.
Amounts designated as “–” are $0 or have been rounded to $0.
The following is a summary of the transactions with affiliates for the year ended September 30, 2017 ($ Thousands):
| Security Description | Value at 9/30/2016 | Purchases at Cost | Proceeds from Sales | Realized Gain (Loss) | Change in Unrealized Appreciation (Depreciation) | Value 9/30/2017 | Dividend Income | |||||||||||||||||||||
SEI Liquidity Fund, L.P. | $245,981 | $568,910 | $(660,304) | $1 | $— | $154,588 | $1,130 | |||||||||||||||||||||
SEI Daily Income Trust, Government Fund, Cl F | 6,665 | 174,215 | (173,053) | — | — | 7,827 | 60 | |||||||||||||||||||||
|
|
|
|
|
|
|
|
|
|
|
|
|
| |||||||||||||||
Totals | $252,646 | $743,125 | $(833,357) | $1 | $— | $162,415 | $1,190 | |||||||||||||||||||||
|
|
|
|
|
|
|
|
|
|
|
|
|
| |||||||||||||||
The accompanying notes are an integral part of the financial statements.
SEI Institutional International Trust / Annual Report / September 30, 2017 |
31 |
SCHEDULE OF INVESTMENTS
September 30, 2017
International Fixed Income Fund
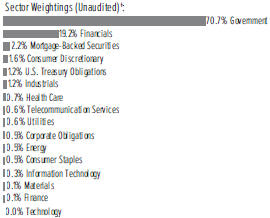
†Percentages based on total investments.
| Description | Face Amount (Thousands) | Market Value ($ Thousands) | ||||||||
GLOBAL BONDS — 89.8% | ||||||||||
Angola — 0.0% | ||||||||||
Republic of Angola Via Northern Lights III | ||||||||||
7.000%, 08/17/2019 | $ | 193 | $ | 198 | ||||||
|
|
| ||||||||
Argentina — 0.3% | ||||||||||
Argentina POM Politica | ||||||||||
26.250%, VAR Argentina Central Bank 7D Repo Ref Rate+0.000%, 06/21/2020 | ARS | 1,179 | 72 | |||||||
Argentine Bonos del Tesoro | ||||||||||
16.000%, 10/17/2023 | 9,727 | 578 | ||||||||
Provincia de Buenos Aires | ||||||||||
9.125%, 03/16/2024 | $ | 170 | 196 | |||||||
Provincia de Cordoba | ||||||||||
7.125%, 06/10/2021 (A) | 280 | 300 | ||||||||
Republic of Argentina | ||||||||||
5.625%, 01/26/2022 | 266 | 280 | ||||||||
5.000%, 01/15/2027 | EUR | 115 | 134 | |||||||
|
|
| ||||||||
| 1,560 | ||||||||||
|
|
| ||||||||
Australia — 2.3% | ||||||||||
Australia & New Zealand Banking Group MTN | ||||||||||
3.625%, 07/18/2022 | 300 | 413 | ||||||||
Commonwealth Bank of Australia MTN | ||||||||||
1.375%, 01/22/2019 | 560 | 677 | ||||||||
Government of Australia | ||||||||||
5.750%, 07/15/2022 | AUD | 885 | 800 | |||||||
4.500%, 04/15/2020 | 270 | 225 | ||||||||
4.500%, 04/21/2033 | 285 | 261 | ||||||||
4.250%, 04/21/2026 | 2,070 | 1,808 | ||||||||
3.750%, 04/21/2037 | 573 | 476 | ||||||||
2.750%, 04/21/2024 | 1,785 | 1,414 | ||||||||
Government of Australia, Ser 122 | ||||||||||
5.250%, 03/15/2019 | 2,000 | 1,645 | ||||||||
| Description | Face Amount (Thousands) | Market Value ($ Thousands) | ||||||||
GLOBAL BONDS (continued) | ||||||||||
Government of Australia, Ser 124 | ||||||||||
5.750%, 05/15/2021 | AUD | 2,350 | $ | 2,070 | ||||||
Westpac Banking MTN | ||||||||||
1.500%, 03/24/2021 | EUR | 220 | 274 | |||||||
1.375%, 04/17/2020 | 230 | 282 | ||||||||
|
|
| ||||||||
| 10,345 | ||||||||||
|
|
| ||||||||
Austria — 2.2% | ||||||||||
JAB Holdings | ||||||||||
2.000%, 05/18/2028 | 300 | 366 | ||||||||
Republic of Austria | ||||||||||
4.150%, 03/15/2037 (A) | 115 | 205 | ||||||||
3.650%, 04/20/2022 (A) | 290 | 404 | ||||||||
3.150%, 06/20/2044 (A) | 475 | 770 | ||||||||
1.950%, 06/18/2019 (A) | 4,875 | 6,017 | ||||||||
1.150%, 10/19/2018 (A) | 300 | 361 | ||||||||
0.750%, 10/20/2026 (A) | 1,612 | 1,940 | ||||||||
Republic of Austria MTN 2.100%, 09/20/2117 (A) | 45 | 54 | ||||||||
|
|
| ||||||||
| 10,117 | ||||||||||
|
|
| ||||||||
Bahrain — 0.1% | ||||||||||
Bahrain Government International Bond | ||||||||||
7.000%, 10/12/2028 | $ | 265 | 270 | |||||||
|
|
| ||||||||
Belgium — 2.7% | ||||||||||
Kingdom of Belgium | ||||||||||
3.750%, 06/22/2045 | EUR | 233 | 402 | |||||||
3.000%, 06/22/2034 (A) | 350 | 523 | ||||||||
1.600%, 06/22/2047 (A) | 450 | 511 | ||||||||
1.000%, 06/22/2031 (A) | 710 | 827 | ||||||||
0.800%, 06/22/2025 (A) | 715 | 872 | ||||||||
0.800%, 06/22/2027 (A) | 1,925 | 2,288 | ||||||||
Kingdom of Belgium, Ser 44 | ||||||||||
5.000%, 03/28/2035 (A) | 94 | 177 | ||||||||
Kingdom of Belgium, Ser 58 | ||||||||||
3.750%, 09/28/2020 (A) | 3,091 | 4,121 | ||||||||
Kingdom of Belgium, Ser 69 | ||||||||||
1.250%, 06/22/2018 | 2,020 | 2,420 | ||||||||
|
|
| ||||||||
| 12,141 | ||||||||||
|
|
| ||||||||
Bermuda — 0.0% | ||||||||||
XLIT | ||||||||||
3.250%, VAR Euribor 3 | ||||||||||
Month+2.900%, 06/29/2047 | 161 | 187 | ||||||||
|
|
| ||||||||
Brazil — 0.6% | ||||||||||
Brazil Notas do Tesouro Nacional, Serie B | ||||||||||
6.000%, 08/15/2050 | BRL | 610 | 652 | |||||||
Brazil Notas do Tesouro Nacional, Serie F | ||||||||||
10.000%, 01/01/2021 | 2,675 | 875 | ||||||||
Cosan | ||||||||||
5.950%, 09/20/2024 | $ | 270 | 277 | |||||||
32 |
SEI Institutional International Trust / Annual Report / September 30, 2017 |
| Description | Face Amount (Thousands) | Market Value ($ Thousands) | ||||||||||
GLOBAL BONDS (continued) | ||||||||||||
Minerva Luxembourg | ||||||||||||
6.500%, 09/20/2026 (A) | $ | 290 | $293 | |||||||||
Odebrecht Finance | ||||||||||||
7.125%, 06/26/2042 | 280 | 105 | ||||||||||
4.375%, 04/25/2025 | 200 | 76 | ||||||||||
Petrobras Global Finance | ||||||||||||
5.999%, 01/27/2028 (A) | 215 | 215 | ||||||||||
Rumo Luxembourg | ||||||||||||
7.375%, 02/09/2024 (A) | 375 | 406 | ||||||||||
|
| |||||||||||
| 2,899 | ||||||||||||
|
| |||||||||||
Canada — 7.6% | ||||||||||||
Bank of Nova Scotia MTN | ||||||||||||
0.750%, 09/17/2021 | EUR | 570 | 693 | |||||||||
Bell Canada | ||||||||||||
3.350%, 06/18/2019 | CAD | 29 | 24 | |||||||||
Bell Canada MTN | ||||||||||||
4.700%, 09/11/2023 | 80 | 69 | ||||||||||
3.250%, 06/17/2020 | 95 | 78 | ||||||||||
Canada Housing Trust No. 1 | ||||||||||||
3.800%, 06/15/2021 (A) | 2,465 | 2,099 | ||||||||||
1.750%, 06/15/2022 (A) | 2,465 | 1,941 | ||||||||||
CDP Financial | ||||||||||||
4.400%, 11/25/2019 (A) | $ | 850 | 895 | |||||||||
Export Development Canada MTN | ||||||||||||
2.400%, 06/07/2021 | AUD | 1,259 | 982 | |||||||||
Government of Canada | ||||||||||||
5.750%, 06/01/2033 | CAD | 660 | 763 | |||||||||
4.000%, 06/01/2041 | 407 | 412 | ||||||||||
1.750%, 09/01/2019 | 2,080 | 1,670 | ||||||||||
1.500%, 06/01/2026 | 4,780 | 3,646 | ||||||||||
1.250%, 09/01/2018 | 1,075 | 858 | ||||||||||
1.000%, 09/01/2022 | 2,975 | 2,293 | ||||||||||
0.750%, 03/01/2021 | 2,440 | 1,894 | ||||||||||
0.750%, 09/01/2021 | 955 | 737 | ||||||||||
Muskrat Falls 3.630%, | ||||||||||||
06/01/2029 (A) | 340 | 291 | ||||||||||
National Bank of Canada | ||||||||||||
1.500%, 03/25/2021 | EUR | 345 | 429 | |||||||||
Province of British Columbia | ||||||||||||
3.250%, 12/18/2021 | CAD | 1,150 | 962 | |||||||||
2.250%, 03/01/2019 | 575 | 464 | ||||||||||
Province of Manitoba Canada | ||||||||||||
3.850%,12/01/2021 | 710 | 606 | ||||||||||
Province of Ontario Canada | ||||||||||||
4.700%, 06/02/2037 | 1,355 | 1,312 | ||||||||||
4.650%, 06/02/2041 | 540 | 528 | ||||||||||
3.500%, 06/02/2024 | 870 | 738 | ||||||||||
3.450%, 06/02/2045 | 355 | 291 | ||||||||||
2.800%, 06/02/2048 | 2,200 | 1,595 | ||||||||||
2.600%, 06/02/2025 | 1,614 | 1,286 | ||||||||||
2.400%, 06/02/2026 | 585 | 455 | ||||||||||
1.950%, 01/27/2023 | 1,000 | 785 | ||||||||||
| Description | Face Amount (Thousands) | Market Value ($ Thousands) | ||||||||||
GLOBAL BONDS (continued) | ||||||||||||
Province of Ontario Canada MTN | ||||||||||||
1.875%, 05/21/2024 | EUR | 150 | $193 | |||||||||
Province of Quebec Canada | ||||||||||||
6.250%, 06/01/2032 | CAD | 720 | 790 | |||||||||
3.700%, 05/20/2026 | AUD | 540 | 429 | |||||||||
3.500%, 12/01/2045 | CAD | 420 | 347 | |||||||||
3.000%, 09/01/2023 | 850 | 702 | ||||||||||
2.750%, 09/01/2025 | 2,175 | 1,750 | ||||||||||
2.250%, 07/17/2023 | EUR | 100 | 131 | |||||||||
Rogers Communications | ||||||||||||
4.000%, 06/06/2022 | CAD | 165 | 139 | |||||||||
Royal Bank of Canada | ||||||||||||
1.625%, 08/04/2020 | EUR | 290 | 360 | |||||||||
Toronto-Dominion Bank MTN | ||||||||||||
0.375%, 01/12/2021 | 345 | 414 | ||||||||||
Yamana Gold | ||||||||||||
4.950%, 07/15/2024 | $ | 286 | 293 | |||||||||
|
| |||||||||||
| 34,344 | ||||||||||||
|
| |||||||||||
China — 0.1% | ||||||||||||
Sinopec Group Overseas Development | ||||||||||||
2.625%, 10/17/2020 | EUR | 240 | 303 | |||||||||
|
| |||||||||||
Colombia — 0.1% | ||||||||||||
Ecopetrol | ||||||||||||
7.375%, 09/18/2043 | $ | 121 | 138 | |||||||||
Republic of Colombia MTN | ||||||||||||
3.875%, 03/22/2026 | EUR | 150 | 204 | |||||||||
|
| |||||||||||
| 342 | ||||||||||||
|
| |||||||||||
Czech Republic — 0.1% | ||||||||||||
Government of Czech Republic | ||||||||||||
4.700%, 09/12/2022 | CZK | 10,860 | 599 | |||||||||
|
| |||||||||||
Denmark — 0.8% | ||||||||||||
Danske Bank | ||||||||||||
3.875%, VAR EUR Swap Annual 5 Yr+2.625%, 10/04/2023 | EUR | 375 | 459 | |||||||||
3.500%, 04/16/2018 | 155 | 187 | ||||||||||
2.000%, 09/08/2021 (A) | $ | 360 | 355 | |||||||||
Danske Bank MTN | ||||||||||||
5.875%, VAR EUR Swap Annual 5 Yr+5.471%, 10/29/2049 | EUR | 344 | 453 | |||||||||
5.375%, VAR ICE LIBOR GDP 3 | GBP | 170 | 236 | |||||||||
Kingdom of Denmark | ||||||||||||
4.500%, 11/15/2039 | DKK | 2,360 | 630 | |||||||||
4.000%, 11/15/2017 | 1,600 | 256 | ||||||||||
1.500%, 11/15/2023 | 5,850 | 1,017 | ||||||||||
|
| |||||||||||
| 3,593 | ||||||||||||
|
| |||||||||||
SEI Institutional International Trust / Annual Report / September 30, 2017 |
33 |
SCHEDULE OF INVESTMENTS
September 30, 2017
International Fixed Income Fund (Continued)
| Description | Face Amount (Thousands) | Market Value ($ Thousands) | ||||||||
GLOBAL BONDS (continued) | ||||||||||
Dominican Republic — 0.1% | ||||||||||
Dominican Republic International Bond | ||||||||||
5.950%, 01/25/2027 (A) | $ | 261 | $ | 281 | ||||||
|
|
| ||||||||
Egypt — 0.1% | ||||||||||
Egypt Government International Bond MTN | ||||||||||
7.500%, 01/31/2027 (A) | 282 | 307 | ||||||||
|
|
| ||||||||
Finland — 0.3% | ||||||||||
Government of Finland | ||||||||||
2.625%, 07/04/2042 (A) | EUR | 195 | 300 | |||||||
1.500%, 04/15/2023 (A) | 340 | 436 | ||||||||
0.500%, 09/15/2027 (A) | 420 | 491 | ||||||||
|
|
| ||||||||
| 1,227 | ||||||||||
|
|
| ||||||||
France — 6.6% | ||||||||||
BNP Paribas | ||||||||||
4.625%, 03/13/2027 (A) | $ | 380 | 402 | |||||||
BNP Paribas MTN | ||||||||||
2.950%, 05/23/2022 (A) | 795 | 802 | ||||||||
BPCE | ||||||||||
5.250%, 04/16/2029 | GBP | 100 | 157 | |||||||
3.750%, 09/13/2021 | EUR | 200 | 272 | |||||||
1.750%, 11/29/2019 | 600 | 741 | ||||||||
1.125%, 01/18/2023 | 300 | 362 | ||||||||
Caisse Centrale du Credit Immobilier de France MTN | ||||||||||
1.125%, 04/22/2019 | 100 | 121 | ||||||||
Caisse Francaise de Financement Local | ||||||||||
3.000%, 10/02/2028 | 100 | 143 | ||||||||
Caisse Francaise de Financement Local MTN | ||||||||||
3.625%, 02/26/2018 | 63 | 76 | ||||||||
CNP Assurances | ||||||||||
4.500%, VAR Euribor 3 Month+4.600%, 06/10/2047 | 200 | 267 | ||||||||
Credit Agricole | ||||||||||
6.500%, VAR EUR Swap Annual 5 Yr+5.120%, 12/31/2049 | 280 | 368 | ||||||||
Credit Agricole MTN | ||||||||||
1.875%, 12/20/2026 | 200 | 246 | ||||||||
1.375%, 05/03/2027 | 900 | 1,077 | ||||||||
Dexia Credit Local MTN | ||||||||||
2.000%, 01/22/2021 | 200 | 253 | ||||||||
1.625%, 10/29/2018 | 565 | 682 | ||||||||
1.375%, 09/18/2019 | 500 | 610 | ||||||||
0.625%, 01/21/2022 | 1,550 | 1,876 | ||||||||
Electricite de France | ||||||||||
5.500%, 03/27/2037 | GBP | 200 | 347 | |||||||
Electricite de France MTN | ||||||||||
5.375%, VAR EUR Swap Annual 12 Yr+3.794%, 12/12/2049 | EUR | 200 | 265 | |||||||
Elis | ||||||||||
3.000%, 04/30/2022 | 250 | 304 | ||||||||
| Description | Face Amount (Thousands) | Market Value ($ Thousands) | ||||||||
GLOBAL BONDS (continued) | ||||||||||
Engie | ||||||||||
0.875%, 03/27/2024 | 300 | $ | 360 | |||||||
Europcar Groupe | ||||||||||
5.750%, 06/15/2022 | 145 | 181 | ||||||||
French Republic Government Bond OAT | ||||||||||
4.000%, 10/25/2038 | 505 | 870 | ||||||||
3.250%, 05/25/2045 | 1,790 | 2,816 | ||||||||
2.500%, 05/25/2030 | 1,845 | 2,554 | ||||||||
2.000%, 05/25/2048 (A) | 250 | 306 | ||||||||
1.750%, 05/25/2023 | 800 | 1,040 | ||||||||
1.750%, 06/25/2039 (A) | 85 | 104 | ||||||||
1.750%, 05/25/2066 (A) | 240 | 263 | ||||||||
1.250%, 05/25/2036 (A) | 1,105 | 1,262 | ||||||||
1.000%, 05/25/2019 | 1,615 | 1,960 | ||||||||
1.000%, 05/25/2027 | 2,110 | 2,552 | ||||||||
0.000%, 05/25/2020 | 543 | 650 | ||||||||
0.000%, 05/25/2021 | 1,350 | 1,616 | ||||||||
0.000%, 05/25/2022 | 2,108 | 2,511 | ||||||||
Groupama | ||||||||||
6.000%, 01/23/2027 | 200 | 292 | ||||||||
Loxam SAS | ||||||||||
4.250%, 04/15/2024 (A) | 190 | 240 | ||||||||
RCI Banque MTN | ||||||||||
1.250%, 06/08/2022 | 200 | 243 | ||||||||
SNCF Reseau | ||||||||||
1.125%, 05/25/2030 | 200 | 233 | ||||||||
Synlab Bondco | ||||||||||
6.250%, 07/01/2022 (A) | 160 | 201 | ||||||||
Total Capital International MTN | ||||||||||
4.250%, 11/26/2021 | AUD | 640 | 526 | |||||||
|
|
| ||||||||
| 30,151 | ||||||||||
|
|
| ||||||||
Germany — 4.4% | ||||||||||
Allianz | ||||||||||
5.625%, VAR Euribor 3 Month+5.000%, 10/17/2042 | EUR | 200 | 287 | |||||||
3.099%, VAR Euribor 3 Month+3.350%, 07/06/2047 | 100 | 127 | ||||||||
Bundesobligation | ||||||||||
0.250%, 10/16/2020 | 1,675 | 2,032 | ||||||||
0.000%, 04/08/2022 | 2,640 | 3,172 | ||||||||
Bundesrepublik Deutschland | ||||||||||
4.000%, 01/04/2037 | 2,265 | 4,100 | ||||||||
2.500%, 07/04/2044 | 257 | 393 | ||||||||
2.500%, 08/15/2046 | 190 | 292 | ||||||||
0.250%, 02/15/2027 | 1,765 | 2,059 | ||||||||
0.000%, 08/15/2026 | 2,227 | 2,563 | ||||||||
Bundesrepublik Deutschland, Ser 00 | ||||||||||
5.500%, 01/04/2031 | 175 | 333 | ||||||||
Bundesrepublik Deutschland, Ser 03 | ||||||||||
4.750%, 07/04/2034 | 280 | 532 | ||||||||
Daimler | ||||||||||
1.500%, 07/03/2029 | 225 | 265 | ||||||||
34 |
SEI Institutional International Trust / Annual Report / September 30, 2017 |
| Description | Face Amount (Thousands) | Market Value ($ Thousands) | ||||||||
GLOBAL BONDS (continued) | ||||||||||
E.ON International Finance MTN | ||||||||||
6.000%, 10/30/2019 | GBP | 300 | $ | 442 | ||||||
Kreditanstalt fuer Wiederaufbau | ||||||||||
1.125%, 09/15/2032 | EUR | 500 | 593 | |||||||
0.500%, 09/15/2027 | 510 | 593 | ||||||||
Kreditanstalt fuer Wiederaufbau MTN | ||||||||||
2.800%, 02/17/2021 | AUD | 1,230 | 974 | |||||||
Volkswagen International Finance | ||||||||||
2.700%, VAR EUR Swap Annual 5 Yr+2.540%, 12/31/2049 | EUR | 300 | 352 | |||||||
1.125%, 10/02/2023 | 600 | 714 | ||||||||
0.500%, 03/30/2021 | 200 | 237 | ||||||||
|
|
| ||||||||
| 20,060 | ||||||||||
|
|
| ||||||||
Guernsey — 0.2% | ||||||||||
Credit Suisse Group Funding Guernsey MTN | ||||||||||
1.250%, 04/14/2022 | 570 | 693 | ||||||||
Hong Kong — 0.1% | ||||||||||
CK Hutchison Finance 16 II | ||||||||||
0.875%, 10/03/2024 | 400 | 466 | ||||||||
|
|
| ||||||||
Hungary — 0.1% | ||||||||||
Republic of Hungary | ||||||||||
3.000%, 06/26/2024 | HUF | 109,020 | 443 | |||||||
|
|
| ||||||||
Indonesia — 0.1% | ||||||||||
Republic of Indonesia MTN | ||||||||||
4.750%, 01/08/2026 | $ | 350 | 382 | |||||||
2.150%, 07/18/2024 (A) | EUR | 200 | 243 | |||||||
|
|
| ||||||||
| 625 | ||||||||||
|
|
| ||||||||
Ireland — 1.3% | ||||||||||
AIB Mortgage Bank MTN | ||||||||||
0.625%, 07/27/2020 | 305 | 368 | ||||||||
Allied Irish Banks MTN | ||||||||||
7.375%, VAR EUR Swap Annual 5 Yr+7.339%, 12/29/2049 | 200 | 263 | ||||||||
4.125%, VAR EUR Swap Annual 5 Yr+3.950%, 11/26/2025 | 177 | 224 | ||||||||
Ardagh Packaging Finance | ||||||||||
4.125%, 05/15/2023 (A) | 245 | 308 | ||||||||
Bank of Ireland | ||||||||||
10.000%, 12/19/2022 | 100 | 167 | ||||||||
7.375%, VAR EUR Swap Annual 5 Yr+6.956%, 12/29/2049 | 200 | 263 | ||||||||
1.750%, 03/19/2019 | �� | 450 | 548 | |||||||
0.375%, 05/07/2022 | 555 | 665 | ||||||||
Bank of Ireland MTN | ||||||||||
4.250%, VAR EUR Swap Annual 5 Yr+3.550%, 06/11/2024 | 220 | 274 | ||||||||
Ireland Government Bond | ||||||||||
4.500%, 10/18/2018 | 345 | 429 | ||||||||
4.500%, 04/18/2020 | 300 | 399 | ||||||||
| Description | Face Amount (Thousands) | Market Value ($ Thousands) | ||||||||
GLOBAL BONDS (continued) | ||||||||||
3.400%, 03/18/2024 | EUR | 185 | $ | 263 | ||||||
2.000%, 02/18/2045 | 265 | 321 | ||||||||
1.000%, 05/15/2026 | 395 | 477 | ||||||||
0.800%, 03/15/2022 | 300 | 370 | ||||||||
Ryanair | ||||||||||
1.125%, 08/15/2023 | 580 | 691 | ||||||||
|
|
| ||||||||
| 6,030 | ||||||||||
|
|
| ||||||||
Israel — 0.4% | ||||||||||
Israel Government Bond | ||||||||||
4.250%, 03/31/2023 | ILS | 3,661 | 1,244 | |||||||
Teva Pharmaceutical Finance Netherlands II | ||||||||||
1.250%, 03/31/2023 | EUR | 415 | 477 | |||||||
1.125%, 10/15/2024 | 220 | 243 | ||||||||
|
|
| ||||||||
| 1,964 | ||||||||||
|
|
| ||||||||
Italy — 7.6% | ||||||||||
Assicurazioni Generali MTN | ||||||||||
7.750%, VAR Euribor 3 Month+7.113%, 12/12/2042 | 300 | 444 | ||||||||
Buoni Poliennali Del Tesoro | ||||||||||
4.000%, 02/01/2037 | 555 | 765 | ||||||||
Enel | ||||||||||
5.000%, VAR EUR Swap Annual 5 Yr+3.648%, 01/15/2075 | 105 | 135 | ||||||||
Enel Finance International | ||||||||||
MTN 5.625%, 08/14/2024 | GBP | 160 | 260 | |||||||
FCA Bank MTN | ||||||||||
2.875%, 01/26/2018 | EUR | 210 | 251 | |||||||
2.625%, 04/17/2019 | 350 | 430 | ||||||||
Intesa Sanpaolo | ||||||||||
3.500%, 01/17/2022 | 200 | 266 | ||||||||
Intesa Sanpaolo MTN | ||||||||||
5.017%, 06/26/2024 (A) | $ | 200 | 203 | |||||||
3.928%, 09/15/2026 | EUR | 165 | 210 | |||||||
0.625%, 03/23/2023 | 300 | 361 | ||||||||
Italy Buoni Poliennali Del Tesoro | ||||||||||
5.500%, 11/01/2022 | 1,000 | 1,451 | ||||||||
5.000%, 08/01/2034 | 335 | 515 | ||||||||
5.000%, 09/01/2040 | 280 | 429 | ||||||||
4.750%, 09/01/2044 (A) | 350 | 524 | ||||||||
4.000%, 09/01/2020 | 1,565 | 2,058 | ||||||||
3.750%, 05/01/2021 | 561 | 743 | ||||||||
3.750%, 09/01/2024 | 1,265 | 1,715 | ||||||||
3.500%, 03/01/2030 (A) | 2,125 | 2,797 | ||||||||
3.450%, 03/01/2048 (A) | 630 | 758 | ||||||||
2.700%, 03/01/2047 (A) | 827 | 874 | ||||||||
2.500%, 12/01/2024 | 625 | 784 | ||||||||
2.050%, 08/01/2027 | 520 | 609 | ||||||||
2.000%, 12/01/2025 | 265 | 318 | ||||||||
1.500%, 08/01/2019 | 1,075 | 1,309 | ||||||||
1.350%, 04/15/2022 | 5,297 | 6,437 | ||||||||
1.250%, 12/01/2026 | 1,850 | 2,058 | ||||||||
35
SEI Institutional International Trust / Annual Report / September 30, 2017 |
35 |
SCHEDULE OF INVESTMENTS
September 30, 2017
International Fixed Income Fund (Continued)
| Description | Face Amount (Thousands) | Market Value ($ Thousands) | ||||||||
GLOBAL BONDS (continued) | ||||||||||
1.200%, 04/01/2022 | EUR | 1,630 | $ | 1,969 | ||||||
0.750%, 01/15/2018 | 720 | 854 | ||||||||
0.700%, 05/01/2020 | 460 | 553 | ||||||||
0.350%, 06/15/2020 | 2,020 | 2,404 | ||||||||
0.300%, 10/15/2018 | 700 | 833 | ||||||||
UniCredit MTN | ||||||||||
6.950%, 10/31/2022 | 361 | 521 | ||||||||
3.000%, 01/31/2024 | 240 | 328 | ||||||||
Unione di Banche Italiane | ||||||||||
1.000%, 01/27/2023 | 185 | 225 | ||||||||
|
|
| ||||||||
| 34,391 | ||||||||||
|
|
| ||||||||
Japan — 17.8% | ||||||||||
Government of Japan 5 Year Bond | ||||||||||
0.200%, 06/20/2019 | JPY | 245,600 | 2,194 | |||||||
0.100%, 12/20/2019 | 607,750 | 5,425 | ||||||||
Government of Japan 10 Year Bond | ||||||||||
0.900%, 06/20/2022 | 748,750 | 6,956 | ||||||||
0.100%, 06/20/2026 | 457,750 | 4,094 | ||||||||
0.100%, 06/20/2027 | 207,750 | 1,853 | ||||||||
Government of Japan 20 Year Bond | ||||||||||
1.700%, 06/20/2033 | 1,220,450 | 13,064 | ||||||||
1.400%, 09/20/2034 | 444,650 | 4,577 | ||||||||
1.000%, 12/20/2035 | 50,000 | 483 | ||||||||
0.500%, 09/20/2036 | 520,050 | 4,593 | ||||||||
0.200%, 06/20/2036 | 169,400 | 1,419 | ||||||||
Government of Japan 20 Year Bond, Ser 106 | ||||||||||
2.200%, 09/20/2028 | 46,600 | 508 | ||||||||
Government of Japan 20 Year Bond, Ser 128 | ||||||||||
1.900%, 06/20/2031 | 55,000 | 597 | ||||||||
Government of Japan 20 Year Bond, Ser 140 | ||||||||||
1.700%, 09/20/2032 | 877,850 | 9,380 | ||||||||
Government of Japan 20 Year Bond, Ser 143 | ||||||||||
1.600%, 03/20/2033 | 58,550 | 618 | ||||||||
Government of Japan 20 Year Bond, Ser 144 | ||||||||||
1.500%, 03/20/2033 | 146,650 | 1,530 | ||||||||
Government of Japan 30 Year Bond | ||||||||||
0.300%, 06/20/2046 | 131,200 | 1,006 | ||||||||
Government of Japan 30 Year Bond, Ser 29 | ||||||||||
2.400%, 09/20/2038 | 85,400 | 1,020 | ||||||||
Government of Japan 30 Year Bond, Ser 30 | ||||||||||
2.300%, 03/20/2039 | 221,750 | 2,616 | ||||||||
Government of Japan 30 Year Bond, Ser 33 | ||||||||||
2.000%, 09/20/2040 | 127,000 | 1,438 | ||||||||
Government of Japan 30 Year Bond, Ser 38 | ||||||||||
1.800%, 03/20/2043 | 377,400 | 4,154 | ||||||||
Government of Japan 40 Year Bond | ||||||||||
0.400%, 03/20/2056 | 441,950 | 3,140 | ||||||||
Government of Japan 40 Year Bond, Ser 6 | ||||||||||
1.900%, 03/20/2053 | 22,400 | 254 | ||||||||
Japanese Government CPI Linked Bond | ||||||||||
0.100%, 03/10/2024 | 283,518 | 2,606 | ||||||||
0.100%, 03/10/2025 | 52,071 | 480 | ||||||||
| Description | Face Amount (Thousands) | Market Value ($ Thousands) | ||||||||
GLOBAL BONDS (continued) | ||||||||||
0.100%, 03/10/2026 | JPY | 740,089 | $ | 6,841 | ||||||
|
|
| ||||||||
| 80,846 | ||||||||||
|
|
| ||||||||
Kazakhstan — 0.1% | ||||||||||
Tengizchevroil Finance International | ||||||||||
4.000%, 08/15/2026 (A) | $ | 385 | 381 | |||||||
|
|
| ||||||||
Luxembourg — 0.1% | ||||||||||
Altice Financing MTN | ||||||||||
5.250%, 02/15/2023 | EUR | 235 | 292 | |||||||
|
|
| ||||||||
Mexico — 1.9% | ||||||||||
Mexican Bonos | ||||||||||
8.000%, 06/11/2020 | MXN | 38,211 | 2,172 | |||||||
7.750%, 11/13/2042 | 11,690 | 682 | ||||||||
5.750%, 03/05/2026 | 11,907 | 611 | ||||||||
Mexican Bonos, Ser M | ||||||||||
6.500%, 06/10/2021 | 7,361 | 403 | ||||||||
Mexican Bonos, Ser M20 | ||||||||||
10.000%, 12/05/2024 | 58,566 | 3,819 | ||||||||
Petroleos Mexicanos MTN | ||||||||||
3.750%, 02/21/2024 | EUR | 360 | 453 | |||||||
United Mexican States MTN | ||||||||||
4.125%, 01/21/2026 | $ | 400 | 421 | |||||||
|
|
| ||||||||
| 8,561 | ||||||||||
|
|
| ||||||||
Netherlands — 2.9% | ||||||||||
ABN AMRO Bank | ||||||||||
5.750%,VAR EUR Swap Annual 5 Yr+5.452%, 12/31/2049 | EUR | 400 | 509 | |||||||
Cooperatieve Centrale Raiffeisen- Boerenleenbank BA | ||||||||||
2.500%, VAR EUR Swap Annual 5 | 260 | 325 | ||||||||
Cooperatieve Rabobank UA | ||||||||||
6.625%, VAR EUR Swap Annual 5 | 200 | 267 | ||||||||
Cooperatieve Rabobank UA MTN | ||||||||||
5.250%, 09/14/2027 | GBP | 195 | 309 | |||||||
ING Bank MTN | ||||||||||
6.875%, VAR ICE LIBOR GDP 3 Month+2.550%, 05/29/2023 | 337 | 468 | ||||||||
ING Groep | ||||||||||
3.150%, 03/29/2022 | $ | 330 | 336 | |||||||
Kingdom of Netherlands | ||||||||||
4.000%, 01/15/2037 (A) | EUR | 635 | 1,144 | |||||||
3.750%, 01/15/2042 (A) | 60 | 110 | ||||||||
2.750%, 01/15/2047 (A) | 50 | 80 | ||||||||
2.000%, 07/15/2024 (A) | 625 | 834 | ||||||||
1.250%, 01/15/2019 (A) | 485 | 588 | ||||||||
0.500%, 07/15/2026 (A) | 1,500 | 1,785 | ||||||||
0.250%, 01/15/2020 | 3,845 | 4,637 | ||||||||
0.250%, 07/15/2025 (A) | 699 | 826 | ||||||||
0.250%, 07/15/2025 (A) | 223 | 263 | ||||||||
36 |
SEI Institutional International Trust / Annual Report / September 30, 2017 |
| Description | Face Amount (Thousands) | Market Value ($ Thousands) | ||||||||
GLOBAL BONDS (continued) | ||||||||||
MARB BondCo | ||||||||||
7.000%, 03/15/2024 (A) | $ | 282 | $ | 278 | ||||||
Petrobras Global Finance | ||||||||||
6.125%, 01/17/2022 | 54 | 58 | ||||||||
Shell International Finance | ||||||||||
2.000%, 11/15/2018 | 560 | 562 | ||||||||
|
|
| ||||||||
| 13,379 | ||||||||||
|
|
| ||||||||
New Zealand — 1.0% | ||||||||||
New Zealand Government Bond | ||||||||||
5.500%, 04/15/2023 | NZD | 1,840 | 1,531 | |||||||
3.000%, 04/15/2020 | 1,535 | 1,134 | ||||||||
2.500%, 09/20/2035 | 1,661 | 1,293 | ||||||||
2.000%, 09/20/2025 | 610 | 472 | ||||||||
Westpac Securities MTN | ||||||||||
0.875%, 06/24/2019 | EUR | 100 | 121 | |||||||
|
|
| ||||||||
| 4,551 | ||||||||||
|
|
| ||||||||
Norway — 0.4% | ||||||||||
DNB Bank | ||||||||||
6.500%, VAR USD Swap Semi 30/360 5 Year Curr+5.080%, 12/29/2049 | $ | 355 | 381 | |||||||
Government of Norway | ||||||||||
2.000%, 05/24/2023 (A) | NOK | 3,895 | 511 | |||||||
Kommunalbanken MTN | ||||||||||
1.000%, 03/15/2018 (A) | $ | 800 | 798 | |||||||
|
|
| ||||||||
| 1,690 | ||||||||||
|
|
| ||||||||
Panama — 0.1% | ||||||||||
Carnival | ||||||||||
1.875%, 11/07/2022 | EUR | 390 | 492 | |||||||
|
|
| ||||||||
Poland — 0.7% | ||||||||||
Republic of Poland | ||||||||||
3.250%, 07/25/2025 | PLN | 2,745 | 758 | |||||||
2.500%, 07/25/2018 | 710 | 197 | ||||||||
2.500%, 07/25/2026 | 2,160 | 557 | ||||||||
2.500%, 07/25/2027 | 1,770 | 450 | ||||||||
Republic of Poland MTN | ||||||||||
1.500%, 01/19/2026 | EUR | 600 | 745 | |||||||
Republic of Poland, Ser 1019 | ||||||||||
5.500%, 10/25/2019 | PLN | 1,520 | 448 | |||||||
|
|
| ||||||||
| 3,155 | ||||||||||
|
|
| ||||||||
Portugal — 0.2% | ||||||||||
EDP - Energias de Portugal | ||||||||||
5.375%, VAR EUR Swap Annual 5 Yr+5.043%, 09/16/2075 | EUR | 300 | 395 | |||||||
EDP Finance MTN | ||||||||||
2.000%, 04/22/2025 | 370 | 458 | ||||||||
|
|
| ||||||||
| 853 | ||||||||||
|
|
| ||||||||
| Description | Face Amount (Thousands) | Market Value ($ Thousands) | ||||||||
GLOBAL BONDS (continued) | ||||||||||
Qatar — 0.0% | ||||||||||
Qatar Government International Bond | ||||||||||
5.250%, 01/20/2020 | $ | 100 | $ | 106 | ||||||
|
|
| ||||||||
Romania — 0.0% | ||||||||||
Romanian Government International Bond MTN | ||||||||||
2.875%, 05/26/2028 | EUR | 150 | 184 | |||||||
|
|
| ||||||||
Saudi Arabia — 0.1% | ||||||||||
Saudi Government International Bond MTN | ||||||||||
2.375%, 10/26/2021 (A) | $ | 275 | 271 | |||||||
Singapore — 0.4% | ||||||||||
Government of Singapore | ||||||||||
4.000%, 09/01/2018 | SGD | 495 | 373 | |||||||
3.125%, 09/01/2022 | 275 | 216 | ||||||||
3.000%, 09/01/2024 | 859 | 675 | ||||||||
Temasek Financial I MTN | ||||||||||
2.375%, 01/23/2023 (A) | $ | 495 | 494 | |||||||
|
|
| ||||||||
| 1,758 | ||||||||||
|
|
| ||||||||
Slovak Republic — 0.0% | ||||||||||
Slovakia Government Bond | ||||||||||
3.375%, 11/15/2024 | EUR | 110 | 156 | |||||||
|
|
| ||||||||
Slovenia — 0.1% | ||||||||||
Slovenia Government Bond | ||||||||||
1.500%, 03/25/2035 | 206 | 237 | ||||||||
|
|
| ||||||||
South Africa — 0.7% | ||||||||||
Republic of South Africa | ||||||||||
8.750%, 02/28/2048 | ZAR | 28,009 | 1,876 | |||||||
8.000%, 01/31/2030 | 11,800 | 804 | ||||||||
7.000%, 02/28/2031 | 2,705 | 167 | ||||||||
4.665%, 01/17/2024 | $ | 100 | 102 | |||||||
4.300%, 10/12/2028 | 200 | 189 | ||||||||
|
|
| ||||||||
| 3,138 | ||||||||||
|
|
| ||||||||
South Korea — 0.1% | ||||||||||
Hyundai Capital Services | ||||||||||
3.500%, 03/30/2022 | 680 | 527 | ||||||||
|
|
| ||||||||
Spain — 4.9% | ||||||||||
Ayt Cedulas Cajas Global | ||||||||||
4.750%, 05/25/2027 | EUR | 400 | 620 | |||||||
3.750%, 12/14/2022 | 600 | 831 | ||||||||
Banco de Sabadell | ||||||||||
0.875%, 11/12/2021 | 400 | 486 | ||||||||
Banco Popular Espanol | ||||||||||
3.750%, 01/22/2019 | 100 | 124 | ||||||||
2.125%, 10/08/2019 | 100 | 124 | ||||||||
SEI Institutional International Trust / Annual Report / September 30, 2017 |
37 |
SCHEDULE OF INVESTMENTS
September 30, 2017
International Fixed Income Fund (Continued)
| Description | Face Amount (Thousands) | Market Value ($ Thousands) | ||||||||
GLOBAL BONDS (continued) | ||||||||||
Bankia | ||||||||||
4.125%, 03/24/2036 | EUR | 200 | $ | 300 | ||||||
0.875%, 01/21/2021 | 300 | 364 | ||||||||
CaixaBank | ||||||||||
1.250%, 01/11/2027 | 500 | 606 | ||||||||
0.313%, VAR Euribor 3 Month+0.075%, 01/09/2018 | 200 | 236 | ||||||||
Cirsa Funding Luxembourg | ||||||||||
5.875%, 05/15/2023 | 165 | 205 | ||||||||
5.750%, 05/15/2021 | 100 | 125 | ||||||||
Criteria Caixa SAU MTN | ||||||||||
1.500%, 05/10/2023 | 500 | 601 | ||||||||
Ferrovial Emisiones MTN | ||||||||||
3.375%, 06/07/2021 | 475 | 627 | ||||||||
Gas Natural Fenosa Finance BV | ||||||||||
3.375%, VAR EUR Swap Annual 9 Yr+3.079%, 12/29/2049 | 100 | 122 | ||||||||
Government of Spain | ||||||||||
6.000%, 01/31/2029 | 465 | 790 | ||||||||
4.700%, 07/30/2041 (A) | 464 | 749 | ||||||||
4.200%, 01/31/2037 (A) | 475 | 716 | ||||||||
2.900%, 10/31/2046 (A) | 1,675 | 2,000 | ||||||||
2.750%, 10/31/2024 (A) | 591 | 786 | ||||||||
1.950%, 04/30/2026 (A) | 675 | 839 | ||||||||
1.950%, 07/30/2030 (A) | 120 | 142 | ||||||||
1.500%, 04/30/2027 (A) | 450 | 532 | ||||||||
1.450%, 10/31/2027 (A) | 620 | 722 | ||||||||
1.400%, 01/31/2020 | 1,360 | 1,667 | ||||||||
1.300%, 10/31/2026 (A) | 1,334 | 1,565 | ||||||||
1.150%, 07/30/2020 | 935 | 1,145 | ||||||||
0.750%, 07/30/2021 | 367 | 445 | ||||||||
0.400%, 04/30/2022 | 1,020 | 1,213 | ||||||||
0.250%, 04/30/2018 | 1,500 | 1,780 | ||||||||
Instituto de Credito Oficial | ||||||||||
6.000%, 03/08/2021 | 465 | 662 | ||||||||
Kutxabank | ||||||||||
1.250%, 09/22/2025 | 300 | 366 | ||||||||
Santander Consumer Finance MTN | ||||||||||
0.900%, 02/18/2020 | 300 | 361 | ||||||||
Santander Issuances MTN | ||||||||||
3.250%, 04/04/2026 | 100 | 127 | ||||||||
Telefonica Emisiones MTN | ||||||||||
5.375%, 02/02/2018 | GBP | 185 | 252 | |||||||
|
|
| ||||||||
| 22,230 | ||||||||||
|
|
| ||||||||
Supra-National — 0.8% | ||||||||||
European Financial Stability Facility | ||||||||||
3.875%, 06/08/2037 | 190 | 328 | ||||||||
1.800%, 07/10/2048 | EUR | 540 | 666 | |||||||
1.200%, 02/17/2045 | 245 | 265 | ||||||||
European Investment Bank | ||||||||||
1.900%, 01/26/2026 | JPY | 50,000 | 515 | |||||||
| Description | Face Amount (Thousands) | Market Value ($ Thousands) | ||||||||
GLOBAL BONDS (continued) | ||||||||||
European Investment Bank MTN | ||||||||||
1.250%, 05/12/2025 | SEK | 7,500 | $ | 931 | ||||||
International Bank for Reconstruction & Development MTN | ||||||||||
2.800%, 01/13/2021 | AUD | 1,230 | 975 | |||||||
|
|
| ||||||||
| 3,680 | ||||||||||
|
|
| ||||||||
Sweden — 0.9% | ||||||||||
Intrum Justitia | ||||||||||
2.750%, 07/15/2022 (A) | EUR | 330 | 395 | |||||||
Kingdom of Sweden | ||||||||||
3.500%, 03/30/2039 | SEK | 545 | 89 | |||||||
1.000%, 11/12/2026 | 2,505 | 315 | ||||||||
Kingdom of Sweden, Ser | ||||||||||
1047 5.000%, 12/01/2020 | 4,900 | 702 | ||||||||
Kingdom of Sweden, Ser | ||||||||||
1052 4.250%, 03/12/2019 | 5,275 | 693 | ||||||||
Nordea Bank MTN | ||||||||||
6.125%, VAR USD Swap Semi 30/360 5 Year Curr+3.388%, 12/31/2049 | $ | 280 | 300 | |||||||
Skandinaviska Enskilda Banken | ||||||||||
1.887%, VAR ICE LIBOR USD 3 Month+0.570%, 09/13/2019 (A) | 200 | 201 | ||||||||
Skandinaviska Enskilda Banken MTN | ||||||||||
5.750%, VAR USD Swap Semi 30/360 5 Year Curr+3.850%, 11/29/2049 | 265 | 274 | ||||||||
Stadshypotek MTN | ||||||||||
4.250%, 10/10/2017 | AUD | 600 | 471 | |||||||
Svenska Handelsbanken | ||||||||||
5.250%, VAR USD Swap Semi 30/360 5 Year Curr+3.335%, 12/29/2049 | $ | 370 | 379 | |||||||
Vattenfall | ||||||||||
3.000%, VAR EUR Swap Annual 5 Yr+2.511%, 03/19/2077 | EUR | 175 | 204 | |||||||
|
|
| ||||||||
| 4,023 | ||||||||||
|
|
| ||||||||
Switzerland — 1.2% | ||||||||||
Aquarius & Investments for Swiss Reinsurance | ||||||||||
6.375%, VAR USD Swap Semi 30/360 5 Year Curr+5.210%, 09/01/2024 | $ | 340 | 358 | |||||||
Credit Suisse Group | ||||||||||
7.500%, VAR USD Swap Semi 30/360 5 Year Curr+4.598%, 12/31/2049 (A) | 270 | 305 | ||||||||
Dufry Finance | ||||||||||
4.500%, 08/01/2023 | 220 | 277 | ||||||||
Government of Switzerland | ||||||||||
3.000%, 05/12/2019 | CHF | 160 | 175 | |||||||
2.000%, 04/28/2021 | 1,070 | 1,209 | ||||||||
2.000%, 05/25/2022 | 110 | 127 | ||||||||
1.500%, 04/30/2042 | 300 | 386 | ||||||||
1.250%, 06/11/2024 | 585 | 666 | ||||||||
38 |
SEI Institutional International Trust / Annual Report / September 30, 2017 |
| Description | Face Amount (Thousands) | Market Value ($ Thousands) | ||||||||
GLOBAL BONDS (continued) | ||||||||||
Swiss Reinsurance via ELM | ||||||||||
2.600%, VAR Euribor 6 Month+3.050%, 09/01/2025 | EUR | 220 | $ | 264 | ||||||
UBS MTN | ||||||||||
4.750%, VAR EUR Swap Annual 5 Yr+3.400%, 02/12/2026 | 200 | 262 | ||||||||
UBS Group | ||||||||||
5.750%, VAR EUR Swap Annual 5 Yr+5.287%, 12/29/2049 | 340 | 450 | ||||||||
UBS Group Funding Switzerland | ||||||||||
4.125%, 09/24/2025 (A) | $ | 220 | 231 | |||||||
1.750%, 11/16/2022 | EUR | 427 | 533 | |||||||
|
|
| ||||||||
| 5,243 | ||||||||||
|
|
| ||||||||
Thailand — 0.4% | ||||||||||
Thailand Government Bond | ||||||||||
4.875%, 06/22/2029 | THB | 16,300 | 604 | |||||||
4.675%, 06/29/2044 | 11,340 | 432 | ||||||||
3.650%, 12/17/2021 | 16,020 | 519 | ||||||||
3.625%, 06/16/2023 | 7,815 | 256 | ||||||||
|
|
| ||||||||
| 1,811 | ||||||||||
|
|
| ||||||||
Turkey — 0.4% | ||||||||||
Coca-Cola Icecek | ||||||||||
4.215%, 09/19/2024 | $ | 360 | 364 | |||||||
Turkey Government Bond | ||||||||||
11.000%, 02/24/2027 | TRY | 2,030 | 581 | |||||||
Turkey Government International Bond | ||||||||||
5.125%, 05/18/2020 | EUR | 415 | 539 | |||||||
Turkiye Yakiflar Bankasi TAO | ||||||||||
2.375%, 05/04/2021 | 185 | 220 | ||||||||
|
|
| ||||||||
| 1,704 | ||||||||||
|
|
| ||||||||
United Kingdom — 11.2% | ||||||||||
Anglian Water Services Financing | ||||||||||
6.875%, 08/21/2023 | GBP | 230 | 398 | |||||||
Anglo American Capital | ||||||||||
3.750%, 04/10/2022 (A) | $ | 280 | 287 | |||||||
Arqiva Financing MTN | ||||||||||
4.040%, 06/30/2020 | GBP | 220 | 312 | |||||||
Aviva MTN | ||||||||||
3.875%, VAR EUR Swap Annual 5 Yr+3.480%, 07/03/2044 | EUR | 223 | 289 | |||||||
3.375%, VAR Euribor 3 Month+3.550%, 12/04/2045 | 280 | 349 | ||||||||
Bank of Scotland MTN | ||||||||||
4.750%, 06/08/2022 | 455 | 653 | ||||||||
Barclays | ||||||||||
8.000%, VAR EUR Swap Annual 5 Yr+6.750%, 12/15/2049 | 340 | 452 | ||||||||
3.125%, 01/17/2024 | 235 | 327 | ||||||||
Barclays MTN | ||||||||||
2.625%, VAR EUR Swap Annual 5 Yr+2.450%, 11/11/2025 | 365 | 447 | ||||||||
| Description | Face Amount (Thousands) | Market Value ($ Thousands) | ||||||||
GLOBAL BONDS (continued) | ||||||||||
1.875%, 03/23/2021 | EUR | 575 | $ | 711 | ||||||
Barclays Bank MTN | ||||||||||
10.000%, 05/21/2021 | GBP | 180 | 305 | |||||||
BP Capital Markets MTN | ||||||||||
2.177%, 09/28/2021 | EUR | 245 | 313 | |||||||
Canary Wharf Finance II | ||||||||||
6.455%, 04/22/2030 | GBP | 13 | 23 | |||||||
5.952%, 01/22/2035 | 20 | 37 | ||||||||
CNH Industrial Finance Europe MTN | ||||||||||
2.875%, 05/17/2023 | EUR | 220 | 283 | |||||||
Coventry Building Society MTN | ||||||||||
4.625%, 04/19/2018 | GBP | 230 | 315 | |||||||
Delphi Automotive | ||||||||||
1.500%, 03/10/2025 | EUR | 420 | 501 | |||||||
FCE Bank MTN | ||||||||||
1.615%, 05/11/2023 | 510 | 622 | ||||||||
HBOS Capital Funding | ||||||||||
6.461%, VAR UK Govt Bonds 5 Year Note Generic Bid Yield+2.850%, 11/29/2049 | GBP | 115 | 162 | |||||||
Heathrow Funding MTN | ||||||||||
6.000%, 03/20/2020 | 100 | 149 | ||||||||
1.875%, 05/23/2022 | EUR | 750 | 947 | |||||||
HSBC Holdings | ||||||||||
6.000%, VAR EUR Swap Annual 5 Yr+5.338%, 12/29/2049 | 345 | 460 | ||||||||
Imperial Brands Finance | ||||||||||
0.500%, 07/27/2021 | 150 | 178 | ||||||||
International Game Technology | ||||||||||
4.750%, 02/15/2023 | 160 | 211 | ||||||||
Lecta | ||||||||||
6.500%, 08/01/2023 (A) | 113 | 141 | ||||||||
Lloyds Banking Group MTN | ||||||||||
1.000%, 11/09/2023 | 280 | 333 | ||||||||
Nationwide Building Society MTN | ||||||||||
4.625%, 02/08/2021 | 550 | 752 | ||||||||
4.125%, VAR EUR Swap Annual 5 Yr+3.300%, 03/20/2023 | 295 | 355 | ||||||||
0.500%, 10/29/2019 | 345 | 412 | ||||||||
Northumbrian Water Finance | ||||||||||
6.875%, 02/06/2023 | GBP | 190 | 320 | |||||||
Royal Bank of Scotland MTN | ||||||||||
3.875%, 10/19/2020 | EUR | 123 | 163 | |||||||
Royal Bank of Scotland Group | ||||||||||
3.655%, VAR ICE LIBOR USD 3 Month+2.320%, 09/29/2017 | $ | 200 | 192 | |||||||
Royal Bank of Scotland Group MTN | ||||||||||
2.500%, 03/22/2023 | EUR | 465 | 590 | |||||||
Santander UK | ||||||||||
6.222%, VAR ICE LIBOR GDP 3 Month+1.130%, 05/29/2049 | GBP | 170 | 219 | |||||||
3.625%, 01/14/2026 | 100 | 144 | ||||||||
SEI Institutional International Trust / Annual Report / September 30, 2017 |
39 |
SCHEDULE OF INVESTMENTS
September 30, 2017
International Fixed Income Fund (Continued)
Description | Face Amount (Thousands) | Market Value ($ Thousands) | ||||||||
GLOBAL BONDS (continued) | ||||||||||
Santander UK MTN | ||||||||||
4.250%, 04/12/2021 | EUR | 350 | $ | 475 | ||||||
1.125%, 01/14/2022 | 330 | 402 | ||||||||
Santander UK Group Holdings | ||||||||||
2.875%, 08/05/2021 | $ | 260 | 261 | |||||||
Standard Chartered | ||||||||||
5.125%, 06/06/2034 | GBP | 100 | 146 | |||||||
2.821%, VAR ICE LIBOR USD 3 Month+1.510%, 01/30/2049 (A) | $ | 500 | 428 | |||||||
Standard Chartered MTN | ||||||||||
3.625%, 11/23/2022 | EUR | 160 | 210 | |||||||
TSB Banking Group MTN | ||||||||||
5.750%, VAR ICE LIBOR GDP 3 Month+3.430%, 05/06/2026 | GBP | 104 | 152 | |||||||
United Kingdom Gilt | ||||||||||
4.750%, 12/07/2030 | 1,035 | 1,912 | ||||||||
4.500%, 12/07/2042 | 335 | 680 | ||||||||
4.250%, 12/07/2027 | 125 | 214 | ||||||||
4.250%, 06/07/2032 | 2,500 | 4,478 | ||||||||
4.250%, 06/07/2032 | 110 | 197 | ||||||||
4.250%, 03/07/2036 | 635 | 1,174 | ||||||||
4.250%, 09/07/2039 | 670 | 1,274 | ||||||||
4.250%, 12/07/2040 | 275 | 529 | ||||||||
3.750%, 09/07/2021 | 1,375 | 2,069 | ||||||||
3.750%, 07/22/2052 | 115 | 230 | ||||||||
3.500%, 01/22/2045 | 2,470 | 4,401 | ||||||||
3.250%, 01/22/2044 | 990 | 1,682 | ||||||||
2.500%, 07/22/2065 | 1,215 | 2,034 | ||||||||
2.000%, 09/07/2025 | 265 | 379 | ||||||||
1.750%, 07/22/2019 | 6,905 | 9,480 | ||||||||
1.500%, 01/22/2021 | 875 | 1,209 | ||||||||
1.250%, 07/22/2018 | 281 | 380 | ||||||||
0.500%, 07/22/2022 | 2,228 | 2,949 | ||||||||
Virgin Media Finance MTN | ||||||||||
4.500%, 01/15/2025 | EUR | 121 | 149 | |||||||
Wales & West Utilities Finance | ||||||||||
6.250%, 11/30/2021 | GBP | 240 | 385 | |||||||
Western Power Distribution West Midlands | ||||||||||
3.875%, 10/17/2024 | 230 | 344 | ||||||||
|
|
| ||||||||
| 50,575 | ||||||||||
|
|
| ||||||||
United States — 5.2% | ||||||||||
Altria Group | ||||||||||
4.750%, 05/05/2021 | $ | 180 | 195 | |||||||
American Express Credit | ||||||||||
0.625%, 11/22/2021 | EUR | 367 | 439 | |||||||
American International Group | ||||||||||
2.032%, VAR ICE LIBOR GDP 3 Month+1.705%, 03/15/2067 | GBP | 150 | 192 | |||||||
Amgen | ||||||||||
1.250%, 02/25/2022 | EUR | 550 | 673 | |||||||
Anthem | ||||||||||
2.300%, 07/15/2018 | $ | 150 | 151 | |||||||
Description | Face Amount (Thousands) | Market Value ($ Thousands) | ||||||||
GLOBAL BONDS (continued) | ||||||||||
AT&T | ||||||||||
3.550%, 09/14/2037 | GBP | 205 | $ | 265 | ||||||
1.050%, 09/04/2023 | EUR | 555 | 663 | |||||||
Bank of America | ||||||||||
%, 02/07/2025 | 165 | 198 | ||||||||
Bank of America MTN | ||||||||||
3.824%, VAR ICE LIBOR USD 3 Month+1.575%, 01/20/2028 | $ | 195 | 200 | |||||||
2.375%, 06/19/2024 | EUR | 835 | 1,071 | |||||||
1.625%, 09/14/2022 | 261 | 323 | ||||||||
0.220%, VAR Euribor 3 Month+0.550%, 09/14/2018 | 375 | 444 | ||||||||
Belden | ||||||||||
3.375%, 07/15/2027 | 127 | 151 | ||||||||
Berkshire Hathaway | ||||||||||
0.625%, 01/17/2023 | 485 | 576 | ||||||||
0.500%, 03/13/2020 | 570 | 682 | ||||||||
Carnival | ||||||||||
1.625%, 02/22/2021 | 180 | 223 | ||||||||
Charter Communications Operating | ||||||||||
4.908%, 07/23/2025 | $ | 375 | 401 | |||||||
Citigroup MTN | ||||||||||
0.750%, 10/26/2023 | EUR | 735 | 862 | |||||||
Community Health Systems | ||||||||||
6.250%, 03/31/2023 | 175 | 172 | ||||||||
5.125%, 08/01/2021 | 98 | 97 | ||||||||
DH Europe Finance | ||||||||||
1.700%, 01/04/2022 | 535 | 671 | ||||||||
Discovery Communications | ||||||||||
2.500%, 09/20/2024 | GBP | 255 | 334 | |||||||
Dover MTN | ||||||||||
2.125%, 12/01/2020 | EUR | 267 | 335 | |||||||
FedEx | ||||||||||
1.000%, 01/11/2023 | 560 | 673 | ||||||||
Fidelity National Information Services | ||||||||||
0.400%, 01/15/2021 | 284 | 336 | ||||||||
General Electric | ||||||||||
1.500%, 05/17/2029 | 170 | 201 | ||||||||
General Motors Financial MTN | ||||||||||
0.955%, 09/07/2023 | 840 | 980 | ||||||||
Goldman Sachs Group | ||||||||||
2.625%, 04/25/2021 | $ | 425 | 427 | |||||||
Goldman Sachs Group MTN | ||||||||||
2.000%, 07/27/2023 | EUR | 900 | 1,126 | |||||||
1.625%, 07/27/2026 | 170 | 201 | ||||||||
Hess | ||||||||||
4.300%, 04/01/2027 | $ | 333 | 330 | |||||||
Hewlett Packard Enterprise | ||||||||||
4.900%, 10/15/2025 | 415 | 439 | ||||||||
Honeywell International | ||||||||||
1.300%, 02/22/2023 | EUR | 520 | 638 | |||||||
40 |
SEI Institutional International Trust / Annual Report / September 30, 2017 |
| Description | Face Amount (Thousands) | Market Value ($ Thousands) | ||||
GLOBAL BONDS (continued) | ||||||||||||
Liberty Mutual Finance Europe | ||||||||||||
1.750%, 03/27/2024 (A) | EUR | 163 | $ | 198 | ||||||||
Mallinckrodt International Finance | ||||||||||||
5.750%, 08/01/2022 (A) | $ | 37 | 36 | |||||||||
4.875%, 04/15/2020 (A) | 137 | 137 | ||||||||||
Mastercard | ||||||||||||
1.100%, 12/01/2022 | EUR | 445 | 543 | |||||||||
McKesson | ||||||||||||
1.500%, 11/17/2025 | 278 | 335 | ||||||||||
0.625%, 08/17/2021 | 355 | 422 | ||||||||||
Morgan Stanley | ||||||||||||
2.625%, 03/09/2027 | 295 | 397 | ||||||||||
1.875%, 03/30/2023 | 490 | 612 | ||||||||||
Morgan Stanley MTN | ||||||||||||
1.375%, 10/27/2026 | 360 | 418 | ||||||||||
Mylan | ||||||||||||
3.950%, 06/15/2026 | 93 | 95 | ||||||||||
1.250%, 11/23/2020 | 151 | 183 | ||||||||||
Nabors Industries | ||||||||||||
5.500%, 01/15/2023 | $ | 187 | 183 | |||||||||
National Capital Trust I | ||||||||||||
5.620%, VAR UK Govt Bonds 5 Year Note Generic Bid Yield+1.930%, 12/17/2018 (A) | GBP | 35 | 49 | |||||||||
5.620%, VAR UK Govt Bonds 5 Year Note Generic Bid Yield+1.930%, 09/29/2049 | 150 | 211 | ||||||||||
National Grid North America | ||||||||||||
1.000%, 07/12/2024 | EUR | 300 | 357 | |||||||||
Nordea Bank MTN | ||||||||||||
2.250%, 05/27/2021 (A) | $ | 425 | 423 | |||||||||
Philip Morris International MTN 1.875%, 03/03/2021 | EUR | 300 | 375 | |||||||||
PNC Funding | ||||||||||||
3.300%, 03/08/2022 | $ | 150 | 155 | |||||||||
QEP Resources | ||||||||||||
5.250%, 05/01/2023 | 108 | 105 | ||||||||||
Seagate HDD Cayman | ||||||||||||
4.750%, 06/01/2023 | 17 | 17 | ||||||||||
4.750%, 01/01/2025 | 123 | 120 | ||||||||||
Societe Generale MTN | ||||||||||||
2.500%, 04/08/2021 (A) | 500 | 501 | ||||||||||
Tenet Healthcare | ||||||||||||
4.500%, 04/01/2021 | 155 | 158 | ||||||||||
4.375%, 10/01/2021 | 110 | 112 | ||||||||||
US Bancorp MTN | ||||||||||||
0.850%, 06/07/2024 | EUR | 701 | 828 | |||||||||
Valeant Pharmaceuticals International | ||||||||||||
4.500%, 05/15/2023 (A) | 170 | 171 | ||||||||||
Verizon Communications | ||||||||||||
4.750%, 02/17/2034 | GBP | 170 | 267 | |||||||||
4.050%, 02/17/2025 | AUD | 680 | 528 | |||||||||
| Description | Face Amount (Thousands) | Market Value ($ Thousands) | ||||||||
GLOBAL BONDS (continued) | ||||||||||
VMware | ||||||||||
2.950%, 08/21/2022 | $ | 113 | $ | 114 | ||||||
Wells Fargo | ||||||||||
2.000%, 04/27/2026 | EUR | 210 | 264 | |||||||
Wells Fargo Bank MTN | ||||||||||
5.250%, 08/01/2023 | GBP | 350 | 554 | |||||||
|
| |||||||||
| 23,537 | ||||||||||
|
| |||||||||
Uruguay — 0.0% | ||||||||||
Republic of Uruguay | ||||||||||
9.875%, 06/20/2022 (A) | UYU | 3,181 | 118 | |||||||
8.500%, 03/15/2028 (A) | 2,325 | 83 | ||||||||
|
| |||||||||
| 201 | ||||||||||
|
| |||||||||
Total Global Bonds | ||||||||||
(Cost $402,335) ($ Thousands) | 407,117 | |||||||||
|
| |||||||||
MORTGAGE-BACKED SECURITIES — 2.1% |
| |||||||||
Agency Mortgage-Backed Obligation — 0.5% |
| |||||||||
FHLMC Structured Agency Credit Risk Debt Notes, Ser 2014-HQ2, Cl M1 | ||||||||||
2.684%, VAR ICE LIBOR USD 1 Month+1.450%, 09/25/2024 | $ | 13 | 13 | |||||||
FHLMC Structured Agency Credit Risk Debt Notes, Ser 2015-DNA1, Cl M2 | ||||||||||
3.084%, VAR ICE LIBOR USD 1 Month+1.850%, 10/25/2027 | 490 | 501 | ||||||||
FHLMC Structured Agency Credit Risk Debt Notes, Ser 2015-DNA2, Cl M2 | ||||||||||
3.834%, VAR ICE LIBOR USD 1 Month+2.600%, 12/25/2027 | 130 | 132 | ||||||||
FHLMC Structured Agency Credit Risk Debt Notes, Ser 2015-HQ2, Cl M1 | ||||||||||
2.334%, VAR ICE LIBOR USD 1 Month+1.100%, 05/25/2025 | 21 | 21 | ||||||||
FHLMC Structured Agency Credit Risk Debt Notes, Ser 2015-HQA2, Cl M2 | ||||||||||
4.037%, VAR ICE LIBOR USD 1 Month+2.800%, 05/25/2028 | 208 | 215 | ||||||||
FHLMC Structured Agency Credit Risk Debt Notes, Ser 2016-DNA1, Cl M2 | ||||||||||
4.137%, VAR ICE LIBOR USD 1 Month+2.900%, 07/25/2028 | 276 | 285 | ||||||||
FHLMC Structured Agency Credit Risk Debt Notes, Ser 2016-HQA1, Cl M3 | ||||||||||
7.584%, VAR ICE LIBOR USD 1 Month+6.350%, 09/25/2028 | 250 | 301 | ||||||||
FHLMC Structured Agency Credit Risk Debt Notes, Ser 2017-DNA1, Cl M1 | ||||||||||
2.437%, VAR ICE LIBOR USD 1 Month+1.200%, 07/25/2029 | 361 | 365 | ||||||||
SEI Institutional International Trust / Annual Report / September 30, 2017 |
41 |
SCHEDULE OF INVESTMENTS
September 30, 2017
International Fixed Income Fund (Continued)
| Description | Face Amount (Thousands) | Market Value ($ Thousands) | ||||
MORTGAGE-BACKED SECURITIES (continued) |
| |||||
FHLMC Structured Agency Credit Risk Debt Notes, Ser 2017-DNA2, Cl M2 | ||||||
4.687%, VAR ICE LIBOR USD 1 | ||||||
Month+3.450%, 10/25/2029 | $ 470 | $ | 497 | |||
|
| |||||
| 2,330 | ||||||
|
| |||||
Non-Agency Mortgage-Backed Obligation — 1.6% |
| |||||
Bear Stearns Adjustable Rate Mortgage | ||||||
Trust, Ser 2004-6, Cl 3A 3.622%, 09/25/2034 (B) | 28 | 28 | ||||
Citigroup Commercial Mortgage Trust, Ser 2014-GC19, Cl D 5.065%, 03/10/2047 (A)(B) | 20 | 18 | ||||
Citigroup Commercial Mortgage Trust, Ser 2015-GC29, Cl A3 2.935%, 04/10/2048 | 30 | 30 | ||||
Citigroup Mortgage Loan Trust, Ser 2005-2, Cl 1A4 3.238%, 05/25/2035 (B) | 291 | 293 | ||||
COMM Mortgage Trust, Ser 2008-LS1, Cl A4B 6.372%, 12/10/2049 (B) | 7 | 7 | ||||
COMM Mortgage Trust, Ser 2012-CR4, Cl A3 2.853%, 10/15/2045 | 130 | 131 | ||||
COMM Mortgage Trust, Ser 2012-CR5, Cl A3 2.540%, 12/10/2045 | 125 | 125 | ||||
COMM Mortgage Trust, Ser 2013-CR6, Cl A4 3.101%, 03/10/2046 | 120 | 123 | ||||
COMM Mortgage Trust, Ser 2013-CR6, Cl D 4.266%, 03/10/2046 (A)(B) | 515 | 476 | ||||
COMM Mortgage Trust, Ser 2013-CR8, Cl A4 3.334%, 06/10/2046 | 120 | 124 | ||||
COMM Mortgage Trust, Ser 2014-CCRE14, | ||||||
Cl A3 3.955%, 02/10/2047 | 70 | 74 | ||||
COMM Mortgage Trust, Ser 2014-CR21, Cl A3 3.528%, 12/10/2047 | 75 | 78 | ||||
COMM Mortgage Trust, Ser 2014-UBS2, Cl A5 3.961%, 03/10/2047 | 60 | 64 | ||||
COMM Mortgage Trust, Ser 2014-UBS4, Cl A5 3.694%, 08/10/2047 | 180 | 188 | ||||
COMM Mortgage Trust, Ser 2015-DC1, Cl A5 3.350%, 02/10/2048 | 155 | 158 | ||||
COMM Mortgage Trust, Ser 2015-PC1, Cl A4 3.620%, 07/10/2050 | 50 | 52 | ||||
COMM Mortgage Trust, Ser 2016-DC2, Cl A5 3.765%, 02/10/2049 | 140 | 146 | ||||
Commercial Mortgage Pass-Through Certificates, Ser 2008-C1, Cl A3 | ||||||
6.520%, 02/15/2041 (B) | 9 | 9 | ||||
Credit Suisse First Boston Mortgage Securities, Ser 2005-C2, Cl AMFX | ||||||
4.877%, 04/15/2037 | 20 | 20 | ||||
| Description | Face Amount (Thousands) | Market Value ($ Thousands) | ||||||||
MORTGAGE-BACKED SECURITIES (continued) |
| |||||||||
CSAIL Commercial Mortgage Trust, Ser 2015- | ||||||||||
C3, Cl A3 3.447%, 08/15/2048 | $ | 85 | $ | 87 | ||||||
CSAIL Commercial Mortgage Trust, Ser 2015- | ||||||||||
C4, Cl A4 3.808%, 11/15/2048 | 165 | 173 | ||||||||
CSAIL Commercial Mortgage Trust, Ser 2016- | ||||||||||
C7, Cl A5 3.502%, 11/15/2049 | 80 | 82 | ||||||||
FNMA Connecticut Avenue Securities, | ||||||||||
Ser 2013-C01, Cl M1 3.234%, VAR ICE LIBOR USD 1 | ||||||||||
Month+2.000%, 10/25/2023 | 28 | 28 | ||||||||
FNMA Connecticut Avenue Securities, | ||||||||||
Ser 2014-C01, Cl M1 2.834%, VAR ICE LIBOR USD 1 | ||||||||||
Month+1.600%, 01/25/2024 | 243 | 245 | ||||||||
FNMA Connecticut Avenue Securities, | ||||||||||
Ser 2014-C02, Cl 2M1 2.184%, VAR ICE LIBOR USD 1 | ||||||||||
Month+0.950%, 05/25/2024 | 1 | 1 | ||||||||
FNMA Connecticut Avenue Securities, | ||||||||||
Ser 2014-C04, Cl 2M2 6.237%, VAR ICE LIBOR USD 1 | ||||||||||
Month+5.000%, 11/25/2024 | 449 | 503 | ||||||||
FNMA Connecticut Avenue Securities, | ||||||||||
Ser 2016-C02, Cl 1M1 3.384%, VAR ICE LIBOR USD 1 | ||||||||||
Month+2.150%, 09/25/2028 | 259 | 262 | ||||||||
FNMA Connecticut Avenue Securities, | ||||||||||
Ser 2016-C04, Cl 1M2 5.487%, VAR ICE LIBOR USD 1 | ||||||||||
Month+4.250%, 01/25/2029 | 95 | 104 | ||||||||
FNMA Connecticut Avenue Securities, | ||||||||||
Ser 2016-C05, Cl 2M1 2.584%, VAR ICE LIBOR USD 1 | ||||||||||
Month+1.350%, 01/25/2029 | 118 | 118 | ||||||||
FNMA Connecticut Avenue Securities, | ||||||||||
Ser 2016-C06, Cl 1M1 2.534%, VAR ICE LIBOR USD 1 | ||||||||||
Month+1.300%, 04/25/2029 | 578 | 585 | ||||||||
FNMA Connecticut Avenue Securities, | ||||||||||
Ser 2016-C07, Cl 2M2 5.587%, VAR ICE LIBOR USD 1 | ||||||||||
Month+4.350%, 05/25/2029 | 153 | 167 | ||||||||
FNMA Connecticut Avenue Securities, | ||||||||||
Ser 2017-C01, Cl 1M1 2.537%, VAR ICE LIBOR USD 1 | ||||||||||
Month+1.300%, 07/25/2029 | 244 | 246 | ||||||||
GS Mortgage Securities Trust, Ser 2014- | ||||||||||
GC20, Cl D 5.021%, 04/10/2047 (A)(B) | 80 | 57 | ||||||||
42 |
SEI Institutional International Trust / Annual Report / September 30, 2017 |
| Description | Face Amount (Thousands) | Market Value ($ Thousands) | ||||||||
MORTGAGE-BACKED SECURITIES (continued) |
| |||||||||
GSR Mortgage Loan Trust, Ser 2005-AR1, Cl 4A1 2.751%, 01/25/2035 (B) | $ | 80 | $ | 77 | ||||||
JPMBB Commercial Mortgage Securities Trust, Ser 2014-C22, Cl A3A1 3.538%, 09/15/2047 | 185 | 192 | ||||||||
JPMorgan Chase Commercial Mortgage Securities, Ser 2007-C1, Cl A4 5.716%, 02/15/2051 | 5 | 5 | ||||||||
JPMorgan Chase Commercial Mortgage Securities, Ser 2008-C2, Cl A4FL 2.736%, VAR LIBOR USD 1 Month+1.500%, 02/12/2051 | 231 | 226 | ||||||||
JPMorgan Chase Commercial Mortgage Securities, Ser 2008-C2, Cl A4 6.068%, 02/12/2051 | 20 | 20 | ||||||||
JPMorgan Chase Commercial Mortgage Securities, Ser 2012-C8, Cl A3 2.829%, 10/15/2045 | 135 | 137 | ||||||||
JPMorgan Chase Commercial Mortgage Securities, Ser 2012-LC9, Cl A5 2.840%, 12/15/2047 | 135 | 136 | ||||||||
JPMorgan Mortgage Trust, Ser 2004-A5, Cl 3A1 3.175%, 12/25/2034 (B) | 64 | 65 | ||||||||
LB-UBS Commercial Mortgage Trust, Ser 2008-C1, Cl A2 6.296%, 04/15/2041 (B) | 32 | 33 | ||||||||
LSTAR Commercial Mortgage Trust, Ser 2016-4, Cl A2 2.458%, 03/10/2049 (A) | 159 | 157 | ||||||||
Morgan Stanley Capital I Trust, Ser 2006- T21, Cl D 5.408%, 10/12/2052 (A)(B) | 15 | 11 | ||||||||
Morgan Stanley Capital I Trust, Ser 2006- T21, Cl E 5.408%, 10/12/2052 (A)(B) | 10 | 1 | ||||||||
Morgan Stanley Capital I Trust, Ser 2016- UB12, Cl A3 3.337%, 12/15/2049 | 155 | 158 | ||||||||
SFAVE Commercial Mortgage Securities Trust, Ser 2015-5AVE, Cl A1 3.872%, 01/05/2043 (A)(B) | 135 | 134 | ||||||||
TAGUS-Sociedade de Titularizacao de Creditos, Ser 2014-2, Cl SNR 2.980%, 02/16/2018 | EUR | 69 | 82 | |||||||
UBS-Barclays Commercial Mortgage Trust, Ser 2013-C5, Cl A4 3.185%, 03/10/2046 | $ | 100 | 102 | |||||||
UBS-Barclays Commercial Mortgage Trust, Ser 2013-C6, Cl A3 2.971%, 04/10/2046 | 70 | 71 | ||||||||
| Description | Face Amount (Thousands) | Market Value ($ Thousands) | ||||||||
MORTGAGE-BACKED SECURITIES (continued) |
| |||||||||
Wells Fargo Commercial Mortgage Trust, | ||||||||||
Ser 2015-C28, Cl A3 3.290%, 05/15/2048 | $ | 120 | $ | 123 | ||||||
Wells Fargo Commercial Mortgage Trust, Ser 2015-C30, Cl A3 3.410%, 09/15/2058 | 80 | 82 | ||||||||
Wells Fargo Commercial Mortgage Trust, Ser 2016-C32, Cl A4 3.560%, 01/15/2059 | 140 | 145 | ||||||||
Wells Fargo Commercial Mortgage Trust, Ser C38, Cl A5 3.453%, 07/15/2050 | 205 | 210 | ||||||||
WFRBS Commercial Mortgage Trust, Ser 2012-C10, Cl A3 2.875%, 12/15/2045 | 125 | 127 | ||||||||
WFRBS Commercial Mortgage Trust, Ser 2012-C6, Cl D 5.766%, 04/15/2045 (A)(B) | 55 | 55 | ||||||||
|
| |||||||||
| 7,151 | ||||||||||
|
| |||||||||
Total Mortgage-Backed Securities | 9,481 | |||||||||
|
| |||||||||
U.S. TREASURY OBLIGATIONS — 1.1% |
| |||||||||
U.S. Treasury Bond 3.750%, 11/15/2043 | 1,150 | 1,348 | ||||||||
U.S. Treasury Bond STRIPS 2.951%, 08/15/2045 (C) | 1,070 | 473 | ||||||||
2.841%, 11/15/2045 (C) | 525 | 230 | ||||||||
U.S. Treasury Inflation Indexed Bonds 0.250%, | ||||||||||
01/15/2025 (D) | 1,324 | 1,312 | ||||||||
U.S. Treasury Note 1.000%, 09/30/2019 | 1,700 | 1,684 | ||||||||
|
| |||||||||
Total U.S. Treasury Obligations (Cost $5,090) ($ Thousands) | 5,047 | |||||||||
|
| |||||||||
CORPORATE OBLIGATIONS — 0.4% |
| |||||||||
United States — 0.4% | ||||||||||
CenturyLink | ||||||||||
6.450%, 06/15/2021 | 144 | 150 | ||||||||
5.800%, 03/15/2022 | 158 | 157 | ||||||||
Cox Communications | ||||||||||
2.950%, 06/30/2023 (A) | 127 | 125 | ||||||||
Dell International | ||||||||||
5.450%, 06/15/2023 (A) | 240 | 262 | ||||||||
Navient MTN | ||||||||||
5.500%, 01/15/2019 | 248 | 256 | ||||||||
Santander Holdings USA | ||||||||||
3.700%, 03/28/2022 (A) | 460 | 469 | ||||||||
SEI Institutional International Trust / Annual Report / September 30, 2017 |
43 |
SCHEDULE OF INVESTMENTS
September 30, 2017
International Fixed Income Fund (Continued)
| Description | Face Amount (Thousands) | Market Value ($ Thousands) | ||||||
CORPORATE OBLIGATIONS (continued) |
| |||||||
Seagate | ||||||||
4.875%, 03/01/2024 (A) | $ | 85 | $ | 84 | ||||
Sprint Spectrum | ||||||||
3.360%, 09/20/2021 (A) | 246 | 250 | ||||||
| Description | Face Amount (Thousands) | Market Value ($ Thousands) | ||||||
CORPORATE OBLIGATIONS (continued) |
| |||||||
Uniti Group | ||||||||
6.000%, 04/15/2023 (A) | $ | 162 | $ | 155 | ||||
|
| |||||||
Total Corporate Obligations |
| 1,908 | ||||||
|
| |||||||
Total Investments in Securities— 93.4% |
| $ | 423,553 | |||||
|
| |||||||
A list of the open futures contracts held by the Fund at September 30, 2017, is as follows:
Type of Contract | Number of Contracts Long (Short) | Expiration Date | Notional Amount ($ Thousands) | Value ($ Thousands) |
Unrealized | |||||||||||||||
90-Day Euro$ | (28 | ) | Sep-2018 | (6,882 | ) | (6,875 | ) | 7 | ||||||||||||
Australian 10-Year Bond | 28 | Dec-2017 | 2,793 | 2,791 | (2 | ) | ||||||||||||||
Australian 3-Year Bond | 14 | Dec-2017 | 1,248 | 1,220 | (5 | ) | ||||||||||||||
Canadian 10-Year Bond | 81 | Dec-2017 | 8,904 | 8,763 | (97 | ) | ||||||||||||||
Euro | (180 | ) | Dec-2017 | (27,103 | ) | (26,695 | ) | 408 | ||||||||||||
Euro-Bob | 58 | Dec-2017 | 8,936 | 8,995 | (1 | ) | ||||||||||||||
Euro-Bund | 33 | Dec-2017 | 6,284 | 6,281 | (2 | ) | ||||||||||||||
Euro-Bund | (69 | ) | Dec-2017 | (13,081 | ) | (13,134 | ) | (16 | ) | |||||||||||
Euro-Buxl 30 Year Bond | 19 | Dec-2017 | 3,771 | 3,667 | (66 | ) | ||||||||||||||
Euro-Buxl 30 Year Bond | (3 | ) | Dec-2017 | (574 | ) | (579 | ) | (3 | ) | |||||||||||
Euro-OAT 10 Year Bond | (2 | ) | Dec-2017 | (371 | ) | (367 | ) | 3 | ||||||||||||
Euro-OAT 10 Year Bond | 23 | Dec-2017 | 4,205 | 4,218 | 4 | |||||||||||||||
Euro-Schatz | (101 | ) | Dec-2017 | (13,348 | ) | (13,389 | ) | 1 | ||||||||||||
Euro-Schatz | 18 | Dec-2007 | 2,406 | 2,386 | (1 | ) | ||||||||||||||
Japanese 10-Year Bond | 19 | Dec-2017 | 25,598 | 25,378 | (15 | ) | ||||||||||||||
Japanese 10-Year Bond E-MINI | 1 | Dec-2017 | 140 | 134 | (1 | ) | ||||||||||||||
Japanese 10-Year Bond E-MINI | (56 | ) | Dec-2017 | (7,479 | ) | (7,481 | ) | (2 | ) | |||||||||||
Long Gilt 10-Year Bond | 4 | Dec-2017 | 655 | 665 | (18 | ) | ||||||||||||||
Long Gilt 10-Year Bond | (16 | ) | Dec-2017 | (2,672 | ) | (2,659 | ) | 3 | ||||||||||||
U.S. 10-Year Treasury Note | (2 | ) | Dec-2017 | (251 | ) | (251 | ) | �� | — | |||||||||||
U.S. 10-Year Treasury Note | (105 | ) | Dec-2017 | (13,258 | ) | (13,158 | ) | 100 | ||||||||||||
U.S. 10-Year Treasury Note | 7 | Dec-2017 | 886 | 877 | (9 | ) | ||||||||||||||
U.S. 2-Year Treasury Note | (33 | ) | Dec-2017 | (7,127 | ) | (7,118 | ) | 8 | ||||||||||||
U.S. 5-Year Treasury Note | (117 | ) | Dec-2017 | (13,798 | ) | (13,748 | ) | 50 | ||||||||||||
U.S. Long Treasury Bond | 10 | Dec-2017 | 1,544 | 1,528 | (15 | ) | ||||||||||||||
U.S. Long Treasury Bond | (2 | ) | Dec-2017 | (311 | ) | (306 | ) | 5 | ||||||||||||
U.S. Ultra Long Treasury Bond | (16 | ) | Dec-2017 | (2,671 | ) | (2,642 | ) | 29 | ||||||||||||
Ultra 10-Year U.S. Treasury Note | (36 | ) | Dec-2017 | (4,893 | ) | (4,836 | ) | 57 | ||||||||||||
Ultra 10-Year U.S. Treasury Note | 1 | Dec-2017 | 136 | 134 | (1 | ) | ||||||||||||||
|
| |||||||||||||||||||
| (46,313 | ) | (46,201 | ) | 421 | ||||||||||||||||
|
| |||||||||||||||||||
44 |
SEI Institutional International Trust / Annual Report / September 30, 2017 |
A list of the open forward foreign currency contracts held by the Fund at September 30, 2017, is as follows:
| Counterparty | Settlement Date | Currency to Deliver (Thousands) | Currency to Receive (Thousands) |
Unrealized Appreciation ($ Thousands) | ||||||||||||||||
ANZ | 10/04/17 | USD | 592 | EUR | 502 | 2 | ||||||||||||||
ANZ | 11/28/17 | CNH | 14,700 | USD | 2,233 | 28 | ||||||||||||||
Bank of America | 10/05/17 | GBP | 161 | USD | 216 | | – | | ||||||||||||
Bank of America | 10/05/17 | USD | 208 | EUR | 176 | | – | | ||||||||||||
Bank of America | 10/05/17 | USD | 327 | EUR | 273 | (4 | ) | |||||||||||||
Bank of America | 10/05/17 | CHF | 3,088 | USD | 3,211 | 19 | ||||||||||||||
Bank of America | 10/05/17 | ZAR | 14,562 | USD | 1,116 | 37 | ||||||||||||||
Bank of America | 10/05/17 | EUR | 35,277 | USD | 42,037 | 329 | ||||||||||||||
Bank of America | 11/07/17 | USD | 1,249 | NOK | 9,907 | (3 | ) | |||||||||||||
Bank of America | 11/07/17 | USD | 2,197 | SEK | 17,801 | (12 | ) | |||||||||||||
Bank of America | 11/07/17 | NOK | 4,359 | USD | 550 | 1 | ||||||||||||||
Bank of America | 11/07/17 | SEK | 15,174 | USD | 1,873 | 10 | ||||||||||||||
Bank of America | 11/22/17 | TWD | 84,266 | USD | 2,796 | 13 | ||||||||||||||
Bank of Montreal | 11/07/17 | CAD | 908 | USD | 731 | 5 | ||||||||||||||
Bank of Montreal | 11/07/17 | USD | 1,032 | GBP | 769 | – | ||||||||||||||
Barclays PLC | 10/05/17 | EUR | 38,469 | USD | 45,806 | 324 | ||||||||||||||
Barclays PLC | 10/04/17 - 11/07/17 | EUR | 41,472 | USD | 49,071 | (46 | ) | |||||||||||||
Barclays PLC | 10/05/17 | USD | 71 | NZD | 97 | (1 | ) | |||||||||||||
Barclays PLC | 10/05/17 | USD | 140 | AUD | 176 | (2 | ) | |||||||||||||
Barclays PLC | 10/05/17 | NZD | 193 | USD | 140 | 1 | ||||||||||||||
Barclays PLC | 10/05/17 | USD | 232 | SEK | 1,846 | (6 | ) | |||||||||||||
Barclays PLC | 10/05/17 | USD | 278 | NOK | 2,170 | (5 | ) | |||||||||||||
Barclays PLC | 10/05/17 | USD | 278 | JPY | 30,686 | (5 | ) | |||||||||||||
Barclays PLC | 10/05/17 | USD | 482 | EUR | 404 | (4 | ) | |||||||||||||
Barclays PLC | 10/05/17 | NOK | 721 | USD | 92 | 2 | ||||||||||||||
Barclays PLC | 10/05/17 | SGD | 1,767 | USD | 1,303 | 1 | ||||||||||||||
Barclays PLC | 10/05/17 | SEK | 3,637 | USD | 457 | 11 | ||||||||||||||
Barclays PLC | 10/05/17 | AUD | 10,836 | USD | 8,582 | 80 | ||||||||||||||
Barclays PLC | 10/05/17 | GBP | 18,239 | USD | 23,514 | (956 | ) | |||||||||||||
Barclays PLC | 10/05/17 | MXN | 34,633 | USD | 1,927 | 21 | ||||||||||||||
Barclays PLC | 10/05/17 | JPY | 7,169,077 | USD | 64,932 | 1,237 | ||||||||||||||
Barclays PLC | 11/07/17 | ZAR | 6,174 | USD | 453 | (1 | ) | |||||||||||||
BNP Paribas | 10/05/17 | USD | 140 | JPY | 15,200 | (5 | ) | |||||||||||||
BNP Paribas | 10/05/17 | NZD | 215 | USD | 156 | 1 | ||||||||||||||
BNP Paribas | 10/05/17 - 11/10/17 | USD | 3,555 | CAD | 4,333 | (91 | ) | |||||||||||||
BNP Paribas | 10/05/17 | JPY | 15,400 | USD | 139 | 2 | ||||||||||||||
BNP Paribas | 11/07/17 | USD | 31,761 | EUR | 26,972 | 183 | ||||||||||||||
BNP Paribas | 10/05/17 | USD | 139 | EUR | 115 | (3 | ) | |||||||||||||
BNP Paribas | 10/13/17 | ARS | 7,392 | USD | 423 | (1 | ) | |||||||||||||
BNP Paribas | 10/26/17 | USD | 1,066 | KRW | 1,220,242 | – | ||||||||||||||
BNP Paribas | 11/03/17 | BRL | 814 | USD | 256 | – | ||||||||||||||
BNP Paribas | 11/07/17 | SGD | 530 | USD | 390 | (1 | ) | |||||||||||||
BNP Paribas | 11/22/17 | RUB | 26,517 | USD | 457 | – | ||||||||||||||
BNP Paribas | 11/30/17 | NZD | 2,614 | AUD | 2,403 | (3 | ) | |||||||||||||
BNP Paribas | 12/01/17 | GBP | 12,673 | USD | 17,171 | 142 | ||||||||||||||
Brown Brothers Harriman | 10/04/17 | EUR | 312 | USD | 369 | – | ||||||||||||||
SEI Institutional International Trust / Annual Report / September 30, 2017 |
45 |
SCHEDULE OF INVESTMENTS
September 30, 2017
International Fixed Income Fund (Continued)
| Counterparty | Settlement Date | Currency to Deliver (Thousands) | Currency to Receive (Thousands) | Unrealized Appreciation ($ Thousands) | ||||||||||||||||
Brown Brothers Harriman | 10/04/17 - 12/15/17 | EUR | 6,586 | USD | 7,695 | (106 | ) | |||||||||||||
Brown Brothers Harriman | 10/04/17 - 12/15/17 | USD | 26,151 | EUR | 22,233 | 205 | ||||||||||||||
Brown Brothers Harriman | 10/04/17 | USD | 4,500 | EUR | 3,764 | (51 | ) | |||||||||||||
Brown Brothers Harriman | 10/06/17 | MXN | 6,616 | USD | 368 | 4 | ||||||||||||||
Brown Brothers Harriman | 10/17/17 | USD | 291 | TRY | 1,040 | 1 | ||||||||||||||
Brown Brothers Harriman | 10/17/17 | USD | 48 | TRY | 165 | (2 | ) | |||||||||||||
Brown Brothers Harriman | 10/17/17 | TRY | 1,455 | USD | 407 | – | ||||||||||||||
Brown Brothers Harriman | 10/20/17 | USD | 463 | PLN | 1,690 | 1 | ||||||||||||||
Brown Brothers Harriman | 10/20/17 | USD | 221 | PLN | 802 | (1 | ) | |||||||||||||
Brown Brothers Harriman | 10/20/17 | PLN | 793 | USD | 217 | – | ||||||||||||||
Brown Brothers Harriman | 11/10/17 | CAD | 321 | USD | 257 | – | ||||||||||||||
Brown Brothers Harriman | 11/10/17 | USD | 734 | CAD | 918 | – | ||||||||||||||
Brown Brothers Harriman | 11/10/17 | USD | 36 | CAD | 44 | (1 | ) | |||||||||||||
Brown Brothers Harriman | 11/28/17 | USD | 553 | CNY | 3,683 | – | ||||||||||||||
Brown Brothers Harriman | 11/30/17 | AUD | 258 | USD | 203 | 1 | ||||||||||||||
Brown Brothers Harriman | 11/30/17 | USD | 551 | NZD | 763 | – | ||||||||||||||
Brown Brothers Harriman | 11/30/17 | USD | 1,947 | AUD | 2,484 | 1 | ||||||||||||||
Brown Brothers Harriman | 11/30/17 | USD | 1,361 | AUD | 1,730 | (5 | ) | |||||||||||||
Brown Brothers Harriman | 12/01/17 | USD | 284 | GBP | 211 | – | ||||||||||||||
Brown Brothers Harriman | 12/01/17 | USD | 3,634 | GBP | 2,704 | (1 | ) | |||||||||||||
Brown Brothers Harriman | 12/05/17 | USD | 20,626 | JPY | 2,314,807 | 3 | ||||||||||||||
Brown Brothers Harriman | 12/05/17 | USD | 64 | JPY | 7,100 | (1 | ) | |||||||||||||
Brown Brothers Harriman | 12/07/17 | USD | 1,017 | ZAR | 13,900 | 2 | ||||||||||||||
Brown Brothers Harriman | 12/07/17 | ZAR | 3,711 | USD | 272 | – | ||||||||||||||
Brown Brothers Harriman | 12/13/17 | SEK | 492 | USD | 62 | 1 | ||||||||||||||
BT Brokerage | 10/05/17 | SEK | 5,953 | USD | 745 | 15 | ||||||||||||||
BT Brokerage | 10/05/17 | CZK | 14,410 | USD | 663 | 8 | ||||||||||||||
BT Brokerage | 11/07/17 | AUD | 525 | USD | 411 | (1 | ) | |||||||||||||
BT Brokerage | 11/07/17 | USD | 1,665 | CAD | 2,071 | (8 | ) | |||||||||||||
BT Brokerage | 11/07/17 | GBP | 2,025 | USD | 2,726 | 6 | ||||||||||||||
BT Brokerage | 11/07/17 | PLN | 7,202 | USD | 1,971 | (6 | ) | |||||||||||||
BT Brokerage | 11/07/17 | EUR | 34,002 | USD | 40,138 | (132 | ) | |||||||||||||
BT Brokerage | 11/07/17 | MXN | 34,633 | USD | 1,896 | (1 | ) | |||||||||||||
BT Brokerage | 11/07/17 | JPY | 2,263,300 | USD | 20,111 | (33 | ) | |||||||||||||
CIBC | 11/07/17 | JPY | 3,715,368 | USD | 33,067 | (1 | ) | |||||||||||||
Citigroup | 10/05/17 | EUR | 351 | USD | 419 | 4 | ||||||||||||||
Citigroup | 10/04/17 - 11/07/17 | EUR | 41,494 | USD | 49,022 | (121 | ) | |||||||||||||
Citigroup | 10/05/17 | USD | 140 | NZD | 195 | 1 | ||||||||||||||
Citigroup | 10/05/17 | USD | 192 | ZAR | 2,493 | (8 | ) | |||||||||||||
Citigroup | 10/05/17 | USD | 209 | AUD | 263 | (3 | ) | |||||||||||||
Citigroup | 10/05/17 | USD | 70 | GBP | 54 | 3 | ||||||||||||||
Citigroup | 10/05/17 | USD | 144 | GBP | 106 | (2 | ) | |||||||||||||
Citigroup | 10/05/17 | CAD | 348 | USD | 281 | 3 | ||||||||||||||
Citigroup | 10/05/17 | GBP | 51 | USD | 69 | 1 | ||||||||||||||
Citigroup | 10/05/17 - 11/07/17 | GBP | 875 | USD | 1,156 | (19 | ) | |||||||||||||
Citigroup | 11/07/17 | USD | 124 | EUR | 105 | – | ||||||||||||||
Citigroup | 10/05/17 | USD | 2,449 | EUR | 2,053 | (21 | ) | |||||||||||||
Citigroup | 10/05/17 | CHF | 268 | USD | 284 | 7 | ||||||||||||||
Citigroup | 11/07/17 | CHF | 3,088 | USD | 3,184 | (15 | ) | |||||||||||||
Citigroup | 10/05/17 | SEK | 6,686 | USD | 840 | 21 | ||||||||||||||
46 |
SEI Institutional International Trust / Annual Report / September 30, 2017 |
| Counterparty | Settlement Date | Currency to Deliver (Thousands) | Currency to Receive (Thousands) | Unrealized Appreciation ($ Thousands) | ||||||||||||||||
Citigroup | 10/05/17 | NZD | 8,064 | USD | 5,778 | (51 | ) | |||||||||||||
Citigroup | 10/05/17 | JPY | 15,400 | USD | 140 | 3 | ||||||||||||||
Citigroup | 10/06/17 | USD | 710 | MXN | 12,806 | (6 | ) | |||||||||||||
Citigroup | 10/13/17 | USD | 439 | ARS | 7,617 | (2 | ) | |||||||||||||
Citigroup | 10/20/17 | PLN | 3,398 | USD | 936 | 3 | ||||||||||||||
Citigroup | 10/26/17 | KRW | 4,244,280 | USD | 3,797 | 88 | ||||||||||||||
Citigroup | 11/03/17 | USD | 1,194 | BRL | 3,797 | 2 | ||||||||||||||
Citigroup | 11/22/17 | USD | 1,797 | RUB | 103,758 | (10 | ) | |||||||||||||
Citigroup | 11/30/17 | AUD | 16,029 | USD | 12,798 | 233 | ||||||||||||||
Credit Agricole | 10/05/17 | USD | 14 | SEK | 113 | – | ||||||||||||||
Credit Suisse First Boston | 10/03/17 | BRL | 5,797 | USD | 1,820 | (12 | ) | |||||||||||||
Credit Suisse First Boston | 10/04/17 | EUR | 3,020 | USD | 3,562 | (9 | ) | |||||||||||||
Credit Suisse First Boston | 10/05/17 | USD | 1,313 | EUR | 1,096 | (17 | ) | |||||||||||||
Credit Suisse First Boston | 10/05/17 | USD | 1,871 | NZD | 2,570 | (14 | ) | |||||||||||||
Credit Suisse First Boston | 10/06/17 | USD | 907 | MXN | 16,088 | (21 | ) | |||||||||||||
Credit Suisse First Boston | 11/07/17 | HUF | 117,758 | USD | 447 | (2 | ) | |||||||||||||
Credit Suisse First Boston | 11/10/17 | USD | 1,408 | CAD | 1,723 | (30 | ) | |||||||||||||
Credit Suisse First Boston | 12/13/17 | SEK | 7,157 | USD | 886 | 5 | ||||||||||||||
Deutsche Bank | 10/04/17 | EUR | 22,851 | USD | 27,432 | 417 | ||||||||||||||
Goldman Sachs | 11/30/17 | NZD | 4,606 | USD | 3,339 | 14 | ||||||||||||||
Goldman Sachs | 12/05/17 | USD | 1,764 | JPY | 196,124 | (17 | ) | |||||||||||||
Goldman Sachs | 12/05/17 | JPY | 3,127,743 | USD | 28,166 | 293 | ||||||||||||||
HSBC | 10/05/17 | USD | 276 | EUR | 235 | 2 | ||||||||||||||
HSBC | 10/05/17 | USD | 986 | EUR | 824 | (12 | ) | |||||||||||||
HSBC | 10/05/17 | CAD | 1,478 | USD | 1,210 | 28 | ||||||||||||||
HSBC | 11/07/17 | GBP | 5,714 | USD | 7,688 | 14 | ||||||||||||||
HSBC | 10/05/17 | GBP | 645 | USD | 860 | (6 | ) | |||||||||||||
HSBC | 11/07/17 | THB | 12,319 | USD | 369 | (1 | ) | |||||||||||||
JPMorgan Chase Bank | 10/05/17 | USD | 82 | NZD | 114 | – | ||||||||||||||
JPMorgan Chase Bank | 10/05/17 | USD | 70 | NZD | 97 | – | ||||||||||||||
JPMorgan Chase Bank | 10/05/17 | USD | 208 | EUR | 176 | – | ||||||||||||||
JPMorgan Chase Bank | 10/05/17 - 11/07/17 | USD | 225 | JPY | 24,514 | (7 | ) | |||||||||||||
JPMorgan Chase Bank | 10/05/17 - 11/07/17 | EUR | 246 | USD | 290 | (1 | ) | |||||||||||||
JPMorgan Chase Bank | 10/05/17 | USD | 279 | CHF | 268 | (2 | ) | |||||||||||||
JPMorgan Chase Bank | 10/05/17 | CAD | 346 | USD | 281 | 4 | ||||||||||||||
JPMorgan Chase Bank | 10/05/17 | AUD | 367 | USD | 293 | 4 | ||||||||||||||
JPMorgan Chase Bank | 10/05/17 | USD | 278 | CAD | 350 | 2 | ||||||||||||||
JPMorgan Chase Bank | 10/05/17 | USD | 140 | CAD | 170 | (4 | ) | |||||||||||||
JPMorgan Chase Bank | 10/05/17 | USD | 769 | AUD | 960 | (16 | ) | |||||||||||||
JPMorgan Chase Bank | 11/07/17 | USD | 76 | NOK | 608 | – | ||||||||||||||
JPMorgan Chase Bank | 10/05/17 - 11/07/17 | USD | 974 | NOK | 7,616 | (17 | ) | |||||||||||||
JPMorgan Chase Bank | 10/05/17 | USD | 1,251 | EUR | 1,047 | (13 | ) | |||||||||||||
JPMorgan Chase Bank | 10/05/17 | USD | 357 | GBP | 270 | 6 | ||||||||||||||
JPMorgan Chase Bank | 10/05/17 | USD | 1,299 | GBP | 958 | (13 | ) | |||||||||||||
JPMorgan Chase Bank | 10/05/17 | GBP | 370 | USD | 499 | 3 | ||||||||||||||
JPMorgan Chase Bank | 10/05/17 - 11/07/17 | GBP | 1,431 | USD | 1,890 | (30 | ) | |||||||||||||
JPMorgan Chase Bank | 10/05/17 - 11/07/17 | NOK | 2,545 | USD | 322 | 2 | ||||||||||||||
JPMorgan Chase Bank | 10/05/17 - 11/07/17 | SEK | 3,333 | USD | 417 | 9 | ||||||||||||||
JPMorgan Chase Bank | 10/05/17 - 11/07/17 | USD | 895 | SEK | 7,292 | 1 | ||||||||||||||
JPMorgan Chase Bank | 10/05/17 - 11/07/17 | USD | 2,831 | SEK | 22,592 | (62 | ) | |||||||||||||
JPMorgan Chase Bank | 10/05/17 | NZD | 958 | USD | 700 | 7 | ||||||||||||||
SEI Institutional International Trust / Annual Report / September 30, 2017 |
47 |
SCHEDULE OF INVESTMENTS
September 30, 2017
International Fixed Income Fund (Continued)
| Counterparty | Settlement Date | Currency to Deliver (Thousands) | Currency to Receive (Thousands) | Unrealized Appreciation ($ Thousands) | ||||||||||||||||
JPMorgan Chase Bank | 11/07/17 | NZD | 3,618 | USD | 2,612 | (1 | ) | |||||||||||||
JPMorgan Chase Bank | 10/05/17 | EUR | 6,092 | USD | 7,278 | 75 | ||||||||||||||
JPMorgan Chase Bank | 10/05/17 | THB | 47,040 | USD | 1,419 | 9 | ||||||||||||||
JPMorgan Chase Bank | 10/05/17 - 11/07/17 | JPY | 3,745,868 | USD | 33,394 | 55 | ||||||||||||||
JPMorgan Chase Bank | 11/07/17 | JPY | 15,500 | USD | 138 | (1 | ) | |||||||||||||
JPMorgan Chase Bank | 10/17/17 | USD | 828 | TRY | 2,882 | (21 | ) | |||||||||||||
JPMorgan Chase Bank | 11/07/17 | SGD | 1,237 | USD | 912 | 1 | ||||||||||||||
JPMorgan Chase Bank | 11/07/17 | ZAR | 12,069 | USD | 887 | (2 | ) | |||||||||||||
JPMorgan Chase Bank | 11/10/17 | CAD | 23,462 | USD | 18,722 | (45 | ) | |||||||||||||
JPMorgan Chase Bank | 11/22/17 | USD | 2,808 | TWD | 84,262 | (25 | ) | |||||||||||||
JPMorgan Chase Bank | 12/07/17 | ZAR | 21,507 | USD | 1,604 | 28 | ||||||||||||||
Montgomery/Bank of America | 11/03/17 | BRL | 5,797 | USD | 1,807 | (19 | ) | |||||||||||||
Morgan Stanley | 10/05/17 | GBP | 103 | USD | 140 | 2 | ||||||||||||||
Morgan Stanley | 10/05/17 | EUR | 248 | USD | 300 | 6 | ||||||||||||||
Morgan Stanley | 10/05/17 | CAD | 355 | USD | 283 | (1 | ) | |||||||||||||
Morgan Stanley | 10/05/17 | USD | 434 | NOK | 3,384 | (9 | ) | |||||||||||||
Morgan Stanley | 10/05/17 | USD | 1,336 | NZD | 1,828 | (15 | ) | |||||||||||||
Morgan Stanley | 10/05/17 | DKK | 3,378 | USD | 542 | 6 | ||||||||||||||
Morgan Stanley | 10/05/17 | NOK | 4,359 | USD | 559 | 12 | ||||||||||||||
Morgan Stanley | 10/05/17 | PLN | 5,338 | USD | 1,497 | 32 | ||||||||||||||
Morgan Stanley | 10/05/17 | JPY | 56,000 | USD | 507 | 9 | ||||||||||||||
Morgan Stanley | 11/07/17 | DKK | 3,378 | USD | 537 | (1 | ) | |||||||||||||
Morgan Stanley | 11/07/17 | CZK | 14,410 | USD | 653 | (5 | ) | |||||||||||||
Morgan Stanley | 11/07/17 | CAD | 21,270 | USD | 17,070 | 56 | ||||||||||||||
Morgan Stanley | 12/01/17 | USD | 2,609 | GBP | 1,918 | (32 | ) | |||||||||||||
National Bank of Australia | 10/05/17 | CAD | 2,035 | USD | 1,659 | 32 | ||||||||||||||
National Bank of Australia | 10/05/17 | JPY | 190,439 | USD | 1,726 | 34 | ||||||||||||||
National Bank of Australia | 11/07/17 | JPY | 58,971 | USD | 524 | (1 | ) | |||||||||||||
National Bank of Australia | 11/07/17 | USD | 485 | CHF | 470 | 2 | ||||||||||||||
National Bank of Australia | 11/07/17 | USD | 737 | AUD | 941 | 1 | ||||||||||||||
National Bank of Australia | 11/07/17 | AUD | 9,702 | USD | 7,602 | (6 | ) | |||||||||||||
National Bank of Australia | 11/07/17 | USD | 10,316 | JPY | 1,160,892 | 17 | ||||||||||||||
RBC | 10/05/17 | USD | 371 | CAD | 450 | (11 | ) | |||||||||||||
RBC | 10/05/17 | USD | 263 | EUR | 223 | – | ||||||||||||||
RBC | 10/05/17 | USD | 1,642 | EUR | 1,386 | (3 | ) | |||||||||||||
RBC | 10/05/17 | CAD | 1,954 | USD | 1,581 | 18 | ||||||||||||||
RBC | 10/05/17 | CAD | 18,741 | USD | 14,969 | (16 | ) | |||||||||||||
RBS | 10/04/17 | USD | 2,365 | EUR | 2,060 | 71 | ||||||||||||||
RBS | 10/05/17 | USD | 627 | AUD | 780 | (14 | ) | |||||||||||||
RBS | 12/01/17 | USD | 732 | GBP | 541 | (4 | ) | |||||||||||||
Societe Generale | 10/05/17 | USD | 749 | CAD | 910 | (21 | ) | |||||||||||||
Standard Chartered | 10/04/17 | USD | 2,313 | EUR | 1,962 | 7 | ||||||||||||||
Standard Chartered | 10/04/17 | EUR | 45,728 | USD | 54,340 | 278 | ||||||||||||||
State Street | 10/05/17 | USD | 0 | SEK | 2 | – | ||||||||||||||
State Street | 10/05/17 | CAD | 2 | USD | 2 | – | ||||||||||||||
State Street | 10/05/17 | EUR | 45 | USD | 54 | – | ||||||||||||||
State Street | 10/05/17 | USD | 143 | GBP | 106 | (1 | ) | |||||||||||||
State Street | 10/05/17 | NZD | 194 | USD | 143 | 3 | ||||||||||||||
State Street | 10/05/17 | USD | 211 | AUD | 263 | (4 | ) | |||||||||||||
State Street | 10/05/17 | USD | 545 | EUR | 458 | (4 | ) | |||||||||||||
48 |
SEI Institutional International Trust / Annual Report / September 30, 2017 |
| Counterparty | Settlement Date | Currency to Deliver (Thousands) | Currency to Receive (Thousands) | Unrealized Appreciation ($ Thousands) | ||||||||||||||||
State Street | 10/05/17 | USD | 808 | NZD | 1,105 | (10 | ) | |||||||||||||
State Street | 10/05/17 | GBP | 51 | USD | 69 | – | ||||||||||||||
State Street | 10/05/17 – 11/07/17 | GBP | 19,738 | USD | 26,420 | (86 | ) | |||||||||||||
State Street | 10/05/17 | JPY | 15,220 | USD | 136 | 1 | ||||||||||||||
State Street | 11/07/17 | JPY | 9,100 | USD | 81 | – | ||||||||||||||
State Street | 10/06/17 | ILS | 2,477 | USD | 693 | (8 | ) | |||||||||||||
State Street | 11/07/17 | DKK | 1,263 | USD | 200 | (1 | ) | |||||||||||||
TD Securities | 11/07/17 | USD | 310 | JPY | 34,800 | – | ||||||||||||||
UBS | 10/05/17 | USD | 301 | EUR | 253 | (2 | ) | |||||||||||||
UBS | 10/05/17 | USD | 862 | SEK | 6,863 | (21 | ) | |||||||||||||
UBS | 10/05/17 | SEK | 9,221 | USD | 1,158 | 27 | ||||||||||||||
UBS | 10/05/17 | EUR | 10,046 | USD | 11,963 | 85 | ||||||||||||||
UBS | 10/06/17 | MXN | 102,464 | USD | 5,705 | 65 | ||||||||||||||
UBS | 11/07/17 | MXN | 46,910 | USD | 2,563 | (4 | ) | |||||||||||||
| 2,352 | ||||||||||||||||||||
A list of the open OTC swap agreements held by the Fund at September 30, 2017, is as follows:
| Credit Default Swaps | ||||||||||||||||||||||||
| Counterparty | Reference Entity/Obligation | Buy/Sell Protection | (Pays)/Receives Rate | Payment Frequency | Termination Date | Notional ($ Thousands) | Value ($ Thousands) | Upfront ($ Thousands) | Net Unrealized Appreciation (Depreciation) ($ Thousands) | |||||||||||||||
Credit Suisse | CMBX.NA.BB.6 | Sell | 5.00% | Monthly | 05/11/2063 | (370) | (90) | (63) | (27 | ) | ||||||||||||||
Credit Suisse | CMBX.NA.BB.6 | Sell | 5.00% | Monthly | 05/11/2063 | (130) | (32) | (17) | (15 | ) | ||||||||||||||
Credit Suisse | CMBX.NA.BB.6 | Sell | 5.00% | Monthly | 05/11/2063 | (240) | (58) | (31) | (27 | ) | ||||||||||||||
Credit Suisse | CMBX.NA.BBB.6 | Sell | 3.00% | Monthly | 05/11/2063 | (373) | (56) | (27) | (29 | ) | ||||||||||||||
Credit Suisse | CMBX.NA.BBB.6 | Sell | 3.00% | Monthly | 05/11/2063 | (134) | (20) | (8) | (12 | ) | ||||||||||||||
Credit Suisse | CMBX.NA.BBB.6 | Sell | 3.00% | Monthly | 05/11/2063 | (127) | (19) | (9) | (10 | ) | ||||||||||||||
Deutsche Bank | CMBX.NA.BBB.6 | Sell | 3.00% | Monthly | 05/11/2063 | (406) | (62) | (30) | (32 | ) | ||||||||||||||
Credit Suisse | CMBX.NA.BBB.6 | Sell | 3.00% | Monthly | 05/11/2063 | (460) | (70) | (36) | (34 | ) | ||||||||||||||
| (221) | (186 | ) | ||||||||||||||||||||||
A list of the open centrally cleared swap agreements held by the Fund at September 30, 2017, is as follows:
| Credit Default Swaps | ||||||||||||||||||||||||||||||||||||||||
| Reference Entity/Obligation | Buy/Sell Protection | (Pays)/Receives Rate | Payment Frequency | Termination Date | Notional Amount ($ Thousands) | Value ($ Thousands) | Upfront Payments/ ($ Thousands) | Net Unrealized Appreciation (Depreciation) ($ Thousands) | ||||||||||||||||||||||||||||||||
ITRAXX EUROPE SERIES 27 | Buy | 5.00% | Quarterly | 06/20/2022 | 1,607 | (202) | (205 | ) | 3 | |||||||||||||||||||||||||||||||
ITRAXX EUROPE SERIES 28 | Sell | 1.00% | Quarterly | 12/20/2022 | (6,439) | 146 | 146 | – | ||||||||||||||||||||||||||||||||
|
| |||||||||||||||||||||||||||||||||||||||
| (59 | ) | 3 | ||||||||||||||||||||||||||||||||||||||
|
| |||||||||||||||||||||||||||||||||||||||
For the year ended September 30, 2017, the total amount of all swap agreements, as presented in the table above, are representative of the volume of activity for the derivative type during the year.
| Percentages | are based on Net Assets of $453,564 ($ Thousands). |
| (A) | Security exempt from registration under Rule 144A of the Securities Act of 1933. These securities may be resold in transactions exempt from registration normally to qualified institutions. On September 30, 2017, the value of these securities amounted to $59,339 ($ Thousands), representing 13.1% of the Net Assets of the Fund. |
| (B) | Variable or floating rate security, the interest rate of which adjusts periodically based on changes in current interest rates and prepayments on the underlying pool of assets. |
| (C) | Zero coupon security. The rate shown on the Schedule of Investments is the security’s effective yield at the time of purchase. |
| (D) | Security, or portion thereof, has been pledged as collateral on open swap contracts. |
| ARS | — | Argentine Peso | ||
| AUD | — | Australian Dollar | ||
| BRL | — | Brazilian Real | ||
| CAD | — | Canadian Dollar | ||
| CHF | — | Swiss Franc | ||
| Cl | — | Class | ||
| CNH | — | Chinese Yuan Offshore |
SEI Institutional International Trust / Annual Report / September 30, 2017 |
49 |
SCHEDULE OF INVESTMENTS
September 30, 2017
International Fixed Income Fund (Concluded)
CNY — Chinese Yuan Onshore |
CZK — Czech Koruna |
DKK — Danish Krone |
EUR — Euro |
EURIBOR — Euro London Interbank Offered Rate |
FHLMC — Federal Home Loan Mortgage Corporation |
FNMA — Federal National Mortgage Association |
GBP — British Pound Sterling |
GDP — Gross Domestic Product |
HUF — Hungarian Forint |
ICE — Intercontinental Exchange |
ILS — Israeli New Sheckels |
JPY — Japanese Yen |
KRW — Korean Won |
L.P. — Limited Partnership |
LIBOR — London Interbank Offered Rate |
MTN — Medium Term Note |
MXN — Mexican Peso |
NOK — Norwegian Krone |
NZD — New Zealand Dollar |
PLN — Polish Zloty |
RUB — Russian Ruble |
SGD — Singapore Dollar |
SEK — Swedish Krona |
Ser — Series |
STRIPS — Separately Traded Registered Interest and Principal Securities |
THB — Thai Bhat |
TRY — Turkish Lira |
TSX — Toronto Stock Exchange |
TWD — Taiwan Dollar |
UK — United Kingdom |
USD — United States Dollar |
UYU — Uruguayan Peso |
VAR — Variable Rate |
ZAR — South African Rand |
The following is a list of the level of inputs used as of September 30, 2017, in valuing the Fund’s investments and other financial instruments carried at value ($ Thousands):
| Investments in Securities | Level 1 | Level 2 | Level 3 | Total | ||||||||||||
Global Bonds | $ | – | $ | 407,117 | $ | – | $ | 407,117 | ||||||||
Mortgage-Backed Securities | – | 9,481 | – | 9,481 | ||||||||||||
U.S. Treasury Obligations | – | 5,047 | – | 5,047 | ||||||||||||
Corporate Obligations | – | 1,908 | – | 1,908 | ||||||||||||
|
|
|
|
|
|
|
| |||||||||
Total Investments in Securities | $ | – | $ | 423,553 | $ | – | $ | 423,553 | ||||||||
|
|
|
|
|
|
|
| |||||||||
| Other Financial Instruments | Level 1 | Level 2 | Level 3 | Total | ||||||||||||
Futures Contracts * | ||||||||||||||||
Unrealized Appreciation | $ | 675 | $ | – | $ | – | $ | 675 | ||||||||
Unrealized Depreciation | (254 | ) | – | – | (254 | ) | ||||||||||
Forwards Contracts * | ||||||||||||||||
Unrealized Appreciation | – | 4,809 | – | 4,809 | ||||||||||||
Unrealized Depreciation | – | (2,457 | ) | – | (2,457 | ) | ||||||||||
OTC Swaps | ||||||||||||||||
Credit Default Swaps * | ||||||||||||||||
Unrealized Depreciation | – | (186 | ) | – | (186 | ) | ||||||||||
Centrally Cleared Swaps | ||||||||||||||||
Credit Default Swaps * | ||||||||||||||||
Unrealized Appreciation | – | 3 | – | 3 | ||||||||||||
|
|
|
|
|
|
|
| |||||||||
Total Other Financial Instruments | $ | 421 | $ | 2,169 | $ | – | $ | 2,590 | ||||||||
|
|
|
|
|
|
|
| |||||||||
*Futures contracts, forwards contracts and swap contracts are valued at the unrealized appreciation (depreciation) on the instrument.
For the year ended September 30, 2017, there were no transfers between Level 1 and Level 2 assets and liabilities.
For the year ended September 30, 2017, there were no transfers between Level 2 and Level 3 assets and liabilities.
For more information on valuation inputs, see note 2 — Significant Accounting Policies in Notes to Financial Statements.
Amounts designated as “–” are $0 or have been rounded to $0.
The accompaying notes are an integral part of the financial statements.
50 |
SEI Institutional International Trust / Annual Report / September 30, 2017 |
SCHEDULE OF INVESTMENTS
September 30, 2017
Emerging Markets Debt Fund
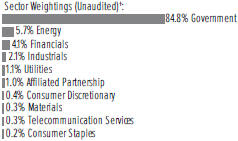
†Percentages based on total investments. Includes investments held as collateral for securities on loan (see Note 9).
| Description | Face Amount (Thousands) | Market Value ($ Thousands) | ||||||||
GLOBAL BONDS — 94.9% | ||||||||||
Angola — 0.2% | ||||||||||
Angolan Government International Bond | ||||||||||
9.500%, 11/12/2025 (A) | $ | 1,009 | $ | 1,083 | ||||||
9.500%, 11/12/2025 | 1,675 | 1,799 | ||||||||
|
| |||||||||
| 2,882 | ||||||||||
Argentina — 4.6% | ||||||||||
Adecoagro | ||||||||||
6.000%, 09/21/2027 (A) | 785 | 782 | ||||||||
Argentina Bonar Bonds | ||||||||||
23.450%, VAR 30-35d Argentina BADLAR Private Banks+2.000%, 04/03/2022 | ARS | 7,084 | 403 | |||||||
Argentina POM Politica Monetaria | ||||||||||
26.250%, VAR Argentina Central Bank 7D Repo Ref Rate+0.000%, 06/21/2020 | 151,560 | 9,103 | ||||||||
Argentina Treasury Bond | ||||||||||
2.500%, 07/22/2021 | 6,000 | 404 | ||||||||
Argentine Bonad Bonds | ||||||||||
2.400%, 03/18/2018 | $ | 1,568 | 1,544 | |||||||
Argentine Bonos del Tesoro | ||||||||||
22.750%, 03/05/2018 | ARS | 13,700 | 779 | |||||||
21.200%, 09/19/2018 | 27,802 | 1,594 | ||||||||
18.200%, 10/03/2021 | 21,053 | 1,248 | ||||||||
Cablevision | ||||||||||
6.500%, 06/15/2021 (A) | $ | 79 | 84 | |||||||
City of Buenos Aires Argentina 24.702%, VAR 30-35d Argentina BADLAR Private Banks+3.250%, 03/29/2024 | ARS | 10,891 | 613 | |||||||
Pampa Energia | ||||||||||
7.500%, 01/24/2027 (A) | $ | 343 | 373 | |||||||
7.375%, 07/21/2023 (A) | 270 | 293 | ||||||||
Provincia de Buenos Aires | ||||||||||
7.875%, 06/15/2027 | 2,762 | 2,994 | ||||||||
5.375%, 01/20/2023 (A) | EUR | 608 | 739 | |||||||
Provincia de Cordoba | ||||||||||
7.125%, 06/10/2021 (A) | $ | 531 | 570 | |||||||
| Description | Face Amount (Thousands) | Market Value ($ Thousands) | ||||||||||
GLOBAL BONDS (continued) | ||||||||||||
Provincia del Chaco Argentina | ||||||||||||
9.375%, 08/18/2024 | $ | 654 | $ | 663 | ||||||||
Republic of Argentina | ||||||||||||
7.820%, 12/31/2033 | EUR | 6,772 | 8,841 | |||||||||
7.820%, 12/31/2033 | 9,877 | 13,031 | ||||||||||
7.625%, 04/22/2046 | $ |
| 991 |
| 1,100 | |||||||
7.500%, 04/22/2026 | 5,050 | 5,676 | ||||||||||
7.125%, 06/28/2117 | 446 | 445 | ||||||||||
5.000%, 01/15/2027 | EUR | 3,555 | 4,151 | |||||||||
2.568%, 12/31/2033 | $ | 1,655 | 1,919 | |||||||||
2.260%, 03/31/2019 (B) | EUR | 564 | 453 | |||||||||
2.260%, 12/31/2038 (B)(C) | 11,529 | 9,268 | ||||||||||
1.453%, 12/31/2033 | $ | 2,426 | 2,735 | |||||||||
0.000%, 12/15/2035 (D) | EUR | 17,850 | 2,237 | |||||||||
YPF MTN | ||||||||||||
24.104%, VAR 30-35d Argentina BADLAR Private Banks+4.000%, 07/07/2020 | $ | 368 | 368 | |||||||||
|
| |||||||||||
| 72,410 | ||||||||||||
|
| |||||||||||
Armenia — 0.0% | ||||||||||||
Republic of Armenia | ||||||||||||
7.150%, 03/26/2025 (A) | 600 | 671 | ||||||||||
|
| |||||||||||
Azerbaijan — 1.4% | ||||||||||||
Republic of Azerbaijan | ||||||||||||
4.750%, 03/18/2024 (A)(C) | 2,291 | 2,354 | ||||||||||
Southern Gas Corridor | ||||||||||||
6.875%, 03/24/2026 | 4,275 | 4,809 | ||||||||||
6.875%, 03/24/2026 | 2,632 | 2,961 | ||||||||||
6.875%, 03/24/2026 (A) | 1,437 | 1,617 | ||||||||||
State Oil of the Azerbaijan Republic | ||||||||||||
6.950%, 03/18/2030 | 3,640 | 3,959 | ||||||||||
6.950%, 03/18/2030 | 963 | 1,047 | ||||||||||
State Oil of the Azerbaijan Republic MTN | ||||||||||||
4.750%, 03/13/2023 | 3,620 | 3,620 | ||||||||||
4.750%, 03/13/2023 | 1,500 | 1,500 | ||||||||||
|
| |||||||||||
| 21,867 | ||||||||||||
Bahrain — 0.2% | ||||||||||||
Bahrain Government International Bond | ||||||||||||
7.000%, 10/12/2028 (A) | 641 | 654 | ||||||||||
7.000%, 10/12/2028 | 679 | 693 | ||||||||||
6.750%, 09/20/2029 | 1,276 | 1,265 | ||||||||||
|
| |||||||||||
| 2,612 | ||||||||||||
|
| |||||||||||
Belize — 0.1% | ||||||||||||
Belize Government International Bond | ||||||||||||
5.000%, 02/20/2034 (B) | 2,637 | 1,635 | ||||||||||
|
| |||||||||||
Bermuda — 0.3% | ||||||||||||
Government of Bermuda | ||||||||||||
4.854%, 02/06/2024 | 2,580 | 2,807 | ||||||||||
SEI Institutional International Trust / Annual Report / September 30, 2017 |
51 |
SCHEDULE OF INVESTMENTS
September 30, 2017
Emerging Markets Debt Fund (Continued)
| Description | Face Amount (Thousands) | Market Value ($ Thousands) | ||||||||
GLOBAL BONDS (continued) |
| |||||||||
3.717%, 01/25/2027 | $ | 1,321 | $ | 1,337 | ||||||
|
| |||||||||
| 4,144 | ||||||||||
|
| |||||||||
Brazil — 8.4% | ||||||||||
Banco Nacional de Desenvolvimento Economico e Social | ||||||||||
6.500%, 06/10/2019 (A) | 660 | 699 | ||||||||
4.750%, 05/09/2024 (A) | 848 | 853 | ||||||||
Braskem Finance | ||||||||||
5.750%, 04/15/2021 | 1,797 | 1,934 | ||||||||
Brazil Letras do Tesouro Nacional (E) | ||||||||||
14.103%, 01/01/2019 | BRL | 77,437 | 22,446 | |||||||
10.760%, 07/01/2020 | 29,821 | 7,551 | ||||||||
10.403%, 01/01/2020 | 38,000 | 10,094 | ||||||||
Brazil Loan Trust 1 | ||||||||||
5.477%, 07/24/2023 (A) | $ | 264 | 278 | |||||||
5.477%, 07/24/2023 | 300 | 315 | ||||||||
Brazil Minas SPE via State of Minas Gerais | ||||||||||
5.333%, 02/15/2028 (A) | 224 | 227 | ||||||||
5.333%, 02/15/2028 | 5,320 | 5,400 | ||||||||
5.333%, 02/15/2028 | 1,176 | 1,194 | ||||||||
Brazil Notas do Tesouro Nacional, Serie B | ||||||||||
6.000%, 08/15/2022 | BRL | 6,000 | 6,143 | |||||||
Brazil Notas do Tesouro Nacional, Serie F | ||||||||||
10.000%, 01/01/2021 | 52,528 | 17,189 | ||||||||
10.000%, 01/01/2023 | 39,819 | 12,945 | ||||||||
10.000%, 01/01/2025 | 39,923 | 12,910 | ||||||||
Cosan Luxembourg | ||||||||||
7.000%, 01/20/2027 (A) | $ | 253 | 274 | |||||||
ESAL GmbH | ||||||||||
6.250%, 02/05/2023 (A) | 104 | 101 | ||||||||
Federal Republic of Brazil | ||||||||||
8.250%, 01/20/2034 | 2,768 | 3,619 | ||||||||
6.000%, 04/07/2026 (C) | 899 | 998 | ||||||||
5.625%, 01/07/2041 | 416 | 419 | ||||||||
5.625%, 02/21/2047 | 679 | 686 | ||||||||
5.000%, 01/27/2045 | 5,018 | 4,670 | ||||||||
Klabin Finance | ||||||||||
5.250%, 07/16/2024 | 790 | 824 | ||||||||
Marfrig Holdings Europe | ||||||||||
8.000%, 06/08/2023 | 1,100 | 1,138 | ||||||||
Minerva Luxembourg | ||||||||||
6.500%, 09/20/2026 | 1,401 | 1,415 | ||||||||
6.500%, 09/20/2026 (A) | 2,293 | 2,317 | ||||||||
Petrobras Global Finance | ||||||||||
8.750%, 05/23/2026 | 2,741 | 3,292 | ||||||||
7.375%, 01/17/2027 | 3,853 | 4,242 | ||||||||
6.250%, 03/17/2024 | 2,199 | 2,350 | ||||||||
Rumo Luxembourg | ||||||||||
7.375%, 02/09/2024 (A) | 898 | 972 | ||||||||
Ultrapar International | ||||||||||
5.250%, 10/06/2026 | 330 | 339 | ||||||||
| Description | Face Amount (Thousands) | Market Value ($ Thousands) | ||||||||
GLOBAL BONDS (continued) |
| |||||||||
Vale Overseas | ||||||||||
6.875%, 11/21/2036 | $ | 920 | $ | 1,053 | ||||||
VM Holding | ||||||||||
5.375%, 05/04/2027 (A) | 2,891 | 3,035 | ||||||||
|
| |||||||||
| 131,922 | ||||||||||
|
| |||||||||
Cameroon — 0.1% | ||||||||||
Republic of Cameroon International Bond | ||||||||||
9.500%, 11/19/2025 (A) | 1,936 | 2,284 | ||||||||
|
| |||||||||
Chile — 0.7% | ||||||||||
Bonos de la Tesoreria de la Republica en pesos | ||||||||||
6.000%, 01/01/2020 | CLP | 80,000 | 134 | |||||||
5.000%, 03/01/2035 | 1,560,000 | 2,498 | ||||||||
4.500%, 02/28/2021 | 350,000 | 565 | ||||||||
Cencosud | ||||||||||
4.375%, 07/17/2027 (A) | $ | 1,819 | 1,827 | |||||||
Empresa de Transporte de Pasajeros Metro | ||||||||||
5.000%, 01/25/2047 (A) | 2,000 | 2,197 | ||||||||
Empresa Electrica Angamos | ||||||||||
4.875%, 05/25/2029 (A) | 1,323 | 1,344 | ||||||||
Empresa Nacional del Petroleo | ||||||||||
4.500%, 09/14/2047 (A) | 332 | 318 | ||||||||
4.375%, 10/30/2024 | 200 | 210 | ||||||||
3.750%, 08/05/2026 | 640 | 640 | ||||||||
3.750%, 08/05/2026 (A) | 387 | 387 | ||||||||
Geopark | ||||||||||
6.500%, 09/21/2024 (A) | 492 | 493 | ||||||||
Republic of Chile | ||||||||||
5.500%, 08/05/2020 | CLP | 323,000 | 536 | |||||||
|
| |||||||||
| 11,149 | ||||||||||
|
| |||||||||
China — 0.2% | ||||||||||
Sinopec Group Overseas Development 2014 | ||||||||||
4.375%, 04/10/2024 (A) | $ | 1,033 | 1,109 | |||||||
Sinopec Group Overseas Development 2017 | ||||||||||
3.250%, 09/13/2027 (A) | 1,388 | 1,373 | ||||||||
|
| |||||||||
| 2,482 | ||||||||||
|
| |||||||||
Colombia — 5.4% | ||||||||||
Bogota Distrito Capital | ||||||||||
9.750%, 07/26/2028 | COP | 370,000 | 134 | |||||||
9.750%, 07/26/2028 (A) | 8,820,000 | 3,193 | ||||||||
Colombian TES | ||||||||||
11.000%, 07/24/2020 | 5,925,800 | 2,290 | ||||||||
10.000%, 07/24/2024 | 26,189,600 | 10,707 | ||||||||
7.750%, 09/18/2030 | 1,040,700 | 386 | ||||||||
7.500%, 08/26/2026 | 40,007,000 | 14,488 | ||||||||
7.000%, 09/11/2019 | 3,623,300 | 1,271 | ||||||||
7.000%, 05/04/2022 | 29,705,000 | 10,477 | ||||||||
7.000%, 06/30/2032 | 7,050,500 | 2,411 | ||||||||
5.000%, 11/21/2018 | 17,813,600 | 6,062 | ||||||||
4.750%, 04/04/2035 | 2,017,200 | 2,032 | ||||||||
52 |
SEI Institutional International Trust / Annual Report / September 30, 2017 |
| Description | Face Amount (Thousands) | Market Value ($ Thousands) | ||||||||
GLOBAL BONDS (continued) |
| |||||||||
Ecopetrol | ||||||||||
7.375%, 09/18/2043 | $ | 280 | $ | 321 | ||||||
5.875%, 05/28/2045 | 745 | 728 | ||||||||
Emgesa ESP | ||||||||||
8.750%, 01/25/2021 | COP | 870,000 | 309 | |||||||
Empresas Publicas de Medellin ESP | ||||||||||
8.375%, 02/01/2021 | 3,962,000 | 1,395 | ||||||||
7.625%, 09/10/2024 (A) | 3,116,000 | 1,057 | ||||||||
Financiera de Desarrollo Territorial Findeter | ||||||||||
7.875%, 08/12/2024 | 884,000 | 306 | ||||||||
7.875%, 08/12/2024 (A) | 1,127,000 | 391 | ||||||||
Republic of Colombia | ||||||||||
11.750%, 02/25/2020 | $ | 322 | 394 | |||||||
9.850%, 06/28/2027 | COP | 3,803,000 | 1,623 | |||||||
9.850%, 06/28/2027 | 1,257,000 | 537 | ||||||||
8.125%, 05/21/2024 | $ | 550 | 704 | |||||||
7.750%, 04/14/2021 | COP | 3,331,000 | 1,208 | |||||||
7.375%, 09/18/2037 | $ | 1,570 | 2,071 | |||||||
6.125%, 01/18/2041 | 3,194 | 3,756 | ||||||||
6.000%, 04/28/2028 | COP | 11,502,900 | 3,736 | |||||||
5.000%, 06/15/2045 (C) | $ | 1,196 | 1,230 | |||||||
4.500%, 01/28/2026 | 1,636 | 1,747 | ||||||||
4.375%, 07/12/2021 (C) | 3,341 | 3,565 | ||||||||
4.375%, 03/21/2023 | COP | 1,089,000 | 354 | |||||||
4.375%, 03/21/2023 | 1,782,000 | 580 | ||||||||
4.000%, 02/26/2024 | $ | 1,885 | 1,964 | |||||||
3.875%, 04/25/2027 | 2,575 | 2,616 | ||||||||
|
| |||||||||
| 84,043 | ||||||||||
|
| |||||||||
Costa Rica — 1.3% | ||||||||||
Banco Nacional de Costa Rica | ||||||||||
6.250%, 11/01/2023 (A) | 753 | 798 | ||||||||
5.875%, 04/25/2021 (A) | 597 | 620 | ||||||||
Instituto Costarricense de Electricidad | ||||||||||
6.950%, 11/10/2021 | 400 | 434 | ||||||||
6.375%, 05/15/2043 | 250 | 233 | ||||||||
Republic of Costa Rica | ||||||||||
7.158%, 03/12/2045 | 4,436 | 4,791 | ||||||||
7.158%, 03/12/2045 (A) | 1,237 | 1,336 | ||||||||
7.158%, 03/12/2045 | 3,436 | 3,711 | ||||||||
7.000%, 04/04/2044 (A) | 4,191 | 4,453 | ||||||||
7.000%, 04/04/2044 | 2,387 | 2,536 | ||||||||
5.625%, 04/30/2043 | 510 | 467 | ||||||||
5.625%, 04/30/2043 (A) | 130 | 119 | ||||||||
4.375%, 04/30/2025 | 1,720 | 1,690 | ||||||||
|
| |||||||||
| 21,188 | ||||||||||
|
| |||||||||
Croatia — 0.6% | ||||||||||
Government of Croatia | ||||||||||
6.000%, 01/26/2024 (A) | 200 | 228 | ||||||||
3.000%, 03/11/2025 | EUR | 5,720 | 7,269 | |||||||
3.000%, 03/20/2027 | 1,020 | 1,266 | ||||||||
|
| |||||||||
| 8,763 | ||||||||||
|
| |||||||||
| Description | Face Amount (Thousands) | Market Value ($ Thousands) | ||||||||
GLOBAL BONDS (continued) |
| |||||||||
Dominican Republic — 1.2% | ||||||||||
Dominican Republic International Bond | ||||||||||
15.950%, 06/04/2021 | DOP | 3,800 | $ | 95 | ||||||
11.500%, 05/10/2024 | 55,000 | 1,227 | ||||||||
11.000%, 01/05/2018 | 6,320 | 134 | ||||||||
11.000%, 07/30/2021 (A) | 53,760 | 1,164 | ||||||||
9.040%, 01/23/2018 | $ | 121 | 123 | |||||||
8.625%, 04/20/2027 | 1,332 | 1,622 | ||||||||
7.500%, 05/06/2021 | 404 | 449 | ||||||||
7.450%, 04/30/2044 | 451 | 537 | ||||||||
7.450%, 04/30/2044 (A) | 1,865 | 2,222 | ||||||||
6.875%, 01/29/2026 | 443 | 505 | ||||||||
6.875%, 01/29/2026 | 2,000 | 2,281 | ||||||||
6.850%, 01/27/2045 | 400 | 447 | ||||||||
6.850%, 01/27/2045 | 200 | 224 | ||||||||
6.850%, 01/27/2045 (A) | 2,788 | 3,119 | ||||||||
6.600%, 01/28/2024 | 656 | 737 | ||||||||
5.950%, 01/25/2027 | 1,114 | 1,198 | ||||||||
5.950%, 01/25/2027 (A)(C) | 888 | 955 | ||||||||
5.875%, 04/18/2024 (A) | 71 | 77 | ||||||||
5.500%, 01/27/2025 | 249 | 263 | ||||||||
5.500%, 01/27/2025 | 690 | 730 | ||||||||
|
| |||||||||
| 18,109 | ||||||||||
|
| |||||||||
Ecuador — 0.6% | ||||||||||
Petroamazonas EP | ||||||||||
4.625%, 02/16/2020 (A) | 380 | 364 | ||||||||
Republic of Ecuador | ||||||||||
10.750%, 03/28/2022 (A) | 751 | 839 | ||||||||
10.500%, 03/24/2020 | 273 | 295 | ||||||||
9.650%, 12/13/2026 (A) | 1,275 | 1,345 | ||||||||
9.625%, 06/02/2027 | 777 | 816 | ||||||||
8.750%, 06/02/2023 | 660 | 682 | ||||||||
7.950%, 06/20/2024 | 4,875 | 4,820 | ||||||||
|
| |||||||||
| 9,161 | ||||||||||
|
| |||||||||
Egypt — 1.8% | ||||||||||
Egypt Government International Bond MTN | ||||||||||
8.500%, 01/31/2047 | 10,360 | 11,543 | ||||||||
8.500%, 01/31/2047 (A) | 865 | 964 | ||||||||
7.500%, 01/31/2027 | 4,302 | 4,681 | ||||||||
6.125%, 01/31/2022 | 497 | 514 | ||||||||
6.125%, 01/31/2022 (A) | 1,194 | 1,235 | ||||||||
Egypt Treasury Bills (E) | ||||||||||
20.471%, 12/19/2017 | EGP | 54,175 | 2,956 | |||||||
20.273%, 07/10/2018 | 12,000 | 599 | ||||||||
19.927%, 01/16/2018 | 41,075 | 2,211 | ||||||||
19.925%, 01/09/2018 | 34,875 | 1,883 | ||||||||
16.364%, 06/19/2018 | 40,475 | 2,034 | ||||||||
|
| |||||||||
| 28,620 | ||||||||||
|
| |||||||||
El Salvador — 0.9% | ||||||||||
Republic of El Salvador | ||||||||||
8.625%, 02/28/2029 | $ | 2,236 | 2,510 | |||||||
SEI Institutional International Trust / Annual Report / September 30, 2017 |
53 |
SCHEDULE OF INVESTMENTS
September 30, 2017
Emerging Markets Debt Fund (Continued)
| Description | Face Amount (Thousands) | Market Value ($ Thousands) | ||||||||
GLOBAL BONDS (continued) |
| |||||||||
8.250%, 04/10/2032 (A) | $ | 126 | $ | 137 | ||||||
8.250%, 04/10/2032 | 647 | 706 | ||||||||
7.750%, 01/24/2023 | 1,323 | 1,419 | ||||||||
7.650%, 06/15/2035 (C) | 2,017 | 2,072 | ||||||||
7.650%, 06/15/2035 | 1,467 | 1,507 | ||||||||
7.625%, 02/01/2041 | 1,542 | 1,577 | ||||||||
7.375%, 12/01/2019 | 226 | 236 | ||||||||
7.375%, 12/01/2019 | 417 | 435 | ||||||||
6.375%, 01/18/2027 | 863 | 854 | ||||||||
6.375%, 01/18/2027 | 1,650 | 1,633 | ||||||||
6.375%, 01/18/2027 (A) | 1,401 | 1,387 | ||||||||
5.875%, 01/30/2025 | 210 | 206 | ||||||||
5.875%, 01/30/2025 | 200 | 196 | ||||||||
|
| |||||||||
| 14,875 | ||||||||||
|
| |||||||||
Ethiopia — 0.0% | ||||||||||
Federal Democratic Republic of Ethiopia | ||||||||||
6.625%, 12/11/2024 (A) | 510 | 524 | ||||||||
|
| |||||||||
Gabon — 0.2% | ||||||||||
Gabonese Republic | ||||||||||
8.200%, 12/12/2017 | 282 | 284 | ||||||||
6.950%, 06/16/2025 (A) | 1,230 | 1,223 | ||||||||
6.375%, 12/12/2024 | 1,315 | 1,282 | ||||||||
6.375%, 12/12/2024 (A) | 513 | 500 | ||||||||
|
| |||||||||
| 3,289 | ||||||||||
|
| |||||||||
Georgia — 0.0% | ||||||||||
Republic of Georgia | ||||||||||
6.875%, 04/12/2021 (A)(C) | 421 | 470 | ||||||||
|
| |||||||||
Ghana — 0.8% | ||||||||||
Republic of Ghana | ||||||||||
24.750%, 07/19/2021 | GHS | 3,864 | 1,045 | |||||||
24.500%, 04/22/2019 | 1,926 | 473 | ||||||||
24.000%, 09/09/2019 | 963 | 238 | ||||||||
10.750%, 10/14/2030 | $ | 6,373 | 8,275 | |||||||
8.125%, 01/18/2026 | 2,050 | 2,179 | ||||||||
|
| |||||||||
| 12,210 | ||||||||||
|
| |||||||||
Guatemala — 0.0% | ||||||||||
Comcel Trust | ||||||||||
6.875%, 02/06/2024 (A) | 390 | 416 | ||||||||
|
| |||||||||
Honduras — 0.1% | ||||||||||
Honduras Government International Bond | ||||||||||
6.250%, 01/19/2027 | 326 | 350 | ||||||||
6.250%, 01/19/2027 (A) | 490 | 527 | ||||||||
|
| |||||||||
| 877 | ||||||||||
|
| |||||||||
Hungary — 1.7% | ||||||||||
Republic of Hungary | ||||||||||
7.625%, 03/29/2041 | 7,530 | 11,659 | ||||||||
5.500%, 06/24/2025 | HUF | 138,870 | 649 | |||||||
| Description | Face Amount (Thousands) | Market Value ($Thousands) | ||||||||
GLOBAL BONDS (continued) |
| |||||||||
5.375%, 02/21/2023 | $ | 1,750 | $ | 1,974 | ||||||
3.000%, 06/26/2024 | HUF | 1,600,150 | 6,504 | |||||||
3.000%, 10/27/2027 | 253,120 | 998 | ||||||||
2.750%, 12/22/2026 | 162,000 | 629 | ||||||||
1.750%, 10/26/2022 | 1,201,820 | 4,691 | ||||||||
|
| |||||||||
| 27,104 | ||||||||||
|
| |||||||||
Indonesia — 8.2% | ||||||||||
Indika Energy Capital II | ||||||||||
6.875%, 04/10/2022 | 45 | 47 | ||||||||
Indo Energy Finance II | ||||||||||
6.375%, 01/24/2023 | 745 | 757 | ||||||||
Indonesia Treasury Bond | ||||||||||
8.750%, 05/15/2031 | IDR | 67,036,000 | 5,766 | |||||||
8.250%, 07/15/2021 | 10,611,000 | 843 | ||||||||
7.500%, 08/15/2032 | 8,200,000 | 638 | ||||||||
Listrindo Capital | ||||||||||
4.950%, 09/14/2026 | $ | 350 | 355 | |||||||
Majapahit Holding | ||||||||||
7.750%, 01/20/2020 | 894 | 997 | ||||||||
Pelabuhan Indonesia III | ||||||||||
4.875%, 10/01/2024 | 1,659 | 1,775 | ||||||||
Pertamina Persero | ||||||||||
6.500%, 05/27/2041 (A) | 380 | 452 | ||||||||
6.000%, 05/03/2042 | 340 | 383 | ||||||||
6.000%, 05/03/2042 (A) | 935 | 1,054 | ||||||||
5.250%, 05/23/2021 (A) | 921 | 996 | ||||||||
4.875%, 05/03/2022 (A) | 220 | 236 | ||||||||
Pertamina Persero MTN | ||||||||||
6.450%, 05/30/2044 | 439 | 520 | ||||||||
6.450%, 05/30/2044 (A) | 665 | 788 | ||||||||
5.625%, 05/20/2043 (A) | 1,434 | 1,544 | ||||||||
Perusahaan Listrik Negara MTN | ||||||||||
5.250%, 10/24/2042 | 1,380 | 1,437 | ||||||||
Republic of Indonesia | ||||||||||
12.800%, 06/15/2021 | IDR | 210,000 | 19 | |||||||
11.000%, 09/15/2025 | 3,200,000 | 304 | ||||||||
9.000%, 03/15/2029 | 136,154,000 | 11,870 | ||||||||
8.500%, 10/12/2035 | $ | 525 | 779 | |||||||
8.500%, 10/12/2035 | 505 | 749 | ||||||||
8.375%, 03/15/2024 | IDR | 207,380,000 | 17,032 | |||||||
8.375%, 09/15/2026 | 21,071,000 | 1,761 | ||||||||
8.375%, 03/15/2034 | 95,294,000 | 7,790 | ||||||||
8.250%, 06/15/2032 | 17,369,000 | 1,443 | ||||||||
8.250%, 05/15/2036 | 116,070,000 | 9,471 | ||||||||
7.750%, 01/17/2038 | $ | 1,797 | 2,554 | |||||||
7.000%, 05/15/2022 | IDR | 122,580,000 | 9,419 | |||||||
7.000%, 05/15/2027 | 42,800,000 | 3,300 | ||||||||
6.625%, 05/15/2033 | 35,776,000 | 2,550 | ||||||||
6.625%, 02/17/2037 | $ | 308 | 392 | |||||||
6.125%, 05/15/2028 | IDR | 26,020,000 | 1,881 | |||||||
5.625%, 05/15/2023 | 13,561,000 | 979 | ||||||||
4.875%, 05/05/2021 | $ | 945 | 1,018 | |||||||
54 |
SEI Institutional International Trust / Annual Report / September 30, 2017 |
| Description | Face Amount (Thousands) | Market Value ($ Thousands) | ||||||||
GLOBAL BONDS (continued) |
| |||||||||
4.350%, 01/08/2027 (A) | $ | 1,481 | $ | 1,571 | ||||||
3.375%, 07/30/2025 | EUR | 4,919 | 6,415 | |||||||
Republic of Indonesia MTN | ||||||||||
11.625%, 03/04/2019 | $ | 1,049 | 1,191 | |||||||
11.625%, 03/04/2019 (A) | 975 | 1,107 | ||||||||
11.625%, 03/04/2019 | 80 | 91 | ||||||||
6.750%, 01/15/2044 (A) | 183 | 245 | ||||||||
5.875%, 01/15/2024 | 6,050 | 6,936 | ||||||||
5.875%, 01/15/2024 | 2,876 | 3,297 | ||||||||
5.250%, 01/17/2042 | 2,132 | 2,378 | ||||||||
5.125%, 01/15/2045 (A) | 217 | 240 | ||||||||
4.750%, 01/08/2026 | 1,044 | 1,138 | ||||||||
4.125%, 01/15/2025 | 1,331 | 1,397 | ||||||||
4.125%, 01/15/2025 | 2,611 | 2,740 | ||||||||
3.850%, 07/18/2027 (A) | 1,098 | 1,128 | ||||||||
3.750%, 06/14/2028 | EUR | 2,675 | 3,538 | |||||||
3.375%, 04/15/2023 (A) | $ | 1,939 | 1,971 | |||||||
2.150%, 07/18/2024 | EUR | 905 | 1,102 | |||||||
|
| |||||||||
| 128,384 | ||||||||||
|
| |||||||||
Iraq — 1.0% | ||||||||||
Iraq International Bond | ||||||||||
6.752%, 03/09/2023 | $ | 732 | 727 | |||||||
6.752%, 03/09/2023 (A) | 1,895 | 1,882 | ||||||||
5.800%, 01/15/2028 | 14,373 | 13,429 | ||||||||
|
| |||||||||
| 16,038 | ||||||||||
|
| |||||||||
Israel — 0.2% | ||||||||||
Israel Government Bond | ||||||||||
5.500%, 01/31/2042 | ILS | 287 | 121 | |||||||
3.750%, 03/31/2047 | 7,908 | 2,565 | ||||||||
|
| |||||||||
| 2,686 | ||||||||||
|
| |||||||||
Ivory Coast — 1.1% | ||||||||||
Ivory Coast Government International Bond | ||||||||||
6.375%, 03/03/2028 (A) | $ | 2,198 | 2,272 | |||||||
6.125%, 06/15/2033 | 825 | 810 | ||||||||
6.125%, 06/15/2033 (A) | 323 | 317 | ||||||||
5.750%, 12/31/2032 | 3,305 | 3,241 | ||||||||
5.750%, 12/31/2032 (A) | 403 | 395 | ||||||||
5.750%, 12/31/2032 | 3,413 | 3,347 | ||||||||
5.750%, 12/31/2032 | 3,367 | 3,302 | ||||||||
5.375%, 07/23/2024 (A)(C) | 1,265 | 1,276 | ||||||||
5.125%, 06/15/2025 | EUR | 1,450 | 1,771 | |||||||
5.125%, 06/15/2025 (A) | 930 | 1,136 | ||||||||
|
| |||||||||
| 17,867 | ||||||||||
|
| |||||||||
Jamaica — 0.1% | ||||||||||
Digicel Group | ||||||||||
7.125%, 04/01/2022 (A) | $ | 236 | 214 | |||||||
Government of Jamaica | ||||||||||
6.750%, 04/28/2028 | 565 | 651 | ||||||||
|
| |||||||||
| 865 | ||||||||||
|
| |||||||||
| Description | Face Amount (Thousands) | Market Value ($ Thousands) | ||||||||
GLOBAL BONDS (continued) |
| |||||||||
Jordan — 0.1% | ||||||||||
Jordan Government International Bond | ||||||||||
6.125%, 01/29/2026 | $ | 1,102 | $ | 1,115 | ||||||
|
| |||||||||
Kazakhstan — 1.3% | ||||||||||
Development Bank of Kazakhstan | ||||||||||
4.125%, 12/10/2022 | 770 | 778 | ||||||||
KazAgro National Management Holding MTN | ||||||||||
4.625%, 05/24/2023 (A) | 349 | 351 | ||||||||
4.625%, 05/24/2023 | 4,595 | 4,624 | ||||||||
Kazakhstan Temir Zholy Finance | ||||||||||
6.950%, 07/10/2042 (A) | 250 | 279 | ||||||||
6.375%, 10/06/2020 (A) | 400 | 433 | ||||||||
KazMunayGas National | ||||||||||
5.750%, 04/19/2047 (A) | 1,335 | 1,314 | ||||||||
4.750%, 04/19/2027 (A) | 1,515 | 1,536 | ||||||||
KazMunayGas National MTN | ||||||||||
6.375%, 04/09/2021 | 1,960 | 2,143 | ||||||||
6.375%, 04/09/2021 (A) | 1,660 | 1,815 | ||||||||
KazTransGas | ||||||||||
4.375%, 09/26/2027 (A) | 1,216 | 1,207 | ||||||||
Republic of Kazakhstan MTN | ||||||||||
6.500%, 07/21/2045 | 4,350 | 5,357 | ||||||||
|
| |||||||||
| 19,837 | ||||||||||
|
| |||||||||
Kenya — 0.1% | ||||||||||
Kenya Government International Bond | ||||||||||
6.875%, 06/24/2024 (C) | 473 | 483 | ||||||||
6.875%, 06/24/2024 (A) | 543 | 554 | ||||||||
5.875%, 06/24/2019 (A) | 805 | 827 | ||||||||
|
| |||||||||
| 1,864 | ||||||||||
|
| |||||||||
Malaysia — 4.1% | ||||||||||
1MDB Energy | ||||||||||
5.990%, 05/11/2022 | 1,000 | 1,090 | ||||||||
1MDB Global Investments | ||||||||||
4.400%, 03/09/2023 | 9,600 | 9,130 | ||||||||
Malaysia Government Bond | ||||||||||
5.248%, 09/15/2028 | MYR | 1,050 | 270 | |||||||
4.935%, 09/30/2043 | 2,200 | 528 | ||||||||
4.392%, 04/15/2026 | 7,081 | 1,718 | ||||||||
4.378%, 11/29/2019 | 5,218 | 1,264 | ||||||||
4.254%, 05/31/2035 | 1,827 | 422 | ||||||||
4.240%, 02/07/2018 | 35,477 | 8,437 | ||||||||
4.232%, 06/30/2031 | 9,200 | 2,143 | ||||||||
4.181%, 07/15/2024 | 4,186 | 1,008 | ||||||||
4.160%, 07/15/2021 | 20 | 5 | ||||||||
3.955%, 09/15/2025 | 9,520 | 2,251 | ||||||||
3.892%, 03/15/2027 | 1,369 | 319 | ||||||||
3.800%, 08/17/2023 | 23,695 | 5,621 | ||||||||
3.795%, 09/30/2022 | 3,500 | 833 | ||||||||
3.759%, 03/15/2019 | 32,541 | 7,776 | ||||||||
3.659%, 10/15/2020 | 1,419 | 338 | ||||||||
SEI Institutional International Trust / Annual Report / September 30, 2017 |
55 |
SCHEDULE OF INVESTMENTS
September 30, 2017
Emerging Markets Debt Fund (Continued)
| Description | Face Amount (Thousands) | Market Value ($ Thousands) | ||||||||
GLOBAL BONDS (continued) |
| |||||||||
3.654%, 10/31/2019 | MYR | 7,740 | $ | 1,846 | ||||||
3.620%, 11/30/2021 | 7,443 | 1,763 | ||||||||
3.580%, 09/28/2018 | 1,157 | 275 | ||||||||
3.502%, 05/31/2027 | 1,050 | 236 | ||||||||
3.492%, 03/31/2020 | 1,420 | 338 | ||||||||
3.480%, 03/15/2023 | 2,858 | 667 | ||||||||
3.418%, 08/15/2022 | 4,289 | 1,004 | ||||||||
3.314%, 10/31/2017 | 40,620 | 9,622 | ||||||||
3.260%, 03/01/2018 | 9,170 | 2,174 | ||||||||
Malaysia Government Investment Issue | ||||||||||
4.070%, 09/30/2026 | 11,606 | 2,722 | ||||||||
|
| |||||||||
| 63,800 | ||||||||||
|
| |||||||||
Mauritius — 0.1% | ||||||||||
Liquid Telecommunications Financing | ||||||||||
8.500%, 07/13/2022 (A) | $ | 1,086 | 1,144 | |||||||
|
| |||||||||
Mexico — 10.2% | ||||||||||
Alfa | ||||||||||
6.875%, 03/25/2044 | 1,750 | 1,973 | ||||||||
America Movil | ||||||||||
7.125%, 12/09/2024 | MXN | 18,110 | 963 | |||||||
6.000%, 06/09/2019 | 12,420 | 665 | ||||||||
Banco Inbursa Institucion de Banca Multiple | ||||||||||
4.375%, 04/11/2027 (A) | $ | 573 | 575 | |||||||
Banco Nacional de Comercio Exterior SNC | ||||||||||
3.800%, VAR US Treas Yield Curve Rate T Note Const Mat 5 Yr+3.000%, 08/11/2026 | 536 | 537 | ||||||||
3.800%, VAR US Treas Yield Curve Rate T Note Const Mat 5 Yr+3.000%, 08/11/2026 (A) | 1,852 | 1,854 | ||||||||
Comision Federal de Electricidad | ||||||||||
7.350%, 11/25/2025 | MXN | 39,785 | 2,094 | |||||||
5.750%, 02/14/2042 (A) | $ | 500 | 529 | |||||||
4.875%, 01/15/2024 (A) | 237 | 254 | ||||||||
4.750%, 02/23/2027 (A) | 658 | 693 | ||||||||
Elementia | ||||||||||
5.500%, 01/15/2025 | 670 | 708 | ||||||||
Fermaca Enterprises S de RL | ||||||||||
6.375%, 03/30/2038 (A) | 609 | 668 | ||||||||
Mexican Bonos | ||||||||||
8.000%, 11/07/2047 | MXN | 50,970 | 3,062 | |||||||
7.750%, 11/23/2034 | 92,281 | 5,393 | ||||||||
7.750%, 11/13/2042 | 124,502 | 7,263 | ||||||||
7.500%, 06/03/2027 | 11,414 | 656 | ||||||||
6.500%, 06/09/2022 | 141,321 | 7,715 | ||||||||
5.750%, 03/05/2026 | 87,650 | 4,501 | ||||||||
5.000%, 12/11/2019 | 127,973 | 6,795 | ||||||||
4.750%, 06/14/2018 | 10,801 | 585 | ||||||||
Mexican Bonos, Ser M | ||||||||||
6.500%, 06/10/2021 | 184,897 | 10,119 | ||||||||
| Description | Face Amount (Thousands) | Market Value ($ Thousands) | ||||||||
GLOBAL BONDS (continued) |
| |||||||||
Mexican Bonos, Ser M10 | ||||||||||
8.500%, 12/13/2018 | MXN | 107,689 | $ | 6,029 | ||||||
Mexican Bonos, Ser M20 | ||||||||||
10.000%, 12/05/2024 | 311,035 | 20,281 | ||||||||
8.500%, 05/31/2029 | 40,211 | 2,487 | ||||||||
8.000%, 12/07/2023 | 11,575 | 678 | ||||||||
7.750%, 05/29/2031 | 124,863 | 7,287 | ||||||||
Mexican Bonos, Ser M30 | ||||||||||
10.000%, 11/20/2036 | 43,198 | 3,071 | ||||||||
8.500%, 11/18/2038 | 66,465 | 4,169 | ||||||||
Mexico City Airport Trust | ||||||||||
5.500%, 07/31/2047 (A) | $ | 2,551 | 2,583 | |||||||
Mexico Government International Bond | ||||||||||
4.150%, 03/28/2027 | 1,779 | 1,870 | ||||||||
Petroleos Mexicanos | ||||||||||
9.500%, 09/15/2027 | 169 | 222 | ||||||||
7.470%, 11/12/2026 | MXN | 106,719 | 5,339 | |||||||
7.190%, 09/12/2024 | 101,382 | 5,103 | ||||||||
6.625%, 06/15/2035 | $ | 4,931 | 5,313 | |||||||
6.625%, 06/15/2038 | 2,088 | 2,217 | ||||||||
6.500%, 03/13/2027 | 400 | 443 | ||||||||
6.500%, 03/13/2027 (A) | 2,362 | 2,618 | ||||||||
6.500%, 06/02/2041 | 572 | 598 | ||||||||
6.375%, 02/04/2021 | 326 | 357 | ||||||||
6.375%, 01/23/2045 | 807 | 821 | ||||||||
6.000%, 03/05/2020 | 335 | 360 | ||||||||
5.625%, 01/23/2046 | 489 | 455 | ||||||||
5.500%, 01/21/2021 | 18 | 19 | ||||||||
4.875%, 01/24/2022 | 1,341 | 1,406 | ||||||||
4.500%, 01/23/2026 | 643 | 642 | ||||||||
4.250%, 01/15/2025 | 450 | 447 | ||||||||
Petroleos Mexicanos MTN | ||||||||||
6.875%, 08/04/2026 | 4,450 | 5,062 | ||||||||
6.750%, 09/21/2047 | 3,373 | 3,589 | ||||||||
6.750%, 09/21/2047 | 396 | 421 | ||||||||
6.500%, 03/13/2027 (A) | 196 | 217 | ||||||||
6.375%, 01/23/2045 (A) | 806 | 820 | ||||||||
5.625%, 01/23/2046 (A) | 800 | 744 | ||||||||
4.875%, 02/21/2028 | EUR | 3,822 | 4,856 | |||||||
4.625%, 09/21/2023 (A) | $ | 1,185 | 1,224 | |||||||
4.250%, 01/15/2025 | 2,450 | 2,436 | ||||||||
Sixsigma Networks Mexico | ||||||||||
8.250%, 11/07/2021 (A) | 465 | 482 | ||||||||
Trust F/1401 | ||||||||||
6.950%, 01/30/2044 | 1,920 | 2,119 | ||||||||
United Mexican States | ||||||||||
4.600%, 01/23/2046 | 628 | 634 | ||||||||
United Mexican States MTN | ||||||||||
5.750%, 10/12/2110 | 3,818 | 4,093 | ||||||||
4.750%, 03/08/2044 | 200 | 206 | ||||||||
|
| |||||||||
| 159,320 | ||||||||||
|
| |||||||||
56 |
SEI Institutional International Trust / Annual Report / September 30, 2017 |
| Description | Face Amount (Thousands) | Market Value ($ Thousands) | ||||||||
GLOBAL BONDS (continued) |
| |||||||||
Mongolia — 0.2% | ||||||||||
Mongolia Government International Bond | ||||||||||
MTN | ||||||||||
10.875%, 04/06/2021 (A) | $ | 1,205 | $ | 1,398 | ||||||
8.750%, 03/09/2024 | 1,451 | 1,627 | ||||||||
Trade & Development Bank of Mongolia MTN | ||||||||||
9.375%, 05/19/2020 | 350 | 378 | ||||||||
9.375%, 05/19/2020 (A) | 355 | 383 | ||||||||
|
| |||||||||
| 3,786 | ||||||||||
|
| |||||||||
Montenegro — 0.0% | ||||||||||
Republic of Montenegro | ||||||||||
5.750%, 03/10/2021 (A) | EUR | 551 | 711 | |||||||
|
| |||||||||
Morocco — 0.5% | ||||||||||
Morocco Government International Bond | ||||||||||
3.500%, 06/19/2024 | 3,580 | 4,702 | ||||||||
OCP | ||||||||||
6.875%, 04/25/2044 | $ | 1,325 | 1,490 | |||||||
5.625%, 04/25/2024 (A) | 1,900 | 2,047 | ||||||||
|
| |||||||||
| 8,239 | ||||||||||
|
| |||||||||
Netherlands — 0.1% | ||||||||||
IHS Netherlands Holdco | ||||||||||
9.500%, 10/27/2021 (A) | 429 | 449 | ||||||||
MARB BondCo | ||||||||||
7.000%, 03/15/2024 (A) | 99 | 97 | ||||||||
Marfrig Holdings Europe | ||||||||||
8.000%, 06/08/2023 (A) | 470 | 486 | ||||||||
VTR Finance | ||||||||||
6.875%, 01/15/2024 | 400 | 424 | ||||||||
|
| |||||||||
| 1,456 | ||||||||||
|
| |||||||||
Nigeria — 0.9% | ||||||||||
Nigeria Government International Bond | ||||||||||
7.875%, 02/16/2032 | 5,382 | 5,880 | ||||||||
7.875%, 02/16/2032 (A)(C) | 488 | 533 | ||||||||
6.375%, 07/12/2023 | 2,025 | 2,122 | ||||||||
5.625%, 06/27/2022 | 1,200 | 1,221 | ||||||||
Nigeria Treasury Bill (E) | ||||||||||
21.326%, 04/05/2018 | NGN | 494,646 | 1,255 | |||||||
20.658%, 08/02/2018 | 1,495,300 | 3,609 | ||||||||
|
| |||||||||
| 14,620 | ||||||||||
|
| |||||||||
Oman — 0.3% | ||||||||||
Oman Government International Bond | ||||||||||
6.500%, 03/08/2047 | $ | 676 | 695 | |||||||
6.500%, 03/08/2047 (A) | 1,620 | 1,666 | ||||||||
5.375%, 03/08/2027 | 659 | 677 | ||||||||
4.750%, 06/15/2026 (A) | 237 | 234 | ||||||||
3.625%, 06/15/2021 | 1,326 | 1,333 | ||||||||
|
| |||||||||
| 4,605 | ||||||||||
|
| |||||||||
| Description | Face Amount (Thousands) | Market Value ($ Thousands) | ||||||||
GLOBAL BONDS (continued) |
| |||||||||
Pakistan — 0.1% | ||||||||||
Pakistan Government International Bond | ||||||||||
8.250%, 09/30/2025 | $ | 1,000 | $ | 1,149 | ||||||
|
| |||||||||
Panama — 0.1% | ||||||||||
Republic of Panama | ||||||||||
9.375%, 04/01/2029 | 630 | 948 | ||||||||
8.125%, 04/28/2034 | 478 | 653 | ||||||||
3.750%, 03/16/2025 | 420 | 439 | ||||||||
|
| |||||||||
| 2,040 | ||||||||||
|
| |||||||||
Paraguay — 0.1% | ||||||||||
Republic of Paraguay | ||||||||||
6.100%, 08/11/2044 (A) | 906 | 1,017 | ||||||||
4.625%, 01/25/2023 | 300 | 316 | ||||||||
Telefonica Celular del Paraguay | ||||||||||
6.750%, 12/13/2022 | 200 | 208 | ||||||||
6.750%, 12/13/2022 | 200 | 208 | ||||||||
|
| |||||||||
| 1,749 | ||||||||||
|
| |||||||||
Peru — 2.3% | ||||||||||
Abengoa Transmision Sur | ||||||||||
6.875%, 04/30/2043 (A) | 273 | 302 | ||||||||
Cerro del Aguila | ||||||||||
4.125%, 08/16/2027 (A) | 723 | 720 | ||||||||
Fondo MIVIVIENDA | ||||||||||
7.000%, 02/14/2024 (A) | PEN | 3,704 | 1,190 | |||||||
Peru Enhanced Pass-Through Finance | ||||||||||
0.639%, 05/31/2018 | $ | 27 | 27 | |||||||
0.638%, 05/31/2018 (A)(E) | 73 | 72 | ||||||||
Petroleos del Peru | ||||||||||
5.625%, 06/19/2047 (A) | 366 | 382 | ||||||||
4.750%, 06/19/2032 (A) | 613 | 630 | ||||||||
Republic of Peru | ||||||||||
8.200%, 08/12/2026 | PEN | 16,008 | 6,054 | |||||||
6.950%, 08/12/2031 | 1,675 | 578 | ||||||||
6.950%, 08/12/2031 | 4,795 | 1,656 | ||||||||
6.900%, 08/12/2037 | 2,094 | 719 | ||||||||
6.900%, 08/12/2037 | 4,723 | 1,621 | ||||||||
6.850%, 02/12/2042 | 613 | 202 | ||||||||
6.350%, 08/12/2028 | 2,061 | 683 | ||||||||
6.350%, 08/12/2028 | 2,895 | 959 | ||||||||
6.350%, 08/12/2028 (A) | 7,925 | 2,625 | ||||||||
6.150%, 08/12/2032 (A) | 19,515 | 6,291 | ||||||||
5.700%, 08/12/2024 | 285 | 93 | ||||||||
5.700%, 08/12/2024 (A) | 5,999 | 1,948 | ||||||||
3.750%, 03/01/2030 | EUR | 6,608 | 9,286 | |||||||
|
| |||||||||
| 36,038 | ||||||||||
|
| |||||||||
Philippines — 0.1% | ||||||||||
Republic of Philippines | ||||||||||
3.900%, 11/26/2022 | PHP | 45,000 | 875 | |||||||
|
| |||||||||
SEI Institutional International Trust / Annual Report / September 30, 2017 |
57 |
SCHEDULE OF INVESTMENTS
September 30, 2017
Emerging Markets Debt Fund (Continued)
| Description | Face Amount (Thousands) | Market Value ($ Thousands) | ||||||||
GLOBAL BONDS (continued) | ||||||||||
Poland — 3.5% | ||||||||||
Republic of Poland | ||||||||||
5.750%, 04/25/2029 | PLN | 2,550 | $ | 858 | ||||||
5.250%, 10/25/2020 | 15,644 | 4,680 | ||||||||
4.000%, 10/25/2023 | 28,308 | 8,223 | ||||||||
3.250%, 07/25/2025 | 21,204 | 5,853 | ||||||||
2.750%, 08/25/2023 | 6,504 | 1,937 | ||||||||
2.500%, 07/25/2026 | 24,236 | 6,249 | ||||||||
2.500%, 07/25/2027 | 29,168 | 7,425 | ||||||||
2.250%, 04/25/2022 | 14,160 | 3,818 | ||||||||
2.000%, 04/25/2021 | 4,980 | 1,351 | ||||||||
1.750%, 07/25/2021 | 24,278 | 6,505 | ||||||||
1.732%, 04/25/2019 (E) | 4,780 | 1,279 | ||||||||
1.110%, 10/25/2018 (E) | 10,800 | 2,917 | ||||||||
Republic of Poland, Ser 0922 | ||||||||||
5.750%, 09/23/2022 | 12,209 | 3,820 | ||||||||
|
| |||||||||
| 54,915 | ||||||||||
|
| |||||||||
Qatar — 0.8% | ||||||||||
Ooredoo International Finance MTN | ||||||||||
3.750%, 06/22/2026 | $ | 750 | 749 | |||||||
State of Qatar | ||||||||||
9.750%, 06/15/2030 | 2,637 | 4,170 | ||||||||
4.500%, 01/20/2022 (A) | 1,730 | 1,837 | ||||||||
3.250%, 06/02/2026 (A) | 5,122 | 5,066 | ||||||||
|
| |||||||||
| 11,822 | ||||||||||
|
| |||||||||
Romania — 1.4% | ||||||||||
Government of Romania | ||||||||||
5.850%, 04/26/2023 | RON | 16,940 | 4,896 | |||||||
5.800%, 07/26/2027 | 20,140 | 5,843 | ||||||||
4.750%, 02/24/2025 | 24,590 | 6,673 | ||||||||
3.500%, 12/19/2022 | 8,945 | 2,324 | ||||||||
Government of Romania MTN | ||||||||||
3.875%, 10/29/2035 | EUR | 1,430 | 1,790 | |||||||
|
| |||||||||
| 21,526 | ||||||||||
|
| |||||||||
Russia — 6.8% | ||||||||||
Credit Bank of Moscow Via CBOM Finance | ||||||||||
5.875%, 11/07/2021 (A) | $ | 1,116 | 1,129 | |||||||
Evraz Group | ||||||||||
8.250%, 01/28/2021 | 1,000 | 1,125 | ||||||||
Gazprom OAO Via Gaz Capital | ||||||||||
4.250%, 04/06/2024 | GBP | 1,660 | 2,316 | |||||||
GTLK Europe DAC | ||||||||||
5.950%, 07/19/2021 | $ | 270 | 286 | |||||||
Ritekro (F) | ||||||||||
16.207%, 11/07/2022 (E)(G) | 914 | 543 | ||||||||
Russian Federal Bond - OFZ | ||||||||||
8.150%, 02/03/2027 | RUB | 501,923 | 9,135 | |||||||
7.750%, 09/16/2026 | 1,323,272 | 23,381 | ||||||||
7.700%, 03/23/2033 | 24,679 | 428 | ||||||||
7.600%, 04/14/2021 | 487,263 | 8,504 | ||||||||
7.600%, 07/20/2022 | 281,338 | 4,917 | ||||||||
| Description | Face Amount (Thousands) | Market Value ($ Thousands) | ||||||||
GLOBAL BONDS (continued) | ||||||||||
7.400%, 12/07/2022 | RUB | 120,877 | $ | 2,093 | ||||||
7.100%, 10/16/2024 | 378,258 | 6,426 | ||||||||
7.050%, 01/19/2028 | 641,052 | 10,812 | ||||||||
7.000%, 01/25/2023 | 192,545 | 3,272 | ||||||||
7.000%, 08/16/2023 | 300,364 | 5,099 | ||||||||
6.800%, 12/11/2019 | 472,520 | 8,103 | ||||||||
6.700%, 05/15/2019 | 236,124 | 4,055 | ||||||||
6.500%, 12/03/2014 (B) | 22,770 | 381 | ||||||||
6.400%, 05/27/2020 | 87,230 | 1,477 | ||||||||
Russian Foreign Bond - Eurobond | ||||||||||
5.250%, 06/23/2047 | $ | 1,800 | 1,839 | |||||||
4.250%, 06/23/2027 | 3,000 | 3,050 | ||||||||
Russian Railways Via RZD Capital | ||||||||||
7.487%, 03/25/2031 | GBP | 1,300 | 2,154 | |||||||
Sberbank of Russia Via SB Capital | ||||||||||
5.500%, VAR US Treas Yield Curve Rate T Note Const Mat 5 Yr+4.023%, 02/26/2024 (A) | $ | 2,292 | 2,338 | |||||||
SCF Capital Designated Activity | ||||||||||
5.375%, 06/16/2023 (A) | 729 | 755 | ||||||||
Vnesheconombank Via VEB Finance | ||||||||||
6.902%, 07/09/2020 | 1,310 | 1,416 | ||||||||
6.800%, 11/22/2025 (A) | 150 | 169 | ||||||||
6.800%, 11/22/2025 | 580 | 654 | ||||||||
5.450%, 11/22/2017 (A) | 400 | 402 | ||||||||
|
| |||||||||
| 106,259 | ||||||||||
|
| |||||||||
Saudi Arabia — 0.2% | ||||||||||
Saudi Government International Bond MTN | ||||||||||
4.625%, 10/04/2047 | 934 | 939 | ||||||||
3.625%, 03/04/2028 | 1,363 | 1,346 | ||||||||
2.875%, 03/04/2023 (A) | 998 | 995 | ||||||||
|
| |||||||||
| 3,280 | ||||||||||
|
| |||||||||
Senegal — 0.2% | ||||||||||
Senegal Government International Bond | ||||||||||
6.250%, 05/23/2033 (A) | 2,910 | 2,992 | ||||||||
|
| |||||||||
Serbia — 0.3% | ||||||||||
Republic of Serbia | ||||||||||
7.250%, 09/28/2021 (A) | 200 | 231 | ||||||||
7.250%, 09/28/2021 | 4,300 | 4,964 | ||||||||
4.875%, 02/25/2020 | 200 | 209 | ||||||||
|
| |||||||||
| 5,404 | ||||||||||
|
| |||||||||
South Africa — 4.4% | ||||||||||
Eskom Holdings | ||||||||||
7.125%, 02/11/2025 (A) | 951 | 985 | ||||||||
7.125%, 02/11/2025 | 1,750 | 1,813 | ||||||||
5.750%, 01/26/2021 (A) | 214 | 218 | ||||||||
Republic of South Africa | ||||||||||
10.500%, 12/21/2026 | ZAR | 116,988 | 9,723 | |||||||
9.000%, 01/31/2040 | 43,665 | 3,006 | ||||||||
8.875%, 02/28/2035 | 20 | 1 | ||||||||
58 |
SEI Institutional International Trust / Annual Report / September 30, 2017 |
| Description | Face Amount (Thousands) | Market Value ($ Thousands) | ||||||||
GLOBAL BONDS (continued) | ||||||||||
8.750%, 01/31/2044 | ZAR | 47,197 | $ | 3,155 | ||||||
8.750%, 02/28/2048 | 157,337 | 10,538 | ||||||||
8.500%, 01/31/2037 | 66,652 | 4,444 | ||||||||
8.250%, 03/31/2032 | 87,495 | 5,925 | ||||||||
8.000%, 01/31/2030 | 87,465 | 5,961 | ||||||||
7.000%, 02/28/2031 | 103,711 | 6,399 | ||||||||
6.750%, 03/31/2021 | 3,663 | 265 | ||||||||
6.500%, 02/28/2041 | 39,901 | 2,095 | ||||||||
6.250%, 03/31/2036 | 78,799 | 4,208 | ||||||||
5.875%, 09/16/2025 (C) | $ | 4,902 | 5,294 | |||||||
5.650%, 09/27/2047 | 1,006 | 1,000 | ||||||||
4.875%, 04/14/2026 | 334 | 337 | ||||||||
4.300%, 10/12/2028 | 1,694 | 1,596 | ||||||||
Stillwater Mining | ||||||||||
7.125%, 06/27/2025 | 636 | 655 | ||||||||
Transnet SOC MTN | ||||||||||
9.500%, 05/13/2021 (A) | ZAR | 13,360 | 969 | |||||||
|
|
| ||||||||
| 68,587 | ||||||||||
|
|
| ||||||||
South Korea — 0.0% | ||||||||||
Kyobo Life Insurance | ||||||||||
3.950%, VAR US Treas Yield Curve Rate T Note Const Mat 5 Yr+2.091%, 07/24/2047 (A) | $ | 548 | 553 | |||||||
|
|
| ||||||||
Sri Lanka — 1.0% | ||||||||||
Republic of Sri Lanka | ||||||||||
11.750%, 06/15/2027 | LKR | 230,000 | 1,613 | |||||||
11.500%, 12/15/2021 | 230,000 | 1,586 | ||||||||
6.850%, 11/03/2025 (A) | $ | 908 | 997 | |||||||
6.850%, 11/03/2025 | 4,639 | 5,093 | ||||||||
6.825%, 07/18/2026 | 500 | 549 | ||||||||
6.825%, 07/18/2026 (A) | 909 | 998 | ||||||||
6.250%, 07/27/2021 | 853 | 917 | ||||||||
6.200%, 05/11/2027 | 745 | 782 | ||||||||
5.875%, 07/25/2022 (A) | 2,445 | 2,604 | ||||||||
|
|
| ||||||||
| 15,139 | ||||||||||
|
|
| ||||||||
Supra-National — 0.6% | ||||||||||
Banque Ouest Africaine de Developpement | ||||||||||
5.000%, 07/27/2027 (A) | 865 | 889 | ||||||||
European Investment Bank MTN | ||||||||||
8.500%, 09/17/2024 | ZAR | 9,200 | 693 | |||||||
7.200%, 07/09/2019 | IDR | 31,560,000 | 2,387 | |||||||
Inter-American Development Bank MTN | ||||||||||
7.875%, 03/14/2023 | 50,880,000 | 4,123 | ||||||||
7.350%, 09/12/2018 | 20,140,000 | 1,511 | ||||||||
| 9,603 | ||||||||||
Thailand — 2.1% | ||||||||||
Thailand Government Bond | ||||||||||
5.670%, 03/13/2028 | THB | 3,000 | 116 | |||||||
4.875%, 06/22/2029 | 22,000 | 815 | ||||||||
3.875%, 06/13/2019 | 68,000 | 2,121 | ||||||||
| Description | Face Amount (Thousands) | Market Value ($ Thousands) | ||||||||
GLOBAL BONDS (continued) | ||||||||||
3.850%, 12/12/2025 | THB | 91,664 | $ | 3,082 | ||||||
3.650%, 12/17/2021 | 117,200 | 3,798 | ||||||||
3.650%, 06/20/2031 | 224,108 | 7,433 | ||||||||
3.625%, 06/16/2023 | 148,077 | 4,861 | ||||||||
3.400%, 06/17/2036 | 102,710 | 3,333 | ||||||||
2.875%, 06/17/2046 | 31,586 | 890 | ||||||||
2.550%, 06/26/2020 | 40,000 | 1,232 | ||||||||
2.125%, 12/17/2026 | 137,000 | 4,042 | ||||||||
1.875%, 06/17/2022 | 57,000 | 1,719 | ||||||||
| 33,442 | ||||||||||
Tunisia — 0.1% | ||||||||||
Banque Centrale de Tunisie | ||||||||||
5.625%, 02/17/2024 | EUR | 700 | 854 | |||||||
Turkey — 5.8% | ||||||||||
Export Credit Bank of Turkey | ||||||||||
5.875%, 04/24/2019 (A) | $ | 200 | 207 | |||||||
5.375%, 10/24/2023 (A) | 1,033 | 1,061 | ||||||||
5.000%, 09/23/2021 (A) | 538 | 551 | ||||||||
Export Credit Bank of Turkey MTN | ||||||||||
5.375%, 02/08/2021 (A) | 896 | 928 | ||||||||
Hazine Mustesarligi Varlik Kiralama | ||||||||||
5.004%, 04/06/2023 | 1,221 | 1,255 | ||||||||
Republic of Turkey | ||||||||||
11.875%, 01/15/2030 | 1,600 | 2,544 | ||||||||
10.700%, 02/17/2021 | TRY | 9,044 | 2,518 | |||||||
10.600%, 02/11/2026 | 12,605 | 3,527 | ||||||||
10.500%, 01/15/2020 | 3,143 | 869 | ||||||||
10.400%, 03/20/2024 | 2,250 | 625 | ||||||||
9.500%, 01/12/2022 | 8,610 | 2,312 | ||||||||
9.400%, 07/08/2020 | 29,131 | 7,840 | ||||||||
9.200%, 09/22/2021 | 51,054 | 13,549 | ||||||||
9.000%, 07/24/2024 | 9,803 | 2,535 | ||||||||
8.800%, 11/14/2018 | 2,343 | 639 | ||||||||
8.500%, 07/10/2019 | 2,790 | 748 | ||||||||
8.500%, 09/14/2022 | 16,848 | 4,328 | ||||||||
8.300%, 06/20/2018 | 4,251 | 1,166 | ||||||||
7.400%, 02/05/2020 | 14,131 | 3,657 | ||||||||
7.375%, 02/05/2025 | $ | 5,525 | 6,418 | |||||||
7.100%, 03/08/2023 | TRY | 6,560 | 1,574 | |||||||
7.000%, 03/11/2019 | $ | 784 | 831 | |||||||
7.000%, 06/05/2020 | 2,190 | 2,391 | ||||||||
6.875%, 03/17/2036 | 1,020 | 1,151 | ||||||||
6.750%, 04/03/2018 | 1,374 | 1,403 | ||||||||
6.750%, 05/30/2040 | 1,480 | 1,644 | ||||||||
6.625%, 02/17/2045 | 1,643 | 1,813 | ||||||||
6.250%, 09/26/2022 | 530 | 581 | ||||||||
6.000%, 03/25/2027 | 3,013 | 3,234 | ||||||||
5.750%, 03/22/2024 | 333 | 354 | ||||||||
5.750%, 05/11/2047 | 1,408 | 1,384 | ||||||||
5.125%, 03/25/2022 (C) | 1,653 | 1,731 | ||||||||
4.875%, 10/09/2026 | 310 | 308 | ||||||||
SEI Institutional International Trust / Annual Report / September 30, 2017 |
59 |
SCHEDULE OF INVESTMENTS
September 30, 2017
Emerging Markets Debt Fund (Continued)
| Description | Face Amount (Thousands) | Market Value ($ Thousands) | ||||||||
GLOBAL BONDS (continued) | ||||||||||
4.250%, 04/14/2026 | $ | 1,521 | $ | 1,461 | ||||||
3.000%, 08/02/2023 | TRY | 7,451 | 2,106 | |||||||
Republic of Turkey MTN | ||||||||||
3.250%, 06/14/2025 | EUR | 2,536 | 2,999 | |||||||
TC Ziraat Bankasi | ||||||||||
4.250%, 07/03/2019 (A) | $ | 940 | 946 | |||||||
TC Ziraat Bankasi MTN | ||||||||||
5.125%, 05/03/2022 (A) | 1,063 | 1,080 | ||||||||
5.125%, 09/29/2023 (A) | 655 | 655 | ||||||||
4.750%, 04/29/2021 (A) | 561 | 568 | ||||||||
Turk Telekomunikasyon | ||||||||||
4.875%, 06/19/2024 | 1,750 | 1,791 | ||||||||
Turkiye Garanti Bankasi | �� | |||||||||
6.125%, VAR USD Swap Semi 30/360 5 Year Curr+4.220%, 05/24/2027 (A) | 1,170 | 1,172 | ||||||||
Turkiye Is Bankasi | ||||||||||
6.125%, 04/25/2024 | 2,080 | 2,128 | ||||||||
Yapi ve Kredi Bankasi MTN | ||||||||||
5.850%, 06/21/2024 (A) | 429 | 431 | ||||||||
| 91,013 | ||||||||||
Ukraine — 3.1% | ||||||||||
Government of Ukraine | ||||||||||
7.750%, 09/01/2020 (A) | 4,220 | 4,473 | ||||||||
7.750%, 09/01/2021 (A) | 5,152 | 5,468 | ||||||||
7.750%, 09/01/2022 (A) | 4,854 | 5,147 | ||||||||
7.750%, 09/01/2023 (A) | 2,048 | 2,150 | ||||||||
7.750%, 09/01/2024 | 2,633 | 2,748 | ||||||||
7.750%, 09/01/2024 (A) | 730 | 762 | ||||||||
7.750%, 09/01/2025 (A) | 3,454 | 3,575 | ||||||||
7.750%, 09/01/2025 | 1,567 | 1,622 | ||||||||
7.750%, 09/01/2026 | 4,942 | 5,085 | ||||||||
7.750%, 09/01/2026 (A) | 1,602 | 1,648 | ||||||||
7.750%, 09/01/2027 | 1,910 | 1,959 | ||||||||
7.750%, 09/01/2027 (A) | 3,156 | 3,237 | ||||||||
7.375%, 09/25/2032 (A) | 5,237 | 5,100 | ||||||||
2.570%, 05/31/2040 (A)(D) | 6,182 | 3,329 | ||||||||
Ukreximbank Via Biz Finance | ||||||||||
9.625%, 04/27/2022 (A) | 1,711 | 1,832 | ||||||||
| 48,135 | ||||||||||
United Arab Emirates — 0.1% | ||||||||||
MAF Global Securities | ||||||||||
7.125%, VAR USD Swap Semi 30/360 5 Year Curr+5.702%, 10/29/2049 | 1,040 | 1,080 | ||||||||
5.500%, VAR USD Swap Semi 30/360 5 Year Curr+3.476%, 12/29/2049 | 870 | 899 | ||||||||
| 1,979 | ||||||||||
United Kingdom — 0.1% | ||||||||||
Tullow Oil | ||||||||||
6.250%, 04/15/2022 | 1,806 | 1,757 | ||||||||
Vedanta Resources | ||||||||||
6.375%, 07/30/2022 (A) | 74 | 77 | ||||||||
| Description | Face Amount (Thousands) | Market Value ($ Thousands) | ||||||||
GLOBAL BONDS (continued) | ||||||||||
6.125%, 08/09/2024 (A) | $ | 488 | $ | 495 | ||||||
| 2,329 | ||||||||||
Uruguay — 0.9% | ||||||||||
Republic of Uruguay | ||||||||||
9.875%, 06/20/2022 (A) | UYU | 31,830 | 1,184 | |||||||
8.500%, 03/15/2028 (A) | 108,088 | 3,844 | ||||||||
5.100%, 06/18/2050 | $ | 4,489 | 4,736 | |||||||
4.375%, 10/27/2027 | 2,738 | 2,950 | ||||||||
4.125%, 11/20/2045 (C) | 346 | 335 | ||||||||
Uruguay Monetary Regulation Bill | ||||||||||
8.552%, 11/08/2017 (E) | UYU | 16,487 | 561 | |||||||
|
|
| ||||||||
| 13,610 | ||||||||||
|
|
| ||||||||
Venezuela — 0.9% | ||||||||||
Petroleos de Venezuela | ||||||||||
6.000%, 05/16/2024 | $ | 7,785 | 2,367 | |||||||
6.000%, 05/16/2024 | 8,752 | 2,661 | ||||||||
6.000%, 11/15/2026 | 2,693 | 817 | ||||||||
5.500%, 04/12/2037 | 1,552 | 469 | ||||||||
5.375%, 04/12/2027 | 6,989 | 2,097 | ||||||||
Republic of Venezuela | ||||||||||
13.625%, 08/15/2018 | 144 | 102 | ||||||||
13.625%, 08/15/2018 | 826 | 625 | ||||||||
11.950%, 08/05/2031 | 1,000 | 402 | ||||||||
8.250%, 10/13/2024 | 1,325 | 447 | ||||||||
7.750%, 10/13/2019 | 6,270 | 2,806 | ||||||||
7.650%, 04/21/2025 | 1,351 | 453 | ||||||||
7.000%, 03/31/2038 | 860 | 286 | ||||||||
| 13,532 | ||||||||||
Zambia — 0.6% | ||||||||||
Republic of Zambia | ||||||||||
8.970%, 07/30/2027 | 2,994 | 3,250 | ||||||||
8.500%, 04/14/2024 (A) | 3,220 | 3,439 | ||||||||
5.375%, 09/20/2022 (A) | 105 | 100 | ||||||||
5.375%, 09/20/2022 | 2,746 | 2,614 | ||||||||
|
|
| ||||||||
| 9,403 | ||||||||||
|
|
| ||||||||
Total Global Bonds | 1,486,272 | |||||||||
|
|
| ||||||||
| Shares | ||||||||||
AFFILIATED PARTNERSHIP — 0.9% | ||||||||||
SEI Liquidity Fund, L.P. 1.110% **† (H) | 14,595,621 | 14,597 | ||||||||
|
|
| ||||||||
Total Affiliated Partnership | 14,597 | |||||||||
|
|
| ||||||||
Total Investments in Securities — 95.8% (Cost $1,465,453) ($ Thousands) | $ | 1,500,869 | ||||||||
|
|
| ||||||||
60 |
SEI Institutional International Trust / Annual Report / September 30, 2017 |
A list of the open futures contracts held by the Fund at September 30, 2017, is as follows:
Type of Contract | Number of Contracts Long (Short) | Expiration Date | Notional Amount ($ Thousands) | Value ($ Thousands) | Unrealized Appreciation (Depreciation) ($ Thousands) | |||||||||||||||
Euro-Bund | (19) | Dec-2017 | (3,678) | (3,617) | 30 | |||||||||||||||
Euro-Bund | (200) | Dec-2017 | (38,257) | (38,069) | 208 | |||||||||||||||
Euro-Buxl 30-Year Bond | (40) | Dec-2017 | (7,860) | (7,720) | 144 | |||||||||||||||
JSE Bond Future R186 | 1,162 | Nov-2017 | 10,339 | 9,985 | 8 | |||||||||||||||
JSE Bond Future R2032 | 199 | Nov-2017 | 1,404 | 1,359 | 4 | |||||||||||||||
JSE Bond Future R2035 | 180 | Nov-2017 | 1,315 | 1,280 | 12 | |||||||||||||||
JSE Bond Future R207 | 205 | Nov-2017 | 1,608 | 1,552 | 1 | |||||||||||||||
JSE Bond Future R208 | 352 | Nov-2017 | 2,664 | 2,568 | (3) | |||||||||||||||
Long Gilt 10-Year Bond | (21) | Dec-2017 | (3,415) | (3,490) | 90 | |||||||||||||||
U.S. 10-Year Treasury Note | 94 | Dec-2017 | 11,861 | 11,779 | (82) | |||||||||||||||
U.S. 2-Year Treasury Note | (100) | Dec-2017 | (21,624) | (21,570) | 54 | |||||||||||||||
U.S. 5-Year Treasury Note | (255) | Dec-2017 | (30,131) | (29,963) | 168 | |||||||||||||||
U.S. 5-Year Treasury Note | (61) | Dec-2017 | (7,213) | (7,168) | 46 | |||||||||||||||
U.S. Ultra Long Treasury Bond | 25 | Dec-2017 | 4,179 | 4,128 | (51) | |||||||||||||||
|
| |||||||||||||||||||
| (78,808) | (78,946) | 629 | ||||||||||||||||||
|
| |||||||||||||||||||
A list of the open forward foreign currency contracts held by the Fund at September 30, 2017, is as follows:
| Counterparty | Settlement Date | Currency to Deliver (Thousands) | Currency to Receive (Thousands) | Unrealized Appreciation (Depreciation) (Thousands) | ||||||||||||||||||
Barclays PLC | 12/20/17 | CNY | 122,044 | USD | 17,261 | $ | (1,016 | ) | ||||||||||||||
Citigroup | 10/03/17 | USD | 1,298 | ARS | 23,619 | 62 | ||||||||||||||||
Citigroup | 10/03/17 - 11/20/17 | USD | 2,282 | COP | 6,724,379 | (3 | ) | |||||||||||||||
Citigroup | 10/03/17 - 11/16/17 | ARS | 52,383 | USD | 2,935 | (41 | ) | |||||||||||||||
Citigroup | 10/04/17 | EUR | 6,756 | USD | 8,085 | 98 | ||||||||||||||||
Citigroup | 11/03/17 - 12/20/17 | EUR | 18,516 | USD | 21,816 | (160 | ) | |||||||||||||||
Citigroup | 10/06/17 | USD | 8,859 | PLN | 31,339 | (259 | ) | |||||||||||||||
Citigroup | 10/10/17 - 12/14/17 | BRL | 1,486 | USD | 465 | (1 | ) | |||||||||||||||
Citigroup | 10/10/17 | USD | 3,536 | BRL | 11,054 | (44 | ) | |||||||||||||||
Citigroup | 10/10/17 - 11/03/17 | USD | 4,607 | EUR | 3,902 | 13 | ||||||||||||||||
Citigroup | 12/20/17 | USD | 7,490 | EUR | 6,236 | (85 | ) | |||||||||||||||
Citigroup | 10/12/17 | USD | 6,308 | CZK | 138,075 | (23 | ) | |||||||||||||||
Citigroup | 10/13/17 - 12/20/17 | USD | 8,325 | ZAR | 109,791 | (268 | ) | |||||||||||||||
Citigroup | 10/13/17 - 12/20/17 | USD | 15,176 | INR | 980,622 | (284 | ) | |||||||||||||||
Citigroup | 10/13/17 | ZAR | 37,413 | USD | 2,886 | 120 | ||||||||||||||||
Citigroup | 10/13/17 | INR | 108,892 | USD | 1,670 | 6 | ||||||||||||||||
Citigroup | 10/18/17 | USD | 8,080 | THB | 267,233 | (65 | ) | |||||||||||||||
Citigroup | 10/18/17 - 12/20/17 | USD | 26,244 | CNY | 179,925 | 729 | ||||||||||||||||
Citigroup | 10/19/17 | TRY | 1,678 | USD | 479 | 10 | ||||||||||||||||
Citigroup | 10/19/17 | TRY | 5,100 | USD | 1,401 | (26 | ) | |||||||||||||||
Citigroup | 10/19/17 | USD | 5,923 | CLP | 3,861,930 | 118 | ||||||||||||||||
Citigroup | 10/26/17 - 12/20/17 | USD | 10,705 | CLP | 6,707,745 | (221 | ) | |||||||||||||||
Citigroup | 10/19/17 - 06/20/18 | USD | 6,603 | TRY | 25,400 | 71 | ||||||||||||||||
Citigroup | 10/19/17 - 09/19/18 | USD | 10,331 | TRY | 38,968 | (317 | ) | |||||||||||||||
Citigroup | 10/20/17 | MYR | 9,613 | USD | 2,222 | (56 | ) | |||||||||||||||
Citigroup | 10/20/17 | RUB | 438,396 | USD | 7,505 | (88 | ) | |||||||||||||||
Citigroup | 10/23/17 - 12/20/17 | COP | 62,409,960 | USD | 21,208 | 98 | ||||||||||||||||
Citigroup | 10/25/17 | USD | 1,471 | PHP | 75,200 | 6 | ||||||||||||||||
Citigroup | 10/26/17 | EUR | 3,485 | CZK | 90,443 | (3 | ) | |||||||||||||||
SEI Institutional International Trust / Annual Report / September 30, 2017 |
61 |
SCHEDULE OF INVESTMENTS
September 30, 2017
Emerging Markets Debt Fund (Continued)
| Counterparty | Settlement Date | Currency to Deliver (Thousands) | Currency to Receive (Thousands) | Unrealized Appreciation (Depreciation) (Thousands) | ||||||||||||||||||
Citigroup | 10/27/17 - 11/09/17 | MXN | 269,835 | USD | 15,040 | $ | 239 | |||||||||||||||
Citigroup | 10/31/17 | IDR | 80,688,080 | USD | 6,049 | 65 | ||||||||||||||||
Citigroup | 11/03/17 - 11/17/17 | EUR | 12,943 | PLN | 55,502 | (95 | ) | |||||||||||||||
Citigroup | 11/07/17 | USD | 330 | UYU | 9,616 | — | ||||||||||||||||
Citigroup | 11/14/17 | USD | 895 | CNH | 6,319 | 53 | ||||||||||||||||
Citigroup | 11/14/17 | CNH | 19,886 | USD | 2,866 | (118 | ) | |||||||||||||||
Citigroup | 11/15/17 | USD | 520 | SGD | 700 | (4 | ) | |||||||||||||||
Citigroup | 11/16/17 | EUR | 5,913 | HUF | 1,794,839 | (159 | ) | |||||||||||||||
Citigroup | 11/17/17 - 12/20/17 | USD | 4,819 | PEN | 15,676 | (35 | ) | |||||||||||||||
Citigroup | 11/28/17 | USD | 417 | IDR | 5,563,300 | (6 | ) | |||||||||||||||
Citigroup | 12/13/17 | HUF | 1,056,750 | EUR | 3,422 | 23 | ||||||||||||||||
Citigroup | 12/20/17 | USD | 1,491 | RUB | 87,558 | 8 | ||||||||||||||||
Citigroup | 12/20/17 | USD | 3,420 | HUF | 879,902 | (55 | ) | |||||||||||||||
Citigroup | 12/20/17 | CNY | 15,330 | USD | 2,162 | (134 | ) | |||||||||||||||
Citigroup | 12/20/17 | ILS | 15,883 | USD | 4,507 | (3 | ) | |||||||||||||||
Citigroup | 12/20/17 | SGD | 16,741 | USD | 12,400 | 56 | ||||||||||||||||
Citigroup | 12/20/17 | RON | 87,917 | USD | 22,884 | 273 | ||||||||||||||||
Citigroup | 12/20/17 | TWD | 199,840 | USD | 6,717 | 106 | ||||||||||||||||
Citigroup | 03/21/18 - 06/20/18 | USD | 13,382 | EGP | 261,015 | 645 | ||||||||||||||||
Citigroup | 01/17/18 | USD | 3,838 | EGP | 68,960 | (25 | ) | |||||||||||||||
Goldman Sachs | 10/05/17 | USD | 17,596 | EUR | 15,397 | 608 | ||||||||||||||||
Goldman Sachs | 10/04/17 - 10/05/17 | USD | 4,396 | EUR | 3,672 | (54 | ) | |||||||||||||||
Goldman Sachs | 10/04/17 | EUR | 25,124 | USD | 29,956 | 253 | ||||||||||||||||
Goldman Sachs | 10/05/17 | EUR | 15,397 | USD | 17,806 | (398 | ) | |||||||||||||||
Goldman Sachs | 10/10/17 - 10/27/17 | USD | 12,565 | BRL | 39,659 | (43 | ) | |||||||||||||||
Goldman Sachs | 12/04/17 | BRL | 25,231 | USD | 7,928 | 17 | ||||||||||||||||
Goldman Sachs | 10/10/17 | BRL | 5,860 | USD | 1,851 | — | ||||||||||||||||
Goldman Sachs | 10/16/17 | HUF | 436,336 | EUR | 1,408 | 4 | ||||||||||||||||
Goldman Sachs | 10/18/17 | USD | 15,192 | CNY | 100,010 | (152 | ) | |||||||||||||||
Goldman Sachs | 10/19/17 | MYR | 5,048 | USD | 1,194 | (2 | ) | |||||||||||||||
Goldman Sachs | 10/19/17 | USD | 2,627 | MYR | 11,600 | 121 | ||||||||||||||||
Goldman Sachs | 12/19/17 | USD | 5,095 | MYR | 21,341 | (43 | ) | |||||||||||||||
Goldman Sachs | 10/25/17 | TRY | 2,451 | USD | 703 | 18 | ||||||||||||||||
Goldman Sachs | 10/19/17 | TRY | 5,600 | USD | 1,550 | (17 | ) | |||||||||||||||
Goldman Sachs | 10/19/17 | CLP | 1,498,745 | USD | 2,411 | 66 | ||||||||||||||||
Goldman Sachs | 10/25/17 | USD | 730 | TRY | 2,627 | 4 | ||||||||||||||||
Goldman Sachs | 09/19/18 | USD | 11,365 | TRY | 42,911 | (395 | ) | |||||||||||||||
Goldman Sachs | 10/25/17 | PHP | 75,215 | USD | 1,463 | (15 | ) | |||||||||||||||
Goldman Sachs | 10/26/17 - 12/20/18 | CZK | 635,521 | EUR | 24,352 | (168 | ) | |||||||||||||||
Goldman Sachs | 11/03/17 | USD | 3,132 | ILS | 11,290 | 68 | ||||||||||||||||
Goldman Sachs | 11/03/17 | ILS | 11,290 | USD | 3,209 | 8 | ||||||||||||||||
Goldman Sachs | 12/20/17 | ILS | 32,247 | USD | 9,147 | (10 | ) | |||||||||||||||
Goldman Sachs | 11/09/17 - 12/20/17 | USD | 14,409 | MXN | 261,041 | (156 | ) | |||||||||||||||
Goldman Sachs | 11/09/17 | MXN | 69,791 | USD | 3,900 | 80 | ||||||||||||||||
Goldman Sachs | 11/14/17 | USD | 2,733 | CNH | 19,575 | 204 | ||||||||||||||||
Goldman Sachs | 11/22/17 | USD | 1,973 | RUB | 115,000 | 8 | ||||||||||||||||
Goldman Sachs | 11/22/17 - 12/20/17 | USD | 9,821 | RUB | 572,586 | (10 | ) | |||||||||||||||
Goldman Sachs | 11/22/17 | RUB | 1,102,857 | USD | 18,378 | (610 | ) | |||||||||||||||
Goldman Sachs | 11/24/17 - 12/20/17 | USD | 9,318 | ZAR | 124,987 | (162 | ) | |||||||||||||||
Goldman Sachs | 11/24/17 - 12/21/17 | ZAR | 111,687 | USD | 8,341 | 156 | ||||||||||||||||
Goldman Sachs | 11/28/17 | USD | 2,040 | IDR | 27,136,938 | (33 | ) | |||||||||||||||
62 |
SEI Institutional International Trust / Annual Report / September 30, 2017 |
| Counterparty | Settlement Date | Currency to Deliver (Thousands) | Currency to Receive (Thousands) | Unrealized Appreciation (Depreciation) (Thousands) | ||||||||||||||||||
Goldman Sachs | 12/05/17 | SGD | 3,500 | USD | 2,579 | $ | (1 | ) | ||||||||||||||
Goldman Sachs | 12/20/17 | USD | 787 | ARS | 14,298 | 2 | ||||||||||||||||
Goldman Sachs | 12/20/17 | USD | 1,179 | SGD | 1,580 | (14 | ) | |||||||||||||||
Goldman Sachs | 12/20/17 | PLN | 1,550 | USD | 438 | 13 | ||||||||||||||||
Goldman Sachs | 12/20/17 | PEN | 2,631 | USD | 803 | — | ||||||||||||||||
Goldman Sachs | 12/20/17 | GBP | 3,250 | USD | 4,324 | (46 | ) | |||||||||||||||
Goldman Sachs | 12/20/17 | USD | 9,602 | THB | 317,336 | (75 | ) | |||||||||||||||
Goldman Sachs | 12/20/17 | USD | 19,045 | TWD | 567,940 | (257 | ) | |||||||||||||||
Goldman Sachs | 12/20/17 | PLN | 19,860 | EUR | 4,579 | (16 | ) | |||||||||||||||
Goldman Sachs | 12/20/17 | INR | 725,830 | USD | 11,085 | 83 | ||||||||||||||||
Goldman Sachs | 12/20/17 | COP | 3,258,460 | USD | 1,108 | 7 | ||||||||||||||||
Goldman Sachs | 06/20/18 | USD | 2,416 | CZK | 54,000 | 86 | ||||||||||||||||
Goldman Sachs | 06/20/18 - 12/20/18 | EUR | 15,263 | CZK | 406,065 | 466 | ||||||||||||||||
JPMorgan Chase Bank | 10/03/17 - 11/03/17 | BRL | 32,844 | USD | 10,287 | (76 | ) | |||||||||||||||
JPMorgan Chase Bank | 10/03/17 | COP | 6,087,854 | USD | 2,035 | (38 | ) | |||||||||||||||
JPMorgan Chase Bank | 10/10/17 - 12/20/17 | USD | 26,673 | EUR | 22,646 | 116 | ||||||||||||||||
JPMorgan Chase Bank | 10/04/17 - 11/03/17 | USD | 39,631 | EUR | 33,294 | (231 | ) | |||||||||||||||
JPMorgan Chase Bank | 10/04/17 - 11/03/17 | EUR | 84,248 | USD | 100,315 | 650 | ||||||||||||||||
JPMorgan Chase Bank | 11/03/17 - 11/10/17 | EUR | 23,436 | USD | 27,717 | (42 | ) | |||||||||||||||
JPMorgan Chase Bank | 10/06/17 | USD | 2,609 | RON | 9,942 | (52 | ) | |||||||||||||||
JPMorgan Chase Bank | 10/06/17 - 12/20/17 | USD | 5,649 | PLN | 20,033 | (150 | ) | |||||||||||||||
JPMorgan Chase Bank | 10/10/17 | EUR | 3,590 | CZK | 93,576 | 14 | ||||||||||||||||
JPMorgan Chase Bank | 10/10/17 | BRL | 11,082 | USD | 3,482 | (19 | ) | |||||||||||||||
JPMorgan Chase Bank | 10/11/17 - 11/16/17 | USD | 2,893 | ARS | 52,606 | 91 | ||||||||||||||||
JPMorgan Chase Bank | 10/11/17 | ARS | 19,820 | USD | 1,131 | (6 | ) | |||||||||||||||
JPMorgan Chase Bank | 12/19/18 | USD | 2,284 | CZK | 53,938 | 239 | ||||||||||||||||
JPMorgan Chase Bank | 10/12/17 | USD | 8,689 | CZK | 190,263 | (29 | ) | |||||||||||||||
JPMorgan Chase Bank | 10/13/17 | USD | 3,517 | INR | 225,681 | (68 | ) | |||||||||||||||
JPMorgan Chase Bank | 10/13/17 | ZAR | 29,518 | USD | 2,277 | 94 | ||||||||||||||||
JPMorgan Chase Bank | 10/13/17 | INR | 225,681 | USD | 3,462 | 12 | ||||||||||||||||
JPMorgan Chase Bank | 10/16/17 | USD | 5,010 | MXN | 90,514 | (36 | ) | |||||||||||||||
JPMorgan Chase Bank | 10/18/17 | USD | 820 | EGP | 10,947 | (201 | ) | |||||||||||||||
JPMorgan Chase Bank | 10/19/17 | USD | 2,026 | TRY | 7,065 | (49 | ) | |||||||||||||||
JPMorgan Chase Bank | 10/20/17 | USD | 791 | THB | 26,141 | (7 | ) | |||||||||||||||
JPMorgan Chase Bank | 10/20/17 | USD | 2,587 | MYR | 11,422 | 119 | ||||||||||||||||
JPMorgan Chase Bank | 10/20/17 | MYR | 3,491 | USD | 806 | (21 | ) | |||||||||||||||
JPMorgan Chase Bank | 10/20/17 | RUB | 169,422 | USD | 2,899 | (35 | ) | |||||||||||||||
JPMorgan Chase Bank | 10/23/17 | EUR | 456 | RON | 2,098 | — | ||||||||||||||||
JPMorgan Chase Bank | 10/23/17 | COP | 7,602,358 | USD | 2,600 | 18 | ||||||||||||||||
JPMorgan Chase Bank | 10/25/17 | TRY | 11,419 | USD | 3,254 | 63 | ||||||||||||||||
JPMorgan Chase Bank | 10/26/17 | USD | 1,569 | IDR | 21,082,200 | (5 | ) | |||||||||||||||
JPMorgan Chase Bank | 10/26/17 | USD | 1,611 | UYU | 47,170 | 10 | ||||||||||||||||
JPMorgan Chase Bank | 10/26/17 | IDR | 10,971,121 | USD | 817 | 3 | ||||||||||||||||
JPMorgan Chase Bank | 10/27/17 | USD | 1,945 | PEN | 6,319 | (13 | ) | |||||||||||||||
JPMorgan Chase Bank | 10/27/17 | USD | 8,455 | TRY | 29,961 | (89 | ) | |||||||||||||||
JPMorgan Chase Bank | 10/31/17 | USD | 658 | ARS | 11,634 | 2 | ||||||||||||||||
JPMorgan Chase Bank | 12/20/17 | USD | 1,685 | ARS | 30,382 | (7 | ) | |||||||||||||||
JPMorgan Chase Bank | 10/31/17 | USD | 2,493 | CNH | 17,900 | 196 | ||||||||||||||||
JPMorgan Chase Bank | 10/31/17 - 11/14/17 | CNH | 44,200 | USD | 6,369 | (270 | ) | |||||||||||||||
JPMorgan Chase Bank | 11/02/17 | CLP | 1,066,411 | USD | 1,694 | 27 | ||||||||||||||||
JPMorgan Chase Bank | 11/03/17 - 12/04/17 | USD | 12,965 | BRL | 41,139 | (47 | ) | |||||||||||||||
SEI Institutional International Trust / Annual Report / September 30, 2017 |
63 |
SCHEDULE OF INVESTMENTS
September 30, 2017
Emerging Markets Debt Fund (Continued)
| Counterparty | Settlement Date | Currency to Deliver (Thousands) | Currency to Receive (Thousands) | Unrealized Appreciation (Depreciation) (Thousands) | ||||||||||||||||
JPMorgan Chase Bank | 11/15/17 | USD | 3,062 | SGD | 4,124 | $ (22) | ||||||||||||||
JPMorgan Chase Bank | 11/15/17 | SGD | 4,824 | USD | 3,542 | (13) | ||||||||||||||
JPMorgan Chase Bank | 11/17/17 | EUR | 403 | PLN | 1,724 | (4) | ||||||||||||||
JPMorgan Chase Bank | 11/17/17 | USD | 3,567 | PEN | 11,620 | (15) | ||||||||||||||
JPMorgan Chase Bank | 11/22/17 | USD | 11,806 | RUB | 697,559 | 205 | ||||||||||||||
JPMorgan Chase Bank | 11/22/17 | RUB | 288,804 | USD | 4,936 | (37) | ||||||||||||||
JPMorgan Chase Bank | 11/24/17 | USD | 577 | ZAR | 7,850 | — | ||||||||||||||
JPMorgan Chase Bank | 12/19/17 | USD | 2,037 | KRW | 2,295,920 | (29) | ||||||||||||||
JPMorgan Chase Bank | 12/20/17 | USD | 7,626 | CLP | 4,783,572 | (155) | ||||||||||||||
JPMorgan Chase Bank | 12/20/17 | PEN | 9,302 | USD | 2,837 | (1) | ||||||||||||||
JPMorgan Chase Bank | 12/20/17 | PHP | 557,610 | USD | 10,842 | (66) | ||||||||||||||
JPMorgan Chase Bank | 09/27/18 | CZK | 26,087 | EUR | 978 | (33) | ||||||||||||||
JPMorgan Chase Bank | 12/19/18 | EUR | 7,585 | CZK | 200,890 | 180 | ||||||||||||||
Standard Bank | 10/03/17 | COP | 11,693,895 | USD | 3,913 | (69) | ||||||||||||||
Standard Bank | 10/04/17 | EUR | 1,367 | USD | 1,630 | 14 | ||||||||||||||
Standard Bank | 10/04/17 | EUR | 1,337 | USD | 1,574 | (6) | ||||||||||||||
Standard Bank | 10/04/17 - 10/23/17 | USD | 33,284 | EUR | 28,243 | 108 | ||||||||||||||
Standard Bank | 10/04/17 | USD | 1,284 | EUR | 1,074 | (15) | ||||||||||||||
Standard Bank | 10/10/17 | BRL | 11,474 | USD | 3,405 | (219) | ||||||||||||||
Standard Bank | 10/16/17 - 12/13/17 | EUR | 9,945 | HUF | 3,042,333 | (178) | ||||||||||||||
Standard Bank | 10/19/17 | USD | 3,440 | TRY | 12,442 | 42 | ||||||||||||||
Standard Bank | 09/19/18 | USD | 2,888 | TRY | 10,912 | (99) | ||||||||||||||
Standard Bank | 10/19/17 | TRY | 12,922 | USD | 3,569 | (47) | ||||||||||||||
Standard Bank | 10/23/17 | EUR | 3,947 | RON | 18,179 | 5 | ||||||||||||||
Standard Bank | 10/26/17 | IDR | 33,931,300 | USD | 2,529 | 12 | ||||||||||||||
Standard Bank | 10/30/17 - 12/20/17 | PHP | 608,348 | USD | 11,796 | (118) | ||||||||||||||
Standard Bank | 10/31/17 | USD | 2,977 | CNH | 20,500 | 102 | ||||||||||||||
Standard Bank | 10/31/17 | USD | 3,304 | INR | 217,900 | 17 | ||||||||||||||
Standard Bank | 12/20/17 | USD | 865 | INR | 55,900 | (18) | ||||||||||||||
Standard Bank | 10/31/17 | MYR | 13,500 | USD | 3,194 | (6) | ||||||||||||||
Standard Bank | 11/02/17 | USD | 5,630 | CLP | 3,668,837 | 107 | ||||||||||||||
Standard Bank | 11/02/17 | CLP | 1,611,838 | USD | 2,593 | 73 | ||||||||||||||
Standard Bank | 11/15/17 | USD | 2,039 | MXN | 36,373 | (50) | ||||||||||||||
Standard Bank | 11/22/17 | USD | 287 | RUB | 16,647 | – | ||||||||||||||
Standard Bank | 11/24/17 | USD | 2,511 | ZAR | 33,497 | (50) | ||||||||||||||
Standard Bank | 11/30/17 | USD | 3,237 | THB | 107,833 | – | ||||||||||||||
Standard Bank | 12/05/17 | USD | 2,599 | SGD | 3,500 | (19) | ||||||||||||||
Standard Bank | 12/08/17 | USD | 3,221 | MYR | 13,700 | 23 | ||||||||||||||
Standard Bank | 12/20/17 | USD | 1,218 | TWD | 36,220 | (20) | ||||||||||||||
Standard Bank | 12/20/17 | USD | 11,844 | IDR | 157,641,438 | (217) | ||||||||||||||
|
|
| ||||||||||||||||||
| $ (1,655) | ||||||||||||||||||||
|
|
| ||||||||||||||||||
A list of the open OTC swap agreements held by the Fund at September 30, 2017, is as follows:
| Interest Rate Swaps | ||||||||||||||||||||
| Counterparty | Fund Pays | Fund Receives | Payment Frequency | Termination Date | Currency | Notional Amount (Thousands) | Value ($ Thousands) | Upfront Payments ($ Thousands) | Net Unrealized Appreciation | |||||||||||
| COP Overnight Intrabank | ||||||||||||||||||||
JPMorgan Chase | 6.960% | Reference Rate | Quarterly | 11/17/2017 | COP | 28,888,912 | 26 | – | 26 | |||||||||||
Goldman Sachs | 1-Year BRL -CDI | 11.805% | Annual | 01/02/2018 | BRL | 9,833 | 41 | – | (67) | |||||||||||
64 |
SEI Institutional International Trust / Annual Report / September 30, 2017 |
| Interest Rate Swaps | ||||||||||||||||||||||||||||||||
| Counterparty | Fund Pays | Fund Receives | Payment Frequency | Termination Date | Currency | Notional Amount (Thousands) | Value ($ Thousands) | Upfront ($ Thousands) | Net Unrealized ($ Thousands) | |||||||||||||||||||||||
Goldman Sachs | 1-Year BRL -CDI | 11.975% | Annual | 01/02/2018 | BRL | 3,338 | 14 | – | (18 | ) | ||||||||||||||||||||||
Goldman Sachs | 1-Day BRL -CETIP | 12.855% | Annual | 01/02/2018 | BRL | 35,816 | 171 | – | 136 | |||||||||||||||||||||||
Goldman Sachs | 3-Month KRW -KWCDC | 1.3225% | Quarterly | 11/04/2018 | KRW | 37,500,000 | (101 | ) | – | (103 | ) | |||||||||||||||||||||
Goldman Sachs | 1-Day BRL - CETIP | 13.39% | Annual | 01/02/2019 | BRL | 14,395 | 413 | – | 461 | |||||||||||||||||||||||
Goldman Sachs | 1-Day BRL - CETIP | 13.42% | Annual | 01/02/2019 | BRL | 19,336 | 557 | – | 626 | |||||||||||||||||||||||
Goldman Sachs | 0.65% | 3-Month HUF - BUBOR | Quarterly | 04/11/2019 | HUF | 8,300,000 | (137 | ) | – | (137 | ) | |||||||||||||||||||||
Goldman Sachs | 1.3275% | 6-Month THB - BKIBOR | Semi-Annual | 09/15/2019 | THB | 710,000 | 119 | – | 122 | |||||||||||||||||||||||
JPMorgan Chase | 0.845% | 6-Month HUF - BUBOR | Semi-Annual | 10/10/2019 | HUF | 3,000,000 | (134 | ) | – | (216 | ) | |||||||||||||||||||||
Goldman Sachs | 1-Day BRL BROIS CETIP | 9.73% | Annual | 01/02/2020 | BRL | 4,194 | 47 | – | 46 | |||||||||||||||||||||||
JPMorgan Chase | 1-Day BRL - CETIP | 11.46% | Annual | 01/02/2020 | BRL | 3,649 | 88 | – | 91 | |||||||||||||||||||||||
JPMorgan Chase | 1-Day BRL BROIS | 9.605% | Annual | 01/02/2020 | BRL | 3,480 | 98 | – | 109 | |||||||||||||||||||||||
JPMorgan Chase | 1-Day BRL BROIS CETIP | 9.065% | Annual | 01/02/2020 | BRL | 5,738 | 160 | – | 176 | |||||||||||||||||||||||
JPMorgan Chase | 0.5375% | 6-Month CZK - PRIBOR | Semi-Annual | 02/16/2020 | CZK | 250,000 | 145 | – | 115 | |||||||||||||||||||||||
Goldman Sachs | 0.585% | 6-Month CZK - PRIBOR | Semi-Annual | 03/13/2020 | CZK | 25,000 | 14 | – | 11 | |||||||||||||||||||||||
JPMorgan Chase | 0.6925% | 6-Month HUF - BUBOR | Semi-Annual | 04/20/2020 | HUF | 1,750,000 | (57 | ) | – | (71 | ) | |||||||||||||||||||||
Goldman Sachs | 1-Day BRL - CDI | 12.725% | Annual | 01/04/2021 | BRL | 10,608 | 541 | – | 513 | |||||||||||||||||||||||
JPMorgan Chase | 8.655% | 1-Day BRL BROIS CETIP | Annual | 01/04/2021 | BRL | 3,303 | (4 | ) | – | (4 | ) | |||||||||||||||||||||
JPMorgan Chase | 1-Day BRL BROIS CETIP | 9.61% | Annual | 01/04/2021 | BRL | 4,626 | 37 | – | 38 | |||||||||||||||||||||||
JPMorgan Chase | 1-Day BRL BROIS CETIP | 10.23% | Annual | 01/04/2021 | BRL | 170 | 2 | – | 3 | |||||||||||||||||||||||
JPMorgan Chase | 1-Day BRL BROIS CETIP | 10.04% | Annual | 01/04/2021 | BRL | 3,557 | 43 | – | 45 | |||||||||||||||||||||||
JPMorgan Chase | 1-Day BRL BROIS CETIP | 9.275% | Annual | 01/04/2021 | BRL | 5,815 | 27 | – | 28 | |||||||||||||||||||||||
JPMorgan Chase | 1-Day BRL BROIS CETIP | 8.87% | Annual | 01/04/2021 | BRL | 8,089 | 7 | – | 8 | |||||||||||||||||||||||
Goldman Sachs | 28-Day MXN - TIIE | 5.37% | Monthly | 03/17/2021 | MXN | 46,500 | (116 | ) | – | (120 | ) | |||||||||||||||||||||
JPMorgan Chase | 1.3775% | 6-Month HUF - BUBOR | Semi-Annual | 06/17/2021 | HUF | 654,998 | (71 | ) | – | (79 | ) | |||||||||||||||||||||
Goldman Sachs | 1.3925% | 3-Month KRW - KWCDC | Quarterly | 11/04/2021 | KRW | 14,000,000 | 237 | – | 236 | |||||||||||||||||||||||
JPMorgan Chase | 6-Month PLN - WIBOR | 2.42% | Annual | 12/12/2021 | PLN | 3,300 | 3 | – | 16 | |||||||||||||||||||||||
Citibank | 6-Month PLN - WIBOR | 2.431% | Annual | 12/14/2021 | PLN | 11,000 | 11 | – | 54 | |||||||||||||||||||||||
Goldman Sachs | 1.265% | 6-Month HUF - BUBOR | Semi-Annual | 01/10/2022 | HUF | 1,537,322 | (128 | ) | – | (179 | ) | |||||||||||||||||||||
Goldman Sachs | 0.8725% | 6-Month CZK - PRIBOR | Semi-Annual | 03/09/2022 | CZK | 25,000 | 23 | – | 17 | |||||||||||||||||||||||
JPMorgan Chase | 1-Day CLP CLOIS | 3.43% | Semi-Annual | 05/10/2022 | CLP | 420,527 | 5 | – | 14 | |||||||||||||||||||||||
JPMorgan Chase | 0.955% | 6-Month CZK - PRIBOR | Semi-Annual | 05/17/2022 | CZK | 28,773 | 23 | – | 20 | |||||||||||||||||||||||
JPMorgan Chase | 3-Month ILS - TELBOR | 0.8025% | Annual | 06/28/2022 | ILS | 21,253 | 43 | – | 55 | |||||||||||||||||||||||
Goldman Sachs | 7.54% | 3-Month ZAR - JIBAR | Quarterly | 07/06/2022 | ZAR | 105,000 | (103 | ) | – | (107 | ) | |||||||||||||||||||||
JPMorgan Chase | 1-Day CLP CLOIS | 3.41% | Semi-Annual | 07/11/2022 | CLP | 900,000 | 14 | – | 25 | |||||||||||||||||||||||
JPMorgan Chase | 3-Month ILS - TELBOR | 0.855% | Annual | 07/12/2022 | ILS | 2,000 | 5 | – | 6 | |||||||||||||||||||||||
Goldman Sachs | 1-Day COP COOIS IBRCOL | 5.4425% | Quarterly | 09/07/2022 | COP | 2,205,023 | 2 | – | 3 | |||||||||||||||||||||||
Citibank | 1.165% | 6-Month CZK -PRIBOR | Semi-Annual | 09/08/2022 | CZK | 43,406 | 19 | – | 18 | |||||||||||||||||||||||
Goldman Sachs | 28-Day MXN - TIIE | 5.900% | Monthly | 09/12/2022 | MXN | 75,956 | (160 | ) | – | (162 | ) | |||||||||||||||||||||
JPMorgan Chase | 1-Day COP COOIS IBRCOL | 5.30% | Quarterly | 09/19/2022 | COP | 9,500,000 | (11 | ) | – | (11 | ) | |||||||||||||||||||||
Goldman Sachs | 6-Month HUF - BUBOR | 0.8385% | Annual | 09/21/2022 | HUF | 1,390,000 | (25 | ) | – | (24 | ) | |||||||||||||||||||||
JPMorgan Chase | 1-Day COP COOIS IBRCOL | 5.38% | Quarterly | 09/25/2022 | COP | 5,391,885 | – | – | – | |||||||||||||||||||||||
Goldman Sachs | 1-Day COP COOIS IBRCOL | 5.36% | Quarterly | 09/26/2022 | COP | 5,391,885 | (2 | ) | – | (2 | ) | |||||||||||||||||||||
Goldman Sachs | 1-Day BRL - CETIP | 11.985% | Annual | 01/02/2023 | BRL | 3,000 | 152 | – | 126 | |||||||||||||||||||||||
Goldman Sachs | 1-Year BRL - CDI | 10.89% | Annual | 01/03/2023 | BRL | 5,012 | 149 | – | 38 | |||||||||||||||||||||||
Goldman Sachs | 28-Day MXN - TIIE | 6.355% | Monthly | 05/21/2025 | MXN | 23,145 | (47 | ) | – | (47 | ) | |||||||||||||||||||||
Goldman Sachs | 28-Day MXN - TIIE | 6.205% | Monthly | 12/08/2025 | MXN | 16,624 | (46 | ) | – | (46 | ) | |||||||||||||||||||||
Goldman Sachs | 28-Day MXN - TIIE | 6.165% | Monthly | 03/05/2026 | MXN | 47,200 | (143 | ) | – | (143 | ) | |||||||||||||||||||||
JPMorgan Chase | 28-Day MXN - TIIE | 6.13% | Monthly | 06/18/2026 | MXN | 40,000 | (132 | ) | – | (132 | ) | |||||||||||||||||||||
Goldman Sachs | 28-Day MXN - TIIE | 6.381% | Monthly | 09/16/2026 | MXN | 26,000 | (64 | ) | – | (64 | ) | |||||||||||||||||||||
Goldman Sachs | 6-Month HUF - BUBOR | 4.07% | Annual | 04/11/2027 | HUF | 2,000,000 | 254 | – | 254 | |||||||||||||||||||||||
JPMorgan Chase | 6-Month HUF - BUBOR | 2.458% | Annual | 05/16/2027 | HUF | 1,000,000 | 124 | – | 156 | |||||||||||||||||||||||
JPMorgan Chase | 1-Day CLP CLOIS | 4.06% | Semi-Annual | 06/02/2027 | CLP | 937,139 | 9 | – | 28 | |||||||||||||||||||||||
Goldman Sachs | 1.18% | 6-Month CZK -PRIBOR | Semi-Annual | 06/30/2027 | CZK | 65,000 | 119 | – | 113 | |||||||||||||||||||||||
JPMorgan Chase | 6-Month HUF - BUBOR | 3.85% | Annual | 07/12/2027 | HUF | 200,000 | (106 | ) | – | (107 | ) | |||||||||||||||||||||
|
|
|
|
|
| |||||||||||||||||||||||||||
| 2,155 | – | 1,894 | ||||||||||||||||||||||||||||||
|
|
|
|
|
| |||||||||||||||||||||||||||
SEI Institutional International Trust / Annual Report / September 30, 2017 |
65 |
SCHEDULE OF INVESTMENTS
September 30, 2017
Emerging Markets Debt Fund (Continued)
| Credit Default Swap | ||||||||||||||||||||||||
| Counterparty | Reference Entity/Obligation | Buy/Sell Protection | (Pays)/Receives Rate | Payment Frequency | Termination Date | Notional Amount ($ Thousands) | Value ($ Thousands) | Upfront Payments/ Receipts ($ Thousands) | Net Unrealized Appreciation (Depreciation) ($ Thousands) | |||||||||||||||
JPMorgan Chase | United Mexican States | Sell | 1.00% | Monthly | 06/20/2026 | (1,200) | (68) | (101) | 37 | |||||||||||||||
|
|
|
|
|
| |||||||||||||||||||
| (68) | (101) | 37 | ||||||||||||||||||||||
|
|
|
|
|
| |||||||||||||||||||
| Cross Currency Swaps | ||||||||||||||||||||||||
| Counterparty | Fund Pays | Fund Receives | Payment Frequency | Termination Date | Currency | Notional (Thousands) | Value ($ Thousands) | Upfront ($ Thousands) | Net Unrealized ($ Thousands) | |||||||||||||||
Goldman Sachs | 6.879% | 3-Month USD -LIBOR | Annual | 05/29/2019 | USD | 16,204 | 7 | – | 7 | |||||||||||||||
JPMorgan Chase | 3-Month USD -LIBOR | 11.185% | Quarterly | 10/25/2018 | TRY | 65,000 | (104 | ) | – | (104 | ) | |||||||||||||
|
|
|
|
|
| |||||||||||||||||||
| (97 | ) | – | (97 | ) | ||||||||||||||||||||
|
|
|
|
|
| |||||||||||||||||||
A list of the open centrally cleared swap agreements held by the Fund at September 30, 2017, is as follows:
| Interest Rate Swaps | ||||||||||||||||||||||||
| Fund Pays | Fund Receives | Payment Frequency | Termination Date | Currency | Notional Amount (Thousands) | Value ($ Thousands) | Upfront Payments/ Receipts ($ Thousands) | Net Unrealized Appreciation (Depreciation) ($ Thousands) | ||||||||||||||||
28-Day MXN - TIIE | 7.915% | Monthly | 01/22/2027 | MXN | 41,115 | 140 | – | 140 | ||||||||||||||||
28-Day MXN - TIIE | 7.72% | Monthly | 12/03/2026 | MXN | 8,000 | 21 | – | 21 | ||||||||||||||||
2.76% | 6-Month PZL - WIBOR | Semi-Annual | 07/03/2027 | PLN | 1,700 | 6 | – | 6 | ||||||||||||||||
28-Day MXN - TIIE | 7.51% | Monthly | 04/20/2027 | MXN | 8,110 | 15 | – | 15 | ||||||||||||||||
28-Day MXN - TIIE | 7.605% | Monthly | 03/07/2024 | MXN | 53,000 | 113 | – | 113 | ||||||||||||||||
28-Day MXN - TIIE | 7.575% | Monthly | 01/28/2022 | MXN | 67,966 | 111 | – | 111 | ||||||||||||||||
6-Month PZL - WIBOR | 2.505% | Annual | 01/10/2022 | PLN | 22,509 | 39 | – | 39 | ||||||||||||||||
28-Day MXN - TIIE | 6.71% | Monthly | 07/07/2022 | MXN | 130,137 | (28 | ) | – | (28 | ) | ||||||||||||||
28-Day MXN - TIIE | 6.745% | Monthly | 06/23/2022 | MXN | 26,758 | (4 | ) | – | (4 | ) | ||||||||||||||
|
| |||||||||||||||||||||||
| 413 | – | 413 | ||||||||||||||||||||||
|
| |||||||||||||||||||||||
For the year ended September 30, 2017 the total amount of all open swap agreements, as presented in the table above, are representative of the volume of activity for the derivative type during the year.
66 |
SEI Institutional International Trust / Annual Report / September 30, 2017 |
| Percentages are based on Net Assets of $1,566,972 ($ Thousands). |
| ** | Rate shown is the 7-day effective yield as of September 30, 2017. |
| † | Investment in Affiliated Security (see Note 5). |
| (A) | Security exempt from registration under Rule 144A of the Securities Act of 1933. These securities may be resold in transactions exempt from registration normally to qualified institutions. On September 30, 2017, the value of these securities amounted to $201,283 ($ Thousands), representing 12.8% of the Net Assets of the Fund. |
| (B) | Step Bonds - The rate reflected on the Schedule of Investments is the effective yield on September 30, 2017. The coupon on a step bond changes on a specified date. |
| (C) | Certain securities or partial positions of certain securities are on loan at September 30, 2017 (see Note 9). The total market value of securities on loan at September 30, 2017 was $12,828 ($ Thousands). |
| (D) | Variable or floating rate security, the interest rate of which adjusts periodically based on changes in current interest rates and prepayments on the underlying pool of assets. |
| (E) | Zero coupon security. The rate shown on the Schedule of Investments is the security’s effective yield at the time of purchase. |
| (F) | Level 3 security in accordance with fair value hierarchy. |
| (G) | Securities considered illiquid. The total value of such securities as of September 30, 2017 was $543 ($ Thousands) and represented 0.0% of the Net Assets of the Fund. |
| (H) | This security was purchased with cash collateral held from securities on loan (see Note 9). The total market value of such securities as of September 30, 2017 was $14,597 ($ Thousands). |
ARS — Argentine Peso
BADLAR — Buenos Aires Deposits of Large Amount Rate
BKIBOR — Bangkok Interbank Offered Rate
BRL — Brazilian Real
BROIS — Overnight Brazil CETIP Interbank Deposit
BUBOR — Budapest Interbank Offered Rate
CDI — Average One-Day Interbank Deposit Rate
CETIP — Central of Custody and Financial Settlement of Securities
CLOIS — CLP Sinacofi Chile Interbank Rate Average
CLP — Chilean Peso
COOIS — Colombia Overnight Interbank Reference Rate
CNH — Chinese Yuan Offshore
CNY — Chinese Yuan Onshore
COP — Colombian Peso
CZK — Czech Koruna
DOP — Dominican Peso
EGP — Egyptian Pound
EUR — Euro
GBP — British Pound Sterling
GHS — Ghanaian Cedi
HUF — Hungarian Forint
IBRCOL — Colombia Overnight Interbank Reference Rate
IDR — Indonesian Rupiah
ILS — Israeli New Sheckels
INR — Indian Rupee
JIBAR — Johannesburg Interbank Agreed Rate
JSE — Johannesburg Stock Exchange
KRW — Korean Won
KWCDC — South Korean Won Certificate of Deposit
L.P. — Limited Partnership
LIBOR — London Interbank Offered Rate
LKR — Sri Lankan Rupee
MTN — Medium Term Note
MXN — Mexican Peso
MYR — Malaysian Ringgit
NGN — Nigerian Naira
PEN — Peruvian Inca
PHP — Philippine Peso
PLC — Public Limited Company
PLN — Polish Zloty
PRIBOR — Prague Interbank Offered Rate
RON — Romanian Leu
RUB — Russian Ruble
SGD — Singapore Dollar
Ser — Series
TELBOR — Tel Aviv Interbank Offered Rate
THB — Thai Bhat
TIIE — Equilibrium Interbank Offered Rate
TRY — Turkish Lira
TWD — Taiwan Dollar
USD — United States Dollar
UYU — Uruguayan Peso
VAR — Variable Rate
WIBOR — Warsaw Interbank Offered Rate
ZAR — South African Rand
The Following is a list of the level of inputs used as of September 30, 2017, in valuing the Fund’s investments and other financial instruments carried at valued ($ Thousands):
| Investments in Securities | Level 1 | Level 2 | Level 3(1) | Total | ||||||||||||
Global Bonds | $ | – | $ | 1,485,729 | $ | 543 | $ | 1,486,272 | ||||||||
Affiliated Partnership | – | 14,597 | – | 14,597 | ||||||||||||
|
|
|
|
|
|
|
| |||||||||
Total Investments in Securities | $ | – | $ | 1,500,326 | $ | 543 | $ | 1,500,869 | ||||||||
|
|
|
|
|
|
|
| |||||||||
| Other Financial Instruments | Level 1 | Level 2 | Level 3 | Total | ||||||||||||
Futures Contracts * | ||||||||||||||||
Unrealized Appreciation | $ | 765 | $ | – | $ | – | $ | 765 | ||||||||
Unrealized Depreciation | (136) | – | – | (136) | ||||||||||||
Forwards Contracts * | ||||||||||||||||
Unrealized Appreciation | – | 7,613 | – | 7,613 | ||||||||||||
Unrealized Depreciation | – | (9,268) | – | (9,268) | ||||||||||||
OTC Swaps | ||||||||||||||||
Interest Rate Swaps * | ||||||||||||||||
Unrealized Appreciation | – | 3,733 | – | 3,733 | ||||||||||||
Unrealized Depreciation | – | (1,839) | – | (1,839) | ||||||||||||
Credit Default Swaps * | ||||||||||||||||
Unrealized Appreciation | – | 37 | – | 37 | ||||||||||||
Cross Currency Swaps * | ||||||||||||||||
Unrealized Appreciation | – | 7 | – | 7 | ||||||||||||
Unrealized Depreciation | – | (104) | – | (104) | ||||||||||||
Centrally Cleared Swaps | ||||||||||||||||
Interest Rate Swaps * | ||||||||||||||||
Unrealized Appreciation | – | 445 | – | 445 | ||||||||||||
Unrealized Depreciation | – | (32) | – | (32) | ||||||||||||
|
|
|
|
|
|
|
| |||||||||
Total Other Financial Instruments | $ | 629 | $ | 592 | $ | – | $ | 1,221 | ||||||||
|
|
|
|
|
|
|
| |||||||||
(1) Of the $543 ($ Thousands) in Level 3 securities as of September 30, 2017, $543 ($ Thousands) or 0.04% as a percent of net assets are not valued via third party pricing vendors and broker quotes. If significant, the disclosure of the unobservable inputs and the interrelationships and sensitivity between these inputs are required for those Level 3 securities that are not valued by third party pricing vendors or broker quotes. A reconciliation of Level 3 investments is presented when the Fund has significant amount of Level 3 investments at the beginning and/or end of the period in relation to net assets.
* Futures contracts, forwards contracts and swap contracts are valued at the unrealized appreciation (depreciation) on the instrument.
For the year ended September 30, 2017, there were no transfers between Level 1 and Level 2 assets and liabilities.
SEI Institutional International Trust / Annual Report / September 30, 2017
|
67 |
SCHEDULE OF INVESTMENTS
September 30, 2017
Emerging Markets Debt Fund (Concluded)
For the year ended September 30, 2017, there were no transfers between Level 2 and Level 3 assets and liabilities.
For more information on valuation inputs, see Note 2 - Significant Accounting Policies in Notes to Financial Statements.
Amounts designated as “–” are $0 or have been rounded to $0.
The following is a summary of the transactions with affiliates for the year ended September 30, 2017 ($ Thousands):
| Security Description | Value at 9/30/2016 | Purchases at Cost | Proceeds from Sales | Realized Gain (Loss) | Change in Unrealized Appreciation (Depreciation) | Value 9/30/2017 | Dividend Income | |||||||||||||||||||||
SEI Liquidity Fund, L.P. | $36,124 | $112,941 | $(134,467) | $(3) | $2 | $14,597 | $126 | |||||||||||||||||||||
|
|
|
|
|
|
|
|
|
|
|
|
|
| |||||||||||||||
The accompanying notes are an integral part of the financial statements.
68 |
SEI Institutional International Trust / Annual Report / September 30, 2017 |
STATEMENTS OF ASSETS AND LIABILITIES ($ Thousands)
September 30, 2017
International Equity Fund | Emerging Markets Equity Fund | International Fixed Income Fund | Emerging Markets Debt Fund | |||||||||||||
Assets: | ||||||||||||||||
Investments, at value † | $ 3,909,545* | $ 1,902,763* | $ 423,553 | $ 1,486,272* | ||||||||||||
Affiliated investments, at value †† | 237,711 | 162,415 | – | 14,597 | ||||||||||||
Cash | 81,058 | 32,207 | 11,489 | 46,959 | ||||||||||||
Cash pledged as collateral for forward foreign currency contracts | – | – | – | 4,400 | ||||||||||||
Cash pledged as collateral for futures contracts | 5,944 | – | 1,737 | 2,552 | ||||||||||||
Cash pledged as collateral for swap contracts | – | – | – | 820 | ||||||||||||
Foreign currency, at value ††† | 498 | 2,332 | – | 10,965 | ||||||||||||
Receivable for fund shares sold | 1,703 | 1,412 | 81 | 735 | ||||||||||||
Receivable for investment securities sold | 16,109 | 15,376 | 41,629 | 7,034 | ||||||||||||
Dividends and interest receivable | 7,674 | 2,205 | 3,014 | 21,821 | ||||||||||||
Unrealized gain on forward foreign currency contracts | – | – | 4,809 | 7,613 | ||||||||||||
Unrealized gain on foreign spot currency contracts | 9 | – | 334 | 45 | ||||||||||||
Due from broker | – | – | – | 12 | ||||||||||||
Swap contracts, at value †††† | – | – | – | 3,742 | ||||||||||||
Foreign tax reclaim receivable | 6,804 | 134 | – | – | ||||||||||||
Receivable for variation margin | 589 | – | 109 | 150 | ||||||||||||
Prepaid expenses | – | 16 | – | 13 | ||||||||||||
Total Assets | 4,267,644 | 2,118,860 | 486,755 | 1,607,730 | ||||||||||||
Liabilities: | ||||||||||||||||
Payable upon return on securities loaned | 131,090 | 154,587 | – | 14,598 | ||||||||||||
Payable for investment securities purchased | 11,331 | 6,946 | 27,654 | 11,513 | ||||||||||||
Payable for fund shares redeemed | 2,615 | 6,983 | 375 | 1,131 | ||||||||||||
Swap contracts, at value †††† | – | – | 406 | 2,009 | ||||||||||||
Foreign currency payable to custodian, at value ††† | – | – | 1,536 | – | ||||||||||||
Payable for variation margin | 43 | – | 138 | 166 | ||||||||||||
Administration fees payable | 1,028 | 701 | 169 | 579 | ||||||||||||
Unrealized loss on foreign currency spot contracts | 34 | 5 | 161 | 17 | ||||||||||||
Unrealized loss on forward foreign currency contracts | – | – | 2,457 | 9,268 | ||||||||||||
Trustees fees payable | 4 | 2 | 1 | 1 | ||||||||||||
Chief compliance officer fees payable | 5 | 2 | 1 | 2 | ||||||||||||
Administrative servicing fees payable | 3 | – | – | – | ||||||||||||
Shareholder servicing fees payable | 733 | 378 | 86 | 302 | ||||||||||||
Investment advisory fees payable | 1,696 | 1,607 | 92 | 767 | ||||||||||||
Accrued expense payable | 561 | 640 | 115 | 405 | ||||||||||||
Accrued foreign capital gains tax on appreciated securities | – | 600 | – | – | ||||||||||||
Total Liabilities | 149,143 | 172,451 | 33,191 | 40,758 | ||||||||||||
Net Assets | $ 4,118,501 | $ 1,946,409 | $ 453,564 | $ 1,566,972 | ||||||||||||
† Cost of investments | $ 3,324,461 | $ 1,610,855 | $ 418,659 | $ 1,450,858 | ||||||||||||
†† Cost of affiliated investments | 237,707 | 162,415 | – | 14,595 | ||||||||||||
††† Cost of foreign currency | 872 | 2,340 | (1,537) | 9,313 | ||||||||||||
††††† Cost (Premiums paid (received)) | – | – | 280 | (101) | ||||||||||||
* Includes market value of securities on loan | 130,618 | 146,754 | – | 12,828 | ||||||||||||
SEI Institutional International Trust / Annual Report / September 30, 2017 |
69 |
STATEMENTS OF ASSETS AND LIABILITIES ($ Thousands) (Concluded)
September 30, 2017
International Equity Fund | Emerging Markets Equity Fund | International Fixed Income Fund | Emerging Markets Debt Fund | |||||||||||||
Net Assets: | ||||||||||||||||
Paid-in Capital — (unlimited authorization — no par value) | $ 4,193,471 | $ 1,699,044 | $ 476,166 | $ 1,568,247 | ||||||||||||
Undistributed (distributions in excess of) net investment income | 43,508 | 9,162 | (25,881) | (7,385) | ||||||||||||
Accumulated net realized loss on investments, futures contracts, foreign currency contracts and swap contracts | (706,377) | (53,103) | (3,614) | (30,474) | ||||||||||||
Net unrealized appreciation on investments | 585,088 | 291,908 | 4,894 | 35,416 | ||||||||||||
Net unrealized appreciation on futures contracts | 2,645 | | – | | 421 | 629 | ||||||||||
Net unrealized appreciation (depreciation) on forward foreign currency contracts, foreign currencies and translation of other assets and liabilities denominated in foreign currencies | 166 | (2) | 1,761 | (1,708) | ||||||||||||
Net unrealized appreciation (depreciation) on swap contracts | – | – | (183) | 2,247 | ||||||||||||
Accumulated foreign capital gains tax on appreciated securities | – | (600) | – | – | ||||||||||||
Net Assets | $ 4,118,501 | $ 1,946,409 | $ 453,564 | $ 1,566,972 | ||||||||||||
Net Asset Value, Offering and Redemption Price Per Share — Class F(1) | $ 11.29 | $ 12.32 | $ 10.13 | $ 10.55 | ||||||||||||
| | ($3,795,857,711 ÷ 336,305,928 shares) | | | ($1,821,009,114÷ 147,768,945 shares) |
| | ($415,581,651÷ 41,016,982 shares) | | | ($1,458,611,176÷ 138,307,457 shares) | | |||||
Net Asset Value, Offering and Redemption Price Per Share — Class I | $ 11.27 | N/A | N/A | N/A | ||||||||||||
| | ($2,954,201 ÷ 262,141 shares) | | ||||||||||||||
Net Asset Value, Offering and Redemption Price Per Share — Class Y | $ 11.31 | $ 12.35 | $ 10.12 | $ 10.57 | ||||||||||||
| | ($319,689,135 ÷ 28,272,342 shares) | | | ($125,399,550 ÷ 10,154,686 shares) | | | ($37,982,435 ÷ 3,752,989 shares) | | | ($108,360,718 ÷ 10,252,860 shares) |
| |||||
(1) Effective January 31, 2017, Class A Shares were renamed as Class F Shares.
N/A – Not applicable. Share classes currently not offered.
Amounts designated as “–” are $0 or have been rounded to $0.
The accompanying notes are an integral part of the financial statements.
70 |
SEI Institutional International Trust / Annual Report / September 30, 2017 |
STATEMENTS OF OPERATIONS ($ Thousands)
For the year ended September 30, 2017
| International Equity Fund | Emerging Markets Equity Fund | International Fixed Income Fund | Emerging Markets Debt Fund | |||||||||||||
Investment Income: | ||||||||||||||||
Dividends | $ | 94,348 | $ | 43,295 | $ | – | $ | – | ||||||||
Dividends from affiliated investments(1) | 589 | 60 | – | – | ||||||||||||
Interest Income | 1,162 | 294 | 7,948 | 95,575 | ||||||||||||
Security lending income – net(1)(2) | 1,925 | 1,130 | – | 126 | ||||||||||||
Less: foreign taxes withheld | (10,802) | (5,002) | (43) | (1,499) | ||||||||||||
Total Investment Income | 87,222 | 39,777 | 7,905 | 94,202 | ||||||||||||
Expenses: | ||||||||||||||||
Investment advisory fees | 18,217 | 18,050 | 1,407 | 12,463 | ||||||||||||
Administration fees | 12,609 | 7,568 | 2,110 | 6,587 | ||||||||||||
Shareholder servicing fees – Class F(3) | 8,392 | 4,071 | 1,106 | 3,419 | ||||||||||||
Shareholder servicing fees – Class I | 9 | – | – | – | ||||||||||||
Administrative servicing fees – Class I | 9 | – | – | – | ||||||||||||
Printing fees | 626 | 295 | 79 | 246 | ||||||||||||
Professional fees | 327 | 94 | 40 | 130 | ||||||||||||
Custodian/wire agent fees | 294 | 928 | 90 | 524 | ||||||||||||
Registration fees | 113 | 27 | 9 | 25 | ||||||||||||
Trustees’ fees | 57 | 27 | 8 | 24 | ||||||||||||
Chief compliance officer fees | 19 | 9 | 3 | 8 | ||||||||||||
Overdraft fees | 15 | 5 | 9 | 48 | ||||||||||||
Other expenses | 155 | 85 | 152 | 143 | ||||||||||||
Total Expenses | 40,842 | 31,159 | 5,013 | 23,617 | ||||||||||||
Less: | ||||||||||||||||
Waiver of investment advisory fees | – | (1,421) | (295) | (3,895) | ||||||||||||
Waiver of shareholder servicing fees(4) | (42) | (20) | – | – | ||||||||||||
Fees paid indirectly | – | (5) | – | – | ||||||||||||
Net Expenses | 40,800 | 29,713 | 4,718 | 19,722 | ||||||||||||
Net Investment Income | 46,422 | 10,064 | 3,187 | 74,480 | ||||||||||||
Net Realized Gain (Loss) on: | ||||||||||||||||
Investments | 89,621 | 120,194 | (609) | �� | 16,124 | |||||||||||
Affiliated investments | (3) | 1 | – | (3) | ||||||||||||
Futures contracts | 27,075 | – | (1,367) | (812) | ||||||||||||
Swap contracts | – | – | 108 | (906) | ||||||||||||
Foreign currency transactions | (411) | (396) | (4,226) | (26,694) | ||||||||||||
Net Change in Unrealized Appreciation (Depreciation) on: | ||||||||||||||||
Investments | 510,342 | 241,499 | (6,305) | 35,038 | ||||||||||||
Affiliated investments | 4 | – | – | 2 | ||||||||||||
Futures contracts | 2,166 | – | 485 | 534 | ||||||||||||
Swap contracts | – | – | – | 3,785 | ||||||||||||
Foreign capital gains tax on appreciated securities | – | 667 | – | – | ||||||||||||
Foreign currency translation of other assets and liabilities denominated in foreign currencies | 413 | (16 | ) | 3,023 | (996 | ) | ||||||||||
Net Increase (Decrease) in Net Assets Resulting from Operations | $ | 675,629 | $ | 372,013 | $ | (5,704) | $ | 100,552 | ||||||||
(1) See Note 5 in the Notes to Financial Statements for additional information.
(2) Income is from the investment of collateral in an affiliated security.
(3) Effective January 31, 2017, Class A Shares were renamed as Class F Shares.
(4) Fees waived prior to new administrative agreement effective on January 31, 2017.
Amounts designated as “–” are $0 or have been rounded to $0.
The accompanying notes are an integral part of the financial statements.
SEI Institutional International Trust / Annual Report / September 30, 2017 |
71 |
STATEMENTS OF CHANGES IN NET ASSETS ($ Thousands)
For the years ended September 30,
| International Equity Fund | Emerging Markets Equity Fund | |||||||||||||||
| 2017 | 2016 | 2017 | 2016 | |||||||||||||
Operations: | ||||||||||||||||
Net investment income | $ | 46,422 | $ | 38,810 | $ | 10,064 | $ | 8,804 | ||||||||
Net realized gain (loss) on investments and futures contracts | 116,693 | (89,758) | 120,195 | (78,102) | ||||||||||||
Net realized loss on forward foreign currency contracts and foreign currency transactions | (411) | (1,906) | (396) | (1,081) | ||||||||||||
Net change in unrealized appreciation on investments and futures contracts | 512,512 | 202,774 | 241,499 | 354,258 | ||||||||||||
Net change in unrealized appreciation (depreciation) on forward foreign currency contracts,foreign currencies and translation of other assets and liabilities denominated in foreign currencies | 413 | 49 | (16) | 52 | ||||||||||||
Net change in unrealized appreciation (depreciation) on foreign capital tax gains on appreciated securities | – | 5 | 667 | (1,097) | ||||||||||||
Net Increase in Net Assets Resulting from Operations | 675,629 | 149,974 | 372,013 | 282,834 | ||||||||||||
Dividends and Distributions to Shareholders: | ||||||||||||||||
Net investment income: | ||||||||||||||||
Class F(1) | (35,403) | (27,578) | (11,400) | (10,995) | ||||||||||||
Class I | (34) | (54) | N/A | N/A | ||||||||||||
Class Y | (3,118) | (1,652) | (816) | (481) | ||||||||||||
Total Dividends and Distributions | (38,555) | (29,284) | (12,216) | (11,476) | ||||||||||||
Capital Share Transactions: | ||||||||||||||||
Class F: | ||||||||||||||||
Proceeds from shares issued | 1,137,139 | 578,672 | 332,975 | 351,777 | ||||||||||||
Reinvestment of dividends & distributions | 32,564 | 25,415 | 10,641 | 10,181 | ||||||||||||
Cost of shares redeemed | (694,561) | (553,805) | (395,178) | (427,796) | ||||||||||||
Net Increase (Decrease) from Class F Transactions | 475,142 | 50,282 | (51,562) | (65,838) | ||||||||||||
Class I: | ||||||||||||||||
Proceeds from shares issued | 585 | 3,755 | N/A | N/A | ||||||||||||
Reinvestment of dividends & distributions | 16 | 23 | N/A | N/A | ||||||||||||
Cost of shares redeemed | (2,586) | (4,492) | N/A | N/A | ||||||||||||
Net Decrease from Class I Transactions | (1,985) | (714) | N/A | N/A | ||||||||||||
Class Y: | ||||||||||||||||
Proceeds from shares issued | 152,319 | 59,717 | 56,280 | 31,024 | ||||||||||||
Reinvestment of dividends & distributions | 3,059 | 1,652 | 788 | 481 | ||||||||||||
Cost of shares redeemed | (49,930) | (32,774) | (24,072) | (18,477) | ||||||||||||
Net Increase from Class Y Transactions | 105,448 | 28,595 | 32,996 | 13,028 | ||||||||||||
Net Increase (Decrease) in Net Assets Derived from Capital Share Transactions | 578,605 | 78,163 | (18,566) | (52,810) | ||||||||||||
Net Increase in Net Assets | 1,215,679 | 198,853 | 341,231 | 218,548 | ||||||||||||
Net Assets: | ||||||||||||||||
Beginning of Year | 2,902,822 | 2,703,969 | 1,605,178 | 1,386,630 | ||||||||||||
End of Year | $ | 4,118,501 | $ | 2,902,822 | $ | 1,946,409 | $ | 1,605,178 | ||||||||
Undistributed Net Investment Income Included in Net Assets at End of Year | $ | 43,508 | $ | 35,332 | $ | 9,162 | $ | 5,897 | ||||||||
Capital Share Transactions: | ||||||||||||||||
Class F: | ||||||||||||||||
Shares issued | 116,607 | 62,276 | 31,049 | 40,420 | ||||||||||||
Reinvestment of distributions | 3,517 | 2,678 | 1,136 | 1,181 | ||||||||||||
Shares redeemed | (68,912) | (60,234) | (36,420) | (48,860) | ||||||||||||
Total Class F Transactions | 51,212 | 4,720 | (4,235) | (7,259) | ||||||||||||
Class I: | ||||||||||||||||
Shares issued | 60 | 401 | N/A | N/A | ||||||||||||
Reinvestment of distributions | 2 | 2 | N/A | N/A | ||||||||||||
Shares redeemed | (254) | (491) | N/A | N/A | ||||||||||||
Total Class I Transactions | (192) | (88) | N/A | N/A | ||||||||||||
Class Y: | ||||||||||||||||
Shares issued | 15,234 | 6,756 | 5,141 | 3,926 | ||||||||||||
Reinvestment of distributions | 330 | 174 | 84 | 56 | ||||||||||||
Shares redeemed | (4,883) | (3,548) | (2,216) | (2,044) | ||||||||||||
Total Class Y Transactions | 10,681 | 3,382 | 3,009 | 1,938 | ||||||||||||
Net Increase (Decrease) in Shares Outstanding from Share Transactions | 61,701 | 8,014 | (1,226) | (5,321) | ||||||||||||
(1) Effective January 31, 2017, Class A Shares were renamed as Class F Shares.
N/A - Not applicable. Share classes currently not offered.
Amounts designated as “–” are $0 or have been rounded to $0.
The accompanying notes are an integral part of the financial statements.
72 |
SEI Institutional International Trust / Annual Report / September 30, 2017 |
| International Fixed Income Fund | Emerging Markets Debt Fund | |||||||||||||||
| 2017 | 2016 | 2017 | 2016 | |||||||||||||
Operations: | ||||||||||||||||
Net investment income | $ | 3,187 | $ | 4,946 | $ | 74,480 | $ | 76,337 | ||||||||
Net realized gain (loss) on investments, futures contracts and swap contracts | (1,868 | ) | 5,692 | 14,403 | (5,758) | |||||||||||
Net realized loss on forward foreign currency contracts and foreign currency transactions | (4,226 | ) | (16,154 | ) | (26,694 | ) | (76,847) | |||||||||
Net change in unrealized appreciation (depreciation) on investments, futures contracts and swap contracts | (5,820 | ) | 44,171 | 39,359 | 227,720 | |||||||||||
Net change in unrealized appreciation (depreciation) on forward foreign currency contracts,foreign currencies and translation of other assets and liabilities denominated in foreign currencies | 3,023 | (3,295 | ) | (996 | ) | (948) | ||||||||||
Net Increase (Decrease) in Net Assets Resulting from Operations | (5,704 | ) | 35,360 | 100,552 | 220,504 | |||||||||||
Dividends and Distributions to Shareholders: | ||||||||||||||||
Net investment income: | ||||||||||||||||
Class F(1) | (7,649 | ) | (27,071 | ) | (27,727 | ) | – | |||||||||
Class Y | (502 | ) | (1 | ) | (2,409 | ) | – | |||||||||
Net realized gains: | ||||||||||||||||
Class F | (4,277 | ) | (812 | ) | – | – | ||||||||||
Class Y | (232 | ) | – | – | – | |||||||||||
Total Dividends and Distributions | (12,660 | ) | (27,884 | ) | (30,136 | ) | – | |||||||||
Capital Share Transactions: | ||||||||||||||||
Class F: | ||||||||||||||||
Proceeds from shares issued | 63,281 | 102,110 | 339,041 | 381,535 | ||||||||||||
Reinvestment of dividends & distributions | 10,886 | 25,432 | 25,042 | – | ||||||||||||
Cost of shares redeemed | (137,899 | ) | (133,070 | ) | (423,845 | ) | (360,386) | |||||||||
Net Increase (Decrease) from Class F Transactions | (63,732 | ) | (5,528 | ) | (59,762 | ) | 21,149 | |||||||||
Class Y: | ||||||||||||||||
Proceeds from shares issued | 26,673 | 17,670 | 39,682 | 29,615 | ||||||||||||
Reinvestment of dividends & distributions | 715 | – | 2,335 | – | ||||||||||||
Cost of shares redeemed | (1,786 | ) | (5,517 | ) | (39,851 | ) | (23,066) | |||||||||
Net Increase from Class Y Transactions | 25,602 | 12,153 | 2,166 | 6,549 | ||||||||||||
Net Increase (Decrease) in Net Assets Derived from Capital Share Transactions | (38,130 | ) | 6,625 | (57,596 | ) | 27,698 | ||||||||||
Net Increase (Decrease) in Net Assets | (56,494 | ) | 14,101 | 12,820 | 248,202 | |||||||||||
Net Assets: | ||||||||||||||||
Beginning of Year | 510,058 | 495,957 | 1,554,152 | 1,305,950 | ||||||||||||
End of Year | $ | 453,564 | $ | 510,058 | $ | 1,566,972 | $ | 1,554,152 | ||||||||
Distributions in Excess of Net Investment Income Included in Net Assets at End of Year | $ | (25,881 | ) | $ | (16,951 | ) | $ | (7,385 | ) | $ | (27,958) | |||||
Capital Share Transactions: | ||||||||||||||||
Class F: | ||||||||||||||||
Shares issued | 6,257 | 9,984 | 34,114 | 41,702 | ||||||||||||
Reinvestment of distributions | 1,084 | 2,578 | 2,623 | – | ||||||||||||
Shares redeemed | (13,617 | ) | (13,033 | ) | (42,597 | ) | (39,212) | |||||||||
Total Class F Transactions | (6,276 | ) | (471 | ) | (5,860 | ) | 2,490 | |||||||||
Class Y: | ||||||||||||||||
Shares issued | 2,630 | 1,784 | 4,007 | 3,391 | ||||||||||||
Reinvestment of distributions | 71 | – | 244 | – | ||||||||||||
Shares redeemed | (176 | ) | (556 | ) | (3,932 | ) | (2,494) | |||||||||
Total Class Y Transactions | 2,525 | 1,228 | 319 | 897 | ||||||||||||
Net Increase (Decrease) in Shares Outstanding from Share Transactions | (3,751 | ) | 757 | (5,541 | ) | 3,387 | ||||||||||
(1) Effective January 31, 2017, Class A Shares were renamed as Class F Shares.
Amounts designated as “–” are $0 or have been rounded to $0.
The accompanying notes are an integral part of the financial statements.
SEI Institutional International Trust / Annual Report / September 30, 2017 |
73 |
For the years or period ended September 30
For a Share Outstanding Throughout Each Year or Period
| Net Asset Value, Beginning of Year | Net Investment Income Loss(1) | Net Realized on | Total from | Dividends from Net Investment Income | Distributions from Net Realized Gains | Total Dividends and Distributions | Net Asset Value, End of Year | Total Return† | Net Assets End of Year ($ Thousands) | Ratio of Net Expenses to Average Net Assets* | Ratio of Expenses to Average Net Assets (Excluding Fees Paid Indirectly and Including Waivers)** | Ratio of Expenses to Average Net Assets (Excluding Fees Paid Indirectly and Waivers)** | Ratio of Net Invest-ment Income (Loss) to Average Net Assets | Portfolio Turnover Rate† | ||||||||||||||||||||||||||||||||||||||||||||||
International Equity Fund |
| |||||||||||||||||||||||||||||||||||||||||||||||||||||||||||
Class F(2) | ||||||||||||||||||||||||||||||||||||||||||||||||||||||||||||
2017 | $9.58 | $0.13 | $1.69 | $1.82 | $(0.11) | $ – | $(0.11) | $11.29 | 19.23 | % | $ | 3,795,858 | 1.15%(3) | 1.15%(3) | 1.15%(3) | 1.27% | 57 | % | ||||||||||||||||||||||||||||||||||||||||||
2016 | 9.16 | 0.13 | 0.39 | 0.52 | (0.10) | – | (0.10) | 9.58 | 5.63 | 2,729,762 | 1.27(3)(4) | 1.27(3)(4) | 1.28(3)(4) | 1.36 | 45 | |||||||||||||||||||||||||||||||||||||||||||||
2015 | 9.94 | 0.10 | (0.69) | (0.59) | (0.19) | – | (0.19) | 9.16 | (5.98 | ) | 2,568,634 | 1.24(3) | 1.24(3) | 1.24(3) | 1.04 | 68 | ||||||||||||||||||||||||||||||||||||||||||||
2014 | 9.71 | 0.18 | 0.18 | 0.36 | (0.13) | – | (0.13) | 9.94 | 3.66 | 2,682,482 | 1.24(3) | 1.24(3) | 1.24(3) | 1.78 | 60 | |||||||||||||||||||||||||||||||||||||||||||||
2013 | 8.19 | 0.13 | 1.53 | 1.66 | (0.14) | – | (0.14) | 9.71 | 20.47 | 2,350,201 | 1.25(3) | 1.25(3) | 1.25(3) | 1.50 | 47 | |||||||||||||||||||||||||||||||||||||||||||||
Class I | ||||||||||||||||||||||||||||||||||||||||||||||||||||||||||||
2017 | $9.55 | $0.10 | $1.70 | $1.80 | $(0.08) | $ – | $(0.08) | $11.27 | 19.00 | % | $ | 2,954 | 1.40%(5) | 1.40%(5) | 1.40%(5) | 0.96% | 57 | % | ||||||||||||||||||||||||||||||||||||||||||
2016 | 9.15 | 0.10 | 0.38 | 0.48 | (0.08) | – | (0.08) | 9.55 | 5.27 | 4,341 | 1.52(4)(5) | 1.52(4)(5) | 1.52(4)(5) | 1.09 | 45 | |||||||||||||||||||||||||||||||||||||||||||||
2015 | 9.92 | 0.08 | (0.69) | (0.61) | (0.16) | – | (0.16) | 9.15 | (6.18 | ) | 4,956 | 1.49(5) | 1.49(5) | 1.49(5) | 0.76 | 68 | ||||||||||||||||||||||||||||||||||||||||||||
2014 | 9.70 | 0.15 | 0.17 | 0.32 | (0.10) | – | (0.10) | 9.92 | 3.33 | 5,342 | 1.49(5) | 1.49(5) | 1.49(5) | 1.48 | 60 | |||||||||||||||||||||||||||||||||||||||||||||
2013 | 8.18 | 0.11 | 1.52 | 1.63 | (0.11) | – | (0.11) | 9.70 | 20.19 | 5,953 | 1.50(5) | 1.50(5) | 1.50(5) | 1.21 | 47 | |||||||||||||||||||||||||||||||||||||||||||||
Class Y | ||||||||||||||||||||||||||||||||||||||||||||||||||||||||||||
2017 | $9.59 | $0.16 | $1.69 | $1.85 | $(0.13) | $ – | $(0.13) | $11.31 | 19.59 | % | $ | 319,689 | 0.90%(6) | 0.90%(6) | 0.90%(6) | 1.53% | 57 | % | ||||||||||||||||||||||||||||||||||||||||||
2016 | 9.18 | 0.16 | 0.37 | 0.53 | (0.12) | – | (0.12) | 9.59 | 5.77 | 168,719 | 1.02(4)(6) | 1.02(4)(6) | 1.03(4)(6) | 1.70 | 45 | |||||||||||||||||||||||||||||||||||||||||||||
2015(7) | 9.39 | 0.13 | (0.34 | ) | (0.21 | ) | – | – | 9.18 | (2.24 | ) | 130,379 | 1.00(6) | 1.00(6) | 1.00(6) | 1.72 | 68 | |||||||||||||||||||||||||||||||||||||||||||
Emerging Markets Equity Fund |
| |||||||||||||||||||||||||||||||||||||||||||||||||||||||||||
Class F(2) | ||||||||||||||||||||||||||||||||||||||||||||||||||||||||||||
2017 | $10.09 | $0.07 | $2.24 | $2.31 | $(0.08) | $ – | $(0.08) | $12.32 | 23.10 | % | $ | 1,821,009 | 1.74%(8) | 1.74%(8) | 1.82%(9) | 0.65% | 66 | % | ||||||||||||||||||||||||||||||||||||||||||
2016 | 8.43 | 0.05 | 1.68 | 1.73 | (0.07) | – | (0.07) | 10.09 | 20.66 | 1,532,960 | 1.76(4)(8) | 1.76(4)(8) | 1.86(4)(9) | 0.59 | 79 | |||||||||||||||||||||||||||||||||||||||||||||
2015 | 10.76 | 0.07 | (2.29) | (2.22) | (0.11) | – | (0.11) | 8.43 | (20.78 | ) | 1,342,618 | 1.72(8) | 1.72(8) | 1.82(9) | 0.67 | 67 | ||||||||||||||||||||||||||||||||||||||||||||
2014 | 10.53 | 0.06 | 0.22 | 0.28 | (0.05) | – | (0.05) | 10.76 | 2.68 | 1,958,078 | 1.96(8) | 1.96(8) | 2.02(9) | 0.58 | 59 | |||||||||||||||||||||||||||||||||||||||||||||
2013 | 10.25 | 0.06 | 0.28 | 0.34 | (0.06) | – | (0.06) | 10.53 | 3.29 | 1,413,683 | 1.96(8) | 1.96(8) | 2.04(9) | 0.52 | 78 | |||||||||||||||||||||||||||||||||||||||||||||
Class Y | ||||||||||||||||||||||||||||||||||||||||||||||||||||||||||||
2017 | $10.11 | $0.10 | $2.24 | $2.34 | $(0.10) | $ – | $(0.10) | $12.35 | 23.46 | % | $ | 125,400 | 1.49%(10) | 1.49%(10) | 1.57%(11) | 0.93% | 66 | % | ||||||||||||||||||||||||||||||||||||||||||
2016 | 8.45 | 0.09 | 1.66 | 1.75 | (0.09) | – | (0.09) | 10.11 | 20.95 | 72,218 | 1.52(4)(10) | 1.52(4)(10) | 1.62(4)(11) | 0.96 | 79 | |||||||||||||||||||||||||||||||||||||||||||||
2015(7) | 10.08 | 0.10 | (1.73) | (1.63) | – | – | – | 8.45 | (16.17 | ) | 44,012 | 1.47(10) | 1.47(10) | 1.57(11) | 1.33 | 67 | ||||||||||||||||||||||||||||||||||||||||||||
International Fixed Income Fund |
| |||||||||||||||||||||||||||||||||||||||||||||||||||||||||||
Class F(2) | ||||||||||||||||||||||||||||||||||||||||||||||||||||||||||||
2017 | $10.51 | $0.07 | $(0.18) | $(0.11) | $(0.17) | $(0.10) | $(0.27) | $10.13 | (1.03 | )% | $ | 415,582 | 1.02%(12) | 1.02%(12) | 1.08%(13) | 0.66% | 113 | % | ||||||||||||||||||||||||||||||||||||||||||
2016 | 10.38 | 0.10 | 0.62 | 0.72 | (0.57) | (0.02) | (0.59) | 10.51 | 7.32 | 497,157 | 1.05(4)(12) | 1.05(4)(12) | 1.11(4)(13) | 0.98 | 106 | |||||||||||||||||||||||||||||||||||||||||||||
2015 | 10.98 | 0.11 | 0.11 | 0.22 | (0.82) | – | (0.82) | 10.38 | 2.02 | 495,957 | 1.02(12) | 1.02(12) | 1.07(13) | 1.00 | 78 | |||||||||||||||||||||||||||||||||||||||||||||
2014 | 10.42 | 0.14 | 0.48 | 0.62 | (0.06) | – | (0.06) | 10.98 | 5.96 | 523,784 | 1.02(12) | 1.02(12) | 1.20(13) | 1.32 | 104 | |||||||||||||||||||||||||||||||||||||||||||||
2013 | 10.82 | 0.14 | (0.06) | 0.08 | (0.48)(14) | – | (0.48) | 10.42 | 0.77 | 473,382 | 1.02(12) | 1.02(12) | 1.20(13) | 1.37 | 86 | |||||||||||||||||||||||||||||||||||||||||||||
Class Y | ||||||||||||||||||||||||||||||||||||||||||||||||||||||||||||
2017 | $10.50 | $0.09 | $(0.17) | $(0.08) | $(0.20) | $(0.10) | $(0.30) | $10.12 | (0.76 | )% | $ | 37,982 | 0.77%(15) | 0.77%(15) | 0.83%(16) | 0.94% | 113 | % | ||||||||||||||||||||||||||||||||||||||||||
2016(17) | 10.45 | 0.12 | 0.55 | 0.67 | (0.60) | (0.02) | (0.62) | 10.50 | 6.79 | 12,901 | 0.80(4)(15) | 0.80(4)(15) | 0.87(4)(16) | 1.23 | 106 | |||||||||||||||||||||||||||||||||||||||||||||
Emerging Markets Debt Fund |
| |||||||||||||||||||||||||||||||||||||||||||||||||||||||||||
Class F(2) | ||||||||||||||||||||||||||||||||||||||||||||||||||||||||||||
2017 | $10.08 | $0.51 | $0.17 | $0.68 | $(0.21) | $ – | $(0.21) | $10.55 | 6.93 | % | $ | 1,458,611 | 1.36%(18) | 1.36%(18) | 1.63%(19) | 5.06% | 79 | % | ||||||||||||||||||||||||||||||||||||||||||
2016 | 8.66 | 0.49 | 0.93 | 1.42 | – | – | – | 10.08 | 16.40 | 1,453,586 | 1.39(4)(18) | 1.39(4)(18) | 1.65(4)(19) | 5.30 | 86 | |||||||||||||||||||||||||||||||||||||||||||||
2015 | 10.20 | 0.47 | (1.81) | (1.34) | (0.19) | (0.01) | (0.20) | 8.66 | (13.35 | ) | 1,227,567 | 1.36(18) | 1.36(18) | 1.61(19) | 4.91 | 71 | ||||||||||||||||||||||||||||||||||||||||||||
2014 | 10.38 | 0.49 | (0.29) | 0.20 | (0.31) | (0.07) | (0.38) | 10.20 | 1.90 | 1,345,731 | 1.36(18) | 1.36(18) | 1.80(19) | 4.73 | 92 | |||||||||||||||||||||||||||||||||||||||||||||
2013 | 12.07 | 0.47 | (1.02) | (0.55) | (0.68) | (0.46) | (1.14) | 10.38 | (5.19 | ) | 1,182,296 | 1.36(18) | 1.36(18) | 1.81(19) | 4.20 | 90 | ||||||||||||||||||||||||||||||||||||||||||||
Class Y | ||||||||||||||||||||||||||||||||||||||||||||||||||||||||||||
2017 | $ | 10.12 | $ | 0.53 | $ | 0.17 | $ | 0.70 | $ | (0.25 | ) | $ | – | $(0.25) | $ | 10.57 | 7.18 | % | $ | 108,361 | 1.11%(20) | 1.11%(20) | 1.38%(21) | 5.31% | 79 | % | ||||||||||||||||||||||||||||||||||
2016 | 8.67 | 0.52 | 0.93 | 1.45 | – | – | – | 10.12 | 16.72 | 100,566 | 1.14(4)(20) | 1.14(4)(20) | 1.40(4)(21) | 5.55 | 86 | |||||||||||||||||||||||||||||||||||||||||||||
2015(7) | 9.63 | 0.37 | (1.28 | ) | (0.91 | ) | (0.05 | ) | – | (0.05 | ) | 8.67 | (9.48 | ) | 78,383 | 1.11(20) | 1.11(20) | 1.36(21) | 5.24 | 71 | ||||||||||||||||||||||||||||||||||||||||
| † | Returns do not reflect the deduction of taxes that a shareholder would pay on fund distributions or the redemption of fund shares. |
| * | Includes Fees Paid Indirectly, if applicable. See Note 5 in Notes to Financial Statements |
| ** | See Note 5 in Notes to Financial Statements. |
| (1) | Per share net investment income and net realized and unrealized gains (losses) calculated using average shares. |
| (2) | Effective January 31, 2017, Class A Shares were renamed as Class F Shares. |
| (3) | The expense ratio includes overdraft fees. Had this expense been excluded the ratios would have been 1.15%, 1.27%, 1.24%, 1.24% and 1.25% for 2017, 2016, 2015, 2014 and 2013. |
74 |
SEI Institutional International Trust / Annual Report / September 30, 2017 |
| (4) | The expense ratio includes proxy expenses outside the cap. |
| (5) | The expense ratio includes overdraft fees. Had this expense been excluded the ratios would have been 1.40%, 1.52%, 1.49%, 1.49% and 1.50% for 2017, 2016, 2015, 2014 and 2013. |
| (6) | The expense ratio includes overdraft fees. Had this expense been excluded the ratios would have been 0.90%, 1.02% and 0.99% for 2017, 2016 and 2015. |
| (7) | Commenced operations on December 31, 2014. All ratios for the period have been annualized. |
| (8) | The expense ratio includes overdraft fees. Had this expense been excluded the ratios would have been 1.74%, 1.76%, 1.71%, 1.96% and 1.96% for 2017, 2016, 2015, 2014 and 2013. |
| (9) | The expense ratio includes overdraft fees. Had this expense been excluded the ratios would have been 1.82%, 1.86%, 1.71%, 2.02% and 2.04% for 2017, 2016, 2015, 2014 and 2013. |
| (10) | The expense ratio includes overdraft fees. Had this expense been excluded the ratios would have been 1.49%, 1.52% and 1.46% for 2017, 2016 and 2015. |
| (11) | The expense ratio includes overdraft fees. Had this expense been excluded the ratios would have been 1.58%, 1.62% and 1.46% for 2017, 2016 and 2015. |
| (12) | The expense ratio includes overdraft fees. Had this expense been excluded the ratios would have been 1.02%, 1.05%, 1.02%, 1.02% and 1.02% for 2017, 2016, 2015, 2014 and 2013. |
| (13) | The expense ratio includes overdraft fees. Had this expense been excluded the ratios would have been 1.08%, 1.11%, 1.07%, 1.20% and 1.20% for 2017, 2016, 2015, 2014 and 2013. |
| (14) | Includes a return of capital of $0.09 per share. |
| (15) | The expense ratio includes overdraft fees. Had this expense been excluded the ratios would have been 0.77% and 0.80% for 2017 and 2016. |
| (16) | The expense ratio includes overdraft fees. Had this expense been excluded the ratios would have been 0.83% and 0.87% for 2017 and 2016. |
| (17) | Commenced operations on October 30, 2015. All ratios for the period have been annualized. |
| (18) | The expense ratio includes overdraft fees. Had this expense been excluded the ratios would have been 1.36%, 1.39%, 1.36%, 1.36% and 1.36% for 2017, 2016, 2015, 2014 and 2013. |
| (19) | The expense ratio includes overdraft fees. Had this expense been excluded the ratios would have been 1.63%, 1.65%, 1.61%, 1.80% and 1.81% for 2017, 2016, 2015, 2014 and 2013. |
| (20) | The expense ratio includes overdraft fees. Had this expense been excluded the ratios would have been 1.11%, 1.14% and 1.11% for 2017, 2016 and 2015. |
| (21) | The expense ratio includes overdraft fees. Had this expense been excluded the ratios would have been 1.38%, 1.40% and 1.36% for 2017, 2016 and 2015. |
Amounts designated as “—” are either $0 or have been rounded to $0.
The accompanying notes are an integral part of the financial statements
SEI Institutional International Trust / Annual Report / September 30, 2017 |
75 |
September 30, 2017
1. ORGANIZATION
SEI Institutional International Trust (the “Trust”) was organized as a Massachusetts business trust under a Declaration of Trust dated June 30, 1988.
The Trust is registered under the Investment Company Act of 1940, as amended, as an open-end investment company with four funds: International Equity Fund, Emerging Markets Equity Fund, International Fixed Income Fund and Emerging Markets Debt Fund (together the “Funds”) each of which are diversified Funds with the exception of the International Fixed Income Fund and the Emerging Markets Debt Fund. Each Fund’s prospectus provides a description of its investment goal, principal investment strategies and risks. The Trust is registered to offer Class F (formerly Class A) and Class Y shares of each of the Funds and Class I shares of the International Equity Fund.
Effective January 31, 2017, Class A Shares were renamed as Class F Shares.
2. SIGNIFICANT ACCOUNTING POLICIES
The following is a summary of significant accounting policies consistently followed by the Funds.
Use of Estimates — The Funds are investment companies in conformity with accounting principles generally accepted in the United States of America (“U.S. GAAP”). Therefore, the Funds follow the accounting and reporting guidelines for investment companies. The preparation of financial statements, in conformity with U.S. GAAP requires management to make estimates and assumptions that affect the reported amounts of assets and liabilities and disclosure of contingent assets and liabilities as of the date of the financial statements and the reported amounts of increases and decreases in net assets from operations during the reporting period. Actual results could differ from those estimates.
Security Valuation — Securities listed on a securities exchange, market or automated quotation system for which quotations are readily available (other than securities traded on National Association of Securities Dealers Automated Quotations (NASDAQ) or as otherwise noted below) at the last quoted sale price on an exchange or market (foreign or domestic) on which the securities are traded, or, if there is no such reported sale, at the most recent quoted bid price. The Funds value securities traded on NASDAQ at the NASDAQ Official Closing Price. If available, debt securities, swaps (which are not centrally cleared), bank loans or collateralized debt obligations (including collateralized loan obligations), such as those held by the Funds, are priced based upon valuations provided by independent, third-party pricing agents. Such values generally reflect
the last reported sales price if the security is actively traded. The third-party pricing agents may also value debt securities at an evaluated bid price by employing methodologies that utilize actual market transactions, broker-supplied valuations or other methodologies designed to identify the market value for such securities. Redeemable securities issued by open-end investment companies are valued at the investment company’s applicable net asset value, with the exception of ETFs, which are priced as equity securities. The prices of foreign securities are reported in local currency and converted to U.S. dollars using currency exchange rates. If a security’s price cannot be obtained, as noted above, the Funds will value the securities using a bid price from at least one independent broker. If such prices are not readily available or cannot be valued using the methodologies described above, the Funds will value the security using the Funds’ Fair Value Pricing Policies and Procedures (“Fair Value Procedures”), as described below.
On the first day a new debt security purchase is recorded, if a price is not available from a third-party pricing agent or an independent broker, the security may be valued at its purchase price. Each day thereafter, the debt security will be valued according to the Funds’ Fair Value Procedures until a price from an independent source can be secured. Securities held by a Fund with remaining maturities of 60 days or less may be valued by the amortized cost method, which involves valuing a security at its cost on the date of purchase and thereafter (absent unusual circumstances) assuming a constant amortization to maturity of any discount or premium, regardless of the impact of fluctuations in general market rates of interest on the value of the instrument. While this method provides certainty in valuation, it may result in periods during which value, as determined by this method, is higher or lower than the price a Fund would receive if it sold the instrument. Further, the value of securities in the Fund can be expected to vary inversely with changes in prevailing interest rates. Should existing credit, liquidity or interest rate conditions in the relevant markets and issuer-specific circumstances suggest that amortized cost does not approximate fair value, then the amortized cost method may not be used.
Futures and swaps cleared through a central clearing house (“centrally cleared swaps”) are valued at the settlement price established each day by the board of exchange on which they are traded. The daily settlement prices for financial futures and centrally cleared swaps are provided by an independent source. On days when there is excessive volume, market volatility or the future or centrally cleared swap does not end trading by the time a Fund calculates its NAV, the settlement price may
76 |
SEI Institutional International Trust / Annual Report / September 30, 2017 |
not be available at the time at which the Fund calculates its NAV. On such days, the best available price (which is typically the last sales price) may be used to value a Fund’s futures or centrally cleared swaps position.
Foreign currency forward contracts are valued at the current day’s interpolated foreign exchange rate, as calculated using the current day’s spot rate, and the thirty, sixty, ninety and one-hundred eighty day forward rates provided by an independent source.
Prices for most securities held by a Fund are provided daily by third-party independent pricing agents. SEI Investments Management Corporation (“SIMC”) or a Sub-Adviser (“Sub-Adviser”), as applicable, reasonably believes that prices provided by independent pricing agents are reliable. However, there can be no assurance that such pricing service’s prices will be reliable. SIMC or a Sub-Adviser, as applicable, will continuously monitor the reliability of prices obtained from any pricing service and shall promptly notify the Funds’ administrator if it believes that a particular pricing service is no longer a reliable source of prices. The Funds’ administrator, in turn, will notify the Fair Value Pricing Committee (the “Committee”) if it receives such notification from SIMC or a Sub-Adviser, as applicable, or if the Funds’ administrator reasonably believes that a particular pricing service is no longer a reliable source for prices.
The Funds’ Fair Value Procedures provide that any change in a primary pricing agent or a pricing methodology requires prior approval by the Board of Trustees (“Board”) or its designated sub-committee. However, when the change would not materially affect valuation of a Fund’s net assets or involve a material departure in pricing methodology from that of the Fund’s existing pricing agent or pricing methodology, approval may be obtained at the next regularly scheduled meeting of the Board.
Securities for which market prices are not readily available, for which market prices are determined to be unreliable, or which cannot be valued using the methodologies described above are valued in accordance with the Fair Value Procedures established by the Board. The Funds’ Fair Value Procedures are implemented through the Committee designated by the Board. The Committee is currently composed of two members of the Board, as well as representatives from SIMC and its affiliates. Some of the more common reasons that may necessitate that a security be valued using Fair Value Procedures include: (i) the security’s trading has been halted or suspended, (ii) the security has been delisted from a national exchange, (iii) the security’s primary trading market is temporarily closed at a time when under normal conditions it would be open, or (iv) the security’s primary pricing source is not
able or willing to provide a price. When a security is valued in accordance with the Fair Value Procedures, the Committee will determine the value after taking into consideration relevant information reasonably available to the Committee. Examples of factors the Committee may consider include: (i) the facts giving rise to the need to fair value, (ii) the last trade price, (iii) the performance of the market or the issuer’s industry, (iv) the liquidity of the security, (v) the size of the holding in a Fund, or (vi) any other appropriate information.
The determination of a security’s fair value price often involves the consideration of a number of subjective factors, and is therefore subject to the unavoidable risk that the value assigned to a security may be higher or lower than the security’s value would be if a reliable market quotation for the security was readily available.
For securities that principally trade on a foreign market or exchange, a significant gap in time can exist between the time of a particular security’s last trade and the time at which a Fund calculates its Net Asset Value (“NAV”). The closing prices of such securities may no longer reflect their market value at the time a Fund calculates NAV if an event that could materially affect the value of those securities (a “Significant Event”), including substantial fluctuations in domestic or foreign markets or occurrences not tied directly to the securities markets, such as natural disasters, armed conflicts or significant governmental actions, has occurred between the time of the security’s last close and the time that the Fund calculates its NAV. A Fund may invest in securities that are primarily listed on foreign exchanges that trade on weekends or other days when the Fund does not price its shares. As a result, the NAV of the Fund’s shares may change on days when shareholders will not be able to purchase or redeem Fund shares.
A Significant Event may relate to a single issuer or to an entire market sector. If SIMC or a Sub-Adviser becomes aware of a Significant Event that has occurred with respect to a security or group of securities after the closing of the exchange or market on which the security or securities principally trade, but before the time at which the Funds calculate NAV, it may request that a Committee meeting be called. In addition, the Funds use several processes, with respect to certain securities to monitor the pricing data supplied by various sources, including price comparisons and price movements. Any identified discrepancies are researched and subject to the procedures described above.
The International Equity Fund and Emerging Markets Equity Fund also use a third-party fair valuation vendor. The vendor provides a fair value for foreign securities held by these Funds based on certain factors and methodologies (involving, generally, tracking valuation
SEI Institutional International Trust / Annual Report / September 30, 2017 |
77 |
NOTES TO FINANCIAL STATEMENTS (Continued)
September 30, 2017
correlations between the U.S. market and each non-U.S. security). Values from the fair value vendor are applied in the event that there is a movement in the U.S. market that exceeds a specific threshold that has been established by the Committee. The Committee has also established a “confidence interval” which is used to determine the level of historical correlation between the value of a specific foreign security and movements in the U.S. market before a particular security will be fair valued when the threshold is exceeded. In the event that the threshold established by the Committee is exceeded on a specific day, the International Equity Fund and Emerging Markets Equity Fund will value the non-U.S. securities in their portfolios that exceed the applicable “confidence interval” based upon the adjusted prices provided by the fair valuation vendor.
In accordance with U.S. GAAP, fair value is defined as the price that the Fund would receive upon selling an investment in an orderly transaction to an independent buyer in the principal or most advantageous market of the investment. A three-tier hierarchy has been established to maximize the use of the observable market data and minimize the use of unobservable inputs and to establish classification of the fair value measurements for disclosure purposes. Inputs refer broadly to the assumptions that market participants would use in pricing an asset. Inputs may be observable or unobservable. Observable inputs are inputs that reflect the assumptions market participants would use in pricing the asset or liability developed based on market data obtained from sources independent of the reporting entity. Unobservable inputs are inputs that reflect the reporting entity’s own assumptions about the assumptions market participants would use in pricing the asset or liability developed based on the best information available in the circumstances.
The three-tier hierarchy of inputs is summarized in the three broad Levels listed below:
Level 1 — quoted prices in active markets for identical investments
Level 2 — other significant observable inputs (including quoted prices for similar investments, interest rates, prepayment speeds, credit risks, etc.)
Level 3 — significant unobservable inputs (including the Fund’s own assumptions in determining the fair value of investments)
Investments are classified within the level of the lowest significant input considered in determining fair value. Investments classified within Level 3 whose fair value measurement considers several inputs may include Level 1 or Level 2 inputs as components of the overall fair value measurement.
The valuation techniques used by the Funds to measure fair value during the year ended September 30, 2017 maximized the use of observable inputs and minimized the use of unobservable inputs.
For the year ended September 30, 2017, there have been no significant changes to the inputs or the Trust’s fair valuation methodologies.
Security Transactions and Investment Income — Security transactions are recorded on the trade date. Cost used in determining net realized capital gains and losses on the sale of securities is determined on the basis of specific identification. Dividend income and expense is recognized on the ex-dividend date, and interest income or expense is recognized using the accrual basis of accounting.
Distributions received on securities that represent a return of capital or capital gain are recorded as a reduction of cost of investments and/ or as a realized gain. The Trust estimates the components of distributions received that may be considered nontaxable distributions or capital gain distributions.
Amortization and accretion is calculated using the scientific interest method, which is not materially different from the effective interest method. Amortization of premiums and discounts is included in interest income.
Expenses — Expenses that are directly related to one of the Funds are charged directly to that Fund. Other operating expenses of the Trust are prorated to the Funds on the basis of relative daily net assets.
Classes — Class-specific expenses are borne by that class. Income, non-class specific expenses, and realized and unrealized gains/losses are allocated to the respective classes on the basis of relative daily net assets.
Foreign Currency Translation — The books and records of the Funds investing in international securities are maintained in U.S. dollars on the following basis:
(i) market value of investment securities, assets and liabilities at the current rate of exchange; and
(ii) purchases and sales of investment securities, income and expenses at the relevant rates of exchange prevailing on the respective dates of such transactions.
The Funds do not isolate that portion of gains and losses on investments in investment securities that is due to changes in the foreign exchange rates from that which is due to changes in market prices of investment securities.
The Funds report certain foreign-currency-related transactions as components of realized gains for
78 |
SEI Institutional International Trust / Annual Report / September 30, 2017 |
financial reporting purposes, whereas such components are treated as ordinary income for Federal income tax purposes.
Forward Foreign Currency Contracts — To the extent consistent with its investment objective and strategies, a Fund may enter into forward foreign currency contracts as hedges against either specific transactions, fund positions, speculative purposes or anticipated fund positions. All commitments are “marked-to-market” daily at the applicable foreign exchange rate, and any resulting unrealized gains or losses are recorded currently. The Fund realizes gains and losses at the time forward contracts are extinguished. Unrealized gains or losses on outstanding positions in forward foreign currency contracts held at the close of the year are recognized as ordinary income or loss for federal income tax purposes. The Fund could be exposed to risk if the counterparties to the contracts are unable to meet the terms of the contract and from unanticipated movements in the value of a foreign currency relative to the U.S. dollar.
Finally, the risk exists that losses could exceed amounts disclosed on the Statement of Assets and Liabilities. Refer to each Fund’s Schedule of Investments for details regarding open forward foreign currency contracts as of September 30, 2017, if applicable.
Futures Contracts — To the extent consistent with its investment objective and strategies, the Funds may purchase futures contracts to gain exposure to market changes, which may be more efficient or cost effective than actually buying the securities. To the extent consistent with its investment objective and strategies, a Fund may utilize futures contracts for tactical hedging purposes as well as to enhance the Funds’ returns and may also utilize futures contracts to efficiently assist in managing the Funds’ duration and yield curve exposure. Upon entering into such a contract, a Fund is required to deposit and maintain as collateral such initial margin as required by the exchange on which the contract is held. The contracts are marked to market daily and the resulting changes in value are accounted for as unrealized gains and losses. Variation margin payments are paid or received, depending upon whether unrealized losses or gains are incurred. When the contract is closed, the Funds record a realized gain or loss equal to the difference between the proceeds from (or cost of) the closing transaction and the amount invested in the contract.
Risks of entering into futures contracts include the possibility that there will be an imperfect price correlation between the futures and the underlying securities. Second, it is possible that a lack of liquidity for futures contracts could exist in the secondary market,
resulting in an inability to close a position prior to its maturity date. Third, the futures contract involves the risk that a Fund could lose more than the original margin deposit required to initiate a futures transaction.
Finally, the risk exists that losses could exceed amounts disclosed on the Statement of Assets and Liabilities. Refer to each Fund’s Schedule of Investments for details regarding open futures contracts as of September 30, 2017, if applicable.
Options/Swaptions Written/Purchased — To the extent consistent with its Investment Objective and Strategies, a Fund may invest in financial options/swaptions contracts for the purpose of hedging its existing portfolio securities, or securities that a Fund intends to purchase, against fluctuations in fair market value caused by changes in prevailing market interest rates. A Fund may also invest in financial option/swaption contracts to enhance its returns. When the Fund writes or purchases an option/swaption, an amount equal to the premium received or paid by the Fund is recorded as a liability or an asset and is subsequently adjusted to the current market value of the option/swaption written or purchased. Premiums received or paid from writing or purchasing options/ swaptions which expire unexercised are treated by the Fund on the expiration date as realized gains or losses. The difference between the premium and the amount paid or received on effecting a closing purchase or sale transaction, including brokerage commissions, is also treated as a realized gain or loss. If an option/swaption is exercised, the premium paid or received is added to the cost of the purchase or proceeds from the sale in determining whether the Fund has realized a gain or a loss.
The risk in writing a call option/swaption is a Fund may give up the opportunity for profit if the market price of the security increases. The risk in writing a put option/ swaption is a Fund may incur a loss if the market price of the security decreases and the option/swaption is exercised. The risk in purchasing an option/swaption is a Fund may pay a premium whether or not the option/swaption is exercised. The Funds also have the additional risk of being unable to enter into a closing transaction at an acceptable price if a liquid secondary market does not exist. Option/swaption contracts also involve the risk that they may not work as intended due to unanticipated developments in market conditions or other causes.
Finally, the risk exists that losses on written options could exceed amounts disclosed on the Statements of Assets and Liabilities. Refer to each Fund’s Schedule of Investments for details regarding open option/swaption contracts as of September 30, 2017, if applicable.
SEI Institutional International Trust / Annual Report / September 30, 2017 |
79 |
NOTES TO FINANCIAL STATEMENTS (Continued)
September 30, 2017
Swap Agreements — To the extent consistent with its investment objective and strategies, a Fund may invest in swap contracts as an efficient means to take and manage risk in the portfolio, including interest rate risk, credit risk and overall yield sensitivity. A swap agreement is a two-party contract under which an agreement is made to exchange returns from predetermined investments or instruments, including a particular interest rate, foreign currency, or “basket” of securities representing a particular index. Swap agreements are privately negotiated in the over-the-counter market (“OTC swaps”) or may be executed in a multilateral or other trade facility platform, such as a registered commodities exchange (“Centrally Cleared swaps”). Interest rate swaps involve the exchange by a Fund with another party of their respective commitments to pay or receive interest (e.g., an exchange of floating rate payments for fixed rate payments) with respect to a notional amount of principal. Credit default swaps involve the periodic payment by a Fund or counterparty of interest based on a specified rate multiplied by a notional amount assigned to an underlying debt instrument or group of debt instruments in exchange for the assumption of credit risk on the same instruments. In the event of a credit event, usually in the form of a credit rating downgrade, the party receiving periodic payments (i.e. floating rate payer) must pay the other party (i.e. fixed rate payer) an amount equal to the outstanding principal of the downgraded debt instrument. Total return swaps allow an investor to benefit from the cash flow without ever actually owning the underlying security. The receiver must pay any decline in value to the payer at the end of the total return swap. However, the investor does not need to make a payment if there is no decline in price. Payments can be made on various indices, bonds (i.e. mortgage backed securities, bank debt and corporate), loans or commodities. The value of a total return swap is equal to the change in value of the underlying asset versus the accrued income payment based on LIBOR (London Interbank Offered Rate) or some other form of index on the notional amount. Interest rate swaps involve the exchange by a Fund with another party of their respective commitments to pay or receive interest (e.g., an exchange of floating rate payments for fixed rate payments) with respect to a notional amount of principal to manage a Fund’s exposure to interest rates. Payments received or made are recorded as realized gains or losses. A Fund could be exposed to credit or market risk due to unfavorable changes in the fluctuation of interest rates or if the counterparty defaults on its obligation to perform. Risk of loss may exceed amounts recognized on the statement of assets and liabilities. In connection with swap agreements, securities/cash may be set aside as collateral by the Fund’s custodian. A Fund may enter
into swap agreements in order to, among other things, change the maturity or duration of the investment portfolio; protect a Fund’s value from changes in interest rates; or expose a Fund to a different security or market.
Swaps are marked-to-market daily based upon quotations from market makers and the resulting changes in market values, if any, are recorded as unrealized gains or losses in the Statement of Operations. Centrally cleared swaps are valued at the settlement price established each day by the board of exchange on which they are traded. The daily settlement prices for centrally cleared swaps are provided by an independent source. Net payments of interest are recorded as realized gains or losses. Daily changes in valuation of Centrally Cleared swaps, if any, are recorded as a receivable or payable for the change in value as appropriate (“variation margin”) on the Statements of Assets and Liabilities.
Entering into swap agreements involves, to varying degrees, elements of credit and market risk in excess of the amounts recognized on the Schedule of Investments or the Statement of Assets and Liabilities. Such risks involve the possibility that there will be no liquid market for these agreements, that the counterparty to the agreement may default on its obligation to perform and that there may be unfavorable changes in the fluctuation of interest rates. Risks also arise from potential losses from adverse market movements.
Counterparty risk may be mitigated by having a master netting arrangement between a Fund and the counterparty and by having the counterparty post collateral to cover a Fund’s exposure to the counterparty. Refer to each Fund’s Schedule of Investments for details regarding open swap contracts as of September 30, 2017, if applicable.
Delayed Delivery Transactions — A Fund may purchase or sell securities on a when-issued or delayed delivery basis. These transactions involve a commitment by the Fund to purchase or sell securities for a predetermined price or yield, with payment and delivery taking place beyond the customary settlement period. When delayed delivery purchases are outstanding, the Fund will set aside liquid assets in an amount sufficient to meet the purchase price. When purchasing a security on a delayed delivery basis, the Fund assumes the rights and risks of ownership of the security, including the risk of price and yield fluctuations, and takes such fluctuations into account when determining its net asset value. The Fund may dispose of or renegotiate a delayed delivery transaction after it is entered into, and may sell when-issued securities before they are delivered, which may result in a capital gain or loss. When the Fund has sold a security on a delayed delivery basis, the Fund does not
80 |
SEI Institutional International Trust / Annual Report / September 30, 2017 |
participate in future gains and losses with respect to the security.
Loan Participations and Brady Bonds — To the extent consistent with its investment objective and strategies, a Fund may invest in U.S. dollar-denominated fixed- and floating-rate loans (“Loans”) arranged through private negotiations between a foreign sovereign entity and one or more financial institutions (“Lenders”). The Fund invests in such Loans in the form of participations in Loans (“Participations”) or assignments of all or a portion of Loans from third parties. Participations typically result in a Fund having a contractual relationship only with the Lenders, not with the sovereign borrowers. The Fund has the right to receive payments of principal, interest and any fees to which it is entitled from the Lender selling the Participation and only upon receipt by the Lender of the payments from the borrower. In connection with purchasing Participations, the Fund generally has no right to enforce compliance by the borrower with the terms of the loan agreement relating to the Loan, nor any rights of set-off against the borrower, and the Fund will not benefit directly from any collateral supporting the Loan in which it has purchased the Participation. As a result, the Fund assumes the credit risk of both the borrower and the Lender that is selling the Participation.
Certain debt obligations, customarily referred to as “Brady Bonds,” are created through the exchange of existing commercial bank loans to foreign entities for new obligations in connection with debt restructuring under a plan introduced by former U.S. Secretary of the Treasury Nicholas F. Brady. Brady Bonds have only been issued since 1989, and, accordingly, do not have a long payment history. They are issued by governments that may have previously defaulted on the loans being restructured by the Brady Bonds, so they are subject to the risk of default by the issuer. They may be fully or partially collateralized or uncollateralized and issued in various currencies.
Dividends and Distributions to Shareholders —
The International Equity, Emerging Markets Equity and International Fixed Income Funds will distribute substantially all of their net investment income and all net realized capital gains, if any, at least annually. The Emerging Markets Debt Fund will distribute substantially all of its net investment income, if any, at least quarterly and all net realized gains, if any, at least annually. All dividends and distributions are recorded on ex-dividend date.
Investments in Real Estate Investment Trusts (“REITs”)
— Dividend income is recorded based on the income included in distributions received from the REIT investments using published REIT reclassifications including management estimates when actual amounts
are not available. Distributions received in excess of this estimated amount are recorded as a reduction of the cost of investments or reclassified to capital gains. The actual amounts of income, return of capital, and capital gains are only determined by each REIT after its fiscal year-end, and may differ from the estimated amounts.
Participation Notes (P-Notes) — To the extent consistent with its Investment Objective and Strategies, a Fund may acquire P-Notes issued by participating banks or broker-dealers. P-Notes are participation interest notes that are designed to offer a return linked to a particular underlying equity, debt, currency or market. The P-Notes in which the Fund may invest will typically have a maturity of one year. When purchasing a P-Note, the posting of margin is not required because the full cost of the P-Note (plus commission) is paid at the time of purchase. When the P-Note matures, the issuer will pay to, or receive from, the purchaser the difference between the minimal value of the underlying instrument at the time of purchase and that instrument’s value at maturity. Investments in P-Notes involve the same risks associated with a direct investment in the underlying foreign companies of foreign securities markets that they seek to replicate. In addition, there can be no assurance that the trading price of P-Notes will equal the underlying value of the foreign companies or foreign securities markets that they seek to replicate. The holder of a participation note that is linked to a particular underlying security is entitled to receive any dividends paid in connection with an underlying security or instrument. However, the holder of a participation note does not receive voting rights as it would if it directly owned the underlying security or instrument. P-Notes are generally traded over-the-counter. P-Notes constitute general unsecured contractual obligations of the banks or broker-dealers that issue them and the counterparty. There is also counterparty risk associated with these investments because the Fund is relying on the creditworthiness of such counterparty and has no rights under a participation note against the issuer of the underlying security.
3. CREDIT DERIVATIVES
A Fund may use credit default swaps to reduce risk where a Fund has exposure to the issuer, or to take an active long or short position with respect to the likelihood of an event of default. The reference obligation of the swap can be a single issuer, a “basket” of issuers, or an index. The underlying referenced assets are corporate debt, sovereign debt and asset backed securities.
The buyer of a credit default swap is generally obligated to pay the seller a periodic stream of payments over the term of the contract in return for a contingent payment
SEI Institutional International Trust / Annual Report / September 30, 2017 |
81 |
NOTES TO FINANCIAL STATEMENTS (Continued)
September 30, 2017
upon the occurrence of a credit event with respect to an underlying reference obligation. Generally, a credit event for corporate or sovereign reference obligations means bankruptcy, failure to pay, obligation acceleration, repudiation/moratorium or restructuring. For credit default swaps on asset-backed securities, a credit event may be triggered by events such as failure to pay principal, maturity extension, rating downgrade or write-down.
If a Fund is a seller of protection, and a credit event occurs, as defined under the terms of that particular swap agreement, a Fund will generally either (i) pay to the buyer an amount equal to the notional amount of the swap and take delivery of the referenced obligation, other deliverable obligations, or underlying securities comprising a referenced index or (ii) pay a net settlement amount in the form of cash or securities equal to the notional amount of the swap less the recovery value of the referenced obligation or underlying securities comprising a referenced index.
If a Fund is a buyer of protection and a credit event occurs, as defined under the terms of that particular swap agreement, a Fund will either (i) receive from the seller of protection an amount equal to the notional amount of the swap and deliver the referenced obligation, other deliverable obligations or underlying securities comprising the referenced index or (ii) receive a net settlement amount in the form of cash or securities equal to the notional amount of the swap less the recovery value of the referenced obligation or underlying securities comprising the referenced index. Recovery values are calculated by market makers considering either industry standard recovery rates or entity specific factors and considerations until a credit event occurs. If a credit event has occurred, the recovery value is determined by a facilitated auction whereby a minimum number of allowable broker bids, together with a specified valuation method, are used to calculate the settlement value.
As of September 30, 2017, the International Fixed Income Fund and the Emerging Markets Debt Fund are the sellers (“providing protection”) on a total notional amount of $2.2 million and $1.2 million, respectively. The notional amounts of the swaps are not recorded in the financial statements; however the notional amounts approximate the maximum potential amount of future payments that the Fund could be required to make if the Fund was the seller of protection and a credit event were to occur. Those credit default swaps (“CDS”) for which the Funds are providing protection at balance sheet date are summarized as follows:
Emerging markets Debt Fund
| ||||||||||||||||||||
Written Credit Derivative Contracts | Single Name CDS | CDS Index | ||||||||||||||||||
Reference Asset | Corp US$ | Sovereign US$ | ABS US$ | Corp US$ | Total | |||||||||||||||
Fair value of written credit derivatives | $ – | $ – | $ (406,163) | $ 146,025 | $ (260,139) | |||||||||||||||
Maximum potential amount of future payments | – | – | 2,240,000 | 6,442,994 | 8,682,994 | |||||||||||||||
Recourse provisions with the third parties any amounts paid under the credit derivative (including any purchased credit protection) | – | – | – | – | – | |||||||||||||||
Collateral held by the Partnership or other third parties which the Partnership can obtain upon occurrence of triggering event | – | – | – | – | – | |||||||||||||||
| 1 | Potential recoveries would include purchased credit derivatives to the extent they offset written credit derivatives which have an identical underlying, or a netting arrangement or credit support annex with the counterparty. There may be other potential recoveries from recourse provisions where agreements cover multiple derivative arrangements but those amounts have not been included. |
| Maximum Potential Amount of Future Payments by Contract Term | ||||||||||||||||||||||||
| 0-6 Months | 6-12 Months | 1-5 Years | 5-10 Years | >10 Years | Total | |||||||||||||||||||
Current credit spread* on underlying (in basis points)(1) | ||||||||||||||||||||||||
0-100 | $ – | $ – | $ – | $6,442,994 | $ | – | $ | 6,442,994 | ||||||||||||||||
>101 | – | – | – | – | 2,240,000 | 2,240,000 | ||||||||||||||||||
Total | $ – | $ – | $ – | $6,442,994 | $ | 2,240,000 | $ | 8,682,994 | ||||||||||||||||
| * | The credit spread on the underlying asset is generally indicative of the current status of the underlying risk of the Fund having to perform. The spread also reflects the cost of buying/selling protection and may include upfront payments required to be made to enter into a contract. Higher credit spreads with a shorter contract term is indicative of a higher likelihood of performance by the Fund. |
82 |
SEI Institutional International Trust / Annual Report / September 30, 2017 |
Emerging Markets Debt Fund
| ||||||||||||||||||||
Written Credit Derivative Contracts | Single Name CDS | CDS Index | ||||||||||||||||||
Reference Asset | Corp US$ | Sovereign US$ | ABS US$ | Corp US$ | Total | |||||||||||||||
Fair value of written credit derivatives | $ – | $ (64,580) | $ – | $ – | $ (64,580) | |||||||||||||||
Maximum potential amount of future payments | – | 1,200,000 | – | – | 1,200,000 | |||||||||||||||
Recourse provisions with the third parties any amounts paid under the credit derivative (including any purchased credit protection) | – | – | – | – | – | |||||||||||||||
Collateral held by the Partnership or other third parties which the Partnership can obtain upon occurrence of triggering event | – | – | – | – | – | |||||||||||||||
| 1 | Potential recoveries would include purchased credit derivatives to the extent they offset written credit derivatives which have an identical underlying, or a netting arrangement or credit support annex with the counterparty. There may be other potential recoveries from recourse provisions where agreements cover multiple derivative arrangements but those amounts have not been included. |
| Maximum Potential Amount of Future Payments by Contract Term | ||||||||||||||||||||||||
| 0-6 Months | 6-12 Months | 1-5 Years | 5-10 Years | >10 Years | Total | |||||||||||||||||||
Current credit spread* on underlying (in basis points)(1) | ||||||||||||||||||||||||
0-100 | $ – | $ – | $ – | $ – | $ | – | $ | – | ||||||||||||||||
>101 | – | – | – | 1,200,000 | – | 1,200,000 | ||||||||||||||||||
Total | $ – | $ – | $ – | $1,200,000 | $ | – | $ | 1,200,000 | ||||||||||||||||
| * | The credit spread on the underlying asset is generally indicative of the current status of the underlying risk of the Fund having to perform. The spread also reflects the cost of buying/selling protection and may include upfront payments required to be made to enter into a contract. Higher credit spreads with a shorter contract term is indicative of a higher likelihood of performance by the Fund. |
The credit spread disclosed above for each reference obligation where the Fund is the seller of protection is a representation of the current payment/performance risk of the swap.
4. DERIVATIVE CONTRACTS
The following tables include only Funds that had exposure to more than one type of risk on derivatives held throughout the year. For Funds that held derivatives throughout the year with only one type of risk exposure, additional information can be found on the Schedules of Investments and the Statements of Operations. The fair value of derivative instruments as of year end was as follows:
| Asset Derivatives | Liability Derivatives | |||||||||||
Year ended September 30, 2017 | Year ended September 30, 2017 ($ Thousands) | |||||||||||
Statements of Assets and Liabilities Location | Fair Value | Statements of Assets and Liabilities Location | Fair Value | |||||||||
International Fixed Income Fund | ||||||||||||
Interest rate contracts | Net Assets — Unrealized appreciation on futures contracts | $ | 675* | Net Assets — Unrealized depreciation on futures contracts | $ | 254* | ||||||
Credit contracts | Net Assets — Unrealized appreciation on swap contracts | 3† | Net Assets — Unrealized depreciation on swap contracts | 186† | ||||||||
Foreign exchange contracts | Unrealized gain on forward foreign currency contracts | 4,809 | Unrealized loss on forward foreign currency contracts | 2,457 | ||||||||
| Total derivatives not accounted for as hedging instruments | $ | 5,487 | $ | 2,897 |
SEI Institutional International Trust / Annual Report / September 30, 2017 |
83 |
NOTES TO FINANCIAL STATEMENTS (Continued)
September 30, 2017
| Asset Derivatives | Liability Derivatives | |||||||||||
Year ended September 30, 2017 | Year ended September 30, 2017 ($ Thousands) | |||||||||||
Statements of Assets and Liabilities Location | Fair Value | Statements of Assets and Liabilities Location | Fair Value | |||||||||
Emerging Markets Debt Fund | ||||||||||||
Interest rate contracts | Net Assets — Unrealized appreciation on futures contracts | $ | 765* | Net Assets — Unrealized depreciation on futures contracts | $ | 136* | ||||||
Net Assets — Unrealized appreciation on swap contracts | 4,178† | Net Assets — Unrealized depreciation on swap contracts | 1,871† | |||||||||
Credit Contracts | Net Assets — Unrealized appreciation on swap contracts | 37† | Net Assets — Unrealized depreciation on swap contracts | –† | ||||||||
Foreign exchange contracts | Unrealized gain on forward foreign currency contracts | 7,613 | Unrealized loss on forward foreign currency contracts | 9,268 | ||||||||
| Net Assets — Unrealized appreciation on swap contracts | 7† | Net Assets — Unrealized depreciation on swap contracts | 104† | |||||||||
| Total derivatives not accounted for as hedging instruments | $ | 12,600 | $ | 11,379 |
| * | Includes cumulative appreciation/depreciation of futures contracts as reported in the Schedules of Investments. Only current day’s variation margin is reported within the Statements of Assets & Liabilities. |
| † | Includes cumulative appreciation/depreciation of swap contracts as reported in the Schedules of Investments. Market Value is reported within the Statements of Assets & Liabilities for OTC swap contracts that have paid premiums. For centrally cleared swap contracts current days variation margin is reported within the Statements of Assets & Liabilities. |
The effect of derivative instruments on the Statements of Operations for the year ended September 30, 2017.
Amount of realized gain or (loss) on derivatives recognized in income ($ Thousands):
| Derivatives Not Accounted for as Hedging Instruments | Futures | Forward Currency Contracts | Swaps | Total | ||||||||||||
International Fixed Income Fund | ||||||||||||||||
Interest rate contracts | $ | (1,978) | $ | – | $ | 25 | $ | (1,953) | ||||||||
Foreign exchange contracts | – | 3,690 | – | 3,690 | ||||||||||||
Credit contracts | 531 | – | 83 | 614 | ||||||||||||
Equity contracts | 80 | – | – | 80 | ||||||||||||
Total | $ | (1,367) | $ | 3,690 | $ | 108 | $ | 2,431 | ||||||||
| Derivatives Not Accounted for as Hedging Instruments | Futures | Forward Currency Contracts | Swaps | Total | ||||||||||||
Emerging Markets Debt Fund | ||||||||||||||||
Interest rate contracts | $ | (812) | $ | – | $ | (936) | $ | (1,748) | ||||||||
Foreign exchange contracts | – | 3,835 | – | 3,835 | ||||||||||||
Credit contracts | – | – | 30 | 30 | ||||||||||||
Total | $ | (812) | $ | 3,835 | $ | (906) | $ | 2,117 | ||||||||
Change in unrealized appreciation or (depreciation) on derivatives recognized in income ($ Thousands):
| ||||||||||||||||
| Derivatives Not Accounted for as Hedging Instruments | Futures | Forward Currency Contracts | Swaps | Total | ||||||||||||
International Fixed Income Fund | ||||||||||||||||
Interest rate contracts | $ | 485 | $ | – | $ | 149 | $ | 634 | ||||||||
Foreign exchange contracts | – | 3,147 | – | 3,147 | ||||||||||||
Credit contracts | – | – | (149) | (149) | ||||||||||||
Total | $ | 485 | $ | 3,147 | $ | – | $ | 3,632 | ||||||||
| 84 |
SEI Institutional International Trust / Annual Report / September 30, 2017 |
| Derivatives Not Accounted for as Hedging Instruments | Futures | Forward Currency Contracts | Swaps | Total | ||||||||||||||||
Emerging Markets Debt Fund | ||||||||||||||||||||
Interest rate contracts | $ | 534 | $ | – | $ | 4,032 | $ | 4,566 | ||||||||||||
Foreign exchange contracts | – | (965) | (294) | (1,259) | ||||||||||||||||
Credit contracts | – | – | 47 | 47 | ||||||||||||||||
Total | $ | 534 | $ | (965) | $ | 3,785 | $ | 3,354 | ||||||||||||
A Fund is subject to various netting arrangements with select counterparties (“Master Agreements”). Master Agreements govern the terms of certain transactions, and reduce the counterparty risk associated with relevant transactions by specifying credit protection mechanisms and providing standardization that improves legal certainty. Since different types of transactions have different mechanics and are sometimes traded out of different legal entities of a particular counterparty organization, each type of transaction may be covered by a different Master Agreement, resulting in the need for multiple agreements with a single counterparty. As the Master Agreements are specific to unique operations of different asset types, they allow a Fund to close out and net its total exposure to a specific counterparty entity in the event of a default with respect to all the transactions governed under a single agreement with a specific counterparty entity.
Master Agreements can also help limit counterparty risk by specifying collateral posting arrangements at pre-arranged exposure levels. Under the Master Agreements, collateral is routinely transferred if the total net exposure to certain transactions (net of existing collateral already in place) governed under the relevant Master Agreement with a counterparty in a given account exceeds a specified threshold, which typically ranges from zero to $250,000 depending on the counterparty and the type of Master Agreement. United States Treasury Securities and U.S. dollar cash
are generally the preferred forms of collateral. Securities and cash pledged as collateral are reflected as assets in the Statements of Assets and Liabilities as either a component of investments at value (securities) or deposits due from counterparties (cash). Cash collateral received is not typically held in a segregated account and as such is reflected as a liability in the Statement of Assets and Liabilities as deposits due to counterparties. The market value of any securities received as collateral is not reflected as a component of net asset value. A Fund’s overall exposure to counterparty risk can change substantially within a short period, as it is affected by each transaction subject to the relevant Master Agreement.
Customer Account Agreements and related addendums govern exchange traded derivatives transactions such as futures, options on futures, and centrally cleared swaps. Exchange traded derivative transactions require posting of initial margin as determined by each relevant clearing agency which is segregated at a broker account registered with the Commodities Futures Trading Commission (CFTC), or the applicable regulator. In the US, counterparty risk is significantly reduced as creditors of the futures broker do not have claim to Fund assets in the segregated account. Additionally, portability of exposure in the event of default further reduces risk to the Funds. Variation margin, or changes in market value, are exchanged daily, but may not be netted between futures and cleared OTC derivatives.
The following is a summary of the market value and variation margin of exchange-traded or centrally cleared financial derivative instruments of the Funds as of September 30, 2017, ($ Thousands):
| Financial Derivatives Assets | Financial Derivatives Liabilities | |||||||||||||||||||||||||||
| Variation Margin Asset | Variation Margin Liability | |||||||||||||||||||||||||||
| Fund | Futures | Swap Agreements | Total | Futures | Swap Agreements | Total | ||||||||||||||||||||||
International Equity Fund | $ | 589 | $ | – | $ | 589 | $ | 43 | $ | – | $ | 43 | ||||||||||||||||
International Fixed Income Fund | 109 | – | 109 | 136 | 2 | 138 | ||||||||||||||||||||||
Emerging Markets Debt Fund | 144 | 6 | 150 | 157 | 9 | 166 | ||||||||||||||||||||||
Cash pledged as collateral for exchange-traded and centrally cleared derivative instruments as of September 30, 2017 amounted to $5,944 ($ Thousands) for the International Equity Fund. Cash pledged as collateral for exchange-traded and centrally cleared derivative instruments as of September 30, 2017 amounted to $1,737 ($ Thousands) for the International Fixed Income
Fund. Cash pledged as collateral for exchange-traded and centrally cleared derivative instruments as of September 30, 2017 amounted to $3,372 ($ Thousands) for the Emerging Markets Debt Fund.
International Swaps and Derivatives Association, Inc. Master Agreements and Credit Support Annexes
| SEI Institutional International Trust / Annual Report / September 30, 2017 |
85 |
NOTES TO FINANCIAL STATEMENTS (Continued)
September 30, 2017
(“ISDA Master Agreements”) govern OTC financial derivative transactions entered into by a Fund and select counterparties. ISDA Master Agreements maintain provisions for general obligations, representations, agreements, collateral and events of default or termination. Events of termination include conditions that may entitle counterparties to elect to terminate early and cause settlement of all outstanding transactions under the applicable ISDA Master Agreement. Any election
to terminate early could be material to the financial statements. In limited circumstances, the ISDA Master Agreement may contain additional provisions that add additional counterparty protection beyond coverage of existing daily exposure if the counterparty has a decline in credit quality below a predefined level. These amounts, if any, may be segregated with a third party custodian.
The following is a summary by derivative type of the market value of OTC financial derivative instruments and collateral (received)/pledged as of September 30, 2017 ($ Thousands):
Financial Derivative Assets | Financial Derivative Liabilities | |||||||||||||||||||||||||||||||||||||||
|
| |||||||||||||||||||||||||||||||||||||||
| International Fixed Income Fund | Forward Foreign Currency Contracts | Swap Agreements | Total Over the Counter | Forward Foreign Currency Contracts | Swap Agreements | Total Counter | Net Market Value of OTC | Collateral (Received)/ Pledged* | Net Exposures^ | |||||||||||||||||||||||||||||||
ANZ | $ | 30 | $ | – | $ | 30 | $ | – | $ | – | $ | – | $ | 30 | $ | – | $ | 30 | ||||||||||||||||||||||
Bank of America | 409 | – | 409 | 19 | – | 19 | 390 | – | 390 | |||||||||||||||||||||||||||||||
Bank of Montreal | 5 | – | 5 | – | – | – | 5 | – | 5 | |||||||||||||||||||||||||||||||
Barclays | 1,677 | – | 1,677 | 1,026 | – | 1,026 | 651 | – | 651 | |||||||||||||||||||||||||||||||
BNP Paribas | 328 | – | 328 | 104 | – | 104 | 224 | – | 224 | |||||||||||||||||||||||||||||||
Brown Brothers Harriman | 219 | – | 220 | 168 | – | 168 | 51 | – | 51 | |||||||||||||||||||||||||||||||
BT Brokerage | 29 | – | 30 | 181 | – | 181 | (152) | – | (152) | |||||||||||||||||||||||||||||||
CIBC | – | – | – | 1 | – | 1 | (1) | – | (1) | |||||||||||||||||||||||||||||||
Citigroup | 369 | – | 368 | 258 | – | 258 | 111 | – | 111 | |||||||||||||||||||||||||||||||
Credit Suisse | 5 | – | 5 | 105 | 154 | 259 | (254) | 254 | – | |||||||||||||||||||||||||||||||
Deutsche Bank | 417 | – | 417 | – | 32 | – | 385 | – | 385 | |||||||||||||||||||||||||||||||
Goldman Sachs | 307 | – | 307 | 17 | – | 17 | 290 | – | 290 | |||||||||||||||||||||||||||||||
HSBC | 44 | – | 44 | 19 | – | 19 | 25 | – | 25 | |||||||||||||||||||||||||||||||
JPMorgan Chase Bank | 206 | – | 206 | 260 | – | 260 | (54) | – | (54) | |||||||||||||||||||||||||||||||
Montgomery/Bank of America | – | – | – | 19 | – | 19 | (19) | – | (19) | |||||||||||||||||||||||||||||||
Morgan Stanley | 123 | – | 126 | 63 | – | 63 | 60 | – | 60 | |||||||||||||||||||||||||||||||
National Bank of Australia | 86 | – | 86 | 7 | – | 7 | 79 | – | 79 | |||||||||||||||||||||||||||||||
RBC | 18 | – | 18 | 30 | – | 30 | (12) | – | (12) | |||||||||||||||||||||||||||||||
Royal Bank of Scotland | 71 | – | 71 | 18 | – | 18 | 53 | – | 53 | |||||||||||||||||||||||||||||||
Societe Generale | – | – | – | 21 | – | 21 | (21) | – | (21) | |||||||||||||||||||||||||||||||
Standard Chartered | 285 | – | 285 | – | – | – | 285 | – | 285 | |||||||||||||||||||||||||||||||
State Street | 4 | – | 4 | 114 | – | 114 | (110) | – | (110) | |||||||||||||||||||||||||||||||
UBS
|
| 177
|
|
| –
|
|
| 177
|
|
| 27
|
|
| –
|
|
| 27
|
|
| 150
|
|
| –
|
|
| 150
|
| |||||||||||||
Financial Derivative Assets |
Financial Derivative Liabilities | |||||||||||||||||||||||||||||||||||||||
|
| |||||||||||||||||||||||||||||||||||||||
| Emerging Markets Debt Fund | Forward Foreign Currency Contracts | Swap Agreements | Total Counter | Forward Foreign Currency Contracts | Swap Agreements | Total Over the Counter | Net Market Value of OTC Derivatives | Collateral (Received)/ Pledged* | Net Exposures^ | |||||||||||||||||||||||||||||||
Barclays | $ | – | $ | – | $ | – | $ | 1,016 | $ | – | $ | 1,016 | $ | (1,016) | $ | – | $ | (1,016) | ||||||||||||||||||||||
Citibank | – | 72 | 72 | – | – | – | 72 | – | 72 | |||||||||||||||||||||||||||||||
Citigroup | 2,799 | – | 2,799 | 2,578 | – | 2,578 | 221 | – | 221 | |||||||||||||||||||||||||||||||
Goldman Sachs | 2,272 | 2,702 | 4,974 | 2,677 | 1,219 | 3,896 | 1,078 | – | 1,078 | |||||||||||||||||||||||||||||||
JPMorgan Chase Bank | 2,039 | 959 | 2,998 | 1,866 | 620 | 2,486 | 512 | – | 512 | |||||||||||||||||||||||||||||||
Standard Bank | 503 | – | 503 | 1,131 | — | 1,131 | (628) | – | (628) | |||||||||||||||||||||||||||||||
| ^ | Net Exposures represents the net receivable/(payable) that would be due from/to the counterparty in the event of default. Exposure from OTC financial derivative instruments can only be netted across transactions governed under the same master agreement with the same legal entity. |
| * | Excess collateral pledged is not shown for financial reporting purposes. |
No securities have been pledged or have been received as collateral for OTC financial derivative instruments as
governed by ISDA Master Agreements as of September 30, 2017.
| 86 |
SEI Institutional International Trust / Annual Report / September 30, 2017 |
The following table discloses the volume of the Fund’s futures contracts, forward foreign currency contracts and swap activity during the period ended September 30, 2017 ($ Thousands):
| International Equity Fund | International Fixed Income Fund | Emerging Markets Debt Fund | ||||
Futures Contracts: | ||||||
Equity Contracts | ||||||
Average Notional Balance Long | $ 95,485 | $ 9,311 | $ – | |||
Average Notional Balance Short | – | 3,584 | – | |||
Ending Notional Balance Long | 112,166 | – | – | |||
Interest Contracts | ||||||
Average Notional Balance Long | 28,604 | 37,801 | 51,393 | |||
Average Notional Balance Short | – | 69,166 | 66,812 | |||
Ending Notional Balance Long | – | 67,505 | 33,369 | |||
Ending Notional Balance Short | – | 86,715 | 112,177 | |||
Currency Contracts | ||||||
Average Notional Balance Long | – | 523 | – | |||
Average Notional Balance Short | – | 18,772 | – | |||
Ending Notional Balance Short | – | 27,103 | – | |||
Forward Foreign Currency Contracts: | ||||||
Average Notional Balance Long | – | 714,524 | 1,131,448 | |||
Average Notional Balance Short | – | 715,412 | 1,129,608 | |||
Ending Notional Balance Long | – | 1,183,323 | 1,188,152 | |||
Ending Notional Balance Short | – | 1,180,798 | 1,189,765 | |||
Swaps: | ||||||
Credit Contracts | ||||||
Average Notional Balance Long | – | 134 | – | |||
Average Notional Balance Short | – | 2,755 | 2,200 | |||
Ending Notional Balance Long | – | 1,608 | – | |||
Ending Notional Balance Short | – | 8,683 | 1,200 | |||
Interest Contracts | ||||||
Average Notional Balance | – | 747 | 244,307 | |||
Ending Notional Balance | – | – | 286,695 | |||
Foreign Exchange Contracts | ||||||
Average Notional Balance Long | – | – | 25,034 | |||
Average Notional Balance Short | – | – | 24,949 | |||
Ending Notional Balance Long | – | – | 34,482 | |||
Ending Notional Balance Short | – | – | 34,303 |
5. INVESTMENT ADVISORY, ADMINISTRATION AND DISTRIBUTION AGREEMENTS, INVESTMENT SUB-ADVISORY AGREEMENTS AND OTHER TRANSACTIONS WITH AFFILIATES
Investment Advisory, Administration and Distribution Agreements — SIMC serves as investment adviser (the “Adviser”) to each Fund. In connection with serving as Adviser, SIMC is entitled to a fee, which is calculated daily and paid monthly, based on the average daily net assets of each fund.
SEI Investments Global Funds Services (the “Administrator”) provides administrative and transfer agency services to the Funds for annual fees, based on the average daily net assets of each fund.
SEI Investments Distribution Co. (the “Distributor”) is the distributor of the shares of the Funds. The Funds have adopted a shareholder services plan and agreement (the Service Plan) with respect to Class F (formerly Class A) and Class I Shares that allows such shares to pay service
providers a fee, based on average daily net assets of each respective Class of Shares, in connection with the ongoing servicing of shareholder accounts owning such shares. The International Equity Fund has also adopted an administrative services plan and agreement (the Administrative Service Plan) with respect to Class I Shares that allows such Shares to pay service providers a fee, based on average daily net assets of the Class I Shares, in connection with ongoing administrative services for shareholder accounts owning such Shares.
The Service Plan and Administrative Service Plan provide that shareholder service fees and administrative service fees, respectively, on Class F (formerly Class A) and Class I Shares will be paid to Distributor, which may then be used by Distributor to compensate financial intermediaries for providing shareholder services and administrative services, as applicable, with respect to the Shares.
The Adviser, Administrator and/or Distributor have voluntarily agreed to waive a portion of their fees in
| SEI Institutional International Trust / Annual Report / September 30, 2017 | 87 |
NOTES TO FINANCIAL STATEMENTS (Continued)
September 30, 2017
order to keep total direct operating expenses (exclusive of interest from borrowings, brokerage commissions, taxes, Trustees fees and extraordinary expenses not incurred in the ordinary course of the Funds’ business) at a specified level. The voluntary waivers by the Funds’ Adviser, Administrator and/or Distributor are limited to
the Funds’ direct operating expenses and, therefore, do not apply to indirect expenses incurred by the Funds, such as acquired fund fees and expenses (AFFE). The waivers are voluntary and the Funds’ Adviser, Administrator and/or Distributor may discontinue all or part of any of these waivers at any time.
The following is a summary of annual fees payable to the Adviser and Distributor and the contractual and voluntary expense limitation for each Fund will be as follows:
| Advisory Fee | Shareholder Servicing Fee | Administrative Servicing Fee | Voluntary Expense Limitations | |||||||||||||
International Equity Fund | ||||||||||||||||
Class F(1) | 0.505% | 0.25% | – | 1.24% | ||||||||||||
Class I | 0.505% | 0.25% | 0.25% | 1.49% | ||||||||||||
Class Y | 0.505% | – | – | 1.00% | ||||||||||||
Emerging Markets Equity Fund* | ||||||||||||||||
Class F | 1.05% | 0.25% | – | N/A | ||||||||||||
Class Y | 1.05% | – | – | N/A | ||||||||||||
International Fixed Income Fund | ||||||||||||||||
Class F | 0.30% | 0.25% | – | 1.02% | ||||||||||||
Class Y | 0.30% | – | – | 0.77% | ||||||||||||
Emerging Markets Debt Fund | ||||||||||||||||
Class F | 0.85% | 0.25% | – | 1.36% | ||||||||||||
Class Y | 0.85% | – | – | 1.11% | ||||||||||||
| (1) | Effective January 31, 2017, Class A Shares were renamed as Class F Shares. |
| * | Renewed as of January 31, 2017, SIMC has contractually agreed to waive its advisory fee as necessary to keep the advisory fee paid by the Fund during its fiscal year from exceeding 0.95%. This fee waiver agreement shall remain in effect until January 31, 2018 and, unless earlier terminated, shall be automatically renewed for successive one-year periods thereafter. The agreement may be amended or terminated only with the consent of the Board of Trustees. |
N/A — Not applicable. Share classes currently not offered.
The following is a summary of annual fees payable to the Administrator:
| Previous Contractual Fees | Administrative Fees as of January 1, 2017 | |||||||||||||||||||||||
| 9/30/16 to 12/31/16 | First $1.5 Billion of Assets | Next $500 Million of Assets | Next $500 Million of Assets | Next $500 Million of Assets | Over $3 Billion of Assets | |||||||||||||||||||
International Equity Fund | 0.450% | 0.450 | % | 0.370 | % | 0.2900 | % | 0.210 | % | 0.130% | ||||||||||||||
Emerging Markets Equity Fund | 0.450% | 0.450 | % | 0.370 | % | 0.2900 | % | 0.210 | % | 0.130% | ||||||||||||||
International Fixed Income Fund | 0.450% | 0.450 | % | 0.370 | % | 0.2900 | % | 0.210 | % | 0.130% | ||||||||||||||
Emerging Markets Debt Fund | 0.450% | 0.450 | % | 0.370 | % | 0.2900 | % | 0.210 | % | 0.130% | ||||||||||||||
Investment Sub-Advisory Agreements — As of September 30, 2017, SIMC has entered into Investment Sub-Advisory Agreements with the following parties:
| Investment Sub-Adviser |
International Equity Fund
Acadian Asset Management LLC
Blackcrane Capital, LLC
Causeway Capital Management LLC
INTECH Investment Management LLC
Neuberger Berman Investment Advisers LLC
NWQ Investment Management Company, LLC
WCM Investment Management
Emerging Markets Equity Fund
Macquarie Investment Management (formerly Delaware
Investment Fund Advisers)
J O Hambro Capital Management Limited
KBI Global Investors (North America) Ltd.
Lazard Asset Management LLC
Neuberger Berman Investment Advisers LLC
PanAgora Asset Management, Inc.
RWC Asset Advisors (US) LLC
International Fixed Income Fund
AllianceBernstein L.P.
Wellington Management Company, LLP
Emerging Markets Debt Fund
Investec Asset Management Ltd.
Neuberger Berman Investment Advisers LLC
Stone Harbor Investment Partners LP
Under the investment sub-advisory agreements, each sub-adviser receives a fee, paid by SIMC.
Brokerage Commissions Paid to Affiliates — The Distributor may receive compensation on fund transactions effected for the Trust in accordance with
88 |
SEI Institutional International Trust / Annual Report / September 30, 2017 |
the rules of the Securities and Exchange Commission (“SEC”). Accordingly, it is expected that fund transactions may result in brokerage commissions being paid to the Distributor. The SEC rules require that such commissions not exceed usual and customary commissions.
There were no such commissions for the year ended September 30, 2017.
Fees Paid Indirectly — The Funds may direct certain fund trades to the Distributor who pays a portion of the Fund’s expenses. Accordingly, the expenses reduced, which were used to pay third party expenses, and the effect on the Fund’s expense ratio, as a percentage of the Fund’s average daily net assets for the year ended September 30, 2017 can be found on the Statement of Operations and Financial Highlights, if applicable.
Investment in Affiliated Securities — The Funds may invest in the SEI Daily Income Trust Government Fund, an affiliated money market fund to manage excess cash or to serve as margin or collateral for derivative positions. Additionally, the Funds may invest cash collateral from the securities lending program in the SEI Liquidity Fund, L.P., also an affiliated fund.
Payment to Affiliates—Certain Officers and Trustees of the Trust are also Officers and/or Directors of the Administrator, Adviser and/or the Distributor.
The Trust pays each unaffiliated Trustee an annual fee for attendance at quarterly, interim, and committee meetings. The Administrator or the Distributor pays compensation of Officers and affiliated Trustees.
A portion of the services provided by the Chief Compliance Officer (“CCO”) and his staff, whom are employees of the Administrator, are paid for by the Trust
as incurred. The services include regulatory oversight of the Trust’s Adviser, sub-advisers and service providers.
Interfund Lending—The SEC has granted an exemption that permits the Trust to participate in an interfund lending program (“the Program”) with existing or future investment companies registered under the 1940 Act that are advised by SIMC (the “SEI Funds”). The Program allows the SEI Funds to lend money to and borrow money from each other for temporary or emergency purposes. Participation in the Program is voluntary for both borrowing and lending funds. Interfund loans may be made only when the rate of interest to be charged is more favorable to the lending fund than an investment in overnight repurchase agreements (“Repo Rate”), and more favorable to the borrowing fund than the rate of interest that would be charged by a bank for short-term borrowings (“Bank Loan Rate”). The Bank Loan Rate will be determined using a formula reviewed annually by the SEI Funds’ Board of Trustees. The interest rate imposed on interfund loans is the average of the Repo Rate and the Bank Loan Rate.
During the year ended September 30, 2017, the following Fund borrowed funds from SEI Institutional Managed Trust, Multi-Asset Accumulation Fund. The amount borrowed, interest paid on the borrowing and the corresponding interest rate were as follows ($ Thousands):
| Account Name | Date | Amount Borrowed | Interest Paid | Rate | ||||||||||||
Emerging Markets Debt Fund | 10/20/2016 | $59,000 | $1 | 0.50% | ||||||||||||
At September 30, 2017, the Trust had no outstanding borrowings.
6. INVESTMENT TRANSACTIONS
The cost of security purchases and the proceeds from the sale of securities, other than temporary cash investments and futures, during the year ended September 30, 2017, were as follows:
| International Equity Fund ($ Thousands) | Emerging Markets Equity Fund ($ Thousands) | International Fixed Income Fund ($ Thousands) | Emerging Markets Debt Fund ($ Thousands) | |||||||||||||
Purchases | ||||||||||||||||
U.S. Government | $– | $– | $106,455 | $309,057 | ||||||||||||
Other | 2,463,270 | 1,117,111 | 393,081 | 708,908 | ||||||||||||
Sales | ||||||||||||||||
U.S. Government | – | – | 70,591 | 193,943 | ||||||||||||
Other | 1,930,919 | 1,156,324 | 481,202 | 898,281 | ||||||||||||
7. FEDERAL TAX INFORMATION:
It is each Fund’s intention to continue to qualify as a regulated investment company under Subchapter M of the Internal Revenue Code and distribute all of its taxable income (including net capital gains). Accordingly, no provision for Federal income taxes is required.
The Funds may be subject to taxes imposed by countries in which they invest with respect to their investments in issuers existing or operating in such countries. Such taxes are generally based on income earned. The Funds accrue such taxes when the related income is earned.
Dividends from net investment income and distributions from net realized capital gains are determined in
SEI Institutional International Trust / Annual Report / September 30, 2017 |
89 |
NOTES TO FINANCIAL STATEMENTS (Continued)
September 30, 2017
accordance with U.S. Federal income tax regulations, which may differ from those amounts determined under U.S. GAAP. These book/tax differences are either temporary or permanent in nature. To the extent these differences are permanent, they are charged or credited to paid-in capital, undistributed net investment income or accumulated net realized gain, as appropriate, in the period that the differences arise.
Accordingly, the following permanent differences, primarily attributable to different treatment for gains and losses on paydowns of mortgage and asset-backed securities for tax purposes, investments in swaps,
investments in passive foreign investment companies, distribution reclassification, REIT income reclassification and foreign currency transactions have been reclassified to/from the following accounts as of September 30, 2017:
Paid-in- ($ Thousands) | Accumulated Gain/(Loss) | Undistributed Net Investment Income ($ Thousands) | ||||||||||
International Equity Fund | $ – | $ | (309) | $ | 309 | |||||||
Emerging Markets Equity Fund | | – | | (5,417) | 5,417 | |||||||
International Fixed Income Fund | (99) | 4,065 | (3,966) | |||||||||
Emerging Markets Debt Fund | | – | | 23,771 | (23,771) | |||||||
The tax character of dividends and distributions declared during the last two years were as follows:
| Ordinary Income ($ Thousands) | Long-term Capital Gain ($ Thousands) | Total ($ Thousands) | ||||||||||||||
International Equity Fund | 2017 | $ | 38,555 | $ | – | $ | 38,555 | |||||||||
| 2016 | 29,284 | – | 29,284 | |||||||||||||
Emerging Markets Equity Fund | 2017 | 12,216 | – | 12,216 | ||||||||||||
| 2016 | 11,476 | – | 11,476 | |||||||||||||
International Fixed Income Fund | 2017 | 11,706 | 954 | 12,660 | ||||||||||||
| 2016 | 27,843 | 41 | 27,884 | |||||||||||||
Emerging Markets Debt Fund | 2017 | 30,136 | – | 30,136 | ||||||||||||
| 2016 | – | – | – | |||||||||||||
As of September 30, 2017, the components of Distributable Earnings (Accumulated Losses) were as follows:
| ||||||||||||||||||||||||||||
Undistributed ($ Thousands) | Capital Loss | Post October ($ Thousands) | Late Year Ordinary Losses ($ Thousands) | Unrealized Appreciation (Depreciation) ($ Thousands) | Other Differences ($ Thousands) | Total Distributable Earnings (Accumulated Losses) ($ Thousands) | ||||||||||||||||||||||
| ||||||||||||||||||||||||||||
International Equity Fund | $ | 56,139 | $ | (684,329 | ) | $ | – | $ | – | $ | 553,217 | $ | 3 | $ | (74,970 | ) | ||||||||||||
Emerging Markets Equity Fund | 25,946 | (32,097 | ) | – | – | 253,520 | (3 | ) | 247,366 | |||||||||||||||||||
International Fixed Income Fund | – | – | (2,227 | ) | (19,091 | ) | 2,983 | (4,267 | ) | (22,602 | ) | |||||||||||||||||
Emerging Markets Debt Fund | 34,666 | (23,541 | ) | – | – | 31,616 | (44,016 | ) | (1,275 | ) | ||||||||||||||||||
Post-October losses represent losses realized on investment transactions from November 1, 2016 through September 30, 2017 that, in accordance with Federal income tax regulations, the Funds may elect to defer and treat as having arisen in the following fiscal year.
For Federal income tax purposes, capital loss carryforwards may be carried forward and applied against future capital gains as follows:
| Expires 2019 ($ Thousands) | Expires 2018 ($ Thousands) | Total Capital Loss Carryforward 9/30/2017 ($ Thousands) | ||||||||||
International Equity Fund | $ | – | $ | 684,329 | $ 684,329 | |||||||
Emerging Markets Equity Fund | – | 10,206 | 10,206 | |||||||||
During the year ended September 30, 2017, the International Equity Fund and the Emerging Markets Debt Fund utilized capital loss carryforwards to offset
capital gains of $22,516 and $14,355 ($ Thousands), respectively.
Under the Regulated Investment Company Modernization Act of 2010, Funds will be permitted to carry forward capital losses incurred in taxable years beginning after December 22, 2010 for an unlimited period. However, any losses incurred during those future taxable years will be required to be utilized prior to the losses incurred in pre-enactment taxable years. As a result of this ordering rule, pre-enactment capital loss carryforwards may be more likely to expire unused. Additionally, post-enactment capital losses that are carried forward will retain their character as either short-term or long-term capital losses rather than being considered all short-term as under previous law.
90 |
SEI Institutional International Trust / Annual Report / September 30, 2017 |
Short-Term ($ Thousands) | Long-Term ($ Thousands) | Total Capital Loss Carryforwards 9/30/2017* ($ Thousands) | ||||||||||
Emerging Market Equity Fund | $ – | $ 21,891 | $ 21,891 | |||||||||
Emerging Markets Debt Fund | 2,309 | 21,232 | 23,541 | |||||||||
* This table should be used in conjunction with the capital loss carryforwards table.
For Federal income tax purposes, the cost of securities owned at September 30, 2017, and the net realized gains or losses on securities sold for the period were not materially different from amounts reported for financial reporting purposes. These differences are primarily due to investments in partnerships, derivatives, passive foreign investment companies and wash sales which cannot be used for Federal income tax purposes in the current year and have been deferred for use in future years. The aggregate gross unrealized appreciation and depreciation on total investments held by the Funds at September 30, 2017, was as follows:
Federal Tax ($ Thousands) | Appreciated Securities ($ Thousands) | Depreciated Securities ($ Thousands) | Net Unrealized Appreciation/ (Depreciation) ($ Thousands) | |||||||||||||
International Equity Fund | $ | 3,709,016 | $ | 665,794 | $ | (112,577 | ) | $ | 553,217 | |||||||
Emerging Markets Equity Fund | 1,811,056 | 376,783 | (123,263 | ) | 253,520 | |||||||||||
International Fixed Income Fund | 376,255 | 13,243 | (10,260 | ) | 2,983 | |||||||||||
Emerging Markets Debt Fund | 1,391,613 | 86,082 | (54,466 | ) | 31,616 | |||||||||||
Management has analyzed the Funds’ tax positions taken on federal income tax returns for all open tax years and has concluded that as of September 30, 2017, no provision for income tax would be required in the Funds’ financial statements. The Funds’ federal and state income and federal excise tax returns for tax years for which the applicable statutes of limitations have not expired are subject to examination by the Internal Revenue Service and state departments of revenue.
8. CONCENTRATION/RISKS
In the normal course of business, the Trust enters into contracts that provide general indemnifications by the Trust to the counterparty to the contract. The Trust’s maximum exposure under these arrangements is dependent on future claims that may be made against the Trust and, therefore, cannot be estimated; however, management believes that, based on experience, the risk of loss from such claims is considered remote.
The following descriptions provide additional information about some of the risks of investing in the Funds:
Asset-Backed Securities Risk — Payment of principal and interest on asset-backed securities is dependent largely on the cash flows generated by the assets backing the securities, and asset-backed securities
may not have the benefit of any security interest in the related assets.
Credit Risk — The risk that the issuer of a security or the counterparty to a contract will default or otherwise become unable to honor a financial obligation.
Currency Risk — To the extent a Fund takes positions in currencies, it will be subject to the risk that currency exchange rates may fluctuate in response to, among other things, changes in interest rates, intervention (or failure to intervene) by U.S. or foreign governments, central banks or supranational entities, or by the imposition of currency controls or other political developments in the United States or abroad.
Fixed Income Market Risk — The prices of a Fund’s fixed income securities respond to economic developments, particularly interest rate changes, as well as to perceptions about the creditworthiness of individual issuers, including governments and their agencies. Generally, the Fund’s fixed income securities will decrease in value if interest rates rise and vice versa. In the case of foreign securities, price fluctuations will reflect international economic and political events, as well as changes in currency valuations relative to the U.S. dollar.
Foreign Investment/Emerging Markets Risk — The risk that non-U.S. securities may be subject to additional risks due to, among other things, political, social and economic developments abroad, currency movements, and different legal, regulatory and tax environments. These additional risks may be heightened with respect to emerging market countries since political turmoil and rapid changes in economic conditions are more likely to occur in these countries.
Interest Rate Risk — The risk that a rise in interest rates will cause a fall in the value of fixed income securities, including U.S. Government Securities, in which the Fund invests. Although U.S. Government securities are considered to be among the safest investments, they are not guaranteed against price movements due to changing interest rates. A low interest rate environment may present greater interest rate risk, because there may be a greater likelihood of rates increasing and rates may increase more rapidly.
Mortgage-Backed Securities Risk — Mortgage-backed securities are affected by, among other things, interest rate changes and the possibility of prepayment of the underlying mortgage loans. Mortgage-backed securities are also subject to the risk that underlying borrowers will be unable to meet their obligations.
Please refer to each Fund’s current prospectus for additional disclosure regarding the risks associated with investing in the Funds. The foregoing is not intended to
SEI Institutional International Trust / Annual Report / September 30, 2017 |
91 |
NOTES TO FINANCIAL STATEMENTS (Concluded)
September 30, 2017
be a complete discussion of the risks associated with the investment strategies of the Funds.
9. SECURITIES LENDING
A Fund may lend portfolio securities to brokers, dealers and other financial organizations that meet capital and other credit requirements or other criteria established by the Trust’s Board of Trustees. These loans may not exceed 33 1/3% of the total asset value of a Fund (including the loan collateral). No Fund will lend portfolio securities to its Adviser, sub-adviser or their affiliates unless it has applied for and received specific authority to do so from the SEC. Loans of portfolio securities will be fully collateralized by cash. Collateral will be maintained in an amount equal to at least 100% of the current market value of the loaned securities by marking to market daily, although the borrower will be required to deliver collateral between 102% and 105% of the market value of borrowed securities for domestic and foreign securities, respectively. However, due to market fluctuations during the day, the value of securities loaned on a particular day may, during the course of the day, exceed the value of collateral. On each business day, the amount of collateral is adjusted based on the prior day’s market fluctuations and the current day’s lending activity. Income from lending activity is determined by the amount of interest earned on collateral, less any amounts payable to the borrowers of the securities and the lending agent. Lending securities involves certain risks, including the risk that a Fund may be delayed or restricted from recovering the loaned securities or disposing of the collateral for the loan which could give rise to loss because of adverse market actions expenses and/or delays in connection with the disposition of the underlying securities.
Cash collateral received in connection with securities lending is invested in eligible securities by the lending agent. These investments may include the SEI Liquidity Fund, L.P. (“Liquidity Fund”) and the Fund bears its pro rata portion of the Liquidity Fund’s expenses and is subject to the risk of loss in the underlying investments of the Liquidity Fund and losses on such investment. There is no guarantee that these investments will not lose value.
The following is a summary of securities lending agreements held by certain Funds which would be subject to offset as of September 30, 2017
($ Thousands):
| Securities Loaned at Value | Cash Collateral Received(1) | Net Amount | ||||||||||||||||||||||||||||
International Equity Fund | $ | 130,618 | $ | 130,618 | $ | – | ||||||||||||||||||||||||
Emerging Markets Equity Fund | 146,754 | 146,754 | – | |||||||||||||||||||||||||||
Emerging Markets Debt Fund | 12,828 | 12,828 | – | |||||||||||||||||||||||||||
| (1) | Excess collateral received in connection with the above securities lending transactions is not shown for financial reporting purposes. See each Fund’s Schedule of Investments for the total collateral received. |
| 10. | CONCENTRATION OF SHAREHOLDERS |
SEI Private Trust Company (“SPTC”) and SIMC are subsidiaries of SEI Investments Company. As of September 30, 2017, SPTC held of record the following:
| Fund | Class F | Class I | Class Y | |||||
International Equity Fund | 97.14% | 41.01% | 36.33% | |||||
Emerging Markets Equity Fund | 91.99% | –% | 57.92% | |||||
International Fixed Income Fund | 96.27% | –% | 99.40% | |||||
Emerging Markets Debt Fund | 97.63% | –% | 40.07% | |||||
SPTC is not a direct service provider to the SEI Funds. However, SPTC performs a role in the comprehensive investment solution that SEI provides to investors. SPTC holds shares in the Funds as custodian for shareholders that are clients of independent registered investment advisers, financial planners, bank trust departments and other financial advisers. SPTC maintains omnibus accounts at the Fund’s transfer agent.
| 11. | REGULATORY MATTERS |
In October 2016, the U.S. Securities and Exchange Commission adopted new rules and amended existing rules (together, final rules) intended to modernize the reporting and disclosure of information by registered investment companies. In part, the final rules amended Regulation S-X and require standardized, enhanced disclosures about derivatives in investment company financial statements, as well as other amendments. As of August 1, 2017, management has implemented the amendments to Regulation S-X, which did not have a material impact on the Funds’ financial statements and related disclosures or impact the Funds’ net assets or results of operations.
| 12. | SUBSEQUENT EVENTS |
Management has evaluated the need for disclosures and/or adjustments resulting from subsequent events through the date the financial statements were issued. Based on this evaluation, no disclosure and/or adjustments were required to the financial statements as of September 30, 2017.
92 |
SEI Institutional International Trust / Annual Report / September 30, 2017 |
REPORT OF INDEPENDENT REGISTERED PUBLIC ACCOUNTING FIRM
The Board of Trustees and Shareholders
SEI Institutional International Trust:
We have audited the accompanying statements of assets and liabilities, including the schedules of investments, of SEI Institutional International Trust, comprised of the International Equity Fund, Emerging Markets Equity Fund, International Fixed Income Fund, and the Emerging Markets Debt Fund (collectively, the “Funds”), as of September 30, 2017, and the related statements of operations for the year then ended, the statements of changes in net assets for each of the years in the two-year period then ended, and the financial highlights for each of the years in the five-year period then ended. These financial statements and financial highlights are the responsibility of the Funds’ management. Our responsibility is to express an opinion on these financial statements and financial highlights based on our audits.
We conducted our audits in accordance with the standards of the Public Company Accounting Oversight Board (United States). Those standards require that we plan and perform the audit to obtain reasonable assurance about whether the financial statements and financial highlights are free of material misstatement. An audit includes examining, on a test basis, evidence supporting the amounts and disclosures in the financial statements. Our procedures included confirmation of securities owned as of September 30, 2017, by correspondence with the custodian, transfer agent and brokers or other appropriate auditing procedures. An audit also includes assessing the accounting principles used and significant estimates made by management, as well as evaluating the overall financial statement presentation. We believe that our audits provide a reasonable basis for our opinion.
In our opinion, the financial statements and financial highlights referred to above present fairly, in all material respects, the financial position of each of the Funds comprising the SEI Institutional International Trust as of September 30, 2017, the results of their operations for the year then ended, the changes in their net assets for each of the years in the two-year period then ended, and the financial highlights for each of the years in the five-year period then ended, in conformity with U.S. generally accepted accounting principles.

Philadelphia, Pennsylvania
November 29, 2017
SEI Institutional International Trust / Annual Report / September 30, 2017 |
93 |
TRUSTEES AND OFFICERS OF THE TRUST (Unaudited)
The following chart lists Trustees and Officers as of September 30, 2017.
Set forth below are the names, addresses, ages, position with the Trust, Term of Office and Length of Time Served, the principal occupations for the last five years, number of positions in fund complex overseen by trustee, and other directorships outside the fund complex of each of the persons currently serving as Trustees and Officers of the Trust. The Trust’s Statement of Additional Information (“SAI”) includes additional information about the Trustees and Officers. The SAI may be obtained without charge by calling 1-800-342-5734.
Name, Address, and Age | Position(s) Held with Trusts | Term of Office and | Principal Occupation(s) During Past Five Years | Number of Complex Overseen | Other Directorships Held by Trustee | |||||
INTERESTED TRUSTEES
| ||||||||||
Robert A. Nesher One Freedom Valley Drive Oaks, PA 19456 70 yrs. old | Chairman of the Board of Trustees* | since 1995 | Currently performs various services on behalf of SEI for which Mr. Nesher is compensated. | 104 | Vice Chairman of The Advisors’ Inner Circle Fund III, Winton Series Trust and Winton Diversified Opportunities Fund since 2014. Vice Chairman of Gallery Trust since 2015. President and Director of SEI Structured Credit Fund, LP. Director of SEI Global Master Fund plc, SEI Global Assets Fund plc, SEI Global Investments Fund plc, SEI Investments—Global Funds Services, Limited, SEI Investments Global, Limited, SEI Investments (Europe) Ltd., SEI Multi-Strategy Funds PLC, SEI Global Nominee Ltd and SEI Investments—Unit Trust Management (UK) Limited. Director and President of SEI Opportunity Fund, L.P. to 2010. President, Director and Chief Executive Officer of SEI Alpha Strategy Portfolios, LP from 2007 to 2013. Trustee of SEI Liquid Asset Trust from 1989 to 2016. Vice Chairman of O’Connor EQUUS (closed-end investment company) from 2014 to 2016. Vice Chairman of The Advisors’ Inner Circle Fund III, Winton Series Trust, Winton Diversified Opportunities Fund (closed-end investment company) and Gallery Trust. Trustee of The Advisors’ Inner Circle Fund, The Advisors’ Inner Circle Fund II, Bishop Street Funds, and the KP Funds. President, Chief Executive Officer and Trustee of SEI Asset Allocation Trust, SEI Daily Income Trust, SEI Institutional Managed Trust, SEI Institutional International Trust, SEI Institutional Investments Trust, SEI Tax Exempt Trust, SEI Insurance Products Trust, Adviser Managed Trust, The New Covenant Funds and SEI Catholic Values Trust. | |||||
William M. Doran One Freedom Valley Drive Oaks, PA 19456 76 yrs. old | Trustee* | since 1995 | Self-employed consultant since 2003.Partner, Morgan, Lewis & Bockius LLP (law firm) from 1976 to 2003, counsel to the Trust, SEI, SIMC, the Administrator and the Distributor. | 104 | Director of SEI since 1974; Secretary of SEI since 1978. Director of SEI Investments Distribution Co. since 2003. Director of SEI Investments—Global Funds Services, Limited, SEI Investments Global, Limited, SEI Investments (Europe), Limited, SEI Investments (Asia) Limited, SEI Global Nominee Ltd. and SEI Investments—Unit Trust Management (UK) Limited. Trustee of SEI Liquid Asset Trust from 1982 to 2016. Trustee of O’Connor EQUUS from 2014 to 2016. Director of SEI Alpha Strategy Portfolios, LP from 2007 to 2013. Trustee of The Advisors’ Inner Circle Fund, The Advisors’ Inner Circle Fund II, The Advisors’ Inner Circle Fund III, Winton Series Trust, Winton Diversified Opportunities Fund, Gallery Trust, Bishop Street Funds, SEI Asset Allocation Trust, SEI Daily Income Trust, SEI Institutional Managed Trust, SEI Institutional International Trust, SEI Institutional Investments Trust, SEI Tax Exempt Trust, SEI Insurance Products Trust, Adviser Managed Trust, New Covenant Funds, The KP Funds and SEI Catholic Values Trust. | |||||
| TRUSTEES | ||||||||||
George J. Sullivan Jr. One Freedom Valley Drive, Oaks, PA 19456 74 yrs. old | Trustee | since 1996 | Retired since January 2012. Self-Employed Consultant, Newfound Consultants Inc. April 1997-December 2011. | 104 | Member of the independent review committee for SEI’s Canadian-registered mutual funds. Director of SEI Opportunity Fund, L.P. to 2010. Director of SEI Alpha Strategy Portfolios, LP from 2007 to 2013. Trustee of SEI Liquid Asset Trust from 1996 to 2016. Trustee/Director of State Street Navigator Securities Lending Trust, The Advisors’ Inner Circle Fund, The Advisors’ Inner Circle Fund II, Bishop Street Funds, SEI Structured Credit Fund, LP, SEI Asset Allocation Trust, SEI Daily Income Trust, SEI Institutional Managed Trust, SEI Institutional International Trust, SEI Institutional Investments Trust, SEI Tax Exempt Trust, SEI Insurance Products Trust, Adviser Managed Trust, New Covenant Funds, The KP Funds and SEI Catholic Values Trust. | |||||
| * | Messrs. Nesher and Doran are Trustees who may be deemed as “interested” persons of the Trust as that term is defined in the 1940 Act by virtue of their affiliation with SIMC and the Trust’s Distributor. |
| 1 | Each trustee shall hold office during the lifetime of this Trust until the election and qualification of his or her successor, or until he or she sooner dies, resigns or is removed in accordance with the Trust’s Declaration of Trust |
| 2 | The Fund Complex includes the following Trusts: SEI Asset Allocation Trust, SEI Daily Income Trust, SEI Institutional Investments Trust, Adviser Managed Trust, SEI Institutional International Trust, SEI Institutional Managed Trust, SEI Tax Exempt Trust, SEI Insurance Products Trust and New Covenant Funds. |
94 |
SEI Institutional International Trust / Annual Report / September 30, 2017 |
Name Address, and Age | Position(s) Held with Trusts | Term of Office and | Principal Occupation(s) During Past Five Years | Number of Portfolios in Fund Complex Overseen by Trustee2 | Other Directorships Held by Trustee | |||||
| TRUSTEES (continued) | ||||||||||
Nina Lesavoy One Freedom Valley Drive, Oaks, PA 19456 59 yrs. old | Trustee | since 2003 | Founder and Managing Director, Avec Capital (strategic fundraising firm) since 2008. Managing Director, Cue Capital (strategic fundraising firm) from 2002-March 2008. | 104 | Director of SEI Alpha Strategy Portfolios, LP from 2007 to 2013. Trustee of SEI Liquid Asset Trust from 2003 to 2016. Trustee/Director of SEI Structured Credit Fund, L.P.,SEI Asset Allocation Trust, SEI Daily Income Trust, SEI Institutional Managed Trust, SEI Institutional International Trust, SEI Institutional Investments Trust, SEI Tax Exempt Trust, SEI Insurance Products Trust, New Covenant Funds, Adviser Managed Trust and SEI Catholic Values Trust. | |||||
James M. Williams One Freedom Valley Drive, Oaks, PA 19456 69 yrs. old | Trustee | since 2004 | Vice President and Chief Investment Officer, J. Paul Getty Trust, Non-Profit Foundation for Visual Arts, since December 2002. President, Harbor Capital Advisors and Harbor Mutual Funds, 2000-2002. Director of SEI Alpha Strategy Portfolios, L.P. from 2007 to 2013. Manager, Pension Asset Management, Ford Motor Company, 1997-1999. | 104 | Director of SEI Alpha Strategy Portfolios, LP from 2007 to 2013, Trustee of SEI Liquid Asset Trust from 2004 to 2016. Trustee/Director of Ariel Mutual Funds, SEI Structured Credit Fund, LP, SEI Asset Allocation Trust, SEI Daily Income Trust, SEI Institutional Managed Trust, SEI Institutional International Trust, SEI Institutional Investments Trust, SEI Tax Exempt Trust, New Covenant Funds, SEI Insurance Products Trust, Adviser Managed Trust and SEI Catholic Values Trust. | |||||
Mitchell A. Johnson One Freedom Valley Drive, Oaks, PA 19456 74 yrs. old | Trustee | since 2007 | Retired Private Investor since 1994. | 104 | Director, Federal Agricultural Mortgage Corporation (Farmer Mac) since 1997. Director of SEI Alpha Strategy Portfolios, LP from 2007 to 2013. Trustee of SEI Liquid Asset Trust from 2007 to 2016. Trustee of the Advisors’ Inner Circle Fund, The Advisors’ Inner Circle Fund II, Bishop Street Funds, SEI Asset Allocation Trust, SEI Daily Income Trust, SEI Institutional Managed Trust, SEI Institutional International Trust, SEI Institutional Investments Trust, SEI Tax Exempt Trust, SEI Insurance Products Trust, Adviser Managed Trust, The KP Funds and SEI Catholic Values Trust. | |||||
Hubert L. Harris, Jr. One Freedom Valley Drive, Oaks, PA 19456 73 yrs. old | Trustee | since 2008 | Retired since December 2005. Owner of Harris Plantation, Inc. since 1995. Chief Executive Officer of Harris CAPM, a consulting asset and property management entity. Chief Executive Officer, INVESCO North America, August 2003-December 2005. Chief Executive Officer and Chair of the Board of Directors, AMVESCAP Retirement, Inc., January 1998- August 2003. | 104 | Director of AMVESCAP PLC from 1993-2004. Served as a director of a bank holding company, 2003-2009. Director, Aaron’s Inc., 2012-present. President and CEO of Oasis Ornamentals LLC since 2011. Member of the Board of Councilors of the Carter Center (nonprofit corporation) and served on the board of other non-profit organizations. Director of SEI Alpha Strategy Portfolios, LP from 2008 to 2013. Trustee of Liquid Asset Trust from 2008 to 2016. Trustee of SEI Asset Allocation Trust, SEI Daily Income Trust, SEI Institutional Managed Trust, SEI Institutional International Trust, SEI Institutional Investments Trust, SEI Tax Exempt Trust, SEI Insurance Products Trust, New Covenant Funds, Adviser Managed Trust and SEI Catholic Values Trust. | |||||
Susan C. Cote One Freedom Valley Drive Oaks, PA 19456 62 years old | Trustee | since 2016 | Retired since July 2015. Americas Director of Asset Management, Ernst & Young LLP from 2006- 2013. Global Asset Management Assurance Leader, Ernst & Young LLP from 2006-2015. Partner Ernst & Young LLP from 1997-2015. Prudential, 1983-1997. Member of the Ernst & Young LLP Retirement Investment Committee, Treasurer and Chair of Finance, Investment and Audit Committee of the New York Women’s Foundation. | 104 | Trustee of SEI Tax Exempt Trust, SEI Daily Income Trust, SEI Institutional International Trust, SEI Institutional Managed Trust, SEI Asset Allocation Trust, SEI Institutional Investments Trust, SEI Insurance Products Trust, New Covenant Funds, Adviser Managed Trust and SEI Catholic Values Trust. | |||||
| OFFICERS | ||||||||||
Robert A. Nesher One Freedom Valley Drive, Oaks, PA 19456 70 yrs. Old | President and CEO | since 2005 | Currently performs various services on behalf of SEI for which Mr. Nesher is compensated. | N/A | N/A | |||||
James J. Hoffmayer One Freedom Valley Drive Oaks, PA 19456 43 yrs. old | Controller and Chief Financial Officer | since 2016 | Senior Director, Funds Accounting and Fund Administration, SEI Investments Global Funds Services (since September 2016); Senior Director of Fund Administration, SEI Investments Global Funds Services (since October 2014). Director of Financial Reporting, SEI Investments Global Funds Services (November 2004 – October 2014). | N/A | N/A | |||||
| 1 | Each trustee shall hold office during the lifetime of this Trust until the election and qualification of his or her successor, or until he or she sooner dies, resigns or is removed in accordance with the Trust’s Declaration of Trust. |
| 2 | The Fund Complex includes the following Trusts: SEI Asset Allocation Trust, SEI Daily Income Trust, SEI Institutional Investments Trust, Adviser Managed Trust, SEI Institutional International Trust, SEI Institutional Managed Trust, SEI Tax Exempt Trust, SEI Insurance Products Trust and New Covenant Funds. |
SEI Institutional International Trust / Annual Report / September 30, 2017 |
95 |
TRUSTEES AND OFFICERS OF THE TRUST (Unaudited) (Concluded)
Name Address, and Age | Position(s) Held with Trusts | Term of Office and | Principal Occupation(s) During Past Five Years | Number of Portfolios in Fund Complex Overseen by Trustee2 | Other Directorships Held by Trustee | |||||
| OFFICERS (continued) | ||||||||||
Glenn R. Kurdziel One Freedom Valley Drive Oaks, PA 19456 43 yrs. old | Assistant Controller | since 2017 | Assistant Controller, Funds Accounting, SEI Investments Global Funds Services (March 2017); Senior Manager, Funds Accounting, SEI Investments Global Funds Services since 2005. | N/A | N/A | |||||
Russell Emery One Freedom Valley Drive Oaks, PA 19456 54 yrs. old | Chief Compliance Officer | since 2006 | Chief Compliance Officer of SEI Daily Income Trust, SEI Institutional Investments Trust, SEI Institutional Managed Trust, SEI Asset Allocation Trust, SEI Institutional International Trust, SEI Tax Exempt Trust, The Advisors’ Inner Circle Fund, The Advisors’ Inner Circle Fund II and Bishop Street Funds since March 2006. Chief Compliance Officer of SEI Liquid Asset Trust from 2006 to 2016. Chief Compliance Officer of SEI Structured Credit Fund, LP June 2007. Chief Compliance Officer of Adviser Managed Trust since December 2010. Chief Compliance Officer of SEI Alpha Strategy Portfolios, LP from 2007 to 2013. Chief Compliance Officer of New Covenant Funds since February 2012. Chief Compliance Officer of SEI Insurance Products Trust and The KP Funds since 2013. Chief Compliance Officer of New Covenant Funds since February 2012. Chief Compliance Officer of O’Connor EQUUS from 2014 to 2016. Chief Compliance Officer of The Advisors’ Inner Circle Fund III, Winton Series Trust and Winton Diversified Opportunities Fund since 2014. Chief Compliance Officer of SEI Catholic Values Trust and Gallery Trust since 2015. | N/A | N/A | |||||
Timothy D Barto One Freedom Valley Drive Oaks, PA 19456 48 yrs. old | Vice President and Secretary | since 2002 | Vice President and Secretary of SEI Institutional Transfer Agent, Inc. since 2009. General Counsel and Secretary of SIMC and the Administrator since 2004. Vice President of SIMC and the Administrator since 1999. Vice President and Assistant Secretary of SEI since 2001. | N/A | N/A | |||||
Aaron Buser One Freedom Valley Drive, Oaks, PA 19456 46 yrs. old | Vice President and Assistant Secretary | since 2008 | Vice President and Assistant Secretary of SEI Institutional Transfer Agent, Inc. since 2009. Vice President and Assistant Secretary of SIMC since 2007. Attorney Stark & Stark (law firm), March 2004-July 2007. | N/A | N/A | |||||
David F. McCann One Freedom Valley Drive, Oaks, PA 19456 40 yrs. old | Vice President and Assistant Secretary | since 2009 | Vice President and Assistant Secretary of SEI Institutional Transfer Agent, Inc. since 2009. Vice President and Assistant Secretary of SIMC since 2008. Attorney, Drinker Biddle & Reath, LLP (law firm), May 2005 - October 2008. | N/A | N/A | |||||
Stephen G. MacRae One Freedom Valley Drive, Oaks, PA 19456 49 yrs. old | Vice President | since 2012 | Director of Global Investment Product Management January 2004 - to present. | N/A | N/A | |||||
Bridget E. Sudall One Freedom Valley Drive Oaks, PA 19456 36 yrs. old | Anti-Money Laundering Compliance Officer and Privacy Officer | since 2015 | Anti-Money Laundering Compliance Officer and Privacy Officer (since 2015), Senior Associate and AML Officer, Morgan Stanley Alternative Investment Partners, April 2011-March 2015, Investor Services Team Lead, Morgan Stanley Alternative Investment Partners, July 2007-April 2011. | N/A | N/A | |||||
| 1 | Each trustee shall hold office during the lifetime of this Trust until the election and qualification of his or her successor, or until he or she sooner dies, resigns or is removed in accordance with the Trust’s Declaration of Trust. |
| 2 | The Fund Complex includes the following Trusts: SEI Asset Allocation Trust, SEI Daily Income Trust, SEI Institutional Investments Trust, Adviser Managed Trust, SEI Institutional International Trust, SEI Institutional Managed Trust, SEI Tax Exempt Trust, SEI Insurance Products Trust and New Covenant Funds. |
96 |
SEI Institutional International Trust / Annual Report / September 30, 2017 |
DISCLOSURE OF FUND EXPENSES (Unaudited)
September 30, 2017
All mutual funds have operating expenses. As a shareholder of a fund, your investment is affected by these ongoing costs, which include (among others) costs for portfolio management, administrative services, and shareholder reports like this one. It is important for you to understand the impact of these costs on your investment returns.
Operating expenses such as these are deducted from the fund’s gross income and directly reduce your final investment return. These expenses are expressed as a percentage of the fund’s average net assets; this percentage is known as the fund’s expense ratio.
The following examples use the expense ratio and are intended to help you understand the ongoing costs (in dollars) of investing in your fund and to compare these costs with those of other mutual funds. The examples are based on an investment of $1,000 made at the beginning of the period shown and held for the entire period.
The table on this page illustrates your fund’s costs in two ways:
•Actual fund return. This section helps you to estimate the actual expenses after fee waivers that your Fund incurred over the period. The “Expenses Paid During Period” column shows the actual dollar expense cost incurred by a $1,000 investment in the Fund, and the “Ending Account Value” number is derived from deducting that expense cost from the Fund’s gross investment return.
You can use this information, together with the actual amount you invested in the Fund, to estimate the expenses you paid over that period. Simply divide your actual account value by $1,000 to arrive at a ratio (for example, an $8,600 account value divided by $1,000 = 8.6), then multiply that ratio by the number shown for your Fund under “Expenses Paid During Period.”
•Hypothetical 5% return. This section helps you compare your Fund’s costs with those of other mutual funds. It assumes that the fund had an annual 5% return before expenses during the year, but that the expense ratio (Column 3) for the period is unchanged. This example is useful in making comparisons because the Securities and Exchange Commission requires all mutual funds to make this 5% calculation. You can assess your Fund’s comparative cost by comparing the hypothetical result for your Fund in the “Expense Paid During Period” column with those that appear in the same charts in the shareholder reports for other funds.
NOTE: Because the return is set at 5% for comparison purposes — NOT your Fund’s actual return — the account values shown may not apply to your specific investment.
Beginning 4/1/17 | Ending Account Value 9/30/17 | Annualized Expense Ratios | Expenses Paid During Period * | |||||||||||||
International Equity Fund |
| |||||||||||||||
Actual Fund Return |
| |||||||||||||||
Class F(1) | $1,000.00 | $1,125.60 | 1.10% | $5.87 | ||||||||||||
Class I | 1,000.00 | 1,124.80 | 1.36 | 7.22 | ||||||||||||
Class Y | 1,000.00 | 1,217.60 | 0.85 | 4.75 | ||||||||||||
Hypothetical 5% Return |
| |||||||||||||||
Class F(1) | $1,000.00 | $1,019.54 | 1.10% | $5.58 | ||||||||||||
Class I | 1,000.00 | 1,018.27 | 1.36 | 6.86 | ||||||||||||
Class Y | 1,000.00 | 1,020.79 | 0.85 | 4.32 | ||||||||||||
Emerging Markets Equity Fund |
| |||||||||||||||
Actual Fund Return |
| |||||||||||||||
Class F(1) | $1,000.00 | $1,152.50 | 1.74% | $9.40 | ||||||||||||
Class Y | 1,000.00 | 1,154.20 | 1.50 | 8.08 | ||||||||||||
Hypothetical 5% Return |
| |||||||||||||||
Class F(1) | $1,000.00 | $1,016.34 | 1.74% | $8.80 | ||||||||||||
Class Y | 1,000.00 | 1,017.57 | 1.50 | 7.57 | ||||||||||||
Beginning 4/1/17 | Ending Account Value 9/30/17 | Annualized Expense Ratios | Expenses Paid During Period * | |||||||||||||
International Fixed Income Fund |
| |||||||||||||||
Actual Fund Return |
| |||||||||||||||
Class F(1) | $1,000.00 | $1,010.00 | 1.02% | $5.13 | ||||||||||||
Class Y | 1,000.00 | 1,012.00 | 0.77 | 3.88 | ||||||||||||
Hypothetical 5% Return |
| |||||||||||||||
Class F(1) | $1,000.00 | $1,019.96 | 1.02% | $5.15 | ||||||||||||
Class Y | 1,000.00 | 1,021.21 | 0.77 | 3.90 | ||||||||||||
Emerging Markets Debt Fund |
| |||||||||||||||
Actual Fund Return |
| |||||||||||||||
Class F(1) | $1,000.00 | $1,066.50 | 1.36% | $7.06 | ||||||||||||
Class Y | 1,000.00 | 1,069.30 | 1.11 | 5.77 | ||||||||||||
Hypothetical 5% Return |
| |||||||||||||||
Class F(1) | $1,000.00 | $1,018.24 | 1.36% | $6.89 | ||||||||||||
Class Y | 1,000.00 | 1,019.49 | 1.11 | 5.63 | ||||||||||||
| (1) | Effective January 31, 2017, Class A Shares were renamed as Class F Shares. |
| * | Expenses are equal to the Fund’s annualized expense ratio multiplied by the average account value over the period, multiplied by 183/365 (to reflect the one-half year period shown). |
SEI Institutional International Trust / Annual Report / September 30, 2017 |
97 |
BOARD OF TRUSTEES’ CONSIDERATIONS IN APPROVING THE ADVISORY AND SUB-ADVISORY AGREEMENTS (Unaudited)
SEI Institutional International Trust (the “Trust”) and SEI Investments Management Corporation (“SIMC”) have entered into an investment advisory agreement (the “Advisory Agreement”). Pursuant to the Advisory Agreement, SIMC is responsible for the investment advisory services provided to the series of the Trust (the “Funds”). Pursuant to separate sub-advisory agreements with SIMC (the “Sub-Advisory Agreements” and, together with the Advisory Agreement, the “Investment Advisory Agreements”), and under the supervision of SIMC and the Trust’s Board of Trustees (the “Board”), the sub-advisers (each, a “Sub-Adviser” and collectively, the “Sub-Advisers”) provide security selection and certain other advisory services with respect to all or a discrete portion of the assets of the Funds. The Sub-Advisers are also responsible for managing their employees who provide services to the Funds. The Sub-Advisers are selected based primarily upon the research and recommendations of SIMC, which evaluates quantitatively and qualitatively the Sub-Advisers’ skills and investment results in managing assets for specific asset classes, investment styles and strategies.
The Investment Company Act of 1940, as amended (the “1940 Act”), requires that the initial approval of, as well as the continuation of, the Funds’ Investment Advisory Agreements be specifically approved: (i) by the vote of the Board or by a vote of the shareholders of the Funds; and (ii) by the vote of a majority of the Trustees who are not parties to the Investment Advisory Agreements or “interested persons” of any party (the “Independent Trustees”), cast in person at a meeting called for the purpose of voting on such approval(s). In connection with their consideration of such approval(s), the Funds’ Trustees must request and evaluate, and SIMC and the Sub-Advisers are required to furnish, such information as may be reasonably necessary to evaluate the terms of the Investment Advisory Agreements. In addition, the Securities and Exchange Commission takes the position that, as part of their fiduciary duties with respect to a mutual fund’s fees, mutual fund boards are required to evaluate the material factors applicable to a decision to approve an Investment Advisory Agreement.
Consistent with these responsibilities, the Board calls and holds meetings each year to consider whether to approve new and/or renew existing Investment Advisory Agreements between the Trust and SIMC and SIMC and the Sub-Advisers with respect to the Funds of the Trust. In preparation for these meetings, the Board requests and reviews a wide variety of materials provided by SIMC and the Sub-Advisers, including information about SIMC’s and the Sub-Advisers’ affiliates, personnel and operations and the services provided pursuant to the Investment Advisory Agreements. The Board also receives data from third parties. This information is provided in addition to the detailed information about the Funds that the Board reviews during the course of each year, including information that relates to Fund operations and Fund performance. The Trustees also receive a memorandum from counsel regarding the responsibilities of Trustees in connection with their consideration of whether to approve the Trust’s Investment Advisory Agreements. Finally, the Independent Trustees receive advice from independent counsel to the Independent Trustees, meet in executive sessions outside the presence of Fund management and participate in question and answer sessions with representatives of SIMC and the Sub-Advisers.
Specifically, during the course of the Trust’s fiscal year, the Board requested and received written materials from SIMC and the Sub-Advisers regarding: (i) the quality of SIMC’s and the Sub-Advisers’ investment management and other services; (ii) SIMC’s and the Sub-Advisers’ investment management personnel; (iii) SIMC’s and the Sub-Advisers’ operations and financial condition; (iv) SIMC’s and the Sub-Advisers’ brokerage practices (including any soft dollar arrangements) and investment strategies; (v) the level of the advisory fees that SIMC charges the Funds and the level of the sub-advisory fees that SIMC pays the Sub-Advisers, compared with fees each charge to comparable accounts; (vi) the advisory fees charged by SIMC and the Funds’ overall fees and operating expenses compared with peer groups of mutual funds prepared by Broadridge, an independent provider of investment company data; (vii) the level of SIMC’s and the Sub-Advisers’ profitability from their Fund-related operations; (viii) SIMC’s and the Sub-Advisers’ compliance program, including a description of material compliance matters and material compliance violations; (ix) SIMC’s potential economies of scale; (x) SIMC’s and the Sub-Advisers’ policies on and compliance procedures for personal securities transactions; (xi) SIMC’s and the Sub-Advisers’ expertise and resources in domestic and/or international financial markets; and (xii) the Funds’ performance over various periods of time compared with peer groups of mutual funds prepared by Broadridge and the Funds’ benchmark indexes.
At the March 27–29, 2017 meeting of the Board, the Trustees, including a majority of the Independent Trustees, approved the renewal of the Advisory Agreement. Also, each Sub-Advisory Agreement was either initially approved or, if the Sub-Advisory Agreement was already in effect (unless operating under an initial two-year term), renewed at meetings of the Board held during the course of the Trust’s fiscal year on December 5–7, 2016, June 26–28, 2017 and September 11–13, 2017. In each case, the Board’s approval (or renewal) was based on its consideration
98 |
SEI Institutional International Trust / Annual Report / September 30, 2017 |
and evaluation of the factors described above, as discussed at the meetings and at prior meetings. The following discusses some, but not all, of the factors that were considered by the Board in connection with its assessment of the Investment Advisory Agreements.
Nature, Extent and Quality of Services. The Board considered the nature, extent and quality of the services provided by SIMC and the Sub-Advisers to the Funds and the resources of SIMC and the Sub-Advisers and their affiliates dedicated to the Funds. In this regard, the Trustees evaluated, among other things, SIMC’s and each Sub-Adviser’s personnel, experience, track record and compliance program. Following evaluation, the Board concluded that, within the context of its full deliberations, the nature, extent and quality of services provided by SIMC and the Sub-Advisers to the Funds and the resources of SIMC and the Sub-Advisers and their affiliates dedicated to the Funds were sufficient to support the renewal of the Investment Advisory Agreements. In addition to advisory services, the Board considered the nature and quality of certain administrative, transfer agency and other non-investment advisory services provided to the Funds by SIMC and/or its affiliates.
Performance. In determining whether to renew SIMC’s Advisory Agreement, the Trustees considered the Funds’ performance relative to their peer groups and appropriate indexes/benchmarks. The Trustees reviewed performance information for each Fund, noting that they receive performance reports that permit them to monitor each Fund’s performance at board meetings throughout the year. As part of this review, the Trustees considered the composition of each peer group and selection criteria. In assessing Fund performance, the Trustees considered a report compiled by Broadridge, an independent third-party that was engaged to prepare an assessment of the Funds in connection with the renewal of the Advisory Agreement (the “Broadridge Report”). The Broadridge Report included metrics on risk analysis, volatility versus total return, net total return and performance consistency for the Funds and a universe of comparable funds. Based on the materials considered and discussed at the meetings, the Trustees found Fund performance satisfactory, or, where performance was materially below the benchmark and/or peer group, the Trustees were satisfied with the reasons provided to explain such performance. In connection with the approval or renewal of Sub-Advisory Agreements, the Board considered the performance of the Sub-Adviser relative to appropriate indexes/benchmarks. Following evaluation, the Board concluded that, within the context of its full deliberations, the performance of the Funds was sufficient to support renewal of SIMC’s Advisory Agreement, and the performance of each Sub-Adviser was sufficient to support approval or renewal of the Sub-Advisory Agreement.
Fees. With respect to the Funds’ expenses under the Investment Advisory Agreements, the Trustees considered the rate of compensation called for by the Investment Advisory Agreements and the Funds’ net operating expense ratio in comparison to those of the Funds’ respective peer groups. In assessing Fund expenses, the Trustees considered the information in the Broadridge Report, which included various metrics related to fund expenses, including, but not limited to, contractual management fees at various asset levels, actual management fees (including transfer agent expenses), actual total expenses for the Funds, total expense components, historical expenses and a universe of comparable funds. Based on the materials considered and discussion at the meetings, the Trustees further determined that fees were either shown to be below the peer average in the comparative fee analysis, or that there was a reasonable basis for the fee level. The Trustees also considered the effects of SIMC’s contractual waiver of its management fee with respect to the Emerging Markets Equity Fund and its voluntary waiver of management and other fees with respect to the International Equity, Emerging Markets Debt and International Fixed Income Funds to prevent total Fund operating expenses from exceeding a specified cap and concluded that SIMC, through waivers, has maintained the Funds’ net operating expenses at competitive levels for its distribution channels. In determining the appropriateness of fees, the Board also took into consideration the impact of fees incurred indirectly by the Funds as a result of investments into underlying funds, including funds from which SIMC or its affiliates earn fees. The Board also took into consideration compensation earned from the Funds by SIMC or its affiliates for non-advisory services, such as administration, transfer agency, shareholder services or brokerage, and considered whether SIMC and its affiliates may have realized other benefits from their relationship with the Funds, such as any research and brokerage services received under soft dollar arrangements. When considering fees paid to Sub-Advisers, the Board took into account the fact that the Sub-Advisers are compensated by SIMC and not by the Funds directly, and that such compensation with respect to any unaffiliated Sub-Adviser reflects an arms-length negotiation between the Sub-Adviser and SIMC. Following evaluation, the Board concluded that, within the context of its full deliberations, the expenses of the Funds are reasonable and supported renewal of the Investment Advisory Agreements. The Board also considered whether the Sub-Advisers and their affiliates may have realized other benefits from their relationship with the Funds, such as any research and brokerage services received under soft dollar arrangements.
SEI Institutional International Trust / Annual Report / September 30, 2017 |
99 |
BOARD OF TRUSTEES’ CONSIDERATIONS IN APPROVING THE ADVISORY AND SUB-ADVISORY AGREEMENTS (Unaudited) (Concluded)
Profitability. With regard to profitability, the Trustees considered compensation flowing to SIMC and the Sub-Advisers and their affiliates, directly or indirectly. The Trustees considered whether the levels of compensation and profitability were reasonable. As with the fee levels, when considering the profitability of the Sub-Advisers, the Board took into account the fact that compensation with respect to any unaffiliated Sub-Adviser reflects an arms-length negotiation between the Sub-Adviser and SIMC. In connection with the approval or renewal of each Sub-Advisory Agreement, the Board also took into consideration the impact that the fees paid to the Sub-Adviser have on SIMC’s advisory fee margin and profitability. Based on this evaluation, the Board concluded that, within the context of its full deliberations, the profitability of each of SIMC and the Sub-Advisers is reasonable and supported renewal of the Investment Advisory Agreements.
Economies of Scale. With respect to the Advisory Agreement, the Trustees considered whether any economies of scale were being realized by SIMC and its affiliates and, if so, whether the benefits of such economies of scale were passed along to the Funds’ shareholders through a graduated investment advisory fee schedule or other means, including any fee waivers by SIMC and its affiliates. The Trustees recognized that economies of scale are difficult to identify and quantify and are rarely identifiable on a fund-by-fund basis. Based on this evaluation, the Board determined that the fees were reasonable in light of the information that was provided by SIMC with respect to economies of scale.
Based on the Trustees’ deliberation and their evaluation of the information described above, the Board, including all of the Independent Trustees, with the assistance of Fund counsel and Independent Trustees’ counsel, unanimously approved the approval or renewal, as applicable, of the Investment Advisory Agreements and concluded that the compensation under the Investment Advisory Agreements is fair and reasonable in light of such services and expenses and such other matters as the Trustees considered to be relevant in the exercise of their reasonable judgment. In the course of its deliberations, the Board did not identify any particular factor (or conclusion with respect thereto) or single piece of information that was all-important, controlling or determinative of its decision, but considered all of the factors together, and each Trustee may have attributed different weights to the various factors (and conclusions with respect thereto) and information.
100 |
SEI Institutional International Trust / Annual Report / September 30, 2017 |
NOTICE TO SHAREHOLDERS (Unaudited)
For shareholders who do not have a September 30, 2017, taxable year end, this notice is for informational purposes only. For shareholders with a September 30, 2017, taxable year end, please consult your tax adviser as to the pertinence of this notice.
For the fiscal year ended September 30, 2017, the Funds are designating long term and qualifying dividend income with regard to distributions paid during the year as follows:
| (A) Return of Capital | (B) Long Term | (C) Ordinary | (D) Total | (E) Dividends Qualifying for Corporate Dividends Rec. Deduction (1) | (F) Qualifying | (G) U.S. | (H) Interest | (I) Short-Term | ||||||||||
International Equity Fund | 0.00% | 0.00% | 100.00% | 100.00% | 0.00% | 99.55% | 0.00% | 0.04% | 0.00% | |||||||||
Emerging Markets Equity Fund | 0.00% | 0.00% | 100.00% | 100.00% | 0.00% | 94.00% | 0.00% | 0.00% | 0.00% | |||||||||
International Fixed Income Fund | 0.00% | 7.53% | 92.47% | 100.00% | 0.00% | 0.00% | 0.26% | 44.63% | 100.00% | |||||||||
Emerging Markets Debt Fund | 0.00% | 0.00% | 100.00% | 100.00% | 0.00% | 0.00% | 0.00% | 0.17% | 0.00% |
The Funds intend to pass through foreign tax credit to shareholders. For the fiscal year ended September 30, 2017, the amount of foreign source income and foreign tax credit are as follows:
| Fund | Foreign Source Income | Foreign Tax Credit | ||||||
International Equity | $90,051,113 | $6,051,547 | ||||||
Emerging Markets Equity | 40,791,182 | 3,920,532 | ||||||
| (1) | “Dividends Received Deduction” represent dividends which qualify for the corporate dividends received deduction. |
| (2) | “Qualifying Dividend Income” represent qualifying dividends as created by the Jobs and Growth Tax Relief Reconciliation Act of 2003. It is the intention of the Fund to designate the max amount permitted by law. |
| (3) | “U.S. Government Interest” represent the amount of interest that was derived from direct U.S. Government obligations and distributed during the fiscal year. Generally, interest from direct U.S. Government obligations is exempt from state income tax. However, for shareholders who are residents of California, Connecticut or New York, the statutory threshold requirements were not satisfied to permit exemption of these amounts from state income. |
| (4) | The percentage in this column represents the amount of “Interest Related Dividend” is reflected as a percentage of ordinary income distribution. Interest related dividends is exempted from U.S. withholding tax when paid to foreign investors. |
| (5) | The percentage of this column represents the amount of “Short Term Capital Gain Dividend” is reflected as a percentage of short term capital gain distribution that is exempted from U.S. withholding tax when paid to foreign investors. |
Items (A), (B), (C) and (D) are based on the percentage of each fund’s total distribution.
Items (E) and (F) are based on the percentage of “Ordinary Income Distributions.”
Item (G) is based on the percentage of gross income of each Fund.
Item (H) is based on the percentage of net investment income distributions.
Item (I) is based on the percentage of short-term capital gains distributions.
Please consult your tax adviser for proper treatment of this information. This notification should be kept with your permanent tax records.
SEI Institutional International Trust / Annual Report / September 30, 2017 |
101 |
(This page intentionally left blank)
(This page intentionally left blank)
(This page intentionally left blank)
SEI INSTITUTIONAL INTERNATIONAL TRUST ANNUAL REPORT SEPTEMBER 30, 2017
Robert A. Nesher, Chairman |
Trustees |
William M. Doran |
George J. Sullivan, Jr. |
Nina Lesavoy |
James M. Williams |
Mitchell A. Johnson |
Susan Cote |
Hubert L. Harris, Jr. |
Officers |
Robert A. Nesher |
President and Chief Executive Officer |
James J. Hoffmayer |
Controller and Chief Financial Officer |
Russell Emery |
Chief Compliance Officer |
Timothy D. Barto |
Vice President, Secretary |
David F. McCann |
Vice President, Assistant Secretary |
Aaron Buser |
Vice President, Assistant Secretary |
Stephen G. MacRae |
Vice President |
Bridget E. Sudall |
Anti-Money Laundering Compliance Officer |
Privacy Officer |
| Investment Adviser |
| SEI Investments Management Corporation |
| Administrator |
| SEI Investments Global Funds Services |
| Distributor |
| SEI Investments Distribution Co. |
| Legal Counsel |
| Morgan, Lewis & Bockius LLP |
| Independent Registered Public Accounting Firm |
| KPMG LLP |
| This report and the financial statements contained herein are submitted for the general information of the shareholders of the Trust and must be preceded or accompanied by a current prospectus. Shares of the Funds are not deposits or obligations of, or guaranteed or endorsed by, any bank. The shares are not federally insured by the Federal Deposit Insurance Corporation (FDIC), the Federal Reserve Board, or any other government agency. Investment in the shares involves risk, including the possible loss of principal. |
| For more information call |
| 1 800 DIAL SEI |
| (1 800 342 5734) |

1 Freedom Valley Drive, P.O. Box 1100, Oaks, PA 19456
| Item 2. | Code of Ethics. |
The Registrant has adopted a code of ethics that applies to the Registrant’s principal executive officer, principal financial officer, principal accounting officer or controller, or persons performing similar functions.
| Item 3. | Audit Committee Financial Expert. |
(a)(1) The Registrant’s Board of Trustees has determined that the Registrant has three audit committee financial experts serving its audit committee.
(a) (2) The audit committee financial experts are Susan C. Cote, George J. Sullivan, Jr. and Hubert L. Harris, Jr. Ms. Cote and Messrs. Sullivan and Harris are independent as defined in Form N-CSR Item 3 (a) (2).
| Item 4. | Principal Accountant Fees and Services. |
Fees billed by KPMG LLP (“KPMG”) related to the Registrant.
KPMG billed the Registrant aggregate fees for services rendered to the Registrant for the fiscal years 2017 and 2016 as follows:
| Fiscal 2017 | Fiscal 2016 | |||||||||||||
All fees and services to the Registrant that were pre- approved | All fees and services to service affiliates that were pre- approved | All other fees and services to service affiliates that did not require pre- approval | All fees and services to the Registrant that were pre- approved | All fees and services to service affiliates that were pre- approved | All other fees and services to service affiliates that did not require pre- approval | |||||||||
(a) | Audit Fees(1) | $198,500 | $0 | N/A | $198,500 | $0 | N/A | |||||||
(b) | Audit-Related Fees | $0 | $0 | $0 | $0 | $0 | $0 | |||||||
(c) | Tax Fees | $0 | $0 | $0 | $0 | $0 | $0 | |||||||
(d) | All Other Fees(2) | $0 | $356,074 | $0 | $0 | $325,515 | $0 | |||||||
Notes:
| (1) | Audit fees include amounts related to the audit of the Registrant’s annual financial statements and services normally provided by the accountant in connection with statutory and regulatory filings. |
| (2) | See Item 4(g) for a description of the services comprising the fees disclosed under this category. |
(e)(1) The Registrant’s Audit Committee has adopted and the Board of Trustees has ratified an Audit and Non-Audit Services Pre-Approval Policy (the “Policy”), which sets forth the procedures and the conditions pursuant to which services proposed to be performed by the independent auditor of the Registrant may be pre-approved. In any instance where services require pre-approval, the Audit Committee will consider whether such services are consistent with SEC rules on auditor independence and whether the provision of such services would compromise the auditor’s independence.
The Policy provides that all requests or applications for proposed services to be provided by the independent auditor must be submitted to the Registrant’s Chief Financial Officer (“CFO”) and must include a detailed description of the services proposed to be rendered. The CFO will determine whether such services: (1) require specific pre-approval; (2) are included within the list of services that have received the general pre-approval of the Audit Committee pursuant to the Policy; or (3) have been previously pre-approved in connection with the independent auditor’s annual engagement letter for the applicable year or otherwise.
Requests or applications to provide services that require specific pre-approval by the Audit Committee will be submitted to the Audit Committee by the CFO. The Audit Committee has delegated specific pre-approval authority to either the Audit Committee Chair or financial experts, provided that the estimated fee for any such proposed pre-approved service does not exceed $100,000 and any pre-approval decisions are reported to the Audit Committee at its next regularly scheduled meeting.
Services that have received the general pre-approval of the Audit Committee are identified and described in the Policy. In addition, the Policy sets forth a maximum fee per engagement with respect to each identified service that has received general pre-approval. The Audit Committee will annually review and pre-approve the services that may be provided by the independent auditor during the following twelve months without obtaining specific pre-approval from the Audit Committee.
The Audit Committee will be informed by the CFO on a quarterly basis of all services rendered by the independent auditor.
All services to be provided by the independent auditor shall be provided pursuant to a signed written engagement letter with the Registrant, the investment advisor or applicable control affiliate (except that matters as to which an engagement letter would be impractical because of timing issues or because the matter is small may not be the subject of an engagement letter) that sets forth both the services to be provided by the independent auditor and the total fees (or the manner of their determination) to be paid to the independent auditor for those services.
In addition, the Audit Committee has determined to take additional measures on an annual basis to meet its responsibility to oversee the work of the independent auditor and to assure the auditor’s independence from the Registrant, such as reviewing a formal written statement from the independent auditor delineating all relationships between the independent auditor and the Registrant, and discussing with the independent auditor its methods and procedures for ensuring independence.
(e)(2) Percentage of fees billed pursuant to waiver of pre-approval requirement were as follows:
| Fiscal 2017 | Fiscal 2016 | |||
Audit-Related Fees | 0% | 0% | ||
Tax Fees | 0% | 0% | ||
All Other Fees | 0% | 0% |
(f) Not Applicable.
(g)(1) The aggregate non-audit fees billed by KPMG for the fiscal years 2017 and 2016 were $356,074 and $325,515, respectively. Non-audit fees consist of SSAE No.16 review of fund accounting and administration operations, and an attestation report in accordance with Rule 17Ad-13.
(h) During the past fiscal year, Registrant’s principal accountant provided certain non-audit services to Registrant’s investment adviser or to entities controlling, controlled by, or under common control with Registrant’s investment adviser that provide ongoing services to Registrant that were not subject to pre-approval pursuant to paragraph (c)(7)(ii) of Rule 2-01 of Regulation S-X. The Audit Committee of Registrant’s Board of Trustees reviewed and considered these non-audit services provided by Registrant’s principal accountant to Registrant’s affiliates, including whether the provision of these non-audit services is compatible with maintaining the principal accountant’s independence.
| Item 5. | Audit Committee of Listed Registrants. |
Not applicable.
| Item 6. | Schedule of Investments |
The Schedules of Investments in securities of unaffiliated issuers as of the close of the reporting period for the International Equity Fund, Emerging Markets Equity Fund, International Fixed Income Fund, and Emerging Markets Debt Fund are included as part of the report to shareholders filed under Item 1 of this form.
| Item 7. | Disclosure of Proxy Voting Policies and Procedures for Closed-End Management Investment Companies. |
Not applicable.
| Item 8. | Portfolio Managers of Closed-End Management Investment Companies |
Not applicable.
| Item 9. | Purchases of Equity Securities by Closed-End Management Company and Affiliated Purchasers. |
Not applicable.
| Item 10. | Submission of Matters to a Vote of Security Holders. |
There have been no material changes to the procedures by which shareholders may recommend nominees to the Registrant’s Board of Trustees (the “Board”). The Registrant has a standing Governance Committee (the “Committee”) currently consisting of the Independent Trustees. The Committee is responsible for evaluating and recommending nominees for election to the Board. Pursuant to the Committee’s Charter, adopted on June 18, 2004, as amended, the Committee will review all shareholder recommendations for nominations to fill vacancies on the Board if such recommendations are submitted in writing and addressed to the Committee at the Registrant’s office.
| Item 11. | Controls and Procedures. |
(a) The Registrant’s principal executive and principal financial officers, or persons performing similar functions, have concluded that the Registrant’s disclosure controls and procedures (as defined in Rule 30a-3(c) under the Investment Company Act of 1940 (the “1940 Act”)) are effective, based on the evaluation of these controls and procedures required by Rule 30a-3(b) under the 1940 Act and Rules 13a-15(b) or 15d-15(b) under the Securities Exchange Act of 1934 as of a date within 90 days of the filing date of this report.
(b) There were no changes in the Registrant’s internal control over financial reporting (as defined in Rule 30a-3(d) under the 1940 Act) that occurred during the last fiscal quarter of the period covered by this report that have materially affected, or are reasonably likely to materially affect, the Registrants internal control over financial reporting.
| Items 12. | Disclosure of Securities Lending Activities for Closed-End Management Investment Companies. |
Not applicable.
| Items 13. | Exhibits. |
(a)(1) Code of Ethics attached hereto.
(a)(2) A separate certification for the principal executive officer and the principal financial officer of the Registrant as required by Rule 30a-2(a) under the Investment Company Act of 1940 are filed herewith.
(b) Officer certifications as required by Rule 30a-2(b) under the Investment Company Act of 1940, as amended also accompany this filing as exhibits.
SIGNATURES
Pursuant to the requirements of the Securities Exchange Act of 1934 and the Investment Company Act of 1940, the Registrant has duly caused this report to be signed on its behalf by the undersigned, thereunto duly authorized.
| SEI Institutional International Trust | ||||||
| By: | /s/ Robert A. Nesher | |||||
| Robert A. Nesher | ||||||
| President & CEO | ||||||
Date: December 8, 2017
Pursuant to the requirements of the Securities Exchange Act of 1934 and the Investment Company Act of 1940, this report has been signed below by the following persons on behalf of the Registrant and in the capacities and on the dates indicated.
| By: | /s/ Robert A. Nesher | |||||
| Robert A. Nesher | ||||||
| President & CEO |
Date: December 8, 2017
| By: | /s/ James J. Hoffmayer | |||||
| James J. Hoffmayer | ||||||
| Controller & CFO |
Date: December 8, 2017