UNITED STATES
SECURITIES AND EXCHANGE COMMISSION
Washington, D.C. 20549
FORMN-CSR
CERTIFIED SHAREHOLDER REPORT OF REGISTERED MANAGEMENT
INVESTMENT COMPANIES
Investment Company Act file number811-05601
SEI Institutional International Trust
(Exact name of registrant as specified in charter)
SEI Investments
One Freedom Valley Drive
Oaks, PA 19456
(Address of principal executive offices) (Zip code)
Timothy D. Barto, Esq.
SEI Investments
One Freedom Valley Drive
Oaks, PA 19456
(Name and address of agent for service)
Registrant’s telephone number, including area code:610-676-1000
Date of fiscal year end: September 30, 2019
Date of reporting period: September 30, 2019
| Item 1. | Reports to Stockholders. |

September 30, 2019
ANNUAL REPORT
SEI Institutional International Trust
 International Equity Fund
Emerging Markets Equity Fund
International Fixed Income Fund
Emerging Markets Debt Fund
Beginning on January 1, 2021, as permitted by regulations adopted by the Securities and Exchange Commission, paper copies of the Funds’ shareholder reports like this one will no longer be sent by mail, unless you specifically request paper copies of the reports from the Funds or from your financial intermediary, such as a broker-dealer or bank. Instead, the reports will be made available on a website, and you will be notified by mail each time a report is posted and provided with a website link to access the report.
If you already elected to receive shareholder reports electronically, you will not be affected by this change and you need not take any action. You may elect to receive shareholder reports and other communications from the Funds electronically by contacting your financial intermediary.
You may elect to receive all future reports in paper free of charge. If you invest through a financial intermediary, you can follow the instructions included with this disclosure, if applicable, or you can contact your financial intermediary to inform it that you wish to continue receiving paper copies of your shareholder reports. If you invest directly with the Funds, you can inform the Funds that you wish to continue receiving paper copies of your shareholder reports by calling1-800-DIAL-SEI. Your election to receive reports in paper will apply to all funds held with the SEI Funds or your financial intermediary.

The Trust files its complete schedule of portfolio holdings with the Securities and Exchange Commission for the first and third quarters of each fiscal year as an exhibit to its reports on FormN-PORT. The Trust’s FormN-PORT reports are available on the Commission’s website at http://www.sec.gov.
A description of the policies and procedures that the Trust uses to determine how to vote proxies relating to portfolio securities, as well as information relating to how a Fund voted proxies relating to portfolio securities during the most recent12-month period ended June 30, is available (i) without charge, upon request, by calling1-800-DIAL-SEI; and (ii) on the Commission’s website at http://www.sec.gov.
September 30, 2019 (Unaudited)
To Our Shareholders:
After an extended period of historical calm and steady gains, volatility returned to financial markets at the start of the fiscal year ending September 30, 2019, with a selloff toward the end of 2018 that sent most global indexes into or near bear market territory; an early-2019 rebound subsequently saw the S&P 500 Index deliver its bestfirst-quarter performance in 20 years. Trade war fears, ongoing Brexit discussions and the U.S. yield curve all weighed on investor expectations throughout the reporting period.
The pace of interest-rate increases by the Federal Reserve (“Fed”) mostly followed the market’s projections. Long-term rates fell by a greater magnitude than short-term rates after the Federal Reserve raised rates at the start of the reporting period but then cut twice over the final quarter; the yield curve flattened to a post-recession low and even inverted at multiple maturities.
The European Central Bank ended its bond-buying program at the end of 2018 but made assurances that it would reinvest maturing securities for some time to help keep rates low. Christine Lagarde resigned as president of the International Monetary Fund after being named to succeed Mario Draghi as European Central Bank (“ECB”) President at the end of October 2019. Lagarde is expected to maintain her predecessor’s dovish policies.
The Japanese yen, typically viewed as a safe-haven asset in“risk-off” environments, finished the period higher against the U.S. dollar while the Bank of Japan (“BOJ”) held monetary policy stable. Driven by trade-related tensions, the Chinese yuan slid to an11-year low against the U.S. dollar during the fiscal period. While China’s currency strengthened earlier in the fiscal year as U.S.-China trade negotiations appeared to be reaching a favorable conclusion, its value weakened again following a breakdown in talks at the beginning of May.
Oil prices began the reporting period near a four-year high, supported by geopolitical tensions and news that Saudi Arabia and Russia would extend an agreement to curb output. However, growing concerns over falling demand and increasing global supply, along with a broad selloff in risk assets, helped drive a correction during the last three months of 2018 that sent the commodity down over 40% from its earlier highs. While support at the start of the New Year saw a 50% recovery from its lows, oil closed the fiscal year down almost 30%.
Geopolitical events
U.S. elections in November 2018 produced a partial shift in power away from Republicans and toward Democrats in Congress and statehouses across the country. The new balance of authority in Congress could substantially limit the ability of President Donald Trump and Republicans to pass meaningful legislation; it also enhances the investigatory powers available to Democrats, thereby adding to political risk for the Trump administration.
The partial shutdown of the U.S. government in December lasted over a month due to an impasse between Congress and President Trump’s administration about whether to fund a multi-billion dollar wall on the U.S.-Mexico border championed by the president. The Trump administration received a measure of resolution in March, when the special counsel investigating the 2016 election could not conclude that the president committed criminal obstruction of justice, although neither did it exonerate him. However, as the fiscal year came to an end, the political war between Trump and congressional Democrats escalated to an official impeachment inquiry following a whistleblower complaint alleging that Mr. Trump asked Ukrainian President Volodymyr Zelensky to investigate political rival Joe Biden.
The North American Free Trade Agreement’s successor came into focus just before the start of the period—first when the U.S. and Mexico came to an agreement in August 2018, and then when the U.S. and Canada finally ironed out their differences in September. Now called the United States-Mexico-Canada Agreement, the revised deal is expected to strengthen its predecessor’s provisions and improve labor standards. The U.S. is projected to offer Canada and Mexico relief from automobile-related trade barriers as a result of the new agreement, although aluminum and steel tariffs will remain.
U.S.-China trade negotiations came to a halt on August 1, 2019 with President Trump’s announcement of new tariffs (10% on $300 billion of Chinese goods) and China’s subsequent promise of retaliation, provoking a disconcerting depreciation in the yuan’s exchange rate with the U.S. dollar. Both sides applied new and higher tariffs beginning September 1. The U.S. imposed a 15% tariff on $112 billion worth of Chinese goods, while China resumed 25% tariffs on American cars and added5%-to-10% tariffs on $75 billion worth of other American goods. As a new round of
SEI Institutional International Trust / Annual Report / September 30, 2019 |
1 |
LETTER TO SHAREHOLDERS (Continued)
September 30, 2019 (Unaudited)
negotiations materialized for October, the U.S. delayed a tariff measure scheduled for October 1 (an increase from 25% to 30% on $250 billion worth of Chinese goods).
U.K. Prime Minister Theresa May announced on May 24 her intention to resign following a poor showing for Conservatives in European Parliamentary elections. May’s inability to establish sufficient support for her Brexit deal or a viable alternative had become an impasse, and her recent overtures for a second referendum alienated a large subset of her party’s leadership. Prime Minister Boris Johnson faced sharp resistance from the outset of his tenure: Conservative members of Parliament defected to support a vote eliminating the prospect of ano-deal departure from the EU on October 31, and the U.K. Supreme Court reversed the Prime Minister’s attempt to suspend Parliament.
Elsewhere, after months of demonstrations, protesters in Hong Kong saw some success when a proposed law that would have allowed for extradition to mainland China was withdrawn. Protests continued, however, amid a reported increase in China’s police presence and undercover activity.
Economic performance
U.S. economic growth slowed to 2.2% in the fourth quarter of 2018, a drop from 3.4% in the previous quarter, primarily due to a softer environment for business investment that was only modestly affected by the partial government shutdown. Still, U.S. GDP for the 2018 calendar year finished at 2.9%, equaling growth in 2015 as the best in 10 years. The government shutdown that continued through most of January likely detracted some in 2019; however, growth rebounded to 3.1% in the first quarter, driven by increases in inventories and trade. GDP growth measured just 2.0% in the second quarter; robust consumer spending countered a decline in exports and inventory builds, allowing the10-year expansion to continue despite decelerating global activity.
The U.S. labor market remained robust throughout the fiscal year: the unemployment rate fell, finishing the period near a50-year low at 3.5%; the labor-force participation rate ended at 63.2%, slightly higher from a year earlier. Average hourly earnings gained 2.9% over the year, although a modest increase in price pressures weighed on real personal income growth. The historically strong labor market and improving wage growth helped boost the debt profile of the U.S. consumer. The Fed’s dovish pivot in the final quarter of the reporting period involved an early conclusion to its balance-sheet reduction program, which was initially scheduled to end in September. These accommodative actions came amid below-target inflation and uncertainty about trade developments.
In September, the ECB cut its benchmark interest rate for the first time since 2016, to a historic low, and announced it would restart quantitative easing. Broad economic growth in the eurozone slowed to its weakest pace in six years at the end of the second quarter of 2019, as slumping exports in Germany and a stagnating Italian economy hampered expansion; the slowdown strengthens the case for continued accommodative policy by the ECB for some time.
The Bank of England held its official bank rate unchanged during the reporting period after raising by 0.25% just before the start of the fiscal year. Committee guidance later in the period noted a bias toward higher rates in the future depending on the Brexit outcome, in contrast to the looser monetary policy shifts of the Fed and ECB. The U.K. economy grew 1.3%year-on-year through the second quarter of 2019, its weakest level since the beginning of 2018.
Japanese GDP grew 1.4%year-on-year at the end of the second quarter of 2019; the BOJ maintained monetary stimulus in an attempt to counter slowing growth and weak productivity gains. Meanwhile, GDP in China expanded by just 6.2%year-on-year in the second quarter of 2019, its weakest pace in 28 years, as a lack of consumer confidence due to the U.S. trade war continued to put pressure on economic growth.
Market developments
The U.S. equity market suffered a significant decline early in the fiscal year ending September 30, 2019, as concerns about rising interest rates, trade issues, and softening global economic growth weighed on investor sentiment. During this time, the highly-cyclical energy sector experienced a notable selloff, while the consumer staples and utilities sectors, in particular, outperformed and helped mitigate some damage in the falling market. However, January marked the best start for equities in thirty years; the recovery rally continued until a slight retreat in May, but touched a record high in July before the end of the fiscal year. The utilities, real estate and consumer staples sectors were top performers over the entire period, while energy, health care and industrials lagged.
2 |
SEI Institutional International Trust / Annual Report / September 30, 2019 |
Small-cap stocks (Russell 2000 Index) failed to keep up with large caps (Russell 1000 Index) in the U.S. during the fiscal year. Large caps finished up 3.87%, easily outpacing small caps, which lost 8.89%.
Brexit concerns continued to overshadow the outlook for business in the U.K.; while the FTSE UK SeriesAll-Share Index gained 10.70% in U.S. dollar terms, the index rose just 2.68% in sterling. The MSCI ACWI Index (Net), a proxy for global equities in both developed and emerging markets, rose 1.38% in U.S. dollar terms; U.S. markets did better, as the S&P 500 Index returned 4.25%. Despite continued accommodative monetary policy from the ECB, European equities lagged, as fears over trade wars and policy uncertainty grew. The MSCI Europe Index (Net) finished down 0.75% in U.S. dollar terms but 5.74% higher in euros; the euro finished up 6.18% versus the U.S. dollar for the period.
Emerging markets failed to keep pace over the full 12 months. The MSCI Emerging Markets Index (Net) finished the reporting period down 2.02% in U.S. dollar terms, after a selloff over the final three months erased itsto-date gains for the fiscal year. Asian markets ended the period lower as trade-related concerns drove regional market weakness.
Led by the dovish tone of global central banks and lukewarm economic data in the U.S. and Europe, global government bonds outperformed global high-yield bonds. A continuing theme for U.S.fixed-income markets was the flattening yield curve, as short-term yields fell less than long-term yields. In early December, the spread between2-year and10-year Treasury bonds compressed to 11 basis points, its narrowest point in more than 12 years. At the same time, the spread between2-year and5-year Treasurys inverted, as did the spread between3-year and5-year Treasurys. Notably, the3-month and10-year rates inverted for the first time in about 12 years in March, a signal of impending recession to some market watchers. While the differential turned back positive in April, it reverted again in May and stayed negative through the end of the period. The Federal Open Market Committee increased the federal-funds rate inmid-December—the first hike of the reporting period but fourth of the calendar year and ninth during the tightening cycle—while softening its projections for future rate increases. The hike failed to sustain an impact on higher short-term yields, while subdued inflation and long-term economic growth expectations pressured the long end of the curve. In July, the central bank cut rates for the first time in 11 years and did so again in September. Yields for10-year U.S. government bonds declined and ended the period 137 basis points lower at 1.68%, while2-year yields rose to almost 3% early in the fiscal year but finished the period down 118 basis points at 1.63%.
Inflation-sensitive assets, such as commodities and Treasury inflation-protected securities (“TIPS”), were mixed. The Bloomberg Commodity Total Return Index (which represents the broad commodity market) slid 6.57%, primarily due to oil market headwinds, while the Bloomberg Barclays1-10 Year US TIPS Index (USD) moved 5.75% higher.
The high-yield market, as measured by the ICE BofAML US High Yield Constrained Index, climbed 6.30%, while global fixed income did slightly better, with the Bloomberg Barclays Global Aggregate Index up 7.60% in U.S. dollar terms during the reporting period.
U.S. investment-grade corporate debt performed well, as the Bloomberg Barclays US Corporate Investment Grade Index returned 13.00%. U.S. asset-backed and mortgage-backed securities also managed gains during the fiscal year, benefiting from favorablesupply-and-demand dynamics and continued improvement in collateral.
Emerging-market debt delivered strong performance. The JP Morgan GBI Emerging Markets Global Diversified Index, which tracks local-currency-denominated emerging-market bonds, climbed 10.13% higher in U.S. dollar terms. The JP Morgan EMBI Global Diversified Index, which tracks emerging-market debt denominated in external currencies (such as the U.S. dollar), gained 11.57%, after starting 2019 down for the reporting period to date.
Our view
We have leaned toward an optimistic view on equities and other risk-oriented assets for the past 10 years. When markets corrected sharply in price—as several U.S. equity indexes did in 2011, 2015 and late last year—we viewed the pullbacks as buying opportunities. We believe that staying invested has been a sound overall strategy. Today, while we still doubt that a true bear market is on the immediate horizon, we are surprised by the resilience of the stock-market averages during the third quarter in the face of numerous economic and political uncertainties, both in the U.S. and globally.
The U.S. economy remains in reasonably good shape and appears to be in little danger of contracting any time soon. Granted, the manufacturing and agricultural sectors are being stressed by the trade war with China. But we think
SEI Institutional International Trust / Annual Report / September 30, 2019 |
3 |
LETTER TO SHAREHOLDERS (Concluded)
September 30, 2019 (Unaudited)
there is a limit to how far this deterioration in economic activity will go. Few economists would dispute that the U.S. consumer sector is in great shape.
Traders in the federal-funds futures market expect more rate cuts on the heels of the FOMC’s July and September cuts. The central bank is also no longer letting its securities portfolio contract now that it halted quantitative easing. If the economy were to weaken in a serious way, it could ramp up its purchases of Treasurys again.
Looking at the U.S. stock market, the forward-earnings trend has flattened in recent quarters. Periods offlat-to-down earnings over several quarters occurred in the2014-to-2015 period, and in 2011, 2007 and 1998, each coinciding withflat-to-declining stock prices, increased volatility andmoderate-to-severe market corrections.
Growth and momentum styles continued to outperform quality and value for much of the third quarter. However, September saw a sharp reversal in this trend for the first time since the beginning of 2018 as value outperformed. It’s hard to say whether this reversal will be sustained, although SEI’s equity managers have been positioned for such an eventuality.
A trade truce between China and the U.S. would be a relief, but it would be only one piece of a larger mosaic that must first come together. Getting the world back on a faster growth track will depend on an economic rebound in the domestic economies of China and Europe.
Our expectation of an economic revival in China rests on the assumption that all the fiscal and monetary-policy measures put in place over the past year will overcome the major challenge posed by the trade war. The latest tranches of import duties are aimed at Chinese goods like apparel and toys, which usually have thin profit margins, are labor-intensive, and can be more easily produced in otherlow-wage nations than higher-tech products. We therefore believe that Chinese President Xi Jinping has an incentive to get a deal done with President Trump. The last thing Xi needs is a sharp rise in unemployment and corporate bankruptcies as profit margins get eviscerated.
China’s currency has weakened further in recent months, reaching an11-year low against the U.S. dollar in September 2019 that amounted to a cumulative decline of 12% since April 2018—thereby offsetting a little more than half of the imposed or announced tariff increases. The Chinese government is reluctant to encourage additional currency depreciation, fearing that capital could flee the country. Rather, there is evidence that it is getting more aggressive when it comes to pulling the monetary and fiscal levers.
Slowing growth in China, the U.S. and the eurozone does not bode well for other economies. On a positive note, many developing countries have been able to cut interest rates in recent months. Meanwhile, capital-market conditions in emerging countries still appear benign. Spreads on U.S. dollar-denominated debt remain in the middle of their range for the past eight years.
Despite all its economic and political problems, European-wide equity markets have done rather well this year in local-currency terms. The MSCI Europe ex UK Index (Net) climbed 21.1% year to date, actually matching that of the MSCI USA Index (Net). The MSCI United Kingdom Index (Net) was the laggard, gaining only 13.8%—still something of an achievement considering the messy political situation in the U.K.
How does one explain the rather robust performance of European equities? It can largely be attributed to the lack of an alternative option. For example, now that Germany’s sovereign yield curve is negative all the way up to 30 years (just one year after yields were positive beyond six years), its investors have no hope of building wealth in less risky fixed-income assets and are therefore forced into equities and other risk-oriented investments. Investors globally face similar challenges, even if not quite to the same extent.
While Germany’s overall economy is not clearly in a recession, its manufacturing sector almost certainly is—the 6.4% decline in industrial production from the peak in November 2017 through July 2019 was worse than Italy’s 2.5% contraction over the same period. Considering that manufacturing represents almost 23% of the country’s GDP (much higher than the average for developed countries), it is easy to understand why the country is in a funk.
We will find out soon whether ano-deal exit from the EU actually takes place or is delayed (for a third time) beyond the October 31st deadline. The political carnage caused by Brexit is already breath-taking. The Conservatives lost their working majority in the Parliament following the expulsion of 21 members of Parliament from the party in the aftermath of a vote to wrest away Brexit negotiations from the government.
4 |
SEI Institutional International Trust / Annual Report / September 30, 2019 |
The battle between the Prime Minister and the Parliament already led to a constitutional crisis when the U.K. Supreme Court declared Johnson’s move to suspend Parliament as invalid. If he defies the will of Parliament and takes the U.K. out of the EU without a trade agreement, that crisis will deepen. More likely, there will be an additional delay, with a new Brexit deadline. That would allow for a general election and, hopefully, a new mandate from the electorate. But the political landscape in Great Britain is in flux. The outcome of the next election could be an unstable coalition.
Despite the rather solid financial position of U.K. households, both consumer and business confidence are nearing levels consistent with recession. Confidence measures in the eurozone, while off the highs of 2017, have not fallen to the same degree.
Japan is also focused on home-grown uncertainty: The consumption tax hike effective October 1st. And despite a tight labor market with an almost record-high number of available jobs per applicant, the decline in earnings growth from last year is surprisingly steep. Regardless of all their efforts, Prime Minister Shinzo Abe’s government and the Bank of Japan have been unable to spur a lasting reflation of the economy.
Like Germany, Japan has been hurt by the slowing growth of China and the general malaise affecting Asia as a whole. To make matters worse, Japan’s political relationship with South Korea has frayed badly in recent months. Both countries have expanded economic sanctions, includingtit-for-tat tariff duties and consumer boycotts. Even more worrisome is the breakdown in direct military intelligence sharing at a time when China is pushing its weight around in the East and South China Seas.
In all, Japan’s outlook appears to be one of stasis. In the meantime, investors will likely continue to view the country as a safe haven owing to its low volatility. We believe the yen will remainwell-bid under this scenario.
In view of the uncertainties facing investors presently, the prediction game is arguably even more challenging than usual. Accordingly, as always, we believe in a diversified approach to investing. Although maintaining exposure to equities and other risk-oriented assets can at times feel uncomfortable, it is our view that investors with long time horizons should avoid timing the market or making outsized sector or regional bets. We think it is best not to assume, for example, that the S&P 500 Index and growth stocks will always be the only games in town. The recent volatility and sharp style rotations in the past quarter should serve as reminders that trends do not last forever.
Sincerely,

William T. Lawrence, CFA
Head and Chief Investment Officer of Traditional Asset Management, SEI
SEI Institutional International Trust / Annual Report / September 30, 2019 |
5 |
MANAGEMENT’S DISCUSSION AND ANALYSIS OF FUND PERFORMANCE
September 30, 2019 (Unaudited)
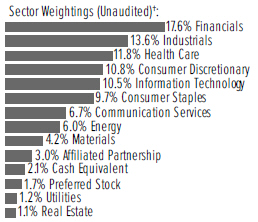
International Equity Fund
I. Objective
The International Equity Fund (the “Fund”) seeks long-term capital appreciation.
II. Multi-Manager Approach Statement
The Fund uses a multi-manager approach, relying on a number ofsub-advisors with differing investment approaches to manage portions of the Fund’s portfolio, under the general supervision of SEI Investments Management Corporation (SIMC). The Fund utilized the followingsub-advisors as of September 30, 2019: Acadian Asset Management LLC, Blackcrane Capital, LLC, Causeway Capital Management LLC, INTECH Investment Management LLC, Lazard Asset Management LLC, Neuberger Berman Investment Advisers LLC, NWQ Investment Management Company, LLC and WCM Investment Management.
During the period, Lazard Asset Management LLC was added to the Fund.
III. Return vs. Benchmark
For the year ended September 30, 2019, the Fund’s Class F shares underperformed the MSCI EAFE Index (Net) (the “Index”), returning-4.63% versus the Index return of-1.34%.
IV. Fund Attribution
As noted in the shareholder letter, developed equities fell sharply at the start of the fiscal year on fears of slowing global growth before recovering in the first quarter of 2019. In addition to political tensions in the EU and U.K., the U.S.-China trade war weighed on sentiment throughout the summer of 2019, leading to choppy performance for the rest of the period.
Pacificex-Japan was the best-performing region in the Index, as Australia was largely immune to the politics that roiled Europe and the U.K. A surprise victory by prime minster candidate Scott Morrison was seen as a positive for the markets and helped boost equity performance for the region. Europe was the next-best performing region as negative market sentiment amid slowing growth concerns led to strong outperformance by defensive sectors. During the fiscal year, manufacturing in Germany weakened as global trade slowed, while yellow vest protests and other populist themes dominated news headlines. In response to lackluster economic data, the European Central Bank announced a fresh set of monetary policies designed to boost the region with lower rates and more asset purchases. The reporting period saw the postponement of the Brexit deadline
in the U.K., along with failed efforts by Teresa May to push through her Brexit deal, leading to Boris Johnson becoming Prime Minister and subsequently roiling markets with his hard Brexit push. Although the U.K. Parliament passed a law preventing Johnson from pursuing such actions, there was extensive volatility in the British pound as markets digested ongoing news. Japan was the worst-performing region during the period. An export-dominated country, Japan took the brunt of the damage from slowing global growth, as the U.S.-China trade war intensified with fresh rounds of tariffs exchanged.
Weakened by slowing global growth, which took a toll on crude oil demand, energy was the worst-performing sector, and the Fund’s slight overweight detracted. The Fund’s underweight to defensive sectors—utilities and consumer staples—also detracted as investors sought to shield themselves from deteriorating economic conditions and volatile market prices, and those sectors outperformed. The Fund was also challenged by selection within the financials sectors, which dealt with persistent headwinds from falling and negative rates in the U.K., Europe and Japan. Materials lagged on similar economic concerns, and the Fund’s overweight contributed. The Fund’s overweight to the information technology sector contributed, as companies with strong but less cyclical growth prospects fared well. From a regional perspective, an overweight to the Pacificex-Japan region, especially in South Korea, detracted as the region faced headwinds driven by the global economic slowdown and trade war disputes.
Manager performance was mixed during the period. Blackcrane was the largest detractor due to weak selection in energy and industrials. Quantitative equity manager INTECH also detracted as its exposure to momentum and selection in the consumer staples and health care sectors struggled. Both managers faced headwinds to momentum, which was buffeted by continued rotation in market leadership throughout the period. Acadian, another quantitative equity manager, underperformed as its exposure to both momentum and value stocks was a headwind. Value was the biggest style headwind during the period as investors shied away from the cyclicality in such sectors. NWQ and Causeway both underperformed due to weak selection affected by the headwind to value. Causeway had weak selection in communication services and consumer staples, while NWQ underperformed in financials and consumer staples.
Stability growth manager WCM contributed to Fund performance with favorable security selection in the
6 |
SEI Institutional International Trust / Annual Report / September 30, 2019 |
information technology and financials sectors; the manager was supported by a market tailwind for defensive stocks with strong profitability and growth prospects. Neuberger Berman also outperformed and benefited from the stability growth tailwind that supported the manager’s investment style.
AVERAGE ANNUAL TOTAL RETURN1
| 1 Year Return | Annualized 3 Year Return | Annualized 5 Year Return | Annualized 10 Year Return | Annualized Inception to Date | ||||||||||||||||
| International Equity Fund, Class F | -4.63% | 5.11% | 2.89% | 4.49% | 3.43% | |||||||||||||||
| International Equity Fund, Class I | -4.90% | 4.85% | 2.63% | 4.21% | 3.17% | |||||||||||||||
| International Equity Fund, Class Y | -4.43% | 5.38% | 3.13% | 4.60% | 3.46% | |||||||||||||||
| MSCI EAFE Index (Net) | -1.34% | 6.48% | 3.27% | 4.90% | 4.87% | |||||||||||||||
Comparison of Change in the Value of a $100,000 Investment in the International Equity Fund, Class F, Class I and Class Y, versus the MSCI EAFE Index (Net)
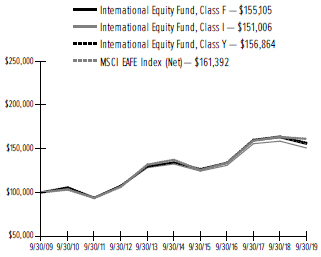
| 1 | For the year ended September 30, 2019. Past performance is no indication of future performance. Class F shares (formerly Class A shares) were offered beginning December 20, 1989. Class I shares were offered beginning January 4, 2002. The performance of Class I shares prior to January 4, 2002 is calculated using the performance of Class F shares adjusted for the higher expenses of the Class I shares. Returns for Class I shares are substantially similar to those of Class F shares and differ only to the extent that Class I shares have higher total annual fund operating expenses than Class F shares. Class Y shares were offered beginning December 31, 2014. Class Y shares performance for the period prior to December 31, 2014 is derived from the performance of Class F shares adjusted for the lower expenses of the Class Y shares. Returns for Class Y shares are substantially similar to those of Class F shares and differ only to the extent that Class Y shares have lower total annual fund operating expenses than Class F shares. Returns shown do not reflect the deduction of taxes that a shareholder would pay on fund distributions or the redemption of fund shares. |
The returns for the period reflect fee waivers and/or reimbursements in effect for the period; absent fee waivers and reimbursements, performance would have been lower.
SEI Institutional International Trust / Annual Report / September 30, 2019 |
7 |
MANAGEMENT’S DISCUSSION AND ANALYSIS OF FUND PERFORMANCE
September 30, 2019 (Unaudited)
Emerging Market Equity Fund
I. Objective
The Emerging Markets Equity Fund (the “Fund”) seeks capital appreciation.
II. Multi-Manager Approach Statement
The Fund uses a multi-manager approach, relying on a number ofsub-advisors with differing investment approaches to manage portions of the Fund’s portfolio, under the general supervision of SEI Investments Management Corp. (SIMC). The Fund utilized the followingsub-advisors as of September 30, 2019: JO Hambro Capital Management Limited, KBI Global Investors (North America) Ltd., Lazard Asset Management LLC, Delaware Investments Fund Advisers, a series of Macquarie Investment Management Business Trust (Macquarie), Neuberger Berman Investment Advisers LLC, Qtron Investments LLC and RWC Asset Advisors (US) LLC.
During the period, Qtron Investments LLC was added to the Fund, while PanAgora Asset Management Inc. was removed from the Fund.
III. Return vs. Benchmark
For the year ended September 30, 2019, the Fund’s Class F shares underperformed the MSCI Emerging Markets Index (Gross) (the “Index”), returning-1.64% versus the Index return of-1.63%.
IV. Fund Attribution
As noted in the shareholder letter, emerging markets were slightly negative during the fiscal year and underperformed both the U.S. and developed markets. The Chinese economy continued to slow gradually, weakened by the effects of the ongoing U.S. trade war and the Chinese government’s deleveraging program. Throughout the year, Chinese regulators attempted to boost growth by adjusting policies to spur more borrowing and growth among consumers and small businesses. The Indian economy also slowed as a result of declining global economic activity and weaker consumer confidence and public finances. As expected, Prime Minister Modi won reelection in May. Elsewhere in Asia, Korea slowed as flagging exports from deteriorating global activity affected growth. Korea was also caught in a trade dispute with Japan that arose out of historical tensions, with each side imposing economic penalties on the other. Latin America was not immune to the slowdown in growth either, although progress in Brazil’s critical pension reform bill helped support equity prices in the country. Argentina, which was added into
the MSCI Emerging Markets Index over the summer, collapsed after a surprise defeat to incumbent president Macri in early election polls caught markets by surprise and caused equities to plummet. In the Europe, Middle East and Africa region, Russia and Greece posted positive returns, while South Africa continued to deal with general economic weakness. During the fiscal year, emerging-market central banks took the opportunity to cut rates after easing by the U.S. Federal Reserve and the European Central Bank.
The Fund’s overweight exposure to defensive sectors, notably real estate, utilities and consumer staples, was the largest contributor to Fund performance, as investors sought to shield themselves from deteriorating economic conditions and volatile market prices; positive selection in the financials and consumer discretionary sectors also benefited. Overweights to health care and materials detracted. From a regional perspective, the Fund’s most prominent contributors were in Greece and Russia, where strong security selection within banks contributed, and in India, which benefited from good selection within the energy sector.
Lazard contributed to relative Fund performance and benefited from positive selection in the financials and consumer discretionary sectors. Neuberger Berman outperformed through strong security selection in the information technology and financials sectors, as well as a tailwind to stability growth stocks. Macquarie also posted strong results due to security selection in the consumer discretionary sector, particularly within internet retailing stocks and the Indian energy sector. RWC showed negative absolute performance but outperformed the Fund benchmark; the manager contributed with strong selection results in semiconductor companies and Greek and Russian banks.
JO Hambro detracted, as the manager’s momentum-driven stock selection—especially in the financials and industrials sectors—was negatively impacted by style headwinds; continued rotation among market leadership was a drag on performance. KBI underperformed as its dividend-yield approach failed to keep up with market returns. Quantitative equity manager Qtron, which was added in December, detracted from Fund performance, with weak results in the industrials and communication services sectors. Before its termination in December, PanAgora detracted due to poor security selection within the consumer staples, materials, energy and industrials sectors.
8 |
SEI Institutional International Trust / Annual Report / September 30, 2019 |
AVERAGE ANNUAL TOTAL RETURN1
| 1 Year Return | Annualized 3 Year Return | Annualized 5 Year Return | Annualized 10 Year Return | Annualized Inception to Date | ||||||||||||||||
| Emerging Markets Equity Fund, Class F | -1.64% | 4.51% | 1.76% | 2.27% | 4.17% | |||||||||||||||
| Emerging Markets Equity Fund, Class Y | -1.44% | 4.78% | 2.02% | 2.40% | 4.22% | |||||||||||||||
| MSCI Emerging Markets Index (Gross) | -1.63% | 6.37% | 2.71% | 3.73% | 5.96% | |||||||||||||||
Comparison of Change in the Value of a $100,000 Investment in the Emerging Markets Equity Fund, Class F and Class Y, versus the MSCI Emerging Markets Index (Gross)
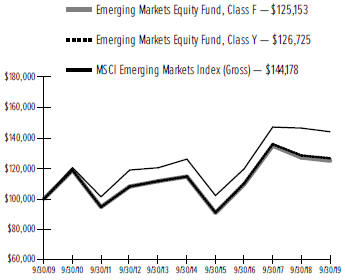
| 1 | For the year ended September 30, 2019. Past performance is no indication of future performance. Class F shares (formerly Class A shares) were offered beginning January 17, 1995. Class Y shares were offered beginning December 31, 2014. Class Y shares performance for the period prior to December 31, 2014 is derived from the performance of Class F shares adjusted for the lower expenses of the Class Y shares. Returns for Class Y shares are substantially similar to those of Class F shares and differ only to the extent that Class Y shares have lower total annual fund operating expenses than Class F shares. Returns shown do not reflect the deduction of taxes that a shareholder would pay on fund distributions or the redemption of fund shares. The returns for the period reflect fee waivers and/or reimbursements in effect for the period; absent fee waivers and reimbursements, performance would have been lower. |
SEI Institutional International Trust / Annual Report / September 30, 2019 |
9 |
MANAGEMENT’S DISCUSSION AND ANALYSIS OF FUND PERFORMANCE
September 30, 2019 (Unaudited)
International Fixed Income Fund
I. Objective
The International Fixed Income Fund (the “Fund”) seeks capital appreciation and current income.
II. Multi-Manager Approach Statement
The Fund uses a multi-manager approach, relying on a number ofsub-advisors with differing investment approaches to manage portions of the Fund’s portfolio, under the general supervision of SEI Investments Management Corporation (“SIMC”). The Fund utilized the followingsub-advisors as of September 30, 2019: AllianceBernstein L.P., Colchester Global Investors Limited and Wellington Management Company LLP.
No manager changes were made during the Fund’s fiscal year.
III. Return vs. Benchmark
For the year ended September 30, 2019, the Fund’s Class F shares underperformed the Bloomberg Barclays Global Aggregateex-USD Index, Hedged (the “Index”), returning 9.28% versus the Index return of 10.84%.
IV. Fund Attribution
Fixed-income markets registered strong performance over the fiscal year. As noted in the shareholder letter, this was fueled by a powerful rally in global bond yields against a backdrop of slowing economic data and more dovish central bank policy, led by the Federal Reserve.
All developed sovereign markets delivered strong returns, with Italy and the U.K. being the standout performers. The former benefited from the dual tailwind of falling global yields and significant spread tightening versus Germany.
Despite the strong bid for duration-sensitive assets, credit sectors also remained resilient, as spreads recovered well from a difficult fourth quarter of 2018. Spread products continued to benefit from the search for yield in a market environment that included approximately $17 trillion of negative-yielding sovereign debt by the end of the reporting period. Spread products are securities with a yield advantage over Treasurys due to investor demand for compensation for risk.
The disinflationary pulse was also evident in emerging markets, where below-trend growth enabled a number of central banks to cut interest rates. However, local-currency returns on an unhedged basis were pared as the U.S. dollar continued to grind higher.
The Fund underperformed its benchmark during the reporting period. Primary detractors were its
underweight duration positions in core Europe and the U.K. Duration overweights in Brazil, New Zealand and Mexico helped to recover some performance. The Fund also suffered fromoff-index exposure to inflation-linked bonds in Brazil and Japan, which underperformed duration-matched nominal bonds as global inflation expectations moderated over the period. Active currency positions yielded mixed results. Overweights to the Norwegian krone (“NOK”), Colombian peso (“COP”), Swedish krona (“SEK”), British pound (“GBP”), Polish zloty (“PLN”), Chilean peso (“CLP”), Mexican peso (“MXN”) and Brazilian real (“BRL”), along with a short in Thai baht (“THB”), all detracted, although some of this underperformance was offset by an overweight to the Japanese yen (“JPY”) and short positions in the Hungarian forint and New Zealand dollar. Currency hedges via euro/U.S. dollar forwards were also profitable. Lastly, theoff-index exposure to higher-yielding U.S. corporate bonds was additive.
Colchester underperformed due to an underweight to hard-currency markets, including the U.K., core Europe and Japan,off-index exposure to Brazilian inflation-linked bonds, overweights to NOK, COP, SEK, GBP, MXN, PLN and CLP and a short position in THB.
AllianceBernstein underperformed during the period. The underperformance was largely driven by duration underweights in the core markets (UK, core Europe, Japan, Switzerland and Canada),out-of-index exposure to U.S. Treasury inflation-protected securities and Japanese government bonds, and an overweight to BRL.
Wellington outperformed during the period, courtesy of overweight duration positions in the U.S., U.K., Australia and New Zealand, and an overweight to JPY.
AVERAGE ANNUAL TOTAL RETURN1
| 1 Year Return | Annualized 3 Year Return | Annualized 5 Year Return | Annualized 10 Year Return | Annualized Inception to Date | ||||||||||||||||
| International Fixed Income Fund, Class F | 9.28% | 3.12% | 3.72% | 3.98% | 4.36% | |||||||||||||||
| International Fixed Income Fund, Class Y | 9.54% | 3.39% | 3.93% | 4.08% | 4.39% | |||||||||||||||
| Bloomberg Barclays Global Aggregateex-USD Index, Hedged | 10.84% | 4.12% | 4.64% | 4.44% | 5.09% | |||||||||||||||
10 |
SEI Institutional International Trust / Annual Report / September 30, 2019 |
Comparison of Change in the Value of a $100,000 Investment in the International Fixed Income Fund, Class F versus the Bloomberg Barclays Global Aggregateex-USD Index, Hedged
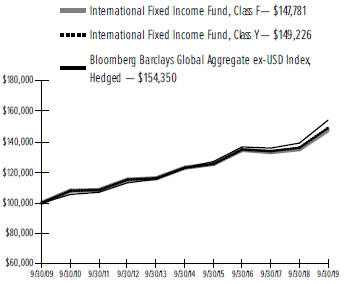
| 1 | For the year ended September 30, 2019. Past performance is no indication of future performance. Class F shares (formerly Class A shares) were offered beginning September 1, 1993. Class Y shares were offered beginning October 30, 2015. Class Y shares performance for the period prior to October 30, 2015 is derived from the performance of Class F shares adjusted for the lower expenses of the Class Y shares. Returns for Class Y shares are substantially similar to those of Class F shares and differ only to the extent that Class Y shares have lower total annual fund operating expenses than Class F shares. Returns shown do not reflect the deduction of taxes that a shareholder would pay on fund distributions or the redemption of fund shares. The returns for the period reflect fee waivers and/or reimbursements in effect for the period; absent fee waivers and reimbursements, performance would have been lower. |
SEI Institutional International Trust / Annual Report / September 30, 2019 |
11 |
MANAGEMENT’S DISCUSSION AND ANALYSIS OF FUND PERFORMANCE
September 30, 2019 (Unaudited)
Emerging Markets Debt Fund
I. Objective
The Emerging Markets Debt Fund (the “Fund”) seeks to maximize total return.
II. Multi-Manager Approach
The Fund uses a multi-manager approach, relying on a number ofsub-advisors with differing investment approaches to manage portions of the Fund’s portfolio, under the general supervision of SEI Investments Management Corp. (“SIMC”). The Fund utilized the followingsub-advisors as of September 30, 2019: Colchester Global Investors Limited, Investec Asset Management Ltd., Marathon Asset Management, L.P., Neuberger Berman Investment Advisers LLC and Stone Harbor Investment Partners LP.
During the period, Colchester Global Investors Limited and Marathon Asset Management, L.P. were added to the Fund.
III. Return vs. Benchmark
For the year ended September 30, 2019, the Fund’s Class F shares underperformed a hybrid of 50% JP Morgan EMBI Global Diversified Index and 50% JP MorganGBI-EM Global Diversified Index (together, “the Index”), returning 8.51% versus the Index return of 10.91%.
IV. Fund Attribution
Although spreads on the hard-currency component of the Fund’s Index only widened 2 basis points (bps)—from 335 bps to 337 bps—during the fiscal year, they were as wide as 423 bps in January and as tight as 319 bps in July (one basis point is equivalent to 0.01%). Nominal yields on the local-currency component of the Index tightened from about 6.60% to 5.21%.
Several macro themes affected markets over the reporting period, namely the shift in the U.S. Federal Reserve’s (Fed) policy from tightening to easing rates, the Trump administration’s protectionist stance, the U.S. trade war with China and continued uncertainty regarding the U.K.’s exit from the European Union. As noted in the shareholder letter, the U.S. Fed hiked rates 25 bps toward the end of December 2018, the ninth rate increase since December 2015, to bring the Fed’s policy rate to a range of2.25-2.50%. The end of this three-year hiking cycle coincided with fears of a global slowdown caused by ongoing trade wars, particularly between the U.S. and China; global assets sold off toward the end of 2018. This selloff reversed in the beginning of 2019 as U.S. bonds rallied. Hard-currency (HC) emerging-market
bonds lagged the U.S. rally, causing HC spreads to widen to 423 bps in early January. This lag was short-lived, however, and by the end of the month, spreads had tightened to 358 bps. Spreads remained range bound for the rest of the period. Hoping to stave off a U.S. recession caused by fears over a global economic slowdown, trade war rhetoric and Brexit uncertainty, the Fed cut 25 bps in both July and September. The Fed’s rate cuts presented the opportunity for other central banks around the globe to also cut their benchmark rates. In all, 17 emerging-market central banks cut rates at least one time in the third quarter of 2019, most citing global growth fears or a slowdown in domestic inflation as the reason for the cuts. Local-currency (LC) emerging-market yields sat at 6.06% at the end of May 2019; by the end of September, they were 5.21%.
An overweight position to Argentina was the most significant detractor over the fiscal year. A surprise result in the country’s primary election in August created serious doubts about incumbent Mauricio Macri’s ability to win a second term as president. Although the primary is designed to trim the field of presidential candidates ahead of the actual general election in October, the results showed Macri polling so poorly that a victory for opposition candidate Alberto Fernandez seemed all but assured. This revelation sent Argentinian assets into freefall; expectations that Macri will be voted out of office leave little chance that the fiscal reforms he has been backing will ever be fully implemented, casting serious doubt that the country will be able to meet future debt obligations or negotiate further deals with the International Monetary Fund. Alberto Fernandez is running with Cristina Fernandez de Kirchner—who is still under investigation for corruption charges dating back to her time as the country’s president—as his vice presidential candidate. Some fear that Alberto Fernandez will simply be a puppet for the former president, but most agree that he will be less market-friendly than Macri. Further complicating the situation is the fact that a long position in Argentina was a popular trade. Because the trade was so crowded, due to the assumption that Macri would win another term as president, there were not many parties on the other side to create liquidity as investors tried to exit their positions. By the end of August, the three major ratings agencies had downgraded Argentina’s sovereign credit rating and the country’s hard- and local-currency denominated debt had fallen by more than 50%. While the expectation remains that a Fernandez administration will be less market-friendly than Macri’s, the Fund’ssub-advisors expect the administration to be a bit more conservative than Argentina’s past liberal governments. Furthermore,
12 |
SEI Institutional International Trust / Annual Report / September 30, 2019 |
assets dropped so precipitously as to have gone past what fundamentals would dictate their fair recovery value to be. As a result, the Fund remains overweight the country.
An overweight to Mexico also detracted. Andres Manuel Lopez Obrador (AMLO) took over as president of Mexico in December 2018. Seen as a left-wing populist, markets were weary of his administration’s potential to increase spending. Although his first budget seemed to show his commitment to fiscal responsibility, a nationwide vote and subsequent cancellation left the already-begun international airport partially constructed and the Mexican government with $6 billion worth of bonds in support of the project to restructure. This situation threw into question how the incoming AMLO administration might treat other large projects and, more relevant to the Fund, the investors that help fund such projects. Despite this uncertainty, the Fund remains overweight Mexico as the Fed’s recent policy shift has relieved rate pressure on Mexican assets closely tied to the U.S. economy.
Egypt contributed to Fund performance. An overweight to local-currency bonds (denominated in Egyptian pounds) has been a long-held position in the Fund that continued to outperform as Egypt continued its strong recovery. After years of turmoil following the Arab Spring in2010-11, Egypt is now a great example of a successful fundamental adjustment to an economy. Egypt’s current account deficit has improved immensely since late 2016 as petroleum exports have doubled in recent years and tourism has rebounded. For much of the reporting period, the Egyptian central bank resisted the urge to cut rates as the situation improved, keeping rates high as core inflation came down below 10%. The central bank eventually did cut rates and growth itself inside the country is strong, near 5%, while revenues have increased as well. The Fund is invested primarily in short-dated local Egyptian bonds as the Egyptian pound is attractive and the bonds themselves offer attractive yields.
An overweight to Ukraine contributed. Sentiment in Ukraine improved following May’s election ofpro-West political newcomer Volodymyr Zelensky to president. The country has been mired in conflict for years aspro-Russian separatists have been fighting to take control of the Crimean Peninsula. Zelensky, however, has stated his commitment to the EU and the west and is viewed positively. Zelensky’s party performed extremely well in June’s parliamentary elections, obtaining an absolute majority in parliament for the first time in Ukraine’s post-Soviet history. This should give Zelensky a mandate to shape policy as he sees fit and allow him to pursue
stronger ties with the West as opposed to Russia, an outcome that markets view positively.
The Fund’s overweight to Gulf Cooperation Council (GCC) countries also contributed. The GCC countries of Saudi Arabia, Qatar, UAE and Bahrain were phased in to the hard currency component of the Fund’s index over nine months ending September 2019. Forced buying from passive strategies and exchange-traded funds, as well as active managers trying to build positioning, helped drive prices for these bonds higher, although the technicals weakened as the index positions grew closer to full implementation.
Stone Harbor detracted from performance throughout the fiscal year. Overweights to Argentina and Mexico hurt its sleeve, while an overweight to Ukraine and a lean into GCC countries entering the index helped. Neuberger Berman also detracted from performance over the period due to overweights to Argentina and Mexico; the manager was helped by overweights to Egypt and Ukraine. Investec contributed thanks to overweights to Egypt and Ukraine, but an overweight to Brazilian local currency detracted. Two managers, Marathon and Colchester, were added during the period as hard-currency only and local-currency only specialists, respectively. Marathon outperformed the Index after its addition to the Fund; it was helped by overweights to GCC countries entering the Index and hurt by underweights to Peru and the Philippines. Colchester also outperformed since its inclusion in the Fund. An overweight to Turkey and underweight to Brazil contributed, while underweights to Thailand and Peru detracted.
Currency forwards and swap contracts were used in the Fund for theone-year period ending September 30, 2019 as a way to either hedge particular positions or gain exposure to additional areas of the market. Currency forwards had a material impact on the Fund during the period as 50% of the Index is directly affected by foreign currencies. Positive and negative impacts differed on acountry-to-country basis, depending on whether the forward increased or decreased currency exposure and whether the currency strengthened or weakened relative to the U.S. dollar.
SEI Institutional International Trust / Annual Report / September 30, 2019 |
13 |
MANAGEMENT’S DISCUSSION AND ANALYSIS OF FUND PERFORMANCE
September 30, 2019 (Unaudited)
Emerging Markets Debt Fund(Concluded)
AVERAGE ANNUAL TOTAL RETURN1
| 1 Year Return | Annualized 3 Year Return | Annualized 5 Year Return | Annualized 10 Year Return | Annualized Inception to Date | ||||||||||||||||
| Emerging Markets Debt Fund, Class F | 8.51% | 2.64% | 1.75% | 3.94% | 7.52% | |||||||||||||||
| Emerging Markets Debt Fund, Class Y | 8.84% | 2.91% | 2.01% | 4.08% | 7.58% | |||||||||||||||
| JP Morgan EMBI Global Diversified Index | 11.57% | 4.61% | 5.74% | 6.88% | 8.37% | |||||||||||||||
| JP MorganGBI-EM Global Diversified Index | 10.13% | 3.06% | 0.55% | 2.47% | N/A | |||||||||||||||
| 50/50 Hybrid of the JP Morgan EMBI Global Diversified Index and the JP MorganGBI-EM Global Diversified Index | 10.91% | 3.89% | 3.19% | 4.95% | N/A | |||||||||||||||
Comparison of Change in the Value of a $100,000 Investment in the Emerging Markets Debt Fund, Class F and Class Y, versus a 50/50 Hybrid of the Following Indexes: the JP Morgan EMBI Global Diversified Index and the JP MorganGBI-EM Global Diversified Index
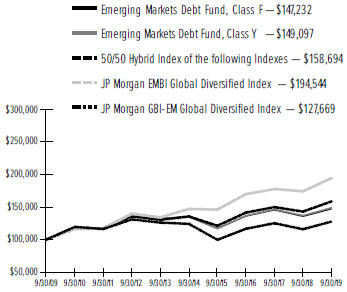
| ¹ | For the year ended September 30, 2019. Past performance is no indication of future performance. Class F shares (formerly Class A shares) were offered beginning June 26, 1997. Class Y shares were offered beginning December 31, 2014. Class Y shares performance for the period prior to December 31, 2014 is derived from the performance of Class F shares adjusted for the lower expenses of the Class Y shares. Returns for Class Y shares are substantially similar to those of Class F shares and differ only to the extent that Class Y shares have lower total annual fund operating expenses than Class F shares. Returns shown do not reflect the deduction of taxes that a shareholder would pay on fund distributions or the redemption of fund shares. The returns for the period reflect fee waivers and/or reimbursements in effect for the period; absent fee waivers and reimbursements, performance would have been lower. |
N/A — Not Available.
14 |
SEI Institutional International Trust / Annual Report / September 30, 2019 |
September 30, 2019
International Equity Fund
†Percentages based on total investments. Includes investments held as collateral for securities on loan (see Note 9).
| Description | Shares | Market Value ($ Thousands) | ||||||
COMMON STOCK — 93.4% | ||||||||
Argentina — 0.0% | ||||||||
Ternium SA ADR | 19,877 | $ | 381 | |||||
|
|
| ||||||
Australia — 2.8% | ||||||||
AGL Energy Ltd | 12,094 | 156 | ||||||
Alumina Ltd | 512,510 | 819 | ||||||
Aristocrat Leisure Ltd | 678,086 | 13,995 | ||||||
ASX Ltd | 31,001 | 1,695 | ||||||
Avita Medical Ltd *(A) | 31,876,085 | 12,684 | ||||||
BlueScope Steel Ltd | 619,881 | 5,021 | ||||||
Caltex Australia Ltd | 8,910 | 158 | ||||||
Challenger Ltd | 10,302 | 51 | ||||||
Coca-Cola Amatil Ltd | 96,571 | 694 | ||||||
Cochlear Ltd | 81,993 | 11,511 | ||||||
Coles Group Ltd | 41,701 | 433 | ||||||
Computershare Ltd | 96,628 | 1,053 | ||||||
CSL Ltd | 124,319 | 19,594 | ||||||
Evolution Mining Ltd | 365,925 | 1,118 | ||||||
Fortescue Metals Group Ltd | 1,405,171 | 8,340 | ||||||
Goodman Group‡ | 114,723 | 1,097 | ||||||
Iluka Resources Ltd | 52,770 | 284 | ||||||
Insurance Australia Group Ltd | 1,253,315 | 6,678 | ||||||
Lendlease Group | 103,482 | 1,226 | ||||||
Macquarie Group Ltd | 14,933 | 1,320 | ||||||
Newcrest Mining Ltd | 262,523 | 6,153 | ||||||
Qantas Airways Ltd | 2,028,241 | 8,605 | ||||||
Regis Resources Ltd | 76,556 | 253 | ||||||
Rio Tinto Ltd (A) | 18,857 | 1,179 | ||||||
Santos Ltd | 129,735 | 676 | ||||||
SEEK Ltd | 39,185 | 567 | ||||||
South32 Ltd | 3,969,894 | 7,015 | ||||||
Sydney Airport | 27,608 | 150 | ||||||
Treasury Wine Estates Ltd | 66,401 | 831 | ||||||
Woodside Petroleum Ltd | 7,453 | 163 | ||||||
|
|
| ||||||
| 113,519 | ||||||||
|
|
| ||||||
| Description | Shares | Market Value ($ Thousands) | ||||||
COMMON STOCK (continued) | ||||||||
Austria — 1.2% | ||||||||
Avita Medical Ltd ADR * | 2,852,265 | $ | 22,504 | |||||
BAWAG Group AG *(B) | 349,892 | 13,778 | ||||||
Erste Group Bank AG * | 56,659 | 1,874 | ||||||
OMV AG | 178,711 | 9,594 | ||||||
Raiffeisen Bank International AG | 34,099 | 792 | ||||||
voestalpine AG | 6,326 | 145 | ||||||
|
|
| ||||||
| 48,687 | ||||||||
|
|
| ||||||
Belgium — 1.2% | ||||||||
Ageas | 384,650 | 21,336 | ||||||
Colruyt SA | 12,143 | 666 | ||||||
Groupe Bruxelles Lambert SA | 110,243 | 10,589 | ||||||
KBC Group NV | 122,592 | 7,968 | ||||||
Proximus SADP | 29,818 | 886 | ||||||
UCB SA | 93,217 | 6,768 | ||||||
Umicore SA | 15,704 | 593 | ||||||
|
|
| ||||||
| 48,806 | ||||||||
|
|
| ||||||
Canada — 3.0% | ||||||||
Alimentation Couche-Tard Inc, Cl B | 246,708 | 7,565 | ||||||
Bank of Montreal | 32,900 | 2,425 | ||||||
Canadian Imperial Bank of Commerce (A) | 160,404 | 13,243 | ||||||
Canadian Natural Resources Ltd | 501,156 | 13,346 | ||||||
Canadian Pacific Railway Ltd | 74,714 | 16,621 | ||||||
CGI Inc, Cl A * | 13,800 | 1,092 | ||||||
Constellation Software Inc/Canada | 600 | 600 | ||||||
Crescent Point Energy Corp | 583,350 | 2,494 | ||||||
Dollarama Inc | 176,667 | 6,329 | ||||||
Encana Corp | 2,275,576 | 10,432 | ||||||
Gildan Activewear Inc | 252,641 | 8,972 | ||||||
Manulife Financial Corp | 388,022 | 7,121 | ||||||
Royal Bank of Canada | 149,493 | 12,134 | ||||||
Suncor Energy Inc | 232,333 | 7,333 | ||||||
Toronto-Dominion Bank/The | 187,186 | 10,922 | ||||||
|
|
| ||||||
| 120,629 | ||||||||
|
|
| ||||||
China — 1.2% | ||||||||
Alibaba Group Holding Ltd ADR * | 79,881 | 13,358 | ||||||
Baidu Inc ADR * | 112,839 | 11,595 | ||||||
BeiGene Ltd ADR * | 229 | 28 | ||||||
China Communications Services Corp Ltd, Cl H | 2,553,584 | 1,446 | ||||||
China Lesso Group Holdings Ltd | 696,000 | 659 | ||||||
Ping An Insurance Group Co of China Ltd, Cl H | 354,500 | 4,072 | ||||||
Sinopharm Group Co Ltd, Cl H | 512,737 | 1,606 | ||||||
Sinotruk Hong Kong Ltd | 153,254 | 227 | ||||||
Tencent Holdings Ltd | 320,700 | 13,508 | ||||||
Tsingtao Brewery Co Ltd, Cl H | 150,000 | 905 | ||||||
Vipshop Holdings Ltd ADR * | 275,507 | 2,458 | ||||||
|
|
| ||||||
| 49,862 | ||||||||
|
|
| ||||||
SEI Institutional International Trust / Annual Report / September 30, 2019 |
15 |
SCHEDULE OF INVESTMENTS
September 30, 2019
International Equity Fund(Continued)
| Description | Shares | Market Value ($ Thousands) | ||||||
COMMON STOCK (continued) | ||||||||
Denmark — 2.2% | ||||||||
AP Moller - Maersk A/S, Cl A | 163 | $ | 174 | |||||
Carlsberg A/S, Cl B | 10,263 | 1,517 | ||||||
Chr Hansen Holding A/S | 102,872 | 8,733 | ||||||
Coloplast A/S, Cl B | 17,592 | 2,119 | ||||||
Demant A/S * | 15,700 | 402 | ||||||
DSV A/S | 91,215 | 8,681 | ||||||
GN Store Nord A/S | 51,674 | 2,099 | ||||||
H Lundbeck A/S | 164,341 | 5,452 | ||||||
ISS A/S | 525,859 | 13,015 | ||||||
Novo Nordisk A/S, Cl B | 412,730 | 21,223 | ||||||
Novozymes A/S, Cl B | 119,878 | 5,041 | ||||||
Orsted A/S | 28,241 | 2,625 | ||||||
Scandinavian Tobacco Group A/S (B) | 1,339,439 | 15,676 | ||||||
SimCorp A/S | 30,019 | 2,637 | ||||||
Tryg A/S | 23,381 | 670 | ||||||
|
|
| ||||||
| 90,064 | ||||||||
|
|
| ||||||
Finland — 0.6% | ||||||||
Elisa Oyj, Cl A | 23,880 | 1,231 | ||||||
Fortum Oyj | 80,898 | 1,913 | ||||||
Neste Oyj | 399,300 | 13,221 | ||||||
Nokian Renkaat Oyj | 5,638 | 159 | ||||||
Orion Oyj, Cl B | 103,112 | 3,847 | ||||||
Stora Enso Oyj, Cl R | 102,724 | 1,238 | ||||||
UPM-Kymmene Oyj | 107,750 | 3,186 | ||||||
Valmet Oyj | 18,845 | 366 | ||||||
|
|
| ||||||
| 25,161 | ||||||||
|
|
| ||||||
France — 8.4% | ||||||||
Aeroports de Paris | 6,078 | 1,081 | ||||||
AirFrance-KLM * | 443,012 | 4,638 | ||||||
Air Liquide SA | 82,097 | 11,689 | ||||||
Airbus SE | 34,677 | 4,506 | ||||||
Akka Technologies | 4,517 | 311 | ||||||
Alstom SA * | 12,938 | 536 | ||||||
Arkema SA | 39,547 | 3,687 | ||||||
Atos SE | 95,103 | 6,706 | ||||||
BNP Paribas SA | 333,275 | 16,230 | ||||||
Bollore SA | 1,733,853 | 7,187 | ||||||
Bouygues SA | 5,771 | 231 | ||||||
Carrefour SA | 1,662,732 | 29,112 | ||||||
CGG SA * | 144,075 | 323 | ||||||
Christian Dior SE | 1,035 | 490 | ||||||
Cie de Saint-Gobain | 155,418 | 6,100 | ||||||
CNP Assurances | 36,439 | 704 | ||||||
Covivio‡ | 7,765 | 822 | ||||||
Credit Agricole SA | 63,862 | 776 | ||||||
Criteo SA ADR * | 60,571 | 1,132 | ||||||
Danone SA | 41,753 | 3,679 | ||||||
Dassault Aviation SA | 1,145 | 1,620 | ||||||
Dassault Systemes SE | 5,495 | 783 | ||||||
Edenred | 33,078 | 1,588 | ||||||
| Description | Shares | Market Value ($ Thousands) | ||||||
COMMON STOCK (continued) | ||||||||
Eiffage SA | 15,499 | $ | 1,607 | |||||
Electricite de France SA | 114,446 | 1,281 | ||||||
Engie SA | 610,661 | 9,973 | ||||||
EssilorLuxottica SA | 136,942 | 19,744 | ||||||
Euronext NV (B) | 59,056 | 4,832 | ||||||
Gecina SA‡ | 4,216 | 663 | ||||||
Hermes International | 6,416 | 4,435 | ||||||
Iliad SA | 3,845 | 361 | ||||||
Ingenico Group SA | 29,483 | 2,877 | ||||||
Ipsen SA | 57,008 | 5,413 | ||||||
IPSOS | 18,645 | 532 | ||||||
Kering SA | 9,764 | 4,977 | ||||||
L’Oreal SA | 23,335 | 6,536 | ||||||
LVMH Moet Hennessy Louis Vuitton SE | 55,919 | 22,230 | ||||||
Pernod Ricard SA | 129,556 | 23,079 | ||||||
Peugeot SA | 467,710 | 11,667 | ||||||
Publicis Groupe SA | 244,069 | 12,006 | ||||||
Quadient SAS | 14,441 | 299 | ||||||
Remy Cointreau SA | 564 | 75 | ||||||
Rexel SA | 190,436 | 2,038 | ||||||
Safran SA | 49,011 | 7,718 | ||||||
Sanofi | 245,620 | 22,777 | ||||||
Sartorius Stedim Biotech | 18,264 | 2,557 | ||||||
Schneider Electric SE | 58,554 | 5,139 | ||||||
SCOR SE | 33,377 | 1,379 | ||||||
SES SA, Cl A | 49,537 | 903 | ||||||
Suez | 27,782 | 437 | ||||||
TechnipFMC PLC | 282,353 | 6,775 | ||||||
Teleperformance | 3,627 | 787 | ||||||
Thales SA | 111,153 | 12,785 | ||||||
TOTAL SA | 517,015 | 26,990 | ||||||
Ubisoft Entertainment SA * | 191,086 | 13,820 | ||||||
Valeo SA | 7,311 | 237 | ||||||
Vivendi SA | 51,893 | 1,425 | ||||||
|
|
| ||||||
| 342,285 | ||||||||
|
|
| ||||||
Germany — 8.0% | ||||||||
adidas AG | 70,559 | 21,973 | ||||||
Allianz SE | 99,614 | 23,224 | ||||||
AURELIUS Equity Opportunities SE & Co KGaA (A) | 335,482 | 13,847 | ||||||
Axel Springer SE | 3,167 | 218 | ||||||
BASF SE | 372,815 | 26,061 | ||||||
Bayer AG | 377,020 | 26,589 | ||||||
Beiersdorf AG | 5,756 | 679 | ||||||
Brenntag AG | 146,038 | 7,069 | ||||||
Continental AG | 38,406 | 4,928 | ||||||
CTS Eventim AG & Co KGaA | 163,896 | 9,238 | ||||||
Deutsche Boerse AG | 54,777 | 8,564 | ||||||
Deutsche Lufthansa AG | 358,386 | 5,697 | ||||||
Deutsche Post AG | 705,643 | 23,575 | ||||||
Deutsche Wohnen SE | 35,082 | 1,281 | ||||||
Fresenius Medical Care AG & Co KGaA | 146,612 | 9,862 | ||||||
16 |
SEI Institutional International Trust / Annual Report / September 30, 2019 |
| Description | Shares | Market Value ($ Thousands) | ||||||
COMMON STOCK (continued) | ||||||||
Gerresheimer AG | 138,813 | $ | 9,958 | |||||
Hamburger Hafen und Logistik AG | 18,329 | 457 | ||||||
Hannover Rueck SE | 7,332 | 1,240 | ||||||
HOCHTIEF AG | 18,137 | 2,068 | ||||||
Infineon Technologies AG | 516,258 | 9,293 | ||||||
Linde PLC | 100,145 | 19,434 | ||||||
MTU Aero Engines AG | 6,839 | 1,818 | ||||||
Puma SE | 7,126 | 552 | ||||||
QIAGEN NV * | 5,213 | 170 | ||||||
RWE AG | 18,872 | 590 | ||||||
SAP SE | 336,208 | 39,542 | ||||||
SAP SE ADR (A) | 97,969 | 11,547 | ||||||
Scout24 AG (B) | 105,326 | 6,005 | ||||||
Siemens AG | 277,623 | 29,737 | ||||||
Siltronic AG | 14,292 | 1,086 | ||||||
TAG Immobilien AG | 16,160 | 369 | ||||||
Talanx AG | 7,946 | 343 | ||||||
Telefonica Deutschland Holding AG | 82,804 | 231 | ||||||
thyssenkrupp AG | 12,460 | 173 | ||||||
TUI AG | 79,974 | 932 | ||||||
Uniper SE | 43,887 | 1,440 | ||||||
United Internet AG | 5,323 | 190 | ||||||
Volkswagen AG | 966 | 166 | ||||||
Vonovia SE | 41,336 | 2,098 | ||||||
Wirecard AG | 2,836 | 454 | ||||||
|
|
| ||||||
| 322,698 | ||||||||
|
|
| ||||||
Greece — 0.0% | ||||||||
Aegean Airlines SA | 12,601 | 111 | ||||||
|
|
| ||||||
Hong Kong — 2.4% | ||||||||
AIA Group Ltd | 2,218,000 | 20,951 | ||||||
ASM Pacific Technology Ltd | 18,700 | 228 | ||||||
Bank of East Asia Ltd/The | 57,200 | 141 | ||||||
Budweiser Brewing Co APAC Ltd *(B) | 416,000 | 1,496 | ||||||
Chaoda Modern Agriculture Holdings Ltd * | 2,440,000 | 18 | ||||||
China Merchants Port Holdings Co Ltd (A) | 2,107,720 | 3,173 | ||||||
China Mobile Ltd | 2,554,982 | 21,136 | ||||||
CITIC Ltd | 523,000 | 660 | ||||||
CLP Holdings Ltd | 81,500 | 856 | ||||||
Country Garden Services Holdings Co Ltd | 402,000 | 1,159 | ||||||
Dairy Farm International Holdings Ltd | 40,800 | 257 | ||||||
Galaxy Entertainment Group Ltd * | 642,000 | 3,992 | ||||||
Hang Seng Bank Ltd | 96,200 | 2,074 | ||||||
Hebei Construction Group Corp Ltd, Cl H (A) | 714,000 | 534 | ||||||
HK Electric Investments & HK Electric Investments Ltd | 472,000 | 450 | ||||||
HKT Trust & HKT Ltd | 686,000 | 1,089 | ||||||
Hong Kong & China Gas Co Ltd | 592,300 | 1,154 | ||||||
Hysan Development Co Ltd | 53,000 | 214 | ||||||
Kingdee International Software Group Co Ltd (A) | 2,235,000 | 2,355 | ||||||
Lenovo Group Ltd | 470,000 | 314 | ||||||
| Description | Shares | Market Value ($ Thousands) | ||||||
COMMON STOCK (continued) | ||||||||
Link REIT‡ | 93,000 | $ | 1,026 | |||||
Logan Property Holdings Co Ltd | 214,000 | 305 | ||||||
Melco Resorts & Entertainment Ltd ADR | 12,240 | 238 | ||||||
NagaCorp Ltd | 286,000 | 447 | ||||||
Samsonite International SA (B) | 4,508,011 | 9,546 | ||||||
SITC International Holdings Co Ltd | 2,340,000 | 2,412 | ||||||
Sun Hung Kai Properties Ltd | 142,000 | 2,043 | ||||||
Swire Pacific Ltd, Cl A | 178,000 | 1,656 | ||||||
Techtronic Industries Co Ltd | 1,873,500 | 13,036 | ||||||
TPV Technology Ltd | 484,798 | 230 | ||||||
West China Cement Ltd | 1,816,000 | 296 | ||||||
Wharf Holdings Ltd/The | 79,000 | 172 | ||||||
Wharf Real Estate Investment Co Ltd | 155,000 | 846 | ||||||
Zoomlion Heavy Industry Science and Technology Co Ltd (A) | 1,600,000 | 1,084 | ||||||
|
|
| ||||||
| 95,588 | ||||||||
|
|
| ||||||
Hungary — 0.0% | ||||||||
MOL Hungarian Oil & Gas PLC | 128,857 | 1,212 | ||||||
|
|
| ||||||
India — 0.4% | ||||||||
HDFC Bank Ltd ADR | 250,494 | 14,291 | ||||||
|
|
| ||||||
Ireland — 1.5% | ||||||||
AIB Group PLC | 49,714 | 148 | ||||||
Experian PLC | 624,677 | 20,007 | ||||||
ICON PLC * | 108,273 | 15,953 | ||||||
Kerry Group PLC, Cl A | 113,228 | 13,245 | ||||||
Ryanair Holdings PLC ADR * | 200,235 | 13,291 | ||||||
|
|
| ||||||
| 62,644 | ||||||||
|
|
| ||||||
Israel — 1.5% | ||||||||
Bank Hapoalim BM | 826,280 | 6,517 | ||||||
Bank LeumiLe-Israel BM | 2,403,772 | 17,106 | ||||||
Check Point Software Technologies Ltd * | 166,536 | 18,236 | ||||||
First International Bank Of Israel Ltd | 35,610 | 948 | ||||||
Israel Chemicals Ltd | 133,589 | 664 | ||||||
Israel Discount Bank Ltd, Cl A | 574,044 | 2,523 | ||||||
Mizrahi Tefahot Bank Ltd | 54,493 | 1,355 | ||||||
Nice Ltd * | 21,786 | 3,190 | ||||||
Nice Ltd ADR *(A) | 82,829 | 11,911 | ||||||
Teva Pharmaceutical Industries Ltd ADR * | 35,720 | 246 | ||||||
|
|
| ||||||
| 62,696 | ||||||||
|
|
| ||||||
Italy — 2.3% | ||||||||
Assicurazioni Generali SpA | 31,155 | 604 | ||||||
Banca Mediolanum SpA | 52,461 | 394 | ||||||
Davide Campari-Milano SpA | 25,681 | 232 | ||||||
Eni SpA | 69,977 | 1,071 | ||||||
ERG SpA | 85,176 | 1,718 | ||||||
EXOR NV | 124,839 | 8,367 | ||||||
Ferrari NV | 7,622 | 1,176 | ||||||
Fiat Chrysler Automobiles NV | 478,388 | 6,192 | ||||||
Hera SpA | 361,886 | 1,486 | ||||||
Leonardo SpA | 534,692 | 6,290 | ||||||
SEI Institutional International Trust / Annual Report / September 30, 2019 |
17 |
SCHEDULE OF INVESTMENTS
September 30, 2019
International Equity Fund(Continued)
| Description | Shares | Market Value ($ Thousands) | ||||||
COMMON STOCK (continued) | ||||||||
Mediobanca Banca di Credito Finanziario SpA | 22,541 | $ | 246 | |||||
Moncler SpA | 28,012 | 999 | ||||||
Nexi SpA *(B) | 403,100 | 4,111 | ||||||
Piaggio & C SpA | 140,715 | 416 | ||||||
Poste Italiane SpA | 89,045 | 1,013 | ||||||
PRADA SpA | 2,059,072 | 5,988 | ||||||
Recordati SpA | 221,109 | 9,488 | ||||||
Saras SpA | 692,920 | 1,186 | ||||||
Telecom Italia SpA/Milano * | 1,846,033 | 1,030 | ||||||
Tenaris SA | 1,378,923 | 14,633 | ||||||
UniCredit SpA | 2,148,991 | 25,350 | ||||||
UnipolSai Assicurazioni SpA | 108,643 | 289 | ||||||
|
|
| ||||||
| 92,279 | ||||||||
|
|
| ||||||
Japan — 16.4% | ||||||||
77 Bank Ltd/The | 71,900 | 1,066 | ||||||
Aeon Co Ltd | 120,700 | 2,212 | ||||||
AGC Inc/Japan | 102,400 | 3,174 | ||||||
Alfresa Holdings Corp | 29,100 | 650 | ||||||
Amada Holdings Co Ltd | 17,100 | 184 | ||||||
Arcland Sakamoto Co Ltd | 33,873 | 393 | ||||||
Asahi Group Holdings Ltd | 26,200 | 1,297 | ||||||
Asahi Kasei Corp | 10,400 | 102 | ||||||
Astellas Pharma Inc | 31,600 | 450 | ||||||
Bandai Namco Holdings Inc (A) | 193,130 | 12,026 | ||||||
Bridgestone Corp | 194,800 | 7,542 | ||||||
Brother Industries Ltd | 8,700 | 157 | ||||||
Canon Marketing Japan Inc | 144,800 | 3,074 | ||||||
Capcom Co Ltd | 174,900 | 4,633 | ||||||
Casio Computer Co Ltd | 32,400 | 502 | ||||||
Chiba Bank Ltd/The | 41,000 | 211 | ||||||
Chubu Electric Power Co Inc | 73,300 | 1,061 | ||||||
Chugoku Electric Power Co Inc/The (A) | 51,900 | 667 | ||||||
Coca-Cola Bottlers Japan Holdings Inc | 94,700 | 2,124 | ||||||
Concordia Financial Group Ltd | 45,600 | 175 | ||||||
CyberAgent Inc | 8,100 | 311 | ||||||
Dai Nippon Printing Co Ltd | 462,700 | 11,949 | ||||||
Daiichi Sankyo Co Ltd | 50,000 | 3,148 | ||||||
Daikin Industries Ltd | 68,500 | 8,988 | ||||||
Daito Trust Construction Co Ltd | 49,100 | 6,274 | ||||||
Daiwa House Industry Co Ltd | 218,500 | 7,088 | ||||||
East Japan Railway Co | 158,000 | 15,073 | ||||||
Eisai Co Ltd | 9,200 | 467 | ||||||
Electric Power Development Co Ltd | 13,800 | 315 | ||||||
FamilyMart Co Ltd | 50,800 | 1,238 | ||||||
FANUC Corp | 88,600 | 16,675 | ||||||
Fast Retailing Co Ltd | 1,200 | 713 | ||||||
FUJIFILM Holdings Corp | 225,900 | 9,908 | ||||||
Fujitsu Ltd | 174,800 | 13,999 | ||||||
Glory Ltd | 9,900 | 278 | ||||||
Goldcrest Co Ltd | 13,992 | 275 | ||||||
GungHo Online Entertainment Inc * | 17,040 | 386 | ||||||
| Description | Shares | Market Value ($ Thousands) | ||||||
COMMON STOCK (continued) | ||||||||
Hakuhodo DY Holdings Inc | 131,900 | $ | 1,905 | |||||
Haseko Corp | 515,300 | 5,998 | ||||||
Hikari Tsushin Inc | 1,000 | 216 | ||||||
Hino Motors Ltd | 21,400 | 176 | ||||||
Hitachi Construction Machinery Co Ltd | 9,400 | 227 | ||||||
Hitachi Ltd | 257,100 | 9,570 | ||||||
Hoya Corp | 100,300 | 8,184 | ||||||
Idemitsu Kosan Co Ltd | 34,156 | 965 | ||||||
IHI Corp | 21,100 | 458 | ||||||
Iida Group Holdings Co Ltd | 12,500 | 203 | ||||||
ITOCHU Corp | 221,700 | 4,577 | ||||||
Japan Airlines Co Ltd | 3,600 | 107 | ||||||
Japan Post Bank Co Ltd (A) | 109,900 | 1,065 | ||||||
Japan Post Holdings Co Ltd (A) | 313,900 | 2,890 | ||||||
Japan Prime Realty Investment Corp, Cl A‡ | 113 | 536 | ||||||
Japan Real Estate Investment Corp, Cl A‡ | 86 | 577 | ||||||
Japan Retail Fund Investment Corp, Cl A | 79 | 167 | ||||||
JTEKT Corp | 15,200 | 174 | ||||||
JXTG Holdings Inc (A) | 611,400 | 2,786 | ||||||
Kansai Paint Co Ltd | 20,700 | 481 | ||||||
Kao Corp | 98,100 | 7,247 | ||||||
KDDI Corp (A) | 782,400 | 20,451 | ||||||
Keihan Holdings Co Ltd | 18,600 | 827 | ||||||
Keio Corp | 13,500 | 841 | ||||||
Keisei Electric Railway Co Ltd | 7,100 | 292 | ||||||
Keyence Corp | 30,800 | 19,066 | ||||||
Kikkoman Corp | 28,700 | 1,370 | ||||||
Kirin Holdings Co Ltd | 112,300 | 2,377 | ||||||
Kobayashi Pharmaceutical Co Ltd | 2,400 | 183 | ||||||
Kohnan Shoji Co Ltd | 18,600 | 411 | ||||||
Kokuyo Co Ltd | 60,300 | 841 | ||||||
Konami Holdings Corp | 116,700 | 5,637 | ||||||
Kose Corp (A) | 58,600 | 9,895 | ||||||
Kyushu Electric Power Co Inc | 45,900 | 433 | ||||||
Mabuchi Motor Co Ltd (A) | 389,800 | 14,517 | ||||||
Marubeni Corp | 265,100 | 1,760 | ||||||
Marui Group Co Ltd | 30,900 | 652 | ||||||
McDonald’s Holdings Co Japan Ltd | 10,600 | 513 | ||||||
Mebuki Financial Group Inc | 96,300 | 237 | ||||||
Medipal Holdings Corp | 24,100 | 536 | ||||||
Mitsubishi Chemical Holdings Corp | 34,500 | 246 | ||||||
Mitsubishi Corp | 68,700 | 1,685 | ||||||
Mitsubishi Heavy Industries Ltd | 12,300 | 482 | ||||||
Mitsubishi UFJ Financial Group Inc | 1,410,800 | 7,159 | ||||||
Mitsui & Co Ltd | 35,900 | 587 | ||||||
Mixi Inc | 141,600 | 2,978 | ||||||
Mizuho Financial Group Inc | 1,864,800 | 2,857 | ||||||
Mizuno Corp | 20,600 | 534 | ||||||
Mochida Pharmaceutical Co Ltd | 6,200 | 237 | ||||||
Morinaga & Co Ltd/Japan | 105,400 | 5,120 | ||||||
MS&AD Insurance Group Holdings Inc | 580,300 | 18,793 | ||||||
Nabtesco Corp | 7,000 | 217 | ||||||
18 |
SEI Institutional International Trust / Annual Report / September 30, 2019 |
| Description | Shares | Market Value ($ Thousands) | ||||||
COMMON STOCK (continued) | ||||||||
NET One Systems Co Ltd | 458,400 | $ | 12,356 | |||||
NGK Spark Plug Co Ltd | 26,800 | 510 | ||||||
Nidec Corp | 12,300 | 1,652 | ||||||
Nihon M&A Center Inc | 261,600 | 7,358 | ||||||
Nihon Unisys Ltd | 117,900 | 3,796 | ||||||
Nikon Corp | 325,700 | 4,063 | ||||||
Nintendo Co Ltd | 11,500 | 4,259 | ||||||
Nippon Building Fund Inc, Cl A | 183 | 1,405 | ||||||
Nippon Paint Holdings Co Ltd | 4,700 | 244 | ||||||
Nippon Prologis REIT Inc | 79 | 217 | ||||||
Nippon Telegraph & Telephone Corp | 210,200 | 10,028 | ||||||
Nippon Telegraph & Telephone Corp ADR | 468,420 | 22,433 | ||||||
Nissan Chemical Corp | 26,500 | 1,102 | ||||||
Nisshin Seifun Group Inc | 34,500 | 638 | ||||||
Nomura Real Estate Holdings Inc | 10,100 | 218 | ||||||
Nomura Real Estate Master Fund Inc‡ | 255 | 461 | ||||||
North Pacific Bank Ltd | 232,900 | 494 | ||||||
NSK Ltd | 21,300 | 179 | ||||||
NTT Data Corp | 258,200 | 3,330 | ||||||
NTT DOCOMO Inc | 213,600 | 5,441 | ||||||
Obic Co Ltd | 9,300 | 1,060 | ||||||
Oji Holdings Corp | 70,300 | 328 | ||||||
Oriental Land Co Ltd/Japan | 22,700 | 3,453 | ||||||
Otsuka Corp | 80,400 | 3,203 | ||||||
Pan Pacific International Holdings Corp | 44,400 | 742 | ||||||
Park24 Co Ltd | 17,100 | 397 | ||||||
Persol Holdings Co Ltd (A) | 314,500 | 5,942 | ||||||
Recruit Holdings Co Ltd | 63,000 | 1,916 | ||||||
Resona Holdings Inc | 1,586,200 | 6,795 | ||||||
Rinnai Corp | 3,100 | 208 | ||||||
Rohm Co Ltd | 198,400 | 15,145 | ||||||
Ryohin Keikaku Co Ltd | 25,000 | 467 | ||||||
Sanwa Holdings Corp | 773,200 | 8,642 | ||||||
SBI Holdings Inc/Japan (A) | 33,500 | 716 | ||||||
SCSK Corp | 136,000 | 6,380 | ||||||
Secom Co Ltd | 8,600 | 785 | ||||||
Seiko Epson Corp | 14,800 | 208 | ||||||
Seiko Holdings Corp | 28,400 | 627 | ||||||
Sekisui House Ltd | 752,600 | 14,798 | ||||||
Seven & i Holdings Co Ltd | 602,000 | 23,016 | ||||||
SG Holdings Co Ltd | 8,700 | 213 | ||||||
Sharp Corp/Japan | 21,700 | 240 | ||||||
Shionogi & Co Ltd | 165,100 | 9,164 | ||||||
Shiseido Co Ltd | 21,100 | 1,685 | ||||||
Showa Corp | 45,600 | 657 | ||||||
SMC Corp/Japan | 7,300 | 3,114 | ||||||
Softbank Corp (A) | 111,900 | 1,516 | ||||||
Sompo Holdings Inc | 280,800 | 11,736 | ||||||
Sony Corp ADR | 108,900 | 6,439 | ||||||
Sony Financial Holdings Inc | 31,700 | 687 | ||||||
SUMCO Corp | 29,800 | 400 | ||||||
Sumitomo Corp | 216,700 | 3,385 | ||||||
| Description | Shares | Market Value ($ Thousands) | ||||||
COMMON STOCK (continued) | ||||||||
Sumitomo Dainippon Pharma Co Ltd | 21,500 | $ | 353 | |||||
Sumitomo Mitsui Financial Group Inc | 416,300 | 14,233 | ||||||
Sumitomo Mitsui Trust Holdings Inc | 423,422 | 15,264 | ||||||
Suzuken Co Ltd/Aichi Japan | 16,600 | 891 | ||||||
Suzuki Motor Corp | 57,555 | 2,443 | ||||||
Taisho Pharmaceutical Holdings Co Ltd | 7,500 | 545 | ||||||
Takeda Pharmaceutical Co Ltd | 1,084,200 | 37,018 | ||||||
Takeda Pharmaceutical Co Ltd ADR | 83,793 | 1,441 | ||||||
Takuma Co Ltd | 25,200 | 286 | ||||||
TDK Corp | 3,600 | 322 | ||||||
Terumo Corp | 191,200 | 6,157 | ||||||
THK Co Ltd | 7,000 | 183 | ||||||
TIS Inc | 76,700 | 4,421 | ||||||
Toho Gas Co Ltd | 15,100 | 577 | ||||||
Tohoku Electric Power Co Inc | 34,200 | 334 | ||||||
Tokio Marine Holdings Inc | 37,600 | 2,010 | ||||||
Tokyo Electric Power Co Holdings Inc * | 915,600 | 4,482 | ||||||
Tokyu Corp | 20,900 | 392 | ||||||
Tomy Co Ltd | 55,500 | 634 | ||||||
Tosoh Corp | 27,100 | 358 | ||||||
Toyo Seikan Group Holdings Ltd | 27,000 | 419 | ||||||
Toyota Motor Corp | 126,400 | 8,439 | ||||||
Toyota Motor Corp ADR (A) | 142,721 | 19,195 | ||||||
United Urban Investment Corp | 403 | 772 | ||||||
Universal Entertainment * | 218,300 | 7,049 | ||||||
Wacoal Holdings Corp | 401,252 | 10,310 | ||||||
Yamaha Corp (A) | 27,400 | 1,230 | ||||||
Yamato Holdings Co Ltd | 55,200 | 830 | ||||||
Yaskawa Electric Corp (A) | 7,400 | 271 | ||||||
Yokogawa Electric Corp | 13,500 | 247 | ||||||
|
|
| ||||||
| 664,382 | ||||||||
|
|
| ||||||
Malta — 0.0% | ||||||||
BGP Holdings *(C) | 198,683 | – | ||||||
|
|
| ||||||
Mexico — 0.6% | ||||||||
Arca Continental SAB de CV | 1,261,305 | 6,835 | ||||||
Becle SAB de CV | 6,126,200 | 9,001 | ||||||
Orbia Advance Corp SAB de CV | 43,366 | 85 | ||||||
Wal-Mart de Mexico SAB de CV | 3,487,100 | 10,330 | ||||||
|
|
| ||||||
| 26,251 | ||||||||
|
|
| ||||||
Netherlands — 5.6% | ||||||||
ABN AMRO Bank NV (B) | 81,140 | 1,431 | ||||||
Aegon NV | 289,717 | 1,206 | ||||||
AerCap Holdings NV * | 202,847 | 11,106 | ||||||
Akzo Nobel NV | 133,550 | 11,908 | ||||||
ASM International NV | 6,231 | 574 | ||||||
ASML Holding NV | 68,732 | 17,028 | ||||||
ASR Nederland NV | 197,831 | 7,305 | ||||||
Basic-Fit NV *(B) | 202,595 | 6,350 | ||||||
Heineken Holding NV | 97,131 | 9,673 | ||||||
Heineken NV | 115,876 | 12,527 | ||||||
ING Groep NV | 2,535,226 | 26,544 | ||||||
SEI Institutional International Trust / Annual Report / September 30, 2019 |
19 |
SCHEDULE OF INVESTMENTS
September 30, 2019
International Equity Fund(Continued)
| Description | Shares | Market Value ($ Thousands) | ||||||
COMMON STOCK (continued) | ||||||||
Intertrust NV (B) | 195,999 | $ | 3,833 | |||||
Koninklijke Ahold Delhaize NV | 666,885 | 16,689 | ||||||
Koninklijke DSM NV | 121,966 | 14,680 | ||||||
Koninklijke KPN NV | 965,592 | 3,012 | ||||||
Koninklijke Philips NV | 255,907 | 11,857 | ||||||
Koninklijke Volkerwessels NV | 31,666 | 561 | ||||||
NN Group NV | 61,885 | 2,195 | ||||||
NXP Semiconductors NV | 77,210 | 8,425 | ||||||
Royal Dutch Shell PLC, Cl A | 6,109 | 180 | ||||||
Royal Dutch Shell PLC, Cl B | 621,054 | 18,337 | ||||||
Royal Dutch Shell PLC ADR, Cl B | 267,285 | 16,010 | ||||||
Unilever NV | 25,422 | 1,529 | ||||||
Wolters Kluwer NV | 353,314 | 25,800 | ||||||
|
|
| ||||||
| 228,760 | ||||||||
|
|
| ||||||
New Zealand — 0.1% | ||||||||
Air New Zealand Ltd | 608,322 | 1,068 | ||||||
Fisher & Paykel Healthcare Corp Ltd | 73,060 | 793 | ||||||
Ryman Healthcare Ltd | 4,272 | 36 | ||||||
Spark New Zealand Ltd | 145,489 | 402 | ||||||
|
|
| ||||||
| 2,299 | ||||||||
|
|
| ||||||
Norway — 2.0% | ||||||||
Adevinta ASA, Cl B * | 743,144 | 8,604 | ||||||
Aker BP ASA | 7,719 | 207 | ||||||
Atlantic Sapphire AS * | 3,048,760 | 35,568 | ||||||
DNB ASA | 38,779 | 684 | ||||||
Equinor ASA | 71,030 | 1,353 | ||||||
Magseis Fairfield ASA *(A) | 6,944,578 | 7,949 | ||||||
Mowi ASA | 1,176,680 | 27,183 | ||||||
|
|
| ||||||
| 81,548 | ||||||||
|
|
| ||||||
Portugal — 0.2% | ||||||||
Altri SGPS SA | 38,046 | 253 | ||||||
EDP - Energias de Portugal SA | 99,359 | 386 | ||||||
Galp Energia SGPS SA, Cl B | 401,083 | 6,045 | ||||||
|
|
| ||||||
| 6,684 | ||||||||
|
|
| ||||||
Russia — 0.1% | ||||||||
Tatneft PJSC ADR | 50,029 | 3,177 | ||||||
|
|
| ||||||
Singapore — 1.1% | ||||||||
CapitaLand Commercial Trust‡ | 114,000 | 171 | ||||||
City Developments Ltd | 1,883,900 | 13,378 | ||||||
ComfortDelGro Corp Ltd | 113,600 | 197 | ||||||
DBS Group Holdings Ltd | 1,082,600 | 19,571 | ||||||
Genting Singapore Ltd | 466,300 | 297 | ||||||
Hong Leong Finance Ltd | 68,524 | 128 | ||||||
Oversea-Chinese Banking Corp Ltd | 996,600 | 7,826 | ||||||
Singapore Exchange Ltd | 381,600 | 2,337 | ||||||
Singapore Technologies Engineering Ltd | 75,100 | 208 | ||||||
United Overseas Bank Ltd | 20,300 | 377 | ||||||
|
|
| ||||||
| 44,490 | ||||||||
|
|
| ||||||
| Description | Shares | Market Value ($ Thousands) | ||||||
COMMON STOCK (continued) | ||||||||
South Africa — 0.1% | ||||||||
DataTec Ltd | 100,188 | $ | 221 | |||||
Investec PLC (A) | 416,323 | 2,165 | ||||||
Reunert Ltd | 66,574 | 303 | ||||||
Telkom SA SOC Ltd | 105,047 | 489 | ||||||
|
|
| ||||||
| 3,178 | ||||||||
|
|
| ||||||
South Korea — 2.0% | ||||||||
BNK Financial Group Inc | 261,151 | 1,570 | ||||||
Daelim Industrial Co Ltd | 14,905 | 1,296 | ||||||
DGB Financial Group Inc | 117,902 | 734 | ||||||
Doosan Bobcat Inc | 12,036 | 356 | ||||||
Doosan Infracore Co Ltd *(A) | 146,354 | 771 | ||||||
Hanwha Aerospace Co Ltd * | 6,332 | 223 | ||||||
Hyundai Wia Corp | 6,494 | 277 | ||||||
ICD Co Ltd (A) | 19,092 | 235 | ||||||
Kangwon Land Inc | 366,844 | 9,063 | ||||||
Kia Motors Corp | 10,621 | 405 | ||||||
KT Corp ADR | 432,095 | 4,887 | ||||||
LG Display Co Ltd *(A) | 41,127 | 486 | ||||||
LG Electronics Inc | 40,173 | 2,264 | ||||||
LMS Co Ltd/South Korea (A) | 43,525 | 631 | ||||||
Meritz Securities Co Ltd | 156,827 | 662 | ||||||
NHN KCP Corp (A) | 18,555 | 331 | ||||||
Samsung Electronics Co Ltd | 442,337 | 18,139 | ||||||
SK Innovation Co Ltd | 23,209 | 3,221 | ||||||
SK Telecom Co Ltd | 70,174 | 14,168 | ||||||
SK Telecom Co Ltd ADR | 715,278 | 15,879 | ||||||
Woongjin Coway Co Ltd | 78,720 | 5,567 | ||||||
|
|
| ||||||
| 81,165 | ||||||||
|
|
| ||||||
Spain — 1.2% | ||||||||
ACS Actividades de Construccion y Servicios SA | 106,020 | 4,237 | ||||||
Amadeus IT Group SA, Cl A | 183,302 | 13,133 | ||||||
Banco de Sabadell SA | 147,865 | 143 | ||||||
Bankinter SA | 114,397 | 723 | ||||||
CaixaBank SA | 2,807,494 | 7,376 | ||||||
Cia de Distribucion Integral Logista Holdings SA | 57,814 | 1,127 | ||||||
Enagas SA | 10,045 | 233 | ||||||
Endesa SA | 15,314 | 403 | ||||||
Iberdrola SA | 175,329 | 1,823 | ||||||
Indra Sistemas SA * | 632,113 | 5,472 | ||||||
Mapfre SA | 90,080 | 243 | ||||||
Naturgy Energy Group SA | 63,264 | 1,679 | ||||||
Red Electrica Corp SA | 23,009 | 467 | ||||||
Repsol SA | 108,142 | 1,691 | ||||||
Unicaja Banco SA (B) | 11,477,455 | 9,134 | ||||||
|
|
| ||||||
| 47,884 | ||||||||
|
|
| ||||||
Sweden — 1.1% | ||||||||
Assa Abloy AB, Cl B | 219,851 | 4,899 | ||||||
Atlas Copco AB, Cl A | 263,656 | 8,130 | ||||||
20 |
SEI Institutional International Trust / Annual Report / September 30, 2019 |
| Description | Shares | Market Value ($ Thousands) | ||||||
COMMON STOCK (continued) | ||||||||
Axfood AB | 48,823 | $ | 1,038 | |||||
Betsson AB | 203,606 | 987 | ||||||
Electrolux AB, Cl B | 6,754 | 160 | ||||||
Epiroc AB, Cl A | 33,344 | 362 | ||||||
Epiroc AB, Cl B | 49,755 | 515 | ||||||
EQT AB * | 150,900 | 1,343 | ||||||
Fastighets AB Balder, Cl B * | 14,503 | 550 | ||||||
Getinge AB, Cl B | 60,456 | 847 | ||||||
ICA Gruppen AB (A) | 90,647 | 4,193 | ||||||
Lundin Petroleum AB | 21,378 | 642 | ||||||
Millicom International Cellular SA | 204,924 | 9,954 | ||||||
Sandvik AB | 58,350 | 910 | ||||||
SKF AB, Cl B | 28,766 | 476 | ||||||
Swedbank AB, Cl A | 267,019 | 3,848 | ||||||
Swedish Match AB | 118,489 | 4,906 | ||||||
Tele2 AB, Cl B | 10,982 | 164 | ||||||
Telefonaktiebolaget LM Ericsson, Cl B | 38,126 | 305 | ||||||
Telia Co AB | 125,333 | 562 | ||||||
|
|
| ||||||
| 44,791 | ||||||||
|
|
| ||||||
Switzerland — 7.0% | ||||||||
ABB Ltd | 1,078,191 | 21,204 | ||||||
Adecco Group AG | 213,092 | 11,801 | ||||||
Alcon Inc * | 234,644 | 13,695 | ||||||
Aryzta AG * | 2,870,877 | 2,188 | ||||||
Baloise Holding AG | 10,010 | 1,795 | ||||||
Barry Callebaut AG | 371 | 766 | ||||||
Chocoladefabriken Lindt & Spruengli AG | 233 | 3,080 | ||||||
Cie Financiere Richemont SA | 57,575 | 4,228 | ||||||
Dufry AG | 4,644 | 389 | ||||||
Geberit AG | 18,435 | 8,811 | ||||||
Givaudan SA | 2,286 | 6,382 | ||||||
Julius Baer Group Ltd | 211,563 | 9,382 | ||||||
Kuehne + Nagel International AG | 1,566 | 231 | ||||||
Lonza Group AG | 21,476 | 7,266 | ||||||
Nestle SA | 163,425 | 17,746 | ||||||
Novartis AG | 352,555 | 30,597 | ||||||
Partners Group Holding AG | 12,071 | 9,270 | ||||||
Roche Holding AG | 176,178 | 51,317 | ||||||
Schindler Holding AG | 2,525 | 565 | ||||||
SGS SA | 3,354 | 8,321 | ||||||
SIG Combibloc Group AG * | 514,972 | 6,869 | ||||||
Sika AG | 77,231 | 11,308 | ||||||
Sonova Holding AG | 52,468 | 12,207 | ||||||
Straumann Holding AG | 375 | 307 | ||||||
Swiss Life Holding AG | 25,877 | 12,381 | ||||||
Swiss Re AG | 44,382 | 4,634 | ||||||
Swisscom AG | 3,155 | 1,558 | ||||||
Tecan Group AG | 3,617 | 865 | ||||||
Temenos AG * | 418 | 70 | ||||||
UBS Group AG * | 1,705,718 | 19,323 | ||||||
Vifor Pharma AG | 9,178 | 1,468 | ||||||
| Description | Shares | Market Value ($ Thousands) | ||||||
COMMON STOCK (continued) | ||||||||
Zurich Insurance Group AG | 9,098 | $ | 3,485 | |||||
|
|
| ||||||
| 283,509 | ||||||||
|
|
| ||||||
Taiwan — 0.8% | ||||||||
Chicony Electronics Co Ltd | 114,000 | 336 | ||||||
Compal Electronics Inc | 697,000 | 403 | ||||||
Foxconn Technology Co Ltd | 372,000 | 777 | ||||||
Global Mixed Mode Technology Inc | 91,000 | 339 | ||||||
Kindom Development Co Ltd | 432,000 | 383 | ||||||
Lite-On Technology Corp | 1,534,000 | 2,433 | ||||||
MediaTek Inc | 752,000 | 8,977 | ||||||
Mirle Automation Corp | 790,000 | 987 | ||||||
Simplo Technology Co Ltd | 158,000 | 1,326 | ||||||
Sitronix Technology Corp | 140,000 | 754 | ||||||
Supreme Electronics Co Ltd | 453,000 | 424 | ||||||
Synnex Technology International Corp | 686,000 | 803 | ||||||
Taiwan Semiconductor Manufacturing Co Ltd ADR | 316,585 | 14,715 | ||||||
Wei Chuan Foods Corp | 236,000 | 193 | ||||||
Zhen Ding Technology Holding Ltd | 84,000 | 301 | ||||||
|
|
| ||||||
| 33,151 | ||||||||
|
|
| ||||||
Thailand — 0.0% | ||||||||
Bangchak Corp PCL | 658,200 | 586 | ||||||
|
|
| ||||||
Turkey — 0.1% | ||||||||
Akbank T.A.S. * | 1,224,572 | 1,761 | ||||||
Turkiye Halk Bankasi AS * | 1,180,311 | 1,371 | ||||||
|
|
| ||||||
| 3,132 | ||||||||
|
|
| ||||||
United Arab Emirates — 0.0% | ||||||||
Abu Dhabi Islamic Bank PJSC | 615,520 | 853 | ||||||
|
|
| ||||||
United Kingdom — 13.9% | ||||||||
3i Group PLC | 187,846 | 2,700 | ||||||
Abcam PLC | 39,473 | 557 | ||||||
Admiral Group PLC | 22,763 | 594 | ||||||
Aggreko PLC | 53,260 | 545 | ||||||
Anglo American PLC | 86,624 | 1,997 | ||||||
Antofagasta PLC | 15,837 | 175 | ||||||
Aon PLC | 52,200 | 10,105 | ||||||
Ashtead Group PLC | 29,090 | 812 | ||||||
AstraZeneca PLC | 164,619 | 14,730 | ||||||
Auto Trader Group PLC | 67,028 | 421 | ||||||
Aviva PLC | 2,109,732 | 10,381 | ||||||
BAE Systems PLC | 93,012 | 653 | ||||||
Balfour Beatty PLC | 2,382,011 | 6,517 | ||||||
Bank of Ireland Group PLC | 2,640,047 | 10,506 | ||||||
Barclays PLC | 10,942,870 | 20,281 | ||||||
Berkeley Group Holdings PLC | 7,276 | 375 | ||||||
BHP Group PLC | 64,221 | 1,371 | ||||||
BP PLC | 4,296,996 | 27,313 | ||||||
BP PLC ADR | 131,693 | 5,003 | ||||||
British American Tobacco PLC | 511,552 | 18,959 | ||||||
British Land Co PLC/The | 25,721 | 185 | ||||||
SEI Institutional International Trust / Annual Report / September 30, 2019 |
21 |
SCHEDULE OF INVESTMENTS
September 30, 2019
International Equity Fund(Continued)
| Description | Shares | Market Value ($ Thousands) | ||||||
COMMON STOCK (continued) | ||||||||
BT Group PLC, Cl A | 1,133,624 | $ | 2,495 | |||||
Bunzl PLC | 491,004 | 12,858 | ||||||
Burberry Group PLC | 13,876 | 372 | ||||||
Carnival PLC | 83,086 | 3,450 | ||||||
Centrica PLC | 118,482 | 108 | ||||||
Cineworld Group PLC | 2,133,575 | 5,995 | ||||||
Cobham PLC | 3,056,268 | 5,907 | ||||||
Compass Group PLC | 1,291,548 | 33,312 | ||||||
Computacenter PLC | 62,379 | 994 | ||||||
CRH PLC | 282,051 | 9,690 | ||||||
Croda International PLC | 25,865 | 1,549 | ||||||
DCC PLC | 86,248 | 7,542 | ||||||
Dialog Semiconductor PLC * | 45,565 | 2,157 | ||||||
Direct Line Insurance Group PLC | 46,741 | 173 | ||||||
Electrocomponents PLC | 629,545 | 4,995 | ||||||
Evraz PLC | 990,183 | 5,706 | ||||||
Ferguson PLC | 246,581 | 18,061 | ||||||
Ferrexpo PLC | 524,939 | 1,043 | ||||||
Fevertree Drinks PLC | 237,123 | 7,080 | ||||||
G4S PLC | 75,662 | 176 | ||||||
Games Workshop Group PLC | 4,061 | 236 | ||||||
GlaxoSmithKline PLC | 518,129 | 11,139 | ||||||
Hargreaves Lansdown PLC | 48,139 | 1,233 | ||||||
Hays PLC | 1,583,408 | 2,942 | ||||||
HSBC Holdings PLC | 738,359 | 5,683 | ||||||
Inchcape PLC | 165,498 | 1,288 | ||||||
Indivior PLC * | 568,551 | 340 | ||||||
InterContinental Hotels Group PLC | 13,898 | 869 | ||||||
International Consolidated Airlines Group SA | 508,597 | 2,977 | ||||||
Intertek Group PLC | 30,747 | 2,076 | ||||||
Investec PLC | 360,194 | 1,859 | ||||||
J Sainsbury PLC | 313,791 | 850 | ||||||
Johnson Matthey PLC | 189,030 | 7,121 | ||||||
Keywords Studios PLC | 239,192 | 3,381 | ||||||
Kingfisher PLC | 4,348,234 | 11,081 | ||||||
Legal & General Group PLC | 1,232,003 | 3,771 | ||||||
Lloyds Banking Group PLC | 14,141,489 | 9,431 | ||||||
London Stock Exchange Group PLC | 180,713 | 16,274 | ||||||
Meggitt PLC | 32,942 | 258 | ||||||
Melrose Industries PLC | 2,687,351 | 6,676 | ||||||
Micro Focus International PLC | 382,051 | 5,352 | ||||||
National Grid PLC | 1,170,318 | 12,718 | ||||||
NMC Health PLC (A) | 17,596 | 588 | ||||||
Pagegroup PLC | 128,208 | 694 | ||||||
Pearson PLC | 221,286 | 2,012 | ||||||
Persimmon PLC | 48,213 | 1,289 | ||||||
Prudential PLC | 2,032,416 | 36,942 | ||||||
QinetiQ Group PLC | 263,158 | 937 | ||||||
Reckitt Benckiser Group PLC | 118,282 | 9,247 | ||||||
RELX PLC | 967,188 | 23,033 | ||||||
Rentokil Initial PLC | 1,112,048 | 6,411 | ||||||
Rolls-Royce Holdings PLC | 1,814,374 | 17,717 | ||||||
| Description | Shares | Market Value ($ Thousands) | ||||||
COMMON STOCK (continued) | ||||||||
Royal Bank of Scotland Group PLC | 5,568,954 | $ | 14,247 | |||||
RSA Insurance Group PLC | 197,746 | 1,302 | ||||||
Schroders PLC | 37,960 | 1,438 | ||||||
Segro PLC‡ | 191,650 | 1,915 | ||||||
Smith & Nephew PLC | 456,505 | 11,020 | ||||||
Spectris PLC | 154,536 | 4,654 | ||||||
SSE PLC | 722,219 | 11,085 | ||||||
SSP Group Plc | 130,608 | 998 | ||||||
St James’s Place PLC | 554,342 | 6,690 | ||||||
Standard Chartered PLC | 209,066 | 1,763 | ||||||
Tate & Lyle PLC | 228,715 | 2,074 | ||||||
Taylor Wimpey PLC | 86,891 | 173 | ||||||
Tesco PLC | 5,141,600 | 15,270 | ||||||
Unilever PLC | 47,965 | 2,890 | ||||||
Vodafone Group PLC | 11,993,045 | 23,942 | ||||||
Wm Morrison Supermarkets PLC | 490,592 | 1,211 | ||||||
|
|
| ||||||
| 564,940 | ||||||||
|
|
| ||||||
United States — 4.4% | ||||||||
Accenture PLC, Cl A | 93,566 | 17,997 | ||||||
Americold Realty Trust | 199,901 | 7,410 | ||||||
ASML Holding NV, Cl G | 40,170 | 9,979 | ||||||
Atlassian Corp PLC, Cl A * | 15,960 | 2,002 | ||||||
Axis Capital Holdings Ltd | 268,888 | 17,940 | ||||||
Biohaven Pharmaceutical Holding Co Ltd * | 198,015 | 8,261 | ||||||
Chubb Ltd | 95,146 | 15,361 | ||||||
Coca-Cola European Partners PLC | 15,087 | 837 | ||||||
Core Laboratories NV | 23,878 | 1,113 | ||||||
Flex Ltd * | 1,018,773 | 10,661 | ||||||
International Game Technology PLC | 438,000 | 6,224 | ||||||
IQVIA Holdings Inc * | 26,413 | 3,946 | ||||||
Mettler-Toledo International Inc * | 13,915 | 9,802 | ||||||
Microsoft Corp | 70,143 | 9,752 | ||||||
Nomad Foods Ltd * | 320,168 | 6,563 | ||||||
QIAGEN NV * | 39,255 | 1,294 | ||||||
ResMed Inc | 105,233 | 14,218 | ||||||
Sensata Technologies Holding PLC * | 215,213 | 10,774 | ||||||
Shopify Inc, Cl A * | 52,985 | 16,513 | ||||||
Unilever NV | 14,051 | 844 | ||||||
Visa Inc, Cl A | 19,496 | 3,354 | ||||||
Wright Medical Group NV * | 171,686 | 3,542 | ||||||
|
|
| ||||||
| 178,387 | ||||||||
|
|
| ||||||
Total Common Stock | 3,790,080 | |||||||
|
|
| ||||||
PREFERRED STOCK — 1.7% | ||||||||
Germany — 1.2% | ||||||||
Bayerische Motoren Werke AG (D) | 2,878 | 160 | ||||||
Henkel AG & Co KGaA (D) | 100,573 | 9,956 | ||||||
Sartorius AG (D) | 4,096 | 748 | ||||||
22 |
SEI Institutional International Trust / Annual Report / September 30, 2019 |
| Description | Shares | Market Value ($ Thousands) | ||||||
PREFERRED STOCK (continued) | ||||||||
Volkswagen AG (D) | 217,586 | $ | 37,019 | |||||
|
|
| ||||||
| 47,883 | ||||||||
|
|
| ||||||
South Korea — 0.5% | ||||||||
Hyundai Motor Co (D) | 132,660 | 8,473 | ||||||
Samsung Electronics Co Ltd (D) | 381,858 | 12,610 | ||||||
|
|
| ||||||
| 21,083 | ||||||||
|
|
| ||||||
Total Preferred Stock | 68,966 | |||||||
|
|
| ||||||
AFFILIATED PARTNERSHIP — 3.0% | ||||||||
SEI Liquidity Fund, L.P. | ||||||||
2.010% **†(E) | 122,502,340 | 122,509 | ||||||
|
|
| ||||||
Total Affiliated Partnership | 122,509 | |||||||
|
|
| ||||||
CASH EQUIVALENT — 2.1% | ||||||||
SEI Daily Income Trust, Government Fund, Cl F | ||||||||
1.800%**† | 83,730,190 | 83,730 | ||||||
|
|
| ||||||
Total Cash Equivalent | 83,730 | |||||||
|
|
| ||||||
Total Investments in Securities — 100.2% | $ | 4,065,285 | ||||||
|
|
| ||||||
A list of the open futures contracts held by the Fund at September 30, 2019, is as follows:
| Type of Contract | Number of Contracts Long | Expiration Date | Notional Amount (Thousands) | Value (Thousands) | Unrealized Appreciation/ (Depreciation) (Thousands) | |||||||||||||||
Euro STOXX 50 | 888 | Dec-2019 | $ | 34,527 | $ | 34,416 | $ | 375 | ||||||||||||
FTSE 100 Index | 194 | Dec-2019 | 17,610 | 17,651 | 264 | |||||||||||||||
Hang Seng Index | 22 | Nov-2019 | 3,653 | 3,654 | 2 | |||||||||||||||
SPI 200 Index | 82 | Dec-2019 | 9,322 | 9,239 | (8) | |||||||||||||||
TOPIX Index | 166 | Dec-2019 | 23,852 | 24,391 | 716 | |||||||||||||||
|
|
|
|
|
| |||||||||||||||
| $ | 88,964 | $ | 89,351 | $ | 1,349 | |||||||||||||||
|
|
|
|
|
| |||||||||||||||
Percentages are based on Net Assets of $4,058,589 ($ Thousands). |
| * | Non-income producing security. |
| ** | Rate shown is the7-day effective yield as of September 30, 2019. |
| † | Investment in Affiliated Security (see Note 5). |
| ‡ | Real Estate Investment Trust. |
| (A) | Certain securities or partial positions of certain securities are on loan at September 30, 2019 (See Note 9). The total market value of securities on loan at September 30, 2019 was $115,350 ($ Thousands). |
| (B) | Security exempt from registration under Rule 144A of the Securities Act of 1933. These securities may be resold in transactions exempt from registration normally to qualified institutions. On September 30, 2019, the value of these securities amounted to $76,192 ($ Thousands), representing 1.9% of the Net Assets of the Fund. |
| (C) | Level 3 security in accordance with fair value hierarchy. |
| (D) | There is currently no rate available. |
| (E) | This security was purchased with cash collateral held from securities on loan. The total market value of such securities as of September 30, 2019 was $122,509 ($ Thousands). |
ADR — American Depositary Receipt
Cl — Class
SEI Institutional International Trust / Annual Report / September 30, 2019 |
23 |
SCHEDULE OF INVESTMENTS
September 30, 2019
International Equity Fund(Concluded)
FTSE — Financial Times and Stock Exchange
L.P. — Limited Partnership
Ltd. — Limited
PJSC — Public Joint-Stock Company
PLC — Public Limited Company
REIT — Real Estate investment Trust
SPI — Share Price Index
TOPIX — Tokyo Price Index
The following is a list of the level of inputs used as of September 30, 2019, in valuing the Fund’s investments and other financial instruments carried at value ($ Thousands):
| Investments in Securities | Level 1 ($) | Level 2 ($) | Level 3 ($) | Total ($) | ||||||||||||
Common Stock | 3,739,340 | 50,740 | –^ | 3,790,080 | ||||||||||||
Preferred Stock | 68,966 | – | – | 68,966 | ||||||||||||
Affiliated Partnership | – | 122,509 | – | 122,509 | ||||||||||||
Cash Equivalent | 83,730 | – | – | 83,730 | ||||||||||||
|
|
|
|
|
|
|
| |||||||||
Total Investments in Securities | 3,892,036 | 173,249 | – | 4,065,285 | ||||||||||||
|
|
|
|
|
|
|
| |||||||||
| Other Financial Instruments | Level 1 ($) | Level 2 ($) | Level 3 ($) | Total ($) | ||||||||||||
Futures Contracts* | ||||||||||||||||
Unrealized Appreciation | 1,357 | – | – | 1,357 | ||||||||||||
Unrealized Depreciation | (8) | – | – | (8) | ||||||||||||
|
|
|
|
|
|
|
| |||||||||
Total Other Financial Instruments | 1,349 | – | – | 1,349 | ||||||||||||
|
|
|
|
|
|
|
| |||||||||
^One security with a market value of $0.
*Futures contracts are valued at the unrealized appreciation/(depreciation) on the instrument.
For the year ended September 30, 2019, there were transfers between Level 1 and Level 2 assets and liabilities. The primary reason for changes in the classifications between Levels 1 and 2 occurs when foreign equity securities are fair valued using other observable market-based inputs in place of the closing exchange price due to events occurring after the close of the exchange or market on which the investment is principally traded.
For the year ended September 30, 2019, there were no transfers between Level 2 and Level 3 assets and liabilities.
For more information on valuation inputs, see Note 2 – Significant Accounting Policies in Notes to Financial Statements.
The following is a summary of the transactions with affiliates for the year ended September 30, 2019 ($ Thousands):
| Security Description | Value at 9/30/2018 | Purchases at Cost | Proceeds from Sales | Realized Gain | Change in Unrealized Appreciation | Value 9/30/2019 | Shares | Income | Capital Gains | |||||||||
SEI Liquidity Fund, L.P. | $248,878 | $1,182,769 | $(1,309,256) | $96 | $22 | $122,509 | 122,502,340 | $2,128 | $— | |||||||||
SEI Daily Income Trust, Government Fund, Cl F | 153,816 | 170,775 | (240,861) | — | — | 83,730 | 83,730,190 | 1,765 | — | |||||||||
|
|
|
|
|
|
|
|
| ||||||||||
Totals | $402,694 | $1,353,544 | $(1,550,117) | $96 | $22 | $206,239 | 206,232,530 | $3,893 | $— | |||||||||
|
|
|
|
|
|
|
|
| ||||||||||
Amounts designated as “—” are $0 or have been rounded to $0.
The accompanying notes are an integral part of the financial statements.
24 |
SEI Institutional International Trust / Annual Report / September 30, 2019 |
SCHEDULE OF INVESTMENTS
September 30, 2019
Emerging Market Equity Fund
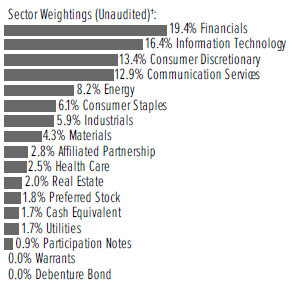
†Percentages based on total investments. Includes investments held as collateral for securities on loan (see Note 9).
| Description | Shares | Market Value ($ Thousands) | ||||||
COMMON STOCK — 93.5% | ||||||||
Argentina — 0.2% | ||||||||
Arcos Dorados Holdings Inc, Cl A | 202,100 | $ | 1,358 | |||||
Cresud SACIF y A ADR *(A) | 78,626 | 465 | ||||||
IRSA Inversiones y Representaciones SA ADR * | 67,500 | 355 | ||||||
IRSA Propiedades Comerciales SA ADR | 1,831 | 23 | ||||||
MercadoLibre Inc * | 874 | 482 | ||||||
Ternium SA ADR | 17,078 | 327 | ||||||
|
|
| ||||||
| 3,010 | ||||||||
|
|
| ||||||
Brazil — 7.4% | ||||||||
Ambev SA * | 506,000 | 2,332 | ||||||
Atacadao SA * | 918,313 | 4,672 | ||||||
B2W Cia Digital | 992,548 | 11,412 | ||||||
B3 SA - Brasil Bolsa Balcao | 601,820 | 6,331 | ||||||
Banco Bradesco SA ADR * | 1,182,722 | 9,627 | ||||||
Banco BTG Pactual SA * | 66,181 | 930 | ||||||
Banco do Brasil SA * | 296,819 | 3,249 | ||||||
Banco Santander Brasil SA | 254,900 | 2,782 | ||||||
Banco Santander Brasil SA ADR | 172,500 | 1,879 | ||||||
BK Brasil Operacao e Assessoria a Restaurantes SA * | 627,830 | 3,097 | ||||||
BRF SA * | 310,847 | 2,855 | ||||||
BRF SA ADR * | 447,425 | 4,098 | ||||||
CCR SA | 541,500 | 2,243 | ||||||
Cia Siderurgica Nacional SA | 107,412 | 342 | ||||||
Construtora Tenda SA | 93,202 | 556 | ||||||
Cosan Ltd, Cl A * | 40,385 | 602 | ||||||
Cosan SA | 291,300 | 3,727 | ||||||
Cyrela Brazil Realty SA Empreendimentos e Participacoes | 337,568 | 1,945 | ||||||
Duratex SA | 637,700 | 1,944 | ||||||
Energisa SA | 455,268 | 5,441 | ||||||
| Description | Shares | Market Value ($ Thousands) | ||||||
COMMON STOCK (continued) | ||||||||
Eneva SA * | 95,847 | $ | 709 | |||||
Gerdau SA ADR | 146,414 | 461 | ||||||
Grupo SBF SA * | 294,399 | 1,606 | ||||||
Hapvida Participacoes e Investimentos SA | 220,876 | 2,882 | ||||||
Hypera SA * | 176,000 | 1,420 | ||||||
IRB Brasil Resseguros S/A | 117,243 | 1,055 | ||||||
JBS SA | 203,139 | 1,596 | ||||||
Localiza Rent a Car SA | 173,800 | 1,897 | ||||||
Lojas Renner SA | 146,477 | 1,771 | ||||||
MRV Engenharia e Participacoes SA | 110,228 | 470 | ||||||
Notre Dame Intermedica Participacoes SA | 480,477 | 6,287 | ||||||
Petrobras Distribuidora SA | 368,447 | 2,431 | ||||||
Petroleo Brasileiro SA | 21,549 | 312 | ||||||
Petroleo Brasileiro SA ADR | 747,795 | 10,820 | ||||||
Porto Seguro SA | 113,288 | 1,608 | ||||||
Qualicorp Consultoria e Corretora de Seguros SA | 111,107 | 827 | ||||||
Rumo SA * | 1,447,510 | 8,535 | ||||||
Sul America SA | 167,061 | 1,914 | ||||||
Telefonica Brasil SA ADR | 319,514 | 4,208 | ||||||
TIM Participacoes SA ADR * | 109,500 | 1,573 | ||||||
Transmissora Alianca de Energia Eletrica SA | 92,364 | 636 | ||||||
Vale SA ADR, Cl B * | 303,545 | 3,491 | ||||||
|
|
| ||||||
| 126,573 | ||||||||
|
|
| ||||||
Canada — 1.0% | ||||||||
Autohome Inc ADR *(A) | 17,882 | 1,486 | ||||||
First Quantum Minerals Ltd | 1,213,247 | 10,199 | ||||||
Pan American Silver Corp | 60,698 | 952 | ||||||
Parex Resources Inc * | 252,211 | 3,867 | ||||||
|
|
| ||||||
| 16,504 | ||||||||
|
|
| ||||||
Chile — 0.3% | ||||||||
CAP SA | 34,027 | 297 | ||||||
Cencosud SA | 426,443 | 703 | ||||||
Cervecerias Unidas ADR | 11,598 | 257 | ||||||
Cia Cervecerias Unidas SA ADR | 57,325 | 1,272 | ||||||
Colbun SA | 1,409,028 | 254 | ||||||
Empresas CMPC SA | 311,960 | 727 | ||||||
Inversiones La Construccion SA | 18,184 | 281 | ||||||
Latam Airlines Group SA ADR | 60,000 | 666 | ||||||
Sociedad Quimica y Minera de Chile SA ADR (A) | 39,000 | 1,084 | ||||||
|
|
| ||||||
| 5,541 | ||||||||
|
|
| ||||||
China — 20.3% | ||||||||
Agricultural Bank of China Ltd, Cl H | 7,727,000 | 3,026 | ||||||
Alibaba Group Holding Ltd ADR * | 279,987 | 46,822 | ||||||
Aluminum Corp of China Ltd, Cl H * | 2,298,000 | 724 | ||||||
Anhui Conch Cement Co Ltd, Cl H | 1,593,164 | 9,460 | ||||||
ANTA Sports Products Ltd | 227,069 | 1,878 | ||||||
Asia Cement China Holdings Corp | 360,000 | 434 | ||||||
Baidu Inc ADR * | 35,693 | 3,668 | ||||||
Bank of China Ltd, Cl H | 9,665,000 | 3,797 | ||||||
SEI Institutional International Trust / Annual Report / September 30, 2019 |
25 |
SCHEDULE OF INVESTMENTS
September 30, 2019
Emerging Market Equity Fund(Continued)
| Description | Shares | Market Value ($ Thousands) | ||||||
COMMON STOCK (continued) | ||||||||
Baozun Inc ADR *(A) | 35,891 | $ | 1,533 | |||||
BeiGene Ltd ADR * | 5,146 | 630 | ||||||
Beijing Sinnet Technology Co Ltd, Cl A | 1,164,995 | 3,032 | ||||||
Bilibili Inc ADR *(A) | 233,578 | 3,298 | ||||||
Bosideng International Holdings Ltd | 2,848,000 | 1,213 | ||||||
CGN Power Co Ltd, Cl H (B) | 3,949,000 | 997 | ||||||
China Coal Energy Co Ltd, Cl H | 1,383,000 | 563 | ||||||
China Communications Services Corp Ltd, Cl H | 1,326,000 | 751 | ||||||
China Construction Bank Corp, Cl H | 14,099,000 | 10,755 | ||||||
China Everbright Bank Co Ltd, Cl A | 3,046,200 | 1,681 | ||||||
China Life Insurance Co Ltd, Cl H | 1,107,000 | 2,565 | ||||||
China Merchants Energy Shipping Co Ltd, Cl A | 471,997 | 315 | ||||||
China Petroleum & Chemical Corp, Cl H | 3,796,000 | 2,257 | ||||||
China Telecom Corp Ltd, Cl H | 1,426,000 | 649 | ||||||
China Vanke Co Ltd, Cl H | 292,000 | 1,017 | ||||||
Chongqing Zhifei Biological Products Co Ltd, Cl A | 247,900 | 1,648 | ||||||
CITIC Securities Co Ltd, Cl H | 637,500 | 1,194 | ||||||
COSCO SHIPPING Energy Transportation Co Ltd, Cl A | 312,989 | 295 | ||||||
COSCO SHIPPING Energy Transportation Co Ltd, Cl H | 698,000 | 309 | ||||||
Country Garden Holdings Co Ltd (A) | 990,000 | 1,254 | ||||||
CRRC Corp Ltd | 4,746,408 | 3,312 | ||||||
Ctrip.com International Ltd ADR * | 409,207 | 11,986 | ||||||
Dongyue Group Ltd | 1,135,000 | 531 | ||||||
Focus Media Information Technology Co Ltd, Cl A | 1,271,200 | 935 | ||||||
Focused Photonics Hangzhou Inc, Cl A | 811,661 | 1,935 | ||||||
Great Wall Motor Co Ltd, Cl H (A) | 981,500 | 657 | ||||||
Gree Electric Appliances Inc of Zhuhai, Cl A * | 239,700 | 1,924 | ||||||
Guangdong Haid Group Co Ltd, Cl A | 373,392 | 1,637 | ||||||
Guangzhou R&F Properties Co Ltd | 1,337,200 | 2,023 | ||||||
Hangzhou Robam Appliances Co Ltd, Cl A | 1,473,954 | 5,430 | ||||||
HUYA Inc ADR * | 2,199 | 52 | ||||||
Industrial & Commercial Bank of China Ltd, Cl H | 33,450,419 | 22,402 | ||||||
JD.com Inc ADR * | 197,135 | 5,561 | ||||||
Jiangsu Hengli Hydraulic Co Ltd, Cl A | 133,712 | 721 | ||||||
Jiangxi Copper Co Ltd, Cl H | 771,000 | 893 | ||||||
Longfor Group Holdings Ltd (B) | 213,000 | 796 | ||||||
Momo Inc ADR * | 196,673 | 6,093 | ||||||
NARI Technology Co Ltd, Cl A | 1,057,083 | 3,028 | ||||||
NetEase Inc ADR | 26,491 | 7,052 | ||||||
New Oriental Education & Technology Group Inc ADR * | 51,038 | 5,653 | ||||||
PetroChina Co Ltd, Cl H | 1,826,000 | 939 | ||||||
Ping An Insurance Group Co of China Ltd, Cl A | 341,382 | 4,162 | ||||||
Ping An Insurance Group Co of China Ltd, Cl H | 2,041,357 | 23,449 | ||||||
| Description | Shares | Market Value ($ Thousands) | ||||||
COMMON STOCK (continued) | ||||||||
Qudian Inc ADR * | 53,935 | $ | 372 | |||||
Shenzhen Sunway Communication Co Ltd, Cl A * | 349,900 | 1,755 | ||||||
SINA Corp/China * | 92,500 | 3,625 | ||||||
Sinopharm Group Co Ltd, Cl H | 1,038,800 | 3,253 | ||||||
Sinotruk Hong Kong Ltd (A) | 1,246,500 | 1,847 | ||||||
Sohu.com Ltd ADR *(A) | 135,900 | 1,381 | ||||||
TAL Education Group ADR * | 14,719 | 504 | ||||||
Tencent Holdings Ltd | 1,476,090 | 62,174 | ||||||
Tingyi Cayman Islands Holding Corp | 1,892,000 | 2,665 | ||||||
Tsingtao Brewery Co Ltd, Cl H | 654,000 | 3,946 | ||||||
Uni-President China Holdings Ltd | 3,320,400 | 3,583 | ||||||
Weibo Corp ADR *(A) | 116,007 | 5,191 | ||||||
Weichai Power Co Ltd, Cl H | 1,341,000 | 1,933 | ||||||
Wens Foodstuffs Group Co Ltd | 746,687 | 3,889 | ||||||
Wuhu Sanqi Interactive Entertainment Network Technology Group Co Ltd, Cl A | 1,184,500 | 2,992 | ||||||
Wuliangye Yibin Co Ltd, Cl A | 145,500 | 2,646 | ||||||
Yantai Jereh Oilfield Services Group Co Ltd, Cl A | 377,700 | 1,429 | ||||||
Yanzhou Coal Mining Co Ltd, Cl H | 428,791 | 435 | ||||||
Yum China Holdings Inc | 29,439 | 1,337 | ||||||
Zhejiang Expressway Co Ltd, Cl H | 2,622,000 | 2,268 | ||||||
Zhejiang Huace Film & TV Co Ltd, Cl A | 2,422,029 | 2,239 | ||||||
Zhejiang Semir Garment Co Ltd, Cl A | 1,322,875 | 2,291 | ||||||
Zhongsheng Group Holdings Ltd | 2,747,500 | 8,674 | ||||||
Zhuzhou CRRC Times Electric Co Ltd, Cl H | 993,147 | 4,111 | ||||||
ZTO Express Cayman Inc ADR * | 283,355 | 6,044 | ||||||
|
|
| ||||||
| 347,520 | ||||||||
|
|
| ||||||
Colombia — 0.6% | ||||||||
Bancolombia SA ADR, Cl R | 160,217 | 7,923 | ||||||
Ecopetrol SA | 1,878,461 | 1,596 | ||||||
Ecopetrol SA ADR | 38,523 | 656 | ||||||
Grupo Aval Acciones y Valores SA ADR | 17,844 | 133 | ||||||
Interconexion Electrica SA ESP | 35,665 | 187 | ||||||
|
|
| ||||||
| 10,495 | ||||||||
|
|
| ||||||
Cyprus — 0.1% | ||||||||
TCS Group Holding PLC GDR (B) | 95,770 | 1,916 | ||||||
|
|
| ||||||
Czech Republic — 0.2% | ||||||||
Komercni banka as | 71,815 | 2,426 | ||||||
|
|
| ||||||
Egypt — 0.2% | ||||||||
Commercial International Bank Egypt SAE | 525,769 | 2,507 | ||||||
|
|
| ||||||
Germany — 0.1% | ||||||||
Delivery Hero SE * | 45,909 | 2,040 | ||||||
|
|
| ||||||
Greece — 0.5% | ||||||||
Eurobank Ergasias SA * | 3,262,782 | 3,159 | ||||||
Motor Oil Hellas Corinth Refineries SA | 61,948 | 1,447 | ||||||
National Bank of Greece SA * | 975,132 | 2,969 | ||||||
|
|
| ||||||
| 7,575 | ||||||||
|
|
| ||||||
26 |
SEI Institutional International Trust / Annual Report / September 30, 2019 |
| Description | Shares | Market Value ($ Thousands) | ||||||
COMMON STOCK (continued) | ||||||||
Hong Kong — 7.8% | ||||||||
3SBio Inc * | 2,921,000 | $ | 4,844 | |||||
A-Living Services Co Ltd, Cl H (B) | 1,562,750 | 3,604 | ||||||
ASM Pacific Technology Ltd | 291,600 | 3,560 | ||||||
BAIC Motor Corp Ltd, Cl H (B) | 4,966,000 | 3,066 | ||||||
Beijing Enterprises Water Group Ltd | 3,878,000 | 1,984 | ||||||
Brilliance China Automotive Holdings Ltd | 2,928,371 | 3,145 | ||||||
Budweiser Brewing Co APAC Ltd *(B) | 295,781 | 1,064 | ||||||
Chaoda Modern Agriculture Holdings Ltd * | 2,056,181 | 15 | ||||||
China Aoyuan Group Ltd | 319,000 | 361 | ||||||
China Conch Venture Holdings Ltd | 592,500 | 2,192 | ||||||
China Everbright Bank Co Ltd, Cl H | 1,633,000 | 696 | ||||||
China Everbright International Ltd | 5,829,100 | 4,491 | ||||||
China Gas Holdings Ltd | 1,714,600 | 6,627 | ||||||
China High Precision Automation Group Ltd * | 1,385,624 | – | ||||||
China Hongqiao Group Ltd | 603,000 | 385 | ||||||
China Medical System Holdings Ltd | 2,423,000 | 2,881 | ||||||
China Mengniu Dairy Co Ltd | 1,141,000 | 4,272 | ||||||
China Mobile Ltd | 1,394,800 | 11,538 | ||||||
China Mobile Ltd ADR | 144,885 | 5,999 | ||||||
China Overseas Grand Oceans Group Ltd | 662,000 | 301 | ||||||
China Resources Gas Group Ltd | 296,000 | 1,463 | ||||||
China Resources Land Ltd | 180,000 | 754 | ||||||
China State Construction International Holdings Ltd | 4,037,123 | 3,795 | ||||||
China Taiping Insurance Holdings Co Ltd | 1,079,400 | 2,410 | ||||||
China Unicom Hong Kong Ltd | 654,000 | 694 | ||||||
CIFI Holdings Group Co Ltd | 1,902,000 | 1,111 | ||||||
CITIC Ltd | 2,110,000 | 2,665 | ||||||
CITIC Telecom International Holdings Ltd | 1,336,000 | 486 | ||||||
CNOOC Ltd | 9,118,200 | 13,911 | ||||||
CSPC Pharmaceutical Group Ltd | 678,000 | 1,361 | ||||||
Future Land Development Holdings Ltd (A) | 370,000 | 323 | ||||||
Geely Automobile Holdings Ltd | 2,172,000 | 3,685 | ||||||
Genscript Biotech Corp *(A) | 538,000 | 1,031 | ||||||
Guangzhou Baiyunshan Pharmaceutical Holdings Co Ltd, Cl H | 152,000 | 501 | ||||||
Haier Electronics Group Co Ltd | 1,334,800 | 3,482 | ||||||
Hang Lung Properties Ltd | 119,000 | 270 | ||||||
Hisense Home Appliances Group Co Ltd, Cl H | 580,000 | 557 | ||||||
Huaneng Renewables Corp Ltd, Cl H (C) | 470,000 | 160 | ||||||
Huatai Securities Co Ltd, Cl H (B) | 2,561,200 | 3,836 | ||||||
Kingboard Laminates Holdings Ltd | 1,767,500 | 1,594 | ||||||
Kunlun Energy Co Ltd | 1,036,000 | 892 | ||||||
Lee & Man Paper Manufacturing Ltd | 520,000 | 281 | ||||||
Li Ning Co Ltd | 723,000 | 2,075 | ||||||
Link REIT‡ | 312,438 | 3,445 | ||||||
Logan Property Holdings Co Ltd | 1,612,000 | 2,295 | ||||||
Metallurgical Corp of China Ltd, Cl H | 1,527,525 | 343 | ||||||
Midea Real Estate Holding Ltd (B) | 129,582 | 315 | ||||||
Shenzhen Expressway Co Ltd, Cl H | 406,000 | 529 | ||||||
Shimao Property Holdings Ltd | 592,000 | 1,729 | ||||||
| Description | Shares | Market Value ($ Thousands) | ||||||
COMMON STOCK (continued) | ||||||||
Shui On Land Ltd | 1,182,080 | $ | 235 | |||||
Sino Biopharmaceutical Ltd | 833,001 | 1,058 | ||||||
SJM Holdings Ltd | 2,996,000 | 2,847 | ||||||
Sunac China Holdings Ltd | 590,909 | 2,375 | ||||||
Sunny Optical Technology Group Co Ltd | 478,900 | 7,037 | ||||||
Techtronic Industries Co Ltd | 216,925 | 1,510 | ||||||
Times China Holdings Ltd | 304,000 | 473 | ||||||
Zoomlion Heavy Industry Science and Technology Co Ltd (A) | 1,265,800 | 857 | ||||||
|
|
| ||||||
| 133,410 | ||||||||
|
|
| ||||||
Hungary — 0.3% | ||||||||
MOL Hungarian Oil & Gas PLC | 349,409 | 3,286 | ||||||
OTP Bank Nyrt | 36,656 | 1,526 | ||||||
Richter Gedeon Nyrt | 27,573 | 446 | ||||||
|
|
| ||||||
| 5,258 | ||||||||
|
|
| ||||||
India — 8.7% | ||||||||
ACC Ltd | 77,785 | 1,765 | ||||||
Apollo Hospitals Enterprise Ltd | 87,176 | 1,717 | ||||||
Axis Bank Ltd | 256,271 | 2,477 | ||||||
Balrampur Chini Mills Ltd | 267,367 | 583 | ||||||
Bharat Heavy Electricals Ltd | 431,844 | 295 | ||||||
Cipla Ltd/India | 160,390 | 963 | ||||||
Cummins India Ltd | 229,433 | 1,854 | ||||||
Dr Reddy’s Laboratories Ltd | 49,429 | 1,885 | ||||||
Dr Reddy’s Laboratories Ltd ADR | 20,928 | 793 | ||||||
Godrej Properties Ltd * | 44,914 | 658 | ||||||
GRUH Finance Ltd | 434,943 | 1,653 | ||||||
Gujarat Narmada Valley Fertilizers & Chemicals Ltd | 55,967 | 160 | ||||||
HCL Technologies Ltd | 159,859 | 2,438 | ||||||
HDFC Bank Ltd | 303,928 | 5,264 | ||||||
HDFC Bank Ltd ADR | 97,762 | 5,577 | ||||||
Hero MotoCorp Ltd | 72,042 | 2,750 | ||||||
Hindustan Petroleum Corp Ltd | 164,115 | 698 | ||||||
Hindustan Unilever Ltd | 127,476 | 3,565 | ||||||
Housing Development Finance Corp Ltd | 373,043 | 10,407 | ||||||
ICICI Bank Ltd | 1,840,508 | 11,264 | ||||||
ICICI Bank Ltd ADR | 579,907 | 7,063 | ||||||
ICICI Lombard General Insurance Co Ltd | 177,285 | 3,027 | ||||||
Infosys Ltd | 549,626 | 6,248 | ||||||
Infosys Ltd ADR | 181,002 | 2,058 | ||||||
ITC Ltd | 1,646,786 | 6,038 | ||||||
JM Financial Ltd | 528,780 | 591 | ||||||
Larsen & Toubro Ltd | 126,066 | 2,623 | ||||||
Mahindra & Mahindra Ltd | 235,240 | 1,816 | ||||||
Manappuram Finance Ltd | 491,210 | 978 | ||||||
Metropolis Healthcare Ltd *(B) | 66,204 | 1,189 | ||||||
Muthoot Finance Ltd * | 135,441 | 1,292 | ||||||
Power Finance Corp Ltd * | 380,369 | 533 | ||||||
Power Grid Corp of India Ltd | 2,558,963 | 7,187 | ||||||
REC Ltd | 747,498 | 1,299 | ||||||
SEI Institutional International Trust / Annual Report / September 30, 2019 |
27 |
SCHEDULE OF INVESTMENTS
September 30, 2019
Emerging Market Equity Fund(Continued)
| Description | Shares | Market Value ($ Thousands) | ||||||
COMMON STOCK (continued) | ||||||||
Reliance Industries Ltd | 494,967 | $ | 9,305 | |||||
Reliance Industries Ltd GDR (B) | 598,657 | 22,330 | ||||||
Shriram Transport Finance Co Ltd | 226,831 | 3,426 | ||||||
State Bank of India * | 407,025 | 1,555 | ||||||
Tata Chemicals Ltd | 160,741 | 1,336 | ||||||
Tata Consultancy Services Ltd | 117,593 | 3,483 | ||||||
United Spirits Ltd * | 302,561 | 2,848 | ||||||
UPL Ltd | 388,800 | 3,313 | ||||||
Wipro Ltd | 193,717 | 656 | ||||||
Zee Entertainment Enterprises Ltd | 406,956 | 1,525 | ||||||
|
|
| ||||||
| 148,485 | ||||||||
|
|
| ||||||
Indonesia — 1.4% | ||||||||
Astra International Tbk PT | 10,243,300 | 4,763 | ||||||
Bank Negara Indonesia Persero Tbk PT | 1,386,100 | 718 | ||||||
Bank Rakyat Indonesia Persero Tbk PT | 34,285,605 | 9,951 | ||||||
Bank Tabungan Pensiunan Nasional Syariah Tbk PT * | 4,418,500 | 1,027 | ||||||
Indofood CBP Sukses Makmur Tbk PT | 633,600 | 537 | ||||||
Map Aktif Adiperkasa PT * | 3,611,900 | 1,323 | ||||||
Mitra Adiperkasa Tbk PT | 4,749,700 | 345 | ||||||
Pakuwon Jati Tbk PT | 7,881,500 | 369 | ||||||
Perusahaan Gas Negara Tbk PT | 10,355,600 | 1,532 | ||||||
Telekomunikasi Indonesia Persero Tbk PT | 8,261,100 | 2,508 | ||||||
Wijaya Karya Persero Tbk PT | 2,256,200 | 306 | ||||||
|
|
| ||||||
| 23,379 | ||||||||
|
|
| ||||||
Malaysia — 0.4% | ||||||||
Inari Amertron Bhd | 5,267,575 | 2,290 | ||||||
Malayan Banking Bhd | 926,600 | 1,883 | ||||||
MISC Bhd | 280,475 | 522 | ||||||
RHB Bank Bhd | 545,200 | 735 | ||||||
Syarikat Takaful Malaysia Keluarga Bhd | 385,428 | 543 | ||||||
Telekom Malaysia Bhd | 517,500 | 445 | ||||||
UEM Sunrise Bhd * | 2,109,395 | 335 | ||||||
|
|
| ||||||
| 6,753 | ||||||||
|
|
| ||||||
Mexico — 2.5% | ||||||||
Alfa SAB de CV, Cl A | 1,184,200 | 1,044 | ||||||
Alsea SAB de CV * | 708,741 | 1,651 | ||||||
America Movil SAB de CV ADR, Cl L | 83,235 | 1,237 | ||||||
Arca Continental SAB de CV | 125,300 | 679 | ||||||
Banco Santander Mexico SA Institucion de Banca Multiple Grupo Financiero Santand ADR | 376,078 | 2,369 | ||||||
Cemex SAB de CV ADR | 158,083 | 620 | ||||||
Coca-Cola Femsa SAB de CV ADR | 59,380 | 3,599 | ||||||
Fomento Economico Mexicano SAB de CV | 497,929 | 4,561 | ||||||
Fomento Economico Mexicano SAB de CV ADR | 20,155 | 1,846 | ||||||
Gruma SAB de CV, Cl B | 85,175 | 871 | ||||||
Grupo Financiero Banorte SAB de CV, Cl O | 1,916,444 | 10,324 | ||||||
Grupo Mexico SAB de CV, Ser B | 948,384 | 2,223 | ||||||
Grupo Televisa SAB ADR | 312,325 | 3,055 | ||||||
| Description | Shares | Market Value ($ Thousands) | ||||||
COMMON STOCK (continued) | ||||||||
Infraestructura Energetica Nova SAB de CV | 436,046 | $ | 1,734 | |||||
Kimberly-Clark de Mexico SAB de CV, Cl A | 377,997 | 759 | ||||||
Megacable Holdings SAB de CV | 169,700 | 683 | ||||||
Orbia Advance Corp SAB de CV | 1,013,081 | 1,985 | ||||||
Qualitas Controladora SAB de CV | 191,603 | 683 | ||||||
Wal-Mart de Mexico SAB de CV | 1,077,096 | 3,191 | ||||||
|
|
| ||||||
| 43,114 | ||||||||
|
|
| ||||||
Netherlands — 0.3% | ||||||||
Prosus NV * | 49,659 | 3,646 | ||||||
SBM Offshore NV | 64,196 | 1,068 | ||||||
VEON Ltd ADR | 307,960 | 739 | ||||||
|
|
| ||||||
| 5,453 | ||||||||
|
|
| ||||||
Pakistan — 0.0% | ||||||||
Oil & Gas Development Co Ltd | 681,000 | 536 | ||||||
|
|
| ||||||
Panama — 0.3% | ||||||||
Copa Holdings SA, Cl A | 52,369 | 5,171 | ||||||
|
|
| ||||||
Peru — 0.7% | ||||||||
Cia de Minas Buenaventura SAA ADR | 141,400 | 2,147 | ||||||
Credicorp Ltd | 45,060 | 9,392 | ||||||
|
|
| ||||||
| 11,539 | ||||||||
|
|
| ||||||
Philippines — 0.8% | ||||||||
Ayala Corp | 65,450 | 1,117 | ||||||
Ayala Land Inc | 1,890,000 | 1,803 | ||||||
BDO Unibank Inc | 1,355,248 | �� | 3,739 | |||||
First Gen Corp | 783,754 | 372 | ||||||
Globe Telecom Inc | 12,972 | 458 | ||||||
GT Capital Holdings Inc | 101,434 | 1,648 | ||||||
Manila Electric Co | 49,730 | 355 | ||||||
Megaworld Corp | 6,367,403 | 537 | ||||||
Metropolitan Bank & Trust Co | 2,311,650 | 3,051 | ||||||
|
|
| ||||||
| 13,080 | ||||||||
|
|
| ||||||
Poland — 0.9% | ||||||||
CD Projekt SA | 14,218 | 863 | ||||||
Dino Polska SA *(B) | 167,780 | 6,570 | ||||||
Grupa Lotos SA | 51,001 | 1,127 | ||||||
Orange Polska SA * | 371,045 | 511 | ||||||
Polski Koncern Naftowy ORLEN SA | 44,149 | 1,087 | ||||||
Powszechna Kasa Oszczednosci Bank Polski SA | 186,006 | 1,824 | ||||||
Powszechny Zaklad Ubezpieczen SA | 380,626 | 3,549 | ||||||
Warsaw Stock Exchange | 27,245 | 273 | ||||||
|
|
| ||||||
| 15,804 | ||||||||
|
|
| ||||||
Portugal — 0.3% | ||||||||
Galp Energia SGPS SA, Cl B | 340,566 | 5,133 | ||||||
|
|
| ||||||
Qatar — 0.1% | ||||||||
Commercial Bank PSQC/The | 278,400 | 330 | ||||||
Qatar International Islamic Bank QSC | 347,200 | 851 | ||||||
28 |
SEI Institutional International Trust / Annual Report / September 30, 2019 |
| Description | Shares | Market Value ($ Thousands) | ||||||
COMMON STOCK (continued) | ||||||||
Qatar Islamic Bank SAQ | 124,950 | $ | 535 | |||||
|
|
| ||||||
| 1,716 | ||||||||
|
|
| ||||||
Russia — 5.5% | ||||||||
Detsky Mir PJSC | 813,840 | 1,115 | ||||||
Gazprom PJSC | 504,140 | 1,755 | ||||||
Gazprom PJSC ADR | 1,021,231 | 7,048 | ||||||
Inter RAO UES PJSC | 7,360,000 | 509 | ||||||
LUKOIL PJSC ADR | 205,075 | 16,966 | ||||||
Mail.Ru Group Ltd GDR * | 152,809 | 3,220 | ||||||
MMC Norilsk Nickel PJSC ADR | 104,600 | 2,677 | ||||||
Mobile TeleSystems PJSC ADR | 113,175 | 917 | ||||||
Novatek PJSC GDR | 4,274 | 872 | ||||||
Rosneft Oil Co PJSC GDR | 720,705 | 4,624 | ||||||
Sberbank of Russia PJSC | 733,815 | 2,575 | ||||||
Sberbank of Russia PJSC ADR | 1,692,876 | 23,948 | ||||||
Tatneft PJSC ADR | 10,300 | 654 | ||||||
X5 Retail Group NV GDR | 225,460 | 7,887 | ||||||
Yandex NV, Cl A * | 559,756 | 19,597 | ||||||
|
|
| ||||||
| 94,364 | ||||||||
|
|
| ||||||
Saudi Arabia — 0.0% | ||||||||
Al Rajhi Bank | 38,231 | 645 | ||||||
|
|
| ||||||
Singapore — 0.1% | ||||||||
Yangzijiang Shipbuilding Holdings Ltd | 896,200 | 622 | ||||||
Yanlord Land Group Ltd | 324,200 | 274 | ||||||
|
|
| ||||||
| 896 | ||||||||
|
|
| ||||||
South Africa — 3.2% | ||||||||
Absa Group Ltd | 55,496 | 559 | ||||||
African Rainbow Minerals Ltd | 50,812 | 472 | ||||||
AngloGold Ashanti Ltd | 106,682 | 1,999 | ||||||
AngloGold Ashanti Ltd ADR | 98,198 | 1,794 | ||||||
Barloworld Ltd | 154,129 | 1,175 | ||||||
Bid Corp Ltd (A) | 163,100 | 3,464 | ||||||
Bidvest Group Ltd/The | 52,050 | 655 | ||||||
Capitec Bank Holdings Ltd | 56,221 | 4,773 | ||||||
FirstRand Ltd (A) | 746,949 | 3,063 | ||||||
Fortress REIT Ltd, Cl A | 321,842 | 437 | ||||||
Foschini Group Ltd/The | 162,788 | 1,755 | ||||||
JSE Ltd | 209,557 | 1,811 | ||||||
Kumba Iron Ore Ltd (A) | 33,000 | 815 | ||||||
Naspers Ltd, Cl N | 68,238 | 10,329 | ||||||
Nedbank Group Ltd | 132,281 | 1,979 | ||||||
Old Mutual Ltd | 1,011,972 | 1,290 | ||||||
Petra Diamonds Ltd * | 1,651,395 | 133 | ||||||
RMB Holdings Ltd (A) | 534,161 | 2,646 | ||||||
SPAR Group Ltd/The | 179,113 | 2,257 | ||||||
Standard Bank Group Ltd | 821,512 | 9,465 | ||||||
Telkom SA SOC Ltd | 188,088 | 876 | ||||||
Truworths International Ltd | 671,067 | 2,346 | ||||||
Vodacom Group Ltd | 88,994 | 702 | ||||||
|
|
| ||||||
| 54,795 | ||||||||
|
|
| ||||||
| Description | Shares | Market Value ($ Thousands) | ||||||
COMMON STOCK (continued) | ||||||||
South Korea — 12.9% | ||||||||
Cheil Worldwide Inc | 136,093 | $ | 2,822 | |||||
Com2uSCorp (A) | 29,920 | 2,333 | ||||||
Daelim Industrial Co Ltd | 13,582 | 1,181 | ||||||
Daewoo Shipbuilding & Marine Engineering Co Ltd * | 17,958 | 460 | ||||||
DB Insurance Co Ltd (A) | �� | 64,821 | 2,796 | |||||
Doosan Bobcat Inc | 80,019 | 2,368 | ||||||
Douzone Bizon Co Ltd | 28,826 | 1,576 | ||||||
GS Engineering & Construction Corp | 14,417 | 398 | ||||||
GS Holdings Corp | 28,841 | 1,213 | ||||||
Hana Financial Group Inc | 52,288 | 1,541 | ||||||
Hotel Shilla Co Ltd | 39,171 | 2,823 | ||||||
Hyundai Department Store Co Ltd | 17,746 | 1,159 | ||||||
Hyundai Glovis Co Ltd | 4,003 | 522 | ||||||
Hyundai Mobis Co Ltd | 5,530 | 1,165 | ||||||
Hyundai Motor Co | 17,985 | 2,015 | ||||||
Innocean Worldwide Inc | 5,160 | 287 | ||||||
IS Dongseo Co Ltd | 10,615 | 267 | ||||||
JB Financial Group Co Ltd | 39,964 | 188 | ||||||
Kakao Corp (A) | 19,933 | 2,258 | ||||||
Kangwon Land Inc | 60,735 | 1,500 | ||||||
KB Financial Group Inc | 68,301 | 2,438 | ||||||
KCC Corp (A) | 4,777 | 870 | ||||||
Kia Motors Corp | 101,449 | 3,867 | ||||||
Korea Zinc Co Ltd | 2,131 | 798 | ||||||
KT&G Corp | 29,387 | 2,592 | ||||||
Kumho Petrochemical Co Ltd | 13,500 | 808 | ||||||
LG Chem Ltd | 11,575 | 2,898 | ||||||
LG Corp | 30,385 | 1,778 | ||||||
LG Electronics Inc | 16,000 | 901 | ||||||
LG Household & Health Care Ltd | 1,955 | 2,136 | ||||||
LG Uplus Corp | 226,621 | 2,586 | ||||||
Lotte Chilsung Beverage Co Ltd | 11,420 | 1,322 | ||||||
Lotte Confectionery Co Ltd (A) | 4,258 | 523 | ||||||
Lotte Corp (A) | 25,996 | 788 | ||||||
Lotte Data Communication Co | 5,017 | 190 | ||||||
LOTTE Fine Chemical Co Ltd | 10,878 | 415 | ||||||
Mando Corp | 40,304 | 1,220 | ||||||
Medy-Tox Inc (A) | 7,222 | 2,174 | ||||||
MegaStudyEdu Co Ltd | 10,405 | 296 | ||||||
Meritz Securities Co Ltd | 166,026 | 701 | ||||||
NAVER Corp (A) | 59,766 | 7,845 | ||||||
NCSoft Corp | 24,873 | 10,834 | ||||||
NHN Corp * | 6,045 | 315 | ||||||
Orion Corp/Republic of Korea (A) | 39,558 | 3,254 | ||||||
Partron Co Ltd (A) | 154,471 | 1,653 | ||||||
POSCO | 2,352 | 447 | ||||||
Samsung Biologics Co Ltd *(A)(B) | 6,118 | 1,573 | ||||||
Samsung C&T Corp | 6,637 | 498 | ||||||
Samsung Electro-Mechanics Co Ltd | 8,410 | 724 | ||||||
Samsung Electronics Co Ltd (A) | 1,764,149 | 72,342 | ||||||
SEI Institutional International Trust / Annual Report / September 30, 2019 |
29 |
SCHEDULE OF INVESTMENTS
September 30, 2019
Emerging Market Equity Fund(Continued)
| Description | Shares | Market Value ($ Thousands) | ||||||
COMMON STOCK (continued) | ||||||||
Samsung Life Insurance Co Ltd (A) | 23,024 | $ | 1,369 | |||||
SK Hynix Inc | 370,517 | 25,462 | ||||||
SK Telecom Co Ltd | 62,136 | 12,545 | ||||||
SK Telecom Co Ltd ADR | 274,320 | 6,090 | ||||||
S-Oil Corp (A) | 72,484 | 6,023 | ||||||
WONIK IPS Co Ltd | 103,876 | 2,510 | ||||||
Woongjin Coway Co Ltd | 71,793 | 5,078 | ||||||
Woori Financial Group Inc | 348,656 | 3,629 | ||||||
Youngone Corp | 14,002 | 418 | ||||||
|
|
| ||||||
| 220,782 | ||||||||
|
|
| ||||||
Switzerland — 0.1% | ||||||||
Wizz Air Holdings Plc *(B) | 37,285 | 1,661 | ||||||
|
|
| ||||||
Taiwan — 9.9% | ||||||||
Accton Technology Corp | 643,200 | 3,401 | ||||||
Airtac International Group | 152,003 | 1,816 | ||||||
ASE Technology Holding Co Ltd | 817,372 | 1,866 | ||||||
Asia Cement Corp | 1,164,000 | 1,627 | ||||||
Bizlink Holding Inc | 402,000 | 2,791 | ||||||
Catcher Technology Co Ltd | 561,040 | 4,257 | ||||||
Cathay Financial Holding Co Ltd | 932,000 | 1,229 | ||||||
Chailease Holding Co Ltd | 641,070 | 2,586 | ||||||
Chang Hwa Commercial Bank Ltd | 765,000 | 534 | ||||||
Chicony Electronics Co Ltd | 187,000 | 552 | ||||||
Chunghwa Telecom Co Ltd | 266,000 | 952 | ||||||
Coretronic Corp | 522,772 | 630 | ||||||
CTBC Financial Holding Co Ltd | 3,729,000 | 2,478 | ||||||
Cub Elecparts Inc | 3 | – | ||||||
Delta Electronics Inc | 328,000 | 1,403 | ||||||
Elite Material Co Ltd | 683,400 | 2,780 | ||||||
eMemory Technology Inc | 172,200 | 1,828 | ||||||
Feng TAY Enterprise Co Ltd | 174,400 | 1,253 | ||||||
Fubon Financial Holding Co Ltd | 1,732,000 | 2,487 | ||||||
Globalwafers Co Ltd | 218,000 | 2,217 | ||||||
Highwealth Construction Corp | 388,000 | 624 | ||||||
Hiwin Technologies Corp | 259,019 | 2,264 | ||||||
Hon Hai Precision Industry Co Ltd | 2,551,003 | 6,034 | ||||||
LandMark Optoelectronics Corp | 192,000 | 1,595 | ||||||
Largan Precision Co Ltd | 12,446 | 1,792 | ||||||
Lite-On Technology Corp | 710,000 | 1,126 | ||||||
Makalot Industrial Co Ltd | 410,400 | 2,181 | ||||||
MediaTek Inc | 1,397,756 | 16,686 | ||||||
Merida Industry Co Ltd | 365,000 | 2,080 | ||||||
Parade Technologies Ltd | 189,600 | 3,303 | ||||||
Phison Electronics Corp | 42,000 | 375 | ||||||
Powertech Technology Inc | 177,000 | 499 | ||||||
Radiant Opto-Electronics Corp | 182,000 | 696 | ||||||
Realtek Semiconductor Corp | 78,000 | 580 | ||||||
Silergy Corp | 58,890 | 1,465 | ||||||
Silicon Motion Technology Corp ADR | 61,809 | 2,185 | ||||||
Sino-American Silicon Products Inc | 250,000 | 665 | ||||||
SinoPac Financial Holdings Co Ltd | 3,308,000 | 1,291 | ||||||
| Description | Shares | Market Value ($ Thousands) | ||||||
COMMON STOCK (continued) | ||||||||
Taiwan Business Bank | 2,806,650 | $ | 1,154 | |||||
Taiwan Mobile Co Ltd | 176,000 | 635 | ||||||
Taiwan Semiconductor Manufacturing Co Ltd | 6,839,276 | 60,211 | ||||||
Taiwan Semiconductor Manufacturing Co Ltd ADR | 255,414 | 11,872 | ||||||
Tripod Technology Corp | 327,000 | 1,179 | ||||||
Unimicron Technology Corp | 505,000 | 716 | ||||||
Uni-President Enterprises Corp | 1,145,000 | 2,759 | ||||||
United Microelectronics Corp | 1,272,000 | 547 | ||||||
Win Semiconductors Corp | 611,963 | 5,524 | ||||||
Wistron Corp | 574,000 | 464 | ||||||
Yuanta Financial Holding Co Ltd | 2,151,000 | 1,282 | ||||||
Zhen Ding Technology Holding Ltd | 316,000 | 1,133 | ||||||
|
|
| ||||||
| 169,604 | ||||||||
|
|
| ||||||
Thailand — 2.6% | ||||||||
Advanced Info Service PCL | 448,600 | 3,227 | ||||||
AP Thailand PCL NVDR | 1,956,113 | 432 | ||||||
Bangkok Bank PCL | 519,000 | 2,944 | ||||||
Charoen Pokphand Foods PCL NVDR | 749,900 | 644 | ||||||
Com7 PCL | 1,363,300 | 1,087 | ||||||
CP ALL PCL | 1,903,500 | 5,057 | ||||||
CP ALL PCL NVDR | 1,186,463 | 3,152 | ||||||
GFPT PCL NVDR | 480,878 | 281 | ||||||
Home Product Center PCL | 13,769,954 | 7,699 | ||||||
Krung Thai Bank PCL NVDR | 1,214,400 | 683 | ||||||
Minor International PCL NVDR | 2,767,747 | 3,393 | ||||||
PTT Exploration & Production PCL | 214,800 | 850 | ||||||
PTT Exploration & Production PCL NVDR | 234,600 | 928 | ||||||
PTT PCL | 1,123,700 | 1,699 | ||||||
Robinson PCL (A) | 1,279,200 | 2,666 | ||||||
Siam Cement PCL/The | 143,300 | 1,912 | ||||||
Sino-Thai Engineering & Construction PCL NVDR | 856,600 | 560 | ||||||
Srisawad Corp PCL | 1,346,700 | 2,521 | ||||||
Thai Beverage PCL | 2,206,300 | 1,412 | ||||||
Thai Union Group PCL NVDR | 922,900 | 504 | ||||||
Thanachart Capital PCL NVDR | 568,300 | 1,059 | ||||||
Tisco Financial Group PCL NVDR | 235,900 | 791 | ||||||
Total Access Communication PCL | 694,700 | 1,306 | ||||||
|
|
| ||||||
| 44,807 | ||||||||
|
|
| ||||||
Turkey — 1.2% | ||||||||
Akbank T.A.S. * | 2,657,440 | 3,822 | ||||||
Anadolu Efes Biracilik Ve Malt Sanayii AS | 161,832 | 627 | ||||||
Ford Otomotiv Sanayi AS | 98,119 | 1,032 | ||||||
KOC Holding AS | 219,059 | 734 | ||||||
Mavi Giyim Sanayi Ve Ticaret AS, | 138,326 | 1,130 | ||||||
Sok Marketler Ticaret AS * | 916,381 | 1,785 | ||||||
Tekfen Holding AS | 114,542 | 388 | ||||||
Turk Hava Yollari AO *(A) | 1,006,463 | 2,207 | ||||||
Turkcell Iletisim Hizmetleri AS | 1,517,244 | 3,496 | ||||||
Turkcell Iletisim Hizmetleri AS ADR | 54,935 | 318 | ||||||
30 |
SEI Institutional International Trust / Annual Report / September 30, 2019 |
| Description | Shares | Market Value ($ Thousands) | ||||||
COMMON STOCK (continued) | ||||||||
Turkiye Garanti Bankasi AS * | 1,918,459 | $ | 3,469 | |||||
Turkiye Is Bankasi AS, Cl C *(A) | 913,324 | 1,014 | ||||||
Turkiye Sise ve Cam Fabrikalari AS | 1,453,619 | 1,202 | ||||||
|
|
| ||||||
| 21,224 | ||||||||
|
|
| ||||||
United Arab Emirates — 0.4% | ||||||||
Aldar Properties PJSC | 2,871,732 | 1,634 | ||||||
Emaar Properties PJSC | 4,309,746 | 5,409 | ||||||
|
|
| ||||||
| 7,043 | ||||||||
|
|
| ||||||
United Kingdom — 1.5% | ||||||||
Anglo American PLC | 82,754 | 1,919 | ||||||
Etalon Group PLC GDR | 56,800 | 108 | ||||||
KAZ Minerals PLC | 778,363 | 4,156 | ||||||
Mail.Ru Group Ltd GDR * | 14,949 | 313 | ||||||
Network International Holdings PLC *(B) | 107,891 | 711 | ||||||
NMC Health PLC (A) | 98,097 | 3,276 | ||||||
Novatek PJSC GDR | 15,339 | 3,111 | ||||||
Polyus PJSC GDR | 15,059 | 872 | ||||||
Rio Tinto PLC | 68,130 | 3,534 | ||||||
Tullow Oil PLC | 2,765,258 | 7,289 | ||||||
Vivo Energy PLC | 456,728 | 704 | ||||||
|
|
| ||||||
| 25,993 | ||||||||
|
|
| ||||||
United States — 0.6% | ||||||||
Corp America Airports SA * | 93,594 | 424 | ||||||
Liberty Latin America Ltd, Cl C * | 122,593 | 2,096 | ||||||
Pagseguro Digital Ltd, Cl A * | 107,800 | 4,992 | ||||||
Southern Copper Corp | 14,226 | 485 | ||||||
StoneCo Ltd, Cl A * | 50,700 | 1,764 | ||||||
|
|
| ||||||
| 9,761 | ||||||||
|
|
| ||||||
Vietnam — 0.1% | ||||||||
Hoa Phat Group JSC * | 179,000 | 169 | ||||||
Vincom Retail JSC | 1,273,675 | 1,817 | ||||||
|
|
| ||||||
| 1,986 | ||||||||
|
|
| ||||||
Total Common Stock (Cost $1,420,377) ($ Thousands) | 1,598,499 | |||||||
|
|
| ||||||
PREFERRED STOCK — 1.9% | ||||||||
Brazil — 1.5% | ||||||||
Banco Bradesco SA (D) | 437,366 | 3,566 | ||||||
Banco do Estado do Rio Grande do Sul SA (D) | 90,198 | 487 | ||||||
Centrais Eletricas Brasileiras SA (D) | 148,500 | 1,496 | ||||||
Cia Brasileira de Distribuicao ADR * (D) | 156,216 | 3,004 | ||||||
Cia de Transmissao de Energia Eletrica Paulista (D) | 184,800 | 1,090 | ||||||
Cia Paranaense de Energia (D) | 51,677 | 619 | ||||||
Itau Unibanco Holding SA (D) | 608,476 | 5,123 | ||||||
Itau Unibanco Holding SA ADR (D) | 482,181 | 4,055 | ||||||
Petroleo Brasileiro SA (D) | 595,892 | 3,936 | ||||||
Petroleo Brasileiro SA ADR, Cl A (D) | 94,908 | 1,247 | ||||||
| Description | Shares | Market Value ($ Thousands) | ||||||
PREFERRED STOCK (continued) | ||||||||
Telefonica Brasil SA (D) | 51,299 | �� | $ | 676 | ||||
|
|
| ||||||
| 25,299 | ||||||||
|
|
| ||||||
Colombia — 0.1% | ||||||||
Grupo Aval Acciones y Valores SA (D) | 1,797,174 | 674 | ||||||
|
|
| ||||||
South Korea — 0.3% | ||||||||
Samsung Electronics Co Ltd (D) | 172,716 | 5,704 | ||||||
|
|
| ||||||
Total Preferred Stock (Cost $28,387) ($ Thousands) | 31,677 | |||||||
|
|
| ||||||
| Number of Participation Notes | ||||||||
PARTICIPATION NOTES — 0.9% | ||||||||
China — 0.2% | ||||||||
Offshore Oil Engineering, Expires 03/28/2020 * | 4,138,839 | 3,115 | ||||||
|
|
| ||||||
Luxembourg — 0.2% | ||||||||
Beijing Sinnet Technology Co Ltd, Expires 10/19/2020 * | 600,015 | 1,560 | ||||||
Hoa Phat Group JSC, Expires 11/20/2020 * | 1,704,862 | 1,597 | ||||||
|
|
| ||||||
| 3,157 | ||||||||
|
|
| ||||||
Switzerland — 0.4% | ||||||||
Han’s Laser, Expires 03/27/2020 * | 536,950 | 2,672 | ||||||
Ping An Insurance Group Co, Expires 10/16/2020 * | 405,400 | 4,940 | ||||||
|
|
| ||||||
| 7,612 | ||||||||
|
|
| ||||||
United States — 0.1% | ||||||||
China Merchants Energy Shipping Co Ltd, Expires 11/24/2020 * | 1,362,898 | 910 | ||||||
COSCO SHIPPING Energy Transportation Co Ltd, Expires 11/24/2020 * | 1,082,330 | 1,018 | ||||||
|
|
| ||||||
| 1,928 | ||||||||
|
|
| ||||||
Total Participation Notes (Cost $16,341) ($ Thousands) | 15,812 | |||||||
|
|
| ||||||
| Number of Warrants | ||||||||
WARRANTS — 0.0% | ||||||||
Thailand — 0.0% | ||||||||
Minor International PCL, Expires 09/30/2021 * | 162,947 | 21 | ||||||
|
|
| ||||||
Total Warrants | 21 | |||||||
|
|
| ||||||
SEI Institutional International Trust / Annual Report / September 30, 2019 |
31 |
SCHEDULE OF INVESTMENTS
September 30, 2019
Emerging Market Equity Fund(Concluded)
| Description | Face Amount (Thousands) | Market Value ($ Thousands) | ||||||
DEBENTURE BOND — 0.0% | ||||||||
Brazil — 0.0% | ||||||||
Vale, Ser 1997 | BRL | 8 | $ | – | ||||
|
|
| ||||||
Total Debenture Bond | – | |||||||
|
|
| ||||||
| Shares | ||||||||
AFFILIATED PARTNERSHIP — 2.8% |
| |||||||
SEI Liquidity Fund, L.P. | ||||||||
2.010% **†(E) | 48,631,028 | 48,638 | ||||||
|
|
| ||||||
Total Affiliated Partnership (Cost $48,631) ($ Thousands) | 48,638 | |||||||
|
|
| ||||||
CASH EQUIVALENT — 1.7% | ||||||||
SEI Daily Income Trust, Government Fund, Cl F | ||||||||
1.800%**† | 29,815,716 | 29,816 | ||||||
|
|
| ||||||
Total Cash Equivalent (Cost $29,816) ($ Thousands) | 29,816 | |||||||
|
|
| ||||||
Total Investments in Securities — 100.8% |
| $ | 1,724,463 | |||||
|
|
| ||||||
A list of the open futures contracts held by the Fund at September 30, 2019, is as follows:
| Type of Contract | Number of Contracts Long | Expiration Date | Notional Amount (Thousands) | Value (Thousands) | Unrealized Depreciation (Thousands) | |||||||||||||||
MSCI Emerging Markets | 681 | Dec-2019 | $ | 34,955 | $ | 34,115 | $ | (840 | ) | |||||||||||
|
|
|
|
|
|
|
|
| ||||||||||||
Percentages are based on Net Assets of $1,710,123 ($ Thousands). |
| * | Non-income producing security. |
| ** | Rate shown is the7-day effective yield as of September 30, 2019. |
| † | Investment in Affiliated Security (see Note 5). |
| ‡ | Real Estate Investment Trust. |
| (A) | Certain securities or partial positions of certain securities are on loan at September 30, 2019 (See Note 9). The total market value of securities on loan at September 30, 2019 was $45,930 ($ Thousands). |
| (B) | Security exempt from registration under Rule 144A of the Securities Act of 1933. These securities may be resold in transactions exempt from registration normally to qualified institutions. On September 30, 2019, the value of these securities amounted to $64,256 ($ Thousands), representing 3.8% of the Net Assets of the Fund. |
| (C) | There is currently no rate available. |
| (D) | Variable or floating rate security, the interest rate of which adjusts periodically based on changes in current interest rates and prepayments on the underlying pool of assets. |
| (E) | This security was purchased with cash collateral held from securities on loan (See Note 9). The total market value of such securities as of September 30, 2019 was $48,638 ($ Thousands). |
ADR — American Depositary Receipt
BRL — Brazilian Real
Cl — Class
GDR — Global Depositary Receipt
JSC — Joint-Stock Company
JSE — Johannesburg Stock Exchange
L.P. — Limited Partnership
Ltd. — Limited
MSCI — Morgan Stanley Capital International
NVDR —Non-Voting Depositary Receipt
PJSC — Public Joint-Stock Company
PLC — Public Limited Company
REIT — Real Estate investment Trust
32 |
SEI Institutional International Trust / Annual Report / September 30, 2019 |
The following is a list of the level of inputs used as of September 30, 2019, in valuing the Fund’s investments and other financial instruments carried at value ($ Thousands):
| Investments in Securities | Level 1 ($) | Level 2 ($) | Level 3 ($) | Total ($) | ||||||||||||
Common Stock | 1,442,952 | 155,547 | –^ | 1,598,499 | ||||||||||||
Preferred Stock | 31,677 | – | – | 31,677 | ||||||||||||
Participation Notes | – | 15,812 | – | 15,812 | ||||||||||||
Debenture Bond | – | –^ | – | – | ||||||||||||
Warrants | – | 21 | – | 21 | ||||||||||||
Affiliated Partnership | – | 48,638 | – | 48,638 | ||||||||||||
Cash Equivalent | 29,816 | – | – | 29,816 | ||||||||||||
|
|
|
|
|
|
|
|
|
|
|
| |||||
Total Investments in Securities | 1,504,445 | 220,018 | – | 1,724,463 | ||||||||||||
|
|
|
|
|
|
|
|
|
|
|
| |||||
| Other Financial Instruments | Level 1 ($) | Level 2 ($) | Level 3 ($) | Total ($) | ||||||||||||
Futures Contracts* | ||||||||||||||||
Unrealized Depreciation | (840 | ) | – | – | (840 | ) | ||||||||||
|
|
|
|
|
|
|
|
|
|
|
| |||||
Total Other Financial Instruments | (840 | ) | – | – | (840 | ) | ||||||||||
|
|
|
|
|
|
|
|
|
|
|
| |||||
^One Security with market value of $0.
*Futures contracts are valued at the unrealized depreciation on the instrument.
For the year ended September 30, 2019, there were transfers between Level 1 and Level 2 assets and liabilities. The primary reason for changes in the classifications between Levels 1 and 2 occurs when foreign equity securities are fair valued using other observable market-based inputs in place of the closing exchange price due to events occurring after the close of the exchange or market on which the investment is principally traded.
For the year ended September 30, 2019, there were no transfers between Level 2 and Level 3 assets and liabilities.
For more information on valuation inputs, see Note 2 – Significant Accounting Policies in Notes to Financial Statements.
The following is a summary of the transactions with affiliates for the year ended September 30, 2019 ($ Thousands):
| Security Description | Value at 9/30/2018 | Purchases at Cost | Proceeds from Sales | Realized Gain | Change in Unrealized Appreciation | Value 9/30/2019 | Shares | Income | Capital Gains | |||||||||
SEI Liquidity Fund, L.P. | $66,697 | $280,016 | $(298,114) | $32 | $ 7 | $48,638 | 48,631,028 | $ 571 | $— | |||||||||
SEI Daily Income Trust, Government Fund, Cl F | 12,932 | 197,618 | (180,734) | — | — | 29,816 | 29,815,716 | 515 | — | |||||||||
|
|
|
|
|
|
|
|
| ||||||||||
Totals | $79,629 | $477,634 | $(478,848) | $32 | $ 7 | $78,454 | 78,446,744 | $1,086 | $— | |||||||||
|
|
|
|
|
|
|
|
|
Amounts designated as “—” are $0 or have been rounded to $0.
The accompanying notes are an integral part of the financial statements.
SEI Institutional International Trust / Annual Report / September 30, 2019 |
33 |
SCHEDULE OF INVESTMENTS
September 30, 2019
International Fixed Income Fund
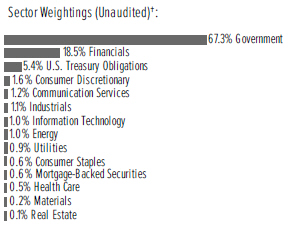
†Percentages based on total investments.
| Description | Face Amount (Thousands) | Market Value ($ Thousands) | ||||||
GLOBAL BONDS — 90.9% | ||||||||
Australia — 1.8% | ||||||||
Australia & New Zealand Banking Group | ||||||||
4.500%, 03/19/2024 (A) | $ | 200 | $ | 213 | ||||
Australia & New Zealand Banking Group MTN | ||||||||
5.000%, 08/16/2023 | AUD | 750 | 575 | |||||
3.625%, 07/18/2022 | EUR | 300 | 364 | |||||
Australia Government Bond | ||||||||
4.750%, 04/21/2027 | AUD | 820 | 707 | |||||
4.500%, 04/15/2020 | 185 | 127 | ||||||
4.500%, 04/21/2033 | 195 | 187 | ||||||
4.250%, 04/21/2026 | 1,425 | 1,167 | ||||||
3.750%, 04/21/2037 | 393 | 365 | ||||||
3.000%, 03/21/2047 | 70 | 62 | ||||||
2.750%, 04/21/2024 | 1,230 | 904 | ||||||
2.750%, 05/21/2041 | 322 | 266 | ||||||
Australia Government Bond, Ser 124 | ||||||||
5.750%, 05/15/2021 | 1,615 | 1,176 | ||||||
BHP Billiton Finance | ||||||||
4.750%, VAR EUR Swap Annual 5 Yr+4.363%, 04/22/2076 | EUR | 101 | 117 | |||||
Commonwealth Bank of Australia | ||||||||
4.500%, 12/09/2025 (A) | $ | 450 | 486 | |||||
Commonwealth Bank of Australia MTN | ||||||||
3.000%, 05/03/2022 | EUR | 330 | 392 | |||||
0.375%, 04/11/2024 | 455 | 511 | ||||||
National Australia Bank | ||||||||
5.000%, 03/11/2024 | AUD | 750 | 583 | |||||
National Australia Bank MTN | ||||||||
2.250%, 06/06/2025 | EUR | 206 | 257 | |||||
Westpac Banking Corp MTN | ||||||||
1.500%, 03/24/2021 | 220 | 247 | ||||||
0.500%, 05/17/2024 | 455 | 514 | ||||||
|
|
| ||||||
| 9,220 | ||||||||
|
|
| ||||||
| Description | Face Amount (Thousands) | Market Value ($ Thousands) | ||||||
GLOBAL BONDS (continued) | ||||||||
Austria — 1.3% | ||||||||
JAB Holdings BV | ||||||||
1.250%, 05/22/2024 | EUR | 200 | $ | 228 | ||||
Republic of Austria Government Bond | ||||||||
4.150%, 03/15/2037 (A) | 326 | 613 | ||||||
3.650%, 04/20/2022 (A) | 1,135 | 1,376 | ||||||
3.150%, 06/20/2044 (A) | 521 | 980 | ||||||
2.400%, 05/23/2034 (A) | 110 | 164 | ||||||
2.100%, 09/20/2117 (A) | 75 | 155 | ||||||
1.500%, 02/20/2047 (A) | 95 | 138 | ||||||
0.750%, 10/20/2026 (A) | 749 | 889 | ||||||
0.500%, 02/20/2029 (A) | 885 | 1,040 | ||||||
0.000%, 07/15/2024 (A)(B) | 765 | 859 | ||||||
Republic of Austria Government Bond, Ser 97-6 | ||||||||
6.250%, 07/15/2027 | 288 | 481 | ||||||
|
|
| ||||||
| 6,923 | ||||||||
|
|
| ||||||
Belgium — 1.9% | ||||||||
Anheuser-Busch InBev MTN | ||||||||
2.250%, 05/24/2029 | GBP | 205 | 263 | |||||
1.500%, 03/17/2025 | EUR | 415 | 487 | |||||
1.125%, 07/01/2027 | 230 | 266 | ||||||
Anheuser-Busch InBev Finance | ||||||||
2.600%, 05/15/2024 | CAD | 550 | 417 | |||||
Kingdom of Belgium Government Bond | ||||||||
4.250%, 03/28/2041 (A) | EUR | 440 | 875 | |||||
3.750%, 09/28/2020 (A) | 2,126 | 2,418 | ||||||
3.750%, 06/22/2045 | 229 | 456 | ||||||
3.000%, 06/22/2034 (A) | 346 | 545 | ||||||
1.700%, 06/22/2050 (A) | 320 | 463 | ||||||
1.600%, 06/22/2047 (A) | 310 | 439 | ||||||
1.000%, 06/22/2031 (A) | 490 | 606 | ||||||
0.800%, 06/22/2028 (A) | 1,249 | 1,498 | ||||||
0.500%, 10/22/2024 (A) | 1,100 | 1,265 | ||||||
Kingdom of Belgium Government Bond, Ser 44 | ||||||||
5.000%, 03/28/2035 (A) | 64 | 123 | ||||||
|
|
| ||||||
| 10,121 | ||||||||
|
|
| ||||||
Brazil — 0.4% | ||||||||
Brazil Notas do Tesouro Nacional, Serie B | ||||||||
6.000%, 08/15/2050 | BRL | 1,406 | 1,578 | |||||
Minerva Luxembourg | ||||||||
6.500%, 09/20/2026 (A) | $ | 290 | 302 | |||||
Odebrecht Finance | ||||||||
7.125%, 06/26/2042 (C) | 280 | 28 | ||||||
4.375%, 04/25/2025 (C) | 200 | 20 | ||||||
|
|
| ||||||
| 1,928 | ||||||||
|
|
| ||||||
Canada — 6.4% | ||||||||
Bank of Montreal | ||||||||
0.750%, 09/21/2022 | EUR | 235 | 265 | |||||
34 |
SEI Institutional International Trust / Annual Report / September 30, 2019 |
| Description | Face Amount (Thousands) | Market Value ($ Thousands) | ||||||
GLOBAL BONDS (continued) | ||||||||
Bank of Montreal MTN | ||||||||
0.125%, 04/19/2021 | EUR | 280 | $ | 308 | ||||
Bank of Nova Scotia MTN | ||||||||
0.750%, 09/17/2021 | 570 | 636 | ||||||
Bell Canada MTN | ||||||||
4.700%, 09/11/2023 | CAD | 80 | 65 | |||||
Canada Housing Trust No. 1 | ||||||||
2.250%, 12/15/2025 (A) | 2,235 | 1,737 | ||||||
1.750%, 06/15/2022 (A) | 2,465 | 1,864 | ||||||
Canadian Government Bond | ||||||||
5.750%, 06/01/2033 | 1,205 | 1,392 | ||||||
5.000%, 06/01/2037 | 816 | 947 | ||||||
2.750%, 12/01/2048 | 400 | 388 | ||||||
2.750%, 12/01/2048 | 300 | 291 | ||||||
2.500%, 06/01/2024 | 1,043 | 826 | ||||||
2.250%, 06/01/2029 | 3,537 | 2,882 | ||||||
1.500%, 06/01/2026 (D) | 7,545 | 5,740 | ||||||
1.000%, 09/01/2022 | 1,268 | 944 | ||||||
1.000%, 06/01/2027 | 1,375 | 1,010 | ||||||
0.750%, 09/01/2021 | 655 | 487 | ||||||
Canadian Imperial Bank of Commerce | ||||||||
0.239%, 07/25/2022 (B) | EUR | 445 | 491 | |||||
CDP Financial | ||||||||
4.400%, 11/25/2019 (A) | $ | 850 | 853 | |||||
Enbridge Pipelines MTN | ||||||||
4.490%, 11/12/2019 | CAD | 2,000 | 1,514 | |||||
Export Development Canada MTN | ||||||||
2.400%, 06/07/2021 | AUD | 1,259 | 868 | |||||
National Bank of Canada | ||||||||
1.500%, 03/25/2021 | EUR | 345 | 387 | |||||
Province of British Columbia Canada | ||||||||
3.250%, 12/18/2021 | CAD | 1,150 | 897 | |||||
Province of Manitoba Canada | ||||||||
3.850%, 12/01/2021 | 710 | 560 | ||||||
Province of Ontario Canada | ||||||||
4.700%, 06/02/2037 | 1,355 | 1,368 | ||||||
4.650%, 06/02/2041 | 540 | 563 | ||||||
2.800%, 06/02/2048 | 2,200 | 1,809 | ||||||
2.600%, 06/02/2025 | 1,614 | 1,265 | ||||||
2.400%, 06/02/2026 | 585 | 454 | ||||||
Province of Ontario Canada MTN | ||||||||
1.650%, 06/08/2020 | JPY | 100,000 | 937 | |||||
Province of Quebec Canada | ||||||||
6.250%, 06/01/2032 | CAD | 720 | 783 | |||||
3.500%, 12/01/2048 | 520 | 488 | ||||||
Rogers Communications | ||||||||
4.000%, 06/06/2022 | 165 | 130 | ||||||
|
|
| ||||||
| 33,149 | ||||||||
|
|
| ||||||
China — 0.1% | ||||||||
Tencent Holdings MTN | ||||||||
3.975%, 04/11/2029 (A) | $ | 260 | 278 | |||||
| Description | Face Amount (Thousands) | Market Value ($ Thousands) | ||||||
GLOBAL BONDS (continued) | ||||||||
3.500%, 07/05/2024 | $ | 200 | $ | 203 | ||||
|
|
| ||||||
| 481 | ||||||||
|
|
| ||||||
Colombia — 0.4% | ||||||||
Colombian TES | ||||||||
10.000%, 07/24/2024 | COP | 1,833,400 | 635 | |||||
7.750%, 09/18/2030 | 2,160,100 | 706 | ||||||
7.500%, 08/26/2026 | 1,100,600 | 352 | ||||||
7.000%, 05/04/2022 | 521,100 | 158 | ||||||
6.000%, 04/28/2028 | 1,112,100 | 323 | ||||||
|
|
| ||||||
| 2,174 | ||||||||
|
|
| ||||||
Czech Republic — 0.1% | ||||||||
Czech Republic Government Bond | ||||||||
4.700%, 09/12/2022 | CZK | 7,470 | 347 | |||||
2.500%, 08/25/2028 | 6,710 | 310 | ||||||
|
|
| ||||||
| 657 | ||||||||
|
|
| ||||||
Denmark — 0.4% | ||||||||
Danske Bank | ||||||||
3.875%, 09/12/2023 (A) | $ | 270 | 280 | |||||
Danske Bank MTN | ||||||||
5.875%, VAR EUR Swap Annual 7 Yr+5.471%, 10/29/2049 | EUR | 344 | 397 | |||||
Kingdom of Denmark | ||||||||
4.500%, 11/15/2039 | DKK | 2,040 | 601 | |||||
1.500%, 11/15/2023 | 4,025 | 644 | ||||||
Orsted | ||||||||
6.250%, VAR EUR Swap Annual 5 Yr+4.750%, 06/26/3013 | EUR | 210 | 274 | |||||
|
|
| ||||||
| 2,196 | ||||||||
|
|
| ||||||
Egypt — 0.0% | ||||||||
Egypt Government International Bond MTN | ||||||||
4.750%, 04/11/2025 (A) | 170 | 192 | ||||||
|
|
| ||||||
Finland — 0.2% | ||||||||
Finland Government Bond | ||||||||
2.000%, 04/15/2024 (A) | 482 | 590 | ||||||
1.375%, 04/15/2047 (A) | 130 | 188 | ||||||
0.500%, 09/15/2029 (A) | 445 | 525 | ||||||
|
|
| ||||||
| 1,303 | ||||||||
|
|
| ||||||
France — 8.0% | ||||||||
BNP Paribas | ||||||||
3.375%, 01/09/2025 (A) | $ | 395 | 408 | |||||
BNP Paribas MTN | ||||||||
3.375%, 01/23/2026 | GBP | 490 | 657 | |||||
BPCE MTN | ||||||||
1.125%, 01/18/2023 | EUR | 300 | 338 | |||||
BPCE SFH | ||||||||
1.750%, 11/29/2019 | 600 | 656 | ||||||
BPCE SFH MTN | ||||||||
3.750%, 09/13/2021 | 200 | 236 | ||||||
SEI Institutional International Trust / Annual Report / September 30, 2019 |
35 |
SCHEDULE OF INVESTMENTS
September 30, 2019
International Fixed Income Fund(Continued)
| Description | Face Amount (Thousands) | Market Value ($ Thousands) | ||||||
GLOBAL BONDS (continued) | ||||||||
Bpifrance Financement | ||||||||
0.064%, 11/25/2022 (B) | EUR | 600 | $ | 663 | ||||
Caisse Francaise de Financement Local MTN | ||||||||
3.000%, 10/02/2028 | 100 | 140 | ||||||
0.500%, 01/19/2026 | 500 | 573 | ||||||
Caisse Nationale de Reassurance Mutuelle Agricole Groupama | ||||||||
6.000%, 01/23/2027 | 400 | 555 | ||||||
Cie de Financement Foncier | ||||||||
0.375%, 12/11/2024 | 300 | 340 | ||||||
Cie de Financement Foncier MTN | ||||||||
5.500%, 01/26/2027 | GBP | 387 | 629 | |||||
CNP Assurances | ||||||||
4.500%, VAR Euribor 3 Month+4.600%, 06/10/2047 | EUR | 200 | 259 | |||||
1.875%, 10/20/2022 | 200 | 229 | ||||||
Credit Agricole Assurances | ||||||||
4.750%, VAR EUR Swap Annual 5 Yr+5.350%, 09/27/2048 | 100 | 131 | ||||||
Credit Agricole Home Loan SFH MTN | ||||||||
1.250%, 03/24/2031 | 300 | 375 | ||||||
Dexia Credit Local MTN | ||||||||
0.625%, 01/21/2022 | 1,550 | 1,731 | ||||||
0.625%, 02/03/2024 | 200 | 227 | ||||||
0.500%, 01/17/2025 | 300 | 341 | ||||||
Electricite de France MTN | ||||||||
5.375%, VAR EUR Swap Annual 12 Yr+3.794%, 01/29/2168 | 200 | 249 | ||||||
4.000%, 11/12/2025 | 350 | 468 | ||||||
2.250%, 04/27/2021 | 100 | 113 | ||||||
Engie | ||||||||
3.250%, VAR EUR Swap Annual 5 Yr+3.169%, 02/28/2168 | 300 | 360 | ||||||
Engie MTN | ||||||||
0.875%, 03/27/2024 | 300 | 340 | ||||||
0.375%, 02/28/2023 | 100 | 111 | ||||||
Europcar Mobility Group | ||||||||
4.000%, 04/30/2026 (A) | 170 | 189 | ||||||
French Republic Government Bond OAT | ||||||||
5.750%, 10/25/2032 | 403 | 780 | ||||||
4.500%, 04/25/2041 | 580 | 1,199 | ||||||
4.000%, 10/25/2038 | 345 | 648 | ||||||
4.000%, 04/25/2055 | 56 | 127 | ||||||
3.250%, 05/25/2045 | 2,061 | 3,821 | ||||||
1.750%, 05/25/2023 | 2,359 | 2,805 | ||||||
1.750%, 06/25/2039 (A) | 60 | 85 | ||||||
1.750%, 05/25/2066 (A) | 165 | 251 | ||||||
1.250%, 05/25/2034 | 800 | 1,032 | ||||||
0.750%, 05/25/2028 | 5,205 | 6,231 | ||||||
0.500%, 05/25/2029 | 2,176 | 2,553 | ||||||
0.000%, 02/25/2020 (B) | 1,990 | 2,175 | ||||||
0.000%, 02/25/2021 (B) | 2,055 | 2,262 | ||||||
| Description | Face Amount (Thousands) | Market Value ($ Thousands) | ||||||
GLOBAL BONDS (continued) | ||||||||
0.000%, 05/25/2021 (B) | EUR | 1,685 | $ | 1,858 | ||||
0.000%, 05/25/2022 (B) | 868 | 965 | ||||||
Orange MTN | ||||||||
2.500%, 03/01/2023 | 500 | 593 | ||||||
2.375%, VAR EUR Swap Annual 5 Yr+2.359%, 04/15/2168 | 300 | 342 | ||||||
SNCF Reseau EPIC MTN | ||||||||
5.500%, 12/01/2021 | GBP | 205 | 278 | |||||
4.250%, 10/07/2026 | EUR | 200 | 287 | |||||
2.250%, 12/20/2047 | 300 | 444 | ||||||
1.125%, 05/19/2027 | 300 | 358 | ||||||
1.125%, 05/25/2030 | 200 | 242 | ||||||
Societe Generale MTN | ||||||||
1.125%, 01/23/2025 | 100 | 113 | ||||||
Suez | ||||||||
2.875%, VAR EUR Swap Annual 5 Yr+2.504%, 04/19/2168 | 300 | 349 | ||||||
TOTAL MTN | ||||||||
3.369%, VAR EUR Swap Annual 5 Yr+3.350%, 10/06/2167 | 260 | 326 | ||||||
Total Capital International MTN | ||||||||
4.250%, 11/26/2021 | AUD | 640 | 458 | |||||
UNEDIC ASSEO MTN | ||||||||
1.250%, 05/25/2033 | EUR | 700 | 885 | |||||
|
|
| ||||||
| 41,785 | ||||||||
|
|
| ||||||
Germany — 5.5% | ||||||||
BMW Finance MTN | ||||||||
0.875%, 11/17/2020 | 585 | 645 | ||||||
0.454%, 01/29/2021 | JPY | 200,000 | 1,854 | |||||
Bundesobligation | ||||||||
0.000%, 10/18/2024 (B) | EUR | 2,330 | 2,642 | |||||
Bundesrepublik Deutschland Bundesanleihe | ||||||||
4.000%, 01/04/2037 | 411 | 798 | ||||||
3.250%, 07/04/2042 | 1,378 | 2,726 | ||||||
2.500%, 07/04/2044 | 390 | 713 | ||||||
2.500%, 08/15/2046 | 267 | 501 | ||||||
0.500%, 02/15/2026 | 863 | 1,019 | ||||||
0.281%, 08/15/2026 (B) | 1,882 | 2,159 | ||||||
0.250%, 02/15/2027 | 2,160 | 2,529 | ||||||
0.250%, 02/15/2029 | 1,678 | 1,980 | ||||||
0.000%, 08/15/2029 (B) | 2,115 | 2,440 | ||||||
Bundesrepublik Deutschland Bundesanleihe, Ser 03 | ||||||||
4.750%, 07/04/2034 | 95 | 186 | ||||||
Bundesrepublik Deutschland Bundesanleihe, Ser 07 | ||||||||
4.250%, 07/04/2039 | 123 | 258 | ||||||
Deutsche Telekom International Finance BV MTN | ||||||||
1.375%, 12/01/2025 | 165 | 193 | ||||||
0.625%, 04/03/2023 | 330 | 367 | ||||||
36 |
SEI Institutional International Trust / Annual Report / September 30, 2019 |
| Description | Face Amount (Thousands) | Market Value ($ Thousands) | ||||||
GLOBAL BONDS (continued) | ||||||||
Gemeinsame Deutsche Bundeslaender | ||||||||
3.500%, 10/07/2019 | EUR | 650 | $ | 709 | ||||
IHO Verwaltungs GmbH | ||||||||
3.625%, 05/15/2025 (A) | 175 | 198 | ||||||
Kreditanstalt fuer Wiederaufbau | ||||||||
2.600%, 06/20/2037 | JPY | 65,000 | 897 | |||||
0.500%, 09/15/2027 | EUR | 510 | 596 | |||||
0.125%, 06/07/2023 | 1,135 | 1,270 | ||||||
Kreditanstalt fuer Wiederaufbau MTN | ||||||||
3.750%, 05/29/2020 | NZD | 483 | 308 | |||||
2.800%, 02/17/2021 | AUD | 1,230 | 849 | |||||
1.125%, 09/15/2032 | EUR | 500 | 634 | |||||
1.125%, 05/09/2033 | 220 | 280 | ||||||
Landwirtschaftliche Rentenbank MTN | ||||||||
0.625%, 05/18/2027 | 225 | 265 | ||||||
Volkswagen Bank GmbH MTN | ||||||||
0.625%, 09/08/2021 | 200 | 220 | ||||||
Volkswagen International Finance | ||||||||
1.875%, 03/30/2027 | 500 | 576 | ||||||
1.125%, 10/02/2023 | 600 | 672 | ||||||
|
|
| ||||||
| 28,484 | ||||||||
|
|
| ||||||
Ghana — 0.0% | ||||||||
Kosmos Energy | ||||||||
7.125%, 04/04/2026 (A) | $ | 200 | 206 | |||||
|
|
| ||||||
Guernsey — 0.1% | ||||||||
Credit Suisse Group Funding Guernsey MTN | ||||||||
1.250%, 04/14/2022 | EUR | 295 | 331 | |||||
|
|
| ||||||
Hungary — 0.1% | ||||||||
Hungary Government Bond | ||||||||
3.000%, 06/26/2024 | HUF | 75,010 | 268 | |||||
|
|
| ||||||
India — 0.0% | ||||||||
Greenko Mauritius | ||||||||
6.250%, 02/21/2023 (A) | $ | 200 | 203 | |||||
|
|
| ||||||
Indonesia — 0.1% | ||||||||
Indonesia Government International Bond | ||||||||
1.450%, 09/18/2026 | EUR | 300 | 343 | |||||
Indonesia Government International Bond MTN | ||||||||
2.150%, 07/18/2024 (A) | 200 | 234 | ||||||
|
|
| ||||||
| 577 | ||||||||
|
|
| ||||||
Ireland — 0.7% | ||||||||
AIB Group MTN | ||||||||
4.263%, VAR ICE LIBOR USD 3 Month+1.874%, 04/10/2025 (A) | $ | 450 | 468 | |||||
Allied Irish Banks MTN | ||||||||
4.125%, VAR EUR Swap Annual 5 Yr+3.950%, 11/26/2025 | EUR | 177 | 201 | |||||
| Description | Face Amount (Thousands) | Market Value ($ Thousands) | ||||||
GLOBAL BONDS (continued) | ||||||||
Bank of Ireland MTN | ||||||||
0.375%, 05/07/2022 | EUR | 555 | $ | 618 | ||||
CRH Funding MTN | ||||||||
1.875%, 01/09/2024 | 310 | 363 | ||||||
Europcar Mobility Group | ||||||||
4.125%, 11/15/2024 (A) | 100 | 112 | ||||||
Ireland Government Bond | ||||||||
5.400%, 03/13/2025 | 351 | 504 | ||||||
4.500%, 04/18/2020 | 205 | 230 | ||||||
1.500%, 05/15/2050 | 165 | 215 | ||||||
1.100%, 05/15/2029 | 670 | 810 | ||||||
|
|
| ||||||
| 3,521 | ||||||||
|
|
| ||||||
Israel — 0.2% | ||||||||
Israel Government Bond | ||||||||
4.250%, 03/31/2023 | ILS | 2,521 | 839 | |||||
2.000%, 03/31/2027 | 925 | 290 | ||||||
|
|
| ||||||
| 1,129 | ||||||||
|
|
| ||||||
Italy — 6.3% | ||||||||
Assicurazioni Generali MTN | ||||||||
5.500%, VAR Euribor 3 Month+5.350%, 10/27/2047 | EUR | 230 | 301 | |||||
Enel | ||||||||
5.000%, VAR EUR Swap Annual 5 Yr+3.648%, 01/15/2075 | 105 | 116 | ||||||
3.500%, VAR EUR Swap Annual 5 Yr+3.564%, 05/24/2080 | 175 | 206 | ||||||
Enel Finance International | ||||||||
2.650%, 09/10/2024 (A) | $ | 340 | 340 | |||||
Enel Finance International MTN | ||||||||
5.625%, 08/14/2024 | GBP | 160 | 235 | |||||
Eni | ||||||||
4.250%, 05/09/2029 (A) | $ | 515 | 565 | |||||
Intesa Sanpaolo MTN | ||||||||
5.017%, 06/26/2024 (A) | 530 | 545 | ||||||
3.625%, 12/05/2022 | EUR | 200 | 246 | |||||
Italy Buoni Poliennali Del Tesoro | ||||||||
5.000%, 09/01/2040 (A) | 1,510 | 2,593 | ||||||
3.850%, 09/01/2049 (A) | 861 | 1,354 | ||||||
3.750%, 05/01/2021 (A) | 386 | 448 | ||||||
3.500%, 03/01/2030 (A) | 831 | 1,138 | ||||||
3.350%, 03/01/2035 (A) | 1,904 | 2,644 | ||||||
3.100%, 03/01/2040 (A) | 975 | 1,327 | ||||||
3.000%, 08/01/2029 | 2,955 | 3,883 | ||||||
2.800%, 03/01/2067 (A) | 90 | 117 | ||||||
2.450%, 09/01/2033 (A) | 552 | 696 | ||||||
2.000%, 02/01/2028 | 894 | 1,083 | ||||||
1.750%, 07/01/2024 | 4,886 | 5,712 | ||||||
0.950%, 03/01/2023 | 1,530 | 1,722 | ||||||
0.900%, 08/01/2022 | 2,312 | 2,592 | ||||||
0.050%, 04/15/2021 | 3,610 | 3,954 | ||||||
SEI Institutional International Trust / Annual Report / September 30, 2019 |
37 |
SCHEDULE OF INVESTMENTS
September 30, 2019
International Fixed Income Fund(Continued)
| Description | Face Amount (Thousands) | Market Value ($ Thousands) | ||||||
GLOBAL BONDS (continued) | ||||||||
UniCredit MTN | ||||||||
6.572%, 01/14/2022 (A) | $ | 350 | $ | 376 | ||||
4.875%, VAR EUAMDB05+4.739%, | ||||||||
02/20/2029 | EUR | 220 | 269 | |||||
Unione di Banche Italiane | ||||||||
1.000%, 01/27/2023 | 185 | 210 | ||||||
|
|
| ||||||
| 32,672 | ||||||||
|
|
| ||||||
Japan — 18.6% | ||||||||
Development Bank of Japan | ||||||||
2.300%, 03/19/2026 | JPY | 220,000 | 2,376 | |||||
1.050%, 06/20/2023 | 132,000 | 1,283 | ||||||
Government of Japan 2 Year Bond | ||||||||
0.100%, 11/01/2020 | 649,250 | 6,033 | ||||||
0.100%, 04/01/2021 | 139,650 | 1,300 | ||||||
Government of Japan 5 Year Bond | ||||||||
0.100%, 12/20/2019 | 147,050 | 1,362 | ||||||
0.100%, 03/20/2020 | 344,050 | 3,189 | ||||||
Government of Japan 10 Year Bond | ||||||||
0.900%, 06/20/2022 | 859,850 | 8,227 | ||||||
0.100%, 06/20/2026 | 39,650 | 379 | ||||||
0.100%, 03/20/2027 | 71,550 | 685 | ||||||
0.100%, 06/20/2027 | 125,400 | 1,202 | ||||||
Government of Japan 20 Year Bond | ||||||||
1.900%, 09/20/2022 | 406,050 | 4,010 | ||||||
1.700%, 06/20/2033 | 1,207,550 | 13,838 | ||||||
1.400%, 09/20/2034 | 444,650 | 4,960 | ||||||
1.000%, 12/20/2035 | 50,000 | 532 | ||||||
0.700%, 03/20/2037 | 92,700 | 944 | ||||||
0.500%, 09/20/2036 | 451,400 | 4,456 | ||||||
0.200%, 06/20/2036 | 169,400 | 1,596 | ||||||
Government of Japan 20 Year Bond, Ser 106 | ||||||||
2.200%, 09/20/2028 | 14,550 | 165 | ||||||
Government of Japan 20 Year Bond, Ser 128 | ||||||||
1.900%, 06/20/2031 | 17,150 | 197 | ||||||
Government of Japan 20 Year Bond, Ser 140 | ||||||||
1.700%, 09/20/2032 | 709,350 | 8,074 | ||||||
Government of Japan 20 Year Bond, Ser 143 | ||||||||
1.600%, 03/20/2033 | 58,550 | 662 | ||||||
Government of Japan 20 Year Bond, Ser 144 | ||||||||
1.500%, 03/20/2033 | 149,750 | 1,674 | ||||||
Government of Japan 30 Year Bond | ||||||||
0.800%, 09/20/2047 | 525,950 | 5,477 | ||||||
0.300%, 06/20/2046 | 134,250 | 1,238 | ||||||
Government of Japan 30 Year Bond, Ser 29 | ||||||||
2.400%, 09/20/2038 | 119,300 | 1,563 | ||||||
Government of Japan 30 Year Bond, Ser 30 | ||||||||
2.300%, 03/20/2039 | 416,150 | 5,397 | ||||||
Government of Japan 30 Year Bond, Ser 33 | ||||||||
2.000%, 09/20/2040 | 212,700 | 2,685 | ||||||
Government of Japan 30 Year Bond, Ser 36 | ||||||||
2.000%, 03/20/2042 | 93,850 | 1,201 | ||||||
| Description | Face Amount (Thousands) | Market Value ($ Thousands) | ||||||
GLOBAL BONDS (continued) | ||||||||
Government of Japan 30 Year Bond, Ser 37 | ||||||||
1.900%, 09/20/2042 | JPY | 62,100 | $ | 785 | ||||
Government of Japan 30 Year Bond, Ser 38 | ||||||||
1.800%, 03/20/2043 | 259,650 | 3,245 | ||||||
Government of Japan 40 Year Bond | ||||||||
0.400%, 03/20/2056 | 304,100 | 2,804 | ||||||
Government of Japan 40 Year Bond, Ser 6 | ||||||||
1.900%, 03/20/2053 | 38,700 | 527 | ||||||
Government of Japan CPI Linked Bond | ||||||||
0.100%, 03/10/2026 | 346,614 | 3,321 | ||||||
Mitsubishi UFJ Financial Group | ||||||||
0.339%, 07/19/2024 | EUR | 250 | 274 | |||||
Mizuho Financial Group MTN | ||||||||
0.956%, 10/16/2024 | 385 | 435 | ||||||
Mizuho Financial Group Cayman 3 | ||||||||
4.600%, 03/27/2024 (A) | $ | 250 | 267 | |||||
Takeda Pharmaceutical | ||||||||
1.125%, 11/21/2022 (A) | EUR | 430 | 483 | |||||
|
|
| ||||||
| 96,846 | ||||||||
|
|
| ||||||
Luxembourg — 0.1% | ||||||||
Enel Finance International MTN | ||||||||
5.750%, 09/14/2040 | GBP | 145 | 263 | |||||
Samsonite Finco SARL | ||||||||
3.500%, 05/15/2026 | EUR | 100 | 110 | |||||
|
|
| ||||||
| 373 | ||||||||
|
|
| ||||||
Malaysia — 1.0% | ||||||||
Malaysia Government Bond | ||||||||
4.181%, 07/15/2024 | MYR | 3,360 | 834 | |||||
4.048%, 09/30/2021 | 3,380 | 822 | ||||||
3.955%, 09/15/2025 | 3,440 | 848 | ||||||
3.885%, 08/15/2029 | 2,032 | 507 | ||||||
3.882%, 03/10/2022 | 780 | 189 | ||||||
3.795%, 09/30/2022 | 3,430 | 834 | ||||||
3.659%, 10/15/2020 | 2,233 | 536 | ||||||
3.654%, 10/31/2019 | 1,771 | 423 | ||||||
3.480%, 03/15/2023 | 1,135 | 274 | ||||||
3.441%, 02/15/2021 | 491 | 118 | ||||||
|
|
| ||||||
| 5,385 | ||||||||
|
|
| ||||||
Mexico — 1.9% | ||||||||
Alfa | ||||||||
5.250%, 03/25/2024 (A) | $ | 205 | 221 | |||||
Mexican Bonos | ||||||||
8.000%, 06/11/2020 | MXN | 8,335 | 425 | |||||
8.000%, 11/07/2047 | 18,935 | 1,032 | ||||||
7.750%, 11/13/2042 | 8,245 | 437 | ||||||
7.500%, 06/03/2027 | 2,435 | 128 | ||||||
6.500%, 06/09/2022 | 22,900 | 1,154 | ||||||
5.750%, 03/05/2026 | 11,907 | 571 | ||||||
Mexican Bonos, Ser M | ||||||||
6.500%, 06/10/2021 | 9,962 | 503 | ||||||
38 |
SEI Institutional International Trust / Annual Report / September 30, 2019 |
| Description | Face Amount (Thousands) | Market Value ($ Thousands) | ||||||
GLOBAL BONDS (continued) | ||||||||
Mexican Bonos, Ser M20 | ||||||||
10.000%, 12/05/2024 | MXN | 46,790 | $ | 2,710 | ||||
7.750%, 05/29/2031 | 28,570 | 1,533 | ||||||
Mexican Bonos, Ser M30 | ||||||||
10.000%, 11/20/2036 | 22,113 | 1,425 | ||||||
|
|
| ||||||
| 10,139 | ||||||||
|
|
| ||||||
Netherlands — 3.5% | ||||||||
ABN AMRO Bank | ||||||||
5.750%, VAR EUR Swap Annual 5 Yr+5.452%, 03/22/2168 | EUR | 400 | 450 | |||||
4.750%, 07/28/2025 | $ | 305 | 328 | |||||
ABN AMRO Bank MTN | ||||||||
1.250%, 01/10/2033 | EUR | 300 | 380 | |||||
Akzo Nobel Sweden Finance MTN | ||||||||
2.625%, 07/27/2022 | 340 | 399 | ||||||
BNG Bank MTN | ||||||||
0.500%, 04/16/2025 | 225 | 258 | ||||||
Cooperatieve Rabobank UA | ||||||||
3.750%, 07/21/2026 | $ | 250 | 259 | |||||
Cooperatieve Rabobank UA MTN | ||||||||
5.250%, 09/14/2027 | GBP | 195 | 292 | |||||
4.625%, 05/23/2029 | 130 | 191 | ||||||
1.250%, 05/31/2032 | EUR | 300 | 379 | |||||
Heineken MTN | ||||||||
1.000%, 05/04/2026 | 335 | 383 | ||||||
ING Bank | ||||||||
5.800%, 09/25/2023 (A) | $ | 315 | 350 | |||||
ING Groep | ||||||||
3.550%, 04/09/2024 | 325 | 340 | ||||||
Intertrust Group BV | ||||||||
3.375%, 11/15/2025 (A) | EUR | 180 | 206 | |||||
Lincoln Financing SARL | ||||||||
3.625%, 04/01/2024 (A) | 170 | 192 | ||||||
Nederlandse Waterschapsbank MTN | ||||||||
1.250%, 05/27/2036 | 281 | 361 | ||||||
0.625%, 01/18/2027 | 225 | 263 | ||||||
Netherlands Government Bond | ||||||||
4.000%, 01/15/2037 (A) | 389 | 740 | ||||||
2.750%, 01/15/2047 (A) | 190 | 369 | ||||||
2.500%, 01/15/2033 (A) | 550 | 830 | ||||||
2.000%, 07/15/2024 (A) | 345 | 426 | ||||||
0.500%, 07/15/2026 (A) | 570 | 669 | ||||||
0.500%, 01/15/2040 (A) | 804 | 986 | ||||||
0.250%, 01/15/2020 (A) | 3,195 | 3,492 | ||||||
0.250%, 07/15/2025 (A) | 922 | 1,059 | ||||||
0.250%, 07/15/2029 (A) | 948 | 1,104 | ||||||
0.000%, 01/15/2022 (A)(B) | 914 | 1,014 | ||||||
0.000%, 01/15/2024 (A)(B) | 2,023 | 2,275 | ||||||
Trivium Packaging Finance BV | ||||||||
3.750%, 08/15/2026 (A) | 100 | 115 | ||||||
|
|
| ||||||
| 18,110 | ||||||||
|
|
| ||||||
| Description | Face Amount (Thousands) | Market Value ($ Thousands) | ||||||
GLOBAL BONDS (continued) | ||||||||
New Zealand — 2.6% | ||||||||
New Zealand Government Bond | ||||||||
5.500%, 04/15/2023 | NZD | 1,608 | $ | 1,173 | ||||
3.000%, 04/15/2020 | 1,626 | 1,031 | ||||||
3.000%, 04/20/2029 | 1,494 | 1,098 | ||||||
2.750%, 04/15/2025 | 14,610 | 10,078 | ||||||
New Zealand Local Government Funding Agency Bond | ||||||||
4.500%, 04/15/2027 | 479 | 362 | ||||||
|
|
| ||||||
| 13,742 | ||||||||
|
|
| ||||||
Norway — 0.7% | ||||||||
DNB Bank | ||||||||
6.500%, VAR USD Swap Semi 30/360 5 Yr Curr+5.080%, 03/26/2168 | $ | 355 | 371 | |||||
Equinor MTN | ||||||||
5.625%, 03/11/2021 | EUR | 216 | 256 | |||||
2.000%, 09/10/2020 | 285 | 317 | ||||||
Norway Government Bond | ||||||||
3.000%, 03/14/2024 (A) | NOK | 1,972 | 233 | |||||
2.000%, 05/24/2023 (A) | 6,849 | 773 | ||||||
2.000%, 04/26/2028 (A) | 4,024 | 470 | ||||||
1.750%, 02/17/2027 (A) | 4,094 | 467 | ||||||
1.750%, 09/06/2029 (A) | 3,571 | 412 | ||||||
1.500%, 02/19/2026 (A) | 2,163 | 242 | ||||||
|
|
| ||||||
| 3,541 | ||||||||
|
|
| ||||||
Poland — 0.5% | ||||||||
Republic of Poland Government Bond | ||||||||
4.000%, 10/25/2023 | PLN | 1,401 | 380 | |||||
2.750%, 04/25/2028 | 2,820 | 747 | ||||||
2.750%, 10/25/2029 | 1,493 | 397 | ||||||
2.000%, 04/25/2021 | 4,961 | 1,248 | ||||||
|
|
| ||||||
| 2,772 | ||||||||
|
|
| ||||||
Portugal — 0.6% | ||||||||
EDP - Energias de Portugal | ||||||||
4.496%, VAR EUR Swap Annual 5 Yr+4.287%, 04/30/2079 | EUR | 300 | 362 | |||||
EDP Finance MTN | ||||||||
2.000%, 04/22/2025 | 260 | 310 | ||||||
Portugal Obrigacoes do Tesouro OT | ||||||||
4.125%, 04/14/2027 (A) | 640 | 914 | ||||||
4.100%, 04/15/2037 (A) | 277 | 468 | ||||||
2.200%, 10/17/2022 (A) | 775 | 913 | ||||||
|
|
| ||||||
| 2,967 | ||||||||
|
|
| ||||||
Qatar �� 0.1% | ||||||||
Qatar Government International Bond | ||||||||
3.375%, 03/14/2024 (A) | $ | 650 | 680 | |||||
|
|
| ||||||
Saudi Arabia — 0.1% | ||||||||
SABIC Capital II BV | ||||||||
4.000%, 10/10/2023 (A) | 345 | 363 | ||||||
SEI Institutional International Trust / Annual Report / September 30, 2019 |
39 |
SCHEDULE OF INVESTMENTS
September 30, 2019
International Fixed Income Fund(Continued)
| Description | Face Amount (Thousands) | Market Value ($ Thousands) | ||||||
GLOBAL BONDS (continued) | ||||||||
Saudi Government International Bond MTN | ||||||||
2.375%, 10/26/2021 (A) | $ | 275 | $ | 275 | ||||
|
|
| ||||||
| 638 | ||||||||
|
|
| ||||||
Singapore — 1.5% | ||||||||
Singapore Government Bond | ||||||||
3.500%, 03/01/2027 | SGD | 1,341 | 1,091 | |||||
3.125%, 09/01/2022 | 2,088 | 1,573 | ||||||
3.000%, 09/01/2024 | 2,860 | 2,198 | ||||||
2.750%, 03/01/2046 | 200 | 164 | ||||||
2.250%, 08/01/2036 | 250 | 190 | ||||||
2.000%, 07/01/2020 | 3,260 | 2,363 | ||||||
Temasek Financial I MTN | ||||||||
2.375%, 01/23/2023 (A) | $ | 495 | 502 | |||||
|
|
| ||||||
| 8,081 | ||||||||
|
|
| ||||||
Slovak Republic — 0.0% | ||||||||
Slovakia Government Bond | ||||||||
3.375%, 11/15/2024 | EUR | 75 | 98 | |||||
|
|
| ||||||
Slovenia — 0.1% | ||||||||
Slovenia Government Bond | ||||||||
1.250%, 03/22/2027 | 305 | 369 | ||||||
|
|
| ||||||
South Korea — 0.5% | ||||||||
Hyundai Capital Services MTN | ||||||||
3.500%, 03/30/2022 | AUD | 680 | 476 | |||||
Korea Treasury Bond | ||||||||
3.000%, 09/10/2024 | KRW | 1,254,790 | 1,128 | |||||
1.500%, 12/10/2026 | 994,000 | 833 | ||||||
|
|
| ||||||
| 2,437 | ||||||||
|
|
| ||||||
Spain — 4.4% | ||||||||
Ayt Cedulas Cajas Global | ||||||||
3.750%, 12/14/2022 | EUR | 600 | 740 | |||||
Banco Bilbao Vizcaya Argentaria | ||||||||
5.875%, VAR EUR Swap Annual 5 Yr+5.660%, 12/24/2167 | 200 | 230 | ||||||
2.250%, 06/12/2024 | 200 | 245 | ||||||
Banco de Sabadell | ||||||||
0.875%, 11/12/2021 | 400 | 448 | ||||||
Banco Santander | ||||||||
5.179%, 11/19/2025 | $ | 400 | 441 | |||||
3.306%, 06/27/2029 | 200 | 207 | ||||||
1.000%, 03/03/2022 | EUR | 400 | 451 | |||||
CaixaBank | ||||||||
1.250%, 01/11/2027 | 500 | 602 | ||||||
Gas Natural Fenosa Finance BV MTN | ||||||||
1.250%, 04/19/2026 | 300 | 349 | ||||||
Iberdrola Finanzas MTN | ||||||||
1.000%, 03/07/2025 | 500 | 573 | ||||||
Instituto de Credito Oficial MTN | ||||||||
6.000%, 03/08/2021 | 180 | 214 | ||||||
| Description | Face Amount (Thousands) | Market Value ($ Thousands) | ||||||
GLOBAL BONDS (continued) | ||||||||
Kutxabank | ||||||||
1.250%, 09/22/2025 | EUR | 300 | $ | 356 | ||||
Spain Government Bond | ||||||||
6.000%, 01/31/2029 | 104 | 176 | ||||||
5.750%, 07/30/2032 | 102 | 187 | ||||||
4.900%, 07/30/2040 (A) | 852 | 1,667 | ||||||
4.700%, 07/30/2041 (A) | 621 | 1,202 | ||||||
3.450%, 07/30/2066 (A) | 240 | 445 | ||||||
2.900%, 10/31/2046 (A) | 361 | 570 | ||||||
2.350%, 07/30/2033 (A) | 507 | 695 | ||||||
1.950%, 07/30/2030 (A) | 141 | 182 | ||||||
1.600%, 04/30/2025 (A) | 572 | 687 | ||||||
1.500%, 04/30/2027 (A) | 4,380 | 5,327 | ||||||
1.450%, 04/30/2029 (A) | 1,401 | 1,721 | ||||||
1.400%, 04/30/2028 (A) | 302 | 368 | ||||||
0.450%, 10/31/2022 | 607 | 680 | ||||||
0.350%, 07/30/2023 | 958 | 1,073 | ||||||
0.250%, 07/30/2024 (A) | 1,466 | 1,641 | ||||||
0.050%, 10/31/2021 | 852 | 939 | ||||||
Telefonica Emisiones SAU MTN | ||||||||
1.528%, 01/17/2025 | 200 | 233 | ||||||
Telefonica Europe BV | ||||||||
4.375%, VAR EUR Swap Annual 6 Yr+4.107%, 03/14/2168 | 300 | 360 | ||||||
|
|
| ||||||
| 23,009 | ||||||||
|
|
| ||||||
Supra-National — 3.4% | ||||||||
Asian Development Bank MTN | ||||||||
2.350%, 06/21/2027 | JPY | 290,000 | 3,265 | |||||
European Financial Stability Facility MTN | ||||||||
1.800%, 07/10/2048 | EUR | 270 | 413 | |||||
0.500%, 07/11/2025 | 695 | 800 | ||||||
0.400%, 02/17/2025 | 1,695 | 1,935 | ||||||
0.200%, 04/28/2025 | 600 | 679 | ||||||
European Investment Bank | ||||||||
1.900%, 01/26/2026 | JPY | 397,500 | 4,241 | |||||
European Investment Bank MTN | ||||||||
1.250%, 05/12/2025 | SEK | 13,180 | 1,432 | |||||
1.000%, 03/14/2031 | EUR | 405 | 502 | |||||
0.250%, 10/14/2024 | 610 | 693 | ||||||
0.250%, 09/14/2029 | 745 | 859 | ||||||
European Stability Mechanism MTN | ||||||||
1.000%, 09/23/2025 | 570 | 677 | ||||||
European Union MTN | ||||||||
2.875%, 04/04/2028 | 575 | 802 | ||||||
International Bank for Reconstruction & Development MTN | ||||||||
2.800%, 01/13/2021 | AUD | 1,230 | 847 | |||||
International Finance MTN | ||||||||
2.375%, 07/19/2023 | CAD | 1,000 | 771 | |||||
|
|
| ||||||
| 17,916 | ||||||||
|
|
| ||||||
40 |
SEI Institutional International Trust / Annual Report / September 30, 2019 |
| Description | Face Amount (Thousands) | Market Value ($ Thousands) | ||||||
GLOBAL BONDS (continued) | ||||||||
Sweden — 1.8% | ||||||||
Kommunivest I Sverige AB MTN | ||||||||
1.000%, 10/02/2024 | SEK | 5,830 | $ | 619 | ||||
Skandinaviska Enskilda Banken MTN | ||||||||
5.750%, VAR USD Swap Semi 30/360 5 Yr Curr+3.850%, 05/13/2168 | $ | 465 | 469 | |||||
Svenska Handelsbanken | ||||||||
5.250%, VAR USD Swap Semi 30/360 5 Yr Curr+3.335%, 12/29/2049 | 325 | 327 | ||||||
Svenska Handelsbanken MTN | ||||||||
1.625%, VAR EUR Swap Annual 5 Yr+1.270%, 03/05/2029 | EUR | 225 | 258 | |||||
Swedbank | ||||||||
6.000%, VAR USD Swap Semi 30/360 5 Yr Curr+4.106%, 03/17/2168 | $ | 200 | 205 | |||||
Swedbank Hypotek | ||||||||
0.375%, 03/11/2022 | EUR | 360 | 400 | |||||
Sweden Government Bond | ||||||||
3.500%, 06/01/2022 | SEK | 3,040 | 344 | |||||
3.500%, 03/30/2039 | 1,205 | 201 | ||||||
2.500%, 05/12/2025 | 34,085 | 4,068 | ||||||
1.000%, 11/12/2026 | 1,725 | 194 | ||||||
0.750%, 11/12/2029 (A) | 13,305 | 1,495 | ||||||
Sweden Government Bond, Ser 1047 | ||||||||
5.000%, 12/01/2020 | 3,370 | 365 | ||||||
Vattenfall | ||||||||
3.000%, VAR EUR Swap Annual 5 Yr+2.511%, 03/19/2077 | EUR | 175 | 204 | |||||
Vattenfall MTN | ||||||||
6.250%, 03/17/2021 | 213 | 254 | ||||||
|
|
| ||||||
| 9,403 | ||||||||
|
|
| ||||||
Switzerland — 0.7% | ||||||||
Credit Suisse MTN | ||||||||
0.750%, 09/17/2021 | 220 | 245 | ||||||
Credit Suisse Group | ||||||||
7.500%, VAR USD Swap Semi 30/360 5 Yr Curr+4.600%, 01/17/2168 | $ | 286 | 306 | |||||
7.500%, VAR USD Swap Semi 30/360 5 Yr Curr+4.600%, | 200 | 214 | ||||||
2.125%, VAR BPSW1+1.230%, 09/12/2025 | GBP | 250 | 312 | |||||
Government of Switzerland | ||||||||
2.000%, 04/28/2021 | CHF | 735 | 771 | |||||
2.000%, 05/25/2022 | 75 | 81 | ||||||
1.500%, 04/30/2042 | 408 | 597 | ||||||
1.250%, 06/11/2024 | 405 | 448 | ||||||
Swiss Re Finance Luxembourg | ||||||||
5.000%, VAR US Treas Yield Curve Rate T Note Const Mat 5 Yr+3.582%, 04/02/2049 (A) | $ | 200 | 221 | |||||
| Description | Face Amount (Thousands) | Market Value ($ Thousands) | ||||||
GLOBAL BONDS (continued) | ||||||||
UBS MTN | ||||||||
4.750%, VAR EUR Swap Annual 5 Yr+3.400%, 02/12/2026 | EUR | 200 | $ | 231 | ||||
UBS Group Funding Switzerland | ||||||||
1.750%, 11/16/2022 | 427 | 489 | ||||||
|
|
| ||||||
| 3,915 | ||||||||
|
|
| ||||||
Thailand — 0.4% | ||||||||
Thailand Government Bond | ||||||||
4.875%, 06/22/2029 | THB | 11,215 | 479 | |||||
4.675%, 06/29/2044 | 20,805 | 1,066 | ||||||
3.650%, 12/17/2021 | 11,020 | 378 | ||||||
3.625%, 06/16/2023 | 5,375 | 190 | ||||||
3.300%, 06/17/2038 | 3,522 | 147 | ||||||
|
|
| ||||||
| 2,260 | ||||||||
|
|
| ||||||
Turkey — 0.1% | ||||||||
Turkiye Vakiflar Bankasi TAO | ||||||||
2.375%, 05/04/2021 | EUR | 265 | 291 | |||||
|
|
| ||||||
United Arab Emirates — 0.1% | ||||||||
DP World | ||||||||
2.375%, 09/25/2026 (A) | 295 | 347 | ||||||
|
|
| ||||||
United Kingdom — 7.6% | ||||||||
Anglo American Capital MTN | ||||||||
1.625%, 09/18/2025 | 220 | 253 | ||||||
Barclays Bank MTN | ||||||||
10.000%, 05/21/2021 | GBP | 180 | 251 | |||||
BAT International Finance MTN | ||||||||
1.250%, 03/13/2027 | EUR | 333 | 362 | |||||
BP Capital Markets MTN | ||||||||
1.526%, 09/26/2022 | 350 | 400 | ||||||
1.117%, 01/25/2024 | 165 | 188 | ||||||
Centrica MTN | ||||||||
4.375%, 03/13/2029 | GBP | 164 | 235 | |||||
4.250%, 09/12/2044 | 100 | 147 | ||||||
CK Hutchison Finance 16 II | ||||||||
0.875%, 10/03/2024 | EUR | 212 | 238 | |||||
CNH Industrial Finance Europe MTN | ||||||||
2.875%, 05/17/2023 | 220 | 262 | ||||||
Coca-Cola European Partners | ||||||||
2.375%, 05/07/2025 | 400 | 486 | ||||||
Diageo Finance MTN | ||||||||
0.250%, 10/22/2021 | 240 | 263 | ||||||
DS Smith MTN | ||||||||
1.375%, 07/26/2024 | 430 | 483 | ||||||
Gatwick Funding MTN | ||||||||
5.250%, 01/23/2024 | GBP | 250 | 357 | |||||
GlaxoSmithKline Capital | ||||||||
0.000%, 09/12/2020 (B) | EUR | 595 | 650 | |||||
Heathrow Funding MTN | ||||||||
2.750%, 08/09/2049 | GBP | 160 | 207 | |||||
SEI Institutional International Trust / Annual Report / September 30, 2019 |
41 |
SCHEDULE OF INVESTMENTS
September 30, 2019
International Fixed Income Fund(Continued)
| Description | Face Amount (Thousands) | Market Value ($ Thousands) | ||||||
GLOBAL BONDS (continued) | ||||||||
1.875%, 05/23/2022 | EUR | 235 | $ | 269 | ||||
HSBC Holdings | ||||||||
4.250%, 03/14/2024 | $ | 505 | 531 | |||||
3.000%, VAR BPSW1+1.650%, 07/22/2028 | GBP | 167 | 220 | |||||
Imperial Brands Finance | ||||||||
0.500%, 07/27/2021 | EUR | 150 | 164 | |||||
InterContinental Hotels Group MTN | ||||||||
3.750%, 08/14/2025 | GBP | 174 | 236 | |||||
Lloyds Banking Group | ||||||||
4.582%, 12/10/2025 | $ | 445 | 467 | |||||
Nationwide Building Society MTN | ||||||||
4.625%, 02/08/2021 | EUR | 550 | 640 | |||||
0.500%, 02/23/2024 | 225 | 254 | ||||||
Next Group | ||||||||
3.625%, 05/18/2028 | GBP | 190 | 249 | |||||
Northumbrian Water Finance | ||||||||
6.875%, 02/06/2023 | 190 | 279 | ||||||
Rio Tinto Finance MTN | ||||||||
2.875%, 12/11/2024 | EUR | 290 | 361 | |||||
Royal Bank of Scotland Group | ||||||||
4.424%, VAR ICE LIBOR USD 3 Month+2.320%, 09/29/2017 | $ | 200 | 188 | |||||
Santander UK Group Holdings PLC MTN | ||||||||
3.625%, 01/14/2026 | GBP | 100 | 133 | |||||
Santander UK PLC MTN | ||||||||
4.250%, 04/12/2021 | EUR | 350 | 409 | |||||
1.125%, 01/14/2022 | 330 | 369 | ||||||
Severn Trent Utilities Finance MTN | ||||||||
3.625%, 01/16/2026 | GBP | 175 | 242 | |||||
Sky PLC MTN | ||||||||
6.000%, 05/21/2027 | 50 | 82 | ||||||
2.500%, 09/15/2026 | EUR | 205 | 257 | |||||
2.250%, 11/17/2025 | 275 | 339 | ||||||
SSE PLC MTN | ||||||||
0.875%, 09/06/2025 | 395 | 440 | ||||||
Standard Chartered | ||||||||
3.776%, VAR ICE LIBOR USD 3 Month+1.510%, 07/30/2168 (A) | $ | 500 | 403 | |||||
Thames Water Utilities Finance MTN | ||||||||
4.625%, 06/04/2046 | GBP | 155 | 262 | |||||
Unilever NV | ||||||||
0.375%, 02/14/2023 | EUR | 220 | 244 | |||||
United Kingdom Gilt | ||||||||
4.750%, 12/07/2030 | GBP | 115 | 207 | |||||
4.500%, 12/07/2042 | 230 | 493 | ||||||
4.250%, 06/07/2032 | 2,295 | 4,083 | ||||||
4.250%, 12/07/2040 | 470 | 951 | ||||||
4.250%, 12/07/2046 | 980 | 2,155 | ||||||
3.750%, 09/07/2020 | 2,950 | 3,744 | ||||||
3.750%, 07/22/2052 | 80 | 177 | ||||||
3.500%, 01/22/2045 | 1,131 | 2,184 | ||||||
| Description | Face Amount (Thousands) | Market Value ($ Thousands) | ||||||
GLOBAL BONDS (continued) | ||||||||
3.250%, 01/22/2044 | GBP | 400 | $ | 736 | ||||
2.750%, 09/07/2024 | 200 | 276 | ||||||
2.500%, 07/22/2065 | 1,717 | 3,413 | ||||||
1.750%, 09/07/2022 | 654 | 840 | ||||||
1.625%, 10/22/2028 | 301 | 411 | ||||||
1.500%, 07/22/2047 | 1,406 | 1,954 | ||||||
1.250%, 07/22/2027 | 1,015 | 1,340 | ||||||
0.750%, 07/22/2023 | 2,170 | 2,721 | ||||||
0.625%, 06/07/2025 | 425 | 534 | ||||||
Wales & West Utilities Finance PLC | ||||||||
6.250%, 11/30/2021 | 240 | 329 | ||||||
Western Power Distribution West Midlands PLC | ||||||||
5.750%, 04/16/2032 | 100 | 173 | ||||||
3.875%, 10/17/2024 | 230 | 316 | ||||||
Wm Morrison Supermarkets MTN | ||||||||
3.500%, 07/27/2026 | 225 | 307 | ||||||
Zurich Finance PLC MTN | ||||||||
6.625%, 10/30/2049 (E) | 235 | 325 | ||||||
|
|
| ||||||
| 39,489 | ||||||||
|
|
| ||||||
United States — 6.6% | ||||||||
Allergan Funding | ||||||||
2.625%, 11/15/2028 | $ | 100 | 125 | |||||
Altria Group | ||||||||
1.700%, 06/15/2025 | EUR | 210 | 239 | |||||
American International Group | ||||||||
2.490%, VAR ICE LIBOR GBP 3 Month+1.705%, 03/15/2037 | GBP | 100 | 100 | |||||
AT&T | ||||||||
1.800%, 09/05/2026 | EUR | 720 | 851 | |||||
0.800%, 03/04/2030 | 310 | 334 | ||||||
Bank of America | ||||||||
6.500%, VAR ICE LIBOR USD 3 Month+4.174%, 04/23/2168 | $ | 67 | 75 | |||||
6.250%, VAR ICE LIBOR USD 3 Month+3.705%, 03/05/2168 | 150 | 163 | ||||||
Bank of America MTN | ||||||||
2.375%, 06/19/2024 | EUR | 835 | 1,007 | |||||
1.625%, 09/14/2022 | 261 | 298 | ||||||
1.379%, VAR Euribor 3 Month+1.030%, 02/07/2025 | 165 | 189 | ||||||
Baxter International MTN | ||||||||
0.400%, 05/15/2024 | 405 | 446 | ||||||
Becton Dickinson | ||||||||
0.632%, 06/04/2023 | $ | 200 | 220 | |||||
Berkshire Hathaway | ||||||||
0.625%, 01/17/2023 | EUR | 265 | 295 | |||||
Berkshire Hathaway Finance | ||||||||
2.625%, 06/19/2059 | GBP | 144 | 206 | |||||
Boardwalk Pipelines | ||||||||
4.800%, 05/03/2029 | $ | 119 | 126 | |||||
42 |
SEI Institutional International Trust / Annual Report / September 30, 2019 |
| Description | Face Amount (Thousands) | Market Value ($ Thousands) | ||||||
GLOBAL BONDS (continued) | ||||||||
Broadcom | ||||||||
4.250%, 04/15/2026 (A) | $ | 195 | $ | 201 | ||||
Capital One Financial | ||||||||
0.800%, 06/12/2024 | EUR | 291 | 323 | |||||
Carnival | ||||||||
1.625%, 02/22/2021 | 180 | 201 | ||||||
Celanese US Holdings | ||||||||
3.500%, 05/08/2024 | $ | 215 | 223 | |||||
Chubb INA Holdings | ||||||||
1.550%, 03/15/2028 | EUR | 325 | 385 | |||||
0.875%, 06/15/2027 | 115 | 129 | ||||||
Cigna | ||||||||
4.125%, 11/15/2025 | $ | 136 | 146 | |||||
Citigroup | ||||||||
5.950%, VAR ICE LIBOR USD 3 Month+3.905%, 11/15/2167 | 185 | 196 | ||||||
2.040%, 09/16/2020 | JPY | 200,000 | 1,885 | |||||
Citigroup MTN | ||||||||
0.750%, 10/26/2023 | EUR | 365 | 408 | |||||
Clean Harbors | ||||||||
5.125%, 07/15/2029 (A) | $ | 43 | 46 | |||||
4.875%, 07/15/2027 (A) | 124 | 129 | ||||||
Comcast | ||||||||
3.450%, 10/01/2021 | 965 | 994 | ||||||
DH Europe Finance | ||||||||
1.700%, 01/04/2022 | EUR | 150 | 170 | |||||
1.200%, 06/30/2027 | $ | 335 | 389 | |||||
DH Europe Finance II | ||||||||
0.450%, 03/18/2028 | 154 | 168 | ||||||
Digital Euro Finco | ||||||||
2.625%, 04/15/2024 | EUR | 175 | 209 | |||||
Dover MTN | ||||||||
2.125%, 12/01/2020 | 267 | 298 | ||||||
FedEx | ||||||||
0.700%, 05/13/2022 | 108 | 120 | ||||||
Fidelity National Information Services | ||||||||
1.500%, 05/21/2027 | 400 | 467 | ||||||
Fiserv | ||||||||
1.125%, 07/01/2027 | 405 | 459 | ||||||
Ford Motor Credit MTN | ||||||||
3.021%, 03/06/2024 | 170 | 195 | ||||||
0.030%, VAR Euribor 3 Month+0.430%, 05/14/2021 | 750 | 810 | ||||||
GE Capital UK Funding Unlimited MTN | ||||||||
6.250%, 05/05/2038 | GBP | 165 | 274 | |||||
General Electric | ||||||||
0.875%, 05/17/2025 | EUR | 180 | 197 | |||||
General Motors Financial MTN | ||||||||
0.955%, 09/07/2023 | 540 | 595 | ||||||
| Description | Face Amount (Thousands) | Market Value ($ Thousands) | ||||||
GLOBAL BONDS (continued) | ||||||||
Goldman Sachs Group | ||||||||
5.500%, VAR US Treas Yield Curve Rate T Note Const Mat 5 Yr+3.623%, 02/10/2168 | $ | 164 | $ | 172 | ||||
2.625%, 04/25/2021 | 425 | 427 | ||||||
Goldman Sachs Group MTN | ||||||||
2.000%, 07/27/2023 | EUR | 900 | 1,047 | |||||
1.625%, 07/27/2026 | 170 | 199 | ||||||
IHS Markit | ||||||||
4.125%, 08/01/2023 | $ | 326 | 343 | |||||
4.000%, 03/01/2026 (A) | 85 | 90 | ||||||
International Business Machines | ||||||||
2.850%, 05/13/2022 | 990 | 1,011 | ||||||
International Business Machines MTN | ||||||||
0.875%, 01/31/2025 | EUR | 593 | 673 | |||||
International Game Technology PLC | ||||||||
3.500%, 07/15/2024 | $ | 170 | 200 | |||||
Johnson Controls International PLC | ||||||||
1.375%, 02/25/2025 | 395 | 451 | ||||||
JPMorgan Chase MTN | ||||||||
1.090%, VAR Euribor 3 Month+0.760%, 03/11/2027 | EUR | 810 | 922 | |||||
Kraft Heinz Foods | ||||||||
2.000%, 06/30/2023 | 235 | 268 | ||||||
Mastercard | ||||||||
1.100%, 12/01/2022 | 445 | 503 | ||||||
McKesson | ||||||||
0.625%, 08/17/2021 | 355 | 392 | ||||||
Medtronic Global Holdings SCA | ||||||||
1.125%, 03/07/2027 | 400 | 463 | ||||||
0.250%, 07/02/2025 | $ | 115 | 126 | |||||
Micron Technology | ||||||||
4.640%, 02/06/2024 | 258 | 274 | ||||||
Molson Coors International | ||||||||
2.750%, 09/18/2020 | CAD | 1,105 | 835 | |||||
Moody’s | ||||||||
1.750%, 03/09/2027 | EUR | 265 | 316 | |||||
Morgan Stanley | ||||||||
1.875%, 03/30/2023 | 490 | 567 | ||||||
Morgan Stanley MTN | ||||||||
1.375%, 10/27/2026 | 360 | 418 | ||||||
0.074%, VAR Euribor 3 Month+0.400%, 05/21/2021 | 850 | 928 | ||||||
National Grid North America MTN | ||||||||
1.000%, 07/12/2024 | 300 | 339 | ||||||
Noble Energy | ||||||||
3.250%, 10/15/2029 | $ | 205 | 203 | |||||
Occidental Petroleum | ||||||||
3.200%, 08/15/2026 | 44 | 44 | ||||||
2.900%, 08/15/2024 | 265 | 267 | ||||||
Panther BF Aggregator 2 | ||||||||
4.375%, 05/15/2026 (A) | EUR | 106 | 118 | |||||
SEI Institutional International Trust / Annual Report / September 30, 2019 |
43 |
SCHEDULE OF INVESTMENTS
September 30, 2019
International Fixed Income Fund(Continued)
| Description | Face Amount (Thousands) | Market Value ($ Thousands) | ||||||
GLOBAL BONDS (continued) | ||||||||
Philip Morris International | ||||||||
0.625%, 11/08/2024 | EUR | 285 | $ | 316 | ||||
Philip Morris International MTN | ||||||||
1.875%, 03/03/2021 | 300 | 336 | ||||||
PNC Funding | ||||||||
3.300%, 03/08/2022 | $ | 150 | 155 | |||||
Priceline Group | ||||||||
2.375%, 09/23/2024 | 355 | 430 | ||||||
Prologis | ||||||||
0.250%, 09/10/2027 | 161 | 174 | ||||||
Prologis MTN | ||||||||
3.000%, 01/18/2022 | EUR | 115 | 133 | |||||
Realty Income | ||||||||
3.250%, 06/15/2029 | $ | 315 | 330 | |||||
Santander Holdings USA | ||||||||
3.700%, 03/28/2022 | 460 | 473 | ||||||
Seagate HDD Cayman | ||||||||
4.750%, 06/01/2023 | 6 | 6 | ||||||
4.750%, 01/01/2025 | 61 | 63 | ||||||
Southern Co/The | ||||||||
2.750%, 06/15/2020 | 700 | 703 | ||||||
Sprint Spectrum | ||||||||
4.738%, 03/20/2025 (A) | 265 | 282 | ||||||
Terraform Global Operating | ||||||||
6.125%, 03/01/2026 (A) | 55 | 57 | ||||||
Toyota Motor Credit MTN | ||||||||
1.800%, 07/23/2020 | EUR | 115 | 128 | |||||
0.625%, 11/21/2024 | 465 | 522 | ||||||
United Technologies Corp | ||||||||
1.250%, 05/22/2023 | 225 | 255 | ||||||
1.150%, 05/18/2024 | 164 | 186 | ||||||
US Bancorp MTN | ||||||||
0.850%, 06/07/2024 | 226 | 255 | ||||||
Verizon Communications | ||||||||
4.016%, 12/03/2029 | $ | 391 | 435 | |||||
0.875%, 04/08/2027 | EUR | 175 | 197 | |||||
Verizon Communications MTN | ||||||||
4.750%, 02/17/2034 | GBP | 170 | 276 | |||||
4.050%, 02/17/2025 | AUD | 680 | 507 | |||||
Wells Fargo | ||||||||
5.900%, VAR ICE LIBOR USD 3 Month+3.110%, 12/15/2167 | $ | 130 | 138 | |||||
Wells Fargo MTN | ||||||||
2.125%, 12/20/2023 | GBP | 345 | 439 | |||||
2.000%, 04/27/2026 | EUR | 210 | 253 | |||||
1.375%, 06/30/2022 | GBP | 195 | 242 | |||||
Western Digital Corp | ||||||||
4.750%, 02/15/2026 | $ | 328 | 337 | |||||
WPC Eurobond BV | ||||||||
1.350%, 04/15/2028 | EUR | 405 | 439 | |||||
| Description | Face Amount (Thousands) | Market Value ($ Thousands) | ||||||
GLOBAL BONDS (continued) | ||||||||
ZF North America Capital | ||||||||
2.750%, 04/27/2023 | EUR | 200 | $ | 232 | ||||
|
|
| ||||||
| 34,186 | ||||||||
|
|
| ||||||
Total Global Bonds (Cost $464,664) ($ Thousands) | 474,514 | |||||||
|
|
| ||||||
U.S. TREASURY OBLIGATIONS — 5.2% |
| |||||||
U.S. Treasury Bills | ||||||||
1.901%, 10/01/2019 (B) | $ | 25,526 | 25,526 | |||||
U.S. Treasury Inflation Protected Securities | ||||||||
1.250%, 07/15/2020 | 1,191 | 1,196 | ||||||
0.750%, 07/15/2028 | 303 | 318 | ||||||
|
|
| ||||||
Total U.S. Treasury Obligations (Cost $27,036) ($ Thousands) | 27,040 | |||||||
|
|
| ||||||
MORTGAGE-BACKED SECURITIES — 0.6% |
| |||||||
Agency Mortgage-Backed Obligation — 0.5% |
| |||||||
FHLMC Structured Agency Credit Risk Debt Notes, Ser 2015-DNA1, Cl M2 | ||||||||
3.868%, VAR ICE LIBOR USD 1 Month+1.850%, 10/25/2027 | 274 | 276 | ||||||
FHLMC Structured Agency Credit Risk Debt Notes, Ser 2015-DNA2, Cl M2 | ||||||||
4.618%, VAR ICE LIBOR USD 1 Month+2.600%, 12/25/2027 | 31 | 31 | ||||||
FHLMC Structured Agency Credit Risk Debt Notes, Ser 2015-HQA2, Cl M2 | ||||||||
4.818%, VAR ICE LIBOR USD 1 Month+2.800%, 05/25/2028 | 66 | 67 | ||||||
FHLMC Structured Agency Credit Risk Debt Notes, Ser 2016-DNA1, Cl M2 | ||||||||
5.045%, VAR ICE LIBOR USD 1 Month+2.900%, 07/25/2028 | 106 | 106 | ||||||
FHLMC Structured Agency Credit Risk Debt Notes, Ser 2016-HQA1, Cl M3 | ||||||||
8.368%, VAR ICE LIBOR USD 1 Month+6.350%, 09/25/2028 | 250 | 278 | ||||||
FHLMC Structured Agency Credit Risk Debt Notes, Ser 2017-DNA1, Cl M1 | ||||||||
3.218%, VAR ICE LIBOR USD 1 Month+1.200%, 07/25/2029 | 190 | 191 | ||||||
FHLMC Structured Agency Credit Risk Debt Notes, Ser 2017-DNA2, Cl M2 | ||||||||
5.468%, VAR ICE LIBOR USD 1 Month+3.450%, 10/25/2029 | 470 | 496 | ||||||
FNMA Connecticut Avenue Securities, Ser 2014-C04, Cl 2M2 | ||||||||
7.018%, VAR ICE LIBOR USD 1 Month+5.000%, 11/25/2024 | 290 | 310 | ||||||
44 |
SEI Institutional International Trust / Annual Report / September 30, 2019 |
| Description | Face Amount (Thousands) | Market Value ($ Thousands) | ||||||
MORTGAGE-BACKED SECURITIES (continued) |
| |||||||
FNMA Connecticut Avenue Securities, Ser 2016-C04, Cl 1M2 | ||||||||
6.268%, VAR ICE LIBOR USD 1 Month+4.250%, 01/25/2029 | $ | 95 | $ | 100 | ||||
FNMA Connecticut Avenue Securities, Ser 2016-C06, Cl 1M1 | ||||||||
3.318%, VAR ICE LIBOR USD 1 Month+1.300%, 04/25/2029 | 192 | 192 | ||||||
FNMA Connecticut Avenue Securities, Ser 2016-C07, Cl 2M2 | ||||||||
6.368%, VAR ICE LIBOR USD 1 Month+4.350%, 05/25/2029 | 143 | 150 | ||||||
FNMA Connecticut Avenue Securities, Ser 2017-C01, Cl 1M1 | ||||||||
3.318%, VAR ICE LIBOR USD 1 Month+1.300%, 07/25/2029 | 62 | 62 | ||||||
|
|
| ||||||
| 2,259 | ||||||||
|
|
| ||||||
Non-Agency Mortgage-Backed Obligation — 0.1% |
| |||||||
Bear Stearns Adjustable Rate Mortgage Trust, Ser 2004-6, Cl 3A | ||||||||
4.606%, 09/25/2034 (E) | 10 | 10 | ||||||
| Description | Face Amount (Thousands) | Market Value ($ Thousands) | ||||||
MORTGAGE-BACKED SECURITIES (continued) |
| |||||||
COMM Mortgage Trust, Ser 2014-CCRE14, Cl A3 | ||||||||
3.955%, 02/10/2047 | $ | 70 | $ | 75 | ||||
JPMorgan Mortgage Trust, Ser 2004-A5, Cl 3A1 | ||||||||
4.194%, 12/25/2034 (E) | 39 | 40 | ||||||
LSTAR Commercial Mortgage Trust, Ser 2016-4, Cl A2 | ||||||||
2.579%, 03/10/2049 (A) | 159 | 159 | ||||||
UBS-Barclays Commercial Mortgage Trust, Ser 2013-C5, Cl A4 | ||||||||
3.185%, 03/10/2046 | 100 | 103 | ||||||
Wells Fargo Commercial Mortgage Trust, Ser 2015-C28, Cl A3 | ||||||||
3.290%, 05/15/2048 | 120 | 126 | ||||||
Wells Fargo Commercial Mortgage Trust, Ser 2015-C30, Cl A3 | ||||||||
3.411%, 09/15/2058 |
| 80
|
|
| 85
|
| ||
|
|
| ||||||
| 598 | ||||||||
|
|
| ||||||
Total Mortgage-Backed Securities | 2,857 | |||||||
|
|
| ||||||
Total Investments in Securities — 96.7% |
| $ | 504,411 | |||||
|
|
| ||||||
A list of the open futures contracts held by the Fund at September 30, 2019, is as follows:
| Type of Contract | Number of Contracts Long (Short) | Expiration Date | Notional Amount (Thousands) | Value (Thousands) | Unrealized Appreciation/ (Depreciation) (Thousands) | |||||||||||||||
Australian 3-Year Bond | 13 | Dec-2019 | $ | 1,028 | $ | 1,014 | $ | 4 | ||||||||||||
Australian 10-Year Bond | 8 | Dec-2019 | 802 | 795 | 10 | |||||||||||||||
Australian 10-Year Bond | 30 | Dec-2019 | 3,005 | 2,981 | 23 | |||||||||||||||
Canadian 5-Year Bond | (21) | Dec-2019 | (1,961 | ) | (1,952 | ) | 16 | |||||||||||||
Canadian 10-Year Bond | (17) | Dec-2019 | (1,829 | ) | (1,831 | ) | – | |||||||||||||
Canadian 10-Year Bond | 16 | Dec-2019 | 1,743 | 1,723 | (23 | ) | ||||||||||||||
Euro | (240) | Dec-2019 | (33,354 | ) | (32,888 | ) | 467 | |||||||||||||
Euro-Bob | (32) | Dec-2019 | (4,817 | ) | (4,732 | ) | 37 | |||||||||||||
Euro-Bob | 13 | Dec-2019 | 1,922 | 1,923 | – | |||||||||||||||
Euro-BTP | 5 | Dec-2019 | 795 | 795 | – | |||||||||||||||
Euro-Bund | 8 | Dec-2019 | 1,551 | 1,520 | (14 | ) | ||||||||||||||
Euro-Bund | (19) | Dec-2019 | (3,620 | ) | (3,609 | ) | (1 | ) | ||||||||||||
Euro-Buxl 30 Year Bond | (3) | Dec-2019 | (732 | ) | (711 | ) | 17 | |||||||||||||
Euro-Buxl 30 Year Bond | 15 | Dec-2019 | 3,614 | 3,557 | (13 | ) | ||||||||||||||
Euro-OAT | (3) | Dec-2019 | (566 | ) | (557 | ) | 6 | |||||||||||||
Euro-OAT | 6 | Dec-2019 | 1,114 | 1,114 | – | |||||||||||||||
Euro-Schatz | 28 | Dec-2019 | 3,445 | 3,429 | 2 | |||||||||||||||
Japanese 10-Year Bond | 23 | Dec-2019 | 33,218 | 32,991 | (6 | ) | ||||||||||||||
Japanese 10-Year Government Bond E-MINI | 38 | Dec-2019 | 5,492 | 5,448 | (4 | ) | ||||||||||||||
Japanese 10-Year Government Bond E-MINI | (10) | Dec-2019 | (1,443 | ) | (1,434 | ) | (1 | ) | ||||||||||||
Long Gilt 10-Year Bond | (9) | Dec-2019 | (1,492 | ) | (1,489 | ) | (11 | ) | ||||||||||||
SEI Institutional International Trust / Annual Report / September 30, 2019 |
45 |
SCHEDULE OF INVESTMENTS
September 30, 2019
International Fixed Income Fund(Continued)
| Type of Contract | Number of Contracts Long (Short) | Expiration Date | Notional Amount | Value (Thousands) | Unrealized Appreciation/ (Depreciation) (Thousands) | |||||||||||||||
Long Gilt 10-Year Bond | 5 | Dec-2019 | $ | 827 | $ | 827 | $ | 12 | ||||||||||||
U.S. 2-Year Treasury Note | 14 | Jan-2020 | 3,016 | 3,017 | 1 | |||||||||||||||
U.S. 2-Year Treasury Note | 32 | Jan-2020 | 6,912 | 6,896 | (16 | ) | ||||||||||||||
U.S. 5-Year Treasury Note | (23) | Jan-2020 | (2,749 | ) | (2,740 | ) | 9 | |||||||||||||
U.S. 5-Year Treasury Note | (40) | Jan-2020 | (4,765 | ) | (4,766 | ) | (1 | ) | ||||||||||||
U.S. 10-Year Treasury Note | 5 | Dec-2019 | 657 | 652 | (5 | ) | ||||||||||||||
U.S. 10-Year Treasury Note | 76 | Dec-2019 | 9,907 | 9,904 | (3 | ) | ||||||||||||||
U.S. Long Treasury Bond | 4 | Dec-2019 | 642 | 649 | 7 | |||||||||||||||
U.S. Ultra Long Treasury Bond | 7 | Dec-2019 | 1,352 | 1,343 | (9 | ) | ||||||||||||||
Ultra 10-Year U.S. Treasury Note | (9) | Dec-2019 | (1,287 | ) | (1,282 | ) | 5 | |||||||||||||
|
|
|
|
|
|
|
|
| ||||||||||||
| $ | 22,427 | $ | 22,587 | $ | 509 | |||||||||||||||
|
|
|
|
|
|
|
|
| ||||||||||||
A list of the open forward foreign currency contracts held by the Fund at September 30, 2019, is as follows:
| Counterparty | Settlement Date | Currency to Deliver (Thousands) | Currency to Receive (Thousands) | Unrealized Appreciation (Depreciation) (Thousands) | ||||||||||||||||||||
Bank of America | 10/03/19 | EUR | 1,370 | USD | 1,509 | $ | 15 | |||||||||||||||||
Bank of America | 10/03/19 | USD | 553 | JPY | 59,750 | — | ||||||||||||||||||
Bank of America | 10/03/19 | USD | 1,684 | JPY | 179,250 | (25 | ) | |||||||||||||||||
Bank of America | 10/03/19 | USD | 2,391 | EUR | 2,171 | (24 | ) | |||||||||||||||||
Bank of America | 10/03/19 | JPY | 120,894 | USD | 1,128 | 9 | ||||||||||||||||||
Bank of America | 11/12/19 | CAD | 2,000 | USD | 1,507 | (5 | ) | |||||||||||||||||
Bank of America | 11/14/19 | USD | 1,953 | RUB | 125,984 | (22 | ) | |||||||||||||||||
Barclays PLC | 10/02/19 | USD | 1,789 | BRL | 7,482 | 6 | ||||||||||||||||||
Barclays PLC | 10/03/19 | USD | 44 | NZD | 70 | — | ||||||||||||||||||
Barclays PLC | 10/03/19 | USD | 66 | NOK | 598 | — | ||||||||||||||||||
Barclays PLC | 10/03/19 | NZD | 88 | USD | 56 | 1 | ||||||||||||||||||
Barclays PLC | 10/03/19 | USD | 126 | SEK | 1,224 | (1 | ) | |||||||||||||||||
Barclays PLC | 10/03/19 | AUD | 132 | USD | 90 | 1 | ||||||||||||||||||
Barclays PLC | 10/03/19 | USD | 151 | TRY | 875 | 4 | ||||||||||||||||||
Barclays PLC | 10/03/19 | USD | 125 | CAD | 167 | 1 | ||||||||||||||||||
Barclays PLC | 10/03/19 | USD | 46 | CAD | 61 | — | ||||||||||||||||||
Barclays PLC | 10/03/19 | CAD | 57 | USD | 43 | — | ||||||||||||||||||
Barclays PLC | 10/03/19 | CAD | 169 | USD | 127 | — | ||||||||||||||||||
Barclays PLC | 11/05/19 | USD | 241 | CHF | 240 | — | ||||||||||||||||||
Barclays PLC | 10/03/19 | USD | 10 | CHF | 10 | — | ||||||||||||||||||
Barclays PLC | 10/03/19 | USD | 223 | GBP | 185 | 5 | ||||||||||||||||||
Barclays PLC | 10/03/19 | USD | 122 | GBP | 98 | (1 | ) | |||||||||||||||||
Barclays PLC | 10/03/19 | USD | 453 | HUF | 135,810 | (11 | ) | |||||||||||||||||
Barclays PLC | 10/03/19 | USD | 567 | EUR | 515 | (6 | ) | |||||||||||||||||
Barclays PLC | 10/03/19 | USD | 589 | PLN | 2,346 | (4 | ) | |||||||||||||||||
Barclays PLC | 10/03/19 | NOK | 398 | USD | 45 | 1 | ||||||||||||||||||
Barclays PLC | 10/03/19 | NOK | 249 | USD | 27 | — | ||||||||||||||||||
Barclays PLC | 10/03/19 | TRY | 859 | USD | 150 | (2 | ) | |||||||||||||||||
Barclays PLC | 10/03/19 | GBP | 24 | USD | 30 | — | ||||||||||||||||||
Barclays PLC | 10/03/19 | GBP | 1,097 | USD | 1,337 | (15 | ) | |||||||||||||||||
Barclays PLC | 10/03/19 | SGD | 1,281 | USD | 923 | (4 | ) | |||||||||||||||||
Barclays PLC | 11/05/19 | USD | 1,362 | JPY | 146,900 | 1 | ||||||||||||||||||
Barclays PLC | 10/03/19 | USD | 655 | JPY | 69,606 | (11 | ) | |||||||||||||||||
Barclays PLC | 10/03/19 | CHF | 42 | USD | 43 | 1 | ||||||||||||||||||
46 |
SEI Institutional International Trust / Annual Report / September 30, 2019 |
| Counterparty | Settlement Date | Currency to Deliver (Thousands) | Currency to Receive (Thousands) | Unrealized Appreciation (Depreciation) (Thousands) | ||||||||||||||||||||
Barclays PLC | 11/05/19 | CHF | 1,977 | USD | 1,989 | $ | (1 | ) | ||||||||||||||||
Barclays PLC | 10/03/19 | PLN | 2,690 | USD | 677 | 6 | ||||||||||||||||||
Barclays PLC | 10/03/19 | MXN | 3,012 | USD | 154 | 1 | ||||||||||||||||||
Barclays PLC | 10/03/19 | ZAR | 6,617 | USD | 432 | (5 | ) | |||||||||||||||||
Barclays PLC | 10/03/19 | JPY | 8,138 | USD | 76 | 1 | ||||||||||||||||||
Barclays PLC | 10/03/19 - 10/10/19 | EUR | 17,675 | USD | 19,905 | 634 | ||||||||||||||||||
Barclays PLC | 10/03/19 | SEK | 32,291 | USD | 3,340 | 56 | ||||||||||||||||||
Barclays PLC | 10/03/19 | CZK | 16,323 | USD | 698 | 8 | ||||||||||||||||||
Barclays PLC | 11/05/19 | CZK | 16,323 | USD | 690 | — | ||||||||||||||||||
Barclays PLC | 10/24/19 | INR | 88,265 | USD | 1,227 | (17 | ) | |||||||||||||||||
Barclays PLC | 02/13/20 | MYR | 1,393 | USD | 332 | — | ||||||||||||||||||
BMO Capital | 10/03/19 | EUR | 26 | USD | 29 | — | ||||||||||||||||||
BMO Capital | 10/03/19 | USD | 4,535 | CAD | 6,024 | 15 | ||||||||||||||||||
BNP Paribas | 10/03/19 | USD | 31 | JPY | 3,319 | — | ||||||||||||||||||
BNP Paribas | 10/03/19 | USD | 271 | PLN | 1,082 | (1 | ) | |||||||||||||||||
BNP Paribas | 10/03/19 | NZD | 2,350 | USD | 1,491 | 17 | ||||||||||||||||||
BNP Paribas | 10/11/19 | PLN | 4,864 | USD | 1,280 | 67 | ||||||||||||||||||
BNP Paribas | 10/28/19 | EUR | 16,399 | USD | 18,298 | 383 | ||||||||||||||||||
BNP Paribas | 11/05/19 | USD | 509 | EUR | 466 | — | ||||||||||||||||||
BNP Paribas | 11/05/19 | USD | 548 | NOK | 4,970 | (1 | ) | |||||||||||||||||
BNP Paribas | 11/05/19 | ILS | 3,960 | USD | 1,138 | (4 | ) | |||||||||||||||||
BNP Paribas | 11/05/19 | NOK | 4,564 | USD | 503 | 1 | ||||||||||||||||||
Brown Brothers Harriman | 10/10/19 | EUR | 1,521 | USD | 1,709 | 49 | ||||||||||||||||||
Brown Brothers Harriman | 10/10/19 | USD | 1,550 | EUR | 1,382 | (42 | ) | |||||||||||||||||
Brown Brothers Harriman | 10/11/19 | USD | 1,937 | PLN | 7,354 | (103 | ) | |||||||||||||||||
Brown Brothers Harriman | 10/18/19 | GBP | 398 | USD | 497 | 6 | ||||||||||||||||||
Brown Brothers Harriman | 10/18/19 | GBP | 515 | USD | 632 | (3 | ) | |||||||||||||||||
Brown Brothers Harriman | 11/07/19 | NZD | 2,053 | USD | 1,309 | 21 | ||||||||||||||||||
Brown Brothers Harriman | 11/22/19 | USD | 434 | CAD | 575 | — | ||||||||||||||||||
BT Brokerage | 10/03/19 | USD | 285 | MXN | 5,755 | 6 | ||||||||||||||||||
BT Brokerage | 10/03/19 | CAD | 535 | USD | 403 | (1 | ) | |||||||||||||||||
BT Brokerage | 10/03/19 | USD | 1,187 | TRY | 6,898 | 34 | ||||||||||||||||||
BT Brokerage | 10/03/19 | USD | 287 | ZAR | 4,428 | 5 | ||||||||||||||||||
BT Brokerage | 10/03/19 | USD | 911 | ZAR | 13,500 | (20 | ) | |||||||||||||||||
BT Brokerage | 10/03/19 | TRY | 8,648 | USD | 1,500 | (32 | ) | |||||||||||||||||
BT Brokerage | 10/03/19 | MXN | 9,036 | USD | 464 | 6 | ||||||||||||||||||
BT Brokerage | 10/03/19 | ZAR | 20,047 | USD | 1,362 | 40 | ||||||||||||||||||
BT Brokerage | 10/03/19 | ZAR | 9,080 | USD | 597 | (2 | ) | |||||||||||||||||
CIBC | 11/05/19 | USD | 215 | CAD | 285 | — | ||||||||||||||||||
Citi | 10/10/19 | EUR | 25,787 | USD | 28,858 | 728 | ||||||||||||||||||
Citi | 11/04/19 | USD | 2,045 | BRL | 8,581 | 11 | ||||||||||||||||||
Citi | 11/14/19 | USD | 341 | COP | 1,145,961 | (12 | ) | |||||||||||||||||
Citi | 11/14/19 | RUB | 59,538 | USD | 918 | 6 | ||||||||||||||||||
Citi | 11/21/19 | USD | 753 | JPY | 80,762 | (3 | ) | |||||||||||||||||
Citigroup | 10/03/19 | USD | 14 | AUD | 20 | — | ||||||||||||||||||
Citigroup | 10/03/19 | CAD | 19 | USD | 14 | — | ||||||||||||||||||
Citigroup | 10/03/19 | USD | 31 | CHF | 31 | — | ||||||||||||||||||
Citigroup | 10/03/19 | USD | 42 | SEK | 408 | (1 | ) | |||||||||||||||||
Citigroup | 10/03/19 | AUD | 87 | USD | 60 | 1 | ||||||||||||||||||
SEI Institutional International Trust / Annual Report / September 30, 2019 |
47 |
SCHEDULE OF INVESTMENTS
September 30, 2019
International Fixed Income Fund(Continued)
| Counterparty | Settlement Date | Currency to Deliver (Thousands) | Currency to Receive (Thousands) | Unrealized Appreciation (Depreciation) (Thousands) | ||||||||||||||||||||
Citigroup | 11/05/19 | USD | 242 | GBP | 196 | $ | — | |||||||||||||||||
Citigroup | 10/03/19 | USD | 93 | GBP | 75 | (1 | ) | |||||||||||||||||
Citigroup | 10/03/19 | USD | 570 | MXN | 11,510 | 13 | ||||||||||||||||||
Citigroup | 10/03/19 | USD | 755 | NZD | 1,175 | (18 | ) | |||||||||||||||||
Citigroup | 10/03/19 | USD | 1,715 | EUR | 1,556 | (19 | ) | |||||||||||||||||
Citigroup | 10/03/19 | GBP | 60 | USD | 75 | 1 | ||||||||||||||||||
Citigroup | 11/05/19 | GBP | 20,168 | USD | 24,851 | (34 | ) | |||||||||||||||||
Citigroup | 10/03/19 | JPY | 65,768 | USD | 613 | 5 | ||||||||||||||||||
Citigroup | 11/05/19 | MXN | 44,810 | USD | 2,259 | 3 | ||||||||||||||||||
Citigroup | 10/03/19 | MXN | 44,810 | USD | 2,218 | (51 | ) | |||||||||||||||||
Citigroup | 10/03/19 - 11/05/19 | EUR | 150,369 | USD | 165,760 | 1,610 | ||||||||||||||||||
Commonwealth Bank Of Australia | 10/03/19 | USD | 199 | AUD | 295 | — | ||||||||||||||||||
Commonwealth Bank Of Australia | 10/03/19 | AUD | 7,233 | USD | 4,878 | (1 | ) | |||||||||||||||||
Credit Suisse First Boston | 10/11/19 | PLN | 2,493 | USD | 628 | 6 | ||||||||||||||||||
Credit Suisse First Boston | 10/25/19 | USD | 614 | MXN | 12,461 | 15 | ||||||||||||||||||
Goldman Sachs | 10/02/19 | USD | 263 | BRL | 1,099 | 1 | ||||||||||||||||||
Goldman Sachs | 10/10/19 | EUR | 1,394 | USD | 1,538 | 17 | ||||||||||||||||||
Goldman Sachs | 10/16/19 | ILS | 4,746 | USD | 1,344 | (23 | ) | |||||||||||||||||
Goldman Sachs | 10/24/19 | USD | 1,289 | INR | 89,493 | (28 | ) | |||||||||||||||||
Goldman Sachs | 10/25/19 | MXN | 39,820 | USD | 1,977 | (31 | ) | |||||||||||||||||
Goldman Sachs | 11/21/19 | JPY | 72,875 | USD | 682 | 5 | ||||||||||||||||||
Goldman Sachs | 11/22/19 | CAD | 19,551 | USD | 14,737 | (43 | ) | |||||||||||||||||
Goldman Sachs | 01/08/20 | SEK | 19,799 | USD | 2,060 | 32 | ||||||||||||||||||
Goldman Sachs | 02/13/20 | MYR | 2,800 | USD | 665 | (2 | ) | |||||||||||||||||
HSBC | 10/03/19 | EUR | 193 | USD | 212 | 2 | ||||||||||||||||||
HSBC | 10/03/19 | USD | 209 | GBP | 173 | 4 | ||||||||||||||||||
HSBC | 10/03/19 | TRY | 859 | USD | 151 | (1 | ) | |||||||||||||||||
HSBC | 10/03/19 - 11/05/19 | THB | 132,470 | USD | 4,328 | (5 | ) | |||||||||||||||||
JPMorgan Chase Bank | 10/03/19 | USD | 27 | NOK | 249 | — | ||||||||||||||||||
JPMorgan Chase Bank | 10/03/19 | USD | 55 | NOK | 500 | (1 | ) | |||||||||||||||||
JPMorgan Chase Bank | 10/03/19 - 11/05/19 | CHF | 128 | USD | 130 | 1 | ||||||||||||||||||
JPMorgan Chase Bank | 10/03/19 | USD | 57 | CAD | 76 | — | ||||||||||||||||||
JPMorgan Chase Bank | 10/03/19 | USD | 73 | CAD | 96 | — | ||||||||||||||||||
JPMorgan Chase Bank | 10/03/19 - 11/05/19 | GBP | 77 | USD | 96 | 1 | ||||||||||||||||||
JPMorgan Chase Bank | 10/03/19 - 11/05/19 | GBP | 63 | USD | 77 | (1 | ) | |||||||||||||||||
JPMorgan Chase Bank | 10/03/19 - 11/05/19 | USD | 183 | AUD | 269 | (1 | ) | |||||||||||||||||
JPMorgan Chase Bank | 10/03/19 - 11/05/19 | USD | 44 | NZD | 70 | — | ||||||||||||||||||
JPMorgan Chase Bank | 10/03/19 | USD | 160 | NZD | 252 | (2 | ) | |||||||||||||||||
JPMorgan Chase Bank | 10/03/19 - 11/05/19 | CAD | 61 | USD | 46 | 1 | ||||||||||||||||||
JPMorgan Chase Bank | 10/03/19 - 11/05/19 | CAD | 215 | USD | 162 | (1 | ) | |||||||||||||||||
JPMorgan Chase Bank | 10/03/19 | USD | 27 | SEK | 270 | — | ||||||||||||||||||
JPMorgan Chase Bank | 10/03/19 - 11/05/19 | USD | 272 | SEK | 2,648 | (3 | ) | |||||||||||||||||
JPMorgan Chase Bank | 10/03/19 - 11/05/19 | USD | 424 | CHF | 419 | (4 | ) | |||||||||||||||||
JPMorgan Chase Bank | 10/03/19 | USD | 304 | GBP | 250 | 5 | ||||||||||||||||||
JPMorgan Chase Bank | 10/03/19 | USD | 165 | GBP | 133 | (1 | ) | |||||||||||||||||
JPMorgan Chase Bank | 10/03/19 | NZD | 906 | USD | 576 | 8 | ||||||||||||||||||
JPMorgan Chase Bank | 10/03/19 | USD | 1,250 | BRL | 5,233 | 6 | ||||||||||||||||||
JPMorgan Chase Bank | 11/05/19 | USD | 37 | EUR | 34 | — | ||||||||||||||||||
JPMorgan Chase Bank | 10/03/19 | USD | 1,694 | EUR | 1,537 | (18 | ) | |||||||||||||||||
JPMorgan Chase Bank | 10/03/19 | NOK | 2,590 | USD | 289 | 4 | ||||||||||||||||||
48 |
SEI Institutional International Trust / Annual Report / September 30, 2019 |
| Counterparty | Settlement Date | Currency to Deliver (Thousands) | Currency to Receive (Thousands) | Unrealized Appreciation (Depreciation) (Thousands) | ||||||||||||||||||||
JPMorgan Chase Bank | 10/03/19 | NOK | 124 | USD | 14 | $ | — | |||||||||||||||||
JPMorgan Chase Bank | 10/03/19 | USD | 3,093 | MXN | 60,617 | (24 | ) | |||||||||||||||||
JPMorgan Chase Bank | 10/03/19 | EUR | 3,123 | USD | 3,448 | 43 | ||||||||||||||||||
JPMorgan Chase Bank | 10/03/19 - 11/06/19 | USD | 3,147 | COP | 10,906,703 | (12 | ) | |||||||||||||||||
JPMorgan Chase Bank | 10/03/19 | ILS | 3,960 | USD | 1,124 | (15 | ) | |||||||||||||||||
JPMorgan Chase Bank | 10/03/19 | SEK | 4,460 | USD | 461 | 7 | ||||||||||||||||||
JPMorgan Chase Bank | 10/03/19 | MXN | 6,024 | USD | 307 | 2 | ||||||||||||||||||
JPMorgan Chase Bank | 10/03/19 | THB | 7,290 | USD | 238 | (1 | ) | |||||||||||||||||
JPMorgan Chase Bank | 10/03/19 - 11/05/19 | AUD | 7,520 | USD | 5,084 | 7 | ||||||||||||||||||
JPMorgan Chase Bank | 10/03/19 | AUD | 132 | USD | 89 | — | ||||||||||||||||||
JPMorgan Chase Bank | 10/03/19 | BRL | 5,233 | USD | 1,257 | 1 | ||||||||||||||||||
JPMorgan Chase Bank | 11/06/19 | BRL | 5,233 | USD | 1,248 | (6 | ) | |||||||||||||||||
JPMorgan Chase Bank | 10/03/19 - 11/05/19 | TRY | 19,943 | USD | 3,443 | (68 | ) | |||||||||||||||||
JPMorgan Chase Bank | 10/03/19 | USD | 14 | JPY | 1,565 | — | ||||||||||||||||||
JPMorgan Chase Bank | 10/03/19 | USD | 32,630 | JPY | 3,500,101 | (242 | ) | |||||||||||||||||
JPMorgan Chase Bank | 11/06/19 | MXN | 60,617 | USD | 3,076 | 24 | ||||||||||||||||||
JPMorgan Chase Bank | 10/03/19 | MXN | 60,617 | USD | 3,008 | (62 | ) | |||||||||||||||||
JPMorgan Chase Bank | 10/03/19 | COP | 5,900,767 | USD | 1,717 | 20 | ||||||||||||||||||
JPMorgan Chase Bank | 10/03/19 - 11/06/19 | JPY | 6,096,840 | USD | 57,346 | 856 | ||||||||||||||||||
JPMorgan Chase Bank | 10/04/19 | USD | 2,105 | KRW | 2,544,501 | 22 | ||||||||||||||||||
JPMorgan Chase Bank | 11/06/19 | USD | 1,410 | KRW | 1,685,321 | (2 | ) | |||||||||||||||||
JPMorgan Chase Bank | 10/04/19 | KRW | 859,180 | USD | 708 | (10 | ) | |||||||||||||||||
JPMorgan Chase Bank | 10/10/19 | USD | 1,674 | EUR | 1,486 | (53 | ) | |||||||||||||||||
JPMorgan Chase Bank | 10/23/19 | PLN | 2,395 | USD | 610 | 13 | ||||||||||||||||||
JPMorgan Chase Bank | 10/23/19 | CAD | 2,743 | USD | 2,070 | (3 | ) | |||||||||||||||||
JPMorgan Chase Bank | 10/23/19 | USD | 3,401 | NOK | 30,442 | (48 | ) | |||||||||||||||||
JPMorgan Chase Bank | 10/23/19 | AUD | 3,541 | USD | 2,423 | 33 | ||||||||||||||||||
JPMorgan Chase Bank | 10/23/19 | CHF | 5,389 | USD | 5,430 | 14 | ||||||||||||||||||
JPMorgan Chase Bank | 10/23/19 | USD | 5,553 | SEK | 53,827 | (69 | ) | |||||||||||||||||
JPMorgan Chase Bank | 10/23/19 | USD | 7,015 | GBP | 5,620 | (84 | ) | |||||||||||||||||
JPMorgan Chase Bank | 10/23/19 | SGD | 8,918 | USD | 6,492 | 40 | ||||||||||||||||||
JPMorgan Chase Bank | 10/23/19 | NZD | 12,879 | USD | 8,165 | 87 | ||||||||||||||||||
JPMorgan Chase Bank | 10/23/19 | EUR | 21,890 | USD | 24,244 | 340 | ||||||||||||||||||
JPMorgan Chase Bank | 10/24/19 | THB | 190,425 | USD | 6,234 | 4 | ||||||||||||||||||
JPMorgan Chase Bank | 10/24/19 | HUF | 1,103,286 | USD | 3,667 | 70 | ||||||||||||||||||
JPMorgan Chase Bank | 10/25/19 | USD | 1,389 | MXN | 27,155 | (19 | ) | |||||||||||||||||
JPMorgan Chase Bank | 10/31/19 | SGD | 1,883 | USD | 1,371 | 8 | ||||||||||||||||||
JPMorgan Chase Bank | 11/14/19 | CLP | 958,944 | USD | 1,351 | 32 | ||||||||||||||||||
Morgan Stanley | 10/03/19 | USD | 14 | SEK | 136 | — | ||||||||||||||||||
Morgan Stanley | 10/03/19 | USD | 14 | CAD | 19 | — | ||||||||||||||||||
Morgan Stanley | 10/03/19 | USD | 22 | GBP | 18 | — | ||||||||||||||||||
Morgan Stanley | 10/03/19 | USD | 33 | GBP | 27 | — | ||||||||||||||||||
Morgan Stanley | 10/03/19 | AUD | 70 | USD | 48 | 1 | ||||||||||||||||||
Morgan Stanley | 10/03/19 | AUD | 21 | USD | 14 | — | ||||||||||||||||||
Morgan Stanley | 10/03/19 | USD | 100 | AUD | 147 | (1 | ) | |||||||||||||||||
Morgan Stanley | 10/03/19 | USD | 14 | NZD | 22 | — | ||||||||||||||||||
Morgan Stanley | 10/03/19 | USD | 87 | NZD | 136 | (1 | ) | |||||||||||||||||
Morgan Stanley | 10/03/19 | USD | 143 | CHF | 141 | (1 | ) | |||||||||||||||||
Morgan Stanley | 10/03/19 | USD | 272 | JPY | 28,886 | (4 | ) | |||||||||||||||||
SEI Institutional International Trust / Annual Report / September 30, 2019 |
49 |
SCHEDULE OF INVESTMENTS
September 30, 2019
International Fixed Income Fund(Continued)
| Counterparty | Settlement Date | Currency to Deliver (Thousands) | Currency to Receive (Thousands) | Unrealized Appreciation (Depreciation) (Thousands) | ||||||||||||||||||||
Morgan Stanley | 10/03/19 | USD | 448 | TRY | 2,570 | $ | 7 | |||||||||||||||||
Morgan Stanley | 10/03/19 | USD | 787 | NOK | 7,147 | (1 | ) | |||||||||||||||||
Morgan Stanley | 10/03/19 | JPY | 1,613 | USD | 15 | — | ||||||||||||||||||
Morgan Stanley | 10/03/19 | CHF | 2,211 | USD | 2,250 | 33 | ||||||||||||||||||
Morgan Stanley | 10/03/19 | ZAR | 2,279 | USD | 154 | 4 | ||||||||||||||||||
Morgan Stanley | 10/03/19 | TRY | 2,609 | USD | 452 | (10 | ) | |||||||||||||||||
Morgan Stanley | 10/03/19 | NOK | 4,564 | USD | 503 | — | ||||||||||||||||||
Morgan Stanley | 10/03/19 | USD | 5,817 | EUR | 5,311 | (26 | ) | |||||||||||||||||
Morgan Stanley | 10/03/19 | GBP | 58 | USD | 72 | 1 | ||||||||||||||||||
Morgan Stanley | 10/03/19 | GBP | 19,436 | USD | 23,749 | (203 | ) | |||||||||||||||||
Morgan Stanley | 10/03/19 | CAD | 61 | USD | 46 | — | ||||||||||||||||||
Morgan Stanley | 10/03/19 | CAD | 23,113 | USD | 17,385 | (72 | ) | |||||||||||||||||
Morgan Stanley | 10/03/19 | NZD | 7,577 | USD | 4,789 | 38 | ||||||||||||||||||
Morgan Stanley | 11/05/19 | NZD | 18,956 | USD | 11,891 | — | ||||||||||||||||||
Morgan Stanley | 10/03/19 - 11/05/19 | SEK | 86,387 | USD | 8,836 | 30 | ||||||||||||||||||
Morgan Stanley | 10/03/19 | HUF | 210,768 | USD | 700 | 14 | ||||||||||||||||||
Morgan Stanley | 11/05/19 | DKK | 7,862 | USD | 1,152 | — | ||||||||||||||||||
Morgan Stanley | 02/13/20 | MYR | 1,335 | USD | 318 | — | ||||||||||||||||||
RBC | 11/05/19 | CAD | 17,891 | USD | 13,509 | (14 | ) | |||||||||||||||||
RBS | 10/03/19 | NZD | 9,113 | USD | 5,772 | 58 | ||||||||||||||||||
RBS | 10/10/19 | USD | 789 | EUR | 702 | (23 | ) | |||||||||||||||||
RBS | 10/10/19 | EUR | 15,505 | USD | 17,502 | 589 | ||||||||||||||||||
RBS | 10/16/19 | USD | 1,373 | ILS | 4,768 | — | ||||||||||||||||||
RBS | 11/08/19 | AUD | 7,770 | USD | 5,254 | 8 | ||||||||||||||||||
Standard Chartered | 10/18/19 | GBP | 7,540 | USD | 9,244 | (53 | ) | |||||||||||||||||
Standard Chartered | 11/05/19 | HUF | 74,958 | USD | 245 | — | ||||||||||||||||||
State Street | 10/03/19 | USD | 185 | JPY | 19,688 | (3 | ) | |||||||||||||||||
State Street | 10/03/19 - 11/05/19 | EUR | 3,024 | USD | 3,333 | 35 | ||||||||||||||||||
State Street | 10/03/19 | DKK | 7,862 | USD | 1,169 | 21 | ||||||||||||||||||
State Street | 10/03/19 | JPY | 8,008,518 | USD | 75,258 | 1,151 | ||||||||||||||||||
TD Securities | 10/03/19 | USD | 33 | CHF | 33 | — | ||||||||||||||||||
TD Securities | 10/03/19 | NZD | 481 | USD | 306 | 4 | ||||||||||||||||||
TD Securities | 10/03/19 | SEK | 24,805 | USD | 2,553 | 30 | ||||||||||||||||||
UBS | 10/03/19 | USD | 41 | MXN | 807 | — | ||||||||||||||||||
UBS | 10/03/19 | GBP | 167 | USD | 208 | 2 | ||||||||||||||||||
UBS | 10/03/19 | USD | 482 | JPY | 51,800 | (3 | ) | |||||||||||||||||
UBS | 10/03/19 | JPY | 182,100 | USD | 1,719 | 34 | ||||||||||||||||||
UBS | 11/05/19 | USD | 585 | PLN | 2,346 | 1 | ||||||||||||||||||
UBS | 11/05/19 | PLN | 1,608 | USD | 401 | (1 | ) | |||||||||||||||||
| $ | 5,769 | |||||||||||||||||||||||
A list of the open OTC swap agreements held by the Fund at September 30, 2019, is as follows:
| Credit Default Swaps | ||||||||||||||||||||||||
| Counterparty | Reference Entity/ Obligation | Buy/Sell Protection | (Pays)/Receives Rate | Payment Frequency | Termination Date | Notional Amount (Thousands) | Value (Thousands) | Upfront Payments/ Receipts (Thousands) | Net Unrealized Appreciation (Depreciation) (Thousands) | |||||||||||||||
Credit Suisse | CMBX.NA.BBB.6 | Sell | 3.00% | Monthly | 05/11/2063 | $(127) | $(11 | ) | $ | (9 | ) | $ | (2 | ) | ||||||||||
Credit Suisse | CMBX.NA.BBB.6 | Sell | 3.00% | Monthly | 05/11/2063 | (134) | (11 | ) | (8 | ) | (3 | ) | ||||||||||||
Deutsche Bank | CMBX.NA.BBB.6 | Sell | 3.00% | Monthly | 05/11/2063 | (406) | (34 | ) | (28 | ) | (6 | ) | ||||||||||||
50 |
SEI Institutional International Trust / Annual Report / September 30, 2019 |
| Counterparty | Reference Entity/ Obligation | Buy/Sell Protection | (Pays)/Receives Rate | Payment Frequency | Termination Date | Notional Amount (Thousands) | Value (Thousands) | Upfront Payments/ Receipts (Thousands) | Net Unrealized Appreciation (Depreciation) (Thousands) | |||||||||||||||
Goldman Sachs | CMBX.NA.BBB.6 | Sell | 3.00% | Monthly | 05/11/2063 | $(1,345) | $(113) | $ | (164) | $ | 51 | |||||||||||||
|
|
|
|
|
|
| ||||||||||||||||||
| $(169) | $ | (209) | $ | 40 | ||||||||||||||||||||
|
|
|
|
|
|
| ||||||||||||||||||
| Interest Rate Swaps | ||||||||||||||||||||||||||||||||||||
| Counterparty | Fund Pays | Fund Receives | Payment Frequency | Termination Date | Currency | Notional Amount (Thousands) | Value (Thousands) | Upfront Payments (Thousands) | Net Unrealized Appreciation (Depreciation) (Thousands) | |||||||||||||||||||||||||||
Deutsche Bank | | China 7-Day Reverse Repo Rate | | 2.985% | Quarterly | 06/03/2024 | CNY | 23,220 | $ | 18 | $ | – | $ | 18 | ||||||||||||||||||||||
Deutsche Bank | | China 7-Day Reverse Repo Rate | | 2.755% | Quarterly | 09/09/2024 | CNY | 31,000 | (24) | – | (24) | |||||||||||||||||||||||||
|
|
|
|
|
|
|
|
| ||||||||||||||||||||||||||||
| $ | (6) | $ | – | $ | (6) | |||||||||||||||||||||||||||||||
|
|
|
|
|
|
|
|
| ||||||||||||||||||||||||||||
A list of the open centrally cleared swap agreements held by the Fund at September 30, 2019, is as follows:
| Credit Default Swap | ||||||||||||||||||||||||||||||||
| Reference Entity/Obligation | Buy/Sell Protection | (Pays)/ Receives Rate | Payment Frequency | Termination Date | Notional Amount (Thousands) | Value (Thousands) | Upfront Payments/ Receipts (Thousands) | Net Unrealized Appreciation (Depreciation) (Thousands) | ||||||||||||||||||||||||
iTraxx Europe Series 32 | Sell | 1.00% | Quarterly | 12/20/2024 | EUR (2,160) | $ | 50 | $ | 51 | $ | (1) | �� | ||||||||||||||||||||
|
|
|
|
|
|
|
|
| ||||||||||||||||||||||||
| $ | 50 | $ | 51 | $ | (1) | |||||||||||||||||||||||||||
|
|
|
|
|
|
|
|
| ||||||||||||||||||||||||
| Interest Rate Swap | ||||||||||||||||||||||||
| Fund Pays | Fund Receives | Payment Frequency | Termination Date | Currency | Notional Amount (Thousands) | Value (Thousands) | Upfront Payments/ Receipts (Thousands) | Net Unrealized Appreciation (Depreciation) (Thousands) | ||||||||||||||||
1.6460% | 6-MONTH GBP - LIBOR | Semi-Annually | 10/03/2047 | GBP | 460 | $ | (142) | $ | – | $ | (142) | |||||||||||||
|
|
|
|
|
|
|
|
| ||||||||||||||||
Percentages are based on Net Assets of $521,831 ($ Thousands). |
| (A) | Security exempt from registration under Rule 144A of the Securities Act of 1933. These securities may be resold in transactions exempt from registration normally to qualified institutions. On September 30, 2019, the value of these securities amounted to $76,223 ($ Thousands), representing 14.6% of the Net Assets of the Fund. |
| (B) | Zero coupon security. The rate shown on the Schedule of Investments is the security’s effective yield at the time of purchase. |
| (C) | Security is in default on interest payment. |
| (D) | Security, or portion thereof, has been pledged as collateral on open futures contracts. |
| (E) | Variable or floating rate security, the interest rate of which adjusts periodically based on changes in current interest rates and prepayments on the underlying pool of assets. |
AUD — Australian Dollar
BRL — Brazilian Real
CAD — Canadian Dollar
CHF — Swiss Franc
Cl — Class
CLP — Chilean Peso
CNY — Chinese Yuan Onshore
COP — Colombian Peso
CZK — Czech Koruna
DKK — Danish Krone
EUR — Euro
FHLMC — Federal Home Loan Mortgage Corporation
FNMA — Federal National Mortgage Association
GBP — British Pound Sterling
HUF — Hungarian Forint
ICE — Intercontinental Exchange
INR — Indian Rupee
ILS — Israeli New Sheckels
JPY — Japanese Yen
KRW — Korean Won
LIBOR — London Interbank Offered Rate
L.P. — Limited Partnership
MTN — Medium Term Note
MXN — Mexican Peso
MYR — Malaysian Ringgit
NOK — Norwegian Krone
NZD — New Zealand Dollar
PLC — Public Limited Company
PLN — Polish Zloty
RUB — Russian Ruble
SGD — Singapore Dollar
SEK — Swedish Krona
THB — Thai Bhat
TRY — Turkish Lira
USD — United States Dollar
VAR — Variable Rate
ZAR — South African Rand
SEI Institutional International Trust / Annual Report / September 30, 2019 |
51 |
SCHEDULE OF INVESTMENTS
September 30, 2019
International Fixed Income Fund(Concluded)
The following is a list of the level of inputs used as of September 30, 2019, in valuing the Fund’s investments and other financial instruments carried at value ($ Thousands):
| Level 1 | Level 2 | Level 3 | Total | |||||||||||||
| Investments in Securities | ($) | ($) | ($) | ($) | ||||||||||||
Global Bonds | – | 474,514 | – | 474,514 | ||||||||||||
U.S. Treasury Obligations | – | 27,040 | – | 27,040 | ||||||||||||
Mortgage-Backed Securities | – | 2,857 | – | 2,857 | ||||||||||||
|
|
|
|
|
|
|
|
|
|
|
| |||||
Total Investments in Securities | – | 504,411 | – | 504,411 | ||||||||||||
|
|
|
|
|
|
|
|
|
|
|
| |||||
| Level 1 | Level 2 | Level 3 | Total | |||||||||||||
| Other Financial Instruments | ($) | ($) | ($) | ($) | ||||||||||||
Futures Contracts* | ||||||||||||||||
Unrealized Appreciation | 616 | – | – | 616 | ||||||||||||
Unrealized Depreciation | (107 | ) | – | – | (107 | ) | ||||||||||
Forwards Contracts* | ||||||||||||||||
Unrealized Appreciation | – | 7,572 | – | 7,572 | ||||||||||||
Unrealized Depreciation | – | (1,803 | ) | – | (1,803 | ) | ||||||||||
OTC Swaps | ||||||||||||||||
Credit Default Swaps* | ||||||||||||||||
Unrealized Appreciation | – | 51 | – | 51 | ||||||||||||
Unrealized Depreciation | – | (11 | ) | – | (11 | ) | ||||||||||
Interest Rate Swaps* | ||||||||||||||||
Unrealized Appreciation | – | 18 | – | 18 | ||||||||||||
Unrealized Depreciation | – | (24 | ) | – | (24 | ) | ||||||||||
Centrally Cleared Swaps | ||||||||||||||||
Credit Default Swaps* | ||||||||||||||||
Unrealized Depreciation | – | (1 | ) | – | (1 | ) | ||||||||||
Interest Rate Swaps* | ||||||||||||||||
Unrealized Depreciation | – | (142 | ) | – | (142 | ) | ||||||||||
|
|
|
|
|
|
|
|
|
|
|
| |||||
Total Other Financial Instruments | 509 | 5,660 | – | 6,169 | ||||||||||||
|
|
|
|
|
|
|
|
|
|
|
| |||||
*Futures contracts, forwards contracts and swap contracts are valued at the unrealized appreciation (depreciation) on the instrument.
For the year ended September 30, 2019, there were no transfers between Level 1 and Level 2 assets and liabilities.
For the year ended September 30, 2019, there were no transfers between Level 2 and Level 3 assets and liabilities.
For more information on valuation inputs, see Note 2 – Significant Accounting Policies in Notes to Financial Statements.
Amounts designated as “—” are $0 or have been rounded to $0.
The accompanying notes are an integral part of the financial statements.
52 |
SEI Institutional International Trust / Annual Report / September 30, 2019 |
SCHEDULE OF INVESTMENTS
September 30, 2019
Emerging Markets Debt Fund
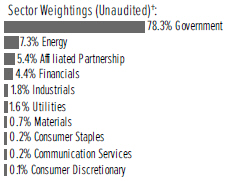
†Percentages based on total investments. Includes investments held as collateral for securities on loan (see Note 9).
| Description | Face Amount (Thousands) | Market Value ($ Thousands) | ||||||
GLOBAL BONDS — 95.6% | ||||||||
Albania — 0.0% | ||||||||
Albania Government International Bond | ||||||||
3.500%, 10/09/2025 | EUR | 403 | $ | 471 | ||||
|
|
| ||||||
Angola — 0.7% | ||||||||
Angolan Government International Bond | ||||||||
9.500%, 11/12/2025 | $ | 1,402 | 1,574 | |||||
9.375%, 05/08/2048 | 3,200 | 3,373 | ||||||
8.250%, 05/09/2028 | 1,126 | 1,165 | ||||||
Republic of Angola Via Avenir II BV MTN | ||||||||
9.713%, VAR ICE LIBOR USD 6 Month+7.500%, 07/01/2023 | 4,554 | 4,968 | ||||||
6.908%, VAR ICE LIBOR USD 6 Month+4.500%, 12/07/2023 | 621 | 626 | ||||||
|
|
| ||||||
| 11,706 | ||||||||
|
|
| ||||||
Argentina — 1.9% | ||||||||
Adecoagro | ||||||||
6.000%, 09/21/2027 (A) | 1,071 | 1,023 | ||||||
Agua y Saneamientos Argentinos | ||||||||
6.625%, 02/01/2023 | 1,230 | 412 | ||||||
Argentina Treasury Bond | ||||||||
2.500%, 07/22/2021 (B) | ARS | 2,000 | 32 | |||||
Argentine Republic Government International Bond | ||||||||
79.499%, VAR Argentina Central Bank 7 Day Repo Rate0.000%, 06/21/2020 | 1,158 | 10 | ||||||
18.200%, 10/03/2021 | 5,928 | 28 | ||||||
8.280%, 12/31/2033 | $ | 2,005 | 982 | |||||
8.280%, 12/31/2033 | 1,262 | 604 | ||||||
7.820%, 12/31/2033 | EUR | 5,377 | 2,740 | |||||
7.820%, 12/31/2033 | 16,638 | 8,648 | ||||||
6.875%, 04/22/2021 (C) | $ | 2,657 | 1,302 | |||||
6.875%, 01/26/2027 | 1,320 | 553 | ||||||
6.875%, 01/11/2048 | 855 | 359 | ||||||
5.875%, 01/11/2028 | 4,379 | 1,774 | ||||||
5.000%, 01/15/2027 | EUR | 2,065 | 863 | |||||
4.740%, 03/31/2029 | 8,640 | 3,588 | ||||||
| Description | Face Amount (Thousands) | Market Value ($ Thousands) | ||||||
GLOBAL BONDS (continued) | ||||||||
4.625%, 01/11/2023 | $ | 3,258 | $ | 1,357 | ||||
4.500%, 02/13/2020 | 2,955 | 1,056 | ||||||
3.375%, 01/15/2023 | EUR | 680 | 282 | |||||
Autonomous City of Buenos Aires Argentina | ||||||||
62.788%, VAR 30-35d Argentina BADLAR Private Banks+3.750%, 02/22/2028 | ARS | 30,497 | 312 | |||||
62.660%, VAR 30-35d Argentina BADLAR Private Banks+3.250%, 03/29/2024 | 66,430 | 631 | ||||||
Bonos de la Nacion Argentina con Ajuste por CER | ||||||||
4.000%, 03/06/2020 (B) | 23,296 | 298 | ||||||
Provincia de Buenos Aires | ||||||||
7.875%, 06/15/2027 | $ | 2,762 | 994 | |||||
5.375%, 01/20/2023 | EUR | 620 | 226 | |||||
Provincia de Cordoba | ||||||||
7.125%, 06/10/2021 (A) | $ | 531 | 329 | |||||
Rio Energy | ||||||||
6.875%, 02/01/2025 (A) | 1,571 | 731 | ||||||
6.875%, 02/01/2025 (C) | 195 | 91 | ||||||
Transportadora de Gas del Sur | ||||||||
6.750%, 05/02/2025 (A)(C) | 238 | 208 | ||||||
YPF | ||||||||
8.500%, 06/27/2029 (A) | 1,673 | 1,313 | ||||||
YPF MTN | ||||||||
51.625%, VAR 30-35d Argentina BADLAR Private Banks+4.000%, 07/07/2020 | 368 | 81 | ||||||
|
|
| ||||||
| 30,827 | ||||||||
|
|
| ||||||
Armenia — 0.0% | ||||||||
Republic of Armenia International Bond | ||||||||
3.950%, 09/26/2029 | 758 | 742 | ||||||
|
|
| ||||||
Azerbaijan — 1.2% | ||||||||
Republic of Azerbaijan International Bond | ||||||||
5.125%, 09/01/2029 | 2,011 | 2,167 | ||||||
4.750%, 03/18/2024 (C) | 1,173 | 1,241 | ||||||
3.500%, 09/01/2032 (A) | 507 | 491 | ||||||
Southern Gas Corridor CJSC | ||||||||
6.875%, 03/24/2026 (A) | 1,437 | 1,666 | ||||||
6.875%, 03/24/2026 (A) | 1,216 | 1,410 | ||||||
6.875%, 03/24/2026 | 4,605 | 5,339 | ||||||
State Oil of the Azerbaijan Republic | ||||||||
6.950%, 03/18/2030 | 2,310 | 2,761 | ||||||
6.950%, 03/18/2030 | 611 | 730 | ||||||
State Oil of the Azerbaijan Republic MTN | ||||||||
4.750%, 03/13/2023 | 1,300 | 1,348 | ||||||
4.750%, 03/13/2023 | 2,353 | 2,439 | ||||||
|
|
| ||||||
| 19,592 | ||||||||
|
|
| ||||||
SEI Institutional International Trust / Annual Report / September 30, 2019 |
53 |
SCHEDULE OF INVESTMENTS
September 30, 2019
Emerging Markets Debt Fund(Continued)
| Description | Face Amount (Thousands) | Market Value ($ Thousands) | ||||||
GLOBAL BONDS (continued) | ||||||||
Bahrain — 0.6% | ||||||||
Bahrain Government International Bond | ||||||||
7.500%, 09/20/2047 (A)(C) | $ | 1,285 | $ | 1,460 | ||||
7.000%, 01/26/2026 (A) | 295 | 331 | ||||||
7.000%, 10/12/2028 | 406 | 455 | ||||||
7.000%, 10/12/2028 (A) | 674 | 756 | ||||||
6.750%, 09/20/2029 (A)(C) | 1,185 | 1,313 | ||||||
6.750%, 09/20/2029 | 200 | 222 | ||||||
6.125%, 08/01/2023 | 520 | 561 | ||||||
6.000%, 09/19/2044 | 200 | 196 | ||||||
5.625%, 09/30/2031 (A) | 1,626 | 1,640 | ||||||
Oil and Gas Holding BSCC | ||||||||
8.375%, 11/07/2028 | 821 | 959 | ||||||
8.375%, 11/07/2028 (A) | 560 | 654 | ||||||
7.625%, 11/07/2024 (A) | 1,158 | 1,312 | ||||||
7.500%, 10/25/2027 | 200 | 221 | ||||||
|
|
| ||||||
| 10,080 | ||||||||
|
|
| ||||||
Belarus — 0.1% | ||||||||
Republic of Belarus International Bond | ||||||||
7.625%, 06/29/2027 | 1,000 | 1,125 | ||||||
6.200%, 02/28/2030 | 358 | 377 | ||||||
|
|
| ||||||
| 1,502 | ||||||||
|
|
| ||||||
Belize — 0.0% | ||||||||
Belize Government International Bond | ||||||||
8.185%, 02/20/2034 | 1,117 | 670 | ||||||
|
|
| ||||||
Benin — 0.1% | ||||||||
Benin Government International Bond | ||||||||
5.750%, 03/26/2026 (A) | EUR | 1,688 | 1,884 | |||||
|
|
| ||||||
Bermuda — 0.2% | ||||||||
Bermuda Government International Bond | ||||||||
4.854%, 02/06/2024 | $ | 868 | 948 | |||||
4.750%, 02/15/2029 | 1,204 | 1,364 | ||||||
3.717%, 01/25/2027 | 1,521 | 1,595 | ||||||
|
|
| ||||||
| 3,907 | ||||||||
|
|
| ||||||
Bolivia — 0.1% | ||||||||
Bolivian Government International Bond | ||||||||
4.500%, 03/20/2028 | 1,201 | 1,140 | ||||||
|
|
| ||||||
Brazil — 6.5% | ||||||||
Brazil Letras do Tesouro Nacional (D) | ||||||||
11.065%, 07/01/2021 | BRL | 5,000 | 1,098 | |||||
10.726%, 01/01/2022 | 8,000 | 1,701 | ||||||
8.523%, 07/01/2020 | 17,181 | 3,982 | ||||||
8.236%, 04/01/2020 | 3,000 | 703 | ||||||
Brazil Loan Trust 1 | ||||||||
5.477%, 07/24/2023 (A) | $ | 1,376 | 1,431 | |||||
5.477%, 07/24/2023 | 217 | 225 | ||||||
Brazil Minas SPE via State of Minas Gerais | ||||||||
5.333%, 02/15/2028 (C) | 2,187 | 2,321 | ||||||
| Description | Face Amount (Thousands) | Market Value ($ Thousands) | ||||||
GLOBAL BONDS (continued) | ||||||||
5.333%, 02/15/2028 | $ | 1,176 | $ | 1,248 | ||||
5.333%, 02/15/2028 (A) | 202 | 214 | ||||||
Brazil Notas do Tesouro Nacional, Serie B | ||||||||
6.000%, 08/15/2020 | BRL | 2,318 | 1,870 | |||||
6.000%, 05/15/2045 | 3,475 | 3,778 | ||||||
6.000%, 08/15/2050 | 3,455 | 3,879 | ||||||
Brazil Notas do Tesouro Nacional, Serie F | ||||||||
10.000%, 01/01/2021 | 67,339 | 17,076 | ||||||
10.000%, 01/01/2023 | 56,278 | 15,000 | ||||||
10.000%, 01/01/2025 | 37,953 | 10,427 | ||||||
10.000%, 01/01/2027 | 24,002 | 6,749 | ||||||
10.000%, 01/01/2029 | 19,032 | 5,439 | ||||||
Brazilian Government International Bond | ||||||||
8.250%, 01/20/2034 | $ | 748 | 1,022 | |||||
6.000%, 04/07/2026 | 1,238 | 1,429 | ||||||
5.625%, 01/07/2041 | 347 | 388 | ||||||
5.625%, 02/21/2047 | 193 | 216 | ||||||
5.000%, 01/27/2045 | 1,557 | 1,613 | ||||||
4.625%, 01/13/2028 | 40 | 43 | ||||||
4.500%, 05/30/2029 (C) | 7,341 | 7,638 | ||||||
CSN Resources | ||||||||
7.625%, 02/13/2023 (A) | 694 | 724 | ||||||
7.625%, 04/17/2026 (A) | 763 | 792 | ||||||
Gol Finance | ||||||||
7.000%, 01/31/2025 (A)(C) | 998 | 973 | ||||||
JBS Investments II GmbH | ||||||||
5.750%, 01/15/2028 (A) | 466 | 485 | ||||||
Minerva Luxembourg | ||||||||
6.500%, 09/20/2026 (A) | 1,247 | 1,297 | ||||||
MV24 Capital BV | ||||||||
6.748%, 06/01/2034 (A) | 895 | 923 | ||||||
Nexa Resources | ||||||||
5.375%, 05/04/2027 (A) | 2,891 | 3,065 | ||||||
Petrobras Global Finance BV | ||||||||
6.900%, 03/19/2049 | 1,756 | 2,014 | ||||||
Rumo Luxembourg Sarl | ||||||||
7.375%, 02/09/2024 (A) | 847 | 912 | ||||||
7.375%, 02/09/2024 | 750 | 807 | ||||||
Suzano Austria GmbH | ||||||||
7.000%, 03/16/2047 (A) | 399 | 455 | ||||||
6.000%, 01/15/2029 (A) | 688 | 748 | ||||||
5.000%, 01/15/2030 (A) | 494 | 495 | ||||||
Votorantim Cimentos International | ||||||||
7.250%, 04/05/2041 | 940 | 1,182 | ||||||
|
|
| ||||||
| 104,362 | ||||||||
|
|
| ||||||
Cameroon — 0.0% | ||||||||
Republic of Cameroon International Bond | ||||||||
9.500%, 11/19/2025 (A) | 324 | 354 | ||||||
|
|
| ||||||
Cayman Islands — 0.3% | ||||||||
Bioceanico | ||||||||
2.600%, 06/05/2034 (A)(D) | 1,993 | 1,383 | ||||||
54 |
SEI Institutional International Trust / Annual Report / September 30, 2019 |
| Description | Face Amount (Thousands) | Market Value ($ Thousands) | ||||||
GLOBAL BONDS (continued) | ||||||||
Neon Capital MTN | ||||||||
2.015%, 01/06/2028 (D) | JPY | 347,452 | $ | 2,673 | ||||
|
|
| ||||||
| 4,056 | ||||||||
|
|
| ||||||
Chile — 1.8% | ||||||||
Banco de Credito e Inversiones | ||||||||
3.500%, 10/12/2027 (A) | $ | 1,046 | 1,095 | |||||
Bonos de la Tesoreria de la Republica en pesos | ||||||||
6.000%, 01/01/2020 | CLP | 80,000 | 113 | |||||
6.000%, 01/01/2043 | 2,815,000 | 5,821 | ||||||
5.100%, 07/15/2050 | 75,000 | 142 | ||||||
4.700%, 09/01/2030 | 1,100,000 | 1,777 | ||||||
Cencosud | ||||||||
4.375%, 07/17/2027 (A) | $ | 1,819 | 1,812 | |||||
Chile Government International Bond | ||||||||
3.500%, 01/25/2050 | 2,627 | 2,831 | ||||||
Empresa Electrica Angamos | ||||||||
4.875%, 05/25/2029 (A)(C) | 1,150 | 1,202 | ||||||
Empresa Nacional del Petroleo | ||||||||
4.750%, 12/06/2021 | 1,621 | 1,694 | ||||||
3.750%, 08/05/2026 | 749 | 773 | ||||||
Geopark | ||||||||
6.500%, 09/21/2024 (A) | 492 | 506 | ||||||
Nacional del Cobre de Chile | ||||||||
5.625%, 10/18/2043 | 442 | 575 | ||||||
4.500%, 09/16/2025 (A) | 2,281 | 2,495 | ||||||
4.375%, 02/05/2049 (A) | 3,824 | 4,264 | ||||||
3.625%, 08/01/2027 (A) | 368 | 387 | ||||||
3.625%, 08/01/2027 (C) | 353 | 372 | ||||||
3.000%, 09/30/2029 (A) | 2,734 | 2,724 | ||||||
|
|
| ||||||
| 28,583 | ||||||||
|
|
| ||||||
China — 1.4% | ||||||||
Alibaba Group Holding | ||||||||
4.200%, 12/06/2047 | 310 | 351 | ||||||
Charming Light Investments MTN | ||||||||
4.375%, 12/21/2027 (C) | 1,600 | 1,714 | ||||||
China Government International Bond | ||||||||
3.250%, 10/19/2023 | 1,535 | 1,607 | ||||||
China Minmetals | ||||||||
4.450%, VAR US Treas Yield Curve Rate T Note Const Mat 3 Yr+6.070%, 11/13/2167 | 640 | 650 | ||||||
3.750%, VAR US Treas Yield Curve Rate T Note Const Mat 5 Yr+4.717%, 05/13/2168 | 2,047 | 2,047 | ||||||
Chinalco Capital Holdings | ||||||||
4.250%, 04/21/2022 (C) | 740 | 747 | ||||||
4.100%, VAR US Treas Yield Curve Rate T Note Const Mat 5 Yr+5.788%, 03/11/2168 | 224 | 224 | ||||||
CNAC HK Finbridge | ||||||||
5.125%, 03/14/2028 | 1,779 | 1,995 | ||||||
| Description | Face Amount (Thousands) | Market Value ($ Thousands) | ||||||
GLOBAL BONDS (continued) | ||||||||
4.625%, 03/14/2023 | $ | 294 | $ | 308 | ||||
3.375%, 06/19/2024 | 592 | 597 | ||||||
Dianjian Haiyu | ||||||||
4.300%, 12/20/2167 | 204 | 208 | ||||||
Dianjian International Finance | ||||||||
4.600%, VAR US Treas Yield Curve Rate T Note Const Mat 5 Yr+6.933%, 07/19/2168 | 303 | 311 | ||||||
HBIS Group Hong Kong | ||||||||
4.250%, 04/07/2020 | 684 | 684 | ||||||
Huarong Finance 2017 | ||||||||
4.500%, VAR US Treas Yield Curve Rate T Note Const Mat 5 Yr+7.773%, 07/24/2168 | 1,378 | 1,392 | ||||||
Leader Goal International Ltd MTN | ||||||||
4.250%, 07/19/2168 (E) | 212 | 215 | ||||||
Sinopec Group Overseas Development 2016 | ||||||||
2.750%, 09/29/2026 | 1,066 | 1,063 | ||||||
Sinopec Group Overseas Development 2017 | ||||||||
3.625%, 04/12/2027 | 2,458 | 2,587 | ||||||
Sinopec Group Overseas Development 2018 | ||||||||
4.250%, 09/12/2028 (C) | 1,616 | 1,786 | ||||||
2.500%, 08/08/2024 (A) | 3,010 | 3,011 | ||||||
|
|
| ||||||
| 21,497 | ||||||||
|
|
| ||||||
Colombia — 4.6% | ||||||||
Colombian TES | ||||||||
10.000%, 07/24/2024 | COP | 27,897,700 | 9,667 | |||||
7.750%, 09/18/2030 | 3,550,700 | 1,161 | ||||||
7.500%, 08/26/2026 | 31,244,000 | 9,983 | ||||||
7.250%, 10/18/2034 | 6,609,500 | 2,079 | ||||||
7.000%, 05/04/2022 | 17,384,100 | 5,258 | ||||||
7.000%, 06/30/2032 | 6,561,700 | 2,024 | ||||||
6.250%, 11/26/2025 | 31,502,600 | 9,454 | ||||||
6.000%, 04/28/2028 | 11,724,600 | 3,411 | ||||||
4.750%, 04/04/2035 | 1,170,600 | 1,151 | ||||||
Ecopetrol | ||||||||
5.875%, 09/18/2023 | $ | 836 | 931 | |||||
Emgesa ESP | ||||||||
8.750%, 01/25/2021 | COP | 870,000 | 260 | |||||
Empresas Publicas de Medellin ESP | ||||||||
8.375%, 11/08/2027 (A) | 1,760,000 | 540 | ||||||
7.625%, 09/10/2024 (A) | 3,116,000 | 937 | ||||||
Financiera de Desarrollo Territorial Findeter | ||||||||
7.875%, 08/12/2024 (A) | 1,127,000 | 343 | ||||||
7.875%, 08/12/2024 | 884,000 | 269 | ||||||
Republic of Colombia | ||||||||
9.850%, 06/28/2027 | 5,060,000 | 1,850 | ||||||
8.125%, 05/21/2024 | $ | 1,127 | 1,393 | |||||
7.750%, 04/14/2021 | COP | 3,331,000 | 997 | |||||
7.375%, 09/18/2037 | $ | 1,091 | 1,553 | |||||
6.125%, 01/18/2041 | 1,584 | 2,063 | ||||||
5.200%, 05/15/2049 | 2,186 | 2,640 | ||||||
SEI Institutional International Trust / Annual Report / September 30, 2019 |
55 |
SCHEDULE OF INVESTMENTS
September 30, 2019
Emerging Markets Debt Fund(Continued)
| Description | Face Amount (Thousands) | Market Value ($ Thousands) | ||||||
GLOBAL BONDS (continued) | ||||||||
5.000%, 06/15/2045 | $ | 3,822 | $ | 4,472 | ||||
4.500%, 01/28/2026 | 2,352 | 2,568 | ||||||
4.500%, 03/15/2029 | 5,504 | 6,118 | ||||||
4.375%, 03/21/2023 | COP | 2,871,000 | 809 | |||||
4.000%, 02/26/2024 | $ | 965 | 1,017 | |||||
3.875%, 04/25/2027 | 946 | 1,003 | ||||||
|
|
| ||||||
| 73,951 | ||||||||
|
|
| ||||||
Costa Rica — 0.4% | ||||||||
Costa Rica Government International Bond | ||||||||
7.158%, 03/12/2045 | 1,643 | 1,643 | ||||||
7.158%, 03/12/2045 (A) | 1,037 | 1,037 | ||||||
7.158%, 03/12/2045 | 912 | 912 | ||||||
7.000%, 04/04/2044 | 1,208 | 1,198 | ||||||
7.000%, 04/04/2044 | 230 | 228 | ||||||
4.250%, 01/26/2023 | 870 | 850 | ||||||
Instituto Costarricense de Electricidad | ||||||||
6.375%, 05/15/2043 | 250 | 207 | ||||||
|
|
| ||||||
| 6,075 | ||||||||
|
|
| ||||||
Croatia — 0.4% | ||||||||
Croatia Government International Bond | ||||||||
6.625%, 07/14/2020 | 2,080 | 2,146 | ||||||
2.750%, 01/27/2030 | EUR | 2,169 | 2,877 | |||||
1.125%, 06/19/2029 | 963 | 1,114 | ||||||
|
|
| ||||||
| 6,137 | ||||||||
|
|
| ||||||
Czech Republic — 1.3% | ||||||||
Czech Republic Government Bond | ||||||||
4.200%, 12/04/2036 | CZK | 28,000 | 1,669 | |||||
2.750%, 07/23/2029 | 115,370 | 5,501 | ||||||
2.500%, 08/25/2028 | 41,920 | 1,939 | ||||||
2.400%, 09/17/2025 | 144,900 | 6,495 | ||||||
2.000%, 10/13/2033 | 36,060 | 1,627 | ||||||
1.000%, 06/26/2026 | 32,290 | 1,336 | ||||||
0.950%, 05/15/2030 | 69,140 | 2,785 | ||||||
|
|
| ||||||
| 21,352 | ||||||||
|
|
| ||||||
Dominican Republic — 1.1% | ||||||||
Dominican Republic International Bond | ||||||||
11.250%, 02/05/2027 | DOP | 14,500 | 297 | |||||
9.750%, 06/05/2026 | 25,300 | 496 | ||||||
8.900%, 02/15/2023 (A) | 65,750 | 1,262 | ||||||
7.450%, 04/30/2044 (A) | $ | 687 | 814 | |||||
6.875%, 01/29/2026 | 989 | 1,115 | ||||||
6.850%, 01/27/2045 | 1,050 | 1,169 | ||||||
6.850%, 01/27/2045 (A) | 479 | 533 | ||||||
6.600%, 01/28/2024 | 656 | 721 | ||||||
6.500%, 02/15/2048 | 2,817 | 3,028 | ||||||
6.400%, 06/05/2049 (A) | 1,440 | 1,534 | ||||||
6.400%, 06/05/2049 | 511 | 544 | ||||||
6.000%, 07/19/2028 | 3,381 | 3,690 | ||||||
5.950%, 01/25/2027 | 638 | 690 | ||||||
5.875%, 04/18/2024 (A) | 71 | 75 | ||||||
| Description | Face Amount (Thousands) | Market Value ($ Thousands) | ||||||
GLOBAL BONDS (continued) | ||||||||
5.500%, 01/27/2025 | $ | 949 | $ | 1,000 | ||||
|
|
| ||||||
| 16,968 | ||||||||
|
|
| ||||||
Ecuador — 1.1% | ||||||||
Ecuador Government International Bond | ||||||||
10.750%, 01/31/2029 (A) | 760 | 821 | ||||||
10.750%, 01/31/2029 | 3,157 | 3,409 | ||||||
10.500%, 03/24/2020 | 862 | 880 | ||||||
9.650%, 12/13/2026 (A) | 206 | 216 | ||||||
9.625%, 06/02/2027 | 777 | 807 | ||||||
9.500%, 03/27/2030 (A) | 788 | 799 | ||||||
8.875%, 10/23/2027 | 4,504 | 4,487 | ||||||
8.875%, 10/23/2027 (A) | 245 | 244 | ||||||
7.950%, 06/20/2024 | 2,153 | 2,196 | ||||||
7.875%, 03/27/2025 (A) | 447 | 446 | ||||||
7.875%, 01/23/2028 (A) | 516 | 489 | ||||||
7.875%, 01/23/2028 | 2,004 | 1,899 | ||||||
Petroamazonas EP | ||||||||
4.625%, 02/16/2020 (A) | 158 | 158 | ||||||
|
|
| ||||||
| 16,851 | ||||||||
|
|
| ||||||
Egypt — 2.5% | ||||||||
Egypt Government International Bond | ||||||||
18.000%, 11/06/2028 | EGP | 30,307 | 2,201 | |||||
17.700%, 08/07/2025 | 29,457 | 2,054 | ||||||
16.300%, 04/09/2024 | 15,034 | 983 | ||||||
16.100%, 05/07/2029 | 14,920 | 996 | ||||||
15.900%, 07/02/2024 | 19,208 | 1,241 | ||||||
15.600%, 08/06/2026 | 25,450 | 1,667 | ||||||
14.800%, 01/30/2023 | 65,021 | 4,048 | ||||||
8.700%, 03/01/2049 (A) | $ | 529 | 569 | |||||
7.903%, 02/21/2048 (A) | 421 | 423 | ||||||
5.577%, 02/21/2023 (A) | 741 | 756 | ||||||
Egypt Government International Bond MTN | ||||||||
8.500%, 01/31/2047 (A) | 934 | 988 | ||||||
8.500%, 01/31/2047 | 6,005 | 6,352 | ||||||
7.600%, 03/01/2029 | 1,550 | 1,640 | ||||||
7.600%, 03/01/2029 (A) | 378 | 400 | ||||||
6.375%, 04/11/2031 (A) | EUR | 1,441 | 1,632 | |||||
6.375%, 04/11/2031 | 442 | 500 | ||||||
6.125%, 01/31/2022 (A) | $ | 865 | 891 | |||||
5.625%, 04/16/2030 | EUR | 3,322 | 3,620 | |||||
5.625%, 04/16/2030 (A) | 2,714 | 2,958 | ||||||
4.750%, 04/11/2025 | 457 | 516 | ||||||
4.750%, 04/16/2026 | 1,584 | 1,768 | ||||||
Egypt Treasury Bills (D) | ||||||||
17.587%, 02/04/2020 | EGP | 44,875 | 2,618 | |||||
16.989%, 08/04/2020 | 33,000 | 1,796 | ||||||
|
|
| ||||||
| 40,617 | ||||||||
|
|
| ||||||
El Salvador — 0.6% | ||||||||
El Salvador Government International Bond | ||||||||
8.250%, 04/10/2032 (A) | $ | 326 | 372 | |||||
7.125%, 01/20/2050 (A) | 545 | 554 | ||||||
56 |
SEI Institutional International Trust / Annual Report / September 30, 2019 |
| Description | Face Amount (Thousands) | Market Value ($ Thousands) | ||||||
GLOBAL BONDS (continued) | ||||||||
Republic of El Salvador | ||||||||
8.250%, 04/10/2032 | $ | 700 | $ | 798 | ||||
7.750%, 01/24/2023 | 1,690 | 1,842 | ||||||
7.650%, 06/15/2035 (C) | 1,153 | 1,237 | ||||||
7.625%, 02/01/2041 | 327 | 351 | ||||||
7.375%, 12/01/2019 | 1,290 | 1,293 | ||||||
7.125%, 01/20/2050 | 640 | 651 | ||||||
5.875%, 01/30/2025 | 2,141 | 2,203 | ||||||
|
|
| ||||||
| 9,301 | ||||||||
|
|
| ||||||
Gabon — 0.1% | ||||||||
Gabonese Republic | ||||||||
6.950%, 06/16/2025 (A) | 913 | 908 | ||||||
|
|
| ||||||
Georgia — 0.0% | ||||||||
Republic of Georgia | ||||||||
6.875%, 04/12/2021 (A) | 66 | 70 | ||||||
|
|
| ||||||
Ghana — 1.0% | ||||||||
Ghana Government International Bond | ||||||||
24.750%, 07/19/2021 | GHS | – | – | |||||
19.750%, 03/25/2024 | 5,311 | 992 | ||||||
19.000%, 11/02/2026 | 11,055 | 1,987 | ||||||
10.750%, 10/14/2030 (A) | $ | 1,577 | 1,999 | |||||
10.750%, 10/14/2030 | 4,683 | 5,937 | ||||||
8.950%, 03/26/2051 | 591 | 592 | ||||||
8.627%, 06/16/2049 | 737 | 735 | ||||||
8.125%, 03/26/2032 (C) | 2,132 | 2,139 | ||||||
7.875%, 03/26/2027 (A) | 1,110 | 1,138 | ||||||
Tullow Oil | ||||||||
7.000%, 03/01/2025 (A) | 660 | 671 | ||||||
|
|
| ||||||
| 16,190 | ||||||||
|
|
| ||||||
Guatemala — 0.1% | ||||||||
Comunicaciones Celulares Via Comcel Trust | ||||||||
6.875%, 02/06/2024 (A) | 390 | 402 | ||||||
Guatemala Government Bond | ||||||||
4.900%, 06/01/2030 (A) | 1,292 | 1,365 | ||||||
|
|
| ||||||
| 1,767 | ||||||||
|
|
| ||||||
Honduras — 0.0% | ||||||||
Honduras Government International Bond | ||||||||
6.250%, 01/19/2027 | 326 | 353 | ||||||
|
|
| ||||||
Hong Kong — 0.1% | ||||||||
NWD | ||||||||
4.125%, 07/18/2029 | 757 | 748 | ||||||
|
|
| ||||||
Hungary — 2.0% | ||||||||
Hungary Government Bond | ||||||||
6.750%, 10/22/2028 | HUF | 419,240 | 1,941 | |||||
6.375%, 03/29/2021 | $ | 3,908 | 4,147 | |||||
5.750%, 11/22/2023 | 886 | 1,004 | ||||||
5.500%, 06/24/2025 (C) | HUF | 500,750 | 2,020 | |||||
| Description | Face Amount (Thousands) | Market Value ($ Thousands) | ||||||
GLOBAL BONDS (continued) | ||||||||
5.375%, 03/25/2024 (C) | $ | 1,107 | $ | 1,250 | ||||
3.000%, 06/26/2024 | HUF | 1,144,280 | 4,082 | |||||
3.000%, 10/27/2027 | 3,041,400 | 10,958 | ||||||
2.750%, 12/22/2026 | 1,072,960 | 3,798 | ||||||
2.500%, 10/24/2024 | 653,680 | 2,273 | ||||||
|
|
| ||||||
| 31,473 | ||||||||
|
|
| ||||||
India — 0.1% | ||||||||
State Bank of India | ||||||||
4.000%, 01/24/2022 | $ | 822 | 843 | |||||
Vedanta Resources | ||||||||
8.250%, 06/07/2021 | 820 | 853 | ||||||
|
|
| ||||||
| 1,696 | ||||||||
|
|
| ||||||
Indonesia — 7.7% | ||||||||
Eterna Capital Pte | ||||||||
7.500%, 12/11/2022 (C) | 153 | 141 | ||||||
Indika Energy Capital III Pte | ||||||||
5.875%, 11/09/2024 (A) | 330 | 322 | ||||||
5.875%, 11/09/2024 | 236 | 230 | ||||||
Indonesia Asahan Aluminium Persero | ||||||||
6.757%, 11/15/2048 | 1,530 | 1,983 | ||||||
6.757%, 11/15/2048 (A) | 232 | 301 | ||||||
5.710%, 11/15/2023 (A) | 618 | 680 | ||||||
Indonesia Government International Bond | ||||||||
9.000%, 03/15/2029 | IDR | 61,750,000 | 4,814 | |||||
8.750%, 05/15/2031 | 60,779,000 | 4,668 | ||||||
8.500%, 10/12/2035 | $ | 1,704 | 2,676 | |||||
8.375%, 03/15/2024 | IDR | 60,173,000 | 4,502 | |||||
8.375%, 09/15/2026 | 31,281,000 | 2,361 | ||||||
8.375%, 03/15/2034 | 149,249,000 | 11,118 | ||||||
8.375%, 04/15/2039 | 152,918,000 | 11,341 | ||||||
8.250%, 05/15/2029 | 76,525,000 | 5,754 | ||||||
8.250%, 06/15/2032 | 12,030,000 | 889 | ||||||
8.250%, 05/15/2036 | 72,516,000 | 5,314 | ||||||
8.125%, 05/15/2024 | 76,235,000 | 5,674 | ||||||
7.750%, 01/17/2038 | $ | 1,797 | 2,691 | |||||
7.500%, 08/15/2032 | IDR | 26,770,000 | 1,867 | |||||
7.500%, 05/15/2038 | 76,662,000 | 5,281 | ||||||
7.000%, 05/15/2022 | 40,233,000 | 2,872 | ||||||
7.000%, 05/15/2027 | 63,129,000 | 4,415 | ||||||
6.625%, 05/15/2033 | 24,323,000 | 1,559 | ||||||
6.125%, 05/15/2028 | 28,570,000 | 1,862 | ||||||
5.625%, 05/15/2023 | 121,661,000 | 8,327 | ||||||
5.250%, 01/08/2047 (A) | $ | 170 | 207 | |||||
4.750%, 02/11/2029 | 985 | 1,120 | ||||||
4.350%, 01/08/2027 (A) | 2,704 | 2,933 | ||||||
Indonesia Government International Bond MTN | ||||||||
5.250%, 01/17/2042 | 3,120 | 3,752 | ||||||
5.125%, 01/15/2045 | 410 | 489 | ||||||
4.750%, 01/08/2026 | 2,159 | 2,380 | ||||||
4.625%, 04/15/2043 | 1,745 | 1,948 | ||||||
SEI Institutional International Trust / Annual Report / September 30, 2019 |
57 |
SCHEDULE OF INVESTMENTS
September 30, 2019
Emerging Markets Debt Fund(Continued)
| Description | Face Amount (Thousands) | Market Value ($ Thousands) | ||||||
GLOBAL BONDS (continued) | ||||||||
4.125%, 01/15/2025 | $ | 1,600 | $ | 1,703 | ||||
3.850%, 07/18/2027 | 3,978 | 4,199 | ||||||
3.750%, 06/14/2028 | EUR | 359 | 484 | |||||
JPMorgan Chase Bank MTN | ||||||||
8.375%, 04/19/2039 (A) | IDR | 3,409,000 | 257 | |||||
7.500%, 06/15/2035 (A) | 63,788,000 | 4,431 | ||||||
Pertamina Persero MTN | ||||||||
4.700%, 07/30/2049 (A) | $ | 244 | 253 | |||||
3.650%, 07/30/2029 (A) | 1,643 | 1,687 | ||||||
Perusahaan Listrik Negara MTN | ||||||||
6.150%, 05/21/2048 (A) | 857 | 1,097 | ||||||
6.150%, 05/21/2048 | 250 | 320 | ||||||
5.450%, 05/21/2028 (A) | 262 | 302 | ||||||
Perusahaan Penerbit SBSN Indonesia III | ||||||||
4.400%, 03/01/2028 | 573 | 624 | ||||||
4.325%, 05/28/2025 | 1,757 | 1,885 | ||||||
Star Energy Geothermal Wayang Windu | ||||||||
6.750%, 04/24/2033 | 451 | 470 | ||||||
|
|
| ||||||
| 122,183 | ||||||||
|
|
| ||||||
Iraq — 0.1% | ||||||||
Iraq International Bond | ||||||||
5.800%, 01/15/2028 | 1,086 | 1,057 | ||||||
|
|
| ||||||
Ivory Coast — 0.9% | ||||||||
Ivory Coast Government International Bond | ||||||||
6.625%, 03/22/2048 | EUR | 1,552 | 1,709 | |||||
6.625%, 03/22/2048 | 271 | 298 | ||||||
6.375%, 03/03/2028 (A) | $ | 139 | 142 | |||||
6.125%, 06/15/2033 (C) | – | – | ||||||
5.750%, 12/31/2032 (F) | 3,413 | 3,348 | ||||||
5.750%, 12/31/2032 | 3,792 | 3,720 | ||||||
5.250%, 03/22/2030 | EUR | 1,578 | 1,727 | |||||
5.125%, 06/15/2025 | 2,216 | 2,582 | ||||||
|
|
| ||||||
| 13,526 | ||||||||
|
|
| ||||||
Jamaica — 0.3% | ||||||||
Government of Jamaica | ||||||||
7.875%, 07/28/2045 | $ | 3,056 | 3,996 | |||||
|
|
| ||||||
Jordan — 0.1% | ||||||||
Jordan Government International Bond | ||||||||
7.375%, 10/10/2047 (A) | 1,629 | 1,713 | ||||||
7.375%, 10/10/2047 | 493 | 518 | ||||||
|
|
| ||||||
| 2,231 | ||||||||
|
|
| ||||||
Kazakhstan — 1.4% | ||||||||
Development Bank of Kazakhstan | ||||||||
4.125%, 12/10/2022 | 770 | 798 | ||||||
Kazakhstan Government International Bond MTN | ||||||||
6.500%, 07/21/2045 (C) | 330 | 480 | ||||||
2.375%, 11/09/2028 | EUR | 556 | 683 | |||||
| Description | Face Amount (Thousands) | Market Value ($ Thousands) | ||||||
GLOBAL BONDS (continued) | ||||||||
KazMunayGas National JSC | ||||||||
6.375%, 10/24/2048 (A) | $ | 1,965 | $ | 2,442 | ||||
5.750%, 04/19/2047 (A) | 2,252 | 2,640 | ||||||
5.750%, 04/19/2047 | 63 | 74 | ||||||
5.375%, 04/24/2030 (A) | 1,834 | 2,061 | ||||||
5.375%, 04/24/2030 | 2,560 | 2,877 | ||||||
4.750%, 04/24/2025 (A) | 2,068 | 2,255 | ||||||
4.750%, 04/19/2027 (A) | 1,703 | 1,842 | ||||||
3.875%, 04/19/2022 | 2,577 | 2,642 | ||||||
KazTransGas JSC | ||||||||
4.375%, 09/26/2027 | 1,796 | 1,881 | ||||||
4.375%, 09/26/2027 (A) | 932 | 976 | ||||||
Nostrum Oil & Gas Finance BV | ||||||||
7.000%, 02/16/2025 (A) | 441 | 223 | ||||||
|
|
| ||||||
| 21,874 | ||||||||
|
|
| ||||||
Kenya — 0.5% | ||||||||
Kenya Government International Bond | ||||||||
8.250%, 02/28/2048 | 660 | 674 | ||||||
8.250%, 02/28/2048 (A) | 654 | 667 | ||||||
8.000%, 05/22/2032 (C) | 1,872 | 1,960 | ||||||
8.000%, 05/22/2032 (A) | 2,256 | 2,362 | ||||||
7.000%, 05/22/2027 | 1,250 | 1,297 | ||||||
7.000%, 05/22/2027 (A) | 671 | 696 | ||||||
6.875%, 06/24/2024 | 473 | 499 | ||||||
|
|
| ||||||
| 8,155 | ||||||||
|
|
| ||||||
Kuwait — 0.1% | ||||||||
Kuwait International Government Bond | ||||||||
3.500%, 03/20/2027 | 418 | 450 | ||||||
2.750%, 03/20/2022 | 390 | 395 | ||||||
|
|
| ||||||
| 845 | ||||||||
|
|
| ||||||
Lebanon — 0.4% | ||||||||
Lebanon Government International Bond | ||||||||
6.000%, 01/27/2023 | 864 | 597 | ||||||
Lebanon Government International Bond MTN | ||||||||
8.250%, 04/12/2021 | 3,065 | 2,605 | ||||||
8.250%, 04/12/2021 | 828 | 704 | ||||||
6.650%, 11/03/2028 | 2,183 | 1,404 | ||||||
6.600%, 11/27/2026 | 93 | 60 | ||||||
6.100%, 10/04/2022 | 1,481 | 1,048 | ||||||
6.100%, 10/04/2022 | 569 | 402 | ||||||
|
|
| ||||||
| 6,820 | ||||||||
|
|
| ||||||
Lithuania — 0.1% | ||||||||
Lithuania Government International Bond | ||||||||
7.375%, 02/11/2020 | 923 | 939 | ||||||
|
|
| ||||||
Luxembourg — 0.0% | ||||||||
Millicom International Cellular | ||||||||
6.250%, 03/25/2029 (A) | 449 | 490 | ||||||
|
|
| ||||||
58 |
SEI Institutional International Trust / Annual Report / September 30, 2019 |
| Description | Face Amount (Thousands) | Market Value ($ Thousands) | ||||||
GLOBAL BONDS (continued) | ||||||||
Malaysia — 5.2% | ||||||||
1MDB Energy | ||||||||
5.990%, 05/11/2022 | $ | 2,000 | $ | 2,102 | ||||
1MDB Global Investments | ||||||||
4.400%, 03/09/2023 | 1,000 | 957 | ||||||
4.400%, 03/09/2023 | 8,600 | 8,228 | ||||||
Malaysia Government Bond | ||||||||
5.248%, 09/15/2028 | MYR | 1,050 | 284 | |||||
4.935%, 09/30/2043 | 2,200 | 616 | ||||||
4.893%, 06/08/2038 | 3,400 | 938 | ||||||
4.642%, 11/07/2033 | 1,700 | 449 | ||||||
4.392%, 04/15/2026 | 3,480 | 879 | ||||||
4.232%, 06/30/2031 | 6,200 | 1,569 | ||||||
4.181%, 07/15/2024 | 4,186 | 1,039 | ||||||
4.160%, 07/15/2021 | 15,369 | 3,737 | ||||||
4.059%, 09/30/2024 | 8,000 | 1,973 | ||||||
4.048%, 09/30/2021 | 2,259 | 549 | ||||||
3.955%, 09/15/2025 | 19,922 | 4,912 | ||||||
3.906%, 07/15/2026 | 12,945 | 3,196 | ||||||
3.899%, 11/16/2027 | 2,500 | 614 | ||||||
3.889%, 07/31/2020 | 7,629 | 1,833 | ||||||
3.885%, 08/15/2029 | 8,452 | 2,109 | ||||||
3.882%, 03/10/2022 | 19,617 | 4,768 | ||||||
3.828%, 07/05/2034 | 1,500 | 367 | ||||||
3.800%, 08/17/2023 | 30,074 | 7,328 | ||||||
3.795%, 09/30/2022 | 3,200 | 778 | ||||||
3.757%, 04/20/2023 | 13,915 | 3,383 | ||||||
3.733%, 06/15/2028 | 12,719 | 3,069 | ||||||
3.659%, 10/15/2020 | 1,419 | 341 | ||||||
3.654%, 10/31/2019 | 31,500 | 7,527 | ||||||
3.620%, 11/30/2021 | 22,657 | 5,466 | ||||||
3.502%, 05/31/2027 | 1,050 | 251 | ||||||
3.492%, 03/31/2020 | 25,134 | 6,015 | ||||||
3.480%, 03/15/2023 | 2,858 | 689 | ||||||
3.418%, 08/15/2022 | 10,450 | 2,516 | ||||||
Malaysia Government Investment Issue | ||||||||
4.369%, 10/31/2028 | 1,200 | 308 | ||||||
4.070%, 09/30/2026 | 6,500 | 1,618 | ||||||
Malaysia Sukuk Global | ||||||||
3.179%, 04/27/2026 | $ | 3,003 | 3,140 | |||||
|
|
| ||||||
| 83,548 | ||||||||
|
|
| ||||||
Mauritius — 0.1% | ||||||||
Liquid Telecommunications Financing | ||||||||
8.500%, 07/13/2022 (A) | 1,286 | 1,269 | ||||||
|
|
| ||||||
Mexico — 8.3% | ||||||||
America Movil | ||||||||
7.125%, 12/09/2024 | MXN | 18,110 | 890 | |||||
Axtel | ||||||||
6.375%, 11/14/2024 (A) | $ | 713 | 734 | |||||
| Description | Face Amount (Thousands) | Market Value ($ Thousands) | ||||||
GLOBAL BONDS (continued) | ||||||||
Banco Mercantil del Norte | ||||||||
7.500%, VAR US Treas Yield Curve Rate T Note Const Mat 10 Yr+5.470%, 09/27/2167 (A) | $ | 476 | $ | 482 | ||||
6.750%, VAR US Treas Yield Curve Rate T Note Const Mat 5 Yr+4.967%, 09/27/2167 (A) | 609 | 608 | ||||||
Banco Nacional de Comercio Exterior SNC | ||||||||
3.800%, VAR US Treas Yield Curve Rate T Note Const Mat 5 Yr+3.000%, 08/11/2026 | 2,166 | 2,190 | ||||||
3.800%, VAR US Treas Yield Curve Rate T Note Const Mat 5 Yr+3.000%, 08/11/2026 (A) | 1,685 | 1,704 | ||||||
BBVA Bancomer | ||||||||
5.875%, VAR US Treas Yield Curve Rate T Note Const Mat 5 Yr+4.308%, 09/13/2034 (A) | 903 | 897 | ||||||
Cemex | ||||||||
7.750%, 04/16/2026 | 670 | 728 | ||||||
Cometa Energia | ||||||||
6.375%, 04/24/2035 (A) | 692 | 736 | ||||||
Comision Federal de Electricidad | ||||||||
7.350%, 11/25/2025 | MXN | 39,785 | 1,824 | |||||
5.750%, 02/14/2042 (A) | $ | 500 | 543 | |||||
4.750%, 02/23/2027 (A) | 458 | 481 | ||||||
Elementia | ||||||||
5.500%, 01/15/2025 | 670 | 650 | ||||||
Grupo Bimbo SAB | ||||||||
4.000%, 09/06/2049 | 608 | 575 | ||||||
Industrias Penoles | ||||||||
5.650%, 09/12/2049 (A) | 359 | 371 | ||||||
Mexican Bonos | ||||||||
8.000%, 11/07/2047 | MXN | 38,771 | 2,113 | |||||
7.750%, 11/23/2034 | 39,185 | 2,097 | ||||||
7.750%, 11/13/2042 | 146,708 | 7,773 | ||||||
7.500%, 06/03/2027 | 159,530 | 8,389 | ||||||
6.500%, 06/09/2022 | 32,396 | 1,632 | ||||||
5.750%, 03/05/2026 | 15,837 | 759 | ||||||
5.750%, 03/05/2026 | 87,650 | 4,202 | ||||||
Mexican Bonos, Ser M20 | ||||||||
10.000%, 12/05/2024 | 403,161 | 23,350 | ||||||
8.500%, 05/31/2029 | 56,640 | 3,193 | ||||||
8.000%, 12/07/2023 | 16,617 | 881 | ||||||
7.750%, 05/29/2031 | 164,453 | 8,825 | ||||||
Mexican Bonos, Ser M30 | ||||||||
8.500%, 11/18/2038 | 65,591 | 3,741 | ||||||
Mexican Udibonos | ||||||||
4.000%, 11/15/2040 | 37,716 | 2,097 | ||||||
4.000%, 11/03/2050 | 40,013 | 2,279 | ||||||
Mexico City Airport Trust | ||||||||
5.500%, 07/31/2047 (A) | $ | 715 | 709 | |||||
SEI Institutional International Trust / Annual Report / September 30, 2019 |
59 |
SCHEDULE OF INVESTMENTS
September 30, 2019
Emerging Markets Debt Fund(Continued)
| Description | Face Amount (Thousands) | Market Value ($ Thousands) | ||||||
GLOBAL BONDS (continued) | ||||||||
Mexico Government International Bond | ||||||||
4.750%, 03/08/2044 | $ | 386 | $ | 418 | ||||
4.500%, 04/22/2029 | 2,636 | 2,863 | ||||||
4.350%, 01/15/2047 (C) | 1,763 | 1,819 | ||||||
3.750%, 01/11/2028 | 1,738 | 1,791 | ||||||
Mexico Government International Bond MTN | ||||||||
5.750%, 10/12/2110 | 3,576 | 4,108 | ||||||
Minera Mexico | ||||||||
4.500%, 01/26/2050 (A) | 627 | 617 | ||||||
Petroleos Mexicanos | ||||||||
9.500%, 09/15/2027 | 169 | 195 | ||||||
7.690%, 01/23/2050 (A)(C) | 6,626 | 6,908 | ||||||
7.470%, 11/12/2026 | MXN | 175,079 | 7,360 | |||||
7.190%, 09/12/2024 | 108,672 | 4,802 | ||||||
6.840%, 01/23/2030 (A) | $ | 4,061 | 4,207 | |||||
6.625%, 06/15/2035 | 3,100 | 3,029 | ||||||
6.500%, 03/13/2027 | 926 | 962 | ||||||
6.500%, 01/23/2029 (A) | 785 | 798 | ||||||
6.350%, 02/12/2048 | 878 | 807 | ||||||
6.350%, 02/12/2048 (A) | 742 | 682 | ||||||
5.625%, 01/23/2046 (C) | 468 | 398 | ||||||
5.350%, 02/12/2028 (A) | 1,079 | 1,031 | ||||||
4.500%, 01/23/2026 (C) | 2,372 | 2,291 | ||||||
Petroleos Mexicanos MTN | ||||||||
6.750%, 09/21/2047 | 553 | 531 | ||||||
6.375%, 01/23/2045 (A) | 806 | 748 | ||||||
4.875%, 02/21/2028 | EUR | 755 | 858 | |||||
|
|
| ||||||
| 132,676 | ||||||||
|
|
| ||||||
Mongolia — 0.4% | ||||||||
Development Bank of Mongolia | ||||||||
7.250%, 10/23/2023 (A) | $ | 784 | 812 | |||||
Mongolia Government International Bond | ||||||||
5.625%, 05/01/2023 | 2,687 | 2,714 | ||||||
Mongolia Government International Bond MTN | ||||||||
8.750%, 03/09/2024 | 1,951 | 2,180 | ||||||
Trade & Development Bank of Mongolia MTN | ||||||||
9.375%, 05/19/2020 (A) | 355 | 364 | ||||||
9.375%, 05/19/2020 | 350 | 359 | ||||||
|
|
| ||||||
| 6,429 | ||||||||
|
|
| ||||||
Montenegro — 0.0% | ||||||||
Montenegro Government International Bond | ||||||||
3.375%, 04/21/2025 | EUR | 230 | 269 | |||||
|
|
| ||||||
Namibia — 0.0% | ||||||||
Namibia International Bonds | ||||||||
5.250%, 10/29/2025 | $ | 379 | 383 | |||||
|
|
| ||||||
Netherlands — 0.1% | ||||||||
Minejesa Capital BV | ||||||||
5.625%, 08/10/2037 (A) | 96 | 104 | ||||||
| Description | Face Amount (Thousands) | Market Value ($ Thousands) | ||||||
GLOBAL BONDS (continued) | ||||||||
4.625%, 08/10/2030 (A) | $ | 599 | $ | 615 | ||||
Petrobras Global Finance BV | ||||||||
5.750%, 02/01/2029 (C) | 790 | 871 | ||||||
|
|
| ||||||
| 1,590 | ||||||||
|
|
| ||||||
Nigeria — 1.3% | ||||||||
IHS Netherlands Holdco | ||||||||
8.000%, 09/18/2027 (A) | 598 | 611 | ||||||
Nigeria Government International Bond | ||||||||
13.980%, 02/23/2028 | NGN | 773,531 | 2,098 | |||||
9.248%, 01/21/2049 | $ | 912 | 1,018 | |||||
8.747%, 01/21/2031 (C) | 2,749 | 3,083 | ||||||
8.747%, 01/21/2031 (A) | 535 | 600 | ||||||
7.875%, 02/16/2032 | 3,714 | 3,908 | ||||||
7.696%, 02/23/2038 (C) | 3,863 | 3,928 | ||||||
7.143%, 02/23/2030 (A)(C) | 618 | 632 | ||||||
Nigeria Government International Bond MTN | ||||||||
7.625%, 11/28/2047 | 402 | 397 | ||||||
6.500%, 11/28/2027 (A)(C) | 2,480 | 2,507 | ||||||
6.500%, 11/28/2027 (C) | 680 | 687 | ||||||
Nigeria Treasury Bill | ||||||||
15.892%, 02/27/2020 (D) | NGN | 229,138 | 601 | |||||
|
|
| ||||||
| 20,070 | ||||||||
|
|
| ||||||
Oman — 0.9% | ||||||||
Oman Government International Bond | ||||||||
6.750%, 01/17/2048 | $ | 2,865 | 2,700 | |||||
6.750%, 01/17/2048 (A) | 808 | 762 | ||||||
6.500%, 03/08/2047 | 2,273 | 2,099 | ||||||
6.500%, 03/08/2047 (A) | 482 | 445 | ||||||
5.625%, 01/17/2028 (A) | 2,663 | 2,620 | ||||||
5.375%, 03/08/2027 (A) | 60 | 59 | ||||||
4.750%, 06/15/2026 | 900 | 864 | ||||||
3.625%, 06/15/2021 (C) | 1,326 | 1,319 | ||||||
Oman Government International Bond MTN | ||||||||
6.000%, 08/01/2029 (A) | 1,419 | 1,411 | ||||||
6.000%, 08/01/2029 (C) | 393 | 391 | ||||||
4.875%, 02/01/2025 (A) | 2,015 | 2,016 | ||||||
|
|
| ||||||
| 14,686 | ||||||||
|
|
| ||||||
Pakistan — 0.2% | ||||||||
Pakistan Government International Bond | ||||||||
8.250%, 09/30/2025 | 1,000 | 1,080 | ||||||
8.250%, 09/30/2025 (A) | 714 | 771 | ||||||
7.875%, 03/31/2036 | 200 | 200 | ||||||
6.875%, 12/05/2027 (C) | 1,328 | 1,308 | ||||||
|
|
| ||||||
| 3,359 | ||||||||
|
|
| ||||||
Panama — 0.9% | ||||||||
Aeropuerto Internacional de Tocumen | ||||||||
6.000%, 11/18/2048 (A) | 413 | 521 | ||||||
Empresa de Transmision Electrica | ||||||||
5.125%, 05/02/2049 (A) | 635 | 730 | ||||||
60 |
SEI Institutional International Trust / Annual Report / September 30, 2019 |
| Description | Face Amount (Thousands) | Market Value ($ Thousands) | ||||||
GLOBAL BONDS (continued) | ||||||||
Panama Notas del Tesoro | ||||||||
3.750%, 04/17/2026 (A) | $ | 997 | $ | 1,052 | ||||
Republic of Panama | ||||||||
9.375%, 04/01/2029 | 1,004 | 1,541 | ||||||
8.125%, 04/28/2034 | 478 | 650 | ||||||
4.500%, 05/15/2047 | 764 | 907 | ||||||
3.870%, 07/23/2060 | 1,148 | 1,241 | ||||||
3.750%, 03/16/2025 | 2,240 | 2,369 | ||||||
3.160%, 01/23/2030 | 4,390 | 4,528 | ||||||
|
|
| ||||||
| 13,539 | ||||||||
|
|
| ||||||
Papua New Guinea — 0.2% | ||||||||
Papua New Guinea Government International Bond | ||||||||
8.375%, 10/04/2028 (A) | 2,203 | 2,330 | ||||||
8.375%, 10/04/2028 | 531 | 561 | ||||||
|
|
| ||||||
| 2,891 | ||||||||
|
|
| ||||||
Paraguay — 0.3% | ||||||||
Paraguay Government International Bond | ||||||||
6.100%, 08/11/2044 | 1,010 | 1,228 | ||||||
6.100%, 08/11/2044 (A) | 530 | 645 | ||||||
5.400%, 03/30/2050 | 367 | 416 | ||||||
5.400%, 03/30/2050 (A) | 240 | 272 | ||||||
5.000%, 04/15/2026 | 885 | 965 | ||||||
5.000%, 04/15/2026 | 595 | 648 | ||||||
|
|
| ||||||
| 4,174 | ||||||||
|
|
| ||||||
Peru — 2.6% | ||||||||
Abengoa Transmision Sur | ||||||||
6.875%, 04/30/2043 (A) | 269 | 333 | ||||||
Banco Internacional del Peru SAA Interbank | ||||||||
3.250%, 10/04/2026 (A) | 1,058 | 1,056 | ||||||
Fondo MIVIVIENDA | ||||||||
7.000%, 02/14/2024 (A) | PEN | 3,704 | 1,215 | |||||
Inkia Energy | ||||||||
5.875%, 11/09/2027 (A) | $ | 359 | 372 | |||||
Kallpa Generacion | ||||||||
4.125%, 08/16/2027 (A) | 723 | 748 | ||||||
Lima Metro Line 2 Finance | ||||||||
4.350%, 04/05/2036 (A) | 1,520 | 1,617 | ||||||
Peru LNG Srl | ||||||||
5.375%, 03/22/2030 (A) | 754 | 782 | ||||||
Peruvian Government International Bond | ||||||||
8.200%, 08/12/2026 | PEN | 963 | 361 | |||||
8.200%, 08/12/2026 | 8,208 | 3,078 | ||||||
8.200%, 08/12/2026 | 11,712 | 4,392 | ||||||
6.950%, 08/12/2031 | 2,240 | 807 | ||||||
6.950%, 08/12/2031 | 10,913 | 3,931 | ||||||
6.900%, 08/12/2037 | 2,480 | 896 | ||||||
6.850%, 02/12/2042 | 613 | 221 | ||||||
6.550%, 03/14/2037 | $ | 520 | 760 | |||||
6.350%, 08/12/2028 | PEN | 5,940 | 2,045 | |||||
6.350%, 08/12/2028 (A) | 1,465 | 504 | ||||||
| Description | Face Amount (Thousands) | Market Value ($ Thousands) | ||||||
GLOBAL BONDS (continued) | ||||||||
6.350%, 08/12/2028 | PEN | 1,570 | $ | 540 | ||||
6.350%, 08/12/2028 | 346 | 119 | ||||||
6.150%, 08/12/2032 | 13,992 | 4,734 | ||||||
5.940%, 02/12/2029 | 3,863 | 1,294 | ||||||
5.700%, 08/12/2024 (A) | 4,932 | 1,624 | ||||||
5.625%, 11/18/2050 (C) | $ | 823 | 1,206 | |||||
5.400%, 08/12/2034 (A) | PEN | 554 | 175 | |||||
4.125%, 08/25/2027 | $ | 607 | 678 | |||||
2.844%, 06/20/2030 | 2,843 | 2,907 | ||||||
Petroleos del Peru | ||||||||
5.625%, 06/19/2047 | 2,272 | 2,698 | ||||||
5.625%, 06/19/2047 (A)(C) | 366 | 435 | ||||||
4.750%, 06/19/2032 (A) | 1,201 | 1,317 | ||||||
4.750%, 06/19/2032 | 633 | 694 | ||||||
|
|
| ||||||
| 41,539 | ||||||||
|
|
| ||||||
Philippines — 0.4% | ||||||||
Philippine Government International Bond | ||||||||
4.000%, 01/15/2021 | 3,560 | 3,638 | ||||||
3.900%, 11/26/2022 | PHP | 45,000 | 867 | |||||
3.750%, 01/14/2029 | $ | 1,035 | 1,157 | |||||
|
|
| ||||||
| 5,662 | ||||||||
|
|
| ||||||
Poland — 2.3% | ||||||||
Republic of Poland Government Bond | ||||||||
5.000%, 03/23/2022 | 2,864 | 3,073 | ||||||
3.250%, 07/25/2025 | PLN | 11,310 | 3,038 | |||||
2.750%, 04/25/2028 | 18,202 | 4,820 | ||||||
2.750%, 10/25/2029 | 1,844 | 491 | ||||||
2.500%, 01/25/2023 | 41,804 | 10,717 | ||||||
2.500%, 04/25/2024 | 6,060 | 1,560 | ||||||
2.500%, 07/25/2026 | 19,771 | 5,110 | ||||||
2.500%, 07/25/2027 | 2,577 | 668 | ||||||
2.250%, 04/25/2022 | 13,055 | 3,309 | ||||||
2.000%, 04/25/2021 | 912 | 229 | ||||||
1.750%, 07/25/2021 | 5,000 | 1,252 | ||||||
1.556%, 07/25/2020 (D) | 10,140 | 2,503 | ||||||
|
|
| ||||||
| 36,770 | ||||||||
|
|
| ||||||
Qatar — 1.2% | ||||||||
Qatar Government International Bond | ||||||||
5.750%, 01/20/2042 (A) | $ | 574 | 793 | |||||
5.103%, 04/23/2048 (A) | 1,218 | 1,556 | ||||||
5.103%, 04/23/2048 | 2,005 | 2,561 | ||||||
4.817%, 03/14/2049 (A) | 2,725 | 3,371 | ||||||
4.817%, 03/14/2049 (C) | 4,636 | 5,735 | ||||||
4.500%, 04/23/2028 (A) | 1,799 | 2,050 | ||||||
4.000%, 03/14/2029 (A) | 3,331 | 3,689 | ||||||
|
|
| ||||||
| 19,755 | ||||||||
|
|
| ||||||
Romania — 1.3% | ||||||||
Romanian Government International Bond | ||||||||
5.800%, 07/26/2027 | RON | 2,680 | 684 | |||||
5.125%, 06/15/2048 (C) | $ | 1,410 | 1,630 | |||||
SEI Institutional International Trust / Annual Report / September 30, 2019 |
61 |
SCHEDULE OF INVESTMENTS
September 30, 2019
Emerging Markets Debt Fund(Continued)
| Description | Face Amount (Thousands) | Market Value ($ Thousands) | ||||||
GLOBAL BONDS (continued) | ||||||||
5.000%, 02/12/2029 | RON | 17,220 | $ | 4,205 | ||||
4.850%, 04/22/2026 | 20,495 | 4,949 | ||||||
4.500%, 06/17/2024 | 8,245 | 1,940 | ||||||
4.250%, 06/28/2023 | 2,730 | 639 | ||||||
4.000%, 10/27/2021 | 10,545 | 2,450 | ||||||
Romanian Government International Bond MTN | ||||||||
6.750%, 02/07/2022 | $ | 1,716 | 1,886 | |||||
4.625%, 04/03/2049 | EUR | 278 | 393 | |||||
4.125%, 03/11/2039 | 528 | 702 | ||||||
3.875%, 10/29/2035 | 140 | 183 | ||||||
3.375%, 02/08/2038 | 973 | 1,219 | ||||||
2.124%, 07/16/2031 | 418 | 473 | ||||||
|
|
| ||||||
| 21,353 | ||||||||
|
|
| ||||||
Russia — 6.4% | ||||||||
Gazprom OAO Via Gaz Capital | ||||||||
5.150%, 02/11/2026 (A) | $ | 2,673 | 2,909 | |||||
GTH Finance BV | ||||||||
6.250%, 04/26/2020 | 580 | 586 | ||||||
GTLK Europe Capital DAC | ||||||||
4.949%, 02/18/2026 | 968 | 971 | ||||||
GTLK Europe DAC | ||||||||
5.950%, 07/19/2021 | 470 | 488 | ||||||
Ritekro (G) | ||||||||
10.490%, 11/07/2022 (D) | 914 | 612 | ||||||
Rusal Capital DAC | ||||||||
5.125%, 02/02/2022 | 860 | 875 | ||||||
Russian Federal Bond - OFZ | ||||||||
8.500%, 09/17/2031 | RUB | 176,982 | 3,050 | |||||
8.150%, 02/03/2027 | 827,610 | 13,731 | ||||||
7.950%, 10/07/2026 | 688,722 | 11,295 | ||||||
7.750%, 09/16/2026 | 68,909 | 1,118 | ||||||
7.700%, 03/23/2033 (C) | 229,686 | 3,714 | ||||||
7.500%, 08/18/2021 | 21,285 | 334 | ||||||
7.250%, 05/10/2034 | 162,776 | 2,533 | ||||||
7.100%, 10/16/2024 | 124,175 | 1,945 | ||||||
7.050%, 01/19/2028 | 1,041,377 | 16,268 | ||||||
7.000%, 08/16/2023 | 402,085 | 6,284 | ||||||
6.900%, 05/23/2029 | 481,563 | 7,422 | ||||||
Russian Foreign Bond - Eurobond | ||||||||
7.500%, 03/31/2030 | $ | 2 | 3 | |||||
5.875%, 09/16/2043 (C) | 2,200 | 2,794 | ||||||
5.625%, 04/04/2042 | 800 | 985 | ||||||
5.250%, 06/23/2047 (C) | 3,400 | 4,037 | ||||||
5.100%, 03/28/2035 (A) | 7,000 | 7,910 | ||||||
5.100%, 03/28/2035 | 600 | 679 | ||||||
4.750%, 05/27/2026 | 3,400 | 3,712 | ||||||
4.375%, 03/21/2029 | 4,000 | 4,278 | ||||||
4.250%, 06/23/2027 | 800 | 851 | ||||||
SCF Capital Designated Activity | ||||||||
5.375%, 06/16/2023 (A) | 729 | 770 | ||||||
| Description | Face Amount (Thousands) | Market Value ($ Thousands) | ||||||
GLOBAL BONDS (continued) | ||||||||
Vnesheconombank Via VEB Finance | ||||||||
6.902%, 07/09/2020 | $ | 1,310 | $ | 1,349 | ||||
6.800%, 11/22/2025 | 580 | 671 | ||||||
6.800%, 11/22/2025 (A) | 150 | 174 | ||||||
|
|
| ||||||
| 102,348 | ||||||||
|
|
| ||||||
Saudi Arabia — 1.3% | ||||||||
Acwa Power Management And Investments One | ||||||||
5.950%, 12/15/2039 (A) | 2,864 | 3,106 | ||||||
Saudi Arabian Oil MTN | ||||||||
4.250%, 04/16/2039 | 1,530 | 1,650 | ||||||
4.250%, 04/16/2039 (A) | 7,519 | 8,106 | ||||||
3.500%, 04/16/2029 (A) | 930 | 970 | ||||||
2.875%, 04/16/2024 | 1,645 | 1,663 | ||||||
Saudi Government International Bond MTN | ||||||||
5.000%, 04/17/2049 (A) | 1,360 | 1,636 | ||||||
5.000%, 04/17/2049 | 1,003 | 1,206 | ||||||
4.625%, 10/04/2047 | 1,041 | 1,182 | ||||||
4.625%, 10/04/2047 (A) | 423 | 480 | ||||||
4.500%, 10/26/2046 | 822 | 917 | ||||||
|
|
| ||||||
| 20,916 | ||||||||
|
|
| ||||||
Senegal — 0.2% | ||||||||
Senegal Government International Bond | ||||||||
6.250%, 07/30/2024 (C) | 877 | 951 | ||||||
6.250%, 05/23/2033 | 740 | 745 | ||||||
6.250%, 05/23/2033 (A) | 151 | 152 | ||||||
4.750%, 03/13/2028 | EUR | 1,135 | 1,284 | |||||
|
|
| ||||||
| 3,132 | ||||||||
|
|
| ||||||
Serbia — 0.9% | ||||||||
Republic of Serbia | ||||||||
7.250%, 09/28/2021 | $ | 2,697 | 2,946 | |||||
7.250%, 09/28/2021 (A) | 200 | 219 | ||||||
Serbia International Bond | ||||||||
1.500%, 06/26/2029 | EUR | 2,176 | 2,468 | |||||
Serbia Treasury Bonds | ||||||||
5.875%, 02/08/2028 | RSD | 354,740 | 3,857 | |||||
4.500%, 01/11/2026 | 211,800 | 2,086 | ||||||
3.750%, 01/17/2022 | 350,070 | 3,360 | ||||||
|
|
| ||||||
| 14,936 | ||||||||
|
|
| ||||||
South Africa — 4.5% | ||||||||
Eskom Holdings SOC | ||||||||
7.125%, 02/11/2025 (A) | $ | 2,085 | 2,146 | |||||
7.125%, 02/11/2025 | 1,430 | 1,472 | ||||||
5.750%, 01/26/2021 | 665 | 670 | ||||||
Eskom Holdings SOC MTN | ||||||||
8.450%, 08/10/2028 (A) | 178 | 196 | ||||||
7.500%, 09/15/2033 | ZAR | 35,200 | 1,772 | |||||
6.750%, 08/06/2023 | $ | 1,556 | 1,598 | |||||
6.750%, 08/06/2023 (A) | 388 | 398 | ||||||
6.350%, 08/10/2028 (A)(C) | 322 | 344 | ||||||
62 |
SEI Institutional International Trust / Annual Report / September 30, 2019 |
| Description | Face Amount (Thousands) | Market Value ($ Thousands) | ||||||
GLOBAL BONDS (continued) | ||||||||
Republic of South Africa | ||||||||
10.500%, 12/21/2026 | ZAR | 248,183 | $ | 18,264 | ||||
9.000%, 01/31/2040 | 119,298 | 7,262 | ||||||
8.875%, 02/28/2035 | 74,378 | 4,616 | ||||||
8.750%, 01/31/2044 | 52,605 | 3,090 | ||||||
8.750%, 02/28/2048 | 43,401 | 2,532 | ||||||
8.500%, 01/31/2037 | 47,889 | 2,832 | ||||||
8.250%, 03/31/2032 | 57,695 | 3,506 | ||||||
7.000%, 02/28/2031 | 51,041 | 2,848 | ||||||
6.500%, 02/28/2041 | 6,319 | 293 | ||||||
6.300%, 06/22/2048 (C) | $ | 964 | 1,041 | |||||
6.250%, 03/31/2036 | ZAR | 68,414 | 3,267 | |||||
5.875%, 09/16/2025 | $ | 2,364 | 2,575 | |||||
5.875%, 06/22/2030 | 1,402 | 1,497 | ||||||
5.750%, 09/30/2049 | 3,964 | 3,944 | ||||||
5.650%, 09/27/2047 | 386 | 385 | ||||||
5.000%, 10/12/2046 | 357 | 334 | ||||||
4.875%, 04/14/2026 | 568 | 586 | ||||||
4.850%, 09/27/2027 | 820 | 838 | ||||||
4.850%, 09/30/2029 | 2,666 | 2,656 | ||||||
SASOL Financing USA | ||||||||
5.875%, 03/27/2024 | 442 | 477 | ||||||
Transnet SOC MTN | ||||||||
9.500%, 05/13/2021 (A) | ZAR | 6,760 | 452 | |||||
|
|
| ||||||
| 71,891 | ||||||||
|
|
| ||||||
South Korea — 0.3% | ||||||||
Export-Import Bank of Korea MTN | ||||||||
8.400%, 11/30/2021 | IDR | 22,400,000 | 1,605 | |||||
7.250%, 12/07/2024 | 700,000 | 50 | ||||||
Korea International Bond | ||||||||
2.500%, 06/19/2029 | $ | 1,469 | 1,500 | |||||
2.000%, 06/19/2024 | 1,024 | 1,027 | ||||||
|
|
| ||||||
| 4,182 | ||||||||
|
|
| ||||||
Spain — 0.1% | ||||||||
AI Candelaria Spain SLU | ||||||||
7.500%, 12/15/2028 (A)(C) | 1,269 | 1,442 | ||||||
|
|
| ||||||
Sri Lanka — 1.3% | ||||||||
Sri Lanka Government International Bond | ||||||||
7.850%, 03/14/2029 | 1,598 | 1,606 | ||||||
7.850%, 03/14/2029 (A) | 408 | 410 | ||||||
7.550%, 03/28/2030 | 405 | 399 | ||||||
6.850%, 03/14/2024 | 1,212 | 1,239 | ||||||
6.850%, 11/03/2025 | 1,339 | 1,342 | ||||||
6.825%, 07/18/2026 (A) | 1,584 | 1,566 | ||||||
6.825%, 07/18/2026 | 500 | 494 | ||||||
6.750%, 04/18/2028 | 1,017 | 970 | ||||||
6.750%, 04/18/2028 (A) | 5,224 | 4,981 | ||||||
6.350%, 06/28/2024 (A) | 1,294 | 1,293 | ||||||
6.250%, 07/27/2021 | 1,834 | 1,862 | ||||||
6.200%, 05/11/2027 | 1,080 | 1,007 | ||||||
| Description | Face Amount (Thousands) | Market Value ($ Thousands) | ||||||
GLOBAL BONDS (continued) | ||||||||
5.875%, 07/25/2022 (A) | $ | 960 | $ | 962 | ||||
5.750%, 04/18/2023 (A) | 2,108 | 2,092 | ||||||
5.750%, 04/18/2023 | 1,252 | 1,243 | ||||||
|
|
| ||||||
| 21,466 | ||||||||
|
|
| ||||||
Supranational — 0.4% | ||||||||
African Export-Import Bank MTN | ||||||||
3.994%, 09/21/2029 (A) | 363 | 363 | ||||||
Banque Ouest Africaine de Developpement | ||||||||
5.000%, 07/27/2027 (A) | 865 | 919 | ||||||
European Bank for Reconstruction & Development MTN | ||||||||
9.250%, 12/02/2020 | IDR | 9,210,000 | 665 | |||||
European Investment Bank MTN | ||||||||
8.500%, 09/17/2024 | ZAR | 9,200 | 640 | |||||
Inter-American Development Bank MTN | ||||||||
7.875%, 03/14/2023 | IDR | 50,880,000 | 3,711 | |||||
International Bank for Reconstruction & Development MTN | ||||||||
7.450%, 08/20/2021 | 10,914,700 | 776 | ||||||
|
|
| ||||||
| 7,074 | ||||||||
|
|
| ||||||
Suriname — 0.0% | ||||||||
Suriname Government International Bond | ||||||||
9.250%, 10/26/2026 | $ | 361 | 322 | |||||
|
|
| ||||||
Thailand — 3.0% | ||||||||
Thailand Government Bond | ||||||||
5.670%, 03/13/2028 | THB | 3,000 | 131 | |||||
4.875%, 06/22/2029 | 22,000 | 939 | ||||||
3.775%, 06/25/2032 | 267,434 | 10,984 | ||||||
3.650%, 06/20/2031 | 84,500 | 3,394 | ||||||
3.625%, 06/16/2023 | 55,000 | 1,942 | ||||||
3.400%, 06/17/2036 | 234,056 | 9,769 | ||||||
3.300%, 06/17/2038 | 30,930 | 1,297 | ||||||
2.875%, 12/17/2028 | 332,842 | 12,158 | ||||||
2.875%, 06/17/2046 | 3,431 | 140 | ||||||
2.550%, 06/26/2020 | 5,000 | 165 | ||||||
2.400%, 12/17/2023 | 88,000 | 2,994 | ||||||
2.125%, 12/17/2026 | 52,817 | 1,805 | ||||||
1.875%, 06/17/2022 | 57,000 | 1,888 | ||||||
|
|
| ||||||
| 47,606 | ||||||||
|
|
| ||||||
Tunisia — 0.2% | ||||||||
Banque Centrale de Tunisie International Bond | ||||||||
6.375%, 07/15/2026 | EUR | 472 | 497 | |||||
5.750%, 01/30/2025 (C) | $ | 646 | 578 | |||||
5.625%, 02/17/2024 | EUR | 1,650 | 1,743 | |||||
|
|
| ||||||
| 2,818 | ||||||||
|
|
| ||||||
Turkey — 3.9% | ||||||||
Export Credit Bank of Turkey | ||||||||
8.250%, 01/24/2024 (A) | $ | 423 | 447 | |||||
SEI Institutional International Trust / Annual Report / September 30, 2019 |
63 |
SCHEDULE OF INVESTMENTS
September 30, 2019
Emerging Markets Debt Fund(Continued)
| Description | Face Amount (Thousands) | Market Value ($ Thousands) | ||||||
GLOBAL BONDS (continued) | ||||||||
6.125%, 05/03/2024 (A) | $ | 547 | $ | 533 | ||||
5.375%, 10/24/2023 (A) | 1,033 | 993 | ||||||
5.000%, 09/23/2021 (A) | 538 | 533 | ||||||
Export Credit Bank of Turkey MTN | ||||||||
5.375%, 02/08/2021 (A) | 896 | 893 | ||||||
Hazine Mustesarligi Varlik Kiralama | ||||||||
5.800%, 02/21/2022 (A) | 2,770 | 2,824 | ||||||
QNB Finansbank | ||||||||
6.875%, 09/07/2024 (A) | 613 | 636 | ||||||
TC Ziraat Bankasi MTN | ||||||||
5.125%, 05/03/2022 (A) | 1,063 | 1,031 | ||||||
5.125%, 09/29/2023 (A)(C) | 655 | 614 | ||||||
4.750%, 04/29/2021 (A) | 561 | 556 | ||||||
Turkey Government International Bond | ||||||||
16.200%, 06/14/2023 | TRY | 20,814 | 3,999 | |||||
12.200%, 01/18/2023 | 22,055 | 3,800 | ||||||
11.000%, 03/02/2022 | 34,649 | 5,866 | ||||||
10.700%, 02/17/2021 | 6,560 | 1,124 | ||||||
10.700%, 08/17/2022 | 21,356 | 3,527 | ||||||
9.500%, 01/12/2022 | 13,693 | 2,239 | ||||||
9.200%, 09/22/2021 | 9,387 | 1,547 | ||||||
8.500%, 09/14/2022 | 3,864 | 608 | ||||||
7.625%, 04/26/2029 | $ | 260 | 276 | |||||
7.375%, 02/05/2025 | 655 | 696 | ||||||
7.250%, 12/23/2023 | 2,322 | 2,455 | ||||||
7.100%, 03/08/2023 | TRY | 37,884 | 5,559 | |||||
6.875%, 03/17/2036 | $ | 1,117 | 1,112 | |||||
6.350%, 08/10/2024 | 1,800 | 1,832 | ||||||
6.125%, 10/24/2028 | 1,712 | 1,671 | ||||||
6.000%, 03/25/2027 | 252 | 247 | ||||||
6.000%, 01/14/2041 | 918 | 822 | ||||||
5.750%, 03/22/2024 | 683 | 680 | ||||||
5.750%, 05/11/2047 | 2,447 | 2,132 | ||||||
5.200%, 02/16/2026 | EUR | 1,502 | 1,703 | |||||
5.125%, 02/17/2028 | $ | 6,296 | 5,818 | |||||
4.875%, 10/09/2026 | 1,587 | 1,468 | ||||||
4.250%, 04/14/2026 | 338 | 305 | ||||||
3.000%, 08/02/2023 | TRY | 10,068 | 1,742 | |||||
Turkiye Garanti Bankasi | ||||||||
6.125%, VAR USD Swap Semi 30/360 5 Yr Curr+4.220%, 05/24/2027 (A) | $ | 1,170 | 1,048 | |||||
Turkiye Sise ve Cam Fabrikalari | ||||||||
6.950%, 03/14/2026 | 500 | 514 | ||||||
Yapi ve Kredi Bankasi MTN | ||||||||
5.850%, 06/21/2024 (A)(C) | 429 | 407 | ||||||
|
|
| ||||||
| 62,257 | ||||||||
|
|
| ||||||
Ukraine — 2.6% | ||||||||
MHP Lux | ||||||||
6.250%, 09/19/2029 (A) | 1,542 | 1,487 | ||||||
NAK Naftogaz Ukraine via Kondor Finance | ||||||||
7.125%, 07/19/2024 | EUR | 500 | 572 | |||||
| Description | Face Amount (Thousands) | Market Value ($ Thousands) | ||||||
GLOBAL BONDS (continued) | ||||||||
Ukraine Government International Bond | ||||||||
17.000%, 05/11/2022 | UAH | 71,848 | $ | 3,036 | ||||
16.000%, 08/11/2021 | 148,624 | 6,134 | ||||||
15.840%, 02/26/2025 | 66,553 | 2,831 | ||||||
15.700%, 01/20/2021 (A) | 48,000 | 1,920 | ||||||
9.750%, 11/01/2028 | $ | 4,396 | 5,034 | |||||
8.994%, 02/01/2024 (A) | 155 | 170 | ||||||
8.994%, 02/01/2024 | 1,487 | 1,630 | ||||||
7.750%, 09/01/2020 | 656 | 671 | ||||||
7.750%, 09/01/2021 | 316 | 329 | ||||||
7.750%, 09/01/2022 | 830 | 871 | ||||||
7.750%, 09/01/2025 (A) | 1,661 | 1,742 | ||||||
7.750%, 09/01/2026 | 5,121 | 5,340 | ||||||
7.750%, 09/01/2026 (A) | 249 | 260 | ||||||
7.750%, 09/01/2027 (A) | 866 | 901 | ||||||
7.750%, 09/01/2027 | 1,424 | 1,481 | ||||||
7.375%, 09/25/2032 (A) | 270 | 271 | ||||||
7.375%, 09/25/2032 | 2,189 | 2,198 | ||||||
6.750%, 06/20/2026 | EUR | 1,122 | 1,317 | |||||
6.750%, 06/20/2026 (A) | 547 | 642 | ||||||
3.254%, 05/31/2040 (A)(E) | $ | 2,206 | 2,058 | |||||
Ukreximbank Via Biz Finance | ||||||||
9.625%, 04/27/2022 (A) | 856 | 891 | ||||||
|
|
| ||||||
| 41,786 | ||||||||
|
|
| ||||||
United Arab Emirates — 1.4% | ||||||||
Abu Dhabi Crude Oil Pipeline | ||||||||
4.600%, 11/02/2047 (A) | 5,448 | 6,349 | ||||||
4.600%, 11/02/2047 | 330 | 385 | ||||||
3.650%, 11/02/2029 (A) | 1,574 | 1,706 | ||||||
Abu Dhabi Government International Bond | ||||||||
3.125%, 09/30/2049 (A) | 2,034 | 1,970 | ||||||
3.125%, 09/30/2049 | 1,063 | 1,030 | ||||||
2.500%, 09/30/2029 (A) | 4,067 | 4,038 | ||||||
2.125%, 09/30/2024 (A) | 3,292 | 3,272 | ||||||
Emirate of Dubai Government International Bonds MTN | ||||||||
5.250%, 01/30/2043 | 490 | 567 | ||||||
MDC-GMTN BV MTN | ||||||||
4.500%, 11/07/2028 | 1,225 | 1,410 | ||||||
4.500%, 11/07/2028 (A) | 772 | 889 | ||||||
Sharjah Sukuk Program MTN | ||||||||
3.854%, 04/03/2026 | 359 | 379 | ||||||
|
|
| ||||||
| 21,995 | ||||||||
|
|
| ||||||
United Kingdom — 0.3% | ||||||||
Standard Chartered Bank MTN | ||||||||
8.375%, 10/18/2039 (A) | IDR | 20,797,000 | 1,542 | |||||
8.250%, 05/17/2029 (A) | 40,930,000 | 3,078 | ||||||
|
|
| ||||||
| 4,620 | ||||||||
|
|
| ||||||
Uruguay — 0.6% | ||||||||
Uruguay Government International Bond | ||||||||
4.375%, 10/27/2027 (C) | $ | 2,904 | 3,187 | |||||
64 |
SEI Institutional International Trust / Annual Report / September 30, 2019 |
| Description | Face Amount (Thousands) | Market Value ($ Thousands) | ||||||
GLOBAL BONDS (continued) | ||||||||
4.375%, 01/23/2031 | $ | 4,754 | $ | 5,246 | ||||
4.125%, 11/20/2045 (C) | 346 | 370 | ||||||
|
|
| ||||||
| 8,803 | ||||||||
|
|
| ||||||
Uzbekistan — 0.1% | ||||||||
Republic of Uzbekistan Bond MTN | ||||||||
5.375%, 02/20/2029 | 1,233 | 1,353 | ||||||
4.750%, 02/20/2024 | 632 | 662 | ||||||
|
|
| ||||||
| 2,015 | ||||||||
|
|
| ||||||
Venezuela — 0.3% | ||||||||
Petroleos de Venezuela | ||||||||
9.750%, 05/17/2035 (H) | 1,000 | 80 | ||||||
9.000%, 11/17/2021 (C)(H) | 4,300 | 344 | ||||||
6.000%, 05/16/2024 (B)(H) | 10,192 | 816 | ||||||
6.000%, 05/16/2024 (H) | 7,785 | 623 | ||||||
6.000%, 11/15/2026 (B)(H) | 13,215 | 1,057 | ||||||
5.500%, 04/12/2037 (H) | 1,740 | 139 | ||||||
5.375%, 04/12/2027 (H) | 4,563 | 365 | ||||||
Venezuela Government International Bond | ||||||||
9.250%, 09/15/2027 (H) | 2,300 | 247 | ||||||
9.250%, 05/07/2028 (H) | 2,941 | 316 | ||||||
8.250%, 10/13/2024 (H) | 3,304 | 355 | ||||||
7.750%, 10/13/2019 (H) | 3,976 | 428 | ||||||
|
|
| ||||||
| 4,770 | ||||||||
|
|
| ||||||
Vietnam — 0.0% | ||||||||
Mong Duong Finance Holdings BV | ||||||||
5.125%, 05/07/2029 (A) | 692 | 705 | ||||||
|
|
| ||||||
Zambia — 0.2% | ||||||||
Zambia Government International Bond | ||||||||
8.500%, 04/14/2024 (A) | 1,901 | 1,351 | ||||||
5.375%, 09/20/2022 (C) | 1,695 | 1,183 | ||||||
5.375%, 09/20/2022 (A) | 794 | 554 | ||||||
|
|
| ||||||
| 3,088 | ||||||||
|
|
| ||||||
Total Global Bonds (Cost $1,544,903) ($ Thousands) | 1,526,080 | |||||||
|
|
| ||||||
| Shares | ||||||||
AFFILIATED PARTNERSHIP — 5.5% |
| |||||||
SEI Liquidity Fund, L.P. | ||||||||
2.010% **†(I) | 87,230,149 | 87,228 | ||||||
|
|
| ||||||
Total Affiliated Partnership (Cost $87,230) ($ Thousands) | 87,228 | |||||||
|
|
| ||||||
Total Investments in Securities — 101.1% |
| $ | 1,613,308 | |||||
|
|
| ||||||
| Description | Contracts | Market Value ($ Thousands) | ||||||
PURCHASED OPTION*(J) — 0.0% | ||||||||
Total Purchased Option | 26,834,317 | $ | 126 | |||||
|
|
| ||||||
SEI Institutional International Trust / Annual Report / September 30, 2019 |
65 |
SCHEDULE OF INVESTMENTS
September 30, 2019
Emerging Markets Debt Fund(Continued)
A list of the open option contracts held by the Fund at September 30, 2019, is as follows:
| Description | Number of Contracts | Notional Amount (Thousands)^ | Exercise Price | Expiration Date | Value (Thousands) | |||||||||||||||
PURCHASED OPTION — 0.0% | ||||||||||||||||||||
Call Options | ||||||||||||||||||||
September 2020, USD Call HKD Put* | 26,834,317 | $ | 279 | $7.85 | 09/19/20 | $ | 126 | |||||||||||||
|
|
|
| |||||||||||||||||
Total Purchased Option | $ | 279 | $ | 126 | ||||||||||||||||
|
|
|
| |||||||||||||||||
^Represents cost.
A list of the open futures contracts held by the Fund at September 30, 2019, is as follows:
| Type of Contract | Number of Contracts Long (Short) | Expiration Date | Notional Amount (Thousands) | Value (Thousands) | Unrealized Appreciation/ (Depreciation) (Thousands) | |||||||||||||||
Euro-Bund | (146) | Dec-2019 | $ | (28,193 | ) | $ | (27,735 | ) | $ | 270 | ||||||||||
Euro-Buxl 30 Year Bond | (11) | Dec-2019 | (2,695 | ) | (2,608 | ) | 73 | |||||||||||||
Korea 3-Year Bond | 97 | Dec-2019 | 8,987 | 8,988 | 2 | |||||||||||||||
R023 Bond Future | 578 | Nov-2019 | 4,308 | 3,909 | (28 | ) | ||||||||||||||
R186 Bond Future | 470 | Nov-2019 | 3,721 | 3,580 | (23 | ) | ||||||||||||||
R2032 Bond Future | 502 | Nov-2019 | 3,436 | 3,074 | (70 | ) | ||||||||||||||
R2035 Bond Future | 581 | Nov-2019 | 4,098 | 3,667 | (84 | ) | ||||||||||||||
R2037 Bond Future | 418 | Nov-2019 | 2,833 | 2,532 | (60 | ) | ||||||||||||||
R2040 Bond Future | 950 | Nov-2019 | 6,627 | 5,928 | (134 | ) | ||||||||||||||
R208 Bond Future | 114 | Nov-2019 | 838 | 759 | (7 | ) | ||||||||||||||
R213 Bond Future | 807 | Nov-2019 | 5,112 | 4,574 | (103 | ) | ||||||||||||||
R214 Bond Future | 255 | Nov-2019 | 1,341 | 1,200 | (27 | ) | ||||||||||||||
U.S. 10-Year Treasury Note | 157 | Dec-2019 | 20,621 | 20,459 | (162 | ) | ||||||||||||||
U.S. Ultra Long Treasury Bond | 40 | Dec-2019 | 7,946 | 7,676 | (270 | ) | ||||||||||||||
|
|
|
|
|
|
|
|
| ||||||||||||
| $ | 38,980 | $ | 36,003 | $ | (623 | ) | ||||||||||||||
|
|
|
|
|
|
|
|
| ||||||||||||
A list of the open forward foreign currency contracts held by the Fund at September 30, 2019, is as follows:
| Counterparty | Settlement Date | Currency to Deliver (Thousands) | Currency to Receive (Thousands) | Unrealized Appreciation (Depreciation) (Thousands) | ||||||||||||||
Barclays PLC | 12/18/19 | USD | 6,092 | ZAR | 90,784 | $ | (164 | ) | ||||||||||
Barclays PLC | 12/18/19 | USD | 7,622 | COP | 25,731,833 | (241 | ) | |||||||||||
Barclays PLC | 12/18/19 | USD | 7,836 | PLN | 30,874 | (124 | ) | |||||||||||
Barclays PLC | 12/18/19 | TWD | 322,719 | USD | 10,531 | 72 | ||||||||||||
Citigroup | 10/03/19 - 12/18/19 | USD | 5,036 | TRY | 29,455 | 93 | ||||||||||||
Citigroup | 10/03/19 - 12/18/19 | USD | 25,610 | EUR | 23,012 | (498 | ) | |||||||||||
Citigroup | 10/04/19 - 12/18/19 | KRW | 23,315,758 | USD | 19,458 | (38 | ) | |||||||||||
Citigroup | 10/07/19 | EUR | 959 | HUF | 311,123 | (33 | ) | |||||||||||
Citigroup | 10/07/19 | HUF | 302,753 | EUR | 906 | 2 | ||||||||||||
Citigroup | 10/09/19 | USD | 183 | GHS | 1,077 | 16 | ||||||||||||
Citigroup | 10/09/19 | USD | 1,270 | ARS | 61,256 | (233 | ) | |||||||||||
Citigroup | 11/04/19 - 12/03/19 | USD | 574 | BRL | 2,400 | 1 | ||||||||||||
Citigroup | 10/09/19 - 12/20/19 | USD | 8,449 | BRL | 34,005 | (300 | ) | |||||||||||
Citigroup | 10/15/19 - 12/18/19 | USD | 12,805 | CNY | 90,711 | (96 | ) | |||||||||||
Citigroup | 10/15/19 | PHP | 128,924 | USD | 2,466 | (22 | ) | |||||||||||
Citigroup | 10/16/19 - 12/09/19 | TRY | 21,360 | USD | 3,667 | (84 | ) | |||||||||||
Citigroup | 10/17/19 - 12/03/19 | BRL | 19,523 | USD | 4,997 | 317 | ||||||||||||
Citigroup | 10/18/19 | USD | 511 | CNH | 3,586 | (9 | ) | |||||||||||
66 |
SEI Institutional International Trust / Annual Report / September 30, 2019 |
| Counterparty | Settlement Date | Currency to Deliver (Thousands) | Currency to Receive (Thousands) | Unrealized Appreciation (Depreciation) (Thousands) | ||||||||||||||
Citigroup | 10/18/19 | CNH | 1,387 | USD | 206 | $ | 12 | |||||||||||
Citigroup | 10/22/19 | USD | 2,529 | ILS | 8,890 | 33 | ||||||||||||
Citigroup | 10/22/19 | ILS | 3,309 | USD | 937 | (17 | ) | |||||||||||
Citigroup | 11/01/19 - 12/20/19 | USD | 7,489 | MXN | 148,303 | (66 | ) | |||||||||||
Citigroup | 11/01/19 | MXN | 19,254 | USD | 989 | 19 | ||||||||||||
Citigroup | 11/01/19 | MXN | 41,576 | USD | 2,090 | (5 | ) | |||||||||||
Citigroup | 11/07/19 | EUR | 1,639 | PLN | 7,103 | (18 | ) | |||||||||||
Citigroup | 11/07/19 | PLN | 10,642 | EUR | 2,466 | 40 | ||||||||||||
Citigroup | 11/07/19 | PLN | 5,450 | EUR | 1,239 | (6 | ) | |||||||||||
Citigroup | 12/04/19 - 12/18/19 | USD | 7,382 | RUB | 489,205 | 85 | ||||||||||||
Citigroup | 12/17/19 - 12/18/19 | COP | 25,436,507 | USD | 7,369 | 73 | ||||||||||||
Citigroup | 12/18/19 | USD | 281 | TWD | 8,670 | — | ||||||||||||
Citigroup | 12/18/19 | USD | 901 | THB | 27,525 | 1 | ||||||||||||
Citigroup | 12/18/19 | USD | 1,178 | CZK | 27,613 | (9 | ) | |||||||||||
Citigroup | 12/18/19 | PLN | 3,698 | USD | 937 | 14 | ||||||||||||
Citigroup | 12/18/19 | PEN | 4,249 | USD | 1,281 | 28 | ||||||||||||
Citigroup | 12/18/19 | USD | 6,253 | COP | 21,053,318 | (214 | ) | |||||||||||
Citigroup | 12/18/19 | EUR | 7,918 | USD | 8,817 | 133 | ||||||||||||
Citigroup | 12/18/19 | THB | 11,760 | USD | 385 | — | ||||||||||||
Citigroup | 12/18/19 | USD | 13,449 | CLP | 9,646,171 | (174 | ) | |||||||||||
Citigroup | 12/18/19 | SGD | 14,215 | USD | 10,318 | 28 | ||||||||||||
Citigroup | 12/18/19 | RUB | 35,202 | USD | 541 | 4 | ||||||||||||
Citigroup | 12/19/19 - 02/03/20 | USD | 3,415 | NGN | 1,302,291 | 139 | ||||||||||||
Citigroup | 12/19/19 | NGN | 1,520,033 | USD | 3,923 | (243 | ) | |||||||||||
Citigroup | 12/20/19 | USD | 1,629 | KRW | 1,936,719 | (10 | ) | |||||||||||
Citigroup | 01/15/20 - 02/19/20 | UGX | 23,216,948 | USD | 6,026 | (152 | ) | |||||||||||
Citigroup | 03/23/20 | EGP | 24,000 | USD | 1,394 | (13 | ) | |||||||||||
Goldman Sachs | 10/03/19 | EUR | 1,144 | USD | 1,271 | 23 | ||||||||||||
Goldman Sachs | 10/03/19 - 12/18/19 | USD | 4,018 | EUR | 3,616 | (59 | ) | |||||||||||
Goldman Sachs | 10/03/19 - 10/16/19 | USD | 8,569 | TRY | 48,869 | 73 | ||||||||||||
Goldman Sachs | 10/03/19 | ARS | 32,960 | USD | 494 | (76 | ) | |||||||||||
Goldman Sachs | 10/04/19 | PHP | 137,781 | USD | 2,633 | (25 | ) | |||||||||||
Goldman Sachs | 10/07/19 | EUR | 2,236 | HUF | 741,393 | (25 | ) | |||||||||||
Goldman Sachs | 10/07/19 | HUF | 1,752,469 | EUR | 5,339 | 117 | ||||||||||||
Goldman Sachs | 10/09/19 | SGD | 3,754 | USD | 2,714 | (1 | ) | |||||||||||
Goldman Sachs | 10/15/19 - 12/18/19 | USD | 11,968 | PHP | 624,998 | 66 | ||||||||||||
Goldman Sachs | 10/16/19 - 11/04/19 | USD | 7,712 | THB | 236,899 | 37 | ||||||||||||
Goldman Sachs | 10/16/19 | USD | 2,680 | THB | 81,309 | (21 | ) | |||||||||||
Goldman Sachs | 10/16/19 | THB | 127,744 | USD | 4,179 | 1 | ||||||||||||
Goldman Sachs | 10/16/19 | THB | 16,966 | USD | 554 | (1 | ) | |||||||||||
Goldman Sachs | 10/18/19 | USD | 2,742 | CNH | 19,055 | (74 | ) | |||||||||||
Goldman Sachs | 10/21/19 | USD | 2,786 | ZAR | 42,868 | 34 | ||||||||||||
Goldman Sachs | 11/06/19 | USD | 506 | ZAR | 7,704 | — | ||||||||||||
Goldman Sachs | 10/21/19 - 12/03/19 | BRL | 26,504 | USD | 6,409 | 56 | ||||||||||||
Goldman Sachs | 12/03/19 | BRL | 36,704 | USD | 8,749 | (31 | ) | |||||||||||
Goldman Sachs | 11/06/19 | ZAR | 35,650 | USD | 2,403 | 62 | ||||||||||||
Goldman Sachs | 10/21/19 | ZAR | 42,868 | USD | 2,786 | (34 | ) | |||||||||||
Goldman Sachs | 10/22/19 | ILS | 5,582 | USD | 1,587 | (21 | ) | |||||||||||
Goldman Sachs | 10/24/19 | IDR | 36,114,136 | USD | 2,537 | (3 | ) | |||||||||||
Goldman Sachs | 11/01/19 - 12/18/19 | MXN | 57,649 | USD | 2,917 | 13 | ||||||||||||
SEI Institutional International Trust / Annual Report / September 30, 2019 |
67 |
SCHEDULE OF INVESTMENTS
September 30, 2019
Emerging Markets Debt Fund(Continued)
| Counterparty | Settlement Date | Currency to Deliver (Thousands) | Currency to Receive (Thousands) | Unrealized Appreciation (Depreciation) (Thousands) | ||||||||||||||
Goldman Sachs | 12/03/19 | USD | 3,097 | BRL | 12,981 | $ | 8 | |||||||||||
Goldman Sachs | 11/04/19 | USD | 996 | BRL | 4,103 | (13 | ) | |||||||||||
Goldman Sachs | 11/07/19 | EUR | 2,273 | PLN | 9,965 | 3 | ||||||||||||
Goldman Sachs | 11/07/19 | PLN | 20,555 | EUR | 4,741 | 52 | ||||||||||||
Goldman Sachs | 11/20/19 | USD | 4,062 | NGN | 1,531,242 | 152 | ||||||||||||
Goldman Sachs | 11/20/19 | NGN | 509,517 | USD | 1,280 | (122 | ) | |||||||||||
Goldman Sachs | 11/27/19 | MYR | 2,437 | USD | 582 | — | ||||||||||||
Goldman Sachs | 12/04/19 | RUB | 163,265 | USD | 2,516 | 20 | ||||||||||||
Goldman Sachs | 12/06/19 | USD | 1,336 | KZT | 525,000 | 1 | ||||||||||||
Goldman Sachs | 12/09/19 - 12/18/19 | TRY | 59,157 | USD | 9,571 | (668 | ) | |||||||||||
Goldman Sachs | 12/17/19 | EUR | 4,380 | RON | 20,920 | 2 | ||||||||||||
Goldman Sachs | 12/18/19 | USD | 1,583 | MXN | 31,290 | (17 | ) | |||||||||||
Goldman Sachs | 12/18/19 | PEN | 2,361 | USD | 708 | 11 | ||||||||||||
Goldman Sachs | 12/18/19 | PEN | 3,349 | USD | 981 | (6 | ) | |||||||||||
Goldman Sachs | 12/18/19 | PLN | 25,267 | USD | 6,442 | 130 | ||||||||||||
Goldman Sachs | 04/02/20 | RON | 11,059 | EUR | 2,290 | (3 | ) | |||||||||||
JPMorgan Chase Bank | 10/03/19 - 10/04/19 | USD | 987 | ARS | 64,291 | 124 | ||||||||||||
JPMorgan Chase Bank | 11/06/19 | USD | 846 | BRL | 3,550 | 4 | ||||||||||||
JPMorgan Chase Bank | 10/03/19 | USD | 853 | BRL | 3,550 | (1 | ) | |||||||||||
JPMorgan Chase Bank | 10/03/19 | USD | 1,594 | ZAR | 24,610 | 29 | ||||||||||||
JPMorgan Chase Bank | 12/17/19 | USD | 1,615 | ZAR | 24,610 | (7 | ) | |||||||||||
JPMorgan Chase Bank | 10/03/19 | EUR | 3,644 | USD | 4,022 | 49 | ||||||||||||
JPMorgan Chase Bank | 10/03/19 - 12/16/19 | USD | 5,629 | CZK | 132,202 | (41 | ) | |||||||||||
JPMorgan Chase Bank | 10/03/19 - 12/18/19 | USD | 6,912 | TRY | 40,474 | 170 | ||||||||||||
JPMorgan Chase Bank | 10/03/19 - 12/18/19 | USD | 9,527 | HUF | 2,845,007 | (238 | ) | |||||||||||
JPMorgan Chase Bank | 10/23/19 | BRL | 20,943 | USD | 5,097 | 77 | ||||||||||||
JPMorgan Chase Bank | 10/03/19 - 10/30/19 | BRL | 5,954 | USD | 1,424 | (5 | ) | |||||||||||
JPMorgan Chase Bank | 10/03/19 - 11/06/19 | TRY | 65,432 | USD | 11,230 | (310 | ) | |||||||||||
JPMorgan Chase Bank | 10/07/19 | EUR | 2,277 | HUF | 747,163 | (51 | ) | |||||||||||
JPMorgan Chase Bank | 10/07/19 | HUF | 80,388 | EUR | 241 | — | ||||||||||||
JPMorgan Chase Bank | 10/15/19 | CNY | 18,944 | USD | 2,666 | 9 | ||||||||||||
JPMorgan Chase Bank | 10/16/19 | THB | 45,325 | USD | 1,480 | (3 | ) | |||||||||||
JPMorgan Chase Bank | 10/18/19 | CNH | 21,085 | USD | 3,012 | 61 | ||||||||||||
JPMorgan Chase Bank | 11/04/19 | USD | 1,851 | BRL | 7,733 | 2 | ||||||||||||
JPMorgan Chase Bank | 10/21/19 - 11/04/19 | USD | 8,383 | BRL | 34,026 | (225 | ) | |||||||||||
JPMorgan Chase Bank | 10/23/19 | USD | 472 | PHP | 24,673 | 4 | ||||||||||||
JPMorgan Chase Bank | 10/23/19 | USD | 838 | IDR | 11,864,334 | (4 | ) | |||||||||||
JPMorgan Chase Bank | 10/23/19 | USD | 884 | COP | 2,993,583 | (24 | ) | |||||||||||
JPMorgan Chase Bank | 10/23/19 | USD | 2,455 | KRW | 2,921,747 | (15 | ) | |||||||||||
JPMorgan Chase Bank | 10/23/19 - 10/25/19 | PEN | 15,488 | USD | 4,623 | 48 | ||||||||||||
JPMorgan Chase Bank | 10/23/19 | RUB | 294,242 | USD | 4,553 | 30 | ||||||||||||
JPMorgan Chase Bank | 10/23/19 - 12/18/19 | IDR | 141,136,888 | USD | 9,944 | 53 | ||||||||||||
JPMorgan Chase Bank | 10/24/19 | THB | 102,328 | USD | 3,350 | 2 | ||||||||||||
JPMorgan Chase Bank | 10/24/19 | INR | 181,200 | USD | 2,538 | (15 | ) | |||||||||||
JPMorgan Chase Bank | 10/30/19 | USD | 6,947 | RON | 30,003 | (50 | ) | |||||||||||
JPMorgan Chase Bank | 10/30/19 | USD | 11,601 | PLN | 46,173 | (77 | ) | |||||||||||
JPMorgan Chase Bank | 10/30/19 - 12/18/19 | USD | 23,612 | THB | 715,455 | (178 | ) | |||||||||||
JPMorgan Chase Bank | 10/30/19 | MXN | 34,071 | USD | 1,742 | 25 | ||||||||||||
JPMorgan Chase Bank | 10/30/19 | ZAR | 125,915 | USD | 8,428 | 155 | ||||||||||||
JPMorgan Chase Bank | 11/01/19 | USD | 15,126 | MXN | 295,926 | (216 | ) | |||||||||||
68 |
SEI Institutional International Trust / Annual Report / September 30, 2019 |
| Counterparty | Settlement Date | Currency to Deliver (Thousands) | Currency to Receive (Thousands) | Unrealized Appreciation (Depreciation) (Thousands) | ||||||||||||||
JPMorgan Chase Bank | 11/01/19 | MXN | 75,400 | USD | 3,776 | $ | (23 | ) | ||||||||||
JPMorgan Chase Bank | 11/04/19 | SGD | 3,142 | USD | 2,275 | 1 | ||||||||||||
JPMorgan Chase Bank | 11/05/19 | USD | 1,134 | EUR | 1,028 | (11 | ) | |||||||||||
JPMorgan Chase Bank | 11/07/19 | EUR | 10,299 | PLN | 44,453 | (163 | ) | |||||||||||
JPMorgan Chase Bank | 11/26/19 | IDR | 32,551,765 | USD | 2,292 | 11 | ||||||||||||
JPMorgan Chase Bank | 12/04/19 | USD | 1,229 | RUB | 83,113 | 41 | ||||||||||||
JPMorgan Chase Bank | 12/04/19 | RUB | 182,554 | USD | 2,808 | 17 | ||||||||||||
JPMorgan Chase Bank | 12/12/19 | USD | 369 | UYU | 13,787 | — | ||||||||||||
JPMorgan Chase Bank | 10/19/20 | USD | 208 | UYU | 7,800 | (12 | ) | |||||||||||
JPMorgan Chase Bank | 12/17/19 | EUR | 374 | RON | 1,788 | 1 | ||||||||||||
JPMorgan Chase Bank | 12/17/19 | USD | 628 | COP | 2,116,540 | (21 | ) | |||||||||||
JPMorgan Chase Bank | 12/17/19 | EUR | 701 | CZK | 18,221 | 3 | ||||||||||||
JPMorgan Chase Bank | 12/18/19 | USD | 1,629 | PEN | 5,469 | (16 | ) | |||||||||||
JPMorgan Chase Bank | 12/19/19 | USD | 525 | NGN | 198,374 | 18 | ||||||||||||
JPMorgan Chase Bank | 01/24/20 | EUR | 24,531 | USD | 27,275 | 296 | ||||||||||||
JPMorgan Chase Bank | 01/24/20 | JPY | 291,628 | USD | 2,725 | 3 | ||||||||||||
JPMorgan Chase Bank | 02/03/20 | NGN | 681,434 | USD | 1,767 | (86 | ) | |||||||||||
Merrill Lynch | 12/18/19 | ZAR | 1,130 | USD | 75 | 1 | ||||||||||||
Merrill Lynch | 12/18/19 | USD | 6,177 | PLN | 24,258 | (118 | ) | |||||||||||
Merrill Lynch | 12/18/19 | IDR | 100,601,653 | USD | 7,095 | 69 | ||||||||||||
Merrill Lynch | 12/19/19 | USD | 1,857 | NGN | 700,497 | 63 | ||||||||||||
Standard Bank | 10/16/19 - 11/18/19 | UGX | 20,462,779 | USD | 5,416 | (116 | ) | |||||||||||
Standard Bank | 11/20/19 | NGN | 1,021,557 | USD | 2,595 | (216 | ) | |||||||||||
Standard Bank | 12/18/19 | USD | 843 | EUR | 760 | (10 | ) | |||||||||||
Standard Bank | 12/18/19 | EUR | 1,888 | USD | 2,086 | 16 | ||||||||||||
Standard Bank | 12/18/19 | SGD | 3,041 | USD | 2,208 | 6 | ||||||||||||
Standard Bank | 12/18/19 | USD | 3,694 | ZAR | 55,520 | (68 | ) | |||||||||||
Standard Bank | 12/18/19 | USD | 651 | MYR | 2,732 | 1 | ||||||||||||
Standard Bank | 12/18/19 | USD | 4,864 | MYR | 20,338 | (11 | ) | |||||||||||
Standard Bank | 12/18/19 | INR | 599,193 | USD | 8,209 | (195 | ) | |||||||||||
Standard Chartered | 10/03/19 - 11/05/19 | USD | 6,050 | EUR | 5,421 | (135 | ) | |||||||||||
Standard Chartered | 10/03/19 - 11/05/19 | EUR | 6,289 | USD | 6,937 | 78 | ||||||||||||
Standard Chartered | 10/04/19 - 10/07/19 | USD | 5,164 | KRW | 6,106,609 | (59 | ) | |||||||||||
Standard Chartered | 10/07/19 | KRW | 2,907,667 | USD | 2,393 | (37 | ) | |||||||||||
Standard Chartered | 10/09/19 - 10/17/19 | USD | 20,898 | BRL | 80,263 | (1,643 | ) | |||||||||||
Standard Chartered | 10/11/19 | MYR | 12,861 | USD | 3,075 | 4 | ||||||||||||
Standard Chartered | 11/27/19 | MYR | 31,909 | USD | 7,569 | (49 | ) | |||||||||||
Standard Chartered | 10/17/19 - 11/04/19 | BRL | 8,839 | USD | 2,248 | 128 | ||||||||||||
Standard Chartered | 10/24/19 | USD | 2,513 | INR | 178,863 | 7 | ||||||||||||
Standard Chartered | 10/24/19 - 11/20/19 | USD | 4,441 | IDR | 62,750,354 | (33 | ) | |||||||||||
Standard Chartered | 11/06/19 | USD | 5,914 | ZAR | 91,168 | 71 | ||||||||||||
Standard Chartered | 12/20/19 | USD | 3,554 | ZAR | 52,615 | (120 | ) | |||||||||||
Standard Chartered | 12/04/19 | USD | 5,969 | RUB | 401,486 | 168 | ||||||||||||
Standard Chartered | 12/04/19 | RUB | 162,607 | USD | 2,502 | 17 | ||||||||||||
Standard Chartered | 12/09/19 | TRY | 3,442 | USD | 593 | (4 | ) | |||||||||||
State Street | 10/03/19 - 12/04/19 | USD | 13,480 | EUR | 12,228 | (115 | ) | |||||||||||
State Street | 10/03/19 - 12/04/19 | EUR | 43,662 | USD | 48,736 | 1,049 | ||||||||||||
State Street | 11/01/19 | MXN | 89,630 | USD | 4,587 | 72 | ||||||||||||
State Street | 11/01/19 | MXN | 39,676 | USD | 1,988 | (11 | ) | |||||||||||
|
|
| ||||||||||||||||
| $ | (3,747 | ) | ||||||||||||||||
|
|
| ||||||||||||||||
SEI Institutional International Trust / Annual Report / September 30, 2019 |
69 |
SCHEDULE OF INVESTMENTS
September 30, 2019
Emerging Markets Debt Fund(Continued)
A list of the open OTC swap agreements held by the Fund at September 30, 2019, is as follows:
| Interest Rate Swaps | ||||||||||||||||||||||||||||||||
| Counterparty | Fund Pays | Fund Receives | Payment Frequency | Termination Date | Currency | Notional Amount (Thousands) | Value (Thousands) | Upfront Payments (Thousands) | Net Unrealized Appreciation (Depreciation) (Thousands) | |||||||||||||||||||||||
JPMorgan Chase | 0.845% | 6-MONTH��HUF - BUBOR | Semi-Annually | 10/10/2019 | HUF | 3,000,000 | $ | (83 | ) | $ | – | $ | (83 | ) | ||||||||||||||||||
Goldman Sachs | 1-DAY BRL - CETIP | 8.220% | Annually | 01/02/2020 | BRL | 4,194 | 84 | – | 84 | |||||||||||||||||||||||
JPMorgan Chase | 1-DAY BRL - CETIP | 11.460% | Annually | 01/02/2020 | BRL | 3,649 | 120 | – | 120 | |||||||||||||||||||||||
JPMorgan Chase | 1-DAY BRL - CETIP | 12.130% | Annually | 01/02/2020 | BRL | 3,480 | 133 | – | 133 | |||||||||||||||||||||||
JPMorgan Chase | 1-DAY BRL - CETIP | 12.130% | Annually | 01/02/2020 | BRL | 5,738 | 215 | – | 215 | |||||||||||||||||||||||
JPMorgan Chase | 0.693% | 6-MONTH HUF - BUBOR | Semi-Annually | 04/20/2020 | HUF | 1,750,000 | (31 | ) | – | (31 | ) | |||||||||||||||||||||
Goldman Sachs | 1-DAY BRL - CETIP | 12.725% | Annually | 01/04/2021 | BRL | 10,608 | 827 | – | 827 | |||||||||||||||||||||||
JPMorgan Chase | 1-DAY BRL - CETIP | 9.610% | Annually | 01/04/2021 | BRL | 4,626 | 149 | – | 149 | |||||||||||||||||||||||
JPMorgan Chase | 1-DAY BRL - CETIP | 10.890% | Annually | 01/04/2021 | BRL | 170 | 7 | – | 7 | |||||||||||||||||||||||
JPMorgan Chase | 1-DAY BRL - CETIP | 10.040% | Annually | 01/04/2021 | BRL | 3,557 | 130 | – | 130 | |||||||||||||||||||||||
JPMorgan Chase | 1-DAY BRL - CETIP | 9.275% | Annually | 01/04/2021 | BRL | 5,815 | 168 | – | 168 | |||||||||||||||||||||||
JPMorgan Chase | 1-DAY BRL - CETIP | 8.870% | Annually | 01/04/2021 | BRL | 8,089 | 203 | – | 203 | |||||||||||||||||||||||
Goldman Sachs | 3-MONTH MosPrime - RUB | 9.005% | Annually | 02/21/2021 | RUB | 1,080,956 | 294 | – | 294 | |||||||||||||||||||||||
Goldman Sachs | 28-DAY MXN - TIIE | 5.370% | Monthly | 03/17/2021 | MXN | 46,500 | (48 | ) | – | (48 | ) | |||||||||||||||||||||
Goldman Sachs | 3-MONTH MosPrime - RUB | 7.515% | Annually | 06/10/2021 | RUB | 1,020,770 | 17 | – | 17 | |||||||||||||||||||||||
JPMorgan Chase | 1.378% | 6-MONTHHUF - BUBOR | Semi-Annually | 06/17/2021 | HUF | 654,998 | (46 | ) | – | (46 | ) | |||||||||||||||||||||
Goldman Sachs | 6-MONTH PLN - WIBOR | 2.208% | Annually | 11/16/2021 | PLN | 6,842 | 40 | – | 40 | |||||||||||||||||||||||
Citigroup | 6-MONTH PLN - WIBOR | 2.431% | Annually | 12/14/2021 | PLN | 11,000 | 96 | – | 96 | |||||||||||||||||||||||
Goldman Sachs | 6-MONTH HUF - BUBOR | 1.265% | Semi-Annually | 01/10/2022 | HUF | 1,537,322 | (145 | ) | – | (145 | ) | |||||||||||||||||||||
Goldman Sachs | 3-MONTH MosPrime - RUB | 8.110% | Quarterly | 03/23/2022 | RUB | 715,570 | 197 | – | 197 | |||||||||||||||||||||||
JPMorgan Chase | 1-DAY-CLP - CHILIBOR RATE AVG | 3.430% | Semi-Annually | 05/10/2022 | CLP | 420,527 | 26 | – | 26 | |||||||||||||||||||||||
Goldman Sachs | 28-DAY MXN - TIIE | 5.900% | Monthly | 09/12/2022 | MXN | 75,956 | (66 | ) | – | (66 | ) | |||||||||||||||||||||
Goldman Sachs | 6-MONTH HUF - BUBOR | 0.839% | Annually | 09/21/2022 | HUF | 1,390,000 | 49 | – | 49 | |||||||||||||||||||||||
Goldman Sachs | 1-DAY BRL - CETIP | 11.985% | Annually | 01/02/2023 | BRL | 3,000 | 308 | – | 308 | |||||||||||||||||||||||
Goldman Sachs | 1-DAY BRL - CETIP | 10.040% | Annually | 01/03/2023 | BRL | 5,012 | 367 | – | 367 | |||||||||||||||||||||||
Citigroup | China 7-Day Reverse Repo Rate | 2.761% | Quarterly | 07/05/2024 | CNY | 99,768 | (24 | ) | – | (24 | ) | |||||||||||||||||||||
Goldman Sachs | China 7-Day Reverse Repo Rate | 2.770% | Quarterly | 07/05/2024 | CNY | 25,760 | (5 | ) | – | (5 | ) | |||||||||||||||||||||
Goldman Sachs | 28-DAY MXN - TIIE | 6.355% | Monthly | 05/21/2025 | MXN | 23,145 | (12 | ) | – | (12 | ) | |||||||||||||||||||||
Goldman Sachs | 28-DAY MXN - TIIE | 6.205% | Monthly | 12/08/2025 | MXN | 16,624 | (17 | ) | – | (17 | ) | |||||||||||||||||||||
Goldman Sachs | 28-DAY MXN - TIIE | 6.165% | Monthly | 03/05/2026 | MXN | 47,200 | (57 | ) | – | (57 | ) | |||||||||||||||||||||
JPMorgan Chase | 28-DAY MXN - TIIE | 6.130% | Monthly | 06/18/2026 | MXN | 40,000 | (56 | ) | – | (56 | ) | |||||||||||||||||||||
Goldman Sachs | 28-DAY MXN - TIIE | 6.381% | Monthly | 09/16/2026 | MXN | 26,000 | (19 | ) | – | (19 | ) | |||||||||||||||||||||
|
|
|
|
|
|
|
|
| ||||||||||||||||||||||||
| $ | 2,821 | $ | – | $ | 2,821 | |||||||||||||||||||||||||||
|
|
|
|
|
|
|
|
| ||||||||||||||||||||||||
70 |
SEI Institutional International Trust / Annual Report / September 30, 2019 |
| Credit Default Swaps | ||||||||||||||||||||||||||||||||||
| Counterparty | Reference Entity/Obligation | Buy/Sell Protection | (Pays)/Receives Rate | Payment Frequency | Termination Date | Notional Amount (Thousands) | Value (Thousands) | Upfront Payments/ Receipts (Thousands) | Net Unrealized Appreciation (Depreciation) (Thousands) | |||||||||||||||||||||||||
JPMorgan Chase | Argentina | Sell | 5.00% | Quarterly | 06/20/2023 | $(1,895) | $(1,124) | $ | 116 | $ | (1,240 | ) | ||||||||||||||||||||||
Credit Suisse | Ecuador | Sell | 5.00% | Quarterly | 12/20/2019 | (2,100) | 6 | (8 | ) | 14 | ||||||||||||||||||||||||
|
|
|
|
|
|
|
| |||||||||||||||||||||||||||
| $(1,118) | $ | 108 | $ | (1,226 | ) | |||||||||||||||||||||||||||||
|
|
|
|
|
|
|
| |||||||||||||||||||||||||||
| Cross Currency Swaps | ||||||||||||||||||||||||||||||||||
| Counterparty | Fund Pays | Fund Receives | Payment Frequency | Termination Date | Currency | Notional Amount (Thousands) | Value (Thousands) | Upfront Payment (Thousands) | Net Unrealized Appreciation (Depreciation) (Thousands) | |||||||||||||||||||||||||
Goldman Sachs | 3-MONTHUSD - LIBOR | 18.230% | Quarterly | 12/09/2024 | TRY | 2,301 | $ | (471 | ) | $ | – | $ | (471 | ) | ||||||||||||||||||||
|
|
|
|
|
|
|
|
| ||||||||||||||||||||||||||
| (471 | ) | – | (471 | ) | ||||||||||||||||||||||||||||||
|
|
|
|
|
|
|
|
| ||||||||||||||||||||||||||
A list of the open centrally cleared swap agreements held by the Fund at September 30, 2019, is as follows:
| Interest Rate Swaps | ||||||||||||||||||||||||
| Fund Pays | Fund Receives | Payment Frequency | Termination Date | Currency | Notional Amount (Thousands) | Value (Thousands) | Upfront Payments/ Receipts (Thousands) | Net Unrealized Appreciation (Depreciation) (Thousands) | ||||||||||||||||
7.450% | 1-DAY BRL - CETIP | Annually | 01/02/2020 | BRL | 67,046 | $ | (93 | ) | $ | – | $ | (93 | ) | |||||||||||
1.675% | 6-MONTH CZK - PRIBOR | Semi-Annually | 07/17/2024 | CZK | 21,146 | 3 | – | 3 | ||||||||||||||||
28-DAY MXN - TIIE | 6.750% | Monthly | 08/26/2024 | MXN | 60,739 | 30 | – | 30 | ||||||||||||||||
6-MONTH HUF - BUBOR | 0.810% | Annually | 09/12/2024 | HUF | 75,000 | 1 | – | 1 | ||||||||||||||||
1-DAY BRL - CETIP | 12.340% | Annually | 01/02/2025 | BRL | 5,215 | 235 | – | 235 | ||||||||||||||||
28-DAY MXN - TIIE | 7.720% | Monthly | 12/03/2026 | MXN | 8,000 | 26 | – | 26 | ||||||||||||||||
28-DAY MXN - TIIE | 7.510% | Monthly | 04/20/2027 | MXN | 8,110 | 21 | – | 21 | ||||||||||||||||
2.379% | 3-MONTH HUF - BUBOR | Semi-Annually | 06/07/2028 | HUF | 279,795 | (97 | ) | – | (97 | ) | ||||||||||||||
China 7-Day Reverse Repo Rate | 2.748% | Quarterly | 07/05/2024 | CNY | 20,500 | (10 | ) | – | (10 | ) | ||||||||||||||
2.439% | 3-MONTH HUF - BUBOR | Semi-Annually | 06/08/2028 | HUF | 220,205 | (80 | ) | ��� | (80 | ) | ||||||||||||||
2.265% | 6-MONTH HUF - BUBOR | Semi-Annually | 04/24/2029 | HUF | 150,000 | (46 | ) | – | (46 | ) | ||||||||||||||
5.915% | 1-DAY COP - COLIBR | Quarterly | 05/15/2029 | COP | 3,600,000 | (60 | ) | – | (60 | ) | ||||||||||||||
5.370% | 1-DAY COP - COLIBR | Quarterly | 06/21/2029 | COP | 1,800,000 | (7 | ) | – | (7 | ) | ||||||||||||||
3-MONTH ZAR - JIBAR | 8.490% | Quarterly | 07/18/2029 | ZAR | 10,000 | (1 | ) | – | (1 | ) | ||||||||||||||
6-MONTH PLN - WIBOR | 1.615% | Annually | 08/16/2029 | PLN | 12,000 | (1 | ) | – | (1 | ) | ||||||||||||||
6.940% | 28-DAY MXN - TIIE | Monthly | 08/20/2029 | MXN | 35,892 | (19 | ) | – | (19 | ) | ||||||||||||||
6.923% | 28-DAY MXN - TIIE | Monthly | 08/31/2029 | MXN | 42,602 | (19 | ) | – | (19 | ) | ||||||||||||||
2.969% | 6-MONTH HUF - BUBOR | Semi-Annually | 02/08/2029 | HUF | 200,000 | (39 | ) | – | (39 | ) | ||||||||||||||
6.820% | 28-DAY MXN - TIIE | Monthly | 09/10/2029 | MXN | 33,993 | (2 | ) | – | (2 | ) | ||||||||||||||
China 7-Day Reverse Repo Rate | 2.863% | Quarterly | 07/03/2024 | CNY | 20,500 | 4 | – | 4 | ||||||||||||||||
1.700% | 6-MONTH CZK - PRIBOR | Semi-Annually | 06/18/2024 | CZK | 140,000 | 13 | – | 13 | ||||||||||||||||
8.090% | 28-DAY MXN - TIIE | Monthly | 01/28/2021 | MXN | 133,260 | (97 | ) | – | (97 | ) | ||||||||||||||
8.125% | 28-DAY MXN - TIIE | Monthly | 01/28/2021 | MXN | 60,000 | (45 | ) | – | (45 | ) | ||||||||||||||
8.145% | 28-DAY MXN - TIIE | Monthly | 01/28/2021 | MXN | 136,359 | (103 | ) | – | (103 | ) | ||||||||||||||
6-MONTHCZK - PRIBOR | 2.100% | Annually | 09/30/2021 | CZK | 150,349 | (2 | ) | – | (2 | ) | ||||||||||||||
6-MONTHCZK - PRIBOR | 2.070% | Annually | 09/30/2021 | CZK | 121,000 | (1 | ) | – | (1 | ) | ||||||||||||||
6-MONTH PLN - WIBOR | 2.263% | Annually | 11/12/2021 | PLN | 7,000 | 20 | – | 20 | ||||||||||||||||
1-DAY BRL - CETIP | 6.065% | Annually | 01/03/2022 | BRL | 9,867 | 25 | – | 25 | ||||||||||||||||
1.640% | 6-MONTH CZK - PRIBOR | Semi-Annually | 06/21/2024 | CZK | 14,000 | 3 | – | 3 | ||||||||||||||||
1-DAY BRL - CETIP | 5.890% | Annually | 01/03/2022 | BRL | 27,057 | 48 | – | 48 | ||||||||||||||||
1-DAY BRL - CETIP | 6.240% | Annually | 01/03/2022 | BRL | 14,709 | 49 | – | 49 | ||||||||||||||||
28-DAY MXN - TIIE | 6.745% | Monthly | 06/23/2022 | MXN | 26,758 | 7 | – | 7 | ||||||||||||||||
28-DAY MXN - TIIE | 6.710% | Monthly | 07/07/2022 | MXN | 37,637 | 8 | – | 8 | ||||||||||||||||
1-DAY BRL - CETIP | 6.475% | Annually | 01/02/2023 | BRL | 16,116 | 51 | – | 51 | ||||||||||||||||
SEI Institutional International Trust / Annual Report / September 30, 2019 |
71 |
SCHEDULE OF INVESTMENTS
September 30, 2019
Emerging Markets Debt Fund(Concluded)
| Fund Pays | Fund Receives | Payment Frequency | Termination Date | Currency | Notional Amount (Thousands) | Value (Thousands) | Upfront Payments/ Receipts (Thousands) | Net Unrealized Appreciation (Depreciation) (Thousands) | ||||||||||||||||||||||||
1-DAY BRL - CETIP | 11.475% | Annually | 01/02/2023 | BRL | 3,524 | $ | 110 | $ | – | $ | 110 | |||||||||||||||||||||
1-DAY BRL - CETIP | 9.255% | Annually | 01/02/2023 | BRL | 2,368 | 46 | – | 46 | ||||||||||||||||||||||||
1.987% | 6-MONTH PLN - WIBOR | Semi-Annually | 03/25/2024 | PLN | 22,000 | (80) | – | (80) | ||||||||||||||||||||||||
1-DAY BRL - CETIP | 6.233% | Annually | 01/03/2022 | BRL | 8,733 | 29 | – | 29 | ||||||||||||||||||||||||
6-MONTH HUF - BUBOR | 1.880% | Annually | 09/13/2029 | HUF | 400,000 | (1) | – | (1) | ||||||||||||||||||||||||
|
|
|
|
|
| |||||||||||||||||||||||||||
| $ | (74) | $ | – | $ | (74) | |||||||||||||||||||||||||||
|
|
|
|
|
| |||||||||||||||||||||||||||
Percentages are based on Net Assets of $1,595,415 ($ Thousands). |
| * | Non-income producing security. |
| ** | Rate shown is the 7-day effective yield as of September 30, 2019. |
| † | Investment in Affiliated Security (see Note 5). |
| (A) | Security exempt from registration under Rule 144A of the Securities Act of 1933. These securities may be resold in transactions exempt from registration normally to qualified institutions. On September 30, 2019, the value of these securities amounted to $260,939 ($ Thousands), representing 16.4% of the Net Assets of the Fund. |
| (B) | Securities considered illiquid. The total value of such securities as of September 30, 2019 was $2,203 ($ Thousands) and represented 0.1% of the Net Assets of the Fund. |
| (C) | Certain securities or partial positions of certain securities are on loan at September 30, 2019 (See Note 9). The total market value of securities on loan at September 30, 2019 was $83,870 ($ Thousands). |
| (D) | Zero coupon security. The rate shown on the Schedule of Investments is the security’s effective yield at the time of purchase. |
| (E) | Variable or floating rate security, the interest rate of which adjusts periodically based on changes in current interest rates and prepayments on the underlying pool of assets. |
| (F) | Step Bonds – Represents the final step rate and the final maturity date. |
| (G) | Level 3 security in accordance with fair value hierarchy. |
| (H) | Security is in default on interest payment. |
| (I) | This security was purchased with cash collateral held from securities on loan. The total market value of such securities as of September 30, 2019 was $87,228 ($ Thousands). |
| (J) | Refer to table below for details on Options Contracts. |
ARS — Argentine Peso
BADLAR — Buenos Aires Deposits of Large Amount Rate
BRL — Brazilian Real
BUBOR — Budapest Interbank Offered Rate
CETIP — Central of Custody and Financial Settlement of Securities
CHILIBR — Chile Interbank Offered Rate
Cl — Class
CLP — Chilean Peso
CNH — Chinese Yuan Offshore
CNY — Chinese Yuan Onshore
COP — Colombian Peso
CZK — Czech Koruna
EGP — Egyptian Pound
EUR — Euro
HKD — Hong Kong Dollar
HUF — Hungarian Forint
ICE — Intercontinental Exchange
IDR — Indonesian Rupiah
ILS — Israeli New Sheckels
INR — Indian Rupee
JPY — Japanese Yen
JSC — Joint-Stock Company
KRW — Korean Won
KZT — Kazakhstani Tenge
L.P. — Limited Partnership
LIBOR — London Interbank Offered Rate
Ltd. — Limited
MosPrime — Moscow Prime Offered Rate
MTN — Medium Term Note
MXN — Mexican Peso
MYR — Malaysian Ringgit
NGN — Nigerian Naira
PEN — Peruvian Nuevo Sol
PHP— Philippine Peso
PLN — Polish Zloty
PRIBOR — Prague Interbank Offered Rate
RON — Romanian Leu
RUB — Russian Ruble
SAR — Saudi Riyal
SGD — Singapore Dollar
THB — Thai Bhat
TIIE — Interbank Equilibrium Interest Rate
TRY — Turkish Lira
TWD — Taiwan Dollar
UAH —Ukrainian Hryvnia
UGX — Ugandan Shilling
USD — United States Dollar
WIBOR — Warsaw Interbank Offered Rate
VAR — Variable Rate
ZAR — South African Rand
The following is a list of the level of inputs used as of September 30, 2019, in valuing the Fund’s investments and other financial instruments carried at value ($ Thousands):
| Investments in Securities | Level 1 ($) | Level 2 ($) | Level 3 ($)(1) | Total ($) | ||||||||||||
Global Bonds | – | 1,525,468 | 612 | 1,526,080 | ||||||||||||
Affiliated Partnership | – | 87,228 | – | 87,228 | ||||||||||||
|
|
|
|
|
|
|
| |||||||||
Total Investments in Securities | – | 1,612,696 | 612 | 1,613,308 | ||||||||||||
|
|
|
|
|
|
|
| |||||||||
| Other Financial Instruments | Level 1 ($) | Level 2 ($) | Level 3 ($) | Total ($) | ||||||||||||
Purchased Options | 126 | – | – | 126 | ||||||||||||
Futures Contracts* | ||||||||||||||||
Unrealized Appreciation | 345 | – | – | 345 | ||||||||||||
Unrealized Depreciation | (968) | – | – | (968) | ||||||||||||
Forwards Contracts* | ||||||||||||||||
Unrealized Appreciation | – | 4,954 | – | 4,954 | ||||||||||||
Unrealized Depreciation | – | (8,701) | – | (8,701) | ||||||||||||
OTC Swaps | ||||||||||||||||
Credit Default Swaps* | ||||||||||||||||
Unrealized Appreciation | – | 14 | – | 14 | ||||||||||||
Unrealized Depreciation | – | (1,240) | – | (1,240) | ||||||||||||
Cross Currency Swaps* | ||||||||||||||||
Unrealized Depreciation | – | (471) | – | (471) | ||||||||||||
Interest Rate Swaps* | ||||||||||||||||
Unrealized Appreciation | – | 3,430 | – | 3,430 | ||||||||||||
Unrealized Depreciation | – | (609) | – | (609) | ||||||||||||
72 |
SEI Institutional International Trust / Annual Report / September 30, 2019 |
| Other Financial Instruments | Level 1 ($) | Level 2 ($) | Level 3 ($) | Total ($) | ||||||||||||
Centrally Cleared Swaps | ||||||||||||||||
Interest Rate Swaps* | ||||||||||||||||
Unrealized Appreciation | – | 729 | – | 729 | ||||||||||||
Unrealized Depreciation | – | (803) | – | (803) | ||||||||||||
|
|
|
|
|
|
|
| |||||||||
Total Other Financial Instruments | (497) | (2,697) | – | (3,194) | ||||||||||||
|
|
|
|
|
|
|
| |||||||||
(1) Of the $612 ($ Thousands) in Level 3 securities as of September 30, 2019, $612 ($ Thousands) or 0.04% as a percent of net assets are not valued via third party pricing vendors and broker quotes. If significant, the disclosure of the unobservable inputs and the interrelationships and sensitivity between these inputs are required for those Level 3 securities that are not valued by third party
pricing vendors or broker quotes. A reconciliation of Level 3 investments is presented when the Fund has significant amount of Level 3 investments at the beginning and/or end of the period in relation to net assets.
* Futures contracts, forwards contracts and swap contracts are valued at the unrealized appreciation (depreciation) on the instrument.
For the year ended September 30, 2019, there were no transfers between Level 1 and Level 2 assets and liabilities.
For the year ended September 30, 2019, there were no transfers between Level 2 and Level 3 assets and liabilities.
For more information on valuation inputs, see Note 2 – Significant Accounting Policies in Notes to Financial Statements.
The following is a summary of the transactions with affiliates for the year ended September 30, 2019 ($ Thousands):
| Security Description | Value at 9/30/2018 | Purchases at Cost | Proceeds from Sales | Realized Gain | Change in Unrealized Appreciation | Value 9/30/2019 | Shares | Income | Capital Gains | |||||||||||||||||||||||||
SEI Liquidity Fund, L.P. | $ 30,585 | $ 346,090 | $ (289,460) | $ 11 | $ 2 | $ 87,228 | 87,230,149 | $ 113 | $ — | |||||||||||||||||||||||||
|
|
|
|
|
|
|
|
|
|
|
|
|
|
|
|
| ||||||||||||||||||
Amounts designated as “—” are $0 or have been rounded to $0.
The accompanying notes are an integral part of the financial statements.
SEI Institutional International Trust / Annual Report / September 30, 2019 |
73 |
STATEMENTS OF ASSETS AND LIABILITIES($ Thousands)
September 30, 2019
International Equity Fund | Emerging Markets Equity Fund | International Fixed Income Fund | Emerging Markets Debt Fund | |||||||||||||||||||||||||||||
Assets: | ||||||||||||||||||||||||||||||||
Investments, at value† | $ | 3,859,046* | $ | 1,646,009* | $ | 504,411 | $ | 1,526,080* | ||||||||||||||||||||||||
Affiliated investments, at value†† | 206,239 | 78,454 | – | 87,228 | ||||||||||||||||||||||||||||
Cash | 91,427 | 26,485 | 9,709 | 44,813 | ||||||||||||||||||||||||||||
Cash pledged as collateral for forward foreign currency contracts | – | – | – | 5,330 | ||||||||||||||||||||||||||||
Cash pledged as collateral for futures contracts | 4,673 | 1,848 | 394 | 1,899 | ||||||||||||||||||||||||||||
Cash pledged as collateral for swap contracts | – | – | – | 679 | ||||||||||||||||||||||||||||
Foreign currency, at value††† | 6,293 | 5,504 | 1,025 | 11,583 | ||||||||||||||||||||||||||||
Receivable for fund shares sold | 2,254 | 3,387 | 238 | 784 | ||||||||||||||||||||||||||||
Receivable for investment securities sold | 20,104 | 4,198 | 1,043 | 11,912 | ||||||||||||||||||||||||||||
Dividends and interest receivable | 9,241 | 3,081 | 2,779 | 23,821 | ||||||||||||||||||||||||||||
Unrealized gain on forward foreign currency contracts | – | – | 7,572 | 4,954 | ||||||||||||||||||||||||||||
Unrealized gain on foreign spot currency contracts | 16 | 5 | 62 | 13 | ||||||||||||||||||||||||||||
Due from broker | – | – | – | 79 | ||||||||||||||||||||||||||||
Swap contracts, at value†††† | – | – | 18 | 3,437 | ||||||||||||||||||||||||||||
Options purchased, at value††††† | – | – | – | 126 | ||||||||||||||||||||||||||||
Foreign tax reclaim receivable | 10,454 | 168 | – | – | ||||||||||||||||||||||||||||
Receivable for variation margin | 251 | 158 | 129 | 75 | ||||||||||||||||||||||||||||
Prepaid expenses | 16 | 7 | 2 | 6 | ||||||||||||||||||||||||||||
Total Assets | 4,210,014 | 1,769,304 | 527,382 | 1,722,819 | ||||||||||||||||||||||||||||
Liabilities: | ||||||||||||||||||||||||||||||||
Payable upon return on securities loaned | 122,504 | 48,630 | – | 87,233 | ||||||||||||||||||||||||||||
Payable for investment securities purchased | 22,939 | 5,892 | 2,134 | 26,075 | ||||||||||||||||||||||||||||
Payable for fund shares redeemed | 2,183 | 1,369 | 727 | 1,066 | ||||||||||||||||||||||||||||
Swap contracts, at value†††† | – | – | 193 | 2,205 | ||||||||||||||||||||||||||||
Payable for variation margin | 169 | �� | – | 88 | 83 | |||||||||||||||||||||||||||
Administration fees payable | 1,025 | 621 | 188 | 489 | ||||||||||||||||||||||||||||
Unrealized loss on foreign currency spot contracts | 5 | – | 130 | 14 | ||||||||||||||||||||||||||||
Unrealized loss on forward foreign currency contracts | – | – | 1,803 | 8,701 | ||||||||||||||||||||||||||||
Trustees fees payable | 2 | 1 | – | 1 | ||||||||||||||||||||||||||||
Chief compliance officer fees payable | 5 | 2 | 1 | 2 | ||||||||||||||||||||||||||||
Administrative servicing fees payable | 4 | – | – | – | ||||||||||||||||||||||||||||
Shareholder servicing fees payable | 563 | 323 | 93 | 306 | ||||||||||||||||||||||||||||
Investment advisory fees payable | 1,682 | 1,341 | 97 | 817 | ||||||||||||||||||||||||||||
Other payables | – | – | – | 18 | ||||||||||||||||||||||||||||
Accrued expense payable | 344 | 434 | 97 | 394 | ||||||||||||||||||||||||||||
Accrued foreign capital gains tax on appreciated securities | – | 568 | – | – | ||||||||||||||||||||||||||||
Total Liabilities | 151,425 | 59,181 | 5,551 | 127,404 | ||||||||||||||||||||||||||||
Net Assets | $ | 4,058,589 | $ | 1,710,123 | $ | 521,831 | $ | 1,595,415 | ||||||||||||||||||||||||
† Cost of investments | $ | 3,633,577 | $ | 1,465,105 | $ | 494,505 | $ | 1,544,903 | ||||||||||||||||||||||||
†† Cost of affiliated investments | 206,233 | 78,447 | – | 87,230 | ||||||||||||||||||||||||||||
††† Cost of foreign currency | 6,302 | 5,501 | 1,031 | 11,568 | ||||||||||||||||||||||||||||
†††† Cost (premiums paid (received)) | – | – | (158) | 108 | ||||||||||||||||||||||||||||
††††† Cost of purchased options | – | – | – | 279 | ||||||||||||||||||||||||||||
* Includes market value of securities on loan | 115,350 | 45,930 | – | 83,870 | ||||||||||||||||||||||||||||
74 |
SEI Institutional International Trust / Annual Report / September 30, 2019 |
| International Equity Fund | Emerging Markets Equity Fund | International Fixed Income Fund | Emerging Markets Debt Fund | |||||||||||||||||||||||
Net Assets: | ||||||||||||||||||||||||||
Paid-in Capital — (unlimited authorization — no par value) | $ | 3,881,279 | $ | 1,631,350 | $ | 513,647 | $ | 1,693,586 | ||||||||||||||||||
Total distributable earnings/(loss) | 177,310 | 78,773 | 8,184 | (98,171) | ||||||||||||||||||||||
Net Assets | $ | 4,058,589 | $ | 1,710,123 | $ | 521,831 | $ | 1,595,415 | ||||||||||||||||||
Net Asset Value, Offering and Redemption Price Per Share — Class F | $ | 10.68 | $ | 11.21 | $ | 10.73 | $ | 9.93 | ||||||||||||||||||
| | ($3,686,195,190 ÷ 345,210,281 shares) |
| ($1,564,522,849 ÷ 139,609,555 shares) |
| ($452,150,102 ÷ 42,120,642 shares) |
| ($1,483,467,460 ÷ 149,334,720 shares) |
| ||||||||||||||||||
Net Asset Value, Offering and Redemption Price Per Share — Class I | $ | 10.68 | N/A | N/A | N/A | |||||||||||||||||||||
| | ($1,931,889 ÷ 180,828 shares) |
| ||||||||||||||||||||||||
Net Asset Value, Offering and Redemption Price Per Share — Class Y | $ | 10.68 | $ | 11.22 | $ | 10.75 | $ | 9.92 | ||||||||||||||||||
| | ($370,462,165 ÷ 34,689,654 shares) |
| ($145,599,788 ÷ 12,981,400 shares) |
| ($69,680,846 ÷ 6,482,690 shares) |
| ($111,948,010 ÷ 11,286,469 shares) |
| ||||||||||||||||||
N/A — Not applicable. Share classes currently not offered.
Amounts designated as “—” are $0 or have been rounded to $0.
The accompanying notes are an integral part of the financial statements.
SEI Institutional International Trust / Annual Report / September 30, 2019 |
75 |
STATEMENTS OF OPERATIONS ($ Thousands)
For the year ended September 30, 2019
| International Equity Fund | Emerging Markets Equity Fund | International Fixed Income Fund | Emerging Markets Debt Fund | |||||||||||||||||||||||||||||
Investment Income: |
| |||||||||||||||||||||||||||||||
Dividends | $ | 126,841 | $ | 48,108 | $ | – | $ | – | ||||||||||||||||||||||||
Income from affiliated investments(1) | 1,765 | 515 | – | – | ||||||||||||||||||||||||||||
Interest Income | 1,459 | 627 | 7,112 | 101,370 | ||||||||||||||||||||||||||||
Security lending income — net(1)(2) | 2,128 | 571 | – | 113 | ||||||||||||||||||||||||||||
Less: foreign taxes withheld | (10,980) | (4,819) | (51) | (2,443) | ||||||||||||||||||||||||||||
Total Investment Income | 121,213 | 45,002 | 7,061 | 99,040 | ||||||||||||||||||||||||||||
Expenses: |
| |||||||||||||||||||||||||||||||
Investment advisory fees | 20,211 | 18,034 | 1,468 | 13,374 | ||||||||||||||||||||||||||||
Administration fees | 12,403 | 7,555 | 2,202 | 7,021 | ||||||||||||||||||||||||||||
Shareholder servicing fees — Class F | 9,118 | 3,952 | 1,089 | 3,635 | ||||||||||||||||||||||||||||
Shareholder servicing fees — Class I | 6 | – | – | – | ||||||||||||||||||||||||||||
Administrative servicing fees — Class I | 6 | – | – | – | ||||||||||||||||||||||||||||
Printing fees | 556 | 246 | 71 | 230 | ||||||||||||||||||||||||||||
Custodian/wire agent fees | 371 | 602 | 94 | 532 | ||||||||||||||||||||||||||||
Professional fees | 198 | 87 | 26 | 84 | ||||||||||||||||||||||||||||
Trustees’ fees | 78 | 34 | 9 | 31 | ||||||||||||||||||||||||||||
Registration fees | 72 | 33 | 6 | 29 | ||||||||||||||||||||||||||||
Chief compliance officer fees | 22 | 9 | 3 | 9 | ||||||||||||||||||||||||||||
Other expenses | 209 | 109 | 124 | 177 | ||||||||||||||||||||||||||||
Total Expenses | 43,250 | 30,661 | 5,092 | 25,122 | ||||||||||||||||||||||||||||
Less: |
| |||||||||||||||||||||||||||||||
Waiver of investment advisory fees | – | (1,849) | (220) | (3,630) | ||||||||||||||||||||||||||||
Waiver of administration fees | – | – | (18) | (352) | ||||||||||||||||||||||||||||
Waiver of shareholder servicing fees — Class F | (73) | – | – | – | ||||||||||||||||||||||||||||
Fees paid indirectly | – | (4) | – | – | ||||||||||||||||||||||||||||
Net Expenses | 43,177 | 28,808 | 4,854 | 21,140 | ||||||||||||||||||||||||||||
Net Investment Income | 78,036 | 16,194 | 2,207 | 77,900 | ||||||||||||||||||||||||||||
Net Realized Gain (Loss) on: |
| |||||||||||||||||||||||||||||||
Investments | (88,434) | (72,287) | 1,077 | (10,915) | ||||||||||||||||||||||||||||
Affiliated investments | 96 | 32 | – | 11 | ||||||||||||||||||||||||||||
Futures contracts | (4,290) | (249) | 3,439 | 622 | ||||||||||||||||||||||||||||
Swap contracts | – | – | 324 | 1,980 | ||||||||||||||||||||||||||||
Foreign currency transactions | (1,944) | (1,474) | (4,737) | (46,026) | ||||||||||||||||||||||||||||
Forward foreign currency contracts |
| – | – | 16,457 | (2,891) | |||||||||||||||||||||||||||
Net Change in Unrealized Appreciation (Depreciation) on: | ||||||||||||||||||||||||||||||||
Investments | (187,837) | 27,598 | 21,446 | 108,930 | ||||||||||||||||||||||||||||
Affiliated investments | 22 | 7 | – | 2 | ||||||||||||||||||||||||||||
Futures contracts | (3,739) | (840) | 384 | (815) | ||||||||||||||||||||||||||||
Option contracts | – | – | – | (153) | ||||||||||||||||||||||||||||
Swap contracts | – | – | 7 | 3,247 | ||||||||||||||||||||||||||||
Foreign capital gains tax on appreciated securities | – | (145) | – | – | ||||||||||||||||||||||||||||
Foreign currency translation of other assets and liabilities denominated in foreign currencies | (332) | 6 | (303) | (11) | ||||||||||||||||||||||||||||
Forward foreign currency contracts | – | – | 3,447 | (3,007) | ||||||||||||||||||||||||||||
Net Increase (Decrease) in Net Assets Resulting from Operations | $ | (208,422) | $ | (31,158) | $ | 43,748 | $ | 128,874 | ||||||||||||||||||||||||
(1) See Note 5 in the Notes to Financial Statements for additional information.
(2) Income is from the investment of collateral in an affiliated security.
Amounts designated as “—” are $0 or have been rounded to $0.
The accompanying notes are an integral part of the financial statements.
76 |
SEI Institutional International Trust / Annual Report / September 30, 2019 |
STATEMENTS OF CHANGES IN NET ASSETS ($ Thousands)
For the years ended September 30,
| International Equity Fund | Emerging Markets Equity Fund | |||||||||||||||
| 2019 | 2018 | 2019 | 2018 | |||||||||||||
Operations: | ||||||||||||||||
Net investment income | $ | 78,036 | $ | 59,195 | $ | 16,194 | $ | 12,301 | ||||||||
Net realized gain (loss) on investments and futures contracts | (92,628) | 198,895 | (72,504) | 26,796 | ||||||||||||
Net realized loss on forward foreign currency contracts and foreign currency transactions | (1,944) | (1,351) | (1,474) | (1,413) | ||||||||||||
Net change in unrealized appreciation (depreciation) on investments and futures contracts | (191,554) | (169,355) | 26,765 | (138,602) | ||||||||||||
Net change in unrealized appreciation (depreciation) on forward foreign currency contracts, foreign currencies and translation of other assets and liabilities denominated in foreign currencies | (332) | (177) | 6 | (12) | ||||||||||||
Net change in unrealized appreciation (depreciation) on foreign capital tax gains on appreciated securities | — | — | (145) | 178 | ||||||||||||
Net Increase (Decrease) in Net Assets Resulting from Operations | (208,422) | 87,207 | (31,158) | (100,752) | ||||||||||||
Distributions:(1) | ||||||||||||||||
Class F | (53,543) | (51,106) | (9,542) | (24,002) | ||||||||||||
Class I | (25) | (29) | N/A | N/A | ||||||||||||
Class Y | (5,551) | (5,482) | (1,045) | (2,093) | ||||||||||||
Total Dividends | (59,119) | (56,617) | (10,587) | (26,095) | ||||||||||||
Capital Share Transactions: | ||||||||||||||||
Class F: | ||||||||||||||||
Proceeds from shares issued | 581,641 | 756,783 | 262,961 | 339,824 | ||||||||||||
Reinvestment of dividends & distributions | 49,614 | 47,452 | 8,884 | 22,506 | ||||||||||||
Cost of shares redeemed | (720,379) | (603,276) | (337,016) | (396,610) | ||||||||||||
Net Increase (Decrease) from Class F Transactions | (89,124) | 200,959 | (65,171) | (34,280) | ||||||||||||
Class I: | ||||||||||||||||
Proceeds from shares issued | 398 | 445 | N/A | N/A | ||||||||||||
Reinvestment of dividends & distributions | 15 | 17 | N/A | N/A | ||||||||||||
Cost of shares redeemed | (960) | (787) | N/A | N/A | ||||||||||||
Net Decrease from Class I Transactions | (547) | (325) | N/A | N/A | ||||||||||||
Class Y: | ||||||||||||||||
Proceeds from shares issued | 107,012 | 63,040 | 50,713 | 27,272 | ||||||||||||
Reinvestment of dividends & distributions | 5,135 | 5,170 | 971 | 1,938 | ||||||||||||
Cost of shares redeemed | (68,972) | (45,309) | (29,199) | (19,938) | ||||||||||||
Net Increase from Class Y Transactions | 43,175 | 22,901 | 22,485 | 9,272 | ||||||||||||
Net Increase (Decrease) in Net Assets Derived from Capital Share Transactions | (46,496) | 223,535 | (42,686) | (25,008) | ||||||||||||
Net Increase (Decrease) in Net Assets | (314,037) | 254,125 | (84,431) | (151,855) | ||||||||||||
Net Assets: | ||||||||||||||||
Beginning of Year | 4,372,626 | 4,118,501 | 1,794,554 | 1,946,409 | ||||||||||||
End of Year(2) | $ | 4,058,589 | $ | 4,372,626 | $ | 1,710,123 | $ | 1,794,554 | ||||||||
Capital Share Transactions: | ||||||||||||||||
Class F: | ||||||||||||||||
Shares issued | 55,772 | 65,585 | 23,647 | 27,336 | ||||||||||||
Reinvestment of distributions | 5,278 | 4,098 | 859 | 1,764 | ||||||||||||
Shares redeemed | (69,493) | (52,335) | (30,383) | (31,382) | ||||||||||||
Total Class F Transactions | (8,443) | 17,348 | (5,877) | (2,282) | ||||||||||||
Class I: | ||||||||||||||||
Shares issued | 38 | 38 | N/A | N/A | ||||||||||||
Reinvestment of distributions | 2 | 2 | N/A | N/A | ||||||||||||
Shares redeemed | (93) | (68) | N/A | N/A | ||||||||||||
Total Class I Transactions | (53) | (28) | N/A | N/A | ||||||||||||
Class Y: | ||||||||||||||||
Shares issued | 10,480 | 5,473 | 4,578 | 2,190 | ||||||||||||
Reinvestment of distributions | 547 | 447 | 94 | 152 | ||||||||||||
Shares redeemed | (6,631) | (3,898) | (2,626) | (1,562) | ||||||||||||
Total Class Y Transactions | 4,396 | 2,022 | 2,046 | 780 | ||||||||||||
Net Increase (Decrease) in Shares Outstanding from Share Transactions | (4,100) | 19,342 | (3,831) | (1,502) | ||||||||||||
| (1) | Current year presentation of distributions conform withS-X Disclosure Simplification. Prior year distributions have been consolidated to conform withS-X Disclosure Simplification (see Note 11). |
| (2) | Includes undistributed net investment income of $48,291 and $1,589, respectively, in 2018. The SEC eliminated the requirement to disclose undistributed net investment income in 2018. |
N/A — Not applicable. Share classes currently not offered.
Amounts designated as “—” are $0 or have been rounded to $0.
The accompanying notes are an integral part of the financial statements.
SEI Institutional International Trust / Annual Report / September 30, 2019 |
77 |
STATEMENTS OF CHANGES IN NET ASSETS ($ Thousands) (Concluded)
For the years ended September 30,
| International Fixed Income Fund | Emerging Markets Debt Fund | |||||||||||||||
| 2019 | 2018 | 2019 | 2018 | |||||||||||||
Operations: | ||||||||||||||||
Net investment income | $ | 2,207 | $ | 3,170 | $ | 77,900 | $ | 80,893 | ||||||||
Net realized gain (loss) on investments, futures contracts and swap contracts | 4,840 | 4,132 | (8,302) | 101 | ||||||||||||
Net realized gain (loss) on forward foreign currency contracts and foreign currency transactions | 11,720 | 15,798 | (48,917) | (23,921) | ||||||||||||
Net change in unrealized appreciation (depreciation) on investments, futures contracts, option contracts and swap contracts | 21,837 | (16,664) | 111,211 | (168,057) | ||||||||||||
Net change in unrealized appreciation (depreciation) on forward foreign currency contracts, foreign currencies and translation of other assets and liabilities denominated in foreign currencies | 3,144 | (91) | (3,018) | 605 | ||||||||||||
Net Increase (Decrease) in Net Assets Resulting from Operations | 43,748 | 6,345 | 128,874 | (110,379) | ||||||||||||
Distributions:(1) | ||||||||||||||||
Class F | (19,278) | — | (24,016) | (82,188) | ||||||||||||
Class Y | (2,040) | — | (2,284) | (6,903) | ||||||||||||
Total Dividends | (21,318) | — | (26,300) | (89,091) | ||||||||||||
Capital Share Transactions: | ||||||||||||||||
Class F: | ||||||||||||||||
Proceeds from shares issued | 76,574 | 86,729 | 224,174 | 336,208 | ||||||||||||
Reinvestment of dividends & distributions | 17,932 | — | 21,787 | 74,710 | ||||||||||||
Cost of shares redeemed | (100,729) | (69,108) | (308,307) | (233,447) | ||||||||||||
Net Increase (Decrease) from Class F Transactions | (6,223) | 17,621 | (62,346) | 177,471 | ||||||||||||
Class Y: | ||||||||||||||||
Proceeds from shares issued | 28,909 | 10,342 | 30,730 | 28,991 | ||||||||||||
Reinvestment of dividends & distributions | 1,813 | — | 2,127 | 6,442 | ||||||||||||
Cost of shares redeemed | (7,009) | (5,961) | (42,670) | (15,406) | ||||||||||||
Net Increase (Decrease) from Class Y Transactions | 23,713 | 4,381 | (9,813) | 20,027 | ||||||||||||
Net Increase (Decrease) in Net Assets Derived from Capital Share Transactions | 17,490 | 22,002 | (72,159) | 197,498 | ||||||||||||
Net Increase (Decrease) in Net Assets | 39,920 | 28,347 | 30,415 | (1,972) | ||||||||||||
Net Assets: | ||||||||||||||||
Beginning of Year | 481,911 | 453,564 | 1,565,000 | 1,566,972 | ||||||||||||
End of Year(2) | $ | 521,831 | $ | 481,911 | $ | 1,595,415 | $ | 1,565,000 | ||||||||
Capital Share Transactions: | ||||||||||||||||
Class F: | ||||||||||||||||
Shares issued | 7,424 | 8,460 | 23,304 | 33,864 | ||||||||||||
Reinvestment of distributions | 1,798 | — | 2,186 | 7,328 | ||||||||||||
Shares redeemed | (9,831) | (6,748) | (32,215) | (23,439) | ||||||||||||
Total Class F Transactions | (609) | 1,712 | (6,725) | 17,753 | ||||||||||||
Class Y: | ||||||||||||||||
Shares issued | 2,797 | 1,010 | 3,226 | 2,913 | ||||||||||||
Reinvestment of distributions | 182 | — | 214 | 633 | ||||||||||||
Shares redeemed | (677) | (582) | (4,425) | (1,528) | ||||||||||||
Total Class Y Transactions | 2,302 | 428 | (985) | 2,018 | ||||||||||||
Net Increase (Decrease) in Shares Outstanding from Share Transactions | 1,693 | 2,140 | (7,710) | 19,771 | ||||||||||||
| (1) | Current year presentation of distributions conform withS-X Disclosure Simplification. Prior year distributions have been consolidated to conform withS-X Disclosure Simplification (see Note 11). |
| (2) | Includes distributions in excess of net investment income of $(4,667) and $(40,703), respectively, in 2018. The SEC eliminated the requirement to disclose undistributed net investment income in 2018. |
Amounts designated as “—” are $0 or have been rounded to $0.
The accompanying notes are an integral part of the financial statements.
78 |
SEI Institutional International Trust / Annual Report / September 30, 2019 |
For the years or period ended September 30
For a Share Outstanding Throughout Each Year or Period
| Net Asset Value, Beginning of Year | Net Investment | Net Realized on | Total from | Dividends from Net Investment Income | Distributions from Net Realized Gains | Total Dividends and Distributions | Net Asset Value, End of Year | Total Return† | Net Assets End of Year ($ Thousands) | Ratio of Net Expenses to Average Net Assets* | Ratio of Expenses Net Assets Paid Indirectly | Ratio of Expenses to Average Net Assets (Excluding Fees Paid Indirectly and Waivers)** | Ratio of Net Investment Income (Loss) to Average Net Assets | Portfolio Turnover Rate† | ||||||||||||||||||||||||||||||||||||||||
International Equity Fund |
| |||||||||||||||||||||||||||||||||||||||||||||||||||||
Class F(2) |
| |||||||||||||||||||||||||||||||||||||||||||||||||||||
2019 | $11.38 | $0.20 | $(0.75) | $(0.55) | $(0.15) | $— | $(0.15) | $10.68 | (4.63) | % | $3,686,195 | 1.10%(3) | 1.10%(3) | 1.10%(3) | 1.92% | 73% | ||||||||||||||||||||||||||||||||||||||
2018 | 11.29 | 0.16 | 0.08 | 0.24 | (0.15) | — | (0.15) | 11.38 | 2.11 | 4,024,987 | 1.09(3) | 1.09(3) | 1.09(3) | 1.35 | 40 | |||||||||||||||||||||||||||||||||||||||
2017 | 9.58 | 0.13 | 1.69 | 1.82 | (0.11) | — | (0.11) | 11.29 | 19.23 | 3,795,858 | 1.15(3) | 1.15(3) | 1.15(3) | 1.27 | 57 | |||||||||||||||||||||||||||||||||||||||
2016 | 9.16 | 0.13 | 0.39 | 0.52 | (0.10) | — | (0.10) | 9.58 | 5.63 | 2,729,762 | 1.27(3)(4) | 1.27(3)(4) | 1.28(3)(4) | 1.36 | 45 | |||||||||||||||||||||||||||||||||||||||
2015 | 9.94 | 0.10 | (0.69) | (0.59) | (0.19) | — | (0.19) | 9.16 | (5.98) | 2,568,634 | 1.24(3) | 1.24(3) | 1.24(3) | 1.04 | 68 | |||||||||||||||||||||||||||||||||||||||
Class I |
| |||||||||||||||||||||||||||||||||||||||||||||||||||||
2019 | $11.37 | $0.17 | $(0.74) | $(0.57) | $(0.12) | $— | $(0.12) | $10.68 | (4.90) | % | $1,932 | 1.35%(5) | 1.35%(5) | 1.35%(5) | 1.61% | 73% | ||||||||||||||||||||||||||||||||||||||
2018 | 11.27 | 0.12 | 0.09 | 0.21 | (0.11) | — | (0.11) | 11.37 | 1.86 | 2,662 | 1.34(5) | 1.34(5) | 1.34(5) | 1.06 | 40 | |||||||||||||||||||||||||||||||||||||||
2017 | 9.55 | 0.10 | 1.70 | 1.80 | (0.08) | — | (0.08) | 11.27 | 19.00 | 2,954 | 1.40(5) | 1.40(5) | 1.40(5) | 0.96 | 57 | |||||||||||||||||||||||||||||||||||||||
2016 | 9.15 | 0.10 | 0.38 | 0.48 | (0.08) | — | (0.08) | 9.55 | 5.27 | 4,341 | 1.52(4)(5) | 1.52(4)(5) | 1.52(4)(5) | 1.09 | 45 | |||||||||||||||||||||||||||||||||||||||
2015 | 9.92 | 0.08 | (0.69) | (0.61) | (0.16) | — | (0.16) | 9.15 | (6.18) | 4,956 | 1.49(5) | 1.49(5) | 1.49(5) | 0.76 | 68 | |||||||||||||||||||||||||||||||||||||||
Class Y |
| |||||||||||||||||||||||||||||||||||||||||||||||||||||
2019 | $11.39 | $0.23 | $(0.76) | $(0.53) | $(0.18) | $— | $(0.18) | $10.68 | (4.43) | % | $370,462 | 0.85%(6) | 0.85%(6) | 0.85%(6) | 2.24% | 73% | ||||||||||||||||||||||||||||||||||||||
2018 | 11.31 | 0.18 | 0.09 | 0.27 | (0.19) | — | (0.19) | 11.39 | 2.40 | 344,977 | 0.84(6) | 0.84(6) | 0.84(6) | 1.60 | 40 | |||||||||||||||||||||||||||||||||||||||
2017 | 9.59 | 0.16 | 1.69 | 1.85 | (0.13) | — | (0.13) | 11.31 | 19.59 | 319,689 | 0.90(6) | 0.90(6) | 0.90(6) | 1.53 | 57 | |||||||||||||||||||||||||||||||||||||||
2016 | 9.18 | 0.16 | 0.37 | 0.53 | (0.12) | — | (0.12) | 9.59 | 5.77 | 168,719 | 1.02(4)(6) | 1.02(4)(6) | 1.03(4)(6) | 1.70 | 45 | |||||||||||||||||||||||||||||||||||||||
2015(7) | 9.39 | 0.13 | (0.34) | (0.21) | — | — | — | 9.18 | (2.24) | 130,379 | 1.00(6) | 1.00(6) | 1.00(6) | 1.72 | 68 | |||||||||||||||||||||||||||||||||||||||
Emerging Markets Equity Fund |
| |||||||||||||||||||||||||||||||||||||||||||||||||||||
Class F(2) |
| |||||||||||||||||||||||||||||||||||||||||||||||||||||
2019 | $11.47 | $0.10 | $(0.29) | $(0.19) | $(0.07) | $— | $(0.07) | $11.21 | (1.64) | % | $1,564,523 | 1.70%(8) | 1.70%(8) | 1.81%(9) | 0.92% | 89% | ||||||||||||||||||||||||||||||||||||||
2018 | 12.32 | 0.08 | (0.77) | (0.69) | (0.16) | — | (0.16) | 11.47 | (5.71) | 1,668,960 | 1.69(8) | 1.69(8) | 1.80(9) | 0.61 | 70 | |||||||||||||||||||||||||||||||||||||||
2017 | 10.09 | 0.07 | 2.24 | 2.31 | (0.08) | — | (0.08) | 12.32 | 23.10 | 1,821,009 | 1.74(8) | 1.74(8) | 1.82(9) | 0.65 | 66 | |||||||||||||||||||||||||||||||||||||||
2016 | 8.43 | 0.05 | 1.68 | 1.73 | (0.07) | — | (0.07) | 10.09 | 20.66 | 1,532,960 | 1.76(4)(8) | 1.76(4)(8) | 1.86(4)(9) | 0.59 | 79 | |||||||||||||||||||||||||||||||||||||||
2015 | 10.76 | 0.07 | (2.29) | (2.22) | (0.11) | — | (0.11) | 8.43 | (20.78) | 1,342,618 | 1.72(8) | 1.72(8) | 1.82(9) | 0.67 | 67 | |||||||||||||||||||||||||||||||||||||||
Class Y |
| |||||||||||||||||||||||||||||||||||||||||||||||||||||
2019 | $11.49 | $0.14 | $(0.31) | $(0.17) | $(0.10) | $— | $(0.10) | $11.22 | (1.44) | % | $145,600 | 1.45%(10) | 1.45%(10) | 1.56%(11) | 1.25% | 89% | ||||||||||||||||||||||||||||||||||||||
2018 | 12.35 | 0.11 | (0.76) | (0.65) | (0.21) | — | (0.21) | 11.49 | (5.46) | 125,594 | 1.44(10) | 1.44(10) | 1.55(11) | 0.89 | 70 | |||||||||||||||||||||||||||||||||||||||
2017 | 10.11 | 0.10 | 2.24 | 2.34 | (0.10) | — | (0.10) | 12.35 | 23.46 | 125,400 | 1.49(10) | 1.49(10) | 1.57(11) | 0.93 | 66 | |||||||||||||||||||||||||||||||||||||||
2016 | 8.45 | 0.09 | 1.66 | 1.75 | (0.09) | — | (0.09) | 10.11 | 20.95 | 72,218 | 1.52(4)(10) | 1.52(4)(10) | 1.62(4)(11) | 0.96 | 79 | |||||||||||||||||||||||||||||||||||||||
2015(7) | 10.08 | 0.10 | (1.73) | (1.63) | — | — | — | 8.45 | (16.17) | 44,012 | 1.47(10) | 1.47(10) | 1.57(11) | 1.33 | 67 | |||||||||||||||||||||||||||||||||||||||
| † | Returns do not reflect the deduction of taxes that a shareholder would pay on fund distributions or the redemption of fund shares. |
| * | Includes Fees Paid Indirectly, if applicable. See Note 5 in Notes to Financial Statements. |
| ** | See Note 5 in Notes to Financial Statements. |
| (1) | Per share net investment income and net realized and unrealized gains (losses) calculated using average shares. |
| (2) | Effective January 31, 2017, Class A Shares converted to Class F Shares of the same Fund. |
| (3) | The expense ratio includes overdraft fees. Had this expense been excluded the ratios would have been 1.10%, 1.09%, 1.15%, 1.27% and 1.24% for 2019, 2018, 2017, 2016 and 2015. |
| (4) | The expense ratio includes proxy expenses outside the cap. |
| (5) | The expense ratio includes overdraft fees. Had this expense been excluded the ratios would have been 1.35%, 1.34%, 1.40%, 1.52% and 1.49% for 2019, 2018, 2017, 2016 and 2015. |
| (6) | The expense ratio includes overdraft fees. Had this expense been excluded the ratios would have been 0.85%, 0.84%, 0.90%, 1.02% and 0.99% for 2019, 2018, 2017, 2016 and 2015. |
| (7) | Commenced operations on December 31, 2014. All ratios for the period have been annualized. |
| (8) | The expense ratio includes overdraft fees. Had this expense been excluded the ratios would have been 1.70%, 1.69%, 1.74%, 1.76% and 1.71% for 2019, 2018, 2017, 2016 and 2015. |
| (9) | The expense ratio includes overdraft fees. Had this expense been excluded the ratios would have been 1.81%, 1.80%, 1.82%, 1.86% and 1.71% for 2019, 2018, 2017, 2016 and 2015. |
| (10) | The expense ratio includes overdraft fees. Had this expense been excluded the ratios would have been 1.45%, 1.44%, 1.49%, 1.52% and 1.46% for 2019, 2018, 2017, 2016 and 2015. |
| (11) | The expense ratio includes overdraft fees. Had this expense been excluded the ratios would have been 1.56%, 1.55%, 1.58%, 1.62% and 1.46% for 2019, 2018, 2017, 2016 and 2015. |
Amounts designated as “—” are either $0 or have been rounded to $0.
The accompanying notes are an integral part of the financial statements.
SEI Institutional International Trust / Annual Report / September 30, 2019 |
79 |
FINANCIAL HIGHLIGHTS
For the years or period ended September 30
For a Share Outstanding Throughout Each Year or Period
| Net Asset Value, Beginning of Year | Net Investment | Net Realized on | Total from | Dividends from Net Investment Income | Distributions from Net Realized Gains | Total Dividends and Distributions | Net Asset Value, End of Year | Total Return† | Net Assets End of Year ($ Thousands) | Ratio of Net Expenses to Average Net Assets* | Ratio of Expenses Net Assets Paid Indirectly | Ratio of Expenses to Average Net Assets (Excluding Fees Paid Indirectly and Waivers)** | Ratio of Net Investment Income (Loss) to Average Net Assets | Portfolio Turnover Rate† | ||||||||||||||||||||||||||||||||||||||||
International Fixed Income Fund |
| |||||||||||||||||||||||||||||||||||||||||||||||||||||
Class F(2) |
| |||||||||||||||||||||||||||||||||||||||||||||||||||||
2019 | $10.27 | $0.04 | $0.88 | $0.92 | $(0.40) | $(0.06) | $(0.46) | $10.73 | 9.28 | % | $452,150 | 1.02%(3) | 1.02%(3) | 1.07%(4) | 0.42% | 58% | ||||||||||||||||||||||||||||||||||||||
2018 | 10.13 | 0.07 | 0.07 | 0.14 | — | — | — | 10.27 | 1.38 | 438,908 | 1.02(3) | 1.02(3) | 1.07(4) | 0.66 | 71 | |||||||||||||||||||||||||||||||||||||||
2017 | 10.51 | 0.07 | (0.18) | (0.11) | (0.17) | (0.10) | (0.27) | 10.13 | (1.03) | 415,582 | 1.02(3) | 1.02(3) | 1.08(4) | 0.66 | 113 | |||||||||||||||||||||||||||||||||||||||
2016 | 10.38 | 0.10 | 0.62 | 0.72 | (0.57) | (0.02) | (0.59) | 10.51 | 7.32 | 497,157 | 1.05(3)(5) | 1.05(3)(5) | 1.11(4)(5) | 0.98 | 106 | |||||||||||||||||||||||||||||||||||||||
2015 | 10.98 | 0.11 | 0.11 | 0.22 | (0.82) | — | (0.82) | 10.38 | 2.02 | 495,957 | 1.02(3) | 1.02(3) | 1.07(4) | 1.00 | 78 | |||||||||||||||||||||||||||||||||||||||
Class Y |
| |||||||||||||||||||||||||||||||||||||||||||||||||||||
2019 | $10.29 | $0.07 | $0.88 | $0.95 | $(0.43) | $(0.06) | $(0.49) | $10.75 | 9.54 | % | $69,681 | 0.77%(6) | 0.77%(6) | 0.82%(7) | 0.66% | 58% | ||||||||||||||||||||||||||||||||||||||
2018 | 10.12 | 0.09 | 0.08 | 0.17 | — | — | — | 10.29 | 1.68 | 43,003 | 0.77(6) | 0.77(6) | 0.82(7) | 0.91 | 71 | |||||||||||||||||||||||||||||||||||||||
2017 | 10.50 | 0.09 | (0.17) | (0.08) | (0.20) | (0.10) | (0.30) | 10.12 | (0.76) | 37,982 | 0.77(6) | 0.77(6) | 0.83(7) | 0.94 | 113 | |||||||||||||||||||||||||||||||||||||||
2016(8) | 10.45 | 0.12 | 0.55 | 0.67 | (0.60) | (0.02) | (0.62) | 10.50 | 6.79 | 12,901 | 0.80(5)(6) | 0.80(5)(6) | 0.87(5)(7) | 1.23 | 106 | |||||||||||||||||||||||||||||||||||||||
Emerging Markets Debt Fund |
| |||||||||||||||||||||||||||||||||||||||||||||||||||||
Class F(2) |
| |||||||||||||||||||||||||||||||||||||||||||||||||||||
2019 | $9.30 | $0.47 | $0.32 | $0.79 | $(0.16) | $— | $(0.16) | $9.93 | 8.51 | % | $1,483,467 | 1.36%(9) | 1.36%(9) | 1.62%(10) | 4.93% | 114% | ||||||||||||||||||||||||||||||||||||||
2018 | 10.55 | 0.51 | (1.19) | (0.68) | (0.57) | — | (0.57) | 9.30 | (6.81) | 1,451,128 | 1.36(9) | 1.36(9) | 1.61(10) | 5.08 | 80 | |||||||||||||||||||||||||||||||||||||||
2017 | 10.08 | 0.51 | 0.17 | 0.68 | (0.21) | — | (0.21) | 10.55 | 6.93 | 1,458,611 | 1.36(9) | 1.36(9) | 1.63(10) | 5.06 | 79 | |||||||||||||||||||||||||||||||||||||||
2016 | 8.66 | 0.49 | 0.93 | 1.42 | — | — | — | 10.08 | 16.40 | 1,453,586 | 1.39(5)(9) | 1.39(5)(9) | 1.65(5)(10) | 5.30 | 86 | |||||||||||||||||||||||||||||||||||||||
2015 | 10.20 | 0.47 | (1.81) | (1.34) | (0.19) | (0.01) | (0.20) | 8.66 | (13.35) | 1,227,567 | 1.36(9) | 1.36(9) | 1.61(10) | 4.91 | 71 | |||||||||||||||||||||||||||||||||||||||
Class Y |
| |||||||||||||||||||||||||||||||||||||||||||||||||||||
2019 | $9.28 | $0.50 | $0.32 | $0.82 | $(0.18) | $— | $(0.18) | $9.92 | 8.84 | % | $111,948 | 1.11%(11) | 1.11%(11) | 1.37%(12) | 5.18% | 114% | ||||||||||||||||||||||||||||||||||||||
2018 | 10.57 | 0.53 | (1.18) | (0.65) | (0.64) | — | (0.64) | 9.28 | (6.57) | 113,872 | 1.11(11) | 1.11(11) | 1.36(12) | 5.34 | 80 | |||||||||||||||||||||||||||||||||||||||
2017 | 10.12 | 0.53 | 0.17 | 0.70 | (0.25) | — | (0.25) | 10.57 | 7.18 | 108,361 | 1.11(11) | 1.11(11) | 1.38(12) | 5.31 | 79 | |||||||||||||||||||||||||||||||||||||||
2016 | 8.67 | 0.52 | 0.93 | 1.45 | — | — | — | 10.12 | 16.72 | 100,566 | 1.14(5)(11) | 1.14(5)(11) | 1.40(5)(12) | 5.55 | 86 | |||||||||||||||||||||||||||||||||||||||
2015(13) | 9.63 | 0.37 | (1.28) | (0.91) | (0.05) | — | (0.05) | 8.67 | (9.48) | 78,383 | 1.11(11) | 1.11(11) | 1.36(12) | 5.24 | 71 | |||||||||||||||||||||||||||||||||||||||
| † | Returns do not reflect the deduction of taxes that a shareholder would pay on fund distributions or the redemption of fund shares. |
| * | Includes Fees Paid Indirectly, if applicable. See Note 5 in Notes to Financial Statements. |
| ** | See Note 5 in Notes to Financial Statements. |
| (1) | Per share net investment income and net realized and unrealized gains (losses) calculated using average shares. |
| (2) | Effective January 31, 2017, Class A Shares converted to Class F Shares of the same Fund. |
| (3) | The expense ratio includes overdraft fees. Had this expense been excluded the ratios would have been 1.02%, 1.02%, 1.02%, 1.05% and 1.02% for 2019, 2018, 2017, 2016 and 2015. |
| (4) | The expense ratio includes overdraft fees. Had this expense been excluded the ratios would have been 1.07%, 1.07%, 1.08%, 1.11% and 1.07% for 2019, 2018, 2017, 2016 and 2015. |
| (5) | The expense ratio includes proxy expenses outside the cap. |
| (6) | The expense ratio includes overdraft fees. Had this expense been excluded the ratios would have been 0.77%, 0.77%, 0.77% and 0.80% for 2019, 2018, 2017 and 2016. |
| (7) | The expense ratio includes overdraft fees. Had this expense been excluded the ratios would have been 0.82%, 0.82%, 0.83% and 0.87% for 2019, 2018, 2017 and 2016. |
| (8) | Commenced operations on October 30, 2015. All ratios for the period have been annualized. |
| (9) | The expense ratio includes overdraft fees. Had this expense been excluded the ratios would have been 1.37%, 1.36%, 1.36%, 1.39% and 1.36% for 2019, 2018, 2017, 2016 and 2015. |
| (10) | The expense ratio includes overdraft fees. Had this expense been excluded the ratios would have been 1.62%, 1.61%, 1.63%, 1.65% and 1.61% for 2019, 2018, 2017, 2016 and 2015. |
| (11) | The expense ratio includes overdraft fees. Had this expense been excluded the ratios would have been 1.11%, 1.11%, 1.11%, 1.14% and 1.11% for 2019, 2018, 2017, 2016 and 2015. |
| (12) | The expense ratio includes overdraft fees. Had this expense been excluded the ratios would have been 1.37%, 1.36%, 1.38%, 1.40% and 1.36% for 2019, 2018, 2017, 2016 and 2015. |
| (13) | Commenced operations on December 31, 2014. All ratios for the period have been annualized. |
Amounts designated as “—” are either $0 or have been rounded to $0.
The accompanying notes are an integral part of the financial statements.
80 |
SEI Institutional International Trust / Annual Report / September 30, 2019 |
September 30, 2019
1. ORGANIZATION
SEI Institutional International Trust (the “Trust”) was organized as a Massachusetts business trust under a Declaration of Trust dated June 30, 1988.
The Trust is registered under the Investment Company Act of 1940, as amended, as anopen-end investment company with four funds: International Equity Fund, Emerging Markets Equity Fund, International Fixed Income Fund and Emerging Markets Debt Fund (together the “Funds”) each of which are diversified Funds with the exception of the International Fixed Income Fund and the Emerging Markets Debt Fund. Each Fund’s prospectus provides a description of its investment goal, principal investment strategies and risks. The Trust is registered to offer Class F (formerly Class A) and Class Y shares of each of the Funds and Class I shares of the International Equity Fund.
2. SIGNIFICANT ACCOUNTING POLICIES
The following are significant accounting policies, which are consistently followed in the preparation of its financial statements by the Funds. The Funds are investment companies that apply the accounting and reporting guidance issued in Topic 946 by the U.S. Financial Accounting Standards Board (“FASB”).
Use of Estimates — The Funds are investment companies in conformity with accounting principles generally accepted in the United States of America (“U.S. GAAP”). Therefore, the Funds follow the accounting and reporting guidelines for investment companies. The preparation of financial statements, in conformity with U.S. GAAP requires management to make estimates and assumptions that affect the reported amounts of assets and liabilities and disclosure of contingent assets and liabilities as of the date of the financial statements and the reported amounts of increases and decreases in net assets from operations during the reporting period. Actual results could differ from those estimates.
Security Valuation — Securities listed on a securities exchange, market or automated quotation system for which quotations are readily available (other than securities traded on National Association of Securities Dealers Automated Quotations (NASDAQ) or as otherwise noted below) at the last quoted sale price on an exchange or market (foreign or domestic) on which the securities are traded, or, if there is no such reported sale, at the most recent quoted bid price. The Funds value securities traded on NASDAQ at the NASDAQ Official Closing Price. If available, debt securities, swaps (which are not centrally cleared), bank loans or collateralized debt obligations (including collateralized loan obligations), such as those held by the Funds, are priced based upon valuations provided by independent,
third-party pricing agents. Such values generally reflect the last reported sales price if the security is actively traded. The third-party pricing agents may also value debt securities at an evaluated bid price by employing methodologies that utilize actual market transactions, broker-supplied valuations or other methodologies designed to identify the market value for such securities. Redeemable securities issued byopen-end investment companies are valued at the investment company’s applicable net asset value, with the exception of ETFs, which are priced as equity securities. The prices of foreign securities are reported in local currency and converted to U.S. dollars using currency exchange rates. If a security’s price cannot be obtained, as noted above, the Funds will value the securities using a bid price from at least one independent broker. If such prices are not readily available or cannot be valued using the methodologies described above, the Funds will value the security using the Funds’ Fair Value Pricing Policies and Procedures (“Fair Value Procedures”), as described below.
On the first day a new debt security purchase is recorded, if a price is not available from a third-party pricing agent or an independent broker, the security may be valued at its purchase price. Each day thereafter, the debt security will be valued according to the Funds’ Fair Value Procedures until a price from an independent source can be secured. Securities held by a Fund with remaining maturities of 60 days or less may be valued by the amortized cost method, which involves valuing a security at its cost on the date of purchase and thereafter (absent unusual circumstances) assuming a constant amortization to maturity of any discount or premium, regardless of the impact of fluctuations in general market rates of interest on the value of the instrument. While this method provides certainty in valuation, it may result in periods during which value, as determined by this method, is higher or lower than the price a Fund would receive if it sold the instrument. Further, the value of securities in the Fund can be expected to vary inversely with changes in prevailing interest rates. Should existing credit, liquidity or interest rate conditions in the relevant markets and issuer-specific circumstances suggest that amortized cost does not approximate fair value, then the amortized cost method may not be used.
Futures and swaps cleared through a central clearing house (“centrally cleared swaps”) are valued at the settlement price established each day by the board of exchange on which they are traded. The daily settlement prices for financial futures and centrally cleared swaps are provided by an independent source. On days when there is excessive volume, market volatility or the future or centrally cleared swap does not end trading by the
SEI Institutional International Trust / Annual Report / September 30, 2019 |
81 |
NOTES TO FINANCIAL STATEMENTS (Continued)
September 30, 2019
time a Fund calculates its Net Asset Value (“NAV”), the settlement price may not be available at the time at which the Fund calculates its NAV. On such days, the best available price (which is typically the last sales price) may be used to value a Fund’s futures or centrally cleared swaps position.
Foreign currency forward contracts are valued at the current day’s interpolated foreign exchange rate, as calculated using forward rates provided by an independent source.
Prices for most securities held by a Fund are provided daily by third-party independent pricing agents. SEI Investments Management Corporation (“SIMC”) or aSub-Adviser(“Sub-Adviser”), as applicable, reasonably believes that prices provided by independent pricing agents are reliable. However, there can be no assurance that such pricing service’s prices will be reliable. SIMC or aSub-Adviser, as applicable, will continuously monitor the reliability of prices obtained from any pricing service and shall promptly notify the Funds’ administrator if it believes that a particular pricing service is no longer a reliable source of prices. The Funds’ administrator, in turn, will notify the Fair Value Pricing Committee (the “Committee”) if it receives such notification from SIMC or aSub-Adviser, as applicable, or if the Funds’ administrator reasonably believes that a particular pricing service is no longer a reliable source for prices.
The Funds’ Fair Value Procedures provide that any change in a primary pricing agent or a pricing methodology requires prior approval by the Board of Trustees (“Board”) or its designatedsub-committee. However, when the change would not materially affect valuation of a Fund’s net assets or involve a material departure in pricing methodology from that of the Fund’s existing pricing agent or pricing methodology, approval may be obtained at the next regularly scheduled meeting of the Board.
Securities for which market prices are not readily available, for which market prices are determined to be unreliable, or which cannot be valued using the methodologies described above are valued in accordance with the Fair Value Procedures established by the Board. The Funds’ Fair Value Procedures are implemented through the Committee designated by the Board. The Committee is currently composed of two members of the Board, as well as representatives from SIMC and its affiliates. Some of the more common reasons that may necessitate that a security be valued using Fair Value Procedures include: (i) the security’s trading has been halted or suspended, (ii) the security has been delisted from a national exchange, (iii) the security’s primary trading market is temporarily closed at a time when under normal conditions it would be
open, or (iv) the security’s primary pricing source is not able or willing to provide a price. When a security is valued in accordance with the Fair Value Procedures, the Committee will determine the value after taking into consideration relevant information reasonably available to the Committee. Examples of factors the Committee may consider include: (i) the facts giving rise to the need to fair value, (ii) the last trade price, (iii) the performance of the market or the issuer’s industry, (iv) the liquidity of the security, (v) the size of the holding in a Fund, or (vi) any other appropriate information.
The determination of a security’s fair value price often involves the consideration of a number of subjective factors, and is therefore subject to the unavoidable risk that the value assigned to a security may be higher or lower than the security’s value would be if a reliable market quotation for the security was readily available.
For securities that principally trade on a foreign market or exchange, a significant gap in time can exist between the time of a particular security’s last trade and the time at which a Fund calculates its NAV. The closing prices of such securities may no longer reflect their market value at the time a Fund calculates NAV if an event that could materially affect the value of those securities (a “Significant Event”), including substantial fluctuations in domestic or foreign markets or occurrences not tied directly to the securities markets, such as natural disasters, armed conflicts or significant governmental actions, has occurred between the time of the security’s last close and the time that the Fund calculates its NAV. A Fund may invest in securities that are primarily listed on foreign exchanges that trade on weekends or other days when the Fund does not price its shares. As a result, the NAV of the Fund’s shares may change on days when shareholders will not be able to purchase or redeem Fund shares.
A Significant Event may relate to a single issuer or to an entire market sector. If SIMC or aSub-Adviser becomes aware of a Significant Event that has occurred with respect to a security or group of securities after the closing of the exchange or market on which the security or securities principally trade, but before the time at which the Funds calculate NAV, it may request that a Committee meeting be called. In addition, the Funds use several processes, with respect to certain securities to monitor the pricing data supplied by various sources, including price comparisons and price movements. Any identified discrepancies are researched and subject to the procedures described above.
The International Equity Fund and Emerging Markets Equity Fund also use a third-party fair valuation vendor. The vendor provides a fair value for foreign securities held by these Funds based on certain factors and
82 |
SEI Institutional International Trust / Annual Report / September 30, 2019 |
methodologies (involving, generally, tracking valuation correlations between the U.S. market and eachnon-U.S. security). Values from the fair value vendor are applied in the event that there is a movement in the U.S. market that exceeds a specific threshold that has been established by the Committee. The Committee has also established a “confidence interval” which is used to determine the level of historical correlation between the value of a specific foreign security and movements in the U.S. market before a particular security will be fair valued when the threshold is exceeded. In the event that the threshold established by the Committee is exceeded on a specific day, the International Equity Fund and Emerging Markets Equity Fund will value thenon-U.S. securities in their portfolios that exceed the applicable “confidence interval” based upon the adjusted prices provided by the fair valuation vendor.
In accordance with U.S. GAAP, fair value is defined as the price that the Fund would receive upon selling an investment in an orderly transaction to an independent buyer in the principal or most advantageous market of the investment. A three-tier hierarchy has been established to maximize the use of the observable market data and minimize the use of unobservable inputs and to establish classification of the fair value measurements for disclosure purposes. Inputs refer broadly to the assumptions that market participants would use in pricing an asset. Inputs may be observable or unobservable. Observable inputs are inputs that reflect the assumptions market participants would use in pricing the asset or liability developed based on market data obtained from sources independent of the reporting entity. Unobservable inputs are inputs that reflect the reporting entity’s own assumptions about the assumptions market participants would use in pricing the asset or liability developed based on the best information available in the circumstances.
The three-tier hierarchy of inputs is summarized in the three broad Levels listed below:
Level 1 — quoted prices in active markets for identical investments
Level 2 — other significant observable inputs (including quoted prices for similar investments, interest rates, prepayment speeds, credit risks, etc.)
Level 3 — significant unobservable inputs (including the Fund’s own assumptions in determining the fair value of investments)
Investments are classified within the level of the lowest significant input considered in determining fair value. Investments classified within Level 3 whose fair value measurement considers several inputs may include
Level 1 or Level 2 inputs as components of the overall fair value measurement.
The valuation techniques used by the Funds to measure fair value during the year ended September 30, 2019 maximized the use of observable inputs and minimized the use of unobservable inputs.
For the year ended September 30, 2019, there have been no significant changes to the inputs or the Trust’s fair valuation methodologies.
Security Transactions and Investment Income— Security transactions are recorded on the trade date. Cost used in determining net realized capital gains and losses on the sale of securities is determined on the basis of specific identification. Dividend income and expense is recognized on theex-dividend date, and interest income or expense is recognized using the accrual basis of accounting.
Distributions received on securities that represent a return of capital or capital gain are recorded as a reduction of cost of investments and/ or as a realized gain. The Trust estimates the components of distributions received that may be considered nontaxable distributions or capital gain distributions.
Amortization and accretion is calculated using the scientific interest method, which is not materially different from the effective interest method. Amortization of premiums and discounts is included in interest income.
Expenses— Expenses that are directly related to one of the Funds are charged directly to that Fund. Other operating expenses of the Trust are prorated to the Funds on the basis of relative daily net assets.
Classes— Class-specific expenses are borne by that class. Income,non-class specific expenses, and realized and unrealized gains/losses are allocated to the respective classes on the basis of relative daily net assets.
Foreign Currency Translation— The books and records of the Funds investing in international securities are maintained in U.S. dollars on the following basis:
(i) market value of investment securities, assets and liabilities at the current rate of exchange; and
(ii) purchases and sales of investment securities, income and expenses at the relevant rates of exchange prevailing on the respective dates of such transactions.
The Funds do not isolate that portion of gains and losses on investments in investment securities that is due to changes in the foreign exchange rates from that which is due to changes in market prices of investment securities.
SEI Institutional International Trust / Annual Report / September 30, 2019 |
83 |
NOTES TO FINANCIAL STATEMENTS (Continued)
September 30, 2019
The Funds report certain foreign-currency-related transactions as components of realized gains for financial reporting purposes, whereas such components are treated as ordinary income for Federal income tax purposes.
Forward Foreign Currency Contracts— To the extent consistent with its investment objective and strategies, a Fund may enter into forward foreign currency contracts as hedges against either specific transactions, fund positions, speculative purposes or anticipated fund positions. All commitments are“marked-to-market” daily at the applicable foreign exchange rate, and any resulting unrealized gains or losses are recorded currently. The Fund realizes gains and losses at the time forward contracts are extinguished. Unrealized gains or losses on outstanding positions in forward foreign currency contracts held at the close of the year are recognized as ordinary income or loss for federal income tax purposes. The Fund could be exposed to risk if the counterparties to the contracts are unable to meet the terms of the contract and from unanticipated movements in the value of a foreign currency relative to the U.S. dollar.
Finally, the risk exists that losses could exceed amounts disclosed on the Statement of Assets and Liabilities. Refer to each Fund’s Schedule of Investments for details regarding open forward foreign currency contracts as of September 30, 2019, if applicable.
Futures Contracts— To the extent consistent with its investment objective and strategies, the Funds may purchase futures contracts to gain exposure to market changes, which may be more efficient or cost effective than actually buying the securities. To the extent consistent with its investment objective and strategies, a Fund may utilize futures contracts for tactical hedging purposes as well as to enhance the Funds’ returns and may also utilize futures contracts to efficiently assist in managing the Funds’ duration and yield curve exposure. Upon entering into such a contract, a Fund is required to deposit and maintain as collateral such initial margin as required by the exchange on which the contract is held. The contracts are marked to market daily and the resulting changes in value are accounted for as unrealized gains and losses. Variation margin payments are paid or received, depending upon whether unrealized losses or gains are incurred. When the contract is closed, the Funds record a realized gain or loss equal to the difference between the proceeds from (or cost of) the closing transaction and the amount invested in the contract.
Risks of entering into futures contracts include the possibility that there will be an imperfect price correlation between the futures and the underlying
securities. Second, it is possible that a lack of liquidity for futures contracts could exist in the secondary market, resulting in an inability to close a position prior to its maturity date. Third, the futures contract involves the risk that a Fund could lose more than the original margin deposit required to initiate a futures transaction.
Finally, the risk exists that losses could exceed amounts disclosed on the Statement of Assets and Liabilities. Refer to each Fund’s Schedule of Investments for details regarding open futures contracts as of September 30, 2019, if applicable.
Options/Swaptions Written/Purchased— To the extent consistent with its investment objective and strategies, a Fund may invest in financial options/swaptions contracts for the purpose of hedging its existing portfolio securities, or securities that a Fund intends to purchase, against fluctuations in fair market value caused by changes in prevailing market interest rates. A Fund may also invest in financial option/swaption contracts to enhance its returns. When the Fund writes or purchases an option/swaption, an amount equal to the premium received or paid by the Fund is recorded as a liability or an asset and is subsequently adjusted to the current market value of the option/swaption written or purchased. Premiums received or paid from writing or purchasing options/swaptions which expire unexercised are treated by the Fund on the expiration date as realized gains or losses. The difference between the premium and the amount paid or received on effecting a closing purchase or sale transaction, including brokerage commissions, is also treated as a realized gain or loss. If an option/swaption is exercised, the premium paid or received is added to the cost of the purchase or proceeds from the sale in determining whether the Fund has realized a gain or a loss.
The risk in writing a call option/swaption is a Fund may give up the opportunity for profit if the market price of the security increases. The risk in writing a put option/swaption is a Fund may incur a loss if the market price of the security decreases and the option/swaption is exercised. The risk in purchasing an option/swaption is a Fund may pay a premium whether or not the option/swaption is exercised. The Funds also have the additional risk of being unable to enter into a closing transaction at an acceptable price if a liquid secondary market does not exist. Option/swaption contracts also involve the risk that they may not work as intended due to unanticipated developments in market conditions or other causes.
Finally, the risk exists that losses on written options could exceed amounts disclosed on the Statements of Assets and Liabilities. Refer to each Fund’s Schedule of
84 |
SEI Institutional International Trust / Annual Report / September 30, 2019 |
Investments for details regarding open option/swaption contracts as of September 30, 2019, if applicable.
Swap Agreements— To the extent consistent with its investment objective and strategies, a Fund may invest in swap contracts as an efficient means to take and manage risk in the portfolio, including interest rate risk, credit risk and overall yield sensitivity. A swap agreement is atwo-party contract under which an agreement is made to exchange returns from predetermined investments or instruments, including a particular interest rate, foreign currency, or “basket” of securities representing a particular index. Swap agreements are privately negotiated in theover-the-counter market (“OTC swaps”) or may be executed in a multilateral or other trade facility platform, such as a registered commodities exchange (“Centrally Cleared swaps”). Interest rate swaps involve the exchange by a Fund with another party of their respective commitments to pay or receive interest (e.g., an exchange of floating rate payments for fixed rate payments) with respect to a notional amount of principal. Credit default swaps involve the periodic payment by a Fund or counterparty of interest based on a specified rate multiplied by a notional amount assigned to an underlying debt instrument or group of debt instruments in exchange for the assumption of credit risk on the same instruments. In the event of a credit event, usually in the form of a credit rating downgrade, the party receiving periodic payments (i.e. floating rate payer) must pay the other party (i.e. fixed rate payer) an amount equal to the outstanding principal of the downgraded debt instrument. Total return swaps allow an investor to benefit from the cash flow without ever actually owning the underlying security. The receiver must pay any decline in value to the payer at the end of the total return swap. However, the investor does not need to make a payment if there is no decline in price. Payments can be made on various indices, bonds (i.e. mortgage backed securities, bank debt and corporate), loans or commodities. The value of a total return swap is equal to the change in value of the underlying asset versus the accrued income payment based on LIBOR (London Interbank Offered Rate) or some other form of index on the notional amount. Interest rate swaps involve the exchange by a Fund with another party of their respective commitments to pay or receive interest (e.g., an exchange of floating rate payments for fixed rate payments) with respect to a notional amount of principal to manage a Fund’s exposure to interest rates. Payments received or made are recorded as realized gains or losses. A Fund could be exposed to credit or market risk due to unfavorable changes in the fluctuation of interest rates or if the counterparty defaults on its obligation to perform. Risk of loss may exceed amounts recognized on the
statement of assets and liabilities. In connection with swap agreements, securities/cash may be set aside as collateral by the Fund’s custodian. A Fund may enter into swap agreements in order to, among other things, change the maturity or duration of the investment portfolio; protect a Fund’s value from changes in interest rates; or expose a Fund to a different security or market.
Swaps aremarked-to-market daily based upon quotations from market makers and the resulting changes in market values, if any, are recorded as unrealized gains or losses in the Statement of Operations. Centrally cleared swaps are valued at the settlement price established each day by the board of exchange on which they are traded. The daily settlement prices for centrally cleared swaps are provided by an independent source. Net payments of interest are recorded as realized gains or losses. Daily changes in valuation of Centrally Cleared swaps, if any, are recorded as a receivable or payable for the change in value as appropriate (“variation margin”) on the Statements of Assets and Liabilities.
Entering into swap agreements involves, to varying degrees, elements of credit and market risk in excess of the amounts recognized on the Schedule of Investments or the Statement of Assets and Liabilities. Such risks involve the possibility that there will be no liquid market for these agreements, that the counterparty to the agreement may default on its obligation to perform and that there may be unfavorable changes in the fluctuation of interest rates. Risks also arise from potential losses from adverse market movements.
Counterparty risk may be mitigated by having a master netting arrangement between a Fund and the counterparty and by having the counterparty post collateral to cover a Fund’s exposure to the counterparty. Refer to each Fund’s Schedule of Investments for details regarding open swap contracts as of September 30, 2019, if applicable.
Delayed Delivery Transactions— A Fund may purchase or sell securities on a when-issued or delayed delivery basis. These transactions involve a commitment by the Fund to purchase or sell securities for a predetermined price or yield, with payment and delivery taking place beyond the customary settlement period. When delayed delivery purchases are outstanding, the Fund will set aside liquid assets in an amount sufficient to meet the purchase price. When purchasing a security on a delayed delivery basis, the Fund assumes the rights and risks of ownership of the security, including the risk of price and yield fluctuations, and takes such fluctuations into account when determining its net asset value. The Fund may dispose of or renegotiate a delayed delivery transaction after it is entered into, and may sell when-
SEI Institutional International Trust / Annual Report / September 30, 2019 |
85 |
NOTES TO FINANCIAL STATEMENTS (Continued)
September 30, 2019
issued securities before they are delivered, which may result in a capital gain or loss. When the Fund has sold a security on a delayed delivery basis, the Fund does not participate in future gains and losses with respect to the security.
Loan Participations and Brady Bonds— To the extent consistent with its investment objective and strategies, a Fund may invest in U.S. dollar-denominated fixed- and floating-rate loans (“Loans”) arranged through private negotiations between a foreign sovereign entity and one or more financial institutions (“Lenders”). The Fund invests in such Loans in the form of participations in Loans (“Participations”) or assignments of all or a portion of Loans from third parties. Participations typically result in a Fund having a contractual relationship only with the Lenders, not with the sovereign borrowers. The Fund has the right to receive payments of principal, interest and any fees to which it is entitled from the Lender selling the Participation and only upon receipt by the Lender of the payments from the borrower. In connection with purchasing Participations, the Fund generally has no right to enforce compliance by the borrower with the terms of the loan agreement relating to the Loan, nor any rights ofset-off against the borrower, and the Fund will not benefit directly from any collateral supporting the Loan in which it has purchased the Participation. As a result, the Fund assumes the credit risk of both the borrower and the Lender that is selling the Participation.
Certain debt obligations, customarily referred to as “Brady Bonds”, are created through the exchange of existing commercial bank loans to foreign entities for new obligations in connection with debt restructuring under a plan introduced by former U.S. Secretary of the Treasury Nicholas F. Brady. Brady Bonds have only been issued since 1989, and, accordingly, do not have a long payment history. They are issued by governments that may have previously defaulted on the loans being restructured by the Brady Bonds, so they are subject to the risk of default by the issuer. They may be fully or partially collateralized or uncollateralized and issued in various currencies.
Dividends and Distributions to Shareholders— The International Equity, Emerging Markets Equity and International Fixed Income Funds will distribute substantially all of their net investment income and all net realized capital gains, if any, at least annually. The Emerging Markets Debt Fund will distribute substantially all of its net investment income, if any, at least quarterly and all net realized gains, if any, at least annually. All dividends and distributions are recorded onex-dividend date.
Investments in Real Estate Investment Trusts (“REITs”)—Dividend income is recorded based on the income
included in distributions received from the REIT investments using published REIT reclassifications including management estimates when actual amounts are not available. Distributions received in excess of this estimated amount are recorded as a reduction of the cost of investments or reclassified to capital gains. The actual amounts of income, return of capital, and capital gains are only determined by each REIT after its fiscalyear-end, and may differ from the estimated amounts.
Participation Notes(P-Notes)— To the extent consistent with its investment objective and strategies, a Fund may acquireP-Notes issued by participating banks or broker-dealers.P-Notes are participation interest notes that are designed to offer a return linked to a particular underlying equity, debt, currency or market. TheP-Notes in which the Fund may invest will typically have a maturity of one year. When purchasing aP-Note, the posting of margin is not required because the full cost of theP-Note (plus commission) is paid at the time of purchase. When theP-Note matures, the issuer will pay to, or receive from, the purchaser the difference between the minimal value of the underlying instrument at the time of purchase and that instrument’s value at maturity. Investments inP-Notes involve the same risks associated with a direct investment in the underlying foreign companies of foreign securities markets that they seek to replicate. In addition, there can be no assurance that the trading price ofP-Notes will equal the underlying value of the foreign companies or foreign securities markets that they seek to replicate. The holder of a participation note that is linked to a particular underlying security is entitled to receive any dividends paid in connection with an underlying security or instrument. However, the holder of a participation note does not receive voting rights as it would if it directly owned the underlying security or instrument.P-Notes are generally tradedover-the-counter.P-Notes constitute general unsecured contractual obligations of the banks or broker-dealers that issue them and the counterparty. There is also counterparty risk associated with these investments because the Fund is relying on the creditworthiness of such counterparty and has no rights under a participation note against the issuer of the underlying security.
3. CREDIT DERIVATIVES
A Fund may use credit default swaps to reduce risk where a Fund has exposure to the issuer, or to take an active long or short position with respect to the likelihood of an event of default. The reference obligation of the swap can be a single issuer, a “basket” of issuers, or an index. The underlying referenced assets are corporate debt, sovereign debt and asset backed securities.
86 |
SEI Institutional International Trust / Annual Report / September 30, 2019 |
The buyer of a credit default swap is generally obligated to pay the seller a periodic stream of payments over the term of the contract in return for a contingent payment upon the occurrence of a credit event with respect to an underlying reference obligation. Generally, a credit event for corporate or sovereign reference obligations means bankruptcy, failure to pay, obligation acceleration, repudiation/moratorium or restructuring. For credit default swaps on asset-backed securities, a credit event may be triggered by events such as failure to pay principal, maturity extension, rating downgrade or write-down.
If a Fund is a seller of protection, and a credit event occurs, as defined under the terms of that particular swap agreement, a Fund will generally either (i) pay to the buyer an amount equal to the notional amount of the swap and take delivery of the referenced obligation, other deliverable obligations, or underlying securities comprising a referenced index or (ii) pay a net settlement amount in the form of cash or securities equal to the notional amount of the swap less the recovery value of the referenced obligation or underlying securities comprising a referenced index.
If a Fund is a buyer of protection and a credit event occurs, as defined under the terms of that particular swap agreement, a Fund will either (i) receive from the seller of protection an amount equal to the notional amount of the swap and deliver the referenced obligation, other deliverable obligations or underlying securities comprising the referenced index or (ii) receive a net settlement amount in the form of cash or securities equal to the notional amount of the swap less the recovery value of the referenced obligation or underlying securities comprising the referenced index. Recovery values are calculated by market makers considering either industry standard recovery rates or entity specific factors and considerations until a credit event occurs. If a credit event has occurred, the recovery value is determined by a facilitated auction whereby a minimum number of allowable broker bids, together with a specified valuation method, are used to calculate the settlement value.
As of September 30, 2019, the International Fixed Income Fund and the Emerging Markets Debt Fund are the sellers (“providing protection”) on a total notional amount of $2.0 million and $4.0 million, respectively. The notional amounts of the swaps are not recorded in the financial statements; however the notional amounts approximate the maximum potential amount of future payments that the Fund could be required to make if the Fund was the seller of protection and a credit event were to occur. Those credit default swaps (“CDS”) for which the Funds are providing protection at balance sheet date are summarized as follows:
International Fixed Income Fund
| ||||||||||||||||||||
Written Credit Derivative Contracts | Single Name CDS | CDS Index | ||||||||||||||||||
Reference Asset | Corp US$ | Sovereign US$ | ABS US$ | Corp US$ | Total | |||||||||||||||
Fair value of written credit derivatives | $ — | $ — | $ (169,307) | $ 50,523 | $ (118,784) | |||||||||||||||
Maximum potential amount of future payments | — | — | 2,012,000 | 2,160,000 | 4,172,000 | |||||||||||||||
Recourse provisions with the third parties any amounts paid under the credit derivative (including any purchased credit protection) | — | — | — | — | — | |||||||||||||||
Collateral held by the Partnership or other third parties which the Partnership can obtain upon occurrence of triggering event | — | — | — | — | — | |||||||||||||||
| Maximum Potential Amount of Future Payments by Contract Term | ||||||||||||||||||||||||
| 0-6 Months | 6-12 Months | 1-5 Years | 5-10 Years | >10 Years | Total | |||||||||||||||||||
Current credit spread* on underlying (in basis points)(1) | ||||||||||||||||||||||||
0-100 | $ — | $ — | $ | — | $ 2,160,000 | $ | — | $ | 2,160,000 | |||||||||||||||
>101 | — | — | — | — | 2,012,000 | 2,012,000 | ||||||||||||||||||
Total | $ — | $ — | $ | — | $ 2,160,000 | $ | 2,012,000 | $ | 4,172,000 | |||||||||||||||
| * | The credit spread on the underlying asset is generally indicative of the current status of the underlying risk of the Fund having to perform. The spread also reflects the cost of buying/selling protection and may include upfront payments required to be made to enter into a contract. Higher credit spreads with a shorter contract term is indicative of a higher likelihood of performance by the Fund. |
| (1) | Potential recoveries would include purchased credit derivatives to the extent they offset written credit derivatives which have an identical underlying, or a netting arrangement or credit support annex with the counterparty. There may be other potential recoveries from recourse provisions where agreements cover multiple derivative arrangements but those amounts have not been included. |
SEI Institutional International Trust / Annual Report / September 30, 2019 |
87 |
NOTES TO FINANCIAL STATEMENTS (Continued)
September 30, 2019
| Emerging Markets Debt Fund | ||||||||||||||||||||
Written Credit Derivative Contracts | Single Name CDS | CDS Index | ||||||||||||||||||
Reference Asset | Corp US$ | Sovereign US$ | ABS US$ | Corp US$ | Total | |||||||||||||||
Fair value of written credit derivatives | $ — | $ (1,118,671) | $ — | $ — | $ (1,118,671) | |||||||||||||||
Maximum potential amount of future payments | — | 3,994,629 | — | — | 3,994,629 | |||||||||||||||
Recourse provisions with the third parties any amounts paid under the credit derivative (including any purchased credit protection) | — | — | — | — | — | |||||||||||||||
Collateral held by the Partnership or other third parties which the Partnership can obtain upon occurrence of triggering event | — | — | — | — | — | |||||||||||||||
| Maximum Potential Amount of Future Payments by Contract Term | ||||||||||||||||||||||||
| 0-6 Months | 6-12 Months | 1-5 Years | 5-10 Years | >10 Years | Total | |||||||||||||||||||
Current credit spread* on underlying (in basis points)(1) | ||||||||||||||||||||||||
0-100 | $ — | $ — | $ | — | $ — | $ — | $ | — | ||||||||||||||||
>101 | 2,100,000 | 1,894,629 | — | — | — | 3,994,629 | ||||||||||||||||||
Total | $ 2,100,000 | $ 1,894,629 | $ | — | $ — | $ — | $ | 3,994,629 | ||||||||||||||||
| * | The credit spread on the underlying asset is generally indicative of the current status of the underlying risk of the Fund having to perform. The spread also reflects the cost of buying/selling protection and may include upfront payments required to be made to enter into a contract. Higher credit spreads with a shorter contract term is indicative of a higher likelihood of performance by the Fund. |
| (1) | Potential recoveries would include purchased credit derivatives to the extent they offset written credit derivatives which have an identical underlying, or a netting arrangement or credit support annex with the counterparty. There may be other potential recoveries from recourse provisions where agreements cover multiple derivative arrangements but those amounts have not been included. |
The credit spread disclosed above for each reference obligation where the Fund is the seller of protection is a representation of the current payment/performance risk of the swap.
4. DERIVATIVE CONTRACTS
The following tables include only Funds that had exposure to more than one type of risk on derivatives held throughout the year. For Funds that held derivatives throughout the year with only one type of risk exposure, additional information can be found on the Schedules of Investments and the Statements of Operations. The fair value of derivative instruments as of year end was as follows:
| Asset Derivatives | Liability Derivatives | |||||||||||
Year Ended September 30, 2019 ($ Thousands) | Year Ended September 30, 2019 ($ Thousands) | |||||||||||
Statements of Assets and Liabilities Location | Fair Value | Statements of Assets and Liabilities Location | Fair Value | |||||||||
International Fixed Income Fund | ||||||||||||
Interest rate contracts | Net Assets — Unrealized appreciation on futures contracts | $ | 616* | Net Assets — Unrealized depreciation on futures contracts | $ | 107* | ||||||
| Net Assets — Unrealized appreciation on swap contracts | 18† | Net Assets — Unrealized depreciation on swap contracts | 166† | |||||||||
Credit contracts | Net Assets — Unrealized appreciation on swap contracts | 51† | Net Assets — Unrealized depreciation on swap contracts | 12† | ||||||||
Foreign exchange contracts | Unrealized gain on forward foreign currency contracts | 7,572 | Unrealized loss on forward foreign currency contracts | 1,803 | ||||||||
| Total derivatives not accounted for as hedging instruments | $ | 8,257 | $ | 2,088 | ||||||||
88 |
SEI Institutional International Trust / Annual Report / September 30, 2019 |
| Asset Derivatives | Liability Derivatives | |||||||||||
Year Ended September 30, 2019 ($ Thousands) | Year Ended September 30, 2019 ($ Thousands) | |||||||||||
Statements of Assets and Liabilities Location | Fair Value | Statements of Assets and Liabilities Location | Fair Value | |||||||||
Emerging Markets Debt Fund | ||||||||||||
Interest rate contracts | Net Assets — Unrealized appreciation on futures contracts | $ | 345* | Net Assets — Unrealized depreciation on futures contracts | $ | 968* | ||||||
Net Assets — Unrealized appreciation on swap contracts | 4,159† | Net Assets — Unrealized depreciation on swap contracts | 1,412† | |||||||||
Credit Contracts | Net Assets — Unrealized appreciation on swap contracts | 14† | Net Assets — Unrealized depreciation on swap contracts | 1,240† | ||||||||
Foreign exchange contracts | Unrealized gain on forward foreign currency contracts | 4,954 | Unrealized loss on forward foreign currency contracts | 8,701 | ||||||||
| Net Assets — Unrealized appreciation on swap contracts | —† | Net Assets — Unrealized depreciation on swap contracts | 471† | |||||||||
| Options Purchased, at value | 126 | Options Written, at value | — | |||||||||
| Total derivatives not accounted for as hedging instruments | $ | 9,598 | $ | 12,792 | ||||||||
| * | Includes cumulative appreciation/depreciation of futures contracts as reported in the Schedules of Investments. Only current day’s variation margin is reported within the Statements of Assets & Liabilities. |
| † | Includes cumulative appreciation/depreciation of swap contracts as reported in the Schedules of Investments. Market Value is reported within the Statements of Assets & Liabilities for OTC swap contracts that have paid premiums. For centrally cleared swap contracts current days variation margin is reported within the Statements of Assets & Liabilities. |
The effect of derivative instruments on the Statements of Operations for the year ended September 30, 2019.
Amount of realized gain or (loss) on derivatives recognized in income ($ Thousands):
| Derivatives Not Accounted for as Hedging Instruments | Futures | Forward Currency Contracts | Swaps | Total | ||||||||||||
International Fixed Income Fund | ||||||||||||||||
Interest rate contracts | $ | 1,773 | $ | — | $ | 258 | $ | 2,031 | ||||||||
Foreign exchange contracts | 1,258 | 16,457 | — | 17,715 | ||||||||||||
Credit contracts | — | — | 66 | 66 | ||||||||||||
Equity contracts | 408 | — | — | 408 | ||||||||||||
Total | $ | 3,439 | $ | 16,457 | $ | 324 | $ | 20,220 | ||||||||
| Derivatives Not Accounted for as Hedging Instruments | Futures | Forward Currency Contracts | Swaps | Total | ||||||||||||
Emerging Markets Debt Fund | ||||||||||||||||
Interest rate contracts | $ | (616) | $ | — | $ | 1,983 | $ | 1,367 | ||||||||
Foreign exchange contracts | — | (2,891) | (236) | (3,127) | ||||||||||||
Equity contracts | 1,238 | — | — | 1,238 | ||||||||||||
Credit contracts | — | — | 233 | 233 | ||||||||||||
Total | $ | 622 | $ | (2,891) | $ | 1,980 | $ | (289) | ||||||||
Change in unrealized appreciation or (depreciation) on derivatives recognized in income ($ Thousands):
| ||||||||||||||||
| Derivatives Not Accounted for as Hedging Instruments | Futures | Forward Currency Contracts | Swaps | Total | ||||||||||||
International Fixed Income Fund | ||||||||||||||||
Interest rate contracts | $ | 384 | $ | — | $ | (148) | $ | 236 | ||||||||
Foreign exchange contracts | — | 3,447 | — | 3,447 | ||||||||||||
Credit contracts | — | — | 155 | 155 | ||||||||||||
Total | $ | 384 | $ | 3,447 | $ | 7 | $ | 3,838 | ||||||||
SEI Institutional International Trust / Annual Report / September 30, 2019 |
89 |
NOTES TO FINANCIAL STATEMENTS (Continued)
September 30, 2019
| Derivatives Not Accounted for as Hedging Instruments | Options | Futures | Forward Currency Contracts | Swaps | Total | |||||||||||||||
Emerging Markets Debt Fund | ||||||||||||||||||||
Interest rate contracts | $ | — | $ | (815) | $ | — | $ | 4,740 | $ | 3,925 | ||||||||||
Foreign exchange contracts | (153) | — | (3,007) | (463) | (3,623) | |||||||||||||||
Credit contracts | — | — | — | (1,030) | (1,030) | |||||||||||||||
Total | $ | (153) | $ | (815) | $ | (3,007) | $ | 3,247 | $ | (728) | ||||||||||
A Fund is subject to various netting arrangements with select counterparties (“Master Agreements”). Master Agreements govern the terms of certain transactions, and reduce the counterparty risk associated with relevant transactions by specifying credit protection mechanisms and providing standardization that improves legal certainty. Since different types of transactions have different mechanics and are sometimes traded out of different legal entities of a particular counterparty organization, each type of transaction may be covered by a different Master Agreement, resulting in the need for multiple agreements with a single counterparty. As the Master Agreements are specific to unique operations of different asset types, they allow a Fund to close out and net its total exposure to a specific counterparty entity in the event of a default with respect to all the transactions governed under a single agreement with a specific counterparty entity.
Master Agreements can also help limit counterparty risk by specifying collateral posting arrangements atpre-arranged exposure levels. Under the Master Agreements, collateral is routinely transferred if the total net exposure to certain transactions (net of existing collateral already in place) governed under the relevant Master Agreement with a counterparty in a given account exceeds a specified threshold, which typically ranges from zero to $250,000 depending on the counterparty and the type of Master Agreement. United States Treasury Securities and U.S. dollar cash
are generally the preferred forms of collateral. Securities and cash pledged as collateral are reflected as assets in the Statements of Assets and Liabilities as either a component of investments at value (securities) or deposits due from counterparties (cash). Cash collateral received is not typically held in a segregated account and as such is reflected as a liability in the Statement of Assets and Liabilities as deposits due to counterparties. The market value of any securities received as collateral is not reflected as a component of net asset value. A Fund’s overall exposure to counterparty risk can change substantially within a short period, as it is affected by each transaction subject to the relevant Master Agreement.
Customer Account Agreements and related addendums govern exchange traded derivatives transactions such as futures, options on futures, and centrally cleared swaps. Exchange traded derivative transactions require posting of initial margin as determined by each relevant clearing agency which is segregated at a broker account registered with the Commodities Futures Trading Commission (CFTC), or the applicable regulator. In the US, counterparty risk is significantly reduced as creditors of the futures broker do not have claim to Fund assets in the segregated account. Additionally, portability of exposure in the event of default further reduces risk to the Funds. Variation margin, or changes in market value, are exchanged daily, but may not be netted between futures and cleared OTC derivatives.
The following is a summary of the market value and variation margin of exchange-traded or centrally cleared financial derivative instruments of the Funds as of September 30, 2019 ($ Thousands):
| Financial Derivatives Assets | Financial Derivatives Liabilities | |||||||||||||||||||||||||||
| Variation Margin Asset | Variation Margin Liability | |||||||||||||||||||||||||||
| Fund | Futures | Swap Agreements | Total | Futures | Swap Agreements | Total | ||||||||||||||||||||||
International Equity Fund | $ | 251 | $ | — | $ | 251 | $ | 169 | $ | — | $ | 169 | ||||||||||||||||
Emerging Markets Equity Fund | 158 | — | 158 | — | — | — | ||||||||||||||||||||||
International Fixed Income Fund | 128 | 1 | 129 | 87 | 1 | 88 | ||||||||||||||||||||||
Emerging Markets Debt Fund | 10 | 65 | 75 | 60 | 23 | 83 | ||||||||||||||||||||||
Cash pledged as collateral for exchange-traded and centrally cleared derivative instruments as of September 30, 2019 amounted to $4,673 ($ Thousands) for the International Equity Fund. Cash pledged as collateral for exchange-traded and centrally cleared derivative instruments as of September 30, 2019 amounted to
$1,848 ($ Thousands) for the Emerging Equity Fund. Cash pledged as collateral for exchange-traded and centrally cleared derivative instruments as of September 30, 2019 amounted to $394 ($ Thousands) for the International Fixed Income Fund. Cash pledged as collateral for exchange-traded and centrally cleared
90 |
SEI Institutional International Trust / Annual Report / September 30, 2019 |
derivative instruments as of September 30, 2019 amounted to $2,578 ($ Thousands) for the Emerging Markets Debt Fund.
International Swaps and Derivatives Association, Inc. Master Agreements and Credit Support Annexes (“ISDA Master Agreements”) govern OTC financial derivative transactions entered into by a Fund and select counterparties. ISDA Master Agreements maintain provisions for general obligations, representations, agreements, collateral and events of default or termination. Events of termination include conditions that
may entitle counterparties to elect to terminate early and cause settlement of all outstanding transactions under the applicable ISDA Master Agreement. Any election to terminate early could be material to the financial statements. In limited circumstances, the ISDA Master Agreement may contain additional provisions that add additional counterparty protection beyond coverage of existing daily exposure if the counterparty has a decline in credit quality below a predefined level. These amounts, if any, may be segregated with a third party custodian.
The following is a summary by derivative type of the market value of OTC financial derivative instruments and collateral (received)/pledged as of September 30, 2019 ($ Thousands):
| Financial Derivative Assets | Financial Derivative Liabilities | |||||||||||||||||||||||||||||||||||||||||
|
| |||||||||||||||||||||||||||||||||||||||||
| International Fixed Income Fund | Forward Foreign Currency Contracts | Swap Agreements | Total Counter | Forward Foreign Currency Contracts | Swap Agreements | Total Over the Counter | Net Market Value of OTC Derivatives | Collateral (Received)/ Pledged* | Net Exposures^ | |||||||||||||||||||||||||||||||||
Bank of America | $ | 25 | $ | — | $ | 25 | $ | 76 | $ | — | $ | 76 | $ | (51) | $ | — | $ | (51) | ||||||||||||||||||||||||
Barclays | 727 | — | 727 | 79 | — | 79 | 648 | — | 648 | |||||||||||||||||||||||||||||||||
BMO Capital Markets | 15 | — | 15 | — | — | — | 15 | — | 15 | |||||||||||||||||||||||||||||||||
BNP Paribas | 468 | — | 468 | 6 | — | 6 | 462 | — | 462 | |||||||||||||||||||||||||||||||||
Brown Brothers Harriman | 77 | — | 77 | 148 | — | 148 | (71) | — | (71) | |||||||||||||||||||||||||||||||||
BT Brokerage | 92 | — | 92 | 55 | — | 55 | 37 | — | 37 | |||||||||||||||||||||||||||||||||
Citigroup | 2,378 | — | 2,378 | 138 | — | 138 | 2,240 | 142 | 2,382 | |||||||||||||||||||||||||||||||||
Credit Suisse | 21 | — | 21 | — | 5 | 5 | 16 | — | 16 | |||||||||||||||||||||||||||||||||
Deutsche Bank | — | 18 | 18 | — | 30 | 30 | (12) | — | (12) | |||||||||||||||||||||||||||||||||
Goldman Sachs | 55 | 51 | 106 | 129 | — | 129 | (23) | 192 | 169 | |||||||||||||||||||||||||||||||||
HSBC | 6 | — | 6 | 7 | — | 7 | (1) | — | (1) | |||||||||||||||||||||||||||||||||
JPMorgan Chase Bank | 1,649 | — | 1,649 | 748 | — | 748 | 901 | — | 901 | |||||||||||||||||||||||||||||||||
Morgan Stanley | 128 | — | 128 | 320 | — | 320 | (192) | — | (192) | |||||||||||||||||||||||||||||||||
RBC | — | — | — | 14 | — | 14 | (14) | — | (14) | |||||||||||||||||||||||||||||||||
Royal Bank of Scotland | 654 | — | 654 | 23 | — | 23 | 631 | — | 631 | |||||||||||||||||||||||||||||||||
Standard Chartered | — | — | — | 53 | — | 53 | (53) | — | (53) | |||||||||||||||||||||||||||||||||
State Street | 1,206 | — | 1,206 | 3 | — | 3 | 1,203 | — | 1,203 | |||||||||||||||||||||||||||||||||
TD Securities | 34 | — | 34 | — | — | — | 34 | — | 34 | |||||||||||||||||||||||||||||||||
UBS
| 37 | — | 37 | 4 | — | 4 | 33 | — | 33 | |||||||||||||||||||||||||||||||||
| Financial Derivative Assets | Financial Derivative Liabilities | |||||||||||||||||||||||||||||||||||||||||
|
| |||||||||||||||||||||||||||||||||||||||||
| Emerging Markets Debt Fund | Forward Foreign Currency Contracts | Swap Agreements | Total Over the Counter | Forward Foreign Currency Contracts | Swap Agreements | Total Over the Counter | Net Market Value of OTC Derivatives | Collateral (Received)/ Pledged* | Net Exposures^ | |||||||||||||||||||||||||||||||||
Barclays | $ | 72 | $ | — | $ | 72 | $ | 529 | $ | — | $ | 529 | $ | (457) | $ | — | $ | (457) | ||||||||||||||||||||||||
Citigroup | 1,035 | 96 | 1,131 | 2,239 | 24 | 2,263 | (1,132) | — | (1,132) | |||||||||||||||||||||||||||||||||
Credit Suisse | — | 14 | 14 | — | — | — | 14 | — | 14 | |||||||||||||||||||||||||||||||||
Goldman Sachs | 864 | 2,183 | 3,047 | 1,202 | 840 | 2,042 | 1,005 | 1,610 | 2,615 | |||||||||||||||||||||||||||||||||
JPMorgan Chase Bank | 1,233 | 1,151 | 2,384 | 1,792 | 1,456 | 3,248 | (864) | — | (864) | |||||||||||||||||||||||||||||||||
Merrill Lynch | 134 | — | 134 | 118 | — | 118 | 16 | — | 16 | |||||||||||||||||||||||||||||||||
Standard Bank | 23 | — | 23 | 616 | — | 616 | (593) | — | (593) | |||||||||||||||||||||||||||||||||
Standard Chartered Bank | 473 | — | 473 | 2,080 | — | 2,080 | (1,607) | — | (1,607) | |||||||||||||||||||||||||||||||||
State Street | 943 | — | 943 | 125 | — | 125 | 818 | — | 818 | |||||||||||||||||||||||||||||||||
| ^ | Net Exposures represents the net receivable/(payable) that would be due from/to the counterparty in the event of default. Exposure from OTC financial derivative instruments can only be netted across transactions governed under the same master agreement with the same legal entity. |
| * | Excess collateral pledged is not shown for financial reporting purposes. |
SEI Institutional International Trust / Annual Report / September 30, 2019 |
91 |
NOTES TO FINANCIAL STATEMENTS (Continued)
September 30, 2019
No securities have been pledged or have been received as collateral for OTC financial derivative instruments as governed by ISDA Master Agreements as of September 30, 2019.
The following table discloses the volume of the Funds’ futures contracts, forward foreign currency contracts and swap activity during the year ended September 30, 2019 ($ Thousands):
| International Equity Fund | Emerging Markets Equity Fund | International Fixed Income Fund | Emerging Markets Debt Fund | |||||||||||||
Futures Contracts: | ||||||||||||||||
Equity Contracts | ||||||||||||||||
Average Notional Balance Long | $ | 68,294 | $ | 28,664 | $ | – | $ | – | ||||||||
Average Notional Balance Short | – | – | – | – | ||||||||||||
Ending Notional Balance Long | 54,436 | 34,955 | – | – | ||||||||||||
Interest Contracts | ||||||||||||||||
Average Notional Balance Long | 26,167 | – | 79,672 | 62,820 | ||||||||||||
Average Notional Balance Short | – | – | 39,737 | 33,237 | ||||||||||||
Ending Notional Balance Long | 34,527 | – | 81,042 | 69,868 | ||||||||||||
Ending Notional Balance Short | – | – | 25,262 | 30,888 | ||||||||||||
Currency Contracts | ||||||||||||||||
Average Notional Balance Short | – | – | 25,418 | – | ||||||||||||
Ending Notional Balance Short | – | – | 33,354 | – | ||||||||||||
Forward Foreign Currency Contracts: | ||||||||||||||||
Average Notional Balance Long | – | – | 791,577 | 847,051 | ||||||||||||
Average Notional Balance Short | – | – | 791,437 | 848,005 | ||||||||||||
Ending Notional Balance Long | – | – | 958,053 | 780,651 | ||||||||||||
Ending Notional Balance Short | – | – | 952,351 | 784,398 | ||||||||||||
Swaps:
Credit Contracts | ||||||||||||||||
Average Notional Balance Long | – | – | – | 712 | ||||||||||||
Average Notional Balance Short | – | – | 5,311 | 4,265 | ||||||||||||
Ending Notional Balance Short | – | – | 4,172 | 3,995 | ||||||||||||
Interest Contracts | ||||||||||||||||
Average Notional Balance | – | – | 5,726 | 234,159 | ||||||||||||
Ending Notional Balance | – | – | 54,680 | 20,048,359 | ||||||||||||
Foreign Exchange Contracts | ||||||||||||||||
Average Notional Balance | – | – | – | 5,963 | ||||||||||||
Ending Notional Balance | – | – | – | 2,301 | ||||||||||||
Options: | ||||||||||||||||
Currency | ||||||||||||||||
Average Notional Balance Long† | – | – | – | 70 | ||||||||||||
Ending Notional Balance Long† | – | – | – | 279 | ||||||||||||
† Represents cost.
5. INVESTMENT ADVISORY, ADMINISTRATION AND DISTRIBUTION AGREEMENTS, INVESTMENTSUB-ADVISORY AGREEMENTS AND OTHER TRANSACTIONS WITH AFFILIATES
Investment Advisory, Administration and Distribution Agreements— SIMC serves as investment adviser (the “Adviser”) to each Fund. In connection with serving as Adviser, SIMC is entitled to a fee, which is calculated daily and paid monthly, based on the average daily net assets of each fund.
SEI Investments Global Funds Services (the “Administrator”) provides administrative and transfer agency services to the Funds for annual fees, based on the average daily net assets of each fund.
SEI Investments Distribution Co. (the “Distributor”) is the distributor of the shares of the Funds. The Funds have adopted a shareholder services plan and agreement (the Service Plan) with respect to Class F (formerly Class A) and Class I Shares that allows such shares to pay service providers a fee, based on average daily net assets of each respective Class of Shares, in connection with the ongoing servicing of shareholder accounts owning such shares. The International Equity Fund has also adopted an administrative services plan and agreement (the Administrative Service Plan) with respect to Class I Shares that allows such Shares to pay service providers a fee, based on average daily net assets of the Class I Shares, in connection with ongoing administrative services for shareholder accounts owning such Shares.
92 |
SEI Institutional International Trust / Annual Report / September 30, 2019 |
The Service Plan and Administrative Service Plan provide that shareholder service fees and administrative service fees, respectively, on Class F (formerly Class A) and Class I Shares will be paid to the Distributor, which may then be used by the Distributor to compensate financial intermediaries for providing shareholder services and administrative services, as applicable, with respect to the Shares.
The Adviser, Administrator and/or Distributor have voluntarily agreed to waive a portion of their fees in order to keep total direct operating expenses (exclusive
of interest from borrowings, brokerage commissions, taxes, Trustees fees and extraordinary expenses not incurred in the ordinary course of the Funds’ business) at a specified level. The voluntary waivers by the Funds’ Adviser, Administrator and/or Distributor are limited to the Funds’ direct operating expenses and, therefore, do not apply to indirect expenses incurred by the Funds, such as acquired fund fees and expenses (AFFE). The waivers are voluntary and the Funds’ Adviser, Administrator and/or Distributor may discontinue all or part of any of these waivers at any time.
The following is a summary of annual fees payable to the Adviser and Distributor and the contractual and voluntary expense limitations for each Fund:
Advisory Fee | Shareholder Servicing Fee | Administrative Servicing Fee | Voluntary Expense Limitation | |||||||||||||
International Equity Fund | ||||||||||||||||
Class F | 0.505% | 0.25% | — | 1.15% | ||||||||||||
Class I | 0.505% | 0.25% | 0.25% | 1.40% | ||||||||||||
Class Y | 0.505% | — | — | 0.90% | ||||||||||||
Emerging Markets Equity Fund* | ||||||||||||||||
Class F | 1.05% | 0.25% | — | N/A | ||||||||||||
Class Y | 1.05% | — | — | N/A | ||||||||||||
International Fixed Income Fund | ||||||||||||||||
Class F | 0.30% | 0.25% | — | 1.02% | ||||||||||||
Class Y | 0.30% | — | — | 0.77% | ||||||||||||
Emerging Markets Debt Fund | ||||||||||||||||
Class F | 0.85% | 0.25% | — | 1.36% | ||||||||||||
Class Y | 0.85% | — | — | 1.11% | ||||||||||||
| * | Renewed as of January 31, 2019, SIMC has contractually agreed to waive its advisory fee as necessary to keep the advisory fee paid by the Fund during its fiscal year from exceeding 0.95%. This fee waiver agreement shall remain in effect until January 31, 2020 and, unless earlier terminated, shall be automatically renewed for successiveone-year periods thereafter. The agreement may be amended or terminated only with the consent of the Board of Trustees. |
N/A — Not applicable.
The following is a summary of annual fees payable to the Administrator:
First $1.5 Billion of Assets | Next $500 Million of Assets | Next $500 Million of Assets | Next $500 Million of Assets | Over $3 Billion of Assets | ||||||||||||||||
International Equity Fund | 0.450% | 0.370 | % | 0.2900 | % | 0.210 | % | 0.130% | ||||||||||||
Emerging Markets Equity Fund | 0.450% | 0.370 | % | 0.2900 | % | 0.210 | % | 0.130% | ||||||||||||
International Fixed Income Fund | 0.450% | 0.370 | % | 0.2900 | % | 0.210 | % | 0.130% | ||||||||||||
Emerging Markets Debt Fund | 0.450% | 0.370 | % | 0.2900 | % | 0.210 | % | 0.130% | ||||||||||||
InvestmentSub-Advisory Agreements— As of September 30, 2019, SIMC has entered into InvestmentSub-Advisory Agreements with the following parties:
InvestmentSub-Adviser
International Equity Fund
Acadian Asset Management LLC
Blackcrane Capital, LLC
Causeway Capital Management LLC
INTECH Investment Management LLC
Lazard Asset Management LLC
Neuberger Berman Investment Advisers LLC
NWQ Investment Management Company, LLC
WCM Investment Management LLC
Emerging Markets Equity Fund
Delaware Investment Fund Advisers, a series of
Macquarie Investment Management Business Trust
J O Hambro Capital Management Limited
KBI Global Investors (North America) Ltd.
Lazard Asset Management LLC
Neuberger Berman Investment Advisers LLC
Qtron Investments LLC
RWC Asset Advisors (US) LLC
International Fixed Income Fund
AllianceBernstein L.P.
Colchester Global Investors Ltd.
Wellington Management Company, LLP
SEI Institutional International Trust / Annual Report / September 30, 2019 |
93 |
NOTES TO FINANCIAL STATEMENTS (Continued)
September 30, 2019
Emerging Markets Debt Fund
Colchester Global Investors Ltd.
Investec Asset Management Ltd.
Marathon Asset Management, L.P.
Neuberger Berman Investment Advisers LLC
Stone Harbor Investment Partners LP
Under the investmentsub-advisory agreements, eachsub-adviser receives a fee, paid by SIMC.
Brokerage Commissions Paid to Affiliates — The Distributor may receive compensation on fund transactions effected for the Trust in accordance with the rules of the Securities and Exchange Commission (“SEC”). Accordingly, it is expected that fund transactions may result in brokerage commissions being paid to the Distributor. The SEC rules require that such commissions not exceed usual and customary commissions.
Such commissions for the year ended September 30, 2019 were as follows ($ Thousands):
International Equity Fund | $ | 79 | ||
Emerging Markets Equity Fund | 132 |
Fees Paid Indirectly— The Funds may direct certain fund trades to the Distributor who pays a portion of the Fund’s expenses. Accordingly, the expenses reduced, which were used to pay third party expenses, and the effect on the Fund’s expense ratio, as a percentage of the Fund’s average daily net assets for the year ended September 30, 2019 can be found on the Statement of Operations and Financial Highlights, if applicable.
Investment in Affiliated Securities— The Funds may invest in the SEI Daily Income Trust Government Fund, an affiliated money market fund to manage excess cash or to serve as margin or collateral for derivative positions. Additionally, the Funds may invest cash
6. INVESTMENT TRANSACTIONS
collateral from the securities lending program in the SEI Liquidity Fund, L.P., also an affiliated fund.
Payment to Affiliates— Certain Officers and Trustees of the Trust are also Officers and/or Directors of the Administrator, Adviser and/or the Distributor.
The Trust pays each unaffiliated Trustee an annual fee for attendance at quarterly, interim, and committee meetings. The Administrator or the Distributor pays compensation of Officers and affiliated Trustees.
A portion of the services provided by the Chief Compliance Officer (“CCO”) and his staff, whom are employees of the Administrator, are paid for by the Trust as incurred. The services include regulatory oversight of the Trust’s Adviser,sub-advisers and service providers.
Interfund Lending— The SEC has granted an exemption that permits the Trust to participate in an interfund lending program (“The Program”) with existing or future investment companies registered under the 1940 Act that are advised by SIMC (the “SEI Funds”). The Program allows the SEI Funds to lend money to and borrow money from each other for temporary or emergency purposes. Participation in The Program is voluntary for both borrowing and lending funds. Interfund loans may be made only when the rate of interest to be charged is more favorable to the lending fund than an investment in overnight repurchase agreements (“Repo Rate”), and more favorable to the borrowing fund than the rate of interest that would be charged by a bank for short-term borrowings (“Bank Loan Rate”). The Bank Loan Rate will be determined using a formula reviewed annually by the SEI Funds’ Board of Trustees. The interest rate imposed on interfund loans is the average of the Repo Rate and the Bank Loan Rate. As of and during the year ended September 30, 2019, the Trust has not participated in the Program.
The cost of security purchases and the proceeds from the sale of securities, other than temporary cash investments, during the year ended September 30, 2019, were as follows:
International Equity Fund ($ Thousands) | Emerging Markets Equity Fund(1) ($ Thousands) | International Fixed Income Fund ($ Thousands) | Emerging Markets Debt Fund ($ Thousands) | |||||||||||||
Purchases | ||||||||||||||||
U.S. Government | $— | $— | $9,393 | $6,214 | ||||||||||||
Other | 2,906,317 | 1,535,373(1) | 276,695 | 1,781,943 | ||||||||||||
Sales | ||||||||||||||||
U.S. Government | — | — | 7,748 | 19,335 | ||||||||||||
Other | 3,021,899 | 1,605,638 | 246,618 | 1,619,725 | ||||||||||||
(1) Includes17a-7 related transactions of $2,029 ($ Thousands).
94 |
SEI Institutional International Trust / Annual Report / September 30, 2019 |
7. FEDERAL TAX INFORMATION:
It is each Fund’s intention to continue to qualify as a regulated investment company under Subchapter M of the Internal Revenue Code and distribute all of its taxable income (including net capital gains). Accordingly, no provision for Federal income taxes is required.
The Funds may be subject to taxes imposed by countries in which they invest with respect to their investments in issuers existing or operating in such countries. Such taxes are generally based on income
earned. The Funds accrue such taxes when the related income is earned.
Dividends from net investment income and distributions from net realized capital gains are determined in accordance with U.S. Federal income tax regulations, which may differ from those amounts determined under U.S. GAAP. These book/tax differences are either temporary or permanent in nature. To the extent these differences are permanent, they are charged or credited topaid-in capital and distributable earnings, as appropriate, in the period that the differences arise.
The tax character of dividends and distributions declared during the last two years were as follows:
| Ordinary Income ($ Thousands) | Long-term Capital Gain ($ Thousands) | Total ($ Thousands) | ||||||||||||||
International Equity Fund | 2019 | $ | 59,119 | $ | — | $ | 59,119 | |||||||||
| 2018 | 56,617 | — | 56,617 | |||||||||||||
Emerging Markets Equity Fund | 2019 | 10,587 | — | 10,587 | ||||||||||||
| 2018 | 26,095 | — | 26,095 | |||||||||||||
International Fixed Income Fund | 2019 | 18,958 | 2,360 | 21,318 | ||||||||||||
| 2018 | — | — | — | |||||||||||||
Emerging Markets Debt Fund | 2019 | 26,300 | — | 26,300 | ||||||||||||
| 2018 | 89,091 | — | 89,091 | |||||||||||||
As of September 30, 2019, the components of Distributable Earnings (Accumulated Losses) were as follows:
| ||||||||||||||||||||||||||||||||
Undistributed Ordinary | Undistributed Long-Term Capital Gain ($ Thousands) | Capital Loss Carryforwards | Post October | Late Year Ordinary Losses ($ Thousands) | Unrealized Appreciation (Depreciation) ($ Thousands) | Other Temporary Differences ($ Thousands) | Total Distributable Earnings (Accumulated Losses) ($ Thousands) | |||||||||||||||||||||||||
| ||||||||||||||||||||||||||||||||
International Equity Fund | $ | 75,809 | $ | — | $ | (81,302 | ) | $ | — | $ | — | $ | 182,801 | $ | 2 | $ | 177,310 | |||||||||||||||
Emerging Markets Equity Fund | 18,779 | — | (77,642 | ) | — | — | 137,641 | (5 | ) | 78,773 | ||||||||||||||||||||||
International Fixed Income Fund | 10,053 | 747 | — | — | — | 8,009 | (10,625 | ) | 8,184 | |||||||||||||||||||||||
Emerging Markets Debt Fund | 5,477 | — | (25,339 | ) | — | (20,515 | ) | (33,460 | ) | (24,334 | ) | (98,171 | ) | |||||||||||||||||||
Post-October losses represent losses realized on investment transactions from November 1, 2018 through September 30, 2019 that, in accordance with Federal income tax regulations, the Funds may elect to defer and treat as having arisen in the following fiscal year.
For Federal income tax purposes, capital loss carryforwards may be carried forward and applied against future capital gains. For the year ended September 30, 2019, the Funds did not have any capital losses eligible to be carried forward.
Under the Regulated Investment Company
Modernization Act of 2010, Funds will be permitted to carry forward capital losses incurred in taxable years beginning after December 22, 2010 for an unlimited period. However, any losses incurred during those future taxable years will be required to be utilized prior to the losses incurred inpre-enactment taxable years. As a result of this ordering rule,pre-enactment capital loss carryforwards may be more likely to expire
unused. Additionally, post-enactment capital losses that are carried forward will retain their character as either short-term or long-term capital losses rather than being considered all short-term as under previous law.
| Short-Term ($ Thousands) | Long-Term ($ Thousands) | Total Capital Loss Carryforwards | ||||||||||
International Equity Fund | $(81,302) | $— | $(81,302) | |||||||||
Emerging Markets Equity Fund | (69,842 | ) | (7,800 | ) | (77,642) | |||||||
Emerging Markets Debt Fund | (160 | ) | (25,179 | ) | (25,339) | |||||||
* This table should be used in conjunction with the capital loss carryforwards table.
For Federal income tax purposes, the cost of securities owned at September 30, 2019, and the net realized gains or losses on securities sold for the period were not materially different from amounts reported for financial reporting purposes. These differences are primarily due to investments in derivatives, passive foreign investment companies and wash sales which
SEI Institutional International Trust / Annual Report / September 30, 2019 |
95 |
NOTES TO FINANCIAL STATEMENTS (Continued)
September 30, 2019
cannot be used for Federal income tax purposes in the current year and have been deferred for use in future years. The aggregate gross unrealized appreciation and depreciation on total investments held by the Funds at September 30, 2019, was as follows:
Federal Tax Cost ($ Thousands) | Appreciated Securities ($ Thousands) | Depreciated ($ Thousands) | Net Unrealized Appreciation/ (Depreciation) ($ Thousands) | |||||||||||||
International Equity Fund | $ | 3,882,851 | $ | 524,627 | $ | (341,826) | $ | 182,801 | ||||||||
Emerging Markets Equity Fund | 1,586,247 | 285,730 | (148,089) | 137,641 | ||||||||||||
International Fixed Income Fund | 495,484 | 19,449 | (11,440) | 8,009 | ||||||||||||
Emerging Markets Debt Fund | 1,644,608 | 66,511 | (99,971) | (33,460) | ||||||||||||
Management has analyzed the Funds’ tax positions taken on federal income tax returns for all open tax years and has concluded that as of September 30, 2019, no provision for income tax would be required in the Funds’ financial statements. The Funds’ federal and state income and federal excise tax returns for tax years for which the applicable statutes of limitations have not expired are subject to examination by the Internal Revenue Service and state departments of revenue.
8. CONCENTRATION/RISKS
In the normal course of business, the Trust enters into contracts that provide general indemnifications by the Trust to the counterparty to the contract. The Trust’s maximum exposure under these arrangements is dependent on future claims that may be made against the Trust and, therefore, cannot be estimated; however, management believes that, based on experience, the risk of loss from such claims is considered remote.
To the extent consistent with its Investment Strategy, a Fund may have one of more of the following principal risks:
Asset-Backed Securities Risk— Payment of principal and interest on asset-backed securities is dependent largely on the cash flows generated by the assets backing the securities. Securitization trusts generally do not have any assets or sources of funds other than the receivables and related property they own, and asset-backed securities are generally not insured or guaranteed by the related sponsor or any other entity. Asset-backed securities may be more illiquid than more conventional types of fixed-income securities that the Funds acquire.
Credit Risk— The risk that the issuer of a security or the counterparty to a contract will default or otherwise become unable to honor a financial obligation.
Currency Risk— As a result of the Funds’ investments in securities denominated in, and/or receiving revenues in, foreign currencies, the Funds will be subject to currency
risk. Currency risk is the risk that foreign currencies will decline in value relative to the U.S. dollar or, in the case of hedging positions, that the U.S. dollar will decline in value relative to the currency hedged. In either event, the dollar value of an investment in the Funds would be adversely affected. Currency exchange rates may fluctuate in response to, among other things, changes in interest rates, intervention (or failure to intervene) by U.S. or foreign governments, central banks or supranational entities, or by the imposition of currency controls or other political developments in the United States or abroad.
Foreign Investment/Emerging Markets Risk— The risk thatnon-U.S. securities may be subject to additional risks due to, among other things, political, social and economic developments abroad, currency movements, and different legal, regulatory and tax environments. These additional risks may be heightened with respect to emerging market countries since political turmoil and rapid changes in economic conditions are more likely to occur in these countries.
Interest Rate Risk— The risk that a rise in interest rates will cause a fall in the value of fixed income securities, including U.S. Government securities, in which the Funds invest. A low interest rate environment may present greater interest rate risk, because there may be a greater likelihood of rates increasing and rates may increase more rapidly.
Market Risk— The risk that the market value of a security may move up and down, sometimes rapidly and unpredictably. Market risk may affect a single issuer, an industry, a sector or the equity or bond market as a whole. The prices of the Funds’ fixed income securities respond to economic developments, particularly interest rate changes, as well as to perceptions about the creditworthiness of individual issuers, including governments and their agencies. Generally, the Funds’ fixed income securities will decrease in value if interest rates rise and vice versa. In a low interest rate environment, risks associated with rising rates are heightened. Declines in dealer market-making capacity as a result of structural or regulatory changes could further decrease liquidity and/or increase volatility in the fixed income markets. In the case of foreign securities, price fluctuations will reflect international economic and political events, as well as changes in currency valuations relative to the U.S. dollar. In response to these events, the Funds’ value may fluctuate and/or the Funds may experience increased redemptions from shareholders, which may impact the Funds’ liquidity
96 |
SEI Institutional International Trust / Annual Report / September 30, 2019 |
or force the Funds to sell securities into a declining or illiquid market.
Mortgage-Backed Securities Risk— Mortgage-backed securities are affected significantly by the rate of prepayments and modifications of the mortgage loans backing those securities, as well as by other factors such as borrower defaults, delinquencies, realized or liquidation losses and other shortfalls. Mortgage-backed securities are particularly sensitive to prepayment risk, which is described below, given that the term to maturity for mortgage loans is generally substantially longer than the expected lives of those securities; however, the timing and amount of prepayments cannot be accurately predicted. The timing of changes in the rate of prepayments of the mortgage loans may significantly affect the Funds’ actual yield to maturity on any mortgage-backed securities, even if the average rate of principal payments is consistent with the Funds’ expectation. Along with prepayment risk, mortgage-backed securities are significantly affected by interest rate risk, which is described above. In a low interest rate environment, mortgage loan prepayments would generally be expected to increase due to factors such as refinancing and loan modifications at lower interest rates. In contrast, if prevailing interest rates rise, prepayments of mortgage loans would generally be expected to decline and therefore extend the weighted average lives of mortgage-backed securities held or acquired by the Funds.
Please refer to each Fund’s current prospectus for additional disclosure regarding the risks associated with investing in the Funds. The foregoing is not intended to be a complete discussion of the risks associated with the investment strategies of the Funds.
9. SECURITIES LENDING
A Fund may lend portfolio securities to brokers, dealers and other financial organizations that meet capital and other credit requirements or other criteria established by the Trust’s Board of Trustees. These loans may not exceed 33 1/3% of the total asset value of a Fund (including the loan collateral). No Fund will lend portfolio securities to its Adviser,sub-adviser or their affiliates unless it has applied for and received specific authority to do so from the SEC. Loans of portfolio securities will be fully collateralized by cash. Collateral will be maintained in an amount equal to at least 100% of the current market value of the loaned securities by marking to market daily, although the borrower will be required to deliver collateral between 102% and 105% of the market value of borrowed securities for domestic and foreign securities, respectively. However, due to market fluctuations during the day, the value of securities loaned on a particular day may, during the course of the
day, exceed the value of collateral. On each business day, the amount of collateral is adjusted based on the prior day’s market fluctuations and the current day’s lending activity. Income from lending activity is determined by the amount of interest earned on collateral, less any amounts payable to the borrowers of the securities and the lending agent. Lending securities involves certain risks, including the risk that a Fund may be delayed or restricted from recovering the loaned securities or disposing of the collateral for the loan which could give rise to loss because of adverse market actions expenses and/or delays in connection with the disposition of the underlying securities.
Cash collateral received in connection with securities lending is invested in eligible securities by the lending agent. These investments may include the SEI Liquidity Fund, L.P. (“Liquidity Fund”) and the Fund bears its pro rata portion of the Liquidity Fund’s expenses and is subject to the risk of loss in the underlying investments of the Liquidity Fund and losses on such investment. There is no guarantee that these investments will not lose value.
The following is a summary of securities lending agreements held by certain Funds which would be subject to offset as of September 30, 2019
($ Thousands):
| Securities Loaned at Value | Cash Collateral Received(1) | Net Amount | ||||||||||||||||||||||||||||
International Equity Fund | $ | 115,350 | $ | 115,350 | $ | — | ||||||||||||||||||||||||
Emerging Markets Equity Fund | 45,930 | 45,930 | — | |||||||||||||||||||||||||||
Emerging Markets Debt Fund | 83,870 | 83,870 | — | |||||||||||||||||||||||||||
| (1) | Excess collateral received in connection with the above securities lending transactions is not shown for financial reporting purposes. See each Fund’s Schedule of Investments for the total collateral received. |
10. CONCENTRATION OF SHAREHOLDERS
SEI Private Trust Company (“SPTC”) and SIMC are subsidiaries of SEI Investments Company. As of September 30, 2019, SPTC held of record the following:
| Fund | Class F | Class I | Class Y | |||||
International Equity Fund | 96.53% | 43.73% | 45.02% | |||||
Emerging Markets Equity Fund | 93.73% | —% | 63.06% | |||||
International Fixed Income Fund | 96.54% | —% | 99.61% | |||||
Emerging Markets Debt Fund | 97.86% | —% | 49.81% | |||||
SPTC is not a direct service provider to the SEI Funds. However, SPTC performs a role in the comprehensive investment solution that SEI provides to investors. SPTC holds shares in the Funds as custodian for shareholders that are clients of independent registered investment advisers, financial planners, bank trust departments
SEI Institutional International Trust / Annual Report / September 30, 2019 |
97 |
NOTES TO FINANCIAL STATEMENTS (Concluded)
September 30, 2019
and other financial advisers. SPTC maintains omnibus accounts at the Fund’s transfer agent.
| 11. | REGULATORY MATTERS |
On August 17, 2018, the SEC adopted amendments to RegulationS-X. These changes are effective for periods after November 5, 2018. The updates to Registered Investment Companies were mainly focused on simplifying the presentation of distributable earnings by eliminating the need to present the components of distributable earnings on a book basis in the Statement of Assets & Liabilities. The update also impacted the presentation of undistributed net investment income and distribution to shareholders on the Statement of Changes in Net Assets. The amounts presented in the current Statement of Changes in Net Assets represent the aggregated total distributions of net investment income and realized capital gains, except for distributions classified as return of capital which are still presented separately.
In July 2017, the Financial Conduct Authority, the United Kingdom’s financial regulatory body, announced that after 2021 it will cease its active encouragement of banks to provide the quotations needed to sustain LIBOR. That announcement suggests that LIBOR very likely will cease to be published after that time. Various financial industry groups have begun planning for that transition, whether through market wide protocols, fallback contractual provisions, bespoke negotiations or amendments or otherwise, but there are obstacles to converting certain securities and transactions to a new benchmark. Transition planning is at an early stage, and neither the effect of the transition process nor its ultimate success can yet be known. The transition process might lead to increased volatility and illiquidity in markets for instruments whose terms currently include LIBOR. It could also lead to a reduction in the value of some LIBOR-based investments and reduce the effectiveness of new hedges placed against existing LIBOR-based investments. While some LIBOR-based instruments may contemplate a scenario where LIBOR is no longer available by providing for an alternative rate-setting methodology and/or increased costs for certain LIBOR-related instruments or financing transactions, not all may have such provisions and there may be significant uncertainty regarding the effectiveness of any such alternative methodologies, resulting in prolonged adverse market conditions for the Fund. Because the usefulness of LIBOR as a benchmark could deteriorate during the transition period, these effects could occur prior to the end of 2021. There also remains uncertainty and risk regarding the willingness and ability of issuers to include enhanced provisions in new and existing
contracts or instruments. All of the aforementioned may adversely affect the Fund’s performance or NAV.
| 12. | NEW ACCOUNTING PRONOUNCEMENTS |
In August 2018, the FASB issued Accounting Standards Update2018-13, Fair Value Measurement (Topic 820). The new guidance includes additions and modifications to disclosures requirements for fair value measurements. For public entities, the amendments are effective for financial statements issued for fiscal years beginning after December 15, 2019, and interim periods within those fiscal years. At this time, management is currently evaluating the impact of this new guidance on the financial statements and disclosures.
| 13. | SUBSEQUENT EVENTS |
Management has evaluated the need for disclosures and/or adjustments resulting from subsequent events through the date the financial statements were issued. Based on this evaluation, no disclosure and/or adjustments were required to the financial statements as of September 30, 2019.
98 |
SEI Institutional International Trust / Annual Report / September 30, 2019 |
REPORT OF INDEPENDENT REGISTERED PUBLIC ACCOUNTING FIRM
To the Shareholders of the Funds and Board of Trustees
SEI Institutional International Trust:
Opinion on the Financial Statements
We have audited the accompanying statements of assets and liabilities of SEI Institutional International Trust, comprised of the International Equity Fund, Emerging Markets Equity Fund, International Fixed Income Fund, and Emerging Markets Debt Fund (collectively, the Funds), including the schedules of investments, as of September 30, 2019, the related statements of operations for the year then ended, the statements of changes in net assets for each of the years in thetwo-year period then ended, and the related notes (collectively, the financial statements) and the financial highlights for each of the years in thefive-year period then ended. In our opinion, the financial statements and financial highlights present fairly, in all material respects, the financial position of the Funds as of September 30, 2019, the results of their operations for the year then ended, the changes in their net assets for each of the years in thetwo-year period then ended, and the financial highlights for each of the years in thefive-year period then ended, in conformity with U.S. generally accepted accounting principles.
Basis for Opinion
These financial statements and financial highlights are the responsibility of the Funds’ management. Our responsibility is to express an opinion on these financial statements and financial highlights based on our audits. We are a public accounting firm registered with the Public Company Accounting Oversight Board (United States) (PCAOB) and are required to be independent with respect to the Company in accordance with the U.S. federal securities laws and the applicable rules and regulations of the Securities and Exchange Commission and the PCAOB.
We conducted our audits in accordance with the standards of the PCAOB. Those standards require that we plan and perform the audit to obtain reasonable assurance about whether the financial statements and financial highlights are free of material misstatement, whether due to error or fraud. Our audits included performing procedures to assess the risks of material misstatement of the financial statements and financial highlights, whether due to error or fraud, and performing procedures that respond to those risks. Such procedures included examining, on a test basis, evidence regarding the amounts and disclosures in the financial statements and financial highlights. Such procedures also included confirmation of securities owned as of September 30, 2019, by correspondence with custodians, transfer agents and brokers or by other appropriate auditing procedures when replies were not received. Our audits also included evaluating the accounting principles used and significant estimates made by management, as well as evaluating the overall presentation of the financial statements and financial highlights. We believe that our audits provide a reasonable basis for our opinion.

We have served as the auditor of one or more SEI Funds investment companies since 2005.
Philadelphia, Pennsylvania
November 27, 2019
SEI Institutional International Trust / Annual Report / September 30, 2019 |
99 |
TRUSTEES AND OFFICERS OF THE TRUST (Unaudited)
The following chart lists Trustees and Officers as of September 30, 2019.
Set forth below are the names, addresses, ages, position with the Trust, term of office and length of time served, the principal occupations for the last five years, number of positions in fund complex overseen by trustee, and other directorships outside the fund complex of each of the persons currently serving as Trustees and Officers of the Trust. The Trust’s Statement of Additional Information (“SAI”) includes additional information about the Trustees and Officers. The SAI may be obtained without charge by calling1-877-835-4531.
Name, Address, and Age | Position(s) Held with Trusts | Term of Office and | Principal Occupation(s) During Past Five Years | Number of Complex Overseen | Other Directorships Held by Trustee | |||||
INTERESTED TRUSTEES
| ||||||||||
| Robert A. Nesher One Freedom Valley Drive Oaks, PA 19456 73 yrs. old | Chairman of the Board of Trustees* | since 1995 | Currently performs various services on behalf of SEI for which Mr. Nesher is compensated. | 98 | President and Director of SEI Structured Credit Fund, LP. Director of SEI Global Master Fund plc, SEI Global Assets Fund plc, SEI Global Investments Fund plc, SEI Investments—Global Funds Services, Limited, SEI Investments Global, Limited, SEI Investments (Europe) Ltd., SEI Multi-Strategy Funds PLC, SEI Global Nominee Ltd and SEI Investments—Unit Trust Management (UK) Limited. President, Director and Chief Executive Officer of SEI Alpha Strategy Portfolios, LP from 2007 to 2013. Trustee of SEI Liquid Asset Trust from 1989 to 2016. Vice Chairman of O’Connor EQUUS(closed-end investment company) from 2014 to 2016. Vice Chairman of Winton Series Trust from 2014 to 2017. Vice Chairman of The Advisors’ Inner Circle Fund III and Winton Diversified Opportunities Fund(closed-end investment company) from 2014 to 2018. Vice Chairman of Gallery Trust, Schroder Series Trust and Schroder Global Series Trust from 2015 to 2018. Trustee of The Advisors’ Inner Circle Fund, The Advisors’ Inner Circle Fund II, Bishop Street Funds, and The KP Funds. President, Chief Executive Officer and Trustee of SEI Asset Allocation Trust, SEI Daily Income Trust, SEI Institutional Managed Trust, SEI Institutional International Trust, SEI Institutional Investments Trust, SEI Tax Exempt Trust, SEI Insurance Products Trust, Adviser Managed Trust, The New Covenant Funds and SEI Catholic Values Trust. | |||||
| William M. Doran One Freedom Valley Drive Oaks, PA 19456 79 yrs. old | Trustee* | since 1995 | Self-employed consultant since 2003. Partner, Morgan, Lewis & Bockius LLP (law firm) from 1976 to 2003. Counsel to the Trust, SEI, SIMC, the Administrator and the Distributor. | 98 | Director of SEI since 1974; Secretary of SEI since 1978. Director of SEI Investments Distribution Co. since 2003. Director of SEI Investments—Global Funds Services, Limited, SEI Investments Global, Limited, SEI Investments (Europe), Limited, SEI Investments (Asia) Limited, SEI Global Nominee Ltd. and SEI Investments—Unit Trust Management (UK) Limited. Trustee of SEI Liquid Asset Trust from 1982 to 2016. Trustee of O’Connor EQUUS from 2014 to 2016. Director of SEI Alpha Strategy Portfolios, LP from 2007 to 2013. Trustee of Winton Series Trust from 2014 to 2017. Trustee of The Advisors’ Inner Circle Fund, The Advisors’ Inner Circle Fund II and Bishop Street Funds from 1991 to 2018. Trustee of The KP Funds from 2013 to 2018. Trustee of Winton Diversified Opportunities Fund from 2014 to 2018. Trustee of The Advisors’ Inner Circle Fund III, Gallery Trust, SEI Asset Allocation Trust, SEI Daily Income Trust, SEI Institutional Managed Trust, SEI Institutional International Trust, SEI Institutional Investments Trust, SEI Tax Exempt Trust, SEI Insurance Products Trust, Adviser Managed Trust, New Covenant Funds, Schroder Series Trust, Schroder Global Series Trust and SEI Catholic Values Trust. | |||||
| TRUSTEES | ||||||||||
George J. Sullivan Jr. One Freedom Valley Drive, Oaks, PA 19456 76 yrs. old | Trustee | since 1996 | Retired since January 2012. Self-Employed Consultant, Newfound Consultants Inc. April 1997-December 2011. | 98 | Member of the independent review committee for SEI’s Canadian-registered mutual funds from 2011 to 2017. Director of SEI Alpha Strategy Portfolios, LP from 2007 to 2013. Trustee of SEI Liquid Asset Trust from 1996 to 2016. Trustee/Director of State Street Navigator Securities Lending Trust from 1996 to 2017. Trustee/Director of The Advisors’ Inner Circle Fund, The Advisors’ Inner Circle Fund II, Bishop Street Funds, SEI Structured Credit Fund, LP, SEI Asset Allocation Trust, SEI Daily Income Trust, SEI Institutional Managed Trust, SEI Institutional International Trust, SEI Institutional Investments Trust, SEI Tax Exempt Trust, SEI Insurance Products Trust, Adviser Managed Trust, New Covenant Funds, The KP Funds and SEI Catholic Values Trust. | |||||
| * | Messrs. Nesher and Doran are Trustees who may be deemed as “interested” persons of the Trust as that term is defined in the 1940 Act by virtue of their affiliation with SIMC and the Trust’s Distributor. |
| 1 | Each trustee shall hold office during the lifetime of this Trust until the election and qualification of his or her successor, or until he or she sooner dies, resigns or is removed in accordance with the Trust’s Declaration of Trust |
| 2 | The Fund Complex includes the following Trusts: SEI Asset Allocation Trust, SEI Daily Income Trust, SEI Institutional Investments Trust, Adviser Managed Trust, SEI Institutional International Trust, SEI Institutional Managed Trust, SEI Tax Exempt Trust, SEI Insurance Products Trust, SEI Catholic Values Trust and New Covenant Funds. |
100 |
SEI Institutional International Trust / Annual Report / September 30, 2019 |
Name, Address, and Age | Position(s) Held with Trusts | Term of Office and | Principal Occupation(s) During Past Five Years | Number of Fund Complex Overseen | Other Directorships Held by Trustee | |||||
TRUSTEES (continued)
| ||||||||||
Nina Lesavoy One Freedom Valley Drive, Oaks, PA 19456 62 yrs. old | Trustee | since 2003 | Founder and Managing Director, Avec Capital (strategic fundraising firm) since 2008. Managing Director, Cue Capital (strategic fundraising firm) from March 2002-March 2008. | 98 | Director of SEI Alpha Strategy Portfolios, LP from 2007 to 2013. Trustee of SEI Liquid Asset Trust from 2003 to 2016. Trustee/Director of SEI Structured Credit Fund, L.P., SEI Asset Allocation Trust, SEI Daily Income Trust, SEI Institutional Managed Trust, SEI Institutional International Trust, SEI Institutional Investments Trust, SEI Tax Exempt Trust, SEI Insurance Products Trust, New Covenant Funds, Adviser Managed Trust and SEI Catholic Values Trust. | |||||
James M. Williams One Freedom Valley Drive, Oaks, PA 19456 71 yrs. old | Trustee | since 2004 | Vice President and Chief Investment Officer, J. Paul Getty Trust,Non-Profit Foundation for Visual Arts, since December 2002. President, Harbor Capital Advisors and Harbor Mutual Funds, 2000-2002. Manager, Pension Asset Management, Ford Motor Company, 1997-1999. | 98 | Director of SEI Alpha Strategy Portfolios, LP from 2007 to 2013, Trustee of SEI Liquid Asset Trust from 2004 to 2016. Trustee/Director of Ariel Mutual Funds, SEI Structured Credit Fund, LP, SEI Asset Allocation Trust, SEI Daily Income Trust, SEI Institutional Managed Trust, SEI Institutional International Trust, SEI Institutional Investments Trust, SEI Tax Exempt Trust, New Covenant Funds, SEI Insurance Products Trust, Adviser Managed Trust and SEI Catholic Values Trust. | |||||
Mitchell A. Johnson One Freedom Valley Drive, Oaks, PA 19456 77 yrs. old | Trustee | since 2007 | Retired Private Investor since 1994. | 98 | Director, Federal Agricultural Mortgage Corporation (Farmer Mac) since 1997. Director of SEI Alpha Strategy Portfolios, LP from 2007 to 2013. Trustee of SEI Liquid Asset Trust from 2007 to 2016. Trustee of the Advisors’ Inner Circle Fund, The Advisors’ Inner Circle Fund II, Bishop Street Funds, SEI Asset Allocation Trust, SEI Daily Income Trust, SEI Institutional Managed Trust, SEI Institutional International Trust, SEI Institutional Investments Trust, SEI Tax Exempt Trust, SEI Insurance Products Trust, Adviser Managed Trust, The KP Funds, New Covenant Funds and SEI Catholic Values Trust. | |||||
Hubert L. Harris, Jr. One Freedom Valley Drive, Oaks, PA 19456 76 yrs. old | Trustee | since 2008 | Retired since December 2005. Owner of Harris Plantation, Inc. since 1995. Chief Executive Officer of Harris CAPM, a consulting asset and property management entity. Chief Executive Officer, INVESCO North America, August 2003-December 2005. Chief Executive Officer and Chair of the Board of Directors, AMVESCAP Retirement, Inc., January 1998- August 2003. | 98 | Director of AMVESCAP PLC from 1993-2004. Served as a director of a bank holding company, 2003-2009. Director, Aaron’s Inc., 2012-present. President and CEO of Oasis Ornamentals LLC since 2011. Member of the Board of Councilors of the Carter Center (nonprofit corporation) and served on the board of othernon-profit organizations. Director of SEI Alpha Strategy Portfolios, LP from 2008 to 2013. Trustee of Liquid Asset Trust from 2008 to 2016. Trustee of SEI Asset Allocation Trust, SEI Daily Income Trust, SEI Institutional Managed Trust, SEI Institutional International Trust, SEI Institutional Investments Trust, SEI Tax Exempt Trust, SEI Insurance Products Trust, New Covenant Funds, Adviser Managed Trust and SEI Catholic Values Trust. | |||||
Susan C. Cote One Freedom Valley Drive Oaks, PA 19456 64 yrs. old | Trustee | since 2016 | Retired since July 2015. Treasurer and Chair of Finance, Investment and Audit Committee of the New York Women’s Foundation from 2009 to 2017. Americas Director of Asset Management, Ernst & Young LLP from 2006-2013. Global Asset Management Assurance Leader, Ernest & Young LLP from 2006- 2015. Partner Ernest & Young LLP from 1997-2015. Prudential, 1983-1997. Member of the Ernst & Young LLP Retirement Investment Committee. | 98 | Trustee of SEI Structured Credit Fund, LP, SEI Tax Exempt Trust, SEI Daily Income Trust, SEI Institutional International Trust, SEI Institutional Managed Trust, SEI Asset Allocation Trust, SEI Institutional Investments Trust, SEI Insurance Products Trust, New Covenant Funds, Adviser Managed Trust and SEI Catholic Values Trust. | |||||
James B. Taylor One Freedom Valley Drive Oaks, PA 19456 68 yrs. old | Trustee | since 2018 | Retired since December 2017. Chief Investment Officer at Georgia Teach Foundation from 2008 to 2017. Chief Investment Officer at Delta Air Lines from 1983 to 2007. Member of the Investment Committee at the Institute of Electrical and Electronic Engineers from 1999 to 2004. President, Vice President and Treasurer at Southern Benefits Conference from 1998 to 2000. | 98 | Trustee of SEI Daily Income Trust, SEI Tax Exempt Trust, SEI Institutional Managed Trust, SEI Institutional International Trust, SEI Institutional Investments Trust, SEI Asset Allocation Trust, Adviser Managed Trust, New Covenant Funds, SEI Insurance Products Trust and SEI Catholic Values Trust. | |||||
| 1 | Each trustee shall hold office during the lifetime of this Trust until the election and qualification of his or her successor, or until he or she sooner dies, resigns or is removed in accordance with the Trust’s Declaration of Trust. |
| 2 | The Fund Complex includes the following Trusts: SEI Asset Allocation Trust, SEI Daily Income Trust, SEI Institutional Investments Trust, Adviser Managed Trust, SEI Institutional International Trust, SEI Institutional Managed Trust, SEI Tax Exempt Trust, SEI Insurance Products Trust, SEI Catholic Values Trust and New Covenant Funds. |
SEI Institutional International Trust / Annual Report / September 30, 2019 |
101 |
TRUSTEES AND OFFICERS OF THE TRUST (Unaudited) (Concluded)
Name, Address, and Age | Position(s) Held with Trusts | Term of Office and | Principal Occupation(s) During Past Five Years | Number of Fund Complex Overseen | Other Directorships Held by Trustee | |||||
| OFFICERS | ||||||||||
Robert A. Nesher One Freedom Valley Drive, Oaks, PA 19456 73 yrs. old | President and CEO | since 2005 | Currently performs various services on behalf of SEI for which Mr. Nesher is compensated. | N/A | N/A | |||||
James J. Hoffmayer One Freedom Valley Drive Oaks, PA 19456 46 yrs. old | Controller and Chief Financial Officer | since 2016 | Senior Director, Funds Accounting and Fund Administration, SEI Investments Global Funds Services (since September 2016); Senior Director of Fund Administration, SEI Investments Global Funds Services (since October 2014). Director of Financial Reporting, SEI Investments Global Funds Services (November 2004 – October 2014). | N/A | N/A | |||||
Glenn R. Kurdziel One Freedom Valley Drive Oaks, PA 19456 45 yrs. old | Assistant Controller | since 2017 | Assistant Controller, Funds Accounting, SEI Investments Global Funds Services (March 2017); Manager, Funds Accounting, SEI Investments Global Funds Services since 2005. | N/A | N/A | |||||
Russell Emery One Freedom Valley Drive Oaks, PA 19456 56 yrs. old | Chief Compliance Officer | since 2006 | Chief Compliance Officer of SEI Daily Income Trust, SEI Institutional Investments Trust, SEI Institutional Managed Trust, SEI Asset Allocation Trust, SEI Institutional International Trust, SEI Tax Exempt Trust, The Advisors’ Inner Circle Fund, The Advisors’ Inner Circle Fund II and Bishop Street Funds since March 2006. Chief Compliance Officer of SEI Liquid Asset Trust from 2006 to 2016. Chief Compliance Officer of SEI Structured Credit Fund, LP June 2007. Chief Compliance Officer of Adviser Managed Trust since December 2010. Chief Compliance Officer of SEI Alpha Strategy Portfolios, LP from 2007 to 2013. Chief Compliance Officer of New Covenant Funds since February 2012. Chief Compliance Officer of SEI Insurance Products Trust and The KP Funds since 2013. Chief Compliance Officer of New Covenant Funds since February 2012. Chief Compliance Officer of O’Connor EQUUS from 2014 to 2016. Chief Compliance Officer of The Advisors’ Inner Circle Fund III, Winton Series Trust and Winton Diversified Opportunities Fund since 2014. Chief Compliance Officer of SEI Catholic Values Trust and Gallery Trust since 2015. | N/A | N/A | |||||
Timothy D. Barto One Freedom Valley Drive Oaks, PA 19456 51 yrs. old | Vice President and Secretary | since 2002 | Vice President and Secretary of SEI Institutional Transfer Agent, Inc. since 2009. General Counsel and Secretary of SIMC and the Administrator since 2004. Vice President of SIMC and the Administrator since 1999. Vice President and Assistant Secretary of SEI since 2001. | N/A | N/A | |||||
Aaron Buser One Freedom Valley Drive, Oaks, PA 19456 48 yrs. old | Vice President and Assistant Secretary | since 2008 | Vice President and Assistant Secretary of SEI Institutional Transfer Agent, Inc. since 2009. Vice President and Assistant Secretary of SIMC since 2007. Attorney Stark & Stark (law firm), March 2004-July 2007. | N/A | N/A | |||||
David F. McCann One Freedom Valley Drive, Oaks, PA 19456 43 yrs. old | Vice President and Assistant Secretary | since 2009 | Vice President and Assistant Secretary of SEI Institutional Transfer Agent, Inc. since 2009. Vice President and Assistant Secretary of SIMC since 2008. Attorney, Drinker Biddle & Reath, LLP (law firm), May 2005 - October 2008. | N/A | N/A | |||||
Stephen G. MacRae One Freedom Valley Drive, Oaks, PA 19456 51 yrs. old | Vice President | since 2012 | Director of Global Investment Product Management, January 2004 - to present. | N/A | N/A | |||||
Bridget E. Sudall One Freedom Valley Drive Oaks, PA 19456 38 yrs. old | Anti-Money Laundering Compliance Officer and Privacy Officer | since 2015 | Anti-Money Laundering Compliance Officer and Privacy Officer (since 2015), Senior Associate and AML Officer, Morgan Stanley Alternative Investment Partners, April 2011-March 2015, Investor Services Team Lead, Morgan Stanley Alternative Investment Partners, July 2007-April 2011. | N/A | N/A | |||||
| 1 | Each trustee shall hold office during the lifetime of this Trust until the election and qualification of his or her successor, or until he or she sooner dies, resigns or is removed in accordance with the Trust’s Declaration of Trust. |
| 2 | The Fund Complex includes the following Trusts: SEI Asset Allocation Trust, SEI Daily Income Trust, SEI Institutional Investments Trust, Adviser Managed Trust, SEI Institutional International Trust, SEI Institutional Managed Trust, SEI Tax Exempt Trust, SEI Insurance Products Trust, SEI Catholic Values Trust and New Covenant Funds. |
102 |
SEI Institutional International Trust / Annual Report / September 30, 2019 |
DISCLOSURE OF FUND EXPENSES (Unaudited)
September 30, 2019
All mutual funds have operating expenses. As a shareholder of a fund, your investment is affected by these ongoing costs, which include (among others) costs for portfolio management, administrative services, and shareholder reports like this one. It is important for you to understand the impact of these costs on your investment returns.
Operating expenses such as these are deducted from the fund’s gross income and directly reduce your final investment return. These expenses are expressed as a percentage of the fund’s average net assets; this percentage is known as the fund’s expense ratio.
The following examples use the expense ratio and are intended to help you understand the ongoing costs (in dollars) of investing in your fund and to compare these costs with those of other mutual funds. The examples are based on an investment of $1,000 made at the beginning of the period shown and held for the entire period.
The table on this page illustrates your fund’s costs in two ways:
•Actual fund return. This section helps you to estimate the actual expenses after fee waivers that your Fund incurred over the period. The “Expenses Paid During Period” column shows the actual dollar expense cost incurred by a $1,000 investment in the Fund, and the “Ending Account Value” number is derived from deducting that expense cost from the Fund’s gross investment return.
You can use this information, together with the actual amount you invested in the Fund, to estimate the expenses you paid over that period. Simply divide your actual account value by $1,000 to arrive at a ratio (for example, an $8,600 account value divided by $1,000 = 8.6), then multiply that ratio by the number shown for your Fund under “Expenses Paid During Period”.
•Hypothetical 5% return. This section helps you compare your Fund’s costs with those of other mutual funds. It assumes that the fund had an annual 5% return before expenses during the year, but that the expense ratio (Column 3) for the period is unchanged. This example is useful in making comparisons because the Securities and Exchange Commission requires all mutual funds to make this 5% calculation. You can assess your Fund’s comparative cost by comparing the hypothetical result for your Fund in the “Expense Paid During Period” column with those that appear in the same charts in the shareholder reports for other funds.
NOTE: Because the return is set at 5% for comparison purposes — NOT your Fund’s actual return — the account values shown may not apply to your specific investment.
Beginning Account Value 4/1/19 | Ending Account Value 9/30/19 | Annualized Expense Ratios | Expenses Paid During Period * | |||||||||||||
International Equity Fund |
| |||||||||||||||
Actual Fund Return |
| |||||||||||||||
Class F | $1,000.00 | $1,016.20 | 1.10% | $5.56 | ||||||||||||
Class I | 1,000.00 | 1,014.20 | 1.35 | 6.82 | ||||||||||||
Class Y | 1,000.00 | 1,017.10 | 0.85 | 4.30 | ||||||||||||
Hypothetical 5% Return |
| |||||||||||||||
Class F | $1,000.00 | $1,019.55 | 1.10% | $5.57 | ||||||||||||
Class I | 1,000.00 | 1,018.30 | 1.35 | 6.83 | ||||||||||||
Class Y | 1,000.00 | 1,020.81 | 0.85 | 4.31 | ||||||||||||
Emerging Markets Equity Fund |
| |||||||||||||||
Actual Fund Return |
| |||||||||||||||
Class F | $1,000.00 | $971.40 | 1.70% | $8.40 | ||||||||||||
Class Y | 1,000.00 | 973.10 | 1.45 | 7.17 | ||||||||||||
Hypothetical 5% Return |
| |||||||||||||||
Class F | $1,000.00 | $1,016.55 | 1.70% | $8.59 | ||||||||||||
Class Y | 1,000.00 | 1,017.80 | 1.45 | 7.33 | ||||||||||||
Beginning Account Value 4/1/19 | Ending Account Value 9/30/19 | Annualized Expense Ratios | Expenses Paid During Period * | |||||||||||||
International Fixed Income Fund |
| |||||||||||||||
Actual Fund Return |
| |||||||||||||||
Class F | $1,000.00 | $1,049.90 | 1.02% | $5.24 | ||||||||||||
Class Y | 1,000.00 | 1,051.90 | 0.77 | 3.96 | ||||||||||||
Hypothetical 5% Return |
| |||||||||||||||
Class F | $1,000.00 | $1,019.95 | 1.02% | $5.16 | ||||||||||||
Class Y | 1,000.00 | 1,021.21 | 0.77 | 3.90 | ||||||||||||
Emerging Markets Debt Fund |
| |||||||||||||||
Actual Fund Return |
| |||||||||||||||
Class F | $1,000.00 | $1,039.20 | 1.36% | $6.95 | ||||||||||||
Class Y | 1,000.00 | 1,041.20 | 1.11 | 5.68 | ||||||||||||
Hypothetical 5% Return |
| |||||||||||||||
Class F | $1,000.00 | $1,018.25 | 1.36% | $6.88 | ||||||||||||
Class Y | 1,000.00 | 1,019.50 | 1.11 | 5.62 | ||||||||||||
| * | Expenses are equal to the Fund’s annualized expense ratio multiplied by the average account value over the period, multiplied by 183/365 (to reflect theone-half year period shown). |
SEI Institutional International Trust / Annual Report / September 30, 2019 |
103 |
BOARD OF TRUSTEES’ CONSIDERATIONS IN APPROVING THE ADVISORY ANDSUB-ADVISORY AGREEMENTS (Unaudited)
SEI Institutional International Trust (the “Trust”) and SEI Investments Management Corporation (“SIMC”) have entered into an investment advisory agreement (the “Advisory Agreement”), pursuant to which SIMC provides investment advisory services to the series of the Trust (the “Funds”). Pursuant to separatesub-advisory agreements with SIMC (the“Sub-Advisory Agreements” and, together with the Advisory Agreement, the “Investment Advisory Agreements”), and under the supervision of SIMC and the Trust’s Board of Trustees (the “Board”), thesub-advisers (each, a“Sub-Adviser” and collectively, the“Sub-Advisers”) provide security selection and certain other advisory services with respect to all or a discrete portion of the assets of the Funds. TheSub-Advisers are also responsible for managing their employees who provide services to the Funds. TheSub-Advisers are selected based primarily upon the research and recommendations of SIMC, which evaluates quantitatively and qualitatively theSub-Advisers’ skills and investment results in managing assets for specific asset classes, investment styles and strategies.
The Investment Company Act of 1940, as amended (the “1940 Act”), requires that the initial approval of a Fund’s Investment Advisory Agreements be specifically approved by the vote of a majority of the outstanding shareholders of the Fund and the vote of a majority of the Trustees who are not parties to the Investment Advisory Agreements or “interested persons” of any party (the “Independent Trustees”) cast in person at a meeting called for such purpose. In addition, the 1940 Act requires that the continuation or renewal of any Investment Advisory Agreement be approved at least annually (after an initial period of up to two years), which also requires the vote of a majority of the Board, including a majority of the Independent Trustees. In the case of the initial approval of aSub-Advisory Agreement, only the approval of a majority of the Board, including a majority of the Independent Trustees, is required, pursuant to an exemptive order that has been granted to the Trust by the Securities and Exchange Commission. In connection with their consideration of such initial approvals and renewals, the Funds’ Trustees must request and evaluate, and SIMC and theSub-Advisers are required to furnish, such information as may be reasonably necessary to evaluate the terms of the Investment Advisory Agreements. In addition, the Securities and Exchange Commission takes the position that, as part of their fiduciary duties with respect to a mutual fund’s fees, mutual fund boards are required to evaluate the material factors applicable to a decision to approve an investment advisory agreement.
Consistent with these responsibilities, the Board calls and holds meetings each year to consider whether to approve new and/or renew existing Investment Advisory Agreements between the Trust and SIMC and SIMC and theSub-Advisers with respect to the Funds of the Trust. In preparation for these meetings, the Board requests and reviews a wide variety of materials provided by SIMC and theSub-Advisers, including information about SIMC’s and theSub-Advisers’ affiliates, personnel and operations and the services provided pursuant to the Investment Advisory Agreements. The Board also receives data from third parties. This information is provided in addition to the detailed information about the Funds that the Board reviews during the course of each year, including information that relates to Fund operations and Fund performance. The Trustees also receive a memorandum from counsel regarding the responsibilities of Trustees in connection with their consideration of whether to approve the Trust’s Investment Advisory Agreements. Finally, the Independent Trustees receive advice from independent counsel to the Independent Trustees, meet in executive sessions outside the presence of Fund management and participate in question and answer sessions with representatives of SIMC and theSub-Advisers.
Specifically, during the course of the Trust’s fiscal year, the Board requested and received written materials from SIMC and theSub-Advisers regarding: (i) the quality of SIMC’s and theSub-Advisers’ investment management and other services; (ii) SIMC’s and theSub-Advisers’ investment management personnel; (iii) SIMC’s and theSub-Advisers’ operations and financial condition; (iv) SIMC’s and theSub-Advisers’ brokerage practices (including any soft dollar arrangements) and investment strategies; (v) the level of the advisory fees that SIMC charges the Funds and the level of thesub-advisory fees that SIMC pays theSub-Advisers, compared with fees each charge to comparable accounts; (vi) the advisory fees charged by SIMC and the Funds’ overall fees and operating expenses compared with peer groups of mutual funds prepared by Broadridge, an independent provider of investment company data; (vii) the level of SIMC’s and theSub-Advisers’ profitability from their Fund-related operations; (viii) SIMC’s and theSub-Advisers’ compliance program, including a description of material compliance matters and material compliance violations; (ix) SIMC’s potential economies of scale; (x) SIMC’s and theSub-Advisers’ policies on and compliance procedures for personal securities transactions; (xi) SIMC’s and theSub-Advisers’ expertise and resources in domestic and/or international financial markets; and (xii) the Funds’ performance over various periods of time compared with peer groups of mutual funds prepared by Broadridge and the Funds’ benchmark indexes.
104 |
SEI Institutional International Trust / Annual Report / September 30, 2019 |
At the December4-5, 2018 meeting of the Board, the Trustees approved a brief extension of the Advisory Agreement and theSub-Advisory Agreements already in effect to accommodate a revised meeting schedule. Accordingly, at the April2-3, 2019 meeting of the Board, the Trustees, including a majority of the Independent Trustees, approved the renewal of the Advisory Agreement. Also, eachSub-Advisory Agreement was either initially approved or, if theSub-Advisory Agreement was already in effect (unless operating under an initialtwo-year term), renewed at meetings of the Board held during the course of the Trust’s fiscal year on December4-5, 2018, June25-26, 2019 and September10-11, 2019. In each case, the Board’s approval (or renewal) was based on its consideration and evaluation of the factors described above, as discussed at the meetings and at prior meetings. The following discusses some, but not all, of the factors that were considered by the Board in connection with its assessment of the Investment Advisory Agreements.
Nature, Extent and Quality of Services. The Board considered the nature, extent and quality of the services provided by SIMC and theSub-Advisers to the Funds and the resources of SIMC and theSub-Advisers and their affiliates dedicated to the Funds. In this regard, the Trustees evaluated, among other things, SIMC’s and eachSub-Adviser’s personnel, experience, track record and compliance program. Following evaluation, the Board concluded that, within the context of its full deliberations, the nature, extent and quality of services provided by SIMC and theSub-Advisers to the Funds and the resources of SIMC and theSub-Advisers and their affiliates dedicated to the Funds were sufficient to support the renewal of the Investment Advisory Agreements. In addition to advisory services, the Board considered the nature and quality of certain administrative, transfer agency and othernon-investment advisory services provided to the Funds by SIMC and/or its affiliates.
Performance. In determining whether to renew SIMC’s Advisory Agreement, the Trustees considered the Funds’ performance relative to their peer groups and appropriate indexes/benchmarks. The Trustees reviewed performance information for each Fund, noting that they receive performance reports that permit them to monitor each Fund’s performance at board meetings throughout the year. As part of this review, the Trustees considered the composition of each peer group and selection criteria. In assessing Fund performance, the Trustees considered a report compiled by Broadridge, an independent third-party that was engaged to prepare an assessment of the Funds in connection with the renewal of the Advisory Agreement (the “Broadridge Report”). The Broadridge Report included metrics on risk analysis, volatility versus total return, net total return and performance consistency for the Funds and a universe of comparable funds. Based on the materials considered and discussed at the meetings, the Trustees found Fund performance satisfactory, or, where performance was materially below the benchmark and/or peer group, the Trustees were satisfied with the reasons provided to explain such performance. In connection with the approval or renewal ofSub-Advisory Agreements, the Board considered the performance of theSub-Adviser relative to appropriate indexes/benchmarks. Following evaluation, the Board concluded that, within the context of its full deliberations, the performance of the Funds was sufficient to support renewal of SIMC’s Advisory Agreement, and the performance of eachSub-Adviser was sufficient to support approval or renewal of theSub-Advisory Agreement.
Fees. With respect to the Funds’ expenses under the Investment Advisory Agreements, the Trustees considered the rate of compensation called for by the Investment Advisory Agreements and the Funds’ net operating expense ratios in comparison to those of the Funds’ respective peer groups. In assessing Fund expenses, the Trustees considered the information in the Broadridge Report, which included various metrics related to fund expenses, including, but not limited to, contractual management fees at various asset levels, actual management fees (including transfer agent expenses), and actual total expenses for the Funds and a universe of comparable funds. Based on the materials considered and discussion at the meetings, the Trustees further determined that fees were either shown to be below the peer average in the comparative fee analysis, or that there was a reasonable basis for the fee level. The Trustees also considered the effects of SIMC’s contractual waivers of its management fee with respect to the Emerging Markets Equity Fund and SIMC’s and its affiliates voluntary waivers of management and other fees with respect to the International Equity, Emerging Markets Debt and International Fixed Income Funds to prevent total Fund operating expenses from exceeding specified caps and concluded that SIMC, through waivers, has maintained the Funds’ net operating expenses at competitive levels for its distribution channels. In determining the appropriateness of fees, the Board also took into consideration the impact of fees incurred indirectly by the Funds as a result of investments into underlying funds, including funds from which SIMC or its affiliates earn fees. The Board also took into consideration compensation earned from the Funds by SIMC or its affiliates fornon-advisory services, such as administration, transfer agency, shareholder services or brokerage, and considered whether SIMC and its affiliates may have realized other benefits from their relationship with the Funds, such as any research and brokerage services received under soft dollar arrangements. When considering fees paid toSub-Advisers, the Board
SEI Institutional International Trust / Annual Report / September 30, 2019 |
105 |
BOARD OF TRUSTEES’ CONSIDERATIONS IN APPROVING THE ADVISORY ANDSUB-ADVISORY AGREEMENTS (Unaudited) (Concluded)
took into account the fact that theSub-Advisers are compensated by SIMC and not by the Funds directly, and that such compensation with respect to any unaffiliatedSub-Adviser reflects an arms-length negotiation between theSub-Adviser and SIMC. Following evaluation, the Board concluded that, within the context of its full deliberations, the expenses of the Funds are reasonable and supported renewal of the Investment Advisory Agreements. The Board also considered whether theSub-Advisers and their affiliates may have realized other benefits from their relationship with the Funds, such as any research and brokerage services received under soft dollar arrangements.
Profitability. With regard to profitability, the Trustees considered compensation flowing to SIMC and theSub-Advisers and their affiliates, directly or indirectly. The Trustees considered whether the levels of compensation and profitability were reasonable. As with the fee levels, when considering the profitability of theSub-Advisers, the Board took into account the fact that compensation with respect to any unaffiliatedSub-Adviser reflects an arms-length negotiation between theSub-Adviser and SIMC. In connection with the approval or renewal of eachSub-Advisory Agreement, the Board also took into consideration the impact that the fees paid to theSub-Adviser have on SIMC’s advisory fee margin and profitability. Based on this evaluation, the Board concluded that, within the context of its full deliberations, the profitability of each of SIMC and theSub-Advisers is reasonable and supported renewal of the Investment Advisory Agreements.
Economies of Scale. With respect to the Advisory Agreement, the Trustees considered whether any economies of scale were being realized by SIMC and its affiliates and, if so, whether the benefits of such economies of scale were passed along to the Funds’ shareholders through a graduated investment advisory fee schedule or other means, including any fee waivers by SIMC and its affiliates. The Trustees recognized that economies of scale are difficult to identify and quantify and are rarely identifiable on afund-by-fund basis. Based on this evaluation, the Board determined that the fees were reasonable in light of the information that was provided by SIMC with respect to economies of scale.
Based on the Trustees’ deliberation and their evaluation of the information described above, the Board, including all of the Independent Trustees, with the assistance of Fund counsel and Independent Trustees’ counsel, unanimously approved the approval or renewal, as applicable, of the Investment Advisory Agreements and concluded that the compensation under the Investment Advisory Agreements is fair and reasonable in light of such services and expenses and such other matters as the Trustees considered to be relevant in the exercise of their reasonable judgment. In the course of its deliberations, the Board did not identify any particular factor (or conclusion with respect thereto) or single piece of information that wasall-important, controlling or determinative of its decision, but considered all of the factors together, and each Trustee may have attributed different weights to the various factors (and conclusions with respect thereto) and information.
106 |
SEI Institutional International Trust / Annual Report / September 30, 2019 |
NOTICE TO SHAREHOLDERS (Unaudited)
For shareholders who do not have a September 30, 2019, taxable year end, this notice is for informational purposes only. For shareholders with a September 30, 2019, taxable year end, please consult your tax adviser as to the pertinence of this notice.
For the fiscal year ended September 30, 2019, the Funds are designating long term and qualifying dividend income with regard to distributions paid during the year as follows:
(A) Return of | (B) Long Term | (C) Ordinary | (D) Total | (E) Dividends | (F) Qualifying for QDI)(2) | (G) U.S. | (H) Interest | (I) Short-Term | ||||||||||
International | 0.00% | 0.00% | 100.00% | 100.00% | 0.00% | 100.00% | 0.00% | 0.00% | 0.00% | |||||||||
Emerging Markets | 0.00% | 0.00% | 100.00% | 100.00% | 0.00% | 100.00% | 0.00% | 0.00% | 0.00% | |||||||||
International Fixed | 0.00% | 11.07% | 88.93% | 100.00% | 0.00% | 0.00% | 0.00% | 0.00% | 100.00% | |||||||||
Emerging Markets | 0.00% | 0.00% | 100.00% | 100.00% | 0.00% | 0.00% | 0.00% | 0.00% | 0.00% |
The Funds intend to pass through foreign tax credit to shareholders. For the fiscal year ended September 30, 2019, the amount of foreign source income and foreign tax credit are as follows:
| Fund | Foreign Source Income | Foreign Tax Credit | ||||||
Emerging Markets Equity | $ | 24,548,661 | $ | 4,580,104 | ||||
International Equity | 81,826,578 | 6,238,622 | ||||||
| (1) | “Dividends Received Deduction” represent dividends which qualify for the corporate dividends received deduction. |
| (2) | “Qualifying Dividend Income” represent qualifying dividends as created by the Jobs and Growth Tax Relief Reconciliation Act of 2003. It is the intention of the Fund to designate the max amount permitted by law. |
| (3) | “U.S. Government Interest” represent the amount of interest that was derived from direct U.S. Government obligations and distributed during the fiscal year. Generally, interest from direct U.S. Government obligations is exempt from state income tax. However, for shareholders who are residents of California, Connecticut or New York, the statutory threshold requirements were not satisfied to permit exemption of these amounts from state income. |
| (4) | The percentage in this column represents the amount of “Interest Related Dividend” is reflected as a percentage of ordinary income distribution. Interest related dividends is exempted from U.S. withholding tax when paid to foreign investors. |
| (5) | The percentage of this column represents the amount of “Short Term Capital Gain Dividend” is reflected as a percentage of short term capital gain distribution that is exempted from U.S. withholding tax when paid to foreign investors. |
Items (A), (B), (C) and (D) are based on the percentage of each fund’s total distribution.
Items (E) and (F) are based on the percentage of “Ordinary Income Distributions.”
Item (G) is based on the percentage of gross income of each Fund.
Item (H) is based on the percentage of net investment income distributions.
Item (I) is based on the percentage of short-term capital gains distributions.
Please consult your tax adviser for proper treatment of this information. This notification should be kept with your permanent tax records.
SEI Institutional International Trust / Annual Report / September 30, 2019 |
107 |
(This page intentionally left blank)
SEI INSTITUTIONAL INTERNATIONAL TRUST / ANNUAL REPORT / SEPTEMBER 30, 2019
Robert A. Nesher,Chairman
Trustees
William M. Doran
George J. Sullivan, Jr.
Nina Lesavoy
James M. Williams
Mitchell A. Johnson
Hubert L. Harris, Jr.
Susan C. Cote
James B. Taylor
Officers
Robert A. Nesher
President and Chief Executive Officer
James J. Hoffmayer
Controller and Chief Financial Officer
Glenn R. Kurdziel
Assistant Controller
Russell Emery
Chief Compliance Officer
Timothy D. Barto
Vice President and Secretary
David F. McCann
Vice President and Assistant Secretary
Aaron Buser
Vice President and Assistant Secretary
Stephen G. MacRae
Vice President
Bridget E. Sudall
Anti-Money Laundering Compliance Officer
and Privacy Officer
Investment Adviser
SEI Investments Management Corporation
Administrator
SEI Investments Global Funds Services
Distributor
SEI Investments Distribution Co.
Legal Counsel
Morgan, Lewis & Bockius LLP
Independent Registered Public Accounting Firm
KPMG LLP
This report and the financial statements contained herein are submitted for the general information of the shareholders of the Trust and must be preceded or accompanied by a current prospectus. Shares of the Funds are not deposits or obligations of, or guaranteed or endorsed by, any bank. The shares are not federally insured by the Federal Deposit Insurance Corporation (FDIC), the Federal Reserve Board, or any other government agency. Investment in the shares involves risk, including the possible loss of principal.
For more information call
1 800 DIAL SEI
(1 800 342 5734)

1 Freedom Valley Drive, P.O. Box 1100, Oaks, PA 19456
SEI-F-018 (9/19)
| Item 2. | Code of Ethics. |
The Registrant has adopted a code of ethics that applies to the Registrant’s principal executive officer, principal financial officer, comptroller or principal accounting officer, or controller, or persons performing similar functions.
| Item 3. | Audit Committee Financial Expert. |
(a)(1) The Registrant’s Board of Trustees has determined that the Registrant has three Audit Committee financial experts serving on its audit committee.
(a) (2) The audit committee financial experts are Susan C. Cote, George J. Sullivan, Jr. and Hubert L. Harris, Jr. Ms. Cote and Messrs. Sullivan and Harris are independent as defined in FormN-CSR Item 3 (a) (2).
| Item 4. | Principal Accountant Fees and Services. |
Fees billed by KPMG LLP (“KPMG”) related to the Registrant.
KPMG billed the Registrant aggregate fees for services rendered to the Registrant for the last two fiscal years as follows:
Fiscal 2019
| Fiscal 2018
| |||||||||||||
| All fees and services to the Registrant that were pre- approved | All fees and services to service affiliates that were pre- approved | All other fees and services to service affiliates that did not require pre- approval | All fees and services to the Registrant that were pre- approved | All fees and services to service affiliates that were pre- approved | All other fees and services to service affiliates that did not require pre- approval | |||||||||
| (a) | Audit Fees(1)
| $206,500 | $0 | N/A | $204,460 | $0 | N/A | |||||||
| (b) | Audit-Related Fees | $0 | $0 | $0 | $0 | $0 | $0 | |||||||
| (c) | Tax Fees
| $0 | $0 | $0 | $0 | $0 | $0 | |||||||
| (d) | All Other Fees(2)
| $0 | $289,100 | $0 | $0 | $372,077 | $0 | |||||||
Notes:
| (1) | Audit fees include amounts related to the audit of the Registrant’s annual financial statements and services normally provided by the accountant in connection with statutory and regulatory filings. |
| (2) | See Item 4(g) for a description of the services comprising the fees disclosed under this category. |
(e)(1) The Registrant’s Audit Committee has adopted and the Board of Trustees has ratified an Audit andNon-Audit ServicesPre-Approval Policy (the “Policy”), which sets forth the procedures and the conditions pursuant to which services proposed to be performed by the independent auditor of the Registrant may bepre-approved. In any instance where services requirepre-approval, the Audit Committee will consider whether such services are consistent with SEC’s rules on auditor independence and whether the provision of such services would compromise the auditor’s independence.
The Policy provides that all requests or applications for proposed services to be provided by the independent auditor must be submitted to the Registrant’s Chief Financial Officer (“CFO”) and must include a detailed description of the services proposed to be rendered. The CFO will determine whether such services: (1) require specificpre-approval; (2) are included within the list of services that have received the generalpre-approval of the Audit Committee pursuant to the Policy; or (3) have been previouslypre-approved in connection with the independent auditor’s annual engagement letter for the applicable year or otherwise.
Requests or applications to provide services that require specificpre-approval by the Audit Committee will be submitted to the Audit Committee by the CFO. The Audit Committee has delegated specificpre-approval authority to either the Audit Committee Chair or financial experts, provided that the estimated fee for any such proposedpre-approved service does not exceed $100,000 and anypre-approval decisions are reported to the Audit Committee at its next regularly scheduled meeting.
Services that have received the generalpre-approval of the Audit Committee are identified and described in the Policy. In addition, the Policy sets forth a maximum fee per engagement with respect to each identified service that has received generalpre-approval. The Audit Committee will annually review andpre-approve the services that may be provided by the independent auditor during the following twelve months without obtaining specificpre-approval from the Audit Committee.
The Audit Committee will be informed by the CFO on a quarterly basis of all services rendered by the independent auditor.
All services to be provided by the independent auditor shall be provided pursuant to a signed written engagement letter with the Registrant, the investment advisor or applicable control affiliate (except that matters as to which an engagement letter would be impractical because of timing issues or because the matter is small may not be the subject of an engagement letter) that sets forth both the services to be provided by the independent auditor and the total fees (or the manner of their determination) to be paid to the independent auditor for those services.
In addition, the Audit Committee has determined to take additional measures on an annual basis to meet its responsibility to oversee the work of the independent auditor and to assure the auditor’s independence from the Registrant, such as reviewing a formal written statement from the independent auditor delineating all relationships between the independent auditor and the Registrant, and discussing with the independent auditor its methods and procedures for ensuring independence.
(e)(2) Percentage of fees billed pursuant to waiver ofpre-approval requirement were as follows:
| Fiscal 2019 | Fiscal 2018 | |||
Audit-Related Fees
| 0%
| 0%
| ||
Tax Fees
| 0%
| 0%
| ||
All Other Fees
| 0%
| 0%
|
(f) Not Applicable.
(g)(1) The aggregatenon-audit fees billed by KPMG for the fiscal years 2019 and 2018 were $289,100 and $372,077, respectively.Non-audit fees consist of a service organization controls report review of fund accounting and administration operations, and an attestation report in accordance with Rule17Ad-13.
(h) During the past fiscal year, the Registrant’s principal accountant provided certain non-audit services to the Registrant’s investment adviser or to entities controlling, controlled by, or under common control with the Registrant’s investment adviser that provide ongoing services to the Registrant that were not subject to pre-approval pursuant to paragraph (c)(7)(ii) ofRule 2-01 of Regulation S-X. The Audit Committee of the Registrant’s Board of Trustees reviewed and considered thesenon-audit services provided by the Registrant’s principal accountant to the Registrant’s affiliates, including whether the provision of these non-audit services is compatible with maintaining the principal accountant’s independence.
| Item 5. | Audit Committee of Listed Registrants. |
Not applicable.
| Item 6. | Investments |
The Schedules of Investments in securities of unaffiliated issuers as of the close of the reporting period for the International Equity Fund, Emerging Markets Equity Fund, International Fixed Income Fund, and Emerging Markets Debt Fund are included as part of the report to shareholders filed under Item 1 of this form.
| Item 7. | Disclosure of Proxy Voting Policies and Procedures forClosed-End Management Investment Companies. |
Not applicable.
| Item 8. | Portfolio Managers ofClosed-End Management Investment Companies |
Not applicable.
| Item 9. | Purchases of Equity Securities byClosed-End Management Company and Affiliated Purchasers. |
Not applicable.
| Item 10. | Submission of Matters to a Vote of Security Holders. |
There have been no material changes to the procedures by which shareholders may recommend nominees to the Registrant’s Board of Trustees (the “Board”). The Registrant has a standing Governance Committee (the “Committee”) currently consisting of the Independent Trustees. The Committee is responsible for evaluating and recommending nominees for election to the Board. Pursuant to the Committee’s Charter, adopted on June 18, 2004, as amended, the Committee will review all shareholder recommendations for nominations to fill vacancies on the Board if such recommendations are submitted in writing and addressed to the Committee at the Registrant’s office.
| Item 11. | Controls and Procedures. |
(a) The Registrant’s principal executive and principal financial officers, or persons performing similar functions, have concluded that the Registrant’s disclosure controls and procedures (as defined in Rule30a-3(c) under the Investment Company Act of 1940 (the “1940 Act”)) (17 CFR270.30a-3(c)) are effective, based on the evaluation of these controls and procedures required by Rule30a-3(b) under the 1940 Act (17 CFR270.30a-3(b)) and Rules13a-15(b) or15d-15(b) under the Securities Exchange Act of 1934 (17 CFR240.13a-15(b) or240.15d-15(b)) as of a date within 90 days of the filing date of this report.
(b) There were no changes in the Registrant’s internal control over financial reporting (as defined in Rule30a-3(d) under the 1940 Act) (17 CFR270.30a-3(d)) that occurred during the period covered by this report that have materially affected, or are reasonably likely to materially affect, the Registrant’s internal control over financial reporting.
| Item 12. | Disclosure of Securities Lending Activities forClosed-End Management Investment Companies. |
Not applicable.
| Item 13. | Exhibits. |
(a)(1) Code of Ethics attached hereto.
(a)(2) A separate certification for the principal executive officer and the principal financial officer of the Registrant as required by Rule30a-2(a) under the Investment Company Act of 1940, are filed herewith.
(b) Officer certifications as required by Rule30a-2(b) under the Investment Company Act of 1940, as amended (17 CFR270.30a-2(b)) also accompany this filing as exhibits.
SIGNATURES
Pursuant to the requirements of the Securities Exchange Act of 1934 and the Investment Company Act of 1940, the Registrant has duly caused this report to be signed on its behalf by the undersigned, thereunto duly authorized.
| SEI Institutional International Trust | ||||||
| By: | /s/ Robert A. Nesher | |||||
| Robert A. Nesher | ||||||
| President & CEO | ||||||
Date: December 6, 2019
Pursuant to the requirements of the Securities Exchange Act of 1934 and the Investment Company Act of 1940, this report has been signed below by the following persons on behalf of the Registrant and in the capacities and on the dates indicated.
| By: | /s/ Robert A. Nesher | |||||
| Robert A. Nesher | ||||||
| President & CEO |
Date: December 6, 2019
| By: | /s/ James J. Hoffmayer | |||||
| James J. Hoffmayer | ||||||
| Controller & CFO |
Date: December 6, 2019