UNITED STATES
SECURITIES AND EXCHANGE COMMISSION
Washington, D.C. 20549
FORM N-CSR
CERTIFIED SHAREHOLDER REPORT OF REGISTERED MANAGEMENT
INVESTMENT COMPANIES
Investment Company Act file number 811-05601
SEI Institutional International Trust
(Exact name of registrant as specified in charter)
SEI Investments
One Freedom Valley Drive
Oaks, PA 19456
(Address of principal executive offices) (Zip code)
Timothy D. Barto, Esq.
SEI Investments
One Freedom Valley Drive
Oaks, PA 19456
(Name and address of agent for service)
Registrant’s telephone number, including area code: 610-676-1000
Date of fiscal year end: September 30, 2020
Date of reporting period: September 30, 2020
| Item 1. | Reports to Stockholders. |

September 30, 2020
ANNUAL REPORT
SEI Institutional International Trust
| International Equity Fund
| |
| Emerging Markets Equity Fund
| |
| International Fixed Income Fund
| |
 | Emerging Markets Debt Fund |
Beginning on January 1, 2021, as permitted by regulations adopted by the Securities and Exchange Commission, paper copies of the Funds’ shareholder reports like this one will no longer be sent by mail, unless you specifically request paper copies of the reports from the Funds or from your financial intermediary, such as a broker-dealer or bank. Instead, the reports will be made available on a website, and you will be notified by mail each time a report is posted and provided with a website link to access the report.
If you already elected to receive shareholder reports electronically, you will not be affected by this change and you need not take any action. You may elect to receive shareholder reports and other communications from the Funds electronically by contacting your financial intermediary.
You may elect to receive all future reports in paper free of charge. If you invest through a financial intermediary, you can follow the instructions included with this disclosure, if applicable, or you can contact your financial intermediary to inform it that you wish to continue receiving paper copies of your shareholder reports. If you invest directly with the Funds, you can inform the Funds that you wish to continue receiving paper copies of your shareholder reports by calling 1-800-DIAL-SEI. Your election to receive reports in paper will apply to all funds held with the SEI Funds or your financial intermediary.

The Trust files its complete schedule of portfolio holdings with the Securities and Exchange Commission for the first and third quarters of each fiscal year as an exhibit to its reports on Form N-PORT. The Trust’s Form N-PORT reports are available on the Commission’s website at http://www.sec.gov.
A description of the policies and procedures that the Trust uses to determine how to vote proxies relating to portfolio securities, as well as information relating to how a Fund voted proxies relating to portfolio securities during the most recent 12-month period ended June 30, is available (i) without charge, upon request, by calling 1-800-DIAL-SEI; and (ii) on the Commission’s website at http://www.sec.gov.
September 30, 2020 (Unaudited)
To Our Shareholders:
The fiscal year ending September 30, 2020, began with strong returns in the equity markets over the final months of 2019. After hitting all-time highs in February, concerns about the international spread of a novel coronavirus (COVID-19) dominated investor concerns, and by the end of March most equity indexes had fallen into bear-market territory. Plans to reopen economic activity and developments in the race for COVID-19 treatments encouraged investors in April and May; global financial markets rallied sharply amid renewed “risk-on” sentiment, with U.S. equity markets eclipsing their pre-pandemic peaks before the end of the fiscal year. Despite tension around a U.S.-China trade deal and ongoing Brexit concerns in late 2019, the lingering effects of COVID-19 demanded plenty of attention from investors.
The Federal Reserve (Fed) cut interest rates three times prior to March. Two off-cycle moves in February brought the federal-funds rate to near zero and were designed to bolster the economy in response to the economic threat posed by the coronavirus outbreak; the emergency actions were the first since the global financial crisis. Additionally, the Fed committed to purchasing unlimited amounts of Treasurys and established or renewed multiple facilities designed to support the economy.
Christine Lagarde succeeded Mario Draghi as European Central Bank (ECB) President in November. The ECB restarted its asset-purchase program in November with a monthly pace of €20 billion and stated it intends to continue to fully reinvest the principal payments from maturing securities purchased under the program. In response to COVID-19, the ECB announced a new quantitative easing (QE) package in March—the Pandemic Emergency Purchase Programme
— amounting to €750 billion, which should bring total QE-related asset purchases to more than €1.3 trillion in 2020.
The Japanese yen, typically viewed as a safe-haven asset in “risk-off” environments, finished the period 2.5% higher against the U.S. dollar, while the Bank of Japan indicated it would continue a negative rate policy through 2023. The Chinese yuan finished the fiscal year up 5.3%; the currency rebounded from an 11-year low reached before the start of the fiscal year after a U.S.-China phase-one trade agreement was signed.
West Texas Intermediate crude-oil prices stayed mostly range-bound over the first quarter of the reporting period. From January onward, the commodity became a victim of an oil-production impasse between Saudi Arabia and Russia and travel restrictions that sapped usage due to the coronavirus pandemic. Between the high price toward the end of 2019 and the April lows, crude-oil prices fell over 80%. Record supply cuts and a pickup in global fuel demand toward the end of the reporting period helped drive a partial price recovery, and oil finished down over 25% for the 12-month period.
Geopolitical events
Market volatility accelerated in the first quarter of 2020 following concerns about COVID-19 and its eventual economic effect: as the outbreak spread from China to other countries, governments issued stay-at-home orders and initiated widespread lockdowns. Beyond the threat to public health, the outbreak and resulting containment measures evoked concerns about the potential halt to global economic activity. The official daily infection rate continued to trend generally higher, with over 33 million cases worldwide at the end of September, while in the U.S., the total recorded number of COVID-19-related deaths surpassed 200,000 by the end of September—out of about 1,000,000 total worldwide. Nevertheless, markets remained generally optimistic over the last half of the reporting period as forward-looking investors attempted to spot sources of encouragement.
At least 68 countries and territories postponed elections between February 21 and July 26, also citing concerns about COVID-19 containment, according to the Wall Street Journal; at least 49 countries and territories committed to holding their elections as scheduled. The U.S. presidential election cycle formally progressed to its final phase before Election Day, as President Donald Trump accepted the Republican Party’s nomination and former Vice President Joe Biden accepted the Democratic Party’s nomination at their respective quadrennial conventions during August. The U.S. general election will proceed in early November.
The United States-Mexico-Canada trade agreement was ratified by all three countries in December and officially replaced the North American Free Trade Agreement on July 1. The Trump administration announced in September that it would not pursue a 10% tariff on U.S. imports of Canadian aluminum previously announced in August, as trade is now expected to normalize in the coming months following high import levels earlier in 2020. President Trump
SEI Institutional International Trust / Annual Report / September 30, 2020 |
1 |
LETTER TO SHAREHOLDERS (Continued)
September 30, 2020 (Unaudited)
and France’s President Emmanuel Macron successfully walked back threats of tariffs that originated with French plans for a digital tax that would have targeted U.S.-based multi-national technology companies. The prospect of a digital tax re-surfaced in other countries—including the U.K., Italy, Austria and Turkey—which prompted more threats of retailiatory tariffs by Treasury Secretary Steven Mnuchin. Sajid Javid, the UK’s former Chancellor of the Exchequer, disappointed Secretary Mnuchin by explaining during a joint interview in late January at the World Economic Forum that the U.K. would prioritize trade negotiations with the EU over a deal with the U.S.
China and the U.S. formalized a “phase one” trade deal in mid-January that offered tariff relief to China (via the reduction of existing tariffs and the delay of additional scheduled tariffs). In exchange, China committed to purchasing $200 billion in U.S. products over a two-year period; addressing its long-standing practice of forcing the transfer of intellectual property and technology to Chinese counterparts in exchange for access to the Chinese market; and promising to continue opening its financial-services industry to foreign investors. The tense U.S.-China relationship was stressed in May by a U.S. push for more transparency in the ownership of U.S.-listed Chinese companies and the U.S. government’s barring of certain Chinese securities from its retirement plans.
Under Boris Johnson, the UK’s Conservative Party consolidated its power in a mid-December election—winning a majority of seats in the House of Commons and gaining approval for Prime Minister Boris Johnson’s EU departure deal. The country officially left the EU at the end of January 2020, giving way to an 11-month transition period to negotiate terms of the future U.K.-EU relationship. Johnson emerged from his personal battle with COVID-19 in April, having been hospitalized in intensive care and temporarily deputizing Foreign Secretary Dominic Raab to fulfill his role while incapacitated.
Japan’s ruling Liberal Democratic Party selected Yoshihide Suga to succeed Prime Minister Shinzo Abe, who resigned in August due to health issues. Elsewhere in Asia, China-Taiwan tensions flared in September after a high-level U.S. government official’s visit to Taiwan; China was angered by what it saw as one of its territories assuming sovereignty by inappropriately conducting international diplomacy. Chinese planes made a show of force to coincide with the visit, prompting Taiwan to quickly mobilize its military jets. The island’s government had previously condemned nearby Chinese military drills as provocations. In Beijing, a military spokesman accused Taiwan’s ruling Democratic Progressive Party of “collusion” with the U.S., and said the U.S. is trying to “use Taiwan to control China.”
Economic performance
U.S. gross domestic product (GDP) grew 2.1% in the fourth quarter of 2019, driven by an increase in net trade but weakened by a sharp slowdown in consumer spending. The economy saw a decline of 5.0% in the first quarter of 2020, the largest drop since the global financial crisis, but reflected just two weeks of lockdowns that began across the country in March. The economy contracted by a worst-ever 31.4% in the second quarter, falling in all 50 states. The abrupt halt to the 10-year economic expansion came amid mandated lockdowns throughout most of the country.
The U.S. unemployment rate touched a 50-year low of 3.5% during the fiscal year before jumping as high as 14.7% in April and settling at 7.9% in the final reading; the number of Americans filing for initial unemployment benefits hit record numbers as many non-essential businesses were forced to close in the wake of the pandemic. The labor-force participation rate ended at 61.4%, down from 63.2% a year earlier. Average hourly earnings gained 4.7% over the fiscal year, as the increase in unemployment tended to hit lower-wage workers hardest.
Broad economic activity in the eurozone slowed to its weakest pace since records began in 1995 during the first quarter of 2020; the 13.6% annualized decline wiped away three years of growth in the area. The region officially fell into recession after a 40.3% contraction in the second quarter and far exceeded that in the U.S. as measures imposed to limit the spread of COVID-19 reflected the closing of everything from restaurants to factories. The magnitude and speed of the contraction solidified the case for continued accommodative policy by the ECB for some time.
The Bank of England’s Monetary Policy Committee cut its Bank Rate to 0.1% in March, the lowest in the 325-year history of its lending rate, during the fiscal year. It also announced a £200 billion asset-purchase program, mostly of government bonds, to be conducted at a monthly pace that will eclipse previous rounds of QE. Additionally, it launched a so-called funding-for-lending scheme to spur banks to lend to small- and medium-sized enterprises, as well as a commercial paper facility with no cap limit, both to be financed by central-bank reserves. Following its mid-June meeting, the central bank announced that it would expand its stock of asset purchases to £745 billion. The U.K.
2 |
SEI Institutional International Trust / Annual Report / September 30, 2020 |
economy shrank a record 19.8% seasonally-adjusted at annual rates through the second quarter of 2020; while the decline was less severe than originally thought, it was also the largest since records have been kept.
Japanese GDP contracted 7.2% in seasonally-adjusted annualized terms in the fourth quarter of 2019 as the country’s sales tax hike weakened consumer and business spending; an additional 2.2% decline in the first quarter of 2020 confirmed that Japan had fallen into recession for the first time in over four years. Japan’s economy contracted 28.1% in the second quarter as capital expenditures were hit hard by the pandemic. The Bank of Japan expanded monetary stimulus as pandemic pain worsened late in the period. Meanwhile, GDP in China shrank by 6.8% year-on-year and seasonally-adjusted in the first quarter of 2020, its worst pace in several decades, as consumer spending, exports and fixed-asset investments all were affected by the lockdowns in January and early February; a 3.2% gain in the second quarter came as restrictions eased and the country rolled out stimulus measures intended to aid the economy.
Market developments
The S&P 500 Index finished the fiscal year up 15.15%, despite falling over 30% from its peak on February 19, 2020, to the trough on March 23. Prior to the coronavirus onset, investors enjoyed the continuation of the modest U.S. economic expansion, reasonably strong corporate profitability and accommodative Fed monetary policy. Over the full reporting period, mega-cap stocks, a narrow group of companies with unusually large weights in the broad equity index, outperformed, and growth companies in the information technology sector generally led, while many value stocks underperformed. Commodity-sensitive stocks, particularly those within the energy sector, lagged the most.
U.S. large-cap stocks (Russell 1000 Index) finished the reporting period up 16.01%; small-cap stocks (Russell 2000 Index) were hit harder in the coronavirus-driven selloff, as investors tended to avoid smaller companies with lesser financial strength, and edged just 0.39% higher over the fiscal year.
Despite continued accommodative monetary policy from the ECB, European equities lagged, as fears over trade wars and COVID-19 grew. The MSCI Europe Index (Net) fell 0.79% in U.S. dollar terms and was 7.33% lower in euros; the euro finished up 6.68% versus the U.S. dollar for the period. The MSCI ACWI Index (Net), a proxy for global equities in both developed and emerging markets, climbed 10.44% in U.S. dollar terms.
Despite a strong rally over the second half of the year, the FTSE UK Series All-Share Index lost 12.30% in U.S. dollar terms over the full reporting period, while it fell 16.59% in sterling.
Emerging-market equities were higher. After gaining 9.56% in the final quarter of the fiscal year, the MSCI Emerging Markets Index (Net) finished the reporting period up 10.54% in U.S. dollar terms. U.S.-China trade news generally drove performance for the first three months; however, a rally after the U.S. and China agreed to a “phase-one” trade deal in January was wiped out until COVID-19 concerns in China began to decelerate.
Global government bonds outperformed global high-yield bonds as the escalation of COVID-19 hit the bond market’s most economically sensitive sectors the hardest. The global high-yield market, as measured by the ICE BofA Global High Yield Constrained Index, was 3.84% higher during the reporting period, while global government bonds, as measured by the Bloomberg Barclays Global Treasury Index, did better and climbed 5.84%.
A continuing theme for U.S. fixed-income markets was the inverted yield curve. The spread between 2-year and 5-year Treasurys yields was inverted early in the reporting period, as was the spread between 3-year and 5-year Treasurys. Notably, the spread between 3-month and 10-year rates was inverted for only the second time in about 12 years during the fiscal year, a signal of impending recession to some market watchers that occurred long before any knowledge of the pandemic. The differential reverted during the period and eventually stayed in positive territory from March onward.
Yields for 10-year U.S. government bonds ended the period down 99 basis points at 0.69%, after hitting an all-time low of 0.54% in March as investors rushed to “safe-haven” securities; 2-year yields declined during the fiscal year to finish down 150 basis points at 0.13%.
Inflation-sensitive assets, such as commodities and Treasury inflation-protected securities (TIPS), were mixed. The Bloomberg Commodity Total Return Index (which represents the broad commodity market) finished down 8.20% over the full one-year period, after an oil-production impasse between Saudi Arabia and Russia created a downdraft in the
SEI Institutional International Trust / Annual Report / September 30, 2020 |
3 |
LETTER TO SHAREHOLDERS (Concluded)
September 30, 2020 (Unaudited)
oil market around the same time that demand contracted due to the coronavirus pandemic; the Bloomberg Barclays 1-10 Year US TIPS Index (USD) moved 7.75% higher during the reporting period.
U.S. investment-grade corporate debt was higher; the Bloomberg Barclays US Corporate Investment Grade Index returned 7.90% as investors remained eager to buy higher-yielding securities. U.S. asset- and mortgage-backed securities also managed to rise during the fiscal year.
Coronavirus concerns and the steep drop in global oil prices led to a declining outlook for economic growth in emerging markets; the JP Morgan Global Bond Index-Emerging Markets (GBI-EM) Global Diversified Index, which tracks local-currency-denominated EM bonds, declined 1.45% in U.S. dollar terms. The JP Morgan Emerging Markets Bond Index (EMBI) Global Diversified Index, which tracks EM debt denominated in external currencies (such as the U.S. dollar), managed a 1.29% gain for the fiscal year.
Our view
It has already been an eventful and exhausting year, but we have a sense that the next few months could prove critical to the future course of the global economy and financial markets. Most countries were in V-shaped recovery mode during the third quarter, moving sharply off their low points in May and June. We assume that future lockdowns to contain COVID-19 outbreaks will be far more limited in scope. For developed countries, treatments have improved, vulnerable populations appear to be better-protected, and younger, generally healthier people are accounting for a much larger share of confirmed new cases.
But we doubt there will be a full return to normal economic behavior until safe and effective vaccines are introduced and distributed globally. The news on this score has been positive, and probably is a key reason for the continued buoyancy of equities and other risk assets. According to the World Health Organization, researchers were testing 38 vaccines in clinical trials at the end of September, while 93 more were in pre-clinical testing. Ten vaccines have been approved for large-scale efficacy and safety trials. We think it is realistic to assume that a few different vaccines will be generally available by this time next year, which means that social-distancing measures must still be followed well into 2021 and, most likely, into 2022.
There’s no disputing that U.S. economic activity remains far below normal. Although incomes are now recovering as more people get back to work, the lack of additional income support may drag down consumer spending as we head into the end of the year. Business sentiment appears to have bottomed, but the outlook remains sufficiently uncertain to keep us in a watch-and-wait mode. We would not be surprised to see the official U.S. unemployment rate move up in the months ahead as hard-hit industries eliminate jobs now that government support has run out.
In August, Fed Chairman Jerome Powell officially unveiled a new framework for conducting the central bank’s monetary policy. The Fed has decided to see how low the U.S. unemployment rate can get before it causes the inflation rate to exceed the 2% mark by a meaningful extent.
The FOMC’s own inflation projection does not envision a return to 2% inflation until the end of its forecast window in 2023, so it may be a long time before the federal-funds rate rises.
In our view, all that’s really left in the Fed’s monetary toolbox is quantitative easing, along with the provision of lifeline support to corporations as well as state and local governments through its various credit facilities. Monetization of debt will likely continue until the pandemic crisis is well past and the U.S. unemployment rate approaches its previous lows.
The U.S. presidential election will have a major impact on the economy and financial markets in the months and years ahead. Still, we firmly believe that it would be a mistake to pursue even a short-term investment strategy that necessitates accurately predicting: (1) the election winner; (2) the policies proposed by the newly inaugurated president; (3) the ways in which Congress will modify those proposals throughout the legislative process; or (4) the impact those new laws would have on the economy and financial markets.
Regardless of the election’s outcome, we assume that both candidates would see their platforms tempered before they’re put into practice. There is a high degree of institutional inertia, which is partly deliberate (constitutional checks and balances) and partly happenstance (increasing polarization of opinion in the country tends to favor a draw). While there could be some market volatility plausibly attributed to the election, it is usually best to pay strict attention to the fundamentals and to ignore the politics.
4 |
SEI Institutional International Trust / Annual Report / September 30, 2020 |
The U.K. is undergoing its own unique political melodrama, with Prime Minister Boris Johnson facing a rebellion among his own backbenchers and intense criticism from senior Conservatives over his proposal to renege on the withdrawal treaty that would allow Northern Ireland to trade without border restrictions with Ireland and the rest of the EU. The move to abrogate the treaty, if successful, would almost certainly lead to a hard Brexit—a reversion to the World Trade Organization’s most-favored-nation trading rules with the EU. It also could breathe new life into the separatist movement in Northern Ireland itself, not to mention Scotland.
Prime Minister Johnson’s decision reflects his government’s frustration with EU negotiators. There are two main sticking points, one small (EU fishing industry demanding full access to U.K. waters) and one large (EU demanding the UK’s continued adherence to EU strictures on government financial assistance to private-sector businesses).
Obviously, a hard Brexit will not help matters. But the worst impact potentially will be sustained by financial companies and other service- producing entities, since World Trade Organization rules deal mostly with tradable goods. The increase in tariffs, for the most part, will be bearable once border-related issues are worked out. In the meantime, the U.K. and the rest of Europe are facing a second wave of COVID-19 that could turn what’s been a V-shaped recovery into something looking more like a W.
This year’s pandemic and postponement of the summer Olympics proved to be a bitter ending to Japanese Prime Minister Shinzo Abe’s record-breaking term in office. His push to lift Japan out of its deflationary spiral was somewhat successful. Prices mostly stopped declining in the aggregate, but there were few occasions when overall consumer-price inflation rose above 1%. Pandemic pressures have caused a return to outright deflation in recent months.
In our view, it is unlikely that radical changes will be made to the direction of policy under Japan’s new Prime Minister Yoshihide Suga. In the near-term, the priority will be on the response to the coronavirus; fiscal policy will remain quite expansionary. The Bank of Japan will continue to buy most of the government-issued bonds, along with other types of corporate debt and equity, as it has been doing as part of its Quantitative and Qualitative Easing program over the past four years.
The contrast of the big Asian stock markets versus other large emerging-market equities is dramatic. China’s strong gains can be chalked up to its rebound in economic activity. Although travel and other services are still constrained due to lingering concerns about the virus, infrastructure-related spending and manufacturing have experienced an almost-complete recovery to pre-pandemic levels. Investors seem to be unfazed by the deterioration in the US-China economic relationship or by the increasingly fraught diplomatic relations between China and other countries.
Emerging markets are already showing some good news. The price of raw industrials bottomed in early May, and have since enjoyed a sharp move higher. If industrial commodity prices advance in a sustained, multi-year fashion as they have in previous cycles, it’s a good bet that emerging-market corporate profits will also rise sharply.
Our optimism is somewhat tempered by the rising debt burden facing many emerging countries. Much of the increase in emerging-market debt has been tied to the corporate sector—especially in China, where private domestic, non-financial debt has reached an eye-watering 216% of GDP. Of more concern are the mostly small-to-medium-sized countries that are running current-account deficits and are too dependent on external hard-currency debt, or do not have the reserves to easily cover their debt service.
The actions of the world’s major central banks back in March, especially the Fed’s provision of U.S. dollar liquidity, have helped to ease the strain on the market for emerging-country debt. Governments and other official lenders, meanwhile, have granted loan forbearance to nearly 80 countries; it’s a tougher job to get private creditors to agree to do the same. Nonetheless, emerging-market sovereign yields on dollar-denominated debt have fallen back toward their previous record lows, more than reversing the spike endured in March, prior to the Fed’s rescue operations.
Sincerely,

William T. Lawrence, CFA
Head and Chief Investment Officer of Traditional Asset Management, SEI
SEI Institutional International Trust / Annual Report / September 30, 2020 |
5 |
MANAGEMENT’S DISCUSSION AND ANALYSIS OF FUND PERFORMANCE
September 30, 2020 (Unaudited)
International Equity Fund
I. Objective
The International Equity Fund (the “Fund”) seeks long-term capital appreciation.
II. Multi-Manager Approach Statement
The Fund uses a multi-manager approach, relying on a number of sub-advisors with differing investment approaches to manage portions of the Fund’s portfolio, under the general supervision of SEI Investments Management Corporation (“SIMC”). The Fund utilized the following sub-advisors as of September 30, 2020: Acadian Asset Management LLC (“Acadian”), Causeway Capital Management LLC (“Causeway”), INTECH Investment Management LLC (“INTECH”), JO Hambro Capital Management Limited (“JO Hambro”), Lazard Asset Management LLC (“Lazard”), NWQ Investment Management Company, LLC (“NWQ”) and WCM Investment Management LLC (“WCM”).
During the period, JO Hambro was added to the Fund, while Blackcrane Capital, LLC (“Blackcrane”), and Neuberger Berman Investment Advisers LLC (“Neuberger Berman”), were removed from the Fund.
III. Return vs. Benchmark
For the year ended September 30, 2020, the Fund’s Class F shares outperformed the MSCI EAFE Index (Net)—which tracks the performance of developed-market equities outside North America—returning 3.44% versus the Index return of 0.49%.
IV. Fund Attribution
As noted in the shareholder letter, developed-market equities rose steadily at the start of the fiscal year as the global economy found footing; the eventual outbreak of COVID-19 in early 2020 forced lockdowns and stay-at-home orders across most countries, sending major equity indexes lower as investors dealt with the economic uncertainty. Over the last half of the reporting period, markets generally rallied as central banks enacted significant monetary and fiscal stimulus measures.
Although Japanese economic growth remained lackluster during the reporting period, Japan was the best-performing country in the MSCI EAFE Index over the full fiscal year. Europe also performed well and was boosted by the strong performance of its healthcare sector. During the worst of the selloff, the European Central Bank announced massive amounts of monetary stimulus, which was eventually accompanied by large amounts of fiscal stimulus from its member nations, to
support the region’s economy. The European Union also made progress in issuing the region’s first common bonds, signaling to investors its determination in helping the region’s economy recuperate. The Pacific ex-Japan region was dragged down by results from Australia’s energy and banking sector. The U.K. was the worst-performing region as the twin headwinds of COVID-19 and a collapse in oil prices put heavy pressure on the region’s equity prices. Lack of progress in Brexit negotiations was also a dampener on equity prices.
The best-performing sectors in the benchmark were information technology and healthcare, with investors flocking to sectors believed to have the most durable and sustainable long-term growth prospects. Healthcare also outperformed given the outbreak-driven demand for healthcare services. Information technology was the Fund’s most significant contributor as stability and momentum managers had favorable results within the sector. The materials sector also did well on strong results from non-commodity-related companies. Real estate contributed as the Fund’s aversion to the sector’s rich valuations and lack of growth opportunities helped avoid losses from the otherwise poorly performing sector. The biggest detractors came from defensive sectors like consumer staples and utilities, which generally matched or outperformed the benchmark and that the Fund was underweight. Energy was the benchmark’s worst-performing sector given the weakness in the oil industry, although the Fund’s underweight was beneficial.
From a regional point of view, Europe was the biggest contributor due to favorable exposure and results in the European industrials and healthcare sectors. Exposure to ex-benchmark emerging-market Asian technology also contributed. An underweight to Pacific ex-Japan, especially the region’s underperforming banks, was beneficial. The U.K. also contributed, primarily due to the Fund’s underweight to the region’s lagging energy sector, which took a hit during the crude oil selloff in the spring. Japan was the biggest regional detractor due to negative results in the Fund’s Japanese healthcare and consumer sectors.
WCM was the Fund’s best-performing manager and outperformed due to tailwinds to stability, especially stocks on the faster growing end of the stability spectrum. During the fiscal year, stocks with durable and stable growth prospects continued to be favored by investors as the COVID-19 break altered expectations for future growth. Acadian also contributed and saw favorable results from its quantitative model-driven selection; headwinds to value were not enough to offset
6 |
SEI Institutional International Trust / Annual Report / September 30, 2020 |
the tailwinds from momentum. Blackcrane contributed and enjoyed a tailwind to momentum, as companies with strong fundamental momentum were heavily rewarded. During the period, momentum became more aligned with stability as companies with strong and consistent earnings growth prospects continued to outperform and trend higher. Stability manager Neuberger Berman also benefited from a similar tailwind to stability, and both of the Fund’s momentum managers, INTECH and JO Hambro, enjoyed positive tailwinds to momentum and added to alpha as well.
The Fund’s three value managers—Causeway, NWQ and Lazard—were the only detractors. Performance for our value managers was in line with expectations given the continued headwinds that value faced as investors preferred stability and momentum throughout most of the fiscal year.
Investing is subject to risk, including the possible loss of principal. Past performance is no indication of future results.
AVERAGE ANNUAL TOTAL RETURN1
| 1 Year Return | Annualized 3 Year Return | Annualized 5 Year Return | Annualized 10 Year Return | Annualized Inception to Date | ||||||||||||||||
| International Equity Fund, Class F | 3.44% | 0.24% | 4.88% | 4.25% | 3.43% | |||||||||||||||
| International Equity Fund, Class I | 3.19% | -0.01% | 4.60% | 3.98% | 3.17% | |||||||||||||||
| International Equity Fund, Class Y | 3.68% | 0.48% | 5.12% | 4.39% | 3.47% | |||||||||||||||
| MSCI EAFE Index (Net) | 0.49% | 0.62% | 5.26% | 4.62% | 4.25% | |||||||||||||||
Comparison of Change in the Value of a $100,000 Investment in the International Equity Fund, Class F, Class I and Class Y, versus the MSCI EAFE Index (Net)
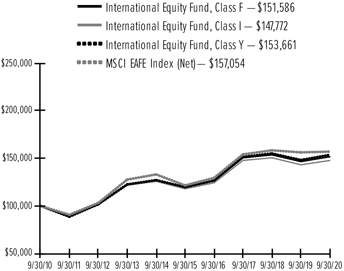
| 1 | For the year ended September 30, 2020. Past performance is no indication of future performance. Class F shares were offered beginning December 20, 1989. Class I shares were offered beginning January 4, 2002. The performance of Class I shares prior to January 4, 2002 is calculated using the performance of Class F shares adjusted for the higher expenses of the Class I shares. Returns for Class I shares are substantially similar to those of Class F shares and differ only to the extent that Class I shares have higher total annual fund operating expenses than Class F shares. The Fund’s Class Y shares commenced operations on December 31, 2014. For periods prior to December 31, 2014, the performance of the Fund’s Class F Shares has been used. Returns for Class Y Shares would have been substantially similar to those of Class F shares and would have differed only to the extent that Class Y shares have lower total annual fund operating expenses than Class F shares. Returns shown do not reflect the deduction of taxes that a shareholder would pay on fund distributions or the redemption of fund shares. The returns for the period reflect fee waivers and/or reimbursements in effect for the period; absent fee waivers and reimbursements, performance would have been lower. |
SEI Institutional International Trust / Annual Report / September 30, 2020 |
7 |
MANAGEMENT’S DISCUSSION AND ANALYSIS OF FUND PERFORMANCE
September 30, 2020 (Unaudited)
Emerging Market Equity Fund
I. Objective
The Emerging Markets Equity Fund (the “Fund”) seeks capital appreciation.
II. Multi-Manager Approach Statement
The Fund uses a multi-manager approach, relying on a number of sub-advisors with differing investment approaches to manage portions of the Fund’s portfolio, under the general supervision of SEI Investments Management Corp. (“SIMC”). The Fund utilized the following sub-advisors as of September 30, 2020: JO Hambro Capital Management Limited (“JO Hambro”), KBI Global Investors (North America) Ltd. (“KBI”), Lazard Asset Management LLC (“Lazard”), Neuberger Berman Investment Advisers LLC (“Neuberger Berman”), Qtron Investments LLC (“Qtron”) and RWC Asset Advisors (US) LLC (“RWC”).
During the period, Delaware Investments Fund Advisers, a series of Macquarie Investment Management Business Trust (“Macquarie”), was removed from the Fund.
III. Return vs. Benchmark
For the year ended September 30, 2020, the Fund’s Class F shares underperformed the MSCI Emerging Markets Index (Net)—which tracks the performance of global emerging market equities—returning 8.75% versus the Index return of 10.54%.
IV. Fund Attribution
Emerging markets finished on a positive note after a rollercoaster performance during the fiscal year. The fourth quarter of 2019 was a positive one, with markets rallying on hopes of a pickup in global economic growth before the outbreak of COVID-19 sent major equity markets into freefall; most global economies enacted business lockdowns and stay-at-home orders. Oil also experienced a major disruption as expected cuts to crude were not realized, sending oil prices crashing and contributing to the equity market freefall, especially in commodity-exporting nations.
Asian countries outperformed the benchmark, led by Chinese equities. China was the first to be impacted by COVID-19 but was also the first to recover, boosted by fiscal and monetary stimulus from the government. Strong demand for online retail and internet platforms (from consumers staying home), as well as technology components, partially fueled the strong performance of Chinese equities. Strong demand for technology components like memory and 5G also helped both Taiwan and Korea outperform. India lagged Asia but kept
pace with the benchmark as COVID-19 exacerbated the country’s economic slowdown.
The Europe, Middle East and Africa region lagged the benchmark as the drop in oil prices, as well as the shock to overall commodity demand, was a drag on South Africa and Russia and the commodity exporters in both countries. A drop in global tourism also impacted Greece and Turkey, which were among the biggest laggards in the region and the benchmark.
Latin America also lagged the benchmark and was the worst-performing region due to weak performance from Brazil, which was affected by both high cases for COVID-19 and the drop in commodity prices. Mexico outperformed the region but lagged the benchmark due to weak performance in banks and consumer stocks.
The best-performing sectors in the benchmark were information technology on strong demand due to significant work-from-home use, as well as healthcare due to pandemic demand. Online retailing and consumer discretionary also outperformed as consumers were forced to stay at home. The worst-performing sectors were energy, which was weakened by price cuts and a slump in demand, and financials, as many emerging-market banks suffered from the drop in local growth.
An overweight to information technology was the largest contributor to Fund performance. Overweights to materials and industrials also contributed due to strong results in select metals, chemicals and capital goods companies. Consumer discretionary was the biggest detractor given the Fund’s low exposure to online retailing stocks amid elevated valuations. Weak selection within the healthcare and consumer staples sectors further challenged Fund performance.
KBI was the biggest detractor as the manager’s dividend-yield process faced headwinds. Investors preferred companies with faster and more durable growth prospects over cheaper companies that tended to have impaired business fundamentals. Neuberger Berman also detracted and lagged expectations given the manager’s stability profile and strong preference for stability. Stability generally outperformed, influenced by investor preferences for fast-growing companies with durable prospects, as well as the large index weights of the big internet and technology companies; Neuberger Berman was tilted towards the smaller, cheaper, and slower-growing end of that stability spectrum. The manager did not have exposure to the expensive and fast-growing online retailing companies that dominated index performance during the reporting period. Lazard was the smallest detractor during the period and
8 |
SEI Institutional International Trust / Annual Report / September 30, 2020 |
underperformed largely due to an oversized exposure to high-quality banks in countries like India and Colombia that were hit by slowing economic growth.
JO Hambro was the top-performing manager and benefited from its momentum philosophy. Momentum outperformed as internet, technology and healthcare companies outperformed for most of the fiscal year. Macquarie also contributed and benefited from an underweight to banks and selection within energy and information technology. Qtron’s quantitative model led to above-benchmark returns in all sectors except healthcare and the consumer sectors. RWC contributed slightly during the fiscal year and was helped by an overweight to information technology and strong selection within materials and internet stocks.
Investing is subject to risk, including the possible loss of principal. Past performance is no indication of future results.
AVERAGE ANNUAL TOTAL RETURN1
| 1 Year Return | Annualized 3 Year Return | Annualized 5 Year Return | Annualized 10 Year Return | Annualized Inception to Date | ||||||||||||||||
| Emerging Markets Equity Fund, Class F | 8.75% | 0.28% | 8.42% | 1.36% | 4.34% | |||||||||||||||
| Emerging Markets Equity Fund, Class Y | 8.99% | 0.52% | 8.69% | 1.51% | 4.40% | |||||||||||||||
| MSCI Emerging Markets Index (Gross) | 10.91% | 2.79% | 9.37% | 2.87% | 6.04% | |||||||||||||||
| MSCI Emerging Markets Index (Net) | 10.54% | 2.42% | 8.97% | 2.50% | N/A | |||||||||||||||
Comparison of Change in the Value of a $100,000 Investment in the Emerging Markets Equity Fund, Class F and Class Y, versus the MSCI Emerging Markets Index (Net) and the MSCI Emerging Markets Index (Gross)
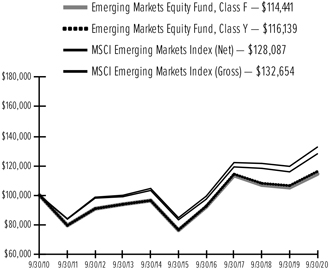
| 1 | For the year ended September 30, 2020. Past performance is no indication of future performance. Class F shares were offered beginning January 17, 1995. Class Y shares were offered beginning December 31, 2014. Class Y shares performance for the period prior to December 31, 2014 is derived from the performance of Class F shares. The Fund’s Class Y shares commenced operations on December 31, 2014. For periods prior to December 31, 2014, the performance of the Fund’s Class F Shares has been used. Returns for Class Y Shares would have been substantially similar to those of Class F shares and would have differed only to the extent that Class Y shares have lower total annual fund operating expenses than Class F shares. Returns shown do not reflect the deduction of taxes that a shareholder would pay on fund distributions or the redemption of fund shares. The returns for the period reflect fee waivers and/or reimbursements in effect for the period; absent fee waivers and reimbursements, performance would have been lower. |
N/A – Not available
SEI Institutional International Trust / Annual Report / September 30, 2020 |
9 |
MANAGEMENT’S DISCUSSION AND ANALYSIS OF FUND PERFORMANCE
September 30, 2020 (Unaudited)
International Fixed Income Fund
I. Objective
The International Fixed Income Fund (the Fund) seeks capital appreciation and current income.
II. Multi-Manager Approach Statement
The Fund uses a multi-manager approach, relying on a number of sub-advisors with differing investment approaches to manage portions of the Fund’s portfolio, under the general supervision of SEI Investments Management Corporation (“SIMC”). The Fund utilized the following sub-advisors as of September 30, 2020: AllianceBernstein L.P. (“AllianceBernstein”), Colchester Global Investors Limited (“Colchester”) and Wellington Management Company LLP (“Wellington”).
No manager changes were made during the Fund’s fiscal year.
III. Return vs. Benchmark
For the year ended September 30, 2020, the Fund’s Class F shares underperformed the Bloomberg Barclays Global Aggregate ex-USD Index, Hedged (the “Index”)—which tracks the performance of the global investment-grade fixed-rate debt markets outside of the U.S.—returning 0.73% versus the Index return of 1.82%.
IV. Fund Attribution
Global fixed income delivered decent performance over the period, although international (ex-U.S. dollar) indexes produced more modest returns given that the U.S. was the best-performing major bond market. Weakness in the U.S. dollar essentially meant that hedged indexes inherently underperformed their unhedged equivalents.
U.S. fixed income started the reporting period with a significant yield advantage over other G7 markets, which gave U.S. bonds a strong starting point from which to outperform through the fiscal year as escalating COVID-19 concerns prompted a sharp rally in sovereign yields. The strong performance of duration-sensitive assets was matched by the weakness in risk assets as credit spreads widened significantly through late February and March. The selloff in credit was dramatic, with spreads widening at a far quicker pace than what was experienced during the global financial crisis. The subsequent retracement in spreads was equally fast, aided by unprecedented levels of monetary support from the U.S. Federal Reserve, European Central Bank and other global central banks, as noted in the shareholder letter. On an excess return basis, sterling and euro corporates outperformed U.S. corporates. Local-currency emerging-market debt (EMD) lagged other risk-sensitive
sectors—including hard-currency debt—during the period as bond gains were pared by general weakness within the EM currency complex.
The Fund underperformed its benchmark during the reporting period. The biggest performance detractor was the overweight to corporate credit, which was a significant drag in March when investor risk aversion peaked. Duration underweights in Japan, core Europe and the U.K. during February/early March also weighed on relative performance as core markets caught a “safe-haven” bid. Active currency positioning was an overall detractor, through long positions in the Mexican peso, Colombian peso, Chilean peso and Russian ruble, as well as shorts in the Swiss franc and New Zealand dollar.
This underperformance was largely offset by out-of-index exposure to the U.S. bond market (both U.S. Treasurys and spread sectors) and an overweight to Mexican local bonds. Currency overweights to British pounds and Swedish krona, as well as shorts in Turkish lira, Hungarian forint and Thai baht also pared losses on other active currency positions.
Wellington lagged during the period. Most of the underperformance was generated at the start of the reporting period due to an ill-timed pivot to overweight duration, and during mid-2020, when the portfolio was short euros. AllianceBernstein was challenged by its overweight exposure to corporate credit (including some off-index high yield) during a period of heightened risk aversion.
Colchester outperformed and benefited from overweights in emerging local-currency debt markets (Mexico and Colombia), off-index exposure to U.S. Treasury inflation-protected securities, as well as currency overweights in Norwegian krone, Swedish krona, British pound, Mexican peso and Colombian peso.
The Fund used financial futures, interest-rate swaps and over-the-counter options during the reporting period to hedge existing exposures and gain exposure to particular areas of the market. The use of derivatives did not have a material impact on performance.
Investing is subject to risk, including the possible loss of principal. Past performance is no indication of future results.
10 |
SEI Institutional International Trust / Annual Report / September 30, 2020 |
AVERAGE ANNUAL TOTAL RETURN1
| 1 Year Return | Annualized 3 Year Return | Annualized 5 Year Return | Annualized 10 Year Return | Annualized Inception to Date | ||||||||||||||||
| International Fixed Income Fund, Class F | 0.73% | 3.73% | 3.46% | 3.26% | 4.22% | |||||||||||||||
| International Fixed Income Fund, Class Y | 0.88% | 3.96% | 3.69% | 3.38% | 4.26% | |||||||||||||||
| Bloomberg Barclays Global Aggregate ex-USD Index, Hedged | 1.82% | 4.94% | 4.33% | 4.06% | 5.58% | |||||||||||||||
Comparison of Change in the Value of a $100,000 Investment in the International Fixed Income Fund, Class F versus the Bloomberg Barclays Global Aggregate ex-USD Index, Hedged
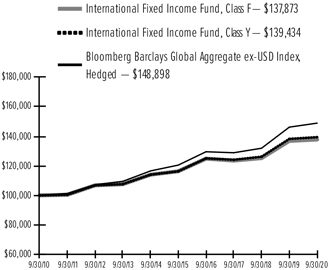
| ¹ | For the year ended September 30, 2020. Past performance is no indication of future performance. Class F shares were offered beginning September 1, 1993. Class Y shares were offered beginning October 30, 2015. Class Y shares performance for the period prior to October 30, 2015 is derived from the performance of Class F shares. The Fund’s Class Y shares commenced operations on December 31, 2014. For periods prior to December 31, 2014, the performance of the Fund’s Class F Shares has been used. Returns for Class Y Shares would have been substantially similar to those of Class F shares and would have differed only to the extent that Class Y shares have lower total annual fund operating expenses than Class F shares. Returns shown do not reflect the deduction of taxes that a shareholder would pay on fund distributions or the redemption of fund shares. The returns for the period reflect fee waivers and/or reimbursements in effect for the period; absent fee waivers and reimbursements, performance would have been lower. |
SEI Institutional International Trust / Annual Report / September 30, 2020 |
11 |
MANAGEMENT’S DISCUSSION AND ANALYSIS OF FUND PERFORMANCE
September 30, 2020 (Unaudited)
Emerging Markets Debt Fund
I. Objective
The Emerging Markets Debt Fund (the “Fund”) seeks to maximize total return.
II. Multi-Manager Approach
The Fund uses a multi-manager approach, relying on a number of sub-advisors with differing investment approaches to manage portions of the Fund’s portfolio, under the general supervision of SEI Investments Management Corp. (“SIMC”). The Fund utilized the following sub-advisors as of September 30, 2020: Colchester Global Investors Limited (“Colchester”), Marathon Asset Management, L.P. (“Marathon”), Neuberger Berman Investment Advisers LLC (“Neuberger Berman”), Ninety One UK Ltd (fka Investec Asset Management Ltd.) (“Ninety One”) and Stone Harbor Investment Partners LP (“Stone Harbor”).
No manager changes were made during the Fund’s fiscal year.
III. Return vs. Benchmark
For the year ended September 30, 2020, the Fund’s Class F shares underperformed a hybrid of 50% JP Morgan EMBI Global Diversified Index (which tracks the performance of external debt instruments in the emerging markets) and 50% JP Morgan GBI-EM Global Diversified Index (which tracks the performance of debt instruments issued in domestic currencies by emerging-market governments), returning -0.53% versus the Index return of -0.02%.
IV. Fund Attribution
Emerging markets began the period strongly, with both hard- and local-currency indexes posting positive returns in the fourth quarter of 2019. Emerging-market debt benefited from positive growth with high real yields and (relatively) attractive spreads, providing positive carry through the end of the calendar year.
The severity of the COVID-19 pandemic began to be realized around mid-February. Much of the damage was done by late March, with spread assets repricing two to three times wider. Emerging-market governments responded to the global slowdown and local lockdowns with fiscal packages aimed at providing help to local businesses and consumers alike (though these fiscal packages were modest in size compared to those seen in developed markets), and central banks slashed policy rates to spur consumption; some also implemented asset purchase programs aimed at maintaining liquidity.
Hard-currency markets, as represented by the JP Morgan EMBI Global Diversified Index, saw spreads widen from under 300 basis points over U.S. Treasurys in February to slightly over 700 basis points at peak crisis in March. The ensuing recovery was mostly concentrated in higher-quality assets. The spread of the investment-grade portion of the index ended February at 196 basis points, widened to more than 400 basis points during March, and ended September back at 196 basis points. Sub-investment-grade spreads remained more than 150 basis points wider at the end of the fiscal year than where they stood at the end of February, a sign that investors remained uncomfortable moving into the riskier names of an already risky asset class.
Local rates provided a positive absolute return for the year as inflation continued to be benign and many emerging-market central banks cut policy rates in response to local lockdowns and the slowdown in global trade. Virtually every country in JP Morgan’s local-currency index saw its central bank cut its policy rate at least one time since February, though most cut rates at least twice. In all, central banks of local-index countries produced more than 50 rate cuts since February. Unlike local rates, emerging-market currencies have experienced significant weakening since the coronavirus pandemic. Many currencies weakened more than 10% to the U.S. dollar and, although they have recovered somewhat in the months since the pandemic’s initial outbreak, a majority of currencies in the local index are weaker on a 12-month basis.
The Fund underperformed its blended benchmark during the fiscal year. Overweights to Venezuela (which continued to experience a political crisis along with U.S. sanctions) and the Russian ruble (which weakened over the period with the twin problems of an economic slowdown and lower oil prices) detracted over the period. An underweight to the Polish zloty and positioning in South Africa (which was experiencing fiscal difficulties before the coronavirus slowdown began) further weakened Fund performance. Argentina and Ecuador contributed to performance as each country reached a debt restructuring deal with creditors over the summer of 2020. An underweight to Turkey (where questionable governance at the central bank produced low policy rates despite an economy dogged by high inflation) also contributed to relative return.
Colchester outperformed its local-currency benchmark, benefiting from overweights to Mexico and Colombia, but detracted from overall Fund performance due to its overweight to Brazil and underweight to Poland. Ninety One also outperformed its local-currency benchmark,
12 |
SEI Institutional International Trust / Annual Report / September 30, 2020 |
benefiting from an off-benchmark position to Egypt and an underweight to Turkey, but detracted from overall Fund performance due to positioning in South Africa and an underweight to Poland.
Stone Harbor outperformed and benefited from overweights to Ecuador and Mexico; the manager was hurt by exposure to Venezuela and an underweight to China. Marathon outperformed and was helped by an off-benchmark position in Israel and security selection in Ecuador, while exposure to Venezuela and an underweight to Saudi Arabia detracted. Neuberger Berman also outperformed thanks to overweights to Argentina and Egypt, while exposure to South Africa and Turkey detracted.
Currency forwards and swap contracts were used in the Fund for the one-year period ending September 30, 2020, as a way to either hedge particular positions or gain exposure to additional areas of the market. Currency forwards had a material impact on the Fund during the period as 50% of the Index is directly affected by foreign currencies. Positive and negative impacts differed on a country-to-country basis, depending on whether the forward increased or decreased currency exposure and whether the currency strengthened or weakened relative to the U.S. dollar.
Investing is subject to risk, including the possible loss of principal. Past performance is no indication of future results.
AVERAGE ANNUAL TOTAL RETURN1
1 Year | Annualized 3 Year | Annualized 5 Year Return | Annualized 10 Year Return | Annualized Inception to Date | ||||||||||||||||
| Emerging Markets Debt Fund, Class F | -0.53% | 0.19% | 4.60% | 2.12% | 7.16% | |||||||||||||||
| Emerging Markets Debt Fund, Class Y | -0.33% | 0.45% | 4.86% | 2.27% | 7.23% | |||||||||||||||
| JP Morgan EMBI Global Diversified Index | 1.29% | 3.49% | 6.15% | 5.43% | 8.06% | |||||||||||||||
| JP Morgan GBI-EM Global Diversified Index | -1.45% | 0.17% | 4.78% | 0.52% | N/A | |||||||||||||||
| 50/50 Hybrid of the JP Morgan EMBI Global Diversified Index and the JP Morgan GBI-EM Global Diversified Index | -0.02% | 1.89% | 5.53% | 3.02% | N/A | |||||||||||||||
Comparison of Change in the Value of a $100,000 Investment in the Emerging Markets Debt Fund, Class F and Class Y, versus a 50/50 Hybrid of the Following Indexes: the JP Morgan EMBI Global Diversified Index and the JP Morgan GBI-EM Global Diversified Index
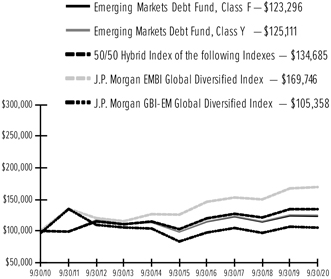
| ¹ | For the year ended September 30, 2020. Past performance is no indication of future performance. Class F shares were offered beginning June 26, 1997. The Fund’s Class Y shares commenced operations on December 31, 2014. For periods prior to December 31, 2014, the performance of the Fund’s Class F Shares has been used. Returns for Class Y Shares would have been substantially similar to those of Class F shares and would have differed only to the extent that Class Y shares have lower total annual fund operating expenses than Class F shares. Returns shown do not reflect the deduction of taxes that a shareholder would pay on fund distributions or the redemption of fund shares. The returns for the period reflect fee waivers and/or reimbursements in effect for the period; absent fee waivers and reimbursements, performance would have been lower. |
N/A — Not Available.
SEI Institutional International Trust / Annual Report / September 30, 2020 |
13 |
September 30, 2020
International Equity Fund
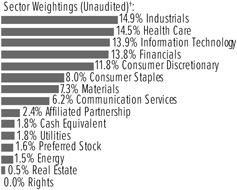
†Percentages based on total investments. Includes investments held as collateral for securities on loan (see Note 9).
Description | Shares | Market Value ($ Thousands) | ||||||
COMMON STOCK — 94.1% | ||||||||
Argentina — 0.5% | ||||||||
MercadoLibre Inc * | 17,228 | $ | 18,649 | |||||
|
|
| ||||||
Australia — 3.2% | ||||||||
a2 Milk Co Ltd/The *(A) | 1,652,395 | 16,737 | ||||||
Australia & New Zealand Banking Group Ltd | 125,050 | 1,551 | ||||||
Avita Therapeutics Inc * | 199,996 | 990 | ||||||
BlueScope Steel Ltd | 896,249 | 8,179 | ||||||
Brambles Ltd | 224,767 | 1,707 | ||||||
Coles Group Ltd | 37,256 | 456 | ||||||
CSL Ltd | 83,863 | 17,347 | ||||||
CSR Ltd | 792,249 | 2,430 | ||||||
Evolution Mining Ltd | 849,680 | 3,512 | ||||||
Fortescue Metals Group Ltd | 1,647,033 | 19,346 | ||||||
Harvey Norman Holdings Ltd | 896,394 | 2,925 | ||||||
Iluka Resources Ltd | 221,712 | 1,434 | ||||||
Newcrest Mining Ltd | 712,097 | 15,960 | ||||||
Orica Ltd | 318,520 | 3,529 | ||||||
Orora Ltd | 1,270,565 | 2,199 | ||||||
OZ Minerals Ltd | 349,366 | 3,528 | ||||||
Rio Tinto Ltd | 202,214 | 13,723 | ||||||
South32 Ltd | 6,544,807 | 9,649 | ||||||
Technology One Ltd | 57,602 | 329 | ||||||
Wesfarmers Ltd | 26,392 | 844 | ||||||
|
|
| ||||||
| 126,375 | ||||||||
|
|
| ||||||
Austria — 0.2% | ||||||||
BAWAG Group AG | 161,151 | 5,823 | ||||||
Verbund AG, Cl A | 37,632 | 2,058 | ||||||
|
|
| ||||||
| 7,881 | ||||||||
|
|
| ||||||
Belgium — 1.2% | ||||||||
Ageas SA/NV | 495,494 | 20,274 | ||||||
Colruyt SA | 58,532 | 3,798 | ||||||
Groupe Bruxelles Lambert SA | 145,793 | 13,167 | ||||||
UCB SA | 48,928 | 5,555 | ||||||
| Description | Shares | Market Value ($ Thousands) | ||||||
COMMON STOCK (continued) | ||||||||
Umicore SA | 91,664 | $ | 3,804 | |||||
|
|
| ||||||
| 46,598 | ||||||||
|
|
| ||||||
Canada — 1.2% | ||||||||
Air Canada, Cl A * | 543,100 | 6,379 | ||||||
BRP Inc * | 10,000 | 527 | ||||||
Canadian Pacific Railway Ltd | 53,934 | 16,419 | ||||||
Dollarama Inc | 75,700 | 2,893 | ||||||
Nutrien Ltd (A) | 339,890 | 13,285 | ||||||
Stantec Inc (A) | 68,200 | 2,064 | ||||||
Sun Life Financial Inc | 150,900 | 6,130 | ||||||
|
|
| ||||||
| 47,697 | ||||||||
|
|
| ||||||
China — 1.5% | ||||||||
Baidu Inc ADR * | 232,815 | 29,472 | ||||||
Beijing Capital International Airport Co Ltd, Cl H | 5,718,000 | 3,447 | ||||||
China Communications Services Corp Ltd, Cl H | 4,389,584 | 2,591 | ||||||
China Lesso Group Holdings Ltd | 327,000 | 593 | ||||||
Industrial & Commercial Bank of China Ltd, Cl H | 9,454,000 | 4,932 | ||||||
STMicroelectronics NV | 48,311 | 1,486 | ||||||
Tencent Holdings Ltd | 233,100 | 15,717 | ||||||
|
|
| ||||||
| 58,238 | ||||||||
|
|
| ||||||
Denmark — 3.1% | ||||||||
Ambu A/S, Cl B (A) | 47,633 | 1,347 | ||||||
AP Moller - Maersk A/S, Cl B | 1,656 | 2,625 | ||||||
Carlsberg AS, Cl B | 95,260 | 12,840 | ||||||
DSV PANALPINA A/S | 113,970 | 18,522 | ||||||
Genmab A/S * | 6,406 | 2,320 | ||||||
H Lundbeck A/S | 151,129 | 4,985 | ||||||
Novo Nordisk A/S, Cl B | 429,553 | 29,697 | ||||||
Novozymes A/S, Cl B | 16,007 | 1,004 | ||||||
Orsted A/S | 73,960 | 10,152 | ||||||
Pandora A/S * | 43,948 | 3,147 | ||||||
ROCKWOOL International A/S, Cl B | 18,518 | 7,091 | ||||||
Scandinavian Tobacco Group A/S | 644,917 | 9,567 | ||||||
Vestas Wind Systems A/S | 118,670 | 19,181 | ||||||
|
|
| ||||||
| 122,478 | ||||||||
|
|
| ||||||
Finland — 1.1% | ||||||||
Kone Oyj, Cl B | 167,622 | 14,722 | ||||||
Neste Oyj | 146,007 | 7,669 | ||||||
Nokia Oyj * | 1,229,753 | 4,818 | ||||||
Nokia Oyj ADR * | 1,095,554 | 4,284 | ||||||
Orion Oyj, Cl B | 207,978 | 9,399 | ||||||
Stora Enso Oyj, Cl R | 131,736 | 2,059 | ||||||
|
|
| ||||||
| 42,951 | ||||||||
|
|
| ||||||
France — 8.6% | ||||||||
Air France-KLM *(A) | 201,300 | 696 | ||||||
Airbus SE * | 163,947 | 11,928 | ||||||
Amundi SA * | 54,884 | 3,873 | ||||||
14 |
SEI Institutional International Trust / Annual Report / September 30, 2020 |
| Description | Shares | Market Value ($ Thousands) | ||||||
COMMON STOCK (continued) | ||||||||
AXA SA | 615,052 | $ 11,343 | ||||||
BioMerieux | 4,660 | 730 | ||||||
BNP Paribas SA | 556,412 | 20,173 | ||||||
Bollore SA | 2,803,117 | 10,462 | ||||||
Carrefour SA | 1,421,223 | 22,769 | ||||||
Cie de Saint-Gobain * | 88,633 | 3,728 | ||||||
Cie Generale des Etablissements Michelin SCA, Cl B | 7,894 | 842 | ||||||
CNP Assurances * | 112,984 | 1,412 | ||||||
Credit Agricole SA * | 1,023,476 | 8,957 | ||||||
Criteo SA ADR * | 60,571 | 738 | ||||||
Danone SA | 165,707 | 10,703 | ||||||
Edenred | 81,226 | 3,649 | ||||||
Engie SA * | 1,213,062 | 16,222 | ||||||
EssilorLuxottica SA * | 54,965 | 7,477 | ||||||
Iliad SA | 761 | 140 | ||||||
Ipsen SA | 45,627 | 4,784 | ||||||
IPSOS | 18,645 | 467 | ||||||
L’Oreal SA | 30,317 | 9,857 | ||||||
LVMH Moet Hennessy Louis Vuitton SE | 30,077 | 14,067 | ||||||
Nexans SA * | 25,765 | 1,489 | ||||||
Pernod Ricard SA | 48,610 | 7,756 | ||||||
Peugeot SA * | 447,567 | 8,116 | ||||||
Publicis Groupe SA | 381,789 | 12,342 | ||||||
Renault SA * | 107,400 | 2,788 | ||||||
Rexel SA * | 527,080 | 6,628 | ||||||
Sanofi | 505,274 | 50,526 | ||||||
Sartorius Stedim Biotech | 24,563 | 8,478 | ||||||
Schneider Electric SE | 78,011 | 9,670 | ||||||
Thales SA | 215,152 | 16,193 | ||||||
TOTAL SE | 380,375 | 12,980 | ||||||
Ubisoft Entertainment SA * | 78,877 | 7,118 | ||||||
Valeo SA | 153,850 | 4,728 | ||||||
Vinci SA | 113,140 | 9,473 | ||||||
Vivendi SA | 308,400 | 8,578 | ||||||
Wendel SE | 15,501 | 1,408 | ||||||
|
|
| ||||||
| 333,288 | ||||||||
|
|
| ||||||
Germany — 8.5% | ||||||||
adidas AG * | 27,977 | 9,029 | ||||||
Allianz SE | 106,120 | 20,359 | ||||||
BASF SE | 395,561 | 24,049 | ||||||
Bayer AG | 508,676 | 31,330 | ||||||
Bayerische Motoren Werke AG | 62,482 | 4,525 | ||||||
CECONOMY AG * | 237,111 | 1,167 | ||||||
Deutsche Boerse AG | 56,898 | 9,977 | ||||||
Deutsche Post AG | 1,078,925 | 49,071 | ||||||
E.ON SE | 431,930 | 4,763 | ||||||
Evonik Industries AG | 50,057 | 1,296 | ||||||
Fresenius Medical Care AG & Co KGaA | 219,531 | 18,533 | ||||||
Hamburger Hafen und Logistik AG | 24,359 | 427 | ||||||
Hannover Rueck SE | 7,749 | 1,197 | ||||||
HeidelbergCement AG | 22,099 | 1,352 | ||||||
| Description | Shares | Market Value ($ Thousands) | ||||||
COMMON STOCK (continued) | ||||||||
HelloFresh SE * | 138,970 | $ 7,755 | ||||||
Infineon Technologies AG | 609,071 | 17,132 | ||||||
KION Group AG | 111,152 | 9,495 | ||||||
Linde PLC | 68,010 | 16,077 | ||||||
Rheinmetall AG | 49,680 | 4,468 | ||||||
RWE AG | 277,463 | 10,378 | ||||||
SAP SE | 204,390 | 31,769 | ||||||
Scout24 AG | 22,886 | 1,998 | ||||||
Siemens AG | 402,821 | 50,900 | ||||||
Siemens Energy AG * | 201,411 | 5,432 | ||||||
thyssenkrupp AG * | 26,790 | 135 | ||||||
|
|
| ||||||
| 332,614 | ||||||||
|
|
| ||||||
Greece — 0.0% | ||||||||
Aegean Airlines SA * | 12,601 | 46 | ||||||
National Bank of Greece SA * | 89,899 | 114 | ||||||
|
|
| ||||||
| 160 | ||||||||
|
|
| ||||||
Hong Kong — 1.9% | ||||||||
AIA Group Ltd | 1,451,200 | 14,386 | ||||||
BOC Hong Kong Holdings Ltd | 385,000 | 1,024 | ||||||
Chaoda Modern Agriculture Holdings Ltd * | 2,440,000 | 16 | ||||||
CITIC Ltd | 839,084 | 620 | ||||||
CK Hutchison Holdings Ltd | 194,500 | 1,178 | ||||||
Country Garden Services Holdings Co Ltd | 402,000 | 2,604 | ||||||
Hong Kong Exchanges & Clearing Ltd | 325,734 | 15,358 | ||||||
Lenovo Group Ltd | 2,622,000 | 1,739 | ||||||
Link REIT ‡ | 293,100 | 2,399 | ||||||
Nine Dragons Paper Holdings Ltd | 1,683,000 | 2,133 | ||||||
Power Assets Holdings Ltd | 10,000 | 53 | ||||||
Sands China Ltd * | 1,242,800 | 4,840 | ||||||
SJM Holdings Ltd | 8,483,340 | 10,119 | ||||||
Techtronic Industries Co Ltd | 444,000 | 5,914 | ||||||
Topsports International Holdings Ltd | 5,332,000 | 7,428 | ||||||
West China Cement Ltd | 3,744,000 | 557 | ||||||
Wharf Real Estate Investment Co Ltd | 166,000 | 680 | ||||||
Zoomlion Heavy Industry Science and Technology Co Ltd | 1,226,800 | 1,189 | ||||||
|
|
| ||||||
| 72,237 | ||||||||
|
|
| ||||||
India — 0.2% | ||||||||
HDFC Bank Ltd ADR * | 180,834 | 9,034 | ||||||
|
|
| ||||||
Ireland — 1.5% | ||||||||
Experian PLC | 409,652 | 15,433 | ||||||
ICON PLC * | 158,190 | 30,229 | ||||||
Ryanair Holdings PLC * | 59,824 | 797 | ||||||
Ryanair Holdings PLC ADR * | 156,760 | 12,817 | ||||||
|
|
| ||||||
| 59,276 | ||||||||
|
|
| ||||||
Israel — 0.8% | ||||||||
Bank Leumi Le-Israel BM | 1,668,755 | 7,381 | ||||||
Check Point Software Technologies Ltd * | 100,467 | 12,090 | ||||||
Isracard Ltd | – | – | ||||||
Mizrahi Tefahot Bank Ltd | 30,121 | 536 | ||||||
SEI Institutional International Trust / Annual Report / September 30, 2020 |
15 |
SCHEDULE OF INVESTMENTS
September 30, 2020
International Equity Fund (Continued)
| Description | Shares | Market Value ($ Thousands) | ||||||
COMMON STOCK (continued) | ||||||||
Nice Ltd * | 9,345 | $ | 2,123 | |||||
Nice Ltd ADR *(A) | 41,714 | 9,470 | ||||||
|
|
| ||||||
| 31,600 | ||||||||
|
|
| ||||||
Italy — 2.7% | ||||||||
A2A SpA | 293,978 | 428 | ||||||
Assicurazioni Generali SpA | 819,445 | 11,537 | ||||||
Banca Mediolanum SpA | 299,871 | 2,158 | ||||||
De’ Longhi SpA * | 2,846 | 97 | ||||||
Enel SpA | 1,195,704 | 10,378 | ||||||
EXOR NV | 115,844 | 6,309 | ||||||
Ferrari NV | 54,815 | 10,059 | ||||||
Fiat Chrysler Automobiles NV * | 495,169 | 6,073 | ||||||
FinecoBank Banca Fineco SpA * | 669,767 | 9,246 | ||||||
Hera SpA | 636,483 | 2,353 | ||||||
Pirelli & C SpA * | 1,251,944 | 5,370 | ||||||
Recordati Industria Chimica e Farmaceutica SpA | 181,268 | 9,287 | ||||||
Telecom Italia SpA/Milano | 6,763,117 | 2,721 | ||||||
Tenaris SA | 888,739 | 4,430 | ||||||
UniCredit SpA * | 2,842,801 | 23,463 | ||||||
|
|
| ||||||
| 103,909 | ||||||||
|
|
| ||||||
Japan — 18.7% | ||||||||
77 Bank Ltd/The | 33,364 | 515 | ||||||
Advantest Corp | 208,000 | 10,087 | ||||||
AEON Financial Service Co Ltd | 29,500 | 268 | ||||||
Arcland Sakamoto Co Ltd | 33,873 | 694 | ||||||
ASKUL Corp | 14,400 | 588 | ||||||
Bandai Namco Holdings Inc | 76,600 | 5,601 | ||||||
Canon Marketing Japan Inc | 106,500 | 2,125 | ||||||
Capcom Co Ltd | 193,300 | 10,797 | ||||||
Chugai Pharmaceutical Co Ltd | 132,300 | 5,931 | ||||||
CyberAgent Inc | 167,800 | 10,364 | ||||||
Dai Nippon Printing Co Ltd | 491,900 | 9,959 | ||||||
Daifuku Co Ltd | 10,300 | 1,037 | ||||||
Daito Trust Construction Co Ltd | 81,900 | 7,252 | ||||||
Daiwa House Industry Co Ltd | 290,800 | 7,456 | ||||||
Disco Corp | 800 | 194 | ||||||
East Japan Railway Co | 129,200 | 7,940 | ||||||
FANUC Corp | 102,200 | 19,674 | ||||||
Fuji Electric Co Ltd | 36,800 | 1,163 | ||||||
FUJIFILM Holdings Corp | 213,800 | 10,536 | ||||||
Fujitsu Ltd | 258,100 | 35,298 | ||||||
Glory Ltd | 57,200 | 1,273 | ||||||
Hakuhodo DY Holdings Inc | 106,900 | 1,380 | ||||||
Haseko Corp | 231,200 | 3,033 | ||||||
Hikari Tsushin Inc | 3,700 | 879 | ||||||
Hitachi Ltd | 369,667 | 12,509 | ||||||
ITOCHU Corp | 207,800 | 5,310 | ||||||
Itoki Corp | 21,300 | 73 | ||||||
Japan Airlines Co Ltd * | 319,000 | 5,972 | ||||||
Japan Exchange Group Inc | 364,400 | 10,164 | ||||||
| Description | Shares | Market Value ($ Thousands) | ||||||
COMMON STOCK (continued) | ||||||||
Japan Post Holdings Co Ltd * | 313,900 | $ | 2,135 | |||||
Japan Post Insurance Co Ltd | 45,200 | 710 | ||||||
Kao Corp | 124,200 | 9,294 | ||||||
KDDI Corp | 430,900 | 10,858 | ||||||
Keyence Corp | 28,200 | 13,134 | ||||||
Kokuyo Co Ltd | 103,900 | 1,303 | ||||||
Komatsu Ltd | 447,900 | 9,844 | ||||||
Konami Holdings Corp | 132,000 | 5,705 | ||||||
K’s Holdings Corp | 82,700 | 1,115 | ||||||
Kyocera Corp | 60,700 | 3,466 | ||||||
Kyowa Kirin Co Ltd | 223,400 | 6,347 | ||||||
Lion Corp | 41,300 | 849 | ||||||
Mabuchi Motor Co Ltd | 389,800 | 15,123 | ||||||
Mebuki Financial Group Inc | 77,900 | 176 | ||||||
Mitsubishi Electric Corp | 294,600 | 3,988 | ||||||
Mitsubishi Estate Co Ltd | 556,000 | 8,375 | ||||||
Mixi Inc (A) | 121,300 | 3,257 | ||||||
Mizuno Corp * | 41,500 | 750 | ||||||
MS&AD Insurance Group Holdings Inc | 671,000 | 17,987 | ||||||
Murata Manufacturing Co Ltd | 266,100 | 17,168 | ||||||
Nexon Co Ltd | 293,600 | 7,314 | ||||||
Nihon Unisys Ltd | 159,700 | 5,031 | ||||||
Nikon Corp | 90,100 | 606 | ||||||
Nintendo Co Ltd | 39,100 | 22,187 | ||||||
Nippon Telegraph & Telephone Corp | 585,800 | 11,933 | ||||||
Nippon Telegraph & Telephone Corp ADR | 840,932 | 17,374 | ||||||
Nitori Holdings Co Ltd | 38,800 | 8,054 | ||||||
Nitto Denko Corp | 44,100 | 2,874 | ||||||
Nomura Holdings Inc | 537,100 | 2,437 | ||||||
NTT DOCOMO Inc | 475,200 | 17,512 | ||||||
ORIX Corp | 672,800 | 8,349 | ||||||
Otsuka Corp | 199,100 | 10,181 | ||||||
Panasonic Corp | 1,264,500 | 10,705 | ||||||
PeptiDream Inc * | 221,200 | 10,352 | ||||||
Persol Holdings Co Ltd * | 139,100 | 2,263 | ||||||
Rakuten Inc * | 906,100 | 9,770 | ||||||
Recruit Holdings Co Ltd * | 278,700 | 11,111 | ||||||
Renesas Electronics Corp * | 32,900 | 240 | ||||||
Rohm Co Ltd | 200,800 | 15,480 | ||||||
Sankyo Co Ltd | 103,300 | 2,708 | ||||||
Sanwa Holdings Corp | 178,600 | 1,896 | ||||||
SBI Holdings Inc/Japan | 518,000 | 13,398 | ||||||
Secom Co Ltd | 52,400 | 4,791 | ||||||
Seiko Holdings Corp * | 42,200 | 569 | ||||||
Sekisui House Ltd | 745,614 | 13,146 | ||||||
Seria Co Ltd | 7,600 | 323 | ||||||
Seven & i Holdings Co Ltd | 494,900 | 15,293 | ||||||
Shin-Etsu Chemical Co Ltd | 88,086 | 11,490 | ||||||
Shiseido Co Ltd | 135,700 | 7,780 | ||||||
Sompo Holdings Inc | 197,500 | 6,801 | ||||||
Sony Corp ADR | 77,850 | 5,975 | ||||||
Sumitomo Dainippon Pharma Co Ltd | 96,100 | 1,267 | ||||||
16 |
SEI Institutional International Trust / Annual Report / September 30, 2020 |
| Description | Shares | Market Value ($ Thousands) | ||||||
COMMON STOCK (continued) | ||||||||
Sumitomo Mitsui Financial Group Inc | 317,400 | $ | 8,811 | |||||
Sumitomo Mitsui Trust Holdings Inc | 365,822 | 9,708 | ||||||
Suruga Bank Ltd | 45,700 | 165 | ||||||
Suzuki Motor Corp * | 151,937 | 6,490 | ||||||
Sysmex Corp | 2,600 | 248 | ||||||
T&D Holdings Inc | 257,000 | 2,523 | ||||||
Takeda Pharmaceutical Co Ltd | 1,077,400 | 38,421 | ||||||
TDK Corp | 24,500 | 2,674 | ||||||
Terumo Corp | 250,900 | 9,985 | ||||||
TIS Inc | 238,900 | 5,062 | ||||||
Tokyo Electric Power Co Holdings Inc * | 1,117,600 | 3,074 | ||||||
Tokyo Electron Ltd (A) | 49,700 | 12,958 | ||||||
Tomy Co Ltd | 135,700 | 1,166 | ||||||
Toppan Printing Co Ltd | 92,600 | 1,303 | ||||||
Toshiba Corp | 142,000 | 3,607 | ||||||
Toyo Suisan Kaisha Ltd | 36,600 | 1,935 | ||||||
Toyota Industries Corp | 110,578 | 6,982 | ||||||
Toyota Motor Corp ADR (A) | 115,231 | 15,261 | ||||||
Universal Entertainment * | 317,053 | 5,808 | ||||||
Yamada Holdings Co Ltd | 296,800 | 1,478 | ||||||
Z Holdings Corp * | 1,632,900 | 10,873 | ||||||
ZOZO Inc | 95,500 | 2,662 | ||||||
|
|
| ||||||
| 730,060 | ||||||||
|
|
| ||||||
Malta — 0.0% | ||||||||
BGP Holdings *(B) | 198,683 | – | ||||||
|
|
| ||||||
Mexico — 0.3% | ||||||||
Arca Continental SAB de CV | 1,940,380 | 8,378 | ||||||
Grupo Financiero Banorte SAB de CV, Cl O * | 1,077,720 | 3,729 | ||||||
|
|
| ||||||
| 12,107 | ||||||||
|
|
| ||||||
Netherlands — 6.3% | ||||||||
Aalberts NV | 44,615 | 1,609 | ||||||
Adyen NV * | 4,775 | 8,799 | ||||||
Akzo Nobel NV | 357,544 | 36,264 | ||||||
ArcelorMittal SA * | 299,342 | 4,003 | ||||||
ASML Holding NV | 26,828 | 9,896 | ||||||
ASR Nederland NV | 180,815 | 6,100 | ||||||
Galapagos NV * | 19,180 | 2,726 | ||||||
ING Groep NV * | 5,070,405 | 36,025 | ||||||
Koninklijke Ahold Delhaize NV | 963,857 | 28,556 | ||||||
Koninklijke DSM NV | 135,711 | 22,373 | ||||||
Koninklijke Philips NV * | 303,632 | 14,292 | ||||||
Koninklijke Vopak NV | 43,888 | 2,476 | ||||||
NN Group NV | 128,474 | 4,823 | ||||||
PostNL NV * | 1,207,552 | 3,688 | ||||||
Prosus NV * | 103,775 | 9,584 | ||||||
Randstad NV * | 153,948 | 8,034 | ||||||
Royal Dutch Shell PLC ADR, Cl B | 429,732 | 10,408 | ||||||
Wolters Kluwer NV | 436,924 | 37,286 | ||||||
|
|
| ||||||
| 246,942 | ||||||||
|
|
| ||||||
| Description | Shares | Market Value ($ Thousands) | ||||||
COMMON STOCK (continued) | ||||||||
New Zealand — 0.3% | ||||||||
a2 Milk Co Ltd/The * | 569,604 | $ | 5,783 | |||||
Fisher & Paykel Healthcare Corp Ltd | 175,906 | 3,861 | ||||||
|
|
| ||||||
| 9,644 | ||||||||
|
|
| ||||||
Norway — 0.8% | ||||||||
Aker BioMarine AS * | 47,749 | 475 | ||||||
Atlantic Sapphire ASA * | 1,293,932 | 15,224 | ||||||
Equinor ASA | 544,173 | 7,708 | ||||||
Kahoot! AS * | 1,409,188 | 6,469 | ||||||
|
|
| ||||||
| 29,876 | ||||||||
|
|
| ||||||
Portugal — 0.0% | ||||||||
EDP - Energias de Portugal SA | 305,767 | 1,503 | ||||||
|
|
| ||||||
Singapore — 0.7% | ||||||||
City Developments Ltd | 1,883,900 | 10,558 | ||||||
DBS Group Holdings Ltd | 467,400 | 6,864 | ||||||
Hong Leong Finance Ltd | 61,282 | 102 | ||||||
Oversea-Chinese Banking Corp Ltd | 1,022,635 | 6,350 | ||||||
Venture Corp Ltd | 83,000 | 1,174 | ||||||
|
|
| ||||||
| 25,048 | ||||||||
|
|
| ||||||
South Africa — 0.0% | ||||||||
DataTec Ltd * | 100,188 | 133 | ||||||
Investec PLC | 416,323 | 775 | ||||||
|
|
| ||||||
| 908 | ||||||||
|
|
| ||||||
South Korea — 2.3% | ||||||||
BNK Financial Group Inc | 353,064 | 1,525 | ||||||
Kangwon Land Inc | 490,300 | 8,999 | ||||||
KT Corp ADR | 389,057 | 3,739 | ||||||
Kumho Petrochemical Co Ltd | 101,720 | 9,548 | ||||||
LG Electronics Inc | 93,216 | 7,343 | ||||||
Samsung Electronics Co Ltd | 457,615 | 22,751 | ||||||
SK Hynix Inc | 257,292 | 18,440 | ||||||
SK Telecom Co Ltd ADR | 787,189 | 17,649 | ||||||
|
|
| ||||||
| 89,994 | ||||||||
|
|
| ||||||
Spain — 1.8% | ||||||||
Aena SME SA * | 53,573 | 7,486 | ||||||
Amadeus IT Group SA, Cl A | 284,786 | 15,857 | ||||||
Banco Bilbao Vizcaya Argentaria SA * | 4,074,280 | 11,331 | ||||||
Banco Santander SA * | 3,188,173 | 5,962 | ||||||
CaixaBank SA | 4,907,558 | 10,422 | ||||||
Cia de Distribucion Integral Logista Holdings SA | 57,814 | 992 | ||||||
Siemens Gamesa Renewable Energy SA | 372,398 | 10,045 | ||||||
Unicaja Banco SA * | 11,477,455 | 8,625 | ||||||
|
|
| ||||||
| 70,720 | ||||||||
|
|
| ||||||
Sweden — 3.1% | ||||||||
Alfa Laval AB * | 34,212 | 757 | ||||||
Atlas Copco AB, Cl A | 222,603 | 10,625 | ||||||
Axfood AB | 33,444 | 767 | ||||||
Betsson AB | 131,332 | 1,011 | ||||||
SEI Institutional International Trust / Annual Report / September 30, 2020 |
17 |
SCHEDULE OF INVESTMENTS
September 30, 2020
International Equity Fund (Continued)
| Description | Shares | Market Value ($ Thousands) | ||||||
COMMON STOCK (continued) | ||||||||
Byggmax Group AB * | 148,444 | $ | 878 | |||||
Elanders AB, Cl B * | 3,872 | 30 | ||||||
Electrolux AB, Cl B | 396,816 | 9,269 | ||||||
Essity AB, Cl B | 591,372 | 19,967 | ||||||
Evolution Gaming Group AB | 33,346 | 2,214 | ||||||
Getinge AB, Cl B | 170,531 | 3,717 | ||||||
Hennes & Mauritz AB, Cl B * | 70,739 | 1,220 | ||||||
Husqvarna AB, Cl B | 725,567 | 7,983 | ||||||
ICA Gruppen AB (A) | 109,424 | 5,569 | ||||||
Kinnevik AB * | 88,053 | 3,588 | ||||||
NCC AB, Cl B | 176,215 | 3,216 | ||||||
Sandvik AB * | 322,819 | 6,300 | ||||||
Securitas AB, Cl B * | 93,252 | 1,427 | ||||||
SKF AB, Cl B | 209,999 | 4,331 | ||||||
Swedish Match AB | 198,481 | 16,231 | ||||||
Tele2 AB, Cl B (A) | 375,530 | 5,317 | ||||||
Telefonaktiebolaget LM Ericsson ADR (A) | 218,705 | 2,382 | ||||||
Telefonaktiebolaget LM Ericsson, Cl B | 385,497 | 4,223 | ||||||
Telia Co AB | 163,350 | 671 | ||||||
Volvo AB, Cl B * | 533,128 | 10,284 | ||||||
|
|
| ||||||
| 121,977 | ||||||||
|
|
| ||||||
Switzerland — 8.9% | ||||||||
ABB Ltd | 796,088 | 20,276 | ||||||
Adecco Group AG | 388,625 | 20,500 | ||||||
Alcon Inc * | 186,979 | 10,623 | ||||||
Cie Financiere Richemont SA, Cl A | 308,640 | 20,672 | ||||||
Clariant AG * | 161,467 | 3,190 | ||||||
Coca-Cola HBC AG * | 500,359 | 12,384 | ||||||
Credit Suisse Group AG | 1,135,097 | 11,397 | ||||||
dormakaba Holding AG | 2,973 | 1,613 | ||||||
EMS-Chemie Holding AG | 7,574 | 6,802 | ||||||
Geberit AG | 10,772 | 6,391 | ||||||
Lonza Group AG | 42,038 | 25,956 | ||||||
Nestle SA | 107,994 | 12,855 | ||||||
Novartis AG | 577,522 | 50,191 | ||||||
Partners Group Holding AG | 8,954 | 8,264 | ||||||
Roche Holding AG | 189,991 | 65,244 | ||||||
Schindler Holding AG | 20,643 | 5,643 | ||||||
Sika AG | 50,315 | 12,371 | ||||||
Sonova Holding AG * | 3,121 | 789 | ||||||
Straumann Holding AG | 7,808 | 7,897 | ||||||
Swatch Group AG/The | 20,157 | 4,700 | ||||||
Swiss Life Holding AG | 8,627 | 3,273 | ||||||
Tecan Group AG | 3,228 | 1,613 | ||||||
UBS Group AG (A) | 1,909,976 | 21,317 | ||||||
Vifor Pharma AG | 29,978 | 4,086 | ||||||
Zurich Insurance Group AG | 22,328 | 7,792 | ||||||
|
|
| ||||||
| 345,839 | ||||||||
|
|
| ||||||
Taiwan — 1.9% | ||||||||
Acter Group Corp Ltd | 16,000 | 106 | ||||||
Asustek Computer Inc | 107,000 | 940 | ||||||
| Description | Shares | Market Value ($ Thousands) | ||||||
COMMON STOCK (continued) | ||||||||
Chicony Electronics Co Ltd | 687,000 | $ | 2,007 | |||||
Chipmos Technologies Inc * | 1,894,000 | 1,879 | ||||||
Compal Electronics Inc | 3,330,000 | 2,200 | ||||||
eGalax_eMPIA Technology Inc | 406,000 | 745 | ||||||
Foxconn Technology Co Ltd | 605,000 | 1,082 | ||||||
General Interface Solution Holding Ltd | 206,000 | 895 | ||||||
Gigabyte Technology Co Ltd | 445,000 | 1,171 | ||||||
Global Mixed Mode Technology Inc | 91,000 | 482 | ||||||
Hon Hai Precision Industry Co Ltd | 2,871,000 | 7,716 | ||||||
Lite-On Technology Corp | 2,772,000 | 4,427 | ||||||
MediaTek Inc | 894,252 | 18,926 | ||||||
Micro-Star International Co Ltd | 542,000 | 2,511 | ||||||
Novatek Microelectronics Corp | 93,000 | 859 | ||||||
Pegatron Corp | 552,000 | 1,225 | ||||||
Sanyang Motor Co Ltd | 264,000 | 205 | ||||||
Simplo Technology Co Ltd | 246,000 | 2,561 | ||||||
Sitronix Technology Corp | 173,000 | 786 | ||||||
Synnex Technology International Corp | 1,787,000 | 2,558 | ||||||
Taiwan Semiconductor Manufacturing Co Ltd ADR | 228,545 | 18,528 | ||||||
Topco Scientific Co Ltd | 219,000 | 869 | ||||||
|
|
| ||||||
| 72,678 | ||||||||
|
|
| ||||||
Turkey — 0.0% | ||||||||
BIM Birlesik Magazalar AS * | 97,034 | 878 | ||||||
|
|
| ||||||
United Arab Emirates — 0.0% | ||||||||
Abu Dhabi Islamic Bank PJSC | 202,345 | 237 | ||||||
|
|
| ||||||
United Kingdom — 7.9% | ||||||||
Aggreko PLC | 165,796 | 789 | ||||||
Anglo American PLC | 203,130 | 4,905 | ||||||
Antofagasta PLC | 129,878 | 1,709 | ||||||
AstraZeneca PLC | 82,366 | 9,010 | ||||||
AstraZeneca PLC ADR | 66,820 | 3,662 | ||||||
Aviva PLC | 3,414,771 | 12,587 | ||||||
B&M European Value Retail SA | 166,334 | 1,061 | ||||||
Balfour Beatty PLC * | 1,931,941 | 5,579 | ||||||
Barclays PLC * | 10,929,043 | 13,803 | ||||||
Barratt Developments PLC * | 702,432 | 4,308 | ||||||
BHP Group PLC | 511,341 | 10,916 | ||||||
BP PLC | 2,850,167 | 8,302 | ||||||
British American Tobacco PLC | 478,024 | 17,190 | ||||||
BT Group PLC, Cl A | 1,065,250 | 1,353 | ||||||
Compass Group PLC * | 553,170 | �� | 8,330 | |||||
Computacenter PLC | 62,379 | 1,911 | ||||||
Dialog Semiconductor PLC * | 45,565 | 1,988 | ||||||
Evraz PLC | 1,669,026 | 7,410 | ||||||
Ferguson PLC | 51,964 | 5,247 | ||||||
Ferrexpo PLC | 524,939 | 1,198 | ||||||
GlaxoSmithKline PLC | 670,993 | 12,577 | ||||||
GVC Holdings PLC * | 374,324 | 4,686 | ||||||
Hays PLC * | 1,583,408 | 2,308 | ||||||
Howden Joinery Group PLC * | 64,573 | 492 | ||||||
18 |
SEI Institutional International Trust / Annual Report / September 30, 2020 |
| Description | Shares | Market Value ($ Thousands) | ||||||
COMMON STOCK (continued) | ||||||||
Inchcape PLC * | 215,309 | $ | 1,225 | |||||
Indivior PLC * | 415,882 | 630 | ||||||
International Consolidated Airlines Group SA (A) | 3,842,716 | 4,690 | ||||||
Investec PLC | 657,648 | 1,213 | ||||||
J Sainsbury PLC | 273,832 | 675 | ||||||
JET2 PLC | 61,134 | 530 | ||||||
Johnson Matthey PLC | 94,700 | 2,878 | ||||||
Kingfisher PLC * | 3,641,566 | 13,956 | ||||||
Legal & General Group PLC | 2,331,659 | 5,644 | ||||||
London Stock Exchange Group PLC | 103,547 | 11,869 | ||||||
M&G PLC | 1,861,325 | 3,834 | ||||||
Micro Focus International PLC * | 226,117 | 717 | ||||||
National Grid PLC | 974,019 | 11,202 | ||||||
Next PLC * | 40,361 | 3,093 | ||||||
Ninety One PLC *(A) | 375,849 | 987 | ||||||
Ocado Group PLC * | 5,768 | 205 | ||||||
Pagegroup PLC * | 97,734 | 472 | ||||||
Playtech Plc * | 36,739 | 172 | ||||||
Plus500 Ltd | 44,090 | 895 | ||||||
Prudential PLC | 1,511,808 | 21,684 | ||||||
QinetiQ Group PLC | 171,097 | 613 | ||||||
Reckitt Benckiser Group PLC | 60,193 | 5,891 | ||||||
RELX PLC | 193,542 | 4,313 | ||||||
Rio Tinto PLC | 76,571 | 4,607 | ||||||
Rio Tinto PLC ADR | 79,425 | 4,796 | ||||||
Rolls-Royce Holdings PLC *(A) | 5,048,574 | 8,421 | ||||||
Royal Mail PLC * | 646,648 | 1,992 | ||||||
Smith & Nephew PLC | 541,054 | 10,586 | ||||||
Tate & Lyle PLC | 239,520 | 2,059 | ||||||
Taylor Wimpey PLC * | 6,401,196 | 8,953 | ||||||
Tesco PLC | 4,941,464 | 13,575 | ||||||
Unilever PLC | 36,791 | 2,269 | ||||||
Vodafone Group PLC | 5,140,903 | 6,844 | ||||||
WH Smith PLC | 325,213 | 4,005 | ||||||
|
|
| ||||||
| 306,816 | ||||||||
|
|
| ||||||
United States — 4.9% | ||||||||
Accenture PLC, Cl A | 112,246 | 25,366 | ||||||
Aon PLC, Cl A | 38,530 | 7,949 | ||||||
Aptiv PLC * | 113,689 | 10,423 | ||||||
ASML Holding NV, Cl G | 35,225 | 13,008 | ||||||
Atlassian Corp PLC, Cl A * | 97,277 | 17,684 | ||||||
Axis Capital Holdings Ltd | 308,388 | 13,582 | ||||||
Coca-Cola European Partners PLC | 100,448 | 3,898 | ||||||
Flex Ltd * | 1,018,773 | 11,349 | ||||||
IHS Markit Ltd | 125,000 | 9,814 | ||||||
Lululemon Athletica Inc * | 40,222 | 13,248 | ||||||
Medtronic PLC | 93,264 | 9,692 | ||||||
Mettler-Toledo International Inc * | 10,220 | 9,870 | ||||||
Nomad Foods Ltd * | 399,072 | 10,168 | ||||||
ResMed Inc | 76,878 | 13,179 | ||||||
Shopify Inc, Cl A * | 12,800 | 13,094 | ||||||
| Description | Shares | Market Value ($ Thousands) | ||||||
COMMON STOCK (continued) | ||||||||
STERIS PLC | 56,651 | $ | 9,981 | |||||
|
|
| ||||||
| 192,305 | ||||||||
|
|
| ||||||
Total Common Stock |
| 3,670,517 | ||||||
|
|
| ||||||
PREFERRED STOCK — 2.0% | ||||||||
Germany — 1.3% | ||||||||
Henkel AG & Co KGaA, 2.200% | 84,950 | 8,880 | ||||||
Porsche Automobil Holding SE, 3.900% | 59,634 | 3,550 | ||||||
Volkswagen AG, 3.200% | 251,643 | 40,422 | ||||||
|
|
| ||||||
| 52,852 | ||||||||
|
|
| ||||||
South Korea — 0.7% | ||||||||
Hyundai Motor Co (C) | 132,660 | 9,616 | ||||||
Samsung Electronics Co Ltd (C) | 381,858 | 16,452 | ||||||
|
|
| ||||||
| 26,068 | ||||||||
|
|
| ||||||
Total Preferred Stock |
| 78,920 | ||||||
|
|
| ||||||
| Number of Rights | ||||||||
RIGHTS — 0.0%* | ||||||||
Taiwan — 0.0% | ||||||||
Simplo Technology Co Ltd ‡‡ | 5,445 | – | ||||||
|
|
| ||||||
Total Rights |
| – | ||||||
|
|
| ||||||
| Shares | ||||||||
AFFILIATED PARTNERSHIP — 2.5% |
| |||||||
SEI Liquidity Fund, L.P. | 94,804,714 | 94,836 | ||||||
|
|
| ||||||
Total Affiliated Partnership |
| 94,836 | ||||||
|
|
| ||||||
CASH EQUIVALENT — 1.8% | ||||||||
SEI Daily Income Trust, Government Fund, | 71,396,914 | 71,397 | ||||||
|
|
| ||||||
Total Cash Equivalent |
| 71,397 | ||||||
|
|
| ||||||
Total Investments in Securities — 100.4% |
| $ | 3,915,670 | |||||
|
|
| ||||||
SEI Institutional International Trust / Annual Report / September 30, 2020 |
19 |
SCHEDULE OF INVESTMENTS
September 30, 2020
International Equity Fund (Concluded)
A list of the open futures contracts held by the Fund at September 30, 2020, is as follows:
| Type of Contract | Number of Contracts Long | Expiration Date | Notional Amount (Thousands) | Value (Thousands) | Unrealized Appreciation (Depreciation) (Thousands) | |||||||||||||||
Euro STOXX 50 | 817 | Dec-2020 | $ | 31,923 | $ | 30,600 | $ | (1,013) | ||||||||||||
FTSE 100 Index | 195 | Dec-2020 | 15,055 | 14,726 | (410) | |||||||||||||||
Hang Seng Index | 21 | Nov-2020 | 3,150 | 3,175 | 24 | |||||||||||||||
SPI 200 Index | 76 | Dec-2020 | 8,155 | 7,901 | (115) | |||||||||||||||
TOPIX Index | 147 | Dec-2020 | 21,957 | 22,643 | 539 | |||||||||||||||
|
|
|
|
|
| |||||||||||||||
| $ | 80,240 | $ | 79,045 | $ | (975) | |||||||||||||||
|
|
|
|
|
| |||||||||||||||
Percentages are based on Net Assets of $3,899,792 ($ Thousands).
| * | Non-income producing security. |
| ** | The rate reported is the 7-day effective yield as of September 30, 2020. |
| † | Investment in Affiliated Security (see Note 5). |
| ‡ | Real Estate Investment Trust. |
| ‡‡ | Expiration date not available. |
| (A) | Certain securities or partial positions of certain securities are on loan at September 30, 2020 (See Note 9). The total market value of securities on loan at September 30, 2020 was $90,323 ($ Thousands). |
| (B) | Level 3 security in accordance with fair value hierarchy. |
| (C) | There is currently no rate available. |
| (D) | This security was purchased with cash collateral held from securities on loan. The total market value of such securities as of September 30, 2020 was $94,836 ($ Thousands). |
ADR — American Depositary Receipt
Cl — Class
FTSE— Financial Times and Stock Exchange
L.P. — Limited Partnership
Ltd. — Limited
PJSC — Public Joint-Stock Company
PLC — Public Limited Company
REIT — Real Estate investment Trust
SPI — Share Price Index
TOPIX- Tokyo Price Index
The following is a list of the level of inputs used as of September 30, 2020, in valuing the Fund’s investments and other financial instruments carried at value ($ Thousands):
| Investments in Securities | Level 1 ($) | Level 2 ($) | Level 3 ($) | Total ($) | ||||||||||||
Common Stock | 3,667,301 | 3,216 | –^ | 3,670,517 | ||||||||||||
Preferred Stock | 78,920 | – | – | 78,920 | ||||||||||||
Rights | – | – | – | – | ||||||||||||
Affiliated Partnership | – | 94,836 | – | 94,836 | ||||||||||||
Cash Equivalent | 71,397 | – | – | 71,397 | ||||||||||||
|
|
|
|
|
|
|
| |||||||||
Total Investments in Securities | 3,817,618 | 98,052 | – | 3,915,670 | ||||||||||||
|
|
|
|
|
|
|
| |||||||||
| Other Financial Instruments | Level 1 ($) | Level 2 ($) | Level 3 ($) | Total ($) | ||||||||||||
Futures Contracts* | ||||||||||||||||
Unrealized Appreciation | 563 | – | – | 563 | ||||||||||||
Unrealized Depreciation | (1,538) | – | – | (1,538) | ||||||||||||
|
|
|
|
|
|
|
| |||||||||
Total Other Financial Instruments | (975) | – | – | (975) | ||||||||||||
|
|
|
|
|
|
|
| |||||||||
^One security with a market value of $0.
*Futures contracts are valued at the unrealized appreciation (depreciation) on the instrument.
For the year ended September 30, 2020, there were no transfers in or out of Level 3.
For more information on valuation inputs, see Note 2 – Significant Accounting Policies in Notes to Financial Statements.
The following is a summary of the transactions with affiliates for the year ended September 30, 2020 ($ Thousands):
Security Description | Value 9/30/2019 | Purchases at Cost | Proceeds from Sales | Realized Gain | Change in Unrealized Appreciation | Value 9/30/2020 | Shares | Income | Capital Gains | |||||||||
SEI Liquidity Fund, L.P. | $122,509 | $ 728,493 | $ (756,182) | $13 | $ 3 | $94,836 | 94,804,714 | $1,027 | $ — | |||||||||
SEI Daily Income Trust, Government Fund, Cl F | 83,730 | 358,479 | (370,812) | — | — | 71,397 | 71,396,914 | 439 | — | |||||||||
|
|
|
|
|
|
|
| |||||||||||
Totals | $206,239 | $1,086,972 | $(1,126,994) | $13 | $ 3 | $166,233 | $1,466 | $ — | ||||||||||
|
|
|
|
|
|
|
|
Amounts designated as “—” are $0 or have been rounded to $0.
The accompanying notes are an integral part of the financial statements.
20 |
SEI Institutional International Trust / Annual Report / September 30, 2020 |
SCHEDULE OF INVESTMENTS
September 30, 2020
Emerging Market Equity Fund
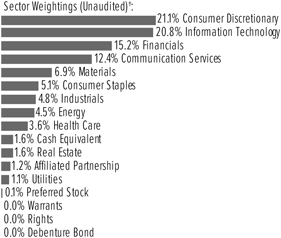
†Percentages based on total investments. Includes investments held as collateral for securities on loan (see Note 9).
| Description | Shares | Market Value ($ Thousands) | ||||||
COMMON STOCK — 95.6% | ||||||||
Argentina — 0.2% | ||||||||
MercadoLibre Inc * | 2,718 | $ | 2,942 | |||||
|
|
| ||||||
Austria — 0.1% | ||||||||
Erste Group Bank AG | 66,053 | 1,381 | ||||||
|
|
| ||||||
Brazil — 3.7% | ||||||||
Ambev SA * | 630,200 | 1,407 | ||||||
Arezzo Industria e Comercio SA | 145,800 | 1,392 | ||||||
Atacadao SA * | 225,310 | 814 | ||||||
B3 SA - Brasil Bolsa Balcao | 631,020 | 6,171 | ||||||
Banco Bradesco SA ADR * | 1,115,411 | 3,826 | ||||||
Banco do Brasil SA * | 456,813 | 2,407 | ||||||
Banco Santander Brasil SA | 450,800 | 2,231 | ||||||
CCR SA | 331,800 | 750 | ||||||
Cia de Saneamento do Parana * | 132,783 | 597 | ||||||
Cosan Ltd, Cl A | 51,454 | 764 | ||||||
Cosan SA | 184,600 | 2,242 | ||||||
CPFL Energia SA | 133,655 | 655 | ||||||
Cyrela Brazil Realty SA Empreendimentos e Participacoes | 333,098 | 1,383 | ||||||
Duratex SA * | 584,887 | 1,851 | ||||||
Energisa SA | 436,168 | 3,196 | ||||||
Engie Brasil Energia SA | 49,200 | 353 | ||||||
Gerdau SA ADR | 608,335 | 2,251 | ||||||
Hypera SA * | 192,500 | 1,015 | ||||||
JBS SA | 186,066 | 683 | ||||||
Lojas Renner SA | 129,100 | 910 | ||||||
Magazine Luiza SA | 32,799 | 521 | ||||||
Notre Dame Intermedica Participacoes SA | 121,400 | 1,404 | ||||||
Petrobras Distribuidora SA | 298,489 | 1,076 | ||||||
Petroleo Brasileiro SA | 21,549 | 153 | ||||||
Petroleo Brasileiro SA ADR | 833,246 | 5,933 | ||||||
Porto Seguro SA | 107,757 | 921 | ||||||
| Description | Shares | Market Value ($ Thousands) | ||||||
COMMON STOCK (continued) | ||||||||
Qualicorp Consultoria e Corretora de Seguros SA | 132,618 | $ | 803 | |||||
Rumo SA * | 2,306,197 | 7,807 | ||||||
SLC Agricola SA | 130,921 | 598 | ||||||
TIM Participacoes SA * | 885,600 | 2,046 | ||||||
TIM Participacoes SA ADR * | 42,119 | 486 | ||||||
TOTVS SA | 456,657 | 2,187 | ||||||
Vale SA ADR, Cl B | 228,963 | 2,422 | ||||||
WEG SA | 81,666 | 947 | ||||||
YDUQS Participacoes SA | 125,688 | 611 | ||||||
|
|
| ||||||
| 62,813 | ||||||||
|
|
| ||||||
Canada — 0.9% | ||||||||
First Quantum Minerals Ltd | 1,264,992 | 11,241 | ||||||
Ivanhoe Mines Ltd, Cl A * | 427,514 | 1,549 | ||||||
Pan American Silver Corp | 38,277 | 1,231 | ||||||
Parex Resources Inc * | 134,497 | 1,413 | ||||||
|
|
| ||||||
| 15,434 | ||||||||
|
|
| ||||||
Chile — 0.2% | ||||||||
Falabella SA | 227,607 | 665 | ||||||
Sociedad Quimica y Minera de Chile SA ADR (A) | 65,886 | 2,136 | ||||||
|
|
| ||||||
| 2,801 | ||||||||
|
|
| ||||||
China — 25.7% | ||||||||
Communication Services — 7.4% | ||||||||
Baidu Inc ADR * | 21,156 | 2,678 | ||||||
Focus Media Information Technology Co Ltd, Cl A | 5,911,041 | 7,034 | ||||||
JOYY Inc ADR | 32,084 | 2,588 | ||||||
Momo Inc ADR * | 149,967 | 2,064 | ||||||
NetEase Inc ADR | 34,764 | 15,806 | ||||||
Tencent Holdings Ltd | 1,233,777 | 83,189 | ||||||
Tencent Music Entertainment Group ADR * | 174,702 | 2,580 | ||||||
Weibo Corp ADR * | 41,089 | 1,497 | ||||||
Wuhu Sanqi Interactive Entertainment Network Technology Group Co Ltd, Cl A | 1,273,000 | 7,444 | ||||||
|
|
| ||||||
| 124,880 | ||||||||
|
|
| ||||||
Consumer Discretionary — 9.8% | ||||||||
Alibaba Group Holding Ltd ADR | 235,928 | 69,358 | ||||||
Alibaba Group Holding Ltd | 699,208 | 25,193 | ||||||
ANTA Sports Products Ltd | 68,000 | 712 | ||||||
BYD Co Ltd, Cl H | 61,000 | 971 | ||||||
Chow Tai Seng Jewellery Co Ltd, Cl A | 428,493 | 1,574 | ||||||
Great Wall Motor Co Ltd, Cl H | 782,000 | 1,002 | ||||||
Gree Electric Appliances Inc of Zhuhai, Cl A | 496,600 | 3,917 | ||||||
Hangzhou Robam Appliances Co Ltd, Cl A | 808,661 | 3,900 | ||||||
Huazhu Group Ltd ADR | 100,693 | 4,354 | ||||||
JD.com Inc ADR | 180,732 | 14,027 | ||||||
New Oriental Education & Technology Group Inc ADR * | 36,907 | 5,518 | ||||||
Oppein Home Group Inc, Cl A | 125,254 | 1,990 | ||||||
SEI Institutional International Trust / Annual Report / September 30, 2020 |
21 |
SCHEDULE OF INVESTMENTS
September 30, 2020
Emerging Market Equity Fund (Continued)
| Description | Shares | Market Value ($ Thousands) | ||||||
COMMON STOCK (continued) | ||||||||
Pinduoduo Inc ADR * | 57,979 | $ | 4,299 | |||||
Shanghai Yuyuan Tourist Mart Group Co Ltd, Cl A | 1,922,200 | 2,502 | ||||||
Shenzhou International Group Holdings Ltd | 68,100 | 1,163 | ||||||
Suofeiya Home Collection Co Ltd, Cl A | 635,400 | 2,470 | ||||||
TAL Education Group ADR * | 19,545 | 1,486 | ||||||
Trip.com Group Ltd ADR * | 158,839 | 4,946 | ||||||
Vipshop Holdings Ltd ADR * | 35,753 | 559 | ||||||
Yum China Holdings Inc * | 39,001 | 2,065 | ||||||
Zhejiang Supor Co Ltd, Cl A * | 104,010 | 1,209 | ||||||
Zhongsheng Group Holdings Ltd | 1,897,867 | 11,974 | ||||||
|
|
| ||||||
| 165,189 | ||||||||
|
|
| ||||||
Consumer Staples — 0.7% | ||||||||
Angel Yeast Co Ltd, Cl A | 49,600 | 445 | ||||||
Kweichow Moutai Co Ltd, Cl A | 10,000 | 2,462 | ||||||
Laobaixing Pharmacy Chain JSC, Cl A | 83,520 | 1,020 | ||||||
Tingyi Cayman Islands Holding Corp | 1,292,000 | 2,280 | ||||||
Tsingtao Brewery Co Ltd, Cl H | 126,000 | 1,029 | ||||||
Uni-President China Holdings Ltd | 646,000 | 595 | ||||||
Wuliangye Yibin Co Ltd, Cl A | 79,700 | 2,602 | ||||||
Yonghui Superstores Co Ltd, Cl A | 1,643,100 | 1,896 | ||||||
|
|
| ||||||
| 12,329 | ||||||||
|
|
| ||||||
Energy — 0.1% | ||||||||
Yantai Jereh Oilfield Services Group Co Ltd, Cl A | 316,097 | 1,389 | ||||||
|
|
| ||||||
Financials — 3.6% | ||||||||
Agricultural Bank of China Ltd, Cl H | 9,356,000 | 2,937 | ||||||
Bank of China Ltd, Cl H | 10,387,000 | 3,235 | ||||||
China Construction Bank Corp, Cl H | 17,087,328 | 11,156 | ||||||
China Life Insurance Co Ltd, Cl H | 1,912,498 | 4,324 | ||||||
China Merchants Bank Co Ltd, Cl H | 1,168,966 | 5,563 | ||||||
CITIC Securities Co Ltd, Cl H | 193,500 | 434 | ||||||
Industrial & Commercial Bank of China Ltd, Cl H | 17,355,068 | 9,054 | ||||||
Jiangsu Changshu Rural Commercial Bank Co Ltd, Cl A | 3,007,774 | 3,454 | ||||||
Ping An Insurance Group Co of China Ltd, Cl H | 2,030,004 | 21,029 | ||||||
|
|
| ||||||
| 61,186 | ||||||||
|
|
| ||||||
Health Care — 0.9% | ||||||||
BeiGene Ltd ADR * | 4,364 | 1,250 | ||||||
China National Medicines Corp Ltd, Cl A | 304,000 | 1,950 | ||||||
Chongqing Zhifei Biological Products Co Ltd, Cl A | 237,000 | 4,878 | ||||||
Huadong Medicine Co Ltd, Cl A | 323,200 | 1,175 | ||||||
Shenzhen Kangtai Biological Products Co Ltd, Cl A | 21,200 | 569 | ||||||
Sichuan Kelun Pharmaceutical Co Ltd, Cl A | 841,598 | 2,759 | ||||||
Zai Lab Ltd ADR * | 8,078 | 672 | ||||||
| Description | Shares | Market Value ($ Thousands) | ||||||
COMMON STOCK (continued) | ||||||||
Zhejiang NHU Co Ltd, Cl A | 592,525 | $ | 2,605 | |||||
|
|
| ||||||
| 15,858 | ||||||||
|
|
| ||||||
Industrials — 1.2% | ||||||||
China Lesso Group Holdings Ltd | 2,242,000 | 4,066 | ||||||
NARI Technology Co Ltd, Cl A | 1,012,783 | 2,950 | ||||||
Shenzhen Inovance Technology Co Ltd, Cl A | 172,500 | 1,474 | ||||||
Sinotruk Hong Kong Ltd | 1,570,580 | 4,059 | ||||||
Zhejiang Expressway Co Ltd, Cl H | 4,404,000 | 3,185 | ||||||
Zhejiang Weixing New Building Materials Co | ||||||||
Ltd, Cl A | 903,786 | 2,132 | ||||||
ZTO Express Cayman Inc ADR * | 57,281 | 1,714 | ||||||
|
|
| ||||||
| 19,580 | ||||||||
|
|
| ||||||
Information Technology — 1.0% | ||||||||
Beijing Sinnet Technology Co Ltd, Cl A | 1,034,547 | 3,420 | ||||||
Beijing Thunisoft Corp Ltd, Cl A | 366,400 | 1,291 | ||||||
Chaozhou Three-Circle Group Co Ltd, Cl A | 267,226 | 1,140 | ||||||
Sangfor Technologies Inc, Cl A | 139,691 | 4,363 | ||||||
Shenzhen Sunway Communication Co Ltd, Cl A | 833,290 | 6,749 | ||||||
|
|
| ||||||
| 16,963 | ||||||||
|
|
| ||||||
Materials — 0.7% | ||||||||
Anhui Conch Cement Co Ltd, Cl H | 941,963 | 6,530 | ||||||
China Jushi Co Ltd, Cl A | 245,900 | 524 | ||||||
China National Building Material Co Ltd, Cl H | 1,084,733 | 1,382 | ||||||
Zhejiang Huayou Cobalt Co Ltd, Cl A * | 641,013 | 3,299 | ||||||
Zhejiang Juhua Co Ltd, Cl A | 700 | 1 | ||||||
|
|
| ||||||
| 11,736 | ||||||||
|
|
| ||||||
Real Estate — 0.3% | ||||||||
KWG Group Holdings Ltd | 1,497,803 | 2,585 | ||||||
Longfor Group Holdings Ltd | 313,197 | 1,775 | ||||||
|
|
| ||||||
| 4,360 | ||||||||
|
|
| ||||||
| 433,470 | ||||||||
|
|
| ||||||
Colombia — 0.2% | ||||||||
Bancolombia SA ADR, Cl R | 63,513 | 1,623 | ||||||
Ecopetrol SA ADR | 73,423 | 722 | ||||||
Grupo de Inversiones Suramericana SA | 148,552 | 795 | ||||||
|
|
| ||||||
| 3,140 | ||||||||
|
|
| ||||||
Cyprus — 0.1% | ||||||||
TCS Group Holding PLC GDR | 73,758 | 1,958 | ||||||
|
|
| ||||||
Czech Republic — 0.2% | ||||||||
Moneta Money Bank AS | 1,277,345 | 2,937 | ||||||
|
|
| ||||||
Egypt — 0.1% | ||||||||
Commercial International Bank Egypt SAE | 525,769 | 2,221 | ||||||
|
|
| ||||||
Germany — 0.4% | ||||||||
Delivery Hero SE * | 53,642 | 6,169 | ||||||
|
|
| ||||||
Greece — 0.3% | ||||||||
Cairo Mezz PLC * | 444,897 | 38 | ||||||
22 |
SEI Institutional International Trust / Annual Report / September 30, 2020 |
| Description | Shares | Market Value ($ Thousands) | ||||||
COMMON STOCK (continued) | ||||||||
Eurobank Ergasias Services and Holdings SA * | 5,653,895 | $ | 2,501 | |||||
Hellenic Telecommunications Organization SA | 62,188 | 895 | ||||||
JUMBO SA * | 25,080 | 438 | ||||||
OPAP SA | 89,224 | 845 | ||||||
|
|
| ||||||
| 4,717 | ||||||||
|
|
| ||||||
Hong Kong — 10.8% | ||||||||
3SBio Inc *(A) | 2,435,500 | 2,772 | ||||||
AIA Group Ltd | 265,400 | 2,631 | ||||||
A-Living Services Co Ltd, Cl H | 1,193,812 | 6,089 | ||||||
ASM Pacific Technology Ltd | 279,400 | 2,860 | ||||||
AviChina Industry & Technology Co Ltd, Cl H | 1,455,000 | 836 | ||||||
BAIC Motor Corp Ltd, Cl H | 4,836,000 | 1,986 | ||||||
Beijing Enterprises Holdings Ltd | 961,000 | 2,903 | ||||||
Beijing Enterprises Water Group Ltd | 3,926,000 | 1,531 | ||||||
Chaoda Modern Agriculture Holdings Ltd * | 2,056,181 | 13 | ||||||
China Conch Venture Holdings Ltd | 418,500 | 1,948 | ||||||
China Education Group Holdings Ltd | 1,694,000 | 3,120 | ||||||
China Gas Holdings Ltd | 1,574,200 | 4,507 | ||||||
China High Precision Automation Group Ltd * | 1,385,624 | – | ||||||
China Medical System Holdings Ltd | 2,642,000 | 2,930 | ||||||
China Meidong Auto Holdings Ltd | 284,000 | 1,094 | ||||||
China Mengniu Dairy Co Ltd | 235,000 | 1,113 | ||||||
China Mobile Ltd | 1,483,909 | 9,542 | ||||||
China Resources Beer Holdings Co Ltd | 173,465 | 1,066 | ||||||
China Resources Cement Holdings Ltd | 1,010,203 | 1,392 | ||||||
China Resources Land Ltd | 794,000 | 3,622 | ||||||
China State Construction International Holdings Ltd | 2,131,123 | 1,401 | ||||||
Chinasoft International Ltd | 1,530,004 | 1,119 | ||||||
CNOOC Ltd | 10,717,462 | 10,359 | ||||||
Country Garden Services Holdings Co Ltd | 290,801 | 1,884 | ||||||
CSPC Pharmaceutical Group Ltd | 584,000 | 1,144 | ||||||
Dali Foods Group Co Ltd | 4,392,000 | 2,703 | ||||||
Far East Horizon Ltd | 705,884 | 575 | ||||||
Fuyao Glass Industry Group Co Ltd, Cl H | 264,400 | 976 | ||||||
Galaxy Entertainment Group Ltd * | 401,800 | 2,717 | ||||||
Geely Automobile Holdings Ltd | 2,898,000 | 5,843 | ||||||
GF Securities Co Ltd, Cl H | 669,200 | 853 | ||||||
Greentown Management Holdings Co Ltd * | 1,223,429 | 484 | ||||||
Haier Electronics Group Co Ltd | 783,407 | 2,849 | ||||||
Hansoh Pharmaceutical Group Co Ltd * | 150,000 | 735 | ||||||
Hengan International Group Co Ltd | 119,000 | 870 | ||||||
Hong Kong Exchanges & Clearing Ltd | 149,500 | 7,049 | ||||||
Huatai Securities Co Ltd, Cl H | 2,454,000 | 4,041 | ||||||
Huazhu Group Ltd * | 14,900 | 661 | ||||||
Innovent Biologics Inc * | 126,000 | 941 | ||||||
JD.com Inc, Cl A * | 106,450 | 4,114 | ||||||
Kaisa Group Holdings Ltd | 1,557,000 | 803 | ||||||
Kingboard Laminates Holdings Ltd | 1,541,500 | 2,127 | ||||||
Kunlun Energy Co Ltd | 1,750,000 | 1,158 | ||||||
| Description | Shares | Market Value ($ Thousands) | ||||||
COMMON STOCK (continued) | ||||||||
Lenovo Group Ltd | 1,468,000 | $ | 974 | |||||
Li Ning Co Ltd | 701,114 | 3,296 | ||||||
Link REIT ‡ | 382,816 | 3,133 | ||||||
Livzon Pharmaceutical Group Inc, Cl H | 125,072 | 572 | ||||||
Logan Group Co Ltd | 3,874,000 | 6,196 | ||||||
Lonking Holdings Ltd | 2,166,000 | 578 | ||||||
Luye Pharma Group Ltd | 2,380,500 | 1,393 | ||||||
Meituan Dianping, Cl B * | 399,238 | 12,600 | ||||||
Minth Group Ltd | 1,302,000 | 5,708 | ||||||
Nine Dragons Paper Holdings Ltd | 2,747,070 | 3,481 | ||||||
Q Technology Group Co Ltd | 603,000 | 679 | ||||||
Shanghai Industrial Holdings Ltd | 1,305,000 | 1,744 | ||||||
Shanghai Industrial Urban Development Group Ltd | 261,000 | 25 | ||||||
Shanghai Pharmaceuticals Holding Co Ltd, Cl H | 906,800 | 1,525 | ||||||
Shenzhen International Holdings Ltd | 14,524 | 23 | ||||||
Shimao Group Holdings Ltd | 237,500 | 990 | ||||||
Sino Biopharmaceutical Ltd | 847,269 | 933 | ||||||
SITC International Holdings Co Ltd | 387,000 | 539 | ||||||
SJM Holdings Ltd | 2,299,000 | 2,742 | ||||||
Sunny Optical Technology Group Co Ltd | 363,629 | 5,621 | ||||||
Techtronic Industries Co Ltd | 161,425 | 2,150 | ||||||
Tianneng Power International Ltd (A) | 514,000 | 928 | ||||||
Topsports International Holdings Ltd | 775,000 | 1,080 | ||||||
United Laboratories International Holdings Ltd/The | 668,602 | 692 | ||||||
Wuxi Biologics Cayman Inc * | 70,361 | 1,729 | ||||||
Xiabuxiabu Catering Management China Holdings Co Ltd (A) | 1,600,500 | 1,983 | ||||||
Xiaomi Corp, Cl B * | 1,349,400 | 3,609 | ||||||
Xinyi Glass Holdings Ltd | 1,720,000 | 3,477 | ||||||
Yihai International Holding Ltd | 83,000 | 1,305 | ||||||
ZhongAn Online P&C Insurance Co Ltd, Cl H *(A) | 313,100 | 1,569 | ||||||
Zhou Hei Ya International Holdings Co Ltd (A) | 969,500 | 1,016 | ||||||
Zoomlion Heavy Industry Science and Technology Co Ltd | 1,714,710 | 1,663 | ||||||
|
|
| ||||||
| 181,314 | ||||||||
|
|
| ||||||
Hungary — 0.4% | ||||||||
OTP Bank Nyrt * | 20,205 | 608 | ||||||
Richter Gedeon Nyrt | 303,336 | 6,414 | ||||||
|
|
| ||||||
| 7,022 | ||||||||
|
|
| ||||||
India — 9.3% | ||||||||
Ambuja Cements Ltd | 757,374 | 2,236 | ||||||
Apollo Hospitals Enterprise Ltd | 72,837 | 2,125 | ||||||
Aurobindo Pharma Ltd | 66,294 | 718 | ||||||
Bajaj Auto Ltd | 65,984 | 2,580 | ||||||
Bharat Electronics Ltd | 542,788 | 708 | ||||||
Britannia Industries Ltd | 16,480 | 850 | ||||||
Dr Reddy’s Laboratories Ltd ADR | 15,819 | 1,100 | ||||||
SEI Institutional International Trust / Annual Report / September 30, 2020 |
23 |
SCHEDULE OF INVESTMENTS
September 30, 2020
Emerging Market Equity Fund (Continued)
| Description | Shares | Market Value ($ Thousands) | ||||||
COMMON STOCK (continued) | ||||||||
Escorts Ltd | 147,194 | $ | 2,646 | |||||
Essel Propack Ltd | 923,632 | 3,054 | ||||||
GMM Pfaudler Ltd | 28,388 | 1,543 | ||||||
Grasim Industries Ltd | 92,199 | 934 | ||||||
HCL Technologies Ltd | 518,059 | 5,725 | ||||||
HDFC Bank Ltd * | 328,388 | 4,827 | ||||||
HDFC Bank Ltd ADR * | 71,233 | 3,559 | ||||||
HDFC Life Insurance Co Ltd * | 110,044 | 838 | ||||||
Hero MotoCorp Ltd | 148,059 | 6,343 | ||||||
Hindalco Industries Ltd | 379,893 | 908 | ||||||
Hindustan Unilever Ltd | 32,765 | 920 | ||||||
Housing Development Finance Corp Ltd | 411,916 | 9,741 | ||||||
ICICI Bank Ltd * | 1,329,504 | 6,450 | ||||||
ICICI Bank Ltd ADR * | 462,301 | 4,544 | ||||||
ICICI Lombard General Insurance Co Ltd | 187,287 | 3,307 | ||||||
IndusInd Bank Ltd * | 604,800 | 4,365 | ||||||
Infosys Ltd | 394,085 | 5,444 | ||||||
Infosys Ltd ADR | 265,853 | 3,671 | ||||||
Ipca Laboratories Ltd | 36,366 | 1,070 | ||||||
JM Financial Ltd | 506,635 | 532 | ||||||
Jubilant Foodworks Ltd | 21,720 | 691 | ||||||
LIC Housing Finance Ltd | 194,234 | 729 | ||||||
Mahindra & Mahindra Ltd | 270,324 | 2,230 | ||||||
Manappuram Finance Ltd | 516,889 | 1,109 | ||||||
Metropolis Healthcare Ltd | 12,312 | 300 | ||||||
Motherson Sumi Systems Ltd | 1,910,388 | 2,993 | ||||||
Mphasis Ltd | 96,297 | 1,809 | ||||||
Multi Commodity Exchange of India Ltd | 81,248 | 1,903 | ||||||
Muthoot Finance Ltd | 115,536 | 1,777 | ||||||
Petronet LNG Ltd | 767,232 | 2,297 | ||||||
Reliance Industries Ltd | 889,619 | 26,842 | ||||||
SBI Cards & Payment Services Ltd | 155,447 | 1,791 | ||||||
Shriram Transport Finance Co Ltd | 110,254 | 931 | ||||||
Spandana Sphoorty Financial Ltd * | 96,705 | 677 | ||||||
Strides Pharma Science Ltd | 188,369 | 1,847 | ||||||
Tata Consultancy Services Ltd | 320,658 | 10,864 | ||||||
UltraTech Cement Ltd | 53,503 | 2,944 | ||||||
United Breweries Ltd | 123,786 | 1,610 | ||||||
United Spirits Ltd * | 253,792 | 1,782 | ||||||
UPL Ltd | 626,546 | 4,303 | ||||||
Vedanta Ltd | 518,151 | 965 | ||||||
Wipro Ltd | 245,158 | 1,045 | ||||||
WNS Holdings Ltd ADR * | 17,029 | 1,089 | ||||||
Zee Entertainment Enterprises Ltd | 699,938 | 1,993 | ||||||
|
|
| ||||||
| 155,259 | ||||||||
|
|
| ||||||
Indonesia — 1.0% | ||||||||
Ace Hardware Indonesia Tbk PT | 18,894,300 | 2,028 | ||||||
Astra International Tbk PT | 2,483,700 | 748 | ||||||
Bank Central Asia Tbk PT | 3,049,767 | 5,564 | ||||||
Bank Mandiri Persero Tbk PT | 4,540,700 | 1,517 | ||||||
Bank Negara Indonesia Persero Tbk PT | 1,768,400 | 529 | ||||||
Bank Rakyat Indonesia Persero Tbk PT | 20,689,905 | 4,244 | ||||||
| Description | Shares | Market Value ($ Thousands) | ||||||
COMMON STOCK (continued) | ||||||||
Indofood Sukses Makmur Tbk PT | 2,458,477 | $ | 1,182 | |||||
Kalbe Farma Tbk PT | 8,412,200 | 877 | ||||||
|
|
| ||||||
| 16,689 | ||||||||
|
|
| ||||||
Jordan — 0.1% | ||||||||
Hikma Pharmaceuticals PLC | 42,916 | 1,436 | ||||||
|
|
| ||||||
Malaysia — 0.8% | ||||||||
Dialog Group Bhd | 1,285,300 | 1,179 | ||||||
Frontken Corp Bhd | 1,091,900 | 958 | ||||||
Inari Amertron Bhd | 5,046,975 | 2,795 | ||||||
Kossan Rubber Industries | 561,200 | 1,853 | ||||||
Petronas Gas Bhd | 227,100 | 900 | ||||||
PPB Group Bhd | 822,800 | 3,768 | ||||||
Public Bank Bhd | 140,200 | 530 | ||||||
RHB Bank Bhd | 1,875,200 | 2,065 | ||||||
|
|
| ||||||
| 14,048 | ||||||||
|
|
| ||||||
Mexico — 1.1% | ||||||||
America Movil SAB de CV ADR, Cl L | 202,222 | 2,526 | ||||||
Arca Continental SAB de CV | 68,800 | 297 | ||||||
Cemex SAB de CV ADR * | 215,242 | 818 | ||||||
Fomento Economico Mexicano SAB de CV | 477,029 | 2,684 | ||||||
Gruma SAB de CV, Cl B | 295,491 | 3,275 | ||||||
Grupo Aeroportuario del Sureste SAB de CV, Cl B | 45,605 | 530 | ||||||
Grupo Financiero Banorte SAB de CV, Cl O * | 752,719 | 2,604 | ||||||
Grupo Mexico SAB de CV, Ser B | 1,273,684 | 3,247 | ||||||
Promotora y Operadora de Infraestructura SAB de CV | 82,200 | 579 | ||||||
Qualitas Controladora SAB de CV | 191,603 | 725 | ||||||
Wal-Mart de Mexico SAB de CV | 169,300 | 406 | ||||||
|
|
| ||||||
| 17,691 | ||||||||
|
|
| ||||||
Netherlands — 0.2% | ||||||||
Prosus NV * | 40,810 | 3,769 | ||||||
|
|
| ||||||
Peru — 0.3% | ||||||||
Credicorp Ltd | 41,800 | 5,183 | ||||||
|
|
| ||||||
Philippines — 0.3% | ||||||||
BDO Unibank Inc | 1,048,215 | 1,875 | ||||||
First Gen Corp | 599,361 | 290 | ||||||
Globe Telecom Inc | 31,155 | 1,337 | ||||||
International Container Terminal Services Inc | 585,258 | 1,324 | ||||||
|
|
| ||||||
| 4,826 | ||||||||
|
|
| ||||||
Poland — 0.7% | ||||||||
Cyfrowy Polsat SA | 85,560 | 598 | ||||||
Dino Polska SA * | 136,680 | 8,068 | ||||||
Polski Koncern Naftowy ORLEN SA | 39,130 | 464 | ||||||
Powszechny Zaklad Ubezpieczen SA * | 276,225 | 1,770 | ||||||
|
|
| ||||||
| 10,900 | ||||||||
|
|
| ||||||
Qatar — 0.3% | ||||||||
Commercial Bank PSQC/The | 420,581 | 470 | ||||||
24 |
SEI Institutional International Trust / Annual Report / September 30, 2020 |
| Description | Shares | Market Value ($ Thousands) | ||||||
COMMON STOCK (continued) | ||||||||
Masraf Al Rayan QSC | 782,506 | $ | 895 | |||||
Ooredoo QPSC | 756,566 | 1,399 | ||||||
Qatar Gas Transport Co Ltd | 1,069,057 | 791 | ||||||
Qatar National Bank QPSC | 239,874 | 1,201 | ||||||
|
|
| ||||||
| 4,756 | ||||||||
|
|
| ||||||
Russia — 3.2% | ||||||||
Detsky Mir PJSC | 1,465,592 | 2,224 | ||||||
Inter RAO UES PJSC | 9,685,000 | 700 | ||||||
LUKOIL PJSC ADR | 205,075 | 11,780 | ||||||
Magnit GDR * | 159,457 | 2,042 | ||||||
Magnit PJSC GDR | 13,117 | 196 | ||||||
Novatek PJSC GDR | 751 | 103 | ||||||
QIWI plc ADR | 108,712 | 1,886 | ||||||
Sberbank of Russia PJSC | 533,262 | 1,567 | ||||||
Sberbank of Russia PJSC ADR | 1,260,466 | 14,709 | ||||||
X5 Retail Group NV GDR | 62,031 | 2,300 | ||||||
Yandex NV, Cl A * | 254,878 | 16,631 | ||||||
|
|
| ||||||
| 54,138 | ||||||||
|
|
| ||||||
Saudi Arabia — 0.7% | ||||||||
Advanced Petrochemical Co | 39,986 | 631 | ||||||
Al Rajhi Bank | 193,515 | 3,396 | ||||||
Arab National Bank | 102,807 | 557 | ||||||
Jarir Marketing Co | 22,918 | 1,146 | ||||||
Riyad Bank | 332,731 | 1,657 | ||||||
Samba Financial Group | 118,058 | 849 | ||||||
Saudi Arabian Fertilizer Co | 82,608 | 1,806 | ||||||
Saudi Arabian Oil Co | 87,445 | 837 | ||||||
Saudi Telecom Co | 27,365 | 734 | ||||||
Savola Group/The | 72,020 | 923 | ||||||
|
|
| ||||||
| 12,536 | ||||||||
|
|
| ||||||
South Africa — 3.3% | ||||||||
Absa Group Ltd | 148,252 | 793 | ||||||
AngloGold Ashanti Ltd | 9,999 | 259 | ||||||
AngloGold Ashanti Ltd ADR | 167,341 | 4,414 | ||||||
Bid Corp Ltd | 160,798 | 2,484 | ||||||
Bidvest Group Ltd/The | 53,538 | 443 | ||||||
Capitec Bank Holdings Ltd * | 77,752 | 4,833 | ||||||
Exxaro Resources Ltd | 87,967 | 658 | ||||||
FirstRand Ltd | 1,828,072 | 4,519 | ||||||
Gold Fields Ltd ADR | 259,966 | 3,195 | ||||||
Impala Platinum Holdings Ltd | 97,797 | 850 | ||||||
Kumba Iron Ore Ltd | 38,672 | 1,151 | ||||||
Mr Price Group Ltd | 556,286 | 4,404 | ||||||
Naspers Ltd, Cl N | 91,875 | 16,342 | ||||||
Nedbank Group Ltd | 188,227 | 1,136 | ||||||
Old Mutual Ltd | 2,051,244 | 1,274 | ||||||
Sanlam Ltd | 216,409 | 674 | ||||||
Shoprite Holdings Ltd (A) | 91,536 | 752 | ||||||
Sibanye Stillwater Ltd | 1,050,424 | 2,893 | ||||||
SPAR Group Ltd/The | 65,425 | 745 | ||||||
| Description | Shares | Market Value ($ Thousands) | ||||||
COMMON STOCK (continued) | ||||||||
Standard Bank Group Ltd | 510,750 | $ | 3,308 | |||||
|
|
| ||||||
| 55,127 | ||||||||
|
|
| ||||||
South Korea — 12.7% | ||||||||
BGF retail Co Ltd | 14,911 | 1,576 | ||||||
Celltrion Healthcare Co Ltd * | 6,013 | 453 | ||||||
Celltrion Inc * | 7,812 | 1,717 | ||||||
Cheil Worldwide Inc | 49,727 | 890 | ||||||
Chong Kun Dang Pharmaceutical Corp | 7,769 | 1,107 | ||||||
CJ CheilJedang Corp | 2,976 | 1,008 | ||||||
CJ ENM Co Ltd | 84,589 | 10,292 | ||||||
CJ Logistics Corp * | 6,037 | 916 | ||||||
Com2uSCorp | 28,665 | 2,808 | ||||||
Coway Co Ltd | 61,335 | 4,184 | ||||||
Daelim Industrial Co Ltd | 10,636 | 706 | ||||||
DB HiTek Co Ltd | 40,164 | 1,296 | ||||||
DB Insurance Co Ltd | 38,506 | 1,484 | ||||||
E-MART Inc | 20,043 | 2,434 | ||||||
Hana Financial Group Inc | 126,404 | 3,040 | ||||||
Hankook Tire & Technology Co Ltd | 31,915 | 858 | ||||||
Hansol Chemical Co Ltd | 5,858 | 752 | ||||||
Hanwha Solutions Corp | 9,089 | 298 | ||||||
Hite Jinro Co Ltd | 22,928 | 711 | ||||||
Hyundai Glovis Co Ltd | 7,005 | 861 | ||||||
Hyundai Mobis Co Ltd | 3,801 | 747 | ||||||
Hyundai Motor Co | 10,141 | 1,544 | ||||||
Iljin Materials Co Ltd | 13,880 | 538 | ||||||
Kakao Corp | 17,354 | 5,411 | ||||||
Kangwon Land Inc | 78,015 | 1,432 | ||||||
KB Financial Group Inc | 96,370 | 3,087 | ||||||
Kia Motors Corp | 118,334 | 4,744 | ||||||
Korea Investment Holdings Co Ltd | 10,408 | 645 | ||||||
Korea Zinc Co Ltd | 6,073 | 1,956 | ||||||
Kumho Petrochemical Co Ltd | 27,312 | 2,564 | ||||||
LG Chem Ltd | 17,129 | 9,572 | ||||||
LG Corp | 13,451 | 854 | ||||||
LG Electronics Inc | 60,920 | 4,799 | ||||||
LG Household & Health Care Ltd | 1,582 | 1,960 | ||||||
LG Innotek Co Ltd | 9,473 | 1,256 | ||||||
Mando Corp | 55,616 | 1,696 | ||||||
NAVER Corp | 30,305 | 7,687 | ||||||
NCSoft Corp | 19,669 | 13,564 | ||||||
Orion Corp/Republic of Korea | 50,608 | 5,690 | ||||||
POSCO ADR | 18,699 | 783 | ||||||
Posco International Corp | 59,658 | 683 | ||||||
Samsung Biologics Co Ltd * | 2,980 | 1,758 | ||||||
Samsung C&T Corp | 10,055 | 901 | ||||||
Samsung Electro-Mechanics Co Ltd | 28,815 | 3,423 | ||||||
Samsung Electronics Co Ltd | 1,495,759 | 74,364 | ||||||
Samsung SDI Co Ltd | 8,527 | 3,163 | ||||||
Seegene Inc | 3,544 | 795 | ||||||
Shinhan Financial Group Co Ltd | 30,500 | 716 | ||||||
SK Hynix Inc | 142,970 | 10,247 | ||||||
SEI Institutional International Trust / Annual Report / September 30, 2020 |
25 |
SCHEDULE OF INVESTMENTS
September 30, 2020
Emerging Market Equity Fund (Continued)
| Description | Shares | Market Value ($ Thousands) | ||||||
COMMON STOCK (continued) | ||||||||
SK Telecom Co Ltd | 19,457 | $ | 3,963 | |||||
WONIK IPS Co Ltd * | 106,267 | 3,052 | ||||||
Yuhan Corp | 36,409 | 2,002 | ||||||
|
|
| ||||||
| 212,987 | ||||||||
|
|
| ||||||
Switzerland — 0.1% | ||||||||
Wizz Air Holdings Plc * | 26,136 | 1,049 | ||||||
|
|
| ||||||
Taiwan — 12.8% | ||||||||
Accton Technology Corp | 736,200 | 5,691 | ||||||
Airtac International Group | 114,000 | 2,594 | ||||||
ASE Technology Holding Co Ltd | 833,372 | 1,714 | ||||||
Asia Cement Corp | 2,469,000 | 3,552 | ||||||
ASMedia Technology Inc | 38,000 | 1,931 | ||||||
Asustek Computer Inc | 165,862 | 1,457 | ||||||
Bizlink Holding Inc | 306,000 | 2,408 | ||||||
Chailease Holding Co Ltd | 1,707,800 | �� | 7,767 | |||||
Chilisin Electronics Corp | 400,000 | 1,379 | ||||||
Chroma ATE Inc | 486,000 | 2,593 | ||||||
Chunghwa Telecom Co Ltd | 955,000 | 3,533 | ||||||
Compeq Manufacturing Co Ltd | 478,000 | 681 | ||||||
CTBC Financial Holding Co Ltd | 995,896 | 635 | ||||||
Delta Electronics Inc | 876,500 | 5,757 | ||||||
Elite Material Co Ltd | 144,000 | 734 | ||||||
eMemory Technology Inc | 48,200 | 860 | ||||||
Epistar Corp * | 932,000 | 1,149 | ||||||
Fubon Financial Holding Co Ltd | 2,738,000 | 3,984 | ||||||
Gigabyte Technology Co Ltd | 280,000 | 737 | ||||||
Globalwafers Co Ltd | 232,000 | 3,103 | ||||||
Hiwin Technologies Corp | 449,300 | 4,463 | ||||||
Hon Hai Precision Industry Co Ltd | 479,000 | 1,287 | ||||||
Hotai Motor Co Ltd | 114,000 | 2,559 | ||||||
Innolux Corp | 5,999,000 | 1,965 | ||||||
Kinsus Interconnect Technology Corp | 480,000 | 1,105 | ||||||
LandMark Optoelectronics Corp | 263,000 | 2,281 | ||||||
Largan Precision Co Ltd | 15,446 | 1,811 | ||||||
MediaTek Inc | 380,137 | 8,045 | ||||||
Mega Financial Holding Co Ltd | 772,177 | 743 | ||||||
Merida Industry Co Ltd | 175,000 | 1,419 | ||||||
Micro-Star International Co Ltd | 944,000 | 4,374 | ||||||
momo.com Inc | 29,000 | 709 | ||||||
Nien Made Enterprise Co Ltd | 95,000 | 1,137 | ||||||
Novatek Microelectronics Corp | 330,000 | 3,047 | ||||||
Parade Technologies Ltd | 98,600 | 3,619 | ||||||
Poya International Co Ltd | 16,000 | 307 | ||||||
Realtek Semiconductor Corp | 102,379 | 1,315 | ||||||
Ruentex Development Co Ltd | 646,500 | 873 | ||||||
Silergy Corp | 18,890 | 1,122 | ||||||
Silicon Motion Technology Corp ADR | 37,880 | 1,431 | ||||||
Simplo Technology Co Ltd | 57,000 | 593 | ||||||
Sinbon Electronics Co Ltd | 148,000 | 922 | ||||||
Sino-American Silicon Products Inc | 306,155 | 1,033 | ||||||
Swancor Holding Co Ltd | 203,000 | 1,027 | ||||||
| Description | Shares | Market Value ($ Thousands) | ||||||
COMMON STOCK (continued) | ||||||||
Synnex Technology International Corp | 604,000 | $ | 865 | |||||
Taishin Financial Holding Co Ltd | 2,854,000 | 1,266 | ||||||
Taiwan Cement Corp | 770,156 | 1,106 | ||||||
Taiwan Cooperative Financial Holding Co Ltd | 945,629 | 638 | ||||||
Taiwan Semiconductor Manufacturing Co Ltd | 5,748,952 | 86,853 | ||||||
Taiwan Semiconductor Manufacturing Co Ltd ADR | 120,310 | 9,754 | ||||||
Tong Hsing Electronic Industries Ltd | 404,000 | 1,870 | ||||||
Topco Scientific Co Ltd | 115,000 | 456 | ||||||
Tripod Technology Corp | 203,000 | 778 | ||||||
Unimicron Technology Corp | 370,853 | 966 | ||||||
Uni-President Enterprises Corp | 2,103,000 | 4,542 | ||||||
United Microelectronics Corp | 3,713,480 | 3,689 | ||||||
Win Semiconductors Corp | 85,000 | 848 | ||||||
Wistron Corp | 1,029,718 | 1,066 | ||||||
Yuanta Financial Holding Co Ltd | 2,152,928 | 1,330 | ||||||
|
|
| ||||||
| 215,473 | ||||||||
|
|
| ||||||
Thailand — 1.7% | ||||||||
Advanced Info Service PCL | 457,200 | 2,476 | ||||||
Carabao Group PCL | 343,800 | 1,278 | ||||||
Carabao Group PCL NVDR (A) | 198,629 | 739 | ||||||
Charoen Pokphand Foods PCL | 1,102,000 | 980 | ||||||
Charoen Pokphand Foods PCL NVDR | 1,342,100 | 1,193 | ||||||
Com7 PCL | 1,173,000 | 1,479 | ||||||
Com7 PCL NVDR | 471,500 | 594 | ||||||
CP ALL PCL * | 1,065,300 | 2,034 | ||||||
Home Product Center PCL | 20,873,454 | 9,521 | ||||||
Intouch Holdings PCL NVDR | 528,200 | 858 | ||||||
Minor International PCL NVDR *(A) | 2,591,664 | 1,647 | ||||||
PTT Exploration & Production PCL NVDR | 235,200 | 588 | ||||||
PTT PCL | 1,918,900 | 1,953 | ||||||
PTT PCL NVDR | 632,328 | 644 | ||||||
Siam Cement PCL | 12,487 | – | ||||||
Thai Beverage PCL | 4,246,250 | 1,894 | ||||||
|
|
| ||||||
| 27,878 | ||||||||
|
|
| ||||||
Turkey — 0.6% | ||||||||
Aselsan Elektronik Sanayi Ve Ticaret AS | 321,920 | 809 | ||||||
Ford Otomotiv Sanayi AS | 58,066 | 662 | ||||||
Haci Omer Sabanci Holding AS | 629,042 | 681 | ||||||
Koza Altin Isletmeleri AS * | 69,194 | 705 | ||||||
Migros Ticaret AS *(A) | 290,177 | 1,554 | ||||||
Turk Hava Yollari AO *(A) | 1,313,088 | 1,792 | ||||||
Turkcell Iletisim Hizmetleri AS | 449,240 | 888 | ||||||
Turkiye Sise ve Cam Fabrikalari AS (A) | 1,772,355 | 1,687 | ||||||
Ulker Biskuvi Sanayi AS * | 201,675 | 601 | ||||||
|
|
| ||||||
| 9,379 | ||||||||
|
|
| ||||||
United Arab Emirates — 0.2% | ||||||||
Aldar Properties PJSC | 4,179,647 | 2,294 | ||||||
Dubai Islamic Bank PJSC | 783,536 | 924 | ||||||
26 |
SEI Institutional International Trust / Annual Report / September 30, 2020 |
| Description | Shares | Market Value ($ Thousands) | ||||||
COMMON STOCK (continued) | ||||||||
Emaar Properties PJSC * | 1,056,677 | $ | 804 | |||||
|
|
| ||||||
| 4,022 | ||||||||
|
|
| ||||||
United Kingdom — 1.4% | ||||||||
Anglo American PLC | 125,860 | 3,049 | ||||||
Antofagasta PLC | 78,067 | 1,028 | ||||||
Halyk Savings Bank of Kazakhstan JSC GDR | 66,132 | 706 | ||||||
KAZ Minerals PLC | 581,829 | 3,940 | ||||||
Mail.Ru Group Ltd GDR * | 74,228 | 2,046 | ||||||
NAC Kazatomprom JSC GDR | 57,894 | 845 | ||||||
Network International Holdings PLC | 429,536 | 1,522 | ||||||
Novatek PJSC GDR | 7,334 | 1,002 | ||||||
Polymetal International PLC | 203,003 | 4,427 | ||||||
Polyus PJSC GDR | 16,784 | 1,757 | ||||||
Rio Tinto PLC | 38,558 | 2,320 | ||||||
Tullow Oil PLC *(A) | 2,881,615 | 569 | ||||||
VTB Bank PJSC GDR | 1,147,366 | 955 | ||||||
|
|
| ||||||
| 24,166 | ||||||||
|
|
| ||||||
United States — 1.2% | ||||||||
360 DigiTech Inc ADR * | 35,350 | 422 | ||||||
DouYu International Holdings Ltd ADR * | 61,193 | 808 | ||||||
NIO Inc ADR * | 393,296 | 8,346 | ||||||
Pagseguro Digital Ltd, Cl A * | 171,276 | 6,459 | ||||||
Southern Copper Corp | 45,441 | 2,057 | ||||||
Vasta Platform Ltd, Cl A * | 103,994 | 1,605 | ||||||
|
|
| ||||||
| 19,697 | ||||||||
|
|
| ||||||
Vietnam — 0.3% | ||||||||
Hoa Phat Group JSC | 2,260,634 | 2,578 | ||||||
Vincom Retail JSC * | 1,461,675 | 1,739 | ||||||
|
|
| ||||||
| 4,317 | ||||||||
|
|
| ||||||
Total Common Stock (Cost $1,241,383) ($ Thousands) | 1,603,645 | |||||||
|
|
| ||||||
PREFERRED STOCK — 1.0% | ||||||||
Brazil — 0.5% | ||||||||
Banco Bradesco SA *(B) | 330,158 | 1,142 | ||||||
Bradespar SA, 3.560% * | 89,428 | 715 | ||||||
Centrais Eletricas Brasileiras SA, 4.880% | 99,600 | 553 | ||||||
Cia Energetica de Minas Gerais (B) | 172,551 | 309 | ||||||
Cia Paranaense de Energia, 2.720% * | 155,677 | 1,718 | ||||||
Itau Unibanco Holding SA (B) | 274,466 | 1,101 | ||||||
Lojas Americanas SA *(B) | 75,000 | 376 | ||||||
Petroleo Brasileiro SA *(B) | 677,212 | 2,367 | ||||||
|
|
| ||||||
| 8,281 | ||||||||
|
|
| ||||||
Chile — 0.1% | ||||||||
Embotelladora Andina SA (B) | 278,442 | 613 | ||||||
|
|
| ||||||
South Korea — 0.4% | ||||||||
LG Household & Health Care Ltd (B) | 3,427 | 2,077 | ||||||
| Description | Shares | Market Value ($ Thousands) | ||||||
PREFERRED STOCK (continued) |
| |||||||
Samsung Electronics Co Ltd (B) | 118,755 | $ | 5,115 | |||||
|
|
| ||||||
| 7,192 | ||||||||
|
|
| ||||||
Total Preferred Stock (Cost $15,408) ($ Thousands) | 16,086 | |||||||
|
|
| ||||||
| Number of Warrants | ||||||||
WARRANTS — 0.0% | ||||||||
Thailand — 0.0% | ||||||||
Minor International PCL, Expires 07/31/2023 * | 117,803 | 28 | ||||||
Minor International PCL, Expires 09/30/2021 * | 162,947 | 2 | ||||||
|
|
| ||||||
Total Warrants | 30 | |||||||
|
|
| ||||||
| Number of Rights | ||||||||
RIGHTS — 0.0% | ||||||||
Taiwan — 0.0% | ||||||||
Simplo Technology Co Ltd *‡‡ | 1,414 | – | ||||||
|
|
| ||||||
Total Rights | – | |||||||
|
|
| ||||||
| Face Amount (Thousands) | ||||||||
DEBENTURE BOND — 0.0% | ||||||||
Brazil — 0.0% | ||||||||
Vale, Ser 1997 | ||||||||
0.000% (C)(D) | BRL | 8 | – | |||||
|
|
| ||||||
Total Debenture Bond | – | |||||||
|
|
| ||||||
| Shares | ||||||||
AFFILIATED PARTNERSHIP — 1.2% |
| |||||||
SEI Liquidity Fund, L.P. 0.100% **†(E) | 20,013,695 | 20,023 | ||||||
|
|
| ||||||
Total Affiliated Partnership (Cost $20,015) ($ Thousands) | 20,023 | |||||||
|
|
| ||||||
SEI Institutional International Trust / Annual Report / September 30, 2020 |
27 |
SCHEDULE OF INVESTMENTS
September 30, 2020
Emerging Market Equity Fund (Concluded)
| Description | Shares | Market Value ($ Thousands) | ||||||
CASH EQUIVALENT — 1.6% | ||||||||
SEI Daily Income Trust, Government Fund, Cl F | 27,198,619 | $ | 27,199 | |||||
|
|
| ||||||
Total Cash Equivalent | 27,199 | |||||||
|
|
| ||||||
Total Investments in Securities — 99.4% |
| $ | 1,666,983 | |||||
|
|
| ||||||
A list of the open futures contracts held by the Fund at September 30, 2020, is as follows:
| Type of Contract | Number of Contracts Long | Expiration Date | Notional Amount (Thousands) | Value (Thousands) | Unrealized Appreciation | |||||||||||||||
MSCI Emerging Markets | 537 | Dec-2020 | $ | 28,761 | $ | 29,226 | $ | 466 | ||||||||||||
|
|
|
|
|
|
|
|
| ||||||||||||
Percentages are based on Net Assets of $1,677,233 ($ Thousands).
| * | Non-income producing security. |
| ** | The rate reported is the 7-day effective yield as of September 30, 2020. |
| † | Investment in Affiliated Security (See Note 5). |
| ‡ | Real Estate Investment Trust. |
| ‡‡ | Expiration date not available. |
| (A) | Certain securities or partial positions of certain securities are on loan at September 30, 2020 (See Note 9). The total market value of securities on loan at September 30, 2020 was $18,725 ($ Thousands). |
| (B) | There is currently no rate available. |
| (C) | Perpetual security with no stated maturity date. |
| (D) | Variable or floating rate security, the interest rate of which adjusts periodically based on changes in current interest rates and prepayments on the underlying pool of assets. |
| (E) | This security was purchased with cash collateral held from securities on loan. The total market value of such securities as of September 30, 2020 was $20,023 ($ Thousands). |
ADR — American Depositary Receipt
BRL — Brazilian Real
Cl — Class
GDR — Global Depositary Receipt
JSC — Joint-Stock Company
L.P. — Limited Partnership
Ltd. — Limited
MSCI — Morgan Stanley Capital International
NVDR — Non-Voting Depositary Receipt
PJSC — Public Joint-Stock Company
PLC — Public Limited Company
REIT — Real Estate investment Trust
Ser — Series
USD — U.S. Dollar
VAR — Variable Rate
The following is a list of the level of inputs used as of September 30, 2020, in valuing the Fund’s investments and other financial instruments carried at value ($ Thousands):
| Investments in Securities | Level 1 ($) | Level 2 ($) | Level 3 ($) | Total ($) | ||||||||||||
Common Stock | 1,599,649 | 3,996 | – | 1,603,645 | ||||||||||||
Preferred Stock | 14,009 | 2,077 | – | 16,086 | ||||||||||||
Warrants | – | 30 | – | 30 | ||||||||||||
Rights | – | – | – | – | ||||||||||||
Debenture Bond | – | – | – | – | ||||||||||||
Affiliated Partnership | – | 20,023 | – | 20,023 | ||||||||||||
Cash Equivalent | 27,199 | – | – | 27,199 | ||||||||||||
|
|
|
|
|
|
|
|
|
|
|
| |||||
Total Investments in Securities | 1,640,857 | 26,126 | – | 1,666,983 | ||||||||||||
|
|
|
|
|
|
|
|
|
|
|
| |||||
| Other Financial Instruments | Level 1 ($) | Level 2 ($) | Level 3 ($) | Total ($) | ||||||||||||
Futures Contracts* | ||||||||||||||||
Unrealized Appreciation | 466 | – | – | 466 | ||||||||||||
|
|
|
|
|
|
|
|
|
|
|
| |||||
Total Other Financial Instruments | 466 | – | – | 466 | ||||||||||||
|
|
|
|
|
|
|
|
|
|
|
| |||||
*Futures contracts are valued at the unrealized appreciation on the instruments.
For the year ended September 30, 2020, there were no transfers in or out of Level 3.
For more information on valuation inputs, see Note 2 – Significant Accounting Policies in Notes to Financial Statements.
28 |
SEI Institutional International Trust / Annual Report / September 30, 2020 |
The following is a summary of the transactions with affiliates for the year ended September 30, 2020 ($ Thousands):
| Security Description | Value 9/30/2019 | Purchases at Cost | Proceeds from Sales | Realized Gain | Change in Unrealized Appreciation | Value 9/30/2020 | Shares | Income | Capital Gains | |||||||||
SEI Liquidity Fund, L.P. | $48,638 | $202,332 | $(230,948) | $1 | $— | $20,023 | 20,013,695 | $ 339 | $— | |||||||||
SEI Daily Income Trust, Government Fund, Cl F | 29,816 | 257,448 | (260,065) | — | — | 27,199 | 27,198,619 | 180 | — | |||||||||
|
|
|
|
|
|
|
| |||||||||||
Totals | $78,454 | $459,780 | $(491,013) | $1 | $— | $47,222 | $ 519 | $— | ||||||||||
|
|
|
|
|
|
|
|
Amounts designated as “—” are $0 or have been rounded to $0.
The accompanying notes are an integral part of the financial statements.
SEI Institutional International Trust / Annual Report / September 30, 2020 |
29 |
SCHEDULE OF INVESTMENTS
September 30, 2020
International Fixed Income Fund
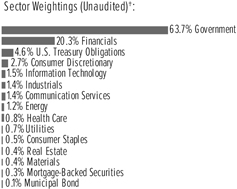
†Percentages based on total investments.
| Description | Face Amount (Thousands) | Market Value ($ Thousands) | ||||||
GLOBAL BONDS — 92.3% | ||||||||
Australia — 2.8% | ||||||||
Australia & New Zealand Banking Group | ||||||||
4.500%, 03/19/2024 (A) | $ | 200 | $ | 220 | ||||
Australia & New Zealand Banking Group MTN | ||||||||
5.000%, 08/16/2023 | AUD | 750 | 606 | |||||
3.625%, 07/18/2022 | EUR | 300 | 378 | |||||
Australia Government Bond | ||||||||
4.750%, 04/21/2027 | AUD | 820 | 749 | |||||
4.500%, 04/21/2033 | 195 | 198 | ||||||
3.750%, 04/21/2037 | 1,463 | 1,439 | ||||||
3.250%, 04/21/2025 | 843 | 685 | ||||||
3.000%, 03/21/2047 | 3,161 | 2,929 | ||||||
2.750%, 04/21/2024 | 1,230 | 961 | ||||||
2.750%, 06/21/2035 | 1,243 | 1,088 | ||||||
2.750%, 05/21/2041 | 609 | 533 | ||||||
2.500%, 05/21/2030 | 607 | 504 | ||||||
1.750%, 06/21/2051 | 305 | 220 | ||||||
BHP Billiton Finance | ||||||||
4.750%, VAR EUR Swap Annual 5 Yr+4.363%, 04/22/2076 | EUR | 101 | 121 | |||||
Commonwealth Bank of Australia MTN | ||||||||
3.000%, 05/03/2022 | 330 | 408 | ||||||
0.375%, 04/11/2024 | 455 | 547 | ||||||
Glencore Finance Europe MTN | ||||||||
1.625%, 01/18/2022 | 240 | 285 | ||||||
1.500%, 10/15/2026 | 120 | 144 | ||||||
National Australia Bank | ||||||||
5.000%, 03/11/2024 | AUD | 750 | 618 | |||||
National Australia Bank MTN | ||||||||
2.250%, 06/06/2025 | EUR | 206 | 271 | |||||
Westpac Banking Corp MTN | ||||||||
1.500%, 03/24/2021 | 220 | 261 | ||||||
0.500%, 05/17/2024 | 885 | 1,070 | ||||||
|
|
| ||||||
| 14,235 | ||||||||
|
|
| ||||||
| Description | Face Amount (Thousands) | Market Value ($ Thousands) | ||||||
GLOBAL BONDS (continued) | ||||||||
Austria — 1.4% | ||||||||
JAB Holdings BV | ||||||||
1.000%, 12/20/2027 | EUR | 400 | $ | 467 | ||||
Republic of Austria Government Bond (A) | ||||||||
4.150%, 03/15/2037 | 326 | 652 | ||||||
3.650%, 04/20/2022 | 1,045 | 1,307 | ||||||
2.400%, 05/23/2034 | 110 | 175 | ||||||
2.100%, 09/20/2117 | 50 | 124 | ||||||
0.850%, 06/30/2120 | 9 | 13 | ||||||
0.750%, 10/20/2026 | 749 | 950 | ||||||
0.750%, 03/20/2051 | 515 | 707 | ||||||
0.500%, 02/20/2029 | 885 | 1,120 | ||||||
0.000%, 07/15/2024 (E) | 765 | 919 | ||||||
Republic of Austria Government Bond, Ser 97-6 | ||||||||
6.250%, 07/15/2027 | 525 | 904 | ||||||
|
| |||||||
| 7,338 | ||||||||
|
| |||||||
Belgium — 2.0% | ||||||||
Anheuser-Busch InBev MTN | ||||||||
2.250%, 05/24/2029 | GBP | 205 | 282 | |||||
2.125%, 12/02/2027 | EUR | 410 | 537 | |||||
1.125%, 07/01/2027 | 230 | 283 | ||||||
Anheuser-Busch InBev Finance | ||||||||
2.600%, 05/15/2024 | CAD | 550 | 440 | |||||
Kingdom of Belgium Government Bond | ||||||||
4.250%, 03/28/2041 (A) | EUR | 470 | 997 | |||||
3.750%, 06/22/2045 | 259 | 553 | ||||||
3.000%, 06/22/2034 (A) | 346 | 579 | ||||||
2.600%, 06/22/2024 (A) | 243 | 320 | ||||||
1.700%, 06/22/2050 (A) | 246 | 394 | ||||||
1.600%, 06/22/2047 (A) | 351 | 542 | ||||||
1.000%, 06/22/2031 (A) | 490 | 651 | ||||||
0.900%, 06/22/2029 (A) | 305 | 398 | ||||||
0.800%, 06/22/2025 (A) | 263 | 329 | ||||||
0.500%, 10/22/2024 (A) | 810 | 994 | ||||||
0.200%, 10/22/2023 (A) | 1,050 | 1,264 | ||||||
0.000%, 10/22/2027 (A) (E) | 1,425 | 1,727 | ||||||
Kingdom of Belgium Government Bond, Ser 44 | ||||||||
5.000%, 03/28/2035 (A) | 64 | 130 | ||||||
|
| |||||||
| 10,420 | ||||||||
|
| |||||||
Brazil — 0.0% | ||||||||
Odebrecht Finance | ||||||||
7.125%, 06/26/2042 (B) | $ | 280 | 17 | |||||
4.375%, 04/25/2025 (B) | 200 | 10 | ||||||
|
| |||||||
| 27 | ||||||||
|
| |||||||
Canada — 6.8% | ||||||||
Bank of Montreal | ||||||||
0.750%, 09/21/2022 | EUR | 235 | 282 | |||||
Bank of Montreal MTN | ||||||||
0.125%, 04/19/2021 | 280 | 330 | ||||||
30 |
SEI Institutional International Trust / Annual Report / September 30, 2020 |
| Description | Face Amount (Thousands) | Market Value ($ Thousands) | ||||||
GLOBAL BONDS (continued) |
| |||||||
Bank of Nova Scotia MTN | ||||||||
0.750%, 09/17/2021 | EUR | 570 | $ | 676 | ||||
Bell Canada MTN | ||||||||
4.700%, 09/11/2023 | CAD | 80 | 66 | |||||
Canada Housing Trust No. 1 (A) | ||||||||
2.250%, 12/15/2025 | 2,235 | 1,814 | ||||||
1.750%, 06/15/2022 | 2,465 | 1,892 | ||||||
Canadian Government Bond | ||||||||
5.750%, 06/01/2033 | 1,205 | 1,451 | ||||||
5.000%, 06/01/2037 | 816 | 1,003 | ||||||
2.750%, 12/01/2048 | 400 | 420 | ||||||
2.750%, 12/01/2048 | 300 | 315 | ||||||
2.500%, 06/01/2024 | 1,761 | 1,425 | ||||||
2.250%, 06/01/2029 | 3,965 | 3,410 | ||||||
1.500%, 06/01/2026 (F) | 7,545 | 6,011 | ||||||
1.000%, 09/01/2022 | 525 | 399 | ||||||
1.000%, 06/01/2027 | 1,375 | 1,071 | ||||||
0.750%, 09/01/2021 | 655 | 493 | ||||||
Canadian Imperial Bank of Commerce | ||||||||
0.239%, 07/25/2022 (E) | EUR | 445 | 526 | |||||
Export Development Canada MTN | ||||||||
2.400%, 06/07/2021 | AUD | 1,259 | 916 | |||||
Husky Energy | ||||||||
4.400%, 04/15/2029 | $ | 205 | 214 | |||||
Province of Alberta Canada MTN | ||||||||
1.000%, 11/15/2021 | GBP | 650 | 847 | |||||
Province of Manitoba Canada | ||||||||
3.850%, 12/01/2021 | CAD | 710 | 554 | |||||
Province of Ontario Canada | ||||||||
4.700%, 06/02/2037 | 1,355 | 1,439 | ||||||
4.650%, 06/02/2041 | 540 | 590 | ||||||
2.800%, 06/02/2048 | 2,200 | 1,909 | ||||||
2.600%, 06/02/2025 | 1,614 | 1,314 | ||||||
2.400%, 06/02/2026 | 585 | 475 | ||||||
Province of Ontario Canada MTN | ||||||||
0.161%, VAR ICE LIBOR GBP 3 Month+0.090%, 11/10/2020 | GBP | 600 | 776 | |||||
Province of Quebec Canada | ||||||||
6.250%, 06/01/2032 | CAD | 720 | 815 | |||||
3.500%, 12/01/2048 | 520 | 511 | ||||||
Rogers Communications | ||||||||
4.000%, 06/06/2022 | 165 | 130 | ||||||
Royal Bank of Canada MTN | ||||||||
0.500%, 12/16/2020 | EUR | 1,000 | 1,175 | |||||
Toronto-Dominion Bank | ||||||||
0.000%, 02/09/2024 (E) | 490 | 582 | ||||||
Toyota Credit Canada MTN | ||||||||
2.200%, 02/25/2021 | CAD | 1,500 | 1,131 | |||||
|
|
| ||||||
| 34,962 | ||||||||
|
|
| ||||||
China — 5.4% | ||||||||
China Development Bank | ||||||||
4.880%, 02/09/2028 | CNY | 10,600 | 1,673 | |||||
| Description | Face Amount (Thousands) | Market Value ($ Thousands) | ||||||
GLOBAL BONDS (continued) |
| |||||||
3.650%, 05/21/2029 | CNY | 18,120 | $ | 2,635 | ||||
3.480%, 01/08/2029 | 23,680 | 3,404 | ||||||
3.390%, 07/10/2027 | 9,530 | 1,381 | ||||||
3.230%, 01/10/2025 | 11,360 | 1,650 | ||||||
China Government Bond | ||||||||
3.390%, 03/16/2050 | 44,030 | 5,922 | ||||||
3.120%, 12/05/2026 | 39,150 | 5,755 | ||||||
2.850%, 06/04/2027 | 22,770 | 3,270 | ||||||
2.680%, 05/21/2030 | 9,350 | 1,320 | ||||||
1.990%, 04/09/2025 | 3,270 | 460 | ||||||
Prosus | ||||||||
3.680%, 01/21/2030 (A) | $ | 275 | 297 | |||||
3.500%, 07/05/2024 | 200 | 210 | ||||||
|
|
| ||||||
| 27,977 | ||||||||
|
|
| ||||||
Colombia — 0.5% | ||||||||
Colombian TES | ||||||||
10.000%, 07/24/2024 | COP | 1,833,400 | 584 | |||||
7.750%, 09/18/2030 | 2,685,700 | 804 | ||||||
7.500%, 08/26/2026 | 1,100,600 | 329 | ||||||
7.250%, 10/18/2034 | 164,600 | 47 | ||||||
7.000%, 05/04/2022 | 312,500 | 87 | ||||||
7.000%, 06/30/2032 | 968,800 | 272 | ||||||
6.000%, 04/28/2028 | 1,690,100 | 463 | ||||||
5.750%, 11/03/2027 | 176,100 | 48 | ||||||
|
|
| ||||||
| 2,634 | ||||||||
|
|
| ||||||
Czech Republic — 0.2% | ||||||||
Czech Republic Government Bond | ||||||||
4.700%, 09/12/2022 | CZK | 7,470 | 352 | |||||
2.500%, 08/25/2028 | 14,630 | 718 | ||||||
|
|
| ||||||
| 1,070 | ||||||||
|
|
| ||||||
Denmark — 0.4% | ||||||||
Danske Bank MTN | ||||||||
5.875%, VAR EUR Swap Annual 7 Yr+5.471% (D) | EUR | 344 | 415 | |||||
Kingdom of Denmark | ||||||||
4.500%, 11/15/2039 | DKK | 2,040 | 611 | |||||
1.500%, 11/15/2023 | 4,025 | 676 | ||||||
Orsted | ||||||||
6.250%, VAR EUR Swap Annual 5 Yr+4.750%, 06/26/2099 | EUR | 210 | 279 | |||||
| 1,981 | ||||||||
|
|
| ||||||
Egypt — 0.0% | ||||||||
Egypt Government International Bond MTN | ||||||||
4.750%, 04/11/2025 (A) | 170 | 194 | ||||||
|
|
| ||||||
Finland — 0.6% | ||||||||
Finland Government Bond (A) | ||||||||
1.375%, 04/15/2047 | 130 | 206 | ||||||
0.000%, 09/15/2030 (E) | 1,397 | 1,692 | ||||||
SEI Institutional International Trust / Annual Report / September 30, 2020 |
31 |
SCHEDULE OF INVESTMENTS
September 30, 2020
International Fixed Income Fund (Continued)
| Description | Face Amount (Thousands) | Market Value ($ Thousands) | ||||||
GLOBAL BONDS (continued) | ||||||||
Government of Finland | ||||||||
0.875%, 09/15/2025 (A) | EUR | 355 | $ | 448 | ||||
Nordea Kiinnitysluottopankki MTN | ||||||||
0.250%, 03/18/2026 | 480 | 583 | ||||||
|
|
| ||||||
| 2,929 | ||||||||
|
|
| ||||||
France — 6.9% | ||||||||
BNP Paribas MTN | ||||||||
3.375%, 01/23/2026 | GBP | 490 | 696 | |||||
2.875%, 10/01/2026 | EUR | 160 | 209 | |||||
1.250%, 03/19/2025 | 375 | 458 | ||||||
BNP Paribas Home Loan SFH | ||||||||
0.375%, 05/07/2025 | 400 | 486 | ||||||
BPCE | ||||||||
5.150%, 07/21/2024 | $ | 310 | 347 | |||||
BPCE MTN | ||||||||
1.125%, 01/18/2023 | EUR | 300 | 360 | |||||
BPCE SFH MTN | ||||||||
3.750%, 09/13/2021 | 200 | 244 | ||||||
Bpifrance Financement | ||||||||
0.064%, 11/25/2022 (E) | 600 | 709 | ||||||
Caisse Francaise de Financement Local MTN | ||||||||
3.000%, 10/02/2028 | 100 | 148 | ||||||
0.500%, 01/19/2026 | 500 | 614 | ||||||
Cie de Financement Foncier | ||||||||
0.375%, 12/11/2024 | 300 | 364 | ||||||
Cie de Financement Foncier MTN | ||||||||
5.500%, 01/26/2027 | GBP | 387 | 648 | |||||
CNP Assurances | ||||||||
1.875%, 10/20/2022 | EUR | 200 | 241 | |||||
Credit Agricole Home Loan SFH MTN | ||||||||
1.250%, 03/24/2031 | 300 | 404 | ||||||
0.250%, 02/23/2024 | 700 | 840 | ||||||
Dexia Credit Local MTN | ||||||||
0.625%, 02/03/2024 | 200 | 242 | ||||||
0.500%, 01/17/2025 | 300 | 363 | ||||||
0.000%, 05/29/2024 (E) | 1,200 | 1,424 | ||||||
Electricite de France MTN | ||||||||
5.375%, VAR EUR Swap Annual 12 Yr+3.794% (D) | 200 | 257 | ||||||
4.000%, 11/12/2025 | 350 | 493 | ||||||
2.250%, 04/27/2021 | 100 | 119 | ||||||
Elis SA | ||||||||
1.000%, 04/03/2025 | 100 | 109 | ||||||
Engie | ||||||||
3.250%, VAR EUR Swap Annual 5 Yr+3.169% (D) | 500 | 627 | ||||||
Engie MTN | ||||||||
0.875%, 03/27/2024 | 300 | 363 | ||||||
0.375%, 02/28/2023 | 100 | 119 | ||||||
French Republic Government Bond OAT | ||||||||
5.750%, 10/25/2032 | 403 | 816 | ||||||
4.500%, 04/25/2041 | 334 | 736 | ||||||
| Description | Face Amount (Thousands) | Market Value ($ Thousands) | ||||||
GLOBAL BONDS (continued) |
| |||||||
4.000%, 10/25/2038 | EUR | 99 | $ | 198 | ||||
4.000%, 04/25/2055 (A) | 195 | 490 | ||||||
3.250%, 05/25/2045 | 2,061 | 4,126 | ||||||
2.750%, 10/25/2027 | 242 | 350 | ||||||
2.500%, 05/25/2030 | 238 | 356 | ||||||
1.750%, 05/25/2023 | 2,359 | 2,944 | ||||||
1.750%, 06/25/2039 (A) | 60 | 92 | ||||||
1.750%, 05/25/2066 (A) | 165 | 291 | ||||||
0.750%, 05/25/2028 | 279 | 357 | ||||||
0.750%, 11/25/2028 | 277 | 356 | ||||||
0.500%, 05/25/2029 | 284 | 358 | ||||||
0.000%, 03/25/2025 (E) | 633 | 763 | ||||||
0.000%, 02/25/2021 (E) | 2,055 | 2,415 | ||||||
0.000%, 05/25/2021 (E) | 1,685 | 1,983 | ||||||
0.000%, 05/25/2022 (E) | 868 | 1,029 | ||||||
0.000%, 02/25/2026 (E) | 530 | 640 | ||||||
0.000%, 11/25/2029 (E) | 297 | 359 | ||||||
Orange MTN | ||||||||
2.500%, 03/01/2023 | 500 | 623 | ||||||
1.750%, VAR EUAMDB05+2.181% (D) | 400 | 469 | ||||||
SNCF Reseau MTN | ||||||||
2.000%, 02/05/2048 | 300 | 458 | ||||||
SNCF Reseau EPIC MTN | ||||||||
5.500%, 12/01/2021 | GBP | 205 | 281 | |||||
4.250%, 10/07/2026 | EUR | 200 | 298 | |||||
2.250%, 12/20/2047 | 300 | 484 | ||||||
1.125%, 05/19/2027 | 300 | 383 | ||||||
1.125%, 05/25/2030 | 200 | 259 | ||||||
Societe Generale | ||||||||
4.250%, 04/14/2025 (A) | $ | 325 | 347 | |||||
Societe Generale MTN | ||||||||
1.125%, 01/23/2025 | EUR | 100 | 120 | |||||
SPCM SA | ||||||||
2.000%, 02/01/2026 | 117 | 137 | ||||||
Suez | ||||||||
2.875%, VAR EUR Swap Annual 5 Yr+2.504% (D) | 300 | 358 | ||||||
TOTAL MTN | ||||||||
3.369%, VAR EUR Swap Annual 5 Yr+3.350% (D) | 260 | 332 | ||||||
1.750%, VAR EUR Swap Annual 5 Yr+1.765% (D) | 115 | 135 | ||||||
Total Capital International MTN | ||||||||
4.250%, 11/26/2021 | AUD | 640 | 476 | |||||
UNEDIC ASSEO MTN | ||||||||
1.250%, 05/25/2033 | EUR | 700 | 945 | |||||
|
|
| ||||||
| 35,648 | ||||||||
|
|
| ||||||
Germany — 5.4% | ||||||||
Allianz | ||||||||
2.241%, VAR Euribor 3 Month+2.650%, 07/07/2045 | 600 | 741 | ||||||
32 |
SEI Institutional International Trust / Annual Report / September 30, 2020 |
| Description | Face Amount (Thousands) | Market Value ($ Thousands) | ||||||
GLOBAL BONDS (continued) | ||||||||
BMW Finance MTN | ||||||||
0.454%, 01/29/2021 | JPY | 200,000 | $ | 1,893 | ||||
Bundesobligation | ||||||||
0.000%, 10/18/2024 (E) | EUR | 1,830 | 2,210 | |||||
Bundesrepublik Deutschland Bundesanleihe | ||||||||
4.000%,01/04/2037 | 411 | 834 | ||||||
3.250%, 07/04/2042 | 1,121 | 2,344 | ||||||
2.500%, 08/15/2046 | 1,242 | 2,478 | ||||||
0.500%, 02/15/2026 | 138 | 173 | ||||||
0.281%, 08/15/2026 | 1,882 | 2,301 | ||||||
0.250%, 02/15/2027 | 2,160 | 2,690 | ||||||
0.281%, 02/15/2030 (E) | 895 | 1,105 | ||||||
Bundesrepublik Deutschland Bundesanleihe, Ser 03 | ||||||||
4.750%, 07/04/2034 | 95 | 193 | ||||||
Cheplapharm Arzneimittel GmbH | ||||||||
3.500%, 02/11/2027 (A) | 191 | 216 | ||||||
Commerzbank MTN | ||||||||
4.000%, VAR EUR Swap Annual 5 Yr+4.350%, 12/05/2030 | 200 | 239 | ||||||
Daimler International Finance BV MTN | ||||||||
0.250%, 11/06/2023 | 430 | 504 | ||||||
Deutsche Telekom International Finance BV MTN | ||||||||
0.625%, 04/03/2023 | 330 | 394 | ||||||
E.ON MTN | ||||||||
0.000%, 12/18/2023 (E) | 550 | 645 | ||||||
IHO Verwaltungs GmbH | ||||||||
3.625%, 05/15/2025 (A) | 175 | 206 | ||||||
Kreditanstalt fuer Wiederaufbau | ||||||||
2.600%, 06/20/2037 | JPY | 160,000 | 2,159 | |||||
0.500%, 09/15/2027 | EUR | 510 | 640 | |||||
0.125%, 06/07/2023 | 1,135 | 1,358 | ||||||
Kreditanstalt fuer Wiederaufbau MTN | ||||||||
2.800%, 02/17/2021 | AUD | 1,230 | 890 | |||||
Landwirtschaftliche Rentenbank MTN | ||||||||
0.625%, 05/18/2027 | EUR | 225 | 283 | |||||
Merck Financial Services GmbH MTN | ||||||||
0.125%, 07/16/2025 | 400 | 472 | ||||||
Vertical Midco GmbH | ||||||||
4.375%, 07/15/2027 (A) | 240 | 286 | ||||||
Volkswagen Bank GmbH MTN | ||||||||
0.625%, 09/08/2021 | 200 | 236 | ||||||
Volkswagen Financial Services MTN | ||||||||
2.750%, 10/02/2020 | GBP | 850 | 1,099 | |||||
Volkswagen International Finance | ||||||||
1.125%, 10/02/2023 | EUR | 400 | 479 | |||||
Volkswagen Leasing GmbH MTN | ||||||||
1.125%, 04/04/2024 | 520 | 618 | ||||||
WEPA Hygieneprodukte GmbH | ||||||||
2.875%, 12/15/2027 | 298 | 343 | ||||||
|
|
| ||||||
| 28,029 | ||||||||
|
|
| ||||||
| Description | Face Amount (Thousands) | Market Value ($ Thousands) | ||||||
GLOBAL BONDS (continued) | ||||||||
Hungary — 0.2% | ||||||||
Hungary Government Bond | ||||||||
3.000%, 06/26/2024 | HUF | 297,650 | $ | 1,014 | ||||
|
|
| ||||||
Indonesia — 0.5% | ||||||||
Indonesia Government International Bond | ||||||||
8.375%, 03/15/2034 | IDR | 797,000 | 1,500 | |||||
1.450%, 09/18/2026 | EUR | 300 | 356 | |||||
Indonesia Treasury Bond | ||||||||
7.375%, 05/15/2048 | IDR | 7,641,000 | 507 | |||||
|
|
| ||||||
| 2,363 | ||||||||
|
|
| ||||||
Ireland — 0.5% | ||||||||
AerCap Ireland Capital DAC | ||||||||
6.500%, 07/15/2025 | $ | 200 | 216 | |||||
4.500%, 09/15/2023 | 205 | 211 | ||||||
Allied Irish Banks MTN | ||||||||
4.125%, VAR EUR Swap Annual 5 Yr+3.950%, 11/26/2025 | EUR | 177 | 208 | |||||
CRH Funding MTN | ||||||||
1.875%, 01/09/2024 | 310 | 384 | ||||||
Ireland Government Bond | ||||||||
5.400%, 03/13/2025 | 351 | 522 | ||||||
1.500%, 05/15/2050 | 250 | 378 | ||||||
1.100%, 05/15/2029 | 670 | 879 | ||||||
|
|
| ||||||
| 2,798 | ||||||||
|
|
| ||||||
Israel — 0.2% | ||||||||
Israel Government Bond | ||||||||
5.500%, 01/31/2042 | ILS | 276 | 141 | |||||
4.250%, 03/31/2023 | 2,521 | 812 | ||||||
2.000%, 03/31/2027 | 925 | 297 | ||||||
|
|
| ||||||
| 1,250 | ||||||||
|
|
| ||||||
Italy — 6.8% | ||||||||
Assicurazioni Generali MTN | ||||||||
5.500%, VAR Euribor 3 Month+5.350%, 10/27/2047 | EUR | 230 | 317 | |||||
Enel | ||||||||
3.500%, VAR EUR Swap Annual 5 Yr+3.564%, 05/24/2080 | 175 | 217 | ||||||
Enel Finance International MTN | ||||||||
5.750%, 09/14/2040 | GBP | 145 | 287 | |||||
Eni | ||||||||
4.250%, 05/09/2029 (A) | $ | 515 | 580 | |||||
Intesa Sanpaolo MTN | ||||||||
5.017%, 06/26/2024 (A) | 530 | 557 | ||||||
3.625%, 12/05/2022 | EUR | 200 | 255 | |||||
Italy Buoni Poliennali Del Tesoro | ||||||||
5.000%, 09/01/2040 (A) | 1,393 | 2,615 | ||||||
3.850%, 09/01/2049 (A) | 245 | 425 | ||||||
3.750%, 05/01/2021 (A) | 386 | 463 | ||||||
3.500%, 03/01/2030 (A) | 665 | 972 | ||||||
3.350%, 03/01/2035 (A) | 1,493 | 2,249 | ||||||
SEI Institutional International Trust / Annual Report / September 30, 2020 |
33 |
SCHEDULE OF INVESTMENTS
September 30, 2020
International Fixed Income Fund (Continued)
| Description | Face Amount (Thousands) | Market Value ($ Thousands) | ||||||
GLOBAL BONDS (continued) | ||||||||
3.100%, 03/01/2040 (A) | EUR | 267 | $ | 399 | ||||
3.000%, 08/01/2029 | 1,609 | 2,255 | ||||||
2.800%, 03/01/2067 (A) | 90 | 131 | ||||||
2.700%, 03/01/2047 (A) | 55 | 79 | ||||||
2.450%, 09/01/2033 (A) | 552 | 753 | ||||||
2.450%, 09/01/2050 (A) | 420 | 572 | ||||||
2.000%, 02/01/2028 | 512 | 661 | ||||||
1.850%, 07/01/2025 (A) | 6,560 | 8,268 | ||||||
1.800%, 03/01/2041 (A) | 1,526 | 1,874 | ||||||
1.650%, 12/01/2030 (A) | 1,509 | 1,904 | ||||||
1.350%, 04/15/2022 | 4,630 | 5,560 | ||||||
0.950%, 03/01/2023 | 1,546 | 1,860 | ||||||
0.300%, 08/15/2023 (A) | 784 | 928 | ||||||
UniCredit MTN | ||||||||
6.572%, 01/14/2022 (A) | $ | 350 | 372 | |||||
4.875%, VAR EUAMDB05+4.739%, 02/20/2029 | EUR | 220 | 273 | |||||
|
|
| ||||||
| 34,826 | ||||||||
|
|
| ||||||
Japan — 14.8% | ||||||||
Development Bank of Japan | ||||||||
2.300%, 03/19/2026 | JPY | 220,000 | 2,339 | |||||
1.050%, 06/20/2023 | 10,000 | 97 | ||||||
Government of Japan 10 Year Bond | ||||||||
0.900%, 06/20/2022 | 859,850 | 8,294 | ||||||
0.100%, 06/20/2026 | 74,300 | 713 | ||||||
0.100%, 03/20/2027 | 71,550 | 687 | ||||||
Government of Japan 20 Year Bond | ||||||||
1.900%, 09/20/2022 | 406,050 | 4,003 | ||||||
1.700%, 06/20/2033 | 1,207,550 | 13,656 | ||||||
1.400%, 09/20/2034 | 444,650 | 4,902 | ||||||
1.000%, 12/20/2035 | 50,000 | 526 | ||||||
0.700%, 03/20/2037 | 38,450 | 387 | ||||||
0.500%, 09/20/2036 | 451,400 | 4,415 | ||||||
0.200%, 06/20/2036 | 169,400 | 1,585 | ||||||
Government of Japan 20 Year Bond, Ser 140 | ||||||||
1.700%, 09/20/2032 | 210,750 | 2,369 | ||||||
Government of Japan 20 Year Bond, Ser 143 | ||||||||
1.600%, 03/20/2033 | 40,450 | 452 | ||||||
Government of Japan 20 Year Bond, Ser 144 | ||||||||
1.500%, 03/20/2033 | 87,200 | 964 | ||||||
Government of Japan 30 Year Bond | ||||||||
0.800%, 09/20/2047 | 549,500 | 5,539 | ||||||
0.300%, 06/20/2046 | 74,600 | 669 | ||||||
Government of Japan 30 Year Bond, Ser 29 | ||||||||
2.400%, 09/20/2038 | 119,300 | 1,532 | ||||||
Government of Japan 30 Year Bond, Ser 30 | ||||||||
2.300%, 03/20/2039 | 387,700 | 4,934 | ||||||
Government of Japan 30 Year Bond, Ser 33 | ||||||||
2.000%, 09/20/2040 | 212,700 | 2,629 | ||||||
Government of Japan 30 Year Bond, Ser 36 | ||||||||
2.000%, 03/20/2042 | 252,050 | 3,147 | ||||||
| Description | Face Amount (Thousands) | Market Value ($ Thousands) | ||||||
GLOBAL BONDS (continued) | ||||||||
Government of Japan 30 Year Bond, Ser 37 | ||||||||
1.900%, 09/20/2042 | JPY | 166,850 | $ | 2,058 | ||||
Government of Japan 30 Year Bond, Ser 38 | ||||||||
1.800%, 03/20/2043 | 207,550 | 2,527 | ||||||
Government of Japan 40 Year Bond | ||||||||
0.400%, 03/20/2056 | 351,250 | 3,099 | ||||||
Government of Japan 40 Year Bond, Ser 6 | ||||||||
1.900%, 03/20/2053 | 38,700 | 506 | ||||||
Japan Bank for International Cooperation | ||||||||
2.125%, 11/16/2020 | $ | 2,200 | 2,205 | |||||
Mitsubishi UFJ Financial Group | ||||||||
0.339%, 07/19/2024 | EUR | 250 | 295 | |||||
Mizuho Financial Group MTN | ||||||||
0.956%, 10/16/2024 | 385 | 466 | ||||||
Mizuho Financial Group Cayman | ||||||||
3 4.600%, 03/27/2024 (A) | $ | 450 | 494 | |||||
Nissan Motor | ||||||||
4.345%, 09/17/2027 (A) | 205 | 205 | ||||||
Takeda Pharmaceutical | ||||||||
1.125%, 11/21/2022 (A) | EUR | 430 | 515 | |||||
0.750%, 07/09/2027 | 125 | 149 | ||||||
|
|
| ||||||
| 76,358 | ||||||||
|
|
| ||||||
Luxembourg — 0.1% | ||||||||
Prologis International Funding II | ||||||||
2.375%, 11/14/2030 | 200 | 274 | ||||||
SIG Combibloc PurchaseCo Sarl | ||||||||
1.875%, 06/18/2023 (A) | 114 | 136 | ||||||
|
|
| ||||||
| 410 | ||||||||
|
|
| ||||||
Malaysia — 1.3% | ||||||||
Malaysia Government Bond | ||||||||
4.232%, 06/30/2031 | MYR | 635 | 172 | |||||
4.181%, 07/15/2024 | 3,360 | 866 | ||||||
4.048%, 09/30/2021 | 3,380 | 832 | ||||||
3.955%, 09/15/2025 | 3,440 | 893 | ||||||
3.885%, 08/15/2029 | 2,032 | 535 | ||||||
3.882%, 03/10/2022 | 568 | 141 | ||||||
3.828%, 07/05/2034 | 2,337 | 609 | ||||||
3.795%, 09/30/2022 | 3,430 | 856 | ||||||
3.502%, 05/31/2027 | 7,477 | 1,917 | ||||||
|
|
| ||||||
| 6,821 | ||||||||
|
|
| ||||||
Mexico — 1.8% | ||||||||
Mexican Bonos | ||||||||
8.000%, 11/07/2047 | MXN | 18,935 | 948 | |||||
7.750%, 11/23/2034 | 4,820 | 245 | ||||||
7.750%, 11/13/2042 | 25,845 | 1,268 | ||||||
7.500%, 06/03/2027 | 2,763 | 139 | ||||||
5.750%, 03/05/2026 | 14,711 | 682 | ||||||
Mexican Bonos, Ser M | ||||||||
6.500%, 06/10/2021 | 5,356 | 246 | ||||||
Mexican Bonos, Ser M20 | ||||||||
10.000%, 12/05/2024 | 46,390 | 2,497 | ||||||
34 |
SEI Institutional International Trust / Annual Report / September 30, 2020 |
| Description | Face Amount (Thousands) | Market Value ($ Thousands) | ||||||
GLOBAL BONDS (continued) | ||||||||
8.500%, 05/31/2029 | MXN | 8,114 | $ | 435 | ||||
7.750%, 05/29/2031 | 25,298 | 1,292 | ||||||
Mexican Bonos, Ser M30 | ||||||||
10.000%, 11/20/2036 | 22,113 | 1,335 | ||||||
8.500%, 11/18/2038 | 3,304 | 175 | ||||||
|
|
| ||||||
| 9,262 | ||||||||
|
|
| ||||||
Netherlands — 2.5% | ||||||||
ABN AMRO Bank | ||||||||
4.750%, 07/28/2025 | $ | 305 | 343 | |||||
ABN AMRO Bank MTN | ||||||||
1.250%, 01/10/2033 | EUR | 300 | 411 | |||||
Akzo Nobel Sweden Finance MTN | ||||||||
2.625%, 07/27/2022 | 340 | 418 | ||||||
BNG Bank MTN | ||||||||
0.250%, 02/22/2023 | 1,505 | 1,796 | ||||||
Cooperatieve Rabobank UA | ||||||||
3.250%, VAR EUR Swap Annual 5 Yr+3.702% (D) | 200 | 221 | ||||||
Cooperatieve Rabobank UA MTN | ||||||||
5.250%, 09/14/2027 | GBP | 195 | 314 | |||||
4.625%, 05/23/2029 | 130 | 206 | ||||||
1.250%, 05/31/2032 | EUR | 300 | 409 | |||||
Heineken MTN | ||||||||
1.000%, 05/04/2026 | 335 | 412 | ||||||
ING Groep | ||||||||
5.750%, VAR US Treas Yield Curve Rate | ||||||||
T Note Const Mat 5 | $ | 200 | 208 | |||||
Intertrust Group BV | ||||||||
3.375%, 11/15/2025 (A) | EUR | 180 | 215 | |||||
Lincoln Financing SARL | ||||||||
3.625%, 04/01/2024 (A) | 170 | 191 | ||||||
Nederlandse Waterschapsbank MTN | ||||||||
1.250%, 05/27/2036 | 281 | 387 | ||||||
0.625%, 01/18/2027 | 225 | 280 | ||||||
Netherlands Government Bond (A) | ||||||||
4.000%, 01/15/2037 | 389 | 776 | ||||||
2.750%, 01/15/2047 | 288 | 592 | ||||||
2.500%, 01/15/2033 | 550 | 874 | ||||||
2.000%, 07/15/2024 | 345 | 446 | ||||||
0.500%, 07/15/2026 | 570 | 713 | ||||||
0.500%, 01/15/2040 | 382 | 504 | ||||||
0.250%, 07/15/2025 | 922 | 1,129 | ||||||
0.000%, 01/15/2022 (E) | 914 | 1,080 | ||||||
0.000%, 07/15/2030 (E) | 865 | 1,056 | ||||||
Q-Park Holding | ||||||||
2.000%, 03/01/2027 | 122 | 128 | ||||||
|
|
| ||||||
| 13,109 | ||||||||
|
|
| ||||||
New Zealand — 1.0% | ||||||||
New Zealand Government Bond | ||||||||
6.000%, 05/15/2021 | NZD | 900 | 617 | |||||
5.500%, 04/15/2023 | 1,608 | 1,211 | ||||||
| Description | Face Amount (Thousands) | Market Value ($ Thousands) | ||||||
GLOBAL BONDS (continued) |
| |||||||
3.000%, 04/20/2029 | NZD | 873 | $ | 704 | ||||
2.750%, 04/15/2025 | 1,289 | 957 | ||||||
2.750%, 04/15/2037 | 687 | 582 | ||||||
1.500%, 05/15/2031 | 956 | 696 | ||||||
New Zealand Local Government Funding Agency Bond | ||||||||
4.500%, 04/15/2027 | 479 | 396 | ||||||
|
|
| ||||||
| 5,163 | ||||||||
|
|
| ||||||
Norway — 0.6% | ||||||||
DNB Bank | ||||||||
6.500%, VAR USD Swap Semi 30/360 5 Yr Curr+5.080% (D) | $ | 355 | 368 | |||||
Norway Government Bond (A) | ||||||||
3.000%, 03/14/2024 | NOK | 2,516 | 295 | |||||
2.000%, 05/24/2023 | 5,358 | 600 | ||||||
2.000%, 04/26/2028 | 3,738 | 444 | ||||||
1.750%, 02/17/2027 | 4,149 | 481 | ||||||
1.750%, 09/06/2029 | 2,174 | 256 | ||||||
1.500%, 02/19/2026 | 2,403 | 272 | ||||||
1.375%, 08/19/2030 | 1,510 | 173 | ||||||
|
|
| ||||||
| 2,889 | ||||||||
|
|
| ||||||
Poland — 0.2% | ||||||||
Republic of Poland Government Bond | ||||||||
2.750%, 10/25/2029 | PLN | 1,493 | 435 | |||||
2.500%, 07/25/2027 | 1,860 | 529 | ||||||
|
|
| ||||||
| 964 | ||||||||
|
|
| ||||||
Portugal — 0.6% | ||||||||
EDP - Energias de Portugal | ||||||||
4.496%, VAR EUR Swap Annual 5 Yr+4.287%, 04/30/2079 | EUR | 300 | 379 | |||||
Portugal Obrigacoes do Tesouro OT (A) | ||||||||
4.100%, 04/15/2037 | 277 | 500 | ||||||
2.200%, 10/17/2022 | 775 | 961 | ||||||
1.950%, 06/15/2029 | 199 | 271 | ||||||
0.900%, 10/12/2035 | 251 | 306 | ||||||
0.700%, 10/15/2027 | 735 | 905 | ||||||
|
|
| ||||||
| 3,322 | ||||||||
|
|
| ||||||
Qatar — 0.1% | ||||||||
Qatar Government International Bond | ||||||||
3.400%, 04/16/2025 (A) | $ | 385 | 422 | |||||
|
|
| ||||||
Romania — 0.1% | ||||||||
Romania Government Bond | ||||||||
3.650%, 07/28/2025 | RON | 1,540 | 376 | |||||
|
|
| ||||||
Saudi Arabia — 0.1% | ||||||||
SABIC Capital II BV | ||||||||
4.000%, 10/10/2023 (A) | $ | 345 | 371 | |||||
SEI Institutional International Trust / Annual Report / September 30, 2020 |
35 |
SCHEDULE OF INVESTMENTS
September 30, 2020
International Fixed Income Fund (Continued)
| Description | Face Amount (Thousands) | Market Value ($ Thousands) | ||||||
GLOBAL BONDS (continued) | ||||||||
Saudi Government International Bond MTN | ||||||||
2.375%, 10/26/2021 (A) | $ | 275 | $ | 279 | ||||
|
|
| ||||||
| 650 | ||||||||
|
|
| ||||||
Singapore — 2.5% | ||||||||
Singapore Government Bond | ||||||||
3.500%, 03/01/2027 | SGD | 1,341 | 1,157 | |||||
3.375%, 09/01/2033 | 112 | 106 | ||||||
3.125%, 09/01/2022 | 3,592 | 2,777 | ||||||
3.000%, 09/01/2024 | 5,560 | 4,488 | ||||||
2.875%, 07/01/2029 | 1,258 | 1,081 | ||||||
2.875%, 09/01/2030 | 189 | 165 | ||||||
2.750%, 04/01/2042 | 114 | 106 | ||||||
2.750%, 03/01/2046 | 200 | 193 | ||||||
2.375%, 07/01/2039 | 963 | 836 | ||||||
2.250%, 08/01/2036 | 412 | 348 | ||||||
2.125%, 06/01/2026 | 1,259 | 1,002 | ||||||
Temasek Financial I MTN | ||||||||
2.375%, 01/23/2023 (A) | $ | 495 | 516 | |||||
|
|
| ||||||
| 12,775 | ||||||||
|
|
| ||||||
Slovak Republic — 0.0% | ||||||||
Slovakia Government Bond | ||||||||
3.375%, 11/15/2024 | EUR | 75 | 102 | |||||
|
|
| ||||||
Slovenia — 0.1% | ||||||||
Slovenia Government Bond | ||||||||
1.250%, 03/22/2027 | 305 | 391 | ||||||
|
|
| ||||||
South Africa — 0.1% | ||||||||
Anglo American Capital MTN | ||||||||
1.625%, 09/18/2025 | 220 | 270 | ||||||
|
|
| ||||||
South Korea — 0.6% | ||||||||
Hyundai Capital Services MTN | ||||||||
3.500%, 03/30/2022 | AUD | 680 | 494 | |||||
Korea Treasury Bond | ||||||||
3.000%, 09/10/2024 | KRW | 1,206,590 | 1,110 | |||||
2.000%, 03/10/2049 | 361,670 | 337 | ||||||
1.875%, 06/10/2029 | 401,030 | 355 | ||||||
1.500%, 12/10/2026 | 994,000 | 863 | ||||||
|
|
| ||||||
| 3,159 | ||||||||
|
|
| ||||||
Spain — 4.4% | ||||||||
Arena Luxembourg Finance | ||||||||
1.875%, 02/01/2028 | EUR | 175 | 184 | |||||
Ayt Cedulas Cajas Global | ||||||||
3.750%, 12/14/2022 | 600 | 767 | ||||||
Banco Bilbao Vizcaya Argentaria | ||||||||
5.875%, VAR EUR Swap Annual 5 Yr+5.660% (D) | 200 | 231 | ||||||
2.250%, 06/12/2024 | 200 | 257 | ||||||
| Description | Face Amount (Thousands) | Market Value ($ Thousands) | ||||||
GLOBAL BONDS (continued) | ||||||||
Banco de Sabadell | ||||||||
0.625%, VAR EUSA1+0.970%, 11/07/2025 | EUR | 400 | $ | 462 | ||||
Banco Santander | ||||||||
5.250%, VAR EUR Swap Annual 5 Yr+4.999% (D) | 200 | 227 | ||||||
5.179%, 11/19/2025 | $ | 400 | 453 | |||||
1.000%, 03/03/2022 | EUR | 400 | 478 | |||||
CaixaBank | ||||||||
1.250%, 01/11/2027 | 500 | 642 | ||||||
Gas Natural Fenosa Finance BV MTN | ||||||||
1.250%, 04/19/2026 | 300 | 371 | ||||||
Instituto de Credito Oficial MTN | ||||||||
6.000%, 03/08/2021 | 180 | 217 | ||||||
Naturgy Finance BV | ||||||||
4.125%, VAR EUR Swap Annual 8 Yr+3.353% (D) | 200 | 243 | ||||||
Spain Government Bond | ||||||||
6.000%, 01/31/2029 | 104 | 182 | ||||||
5.750%, 07/30/2032 | 102 | 195 | ||||||
4.900%, 07/30/2040 (A) | 28 | 58 | ||||||
4.700%, 07/30/2041 (A) | 781 | 1,599 | ||||||
3.450%, 07/30/2066 (A) | 192 | 390 | ||||||
2.350%, 07/30/2033 (A) | 605 | 879 | ||||||
1.950%, 07/30/2030 (A) | 141 | �� | 194 | |||||
1.850%, 07/30/2035 (A) | 135 | 187 | ||||||
1.600%, 04/30/2025 (A) | 504 | 643 | ||||||
1.500%, 04/30/2027 (A) | 393 | 510 | ||||||
1.400%, 04/30/2028 (A) | 1,009 | 1,308 | ||||||
1.250%, 10/31/2030 (A) | 1,278 | 1,647 | ||||||
1.200%, 10/31/2040 (A) | 1,170 | 1,469 | ||||||
1.000%, 10/31/2050 (A) | 412 | 475 | ||||||
0.800%, 07/30/2027 (A) | 3,965 | 4,918 | ||||||
0.600%, 10/31/2029 (A) | 151 | 184 | ||||||
0.500%, 04/30/2030 (A) | 251 | 303 | ||||||
0.000%, 04/30/2023 (E) | 1,869 | 2,215 | ||||||
Telefonica Europe BV | ||||||||
4.375%, VAR EUR Swap Annual 6 Yr+4.107% (D) | 300 | 370 | ||||||
3.750%, VAR EUR Swap Annual 5 Yr+3.858% (D) | 100 | 119 | ||||||
|
|
| ||||||
| 22,377 | ||||||||
|
|
| ||||||
Supra-National — 2.4% | ||||||||
Asian Development Bank MTN | ||||||||
2.350%, 06/21/2027 | JPY | 290,000 | 3,216 | |||||
European Financial Stability Facility MTN | ||||||||
0.500%, 07/11/2025 | EUR | 695 | 855 | |||||
European Investment Bank | ||||||||
1.900%, 01/26/2026 | JPY | 397,500 | 4,182 | |||||
European Investment Bank MTN | ||||||||
1.250%, 05/12/2025 | SEK | 13,180 | 1,544 | |||||
0.250%, 10/14/2024 | EUR | 156 | 189 | |||||
36 |
SEI Institutional International Trust / Annual Report / September 30, 2020 |
| Description | Face Amount (Thousands) | Market Value ($ Thousands) | ||||||
GLOBAL BONDS (continued) | ||||||||
European Stability Mechanism MTN | ||||||||
1.000%, 09/23/2025 | EUR | 570 | $ | 718 | ||||
International Bank for Reconstruction & Development MTN | ||||||||
2.800%, 01/13/2021 | AUD | 1,230 | 888 | |||||
International Finance MTN | ||||||||
2.375%, 07/19/2023 | CAD | 1,000 | 789 | |||||
|
|
| ||||||
| 12,381 | ||||||||
|
|
| ||||||
Sweden — 0.7% | ||||||||
Kommunivest I Sverige AB MTN | ||||||||
1.000%, 10/02/2024 | SEK | 5,830 | 676 | |||||
Skandinaviska Enskilda Banken MTN | ||||||||
0.250%, 06/20/2024 | EUR | 460 | 553 | |||||
Stadshypotek MTN | ||||||||
0.375%, 02/22/2023 | 485 | 581 | ||||||
Swedbank | ||||||||
5.625%, VAR US Treas Yield Curve Rate T Note Const Mat 5 Yr+4.134% (D) | $ | 200 | 209 | |||||
Swedbank Hypotek | ||||||||
0.375%, 03/11/2022 | EUR | 360 | 427 | |||||
Sweden Government Bond | ||||||||
3.500%, 06/01/2022 | SEK | 3,040 | 361 | |||||
3.500%, 03/30/2039 | 1,205 | 212 | ||||||
1.000%, 11/12/2026 | 1,725 | 208 | ||||||
Vattenfall MTN | ||||||||
6.250%, 03/17/2021 | EUR | 213 | 257 | |||||
|
|
| ||||||
| 3,484 | ||||||||
|
|
| ||||||
Switzerland — 0.8% | ||||||||
Credit Suisse MTN | ||||||||
0.750%, 09/17/2021 | 220 | 261 | ||||||
Credit Suisse Group | ||||||||
7.500%, VAR USD Swap Semi 30/360 5 Yr Curr+4.600% (D) | $ | 286 | 302 | |||||
7.500%, VAR USD Swap Semi 30/360 5 Yr Curr+4.600% (A)(D) | 200 | 211 | ||||||
Credit Suisse Group Funding Guernsey MTN | ||||||||
1.250%, 04/14/2022 | EUR | 295 | 353 | |||||
Government of Switzerland | ||||||||
2.000%, 04/28/2021 | CHF | 735 | 813 | |||||
2.000%, 05/25/2022 | 75 | 86 | ||||||
1.500%, 04/30/2042 | 408 | 623 | ||||||
1.250%, 06/11/2024 | 405 | 474 | ||||||
Swiss Re Finance Luxembourg | ||||||||
5.000%, VAR US Treas Yield Curve Rate T Note Const Mat 5 Yr+3.582%, 04/02/2049 (A) | $ | 200 | 227 | |||||
UBS MTN | ||||||||
4.750%, VAR EUR Swap Annual 5 Yr+3.400%, 02/12/2026 | EUR | 200 | 237 | |||||
| Description | Face Amount (Thousands) | Market Value ($ Thousands) | ||||||
GLOBAL BONDS (continued) | ||||||||
UBS Group Funding Switzerland | ||||||||
1.750%, 11/16/2022 | EUR | 427 | $ | 520 | ||||
|
|
| ||||||
| 4,107 | ||||||||
|
|
| ||||||
Thailand — 0.5% | ||||||||
Thailand Government Bond | ||||||||
4.875%, 06/22/2029 | THB | 16,455 | 669 | |||||
4.675%, 06/29/2044 | 17,119 | 801 | ||||||
3.650%, 12/17/2021 | 11,020 | 361 | ||||||
3.625%, 06/16/2023 | 5,375 | 183 | ||||||
3.300%, 06/17/2038 | 3,522 | 134 | ||||||
2.125%, 12/17/2026 | 7,336 | 247 | ||||||
|
|
| ||||||
| 2,395 | ||||||||
|
|
| ||||||
Turkey — 0.1% | ||||||||
Turkiye Vakiflar Bankasi TAO | ||||||||
2.375%, 05/04/2021 | EUR | 265 | 307 | |||||
|
|
| ||||||
United Arab Emirates — 0.1% | ||||||||
Abu Dhabi Government International Bond MTN | ||||||||
2.500%, 04/16/2025 (A) | $ | 255 | 271 | |||||
DP World Crescent MTN | ||||||||
4.848%, 09/26/2028 | 265 | 293 | ||||||
|
|
| ||||||
| 564 | ||||||||
|
|
| ||||||
United Kingdom — 7.3% | ||||||||
Barclays Bank MTN | ||||||||
10.000%, 05/21/2021 | GBP | 180 | 245 | |||||
BAT International Finance MTN | ||||||||
1.250%, 03/13/2027 | EUR | 333 | 399 | |||||
BG Energy Capital MTN | ||||||||
2.250%, 11/21/2029 | 400 | 538 | ||||||
BP Capital Markets | ||||||||
4.375%, VAR US Treas Yield Curve Rate T Note Const Mat 5 Yr+4.036% (D) | $ | 470 | 490 | |||||
3.250%, VAR EUR Swap Annual 5 Yr+3.880% (D) | EUR | 110 | 132 | |||||
BP Capital Markets MTN | ||||||||
1.117%, 01/25/2024 | 165 | 200 | ||||||
0.831%, 11/08/2027 | 130 | 156 | ||||||
Centrica MTN | ||||||||
4.375%, 03/13/2029 | GBP | 164 | 254 | |||||
CK Hutchison Finance 16 II | ||||||||
0.875%, 10/03/2024 | EUR | 212 | 253 | |||||
CNH Industrial Finance Europe MTN | ||||||||
2.875%, 05/17/2023 | 220 | 275 | ||||||
1.750%, 09/12/2025 | 130 | 158 | ||||||
CPUK Finance | ||||||||
3.588%, 08/28/2025 | 215 | 285 | ||||||
DS Smith MTN | ||||||||
1.375%, 07/26/2024 | 430 | 514 | ||||||
Gatwick Funding MTN | ||||||||
5.250%, 01/23/2024 | GBP | 250 | 348 | |||||
SEI Institutional International Trust / Annual Report / September 30, 2020 |
37 |
SCHEDULE OF INVESTMENTS
September 30, 2020
International Fixed Income Fund (Continued)
| Description | Face Amount (Thousands) | Market Value ($ Thousands) | ||||||
GLOBAL BONDS (continued) | ||||||||
Heathrow Funding MTN | ||||||||
2.750%, 08/09/2049 | GBP | 160 | $ | 188 | ||||
1.875%, 05/23/2022 | EUR | 235 | 280 | |||||
HSBC Holdings | ||||||||
6.375%, VAR USD ICE Swap 11:00 NY 5 Yr+4.368% (D) | $ | 200 | 209 | |||||
3.000%, VAR BPSW1+1.650%, 07/22/2028 | GBP | 167 | 231 | |||||
HSBC Holdings MTN | ||||||||
6.000%, 03/29/2040 | 70 | 121 | ||||||
Imperial Brands Finance | ||||||||
0.500%, 07/27/2021 | EUR | 150 | 176 | |||||
Nationwide Building Society MTN | ||||||||
4.625%, 02/08/2021 | 550 | 657 | ||||||
Natwest Group | ||||||||
2.540%, VAR ICE LIBOR USD 3 Month+2.320% (D) | $ | 200 | 190 | |||||
Northumbrian Water Finance | ||||||||
6.875%, 02/06/2023 | GBP | 190 | 280 | |||||
Rolls-Royce MTN | ||||||||
0.875%, 05/09/2024 | EUR | 140 | 142 | |||||
Santander UK Group Holdings PLC MTN | ||||||||
3.625%, 01/14/2026 | GBP | 100 | 142 | |||||
Santander UK PLC MTN | ||||||||
4.250%, 04/12/2021 | EUR | 350 | 421 | |||||
Severn Trent Utilities Finance MTN | ||||||||
3.625%, 01/16/2026 | GBP | 175 | 258 | |||||
Sky PLC MTN | ||||||||
6.000%, 05/21/2027 | 50 | 86 | ||||||
2.250%, 11/17/2025 | EUR | 275 | 359 | |||||
Standard Chartered | ||||||||
1.778%, VAR ICE LIBOR USD 3 Month+1.510% | $ | 500 | 423 | |||||
Thames Water Utilities Finance MTN | ||||||||
4.625%, 06/04/2046 | GBP | 155 | 291 | |||||
United Kingdom Gilt | ||||||||
5.000%, 03/07/2025 | 43 | 68 | ||||||
4.500%, 12/07/2042 | 279 | 640 | ||||||
4.250%, 03/07/2036 | 56 | 112 | ||||||
4.250%, 09/07/2039 | 53 | 112 | ||||||
4.250%, 12/07/2040 | 561 | 1,211 | ||||||
4.250%, 12/07/2046 | 1,259 | 2,975 | ||||||
4.250%, 12/07/2049 | 108 | 267 | ||||||
3.750%, 07/22/2052 | 80 | 192 | ||||||
3.500%, 01/22/2045 | 902 | 1,875 | ||||||
3.250%, 01/22/2044 | 457 | 906 | ||||||
2.750%, 09/07/2024 | 248 | 356 | ||||||
2.500%, 07/22/2065 | 1,197 | 2,613 | ||||||
2.250%, 09/07/2023 | 19 | 26 | ||||||
1.750%, 09/07/2022 | 654 | 875 | ||||||
1.750%, 09/07/2037 | 74 | 113 | ||||||
1.500%, 07/22/2047 | 356 | 542 | ||||||
| Description | Face Amount (Thousands) | Market Value ($ Thousands) | ||||||
GLOBAL BONDS (continued) | ||||||||
1.250%, 10/22/2041 | GBP | 79 | $ | 112 | ||||
1.000%, 04/22/2024 | 52 | 70 | ||||||
0.750%, 07/22/2023 | 2,170 | 2,871 | ||||||
0.625%, 06/07/2025 | 497 | 663 | ||||||
0.625%, 10/22/2050 | 400 | 496 | ||||||
0.500%, 10/22/2061 | 680 | 816 | ||||||
0.125%, 01/31/2023 | 7,050 | 9,146 | ||||||
United Kingdom Gilt - Inflation Linked | ||||||||
1.250%, 11/22/2027 | 265 | 460 | ||||||
United Kingdom Treasury | ||||||||
4.750%, 12/07/2038 | 51 | 113 | ||||||
Western Power Distribution West Midlands PLC | ||||||||
3.875%, 10/17/2024 | 230 | 331 | ||||||
Wm Morrison Supermarkets MTN | ||||||||
3.500%, 07/27/2026 | 225 | 329 | ||||||
Zurich Finance PLC MTN | ||||||||
6.625%, 10/30/2049 (C) | 235 | 333 | ||||||
|
|
| ||||||
| 37,324 | ||||||||
|
|
| ||||||
United States — 8.9% | ||||||||
AbbVie (A) | ||||||||
2.625%, 11/15/2028 | EUR | 100 | 137 | |||||
2.300%, 11/21/2022 | $ | 800 | 828 | |||||
Aircastle | ||||||||
5.250%, 08/11/2025 (A) | 221 | 216 | ||||||
4.400%, 09/25/2023 | 10 | 10 | ||||||
Alleghany | ||||||||
3.625%, 05/15/2030 | 336 | 378 | ||||||
Altria Group | ||||||||
3.125%, 06/15/2031 | EUR | 310 | 415 | |||||
American Honda Finance | ||||||||
1.950%, 10/18/2024 | 159 | 200 | ||||||
0.350%, 08/26/2022 | 375 | 443 | ||||||
American Tower | ||||||||
1.950%, 05/22/2026 | 275 | 349 | ||||||
1.300%, 09/15/2025 | $ | 535 | 541 | |||||
AT&T | ||||||||
3.825%, 11/25/2020 | CAD | 1,125 | 846 | |||||
2.875%, VAR EUAMDB05+3.140% (D) | EUR | 200 | 226 | |||||
1.800%, 09/05/2026 | 365 | 460 | ||||||
1.650%, 02/01/2028 | $ | 870 | 872 | |||||
1.600%, 05/19/2028 | EUR | 390 | 484 | |||||
AutoNation | ||||||||
4.750%, 06/01/2030 | $ | 172 | 203 | |||||
Aviation Capital Group LLC (A) | ||||||||
5.500%, 12/15/2024 | 80 | 83 | ||||||
4.375%, 01/30/2024 | 27 | 27 | ||||||
3.875%, 05/01/2023 | 6 | 6 | ||||||
3.500%, 11/01/2027 | 5 | 4 | ||||||
Bank of America | ||||||||
6.500%, VAR ICE LIBOR USD 3 Month+4.174% (D) | 67 | 74 | ||||||
38 |
SEI Institutional International Trust / Annual Report / September 30, 2020 |
| Description | Face Amount (Thousands) | Market Value ($ Thousands) | ||||||
GLOBAL BONDS (continued) | ||||||||
Bank of America MTN | ||||||||
2.375%, 06/19/2024 | EUR | 835 | $ | 1,058 | ||||
Bank of New York Mellon | ||||||||
4.700% (C)(D) | $ | 40 | 42 | |||||
Becton Dickinson | ||||||||
0.632%, 06/04/2023 | 200 | 236 | ||||||
Berkshire Hathaway | ||||||||
0.625%, 01/17/2023 | EUR | 265 | 315 | |||||
Berkshire Hathaway Finance | ||||||||
2.625%, 06/19/2059 | GBP | 144 | 226 | |||||
Boardwalk Pipelines | ||||||||
4.800%, 05/03/2029 | $ | 119 | 130 | |||||
Booking Holdings | ||||||||
4.625%, 04/13/2030 | 80 | 96 | ||||||
2.375%, 09/23/2024 | 355 | 444 | ||||||
Broadcom | ||||||||
4.250%, 04/15/2026 | 195 | 220 | ||||||
Capital One Financial | ||||||||
1.650%, 06/12/2029 | EUR | 300 | 360 | |||||
0.800%, 06/12/2024 | 291 | 341 | ||||||
Carnival | ||||||||
1.625%, 02/22/2021 | 180 | 206 | ||||||
1.000%, 10/28/2029 | 316 | 231 | ||||||
Carrier Global Corp | ||||||||
1.923%, 02/15/2023 (A) | $ | 290 | 298 | |||||
Catalent Pharma Solutions | ||||||||
2.375%, 03/01/2028 (A) | EUR | 119 | 134 | |||||
Charles Schwab | ||||||||
5.375%, VAR US Treas Yield Curve Rate T Note Const Mat 5 Yr+4.971% (D) | $ | 395 | 428 | |||||
Chubb INA Holdings | ||||||||
1.550%, 03/15/2028 | EUR | 325 | 408 | |||||
0.875%, 06/15/2027 | 115 | 138 | ||||||
0.300%, 12/15/2024 | 190 | 223 | ||||||
Citigroup | ||||||||
0.457%, 02/18/2021 | JPY | 100,000 | 946 | |||||
Citigroup MTN | ||||||||
1.500%, VAR Euribor 3 Month+1.074%, 07/24/2026 | EUR | 325 | 400 | |||||
0.750%, 10/26/2023 | 365 | 436 | ||||||
Comcast | ||||||||
0.750%, 02/20/2032 | 180 | 212 | ||||||
CyrusOne | ||||||||
1.450%, 01/22/2027 | 154 | 179 | ||||||
Delta Airlines Inc | ||||||||
4.500%, 10/20/2025 (A) | 125 | 128 | ||||||
DH Europe Finance | ||||||||
1.700%, 01/04/2022 | 150 | 180 | ||||||
1.200%, 06/30/2027 | 335 | 412 | ||||||
DH Europe Finance II | ||||||||
0.450%, 03/18/2028 | $ | 154 | 179 | |||||
| Description | Face Amount (Thousands) | Market Value ($ Thousands) | ||||||
GLOBAL BONDS (continued) | ||||||||
Discover Bank | ||||||||
4.682%, VAR USD Swap Semi 30/360 5 Yr | $ | 400 | $ | 419 | ||||
Dover Corp | ||||||||
0.750%, 11/04/2027 | EUR | 440 | 520 | |||||
Emerson Electric | ||||||||
0.375%, 05/22/2024 | 350 | 415 | ||||||
Exxon Mobil | ||||||||
4.327%, 03/19/2050 | $ | 200 | 250 | |||||
0.835%, 06/26/2032 | EUR | 600 | 695 | |||||
FedEx | ||||||||
0.700%, 05/13/2022 | 108 | 128 | ||||||
Fidelity National Information Services | ||||||||
0.625%, 12/03/2025 | 185 | 221 | ||||||
0.400%, 01/15/2021 | 700 | 822 | ||||||
0.125%, 12/03/2022 | 500 | 588 | ||||||
Fifth Third Bancorp | ||||||||
4.500%, VAR US Treas Yield Curve Rate T Note Const Mat 5 Yr+4.215% (D) | $ | 65 | 65 | |||||
GE Capital UK Funding Unlimited MTN | ||||||||
6.250%, 05/05/2038 | GBP | 165 | 270 | |||||
5.875%, 11/04/2020 | 500 | 649 | ||||||
5.875%, 01/18/2033 | 160 | 250 | ||||||
General Motors Financial | ||||||||
0.850%, 02/26/2026 | EUR | 125 | 139 | |||||
General Motors Financial MTN | ||||||||
0.955%, 09/07/2023 | 275 | 321 | ||||||
Gilead Sciences Inc | ||||||||
0.750%, 09/29/2023 | 725 | 727 | ||||||
Goldman Sachs Group | ||||||||
2.625%, 04/25/2021 | $ | 425 | 430 | |||||
Goldman Sachs Group MTN | ||||||||
2.125%, 09/30/2024 | EUR | 536 | 672 | |||||
2.000%, 07/27/2023 | 352 | 435 | ||||||
1.625%, 07/27/2026 | 170 | 212 | ||||||
Harley-Davidson Financial Services | ||||||||
3.875%, 05/19/2023 | 110 | 139 | ||||||
0.900%, 11/19/2024 | 335 | 389 | ||||||
Host Hotels & Resorts | ||||||||
3.500%, 09/15/2030 | 200 | 192 | ||||||
Intercontinental Exchange | ||||||||
0.700%, 06/15/2023 | $ | 535 | 536 | |||||
International Business Machines | ||||||||
2.850%, 05/13/2022 | 990 | 1,031 | ||||||
International Business Machines MTN | ||||||||
0.875%, 01/31/2025 | EUR | 593 | 724 | |||||
International Flavors & Fragrances | ||||||||
1.800%, 09/25/2026 | 100 | 123 | ||||||
IQVIA | ||||||||
2.875%, 06/15/2028 (A) | 180 | 213 | ||||||
SEI Institutional International Trust / Annual Report / September 30, 2020 |
39 |
SCHEDULE OF INVESTMENTS
September 30, 2020
International Fixed Income Fund (Continued)
| Description | Face Amount (Thousands) | Market Value ($ Thousands) | ||||||
GLOBAL BONDS (continued) | ||||||||
Johnson Controls International PLC | ||||||||
1.375%, 02/25/2025 | EUR | 395 | $ | 485 | ||||
JPMorgan Chase MTN | ||||||||
1.090%, VAR Euribor 3 Month+0.760%, 03/11/2027 | 810 | 981 | ||||||
Lear | ||||||||
4.250%, 05/15/2029 | $ | 35 | 38 | |||||
3.800%, 09/15/2027 | 193 | 204 | ||||||
3.500%, 05/30/2030 | 42 | 43 | ||||||
Liberty Mutual Group | ||||||||
3.625%, VAR EUR Swap Annual 5 Yr+3.700%, 05/23/2059 | EUR | 300 | 347 | |||||
LYB International Finance II BV | ||||||||
1.875%, 03/02/2022 | 355 | 424 | ||||||
Marriott International | ||||||||
4.650%, 12/01/2028 | $ | 120 | 128 | |||||
MassMutual Global Funding II MTN | ||||||||
0.850%, 06/09/2023 (A) | 998 | 1,009 | ||||||
Medtronic Global Holdings SCA | ||||||||
1.125%, 03/07/2027 | EUR | 400 | 494 | |||||
0.375%, 10/15/2028 | 163 | 192 | ||||||
0.250%, 07/02/2025 | 115 | 136 | ||||||
Metropolitan Life Global Funding I MTN | ||||||||
1.950%, 01/13/2023 (A) | $ | 1,000 | 1,034 | |||||
Moody’s | ||||||||
1.750%, 03/09/2027 | EUR | 375 | 482 | |||||
Morgan Stanley | ||||||||
1.875%, 03/30/2023 | 490 | 600 | ||||||
Morgan Stanley MTN | ||||||||
1.375%, 10/27/2026 | 360 | 447 | ||||||
0.000%, VAR Euribor 3 Month+0.400%, 05/21/2021 | 850 | 999 | ||||||
National Grid North America MTN | ||||||||
1.000%, 07/12/2024 | 300 | 364 | ||||||
National Oil Well | ||||||||
3.600%, 12/01/2029 | $ | 205 | 199 | |||||
Noble Energy | ||||||||
3.250%, 10/15/2029 | 205 | 227 | ||||||
ONEOK | ||||||||
6.350%, 01/15/2031 | 89 | 103 | ||||||
Philip Morris International | ||||||||
0.625%,11/08/2024 | EUR | 285 | 341 | |||||
Philip Morris International MTN | ||||||||
2.875%, 03/03/2026 | 170 | 227 | ||||||
1.875%, 03/03/2021 | 300 | 355 | ||||||
Plains All American Pipeline | ||||||||
4.500%, 12/15/2026 | $ | 204 | 217 | |||||
3.550%, 12/15/2029 | 79 | 76 | ||||||
PNC Financial Services Group | ||||||||
2.200%, 11/01/2024 | 885 | 936 | ||||||
PNC Funding | ||||||||
3.300%, 03/08/2022 | 150 | 156 | ||||||
| Description | Face Amount (Thousands) | Market Value ($ Thousands) | ||||||
GLOBAL BONDS (continued) | ||||||||
Principal Life Global Funding II | ||||||||
1.250%, 06/23/2025 (A) | $ | 315 | $ | 321 | ||||
Prudential Financial | ||||||||
5.875%, VAR ICE LIBOR USD 3 Month+4.175%, 09/15/2042 | 199 | 210 | ||||||
Ralph Lauren Corp | ||||||||
2.950%, 06/15/2030 | 390 | 407 | ||||||
Ross Stores | ||||||||
4.700%, 04/15/2027 | 265 | 312 | ||||||
Schlumberger Finance France SAS | ||||||||
1.000%, 02/18/2026 | EUR | 305 | 367 | |||||
Seagate HDD Cayman | ||||||||
4.750%, 06/01/2023 | $ | 6 | 7 | |||||
Simon International Finance SCA | ||||||||
1.250%, 05/13/2025 | 134 | 159 | ||||||
Southern Power | ||||||||
0.777%, VAR ICE | 400 | 400 | ||||||
Starbucks Corp | ||||||||
1.300%, 05/07/2022 | 350 | 355 | ||||||
Toyota Motor Credit MTN | ||||||||
0.625%, 11/21/2024 | EUR | 465 | 557 | |||||
UnitedHealth Group | ||||||||
1.250%, 01/15/2026 | $ | 175 | 180 | |||||
US Bancorp MTN | ||||||||
0.850%, 06/07/2024 | EUR | 226 | 272 | |||||
Verizon Communications | ||||||||
4.016%, 12/03/2029 | $ | 391 | 468 | |||||
0.875%, 04/08/2027 | EUR | 175 | 212 | |||||
Verizon Communications MTN | ||||||||
4.750%, 02/17/2034 | GBP | 170 | 300 | |||||
4.050%, 02/17/2025 | AUD | 680 | 546 | |||||
ViacomCBS | ||||||||
3.700%, 06/01/2028 | $ | 180 | 200 | |||||
Wells Fargo MTN | ||||||||
2.125%, 12/20/2023 | GBP | 345 | 462 | |||||
2.000%, 04/27/2026 | EUR | 210 | 264 | |||||
1.375%, 06/30/2022 | GBP | 195 | 255 | |||||
0.500%, 04/26/2024 | EUR | 500 | 588 | |||||
Welltower Inc | ||||||||
4.500%, 12/01/2034 | 140 | 211 | ||||||
WPC Eurobond BV | ||||||||
1.350%, 04/15/2028 | 405 | 480 | ||||||
|
|
| ||||||
| 45,760 | ||||||||
|
|
| ||||||
Total Global Bonds |
| 474,837 | ||||||
|
|
| ||||||
U.S. TREASURY OBLIGATIONS — 4.5% |
| |||||||
U.S. Treasury Bills | ||||||||
0.078%, 10/20/2020 (E) | $ | 21,925 | 21,924 | |||||
40 |
SEI Institutional International Trust / Annual Report / September 30, 2020 |
| Description | Face Amount (Thousands) | Market Value ($ Thousands) | ||||||
U.S. TREASURY OBLIGATIONS (continued) |
| |||||||
U.S. Treasury Inflation Protected Securities | ||||||||
0.750%, 07/15/2028 | $ | 306 | $ | 353 | ||||
U.S. Treasury Notes | ||||||||
1.625%, 11/15/2022 | 432 | 446 | ||||||
1.500%, 08/15/2022 | 437 | 448 | ||||||
|
|
| ||||||
Total U.S. Treasury Obligations | 23,171 | |||||||
|
|
| ||||||
MORTGAGE-BACKED SECURITIES — 0.3% |
| |||||||
Agency Mortgage-Backed Obligation — 0.2% |
| |||||||
FHLMC Structured Agency Credit Risk Debt Notes, Ser 2016-HQA1, Cl M3 | ||||||||
6.498%, VAR ICE LIBOR USD 1 Month+6.350%, 09/25/2028 | 196 | 204 | ||||||
FHLMC Structured Agency Credit Risk Debt Notes, Ser 2017-DNA2, Cl M2 | ||||||||
3.598%, VAR ICE LIBOR USD 1 Month+3.450%, 10/25/2029 | 470 | 484 | ||||||
FNMA Connecticut Avenue Securities, Ser 2014-C04, Cl 2M2 | ||||||||
5.148%, VAR ICE LIBOR USD 1 Month+5.000%, 11/25/2024 | 188 | 193 | ||||||
FNMA Connecticut Avenue Securities, Ser 2016-C04, Cl 1M2 | ||||||||
4.398%, VAR ICE LIBOR USD 1 Month+4.250%, 01/25/2029 | 63 | 65 | ||||||
FNMA Connecticut Avenue Securities, Ser 2016-C07, Cl 2M2 | ||||||||
4.498%, VAR ICE LIBOR USD 1 Month+4.350%, 05/25/2029 | 86 | 89 | ||||||
|
|
| ||||||
| 1,035 | ||||||||
|
|
| ||||||
Non-Agency Mortgage-Backed Obligation — 0.1% | ||||||||
Bear Stearns Adjustable Rate Mortgage Trust, Ser 2004-6, Cl 3A | ||||||||
2.743%, 09/25/2034 (C) | 9 | 8 | ||||||
COMM Mortgage Trust, Ser 2014-CCRE14, Cl A3 | ||||||||
3.955%, 02/10/2047 | 70 | 75 | ||||||
JPMorgan Mortgage Trust, Ser 2004-A5, Cl 3A1 | ||||||||
3.025%, 12/25/2034 (C) | 29 | 29 | ||||||
LSTAR Commercial Mortgage Trust, Ser 2016-4, Cl A2 | ||||||||
2.579%, 03/10/2049 (A) | 142 | 144 | ||||||
Wells Fargo Commercial Mortgage Trust, Ser 2015-C28, Cl A3 | ||||||||
3.290%, 05/15/2048 | 108 | 116 | ||||||
| Description | Face Amount (Thousands) | Market Value ($ Thousands) | ||||||
MORTGAGE-BACKED SECURITIES (continued) |
| |||||||
Wells Fargo Commercial Mortgage Trust, Ser 2015-C30, Cl A3 | ||||||||
3.411%, 09/15/2058 | $ | 75 | $ | 82 | ||||
|
|
| ||||||
| 454 | ||||||||
|
|
| ||||||
Total Mortgage-Backed Securities | 1,489 | |||||||
|
|
| ||||||
MUNICIPAL BOND — 0.0% |
| |||||||
New York — 0.0% |
| |||||||
Port Authority of New York & New Jersey, Ser AAA, RB | ||||||||
1.086%, 07/01/2023 | 330 | 335 | ||||||
|
|
| ||||||
Total Municipal Bond | 335 | |||||||
|
|
| ||||||
Total Investments in Securities — 97.1% |
| $ | 499,832 | |||||
|
|
| ||||||
SEI Institutional International Trust / Annual Report / September 30, 2020 |
41 |
SCHEDULE OF INVESTMENTS
September 30, 2020
International Fixed Income Fund (Continued)
A list of the open futures contracts held by the Fund at September 30, 2020, is as follows:
| Type of Contract | Number of (Short) | Expiration Date | Notional Amount (Thousands) | Value (Thousands) | Unrealized Appreciation (Depreciation) (Thousands) | |||||||||||||||
Australian 3-Year Bond | 12 | Dec-2020 | $ | 1,022 | $ | 1,009 | $ | 3 | ||||||||||||
Australian 10-Year Bond | (14) | Dec-2020 | (1,507 | ) | (1,499 | ) | (14 | ) | ||||||||||||
Australian 10-Year Bond | 21 | Dec-2020 | 2,247 | 2,249 | 18 | |||||||||||||||
Canadian 5-Year Bond | (19) | Dec-2020 | (1,864 | ) | (1,845 | ) | (2 | ) | ||||||||||||
Canadian 10-Year Bond | (44) | Dec-2020 | (5,060 | ) | (5,000 | ) | 2 | |||||||||||||
Canadian 10-Year Bond | 45 | Dec-2020 | 5,158 | 5,114 | 15 | |||||||||||||||
Euro | (240) | Dec-2020 | (35,533 | ) | (35,206 | ) | 327 | |||||||||||||
Euro-Bob | 17 | Dec-2020 | 2,709 | 2,695 | 1 | |||||||||||||||
Euro-Bob | (10) | Dec-2020 | (1,589 | ) | (1,585 | ) | 1 | |||||||||||||
Euro-BTP | (11) | Dec-2020 | (1,878 | ) | (1,904 | ) | (36 | ) | ||||||||||||
Euro-Bund | 11 | Dec-2020 | 2,263 | 2,251 | 2 | |||||||||||||||
Euro-Bund | 9 | Dec-2020 | 1,855 | 1,842 | 4 | |||||||||||||||
Euro-Buxl | 19 | Dec-2020 | 4,922 | 4,961 | 68 | |||||||||||||||
Euro-Buxl | (7) | Dec-2020 | (1,815 | ) | (1,828 | ) | (20 | ) | ||||||||||||
Euro-OAT | 49 | Dec-2020 | 9,648 | 9,685 | – | |||||||||||||||
Euro-Schatz | (49) | Dec-2020 | (6,513 | ) | (6,452 | ) | (1 | ) | ||||||||||||
Japanese 10-Year Bond | 22 | Dec-2020 | 31,463 | 31,711 | 54 | |||||||||||||||
Japanese 10-Year Government Bond E-MINI | 8 | Dec-2020 | 1,144 | 1,153 | 1 | |||||||||||||||
Long Gilt 10-Year Bond | 76 | Jan-2021 | 13,362 | 13,373 | (24 | ) | ||||||||||||||
Short-Term Euro-BTP | 23 | Dec-2020 | 3,055 | 3,055 | – | |||||||||||||||
U.S. 2-Year Treasury Note | (66) | Jan-2021 | (14,580 | ) | (14,583 | ) | (3 | ) | ||||||||||||
U.S. 2-Year Treasury Note | 41 | Jan-2021 | 9,058 | 9,059 | 1 | |||||||||||||||
U.S. 5-Year Treasury Note | (21) | Jan-2021 | (2,647 | ) | (2,647 | ) | – | |||||||||||||
U.S. 5-Year Treasury Note | (95) | Jan-2021 | (11,957 | ) | (11,973 | ) | (16 | ) | ||||||||||||
U.S. 10-Year Treasury Note | (7) | Dec-2020 | (978 | ) | (977 | ) | 1 | |||||||||||||
U.S. 10-Year Treasury Note | 27 | Dec-2020 | 3,763 | 3,767 | 4 | |||||||||||||||
U.S. Ultra Long Treasury Bond | 9 | Dec-2020 | 2,017 | 1,996 | (21 | ) | ||||||||||||||
U.S. Ultra Long Treasury Bond | (18) | Dec-2020 | (4,015 | ) | (3,993 | ) | 22 | |||||||||||||
Ultra 10-Year U.S. Treasury Note | (33) | Dec-2020 | (5,263 | ) | (5,277 | ) | (14 | ) | ||||||||||||
|
|
|
|
|
|
|
|
| ||||||||||||
| $ | (1,513 | ) | $ | (849 | ) | $ | 373 | |||||||||||||
|
|
|
|
|
|
|
|
| ||||||||||||
A list of the open forward foreign currency contracts held by the Fund at September 30, 2020, is as follows:
| Counterparty | Settlement Date | Currency to Deliver (Thousands) | Currency to Receive (Thousands) | Unrealized Appreciation (Depreciation) (Thousands) | ||||||||||||||||||||
Bank of America | 10/02/20 | EUR | 466 | USD | 551 | $ | 5 | |||||||||||||||||
Bank of America | 10/02/20 | USD | 551 | JPY | 58,497 | 3 | ||||||||||||||||||
Bank of America | 10/02/20 | AUD | 6,910 | USD | 5,107 | 154 | ||||||||||||||||||
Bank of America | 10/15/20 | USD | 1,233 | EUR | 1,045 | (8 | ) | |||||||||||||||||
Bank of America | 11/10/20 | KRW | 6,100 | USD | 5 | — | ||||||||||||||||||
Bank of America | 11/19/20 | USD | 559 | GBP | 440 | 9 | ||||||||||||||||||
Bank of America | 11/27/20 | ZAR | 25,862 | USD | 1,547 | 6 | ||||||||||||||||||
Barclays PLC | 10/02/20 | USD | 26 | AUD | 35 | (1 | ) | |||||||||||||||||
Barclays PLC | 10/02/20 | NZD | 26 | USD | 18 | — | ||||||||||||||||||
Barclays PLC | 10/02/20 | CHF | 28 | USD | 31 | — | ||||||||||||||||||
Barclays PLC | 10/02/20 | USD | 30 | NZD | 45 | — | ||||||||||||||||||
Barclays PLC | 10/02/20 | USD | 15 | SEK | 137 | 1 | ||||||||||||||||||
Barclays PLC | 10/02/20 | USD | 15 | SEK | 137 | — | ||||||||||||||||||
Barclays PLC | 10/02/20 | SGD | 35 | USD | 26 | — | ||||||||||||||||||
42 |
SEI Institutional International Trust / Annual Report / September 30, 2020 |
| Counterparty | Settlement Date | Currency to Deliver (Thousands) | Currency to Receive (Thousands) | Unrealized Appreciation (Depreciation) (Thousands) | ||||||||||||||||||||
Barclays PLC | 10/02/20 | USD | 43 | CAD | 57 | $ | (1 | ) | ||||||||||||||||
Barclays PLC | 10/02/20 | USD | 44 | NOK | 399 | (2 | ) | |||||||||||||||||
Barclays PLC | 10/02/20 | CAD | 46 | USD | 35 | 1 | ||||||||||||||||||
Barclays PLC | 10/02/20 | CAD | 20 | USD | 15 | — | ||||||||||||||||||
Barclays PLC | 10/02/20 | USD | 76 | CHF | 69 | (1 | ) | |||||||||||||||||
Barclays PLC | 10/02/20 | AUD | 264 | USD | 192 | 2 | ||||||||||||||||||
Barclays PLC | 11/04/20 | AUD | 25 | USD | 18 | — | ||||||||||||||||||
Barclays PLC | 10/02/20 - 11/04/20 | USD | 301 | GBP | 235 | 3 | ||||||||||||||||||
Barclays PLC | 10/02/20 | USD | 105 | GBP | 80 | (2 | ) | |||||||||||||||||
Barclays PLC | 10/02/20 | SEK | 519 | USD | 59 | 1 | ||||||||||||||||||
Barclays PLC | 10/02/20 | NOK | 835 | USD | 93 | 3 | ||||||||||||||||||
Barclays PLC | 11/04/20 | NOK | 150 | USD | 16 | — | ||||||||||||||||||
Barclays PLC | 10/02/20 | USD | 3,660 | JPY | 386,591 | 4 | ||||||||||||||||||
Barclays PLC | 10/02/20 | USD | 14 | JPY | 1,500 | — | ||||||||||||||||||
Barclays PLC | 10/02/20 | ILS | 4,438 | USD | 1,323 | 25 | ||||||||||||||||||
Barclays PLC | 10/02/20 | ZAR | 4,920 | USD | 294 | (1 | ) | |||||||||||||||||
Barclays PLC | 10/02/20 - 11/04/20 | USD | 9,376 | EUR | 8,026 | 40 | ||||||||||||||||||
Barclays PLC | 10/02/20 | USD | 65 | EUR | 55 | (1 | ) | |||||||||||||||||
Barclays PLC | 10/02/20 | CZK | 25,007 | USD | 1,144 | 62 | ||||||||||||||||||
Barclays PLC | 10/02/20 | EUR | 36,709 | USD | 43,946 | 899 | ||||||||||||||||||
Barclays PLC | 11/04/20 | EUR | 84 | USD | 98 | (1 | ) | |||||||||||||||||
Barclays PLC | 10/02/20 | GBP | 23,270 | USD | 31,235 | 1,152 | ||||||||||||||||||
Barclays PLC | 10/02/20 - 11/04/20 | GBP | 30,554 | USD | 39,404 | (97 | ) | |||||||||||||||||
Barclays PLC | 10/02/20 | JPY | 9,413 | USD | 90 | 1 | ||||||||||||||||||
Barclays PLC | 10/02/20 | JPY | 6,557,674 | USD | 62,079 | (62 | ) | |||||||||||||||||
Barclays PLC | 11/04/20 | USD | 547 | MXN | 12,260 | 7 | ||||||||||||||||||
Barclays PLC | 11/18/20 | TWD | 211 | USD | 7 | — | ||||||||||||||||||
BNP Paribas | 10/02/20 | USD | 776 | CAD | 1,023 | (10 | ) | |||||||||||||||||
BNP Paribas | 10/02/20 | USD | 1,429 | EUR | 1,200 | (22 | ) | |||||||||||||||||
BNP Paribas | 10/02/20 | PLN | 3,559 | USD | 970 | 50 | ||||||||||||||||||
BNP Paribas | 11/04/20 | PLN | 3,559 | USD | 912 | (9 | ) | |||||||||||||||||
BNP Paribas | 10/02/20 | MYR | 8,712 | USD | 2,100 | 4 | ||||||||||||||||||
BNP Paribas | 11/04/20 | MYR | 8,712 | USD | 2,084 | (16 | ) | |||||||||||||||||
BNP Paribas | 10/02/20 - 11/04/20 | EUR | 36,352 | USD | 43,563 | 934 | ||||||||||||||||||
BNP Paribas | 10/15/20 | IDR | 19,266,370 | USD | 1,279 | (15 | ) | |||||||||||||||||
BNP Paribas | 11/04/20 | BRL | 10 | USD | 2 | — | ||||||||||||||||||
BNP Paribas | 11/04/20 | USD | 191 | CHF | 177 | 2 | ||||||||||||||||||
BNP Paribas | 11/04/20 | CHF | 1,977 | USD | 2,132 | (23 | ) | |||||||||||||||||
BNP Paribas | 11/04/20 | AUD | 7,090 | USD | 5,003 | (78 | ) | |||||||||||||||||
BNP Paribas | 11/04/20 | CZK | 25,007 | USD | 1,075 | (8 | ) | |||||||||||||||||
BNP Paribas | 11/27/20 | USD | 664 | ZAR | 11,405 | 15 | ||||||||||||||||||
BNP Paribas | 11/27/20 | ZAR | 11,399 | USD | 666 | (14 | ) | |||||||||||||||||
Brown Brothers Harriman | 10/08/20 | USD | 1,356 | MXN | 30,700 | 34 | ||||||||||||||||||
Brown Brothers Harriman | 10/09/20 | USD | 15 | CAD | 20 | — | ||||||||||||||||||
Brown Brothers Harriman | 10/09/20 | USD | 708 | CNY | 4,826 | — | ||||||||||||||||||
Brown Brothers Harriman | 10/09/20 | USD | 1,399 | CNY | 9,489 | (5 | ) | |||||||||||||||||
Brown Brothers Harriman | 10/15/20 | USD | 1,107 | EUR | 949 | 7 | ||||||||||||||||||
Brown Brothers Harriman | 10/15/20 | USD | 5,094 | EUR | 4,296 | (55 | ) | |||||||||||||||||
Brown Brothers Harriman | 10/15/20 - 11/04/20 | EUR | 15,354 | USD | 18,196 | 181 | ||||||||||||||||||
Brown Brothers Harriman | 10/22/20 | EUR | 20,737 | USD | 23,746 | (579 | ) | |||||||||||||||||
SEI Institutional International Trust / Annual Report / September 30, 2020 |
43 |
SCHEDULE OF INVESTMENTS
September 30, 2020
International Fixed Income Fund (Continued)
| Counterparty | Settlement Date | Currency to Deliver (Thousands) | Currency to Receive (Thousands) | Unrealized Appreciation (Depreciation) (Thousands) | ||||||||||||||||||||
Brown Brothers Harriman | 10/21/20 | CNY | 9,489 | USD | 1,397 | $ | 3 | |||||||||||||||||
Brown Brothers Harriman | 10/22/20 | PLN | 52 | USD | 14 | — | ||||||||||||||||||
Brown Brothers Harriman | 10/27/20 | USD | 14 | NZD | 21 | — | ||||||||||||||||||
Brown Brothers Harriman | 10/29/20 | USD | 74 | AUD | 106 | 2 | ||||||||||||||||||
Brown Brothers Harriman | 10/29/20 | AUD | 586 | USD | 420 | 1 | ||||||||||||||||||
Brown Brothers Harriman | 10/29/20 | AUD | 9,281 | USD | 6,651 | (1 | ) | |||||||||||||||||
Brown Brothers Harriman | 11/19/20 | GBP | 319 | USD | 411 | (1 | ) | |||||||||||||||||
Citi | 10/21/20 | CNY | 70,683 | USD | 10,116 | (285 | ) | |||||||||||||||||
Citi | 10/27/20 | USD | 1,761 | NZD | 2,693 | 18 | ||||||||||||||||||
Citi | 11/10/20 | KRW | 1,303,795 | USD | 1,116 | (4 | ) | |||||||||||||||||
Citigroup | 10/02/20 | CHF | 14 | USD | 15 | — | ||||||||||||||||||
Citigroup | 10/02/20 | USD | 14 | CAD | 19 | — | ||||||||||||||||||
Citigroup | 11/04/20 | USD | 9 | NOK | 85 | — | ||||||||||||||||||
Citigroup | 10/02/20 | USD | 43 | NOK | 374 | (3 | ) | |||||||||||||||||
Citigroup | 10/02/20 | NZD | 89 | USD | 60 | 1 | ||||||||||||||||||
Citigroup | 10/02/20 - 11/04/20 | USD | 123 | NZD | 188 | 1 | ||||||||||||||||||
Citigroup | 10/02/20 | USD | 44 | JPY | 4,698 | — | ||||||||||||||||||
Citigroup | 10/02/20 | USD | 216 | JPY | 22,620 | (2 | ) | |||||||||||||||||
Citigroup | 10/02/20 | GBP | 272 | USD | 357 | 5 | ||||||||||||||||||
Citigroup | 10/02/20 | GBP | 113 | USD | 146 | (1 | ) | |||||||||||||||||
Citigroup | 10/02/20 | USD | 745 | GBP | 584 | 10 | ||||||||||||||||||
Citigroup | 11/04/20 | USD | 2,483 | EUR | 2,126 | 11 | ||||||||||||||||||
Citigroup | 10/02/20 | USD | 770 | EUR | 643 | (16 | ) | |||||||||||||||||
Citigroup | 10/02/20 | JPY | 3,125 | USD | 30 | — | ||||||||||||||||||
Citigroup | 10/02/20 | JPY | 1,571 | USD | 15 | — | ||||||||||||||||||
Citigroup | 10/02/20 | DKK | 7,862 | USD | 1,265 | 27 | ||||||||||||||||||
Citigroup | 10/02/20 | NOK | 4,375 | USD | 503 | 35 | ||||||||||||||||||
Citigroup | 11/04/20 | NOK | 4,375 | USD | 459 | (8 | ) | |||||||||||||||||
Citigroup | 10/02/20 | SGD | 6,853 | USD | 5,052 | 32 | ||||||||||||||||||
Citigroup | 11/04/20 | SGD | 6,890 | USD | 5,005 | (44 | ) | |||||||||||||||||
Citigroup | 10/02/20 | CAD | 22,457 | USD | 17,196 | 384 | ||||||||||||||||||
Citigroup | 10/02/20 | EUR | 135 | USD | 160 | 2 | ||||||||||||||||||
Citigroup | 11/04/20 | EUR | 66,949 | USD | 77,996 | (555 | ) | |||||||||||||||||
Citigroup | 10/02/20 | MXN | 49,920 | USD | 2,292 | 31 | ||||||||||||||||||
Citigroup | 11/04/20 | MXN | 49,920 | USD | 2,207 | (46 | ) | |||||||||||||||||
Citigroup | 11/04/20 | USD | 77 | SEK | 696 | 1 | ||||||||||||||||||
Citigroup | 11/04/20 | AUD | 80 | USD | 57 | (1 | ) | |||||||||||||||||
Citigroup | 11/04/20 | ILS | 4,438 | USD | 1,283 | (15 | ) | |||||||||||||||||
Citigroup | 11/04/20 | SEK | 8,658 | USD | 955 | (13 | ) | |||||||||||||||||
Commonwealth Bank Of Australia | 10/02/20 | AUD | 30 | USD | 21 | — | ||||||||||||||||||
Commonwealth Bank Of Australia | 10/02/20 | EUR | 287 | USD | 340 | 4 | ||||||||||||||||||
Commonwealth Bank Of Australia | 10/21/20 | CNY | 7,407 | USD | 1,078 | (12 | ) | |||||||||||||||||
Commonwealth Bank Of Australia | 11/04/20 | USD | 6,525 | GBP | 5,074 | 35 | ||||||||||||||||||
Credit Suisse First Boston | 10/08/20 | USD | 1,416 | MXN | 29,895 | (63 | ) | |||||||||||||||||
Credit Suisse First Boston | 10/08/20 | MXN | 60,680 | USD | 2,776 | 29 | ||||||||||||||||||
Credit Suisse First Boston | 10/09/20 | CAD | 1,770 | USD | 1,343 | 18 | ||||||||||||||||||
Credit Suisse First Boston | 10/15/20 | GBP | 915 | EUR | 1,011 | 3 | ||||||||||||||||||
Credit Suisse First Boston | 10/27/20 | NZD | 2,688 | USD | 1,766 | (10 | ) | |||||||||||||||||
Goldman Sachs | 10/02/20 | GBP | 191 | USD | 246 | (1 | ) | |||||||||||||||||
44 |
SEI Institutional International Trust / Annual Report / September 30, 2020 |
��
| Counterparty | Settlement Date | Currency to Deliver (Thousands) | Currency to Receive (Thousands) | Unrealized Appreciation (Depreciation) (Thousands) | ||||||||||||||||||||
Goldman Sachs | 10/02/20 | USD | 725 | JPY | 76,800 | $ | 3 | |||||||||||||||||
Goldman Sachs | 10/02/20 - 11/04/20 | USD | 859 | ZAR | 14,720 | 21 | ||||||||||||||||||
Goldman Sachs | 10/02/20 | USD | 935 | GBP | 698 | (32 | ) | |||||||||||||||||
Goldman Sachs | 10/02/20 | USD | 957 | EUR | 802 | (17 | ) | |||||||||||||||||
Goldman Sachs | 10/02/20 - 11/04/20 | USD | 847 | TRY | 6,610 | 7 | ||||||||||||||||||
Goldman Sachs | 10/02/20 | USD | 140 | TRY | 1,075 | — | ||||||||||||||||||
Goldman Sachs | 10/02/20 - 11/04/20 | TRY | 10,678 | USD | 1,424 | 39 | ||||||||||||||||||
Goldman Sachs | 11/04/20 | TRY | 8,513 | USD | 1,083 | (14 | ) | |||||||||||||||||
Goldman Sachs | 10/08/20 | USD | 1,055 | MXN | 23,712 | 18 | ||||||||||||||||||
Goldman Sachs | 10/15/20 | USD | 687 | INR | 52,133 | 20 | ||||||||||||||||||
Goldman Sachs | 10/27/20 | MYR | 6 | USD | 2 | — | ||||||||||||||||||
Goldman Sachs | 11/04/20 | ZAR | 18,538 | USD | 1,076 | (31 | ) | |||||||||||||||||
Goldman Sachs | 11/13/20 | USD | 0 | CLP | 78 | — | ||||||||||||||||||
HSBC | 10/02/20 | AUD | 120 | USD | 85 | (1 | ) | |||||||||||||||||
HSBC | 10/02/20 | USD | 838 | CAD | 1,105 | (11 | ) | |||||||||||||||||
HSBC | 10/02/20 | USD | 613 | GBP | 483 | 11 | ||||||||||||||||||
HSBC | 10/02/20 | USD | 263 | GBP | 202 | (2 | ) | |||||||||||||||||
HSBC | 10/02/20 | GBP | 1,126 | USD | 1,489 | 33 | ||||||||||||||||||
HSBC | 10/15/20 | EUR | 2,245 | USD | 2,639 | 6 | ||||||||||||||||||
HSBC | 10/02/20 - 11/04/20 | EUR | 358 | USD | 418 | (2 | ) | |||||||||||||||||
HSBC | 10/02/20 | BRL | 7,363 | USD | 1,324 | 17 | ||||||||||||||||||
HSBC | 10/15/20 | INR | 51,967 | USD | 703 | (2 | ) | |||||||||||||||||
HSBC | 10/16/20 | SEK | 19,796 | USD | 2,167 | (45 | ) | |||||||||||||||||
HSBC | 10/27/20 | NZD | 2,714 | USD | 1,790 | (3 | ) | |||||||||||||||||
HSBC | 11/04/20 | JPY | 20,861 | USD | 198 | — | ||||||||||||||||||
HSBC | 11/18/20 | USD | 1,840 | TWD | 52,699 | (6 | ) | |||||||||||||||||
JPMorgan Chase Bank | 10/02/20 | CHF | 14 | USD | 15 | — | ||||||||||||||||||
JPMorgan Chase Bank | 10/02/20 | SGD | 20 | USD | 15 | — | ||||||||||||||||||
JPMorgan Chase Bank | 10/02/20 | USD | 29 | SGD | 40 | — | ||||||||||||||||||
JPMorgan Chase Bank | 10/02/20 | USD | 56 | NZD | 85 | 1 | ||||||||||||||||||
JPMorgan Chase Bank | 10/02/20 | USD | 45 | NZD | 67 | — | ||||||||||||||||||
JPMorgan Chase Bank | 10/02/20 | USD | 16 | NOK | 150 | — | ||||||||||||||||||
JPMorgan Chase Bank | 10/02/20 | USD | 119 | NOK | 1,076 | (4 | ) | |||||||||||||||||
JPMorgan Chase Bank | 11/04/20 | USD | 29 | CAD | 39 | — | ||||||||||||||||||
JPMorgan Chase Bank | 10/02/20 - 11/04/20 | USD | 119 | CAD | 157 | (2 | ) | |||||||||||||||||
JPMorgan Chase Bank | 10/02/20 | USD | 35 | AUD | 50 | 1 | ||||||||||||||||||
JPMorgan Chase Bank | 10/02/20 | USD | 122 | AUD | 168 | (2 | ) | |||||||||||||||||
JPMorgan Chase Bank | 10/02/20 | AUD | 98 | USD | 71 | 1 | ||||||||||||||||||
JPMorgan Chase Bank | 10/02/20 - 11/04/20 | AUD | 65 | USD | 46 | — | ||||||||||||||||||
JPMorgan Chase Bank | 10/02/20 - 11/04/20 | USD | 38 | CHF | 35 | — | ||||||||||||||||||
JPMorgan Chase Bank | 10/02/20 | USD | 144 | CHF | 131 | (1 | ) | |||||||||||||||||
JPMorgan Chase Bank | 10/02/20 | CAD | 166 | USD | 126 | 2 | ||||||||||||||||||
JPMorgan Chase Bank | 10/02/20 | CAD | 20 | USD | 15 | — | ||||||||||||||||||
JPMorgan Chase Bank | 10/02/20 - 11/04/20 | USD | 34 | SEK | 310 | — | ||||||||||||||||||
JPMorgan Chase Bank | 10/02/20 | USD | 250 | SEK | 2,178 | (7 | ) | |||||||||||||||||
JPMorgan Chase Bank | 10/02/20 | NZD | 295 | USD | 199 | 4 | ||||||||||||||||||
JPMorgan Chase Bank | 11/04/20 | NZD | 25 | USD | 16 | — | ||||||||||||||||||
JPMorgan Chase Bank | 10/02/20 | USD | 430 | ZAR | 7,290 | 7 | ||||||||||||||||||
JPMorgan Chase Bank | 10/02/20 | USD | 631 | EUR | 540 | 2 | ||||||||||||||||||
JPMorgan Chase Bank | 10/02/20 | USD | 269 | EUR | 225 | (5 | ) | |||||||||||||||||
SEI Institutional International Trust / Annual Report / September 30, 2020 |
45 |
SCHEDULE OF INVESTMENTS
September 30, 2020
International Fixed Income Fund (Continued)
| Counterparty | Settlement Date | Currency to Deliver (Thousands) | Currency to Receive (Thousands) | Unrealized Appreciation (Depreciation) (Thousands) | ||||||||||||||||||||
JPMorgan Chase Bank | 10/02/20 - 11/04/20 | GBP | 293 | USD | 383 | $ | 4 | |||||||||||||||||
JPMorgan Chase Bank | 10/02/20 - 11/04/20 | GBP | 714 | USD | 917 | (6 | ) | |||||||||||||||||
JPMorgan Chase Bank | 10/02/20 | SEK | 874 | USD | 99 | 1 | ||||||||||||||||||
JPMorgan Chase Bank | 10/02/20 | SEK | 170 | USD | 19 | — | ||||||||||||||||||
JPMorgan Chase Bank | 10/02/20 - 11/04/20 | USD | 592 | JPY | 62,827 | 3 | ||||||||||||||||||
JPMorgan Chase Bank | 10/02/20 | USD | 482 | JPY | 50,530 | (3 | ) | |||||||||||||||||
JPMorgan Chase Bank | 10/02/20 | NOK | 1,124 | USD | 127 | 7 | ||||||||||||||||||
JPMorgan Chase Bank | 11/04/20 | NOK | 150 | USD | 16 | — | ||||||||||||||||||
JPMorgan Chase Bank | 10/02/20 - 11/04/20 | USD | 1,625 | GBP | 1,268 | 15 | ||||||||||||||||||
JPMorgan Chase Bank | 10/02/20 | USD | 218 | GBP | 167 | (3 | ) | |||||||||||||||||
JPMorgan Chase Bank | 10/02/20 | EUR | 2,263 | USD | 2,676 | 22 | ||||||||||||||||||
JPMorgan Chase Bank | 10/02/20 | EUR | 78 | USD | 91 | — | ||||||||||||||||||
JPMorgan Chase Bank | 10/02/20 | RON | 1,562 | USD | 384 | 8 | ||||||||||||||||||
JPMorgan Chase Bank | 11/04/20 | RON | 1,562 | USD | 375 | — | ||||||||||||||||||
JPMorgan Chase Bank | 10/02/20 | ZAR | 2,570 | USD | 155 | 1 | ||||||||||||||||||
JPMorgan Chase Bank | 10/02/20 - 11/04/20 | ZAR | 25,768 | USD | 1,535 | (9 | ) | |||||||||||||||||
JPMorgan Chase Bank | 10/02/20 | JPY | 10,915 | USD | 104 | 1 | ||||||||||||||||||
JPMorgan Chase Bank | 10/02/20 | JPY | 48,140 | USD | 455 | (1 | ) | |||||||||||||||||
JPMorgan Chase Bank | 10/02/20 | THB | 71,207 | USD | 2,269 | 22 | ||||||||||||||||||
JPMorgan Chase Bank | 11/04/20 | THB | 71,207 | USD | 2,246 | (1 | ) | |||||||||||||||||
JPMorgan Chase Bank | 10/05/20 | USD | 880 | KRW | 1,031,807 | 2 | ||||||||||||||||||
JPMorgan Chase Bank | 10/05/20 | USD | 44 | KRW | 51,349 | — | ||||||||||||||||||
JPMorgan Chase Bank | 10/05/20 | KRW | 1,083,156 | USD | 910 | (16 | ) | |||||||||||||||||
JPMorgan Chase Bank | 10/08/20 | USD | 1,233 | JPY | 130,725 | 6 | ||||||||||||||||||
JPMorgan Chase Bank | 10/08/20 | MXN | 23,662 | USD | 1,096 | 25 | ||||||||||||||||||
JPMorgan Chase Bank | 10/09/20 | USD | 1,392 | CAD | 1,825 | (26 | ) | |||||||||||||||||
JPMorgan Chase Bank | 10/09/20 | CAD | 15,783 | USD | 11,769 | (47 | ) | |||||||||||||||||
JPMorgan Chase Bank | 10/15/20 | USD | 1,325 | IDR | 19,619,595 | (7 | ) | |||||||||||||||||
JPMorgan Chase Bank | 10/16/20 | USD | 1,097 | NOK | 9,686 | (61 | ) | |||||||||||||||||
JPMorgan Chase Bank | 10/19/20 | USD | 1,616 | RUB | 123,160 | (32 | ) | |||||||||||||||||
JPMorgan Chase Bank | 10/21/20 - 10/22/20 | THB | 134,214 | USD | 4,293 | 57 | ||||||||||||||||||
JPMorgan Chase Bank | 10/26/20 | USD | 364 | EUR | 307 | (4 | ) | |||||||||||||||||
JPMorgan Chase Bank | 10/26/20 - 12/15/20 | EUR | 43,515 | USD | 51,596 | 521 | ||||||||||||||||||
JPMorgan Chase Bank | 10/27/20 | USD | 50 | NZD | 75 | (1 | ) | |||||||||||||||||
JPMorgan Chase Bank | 10/27/20 | NZD | 15,036 | USD | 10,145 | 209 | ||||||||||||||||||
JPMorgan Chase Bank | 10/28/20 | USD | 208 | SGD | 283 | — | ||||||||||||||||||
JPMorgan Chase Bank | 10/28/20 | USD | 864 | PLN | 3,255 | (21 | ) | |||||||||||||||||
JPMorgan Chase Bank | 10/28/20 | CAD | 2,593 | USD | 1,968 | 26 | ||||||||||||||||||
JPMorgan Chase Bank | 10/28/20 | USD | 80 | GBP | 63 | 1 | ||||||||||||||||||
JPMorgan Chase Bank | 10/28/20 | USD | 3,520 | GBP | 2,716 | (9 | ) | |||||||||||||||||
JPMorgan Chase Bank | 10/28/20 | AUD | 3,858 | USD | 2,814 | 49 | ||||||||||||||||||
JPMorgan Chase Bank | 10/28/20 | USD | 46 | NOK | 439 | 1 | ||||||||||||||||||
JPMorgan Chase Bank | 10/28/20 | USD | 3,855 | NOK | 35,045 | (109 | ) | |||||||||||||||||
JPMorgan Chase Bank | 10/28/20 | CHF | 6,809 | USD | 7,486 | 68 | ||||||||||||||||||
JPMorgan Chase Bank | 10/28/20 | USD | 6,829 | SEK | 60,021 | (119 | ) | |||||||||||||||||
JPMorgan Chase Bank | 10/28/20 | SGD | 10,007 | USD | 7,365 | 33 | ||||||||||||||||||
JPMorgan Chase Bank | 10/30/20 | USD | 97 | MXN | 2,170 | 1 | ||||||||||||||||||
JPMorgan Chase Bank | 10/30/20 | USD | 437 | COP | 1,659,231 | (7 | ) | |||||||||||||||||
JPMorgan Chase Bank | 10/30/20 | MXN | 65,756 | USD | 3,059 | 90 | ||||||||||||||||||
JPMorgan Chase Bank | 10/30/20 | KRW | 1,031,807 | USD | 880 | (6 | ) | |||||||||||||||||
46 |
SEI Institutional International Trust / Annual Report / September 30, 2020 |
| Counterparty | Settlement Date | Currency to Deliver (Thousands) | Currency to Receive (Thousands) | Unrealized Appreciation (Depreciation) (Thousands) | ||||||||||||||||||||
JPMorgan Chase Bank | 10/30/20 | JPY | 2,462,370 | USD | 23,571 | $ | 226 | |||||||||||||||||
JPMorgan Chase Bank | 11/02/20 | USD | 44 | IDR | 656,879 | — | ||||||||||||||||||
JPMorgan Chase Bank | 11/02/20 | IDR | 27,404,940 | USD | 1,846 | 7 | ||||||||||||||||||
JPMorgan Chase Bank | 11/04/20 | CNY | 105,629 | USD | 15,425 | (108 | ) | |||||||||||||||||
JPMorgan Chase Bank | 11/27/20 | USD | 837 | ZAR | 14,236 | 12 | ||||||||||||||||||
JPMorgan Chase Bank | 11/27/20 | USD | 697 | ZAR | 11,533 | (10 | ) | |||||||||||||||||
Morgan Stanley | 10/02/20 | USD | 15 | SGD | 20 | — | ||||||||||||||||||
Morgan Stanley | 10/02/20 | SGD | 42 | USD | 31 | — | ||||||||||||||||||
Morgan Stanley | 10/02/20 | USD | 13 | NZD | 20 | — | ||||||||||||||||||
Morgan Stanley | 10/02/20 | USD | 33 | NZD | 49 | (1 | ) | |||||||||||||||||
Morgan Stanley | 11/04/20 | USD | 14 | NOK | 130 | 1 | ||||||||||||||||||
Morgan Stanley | 10/02/20 | USD | 37 | NOK | 327 | (1 | ) | |||||||||||||||||
Morgan Stanley | 10/02/20 | USD | 58 | CAD | 76 | (1 | ) | |||||||||||||||||
Morgan Stanley | 10/02/20 | USD | 16 | CHF | 15 | — | ||||||||||||||||||
Morgan Stanley | 10/02/20 | USD | 75 | CHF | 68 | (1 | ) | |||||||||||||||||
Morgan Stanley | 10/02/20 | USD | 72 | GBP | 56 | — | ||||||||||||||||||
Morgan Stanley | 10/02/20 | USD | 86 | GBP | 66 | (1 | ) | |||||||||||||||||
Morgan Stanley | 10/02/20 - 11/04/20 | USD | 58 | AUD | 82 | — | ||||||||||||||||||
Morgan Stanley | 10/02/20 | USD | 104 | AUD | 143 | (1 | ) | |||||||||||||||||
Morgan Stanley | 10/02/20 - 11/04/20 | USD | 1,239 | SEK | 11,192 | 12 | ||||||||||||||||||
Morgan Stanley | 10/02/20 | USD | 53 | SEK | 465 | (1 | ) | |||||||||||||||||
Morgan Stanley | 10/02/20 | USD | 1,317 | BRL | 7,353 | (13 | ) | |||||||||||||||||
Morgan Stanley | 10/02/20 | CHF | 2,047 | USD | 2,274 | 46 | ||||||||||||||||||
Morgan Stanley | 10/02/20 - 11/04/20 | CHF | 29 | USD | 31 | — | ||||||||||||||||||
Morgan Stanley | 10/02/20 - 10/29/20 | AUD | 2,414 | USD | 1,730 | 1 | ||||||||||||||||||
Morgan Stanley | 10/02/20 - 11/04/20 | AUD | 95 | USD | 67 | (1 | ) | |||||||||||||||||
Morgan Stanley | 10/02/20 | USD | 210 | EUR | 180 | 1 | ||||||||||||||||||
Morgan Stanley | 10/02/20 | USD | 4,386 | EUR | 3,670 | (82 | ) | |||||||||||||||||
Morgan Stanley | 10/02/20 | NZD | 3,304 | USD | 2,234 | 50 | ||||||||||||||||||
Morgan Stanley | 11/04/20 | NZD | 3,750 | USD | 2,456 | (22 | ) | |||||||||||||||||
Morgan Stanley | 10/02/20 - 11/19/20 | GBP | 7,343 | USD | 9,547 | 54 | ||||||||||||||||||
Morgan Stanley | 10/02/20 - 11/04/20 | GBP | 48 | USD | 61 | (1 | ) | |||||||||||||||||
Morgan Stanley | 10/02/20 - 11/04/20 | USD | 630 | JPY | 66,832 | 3 | ||||||||||||||||||
Morgan Stanley | 10/02/20 - 11/04/20 | USD | 8,570 | JPY | 901,891 | (19 | ) | |||||||||||||||||
Morgan Stanley | 10/02/20 | SEK | 9,583 | USD | 1,110 | 40 | ||||||||||||||||||
Morgan Stanley | 10/02/20 - 10/16/20 | NOK | 9,978 | USD | 1,099 | 33 | ||||||||||||||||||
Morgan Stanley | 11/04/20 | NOK | 280 | USD | 29 | (1 | ) | |||||||||||||||||
Morgan Stanley | 10/02/20 - 12/10/20 | EUR | 11,468 | USD | 13,552 | 86 | ||||||||||||||||||
Morgan Stanley | 10/02/20 - 11/04/20 | EUR | 25 | USD | 29 | — | ||||||||||||||||||
Morgan Stanley | 10/02/20 | CAD | 76 | USD | 58 | 1 | ||||||||||||||||||
Morgan Stanley | 10/02/20 - 11/04/20 | CAD | 20,408 | USD | 15,249 | (33 | ) | |||||||||||||||||
Morgan Stanley | 10/02/20 | HUF | 314,649 | USD | 1,063 | 47 | ||||||||||||||||||
Morgan Stanley | 11/04/20 | HUF | 314,649 | USD | 1,007 | (8 | ) | |||||||||||||||||
Morgan Stanley | 10/02/20 - 11/04/20 | JPY | 6,378,519 | USD | 60,573 | 95 | ||||||||||||||||||
Morgan Stanley | 10/02/20 | JPY | 180,892 | USD | 1,704 | (10 | ) | |||||||||||||||||
Morgan Stanley | 10/15/20 | GBP | 1,015 | EUR | 1,127 | 10 | ||||||||||||||||||
Morgan Stanley | 11/04/20 | DKK | 7,862 | USD | 1,232 | (8 | ) | |||||||||||||||||
RBC | 10/02/20 | USD | 1,888 | JPY | 200,000 | 8 | ||||||||||||||||||
RBC | 10/02/20 | USD | 2,401 | EUR | 2,020 | (32 | ) | |||||||||||||||||
RBS | 11/13/20 | COP | 3,207 | USD | 1 | — | ||||||||||||||||||
Standard Chartered | 11/10/20 | USD | 1,099 | KRW | 1,308,383 | 24 | ||||||||||||||||||
SEI Institutional International Trust / Annual Report / September 30, 2020 |
47 |
SCHEDULE OF INVESTMENTS
September 30, 2020
International Fixed Income Fund (Concluded)
| Counterparty | Settlement Date | Currency to Deliver (Thousands) | Currency to Receive (Thousands) | Unrealized Appreciation (Depreciation) (Thousands) | ||||||||||||||||||||
Standard Chartered | 11/18/20 | TWD | 51,987 | USD | 1,783 | $ | (27 | ) | ||||||||||||||||
State Street | 10/02/20 | EUR | 100 | USD | 118 | 1 | ||||||||||||||||||
State Street | 10/02/20 | USD | 134 | EUR | 113 | (1 | ) | |||||||||||||||||
State Street | 10/02/20 | NZD | 325 | USD | 219 | 5 | ||||||||||||||||||
State Street | 10/02/20 | USD | 2,739 | JPY | 286,900 | (20 | ) | |||||||||||||||||
State Street | 10/02/20 - 11/04/20 | GBP | 912 | USD | 1,200 | 21 | ||||||||||||||||||
State Street | 10/02/20 | GBP | 7,677 | USD | 9,898 | (27 | ) | |||||||||||||||||
State Street | 11/04/20 | USD | 73 | MXN | 1,625 | — | ||||||||||||||||||
State Street | 11/04/20 | SGD | 226 | USD | 165 | — | ||||||||||||||||||
TD Securities | 10/02/20 | USD | 398 | JPY | 41,999 | — | ||||||||||||||||||
UBS | 10/02/20 | USD | 285 | EUR | 241 | (3 | ) | |||||||||||||||||
UBS | 10/02/20 | USD | 303 | ZAR | 5,140 | 5 | ||||||||||||||||||
UBS | 10/02/20 | USD | 147 | ZAR | 2,430 | (1 | ) | |||||||||||||||||
UBS | 10/02/20 | EUR | 1,059 | USD | 1,254 | 12 | ||||||||||||||||||
UBS | 10/02/20 | TRY | 1,060 | USD | 142 | 4 | ||||||||||||||||||
UBS | 10/02/20 | ZAR | 2,430 | USD | 148 | 2 | ||||||||||||||||||
UBS | 10/02/20 | ZAR | 5,140 | USD | 306 | (2 | ) | |||||||||||||||||
| $ | 3,228 | |||||||||||||||||||||||
A list of the open OTC swap agreements held by the Fund at September 30, 2020, is as follows:
| Credit Default Swap | ||||||||||||||||||||||||
| Counterparty | Reference Entity/ Obligation | Buy/Sell Protection | (Pays)/Receives Rate | Payment Frequency | Termination Date | Notional Amount (Thousands) | Value (Thousands) | Upfront (Thousands) | Net Unrealized Depreciation (Thousands) | |||||||||||||||
Goldman Sachs | CMBX.NA.BBB.6 | Sell | 3.00% | Monthly | 05/11/2063 | $(882) | $ | (294) | $ | (105) | $ | (189 | ) | |||||||||||
|
|
|
|
|
| |||||||||||||||||||
| Interest Rate Swaps | ||||||||||||||||||||||||||||||||||||
| Counterparty | Fund Pays | Fund Receives | Payment Frequency | Termination Date | Currency | Notional (Thousands) | Value (Thousands) | Upfront (Thousands) | Net Unrealized Appreciation (Thousands) | |||||||||||||||||||||||||||
Deutsche Bank | | China 7-Day Reverse Repo Rate | | 2.985% | Quarterly | 06/03/2024 | CNY | 23,220 | $ | 59 | $ | – | $ | 59 | ||||||||||||||||||||||
Deutsche Bank | | China 7-Day Reverse Repo Rate | | 2.755% | Quarterly | 09/09/2024 | CNY | 31,000 | 38 | – | 38 | |||||||||||||||||||||||||
|
|
|
|
|
|
|
|
| ||||||||||||||||||||||||||||
| $ | 97 | $ | – | $ | 97 | |||||||||||||||||||||||||||||||
|
|
|
|
|
|
|
|
| ||||||||||||||||||||||||||||
A list of the open centrally cleared swap agreements held by the Fund at September 30, 2020, is as follows:
Interest Rate Swaps | ||||||||||||||||||||||||||||||
| Fund Pays | Fund Receives | Payment Frequency | Termination Date | Currency | Notional Amount (Thousands) | Value (Thousands) | Upfront Payments/ Receipts (Thousands) | Net Unrealized Appreciation (Depreciation) (Thousands) | ||||||||||||||||||||||
6-MONTH GBP - LIBOR | 5.635% | Semi-Annual | 02/28/2025 | GBP | 1,230 | $ | 28 | $ | – | $ | 28 | |||||||||||||||||||
1.6460% | 6-MONTH GBP - LIBOR | Semi-Annual | 10/03/2047 | GBP | 460 | (169 | ) | – | (169 | ) | ||||||||||||||||||||
6-MONTH GBP - LIBOR | 4.385% | Semi-Annual | 07/20/2050 | GBP | 1,060 | (45 | ) | – | (45 | ) | ||||||||||||||||||||
|
|
|
|
|
|
|
|
| ||||||||||||||||||||||
| $ | (186 | ) | $ | – | $ | (186 | ) | |||||||||||||||||||||||
|
|
|
|
|
|
|
|
| ||||||||||||||||||||||
48 |
SEI Institutional International Trust / Annual Report / September 30, 2020 |
Percentages are based on Net Assets of $514,528 ($ Thousands). |
| (A) | Security exempt from registration under Rule 144A of the Securities Act of 1933. These securities may be resold in transactions exempt from registration normally to qualified institutions. On September 30, 2020, the value of these securities amounted to $82,580 ($ Thousands), representing 16.0% of the Net Assets of the Fund. |
| (B) | Security is in default on interest payment. |
| (C) | Variable or floating rate security, the interest rate of which adjusts periodically based on changes in current interest rates and prepayments on the underlying pool of assets. |
| (D) | Perpetual security with no stated maturity date. |
| (E) | Zero coupon security. The rate shown on the Schedule of Investments is the security’s effective yield at the time of purchase. |
| (F) | Security, or portion thereof, has been pledged as collateral on open futures comments. |
AUD — Australian Dollar
BRL — Brazilian Real
CAD — Canadian Dollar
CHF — Swiss Franc
Cl — Class
CLP — Chilean Peso
CNY — Chinese Yuan Onshore
COP — Colombian Peso
CZK — Czech Koruna
DAC — Designated Activity Company
DKK — Danish Krone
EUR — Euro
FHLMC — Federal Home Loan Mortgage Corporation
FNMA — Federal National Mortgage Association
GBP — British Pound Sterling
HUF — Hungarian Forint
ICE— Intercontinental Exchange
IDR — Indonesian Rupiah
ILS — Israeli New Sheckels
INR — Indian Rupee
JPY — Japanese Yen
KRW — Korean Won
LIBOR — London Interbank Offered Rate
LLC — Limited Liability Company
MTN — Medium Term Note
MXN — Mexican Peso
MYR — Malaysian Ringgit
NOK — Norwegian Krone
NZD — New Zealand Dollar
PLC — Public Limited Company
PLN — Polish Zloty
RON — Romanian Leu
RUB — Russian Ruble
SEK — Swedish Krona
SGD — Singapore Dollar
Ser — Series
THB — Thai Bhat
TRY — Turkish Lira
TWD — Taiwan Dollar
USD — U.S. Dollar
VAR — Variable Rate
ZAR — South African Rand
The following is a list of the level of inputs used as of September 30, 2020, in valuing the Fund’s investments and other financial instruments carried at value ($ Thousands):
| Level 1 | Level 2 | Level 3 | Total | |||||||||||||
| Investments in Securities | ($) | ($) | ($) | ($) | ||||||||||||
Global Bonds | – | 474,837 | – | 474,837 | ||||||||||||
U.S. Treasury Obligations | – | 23,171 | – | 23,171 | ||||||||||||
Mortgage-Backed Securities | – | 1,489 | – | 1,489 | ||||||||||||
Municipal Bond | – | 335 | – | 335 | ||||||||||||
|
|
|
|
|
|
|
|
|
|
|
| |||||
Total Investments in Securities | – | 499,832 | – | 499,832 | ||||||||||||
|
|
|
|
|
|
|
|
|
|
|
| |||||
| Other Financial Instruments | Level 1 ($) | Level 2 ($) | Level 3 ($) | Total ($) | ||||||||||||
Futures Contracts* | ||||||||||||||||
Unrealized Appreciation | 524 | – | – | 524 | ||||||||||||
Unrealized Depreciation | (151 | ) | – | – | (151 | ) | ||||||||||
Forwards Contracts* | ||||||||||||||||
Unrealized Appreciation | – | 6,431 | – | 6,431 | ||||||||||||
Unrealized Depreciation | – | (3,203 | ) | – | (3,203 | ) | ||||||||||
OTC Swaps | ||||||||||||||||
Credit Default Swaps* | ||||||||||||||||
Unrealized Depreciation | – | (189 | ) | – | (189 | ) | ||||||||||
Interest Rate Swaps* | ||||||||||||||||
Unrealized Appreciation | – | 97 | – | 97 | ||||||||||||
Centrally Cleared Swaps | ||||||||||||||||
Interest Rate Swaps* | ||||||||||||||||
Unrealized Appreciation | – | 28 | – | 28 | ||||||||||||
Unrealized Depreciation | – | (214 | ) | – | (214 | ) | ||||||||||
|
|
|
|
|
|
|
|
|
|
|
| |||||
Total Other Financial Instruments | 373 | 2,950 | – | 3,323 | ||||||||||||
|
|
|
|
|
|
|
|
|
|
|
| |||||
*Futures contracts, forwards contracts and swap contracts are valued at the unrealized appreciation (depreciation) on the instruments.
For the year ended September 30, 2020, there were no transfers in or out of Level 3.
For more information on valuation inputs, see Note 2 – Significant Accounting Policies in Notes to Financial Statements.
Amounts designated as “—” are $0 or have been rounded to $0.
The accompanying notes are an integral part of the financial statements.
SEI Institutional International Trust / Annual Report / September 30, 2020 |
49 |
SCHEDULE OF INVESTMENTS
September 30, 2020
Emerging Markets Debt Fund
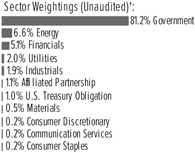
†Percentages based on total investments. Includes investments held as collateral for securities on loan (see Note 9).
| Description | Face Amount (Thousands) | Market Value ($ Thousands) | ||||||
GLOBAL BONDS — 95.4% | ||||||||
Albania — 0.0% | ||||||||
Albania Government International Bond | ||||||||
3.500%, 10/09/2025 | EUR | 403 | $ | 484 | ||||
|
|
| ||||||
Angola — 0.7% | ||||||||
Angolan Government International Bond | ||||||||
9.375%, 05/08/2048 | $ | 2,800 | 2,183 | |||||
8.250%, 05/09/2028 | 1,085 | 862 | ||||||
Angolan Government International Bond MTN | ||||||||
9.125%, 11/26/2049 | 1,061 | 825 | ||||||
9.125%, 11/26/2049 (A)(B) | 670 | 521 | ||||||
8.000%, 11/26/2029 (A) | 1,357 | 1,071 | ||||||
8.000%, 11/26/2029 | 1,017 | 803 | ||||||
Republic of Angola Via Avenir II BV MTN | ||||||||
7.867%, VAR ICE LIBOR USD 6 Month+7.500%, 07/01/2023 | 4,007 | 3,546 | ||||||
4.981%, VAR ICE LIBOR USD 6 Month+4.500%, 12/07/2023 | 483 | 418 | ||||||
Republic of Angola Via Avenir Issuer II | ||||||||
Ireland DAC | 700 | 555 | ||||||
|
|
| ||||||
| 10,784 | ||||||||
|
|
| ||||||
Argentina — 1.6% | ||||||||
Adecoagro | ||||||||
6.000%, 09/21/2027 (A)(B) | 663 | 656 | ||||||
Argentina Treasury Bond BONCER | ||||||||
2.000%, 11/09/2026 | ARS | 102,998 | 579 | |||||
Argentine Republic Government International Bond | ||||||||
1.000%, 07/09/2029 | $ | 5,966 | 2,721 | |||||
0.500%, 07/09/2029 | EUR | 13 | 6 | |||||
0.125%, 0.500%, 07/09/2021, 07/09/2030 (C) | $ | 17,129 | 7,194 | |||||
0.125%, 07/09/2030 | EUR | 403 | 186 | |||||
0.125%, 1.125%, 07/09/2021, 07/09/2035 (C) | $ | 5,406 | 2,033 | |||||
0.125%, 2.000%, 07/09/2021, 01/09/2038 (C) | 7,301 | 3,139 | ||||||
| Description | Face Amount (Thousands) | Market Value ($ Thousands) | ||||||
GLOBAL BONDS (continued) | ||||||||
0.125%, 2.500%, 07/09/2021, 07/09/2041 (C) | $ | 9,247 | $ | 3,671 | ||||
0.125%, 1.125%, 07/09/2021, 07/09/2046 (C) | 4,969 | 1,907 | ||||||
Provincia de Buenos Aires | ||||||||
7.875%, 06/15/2027 (D) | 350 | 136 | ||||||
5.375%, 01/20/2023 (D) | EUR | 620 | 298 | |||||
Provincia de Cordoba | ||||||||
7.125%, 06/10/2021 (A) | $ | 531 | 324 | |||||
Rio Energy | ||||||||
6.875%, 02/01/2025 (A) | 1,040 | 637 | ||||||
|
|
| ||||||
| 23,487 | ||||||||
|
|
| ||||||
Armenia — 0.1% | ||||||||
Republic of Armenia International Bond | ||||||||
3.950%, 09/26/2029 | 758 | 734 | ||||||
|
|
| ||||||
Azerbaijan — 1.0% | ||||||||
Republic of Azerbaijan International Bond | ||||||||
5.125%, 09/01/2029 | 1,711 | 1,798 | ||||||
Southern Gas Corridor CJSC | ||||||||
6.875%, 03/24/2026 (A) | 1,437 | 1,632 | ||||||
6.875%, 03/24/2026 | 4,625 | 5,252 | ||||||
State Oil of the Azerbaijan Republic | ||||||||
6.950%, 03/18/2030 | 2,110 | 2,487 | ||||||
State Oil of the Azerbaijan Republic MTN | ||||||||
4.750%, 03/13/2023 | 2,353 | 2,435 | ||||||
4.750%, 03/13/2023 | 500 | 517 | ||||||
|
|
| ||||||
| 14,121 | ||||||||
|
|
| ||||||
Bahrain — 0.5% | ||||||||
Bahrain Government International Bond | ||||||||
6.750%, 09/20/2029 | 200 | 214 | ||||||
6.125%, 08/01/2023 | 520 | 551 | ||||||
5.625%, 09/30/2031 (A) | 717 | 699 | ||||||
5.625%, 09/30/2031 | 462 | 450 | ||||||
5.450%, 09/16/2032 (A) | 1,929 | 1,832 | ||||||
5.450%, 09/16/2032 | 364 | 343 | ||||||
CBB International Sukuk Programme SPC | ||||||||
3.950%, 09/16/2027 (A) | 1,929 | 1,885 | ||||||
Oil and Gas Holding BSCC (A) | ||||||||
8.375%, 11/07/2028 | 560 | 621 | ||||||
7.625%, 11/07/2024 | 1,158 | 1,235 | ||||||
|
|
| ||||||
| 7,830 | ||||||||
|
|
| ||||||
Belarus — 0.3% | ||||||||
Republic of Belarus International Bond | ||||||||
7.625%, 06/29/2027 | 1,754 | 1,708 | ||||||
6.200%, 02/28/2030 | 358 | 334 | ||||||
Republic of Belarus Ministry of Finance | ||||||||
6.378%, 02/24/2031 | 721 | 672 | ||||||
6.378%, 02/24/2031 (A) | 604 | 563 | ||||||
5.875%, 02/24/2026 | 1,077 | 997 | ||||||
50 |
SEI Institutional International Trust / Annual Report / September 30, 2020 |
| Description | Face Amount (Thousands) | Market Value ($ Thousands) | ||||||
GLOBAL BONDS (continued) |
| |||||||
5.875%, 02/24/2026 (A) | $ | 410 | $ | 380 | ||||
|
|
| ||||||
| 4,654 | ||||||||
|
|
| ||||||
Belize — 0.0% | ||||||||
Belize Government International Bond | ||||||||
4.938%, 02/20/2038 | 1,117 | 486 | ||||||
|
|
| ||||||
Benin — 0.1% | ||||||||
Benin Government International Bond | ||||||||
5.750%, 03/26/2026 (A) | EUR | 1,688 | 1,873 | |||||
|
|
| ||||||
Bermuda — 0.4% | ||||||||
Bermuda Government International Bond | ||||||||
4.854%, 02/06/2024 | $ | 268 | 294 | |||||
4.750%, 02/15/2029 | 1,204 | 1,436 | ||||||
3.717%, 01/25/2027 | 1,521 | 1,666 | ||||||
3.375%, 08/20/2050 | 330 | 339 | ||||||
2.375%, 08/20/2030 (A) | 1,720 | 1,739 | ||||||
2.375%, 08/20/2030 | 221 | 224 | ||||||
|
|
| ||||||
| 5,698 | ||||||||
|
|
| ||||||
Brazil — 5.3% | ||||||||
Brazil Letras do Tesouro Nacional (E) | ||||||||
11.065%, 07/01/2021 | BRL | 5,000 | 871 | |||||
5.851%, 01/01/2024 | 20,000 | 2,947 | ||||||
Brazil Loan Trust | ||||||||
1 5.477%, 07/24/2023 (A) | $ | 1,034 | 1,058 | |||||
5.477%, 07/24/2023 | 217 | 221 | ||||||
Brazil Minas SPE via State of Minas Gerais | ||||||||
5.333%, 02/15/2028 | 1,745 | 1,791 | ||||||
5.333%, 02/15/2028 | 1,176 | 1,207 | ||||||
5.333%, 02/15/2028 (A) | 179 | 184 | ||||||
Brazil Notas do Tesouro Nacional, Serie B | ||||||||
6.000%, 05/15/2045 | BRL | 562 | 412 | |||||
6.000%, 08/15/2050 | 1,670 | 1,246 | ||||||
Brazil Notas do Tesouro Nacional, Serie F | ||||||||
10.000%, 01/01/2021 | 1,510 | 273 | ||||||
10.000%, 01/01/2023 | 101,817 | 20,064 | ||||||
10.000%, 01/01/2025 | 32,832 | 6,591 | ||||||
10.000%, 01/01/2027 | 41,212 | 8,313 | ||||||
10.000%, 01/01/2029 | 34,338 | 7,033 | ||||||
10.000%, 01/01/2031 | 6,682 | 1,373 | ||||||
Brazilian Government International Bond | ||||||||
5.625%, 01/07/2041 | $ | 360 | 390 | |||||
5.625%, 02/21/2047 | 709 | 771 | ||||||
5.000%, 01/27/2045 | 2,078 | 2,093 | ||||||
4.625%, 01/13/2028 | 618 | 670 | ||||||
3.875%, 06/12/2030 | 6,250 | 6,250 | ||||||
Centrais Eletricas Brasileiras | ||||||||
4.625%, 02/04/2030 (A) | 226 | 227 | ||||||
CSN Islands XI | ||||||||
6.750%, 01/28/2028 (A) | 592 | 573 | ||||||
| Description | Face Amount (Thousands) | Market Value ($ Thousands) | ||||||
GLOBAL BONDS (continued) | ||||||||
CSN Resources | ||||||||
7.625%, 04/17/2026 (A) | $ | 763 | $ | 772 | ||||
Gol Finance | ||||||||
7.000%, 01/31/2025 (A)(B) | 998 | 699 | ||||||
JBS Investments II GmbH | ||||||||
5.750%, 01/15/2028 (A) | 466 | 485 | ||||||
Minerva Luxembourg | ||||||||
6.500%, 09/20/2026 (A) | 741 | 769 | ||||||
MV24 Capital BV | ||||||||
6.748%, 06/01/2034 (A) | 1,215 | 1,227 | ||||||
Nexa Resources | ||||||||
5.375%, 05/04/2027 (A) | 2,591 | 2,691 | ||||||
Petrobras Global Finance BV | ||||||||
6.900%, 03/19/2049 | 2,296 | 2,566 | ||||||
5.999%, 01/27/2028 | 437 | 485 | ||||||
5.093%, 01/15/2030 | 256 | 269 | ||||||
Raizen Fuels Finance | ||||||||
5.300%, 01/20/2027 (A) | 661 | 718 | ||||||
Suzano Austria GmbH (A) | ||||||||
7.000%, 03/16/2047 | 399 | 472 | ||||||
6.000%, 01/15/2029 | 288 | 328 | ||||||
5.000%, 01/15/2030 | 494 | 532 | ||||||
Vale Overseas Ltd | ||||||||
3.750%, 07/08/2030 | BRL | 180 | 185 | |||||
Votorantim Cimentos International | ||||||||
7.250%, 04/05/2041 | $ | 536 | 687 | |||||
|
|
| ||||||
| 77,443 | ||||||||
|
|
| ||||||
Cameroon — 0.0% | ||||||||
Republic of Cameroon International Bond | ||||||||
9.500%, 11/19/2025 (A) | 283 | 291 | ||||||
|
|
| ||||||
Cayman Islands — 0.3% | ||||||||
Bioceanico Sovereign Certificate Ltd | ||||||||
2.471%, 06/05/2034 (E) | 2,303 | 1,710 | ||||||
Neon Capital MTN | ||||||||
2.015%, 01/06/2028 (E)(F) | JPY | 306,529 | 2,168 | |||||
|
|
| ||||||
| 3,878 | ||||||||
|
|
| ||||||
Chile — 1.4% | ||||||||
Banco de Credito e Inversiones | ||||||||
3.500%, 10/12/2027 (A) | $ | 1,046 | 1,139 | |||||
Bonos de la Tesoreria de la Republica en pesos | ||||||||
6.000%, 01/01/2043 | CLP | 1,515,000 | 2,636 | |||||
4.700%, 09/01/2030 (A) | 815,000 | 1,215 | ||||||
Celulosa Arauco y Constitucion | ||||||||
5.150%, 01/29/2050 (A) | $ | 576 | 610 | |||||
Cencosud | ||||||||
4.375%, 07/17/2027 (A) | 1,819 | 1,979 | ||||||
Chile Government International Bond | ||||||||
3.500%, 01/25/2050 | 1,423 | 1,622 | ||||||
2.550%, 01/27/2032 | 540 | 570 | ||||||
SEI Institutional International Trust / Annual Report / September 30, 2020 |
51 |
SCHEDULE OF INVESTMENTS
September 30, 2020
Emerging Markets Debt Fund (Continued)
| Description | Face Amount (Thousands) | Market Value ($ Thousands) | ||||||
GLOBAL BONDS (continued) |
| |||||||
2.450%, 01/31/2031 | $ | 3,509 | $ | 3,690 | ||||
Empresa de Transporte de Pasajeros Metro | ||||||||
3.650%, 05/07/2030 (A) | 217 | 240 | ||||||
Empresa Nacional del Petroleo | ||||||||
3.750%, 08/05/2026 (B) | 749 | 795 | ||||||
Geopark | ||||||||
6.500%, 09/21/2024 (A) | 492 | 466 | ||||||
Nacional del Cobre de Chile | ||||||||
5.625%, 10/18/2043 | 442 | 595 | ||||||
4.500%, 09/16/2025 (A) | 735 | 828 | ||||||
4.375%, 02/05/2049 (A) | 506 | 598 | ||||||
3.750%, 01/15/2031 (A) | 234 | 260 | ||||||
3.700%, 01/30/2050 (A) | 1,216 | 1,286 | ||||||
3.625%, 08/01/2027 (A)(B) | 368 | 402 | ||||||
3.625%, 08/01/2027 | 353 | 386 | ||||||
3.150%, 01/14/2030 | 300 | 319 | ||||||
3.150%, 01/14/2030 (A) | 297 | 316 | ||||||
3.000%, 09/30/2029 (A) | 442 | 467 | ||||||
|
|
| ||||||
| 20,419 | ||||||||
|
|
| ||||||
China — 2.4% | ||||||||
Alibaba Group Holding | ||||||||
4.200%, 12/06/2047 | 310 | 394 | ||||||
Charming Light Investments MTN | ||||||||
4.375%, 12/21/2027 | 1,341 | 1,520 | ||||||
China Government Bond | ||||||||
3.390%, 03/16/2050 | CNY | 8,350 | 1,123 | |||||
3.130%, 11/21/2029 | 6,500 | 949 | ||||||
3.120%, 12/05/2026 | 9,040 | 1,329 | ||||||
2.850%, 06/04/2027 | 9,640 | 1,384 | ||||||
2.680%, 05/21/2030 | 36,100 | 5,095 | ||||||
1.990%, 04/09/2025 | 60,830 | 8,550 | ||||||
China Government International Bond | ||||||||
3.250%, 10/19/2023 | $ | 1,762 | 1,907 | |||||
1.875%, 12/03/2022 | 752 | 775 | ||||||
China Minmetals | ||||||||
4.450%, VAR US Treas Yield Curve Rate | ||||||||
T Note Const Mat 3 Yr+6.070%, 11/13/2168 | 640 | 645 | ||||||
3.750%, VAR US Treas Yield Curve Rate | ||||||||
T Note Const Mat 5 Yr+4.717% (G) | 2,047 | 2,082 | ||||||
Chinalco Capital Holdings | ||||||||
4.250%, 04/21/2022 (B) | 740 | 752 | ||||||
4.100%, VAR US Treas Yield Curve Rate | ||||||||
T Note Const Mat 5 Yr+5.788% (G) | 224 | 227 | ||||||
CNAC HK Finbridge | ||||||||
5.125%, 03/14/2028 | 780 | 888 | ||||||
Country Garden Holdings | ||||||||
4.800%, 08/06/2030 | 407 | 423 | ||||||
Dianjian Haiyu | ||||||||
4.300% (G) | 204 | 210 | ||||||
| Description | Face Amount (Thousands) | Market Value ($ Thousands) | ||||||
GLOBAL BONDS (continued) |
| |||||||
Dianjian International Finance | ||||||||
4.600%, VAR US Treas Yield | ||||||||
Curve Rate T Note Const Mat 5 Yr+6.933% (G) | $ | 303 | $ | 312 | ||||
ENN Clean Energy International Investment | ||||||||
7.500%, 02/27/2021 | 475 | 476 | ||||||
Huarong Finance 2017 | ||||||||
4.500%, VAR US Treas Yield Curve | ||||||||
Rate T Note Const Mat 5 Yr+7.773% (G) | 1,378 | 1,392 | ||||||
Leader Goal International Ltd MTN | ||||||||
4.250% (F)(G) | 212 | 216 | ||||||
Minmetals Bounteous Finance BVI | ||||||||
3.375%, VAR US Treas Yield Curve Rate | ||||||||
T Note Const Mat 5 Yr+5.209% (G) | 805 | 812 | ||||||
Shimao Group Holdings | ||||||||
5.600%, 07/15/2026 | 400 | 437 | ||||||
Sinopec Group Overseas Development 2018 | ||||||||
2.500%, 08/08/2024 | 2,394 | 2,496 | ||||||
Tencent Holdings LTD MTN | ||||||||
3.240%, 06/03/2050 (A) | THB | 450 | 457 | |||||
Wanda Properties International | ||||||||
7.250%, 01/29/2024 | $ | 400 | 398 | |||||
|
|
| ||||||
| 35,249 | ||||||||
|
|
| ||||||
Colombia — 5.5% | ||||||||
Colombia Government International Bond | ||||||||
3.125%, 04/15/2031 | 3,061 | 3,141 | ||||||
3.000%, 01/30/2030 | 1,842 | 1,883 | ||||||
Colombian TES | ||||||||
10.000%, 07/24/2024 | COP | 9,671,700 | 6,270 | |||||
7.750%, 09/18/2030 | 2,839,000 | 3,844 | ||||||
7.500%, 08/26/2026 | 2,033,500 | 9,576 | ||||||
7.250%, 10/18/2034 | 9,926,900 | 2,816 | ||||||
7.000%, 05/04/2022 | 83,500 | 2,798 | ||||||
7.000%, 06/30/2032 | 1,931,400 | 3,349 | ||||||
6.250%, 11/26/2025 | 2,448,500 | 9,227 | ||||||
6.000%, 04/28/2028 | 2,148,200 | 8,812 | ||||||
5.750%, 11/03/2027 | 4,339,900 | 9,321 | ||||||
4.750%, 04/04/2035 | 1,170,600 | 1,023 | ||||||
2.250%, 04/18/2029 | 805,600 | 580 | ||||||
Ecopetrol | ||||||||
7.375%, 09/18/2043 | $ | 268 | 336 | |||||
6.875%, 04/29/2030 | 1,228 | 1,470 | ||||||
5.875%, 05/28/2045 | 420 | 458 | ||||||
Emgesa ESP | ||||||||
8.750%, 01/25/2021 | COP | 870,000 | 229 | |||||
Empresas Publicas de Medellin ESP (A) | ||||||||
8.375%, 11/08/2027 | 2,351,000 | 630 | ||||||
7.625%, 09/10/2024 | 3,116,000 | 846 | ||||||
Financiera de Desarrollo Territorial Findeter | ||||||||
7.875%, 08/12/2024 (A) | 1,127,000 | 317 | ||||||
7.875%, 08/12/2024 | 884,000 | 249 | ||||||
52 |
SEI Institutional International Trust / Annual Report / September 30, 2020 |
| Description | Face Amount (Thousands) | Market Value ($ Thousands) | ||||||
GLOBAL BONDS (continued) |
| |||||||
Grupo Aval | ||||||||
4.375%, 02/04/2030 (A) | $ | 812 | $ | 784 | ||||
Republic of Colombia |
| |||||||
9.850%, 06/28/2027 | COP | 5,060,000 | 1,685 | |||||
8.125%, 05/21/2024 | $ | 908 | 1,094 | |||||
7.750%, 04/14/2021 | COP | 3,331,000 | 884 | |||||
7.375%, 09/18/2037 | $ | 749 | 1,054 | |||||
6.125%, 01/18/2041 | 2,137 | 2,741 | ||||||
5.625%, 02/26/2044 | 132 | 164 | ||||||
5.000%, 06/15/2045 | 2,530 | 2,948 | ||||||
4.500%, 01/28/2026 | 581 | 644 | ||||||
4.375%, 03/21/2023 | COP | 2,871,000 | 753 | |||||
4.000%, 02/26/2024 | $ | 965 | 1,029 | |||||
|
|
| ||||||
| 80,955 | ||||||||
|
|
| ||||||
Costa Rica — 0.6% | ||||||||
Costa Rica Government International Bond | ||||||||
7.158%, 03/12/2045 | 500 | 455 | ||||||
7.158%, 03/12/2045 | 4,816 | 4,385 | ||||||
7.158%, 03/12/2045 (A) | 387 | 352 | ||||||
7.000%, 04/04/2044 | 1,208 | 1,093 | ||||||
7.000%, 04/04/2044 | 230 | 208 | ||||||
6.125%, 02/19/2031 | 1,362 | 1,280 | ||||||
Instituto Costarricense de Electricidad | ||||||||
6.375%, 05/15/2043 | 250 | 198 | ||||||
Republic of Costa Rica | ||||||||
5.625%, 04/30/2043 (A) | 450 | 371 | ||||||
|
|
| ||||||
| 8,342 | ||||||||
|
|
| ||||||
Croatia — 0.1% | ||||||||
Croatia Government International Bond | ||||||||
6.375%, 03/24/2021 | 1,181 | 1,211 | ||||||
1.500%, 06/17/2031 | EUR | 650 | 791 | |||||
|
|
| ||||||
| 2,002 | ||||||||
|
|
| ||||||
Czech Republic — 1.2% |
| |||||||
Czech Republic Government Bond | ||||||||
4.200%, 12/04/2036 | CZK | 9,570 | 608 | |||||
2.750%, 07/23/2029 | 97,920 | 4,946 | ||||||
2.500%, 08/25/2028 | 18,330 | 900 | ||||||
2.400%, 09/17/2025 | 99,550 | 4,710 | ||||||
2.000%, 10/13/2033 | 24,480 | 1,185 | ||||||
1.200%, 03/13/2031 | 40,700 | 1,807 | ||||||
1.000%, 06/26/2026 | 16,430 | 727 | ||||||
0.950%, 05/15/2030 | 61,080 | 2,668 | ||||||
|
|
| ||||||
| 17,551 | ||||||||
|
|
| ||||||
Dominican Republic — 1.7% |
| |||||||
Dominican Republic International Bond | ||||||||
11.250%, 02/05/2027 | DOP | 14,500 | 270 | |||||
9.750%, 06/05/2026 (A) | 29,200 | 508 | ||||||
8.900%, 02/15/2023 (A) | 43,400 | 740 | ||||||
7.450%, 04/30/2044 | $ | 1,672 | 1,881 | |||||
7.450%, 04/30/2044 (A) | 687 | 773 | ||||||
| Description | Face Amount (Thousands) | Market Value ($ Thousands) | ||||||
GLOBAL BONDS (continued) |
| |||||||
6.850%, 01/27/2045 (A) | $ | 129 | $ | 136 | ||||
6.850%, 01/27/2045 | 2,391 | 2,518 | ||||||
6.600%, 01/28/2024 | 656 | 719 | ||||||
6.500%, 02/15/2048 | 3,120 | 3,156 | ||||||
6.400%, 06/05/2049 | 959 | 962 | ||||||
5.950%, 01/25/2027 | 638 | 685 | ||||||
5.875%, 04/18/2024 (A) | 71 | 75 | ||||||
5.875%, 01/30/2060 (A) | 3,727 | 3,522 | ||||||
5.875%, 01/30/2060 | 2,782 | 2,629 | ||||||
5.500%, 01/27/2025 | 949 | 1,009 | ||||||
4.875%, 09/23/2032 (A) | 2,441 | 2,428 | ||||||
4.500%, 01/30/2030 (A) | 3,240 | 3,183 | ||||||
|
|
| ||||||
| 25,194 | ||||||||
|
|
| ||||||
Ecuador — 0.8% | ||||||||
Ecuador Government International Bond | ||||||||
6.500%, 07/31/2030 (A)(E) | 2,297 | 1,066 | ||||||
0.500%, 5.000%, 07/31/2021, 07/31/2030 (A)(C) | 5,415 | 3,655 | ||||||
0.500%, 5.000%, 07/31/2021, 07/31/2030 (C) | 360 | 243 | ||||||
0.500%, 1.000%, 07/31/2021, 07/31/2035 (A)(C) | 9,663 | 5,339 | ||||||
0.500%, 0.500%, 07/31/2021, 07/31/2040 (A)(C) | 2,978 | 1,485 | ||||||
|
|
| ||||||
| 11,788 | ||||||||
|
|
| ||||||
Egypt — 3.2% | ||||||||
Egypt Government Bond | ||||||||
14.406%, 07/07/2027 | EGP | 17,842 | 1,124 | |||||
14.196%, 07/07/2023 | 21,779 | 1,375 | ||||||
Egypt Government International Bond | ||||||||
18.000%, 11/06/2028 | 30,307 | 2,236 | ||||||
17.700%, 08/07/2025 | 29,457 | 2,071 | ||||||
16.300%, 04/09/2024 | 15,034 | 1,002 | ||||||
16.100%, 05/07/2029 | 14,920 | 1,021 | ||||||
8.875%, 05/29/2050 (A) | $ | 4,440 | 4,394 | |||||
8.700%, 03/01/2049 (A) | 816 | 794 | ||||||
8.700%, 03/01/2049 | 800 | 778 | ||||||
7.903%, 02/21/2048 (A) | 421 | 388 | ||||||
7.625%, 05/29/2032 (A) | 6,199 | 6,052 | ||||||
7.625%, 05/29/2032 | 621 | 606 | ||||||
5.250%, 10/06/2025 (A) | 2,585 | 2,579 | ||||||
Egypt Government International Bond MTN | ||||||||
8.500%, 01/31/2047 | 4,131 | 3,991 | ||||||
8.150%, 11/20/2059 (A) | 485 | 451 | ||||||
8.150%, 11/20/2059 | 277 | 258 | ||||||
7.053%, 01/15/2032 (A) | 547 | 521 | ||||||
6.375%, 04/11/2031 | EUR | 1,230 | 1,338 | |||||
6.375%, 04/11/2031 (A) | 300 | 326 | ||||||
6.125%, 01/31/2022 (A) | $ | 865 | 886 | |||||
5.625%, 04/16/2030 | EUR | 2,433 | 2,578 | |||||
5.625%, 04/16/2030 (A) | 244 | 258 | ||||||
SEI Institutional International Trust / Annual Report / September 30, 2020 |
53 |
SCHEDULE OF INVESTMENTS
September 30, 2020
Emerging Markets Debt Fund (Continued)
| Description | Face Amount (Thousands) | Market Value ($ Thousands) | ||||||
GLOBAL BONDS (continued) | ||||||||
4.750%, 04/11/2025 | EUR | 457 | $ | 522 | ||||
4.750%, 04/16/2026 | 670 | 747 | ||||||
Egypt Treasury Bills (E) | ||||||||
13.474%, 01/05/2021 | EGP | 84,700 | 5,201 | |||||
13.528%, 04/06/2021 | 87,225 | 5,184 | ||||||
|
|
| ||||||
| 46,681 | ||||||||
|
|
| ||||||
El Salvador — 0.6% | ||||||||
El Salvador Government International Bond | ||||||||
9.500%, 07/15/2052 | $ | 568 | 537 | |||||
8.250%, 04/10/2032 (A) | 326 | 294 | ||||||
Republic of El Salvador | ||||||||
8.250%, 04/10/2032 | 3,324 | 3,000 | ||||||
7.750%, 01/24/2023 | 2,488 | 2,401 | ||||||
7.650%, 06/15/2035 | 499 | 429 | ||||||
7.625%, 02/01/2041 | 327 | 274 | ||||||
7.125%, 01/20/2050 | 640 | 498 | ||||||
5.875%, 01/30/2025 | 1,396 | 1,217 | ||||||
|
|
| ||||||
| 8,650 | ||||||||
|
|
| ||||||
Gabon — 0.1% | ||||||||
Gabon Government International Bond | ||||||||
6.625%, 02/06/2031 | 603 | 538 | ||||||
6.625%, 02/06/2031 (A) | 247 | 220 | ||||||
Gabonese Republic | ||||||||
6.950%, 06/16/2025 (A) | 465 | 435 | ||||||
6.375%, 12/12/2024 | 946 | 892 | ||||||
|
|
| ||||||
| 2,085 | ||||||||
|
|
| ||||||
Georgia — 0.0% | ||||||||
Republic of Georgia | ||||||||
6.875%, 04/12/2021 (A) | 66 | 67 | ||||||
|
|
| ||||||
Ghana — 1.3% | ||||||||
Ghana Government International Bond | ||||||||
24.750%, 07/19/2021 | GHS | – | – | |||||
19.750%, 03/25/2024 | 5,311 | 912 | ||||||
19.000%, 11/02/2026 | 11,055 | 1,826 | ||||||
10.750%, 10/14/2030 | $ | 2,854 | 3,459 | |||||
8.950%, 03/26/2051 (A) | 3,695 | 3,191 | ||||||
8.750%, 03/11/2061 (A) | 658 | 554 | ||||||
8.750%, 03/11/2061 | 233 | 196 | ||||||
8.627%, 06/16/2049 (A) | 593 | 498 | ||||||
8.125%, 03/26/2032 (A) | 246 | 215 | ||||||
7.875%, 03/26/2027 (A) | 1,357 | 1,288 | ||||||
7.875%, 03/26/2027 | 72 | 68 | ||||||
7.875%, 02/11/2035 (A) | 1,589 | 1,338 | ||||||
7.875%, 02/11/2035 | 1,055 | 888 | ||||||
7.625%, 05/16/2029 | 995 | 897 | ||||||
7.625%, 05/16/2029 (A) | 653 | 589 | ||||||
6.375%, 02/11/2027 (A) | 2,568 | 2,308 | ||||||
Kosmos Energy | ||||||||
7.125%, 04/04/2026 (A) | 182 | 160 | ||||||
| Description | Face Amount (Thousands) | Market Value ($ Thousands) | ||||||
GLOBAL BONDS (continued) | ||||||||
Republic of Ghana | ||||||||
8.125%, 01/18/2026 (A) | $ | 83 | $ | 83 | ||||
Tullow Oil | ||||||||
7.000%, 03/01/2025 (A) | 783 | 364 | ||||||
|
|
| ||||||
| 18,834 | ||||||||
|
|
| ||||||
Guatemala — 0.2% | ||||||||
Comunicaciones Celulares Via Comcel Trust | ||||||||
6.875%, 02/06/2024 (A) | 390 | 399 | ||||||
Guatemala Government Bond | ||||||||
6.125%, 06/01/2050 | 962 | 1,147 | ||||||
5.375%, 04/24/2032 | 600 | 688 | ||||||
4.900%, 06/01/2030 | 558 | 618 | ||||||
|
|
| ||||||
| 2,852 | ||||||||
|
|
| ||||||
Honduras — 0.1% | ||||||||
Honduras Government International Bond | ||||||||
6.250%, 01/19/2027 | 326 | 357 | ||||||
5.625%, 06/24/2030 (A) | 736 | 787 | ||||||
5.625%, 06/24/2030 | 299 | 320 | ||||||
|
|
| ||||||
| 1,464 | ||||||||
|
|
| ||||||
Hong Kong — 0.1% | ||||||||
AIA Group | ||||||||
3.200%, 09/16/2040 (A) | 200 | 207 | ||||||
NWD | ||||||||
4.125%, 07/18/2029 | 757 | 769 | ||||||
|
|
| ||||||
| 976 | ||||||||
|
|
| ||||||
Hungary — 1.4% | ||||||||
Hungary Government Bond | ||||||||
6.750%, 10/22/2028 | HUF | 489,630 | 2,138 | |||||
6.375%, 03/29/2021 | $ | 2,228 | 2,291 | |||||
5.500%, 06/24/2025 | HUF | 500,750 | 1,909 | |||||
3.000%, 06/26/2024 | 413,620 | 1,409 | ||||||
3.000%, 10/27/2027 | 1,192,460 | 4,123 | ||||||
3.000%, 08/21/2030 | 727,940 | 2,513 | ||||||
2.750%, 12/22/2026 | 1,072,960 | 3,638 | ||||||
2.500%, 10/24/2024 | 653,680 | 2,199 | ||||||
Hungary Government International Bond | ||||||||
1.750%, 06/05/2035 | EUR | 265 | 326 | |||||
|
|
| ||||||
| 20,546 | ||||||||
|
|
| ||||||
India — 0.2% | ||||||||
Adani Electricity Mumbai | ||||||||
3.949%, 02/12/2030 (A) | $ | 540 | 528 | |||||
Export-Import Bank of India MTN | ||||||||
3.250%, 01/15/2030 (A) | 1,060 | 1,068 | ||||||
Network i2i | ||||||||
5.650%, VAR US Treas Yield Curve Rate T Note Const Mat 5 Yr+4.277% (A)(G) | 275 | 275 | ||||||
Power Finance MTN | ||||||||
3.950%, 04/23/2030 (A) | 569 | 549 | ||||||
54 |
SEI Institutional International Trust / Annual Report / September 30, 2020 |
| Description | Face Amount (Thousands) | Market Value ($ Thousands) | ||||||
GLOBAL BONDS (continued) |
| |||||||
Vedanta Holdings Mauritius II | ||||||||
13.000%, 08/21/2023 (A) | $ | 601 | $ | 619 | ||||
|
|
| ||||||
| 3,039 | ||||||||
|
|
| ||||||
Indonesia — 7.2% | ||||||||
Indonesia Asahan Aluminium Persero | ||||||||
6.757%, 11/15/2048 (A) | 331 | 425 | ||||||
6.757%, 11/15/2048 | 257 | 330 | ||||||
5.800%, 05/15/2050 (A) | 2,234 | 2,609 | ||||||
5.710%, 11/15/2023 (A) | 618 | 686 | ||||||
5.450%, 05/15/2030 (A) | 1,051 | 1,215 | ||||||
4.750%, 05/15/2025 (A) | 1,370 | 1,507 | ||||||
Indonesia Government International Bond | ||||||||
9.000%, 03/15/2029 | IDR | 2,750,000 | 3,236 | |||||
8.750%, 05/15/2031 | 779,000 | 4,556 | ||||||
8.500%, 10/12/2035 | $ | 1,969 | 3,148 | |||||
8.375%, 03/15/2024 | IDR | 173,000 | 1,474 | |||||
8.375%, 03/15/2034 | 2,065,000 | 10,243 | ||||||
8.375%, 04/15/2039 | 801,000 | 5,779 | ||||||
8.250%, 05/15/2029 | 8,743,000 | 5,030 | ||||||
8.250%, 06/15/2032 | 2,030,000 | 864 | ||||||
8.250%, 05/15/2036 | 2,516,000 | 5,148 | ||||||
8.125%, 05/15/2024 | 6,235,000 | 5,533 | ||||||
7.750%, 01/17/2038 | $ | 1,797 | 2,776 | |||||
7.500%, 08/15/2032 | IDR | 6,770,000 | 1,826 | |||||
7.500%, 05/15/2038 | 8,662,000 | 3,909 | ||||||
7.000%, 05/15/2022 | 233,000 | 2,814 | ||||||
7.000%, 05/15/2027 | 3,129,000 | 4,370 | ||||||
6.625%, 05/15/2033 | 4,323,000 | 1,557 | ||||||
6.125%, 05/15/2028 | 9,066,000 | 586 | ||||||
5.625%, 05/15/2023 | 3,267,000 | 223 | ||||||
5.250%, 01/08/2047 (A) | $ | 170 | 220 | |||||
4.750%, 02/11/2029 | 985 | 1,168 | ||||||
4.350%, 01/08/2027 (A) | 206 | 236 | ||||||
3.500%, 01/11/2028 | 2,300 | 2,514 | ||||||
2.850%, 02/14/2030 | 1,059 | 1,112 | ||||||
1.400%, 10/30/2031 | EUR | 300 | 343 | |||||
0.900%, 02/14/2027 | 428 | 490 | ||||||
Indonesia Government International Bond MTN | ||||||||
5.250%, 01/17/2042 | $ | 3,200 | 4,046 | |||||
5.125%, 01/15/2045 | 410 | 515 | ||||||
4.625%, 04/15/2043 | 1,320 | 1,544 | ||||||
3.850%, 07/18/2027 | 400 | 450 | ||||||
Indonesia Treasury Bond | ||||||||
7.500%, 06/15/2035 | IDR | 1,796,000 | 2,151 | |||||
7.500%, 04/15/2040 | 1,221,000 | 2,111 | ||||||
7.000%, 09/15/2030 | 3,842,000 | 6,327 | ||||||
6.500%, 06/15/2025 | 2,680,000 | 3,652 | ||||||
6.500%, 02/15/2031 | 1,038,000 | 67 | ||||||
JPMorgan Chase Bank MTN | ||||||||
7.500%, 06/15/2035 (A) | 1,500,000 | 2,807 | ||||||
| Description | Face Amount (Thousands) | Market Value ($ Thousands) | ||||||
GLOBAL BONDS (continued) | ||||||||
Medco Bell Pte | ||||||||
6.375%, 01/30/2027 (A) | $ | 466 | $ | 401 | ||||
Pertamina Persero MTN | ||||||||
6.450%, 05/30/2044 | 529 | 685 | ||||||
3.650%, 07/30/2029 (A) | 1,035 | 1,110 | ||||||
Perusahaan Listrik Negara | ||||||||
1.875%, 11/05/2031 (A) | EUR | 691 | 776 | |||||
Perusahaan Listrik Negara MTN | ||||||||
6.150%, 05/21/2048 (A) | $ | 657 | 845 | |||||
6.150%, 05/21/2048 | 250 | 322 | ||||||
4.375%, 02/05/2050 (A) | 265 | 274 | ||||||
Perusahaan Penerbit SBSN Indonesia III | ||||||||
4.325%, 05/28/2025 | 2,135 | 2,409 | ||||||
|
|
| ||||||
| 106,419 | ||||||||
|
|
| ||||||
Iraq — 0.1% | ||||||||
Iraq International Bond | ||||||||
5.800%, 01/15/2028 | 1,405 | 1,252 | ||||||
|
|
| ||||||
Israel — 0.6% | ||||||||
Bank Leumi Le-Israel | ||||||||
3.275%, VAR US Treas Yield Curve Rate T Note Const Mat 5 Yr+1.631%, 01/29/2031 (A) | 431 | 433 | ||||||
Leviathan Bond (A) | ||||||||
6.750%, 06/30/2030 | 394 | 408 | ||||||
6.500%, 06/30/2027 | 959 | 995 | ||||||
State of Israel | ||||||||
4.500%, 04/03/2120 | 2,842 | 3,893 | ||||||
3.875%, 07/03/2050 | 2,695 | 3,234 | ||||||
|
|
| ||||||
| 8,963 | ||||||||
|
|
| ||||||
Ivory Coast — 0.6% | ||||||||
Ivory Coast Government International Bond | ||||||||
6.875%, 10/17/2040 | EUR | 1,515 | 1,594 | |||||
6.625%, 03/22/2048 | 1,552 | 1,533 | ||||||
6.625%, 03/22/2048 | 271 | 268 | ||||||
5.875%, 10/17/2031 | 1,729 | 1,832 | ||||||
5.875%, 10/17/2031 (A) | 1,157 | 1,226 | ||||||
5.750%, 12/31/2032 | $ | 1,162 | 1,075 | |||||
5.250%, 03/22/2030 | EUR | 855 | 907 | |||||
5.125%, 06/15/2025 | 371 | 443 | ||||||
|
|
| ||||||
| 8,878 | ||||||||
|
|
| ||||||
Jamaica — 0.1% | ||||||||
Government of Jamaica | ||||||||
7.875%, 07/28/2045 | $ | 736 | 931 | |||||
|
|
| ||||||
Jordan — 0.2% | ||||||||
Jordan Government International Bond | ||||||||
7.375%, 10/10/2047 (A) | 228 | 226 | ||||||
7.375%, 10/10/2047 | 141 | 140 | ||||||
5.850%, 07/07/2030 (A) | 1,238 | 1,199 | ||||||
SEI Institutional International Trust / Annual Report / September 30, 2020 |
55 |
SCHEDULE OF INVESTMENTS
September 30, 2020
Emerging Markets Debt Fund (Continued)
| Description | Face Amount (Thousands) | Market Value ($ Thousands) | ||||||
GLOBAL BONDS (continued) | ||||||||
4.950%, 07/07/2025 (A) | $ | 1,030 | $ | 1,026 | ||||
|
|
| ||||||
| 2,591 | ||||||||
|
|
| ||||||
Kazakhstan — 1.3% | ||||||||
Development Bank of Kazakhstan | ||||||||
4.125%, 12/10/2022 | 770 | 807 | ||||||
Kazakhstan Government International Bond MTN | ||||||||
6.500%, 07/21/2045 | 330 | 512 | ||||||
KazMunayGas National JSC | ||||||||
6.375%, 10/24/2048 (A) | 1,688 | 2,152 | ||||||
5.750%, 04/19/2047 (A) | 2,247 | 2,662 | ||||||
5.750%, 04/19/2047 | 63 | 75 | ||||||
5.375%, 04/24/2030 (A) | 984 | 1,149 | ||||||
5.375%, 04/24/2030 | 3,678 | 4,293 | ||||||
4.750%, 04/24/2025 (A) | 732 | 804 | ||||||
3.875%, 04/19/2022 | 1,777 | 1,834 | ||||||
KazTransGas JSC | ||||||||
4.375%, 09/26/2027 (A) | 932 | 1,003 | ||||||
4.375%, 09/26/2027 | 799 | 859 | ||||||
Tengizchevroil Finance International (A) | ||||||||
3.250%, 08/15/2030 | 450 | 454 | ||||||
2.625%, 08/15/2025 | 1,990 | 1,998 | ||||||
|
|
| ||||||
| 18,602 | ||||||||
|
|
| ||||||
Kenya — 0.3% | ||||||||
Kenya Government International Bond | ||||||||
8.250%, 02/28/2048 | 1,793 | 1,718 | ||||||
8.250%, 02/28/2048 (A) | 654 | 626 | ||||||
8.000%, 05/22/2032 | 368 | 363 | ||||||
7.000%, 05/22/2027 | 1,394 | 1,367 | ||||||
7.000%, 05/22/2027 (A) | 362 | 355 | ||||||
|
|
| ||||||
| 4,429 | ||||||||
|
|
| ||||||
Kuwait — 0.1% | ||||||||
Kuwait International Government Bond | ||||||||
3.500%, 03/20/2027 | 418 | 470 | ||||||
2.750%, 03/20/2022 | 645 | 662 | ||||||
Meglobal Canada ULC MTN | ||||||||
5.875%, 05/18/2030 (A) | 222 | 259 | ||||||
NBK Tier 1 Financing 2 | ||||||||
4.500%, VAR USD Swap Semi 30/360 6 Yr Curr+2.832% (A)(G) | 513 | 506 | ||||||
|
|
| ||||||
| 1,897 | ||||||||
|
|
| ||||||
Lebanon — 0.2% | ||||||||
Lebanon Government International Bond | ||||||||
8.250%, 05/17/2034 (D) | 4,532 | 703 | ||||||
8.200%, 05/17/2033 (D) | 2,700 | 418 | ||||||
6.650%, 04/22/2024 (D) | 2,250 | 354 | ||||||
6.000%, 01/27/2023 (D) | 560 | 88 | ||||||
Lebanon Government International Bond MTN | ||||||||
8.250%, 04/12/2021 (D) | 1,073 | 184 | ||||||
| Description | Face Amount (Thousands) | Market Value ($ Thousands) | ||||||
GLOBAL BONDS (continued) | ||||||||
7.000%, 03/20/2028 (D) | $ | 2,432 | $ | 376 | ||||
6.850%, 05/25/2029 (D) | 387 | 60 | ||||||
6.650%, 02/26/2030 (D) | 1,225 | 188 | ||||||
6.600%, 11/27/2026 (D) | 2,201 | 347 | ||||||
6.400%, 05/26/2023 (D) | 1,555 | 246 | ||||||
6.100%, 10/04/2022 (D) | 1,573 | 259 | ||||||
6.100%, 10/04/2022 (D) | 569 | 93 | ||||||
|
|
| ||||||
| 3,316 | ||||||||
|
|
| ||||||
Luxembourg — 0.0% | ||||||||
Millicom International Cellular | ||||||||
6.250%, 03/25/2029 (A) | 449 | 479 | ||||||
|
|
| ||||||
Macau — 0.1% | ||||||||
Sands China | ||||||||
5.400%, 08/08/2028 | 635 | 706 | ||||||
Studio City Finance (A) | ||||||||
6.500%, 01/15/2028 | 371 | 388 | ||||||
6.000%, 07/15/2025 | 142 | 145 | ||||||
|
|
| ||||||
| 1,239 | ||||||||
|
|
| ||||||
Malaysia — 6.2% | ||||||||
1MDB Energy | ||||||||
5.990%, 05/11/2022 | 2,000 | 2,084 | ||||||
1MDB Global Investments | ||||||||
4.400%, 03/09/2023 | 3,000 | 3,003 | ||||||
4.400%, 03/09/2023 | 7,400 | 7,407 | ||||||
Gohl Capital | ||||||||
4.250%, 01/24/2027 | 850 | 845 | ||||||
Malaysia Government Bond | ||||||||
5.248%, 09/15/2028 | MYR | 1,050 | 299 | |||||
4.935%, 09/30/2043 | 2,200 | 609 | ||||||
4.921%, 07/06/2048 | 1,768 | 494 | ||||||
4.893%, 06/08/2038 | 800 | 227 | ||||||
4.642%, 11/07/2033 | 500 | 139 | ||||||
4.392%, 04/15/2026 | 3,480 | 923 | ||||||
4.232%, 06/30/2031 | 1,200 | 325 | ||||||
4.181%, 07/15/2024 | 4,186 | 1,079 | ||||||
4.160%, 07/15/2021 | 1,920 | 471 | ||||||
4.059%, 09/30/2024 | 8,576 | 2,209 | ||||||
3.955%, 09/15/2025 | 19,783 | 5,135 | ||||||
3.906%, 07/15/2026 | 16,152 | 4,199 | ||||||
3.899%, 11/16/2027 | 2,500 | 655 | ||||||
3.885%, 08/15/2029 | 30,830 | 8,124 | ||||||
3.882%, 03/10/2022 | 5,848 | 1,449 | ||||||
3.828%, 07/05/2034 | 28,209 | 7,354 | ||||||
3.800%, 08/17/2023 | 30,074 | 7,583 | ||||||
3.795%, 09/30/2022 | 3,200 | 799 | ||||||
3.757%, 04/20/2023 | 13,915 | 3,492 | ||||||
3.757%, 05/22/2040 | 1,500 | 382 | ||||||
3.733%, 06/15/2028 | 12,719 | 3,299 | ||||||
3.659%, 10/15/2020 | 36,600 | 8,813 | ||||||
3.620%, 11/30/2021 | 18,334 | 4,506 | ||||||
56 |
SEI Institutional International Trust / Annual Report / September 30, 2020 |
| Description | Face Amount (Thousands) | Market Value ($ Thousands) | ||||||
GLOBAL BONDS (continued) |
| |||||||
3.502%, 05/31/2027 | MYR | 2,412 | $ | 618 | ||||
3.480%, 03/15/2023 | 5,870 | 1,462 | ||||||
3.478%, 06/14/2024 | 6,160 | 1,550 | ||||||
3.418%, 08/15/2022 | 10,450 | 2,585 | ||||||
Malaysia Government Investment Issue | ||||||||
4.369%, 10/31/2028 | 1,200 | 324 | ||||||
4.119%, 11/30/2034 | 5,564 | 1,475 | ||||||
4.070%, 09/30/2026 | 6,500 | 1,706 | ||||||
Malaysia Sukuk Global | ||||||||
3.179%, 04/27/2026 | $ | 1,777 | 1,976 | |||||
Petronas Capital MTN | ||||||||
4.550%, 04/21/2050 (A) | 563 | 715 | ||||||
4.550%, 04/21/2050 | 561 | 713 | ||||||
3.500%, 04/21/2030 (A) | 2,200 | 2,459 | ||||||
|
|
| ||||||
| 91,487 | ||||||||
|
|
| ||||||
Mauritius — 0.0% | ||||||||
Liquid Telecommunications Financing | ||||||||
8.500%, 07/13/2022 (A) | 496 | 501 | ||||||
|
|
| ||||||
Mexico — 8.4% | ||||||||
America Movil | ||||||||
7.125%, 12/09/2024 | MXN | 18,110 | 856 | |||||
Axtel | ||||||||
6.375%, 11/14/2024 (A) | $ | 713 | 741 | |||||
Banco Mercantil del Norte (A) | ||||||||
7.500%, VAR US Treas Yield Curve Rate T Note Const Mat 10 Yr+5.470% (G) | 476 | 469 | ||||||
6.750%, VAR US Treas Yield Curve Rate T Note Const Mat 5 Yr+4.967% (G) | 609 | 600 | ||||||
Banco Nacional de Comercio Exterior SNC | ||||||||
3.800%, VAR US Treas Yield Curve Rate T Note Const Mat 5 Yr+3.000%, 08/11/2026 (A) | 1,015 | 1,012 | ||||||
3.800%, VAR US Treas Yield Curve Rate T Note Const Mat 5 Yr+3.000%, 08/11/2026 | 844 | 842 | ||||||
Banco Santander Mexico Institucion de Banca Multiple Grupo Financiero Santand | ||||||||
5.375%, 04/17/2025 (A) | 414 | 461 | ||||||
Cemex (A) | ||||||||
7.375%, 06/05/2027 | 572 | 618 | ||||||
5.450%, 11/19/2029 | 750 | 758 | ||||||
Cometa Energia | ||||||||
6.375%, 04/24/2035 (A) | 1,333 | 1,459 | ||||||
Comision Federal de Electricidad | ||||||||
7.350%, 11/25/2025 | MXN | 39,785 | 1,734 | |||||
5.750%, 02/14/2042 (A) | $ | 500 | 551 | |||||
4.750%, 02/23/2027 (A) | 458 | 492 | ||||||
Grupo Televisa | ||||||||
6.625%, 01/15/2040 | 616 | 813 | ||||||
Industrias Penoles | ||||||||
5.650%, 09/12/2049 (A) | 359 | 418 | ||||||
| Description | Face Amount (Thousands) | Market Value ($ Thousands) | ||||||
GLOBAL BONDS (continued) |
| |||||||
Infraestructura Energetica Nova | ||||||||
4.750%, 01/15/2051 (A) | $ | 1,410 | $ | 1,322 | ||||
Mexican Bonos | ||||||||
8.000%, 11/07/2047 | MXN | 62,579 | 3,132 | |||||
7.750%, 11/23/2034 | 39,185 | 1,990 | ||||||
7.750%, 11/13/2042 | 94,898 | 4,654 | ||||||
7.500%, 06/03/2027 | 146,597 | 7,381 | ||||||
6.500%, 06/09/2022 | 12,008 | 562 | ||||||
5.750%, 03/05/2026 | 87,650 | 4,065 | ||||||
Mexican Bonos, Ser M20 | ||||||||
10.000%, 12/05/2024 | 305,382 | 16,440 | ||||||
8.500%, 05/31/2029 | 55,069 | 2,950 | ||||||
8.000%, 12/07/2023 | 3,082 | 153 | ||||||
7.750%, 05/29/2031 | 134,983 | 6,893 | ||||||
Mexican Bonos, Ser M30 | ||||||||
8.500%, 11/18/2038 | 91,941 | 4,881 | ||||||
Mexican Udibonos | ||||||||
4.000%, 11/15/2040 | 39,297 | 2,042 | ||||||
4.000%, 11/03/2050 | 41,686 | 2,230 | ||||||
Mexico City Airport Trust | ||||||||
5.500%, 07/31/2047 (A) | $ | 715 | 584 | |||||
Mexico Government International Bond | ||||||||
5.000%, 04/27/2051 | 397 | 445 | ||||||
4.750%, 04/27/2032 | 3,640 | 4,108 | ||||||
4.500%, 04/22/2029 | 2,486 | 2,788 | ||||||
4.500%, 01/31/2050 | 893 | 944 | ||||||
Mexico Government International Bond MTN | ||||||||
5.750%, 10/12/2110 | 1,906 | 2,206 | ||||||
4.750%, 03/08/2044 | 386 | 421 | ||||||
Minera Mexico | ||||||||
4.500%, 01/26/2050 (A) | 627 | 680 | ||||||
Petroleos Mexicanos | ||||||||
9.500%, 09/15/2027 | 169 | 179 | ||||||
7.690%, 01/23/2050 (A) | 8,402 | 7,033 | ||||||
7.470%, 11/12/2026 | MXN | 175,079 | 6,257 | |||||
7.190%, 09/12/2024 | 108,672 | 4,264 | ||||||
6.950%, 01/28/2060 (A) | $ | 3,398 | 2,628 | |||||
6.950%, 01/28/2060 | 5,749 | 4,447 | ||||||
6.840%, 01/23/2030 | 3,342 | 2,983 | ||||||
6.625%, 06/15/2035 | 4,400 | 3,654 | ||||||
6.500%, 01/23/2029 | 423 | 380 | ||||||
6.500%, 01/23/2029 (A) | 785 | 706 | ||||||
6.490%, 01/23/2027 (A) | 62 | 58 | ||||||
6.350%, 02/12/2048 | 678 | 510 | ||||||
6.350%, 02/12/2048 (A) | 430 | 324 | ||||||
5.950%, 01/28/2031 | 1,490 | 1,258 | ||||||
5.950%, 01/28/2031 (A) | 2,188 | 1,848 | ||||||
5.625%, 01/23/2046 | 253 | 185 | ||||||
5.350%, 02/12/2028 (A) | 1,079 | 933 | ||||||
4.500%, 01/23/2026 | 602 | 538 | ||||||
Petroleos Mexicanos MTN | ||||||||
6.875%, 08/04/2026 | 741 | 713 | ||||||
SEI Institutional International Trust / Annual Report / September 30, 2020 |
57 |
SCHEDULE OF INVESTMENTS
September 30, 2020
Emerging Markets Debt Fund (Continued)
| Description | Face Amount (Thousands) | Market Value ($ Thousands) | ||||||
GLOBAL BONDS (continued) | ||||||||
6.750%, 09/21/2047 | $ | 553 | $ | 429 | ||||
4.875%, 02/21/2028 | EUR | 755 | 775 | |||||
United Mexican States MTN | ||||||||
6.050%, 01/11/2040 | $ | 1,116 | 1,397 | |||||
|
|
| ||||||
| 124,194 | ||||||||
|
|
| ||||||
Mongolia — 0.4% | ||||||||
Development Bank of Mongolia | ||||||||
7.250%, 10/23/2023 (A) | 784 | 819 | ||||||
Mongolia Government International Bond | ||||||||
5.625%, 05/01/2023 | 1,287 | 1,321 | ||||||
5.125%, 04/07/2026 | 381 | 384 | ||||||
5.125%, 04/07/2026 (A) | 201 | 202 | ||||||
Mongolia Government International Bond MTN | ||||||||
8.750%, 03/09/2024 | 1,951 | 2,176 | ||||||
5.125%, 12/05/2022 | 500 | 510 | ||||||
|
|
| ||||||
| 5,412 | ||||||||
|
|
| ||||||
Morocco — 0.0% | ||||||||
Morocco Government International Bond | ||||||||
1.500%, 11/27/2031 | EUR | 481 | 530 | |||||
|
|
| ||||||
Mozambique — 0.2% | ||||||||
Mozambique International Bond | ||||||||
5.000%, 09/15/2031 (A) | $ | 3,120 | 2,527 | |||||
|
|
| ||||||
Namibia — 0.0% | ||||||||
Namibia International Bonds | ||||||||
5.250%, 10/29/2025 | 379 | 376 | ||||||
|
|
| ||||||
Netherlands — 0.0% | ||||||||
Minejesa Capital BV (A) | ||||||||
5.625%, 08/10/2037 | 82 | 84 | ||||||
4.625%, 08/10/2030 | 557 | 573 | ||||||
|
|
| ||||||
| 657 | ||||||||
|
|
| ||||||
Nigeria — 0.7% | ||||||||
IHS Netherlands Holdco | ||||||||
8.000%, 09/18/2027 (A) | 299 | 306 | ||||||
Nigeria Government International Bond | ||||||||
9.248%, 01/21/2049 | 322 | 319 | ||||||
8.747%, 01/21/2031 | 1,719 | 1,754 | ||||||
8.747%, 01/21/2031 (A) | 535 | 546 | ||||||
7.875%, 02/16/2032 | 1,803 | 1,718 | ||||||
7.875%, 02/16/2032 (A) | 588 | 560 | ||||||
7.696%, 02/23/2038 | 3,163 | 2,851 | ||||||
7.696%, 02/23/2038 (A) | 601 | 542 | ||||||
7.143%, 02/23/2030 | 682 | 646 | ||||||
Nigeria Government International Bond MTN | ||||||||
6.500%, 11/28/2027 (A) | 1,129 | 1,074 | ||||||
6.500%, 11/28/2027 | 130 | 124 | ||||||
|
|
| ||||||
| 10,440 | ||||||||
|
|
| ||||||
| Description | Face Amount (Thousands) | Market Value ($ Thousands) | ||||||
GLOBAL BONDS (continued) | ||||||||
Oman — 0.7% | ||||||||
Oman Government International Bond | ||||||||
6.750%, 01/17/2048 (A) | $ | 1,059 | $ | 875 | ||||
6.750%, 01/17/2048 | 7,649 | 6,317 | ||||||
5.625%, 01/17/2028 (A) | 366 | 336 | ||||||
4.750%, 06/15/2026 | 900 | 825 | ||||||
3.625%, 06/15/2021 | 1,326 | 1,318 | ||||||
Oman Government International Bond MTN (A) | ||||||||
6.000%, 08/01/2029 | 309 | 284 | ||||||
4.875%, 02/01/2025 | 917 | 884 | ||||||
|
|
| ||||||
| 10,839 | ||||||||
|
|
| ||||||
Pakistan — 0.2% | ||||||||
Pakistan Government International Bond | ||||||||
8.250%, 09/30/2025 (B) | 1,000 | 1,062 | ||||||
7.875%, 03/31/2036 | 200 | 199 | ||||||
6.875%, 12/05/2027 | 1,114 | 1,107 | ||||||
Third Pakistan International Sukuk | ||||||||
5.500%, 10/13/2021 | 1,201 | 1,198 | ||||||
|
|
| ||||||
| 3,566 | ||||||||
|
|
| ||||||
Panama — 1.4% | ||||||||
Aeropuerto Internacional de Tocumen | ||||||||
6.000%, 11/18/2048 (A) | 672 | 748 | ||||||
5.625%, 05/18/2036 | 555 | 615 | ||||||
AES Panama Generation Holdings SRL | ||||||||
4.375%, 05/31/2030 (A) | 984 | 1,010 | ||||||
Banco Nacional de Panama | ||||||||
2.500%, 08/11/2030 (A) | 791 | 783 | ||||||
Cable Onda | ||||||||
4.500%, 01/30/2030 (A) | 208 | 216 | ||||||
Empresa de Transmision Electrica | ||||||||
5.125%, 05/02/2049 (A) | 635 | 736 | ||||||
Panama Government International Bond | ||||||||
4.500%, 04/16/2050 | 1 | 1 | ||||||
2.252%, 09/29/2032 | 1,719 | 1,732 | ||||||
Republic of Panama | ||||||||
9.375%, 04/01/2029 | 1,004 | 1,542 | ||||||
8.125%, 04/28/2034 | 478 | 685 | ||||||
4.500%, 04/01/2056 | 4,367 | 5,470 | ||||||
3.870%, 07/23/2060 | 2,826 | 3,232 | ||||||
3.750%, 03/16/2025 | 2,016 | 2,200 | ||||||
3.160%, 01/23/2030 | 2,099 | 2,283 | ||||||
|
|
| ||||||
| 21,253 | ||||||||
|
|
| ||||||
Papua New Guinea — 0.2% | ||||||||
Papua New Guinea Government International Bond | ||||||||
8.375%, 10/04/2028 (A) | 2,882 | 2,885 | ||||||
8.375%, 10/04/2028 | 306 | 306 | ||||||
|
|
| ||||||
| 3,191 | ||||||||
|
|
| ||||||
58 |
SEI Institutional International Trust / Annual Report / September 30, 2020 |
| Description | Face Amount (Thousands) | Market Value ($ Thousands) | ||||||
GLOBAL BONDS (continued) | ||||||||
Paraguay — 0.2% | ||||||||
Paraguay Government International Bond | ||||||||
6.100%, 08/11/2044 | $ | 1,010 | $ | 1,306 | ||||
5.400%, 03/30/2050 | 571 | 692 | ||||||
4.950%, 04/28/2031 | 847 | 975 | ||||||
|
|
| ||||||
| 2,973 | ||||||||
|
|
| ||||||
Peru — 2.9% | ||||||||
Abengoa Transmision Sur | ||||||||
6.875%, 04/30/2043 (A) | 266 | 347 | ||||||
Fondo MIVIVIENDA | ||||||||
7.000%, 02/14/2024 (A) | PEN | 3,704 | 1,150 | |||||
Inkia Energy | ||||||||
5.875%, 11/09/2027 (A) | $ | 359 | 374 | |||||
Kallpa Generacion (A) | ||||||||
4.875%, 05/24/2026 | 192 | 207 | ||||||
4.125%, 08/16/2027 | 1,197 | 1,251 | ||||||
Peru Government Bond | ||||||||
5.350%, 08/12/2040 | PEN | 708 | 195 | |||||
Peruvian Government International Bond | ||||||||
8.200%, 08/12/2026 | 4,697 | 1,734 | ||||||
8.200%, 08/12/2026 | 4,478 | 1,654 | ||||||
6.950%, 08/12/2031 | 154 | 52 | ||||||
6.950%, 08/12/2031 | 23,360 | 7,949 | ||||||
6.900%, 08/12/2037 | 7,121 | 2,359 | ||||||
6.850%, 02/12/2042 | 613 | 197 | ||||||
6.550%, 03/14/2037 | $ | 309 | 467 | |||||
6.350%, 08/12/2028 (A) | PEN | 1,465 | 492 | |||||
6.350%, 08/12/2028 | 346 | 116 | ||||||
6.350%, 08/12/2028 | 1,570 | 527 | ||||||
6.350%, 08/12/2028 | 5,940 | 1,994 | ||||||
6.150%, 08/12/2032 | 21,790 | 6,950 | ||||||
5.940%, 02/12/2029 | 367 | 120 | ||||||
5.700%, 08/12/2024 (A) | 4,932 | 1,614 | ||||||
5.625%, 11/18/2050 | $ | 758 | 1,207 | |||||
5.400%, 08/12/2034 | PEN | 4,002 | 1,164 | |||||
2.844%, 06/20/2030 | $ | 1,153 | 1,254 | |||||
2.783%, 01/23/2031 | 1,840 | 1,988 | ||||||
2.392%, 01/23/2026 | 1,475 | 1,547 | ||||||
Petroleos del Peru | ||||||||
5.625%, 06/19/2047 | 1,993 | 2,292 | ||||||
5.625%, 06/19/2047 (A) | 366 | 421 | ||||||
4.750%, 06/19/2032 | 1,843 | 1,996 | ||||||
4.750%, 06/19/2032 (A) | 1,201 | 1,301 | ||||||
|
|
| ||||||
| 42,919 | ||||||||
|
|
| ||||||
Philippines — 0.4% | ||||||||
Philippine Government International Bond | ||||||||
4.000%, 01/15/2021 | 157 | 158 | ||||||
3.900%, 11/26/2022 | PHP | 45,000 | 946 | |||||
3.750%, 01/14/2029 | $ | 2,522 | 2,942 | |||||
2.950%, 05/05/2045 | 530 | 561 | ||||||
| Description | Face Amount (Thousands) | Market Value ($ Thousands) | ||||||
GLOBAL BONDS (continued) | ||||||||
2.457%, 05/05/2030 | $ | 915 | $ | 986 | ||||
|
|
| ||||||
| 5,593 | ||||||||
|
|
| ||||||
Poland — 2.9% | ||||||||
Republic of Poland Government Bond | ||||||||
5.000%, 03/23/2022 | 2,281 | 2,437 | ||||||
3.250%, 07/25/2025 | PLN | 8,585 | 2,499 | |||||
2.750%, 04/25/2028 | 21,486 | 6,214 | ||||||
2.750%, 10/25/2029 | 25,298 | 7,374 | ||||||
2.500%, 01/25/2023 | 16,804 | 4,589 | ||||||
2.500%, 04/25/2024 | 6,060 | 1,690 | ||||||
2.500%, 07/25/2026 | 29,930 | 8,482 | ||||||
2.500%, 07/25/2027 | 16,396 | 4,659 | ||||||
2.250%, 04/25/2022 | 13,055 | 3,493 | ||||||
2.000%, 04/25/2021 | 912 | 238 | ||||||
1.750%, 07/25/2021 | 5,000 | 1,312 | ||||||
|
|
| ||||||
| 42,987 | ||||||||
|
|
| ||||||
Qatar — 1.4% | ||||||||
Qatar Government International Bond | ||||||||
5.750%, 01/20/2042 (A) | $ | 574 | 846 | |||||
5.103%, 04/23/2048 (A) | 694 | 964 | ||||||
5.103%, 04/23/2048 | 567 | 788 | ||||||
4.817%, 03/14/2049 (A) | 573 | 771 | ||||||
4.817%, 03/14/2049 | 3,737 | 5,032 | ||||||
4.400%, 04/16/2050 (A) | 662 | 852 | ||||||
4.400%, 04/16/2050 | 317 | 408 | ||||||
4.000%, 03/14/2029 | 1,334 | 1,559 | ||||||
4.000%, 03/14/2029 (A) | 2,833 | 3,311 | ||||||
3.750%, 04/16/2030 (A) | 4,027 | 4,666 | ||||||
3.750%, 04/16/2030 | 367 | 425 | ||||||
3.400%, 04/16/2025 | 654 | 717 | ||||||
|
|
| ||||||
| 20,339 | ||||||||
|
|
| ||||||
Romania — 2.1% | ||||||||
Government of Romania | ||||||||
5.850%, 04/26/2023 | RON | 7,190 | 1,842 | |||||
Romania Government Bond | ||||||||
4.850%, 04/22/2026 | 9,840 | 2,544 | ||||||
4.400%, 09/25/2023 | 790 | 197 | ||||||
4.150%, 01/26/2028 | 3,980 | 999 | ||||||
3.700%, 11/25/2024 | 1,740 | 425 | ||||||
3.650%, 07/28/2025 | 8,440 | 2,061 | ||||||
Romanian Government International Bond | ||||||||
5.125%, 06/15/2048 | $ | 628 | 765 | |||||
5.000%, 02/12/2029 | RON | 8,095 | 2,156 | |||||
4.500%, 06/17/2024 | 8,245 | 2,070 | ||||||
4.250%, 06/28/2023 | 2,730 | 675 | ||||||
4.000%, 10/27/2021 | 10,545 | 2,569 | ||||||
4.000%, 02/14/2051 (A) | $ | 1,742 | 1,794 | |||||
3.000%, 02/14/2031 (A) | 1,224 | 1,256 | ||||||
Romanian Government International Bond MTN | ||||||||
4.625%, 04/03/2049 (A) | EUR | 1,338 | 1,911 | |||||
SEI Institutional International Trust / Annual Report / September 30, 2020 |
59 |
SCHEDULE OF INVESTMENTS
September 30, 2020
Emerging Markets Debt Fund (Continued)
| Description | Face Amount (Thousands) | Market Value ($ Thousands) | ||||||
GLOBAL BONDS (continued) | ||||||||
4.625%, 04/03/2049 | EUR | 1,248 | $ | 1,781 | ||||
4.125%, 03/11/2039 | 1,258 | 1,674 | ||||||
3.875%, 10/29/2035 | 330 | 439 | ||||||
3.375%, 02/08/2038 | 973 | 1,212 | ||||||
3.375%, 01/28/2050 | 1,660 | 1,985 | ||||||
3.375%, 01/28/2050 (A) | 471 | 563 | ||||||
2.124%, 07/16/2031 | 158 | 185 | ||||||
2.000%, 01/28/2032 | 950 | 1,097 | ||||||
|
|
| ||||||
| 30,200 | ||||||||
|
|
| ||||||
Russia — 5.5% | ||||||||
Gazprom OAO Via Gaz Capital (A) | ||||||||
5.150%, 02/11/2026 | $ | 2,673 | 2,978 | |||||
4.950%, 02/06/2028 | 640 | 714 | ||||||
Gtlk Europe Capital DAC | ||||||||
4.650%, 03/10/2027 | 596 | 590 | ||||||
GTLK Europe Capital DAC | ||||||||
4.949%, 02/18/2026 | 968 | 989 | ||||||
GTLK Europe DAC | ||||||||
5.950%, 07/19/2021 | 220 | 224 | ||||||
Rusal Capital DAC | ||||||||
5.125%, 02/02/2022 | 860 | 866 | ||||||
Russian Federal Bond - OFZ | ||||||||
8.500%, 09/17/2031 | RUB | 176,982 | 2,686 | |||||
8.150%, 02/03/2027 | 827,610 | 12,036 | ||||||
7.950%, 10/07/2026 | 280,027 | 4,034 | ||||||
7.700%, 03/23/2033 | 345,745 | 4,978 | ||||||
7.700%, 03/16/2039 | 54,617 | 802 | ||||||
7.650%, 04/10/2030 | 100,827 | 1,437 | ||||||
7.250%, 05/10/2034 | 238,383 | 3,318 | ||||||
7.100%, 10/16/2024 | 139,464 | 1,925 | ||||||
7.050%, 01/19/2028 | 953,320 | 13,074 | ||||||
7.000%, 08/16/2023 | 321,552 | 4,374 | ||||||
6.900%, 05/23/2029 | 334,404 | 4,535 | ||||||
6.000%, 10/06/2027 | 16,284 | 211 | ||||||
Russian Foreign Bond - Eurobond | ||||||||
7.500%, 03/31/2030 | $ | 2 | 2 | |||||
5.875%, 09/16/2043 | 3,800 | 5,263 | ||||||
5.625%, 04/04/2042 | 2,200 | 2,939 | ||||||
5.250%, 06/23/2047 | 1,000 | 1,324 | ||||||
5.100%, 03/28/2035 | 3,200 | 3,922 | ||||||
4.375%, 03/21/2029 (B) | 5,600 | 6,425 | ||||||
SCF Capital Designated Activity | ||||||||
5.375%, 06/16/2023 (A) | 529 | 568 | ||||||
Vnesheconombank Via VEB Finance | ||||||||
6.800%, 11/22/2025 | 580 | 692 | ||||||
6.800%, 11/22/2025 (A) | 150 | 179 | ||||||
|
|
| ||||||
| 81,085 | ||||||||
|
|
| ||||||
Saudi Arabia — 1.3% | ||||||||
Acwa Power Management And Investments One | ||||||||
5.950%, 12/15/2039 (A) | 1,742 | 1,966 | ||||||
| Description | Face Amount (Thousands) | Market Value ($ Thousands) | ||||||
GLOBAL BONDS (continued) | ||||||||
Saudi Arabian Oil MTN | ||||||||
4.250%, 04/16/2039 (A) | $ | 1,597 | $ | 1,836 | ||||
4.250%, 04/16/2039 | 2,150 | 2,471 | ||||||
Saudi Government International Bond | ||||||||
5.250%, 01/16/2050 | 680 | 914 | ||||||
5.250%, 01/16/2050 (A) | 326 | 438 | ||||||
Saudi Government International Bond MTN | ||||||||
5.000%, 04/17/2049 (A) | 1,013 | 1,310 | ||||||
5.000%, 04/17/2049 | 803 | 1,038 | ||||||
4.500%, 10/26/2046 | 580 | 696 | ||||||
3.250%, 10/26/2026 (A) | 1,884 | 2,049 | ||||||
3.250%, 10/22/2030 (A) | 3,329 | 3,615 | ||||||
3.250%, 10/22/2030 | 395 | 429 | ||||||
2.750%, 02/03/2032 | 1,146 | 1,192 | ||||||
2.750%, 02/03/2032 (A) | 727 | 756 | ||||||
|
|
| ||||||
| 18,710 | ||||||||
|
|
| ||||||
Senegal — 0.1% | ||||||||
Senegal Government International Bond | ||||||||
6.750%, 03/13/2048 | 260 | 246 | ||||||
6.250%, 07/30/2024 | 677 | 696 | ||||||
|
|
| ||||||
| 942 | ||||||||
|
|
| ||||||
Serbia — 0.8% | ||||||||
Republic of Serbia | ||||||||
7.250%, 09/28/2021 | 437 | 462 | ||||||
Serbia International Bond | ||||||||
3.125%, 05/15/2027 | 320 | 401 | ||||||
1.500%, 06/26/2029 | EUR | 2,344 | 2,653 | |||||
Serbia Treasury Bonds | ||||||||
5.875%, 02/08/2028 | RSD | 203,510 | 2,368 | |||||
4.500%, 01/11/2026 | 211,800 | 2,279 | ||||||
4.500%, 08/20/2032 | 177,880 | 1,874 | ||||||
3.750%, 01/17/2022 | 159,400 | 1,628 | ||||||
|
|
| ||||||
| 11,665 | ||||||||
|
|
| ||||||
South Africa — 4.1% | ||||||||
Eskom Holdings SOC | ||||||||
7.125%, 02/11/2025 (A) | $ | 2,085 | 1,899 | |||||
7.125%, 02/11/2025 | 1,430 | 1,302 | ||||||
5.750%, 01/26/2021 (A) | 1,681 | 1,640 | ||||||
Eskom Holdings SOC MTN | ||||||||
8.450%, 08/10/2028 (A) | 471 | 432 | ||||||
7.500%, 09/15/2033 | ZAR | 35,200 | 1,492 | |||||
6.750%, 08/06/2023 | $ | 1,556 | 1,431 | |||||
6.750%, 08/06/2023 (A) | 1,329 | 1,222 | ||||||
6.350%, 08/10/2028 (A) | 322 | 323 | ||||||
Republic of South Africa | ||||||||
10.500%, 12/21/2026 | ZAR | 192,764 | 13,374 | |||||
9.000%, 01/31/2040 | 54,699 | 2,625 | ||||||
8.875%, 02/28/2035 | 41,899 | 2,102 | ||||||
8.750%, 01/31/2044 | 85,589 | 3,958 | ||||||
8.750%, 02/28/2048 | 127,725 | 5,885 | ||||||
8.500%, 01/31/2037 | 114,313 | 5,372 | ||||||
60 |
SEI Institutional International Trust / Annual Report / September 30, 2020 |
| Description | Face Amount (Thousands) | Market Value ($ Thousands) | ||||||
GLOBAL BONDS (continued) | ||||||||
8.250%, 03/31/2032 | ZAR | 4,180 | $ | 215 | ||||
8.000%, 01/31/2030 | 63,249 | 3,460 | ||||||
7.750%, 02/28/2023 | 5,181 | 333 | ||||||
7.000%, 02/28/2031 | 51,041 | 2,488 | ||||||
6.500%, 02/28/2041 | 16,423 | 613 | ||||||
6.300%, 06/22/2048 | $ | 964 | 877 | |||||
6.250%, 03/31/2036 | ZAR | 68,414 | 2,669 | |||||
5.875%, 09/16/2025 | $ | 790 | 844 | |||||
5.750%, 09/30/2049 | 3,772 | 3,194 | ||||||
5.650%, 09/27/2047 | 386 | 327 | ||||||
5.000%, 10/12/2046 | 357 | 286 | ||||||
4.850%, 09/27/2027 | 420 | 414 | ||||||
4.850%, 09/30/2029 | 1,508 | 1,437 | ||||||
SASOL Financing USA | ||||||||
5.875%, 03/27/2024 | 442 | 425 | ||||||
Transnet SOC MTN | ||||||||
9.500%, 05/13/2021 (A) | ZAR | 6,760 | 411 | |||||
|
|
| ||||||
| 61,050 | ||||||||
|
|
| ||||||
South Korea — 0.3% | ||||||||
Export-Import Bank of Korea MTN | ||||||||
8.400%, 11/30/2021 | IDR | 2,400,000 | 1,539 | |||||
7.250%, 12/07/2024 | 700,000 | 49 | ||||||
Korea International Bond | ||||||||
2.000%, 06/19/2024 | $ | 1,026 | 1,074 | |||||
1.000%, 09/16/2030 | 1,948 | 1,921 | ||||||
|
|
| ||||||
| 4,583 | ||||||||
|
|
| ||||||
Spain — 0.1% | ||||||||
AI Candelaria Spain SLU | ||||||||
7.500%, 12/15/2028 (A) | 975 | 1,053 | ||||||
|
|
| ||||||
Sri Lanka — 0.9% | ||||||||
Sri Lanka Government International Bond | ||||||||
7.850%, 03/14/2029 | 1,598 | 1,103 | ||||||
7.550%, 03/28/2030 | 1,689 | 1,140 | ||||||
6.850%, 03/14/2024 | 512 | 374 | ||||||
6.850%, 11/03/2025 | 1,339 | 937 | ||||||
6.825%, 07/18/2026 (A) | 1,584 | 1,103 | ||||||
6.825%, 07/18/2026 | 500 | 348 | ||||||
6.750%, 04/18/2028 (A) | 4,437 | 2,995 | ||||||
6.750%, 04/18/2028 | 746 | 504 | ||||||
6.350%, 06/28/2024 (A) | 1,294 | 938 | ||||||
6.250%, 07/27/2021 | 1,834 | 1,596 | ||||||
6.200%, 05/11/2027 | 1,186 | 800 | ||||||
5.875%, 07/25/2022 (A) | 308 | 245 | ||||||
5.750%, 04/18/2023 (A) | 1,031 | 758 | ||||||
5.750%, 04/18/2023 | 995 | 731 | ||||||
|
|
| ||||||
| 13,572 | ||||||||
|
|
| ||||||
Supra-National — 0.5% | ||||||||
African Export-Import Bank MTN | ||||||||
3.994%, 09/21/2029 (A) | 363 | 374 | ||||||
| Description | Face Amount (Thousands) | Market Value ($ Thousands) | ||||||
GLOBAL BONDS (continued) | ||||||||
Banque Ouest Africaine de Developpement (A) | ||||||||
5.000%, 07/27/2027 | $ | 865 | $ | 931 | ||||
4.700%, 10/22/2031 | 683 | 715 | ||||||
European Bank for Reconstruction & Development MTN | ||||||||
6.450%, 12/13/2022 | 9,486,000 | 644 | ||||||
European Investment Bank MTN | ||||||||
8.500%, 09/17/2024 | ZAR | 9,200 | 621 | |||||
Inter-American Development Bank MTN | ||||||||
7.875%, 03/14/2023 | IDR | 880,000 | 3,587 | |||||
International Bank for Reconstruction & Development MTN | ||||||||
7.450%, 08/20/2021 | 914,700 | 744 | ||||||
|
|
| ||||||
| 7,616 | ||||||||
|
|
| ||||||
Tanzania — 0.0% | ||||||||
AngloGold Ashanti Holdings | ||||||||
3.750%, 10/01/2030 | $ | 229 | 235 | |||||
|
|
| ||||||
Thailand — 2.6% | ||||||||
Thailand Government Bond | ||||||||
5.670%, 03/13/2028 | THB | 3,000 | 125 | |||||
3.775%, 06/25/2032 | 210,074 | 8,263 | ||||||
3.650%, 06/20/2031 | 84,500 | 3,243 | ||||||
3.625%, 06/16/2023 | 30,000 | 1,022 | ||||||
3.400%, 06/17/2036 | 216,743 | 8,424 | ||||||
3.300%, 06/17/2038 | 99,572 | 3,803 | ||||||
2.875%, 12/17/2028 | 85,796 | 3,051 | ||||||
2.875%, 06/17/2046 | 3,431 | 125 | ||||||
2.400%, 12/17/2023 | 88,000 | 2,926 | ||||||
2.125%, 12/17/2026 | 15,000 | 505 | ||||||
1.875%, 06/17/2022 | 20,000 | 645 | ||||||
1.600%, 12/17/2029 | 40,631 | 1,310 | ||||||
1.600%, 06/17/2035 | 27,023 | 857 | ||||||
1.585%, 12/17/2035 | 32,515 | 1,029 | ||||||
1.450%, 12/17/2024 | 85,200 | 2,760 | ||||||
1.250%, 03/12/2028 | 404 | 12 | ||||||
|
|
| ||||||
| 38,100 | ||||||||
|
|
| ||||||
Trinidad & Tobago — 0.2% | ||||||||
Trinidad & Tobago Government International Bond | ||||||||
4.500%, 06/26/2030 (A) | $ | 1,026 | 1,007 | |||||
4.375%, 01/16/2024 | 1,287 | 1,306 | ||||||
|
|
| ||||||
| 2,313 | ||||||||
|
|
| ||||||
Tunisia — 0.3% | ||||||||
Banque Centrale de Tunisie | ||||||||
8.250%, 09/19/2027 | 337 | 316 | ||||||
Banque Centrale de Tunisie International Bond | ||||||||
6.375%, 07/15/2026 | EUR | 1,630 | 1,719 | |||||
SEI Institutional International Trust / Annual Report / September 30, 2020 |
61 |
SCHEDULE OF INVESTMENTS
September 30, 2020
Emerging Markets Debt Fund (Continued)
| Description | Face Amount (Thousands) | Market Value ($ Thousands) | ||||||
GLOBAL BONDS (continued) |
| |||||||
5.625%, 02/17/2024 | EUR | 1,650 | $ | 1,747 | ||||
|
|
| ||||||
| 3,782 | ||||||||
|
|
| ||||||
Turkey — 2.3% | ||||||||
Export Credit Bank of Turkey (A) |
| |||||||
6.125%, 05/03/2024 | $ | 247 | 236 | |||||
5.375%, 10/24/2023 | 1,033 | 973 | ||||||
5.000%, 09/23/2021 | 538 | 533 | ||||||
Export Credit Bank of Turkey MTN |
| |||||||
5.375%, 02/08/2021 (A) | 896 | 894 | ||||||
Hazine Mustesarligi Varlik Kiralama |
| |||||||
5.800%, 02/21/2022 (A)(B) | 2,770 | 2,756 | ||||||
QNB Finansbank | ||||||||
6.875%, 09/07/2024 (A) | 613 | 620 | ||||||
Republic of Turkey | ||||||||
4.875%, 04/16/2043 | 4,934 | 3,670 | ||||||
TC Ziraat Bankasi MTN (A) | ||||||||
5.125%, 05/03/2022 | 1,063 | 1,032 | ||||||
4.750%, 04/29/2021 | 311 | 309 | ||||||
Turkey Government International Bond |
| |||||||
16.200%, 06/14/2023 | TRY | 11,584 | 1,606 | |||||
12.200%, 01/18/2023 | 6,050 | 777 | ||||||
11.000%, 03/02/2022 | 3,700 | 468 | ||||||
10.700%, 08/17/2022 | 21,356 | 2,672 | ||||||
10.600%, 02/11/2026 | 13,916 | 1,656 | ||||||
10.500%, 08/11/2027 | 24,059 | 2,801 | ||||||
7.250%, 12/23/2023 | $ | 1,732 | 1,784 | |||||
6.875%, 03/17/2036 | 1,757 | 1,644 | ||||||
6.350%, 08/10/2024 | 294 | 293 | ||||||
6.125%, 10/24/2028 | 1,455 | 1,382 | ||||||
6.000%, 03/25/2027 | 597 | 572 | ||||||
6.000%, 01/14/2041 | 308 | 255 | ||||||
5.750%, 03/22/2024 | 1,918 | 1,882 | ||||||
5.750%, 05/11/2047 | 252 | 199 | ||||||
5.600%, 11/14/2024 | 870 | 843 | ||||||
5.125%, 02/17/2028 | 242 | 220 | ||||||
4.875%, 10/09/2026 | 1,017 | 930 | ||||||
4.250%, 04/14/2026 | 338 | 304 | ||||||
3.000%, 08/02/2023 | TRY | 11,253 | 1,486 | |||||
Turkiye Garanti Bankasi | ||||||||
6.125%, VAR USD Swap Semi 30/360 5 | ||||||||
Yr Curr+4.220%, 05/24/2027 (A) | $656 | 588 | ||||||
Turkiye Sise ve Cam Fabrikalari | ||||||||
6.950%, 03/14/2026 | 500 | 508 | ||||||
Yapi ve Kredi Bankasi MTN | ||||||||
5.850%, 06/21/2024 (A) | 429 | 404 | ||||||
|
|
| ||||||
| 34,297 | ||||||||
|
|
| ||||||
Ukraine — 2.4% | ||||||||
Government of Ukraine | ||||||||
7.750%, 09/01/2023 | 376 | 382 | ||||||
NAK Naftogaz Ukraine via Kondor Finance |
| |||||||
7.625%, 11/08/2026 (A) | 990 | 949 | ||||||
| Description | Face Amount (Thousands) | Market Value ($ Thousands) | ||||||
GLOBAL BONDS (continued) |
| |||||||
7.125%, 07/19/2024 | EUR | 720 | $ | 812 | ||||
Ukraine Government International Bond |
| |||||||
17.000%, 05/11/2022 | UAH | 71,848 | 2,751 | |||||
16.000%, 08/11/2021 | 148,624 | 5,492 | ||||||
15.840%, 02/26/2025 | 66,553 | 2,633 | ||||||
15.700%, 01/20/2021 (A) | 48,000 | 1,730 | ||||||
9.750%, 11/01/2028 | $ | 1,807 | 1,951 | |||||
9.750%, 11/01/2028 (A) | 375 | 405 | ||||||
8.994%, 02/01/2024 | 1,128 | 1,176 | ||||||
7.750%, 09/01/2021 | 2,047 | 2,096 | ||||||
7.750%, 09/01/2022 | 566 | 579 | ||||||
7.750%, 09/01/2024 (A) | 245 | 246 | ||||||
7.750%, 09/01/2025 | 1,058 | 1,059 | ||||||
7.750%, 09/01/2026 (A) | 45 | 45 | ||||||
7.750%, 09/01/2026 | 3,153 | 3,133 | ||||||
7.750%, 09/01/2027 | 1,030 | 1,019 | ||||||
7.750%, 09/01/2027 (A) | 223 | 221 | ||||||
7.375%, 09/25/2032 | 2,536 | 2,378 | ||||||
7.253%, 03/15/2033 | 453 | 416 | ||||||
7.253%, 03/15/2033 (A) | 1,568 | 1,441 | ||||||
6.750%, 06/20/2026 | EUR | 1,299 | 1,481 | |||||
4.375%, 01/27/2030 (A) | 961 | 918 | ||||||
3.000%, 05/31/2040 (A)(F) | $ | 2,206 | 2,004 | |||||
Ukreximbank Via Biz Finance 9.625%, 04/27/2022 (A) | 570 | 582 | ||||||
|
|
| ||||||
| �� | 35,899 | |||||||
|
|
| ||||||
United Arab Emirates — 1.9% | ||||||||
Abu Dhabi Crude Oil Pipeline | ||||||||
4.600%, 11/02/2047 (A) | 3,268 | 4,000 | ||||||
4.600%, 11/02/2047 | 330 | 404 | ||||||
3.650%, 11/02/2029 (A) | 1,794 | 2,037 | ||||||
Abu Dhabi Government International Bond |
| |||||||
4.125%, 10/11/2047 (A) | 824 | 1,037 | ||||||
3.125%, 09/30/2049 (A) | 2,552 | 2,731 | ||||||
3.125%, 09/30/2049 | 293 | 314 | ||||||
Abu Dhabi Government International Bond MTN |
| |||||||
3.875%, 04/16/2050 | 460 | 561 | ||||||
3.875%, 04/16/2050 (A) | 201 | 245 | ||||||
3.125%, 04/16/2030 | 300 | 335 | ||||||
2.700%, 09/02/2070 | 681 | 658 | ||||||
2.700%, 09/02/2070 (A) | 2,830 | 2,734 | ||||||
2.500%, 04/16/2025 (A) | 3,135 | 3,326 | ||||||
DP World MTN (A) | ||||||||
6.850%, 07/02/2037 | 421 | 525 | ||||||
5.625%, 09/25/2048 | 1,009 | 1,150 | ||||||
4.700%, 09/30/2049 | 134 | 135 | ||||||
DP World Salaam | ||||||||
6.000%, VAR US Treas Yield Curve Rate T Note Const Mat 5 Yr+5.750% (G) | 200 | 209 | ||||||
62 |
SEI Institutional International Trust / Annual Report / September 30, 2020 |
| Description | Face Amount (Thousands) | Market Value ($ Thousands) | ||||||
GLOBAL BONDS (continued) |
| |||||||
Emirate of Dubai Government International Bonds MTN |
| |||||||
5.250%, 01/30/2043 | $ | 490 | $ | 558 | ||||
Finance Department Government of Sharjah MTN |
| |||||||
4.000%, 07/28/2050 | 674 | 690 | ||||||
4.000%, 07/28/2050 (A) | 2,031 | 2,077 | ||||||
MAF Sukuk MTN | ||||||||
3.933%, 02/28/2030 | 691 | 723 | ||||||
MDC-GMTN BV MTN | ||||||||
4.500%, 11/07/2028 (A) | 1,346 | 1,611 | ||||||
MDGH - GMTN BV MTN | ||||||||
3.950%, 05/21/2050 | 200 | 234 | ||||||
3.700%, 11/07/2049 (A) | 711 | 795 | ||||||
Sharjah Sukuk Program MTN |
| |||||||
3.854%, 04/03/2026 | 359 | 390 | ||||||
|
|
| ||||||
| 27,479 | ||||||||
|
|
| ||||||
United Kingdom — 0.3% | ||||||||
Standard Chartered Bank MTN (A) |
| |||||||
8.375%, 10/18/2039 | IDR | 797,000 | 1,487 | |||||
8.250%, 05/18/2029 | 930,000 | 2,995 | ||||||
|
|
| ||||||
| 4,482 | ||||||||
|
|
| ||||||
United States — 0.3% | ||||||||
JPMorgan Chase Bank MTN | ||||||||
7.000%, 09/18/2030 (A)(F) | 7,028,000 | 4,519 | ||||||
|
|
| ||||||
Uruguay — 0.8% | ||||||||
Republic of Uruguay | ||||||||
5.100%, 06/18/2050 | $ | 535 | 719 | |||||
Uruguay Government International Bond |
| |||||||
9.875%, 06/20/2022 | UYU | 42,797 | 1,052 | |||||
8.500%, 03/15/2028 | 8,397 | 205 | ||||||
4.975%, 04/20/2055 | $ | 661 | 879 | |||||
4.375%, 10/27/2027 | 2,310 | 2,668 | ||||||
4.375%, 01/23/2031 | 4,957 | 5,893 | ||||||
|
|
| ||||||
| 11,416 | ||||||||
|
|
| ||||||
Uzbekistan — 0.1% | ||||||||
Republic of Uzbekistan Bond MTN | ||||||||
5.375%, 02/20/2029 | 783 | 873 | ||||||
4.750%, 02/20/2024 | 232 | 244 | ||||||
|
|
| ||||||
| 1,117 | ||||||||
|
|
| ||||||
Venezuela — 0.1% | ||||||||
Petroleos de Venezuela | ||||||||
9.750%, 05/17/2035 (D) | 1,000 | 25 | ||||||
9.000%, 11/17/2021 (B)(D) | 4,300 | 108 | ||||||
6.000%, 05/16/2024 (D) | 10,192 | 255 | ||||||
6.000%, 05/16/2024 (D) | 7,785 | 195 | ||||||
6.000%, 11/15/2026 (D) | 13,215 | 330 | ||||||
5.500%, 04/12/2037 (D) | 1,740 | 43 | ||||||
5.375%, 04/12/2027 (D) | 4,563 | 114 | ||||||
| Description | Face Amount (Thousands) | Market Value ($ Thousands) | ||||||
GLOBAL BONDS (continued) |
| |||||||
Venezuela Government International Bond |
| |||||||
9.250%, 09/15/2027 (D) | $ | 2,300 | $ | 172 | ||||
9.250%, 05/07/2028 (D) | 2,941 | 221 | ||||||
8.250%, 10/13/2024 (D) | 3,304 | 248 | ||||||
7.750%, 10/13/2019 (D) | 3,976 | 298 | ||||||
|
|
| ||||||
| 2,009 | ||||||||
|
|
| ||||||
Vietnam — 0.1% | ||||||||
Mong Duong Finance Holdings BV |
| |||||||
5.125%, 05/07/2029 (A) | 684 | 697 | ||||||
|
|
| ||||||
Zambia — 0.1% | ||||||||
First Quantum Minerals (A) | ||||||||
7.500%, 04/01/2025 | 404 | 400 | ||||||
6.875%, 03/01/2026 | 403 | 388 | ||||||
Zambia Government International Bond | ||||||||
5.375%, 09/20/2022 | 1,053 | 522 | ||||||
5.375%, 09/20/2022 (A) | 794 | 394 | ||||||
|
|
| ||||||
| 1,704 | ||||||||
|
|
| ||||||
Total Global Bonds | ||||||||
(Cost $1,450,538) ($ Thousands) | 1,405,762 | |||||||
|
|
| ||||||
U.S. TREASURY OBLIGATION — 1.0% |
| |||||||
U.S. Treasury Bills | ||||||||
0.100%, 05/20/2021 (E) | 14,991 | 14,981 | ||||||
|
|
| ||||||
Total U.S. Treasury Obligation | ||||||||
(Cost $14,981) ($ Thousands) | 14,981 | |||||||
|
|
| ||||||
| Shares | ||||||||
AFFILIATED PARTNERSHIP — 1.1% |
| |||||||
SEI Liquidity Fund, L.P. | ||||||||
0.100% **†(H) | 15,314,028 | 15,318 | ||||||
|
|
| ||||||
Total Affiliated Partnership | 15,318 | |||||||
|
|
| ||||||
Total Investments in Securities — 97.5% |
| $ | 1,436,061 | |||||
|
|
| ||||||
SEI Institutional International Trust / Annual Report / September 30, 2020 |
63 |
SCHEDULE OF INVESTMENTS
September 30, 2020
Emerging Markets Debt Fund (Continued)
A list of the open futures contracts held by the Fund at September 30, 2020, is as follows:
| Type of Contract | Number of Contracts Long (Short) | Expiration Date | Notional Amount (Thousands) | Value (Thousands) | Unrealized Appreciation (Depreciation) (Thousands) | |||||||||||||||
Euro-Bund | (71) | Dec-2020 | $ | (14,689 | ) | $ | (14,530 | ) | $ | (133 | ) | |||||||||
Euro-Buxl | (18) | Dec-2020 | (4,647 | ) | (4,700 | ) | (146 | ) | ||||||||||||
R023 Bond Future | 594 | Nov-2020 | 3,890 | 3,866 | 39 | |||||||||||||||
R186 Bond Future | 1,511 | Nov-2020 | 10,664 | 10,849 | 173 | |||||||||||||||
R2032 Bond Future | 525 | Nov-2020 | 2,804 | 2,712 | (44 | ) | ||||||||||||||
R2035 Bond Future | 976 | Nov-2020 | 5,188 | 4,968 | (131 | ) | ||||||||||||||
R2037 Bond Future | 419 | Nov-2020 | 2,110 | 2,014 | (59 | ) | ||||||||||||||
R2040 Bond Future | 379 | Nov-2020 | 1,943 | 1,871 | (39 | ) | ||||||||||||||
R208 Bond Future | 117 | Nov-2020 | 729 | 716 | (1 | ) | ||||||||||||||
R213 Bond Future | 837 | Nov-2020 | 4,262 | 4,131 | (58 | ) | ||||||||||||||
U.S. 10-Year Treasury Note | (11) | Dec-2020 | (1,533 | ) | (1,535 | ) | (2 | ) | ||||||||||||
U.S. 10-Year Treasury Note | 102 | Dec-2020 | 14,196 | 14,232 | 36 | |||||||||||||||
U.S. Long Treasury Bond | (22) | Dec-2020 | (3,908 | ) | (3,878 | ) | 30 | |||||||||||||
U.S. Ultra Long Treasury Bond | 42 | Dec-2020 | 9,382 | 9,316 | (66 | ) | ||||||||||||||
|
|
|
|
|
|
|
|
| ||||||||||||
| $ | 30,391 | $ | 30,032 | $ | (401 | ) | ||||||||||||||
|
|
|
|
|
|
|
|
| ||||||||||||
A list of the open forward foreign currency contracts held by the Fund at September 30, 2020, is as follows:
| Counterparty | Settlement Date | Currency to Deliver (Thousands) | Currency to Receive (Thousands) | Unrealized Appreciation (Depreciation) (Thousands) | ||||||||||||||||||||
Barclays PLC | 12/16/20 | IDR | 31,854,320 | USD | 2,114 | $ | (3 | ) | ||||||||||||||||
Barclays PLC | 12/17/20 | USD | 22,483 | ZAR | 381,050 | 160 | ||||||||||||||||||
Brown Brothers Harriman | 10/09/20 | USD | 2,550 | CNY | 17,375 | 2 | ||||||||||||||||||
Citigroup | 10/02/20 - 12/02/20 | USD | 2,297 | BRL | 12,241 | (126 | ) | |||||||||||||||||
Citigroup | 10/05/20 - 12/16/20 | USD | 4,576 | EUR | 3,858 | (50 | ) | |||||||||||||||||
Citigroup | 10/05/20 - 12/16/20 | EUR | 12,712 | USD | 15,070 | 151 | ||||||||||||||||||
Citigroup | 10/05/20 | EUR | 521 | USD | 606 | (5 | ) | |||||||||||||||||
Citigroup | 10/07/20 - 12/16/20 | USD | 13,586 | RUB | 998,838 | (761 | ) | |||||||||||||||||
Citigroup | 10/07/20 | RUB | 80,108 | USD | 1,098 | 66 | ||||||||||||||||||
Citigroup | 10/09/20 - 12/16/20 | USD | 18,440 | CNY | 127,218 | 226 | ||||||||||||||||||
Citigroup | 10/21/20 | UAH | – | USD | – | – | ||||||||||||||||||
Citigroup | 10/29/20 - 11/05/20 | UAH | 312,679 | USD | 10,954 | (3,681 | ) | |||||||||||||||||
Citigroup | 11/03/20 | EUR | 2,125 | HUF | 753,669 | (59 | ) | |||||||||||||||||
Citigroup | 11/03/20 - 12/11/20 | HUF | 1,536,767 | EUR | 4,213 | (16 | ) | |||||||||||||||||
Citigroup | 11/04/20 | EUR | 2,053 | RON | 9,998 | (8 | ) | |||||||||||||||||
Citigroup | 11/04/20 - 12/09/20 | RON | 6,283 | EUR | 1,283 | – | ||||||||||||||||||
Citigroup | 12/02/20 | BRL | 27,576 | USD | 4,971 | 85 | ||||||||||||||||||
Citigroup | 11/04/20 | BRL | 9,411 | USD | 1,662 | (7 | ) | |||||||||||||||||
Citigroup | 11/06/20 - 12/17/20 | USD | 7,393 | ZAR | 126,737 | 172 | ||||||||||||||||||
Citigroup | 11/06/20 | USD | 3,846 | ZAR | 63,619 | (48 | ) | |||||||||||||||||
Citigroup | 11/06/20 | USD | 3,306 | MXN | 73,817 | 25 | ||||||||||||||||||
Citigroup | 12/16/20 | USD | 13,502 | MXN | 290,390 | (459 | ) | |||||||||||||||||
Citigroup | 11/06/20 | MXN | 54,793 | USD | 2,494 | 22 | ||||||||||||||||||
Citigroup | 11/06/20 - 12/16/20 | MXN | 28,262 | USD | 1,262 | (11 | ) | |||||||||||||||||
Citigroup | 11/06/20 | ZAR | 95,548 | USD | 5,650 | (56 | ) | |||||||||||||||||
Citigroup | 11/10/20 | EUR | 2,129 | CZK | 56,980 | (30 | ) | |||||||||||||||||
Citigroup | 11/10/20 | CZK | 28,275 | EUR | 1,045 | 2 | ||||||||||||||||||
Citigroup | 11/10/20 | CZK | 9,894 | EUR | 364 | (1 | ) | |||||||||||||||||
Citigroup | 11/19/20 - 01/27/21 | EGP | 37,425 | USD | 2,192 | (152 | ) | |||||||||||||||||
Citigroup | 11/27/20 - 12/16/20 | USD | 10,751 | INR | 798,962 | 26 | ||||||||||||||||||
64 |
SEI Institutional International Trust / Annual Report / September 30, 2020 |
| Counterparty | Settlement Date | Currency to Deliver (Thousands) | Currency to Receive (Thousands) | Unrealized Appreciation (Depreciation) (Thousands) | ||||||||||||||||||||
Citigroup | 11/27/20 | IDR | 11,462,626 | USD | 773 | $ | 8 | |||||||||||||||||
Citigroup | 12/16/20 | IDR | 26,176,634 | USD | 1,730 | (10 | ) | |||||||||||||||||
Citigroup | 12/02/20 | KRW | 260,352 | USD | 220 | (3 | ) | |||||||||||||||||
Citigroup | 12/07/20 | USD | 338 | UYU | 13,787 | (17 | ) | |||||||||||||||||
Citigroup | 12/16/20 | USD | 432 | COP | 1,679,866 | 2 | ||||||||||||||||||
Citigroup | 12/16/20 | USD | 465 | PEN | 1,667 | (2 | ) | |||||||||||||||||
Citigroup | 12/16/20 | EUR | 1,495 | PLN | 6,662 | (32 | ) | |||||||||||||||||
Citigroup | 12/16/20 | PLN | 2,887 | EUR | 635 | (1 | ) | |||||||||||||||||
Citigroup | 12/16/20 | PLN | 2,935 | USD | 783 | 24 | ||||||||||||||||||
Citigroup | 12/16/20 | USD | 2,938 | CZK | 66,301 | (63 | ) | |||||||||||||||||
Citigroup | 12/16/20 | USD | 9,106 | PLN | 34,275 | (235 | ) | |||||||||||||||||
Citigroup | 12/16/20 | RON | 8,265 | USD | 1,999 | 20 | ||||||||||||||||||
Citigroup | 12/16/20 | RON | 3,081 | USD | 737 | (1 | ) | |||||||||||||||||
Citigroup | 12/16/20 | USD | 13,656 | THB | 428,612 | (129 | ) | |||||||||||||||||
Citigroup | 12/16/20 | PEN | 36,210 | USD | 10,165 | 93 | ||||||||||||||||||
Citigroup | 12/16/20 | PHP | 357,250 | USD | 7,319 | (28 | ) | |||||||||||||||||
Citigroup | 01/28/21 | NGN | 547,260 | USD | 1,289 | (70 | ) | |||||||||||||||||
Goldman Sachs | 10/02/20 | BRL | 5,985 | USD | 1,088 | 26 | ||||||||||||||||||
Goldman Sachs | 10/07/20 | USD | 6,135 | RUB | 461,905 | (185 | ) | |||||||||||||||||
Goldman Sachs | 10/07/20 - 12/16/20 | RUB | 136,883 | USD | 1,798 | 45 | ||||||||||||||||||
Goldman Sachs | 10/16/20 - 11/05/20 | TRY | 44,664 | USD | 6,147 | 391 | ||||||||||||||||||
Goldman Sachs | 12/16/20 | TRY | 9,428 | USD | 1,196 | (2 | ) | |||||||||||||||||
Goldman Sachs | 12/16/20 | USD | 7,246 | CNY | 49,865 | 64 | ||||||||||||||||||
Goldman Sachs | 10/21/20 | USD | 2,407 | CNY | 16,329 | (6 | ) | |||||||||||||||||
Goldman Sachs | 10/26/20 - 12/16/20 | USD | 4,899 | IDR | 73,751,434 | 27 | ||||||||||||||||||
Goldman Sachs | 11/03/20 | EUR | 2,017 | HUF | 721,716 | (36 | ) | |||||||||||||||||
Goldman Sachs | 11/05/20 - 12/16/20 | USD | 4,196 | TRY | 32,704 | (25 | ) | |||||||||||||||||
Goldman Sachs | 11/05/20 | UAH | 10,069 | USD | 353 | (125 | ) | |||||||||||||||||
Goldman Sachs | 11/06/20 | USD | 486 | ZAR | 8,207 | 4 | ||||||||||||||||||
Goldman Sachs | 11/06/20 | MXN | 12,133 | USD | 541 | (7 | ) | |||||||||||||||||
Goldman Sachs | 11/06/20 | USD | 7,830 | MXN | 175,706 | 98 | ||||||||||||||||||
Goldman Sachs | 12/16/20 | USD | 7,585 | MXN | 163,344 | (248 | ) | |||||||||||||||||
Goldman Sachs | 11/06/20 | ZAR | 59,544 | USD | 3,584 | 28 | ||||||||||||||||||
Goldman Sachs | 11/19/20 - 01/21/21 | EGP | 64,552 | USD | 3,861 | (156 | ) | |||||||||||||||||
Goldman Sachs | 11/27/20 | IDR | 4,833,064 | USD | 328 | 6 | ||||||||||||||||||
Goldman Sachs | 12/16/20 | IDR | 12,407,849 | USD | 818 | (7 | ) | |||||||||||||||||
Goldman Sachs | 12/02/20 | USD | 9,284 | BRL | 51,932 | (84 | ) | |||||||||||||||||
Goldman Sachs | 12/09/20 | RON | 2,423 | EUR | 494 | (1 | ) | |||||||||||||||||
Goldman Sachs | 12/09/20 | EUR | 3,214 | RON | 15,727 | (7 | ) | |||||||||||||||||
Goldman Sachs | 12/16/20 | USD | 375 | RON | 1,544 | (5 | ) | |||||||||||||||||
Goldman Sachs | 12/16/20 | USD | 891 | PEN | 3,165 | (10 | ) | |||||||||||||||||
Goldman Sachs | 12/16/20 | USD | 2,061 | HUF | 621,215 | (56 | ) | |||||||||||||||||
Goldman Sachs | 12/16/20 | RON | 2,146 | USD | 519 | 5 | ||||||||||||||||||
Goldman Sachs | 12/16/20 | USD | 2,936 | CLP | 2,263,405 | (60 | ) | |||||||||||||||||
Goldman Sachs | 12/16/20 | USD | 15,686 | CZK | 351,737 | (438 | ) | |||||||||||||||||
Goldman Sachs | 12/16/20 | HUF | 207,734 | EUR | 568 | (3 | ) | |||||||||||||||||
Goldman Sachs | 12/16/20 | CLP | 1,453,238 | USD | 1,886 | 39 | ||||||||||||||||||
Goldman Sachs | 12/16/20 | COP | 53,323,499 | USD | 14,385 | 589 | ||||||||||||||||||
JPMorgan Chase Bank | 10/05/20 | USD | 2,734 | EUR | 2,333 | 2 | ||||||||||||||||||
JPMorgan Chase Bank | 10/05/20 - 12/15/20 | USD | 5,766 | EUR | 4,864 | (58 | ) | |||||||||||||||||
SEI Institutional International Trust / Annual Report / September 30, 2020 |
65 |
SCHEDULE OF INVESTMENTS
September 30, 2020
Emerging Markets Debt Fund (Continued)
| Counterparty | Settlement Date | Currency to Deliver (Thousands) | Currency to Receive (Thousands) | Unrealized Appreciation (Depreciation) (Thousands) | ||||||||||||||||||||
JPMorgan Chase Bank | 10/05/20 - 12/15/20 | EUR | 17,552 | USD | 20,870 | $ | 259 | |||||||||||||||||
JPMorgan Chase Bank | 11/04/20 - 12/15/20 | EUR | 1,192 | USD | 1,394 | (5 | ) | |||||||||||||||||
JPMorgan Chase Bank | 10/05/20 | KRW | 2,974,856 | USD | 2,503 | (42 | ) | |||||||||||||||||
JPMorgan Chase Bank | 10/15/20 | PEN | 1,240 | USD | 1,243 | 3 | ||||||||||||||||||
JPMorgan Chase Bank | 12/18/20 | USD | 764 | RUB | 60,102 | 4 | ||||||||||||||||||
JPMorgan Chase Bank | 10/07/20 | USD | 2,639 | RUB | 200,877 | (52 | ) | |||||||||||||||||
JPMorgan Chase Bank | 10/07/20 | RUB | 152,779 | USD | 2,057 | 89 | ||||||||||||||||||
JPMorgan Chase Bank | 10/13/20 | MYR | 10,191 | USD | 2,448 | (6 | ) | |||||||||||||||||
JPMorgan Chase Bank | 10/16/20 | TRY | 4,388 | USD | 580 | 12 | ||||||||||||||||||
JPMorgan Chase Bank | 10/19/20 | USD | 189 | PEN | 668 | (4 | ) | |||||||||||||||||
JPMorgan Chase Bank | 10/19/20 | USD | 208 | UYU | 7,800 | (25 | ) | |||||||||||||||||
JPMorgan Chase Bank | 10/19/20 | USD | 507 | PHP | 24,673 | 2 | ||||||||||||||||||
JPMorgan Chase Bank | 10/19/20 | USD | 1,628 | THB | 50,939 | (21 | ) | |||||||||||||||||
JPMorgan Chase Bank | 10/19/20 - 10/26/20 | USD | 6,354 | CLP | 4,839,436 | (208 | ) | |||||||||||||||||
JPMorgan Chase Bank | 10/19/20 - 10/26/20 | BRL | 15,921 | USD | 3,018 | 194 | ||||||||||||||||||
JPMorgan Chase Bank | 10/19/20 - 10/21/20 | RUB | 248,312 | USD | 3,279 | 85 | ||||||||||||||||||
JPMorgan Chase Bank | 10/20/20 | USD | 91 | COP | 353,691 | 1 | ||||||||||||||||||
JPMorgan Chase Bank | 10/20/20 | COP | 12,399,270 | USD | 3,356 | 141 | ||||||||||||||||||
JPMorgan Chase Bank | 10/27/20 - 11/02/20 | IDR | 137,212,476 | USD | 9,263 | 55 | ||||||||||||||||||
JPMorgan Chase Bank | 10/20/20 - 11/03/20 | IDR | 92,579,647 | USD | 6,196 | (19 | ) | |||||||||||||||||
JPMorgan Chase Bank | 10/21/20 | USD | 1,239 | MYR | 5,130 | (3 | ) | |||||||||||||||||
JPMorgan Chase Bank | 10/21/20 | USD | 3,442 | TRY | 26,108 | (67 | ) | |||||||||||||||||
JPMorgan Chase Bank | 10/30/20 | USD | 140 | BRL | 792 | — | ||||||||||||||||||
JPMorgan Chase Bank | 10/21/20 - 10/30/20 | USD | 7,153 | BRL | 38,806 | (271 | ) | |||||||||||||||||
JPMorgan Chase Bank | 11/27/20 | USD | 6,388 | CNY | 44,393 | 129 | ||||||||||||||||||
JPMorgan Chase Bank | 10/21/20 | USD | 1,451 | CNY | 9,856 | (2 | ) | |||||||||||||||||
JPMorgan Chase Bank | 10/21/20 - 10/26/20 | PEN | 11,616 | USD | 3,272 | 41 | ||||||||||||||||||
JPMorgan Chase Bank | 10/22/20 | ZAR | 123,754 | USD | 7,420 | 18 | ||||||||||||||||||
JPMorgan Chase Bank | 10/22/20 | ZAR | 855 | USD | 49 | (2 | ) | |||||||||||||||||
JPMorgan Chase Bank | 10/29/20 | USD | 1,591 | CNY | 10,854 | 5 | ||||||||||||||||||
JPMorgan Chase Bank | 11/02/20 | USD | 103 | IDR | 1,532,730 | — | ||||||||||||||||||
JPMorgan Chase Bank | 11/06/20 - 11/20/20 | USD | 2,723 | MXN | 61,746 | 62 | ||||||||||||||||||
JPMorgan Chase Bank | 11/06/20 | MXN | 7,792 | USD | 354 | 2 | ||||||||||||||||||
JPMorgan Chase Bank | 11/06/20 - 11/20/20 | MXN | 52,260 | USD | 2,340 | (15 | ) | |||||||||||||||||
JPMorgan Chase Bank | 11/10/20 | EUR | 3,232 | CZK | 85,264 | (100 | ) | |||||||||||||||||
JPMorgan Chase Bank | 11/10/20 | CZK | 33,934 | EUR | 1,291 | 46 | ||||||||||||||||||
JPMorgan Chase Bank | 11/19/20 | USD | 4,545 | ZAR | 79,809 | 214 | ||||||||||||||||||
JPMorgan Chase Bank | 11/20/20 | USD | 4,043 | RON | 16,685 | (41 | ) | |||||||||||||||||
JPMorgan Chase Bank | 11/20/20 | USD | 5,793 | PLN | 21,568 | (212 | ) | |||||||||||||||||
JPMorgan Chase Bank | 11/27/20 | USD | 253 | IDR | 3,790,752 | — | ||||||||||||||||||
JPMorgan Chase Bank | 11/27/20 | INR | 189,037 | USD | 2,551 | (3 | ) | |||||||||||||||||
JPMorgan Chase Bank | 12/11/20 | USD | 215 | THB | 6,788 | (1 | ) | |||||||||||||||||
JPMorgan Chase Bank | 12/15/20 | JPY | 237,343 | USD | 2,242 | (10 | ) | |||||||||||||||||
JPMorgan Chase Bank | 12/16/20 | USD | 716 | PEN | 2,561 | (3 | ) | |||||||||||||||||
JPMorgan Chase Bank | 12/16/20 | HUF | 39,006 | EUR | 109 | 2 | ||||||||||||||||||
JPMorgan Chase Bank | 12/16/20 | KRW | 9,178,548 | USD | 7,733 | (149 | ) | |||||||||||||||||
JPMorgan Chase Bank | 12/16/20 | COP | 14,074,855 | USD | 3,786 | 145 | ||||||||||||||||||
JPMorgan Chase Bank | 12/16/20 | COP | 948,453 | USD | 245 | (1 | ) | |||||||||||||||||
JPMorgan Chase Bank | 12/17/20 | USD | 110 | CZK | 2,461 | (3 | ) | |||||||||||||||||
JPMorgan Chase Bank | 12/17/20 | USD | 4,241 | HUF | 1,283,476 | (100 | ) | |||||||||||||||||
66 |
SEI Institutional International Trust / Annual Report / September 30, 2020 |
| Counterparty | Settlement Date | Currency to Deliver (Thousands) | Currency to Receive (Thousands) | Unrealized Appreciation (Depreciation) (Thousands) | ||||||||||||||||||||
JPMorgan Chase Bank | 12/30/20 | EUR | 4,146 | RON | 20,386 | $ | 4 | |||||||||||||||||
JPMorgan Chase Bank | 02/26/21 | USD | 689 | UAH | 19,981 | 244 | ||||||||||||||||||
Merrill Lynch | 12/16/20 | SGD | 15,817 | USD | 11,562 | (29 | ) | |||||||||||||||||
Morgan Stanley | 12/18/20 | USD | 1,182 | RUB | 93,542 | 13 | ||||||||||||||||||
Morgan Stanley | 10/07/20 | USD | 1,277 | RUB | 94,668 | (58 | ) | |||||||||||||||||
Morgan Stanley | 10/07/20 | RUB | 104,691 | USD | 1,390 | 42 | ||||||||||||||||||
Morgan Stanley | 10/21/20 | USD | 2,690 | INR | 198,690 | 3 | ||||||||||||||||||
Morgan Stanley | 10/26/20 | KRW | 2,881,967 | USD | 2,480 | 7 | ||||||||||||||||||
Morgan Stanley | 11/06/20 | MXN | 55,794 | USD | 2,480 | (38 | ) | |||||||||||||||||
Morgan Stanley | 11/06/20 | ZAR | 65,982 | USD | 3,825 | (116 | ) | |||||||||||||||||
Morgan Stanley | 11/10/20 | CZK | 28,275 | EUR | 1,043 | (1 | ) | |||||||||||||||||
Morgan Stanley | 11/23/20 | EUR | 5,390 | PLN | 23,691 | (196 | ) | |||||||||||||||||
Morgan Stanley | 11/23/20 | PLN | 7,058 | EUR | 1,606 | 58 | ||||||||||||||||||
Standard Bank | 10/05/20 | USD | 2,029 | EUR | 1,712 | (21 | ) | |||||||||||||||||
Standard Bank | 12/16/20 | EUR | 7,797 | USD | 9,257 | 98 | ||||||||||||||||||
Standard Bank | 10/05/20 | EUR | 818 | USD | 952 | (8 | ) | |||||||||||||||||
Standard Bank | 11/02/20 - 02/04/21 | NGN | 1,635,311 | USD | 3,744 | (358 | ) | |||||||||||||||||
Standard Bank | 11/06/20 | USD | 616 | ZAR | 10,682 | 21 | ||||||||||||||||||
Standard Bank | 12/16/20 | USD | 3,960 | MYR | 16,511 | 21 | ||||||||||||||||||
Standard Bank | 12/16/20 | RUB | 24,160 | USD | 314 | 5 | ||||||||||||||||||
Standard Bank | 12/16/20 | IDR | 11,516,114 | USD | 767 | 1 | ||||||||||||||||||
Standard Bank | 12/16/20 | IDR | 11,655,729 | USD | 774 | — | ||||||||||||||||||
Standard Bank | 12/17/20 | ZAR | 1,100 | USD | 64 | (1 | ) | |||||||||||||||||
Standard Bank | 02/17/21 - 02/24/21 | GHS | 8,035 | USD | 1,291 | (36 | ) | |||||||||||||||||
Standard Chartered | 11/04/20 - 01/05/21 | USD | 953 | BRL | 5,399 | 4 | ||||||||||||||||||
Standard Chartered | 10/02/20 - 01/05/21 | USD | 14,182 | BRL | 76,041 | (705 | ) | |||||||||||||||||
Standard Chartered | 10/02/20 - 12/02/20 | BRL | 52,032 | USD | 9,554 | 326 | ||||||||||||||||||
Standard Chartered | 10/05/20 | USD | 2,524 | KRW | 2,984,362 | 29 | ||||||||||||||||||
Standard Chartered | 10/07/20 | RUB | 274,493 | USD | 3,723 | 187 | ||||||||||||||||||
Standard Chartered | 10/07/20 | RUB | 664,258 | USD | 8,417 | (138 | ) | |||||||||||||||||
Standard Chartered | 10/13/20 | USD | 2,454 | MYR | 10,244 | 13 | ||||||||||||||||||
Standard Chartered | 10/21/20 | MYR | 19,322 | USD | 4,631 | (22 | ) | |||||||||||||||||
Standard Chartered | 10/21/20 | INR | 184,096 | USD | 2,498 | 3 | ||||||||||||||||||
Standard Chartered | 11/05/20 | TRY | 5,462 | USD | 723 | 19 | ||||||||||||||||||
Standard Chartered | 11/27/20 | IDR | 22,703,713 | USD | 1,525 | 11 | ||||||||||||||||||
Standard Chartered | 12/11/20 | EUR | 2,024 | HUF | 726,042 | (34 | ) | |||||||||||||||||
Standard Chartered | 12/16/20 | IDR | – | USD | — | — | ||||||||||||||||||
Standard Chartered | 12/16/20 | USD | 1,656 | CLP | 1,266,028 | (47 | ) | |||||||||||||||||
Standard Chartered | 12/17/20 | PHP | 17,839 | USD | 367 | — | ||||||||||||||||||
Standard Chartered | 12/18/20 | USD | 7,851 | RUB | 624,380 | 127 | ||||||||||||||||||
State Street | 10/05/20 | EUR | 11,120 | USD | 12,573 | (467 | ) | |||||||||||||||||
State Street | 10/05/20 - 12/03/20 | EUR | 17,257 | USD | 20,661 | 404 | ||||||||||||||||||
State Street | 10/05/20 - 11/04/20 | EUR | 1,278 | USD | 1,492 | (6 | ) | |||||||||||||||||
State Street | 10/05/20 - 11/04/20 | USD | 8,356 | EUR | 7,166 | 51 | ||||||||||||||||||
State Street | 10/05/20 | USD | 18,731 | EUR | 15,810 | (191 | ) | |||||||||||||||||
State Street | 10/07/20 | RUB | 32,022 | USD | 430 | 18 | ||||||||||||||||||
State Street | 11/04/20 -12/16/20 | USD | 8,208 | BRL | 42,831 | (615 | ) | |||||||||||||||||
State Street | 11/06/20 | USD | 1,220 | ZAR | 21,264 | 50 | ||||||||||||||||||
State Street | 11/06/20 | MXN | 57,607 | USD | 2,537 | (62 | ) | |||||||||||||||||
State Street | 11/10/20 | EUR | 1,050 | CZK | 27,558 | (38 | ) | |||||||||||||||||
SEI Institutional International Trust / Annual Report / September 30, 2020 |
67 |
SCHEDULE OF INVESTMENTS
September 30, 2020
Emerging Markets Debt Fund (Continued)
| Counterparty | Settlement Date | Currency to Deliver (Thousands) | Currency to Receive (Thousands) | Unrealized Appreciation (Depreciation) (Thousands) | ||||||||||||||
State Street | 11/10/20 | CZK | 47,135 | EUR | 1,806 | $ | 77 | |||||||||||
State Street | 12/16/20 | USD | 1,669 | INR | 124,042 | 3 | ||||||||||||
State Street | 12/16/20 | USD | 1,682 | KRW | 1,971,690 | 12 | ||||||||||||
|
|
| ||||||||||||||||
| $ | (6,367) | |||||||||||||||||
|
|
| ||||||||||||||||
A list of the open OTC swap agreements held by the Fund at September 30, 2020, is as follows:
| Interest Rate Swaps | ||||||||||||||||||||||||||
| Counterparty | Fund Pays | Fund Receives | Payment Frequency | Termination Date | Currency | Notional Amount (Thousands) | Value (Thousands) | Upfront Payments (Thousands) | Net Unrealized Appreciation (Depreciation) (Thousands) | |||||||||||||||||
Goldman Sachs | 1-DAY BRL - CETIP | 12.725% | Annually | 01/04/2021 | BRL | 10,608 | $ | 711 | $ | – | $ | 711 | ||||||||||||||
JPMorgan Chase | 1-DAY BRL - CETIP | 9.61% | Annually | 01/04/2021 | BRL | 4,626 | 138 | – | 138 | |||||||||||||||||
JPMorgan Chase | 1-DAY BRL - CETIP | 10.89% | Annually | 01/04/2021 | BRL | 170 | 6 | – | 6 | |||||||||||||||||
JPMorgan Chase | 1-DAY BRL - CETIP | 10.04% | Annually | 01/04/2021 | BRL | 3,557 | 118 | – | 118 | |||||||||||||||||
JPMorgan Chase | 1-DAY BRL - CETIP | 9.275% | Annually | 01/04/2021 | BRL | 5,815 | 157 | – | 157 | |||||||||||||||||
JPMorgan Chase | 1-DAY BRL - CETIP | 8.87% | Annually | 01/04/2021 | BRL | 8,089 | 195 | – | 195 | |||||||||||||||||
Goldman Sachs | 28-DAY MXN - TIIE | 5.37% | Monthly | 03/17/2021 | MXN | 46,500 | 9 | – | 9 | |||||||||||||||||
Goldman Sachs | 3-MONTH MosPrime - RUB | 7.515% | Annually | 06/10/2021 | RUB | 1,020,770 | 481 | – | 481 | |||||||||||||||||
JPMorgan Chase | 1.3775% | 6-MONTH HUF - BUBOR | Semi- Annually | 06/17/2021 | HUF | 654,998 | (14 | ) | – | (14 | ) | |||||||||||||||
Goldman Sachs | 6-MONTH PLN - WIBOR | 2.208% | Annually | 11/16/2021 | PLN | 6,842 | 73 | – | 73 | |||||||||||||||||
Citibank | 6-MONTH PLN - WIBOR | 2.431% | Annually | 12/14/2021 | PLN | 11,000 | 131 | – | 131 | |||||||||||||||||
Goldman Sachs | 3-MONTH MosPrime - RUB | 6.29% | Annually | 12/14/2021 | RUB | 535,000 | 92 | – | 92 | |||||||||||||||||
Goldman Sachs | 6-MONTH HUF - BUBOR | 1.265% | Semi- Annually | 01/10/2022 | HUF | 1,537,322 | (59 | ) | – | (59 | ) | |||||||||||||||
| 1-DAY-CLP - Sinacofi Chile | ||||||||||||||||||||||||||
JPMorgan Chase | Interbank Rate Avg | 3.430% | Semi- Annually | 05/10/2022 | CLP | 420,527 | 31 | – | 31 | |||||||||||||||||
Goldman Sachs | 28-DAY MXN - TIIE | 5.900% | Monthly | 09/12/2022 | MXN | 75,956 | 89 | – | 89 | |||||||||||||||||
Goldman Sachs | 6-MONTH HUF - BUBOR | 0.8385% | Annually | 09/21/2022 | HUF | 1,390,000 | (22 | ) | – | (22 | ) | |||||||||||||||
Goldman Sachs | 1-DAY BRL - CETIP | 11.985% | Annually | 01/02/2023 | BRL | 3,000 | 297 | – | 297 | |||||||||||||||||
Goldman Sachs | 1-DAY BRL - CETIP | 10.04% | Annually | 01/03/2023 | BRL | 5,012 | 384 | – | 384 | |||||||||||||||||
Goldman Sachs | 3-MONTH MosPrime - RUB | 7.072% | Annually | 04/02/2023 | RUB | 715,570 | 310 | – | 310 | |||||||||||||||||
Goldman Sachs | 28-DAY MXN - TIIE | 6.355% | Monthly | 05/21/2025 | MXN | 23,145 | 60 | – | 60 | |||||||||||||||||
Citibank | .953% | 3-MONTH MYR - KLIBOR | Quarterly | 08/18/2025 | MYR | 11,000 | 30 | – | 30 | |||||||||||||||||
Goldman Sachs | 28-DAY MXN - TIIE | 6.205% | Monthly | 12/08/2025 | MXN | 16,624 | 38 | – | 38 | |||||||||||||||||
Goldman Sachs | 28-DAY MXN - TIIE | 6.165% | Monthly | 03/05/2026 | MXN | 47,200 | 104 | – | 104 | |||||||||||||||||
JPMorgan Chase | 28-DAY MXN - TIIE | 6.13% | Monthly | 06/18/2026 | MXN | 40,000 | 83 | – | 83 | |||||||||||||||||
Goldman Sachs | 28-DAY MXN - TIIE | 6.381% | Monthly | 09/16/2026 | MXN | 26,000 | 68 | – | 68 | |||||||||||||||||
|
|
|
|
|
|
|
|
| ||||||||||||||||||
| $ | 3,510 | $ | – | $ | 3,510 | |||||||||||||||||||||
|
|
|
|
|
|
|
|
| ||||||||||||||||||
| Cross Currency Swaps | ||||||||||||||||||||||||||
| Counterparty | Fund Pays | Fund Receives | Payment Frequency | Termination Date | Currency | Notional Amount (Thousands) | Value (Thousands) | Upfront Payment (Thousands) | Net Unrealized Appreciation (Thousands) | |||||||||||||||||
JPMorgan Chase | 3-MONTH USD - LIBOR | 12.90% | Quarterly | 10/07/2025 | TRY | 3,070 | $ | 69 | $ | – | $ | 69 | ||||||||||||||
JPMorgan Chase | 3-MONTH USD - LIBOR | 11.065% | Quarterly | 12/07/2025 | TRY | 2,351 | 163 | – | 163 | |||||||||||||||||
|
|
|
|
|
|
|
|
| ||||||||||||||||||
| $ | 232 | $ | – | $ | 232 | |||||||||||||||||||||
|
|
|
|
|
|
|
|
| ||||||||||||||||||
68 |
SEI Institutional International Trust / Annual Report / September 30, 2020 |
A list of the open centrally cleared swap agreements held by the Fund at September 30, 2020, is as follows:
| Interest Rate Swaps | ||||||||||||||||||||||||
| Fund Pays | Fund Receives | Payment Frequency | Termination Date | Currency | Notional Amount (Thousands) | Value (Thousands) | Upfront Payments/ Receipts (Thousands) | Net Unrealized Appreciation (Depreciation) (Thousands) | ||||||||||||||||
8.09% | 28-DAY MXN - TIIE | Monthly | 01/28/2021 | MXN | 133,260 | $ | (71 | ) | $ | – | $ | (71 | ) | |||||||||||
28-DAY MXN - TIIE | 4.85 FIXED | Monthly | 07/25/2025 | MXN | 6,144 | (2 | ) | – | (2 | ) | ||||||||||||||
D CHINA FIXING REPO RATES (CNRR07) | .605% | Quarterly | 07/16/2025 | CNY | 45,500 | (6 | ) | – | (6 | ) | ||||||||||||||
1-DAY-CLP - Sinacofi Chile Interbank Rate Avg | 1.16% | Semi-Annually | 06/23/2025 | CLP | 2,335,691 | (4 | ) | – | (4 | ) | ||||||||||||||
9925% | 6-MONTH HUF - BUBOR | Semi-Annually | 06/23/2025 | HUF | 734,635 | 36 | – | 36 | ||||||||||||||||
1-DAY-CLP - Sinacofi Chile Interbank Rate Avg | .36% | Semi-Annually | 06/17/2025 | CLP | 1,931,133 | 21 | – | 21 | ||||||||||||||||
0.644 FIXED | 6-MONTH PLN - WIBOR | Semi-Annually | 06/09/2025 | PLN | 11,248 | (25 | ) | – | (25 | ) | ||||||||||||||
28-DAY MXN - TIIE | .45% FIXED | Monthly | 04/01/2025 | MXN | 27,064 | 74 | – | 74 | ||||||||||||||||
6-MONTH HUF - BUBOR | .725% | Annually | 03/25/2025 | HUF | 598,334 | (50 | ) | – | (50 | ) | ||||||||||||||
28-DAY MXN - TIIE | .62 FIXED | Monthly | 03/21/2025 | MXN | 19,328 | 59 | – | 59 | ||||||||||||||||
5.0975% | INR - MIBOR | Semi-Annually | 02/26/2025 | INR | 76,447 | (31 | ) | – | (31 | ) | ||||||||||||||
5.08125% | INR - MIBOR | Semi-Annually | 02/25/2025 | INR | 152,895 | (61 | ) | – | (61 | ) | ||||||||||||||
1-DAY BRL - CETIP | .455% | Annually | 01/02/2025 | BRL | 3,591 | 10 | – | 10 | ||||||||||||||||
1-DAY BRL - CETIP | 6.82% | Annually | 01/02/2025 | BRL | 3,362 | 10 | – | 10 | ||||||||||||||||
1-DAY BRL - CETIP | .65% | Annually | 01/02/2025 | BRL | 12,389 | (48 | ) | – | (48 | ) | ||||||||||||||
1-DAY BRL - CETIP | .77 FIXED | Annually | 01/02/2025 | BRL | 4,102 | 11 | – | 11 | ||||||||||||||||
1-Day Mumbai Interbank Bid Rate - (MIBID) | 4.26% | Semi-Annually | 08/14/2025 | INR | 204,000 | (21 | ) | – | (21 | ) | ||||||||||||||
6-MONTH HUF - BUBOR | 0.81% | Annually | 09/12/2024 | HUF | 75,000 | (4 | ) | – | (4 | ) | ||||||||||||||
28-DAY MXN - TIIE | 7.72% | Monthly | 12/03/2026 | MXN | 8,000 | 47 | – | 47 | ||||||||||||||||
2.969% | 6-MONTH HUF - BUBOR | Semi-Annually | 02/08/2029 | HUF | 200,000 | (32 | ) | – | (32 | ) | ||||||||||||||
% | 6-MONTH PLN - WIBOR | Semi-Annually | 06/12/2030 | PLN | 8,141 | (21 | ) | – | (21 | ) | ||||||||||||||
.33% | 1-DAY-CLP - Sinacofi Chile Interbank Rate Avg | Semi-Annually | 06/05/2030 | CLP | 830,041 | (80 | ) | – | (80 | ) | ||||||||||||||
1-DAY COP - COLUMBIA IBR | 5.45% | Quarterly | 03/12/2030 | COP | 1,338,006 | (33 | ) | – | (33 | ) | ||||||||||||||
1-DAY COP - COLUMBIA IBR | 5.47% | Quarterly | 03/11/2030 | COP | 879,919 | (22 | ) | – | (22 | ) | ||||||||||||||
1-DAY COP - COLUMBIA IBR | 5.4% | Quarterly | 03/11/2030 | COP | 2,751,828 | (66 | ) | – | (66 | ) | ||||||||||||||
6-MONTH PLN - WIBOR | 1.75% | Annually | 02/26/2030 | PLN | 11,700 | 243 | – | 243 | ||||||||||||||||
1.61% | 6-MONTH HUF - BUBOR | Semi-Annually | 01/17/2030 | HUF | 135,000 | 3 | – | 3 | ||||||||||||||||
1.81% | 6-MONTH CZK - PRIBOR | Semi-Annually | 01/17/2030 | CZK | 10,000 | (43 | ) | – | (43 | ) | ||||||||||||||
1.805% | 6-MONTH PLN - WIBOR | Semi-Annually | 12/17/2029 | PLN | 11,500 | (252 | ) | – | (252 | ) | ||||||||||||||
1.4925% | 6-MONTH CZK - PRIBOR | Semi-Annually | 11/18/2029 | CZK | 33,000 | 97 | – | 97 | ||||||||||||||||
6.82% | 28-DAY MXN - TIIE | Monthly | 09/10/2029 | MXN | 33,993 | (121 | ) | – | (121 | ) | ||||||||||||||
6.9225% | 28-DAY MXN - TIIE | Monthly | 08/31/2029 | MXN | 42,602 | (166 | ) | – | (166 | ) | ||||||||||||||
3-MONTH ZAR - JIBAR | 8.49% | Quarterly | 07/18/2029 | ZAR | 10,000 | (11 | ) | – | (11 | ) | ||||||||||||||
5.37 | 1-DAY COP- COLUMBIA IBR | Quarterly | 06/21/2029 | COP | 1,800,000 | (44 | ) | – | (44 | ) | ||||||||||||||
5.915% | 1-DAY COP- COLUMBIA IBR | Quarterly | 05/15/2029 | COP | 3,600,000 | (133 | ) | – | (133 | ) | ||||||||||||||
28-DAY MXN - TIIE | 7.51% | Monthly | 04/20/2027 | MXN | 8,110 | 45 | – | 45 | ||||||||||||||||
1.675% | 6-MONTH CZK - PRIBOR | Semi-Annually | 07/17/2024 | CZK | 21,146 | (41 | ) | – | (41 | ) | ||||||||||||||
1.64 | 6-MONTH CZK - PRIBOR | Semi-Annually | 06/21/2024 | CZK | 14,000 | (26 | ) | – | (26 | ) | ||||||||||||||
28-DAY MXN - TIIE | .47% | Monthly | 06/19/2024 | MXN | 95,833 | 3 | – | 3 | ||||||||||||||||
28-DAY MXN - TIIE | 6.71% | Monthly | 07/07/2022 | MXN | 37,637 | 65 | – | 65 | ||||||||||||||||
6-MONTH HUF - BUBOR | .645& | Annually | 06/25/2022 | HUF | 1,811,931 | (50 | ) | – | (50 | ) | ||||||||||||||
28-DAY MXN - TIIE | 6.745% | Monthly | 06/23/2022 | MXN | 26,758 | 46 | – | 46 | ||||||||||||||||
6-MONTH HUF - BUBOR | 675% | Annually | 06/23/2022 | HUF | 1,807,262 | (28 | ) | – | (28 | ) | ||||||||||||||
1-DAY BRL - CETIP | .885 FIXED | Annually | 01/03/2022 | BRL | 15,625 | (4 | ) | – | (4 | ) | ||||||||||||||
1-DAY BRL - CETIP | 2.99% | Annually | 01/03/2022 | BRL | 20,697 | (1 | ) | – | (1 | ) | ||||||||||||||
1-DAY BRL - CETIP | 5.89% | Annually | 01/03/2022 | BRL | 27,057 | 160 | – | 160 | ||||||||||||||||
SEI Institutional International Trust / Annual Report / September 30, 2020 |
69 |
SCHEDULE OF INVESTMENTS
September 30, 2020
Emerging Markets Debt Fund (Concluded)
| Fund Pays | Fund Receives | Payment Frequency | Termination Date | Currency | Notional Amount (Thousands) | Value (Thousands) | Upfront (Thousands) | Net Appreciation (Depreciation) (Thousands) | ||||||||||||||||||||||
1.960% | 1-DAY-CLP - Sinacofi Chile | Semi-Annually | 12/12/2021 | CLP | ||||||||||||||||||||||||||
| Interbank Rate Avg | 2,569,905 | $ | (58 | ) | $ | – | $ | (58 | ) | |||||||||||||||||||||
6-MONTH CZK - PRIBOR | 2.135% | Annually | 11/18/2021 | CZK | 155,000 | 138 | – | 138 | ||||||||||||||||||||||
6-MONTH PLN - WIBOR | 2.263% | Annually | 11/12/2021 | PLN | 7,000 | 40 | – | 40 | ||||||||||||||||||||||
6-MONTH CZK - PRIBOR | 2.225% | Annually | 11/11/2021 | CZK | 40,000 | 36 | – | 36 | ||||||||||||||||||||||
6-MONTH CZK - PRIBOR | 2.07% | Annually | 09/30/2021 | CZK | 121,000 | 92 | – | 92 | ||||||||||||||||||||||
6-MONTH CZK - PRIBOR | 2.1% | Annually | 09/30/2021 | CZK | 150,349 | 114 | – | 114 | ||||||||||||||||||||||
8.145% | 28-DAY MXN - TIIE | Monthly | 01/28/2021 | MXN | 136,359 | (74 | ) | – | (74 | ) | ||||||||||||||||||||
8.125% | 28-DAY MXN - TIIE | Monthly | 01/28/2021 | MXN | 60,000 | (33 | ) | – | (33 | ) | ||||||||||||||||||||
China 7-Day Reverse Repo Rate | 2.5375% | Quarterly | 08/31/2022 | CNY | 44,500 | 13 | – | 13 | ||||||||||||||||||||||
1-DAY COP - COLUMBIA IBR | 2.87% | Annually | 09/01/2022 | COP | 16,554,805 | 21 | – | 21 | ||||||||||||||||||||||
1-DAY COP - COLUMBIA IBR | .775% | Annually | 09/02/2022 | COP | 12,743,638 | 13 | – | 13 | ||||||||||||||||||||||
1-DAY BRL - CETIP | 5.25% | Annually | 01/02/2023 | BRL | 11,519 | 33 | – | 33 | ||||||||||||||||||||||
1.7 | 6-MONTH CZK - PRIBOR | Semi-Annually | 06/18/2024 | CZK | 140,000 | (270 | ) | – | (270 | ) | ||||||||||||||||||||
6-MONTH PLN - WIBOR | .65 FIXED | Annually | 03/26/2024 | PLN | 2,804 | 8 | – | 8 | ||||||||||||||||||||||
6-MONTH PLN - WIBOR | .63 FIXED | Annually | 03/26/2024 | PLN | 3,196 | 8 | – | 8 | ||||||||||||||||||||||
1.9865% | 6-MONTH PLN - WIBOR | Semi-Annually | 03/25/2024 | PLN | 14,396 | (214 | ) | – | (214 | ) | ||||||||||||||||||||
1-DAY BRL - CETIP | 4.835% | Annually | 01/02/2024 | BRL | 21,544 | (76 | ) | – | (76 | ) | ||||||||||||||||||||
1-DAY BRL - CETIP | .5 FIXED | Annually | 01/02/2024 | BRL | 4,808 | 21 | – | 21 | ||||||||||||||||||||||
1-DAY BRL - CETIP | 5.56% | Annually | 01/02/2024 | BRL | 18,819 | (1 | ) | – | (1 | ) | ||||||||||||||||||||
.21% | 1-DAY COP- COLUMBIA IBR | Quarterly | 07/08/2030 | COP | 1,318,748 | 3 | – | 3 | ||||||||||||||||||||||
1-DAY BRL - CETIP | .76% | Annually | 01/02/2024 | BRL | 8,953 | 8 | – | 8 | ||||||||||||||||||||||
1-DAY BRL - CETIP | .23 FIXED | Annually | 01/02/2023 | BRL | 5,579 | 35 | – | 35 | ||||||||||||||||||||||
1-DAY BRL - CETIP | .77 FIXED | Annually | 01/02/2023 | BRL | 6,361 | 51 | – | 51 | ||||||||||||||||||||||
1-DAY BRL - CETIP | 3.8875% | Annually | 01/02/2023 | BRL | 12,478 | (24 | ) | – | (24 | ) | ||||||||||||||||||||
1-DAY BRL - CETIP | 9.255% | Annually | 01/02/2023 | BRL | 2,368 | 38 | – | 38 | ||||||||||||||||||||||
1-DAY BRL - CETIP | 11.475% | Annually | 01/02/2023 | BRL | 3,524 | 80 | – | 80 | ||||||||||||||||||||||
1-DAY BRL - CETIP | 5.655 | Annually | 01/02/2023 | BRL | 2,705 | 12 | – | 12 | ||||||||||||||||||||||
1-DAY BRL - CETIP | 6.61% | Annually | 01/02/2023 | BRL | 4,693 | 35 | – | 35 | ||||||||||||||||||||||
28-DAY MXN - TIIE | .55% FIXED | Monthly | 04/13/2023 | MXN | 52,615 | 56 | – | 56 | ||||||||||||||||||||||
1-DAY-CLP - Sinacofi Chile Interbank Rate Avg | .145% | Semi-Annually | 08/24/2030 | CLP | 444,725 | (8 | ) | – | (8 | ) | ||||||||||||||||||||
|
|
|
|
|
| |||||||||||||||||||||||||
| $ | (470 | ) | $ | – | $ | (470 | ) | |||||||||||||||||||||||
|
|
|
|
|
| |||||||||||||||||||||||||
| Credit Default Swap | ||||||||||||||||||||||||
| Reference Entity/ Obligation | Buy/Sell Protection | (Pays)/Receives Rate | Payment Frequency | Termination Date | Notional Amount (Thousands) | Value (Thousands) | Upfront Payments/ Receipts (Thousands) | Net Unrealized Depreciation (Thousands) | ||||||||||||||||
CDX.EM.34.V1 | Buy | 1.00% | Quarterly | 12/20/2025 | 21,298 | $ | 1,355 | $ | 1,427 | $ | (72 | ) | ||||||||||||
|
| |||||||||||||||||||||||
Percentages are based on Net Assets of $1,473,435 ($ Thousands). |
| ** | The rate reported is the 7-day effective yield as of September 30, 2020. |
| † | Investment in Affiliated Security (see Note 5). |
| (A) | Security exempt from registration under Rule 144A of the Securities Act of 1933. These securities may be resold in transactions exempt from registration normally to qualified institutions. On September 30, 2020, the value of these securities amounted to $277,531 ($ Thousands), representing 18.8% of the Net Assets of the Fund. |
| (B) | Certain securities or partial positions of certain securities are on loan at September 30, 2020 (See Note 9). The total market value of securities on loan at September 30, 2020 was $14,743 ($ Thousands). |
| (C) | Step Bonds – Represents the current rate, the step rate, the step date and the final maturity date. |
| (D) | Security is in default on interest payment. |
| (E) | Zero coupon security. The rate shown on the Schedule of Investments is the security’s effective yield at the time of purchase. |
| (F) | Variable or floating rate security, the interest rate of which adjusts periodically based on changes in current interest rates and prepayments on the underlying pool of assets. |
| (G) | Perpetual security with no stated maturity date. |
| (H) | This security was purchased with cash collateral held from securities on loan. The total market value of such securities as of September 30, 2020 was $15,318 ($ Thousands). |
70 |
SEI Institutional International Trust / Annual Report / September 30, 2020 |
ARS — Argentine Peso
BRL — Brazilian Real
BUBOR— Budapest Interbank Offered Rate
CETIP— Central of Custody and Financial Settlement of Securities
CLP — Chilean Peso
CNY — Chinese Yuan Onshore
COP — Colombian Peso
CZK — Czech Koruna
DAC — Designated Activity Company
DOP — Dominican Peso
EGP — Egyptian Pound
EUR — Euro
GHS — Ghanaian Cedi
HUF — Hungarian Forint
IBR — Interbank Rate
ICE— Intercontinental Exchange
IDR — Indonesian Rupiah
INR — Indian Rupee
JPY — Japanese Yen
JSC — Joint-Stock Company
KLIBOR — Kuala Lumpur Interbank Offered Rate
KRW — Korean Won
LIBOR— London Interbank Offered Rate
L.P. — Limited Partnership
Ltd. — Limited
MTN — Medium Term Note
MXN — Mexican Peso
MYR — Malaysian Ringgit
NGN — Nigerian Naira
PEN — Peruvian Nuevo Sol
PHP— Philippine Peso
PLN — Polish Zloty
PRIBOR— Prague Interbank Offered Rate
RON — Romanian Leu
RSD — Serbian Dinar
RUB — Russian Ruble
SGD — Singapore Dollar
Ser — Series
THB — Thai Bhat
TIIE —Interbank Equilibrium Interest Rate
TRY — Turkish Lira
UAH — Ukrainian Hryvnia
ULC — Unlimited Liability Company
USD — U.S. Dollar
UYU — Uruguayan Peso
WIBOR— Warsaw Interbank Offered Rate
VAR — Variable Rate
ZAR — South African Rand
| Investments in Securities | Level 1 ($) | Level 2 ($) | Level 3 ($)(1) | Total ($) | ||||||||||||
Global Bonds | – | 1,405,762 | – | 1,405,762 | ||||||||||||
U.S. Treasury Obligation | – | 14,981 | – | 14,981 | ||||||||||||
Affiliated Partnership | – | 15,318 | – | 15,318 | ||||||||||||
|
|
|
|
|
|
|
| |||||||||
Total Investments in Securities | – | 1,436,061 | – | 1,436,061 | ||||||||||||
|
|
|
|
|
|
|
| |||||||||
| Other Financial Instruments | Level 1 ($) | Level 2 ($) | Level 3 ($) | Total ($) | ||||||||||||
Futures Contracts* | ||||||||||||||||
Unrealized Appreciation | 278 | – | – | 278 | ||||||||||||
Unrealized Depreciation | (679 | ) | – | – | (679 | ) | ||||||||||
Forwards Contracts* | ||||||||||||||||
Unrealized Appreciation | – | 5,765 | – | 5,765 | ||||||||||||
Unrealized Depreciation | – | (12,132 | ) | – | (12,132 | ) | ||||||||||
OTC Swaps | ||||||||||||||||
Interest Rate Swaps* | ||||||||||||||||
Unrealized Appreciation | – | 3,605 | – | 3,605 | ||||||||||||
Unrealized Depreciation | – | (95 | ) | – | (95 | ) | ||||||||||
Cross Currency Swaps* | ||||||||||||||||
Unrealized Appreciation | – | 232 | – | 232 | ||||||||||||
Centrally Cleared Swaps | ||||||||||||||||
Interest Rate Swaps* | ||||||||||||||||
Unrealized Appreciation | – | 1,785 | – | 1,785 | ||||||||||||
Unrealized Depreciation | – | (2,255 | ) | – | (2,255 | ) | ||||||||||
Credit Default Swaps* | ||||||||||||||||
Unrealized Depreciation | – | (72 | ) | – | (72 | ) | ||||||||||
|
|
|
|
|
|
|
| |||||||||
Total Other Financial Instruments | (401 | ) | (3,167 | ) | – | (3,568 | ) | |||||||||
|
|
|
|
|
|
|
| |||||||||
* Futures contracts, forwards contracts and swap contracts are valued at the unrealized appreciation (depreciation) on the instrument.
For the year ended September 30, 2020, there were no transfers in or out of Level 3.
For more information on valuation inputs, see Note 2 – Significant Accounting Policies in Notes to Financial Statements.
The following is a summary of the transactions with affiliates for the period ended September 30, 2020 ($ Thousands):
| Security Description | Value 9/30/2019 | Purchases at Cost | Proceeds from Sales | Realized Gain | Change in Unrealized Appreciation | Value 9/30/2020 | Shares | Income | Capital Gains | |||||||||
SEI Liquidity Fund, L.P. | $87,228 | $231,055 | $(302,978) | $8 | $5 | $15,318 | 15,314,028 | $177 | $— | |||||||||
|
|
|
|
|
|
|
|
Amounts designated as “—” are $0 or have been rounded to $0.
The accompanying notes are an integral part of the financial statements.
SEI Institutional International Trust / Annual Report / September 30, 2020 |
71 |
STATEMENTS OF ASSETS AND LIABILITIES ($ Thousands)
September 30, 2020
| International Equity Fund | Emerging Markets Equity Fund | International Fixed Income Fund | Emerging Markets Debt Fund | |||||||||||||||||||||||||||||
Assets: | ||||||||||||||||||||||||||||||||
Investments, at value † | $ | 3,749,437 | * | $ | 1,619,761 | * | $ | 499,832 | $ | 1,420,743* | ||||||||||||||||||||||
Affiliated investments, at value †† | 166,233 | 47,222 | – | 15,318 | ||||||||||||||||||||||||||||
Cash | 49,222 | 18,462 | 7,428 | 32,797 | ||||||||||||||||||||||||||||
Cash pledged as collateral for forward foreign currency contracts | – | – | – | 3,520 | ||||||||||||||||||||||||||||
Cash pledged as collateral for futures contracts | 7,756 | 3,370 | 435 | 2,475 | ||||||||||||||||||||||||||||
Cash pledged as collateral for swap contracts | – | – | 142 | 1,330 | ||||||||||||||||||||||||||||
Foreign currency, at value ††† | 6,376 | 7,501 | 1,163 | 3,046 | ||||||||||||||||||||||||||||
Receivable for fund shares sold | 1,236 | 615 | 245 | 562 | ||||||||||||||||||||||||||||
Receivable for investment securities sold | 16,664 | 8,579 | 2,810 | 6,598 | ||||||||||||||||||||||||||||
Dividends and interest receivable | 9,046 | 2,411 | 2,944 | 20,753 | ||||||||||||||||||||||||||||
Unrealized gain on forward foreign currency contracts | – | – | 6,431 | 5,765 | ||||||||||||||||||||||||||||
Unrealized gain on foreign spot currency contracts | – | – | 1,051 | 22 | ||||||||||||||||||||||||||||
Due from broker | – | – | – | 1,523 | ||||||||||||||||||||||||||||
Swap contracts, at value †††† | – | – | 97 | 3,837 | ||||||||||||||||||||||||||||
Foreign tax reclaim receivable | 12,343 | 72 | – | – | ||||||||||||||||||||||||||||
Receivable for variation margin | 23 | 501 | 166 | 282 | ||||||||||||||||||||||||||||
Prepaid expenses | 40 | 17 | 6 | 16 | ||||||||||||||||||||||||||||
Total Assets | 4,018,376 | 1,708,511 | 522,750 | 1,518,587 | ||||||||||||||||||||||||||||
Liabilities: | ||||||||||||||||||||||||||||||||
Payable upon return on securities loaned | 94,816 | 20,013 | – | 15,310 | ||||||||||||||||||||||||||||
Payable for investment securities purchased | 16,336 | 3,200 | 3,764 | 14,319 | ||||||||||||||||||||||||||||
Payable for fund shares redeemed | 3,180 | 2,917 | 278 | 1,232 | ||||||||||||||||||||||||||||
Swap contracts, at value †††† | – | – | 294 | 95 | ||||||||||||||||||||||||||||
Payable for variation margin | 812 | – | 150 | 206 | ||||||||||||||||||||||||||||
Administration fees payable | 1,013 | 615 | 137 | 530 | ||||||||||||||||||||||||||||
Unrealized loss on foreign currency spot contracts | 14 | 9 | 128 | 68 | ||||||||||||||||||||||||||||
Unrealized loss on forward foreign currency contracts | – | – | 3,203 | 12,132 | ||||||||||||||||||||||||||||
Trustees fees payable | 1 | – | – | – | ||||||||||||||||||||||||||||
Chief compliance officer fees payable | 5 | 2 | 1 | 2 | ||||||||||||||||||||||||||||
Administrative servicing fees payable | 4 | – | – | – | ||||||||||||||||||||||||||||
Shareholder servicing fees payable | 479 | 321 | 91 | 288 | ||||||||||||||||||||||||||||
Investment advisory fees payable | 1,642 | 1,325 | 96 | 766 | ||||||||||||||||||||||||||||
Accrued expense payable | 282 | 241 | 80 | 204 | ||||||||||||||||||||||||||||
Accrued foreign capital gains tax on appreciated securities | – | 2,635 | – | – | ||||||||||||||||||||||||||||
Total Liabilities | 118,584 | 31,278 | 8,222 | 45,152 | ||||||||||||||||||||||||||||
Net Assets | $ | 3,899,792 | $ | 1,677,233 | $ | 514,528 | $ | 1,473,435 | ||||||||||||||||||||||||
† Cost of investments | $ | 3,474,342 | $ | 1,256,791 | $ | 471,916 | $ | 1,465,519 | ||||||||||||||||||||||||
†† Cost of affiliated investments | 166,224 | 47,214 | – | 15,315 | ||||||||||||||||||||||||||||
††† Cost of foreign currency | 6,382 | 7,461 | 1,159 | 3,036 | ||||||||||||||||||||||||||||
†††† Cost (premiums received) | – | – | (105 | ) | – | |||||||||||||||||||||||||||
* Includes market value of securities on loan | 90,323 | 18,725 | – | 14,743 | ||||||||||||||||||||||||||||
72 |
SEI Institutional International Trust / Annual Report / September 30, 2020 |
| International Equity Fund | Emerging Markets Equity Fund | International Fixed Income Fund | Emerging Markets Debt Fund | |||||||||||||||||||||||||||||
Net Assets: | ||||||||||||||||||||||||||||||||
Paid-in Capital — (unlimited authorization — no par value) | $ | 3,678,629 | $ | 1,480,081 | $ | 510,034 | $ | 1,599,424 | ||||||||||||||||||||||||
Total distributable earnings/(loss) | 221,163 | 197,152 | 4,494 | (125,989) | ||||||||||||||||||||||||||||
Net Assets | $ | 3,899,792 | $ | 1,677,233 | $ | 514,528 | $ | 1,473,435 | ||||||||||||||||||||||||
Net Asset Value, Offering and Redemption Price Per Share — Class F | $ | 10.86 | $ | 12.06 | $ | 10.46 | $ | 9.80 | ||||||||||||||||||||||||
| | ($3,568,372,946 ÷ 328,728,110 shares) | | | ($1,542,551,467 ÷ 127,941,213 shares) | | | ($445,864,185 ÷ 42,641,783 shares) | | | ($1,374,566,013 ÷ 140,280,940 shares) | | |||||||||||||||||||||
Net Asset Value, Offering and Redemption Price Per Share — Class I | $ | 10.87 | N/A | N/A | N/A | |||||||||||||||||||||||||||
| | ($1,350,165 ÷ 124,231 shares) | | ||||||||||||||||||||||||||||||
Net Asset Value, Offering and Redemption Price Per Share — Class Y | $ | 10.86 | $ | 12.07 | $ | 10.47 | $ | 9.79 | ||||||||||||||||||||||||
| | ($330,068,495÷ 30,398,865 shares) | | | ($134,681,529 ÷ 11,159,072 shares) | | | ($68,664,161 ÷ 6,557,890 shares) | | | ($98,868,564 ÷ 10,100,457 shares) | | |||||||||||||||||||||
N/A — Not applicable. Share classes currently not offered.
Amounts designated as “—” are $0 or have been rounded to $0.
The accompanying notes are an integral part of the financial statements.
SEI Institutional International Trust / Annual Report / September 30, 2020 |
73 |
STATEMENTS OF OPERATIONS ($ Thousands)
For the year ended September 30, 2020
International Equity | Emerging Markets | International Fixed | Emerging Markets | |||||||||||||||||||||
Investment Income: | ||||||||||||||||||||||||
Dividends | $ | 89,618 | $ | 39,732 | $ | – | $ | – | ||||||||||||||||
Income from affiliated investments(1) | 439 | 180 | – | – | ||||||||||||||||||||
Interest Income | 477 | 185 | 6,843 | 84,852 | ||||||||||||||||||||
Security lending income — net(2)(3) | 1,027 | 339 | – | 177 | ||||||||||||||||||||
Less: foreign taxes withheld | (11,298 | ) | (4,472 | ) | (82 | ) | (1,816 | ) | ||||||||||||||||
Total Investment Income | 80,263 | 35,964 | 6,761 | 83,213 | ||||||||||||||||||||
Expenses: | ||||||||||||||||||||||||
Investment advisory fees | 19,891 | 17,597 | 1,542 | 13,031 | ||||||||||||||||||||
Administration fees | 12,323 | 7,385 | 2,313 | 6,849 | ||||||||||||||||||||
Shareholder servicing fees — Class F | 8,983 | 3,845 | 1,113 | 3,571 | ||||||||||||||||||||
Shareholder servicing fees — Class I | 4 | – | – | – | ||||||||||||||||||||
Administrative servicing fees — Class I | 4 | – | – | – | ||||||||||||||||||||
Printing fees | 573 | 245 | 74 | 221 | ||||||||||||||||||||
Custodian/wire agent fees | 430 | 750 | 139 | 453 | ||||||||||||||||||||
Professional fees | 195 | 64 | 25 | 75 | ||||||||||||||||||||
Trustees’ fees | 82 | 35 | 11 | 31 | ||||||||||||||||||||
Registration fees | 60 | 26 | 8 | 24 | ||||||||||||||||||||
Chief compliance officer fees | 22 | 9 | 3 | 8 | ||||||||||||||||||||
Other expenses | 181 | 89 | 132 | 177 | ||||||||||||||||||||
Total Expenses | 42,748 | 30,045 | 5,360 | 24,440 | ||||||||||||||||||||
Less: | ||||||||||||||||||||||||
Waiver of investment advisory fees | – | (1,676 | ) | (227 | ) | (3,524 | ) | |||||||||||||||||
Waiver of administration fees | – | – | (51 | ) | (300 | ) | ||||||||||||||||||
Waiver of shareholder servicing fees — Class F | (72 | ) | – | – | – | |||||||||||||||||||
Net Expenses | 42,676 | 28,369 | 5,082 | 20,616 | ||||||||||||||||||||
Net Investment Income | 37,587 | 7,595 | 1,679 | 62,597 | ||||||||||||||||||||
Net Realized Gain (Loss) on: | ||||||||||||||||||||||||
Investments | 30,468 | (55,201 | ) | 3,939 | (6,780 | ) | ||||||||||||||||||
Affiliated investments | 13 | 1 | – | 8 | ||||||||||||||||||||
Futures contracts | 3,147 | 6,223 | (3,952 | ) | 1,550 | |||||||||||||||||||
Swap contracts | – | – | (333 | ) | 469 | |||||||||||||||||||
Purchased and written options | – | – | – | (279 | ) | |||||||||||||||||||
Foreign currency transactions | (250 | ) | (944 | ) | (265 | ) | (37,890 | ) | ||||||||||||||||
Forward foreign currency contracts | 211 | – | (14,131 | ) | (9,493 | ) | ||||||||||||||||||
Net Change in Unrealized Appreciation (Depreciation) on: | ||||||||||||||||||||||||
Investments | 49,626 | 182,067 | 18,010 | (25,953 | ) | |||||||||||||||||||
Affiliated investments | 3 | – | – | 5 | ||||||||||||||||||||
Futures contracts | (2,324 | ) | 1,306 | (136 | ) | 222 | ||||||||||||||||||
Option contracts | – | – | – | 153 | ||||||||||||||||||||
Swap contracts | – | – | (169 | ) | 2,150 | |||||||||||||||||||
Foreign capital gains tax on appreciated securities | – | (2,067 | ) | – | – | |||||||||||||||||||
Foreign currency translation of other assets and liabilities denominated in foreign currencies | 892 | 80 | 1,095 | 554 | ||||||||||||||||||||
Forward foreign currency contracts | – | – | (2,541 | ) | (2,620 | ) | ||||||||||||||||||
Net Increase (Decrease) in Net Assets Resulting from Operations | $ | 119,373 | $ | 139,060 | $ | 3,196 | $ | (15,307 | ) | |||||||||||||||
(1) See Note 5 in the Notes to Financial Statements for additional information.
(2) Income is from the investment of collateral in an affiliated security.
(3) See Note 9 in the Notes to Financial Statements for additional information.
Amounts designated as “—” are $0 or have been rounded to $0.
The accompanying notes are an integral part of the financial statements.
74 |
SEI Institutional International Trust / Annual Report / September 30, 2020 |
STATEMENTS OF CHANGES IN NET ASSETS ($ Thousands)
For the years ended September 30,
| International Equity Fund | Emerging Markets Equity Fund | |||||||||||||||
| 2020 | 2019 | 2020 | 2019 | |||||||||||||
Operations: | ||||||||||||||||
Net investment income | $ | 37,587 | $ | 78,036 | $ | 7,595 | $ | 16,194 | ||||||||
Net realized gain (loss) on investments and futures contracts | 33,628 | (92,628) | (48,977) | (72,504) | ||||||||||||
Net realized loss on forward foreign currency contracts and foreign currency transactions | (39) | (1,944) | (944) | (1,474) | ||||||||||||
Net change in unrealized appreciation (depreciation) on investments and futures contracts | 47,305 | (191,554) | 183,373 | 26,765 | ||||||||||||
Net change in unrealized appreciation (depreciation) on forward foreign currency contracts, foreign currencies and translation of other assets and liabilities denominated in foreign currencies | 892 | (332) | 80 | 6 | ||||||||||||
Net change in unrealized depreciation on foreign capital tax gains on appreciated securities | — | — | (2,067) | (145) | ||||||||||||
Net Increase (Decrease) in Net Assets Resulting from Operations | 119,373 | (208,422) | 139,060 | (31,158) | ||||||||||||
Distributions: | ||||||||||||||||
Class F | (67,877) | (53,543) | (18,642) | (9,542) | ||||||||||||
Class I | (25) | (25) | N/A | N/A | ||||||||||||
Class Y | (7,618) | (5,551) | (2,039) | (1,045) | ||||||||||||
Total Distributions | (75,520) | (59,119) | (20,681) | (10,587) | ||||||||||||
Capital Share Transactions: | ||||||||||||||||
Class F: | ||||||||||||||||
Proceeds from shares issued | 568,725 | 581,641 | 259,125 | 262,961 | ||||||||||||
Reinvestment of dividends & distributions | 62,626 | 49,614 | 17,191 | 8,884 | ||||||||||||
Cost of shares redeemed | (794,429) | (720,379) | (408,775) | (337,016) | ||||||||||||
Net Decrease from Class F Transactions | (163,078) | (89,124) | (132,459) | (65,171) | ||||||||||||
Class I: | ||||||||||||||||
Proceeds from shares issued | 491 | 398 | N/A | N/A | ||||||||||||
Reinvestment of dividends & distributions | 13 | 15 | N/A | N/A | ||||||||||||
Cost of shares redeemed | (1,060) | (960) | N/A | N/A | ||||||||||||
Net Decrease from Class I Transactions | (556) | (547) | N/A | N/A | ||||||||||||
Class Y: | ||||||||||||||||
Proceeds from shares issued | 72,880 | 107,012 | 30,639 | 50,713 | ||||||||||||
Reinvestment of dividends & distributions | 7,068 | 5,135 | 1,901 | 971 | ||||||||||||
Cost of shares redeemed | (118,964) | (68,972) | (51,350) | (29,199) | ||||||||||||
Net Increase (Decrease) from Class Y Transactions | (39,016) | 43,175 | (18,810) | 22,485 | ||||||||||||
Net Decrease in Net Assets Derived from Capital Share Transactions | (202,650) | (46,496) | (151,269) | (42,686) | ||||||||||||
Net Decrease in Net Assets | (158,797) | (314,037) | (32,890) | (84,431) | ||||||||||||
Net Assets: | ||||||||||||||||
Beginning of Year | 4,058,589 | 4,372,626 | 1,710,123 | 1,794,554 | ||||||||||||
End of Year | $ | 3,899,792 | $ | 4,058,589 | $ | 1,677,233 | $ | 1,710,123 | ||||||||
Capital Share Transactions: | ||||||||||||||||
Class F: | ||||||||||||||||
Shares issued | 56,479 | 55,772 | 23,437 | 23,647 | ||||||||||||
Reinvestment of distributions | 5,441 | 5,278 | 1,385 | 859 | ||||||||||||
Shares redeemed | (78,402) | (69,493) | (36,491) | (30,383) | ||||||||||||
Total Class F Transactions | (16,482) | (8,443) | (11,669) | (5,877) | ||||||||||||
Class I: | ||||||||||||||||
Shares issued | 51 | 38 | N/A | N/A | ||||||||||||
Reinvestment of distributions | 1 | 2 | N/A | N/A | ||||||||||||
Shares redeemed | (109) | (93) | N/A | N/A | ||||||||||||
Total Class I Transactions | (57) | (53) | N/A | N/A | ||||||||||||
Class Y: | ||||||||||||||||
Shares issued | 7,463 | 10,480 | 2,869 | 4,578 | ||||||||||||
Reinvestment of distributions | 615 | 547 | 153 | 94 | ||||||||||||
Shares redeemed | (12,369) | (6,631) | (4,844) | (2,626) | ||||||||||||
Total Class Y Transactions | (4,291) | 4,396 | (1,822) | 2,046 | ||||||||||||
Net Decrease in Shares Outstanding from Share Transactions | (20,830) | (4,100) | (13,491) | (3,831) | ||||||||||||
N/A — Not applicable. Share classes currently not offered.
Amounts designated as “—” are $0 or have been rounded to $0.
The accompanying notes are an integral part of the financial statements.
SEI Institutional International Trust / Annual Report / September 30, 2020 |
75 |
STATEMENTS OF CHANGES IN NET ASSETS ($ Thousands) (Concluded)
For the years ended September 30,
| International Fixed Income Fund | Emerging Markets Debt Fund | |||||||||||||||
| 2020 | 2019 | 2020 | 2019 | |||||||||||||
Operations: | ||||||||||||||||
Net investment income | $ | 1,679 | $ | 2,207 | $ | 62,597 | $ | 77,900 | ||||||||
Net realized gain (loss) on investments, futures contracts and swap contracts | (346) | 4,840 | (5,032) | (8,302) | ||||||||||||
Net realized gain (loss) on forward foreign currency contracts and foreign currency transactions | (14,396) | 11,720 | (47,383) | (48,917) | ||||||||||||
Net change in unrealized appreciation (depreciation) on investments, futures contracts, option contracts and swap contracts | 17,705 | 21,837 | (23,423) | 111,211 | ||||||||||||
Net change in unrealized appreciation (depreciation) on forward foreign currency contracts, foreign currencies and translation of other assets and liabilities denominated in foreign currencies | (1,446) | 3,144 | (2,066) | (3,018) | ||||||||||||
Net Increase (Decrease) in Net Assets Resulting from Operations | 3,196 | 43,748 | (15,307) | 128,874 | ||||||||||||
Distributions: | ||||||||||||||||
Class F | (14,461) | (19,278) | (11,445) | (24,016) | ||||||||||||
Class Y | (2,410) | (2,040) | (1,066) | (2,284) | ||||||||||||
Total Distributions | (16,871) | (21,318) | (12,511) | (26,300) | ||||||||||||
Capital Share Transactions: | ||||||||||||||||
Class F: | ||||||||||||||||
Proceeds from shares issued | 80,130 | 76,574 | 207,358 | 224,174 | ||||||||||||
Reinvestment of dividends & distributions | 13,322 | 17,932 | 10,357 | 21,787 | ||||||||||||
Cost of shares redeemed | (87,928) | (100,729) | (300,839) | (308,307) | ||||||||||||
Net Increase (Decrease) from Class F Transactions | 5,524 | (6,223) | (83,124) | (62,346) | ||||||||||||
Class Y: | ||||||||||||||||
Proceeds from shares issued | 16,132 | 28,909 | 23,514 | 30,730 | ||||||||||||
Reinvestment of dividends & distributions | 2,180 | 1,813 | 985 | 2,127 | ||||||||||||
Cost of shares redeemed | (17,464) | (7,009) | (35,537) | (42,670) | ||||||||||||
Net Increase (Decrease) from Class Y Transactions | 848 | 23,713 | (11,038) | (9,813) | ||||||||||||
Net Increase (Decrease) in Net Assets Derived from Capital Share Transactions | 6,372 | 17,490 | (94,162) | (72,159) | ||||||||||||
Net Increase (Decrease) in Net Assets | (7,303) | 39,920 | (121,980) | 30,415 | ||||||||||||
Net Assets: | ||||||||||||||||
Beginning of Year | 521,831 | 481,911 | 1,595,415 | 1,565,000 | ||||||||||||
End of Year | $ | 514,528 | $ | 521,831 | $ | 1,473,435 | $ | 1,595,415 | ||||||||
Capital Share Transactions: | ||||||||||||||||
Class F: | ||||||||||||||||
Shares issued | 7,694 | 7,424 | 21,356 | 23,304 | ||||||||||||
Reinvestment of distributions | 1,290 | 1,798 | 1,060 | 2,186 | ||||||||||||
Shares redeemed | (8,463) | (9,831) | (31,470) | (32,215) | ||||||||||||
Total Class F Transactions | 521 | (609) | (9,054) | (6,725) | ||||||||||||
Class Y: | ||||||||||||||||
Shares issued | 1,551 | 2,797 | 2,528 | 3,226 | ||||||||||||
Reinvestment of distributions | 211 | 182 | 102 | 214 | ||||||||||||
Shares redeemed | (1,687) | (677) | (3,816) | (4,425) | ||||||||||||
Total Class Y Transactions | 75 | 2,302 | (1,186) | (985) | ||||||||||||
Net Increase (Decrease) in Shares Outstanding from Share Transactions | 596 | 1,693 | (10,240) | (7,710) | ||||||||||||
Amounts designated as “—” are $0 or have been rounded to $0.
The accompanying notes are an integral part of the financial statements.
76 |
SEI Institutional International Trust / Annual Report / September 30, 2020 |
For the years or period ended September 30
For a Share Outstanding Throughout Each Year or Period
| Net Asset Value, Beginning of Year | Net Investment | Net Realized on | Total from | Dividends from Net Investment Income | Distributions from Net Realized Gains | Total Dividends and Distributions | Net Asset Value, End of Year | Total Return† | Net Assets End of Year ($ Thousands) | Ratio of Net Expenses to Average Net Assets* | Ratio of Expenses Net Assets Paid Indirectly | Ratio of Expenses to Average Net Assets (Excluding Fees Paid Indirectly and Waivers)** | Ratio of Net Investment Income (Loss) to Average Net Assets | Portfolio Turnover Rate† | ||||||||||||||||||||||||||||||||||||||||
International Equity Fund |
| |||||||||||||||||||||||||||||||||||||||||||||||||||||
Class F(2) |
| |||||||||||||||||||||||||||||||||||||||||||||||||||||
2020 | $10.68 | $0.10 | $0.28 | $0.38 | $(0.20) | $— | $(0.20) | $10.86 | 3.44% | $3,568,373 | 1.11% | 1.11% | 1.11% | 0.94% | 102% | |||||||||||||||||||||||||||||||||||||||
2019 | 11.38 | 0.20 | (0.75) | (0.55) | (0.15) | — | (0.15) | 10.68 | (4.63) | 3,686,195 | 1.10(3) | 1.10(3) | 1.10(3) | 1.92 | 73 | |||||||||||||||||||||||||||||||||||||||
2018 | 11.29 | 0.16 | 0.08 | 0.24 | (0.15) | — | (0.15) | 11.38 | 2.11 | 4,024,987 | 1.09(3) | 1.09(3) | 1.09(3) | 1.35 | 40 | |||||||||||||||||||||||||||||||||||||||
2017 | 9.58 | 0.13 | 1.69 | 1.82 | (0.11) | — | (0.11) | 11.29 | 19.23 | 3,795,858 | 1.15(3) | 1.15(3) | 1.15(3) | 1.27 | 57 | |||||||||||||||||||||||||||||||||||||||
2016 | 9.16 | 0.13 | 0.39 | 0.52 | (0.10) | — | (0.10) | 9.58 | 5.63 | 2,729,762 | 1.27(3)(4) | 1.27(3)(4) | 1.28(3)(4) | 1.36 | 45 | |||||||||||||||||||||||||||||||||||||||
Class I |
| |||||||||||||||||||||||||||||||||||||||||||||||||||||
2020 | $10.68 | $0.07 | $0.28 | $0.35 | $(0.16) | $— | $(0.16) | $10.87 | 3.19% | $1,350 | 1.36% | 1.36% | 1.36% | 0.63% | 102% | |||||||||||||||||||||||||||||||||||||||
2019 | 11.37 | 0.17 | (0.74) | (0.57) | (0.12) | — | (0.12) | 10.68 | (4.90) | 1,932 | 1.35(5) | 1.35(5) | 1.35(5) | 1.61 | 73 | |||||||||||||||||||||||||||||||||||||||
2018 | 11.27 | 0.12 | 0.09 | 0.21 | (0.11) | — | (0.11) | 11.37 | 1.86 | 2,662 | 1.34(5) | 1.34(5) | 1.34(5) | 1.06 | 40 | |||||||||||||||||||||||||||||||||||||||
2017 | 9.55 | 0.10 | 1.70 | 1.80 | (0.08) | — | (0.08) | 11.27 | 19.00 | 2,954 | 1.40(5) | 1.40(5) | 1.40(5) | 0.96 | 57 | |||||||||||||||||||||||||||||||||||||||
2016 | 9.15 | 0.10 | 0.38 | 0.48 | (0.08) | — | (0.08) | 9.55 | 5.27 | 4,341 | 1.52(4)(5) | 1.52(4)(5) | 1.52(4)(5) | 1.09 | 45 | |||||||||||||||||||||||||||||||||||||||
Class Y |
| |||||||||||||||||||||||||||||||||||||||||||||||||||||
2020 | $10.68 | $0.12 | $0.29 | $0.41 | $(0.23) | $— | $(0.23) | $10.86 | 3.68% | $330,069 | 0.86% | 0.86% | 0.86% | 1.16% | 102% | |||||||||||||||||||||||||||||||||||||||
2019 | 11.39 | 0.23 | (0.76) | (0.53) | (0.18) | — | (0.18) | 10.68 | (4.43) | 370,462 | 0.85(6) | 0.85(6) | 0.85(6) | 2.24 | 73 | |||||||||||||||||||||||||||||||||||||||
2018 | 11.31 | 0.18 | 0.09 | 0.27 | (0.19) | — | (0.19) | 11.39 | 2.40 | 344,977 | 0.84(6) | 0.84(6) | 0.84(6) | 1.60 | 40 | |||||||||||||||||||||||||||||||||||||||
2017 | 9.59 | 0.16 | 1.69 | 1.85 | (0.13) | — | (0.13) | 11.31 | 19.59 | 319,689 | 0.90(6) | 0.90(6) | 0.90(6) | 1.53 | 57 | |||||||||||||||||||||||||||||||||||||||
2016 | 9.18 | 0.16 | 0.37 | 0.53 | (0.12) | — | (0.12) | 9.59 | 5.77 | 168,719 | 1.02(4)(6) | 1.02(4)(6) | 1.03(4)(6) | 1.70 | 45 | |||||||||||||||||||||||||||||||||||||||
Emerging Markets Equity Fund |
| |||||||||||||||||||||||||||||||||||||||||||||||||||||
Class F(2) |
| |||||||||||||||||||||||||||||||||||||||||||||||||||||
2020 | $11.21 | $0.05 | $0.93 | $0.98 | $(0.13) | $— | $(0.13) | $12.06 | 8.75% | $1,542,551 | 1.71%(7) | 1.71%(7) | 1.81%(8) | 0.43% | 90% | |||||||||||||||||||||||||||||||||||||||
2019 | 11.47 | 0.10 | (0.29) | (0.19) | (0.07) | — | (0.07) | 11.21 | (1.64) | 1,564,523 | 1.70(7) | 1.70(7) | 1.81(8) | 0.92 | 89 | |||||||||||||||||||||||||||||||||||||||
2018 | 12.32 | 0.08 | (0.77) | (0.69) | (0.16) | — | (0.16) | 11.47 | (5.71) | 1,668,960 | 1.69(7) | 1.69(7) | 1.80(8) | 0.61 | 70 | |||||||||||||||||||||||||||||||||||||||
2017 | 10.09 | 0.07 | 2.24 | 2.31 | (0.08) | — | (0.08) | 12.32 | 23.10 | 1,821,009 | 1.74(7) | 1.74(7) | 1.82(8) | 0.65 | 66 | |||||||||||||||||||||||||||||||||||||||
2016 | 8.43 | 0.05 | 1.68 | 1.73 | (0.07) | — | (0.07) | 10.09 | 20.66 | 1,532,960 | 1.76(4)(7) | 1.76(4)(7) | 1.86(4),(8) | 0.59 | 79 | |||||||||||||||||||||||||||||||||||||||
Class Y |
| |||||||||||||||||||||||||||||||||||||||||||||||||||||
2020 | $11.22 | $0.08 | $0.93 | $1.01 | $(0.16) | $— | $(0.16) | $12.07 | 8.99% | $134,682 | 1.46%(9) | 1.46%(9) | 1.56%(10) | 0.66% | 90% | |||||||||||||||||||||||||||||||||||||||
2019 | 11.49 | 0.14 | (0.31) | (0.17) | (0.10) | — | (0.10) | 11.22 | (1.44) | 145,600 | 1.45(9) | 1.45(9) | 1.56(10) | 1.25 | 89 | |||||||||||||||||||||||||||||||||||||||
2018 | 12.35 | 0.11 | (0.76) | (0.65) | (0.21) | — | (0.21) | 11.49 | (5.46) | 125,594 | 1.44(9) | 1.44(9) | 1.55(10) | 0.89 | 70 | |||||||||||||||||||||||||||||||||||||||
2017 | 10.11 | 0.10 | 2.24 | 2.34 | (0.10) | — | (0.10) | 12.35 | 23.46 | 125,400 | 1.49(9) | 1.49(9) | 1.57(10) | 0.93 | 66 | |||||||||||||||||||||||||||||||||||||||
2016 | 8.45 | 0.09 | 1.66 | 1.75 | (0.09) | — | (0.09) | 10.11 | 20.95 | 72,218 | 1.52(4),(9) | 1.52(4),(9) | 1.62(4) (10) | 0.96 | 79 | |||||||||||||||||||||||||||||||||||||||
| † | Returns do not reflect the deduction of taxes that a shareholder would pay on fund distributions or the redemption of fund shares. |
| * | Includes Fees Paid Indirectly, if applicable. See Note 5 in Notes to Financial Statements |
| ** | See Note 5 in Notes to Financial Statements. |
| (1) | Per share net investment income and net realized and unrealized gains (losses) calculated using average shares. |
| (2) | Effective January 31, 2017, Class A Shares converted to Class F Shares of the same Fund. |
| (3) | The expense ratio includes overdraft fees. Had this expense been excluded the ratios would have been 1.10%, 1.09%, 1.15% and 1.27% for 2019, 2018, 2017 and 2016. |
| (4) | The expense ratio includes proxy expenses outside the cap. |
| (5) | The expense ratio includes overdraft fees. Had this expense been excluded the ratios would have been 1.35%, 1.34%, 1.40% and 1.52% for 2019, 2018, 2017 and 2016. |
| (6) | The expense ratio includes overdraft fees. Had this expense been excluded the ratios would have been 0.85%, 0.84%, 0.90% and 1.02% for 2019, 2018, 2017 and 2016. |
| (7) | The expense ratio includes overdraft fees. Had this expense been excluded the ratios would have been 1.71%, 1.70%, 1.69%, 1.74%, and 1.76% for 2020, 2019, 2018, 2017 and 2016. |
| (8) | The expense ratio includes overdraft fees. Had this expense been excluded the ratios would have been 1.81%, 1.81%, 1.80%, 1.82%, and 1.86% for 2020, 2019, 2018, 2017 and 2016. |
| (9) | The expense ratio includes overdraft fees. Had this expense been excluded the ratios would have been 1.46%, 1.45%, 1.44%, 1.49% and 1.52% for 2020, 2019, 2018, 2017 and 2016. |
| (10) | The expense ratio includes overdraft fees. Had this expense been excluded the ratios would have been 1.56%, 1.56%, 1.55%, 1.58% and 1.62% for 2020, 2019, 2018, 2017 and 2016. |
Amounts designated as “—” are either $0 or have been rounded to $0.
The accompanying notes are an integral part of the financial statements.
SEI Institutional International Trust / Annual Report / September 30, 2020 |
77 |
FINANCIAL HIGHLIGHTS
For the years or period ended September 30
For a Share Outstanding Throughout Each Year or Period
| Net Asset Value, Beginning of Year | Net Investment | Net Realized on | Total from | Dividends from Net Investment Income | Distributions from Net Realized Gains | Total Dividends and Distributions | Net Asset Value, End of Year | Total Return† | Net Assets End of Year ($ Thousands) | Ratio of Net Expenses to Average Net Assets* | Ratio of Expenses Net Assets Paid Indirectly | Ratio of Expenses to Average Net Assets (Excluding Fees Paid Indirectly and Waivers)** | Ratio of Net Investment Income (Loss) to Average Net Assets | Portfolio Turnover Rate† | ||||||||||||||||||||||||||||||||||||||||
International Fixed Income Fund |
| |||||||||||||||||||||||||||||||||||||||||||||||||||||
Class F(2) |
| |||||||||||||||||||||||||||||||||||||||||||||||||||||
2020 | $10.73 | $0.03 | $0.04 | $0.07 | $(0.26) | $(0.08) | $(0.34) | $10.46 | 0.73% | $445,864 | 1.02% | 1.02% | 1.08% | 0.29% | 64% | |||||||||||||||||||||||||||||||||||||||
2019 | 10.27 | 0.04 | 0.88 | 0.92 | (0.40) | (0.06) | (0.46) | 10.73 | 9.28 | 452,150 | 1.02(3) | 1.02(3) | 1.07(4) | 0.42 | 58 | |||||||||||||||||||||||||||||||||||||||
2018 | 10.13 | 0.07 | 0.07 | 0.14 | — | — | — | 10.27 | 1.38 | 438,908 | 1.02(3) | 1.02(3) | 1.07(4) | 0.66 | 71 | |||||||||||||||||||||||||||||||||||||||
2017 | 10.51 | 0.07 | (0.18) | (0.11) | (0.17) | (0.10) | (0.27) | 10.13 | (1.03) | 415,582 | 1.02(3) | 1.02(3) | 1.08(4) | 0.66 | 113 | |||||||||||||||||||||||||||||||||||||||
2016 | 10.38 | 0.10 | 0.62 | 0.72 | (0.57) | (0.02) | (0.59) | 10.51 | 7.32 | 497,157 | 1.05(3)(5) | 1.05(3)(5) | 1.11(4)(5) | 0.98 | 106 | |||||||||||||||||||||||||||||||||||||||
Class Y |
| |||||||||||||||||||||||||||||||||||||||||||||||||||||
2020 | $10.75 | $0.06 | $0.03 | $0.09 | $(0.29) | $(0.08) | $(0.37) | $10.47 | 0.88% | $68,664 | 0.77% | 0.77% | 0.83% | 0.54% | 64% | |||||||||||||||||||||||||||||||||||||||
2019 | 10.29 | 0.07 | 0.88 | 0.95 | (0.43) | (0.06) | (0.49) | 10.75 | 9.54 | 69,681 | 0.77(6) | 0.77(6) | 0.82(7) | 0.66 | 58 | |||||||||||||||||||||||||||||||||||||||
2018 | 10.12 | 0.09 | 0.08 | 0.17 | — | — | — | 10.29 | 1.68 | 43,003 | 0.77(6) | 0.77(6) | 0.82(7) | 0.91 | 71 | |||||||||||||||||||||||||||||||||||||||
2017 | 10.50 | 0.09 | (0.17) | (0.08) | (0.20) | (0.10) | (0.30) | 10.12 | (0.76) | 37,982 | 0.77(6) | 0.77(6) | 0.83(7) | 0.94 | 113 | |||||||||||||||||||||||||||||||||||||||
2016(8) | 10.45 | 0.12 | 0.55 | 0.67 | (0.60) | (0.02) | (0.62) | 10.50 | 6.79 | 12,901 | 0.80(5)(6) | 0.80(5)(6) | 0.87(5)(7) | 1.23 | 106 | |||||||||||||||||||||||||||||||||||||||
Emerging Markets Debt Fund |
| |||||||||||||||||||||||||||||||||||||||||||||||||||||
Class F(2) |
| |||||||||||||||||||||||||||||||||||||||||||||||||||||
2020 | $9.93 | $0.40 | $(0.45) | $(0.05) | $(0.08) | $— | $(0.08) | $9.80 | (0.53)% | $1,374,566 | 1.36% | 1.36% | 1.61% | 4.07% | 95% | |||||||||||||||||||||||||||||||||||||||
2019 | 9.30 | 0.47 | 0.32 | 0.79 | (0.16) | — | (0.16) | 9.93 | 8.51 | 1,483,467 | 1.36(9) | 1.36(9) | 1.62(10) | 4.93 | 114 | |||||||||||||||||||||||||||||||||||||||
2018 | 10.55 | 0.51 | (1.19) | (0.68) | (0.57) | — | (0.57) | 9.30 | (6.81) | 1,451,128 | 1.36(9) | 1.36(9) | 1.61(10) | 5.08 | 80 | |||||||||||||||||||||||||||||||||||||||
2017 | 10.08 | 0.51 | 0.17 | 0.68 | (0.21) | — | (0.21) | 10.55 | 6.93 | 1,458,611 | 1.36(9) | 1.36(9) | 1.63(10) | 5.06 | 79 | |||||||||||||||||||||||||||||||||||||||
2016 | 8.66 | 0.49 | 0.93 | 1.42 | — | — | — | 10.08 | 16.40 | 1,453,586 | 1.39(5)(9) | 1.39(5)(9) | 1.65(5)(10) | 5.30 | 86 | |||||||||||||||||||||||||||||||||||||||
Class Y |
| |||||||||||||||||||||||||||||||||||||||||||||||||||||
2020 | $9.92 | $0.42 | $(0.45) | $(0.03) | $(0.10) | $— | $(0.10) | $9.79 | (0.33)% | $98,869 | 1.11% | 1.11% | 1.36% | 4.33% | 95% | |||||||||||||||||||||||||||||||||||||||
2019 | 9.28 | 0.50 | 0.32 | 0.82 | (0.18) | — | (0.18) | 9.92 | 8.84 | 111,948 | 1.11(11) | 1.11(11) | 1.37(12) | 5.18 | 114 | |||||||||||||||||||||||||||||||||||||||
2018 | 10.57 | 0.53 | (1.18) | (0.65) | (0.64) | — | (0.64) | 9.28 | (6.57) | 113,872 | 1.11(11) | 1.11(11) | 1.36(12) | 5.34 | 80 | |||||||||||||||||||||||||||||||||||||||
2017 | 10.12 | 0.53 | 0.17 | 0.70 | (0.25) | — | (0.25) | 10.57 | 7.18 | 108,361 | 1.11(11) | 1.11(11) | 1.38(12) | 5.31 | 79 | |||||||||||||||||||||||||||||||||||||||
2016 | 8.67 | 0.52 | 0.93 | 1.45 | — | — | — | 10.12 | 16.72 | 100,566 | 1.14(5)(11) | 1.14(5)(11) | 1.40(5)(12) | 5.55 | 86 | |||||||||||||||||||||||||||||||||||||||
| † | Returns do not reflect the deduction of taxes that a shareholder would pay on fund distributions or the redemption of fund shares. |
| * | Includes Fees Paid Indirectly, if applicable. See Note 5 in Notes to Financial Statements |
| ** | See Note 5 in Notes to Financial Statements. |
| (1) | Per share net investment income and net realized and unrealized gains (losses) calculated using average shares. |
| (2) | Effective January 31, 2017, Class A Shares converted to Class F Shares of the same Fund. |
| (3) | The expense ratio includes overdraft fees. Had this expense been excluded the ratios would have been 1.02%, 1.02%, 1.02% and 1.05% for 2019, 2018, 2017 and 2016. |
| (4) | The expense ratio includes overdraft fees. Had this expense been excluded the ratios would have been 1.07%, 1.07%, 1.08% and 1.11% for 2019, 2018, 2017 and 2016. |
| (5) | The expense ratio includes proxy expenses outside the cap. |
| (6) | The expense ratio includes overdraft fees. Had this expense been excluded the ratios would have been 0.77%, 0.77%, 0.77% and 0.80% for 2019, 2018, 2017 and 2016. |
| (7) | The expense ratio includes overdraft fees. Had this expense been excluded the ratios would have been 0.82%, 0.82%, 0.83% and 0.87% for 2019, 2018, 2017 and 2016. |
| (8) | Commenced operations on October 30, 2015. All ratios for the period have been annualized. |
| (9) | The expense ratio includes overdraft fees. Had this expense been excluded the ratios would have been 1.37%, 1.36%, 1.36% and 1.39% for 2019, 2018, 2017 and 2016. |
| (10) | The expense ratio includes overdraft fees. Had this expense been excluded the ratios would have been 1.62%, 1.61%, 1.63% and 1.65% for 2019, 2018, 2016 and 2015. |
| (11) | The expense ratio includes overdraft fees. Had this expense been excluded the ratios would have been 1.11%, 1.11%, 1.11% and 1.14% for 2019, 2018, 2017 and 2016. |
| (12) | The expense ratio includes overdraft fees. Had this expense been excluded the ratios would have been 1.37%, 1.36%, 1.38% and 1.40% for 2019, 2018, 2017 and 2016. |
Amounts designated as “—” are either $0 or have been rounded to $0.
The accompanying notes are an integral part of the financial statements.
78 |
SEI Institutional International Trust / Annual Report / September 30, 2020 |
September 30, 2020
1. ORGANIZATION
SEI Institutional International Trust (the “Trust”) was organized as a Massachusetts business trust under a Declaration of Trust dated June 30, 1988.
The Trust is registered under the Investment Company Act of 1940, as amended, as an open-end investment company with four funds: International Equity Fund, Emerging Markets Equity Fund, International Fixed Income Fund and Emerging Markets Debt Fund (together the “Funds”) each of which are diversified Funds with the exception of the International Fixed Income Fund and the Emerging Markets Debt Fund. Each Fund’s prospectus provides a description of its investment goal, principal investment strategies and risks. The Trust is registered to offer Class F (formerly Class A) and Class Y shares of each of the Funds and Class I shares of the International Equity Fund.
2. SIGNIFICANT ACCOUNTING POLICIES
The following are significant accounting policies, which are consistently followed in the preparation of its financial statements by the Funds. The Funds are investment companies that apply the accounting and reporting guidance issued in Topic 946 by the U.S. Financial Accounting Standards Board (“FASB”).
Use of Estimates — The Funds are investment companies in conformity with accounting principles generally accepted in the United States of America (“U.S. GAAP”). Therefore, the Funds follow the accounting and reporting guidelines for investment companies. The preparation of financial statements, in conformity with U.S. GAAP requires management to make estimates and assumptions that affect the reported amounts of assets and liabilities and disclosure of contingent assets and liabilities as of the date of the financial statements and the reported amounts of increases and decreases in net assets from operations during the reporting period. Actual results could differ from those estimates.
Security Valuation — Securities listed on a securities exchange, market or automated quotation system for which quotations are readily available (other than securities traded on National Association of Securities Dealers Automated Quotations (NASDAQ) or as otherwise noted below) at the last quoted sale price on an exchange or market (foreign or domestic) on which the securities are traded, or, if there is no such reported sale, at the most recent quoted bid price. The Funds value securities traded on NASDAQ at the NASDAQ Official Closing Price. If available, debt securities, swaps (which are not centrally cleared), bank loans or collateralized debt obligations (including collateralized loan obligations), such as those held by the Funds, are priced based upon valuations provided by independent,
third-party pricing agents. Such values generally reflect the last reported sales price if the security is actively traded. The third-party pricing agents may also value debt securities at an evaluated bid price by employing methodologies that utilize actual market transactions, broker-supplied valuations or other methodologies designed to identify the market value for such securities. Redeemable securities issued by open-end investment companies are valued at the investment company’s applicable net asset value, with the exception of ETFs, which are priced as equity securities. The prices of foreign securities are reported in local currency and converted to U.S. dollars using currency exchange rates. If a security’s price cannot be obtained, as noted above, the Funds will value the securities using a bid price from at least one independent broker. If such prices are not readily available or cannot be valued using the methodologies described above, the Funds will value the security using the Funds’ Fair Value Pricing Policies and Procedures (“Fair Value Procedures”), as described below.
On the first day a new debt security purchase is recorded, if a price is not available from a third-party pricing agent or an independent broker, the security may be valued at its purchase price. Each day thereafter, the debt security will be valued according to the Funds’ Fair Value Procedures until a price from an independent source can be secured. Securities held by a Fund with remaining maturities of 60 days or less may be valued by the amortized cost method, which involves valuing a security at its cost on the date of purchase and thereafter (absent unusual circumstances) assuming a constant amortization to maturity of any discount or premium, regardless of the impact of fluctuations in general market rates of interest on the value of the instrument. While this method provides certainty in valuation, it may result in periods during which value, as determined by this method, is higher or lower than the price a Fund would receive if it sold the instrument. Further, the value of securities in the Fund can be expected to vary inversely with changes in prevailing interest rates. Should existing credit, liquidity or interest rate conditions in the relevant markets and issuer-specific circumstances suggest that amortized cost does not approximate fair value, then the amortized cost method may not be used.
Futures and swaps cleared through a central clearing house (“centrally cleared swaps”) are valued at the settlement price established each day by the board of exchange on which they are traded. The daily settlement prices for financial futures and centrally cleared swaps are provided by an independent source. On days when there is excessive volume, market volatility or the future or centrally cleared swap does not end trading by the
SEI Institutional International Trust / Annual Report / September 30, 2020 |
79 |
NOTES TO FINANCIAL STATEMENTS (Continued)
September 30, 2020
time a Fund calculates its Net Asset Value (“NAV”), the settlement price may not be available at the time at which the Fund calculates its NAV. On such days, the best available price (which is typically the last sales price) may be used to value a Fund’s futures or centrally cleared swaps position.
Foreign currency forward contracts are valued at the current day’s interpolated foreign exchange rate, as calculated using forward rates provided by an independent source.
Prices for most securities held by a Fund are provided daily by third-party independent pricing agents. SEI Investments Management Corporation (“SIMC”) or a Sub-Adviser (“Sub-Adviser”), as applicable, reasonably believes that prices provided by independent pricing agents are reliable. However, there can be no assurance that such pricing service’s prices will be reliable. SIMC or a Sub-Adviser, as applicable, will continuously monitor the reliability of prices obtained from any pricing service and shall promptly notify the Funds’ administrator if it believes that a particular pricing service is no longer a reliable source of prices. The Funds’ administrator, in turn, will notify the Fair Value Pricing Committee (the “Committee”) if it receives such notification from SIMC or a Sub-Adviser, as applicable, or if the Funds’ administrator reasonably believes that a particular pricing service is no longer a reliable source for prices.
The Funds’ Fair Value Procedures provide that any change in a primary pricing agent or a pricing methodology requires prior approval by the Board of Trustees (“Board”) or its designated sub-committee. However, when the change would not materially affect valuation of a Fund’s net assets or involve a material departure in pricing methodology from that of the Fund’s existing pricing agent or pricing methodology, approval may be obtained at the next regularly scheduled meeting of the Board.
Securities for which market prices are not readily available, for which market prices are determined to be unreliable, or which cannot be valued using the methodologies described above are valued in accordance with the Fair Value Procedures established by the Board. The Funds’ Fair Value Procedures are implemented through the Committee designated by the Board. The Committee is currently composed of one member of the Board, as well as representatives from SIMC and its affiliates. Some of the more common reasons that may necessitate that a security be valued using Fair Value Procedures include: (i) the security’s trading has been halted or suspended, (ii) the security has been delisted from a national exchange, (iii) the security’s primary trading market is temporarily closed at a time when under normal conditions it would be
open, or (iv) the security’s primary pricing source is not able or willing to provide a price. When a security is valued in accordance with the Fair Value Procedures, the Committee will determine the value after taking into consideration relevant information reasonably available to the Committee. Examples of factors the Committee may consider include: (i) the facts giving rise to the need to fair value, (ii) the last trade price, (iii) the performance of the market or the issuer’s industry, (iv) the liquidity of the security, (v) the size of the holding in a Fund, or (vi) any other appropriate information.
The determination of a security’s fair value price often involves the consideration of a number of subjective factors, and is therefore subject to the unavoidable risk that the value assigned to a security may be higher or lower than the security’s value would be if a reliable market quotation for the security was readily available.
For securities that principally trade on a foreign market or exchange, a significant gap in time can exist between the time of a particular security’s last trade and the time at which a Fund calculates its NAV. The closing prices of such securities may no longer reflect their market value at the time a Fund calculates NAV if an event that could materially affect the value of those securities (a “Significant Event”), including substantial fluctuations in domestic or foreign markets or occurrences not tied directly to the securities markets, such as natural disasters, armed conflicts or significant governmental actions, has occurred between the time of the security’s last close and the time that the Fund calculates its NAV. A Fund may invest in securities that are primarily listed on foreign exchanges that trade on weekends or other days when the Fund does not price its shares. As a result, the NAV of the Fund’s shares may change on days when shareholders will not be able to purchase or redeem Fund shares.
A Significant Event may relate to a single issuer or to an entire market sector. If SIMC or a Sub-Adviser becomes aware of a Significant Event that has occurred with respect to a security or group of securities after the closing of the exchange or market on which the security or securities principally trade, but before the time at which the Funds calculate NAV, it may request that a Committee meeting be called. In addition, the Funds use several processes, with respect to certain securities to monitor the pricing data supplied by various sources, including price comparisons and price movements. Any identified discrepancies are researched and subject to the procedures described above.
The International Equity Fund and Emerging Markets Equity Fund also use a third-party fair valuation vendor. The vendor provides a fair value for foreign securities held by these Funds based on certain factors and
80 |
SEI Institutional International Trust / Annual Report / September 30, 2020 |
methodologies (involving, generally, tracking valuation correlations between the U.S. market and each non-U.S. security). Values from the fair value vendor are applied in the event that there is a movement in the U.S. market that exceeds a specific threshold that has been established by the Committee. The Committee has also established a “confidence interval” which is used to determine the level of historical correlation between the value of a specific foreign security and movements in the U.S. market before a particular security will be fair valued when the threshold is exceeded. In the event that the threshold established by the Committee is exceeded on a specific day, the International Equity Fund and Emerging Markets Equity Fund will value the non-U.S. securities in their portfolios that exceed the applicable “confidence interval” based upon the adjusted prices provided by the fair valuation vendor.
In accordance with U.S. GAAP, fair value is defined as the price that the Fund would receive upon selling an investment in an orderly transaction to an independent buyer in the principal or most advantageous market of the investment. A three-tier hierarchy has been established to maximize the use of the observable market data and minimize the use of unobservable inputs and to establish classification of the fair value measurements for disclosure purposes. Inputs refer broadly to the assumptions that market participants would use in pricing an asset. Inputs may be observable or unobservable. Observable inputs are inputs that reflect the assumptions market participants would use in pricing the asset or liability developed based on market data obtained from sources independent of the reporting entity. Unobservable inputs are inputs that reflect the reporting entity’s own assumptions about the assumptions market participants would use in pricing the asset or liability developed based on the best information available in the circumstances.
The three-tier hierarchy of inputs is summarized in the three broad Levels listed below:
Level 1 — quoted prices in active markets for identical investments
Level 2 — other significant observable inputs (including quoted prices for similar investments, interest rates, prepayment speeds, credit risks, etc.)
Level 3 — significant unobservable inputs (including the Fund’s own assumptions in determining the fair value of investments)
Investments are classified within the level of the lowest significant input considered in determining fair value. Investments classified within Level 3 whose fair value measurement considers several inputs may include
Level 1 or Level 2 inputs as components of the overall fair value measurement.
The valuation techniques used by the Funds to measure fair value during the year ended September 30, 2020 maximized the use of observable inputs and minimized the use of unobservable inputs.
For the year ended September 30, 2020, there have been no significant changes to the inputs or the Trust’s fair valuation methodologies.
Security Transactions and Investment Income — Security transactions are recorded on the trade date. Cost used in determining net realized capital gains and losses on the sale of securities is determined on the basis of specific identification. Dividend income and expense is recognized on the ex-dividend date, and interest income or expense is recognized using the accrual basis of accounting.
Distributions received on securities that represent a return of capital or capital gain are recorded as a reduction of cost of investments and/ or as a realized gain. The Trust estimates the components of distributions received that may be considered nontaxable distributions or capital gain distributions.
Amortization and accretion is calculated using the scientific interest method, which is not materially different from the effective interest method. Amortization of premiums and discounts is included in interest income.
Cash and Cash Equivalents — Idle cash and currency balances may be swept into various overnight sweep accounts and are classified as cash and cash equivalents on the Statement of Assets and Liabilities/ Consolidated Statement of Assets and Liabilities and Consolidated Statement of Cash Flows. These amounts, at times, may exceed United States federally insured limits. Amounts swept are available on the next business day.
Expenses — Expenses that are directly related to one of the Funds are charged directly to that Fund. Other operating expenses of the Trust are prorated to the Funds on the basis of relative daily net assets.
Classes — Class-specific expenses are borne by that class. Income, non-class specific expenses, and realized and unrealized gains/losses are allocated to
SEI Institutional International Trust / Annual Report / September 30, 2020 |
81 |
NOTES TO FINANCIAL STATEMENTS (Continued)
September 30, 2020
the respective classes on the basis of relative daily net assets.
Foreign Currency Translation — The books and records of the Funds investing in international securities are maintained in U.S. dollars on the following basis:
(i) market value of investment securities, assets and liabilities at the current rate of exchange; and
(ii) purchases and sales of investment securities, income and expenses at the relevant rates of exchange prevailing on the respective dates of such transactions.
The Funds do not isolate that portion of gains and losses on investments in investment securities that is due to changes in the foreign exchange rates from that which is due to changes in market prices of investment securities.
The Funds report certain foreign-currency-related transactions as components of realized gains for financial reporting purposes, whereas such components are treated as ordinary income for Federal income tax purposes.
Forward Foreign Currency Contracts — To the extent consistent with its investment objective and strategies, a Fund may enter into forward foreign currency contracts as hedges against either specific transactions, fund positions, speculative purposes or anticipated fund positions. All commitments are “marked-to-market” daily at the applicable foreign exchange rate, and any resulting unrealized gains or losses are recorded currently. The Fund realizes gains and losses at the time forward contracts are extinguished. Unrealized gains or losses on outstanding positions in forward foreign currency contracts held at the close of the year are recognized as ordinary income or loss for federal income tax purposes. The Fund could be exposed to risk if the counterparties to the contracts are unable to meet the terms of the contract and from unanticipated movements in the value of a foreign currency relative to the U.S. dollar.
Finally, the risk exists that losses could exceed amounts disclosed on the Statement of Assets and Liabilities. Refer to each Fund’s Schedule of Investments for details regarding open forward foreign currency contracts as of September 30, 2020, if applicable.
Futures Contracts — To the extent consistent with its investment objective and strategies, the Funds may purchase futures contracts to gain exposure to market changes, which may be more efficient or cost effective than actually buying the securities. To the extent consistent with its investment objective and strategies, a Fund may utilize futures contracts for tactical hedging purposes as well as to enhance the Funds’ returns
and may also utilize futures contracts to efficiently assist in managing the Funds’ duration and yield curve exposure. Upon entering into such a contract, a Fund is required to deposit and maintain as collateral such initial margin as required by the exchange on which the contract is held. The contracts are marked to market daily and the resulting changes in value are accounted for as unrealized gains and losses. Variation margin payments are paid or received, depending upon whether unrealized losses or gains are incurred. When the contract is closed, the Funds record a realized gain or loss equal to the difference between the proceeds from (or cost of) the closing transaction and the amount invested in the contract.
Risks of entering into futures contracts include the possibility that there will be an imperfect price correlation between the futures and the underlying securities. Second, it is possible that a lack of liquidity for futures contracts could exist in the secondary market, resulting in an inability to close a position prior to its maturity date. Third, the futures contract involves the risk that a Fund could lose more than the original margin deposit required to initiate a futures transaction.
Finally, the risk exists that losses could exceed amounts disclosed on the Statement of Assets and Liabilities. Refer to each Fund’s Schedule of Investments for details regarding open futures contracts as of September 30, 2020, if applicable.
Options/Swaptions Written/Purchased — To the extent consistent with its investment objective and strategies, a Fund may invest in financial options/swaptions contracts for the purpose of hedging its existing portfolio securities, or securities that a Fund intends to purchase, against fluctuations in fair market value caused by changes in prevailing market interest rates. A Fund may also invest in financial option/swaption contracts to enhance its returns. When the Fund writes or purchases an option/swaption, an amount equal to the premium received or paid by the Fund is recorded as a liability or an asset and is subsequently adjusted to the current market value of the option/swaption written or purchased. Premiums received or paid from writing or purchasing options/swaptions which expire unexercised are treated by the Fund on the expiration date as realized gains or losses. The difference between the premium and the amount paid or received on effecting a closing purchase or sale transaction, including brokerage commissions, is also treated as a realized gain or loss. If an option/swaption is exercised, the premium paid or received is added to the cost of
82 |
SEI Institutional International Trust / Annual Report / September 30, 2020 |
the purchase or proceeds from the sale in determining whether the Fund has realized a gain or a loss.
The risk in writing a call option/swaption is a Fund may give up the opportunity for profit if the market price of the security increases. The risk in writing a put option/swaption is a Fund may incur a loss if the market price of the security decreases and the option/swaption is exercised. The risk in purchasing an option/swaption is a Fund may pay a premium whether or not the option/swaption is exercised. The Funds also have the additional risk of being unable to enter into a closing transaction at an acceptable price if a liquid secondary market does not exist. Option/swaption contracts also involve the risk that they may not work as intended due to unanticipated developments in market conditions or other causes.
Finally, the risk exists that losses on written options could exceed amounts disclosed on the Statements of Assets and Liabilities. Refer to each Fund’s Schedule of Investments for details regarding open option/swaption contracts as of September 30, 2020, if applicable.
Swap Agreements — To the extent consistent with its investment objective and strategies, a Fund may invest in swap contracts as an efficient means to take and manage risk in the portfolio, including interest rate risk, credit risk and overall yield sensitivity. A swap agreement is a two-party contract under which an agreement is made to exchange returns from predetermined investments or instruments, including a particular interest rate, foreign currency, or “basket” of securities representing a particular index. Swap agreements are privately negotiated in the over-the-counter market (“OTC swaps”) or may be executed in a multilateral or other trade facility platform, such as a registered commodities exchange (“Centrally Cleared swaps”). Interest rate swaps involve the exchange by a Fund with another party of their respective commitments to pay or receive interest (e.g., an exchange of floating rate payments for fixed rate payments) with respect to a notional amount of principal. Credit default swaps involve the periodic payment by a Fund or counterparty of interest based on a specified rate multiplied by a notional amount assigned to an underlying debt instrument or group of debt instruments in exchange for the assumption of credit risk on the same instruments. In the event of a credit event, usually in the form of a credit rating downgrade, the party receiving periodic payments (i.e. floating rate payer) must pay the other party (i.e. fixed rate payer) an amount equal to the outstanding principal of the downgraded debt instrument. Total return swaps allow an investor to benefit from the cash flow without ever actually owning the underlying security. The receiver must pay any decline in value to
the payer at the end of the total return swap. However, the investor does not need to make a payment if there is no decline in price. Payments can be made on various indices, bonds (i.e. mortgage backed securities, bank debt and corporate), loans or commodities. The value of a total return swap is equal to the change in value of the underlying asset versus the accrued income payment based on LIBOR (London Interbank Offered Rate) or some other form of index on the notional amount. Interest rate swaps involve the exchange by a Fund with another party of their respective commitments to pay or receive interest (e.g., an exchange of floating rate payments for fixed rate payments) with respect to a notional amount of principal to manage a Fund��s exposure to interest rates. Payments received or made are recorded as realized gains or losses. A Fund could be exposed to credit or market risk due to unfavorable changes in the fluctuation of interest rates or if the counterparty defaults on its obligation to perform. Risk of loss may exceed amounts recognized on the statement of assets and liabilities. In connection with swap agreements, securities/cash may be set aside as collateral by the Fund’s custodian. A Fund may enter into swap agreements in order to, among other things, change the maturity or duration of the investment portfolio; protect a Fund’s value from changes in interest rates; or expose a Fund to a different security or market.
Swaps are marked-to-market daily based upon quotations from market makers and the resulting changes in market values, if any, are recorded as unrealized gains or losses in the Statement of Operations. Centrally cleared swaps are valued at the settlement price established each day by the board of exchange on which they are traded. The daily settlement prices for centrally cleared swaps are provided by an independent source. Net payments of interest are recorded as realized gains or losses. Daily changes in valuation of Centrally Cleared swaps, if any, are recorded as a receivable or payable for the change in value as appropriate (“variation margin”) on the Statements of Assets and Liabilities.
Entering into swap agreements involves, to varying degrees, elements of credit and market risk in excess of the amounts recognized on the Schedule of Investments or the Statement of Assets and Liabilities. Such risks involve the possibility that there will be no liquid market for these agreements, that the counterparty to the agreement may default on its obligation to perform and that there may be unfavorable changes in the fluctuation of interest rates. Risks also arise from potential losses from adverse market movements.
Counterparty risk may be mitigated by having a master netting arrangement between a Fund and
SEI Institutional International Trust / Annual Report / September 30, 2020 |
83 |
NOTES TO FINANCIAL STATEMENTS (Continued)
September 30, 2020
the counterparty and by having the counterparty post collateral to cover a Fund’s exposure to the counterparty. Refer to each Fund’s Schedule of Investments for details regarding open swap contracts as of September 30, 2020, if applicable.
Delayed Delivery Transactions — A Fund may purchase or sell securities on a when-issued or delayed delivery basis. These transactions involve a commitment by the Fund to purchase or sell securities for a predetermined price or yield, with payment and delivery taking place beyond the customary settlement period. When delayed delivery purchases are outstanding, the Fund will set aside liquid assets in an amount sufficient to meet the purchase price. When purchasing a security on a delayed delivery basis, the Fund assumes the rights and risks of ownership of the security, including the risk of price and yield fluctuations, and takes such fluctuations into account when determining its net asset value. The Fund may dispose of or renegotiate a delayed delivery transaction after it is entered into, and may sell when-issued securities before they are delivered, which may result in a capital gain or loss. When the Fund has sold a security on a delayed delivery basis, the Fund does not participate in future gains and losses with respect to the security.
Loan Participations and Brady Bonds — To the extent consistent with its investment objective and strategies, a Fund may invest in U.S. dollar-denominated fixed- and floating-rate loans (“Loans”) arranged through private negotiations between a foreign sovereign entity and one or more financial institutions (“Lenders”). The Fund invests in such Loans in the form of participations in Loans (“Participations”) or assignments of all or a portion of Loans from third parties. Participations typically result in a Fund having a contractual relationship only with the Lenders, not with the sovereign borrowers. The Fund has the right to receive payments of principal, interest and any fees to which it is entitled from the Lender selling the Participation and only upon receipt by the Lender of the payments from the borrower. In connection with purchasing Participations, the Fund generally has no right to enforce compliance by the borrower with the terms of the loan agreement relating to the Loan, nor any rights of set-off against the borrower, and the Fund will not benefit directly from any collateral supporting the Loan in which it has purchased the Participation. As a result, the Fund assumes the credit risk of both the borrower and the Lender that is selling the Participation.
Certain debt obligations, customarily referred to as “Brady Bonds”, are created through the exchange of existing commercial bank loans to foreign entities for new obligations in connection with debt restructuring under a plan introduced by former U.S. Secretary of the Treasury Nicholas F. Brady. Brady Bonds have only
been issued since 1989, and, accordingly, do not have a long payment history. They are issued by governments that may have previously defaulted on the loans being restructured by the Brady Bonds, so they are subject to the risk of default by the issuer. They may be fully or partially collateralized or uncollateralized and issued in various currencies.
Dividends and Distributions to Shareholders — The International Equity, Emerging Markets Equity and International Fixed Income Funds will distribute substantially all of their net investment income and all net realized capital gains, if any, at least annually. The Emerging Markets Debt Fund will distribute substantially all of its net investment income, if any, at least quarterly and all net realized gains, if any, at least annually. All dividends and distributions are recorded on ex-dividend date.
Investments in Real Estate Investment Trusts (“REITs”) — Dividend income is recorded based on the income included in distributions received from the REIT investments using published REIT reclassifications including management estimates when actual amounts are not available. Distributions received in excess of this estimated amount are recorded as a reduction of the cost of investments or reclassified to capital gains. The actual amounts of income, return of capital, and capital gains are only determined by each REIT after its fiscal year-end, and may differ from the estimated amounts.
Participation Notes (P-Notes) — To the extent consistent with its investment objective and strategies, a Fund may acquire P-Notes issued by participating banks or broker-dealers. P-Notes are participation interest notes that are designed to offer a return linked to a particular underlying equity, debt, currency or market. The P-Notes in which the Fund may invest will typically have a maturity of one year. When purchasing a P-Note, the posting of margin is not required because the full cost of the P-Note (plus commission) is paid at the time of purchase. When the P-Note matures, the issuer will pay to, or receive from, the purchaser the difference between the minimal value of the underlying instrument at the time of purchase and that instrument’s value at maturity. Investments in P-Notes involve the same risks associated with a direct investment in the underlying foreign companies of foreign securities markets that they seek to replicate. In addition, there can be no assurance that the trading price of P-Notes will equal the underlying value of the foreign companies or foreign securities markets that they seek to replicate. The holder of a participation note that is linked to a particular underlying security is entitled to receive any dividends paid in connection with an underlying security or instrument. However, the holder of a participation note does not receive voting rights as it would if it
84 |
SEI Institutional International Trust / Annual Report / September 30, 2020 |
directly owned the underlying security or instrument. P-Notes are generally traded over-the-counter. P-Notes constitute general unsecured contractual obligations of the banks or broker-dealers that issue them and the counterparty. There is also counterparty risk associated with these investments because the Fund is relying on the creditworthiness of such counterparty and has no rights under a participation note against the issuer of the underlying security.
3. CREDIT DERIVATIVES
A Fund may use credit default swaps to reduce risk where a Fund has exposure to the issuer, or to take an active long or short position with respect to the likelihood of an event of default. The reference obligation of the swap can be a single issuer, a “basket” of issuers, or an index. The underlying referenced assets are corporate debt, sovereign debt and asset backed securities.
The buyer of a credit default swap is generally obligated to pay the seller a periodic stream of payments over the term of the contract in return for a contingent payment upon the occurrence of a credit event with respect to an underlying reference obligation. Generally, a credit event for corporate or sovereign reference obligations means bankruptcy, failure to pay, obligation acceleration, repudiation/
moratorium or restructuring. For credit default swaps on asset-backed securities, a credit event may be triggered by events such as failure to pay principal, maturity extension, rating downgrade or write-down.
If a Fund is a seller of protection, and a credit event occurs, as defined under the terms of that particular swap agreement, a Fund will generally either (i) pay to the buyer an amount equal to the notional amount of the swap and take delivery of the referenced obligation, other deliverable obligations, or underlying securities comprising a referenced index or (ii) pay a net settlement amount in the form of cash or securities equal to the notional amount of the swap less the recovery value of the referenced obligation or underlying securities comprising a referenced index.
If a Fund is a buyer of protection and a credit event occurs, as defined under the terms of that particular swap agreement, a Fund will either (i) receive from the seller of protection an amount equal to the notional amount of the swap and deliver the referenced obligation, other deliverable obligations or underlying securities comprising the referenced index or (ii) receive a net settlement amount in the form of cash or securities equal to the notional amount of the swap less the recovery value of the referenced obligation or underlying securities comprising the referenced index. Recovery values are calculated by market makers considering either industry standard recovery rates or entity specific factors and considerations until a credit event occurs. If a credit event has occurred, the recovery value is determined by a facilitated auction whereby a minimum number of allowable broker bids, together with a specified valuation method, are used to calculate the settlement value.
As of September 30, 2020, the International Fixed Income Fund is the seller (“providing protection”) on a total notional amount of approximately $1 million. The notional amounts of the swaps are not recorded in the financial statements; however the notional amounts approximate the maximum potential amount of future payments that the Fund could be required to make if the Fund was the seller of protection and a credit event were to occur. Those credit default swaps (“CDS”) for which the Funds are providing protection at balance sheet date are summarized as follows:
International Fixed Income Fund
| ||||||||||||||||||||
Written Credit Derivative Contracts | Single Name CDS | CDS Index | ||||||||||||||||||
Reference Asset | Corp US$ | Sovereign US$ | ABS US$ | Corp US$ | Total | |||||||||||||||
Fair value of written credit derivatives | $ — | $ — | $ (294,546) | $ — | $ (294,546) | |||||||||||||||
Maximum potential amount of future payments | — | — | 882,000 | — | 882,000 | |||||||||||||||
SEI Institutional International Trust / Annual Report / September 30, 2020 |
85 |
NOTES TO FINANCIAL STATEMENTS (Continued)
September 30, 2020
International Fixed Income Fund | ||||||||||||||||||||
Recourse provisions with the third parties any amounts paid under the credit derivative (including any purchased credit protection) | $ — | $ — | $ — | $ — | $ — | |||||||||||||||
Collateral held by the Fund or other third parties which the Fund can obtain upon occurrence of triggering event | — | — | — | — | — |
| Maximum Potential Amount of Future Payments by Contract Term | ||||||||||||||||||||||||
| 0-6 Months | 6-12 Months | 1-5 Years | 5-10 Years | >10 Years | Total | |||||||||||||||||||
Current credit spread* on underlying (in basis points)(1) | ||||||||||||||||||||||||
0-100 | $ — | $ — | $ | — | $ — | $ | — | $ | — | |||||||||||||||
101-200 | — | — | — | — | — | — | ||||||||||||||||||
201-300 | — | — | — | — | — | — | ||||||||||||||||||
301-400 | — | — | — | — | — | — | ||||||||||||||||||
>401 | — | — | — | — | 882,000 | 882,000 | ||||||||||||||||||
Total | $ — | $ — | $ | — | $ — | $ | 882,000 | | $ | 882,000 | ||||||||||||||
| * | The credit spread on the underlying asset is generally indicative of the current status of the underlying risk of the Fund having to perform. The spread also reflects the cost of buying/selling protection and may include upfront payments required to be made to enter into a contract. Higher credit spreads with a shorter contract term is indicative of a higher likelihood of performance by the Fund. |
| (1) | Potential recoveries would include purchased credit derivatives to the extent they offset written credit derivatives which have an identical underlying, or a netting arrangement or credit support annex with the counterparty. There may be other potential recoveries from recourse provisions where agreements cover multiple derivative arrangements but those amounts have not been included. |
The credit spread disclosed above for each reference obligation where the Fund is the seller of protection is a representation of the current payment/performance risk of the swap.
4. DERIVATIVE CONTRACTS
The following tables include only Funds that had exposure to more than one type of risk on derivatives held throughout the year. For Funds that held derivatives throughout the year with only one type of risk exposure, additional information can be found on the Schedules of Investments and the Statements of Operations. The fair value of derivative instruments as of period end was as follows ($ Thousand):
| Asset Derivatives | Liability Derivatives | |||||||||||
Year Ended September 30, 2020 | Year Ended September 30, 2020 | |||||||||||
Statements of Assets and Liabilities Location | Fair Value | Statements of Assets and Liabilities Location | Fair Value | |||||||||
International Fixed Income Fund | ||||||||||||
Interest rate contracts | Net Assets — Unrealized appreciation on swaps contracts | $ | 125† | Net Assets — Unrealized depreciation on swaps contracts | $ | 214† | ||||||
| Net Assets — Unrealized appreciation on futures contracts | 524* | Net Assets — Unrealized depreciation on futures contracts | 151* | |||||||||
Credit contracts | Net Assets — Unrealized appreciation on swaps contracts | —† | Net Assets — Unrealized depreciation on swap contracts | 189† | ||||||||
Foreign exchange contracts | Unrealized gain on forward foreign currency contracts | 6,431 | Unrealized loss on forward foreign currency contracts | 3,203 | ||||||||
Total derivatives not accounted for as hedging instruments | $ | 7,080 | $ | 3,757 |
86 |
SEI Institutional International Trust / Annual Report / September 30, 2020 |
| Asset Derivatives | Liability Derivatives | |||||||||||
Year ended September 30, 2020 | Year ended September 30, 2020 | |||||||||||
Statements of Assets and Liabilities | Fair Value | Statements of Assets and Liabilities Location | Fair Value | |||||||||
Emerging Markets Debt Fund | ||||||||||||
Interest rate contracts | Net Assets — Unrealized appreciation on futures contracts | $ | 278* | Net Assets — Unrealized depreciation on futures contracts | $ | 679* | ||||||
| Net Assets — Unrealized appreciation on swaps contracts | 5,390† | Net Assets — Unrealized depreciation on swaps contracts | 2,350† | |||||||||
Credit Contracts | Net Assets — Unrealized appreciation on swaps contracts | —† | Net Assets — Unrealized depreciation on swap contracts | 72† | ||||||||
Foreign exchange contracts | Unrealized gain on forward foreign currency contracts | 5,765 | Unrealized loss on forward foreign currency contracts | 12,132 | ||||||||
| Net Assets — Unrealized appreciation on swaps contracts | 232† | Net Assets — Unrealized depreciation on swap contracts | —† | |||||||||
Total derivatives not accounted for as hedging instruments | $ | 11,665 | $ | 15,233 |
| * | Includes cumulative appreciation/depreciation of futures contracts as reported in the Schedules of Investments. Only current day’s variation margin is reported within the Statements of Assets & Liabilities. |
| † | Includes cumulative appreciation/depreciation of swap contracts as reported in the Schedules of Investments. Market Value is reported within the Statements of Assets & Liabilities for OTC swap contracts that have paid premiums. For centrally cleared swap contracts current days variation margin is reported within the Statements of Assets & Liabilities. |
The effect of derivative instruments on the Statements of Operations for the year ended September 30, 2020.
Amount of realized gain or (loss) on derivatives recognized in income ($ Thousands):
| Derivatives Not Accounted for as Hedging Instruments | Futures | Forward Currency Contracts | Swaps | Total | ||||||||||||||||
International Fixed Income Fund | ||||||||||||||||||||
Interest rate contracts | $ | (2,237) | $ | — | $ | — | $ | (2,237) | ||||||||||||
Foreign exchange contracts | (1,715) | (14,131) | — | (15,846) | ||||||||||||||||
Credit contracts | — | — | (333) | (333) | ||||||||||||||||
Total | $ | (3,952) | $ | (14,131) | $ | (333) | $ | (18,416) | ||||||||||||
| Derivatives Not Accounted for as Hedging Instruments | Options | Futures | Forward Currency Contracts | Swaps | Total | |||||||||||||||
Emerging Markets Debt Fund | ||||||||||||||||||||
Interest rate contracts | $ | — | $ | 1,550 | $ | — | $ | 469 | $ | 2,019 | ||||||||||
Foreign exchange contracts | (279) | — | (9,493) | — | (9,772) | |||||||||||||||
Total | $ | (279) | $ | 1,550 | $ | (9,493) | $ | 469 | $ | (7,753) | ||||||||||
Change in unrealized appreciation or (depreciation) on derivatives recognized in income ($ Thousands):
| ||||||||||||||||||||
| Derivatives Not Accounted for as Hedging Instruments | Futures | Forward Currency Contracts | Swaps | Total | ||||||||||||||||
International Fixed Income Fund | ||||||||||||||||||||
Interest rate contracts | $ | (136) | $ | — | $ | 59 | $ | (77) | ||||||||||||
Foreign exchange contracts | — | (2,541) | — | (2,541) | ||||||||||||||||
Credit contracts | — | — | (228) | (228) | ||||||||||||||||
Total | $ | (136) | $ | (2,541) | $ | (169) | $ | (2,846) | ||||||||||||
SEI Institutional International Trust / Annual Report / September 30, 2020 |
87 |
NOTES TO FINANCIAL STATEMENTS (Continued)
September 30, 2020
| Derivatives Not Accounted for as Hedging Instruments | Options | Futures | Forward Currency Contracts | Swaps | Total | |||||||||||||||
Emerging Markets Debt Fund | ||||||||||||||||||||
Interest rate contracts | $ | — | $ | 222 | $ | — | $ | 293 | $ | 515 | ||||||||||
Credit contracts | — | — | — | 1,154 | 1,154 | |||||||||||||||
Foreign exchange contracts | 153 | — | (2,620) | 703 | (1,764) | |||||||||||||||
Total | $ | 153 | $ | 222 | $ | (2,620) | $ | 2,150 | $ | (95) | ||||||||||
A Fund is subject to various netting arrangements with select counterparties (“Master Agreements”). Master Agreements govern the terms of certain transactions, and reduce the counterparty risk associated with relevant transactions by specifying credit protection mechanisms and providing standardization that improves legal certainty. Since different types of transactions have different mechanics and are sometimes traded out of different legal entities of a particular counterparty organization, each type of transaction may be covered by a different Master Agreement, resulting in the need for multiple agreements with a single counterparty. As the Master Agreements are specific to unique operations of different asset types, they allow a Fund to close out and net its total exposure to a specific counterparty entity in the event of a default with respect to all the transactions governed under a single agreement with a specific counterparty entity.
Master Agreements can also help limit counterparty risk by specifying collateral posting arrangements at pre-arranged exposure levels. Under the Master Agreements, collateral is routinely transferred if the total net exposure to certain transactions (net of existing collateral already in place) governed under the relevant Master Agreement with a counterparty in a given account exceeds a specified threshold, which typically ranges from zero to $250,000 depending on the counterparty and the type of Master Agreement. United States Treasury Securities and U.S. dollar cash
are generally the preferred forms of collateral. Securities and cash pledged as collateral are reflected as assets in the Statements of Assets and Liabilities as either a component of investments at value (securities) or deposits due from counterparties (cash). Cash collateral received is not typically held in a segregated account and as such is reflected as a liability in the Statement of Assets and Liabilities as deposits due to counterparties. The market value of any securities received as collateral is not reflected as a component of net asset value. A Fund’s overall exposure to counterparty risk can change substantially within a short period, as it is affected by each transaction subject to the relevant Master Agreement.
Customer Account Agreements and related addendums govern exchange traded derivatives transactions such as futures, options on futures, and centrally cleared swaps. Exchange traded derivative transactions require posting of initial margin as determined by each relevant clearing agency which is segregated at a broker account registered with the Commodities Futures Trading Commission (CFTC), or the applicable regulator. In the US, counterparty risk is significantly reduced as creditors of the futures broker do not have claim to Fund assets in the segregated account. Additionally, portability of exposure in the event of default further reduces risk to the Funds. Variation margin, or changes in market value, are exchanged daily, but may not be netted between futures and cleared OTC derivatives.
The following is a summary of the market value and variation margin of exchange-traded or centrally cleared
financial derivative instruments of the Funds as of September 30, 2020 ($ Thousands):
| Financial Derivatives Assets | Financial Derivatives Liabilities | ||||||||||||||||||||||||||||||||||
| Variation Margin Asset | Variation Margin Liability | ||||||||||||||||||||||||||||||||||
| Fund | Futures | Swap Agreements | Total | Futures | Swap Agreements | Total | |||||||||||||||||||||||||||||
International Equity Fund | $ | 23 | $ | — | $ | 23 | $ | 812 | $ | — | $ | 812 | |||||||||||||||||||||||
Emerging Markets Equity Fund | 501 | — | 501 | — | — | — | |||||||||||||||||||||||||||||
International Fixed Income Fund | 160 | 6 | 166 | 136 | 14 | 150 | |||||||||||||||||||||||||||||
Emerging Markets Debt Fund | 133 | 149 | 282 | 110 | 96 | 206 | |||||||||||||||||||||||||||||
Cash pledged as collateral for exchange-traded and centrally cleared derivative instruments as of September 30, 2020 amounted to $7,756 ($ Thousands) for the International Equity Fund. Cash pledged as collateral for exchange-traded and centrally cleared derivative instruments as of September 30, 2020 amounted to
$3,370 ($ Thousands) for the Emerging Markets Equity Fund. Cash pledged as collateral for exchange-traded and centrally cleared derivative instruments as of September 30, 2020 amounted to $577 ($ Thousands) for the International Fixed Income Fund. Cash pledged as collateral for exchange-traded and centrally cleared
88 |
SEI Institutional International Trust / Annual Report / September 30, 2020 |
derivative instruments as of September 30, 2020 amounted to $7,325 ($ Thousands) for the Emerging Markets Debt Fund.
International Swaps and Derivatives Association, Inc. Master Agreements and Credit Support Annexes (“ISDA Master Agreements”) govern OTC financial derivative transactions entered into by a Fund and select counterparties. ISDA Master Agreements maintain provisions for general obligations, representations, agreements, collateral and events of default or termination. Events of termination include conditions that
may entitle counterparties to elect to terminate early and cause settlement of all outstanding transactions under the applicable ISDA Master Agreement. Any election to terminate early could be material to the financial statements. In limited circumstances, the ISDA Master Agreement may contain additional provisions that add additional counterparty protection beyond coverage of existing daily exposure if the counterparty has a decline in credit quality below a predefined level. These amounts, if any, may be segregated with a third party custodian.
The following is a summary by derivative type of the market value of OTC financial derivative instruments and collateral (received)/pledged as of September 30, 2020 ($ Thousands):
| Financial Derivative Assets | Financial Derivative Liabilities | |||||||||||||||||||||||||||||||||||||||||
|
| |||||||||||||||||||||||||||||||||||||||||
| International Fixed Income Fund | Forward Foreign Currency Contracts | Swap Agreements | Total Counter | Forward Foreign Currency Contracts | Swap Agreements | Total Over the Counter | Net Market Value of OTC Derivatives | Collateral (Received)/ Pledged* | Net Exposures^ | |||||||||||||||||||||||||||||||||
Bank of America | $ | 177 | $ | — | $ | 177 | $ | 8 | $ | — | $ | 8 | $ | 169 | $ | — | $ | 169 | ||||||||||||||||||||||||
Barclays PLC | 2,201 | — | 2,201 | 169 | — | 169 | 2,032 | — | 2,032 | |||||||||||||||||||||||||||||||||
BNP Paribas | 1,005 | — | 1,005 | 195 | — | 195 | 810 | — | 810 | |||||||||||||||||||||||||||||||||
Brown Brothers Harriman | 228 | — | 228 | 641 | — | 641 | (413) | — | (413) | |||||||||||||||||||||||||||||||||
Citi | 18 | — | 18 | 289 | — | 289 | (271) | — | (271) | |||||||||||||||||||||||||||||||||
Citigroup | 540 | — | 540 | 704 | — | 704 | (164) | — | (164) | |||||||||||||||||||||||||||||||||
Commonwealth Bank Of Australia | 39 | — | 39 | 12 | — | 12 | 27 | — | 27 | |||||||||||||||||||||||||||||||||
Credit Suisse First Boston | 50 | — | 50 | 73 | — | 73 | (23) | — | (23) | |||||||||||||||||||||||||||||||||
Deutsche Bank | — | 97 | 97 | — | — | — | 97 | — | 97 | |||||||||||||||||||||||||||||||||
Goldman Sachs | 108 | — | 108 | 95 | 189 | 284 | (176) | — | (176) | |||||||||||||||||||||||||||||||||
HSBC | 67 | — | 67 | 72 | — | 72 | (5) | — | (5) | |||||||||||||||||||||||||||||||||
JPMorgan Chase Bank | 1,436 | — | 1,436 | 627 | — | 627 | 809 | — | 809 | |||||||||||||||||||||||||||||||||
Morgan Stanley | 480 | — | 480 | 205 | — | 205 | 275 | — | 275 | |||||||||||||||||||||||||||||||||
RBC | 8 | — | 8 | 32 | — | 32 | (24) | — | (24) | |||||||||||||||||||||||||||||||||
Standard Chartered | 24 | — | 24 | 27 | — | 27 | (3) | — | (3) | |||||||||||||||||||||||||||||||||
State Street | 27 | — | 27 | 48 | — | 48 | (21) | — | (21) | |||||||||||||||||||||||||||||||||
UBS
| 23 | — | 23 | 6 | — | 6 | 17 | — | 17 | |||||||||||||||||||||||||||||||||
| Financial Derivative Assets | Financial Derivative Liabilities | |||||||||||||||||||||||||||||||||||||||||
|
| |||||||||||||||||||||||||||||||||||||||||
| Emerging Markets Debt Fund | Forward Foreign Currency Contracts | Swap Agreements | Total Counter | Forward Foreign Currency Contracts | Swap Agreements | Total Over the Counter | Net Market Value of OTC Derivatives | Collateral (Received)/ Pledged* | Net Exposures^ | |||||||||||||||||||||||||||||||||
Barclays PLC | $ | 160 | $ | — | $ | 160 | $ | 3 | $ | — | $ | 3 | $ | 157 | $ | — | $ | 157 | ||||||||||||||||||||||||
Brown Brothers Harriman | 2 | — | 2 | — | — | — | 2 | — | 2 | |||||||||||||||||||||||||||||||||
Citigroup | 922 | 161 | 1,083 | 6,061 | — | 6,061 | (4,978) | 2,200 | (2,778) | |||||||||||||||||||||||||||||||||
Goldman Sachs | 1,322 | 2,716 | 4,038 | 1,461 | 81 | 1,542 | 2,496 | — | 2,496 | |||||||||||||||||||||||||||||||||
JPMorgan Chase Bank | 1,756 | 960 | 2,716 | 1,423 | 14 | 1,437 | 1,279 | — | 1,279 | |||||||||||||||||||||||||||||||||
Merrill Lynch | — | — | — | 29 | — | 29 | (29) | — | (29) | |||||||||||||||||||||||||||||||||
Morgan Stanley | 123 | — | 123 | 409 | — | 409 | (286) | 260 | (26) | |||||||||||||||||||||||||||||||||
Standard Bank | 146 | — | 146 | 424 | — | 424 | (278) | — | (278) | |||||||||||||||||||||||||||||||||
Standard Chartered | 719 | — | 719 | 946 | — | 946 | (227) | — | (227) | |||||||||||||||||||||||||||||||||
State Street | 615 | — | 615 | 1,376 | — | 1,376 | (761) | — | (761) | |||||||||||||||||||||||||||||||||
| ^ | Net Exposures represents the net receivable/(payable) that would be due from/to the counterparty in the event of default. Exposure from OTC financial derivative instruments can only be netted across transactions governed under the same master agreement with the same legal entity. |
| * | Excess collateral pledged is not shown for financial reporting purposes. |
SEI Institutional International Trust / Annual Report / September 30, 2020 |
89 |
NOTES TO FINANCIAL STATEMENTS (Continued)
September 30, 2020
No securities have been pledged or have been received as collateral for OTC financial derivative instruments as governed by ISDA Master Agreements as of September 30, 2020.
The following table discloses the volume of the Funds’ futures contracts, forward foreign currency contracts and swap activity during the six months ended September 30, 2020 ($ Thousands):
| International Equity Fund | Emerging Markets Equity Fund | International Fixed Income Fund | Emerging Markets Debt Fund | |||||||||||||
Futures Contracts: | ||||||||||||||||
Equity Contracts | ||||||||||||||||
Average Notional Balance Long | $ | 46,978 | $ | 25,152 | $ | – | $ | – | ||||||||
Average Notional Balance Short | – | – | – | – | ||||||||||||
Ending Notional Balance Long | 80,240 | 28,761 | – | – | ||||||||||||
Ending Notional Balance Short | – | – | – | – | ||||||||||||
Interest Contracts | ||||||||||||||||
Average Notional Balance Long | – | – | 89,924 | 53,978 | ||||||||||||
Average Notional Balance Short | – | – | 45,420 | 24,742 | ||||||||||||
Ending Notional Balance Long | – | – | 93,686 | 55,167 | ||||||||||||
Ending Notional Balance Short | – | – | 59,666 | 24,776 | ||||||||||||
Currency Contracts | ||||||||||||||||
Average Notional Balance Short | – | – | 34,315 | – | ||||||||||||
Ending Notional Balance Short | – | – | 35,533 | – | ||||||||||||
Forward Foreign Currency Contracts: | ||||||||||||||||
Average Notional Balance Long | – | – | 996,402 | 738,971 | ||||||||||||
Average Notional Balance Short | – | – | 996,648 | 742,672 | ||||||||||||
Ending Notional Balance Long | – | – | 1,078,203 | 711,255 | ||||||||||||
Ending Notional Balance Short | – | – | 1,074,046 | 717,673 | ||||||||||||
Swaps: | ||||||||||||||||
Credit Contracts | ||||||||||||||||
Average Notional Balance Long | – | – | 54 | 8,266 | ||||||||||||
Average Notional Balance Short | – | – | 4,300 | 947 | ||||||||||||
Ending Notional Balance Long | – | – | – | 21,298 | ||||||||||||
Ending Notional Balance Short | – | – | 882 | – | ||||||||||||
Interest Contracts | ||||||||||||||||
Average Notional Balance | – | – | 9,912 | 251,421 | ||||||||||||
Ending Notional Balance | – | – | 56,970 | 63,245,632 | ||||||||||||
Foreign Exchange Contracts | ||||||||||||||||
Average Notional Balance Long | – | – | – | 5,421 | ||||||||||||
Ending Notional Balance Long | – | – | – | 5,421 | ||||||||||||
Options: | ||||||||||||||||
Currency | ||||||||||||||||
Average Notional Balance Long† | – | – | – | 209 | ||||||||||||
† Represents cost.
5. INVESTMENT ADVISORY, ADMINISTRATION AND DISTRIBUTION AGREEMENTS, INVESTMENT SUB-ADVISORY AGREEMENTS AND OTHER TRANSACTIONS WITH AFFILIATES
Investment Advisory, Administration and Distribution Agreements — SIMC serves as investment adviser (the “Adviser”) to each Fund. In connection with serving as Adviser, SIMC is entitled to a fee, which is calculated daily and paid monthly, based on the average daily net assets of each fund.
SEI Investments Global Funds Services (the
“Administrator”) provides administrative and transfer agency services to the Funds for annual fees, based on the average daily net assets of each fund.
SEI Investments Distribution Co. (the “Distributor”) is the distributor of the shares of the Funds. The Funds have adopted a shareholder services plan and agreement (the Service Plan) with respect to Class F (formerly Class A) and Class I Shares that allows such shares to pay service providers a fee, based on average daily net assets of each respective Class of Shares, in connection with the ongoing servicing of shareholder accounts owning such shares. The International Equity Fund has also adopted an administrative services plan and agreement (the Administrative Service Plan) with respect to Class I Shares that allows such Shares to pay service providers a fee, based on average daily net assets of the Class I Shares, in connection with ongoing administrative services for shareholder accounts owning such Shares.
90 |
SEI Institutional International Trust / Annual Report / September 30, 2020 |
The Service Plan and Administrative Service Plan provide that shareholder service fees and administrative service fees, respectively, on Class F (formerly Class A) and Class I Shares will be paid to the Distributor, which may then be used by the Distributor to compensate financial intermediaries for providing shareholder services and administrative services, as applicable, with respect to the Shares.
The Adviser, Administrator and/or Distributor have voluntarily agreed to waive a portion of their fees in order to keep total direct operating expenses (exclusive
of interest from borrowings, brokerage commissions, taxes, Trustees fees and extraordinary expenses not incurred in the ordinary course of the Funds’ business) at a specified level. The voluntary waivers by the Funds’ Adviser, Administrator and/or Distributor are limited to the Funds’ direct operating expenses and, therefore, do not apply to indirect expenses incurred by the Funds, such as acquired fund fees and expenses (AFFE). The waivers are voluntary and the Funds’ Adviser, Administrator and/or Distributor may discontinue all or part of any of these waivers at any time.
The following is a summary of annual fees payable to the Adviser and Distributor and the contractual and voluntary
expense limitations for each Fund:
| Advisory Fee | Shareholder Servicing Fee | Administrative Servicing Fee | Voluntary Expense Limitation | |||||||||||||
International Equity Fund | ||||||||||||||||
Class F | 0.505% | 0.25% | — | 1.15% | ||||||||||||
Class I | 0.505% | 0.25% | 0.25% | 1.40% | ||||||||||||
Class Y | 0.505% | — | — | 0.90% | ||||||||||||
Emerging Markets Equity Fund* | ||||||||||||||||
Class F | 1.05% | 0.25% | — | N/A | ||||||||||||
Class Y | 1.05% | — | — | N/A | ||||||||||||
International Fixed Income Fund | ||||||||||||||||
Class F | 0.30% | 0.25% | — | 1.02% | ||||||||||||
Class Y | 0.30% | — | — | 0.77% | ||||||||||||
Emerging Markets Debt Fund | ||||||||||||||||
Class F | 0.85% | 0.25% | — | 1.36% | ||||||||||||
Class Y | 0.85% | — | — | 1.11% | ||||||||||||
| * | Renewed as of January 31, 2020, SIMC has contractually agreed to waive its advisory fee as necessary to keep the advisory fee paid by the Fund during its fiscal year from exceeding 0.95%. This fee waiver agreement shall remain in effect until January 31, 2021 and, unless earlier terminated, shall be automatically renewed for successive one-year periods thereafter. The agreement may be amended or terminated only with the consent of the Board of Trustees. |
N/A — Not applicable.
The following is a summary of annual fees payable to the Administrator:
| First $1.5 Billion of Assets | Next $500 Million of Assets | Next $500 Million of Assets | Next $500 Million of Assets | Over $3 Billion of Assets | ||||||||||||||||
International Equity Fund | 0.450% | 0.370 | % | 0.2900 | % | 0.210 | % | 0.130% | ||||||||||||
Emerging Markets Equity Fund | 0.450% | 0.370 | % | 0.2900 | % | 0.210 | % | 0.130% | ||||||||||||
International Fixed Income Fund | 0.450% | 0.370 | % | 0.2900 | % | 0.210 | % | 0.130% | ||||||||||||
Emerging Markets Debt Fund | 0.450% | 0.370 | % | 0.2900 | % | 0.210 | % | 0.130% | ||||||||||||
Investment Sub-Advisory Agreements — As of September 30, 2020, SIMC has entered into Investment Sub-Advisory Agreements with the following parties:
Investment Sub-Adviser
International Equity Fund
Acadian Asset Management LLC
Causeway Capital Management LLC
INTECH Investment Management LLC
JO Hambro Capital Management Limited
Lazard Asset Management LLC
NWQ Investment Management Company, LLC
WCM Investment Management LLC
Emerging Markets Equity Fund
JO Hambro Capital Management Limited
KBI Global Investors (North America) Ltd.
Lazard Asset Management LLC
Neuberger Berman Investment Advisers LLC
Qtron Investments LLC
RWC Asset Advisors (US) LLC
International Fixed Income Fund
AllianceBernstein L.P.
Colchester Global Investors Ltd.
Wellington Management Company, LLP
Emerging Markets Debt Fund
Colchester Global Investors Ltd.
Marathon Asset Management, L.P.
Neuberger Berman Investment Advisers LLC
Ninety One UK Ltd.
Stone Harbor Investment Partners LP
SEI Institutional International Trust / Annual Report / September 30, 2020 |
91 |
NOTES TO FINANCIAL STATEMENTS (Continued)
September 30, 2020
Under the investment sub-advisory agreements, each sub-adviser receives a fee, paid by SIMC.
Brokerage Commissions Paid to Affiliates — The Distributor may receive compensation on fund transactions effected for the Trust in accordance with the rules of the Securities and Exchange Commission (“SEC”). Accordingly, it is expected that fund transactions may result in brokerage commissions being paid to the Distributor. The SEC rules require that such commissions not exceed usual and customary commissions.
Such commissions for the year ended September 30, 2020 were as follows ($ Thousands):
International Equity Fund | $ | 188 | ||
Emerging Markets Equity Fund | 129 |
Fees Paid Indirectly — The Funds may direct certain fund trades to the Distributor who pays a portion of the Fund’s expenses. Accordingly, the expenses reduced, which were used to pay third party expenses, and the effect on the Fund’s expense ratio, as a percentage of the Fund’s average daily net assets for the year ended September 30, 2020 can be found on the Statement of Operations and Financial Highlights, if applicable.
Investment in Affiliated Securities — The Funds may invest in the SEI Daily Income Trust Government Fund, an affiliated money market fund to manage excess cash or to serve as margin or collateral for derivative positions. Additionally, the Funds may invest cash
collateral from the securities lending program in the SEI Liquidity Fund, L.P., also an affiliated fund.
Payment to Affiliates — Certain Officers and Trustees of the Trust are also Officers and/or Directors of the Administrator, Adviser and/or the Distributor.
The Trust pays each unaffiliated Trustee an annual fee for attendance at quarterly, interim, and committee meetings. The Administrator or the Distributor pays compensation of Officers and affiliated Trustees.
A portion of the services provided by the Chief Compliance Officer (“CCO”) and his staff, whom are employees of the Administrator, are paid for by the Trust as incurred. The services include regulatory oversight of the Trust’s Adviser, sub-advisers and service providers.
Interfund Lending — The SEC has granted an exemption that permits the Trust to participate in an interfund lending program (“The Program”) with existing or future investment companies registered under the 1940 Act that are advised by SIMC (the “SEI Funds”). The Program allows the SEI Funds to lend money to and borrow money from each other for temporary or emergency purposes. Participation in The Program is voluntary for both borrowing and lending funds. Interfund loans may be made only when the rate of interest to be charged is more favorable to the lending fund than an investment in overnight repurchase agreements (“Repo Rate”), and more favorable to the borrowing fund than the rate of interest that would be charged by a bank for short-term borrowings (“Bank Loan Rate”). The Bank Loan Rate will be determined using a formula reviewed annually by the SEI Funds’ Board of Trustees. The interest rate imposed on interfund loans is the average of the Repo Rate and the Bank Loan Rate. As of and during the year ended September 30, 2020, the Trust has not participated in the Program.
6. INVESTMENT TRANSACTIONS
The cost of security purchases and the proceeds from the sale of securities, other than temporary cash investments,
during the year ended September 30, 2020, were as follows:
| International Equity Fund ($ Thousands) | Emerging Markets Equity ($ Thousands) | International Fixed Income ($ Thousands) | Emerging Markets Debt Fund ($ Thousands) | |||||||||||||
Purchases | ||||||||||||||||
U.S. Government | $— | $— | $3,926 | $— | ||||||||||||
Other | 3,928,513 | 1,480,852 | 299,741 | 1,379,561 | ||||||||||||
Sales | ||||||||||||||||
U.S. Government | — | — | 12,789 | — | ||||||||||||
Other | 4,139,726 | 1,659,099 | 316,561 | 1,492,243 | ||||||||||||
7. FEDERAL TAX INFORMATION:
It is each Fund’s intention to continue to qualify as a regulated investment company under Subchapter M of the Internal Revenue Code and distribute all of its
taxable income (including net capital gains). Accordingly, no provision for Federal income taxes is required.
The Funds may be subject to taxes imposed by countries in which they invest with respect to their
92 |
SEI Institutional International Trust / Annual Report / September 30, 2020 |
investments in issuers existing or operating in such countries. Such taxes are generally based on income earned. The Funds accrue such taxes when the related income is earned.
Dividends from net investment income and distributions from net realized capital gains are determined in accordance with U.S. Federal income tax regulations, which may differ from those amounts determined under U.S. GAAP. These book/tax differences are either temporary or permanent in nature. To the extent these differences are permanent, they are charged or credited to paid-in capital and distributable earnings, as appropriate, in the period that the differences arise.
Accordingly, the following permanent differences, primarily attributable to different treatment for gains
and losses on paydowns of mortgage and asset-backed securities for tax purposes, investments in swaps, investments in passive foreign investment companies, distribution reclassification, REIT income reclassification and foreign currency transactions. The permanent difference that is credited or charged to Paid in Capital and Distributable Earnings as of September 30, 2020 is primarily related to net operating losses and distribution in excess of net investment income.
Paid-in Capital | Distributable Earning (Accumulated Losses) | |||||||
International Fixed Income Fund | $ | (9,985 | ) | $ 9,985 | ||||
These reclassifications have no impact on net assets of the net asset value per share.
The tax character of dividends and distributions declared during the last two years were as follows:
| Ordinary Income ($ Thousands) | Long-term Capital Gain ($ Thousands) | Total ($ Thousands) | ||||||||||||||
International Equity Fund | 2020 | $ | 75,520 | $ | — | $ | 75,520 | |||||||||
| 2019 | 59,119 | — | 59,119 | |||||||||||||
Emerging Markets Equity Fund | 2020 | 20,681 | — | 20,681 | ||||||||||||
| 2019 | 10,587 | — | 10,587 | |||||||||||||
International Fixed Income Fund | 2020 | 16,125 | 746 | 16,871 | ||||||||||||
| 2019 | 18,958 | 2,360 | 21,318 | |||||||||||||
Emerging Markets Debt Fund | 2020 | 12,511 | — | 12,511 | ||||||||||||
| 2019 | 26,300 | — | 26,300 | |||||||||||||
As of September 30, 2020, the components of Distributable Earnings (Accumulated Losses) were as follows:
| ||||||||||||||||||||||||||||||||
| Undistributed Ordinary Income ($ Thousands) | Undistributed Long-Term Capital Gain ($ Thousands) | Capital Loss Carryforwards | Post October | Late Year Ordinary Losses ($ Thousands) | Unrealized Appreciation (Depreciation) ($ Thousands) | Other Temporary Differences ($ Thousands) | Total Distributable Earnings (Accumulated Losses) ($ Thousands) | |||||||||||||||||||||||||
| ||||||||||||||||||||||||||||||||
International Equity Fund | $ | 43,972 | $ | — | $ | (29,194 | ) | $ | — | $ | — | $ | 206,384 | $ | 1 | $ | 221,163 | |||||||||||||||
Emerging Markets Equity Fund | 10,009 | — | (83,070 | ) | (44,681 | ) | — | 314,897 | (3 | ) | 197,152 | |||||||||||||||||||||
International Fixed Income Fund | — | — | (418 | ) | (388 | ) | (7,367 | ) | 26,026 | (13,359 | ) | 4,494 | ||||||||||||||||||||
Emerging Markets Debt Fund | — | — | (23,012 | ) | (6,212 | ) | (16,663 | ) | (60,729 | ) | (19,373 | ) | (125,989 | ) | ||||||||||||||||||
Post-October losses represent losses realized on investment transactions from November 1, 2019 through September 30, 2020 that, in accordance with Federal income tax regulations, the Funds may elect to defer and treat as having arisen in the following fiscal year.
For the year ended September 30, 2020, the International Equity Fund and Emerging Markets Debt Fund utilized capital loss carryforwards to offset capital gains of $52,104 and $2,327 ($ Thousands), respectively.
For Federal income tax purposes, capital loss carryforwards may be carried forward and applied against future capital gains.
The Funds have capital losses carried forward as follows:
| Short-Term ($ Thousands) | Long-Term ($ Thousands) | Total Capital Loss Carryforwards ($ Thousands) | ||||||||||
International Equity Fund | $(29,194) | $— | $(29,194) | |||||||||
Emerging Markets Equity Fund | (73,672 | ) | (9,398 | ) | (83,070) | |||||||
International Fixed Income Fund | (2 | ) | (416 | ) | (418) | |||||||
Emerging Markets Debt Fund | — | (23,012 | ) | (23,012) | ||||||||
For Federal income tax purposes, the cost of securities owned at September 30, 2020, and the net realized gains or losses on securities sold for the period were not materially different from amounts reported for financial reporting purposes. These differences are primarily due to investments in derivatives, passive
SEI Institutional International Trust / Annual Report / September 30, 2020 |
93 |
NOTES TO FINANCIAL STATEMENTS (Continued)
September 30, 2020
foreign investment companies and wash sales which cannot be used for Federal income tax purposes in the current year and have been deferred for use in future years. The aggregate gross unrealized appreciation and depreciation on total investments held by the Funds at September 30, 2020, was as follows:
| Federal Tax Cost ($ Thousands) | Appreciated Securities ($ Thousands) | Depreciated Securities ($ Thousands) | Net Unrealized Appreciation/ (Depreciation) ($ Thousands) | |||||||||||
International Equity Fund | $ | 3,710,284 | $ | 550,494 | $ | (344,110 | ) | $206,384 | ||||||
Emerging Markets Equity Fund | 1,349,530 | 438,306 | (123,409 | ) | 314,897 | |||||||||
International Fixed Income Fund | 472,923 | 31,342 | (5,316 | ) | 26,026 | |||||||||
Emerging Markets Debt Fund | 1,493,887 | 53,066 | (113,795 | ) | (60,729) | |||||||||
Management has analyzed the Funds’ tax positions taken on federal income tax returns for all open tax years and has concluded that as of September 30, 2020, no provision for income tax would be required in the Funds’ financial statements. The Funds’ federal and state income and federal excise tax returns for tax years for which the applicable statutes of limitations have not expired are subject to examination by the Internal Revenue Service and state departments of revenue.
8. CONCENTRATION/RISKS
In the normal course of business, the Trust enters into contracts that provide general indemnifications by the Trust to the counterparty to the contract. The Trust’s maximum exposure under these arrangements is dependent on future claims that may be made against the Trust and, therefore, cannot be estimated; however, management believes that, based on experience, the risk of loss from such claims is considered remote.
To the extent consistent with its Investment Strategy, a Fund may have one of more of the following principal risks:
Asset-Backed Securities Risk — Payment of principal and interest on asset-backed securities is dependent largely on the cash flows generated by the assets backing the securities. Securitization trusts generally do not have any assets or sources of funds other than the receivables and related property they own, and asset-backed securities are generally not insured or guaranteed by the related sponsor or any other entity. Asset-backed securities may be more illiquid than more conventional types of fixed-income securities that the Funds acquire.
Credit Risk — The risk that the issuer of a security or the counterparty to a contract will default or otherwise become unable to honor a financial obligation.
Currency Risk — As a result of the Funds’ investments in securities denominated in, and/or receiving revenues in,
foreign currencies, the Funds will be subject to currency risk. Currency risk is the risk that foreign currencies will decline in value relative to the U.S. dollar or, in the case of hedging positions, that the U.S. dollar will decline in value relative to the currency hedged. In either event, the dollar value of an investment in the Funds would be adversely affected. Currency exchange rates may fluctuate in response to, among other things, changes in interest rates, intervention (or failure to intervene) by U.S. or foreign governments, central banks or supranational entities, or by the imposition of currency controls or other political developments in the United States or abroad.
Economic Risks of Global Health Events — Global health events and pandemics, such as COVID-19, have the ability to affect—quickly, drastically and substantially the economies of many nations, states, individual companies and the markets in general and can cause disruptions that cannot necessarily be foreseen. The spread of COVID-19 around the world in 2020 resulted in a substantial number of nations implementing social distancing measures, quarantines, and the shutdown of non-essential businesses and governmental services. Further, it has caused significant volatility in U.S. and international markets. The impact of the outbreak may be short term or may last for an extended period of time.
Foreign Investment/Emerging Markets Risk — The risk that non-U.S. securities may be subject to additional risks due to, among other things, political, social and economic developments abroad, currency movements, and different legal, regulatory and tax environments. These additional risks may be heightened with respect to emerging market countries since political turmoil and rapid changes in economic conditions are more likely to occur in these countries.
Interest Rate Risk — The risk that a rise in interest rates will cause a fall in the value of fixed income securities, including U.S. Government securities, in which the Funds invest. A low interest rate environment may present greater interest rate risk, because there may be a greater likelihood of rates increasing and rates may increase more rapidly.
Market Risk — The risk that the market value of a security may move up and down, sometimes rapidly and unpredictably. Market risk may affect a single issuer, an industry, a sector or the equity or bond market as a whole. The prices of the Funds’ fixed income securities respond to economic developments, particularly interest rate changes, as well as to perceptions about the creditworthiness of individual issuers, including governments and their agencies. Generally, the Funds’ fixed income securities will decrease in value if interest rates rise and vice versa. In a low interest
94 |
SEI Institutional International Trust / Annual Report / September 30, 2020 |
rate environment, risks associated with rising rates are heightened. Declines in dealer market-making capacity as a result of structural or regulatory changes could further decrease liquidity and/or increase volatility in the fixed income markets. In the case of foreign securities, price fluctuations will reflect international economic and political events, as well as changes in currency valuations relative to the U.S. dollar. In response to these events, the Funds’ value may fluctuate and/or the Funds may experience increased redemptions from shareholders, which may impact the Funds’ liquidity or force the Funds to sell securities into a declining or illiquid market.
Mortgage-Backed Securities Risk — Mortgage-backed securities are affected significantly by the rate of prepayments and modifications of the mortgage loans backing those securities, as well as by other factors such as borrower defaults, delinquencies, realized or liquidation losses and other shortfalls. Mortgage-backed securities are particularly sensitive to prepayment risk, which is described below, given that the term to maturity for mortgage loans is generally substantially longer than the expected lives of those securities; however, the timing and amount of prepayments cannot be accurately predicted. The timing of changes in the rate of prepayments of the mortgage loans may significantly affect the Funds’ actual yield to maturity on any mortgage-backed securities, even if the average rate of principal payments is consistent with the Funds’ expectation. Along with prepayment risk, mortgage-backed securities are significantly affected by interest rate risk, which is described above. In a low interest rate environment, mortgage loan prepayments would generally be expected to increase due to factors such as refinancing and loan modifications at lower interest rates. In contrast, if prevailing interest rates rise, prepayments of mortgage loans would generally be expected to decline and therefore extend the weighted average lives of mortgage-backed securities held or acquired by the Funds.
Please refer to each Fund’s current prospectus for additional disclosure regarding the risks associated with investing in the Funds. The foregoing is not intended to be a complete discussion of the risks associated with the investment strategies of the Funds.
9. SECURITIES LENDING
A Fund may lend portfolio securities to brokers, dealers and other financial organizations that meet capital and other credit requirements or other criteria established by the Trust’s Board of Trustees. These loans may not exceed 33 1/3% of the total asset value of a Fund (including the loan collateral). No Fund will lend portfolio securities to its Adviser, sub-adviser or their affiliates
unless it has applied for and received specific authority to do so from the SEC. Loans of portfolio securities will be fully collateralized by cash. Collateral will be maintained in an amount equal to at least 100% of the current market value of the loaned securities by marking to market daily, although the borrower will be required to deliver collateral between 102% and 105% of the market value of borrowed securities for domestic and foreign securities, respectively. However, due to market fluctuations during the day, the value of securities loaned on a particular day may, during the course of the day, exceed the value of collateral. On each business day, the amount of collateral is adjusted based on the prior day’s market fluctuations and the current day’s lending activity. Income from lending activity is determined by the amount of interest earned on collateral, less any amounts payable to the borrowers of the securities and the lending agent. Lending securities involves certain risks, including the risk that a Fund may be delayed or restricted from recovering the loaned securities or disposing of the collateral for the loan which could give rise to loss because of adverse market actions expenses and/or delays in connection with the disposition of the underlying securities.
Cash collateral received in connection with securities lending is invested in eligible securities by the lending agent. These investments may include the SEI Liquidity Fund, L.P. (“Liquidity Fund”) and the Fund bears its pro rata portion of the Liquidity Fund’s expenses and is subject to the risk of loss in the underlying investments of the Liquidity Fund and losses on such investment. There is no guarantee that these investments will not lose value.
The following is a summary of securities lending agreements held by certain Funds which would be subject to offset as of September 30, 2020 ($ Thousands):
| Securities Loaned at Value | Cash Collateral Received(1) | Net Amount | |||||||||||||||||||||||
International Equity Fund | $ | 90,323 | $ | 90,323 | $ | — | |||||||||||||||||||
Emerging Markets Equity Fund | 18,725 | 18,725 | — | ||||||||||||||||||||||
Emerging Markets Debt Fund | 14,743 | 14,743 | — | ||||||||||||||||||||||
| (1) | Excess collateral received in connection with the above securities lending transactions is not shown for financial reporting purposes. See each Fund’s Schedule of Investments for the total collateral received. |
SEI Institutional International Trust / Annual Report / September 30, 2020 |
95 |
NOTES TO FINANCIAL STATEMENTS (Concluded)
September 30, 2020
10. CONCENTRATION OF SHAREHOLDERS
SEI Private Trust Company (“SPTC”) and SIMC are subsidiaries of SEI Investments Company. As of
September 30, 2020, SPTC held of record the following:
| Fund | Class F | Class I | Class Y | |||||||||
International Equity Fund | 96.88% | 37.87% | 45.38% | |||||||||
Emerging Markets Equity Fund | 95.40% | —% | 65.99% | |||||||||
International Fixed Income Fund | 96.68% | —% | 99.45% | |||||||||
Emerging Markets Debt Fund | 97.87% | —% | 52.36% | |||||||||
SPTC is not a direct service provider to the SEI Funds. However, SPTC performs a role in the comprehensive investment solution that SEI provides to investors. SPTC holds shares in the Funds as custodian for shareholders that are clients of independent registered investment advisers, financial planners, bank trust departments and other financial advisers. SPTC maintains omnibus accounts at the Fund’s transfer agent.
11. NEW ACCOUNTING PRONOUNCEMENTS
In August 2018, the FASB issued Accounting Standards Update 2018-13, Fair Value Measurement (Topic 820). The new guidance includes additions and modifications to disclosures requirements for fair value measurements. For public entities, the amendments are effective for financial statements issued for fiscal years beginning after December 15, 2019, and interim periods within those fiscal years. Management elected to early adopt the removal and modifications of certain disclosures and delay the adoption of additional disclosures until the effective date.
12. REGULATORY MATTERS
In July 2017, the Financial Conduct Authority, the United Kingdom’s financial regulatory body, announced that after 2021 it will cease its active encouragement of banks to provide the quotations needed to sustain LIBOR. That announcement suggests that LIBOR very likely will cease to be published after that time. Various financial industry groups have begun planning for that transition, whether through marketwide protocols, fallback contractual provisions, bespoke negotiations or amendments or otherwise, but there are obstacles to converting certain securities and transactions to a new benchmark. Transition planning is at an early stage, and neither the effect of the transition process nor its ultimate success can yet be known. The transition process might lead to increased volatility and illiquidity in markets for instruments whose terms currently include LIBOR. It could also lead to a reduction in the value of some LIBOR-based investments and reduce the
effectiveness of new hedges placed against existing LIBOR-based investments. While some LIBOR-based instruments may contemplate a scenario where LIBOR is no longer available by providing for an alternative rate-setting methodology and/or increased costs for certain LIBOR-related instruments or financing transactions, not all may have such provisions and there may be significant uncertainty regarding the effectiveness of any such alternative methodologies, resulting in prolonged adverse market conditions for the Fund. Because the usefulness of LIBOR as a benchmark could deteriorate during the transition period, these effects could occur prior to the end of 2021. There also remains uncertainty and risk regarding the willingness and ability of issuers to include enhanced provisions in new and existing contracts or instruments. All of the aforementioned may adversely affect the Fund’s performance or NAV.
13. SUBSEQUENT EVENTS
Management has evaluated the need for disclosures and/or adjustments resulting from subsequent events through the date the financial statements were issued. Based on this evaluation, no disclosure and/or adjustments were required to the financial statements as of September 30, 2020.
96 |
SEI Institutional International Trust / Annual Report / September 30, 2020 |
REPORT OF INDEPENDENT REGISTERED PUBLIC ACCOUNTING FIRM
To the Shareholders of the Funds and Board of Trustees
SEI Institutional International Trust:
Opinion on the Financial Statements
We have audited the accompanying statements of assets and liabilities of SEI Institutional International Trust, comprised of the International Equity Fund, Emerging Markets Equity Fund, International Fixed Income Fund, and Emerging Markets Debt Fund (collectively, the Funds), including the schedules of investments, as of September 30 2020, the related statements of operations for the year then ended, the statements of changes in net assets for each of the years in the two year period then ended, and the related notes (collectively, the financial statements) and the financial highlights for each of the years in the five year period then ended. In our opinion, the financial statements and financial highlights present fairly, in all material respects, the financial position of the Funds as of September 30, 2020, the results of their operations for the year then ended, the changes in its net assets for each of the years in the two year period then ended, and the financial highlights for each of the years or periods in the five year period then ended, in conformity with U.S. generally accepted accounting principles.
Basis for Opinion
These financial statements and financial highlights are the responsibility of the Funds’ management. Our responsibility is to express an opinion on these financial statements and financial highlights based on our audits. We are a public accounting firm registered with the Public Company Accounting Oversight Board (United States) (PCAOB) and are required to be independent with respect to the Company in accordance with the U.S. federal securities laws and the applicable rules and regulations of the Securities and Exchange Commission and the PCAOB.
We conducted our audits in accordance with the standards of the PCAOB. Those standards require that we plan and perform the audit to obtain reasonable assurance about whether the financial statements and financial highlights are free of material misstatement, whether due to error or fraud. Our audits included performing procedures to assess the risks of material misstatement of the financial statements and financial highlights, whether due to error or fraud, and performing procedures that respond to those risks. Such procedures included examining, on a test basis, evidence regarding the amounts and disclosures in the financial statements and financial highlights. Such procedures also included confirmation of securities owned as of September 30, 2020, by correspondence with custodians, transfer agents and brokers or by other appropriate auditing procedures when replies were not received. Our audits also included evaluating the accounting principles used and significant estimates made by management, as well as evaluating the overall presentation of the financial statements and financial highlights. We believe that our audits provide a reasonable basis for our opinion.

We have served as the auditor of one or more SEI Funds investment companies since 2005.
Philadelphia, Pennsylvania
November 27, 2020
SEI Institutional International Trust / Annual Report / September 30, 2020 |
97 |
TRUSTEES AND OFFICERS OF THE TRUST (Unaudited)
The following chart lists Trustees and Officers as of September 30, 2020.
Set forth below are the names, addresses, ages, position with the Trust, Term of Office and Length of Time Served, the principal occupations for the last five years, number of positions in fund complex overseen by trustee, and other directorships outside the fund complex of each of the persons currently serving as Trustees and Officers of the Trust. The Trust’s Statement of Additional Information (“SAI”) includes additional information about the Trustees and Officers. The SAI may be obtained without charge by calling 1-800-835-4531.
Name, Address, and Age | Position(s) Held with Trusts | Term of Office and Length of Time Served1 | Principal Occupation(s) During Past Five Years | Number of Portfolios in Fund by Trustee2 | Other Directorships Held by Trustee | |||||
INTERESTED TRUSTEES
| ||||||||||
Robert A. Nesher One Freedom Valley Drive Oaks, PA 19456 74 yrs. old | Chairman of the Board of Trustees* | since 1989 | Currently performs various services on behalf of SEI for which Mr. Nesher is compensated. | 92 | President and Director of SEI Structured Credit Fund, LP. Director of SEI Global Master Fund plc, SEI Global Assets Fund plc, SEI Global Investments Fund plc, SEI Investments—Global Funds Services, Limited, SEI Investments Global, Limited, SEI Investments (Europe) Ltd., SEI Multi-Strategy Funds PLC, SEI Global Nominee Ltd and SEI Investments—Unit Trust Management (UK) Limited. President, Director and Chief Executive Officer of SEI Alpha Strategy Portfolios, LP from 2007 to 2013. Trustee of SEI Liquid Asset Trust from 1989 to 2016. Trustee of SEI Insurance Products Trust from 2013 to 2020. Vice Chairman of O’Connor EQUUS (closed-end investment company) from 2014 to 2016. Vice Chairman of Winton Series Trust from 2014 to 2017. Vice Chairman of The Advisors’ Inner Circle Fund III and Winton Diversified Opportunities Fund (closed-end investment company) from 2014 to 2018. Vice Chairman of Gallery Trust, Schroder Series Trust and Schroder Global Series Trust from 2015 to 2018. Trustee of The Advisors’ Inner Circle Fund, The Advisors’ Inner Circle Fund II, Bishop Street Funds, and the KP Funds. President, Chief Executive Officer and Trustee of SEI Asset Allocation Trust, SEI Daily Income Trust, SEI Institutional Managed Trust, SEI Institutional International Trust, SEI Institutional Investments Trust, SEI Tax Exempt Trust, Adviser Managed Trust, The New Covenant Funds and SEI Catholic Values Trust. | |||||
William M. Doran One Freedom Valley Drive Oaks, PA 19456 80 yrs. old | Trustee* | since 1988 | Self-employed consultant since 2003.Partner, Morgan, Lewis & Bockius LLP (law firm) from 1976 to 2003, counsel to the Trust, SEI, SIMC, the Administrator and the Distributor. | 92 | Director of SEI since 1974; Secretary of SEI since 1978. Director of SEI Investments Distribution Co. since 2003. Director of SEI Investments—Global Funds Services, Limited, SEI Investments Global, Limited, SEI Investments (Europe), Limited, SEI Investments (Asia) Limited, SEI Global Nominee Ltd. and SEI Investments—Unit Trust Management (UK) Limited. Trustee of SEI Liquid Asset Trust from 1982 to 2016. Trustee of O’Connor EQUUS from 2014 to 2016. Director of SEI Alpha Strategy Portfolios, LP from 2007 to 2013. Trustee of Winton Series Trust from 2014 to 2017. Trustee of The Advisors’ Inner Circle Fund, The Advisors’ Inner Circle Fund II and Bishop Street Funds from 1991 to 2018. Trustee of The KP Funds from 2013 to 2018. Trustee of Winton Diversified Opportunities Fund from 2014 to 2018. Trustee of SEI Insurance Products Trust from 2013 to 2020. Trustee of The Advisors’ Inner Circle Fund III, Gallery Trust, SEI Asset Allocation Trust, SEI Daily Income Trust, SEI Institutional Managed Trust, SEI Institutional International Trust, SEI Institutional Investments Trust, SEI Tax Exempt Trust, Adviser Managed Trust, New Covenant Funds, Schroder Series Trust, Schroder Global Series Trust and SEI Catholic Values Trust. | |||||
| TRUSTEES | ||||||||||
George J. Sullivan Jr. One Freedom Valley Drive, Oaks, PA 19456 77 yrs. old | Trustee | since 1996 | Retired since January 2012. Self-Employed Consultant, Newfound Consultants Inc. April 1997-December 2011. | 92 | Member of the independent review committee for SEI’s Canadian-registered mutual funds from 2011 to 2017. Director of SEI Alpha Strategy Portfolios, LP from 2007 to 2013. Trustee of SEI Liquid Asset Trust from 1996 to 2016. Trustee/Director of State Street Navigator Securities Lending Trust from 1996 to 2017. Trustee of SEI Insurance Products Trust from 2013 to 2020. Trustee/Director of The Advisors’ Inner Circle Fund, The Advisors’ Inner Circle Fund II, Bishop Street Funds, SEI Structured Credit Fund, LP, SEI Asset Allocation Trust, SEI Daily Income Trust, SEI Institutional Managed Trust, SEI Institutional International Trust, SEI Institutional Investments Trust, SEI Tax Exempt Trust, Adviser Managed Trust, New Covenant Funds, The KP Funds and SEI Catholic Values Trust. | |||||
| * | Messrs. Nesher and Doran are Trustees who may be deemed as “interested” persons of the Trust as that term is defined in the 1940 Act by virtue of their affiliation with SIMC and the Trust’s Distributor. |
| 1 | Each trustee shall hold office during the lifetime of this Trust until the election and qualification of his or her successor, or until he or she sooner dies, resigns or is removed in accordance with the Trust’s Declaration of Trust |
| 2 | The Fund Complex includes the following Trusts: SEI Asset Allocation Trust, SEI Daily Income Trust, SEI Institutional Investments Trust, Adviser Managed Trust, SEI Institutional International Trust, SEI Institutional Managed Trust, SEI Tax Exempt Trust, SEI Catholic Values Trust and New Covenant Funds. |
98 |
SEI Institutional International Trust / Annual Report / September 30, 2020 |
| Name Address, and Age | Position(s) Held with Trusts | Term of Office and Length of Time Served1 | Principal Occupation(s) During Past Five Years | Number of Portfolios in Fund Complex Overseen by Trustee2 | Other Directorships Held by Trustee | |||||
TRUSTEES (continued)
| ||||||||||
Nina Lesavoy One Freedom Valley Drive, Oaks, PA 19456 63 yrs. old | Trustee | since 2003 | Founder and Managing Director, Avec Capital (strategic fundraising firm) since 2008. Managing Director, Cue Capital (strategic fundraising firm) from March 2002-March 2008. | 92 | Director of SEI Alpha Strategy Portfolios, LP from 2007 to 2013. Trustee of SEI Liquid Asset Trust from 2003 to 2016. Trustee of SEI Insurance Products Trust from 2013 to 2020. Trustee/Director of SEI Structured Credit Fund, L.P., SEI Asset Allocation Trust, SEI Daily Income Trust, SEI Institutional Managed Trust, SEI Institutional International Trust, SEI Institutional Investments Trust, SEI Tax Exempt Trust, New Covenant Funds, Adviser Managed Trust and SEI Catholic Values Trust. | |||||
James M. Williams One Freedom Valley Drive, Oaks, PA 19456 72 yrs. old | Trustee | since 2004 | Vice President and Chief Investment Officer, J. Paul Getty Trust, Non-Profit Foundation for Visual Arts, since December 2002. President, Harbor Capital Advisors and Harbor Mutual Funds, 2000-2002. Manager, Pension Asset Management, Ford Motor Company, 1997-1999. | 92 | Director of SEI Alpha Strategy Portfolios, LP from 2007 to 2013, Trustee of SEI Liquid Asset Trust from 2004 to 2016. Trustee of SEI Insurance Products Trust from 2013 to 2020. Trustee/Director of Ariel Mutual Funds, SEI Structured Credit Fund, LP, SEI Asset Allocation Trust, SEI Daily Income Trust, SEI Institutional Managed Trust, SEI Institutional International Trust, SEI Institutional Investments Trust, SEI Tax Exempt Trust, New Covenant Funds, Adviser Managed Trust and SEI Catholic Values Trust. | |||||
Mitchell A. Johnson One Freedom Valley Drive, Oaks, PA 19456 78 yrs. old | Trustee | since 2007 | Retired Private Investor since 1994. | 92 | Director, Federal Agricultural Mortgage Corporation (Farmer Mac) since 1997. Director of SEI Alpha Strategy Portfolios, LP from 2007 to 2013. Trustee of SEI Liquid Asset Trust from 2007 to 2016. Trustee of SEI Insurance Products Trust from 2013 to 2020. Trustee of the Advisors’ Inner Circle Fund, The Advisors’ Inner Circle Fund II, Bishop Street Funds, SEI Asset Allocation Trust, SEI Daily Income Trust, SEI Institutional Managed Trust, SEI Institutional International Trust, SEI Institutional Investments Trust, SEI Tax Exempt Trust, Adviser Managed Trust, The KP Funds, New Covenant Funds and SEI Catholic Values Trust. | |||||
Hubert L. Harris, Jr. One Freedom Valley Drive, Oaks, PA 19456 77 yrs. old | Trustee | since 2008 | Retired since December 2005. Owner of Harris Plantation, Inc. since 1995. Chief Executive Officer of Harris CAPM, a consulting asset and property management entity. Chief Executive Officer, INVESCO North America, August 2003-December 2005. Chief Executive Officer and Chair of the Board of Directors, AMVESCAP Retirement, Inc., January 1998- August 2003. | 92 | Director of AMVESCAP PLC from 1993-2004. Served as a director of a bank holding company, 2003-2009. Director, Aaron’s Inc., 2012-present. President and CEO of Oasis Ornamentals LLC since 2011. Member of the Board of Councilors of the Carter Center (nonprofit corporation) and served on the board of other non-profit organizations. Director of SEI Alpha Strategy Portfolios, LP from 2008 to 2013. Trustee of SEI Liquid Asset Trust from 2008 to 2016. Trustee of SEI Insurance Products Trust from 2013 to 2020. Trustee of SEI Asset Allocation Trust, SEI Daily Income Trust, SEI Institutional Managed Trust, SEI Institutional International Trust, SEI Institutional Investments Trust, SEI Tax Exempt Trust, New Covenant Funds, Adviser Managed Trust and SEI Catholic Values Trust. | |||||
Susan C. Cote One Freedom Valley Drive Oaks, PA 19456 65 yrs. old | Trustee | since 2016 | Retired since July 2015. Americas Director of Asset Management, Ernst & Young LLP from 2006-2013. Global Asset Management Assurance Leader, Ernest & Young LLP from 2006-2015. Partner Ernest & Young LLP from 1997-2015. Prudential, 1983-1997.Member of the Ernst & Young LLP Retirement Investment Committee, Treasurer and Chair of Finance, Investment and Audit Committee of the New York Women’s Foundation. | 92 | Trustee of SEI Insurance Products Trust from 2016 to 2020. Trustee of SEI Structured Credit Fund, LP, SEI Tax Exempt Trust, SEI Daily Income Trust, SEI Institutional International Trust, SEI Institutional Managed Trust, SEI Asset Allocation Trust, SEI Institutional Investments Trust, New Covenant Funds, Adviser Managed Trust and SEI Catholic Values Trust. | |||||
James B. Taylor One Freedom Valley Drive Oaks, PA 19456 69 yrs. old | Trustee | since 2018 | Retired since December 2017. Chief Investment Officer at Georgia Tech Foundation from 2008 to 2017. Chief Investment Officer at Delta Air Lines from 1983 to 2007. Member of the Investment Committee at the Institute of Electrical and Electronic Engineers from 1999 to 2004. President, Vice President and Treasurer at Southern Benefits Conference from 1998 to 2000. | 92 | Trustee of SEI Insurance Products Trust from 2018 to 2020. Trustee of SEI Daily Income Trust, SEI Tax Exempt Trust, SEI Institutional Managed Trust, SEI Institutional International Trust, SEI Institutional Investments Trust, SEI Asset Allocation Trust, Adviser Managed Trust, New Covenant Funds and SEI Catholic Values Trust. | |||||
Christine Reynolds One Freedom Valley Drive Oaks, PA 19456 62 yrs. old | Trustee | since 2019 | Retired since December 2016. Executive Vice President, Fidelity Investments from 2014-2016. President, Fidelity Pricing and Cash Management Services and Chief Financial Officer of Fidelity Funds from 2008-2014. Chief Operating Officer, Fidelity Pricing and Cash Management Services from 2007-2008. President and Treasurer, Fidelity Funds from 2004-2007. Anti-Money Laundering Officer, Fidelity Funds in 2004. Executive Vice President, Fidelity Funds from 2002-2004. Audit Partner, PricewaterhouseCoopers from 1992-2002. | 92 | Trustee of SEI Insurance Products Trust from 2019 to 2020. Trustee of SEI Daily Income Trust, SEI Tax Exempt Trust, SEI Institutional Managed Trust, SEI Institutional International Trust, SEI Institutional Investments Trust, SEI Asset Allocation Trust, Adviser Managed Trust, New Covenant Funds and SEI Catholic Values Trust. | |||||
| 1 | Each trustee shall hold office during the lifetime of this Trust until the election and qualification of his or her successor, or until he or she sooner dies, resigns or is removed in accordance with the Trust’s Declaration of Trust. |
| 2 | The Fund Complex includes the following Trusts: SEI Asset Allocation Trust, SEI Daily Income Trust, SEI Institutional Investments Trust, Adviser Managed Trust, SEI Institutional International Trust, SEI Institutional Managed Trust, SEI Tax Exempt Trust, SEI Catholic Values Trust and New Covenant Funds. |
SEI Institutional International Trust / Annual Report / September 30, 2020 |
99 |
TRUSTEES AND OFFICERS OF THE TRUST (Unaudited) (Concluded)
| Name Address, and Age | Position(s) Held with Trusts | Term of Office and Length of Time Served1 | Principal Occupation(s) During Past Five Years | Number of Portfolios in Fund Complex Overseen by Trustee2 | Other Directorships Held by Trustee | |||||
OFFICERS
| ||||||||||
Robert A. Nesher One Freedom Valley Drive, Oaks, PA 19456 74 yrs. Old | President and CEO | since 2005 | Currently performs various services on behalf of SEI for which Mr. Nesher is compensated. | N/A | N/A | |||||
Peter A. Rodriguez One Freedom Valley Drive Oaks, PA 19456 58 yrs. old | Controller and Chief Financial Officer | since 2020 | Director, Fund Accounting, SEI Investments Global Funds Services since April 2020 and previously from March 2011 to March 2015; Director, Financial Reporting from June 2017 to March 2020. Director, Centralized Operations from March 2015 to June 2017. | N/A | N/A | |||||
Glenn R. Kurdziel One Freedom Valley Drive Oaks, PA 19456 46 yrs. old | Assistant Controller | since 2017 | Assistant Controller, Funds Accounting, SEI Investments Global Funds Services (March 2017); Manager, Funds Accounting, SEI Investments Global Funds Services since 2005. | N/A | N/A | |||||
Russell Emery One Freedom Valley Drive Oaks, PA 19456 57 yrs. old | Chief Compliance Officer | since 2006 | Chief Compliance Officer of SEI Daily Income Trust, SEI Institutional Investments Trust, SEI Institutional Managed Trust, SEI Asset Allocation Trust, SEI Institutional International Trust, SEI Tax Exempt Trust, The Advisors’ Inner Circle Fund, The Advisors’ Inner Circle Fund II and Bishop Street Funds since March 2006. Chief Compliance Officer of SEI Liquid Asset Trust from 2006 to 2016. Chief Compliance Officer of SEI Structured Credit Fund, LP since June 2007. Chief Compliance Officer of Adviser Managed Trust since December 2010. Chief Compliance Officer of SEI Alpha Strategy Portfolios, LP from 2007 to 2013. Chief Compliance Officer of New Covenant Funds since February 2012. Chief Compliance Officer of SEI Insurance Products Trust from 2013 to 2020. Chief Compliance Officer of The KP Funds since 2013. Chief Compliance Officer of New Covenant Funds since February 2012. Chief Compliance Officer of O’Connor EQUUS from 2014 to 2016. Chief Compliance Officer of The Advisors’ Inner Circle Fund III since 2014. Chief Compliance Officer of Winton Series Trust from 2014 to 2017. Chief Compliance Officer of Winton Diversified Opportunities Fund from 2014 to 2018. Chief Compliance Officer of SEI Catholic Values Trust and Gallery Trust since 2015. Chief Compliance Officer of Schroder Series Trust and Schroder Global Series Trust since 2017. | N/A | N/A | |||||
Timothy D Barto One Freedom Valley Drive Oaks, PA 19456 52 yrs. old | Vice President and Secretary | since 2002 | Vice President and Secretary of SEI Institutional Transfer Agent, Inc. since 2009. General Counsel and Secretary of SIMC and the Administrator since 2004. Vice President of SIMC and the Administrator since 1999. Vice President and Assistant Secretary of SEI since 2001. | N/A | N/A | |||||
Aaron Buser One Freedom Valley Drive, Oaks, PA 19456 49 yrs. old | Vice President and Assistant Secretary | since 2008 | Vice President and Assistant Secretary of SEI Institutional Transfer Agent, Inc. since 2009. Vice President and Assistant Secretary of SIMC since 2007. Attorney Stark & Stark (law firm), March 2004-July 2007. | N/A | N/A | |||||
David F. McCann One Freedom Valley Drive, Oaks, PA 19456 44 yrs. old | Vice President and Assistant Secretary | since 2009 | Vice President and Assistant Secretary of SEI Institutional Transfer Agent, Inc. since 2009. Vice President and Assistant Secretary of SIMC since 2008. Attorney, Drinker Biddle & Reath, LLP (law firm), May 2005 - October 2008. | N/A | N/A | |||||
Stephen G. MacRae One Freedom Valley Drive, Oaks, PA 19456 52 yrs. old | Vice President | since 2012 | Director of Global Investment Product Management since January 2004. | N/A | N/A | |||||
Bridget E. Sudall One Freedom Valley Drive Oaks, PA 19456 39 yrs. old | Anti-Money Laundering Compliance Officer and Privacy Officer | since 2015 | Anti-Money Laundering Compliance Officer and Privacy Officer (since 2015), Senior Associate and AML Officer, Morgan Stanley Alternative Investment Partners, April 2011-March 2015, Investor Services Team Lead, Morgan Stanley Alternative Investment Partners, July 2007-April 2011. | N/A | N/A | |||||
| 1 | Each trustee shall hold office during the lifetime of this Trust until the election and qualification of his or her successor, or until he or she sooner dies, resigns or is removed in accordance with the Trust’s Declaration of Trust. |
| 2 | The Fund Complex includes the following Trusts: SEI Asset Allocation Trust, SEI Daily Income Trust, SEI Institutional Investments Trust, Adviser Managed Trust, SEI Institutional International Trust, SEI Institutional Managed Trust, SEI Tax Exempt Trust, SEI Catholic Values Trust and New Covenant Funds. |
100 |
SEI Institutional International Trust / Annual Report / September 30, 2020 |
DISCLOSURE OF FUND EXPENSES (Unaudited)
September 30, 2020
All mutual funds have operating expenses. As a shareholder of a fund, your investment is affected by these ongoing costs, which include (among others) costs for portfolio management, administrative services, and shareholder reports like this one. It is important for you to understand the impact of these costs on your investment returns.
Operating expenses such as these are deducted from the fund’s gross income and directly reduce your final investment return. These expenses are expressed as a percentage of the fund’s average net assets; this percentage is known as the fund’s expense ratio.
The following examples use the expense ratio and are intended to help you understand the ongoing costs (in dollars) of investing in your fund and to compare these costs with those of other mutual funds. The examples are based on an investment of $1,000 made at the beginning of the period shown and held for the entire period April 1, 2020 to September 30, 2020.
The table on this page illustrates your fund’s costs in two ways:
• Actual fund return. This section helps you to estimate the actual expenses after fee waivers that your Fund incurred over the period. The “Expenses Paid During Period” column shows the actual dollar expense cost incurred by a $1,000 investment in the Fund, and the “Ending Account Value” number is derived from deducting that expense cost from the Fund’s gross investment return.
You can use this information, together with the actual amount you invested in the Fund, to estimate the expenses you paid over that period. Simply divide your actual account value by $1,000 to arrive at a ratio (for example, an $8,600 account value divided by $1,000 = 8.6), then multiply that ratio by the number shown for your Fund under “Expenses Paid During Period”.
• Hypothetical 5% return. This section helps you compare your Fund’s costs with those of other mutual funds. It assumes that the fund had an annual 5% return before expenses during the year, but that the expense ratio (Column 3) for the period is unchanged. This example is useful in making comparisons because the Securities and Exchange Commission requires all mutual funds to make this 5% calculation. You can assess your Fund’s comparative cost by comparing the hypothetical result for your Fund in the “Expense Paid During Period” column with those that appear in the same charts in the shareholder reports for other funds.
NOTE: Because the return is set at 5% for comparison purposes — NOT your Fund’s actual return — the account values shown may not apply to your specific investment.
| Beginning Account Value 4/1/20 | Ending Account Value 9/30/20 | Annualized Expense Ratios | Expenses Paid During Period * | |||||||||||||
International Equity Fund |
| |||||||||||||||
Actual Fund Return |
| |||||||||||||||
Class F | $1,000.00 | $1,265.70 | 1.12% | $6.34 | ||||||||||||
Class I | 1,000.00 | 1,264.00 | 1.37 | 7.75 | ||||||||||||
Class Y | 1,000.00 | 1,267.20 | 0.87 | 4.93 | ||||||||||||
Hypothetical 5% Return |
| |||||||||||||||
Class F | $1,000.00 | $1,019.40 | 1.12% | $5.65 | ||||||||||||
Class I | 1,000.00 | 1,018.15 | 1.37 | 6.91 | ||||||||||||
Class Y | 1,000.00 | 1,020.65 | 0.87 | 4.39 | ||||||||||||
Emerging Markets Equity Fund |
| |||||||||||||||
Actual Fund Return |
| |||||||||||||||
Class F | $1,000.00 | $1,310.90 | 1.72% | $9.94 | ||||||||||||
Class Y | 1,000.00 | 1,312.00 | 1.47 | 8.50 | ||||||||||||
Hypothetical 5% Return |
| |||||||||||||||
Class F | $1,000.00 | $1,016.40 | 1.72% | $8.67 | ||||||||||||
Class Y | 1,000.00 | 1,017.65 | 1.47 | 7.41 | ||||||||||||
| Beginning Account Value 4/1/20 | Ending Account Value 9/30/20 | Annualized Expense Ratios | Expenses Paid During Period * | |||||||||||||
International Fixed Income Fund |
| |||||||||||||||
Actual Fund Return |
| |||||||||||||||
Class F | $1,000.00 | $1,027.50 | 1.02% | $5.17 | ||||||||||||
Class Y | 1,000.00 | 1,028.50 | 0.77 | 3.90 | ||||||||||||
Hypothetical 5% Return |
| |||||||||||||||
Class F | $1,000.00 | $1,019.90 | 1.02% | $5.15 | ||||||||||||
Class Y | 1,000.00 | 1,021.15 | 0.77 | 3.89 | ||||||||||||
Emerging Markets Debt Fund |
| |||||||||||||||
Actual Fund Return |
| |||||||||||||||
Class F | $1,000.00 | $1,145.40 | 1.36% | $7.29 | ||||||||||||
Class Y | 1,000.00 | 1,146.50 | 1.11 | 5.96 | ||||||||||||
Hypothetical 5% Return |
| |||||||||||||||
Class F | $1,000.00 | $1,018.20 | 1.36% | $6.86 | ||||||||||||
Class Y | 1,000.00 | 1,019.45 | 1.11 | 5.60 | ||||||||||||
| * | Expenses are equal to the Fund’s annualized expense ratio multiplied by the average account value over the period, multiplied by 182/366 (to reflect the one-half year period shown). |
SEI Institutional International Trust / Annual Report / September 30, 2020 |
101 |
LIQUIDITY RISK MANAGEMENT PROGRAM (Unaudited)
September 30, 2020
Pursuant to Rule 22e-4 under the 1940 Act, the Trust, on behalf of the Funds, has adopted a liquidity risk management program (the “Program”) to govern the Trust’s approach to managing liquidity risk. The Program is overseen by the SIMC Liquidity Risk Oversight Committee, and the Program’s principal objectives include assessing, managing and periodically reviewing each Fund’s liquidity risk, based on factors specific to the circumstances of the Fund.
At a meeting of the Board held on March 24, 2020, the Trustees received a report from the SIMC Liquidity Risk Oversight Committee addressing the operations of the Program and assessing its adequacy and effectiveness of implementation. The SIMC Liquidity Risk Oversight Committee determined, and reported to the Board, that the Program is reasonably designed to assess and manage each Fund’s liquidity risk and has operated adequately and effectively to manage each Fund’s liquidity risk since the Program was implemented on December 1, 2018. The SIMC Liquidity Risk Oversight Committee reported that during the period covered by the report, there were no liquidity events that impacted the Funds or their ability to timely meet redemptions without dilution to existing shareholders. The SIMC Liquidity Risk Oversight Committee further noted that no material changes have been made to the Program since its implementation.
There can be no assurance that the Program will achieve its objectives in the future. Please refer to the prospectus for more information regarding a Fund’s exposure to liquidity risk and other principal risks to which an investment in the Funds may be subject.
102 |
SEI Institutional International Trust / Annual Report / September 30, 2020 |
BOARD OF TRUSTEES’ CONSIDERATIONS IN APPROVING THE ADVISORY AND SUB-ADVISORY AGREEMENTS (Unaudited)
SEI Institutional International Trust (the “Trust”) and SEI Investments Management Corporation (“SIMC”) have entered into an investment advisory agreement (the “Advisory Agreement”), pursuant to which SIMC provides investment advisory services to the series of the Trust (the “Funds”). Pursuant to separate sub-advisory agreements with SIMC (the “Sub-Advisory Agreements” and, together with the Advisory Agreement, the “Investment Advisory Agreements”), and under the supervision of SIMC and the Trust’s Board of Trustees (the “Board”), the sub-advisers (each, a “Sub-Adviser” and collectively, the “Sub-Advisers”) provide security selection and certain other advisory services with respect to all or a discrete portion of the assets of the Funds. The Sub-Advisers are also responsible for managing their employees who provide services to the Funds. The Sub-Advisers are selected based primarily upon the research and recommendations of SIMC, which evaluates quantitatively and qualitatively the Sub-Advisers’ skills and investment results in managing assets for specific asset classes, investment styles and strategies.
The Investment Company Act of 1940, as amended (the “1940 Act”), requires that the initial approval of a Fund’s Investment Advisory Agreements be specifically approved by the vote of a majority of the outstanding shareholders of the Funds and the vote of a majority of the Trustees who are not parties to the Investment Advisory Agreements or “interested persons” of any party (the “Independent Trustees”) cast in person (or otherwise, as consistent with applicable laws, regulations and related guidance and relief) at a meeting called for such purpose. In addition, the 1940 Act requires that the continuation or renewal of any Investment Advisory Agreement be approved at least annually (after an initial period of up to two years), which also requires the vote of a majority of the Board, including a majority of the Independent Trustees. In the case of the initial approval of a Sub-Advisory Agreement, only the approval of a majority of the Board, including a majority of the Independent Trustees, is required, pursuant to an exemptive order that has been granted to the Trust by the Securities and Exchange Commission. In connection with their consideration of such initial approvals and renewals, the Funds’ Trustees must request and evaluate, and SIMC and the Sub-Advisers are required to furnish, such information as may be reasonably necessary to evaluate the terms of the Investment Advisory Agreements. In addition, the Securities and Exchange Commission takes the position that, as part of their fiduciary duties with respect to a mutual fund’s fees, mutual fund boards are required to evaluate the material factors applicable to a decision to approve an investment advisory agreement.
Consistent with these responsibilities, the Board calls and holds meetings each year to consider whether to approve new and/or renew existing Investment Advisory Agreements between the Trust and SIMC and SIMC and the Sub-Advisers with respect to the Funds of the Trust. In preparation for these meetings, the Board requests and reviews a wide variety of materials provided by SIMC and the Sub-Advisers, including information about SIMC’s and the Sub-Advisers’ affiliates, personnel and operations and the services provided pursuant to the Investment Advisory Agreements. The Board also receives data from third parties. This information is provided in addition to the detailed information about the Funds that the Board reviews during the course of each year, including information that relates to Fund operations and Fund performance. The Trustees also receive a memorandum from counsel regarding the responsibilities of Trustees in connection with their consideration of whether to approve the Trust’s Investment Advisory Agreements. Finally, the Independent Trustees receive advice from independent counsel to the Independent Trustees, meet in executive sessions outside the presence of Fund management and participate in question and answer sessions with representatives of SIMC and the Sub-Advisers.
Specifically, during the course of the Trust’s fiscal year, the Board requested and received written materials from SIMC and the Sub-Advisers regarding: (i) the quality of SIMC’s and the Sub-Advisers’ investment management and other services; (ii) SIMC’s and the Sub-Advisers’ investment management personnel; (iii) SIMC’s and the Sub-Advisers’ operations and financial condition; (iv) SIMC’s and the Sub-Advisers’ brokerage practices (including any soft dollar arrangements) and investment strategies; (v) the level of the advisory fees that SIMC charges the Funds and the level of the sub-advisory fees that SIMC pays the Sub-Advisers, compared with fees each charge to comparable accounts; (vi) the advisory fees charged by SIMC and the Funds’ overall fees and operating expenses compared with peer groups of mutual funds prepared by Broadridge, an independent provider of investment company data; (vii) the level of SIMC’s and the Sub-Advisers’ profitability from their Fund-related operations; (viii) SIMC’s and the Sub-Advisers’ compliance program, including a description of material compliance matters and material compliance violations; (ix) SIMC’s potential economies of scale; (x) SIMC’s and the Sub-Advisers’ policies on and compliance procedures for personal securities transactions; (xi) SIMC’s and the Sub-Advisers’ expertise and resources in domestic and/or international financial markets; and (xii) the Funds’ performance over various periods of time compared with peer groups of mutual funds prepared by Broadridge and the Funds’ benchmark indexes.
SEI Institutional International Trust / Annual Report / September 30, 2020 |
103 |
BOARD OF TRUSTEES’ CONSIDERATIONS IN APPROVING THE ADVISORY AND SUB-ADVISORY AGREEMENTS (Unaudited) (Concluded)
At the March 23-25, 2020 meeting of the Board, the Trustees, including a majority of the Independent Trustees, approved the renewal of the Advisory Agreement. Also, each Sub-Advisory Agreement was either initially approved or, if the Sub-Advisory Agreement was already in effect (unless operating under an initial two-year term), renewed at meetings of the Board held during the course of the Trust’s fiscal year on December 2-4, 2019, June 22-24, 2020 and September 14-16, 2020. In each case, the Board’s approval (or renewal) was based on its consideration and evaluation of the factors described above, as discussed at the meetings and at prior meetings. The following discusses some, but not all, of the factors that were considered by the Board in connection with its assessment of the Investment Advisory Agreements.
Nature, Extent and Quality of Services. The Board considered the nature, extent and quality of the services provided by SIMC and the Sub-Advisers to the Funds and the resources of SIMC and the Sub-Advisers and their affiliates dedicated to the Funds. In this regard, the Trustees evaluated, among other things, SIMC’s and each Sub-Adviser’s personnel, experience, track record and compliance program. Following evaluation, the Board concluded that, within the context of its full deliberations, the nature, extent and quality of services provided by SIMC and the Sub-Advisers to the Funds and the resources of SIMC and the Sub-Advisers and their affiliates dedicated to the Funds were sufficient to support the renewal of the Investment Advisory Agreements. In addition to advisory services, the Board considered the nature and quality of certain administrative, transfer agency and other non-investment advisory services provided to the Funds by SIMC and/or its affiliates.
Performance. In determining whether to renew SIMC’s Advisory Agreement, the Trustees considered the Funds’ performance relative to their peer groups and appropriate indexes/benchmarks. The Trustees reviewed performance information for each Fund, noting that they receive performance reports that permit them to monitor each Fund’s performance at board meetings throughout the year. As part of this review, the Trustees considered the composition of each peer group and selection criteria. In assessing Fund performance, the Trustees considered a report compiled by Broadridge, an independent third-party that was engaged to prepare an assessment of the Funds in connection with the renewal of the Advisory Agreement (the “Broadridge Report”). The Broadridge Report included metrics on risk analysis, volatility versus total return, net total return and performance consistency for the Funds and a universe of comparable funds. Based on the materials considered and discussed at the meetings, the Trustees found Fund performance satisfactory, or, where performance was materially below the benchmark and/or peer group, the Trustees were satisfied with the reasons provided to explain such performance. In connection with the approval or renewal of Sub-Advisory Agreements, the Board considered the performance of the Sub-Adviser relative to appropriate indexes/benchmarks. Following evaluation, the Board concluded that, within the context of its full deliberations, the performance of the Funds was sufficient to support renewal of SIMC’s Advisory Agreement, and the performance of each Sub-Adviser was sufficient to support approval or renewal of the Sub-Advisory Agreement.
Fees. With respect to the Funds’ expenses under the Investment Advisory Agreements, the Trustees considered the rate of compensation called for by the Investment Advisory Agreements and the Funds’ net operating expense ratios in comparison to those of the Funds’ respective peer groups. In assessing Fund expenses, the Trustees considered the information in the Broadridge Report, which included various metrics related to fund expenses, including, but not limited to, contractual management fees at various asset levels, actual management fees (including transfer agent expenses), and actual total expenses for the Funds and a universe of comparable funds. Based on the materials considered and discussion at the meetings, the Trustees further determined that fees were either shown to be below the peer average in the comparative fee analysis, or that there was a reasonable basis for the fee level. The Trustees also considered the effects of SIMC’s and its affiliates’ voluntary waivers of management and other fees to prevent total Fund operating expenses from exceeding any applicable cap, as well as SIMC’s contractual waiver of its management fee with respect to the Emerging Markets Equity Fund to prevent the management fee from exceeding a specified cap, and concluded that SIMC, through waivers, has maintained the Funds’ net operating expenses at competitive levels for its distribution channels. In determining the appropriateness of fees, the Board also took into consideration the impact of fees incurred indirectly by the Funds as a result of investments into underlying funds, including funds from which SIMC or its affiliates earn fees. The Board also took into consideration compensation earned from the Funds by SIMC or its affiliates for non-advisory services, such as administration, transfer agency, shareholder services or brokerage, and considered whether SIMC and its affiliates may have realized other benefits from their relationship with the Funds, such as any research and brokerage services received under soft dollar arrangements. When considering fees paid to Sub-Advisers, the Board took into account the fact that the Sub-Advisers are compensated by SIMC and not by the Funds directly, and that such compensation with respect to any unaffiliated Sub-Adviser reflects an arms-length negotiation between the Sub-Adviser and SIMC. Following
104 |
SEI Institutional International Trust / Annual Report / September 30, 2020 |
evaluation, the Board concluded that, within the context of its full deliberations, the expenses of the Funds are reasonable and supported renewal of the Investment Advisory Agreements. The Board also considered whether the Sub-Advisers and their affiliates may have realized other benefits from their relationship with the Funds, such as any research and brokerage services received under soft dollar arrangements.
Profitability. With regard to profitability, the Trustees considered compensation flowing to SIMC and the Sub-Advisers and their affiliates, directly or indirectly. The Trustees considered whether the levels of compensation and profitability were reasonable. As with the fee levels, when considering the profitability of the Sub-Advisers, the Board took into account the fact that compensation with respect to any unaffiliated Sub-Adviser reflects an arms-length negotiation between the Sub-Adviser and SIMC. In connection with the approval or renewal of each Sub-Advisory Agreement, the Board also took into consideration the impact that the fees paid to the Sub-Adviser have on SIMC’s advisory fee margin and profitability. Based on this evaluation, the Board concluded that, within the context of its full deliberations, the profitability of each of SIMC and the Sub-Advisers is reasonable and supported renewal of the Investment Advisory Agreements.
Economies of Scale. With respect to the Advisory Agreement, the Trustees considered whether any economies of scale were being realized by SIMC and its affiliates and, if so, whether the benefits of such economies of scale were passed along to the Funds’ shareholders through a graduated investment advisory fee schedule or other means, including any fee waivers by SIMC and its affiliates. The Trustees recognized that economies of scale are difficult to identify and quantify and are rarely identifiable on a fund-by-fund basis. Based on this evaluation, the Board determined that the fees were reasonable in light of the information that was provided by SIMC with respect to economies of scale.
Based on the Trustees’ deliberation and their evaluation of the information described above, the Board, including all of the Independent Trustees, with the assistance of Fund counsel and Independent Trustees’ counsel, unanimously approved the approval or renewal, as applicable, of the Investment Advisory Agreements and concluded that the compensation under the Investment Advisory Agreements is fair and reasonable in light of such services and expenses and such other matters as the Trustees considered to be relevant in the exercise of their reasonable judgment. In the course of its deliberations, the Board did not identify any particular factor (or conclusion with respect thereto) or single piece of information that was all-important, controlling or determinative of its decision, but considered all of the factors together, and each Trustee may have attributed different weights to the various factors (and conclusions with respect thereto) and information.
SEI Institutional International Trust / Annual Report / September 30, 2020 |
105 |
NOTICE TO SHAREHOLDERS (Unaudited)
For shareholders who do not have a September 30, 2020, taxable year end, this notice is for informational purposes only. For shareholders with a September 30, 2020, taxable year end, please consult your tax adviser as to the pertinence of this notice.
For the fiscal year ended September 30, 2020, the Funds are designating long term and qualifying dividend income with regard to distributions paid during the year as follows:
| (A) Return of Capital | (B) Long Term | (C) Ordinary Income Distributions (Tax Basis) | (D) Total | (E) Dividends | (F) Qualifying | (G) U.S. | (H) Interest | (I) Short-Term | ||||||||||
International | 0.00% | 0.00% | 100.00% | 100.00% | 0.04% | 100.00% | 0.00% | 0.05% | 0.00% | |||||||||
Emerging Markets | 0.00% | 0.00% | 100.00% | 100.00% | 0.05% | 100.00% | 0.00% | 0.15% | 0.00% | |||||||||
International Fixed | 0.00% | 10.85% | 89.15% | 100.00% | 0.00% | 0.00% | 0.00% | 0.00% | 100.00% | |||||||||
Emerging Markets | 0.00% | 0.00% | 100.00% | 100.00% | 0.00% | 0.00% | 0.00% | 0.00% | 0.00% |
The Funds intend to pass through foreign tax credit to shareholders. For the fiscal year ended September 30, 2020, the amount of foreign source income and foreign tax credit are as follows:
| Fund | Foreign Source Income | Foreign Tax Credit Pass Through | ||||||
Emerging Markets Equity | $ | 13,402,348 | $ | 4,389,845 | ||||
International Equity | 52,215,806 | 8,187,257 | ||||||
| (1) | “Dividends Received Deduction” represent dividends which qualify for the corporate dividends received deduction. |
| (2) | “Qualifying Dividend Income” represent qualifying dividends as created by the Jobs and Growth Tax Relief Reconciliation Act of 2003. It is the intention of the Fund to designate the max amount permitted by law. |
| (3) | “U.S. Government Interest” represent the amount of interest that was derived from direct U.S. Government obligations and distributed during the fiscal year. Generally, interest from direct U.S. Government obligations is exempt from state income tax. However, for shareholders who are residents of California, Connecticut or New York, the statutory threshold requirements were not satisfied to permit exemption of these amounts from state income. |
| (4) | The percentage in this column represents the amount of “Interest Related Dividend” is reflected as a percentage of ordinary income distribution. Interest related dividends is exempted from U.S. withholding tax when paid to foreign investors. |
| (5) | The percentage of this column represents the amount of “Short Term Capital Gain Dividend” is reflected as a percentage of short term capital gain distribution that is exempted from U.S. withholding tax when paid to foreign investors. |
Items (A), (B), (C) and (D) are based on the percentage of each fund’s total distribution.
Items (E) and (F) are based on the percentage of “Ordinary Income Distributions.”
Item (G) is based on the percentage of gross income of each Fund.
Item (H) is based on the percentage of net investment income distributions.
Item (I) is based on the percentage of short-term capital gains distributions.
Please consult your tax adviser for proper treatment of this information. This notification should be kept with your permanent tax records.
106 |
SEI Institutional International Trust / Annual Report / September 30, 2020 |
SEI INSTITUTIONAL INTERNATIONAL TRUST / ANNUAL REPORT / SEPTEMBER 30, 2020
Robert A. Nesher, Chairman
Trustees
William M. Doran
George J. Sullivan, Jr.
Nina Lesavoy
James M. Williams
Mitchell A. Johnson
Hubert L. Harris, Jr.
Susan C. Cote
James B. Taylor
Christine Reynolds
Officers
Robert A. Nesher
President and Chief Executive Officer
Peter A. Rodriguez
Controller and Chief Financial Officer
Glenn R. Kurdziel
Assistant Controller
Russell Emery
Chief Compliance Officer
Timothy D. Barto
Vice President and Secretary
David F. McCann
Vice President and Assistant Secretary
Aaron Buser
Vice President and Assistant Secretary
Stephen G. MacRae
Vice President
Bridget E. Sudall
Anti-Money Laundering Compliance Officer and Privacy Officer
Investment Adviser
SEI Investments Management Corporation
Administrator
SEI Investments Global Funds Services
Distributor
SEI Investments Distribution Co.
Legal Counsel
Morgan, Lewis & Bockius LLP
Independent Registered Public Accounting Firm
KPMG LLP
This report and the financial statements contained herein are submitted for the general information of the shareholders of the Trust and must be preceded or accompanied by a current prospectus. Shares of the Funds are not deposits or obligations of, or guaranteed or endorsed by, any bank. The shares are not federally insured by the Federal Deposit Insurance Corporation (FDIC), the Federal Reserve Board, or any other government agency. Investment in the shares involves risk, including the possible loss of principal.
For more information call
1 800 DIAL SEI
(1 800 342 5734)

1 Freedom Valley Drive, P.O. Box 1100, Oaks, PA 19456
SEI-F-018 (9/20)
| Item 2. | Code of Ethics. |
The Registrant has adopted a code of ethics that applies to the Registrant’s principal executive officer, principal financial officer, principal accounting officer, or controller, or persons performing similar functions.
| Item 3. | Audit Committee Financial Expert. |
(a)(1) The Registrant’s Board of Trustees has determined that the Registrant has three financial experts serving on the audit committee.
(a) (2) The audit committee financial experts are Susan C. Cote, George J. Sullivan, Jr. and Hubert L. Harris, Jr. Ms. Cote and Messrs. Sullivan and Harris are independent as defined in Form N-CSR Item 3 (a) (2).
| Item 4. | Principal Accountant Fees and Services. |
Fees billed by KPMG LLP (“KPMG”) related to the Registrant.
KPMG billed the Registrant aggregate fees for services rendered to the Registrant for the fiscal years 2020 and 2019 as follows:
Fiscal Year 2020
| Fiscal Year 2019
| |||||||||||||
| All fees and services to the Registrant that were pre- approved | All fees and services to service affiliates that were pre- approved | All other fees and services to service affiliates that did not require pre- approval | All fees and services to the Registrant that were pre- approved | All fees and services to service affiliates that were pre- approved | All other fees and services to service affiliates that did not require pre- approval | |||||||||
| (a) | Audit Fees(1)
| $208,580 | $0 | N/A | $206,500 | $0 | N/A | |||||||
| (b) | Audit-Related Fees | $0 | $0 | $0 | $0 | $0 | $0 | |||||||
| (c) | Tax
| $0 | $0 | $0 | $0 | $0 | $0 | |||||||
| (d) | All Other Fees(2) | $0 | $534,502 | $0 | $0 | $289,100 | $0 | |||||||
Notes:
| (1) | Audit fees include amounts related to the audit of the Registrant’s annual financial statements and services normally provided by the accountant in connection with statutory and regulatory filings. |
| (2) | See Item 4(g) for a description of the services comprising the fees disclosed under this category. |
(e)(1) The Registrant’s Audit Committee has adopted and the Board of Trustees has ratified an Audit and Non-Audit Services Pre-Approval Policy (the “Policy”), which sets forth the procedures and the conditions pursuant to which services proposed to be performed by the independent auditor of the Registrant may be pre-approved. In any instance where services require pre-approval, the Audit Committee will consider whether such services are consistent with SEC’s rules on auditor independence and whether the provision of such services would compromise the auditor’s independence.
The Policy provides that all requests or applications for proposed services to be provided by the independent auditor must be submitted to the Registrant’s Chief Financial Officer (“CFO”) and must include a detailed description of the services proposed to be rendered. The CFO will determine whether such services: (1) require specific pre-approval; (2) are included within the list of services that have received the general pre-approval of the Audit Committee pursuant to the Policy; or (3) have been previously pre-approved in connection with the independent auditor’s annual engagement letter for the applicable year or otherwise.
Requests or applications to provide services that require specific pre-approval by the Audit Committee will be submitted to the Audit Committee by the CFO. The Audit Committee has delegated specific pre-approval authority to either the Audit Committee Chair or financial experts, provided that the estimated fee for any such proposed pre-approved service does not exceed $100,000 and any pre-approval decisions are reported to the Audit Committee at its next regularly scheduled meeting.
Services that have received the general pre-approval of the Audit Committee are identified and described in the Policy. In addition, the Policy sets forth a maximum fee per engagement with respect to each identified service that has received general pre-approval. The Audit Committee will annually review and pre-approve the services that may be provided by the independent auditor during the following twelve months without obtaining specific pre-approval from the Audit Committee.
The Audit Committee will be informed by the CFO on a quarterly basis of all services rendered by the independent auditor.
All services to be provided by the independent auditor shall be provided pursuant to a signed written engagement letter with the Registrant, the investment advisor or applicable control affiliate (except that matters as to which an engagement letter would be impractical because of timing issues or because the matter is small may not be the subject of an engagement letter) that sets forth both the services to be provided by the independent auditor and the total fees (or the manner of their determination) to be paid to the independent auditor for those services.
In addition, the Audit Committee has determined to take additional measures on an annual basis to meet its responsibility to oversee the work of the independent auditor and to assure the auditor’s independence from the Registrant, such as reviewing a formal written statement from the independent auditor delineating all relationships between the independent auditor and the Registrant, and discussing with the independent auditor its methods and procedures for ensuring independence.
(e)(2) Percentage of fees billed applicable to non-audit services pursuant to waiver of pre-approval requirement were as follows:
| Fiscal 2020 | Fiscal 2019 | |||
Audit-Related Fees
| 0%
| 0%
| ||
Tax Fees
| 0%
| 0%
| ||
All Other Fees
| 0%
| 0%
|
(f) Not Applicable.
(g)(1) The aggregate non-audit fees and services billed by KPMG for the fiscal years 2020 and 2019 were $534,502 and $289,100, respectively. Non-audit fees consist of SSAE No. 16 review of fund accounting and administration operations, and an attestation report in accordance with Rule 17Ad-13.
(h) During the past fiscal year, the Registrant’s principal accountant provided certain non-audit services to the Registrant’s investment adviser or to entities controlling, controlled by, or under common control with the Registrant’s investment adviser that provide ongoing services to the Registrant that were not subject to pre-approval pursuant to paragraph (c)(7)(ii) of Rule 2-01 of Regulation S-X. The Audit Committee of the Registrant’s Board of Trustees reviewed and considered these non-audit services provided by the Registrant’s principal accountant to the Registrant’s affiliates, including whether the provision of these non-audit services is compatible with maintaining the principal accountant’s independence.
| Item 5. | Audit Committee of Listed Registrants. |
Not applicable.
| Item 6. | Investments |
The Schedules of Investments in securities of unaffiliated issuers as of the close of the reporting period for the International Equity Fund, Emerging Markets Equity Fund, International Fixed Income Fund, and Emerging Markets Debt Fund are included as part of the report to shareholders filed under Item 1 of this form.
| Item 7. | Disclosure of Proxy Voting Policies and Procedures for Closed-End Management Investment Companies. |
Not applicable.
| Item 8. | Portfolio Managers of Closed-End Management Investment Companies |
Not applicable.
| Item 9. | Purchases of Equity Securities by Closed-End Management Company and Affiliated Purchasers. |
Not applicable.
| Item 10. | Submission of Matters to a Vote of Security Holders. |
There have been no material changes to the procedures by which shareholders may recommend nominees to the Registrant’s Board of Trustees (the “Board”). The Registrant has a standing Governance Committee (the “Committee”) currently consisting of the Independent Trustees. The Committee is responsible for evaluating and recommending nominees for election to the Board. Pursuant to the Committee’s Charter, adopted on June 18, 2004, as amended, the Committee will review all shareholder recommendations for nominations to fill vacancies on the Board if such recommendations are submitted in writing and addressed to the Committee at the Registrant’s office.
| Item 11. | Controls and Procedures. |
(a) The Registrant’s principal executive and principal financial officers, or persons performing similar functions, have concluded that the Registrant’s disclosure controls and procedures (as defined in Rule
30a-3(c) under the Investment Company Act of 1940 (the “1940 Act”)) are effective, based on the evaluation of these controls and procedures required by Rule 30a-3(b) under the 1940 Act and Rules 13a-15(b) or 15d-15(b) under the Securities Exchange Act of 1934 as of a date within 90 days of the filing date of this report.
(b) There were no changes in the Registrant’s internal control over financial reporting (as defined in Rule 30a-3(d) under the 1940 Act) that occurred during the period covered by this report that have materially affected, or are reasonably likely to materially affect, the Registrant’s internal control over financial reporting.
| Item 12. | Disclosure of Securities Lending Activities for Closed-End Management Investment Companies. |
Not applicable.
| Item 13. | Exhibits. |
(a)(1) Code of Ethics attached hereto.
SIGNATURES
Pursuant to the requirements of the Securities Exchange Act of 1934 and the Investment Company Act of 1940, the Registrant has duly caused this report to be signed on its behalf by the undersigned, thereunto duly authorized.
| SEI Institutional International Trust | ||||||
| By: | /s/ Robert A. Nesher | |||||
| Robert A. Nesher | ||||||
| President & CEO | ||||||
Date: December 8, 2020
Pursuant to the requirements of the Securities Exchange Act of 1934 and the Investment Company Act of 1940, this report has been signed below by the following persons on behalf of the Registrant and in the capacities and on the dates indicated.
| By: | /s/ Robert A. Nesher | |||||
| Robert A. Nesher | ||||||
| President & CEO |
Date: December 8, 2020
| By: | /s/ Peter A. Rodriguez | |||||
| Peter A. Rodriguez | ||||||
| Controller & CFO |
Date: December 8, 2020